UNITED STATES
SECURITIES AND EXCHANGE COMMISSION
Washington, D.C. 20549
FORMN-CSR
CERTIFIED SHAREHOLDER REPORT OF
REGISTERED MANAGEMENT INVESTMENT COMPANIES
Investment Company Act file number811-04777
MFS SERIES TRUST I
(Exact name of registrant as specified in charter)
111 Huntington Avenue, Boston, Massachusetts 02199
(Address of principal executive offices) (Zip code)
Christopher R. Bohane
Massachusetts Financial Services Company
111 Huntington Avenue
Boston, Massachusetts 02199
(Name and address of agents for service)
Registrant’s telephone number, including area code: (617)954-5000
Date of fiscal year end: August 31
Date of reporting period: February 29, 2020
| ITEM 1. | REPORTS TO STOCKHOLDERS. |
Semiannual Report
February 29, 2020

MFS® Core Equity Fund

Beginning on January 1, 2021, as permitted by regulations adopted by the U.S. Securities and Exchange Commission, paper copies of the fund’s annual and semiannual shareholder reports will no longer be sent by mail, unless you specifically request paper copies of the reports. Instead, the complete reports will be made available on the fund’s Web site (funds.mfs.com), and you will be notified by mail each time a report is posted and provided with a Web site link to access the report.
If you are already signed up to receive shareholder reports by email, you will not be affected by this change and you need not take any action. You may sign up to receive shareholder reports and other communications from the fund by email by contacting your financial intermediary (such as a broker-dealer or bank) or, if you hold your shares directly with the fund, by calling 1-800-225-2606 or by logging on to MFS Access at mfs.com.
Beginning on January 1, 2019, you may elect to receive all future reports in paper free of charge. Contact your financial intermediary to request that you continue to receive paper copies of your shareholder reports. If you invest directly with the fund, you can call 1-800-225-2606 or send an email request to orderliterature@mfs.com to let the fund know that you wish to continue receiving paper copies of your shareholder reports. Your election to receive reports in paper will apply to all funds held in your account if you invest through your financial intermediary or all funds held with the MFS fund complex if you invest directly.
RGI-SEM
MFS® Core Equity Fund
CONTENTS
The report is prepared for the general information of shareholders.
It is authorized for distribution to prospective investors only when preceded or accompanied by a current prospectus.
NOT FDIC INSURED• MAY LOSE VALUE• NO BANK GUARANTEE

LETTER FROM THE EXECUTIVE CHAIR
Dear Shareholders:
During the first quarter of 2020, market volatility reached levels not seen since the global financial crisis. Optimism heading into the year — on receding trade and
geopolitical risk along with easier central bank policies — was overwhelmed in February as the health effects of a novel coronavirus,COVID-19, spread beyond China’s borders, ultimately impacting more than 200 countries. The global pandemic prompted many governments to take drastic action to slow the spread of the virus, such as quarantines, school and business closures, and prohibitions on public gatherings. While these are important steps to protect the public health, they come at a cost: rising market volatility and an abrupt decline in economic growth.
Global central banks have taken aggressive, coordinated steps to cushion the economic and market fallout related to the virus, and
governments are undertaking unprecedented levels of fiscal stimulus. As uncertainty recedes, these measures can help create a supportive environment and encourage economic recovery. In the aftermath of the crisis, there are likely to be societal changes as households, businesses and governments adjust to a new reality and these alterations could change the investment landscape. Occurrences such as the COVID-19 outbreak demonstrate the importance of having a deep understanding of company fundamentals, and our global research platform has been built to do just that.
Here at MFS®, we aim to help our clients navigate the growing complexity of the markets and world economies. Our long-term investment philosophy and commitment to the responsible allocation of capital allow us to tune out the noise and uncover what we believe are the best, most durable investment opportunities in the market. Through our powerful global investment platform, we combine collective expertise, thoughtful risk management, and long-term discipline to create sustainable value for investors.
Respectfully,

Robert J. Manning
Executive Chair
MFS Investment Management
April 16, 2020
The opinions expressed in this letter are subject to change and may not be relied upon for investment advice. No forecasts can be guaranteed.
1
PORTFOLIO COMPOSITION
Portfolio structure

| | | | |
| Top ten holdings | | | | |
| Apple, Inc. | | | 4.9% | |
| Microsoft Corp. | | | 4.2% | |
| Amazon.com, Inc. | | | 3.4% | |
| Alphabet, Inc., “A” | | | 3.2% | |
| Johnson & Johnson | | | 2.2% | |
| Aon PLC | | | 2.1% | |
| Visa, Inc., “A” | | | 2.0% | |
| Facebook, Inc., “A” | | | 2.0% | |
| American Tower Corp., REIT | | | 1.7% | |
| Salesforce.com, Inc. | | | 1.6% | |
| | | | |
| Global equity sectors (k) | | | | |
| Technology | | | 27.5% | |
| Financial Services | | | 17.6% | |
| Health Care (s) | | | 14.1% | |
| Consumer Cyclicals | | | 12.0% | |
| Capital Goods (s) | | | 11.8% | |
| Energy | | | 6.7% | |
| Consumer Staples | | | 5.1% | |
| Telecommunications/Cable Television (s) | | | 3.9% | |
| (k) | The sectors set forth above and the associated portfolio composition are based on MFS’ own custom sector classification methodology. |
| (s) | Includes securities sold short. |
Cash & Cash Equivalents includes any cash, investments in money market funds, short-term securities, and other assets less liabilities. Please see the Statement of Assets and Liabilities for additional information related to the fund’s cash position and other assets and liabilities.
Percentages are based on net assets as of February 29, 2020.
The portfolio is actively managed and current holdings may be different.
2
EXPENSE TABLE
Fund expenses borne by the shareholders during the period, September 1, 2019 through February 29, 2020
As a shareholder of the fund, you incur two types of costs: (1) transaction costs, including sales charges (loads) on certain purchase or redemption payments, and (2) ongoing costs, including management fees; distribution and service(12b-1) fees; and other fund expenses. This example is intended to help you understand your ongoing costs (in dollars) of investing in the fund and to compare these costs with the ongoing costs of investing in other mutual funds.
The example is based on an investment of $1,000 invested at the beginning of the period and held for the entire period September 1, 2019 through February 29, 2020.
Actual Expenses
The first line for each share class in the following table provides information about actual account values and actual expenses. You may use the information in this line, together with the amount you invested, to estimate the expenses that you paid over the period. Simply divide your account value by $1,000 (for example, an $8,600 account value divided by $1,000 = 8.6), then multiply the result by the number in the first line under the heading entitled “Expenses Paid During Period” to estimate the expenses you paid on your account during this period.
Hypothetical Example for Comparison Purposes
The second line for each share class in the following table provides information about hypothetical account values and hypothetical expenses based on the fund’s actual expense ratio and an assumed rate of return of 5% per year before expenses, which is not the fund’s actual return. The hypothetical account values and expenses may not be used to estimate the actual ending account balance or expenses you paid for the period. You may use this information to compare the ongoing costs of investing in the fund and other funds. To do so, compare this 5% hypothetical example with the 5% hypothetical examples that appear in the shareholder reports of the other funds.
Please note that the expenses shown in the table are meant to highlight your ongoing costs only and do not reflect any transactional costs, such as sales charges (loads). Therefore, the second line for each share class in the table is useful in comparing ongoing costs only, and will not help you determine the relative total costs of owning different funds. In addition, if these transactional costs were included, your costs would have been higher.
3
Expense Table – continued
| | | | | | | | | | | | | | | | | | |
Share
Class | | | | Annualized
Expense Ratio | | | Beginning
Account Value
9/01/19 | | | Ending
Account Value
2/29/20 | | | Expenses
Paid During
Period (p)
9/01/19-2/29/20 | |
| A | | Actual | | | 0.94% | | | | $1,000.00 | | | | $1,015.03 | | | | $4.71 | |
| | Hypothetical (h) | | | 0.94% | | | | $1,000.00 | | | | $1,020.19 | | | | $4.72 | |
| B | | Actual | | | 1.69% | | | | $1,000.00 | | | | $1,011.48 | | | | $8.45 | |
| | Hypothetical (h) | | | 1.69% | | | | $1,000.00 | | | | $1,016.46 | | | | $8.47 | |
| C | | Actual | | | 1.69% | | | | $1,000.00 | | | | $1,011.22 | | | | $8.45 | |
| | Hypothetical (h) | | | 1.69% | | | | $1,000.00 | | | | $1,016.46 | | | | $8.47 | |
| I | | Actual | | | 0.69% | | | | $1,000.00 | | | | $1,016.61 | | | | $3.46 | |
| | Hypothetical (h) | | | 0.69% | | | | $1,000.00 | | | | $1,021.43 | | | | $3.47 | |
| R1 | | Actual | | | 1.69% | | | | $1,000.00 | | | | $1,011.27 | | | | $8.45 | |
| | Hypothetical (h) | | | 1.69% | | | | $1,000.00 | | | | $1,016.46 | | | | $8.47 | |
| R2 | | Actual | | | 1.18% | | | | $1,000.00 | | | | $1,013.98 | | | | $5.91 | |
| | Hypothetical (h) | | | 1.18% | | | | $1,000.00 | | | | $1,019.00 | | | | $5.92 | |
| R3 | | Actual | | | 0.94% | | | | $1,000.00 | | | | $1,015.13 | | | | $4.71 | |
| | Hypothetical (h) | | | 0.94% | | | | $1,000.00 | | | | $1,020.19 | | | | $4.72 | |
| R4 | | Actual | | | 0.69% | | | | $1,000.00 | | | | $1,016.35 | | | | $3.46 | |
| | Hypothetical (h) | | | 0.69% | | | | $1,000.00 | | | | $1,021.43 | | | | $3.47 | |
| R6 | | Actual | | | 0.62% | | | | $1,000.00 | | | | $1,016.76 | | | | $3.11 | |
| | Hypothetical (h) | | | 0.62% | | | | $1,000.00 | | | | $1,021.78 | | | | $3.12 | |
| (h) | 5% class return per year before expenses. |
| (p) | “Expenses Paid During Period” are equal to each class’s annualized expense ratio, as shown above, multiplied by the average account value over the period, multiplied by 182/366 (to reflect theone-half year period). Expenses paid do not include any applicable sales charges (loads). If these transaction costs had been included, your costs would have been higher. |
Notes to Expense Table
Expense ratios include 0.03% of investment related expenses from short sales (See Note 2 of the Notes to Financial Statements). Each class with a Rule12b-1 service fee is subject to a rebate of a portion of such fee. Such rebates are included in the expense ratios above. For Class A and Class R2 shares, this rebate reduced the expense ratios above by 0.01%. See Note 3 in the Notes to Financial Statements for additional information.
4
PORTFOLIO OF INVESTMENTS
2/29/20 (unaudited)
The Portfolio of Investments is a complete list of all securities owned by your fund. It is categorized by broad-based asset classes.
| | | | | | | | |
| | |
| Issuer | | Shares/Par | | | Value ($) | |
| Common Stocks - 99.1% | | | | | | |
| Aerospace - 3.6% | | | | | | |
| CACI International, Inc., “A” (a) | | | 28,276 | | | $ | 6,928,186 | |
| Curtiss-Wright Corp. | | | 46,685 | | | | 5,599,399 | |
| Honeywell International, Inc. | | | 223,516 | | | | 36,247,590 | |
| Huntington Ingalls Industries, Inc. | | | 24,244 | | | | 4,982,869 | |
| L3Harris Technologies, Inc. | | | 61,281 | | | | 12,117,092 | |
| Northrop Grumman Corp. | | | 52,786 | | | | 17,358,148 | |
| PAE, Inc. (a) | | | 706,683 | | | | 7,738,179 | |
| United Technologies Corp. | | | 226,927 | | | | 29,634,397 | |
| | | | | | | | |
| | | | | | | $ | 120,605,860 | |
| Alcoholic Beverages - 0.3% | | | | | | |
| Constellation Brands, Inc., “A” | | | 60,030 | | | $ | 10,347,971 | |
| | |
| Automotive - 0.6% | | | | | | |
| Copart, Inc. (a) | | | 100,793 | | | $ | 8,514,993 | |
| IAA, Inc. (a) | | | 82,130 | | | | 3,508,593 | |
| Lear Corp. | | | 55,942 | | | | 6,220,750 | |
| Stoneridge, Inc. (a) | | | 157,777 | | | | 3,486,872 | |
| | | | | | | | |
| | | | | | | $ | 21,731,208 | |
| Biotechnology - 0.4% | | | | | | |
| Adaptive Biotechnologies Corp. (a) | | | 65,354 | | | $ | 1,836,448 | |
| Illumina, Inc. (a) | | | 48,814 | | | | 12,968,415 | |
| | | | | | | | |
| | | | | | | $ | 14,804,863 | |
| Broadcasting - 0.6% | | | | | | |
| Netflix, Inc. (a) | | | 52,137 | | | $ | 19,240,117 | |
| | |
| Brokerage & Asset Managers - 1.8% | | | | | | |
| Charles Schwab Corp. | | | 968,536 | | | $ | 39,467,842 | |
| NASDAQ, Inc. | | | 187,807 | | | | 19,259,608 | |
| | | | | | | | |
| | | | | | | $ | 58,727,450 | |
| Business Services - 3.8% | | | | | | |
| Accenture PLC, “A” | | | 54,998 | | | $ | 9,932,089 | |
| Amdocs Ltd. | | | 131,519 | | | | 8,384,336 | |
| Clarivate Analytics PLC (a) | | | 1,164,376 | | | | 23,683,408 | |
| Fidelity National Information Services, Inc. | | | 145,925 | | | | 20,388,641 | |
| Fiserv, Inc. (a) | | | 150,533 | | | | 16,462,289 | |
| Global Payments, Inc. | | | 112,375 | | | | 20,673,628 | |
| Verisk Analytics, Inc., “A” | | | 171,845 | | | | 26,654,878 | |
| | | | | | | | |
| | | | | | | $ | 126,179,269 | |
5
Portfolio of Investments (unaudited) – continued
| | | | | | | | |
| | |
| Issuer | | Shares/Par | | | Value ($) | |
| Common Stocks - continued | | | | | | |
| Cable TV - 1.3% | | | | | | |
| Cable One, Inc. | | | 2,601 | | | $ | 4,091,425 | |
| Charter Communications, Inc., “A” (a) | | | 67,075 | | | | 33,079,378 | |
| Comcast Corp., “A” | | | 188,673 | | | | 7,628,049 | |
| | | | | | | | |
| | | | | | | $ | 44,798,852 | |
| Chemicals - 0.3% | | | | | | |
| FMC Corp. | | | 72,639 | | | $ | 6,762,691 | |
| Ingevity Corp. (a) | | | 56,479 | | | | 2,543,814 | |
| | | | | | | | |
| | | | | | | $ | 9,306,505 | |
| Computer Software - 8.3% | | | | | | |
| Adobe Systems, Inc. (a) | | | 138,527 | | | $ | 47,808,438 | |
| Black Knight, Inc. (a) | | | 149,886 | | | | 9,998,895 | |
| Cadence Design Systems, Inc. (a) | | | 226,688 | | | | 14,993,144 | |
| Everbridge, Inc. (a) | | | 115,851 | | | | 12,240,817 | |
| Microsoft Corp. | | | 864,975 | | | | 140,134,600 | |
| Salesforce.com, Inc. (a) | | | 306,274 | | | | 52,189,090 | |
| | | | | | | | |
| | | | | | | $ | 277,364,984 | |
| Computer Software - Systems - 6.7% | | | | | | |
| Apple, Inc. (s) | | | 601,388 | | | $ | 164,395,424 | |
| EPAM Systems, Inc. (a) | | | 49,263 | | | | 10,995,501 | |
| Rapid7, Inc. (a) | | | 178,863 | | | | 8,281,357 | |
| ServiceNow, Inc. (a) | | | 63,376 | | | | 20,666,280 | |
| Square, Inc., “A” (a) | | | 100,057 | | | | 8,337,750 | |
| Zebra Technologies Corp., “A” (a) | | | 44,581 | | | | 9,405,253 | |
| | | | | | | | |
| | | | | | | $ | 222,081,565 | |
| Construction - 1.1% | | | | | | |
| Masco Corp. | | | 176,617 | | | $ | 7,297,815 | |
| Toll Brothers, Inc. | | | 580,494 | | | | 21,495,693 | |
| Vulcan Materials Co. | | �� | 69,001 | | | | 8,298,060 | |
| | | | | | | | |
| | | | | | | $ | 37,091,568 | |
| Consumer Products - 1.5% | | | | | | |
| Colgate-Palmolive Co. | | | 229,848 | | | $ | 15,530,830 | |
| Energizer Holdings, Inc. | | | 48,098 | | | | 2,067,733 | |
| Kimberly-Clark Corp. | | | 107,343 | | | | 14,082,328 | |
| Procter & Gamble Co. | | | 153,009 | | | | 17,325,209 | |
| | | | | | | | |
| | | | | | | $ | 49,006,100 | |
| Consumer Services - 0.8% | | | | | | |
| Booking Holdings, Inc. (a) | | | 5,905 | | | $ | 10,012,872 | |
| Bright Horizons Family Solutions, Inc. (a) | | | 50,066 | | | | 7,867,872 | |
6
Portfolio of Investments (unaudited) – continued
| | | | | | | | |
| | |
| Issuer | | Shares/Par | | | Value ($) | |
| Common Stocks - continued | | | | | | |
| Consumer Services - continued | | | | | | |
| Grand Canyon Education, Inc. (a) | | | 100,296 | | | $ | 8,091,881 | |
| | | | | | | | |
| | | | | | | $ | 25,972,625 | |
| Containers - 0.2% | | | | | | |
| Ball Corp. | | | 50,270 | | | $ | 3,542,024 | |
| Sealed Air Corp. | | | 127,822 | | | | 3,874,285 | |
| | | | | | | | |
| | | | | | | $ | 7,416,309 | |
| Electrical Equipment - 1.8% | | | | | | |
| AMETEK, Inc. | | | 262,259 | | | $ | 22,554,274 | |
| Fortive Corp. | | | 208,204 | | | | 14,399,389 | |
| HD Supply Holdings, Inc. (a) | | | 255,061 | | | | 9,697,419 | |
| Sensata Technologies Holding PLC (a) | | | 225,150 | | | | 9,186,120 | |
| TE Connectivity Ltd. | | | 68,535 | | | | 5,679,495 | |
| | | | | | | | |
| | | | | | | $ | 61,516,697 | |
| Electronics - 3.1% | | | | | | |
| Analog Devices, Inc. | | | 161,195 | | | $ | 17,578,315 | |
| Applied Materials, Inc. | | | 119,697 | | | | 6,956,790 | |
| Marvell Technology Group Ltd. | | | 502,798 | | | | 10,709,597 | |
| Mellanox Technologies Ltd. (a) | | | 39,113 | | | | 4,670,874 | |
| Monolithic Power Systems, Inc. | | | 28,009 | | | | 4,443,348 | |
| nLIGHT, Inc. (a) | | | 131,050 | | | | 2,163,636 | |
| NXP Semiconductors N.V. | | | 237,926 | | | | 27,049,807 | |
| Silicon Laboratories, Inc. (a) | | | 42,877 | | | | 3,802,332 | |
| Texas Instruments, Inc. | | | 231,134 | | | | 26,381,635 | |
| | | | | | | | |
| | | | | | | $ | 103,756,334 | |
| Energy - Independent - 1.2% | | | | | | |
| ConocoPhillips | | | 275,934 | | | $ | 13,360,724 | |
| Diamondback Energy, Inc. | | | 81,162 | | | | 5,032,044 | |
| Pioneer Natural Resources Co. | | | 59,232 | | | | 7,272,505 | |
| Valero Energy Corp. | | | 236,163 | | | | 15,645,799 | |
| | | | | | | | |
| | | | | | | $ | 41,311,072 | |
| Energy - Integrated - 1.3% | | | | | | |
| Chevron Corp. | | | 472,431 | | | $ | 44,096,710 | |
| | |
| Engineering - Construction - 0.2% | | | | | | |
| KBR, Inc. | | | 225,395 | | | $ | 5,851,254 | |
| | |
| Food & Beverages - 2.8% | | | | | | |
| Archer Daniels Midland Co. | | | 220,979 | | | $ | 8,319,859 | |
| Coca-Cola Co. | | | 134,187 | | | | 7,177,663 | |
| Coca-Cola European Partners PLC | | | 127,563 | | | | 6,500,611 | |
7
Portfolio of Investments (unaudited) – continued
| | | | | | | | |
| | |
| Issuer | | Shares/Par | | | Value ($) | |
| Common Stocks - continued | | | | | | |
| Food & Beverages - continued | | | | | | |
| Hostess Brands, Inc. (a) | | | 431,244 | | | $ | 5,481,111 | |
| J.M. Smucker Co. | | | 55,161 | | | | 5,681,031 | |
| Mondelez International, Inc. | | | 438,781 | | | | 23,167,637 | |
| Nomad Foods Ltd. (a) | | | 163,076 | | | | 3,010,383 | |
| PepsiCo, Inc. | | | 250,033 | | | | 33,011,857 | |
| | | | | | | | |
| | | | | | | $ | 92,350,152 | |
| Food & Drug Stores - 1.0% | | | | | | |
| Wal-Mart Stores, Inc. | | | 303,609 | | | $ | 32,692,617 | |
| | |
| Gaming & Lodging - 0.8% | | | | | | |
| Marriott International, Inc., “A” | | | 141,885 | | | $ | 17,593,740 | |
| Wyndham Hotels & Resorts, Inc. | | | 208,782 | | | | 10,637,443 | |
| | | | | | | | |
| | | | | | | $ | 28,231,183 | |
| General Merchandise - 1.7% | | | | | | |
| Dollar General Corp. | | | 158,488 | | | $ | 23,820,747 | |
| Dollar Tree, Inc. (a) | | | 233,969 | | | | 19,426,446 | |
| Ollie’s Bargain Outlet Holdings, Inc. (a) | | | 240,274 | | | | 12,222,738 | |
| | | | | | | | |
| | | | | | | $ | 55,469,931 | |
| Health Maintenance Organizations - 1.6% | | | | | | |
| Cigna Corp. | | | 160,418 | | | $ | 29,346,869 | |
| Humana, Inc. | | | 71,336 | | | | 22,804,692 | |
| | | | | | | | |
| | | | | | | $ | 52,151,561 | |
| Insurance - 4.3% | | | | | | |
| Aon PLC | | | 343,705 | | | $ | 71,490,640 | |
| Assurant, Inc. | | | 92,698 | | | | 11,178,452 | |
| Chubb Ltd. | | | 157,966 | | | | 22,909,809 | |
| Everest Re Group Ltd. | | | 24,899 | | | | 6,171,964 | |
| Hartford Financial Services Group, Inc. | | | 231,259 | | | | 11,551,387 | |
| MetLife, Inc. | | | 213,096 | | | | 9,103,461 | |
| Reinsurance Group of America, Inc. | | | 44,285 | | | | 5,404,099 | |
| Third Point Reinsurance Ltd. (a) | | | 809,181 | | | | 7,217,894 | |
| | | | | | | | |
| | | | | | | $ | 145,027,706 | |
| Internet - 5.2% | | | | | | |
| Alphabet, Inc., “A” (a)(s) | | | 78,821 | | | $ | 105,561,024 | |
| Facebook, Inc., “A” (a) | | | 347,652 | | | | 66,912,581 | |
| | | | | | | | |
| | | | | | | $ | 172,473,605 | |
| Leisure & Toys - 0.6% | | | | | | |
| Electronic Arts, Inc. (a) | | | 195,755 | | | $ | 19,843,684 | |
8
Portfolio of Investments (unaudited) – continued
| | | | | | | | |
| | |
| Issuer | | Shares/Par | | | Value ($) | |
| Common Stocks - continued | | | | | | |
| Machinery & Tools - 1.2% | | | | | | |
| Flowserve Corp. | | | 209,505 | | | $ | 8,420,006 | |
| IDEX Corp. | | | 38,014 | | | | 5,626,072 | |
| ITT, Inc. | | | 94,096 | | | | 5,659,874 | |
| Roper Technologies, Inc. | | | 55,922 | | | | 19,667,768 | |
| | | | | | | | |
| | | | | | | $ | 39,373,720 | |
| Major Banks - 1.9% | | | | | | |
| Goldman Sachs Group, Inc. | | | 219,043 | | | $ | 43,977,263 | |
| PNC Financial Services Group, Inc. | | | 163,409 | | | | 20,654,898 | |
| | | | | | | | |
| | | | | | | $ | 64,632,161 | |
| Medical & Health Technology & Services - 1.5% | | | | | | |
| Guardant Health, Inc. (a) | | | 21,497 | | | $ | 1,869,379 | |
| HCA Healthcare, Inc. | | | 112,901 | | | | 14,339,556 | |
| HealthEquity, Inc. (a) | | | 132,413 | | | | 9,399,999 | |
| McKesson Corp. | | | 73,006 | | | | 10,210,619 | |
| PRA Health Sciences, Inc. (a) | | | 106,449 | | | | 10,027,496 | |
| Premier, Inc., “A” (a) | | | 193,114 | | | | 5,683,345 | |
| | | | | | | | |
| | | | | | | $ | 51,530,394 | |
| Medical Equipment - 4.1% | | | | | | |
| Becton, Dickinson and Co. | | | 85,967 | | | $ | 20,444,672 | |
| Boston Scientific Corp. (a) | | | 563,264 | | | | 21,060,441 | |
| Danaher Corp. | | | 98,136 | | | | 14,188,503 | |
| Masimo Corp. (a) | | | 39,942 | | | | 6,523,727 | |
| Medtronic PLC | | | 367,264 | | | | 36,972,467 | |
| PerkinElmer, Inc. | | | 206,554 | | | | 17,854,528 | |
| STERIS PLC | | | 81,262 | | | | 12,889,778 | |
| West Pharmaceutical Services, Inc. | | | 44,552 | | | | 6,707,749 | |
| | | | | | | | |
| | | | | | | $ | 136,641,865 | |
| Natural Gas - Pipeline - 0.4% | | | | | | |
| Enterprise Products Partners LP | | | 368,563 | | | $ | 8,602,260 | |
| Equitrans Midstream Corp. | | | 470,150 | | | | 3,319,259 | |
| | | | | | | | |
| | | | | | | $ | 11,921,519 | |
| Network & Telecom - 0.5% | | | | | | |
| Equinix, Inc., REIT | | | 22,384 | | | $ | 12,821,555 | |
| Interxion Holding N.V. (a) | | | 53,909 | | | | 4,576,335 | |
| | | | | | | | |
| | | | | | | $ | 17,397,890 | |
| Oil Services - 0.3% | | | | | | |
| Cactus, Inc., “A” | | | 99,216 | | | $ | 2,709,589 | |
| Core Laboratories N.V. | | | 131,962 | | | | 3,541,860 | |
9
Portfolio of Investments (unaudited) – continued
| | | | | | | | |
| | |
| Issuer | | Shares/Par | | | Value ($) | |
| Common Stocks - continued | | | | | | |
| Oil Services - continued | | | | | | |
| Patterson-UTI Energy, Inc. | | | 736,522 | | | $ | 4,220,271 | |
| | | | | | | | |
| | | | | | | $ | 10,471,720 | |
| Other Banks & Diversified Financials - 6.7% | | | | | | |
| Bank OZK | | | 335,384 | | | $ | 8,515,400 | |
| Citigroup, Inc. | | | 666,430 | | | | 42,291,648 | |
| Northern Trust Corp. | | | 116,347 | | | | 10,210,613 | |
| Prosperity Bancshares, Inc. | | | 53,491 | | | | 3,455,518 | |
| S&P Global, Inc. | | | 44,087 | | | | 11,723,174 | |
| SLM Corp. | | | 1,214,331 | | | | 12,592,612 | |
| SVB Financial Group (a) | | | 19,286 | | | | 4,014,574 | |
| Truist Financial Corp. | | | 743,917 | | | | 34,324,330 | |
| U.S. Bancorp | | | 633,591 | | | | 29,423,966 | |
| Visa, Inc., “A” | | | 369,364 | | | | 67,135,601 | |
| | | | | | | | |
| | | | | | | $ | 223,687,436 | |
| Pharmaceuticals - 6.8% | | | | | | |
| Elanco Animal Health, Inc. (a) | | | 740,079 | | | $ | 20,278,165 | |
| Eli Lilly & Co. | | | 331,061 | | | | 41,756,724 | |
| Johnson & Johnson | | | 557,284 | | | | 74,943,552 | |
| Merck & Co., Inc. | | | 548,045 | | | | 41,958,325 | |
| Zoetis, Inc. | | | 352,136 | | | | 46,915,079 | |
| | | | | | | | |
| | | | | | | $ | 225,851,845 | |
| Pollution Control - 0.3% | | | | | | |
| Waste Connections, Inc. | | | 107,538 | | | $ | 10,376,342 | |
| | |
| Railroad & Shipping - 1.2% | | | | | | |
| Canadian National Railway Co. | | | 229,936 | | | $ | 19,523,866 | |
| Canadian Pacific Railway Ltd. | | | 82,002 | | | | 20,399,637 | |
| | | | | | | | |
| | | | | | | $ | 39,923,503 | |
| Real Estate - 2.6% | | | | | | |
| EPR Properties, REIT | | | 225,672 | | | $ | 13,368,809 | |
| Industrial Logistics Properties Trust, REIT | | | 571,102 | | | | 11,798,967 | |
| Lexington Realty Trust, REIT | | | 517,840 | | | | 5,370,001 | |
| Medical Properties Trust, Inc., REIT | | | 956,973 | | | | 20,220,840 | |
| STORE Capital Corp., REIT | | | 413,774 | | | | 13,596,614 | |
| Sun Communities, Inc., REIT | | | 34,381 | | | | 5,256,167 | |
| W.P. Carey, Inc., REIT | | | 239,762 | | | | 18,559,976 | |
| | | | | | | | |
| | | | | | | $ | 88,171,374 | |
10
Portfolio of Investments (unaudited) – continued
| | | | | | | | |
| | |
| Issuer | | Shares/Par | | | Value ($) | |
| Common Stocks - continued | | | | | | |
| Restaurants - 1.1% | | | | | | |
| Starbucks Corp. | | | 357,138 | | | $ | 28,010,333 | |
| U.S. Foods Holding Corp. (a) | | | 234,658 | | | | 7,893,895 | |
| | | | | | | | |
| | | | | | | $ | 35,904,228 | |
| Specialty Chemicals - 1.5% | | | | | | |
| Axalta Coating Systems Ltd. (a) | | | 639,746 | | | $ | 15,942,470 | |
| Corteva, Inc. | | | 404,126 | | | | 10,992,227 | |
| DuPont de Nemours, Inc. | | | 249,331 | | | | 10,696,300 | |
| Element Solutions, Inc. (a) | | | 611,195 | | | | 6,350,316 | |
| Univar Solutions, Inc. (a) | | | 268,715 | | | | 4,565,468 | |
| | | | | | | | |
| | | | | | | $ | 48,546,781 | |
| Specialty Stores - 5.3% | | | | | | |
| Amazon.com, Inc. (a)(s) | | | 59,955 | | | $ | 112,940,231 | |
| Burlington Stores, Inc. (a) | | | 86,323 | | | | 18,668,212 | |
| Ross Stores, Inc. | | | 182,830 | | | | 19,888,248 | |
| Target Corp. | | | 237,026 | | | | 24,413,678 | |
| | | | | | | | |
| | | | | | | $ | 175,910,369 | |
| Telecommunications - Wireless - 1.7% | | | | | | |
| American Tower Corp., REIT | | | 251,142 | | | $ | 56,959,006 | |
| | |
| Telephone Services - 1.0% | | | | | | |
| Verizon Communications, Inc. | | | 640,813 | | | $ | 34,706,432 | |
| | |
| Tobacco - 0.6% | | | | | | |
| Philip Morris International, Inc. | | | 229,942 | | | $ | 18,825,352 | |
| | |
| Trucking - 0.2% | | | | | | |
| Forward Air Corp. | | | 113,360 | | | $ | 6,689,374 | |
| | |
| Utilities - Electric Power - 3.3% | | | | | | |
| American Electric Power Co., Inc. | | | 170,879 | | | $ | 15,252,659 | |
| CenterPoint Energy, Inc. | | | 366,310 | | | | 8,432,456 | |
| CMS Energy Corp. | | | 208,018 | | | | 12,568,448 | |
| Duke Energy Corp. | | | 40,151 | | | | 3,681,847 | |
| Evergy, Inc. | | | 198,983 | | | | 13,003,539 | |
| Exelon Corp. | | | 294,540 | | | | 12,697,619 | |
| NextEra Energy, Inc. | | | 99,693 | | | | 25,198,403 | |
| Southern Co. | | | 105,116 | | | | 6,344,802 | |
| Xcel Energy, Inc. | | | 224,916 | | | | 14,016,765 | |
| | | | | | | | |
| | | | | | | $ | 111,196,538 | |
| Total Common Stocks (Identified Cost, $2,785,824,455) | | | $ | 3,308,165,601 | |
11
Portfolio of Investments (unaudited) – continued
| | | | | | | | |
| | |
| Issuer | | Shares/Par | | | Value ($) | |
| Convertible Preferred Stocks - 0.1% | | | | | | |
| Natural Gas - Distribution - 0.1% | | | | | | |
| South Jersey Industries, Inc. | | | 40,507 | | | $ | 1,866,562 | |
| | |
| Utilities - Electric Power - 0.0% | | | | | | |
| American Electric Power Co., Inc. | | | 14,450 | | | $ | 749,666 | |
Total Convertible Preferred Stocks
(Identified Cost, $2,755,559) | | | | | | $ | 2,616,228 | |
| | |
| Investment Companies (h) - 1.7% | | | | | | |
| Money Market Funds - 1.7% | | | | | | |
MFS Institutional Money Market Portfolio, 1.61% (v)
(Identified Cost, $59,061,157) | | | 59,063,086 | | | $ | 59,068,993 | |
| | |
| Securities Sold Short - (0.5)% | | | | | | |
| Medical & Health Technology & Services - (0.3)% | | | | | | |
| Healthcare Services Group, Inc. | | | (326,437 | ) | | $ | (8,990,075 | ) |
| | |
| Telecommunications - Wireless - (0.2)% | | | | | | |
| Crown Castle International Corp., REIT | | | (44,300 | ) | | $ | (6,347,747 | ) |
| | |
| Trucking - (0.0)% | | | | | | |
| XPO Logistics, Inc. (s) | | | (25,219 | ) | | $ | (1,865,449 | ) |
Total Securities Sold Short
(Proceeds Received, $15,997,832) | | | | | | $ | (17,203,271 | ) |
| | |
| Other Assets, Less Liabilities - (0.4)% | | | | | (14,582,263) | |
| Net Assets - 100.0% | | | | | | $ | 3,338,065,288 | |
| (a) | Non-income producing security. |
| (h) | An affiliated issuer, which may be considered one in which the fund owns 5% or more of the outstanding voting securities, or a company which is under common control. At period end, the aggregate values of the fund’s investments in affiliated issuers and in unaffiliated issuers were $59,068,993 and $3,310,781,829, respectively. |
| (s) | Security or a portion of the security was pledged to cover collateral requirements for securities sold short. |
| (v) | Affiliated issuer that is available only to investment companies managed by MFS. The rate quoted for the MFS Institutional Money Market Portfolio is the annualizedseven-day yield of the fund at period end. |
The following abbreviations are used in this report and are defined:
| REIT | | Real Estate Investment Trust |
At February 29, 2020, the fund had cash collateral of $360,281 and other liquid securities with an aggregate value of $38,173,252 to cover any collateral or margin obligations for securities sold short. Restricted cash and/or deposits with brokers in the Statement of Assets and Liabilities are comprised of cash collateral.
See Notes to Financial Statements
12
Financial Statements
STATEMENT OF ASSETS AND LIABILITIES
At 2/29/20 (unaudited)
This statement represents your fund’s balance sheet, which details the assets and liabilities comprising the total value of the fund.
| | | | |
| Assets | | | | |
Investments in unaffiliated issuers, at value (identified cost, $2,788,580,014) | | | $3,310,781,829 | |
Investments in affiliated issuers, at value (identified cost, $59,061,157) | | | 59,068,993 | |
Deposits with brokers for | | | | |
Securities sold short | | | 360,281 | |
Receivables for | | | | |
Investments sold | | | 6,674,162 | |
Fund shares sold | | | 13,264,505 | |
Dividends | | | 5,635,461 | |
Other assets | | | 10,358 | |
Total assets | | | $3,395,795,589 | |
| |
| Liabilities | | | | |
Payables for | | | | |
Dividends on securities sold short | | | $65,695 | |
Securities sold short, at value (proceeds received, $15,997,832) | | | 17,203,271 | |
Investments purchased | | | 10,272,096 | |
Fund shares reacquired | | | 28,958,218 | |
Payable to affiliates | | | | |
Investment adviser | | | 152,270 | |
Administrative services fee | | | 3,790 | |
Shareholder servicing costs | | | 913,861 | |
Distribution and service fees | | | 38,411 | |
Payable for independent Trustees’ compensation | | | 11,328 | |
Accrued expenses and other liabilities | | | 111,361 | |
Total liabilities | | | $57,730,301 | |
Net assets | | | $3,338,065,288 | |
| |
| Net assets consist of | | | | |
Paid-in capital | | | $2,717,263,982 | |
Total distributable earnings (loss) | | | 620,801,306 | |
Net assets | | | $3,338,065,288 | |
Shares of beneficial interest outstanding | | | 101,126,358 | |
13
Statement of Assets and Liabilities (unaudited) – continued
| | | | | | | | | | | | |
| | | |
| | | Net assets | | | Shares
outstanding | | | Net asset value
per share (a) | |
Class A | | | $1,569,612,604 | | | | 48,546,895 | | | | $32.33 | |
Class B | | | 25,651,692 | | | | 913,336 | | | | 28.09 | |
Class C | | | 113,619,437 | | | | 4,108,930 | | | | 27.65 | |
Class I | | | 584,016,463 | | | | 16,994,642 | | | | 34.36 | |
Class R1 | | | 3,044,112 | | | | 109,931 | | | | 27.69 | |
Class R2 | | | 13,829,254 | | | | 438,666 | | | | 31.53 | |
Class R3 | | | 53,811,492 | | | | 1,669,232 | | | | 32.24 | |
Class R4 | | | 30,288,720 | | | | 928,182 | | | | 32.63 | |
Class R6 | | | 944,191,514 | | | | 27,416,544 | | | | 34.44 | |
| (a) | Maximum offering price per share was equal to the net asset value per share for all share classes, except for Class A, for which the maximum offering price per share was $34.30 [100 / 94.25 x $32.33]. On sales of $50,000 or more, the maximum offering price of Class A shares is reduced. A contingent deferred sales charge may be imposed on redemptions of Class A, Class B, and Class C shares. Redemption price per share was equal to the net asset value per share for Classes I, R1, R2, R3, R4, and R6. |
See Notes to Financial Statements
14
Financial Statements
STATEMENT OF OPERATIONS
Six months ended 2/29/20 (unaudited)
This statement describes how much your fund earned in investment income and accrued in expenses. It also describes any gains and/or losses generated by fund operations.
| | | | |
| Net investment income (loss) | | | | |
Income | | | | |
Dividends | | | $24,996,402 | |
Dividends from affiliated issuers | | | 449,718 | |
Other | | | 219,155 | |
Income on securities loaned | | | 83,209 | |
Foreign taxes withheld | | | (51,600 | ) |
Total investment income | | | $25,696,884 | |
Expenses | | | | |
Management fee | | | $9,126,281 | |
Distribution and service fees | | | 2,759,222 | |
Shareholder servicing costs | | | 1,171,201 | |
Administrative services fee | | | 216,859 | |
Independent Trustees’ compensation | | | 21,850 | |
Custodian fee | | | 60,878 | |
Shareholder communications | | | 73,119 | |
Audit and tax fees | | | 29,386 | |
Legal fees | | | 12,127 | |
Dividend and interest expense on securities sold short | | | 423,285 | |
Interest expense and fees | | | 7,605 | |
Miscellaneous | | | 154,308 | |
Total expenses | | | $14,056,121 | |
Reduction of expenses by investment adviser and distributor | | | (212,536 | ) |
Net expenses | | | $13,843,585 | |
Net investment income (loss) | | | $11,853,299 | |
| |
| Realized and unrealized gain (loss) | | | | |
Realized gain (loss) (identified cost basis) | | | | |
Unaffiliated issuers | | | $95,799,500 | |
Affiliated issuers | | | (5,208 | ) |
Foreign currency | | | 408 | |
Net realized gain (loss) | | | $95,794,700 | |
Change in unrealized appreciation or depreciation | | | | |
Unaffiliated issuers | | | $(75,754,128 | ) |
Affiliated issuers | | | 1,628 | |
Securities sold short | | | (1,446,279 | ) |
Net unrealized gain (loss) | | | $(77,198,779 | ) |
Net realized and unrealized gain (loss) | | | $18,595,921 | |
Change in net assets from operations | | | $30,449,220 | |
See Notes to Financial Statements
15
Financial Statements
STATEMENTS OF CHANGES IN NET ASSETS
These statements describe the increases and/or decreases in net assets resulting from operations, any distributions, and any shareholder transactions.
| | | | | | | | |
| Change in net assets | | Six months ended
2/29/20
(unaudited) | | | Year ended
8/31/19 | |
| | |
| From operations | | | | | | | | |
Net investment income (loss) | | | $11,853,299 | | | | $17,641,294 | |
Net realized gain (loss) | | | 95,794,700 | | | | 45,641,322 | |
Net unrealized gain (loss) | | | (77,198,779 | ) | | | 74,564,469 | |
Change in net assets from operations | | | $30,449,220 | | | | $137,847,085 | |
Total distributions to shareholders | | | $(63,849,491 | ) | | | $(199,800,134 | ) |
Change in net assets from fund share transactions | | | $563,871,815 | | | | $695,524,955 | |
Total change in net assets | | | $530,471,544 | | | | $633,571,906 | |
| | |
| Net assets | | | | | | | | |
At beginning of period | | | 2,807,593,744 | | | | 2,174,021,838 | |
At end of period | | | $3,338,065,288 | | | | $2,807,593,744 | |
See Notes to Financial Statements
16
Financial Statements
FINANCIAL HIGHLIGHTS
The financial highlights table is intended to help you understand the fund’s financial performance for the semiannual period and the past 5 fiscal years. Certain information reflects financial results for a single fund share. The total returns in the table represent the rate that an investor would have earned (or lost) on an investment in the fund share class (assuming reinvestment of all distributions) held for the entire period.
| | | | | | | | | | | | | | | | | | | | | | | | |
| | | Six months
ended 2/29/20 | | | Year ended | |
| Class A | | 8/31/19 | | | 8/31/18 | | | 8/31/17 | | | 8/31/16 | | | 8/31/15 | |
| | | (unaudited) | | | | | | | | | | | | | | | | |
Net asset value, beginning of period | | | $32.45 | | | | $34.18 | | | | $30.46 | | | | $26.72 | | | | $27.19 | | | | $29.19 | |
| | | |
| Income (loss) from investment operations | | | | | | | | | | | | | |
Net investment income (loss) (d) | | | $0.11 | | | | $0.20 | | | | $0.20 | | | | $0.18 | (c) | | | $0.18 | | | | $0.15 | |
Net realized and unrealized
gain (loss) | | | 0.41 | | | | 1.05 | | | | 5.63 | | | | 4.53 | | | | 2.08 | | | | 0.13 | |
Total from investment operations | | | $0.52 | | | | $1.25 | | | | $5.83 | | | | $4.71 | | | | $2.26 | | | | $0.28 | |
| | | |
| Less distributions declared to shareholders | | | | | | | | | | | | | |
From net investment income | | | $(0.15 | ) | | | $(0.16 | ) | | | $(0.17 | ) | | | $(0.16 | ) | | | $(0.14 | ) | | | $(0.13 | ) |
From net realized gain | | | (0.49 | ) | | | (2.82 | ) | | | (1.94 | ) | | | (0.81 | ) | | | (2.59 | ) | | | (2.15 | ) |
Total distributions declared to
shareholders | | | $(0.64 | ) | | | $(2.98 | ) | | | $(2.11 | ) | | | $(0.97 | ) | | | $(2.73 | ) | | | $(2.28 | ) |
Net asset value, end of period (x) | | | $32.33 | | | | $32.45 | | | | $34.18 | | | | $30.46 | | | | $26.72 | | | | $27.19 | |
Total return (%) (r)(s)(t)(x) | | | 1.50 | (n) | | | 4.94 | | | | 19.89 | | | | 18.11 | (c) | | | 9.09 | | | | 0.98 | |
| | | |
Ratios (%) (to average net assets)
and Supplemental data: | | | | | | | | | | | | | |
Expenses before expense reductions (f) | | | 0.95 | (a) | | | 1.00 | | | | 1.00 | | | | 1.03 | (c) | | | 1.07 | | | | 1.05 | |
Expenses after expense reductions (f) | | | 0.94 | (a) | | | 0.98 | | | | 0.99 | | | | 1.01 | (c) | | | 1.05 | | | | 1.04 | |
Net investment income (loss) | | | 0.62 | (a) | | | 0.65 | | | | 0.62 | | | | 0.63 | (c) | | | 0.70 | | | | 0.52 | |
Portfolio turnover | | | 24 | (n) | | | 39 | | | | 42 | | | | 46 | | | | 68 | | | | 53 | |
Net assets at end of period
(000 omitted) | | | $1,569,613 | | | | $1,373,524 | | | | $1,184,976 | | | | $992,736 | | | | $959,812 | | | | $963,167 | |
| | | |
| Supplemental Ratios (%): | | | | | | | | | | | | | |
Ratios of expenses to average net
assets after expense reductions
excluding short sale expenses and
interest expense and fees (f) | | | 0.91 | (a) | | | 0.96 | | | | 0.97 | | | | 1.00 | (c) | | | 1.04 | | | | 1.03 | |
See Notes to Financial Statements
17
Financial Highlights – continued
| | | | | | | | | | | | | | | | | | | | | | | | |
| | | Six months
ended 2/29/20 | | | Year ended | |
| Class B | | 8/31/19 | | | 8/31/18 | | | 8/31/17 | | | 8/31/16 | | | 8/31/15 | |
| | | (unaudited) | | | | | | | | | | | | | | | | |
Net asset value, beginning of period | | | $28.23 | | | | $30.19 | | | | $27.17 | | | | $23.96 | | | | $24.70 | | | | $26.78 | |
| | | |
| Income (loss) from investment operations | | | | | | | | | | | | | |
Net investment income (loss) (d) | | | $(0.02 | ) | | | $(0.03 | ) | | | $(0.04 | ) | | | $(0.03 | )(c) | | | $(0.02 | ) | | | $(0.06 | ) |
Net realized and unrealized
gain (loss) | | | 0.37 | | | | 0.89 | | | | 5.00 | | | | 4.05 | | | | 1.87 | | | | 0.13 | |
Total from investment operations | | | $0.35 | | | | $0.86 | | | | $4.96 | | | | $4.02 | | | | $1.85 | | | | $0.07 | |
| | | |
| Less distributions declared to shareholders | | | | | | | | | | | | | |
From net investment income | | | $— | | | | $— | | | | $— | | | | $— | | | | $— | | | | $— | |
From net realized gain | | | (0.49 | ) | | | (2.82 | ) | | | (1.94 | ) | | | (0.81 | ) | | | (2.59 | ) | | | (2.15 | ) |
Total distributions declared to
shareholders | | | $(0.49 | ) | | | $(2.82 | ) | | | $(1.94 | ) | | | $(0.81 | ) | | | $(2.59 | ) | | | $(2.15 | ) |
Net asset value, end of period (x) | | | $28.09 | | | | $28.23 | | | | $30.19 | | | | $27.17 | | | | $23.96 | | | | $24.70 | |
Total return (%) (r)(s)(t)(x) | | | 1.15 | (n) | | | 4.16 | | | | 19.01 | | | | 17.21 | (c) | | | 8.24 | | | | 0.25 | |
| | | |
Ratios (%) (to average net assets)
and Supplemental data: | | | | | | | | | | | | | |
Expenses before expense reductions (f) | | | 1.70 | (a) | | | 1.75 | | | | 1.75 | | | | 1.78 | (c) | | | 1.82 | | | | 1.80 | |
Expenses after expense reductions (f) | | | 1.69 | (a) | | | 1.73 | | | | 1.74 | | | | 1.77 | (c) | | | 1.81 | | | | 1.80 | |
Net investment income (loss) | | | (0.13 | )(a) | | | (0.11 | ) | | | (0.14 | ) | | | (0.12 | )(c) | | | (0.07 | ) | | | (0.23 | ) |
Portfolio turnover | | | 24 | (n) | | | 39 | | | | 42 | | | | 46 | | | | 68 | | | | 53 | |
Net assets at end of period
(000 omitted) | | | $25,652 | | | | $22,759 | | | | $26,993 | | | | $27,139 | | | | $30,324 | | | | $34,126 | |
| | | |
| Supplemental Ratios (%): | | | | | | | | | | | | | |
Ratios of expenses to average net
assets after expense reductions
excluding short sale expenses and
interest expense and fees (f) | | | 1.66 | (a) | | | 1.71 | | | | 1.72 | | | | 1.75 | (c) | | | 1.79 | | | | 1.79 | |
See Notes to Financial Statements
18
Financial Highlights – continued
| | | | | | | | | | | | | | | | | | | | | | | | |
| | | Six months
ended 2/29/20 | | | Year ended | |
| Class C | | 8/31/19 | | | 8/31/18 | | | 8/31/17 | | | 8/31/16 | | | 8/31/15 | |
| | | (unaudited) | | | | | | | | | | | | | | | | |
Net asset value, beginning of period | | | $27.86 | | | | $29.84 | | | | $26.88 | | | | $23.71 | | | | $24.47 | | | | $26.55 | |
| | | |
| Income (loss) from investment operations | | | | | | | | | | | | | |
Net investment income (loss) (d) | | | $(0.02 | ) | | | $(0.03 | ) | | | $(0.05 | ) | | | $(0.03 | )(c) | | | $(0.01 | ) | | | $(0.06 | ) |
Net realized and unrealized
gain (loss) | | | 0.36 | | | | 0.87 | | | | 4.95 | | | | 4.01 | | | | 1.84 | | | | 0.13 | |
Total from investment operations | | | $0.34 | | | | $0.84 | | | | $4.90 | | | | $3.98 | | | | $1.83 | | | | $0.07 | |
| | | |
| Less distributions declared to shareholders | | | | | | | | | | | | | |
From net investment income | | | $(0.06 | ) | | | $— | | | | $— | | | | $— | | | | $— | | | | $— | |
From net realized gain | | | (0.49 | ) | | | (2.82 | ) | | | (1.94 | ) | | | (0.81 | ) | | | (2.59 | ) | | | (2.15 | ) |
Total distributions declared to
shareholders | | | $(0.55 | ) | | | $(2.82 | ) | | | $(1.94 | ) | | | $(0.81 | ) | | | $(2.59 | ) | | | $(2.15 | ) |
Net asset value, end of period (x) | | | $27.65 | | | | $27.86 | | | | $29.84 | | | | $26.88 | | | | $23.71 | | | | $24.47 | |
Total return (%) (r)(s)(t)(x) | | | 1.12 | (n) | | | 4.14 | | | | 18.98 | | | | 17.22 | (c) | | | 8.24 | | | | 0.26 | |
| | | |
Ratios (%) (to average net assets)
and Supplemental data: | | | | | | | | | | | | | |
Expenses before expense reductions (f) | | | 1.70 | (a) | | | 1.75 | | | | 1.75 | | | | 1.78 | (c) | | | 1.82 | | | | 1.80 | |
Expenses after expense reductions (f) | | | 1.69 | (a) | | | 1.74 | | | | 1.74 | | | | 1.77 | (c) | | | 1.81 | | | | 1.80 | |
Net investment income (loss) | | | (0.11 | )(a) | | | (0.10 | ) | | | (0.17 | ) | | | (0.12 | )(c) | | | (0.05 | ) | | | (0.23 | ) |
Portfolio turnover | | | 24 | (n) | | | 39 | | | | 42 | | | | 46 | | | | 68 | | | | 53 | |
Net assets at end of period
(000 omitted) | | | $113,619 | | | | $72,093 | | | | $56,413 | | | | $89,946 | | | | $89,160 | | | | $88,020 | |
| | | |
| Supplemental Ratios (%): | | | | �� | | | | | | | | | |
Ratios of expenses to average net
assets after expense reductions
excluding short sale expenses and
interest expense and fees (f) | | | 1.67 | (a) | | | 1.71 | | | | 1.72 | | | | 1.75 | (c) | | | 1.79 | | | | 1.79 | |
See Notes to Financial Statements
19
Financial Highlights – continued
| | | | | | | | | | | | | | | | | | | | | | | | |
| | | Six months
ended 2/29/20 | | | Year ended | |
| Class I | | 8/31/19 | | | 8/31/18 | | | 8/31/17 | | | 8/31/16 | | | 8/31/15 | |
| | | (unaudited) | | | | | | | | | | | | | | | | |
Net asset value, beginning of period | | | $34.47 | | | | $36.12 | | | | $32.07 | | | | $28.10 | | | | $28.44 | | | | $30.43 | |
| | | |
| Income (loss) from investment operations | | | | | | | | | | | | | |
Net investment income (loss) (d) | | | $0.16 | | | | $0.30 | | | | $0.30 | | | | $0.26 | (c) | | | $0.29 | | | | $0.23 | |
Net realized and unrealized
gain (loss) | | | 0.44 | | | | 1.11 | | | | 5.93 | | | | 4.76 | | | | 2.15 | | | | 0.13 | |
Total from investment operations | | | $0.60 | | | | $1.41 | | | | $6.23 | | | | $5.02 | | | | $2.44 | | | | $0.36 | |
| | | |
| Less distributions declared to shareholders | | | | | | | | | | | | | |
From net investment income | | | $(0.22 | ) | | | $(0.24 | ) | | | $(0.24 | ) | | | $(0.24 | ) | | | $(0.19 | ) | | | $(0.20 | ) |
From net realized gain | | | (0.49 | ) | | | (2.82 | ) | | | (1.94 | ) | | | (0.81 | ) | | | (2.59 | ) | | | (2.15 | ) |
Total distributions declared to
shareholders | | | $(0.71 | ) | | | $(3.06 | ) | | | $(2.18 | ) | | | $(1.05 | ) | | | $(2.78 | ) | | | $(2.35 | ) |
Net asset value, end of period (x) | | | $34.36 | | | | $34.47 | | | | $36.12 | | | | $32.07 | | | | $28.10 | | | | $28.44 | |
Total return (%) (r)(s)(t)(x) | | | 1.63 | (n) | | | 5.17 | | | | 20.21 | | | | 18.38 | (c) | | | 9.36 | | | | 1.23 | |
| | | |
Ratios (%) (to average net assets)
and Supplemental data: | | | | | | | | | | | | | |
Expenses before expense reductions (f) | | | 0.70 | (a) | | | 0.75 | | | | 0.75 | | | | 0.78 | (c) | | | 0.81 | | | | 0.80 | |
Expenses after expense reductions (f) | | | 0.69 | (a) | | | 0.74 | | | | 0.74 | | | | 0.77 | (c) | | | 0.80 | | | | 0.80 | |
Net investment income (loss) | | | 0.87 | (a) | | | 0.90 | | | | 0.88 | | | | 0.88 | (c) | | | 1.07 | | | | 0.77 | |
Portfolio turnover | | | 24 | (n) | | | 39 | | | | 42 | | | | 46 | | | | 68 | | | | 53 | |
Net assets at end of period
(000 omitted) | | | $584,016 | | | | $467,860 | | | | $246,779 | | | | $122,055 | | | | $61,739 | | | | $49,768 | |
| | | |
| Supplemental Ratios (%): | | | | | | | | | | | | | |
Ratios of expenses to average net
assets after expense reductions
excluding short sale expenses and
interest expense and fees (f) | | | 0.67 | (a) | | | 0.72 | | | | 0.73 | | | | 0.75 | (c) | | | 0.79 | | | | 0.79 | |
See Notes to Financial Statements
20
Financial Highlights – continued
| | | | | | | | | | | | | | | | | | | | | | | | |
| | | Six months
ended 2/29/20 | | | Year ended | |
| Class R1 | | 8/31/19 | | | 8/31/18 | | | 8/31/17 | | | 8/31/16 | | | 8/31/15 | |
| | | (unaudited) | | | | | | | | | | | | | | | | |
Net asset value, beginning of period | | | $27.84 | | | | $29.82 | | | | $26.86 | | | | $23.70 | | | | $24.45 | | | | $26.54 | |
| | | |
| Income (loss) from investment operations | | | | | | | | | | | | | |
Net investment income (loss) (d) | | | $(0.02 | ) | | | $(0.03 | ) | | | $(0.04 | ) | | | $(0.03 | )(c) | | | $(0.02 | ) | | | $(0.06 | ) |
Net realized and unrealized
gain (loss) | | | 0.36 | | | | 0.87 | | | | 4.94 | | | | 4.00 | | | | 1.86 | | | | 0.12 | |
Total from investment operations | | | $0.34 | | | | $0.84 | | | | $4.90 | | | | $3.97 | | | | $1.84 | | | | $0.06 | |
| | | |
| Less distributions declared to shareholders | | | | | | | | | | | | | |
From net investment income | | | $— | | | | $— | | | | $— | | | | $— | | | | $— | | | | $— | |
From net realized gain | | | (0.49 | ) | | | (2.82 | ) | | | (1.94 | ) | | | (0.81 | ) | | | (2.59 | ) | | | (2.15 | ) |
Total distributions declared to
shareholders | | | $(0.49 | ) | | | $(2.82 | ) | | | $(1.94 | ) | | | $(0.81 | ) | | | $(2.59 | ) | | | $(2.15 | ) |
Net asset value, end of period (x) | | | $27.69 | | | | $27.84 | | | | $29.82 | | | | $26.86 | | | | $23.70 | | | | $24.45 | |
Total return (%) (r)(s)(t)(x) | | | 1.13 | (n) | | | 4.14 | | | | 19.00 | | | | 17.19 | (c) | | | 8.29 | | | | 0.22 | |
| | | |
Ratios (%) (to average net assets)
and Supplemental data: | | | | | | | | | | | | | |
Expenses before expense reductions (f) | | | 1.70 | (a) | | | 1.75 | | | | 1.75 | | | | 1.78 | (c) | | | 1.82 | | | | 1.80 | |
Expenses after expense reductions (f) | | | 1.69 | (a) | | | 1.74 | | | | 1.74 | | | | 1.77 | (c) | | | 1.81 | | | | 1.80 | |
Net investment income (loss) | | | (0.15 | )(a) | | | (0.11 | ) | | | (0.14 | ) | | | (0.13 | )(c) | | | (0.09 | ) | | | (0.23 | ) |
Portfolio turnover | | | 24 | (n) | | | 39 | | | | 42 | | | | 46 | | | | 68 | | | | 53 | |
Net assets at end of period
(000 omitted) | | | $3,044 | | | | $3,186 | | | | $3,448 | | | | $3,103 | | | | $2,935 | | | | $3,625 | |
| | | |
| Supplemental Ratios (%): | | | | | | | | | | | | | |
Ratios of expenses to average net
assets after expense reductions
excluding short sale expenses and
interest expense and fees (f) | | | 1.67 | (a) | | | 1.71 | | | | 1.73 | | | | 1.75 | (c) | | | 1.80 | | | | 1.79 | |
See Notes to Financial Statements
21
Financial Highlights – continued
| | | | | | | | | | | | | | | | | | | | | | | | |
| | | Six months
ended 2/29/20 | | | Year ended | |
| Class R2 | | 8/31/19 | | | 8/31/18 | | | 8/31/17 | | | 8/31/16 | | | 8/31/15 | |
| | | (unaudited) | | | | | | | | | | | | | | | | |
Net asset value, beginning of period | | | $31.61 | | | | $33.33 | | | | $29.75 | | | | $26.12 | | | | $26.62 | | | | $28.59 | |
| | | |
| Income (loss) from investment operations | | | | | | | | | | | | | |
Net investment income (loss) (d) | | | $0.06 | | | | $0.12 | | | | $0.11 | | | | $0.10 | (c) | | | $0.11 | | | | $0.07 | |
Net realized and unrealized
gain (loss) | | | 0.41 | | | | 1.02 | | | | 5.50 | | | | 4.43 | | | | 2.04 | | | | 0.14 | |
Total from investment operations | | | $0.47 | | | | $1.14 | | | | $5.61 | | | | $4.53 | | | | $2.15 | | | | $0.21 | |
| | | |
| Less distributions declared to shareholders | | | | | | | | | | | | | |
From net investment income | | | $(0.06 | ) | | | $(0.04 | ) | | | $(0.09 | ) | | | $(0.09 | ) | | | $(0.06 | ) | | | $(0.03 | ) |
From net realized gain | | | (0.49 | ) | | | (2.82 | ) | | | (1.94 | ) | | | (0.81 | ) | | | (2.59 | ) | | | (2.15 | ) |
Total distributions declared to
shareholders | | | $(0.55 | ) | | | $(2.86 | ) | | | $(2.03 | ) | | | $(0.90 | ) | | | $(2.65 | ) | | | $(2.18 | ) |
Net asset value, end of period (x) | | | $31.53 | | | | $31.61 | | | | $33.33 | | | | $29.75 | | | | $26.12 | | | | $26.62 | |
Total return (%) (r)(s)(t)(x) | | | 1.40 | (n) | | | 4.66 | | | | 19.61 | | | | 17.80 | (c) | | | 8.82 | | | | 0.75 | |
| | | |
Ratios (%) (to average net assets)
and Supplemental data: | | | | | | | | | | | | | |
Expenses before expense reductions (f) | | | 1.20 | (a) | | | 1.25 | | | | 1.25 | | | | 1.28 | (c) | | | 1.32 | | | | 1.30 | |
Expenses after expense reductions (f) | | | 1.18 | (a) | | | 1.23 | | | | 1.24 | | | | 1.27 | (c) | | | 1.31 | | | | 1.30 | |
Net investment income (loss) | | | 0.36 | (a) | | | 0.39 | | | | 0.35 | | | | 0.38 | (c) | | | 0.46 | | | | 0.27 | |
Portfolio turnover | | | 24 | (n) | | | 39 | | | | 42 | | | | 46 | | | | 68 | | | | 53 | |
Net assets at end of period
(000 omitted) | | | $13,829 | | | | $13,416 | | | | $15,202 | | | | $16,508 | | | | $15,932 | | | | $16,332 | |
| | | |
| Supplemental Ratios (%): | | | | | | | | | | | | | |
Ratios of expenses to average net
assets after expense reductions
excluding short sale expenses and
interest expense and fees (f) | | | 1.16 | (a) | | | 1.20 | | | | 1.22 | | | | 1.25 | (c) | | | 1.29 | | | | 1.29 | |
See Notes to Financial Statements
22
Financial Highlights – continued
| | | | | | | | | | | | | | | | | | | | | | | | |
| | | Six months
ended 2/29/20 | | | Year ended | |
| Class R3 | | 8/31/19 | | | 8/31/18 | | | 8/31/17 | | | 8/31/16 | | | 8/31/15 | |
| | | (unaudited) | | | | | | | | | | | | | | | | |
Net asset value, beginning of period | | | $32.36 | | | | $34.11 | | | | $30.33 | | | | $26.61 | | | | $27.10 | | | | $29.10 | |
| | | |
| Income (loss) from investment operations | | | | | | | | | | | | | |
Net investment income (loss) (d) | | | $0.11 | | | | $0.20 | | | | $0.20 | | | | $0.17 | (c) | | | $0.18 | | | | $0.15 | |
Net realized and unrealized
gain (loss) | | | 0.41 | | | | 1.04 | | | | 5.61 | | | | 4.52 | | | | 2.06 | | | | 0.13 | |
Total from investment operations | | | $0.52 | | | | $1.24 | | | | $5.81 | | | | $4.69 | | | | $2.24 | | | | $0.28 | |
| | | |
| Less distributions declared to shareholders | | | | | | | | | | | | | |
From net investment income | | | $(0.15 | ) | | | $(0.17 | ) | | | $(0.09 | ) | | | $(0.16 | ) | | | $(0.14 | ) | | | $(0.13 | ) |
From net realized gain | | | (0.49 | ) | | | (2.82 | ) | | | (1.94 | ) | | | (0.81 | ) | | | (2.59 | ) | | | (2.15 | ) |
Total distributions declared to
shareholders | | | $(0.64 | ) | | | $(2.99 | ) | | | $(2.03 | ) | | | $(0.97 | ) | | | $(2.73 | ) | | | $(2.28 | ) |
Net asset value, end of period (x) | | | $32.24 | | | | $32.36 | | | | $34.11 | | | | $30.33 | | | | $26.61 | | | | $27.10 | |
Total return (%) (r)(s)(t)(x) | | | 1.51 | (n) | | | 4.91 | | | | 19.91 | | | | 18.10 | (c) | | | 9.06 | | | | 0.99 | |
| | | |
Ratios (%) (to average net assets)
and Supplemental data: | | | | | | | | | | | | | |
Expenses before expense reductions (f) | | | 0.95 | (a) | | | 1.00 | | | | 1.00 | | | | 1.02 | (c) | | | 1.07 | | | | 1.05 | |
Expenses after expense reductions (f) | | | 0.94 | (a) | | | 0.99 | | | | 0.99 | | | | 1.02 | (c) | | | 1.06 | | | | 1.05 | |
Net investment income (loss) | | | 0.62 | (a) | | | 0.64 | | | | 0.61 | | | | 0.62 | (c) | | | 0.71 | | | | 0.52 | |
Portfolio turnover | | | 24 | (n) | | | 39 | | | | 42 | | | | 46 | | | | 68 | | | | 53 | |
Net assets at end of period
(000 omitted) | | | $53,811 | | | | $42,199 | | | | $34,916 | | | | $28,075 | | | | $77,217 | | | | $65,775 | |
| | | |
| Supplemental Ratios (%): | | | | | | | | | | | | | |
Ratios of expenses to average net
assets after expense reductions
excluding short sale expenses and
interest expense and fees (f) | | | 0.92 | (a) | | | 0.96 | | | | 0.98 | | | | 1.00 | (c) | | | 1.04 | | | | 1.04 | |
See Notes to Financial Statements
23
Financial Highlights – continued
| | | | | | | | | | | | | | | | | | | | | | | | |
| | | Six months
ended 2/29/20 | | | Year ended | |
| Class R4 | | 8/31/19 | | | 8/31/18 | | | 8/31/17 | | | 8/31/16 | | | 8/31/15 | |
| | | (unaudited) | | | | | | | | | | | | | | | | |
Net asset value, beginning of period | | | $32.76 | | | | $34.48 | | | | $30.71 | | | | $26.93 | | | | $27.39 | | | | $29.40 | |
| | | |
| Income (loss) from investment operations | | | | | | | | | | | | | |
Net investment income (loss) (d) | | | $0.15 | | | | $0.28 | | | | $0.28 | | | | $0.25 | (c) | | | $0.23 | | | | $0.22 | |
Net realized and unrealized
gain (loss) | | | 0.42 | | | | 1.05 | | | | 5.67 | | | | 4.57 | | | | 2.11 | | | | 0.12 | |
Total from investment operations | | | $0.57 | | | | $1.33 | | | | $5.95 | | | | $4.82 | | | | $2.34 | | | | $0.34 | |
| | | |
| Less distributions declared to shareholders | | | | | | | | | | | | | |
From net investment income | | | $(0.21 | ) | | | $(0.23 | ) | | | $(0.24 | ) | | | $(0.23 | ) | | | $(0.21 | ) | | | $(0.20 | ) |
From net realized gain | | | (0.49 | ) | | | (2.82 | ) | | | (1.94 | ) | | | (0.81 | ) | | | (2.59 | ) | | | (2.15 | ) |
Total distributions declared to
shareholders | | | $(0.70 | ) | | | $(3.05 | ) | | | $(2.18 | ) | | | $(1.04 | ) | | | $(2.80 | ) | | | $(2.35 | ) |
Net asset value, end of period (x) | | | $32.63 | | | | $32.76 | | | | $34.48 | | | | $30.71 | | | | $26.93 | | | | $27.39 | |
Total return (%) (r)(s)(t)(x) | | | 1.64 | (n) | | | 5.18 | | | | 20.18 | | | | 18.40 | (c) | | | 9.36 | | | | 1.22 | |
| | | |
Ratios (%) (to average net assets)
and Supplemental data: | | | | | | | | | | | | | |
Expenses before expense reductions (f) | | | 0.70 | (a) | | | 0.75 | | | | 0.75 | | | | 0.78 | (c) | | | 0.82 | | | | 0.80 | |
Expenses after expense reductions (f) | | | 0.69 | (a) | | | 0.74 | | | | 0.74 | | | | 0.77 | (c) | | | 0.81 | | | | 0.80 | |
Net investment income (loss) | | | 0.85 | (a) | | | 0.89 | | | | 0.86 | | | | 0.87 | (c) | | | 0.90 | | | | 0.76 | |
Portfolio turnover | | | 24 | (n) | | | 39 | | | | 42 | | | | 46 | | | | 68 | | | | 53 | |
Net assets at end of period
(000 omitted) | | | $30,289 | | | | $29,218 | | | | $27,707 | | | | $22,494 | | | | $15,799 | | | | $21,159 | |
| | | |
| Supplemental Ratios (%): | | | | | | | | | | | | | |
Ratios of expenses to average net
assets after expense reductions
excluding short sale expenses and
interest expense and fees (f) | | | 0.67 | (a) | | | 0.71 | | | | 0.73 | | | | 0.76 | (c) | | | 0.79 | | | | 0.79 | |
See Notes to Financial Statements
24
Financial Highlights – continued
| | | | | | | | | | | | | | | | | | | | | | | | |
| | | Six months
ended 2/29/20 | | | Year ended | |
| Class R6 | | 8/31/19 | | | 8/31/18 | | | 8/31/17 | | | 8/31/16 | | | 8/31/15 | |
| | | (unaudited) | | | | | | | | | | | | | | | | |
Net asset value, beginning of period | | | $34.55 | | | | $36.18 | | | | $32.12 | | | | $28.13 | | | | $28.49 | | | | $30.47 | |
| | | |
| Income (loss) from investment operations | | | | | | | | | | | | | |
Net investment income (loss) (d) | | | $0.17 | | | | $0.32 | | | | $0.32 | | | | $0.29 | (c) | | | $0.58 | | | | $0.24 | |
Net realized and unrealized
gain (loss) | | | 0.44 | | | | 1.13 | | | | 5.95 | | | | 4.77 | | | | 1.89 | | | | 0.15 | |
Total from investment operations | | | $0.61 | | | | $1.45 | | | | $6.27 | | | | $5.06 | | | | $2.47 | | | | $0.39 | |
| | | |
| Less distributions declared to shareholders | | | | | | | | | | | | | |
From net investment income | | | $(0.23 | ) | | | $(0.26 | ) | | | $(0.27 | ) | | | $(0.27 | ) | | | $(0.24 | ) | | | $(0.22 | ) |
From net realized gain | | | (0.49 | ) | | | (2.82 | ) | | | (1.94 | ) | | | (0.81 | ) | | | (2.59 | ) | | | (2.15 | ) |
Total distributions declared to
shareholders | | | $(0.72 | ) | | | $(3.08 | ) | | | $(2.21 | ) | | | $(1.07 | ) | | | $(2.83 | ) | | | $(2.37 | ) |
Net asset value, end of period (x) | | | $34.44 | | | | $34.55 | | | | $36.18 | | | | $32.12 | | | | $28.13 | | | | $28.49 | |
Total return (%) (r)(s)(t)(x) | | | 1.68 | (n) | | | 5.28 | | | | 20.29 | | | | 18.49 | (c) | | | 9.46 | | | | 1.34 | |
| | | |
Ratios (%) (to average net assets)
and Supplemental data: | | | | | | | | | | | | | |
Expenses before expense reductions (f) | | | 0.63 | (a) | | | 0.67 | | | | 0.67 | | | | 0.69 | (c) | | | 0.70 | | | | 0.71 | |
Expenses after expense reductions (f) | | | 0.62 | (a) | | | 0.66 | | | | 0.66 | | | | 0.68 | (c) | | | 0.69 | | | | 0.70 | |
Net investment income (loss) | | | 0.93 | (a) | | | 0.98 | | | | 0.95 | | | | 0.97 | (c) | | | 2.10 | | | | 0.82 | |
Portfolio turnover | | | 24 | (n) | | | 39 | | | | 42 | | | | 46 | | | | 68 | | | | 53 | |
Net assets at end of period
(000 omitted) | | | $944,192 | | | | $783,340 | | | | $577,588 | | | | $393,153 | | | | $300,078 | | | | $6,198 | |
| | | |
| Supplemental Ratios (%): | | | | | | | | | | | | | |
Ratios of expenses to average net
assets after expense reductions
excluding short sale expenses and
interest expense and fees (f) | | | 0.60 | (a) | | | 0.63 | | | | 0.65 | | | | 0.66 | (c) | | | 0.68 | | | | 0.69 | |
See Notes to Financial Statements
25
Financial Highlights – continued
| (c) | Amount reflects aone-time reimbursement of expenses by the custodian (or former custodian) without which net investment income and performance would be lower and expenses would be higher. |
| (d) | Per share data is based on average shares outstanding. |
| (f) | Ratios do not reflect reductions from fees paid indirectly, if applicable. |
| (r) | Certain expenses have been reduced without which performance would have been lower. |
| (s) | From time to time the fund may receive proceeds from litigation settlements, without which performance would be lower. Excluding the effect of the proceeds received from anon-recurring litigation settlement against Household International, Inc., the total return for the year ended August 31, 2017 would have been lower by approximately 0.85%. |
| (t) | Total returns do not include any applicable sales charges. |
| (x) | The net asset values and total returns have been calculated on net assets which include adjustments made in accordance with U.S. generally accepted accounting principles required at period end for financial reporting purposes. |
See Notes to Financial Statements
26
NOTES TO FINANCIAL STATEMENTS
(unaudited)
(1) Business and Organization
MFS Core Equity Fund (the fund) is a diversified series of MFS Series Trust I (the trust). The trust is organized as a Massachusetts business trust and is registered under the Investment Company Act of 1940, as amended, as anopen-end management investment company.
The fund is an investment company and accordingly follows the investment company accounting and reporting guidance of the Financial Accounting Standards Board (FASB) Accounting Standards Codification Topic 946 Financial Services - Investment Companies.
(2) Significant Accounting Policies
General– The preparation of financial statements in conformity with U.S. generally accepted accounting principles requires management to make estimates and assumptions that affect the reported amounts of assets and liabilities, and disclosure of contingent assets and liabilities at the date of the financial statements and the reported amounts of increases and decreases in net assets from operations during the reporting period. Actual results could differ from those estimates. In the preparation of these financial statements, management has evaluated subsequent events occurring after the date of the fund’s Statement of Assets and Liabilities through the date that the financial statements were issued.
In March 2020, the FASB issued Accounting Standards Update2020-04, Reference Rate Reform (Topic 848) – Facilitation of the Effects of Reference Rate Reform on Financial Reporting (“ASU2020-04”), which provides optional, temporary relief with respect to the financial reporting of contracts subject to certain types of modifications due to the planned discontinuation of the London Interbank Offered Rate (LIBOR) and other IBOR-based reference rates as of the end of 2021. The temporary relief provided by ASU2020-04 is effective for certain reference rate-related contract modifications that occur during the period from March 12, 2020 through December 31, 2022. Management is evaluating the impact of ASU2020-04 on the fund’s investments, derivatives, debt and other contracts that will undergo reference rate-related modifications as a result of the reference rate reform.
Balance Sheet Offsetting– The fund’s accounting policy with respect to balance sheet offsetting is that, absent an event of default by the counterparty or a termination of the agreement, the International Swaps and Derivatives Association (ISDA) Master Agreement, or similar agreement, does not result in an offset of reported amounts of financial assets and financial liabilities in the Statement of Assets and Liabilities across transactions between the fund and the applicable counterparty. The fund’s right to setoff may be restricted or prohibited by the bankruptcy or insolvency laws of the particular jurisdiction to which a specific master netting agreement counterparty is subject. Balance sheet offsetting disclosures, to the extent applicable to the fund, have been included in the fund’s Significant Accounting Policies note under the captions for each of the fund’sin-scope financial instruments and transactions.
Investment Valuations– Equity securities, including restricted equity securities and equity securities sold short, are generally valued at the last sale or official closing price on their primary market or exchange as provided by a third-party pricing service. Equity
27
Notes to Financial Statements (unaudited) – continued
securities, for which there were no sales reported that day, are generally valued at the last quoted daily bid quotation on their primary market or exchange as provided by a third-party pricing service. Equity securities sold short, for which there were no sales reported for that day, are generally valued at the last quoted daily ask quotation on their primary market or exchange as provided by a third-party pricing service.Short-term instruments with a maturity at issuance of 60 days or less may be valued at amortized cost, which approximates market value.Open-end investment companies are generally valued at net asset value per share. Securities and other assets generally valued on the basis of information from a third-party pricing service may also be valued at a broker/dealer bid quotation. In determining values, third-party pricing services can utilize both transaction data and market information such as yield, quality, coupon rate, maturity, type of issue, trading characteristics, and other market data. The values of foreign securities and other assets and liabilities expressed in foreign currencies are converted to U.S. dollars using the mean of bid and asked prices for rates provided by a third-party pricing service.
The Board of Trustees has delegated primary responsibility for determining or causing to be determined the value of the fund’s investments (including any fair valuation) to the adviser pursuant to valuation policies and procedures approved by the Board. If the adviser determines that reliable market quotations are not readily available, investments are valued at fair value as determined in good faith by the adviser in accordance with such procedures under the oversight of the Board of Trustees. Under the fund’s valuation policies and procedures, market quotations are not considered to be readily available for most types of debt instruments and floating rate loans and many types of derivatives. These investments are generally valued at fair value based on information from third-party pricing services. In addition, investments may be valued at fair value if the adviser determines that an investment’s value has been materially affected by events occurring after the close of the exchange or market on which the investment is principally traded (such as foreign exchange or market) and prior to the determination of the fund’s net asset value, or after the halt of trading of a specific security where trading does not resume prior to the close of the exchange or market on which the security is principally traded. Events that occur after foreign markets close (such as developments in foreign markets and significant movements in the U.S. markets) and prior to the determination of the fund’s net asset value may be deemed to have a material effect on the value of securities traded in foreign markets. Accordingly, the fund’s foreign equity securities may often be valued at fair value. The adviser generally relies on third-party pricing services or other information (such as the correlation with price movements of similar securities in the same or other markets; the type, cost and investment characteristics of the security; the business and financial condition of the issuer; and trading and other market data) to assist in determining whether to fair value and at what value to fair value an investment. The value of an investment for purposes of calculating the fund’s net asset value can differ depending on the source and method used to determine value. When fair valuation is used, the value of an investment used to determine the fund’s net asset value may differ from quoted or published prices for the same investment. There can be no assurance that the fund could obtain the fair value assigned to an investment if it were to sell the investment at the same time at which the fund determines its net asset value per share.
28
Notes to Financial Statements (unaudited) – continued
Various inputs are used in determining the value of the fund’s assets or liabilities. These inputs are categorized into three broad levels. In certain cases, the inputs used to measure fair value may fall into different levels of the fair value hierarchy. In such cases, an investment’s level within the fair value hierarchy is based on the lowest level of input that is significant to the fair value measurement. The fund’s assessment of the significance of a particular input to the fair value measurement in its entirety requires judgment, and considers factors specific to the investment. Level 1 includes unadjusted quoted prices in active markets for identical assets or liabilities. Level 2 includes other significant observable market-based inputs (including quoted prices for similar securities, interest rates, prepayment speed, and credit risk). Level 3 includes unobservable inputs, which may include the adviser’s own assumptions in determining the fair value of investments. The following is a summary of the levels used as of February 29, 2020 in valuing the fund’s assets or liabilities:
| | | | | | | | | | | | | | | | |
| | | | |
| Financial Instruments | | Level 1 | | | Level 2 | | | Level 3 | | | Total | |
| Equity Securities | | | $3,310,781,829 | | | | $— | | | | $— | | | | $3,310,781,829 | |
| Mutual Funds | | | 59,068,993 | | | | — | | | | — | | | | 59,068,993 | |
| Total | | | $3,369,850,822 | | | | $— | | | | $— | | | | $3,369,850,822 | |
| Securities Sold Short | | | $(17,203,271 | ) | | | $— | | | | $— | | | | $(17,203,271 | ) |
For further information regarding security characteristics, see the Portfolio of Investments.
Foreign Currency Translation– Purchases and sales of foreign investments, income, and expenses are converted into U.S. dollars based upon currency exchange rates prevailing on the respective dates of such transactions or on the reporting date for foreign denominated receivables and payables. Gains and losses attributable to foreign currency exchange rates on sales of securities are recorded for financial statement purposes as net realized gains and losses on investments. Gains and losses attributable to foreign exchange rate movements on receivables, payables, income and expenses are recorded for financial statement purposes as foreign currency transaction gains and losses. That portion of both realized and unrealized gains and losses on investments that results from fluctuations in foreign currency exchange rates is not separately disclosed.
Short Sales– The fund entered into short sales whereby it sells a security it does not own in anticipation of a decline in the value of that security. The fund will realize a gain if the security price decreases and a loss if the security price increases between the date of the short sale and the date on which the fund replaces the borrowed security. Losses from short sales can exceed the proceeds of the security sold; and they can also exceed the potential loss from an ordinary buy and sell transaction. The amount of any premium, dividends, or interest the fund may be required to pay in connection with a short sale will be recognized as a fund expense. During the six months ended February 29, 2020, this expense amounted to $423,285. The fund segregates cash or marketable securities in an amount that, when combined with the amount of proceeds from the short sale deposited with the broker, at least equals the current market value of the security sold short.
Security Loans– Under its Securities Lending Agency Agreement with the fund, State Street Bank and Trust Company, as lending agent, loans the securities of the fund to certain qualified institutions (the “Borrowers”) approved by the fund. Security loans
29
Notes to Financial Statements (unaudited) – continued
can be terminated at the discretion of either the lending agent or the fund and the related securities must be returned within the earlier of the standard trade settlement period for such securities or within three business days. The loans are collateralized by cash and/or U.S. Treasury and federal agency obligations in an amount typically at least equal to the market value of the securities loaned. On loans collateralized by cash, the cash collateral is invested in a money market fund. The market value of the loaned securities is determined at the close of business of the fund and any additional required collateral is delivered to the fund on the next business day. The lending agent provides the fund with indemnification against Borrower default. In the event of Borrower default, the lending agent will, for the benefit of the fund, either purchase securities identical to those loaned or, when such purchase is commercially impracticable, pay the fund the market value of the loaned securities. In return, the lending agent assumes the fund’s rights to the related collateral. If the collateral value is less than the cost to purchase identical securities, the lending agent is responsible for the shortfall, but only to the extent that such shortfall is not due to a decline in collateral value resulting from collateral reinvestment for which the fund bears the risk of loss. A portion of the income generated upon investment of the collateral is remitted to the Borrowers, and the remainder is allocated between the fund and the lending agent. On loans collateralized by U.S. Treasury and/or federal agency obligations, a fee is received from the Borrower, and is allocated between the fund and the lending agent. Income from securities lending is separately reported in the Statement of Operations. The dividend and interest income earned on the securities loaned is accounted for in the same manner as other dividend and interest income. At February 29, 2020, there were no securities on loan or collateral outstanding.
Indemnifications– Under the fund’s organizational documents, its officers and Trustees may be indemnified against certain liabilities and expenses arising out of the performance of their duties to the fund. Additionally, in the normal course of business, the fund enters into agreements with service providers that may contain indemnification clauses. The fund’s maximum exposure under these agreements is unknown as this would involve future claims that may be made against the fund that have not yet occurred.
Investment Transactions and Income– Investment transactions are recorded on the trade date. Dividends received in cash are recorded on theex-dividend date. Certain dividends from foreign securities will be recorded when the fund is informed of the dividend if such information is obtained subsequent to theex-dividend date. Dividend payments received in additional securities are recorded on theex-dividend date in an amount equal to the value of the security on such date.
The fund may receive proceeds from litigation settlements. Any proceeds received from litigation involving portfolio holdings are reflected in the Statement of Operations in realized gain/loss if the security has been disposed of by the fund or in unrealized gain/loss if the security is still held by the fund. Any other proceeds from litigation not related to portfolio holdings are reflected as other income in the Statement of Operations.
Tax Matters and Distributions– The fund intends to qualify as a regulated investment company, as defined under Subchapter M of the Internal Revenue Code, and to distribute all of its taxable income, including realized capital gains. As a result,
30
Notes to Financial Statements (unaudited) – continued
no provision for federal income tax is required. The fund’s federal tax returns, when filed, will remain subject to examination by the Internal Revenue Service for a three year period. Management has analyzed the fund’s tax positions taken on federal and state tax returns for all open tax years and does not believe that there are any uncertain tax positions that require recognition of a tax liability. Foreign taxes, if any, have been accrued by the fund in the accompanying financial statements in accordance with the applicable foreign tax law. Foreign income taxes may be withheld by certain countries in which the fund invests. Additionally, capital gains realized by the fund on securities issued in or by certain foreign countries may be subject to capital gains tax imposed by those countries.
Distributions to shareholders are recorded on theex-dividend date. Income and capital gain distributions are determined in accordance with income tax regulations, which may differ from U.S. generally accepted accounting principles. Certain capital accounts in the financial statements are periodically adjusted for permanent differences in order to reflect their tax character. These adjustments have no impact on net assets or net asset value per share. Temporary differences which arise from recognizing certain items of income, expense, gain or loss in different periods for financial statement and tax purposes will reverse at some time in the future.
Book/tax differences primarily relate to wash sale loss deferrals and treating a portion of the proceeds from redemptions as a distribution for tax purposes.
The tax character of distributions made during the current period will be determined at fiscal year end. The tax character of distributions declared to shareholders for the last fiscal year is as follows:
| | | | |
| |
| | | Year ended
8/31/19 | |
Ordinary income (including any
short-term capital gains) | | | $27,039,464 | |
| Long-term capital gains | | | 172,760,670 | |
| |
| Total distributions | | | $199,800,134 | |
The federal tax cost and the tax basis components of distributable earnings were as follows:
| | | | |
| |
| As of 2/29/20 | | | |
| |
| Cost of investments | | | $2,856,545,915 | |
| Gross appreciation | | | 634,941,165 | |
| |
| Gross depreciation | | | (121,636,258 | ) |
| Net unrealized appreciation (depreciation) | | | $513,304,907 | |
| |
| As of 8/31/19 | | | |
| |
| Undistributed ordinary income | | | 21,523,258 | |
| Undistributed long-term capital gain | | | 42,076,042 | |
| Other temporary differences | | | 867,245 | |
| Net unrealized appreciation (depreciation) | | | 584,605,909 | |
The aggregate cost above includes prior fiscal year end tax adjustments, if applicable.
31
Notes to Financial Statements (unaudited) – continued
Multiple Classes of Shares of Beneficial Interest– The fund offers multiple classes of shares, which differ in their respective distribution and service fees. The fund’s income, realized and unrealized gain (loss), and common expenses are allocated to shareholders based on the daily net assets of each class. Dividends are declared separately for each class. Differences in per share dividend rates are generally due to differences in separate class expenses. Class B shares will convert to Class A shares approximately eight years after purchase. Class C shares will convert to Class A shares approximately ten years after purchase. The fund’s distributions declared to shareholders as reported in the Statements of Changes in Net Assets are presented by class as follows:
| | | | | | | | |
| | |
| | | Six months
ended
2/29/20 | | | Year
ended
8/31/19 | |
| Class A | | | $29,982,091 | | | | $105,866,198 | |
| Class B | | | 475,008 | | | | 2,489,868 | |
| Class C | | | 2,151,200 | | | | 5,804,466 | |
| Class I | | | 11,488,721 | | | | 25,883,573 | |
| Class R1 | | | 53,748 | | | | 326,330 | |
| Class R2 | | | 241,357 | | | | 1,217,794 | |
| Class R3 | | | 966,738 | | | | 3,436,027 | |
| Class R4 | | | 613,572 | | | | 2,469,308 | |
| Class R6 | | | 17,877,056 | | | | 52,306,570 | |
| Total | | | $63,849,491 | | | | $199,800,134 | |
(3) Transactions with Affiliates
Investment Adviser– The fund has an investment advisory agreement with MFS to provide overall investment management and related administrative services and facilities to the fund. The management fee is computed daily and paid monthly at the following annual rates based on the fund’s average daily net assets:
| | | | |
| Up to $500 million | | | 0.65 | % |
| In excess of $500 million and up to $2.5 billion | | | 0.55 | % |
| In excess of $2.5 billion and up to $5 billion | | | 0.50 | % |
| In excess of $5 billion and up to $10 billion | | | 0.47 | % |
| In excess of $10 billion | | | 0.45 | % |
MFS has agreed in writing to reduce its management fee by a specified amount if certain MFS mutual fund assets exceed thresholds agreed to by MFS and the fund’s Board of Trustees. For the six months ended February 29, 2020, this management fee reduction amounted to $167,763, which is included in the reduction of total expenses in the Statement of Operations. The management fee incurred for the six months ended February 29, 2020 was equivalent to an annual effective rate of 0.54% of the fund’s average daily net assets.
Distributor– MFS Fund Distributors, Inc. (MFD), a wholly-owned subsidiary of MFS, as distributor, received $257,257 for the six months ended February 29, 2020, as its portion of the initial sales charge on sales of Class A shares of the fund.
The Board of Trustees has adopted a distribution plan for certain share classes pursuant to Rule12b-1 of the Investment Company Act of 1940.
32
Notes to Financial Statements (unaudited) – continued
The fund’s distribution plan provides that the fund will pay MFD for services provided by MFD and financial intermediaries in connection with the distribution and servicing of certain share classes. One component of the plan is a distribution fee paid to MFD and another component of the plan is a service fee paid to MFD. MFD may subsequently pay all, or a portion, of the distribution and/or service fees to financial intermediaries.
Distribution Plan Fee Table:
| | | | | | | | | | | | | | | | | | | | |
| | | | | |
| | | Distribution
Fee Rate (d) | | | Service
Fee Rate (d) | | | Total
Distribution
Plan (d) | | | Annual
Effective
Rate (e) | | | Distribution
and Service
Fee | |
| Class A | | | — | | | | 0.25% | | | | 0.25% | | | | 0.24% | | | | $1,979,788 | |
| Class B | | | 0.75% | | | | 0.25% | | | | 1.00% | | | | 1.00% | | | | 135,816 | |
| Class C | | | 0.75% | | | | 0.25% | | | | 1.00% | | | | 1.00% | | | | 526,158 | |
| Class R1 | | | 0.75% | | | | 0.25% | | | | 1.00% | | | | 1.00% | | | | 16,170 | |
| Class R2 | | | 0.25% | | | | 0.25% | | | | 0.50% | | | | 0.49% | | | | 36,687 | |
| Class R3 | | | — | | | | 0.25% | | | | 0.25% | | | | 0.25% | | | | 64,603 | |
| Total Distribution and Service Fees | | | | | | | | | | | | $2,759,222 | |
| (d) | In accordance with the distribution plan for certain classes, the fund pays distribution and/or service fees equal to these annual percentage rates of each class’s average daily net assets. The distribution and service fee rates disclosed by class represent the current rates in effect at the end of the reporting period. Any rate changes, if applicable, are detailed below. |
| (e) | The annual effective rates represent actual fees incurred under the distribution plan for the six months ended February 29, 2020 based on each class’s average daily net assets. MFD has voluntarily agreed to rebate a portion of each class’s 0.25% service fee attributable to accounts for which MFD retains the 0.25% service fee except for accounts attributable to MFS or its affiliates’ seed money. For the six months ended February 29, 2020, this rebate amounted to $43,036, $504, $326, and $907 for Class A, Class B, Class C, and Class R2, respectively, and is included in the reduction of total expenses in the Statement of Operations. |
Certain Class A shares are subject to a contingent deferred sales charge (CDSC) in the event of a shareholder redemption within 18 months of purchase. Class B shares are subject to a CDSC in the event of a shareholder redemption within six years of purchase. Class C shares are subject to a CDSC in the event of a shareholder redemption within 12 months of purchase. All contingent deferred sales charges are paid to MFD and during the six months ended February 29, 2020, were as follows:
| | | | |
| |
| | | Amount | |
| Class A | | | $12,780 | |
| Class B | | | 7,601 | |
| Class C | | | 2,995 | |
Shareholder Servicing Agent– MFS Service Center, Inc. (MFSC), a wholly-owned subsidiary of MFS, receives a fee from the fund for its services as shareholder servicing agent calculated as a percentage of the average daily net assets of the fund as determined periodically under the supervision of the fund’s Board of Trustees. For the six months ended February 29, 2020, the fee was $182,243, which equated to 0.0110% annually of the fund’s average daily net assets. MFSC also receives payment from the fund forout-of-pocket expenses,sub-accounting and other shareholder servicing costs which may be paid to affiliated and unaffiliated service providers. Class R6 shares do not incursub-accounting fees. For the six months ended
33
Notes to Financial Statements (unaudited) – continued
February 29, 2020, theseout-of-pocket expenses,sub-accounting and other shareholder servicing costs amounted to $988,958.
Administrator– MFS provides certain financial, legal, shareholder communications, compliance, and other administrative services to the fund. Under an administrative services agreement, the fund reimburses MFS the costs incurred to provide these services. The fund is charged an annual fixed amount of $17,500 plus a fee based on average daily net assets. The administrative services fee incurred for the six months ended February 29, 2020 was equivalent to an annual effective rate of 0.0131% of the fund’s average daily net assets.
Trustees’ and Officers’ Compensation– The fund pays compensation to independent Trustees in the form of a retainer, attendance fees, and additional compensation to Board and Committee chairpersons. The fund does not pay compensation directly to Trustees or officers of the fund who are also officers of the investment adviser, all of whom receive remuneration from MFS for their services to the fund. Certain officers and Trustees of the fund are officers or directors of MFS, MFD, and MFSC.
Prior to December 31, 2001, the fund had an unfunded defined benefit plan (“DB plan”) for independent Trustees. As of December 31, 2001, the Board took action to terminate the DB plan with respect to then-current and any future independent Trustees, such that the DB plan covers only certain of those former independent Trustees who retired on or before December 31, 2001. The DB plan resulted in a net decrease in pension expense of $487 and is included in “Independent Trustees’ compensation” in the Statement of Operations for the six months ended February 29, 2020. The liability for deferred retirement benefits payable to those former independent Trustees under the DB plan amounted to $8,222 at February 29, 2020, and is included in “Payable for independent Trustees’ compensation” in the Statement of Assets and Liabilities.
Other –The fund invests in the MFS Institutional Money Market Portfolio which is managed by MFS and seeks current income consistent with preservation of capital and liquidity. This money market fund does not pay a management fee to MFS but does incur investment and operating costs.
On October 25, 2019, MFS purchased 3,570 shares of Class R4 for an aggregate amount of $124,919.
The fund is permitted to engage in purchase and sale transactions with funds and accounts for which MFS serves as investment adviser orsub-adviser (“cross-trades”) pursuant to a policy adopted by the Board of Trustees. This policy has been designed to ensure that cross-trades conducted by the fund comply with Rule17a-7 under the Investment Company Act of 1940. During the six months ended February 29, 2020, the fund engaged in purchase transactions pursuant to this policy, which amounted to $494,891.
The adviser has voluntarily undertaken to reimburse the fund from its own resources on a quarterly basis for the cost of investment research embedded in the cost of the fund’s securities trades. This agreement may be rescinded at any time. For the six months ended February 29, 2020, this reimbursement amounted to $86,871, which is included in “Other” income in the Statement of Operations.
34
Notes to Financial Statements (unaudited) – continued
(4) Portfolio Securities
For the six months ended February 29, 2020, purchases and sales of investments, other than short sales and short-term obligations, aggregated $1,050,435,918 and $753,965,967, respectively.
(5) Shares of Beneficial Interest
The fund’s Declaration of Trust permits the Trustees to issue an unlimited number of full and fractional shares of beneficial interest. Transactions in fund shares were as follows:
| | | | | | | | | | | | | | | | |
| | | Six months ended
2/29/20 | | | Year ended
8/31/19 | |
| | | | |
| | | Shares | | | Amount | | | Shares | | | Amount | |
| Shares sold | | | | | | | | | | | | | | | | |
Class A | | | 5,567,415 | | | | $190,419,973 | | | | 9,634,178 | | | | $300,587,873 | |
Class B | | | 9,057 | | | | 272,708 | | | | 108,329 | | | | 2,957,560 | |
Class C | | | 669,614 | | | | 19,692,591 | | | | 1,116,113 | | | | 29,419,493 | |
Class I | | | 5,091,554 | | | | 185,752,640 | | | | 10,576,543 | | | | 346,152,292 | |
Class R1 | | | 13,023 | | | | 383,890 | | | | 19,278 | | | | 514,159 | |
Class R2 | | | 75,351 | | | | 2,498,085 | | | | 140,877 | | | | 4,281,134 | |
Class R3 | | | 477,072 | | | | 16,335,249 | | | | 558,827 | | | | 17,349,962 | |
Class R4 | | | 105,983 | | | | 3,689,962 | | | | 235,627 | | | | 7,596,808 | |
Class R6 | | | 6,387,798 | | | | 235,197,031 | | | | 8,080,095 | | | | 268,741,520 | |
| | | 18,396,867 | | | | $654,242,129 | | | | 30,469,867 | | | | $977,600,801 | |
| | | | |
| Shares issued in connection with acquisition of MFS Equity | | | | | | | | | | | | | | | | |
| Opportunities Fund | | | | | | | | | | | | | | | | |
Class A | | | 3,575,449 | | | | $118,383,117 | | | | | | | | | |
Class B | | | 246,884 | | | | 7,102,850 | | | | | | | | | |
Class C | | | 1,200,588 | | | | 34,084,698 | | | | | | | | | |
Class I | | | 1,634,666 | | | | 57,523,902 | | | | | | | | | |
Class R1 | | | 3,682 | | | | 104,467 | | | | | | | | | |
Class R2 | | | 15,173 | | | | 489,189 | | | | | | | | | |
Class R3 | | | 23,823 | | | | 786,385 | | | | | | | | | |
Class R4 | | | 22,752 | | | | 760,839 | | | | | | | | | |
Class R6 | | | 229,660 | | | | 8,100,125 | | | | | | | | | |
| | | 6,952,677 | | | | $227,335,572 | | | | | | | | | |
35
Notes to Financial Statements (unaudited) – continued
| | | | | | | | | | | | | | | | |
| | | Six months ended
2/29/20 | | | Year ended
8/31/19 | |
| | | | |
| | | Shares | | | Amount | | | Shares | | | Amount | |
| Shares issued to shareholders in reinvestment of distributions | | | | | | | | | | | | | | | | |
Class A | | | 856,833 | | | | $28,952,375 | | | | 3,617,902 | | | | $102,241,924 | |
Class B | | | 15,738 | | | | 462,711 | | | | 98,656 | | | | 2,438,781 | |
Class C | | | 69,056 | | | | 1,999,170 | | | | 228,301 | | | | 5,570,537 | |
Class I | | | 301,669 | | | | 10,829,902 | | | | 818,315 | | | | 24,524,913 | |
Class R1 | | | 1,854 | | | | 53,748 | | | | 13,385 | | | | 326,330 | |
Class R2 | | | 7,179 | | | | 236,698 | | | | 42,497 | | | | 1,172,074 | |
Class R3 | | | 28,695 | | | | 966,738 | | | | 121,888 | | | | 3,436,027 | |
Class R4 | | | 17,867 | | | | 609,088 | | | | 86,084 | | | | 2,452,539 | |
Class R6 | | | 467,693 | | | | 16,822,916 | | | | 1,640,473 | | | | 49,246,989 | |
| | | 1,766,584 | | | | $60,933,346 | | | | 6,667,501 | | | | $191,410,114 | |
| | | | |
| Shares reacquired | | | | | | | | | | | | | | | | |
Class A | | | (3,783,624 | ) | | | $(129,913,811 | ) | | | (5,585,845 | ) | | | $(172,873,286 | ) |
Class B | | | (164,608 | ) | | | (4,919,509 | ) | | | (294,676 | ) | | | (7,961,871 | ) |
Class C | | | (418,108 | ) | | | (12,254,341 | ) | | | (647,045 | ) | | | (17,059,886 | ) |
Class I | | | (3,605,757 | ) | | | (132,147,306 | ) | | | (4,654,776 | ) | | | (148,719,791 | ) |
Class R1 | | | (23,064 | ) | | | (674,834 | ) | | | (33,857 | ) | | | (870,193 | ) |
Class R2 | | | (83,489 | ) | | | (2,785,220 | ) | | | (215,066 | ) | | | (6,465,638 | ) |
Class R3 | | | (164,518 | ) | | | (5,635,174 | ) | | | (400,269 | ) | | | (12,423,690 | ) |
Class R4 | | | (110,297 | ) | | | (3,799,647 | ) | | | (233,321 | ) | | | (7,058,208 | ) |
Class R6 | | | (2,342,081 | ) | | | (86,509,390 | ) | | | (3,009,716 | ) | | | (100,053,397 | ) |
| | | (10,695,546 | ) | | | $(378,639,232 | ) | | | (15,074,571 | ) | | | $(473,485,960 | ) |
| | | | |
| Net change | | | | | | | | | | | | | | | | |
Class A | | | 6,216,073 | | | | $207,841,654 | | | | 7,666,235 | | | | $229,956,511 | |
Class B | | | 107,071 | | | | 2,918,760 | | | | (87,691 | ) | | | (2,565,530 | ) |
Class C | | | 1,521,150 | | | | 43,522,118 | | | | 697,369 | | | | 17,930,144 | |
Class I | | | 3,422,132 | | | | 121,959,138 | | | | 6,740,082 | | | | 221,957,414 | |
Class R1 | | | (4,505 | ) | | | (132,729 | ) | | | (1,194 | ) | | | (29,704 | ) |
Class R2 | | | 14,214 | | | | 438,752 | | | | (31,692 | ) | | | (1,012,430 | ) |
Class R3 | | | 365,072 | | | | 12,453,198 | | | | 280,446 | | | | 8,362,299 | |
Class R4 | | | 36,305 | | | | 1,260,242 | | | | 88,390 | | | | 2,991,139 | |
Class R6 | | | 4,743,070 | | | | 173,610,682 | | | | 6,710,852 | | | | 217,935,112 | |
| | | 16,420,582 | | | | $563,871,815 | | | | 22,062,797 | | | | $695,524,955 | |
Class T shares were not publicly available for sale during the period. Please see the fund’s prospectus for details.
Effective June 1, 2019, purchases of the fund’s Class B shares are closed to new and existing investors subject to certain exceptions. Please see the fund’s prospectus for details.
36
Notes to Financial Statements (unaudited) – continued
(6) Line of Credit
The fund and certain other funds managed by MFS participate in a $1.25 billion unsecured committed line of credit, subject to a $1 billion sublimit, provided by a syndicate of banks under a credit agreement. Borrowings may be made for temporary financing needs. Interest is charged to each fund, based on its borrowings, generally at a rate equal to the highest of one month LIBOR, the Federal Funds Effective Rate and the Overnight Bank Funding Rate, plus an agreed upon spread. A commitment fee, based on the average daily, unused portion of the committed line of credit, is allocated among the participating funds. In addition, the fund and other funds managed by MFS have established unsecured uncommitted borrowing arrangements with certain banks for temporary financing needs. Interest is charged to each fund, based on its borrowings, at rates equal to customary reference rates plus an agreed upon spread. For the six months ended February 29, 2020, the fund’s commitment fee and interest expense were $7,450 and $0, respectively, and are included in “Interest expense and fees” in the Statement of Operations.
(7) Investments in Affiliated Issuers
An affiliated issuer may be considered one in which the fund owns 5% or more of the outstanding voting securities, or a company which is under common control. For the purposes of this report, the following were affiliated issuers:
| | | | | | | | | | | | | | | | | | | | | | | | |
| | | | | | |
| Affiliated Issuers | | Beginning
Value | | | Purchases | | | Sales
Proceeds | | | Realized
Gain
(Loss) | | | Change in
Unrealized
Appreciation or
Depreciation | | | Ending
Value | |
| MFS Institutional Money | | | | | | | | | | | | | | | | | | | | | | | | |
| Market Portfolio | | | $36,346,848 | | | | $374,600,160 | | | | $351,874,435 | | | | $(5,208 | ) | | | $1,628 | | | | $59,068,993 | |
| | | | | | |
| Affiliated Issuers | | | | | | | | | | | | | | Dividend
Income | | | Capital Gain
Distributions | |
| MFS Institutional Money Market Portfolio | | | | | | | | | | | | | | | | $449,718 | | | | $— | |
(8) Acquisitions
At close of business on October 25, 2019, the MFS Core Equity Fund with net assets of approximately $2,981,074,655, acquired all of the assets and liabilities of MFS Equity Opportunities Fund. The purpose of the transaction was to provide shareholders of MFS Equity Opportunities Fund the opportunity to participate in a larger combined portfolio with a similar investment objective and similar investment policies and strategies. The acquisition was accomplished by atax-free exchange of approximately 6,952,677 shares of the fund (valued at approximately $227,335,572) for all of the assets and liabilities of MFS Equity Opportunities Fund. MFS Equity Opportunities Fund then distributed the shares of the fund that MFS Equity Opportunities Fund received from the fund to its shareholders. MFS Equity Opportunities Fund’s investments on that date were valued at approximately $227,592,285 with a cost basis of approximately $222,463,162. For financial reporting purposes, assets received and shares issued by the fund were recorded at fair value; however, the cost basis of the investments received from MFS Equity Opportunities Fund were carried forward to align ongoing reporting of the fund’s realized and unrealized gains and losses with amounts distributable to shareholders for tax purposes. Because the combined investment
37
Notes to Financial Statements (unaudited) – continued
portfolios have been managed as a single integrated portfolio since the acquisition was completed, it is not practicable to separate the amounts of revenue and earnings of MFS Equity Opportunities Fund that have been included in the fund’s Statement of Operations since October 25, 2019. No pro forma information is provided as it is not material to the combined fund results.
(9) Impacts of COVID-19
The pandemic related to the global spread of novel coronavirus disease (COVID-19), which was first detected in December 2019, has resulted in significant disruptions to global business activity and the global economy, as well as the economies of individual countries, the financial performance of individual companies and sectors, and the securities and commodities markets in general. This pandemic, the full effects of which are still unknown, has resulted in substantial market volatility and may have adversely impacted the prices and liquidity of the fund’s investments and the fund’s performance during the period February 29, 2020 through April 16, 2020, the date that these financial statements were issued.
38
PROXY VOTING POLICIES AND INFORMATION
MFS votes proxies on behalf of the fund pursuant to proxy voting policies and procedures that are available without charge, upon request, by calling1-800-225-2606, by visitingmfs.com/proxyvoting, or by visiting the SEC’s Web site athttp://www.sec.gov.
Information regarding how the fund voted proxies relating to portfolio securities during the most recent twelve-month period ended June 30 is available by August 31 of each year without charge by visitingmfs.com/proxyvoting, or by visiting the SEC’s Web site athttp://www.sec.gov.
QUARTERLY PORTFOLIO DISCLOSURE
The fund files a complete schedule of portfolio holdings with the SEC for the first and third quarters of each fiscal year as an exhibit to its reports onForm N-PORT. The fund’s Form N-PORT reports are available on the SEC’s website athttp://www.sec.gov.A shareholder can obtain the portfolio holdings report for the first and third quarters of the fund’s fiscal year atmfs.com/openendfunds by choosing the fund’s name and then selecting the “Resources” tab and clicking on “Prospectus and Reports”.
FURTHER INFORMATION
From time to time, MFS may post important information about the fund or the MFS funds on the MFS web site (mfs.com). This information is available athttps://www.mfs.com/en-us/what-we-do/announcements.html or atmfs.com/openendfunds by choosing the fund’s name.
INFORMATION ABOUT FUND CONTRACTS AND LEGAL CLAIMS
The fund has entered into contractual arrangements with an investment adviser, administrator, distributor, shareholder servicing agent, 529 program manager (if applicable), and custodian who each provide services to the fund. Unless expressly stated otherwise, shareholders are not parties to, or intended beneficiaries of these contractual arrangements, and these contractual arrangements are not intended to create any shareholder right to enforce them against the service providers or to seek any remedy under them against the service providers, either directly or on behalf of the fund.
Under the Trust’s By-Laws and Declaration of Trust, any claims asserted against or on behalf of the MFS Funds, including claims against Trustees and Officers, must be brought in state and federal courts located within the Commonwealth of Massachusetts.
PROVISION OF FINANCIAL REPORTS AND SUMMARY PROSPECTUSES
The fund produces financial reports every six months and updates its summary prospectus and prospectus annually. To avoid sending duplicate copies of materials to households, only one copy of the fund’s annual and semiannual report and summary prospectus may be mailed to shareholders having the same last name and residential address on the fund’s records. However, any shareholder may contact MFSC (please see back cover for address and telephone number) to request that copies of these reports and summary prospectuses be sent personally to that shareholder.
39
Save paper with eDelivery.

| MFS® will send you prospectuses, |
reports, and proxies directly viae-mail so you will get information faster with less mailbox clutter.
To sign up:
1. Go to mfs.com.
2. Log in via MFS® Access.
3. Select eDelivery.
If you own your MFS fund shares through a financial institution or a retirement plan, MFS® TALK, MFS® Access, or eDelivery may not be available to you.
CONTACT
WEB SITE
mfs.com
MFS TALK
1-800-637-8255
24 hours a day
ACCOUNT SERVICE AND LITERATURE
Shareholders
1-800-225-2606
Financial advisors
1-800-343-2829
Retirement plan services
1-800-637-1255
MAILING ADDRESS
MFS Service Center, Inc.
P.O. Box 219341
Kansas City, MO 64121-9341
OVERNIGHT MAIL
MFS Service Center, Inc.
Suite 219341
430 W 7th Street
Kansas City, MO 64105-1407
Semiannual Report
February 29, 2020

MFS® Low Volatility Global Equity Fund

Beginning on January 1, 2021, as permitted by regulations adopted by the U.S. Securities and Exchange Commission, paper copies of the fund’s annual and semiannual shareholder reports will no longer be sent by mail, unless you specifically request paper copies of the reports. Instead, the complete reports will be made available on the fund’s Web site (funds.mfs.com), and you will be notified by mail each time a report is posted and provided with a Web site link to access the report.
If you are already signed up to receive shareholder reports by email, you will not be affected by this change and you need not take any action. You may sign up to receive shareholder reports and other communications from the fund by email by contacting your financial intermediary (such as a broker-dealer or bank) or, if you hold your shares directly with the fund, by calling 1-800-225-2606 or by logging on to MFS Access at mfs.com.
Beginning on January 1, 2019, you may elect to receive all future reports in paper free of charge. Contact your financial intermediary to request that you continue to receive paper copies of your shareholder reports. If you invest directly with the fund, you can call 1-800-225-2606 or send an email request to orderliterature@mfs.com to let the fund know that you wish to continue receiving paper copies of your shareholder reports. Your election to receive reports in paper will apply to all funds held in your account if you invest through your financial intermediary or all funds held with the MFS fund complex if you invest directly.
LVO-SEM
MFS® Low Volatility Global Equity Fund
CONTENTS
The report is prepared for the general information of shareholders.
It is authorized for distribution to prospective investors only when preceded or accompanied by a current prospectus.
NOT FDIC INSURED• MAY LOSE VALUE• NO BANK GUARANTEE

LETTER FROM THE EXECUTIVE CHAIR
Dear Shareholders:
During the first quarter of 2020, market volatility reached levels not seen since the global financial crisis. Optimism heading into the year — on receding trade and
geopolitical risk along with easier central bank policies — was overwhelmed in February as the health effects of a novel coronavirus,COVID-19, spread beyond China’s borders, ultimately impacting more than 200 countries. The global pandemic prompted many governments to take drastic action to slow the spread of the virus, such as quarantines, school and business closures, and prohibitions on public gatherings. While these are important steps to protect the public health, they come at a cost: rising market volatility and an abrupt decline in economic growth.
Global central banks have taken aggressive, coordinated steps to cushion the economic and market fallout related to the virus, and
governments are undertaking unprecedented levels of fiscal stimulus. As uncertainty recedes, these measures can help create a supportive environment and encourage economic recovery. In the aftermath of the crisis, there are likely to be societal changes as households, businesses and governments adjust to a new reality and these alterations could change the investment landscape. Occurrences such as the COVID-19 outbreak demonstrate the importance of having a deep understanding of company fundamentals, and our global research platform has been built to do just that.
Here at MFS®, we aim to help our clients navigate the growing complexity of the markets and world economies. Our long-term investment philosophy and commitment to the responsible allocation of capital allow us to tune out the noise and uncover what we believe are the best, most durable investment opportunities in the market. Through our powerful global investment platform, we combine collective expertise, thoughtful risk management, and long-term discipline to create sustainable value for investors.
Respectfully,

Robert J. Manning
Executive Chair
MFS Investment Management
April 16, 2020
The opinions expressed in this letter are subject to change and may not be relied upon for investment advice. No forecasts can be guaranteed.
1
PORTFOLIO COMPOSITION
Portfolio structure

| | | | |
| Top ten holdings | | | | |
| Roche Holding AG | | | 3.9% | |
| Taiwan Semiconductor Manufacturing Co. Ltd., ADR | | | 2.9% | |
| Johnson & Johnson | | | 2.7% | |
| Adobe Systems, Inc. | | | 2.7% | |
| STORE Capital Corp., REIT | | | 2.3% | |
| PepsiCo, Inc. | | | 2.1% | |
| Lockheed Martin Corp. | | | 2.1% | |
| Terumo Corp. | | | 2.1% | |
| Starbucks Corp. | | | 2.1% | |
| ABC-MART, Inc. | | | 2.0% | |
| | | | |
| GICS equity sectors (g) | |
| Health Care | | | 16.0% | |
| Consumer Staples | | | 14.9% | |
| Information Technology | | | 13.5% | |
| Consumer Discretionary | | | 11.0% | |
| Financials | | | 11.0% | |
| Communication Services | | | 10.3% | |
| Real Estate | | | 8.3% | |
| Utilities | | | 8.1% | |
| Industrials | | | 6.1% | |
| Materials | | | 2.5% | |
| Energy | | | 2.1% | |
|
| Issuer country weightings (x) | |
| United States | | | 42.5% | |
| Japan | | | 12.6% | |
| Canada | | | 8.9% | |
| Switzerland | | | 7.4% | |
| United Kingdom | | | 3.8% | |
| Hong Kong | | | 3.6% | |
| Germany | | | 3.3% | |
| Taiwan | | | 2.9% | |
| Australia | | | 2.1% | |
| Other Countries | | | 12.9% | |
2
Portfolio Composition – continued
| | | | |
| Currency exposure weightings (y) | |
| United States Dollar | | | 51.4% | |
| Japanese Yen | | | 12.6% | |
| Swiss Franc | | | 7.4% | |
| Euro | | | 5.7% | |
| British Pound Sterling | | | 3.8% | |
| Hong Kong Dollar | | | 3.0% | |
| Taiwan Dollar | | | 2.9% | |
| Australian Dollar | | | 2.1% | |
| Indian Rupee | | | 1.7% | |
| Other Currencies | | | 9.4% | |
| (g) | The Global Industry Classification Standard (GICS®) was developed by and/or is the exclusive property of MSCI, Inc. and S&P Global Market Intelligence Inc. (“S&P Global Market Intelligence”). GICS is a service mark of MSCI and S&P Global Market Intelligence and has been licensed for use by MFS. |
| (x) | Represents the portfolio’s exposure to issuer countries as a percentage of a portfolio’s net assets. For purposes of this presentation, United States includes Cash & Cash Equivalents. |
| (y) | Represents the portfolio’s exposure to a particular currency as a percentage of a portfolio’s net assets. For purposes of this presentation, United States Dollar includes Cash & Cash Equivalents. |
Cash & Cash Equivalents includes any cash, investments in money market funds, short-term securities, and other assets less liabilities. Please see the Statement of Assets and Liabilities for additional information related to the fund’s cash position and other assets and liabilities.
From time to time Cash & Cash Equivalents may be negative due to timing of cash receipts and disbursements.
Percentages are based on net assets as of February 29, 2020.
The portfolio is actively managed and current holdings may be different.
3
EXPENSE TABLE
Fund expenses borne by the shareholders during the period, September 1, 2019 through February 29, 2020
As a shareholder of the fund, you incur two types of costs: (1) transaction costs, including sales charges (loads) on certain purchase or redemption payments, and (2) ongoing costs, including management fees; distribution and service(12b-1) fees; and other fund expenses. This example is intended to help you understand your ongoing costs (in dollars) of investing in the fund and to compare these costs with the ongoing costs of investing in other mutual funds.
The example is based on an investment of $1,000 invested at the beginning of the period and held for the entire period September 1, 2019 through February 29, 2020.
Actual Expenses
The first line for each share class in the following table provides information about actual account values and actual expenses. You may use the information in this line, together with the amount you invested, to estimate the expenses that you paid over the period. Simply divide your account value by $1,000 (for example, an $8,600 account value divided by $1,000 = 8.6), then multiply the result by the number in the first line under the heading entitled “Expenses Paid During Period” to estimate the expenses you paid on your account during this period.
Hypothetical Example for Comparison Purposes
The second line for each share class in the following table provides information about hypothetical account values and hypothetical expenses based on the fund’s actual expense ratio and an assumed rate of return of 5% per year before expenses, which is not the fund’s actual return. The hypothetical account values and expenses may not be used to estimate the actual ending account balance or expenses you paid for the period. You may use this information to compare the ongoing costs of investing in the fund and other funds. To do so, compare this 5% hypothetical example with the 5% hypothetical examples that appear in the shareholder reports of the other funds.
Please note that the expenses shown in the table are meant to highlight your ongoing costs only and do not reflect any transactional costs, such as sales charges (loads). Therefore, the second line for each share class in the table is useful in comparing ongoing costs only, and will not help you determine the relative total costs of owning different funds. In addition, if these transactional costs were included, your costs would have been higher.
4
Expense Table – continued
| | | | | | | | | | | | | | | | | | |
Share
Class | | | | Annualized
Expense
Ratio | | | Beginning
Account Value
9/01/19 | | | Ending
Account Value
2/29/20 | | | Expenses
Paid During
Period (p)
9/01/19-2/29/20 | |
| A | | Actual | | | 1.00% | | | | $1,000.00 | | | | $982.91 | | | | $4.93 | |
| | Hypothetical (h) | | | 1.00% | | | | $1,000.00 | | | | $1,019.89 | | | | $5.02 | |
| B | | Actual | | | 1.75% | | | | $1,000.00 | | | | $979.53 | | | | $8.61 | |
| | Hypothetical (h) | | | 1.75% | | | | $1,000.00 | | | | $1,016.16 | | | | $8.77 | |
| C | | Actual | | | 1.75% | | | | $1,000.00 | | | | $979.67 | | | | $8.61 | |
| | Hypothetical (h) | | | 1.75% | | | | $1,000.00 | | | | $1,016.16 | | | | $8.77 | |
| I | | Actual | | | 0.75% | | | | $1,000.00 | | | | $984.83 | | | | $3.70 | |
| | Hypothetical (h) | | | 0.75% | | | | $1,000.00 | | | | $1,021.13 | | | | $3.77 | |
| R1 | | Actual | | | 1.75% | | | | $1,000.00 | | | | $978.97 | | | | $8.61 | |
| | Hypothetical (h) | | | 1.75% | | | | $1,000.00 | | | | $1,016.16 | | | | $8.77 | |
| R2 | | Actual | | | 1.25% | | | | $1,000.00 | | | | $981.64 | | | | $6.16 | |
| | Hypothetical (h) | | | 1.25% | | | | $1,000.00 | | | | $1,018.65 | | | | $6.27 | |
| R3 | | Actual | | | 1.00% | | | | $1,000.00 | | | | $982.88 | | | | $4.93 | |
| | Hypothetical (h) | | | 1.00% | | | | $1,000.00 | | | | $1,019.89 | | | | $5.02 | |
| R4 | | Actual | | | 0.75% | | | | $1,000.00 | | | | $984.84 | | | | $3.70 | |
| | Hypothetical (h) | | | 0.75% | | | | $1,000.00 | | | | $1,021.13 | | | | $3.77 | |
| R6 | | Actual | | | 0.68% | | | | $1,000.00 | | | | $984.59 | | | | $3.36 | |
| | Hypothetical (h) | | | 0.68% | | | | $1,000.00 | | | | $1,021.48 | | | | $3.42 | |
| (h) | 5% class return per year before expenses. |
| (p) | “Expenses Paid During Period” are equal to each class’s annualized expense ratio, as shown above, multiplied by the average account value over the period, multiplied by 182/366 (to reflect theone-half year period). Expenses paid do not include any applicable sales charges (loads). If these transaction costs had been included, your costs would have been higher. |
Notes to Expense Table
Expense ratios include approximately 0.01% of interest expenses that are outside of the expense limitation arrangement (See Note 3 of the Notes to Financial Statements).
5
PORTFOLIO OF INVESTMENTS
2/29/20 (unaudited)
The Portfolio of Investments is a complete list of all securities owned by your fund. It is categorized by broad-based asset classes.
| | | | | | | | |
| | |
| Issuer | | Shares/Par | | | Value ($) | |
| Common Stocks - 103.8% | | | | | | |
| Aerospace - 2.6% | | | | | | |
| Leidos Holdings, Inc. | | | 11,800 | | | $ | 1,211,270 | |
| Lockheed Martin Corp. | | | 13,070 | | | | 4,834,201 | |
| | | | | | | | |
| | | | | | | $ | 6,045,471 | |
| Airlines - 0.4% | | | | | | |
| Malaysia Airports Holdings Berhad | | | 606,800 | | | $ | 952,134 | |
| | |
| Automotive - 0.8% | | | | | | |
| USS Co. Ltd. | | | 113,000 | | | $ | 1,781,145 | |
| | |
| Broadcasting - 0.5% | | | | | | |
| Publicis Groupe S.A. | | | 32,415 | | | $ | 1,253,886 | |
| | |
| Business Services - 4.1% | | | | | | |
| Auto Trader Group PLC | | | 190,556 | | | $ | 1,285,888 | |
| CGI, Inc. (a) | | | 22,300 | | | | 1,570,143 | |
| Fiserv, Inc. (a) | | | 25,291 | | | | 2,765,824 | |
| Infosys Technologies Ltd., ADR | | | 382,020 | | | | 3,846,941 | |
| | | | | | | | |
| | | | | | | $ | 9,468,796 | |
| Cable TV - 0.4% | | | | | | |
| Comcast Corp., “A” | | | 22,191 | | | $ | 897,182 | |
| | |
| Computer Software - 2.7% | | | | | | |
| Adobe Systems, Inc. (a) | | | 17,633 | | | $ | 6,085,501 | |
| | |
| Computer Software - Systems - 2.3% | | | | | | |
| Fujitsu Ltd. | | | 12,800 | | | $ | 1,350,833 | |
| Hitachi Ltd. | | | 34,000 | | | | 1,140,461 | |
| NICE Systems Ltd., ADR (a) | | | 16,573 | | | | 2,715,155 | |
| | | | | | | | |
| | | | | | | $ | 5,206,449 | |
| Construction - 1.9% | | | | | | |
| AvalonBay Communities, Inc., REIT | | | 16,247 | | | $ | 3,258,985 | |
| Rinnai Corp. | | | 17,500 | | | | 1,183,399 | |
| | | | | | | | |
| | | | | | | $ | 4,442,384 | |
| Consumer Products - 2.8% | | | | | | |
| Kimberly-Clark Corp. | | | 17,724 | | | $ | 2,325,212 | |
| L’Oréal | | | 4,154 | | | | 1,117,200 | |
6
Portfolio of Investments (unaudited) – continued
| | | | | | | | |
| | |
| Issuer | | Shares/Par | | | Value ($) | |
| Common Stocks - continued | | | | | | |
| Consumer Products - continued | | | | | | |
| Procter & Gamble Co. | | | 26,432 | | | $ | 2,992,895 | |
| | | | | | | | |
| | | | | | | $ | 6,435,307 | |
| Electronics - 4.5% | | | | | | |
| Kyocera Corp. | | | 56,100 | | | $ | 3,516,099 | |
| Taiwan Semiconductor Manufacturing Co. Ltd., ADR | | | 124,491 | | | | 6,702,595 | |
| | | | | | | | |
| | | | | | | $ | 10,218,694 | |
| Energy - Integrated - 1.1% | | | | | | |
| Eni S.p.A. | | | 61,845 | | | $ | 765,610 | |
| Royal Dutch Shell PLC, “B” | | | 79,497 | | | | 1,726,344 | |
| | | | | | | | |
| | | | | | | $ | 2,491,954 | |
| Entertainment - 0.4% | | | | | | |
| CTS Eventim AG | | | 18,565 | | | $ | 981,933 | |
| | |
| Food & Beverages - 7.8% | | | | | | |
| General Mills, Inc. | | | 62,094 | | | $ | 3,042,606 | |
| Mondelez International, Inc. | | | 40,161 | | | | 2,120,501 | |
| Mowi A.S.A. | | | 102,530 | | | | 2,173,066 | |
| Nestle S.A. | | | 40,686 | | | | 4,215,353 | |
| PepsiCo, Inc. | | | 37,346 | | | | 4,930,792 | |
| Toyo Suisan Kaisha Ltd. | | | 37,300 | | | | 1,494,325 | |
| | | | | | | | |
| | | | | | | $ | 17,976,643 | |
| Food & Drug Stores - 3.8% | | | | | | |
| Dairy Farm International Holdings Ltd. | | | 281,900 | | | $ | 1,353,120 | |
| Lawson, Inc. (l) | | | 18,900 | | | | 1,015,005 | |
| Seven & I Holdings Co. Ltd. (l) | | | 68,200 | | | | 2,328,869 | |
| Tesco PLC | | | 310,353 | | | | 916,716 | |
| Wesfarmers Ltd. | | | 120,933 | | | | 3,157,335 | |
| | | | | | | | |
| | | | | | | $ | 8,771,045 | |
| Gaming & Lodging - 1.9% | | | | | | |
| Crown Resorts Ltd. | | | 258,067 | | | $ | 1,723,053 | |
| Genting Berhad | | | 2,310,300 | | | | 2,713,164 | |
| | | | | | | | |
| | | | | | | $ | 4,436,217 | |
| Health Maintenance Organizations - 1.0% | | | | | | |
| Cigna Corp. | | | 12,185 | | | $ | 2,229,124 | |
| | |
| Insurance - 6.0% | | | | | | |
| Beazley PLC | | | 253,172 | | | $ | 1,742,244 | |
| Everest Re Group Ltd. | | | 14,682 | | | | 3,639,374 | |
7
Portfolio of Investments (unaudited) – continued
| | | | | | | | |
| | |
| Issuer | | Shares/Par | | | Value ($) | |
| Common Stocks - continued | | | | | | |
| | |
| Insurance - continued | | | | | | |
| MetLife, Inc. | | | 85,978 | | | $ | 3,672,980 | |
| Reinsurance Group of America, Inc. | | | 12,600 | | | | 1,537,578 | |
| Samsung Fire & Marine Insurance Co. Ltd. | | | 7,658 | | | | 1,248,484 | |
| Zurich Insurance Group AG | | | 5,172 | | | | 2,012,780 | |
| | | | | | | | |
| | | | | | | $ | 13,853,440 | |
| Internet - 0.9% | | | | | | |
| Alphabet, Inc., “A” (a) | | | 1,610 | | | $ | 2,156,192 | |
| | |
| Machinery & Tools - 0.8% | | | | | | |
| AGCO Corp. | | | 15,164 | | | $ | 916,361 | |
| Doosan Bobcat, Inc. | | | 38,139 | | | | 902,949 | |
| | | | | | | | |
| | | | | | | $ | 1,819,310 | |
| Major Banks - 2.1% | | | | | | |
| Bank of Nova Scotia | | | 20,354 | | | $ | 1,065,532 | |
| PNC Financial Services Group, Inc. | | | 12,914 | | | | 1,632,329 | |
| Royal Bank of Canada | | | 27,853 | | | | 2,074,213 | |
| | | | | | | | |
| | | | | | | $ | 4,772,074 | |
| Medical & Health Technology & Services - 0.4% | | | | | | |
| McKesson Corp. | | | 6,717 | | | $ | 939,440 | |
| | |
| Medical Equipment - 3.0% | | | | | | |
| EssilorLuxottica | | | 16,257 | | | $ | 2,240,726 | |
| Terumo Corp. | | | 147,900 | | | | 4,738,053 | |
| | | | | | | | |
| | | | | | | $ | 6,978,779 | |
| Natural Gas - Pipeline - 1.0% | | | | | | |
| Enbridge, Inc. | | | 63,384 | | | $ | 2,372,463 | |
| | |
| Other Banks & Diversified Financials - 2.9% | | | | | | |
| Credicorp Ltd. | | | 10,219 | | | $ | 1,852,398 | |
| DBS Group Holdings Ltd. | | | 52,800 | | | | 922,016 | |
| Komercni Banka A.S. | | | 40,521 | | | | 1,243,843 | |
| U.S. Bancorp | | | 57,098 | | | | 2,651,631 | |
| | | | | | | | |
| | | | | | | $ | 6,669,888 | |
| Pharmaceuticals - 12.5% | | | | | | |
| Eli Lilly & Co. | | | 23,246 | | | $ | 2,932,018 | |
| Johnson & Johnson | | | 46,819 | | | | 6,296,219 | |
| Merck & Co., Inc. | | | 44,190 | | | | 3,383,186 | |
| Novartis AG | | | 21,607 | | | | 1,813,891 | |
| Novo Nordisk A.S., “B” | | | 60,671 | | | | 3,605,888 | |
8
Portfolio of Investments (unaudited) – continued
| | | | | | | | |
| | |
| Issuer | | Shares/Par | | | Value ($) | |
| Common Stocks - continued | | | | | | |
| Pharmaceuticals - continued | | | | | | |
| Pfizer, Inc. | | | 55,669 | | | $ | 1,860,458 | |
| Roche Holding AG | | | 27,329 | | | | 8,907,737 | |
| | | | | | | | |
| | | | | | | $ | 28,799,397 | |
| Pollution Control - 2.0% | | | | | | |
| Waste Connections, Inc. | | | 47,167 | | | $ | 4,551,144 | |
| | |
| Precious Metals & Minerals - 1.3% | | | | | | |
| Franco-Nevada Corp. | | | 27,444 | | | $ | 2,946,307 | |
| | |
| Railroad & Shipping - 0.8% | | | | | | |
| Canadian National Railway Co. | | | 21,924 | | | $ | 1,861,567 | |
| | |
| Real Estate - 6.9% | | | | | | |
| Grand City Properties S.A. | | | 165,975 | | | $ | 3,890,636 | |
| Life Storage, Inc., REIT | | | 17,403 | | | | 1,877,958 | |
| Public Storage, Inc., REIT | | | 7,249 | | | | 1,515,911 | |
| STORE Capital Corp., REIT | | | 157,417 | | | | 5,172,722 | |
| Sun Communities, Inc., REIT | | | 21,784 | | | | 3,330,338 | |
| | | | | | | | |
| | | | | | | $ | 15,787,565 | |
| Restaurants - 4.1% | | | | | | |
| McDonald’s Corp. | | | 16,867 | | | $ | 3,275,065 | |
| Starbucks Corp. | | | 60,067 | | | | 4,711,055 | |
| U.S. Foods Holding Corp. (a) | | | 41,826 | | | | 1,407,027 | |
| | | | | | | | |
| | | | | | | $ | 9,393,147 | |
| Specialty Chemicals - 1.2% | | | | | | |
| Symrise AG | | | 27,616 | | | $ | 2,689,770 | |
| | |
| Specialty Stores - 2.0% | | | | | | |
| ABC-MART, Inc. | | | 79,600 | | | $ | 4,585,910 | |
| | |
| Telecommunications - Wireless - 3.3% | | | | | | |
| Advanced Info Service Public Co. Ltd. | | | 213,000 | | | $ | 1,356,774 | |
| KDDI Corp. | | | 142,400 | | | | 4,024,279 | |
| Vodafone Group PLC | | | 1,197,435 | | | | 2,091,225 | |
| | | | | | | | |
| | | | | | | $ | 7,472,278 | |
| Telephone Services - 4.2% | | | | | | |
| HKT Trust and HKT Ltd. | | | 2,154,000 | | | $ | 3,230,084 | |
| TELUS Corp. | | | 107,401 | | | | 3,895,434 | |
| Verizon Communications, Inc. | | | 46,326 | | | | 2,509,016 | |
| | | | | | | | |
| | | | | | | $ | 9,634,534 | |
9
Portfolio of Investments (unaudited) – continued
| | | | | | | | |
| | |
| Issuer | | Shares/Par | | | Value ($) | |
| Common Stocks - continued | | | | | | |
| Tobacco - 1.3% | | | | | | |
| British American Tobacco PLC | | | 26,230 | | | $ | 1,042,375 | |
| Japan Tobacco, Inc. | | | 92,500 | | | | 1,834,412 | |
| | | | | | | | |
| | | | | | | $ | 2,876,787 | |
| Utilities - Electric Power - 8.1% | | | | | | |
| American Electric Power Co., Inc. | | | 29,449 | | | $ | 2,628,618 | |
| Avangrid, Inc. | | | 33,205 | | | | 1,649,956 | |
| CEZ A.S. (Czech Republic) | | | 36,304 | | | | 695,772 | |
| CLP Holdings Ltd. | | | 351,000 | | | | 3,698,441 | |
| Duke Energy Corp. | | | 11,184 | | | | 1,025,573 | |
| Evergy, Inc. | | | 40,996 | | | | 2,679,089 | |
| WEC Energy Group, Inc. | | | 33,494 | | | | 3,092,501 | |
| Xcel Energy, Inc. | | | 49,453 | | | | 3,081,911 | |
| | | | | | | | |
| | | | | | | $ | 18,551,861 | |
| Total Common Stocks (Identified Cost, $210,698,290) | | | | | | $ | 238,385,718 | |
| | |
| Investment Companies (h) - 0.4% | | | | | | |
| Money Market Funds - 0.4% | | | | | | |
MFS Institutional Money Market Portfolio, 1.61% (v)
(Identified Cost, $953,485) | | | 953,485 | | | $ | 953,580 | |
| | |
| Collateral for Securities Loaned - 0.0% | | | | | | |
State Street Navigator Securities Lending Government Money Market
Portfolio, 1.61% (j) (Identified Cost, $22,995) | | | 22,995 | | | $ | 22,995 | |
| | |
| Other Assets, Less Liabilities - (4.2)% | | | | | (9,750,464) | |
| Net Assets - 100.0% | | | | | | $ | 229,611,829 | |
| (a) | Non-income producing security. |
| (h) | An affiliated issuer, which may be considered one in which the fund owns 5% or more of the outstanding voting securities, or a company which is under common control. At period end, the aggregate values of the fund’s investments in affiliated issuers and in unaffiliated issuers were $953,580 and $238,408,713, respectively. |
| (j) | The rate quoted is the annualizedseven-day yield of the fund at period end. |
| (l) | A portion of this security is on loan. See Note 2 for additional information. |
| (v) | Affiliated issuer that is available only to investment companies managed by MFS. The rate quoted for the MFS Institutional Money Market Portfolio is the annualizedseven-day yield of the fund at period end. |
The following abbreviations are used in this report and are defined:
| ADR | | American Depositary Receipt |
| REIT | | Real Estate Investment Trust |
See Notes to Financial Statements
10
Financial Statements
STATEMENT OF ASSETS AND LIABILITIES
At 2/29/20 (unaudited)
This statement represents your fund’s balance sheet, which details the assets and liabilities comprising the total value of the fund.
| | | | |
| Assets | | | | |
Investments in unaffiliated issuers, at value, including $2,835,202 of securities on loan (identified cost, $210,721,285) | | | $238,408,713 | |
Investments in affiliated issuers, at value (identified cost, $953,485) | | | 953,580 | |
Cash | | | 23,479 | |
Receivables for | | | | |
Fund shares sold | | | 1,171,942 | |
Interest and dividends | | | 869,459 | |
Other assets | | | 976 | |
Total assets | | | $241,428,149 | |
| Liabilities | | | | |
Payables for | | | | |
Investments purchased | | | $326,657 | |
Fund shares reacquired | | | 11,361,592 | |
Collateral for securities loaned, at value (c) | | | 22,995 | |
Payable to affiliates | | | | |
Investment adviser | | | 6,944 | |
Administrative services fee | | | 355 | |
Shareholder servicing costs | | | 53,329 | |
Distribution and service fees | | | 701 | |
Payable for independent Trustees’ compensation | | | 776 | |
Deferred country tax expense payable | | | 5,186 | |
Accrued expenses and other liabilities | | | 37,785 | |
Total liabilities | | | $11,816,320 | |
Net assets | | | $229,611,829 | |
| Net assets consist of | | | | |
Paid-in capital | | | $204,803,371 | |
Total distributable earnings (loss) | | | 24,808,458 | |
Net assets | | | $229,611,829 | |
Shares of beneficial interest outstanding | | | 17,071,870 | |
| (c) | Non-cash collateral is not included. |
11
Statement of Assets and Liabilities (unaudited) – continued
| | | | | | | | | | | | |
| | | |
| | | Net assets | | | Shares
outstanding | | | Net asset value
per share (a) | |
Class A | | | $23,317,143 | | | | 1,733,353 | | | | $13.45 | |
Class B | | | 394,971 | | | | 29,569 | | | | 13.36 | |
Class C | | | 3,035,826 | | | | 227,594 | | | | 13.34 | |
Class I | | | 106,847,306 | | | | 7,939,668 | | | | 13.46 | |
Class R1 | | | 99,513 | | | | 7,419 | | | | 13.41 | |
Class R2 | | | 159,599 | | | | 11,864 | | | | 13.45 | |
Class R3 | | | 74,456 | | | | 5,528 | | | | 13.47 | |
Class R4 | | | 70,651 | | | | 5,249 | | | | 13.46 | |
Class R6 | | | 95,612,364 | | | | 7,111,626 | | | | 13.44 | |
| (a) | Maximum offering price per share was equal to the net asset value per share for all share classes, except for Class A, for which the maximum offering price per share was $14.27 [100 / 94.25 x $13.45]. On sales of $50,000 or more, the maximum offering price of Class A shares is reduced. A contingent deferred sales charge may be imposed on redemptions of Class A, Class B, and Class C shares. Redemption price per share was equal to the net asset value per share for Classes I, R1, R2, R3, R4, and R6. |
See Notes to Financial Statements
12
Financial Statements
STATEMENT OF OPERATIONS
Six months ended 2/29/20 (unaudited)
This statement describes how much your fund earned in investment income and accrued in expenses. It also describes any gains and/or losses generated by fund operations.
| | | | |
| Net investment income (loss) | | | | |
Income | | | | |
Dividends | | | $2,581,833 | |
Dividends from affiliated issuers | | | 12,281 | |
Other | | | 5,036 | |
Income on securities loaned | | | 331 | |
Foreign taxes withheld | | | (126,843 | ) |
Total investment income | | | $2,472,638 | |
Expenses | | | | |
Management fee | | | $643,059 | |
Distribution and service fees | | | 46,866 | |
Shareholder servicing costs | | | 67,833 | |
Administrative services fee | | | 20,488 | |
Independent Trustees’ compensation | | | 4,823 | |
Custodian fee | | | 37,063 | |
Shareholder communications | | | 14,383 | |
Audit and tax fees | | | 28,131 | |
Legal fees | | | 1,069 | |
Registration fees | | | 65,596 | |
Miscellaneous | | | 30,564 | |
Total expenses | | | $959,875 | |
Reduction of expenses by investment adviser and distributor | | | (67,479 | ) |
Net expenses | | | $892,396 | |
Net investment income (loss) | | | $1,580,242 | |
| |
| Realized and unrealized gain (loss) | | | | |
Realized gain (loss) (identified cost basis) | | | | |
Unaffiliated issuers (net of $1,386 country tax) | | | $326,089 | |
Affiliated issuers | | | 476 | |
Foreign currency | | | (3,517 | ) |
Net realized gain (loss) | | | $323,048 | |
Change in unrealized appreciation or depreciation | | | | |
Unaffiliated issuers (net of $31,442 decrease in deferred country tax) | | | $(7,318,980 | ) |
Affiliated issuers | | | 50 | |
Translation of assets and liabilities in foreign currencies | | | 2,119 | |
Net unrealized gain (loss) | | | $(7,316,811 | ) |
Net realized and unrealized gain (loss) | | | $(6,993,763 | ) |
Change in net assets from operations | | | $(5,413,521 | ) |
See Notes to Financial Statements
13
Financial Statements
STATEMENTS OF CHANGES IN NET ASSETS
These statements describe the increases and/or decreases in net assets resulting from operations, any distributions, and any shareholder transactions.
| | | | | | | | |
| Change in net assets | | Six months ended
2/29/20
(unaudited) | | | Year ended
8/31/19 | |
| | |
| From operations | | | | | | | | |
Net investment income (loss) | | | $1,580,242 | | | | $4,684,916 | |
Net realized gain (loss) | | | 323,048 | | | | 1,976,712 | |
Net unrealized gain (loss) | | | (7,316,811 | ) | | | 10,762,414 | |
Change in net assets from operations | | | $(5,413,521 | ) | | | $17,424,042 | |
Total distributions to shareholders | | | $(4,251,075 | ) | | | $(10,518,952 | ) |
Change in net assets from fund share transactions | | | $19,886,224 | | | | $17,311,467 | |
Total change in net assets | | | $10,221,628 | | | | $24,216,557 | |
| | |
| Net assets | | | | | | | | |
At beginning of period | | | 219,390,201 | | | | 195,173,644 | |
At end of period | | | $229,611,829 | | | | $219,390,201 | |
See Notes to Financial Statements
14
Financial Statements
FINANCIAL HIGHLIGHTS
The financial highlights table is intended to help you understand the fund’s financial performance for the semiannual period and the past 5 fiscal years. Certain information reflects financial results for a single fund share. The total returns in the table represent the rate that an investor would have earned (or lost) on an investment in the fund share class (assuming reinvestment of all distributions) held for the entire period.
| | | | | | | | | | | | | | | | | | | | | | | | |
| | | Six months
ended 2/29/20 | | | Year ended | |
| Class A | | 8/31/19 | | | 8/31/18 | | | 8/31/17 | | | 8/31/16 | | | 8/31/15 | |
| | | (unaudited) | | | | | | | | | | | | | | | | |
Net asset value, beginning of period | | | $13.92 | | | | $13.73 | | | | $12.82 | | | | $11.87 | | | | $10.75 | | | | $10.92 | |
| | | |
| Income (loss) from investment operations | | | | | | | | | | | | | |
Net investment income (loss) (d) | | | $0.08 | | | | $0.25 | | | | $0.23 | | | | $0.19 | | | | $0.18 | | | | $0.19 | |
Net realized and unrealized gain (loss) | | | (0.31 | ) | | | 0.56 | | | | 0.92 | | | | 0.91 | | | | 1.11 | | | | (0.22 | ) |
Total from investment operations | | | $(0.23 | ) | | | $0.81 | | | | $1.15 | | | | $1.10 | | | | $1.29 | | | | $(0.03 | ) |
| | | |
| Less distributions declared to shareholders | | | | | | | | | | | | | |
From net investment income | | | $(0.15 | ) | | | $(0.23 | ) | | | $(0.24 | ) | | | $(0.15 | ) | | | $(0.17 | ) | | | $(0.12 | ) |
From net realized gain | | | (0.09 | ) | | | (0.39 | ) | | | — | | | | — | | | | — | | | | (0.02 | ) |
Total distributions declared to
shareholders | | | $(0.24 | ) | | | $(0.62 | ) | | | $(0.24 | ) | | | $(0.15 | ) | | | $(0.17 | ) | | | $(0.14 | ) |
Net asset value, end of period (x) | | | $13.45 | | | | $13.92 | | | | $13.73 | | | | $12.82 | | | | $11.87 | | | | $10.75 | |
Total return (%) (r)(s)(t)(x) | | | (1.71 | )(n) | | | 6.38 | | | | 9.09 | | | | 9.36 | | | | 12.12 | | | | (0.36 | ) |
| | | |
Ratios (%) (to average net assets)
and Supplemental data: | | | | | | | | | | | | | |
Expenses before expense reductions (f) | | | 1.06 | (a) | | | 1.05 | | | | 1.06 | | | | 1.23 | | | | 1.51 | | | | 1.88 | |
Expenses after expense reductions (f) | | | 1.00 | (a) | | | 0.98 | | | | 0.97 | | | | 1.17 | | | | 1.19 | | | | 1.23 | |
Net investment income (loss) | | | 1.11 | (a)(l) | | | 1.86 | | | | 1.75 | | | | 1.55 | | | | 1.56 | | | | 1.65 | |
Portfolio turnover | | | 8 | (n) | | | 65 | | | | 41 | | | | 24 | | | | 28 | | | | 61 | |
Net assets at end of period
(000 omitted) | | | $23,317 | | | | $19,981 | | | | $9,102 | | | | $9,215 | | | | $7,473 | | | | $3,981 | |
See Notes to Financial Statements
15
Financial Highlights – continued
| | | | | | | | | | | | | | | | | | | | | | | | |
| | | Six months
ended 2/29/20 | | | Year ended | |
| Class B | | 8/31/19 | | | 8/31/18 | | | 8/31/17 | | | 8/31/16 | | | 8/31/15 | |
| | | (unaudited) | | | | | | | | | | | | | | | | |
Net asset value, beginning of period | | | $13.82 | | | | $13.63 | | | | $12.73 | | | | $11.79 | | | | $10.70 | | | | $10.91 | |
| | | |
| Income (loss) from investment operations | | | | | | | | | | | | | |
Net investment income (loss) (d) | | | $0.03 | | | | $0.14 | | | | $0.13 | | | | $0.09 | | | | $0.07 | | | | $0.08 | |
Net realized and unrealized gain (loss) | | | (0.30 | ) | | | 0.57 | | | | 0.91 | | | | 0.91 | | | | 1.12 | | | | (0.20 | ) |
Total from investment operations | | | $(0.27 | ) | | | $0.71 | | | | $1.04 | | | | $1.00 | | | | $1.19 | | | | $(0.12 | ) |
| | | |
| Less distributions declared to shareholders | | | | | | | | | | | | | |
From net investment income | | | $(0.10 | ) | | | $(0.13 | ) | | | $(0.14 | ) | | | $(0.06 | ) | | | $(0.10 | ) | | | $(0.07 | ) |
From net realized gain | | | (0.09 | ) | | | (0.39 | ) | | | — | | | | — | | | | — | | | | (0.02 | ) |
Total distributions declared to
shareholders | | | $(0.19 | ) | | | $(0.52 | ) | | | $(0.14 | ) | | | $(0.06 | ) | | | $(0.10 | ) | | | $(0.09 | ) |
Net asset value, end of period (x) | | | $13.36 | | | | $13.82 | | | | $13.63 | | | | $12.73 | | | | $11.79 | | | | $10.70 | |
Total return (%) (r)(s)(t)(x) | | | (2.05 | )(n) | | | 5.60 | | | | 8.25 | | | | 8.48 | | | | 11.16 | | | | (1.16 | ) |
| | | |
Ratios (%) (to average net assets)
and Supplemental data: | | | | | | | | | | | | | |
Expenses before expense reductions (f) | | | 1.81 | (a) | | | 1.79 | | | | 1.81 | | | | 1.98 | | | | 2.33 | | | | 2.68 | |
Expenses after expense reductions (f) | | | 1.75 | (a) | | | 1.74 | | | | 1.74 | | | | 1.96 | | | | 1.98 | | | | 2.01 | |
Net investment income (loss) | | | 0.35 | (a)(l) | | | 1.03 | | | | 1.02 | | | | 0.73 | | | | 0.65 | | | | 0.74 | |
Portfolio turnover | | | 8 | (n) | | | 65 | | | | 41 | | | | 24 | | | | 28 | | | | 61 | |
Net assets at end of period
(000 omitted) | | | $395 | | | | $410 | | | | $380 | | | | $350 | | | | $341 | | | | $446 | |
See Notes to Financial Statements
16
Financial Highlights – continued
| | | | | | | | | | | | | | | | | | | | | | | | |
| | | Six months
ended 2/29/20 | | | Year ended | |
| Class C | | 8/31/19 | | | 8/31/18 | | | 8/31/17 | | | 8/31/16 | | | 8/31/15 | |
| | | (unaudited) | | | | | | | | | | | | | | | | |
Net asset value, beginning of period | | | $13.80 | | | | $13.62 | | | | $12.71 | | | | $11.78 | | | | $10.69 | | | | $10.91 | |
| | | |
| Income (loss) from investment operations | | | | | | | | | | | | | |
Net investment income (loss) (d) | | | $0.02 | | | | $0.14 | | | | $0.13 | | | | $0.09 | | | | $0.08 | | | | $0.10 | |
Net realized and unrealized gain (loss) | | | (0.29 | ) | | | 0.57 | | | | 0.92 | | | | 0.91 | | | | 1.11 | | | | (0.23 | ) |
Total from investment operations | | | $(0.27 | ) | | | $0.71 | | | | $1.05 | | | | $1.00 | | | | $1.19 | | | | $(0.13 | ) |
| | | |
| Less distributions declared to shareholders | | | | | | | | | | | | | |
From net investment income | | | $(0.10 | ) | | | $(0.14 | ) | | | $(0.14 | ) | | | $(0.07 | ) | | | $(0.10 | ) | | | $(0.07 | ) |
From net realized gain | | | (0.09 | ) | | | (0.39 | ) | | | — | | | | — | | | | — | | | | (0.02 | ) |
Total distributions declared to
shareholders | | | $(0.19 | ) | | | $(0.53 | ) | | | $(0.14 | ) | | | $(0.07 | ) | | | $(0.10 | ) | | | $(0.09 | ) |
Net asset value, end of period (x) | | | $13.34 | | | | $13.80 | | | | $13.62 | | | | $12.71 | | | | $11.78 | | | | $10.69 | |
Total return (%) (r)(s)(t)(x) | | | (2.03 | )(n) | | | 5.57 | | | | 8.28 | | | | 8.49 | | | | 11.22 | | | | (1.23 | ) |
| | | |
Ratios (%) (to average net assets)
and Supplemental data: | | | | | | | | | | | | | |
Expenses before expense reductions (f) | | | 1.81 | (a) | | | 1.80 | | | | 1.81 | | | | 1.98 | | | | 2.23 | | | | 2.66 | |
Expenses after expense reductions (f) | | | 1.75 | (a) | | | 1.74 | | | | 1.74 | | | | 1.96 | | | | 1.99 | | | | 2.00 | |
Net investment income (loss) | | | 0.35 | (a)(l) | | | 1.02 | | | | 1.01 | | | | 0.76 | | | | 0.74 | | | | 0.89 | |
Portfolio turnover | | | 8 | (n) | | | 65 | | | | 41 | | | | 24 | | | | 28 | | | | 61 | |
Net assets at end of period
(000 omitted) | | | $3,036 | | | | $2,876 | | | | $1,773 | | | | $1,924 | | | | $1,554 | | | | $453 | |
See Notes to Financial Statements
17
Financial Highlights – continued
| | | | | | | | | | | | | | | | | | | | | | | | |
| | | Six months
ended 2/29/20 | | | Year ended | |
| Class I | | 8/31/19 | | | 8/31/18 | | | 8/31/17 | | | 8/31/16 | | | 8/31/15 | |
| | | (unaudited) | | | | | | | | | | | | | | | | |
Net asset value, beginning of period | | | $13.92 | | | | $13.73 | | | | $12.82 | | | | $11.87 | | | | $10.76 | | | | $10.93 | |
| | | |
| Income (loss) from investment operations | | | | | | | | | | | | | |
Net investment income (loss) (d) | | | $0.10 | | | | $0.28 | | | | $0.27 | | | | $0.23 | | | | $0.21 | | | | $0.24 | |
Net realized and unrealized gain (loss) | | | (0.30 | ) | | | 0.56 | | | | 0.91 | | | | 0.90 | | | | 1.10 | | | | (0.25 | ) |
Total from investment operations | | | $(0.20 | ) | | | $0.84 | | | | $1.18 | | | | $1.13 | | | | $1.31 | | | | $(0.01 | ) |
| | | |
| Less distributions declared to shareholders | | | | | | | | | | | | | |
From net investment income | | | $(0.17 | ) | | | $(0.26 | ) | | | $(0.27 | ) | | | $(0.18 | ) | | | $(0.20 | ) | | | $(0.14 | ) |
From net realized gain | | | (0.09 | ) | | | (0.39 | ) | | | — | | | | — | | | | — | | | | (0.02 | ) |
Total distributions declared to
shareholders | | | $(0.26 | ) | | | $(0.65 | ) | | | $(0.27 | ) | | | $(0.18 | ) | | | $(0.20 | ) | | | $(0.16 | ) |
Net asset value, end of period (x) | | | $13.46 | | | | $13.92 | | | | $13.73 | | | | $12.82 | | | | $11.87 | | | | $10.76 | |
Total return (%) (r)(s)(t)(x) | | | (1.52 | )(n) | | | 6.61 | | | | 9.34 | | | | 9.59 | | | | 12.34 | | | | (0.18 | ) |
| | | |
Ratios (%) (to average net assets)
and Supplemental data: | | | | | | | | | | | | | |
Expenses before expense reductions (f) | | | 0.81 | (a) | | | 0.79 | | | | 0.81 | | | | 0.94 | | | | 1.17 | | | | 1.63 | |
Expenses after expense reductions (f) | | | 0.75 | (a) | | | 0.74 | | | | 0.74 | | | | 0.90 | | | | 0.98 | | | | 1.00 | |
Net investment income (loss) | | | 1.36 | (a)(l) | | | 2.09 | | | | 2.03 | | | | 1.87 | | | | 1.86 | | | | 2.10 | |
Portfolio turnover | | | 8 | (n) | | | 65 | | | | 41 | | | | 24 | | | | 28 | | | | 61 | |
Net assets at end of period
(000 omitted) | | | $106,847 | | | | $118,907 | | | | $114,259 | | | | $97,952 | | | | $10,669 | | | | $2,685 | |
See Notes to Financial Statements
18
Financial Highlights – continued
| | | | | | | | | | | | | | | | | | | | | | | | |
| | | Six months
ended 2/29/20 | | | Year ended | |
| Class R1 | | 8/31/19 | | | 8/31/18 | | | 8/31/17 | | | 8/31/16 | | | 8/31/15 | |
| | | (unaudited) | | | | | | | | | | | | | | | | |
Net asset value, beginning of period | | | $13.88 | | | | $13.69 | | | | $12.78 | | | | $11.84 | | | | $10.70 | | | | $10.91 | |
| | | |
| Income (loss) from investment operations | | | | | | | | | | | | | |
Net investment income (loss) (d) | | | $0.03 | | | | $0.14 | | | | $0.14 | | | | $0.09 | | | | $0.08 | | | | $0.07 | |
Net realized and unrealized gain (loss) | | | (0.31 | ) | | | 0.58 | | | | 0.91 | | | | 0.91 | | | | 1.12 | | | | (0.19 | ) |
Total from investment operations | | | $(0.28 | ) | | | $0.72 | | | | $1.05 | | | | $1.00 | | | | $1.20 | | | | $(0.12 | ) |
| | | |
| Less distributions declared to shareholders | | | | | | | | | | | | | |
From net investment income | | | $(0.10 | ) | | | $(0.14 | ) | | | $(0.14 | ) | | | $(0.06 | ) | | | $(0.06 | ) | | | $(0.07 | ) |
From net realized gain | | | (0.09 | ) | | | (0.39 | ) | | | — | | | | — | | | | — | | | | (0.02 | ) |
Total distributions declared to
shareholders | | | $(0.19 | ) | | | $(0.53 | ) | | | $(0.14 | ) | | | $(0.06 | ) | | | $(0.06 | ) | | | $(0.09 | ) |
Net asset value, end of period (x) | | | $13.41 | | | | $13.88 | | | | $13.69 | | | | $12.78 | | | | $11.84 | | | | $10.70 | |
Total return (%) (r)(s)(t)(x) | | | (2.10 | )(n) | | | 5.61 | | | | 8.29 | | | | 8.47 | | | | 11.24 | | | | (1.22 | ) |
| | | |
Ratios (%) (to average net assets)
and Supplemental data: | | | | | | | | | | | | | |
Expenses before expense reductions (f) | | | 1.81 | (a) | | | 1.79 | | | | 1.81 | | | | 1.98 | | | | 2.31 | | | | 2.69 | |
Expenses after expense reductions (f) | | | 1.75 | (a) | | | 1.74 | | | | 1.74 | | | | 1.96 | | | | 1.99 | | | | 2.01 | |
Net investment income (loss) | | | 0.36 | (a)(l) | | | 1.03 | | | | 1.03 | | | | 0.75 | | | | 0.69 | | | | 0.66 | |
Portfolio turnover | | | 8 | (n) | | | 65 | | | | 41 | | | | 24 | | | | 28 | | | | 61 | |
Net assets at end of period
(000 omitted) | | | $100 | | | | $96 | | | | $74 | | | | $68 | | | | $56 | | | | $108 | |
See Notes to Financial Statements
19
Financial Highlights – continued
| | | | | | | | | | | | | | | | | | | | | | | | |
| | | Six months
ended 2/29/20 | | | Year ended | |
| Class R2 | | 8/31/19 | | | 8/31/18 | | | 8/31/17 | | | 8/31/16 | | | 8/31/15 | |
| | | (unaudited) | | | | | | | | | | | | | | | | |
Net asset value, beginning of period | | | $13.92 | | | | $13.73 | | | | $12.81 | | | | $11.87 | | | | $10.74 | | | | $10.92 | |
| | | |
| Income (loss) from investment operations | | | | | | | | | | | | | |
Net investment income (loss) (d) | | | $0.05 | | | | $0.21 | | | | $0.20 | | | | $0.15 | | | | $0.13 | | | | $0.13 | |
Net realized and unrealized gain (loss) | | | (0.29 | ) | | | 0.57 | | | | 0.92 | | | | 0.90 | | | | 1.13 | | | | (0.20 | ) |
Total from investment operations | | | $(0.24 | ) | | | $0.78 | | | | $1.12 | | | | $1.05 | | | | $1.26 | | | | $(0.07 | ) |
| | | |
| Less distributions declared to shareholders | | | | | | | | | | | | | |
From net investment income | | | $(0.14 | ) | | | $(0.20 | ) | | | $(0.20 | ) | | | $(0.11 | ) | | | $(0.13 | ) | | | $(0.09 | ) |
From net realized gain | | | (0.09 | ) | | | (0.39 | ) | | | — | | | | — | | | | — | | | | (0.02 | ) |
Total distributions declared to
shareholders | | | $(0.23 | ) | | | $(0.59 | ) | | | $(0.20 | ) | | | $(0.11 | ) | | | $(0.13 | ) | | | $(0.11 | ) |
Net asset value, end of period (x) | | | $13.45 | | | | $13.92 | | | | $13.73 | | | | $12.81 | | | | $11.87 | | | | $10.74 | |
Total return (%) (r)(s)(t)(x) | | | (1.84 | )(n) | | | 6.09 | | | | 8.87 | | | | 8.94 | | | | 11.83 | | | | (0.71 | ) |
| | | |
Ratios (%) (to average net assets)
and Supplemental data: | | | | | | | | | | | | | |
Expenses before expense reductions (f) | | | 1.31 | (a) | | | 1.29 | | | | 1.31 | | | | 1.49 | | | | 1.79 | | | | 2.19 | |
Expenses after expense reductions (f) | | | 1.25 | (a) | | | 1.24 | | | | 1.24 | | | | 1.47 | | | | 1.49 | | | | 1.51 | |
Net investment income (loss) | | | 0.74 | (a)(l) | | | 1.53 | | | | 1.52 | | | | 1.24 | | | | 1.20 | | | | 1.16 | |
Portfolio turnover | | | 8 | (n) | | | 65 | | | | 41 | | | | 24 | | | | 28 | | | | 61 | |
Net assets at end of period
(000 omitted) | | | $160 | | | | $75 | | | | $66 | | | | $61 | | | | $72 | | | | $112 | |
See Notes to Financial Statements
20
Financial Highlights – continued
| | | | | | | | | | | | | | | | | | | | | | | | |
| | | Six months
ended 2/29/20 | | | Year ended | |
| Class R3 | | 8/31/19 | | | 8/31/18 | | | 8/31/17 | | | 8/31/16 | | | 8/31/15 | |
| | | (unaudited) | | | | | | | | | | | | | | | | |
Net asset value, beginning of period | | | $13.94 | | | | $13.74 | | | | $12.82 | | | | $11.88 | | | | $10.76 | | | | $10.92 | |
| | | |
| Income (loss) from investment operations | | | | | | | | | | | | | |
Net investment income (loss) (d) | | | $0.08 | | | | $0.24 | | | | $0.22 | | | | $0.19 | | | | $0.16 | | | | $0.16 | |
Net realized and unrealized gain (loss) | | | (0.31 | ) | | | 0.58 | | | | 0.93 | | | | 0.90 | | | | 1.12 | | | | (0.19 | ) |
Total from investment operations | | | $(0.23 | ) | | | $0.82 | | | | $1.15 | | | | $1.09 | | | | $1.28 | | | | $(0.03 | ) |
| | | |
| Less distributions declared to shareholders | | | | | | | | | | | | | |
From net investment income | | | $(0.15 | ) | | | $(0.23 | ) | | | $(0.23 | ) | | | $(0.15 | ) | | | $(0.16 | ) | | | $(0.11 | ) |
From net realized gain | | | (0.09 | ) | | | (0.39 | ) | | | — | | | | — | | | | — | | | | (0.02 | ) |
Total distributions declared to
shareholders | | | $(0.24 | ) | | | $(0.62 | ) | | | $(0.23 | ) | | | $(0.15 | ) | | | $(0.16 | ) | | | $(0.13 | ) |
Net asset value, end of period (x) | | | $13.47 | | | | $13.94 | | | | $13.74 | | | | $12.82 | | | | $11.88 | | | | $10.76 | |
Total return (%) (r)(s)(t)(x) | | | (1.71 | )(n) | | | 6.42 | | | | 9.11 | | | | 9.24 | | | | 12.05 | | | | (0.34 | ) |
| | | |
Ratios (%) (to average net assets)
and Supplemental data: | | | | | | | | | | | | | |
Expenses before expense reductions (f) | | | 1.06 | (a) | | | 1.04 | | | | 1.05 | | | | 1.21 | | | | 1.56 | | | | 1.94 | |
Expenses after expense reductions (f) | | | 1.00 | (a) | | | 0.99 | | | | 0.99 | | | | 1.18 | | | | 1.24 | | | | 1.26 | |
Net investment income (loss) | | | 1.11 | (a)(l) | | | 1.78 | | | | 1.69 | | | | 1.55 | | | | 1.44 | | | | 1.41 | |
Portfolio turnover | | | 8 | (n) | | | 65 | | | | 41 | | | | 24 | | | | 28 | | | | 61 | |
Net assets at end of period
(000 omitted) | | | $74 | | | | $71 | | | | $67 | | | | $151 | | | | $56 | | | | $110 | |
See Notes to Financial Statements
21
Financial Highlights – continued
| | | | | | | | | | | | | | | | | | | | | | | | |
| | | Six months
ended 2/29/20 | | | Year ended | |
| Class R4 | | 8/31/19 | | | 8/31/18 | | | 8/31/17 | | | 8/31/16 | | | 8/31/15 | |
| | | (unaudited) | | | | | | | | | | | | | | | | |
Net asset value, beginning of period | | | $13.92 | | | | $13.73 | | | | $12.82 | | | | $11.87 | | | | $10.76 | | | | $10.93 | |
| | | |
| Income (loss) from investment operations | | | | | | | | | | | | | |
Net investment income (loss) (d) | | | $0.10 | | | | $0.27 | | | | $0.27 | | | | $0.21 | | | | $0.19 | | | | $0.19 | |
Net realized and unrealized gain (loss) | | | (0.30 | ) | | | 0.57 | | | | 0.91 | | | | 0.92 | | | | 1.12 | | | | (0.20 | ) |
Total from investment operations | | | $(0.20 | ) | | | $0.84 | | | | $1.18 | | | | $1.13 | | | | $1.31 | | | | $(0.01 | ) |
| | | |
| Less distributions declared to shareholders | | | | | | | | | | | | | |
From net investment income | | | $(0.17 | ) | | | $(0.26 | ) | | | $(0.27 | ) | | | $(0.18 | ) | | | $(0.20 | ) | | | $(0.14 | ) |
From net realized gain | | | (0.09 | ) | | | (0.39 | ) | | | — | | | | — | | | | — | | | | (0.02 | ) |
Total distributions declared to
shareholders | | | $(0.26 | ) | | | $(0.65 | ) | | | $(0.27 | ) | | | $(0.18 | ) | | | $(0.20 | ) | | | $(0.16 | ) |
Net asset value, end of period (x) | | | $13.46 | | | | $13.92 | | | | $13.73 | | | | $12.82 | | | | $11.87 | | | | $10.76 | |
Total return (%) (r)(s)(t)(x) | | | (1.52 | )(n) | | | 6.61 | | | | 9.34 | | | | 9.58 | | | | 12.32 | | | | (0.18 | ) |
| | | |
Ratios (%) (to average net assets)
and Supplemental data: | | | | | | | | | | | | | |
Expenses before expense reductions (f) | | | 0.81 | (a) | | | 0.79 | | | | 0.81 | | | | 0.98 | | | | 1.31 | | | | 1.69 | |
Expenses after expense reductions (f) | | | 0.75 | (a) | | | 0.74 | | | | 0.74 | | | | 0.96 | | | | 0.99 | | | | 1.02 | |
Net investment income (loss) | | | 1.35 | (a)(l) | | | 2.03 | | | | 2.02 | | | | 1.74 | | | | 1.69 | | | | 1.66 | |
Portfolio turnover | | | 8 | (n) | | | 65 | | | | 41 | | | | 24 | | | | 28 | | | | 61 | |
Net assets at end of period
(000 omitted) | | | $71 | | | | $72 | | | | $67 | | | | $62 | | | | $56 | | | | $110 | |
See Notes to Financial Statements
22
Financial Highlights – continued
| | | | | | | | | | | | | | | | | | | | | | | | |
| | | Six months
ended 2/29/20 | | | Year ended | |
| Class R6 | | 8/31/19 | | | 8/31/18 | | | 8/31/17 | | | 8/31/16 | | | 8/31/15 | |
| | | (unaudited) | | | | | | | | | | | | | | | | |
Net asset value, beginning of period | | | $13.91 | | | | $13.72 | | | | $12.81 | | | | $11.86 | | | | $10.76 | | | | $10.92 | |
| | | |
| Income (loss) from investment operations | | | | | | | | | | | | | |
Net investment income (loss) (d) | | | $0.10 | | | | $0.28 | | | | $0.27 | | | | $0.21 | | | | $0.20 | | | | $0.20 | |
Net realized and unrealized gain (loss) | | | (0.30 | ) | | | 0.57 | | | | 0.92 | | | | 0.92 | | | | 1.11 | | | | (0.20 | ) |
Total from investment operations | | | $(0.20 | ) | | | $0.85 | | | | $1.19 | | | | $1.13 | | | | $1.31 | | | | $0.00 | |
| | | |
| Less distributions declared to shareholders | | | | | | | | | | | | | |
From net investment income | | | $(0.18 | ) | | | $(0.27 | ) | | | $(0.28 | ) | | | $(0.18 | ) | | | $(0.21 | ) | | | $(0.14 | ) |
From net realized gain | | | (0.09 | ) | | | (0.39 | ) | | | — | | | | — | | | | — | | | | (0.02 | ) |
Total distributions declared to
shareholders | | | $(0.27 | ) | | | $(0.66 | ) | | | $(0.28 | ) | | | $(0.18 | ) | | | $(0.21 | ) | | | $(0.16 | ) |
Net asset value, end of period (x) | | | $13.44 | | | | $13.91 | | | | $13.72 | | | | $12.81 | | | | $11.86 | | | | $10.76 | |
Total return (%) (r)(s)(t)(x) | | | (1.54 | )(n) | | | 6.68 | | | | 9.42 | | | | 9.63 | | | | 12.37 | | | | (0.09 | ) |
| | | |
Ratios (%) (to average net assets)
and Supplemental data: | | | | | | | | | | | | | |
Expenses before expense reductions (f) | | | 0.73 | (a) | | | 0.72 | | | | 0.74 | | | | 0.94 | | | | 1.21 | | | | 1.63 | |
Expenses after expense reductions (f) | | | 0.68 | (a) | | | 0.67 | | | | 0.67 | | | | 0.92 | | | | 0.93 | | | | 0.97 | |
Net investment income (loss) | | | 1.44 | (a)(l) | | | 2.11 | | | | 2.08 | | | | 1.77 | | | | 1.76 | | | | 1.79 | |
Portfolio turnover | | | 8 | (n) | | | 65 | | | | 41 | | | | 24 | | | | 28 | | | | 61 | |
Net assets at end of period
(000 omitted) | | | $95,612 | | | | $76,901 | | | | $69,385 | | | | $68,569 | | | | $45,799 | | | | $27,802 | |
| (d) | Per share data is based on average shares outstanding. |
| (f) | Ratios do not reflect reductions from fees paid indirectly, if applicable. |
| (l) | Recognition of net investment income by the fund may be affected by the timing of the declaration of dividends by companies in which the fund invests and the actual annual net investment income ratio may differ. |
| (r) | Certain expenses have been reduced without which performance would have been lower. |
| (s) | From time to time the fund may receive proceeds from litigation settlements, without which performance would be lower. |
| (t) | Total returns do not include any applicable sales charges. |
| (x) | The net asset values and total returns have been calculated on net assets which include adjustments made in accordance with U.S. generally accepted accounting principles required at period end for financial reporting purposes. |
See Notes to Financial Statements
23
NOTES TO FINANCIAL STATEMENTS
(unaudited)
(1) Business and Organization
MFS Low Volatility Global Equity Fund (the fund) is a diversified series of MFS Series Trust I (the trust). The trust is organized as a Massachusetts business trust and is registered under the Investment Company Act of 1940, as amended, as anopen-end management investment company.
The fund is an investment company and accordingly follows the investment company accounting and reporting guidance of the Financial Accounting Standards Board (FASB) Accounting Standards Codification Topic 946 Financial Services – Investment Companies.
(2) Significant Accounting Policies
General– The preparation of financial statements in conformity with U.S. generally accepted accounting principles requires management to make estimates and assumptions that affect the reported amounts of assets and liabilities, and disclosure of contingent assets and liabilities at the date of the financial statements and the reported amounts of increases and decreases in net assets from operations during the reporting period. Actual results could differ from those estimates. In the preparation of these financial statements, management has evaluated subsequent events occurring after the date of the fund’s Statement of Assets and Liabilities through the date that the financial statements were issued. The fund invests in foreign securities, including securities of emerging market issuers. Investments in foreign securities are vulnerable to the effects of changes in the relative values of the local currency and the U.S. dollar and to the effects of changes in each country’s market, economic, industrial, political, regulatory, geopolitical, and other conditions. Investments in emerging markets can involve additional and greater risks than the risks associated with investments in developed foreign markets. Emerging markets can have less developed markets, greater custody and operational risk, less developed legal, regulatory, and accounting systems, and greater political, social, and economic instability than developed markets.
In March 2020, the FASB issued Accounting Standards Update2020-04, Reference Rate Reform (Topic 848) – Facilitation of the Effects of Reference Rate Reform on Financial Reporting (“ASU2020-04”), which provides optional, temporary relief with respect to the financial reporting of contracts subject to certain types of modifications due to the planned discontinuation of the London Interbank Offered Rate (LIBOR) and other IBOR-based reference rates as of the end of 2021. The temporary relief provided by ASU2020-04 is effective for certain reference rate-related contract modifications that occur during the period from March 12, 2020 through December 31, 2022. Management is evaluating the impact of ASU2020-04 on the fund’s investments, derivatives, debt and other contracts that will undergo reference rate-related modifications as a result of the reference rate reform.
Balance Sheet Offsetting– The fund’s accounting policy with respect to balance sheet offsetting is that, absent an event of default by the counterparty or a termination of the agreement, the International Swaps and Derivatives Association (ISDA) Master Agreement, or similar agreement, does not result in an offset of reported amounts of financial assets and financial liabilities in the Statement of Assets and Liabilities across transactions between the fund and the applicable counterparty. The fund’s right to
24
Notes to Financial Statements (unaudited) – continued
setoff may be restricted or prohibited by the bankruptcy or insolvency laws of the particular jurisdiction to which a specific master netting agreement counterparty is subject. Balance sheet offsetting disclosures, to the extent applicable to the fund, have been included in the fund’s Significant Accounting Policies note under the captions for each of the fund’sin-scope financial instruments and transactions.
Investment Valuations–Equity securities, including restricted equity securities, are generally valued at the last sale or official closing price on their primary market or exchange as provided by a third-party pricing service. Equity securities, for which there were no sales reported that day, are generally valued at the last quoted daily bid quotation on their primary market or exchange as provided by a third-party pricing service. Short-term instruments with a maturity at issuance of 60 days or less may be valued at amortized cost, which approximates market value.Open-end investment companies are generally valued at net asset value per share. Securities and other assets generally valued on the basis of information from a third-party pricing service may also be valued at a broker/dealer bid quotation. In determining values, third-party pricing services can utilize both transaction data and market information such as yield, quality, coupon rate, maturity, type of issue, trading characteristics, and other market data. The values of foreign securities and other assets and liabilities expressed in foreign currencies are converted to U.S. dollars using the mean of bid and asked prices for rates provided by a third-party pricing service.
The Board of Trustees has delegated primary responsibility for determining or causing to be determined the value of the fund’s investments (including any fair valuation) to the adviser pursuant to valuation policies and procedures approved by the Board. If the adviser determines that reliable market quotations are not readily available, investments are valued at fair value as determined in good faith by the adviser in accordance with such procedures under the oversight of the Board of Trustees. Under the fund’s valuation policies and procedures, market quotations are not considered to be readily available for most types of debt instruments and floating rate loans and many types of derivatives. These investments are generally valued at fair value based on information from third-party pricing services. In addition, investments may be valued at fair value if the adviser determines that an investment’s value has been materially affected by events occurring after the close of the exchange or market on which the investment is principally traded (such as foreign exchange or market) and prior to the determination of the fund’s net asset value, or after the halt of trading of a specific security where trading does not resume prior to the close of the exchange or market on which the security is principally traded. Events that occur after foreign markets close (such as developments in foreign markets and significant movements in the U.S. markets) and prior to the determination of the fund’s net asset value may be deemed to have a material effect on the value of securities traded in foreign markets. Accordingly, the fund’s foreign equity securities may often be valued at fair value. The adviser generally relies on third-party pricing services or other information (such as the correlation with price movements of similar securities in the same or other markets; the type, cost and investment characteristics of the security; the business and financial condition of the issuer; and trading and other market data) to assist in determining whether to fair value and at what value to fair value an investment. The value of an investment for purposes of calculating the fund’s net asset value can differ depending on the source
25
Notes to Financial Statements (unaudited) – continued
and method used to determine value. When fair valuation is used, the value of an investment used to determine the fund’s net asset value may differ from quoted or published prices for the same investment. There can be no assurance that the fund could obtain the fair value assigned to an investment if it were to sell the investment at the same time at which the fund determines its net asset value per share.
Various inputs are used in determining the value of the fund’s assets or liabilities. These inputs are categorized into three broad levels. In certain cases, the inputs used to measure fair value may fall into different levels of the fair value hierarchy. In such cases, an investment’s level within the fair value hierarchy is based on the lowest level of input that is significant to the fair value measurement. The fund’s assessment of the significance of a particular input to the fair value measurement in its entirety requires judgment, and considers factors specific to the investment. Level 1 includes unadjusted quoted prices in active markets for identical assets or liabilities. Level 2 includes other significant observable market-based inputs (including quoted prices for similar securities, interest rates, prepayment speed, and credit risk). Level 3 includes unobservable inputs, which may include the adviser’s own assumptions in determining the fair value of investments. The following is a summary of the levels used as of February 29, 2020 in valuing the fund’s assets or liabilities:
| | | | | | | | | | | | | | | | |
| | | | |
| Financial Instruments | | Level 1 | | | Level 2 | | | Level 3 | | | Total | |
| Equity Securities: | | | | | | | | | | | | | | | | |
United States | | | $106,268,599 | | | | $— | | | | $— | | | | $106,268,599 | |
Japan | | | — | | | | 28,992,790 | | | | — | | | | 28,992,790 | |
Canada | | | 20,336,803 | | | | — | | | | — | | | | 20,336,803 | |
Switzerland | | | — | | | | 16,949,761 | | | | — | | | | 16,949,761 | |
United Kingdom | | | — | | | | 8,804,792 | | | | — | | | | 8,804,792 | |
Hong Kong | | | 1,353,120 | | | | 6,928,525 | | | | — | | | | 8,281,645 | |
Germany | | | — | | | | 7,562,339 | | | | — | | | | 7,562,339 | |
Taiwan | | | 6,702,595 | | | | — | | | | — | | | | 6,702,595 | |
Australia | | | — | | | | 4,880,388 | | | | — | | | | 4,880,388 | |
Other Countries | | | 13,732,916 | | | | 15,873,090 | | | | — | | | | 29,606,006 | |
| Mutual Funds | | | 976,575 | | | | — | | | | — | | | | 976,575 | |
| Total | | | $149,370,608 | | | | $89,991,685 | | | | $— | | | | $239,362,293 | |
For further information regarding security characteristics, see the Portfolio of Investments.
Foreign Currency Translation– Purchases and sales of foreign investments, income, and expenses are converted into U.S. dollars based upon currency exchange rates prevailing on the respective dates of such transactions or on the reporting date for foreign denominated receivables and payables. Gains and losses attributable to foreign currency exchange rates on sales of securities are recorded for financial statement purposes as net realized gains and losses on investments. Gains and losses attributable to foreign exchange rate movements on receivables, payables, income and expenses are recorded for financial statement purposes as foreign currency transaction gains and losses. That portion of both realized and unrealized gains and losses on investments that results from fluctuations in foreign currency exchange rates is not separately disclosed.
26
Notes to Financial Statements (unaudited) – continued
Security Loans– Under its Securities Lending Agency Agreement with the fund, State Street Bank and Trust Company, as lending agent, loans the securities of the fund to certain qualified institutions (the “Borrowers”) approved by the fund. Security loans can be terminated at the discretion of either the lending agent or the fund and the related securities must be returned within the earlier of the standard trade settlement period for such securities or within three business days. The loans are collateralized by cash and/or U.S. Treasury and federal agency obligations in an amount typically at least equal to the market value of the securities loaned. On loans collateralized by cash, the cash collateral is invested in a money market fund. The market value of the loaned securities is determined at the close of business of the fund and any additional required collateral is delivered to the fund on the next business day. The lending agent provides the fund with indemnification against Borrower default. In the event of Borrower default, the lending agent will, for the benefit of the fund, either purchase securities identical to those loaned or, when such purchase is commercially impracticable, pay the fund the market value of the loaned securities. In return, the lending agent assumes the fund’s rights to the related collateral. If the collateral value is less than the cost to purchase identical securities, the lending agent is responsible for the shortfall, but only to the extent that such shortfall is not due to a decline in collateral value resulting from collateral reinvestment for which the fund bears the risk of loss. At period end, the fund had investment securities on loan, all of which were classified as equity securities in the fund’s Portfolio of Investments, with a fair value of $2,835,202. The fair value of the fund’s investment securities on loan and a related liability of $22,995 for cash collateral received on securities loaned are both presented gross in the Statement of Assets and Liabilities. Additionally, these loans were collateralized by U.S. Treasury Obligations of $2,903,682 held by the lending agent. The collateral on securities loaned exceeded the value of securities on loan at period end. The liability for cash collateral for securities loaned is carried at fair value, which is categorized as level 2 within the fair value hierarchy. A portion of the income generated upon investment of the collateral is remitted to the Borrowers, and the remainder is allocated between the fund and the lending agent. On loans collateralized by U.S. Treasury and/or federal agency obligations, a fee is received from the Borrower, and is allocated between the fund and the lending agent. Income from securities lending is separately reported in the Statement of Operations. The dividend and interest income earned on the securities loaned is accounted for in the same manner as other dividend and interest income.
Indemnifications– Under the fund’s organizational documents, its officers and Trustees may be indemnified against certain liabilities and expenses arising out of the performance of their duties to the fund. Additionally, in the normal course of business, the fund enters into agreements with service providers that may contain indemnification clauses. The fund’s maximum exposure under these agreements is unknown as this would involve future claims that may be made against the fund that have not yet occurred.
Investment Transactions and Income– Investment transactions are recorded on the trade date. Dividends received in cash are recorded on theex-dividend date. Certain dividends from foreign securities will be recorded when the fund is informed of the dividend if such information is obtained subsequent to theex-dividend date. Dividend payments received in additional securities are recorded on theex-dividend date in an amount equal to the value of the security on such date.
27
Notes to Financial Statements (unaudited) – continued
The fund may receive proceeds from litigation settlements. Any proceeds received from litigation involving portfolio holdings are reflected in the Statement of Operations in realized gain/loss if the security has been disposed of by the fund or in unrealized gain/loss if the security is still held by the fund. Any other proceeds from litigation not related to portfolio holdings are reflected as other income in the Statement of Operations.
Tax Matters and Distributions– The fund intends to qualify as a regulated investment company, as defined under Subchapter M of the Internal Revenue Code, and to distribute all of its taxable income, including realized capital gains. As a result, no provision for federal income tax is required. The fund’s federal tax returns, when filed, will remain subject to examination by the Internal Revenue Service for a three year period. Management has analyzed the fund’s tax positions taken on federal and state tax returns for all open tax years and does not believe that there are any uncertain tax positions that require recognition of a tax liability. Foreign taxes, if any, have been accrued by the fund in the accompanying financial statements in accordance with the applicable foreign tax law. Foreign income taxes may be withheld by certain countries in which the fund invests. Additionally, capital gains realized by the fund on securities issued in or by certain foreign countries may be subject to capital gains tax imposed by those countries.
Distributions to shareholders are recorded on theex-dividend date. Income and capital gain distributions are determined in accordance with income tax regulations, which may differ from U.S. generally accepted accounting principles. Certain capital accounts in the financial statements are periodically adjusted for permanent differences in order to reflect their tax character. These adjustments have no impact on net assets or net asset value per share. Temporary differences which arise from recognizing certain items of income, expense, gain or loss in different periods for financial statement and tax purposes will reverse at some time in the future.
Book/tax differences primarily relate to passive foreign investment companies and wash sale loss deferrals.
The tax character of distributions made during the current period will be determined at fiscal year end. The tax character of distributions declared to shareholders for the last fiscal year is as follows:
| | | | |
| |
| | | Year ended
8/31/19 | |
Ordinary income (including any
short-term capital gains) | | | $4,465,803 | |
| Long-term capital gains | | | 6,053,149 | |
| |
| Total distributions | | | $10,518,952 | |
28
Notes to Financial Statements (unaudited) – continued
The federal tax cost and the tax basis components of distributable earnings were as follows:
| | | | |
| |
| As of 2/29/20 | | | |
| |
| Cost of investments | | | $214,380,924 | |
| Gross appreciation | | | 33,696,909 | |
| |
| Gross depreciation | | | (8,715,540 | ) |
| Net unrealized appreciation (depreciation) | | | $24,981,369 | |
| |
| As of 8/31/19 | | | |
| |
| Undistributed ordinary income | | | 1,949,792 | |
| Undistributed long-term capital gain | | | 244,641 | |
| Other temporary differences | | | (70,923 | ) |
| Net unrealized appreciation (depreciation) | | | 32,349,544 | |
The aggregate cost above includes prior fiscal year end tax adjustments, if applicable.
Multiple Classes of Shares of Beneficial Interest– The fund offers multiple classes of shares, which differ in their respective distribution and service fees. The fund’s income, realized and unrealized gain (loss), and common expenses are allocated to shareholders based on the daily net assets of each class. Dividends are declared separately for each class. Differences in per share dividend rates are generally due to differences in separate class expenses. Class B shares will convert to Class A shares approximately eight years after purchase. Class C shares will convert to Class A shares approximately ten years after purchase. The fund’s distributions declared to shareholders as reported in the Statements of Changes in Net Assets are presented by class as follows:
| | | | | | | | |
| | |
| | | Six months
ended
2/29/20 | | | Year
ended
8/31/19 | |
| Class A | | | $383,341 | | | | $549,580 | |
| Class B | | | 5,599 | | | | 14,039 | |
| Class C | | | 42,211 | | | | 77,581 | |
| Class I | | | 2,168,954 | | | | 6,406,191 | |
| Class R1 | | | 1,372 | | | | 2,931 | |
| Class R2 | | | 2,280 | | | | 2,854 | |
| Class R3 | | | 1,317 | | | | 3,034 | |
| Class R4 | | | 1,365 | | | | 3,226 | |
| Class R6 | | | 1,644,636 | | | | 3,459,516 | |
| Total | | | $4,251,075 | | | | $10,518,952 | |
(3) Transactions with Affiliates
Investment Adviser– The fund has an investment advisory agreement with MFS to provide overall investment management and related administrative services and facilities to the fund. The management fee is computed daily and paid monthly at the following annual rates based on the fund’s average daily net assets:
| | | | |
| Up to $1 billion | | | 0.55 | % |
| In excess of $1 billion and up to $2.5 billion | | | 0.525 | % |
| In excess of $2.5 billion | | | 0.50 | % |
29
Notes to Financial Statements (unaudited) – continued
MFS has agreed in writing to reduce its management fee by a specified amount if certain MFS mutual fund assets exceed thresholds agreed to by MFS and the fund’s Board of Trustees. For the six months ended February 29, 2020, this management fee reduction amounted to $11,866, which is included in the reduction of total expenses in the Statement of Operations. The management fee incurred for the six months ended February 29, 2020 was equivalent to an annual effective rate of 0.54% of the fund’s average daily net assets.
The investment adviser has agreed in writing to pay a portion of the fund’s total annual operating expenses, excluding interest, taxes, extraordinary expenses, brokerage and transaction costs, and investment-related expenses, such that total fund operating expenses do not exceed the following rates annually of each class’s average daily net assets:
| | | | | | | | | | | | | | | | | | | | | | | | | | | | | | | | |
| Classes | |
| | | | | | | | |
| A | | B | | | C | | | I | | | R1 | | | R2 | | | R3 | | | R4 | | | R6 | |
| 0.99% | | | 1.74% | | | | 1.74% | | | | 0.74% | | | | 1.74% | | | | 1.24% | | | | 0.99% | | | | 0.74% | | | | 0.68% | |
This written agreement will continue until modified by the fund’s Board of Trustees, but such agreement will continue at least until December 31, 2020. For the six months ended February 29, 2020, this reduction amounted to $55,172, which is included in the reduction of total expenses in the Statement of Operations.
Distributor– MFS Fund Distributors, Inc. (MFD), a wholly-owned subsidiary of MFS, as distributor, received $5,873 for the six months ended February 29, 2020, as its portion of the initial sales charge on sales of Class A shares of the fund.
The Board of Trustees has adopted a distribution plan for certain share classes pursuant to Rule12b-1 of the Investment Company Act of 1940.
The fund’s distribution plan provides that the fund will pay MFD for services provided by MFD and financial intermediaries in connection with the distribution and servicing of certain share classes. One component of the plan is a distribution fee paid to MFD and another component of the plan is a service fee paid to MFD. MFD may subsequently pay all, or a portion, of the distribution and/or service fees to financial intermediaries.
Distribution Plan Fee Table:
| | | | | | | | | | | | | | | | | | | | |
| | | | | |
| | | Distribution
Fee Rate (d) | | | Service
Fee Rate (d) | | | Total
Distribution
Plan (d) | | | Annual
Effective
Rate (e) | | | Distribution
and Service
Fee | |
| Class A | | | — | | | | 0.25% | | | | 0.25% | | | | 0.25% | | | | $28,112 | |
| Class B | | | 0.75% | | | | 0.25% | | | | 1.00% | | | | 1.00% | | | | 2,105 | |
| Class C | | | 0.75% | | | | 0.25% | | | | 1.00% | | | | 1.00% | | | | 15,669 | |
| Class R1 | | | 0.75% | | | | 0.25% | | | | 1.00% | | | | 1.00% | | | | 509 | |
| Class R2 | | | 0.25% | | | | 0.25% | | | | 0.50% | | | | 0.50% | | | | 376 | |
| Class R3 | | | — | | | | 0.25% | | | | 0.25% | | | | 0.25% | | | | 95 | |
| Total Distribution and Service Fees | | | | | | | | $46,866 | |
| (d) | In accordance with the distribution plan for certain classes, the fund pays distribution and/or service fees equal to these annual percentage rates of each class’s average daily net assets. The distribution and service fee rates disclosed by class represent the current rates in effect at the end of the reporting period. Any rate changes, if applicable, are detailed below. |
30
Notes to Financial Statements (unaudited) – continued
| (e) | The annual effective rates represent actual fees incurred under the distribution plan for the six months ended February 29, 2020 based on each class’s average daily net assets. MFD has voluntarily agreed to rebate a portion of each class’s 0.25% service fee attributable to accounts for which MFD retains the 0.25% service fee except for accounts attributable to MFS or its affiliates’ seed money. For the six months ended February 29, 2020, this rebate amounted to $441 for Class A and is included in the reduction of total expenses in the Statement of Operations. |
Certain Class A shares are subject to a contingent deferred sales charge (CDSC) in the event of a shareholder redemption within 18 months of purchase. Class B shares are subject to a CDSC in the event of a shareholder redemption within six years of purchase. Class C shares are subject to a CDSC in the event of a shareholder redemption within 12 months of purchase. All contingent deferred sales charges are paid to MFD and during the six months ended February 29, 2020, were as follows:
| | | | |
| |
| | | Amount | |
| Class A | | | $56 | |
| Class B | | | — | |
| Class C | | | 12 | |
Shareholder Servicing Agent– MFS Service Center, Inc. (MFSC), a wholly-owned subsidiary of MFS, receives a fee from the fund for its services as shareholder servicing agent calculated as a percentage of the average daily net assets of the fund as determined periodically under the supervision of the fund’s Board of Trustees. For the six months ended February 29, 2020, the fee was $6,549, which equated to 0.0056% annually of the fund’s average daily net assets. MFSC also receives payment from the fund forout-of-pocket expenses,sub-accounting and other shareholder servicing costs which may be paid to affiliated and unaffiliated service providers. Class R6 shares do not incursub-accounting fees. For the six months ended February 29, 2020, theseout-of-pocket expenses,sub-accounting and other shareholder servicing costs amounted to $61,284.
Administrator– MFS provides certain financial, legal, shareholder communications, compliance, and other administrative services to the fund. Under an administrative services agreement, the fund reimburses MFS the costs incurred to provide these services. The fund is charged an annual fixed amount of $17,500 plus a fee based on average daily net assets. The administrative services fee incurred for the six months ended February 29, 2020 was equivalent to an annual effective rate of 0.0175% of the fund’s average daily net assets.
Trustees’ and Officers’ Compensation– The fund pays compensation to independent Trustees in the form of a retainer, attendance fees, and additional compensation to Board and Committee chairpersons. The fund does not pay compensation directly to Trustees or officers of the fund who are also officers of the investment adviser, all of whom receive remuneration from MFS for their services to the fund. Certain officers and Trustees of the fund are officers or directors of MFS, MFD, and MFSC.
Other –The fund invests in the MFS Institutional Money Market Portfolio which is managed by MFS and seeks current income consistent with preservation of capital and liquidity. This money market fund does not pay a management fee to MFS but does incur investment and operating costs.
31
Notes to Financial Statements (unaudited) – continued
At February 29, 2020, MFS held approximately 68% of the outstanding shares of Class R1, 94% of the outstanding shares of Class R3, and 100% of the outstanding shares of Class R4, respectively.
The fund is permitted to engage in purchase and sale transactions with funds and accounts for which MFS serves as investment adviser orsub-adviser (“cross-trades”) pursuant to a policy adopted by the Board of Trustees. This policy has been designed to ensure that cross-trades conducted by the fund comply with Rule17a-7 under the Investment Company Act of 1940. During the six months ended February 29, 2020, the fund engaged in purchase transactions pursuant to this policy, which amounted to $62,558.
The adviser has voluntarily undertaken to reimburse the fund from its own resources on a quarterly basis for the cost of investment research embedded in the cost of the fund’s securities trades. This agreement may be rescinded at any time. For the six months ended February 29, 2020, this reimbursement amounted to $4,833, which is included in “Other” income in the Statement of Operations.
(4) Portfolio Securities
For the six months ended February 29, 2020, purchases and sales of investments, other than short-term obligations, aggregated $46,034,693 and $18,340,368, respectively.
(5) Shares of Beneficial Interest
The fund’s Declaration of Trust permits the Trustees to issue an unlimited number of full and fractional shares of beneficial interest. Transactions in fund shares were as follows:
| | | | | | | | | | | | | | | | |
| | | Six months ended
2/29/20 | | | Year ended
8/31/19 | |
| | | | |
| | | Shares | | | Amount | | | Shares | | | Amount | |
| Shares sold | | | | | | | | | | | | | | | | |
Class A | | | 544,535 | | | | $7,840,801 | | | | 1,041,729 | | | | $13,809,908 | |
Class B | | | — | | | | — | | | | 3,234 | | | | 41,580 | |
Class C | | | 29,290 | | | | 414,242 | | | | 131,925 | | | | 1,728,080 | |
Class I | | | 2,141,589 | | | | 30,772,699 | | | | 8,478,173 | | | | 112,927,999 | |
Class R1 | | | 383 | | | | 5,497 | | | | 1,336 | | | | 18,304 | |
Class R2 | | | 6,293 | | | | 88,578 | | | | 358 | | | | 4,947 | |
Class R3 | | | 338 | | | | 4,863 | | | | — | | | | — | |
Class R6 | | | 1,647,990 | | | | 23,696,065 | | | | 1,744,896 | | | | 23,529,647 | |
| | | 4,370,418 | | | | $62,822,745 | | | | 11,401,651 | | | | $152,060,465 | |
| |
Shares issued to shareholders in
reinvestment of distributions | | | | | |
Class A | | | 26,713 | | | | $383,172 | | | | 42,848 | | | | $548,615 | |
Class B | | | 392 | | | | 5,599 | | | | 1,114 | | | | 14,039 | |
Class C | | | 2,909 | | | | 41,484 | | | | 6,003 | | | | 75,592 | |
Class I | | | 128,329 | | | | 1,838,070 | | | | 476,060 | | | | 6,073,699 | |
Class R1 | | | 96 | | | | 1,372 | | | | 231 | | | | 2,931 | |
Class R2 | | | 158 | | | | 2,280 | | | | 224 | | | | 2,854 | |
Class R3 | | | 92 | | | | 1,317 | | | | 238 | | | | 3,033 | |
Class R4 | | | 95 | | | | 1,365 | | | | 252 | | | | 3,226 | |
Class R6 | | | 110,203 | | | | 1,578,067 | | | | 261,566 | | | | 3,338,647 | |
| | | 268,987 | | | | $3,852,726 | | | | 788,536 | | | | $10,062,636 | |
32
Notes to Financial Statements (unaudited) – continued
| | | | | | | | | | | | | | | | |
| | | Six months ended
2/29/20 | | | Year ended
8/31/19 | |
| | | | |
| | | Shares | | | Amount | | | Shares | | | Amount | |
| | | | |
| Shares reacquired | | | | | | | | | | | | | | | | |
Class A | | | (273,525 | ) | | | $(3,966,388 | ) | | | (311,945 | ) | | | $(4,142,094 | ) |
Class B | | | (496 | ) | | | (7,204 | ) | | | (2,521 | ) | | | (32,865 | ) |
Class C | | | (13,017 | ) | | | (184,933 | ) | | | (59,697 | ) | | | (780,451 | ) |
Class I | | | (2,870,450 | ) | | | (40,100,305 | ) | | | (8,734,942 | ) | | | (119,271,353 | ) |
Class R1 | | | (7 | ) | | | (95 | ) | | | (43 | ) | | | (600 | ) |
Class R6 | | | (174,437 | ) | | | (2,530,322 | ) | | | (1,535,830 | ) | | | (20,584,271 | ) |
| | | (3,331,932 | ) | | | $(46,789,247 | ) | | | (10,644,978 | ) | | | $(144,811,634 | ) |
| | | | |
| Net change | | | | | | | | | | | | | | | | |
Class A | | | 297,723 | | | | $4,257,585 | | | | 772,632 | | | | $10,216,429 | |
Class B | | | (104 | ) | | | (1,605 | ) | | | 1,827 | | | | 22,754 | |
Class C | | | 19,182 | | | | 270,793 | | | | 78,231 | | | | 1,023,221 | |
Class I | | | (600,532 | ) | | | (7,489,536 | ) | | | 219,291 | | | | (269,655 | ) |
Class R1 | | | 472 | | | | 6,774 | | | | 1,524 | | | | 20,635 | |
Class R2 | | | 6,451 | | | | 90,858 | | | | 582 | | | | 7,801 | |
Class R3 | | | 430 | | | | 6,180 | | | | 238 | | | | 3,033 | |
Class R4 | | | 95 | | | | 1,365 | | | | 252 | | | | 3,226 | |
Class R6 | | | 1,583,756 | | | | 22,743,810 | | | | 470,632 | | | | 6,284,023 | |
| | | 1,307,473 | | | | $19,886,224 | | | | 1,545,209 | | | | $17,311,467 | |
Effective June 1, 2019, purchases of the fund’s Class B shares are closed to new and existing investors subject to certain exceptions. Please see the fund’s prospectus for details.
(6) Line of Credit
The fund and certain other funds managed by MFS participate in a $1.25 billion unsecured committed line of credit, subject to a $1 billion sublimit, provided by a syndicate of banks under a credit agreement. Borrowings may be made for temporary financing needs. Interest is charged to each fund, based on its borrowings, generally at a rate equal to the highest of one month LIBOR, the Federal Funds Effective Rate and the Overnight Bank Funding Rate, plus an agreed upon spread. A commitment fee, based on the average daily, unused portion of the committed line of credit, is allocated among the participating funds. In addition, the fund and other funds managed by MFS have established unsecured uncommitted borrowing arrangements with certain banks for temporary financing needs. Interest is charged to each fund, based on its borrowings, at rates equal to customary reference rates plus an agreed upon spread. For the six months ended February 29, 2020, the fund’s commitment fee and interest expense were $658 and $0, respectively, and are included in “Miscellaneous” expense in the Statement of Operations.
33
Notes to Financial Statements (unaudited) – continued
(7) Investments in Affiliated Issuers
An affiliated issuer may be considered one in which the fund owns 5% or more of the outstanding voting securities, or a company which is under common control. For the purposes of this report, the following were affiliated issuers:
| | | | | | | | | | | | | | | | | | | | | | | | |
| | | | | | |
| Affiliated Issuers | | Beginning
Value | | | Purchases | | | Sales
Proceeds | | | Realized
Gain
(Loss) | | | Change in
Unrealized
Appreciation or
Depreciation | | | Ending
Value | |
MFS Institutional Money
Market Portfolio | | | $588,609 | | | | $34,645,447 | | | | $34,281,002 | | | | $476 | | | | $50 | | | | $953,580 | |
| | | | | | |
| Affiliated Issuers | | | | | | | | | | | | | | Dividend
Income | | | Capital Gain
Distributions | |
| MFS Institutional Money Market Portfolio | | | | | | | | | | | | $12,281 | | | | $— | |
(8) Impacts of COVID-19
The pandemic related to the global spread of novel coronavirus disease (COVID-19), which was first detected in December 2019, has resulted in significant disruptions to global business activity and the global economy, as well as the economies of individual countries, the financial performance of individual companies and sectors, and the securities and commodities markets in general. This pandemic, the full effects of which are still unknown, has resulted in substantial market volatility and may have adversely impacted the prices and liquidity of the fund’s investments and the fund’s performance during the period February 29, 2020 through April 16, 2020, the date that these financial statements were issued.
34
PROXY VOTING POLICIES AND INFORMATION
MFS votes proxies on behalf of the fund pursuant to proxy voting policies and procedures that are available without charge, upon request, by calling1-800-225-2606, by visitingmfs.com/proxyvoting, or by visiting the SEC’s Web site athttp://www.sec.gov.
Information regarding how the fund voted proxies relating to portfolio securities during the most recent twelve-month period ended June 30 is available by August 31 of each year without charge by visitingmfs.com/proxyvoting, or by visiting the SEC’s Web site athttp://www.sec.gov.
QUARTERLY PORTFOLIO DISCLOSURE
The fund files a complete schedule of portfolio holdings with the SEC for the first and third quarters of each fiscal year as an exhibit to its reports onForm N-PORT. The fund’s Form N-PORT reports are available on the SEC’s website athttp://www.sec.gov.A shareholder can obtain the portfolio holdings report for the first and third quarters of the fund’s fiscal year atmfs.com/openendfunds by choosing the fund’s name and then selecting the “Resources” tab and clicking on “Prospectus and Reports”.
FURTHER INFORMATION
From time to time, MFS may post important information about the fund or the MFS funds on the MFS web site (mfs.com). This information is available athttps://www.mfs.com/en-us/what-we-do/announcements.html or atmfs.com/openendfunds by choosing the fund’s name.
INFORMATION ABOUT FUND CONTRACTS AND LEGAL CLAIMS
The fund has entered into contractual arrangements with an investment adviser, administrator, distributor, shareholder servicing agent, 529 program manager (if applicable), and custodian who each provide services to the fund. Unless expressly stated otherwise, shareholders are not parties to, or intended beneficiaries of these contractual arrangements, and these contractual arrangements are not intended to create any shareholder right to enforce them against the service providers or to seek any remedy under them against the service providers, either directly or on behalf of the fund.
Under the Trust’s By-Laws and Declaration of Trust, any claims asserted against or on behalf of the MFS Funds, including claims against Trustees and Officers, must be brought in state and federal courts located within the Commonwealth of Massachusetts.
PROVISION OF FINANCIAL REPORTS AND SUMMARY PROSPECTUSES
The fund produces financial reports every six months and updates its summary prospectus and prospectus annually. To avoid sending duplicate copies of materials to households, only one copy of the fund’s annual and semiannual report and summary prospectus may be mailed to shareholders having the same last name and residential address on the fund’s records. However, any shareholder may contact MFSC (please see back cover for address and telephone number) to request that copies of these reports and summary prospectuses be sent personally to that shareholder.
35
Save paper with eDelivery.

| MFS® will send you prospectuses, |
reports, and proxies directly viae-mail so you will get information faster with less mailbox clutter.
To sign up:
1. Go to mfs.com.
2. Log in via MFS® Access.
3. Select eDelivery.
If you own your MFS fund shares through a financial institution or a retirement plan, MFS® TALK, MFS® Access, or eDelivery may not be available to you.
CONTACT
WEB SITE
mfs.com
MFS TALK
1-800-637-8255
24 hours a day
ACCOUNT SERVICE AND LITERATURE
Shareholders
1-800-225-2606
Financial advisors
1-800-343-2829
Retirement plan services
1-800-637-1255
MAILING ADDRESS
MFS Service Center, Inc.
P.O. Box 219341
Kansas City, MO 64121-9341
OVERNIGHT MAIL
MFS Service Center, Inc.
Suite 219341
430 W 7th Street
Kansas City, MO 64105-1407
Semiannual Report
February 29, 2020

MFS® Low Volatility Equity Fund

Beginning on January 1, 2021, as permitted by regulations adopted by the U.S. Securities and Exchange Commission, paper copies of the fund’s annual and semiannual shareholder reports will no longer be sent by mail, unless you specifically request paper copies of the reports. Instead, the complete reports will be made available on the fund’s Web site (funds.mfs.com), and you will be notified by mail each time a report is posted and provided with a Web site link to access the report.
If you are already signed up to receive shareholder reports by email, you will not be affected by this change and you need not take any action. You may sign up to receive shareholder reports and other communications from the fund by email by contacting your financial intermediary (such as a broker-dealer or bank) or, if you hold your shares directly with the fund, by calling 1-800-225-2606 or by logging on to MFS Access at mfs.com.
Beginning on January 1, 2019, you may elect to receive all future reports in paper free of charge. Contact your financial intermediary to request that you continue to receive paper copies of your shareholder reports. If you invest directly with the fund, you can call 1-800-225-2606 or send an email request to orderliterature@mfs.com to let the fund know that you wish to continue receiving paper copies of your shareholder reports. Your election to receive reports in paper will apply to all funds held in your account if you invest through your financial intermediary or all funds held with the MFS fund complex if you invest directly.
LVU-SEM
MFS® Low Volatility Equity Fund
CONTENTS
The report is prepared for the general information of shareholders.
It is authorized for distribution to prospective investors only when preceded or accompanied by a current prospectus.
NOT FDIC INSURED• MAY LOSE VALUE• NO BANK GUARANTEE

LETTER FROM THE EXECUTIVE CHAIR
Dear Shareholders:
During the first quarter of 2020, market volatility reached levels not seen since the global financial crisis. Optimism heading into the year — on receding trade and
geopolitical risk along with easier central bank policies — was overwhelmed in February as the health effects of a novel coronavirus,COVID-19, spread beyond China’s borders, ultimately impacting more than 200 countries. The global pandemic prompted many governments to take drastic action to slow the spread of the virus, such as quarantines, school and business closures, and prohibitions on public gatherings. While these are important steps to protect the public health, they come at a cost: rising market volatility and an abrupt decline in economic growth.
Global central banks have taken aggressive, coordinated steps to cushion the economic and market fallout related to the virus, and
governments are undertaking unprecedented levels of fiscal stimulus. As uncertainty recedes, these measures can help create a supportive environment and encourage economic recovery. In the aftermath of the crisis, there are likely to be societal changes as households, businesses and governments adjust to a new reality and these alterations could change the investment landscape. Occurrences such as the COVID-19 outbreak demonstrate the importance of having a deep understanding of company fundamentals, and our global research platform has been built to do just that.
Here at MFS®, we aim to help our clients navigate the growing complexity of the markets and world economies. Our long-term investment philosophy and commitment to the responsible allocation of capital allow us to tune out the noise and uncover what we believe are the best, most durable investment opportunities in the market. Through our powerful global investment platform, we combine collective expertise, thoughtful risk management, and long-term discipline to create sustainable value for investors.
Respectfully,

Robert J. Manning
Executive Chair
MFS Investment Management
April 16, 2020
The opinions expressed in this letter are subject to change and may not be relied upon for investment advice. No forecasts can be guaranteed.
1
PORTFOLIO COMPOSITION
Portfolio structure
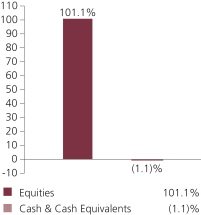
| | | | |
| Top ten holdings | | | | |
| Eli Lilly & Co. | | | 3.2% | |
| Microsoft Corp. | | | 2.9% | |
| Waste Connections, Inc. | | | 2.9% | |
| Costco Wholesale Corp. | | | 2.7% | |
| PepsiCo, Inc. | | | 2.7% | |
| Starbucks Corp. | | | 2.7% | |
| Alphabet, Inc., “A” | | | 2.6% | |
| MetLife, Inc. | | | 2.4% | |
| Amdocs Ltd. | | | 2.4% | |
| Johnson & Johnson | | | 2.4% | |
| | | | |
| GICS equity sectors (g) | | | | |
| Industrials | | | 16.5% | |
| Health Care | | | 16.3% | |
| Information Technology | | | 13.8% | |
| Consumer Staples | | | 11.7% | |
| Financials | | | 11.3% | |
| Utilities | | | 8.4% | |
| Real Estate | | | 7.8% | |
| Communication Services | | | 6.4% | |
| Consumer Discretionary | | | 6.2% | |
| Materials | | | 1.5% | |
| Energy | | | 1.2% | |
| (g) | The Global Industry Classification Standard (GICS®) was developed by and/or is the exclusive property of MSCI, Inc. and S&P Global Market Intelligence Inc. (“S&P Global Market Intelligence”). GICS is a service mark of MSCI and S&P Global Market Intelligence and has been licensed for use by MFS. |
Cash & Cash Equivalents includes any cash, investments in money market funds, short-term securities, and other assets less liabilities. Please see the Statement of Assets and Liabilities for additional information related to the fund’s cash position and other assets and liabilities.
From time to time Cash & Cash Equivalents may be negative due to timing of cash receipts and disbursements.
Percentages are based on net assets as of February 29, 2020.
The portfolio is actively managed and current holdings may be different.
2
EXPENSE TABLE
Fund expenses borne by the shareholders during the period, September 1, 2019 through February 29, 2020
As a shareholder of the fund, you incur two types of costs: (1) transaction costs, including sales charges (loads) on certain purchase or redemption payments, and (2) ongoing costs, including management fees; distribution and service(12b-1) fees; and other fund expenses. This example is intended to help you understand your ongoing costs (in dollars) of investing in the fund and to compare these costs with the ongoing costs of investing in other mutual funds.
The example is based on an investment of $1,000 invested at the beginning of the period and held for the entire period September 1, 2019 through February 29, 2020.
Actual Expenses
The first line for each share class in the following table provides information about actual account values and actual expenses. You may use the information in this line, together with the amount you invested, to estimate the expenses that you paid over the period. Simply divide your account value by $1,000 (for example, an $8,600 account value divided by $1,000 = 8.6), then multiply the result by the number in the first line under the heading entitled “Expenses Paid During Period” to estimate the expenses you paid on your account during this period.
Hypothetical Example for Comparison Purposes
The second line for each share class in the following table provides information about hypothetical account values and hypothetical expenses based on the fund’s actual expense ratio and an assumed rate of return of 5% per year before expenses, which is not the fund’s actual return. The hypothetical account values and expenses may not be used to estimate the actual ending account balance or expenses you paid for the period. You may use this information to compare the ongoing costs of investing in the fund and other funds. To do so, compare this 5% hypothetical example with the 5% hypothetical examples that appear in the shareholder reports of the other funds.
Please note that the expenses shown in the table are meant to highlight your ongoing costs only and do not reflect any transactional costs, such as sales charges (loads). Therefore, the second line for each share class in the table is useful in comparing ongoing costs only, and will not help you determine the relative total costs of owning different funds. In addition, if these transactional costs were included, your costs would have been higher.
3
Expense Table – continued
| | | | | | | | | | | | | | | | | | |
Share
Class | | | | Annualized
Expense
Ratio | | | Beginning
Account Value
9/01/19 | | | Ending
Account Value
2/29/20 | | | Expenses
Paid During
Period (p)
9/01/19-2/29/20 | |
| A | | Actual | | | 0.89% | | | | $1,000.00 | | | | $981.49 | | | | $4.38 | |
| | Hypothetical (h) | | | 0.89% | | | | $1,000.00 | | | | $1,020.44 | | | | $4.47 | |
| B | | Actual | | | 1.64% | | | | $1,000.00 | | | | $977.09 | | | | $8.06 | |
| | Hypothetical (h) | | | 1.64% | | | | $1,000.00 | | | | $1,016.71 | | | | $8.22 | |
| C | | Actual | | | 1.64% | | | | $1,000.00 | | | | $976.89 | | | | $8.06 | |
| | Hypothetical (h) | | | 1.64% | | | | $1,000.00 | | | | $1,016.71 | | | | $8.22 | |
| I | | Actual | | | 0.64% | | | | $1,000.00 | | | | $982.03 | | | | $3.15 | |
| | Hypothetical (h) | | | 0.64% | | | | $1,000.00 | | | | $1,021.68 | | | | $3.22 | |
| R1 | | Actual | | | 1.64% | | | | $1,000.00 | | | | $977.19 | | | | $8.06 | |
| | Hypothetical (h) | | | 1.64% | | | | $1,000.00 | | | | $1,016.71 | | | | $8.22 | |
| R2 | | Actual | | | 1.14% | | | | $1,000.00 | | | | $979.31 | | | | $5.61 | |
| | Hypothetical (h) | | | 1.14% | | | | $1,000.00 | | | | $1,019.19 | | | | $5.72 | |
| R3 | | Actual | | | 0.89% | | | | $1,000.00 | | | | $981.17 | | | | $4.38 | |
| | Hypothetical (h) | | | 0.89% | | | | $1,000.00 | | | | $1,020.44 | | | | $4.47 | |
| R4 | | Actual | | | 0.64% | | | | $1,000.00 | | | | $981.96 | | | | $3.15 | |
| | Hypothetical (h) | | | 0.64% | | | | $1,000.00 | | | | $1,021.68 | | | | $3.22 | |
| R6 | | Actual | | | 0.56% | | | | $1,000.00 | | | | $982.32 | | | | $2.76 | |
| | Hypothetical (h) | | | 0.56% | | | | $1,000.00 | | | | $1,022.08 | | | | $2.82 | |
| (h) | 5% class return per year before expenses. |
| (p) | “Expenses Paid During Period” are equal to each class’s annualized expense ratio, as shown above, multiplied by the average account value over the period, multiplied by 182/366 (to reflect theone-half year period). Expenses paid do not include any applicable sales charges (loads). If these transaction costs had been included, your costs would have been higher. |
4
PORTFOLIO OF INVESTMENTS
2/29/20 (unaudited)
The Portfolio of Investments is a complete list of all securities owned by your fund. It is categorized by broad-based asset classes.
| | | | | | | | |
| | |
| Issuer | | Shares/Par | | | Value ($) | |
| Common Stocks - 101.1% | | | | | | |
| Aerospace - 4.9% | | | | | | |
| CACI International, Inc., “A” (a) | | | 19,865 | | | $ | 4,867,322 | |
| Honeywell International, Inc. | | | 49,496 | | | | 8,026,766 | |
| Lockheed Martin Corp. | | | 16,666 | | | | 6,164,254 | |
| Northrop Grumman Corp. | | | 17,965 | | | | 5,907,611 | |
| United Technologies Corp. | | | 25,014 | | | | 3,266,578 | |
| | | | | | | | |
| | | | | | | $ | 28,232,531 | |
| Automotive - 1.6% | | | | | | |
| Copart, Inc. (a) | | | 106,232 | | | $ | 8,974,479 | |
| | |
| Business Services - 6.0% | | | | | | |
| Amdocs Ltd. | | | 218,043 | | | $ | 13,900,241 | |
| CoStar Group, Inc. (a) | | | 12,608 | | | | 8,416,975 | |
| FleetCor Technologies, Inc. (a) | | | 10,367 | | | | 2,755,445 | |
| Global Payments, Inc. | | | 34,852 | | | | 6,411,722 | |
| Verisk Analytics, Inc., “A” | | | 18,847 | | | | 2,923,358 | |
| | | | | | | | |
| | | | | | | $ | 34,407,741 | |
| Cable TV - 2.4% | | | | | | |
| Cable One, Inc. | | | 4,031 | | | $ | 6,340,844 | |
| Charter Communications, Inc., “A” (a) | | | 4,741 | | | | 2,338,119 | |
| Comcast Corp., “A” | | | 124,113 | | | | 5,017,888 | |
| | | | | | | | |
| | | | | | | $ | 13,696,851 | |
| Computer Software - 4.7% | | | | | | |
| Adobe Systems, Inc. (a) | | | 21,063 | | | $ | 7,269,263 | |
| Microsoft Corp. | | | 103,916 | | | | 16,835,431 | |
| Oracle Corp. | | | 57,492 | | | | 2,843,554 | |
| | | | | | | | |
| | | | | | | $ | 26,948,248 | |
| Construction - 2.4% | | | | | | | | |
| AvalonBay Communities, Inc., REIT | | | 31,647 | | | $ | 6,348,072 | |
| Mid-America Apartment Communities, Inc., REIT | | | 34,478 | | | | 4,456,626 | |
| Stanley Black & Decker, Inc. | | | 21,356 | | | | 3,068,857 | |
| | | | | | | | |
| | | | | | | $ | 13,873,555 | |
| Consumer Products - 1.8% | | | | | | |
| Procter & Gamble Co. | | | 92,595 | | | $ | 10,484,532 | |
5
Portfolio of Investments (unaudited) – continued
| | | | | | | | |
| | |
| Issuer | | Shares/Par | | | Value ($) | |
| Common Stocks - continued | | | | | | |
| Consumer Services - 2.2% | | | | | | |
| Booking Holdings, Inc. (a) | | | 2,232 | | | $ | 3,784,713 | |
| Bright Horizons Family Solutions, Inc. (a) | | | 56,475 | | | | 8,875,046 | |
| | | | | | | | |
| | | | | | | $ | 12,659,759 | |
| Electrical Equipment - 1.6% | | | | | | |
| AMETEK, Inc. | | | 30,480 | | | $ | 2,621,280 | |
| Johnson Controls International PLC | | | 106,432 | | | | 3,892,218 | |
| TE Connectivity Ltd. | | | 31,097 | | | | 2,577,009 | |
| | | | | | | | |
| | | | | | | $ | 9,090,507 | |
| Electronics - 1.2% | | | | | | |
| Texas Instruments, Inc. | | | 60,216 | | | $ | 6,873,054 | |
| | |
| Energy - Integrated - 1.2% | | | | | | |
| Chevron Corp. | | | 20,372 | | | $ | 1,901,523 | |
| Exxon Mobil Corp. | | | 91,566 | | | | 4,710,155 | |
| | | | | | | | |
| | | | | | | $ | 6,611,678 | |
| Food & Beverages - 6.8% | | | | | | |
| General Mills, Inc. | | | 138,418 | | | $ | 6,782,482 | |
| Ingredion, Inc. | | | 117,325 | | | | 9,773,173 | |
| J.M. Smucker Co. | | | 27,972 | | | | 2,880,836 | |
| Mondelez International, Inc. | | | 78,998 | | | | 4,171,094 | |
| PepsiCo, Inc. | | | 116,473 | | | | 15,377,930 | |
| | | | | | | | |
| | | | | | | $ | 38,985,515 | |
| Insurance - 10.2% | | | | | | |
| Allstate Corp. | | | 42,454 | | | $ | 4,468,283 | |
| Aon PLC | | | 36,552 | | | | 7,602,816 | |
| Chubb Ltd. | | | 44,740 | | | | 6,488,642 | |
| Everest Re Group Ltd. | | | 43,162 | | | | 10,698,997 | |
| Hartford Financial Services Group, Inc. | | | 116,575 | | | | 5,822,921 | |
| Loews Corp. | | | 127,052 | | | | 5,797,383 | |
| MetLife, Inc. | | | 326,662 | | | | 13,955,001 | |
| Reinsurance Group of America, Inc. | | | 26,945 | | | | 3,288,098 | |
| | | | | | | | |
| | | | | | | $ | 58,122,141 | |
| Internet - 3.2% | | | | | | |
| Alphabet, Inc., “A” (a) | | | 10,986 | | | $ | 14,713,001 | |
| Alphabet, Inc., “C” (a) | | | 2,449 | | | | 3,280,019 | |
| | | | | | | | |
| | | | | | | $ | 17,993,020 | |
6
Portfolio of Investments (unaudited) – continued
| | | | | | | | |
| | |
| Issuer | | Shares/Par | | | Value ($) | |
| Common Stocks - continued | | | | | | |
| Machinery & Tools - 3.3% | | | | | | |
| AGCO Corp. | | | 102,543 | | | $ | 6,196,674 | |
| Eaton Corp. PLC | | | 79,500 | | | | 7,212,240 | |
| Illinois Tool Works, Inc. | | | 15,707 | | | | 2,635,320 | |
| Roper Technologies, Inc. | | | 7,961 | | | | 2,799,884 | |
| | | | | | | | |
| | | | | | | $ | 18,844,118 | |
| Major Banks - 0.7% | | | | | | |
| PNC Financial Services Group, Inc. | | | 33,165 | | | $ | 4,192,056 | |
| | |
| Medical & Health Technology & Services - 1.2% | | | | | | |
| McKesson Corp. | | | 30,510 | | | $ | 4,267,129 | |
| Quest Diagnostics, Inc. | | | 22,137 | | | | 2,347,850 | |
| | | | | | | | |
| | | | | | | $ | 6,614,979 | |
| Medical Equipment - 6.4% | | | | | | |
| Danaher Corp. | | | 70,302 | | | $ | 10,164,263 | |
| Medtronic PLC | | | 91,374 | | | | 9,198,621 | |
| STERIS PLC | | | 71,579 | | | | 11,353,861 | |
| Stryker Corp. | | | 17,561 | | | | 3,346,951 | |
| Thermo Fisher Scientific, Inc. | | | 8,374 | | | | 2,435,159 | |
| | | | | | | | |
| | | | | | | $ | 36,498,855 | |
| Natural Gas - Distribution - 0.4% | | | | | | |
| Sempra Energy | | | 15,353 | | | $ | 2,146,042 | |
| | |
| Network & Telecom - 0.5% | | | | | | |
| Motorola Solutions, Inc. | | | 17,718 | | | $ | 2,935,518 | |
| | |
| Other Banks & Diversified Financials - 2.4% | | | | | | |
| Mastercard, Inc., “A” | | | 24,329 | | | $ | 7,061,492 | |
| U.S. Bancorp | | | 52,391 | | | | 2,433,038 | |
| Visa, Inc., “A” | | | 24,548 | | | | 4,461,845 | |
| | | | | | | | |
| | | | | | | $ | 13,956,375 | |
| Pharmaceuticals - 8.7% | | | | | | |
| Eli Lilly & Co. | | | 146,101 | | | $ | 18,427,719 | |
| Johnson & Johnson | | | 101,337 | | | | 13,627,800 | |
| Merck & Co., Inc. | | | 44,132 | | | | 3,378,746 | |
| Pfizer, Inc. | | | 274,727 | | | | 9,181,376 | |
| Zoetis, Inc. | | | 39,954 | | | | 5,323,072 | |
| | | | | | | | |
| | | | | | | $ | 49,938,713 | |
7
Portfolio of Investments (unaudited) – continued
| | | | | | | | |
| | |
| Issuer | | Shares/Par | | | Value ($) | |
| Common Stocks - continued | | | | | | |
| Pollution Control - 3.9% | | | | | | |
| Waste Connections, Inc. | | | 169,748 | | | $ | 16,378,985 | |
| Waste Management, Inc. | | | 51,530 | | | | 5,710,039 | |
| | | | | | | | |
| | | | | | | $ | 22,089,024 | |
| Real Estate - 5.9% | | | | | | |
| EPR Properties, REIT | | | 33,699 | | | $ | 1,996,329 | |
| Extra Space Storage, Inc., REIT | | | 25,732 | | | | 2,582,464 | |
| Public Storage, Inc., REIT | | | 24,584 | | | | 5,141,006 | |
| Spirit Realty Capital, Inc., REIT | | | 124,873 | | | | 5,681,721 | |
| STAG Industrial, Inc., REIT | | | 76,870 | | | | 2,150,823 | |
| STORE Capital Corp., REIT | | | 295,143 | | | | 9,698,399 | |
| Sun Communities, Inc., REIT | | | 42,832 | | | | 6,548,156 | |
| | | | | | | | |
| | | | | | | $ | 33,798,898 | |
| Restaurants - 4.4% | | | | | | |
| Darden Restaurants, Inc. | | | 25,670 | | | $ | 2,502,825 | |
| McDonald’s Corp. | | | 25,743 | | | | 4,998,518 | |
| Starbucks Corp. | | | 195,563 | | | | 15,338,006 | |
| U.S. Foods Holding Corp. (a) | | | 60,147 | | | | 2,023,345 | |
| | | | | | | | |
| | | | | | | $ | 24,862,694 | |
| Specialty Chemicals - 1.5% | | | | | | |
| Ecolab, Inc. | | | 47,733 | | | $ | 8,613,420 | |
| | |
| Specialty Stores - 2.7% | | | | | | |
| Costco Wholesale Corp. | | | 54,783 | | | $ | 15,401,693 | |
| | |
| Telephone Services - 0.8% | | | | | | |
| Verizon Communications, Inc. | | | 85,656 | | | $ | 4,639,129 | |
| | |
| Utilities - Electric Power - 8.1% | | | | | | |
| American Electric Power Co., Inc. | | | 39,620 | | | $ | 3,536,481 | |
| Avangrid, Inc. | | | 46,527 | | | | 2,311,926 | |
| DTE Energy Co. | | | 50,473 | | | | 5,636,320 | |
| Duke Energy Corp. | | | 68,474 | | | | 6,279,066 | |
| Evergy, Inc. | | | 71,508 | | | | 4,673,048 | |
| Exelon Corp. | | | 60,520 | | | | 2,609,017 | |
| NextEra Energy, Inc. | | | 41,441 | | | | 10,474,627 | |
| WEC Energy Group, Inc. | | | 25,105 | | | | 2,317,945 | |
| Xcel Energy, Inc. | | | 130,621 | | | | 8,140,301 | |
| | | | | | | | |
| | | | | | | $ | 45,978,731 | |
| Total Common Stocks (Identified Cost, $558,183,169) | | | | | | $ | 577,463,856 | |
8
Portfolio of Investments (unaudited) – continued
| | | | | | | | |
| | |
| Issuer | | Shares/Par | | | Value ($) | |
| Investment Companies (h) - 0.9% | | | | | | |
| Money Market Funds - 0.9% | | | | | | |
MFS Institutional Money Market Portfolio, 1.61% (v)
(Identified Cost, $5,315,134) | | | 5,315,030 | | | $ | 5,315,562 | |
| | |
| Other Assets, Less Liabilities - (2.0)% | | | | | (11,686,322) | |
| Net Assets - 100.0% | | | | | | $ | 571,093,096 | |
| (a) | Non-income producing security. |
| (h) | An affiliated issuer, which may be considered one in which the fund owns 5% or more of the outstanding voting securities, or a company which is under common control. At period end, the aggregate values of the fund’s investments in affiliated issuers and in unaffiliated issuers were $5,315,562 and $577,463,856, respectively. |
| (v) | Affiliated issuer that is available only to investment companies managed by MFS. The rate quoted for the MFS Institutional Money Market Portfolio is the annualizedseven-day yield of the fund at period end. |
The following abbreviations are used in this report and are defined:
| REIT | | Real Estate Investment Trust |
See Notes to Financial Statements
9
Financial Statements
STATEMENT OF ASSETS AND LIABILITIES
At 2/29/20 (unaudited)
This statement represents your fund’s balance sheet, which details the assets and liabilities comprising the total value of the fund.
| | | | |
| Assets | | | | |
Investments in unaffiliated issuers, at value (identified cost, $558,183,169) | | | $577,463,856 | |
Investments in affiliated issuers, at value (identified cost, $5,315,134) | | | 5,315,562 | |
Receivables for | | | | |
Fund shares sold | | | 5,466,731 | |
Dividends | | | 1,148,193 | |
Other assets | | | 38,671 | |
Total assets | | | $589,433,013 | |
| |
| Liabilities | | | | |
Payables for | | | | |
Investments purchased | | | $3,658,211 | |
Fund shares reacquired | | | 14,422,469 | |
Payable to affiliates | | | | |
Investment adviser | | | 17,045 | |
Administrative services fee | | | 736 | |
Shareholder servicing costs | | | 201,263 | |
Distribution and service fees | | | 4,960 | |
Accrued expenses and other liabilities | | | 35,233 | |
Total liabilities | | | $18,339,917 | |
Net assets | | | $571,093,096 | |
| |
| Net assets consist of | | | | |
Paid-in capital | | | $549,719,950 | |
Total distributable earnings (loss) | | | 21,373,146 | |
Net assets | | | $571,093,096 | |
Shares of beneficial interest outstanding | | | 35,916,293 | |
10
Statement of Assets and Liabilities (unaudited) – continued
| | | | | | | | | | | | |
| | | |
| | | | | | | | | | |
| | | |
| | | Net assets | | | Shares
outstanding | | | Net asset value
per share (a) | |
Class A | | | $115,308,804 | | | | 7,258,186 | | | | $15.89 | |
Class B | | | 2,385,541 | | | | 150,476 | | | | 15.85 | |
Class C | | | 28,101,384 | | | | 1,779,240 | | | | 15.79 | |
Class I | | | 360,489,221 | | | | 22,660,068 | | | | 15.91 | |
Class R1 | | | 240,568 | | | | 15,137 | | | | 15.89 | |
Class R2 | | | 430,619 | | | | 26,992 | | | | 15.95 | |
Class R3 | | | 567,913 | | | | 35,622 | | | | 15.94 | |
Class R4 | | | 73,768 | | | | 4,633 | | | | 15.92 | |
Class R6 | | | 63,495,278 | | | | 3,985,939 | | | | 15.93 | |
| (a) | Maximum offering price per share was equal to the net asset value per share for all share classes, except for Class A, for which the maximum offering price per share was $16.86 [100 / 94.25 x $15.89]. On sales of $50,000 or more, the maximum offering price of Class A shares is reduced. A contingent deferred sales charge may be imposed on redemptions of Class A, Class B, and Class C shares. Redemption price per share was equal to the net asset value per share for Classes I, R1, R2, R3, R4, and R6. |
See Notes to Financial Statements
11
Financial Statements
STATEMENT OF OPERATIONS
Six months ended 2/29/20 (unaudited)
This statement describes how much your fund earned in investment income and accrued in expenses. It also describes any gains and/or losses generated by fund operations.
| | | | |
| Net investment income (loss) | | | | |
Income | | | | |
Dividends | | | $5,089,220 | |
Dividends from affiliated issuers | | | 42,371 | |
Other | | | 7,824 | |
Foreign taxes withheld | | | (8,947 | ) |
Total investment income | | | $5,130,468 | |
Expenses | | | | |
Management fee | | | $1,329,169 | |
Distribution and service fees | | | 280,602 | |
Shareholder servicing costs | | | 207,388 | |
Administrative services fee | | | 39,540 | |
Independent Trustees’ compensation | | | 3,609 | |
Custodian fee | | | 7,223 | |
Shareholder communications | | | 12,995 | |
Audit and tax fees | | | 25,669 | |
Legal fees | | | 984 | |
Registration fees | | | 96,130 | |
Miscellaneous | | | 16,311 | |
Total expenses | | | $2,019,620 | |
Reduction of expenses by investment adviser and distributor | | | (55,940 | ) |
Net expenses | | | $1,963,680 | |
Net investment income (loss) | | | $3,166,788 | |
| |
| Realized and unrealized gain (loss) | | | | |
Realized gain (loss) (identified cost basis) | | | | |
Unaffiliated issuers | | | $1,753,357 | |
Affiliated issuers | | | (2,563 | ) |
Foreign currency | | | (1 | ) |
Net realized gain (loss) | | | $1,750,793 | |
Change in unrealized appreciation or depreciation | | | | |
Unaffiliated issuers | | | $(20,015,363 | ) |
Affiliated issuers | | | 164 | |
Net unrealized gain (loss) | | | $(20,015,199 | ) |
Net realized and unrealized gain (loss) | | | $(18,264,406 | ) |
Change in net assets from operations | | | $(15,097,618 | ) |
See Notes to Financial Statements
12
Financial Statements
STATEMENTS OF CHANGES IN NET ASSETS
These statements describe the increases and/or decreases in net assets resulting from operations, any distributions, and any shareholder transactions.
| | | | | | | | |
| Change in net assets | | Six months ended
2/29/20
(unaudited) | | | Year ended
8/31/19 | |
| | |
| From operations | | | | | | | | |
Net investment income (loss) | | | $3,166,788 | | | | $2,128,879 | |
Net realized gain (loss) | | | 1,750,793 | | | | 567,571 | |
Net unrealized gain (loss) | | | (20,015,199 | ) | | | 22,926,394 | |
Change in net assets from operations | | | $(15,097,618 | ) | | | $25,622,844 | |
Total distributions to shareholders | | | $(3,214,012 | ) | | | $(4,818,533 | ) |
Change in net assets from fund share transactions | | | $201,730,789 | | | | $269,731,498 | |
Total change in net assets | | | $183,419,159 | | | | $290,535,809 | |
| | |
| Net assets | | | | | | | | |
At beginning of period | | | 387,673,937 | | | | 97,138,128 | |
At end of period | | | $571,093,096 | | | | $387,673,937 | |
See Notes to Financial Statements
13
Financial Statements
FINANCIAL HIGHLIGHTS
The financial highlights table is intended to help you understand the fund’s financial performance for the semiannual period and the past 5 fiscal years. Certain information reflects financial results for a single fund share. The total returns in the table represent the rate that an investor would have earned (or lost) on an investment in the fund share class (assuming reinvestment of all distributions) held for the entire period.
| | | | | | | | | | | | | | | | | | | | | | | | |
| | | Six months ended 2/29/20 | | | Year ended | |
| Class A | | 8/31/19 | | | 8/31/18 | | | 8/31/17 | | | 8/31/16 | | | 8/31/15 | |
| | | (unaudited) | | | | | | | | | | | | | | | | |
Net asset value, beginning of period | | | $16.28 | | | | $15.05 | | | | $13.77 | | | | $12.56 | | | | $11.12 | | | | $10.82 | |
| | | |
| Income (loss) from investment operations | | | | | | | | | | | | | |
Net investment income (loss) (d) | | | $0.09 | | | | $0.18 | | | | $0.18 | | | | $0.16 | | | | $0.15 | | | | $0.14 | |
Net realized and unrealized gain (loss) | | | (0.39 | ) | | | 1.68 | | | | 1.47 | | | | 1.23 | | | | 1.49 | | | | 0.30 | (g) |
Total from investment operations | | | $(0.30 | ) | | | $1.86 | | | | $1.65 | | | | $1.39 | | | | $1.64 | | | | $0.44 | |
| | | |
| Less distributions declared to shareholders | | | | | | | | | | | | | |
From net investment income | | | $(0.07 | ) | | | $(0.17 | ) | | | $(0.18 | ) | | | $(0.15 | ) | | | $(0.11 | ) | | | $(0.13 | ) |
From net realized gain | | | (0.02 | ) | | | (0.46 | ) | | | (0.19 | ) | | | (0.03 | ) | | | (0.09 | ) | | | (0.01 | ) |
Total distributions declared to
shareholders | | | $(0.09 | ) | | | $(0.63 | ) | | | $(0.37 | ) | | | $(0.18 | ) | | | $(0.20 | ) | | | $(0.14 | ) |
Net asset value, end of period (x) | | | $15.89 | | | | $16.28 | | | | $15.05 | | | | $13.77 | | | | $12.56 | | | | $11.12 | |
Total return (%) (r)(s)(t)(x) | | | (1.85 | )(n) | | | 13.23 | | | | 12.14 | | | | 11.18 | | | | 14.87 | | | | 4.01 | |
| | | |
Ratios (%) (to average net assets)
and Supplemental data: | | | | | | | | | | | | | |
Expenses before expense reductions (f) | | | 0.91 | (a) | | | 1.05 | | | | 1.16 | | | | 1.33 | | | | 1.65 | | | | 2.72 | |
Expenses after expense reductions (f) | | | 0.89 | (a) | | | 0.89 | | | | 0.88 | | | | 1.16 | | | | 1.19 | | | | 1.18 | |
Net investment income (loss) | | | 1.04 | (a) | | | 1.22 | | | | 1.25 | | | | 1.19 | | | | 1.25 | | | | 1.22 | |
Portfolio turnover | | | 15 | (n) | | | 28 | | | | 30 | | | | 36 | | | | 38 | | | | 33 | |
Net assets at end of period (000 omitted) | | | $115,309 | | | | $85,022 | | | | $41,177 | | | | $39,568 | | | | $29,508 | | | | $11,267 | |
See Notes to Financial Statements
14
Financial Highlights – continued
| | | | | | | | | | | | | | | | | | | | | | | | |
| | | Six months ended 2/29/20 | | | Year ended | |
| Class B | | 8/31/19 | | | 8/31/18 | | | 8/31/17 | | | 8/31/16 | | | 8/31/15 | |
| | | (unaudited) | | | | | | | | | | | | | | | | |
Net asset value, beginning of period | | | $16.25 | | | | $15.02 | | | | $13.74 | | | | $12.53 | | | | $11.10 | | | | $10.81 | |
| | | |
| Income (loss) from investment operations | | | | | | | | | | | | | |
Net investment income (loss) (d) | | | $0.02 | | | | $0.07 | | | | $0.07 | | | | $0.06 | | | | $0.06 | | | | $0.05 | |
Net realized and unrealized gain (loss) | | | (0.39 | ) | | | 1.68 | | | | 1.47 | | | | 1.23 | | | | 1.48 | | | | 0.30 | (g) |
Total from investment operations | | | $(0.37 | ) | | | $1.75 | | | | $1.54 | | | | $1.29 | | | | $1.54 | | | | $0.35 | |
| | | |
| Less distributions declared to shareholders | | | | | | | | | | | | | |
From net investment income | | | $(0.01 | ) | | | $(0.06 | ) | | | $(0.07 | ) | | | $(0.05 | ) | | | $(0.02 | ) | | | $(0.05 | ) |
From net realized gain | | | (0.02 | ) | | | (0.46 | ) | | | (0.19 | ) | | | (0.03 | ) | | | (0.09 | ) | | | (0.01 | ) |
Total distributions declared to
shareholders | | | $(0.03 | ) | | | $(0.52 | ) | | | $(0.26 | ) | | | $(0.08 | ) | | | $(0.11 | ) | | | $(0.06 | ) |
Net asset value, end of period (x) | | | $15.85 | | | | $16.25 | | | | $15.02 | | | | $13.74 | | | | $12.53 | | | | $11.10 | |
Total return (%) (r)(s)(t)(x) | | | (2.29 | )(n) | | | 12.41 | | | | 11.32 | | | | 10.36 | | | | 13.96 | | | | 3.20 | |
| | | |
Ratios (%) (to average net assets)
and Supplemental data: | | | | | | | | | | | | | |
Expenses before expense reductions (f) | | | 1.66 | (a) | | | 1.81 | | | | 1.91 | | | | 2.08 | | | | 2.42 | | | | 3.79 | |
Expenses after expense reductions (f) | | | 1.64 | (a) | | | 1.64 | | | | 1.64 | | | | 1.92 | | | | 1.95 | | | | 1.95 | |
Net investment income (loss) | | | 0.29 | (a) | | | 0.48 | | | | 0.50 | | | | 0.43 | | | | 0.49 | | | | 0.43 | |
Portfolio turnover | | | 15 | (n) | | | 28 | | | | 30 | | | | 36 | | | | 38 | | | | 33 | |
Net assets at end of period (000 omitted) | | | $2,386 | | | | $2,558 | | | | $2,211 | | | | $2,081 | | | | $1,885 | | | | $717 | |
See Notes to Financial Statements
15
Financial Highlights – continued
| | | | | | | | | | | | | | | | | | | | | | | | |
| | | Six months
ended
2/29/20 | | | Year ended | |
| Class C | | 8/31/19 | | | 8/31/18 | | | 8/31/17 | | | 8/31/16 | | | 8/31/15 | |
| | | (unaudited) | | | | | | | | | | | | | | | | |
Net asset value, beginning of period | | | $16.20 | | | | $14.98 | | | | $13.70 | | | | $12.50 | | | | $11.09 | | | | $10.80 | |
| | | |
| Income (loss) from investment operations | | | | | | | | | | | | | |
Net investment income (loss) (d) | | | $0.02 | | | | $0.07 | | | | $0.07 | | | | $0.06 | | | | $0.06 | | | | $0.05 | |
Net realized and unrealized gain (loss) | | | (0.39 | ) | | | 1.67 | | | | 1.48 | | | | 1.23 | | | | 1.48 | | | | 0.30 | (g) |
Total from investment operations | | | $(0.37 | ) | | | $1.74 | | | | $1.55 | | | | $1.29 | | | | $1.54 | | | | $0.35 | |
| | | |
| Less distributions declared to shareholders | | | | | | | | | | | | | |
From net investment income | | | $(0.02 | ) | | | $(0.06 | ) | | | $(0.08 | ) | | | $(0.06 | ) | | | $(0.04 | ) | | | $(0.05 | ) |
From net realized gain | | | (0.02 | ) | | | (0.46 | ) | | | (0.19 | ) | | | (0.03 | ) | | | (0.09 | ) | | | (0.01 | ) |
Total distributions declared to
shareholders | | | $(0.04 | ) | | | $(0.52 | ) | | | $(0.27 | ) | | | $(0.09 | ) | | | $(0.13 | ) | | | $(0.06 | ) |
Net asset value, end of period (x) | | | $15.79 | | | | $16.20 | | | | $14.98 | | | | $13.70 | | | | $12.50 | | | | $11.09 | |
Total return (%) (r)(s)(t)(x) | | | (2.31 | )(n) | | | 12.40 | | | | 11.36 | | | | 10.36 | | | | 13.91 | | | | 3.23 | |
| | | |
Ratios (%) (to average net assets)
and Supplemental data: | | | | | | | | | | | | | |
Expenses before expense reductions (f) | | | 1.66 | (a) | | | 1.81 | | | | 1.91 | | | | 2.08 | | | | 2.31 | | | | 3.73 | |
Expenses after expense reductions (f) | | | 1.64 | (a) | | | 1.64 | | | | 1.64 | | | | 1.92 | | | | 1.95 | | | | 1.95 | |
Net investment income (loss) | | | 0.29 | (a) | | | 0.47 | | | | 0.50 | | | | 0.43 | | | | 0.48 | | | | 0.43 | |
Portfolio turnover | | | 15 | (n) | | | 28 | | | | 30 | | | | 36 | | | | 38 | | | | 33 | |
Net assets at end of period (000 omitted) | | | $28,101 | | | | $21,859 | | | | $13,942 | | | | $12,422 | | | | $9,977 | | | | $1,564 | |
See Notes to Financial Statements
16
Financial Highlights – continued
| | | | | | | | | | | | | | | | | | | | | | | | |
| | | Six months
ended 2/29/20 | | | Year ended | |
| Class I | | 8/31/19 | | | 8/31/18 | | | 8/31/17 | | | 8/31/16 | | | 8/31/15 | |
| | | (unaudited) | | | | | | | | | | | | | | | | |
Net asset value, beginning of period | | | $16.31 | | | | $15.07 | | | | $13.78 | | | | $12.57 | | | | $11.14 | | | | $10.84 | |
| | | |
| Income (loss) from investment operations | | | | | | | | | | | | | |
Net investment income (loss) (d) | | | $0.11 | | | | $0.23 | | | | $0.21 | | | | $0.19 | | | | $0.18 | | | | $0.16 | |
Net realized and unrealized gain (loss) | | | (0.40 | ) | | | 1.68 | | | | 1.49 | | | | 1.23 | | | | 1.48 | | | | 0.30 | (g) |
Total from investment operations | | | $(0.29 | ) | | | $1.91 | | | | $1.70 | | | | $1.42 | | | | $1.66 | | | | $0.46 | |
| | | |
| Less distributions declared to shareholders | | | | | | | | | | | | | |
From net investment income | | | $(0.09 | ) | | | $(0.21 | ) | | | $(0.22 | ) | | | $(0.18 | ) | | | $(0.14 | ) | | | $(0.15 | ) |
From net realized gain | | | (0.02 | ) | | | (0.46 | ) | | | (0.19 | ) | | | (0.03 | ) | | | (0.09 | ) | | | (0.01 | ) |
Total distributions declared to
shareholders | | | $(0.11 | ) | | | $(0.67 | ) | | | $(0.41 | ) | | | $(0.21 | ) | | | $(0.23 | ) | | | $(0.16 | ) |
Net asset value, end of period (x) | | | $15.91 | | | | $16.31 | | | | $15.07 | | | | $13.78 | | | | $12.57 | | | | $11.14 | |
Total return (%) (r)(s)(t)(x) | | | (1.80 | )(n) | | | 13.55 | | | | 12.49 | | | | 11.44 | | | | 15.05 | | | | 4.20 | |
| | | |
Ratios (%) (to average net assets)
and Supplemental data: | | | | | | | | | | | | | |
Expenses before expense reductions (f) | | | 0.66 | (a) | | | 0.78 | | | | 0.91 | | | | 1.07 | | | | 1.20 | | | | 2.53 | |
Expenses after expense reductions (f) | | | 0.64 | (a) | | | 0.64 | | | | 0.64 | | | | 0.92 | | | | 0.95 | | | | 0.95 | |
Net investment income (loss) | | | 1.29 | (a) | | | 1.46 | | | | 1.50 | | | | 1.47 | | | | 1.51 | | | | 1.36 | |
Portfolio turnover | | | 15 | (n) | | | 28 | | | | 30 | | | | 36 | | | | 38 | | | | 33 | |
Net assets at end of period (000 omitted) | | | $360,489 | | | | $246,245 | | | | $30,751 | | | | $21,814 | | | | $16,123 | | | | $964 | |
See Notes to Financial Statements
17
Financial Highlights – continued
| | | | | | | | | | | | | | | | | | | | | | | | |
| | | Six months
ended 2/29/20 | | | Year ended | |
| Class R1 | | 8/31/19 | | | 8/31/18 | | | 8/31/17 | | | 8/31/16 | | | 8/31/15 | |
| | | (unaudited) | | | | | | | | | | | | | | | | |
Net asset value, beginning of period | | | $16.29 | | | | $15.06 | | | | $13.77 | | | | $12.57 | | | | $11.12 | | | | $10.82 | |
| | | |
| Income (loss) from investment operations | | | | | | | | | | | | | |
Net investment income (loss) (d) | | | $0.02 | | | | $0.07 | | | | $0.07 | | | | $0.05 | | | | $0.06 | | | | $0.04 | |
Net realized and unrealized gain (loss) | | | (0.39 | ) | | | 1.68 | | | | 1.48 | | | | 1.24 | | | | 1.49 | | | | 0.31 | (g) |
Total from investment operations | | | $(0.37 | ) | | | $1.75 | | | | $1.55 | | | | $1.29 | | | | $1.55 | | | | $0.35 | |
| | | |
| Less distributions declared to shareholders | | | | | | | | | | | | | |
From net investment income | | | $(0.01 | ) | | | $(0.06 | ) | | | $(0.07 | ) | | | $(0.06 | ) | | | $(0.01 | ) | | | $(0.04 | ) |
From net realized gain | | | (0.02 | ) | | | (0.46 | ) | | | (0.19 | ) | | | (0.03 | ) | | | (0.09 | ) | | | (0.01 | ) |
Total distributions declared to
shareholders | | | $(0.03 | ) | | | $(0.52 | ) | | | $(0.26 | ) | | | $(0.09 | ) | | | $(0.10 | ) | | | $(0.05 | ) |
Net asset value, end of period (x) | | | $15.89 | | | | $16.29 | | | | $15.06 | | | | $13.77 | | | | $12.57 | | | | $11.12 | |
Total return (%) (r)(s)(t)(x) | | | (2.28 | )(n) | | | 12.37 | | | | 11.36 | | | | 10.33 | | | | 13.96 | | | | 3.18 | |
| | | |
Ratios (%) (to average net assets)
and Supplemental data: | | | | | | | | | | | | | |
Expenses before expense reductions (f) | | | 1.66 | (a) | | | 1.81 | | | | 1.91 | | | | 2.07 | | | | 2.56 | | | | 4.18 | |
Expenses after expense reductions (f) | | | 1.64 | (a) | | | 1.64 | | | | 1.64 | | | | 1.91 | | | | 1.95 | | | | 1.95 | |
Net investment income (loss) | | | 0.27 | (a) | | | 0.48 | | | | 0.49 | | | | 0.41 | | | | 0.48 | | | | 0.39 | |
Portfolio turnover | | | 15 | (n) | | | 28 | | | | 30 | | | | 36 | | | | 38 | | | | 33 | |
Net assets at end of period (000 omitted) | | | $241 | | | | $164 | | | | $136 | | | | $108 | | | | $57 | | | | $112 | |
See Notes to Financial Statements
18
Financial Highlights – continued
| | | | | | | | | | | | | | | | | | | | | | | | |
| | | Six months
ended 2/29/20 | | | Year ended | |
| Class R2 | | 8/31/19 | | | 8/31/18 | | | 8/31/17 | | | 8/31/16 | | | 8/31/15 | |
| | | (unaudited) | | | | | | | | | | | | | | | | |
Net asset value, beginning of period | | | $16.36 | | | | $15.12 | | | | $13.83 | | | | $12.61 | | | | $11.13 | | | | $10.83 | |
| | | |
| Income (loss) from investment operations | | | | | | | | | | | | | |
Net investment income (loss) (d) | | | $0.07 | | | | $0.15 | | | | $0.14 | | | | $0.12 | | | | $0.12 | | | | $0.10 | |
Net realized and unrealized gain (loss) | | | (0.41 | ) | | | 1.68 | | | | 1.49 | | | | 1.25 | | | | 1.49 | | | | 0.30 | (g) |
Total from investment operations | | | $(0.34 | ) | | | $1.83 | | | | $1.63 | | | | $1.37 | | | | $1.61 | | | | $0.40 | |
| | | |
| Less distributions declared to shareholders | | | | | | | | | | | | | |
From net investment income | | | $(0.05 | ) | | | $(0.13 | ) | | | $(0.15 | ) | | | $(0.12 | ) | | | $(0.04 | ) | | | $(0.09 | ) |
From net realized gain | | | (0.02 | ) | | | (0.46 | ) | | | (0.19 | ) | | | (0.03 | ) | | | (0.09 | ) | | | (0.01 | ) |
Total distributions declared to
shareholders | | | $(0.07 | ) | | | $(0.59 | ) | | | $(0.34 | ) | | | $(0.15 | ) | | | $(0.13 | ) | | | $(0.10 | ) |
Net asset value, end of period (x) | | | $15.95 | | | | $16.36 | | | | $15.12 | | | | $13.83 | | | | $12.61 | | | | $11.13 | |
Total return (%) (r)(s)(t)(x) | | | (2.07 | )(n) | | | 12.94 | | | | 11.93 | | | | 10.93 | | | | 14.57 | | | | 3.69 | |
| | | |
Ratios (%) (to average net assets)
and Supplemental data: | | | | | | | | | | | | | |
Expenses before expense reductions (f) | | | 1.16 | (a) | | | 1.30 | | | | 1.42 | | | | 1.58 | | | | 2.07 | | | | 3.68 | |
Expenses after expense reductions (f) | | | 1.14 | (a) | | | 1.14 | | | | 1.14 | | | | 1.42 | | | | 1.45 | | | | 1.45 | |
Net investment income (loss) | | | 0.79 | (a) | | | 0.98 | | | | 1.01 | | | | 0.91 | | | | 0.98 | | | | 0.89 | |
Portfolio turnover | | | 15 | (n) | | | 28 | | | | 30 | | | | 36 | | | | 38 | | | | 33 | |
Net assets at end of period (000 omitted) | | | $431 | | | | $368 | | | | $156 | | | | $74 | | | | $53 | | | | $113 | |
See Notes to Financial Statements
19
Financial Highlights – continued
| | | | | | | | | | | | | | | | | | | | | | | | |
| | | Six months
ended 2/29/20 | | | Year ended | |
| Class R3 | | 8/31/19 | | | 8/31/18 | | | 8/31/17 | | | 8/31/16 | | | 8/31/15 | |
| | | (unaudited) | | | | | | | | | | | | | | | | |
Net asset value, beginning of period | | | $16.34 | | | | $15.10 | | | | $13.81 | | | | $12.59 | | | | $11.14 | | | | $10.83 | |
| | | |
| Income (loss) from investment operations | | | | | | | | | | | | | |
Net investment income (loss) (d) | | | $0.09 | | | | $0.19 | | | | $0.18 | | | | $0.15 | | | | $0.15 | | | | $0.13 | |
Net realized and unrealized gain (loss) | | | (0.39 | ) | | | 1.68 | | | | 1.48 | | | | 1.25 | | | | 1.48 | | | | 0.31 | (g) |
Total from investment operations | | | $(0.30 | ) | | | $1.87 | | | | $1.66 | | | | $1.40 | | | | $1.63 | | | | $0.44 | |
| | | |
| Less distributions declared to shareholders | | | | | | | | | | | | | |
From net investment income | | | $(0.08 | ) | | | $(0.17 | ) | | | $(0.18 | ) | | | $(0.15 | ) | | | $(0.09 | ) | | | $(0.12 | ) |
From net realized gain | | | (0.02 | ) | | | (0.46 | ) | | | (0.19 | ) | | | (0.03 | ) | | | (0.09 | ) | | | (0.01 | ) |
Total distributions declared to
shareholders | | | $(0.10 | ) | | | $(0.63 | ) | | | $(0.37 | ) | | | $(0.18 | ) | | | $(0.18 | ) | | | $(0.13 | ) |
Net asset value, end of period (x) | | | $15.94 | | | | $16.34 | | | | $15.10 | | | | $13.81 | | | | $12.59 | | | | $11.14 | |
Total return (%) (r)(s)(t)(x) | | | (1.88 | )(n) | | | 13.24 | | | | 12.18 | | | | 11.22 | | | | 14.72 | | | | 4.04 | |
| | | |
Ratios (%) (to average net assets)
and Supplemental data: | | | | | | | | | | | | | |
Expenses before expense reductions (f) | | | 0.91 | (a) | | | 1.05 | | | | 1.16 | | | | 1.33 | | | | 1.82 | | | | 3.43 | |
Expenses after expense reductions (f) | | | 0.89 | (a) | | | 0.89 | | | | 0.89 | | | | 1.17 | | | | 1.20 | | | | 1.20 | |
Net investment income (loss) | | | 1.09 | (a) | | | 1.22 | | | | 1.25 | | | | 1.18 | | | | 1.23 | | | | 1.14 | |
Portfolio turnover | | | 15 | (n) | | | 28 | | | | 30 | | | | 36 | | | | 38 | | | | 33 | |
Net assets at end of period (000 omitted) | | | $568 | | | | $100 | | | | $67 | | | | $59 | | | | $53 | | | | $113 | |
See Notes to Financial Statements
20
Financial Highlights – continued
| | | | | | | | | | | | | | | | | | | | | | | | |
| | | Six months
ended 2/29/20 | | | Year ended | |
| Class R4 | | 8/31/19 | | | 8/31/18 | | | 8/31/17 | | | 8/31/16 | | | 8/31/15 | |
| | | (unaudited) | | | | | | | | | | | | | | | | |
Net asset value, beginning of period | | | $16.32 | | | | $15.08 | | | | $13.79 | | | | $12.58 | | | | $11.14 | | | | $10.84 | |
| | | |
| Income (loss) from investment operations | | | | | | | | | | | | | |
Net investment income (loss) (d) | | | $0.11 | | | | $0.22 | | | | $0.21 | | | | $0.19 | | | | $0.17 | | | | $0.16 | |
Net realized and unrealized gain (loss) | | | (0.40 | ) | | | 1.69 | | | | 1.49 | | | | 1.23 | | | | 1.49 | | | | 0.30 | (g) |
Total from investment operations | | | $(0.29 | ) | | | $1.91 | | | | $1.70 | | | | $1.42 | | | | $1.66 | | | | $0.46 | |
| | | |
| Less distributions declared to shareholders | | | | | | | | | | | | | |
From net investment income | | | $(0.09 | ) | | | $(0.21 | ) | | | $(0.22 | ) | | | $(0.18 | ) | | | $(0.13 | ) | | | $(0.15 | ) |
From net realized gain | | | (0.02 | ) | | | (0.46 | ) | | | (0.19 | ) | | | (0.03 | ) | | | (0.09 | ) | | | (0.01 | ) |
Total distributions declared to
shareholders | | | $(0.11 | ) | | | $(0.67 | ) | | | $(0.41 | ) | | | $(0.21 | ) | | | $(0.22 | ) | | | $(0.16 | ) |
Net asset value, end of period (x) | | | $15.92 | | | | $16.32 | | | | $15.08 | | | | $13.79 | | | | $12.58 | | | | $11.14 | |
Total return (%) (r)(s)(t)(x) | | | (1.80 | )(n) | | | 13.53 | | | | 12.48 | | | | 11.42 | | | | 15.08 | | | | 4.20 | |
| | | |
Ratios (%) (to average net assets)
and Supplemental data: | | | | | | | | | | | | | |
Expenses before expense reductions (f) | | | 0.66 | (a) | | | 0.81 | | | | 0.91 | | | | 1.08 | | | | 1.57 | | | | 3.18 | |
Expenses after expense reductions (f) | | | 0.64 | (a) | | | 0.64 | | | | 0.64 | | | | 0.92 | | | | 0.95 | | | | 0.95 | |
Net investment income (loss) | | | 1.29 | (a) | | | 1.48 | | | | 1.50 | | | | 1.42 | | | | 1.48 | | | | 1.39 | |
Portfolio turnover | | | 15 | (n) | | | 28 | | | | 30 | | | | 36 | | | | 38 | | | | 33 | |
Net assets at end of period (000 omitted) | | | $74 | | | | $75 | | | | $66 | | | | $59 | | | | $53 | | | | $114 | |
See Notes to Financial Statements
21
Financial Highlights – continued
| | | | | | | | | | | | | | | | | | | | | | | | |
| | | Six months
ended 2/29/20 | | | Year ended | |
| Class R6 | | 8/31/19 | | | 8/31/18 | | | 8/31/17 | | | 8/31/16 | | | 8/31/15 | |
| | | (unaudited) | | | | | | | | | | | | | | | | |
Net asset value, beginning of period | | | $16.32 | | | | $15.09 | | | | $13.80 | | | | $12.58 | | | | $11.14 | | | | $10.84 | |
| | | |
| Income (loss) from investment operations | | | | | | | | | | | | | |
Net investment income (loss) (d) | | | $0.12 | | | | $0.23 | | | | $0.23 | | | | $0.18 | | | | $0.18 | | | | $0.16 | |
Net realized and unrealized gain (loss) | | | (0.39 | ) | | | 1.68 | | | | 1.48 | | | | 1.27 | | | | 1.50 | | | | 0.30 | (g) |
Total from investment operations | | | $(0.27 | ) | | | $1.91 | | | | $1.71 | | | | $1.45 | | | | $1.68 | | | | $0.46 | |
| | | |
| Less distributions declared to shareholders | | | | | | | | | | | | | |
From net investment income | | | $(0.10 | ) | | | $(0.22 | ) | | | $(0.23 | ) | | | $(0.20 | ) | | | $(0.15 | ) | | | $(0.15 | ) |
From net realized gain | | | (0.02 | ) | | | (0.46 | ) | | | (0.19 | ) | | | (0.03 | ) | | | (0.09 | ) | | | (0.01 | ) |
Total distributions declared to
shareholders | | | $(0.12 | ) | | | $(0.68 | ) | | | $(0.42 | ) | | | $(0.23 | ) | | | $(0.24 | ) | | | $(0.16 | ) |
Net asset value, end of period (x) | | | $15.93 | | | | $16.32 | | | | $15.09 | | | | $13.80 | | | | $12.58 | | | | $11.14 | |
Total return (%) (r)(s)(t)(x) | | | (1.71 | )(n) | | | 13.56 | | | | 12.57 | | | | 11.61 | | | | 15.21 | | | | 4.22 | |
| | | |
Ratios (%) (to average net assets)
and Supplemental data: | | | | | | | | | | | | | |
Expenses before expense reductions (f) | | | 0.58 | (a) | | | 0.71 | | | | 0.82 | | | | 0.97 | | | | 1.36 | | | | 3.14 | |
Expenses after expense reductions (f) | | | 0.56 | (a) | | | 0.56 | | | | 0.54 | | | | 0.78 | | | | 0.88 | | | | 0.91 | |
Net investment income (loss) | | | 1.37 | (a) | | | 1.53 | | | | 1.60 | | | | 1.38 | | | | 1.53 | | | | 1.43 | |
Portfolio turnover | | | 15 | (n) | | | 28 | | | | 30 | | | | 36 | | | | 38 | | | | 33 | |
Net assets at end of period (000 omitted) | | | $63,495 | | | | $31,283 | | | | $8,632 | | | | $6,515 | | | | $1,693 | | | | $1,593 | |
| (d) | Per share data is based on average shares outstanding. |
| (f) | Ratios do not reflect reductions from fees paid indirectly, if applicable. |
| (g) | The per share amount varies from the net realized and unrealized gain/loss for the period because of the timing of sales of fund shares and the per share amount of realized and unrealized gains and losses at such time. |
| (r) | Certain expenses have been reduced without which performance would have been lower. |
| (s) | From time to time the fund may receive proceeds from litigation settlements, without which performance would be lower. |
| (t) | Total returns do not include any applicable sales charges. |
| (x) | The net asset values and total returns have been calculated on net assets which include adjustments made in accordance with U.S. generally accepted accounting principles required at period end for financial reporting purposes. |
See Notes to Financial Statements
22
NOTES TO FINANCIAL STATEMENTS
(unaudited)
(1) Business and Organization
MFS Low Volatility Equity Fund (the fund) is a diversified series of MFS Series Trust I (the trust). The trust is organized as a Massachusetts business trust and is registered under the Investment Company Act of 1940, as amended, as anopen-end management investment company.
The fund is an investment company and accordingly follows the investment company accounting and reporting guidance of the Financial Accounting Standards Board (FASB) Accounting Standards Codification Topic 946 Financial Services – Investment Companies.
(2) Significant Accounting Policies
General– The preparation of financial statements in conformity with U.S. generally accepted accounting principles requires management to make estimates and assumptions that affect the reported amounts of assets and liabilities, and disclosure of contingent assets and liabilities at the date of the financial statements and the reported amounts of increases and decreases in net assets from operations during the reporting period. Actual results could differ from those estimates. In the preparation of these financial statements, management has evaluated subsequent events occurring after the date of the fund’s Statement of Assets and Liabilities through the date that the financial statements were issued.
In March 2020, the FASB issued Accounting Standards Update 2020-04, Reference Rate Reform (Topic 848) – Facilitation of the Effects of Reference Rate Reform on Financial Reporting (“ASU 2020-04”), which provides optional, temporary relief with respect to the financial reporting of contracts subject to certain types of modifications due to the planned discontinuation of the London Interbank Offered Rate (LIBOR) and other IBOR-based reference rates as of the end of 2021. The temporary relief provided by ASU 2020-04 is effective for certain reference rate-related contract modifications that occur during the period from March 12, 2020 through December 31, 2022. Management is evaluating the impact of ASU 2020-04 on the fund’s investments, derivatives, debt and other contracts that will undergo reference rate-related modifications as a result of the reference rate reform.
Balance Sheet Offsetting– The fund’s accounting policy with respect to balance sheet offsetting is that, absent an event of default by the counterparty or a termination of the agreement, the International Swaps and Derivatives Association (ISDA) Master Agreement, or similar agreement, does not result in an offset of reported amounts of financial assets and financial liabilities in the Statement of Assets and Liabilities across transactions between the fund and the applicable counterparty. The fund’s right to setoff may be restricted or prohibited by the bankruptcy or insolvency laws of the particular jurisdiction to which a specific master netting agreement counterparty is subject. Balance sheet offsetting disclosures, to the extent applicable to the fund, have been included in the fund’s Significant Accounting Policies note under the captions for each of the fund’sin-scope financial instruments and transactions.
Investment Valuations– Equity securities, including restricted equity securities, are generally valued at the last sale or official closing price on their primary market or
23
Notes to Financial Statements (unaudited) – continued
exchange as provided by a third-party pricing service. Equity securities, for which there were no sales reported that day, are generally valued at the last quoted daily bid quotation on their primary market or exchange as provided by a third-party pricing service. Short-term instruments with a maturity at issuance of 60 days or less may be valued at amortized cost, which approximates market value.Open-end investment companies are generally valued at net asset value per share. Securities and other assets generally valued on the basis of information from a third-party pricing service may also be valued at a broker/dealer bid quotation. In determining values, third-party pricing services can utilize both transaction data and market information such as yield, quality, coupon rate, maturity, type of issue, trading characteristics, and other market data.
The Board of Trustees has delegated primary responsibility for determining or causing to be determined the value of the fund’s investments (including any fair valuation) to the adviser pursuant to valuation policies and procedures approved by the Board. If the adviser determines that reliable market quotations are not readily available, investments are valued at fair value as determined in good faith by the adviser in accordance with such procedures under the oversight of the Board of Trustees. Under the fund’s valuation policies and procedures, market quotations are not considered to be readily available for most types of debt instruments and floating rate loans and many types of derivatives. These investments are generally valued at fair value based on information from third-party pricing services. In addition, investments may be valued at fair value if the adviser determines that an investment’s value has been materially affected by events occurring after the close of the exchange or market on which the investment is principally traded (such as foreign exchange or market) and prior to the determination of the fund’s net asset value, or after the halt of trading of a specific security where trading does not resume prior to the close of the exchange or market on which the security is principally traded. Events that occur after foreign markets close (such as developments in foreign markets and significant movements in the U.S. markets) and prior to the determination of the fund’s net asset value may be deemed to have a material effect on the value of securities traded in foreign markets. Accordingly, the fund’s foreign equity securities may often be valued at fair value. The adviser generally relies on third-party pricing services or other information (such as the correlation with price movements of similar securities in the same or other markets; the type, cost and investment characteristics of the security; the business and financial condition of the issuer; and trading and other market data) to assist in determining whether to fair value and at what value to fair value an investment. The value of an investment for purposes of calculating the fund’s net asset value can differ depending on the source and method used to determine value. When fair valuation is used, the value of an investment used to determine the fund’s net asset value may differ from quoted or published prices for the same investment. There can be no assurance that the fund could obtain the fair value assigned to an investment if it were to sell the investment at the same time at which the fund determines its net asset value per share.
Various inputs are used in determining the value of the fund’s assets or liabilities. These inputs are categorized into three broad levels. In certain cases, the inputs used to measure fair value may fall into different levels of the fair value hierarchy. In such cases, an investment’s level within the fair value hierarchy is based on the lowest level of input that is significant to the fair value measurement. The fund’s assessment of the
24
Notes to Financial Statements (unaudited) – continued
significance of a particular input to the fair value measurement in its entirety requires judgment, and considers factors specific to the investment. Level 1 includes unadjusted quoted prices in active markets for identical assets or liabilities. Level 2 includes other significant observable market-based inputs (including quoted prices for similar securities, interest rates, prepayment speed, and credit risk). Level 3 includes unobservable inputs, which may include the adviser’s own assumptions in determining the fair value of investments. The following is a summary of the levels used as of February 29, 2020 in valuing the fund’s assets or liabilities:
| | | | | | | | | | | | | | | | |
| | | | |
| Financial Instruments | | Level 1 | | | Level 2 | | | Level 3 | | | Total | |
| Equity Securities | | | $577,463,856 | | | | $— | | | | $— | | | | $577,463,856 | |
| Mutual Funds | | | 5,315,562 | | | | — | | | | — | | | | 5,315,562 | |
| Total | | | $582,779,418 | | | | $— | | | | $— | | | | $582,779,418 | |
For further information regarding security characteristics, see the Portfolio of Investments.
Indemnifications– Under the fund’s organizational documents, its officers and Trustees may be indemnified against certain liabilities and expenses arising out of the performance of their duties to the fund. Additionally, in the normal course of business, the fund enters into agreements with service providers that may contain indemnification clauses. The fund’s maximum exposure under these agreements is unknown as this would involve future claims that may be made against the fund that have not yet occurred.
Investment Transactions and Income– Investment transactions are recorded on the trade date. Dividends received in cash are recorded on theex-dividend date. Certain dividends from foreign securities will be recorded when the fund is informed of the dividend if such information is obtained subsequent to theex-dividend date. Dividend payments received in additional securities are recorded on theex-dividend date in an amount equal to the value of the security on such date.
The fund may receive proceeds from litigation settlements. Any proceeds received from litigation involving portfolio holdings are reflected in the Statement of Operations in realized gain/loss if the security has been disposed of by the fund or in unrealized gain/loss if the security is still held by the fund. Any other proceeds from litigation not related to portfolio holdings are reflected as other income in the Statement of Operations.
Tax Matters and Distributions– The fund intends to qualify as a regulated investment company, as defined under Subchapter M of the Internal Revenue Code, and to distribute all of its taxable income, including realized capital gains. As a result, no provision for federal income tax is required. The fund’s federal tax returns, when filed, will remain subject to examination by the Internal Revenue Service for a three year period. Management has analyzed the fund’s tax positions taken on federal and state tax returns for all open tax years and does not believe that there are any uncertain tax positions that require recognition of a tax liability. Foreign taxes, if any, have been accrued by the fund in the accompanying financial statements in accordance with the applicable foreign tax law. Foreign income taxes may be withheld by certain countries in which the fund invests. Additionally, capital gains realized by the fund on
25
Notes to Financial Statements (unaudited) – continued
securities issued in or by certain foreign countries may be subject to capital gains tax imposed by those countries.
Distributions to shareholders are recorded on theex-dividend date. Income and capital gain distributions are determined in accordance with income tax regulations, which may differ from U.S. generally accepted accounting principles. Certain capital accounts in the financial statements are periodically adjusted for permanent differences in order to reflect their tax character. These adjustments have no impact on net assets or net asset value per share. Temporary differences which arise from recognizing certain items of income, expense, gain or loss in different periods for financial statement and tax purposes will reverse at some time in the future.
Book/tax differences primarily relate to wash sale loss deferrals.
The tax character of distributions made during the current period will be determined at fiscal year end. The tax character of distributions declared to shareholders for the last fiscal year is as follows:
| | | | |
| |
| | | Year ended
8/31/19 | |
Ordinary income (including any
short-term capital gains) | | | $2,003,416 | |
| Long-term capital gains | | | 2,815,117 | |
| |
| Total distributions | | | $4,818,533 | |
The federal tax cost and the tax basis components of distributable earnings were as follows:
| | | | |
| |
| As of 2/29/20 | | | |
| |
| Cost of investments | | | $564,484,890 | |
| Gross appreciation | | | 36,891,275 | |
| |
| Gross depreciation | | | (18,596,747 | ) |
| Net unrealized appreciation (depreciation) | | | $18,294,528 | |
| |
| As of 8/31/19 | | | |
| |
| Undistributed ordinary income | | | 672,340 | |
| Undistributed long-term capital gain | | | 678,160 | |
| Net unrealized appreciation (depreciation) | | | 38,334,276 | |
The aggregate cost above includes prior fiscal year end tax adjustments, if applicable.
Multiple Classes of Shares of Beneficial Interest– The fund offers multiple classes of shares, which differ in their respective distribution and service fees. The fund’s income, realized and unrealized gain (loss), and common expenses are allocated to shareholders based on the daily net assets of each class. Dividends are declared separately for each class. Differences in per share dividend rates are generally due to differences in separate class expenses. Class B shares will convert to Class A shares approximately eight years after purchase. Class C shares will convert to Class A shares
26
Notes to Financial Statements (unaudited) – continued
approximately ten years after purchase. The fund’s distributions declared to shareholders as reported in the Statements of Changes in Net Assets are presented by class as follows:
| | | | | | | | |
| | |
| | | Six months
ended
2/29/20 | | | Year
ended
8/31/19 | |
| Class A | | | $570,647 | | | | $1,941,936 | |
| Class B | | | 4,567 | | | | 78,678 | |
| Class C | | | 62,248 | | | | 519,468 | |
| Class I | | | 2,252,243 | | | | 1,788,527 | |
| Class R1 | | | 444 | | | | 4,789 | |
| Class R2 | | | 1,744 | | | | 6,328 | |
| Class R3 | | | 1,500 | | | | 2,871 | |
| Class R4 | | | 509 | | | | 2,945 | |
| Class R6 | | | 320,110 | | | | 472,991 | |
| Total | | | $3,214,012 | | | | $4,818,533 | |
(3) Transactions with Affiliates
Investment Adviser– The fund has an investment advisory agreement with MFS to provide overall investment management and related administrative services and facilities to the fund. The management fee is computed daily and paid monthly at the following annual rates based on the fund’s average daily net assets:
| | | | |
| Up to $1 billion | | | 0.50 | % |
| In excess of $1 billion and up to $2.5 billion | | | 0.475 | % |
| In excess of $2.5 billion | | | 0.45 | % |
MFS has agreed in writing to reduce its management fee by a specified amount if certain MFS mutual fund assets exceed thresholds agreed to by MFS and the fund’s Board of Trustees. For the six months ended February 29, 2020, this management fee reduction amounted to $27,046, which is included in the reduction of total expenses in the Statement of Operations. The management fee incurred for the six months ended February 29, 2020 was equivalent to an annual effective rate of 0.49% of the fund’s average daily net assets.
The investment adviser has agreed in writing to pay a portion of the fund’s total annual operating expenses, excluding interest, taxes, extraordinary expenses, brokerage and transaction costs, and investment-related expenses, such that total fund operating expenses do not exceed the following rates annually of each class’s average daily net assets:
| | | | | | | | | | | | | | | | | | | | | | | | | | | | | | | | |
| Classes | |
| A | | B | | | C | | | I | | | R1 | | | R2 | | | R3 | | | R4 | | | R6 | |
| 0.89% | | | 1.64% | | | | 1.64% | | | | 0.64% | | | | 1.64% | | | | 1.14% | | | | 0.89% | | | | 0.64% | | | | 0.57% | |
This written agreement will continue until modified by the fund’s Board of Trustees, but such agreement will continue at least until December 31, 2020. For the six months ended February 29, 2020, this reduction amounted to $28,363, which is included in the reduction of total expenses in the Statement of Operations.
27
Notes to Financial Statements (unaudited) – continued
Distributor– MFS Fund Distributors, Inc. (MFD), a wholly-owned subsidiary of MFS, as distributor, received $73,852 for the six months ended February 29, 2020, as its portion of the initial sales charge on sales of Class A shares of the fund.
The Board of Trustees has adopted a distribution plan for certain share classes pursuant to Rule12b-1 of the Investment Company Act of 1940.
The fund’s distribution plan provides that the fund will pay MFD for services provided by MFD and financial intermediaries in connection with the distribution and servicing of certain share classes. One component of the plan is a distribution fee paid to MFD and another component of the plan is a service fee paid to MFD. MFD may subsequently pay all, or a portion, of the distribution and/or service fees to financial intermediaries.
Distribution Plan Fee Table:
| | | | | | | | | | | | | | | | | | | | |
| | | | | |
| | | Distribution
Fee Rate (d) | | | Service
Fee Rate (d) | | | Total
Distribution
Plan (d) | | | Annual
Effective
Rate (e) | | | Distribution
and Service
Fee | |
| Class A | | | — | | | | 0.25% | | | | 0.25% | | | | 0.25% | | | | $131,679 | |
| Class B | | | 0.75% | | | | 0.25% | | | | 1.00% | | | | 1.00% | | | | 13,008 | |
| Class C | | | 0.75% | | | | 0.25% | | | | 1.00% | | | | 1.00% | | | | 133,384 | |
| Class R1 | | | 0.75% | | | | 0.25% | | | | 1.00% | | | | 1.00% | | | | 1,169 | |
| Class R2 | | | 0.25% | | | | 0.25% | | | | 0.50% | | | | 0.50% | | | | 1,024 | |
| Class R3 | | | — | | | | 0.25% | | | | 0.25% | | | | 0.25% | | | | 338 | |
| Total Distribution and Service Fees | | | | | | | | | | | | $280,602 | |
| (d) | In accordance with the distribution plan for certain classes, the fund pays distribution and/or service fees equal to these annual percentage rates of each class’s average daily net assets. The distribution and service fee rates disclosed by class represent the current rates in effect at the end of the reporting period. Any rate changes, if applicable, are detailed below. |
| (e) | The annual effective rates represent actual fees incurred under the distribution plan for the six months ended February 29, 2020 based on each class’s average daily net assets. MFD has voluntarily agreed to rebate a portion of each class’s 0.25% service fee attributable to accounts for which MFD retains the 0.25% service fee except for accounts attributable to MFS or its affiliates’ seed money. For the six months ended February 29, 2020, this rebate amounted to $522, $8, and $1 for Class A, Class B, and Class C, respectively, and is included in the reduction of total expenses in the Statement of Operations. |
Certain Class A shares are subject to a contingent deferred sales charge (CDSC) in the event of a shareholder redemption within 18 months of purchase. Class B shares are subject to a CDSC in the event of a shareholder redemption within six years of purchase. Class C shares are subject to a CDSC in the event of a shareholder redemption within 12 months of purchase. All contingent deferred sales charges are paid to MFD and during the six months ended February 29, 2020, were as follows:
| | | | |
| |
| | | Amount | |
| Class A | | | $3,078 | |
| Class B | | | 1,368 | |
| Class C | | | 1,160 | |
Shareholder Servicing Agent– MFS Service Center, Inc. (MFSC), a wholly-owned subsidiary of MFS, receives a fee from the fund for its services as shareholder servicing agent calculated as a percentage of the average daily net assets of the fund as determined periodically under the supervision of the fund’s Board of Trustees. For the
28
Notes to Financial Statements (unaudited) – continued
six months ended February 29, 2020, the fee was $10,516, which equated to
0.0040% annually of the fund’s average daily net assets. MFSC also receives payment from the fund forout-of-pocket expenses,sub-accounting and other shareholder servicing costs which may be paid to affiliated and unaffiliated service providers. Class R6 shares do not incursub-accounting fees. For the six months ended February 29, 2020, theseout-of-pocket expenses,sub-accounting and other shareholder servicing costs amounted to $196,872.
Administrator– MFS provides certain financial, legal, shareholder communications, compliance, and other administrative services to the fund. Under an administrative services agreement, the fund reimburses MFS the costs incurred to provide these services. The fund is charged an annual fixed amount of $17,500 plus a fee based on average daily net assets. The administrative services fee incurred for the six months ended February 29, 2020 was equivalent to an annual effective rate of 0.0149% of the fund’s average daily net assets.
Trustees’ and Officers’ Compensation– The fund pays compensation to independent Trustees in the form of a retainer, attendance fees, and additional compensation to Board and Committee chairpersons. The fund does not pay compensation directly to Trustees or officers of the fund who are also officers of the investment adviser, all of whom receive remuneration from MFS for their services to the fund. Certain officers and Trustees of the fund are officers or directors of MFS, MFD, and MFSC.
Other –The fund invests in the MFS Institutional Money Market Portfolio which is managed by MFS and seeks current income consistent with preservation of capital and liquidity. This money market fund does not pay a management fee to MFS but does incur investment and operating costs.
On September 16, 2019, MFS purchased 867 shares of Class I for an aggregate amount of $14,162.
At February 29, 2020, MFS held approximately 100% of the outstanding shares of Class R4.
The fund is permitted to engage in purchase and sale transactions with funds and accounts for which MFS serves as investment adviser orsub-adviser (“cross-trades”) pursuant to a policy adopted by the Board of Trustees. This policy has been designed to ensure that cross-trades conducted by the fund comply with Rule17a-7 under the Investment Company Act of 1940. During the six months ended February 29, 2020, the fund engaged in purchase transactions pursuant to this policy, which amounted to $512,489.
The adviser has voluntarily undertaken to reimburse the fund from its own resources on a quarterly basis for the cost of investment research embedded in the cost of the fund’s securities trades. This agreement may be rescinded at any time. For the six months ended February 29, 2020, this reimbursement amounted to $7,824, which is included in “Other” income in the Statement of Operations.
(4) Portfolio Securities
For the six months ended February 29, 2020, purchases and sales of investments, other than short-term obligations, aggregated $303,466,653 and $75,688,444, respectively.
29
Notes to Financial Statements (unaudited) – continued
(5) Shares of Beneficial Interest
The fund’s Declaration of Trust permits the Trustees to issue an unlimited number of full and fractional shares of beneficial interest. Transactions in fund shares were as follows:
| | | | | | | | | | | | | | | | |
| | | Six months ended
2/29/20 | | | Year ended
8/31/19 | |
| | | | |
| | | Shares | | | Amount | | | Shares | | | Amount | |
| Shares sold | | | | | | | | | | | | | | | | |
Class A | | | 2,625,192 | | | | $43,853,678 | | | | 3,235,271 | | | | $48,902,099 | |
Class B | | | 3,640 | | | | 59,763 | | | | 23,122 | | | | 339,299 | |
Class C | | | 541,228 | | | | 8,945,740 | | | | 647,279 | | | | 9,609,566 | |
Class I | | | 11,523,457 | | | | 191,895,732 | | | | 15,531,431 | | | | 243,089,354 | |
Class R1 | | | 5,058 | | | | 83,058 | | | | 1,739 | | | | 27,454 | |
Class R2 | | | 4,402 | | | | 74,313 | | | | 11,703 | | | | 189,116 | |
Class R3 | | | 29,570 | | | | 505,315 | | | | 1,477 | | | | 22,634 | |
Class R4 | | | 1 | | | | 12 | | | | — | | | | — | |
Class R6 | | | 2,258,093 | | | | 37,902,698 | | | | 1,485,520 | | | | 22,946,373 | |
| | | 16,990,641 | | | | $283,320,309 | | | | 20,937,542 | | | | $325,125,895 | |
| | | | |
Shares issued to shareholders in
reinvestment of distributions | | | | | | | | | | | | | | | | |
Class A | | | 34,204 | | | | $569,841 | | | | 141,448 | | | | $1,933,913 | |
Class B | | | 272 | | | | 4,567 | | | | 5,642 | | | | 75,618 | |
Class C | | | 3,734 | | | | 62,227 | | | | 38,814 | | | | 519,165 | |
Class I | | | 135,065 | | | | 2,250,851 | | | | 127,726 | | | | 1,787,923 | |
Class R1 | | | 26 | | | | 444 | | | | 356 | | | | 4,789 | |
Class R2 | | | 104 | | | | 1,744 | | | | 464 | | | | 6,328 | |
Class R3 | | | 89 | | | | 1,500 | | | | 210 | | | | 2,871 | |
Class R4 | | | 31 | | | | 509 | | | | 214 | | | | 2,944 | |
Class R6 | | | 17,776 | | | | 296,877 | | | | 28,277 | | | | 392,678 | |
| | | 191,301 | | | | $3,188,560 | | | | 343,151 | | | | $4,726,229 | |
| | | | |
| Shares reacquired | | | | | | | | | | | | | | | | |
Class A | | | (622,214 | ) | | | $(10,407,801 | ) | | | (890,885 | ) | | | $(13,424,228 | ) |
Class B | | | (10,832 | ) | | | (177,321 | ) | | | (18,557 | ) | | | (280,249 | ) |
Class C | | | (115,347 | ) | | | (1,949,310 | ) | | | (267,226 | ) | | | (4,024,024 | ) |
Class I | | | (4,100,443 | ) | | | (68,756,929 | ) | | | (2,597,814 | ) | | | (39,783,835 | ) |
Class R1 | | | (6 | ) | | | (101 | ) | | | (1,095 | ) | | | (17,588 | ) |
Class R2 | | | (8 | ) | | | (128 | ) | | | (15 | ) | | | (235 | ) |
Class R3 | | | (161 | ) | | | (2,736 | ) | | | (1 | ) | | | (10 | ) |
Class R6 | | | (206,183 | ) | | | (3,483,754 | ) | | | (169,611 | ) | | | (2,590,457 | ) |
| | | (5,055,194 | ) | | | $(84,778,080 | ) | | | (3,945,204 | ) | | | $(60,120,626 | ) |
30
Notes to Financial Statements (unaudited) – continued
| | | | | | | | | | | | | | | | |
| | | Six months ended
2/29/20 | | | Year ended
8/31/19 | |
| | | | |
| | | Shares | | | Amount | | | Shares | | | Amount | |
| Net change | | | | | | | | | | | | | | | | |
Class A | | | 2,037,182 | | | | $34,015,718 | | | | 2,485,834 | | | | $37,411,784 | |
Class B | | | (6,920 | ) | | | (112,991 | ) | | | 10,207 | | | | 134,668 | |
Class C | | | 429,615 | | | | 7,058,657 | | | | 418,867 | | | | 6,104,707 | |
Class I | | | 7,558,079 | | | | 125,389,654 | | | | 13,061,343 | | | | 205,093,442 | |
Class R1 | | | 5,078 | | | | 83,401 | | | | 1,000 | | | | 14,655 | |
Class R2 | | | 4,498 | | | | 75,929 | | | | 12,152 | | | | 195,209 | |
Class R3 | | | 29,498 | | | | 504,079 | | | | 1,686 | | | | 25,495 | |
Class R4 | | | 32 | | | | 521 | | | | 214 | | | | 2,944 | |
Class R6 | | | 2,069,686 | | | | 34,715,821 | | | | 1,344,186 | | | | 20,748,594 | |
| | | 12,126,748 | | | | $201,730,789 | | | | 17,335,489 | | | | $269,731,498 | |
Class T shares were not publicly available for sale during the period. Please see the fund’s prospectus for details.
Effective June 1, 2019, purchases of the fund’s Class B shares are closed to new and existing investors subject to certain exceptions. Please see the fund’s prospectus for details.
(6) Line of Credit
The fund and certain other funds managed by MFS participate in a $1.25 billion unsecured committed line of credit, subject to a $1 billion sublimit, provided by a syndicate of banks under a credit agreement. Borrowings may be made for temporary financing needs. Interest is charged to each fund, based on its borrowings, generally at a rate equal to the highest of one month LIBOR, the Federal Funds Effective Rate and the Overnight Bank Funding Rate, plus an agreed upon spread. A commitment fee, based on the average daily, unused portion of the committed line of credit, is allocated among the participating funds. In addition, the fund and other funds managed by MFS have established unsecured uncommitted borrowing arrangements with certain banks for temporary financing needs. Interest is charged to each fund, based on its borrowings, at rates equal to customary reference rates plus an agreed upon spread. For the six months ended February 29, 2020, the fund’s commitment fee and interest expense were $727 and $0, respectively, and are included in “Miscellaneous” expense in the Statement of Operations.
(7) Investments in Affiliated Issuers
An affiliated issuer may be considered one in which the fund owns 5% or more of the outstanding voting securities, or a company which is under common control. For the purposes of this report, the following were affiliated issuers:
| | | | | | | | | | | | | | | | | | | | | | | | |
| | | | | | |
| Affiliated Issuers | | Beginning
Value | | | Purchases | | | Sales
Proceeds | | | Realized
Gain
(Loss) | | | Change in
Unrealized
Appreciation or
Depreciation | | | Ending
Value | |
MFS Institutional Money Market Portfolio | | | $2,645,173 | | | | $136,840,980 | | | | $134,168,192 | | | | $(2,563 | ) | | | $164 | | | | $5,315,562 | |
| | | | | | | | | | | | | | | | | | | | | | | | |
| | | | | | |
| Affiliated Issuers | | | | | | | | | | | | | | Dividend
Income | | | Capital Gain
Distributions | |
| MFS Institutional Money Market Portfolio | | | | | | | | $42,371 | | | | $— | |
31
Notes to Financial Statements (unaudited) – continued
(8) Impacts of COVID-19
The pandemic related to the global spread of novel coronavirus disease (COVID-19), which was first detected in December 2019, has resulted in significant disruptions to global business activity and the global economy, as well as the economies of individual countries, the financial performance of individual companies and sectors, and the securities and commodities markets in general. This pandemic, the full effects of which are still unknown, has resulted in substantial market volatility and may have adversely impacted the prices and liquidity of the fund’s investments and the fund’s performance during the period February 29, 2020 through April 16, 2020, the date that these financial statements were issued.
32
PROXY VOTING POLICIES AND INFORMATION
MFS votes proxies on behalf of the fund pursuant to proxy voting policies and procedures that are available without charge, upon request, by calling1-800-225-2606, by visitingmfs.com/proxyvoting, or by visiting the SEC’s Web site athttp://www.sec.gov.
Information regarding how the fund voted proxies relating to portfolio securities during the most recent twelve-month period ended June 30 is available by August 31 of each year without charge by visitingmfs.com/proxyvoting, or by visiting the SEC’s Web site athttp://www.sec.gov.
QUARTERLY PORTFOLIO DISCLOSURE
The fund files a complete schedule of portfolio holdings with the SEC for the first and third quarters of each fiscal year as an exhibit to its reports onForm N-PORT. The fund’s Form N-PORT reports are available on the SEC’s website athttp://www.sec.gov.A shareholder can obtain the portfolio holdings report for the first and third quarters of the fund’s fiscal year atmfs.com/openendfunds by choosing the fund’s name and then selecting the “Resources” tab and clicking on “Prospectus and Reports”.
FURTHER INFORMATION
From time to time, MFS may post important information about the fund or the MFS funds on the MFS web site (mfs.com). This information is available athttps://www.mfs.com/en-us/what-we-do/announcements.html or atmfs.com/openendfunds by choosing the fund’s name.
INFORMATION ABOUT FUND CONTRACTS AND LEGAL CLAIMS
The fund has entered into contractual arrangements with an investment adviser, administrator, distributor, shareholder servicing agent, 529 program manager (if applicable), and custodian who each provide services to the fund. Unless expressly stated otherwise, shareholders are not parties to, or intended beneficiaries of these contractual arrangements, and these contractual arrangements are not intended to create any shareholder right to enforce them against the service providers or to seek any remedy under them against the service providers, either directly or on behalf of the fund.
Under the Trust’s By-Laws and Declaration of Trust, any claims asserted against or on behalf of the MFS Funds, including claims against Trustees and Officers, must be brought in state and federal courts located within the Commonwealth of Massachusetts.
PROVISION OF FINANCIAL REPORTS AND SUMMARY PROSPECTUSES
The fund produces financial reports every six months and updates its summary prospectus and prospectus annually. To avoid sending duplicate copies of materials to households, only one copy of the fund’s annual and semiannual report and summary prospectus may be mailed to shareholders having the same last name and residential address on the fund’s records. However, any shareholder may contact MFSC (please see back cover for address and telephone number) to request that copies of these reports and summary prospectuses be sent personally to that shareholder.
33
Save paper with eDelivery.

| MFS® will send you prospectuses, |
reports, and proxies directly viae-mail so you will get information faster with less mailbox clutter.
To sign up:
1. Go to mfs.com.
2. Log in via MFS® Access.
3. Select eDelivery.
If you own your MFS fund shares through a financial institution or a retirement plan, MFS® TALK, MFS® Access, or eDelivery may not be available to you.
CONTACT
WEB SITE
mfs.com
MFS TALK
1-800-637-8255
24 hours a day
ACCOUNT SERVICE AND LITERATURE
Shareholders
1-800-225-2606
Financial advisors
1-800-343-2829
Retirement plan services
1-800-637-1255
MAILING ADDRESS
MFS Service Center, Inc.
P.O. Box 219341
Kansas City, MO 64121-9341
OVERNIGHT MAIL
MFS Service Center, Inc.
Suite 219341
430 W 7th Street
Kansas City, MO 64105-1407
Semiannual Report
February 29, 2020

MFS® New Discovery Fund

Beginning on January 1, 2021, as permitted by regulations adopted by the U.S. Securities and Exchange Commission, paper copies of the fund’s annual and semiannual shareholder reports will no longer be sent by mail, unless you specifically request paper copies of the reports. Instead, the complete reports will be made available on the fund’s Web site (funds.mfs.com), and you will be notified by mail each time a report is posted and provided with a Web site link to access the report.
If you are already signed up to receive shareholder reports by email, you will not be affected by this change and you need not take any action. You may sign up to receive shareholder reports and other communications from the fund by email by contacting your financial intermediary (such as a broker-dealer or bank) or, if you hold your shares directly with the fund, by calling 1-800-225-2606 or by logging on to MFS Access at mfs.com.
Beginning on January 1, 2019, you may elect to receive all future reports in paper free of charge. Contact your financial intermediary to request that you continue to receive paper copies of your shareholder reports. If you invest directly with the fund, you can call 1-800-225-2606 or send an email request to orderliterature@mfs.com to let the fund know that you wish to continue receiving paper copies of your shareholder reports. Your election to receive reports in paper will apply to all funds held in your account if you invest through your financial intermediary or all funds held with the MFS fund complex if you invest directly.
NDF-SEM
MFS® New Discovery Fund
CONTENTS
The report is prepared for the general information of shareholders.
It is authorized for distribution to prospective investors only when preceded or accompanied by a current prospectus.
NOT FDIC INSURED• MAY LOSE VALUE• NO BANK GUARANTEE

LETTER FROM THE EXECUTIVE CHAIR
Dear Shareholders:
During the first quarter of 2020, market volatility reached levels not seen since the global financial crisis. Optimism heading into the year — on receding trade and
geopolitical risk along with easier central bank policies — was overwhelmed in February as the health effects of a novel coronavirus,COVID-19, spread beyond China’s borders, ultimately impacting more than 200 countries. The global pandemic prompted many governments to take drastic action to slow the spread of the virus, such as quarantines, school and business closures, and prohibitions on public gatherings. While these are important steps to protect the public health, they come at a cost: rising market volatility and an abrupt decline in economic growth.
Global central banks have taken aggressive, coordinated steps to cushion the economic and market fallout related to the virus, and
governments are undertaking unprecedented levels of fiscal stimulus. As uncertainty recedes, these measures can help create a supportive environment and encourage economic recovery. In the aftermath of the crisis, there are likely to be societal changes as households, businesses and governments adjust to a new reality and these alterations could change the investment landscape. Occurrences such as the COVID-19 outbreak demonstrate the importance of having a deep understanding of company fundamentals, and our global research platform has been built to do just that.
Here at MFS®, we aim to help our clients navigate the growing complexity of the markets and world economies. Our long-term investment philosophy and commitment to the responsible allocation of capital allow us to tune out the noise and uncover what we believe are the best, most durable investment opportunities in the market. Through our powerful global investment platform, we combine collective expertise, thoughtful risk management, and long-term discipline to create sustainable value for investors.
Respectfully,

Robert J. Manning
Executive Chair
MFS Investment Management
April 16, 2020
The opinions expressed in this letter are subject to change and may not be relied upon for investment advice. No forecasts can be guaranteed.
1
PORTFOLIO COMPOSITION
Portfolio structure

| | | | |
| Top ten holdings | | | | |
| Everbridge, Inc. | | | 2.1% | |
| WNS (Holdings) Ltd., ADR | | | 1.8% | |
| CACI International, Inc., “A” | | | 1.7% | |
| QTS Realty Trust, Inc., REIT, “A” | | | 1.7% | |
| PRA Health Sciences, Inc. | | | 1.6% | |
| Rapid7, Inc. | | | 1.6% | |
| Q2 Holdings, Inc. | | | 1.6% | |
| Charles River Laboratories International, Inc. | | | 1.5% | |
| Generac Holdings, Inc. | | | 1.5% | |
| Ollie’s Bargain Outlet Holdings, Inc. | | | 1.4% | |
| | | | |
| GICS equity sectors (g) | |
| Health Care | | | 26.9% | |
| Information Technology | | | 25.3% | |
| Consumer Discretionary | | | 11.7% | |
| Industrials | | | 9.4% | |
| Financials | | | 7.9% | |
| Materials | | | 5.1% | |
| Real Estate | | | 4.8% | |
| Communication Services | | | 2.1% | |
| Consumer Staples | | | 1.9% | |
| Energy | | | 1.2% | |
| (g) | The Global Industry Classification Standard (GICS®) was developed by and/or is the exclusive property of MSCI, Inc. and S&P Global Market Intelligence Inc. (“S&P Global Market Intelligence”). GICS is a service mark of MSCI and S&P Global Market Intelligence and has been licensed for use by MFS. |
Cash & Cash Equivalents includes any cash, investments in money market funds, short-term securities, and other assets less liabilities. Please see the Statement of Assets and Liabilities for additional information related to the fund’s cash position and other assets and liabilities.
Percentages are based on net assets as of February 29, 2020.
The portfolio is actively managed and current holdings may be different.
2
EXPENSE TABLE
Fund expenses borne by the shareholders during the period, September 1, 2019 through February 29, 2020
As a shareholder of the fund, you incur two types of costs: (1) transaction costs, including sales charges (loads) on certain purchase or redemption payments, and (2) ongoing costs, including management fees; distribution and service(12b-1) fees; and other fund expenses. This example is intended to help you understand your ongoing costs (in dollars) of investing in the fund and to compare these costs with the ongoing costs of investing in other mutual funds.
The example is based on an investment of $1,000 invested at the beginning of the period and held for the entire period September 1, 2019 through February 29, 2020.
Actual Expenses
The first line for each share class in the following table provides information about actual account values and actual expenses. You may use the information in this line, together with the amount you invested, to estimate the expenses that you paid over the period. Simply divide your account value by $1,000 (for example, an $8,600 account value divided by $1,000 = 8.6), then multiply the result by the number in the first line under the heading entitled “Expenses Paid During Period” to estimate the expenses you paid on your account during this period.
Hypothetical Example for Comparison Purposes
The second line for each share class in the following table provides information about hypothetical account values and hypothetical expenses based on the fund’s actual expense ratio and an assumed rate of return of 5% per year before expenses, which is not the fund’s actual return. The hypothetical account values and expenses may not be used to estimate the actual ending account balance or expenses you paid for the period. You may use this information to compare the ongoing costs of investing in the fund and other funds. To do so, compare this 5% hypothetical example with the 5% hypothetical examples that appear in the shareholder reports of the other funds.
Please note that the expenses shown in the table are meant to highlight your ongoing costs only and do not reflect any transactional costs, such as sales charges (loads). Therefore, the second line for each share class in the table is useful in comparing ongoing costs only, and will not help you determine the relative total costs of owning different funds. In addition, if these transactional costs were included, your costs would have been higher.
3
Expense Table – continued
| | | | | | | | | | | | | | | | | | |
Share
Class | | | | Annualized
Expense Ratio | | | Beginning
Account Value
9/01/19 | | | Ending Account Value
2/29/20 | | | Expenses Paid During
Period (p) 9/01/19-2/29/20 | |
| A | | Actual | | | 1.26% | | | | $1,000.00 | | | | $1,026.39 | | | | $6.35 | |
| | Hypothetical (h) | | | 1.26% | | | | $1,000.00 | | | | $1,018.60 | | | | $6.32 | |
| B | | Actual | | | 2.02% | | | | $1,000.00 | | | | $1,022.32 | | | | $10.16 | |
| | Hypothetical (h) | | | 2.02% | | | | $1,000.00 | | | | $1,014.82 | | | | $10.12 | |
| C | | Actual | | | 2.02% | | | | $1,000.00 | | | | $1,022.27 | | | | $10.16 | |
| | Hypothetical (h) | | | 2.02% | | | | $1,000.00 | | | | $1,014.82 | | | | $10.12 | |
| I | | Actual | | | 1.02% | | | | $1,000.00 | | | | $1,027.41 | | | | $5.14 | |
| | Hypothetical (h) | | | 1.02% | | | | $1,000.00 | | | | $1,019.79 | | | | $5.12 | |
| R1 | | Actual | | | 2.02% | | | | $1,000.00 | | | | $1,022.56 | | | | $10.16 | |
| | Hypothetical (h) | | | 2.02% | | | | $1,000.00 | | | | $1,014.82 | | | | $10.12 | |
| R2 | | Actual | | | 1.52% | | | | $1,000.00 | | | | $1,025.41 | | | | $7.65 | |
| | Hypothetical (h) | | | 1.52% | | | | $1,000.00 | | | | $1,017.30 | | | | $7.62 | |
| R3 | | Actual | | | 1.27% | | | | $1,000.00 | | | | $1,026.41 | | | | $6.40 | |
| | Hypothetical (h) | | | 1.27% | | | | $1,000.00 | | | | $1,018.55 | | | | $6.37 | |
| R4 | | Actual | | | 1.02% | | | | $1,000.00 | | | | $1,027.79 | | | | $5.14 | |
| | Hypothetical (h) | | | 1.02% | | | | $1,000.00 | | | | $1,019.79 | | | | $5.12 | |
| R6 | | Actual | | | 0.92% | | | | $1,000.00 | | | | $1,028.08 | | | | $4.64 | |
| | Hypothetical (h) | | | 0.92% | | | | $1,000.00 | | | | $1,020.29 | | | | $4.62 | |
| (h) | 5% class return per year before expenses. |
| (p) | “Expenses Paid During Period” are equal to each class’s annualized expense ratio, as shown above, multiplied by the average account value over the period, multiplied by 182/366 (to reflect theone-half year period). Expenses paid do not include any applicable sales charges (loads). If these transaction costs had been included, your costs would have been higher. |
Notes to Expense Table
Each class with a Rule12b-1 service fee is subject to a rebate of a portion of such fee. Such rebates are included in the expense ratios above. For Class A shares, this rebate reduced the expense ratio above by 0.01%. See Note 3 in the Notes to Financial Statements for additional information.
4
PORTFOLIO OF INVESTMENTS
2/29/20 (unaudited)
The Portfolio of Investments is a complete list of all securities owned by your fund. It is categorized by broad-based asset classes.
| | | | | | | | |
| | |
| Issuer | | Shares/Par | | | Value ($) | |
| Common Stocks - 96.3% | | | | | | |
| Aerospace - 4.2% | | | | | | |
| CACI International, Inc., “A” (a) | | | 109,622 | | | $ | 26,859,583 | |
| FLIR Systems, Inc. | | | 464,600 | | | | 19,731,562 | |
| Kratos Defense & Security Solutions, Inc. (a) | | | 1,102,620 | | | | 17,928,601 | |
| | | | | | | | |
| | | | | | | $ | 64,519,746 | |
| Apparel Manufacturers - 1.9% | | | | | | |
| Levi Strauss & Co., “A” | | | 1,158,662 | | | $ | 19,685,667 | |
| Skechers USA, Inc., “A” (a) | | | 277,118 | | | | 9,167,064 | |
| | | | | | | | |
| | | | | | | $ | 28,852,731 | |
| Automotive - 2.9% | | | | | | |
| Hella KGaA Hueck & Co. | | | 161,457 | | | $ | 6,672,012 | |
| IAA, Inc. (a) | | | 333,379 | | | | 14,241,951 | |
| Stoneridge, Inc. (a) | | | 588,369 | | | | 13,002,955 | |
| Visteon Corp. (a) | | | 179,594 | | | | 11,680,793 | |
| | | | | | | | |
| | | | | | | $ | 45,597,711 | |
| Biotechnology - 6.1% | | | | | | |
| 10x Genomics, Inc., “A” (a) | | | 83,508 | | | $ | 6,655,588 | |
| Adaptive Biotechnologies Corp. (a) | | | 340,657 | | | | 9,572,462 | |
| Aimmune Therapeutics, Inc. (a)(l) | | | 235,921 | | | | 5,617,279 | |
| Amicus Therapeutics, Inc. (a) | | | 1,125,335 | | | | 10,741,323 | |
| Bio-Techne Corp. | | | 71,172 | | | | 13,443,679 | |
| BioXcel Therapeutics, Inc. (a) | | | 184,955 | | | | 6,935,812 | |
| Immunomedics, Inc. (a) | | | 298,015 | | | | 4,768,240 | |
| Morphosys AG, ADR (a)(l) | | | 300,196 | | | | 8,012,231 | |
| Neurocrine Biosciences, Inc. (a) | | | 84,636 | | | | 8,015,029 | |
| Sarepta Therapeutics, Inc. (a) | | | 39,462 | | | | 4,517,215 | |
| Tricida, Inc. (a) | | | 202,940 | | | | 6,449,433 | |
| Twist Bioscience Corp. (a) | | | 348,738 | | | | 10,678,358 | |
| | | | | | | | |
| | | | | | | $ | 95,406,649 | |
| Brokerage & Asset Managers - 2.8% | | | | | | |
| Hamilton Lane, Inc., “A” | | | 325,946 | | | $ | 20,254,284 | |
| TMX Group Ltd. | | | 213,682 | | | | 17,783,882 | |
| WisdomTree Investments, Inc. | | | 1,331,260 | | | | 5,404,916 | |
| | | | | | | | |
| | | | | | | $ | 43,443,082 | |
5
Portfolio of Investments (unaudited) – continued
| | | | | | | | |
| | |
| Issuer | | Shares/Par | | | Value ($) | |
| Common Stocks - continued | | | | | | |
| Business Services - 4.3% | | | | | | |
| Endava PLC, ADR (a) | | | 164,846 | | | $ | 8,745,080 | |
| EVO Payments, Inc., “A” (a) | | | 465,840 | | | | 11,776,435 | |
| TriNet Group, Inc. (a) | | | 339,662 | | | | 17,954,534 | |
| WNS (Holdings) Ltd., ADR (a) | | | 427,168 | | | | 28,124,741 | |
| | | | | | | | |
| | | | | | | $ | 66,600,790 | |
| Chemicals - 1.0% | | | | | | |
| Ingevity Corp. (a) | | | 349,069 | | | $ | 15,722,068 | |
| | |
| Computer Software - 9.1% | | | | | | |
| 8x8, Inc. (a) | | | 629,714 | | | $ | 11,649,709 | |
| Altair Engineering, Inc., “A” (a) | | | 365,539 | | | | 12,720,757 | |
| Avalara, Inc. (a) | | | 189,419 | | | | 16,053,260 | |
| Bill.com Holdings, Inc. (a) | | | 96,207 | | | | 5,460,709 | |
| DocuSign, Inc. (a) | | | 133,354 | | | | 11,509,784 | |
| Everbridge, Inc. (a) | | | 302,879 | | | | 32,002,195 | |
| Pagerduty, Inc. (a) | | | 627,017 | | | | 12,916,550 | |
| Paylocity Holding Corp. (a) | | | 129,416 | | | | 16,761,961 | |
| Phreesia, Inc. (a) | | | 272,675 | | | | 8,463,832 | |
| Zendesk, Inc. (a) | | | 182,804 | | | | 14,498,185 | |
| | | | | | | | |
| | | | | | | $ | 142,036,942 | |
| Computer Software - Systems - 6.9% | | | | | | |
| Box, Inc., “A” (a) | | | 614,878 | | | $ | 10,299,206 | |
| Five9, Inc. (a) | | | 94,545 | | | | 6,904,621 | |
| Pluralsight, Inc., “A” (a) | | | 439,441 | | | | 7,835,233 | |
| Proofpoint, Inc. (a) | | | 109,829 | | | | 11,713,263 | |
| Q2 Holdings, Inc. (a) | | | 326,534 | | | | 24,610,868 | |
| Rapid7, Inc. (a) | | | 550,517 | | | | 25,488,937 | |
| RealPage, Inc. (a) | | | 304,507 | | | | 19,518,899 | |
| | | | | | | | |
| | | | | | | $ | 106,371,027 | |
| Construction - 2.5% | | | | | | |
| Summit Materials, Inc., “A” (a) | | | 966,377 | | | $ | 18,883,007 | |
| Trex Co., Inc. (a) | | | 216,193 | | | | 20,678,860 | |
| | | | | | | | |
| | | | | | | $ | 39,561,867 | |
| Consumer Services - 3.9% | | | | | | |
| Bright Horizons Family Solutions, Inc. (a) | | | 121,768 | | | $ | 19,135,841 | |
| MakeMyTrip Ltd. (a) | | | 580,071 | | | | 13,347,434 | |
| OneSpaWorld Holdings Ltd. (l) | | | 737,862 | | | | 9,016,674 | |
| Planet Fitness, Inc. (a) | | | 278,380 | | | | 18,787,866 | |
| | | | | | | | |
| | | | | | | $ | 60,287,815 | |
6
Portfolio of Investments (unaudited) – continued
| | | | | | | | |
| | |
| Issuer | | Shares/Par | | | Value ($) | |
| Common Stocks - continued | | | | | | |
| Containers - 0.5% | | | | | | |
| Gerresheimer AG | | | 114,507 | | | $ | 8,273,675 | |
| | |
| Electrical Equipment - 2.8% | | | | | | |
| CTS Corp. | | | 221,179 | | | $ | 5,766,136 | |
| Generac Holdings, Inc. (a) | | | 230,020 | | | | 23,689,760 | |
| Littlefuse, Inc. | | | 83,107 | | | | 13,270,526 | |
| | | | | | | | |
| | | | | | | $ | 42,726,422 | |
| Electronics - 1.7% | | | | | | |
| Monolithic Power Systems, Inc. | | | 67,953 | | | $ | 10,780,064 | |
| nLIGHT, Inc. (a) | | | 403,419 | | | | 6,660,448 | |
| Silicon Laboratories, Inc. (a) | | | 94,386 | | | | 8,370,150 | |
| | | | | | | | |
| | | | | | | $ | 25,810,662 | |
| Entertainment - 2.1% | | | | | | |
| CTS Eventim AG | | | 302,164 | | | $ | 15,981,942 | |
| Manchester United PLC, “A” | | | 936,766 | | | | 16,384,037 | |
| | | | | | | | |
| | | | | | | $ | 32,365,979 | |
| Food & Drug Stores - 1.0% | | | | | | |
| Grocery Outlet Holding Corp. (a) | | | 493,386 | | | $ | 15,615,667 | |
| | |
| Gaming & Lodging - 1.4% | | | | | | |
| Wyndham Hotels & Resorts, Inc. | | | 426,935 | | | $ | 21,752,338 | |
| | |
| General Merchandise - 1.4% | | | | | | |
| Ollie’s Bargain Outlet Holdings, Inc. (a) | | | 432,742 | | | $ | 22,013,586 | |
| | |
| Leisure & Toys - 0.7% | | | | | | |
| Funko, Inc., “A” (a)(l) | | | 1,278,146 | | | $ | 10,365,764 | |
| | |
| Machinery & Tools - 0.6% | | | | | | |
| Ritchie Bros. Auctioneers, Inc. | | | 246,841 | | | $ | 9,799,588 | |
| | |
| Medical & Health Technology & Services - 7.5% | | | | | | |
| Charles River Laboratories International, Inc. (a) | | | 152,743 | | | $ | 23,762,229 | |
| Guardant Health, Inc. (a) | | | 127,963 | | | | 11,127,662 | |
| HealthEquity, Inc. (a) | | | 195,606 | | | | 13,886,070 | |
| ICON PLC (a) | | | 123,906 | | | | 19,336,770 | |
| PRA Health Sciences, Inc. (a) | | | 271,283 | | | | 25,554,859 | |
| Schrodinger, Inc. (a) | | | 136,550 | | | | 6,333,189 | |
| Teladoc Health, Inc. (a) | | | 130,870 | | | | 16,353,515 | |
| | | | | | | | |
| | | | | | | $ | 116,354,294 | |
7
Portfolio of Investments (unaudited) – continued
| | | | | | | | |
| | |
| Issuer | | Shares/Par | | | Value ($) | |
| Common Stocks - continued | | | | | | |
| Medical Equipment - 9.0% | | | | | | |
| Inspire Medical Systems, Inc. (a) | | | 89,561 | | | $ | 7,690,603 | |
| iRhythm Technologies, Inc. (a) | | | 169,709 | | | | 14,759,592 | |
| Masimo Corp. (a) | | | 95,665 | | | | 15,624,965 | |
| Merit Medical Systems, Inc. (a) | | | 299,337 | | | | 10,779,125 | |
| Nevro Corp. (a) | | | 79,585 | | | | 10,357,988 | |
| OptiNose, Inc. (a) | | | 970,729 | | | | 5,872,910 | |
| OrthoPediatrics Corp. (a) | | | 381,988 | | | | 17,731,883 | |
| PerkinElmer, Inc. | | | 142,682 | | | | 12,333,432 | |
| Quidel Corp. (a) | | | 219,821 | | | | 16,978,974 | |
| Silk Road Medical, Inc. (a) | | | 286,122 | | | | 11,401,962 | |
| STERIS PLC | | | 73,881 | | | | 11,719,004 | |
| TransMedics Group, Inc. (a)(l) | | | 236,061 | | | | 3,706,158 | |
| | | | | | | | |
| | | | | | | $ | 138,956,596 | |
| Network & Telecom - 2.1% | | | | | | |
| Interxion Holding N.V. (a) | | | 67,139 | | | $ | 5,699,430 | |
| QTS Realty Trust, Inc., REIT, “A” | | | 468,099 | | | | 26,293,121 | |
| | | | | | | | |
| | | | | | | $ | 31,992,551 | |
| Oil Services - 1.0% | | | | | | |
| Core Laboratories N.V. | | | 422,135 | | | $ | 11,330,104 | |
| Patterson-UTI Energy, Inc. | | | 704,136 | | | | 4,034,699 | |
| | | | | | | | |
| | | | | | | $ | 15,364,803 | |
| Other Banks & Diversified Financials - 5.1% | | | | | | |
| Bank OZK | | | 245,538 | | | $ | 6,234,210 | |
| Diamond Eagle Acquisition Corp. (a) | | | 646,449 | | | | 10,356,113 | |
| Nebula Acquisition Corp. (a) | | | 910,512 | | | | 9,760,689 | |
| Prosperity Bancshares, Inc. | | | 208,666 | | | | 13,479,823 | |
| Signature Bank | | | 57,324 | | | | 7,171,232 | |
| Texas Capital Bancshares, Inc. (a) | | | 352,504 | | | | 16,595,888 | |
| Wintrust Financial Corp. | | | 297,621 | | | | 15,895,938 | |
| | | | | | | | |
| | | | | | | $ | 79,493,893 | |
| Pharmaceuticals - 3.7% | | | | | | |
| BridgeBio Pharma, Inc. (a) | | | 202,345 | | | $ | 6,450,759 | |
| Collegium Pharmaceutical, Inc. (a) | | | 323,779 | | | | 7,689,751 | |
| Forty Seven, Inc. (a) | | | 197,921 | | | | 11,479,418 | |
| GW Pharmaceuticals PLC, ADR (a)(l) | | | 104,861 | | | | 10,728,329 | |
| Orchard RX Ltd., ADR (a) | | | 321,588 | | | | 4,145,269 | |
| Principia Biopharma, Inc. (a) | | | 121,315 | | | | 7,832,097 | |
| SpringWorks Therapeutics, Inc. (a) | | | 271,994 | | | | 8,692,928 | |
| | | | | | | | |
| | | | | | | $ | 57,018,551 | |
8
Portfolio of Investments (unaudited) – continued
| | | | | | | | |
| | |
| Issuer | | Shares/Par | | | Value ($) | |
| Common Stocks - continued | | | | | | |
| Pollution Control - 0.6% | | | | | | |
| Casella Waste Systems, Inc., “A” (a) | | | 181,881 | | | $ | 8,812,134 | |
| | |
| Railroad & Shipping - 0.2% | | | | | | |
| StealthGas, Inc. (a) | | | 1,008,631 | | | $ | 2,753,563 | |
| | |
| Real Estate - 3.1% | | | | | | |
| Big Yellow Group PLC, REIT | | | 686,100 | | | $ | 9,410,232 | |
| Industrial Logistics Properties Trust, REIT | | | 906,939 | | | | 18,737,360 | |
| STAG Industrial, Inc., REIT | | | 727,200 | | | | 20,347,056 | |
| | | | | | | | |
| | | | | | | $ | 48,494,648 | |
| Restaurants - 0.9% | | | | | | |
| Performance Food Group Co. (a) | | | 340,722 | | | $ | 14,446,613 | |
| | |
| Special Products & Services - 1.0% | | | | | | |
| Boyd Group Services, Inc. | | | 101,211 | | | $ | 15,834,837 | |
| | |
| Specialty Chemicals - 3.1% | | | | | | |
| Axalta Coating Systems Ltd. (a) | | | 761,206 | | | $ | 18,969,253 | |
| Ferro Corp. (a) | | | 1,418,219 | | | | 16,479,705 | |
| RPM International, Inc. | | | 146,791 | | | | 9,410,771 | |
| Univar Solutions, Inc. (a) | | | 200,213 | | | | 3,401,619 | |
| | | | | | | | |
| | | | | | | $ | 48,261,348 | |
| Specialty Stores - 0.4% | | | | | | |
| Hudson Ltd., “A” (a) | | | 717,954 | | | $ | 6,684,152 | |
| | |
| Trucking - 0.8% | | | | | | |
| Schneider National, Inc. | | | 730,810 | | | $ | 13,088,807 | |
| Total Common Stocks (Identified Cost, $1,274,440,191) | | | | | | $ | 1,494,680,899 | |
| | |
| Investment Companies (h) - 5.4% | | | | | | |
| Money Market Funds - 5.4% | | | | | | |
MFS Institutional Money Market Portfolio, 1.61% (v)
(Identified Cost, $83,551,167) | | | 83,553,695 | | | $ | 83,562,050 | |
| | |
| Collateral for Securities Loaned - 0.9% | | | | | | |
| State Street Navigator Securities Lending Government Money Market Portfolio, 1.61% (j) (Identified Cost, $14,794,456) | | | 14,794,456 | | | $ | 14,794,456 | |
| | |
| Other Assets, Less Liabilities - (2.6)% | | | | | (40,523,547) | |
| Net Assets - 100.0% | | | | | | $ | 1,552,513,858 | |
9
Portfolio of Investments (unaudited) – continued
| (a) | Non-income producing security. |
| (h) | An affiliated issuer, which may be considered one in which the fund owns 5% or more of the outstanding voting securities, or a company which is under common control. At period end, the aggregate values of the fund’s investments in affiliated issuers and in unaffiliated issuers were $83,562,050 and $1,509,475,355, respectively. |
| (j) | The rate quoted is the annualized seven-day yield of the fund at period end. |
| (l) | A portion of this security is on loan. See Note 2 for additional information. |
| (v) | Affiliated issuer that is available only to investment companies managed by MFS. The rate quoted for the MFS Institutional Money Market Portfolio is the annualizedseven-day yield of the fund at period end. |
The following abbreviations are used in this report and are defined:
| ADR | | American Depositary Receipt |
| REIT | | Real Estate Investment Trust |
See Notes to Financial Statements
10
Financial Statements
STATEMENT OF ASSETS AND LIABILITIES
At 2/29/20 (unaudited)
This statement represents your fund’s balance sheet, which details the assets and liabilities comprising the total value of the fund.
| | | | |
| Assets | | | | |
Investments in unaffiliated issuers, at value, including $25,454,485 of securities on loan (identified cost, $1,289,234,647) | | | $1,509,475,355 | |
Investments in affiliated issuers, at value (identified cost, $83,551,167) | | | 83,562,050 | |
Cash | | | 89,283 | |
Receivables for | | | | |
Investments sold | | | 7,347,996 | |
Fund shares sold | | | 5,518,307 | |
Interest and dividends | | | 465,308 | |
Other assets | | | 4,599 | |
Total assets | | | $1,606,462,898 | |
| |
| Liabilities | | | | |
Payables for | | | | |
Investments purchased | | | $30,220,099 | |
Fund shares reacquired | | | 8,256,797 | |
Collateral for securities loaned, at value (c) | | | 14,794,456 | |
Payable to affiliates | | | | |
Investment adviser | | | 110,657 | |
Administrative services fee | | | 1,794 | |
Shareholder servicing costs | | | 479,589 | |
Distribution and service fees | | | 18,029 | |
Payable for independent Trustees’ compensation | | | 1,721 | |
Accrued expenses and other liabilities | | | 65,898 | |
Total liabilities | | | $53,949,040 | |
Net assets | | | $1,552,513,858 | |
| |
| Net assets consist of | | | | |
Paid-in capital | | | $1,293,500,001 | |
Total distributable earnings (loss) | | | 259,013,857 | |
Net assets | | | $1,552,513,858 | |
Shares of beneficial interest outstanding | | | 56,424,570 | |
| (c) | Non-cash collateral is not included. |
11
Statement of Assets and Liabilities (unaudited) – continued
| | | | | | | | | | | | |
| | | |
| | | Net assets | | | Shares
outstanding | | | Net asset value
per share (a) | |
Class A | | | $587,644,047 | | | | 22,498,719 | | | | $26.12 | |
Class B | | | 16,246,948 | | | | 853,926 | | | | 19.03 | |
Class C | | | 55,449,448 | | | | 2,905,569 | | | | 19.08 | |
Class I | | | 203,751,364 | | | | 6,795,116 | | | | 29.98 | |
Class R1 | | | 4,205,437 | | | | 223,522 | | | | 18.81 | |
Class R2 | | | 26,965,817 | | | | 1,128,385 | | | | 23.90 | |
Class R3 | | | 56,704,137 | | | | 2,174,776 | | | | 26.07 | |
Class R4 | | | 12,269,438 | | | | 436,809 | | | | 28.09 | |
Class R6 | | | 589,277,222 | | | | 19,407,748 | | | | 30.36 | |
| (a) | Maximum offering price per share was equal to the net asset value per share for all share classes, except for Class A, for which the maximum offering price per share was $27.71 [100 / 94.25 x $26.12]. On sales of $50,000 or more, the maximum offering price of Class A shares is reduced. A contingent deferred sales charge may be imposed on redemptions of Class A, Class B, and Class C shares. Redemption price per share was equal to the net asset value per share for Classes I, R1, R2, R3, R4, and R6. |
See Notes to Financial Statements
12
Financial Statements
STATEMENT OF OPERATIONS
Six months ended 2/29/20 (unaudited)
This statement describes how much your fund earned in investment income and accrued in expenses. It also describes any gains and/or losses generated by fund operations.
| | | | |
| Net investment income (loss) | | | | |
Income | | | | |
Dividends | | | $4,527,695 | |
Dividends from affiliated issuers | | | 517,114 | |
Income on securities loaned | | | 470,669 | |
Other | | | 41,345 | |
Foreign taxes withheld | | | (213,576 | ) |
Total investment income | | | $5,343,247 | |
Expenses | | | | |
Management fee | | | $6,674,918 | |
Distribution and service fees | | | 1,292,135 | |
Shareholder servicing costs | | | 611,307 | |
Administrative services fee | | | 104,374 | |
Independent Trustees’ compensation | | | 12,358 | |
Custodian fee | | | 53,464 | |
Shareholder communications | | | 59,924 | |
Audit and tax fees | | | 29,603 | |
Legal fees | | | 5,917 | |
Miscellaneous | | | 111,059 | |
Total expenses | | | $8,955,059 | |
Reduction of expenses by investment adviser and distributor | | | (94,552 | ) |
Net expenses | | | $8,860,507 | |
Net investment income (loss) | | | $(3,517,260 | ) |
| |
| Realized and unrealized gain (loss) | | | | |
Realized gain (loss) (identified cost basis) | | | | |
Unaffiliated issuers | | | $57,443,614 | |
Affiliated issuers | | | (922 | ) |
Foreign currency | | | (1,356 | ) |
Net realized gain (loss) | | | $57,441,336 | |
Change in unrealized appreciation or depreciation | | | | |
Unaffiliated issuers | | | $(18,849,895 | ) |
Affiliated issuers | | | 1,492 | |
Translation of assets and liabilities in foreign currencies | | | 16,623 | |
Net unrealized gain (loss) | | | $(18,831,780 | ) |
Net realized and unrealized gain (loss) | | | $38,609,556 | |
Change in net assets from operations | | | $35,092,296 | |
See Notes to Financial Statements
13
Financial Statements
STATEMENTS OF CHANGES IN NET ASSETS
These statements describe the increases and/or decreases in net assets resulting from operations, any distributions, and any shareholder transactions.
| | | | | | | | |
| Change in net assets | | Six months ended
2/29/20
(unaudited) | | | Year ended
8/31/19 | |
| | |
| From operations | | | | | | | | |
Net investment income (loss) | | | $(3,517,260 | ) | | | $(7,785,281 | ) |
Net realized gain (loss) | | | 57,441,336 | | | | 164,304,985 | |
Net unrealized gain (loss) | | | (18,831,780 | ) | | | (111,646,966 | ) |
Change in net assets from operations | | | $35,092,296 | | | | $44,872,738 | |
Total distributions to shareholders | | | $(114,138,918 | ) | | | $(230,450,032 | ) |
Change in net assets from fund share transactions | | | $200,103,192 | | | | $236,885,028 | |
Total change in net assets | | | $121,056,570 | | | | $51,307,734 | |
| | |
| Net assets | | | | | | | | |
At beginning of period | | | 1,431,457,288 | | | | 1,380,149,554 | |
At end of period | | | $1,552,513,858 | | | | $1,431,457,288 | |
See Notes to Financial Statements
14
Financial Statements
FINANCIAL HIGHLIGHTS
The financial highlights table is intended to help you understand the fund’s financial performance for the semiannual period and the past 5 fiscal years. Certain information reflects financial results for a single fund share. The total returns in the table represent the rate that an investor would have earned (or lost) on an investment in the fund share class (assuming reinvestment of all distributions) held for the entire period.
| | | | | | | | | | | | | | | | | | | | | | | | |
| | | Six months
ended 2/29/20 | | | Year ended | |
| Class A | | 8/31/19 | | | 8/31/18 | | | 8/31/17 | | | 8/31/16 | | | 8/31/15 | |
| | | (unaudited) | | | | | | | | | | | | | | | | |
Net asset value, beginning of period | | | $27.56 | | | | $33.30 | | | | $27.27 | | | | $24.11 | | | | $23.69 | | | | $25.49 | |
| | | | |
| Income (loss) from investment operations | | | | | | | | | | | | | | | | | |
Net investment income (loss) (d) | | | $(0.08 | ) | | | $(0.19 | ) | | | $(0.23 | ) | | | $(0.18 | )(c) | | | $(0.11 | ) | | | $(0.20 | ) |
Net realized and unrealized
gain (loss) | | | 0.88 | | | | 0.06 | (g) | | | 9.07 | | | | 3.92 | | | | 0.53 | | | | 0.22 | |
Total from investment operations | | | $0.80 | | | | $(0.13 | ) | | | $8.84 | | | | $3.74 | | | | $0.42 | | | | $0.02 | |
| | | | |
| Less distributions declared to shareholders | | | | | | | | | | | | | | | | | |
From net realized gain | | | $(2.24 | ) | | | $(5.61 | ) | | | $(2.81 | ) | | | $(0.58 | ) | | | $— | | | | $(1.82 | ) |
Net asset value, end of period (x) | | | $26.12 | | | | $27.56 | | | | $33.30 | | | | $27.27 | | | | $24.11 | | | | $23.69 | |
Total return (%) (r)(s)(t)(x) | | | 2.64 | (n) | | | 3.49 | | | | 34.98 | | | | 15.83 | (c) | | | 1.77 | | | | 0.47 | |
| | | | |
Ratios (%) (to average net assets)
and Supplemental data: | | | | | | | | | | | | | | | | | |
Expenses before expense reductions (f) | | | 1.28 | (a) | | | 1.30 | | | | 1.33 | | | | 1.35 | (c) | | | 1.36 | | | | 1.36 | |
Expenses after expense reductions (f) | | | 1.26 | (a) | | | 1.29 | | | | 1.31 | | | | 1.33 | (c) | | | 1.34 | | | | 1.31 | |
Net investment income (loss) | | | (0.57 | )(a) | | | (0.70 | ) | | | (0.80 | ) | | | (0.70 | )(c) | | | (0.50 | ) | | | (0.81 | ) |
Portfolio turnover | | | 24 | (n) | | | 69 | | | | 67 | | | | 53 | | | | 49 | | | | 56 | |
Net assets at end of period
(000 omitted) | | | $587,644 | | | | $549,660 | | | | $525,698 | | | | $394,878 | | | | $400,997 | | | | $457,437 | |
See Notes to Financial Statements
15
Financial Highlights – continued
| | | | | | | | | | | | | | | | | | | | | | | | |
| | | Six months
ended 2/29/20 | | | Year ended | |
| Class B | | 8/31/19 | | | 8/31/18 | | | 8/31/17 | | | 8/31/16 | | | 8/31/15 | |
| | | (unaudited) | | | | | | | | | | | | | | | | |
Net asset value, beginning of period | | | $20.72 | | | | $26.86 | | | | $22.65 | | | | $20.27 | | | | $20.07 | | | | $22.04 | |
| | | |
| Income (loss) from investment operations | | | | | | | | | | | | | |
Net investment income (loss) (d) | | | $(0.14 | ) | | | $(0.30 | ) | | | $(0.37 | ) | | | $(0.30 | )(c) | | | $(0.24 | ) | | | $(0.32 | ) |
Net realized and unrealized
gain (loss) | | | 0.69 | | | | (0.23 | )(g) | | | 7.39 | | | | 3.26 | | | | 0.44 | | | | 0.17 | |
Total from investment operations | | | $0.55 | | | | $(0.53 | ) | | | $7.02 | | | | $2.96 | | | | $0.20 | | | | $(0.15 | ) |
| | | |
| Less distributions declared to shareholders | | | | | | | | | | | | | |
From net realized gain | | | $(2.24 | ) | | | $(5.61 | ) | | | $(2.81 | ) | | | $(0.58 | ) | | | $— | | | | $(1.82 | ) |
Net asset value, end of period (x) | | | $19.03 | | | | $20.72 | | | | $26.86 | | | | $22.65 | | | | $20.27 | | | | $20.07 | |
Total return (%) (r)(s)(t)(x) | | | 2.29 | (n) | | | 2.69 | | | | 34.00 | | | | 14.97 | (c) | | | 1.00 | | | | (0.27 | ) |
| | | | |
Ratios (%) (to average net assets)
and Supplemental data: | | | | | | | | | | | | | | | | | |
Expenses before expense reductions (f) | | | 2.03 | (a) | | | 2.06 | | | | 2.08 | | | | 2.10 | (c) | | | 2.11 | | | | 2.11 | |
Expenses after expense reductions (f) | | | 2.02 | (a) | | | 2.04 | | | | 2.06 | | | | 2.08 | (c) | | | 2.09 | | | | 2.06 | |
Net investment income (loss) | | | (1.32 | )(a) | | | (1.45 | ) | | | (1.55 | ) | | | (1.45 | )(c) | | | (1.26 | ) | | | (1.57 | ) |
Portfolio turnover | | | 24 | (n) | | | 69 | | | | 67 | | | | 53 | | | | 49 | | | | 56 | |
Net assets at end of period
(000 omitted) | | | $16,247 | | | | $18,708 | | | | $23,424 | | | | $20,143 | | | | $22,906 | | | | $27,455 | |
| | |
| | | Six months
ended 2/29/20 | | | Year ended | |
| Class C | | 8/31/19 | | | 8/31/18 | | | 8/31/17 | | | 8/31/16 | | | 8/31/15 | |
| | | (unaudited) | | | | | | | | | | | | | | | | |
Net asset value, beginning of period | | | $20.78 | | | | $26.91 | | | | $22.70 | | | | $20.31 | | | | $20.11 | | | | $22.08 | |
| | | | |
| Income (loss) from investment operations | | | | | | | | | | | | | | | | | |
Net investment income (loss) (d) | | | $(0.14 | ) | | | $(0.30 | ) | | | $(0.37 | ) | | | $(0.31 | )(c) | | | $(0.24 | ) | | | $(0.32 | ) |
Net realized and unrealized
gain (loss) | | | 0.68 | | | | (0.22 | )(g) | | | 7.39 | | | | 3.28 | | | | 0.44 | | | | 0.17 | |
Total from investment operations | | | $0.54 | | | | $(0.52 | ) | | | $7.02 | | | | $2.97 | | | | $0.20 | | | | $(0.15 | ) |
| | | | |
| Less distributions declared to shareholders | | | | | | | | | | | | | | | | | |
From net realized gain | | | $(2.24 | ) | | | $(5.61 | ) | | | $(2.81 | ) | | | $(0.58 | ) | | | $— | | | | $(1.82 | ) |
Net asset value, end of period (x) | | | $19.08 | | | | $20.78 | | | | $26.91 | | | | $22.70 | | | | $20.31 | | | | $20.11 | |
Total return (%) (r)(s)(t)(x) | | | 2.23 | (n) | | | 2.72 | | | | 33.92 | | | | 14.99 | (c) | | | 0.99 | | | | (0.28 | ) |
| | |
Ratios (%) (to average net assets)
and Supplemental data: | | | | | | | | | |
Expenses before expense reductions (f) | | | 2.03 | (a) | | | 2.05 | | | | 2.08 | | | | 2.10 | (c) | | | 2.11 | | | | 2.11 | |
Expenses after expense reductions (f) | | | 2.02 | (a) | | | 2.04 | | | | 2.07 | | | | 2.09 | (c) | | | 2.09 | | | | 2.06 | |
Net investment income (loss) | | | (1.32 | )(a) | | | (1.45 | ) | | | (1.55 | ) | | | (1.45 | )(c) | | | (1.27 | ) | | | (1.57 | ) |
Portfolio turnover | | | 24 | (n) | | | 69 | | | | 67 | | | | 53 | | | | 49 | | | | 56 | |
Net assets at end of period
(000 omitted) | | | $55,449 | | | | $59,253 | | | | $69,498 | | | | $76,724 | | | | $85,370 | | | | $105,686 | |
See Notes to Financial Statements
16
Financial Highlights – continued
| | | | | | | | | | | | | | | | | | | | | | | | |
| | | Six months
ended 2/29/20 | | | Year ended | |
| Class I | | 8/31/19 | | | 8/31/18 | | | 8/31/17 | | | 8/31/16 | | | 8/31/15 | |
| | | (unaudited) | | | | | | | | | | | | | | | | |
Net asset value, beginning of period | | | $31.29 | | | | $36.82 | | | | $29.81 | | | | $26.24 | | | | $25.72 | | | | $27.44 | |
| | | | |
| Income (loss) from investment operations | | | | | | | | | | | | | | | | | |
Net investment income (loss) (d) | | | $(0.05 | ) | | | $(0.14 | ) | | | $(0.18 | ) | | | $(0.12 | )(c) | | | $(0.07 | ) | | | $(0.14 | ) |
Net realized and unrealized
gain (loss) | | | 0.98 | | | | 0.22 | (g) | | | 10.00 | | | | 4.27 | | | | 0.59 | | | | 0.24 | |
Total from investment operations | | | $0.93 | | | | $0.08 | | | | $9.82 | | | | $4.15 | | | | $0.52 | | | | $0.10 | |
| | | | |
| Less distributions declared to shareholders | | | | | | | | | | | | | | | | | |
From net realized gain | | | $(2.24 | ) | | | $(5.61 | ) | | | $(2.81 | ) | | | $(0.58 | ) | | | $— | | | | $(1.82 | ) |
Net asset value, end of period (x) | | | $29.98 | | | | $31.29 | | | | $36.82 | | | | $29.81 | | | | $26.24 | | | | $25.72 | |
Total return (%) (r)(s)(t)(x) | | | 2.74 | (n) | | | 3.76 | | | | 35.31 | | | | 16.12 | (c) | | | 2.02 | | | | 0.74 | |
| | | | |
Ratios (%) (to average net assets)
and Supplemental data: | | | | | | | | | | | | | | | | | |
Expenses before expense reductions (f) | | | 1.03 | (a) | | | 1.05 | | | | 1.08 | | | | 1.10 | (c) | | | 1.12 | | | | 1.11 | |
Expenses after expense reductions (f) | | | 1.02 | (a) | | | 1.05 | | | | 1.07 | | | | 1.09 | (c) | | | 1.09 | | | | 1.06 | |
Net investment income (loss) | | | (0.33 | )(a) | | | (0.45 | ) | | | (0.55 | ) | | | (0.45 | )(c) | | | (0.30 | ) | | | (0.55 | ) |
Portfolio turnover | | | 24 | (n) | | | 69 | | | | 67 | | | | 53 | | | | 49 | | | | 56 | |
Net assets at end of period
(000 omitted) | | | $203,751 | | | | $164,593 | | | | $180,591 | | | | $106,459 | | | | $101,635 | | | | $166,513 | |
| | |
| | | Six months
ended 2/29/20 | | | Year ended | |
| Class R1 | | 8/31/19 | | | 8/31/18 | | | 8/31/17 | | | 8/31/16 | | | 8/31/15 | |
| | | (unaudited) | | | | | | | | | | | | | | | | |
Net asset value, beginning of period | | | $20.51 | | | | $26.66 | | | | $22.50 | | | | $20.15 | | | | $19.94 | | | | $21.91 | |
| | | | |
| Income (loss) from investment operations | | | | | | | | | | | | | | | | | |
Net investment income (loss) (d) | | | $(0.14 | ) | | | $(0.30 | ) | | | $(0.37 | ) | | | $(0.30 | )(c) | | | $(0.23 | ) | | | $(0.32 | ) |
Net realized and unrealized
gain (loss) | | | 0.68 | | | | (0.24 | )(g) | | | 7.34 | | | | 3.23 | | | | 0.44 | | | | 0.17 | |
Total from investment operations | | | $0.54 | | | | $(0.54 | ) | | | $6.97 | | | | $2.93 | | | | $0.21 | | | | $(0.15 | ) |
| | | | |
| Less distributions declared to shareholders | | | | | | | | | | | | | | | | | |
From net realized gain | | | $(2.24 | ) | | | $(5.61 | ) | | | $(2.81 | ) | | | $(0.58 | ) | | | $— | | | | $(1.82 | ) |
Net asset value, end of period (x) | | | $18.81 | | | | $20.51 | | | | $26.66 | | | | $22.50 | | | | $20.15 | | | | $19.94 | |
Total return (%) (r)(s)(t)(x) | | | 2.26 | (n) | | | 2.67 | | | | 34.01 | | | | 14.91 | (c) | | | 1.05 | | | | (0.28 | ) |
| | | | |
Ratios (%) (to average net assets)
and Supplemental data: | | | | | | | | | | | | | | | | | |
Expenses before expense reductions (f) | | | 2.03 | (a) | | | 2.05 | | | | 2.08 | | | | 2.10 | (c) | | | 2.11 | | | | 2.11 | |
Expenses after expense reductions (f) | | | 2.02 | (a) | | | 2.05 | | | | 2.07 | | | | 2.09 | (c) | | | 2.09 | | | | 2.06 | |
Net investment income (loss) | | | (1.32 | )(a) | | | (1.45 | ) | | | (1.55 | ) | | | (1.45 | )(c) | | | (1.26 | ) | | | (1.57 | ) |
Portfolio turnover | | | 24 | (n) | | | 69 | | | | 67 | | | | 53 | | | | 49 | | | | 56 | |
Net assets at end of period
(000 omitted) | | | $4,205 | | | | $4,652 | | | | $5,342 | | | | $4,377 | | | | $5,647 | | | | $6,573 | |
See Notes to Financial Statements
17
Financial Highlights – continued
| | | | | | | | | | | | | | | | | | | | | | | | |
| | | Six months
ended 2/29/20 | | | Year ended | |
| Class R2 | | 8/31/19 | | | 8/31/18 | | | 8/31/17 | | | 8/31/16 | | | 8/31/15 | |
| | | (unaudited) | | | | | | | | | | | | | | | | |
Net asset value, beginning of period | | | $25.42 | | | | $31.31 | | | | $25.85 | | | | $22.95 | | | | $22.60 | | | | $24.46 | |
| | | |
| Income (loss) from investment operations | | | | | | | | | | | | | |
Net investment income (loss) (d) | | | $(0.10 | ) | | | $(0.24 | ) | | | $(0.29 | ) | | | $(0.23 | )(c) | | | $(0.17 | ) | | | $(0.25 | ) |
Net realized and unrealized
gain (loss) | | | 0.82 | | | | (0.04 | )(g) | | | 8.56 | | | | 3.71 | | | | 0.52 | | | | 0.21 | |
Total from investment operations | | | $0.72 | | | | $(0.28 | ) | | | $8.27 | | | | $3.48 | | | | $0.35 | | | | $(0.04 | ) |
| | | |
| Less distributions declared to shareholders | | | | | | | | | | | | | |
From net realized gain | | | $(2.24 | ) | | | $(5.61 | ) | | | $(2.81 | ) | | | $(0.58 | ) | | | $— | | | | $(1.82 | ) |
Net asset value, end of period (x) | | | $23.90 | | | | $25.42 | | | | $31.31 | | | | $25.85 | | | | $22.95 | | | | $22.60 | |
Total return (%) (r)(s)(t)(x) | | | 2.54 | (n) | | | 3.19 | | | | 34.68 | | | | 15.50 | (c) | | | 1.55 | | | | 0.23 | |
| | | | |
Ratios (%) (to average net assets)
and Supplemental data: | | | | | | | | | | | | | | | | | |
Expenses before expense reductions (f) | | | 1.53 | (a) | | | 1.56 | | | | 1.58 | | | | 1.60 | (c) | | | 1.62 | | | | 1.61 | |
Expenses after expense reductions (f) | | | 1.52 | (a) | | | 1.54 | | | | 1.57 | | | | 1.59 | (c) | | | 1.59 | | | | 1.56 | |
Net investment income (loss) | | | (0.82 | )(a) | | | (0.95 | ) | | | (1.05 | ) | | | (0.95 | )(c) | | | (0.82 | ) | | | (1.07 | ) |
Portfolio turnover | | | 24 | (n) | | | 69 | | | | 67 | | | | 53 | | | | 49 | | | | 56 | |
Net assets at end of period
(000 omitted) | | | $26,966 | | | | $32,381 | | | | $36,272 | | | | $29,130 | | | | $35,890 | | | | $57,077 | |
| | |
| | | Six months
ended 2/29/20 | | | Year ended | |
| Class R3 | | 8/31/19 | | | 8/31/18 | | | 8/31/17 | | | 8/31/16 | | | 8/31/15 | |
| | | (unaudited) | | | | | | | | | | | | | | | | |
Net asset value, beginning of period | | | $27.51 | | | | $33.26 | | | | $27.24 | | | | $24.09 | | | | $23.67 | | | | $25.47 | |
| | | |
| Income (loss) from investment operations | | | | | | | | | | | | | |
Net investment income (loss) (d) | | | $(0.08 | ) | | | $(0.19 | ) | | | $(0.24 | ) | | | $(0.17 | )(c) | | | $(0.12 | ) | | | $(0.20 | ) |
Net realized and unrealized
gain (loss) | | | 0.88 | | | | 0.05 | (g) | | | 9.07 | | | | 3.90 | | | | 0.54 | | | | 0.22 | |
Total from investment operations | | | $0.80 | | | | $(0.14 | ) | | | $8.83 | | | | $3.73 | | | | $0.42 | | | | $0.02 | |
| | | |
| Less distributions declared to shareholders | | | | | | | | | | | | | |
From net realized gain | | | $(2.24 | ) | | | $(5.61 | ) | | | $(2.81 | ) | | | $(0.58 | ) | | | $— | | | | $(1.82 | ) |
Net asset value, end of period (x) | | | $26.07 | | | | $27.51 | | | | $33.26 | | | | $27.24 | | | | $24.09 | | | | $23.67 | |
Total return (%) (r)(s)(t)(x) | | | 2.64 | (n) | | | 3.45 | | | | 34.98 | | | | 15.81 | (c) | | | 1.77 | | | | 0.47 | |
| | | | |
Ratios (%) (to average net assets)
and Supplemental data: | | | | | | | | | | | | | | | | | |
Expenses before expense reductions (f) | | | 1.28 | (a) | | | 1.30 | | | | 1.33 | | | | 1.35 | (c) | | | 1.37 | | | | 1.36 | |
Expenses after expense reductions (f) | | | 1.27 | (a) | | | 1.30 | | | | 1.32 | | | | 1.34 | (c) | | | 1.34 | | | | 1.31 | |
Net investment income (loss) | | | (0.58 | )(a) | | | (0.70 | ) | | | (0.80 | ) | | | (0.70 | )(c) | | | (0.55 | ) | | | (0.82 | ) |
Portfolio turnover | | | 24 | (n) | | | 69 | | | | 67 | | | | 53 | | | | 49 | | | | 56 | |
Net assets at end of period
(000 omitted) | | | $56,704 | | | | $52,559 | | | | $50,895 | | | | $42,346 | | | | $57,593 | | | | $89,659 | |
See Notes to Financial Statements
18
Financial Highlights – continued
| | | | | | | | | | | | | | | | | | | | | | | | |
| | | Six months
ended 2/29/20 | | | Year ended | |
| Class R4 | | 8/31/19 | | | 8/31/18 | | | 8/31/17 | | | 8/31/16 | | | 8/31/15 | |
| | | (unaudited) | | | | | | | | | | | | | | | | |
Net asset value, beginning of period | | | $29.44 | | | | $35.05 | | | | $28.48 | | | | $25.09 | | | | $24.60 | | | | $26.33 | |
| | | |
| Income (loss) from investment operations | | | | | | | | | | | | | |
Net investment income (loss) (d) | | | $(0.05 | ) | | | $(0.13 | ) | | | $(0.15 | ) | | | $(0.12 | )(c) | | | $(0.07 | ) | | | $(0.14 | ) |
Net realized and unrealized
gain (loss) | | | 0.94 | | | | 0.13 | (g) | | | 9.53 | | | | 4.09 | | | | 0.56 | | | | 0.23 | |
Total from investment operations | | | $0.89 | | | | $0.00 | (w) | | | $9.38 | | | | $3.97 | | | | $0.49 | | | | $0.09 | |
| | | |
| Less distributions declared to shareholders | | | | | | | | | | | | | |
From net realized gain | | | $(2.24 | ) | | | $(5.61 | ) | | | $(2.81 | ) | | | $(0.58 | ) | | | $— | | | | $(1.82 | ) |
Net asset value, end of period (x) | | | $28.09 | | | | $29.44 | | | | $35.05 | | | | $28.48 | | | | $25.09 | | | | $24.60 | |
Total return (%) (r)(s)(t)(x) | | | 2.78 | (n) | | | 3.72 | | | | 35.42 | | | | 16.14 | (c) | | | 1.99 | | | | 0.73 | |
| | | | |
Ratios (%) (to average net assets)
and Supplemental data: | | | | | | | | | | | | | | | | | |
Expenses before expense reductions (f) | | | 1.03 | (a) | | | 1.05 | | | | 1.08 | | | | 1.10 | (c) | | | 1.12 | | | | 1.11 | |
Expenses after expense reductions (f) | | | 1.02 | (a) | | | 1.05 | | | | 1.07 | | | | 1.09 | (c) | | | 1.09 | | | | 1.06 | |
Net investment income (loss) | | | (0.34 | )(a) | | | (0.45 | ) | | | (0.51 | ) | | | (0.45 | )(c) | | | (0.32 | ) | | | (0.57 | ) |
Portfolio turnover | | | 24 | (n) | | | 69 | | | | 67 | | | | 53 | | | | 49 | | | | 56 | |
Net assets at end of period
(000 omitted) | | | $12,269 | | | | $8,384 | | | | $10,612 | | | | $83,186 | | | | $91,974 | | | | $142,857 | |
| | |
| | | Six months
ended 2/29/20 | | | Year ended | |
| Class R6 | | 8/31/19 | | | 8/31/18 | | | 8/31/17 | | | 8/31/16 | | | 8/31/15 | |
| | | (unaudited) | | | | | | | | | | | | | | | | |
Net asset value, beginning of period | | | $31.64 | | | | $37.13 | | | | $30.01 | | | | $26.38 | | | | $25.83 | | | | $27.52 | |
| | | |
| Income (loss) from investment operations | | | | | | | | | | | | | |
Net investment income (loss) (d) | | | $(0.04 | ) | | | $(0.11 | ) | | | $(0.14 | ) | | | $(0.09 | )(c) | | | $(0.03 | ) | | | $(0.12 | ) |
Net realized and unrealized
gain (loss) | | | 1.00 | | | | 0.23 | (g) | | | 10.07 | | | | 4.30 | | | | 0.58 | | | | 0.25 | |
Total from investment operations | | | $0.96 | | | | $0.12 | | | | $9.93 | | | | $4.21 | | | | $0.55 | | | | $0.13 | |
| | | |
| Less distributions declared to shareholders | | | | | | | | | | | | | |
From net realized gain | | | $(2.24 | ) | | | $(5.61 | ) | | | $(2.81 | ) | | | $(0.58 | ) | | | $— | | | | $(1.82 | ) |
Net asset value, end of period (x) | | | $30.36 | | | | $31.64 | | | | $37.13 | | | | $30.01 | | | | $26.38 | | | | $25.83 | |
Total return (%) (r)(s)(t)(x) | | | 2.81 | (n) | | | 3.85 | | | | 35.45 | | | | 16.26 | (c) | | | 2.13 | | | | 0.85 | |
| | | | |
Ratios (%) (to average net assets)
and Supplemental data: | | | | | | | | | | | | | | | | | |
Expenses before expense reductions (f) | | | 0.93 | (a) | | | 0.96 | | | | 0.97 | | | | 0.98 | (c) | | | 0.99 | | | | 0.98 | |
Expenses after expense reductions (f) | | | 0.92 | (a) | | | 0.95 | | | | 0.96 | | | | 0.97 | (c) | | | 0.97 | | | | 0.93 | |
Net investment income (loss) | | | (0.23 | )(a) | | | (0.35 | ) | | | (0.44 | ) | | | (0.34 | )(c) | | | (0.11 | ) | | | (0.44 | ) |
Portfolio turnover | | | 24 | (n) | | | 69 | | | | 67 | | | | 53 | | | | 49 | | | | 56 | |
Net assets at end of period
(000 omitted) | | | $589,277 | | | | $541,266 | | | | $477,818 | | | | $385,440 | | | | $320,645 | | | | $313,080 | |
See Notes to Financial Statements
19
Financial Highlights – continued
| (c) | Amount reflects aone-time reimbursement of expenses by the custodian (or former custodian) without which net investment income and performance would be lower and expenses would be higher. |
| (d) | Per share data is based on average shares outstanding. |
| (f) | Ratios do not reflect reductions from fees paid indirectly, if applicable. |
| (g) | The per share amount varies from the net realized and unrealized gain/loss for the period because of the timing of sales of fund shares and the per share amount of realized and unrealized gains and losses at such time. |
| (r) | Certain expenses have been reduced without which performance would have been lower. |
| (s) | From time to time the fund may receive proceeds from litigation settlements, without which performance would be lower. |
| (t) | Total returns do not include any applicable sales charges. |
| (w) | Per share amount was less than $0.01. |
| (x) | The net asset values and total returns have been calculated on net assets which include adjustments made in accordance with U.S. generally accepted accounting principles required at period end for financial reporting purposes. |
See Notes to Financial Statements
20
NOTES TO FINANCIAL STATEMENTS
(unaudited)
(1) Business and Organization
MFS New Discovery Fund (the fund) is a diversified series of MFS Series Trust I (the trust). The trust is organized as a Massachusetts business trust and is registered under the Investment Company Act of 1940, as amended, as anopen-end management investment company.
The fund is an investment company and accordingly follows the investment company accounting and reporting guidance of the Financial Accounting Standards Board (FASB) Accounting Standards Codification Topic 946 Financial Services – Investment Companies.
(2) Significant Accounting Policies
General– The preparation of financial statements in conformity with U.S. generally accepted accounting principles requires management to make estimates and assumptions that affect the reported amounts of assets and liabilities, and disclosure of contingent assets and liabilities at the date of the financial statements and the reported amounts of increases and decreases in net assets from operations during the reporting period. Actual results could differ from those estimates. In the preparation of these financial statements, management has evaluated subsequent events occurring after the date of the fund’s Statement of Assets and Liabilities through the date that the financial statements were issued. The fund will generally focus on securities of small size companies which may be more volatile than those of larger companies. The fund invests in foreign securities. Investments in foreign securities are vulnerable to the effects of changes in the relative values of the local currency and the U.S. dollar and to the effects of changes in each country’s market, economic, industrial, political, regulatory, geopolitical, and other conditions.
In March 2020, the FASB issued Accounting Standards Update2020-04, Reference Rate Reform (Topic 848) – Facilitation of the Effects of Reference Rate Reform on Financial Reporting (“ASU2020-04”), which provides optional, temporary relief with respect to the financial reporting of contracts subject to certain types of modifications due to the planned discontinuation of the London Interbank Offered Rate (LIBOR) and other IBOR-based reference rates as of the end of 2021. The temporary relief provided by ASU2020-04 is effective for certain reference rate-related contract modifications that occur during the period from March 12, 2020 through December 31, 2022. Management is evaluating the impact of ASU2020-04 on the fund’s investments, derivatives, debt and other contracts that will undergo reference rate-related modifications as a result of the reference rate reform.
Balance Sheet Offsetting– The fund’s accounting policy with respect to balance sheet offsetting is that, absent an event of default by the counterparty or a termination of the agreement, the International Swaps and Derivatives Association (ISDA) Master Agreement, or similar agreement, does not result in an offset of reported amounts of financial assets and financial liabilities in the Statement of Assets and Liabilities across transactions between the fund and the applicable counterparty. The fund’s right to setoff may be restricted or prohibited by the bankruptcy or insolvency laws of the particular jurisdiction to which a specific master netting agreement counterparty is
21
Notes to Financial Statements (unaudited) – continued
subject. Balance sheet offsetting disclosures, to the extent applicable to the fund, have been included in the fund’s Significant Accounting Policies note under the captions for each of the fund’sin-scope financial instruments and transactions.
Investment Valuations– Equity securities, including restricted equity securities, are generally valued at the last sale or official closing price on their primary market or exchange as provided by a third-party pricing service. Equity securities, for which there were no sales reported that day, are generally valued at the last quoted daily bid quotation on their primary market or exchange as provided by a third-party pricing service. Short-term instruments with a maturity at issuance of 60 days or less may be valued at amortized cost, which approximates market value.Open-end investment companies are generally valued at net asset value per share. Securities and other assets generally valued on the basis of information from a third-party pricing service may also be valued at a broker/dealer bid quotation. In determining values, third-party pricing services can utilize both transaction data and market information such as yield, quality, coupon rate, maturity, type of issue, trading characteristics, and other market data. The values of foreign securities and other assets and liabilities expressed in foreign currencies are converted to U.S. dollars using the mean of bid and asked prices for rates provided by a third-party pricing service.
The Board of Trustees has delegated primary responsibility for determining or causing to be determined the value of the fund’s investments (including any fair valuation) to the adviser pursuant to valuation policies and procedures approved by the Board. If the adviser determines that reliable market quotations are not readily available, investments are valued at fair value as determined in good faith by the adviser in accordance with such procedures under the oversight of the Board of Trustees. Under the fund’s valuation policies and procedures, market quotations are not considered to be readily available for most types of debt instruments and floating rate loans and many types of derivatives. These investments are generally valued at fair value based on information from third-party pricing services. In addition, investments may be valued at fair value if the adviser determines that an investment’s value has been materially affected by events occurring after the close of the exchange or market on which the investment is principally traded (such as foreign exchange or market) and prior to the determination of the fund’s net asset value, or after the halt of trading of a specific security where trading does not resume prior to the close of the exchange or market on which the security is principally traded. Events that occur after foreign markets close (such as developments in foreign markets and significant movements in the U.S. markets) and prior to the determination of the fund’s net asset value may be deemed to have a material effect on the value of securities traded in foreign markets. Accordingly, the fund’s foreign equity securities may often be valued at fair value. The adviser generally relies on third-party pricing services or other information (such as the correlation with price movements of similar securities in the same or other markets; the type, cost and investment characteristics of the security; the business and financial condition of the issuer; and trading and other market data) to assist in determining whether to fair value and at what value to fair value an investment. The value of an investment for purposes of calculating the fund’s net asset value can differ depending on the source and method used to determine value. When fair valuation is used, the value of an investment used to determine the fund’s net asset value may differ from quoted or
22
Notes to Financial Statements (unaudited) – continued
published prices for the same investment. There can be no assurance that the fund could obtain the fair value assigned to an investment if it were to sell the investment at the same time at which the fund determines its net asset value per share.
Various inputs are used in determining the value of the fund’s assets or liabilities. These inputs are categorized into three broad levels. In certain cases, the inputs used to measure fair value may fall into different levels of the fair value hierarchy. In such cases, an investment’s level within the fair value hierarchy is based on the lowest level of input that is significant to the fair value measurement. The fund’s assessment of the significance of a particular input to the fair value measurement in its entirety requires judgment, and considers factors specific to the investment. Level 1 includes unadjusted quoted prices in active markets for identical assets or liabilities. Level 2 includes other significant observable market-based inputs (including quoted prices for similar securities, interest rates, prepayment speed, and credit risk). Level 3 includes unobservable inputs, which may include the adviser’s own assumptions in determining the fair value of investments. The following is a summary of the levels used as of February 29, 2020 in valuing the fund’s assets or liabilities:
| | | | | | | | | | | | | | | | |
| | | | |
| Financial Instruments | | Level 1 | | | Level 2 | | | Level 3 | | | Total | |
| Equity Securities: | | | | | | | | | | | | | | | | |
United States | | | $1,293,647,847 | | | | $— | | | | $— | | | | $1,293,647,847 | |
United Kingdom | | | 40,002,715 | | | | 9,410,232 | | | | — | | | | 49,412,947 | |
Canada | | | 43,418,307 | | | | — | | | | — | | | | 43,418,307 | |
India | | | 41,472,175 | | | | — | | | | — | | | | 41,472,175 | |
Germany | | | 8,012,231 | | | | 30,927,629 | | | | — | | | | 38,939,860 | |
Ireland | | | 19,336,770 | | | | — | | | | — | | | | 19,336,770 | |
Netherlands | | | 5,699,430 | | | | — | | | | — | | | | 5,699,430 | |
Greece | | | 2,753,563 | | | | — | | | | — | | | | 2,753,563 | |
| Mutual Funds | | | 98,356,506 | | | | — | | | | — | | | | 98,356,506 | |
| Total | | | $1,552,699,544 | | | | $40,337,861 | | | | $— | | | | $1,593,037,405 | |
For further information regarding security characteristics, see the Portfolio of Investments.
Foreign Currency Translation– Purchases and sales of foreign investments, income, and expenses are converted into U.S. dollars based upon currency exchange rates prevailing on the respective dates of such transactions or on the reporting date for foreign denominated receivables and payables. Gains and losses attributable to foreign currency exchange rates on sales of securities are recorded for financial statement purposes as net realized gains and losses on investments. Gains and losses attributable to foreign exchange rate movements on receivables, payables, income and expenses are recorded for financial statement purposes as foreign currency transaction gains and losses. That portion of both realized and unrealized gains and losses on investments that results from fluctuations in foreign currency exchange rates is not separately disclosed.
Security Loans– Under its Securities Lending Agency Agreement with the fund, State Street Bank and Trust Company, as lending agent, loans the securities of the fund to certain qualified institutions (the “Borrowers”) approved by the fund. Security loans can be terminated at the discretion of either the lending agent or the fund and the
23
Notes to Financial Statements (unaudited) – continued
related securities must be returned within the earlier of the standard trade settlement period for such securities or within three business days. The loans are collateralized by cash and/or U.S. Treasury and federal agency obligations in an amount typically at least equal to the market value of the securities loaned. On loans collateralized by cash, the cash collateral is invested in a money market fund. The market value of the loaned securities is determined at the close of business of the fund and any additional required collateral is delivered to the fund on the next business day. The lending agent provides the fund with indemnification against Borrower default. In the event of Borrower default, the lending agent will, for the benefit of the fund, either purchase securities identical to those loaned or, when such purchase is commercially impracticable, pay the fund the market value of the loaned securities. In return, the lending agent assumes the fund’s rights to the related collateral. If the collateral value is less than the cost to purchase identical securities, the lending agent is responsible for the shortfall, but only to the extent that such shortfall is not due to a decline in collateral value resulting from collateral reinvestment for which the fund bears the risk of loss. At period end, the fund had investment securities on loan, all of which were classified as equity securities in the fund’s Portfolio of Investments, with a fair value of $25,454,485. The fair value of the fund’s investment securities on loan and a related liability of $14,794,456 for cash collateral received on securities loaned are both presented gross in the Statement of Assets and Liabilities. Additionally, these loans were collateralized by U.S. Treasury Obligations of $11,731,690 held by the lending agent. The collateral on securities loaned exceeded the value of securities on loan at period end. The liability for cash collateral for securities loaned is carried at fair value, which is categorized as level 2 within the fair value hierarchy. A portion of the income generated upon investment of the collateral is remitted to the Borrowers, and the remainder is allocated between the fund and the lending agent. On loans collateralized by U.S. Treasury and/or federal agency obligations, a fee is received from the Borrower, and is allocated between the fund and the lending agent. Income from securities lending is separately reported in the Statement of Operations. The dividend and interest income earned on the securities loaned is accounted for in the same manner as other dividend and interest income.
Indemnifications– Under the fund’s organizational documents, its officers and Trustees may be indemnified against certain liabilities and expenses arising out of the performance of their duties to the fund. Additionally, in the normal course of business, the fund enters into agreements with service providers that may contain indemnification clauses. The fund’s maximum exposure under these agreements is unknown as this would involve future claims that may be made against the fund that have not yet occurred.
Investment Transactions and Income– Investment transactions are recorded on the trade date. Dividends received in cash are recorded on theex-dividend date. Certain dividends from foreign securities will be recorded when the fund is informed of the dividend if such information is obtained subsequent to theex-dividend date. Dividend payments received in additional securities are recorded on theex-dividend date in an amount equal to the value of the security on such date.
The fund may receive proceeds from litigation settlements. Any proceeds received from litigation involving portfolio holdings are reflected in the Statement of Operations in realized gain/loss if the security has been disposed of by the fund or in unrealized
24
Notes to Financial Statements (unaudited) – continued
gain/loss if the security is still held by the fund. Any other proceeds from litigation not related to portfolio holdings are reflected as other income in the Statement of Operations.
Tax Matters and Distributions– The fund intends to qualify as a regulated investment company, as defined under Subchapter M of the Internal Revenue Code, and to distribute all of its taxable income, including realized capital gains. As a result, no provision for federal income tax is required. The fund’s federal tax returns, when filed, will remain subject to examination by the Internal Revenue Service for a three year period. Management has analyzed the fund’s tax positions taken on federal and state tax returns for all open tax years and does not believe that there are any uncertain tax positions that require recognition of a tax liability. Foreign taxes, if any, have been accrued by the fund in the accompanying financial statements in accordance with the applicable foreign tax law. Foreign income taxes may be withheld by certain countries in which the fund invests. Additionally, capital gains realized by the fund on securities issued in or by certain foreign countries may be subject to capital gains tax imposed by those countries.
Distributions to shareholders are recorded on theex-dividend date. Income and capital gain distributions are determined in accordance with income tax regulations, which may differ from U.S. generally accepted accounting principles. Certain capital accounts in the financial statements are periodically adjusted for permanent differences in order to reflect their tax character. These adjustments have no impact on net assets or net asset value per share. Temporary differences which arise from recognizing certain items of income, expense, gain or loss in different periods for financial statement and tax purposes will reverse at some time in the future.
Book/tax differences primarily relate to wash sale loss deferrals and treating a portion of the proceeds from redemptions as a distribution for tax purposes.
The tax character of distributions made during the current period will be determined at fiscal year end. The tax character of distributions declared to shareholders for the last fiscal year is as follows:
| | | | |
| |
| | | Year ended
8/31/19 | |
Ordinary income (including any
short-term capital gains) | | | $77,700,077 | |
| Long-term capital gains | | | 152,749,955 | |
| |
| Total distributions | | | $230,450,032 | |
25
Notes to Financial Statements (unaudited) – continued
The federal tax cost and the tax basis components of distributable earnings were as follows:
| | | | |
| |
| As of 2/29/20 | | | |
| |
| Cost of investments | | | $1,377,738,857 | |
| Gross appreciation | | | 353,357,680 | |
| |
| Gross depreciation | | | (138,059,132 | ) |
| Net unrealized appreciation (depreciation) | | | $215,298,548 | |
| |
| As of 8/31/19 | | | |
| |
| Undistributed ordinary income | | | 33,529,410 | |
| Undistributed long-term capital gain | | | 70,388,231 | |
| Other temporary differences | | | (4,113 | ) |
| Net unrealized appreciation (depreciation) | | | 234,146,951 | |
The aggregate cost above includes prior fiscal year end tax adjustments, if applicable.
Multiple Classes of Shares of Beneficial Interest– The fund offers multiple classes of shares, which differ in their respective distribution and service fees. The fund’s income, realized and unrealized gain (loss), and common expenses are allocated to shareholders based on the daily net assets of each class. Dividends are declared separately for each class. Differences in per share dividend rates are generally due to differences in separate class expenses. Class B shares will convert to Class A shares approximately eight years after purchase. Class C shares will convert to Class A shares approximately ten years after purchase. The fund’s distributions declared to shareholders as reported in the Statements of Changes in Net Assets are presented by class as follows:
| | | | | | | | |
| | |
| | | Six months
ended
2/29/20 | | | Year
ended
8/31/19 | |
| Class A | | | $45,480,404 | | | | $88,854,670 | |
| Class B | | | 1,857,992 | | | | 4,829,407 | |
| Class C | | | 5,934,396 | | | | 13,810,640 | |
| Class I | | | 12,867,161 | | | | 26,484,311 | |
| Class R1 | | | 463,207 | | | | 1,085,473 | |
| Class R2 | | | 2,558,232 | | | | 6,518,565 | |
| Class R3 | | | 4,552,802 | | | | 8,385,161 | |
| Class R4 | | | 737,611 | | | | 1,643,025 | |
| Class R6 | | | 39,687,113 | | | | 78,838,780 | |
| Total | | | $114,138,918 | | | | $230,450,032 | |
(3) Transactions with Affiliates
Investment Adviser– The fund has an investment advisory agreement with MFS to provide overall investment management and related administrative services and
26
Notes to Financial Statements (unaudited) – continued
facilities to the fund. The management fee is computed daily and paid monthly at the following annual rates based on the fund’s average daily net assets:
| | | | |
| Up to $1 billion | | | 0.90 | % |
| In excess of $1 billion and up to $2.5 billion | | | 0.80 | % |
| In excess of $2.5 billion and up to $5 billion | | | 0.75 | % |
| In excess of $5 billion | | | 0.70 | % |
MFS has agreed in writing to reduce its management fee by a specified amount if certain MFS mutual fund assets exceed thresholds agreed to by MFS and the fund’s Board of Trustees. For the six months ended February 29, 2020, this management fee reduction amounted to $78,377, which is included in the reduction of total expenses in the Statement of Operations. The management fee incurred for the six months ended February 29, 2020 was equivalent to an annual effective rate of 0.85% of the fund’s average daily net assets.
Distributor– MFS Fund Distributors, Inc. (MFD), a wholly-owned subsidiary of MFS, as distributor, received $160,815 for the six months ended February 29, 2020, as its portion of the initial sales charge on sales of Class A shares of the fund.
The Board of Trustees has adopted a distribution plan for certain share classes pursuant to Rule12b-1 of the Investment Company Act of 1940.
The fund’s distribution plan provides that the fund will pay MFD for services provided by MFD and financial intermediaries in connection with the distribution and servicing of certain share classes. One component of the plan is a distribution fee paid to MFD and another component of the plan is a service fee paid to MFD. MFD may subsequently pay all, or a portion, of the distribution and/or service fees to financial intermediaries.
Distribution Plan Fee Table:
| | | | | | | | | | | | | | | | | | | | |
| | | | | |
| | | Distribution
Fee Rate (d) | | | Service
Fee Rate (d) | | | Total
Distribution
Plan (d) | | | Annual
Effective
Rate (e) | | | Distribution
and Service
Fee | |
| Class A | | | — | | | | 0.25% | | | | 0.25% | | | | 0.24% | | | | $736,783 | |
| Class B | | | 0.75% | | | | 0.25% | | | | 1.00% | | | | 1.00% | | | | 90,496 | |
| Class C | | | 0.75% | | | | 0.25% | | | | 1.00% | | | | 1.00% | | | | 293,069 | |
| Class R1 | | | 0.75% | | | | 0.25% | | | | 1.00% | | | | 1.00% | | | | 22,648 | |
| Class R2 | | | 0.25% | | | | 0.25% | | | | 0.50% | | | | 0.50% | | | | 76,507 | |
| Class R3 | | | — | | | | 0.25% | | | | 0.25% | | | | 0.25% | | | | 72,632 | |
| Total Distribution and Service Fees | | | | | | | | $1,292,135 | |
| (d) | In accordance with the distribution plan for certain classes, the fund pays distribution and/or service fees equal to these annual percentage rates of each class’s average daily net assets. The distribution and service fee rates disclosed by class represent the current rates in effect at the end of the reporting period. Any rate changes, if applicable, are detailed below. |
| (e) | The annual effective rates represent actual fees incurred under the distribution plan for the six months ended February 29, 2020 based on each class’s average daily net assets. MFD has voluntarily agreed to rebate a portion of each class’s 0.25% service fee attributable to accounts for which MFD retains the 0.25% service fee except for accounts attributable to MFS or its affiliates’ seed money. For the six months ended February 29, 2020, this rebate amounted to $15,518, $346, $95, and $216 for Class A, Class B, Class C, and Class R2, respectively, and is included in the reduction of total expenses in the Statement of Operations. |
27
Notes to Financial Statements (unaudited) – continued
Certain Class A shares are subject to a contingent deferred sales charge (CDSC) in the event of a shareholder redemption within 18 months of purchase. Class B shares are subject to a CDSC in the event of a shareholder redemption within six years of purchase. Class C shares are subject to a CDSC in the event of a shareholder redemption within 12 months of purchase. All contingent deferred sales charges are paid to MFD and during the six months ended February 29, 2020, were as follows:
| | | | |
| |
| | | Amount | |
| Class A | | | $9,860 | |
| Class B | | | 5,099 | |
| Class C | | | 1,321 | |
Shareholder Servicing Agent– MFS Service Center, Inc. (MFSC), a wholly-owned subsidiary of MFS, receives a fee from the fund for its services as shareholder servicing agent calculated as a percentage of the average daily net assets of the fund as determined periodically under the supervision of the fund’s Board of Trustees. For the six months ended February 29, 2020, the fee was $82,415, which equated to 0.0107% annually of the fund’s average daily net assets. MFSC also receives payment from the fund forout-of-pocket expenses,sub-accounting and other shareholder servicing costs which may be paid to affiliated and unaffiliated service providers. Class R6 shares do not incursub-accounting fees. For the six months ended February 29, 2020, theseout-of-pocket expenses,sub-accounting and other shareholder servicing costs amounted to $528,892.
Administrator– MFS provides certain financial, legal, shareholder communications, compliance, and other administrative services to the fund. Under an administrative services agreement, the fund reimburses MFS the costs incurred to provide these services. The fund is charged an annual fixed amount of $17,500 plus a fee based on average daily net assets. The administrative services fee incurred for the six months ended February 29, 2020 was equivalent to an annual effective rate of 0.0135% of the fund’s average daily net assets.
Trustees’ and Officers’ Compensation– The fund pays compensation to independent Trustees in the form of a retainer, attendance fees, and additional compensation to Board and Committee chairpersons. The fund does not pay compensation directly to Trustees or officers of the fund who are also officers of the investment adviser, all of whom receive remuneration from MFS for their services to the fund. Certain officers and Trustees of the fund are officers or directors of MFS, MFD, and MFSC.
Other –The fund invests in the MFS Institutional Money Market Portfolio which is managed by MFS and seeks current income consistent with preservation of capital and liquidity. This money market fund does not pay a management fee to MFS but does incur investment and operating costs.
The fund is permitted to engage in purchase and sale transactions with funds and accounts for which MFS serves as investment adviser orsub-adviser (“cross-trades”) pursuant to a policy adopted by the Board of Trustees. This policy has been designed to ensure that cross-trades conducted by the fund comply with Rule17a-7 under the Investment Company Act of 1940. During the six months ended February 29, 2020,
28
Notes to Financial Statements (unaudited) – continued
the fund engaged in purchase and sale transactions pursuant to this policy, which amounted to $499,240 and $460,164, respectively. The sales transactions resulted in net realized gains (losses) of $(178,021).
The adviser has voluntarily undertaken to reimburse the fund from its own resources on a quarterly basis for the cost of investment research embedded in the cost of the fund’s securities trades. This agreement may be rescinded at any time. For the six months ended February 29, 2020, this reimbursement amounted to $41,345, which is included in “Other” income in the Statement of Operations.
(4) Portfolio Securities
For the six months ended February 29, 2020, purchases and sales of investments, other than short-term obligations, aggregated $429,056,663 and $352,111,655, respectively.
(5) Shares of Beneficial Interest
The fund’s Declaration of Trust permits the Trustees to issue an unlimited number of full and fractional shares of beneficial interest. Transactions in fund shares were as follows:
| | | | | | | | | | | | | | | | |
| | | Six months ended
2/29/20 | | | Year ended
8/31/19 | |
| | | | |
| | | Shares | | | Amount | | | Shares | | | Amount | |
| Shares sold | | | | | | | | | | | | | | | | |
Class A | | | 3,012,509 | | | | $84,471,604 | | | | 4,174,526 | | | | $111,128,979 | |
Class B | | | 6,826 | | | | 139,418 | | | | 119,514 | | | | 2,451,739 | |
Class C | | | 319,517 | | | | 6,592,765 | | | | 582,894 | | | | 11,635,600 | |
Class I | | | 2,493,453 | | | | 80,116,218 | | | | 2,246,267 | | | | 67,695,575 | |
Class R1 | | | 13,293 | | | | 271,635 | | | | 48,692 | | | | 1,012,673 | |
Class R2 | | | 123,496 | | | | 3,177,248 | | | | 283,452 | | | | 6,968,591 | |
Class R3 | | | 523,654 | | | | 14,515,424 | | | | 470,712 | | | | 12,582,867 | |
Class R4 | | | 226,472 | | | | 6,794,736 | | | | 85,788 | | | | 2,403,986 | |
Class R6 | | | 2,795,482 | | | | 90,259,561 | | | | 4,412,506 | | | | 134,149,812 | |
| | | 9,514,702 | | | | $286,338,609 | | | | 12,424,351 | | | | $350,029,822 | |
| | | | |
Shares issued to shareholders in
reinvestment of distributions | | | | | | | | | | | | | | | | |
Class A | | | 1,649,802 | | | | $44,577,655 | | | | 3,869,394 | | | | $86,751,808 | |
Class B | | | 91,737 | | | | 1,809,047 | | | | 272,245 | | | | 4,614,555 | |
Class C | | | 262,614 | | | | 5,194,497 | | | | 703,090 | | | | 11,952,526 | |
Class I | | | 370,322 | | | | 11,483,689 | | | | 930,538 | | | | 23,644,963 | |
Class R1 | | | 23,754 | | | | 463,207 | | | | 64,689 | | | | 1,085,473 | |
Class R2 | | | 96,986 | | | | 2,399,424 | | | | 284,154 | | | | 5,887,667 | |
Class R3 | | | 168,747 | | | | 4,552,802 | | | | 374,505 | | | | 8,385,161 | |
Class R4 | | | 25,391 | | | | 737,611 | | | | 68,717 | | | | 1,643,025 | |
Class R6 | | | 1,195,889 | | | | 37,538,966 | | | | 2,885,648 | | | | 74,103,434 | |
| | | 3,885,242 | | | | $108,756,898 | | | | 9,452,980 | | | | $218,068,612 | |
29
Notes to Financial Statements (unaudited) – continued
| | | | | | | | | | | | | | | | |
| | | Six months ended
2/29/20 | | | Year ended
8/31/19 | |
| | | | |
| | | Shares | | | Amount | | | Shares | | | Amount | |
| Shares reacquired | | | | | | | | | | | | | | | | |
Class A | | | (2,109,033 | ) | | | $(59,032,494 | ) | | | (3,885,501 | ) | | | $(100,360,171 | ) |
Class B | | | (147,473 | ) | | | (3,070,222 | ) | | | (361,062 | ) | | | (7,129,308 | ) |
Class C | | | (528,298 | ) | | | (10,957,059 | ) | | | (1,016,652 | ) | | | (20,620,050 | ) |
Class I | | | (1,329,358 | ) | | | (42,325,571 | ) | | | (2,820,194 | ) | | | (80,345,484 | ) |
Class R1 | | | (40,278 | ) | | | (828,188 | ) | | | (87,036 | ) | | | (1,774,307 | ) |
Class R2 | | | (365,728 | ) | | | (9,364,170 | ) | | | (452,605 | ) | | | (10,891,533 | ) |
Class R3 | | | (427,901 | ) | | | (11,844,271 | ) | | | (465,291 | ) | | | (12,527,864 | ) |
Class R4 | | | (99,818 | ) | | | (2,991,202 | ) | | | (172,526 | ) | | | (5,073,303 | ) |
Class R6 | | | (1,690,141 | ) | | | (54,579,138 | ) | | | (3,059,304 | ) | | | (92,491,386 | ) |
| | | (6,738,028 | ) | | | $(194,992,315 | ) | | | (12,320,171 | ) | | | $(331,213,406 | ) |
| | | | |
| Net change | | | | | | | | | | | | | | | | |
Class A | | | 2,553,278 | | | | $70,016,765 | | | | 4,158,419 | | | | $97,520,616 | |
Class B | | | (48,910 | ) | | | (1,121,757 | ) | | | 30,697 | | | | (63,014 | ) |
Class C | | | 53,833 | | | | 830,203 | | | | 269,332 | | | | 2,968,076 | |
Class I | | | 1,534,417 | | | | 49,274,336 | | | | 356,611 | | | | 10,995,054 | |
Class R1 | | | (3,231 | ) | | | (93,346 | ) | | | 26,345 | | | | 323,839 | |
Class R2 | | | (145,246 | ) | | | (3,787,498 | ) | | | 115,001 | | | | 1,964,725 | |
Class R3 | | | 264,500 | | | | 7,223,955 | | | | 379,926 | | | | 8,440,164 | |
Class R4 | | | 152,045 | | | | 4,541,145 | | | | (18,021 | ) | | | (1,026,292 | ) |
Class R6 | | | 2,301,230 | | | | 73,219,389 | | | | 4,238,850 | | | | 115,761,860 | |
| | | 6,661,916 | | | | $200,103,192 | | | | 9,557,160 | | | | $236,885,028 | |
Class T shares were not publicly available for sale during the period. Please see the fund’s prospectus for details.
Effective June 1, 2019, purchases of the fund’s Class B shares are closed to new and existing investors subject to certain exceptions. Please see the fund’s prospectus for details.
The fund is one of several mutual funds in which certain MFS funds may invest. The MFS funds do not invest in the underlying funds for the purpose of exercising management or control. At the end of the period, the MFS Growth Allocation Fund, the MFS Moderate Allocation Fund, the MFS Aggressive Growth Allocation Fund, and the MFS Conservative Allocation Fund were the owners of record of approximately 7%, 6%, 3%, and 2%, respectively, of the value of outstanding voting shares of the fund. In addition, the MFS Lifetime 2020 Fund, the MFS Lifetime 2025 Fund, the MFS Lifetime 2030 Fund, the MFS Lifetime 2035 Fund, the MFS Lifetime 2040 Fund, the MFS Lifetime 2045 Fund, the MFS Lifetime 2050 Fund, the MFS Lifetime 2055 Fund, the MFS Lifetime 2060 Fund, and the MFS Lifetime Income Fund were each the owners of record of less than 1% of the value of outstanding voting shares of the fund.
(6) Line of Credit
The fund and certain other funds managed by MFS participate in a $1.25 billion unsecured committed line of credit, subject to a $1 billion sublimit, provided by a syndicate of banks under a credit agreement. Borrowings may be made for temporary
30
Notes to Financial Statements (unaudited) – continued
financing needs. Interest is charged to each fund, based on its borrowings, generally at a rate equal to the highest of one month LIBOR, the Federal Funds Effective Rate and the Overnight Bank Funding Rate, plus an agreed upon spread. A commitment fee, based on the average daily, unused portion of the committed line of credit, is allocated among the participating funds. In addition, the fund and other funds managed by MFS have established unsecured uncommitted borrowing arrangements with certain banks for temporary financing needs. Interest is charged to each fund, based on its borrowings, at rates equal to customary reference rates plus an agreed upon spread. For the six months ended February 29, 2020, the fund’s commitment fee and interest expense were $3,766 and $0, respectively, and are included in “Miscellaneous” expense in the Statement of Operations.
(7) Investments in Affiliated Issuers
An affiliated issuer may be considered one in which the fund owns 5% or more of the outstanding voting securities, or a company which is under common control. For the purposes of this report, the following were affiliated issuers:
| | | | | | | | | | | | | | | | | | | | | | | | |
| | | | | | |
| Affiliated Issuers | | Beginning
Value | | | Purchases | | | Sales
Proceeds | | | Realized
Gain
(Loss) | | | Change in
Unrealized
Appreciation or
Depreciation | | | Ending
Value | |
| MFS Institutional Money Market Portfolio | | | $48,505,120 | | | | $189,415,034 | | | | $154,358,674 | | | | $(922 | ) | | | $1,492 | | | | $83,562,050 | |
| | | | | | |
| Affiliated Issuers | | | | | | | | | | | | | | Dividend
Income | | | Capital Gain
Distributions | |
| MFS Institutional Money Market Portfolio | | | | | | | | | | | | | | | | $517,114 | | | | $— | |
(8) Impacts of COVID-19
The pandemic related to the global spread of novel coronavirus disease (COVID-19), which was first detected in December 2019, has resulted in significant disruptions to global business activity and the global economy, as well as the economies of individual countries, the financial performance of individual companies and sectors, and the securities and commodities markets in general. This pandemic, the full effects of which are still unknown, has resulted in substantial market volatility and may have adversely impacted the prices and liquidity of the fund’s investments and the fund’s performance during the period February 29, 2020 through April 16, 2020, the date that these financial statements were issued.
31
PROXY VOTING POLICIES AND INFORMATION
MFS votes proxies on behalf of the fund pursuant to proxy voting policies and procedures that are available without charge, upon request, by calling1-800-225-2606, by visitingmfs.com/proxyvoting, or by visiting the SEC’s Web site athttp://www.sec.gov.
Information regarding how the fund voted proxies relating to portfolio securities during the most recent twelve-month period ended June 30 is available by August 31 of each year without charge by visitingmfs.com/proxyvoting, or by visiting the SEC’s Web site athttp://www.sec.gov.
QUARTERLY PORTFOLIO DISCLOSURE
The fund files a complete schedule of portfolio holdings with the SEC for the first and third quarters of each fiscal year as an exhibit to its reports onForm N-PORT. The fund’s Form N-PORT reports are available on the SEC’s website athttp://www.sec.gov.A shareholder can obtain the portfolio holdings report for the first and third quarters of the fund’s fiscal year atmfs.com/openendfunds by choosing the fund’s name and then selecting the “Resources” tab and clicking on “Prospectus and Reports”.
FURTHER INFORMATION
From time to time, MFS may post important information about the fund or the MFS funds on the MFS web site (mfs.com). This information is available athttps://www.mfs.com/en-us/what-we-do/announcements.html or atmfs.com/openendfunds by choosing the fund’s name.
INFORMATION ABOUT FUND CONTRACTS AND LEGAL CLAIMS
The fund has entered into contractual arrangements with an investment adviser, administrator, distributor, shareholder servicing agent, 529 program manager (if applicable), and custodian who each provide services to the fund. Unless expressly stated otherwise, shareholders are not parties to, or intended beneficiaries of these contractual arrangements, and these contractual arrangements are not intended to create any shareholder right to enforce them against the service providers or to seek any remedy under them against the service providers, either directly or on behalf of the fund.
Under the Trust’s By-Laws and Declaration of Trust, any claims asserted against or on behalf of the MFS Funds, including claims against Trustees and Officers, must be brought in state and federal courts located within the Commonwealth of Massachusetts.
PROVISION OF FINANCIAL REPORTS AND SUMMARY PROSPECTUSES
The fund produces financial reports every six months and updates its summary prospectus and prospectus annually. To avoid sending duplicate copies of materials to households, only one copy of the fund’s annual and semiannual report and summary prospectus may be mailed to shareholders having the same last name and residential address on the fund’s records. However, any shareholder may contact MFSC (please see back cover for address and telephone number) to request that copies of these reports and summary prospectuses be sent personally to that shareholder.
32
Save paper with eDelivery.

| MFS® will send you prospectuses, |
reports, and proxies directly viae-mail so you will get information faster with less mailbox clutter.
To sign up:
1. Go to mfs.com.
2. Log in via MFS® Access.
3. Select eDelivery.
If you own your MFS fund shares through a financial institution or a retirement plan, MFS® TALK, MFS® Access, or eDelivery may not be available to you.
CONTACT
WEB SITE
mfs.com
MFS TALK
1-800-637-8255
24 hours a day
ACCOUNT SERVICE AND LITERATURE
Shareholders
1-800-225-2606
Financial advisors
1-800-343-2829
Retirement plan services
1-800-637-1255
MAILING ADDRESS
MFS Service Center, Inc.
P.O. Box 219341
Kansas City, MO 64121-9341
OVERNIGHT MAIL
MFS Service Center, Inc.
Suite 219341
430 W 7th Street
Kansas City, MO 64105-1407
Semiannual Report
February 29, 2020

MFS® Research International Fund

Beginning on January 1, 2021, as permitted by regulations adopted by the U.S. Securities and Exchange Commission, paper copies of the fund’s annual and semiannual shareholder reports will no longer be sent by mail, unless you specifically request paper copies of the reports. Instead, the complete reports will be made available on the fund’s Web site (funds.mfs.com), and you will be notified by mail each time a report is posted and provided with a Web site link to access the report.
If you are already signed up to receive shareholder reports by email, you will not be affected by this change and you need not take any action. You may sign up to receive shareholder reports and other communications from the fund by email by contacting your financial intermediary (such as a broker-dealer or bank) or, if you hold your shares directly with the fund, by calling 1-800-225-2606 or by logging on to MFS Access at mfs.com.
Beginning on January 1, 2019, you may elect to receive all future reports in paper free of charge. Contact your financial intermediary to request that you continue to receive paper copies of your shareholder reports. If you invest directly with the fund, you can call 1-800-225-2606 or send an email request to orderliterature@mfs.com to let the fund know that you wish to continue receiving paper copies of your shareholder reports. Your election to receive reports in paper will apply to all funds held in your account if you invest through your financial intermediary or all funds held with the MFS fund complex if you invest directly.
RIF-SEM
MFS® Research International Fund
CONTENTS
The report is prepared for the general information of shareholders.
It is authorized for distribution to prospective investors only when preceded or accompanied by a current prospectus.
NOT FDIC INSURED• MAY LOSE VALUE• NO BANK GUARANTEE

LETTER FROM THE EXECUTIVE CHAIR
Dear Shareholders:
During the first quarter of 2020, market volatility reached levels not seen since the global financial crisis. Optimism heading into the year — on receding trade and
geopolitical risk along with easier central bank policies — was overwhelmed in February as the health effects of a novel coronavirus,COVID-19, spread beyond China’s borders, ultimately impacting more than 200 countries. The global pandemic prompted many governments to take drastic action to slow the spread of the virus, such as quarantines, school and business closures, and prohibitions on public gatherings. While these are important steps to protect the public health, they come at a cost: rising market volatility and an abrupt decline in economic growth.
Global central banks have taken aggressive, coordinated steps to cushion the economic and market fallout related to the virus, and
governments are undertaking unprecedented levels of fiscal stimulus. As uncertainty recedes, these measures can help create a supportive environment and encourage economic recovery. In the aftermath of the crisis, there are likely to be societal changes as households, businesses and governments adjust to a new reality and these alterations could change the investment landscape. Occurrences such as the COVID-19 outbreak demonstrate the importance of having a deep understanding of company fundamentals, and our global research platform has been built to do just that.
Here at MFS®, we aim to help our clients navigate the growing complexity of the markets and world economies. Our long-term investment philosophy and commitment to the responsible allocation of capital allow us to tune out the noise and uncover what we believe are the best, most durable investment opportunities in the market. Through our powerful global investment platform, we combine collective expertise, thoughtful risk management, and long-term discipline to create sustainable value for investors.
Respectfully,

Robert J. Manning
Executive Chair
MFS Investment Management
April 16, 2020
The opinions expressed in this letter are subject to change and may not be relied upon for investment advice. No forecasts can be guaranteed.
1
PORTFOLIO COMPOSITION
Portfolio structure

| | | | |
| Top ten holdings | | | | |
| Nestle S.A. | | | 3.4% | |
| Roche Holding AG | | | 3.3% | |
| Schneider Electric S.A. | | | 2.5% | |
| Linde PLC | | | 2.4% | |
| Novo Nordisk A.S., “B” | | | 2.1% | |
| AIA Group Ltd. | | | 1.9% | |
LVMH Moet Hennessy Louis
Vuitton SE | | | 1.8% | |
| Daikin Industries Ltd. | | | 1.6% | |
| Aon PLC | | | 1.6% | |
| BNP Paribas | | | 1.5% | |
| |
| Global equity sectors (k) | | | | |
| Capital Goods | | | 22.5% | |
| Financial Services | | | 22.0% | |
| Health Care | | | 11.9% | |
| Technology | | | 11.7% | |
| Consumer Staples | | | 9.9% | |
| Consumer Cyclicals | | | 8.7% | |
| Energy | | | 8.4% | |
| Telecommunications/Cable Television | | | 4.0% | |
| | | | |
| Issuer country weightings (x) | | | | |
| Japan | | | 19.8% | |
| Switzerland | | | 13.9% | |
| France | | | 11.9% | |
| Germany | | | 7.6% | |
| United Kingdom | | | 7.5% | |
| United States | | | 7.1% | |
| Hong Kong | | | 4.8% | |
| Netherlands | | | 2.9% | |
| Spain | | | 2.9% | |
| Other Countries | | | 21.6% | |
|
| Currency exposure weightings (y) | |
| Euro | | | 33.3% | |
| Japanese Yen | | | 19.8% | |
| Swiss Franc | | | 13.9% | |
| British Pound Sterling | | | 7.2% | |
| United States Dollar | | | 6.7% | |
| Hong Kong Dollar | | | 5.2% | |
| Australian Dollar | | | 2.9% | |
| Danish Krone | | | 2.7% | |
| Taiwan Dollar | | | 1.6% | |
| Other Currencies | | | 6.7% | |
| (k) | The sectors set forth above and the associated portfolio composition are based on MFS’ own custom sector classification methodology. |
| (x) | Represents the portfolio’s exposure to issuer countries as a percentage of a portfolio’s net assets. For purposes of this presentation, United States includes Cash & Cash Equivalents. |
| (y) | Represents the portfolio’s exposure to a particular currency as a percentage of a portfolio’s net assets. For purposes of this presentation, United States Dollar includes Cash & Cash Equivalents. |
2
Portfolio Composition – continued
Cash & Cash Equivalents includes any cash, investments in money market funds, short-term securities, and other assets less liabilities. Please see the Statement of Assets and Liabilities for additional information related to the fund’s cash position and other assets and liabilities.
Percentages are based on net assets as of February 29, 2020.
The portfolio is actively managed and current holdings may be different.
3
EXPENSE TABLE
Fund expenses borne by the shareholders during the period, September 1, 2019 through February 29, 2020
As a shareholder of the fund, you incur two types of costs: (1) transaction costs, including sales charges (loads) on certain purchase or redemption payments, and (2) ongoing costs, including management fees; distribution and service(12b-1) fees; and other fund expenses. This example is intended to help you understand your ongoing costs (in dollars) of investing in the fund and to compare these costs with the ongoing costs of investing in other mutual funds.
The example is based on an investment of $1,000 invested at the beginning of the period and held for the entire period September 1, 2019 through February 29, 2020.
Actual Expenses
The first line for each share class in the following table provides information about actual account values and actual expenses. You may use the information in this line, together with the amount you invested, to estimate the expenses that you paid over the period. Simply divide your account value by $1,000 (for example, an $8,600 account value divided by $1,000 = 8.6), then multiply the result by the number in the first line under the heading entitled “Expenses Paid During Period” to estimate the expenses you paid on your account during this period.
Hypothetical Example for Comparison Purposes
The second line for each share class in the following table provides information about hypothetical account values and hypothetical expenses based on the fund’s actual expense ratio and an assumed rate of return of 5% per year before expenses, which is not the fund’s actual return. The hypothetical account values and expenses may not be used to estimate the actual ending account balance or expenses you paid for the period. You may use this information to compare the ongoing costs of investing in the fund and other funds. To do so, compare this 5% hypothetical example with the 5% hypothetical examples that appear in the shareholder reports of the other funds.
Please note that the expenses shown in the table are meant to highlight your ongoing costs only and do not reflect any transactional costs, such as sales charges (loads). Therefore, the second line for each share class in the table is useful in comparing ongoing costs only, and will not help you determine the relative total costs of owning different funds. In addition, if these transactional costs were included, your costs would have been higher.
4
Expense Table – continued
| | | | | | | | | | | | | | | | | | |
Share
Class | | | | Annualized
Expense
Ratio | | | Beginning
Account Value
9/01/19 | | | Ending
Account Value
2/29/20 | | | Expenses
Paid During
Period (p)
9/01/19-2/29/20 | |
| A | | Actual | | | 1.05% | | | | $1,000.00 | | | | $1,027.11 | | | | $5.29 | |
| | Hypothetical (h) | | | 1.05% | | | | $1,000.00 | | | | $1,019.64 | | | | $5.27 | |
| B | | Actual | | | 1.81% | | | | $1,000.00 | | | | $1,023.68 | | | | $9.11 | |
| | Hypothetical (h) | | | 1.81% | | | | $1,000.00 | | | | $1,015.86 | | | | $9.07 | |
| C | | Actual | | | 1.81% | | | | $1,000.00 | | | | $1,022.93 | | | | $9.10 | |
| | Hypothetical (h) | | | 1.81% | | | | $1,000.00 | | | | $1,015.86 | | | | $9.07 | |
| I | | Actual | | | 0.81% | | | | $1,000.00 | | | | $1,028.39 | | | | $4.09 | |
| | Hypothetical (h) | | | 0.81% | | | | $1,000.00 | | | | $1,020.84 | | | | $4.07 | |
| R1 | | Actual | | | 1.81% | | | | $1,000.00 | | | | $1,023.38 | | | | $9.11 | |
| | Hypothetical (h) | | | 1.81% | | | | $1,000.00 | | | | $1,015.86 | | | | $9.07 | |
| R2 | | Actual | | | 1.30% | | | | $1,000.00 | | | | $1,025.98 | | | | $6.55 | |
| | Hypothetical (h) | | | 1.30% | | | | $1,000.00 | | | | $1,018.40 | | | | $6.52 | |
| R3 | | Actual | | | 1.06% | | | | $1,000.00 | | | | $1,027.21 | | | | $5.34 | |
| | Hypothetical (h) | | | 1.06% | | | | $1,000.00 | | | | $1,019.59 | | | | $5.32 | |
| R4 | | Actual | | | 0.81% | | | | $1,000.00 | | | | $1,028.42 | | | | $4.09 | |
| | Hypothetical (h) | | | 0.81% | | | | $1,000.00 | | | | $1,020.84 | | | | $4.07 | |
| R6 | | Actual | | | 0.70% | | | | $1,000.00 | | | | $1,029.14 | | | | $3.53 | |
| | Hypothetical (h) | | | 0.70% | | | | $1,000.00 | | | | $1,021.38 | | | | $3.52 | |
| 529A | | Actual | | | 1.09% | | | | $1,000.00 | | | | $1,027.37 | | | | $5.49 | |
| | Hypothetical (h) | | | 1.09% | | | | $1,000.00 | | | | $1,019.44 | | | | $5.47 | |
| 529B | | Actual | | | 1.85% | | | | $1,000.00 | | | | $1,023.55 | | | | $9.31 | |
| | Hypothetical (h) | | | 1.85% | | | | $1,000.00 | | | | $1,015.66 | | | | $9.27 | |
| 529C | | Actual | | | 1.85% | | | | $1,000.00 | | | | $1,023.64 | | | | $9.31 | |
| | Hypothetical (h) | | | 1.85% | | | | $1,000.00 | | | | $1,015.66 | | | | $9.27 | |
| (h) | 5% class return per year before expenses. |
| (p) | “Expenses Paid During Period” are equal to each class’s annualized expense ratio, as shown above, multiplied by the average account value over the period, multiplied by 182/366 (to reflect theone-half year period). Expenses paid do not include any applicable sales charges (loads). If these transaction costs had been included, your costs would have been higher. |
Notes to Expense Table
Each class with a Rule12b-1 service fee is subject to a rebate of a portion of such fee. Such rebates are included in the expense ratios above. For Class 529A and Class 529C shares, this rebate reduced the expense ratios above by 0.02% and 0.01%, respectively. See Note 3 in the Notes to Financial Statements for additional information.
5
PORTFOLIO OF INVESTMENTS
2/29/20 (unaudited)
The Portfolio of Investments is a complete list of all securities owned by your fund. It is categorized by broad-based asset classes.
| | | | | | | | |
| | |
| Issuer | | Shares/Par | | | Value ($) | |
| Common Stocks - 99.1% | | | | | | |
| Airlines - 1.0% | | | | | | |
| Aena S.A. | | | 276,052 | | | $ | 44,435,555 | |
| Malaysia Airports Holdings Berhad | | | 8,399,400 | | | | 13,179,551 | |
| Ryanair Holdings PLC, ADR (a) | | | 496,964 | | | | 35,622,380 | |
| | | | | | | | |
| | | | | | | $ | 93,237,486 | |
| Alcoholic Beverages - 0.3% | | | | | | |
| Ambev S.A., ADR | | | 8,511,277 | | | $ | 27,321,199 | |
| | |
| Apparel Manufacturers - 3.6% | | | | | | |
| Adidas AG | | | 395,250 | | | $ | 110,124,093 | |
| Compagnie Financiere Richemont S.A. | | | 1,090,445 | | | | 74,887,141 | |
| LVMH Moet Hennessy Louis Vuitton SE | | | 420,382 | | | | 173,440,573 | |
| | | | | | | | |
| | | | | | | $ | 358,451,807 | |
| Automotive - 1.6% | | | | | | |
| Koito Manufacturing Co. Ltd. | | | 1,726,000 | | | $ | 69,557,682 | |
| USS Co. Ltd. | | | 5,474,500 | | | | 86,290,943 | |
| | | | | | | | |
| | | | | | | $ | 155,848,625 | |
| Brokerage & Asset Managers - 2.3% | | | | | | |
| Euronext N.V. | | | 1,697,035 | | | $ | 141,675,758 | |
| Hong Kong Exchanges & Clearing Ltd. | | | 2,466,200 | | | | 81,562,578 | |
| | | | | | | | |
| | | | | | | $ | 223,238,336 | |
| Business Services - 0.7% | | | | | | |
| Nomura Research Institute Ltd. | | | 2,994,000 | | | $ | 66,483,768 | |
| | |
| Computer Software - 1.2% | | | | | | |
| Cadence Design Systems, Inc. (a) | | | 560,124 | | | $ | 37,046,601 | |
| Check Point Software Technologies Ltd. (a) | | | 751,277 | | | | 77,982,553 | |
| | | | | | | | |
| | | | | | | $ | 115,029,154 | |
| Computer Software - Systems - 3.9% | | | | | | |
| Amadeus IT Group S.A. | | | 1,380,849 | | | $ | 97,836,930 | |
| Constellation Software, Inc. | | | 57,388 | | | | 58,464,573 | |
| EPAM Systems, Inc. (a) | | | 213,349 | | | | 47,619,497 | |
| Fujitsu Ltd. | | | 793,900 | | | | 83,783,320 | |
| Hitachi Ltd. | | | 2,923,300 | | | | 98,056,192 | |
| | | | | | | | |
| | | | | | | $ | 385,760,512 | |
6
Portfolio of Investments (unaudited) – continued
| | | | | | | | |
| | |
| Issuer | | Shares/Par | | | Value ($) | |
| Common Stocks - continued | | | | | | |
| Conglomerates - 0.5% | | | | | | |
| Melrose Industries PLC | | | 19,251,400 | | | $ | 52,536,472 | |
| | |
| Construction - 2.1% | | | | | | |
| Techtronic Industries Co. Ltd. | | | 14,440,000 | | | $ | 118,039,535 | |
| Toto Ltd. | | | 2,459,800 | | | | 92,742,601 | |
| | | | | | | | |
| | | | | | | $ | 210,782,136 | |
| Consumer Products - 3.2% | | | | | | |
| Kao Corp. | | | 1,287,600 | | | $ | 93,706,108 | |
| L’Oréal | | | 423,659 | | | | 113,941,211 | |
| Reckitt Benckiser Group PLC | | | 1,488,769 | | | | 109,892,082 | |
| | | | | | | | |
| | | | | | | $ | 317,539,401 | |
| Consumer Services - 1.2% | | | | | | |
| 51job, Inc., ADR (a) | | | 574,895 | | | $ | 42,984,899 | |
| Carsales.com Ltd. | | | 1,373,555 | | | | 14,211,148 | |
| Persol Holdings Co. Ltd. | | | 2,543,700 | | | | 33,565,702 | |
| SEEK Ltd. | | | 1,725,255 | | | | 22,867,572 | |
| | | | | | | | |
| | | | | | | $ | 113,629,321 | |
| Containers - 0.9% | | | | | | |
| Brambles Ltd. | | | 11,703,812 | | | $ | 90,092,973 | |
| | |
| Electrical Equipment - 3.7% | | | | | | |
| Legrand S.A. | | | 1,510,077 | | | $ | 116,580,287 | |
| Schneider Electric SE | | | 2,430,202 | | | | 247,694,019 | |
| | | | | | | | |
| | | | | | | $ | 364,274,306 | |
| Electronics - 4.3% | | | | | | |
| Kyocera Corp. | | | 1,178,000 | | | $ | 73,831,801 | |
| Mellanox Technologies Ltd. (a) | | | 523,922 | | | | 62,566,765 | |
| NXP Semiconductors N.V. | | | 451,736 | | | | 51,357,866 | |
| Samsung Electronics Co. Ltd. | | | 1,671,990 | | | | 75,640,860 | |
| Silicon Motion Technology Corp., ADR | | | 1,077,195 | | | | 40,093,198 | |
| Taiwan Semiconductor Manufacturing Co. Ltd. | | | 11,473,326 | | | | 117,638,910 | |
| | | | | | | | |
| | | | | | | $ | 421,129,400 | |
| Energy - Independent - 0.4% | | | | | | |
| Oil Search Ltd. | | | 12,440,882 | | | $ | 43,675,723 | |
| | |
| Energy - Integrated - 3.9% | | | | | | |
| BP PLC | | | 25,395,782 | | | $ | 131,545,228 | |
| Cairn Energy PLC (a) | | | 21,935,995 | | | | 39,786,350 | |
| Eni S.p.A. | | | 5,959,185 | | | | 73,771,740 | |
| Galp Energia SGPS S.A., “B” | | | 6,011,259 | | | | 82,515,549 | |
7
Portfolio of Investments (unaudited) – continued
| | | | | | | | |
| | |
| Issuer | | Shares/Par | | | Value ($) | |
| Common Stocks - continued | | | | | | |
| | |
| Energy - Integrated - continued | | | | | | |
| Idemitsu Kosan Co. Ltd. | | | 2,135,700 | | | $ | 52,312,130 | |
| | | | | | | | |
| | | | | | | $ | 379,930,997 | |
| Food & Beverages - 4.4% | | | | | | |
| Danone S.A. | | | 1,380,420 | | | $ | 97,726,097 | |
| Nestle S.A. | | | 3,189,863 | | | | 330,491,982 | |
| | | | | | | | |
| | | | | | | $ | 428,218,079 | |
| Gaming & Lodging - 0.4% | | | | | | |
| Flutter Entertainment PLC | | | 338,339 | | | $ | 36,106,871 | |
| | |
| Insurance - 6.2% | | | | | | |
| AIA Group Ltd. | | | 19,437,000 | | | $ | 187,984,840 | |
| Aon PLC | | | 759,373 | | | | 157,949,584 | |
| Hiscox Ltd. | | | 5,500,637 | | | | 87,341,968 | |
| Swiss Re Ltd. | | | 650,032 | | | | 62,070,914 | |
| Zurich Insurance Group AG | | | 308,623 | | | | 120,106,379 | |
| | | | | | | | |
| | | | | | | $ | 615,453,685 | |
| Internet - 1.3% | | | | | | |
| NAVER Corp. | | | 475,517 | | | $ | 69,112,901 | |
| Scout24 AG | | | 852,592 | | | | 55,920,873 | |
| | | | | | | | |
| | | | | | | $ | 125,033,774 | |
| Machinery & Tools - 4.9% | | | | | | |
| Daikin Industries Ltd. | | | 1,184,900 | | | $ | 160,896,764 | |
| GEA Group AG | | | 2,390,851 | | | | 63,294,119 | |
| Kubota Corp. | | | 7,489,000 | | | | 104,889,094 | |
| Ritchie Bros. Auctioneers, Inc. | | | 1,504,869 | | | | 59,679,029 | |
| Schindler Holding AG | | | 433,932 | | | | 97,633,835 | |
| | | | | | | | |
| | | | | | | $ | 486,392,841 | |
| Major Banks - 3.9% | | | | | | |
| BNP Paribas | | | 2,960,642 | | | $ | 144,661,947 | |
| Mitsubishi UFJ Financial Group, Inc. | | | 23,156,300 | | | | 113,598,660 | |
| UBS Group AG | | | 11,560,616 | | | | 128,047,290 | |
| | | | | | | | |
| | | | | | | $ | 386,307,897 | |
| Medical & Health Technology & Services - 0.6% | | | | | | |
| Sonic Healthcare Ltd. | | | 3,104,494 | | | $ | 57,543,627 | |
| | |
| Medical Equipment - 2.4% | | | | | | |
| EssilorLuxottica | | | 1,009,453 | | | $ | 139,134,348 | |
| Terumo Corp. | | | 3,145,100 | | | | 100,754,916 | |
| | | | | | | | |
| | | | | | | $ | 239,889,264 | |
8
Portfolio of Investments (unaudited) – continued
| | | | | | | | |
| | |
| Issuer | | Shares/Par | | | Value ($) | |
| Common Stocks - continued | | | | | | |
| Natural Gas - Distribution - 0.4% | | | | | | |
| China Resources Gas Group Ltd. | | | 8,094,000 | | | $ | 40,576,918 | |
| | |
| Natural Gas - Pipeline - 0.8% | | | | | | |
| APA Group | | | 7,862,277 | | | $ | 54,352,086 | |
| TC Energy Corp. | | | 549,463 | | | | 28,638,802 | |
| | | | | | | | |
| | | | | | | $ | 82,990,888 | |
| Network & Telecom - 0.4% | | | | | | |
| LM Ericsson Telephone Co., “B” | | | 5,286,580 | | | $ | 42,185,471 | |
| | |
| Other Banks & Diversified Financials - 6.8% | | | | | | |
| AEON Financial Service Co. Ltd. (l) | | | 5,426,400 | | | $ | 78,377,919 | |
| AIB Group PLC | | | 26,354,281 | | | | 62,857,531 | |
| Bank Rakyat Indonesia | | | 170,058,000 | | | | 49,663,218 | |
| HDFC Bank Ltd. | | | 5,174,923 | | | | 85,110,807 | |
| Intesa Sanpaolo S.p.A. | | | 52,151,489 | | | | 126,996,963 | |
| Julius Baer Group Ltd. | | | 2,317,796 | | | | 97,368,556 | |
| KBC Group N.V. | | | 1,522,249 | | | | 101,378,441 | |
| Mastercard, Inc., “A” | | | 249,922 | | | | 72,539,861 | |
| | | | | | | | |
| | | | | | | $ | 674,293,296 | |
| Pharmaceuticals - 8.8% | | | | | | |
| Bayer AG | | | 1,931,026 | | | $ | 139,803,788 | |
| Kyowa Kirin Co. Ltd. | | | 2,433,100 | | | | 57,725,270 | |
| Novo Nordisk A.S., “B” | | | 3,559,579 | | | | 211,558,126 | |
| Roche Holding AG | | | 986,771 | | | | 321,632,564 | |
| Santen Pharmaceutical Co. Ltd. | | | 8,758,300 | | | | 140,639,492 | |
| | | | | | | | |
| | | | | | | $ | 871,359,240 | |
| Printing & Publishing - 1.8% | | | | | | |
| RELX PLC | | | 2,503,095 | | | $ | 60,575,693 | |
| Wolters Kluwer N.V. | | | 1,566,782 | | | | 115,154,151 | |
| | | | | | | | |
| | | | | | | $ | 175,729,844 | |
| Real Estate - 2.7% | | | | | | |
| Grand City Properties S.A. | | | 5,912,042 | | | $ | 138,584,740 | |
| LEG Immobilien AG | | | 1,081,979 | | | | 129,287,352 | |
| | | | | | | | |
| | | | | | | $ | 267,872,092 | |
| Restaurants - 0.7% | | | | | | |
| Yum China Holdings, Inc. | | | 1,562,334 | | | $ | 68,414,606 | |
| | |
| Specialty Chemicals - 8.4% | | | | | | |
| Akzo Nobel N.V. | | | 1,514,512 | | | $ | 121,590,144 | |
| Croda International PLC | | | 1,902,532 | | | | 111,565,707 | |
9
Portfolio of Investments (unaudited) – continued
| | | | | | | | |
| | |
| Issuer | | Shares/Par | | | Value ($) | |
| Common Stocks - continued | | | | | | |
| | |
| Specialty Chemicals - continued | | | | | | |
| Kansai Paint Co. Ltd. | | | 2,362,900 | | | $ | 51,445,125 | |
| Linde PLC | | | 1,229,712 | | | | 232,844,260 | |
| Nitto Denko Corp. | | | 1,384,000 | | | | 69,007,881 | |
| Sika AG | | | 677,900 | | | | 121,116,614 | |
| Symrise AG | | | 1,185,490 | | | | 115,465,519 | |
| | | | | | | | |
| | | | | | | $ | 823,035,250 | |
| Specialty Stores - 0.2% | | | | | | |
| Dufry AG | | | 214,632 | | | $ | 15,698,968 | |
| | |
| Telecommunications - Wireless - 3.4% | | | | | | |
| Advanced Info Service Public Co. Ltd. | | | 8,297,700 | | | $ | 52,854,942 | |
| KDDI Corp. | | | 3,856,700 | | | | 108,991,839 | |
| SoftBank Corp. | | | 2,520,600 | | | | 116,125,354 | |
| Tele2 AB, “B” | | | 4,077,603 | | | | 59,357,296 | |
| | | | | | | | |
| | | | | | | $ | 337,329,431 | |
| Telephone Services - 0.6% | | | | | | |
| Hellenic Telecommunications Organization S.A. | | | 3,933,166 | | | $ | 55,814,091 | |
| | |
| Tobacco - 2.1% | | | | | | |
| British American Tobacco PLC | | | 3,597,177 | | | $ | 142,951,022 | |
| Japan Tobacco, Inc. | | | 3,220,000 | | | | 63,857,376 | |
| | | | | | | | |
| | | | | | | $ | 206,808,398 | |
| Trucking - 0.3% | | | | | | |
| Yamato Holdings Co. Ltd. | | | 2,121,000 | | | $ | 33,289,884 | |
| | |
| Utilities - Electric Power - 2.8% | | | | | | |
| CLP Holdings Ltd. | | | 8,055,500 | | | $ | 84,879,743 | |
| Iberdrola S.A. | | | 12,574,243 | | | | 143,920,389 | |
| Orsted A.S. | | | 493,048 | | | | 50,737,531 | |
| | | | | | | | |
| | | | | | | $ | 279,537,663 | |
| Total Common Stocks (Identified Cost, $8,964,411,043) | | | | | | $ | 9,768,843,694 | |
| | |
| Investment Companies (h) - 0.7% | | | | | | |
| Money Market Funds - 0.7% | | | | | | |
MFS Institutional Money Market Portfolio, 1.61% (v)
(Identified Cost, $71,008,132) | | | 71,012,329 | | | $ | 71,019,430 | |
| | |
| Other Assets, Less Liabilities - 0.2% | | | | | 15,860,636 | |
| Net Assets - 100.0% | | | | | | $ | 9,855,723,760 | |
10
Portfolio of Investments (unaudited) – continued
| (a) | Non-income producing security. |
| (h) | An affiliated issuer, which may be considered one in which the fund owns 5% or more of the outstanding voting securities, or a company which is under common control. At period end, the aggregate values of the fund’s investments in affiliated issuers and in unaffiliated issuers were $71,019,430 and $9,768,843,694, respectively. |
| (l) | A portion of this security is on loan. See Note 2 for additional information. |
| (v) | Affiliated issuer that is available only to investment companies managed by MFS. The rate quoted for the MFS Institutional Money Market Portfolio is the annualizedseven-day yield of the fund at period end. |
The following abbreviations are used in this report and are defined:
| ADR | | American Depositary Receipt |
See Notes to Financial Statements
11
Financial Statements
STATEMENT OF ASSETS AND LIABILITIES
At 2/29/20 (unaudited)
This statement represents your fund’s balance sheet, which details the assets and liabilities comprising the total value of the fund.
| | | | |
| Assets | | | | |
Investments in unaffiliated issuers, at value, including $2,202,728 of securities on loan (identified cost, $8,964,411,043) | | | $9,768,843,694 | |
Investments in affiliated issuers, at value (identified cost, $71,008,132) | | | 71,019,430 | |
Cash | | | 432,577 | |
Foreign currency, at value (identified cost, $3,733,341) | | | 3,757,842 | |
Receivables for | | | | |
Investments sold | | | 17,049,739 | |
Fund shares sold | | | 50,159,093 | |
Interest and dividends | | | 34,873,661 | |
Other assets | | | 26,203 | |
Total assets | | | $9,946,162,239 | |
| |
| Liabilities | | | | |
Payables for | | | | |
Investments purchased | | | $62,685,582 | |
Fund shares reacquired | | | 23,983,023 | |
Payable to affiliates | | | | |
Investment adviser | | | 547,688 | |
Administrative services fee | | | 4,666 | |
Shareholder servicing costs | | | 793,797 | |
Distribution and service fees | | | 19,580 | |
Program manager fees | | | 63 | |
Payable for independent Trustees’ compensation | | | 6,912 | |
Deferred country tax expense payable | | | 1,611,728 | |
Accrued expenses and other liabilities | | | 785,440 | |
Total liabilities | | | $90,438,479 | |
Net assets | | | $9,855,723,760 | |
| |
| Net assets consist of | | | | |
Paid-in capital | | | $9,201,814,582 | |
Total distributable earnings (loss) | | | 653,909,178 | |
Net assets | | | $9,855,723,760 | |
Shares of beneficial interest outstanding | | | 547,598,736 | |
12
Statement of Assets and Liabilities (unaudited) – continued
| | | | | | | | | | | | |
| | | |
| | | Net assets | | | Shares
outstanding | | | Net asset value
per share (a) | |
Class A | | | $641,444,251 | | | | 35,503,574 | | | | $18.07 | |
Class B | | | 2,900,597 | | | | 165,978 | | | | 17.48 | |
Class C | | | 20,832,831 | | | | 1,224,513 | | | | 17.01 | |
Class I | | | 691,407,435 | | | | 36,918,852 | | | | 18.73 | |
Class R1 | | | 1,769,129 | | | | 106,229 | | | | 16.65 | |
Class R2 | | | 90,302,571 | | | | 5,176,756 | | | | 17.44 | |
Class R3 | | | 60,638,002 | | | | 3,392,105 | | | | 17.88 | |
Class R4 | | | 35,038,865 | | | | 1,935,991 | | | | 18.10 | |
Class R6 | | | 8,296,350,894 | | | | 462,310,763 | | | | 17.95 | |
Class 529A | | | 11,973,101 | | | | 676,614 | | | | 17.70 | |
Class 529B | | | 253,203 | | | | 15,175 | | | | 16.69 | |
Class 529C | | | 2,812,881 | | | | 172,186 | | | | 16.34 | |
| (a) | Maximum offering price per share was equal to the net asset value per share for all share classes, except for Classes A and 529A, for which the maximum offering prices per share were $19.17 [100 / 94.25 x $18.07] and $18.78 [100 / 94.25 x $17.70], respectively. On sales of $50,000 or more, the maximum offering prices of Class A and Class 529A shares are reduced. A contingent deferred sales charge may be imposed on redemptions of Class A, Class B, Class C, Class 529B, and Class 529C shares. Redemption price per share was equal to the net asset value per share for Classes I, R1, R2, R3, R4, R6, and 529A. |
See Notes to Financial Statements
13
Financial Statements
STATEMENT OF OPERATIONS
Six months ended 2/29/20 (unaudited)
This statement describes how much your fund earned in investment income and accrued in expenses. It also describes any gains and/or losses generated by fund operations.
| | | | |
| Net investment income (loss) | | | | |
Income | | | | |
Dividends | | | $68,046,082 | |
Dividends from affiliated issuers | | | 981,476 | |
Other | | | 53,589 | |
Income on securities loaned | | | 5,912 | |
Interest | | | 14 | |
Foreign taxes withheld | | | (5,669,027 | ) |
Total investment income | | | $63,418,046 | |
Expenses | | | | |
Management fee | | | $33,422,046 | |
Distribution and service fees | | | 1,341,924 | |
Shareholder servicing costs | | | 941,960 | |
Program manager fees | | | 3,976 | |
Administrative services fee | | | 275,671 | |
Independent Trustees’ compensation | | | 50,523 | |
Custodian fee | | | 652,830 | |
Shareholder communications | | | 111,465 | |
Audit and tax fees | | | 36,341 | |
Legal fees | | | 36,824 | |
Miscellaneous | | | 175,136 | |
Total expenses | | | $37,048,696 | |
Reduction of expenses by investment adviser and distributor | | | (505,162 | ) |
Net expenses | | | $36,543,534 | |
Net investment income (loss) | | | $26,874,512 | |
| |
| Realized and unrealized gain (loss) | | | | |
Realized gain (loss) (identified cost basis) | | | | |
Unaffiliated issuers (net of $165,944 country tax) | | | $87,667,271 | |
Affiliated issuers | | | 102 | |
Foreign currency | | | (203,565 | ) |
Net realized gain (loss) | | | $87,463,808 | |
Change in unrealized appreciation or depreciation | | | | |
Unaffiliated issuers (net of $1,026,530 decrease in deferred country tax) | | | $90,387,118 | |
Affiliated issuers | | | (223 | ) |
Translation of assets and liabilities in foreign currencies | | | 413,160 | |
Net unrealized gain (loss) | | | $90,800,055 | |
Net realized and unrealized gain (loss) | | | $178,263,863 | |
Change in net assets from operations | | | $205,138,375 | |
See Notes to Financial Statements
14
Financial Statements
STATEMENTS OF CHANGES IN NET ASSETS
These statements describe the increases and/or decreases in net assets resulting from operations, any distributions, and any shareholder transactions.
| | | | | | | | |
| Change in net assets | | Six months ended
2/29/20
(unaudited) | | | Year ended
8/31/19 | |
| | |
| From operations | | | | | | | | |
Net investment income (loss) | | | $26,874,512 | | | | $173,044,547 | |
Net realized gain (loss) | | | 87,463,808 | | | | (159,620,089 | ) |
Net unrealized gain (loss) | | | 90,800,055 | | | | (109,450,837 | ) |
Change in net assets from operations | | | $205,138,375 | | | | $(96,026,379 | ) |
Total distributions to shareholders | | | $(195,001,414 | ) | | | $(399,506,930 | ) |
Change in net assets from fund share transactions | | | $1,021,744,409 | | | | $904,797,447 | |
Total change in net assets | | | $1,031,881,370 | | | | $409,264,138 | |
| | |
| Net assets | | | | | | | | |
At beginning of period | | | 8,823,842,390 | | | | 8,414,578,252 | |
At end of period | | | $9,855,723,760 | | | | $8,823,842,390 | |
See Notes to Financial Statements
15
Financial Statements
FINANCIAL HIGHLIGHTS
The financial highlights table is intended to help you understand the fund’s financial performance for the semiannual period and the past 5 fiscal years. Certain information reflects financial results for a single fund share. The total returns in the table represent the rate that an investor would have earned (or lost) on an investment in the fund share class (assuming reinvestment of all distributions) held for the entire period.
| | | | | | | | | | | | | | | | | | | | | | | | |
| | | Six months
ended
2/29/20 | | | Year ended | |
| Class A | | 8/31/19 | | | 8/31/18 | | | 8/31/17 | | | 8/31/16 | | | 8/31/15 | |
| | | (unaudited) | | | | | | | | | | | | | | | | |
Net asset value, beginning of
period | | | $17.89 | | | | $19.19 | | | | $18.16 | | | | $15.83 | | | | $16.34 | | | | $18.06 | |
| | | |
| Income (loss) from investment operations | | | | | | | | | | | | | |
Net investment income (loss) (d) | | | $0.02 | | | | $0.32 | | | | $0.26 | | | | $0.20 | (c) | | | $0.25 | | | | $0.26 | |
Net realized and unrealized
gain (loss) | | | 0.48 | | | | (0.77 | ) | | | 0.97 | | | | 2.39 | | | | (0.50 | ) | | | (1.60 | ) |
Total from investment operations | | | $0.50 | | | | $(0.45 | ) | | | $1.23 | | | | $2.59 | | | | $(0.25 | ) | | | $(1.34 | ) |
| | | |
| Less distributions declared to shareholders | | | | | | | | | | | | | |
From net investment income | | | $(0.32 | ) | | | $(0.72 | ) | | | $(0.20 | ) | | | $(0.26 | ) | | | $(0.26 | ) | | | $(0.38 | ) |
From net realized gain | | | — | | | | (0.13 | ) | | | — | | | | — | | | | — | | | | — | |
Total distributions declared to
shareholders | | | $(0.32 | ) | | | $(0.85 | ) | | | $(0.20 | ) | | | $(0.26 | ) | | | $(0.26 | ) | | | $(0.38 | ) |
Net asset value, end of period (x) | | | $18.07 | | | | $17.89 | | | | $19.19 | | | | $18.16 | | | | $15.83 | | | | $16.34 | |
Total return (%) (r)(s)(t)(x) | | | 2.71 | (n) | | | (1.82 | ) | | | 6.79 | | | | 16.66 | (c) | | | (1.50 | ) | | | (7.44 | ) |
| | | |
Ratios (%) (to average net assets)
and Supplemental data: | | | | | | | | | | | | | |
Expenses before expense
reductions (f) | | | 1.07 | (a) | | | 1.10 | | | | 1.09 | | | | 1.12 | (c) | | | 1.14 | | | | 1.13 | |
Expenses after expense
reductions (f) | | | 1.05 | (a) | | | 1.09 | | | | 1.08 | | | | 1.10 | (c) | | | 1.11 | | | | 1.09 | |
Net investment income (loss) | | | 0.25 | (a)(l) | | | 1.79 | | | | 1.37 | | | | 1.25 | (c) | | | 1.62 | | | | 1.53 | |
Portfolio turnover | | | 8 | (n) | | | 22 | | | | 25 | | | | 33 | | | | 40 | | | | 28 | |
Net assets at end of period
(000 omitted) | | | $641,444 | | | | $622,639 | | | | $686,128 | | | | $693,538 | | | | $971,630 | | | | $1,178,013 | |
See Notes to Financial Statements
16
Financial Highlights – continued
| | | | | | | | | | | | | | | | | | | | | | | | |
| | | Six months
ended
2/29/20 | | | Year ended | |
| Class B | | 8/31/19 | | | 8/31/18 | | | 8/31/17 | | | 8/31/16 | | | 8/31/15 | |
| | | (unaudited) | | | | | | | | | | | | | | | | |
Net asset value, beginning of
period | | | $17.23 | | | | $18.48 | | | | $17.48 | | | | $15.21 | | | | $15.65 | | | | $17.26 | |
| | | |
| Income (loss) from investment operations | | | | | | | | | | | | | |
Net investment income (loss) (d) | | | $(0.04 | ) | | | $0.16 | | | | $0.10 | | | | $0.10 | (c) | | | $0.12 | | | | $0.12 | |
Net realized and unrealized
gain (loss) | | | 0.46 | | | | (0.72 | ) | | | 0.95 | | | | 2.28 | | | | (0.47 | ) | | | (1.52 | ) |
Total from investment operations | | | $0.42 | | | | $(0.56 | ) | | | $1.05 | | | | $2.38 | | | | $(0.35 | ) | | | $(1.40 | ) |
| | | |
| Less distributions declared to shareholders | | | | | | | | | | | | | |
From net investment income | | | $(0.17 | ) | | | $(0.56 | ) | | | $(0.05 | ) | | | $(0.11 | ) | | | $(0.09 | ) | | | $(0.21 | ) |
From net realized gain | | | — | | | | (0.13 | ) | | | — | | | | — | | | | — | | | | — | |
Total distributions declared to
shareholders | | | $(0.17 | ) | | | $(0.69 | ) | | | $(0.05 | ) | | | $(0.11 | ) | | | $(0.09 | ) | | | $(0.21 | ) |
Net asset value, end of period (x) | | | $17.48 | | | | $17.23 | | | | $18.48 | | | | $17.48 | | | | $15.21 | | | | $15.65 | |
Total return (%) (r)(s)(t)(x) | | | 2.37 | (n) | | | (2.63 | ) | | | 6.01 | | | | 15.77 | (c) | | | (2.20 | ) | | | (8.15 | ) |
| | | |
Ratios (%) (to average net assets)
and Supplemental data: | | | | | | | | | | | | | |
Expenses before expense
reductions (f) | | | 1.82 | (a) | | | 1.85 | | | | 1.84 | | | | 1.87 | (c) | | | 1.89 | | | | 1.88 | |
Expenses after expense
reductions (f) | | | 1.81 | (a) | | | 1.84 | | | | 1.82 | | | | 1.85 | (c) | | | 1.86 | | | | 1.84 | |
Net investment income (loss) | | | (0.48 | )(a)(l) | | | 0.97 | | | | 0.55 | | | | 0.61 | (c) | | | 0.82 | | | | 0.70 | |
Portfolio turnover | | | 8 | (n) | | | 22 | | | | 25 | | | | 33 | | | | 40 | | | | 28 | |
Net assets at end of period
(000 omitted) | | | $2,901 | | | | $3,347 | | | | $4,922 | | | | $6,228 | | | | $7,967 | | | | $11,228 | |
See Notes to Financial Statements
17
Financial Highlights – continued
| | | | | | | | | | | | | | | | | | | | | | | | |
| | | Six months
ended
2/29/20 | | | Year ended | |
| Class C | | 8/31/19 | | | 8/31/18 | | | 8/31/17 | | | 8/31/16 | | | 8/31/15 | |
| | | (unaudited) | | | | | | | | | | | | | | | | |
Net asset value, beginning of
period | | | $16.79 | | | | $17.99 | | | | $17.03 | | | | $14.85 | | | | $15.31 | | | | $16.93 | |
| | | |
| Income (loss) from investment operations | | | | | | | | | | | | | |
Net investment income (loss) (d) | | | $(0.04 | ) | | | $0.17 | | | | $0.08 | | | | $0.10 | (c) | | | $0.12 | | | | $0.12 | |
Net realized and unrealized
gain (loss) | | | 0.43 | | | | (0.70 | ) | | | 0.94 | | | | 2.21 | | | | (0.45 | ) | | | (1.50 | ) |
Total from investment operations | | | $0.39 | | | | $(0.53 | ) | | | $1.02 | | | | $2.31 | | | | $(0.33 | ) | | | $(1.38 | ) |
| | | |
| Less distributions declared to shareholders | | | | | | | | | | | | | |
From net investment income | | | $(0.17 | ) | | | $(0.54 | ) | | | $(0.06 | ) | | | $(0.13 | ) | | | $(0.13 | ) | | | $(0.24 | ) |
From net realized gain | | | — | | | | (0.13 | ) | | | — | | | | — | | | | — | | | | — | |
Total distributions declared to
shareholders | | | $(0.17 | ) | | | $(0.67 | ) | | | $(0.06 | ) | | | $(0.13 | ) | | | $(0.13 | ) | | | $(0.24 | ) |
Net asset value, end of period (x) | | | $17.01 | | | | $16.79 | | | | $17.99 | | | | $17.03 | | | | $14.85 | | | | $15.31 | |
Total return (%) (r)(s)(t)(x) | | | 2.29 | (n) | | | (2.56 | ) | | | 5.97 | | | | 15.74 | (c) | | | (2.16 | ) | | | (8.17 | ) |
| | | |
Ratios (%) (to average net assets)
and Supplemental data: | | | | | | | | | | | | | |
Expenses before expense
reductions (f) | | | 1.82 | (a) | | | 1.85 | | | | 1.84 | | | | 1.87 | (c) | | | 1.89 | | | | 1.88 | |
Expenses after expense
reductions (f) | | | 1.81 | (a) | | | 1.84 | | | | 1.83 | | | | 1.85 | (c) | | | 1.86 | | | | 1.84 | |
Net investment income (loss) | | | (0.48 | )(a)(l) | | | 1.05 | | | | 0.44 | | | | 0.64 | (c) | | | 0.85 | | | | 0.76 | |
Portfolio turnover | | | 8 | (n) | | | 22 | | | | 25 | | | | 33 | | | | 40 | | | | 28 | |
Net assets at end of period
(000 omitted) | | | $20,833 | | | | $22,825 | | | | $27,800 | | | | $48,570 | | | | $62,124 | | | | $77,442 | |
See Notes to Financial Statements
18
Financial Highlights – continued
| | | | | | | | | | | | | | | | | | | | | | | | |
| | | Six months
ended
2/29/20 | | | Year ended | |
| Class I | | 8/31/19 | | | 8/31/18 | | | 8/31/17 | | | 8/31/16 | | | 8/31/15 | |
| | | (unaudited) | | | | | | | | | | | | | | | | |
Net asset value, beginning of
period | | | $18.55 | | | | $19.87 | | | | $18.79 | | | | $16.38 | | | | $16.90 | | | | $18.66 | |
| | | |
| Income (loss) from investment operations | | | | | | | | | | | | | |
Net investment income (loss) (d) | | | $0.05 | | | | $0.37 | | | | $0.26 | | | | $0.30 | (c) | | | $0.30 | | | | $0.32 | |
Net realized and unrealized
gain (loss) | | | 0.50 | | | | (0.80 | ) | | | 1.06 | | | | 2.42 | | | | (0.51 | ) | | | (1.66 | ) |
Total from investment operations | | | $0.55 | | | | $(0.43 | ) | | | $1.32 | | | | $2.72 | | | | $(0.21 | ) | | | $(1.34 | ) |
| | | |
| Less distributions declared to shareholders | | | | | | | | | | | | | |
From net investment income | | | $(0.37 | ) | | | $(0.76 | ) | | | $(0.24 | ) | | | $(0.31 | ) | | | $(0.31 | ) | | | $(0.42 | ) |
From net realized gain | | | — | | | | (0.13 | ) | | | — | | | | — | | | | — | | | | — | |
Total distributions declared to
shareholders | | | $(0.37 | ) | | | $(0.89 | ) | | | $(0.24 | ) | | | $(0.31 | ) | | | $(0.31 | ) | | | $(0.42 | ) |
Net asset value, end of period (x) | | | $18.73 | | | | $18.55 | | | | $19.87 | | | | $18.79 | | | | $16.38 | | | | $16.90 | |
Total return (%) (r)(s)(t)(x) | | | 2.84 | (n) | | | (1.61 | ) | | | 7.05 | | | | 16.95 | (c) | | | (1.24 | ) | | | (7.19 | ) |
| | | |
Ratios (%) (to average net assets)
and Supplemental data: | | | | | | | | | | | | | |
Expenses before expense
reductions (f) | | | 0.82 | (a) | | | 0.85 | | | | 0.84 | | | | 0.87 | (c) | | | 0.89 | | | | 0.88 | |
Expenses after expense
reductions (f) | | | 0.81 | (a) | | | 0.84 | | | | 0.83 | | | | 0.86 | (c) | | | 0.86 | | | | 0.84 | |
Net investment income (loss) | | | 0.50 | (a)(l) | | | 2.03 | | | | 1.31 | | | | 1.79 | (c) | | | 1.86 | | | | 1.80 | |
Portfolio turnover | | | 8 | (n) | | | 22 | | | | 25 | | | | 33 | | | | 40 | | | | 28 | |
Net assets at end of period
(000 omitted) | | | $691,407 | | | | $593,064 | | | | $658,193 | | | | $1,099,134 | | | | $2,187,011 | | | | $2,410,936 | |
See Notes to Financial Statements
19
Financial Highlights – continued
| | | | | | | | | | | | | | | | | | | | | | | | |
| | | Six months
ended
2/29/20 | | | Year ended | |
| Class R1 | | 8/31/19 | | | 8/31/18 | | | 8/31/17 | | | 8/31/16 | | | 8/31/15 | |
| | | (unaudited) | | | | | | | | | | | | | | | | |
Net asset value, beginning of
period | | | $16.46 | | | | $17.72 | | | | $16.80 | | | | $14.63 | | | | $15.08 | | | | $16.69 | |
| | | |
| Income (loss) from investment operations | | | | | | | | | | | | | |
Net investment income (loss) (d) | | | $(0.04 | ) | | | $0.15 | | | | $0.11 | | | | $0.09 | (c) | | | $0.11 | | | | $0.11 | |
Net realized and unrealized
gain (loss) | | | 0.44 | | | | (0.69 | ) | | | 0.90 | | | | 2.20 | | | | (0.44 | ) | | | (1.47 | ) |
Total from investment operations | | | $0.40 | | | | $(0.54 | ) | | | $1.01 | | | | $2.29 | | | | $(0.33 | ) | | | $(1.36 | ) |
| | | |
| Less distributions declared to shareholders | | | | | | | | | | | | | |
From net investment income | | | $(0.21 | ) | | | $(0.59 | ) | | | $(0.09 | ) | | | $(0.12 | ) | | | $(0.12 | ) | | | $(0.25 | ) |
From net realized gain | | | — | | | | (0.13 | ) | | | — | | | | — | | | | — | | | | — | |
Total distributions declared to
shareholders | | | $(0.21 | ) | | | $(0.72 | ) | | | $(0.09 | ) | | | $(0.12 | ) | | | $(0.12 | ) | | | $(0.25 | ) |
Net asset value, end of period (x) | | | $16.65 | | | | $16.46 | | | | $17.72 | | | | $16.80 | | | | $14.63 | | | | $15.08 | |
Total return (%) (r)(s)(t)(x) | | | 2.34 | (n) | | | (2.62 | ) | | | 5.99 | | | | 15.79 | (c) | | | (2.19 | ) | | | (8.18 | ) |
| | | |
Ratios (%) (to average net assets)
and Supplemental data: | | | | | | | | | | | | | |
Expenses before expense
reductions (f) | | | 1.82 | (a) | | | 1.85 | | | | 1.84 | | | | 1.87 | (c) | | | 1.89 | | | | 1.88 | |
Expenses after expense
reductions (f) | | | 1.81 | (a) | | | 1.84 | | | | 1.83 | | | | 1.85 | (c) | | | 1.86 | | | | 1.84 | |
Net investment income (loss) | | | (0.50 | )(a)(l) | | | 0.95 | | | | 0.60 | | | | 0.61 | (c) | | | 0.78 | | | | 0.72 | |
Portfolio turnover | | | 8 | (n) | | | 22 | | | | 25 | | | | 33 | | | | 40 | | | | 28 | |
Net assets at end of period
(000 omitted) | | | $1,769 | | | | $1,751 | | | | $2,153 | | | | $2,089 | | | | $2,418 | | | | $3,509 | |
See Notes to Financial Statements
20
Financial Highlights – continued
| | | | | | | | | | | | | | | | | | | | | | | | |
| | | Six months
ended
2/29/20 | | | Year ended | |
| Class R2 | | 8/31/19 | | | 8/31/18 | | | 8/31/17 | | | 8/31/16 | | | 8/31/15 | |
| | | (unaudited) | | | | | | | | | | | | | | | | |
Net asset value, beginning of
period | | | $17.25 | | | | $18.53 | | | | $17.55 | | | | $15.31 | | | | $15.80 | | | | $17.48 | |
| | | |
| Income (loss) from investment operations | | | | | | | | | | | | | |
Net investment income (loss) (d) | | | $0.00 | (w) | | | $0.26 | | | | $0.19 | | | | $0.17 | (c) | | | $0.21 | | | | $0.22 | |
Net realized and unrealized
gain (loss) | | | 0.46 | | | | (0.75 | ) | | | 0.95 | | | | 2.30 | | | | (0.48 | ) | | | (1.56 | ) |
Total from investment operations | | | $0.46 | | | | $(0.49 | ) | | | $1.14 | | | | $2.47 | | | | $(0.27 | ) | | | $(1.34 | ) |
| | | |
| Less distributions declared to shareholders | | | | | | | | | | | | | |
From net investment income | | | $(0.27 | ) | | | $(0.66 | ) | | | $(0.16 | ) | | | $(0.23 | ) | | | $(0.22 | ) | | | $(0.34 | ) |
From net realized gain | | | — | | | | (0.13 | ) | | | — | | | | — | | | | — | | | | — | |
Total distributions declared to
shareholders | | | $(0.27 | ) | | | $(0.79 | ) | | | $(0.16 | ) | | | $(0.23 | ) | | | $(0.22 | ) | | | $(0.34 | ) |
Net asset value, end of period (x) | | | $17.44 | | | | $17.25 | | | | $18.53 | | | | $17.55 | | | | $15.31 | | | | $15.80 | |
Total return (%) (r)(s)(t)(x) | | | 2.60 | (n) | | | (2.14 | ) | | | 6.49 | | | | 16.37 | (c) | | | (1.69 | ) | | | (7.69 | ) |
| | | |
Ratios (%) (to average net assets)
and Supplemental data: | | | | | | | | | | | | | |
Expenses before expense
reductions (f) | | | 1.32 | (a) | | | 1.35 | | | | 1.34 | | | | 1.37 | (c) | | | 1.39 | | | | 1.38 | |
Expenses after expense
reductions (f) | | | 1.30 | (a) | | | 1.34 | | | | 1.33 | | | | 1.35 | (c) | | | 1.36 | | | | 1.34 | |
Net investment income (loss) | | | 0.02 | (a)(l) | | | 1.51 | | | | 1.04 | | | | 1.10 | (c) | | | 1.38 | | | | 1.29 | |
Portfolio turnover | | | 8 | (n) | | | 22 | | | | 25 | | | | 33 | | | | 40 | | | | 28 | |
Net assets at end of period
(000 omitted) | | | $90,303 | | | | $98,935 | | | | $121,197 | | | | $132,988 | | | | $152,133 | | | | $169,812 | |
See Notes to Financial Statements
21
Financial Highlights – continued
| | | | | | | | | | | | | | | | | | | | | | | | |
| | | Six months
ended
2/29/20 | | | Year ended | |
| Class R3 | | 8/31/19 | | | 8/31/18 | | | 8/31/17 | | | 8/31/16 | | | 8/31/15 | |
| | | (unaudited) | | | | | | | | | | | | | | | | |
Net asset value, beginning of
period | | | $17.70 | | | | $18.99 | | | | $17.98 | | | | $15.67 | | | | $16.16 | | | | $17.86 | |
| | | |
| Income (loss) from investment operations | | | | | | | | | | | | | |
Net investment income (loss) (d) | | | $0.02 | | | | $0.30 | | | | $0.25 | | | | $0.22 | (c) | | | $0.24 | | | | $0.25 | |
Net realized and unrealized
gain (loss) | | | 0.48 | | | | (0.75 | ) | | | 0.96 | | | | 2.35 | | | | (0.48 | ) | | | (1.58 | ) |
Total from investment operations | | | $0.50 | | | | $(0.45 | ) | | | $1.21 | | | | $2.57 | | | | $(0.24 | ) | | | $(1.33 | ) |
| | | |
| Less distributions declared to shareholders | | | | | | | | | | | | | |
From net investment income | | | $(0.32 | ) | | | $(0.71 | ) | | | $(0.20 | ) | | | $(0.26 | ) | | | $(0.25 | ) | | | $(0.37 | ) |
From net realized gain | | | — | | | | (0.13 | ) | | | — | | | | — | | | | — | | | | — | |
Total distributions declared to
shareholders | | | $(0.32 | ) | | | $(0.84 | ) | | | $(0.20 | ) | | | $(0.26 | ) | | | $(0.25 | ) | | | $(0.37 | ) |
Net asset value, end of period (x) | | | $17.88 | | | | $17.70 | | | | $18.99 | | | | $17.98 | | | | $15.67 | | | | $16.16 | |
Total return (%) (r)(s)(t)(x) | | | 2.72 | (n) | | | (1.83 | ) | | | 6.75 | | | | 16.67 | (c) | | | (1.47 | ) | | | (7.44 | ) |
| | | |
Ratios (%) (to average net assets)
and Supplemental data: | | | | | | | | | | | | | |
Expenses before expense
reductions (f) | | | 1.07 | (a) | | | 1.10 | | | | 1.09 | | | | 1.12 | (c) | | | 1.14 | | | | 1.13 | |
Expenses after expense
reductions (f) | | | 1.06 | (a) | | | 1.09 | | | | 1.08 | | | | 1.10 | (c) | | | 1.11 | | | | 1.09 | |
Net investment income (loss) | | | 0.25 | (a)(l) | | | 1.73 | | | | 1.31 | | | | 1.37 | (c) | | | 1.59 | | | | 1.46 | |
Portfolio turnover | | | 8 | (n) | | | 22 | | | | 25 | | | | 33 | | | | 40 | | | | 28 | |
Net assets at end of period
(000 omitted) | | | $60,638 | | | | $61,214 | | | | $82,289 | | | | $91,653 | | | | $126,980 | | | | $165,656 | |
See Notes to Financial Statements
22
Financial Highlights – continued
| | | | | | | | | | | | | | | | | | | | | | | | |
| | | Six months
ended
2/29/20 | | | Year ended | |
| Class R4 | | 8/31/19 | | | 8/31/18 | | | 8/31/17 | | | 8/31/16 | | | 8/31/15 | |
| | | (unaudited) | | | | | | | | | | | | | | | | |
Net asset value, beginning of
period | | | $17.93 | | | | $19.25 | | | | $18.21 | | | | $15.86 | | | | $16.36 | | | | $18.09 | |
| | | |
| Income (loss) from investment operations | | | | | | | | | | | | | |
Net investment income (loss) (d) | | | $0.06 | | | | $0.36 | | | | $0.30 | | | | $0.28 | (c) | | | $0.30 | | | | $0.29 | |
Net realized and unrealized
gain (loss) | | | 0.47 | | | | (0.78 | ) | | | 0.98 | | | | 2.35 | | | | (0.50 | ) | | | (1.60 | ) |
Total from investment operations | | | $0.53 | | | | $(0.42 | ) | | | $1.28 | | | | $2.63 | | | | $(0.20 | ) | | | $(1.31 | ) |
| | | |
| Less distributions declared to shareholders | | | | | | | | | | | | | |
From net investment income | | | $(0.36 | ) | | | $(0.77 | ) | | | $(0.24 | ) | | | $(0.28 | ) | | | $(0.30 | ) | | | $(0.42 | ) |
From net realized gain | | | — | | | | (0.13 | ) | | | — | | | | — | | | | — | | | | — | |
Total distributions declared to
shareholders | | | $(0.36 | ) | | | $(0.90 | ) | | | $(0.24 | ) | | | $(0.28 | ) | | | $(0.30 | ) | | | $(0.42 | ) |
Net asset value, end of period (x) | | | $18.10 | | | | $17.93 | | | | $19.25 | | | | $18.21 | | | | $15.86 | | | | $16.36 | |
Total return (%) (r)(s)(t)(x) | | | 2.84 | (n) | | | (1.65 | ) | | | 7.07 | | | | 16.92 | (c) | | | (1.20 | ) | | | (7.26 | ) |
| | | |
Ratios (%) (to average net assets)
and Supplemental data: | | | | | | | | | | | | | |
Expenses before expense
reductions (f) | | | 0.82 | (a) | | | 0.85 | | | | 0.84 | | | | 0.87 | (c) | | | 0.89 | | | | 0.88 | |
Expenses after expense
reductions (f) | | | 0.81 | (a) | | | 0.84 | | | | 0.83 | | | | 0.86 | (c) | | | 0.86 | | | | 0.85 | |
Net investment income (loss) | | | 0.61 | (a)(l) | | | 2.04 | | | | 1.57 | | | | 1.73 | (c) | | | 1.93 | | | | 1.70 | |
Portfolio turnover | | | 8 | (n) | | | 22 | | | | 25 | | | | 33 | | | | 40 | | | | 28 | |
Net assets at end of period
(000 omitted) | | | $35,039 | | | | $54,352 | | | | $58,578 | | | | $63,884 | | | | $148,243 | | | | $343,475 | |
See Notes to Financial Statements
23
Financial Highlights – continued
| | | | | | | | | | | | | | | | | | | | | | | | |
| | | Six months
ended
2/29/20 | | | Year ended | |
| Class R6 | | 8/31/19 | | | 8/31/18 | | | 8/31/17 | | | 8/31/16 | | | 8/31/15 | |
| | | (unaudited) | | | | | | | | | | | | | | | | |
Net asset value, beginning of
period | | | $17.80 | | | | $19.11 | | | | $18.10 | | | | $15.79 | | | | $16.30 | | | | $18.02 | |
| | | |
| Income (loss) from investment operations | | | | | | | | | | | | | |
Net investment income (loss) (d) | | | $0.06 | | | | $0.38 | | | | $0.34 | | | | $0.28 | (c) | | | $0.31 | | | | $0.32 | |
Net realized and unrealized
gain (loss) | | | 0.48 | | | | (0.77 | ) | | | 0.95 | | | | 2.36 | | | | (0.50 | ) | | | (1.60 | ) |
Total from investment operations | | | $0.54 | | | | $(0.39 | ) | | | $1.29 | | | | $2.64 | | | | $(0.19 | ) | | | $(1.28 | ) |
| | | |
| Less distributions declared to shareholders | | | | | | | | | | | | | |
From net investment income | | | $(0.39 | ) | | | $(0.79 | ) | | | $(0.28 | ) | | | $(0.33 | ) | | | $(0.32 | ) | | | $(0.44 | ) |
From net realized gain | | | — | | | | (0.13 | ) | | | — | | | | — | | | | — | | | | — | |
Total distributions declared to
shareholders | | | $(0.39 | ) | | | $(0.92 | ) | | | $(0.28 | ) | | | $(0.33 | ) | | | $(0.32 | ) | | | $(0.44 | ) |
Net asset value, end of period (x) | | | $17.95 | | | | $17.80 | | | | $19.11 | | | | $18.10 | | | | $15.79 | | | | $16.30 | |
Total return (%) (r)(s)(t)(x) | | | 2.91 | (n) | | | (1.48 | ) | | | 7.12 | | | | 17.07 | (c) | | | (1.13 | ) | | | (7.13 | ) |
| | | |
Ratios (%) (to average net assets)
and Supplemental data: | | | | | | | | | | | | | |
Expenses before expense
reductions (f) | | | 0.71 | (a) | | | 0.74 | | | | 0.74 | | | | 0.77 | (c) | | | 0.79 | | | | 0.79 | |
Expenses after expense
reductions (f) | | | 0.70 | (a) | | | 0.73 | | | | 0.73 | | | | 0.76 | (c) | | | 0.76 | | | | 0.75 | |
Net investment income (loss) | | | 0.59 | (a)(l) | | | 2.18 | | | | 1.80 | | | | 1.72 | (c) | | | 2.02 | | | | 1.88 | |
Portfolio turnover | | | 8 | (n) | | | 22 | | | | 25 | | | | 33 | | | | 40 | | | | 28 | |
Net assets at end of period
(000 omitted) | | | $8,296,351 | | | | $7,350,641 | | | | $6,756,773 | | | | $5,228,377 | | | | $2,766,544 | | | | $3,010,863 | |
See Notes to Financial Statements
24
Financial Highlights – continued
| | | | | | | | | | | | | | | | | | | | | | | | |
| | | Six months
ended
2/29/20 | | | Year ended | |
| Class 529A | | 8/31/19 | | | 8/31/18 | | | 8/31/17 | | | 8/31/16 | | | 8/31/15 | |
| | | (unaudited) | | | | | | | | | | | | | | | | |
Net asset value, beginning of
period | | | $17.52 | | | | $18.83 | | | | $17.84 | | | | $15.61 | | | | $16.12 | | | | $17.81 | |
| | | |
| Income (loss) from investment operations | | | | | | | | | | | | | |
Net investment income (loss) (d) | | | $0.02 | | | | $0.31 | | | | $0.26 | | | | $0.23 | (c) | | | $0.19 | | | | $0.26 | |
Net realized and unrealized
gain (loss) | | | 0.48 | | | | (0.77 | ) | | | 0.95 | | | | 2.31 | | | | (0.44 | ) | | | (1.58 | ) |
Total from investment operations | | | $0.50 | | | | $(0.46 | ) | | | $1.21 | | | | $2.54 | | | | $(0.25 | ) | | | $(1.32 | ) |
| | | |
| Less distributions declared to shareholders | | | | | | | | | | | | | |
From net investment income | | | $(0.32 | ) | | | $(0.72 | ) | | | $(0.22 | ) | | | $(0.31 | ) | | | $(0.26 | ) | | | $(0.37 | ) |
From net realized gain | | | — | | | | (0.13 | ) | | | — | | | | — | | | | — | | | | — | |
Total distributions declared to
shareholders | | | $(0.32 | ) | | | $(0.85 | ) | | | $(0.22 | ) | | | $(0.31 | ) | | | $(0.26 | ) | | | $(0.37 | ) |
Net asset value, end of period (x) | | | $17.70 | | | | $17.52 | | | | $18.83 | | | | $17.84 | | | | $15.61 | | | | $16.12 | |
Total return (%) (r)(s)(t)(x) | | | 2.74 | (n) | | | (1.94 | ) | | | 6.78 | | | | 16.60 | (c) | | | (1.52 | ) | | | (7.43 | ) |
| | | |
Ratios (%) (to average net assets)
and Supplemental data: | | | | | | | | | | | | | |
Expenses before expense
reductions (f) | | | 1.12 | (a) | | | 1.15 | | | | 1.15 | | | | 1.22 | (c) | | | 1.23 | | | | 1.23 | |
Expenses after expense
reductions (f) | | | 1.09 | (a) | | | 1.13 | | | | 1.11 | | | | 1.13 | (c) | | | 1.13 | | | | 1.12 | |
Net investment income (loss) | | | 0.22 | (a)(l) | | | 1.77 | | | | 1.37 | | | | 1.39 | (c) | | | 1.22 | | | | 1.51 | |
Portfolio turnover | | | 8 | (n) | | | 22 | | | | 25 | | | | 33 | | | | 40 | | | | 28 | |
Net assets at end of period
(000 omitted) | | | $11,973 | | | | $11,805 | | | | $12,615 | | | | $10,464 | | | | $9,101 | | | | $2,419 | |
See Notes to Financial Statements
25
Financial Highlights – continued
| | | | | | | | | | | | | | | | | | | | | | | | |
| | | Six months
ended
2/29/20 | | | Year ended | |
| Class 529B | | 8/31/19 | | | 8/31/18 | | | 8/31/17 | | | 8/31/16 | | | 8/31/15 | |
| | | (unaudited) | | | | | | | | | | | | | | | | |
Net asset value, beginning of
period | | | $16.47 | | | | $17.72 | | | | $16.79 | | | | $14.78 | | | | $15.19 | | | | $16.80 | |
| | | |
| Income (loss) from investment operations | | | | | | | | | | | | | |
Net investment income (loss) (d) | | | $(0.05 | ) | | | $0.16 | | | | $0.10 | | | | $0.09 | (c) | | | $0.05 | | | | $0.10 | |
Net realized and unrealized
gain (loss) | | | 0.45 | | | | (0.71 | ) | | | 0.90 | | | | 2.18 | | | | (0.39 | ) | | | (1.47 | ) |
Total from investment operations | | | $0.40 | | | | $(0.55 | ) | | | $1.00 | | | | $2.27 | | | | $(0.34 | ) | | | $(1.37 | ) |
| | | |
| Less distributions declared to shareholders | | | | | | | | | | | | | |
From net investment income | | | $(0.18 | ) | | | $(0.57 | ) | | | $(0.07 | ) | | | $(0.26 | ) | | | $(0.07 | ) | | | $(0.24 | ) |
From net realized gain | | | — | | | | (0.13 | ) | | | — | | | | — | | | | — | | | | — | |
Total distributions declared to
shareholders | | | $(0.18 | ) | | | $(0.70 | ) | | | $(0.07 | ) | | | $(0.26 | ) | | | $(0.07 | ) | | | $(0.24 | ) |
Net asset value, end of period (x) | | | $16.69 | | | | $16.47 | | | | $17.72 | | | | $16.79 | | | | $14.78 | | | | $15.19 | |
Total return (%) (r)(s)(t)(x) | | | 2.36 | (n) | | | (2.64 | ) | | | 5.94 | | | | 15.68 | (c) | | | (2.25 | ) | | | (8.17 | ) |
| | | |
Ratios (%) (to average net assets)
and Supplemental data: | | | | | | | | | | | | | |
Expenses before expense
reductions (f) | | | 1.87 | (a) | | | 1.90 | | | | 1.90 | | | | 1.97 | (c) | | | 1.98 | | | | 1.98 | |
Expenses after expense
reductions (f) | | | 1.85 | (a) | | | 1.89 | | | | 1.88 | | | | 1.90 | (c) | | | 1.90 | | | | 1.89 | |
Net investment income (loss) | | | (0.53 | )(a)(l) | | | 1.00 | | | | 0.56 | | | | 0.58 | (c) | | | 0.37 | | | | 0.63 | |
Portfolio turnover | | | 8 | (n) | | | 22 | | | | 25 | | | | 33 | | | | 40 | | | | 28 | |
Net assets at end of period
(000 omitted) | | | $253 | | | | $287 | | | | $358 | | | | $386 | | | | $434 | | | | $138 | |
See Notes to Financial Statements
26
Financial Highlights – continued
| | | | | | | | | | | | | | | | | | | | | | | | |
| | | Six months
ended
2/29/20 | | | Year ended | |
| Class 529C | | 8/31/19 | | | 8/31/18 | | | 8/31/17 | | | 8/31/16 | | | 8/31/15 | |
| | | (unaudited) | | | | | | | | | | | | | | | | |
Net asset value, beginning of
period | | | $16.13 | | | | $17.38 | | | | $16.51 | | | | $14.53 | | | | $15.01 | | | | $16.61 | |
| | | |
| Income (loss) from investment operations | | | | | | | | | | | | | |
Net investment income (loss) (d) | | | $(0.05 | ) | | | $0.15 | | | | $0.09 | | | | $0.10 | (c) | | | $0.07 | | | | $0.11 | |
Net realized and unrealized
gain (loss) | | | 0.44 | | | | (0.69 | ) | | | 0.89 | | | | 2.15 | | | | (0.41 | ) | | | (1.46 | ) |
Total from investment operations | | | $0.39 | | | | $(0.54 | ) | | | $0.98 | �� | | | $2.25 | | | | $(0.34 | ) | | | $(1.35 | ) |
| | | |
| Less distributions declared to shareholders | | | | | | | | | | | | | |
From net investment income | | | $(0.18 | ) | | | $(0.58 | ) | | | $(0.11 | ) | | | $(0.27 | ) | | | $(0.14 | ) | | | $(0.25 | ) |
From net realized gain | | | — | | | | (0.13 | ) | | | — | | | | — | | | | — | | | | — | |
Total distributions declared to
shareholders | | | $(0.18 | ) | | | $(0.71 | ) | | | $(0.11 | ) | | | $(0.27 | ) | | | $(0.14 | ) | | | $(0.25 | ) |
Net asset value, end of period (x) | | | $16.34 | | | | $16.13 | | | | $17.38 | | | | $16.51 | | | | $14.53 | | | | $15.01 | |
Total return (%) (r)(s)(t)(x) | | | 2.36 | (n) | | | (2.68 | ) | | | 5.93 | | | | 15.78( | c) | | | (2.28 | ) | | | (8.17 | ) |
| | | |
Ratios (%) (to average net assets)
and Supplemental data: | | | | | | | | | | | | | |
Expenses before expense
reductions (f) | | | 1.87 | (a) | | | 1.90 | | | | 1.90 | | | | 1.97 | (c) | | | 1.99 | | | | 1.98 | |
Expenses after expense
reductions (f) | | | 1.85 | (a) | | | 1.89 | | | | 1.87 | | | | 1.89 | (c) | | | 1.90 | | | | 1.89 | |
Net investment income (loss) | | | (0.52 | )(a)(l) | | | 0.95 | | | | 0.53 | | | | 0.63 | (c) | | | 0.47 | | | | 0.72 | |
Portfolio turnover | | | 8 | (n) | | | 22 | | | | 25 | | | | 33 | | | | 40 | | | | 28 | |
Net assets at end of period
(000 omitted) | | | $2,813 | | | | $2,981 | | | | $3,572 | | | | $3,856 | | | | $3,298 | | | | $980 | |
| (c) | Amount reflects aone-time reimbursement of expenses by the custodian (or former custodian) without which net investment income and performance would be lower and expenses would be higher. |
| (d) | Per share data is based on average shares outstanding. |
| (f) | Ratios do not reflect reductions from fees paid indirectly, if applicable. |
| (l) | Recognition of net investment income by the fund may be affected by the timing of the declaration of dividends by companies in which the fund invests and the actual annual net investment income ratio may differ. |
| (r) | Certain expenses have been reduced without which performance would have been lower. |
| (s) | From time to time the fund may receive proceeds from litigation settlements, without which performance would be lower. |
| (t) | Total returns do not include any applicable sales charges. |
| (w) | Per share amount was less than $0.01. |
| (x) | The net asset values and total returns have been calculated on net assets which include adjustments made in accordance with U.S. generally accepted accounting principles required at period end for financial reporting purposes. |
See Notes to Financial Statements
27
NOTES TO FINANCIAL STATEMENTS
(unaudited)
(1) Business and Organization
MFS Research International Fund (the fund) is a diversified series of MFS Series Trust I (the trust). The trust is organized as a Massachusetts business trust and is registered under the Investment Company Act of 1940, as amended, as anopen-end management investment company.
The fund is an investment company and accordingly follows the investment company accounting and reporting guidance of the Financial Accounting Standards Board (FASB) Accounting Standards Codification Topic 946 Financial Services – Investment Companies.
(2) Significant Accounting Policies
General– The preparation of financial statements in conformity with U.S. generally accepted accounting principles requires management to make estimates and assumptions that affect the reported amounts of assets and liabilities, and disclosure of contingent assets and liabilities at the date of the financial statements and the reported amounts of increases and decreases in net assets from operations during the reporting period. Actual results could differ from those estimates. In the preparation of these financial statements, management has evaluated subsequent events occurring after the date of the fund’s Statement of Assets and Liabilities through the date that the financial statements were issued. The fund invests in foreign securities. Investments in foreign securities are vulnerable to the effects of changes in the relative values of the local currency and the U.S. dollar and to the effects of changes in each country’s market, economic, industrial, political, regulatory, geopolitical, and other conditions.
In March 2020, the FASB issued Accounting Standards Update2020-04, Reference Rate Reform (Topic 848) – Facilitation of the Effects of Reference Rate Reform on Financial Reporting (“ASU2020-04”), which provides optional, temporary relief with respect to the financial reporting of contracts subject to certain types of modifications due to the planned discontinuation of the London Interbank Offered Rate (LIBOR) and other IBOR-based reference rates as of the end of 2021. The temporary relief provided by ASU2020-04 is effective for certain reference rate-related contract modifications that occur during the period from March 12, 2020 through December 31, 2022. Management is evaluating the impact of ASU2020-04 on the fund’s investments, derivatives, debt and other contracts that will undergo reference rate-related modifications as a result of the reference rate reform.
Balance Sheet Offsetting– The fund’s accounting policy with respect to balance sheet offsetting is that, absent an event of default by the counterparty or a termination of the agreement, the International Swaps and Derivatives Association (ISDA) Master Agreement, or similar agreement, does not result in an offset of reported amounts of financial assets and financial liabilities in the Statement of Assets and Liabilities across transactions between the fund and the applicable counterparty. The fund’s right to setoff may be restricted or prohibited by the bankruptcy or insolvency laws of the particular jurisdiction to which a specific master netting agreement counterparty is subject. Balance sheet offsetting disclosures, to the extent applicable to the fund, have been included in the fund’s Significant Accounting Policies note under the captions for each of the fund’sin-scope financial instruments and transactions.
28
Notes to Financial Statements (unaudited) – continued
Investment Valuations– Equity securities, including restricted equity securities, are generally valued at the last sale or official closing price on their primary market or exchange as provided by a third-party pricing service. Equity securities, for which there were no sales reported that day, are generally valued at the last quoted daily bid quotation on their primary market or exchange as provided by a third-party pricing service. Short-term instruments with a maturity at issuance of 60 days or less may be valued at amortized cost, which approximates market value.Open-end investment companies are generally valued at net asset value per share. Securities and other assets generally valued on the basis of information from a third-party pricing service may also be valued at a broker/dealer bid quotation. In determining values, third-party pricing services can utilize both transaction data and market information such as yield, quality, coupon rate, maturity, type of issue, trading characteristics, and other market data. The values of foreign securities and other assets and liabilities expressed in foreign currencies are converted to U.S. dollars using the mean of bid and asked prices for rates provided by a third-party pricing service.
The Board of Trustees has delegated primary responsibility for determining or causing to be determined the value of the fund’s investments (including any fair valuation) to the adviser pursuant to valuation policies and procedures approved by the Board. If the adviser determines that reliable market quotations are not readily available, investments are valued at fair value as determined in good faith by the adviser in accordance with such procedures under the oversight of the Board of Trustees. Under the fund’s valuation policies and procedures, market quotations are not considered to be readily available for most types of debt instruments and floating rate loans and many types of derivatives. These investments are generally valued at fair value based on information from third-party pricing services. In addition, investments may be valued at fair value if the adviser determines that an investment’s value has been materially affected by events occurring after the close of the exchange or market on which the investment is principally traded (such as foreign exchange or market) and prior to the determination of the fund’s net asset value, or after the halt of trading of a specific security where trading does not resume prior to the close of the exchange or market on which the security is principally traded. Events that occur after foreign markets close (such as developments in foreign markets and significant movements in the U.S. markets) and prior to the determination of the fund’s net asset value may be deemed to have a material effect on the value of securities traded in foreign markets. Accordingly, the fund’s foreign equity securities may often be valued at fair value. The adviser generally relies on third-party pricing services or other information (such as the correlation with price movements of similar securities in the same or other markets; the type, cost and investment characteristics of the security; the business and financial condition of the issuer; and trading and other market data) to assist in determining whether to fair value and at what value to fair value an investment. The value of an investment for purposes of calculating the fund’s net asset value can differ depending on the source and method used to determine value. When fair valuation is used, the value of an investment used to determine the fund’s net asset value may differ from quoted or published prices for the same investment. There can be no assurance that the fund could obtain the fair value assigned to an investment if it were to sell the investment at the same time at which the fund determines its net asset value per share.
29
Notes to Financial Statements (unaudited) – continued
Various inputs are used in determining the value of the fund’s assets or liabilities. These inputs are categorized into three broad levels. In certain cases, the inputs used to measure fair value may fall into different levels of the fair value hierarchy. In such cases, an investment’s level within the fair value hierarchy is based on the lowest level of input that is significant to the fair value measurement. The fund’s assessment of the significance of a particular input to the fair value measurement in its entirety requires judgment, and considers factors specific to the investment. Level 1 includes unadjusted quoted prices in active markets for identical assets or liabilities. Level 2 includes other significant observable market-based inputs (including quoted prices for similar securities, interest rates, prepayment speed, and credit risk). Level 3 includes unobservable inputs, which may include the adviser’s own assumptions in determining the fair value of investments. The following is a summary of the levels used as of February 29, 2020 in valuing the fund’s assets or liabilities:
| | | | | | | | | | | | | | | | |
| | | | |
| Financial Instruments | | Level 1 | | | Level 2 | | | Level 3 | | | Total | |
| Equity Securities: | | | | | | | | | | | | | | | | |
Japan | | | $140,639,492 | | | | $1,809,290,329 | | | | $— | | | | $1,949,929,821 | |
Switzerland | | | — | | | | 1,369,054,243 | | | | — | | | | 1,369,054,243 | |
France | | | — | | | | 1,174,854,240 | | | | — | | | | 1,174,854,240 | |
Germany | | | — | | | | 752,480,484 | | | | — | | | | 752,480,484 | |
United Kingdom | | | — | | | | 736,194,522 | | | | — | | | | 736,194,522 | |
United States | | | 377,722,308 | | | | 232,844,260 | | | | — | | | | 610,566,568 | |
Hong Kong | | | — | | | | 472,466,696 | | | | — | | | | 472,466,696 | |
Netherlands | | | 51,357,866 | | | | 236,744,295 | | | | — | | | | 288,102,161 | |
Spain | | | — | | | | 286,192,874 | | | | — | | | | 286,192,874 | |
Other Countries | | | 583,904,870 | | | | 1,545,097,215 | | | | — | | | | 2,129,002,085 | |
| Mutual Funds | | | 71,019,430 | | | | — | | | | — | | | | 71,019,430 | |
| Total | | | $1,224,643,966 | | | | $8,615,219,158 | | | | $— | | | | $9,839,863,124 | |
For further information regarding security characteristics, see the Portfolio of Investments.
Foreign Currency Translation– Purchases and sales of foreign investments, income, and expenses are converted into U.S. dollars based upon currency exchange rates prevailing on the respective dates of such transactions or on the reporting date for foreign denominated receivables and payables. Gains and losses attributable to foreign currency exchange rates on sales of securities are recorded for financial statement purposes as net realized gains and losses on investments. Gains and losses attributable to foreign exchange rate movements on receivables, payables, income and expenses are recorded for financial statement purposes as foreign currency transaction gains and losses. That portion of both realized and unrealized gains and losses on investments that results from fluctuations in foreign currency exchange rates is not separately disclosed.
Security Loans– Under its Securities Lending Agency Agreement with the fund, State Street Bank and Trust Company, as lending agent, loans the securities of the fund to certain qualified institutions (the “Borrowers”) approved by the fund. Security loans can be terminated at the discretion of either the lending agent or the fund and the related securities must be returned within the earlier of the standard trade settlement period for such securities or within three business days. The loans are collateralized by
30
Notes to Financial Statements (unaudited) – continued
cash and/or U.S. Treasury and federal agency obligations in an amount typically at least equal to the market value of the securities loaned. On loans collateralized by cash, the cash collateral is invested in a money market fund. The market value of the loaned securities is determined at the close of business of the fund and any additional required collateral is delivered to the fund on the next business day. The lending agent provides the fund with indemnification against Borrower default. In the event of Borrower default, the lending agent will, for the benefit of the fund, either purchase securities identical to those loaned or, when such purchase is commercially impracticable, pay the fund the market value of the loaned securities. In return, the lending agent assumes the fund’s rights to the related collateral. If the collateral value is less than the cost to purchase identical securities, the lending agent is responsible for the shortfall, but only to the extent that such shortfall is not due to a decline in collateral value resulting from collateral reinvestment for which the fund bears the risk of loss. At period end, the fund had investment securities on loan, all of which were classified as equity securities in the fund’s Portfolio of Investments, with a fair value of $2,202,728. The fair value of the fund’s investment securities on loan is presented gross in the Statement of Assets and Liabilities. These loans were collateralized by U.S. Treasury Obligations of $2,271,278 held by the lending agent. The collateral on securities loaned exceeded the value of securities on loan at period end. A portion of the income generated upon investment of the collateral is remitted to the Borrowers, and the remainder is allocated between the fund and the lending agent. On loans collateralized by U.S. Treasury and/or federal agency obligations, a fee is received from the Borrower, and is allocated between the fund and the lending agent. Income from securities lending is separately reported in the Statement of Operations. The dividend and interest income earned on the securities loaned is accounted for in the same manner as other dividend and interest income.
Indemnifications– Under the fund’s organizational documents, its officers and Trustees may be indemnified against certain liabilities and expenses arising out of the performance of their duties to the fund. Additionally, in the normal course of business, the fund enters into agreements with service providers that may contain indemnification clauses. The fund’s maximum exposure under these agreements is unknown as this would involve future claims that may be made against the fund that have not yet occurred.
Investment Transactions and Income– Investment transactions are recorded on the trade date. Interest income is recorded on the accrual basis. Dividends received in cash are recorded on theex-dividend date. Certain dividends from foreign securities will be recorded when the fund is informed of the dividend if such information is obtained subsequent to theex-dividend date. Dividend and interest payments received in additional securities are recorded on theex-dividend orex-interest date in an amount equal to the value of the security on such date.
The fund may receive proceeds from litigation settlements. Any proceeds received from litigation involving portfolio holdings are reflected in the Statement of Operations in realized gain/loss if the security has been disposed of by the fund or in unrealized gain/loss if the security is still held by the fund. Any other proceeds from litigation not related to portfolio holdings are reflected as other income in the Statement of Operations.
31
Notes to Financial Statements (unaudited) – continued
Tax Matters and Distributions– The fund intends to qualify as a regulated investment company, as defined under Subchapter M of the Internal Revenue Code, and to distribute all of its taxable income, including realized capital gains. As a result, no provision for federal income tax is required. The fund’s federal tax returns, when filed, will remain subject to examination by the Internal Revenue Service for a three year period. Management has analyzed the fund’s tax positions taken on federal and state tax returns for all open tax years and does not believe that there are any uncertain tax positions that require recognition of a tax liability. Foreign taxes, if any, have been accrued by the fund in the accompanying financial statements in accordance with the applicable foreign tax law. Foreign income taxes may be withheld by certain countries in which the fund invests. Additionally, capital gains realized by the fund on securities issued in or by certain foreign countries may be subject to capital gains tax imposed by those countries.
Distributions to shareholders are recorded on theex-dividend date. Income and capital gain distributions are determined in accordance with income tax regulations, which may differ from U.S. generally accepted accounting principles. Certain capital accounts in the financial statements are periodically adjusted for permanent differences in order to reflect their tax character. These adjustments have no impact on net assets or net asset value per share. Temporary differences which arise from recognizing certain items of income, expense, gain or loss in different periods for financial statement and tax purposes will reverse at some time in the future.
Book/tax differences primarily relate to passive foreign investment companies and wash sale loss deferrals.
The tax character of distributions made during the current period will be determined at fiscal year end. The tax character of distributions declared to shareholders for the last fiscal year is as follows:
| | | | |
| |
| | | Year ended
8/31/19 | |
Ordinary income (including any
short-term capital gains) | | | $342,429,321 | |
| Long-term capital gains | | | 57,077,609 | |
| |
| Total distributions | | | $399,506,930 | |
The federal tax cost and the tax basis components of distributable earnings were as follows:
| | | | |
| |
| As of 2/29/20 | | | |
| |
| Cost of investments | | | $9,100,517,473 | |
| Gross appreciation | | | 1,481,140,936 | |
| |
| Gross depreciation | | | (741,795,285 | ) |
| Net unrealized appreciation (depreciation) | | | $739,345,651 | |
| |
| As of 8/31/19 | | | |
| |
| Undistributed ordinary income | | | 161,295,878 | |
| Post-October capital loss deferral | | | (163,984,198 | ) |
| Other temporary differences | | | (886,491 | ) |
| Net unrealized appreciation (depreciation) | | | 647,347,028 | |
The aggregate cost above includes prior fiscal year end tax adjustments, if applicable.
32
Notes to Financial Statements (unaudited) – continued
Multiple Classes of Shares of Beneficial Interest– The fund offers multiple classes of shares, which differ in their respective distribution, service, and program manager fees. The fund’s income, realized and unrealized gain (loss), and common expenses are allocated to shareholders based on the daily net assets of each class. Dividends are declared separately for each class. Differences in per share dividend rates are generally due to differences in separate class expenses. Class B and Class 529B shares will convert to Class A and Class 529A shares, respectively, approximately eight years after purchase. Class C and Class 529C shares will convert to Class A and Class 529A shares, respectively, approximately ten years after purchase. The fund’s distributions declared to shareholders as reported in the Statements of Changes in Net Assets are presented by class as follows:
| | | | | | | | |
| | |
| | | Six months
ended
2/29/20 | | | Year
ended
8/31/19 | |
| Class A | | | $11,396,463 | | | | $30,548,265 | |
| Class B | | | 30,070 | | | | 168,883 | |
| Class C | | | 220,193 | | | | 980,659 | |
| Class I | | | 11,272,253 | | | | 28,945,460 | |
| Class R1 | | | 22,306 | | | | 84,285 | |
| Class R2 | | | 1,489,011 | | | | 4,982,298 | |
| Class R3 | | | 1,090,789 | | | | 3,381,859 | |
| Class R4 | | | 725,317 | | | | 2,607,048 | |
| Class R6 | | | 168,508,766 | | | | 327,097,188 | |
| Class 529A | | | 212,373 | | | | 556,856 | |
| Class 529B | | | 3,033 | | | | 13,781 | |
| Class 529C | | | 30,840 | | | | 140,348 | |
| Total | | | $195,001,414 | | | | $399,506,930 | |
(3) Transactions with Affiliates
Investment Adviser– The fund has an investment advisory agreement with MFS to provide overall investment management and related administrative services and facilities to the fund. The management fee is computed daily and paid monthly at the following annual rates based on the fund’s average daily net assets:
| | | | |
| Up to $1 billion | | | 0.90 | % |
| In excess of $1 billion and up to $2 billion | | | 0.80 | % |
| In excess of $2 billion and up to $5 billion | | | 0.70 | % |
| In excess of $5 billion and up to $10 billion | | | 0.60 | % |
| In excess of $10 billion and up to $20 billion | | | 0.55 | % |
| In excess of $20 billion | | | 0.50 | % |
MFS has agreed in writing to reduce its management fee by a specified amount if certain MFS mutual fund assets exceed thresholds agreed to by MFS and the fund’s Board of Trustees. For the six months ended February 29, 2020, this management fee reduction amounted to $498,271, which is included in the reduction of total expenses in the Statement of Operations. The management fee incurred for the six months ended February 29, 2020 was equivalent to an annual effective rate of 0.67% of the fund’s average daily net assets.
33
Notes to Financial Statements (unaudited) – continued
Distributor– MFS Fund Distributors, Inc. (MFD), a wholly-owned subsidiary of MFS, as distributor, received $40,853 and $3,022 for the six months ended February 29, 2020, as its portion of the initial sales charge on sales of Class A and Class 529A shares of the fund, respectively.
The Board of Trustees has adopted a distribution plan for certain share classes pursuant to Rule12b-1 of the Investment Company Act of 1940.
The fund’s distribution plan provides that the fund will pay MFD for services provided by MFD and financial intermediaries in connection with the distribution and servicing of certain share classes. One component of the plan is a distribution fee paid to MFD and another component of the plan is a service fee paid to MFD. MFD may subsequently pay all, or a portion, of the distribution and/or service fees to financial intermediaries.
Distribution Plan Fee Table:
| | | | | | | | | | | | | | | | | | | | |
| | | | | |
| | | Distribution
Fee Rate (d) | | | Service
Fee Rate (d) | | | Total
Distribution
Plan (d) | | | Annual
Effective
Rate (e) | | | Distribution
and Service
Fee | |
| Class A | | | — | | | | 0.25% | | | | 0.25% | | | | 0.25% | | | | $835,930 | |
| Class B | | | 0.75% | | | | 0.25% | | | | 1.00% | | | | 1.00% | | | | 16,608 | |
| Class C | | | 0.75% | | | | 0.25% | | | | 1.00% | | | | 1.00% | | | | 114,372 | |
| Class R1 | | | 0.75% | | | | 0.25% | | | | 1.00% | | | | 1.00% | | | | 9,420 | |
| Class R2 | | | 0.25% | | | | 0.25% | | | | 0.50% | | | | 0.50% | | | | 251,646 | |
| Class R3 | | | — | | | | 0.25% | | | | 0.25% | | | | 0.25% | | | | 81,667 | |
| Class 529A | | | — | | | | 0.25% | | | | 0.25% | | | | 0.23% | | | | 15,748 | |
| Class 529B | | | 0.75% | | | | 0.25% | | | | 1.00% | | | | 1.00% | | | | 1,465 | |
| Class 529C | | | 0.75% | | | | 0.25% | | | | 1.00% | | | | 0.99% | | | | 15,068 | |
| Total Distribution and Service Fees | | | | | | | | | | | | $1,341,924 | |
| (d) | In accordance with the distribution plan for certain classes, the fund pays distribution and/or service fees equal to these annual percentage rates of each class’s average daily net assets. The distribution and service fee rates disclosed by class represent the current rates in effect at the end of the reporting period. Any rate changes, if applicable, are detailed below. |
| (e) | The annual effective rates represent actual fees incurred under the distribution plan for the six months ended February 29, 2020 based on each class’s average daily net assets. MFD has voluntarily agreed to rebate a portion of each class’s 0.25% service fee attributable to accounts for which MFD retains the 0.25% service fee except for accounts attributable to MFS or its affiliates’ seed money. For the six months ended February 29, 2020, this rebate amounted to $5,176, $1, $44, $433, $1,133, $3, and $101 for Class A, Class B, Class C, Class R2, Class 529A, Class 529B, and Class 529C, respectively, and is included in the reduction of total expenses in the Statement of Operations. |
Certain Class A shares are subject to a contingent deferred sales charge (CDSC) in the event of a shareholder redemption within 18 months of purchase. Class B and Class 529B shares are subject to a CDSC in the event of a shareholder redemption within six years of purchase. Class C and Class 529C shares are subject to a CDSC in
34
Notes to Financial Statements (unaudited) – continued
the event of a shareholder redemption within 12 months of purchase. All contingent deferred sales charges are paid to MFD and during the six months ended February 29, 2020, were as follows:
| | | | |
| |
| | | Amount | |
| Class A | | | $855 | |
| Class B | | | 2,201 | |
| Class C | | | 643 | |
| Class 529B | | | 5 | |
| Class 529C | | | 36 | |
The fund has entered into and may from time to time enter into contracts with program managers and other parties which administer the tuition programs through which an investment in the fund’s 529 share classes is made. The fund has entered into an agreement with MFD pursuant to which MFD receives an annual fee of up to 0.05% of the average daily net assets attributable to each 529 share class. The services provided by MFD, or a third party with which MFD contracts, include recordkeeping and tax reporting and account services, as well as services designed to maintain the program’s compliance with the Internal Revenue Code and other regulatory requirements. Program manager fees for the six months ended February 29, 2020, were as follows:
| | | | |
| |
| | | Fee | |
| Class 529A | | | $3,150 | |
| Class 529B | | | 73 | |
| Class 529C | | | 753 | |
| |
| Total Program Manager Fees | | | $3,976 | |
Shareholder Servicing Agent– MFS Service Center, Inc. (MFSC), a wholly-owned subsidiary of MFS, receives a fee from the fund for its services as shareholder servicing agent calculated as a percentage of the average daily net assets of the fund as determined periodically under the supervision of the fund’s Board of Trustees. For the six months ended February 29, 2020, the fee was $60,388, which equated to 0.0012% annually of the fund’s average daily net assets. MFSC also receives payment from the fund forout-of-pocket expenses,sub-accounting and other shareholder servicing costs which may be paid to affiliated and unaffiliated service providers. Class R6 shares do not incursub-accounting fees. For the six months ended February 29, 2020, theseout-of-pocket expenses,sub-accounting and other shareholder servicing costs amounted to $881,572.
Administrator– MFS provides certain financial, legal, shareholder communications, compliance, and other administrative services to the fund. Under an administrative services agreement, the fund reimburses MFS the costs incurred to provide these services. The fund is charged an annual fixed amount of $17,500 plus a fee based on average daily net assets. The administrative services fee incurred for the six months ended February 29, 2020 was equivalent to an annual effective rate of 0.0056% of the fund’s average daily net assets.
Trustees’ and Officers’ Compensation– The fund pays compensation to independent Trustees in the form of a retainer, attendance fees, and additional compensation to Board and Committee chairpersons. The fund does not pay
35
Notes to Financial Statements (unaudited) – continued
compensation directly to Trustees or officers of the fund who are also officers of the investment adviser, all of whom receive remuneration from MFS for their services to the fund. Certain officers and Trustees of the fund are officers or directors of MFS, MFD, and MFSC.
Other –The fund invests in the MFS Institutional Money Market Portfolio which is managed by MFS and seeks current income consistent with preservation of capital and liquidity. This money market fund does not pay a management fee to MFS but does incur investment and operating costs.
The fund is permitted to engage in purchase and sale transactions with funds and accounts for which MFS serves as investment adviser orsub-adviser (“cross-trades”) pursuant to a policy adopted by the Board of Trustees. This policy has been designed to ensure that cross-trades conducted by the fund comply with Rule17a-7 under the Investment Company Act of 1940. During the six months ended February 29, 2020, the fund engaged in purchase and sale transactions pursuant to this policy, which amounted to $8,347,414 and $720,279, respectively. The sales transactions resulted in net realized gains (losses) of $296,037.
(4) Portfolio Securities
For the six months ended February 29, 2020, purchases and sales of investments, other than short-term obligations, aggregated $1,610,081,059 and $725,323,616, respectively.
(5) Shares of Beneficial Interest
The fund’s Declaration of Trust permits the Trustees to issue an unlimited number of full and fractional shares of beneficial interest. Transactions in fund shares were as follows:
| | | | | | | | | | | | | | | | |
| | | Six months ended
2/29/20 | | | Year ended
8/31/19 | |
| | | | |
| | | Shares | | | Amount | | | Shares | | | Amount | |
| Shares sold | | | | | | | | | | | | | | | | |
Class A | | | 4,782,829 | | | | $91,700,612 | | | | 6,308,181 | | | | $108,057,448 | |
Class B | | | 319 | | | | 6,125 | | | | 6,034 | | | | 99,733 | |
Class C | | | 58,819 | | | | 1,059,812 | | | | 376,118 | | | | 5,774,726 | |
Class I | | | 10,147,493 | | | | 200,992,100 | | | | 10,627,716 | | | | 191,924,273 | |
Class R1 | | | 5,313 | | | | 93,830 | | | | 11,118 | | | | 182,062 | |
Class R2 | | | 275,364 | | | | 5,091,529 | | | | 671,662 | | | | 11,368,179 | |
Class R3 | | | 636,318 | | | | 11,909,205 | | | | 431,846 | | | | 7,494,227 | |
Class R4 | | | 150,064 | | | | 2,876,246 | | | | 550,567 | | | | 9,576,959 | |
Class R6 | | | 53,977,313 | | | | 1,034,090,815 | | | | 108,922,349 | | | | 1,895,362,745 | |
Class 529A | | | 37,599 | | | | 709,982 | | | | 87,876 | | | | 1,489,187 | |
Class 529B | | | 266 | | | | 4,879 | | | | 805 | | | | 12,865 | |
Class 529C | | | 10,266 | | | | 179,641 | | | | 17,370 | | | | 275,909 | |
| | | 70,081,963 | | | | $1,348,714,776 | | | | 128,011,642 | | | | $2,231,618,313 | |
36
Notes to Financial Statements (unaudited) – continued
| | | | | | | | | | | | | | | | |
| | | Six months ended
2/29/20 | | | Year ended
8/31/19 | |
| | | | |
| | | Shares | | | Amount | | | Shares | | | Amount | |
Shares issued to shareholders in
reinvestment of distributions | | | | | | | | | | | | | | | | |
Class A | | | 437,195 | | | | $8,359,174 | | | | 1,384,970 | | | | $22,173,336 | |
Class B | | | 1,242 | | | | 23,006 | | | | 8,845 | | | | 137,183 | |
Class C | | | 9,214 | | | | 166,220 | | | | 44,618 | | | | 674,185 | |
Class I | | | 442,527 | | | | 8,766,464 | | | | 1,213,492 | | | | 20,107,565 | |
Class R1 | | | 1,263 | | | | 22,306 | | | | 5,660 | | | | 83,875 | |
Class R2 | | | 79,497 | | | | 1,469,099 | | | | 310,892 | | | | 4,809,494 | |
Class R3 | | | 57,653 | | | | 1,090,789 | | | | 213,501 | | | | 3,381,859 | |
Class R4 | | | 37,248 | | | | 713,292 | | | | 160,956 | | | | 2,578,518 | |
Class R6 | | | 8,352,804 | | | | 158,536,225 | | | | 19,346,528 | | | | 307,416,337 | |
Class 529A | | | 11,339 | | | | 212,373 | | | | 35,487 | | | | 556,785 | |
Class 529B | | | 171 | | | | 3,033 | | | | 929 | | | | 13,781 | |
Class 529C | | | 1,781 | | | | 30,840 | | | | 9,666 | | | | 140,348 | |
| | | 9,431,934 | | | | $179,392,821 | | | | 22,735,544 | | | | $362,073,266 | |
| | | | |
| Shares reacquired | | | | | | | | | | | | | | | | |
Class A | | | (4,528,758 | ) | | | $(86,542,868 | ) | | | (8,627,351 | ) | | | $(149,525,414 | ) |
Class B | | | (29,801 | ) | | | (552,777 | ) | | | (87,072 | ) | | | (1,469,628 | ) |
Class C | | | (203,311 | ) | | | (3,643,644 | ) | | | (606,008 | ) | | | (9,833,848 | ) |
Class I | | | (5,648,662 | ) | | | (111,273,452 | ) | | | (12,990,232 | ) | | | (235,108,050 | ) |
Class R1 | | | (6,708 | ) | | | (120,273 | ) | | | (31,884 | ) | | | (499,317 | ) |
Class R2 | | | (911,857 | ) | | | (16,886,904 | ) | | | (1,789,045 | ) | | | (30,140,366 | ) |
Class R3 | | | (760,915 | ) | | | (14,331,282 | ) | | | (1,518,596 | ) | | | (26,270,828 | ) |
Class R4 | | | (1,282,732 | ) | | | (24,348,812 | ) | | | (723,854 | ) | | | (12,619,137 | ) |
Class R6 | | | (13,023,849 | ) | | | (247,322,894 | ) | | | (68,790,407 | ) | | | (1,220,513,670 | ) |
Class 529A | | | (46,080 | ) | | | (869,328 | ) | | | (119,736 | ) | | | (2,083,794 | ) |
Class 529B | | | (2,696 | ) | | | (48,890 | ) | | | (4,495 | ) | | | (74,302 | ) |
Class 529C | | | (24,634 | ) | | | (422,064 | ) | | | (47,818 | ) | | | (755,778 | ) |
| | | (26,470,003 | ) | | | $(506,363,188 | ) | | | (95,336,498 | ) | | | $(1,688,894,132 | ) |
| | | | |
| Net change | | | | | | | | | | | | | | | | |
Class A | | | 691,266 | | | | $13,516,918 | | | | (934,200 | ) | | | $(19,294,630 | ) |
Class B | | | (28,240 | ) | | | (523,646 | ) | | | (72,193 | ) | | | (1,232,712 | ) |
Class C | | | (135,278 | ) | | | (2,417,612 | ) | | | (185,272 | ) | | | (3,384,937 | ) |
Class I | | | 4,941,358 | | | | 98,485,112 | | | | (1,149,024 | ) | | | (23,076,212 | ) |
Class R1 | | | (132 | ) | | | (4,137 | ) | | | (15,106 | ) | | | (233,380 | ) |
Class R2 | | | (556,996 | ) | | | (10,326,276 | ) | | | (806,491 | ) | | | (13,962,693 | ) |
Class R3 | | | (66,944 | ) | | | (1,331,288 | ) | | | (873,249 | ) | | | (15,394,742 | ) |
Class R4 | | | (1,095,420 | ) | | | (20,759,274 | ) | | | (12,331 | ) | | | (463,660 | ) |
Class R6 | | | 49,306,268 | | | | 945,304,146 | | | | 59,478,470 | | | | 982,265,412 | |
Class 529A | | | 2,858 | | | | 53,027 | | | | 3,627 | | | | (37,822 | ) |
Class 529B | | | (2,259 | ) | | | (40,978 | ) | | | (2,761 | ) | | | (47,656 | ) |
Class 529C | | | (12,587 | ) | | | (211,583 | ) | | | (20,782 | ) | | | (339,521 | ) |
| | | 53,043,894 | | | | $1,021,744,409 | | | | 55,410,688 | | | | $904,797,447 | |
37
Notes to Financial Statements (unaudited) – continued
Class T shares were not publicly available for sale during the period. Please see the fund’s prospectus for details.
Effective June 1, 2019, purchases of the fund’s Class B and Class 529B shares are closed to new and existing investors subject to certain exceptions. Please see the fund’s prospectus for details.
The fund is one of several mutual funds in which certain MFS funds may invest. The MFS funds do not invest in the underlying funds for the purpose of exercising management or control. At the end of the period, the MFS International Diversification Fund, the MFS Growth Allocation Fund, the MFS Moderate Allocation Fund, the MFS Aggressive Growth Allocation Fund, and the MFS Conservative Allocation Fund were the owners of record of approximately 64%, 4%, 3%, 2%, and 1%, respectively, of the value of outstanding voting shares of the fund. In addition, the MFS Lifetime 2020 Fund, the MFS Lifetime 2025 Fund, the MFS Lifetime 2030 Fund, the MFS Lifetime 2035 Fund, the MFS Lifetime 2040 Fund, the MFS Lifetime 2045 Fund, the MFS Lifetime 2050 Fund, the MFS Lifetime 2055 Fund, the MFS Lifetime 2060 Fund, and the MFS Lifetime Income Fund were each the owners of record of less than 1% of the value of outstanding voting shares of the fund.
(6) Line of Credit
The fund and certain other funds managed by MFS participate in a $1.25 billion unsecured committed line of credit, subject to a $1 billion sublimit, provided by a syndicate of banks under a credit agreement. Borrowings may be made for temporary financing needs. Interest is charged to each fund, based on its borrowings, generally at a rate equal to the highest of one month LIBOR, the Federal Funds Effective Rate and the Overnight Bank Funding Rate, plus an agreed upon spread. A commitment fee, based on the average daily, unused portion of the committed line of credit, is allocated among the participating funds. In addition, the fund and other funds managed by MFS have established unsecured uncommitted borrowing arrangements with certain banks for temporary financing needs. Interest is charged to each fund, based on its borrowings, at rates equal to customary reference rates plus an agreed upon spread. For the six months ended February 29, 2020, the fund’s commitment fee and interest expense were $23,187 and $0, respectively, and are included in “Miscellaneous” expense in the Statement of Operations.
(7) Investments in Affiliated Issuers
An affiliated issuer may be considered one in which the fund owns 5% or more of the outstanding voting securities, or a company which is under common control. For the purposes of this report, the following were affiliated issuers:
| | | | | | | | | | | | | | | | | | | | | | | | |
| | | | | | |
| Affiliated Issuers | | Beginning
Value | | | Purchases | | | Sales
Proceeds | | | Realized
Gain
(Loss) | | | Change in
Unrealized
Appreciation or
Depreciation | | | Ending
Value | |
| MFS Institutional Money Market Portfolio | | | $73,245,985 | | | | $944,005,814 | | | | $946,232,248 | | | | $102 | | | | $(223 | ) | | | $71,019,430 | |
| | | | | | |
| Affiliated Issuers | | | | | | | | | | | | | | Dividend
Income | | | Capital Gain
Distributions | |
| MFS Institutional Money Market Portfolio | | | | | | | | $981,476 | | | | $— | |
38
Notes to Financial Statements (unaudited) – continued
(8) Impacts of COVID-19
The pandemic related to the global spread of novel coronavirus disease (COVID-19), which was first detected in December 2019, has resulted in significant disruptions to global business activity and the global economy, as well as the economies of individual countries, the financial performance of individual companies and sectors, and the securities and commodities markets in general. This pandemic, the full effects of which are still unknown, has resulted in substantial market volatility and may have adversely impacted the prices and liquidity of the fund’s investments and the fund’s performance during the period February 29, 2020 through April 16, 2020, the date that these financial statements were issued.
39
PROXY VOTING POLICIES AND INFORMATION
MFS votes proxies on behalf of the fund pursuant to proxy voting policies and procedures that are available without charge, upon request, by calling1-800-225-2606, by visitingmfs.com/proxyvoting, or by visiting the SEC’s Web site athttp://www.sec.gov.
Information regarding how the fund voted proxies relating to portfolio securities during the most recent twelve-month period ended June 30 is available by August 31 of each year without charge by visitingmfs.com/proxyvoting, or by visiting the SEC’s Web site athttp://www.sec.gov.
QUARTERLY PORTFOLIO DISCLOSURE
The fund files a complete schedule of portfolio holdings with the SEC for the first and third quarters of each fiscal year as an exhibit to its reports onForm N-PORT. The fund’s Form N-PORT reports are available on the SEC’s website athttp://www.sec.gov.A shareholder can obtain the portfolio holdings report for the first and third quarters of the fund’s fiscal year atmfs.com/openendfunds by choosing the fund’s name and then selecting the “Resources” tab and clicking on “Prospectus and Reports”.
FURTHER INFORMATION
From time to time, MFS may post important information about the fund or the MFS funds on the MFS web site (mfs.com). This information is available athttps://www.mfs.com/en-us/what-we-do/announcements.html or atmfs.com/openendfunds by choosing the fund’s name.
INFORMATION ABOUT FUND CONTRACTS AND LEGAL CLAIMS
The fund has entered into contractual arrangements with an investment adviser, administrator, distributor, shareholder servicing agent, 529 program manager (if applicable), and custodian who each provide services to the fund. Unless expressly stated otherwise, shareholders are not parties to, or intended beneficiaries of these contractual arrangements, and these contractual arrangements are not intended to create any shareholder right to enforce them against the service providers or to seek any remedy under them against the service providers, either directly or on behalf of the fund.
Under the Trust’s By-Laws and Declaration of Trust, any claims asserted against or on behalf of the MFS Funds, including claims against Trustees and Officers, must be brought in state and federal courts located within the Commonwealth of Massachusetts.
PROVISION OF FINANCIAL REPORTS AND SUMMARY PROSPECTUSES
The fund produces financial reports every six months and updates its summary prospectus and prospectus annually. To avoid sending duplicate copies of materials to households, only one copy of the fund’s annual and semiannual report and summary prospectus may be mailed to shareholders having the same last name and residential address on the fund’s records. However, any shareholder may contact MFSC (please see back cover for address and telephone number) to request that copies of these reports and summary prospectuses be sent personally to that shareholder.
40
Save paper with eDelivery.

| MFS® will send you prospectuses, |
reports, and proxies directly viae-mail so you will get information faster with less mailbox clutter.
To sign up:
1. Go to mfs.com.
2. Log in via MFS® Access.
3. Select eDelivery.
If you own your MFS fund shares through a financial institution or a retirement plan, MFS® TALK, MFS® Access, or eDelivery may not be available to you.
CONTACT
WEB SITE
mfs.com
MFS TALK
1-800-637-8255
24 hours a day
ACCOUNT SERVICE AND LITERATURE
Shareholders
1-800-225-2606
Financial advisors
1-800-343-2829
Retirement plan services
1-800-637-1255
MAILING ADDRESS
MFS Service Center, Inc.
P.O. Box 219341
Kansas City, MO 64121-9341
OVERNIGHT MAIL
MFS Service Center, Inc.
Suite 219341
430 W 7th Street
Kansas City, MO 64105-1407
Semiannual Report
February 29, 2020

MFS® Technology Fund

Beginning on January 1, 2021, as permitted by regulations adopted by the U.S. Securities and Exchange Commission, paper copies of the fund’s annual and semiannual shareholder reports will no longer be sent by mail, unless you specifically request paper copies of the reports. Instead, the complete reports will be made available on the fund’s Web site (funds.mfs.com), and you will be notified by mail each time a report is posted and provided with a Web site link to access the report.
If you are already signed up to receive shareholder reports by email, you will not be affected by this change and you need not take any action. You may sign up to receive shareholder reports and other communications from the fund by email by contacting your financial intermediary (such as a broker-dealer or bank) or, if you hold your shares directly with the fund, by calling 1-800-225-2606 or by logging on to MFS Access at mfs.com.
Beginning on January 1, 2019, you may elect to receive all future reports in paper free of charge. Contact your financial intermediary to request that you continue to receive paper copies of your shareholder reports. If you invest directly with the fund, you can call 1-800-225-2606 or send an email request to orderliterature@mfs.com to let the fund know that you wish to continue receiving paper copies of your shareholder reports. Your election to receive reports in paper will apply to all funds held in your account if you invest through your financial intermediary or all funds held with the MFS fund complex if you invest directly.
SCT-SEM
MFS® Technology Fund
CONTENTS
The report is prepared for the general information of shareholders.
It is authorized for distribution to prospective investors only when preceded or accompanied by a current prospectus.
NOT FDIC INSURED• MAY LOSE VALUE• NO BANK GUARANTEE

LETTER FROM THE EXECUTIVE CHAIR
Dear Shareholders:
During the first quarter of 2020, market volatility reached levels not seen since the global financial crisis. Optimism heading into the year — on receding trade and
geopolitical risk along with easier central bank policies — was overwhelmed in February as the health effects of a novel coronavirus,COVID-19, spread beyond China’s borders, ultimately impacting more than 200 countries. The global pandemic prompted many governments to take drastic action to slow the spread of the virus, such as quarantines, school and business closures, and prohibitions on public gatherings. While these are important steps to protect the public health, they come at a cost: rising market volatility and an abrupt decline in economic growth.
Global central banks have taken aggressive, coordinated steps to cushion the economic and market fallout related to the virus, and
governments are undertaking unprecedented levels of fiscal stimulus. As uncertainty recedes, these measures can help create a supportive environment and encourage economic recovery. In the aftermath of the crisis, there are likely to be societal changes as households, businesses and governments adjust to a new reality and these alterations could change the investment landscape. Occurrences such as the COVID-19 outbreak demonstrate the importance of having a deep understanding of company fundamentals, and our global research platform has been built to do just that.
Here at MFS®, we aim to help our clients navigate the growing complexity of the markets and world economies. Our long-term investment philosophy and commitment to the responsible allocation of capital allow us to tune out the noise and uncover what we believe are the best, most durable investment opportunities in the market. Through our powerful global investment platform, we combine collective expertise, thoughtful risk management, and long-term discipline to create sustainable value for investors.
Respectfully,

Robert J. Manning
Executive Chair
MFS Investment Management
April 16, 2020
The opinions expressed in this letter are subject to change and may not be relied upon for investment advice. No forecasts can be guaranteed.
1
PORTFOLIO COMPOSITION
Portfolio structure

| | | | |
| Top ten holdings | | | | |
| Amazon.com, Inc. | | | 9.4% | |
| Microsoft Corp. | | | 7.8% | |
| Alphabet, Inc., “A” | | | 7.4% | |
| Facebook, Inc., “A” | | | 6.5% | |
| Visa, Inc., “A” | | | 4.9% | |
| Mastercard, Inc., “A” | | | 4.5% | |
| Adobe Systems, Inc. | | | 4.2% | |
| Salesforce.com, Inc. | | | 3.5% | |
| Global Payments, Inc. | | | 3.5% | |
| Fiserv, Inc. | | | 3.2% | |
| | | | |
| Top five industries | | | | |
| Computer Software | | | 21.4% | |
| Internet | | | 16.1% | |
| Business Services | | | 15.2% | |
| Computer Software - Systems | | | 10.6% | |
| Specialty Stores | | | 10.0% | |
| (s) | Includes securities sold short. |
Cash & Cash Equivalents includes any cash, investments in money market funds, short-term securities, and other assets less liabilities. Please see the Statement of Assets and Liabilities for additional information related to the fund’s cash position and other assets and liabilities.
Percentages are based on net assets as of February 29, 2020.
The portfolio is actively managed and current holdings may be different.
2
EXPENSE TABLE
Fund expenses borne by the shareholders during the period, September 1, 2019 through February 29, 2020
As a shareholder of the fund, you incur two types of costs: (1) transaction costs, including sales charges (loads) on certain purchase or redemption payments, and (2) ongoing costs, including management fees; distribution and service(12b-1) fees; and other fund expenses. This example is intended to help you understand your ongoing costs (in dollars) of investing in the fund and to compare these costs with the ongoing costs of investing in other mutual funds.
The example is based on an investment of $1,000 invested at the beginning of the period and held for the entire period September 1, 2019 through February 29, 2020.
Actual Expenses
The first line for each share class in the following table provides information about actual account values and actual expenses. You may use the information in this line, together with the amount you invested, to estimate the expenses that you paid over the period. Simply divide your account value by $1,000 (for example, an $8,600 account value divided by $1,000 = 8.6), then multiply the result by the number in the first line under the heading entitled “Expenses Paid During Period” to estimate the expenses you paid on your account during this period.
Hypothetical Example for Comparison Purposes
The second line for each share class in the following table provides information about hypothetical account values and hypothetical expenses based on the fund’s actual expense ratio and an assumed rate of return of 5% per year before expenses, which is not the fund’s actual return. The hypothetical account values and expenses may not be used to estimate the actual ending account balance or expenses you paid for the period. You may use this information to compare the ongoing costs of investing in the fund and other funds. To do so, compare this 5% hypothetical example with the 5% hypothetical examples that appear in the shareholder reports of the other funds.
Please note that the expenses shown in the table are meant to highlight your ongoing costs only and do not reflect any transactional costs, such as sales charges (loads). Therefore, the second line for each share class in the table is useful in comparing ongoing costs only, and will not help you determine the relative total costs of owning different funds. In addition, if these transactional costs were included, your costs would have been higher.
3
Expense Table – continued
| | | | | | | | | | | | | | | | | | |
Share
Class | | | | Annualized
Expense
Ratio | | | Beginning
Account Value
9/01/19 | | | Ending
Account Value
2/29/20 | | | Expenses
Paid During
Period (p)
9/01/19-2/29/20 | |
| A | | Actual | | | 1.18% | | | | $1,000.00 | | | | $1,071.15 | | | | $6.08 | |
| | Hypothetical (h) | | | 1.18% | | | | $1,000.00 | | | | $1,019.00 | | | | $5.92 | |
| B | | Actual | | | 1.93% | | | | $1,000.00 | | | | $1,066.84 | | | | $9.92 | |
| | Hypothetical (h) | | | 1.93% | | | | $1,000.00 | | | | $1,015.27 | | | | $9.67 | |
| C | | Actual | | | 1.93% | | | | $1,000.00 | | | | $1,067.27 | | | | $9.92 | |
| | Hypothetical (h) | | | 1.93% | | | | $1,000.00 | | | | $1,015.27 | | | | $9.67 | |
| I | | Actual | | | 0.93% | | | | $1,000.00 | | | | $1,072.32 | | | | $4.79 | |
| | Hypothetical (h) | | | 0.93% | | | | $1,000.00 | | | | $1,020.24 | | | | $4.67 | |
| R1 | | Actual | | | 1.93% | | | | $1,000.00 | | | | $1,067.14 | | | | $9.92 | |
| | Hypothetical (h) | | | 1.93% | | | | $1,000.00 | | | | $1,015.27 | | | | $9.67 | |
| R2 | | Actual | | | 1.43% | | | | $1,000.00 | | | | $1,069.78 | | | | $7.36 | |
| | Hypothetical (h) | | | 1.43% | | | | $1,000.00 | | | | $1,017.75 | | | | $7.17 | |
| R3 | | Actual | | | 1.18% | | | | $1,000.00 | | | | $1,070.96 | | | | $6.08 | |
| | Hypothetical (h) | | | 1.18% | | | | $1,000.00 | | | | $1,019.00 | | | | $5.92 | |
| R4 | | Actual | | | 0.93% | | | | $1,000.00 | | | | $1,072.42 | | | | $4.79 | |
| | Hypothetical (h) | | | 0.93% | | | | $1,000.00 | | | | $1,020.24 | | | | $4.67 | |
| R6 | | Actual | | | 0.84% | | | | $1,000.00 | | | | $1,072.83 | | | | $4.33 | |
| | Hypothetical (h) | | | 0.84% | | | | $1,000.00 | | | | $1,020.69 | | | | $4.22 | |
| (h) | 5% class return per year before expenses. |
| (p) | “Expenses Paid During Period” are equal to each class’s annualized expense ratio, as shown above, multiplied by the average account value over the period, multiplied by 182/366 (to reflect theone-half year period). Expenses paid do not include any applicable sales charges (loads). If these transaction costs had been included, your costs would have been higher. |
Notes to Expense Table
Expense ratios include 0.05% of investment related expenses from short sales (See Note 2 of the Notes to Financial Statements).
4
PORTFOLIO OF INVESTMENTS
2/29/20 (unaudited)
The Portfolio of Investments is a complete list of all securities owned by your fund. It is categorized by broad-based asset classes.
| | | | | | | | |
| | |
| Issuer | | Shares/Par | | | Value ($) | |
| Common Stocks - 97.8% | | | | | | |
| Aerospace - 1.6% | | | | | | |
| L3Harris Technologies, Inc. | | | 56,492 | | | $ | 11,170,163 | |
| Northrop Grumman Corp. | | | 19,782 | | | | 6,505,113 | |
| PAE, Inc. (a) | | | 328,118 | | | | 3,592,892 | |
| | | | | | | | |
| | | | | | | $ | 21,268,168 | |
| Biotechnology - 1.5% | | | | | | |
| Adaptive Biotechnologies Corp. (a) | | | 163,600 | | | $ | 4,597,160 | |
| Bio-Techne Corp. | | | 44,576 | | | | 8,419,960 | |
| Illumina, Inc. (a) | | | 24,449 | | | | 6,495,366 | |
| | | | | | | | |
| | | | | | | $ | 19,512,486 | |
| Brokerage & Asset Managers - 1.2% | | | | | | |
| NASDAQ, Inc. | | | 90,113 | | | $ | 9,241,088 | |
| Tradeweb Markets, Inc. | | | 151,868 | | | | 7,323,075 | |
| | | | | | | | |
| | | | | | | $ | 16,564,163 | |
| Business Services - 15.2% | | | | | | |
| Clarivate Analytics PLC (a) | | | 455,754 | | | $ | 9,270,037 | |
| Endava PLC, ADR (a) | | | 353,559 | | | | 18,756,305 | |
| Equifax, Inc. | | | 57,010 | | | | 8,097,701 | |
| Fidelity National Information Services, Inc. | | | 232,742 | | | | 32,518,712 | |
| Fiserv, Inc. (a) | | | 386,237 | | | | 42,238,878 | |
| Global Payments, Inc. | | | 251,835 | | | | 46,330,091 | |
| PayPal Holdings, Inc. (a) | | | 257,496 | | | | 27,806,993 | |
| TransUnion | | | 113,402 | | | | 10,083,706 | |
| Verisk Analytics, Inc., “A” | | | 54,703 | | | | 8,484,982 | |
| | | | | | | | |
| | | | | | | $ | 203,587,405 | |
| Cable TV - 0.8% | | | | | | |
| Charter Communications, Inc., “A” (a) | | | 21,428 | | | $ | 10,567,647 | |
| | |
| Computer Software - 21.4% | | | | | | |
| Adobe Systems, Inc. (a) | | | 165,017 | | | $ | 56,950,667 | |
| Autodesk, Inc. (a) | | | 76,734 | | | | 14,646,986 | |
| Black Knight, Inc. (a) | | | 66,502 | | | | 4,436,349 | |
| Blue Prism Group PLC (a) | | | 400,847 | | | | 7,431,658 | |
| DocuSign, Inc. (a) | | | 118,090 | | | | 10,192,348 | |
| Everbridge, Inc. (a) | | | 20,448 | | | | 2,160,536 | |
| Freee KK (a) | | | 41,600 | | | | 1,309,401 | |
| Microsoft Corp. | | | 648,830 | | | | 105,116,948 | |
| Rakus Co. Ltd. | | | 503,100 | | | | 7,185,679 | |
| RingCentral, Inc. (a) | | | 70,673 | | | | 16,661,160 | |
| Salesforce.com, Inc. (a) | | | 274,713 | | | | 46,811,095 | |
5
Portfolio of Investments (unaudited) – continued
| | | | | | | | |
| | |
| Issuer | | Shares/Par | | | Value ($) | |
| Common Stocks - continued | | | | | | |
| | |
| Computer Software - continued | | | | | | |
| Uber Technologies, Inc. (a) | | | 182,224 | | | $ | 6,171,927 | |
| Zendesk, Inc. (a) | | | 97,088 | | | | 7,700,049 | |
| | | | | | | | |
| | | | | | | $ | 286,774,803 | |
| Computer Software - Systems - 10.6% | | | | | | |
| Apple, Inc. | | | 141,714 | | | $ | 38,738,939 | |
| Constellation Software, Inc. | | | 12,856 | | | | 13,097,173 | |
| Descartes Systems Group, Inc. (a) | | | 178,676 | | | | 7,418,598 | |
| EPAM Systems, Inc. (a) | | | 29,857 | | | | 6,664,082 | |
| HubSpot, Inc. (a) | | | 77,448 | | | | 13,898,044 | |
| OneConnect Financial Technology, ADR (a) | | | 247,888 | | | | 2,689,585 | |
| Pluralsight, Inc., “A” (a) | | | 308,521 | | | | 5,500,929 | |
| Q2 Holdings, Inc. (a) | | | 92,833 | | | | 6,996,823 | |
| ServiceNow, Inc. (a) | | | 65,441 | | | | 21,339,656 | |
| Square, Inc., “A” (a) | | | 145,061 | | | | 12,087,933 | |
| Wix.com Ltd. (a) | | | 71,602 | | | | 9,596,816 | |
| Workday, Inc. (a) | | | 20,122 | | | | 3,486,137 | |
| | | | | | | | |
| | | | | | | $ | 141,514,715 | |
| Electrical Equipment - 0.9% | | | | | | |
| Amphenol Corp., “A” | | | 128,123 | | | $ | 11,746,317 | |
| | |
| Electronics - 4.7% | | | | | | |
| Applied Materials, Inc. | | | 397,375 | | | $ | 23,095,435 | |
| Marvell Technology Group Ltd. | | | 423,926 | | | | 9,029,624 | |
| Microchip Technology, Inc. | | | 236,508 | | | | 21,453,641 | |
| NXP Semiconductors N.V. | | | 59,192 | | | | 6,729,538 | |
| Silicon Laboratories, Inc. (a) | | | 36,034 | | | | 3,195,495 | |
| | | | | | | | |
| | | | | | | $ | 63,503,733 | |
| Internet - 16.1% | | | | | | |
| Alibaba Group Holding Ltd., ADR (a) | | | 45,297 | | | $ | 9,421,776 | |
| Alphabet, Inc., “A” (a)(s) | | | 74,314 | | | | 99,525,024 | |
| Facebook, Inc., “A” (a)(s) | | | 453,971 | | | | 87,375,798 | |
| GoDaddy, Inc. (a) | | | 177,673 | | | | 12,433,557 | |
| Tencent Holdings Ltd. | | | 148,400 | | | | 7,319,890 | |
| | | | | | | | |
| | | | | | | $ | 216,076,045 | |
| Leisure & Toys - 2.3% | | | | | | |
| Activision Blizzard, Inc. | | | 192,044 | | | $ | 11,163,518 | |
| Electronic Arts, Inc. (a) | | | 195,050 | | | | 19,772,218 | |
| | | | | | | | |
| | | | | | | $ | 30,935,736 | |
| Medical & Health Technology & Services - 0.8% | | | | | | |
| Guardant Health, Inc. (a) | | | 130,058 | | | $ | 11,309,844 | |
6
Portfolio of Investments (unaudited) – continued
| | | | | | | | |
| | |
| Issuer | | Shares/Par | | | Value ($) | |
| Common Stocks - continued | | | | | | |
| Other Banks & Diversified Financials - 9.4% | | | | | | |
| Mastercard, Inc., “A” | | | 206,338 | | | $ | 59,889,604 | |
| Visa, Inc., “A” | | | 359,896 | | | | 65,414,697 | |
| | | | | | | | |
| | | | | | | $ | 125,304,301 | |
| Printing & Publishing - 1.3% | | | | | | |
| IHS Markit Ltd. | | | 136,136 | | | $ | 9,698,329 | |
| Wolters Kluwer N.V. | | | 109,867 | | | | 8,074,921 | |
| | | | | | | | |
| | | | | | | $ | 17,773,250 | |
| Specialty Stores - 10.0% | | | | | | |
| Amazon.com, Inc. (a)(s) | | | 66,704 | | | $ | 125,653,660 | |
| Chewy, Inc., “A” (a) | | | 266,279 | | | | 7,881,858 | |
| | | | | | | | |
| | | | | | | $ | 133,535,518 | |
| Total Common Stocks (Identified Cost, $664,886,933) | | | | | | $ | 1,309,974,131 | |
| | |
| Investment Companies (h) - 1.6% | | | | | | |
| Money Market Funds - 1.6% | | | | | | |
MFS Institutional Money Market Portfolio, 1.61% (v)
(Identified Cost, $21,848,333) | | | 21,847,725 | | | $ | 21,849,909 | |
| | |
| Securities Sold Short - (0.0)% | | | | | | |
| Automotive - (0.0)% | | | | | | |
| Tesla, Inc. (Proceeds Received, $21,675) | | | (43 | ) | | $ | (28,723 | ) |
| | |
| Other Assets, Less Liabilities - 0.6% | | | | | 8,514,717 | |
| Net Assets - 100.0% | | | | | | $ | 1,340,310,034 | |
| (a) | Non-income producing security. |
| (h) | An affiliated issuer, which may be considered one in which the fund owns 5% or more of the outstanding voting securities, or a company which is under common control. At period end, the aggregate values of the fund’s investments in affiliated issuers and in unaffiliated issuers were $21,849,909 and $1,309,974,131, respectively. |
| (s) | Security or a portion of the security was pledged to cover collateral requirements for securities sold short and/or certain derivative transactions. |
| (v) | Affiliated issuer that is available only to investment companies managed by MFS. The rate quoted for the MFS Institutional Money Market Portfolio is the annualizedseven-day yield of the fund at period end. |
The following abbreviations are used in this report and are defined:
| ADR | | American Depositary Receipt |
At February 29, 2020, the fund had cash collateral of $13,344,290 and other liquid securities with an aggregate value of $26,445,245 to cover any collateral or margin obligations for securities sold short and certain derivative contracts. Restricted cash and/or deposits with brokers in the Statement of Assets and Liabilities are comprised of cash collateral.
See Notes to Financial Statements
7
Financial Statements
STATEMENT OF ASSETS AND LIABILITIES
At 2/29/20 (unaudited)
This statement represents your fund’s balance sheet, which details the assets and liabilities comprising the total value of the fund.
| | | | |
| Assets | | | | |
Investments in unaffiliated issuers, at value (identified cost, $664,886,933) | | | $1,309,974,131 | |
Investments in affiliated issuers, at value (identified cost, $21,848,333) | | | 21,849,909 | |
Deposits with brokers for | | | | |
Securities sold short | | | 13,344,290 | |
Receivables for | | | | |
Investments sold | | | 4,671,785 | |
Fund shares sold | | | 13,880,676 | |
Interest and dividends | | | 679,173 | |
Other assets | | | 4,044 | |
Total assets | | | $1,364,404,008 | |
| |
| Liabilities | | | | |
Payables for | | | | |
Securities sold short, at value (proceeds received, $21,675) | | | $28,723 | |
Investments purchased | | | 1,350,344 | |
Fund shares reacquired | | | 22,023,641 | |
Payable to affiliates | | | | |
Investment adviser | | | 80,512 | |
Administrative services fee | | | 1,545 | |
Shareholder servicing costs | | | 544,556 | |
Distribution and service fees | | | 25,706 | |
Payable for independent Trustees’ compensation | | | 2,018 | |
Accrued expenses and other liabilities | | | 36,929 | |
Total liabilities | | | $24,093,974 | |
Net assets | | | $1,340,310,034 | |
| |
| Net assets consist of | | | | |
Paid-in capital | | | $707,536,414 | |
Total distributable earnings (loss) | | | 632,773,620 | |
Net assets | | | $1,340,310,034 | |
Shares of beneficial interest outstanding | | | 28,455,917 | |
8
Statement of Assets and Liabilities (unaudited) – continued
| | | | | | | | | | | | |
| | | |
| | | Net assets | | | Shares
outstanding | | | Net asset value
per share (a) | |
Class A | | | $507,562,633 | | | | 10,822,604 | | | | $46.90 | |
Class B | | | 38,774,296 | | | | 976,603 | | | | 39.70 | |
Class C | | | 132,558,043 | | | | 3,346,141 | | | | 39.62 | |
Class I | | | 327,105,598 | | | | 6,479,431 | | | | 50.48 | |
Class R1 | | | 5,852,248 | | | | 148,057 | | | | 39.53 | |
Class R2 | | | 29,076,569 | | | | 654,907 | | | | 44.40 | |
Class R3 | | | 75,037,193 | | | | 1,600,960 | | | | 46.87 | |
Class R4 | | | 25,966,516 | | | | 528,991 | | | | 49.09 | |
Class R6 | | | 198,376,938 | | | | 3,898,223 | | | | 50.89 | |
| (a) | Maximum offering price per share was equal to the net asset value per share for all share classes, except for Class A, for which the maximum offering price per share was $49.76 [100 / 94.25 x $46.90]. On sales of $50,000 or more, the maximum offering price of Class A shares is reduced. A contingent deferred sales charge may be imposed on redemptions of Class A, Class B, and Class C shares. Redemption price per share was equal to the net asset value per share for Classes I, R1, R2, R3, R4, and R6. |
See Notes to Financial Statements
9
Financial Statements
STATEMENT OF OPERATIONS
Six months ended 2/29/20 (unaudited)
This statement describes how much your fund earned in investment income and accrued in expenses. It also describes any gains and/or losses generated by fund operations.
| | | | |
| Net investment income (loss) | | | | |
Income | | | | |
Dividends | | | $2,613,163 | |
Other | | | 236,898 | |
Dividends from affiliated issuers | | | 219,588 | |
Income on securities loaned | | | 95,254 | |
Foreign taxes withheld | | | (5,735 | ) |
Total investment income | | | $3,159,168 | |
Expenses | | | | |
Management fee | | | $4,909,293 | |
Distribution and service fees | | | 1,692,117 | |
Shareholder servicing costs | | | 668,627 | |
Administrative services fee | | | 90,810 | |
Independent Trustees’ compensation | | | 12,524 | |
Custodian fee | | | 34,058 | |
Shareholder communications | | | 36,016 | |
Audit and tax fees | | | 30,299 | |
Legal fees | | | 5,369 | |
Dividend and interest expense on securities sold short | | | 312,631 | |
Interest expense and fees | | | 3,588 | |
Miscellaneous | | | 98,227 | |
Total expenses | | | $7,893,559 | |
Reduction of expenses by investment adviser and distributor | | | (79,672 | ) |
Net expenses | | | $7,813,887 | |
Net investment income (loss) | | | $(4,654,719 | ) |
| |
| Realized and unrealized gain (loss) | | | | |
Realized gain (loss) (identified cost basis) | | | | |
Unaffiliated issuers | | | $24,212,104 | |
Affiliated issuers | | | 4,624 | |
Written options | | | 606,271 | |
Securities sold short | | | (19,439,014 | ) |
Foreign currency | | | (3,895 | ) |
Net realized gain (loss) | | | $5,380,090 | |
Change in unrealized appreciation or depreciation | | | | |
Unaffiliated issuers | | | $90,614,945 | |
Affiliated issuers | | | (4,218 | ) |
Securities sold short | | | (2,009,410 | ) |
Translation of assets and liabilities in foreign currencies | | | (46 | ) |
Net unrealized gain (loss) | | | $88,601,271 | |
Net realized and unrealized gain (loss) | | | $93,981,361 | |
Change in net assets from operations | | | $89,326,642 | |
See Notes to Financial Statements
10
Financial Statements
STATEMENTS OF CHANGES IN NET ASSETS
These statements describe the increases and/or decreases in net assets resulting from operations, any distributions, and any shareholder transactions.
| | | | | | | | |
| Change in net assets | | Six months ended
2/29/20
(unaudited) | | | Year ended
8/31/19 | |
| | |
| From operations | | | | | | | | |
Net investment income (loss) | | | $(4,654,719 | ) | | | $(7,674,688 | ) |
Net realized gain (loss) | | | 5,380,090 | | | | 30,801,602 | |
Net unrealized gain (loss) | | | 88,601,271 | | | | 10,211,911 | |
Change in net assets from operations | | | $89,326,642 | | | | $33,338,825 | |
Total distributions to shareholders | | | $(27,686,049 | ) | | | $(51,440,197 | ) |
Change in net assets from fund share transactions | | | $12,753,381 | | | | $47,069,408 | |
Total change in net assets | | | $74,393,974 | | | | $28,968,036 | |
| | |
| Net assets | | | | | | | | |
At beginning of period | | | 1,265,916,060 | | | | 1,236,948,024 | |
At end of period | | | $1,340,310,034 | | | | $1,265,916,060 | |
See Notes to Financial Statements
11
Financial Statements
FINANCIAL HIGHLIGHTS
The financial highlights table is intended to help you understand the fund’s financial performance for the semiannual period and the past 5 fiscal years. Certain information reflects financial results for a single fund share. The total returns in the table represent the rate that an investor would have earned (or lost) on an investment in the fund share class (assuming reinvestment of all distributions) held for the entire period.
| | | | | | | | | | | | | | | | | | | | | | | | |
| | | Six months
ended 2/29/20 | | | Year ended | |
| Class A | | 8/31/19 | | | 8/31/18 | | | 8/31/17 | | | 8/31/16 | | | 8/31/15 | |
| | | (unaudited) | | | | | | | | | | | | | | | | |
Net asset value, beginning of period | | | $44.73 | | | | $45.65 | | | | $35.67 | | | | $28.27 | | | | $24.62 | | | | $24.47 | |
| | | |
| Income (loss) from investment operations | | | | | | | | | | | | | |
Net investment income (loss) (d) | | | $(0.16 | ) | | | $(0.27 | ) | | | $(0.26 | ) | | | $(0.19 | )(c) | | | $(0.12 | ) | | | $(0.15 | ) |
Net realized and unrealized
gain (loss) | | | 3.31 | | | | 1.24 | | | | 11.61 | | | | 8.13 | | | | 4.76 | | | | 1.15 | |
Total from investment operations | | | $3.15 | | | | $0.97 | | | | $11.35 | | | | $7.94 | | | | $4.64 | | | | $1.00 | |
| | | |
| Less distributions declared to shareholders | | | | | | | | | | | | | |
From net realized gain | | | $(0.98 | ) | | | $(1.89 | ) | | | $(1.37 | ) | | | $(0.54 | ) | | | $(0.99 | ) | | | $(0.85 | ) |
Net asset value, end of period (x) | | | $46.90 | | | | $44.73 | | | | $45.65 | | | | $35.67 | | | | $28.27 | | | | $24.62 | |
Total return (%) (r)(s)(t)(x) | | | 7.12 | (n) | | | 2.97 | | | | 32.79 | | | | 28.58 | (c) | | | 19.20 | | | | 4.18 | |
| | | |
Ratios (%) (to average net assets)
and Supplemental data: | | | | | | | | | | | | | |
Expenses before expense reductions (f) | | | 1.19 | (a) | | | 1.19 | | | | 1.24 | | | | 1.24 | (c) | | | 1.27 | | | | 1.30 | |
Expenses after expense reductions (f) | | | 1.18 | (a) | | | 1.18 | | | | 1.22 | | | | 1.23 | (c) | | | 1.26 | | | | 1.29 | |
Net investment income (loss) | | | (0.71 | )(a) | | | (0.64 | ) | | | (0.66 | ) | | | (0.63 | )(c) | | | (0.48 | ) | | | (0.60 | ) |
Portfolio turnover | | | 17 | (n) | | | 32 | | | | 30 | | | | 43 | | | | 30 | | | | 43 | |
Net assets at end of period
(000 omitted) | | | $507,563 | | | | $471,468 | | | | $484,477 | | | | $359,698 | | | | $320,898 | | | | $199,313 | |
| | | |
| Supplemental Ratios (%): | | | | | | | | | | | | | |
Ratios of expenses to average net
assets after expense reductions
excluding short sale expenses
and interest expense and fees (f) | | | 1.13 | (a) | | | 1.15 | | | | 1.16 | | | | 1.19 | (c) | | | 1.24 | | | | 1.27 | |
See Notes to Financial Statements
12
Financial Highlights – continued
| | | | | | | | | | | | | | | | | | | | | | | | |
| | | Six months ended 2/29/20 | | | Year ended | |
| Class B | | 8/31/19 | | | 8/31/18 | | | 8/31/17 | | | 8/31/16 | | | 8/31/15 | |
| | | (unaudited) | | | | | | | | | | | | | | | | |
Net asset value, beginning of period | | | $38.16 | | | | $39.55 | | | | $31.31 | | | | $25.06 | | | | $22.09 | | | | $22.20 | |
| | | |
| Income (loss) from investment operations | | | | | | | | | | | | | |
Net investment income (loss) (d) | | | $(0.29 | ) | | | $(0.50 | ) | | | $(0.49 | ) | | | $(0.38 | )(c) | | | $(0.28 | ) | | | $(0.30 | ) |
Net realized and unrealized
gain (loss) | | | 2.81 | | | | 1.00 | | | | 10.10 | | | | 7.17 | | | | 4.24 | | | | 1.04 | |
Total from investment operations | | | $2.52 | | | | $0.50 | | | | $9.61 | | | | $6.79 | | | | $3.96 | | | | $0.74 | |
| | | |
| Less distributions declared to shareholders | | | | | | | | | | | | | |
From net realized gain | | | $(0.98 | ) | | | $(1.89 | ) | | | $(1.37 | ) | | | $(0.54 | ) | | | $(0.99 | ) | | | $(0.85 | ) |
Net asset value, end of period (x) | | | $39.70 | | | | $38.16 | | | | $39.55 | | | | $31.31 | | | | $25.06 | | | | $22.09 | |
Total return (%) (r)(s)(t)(x) | | | 6.68 | (n) | | | 2.21 | | | | 31.77 | | | | 27.64 | (c) | | | 18.29 | | | | 3.41 | |
| | | |
Ratios (%) (to average net assets)
and Supplemental data: | | | | | | | | | | | | | |
Expenses before expense reductions (f) | | | 1.94 | (a) | | | 1.94 | | | | 1.99 | | | | 1.99 | (c) | | | 2.02 | | | | 2.05 | |
Expenses after expense reductions (f) | | | 1.93 | (a) | | | 1.93 | | | | 1.98 | | | | 1.98 | (c) | | | 2.01 | | | | 2.04 | |
Net investment income (loss) | | | (1.46 | )(a) | | | (1.39 | ) | | | (1.41 | ) | | | (1.38 | )(c) | | | (1.22 | ) | | | (1.35 | ) |
Portfolio turnover | | | 17 | (n) | | | 32 | | | | 30 | | | | 43 | | | | 30 | | | | 43 | |
Net assets at end of period
(000 omitted) | | | $38,774 | | | | $41,017 | | | | $45,337 | | | | $34,396 | | | | $25,990 | | | | $18,791 | |
| | | |
| Supplemental Ratios (%): | | | | | | | | | | | | | |
Ratios of expenses to average net
assets after expense reductions
excluding short sale expenses
and interest expense and fees (f) | | | 1.89 | (a) | | | 1.90 | | | | 1.92 | | | | 1.94 | (c) | | | 1.99 | | | | 2.02 | |
See Notes to Financial Statements
13
Financial Highlights – continued
| | | | | | | | | | | | | | | | | | | | | | | | |
| | | Six months ended 2/29/20 | | | Year ended | |
| Class C | | 8/31/19 | | | 8/31/18 | | | 8/31/17 | | | 8/31/16 | | | 8/31/15 | |
| | | (unaudited) | | | | | | | | | | | | | | | | |
Net asset value, beginning of period | | | $38.07 | | | | $39.47 | | | | $31.24 | | | | $25.01 | | | | $22.05 | | | | $22.16 | |
| | | |
| Income (loss) from investment operations | | | | | | | | | | | | | |
Net investment income (loss) (d) | | | $(0.29 | ) | | | $(0.50 | ) | | | $(0.49 | ) | | | $(0.38 | )(c) | | | $(0.28 | ) | | | $(0.30 | ) |
Net realized and unrealized
gain (loss) | | | 2.82 | | | | 0.99 | | | | 10.09 | | | | 7.15 | | | | 4.23 | | | | 1.04 | |
Total from investment operations | | | $2.53 | | | | $0.49 | | | | $9.60 | | | | $6.77 | | | | $3.95 | | | | $0.74 | |
| | | |
| Less distributions declared to shareholders | | | | | | | | | | | | | |
From net realized gain | | | $(0.98 | ) | | | $(1.89 | ) | | | $(1.37 | ) | | | $(0.54 | ) | | | $(0.99 | ) | | | $(0.85 | ) |
Net asset value, end of period (x) | | | $39.62 | | | | $38.07 | | | | $39.47 | | | | $31.24 | | | | $25.01 | | | | $22.05 | |
Total return (%) (r)(s)(t)(x) | | | 6.73 | (n) | | | 2.19 | | | | 31.81 | | | | 27.62 | (c) | | | 18.28 | | | | 3.42 | |
| | | |
Ratios (%) (to average net assets)
and Supplemental data: | | | | | | | | | | | | | |
Expenses before expense reductions (f) | | | 1.94 | (a) | | | 1.94 | | | | 1.98 | | | | 1.99 | (c) | | | 2.02 | | | | 2.05 | |
Expenses after expense reductions (f) | | | 1.93 | (a) | | | 1.93 | | | | 1.97 | | | | 1.98 | (c) | | | 2.01 | | | | 2.04 | |
Net investment income (loss) | | | (1.46 | )(a) | | | (1.40 | ) | | | (1.41 | ) | | | (1.38 | )(c) | | | (1.23 | ) | | | (1.35 | ) |
Portfolio turnover | | | 17 | (n) | | | 32 | | | | 30 | | | | 43 | | | | 30 | | | | 43 | |
Net assets at end of period
(000 omitted) | | | $132,558 | | | | $128,817 | | | | $128,707 | | | | $101,656 | | | | $73,071 | | | | $43,037 | |
| | | |
| Supplemental Ratios (%): | | | | | | | | | | | | | |
Ratios of expenses to average net
assets after expense reductions
excluding short sale expenses
and interest expense and fees (f) | | | 1.89 | (a) | | | 1.91 | | | | 1.92 | | | | 1.94 | (c) | | | 2.00 | | | | 2.02 | |
See Notes to Financial Statements
14
Financial Highlights – continued
| | | | | | | | | | | | | | | | | | | | | | | | |
| | | Six months
ended 2/29/20 | | | Year ended | |
| Class I | | 8/31/19 | | | 8/31/18 | | | 8/31/17 | | | 8/31/16 | | | 8/31/15 | |
| | | (unaudited) | | | | | | | | | | | | | | | | |
Net asset value, beginning of period | | | $48.02 | | | | $48.74 | | | | $37.90 | | | | $29.93 | | | | $25.96 | | | | $25.69 | |
| | | |
| Income (loss) from investment operations | | | | | | | | | | | | | |
Net investment income (loss) (d) | | | $(0.12 | ) | | | $(0.18 | ) | | | $(0.18 | ) | | | $(0.13 | )(c) | | | $(0.07 | ) | | | $(0.09 | ) |
Net realized and unrealized
gain (loss) | | | 3.56 | | | | 1.35 | | | | 12.39 | | | | 8.64 | | | | 5.03 | | | | 1.21 | |
Total from investment operations | | | $3.44 | | | | $1.17 | | | | $12.21 | | | | $8.51 | | | | $4.96 | | | | $1.12 | |
| | | |
| Less distributions declared to shareholders | | | | | | | | | | | | | |
From net realized gain | | | $(0.98 | ) | | | $(1.89 | ) | | | $(1.37 | ) | | | $(0.54 | ) | | | $(0.99 | ) | | | $(0.85 | ) |
Net asset value, end of period (x) | | | $50.48 | | | | $48.02 | | | | $48.74 | | | | $37.90 | | | | $29.93 | | | | $25.96 | |
Total return (%) (r)(s)(t)(x) | | | 7.23 | (n) | | | 3.20 | | | | 33.14 | | | | 28.91 | (c) | | | 19.45 | | | | 4.45 | |
| | | |
Ratios (%) (to average net assets)
and Supplemental data: | | | | | | | | | | | | | |
Expenses before expense reductions (f) | | | 0.94 | (a) | | | 0.94 | | | | 0.99 | | | | 0.99 | (c) | | | 1.02 | | | | 1.05 | |
Expenses after expense reductions (f) | | | 0.93 | (a) | | | 0.93 | | | | 0.98 | | | | 0.98 | (c) | | | 1.01 | | | | 1.04 | |
Net investment income (loss) | | | (0.46 | )(a) | | | (0.40 | ) | | | (0.41 | ) | | | (0.39 | )(c) | | | (0.24 | ) | | | (0.35 | ) |
Portfolio turnover | | | 17 | (n) | | | 32 | | | | 30 | | | | 43 | | | | 30 | | | | 43 | |
Net assets at end of period
(000 omitted) | | | $327,106 | | | | $315,655 | | | | $303,359 | | | | $174,275 | | | | $96,700 | | | | $56,619 | |
| | | |
| Supplemental Ratios (%): | | | | | | | | | | | | | |
Ratios of expenses to average net
assets after expense reductions
excluding short sale expenses
and interest expense and fees (f) | | | 0.89 | (a) | | | 0.91 | | | | 0.92 | | | | 0.95 | (c) | | | 1.00 | | | | 1.02 | |
See Notes to Financial Statements
15
Financial Highlights – continued
| | | | | | | | | | | | | | | | | | | | | | | | |
| | | Six months
ended 2/29/20 | | | Year ended | |
| Class R1 | | 8/31/19 | | | 8/31/18 | | | 8/31/17 | | | 8/31/16 | | | 8/31/15 | |
| | | (unaudited) | | | | | | | | | | | | | | | | |
Net asset value, beginning of period | | | $37.99 | | | | $39.39 | | | | $31.18 | | | | $24.96 | | | | $22.01 | | | | $22.12 | |
| | | |
| Income (loss) from investment operations | | | | | | | | | | | | | |
Net investment income (loss) (d) | | | $(0.29 | ) | | | $(0.50 | ) | | | $(0.49 | ) | | | $(0.38 | )(c) | | | $(0.28 | ) | | | $(0.30 | ) |
Net realized and unrealized
gain (loss) | | | 2.81 | | | | 0.99 | | | | 10.07 | | | | 7.14 | | | | 4.22 | | | | 1.04 | |
Total from investment operations | | | $2.52 | | | | $0.49 | | | | $9.58 | | | | $6.76 | | | | $3.94 | | | | $0.74 | |
| | | |
| Less distributions declared to shareholders | | | | | | | | | | | | | |
From net realized gain | | | $(0.98 | ) | | | $(1.89 | ) | | | $(1.37 | ) | | | $(0.54 | ) | | | $(0.99 | ) | | | $(0.85 | ) |
Net asset value, end of period (x) | | | $39.53 | | | | $37.99 | | | | $39.39 | | | | $31.18 | | | | $24.96 | | | | $22.01 | |
Total return (%) (r)(s)(t)(x) | | | 6.71 | (n) | | | 2.19 | | | | 31.80 | | | | 27.63 | (c) | | | 18.27 | | | | 3.43 | |
| | | |
Ratios (%) (to average net assets)
and Supplemental data: | | | | | | | | | | | | | |
Expenses before expense reductions (f) | | | 1.94 | (a) | | | 1.94 | | | | 1.99 | | | | 1.99 | (c) | | | 2.02 | | | | 2.05 | |
Expenses after expense reductions (f) | | | 1.93 | (a) | | | 1.93 | | | | 1.98 | | | | 1.98 | (c) | | | 2.01 | | | | 2.04 | |
Net investment income (loss) | | | (1.46 | )(a) | | | (1.40 | ) | | | (1.41 | ) | | | (1.38 | )(c) | | | (1.22 | ) | | | (1.36 | ) |
Portfolio turnover | | | 17 | (n) | | | 32 | | | | 30 | | | | 43 | | | | 30 | | | | 43 | |
Net assets at end of period
(000 omitted) | | | $5,852 | | | | $5,715 | | | | $5,534 | | | | $4,256 | | | | $3,073 | | | | $2,516 | |
| | | |
| Supplemental Ratios (%): | | | | | | | | | | | | | |
Ratios of expenses to average net
assets after expense reductions
excluding short sale expenses
and interest expense and fees (f) | | | 1.89 | (a) | | | 1.91 | | | | 1.92 | | | | 1.95 | (c) | | | 1.99 | | | | 2.02 | |
See Notes to Financial Statements
16
Financial Highlights – continued
| | | | | | | | | | | | | | | | | | | | | | | | |
| | | Six months
ended 2/29/20 | | | Year ended | |
| Class R2 | | 8/31/19 | | | 8/31/18 | | | 8/31/17 | | | 8/31/16 | | | 8/31/15 | |
| | | (unaudited) | | | | | | | | | | | | | | | | |
Net asset value, beginning of period | | | $42.45 | | | | $43.55 | | | | $34.17 | | | | $27.17 | | | | $23.76 | | | | $23.70 | |
| | | |
| Income (loss) from investment operations | | | | | | | | | | | | | |
Net investment income (loss) (d) | | | $(0.21 | ) | | | $(0.36 | ) | | | $(0.35 | ) | | | $(0.26 | )(c) | | | $(0.18 | ) | | | $(0.20 | ) |
Net realized and unrealized
gain (loss) | | | 3.14 | | | | 1.15 | | | | 11.10 | | | | 7.80 | | | | 4.58 | | | | 1.11 | |
Total from investment operations | | | $2.93 | | | | $0.79 | | | | $10.75 | | | �� | $7.54 | | | | $4.40 | | | | $0.91 | |
| | | |
| Less distributions declared to shareholders | | | | | | | | | | | | | |
From net realized gain | | | $(0.98 | ) | | | $(1.89 | ) | | | $(1.37 | ) | | | $(0.54 | ) | | | $(0.99 | ) | | | $(0.85 | ) |
Net asset value, end of period (x) | | | $44.40 | | | | $42.45 | | | | $43.55 | | | | $34.17 | | | | $27.17 | | | | $23.76 | |
Total return (%) (r)(s)(t)(x) | | | 6.98 | (n) | | | 2.69 | | | | 32.46 | | | | 28.27 | (c) | | | 18.88 | | | | 3.93 | |
| | | |
Ratios (%) (to average net assets)
and Supplemental data: | | | | | | | | | | | | | |
Expenses before expense reductions (f) | | | 1.44 | (a) | | | 1.44 | | | | 1.48 | | | | 1.49 | (c) | | | 1.52 | | | | 1.55 | |
Expenses after expense reductions (f) | | | 1.43 | (a) | | | 1.43 | | | | 1.48 | | | | 1.49 | (c) | | | 1.51 | | | | 1.54 | |
Net investment income (loss) | | | (0.96 | )(a) | | | (0.90 | ) | | | (0.91 | ) | | | (0.89 | )(c) | | | (0.72 | ) | | | (0.84 | ) |
Portfolio turnover | | | 17 | (n) | | | 32 | | | | 30 | | | | 43 | | | | 30 | | | | 43 | |
Net assets at end of period
(000 omitted) | | | $29,077 | | | | $29,339 | | | | $28,071 | | | | $23,625 | | | | $17,031 | | | | $14,946 | |
| | | |
| Supplemental Ratios (%): | | | | | | | | | | | | | |
Ratios of expenses to average net
assets after expense reductions
excluding short sale expenses
and interest expense and fees (f) | | | 1.39 | (a) | | | 1.41 | | | | 1.42 | | | | 1.45 | (c) | | | 1.49 | | | | 1.52 | |
See Notes to Financial Statements
17
Financial Highlights – continued
| | | | | | | | | | | | | | | | | | | | | | | | |
| | | Six months ended 2/29/20 | | | Year ended | |
| Class R3 | | 8/31/19 | | | 8/31/18 | | | 8/31/17 | | | 8/31/16 | | | 8/31/15 | |
| | | (unaudited) | | | | | | | | | | | | | | | | |
Net asset value, beginning of period | | | $44.71 | | | | $45.63 | | | | $35.66 | | | | $28.26 | | | | $24.61 | | | | $24.46 | |
| | | |
| Income (loss) from investment operations | | | | | | | | | | | | | |
Net investment income (loss) (d) | | | $(0.17 | ) | | | $(0.27 | ) | | | $(0.27 | ) | | | $(0.20 | )(c) | | | $(0.13 | ) | | | $(0.15 | ) |
Net realized and unrealized
gain (loss) | | | 3.31 | | | | 1.24 | | | | 11.61 | | | | 8.14 | | | | 4.77 | | | | 1.15 | |
Total from investment operations | | | $3.14 | | | | $0.97 | | | | $11.34 | | | | $7.94 | | | | $4.64 | | | | $1.00 | |
| | | |
| Less distributions declared to shareholders | | | | | | | | | | | | | |
From net realized gain | | | $(0.98 | ) | | | $(1.89 | ) | | | $(1.37 | ) | | | $(0.54 | ) | | | $(0.99 | ) | | | $(0.85 | ) |
Net asset value, end of period (x) | | | $46.87 | | | | $44.71 | | | | $45.63 | | | | $35.66 | | | | $28.26 | | | | $24.61 | |
Total return (%) (r)(s)(t)(x) | | | 7.10 | (n) | | | 2.97 | | | | 32.77 | | | | 28.59 | (c) | | | 19.21 | | | | 4.18 | |
| | | |
Ratios (%) (to average net assets)
and Supplemental data: | | | | | | | | | | | | | |
Expenses before expense reductions (f) | | | 1.19 | (a) | | | 1.19 | | | | 1.24 | | | | 1.24 | (c) | | | 1.27 | | | | 1.30 | |
Expenses after expense reductions (f) | | | 1.18 | (a) | | | 1.18 | | | | 1.23 | | | | 1.23 | (c) | | | 1.26 | | | | 1.29 | |
Net investment income (loss) | | | (0.71 | )(a) | | | (0.65 | ) | | | (0.66 | ) | | | (0.65 | )(c) | | | (0.49 | ) | | | (0.60 | ) |
Portfolio turnover | | | 17 | (n) | | | 32 | | | | 30 | | | | 43 | | | | 30 | | | | 43 | |
Net assets at end of period
(000 omitted) | | | $75,037 | | | | $80,242 | | | | $79,534 | | | | $53,199 | | | | $20,180 | | | | $9,732 | |
| | | |
| Supplemental Ratios (%): | | | | | | | | | | | | | |
Ratios of expenses to average net
assets after expense reductions
excluding short sale expenses
and interest expense and fees (f) | | | 1.14 | (a) | | | 1.16 | | | | 1.17 | | | | 1.20 | (c) | | | 1.25 | | | | 1.27 | |
See Notes to Financial Statements
18
Financial Highlights – continued
| | | | | | | | | | | | | | | | | | | | | | | | |
| | | Six months
ended 2/29/20 | | | Year ended | |
| Class R4 | | 8/31/19 | | | 8/31/18 | | | 8/31/17 | | | 8/31/16 | | | 8/31/15 | |
| | | (unaudited) | | | | | | | | | | | | | | | | |
Net asset value, beginning of period | | | $46.72 | | | | $47.47 | | | | $36.95 | | | | $29.19 | | | | $25.34 | | | | $25.10 | |
| | | |
| Income (loss) from investment operations | | | | | | | | | | | | | |
Net investment income (loss) (d) | | | $(0.11 | ) | | | $(0.17 | ) | | | $(0.17 | ) | | | $(0.13 | )(c) | | | $(0.06 | ) | | | $(0.09 | ) |
Net realized and unrealized
gain (loss) | | | 3.46 | | | | 1.31 | | | | 12.06 | | | | 8.43 | | | | 4.90 | | | | 1.18 | |
Total from investment operations | | | $3.35 | | | | $1.14 | | | | $11.89 | | | | $8.30 | | | | $4.84 | | | | $1.09 | |
| | | |
| Less distributions declared to shareholders | | | | | | | | | | | | | |
From net realized gain | | | $(0.98 | ) | | | $(1.89 | ) | | | $(1.37 | ) | | | $(0.54 | ) | | | $(0.99 | ) | | | $(0.85 | ) |
Net asset value, end of period (x) | | | $49.09 | | | | $46.72 | | | | $47.47 | | | | $36.95 | | | | $29.19 | | | | $25.34 | |
Total return (%) (r)(s)(t)(x) | | | 7.24 | (n) | | | 3.22 | | | | 33.12 | | | | 28.92 | (c) | | | 19.45 | | | | 4.44 | |
| | | |
Ratios (%) (to average net assets)
and Supplemental data: | | | | | | | | | | | | | |
Expenses before expense reductions (f) | | | 0.94 | (a) | | | 0.94 | | | | 0.99 | | | | 0.99 | (c) | | | 1.02 | | | | 1.05 | |
Expenses after expense reductions (f) | | | 0.93 | (a) | | | 0.93 | | | | 0.98 | | | | 0.99 | (c) | | | 1.01 | | | | 1.04 | |
Net investment income (loss) | | | (0.46 | )(a) | | | (0.40 | ) | | | (0.41 | ) | | | (0.39 | )(c) | | | (0.24 | ) | | | (0.37 | ) |
Portfolio turnover | | | 17 | (n) | | | 32 | | | | 30 | | | | 43 | | | | 30 | | | | 43 | |
Net assets at end of period
(000 omitted) | | | $25,967 | | | | $25,310 | | | | $23,004 | | | | $14,443 | | | | $8,141 | | | | $2,234 | |
| | | |
| Supplemental Ratios (%): | | | | | | | | | | | | | |
Ratios of expenses to average net
assets after expense reductions
excluding short sale expenses
and interest expense and fees (f) | | | 0.89 | (a) | | | 0.91 | | | | 0.92 | | | | 0.95 | (c) | | | 1.00 | | | | 1.02 | |
See Notes to Financial Statements
19
Financial Highlights – continued
| | | | | | | | | | | | | | | | | | | | | | | | |
| | | Six months ended 2/29/20 | | | Year ended | |
| Class R6 | | 8/31/19 | | | 8/31/18 | | | 8/31/17 | | | 8/31/16 | | | 8/31/15 | |
| | | (unaudited) | | | | | | | | | | | | | | | | |
Net asset value, beginning of period | | | $48.38 | | | | $49.03 | | | | $38.09 | | | | $30.05 | | | | $26.03 | | | | $25.73 | |
| | | |
| Income (loss) from investment operations | | | | | | | | | | | | | |
Net investment income (loss) (d) | | | $(0.09 | ) | | | $(0.13 | ) | | | $(0.13 | ) | | | $(0.10 | )(c) | | | $(0.04 | ) | | | $(0.07 | ) |
Net realized and unrealized
gain (loss) | | | 3.58 | | | | 1.37 | | | | 12.44 | | | | 8.68 | | | | 5.05 | | | | 1.22 | |
Total from investment operations | | | $3.49 | | | | $1.24 | | | | $12.31 | | | | $8.58 | | | | $5.01 | | | | $1.15 | |
| | | |
| Less distributions declared to shareholders | | | | | | | | | | | | | |
From net realized gain | | | $(0.98 | ) | | | $(1.89 | ) | | | $(1.37 | ) | | | $(0.54 | ) | | | $(0.99 | ) | | | $(0.85 | ) |
Net asset value, end of period (x) | | | $50.89 | | | | $48.38 | | | | $49.03 | | | | $38.09 | | | | $30.05 | | | | $26.03 | |
Total return (%) (r)(s)(t)(x) | | | 7.28 | (n) | | | 3.33 | | | | 33.24 | | | | 29.03 | (c) | | | 19.59 | | | | 4.57 | |
| | | |
Ratios (%) (to average net assets)
and Supplemental data: | | | | | | | | | | | | | |
Expenses before expense reductions (f) | | | 0.85 | (a) | | | 0.84 | | | | 0.89 | | | | 0.90 | (c) | | | 0.92 | | | | 0.95 | |
Expenses after expense reductions (f) | | | 0.84 | (a) | | | 0.83 | | | | 0.88 | | | | 0.89 | (c) | | | 0.91 | | | | 0.94 | |
Net investment income (loss) | | | (0.36 | )(a) | | | (0.30 | ) | | | (0.31 | ) | | | (0.30 | )(c) | | | (0.13 | ) | | | (0.27 | ) |
Portfolio turnover | | | 17 | (n) | | | 32 | | | | 30 | | | | 43 | | | | 30 | | | | 43 | |
Net assets at end of period
(000 omitted) | | | $198,377 | | | | $168,352 | | | | $138,924 | | | | $95,534 | | | | $33,411 | | | | $7,079 | |
| | | |
| Supplemental Ratios (%): | | | | | | | | | | | | | |
Ratios of expenses to average net
assets after expense reductions
excluding short sale expenses
and interest expense and fees (f) | | | 0.79 | (a) | | | 0.81 | | | | 0.82 | | | | 0.85 | (c) | | | 0.90 | | | | 0.92 | |
| (c) | Amount reflects aone-time reimbursement of expenses by the custodian (or former custodian) without which net investment income and performance would be lower and expenses would be higher. |
| (d) | Per share data is based on average shares outstanding. |
| (f) | Ratios do not reflect reductions from fees paid indirectly, if applicable. |
| (r) | Certain expenses have been reduced without which performance would have been lower. |
| (s) | From time to time the fund may receive proceeds from litigation settlements, without which performance would be lower. |
| (t) | Total returns do not include any applicable sales charges. |
| (x) | The net asset values and total returns have been calculated on net assets which include adjustments made in accordance with U.S. generally accepted accounting principles required at period end for financial reporting purposes. |
See Notes to Financial Statements
20
NOTES TO FINANCIAL STATEMENTS
(unaudited)
(1) Business and Organization
MFS Technology Fund (the fund) is anon-diversified series of MFS Series Trust I (the trust). The trust is organized as a Massachusetts business trust and is registered under the Investment Company Act of 1940, as amended, as anopen-end management investment company.
The fund is an investment company and accordingly follows the investment company accounting and reporting guidance of the Financial Accounting Standards Board (FASB) Accounting Standards Codification Topic 946 Financial Services – Investment Companies.
(2) Significant Accounting Policies
General– The preparation of financial statements in conformity with U.S. generally accepted accounting principles requires management to make estimates and assumptions that affect the reported amounts of assets and liabilities, and disclosure of contingent assets and liabilities at the date of the financial statements and the reported amounts of increases and decreases in net assets from operations during the reporting period. Actual results could differ from those estimates. In the preparation of these financial statements, management has evaluated subsequent events occurring after the date of the fund’s Statement of Assets and Liabilities through the date that the financial statements were issued. The fund invests primarily in securities of issuers in the technology industry. Issuers in a single industry can react similarly to market, currency, political, economic, regulatory, geopolitical, and other conditions. The value of stocks in the technology sector can be very volatile due to the rapid pace of product change, technological developments, and other factors.
In March 2020, the FASB issued Accounting Standards Update 2020-04, Reference Rate Reform (Topic 848) – Facilitation of the Effects of Reference Rate Reform on Financial Reporting (“ASU 2020-04”), which provides optional, temporary relief with respect to the financial reporting of contracts subject to certain types of modifications due to the planned discontinuation of the London Interbank Offered Rate (LIBOR) and other IBOR-based reference rates as of the end of 2021. The temporary relief provided by ASU 2020-04 is effective for certain reference rate-related contract modifications that occur during the period from March 12, 2020 through December 31, 2022. Management is evaluating the impact of ASU 2020-04 on the fund’s investments, derivatives, debt and other contracts that will undergo reference rate-related modifications as a result of the reference rate reform.
Balance Sheet Offsetting– The fund’s accounting policy with respect to balance sheet offsetting is that, absent an event of default by the counterparty or a termination of the agreement, the International Swaps and Derivatives Association (ISDA) Master Agreement, or similar agreement, does not result in an offset of reported amounts of financial assets and financial liabilities in the Statement of Assets and Liabilities across transactions between the fund and the applicable counterparty. The fund’s right to setoff may be restricted or prohibited by the bankruptcy or insolvency laws of the particular jurisdiction to which a specific master netting agreement counterparty is
21
Notes to Financial Statements (unaudited) – continued
subject. Balance sheet offsetting disclosures, to the extent applicable to the fund, have been included in the fund’s Significant Accounting Policies note under the captions for each of the fund’sin-scope financial instruments and transactions.
Investment Valuations– Equity securities, including restricted equity securities and equity securities sold short, are generally valued at the last sale or official closing price on their primary market or exchange as provided by a third-party pricing service. Equity securities, for which there were no sales reported that day, are generally valued at the last quoted daily bid quotation on their primary market or exchange as provided by a third-party pricing service. Equity securities sold short, for which there were no sales reported for that day, are generally valued at the last quoted daily ask quotation on their primary market or exchange as provided by a third-party pricing service.Short-term instruments with a maturity at issuance of 60 days or less may be valued at amortized cost, which approximates market value. Exchange-traded options are generally valued at the last sale or official closing price on their primary exchange as provided by a third-party pricing service. Exchange-traded options for which there were no sales reported that day are generally valued at the last daily bid quotation on their primary exchange as provided by a third-party pricing service. For put options, the position may be valued at the last daily ask quotation if there are no trades reported during the day. Options not traded on an exchange are generally valued at a broker/dealer bid quotation. Foreign currency options are generally valued at valuations provided by a third-party pricing service.Open-end investment companies are generally valued at net asset value per share. Securities and other assets generally valued on the basis of information from a third-party pricing service may also be valued at a broker/dealer bid quotation. In determining values, third-party pricing services can utilize both transaction data and market information such as yield, quality, coupon rate, maturity, type of issue, trading characteristics, and other market data. The values of foreign securities and other assets and liabilities expressed in foreign currencies are converted to U.S. dollars using the mean of bid and asked prices for rates provided by a third-party pricing service.
The Board of Trustees has delegated primary responsibility for determining or causing to be determined the value of the fund’s investments (including any fair valuation) to the adviser pursuant to valuation policies and procedures approved by the Board. If the adviser determines that reliable market quotations are not readily available, investments are valued at fair value as determined in good faith by the adviser in accordance with such procedures under the oversight of the Board of Trustees. Under the fund’s valuation policies and procedures, market quotations are not considered to be readily available for most types of debt instruments and floating rate loans and many types of derivatives. These investments are generally valued at fair value based on information from third-party pricing services. In addition, investments may be valued at fair value if the adviser determines that an investment’s value has been materially affected by events occurring after the close of the exchange or market on which the investment is principally traded (such as foreign exchange or market) and prior to the determination of the fund’s net asset value, or after the halt of trading of a specific security where trading does not resume prior to the close of the exchange or market on which the security is principally traded. Events that occur after foreign markets close (such as developments in foreign markets and significant movements in the U.S. markets) and prior to the determination of the fund’s net asset value may be deemed to have a
22
Notes to Financial Statements (unaudited) – continued
material effect on the value of securities traded in foreign markets. Accordingly, the fund’s foreign equity securities may often be valued at fair value. The adviser generally relies on third-party pricing services or other information (such as the correlation with price movements of similar securities in the same or other markets; the type, cost and investment characteristics of the security; the business and financial condition of the issuer; and trading and other market data) to assist in determining whether to fair value and at what value to fair value an investment. The value of an investment for purposes of calculating the fund’s net asset value can differ depending on the source and method used to determine value. When fair valuation is used, the value of an investment used to determine the fund’s net asset value may differ from quoted or published prices for the same investment. There can be no assurance that the fund could obtain the fair value assigned to an investment if it were to sell the investment at the same time at which the fund determines its net asset value per share.
Various inputs are used in determining the value of the fund’s assets or liabilities. These inputs are categorized into three broad levels. In certain cases, the inputs used to measure fair value may fall into different levels of the fair value hierarchy. In such cases, an investment’s level within the fair value hierarchy is based on the lowest level of input that is significant to the fair value measurement. The fund’s assessment of the significance of a particular input to the fair value measurement in its entirety requires judgment, and considers factors specific to the investment. Level 1 includes unadjusted quoted prices in active markets for identical assets or liabilities. Level 2 includes other significant observable market-based inputs (including quoted prices for similar securities, interest rates, prepayment speed, and credit risk). Level 3 includes unobservable inputs, which may include the adviser’s own assumptions in determining the fair value of investments. The following is a summary of the levels used as of February 29, 2020 in valuing the fund’s assets or liabilities:
| | | | | | | | | | | | | | | | |
| | | | |
| Financial Instruments | | Level 1 | | | Level 2 | | | Level 3 | | | Total | |
| Equity Securities: | | | | | | | | | | | | | | | | |
United States | | | $1,201,672,754 | | | | $— | | | | $— | | | | $1,201,672,754 | |
United Kingdom | | | 35,458,000 | | | | — | | | | — | | | | 35,458,000 | |
Canada | | | 20,515,771 | | | | — | | | | — | | | | 20,515,771 | |
China | | | 12,111,361 | | | | 7,319,890 | | | | — | | | | 19,431,251 | |
Netherlands | | | 6,729,538 | | | | 8,074,921 | | | | — | | | | 14,804,459 | |
Israel | | | 9,596,816 | | | | — | | | | — | | | | 9,596,816 | |
Japan | | | 1,309,401 | | | | 7,185,679 | | | | — | | | | 8,495,080 | |
| Mutual Funds | | | 21,849,909 | | | | — | | | | — | | | | 21,849,909 | |
| Total | | | $1,309,243,550 | | | | $22,580,490 | | | | $— | | | | $1,331,824,040 | |
| Securities Sold Short | | | $(28,723 | ) | | | $— | | | | $— | | | | $(28,723 | ) |
For further information regarding security characteristics, see the Portfolio of Investments.
Foreign Currency Translation– Purchases and sales of foreign investments, income, and expenses are converted into U.S. dollars based upon currency exchange rates prevailing on the respective dates of such transactions or on the reporting date for foreign denominated receivables and payables. Gains and losses attributable to foreign currency exchange rates on sales of securities are recorded for financial statement purposes as net realized gains and losses on investments. Gains and losses attributable
23
Notes to Financial Statements (unaudited) – continued
to foreign exchange rate movements on receivables, payables, income and expenses are recorded for financial statement purposes as foreign currency transaction gains and losses. That portion of both realized and unrealized gains and losses on investments that results from fluctuations in foreign currency exchange rates is not separately disclosed.
Derivatives– The fund uses derivatives primarily to increase or decrease exposure to a particular market or segment of the market, or security, to increase or decrease interest rate or currency exposure, or as alternatives to direct investments. Derivatives are used for hedging ornon-hedging purposes. While hedging can reduce or eliminate losses, it can also reduce or eliminate gains. When the fund uses derivatives as an investment to increase market exposure, or for hedging purposes, gains and losses from derivative instruments may be substantially greater than the derivative’s original cost.
The derivative instruments used by the fund during the period were written options. Depending on the type of derivative, the fund may exit a derivative position by entering into an offsetting transaction with a counterparty or exchange, negotiating an agreement with the derivative counterparty, or novating the position to a third party. At February 29, 2020, the fund did not have any outstanding derivative instruments.
The following table presents, by major type of derivative contract, the realized gain (loss) on derivatives held by the fund for the six months ended February 29, 2020 as reported in the Statement of Operations:
| | | | |
| |
| Risk | | Written
Options | |
| Equity | | | $606,271 | |
There is no change in unrealized appreciation (depreciation) on derivative transactions at period end.
Derivative counterparty credit risk is managed through formal evaluation of the creditworthiness of all potential counterparties. On certain, but not all, uncleared derivatives, the fund attempts to reduce its exposure to counterparty credit risk whenever possible by entering into an ISDA Master Agreement on a bilateral basis. The ISDA Master Agreement gives each party to the agreement the right to terminate all transactions traded under such agreement if there is a specified deterioration in the credit quality of the other party. Upon an event of default or a termination of the ISDA Master Agreement, thenon-defaulting party has the right to close out all transactions traded under such agreement and to net amounts owed under each agreement to one net amount payable by one party to the other. This right to close out and net payments across all transactions traded under the ISDA Master Agreement could result in a reduction of the fund’s credit risk to such counterparty equal to any amounts payable by the fund under the applicable transactions, if any.
Collateral and margin requirements differ by type of derivative. For cleared derivatives (e.g., futures contracts, cleared swaps, and exchange-traded options), margin requirements are set by the clearing broker and the clearing house and collateral, in the form of cash or securities, is posted by the fund directly with the clearing broker. Collateral terms are counterparty agreement specific for uncleared derivatives (e.g., forward foreign currency exchange contracts, uncleared swap agreements, and uncleared options) and collateral, in the form of cash and securities, is held in
24
Notes to Financial Statements (unaudited) – continued
segregated accounts with the fund’s custodian in connection with these agreements. For derivatives traded under an ISDA Master Agreement, which contains a collateral support annex, the collateral requirements are netted across all transactions traded under such counterparty-specific agreement and an amount is posted from one party to the other to collateralize such obligations. Cash that has been segregated or delivered to cover the fund’s collateral or margin obligations under derivative contracts, if any, will be reported separately in the Statement of Assets and Liabilities as restricted cash for uncleared derivatives and/or deposits with brokers for cleared derivatives. Securities pledged as collateral or margin for the same purpose, if any, are noted in the Portfolio of Investments. The fund may be required to make payments of interest on uncovered collateral or margin obligations with the broker. Any such payments are included in “Interest expense and fees” in the Statement of Operations.
Written Options– In exchange for a premium, the fund wrote call options on securities for which it anticipated the price would decline and also wrote put options on securities for which it anticipated the price would increase. At the time the option was written, the fund believed the premium received exceeded the potential loss that could result from adverse price changes in the options’ underlying securities. In a written option, the fund as the option writer grants the buyer the right to purchase from, or sell to, the fund a specified number of shares or units of a particular security, currency or index at a specified price within a specified period of time.
The premium received is initially recorded as a liability in the Statement of Assets and Liabilities. The option is subsequentlymarked-to-market daily with the difference between the premium received and the market value of the written option being recorded as unrealized appreciation or depreciation. When a written option expires, the fund realizes a gain equal to the amount of the premium received. The difference between the premium received and the amount paid on effecting a closing transaction is considered a realized gain or loss. When a written call option is exercised, the premium received is offset against the proceeds to determine the realized gain or loss. When a written put option is exercised, the premium reduces the cost basis of the security purchased by the fund.
At the initiation of the written option contract, for exchange traded options, the fund is required to deposit securities or cash as collateral with the custodian for the benefit of the broker or directly with the clearing broker, based on the type of option. For uncleared options, the fund may post collateral subject to the terms of an ISDA Master Agreement as generally described above if the market value of the options contract moves against it. The fund, as writer of an option, may have no control over whether the underlying securities may be sold (call) or purchased (put) and, as a result, bears the market risk of an unfavorable change in the price of the securities underlying the written option. Losses from writing options can exceed the premium received and can exceed the potential loss from an ordinary buy and sell transaction. Although the fund’s market risk may be significant, the maximum counterparty credit risk to the fund is equal to the market value of any collateral posted to the broker. For uncleared options, this risk is mitigated in cases where there is an ISDA Master Agreement between the fund and the counterparty providing for netting as described above.
Short Sales– The fund entered into short sales whereby it sells a security it does not own in anticipation of a decline in the value of that security. The fund will realize a gain
25
Notes to Financial Statements (unaudited) – continued
if the security price decreases and a loss if the security price increases between the date of the short sale and the date on which the fund replaces the borrowed security. Losses from short sales can exceed the proceeds of the security sold; and they can also exceed the potential loss from an ordinary buy and sell transaction. The amount of any premium, dividends, or interest the fund may be required to pay in connection with a short sale will be recognized as a fund expense. During the six months ended February 29, 2020, this expense amounted to $312,631. The fund segregates cash or marketable securities in an amount that, when combined with the amount of proceeds from the short sale deposited with the broker, at least equals the current market value of the security sold short.
Security Loans– Under its Securities Lending Agency Agreement with the fund, State Street Bank and Trust Company, as lending agent, loans the securities of the fund to certain qualified institutions (the “Borrowers”) approved by the fund. Security loans can be terminated at the discretion of either the lending agent or the fund and the related securities must be returned within the earlier of the standard trade settlement period for such securities or within three business days. The loans are collateralized by cash and/or U.S. Treasury and federal agency obligations in an amount typically at least equal to the market value of the securities loaned. On loans collateralized by cash, the cash collateral is invested in a money market fund. The market value of the loaned securities is determined at the close of business of the fund and any additional required collateral is delivered to the fund on the next business day. The lending agent provides the fund with indemnification against Borrower default. In the event of Borrower default, the lending agent will, for the benefit of the fund, either purchase securities identical to those loaned or, when such purchase is commercially impracticable, pay the fund the market value of the loaned securities. In return, the lending agent assumes the fund’s rights to the related collateral. If the collateral value is less than the cost to purchase identical securities, the lending agent is responsible for the shortfall, but only to the extent that such shortfall is not due to a decline in collateral value resulting from collateral reinvestment for which the fund bears the risk of loss. A portion of the income generated upon investment of the collateral is remitted to the Borrowers, and the remainder is allocated between the fund and the lending agent. On loans collateralized by U.S. Treasury and/or federal agency obligations, a fee is received from the Borrower, and is allocated between the fund and the lending agent. Income from securities lending is separately reported in the Statement of Operations. The dividend and interest income earned on the securities loaned is accounted for in the same manner as other dividend and interest income. At February 29, 2020, there were no securities on loan or collateral outstanding.
Indemnifications– Under the fund’s organizational documents, its officers and Trustees may be indemnified against certain liabilities and expenses arising out of the performance of their duties to the fund. Additionally, in the normal course of business, the fund enters into agreements with service providers that may contain indemnification clauses. The fund’s maximum exposure under these agreements is unknown as this would involve future claims that may be made against the fund that have not yet occurred.
Investment Transactions and Income– Investment transactions are recorded on the trade date. Dividends received in cash are recorded on theex-dividend date. Certain
26
Notes to Financial Statements (unaudited) – continued
dividends from foreign securities will be recorded when the fund is informed of the dividend if such information is obtained subsequent to theex-dividend date. Dividend payments received in additional securities are recorded on theex-dividend date in an amount equal to the value of the security on such date.
The fund may receive proceeds from litigation settlements. Any proceeds received from litigation involving portfolio holdings are reflected in the Statement of Operations in realized gain/loss if the security has been disposed of by the fund or in unrealized gain/loss if the security is still held by the fund. Any other proceeds from litigation not related to portfolio holdings are reflected as other income in the Statement of Operations.
Tax Matters and Distributions– The fund intends to qualify as a regulated investment company, as defined under Subchapter M of the Internal Revenue Code, and to distribute all of its taxable income, including realized capital gains. As a result, no provision for federal income tax is required. The fund’s federal tax returns, when filed, will remain subject to examination by the Internal Revenue Service for a three year period. Management has analyzed the fund’s tax positions taken on federal and state tax returns for all open tax years and does not believe that there are any uncertain tax positions that require recognition of a tax liability. Foreign taxes, if any, have been accrued by the fund in the accompanying financial statements in accordance with the applicable foreign tax law. Foreign income taxes may be withheld by certain countries in which the fund invests. Additionally, capital gains realized by the fund on securities issued in or by certain foreign countries may be subject to capital gains tax imposed by those countries.
Distributions to shareholders are recorded on theex-dividend date. Income and capital gain distributions are determined in accordance with income tax regulations, which may differ from U.S. generally accepted accounting principles. Certain capital accounts in the financial statements are periodically adjusted for permanent differences in order to reflect their tax character. These adjustments have no impact on net assets or net asset value per share. Temporary differences which arise from recognizing certain items of income, expense, gain or loss in different periods for financial statement and tax purposes will reverse at some time in the future.
Book/tax differences primarily relate to net operating losses, wash sale loss deferrals, straddle loss deferrals, and treating a portion of the proceeds from redemptions as a distribution for tax purposes.
The tax character of distributions made during the current period will be determined at fiscal year end. The tax character of distributions declared to shareholders for the last fiscal year is as follows:
| | | | |
| |
| | | Year ended
8/31/19 | |
Ordinary income (including any
short-term capital gains) | | | $8,438,597 | |
| Long-term capital gains | | | 43,001,600 | |
| |
| Total distributions | | | $51,440,197 | |
27
Notes to Financial Statements (unaudited) – continued
The federal tax cost and the tax basis components of distributable earnings were as follows:
| | | | |
| |
| As of 2/29/20 | | | |
| |
| Cost of investments | | | $692,096,791 | |
| Gross appreciation | | | 648,539,711 | |
| |
| Gross depreciation | | | (8,841,185 | ) |
| Net unrealized appreciation (depreciation) | | | $639,698,526 | |
| |
| As of 8/31/19 | | | |
| |
| Undistributed long-term capital gain | | | 27,685,821 | |
| Post-October capital loss deferral | | | (2,429,753 | ) |
| Late year ordinary loss deferral | | | (5,219,836 | ) |
| Other temporary differences | | | (415 | ) |
| Net unrealized appreciation (depreciation) | | | 551,097,210 | |
The aggregate cost above includes prior fiscal year end tax adjustments, if applicable.
Multiple Classes of Shares of Beneficial Interest– The fund offers multiple classes of shares, which differ in their respective distribution and service fees. The fund’s income, realized and unrealized gain (loss), and common expenses are allocated to shareholders based on the daily net assets of each class. Dividends are declared separately for each class. Differences in per share dividend rates are generally due to differences in separate class expenses. Class B shares will convert to Class A shares approximately eight years after purchase. Class C shares will convert to Class A shares approximately ten years after purchase. The fund’s distributions declared to shareholders as reported in the Statements of Changes in Net Assets are presented by class as follows:
| | | | | | | | |
| | |
| | | Six months
ended
2/29/20 | | | Year
ended
8/31/19 | |
| Class A | | | $10,280,837 | | | | $20,061,820 | |
| Class B | | | 1,005,040 | | | | 2,165,547 | |
| Class C | | | 3,234,463 | | | | 6,237,227 | |
| Class I | | | 6,452,463 | | | | 11,628,427 | |
| Class R1 | | | 145,838 | | | | 267,264 | |
| Class R2 | | | 661,860 | | | | 1,292,150 | |
| Class R3 | | | 1,720,727 | | | | 3,217,992 | |
| Class R4 | | | 561,942 | | | | 875,507 | |
| Class R6 | | | 3,622,879 | | | | 5,694,263 | |
| Total | | | $27,686,049 | | | | $51,440,197 | |
28
Notes to Financial Statements (unaudited) – continued
(3) Transactions with Affiliates
Investment Adviser– The fund has an investment advisory agreement with MFS to provide overall investment management and related administrative services and facilities to the fund. The management fee is computed daily and paid monthly at the following annual rates based on the fund’s average daily net assets:
| | | | |
| Up to $1 billion | | | 0.75 | % |
| In excess of $1 billion and up to $2.5 billion | | | 0.70 | % |
| In excess of $2.5 billion | | | 0.65 | % |
MFS has agreed in writing to reduce its management fee by a specified amount if certain MFS mutual fund assets exceed thresholds agreed to by MFS and the fund’s Board of Trustees. For the six months ended February 29, 2020, this management fee reduction amounted to $67,606, which is included in the reduction of total expenses in the Statement of Operations. The management fee incurred for the six months ended February 29, 2020 was equivalent to an annual effective rate of 0.73% of the fund’s average daily net assets.
Distributor– MFS Fund Distributors, Inc. (MFD), a wholly-owned subsidiary of MFS, as distributor, received $95,838 for the six months ended February 29, 2020, as its portion of the initial sales charge on sales of Class A shares of the fund.
The Board of Trustees has adopted a distribution plan for certain share classes pursuant to Rule12b-1 of the Investment Company Act of 1940.
The fund’s distribution plan provides that the fund will pay MFD for services provided by MFD and financial intermediaries in connection with the distribution and servicing of certain share classes. One component of the plan is a distribution fee paid to MFD and another component of the plan is a service fee paid to MFD. MFD may subsequently pay all, or a portion, of the distribution and/or service fees to financial intermediaries.
Distribution Plan Fee Table:
| | | | | | | | | | | | | | | | | | | | |
| | | | | |
| | | Distribution
Fee Rate (d) | | | Service
Fee Rate (d) | | | Total
Distribution
Plan (d) | | | Annual
Effective
Rate (e) | | | Distribution
and Service
Fee | |
| Class A | | | — | | | | 0.25% | | | | 0.25% | | | | 0.25% | | | | $617,159 | |
| Class B | | | 0.75% | | | | 0.25% | | | | 1.00% | | | | 1.00% | | | | 205,320 | |
| Class C | | | 0.75% | | | | 0.25% | | | | 1.00% | | | | 1.00% | | | | 662,147 | |
| Class R1 | | | 0.75% | | | | 0.25% | | | | 1.00% | | | | 1.00% | | | | 29,759 | |
| Class R2 | | | 0.25% | | | | 0.25% | | | | 0.50% | | | | 0.50% | | | | 75,502 | |
| Class R3 | | | — | | | | 0.25% | | | | 0.25% | | | | 0.25% | | | | 102,230 | |
| Total Distribution and Service Fees | | | | | | | | | | | | $1,692,117 | |
| (d) | In accordance with the distribution plan for certain classes, the fund pays distribution and/or service fees equal to these annual percentage rates of each class’s average daily net assets. The distribution and service fee rates disclosed by class represent the current rates in effect at the end of the reporting period. Any rate changes, if applicable, are detailed below. |
| (e) | The annual effective rates represent actual fees incurred under the distribution plan for the six months ended February 29, 2020 based on each class’s average daily net assets. MFD has voluntarily agreed to rebate a portion of each class’s 0.25% service fee attributable to accounts for which MFD retains the 0.25% service fee except for accounts attributable to MFS or its affiliates’ seed money. For the six months ended February 29, 2020, this rebate amounted to $11,465, $167, and $434 for Class A, Class B, and Class C, respectively, and is included in the reduction of total expenses in the Statement of Operations. |
29
Notes to Financial Statements (unaudited) – continued
Certain Class A shares are subject to a contingent deferred sales charge (CDSC) in the event of a shareholder redemption within 18 months of purchase. Class B shares are subject to a CDSC in the event of a shareholder redemption within six years of purchase. Class C shares are subject to a CDSC in the event of a shareholder redemption within 12 months of purchase. All contingent deferred sales charges are paid to MFD and during the six months ended February 29, 2020, were as follows:
| | | | |
| |
| | | Amount | |
| Class A | | | $2,745 | |
| Class B | | | 41,779 | |
| Class C | | | 7,328 | |
Shareholder Servicing Agent– MFS Service Center, Inc. (MFSC), a wholly-owned subsidiary of MFS, receives a fee from the fund for its services as shareholder servicing agent calculated as a percentage of the average daily net assets of the fund as determined periodically under the supervision of the fund’s Board of Trustees. For the six months ended February 29, 2020, the fee was $69,880, which equated to 0.0105% annually of the fund’s average daily net assets. MFSC also receives payment from the fund forout-of-pocket expenses,sub-accounting and other shareholder servicing costs which may be paid to affiliated and unaffiliated service providers. Class R6 shares do not incursub-accounting fees. For the six months ended February 29, 2020, theseout-of-pocket expenses,sub-accounting and other shareholder servicing costs amounted to $598,747.
Administrator– MFS provides certain financial, legal, shareholder communications, compliance, and other administrative services to the fund. Under an administrative services agreement, the fund reimburses MFS the costs incurred to provide these services. The fund is charged an annual fixed amount of $17,500 plus a fee based on average daily net assets. The administrative services fee incurred for the six months ended February 29, 2020 was equivalent to an annual effective rate of 0.0136% of the fund’s average daily net assets.
Trustees’ and Officers’ Compensation– The fund pays compensation to independent Trustees in the form of a retainer, attendance fees, and additional compensation to Board and Committee chairpersons. The fund does not pay compensation directly to Trustees or officers of the fund who are also officers of the investment adviser, all of whom receive remuneration from MFS for their services to the fund. Certain officers and Trustees of the fund are officers or directors of MFS, MFD, and MFSC.
Other–The fund invests in the MFS Institutional Money Market Portfolio which is managed by MFS and seeks current income consistent with preservation of capital and liquidity. This money market fund does not pay a management fee to MFS but does incur investment and operating costs.
The adviser has voluntarily undertaken to reimburse the fund from its own resources on a quarterly basis for the cost of investment research embedded in the cost of the fund’s securities trades. This agreement may be rescinded at any time. For the six months ended February 29, 2020, this reimbursement amounted to $36,614, which is included in “Other” income in the Statement of Operations.
30
Notes to Financial Statements (unaudited) – continued
(4) Portfolio Securities
For the six months ended February 29, 2020, purchases and sales of investments, other than short sales and short-term obligations, aggregated $228,192,850 and $273,660,556, respectively.
(5) Shares of Beneficial Interest
The fund’s Declaration of Trust permits the Trustees to issue an unlimited number of full and fractional shares of beneficial interest. Transactions in fund shares were as follows:
| | | | | | | | | | | | | | | | |
| | | Six months ended
2/29/20 | | | Year ended
8/31/19 | |
| | | | |
| | | Shares | | | Amount | | | Shares | | | Amount | |
| Shares sold | | | | | | | | | | | | | | | | |
Class A | | | 1,069,435 | | | | $50,462,650 | | | | 1,975,893 | | | | $83,003,835 | |
Class B | | | 4,434 | | | | 175,717 | | | | 120,191 | | | | 4,301,477 | |
Class C | | | 269,108 | | | | 10,741,401 | | | | 677,632 | | | | 24,341,867 | |
Class I | | | 933,833 | | | | 47,703,970 | | | | 2,550,161 | | | | 113,611,517 | |
Class R1 | | | 18,125 | | | | 727,885 | | | | 47,490 | | | | 1,684,411 | |
Class R2 | | | 112,471 | | | | 5,023,965 | | | | 299,032 | | | | 11,915,742 | |
Class R3 | | | 265,676 | | | | 12,633,539 | | | | 666,590 | | | | 27,985,848 | |
Class R4 | | | 141,415 | | | | 6,866,378 | | | | 204,948 | | | | 8,719,675 | |
Class R6 | | | 912,666 | | | | 46,640,355 | | | | 1,474,545 | | | | 66,395,491 | |
| | | 3,727,163 | | | | $180,975,860 | | | | 8,016,482 | | | | $341,959,863 | |
| | | | |
Shares issued to shareholders in
reinvestment of distributions | | | | | | | | | | | | | | | | |
Class A | | | 219,633 | | | | $9,997,680 | | | | 520,757 | | | | $19,351,348 | |
Class B | | | 25,706 | | | | 992,506 | | | | 67,268 | | | | 2,143,844 | |
Class C | | | 77,734 | | | | 2,994,325 | | | | 179,366 | | | | 5,703,832 | |
Class I | | | 115,169 | | | | 5,640,993 | | | | 255,108 | | | | 10,158,414 | |
Class R1 | | | 3,780 | | | | 145,294 | | | | 8,390 | | | | 266,220 | |
Class R2 | | | 14,422 | | | | 621,865 | | | | 32,936 | | | | 1,163,614 | |
Class R3 | | | 37,818 | | | | 1,720,727 | | | | 86,645 | | | | 3,217,992 | |
Class R4 | | | 10,015 | | | | 476,930 | | | | 18,432 | | | | 714,074 | |
Class R6 | | | 60,950 | | | | 3,008,484 | | | | 113,449 | | | | 4,548,175 | |
| | | 565,227 | | | | $25,598,804 | | | | 1,282,351 | | | | $47,267,513 | |
| | | | |
| Shares reacquired | | | | | | | | | | | | | | | | |
Class A | | | (1,006,198 | ) | | | $(47,145,423 | ) | | | (2,568,696 | ) | | | $(105,539,945 | ) |
Class B | | | (128,483 | ) | | | (5,185,735 | ) | | | (258,701 | ) | | | (9,209,777 | ) |
Class C | | | (383,957 | ) | | | (15,151,627 | ) | | | (734,328 | ) | | | (26,311,197 | ) |
Class I | | | (1,142,466 | ) | | | (58,234,918 | ) | | | (2,456,918 | ) | | | (109,249,971 | ) |
Class R1 | | | (24,265 | ) | | | (950,492 | ) | | | (45,940 | ) | | | (1,644,386 | ) |
Class R2 | | | (163,088 | ) | | | (7,257,318 | ) | | | (285,477 | ) | | | (11,417,715 | ) |
Class R3 | | | (497,307 | ) | | | (23,358,546 | ) | | | (701,327 | ) | | | (29,333,688 | ) |
Class R4 | | | (164,160 | ) | | | (8,163,606 | ) | | | (166,210 | ) | | | (7,057,361 | ) |
Class R6 | | | (555,271 | ) | | | (28,373,618 | ) | | | (941,393 | ) | | | (42,393,928 | ) |
| | | (4,065,195 | ) | | | $(193,821,283 | ) | | | (8,158,990 | ) | | | $(342,157,968 | ) |
31
Notes to Financial Statements (unaudited) – continued
| | | | | | | | | | | | | | | | |
| | | Six months ended
2/29/20 | | | Year ended
8/31/19 | |
| | | | |
| | | Shares | | | Amount | | | Shares | | | Amount | |
| Net change | | | | | | | | | | | | | | | | |
Class A | | | 282,870 | | | | $13,314,907 | | | | (72,046 | ) | | | $(3,184,762 | ) |
Class B | | | (98,343 | ) | | | (4,017,512 | ) | | | (71,242 | ) | | | (2,764,456 | ) |
Class C | | | (37,115 | ) | | | (1,415,901 | ) | | | 122,670 | | | | 3,734,502 | |
Class I | | | (93,464 | ) | | | (4,889,955 | ) | | | 348,351 | | | | 14,519,960 | |
Class R1 | | | (2,360 | ) | | | (77,313 | ) | | | 9,940 | | | | 306,245 | |
Class R2 | | | (36,195 | ) | | | (1,611,488 | ) | | | 46,491 | | | | 1,661,641 | |
Class R3 | | | (193,813 | ) | | | (9,004,280 | ) | | | 51,908 | | | | 1,870,152 | |
Class R4 | | | (12,730 | ) | | | (820,298 | ) | | | 57,170 | | | | 2,376,388 | |
Class R6 | | | 418,345 | | | | 21,275,221 | | | | 646,601 | | | | 28,549,738 | |
| | | 227,195 | | | | $12,753,381 | | | | 1,139,843 | | | | $47,069,408 | |
Class T shares were not publicly available for sale during the period. Please see the fund’s prospectus for details.
Effective June 1, 2019, purchases of the fund’s Class B shares are closed to new and existing investors subject to certain exceptions. Please see the fund’s prospectus for details.
(6) Line of Credit
The fund and certain other funds managed by MFS participate in a $1.25 billion unsecured committed line of credit, subject to a $1 billion sublimit, provided by a syndicate of banks under a credit agreement. Borrowings may be made for temporary financing needs. Interest is charged to each fund, based on its borrowings, generally at a rate equal to the highest of one month LIBOR, the Federal Funds Effective Rate and the Overnight Bank Funding Rate, plus an agreed upon spread. A commitment fee, based on the average daily, unused portion of the committed line of credit, is allocated among the participating funds. In addition, the fund and other funds managed by MFS have established unsecured uncommitted borrowing arrangements with certain banks for temporary financing needs. Interest is charged to each fund, based on its borrowings, at rates equal to customary reference rates plus an agreed upon spread. For the six months ended February 29, 2020, the fund’s commitment fee and interest expense were $3,442 and $0, respectively, and are included in “Interest expense and fees” in the Statement of Operations.
32
Notes to Financial Statements (unaudited) – continued
(7) Investments in Affiliated Issuers
An affiliated issuer may be considered one in which the fund owns 5% or more of the outstanding voting securities, or a company which is under common control. For the purposes of this report, the following were affiliated issuers:
| | | | | | | | | | | | | | | | | | | | | | | | |
| | | | | | |
| Affiliated Issuers | | Beginning
Value | | | Purchases | | | Sales
Proceeds | | | Realized
Gain
(Loss) | | | Change in
Unrealized
Appreciation or
Depreciation | | | Ending
Value | |
| MFS Institutional Money Market Portfolio | | | $34,879,336 | | | | $139,990,751 | | | | $153,020,584 | | | | $4,624 | | | | $(4,218 | ) | | | $21,849,909 | |
| | | | | | |
| Affiliated Issuers | | | | | | | | | | | | | | Dividend
Income | | | Capital Gain
Distributions | |
| MFS Institutional Money Market Portfolio | | | | | | | | $219,588 | | | | $— | |
(8) Impacts of COVID-19
The pandemic related to the global spread of novel coronavirus disease (COVID-19), which was first detected in December 2019, has resulted in significant disruptions to global business activity and the global economy, as well as the economies of individual countries, the financial performance of individual companies and sectors, and the securities and commodities markets in general. This pandemic, the full effects of which are still unknown, has resulted in substantial market volatility and may have adversely impacted the prices and liquidity of the fund’s investments and the fund’s performance during the period February 29, 2020 through April 16, 2020, the date that these financial statements were issued.
33
PROXY VOTING POLICIES AND INFORMATION
MFS votes proxies on behalf of the fund pursuant to proxy voting policies and procedures that are available without charge, upon request, by calling1-800-225-2606, by visitingmfs.com/proxyvoting, or by visiting the SEC’s Web site athttp://www.sec.gov.
Information regarding how the fund voted proxies relating to portfolio securities during the most recent twelve-month period ended June 30 is available by August 31 of each year without charge by visitingmfs.com/proxyvoting, or by visiting the SEC’s Web site athttp://www.sec.gov.
QUARTERLY PORTFOLIO DISCLOSURE
The fund files a complete schedule of portfolio holdings with the SEC for the first and third quarters of each fiscal year as an exhibit to its reports onForm N-PORT. The fund’s Form N-PORT reports are available on the SEC’s website athttp://www.sec.gov.A shareholder can obtain the portfolio holdings report for the first and third quarters of the fund’s fiscal year atmfs.com/openendfunds by choosing the fund’s name and then selecting the “Resources” tab and clicking on “Prospectus and Reports”.
FURTHER INFORMATION
From time to time, MFS may post important information about the fund or the MFS funds on the MFS web site (mfs.com). This information is available athttps://www.mfs.com/en-us/what-we-do/announcements.html or atmfs.com/openendfunds by choosing the fund’s name.
INFORMATION ABOUT FUND CONTRACTS AND LEGAL CLAIMS
The fund has entered into contractual arrangements with an investment adviser, administrator, distributor, shareholder servicing agent, 529 program manager (if applicable), and custodian who each provide services to the fund. Unless expressly stated otherwise, shareholders are not parties to, or intended beneficiaries of these contractual arrangements, and these contractual arrangements are not intended to create any shareholder right to enforce them against the service providers or to seek any remedy under them against the service providers, either directly or on behalf of the fund.
Under the Trust’s By-Laws and Declaration of Trust, any claims asserted against or on behalf of the MFS Funds, including claims against Trustees and Officers, must be brought in state and federal courts located within the Commonwealth of Massachusetts.
PROVISION OF FINANCIAL REPORTS AND SUMMARY PROSPECTUSES
The fund produces financial reports every six months and updates its summary prospectus and prospectus annually. To avoid sending duplicate copies of materials to households, only one copy of the fund’s annual and semiannual report and summary prospectus may be mailed to shareholders having the same last name and residential address on the fund’s records. However, any shareholder may contact MFSC (please see back cover for address and telephone number) to request that copies of these reports and summary prospectuses be sent personally to that shareholder.
34
Save paper with eDelivery.

| MFS® will send you prospectuses, |
reports, and proxies directly viae-mail so you will get information faster with less mailbox clutter.
To sign up:
1. Go to mfs.com.
2. Log in via MFS® Access.
3. Select eDelivery.
If you own your MFS fund shares through a financial institution or a retirement plan, MFS® TALK, MFS® Access, or eDelivery may not be available to you.
CONTACT
WEB SITE
mfs.com
MFS TALK
1-800-637-8255
24 hours a day
ACCOUNT SERVICE AND LITERATURE
Shareholders
1-800-225-2606
Financial advisors
1-800-343-2829
Retirement plan services
1-800-637-1255
MAILING ADDRESS
MFS Service Center, Inc.
P.O. Box 219341
Kansas City, MO 64121-9341
OVERNIGHT MAIL
MFS Service Center, Inc.
Suite 219341
430 W 7th Street
Kansas City, MO 64105-1407
Semiannual Report
February 29, 2020

MFS® U.S. Government Cash Reserve Fund

Beginning on January 1, 2021, as permitted by regulations adopted by the U.S. Securities and Exchange Commission, paper copies of the fund’s annual and semiannual shareholder reports will no longer be sent by mail, unless you specifically request paper copies of the reports. Instead, the complete reports will be made available on the fund’s Web site (funds.mfs.com), and you will be notified by mail each time a report is posted and provided with a Web site link to access the report.
If you are already signed up to receive shareholder reports by email, you will not be affected by this change and you need not take any action. You may sign up to receive shareholder reports and other communications from the fund by email by contacting your financial intermediary (such as a broker-dealer or bank) or, if you hold your shares directly with the fund, by calling 1-800-225-2606 or by logging on to MFS Access at mfs.com.
Beginning on January 1, 2019, you may elect to receive all future reports in paper free of charge. Contact your financial intermediary to request that you continue to receive paper copies of your shareholder reports. If you invest directly with the fund, you can call 1-800-225-2606 or send an email request to orderliterature@mfs.com to let the fund know that you wish to continue receiving paper copies of your shareholder reports. Your election to receive reports in paper will apply to all funds held in your account if you invest through your financial intermediary or all funds held with the MFS fund complex if you invest directly.
LMM-SEM
MFS® U.S. Government Cash Reserve Fund
CONTENTS
The report is prepared for the general information of shareholders.
It is authorized for distribution to prospective investors only when preceded or accompanied by a current prospectus.
NOT FDIC INSURED• MAY LOSE VALUE• NO BANK GUARANTEE

LETTER FROM THE EXECUTIVE CHAIR
Dear Shareholders:
During the first quarter of 2020, market volatility reached levels not seen since the global financial crisis. Optimism heading into the year — on receding trade and
geopolitical risk along with easier central bank policies — was overwhelmed in February as the health effects of a novel coronavirus,COVID-19, spread beyond China’s borders, ultimately impacting more than 200 countries. The global pandemic prompted many governments to take drastic action to slow the spread of the virus, such as quarantines, school and business closures, and prohibitions on public gatherings. While these are important steps to protect the public health, they come at a cost: rising market volatility and an abrupt decline in economic growth.
Global central banks have taken aggressive, coordinated steps to cushion the economic and market fallout related to the virus, and
governments are undertaking unprecedented levels of fiscal stimulus. As uncertainty recedes, these measures can help create a supportive environment and encourage economic recovery. In the aftermath of the crisis, there are likely to be societal changes as households, businesses and governments adjust to a new reality and these alterations could change the investment landscape. Occurrences such as the COVID-19 outbreak demonstrate the importance of having a deep understanding of company fundamentals, and our global research platform has been built to do just that.
Here at MFS®, we aim to help our clients navigate the growing complexity of the markets and world economies. Our long-term investment philosophy and commitment to the responsible allocation of capital allow us to tune out the noise and uncover what we believe are the best, most durable investment opportunities in the market. Through our powerful global investment platform, we combine collective expertise, thoughtful risk management, and long-term discipline to create sustainable value for investors.
Respectfully,

Robert J. Manning
Executive Chair
MFS Investment Management
April 16, 2020
The opinions expressed in this letter are subject to change and may not be relied upon for investment advice. No forecasts can be guaranteed.
1
PORTFOLIO COMPOSITION
Portfolio structure (u)
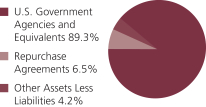
| | | | |
| Composition including fixed income credit quality (a)(u) | |
| A-1+ | | | 10.1% | |
| A-1 | | | 85.7% | |
| Other Assets Less Liabilities | | | 4.2% | |
| | | | |
| Maturity breakdown (u) | | | | |
| 0 - 7 days | | | 19.8% | |
| 8 - 29 days | | | 30.2% | |
| 30 - 59 days | | | 29.9% | |
| 60 - 89 days | | | 11.1% | |
| 90 - 365 days | | | 4.8% | |
| Other Assets Less Liabilities | | | 4.2% | |
| (a) | Ratings are assigned to portfolio securities utilizing ratings from Moody’s, Fitch, and Standard & Poor’s rating agencies and applying the following hierarchy: If all three agencies provide a rating, the middle rating (after dropping the highest and lowest ratings) is assigned; if two of the three agencies rate a security, the lower of the two is assigned. Ratings are shown in the S&P scale. All ratings are subject to change. The fund did not hold unrated securities. The fund is not rated by these agencies. |
| (u) | For purposes of this presentation, accrued interest, where applicable, is included. |
Percentages are based on net assets as of February 29, 2020.
The portfolio is actively managed and current holdings may be different.
2
EXPENSE TABLE
Fund expenses borne by the shareholders during the period, September 1, 2019 through February 29, 2020
As a shareholder of the fund, you incur two types of costs: (1) transaction costs, including sales charges (loads) on certain purchase or redemption payments, and (2) ongoing costs, including management fees; distribution and service(12b-1) fees; and other fund expenses. This example is intended to help you understand your ongoing costs (in dollars) of investing in the fund and to compare these costs with the ongoing costs of investing in other mutual funds.
The example is based on an investment of $1,000 invested at the beginning of the period and held for the entire period September 1, 2019 through February 29, 2020.
Actual Expenses
The first line for each share class in the following table provides information about actual account values and actual expenses. You may use the information in this line, together with the amount you invested, to estimate the expenses that you paid over the period. Simply divide your account value by $1,000 (for example, an $8,600 account value divided by $1,000 = 8.6), then multiply the result by the number in the first line under the heading entitled “Expenses Paid During Period” to estimate the expenses you paid on your account during this period.
Hypothetical Example for Comparison Purposes
The second line for each share class in the following table provides information about hypothetical account values and hypothetical expenses based on the fund’s actual expense ratio and an assumed rate of return of 5% per year before expenses, which is not the fund’s actual return. The hypothetical account values and expenses may not be used to estimate the actual ending account balance or expenses you paid for the period. You may use this information to compare the ongoing costs of investing in the fund and other funds. To do so, compare this 5% hypothetical example with the 5% hypothetical examples that appear in the shareholder reports of the other funds.
Please note that the expenses shown in the table are meant to highlight your ongoing costs only and do not reflect any transactional costs, such as sales charges (loads). Therefore, the second line for each share class in the table is useful in comparing ongoing costs only, and will not help you determine the relative total costs of owning different funds. In addition, if these transactional costs were included, your costs would have been higher.
3
Expense Table – continued
| | | | | | | | | | | | | | | | | | |
Share
Class | | | | Annualized
Expense
Ratio | | | Beginning
Account Value
9/01/19 | | | Ending
Account Value
2/29/20 | | | Expenses
Paid During
Period (p) 9/01/19-2/29/20 | |
| A | | Actual | | | 0.71% | | | | $1,000.00 | | | | $1,005.09 | | | | $3.54 | |
| | Hypothetical (h) | | | 0.71% | | | | $1,000.00 | | | | $1,021.33 | | | | $3.57 | |
| B | | Actual | | | 0.71% | | | | $1,000.00 | | | | $1,005.10 | | | | $3.54 | |
| | Hypothetical (h) | | | 0.71% | | | | $1,000.00 | | | | $1,021.33 | | | | $3.57 | |
| C | | Actual | | | 0.71% | | | | $1,000.00 | | | | $1,005.10 | | | | $3.54 | |
| | Hypothetical (h) | | | 0.71% | | | | $1,000.00 | | | | $1,021.33 | | | | $3.57 | |
| I | | Actual | | | 0.72% | | | | $1,000.00 | | | | $1,005.11 | | | | $3.59 | |
| | Hypothetical (h) | | | 0.72% | | | | $1,000.00 | | | | $1,021.28 | | | | $3.62 | |
| R1 | | Actual | | | 0.71% | | | | $1,000.00 | | | | $1,005.09 | | | | $3.54 | |
| | Hypothetical (h) | | | 0.71% | | | | $1,000.00 | | | | $1,021.33 | | | | $3.57 | |
| R2 | | Actual | | | 0.71% | | | | $1,000.00 | | | | $1,005.10 | | | | $3.54 | |
| | Hypothetical (h) | | | 0.71% | | | | $1,000.00 | | | | $1,021.33 | | | | $3.57 | |
| R3 | | Actual | | | 0.71% | | | | $1,000.00 | | | | $1,005.10 | | | | $3.54 | |
| | Hypothetical (h) | | | 0.71% | | | | $1,000.00 | | | | $1,021.33 | | | | $3.57 | |
| R4 | | Actual | | | 0.71% | | | | $1,000.00 | | | | $1,005.10 | | | | $3.54 | |
| | Hypothetical (h) | | | 0.71% | | | | $1,000.00 | | | | $1,021.33 | | | | $3.57 | |
| R6 | | Actual | | | 0.65% | | | | $1,000.00 | | | | $1,005.45 | | | | $3.24 | |
| | Hypothetical (h) | | | 0.65% | | | | $1,000.00 | | | | $1,021.63 | | | | $3.27 | |
| 529A | | Actual | | | 0.76% | | | | $1,000.00 | | | | $1,004.84 | | | | $3.79 | |
| | Hypothetical (h) | | | 0.76% | | | | $1,000.00 | | | | $1,021.08 | | | | $3.82 | |
| 529B | | Actual | | | 0.76% | | | | $1,000.00 | | | | $1,004.84 | | | | $3.79 | |
| | Hypothetical (h) | | | 0.76% | | | | $1,000.00 | | | | $1,021.08 | | | | $3.82 | |
| 529C | | Actual | | | 0.76% | | | | $1,000.00 | | | | $1,004.85 | | | | $3.79 | |
| | Hypothetical (h) | | | 0.76% | | | | $1,000.00 | | | | $1,021.08 | | | | $3.82 | |
| (h) | 5% class return per year before expenses. |
| (p) | “Expenses Paid During Period” are equal to each class’s annualized expense ratio, as shown above, multiplied by the average account value over the period, multiplied by 182/366 (to reflect theone-half year period). Expenses paid do not include any applicable sales charges (loads). If these transaction costs had been included, your costs would have been higher. |
4
PORTFOLIO OF INVESTMENTS
2/29/20 (unaudited)
The Portfolio of Investments is a complete list of all securities owned by your fund. It is categorized by broad-based asset classes.
| | | | | | | | |
| | |
| Issuer | | Shares/Par | | | Value ($) | |
| U.S. Government Agencies and Equivalents (y) - 89.3% | | | | |
| Fannie Mae, 1.424%, due 3/02/2020 | | $ | 15,970,000 | | | $ | 15,969,379 | |
| Fannie Mae, 1.566%, due 3/04/2020 | | | 4,148,000 | | | | 4,147,468 | |
| Fannie Mae, 1.554%, due 3/13/2020 | | | 7,180,000 | | | | 7,176,350 | |
| Fannie Mae, 1.590%, due 4/16/2020 | | | 13,070,000 | | | | 13,043,948 | |
| Federal Farm Credit Bank, 1.548%, due 3/05/2020 | | | 8,700,000 | | | | 8,698,531 | |
| Federal Farm Credit Bank, 1.568%, due 3/17/2020 | | | 26,080,000 | | | | 26,062,150 | |
| Federal Farm Credit Bank, 1.588%, due 3/19/2020 | | | 5,325,000 | | | | 5,320,846 | |
| Federal Home Loan Bank, 1.584%, due 4/03/2020 | | | 24,245,000 | | | | 24,210,441 | |
| Federal Home Loan Bank, 1.576%, due 4/08/2020 | | | 8,020,000 | | | | 8,006,921 | |
| Federal Home Loan Bank, 1.6%, due 4/15/2020 | | | 8,040,000 | | | | 8,024,221 | |
| Federal Home Loan Bank, 1.603%, due 5/06/2020 | | | 10,030,000 | | | | 10,001,130 | |
| Freddie Mac, 1.566%, due 3/09/2020 | | | 14,600,000 | | | | 14,595,003 | |
| Freddie Mac, 1.561%, due 4/08/2020 | | | 7,518,000 | | | | 7,505,858 | |
| Freddie Mac, 1.571%, due 4/30/2020 | | | 8,025,000 | | | | 8,004,402 | |
| Freddie Mac, 1.579%, due 6/17/2020 | | | 10,370,000 | | | | 10,321,935 | |
| U.S. Treasury Bill, 1.499%, due 3/12/2020 | | | 12,140,000 | | | | 12,134,547 | |
| U.S. Treasury Bill, 1.591%, due 4/14/2020 | | | 3,875,000 | | | | 3,867,607 | |
| U.S. Treasury Bill, 1.557%, due 5/14/2020 | | | 6,000,000 | | | | 5,981,192 | |
Total U.S. Government Agencies and Equivalents,
at Amortized Cost and Value | | | | | | $ | 193,071,929 | |
| | |
| Repurchase Agreements - 6.5% | | | | | | |
| JPMorgan Chase & Co. Repurchase Agreement, 1.58%, dated 2/28/2020, due 3/02/2020, total to be received $14,119,859 (secured by U.S. Treasury obligations valued $14,402,257 in a jointly traded account), at Cost and Value | | $ | 14,118,000 | | | $ | 14,118,000 | |
| | |
| Other Assets, Less Liabilities - 4.2% | | | | | 8,988,662 | |
| Net Assets - 100.0% | | | | | | $ | 216,178,591 | |
| (y) | The rate shown represents an annualized yield at time of purchase. |
See Notes to Financial Statements
5
Financial Statements
STATEMENT OF ASSETS AND LIABILITIES
At 2/29/20 (unaudited)
This statement represents your fund’s balance sheet, which details the assets and liabilities comprising the total value of the fund.
| | | | |
| Assets | | | | |
Investments in unaffiliated issuers, at cost and value | | | $207,189,929 | |
Cash | | | 245 | |
Receivables for | | | | |
Fund shares sold | | | 9,474,404 | |
Interest | | | 1,239 | |
Other assets | | | 920 | |
Total assets | | | $216,666,737 | |
| |
| Liabilities | | | | |
Payables for | | | | |
Distributions | | | $1,829 | |
Fund shares reacquired | | | 343,020 | |
Payable to affiliates | | | | |
Investment adviser | | | 6,610 | |
Administrative services fee | | | 312 | |
Shareholder servicing costs | | | 92,949 | |
Program manager fees | | | 111 | |
Payable for independent Trustees’ compensation | | | 5,381 | |
Accrued expenses and other liabilities | | | 37,934 | |
Total liabilities | | | $488,146 | |
Net assets | | | $216,178,591 | |
| |
| Net assets consist of | | | | |
Paid-in capital | | | $216,186,117 | |
Total distributable earnings (loss) | | | (7,526 | ) |
Net assets | | | $216,178,591 | |
Shares of beneficial interest outstanding | | | 216,408,598 | |
6
Statement of Assets and Liabilities (unaudited) – continued
| | | | | | | | | | | | |
| | | |
| | | Net assets | | | Shares
outstanding | | | Net asset value
per share | |
Class A | | | $103,115,067 | | | | 103,225,371 | | | | $1.00 | |
Class B | | | 8,255,220 | | | | 8,264,206 | | | | 1.00 | |
Class C | | | 17,592,387 | | | | 17,610,355 | | | | 1.00 | |
Class I | | | 1,133,375 | | | | 1,134,337 | | | | 1.00 | |
Class R1 | | | 7,870,638 | | | | 7,879,392 | | | | 1.00 | |
Class R2 | | | 32,233,524 | | | | 32,265,109 | | | | 1.00 | |
Class R3 | | | 15,486,410 | | | | 15,503,556 | | | | 1.00 | |
Class R4 | | | 2,706,910 | | | | 2,710,011 | | | | 1.00 | |
Class R6 | | | 119,249 | | | | 119,386 | | | | 1.00 | |
Class 529A | | | 20,790,102 | | | | 20,813,481 | | | | 1.00 | |
Class 529B | | | 215,666 | | | | 215,910 | | | | 1.00 | |
Class 529C | | | 6,660,043 | | | | 6,667,484 | | | | 1.00 | |
A contingent deferred sales charge may be imposed on redemptions of Class A, Class B, Class C, Class 529B, and Class 529C shares. Redemption price per share was equal to the net asset value per share for Classes I, R1, R2, R3, R4, R6, and 529A.
See Notes to Financial Statements
7
Financial Statements
STATEMENT OF OPERATIONS
Six months ended 2/29/20 (unaudited)
This statement describes how much your fund earned in investment income and accrued in expenses. It also describes any gains and/or losses generated by fund operations.
| | | | |
| Net investment income (loss) | | | | |
Income | | | | |
Interest | | | $1,776,564 | |
Expenses | | | | |
Management fee | | | $408,241 | |
Distribution and service fees | | | 438,357 | |
Shareholder servicing costs | | | 183,610 | |
Program manager fees | | | 6,686 | |
Administrative services fee | | | 18,568 | |
Independent Trustees’ compensation | | | 5,399 | |
Custodian fee | | | 9,201 | |
Shareholder communications | | | 8,593 | |
Audit and tax fees | | | 19,500 | |
Legal fees | | | 979 | |
Registration fees | | | 63,902 | |
Miscellaneous | | | 20,443 | |
Total expenses | | | $1,183,479 | |
Reduction of expenses by investment adviser and distributor | | | (448,702 | ) |
Net expenses | | | $734,777 | |
Net investment income (loss) | | | $1,041,787 | |
Change in net assets from operations | | | $1,041,787 | |
See Notes to Financial Statements
8
Financial Statements
STATEMENTS OF CHANGES IN NET ASSETS
These statements describe the increases and/or decreases in net assets resulting from operations, any distributions, and any shareholder transactions.
| | | | | | | | |
| Change in net assets | | Six months ended 2/29/20 (unaudited) | | | Year ended 8/31/19 | |
| | |
| From operations | | | | | | | | |
Net investment income (loss) | | | $1,041,787 | | | | $3,428,421 | |
Net realized gain (loss) | | | — | | | | 1 | |
Change in net assets from operations | | | $1,041,787 | | | | $3,428,422 | |
Total distributions to shareholders | | | $(1,041,787 | ) | | | $(3,428,422 | ) |
Change in net assets from fund share transactions | | | $3,967,947 | | | | $(12,531,450 | ) |
Total change in net assets | | | $3,967,947 | | | | $(12,531,450 | ) |
| | |
| Net assets | | | | | | | | |
At beginning of period | | | 212,210,644 | | | | 224,742,094 | |
At end of period | | | $216,178,591 | | | | $212,210,644 | |
See Notes to Financial Statements
9
Financial Statements
FINANCIAL HIGHLIGHTS
The financial highlights table is intended to help you understand the fund’s financial performance for the semiannual period and the past 5 fiscal years (or life of a particular share class, if shorter). Certain information reflects financial results for a single fund share. The total returns in the table represent the rate that an investor would have earned (or lost) on an investment in the fund share class (assuming reinvestment of all distributions) held for the entire period.
| | | | | | | | | | | | | | | | | | | | | | | | |
| | | Six months
ended 2/29/20 | | | Year ended | |
| Class A | | 8/31/19 | | | 8/31/18 | | | 8/31/17 | | | 8/31/16 | | | 8/31/15 | |
| | | (unaudited) | | | | | | | | | | | | | | | | |
Net asset value, beginning of period | | | $1.00 | | | | $1.00 | | | | $1.00 | | | | $1.00 | | | | $1.00 | | | | $1.00 | |
| | | |
| Income (loss) from investment operations | | | | | | | | | | | | | |
Net investment income (loss) (d) | | | $0.01 | | | | $0.02 | | | | $0.01 | | | | $0.00 | (c)(w) | | | $0.00 | | | | $0.00 | |
Net realized and unrealized
gain (loss) | | | — | | | | 0.00 | (w) | | | — | | | | (0.00 | )(w) | | | — | | | | 0.00 | (w) |
Total from investment operations | | | $0.01 | | | | $0.02 | | | | $0.01 | | | | $0.00 | (w) | | | $0.00 | | | | $0.00 | (w) |
| | | |
| Less distributions declared to shareholders | | | | | | | | | | | | | |
From net investment income | | | $(0.01 | ) | | | $(0.02 | ) | | | $(0.01 | ) | | | $(0.00 | )(w) | | | $— | | | | $— | |
Net asset value, end of period | | | $1.00 | | | | $1.00 | | | | $1.00 | | | | $1.00 | | | | $1.00 | | | | $1.00 | |
Total return (%) (r)(t) | | | 0.51 | (n) | | | 1.58 | | | | 0.76 | | | | 0.08 | (c) | | | 0.00 | | | | 0.00 | (w) |
| | | |
Ratios (%) (to average net assets)
and Supplemental data: | | | | | | | | | | | | | |
Expenses before expense reductions (f) | | | 0.97 | (a) | | | 0.98 | | | | 0.94 | | | | 0.91 | (c) | | | 0.91 | | | | 0.92 | |
Expenses after expense reductions (f) | | | 0.71 | (a) | | | 0.72 | | | | 0.68 | | | | 0.50 | (c) | | | 0.23 | | | | 0.07 | |
Net investment income (loss) | | | 1.03 | (a) | | | 1.57 | | | | 0.76 | | | | 0.08 | (c) | | | 0.00 | | | | 0.00 | |
Net assets at end of period
(000 omitted) | | | $103,115 | | | | $99,511 | | | | $100,463 | | | | $105,859 | | | | $120,740 | | | | $122,085 | |
See Notes to Financial Statements
10
Financial Highlights – continued
| | | | | | | | | | | | | | | | | | | | | | | | |
| | | Six months
ended 2/29/20 | | | Year ended | |
| Class B | | 8/31/19 | | | 8/31/18 | | | 8/31/17 | | | 8/31/16 | | | 8/31/15 | |
| | | (unaudited) | | | | | | | | | | | | | | | | |
Net asset value, beginning of period | | | $1.00 | | | | $1.00 | | | | $1.00 | | | | $1.00 | | | | $1.00 | | | | $1.00 | |
| | | |
| Income (loss) from investment operations | | | | | | | | | | | | | |
Net investment income (loss) (d) | | | $0.01 | | | | $0.02 | | | | $0.01 | | | | $0.00 | (c)(w) | | | $0.00 | | | | $0.00 | |
Net realized and unrealized
gain (loss) | | | — | | | | 0.00 | (w) | | | — | | | | (0.00 | )(w) | | | — | | | | 0.00 | (w) |
Total from investment operations | | | $0.01 | | | | $0.02 | | | | $0.01 | | | | $0.00 | (w) | | | $0.00 | | | | $0.00 | (w) |
| | | |
| Less distributions declared to shareholders | | | | | | | | | | | | | |
From net investment income | | | $(0.01 | ) | | | $(0.02 | ) | | | $(0.01 | ) | | | $(0.00 | )(w) | | | $— | | | | $— | |
Net asset value, end of period | | | $1.00 | | | | $1.00 | | | | $1.00 | | | | $1.00 | | | | $1.00 | | | | $1.00 | |
Total return (%) (r)(t) | | | 0.51 | (n) | | | 1.58 | | | | 0.76 | | | | 0.08 | (c) | | | 0.00 | | | | 0.00 | (w) |
| | | |
Ratios (%) (to average net assets)
and Supplemental data: | | | | | | | | | | | | | |
Expenses before expense reductions (f) | | | 1.72 | (a) | | | 1.73 | | | | 1.69 | | | | 1.66 | (c) | | | 1.66 | | | | 1.67 | |
Expenses after expense reductions (f) | | | 0.71 | (a) | | | 0.72 | | | | 0.68 | | | | 0.51 | (c) | | | 0.23 | | | | 0.07 | |
Net investment income (loss) | | | 1.03 | (a) | | | 1.57 | | | | 0.72 | | | | 0.07 | (c) | | | 0.00 | | | | 0.00 | |
Net assets at end of period
(000 omitted) | | | $8,255 | | | | $8,977 | | | | $11,664 | | | | $17,338 | | | | $18,096 | | | | $18,831 | |
| | |
| | | Six months
ended 2/29/20 | | | Year ended | |
| Class C | | 8/31/19 | | | 8/31/18 | | | 8/31/17 | | | 8/31/16 | | | 8/31/15 | |
| | | (unaudited) | | | | | | | | | | | | | | | | |
Net asset value, beginning of period | | | $1.00 | | | | $1.00 | | | | $1.00 | | | | $1.00 | | | | $1.00 | | | | $1.00 | |
| | | |
| Income (loss) from investment operations | | | | | | | | | | | | | |
Net investment income (loss) (d) | | | $0.01 | | | | $0.02 | | | | $0.01 | | | | $0.00 | (c)(w) | | | $0.00 | | | | $0.00 | |
Net realized and unrealized
gain (loss) | | | — | | | | 0.00 | (w) | | | — | | | | (0.00 | )(w) | | | — | | | | 0.00 | (w) |
Total from investment operations | | | $0.01 | | | | $0.02 | | | | $0.01 | | | | $0.00 | (w) | | | $0.00 | | | | $0.00 | (w) |
| | | |
| Less distributions declared to shareholders | | | | | | | | | | | | | |
From net investment income | | | $(0.01 | ) | | | $(0.02 | ) | | | $(0.01 | ) | | | $(0.00 | )(w) | | | $— | | | | $— | |
Net asset value, end of period | | | $1.00 | | | | $1.00 | | | | $1.00 | | | | $1.00 | | | | $1.00 | | | | $1.00 | |
Total return (%) (r)(t) | | | 0.51 | (n) | | | 1.58 | | | | 0.76 | | | | 0.08 | (c) | | | 0.00 | | | | 0.00 | (w) |
| | | |
Ratios (%) (to average net assets)
and Supplemental data: | | | | | | | | | | | | | |
Expenses before expense reductions (f) | | | 1.72 | (a) | | | 1.73 | | | | 1.69 | | | | 1.66 | (c) | | | 1.66 | | | | 1.67 | |
Expenses after expense reductions (f) | | | 0.71 | (a) | | | 0.72 | | | | 0.68 | | | | 0.50 | (c) | | | 0.24 | | | | 0.07 | |
Net investment income (loss) | | | 1.04 | (a) | | | 1.57 | | | | 0.68 | | | | 0.07 | (c) | | | 0.00 | | | | 0.00 | |
Net assets at end of period
(000 omitted) | | | $17,592 | | | | $19,438 | | | | $18,451 | | | | $38,458 | | | | $48,749 | | | | $42,522 | |
See Notes to Financial Statements
11
Financial Highlights – continued
| | | | | | | | | | | | | | | | | | | | | | | | |
| | | | | | | | | | | | Six months
ended 2/29/20 | | | Year ended 8/31/19 (i) | |
| Class I | | | | | | | | | |
| | | | | | | | | | | | (unaudited) | | | | | | | |
Net asset value, beginning of period | | | | | | | | | | | | | | | $1.00 | | | | | | | | $1.00 | |
| | | |
| Income (loss) from investment operations | | | | | | | | | | | | | |
Net investment income (loss) (d) | | | | | | | | | | | | | | | $0.01 | | | | | | | | $0.02 | |
Net realized and unrealized gain (loss) | | | | | | | | | | | | | | | — | | | | | | | | 0.00 | (w) |
Total from investment operations | | | | | | | | | | | | | | | $0.01 | | | | | | | | $0.02 | |
| | | |
| Less distributions declared to shareholders | | | | | | | | | | | | | |
From net investment income | | | | | | | | | | | | | | | $(0.01 | ) | | | | | | | $(0.02 | ) |
Net asset value, end of period | | | | | | | | | | | | | | | $1.00 | | | | | | | | $1.00 | |
Total return (%) (r)(t) | | | | | | | | | | | | | | | 0.51 | (n) | | | | | | | 1.52 | (n) |
| | | |
Ratios (%) (to average net assets)
and Supplemental data: | | | | | | | | | | | | | |
Expenses before expense reductions (f) | | | | | | | | | | | | | | | 0.73 | (a) | | | | | | | 0.73 | (a) |
Expenses after expense reductions (f) | | | | | | | | | | | | | | | 0.72 | (a) | | | | | | | 0.72 | (a) |
Net investment income (loss) | | | | | | | | | | | | | | | 0.88 | (a) | | | | | | | 1.60 | (a) |
Net assets at end of period (000 omitted) | | | | | | | | | | | | | | | $1,133 | | | | | | | | $56 | |
| | | | | | | | | | | | | | | | | | | | | | | | |
| | | Six months
ended 2/29/20 | | | Year ended | |
| Class R1 | | 8/31/19 | | | 8/31/18 | | | 8/31/17 | | | 8/31/16 | | | 8/31/15 | |
| | | (unaudited) | | | | | | | | | | | | | | | | |
Net asset value, beginning of period | | | $1.00 | | | | $1.00 | | | | $1.00 | | | | $1.00 | | | | $1.00 | | | | $1.00 | |
| | | |
| Income (loss) from investment operations | | | | | | | | | | | | | |
Net investment income (loss) (d) | | | $0.01 | | | | $0.02 | | | | $0.01 | | | | $0.00 | (c)(w) | | | $0.00 | | | | $0.00 | |
Net realized and unrealized
gain (loss) | | | — | | | | 0.00 | (w) | | | — | | | | (0.00 | )(w) | | | — | | | | 0.00 | (w) |
Total from investment operations | | | $0.01 | | | | $0.02 | | | | $0.01 | | | | $0.00 | (w) | | | $0.00 | | | | $0.00 | (w) |
| | | |
| Less distributions declared to shareholders | | | | | | | | | | | | | |
From net investment income | | | $(0.01 | ) | | | $(0.02 | ) | | | $(0.01 | ) | | | $(0.00 | )(w) | | | $— | | | | $— | |
Net asset value, end of period | | | $1.00 | | | | $1.00 | | | | $1.00 | | | | $1.00 | | | | $1.00 | | | | $1.00 | |
Total return (%) (r)(t) | | | 0.51 | (n) | | | 1.57 | | | | 0.76 | | | | 0.08 | (c) | | | 0.00 | | | | 0.00 | (w) |
| | | |
Ratios (%) (to average net assets)
and Supplemental data: | | | | | | | | | | | | | |
Expenses before expense reductions (f) | | | 1.72 | (a) | | | 1.73 | | | | 1.69 | | | | 1.66 | (c) | | | 1.66 | | | | 1.67 | |
Expenses after expense reductions (f) | | | 0.71 | (a) | | | 0.72 | | | | 0.68 | | | | 0.50 | (c) | | | 0.23 | | | | 0.07 | |
Net investment income (loss) | | | 1.02 | (a) | | | 1.57 | | | | 0.72 | | | | 0.07 | (c) | | | 0.00 | | | | 0.00 | |
Net assets at end of period
(000 omitted) | | | $7,871 | | | | $7,610 | | | | $8,305 | | | | $12,236 | | | | $14,569 | | | | $14,363 | |
See Notes to Financial Statements
12
Financial Highlights – continued
| | | | | | | | | | | | | | | | | | | | | | | | |
| | | Six months
ended 2/29/20 | | | Year ended | |
| Class R2 | | 8/31/19 | | | 8/31/18 | | | 8/31/17 | | | 8/31/16 | | | 8/31/15 | |
| | | (unaudited) | | | | | | | | | | | | | | | | |
Net asset value, beginning of period | | | $1.00 | | | | $1.00 | | | | $1.00 | | | | $1.00 | | | | $1.00 | | | | $1.00 | |
| | | |
| Income (loss) from investment operations | | | | | | | | | | | | | |
Net investment income (loss) (d) | | | $0.01 | | | | $0.02 | | | | $0.01 | | | | $0.00 | (c)(w) | | | $0.00 | | | | $0.00 | |
Net realized and unrealized
gain (loss) | | | — | | | | 0.00 | (w) | | | — | | | | (0.00 | )(w) | | | — | | | | 0.00 | (w) |
Total from investment operations | | | $0.01 | | | | $0.02 | | | | $0.01 | | | | $0.00 | (w) | | | $0.00 | | | | $0.00 | (w) |
| | | |
| Less distributions declared to shareholders | | | | | | | | | | | | | |
From net investment income | | | $(0.01 | ) | | | $(0.02 | ) | | | $(0.01 | ) | | | $(0.00 | )(w) | | | $— | | | | $— | |
Net asset value, end of period | | | $1.00 | | | | $1.00 | | | | $1.00 | | | | $1.00 | | | | $1.00 | | | | $1.00 | |
Total return (%) (r)(t) | | | 0.51 | (n) | | | 1.57 | | | | 0.76 | | | | 0.08 | (c)�� | | | 0.00 | | | | 0.00 | (w) |
| | | |
Ratios (%) (to average net assets)
and Supplemental data: | | | | | | | | | | | | | |
Expenses before expense reductions (f) | | | 1.22 | (a) | | | 1.23 | | | | 1.19 | | | | 1.16 | (c) | | | 1.16 | | | | 1.17 | |
Expenses after expense reductions (f) | | | 0.71 | (a) | | | 0.72 | | | | 0.68 | | | | 0.51 | (c) | | | 0.23 | | | | 0.07 | |
Net investment income (loss) | | | 1.03 | (a) | | | 1.57 | | | | 0.73 | | | | 0.08 | (c) | | | 0.00 | | | | 0.00 | |
Net assets at end of period
(000 omitted) | | | $32,234 | | | | $31,672 | | | | $34,993 | | | | $48,184 | | | | $51,537 | | | | $53,058 | |
| | |
| | | Six months
ended 2/29/20 | | | Year ended | |
| Class R3 | | 8/31/19 | | | 8/31/18 | | | 8/31/17 | | | 8/31/16 | | | 8/31/15 | |
| | | (unaudited) | | | | | | | | | | | | | | | | |
Net asset value, beginning of period | | | $1.00 | | | | $1.00 | | | | $1.00 | | | | $1.00 | | | | $1.00 | | | | $1.00 | |
| | | |
| Income (loss) from investment operations | | | | | | | | | | | | | |
Net investment income (loss) (d) | | | $0.01 | | | | $0.02 | | | | $0.01 | | | | $0.00 | (c)(w) | | | $0.00 | | | | $0.00 | |
Net realized and unrealized
gain (loss) | | | — | | | | 0.00 | (w) | | | — | | | | (0.00 | )(w) | | | — | | | | 0.00 | (w) |
Total from investment operations | | | $0.01 | | | | $0.02 | | | | $0.01 | | | | $0.00 | (w) | | | $0.00 | | | | $0.00 | (w) |
| | | |
| Less distributions declared to shareholders | | | | | | | | | | | | | |
From net investment income | | | $(0.01 | ) | | | $(0.02 | ) | | | $(0.01 | ) | | | $(0.00 | )(w) | | | $— | | | | $— | |
Net asset value, end of period | | | $1.00 | | | | $1.00 | | | | $1.00 | | | | $1.00 | | | | $1.00 | | | | $1.00 | |
Total return (%) (r)(t) | | | 0.51 | (n) | | | 1.57 | | | | 0.76 | | | | 0.08 | (c) | | | 0.00 | | | | 0.00 | (w) |
| | | |
Ratios (%) (to average net assets)
and Supplemental data: | | | | | | | | | | | | | |
Expenses before expense reductions (f) | | | 0.97 | (a) | | | 0.98 | | | | 0.94 | | | | 0.91 | (c) | | | 0.91 | | | | 0.92 | |
Expenses after expense reductions (f) | | | 0.71 | (a) | | | 0.72 | | | | 0.68 | | | | 0.51 | (c) | | | 0.23 | | | | 0.07 | |
Net investment income (loss) | | | 1.03 | (a) | | | 1.55 | | | | 0.73 | | | | 0.08 | (c) | | | 0.00 | | | | 0.00 | |
Net assets at end of period
(000 omitted) | | | $15,486 | | | | $16,471 | | | | $26,227 | | | | $35,196 | | | | $37,650 | | | | $44,872 | |
See Notes to Financial Statements
13
Financial Highlights – continued
| | | | | | | | | | | | | | | | | | | | | | | | |
| | | Six months
ended 2/29/20 | | | Year ended | |
| Class R4 | | 8/31/19 | | | 8/31/18 | | | 8/31/17 | | | 8/31/16 | | | 8/31/15 | |
| | | (unaudited) | | | | | | | | | | | | | | | | |
Net asset value, beginning of period | | | $1.00 | | | | $1.00 | | | | $1.00 | | | | $1.00 | | | | $1.00 | | | | $1.00 | |
| | | |
| Income (loss) from investment operations | | | | | | | | | | | | | |
Net investment income (loss) (d) | | | $0.01 | | | | $0.02 | | | | $0.01 | | | | $0.00 | (c)(w) | | | $0.00 | | | | $0.00 | |
Net realized and unrealized
gain (loss) | | | — | | | | 0.00 | (w) | | | — | | | | (0.00 | )(w) | | | — | | | | 0.00 | (w) |
Total from investment operations | | | $0.01 | | | | $0.02 | | | | $0.01 | | | | $0.00 | (w) | | | $0.00 | | | | $0.00 | (w) |
| | | |
| Less distributions declared to shareholders | | | | | | | | | | | | | |
From net investment income | | | $(0.01 | ) | | | $(0.02 | ) | | | $(0.01 | ) | | | $(0.00 | )(w) | | | $— | | | | $— | |
Net asset value, end of period | | | $1.00 | | | | $1.00 | | | | $1.00 | | | | $1.00 | | | | $1.00 | | | | $1.00 | |
Total return (%) (r)(t) | | | 0.51 | (n) | | | 1.57 | | | | 0.76 | | | | 0.08 | (c) | | | 0.00 | | | | 0.00 | (w) |
| | | |
Ratios (%) (to average net assets)
and Supplemental data: | | | | | | | | | | | | | |
Expenses before expense reductions (f) | | | 0.72 | (a) | | | 0.73 | | | | 0.69 | | | | 0.67 | (c) | | | 0.66 | | | | 0.67 | |
Expenses after expense reductions (f) | | | 0.71 | (a) | | | 0.72 | | | | 0.68 | | | | 0.52 | (c) | | | 0.23 | | | | 0.07 | |
Net investment income (loss) | | | 1.02 | (a) | | | 1.57 | | | | 0.74 | | | | 0.08 | (c) | | | 0.00 | | | | 0.00 | |
Net assets at end of period
(000 omitted) | | | $2,707 | | | | $2,676 | | | | $2,729 | | | | $3,250 | | | | $3,077 | | | | $3,034 | |
| | | | | | | | | | | | | | | | | | | | |
| | | | | | | | | | | | Six months
ended 2/29/20 | | | Year ended | |
| Class R6 | | | | | | | | 8/31/19 (i) | |
| | | | | | | | | | | | (unaudited) | | | | |
Net asset value, beginning of period | | | | | | | | | | | | | | | $1.00 | | | | $1.00 | |
| | |
| Income (loss) from investment operations | | | | | | | | | |
Net investment income (loss) (d) | | | | | | | | | | | | | | | $0.01 | | | | $0.02 | |
Net realized and unrealized gain (loss) | | | | | | | | | | | | | | | — | | | | 0.00 | (w) |
Total from investment operations | | | | | | | | | | | | | | | $0.01 | | | | $0.02 | |
| | |
| Less distributions declared to shareholders | | | | | | | | | |
From net investment income | | | | | | | | | | | | | | | $(0.01 | ) | | | $(0.02 | ) |
Net asset value, end of period | | | | | | | | | | | | | | | $1.00 | | | | $1.00 | |
Total return (%) (r)(t) | | | | | | | | | | | | | | | 0.55 | (n) | | | 1.58 | (n) |
| | |
Ratios (%) (to average net assets)
and Supplemental data: | | | | | | | | | |
Expenses before expense reductions (f) | | | | | | | | | | | | | | | 0.66 | (a) | | | 0.66 | (a) |
Expenses after expense reductions (f) | | | | | | | | | | | | | | | 0.65 | (a) | | | 0.65 | (a) |
Net investment income (loss) | | | | | | | | | | | | | | | 1.04 | (a) | | | 1.65 | (a) |
Net assets at end of period (000 omitted) | | | | | | | | | | | | | | | $119 | | | | $54 | |
See Notes to Financial Statements
14
Financial Highlights – continued
| | | | | | | | | | | | | | | | | | | | | | | | |
| | | Six months
ended 2/29/20 | | | Year ended | |
| Class 529A | | 8/31/19 | | | 8/31/18 | | | 8/31/17 | | | 8/31/16 | | | 8/31/15 | |
| | | (unaudited) | | | | | | | | | | | | | | | | |
Net asset value, beginning of period | | | $1.00 | | | | $1.00 | | | | $1.00 | | | | $1.00 | | | | $1.00 | | | | $1.00 | |
| | | |
| Income (loss) from investment operations | | | | | | | | | | | | | |
Net investment income (loss) (d) | | | $0.00 | (w) | | | $0.02 | | | | $0.01 | | | | $0.00 | (c)(w) | | | $0.00 | | | | $0.00 | |
Net realized and unrealized
gain (loss) | | | — | | | | 0.00 | (w) | | | — | | | | (0.00 | )(w) | | | — | | | | 0.00 | (w) |
Total from investment operations | | | $0.00 | (w) | | | $0.02 | | | | $0.01 | | | | $0.00 | (w) | | | $0.00 | | | | $0.00 | (w) |
| | | |
| Less distributions declared to shareholders | | | | | | | | | | | | | |
From net investment income | | | $(0.00 | )(w) | | | $(0.02 | ) | | | $(0.01 | ) | | | $(0.00 | )(w) | | | $— | | | | $— | |
Net asset value, end of period | | | $1.00 | | | | $1.00 | | | | $1.00 | | | | $1.00 | | | | $1.00 | | | | $1.00 | |
Total return (%) (r)(t) | | | 0.48 | (n) | | | 1.53 | | | | 0.71 | | | | 0.06 | (c) | | | 0.00 | | | | 0.00 | (w) |
| | | |
Ratios (%) (to average net assets)
and Supplemental data: | | | | | | | | | | | | | |
Expenses before expense reductions (f) | | | 1.02 | (a) | | | 1.03 | | | | 1.00 | | | | 1.01 | (c) | | | 1.00 | | | | 1.02 | |
Expenses after expense reductions (f) | | | 0.76 | (a) | | | 0.77 | | | | 0.73 | | | | 0.53 | (c) | | | 0.23 | | | | 0.07 | |
Net investment income (loss) | | | 0.97 | (a) | | | 1.52 | | | | 0.73 | | | | 0.06 | (c) | | | 0.00 | | | | 0.00 | |
Net assets at end of period
(000 omitted) | | | $20,790 | | | | $19,061 | | | | $15,197 | | | | $13,208 | | | | $12,841 | | | | $11,383 | |
| | |
| | | Six months
ended 2/29/20 | | | Year ended | |
| Class 529B | | 8/31/19 | | | 8/31/18 | | | 8/31/17 | | | 8/31/16 | | | 8/31/15 | |
| | | | | | |
| | | (unaudited) | | | | | | | | | | | | | | | | |
Net asset value, beginning of period | | | $1.00 | | | | $1.00 | | | | $1.00 | | | | $1.00 | | | | $1.00 | | | | $1.00 | |
| | | |
| Income (loss) from investment operations | | | | | | | | | | | | | |
Net investment income (loss) (d) | | | $0.00 | (w) | | | $0.02 | | | | $0.01 | | | | $0.00 | (c)(w) | | | $0.00 | | | | $0.00 | |
Net realized and unrealized
gain (loss) | | | — | | | | 0.00 | (w) | | | — | | | | (0.00 | )(w) | | | — | | | | 0.00 | (w) |
Total from investment operations | | | $0.00 | (w) | | | $0.02 | | | | $0.01 | | | | $0.00 | (w) | | | $0.00 | | | | $0.00 | (w) |
| | | |
| Less distributions declared to shareholders | | | | | | | | | | | | | |
From net investment income | | | $(0.00 | )(w) | | | $(0.02 | ) | | | $(0.01 | ) | | | $(0.00 | )(w) | | | $— | | | | $— | |
Net asset value, end of period | | | $1.00 | | | | $1.00 | | | | $1.00 | | | | $1.00 | | | | $1.00 | | | | $1.00 | |
Total return (%) (r)(t) | | | 0.48 | (n) | | | 1.53 | | | | 0.71 | | | | 0.06 | (c) | | | 0.00 | | | | 0.00 | (w) |
| | | |
Ratios (%) (to average net assets)
and Supplemental data: | | | | | | | | | | | | | |
Expenses before expense reductions (f) | | | 1.77 | (a) | | | 1.78 | | | | 1.75 | | | | 1.76 | (c) | | | 1.76 | | | | 1.77 | |
Expenses after expense reductions (f) | | | 0.76 | (a) | | | 0.77 | | | | 0.73 | | | | 0.53 | (c) | | | 0.22 | | | | 0.07 | |
Net investment income (loss) | | | 0.98 | (a) | | | 1.51 | | | | 0.71 | | | | 0.06 | (c) | | | 0.00 | | | | 0.00 | |
Net assets at end of period
(000 omitted) | | | $216 | | | | $247 | | | | $293 | | | | $348 | | | | $355 | | | | $440 | |
See Notes to Financial Statements
15
Financial Highlights – continued
| | | | | | | | | | | | | | | | | | | | | | | | |
| | | Six months
ended 2/29/20 | | | Year ended | |
| Class 529C | | 8/31/19 | | | 8/31/18 | | | 8/31/17 | | | 8/31/16 | | | 8/31/15 | |
| | | | | | |
| | | (unaudited) | | | | | | | | | | | | | | | | |
Net asset value, beginning of period | | | $1.00 | | | | $1.00 | | | | $1.00 | | | | $1.00 | | | | $1.00 | | | | $1.00 | |
| | | |
| Income (loss) from investment operations | | | | | | | | | | | | | |
Net investment income (loss) (d) | | | $0.00 | (w) | | | $0.02 | | | | $0.01 | | | | $0.00 | (c)(w) | | | $0.00 | | | | $0.00 | |
Net realized and unrealized
gain (loss) | | | — | | | | 0.00 | (w) | | | — | | | | (0.00 | )(w) | | | — | | | | 0.00 | (w) |
Total from investment operations | | | $0.00 | (w) | | | $0.02 | | | | $0.01 | | | | $0.00 | (w) | | | $0.00 | | | | $0.00 | (w) |
| | | |
| Less distributions declared to shareholders | | | | | | | | | | | | | |
From net investment income | | | $(0.00 | )(w) | | | $(0.02 | ) | | | $(0.01 | ) | | | $(0.00 | )(w) | | | $— | | | | $— | |
Net asset value, end of period | | | $1.00 | | | | $1.00 | | | | $1.00 | | | | $1.00 | | | | $1.00 | | | | $1.00 | |
Total return (%) (r)(t) | | | 0.48 | (n) | | | 1.53 | | | | 0.71 | | | | 0.06 | (c) | | | 0.00 | | | | 0.00 | (w) |
| | | |
Ratios (%) (to average net assets)
and Supplemental data: | | | | | | | | | | | | | |
Expenses before expense reductions (f) | | | 1.77 | (a) | | | 1.78 | | | | 1.75 | | | | 1.76 | (c) | | | 1.76 | | | | 1.77 | |
Expenses after expense reductions (f) | | | 0.76 | (a) | | | 0.77 | | | | 0.73 | | | | 0.54 | (c) | | | 0.24 | | | | 0.07 | |
Net investment income (loss) | | | 0.97 | (a) | | | 1.52 | | | | 0.70 | | | | 0.06 | (c) | | | 0.00 | | | | 0.00 | |
Net assets at end of period
(000 omitted) | | | $6,660 | | | | $6,437 | | | | $6,419 | | | | $6,957 | | | | $6,728 | | | | $5,866 | |
| (c) | Amount reflects aone-time reimbursement of expenses by the custodian (or former custodian) without which net investment income and performance would be lower and expenses would be higher. |
| (d) | Per share data is based on average shares outstanding. |
| (f) | Ratios do not reflect reductions from fees paid indirectly, if applicable. |
| (i) | For Class I and Class R6, the period is from the class inception, September 18, 2018, through the stated period end. |
| (r) | Certain expenses have been reduced without which performance would have been lower. |
| (t) | Total returns do not include any applicable sales charges. |
| (w) | Per share amount was less than $0.01 and total return or ratio was less than 0.01%, as applicable. |
See Notes to Financial Statements
16
NOTES TO FINANCIAL STATEMENTS
(unaudited)
(1) Business and Organization
MFS U.S. Government Cash Reserve Fund (the fund) is a diversified series of MFS Series Trust I (the trust). The trust is organized as a Massachusetts business trust and is registered under the Investment Company Act of 1940, as amended, as anopen-end management investment company.
The fund is an investment company and accordingly follows the investment company accounting and reporting guidance of the Financial Accounting Standards Board (FASB) Accounting Standards Codification Topic 946 Financial Services – Investment Companies.
(2) Significant Accounting Policies
General– The preparation of financial statements in conformity with U.S. generally accepted accounting principles requires management to make estimates and assumptions that affect the reported amounts of assets and liabilities, and disclosure of contingent assets and liabilities at the date of the financial statements and the reported amounts of increases and decreases in net assets from operations during the reporting period. Actual results could differ from those estimates. In the preparation of these financial statements, management has evaluated subsequent events occurring after the date of the fund’s Statement of Assets and Liabilities through the date that the financial statements were issued.
In March 2020, the FASB issued Accounting Standards Update2020-04, Reference Rate Reform (Topic 848) – Facilitation of the Effects of Reference Rate Reform on Financial Reporting (“ASU2020-04”), which provides optional, temporary relief with respect to the financial reporting of contracts subject to certain types of modifications due to the planned discontinuation of the London Interbank Offered Rate (LIBOR) and other IBOR-based reference rates as of the end of 2021. The temporary relief provided by ASU2020-04 is effective for certain reference rate-related contract modifications that occur during the period from March 12, 2020 through December 31, 2022. Management is evaluating the impact of ASU2020-04 on the fund’s investments, derivatives, debt and other contracts that will undergo reference rate-related modifications as a result of the reference rate reform.
Balance Sheet Offsetting– The fund’s accounting policy with respect to balance sheet offsetting is that, absent an event of default by the counterparty or a termination of the agreement, the International Swaps and Derivatives Association (ISDA) Master Agreement, or similar agreement, does not result in an offset of reported amounts of financial assets and financial liabilities in the Statement of Assets and Liabilities across transactions between the fund and the applicable counterparty. The fund’s right to setoff may be restricted or prohibited by the bankruptcy or insolvency laws of the particular jurisdiction to which a specific master netting agreement counterparty is subject. Balance sheet offsetting disclosures, to the extent applicable to the fund, have been included in the fund’s Significant Accounting Policies note under the captions for each of the fund’sin-scope financial instruments and transactions.
Investment Valuations– Pursuant to procedures approved by the Board of Trustees, investments held by the fund are generally valued at amortized cost, which approximates market value. Amortized cost involves valuing an instrument at its cost as
17
Notes to Financial Statements (unaudited) – continued
adjusted for amortization of premium or accretion of discount rather than its current market value. The amortized cost value of an instrument can be different from the market value of an instrument.
Various inputs are used in determining the value of the fund’s assets or liabilities. These inputs are categorized into three broad levels. In certain cases, the inputs used to measure fair value may fall into different levels of the fair value hierarchy. In such cases, an investment’s level within the fair value hierarchy is based on the lowest level of input that is significant to the fair value measurement. The fund’s assessment of the significance of a particular input to the fair value measurement in its entirety requires judgment, and considers factors specific to the investment. Level 1 includes unadjusted quoted prices in active markets for identical assets or liabilities. Level 2 includes other significant observable market-based inputs (including quoted prices for similar securities, interest rates, prepayment speed, and credit risk). Level 3 includes unobservable inputs, which may include the adviser’s own assumptions in determining the fair value of investments. The following is a summary of the levels used as of February 29, 2020 in valuing the fund’s assets or liabilities:
| | | | | | | | | | | | | | | | |
| | | | |
| Financial Instruments | | Level 1 | | | Level 2 | | | Level 3 | | | Total | |
| Short-Term Securities | | | $— | | | | $207,189,929 | | | | $— | | | | $207,189,929 | |
For further information regarding security characteristics, see the Portfolio of Investments.
Repurchase Agreements– The fund enters into repurchase agreements under the terms of Master Repurchase Agreements with approved counterparties. Each repurchase agreement is recorded at cost. The fund requires that the securities collateral in a repurchase transaction be transferred to a custodian. The fund monitors, on a daily basis, the value of the collateral to ensure that its value, including accrued interest, is greater than amounts owed to the fund under each such repurchase agreement. Upon an event of default under a Master Repurchase Agreement, thenon-defaulting party may close out all transactions traded under such agreement and net amounts owed under each transaction to one net amount payable by one party to the other. Absent an event of default, the Master Repurchase Agreement does not result in an offset of reported amounts of assets and liabilities in the Statement of Assets and Liabilities across transactions between the fund and the applicable counterparty. The fund and other funds managed by MFS may utilize a joint trading account for the purpose of entering into one or more repurchase agreements. At February 29, 2020, the fund had investments in repurchase agreements with a gross value of $14,118,000 included in investments in unaffiliated issuers in the Statement of Assets and Liabilities. The value of the related collateral exceeded the value of the repurchase agreements at period end.
Indemnifications– Under the fund’s organizational documents, its officers and Trustees may be indemnified against certain liabilities and expenses arising out of the performance of their duties to the fund. Additionally, in the normal course of business, the fund enters into agreements with service providers that may contain indemnification clauses. The fund’s maximum exposure under these agreements is unknown as this would involve future claims that may be made against the fund that have not yet occurred.
18
Notes to Financial Statements (unaudited) – continued
Investment Transactions and Income– Investment transactions are recorded on the trade date. Interest income is recorded on the accrual basis. All premium and discount is amortized or accreted for financial statement purposes in accordance with U.S. generally accepted accounting principles.
Tax Matters and Distributions– The fund intends to qualify as a regulated investment company, as defined under Subchapter M of the Internal Revenue Code, and to distribute all of its taxable income, including realized capital gains. As a result, no provision for federal income tax is required. The fund’s federal tax returns, when filed, will remain subject to examination by the Internal Revenue Service for a three year period. Management has analyzed the fund’s tax positions taken on federal and state tax returns for all open tax years and does not believe that there are any uncertain tax positions that require recognition of a tax liability.
Distributions to shareholders are recorded on theex-dividend date. Income and capital gain distributions are determined in accordance with income tax regulations, which may differ from U.S. generally accepted accounting principles. Certain capital accounts in the financial statements are periodically adjusted for permanent differences in order to reflect their tax character. These adjustments have no impact on net assets or net asset value per share. Temporary differences which arise from recognizing certain items of income, expense, gain or loss in different periods for financial statement and tax purposes will reverse at some time in the future.
During the year ended August 31, 2019, there were no significant adjustments due to differences between book and tax accounting.
The tax character of distributions made during the current period will be determined at fiscal year end. The tax character of distributions declared to shareholders for the last fiscal year is as follows:
| | | | |
| |
| | | Year ended
8/31/19 | |
Ordinary income (including any
short-term capital gains) | | | $3,428,422 | |
The federal tax cost and the tax basis components of distributable earnings were as follows:
| | | | |
| |
| As of 2/29/20 | | | |
| |
| Cost of investments | | | $207,189,929 | |
| |
| As of 8/31/19 | | | |
| |
| Capital loss carryforwards | | | (4 | ) |
| Other temporary differences | | | (7,522 | ) |
The aggregate cost above includes prior fiscal year end tax adjustments, if applicable.
As of August 31, 2019, the fund had capital loss carryforwards available to offset future realized gains. These net capital losses may be carried forward indefinitely and their character is retained as short-term and/or long-term losses. Such losses are characterized as follows:
19
Notes to Financial Statements (unaudited) – continued
Multiple Classes of Shares of Beneficial Interest– The fund offers multiple classes of shares, which differ in their respective distribution, service, and program manager fees. The fund’s income and common expenses are allocated to shareholders based on the value of settled shares outstanding of each class. The fund’s realized and unrealized gain (loss) are allocated to shareholders based on the daily net assets of each class. Dividends are declared separately for each class. Differences in per share dividend rates are generally due to differences in separate class expenses. Class B and Class 529B shares will convert to Class A and Class 529A shares, respectively, approximately eight years after purchase. Class C and Class 529C shares will convert to Class A and Class 529A shares, respectively, approximately ten years after purchase. The fund’s distributions declared to shareholders as reported in the Statements of Changes in Net Assets are presented by class as follows:
| | | | | | | | |
| | |
| | | Six months
ended
2/29/20 | | | Year
ended
8/31/19 (i) | |
| Class A | | | $495,227 | | | | $1,584,216 | |
| Class B | | | 43,518 | | | | 162,414 | |
| Class C | | | 90,651 | | | | 317,540 | |
| Class I | | | 1,012 | | | | 1,185 | |
| Class R1 | | | 38,230 | | | | 127,647 | |
| Class R2 | | | 150,992 | | | | 527,732 | |
| Class R3 | | | 78,402 | | | | 291,144 | |
| Class R4 | | | 13,791 | | | | 42,820 | |
| Class R6 | | | 389 | | | | 819 | |
| Class 529A | | | 96,865 | | | | 268,010 | |
| Class 529B | | | 1,171 | | | | 3,915 | |
| Class 529C | | | 31,539 | | | | 100,980 | |
| Total | | | $1,041,787 | | | | $3,428,422 | |
| (i) | For Class I and Class R6, the period is from the class inception, September 18, 2018, through the stated period end. |
(3) Transactions with Affiliates
Investment Adviser– The fund has an investment advisory agreement with MFS to provide overall investment management and related administrative services and facilities to the fund. The management fee is computed daily and paid monthly at an annual rate of 0.40% of the fund’s average daily net assets.
MFS has also agreed in writing to reduce its management fee by a specified amount if certain MFS mutual fund assets exceed thresholds agreed to by MFS and the fund’s Board of Trustees. For the six months ended February 29, 2020, this management fee reduction amounted to $10,345, which is included in the reduction of total expenses in the Statement of Operations. The management fee incurred for the six months ended February 29, 2020 was equivalent to an annual effective rate of 0.39% of the fund’s average daily net assets.
Distributor– The Board of Trustees has adopted a distribution plan for certain share classes pursuant to Rule12b-1 of the Investment Company Act of 1940.
20
Notes to Financial Statements (unaudited) – continued
The fund’s distribution plan provides that the fund will pay MFS Fund Distributors, Inc. (MFD), a wholly-owned subsidiary of MFS, for services provided by MFD and financial intermediaries in connection with the distribution and servicing of certain share classes. One component of the plan is a distribution fee paid to MFD and another component of the plan is a service fee paid to MFD. MFD may subsequently pay all, or a portion, of the distribution and/or service fees to financial intermediaries.
Distribution Plan Fee Table:
| | | | | | | | | | | | | | | | | | | | |
| | | | | |
| | | Distribution
Fee Rate (d) | | | Service
Fee Rate (d) | | | Total
Distribution
Plan (d) | | | Annual
Effective
Rate (e) | | | Distribution
and Service
Fee | |
| Class A | | | — | | | | 0.25% | | | | 0.25% | | | | 0.00% | | | | $120,593 | |
| Class B | | | 0.75% | | | | 0.25% | | | | 1.00% | | | | 0.00% | | | | 42,251 | |
| Class C | | | 0.75% | | | | 0.25% | | | | 1.00% | | | | 0.00% | | | | 87,328 | |
| Class R1 | | | 0.75% | | | | 0.25% | | | | 1.00% | | | | 0.00% | | | | 37,363 | |
| Class R2 | | | 0.25% | | | | 0.25% | | | | 0.50% | | | | 0.00% | | | | 73,099 | |
| Class R3 | | | — | | | | 0.25% | | | | 0.25% | | | | 0.00% | | | | 19,091 | |
| Class 529A | | | — | | | | 0.25% | | | | 0.25% | | | | 0.00% | | | | 25,029 | |
| Class 529B | | | 0.75% | | | | 0.25% | | | | 1.00% | | | | 0.00% | | | | 1,190 | |
| Class 529C | | | 0.75% | | | | 0.25% | | | | 1.00% | | | | 0.00% | | | | 32,413 | |
| Total Distribution and Service Fees | | | | | | | | | | | | $438,357 | |
| (d) | In accordance with the distribution plan for certain classes, the fund pays distribution and/or service fees equal to these annual percentage rates of each class’s average daily net assets. The distribution and service fee rates disclosed by class represent the current rates in effect at the end of the reporting period. Any rate changes, if applicable, are detailed below. |
| (e) | The annual effective rates represent actual fees incurred under the distribution plan for the six months ended February 29, 2020 based on each class’s average daily net assets. MFD has agreed in writing to waive any distribution and/or service fees for Class A, Class B, Class C, Class R1, Class R2, Class R3, Class 529A, Class 529B, and Class 529C. This written agreement will continue until modified by the fund’s Board of Trustees, but such agreement will continue until at least December 31, 2020. These reductions, for the six months ended February 29, 2020, for Class A, Class B, Class C, Class R1, Class R2, Class R3, Class 529A, Class 529B, and Class 529C amounted to $120,593, $42,251, $87,328, $37,363, $73,099, $19,091, $25,029, $1,190, and $32,413, respectively, and are included in the reduction of total expenses in the Statement of Operations. |
Certain Class A shares are subject to a contingent deferred sales charge (CDSC) in the event of a shareholder redemption within 18 months of purchase. Class B and Class 529B shares are subject to a CDSC in the event of a shareholder redemption within six years of purchase. Class C and Class 529C shares are subject to a CDSC in the event of a shareholder redemption within 12 months of purchase. All contingent deferred sales charges are paid to MFD and during the six months ended February 29, 2020, were as follows:
| | | | |
| |
| | | Amount | |
| Class A | | | $113 | |
| Class B | | | 15,208 | |
| Class C | | | 3,229 | |
| Class 529B | | | — | |
| Class 529C | | | 350 | |
21
Notes to Financial Statements (unaudited) – continued
The fund has entered into and may from time to time enter into contracts with program managers and other parties which administer the tuition programs through which an investment in the fund’s 529 share classes is made. The fund has entered into an agreement with MFD pursuant to which MFD receives an annual fee of up to 0.05% of the average daily net assets attributable to each 529 share class. The services provided by MFD, or a third party with which MFD contracts, include recordkeeping and tax reporting and account services, as well as services designed to maintain the program’s compliance with the Internal Revenue Code and other regulatory requirements. Program manager fees for the six months ended February 29, 2020, were as follows:
| | | | |
| |
| | | Fee | |
| Class 529A | | | $5,006 | |
| Class 529B | | | 59 | |
| Class 529C | | | 1,621 | |
| Total Program Manager Fees | | | $6,686 | |
Shareholder Servicing Agent– MFS Service Center, Inc. (MFSC), a wholly-owned subsidiary of MFS, receives a fee from the fund for its services as shareholder servicing agent calculated as a percentage of the average daily net assets of the fund as determined periodically under the supervision of the fund’s Board of Trustees. For the six months ended February 29, 2020, the fee was $63,956, which equated to 0.0627% annually of the fund’s average daily net assets. MFSC also receives payment from the fund forout-of-pocket expenses,sub-accounting and other shareholder servicing costs which may be paid to affiliated and unaffiliated service providers. Class R6 shares do not incursub-accounting fees. For the six months ended February 29, 2020, theseout-of-pocket expenses,sub-accounting and other shareholder servicing costs amounted to $119,654.
Administrator– MFS provides certain financial, legal, shareholder communications, compliance, and other administrative services to the fund. Under an administrative services agreement, the fund reimburses MFS the costs incurred to provide these services. The fund is charged an annual fixed amount of $17,500 plus a fee based on average daily net assets. The administrative services fee incurred for the six months ended February 29, 2020 was equivalent to an annual effective rate of 0.0182% of the fund’s average daily net assets.
Trustees’ and Officers’ Compensation– The fund pays compensation to independent Trustees in the form of a retainer, attendance fees, and additional compensation to Board and Committee chairpersons. The fund does not pay compensation directly to Trustees or officers of the fund who are also officers of the investment adviser, all of whom receive remuneration from MFS for their services to the fund. Certain officers and Trustees of the fund are officers or directors of MFS, MFD, and MFSC.
Prior to December 31, 2001, the fund had an unfunded defined benefit plan (“DB plan”) for independent Trustees. As of December 31, 2001, the Board took action to terminate the DB plan with respect to then-current and any future independent Trustees, such that the DB plan covers only certain of those former independent Trustees who retired on or before December 31, 2001. The DB plan resulted in a
22
Notes to Financial Statements (unaudited) – continued
pension expense of $593 and is included in “Independent Trustees’ compensation” in the Statement of Operations for the six months ended February 29, 2020. The liability for deferred retirement benefits payable to those former independent Trustees under the DB plan amounted to $4,612 at February 29, 2020, and is included in “Payable for independent Trustees’ compensation” in the Statement of Assets and Liabilities.
Other– On September 17, 2018, MFS purchased 50,000 shares of Class I for an aggregate amount of $50,000 and 50,000 shares of Class R6 for an aggregate amount of $50,000 as an initial investment in the class.
At February 29, 2020, MFS held approximately 99% of the outstanding shares of Class R4.
(4) Shares of Beneficial Interest
The fund’s Declaration of Trust permits the Trustees to issue an unlimited number of full and fractional shares of beneficial interest. The number of shares sold, reinvested and reacquired corresponds to the net proceeds from the sale of shares, reinvestment of distributions and cost of shares reacquired, respectively, since shares are sold and reacquired at $1.00 per share. Transactions in fund shares were as follows:
| | | | | | | | |
| | | Six months ended
2/29/20 | | | Year ended
8/31/19 (i) | |
| Shares sold | | | | | | | | |
Class A | | | 26,796,682 | | | | 59,431,027 | |
Class B | | | 2,064,923 | | | | 5,310,326 | |
Class C | | | 8,107,177 | | | | 24,050,108 | |
Class I | | | 1,334,508 | | | | 354,368 | |
Class R1 | | | 1,468,258 | | | | 2,191,482 | |
Class R2 | | | 7,272,135 | | | | 10,113,188 | |
Class R3 | | | 3,036,393 | | | | 8,456,459 | |
Class R4 | | | 36,929 | | | | 17,622 | |
Class R6 | | | 64,638 | | | | 72,440 | |
Class 529A | | | 6,950,279 | | | | 12,190,039 | |
Class 529B | | | 44,533 | | | | 126,828 | |
Class 529C | | | 2,012,907 | | | | 3,281,304 | |
| | | 59,189,362 | | | | 125,595,191 | |
23
Notes to Financial Statements (unaudited) – continued
| | | | | | | | |
| | | Six months ended
2/29/20 | | | Year ended
8/31/19 (i) | |
Shares issued to shareholders in
reinvestment of distributions | | | | | |
Class A | | | 480,961 | | | | 1,537,241 | |
Class B | | | 40,891 | | | | 152,269 | |
Class C | | | 86,622 | | | | 307,001 | |
Class I | | | 903 | | | | 888 | |
Class R1 | | | 38,217 | | | | 127,564 | |
Class R2 | | | 151,144 | | | | 527,539 | |
Class R3 | | | 78,483 | | | | 291,144 | |
Class R4 | | | 13,791 | | | | 42,820 | |
Class R6 | | | 389 | | | | 819 | |
Class 529A | | | 96,310 | | | | 266,573 | |
Class 529B | | | 1,156 | | | | 3,891 | |
Class 529C | | | 31,356 | | | | 100,345 | |
| | | 1,020,223 | | | | 3,358,094 | |
| | |
| Shares reacquired | | | | | | | | |
Class A | | | (23,671,484 | ) | | | (61,915,466 | ) |
Class B | | | (2,828,447 | ) | | | (8,152,109 | ) |
Class C | | | (10,041,913 | ) | | | (23,369,100 | ) |
Class I | | | (256,962 | ) | | | (299,368 | ) |
Class R1 | | | (1,245,688 | ) | | | (3,014,203 | ) |
Class R2 | | | (6,864,830 | ) | | | (13,961,909 | ) |
Class R3 | | | (4,099,738 | ) | | | (18,513,241 | ) |
Class R4 | | | (19,938 | ) | | | (113,448 | ) |
Class R6 | | | (145 | ) | | | (18,755 | ) |
Class 529A | | | (5,314,122 | ) | | | (8,587,889 | ) |
Class 529B | | | (77,101 | ) | | | (176,267 | ) |
Class 529C | | | (1,821,270 | ) | | | (3,362,980 | ) |
| | | (56,241,638 | ) | | | (141,484,735 | ) |
| | |
| Net change | | | | | | | | |
Class A | | | 3,606,159 | | | | (947,198 | ) |
Class B | | | (722,633 | ) | | | (2,689,514 | ) |
Class C | | | (1,848,114 | ) | | | 988,009 | |
Class I | | | 1,078,449 | | | | 55,888 | |
Class R1 | | | 260,787 | | | | (695,157 | ) |
Class R2 | | | 558,449 | | | | (3,321,182 | ) |
Class R3 | | | (984,862 | ) | | | (9,765,638 | ) |
Class R4 | | | 30,782 | | | | (53,006 | ) |
Class R6 | | | 64,882 | | | | 54,504 | |
Class 529A | | | 1,732,467 | | | | 3,868,723 | |
Class 529B | | | (31,412 | ) | | | (45,548 | ) |
Class 529C | | | 222,993 | | | | 18,669 | |
| | | 3,967,947 | | | | (12,531,450 | ) |
| (i) | For Class I and Class R6, the period is from the class inception, September 18, 2018, through the stated period end. |
24
Notes to Financial Statements (unaudited) – continued
Effective June 1, 2019, purchases of the fund’s Class B and Class 529B shares are closed to new and existing investors subject to certain exceptions. Please see the fund’s prospectus for details.
(5) Line of Credit
The fund and certain other funds managed by MFS participate in a $1.25 billion unsecured committed line of credit, subject to a $1 billion sublimit, provided by a syndicate of banks under a credit agreement. Borrowings may be made for temporary financing needs. Interest is charged to each fund, based on its borrowings, generally at a rate equal to the highest of one month LIBOR, the Federal Funds Effective Rate and the Overnight Bank Funding Rate, plus an agreed upon spread. A commitment fee, based on the average daily, unused portion of the committed line of credit, is allocated among the participating funds. In addition, the fund and other funds managed by MFS have established unsecured uncommitted borrowing arrangements with certain banks for temporary financing needs. Interest is charged to each fund, based on its borrowings, at rates equal to customary reference rates plus an agreed upon spread. For the six months ended February 29, 2020, the fund’s commitment fee and interest expense were $533 and $0, respectively, and are included in “Miscellaneous” expense in the Statement of Operations.
(6) Impacts of COVID-19
The pandemic related to the global spread of novel coronavirus disease (COVID-19), which was first detected in December 2019, has resulted in significant disruptions to global business activity and the global economy, as well as the economies of individual countries, the financial performance of individual companies and sectors, and the securities and commodities markets in general. This pandemic, the full effects of which are still unknown, has resulted in substantial market volatility and may have adversely impacted the prices and liquidity of the fund’s investments and the fund’s performance during the period February 29, 2020 through April 16, 2020, the date that these financial statements were issued.
(7) Subsequent Event
Effective the close of business May 29, 2020, purchases of the fund are closed to new and existing investors subject to certain exceptions. Please see the fund’s prospectus for details.
25
PROXY VOTING POLICIES AND INFORMATION
MFS votes proxies on behalf of the fund pursuant to proxy voting policies and procedures that are available without charge, upon request, by calling1-800-225-2606, by visitingmfs.com/proxyvoting, or by visiting the SEC’s Web site athttp://www.sec.gov.
Information regarding how the fund voted proxies relating to portfolio securities during the most recent twelve-month period ended June 30 is available by August 31 of each year without charge by visitingmfs.com/proxyvoting, or by visiting the SEC’s Web site athttp://www.sec.gov.
PORTFOLIO HOLDINGS INFORMATION
The fund files monthly portfolio information with the SEC on Form N-MFP. The fund’s Form N-MFP reports are available on the SEC’s website athttp://www.sec.gov. A shareholder can also access the fund’s portfolio holdings as of each month end and the fund’s Form N-MFP reports at mfs.com/openendfunds after choosing “Click here for access to Money Market fund reports”.
FURTHER INFORMATION
From time to time, MFS may post important information about the fund or the MFS funds on the MFS web site (mfs.com). This information is available athttps://www.mfs.com/en-us/what-we-do/announcements.html or atmfs.com/openendfunds by choosing the fund’s name.
INFORMATION ABOUT FUND CONTRACTS AND LEGAL CLAIMS
The fund has entered into contractual arrangements with an investment adviser, administrator, distributor, shareholder servicing agent, 529 program manager (if applicable), and custodian who each provide services to the fund. Unless expressly stated otherwise, shareholders are not parties to, or intended beneficiaries of these contractual arrangements, and these contractual arrangements are not intended to create any shareholder right to enforce them against the service providers or to seek any remedy under them against the service providers, either directly or on behalf of the fund.
Under the Trust’s By-Laws and Declaration of Trust, any claims asserted against or on behalf of the MFS Funds, including claims against Trustees and Officers, must be brought in state and federal courts located within the Commonwealth of Massachusetts.
PROVISION OF FINANCIAL REPORTS AND SUMMARY PROSPECTUSES
The fund produces financial reports every six months and updates its summary prospectus and prospectus annually. To avoid sending duplicate copies of materials to households, only one copy of the fund’s annual and semiannual report and summary prospectus may be mailed to shareholders having the same last name and residential address on the fund’s records. However, any shareholder may contact MFSC (please see back cover for address and telephone number) to request that copies of these reports and summary prospectuses be sent personally to that shareholder.
26
Save paper with eDelivery.

| MFS® will send you prospectuses, |
reports, and proxies directly viae-mail so you will get information faster with less mailbox clutter.
To sign up:
1. Go to mfs.com.
2. Log in via MFS® Access.
3. Select eDelivery.
If you own your MFS fund shares through a financial institution or a retirement plan, MFS® TALK, MFS® Access, or eDelivery may not be available to you.
CONTACT
WEB SITE
mfs.com
MFS TALK
1-800-637-8255
24 hours a day
ACCOUNT SERVICE AND LITERATURE
Shareholders
1-800-225-2606
Financial advisors
1-800-343-2829
Retirement plan services
1-800-637-1255
MAILING ADDRESS
MFS Service Center, Inc.
P.O. Box 219341
Kansas City, MO 64121-9341
OVERNIGHT MAIL
MFS Service Center, Inc.
Suite 219341
430 W 7th Street
Kansas City, MO 64105-1407
Semiannual Report
February 29, 2020

MFS® Value Fund

Beginning on January 1, 2021, as permitted by regulations adopted by the U.S. Securities and Exchange Commission, paper copies of the fund’s annual and semiannual shareholder reports will no longer be sent by mail, unless you specifically request paper copies of the reports. Instead, the complete reports will be made available on the fund’s Web site (funds.mfs.com), and you will be notified by mail each time a report is posted and provided with a Web site link to access the report.
If you are already signed up to receive shareholder reports by email, you will not be affected by this change and you need not take any action. You may sign up to receive shareholder reports and other communications from the fund by email by contacting your financial intermediary (such as a broker-dealer or bank) or, if you hold your shares directly with the fund, by calling 1-800-225-2606 or by logging on to MFS Access at mfs.com.
Beginning on January 1, 2019, you may elect to receive all future reports in paper free of charge. Contact your financial intermediary to request that you continue to receive paper copies of your shareholder reports. If you invest directly with the fund, you can call 1-800-225-2606 or send an email request to orderliterature@mfs.com to let the fund know that you wish to continue receiving paper copies of your shareholder reports. Your election to receive reports in paper will apply to all funds held in your account if you invest through your financial intermediary or all funds held with the MFS fund complex if you invest directly.
EIF-SEM
MFS® Value Fund
CONTENTS
The report is prepared for the general information of shareholders.
It is authorized for distribution to prospective investors only when preceded or accompanied by a current prospectus.
NOT FDIC INSURED• MAY LOSE VALUE• NO BANK GUARANTEE

LETTER FROM THE EXECUTIVE CHAIR
Dear Shareholders:
During the first quarter of 2020, market volatility reached levels not seen since the global financial crisis. Optimism heading into the year — on receding trade and
geopolitical risk along with easier central bank policies — was overwhelmed in February as the health effects of a novel coronavirus,COVID-19, spread beyond China’s borders, ultimately impacting more than 200 countries. The global pandemic prompted many governments to take drastic action to slow the spread of the virus, such as quarantines, school and business closures, and prohibitions on public gatherings. While these are important steps to protect the public health, they come at a cost: rising market volatility and an abrupt decline in economic growth.
Global central banks have taken aggressive, coordinated steps to cushion the economic and market fallout related to the virus, and
governments are undertaking unprecedented levels of fiscal stimulus. As uncertainty recedes, these measures can help create a supportive environment and encourage economic recovery. In the aftermath of the crisis, there are likely to be societal changes as households, businesses and governments adjust to a new reality and these alterations could change the investment landscape. Occurrences such as the COVID-19 outbreak demonstrate the importance of having a deep understanding of company fundamentals, and our global research platform has been built to do just that.
Here at MFS®, we aim to help our clients navigate the growing complexity of the markets and world economies. Our long-term investment philosophy and commitment to the responsible allocation of capital allow us to tune out the noise and uncover what we believe are the best, most durable investment opportunities in the market. Through our powerful global investment platform, we combine collective expertise, thoughtful risk management, and long-term discipline to create sustainable value for investors.
Respectfully,

Robert J. Manning
Executive Chair
MFS Investment Management
April 16, 2020
The opinions expressed in this letter are subject to change and may not be relied upon for investment advice. No forecasts can be guaranteed.
1
PORTFOLIO COMPOSITION
Portfolio structure

| | | | |
| Top ten holdings | |
| JPMorgan Chase & Co. | | | 4.6% | |
| Johnson & Johnson | | | 3.5% | |
| Medtronic PLC | | | 2.9% | |
| Comcast Corp., “A” | | | 2.8% | |
| Accenture PLC, “A” | | | 2.6% | |
| Aon PLC | | | 2.6% | |
| Duke Energy Corp. | | | 2.5% | |
| Honeywell International, Inc. | | | 2.5% | |
| Northrop Grumman Corp. | | | 2.4% | |
| Citigroup, Inc. | | | 2.4% | |
| | | | |
| GICS equity sectors (g) | |
| Financials | | | 28.8% | |
| Health Care | | | 17.2% | |
| Industrials | | | 16.9% | |
| Information Technology | | | 9.6% | |
| Consumer Staples | | | 7.8% | |
| Utilities | | | 6.4% | |
| Materials | | | 3.5% | |
| Communication Services | | | 3.4% | |
| Energy | | | 3.2% | |
| Consumer Discretionary | | | 1.2% | |
| Real Estate | | | 0.4% | |
| (g) | The Global Industry Classification Standard (GICS®) was developed by and/or is the exclusive property of MSCI, Inc. and S&P Global Market Intelligence Inc. (“S&P Global Market Intelligence”). GICS is a service mark of MSCI and S&P Global Market Intelligence and has been licensed for use by MFS. |
Cash & Cash Equivalents includes any cash, investments in money market funds, short-term securities, and other assets less liabilities. Please see the Statement of Assets and Liabilities for additional information related to the fund’s cash position and other assets and liabilities.
Percentages are based on net assets as of February 29, 2020.
The portfolio is actively managed and current holdings may be different.
2
EXPENSE TABLE
Fund expenses borne by the shareholders during the period, September 1, 2019 through February 29, 2020
As a shareholder of the fund, you incur two types of costs: (1) transaction costs, including sales charges (loads) on certain purchase or redemption payments, and (2) ongoing costs, including management fees; distribution and service(12b-1) fees; and other fund expenses. This example is intended to help you understand your ongoing costs (in dollars) of investing in the fund and to compare these costs with the ongoing costs of investing in other mutual funds.
The example is based on an investment of $1,000 invested at the beginning of the period and held for the entire period September 1, 2019 through February 29, 2020.
Actual Expenses
The first line for each share class in the following table provides information about actual account values and actual expenses. You may use the information in this line, together with the amount you invested, to estimate the expenses that you paid over the period. Simply divide your account value by $1,000 (for example, an $8,600 account value divided by $1,000 = 8.6), then multiply the result by the number in the first line under the heading entitled “Expenses Paid During Period” to estimate the expenses you paid on your account during this period.
Hypothetical Example for Comparison Purposes
The second line for each share class in the following table provides information about hypothetical account values and hypothetical expenses based on the fund’s actual expense ratio and an assumed rate of return of 5% per year before expenses, which is not the fund’s actual return. The hypothetical account values and expenses may not be used to estimate the actual ending account balance or expenses you paid for the period. You may use this information to compare the ongoing costs of investing in the fund and other funds. To do so, compare this 5% hypothetical example with the 5% hypothetical examples that appear in the shareholder reports of the other funds.
Please note that the expenses shown in the table are meant to highlight your ongoing costs only and do not reflect any transactional costs, such as sales charges (loads). Therefore, the second line for each share class in the table is useful in comparing ongoing costs only, and will not help you determine the relative total costs of owning different funds. In addition, if these transactional costs were included, your costs would have been higher.
3
Expense Table – continued
| | | | | | | | | | | | | | | | | | |
Share
Class | | | | Annualized
Expense
Ratio | | | Beginning
Account Value
9/01/19 | | | Ending
Account Value
2/29/20 | | | Expenses
Paid During
Period (p)
9/01/19-2/29/20 | |
| A | | Actual | | | 0.81% | | | | $1,000.00 | | | | $979.70 | | | | $3.99 | |
| | Hypothetical (h) | | | 0.81% | | | | $1,000.00 | | | | $1,020.84 | | | | $4.07 | |
| B | | Actual | | | 1.56% | | | | $1,000.00 | | | | $975.83 | | | | $7.66 | |
| | Hypothetical (h) | | | 1.56% | | | | $1,000.00 | | | | $1,017.11 | | | | $7.82 | |
| C | | Actual | | | 1.56% | | | | $1,000.00 | | | | $975.80 | | | | $7.66 | |
| | Hypothetical (h) | | | 1.56% | | | | $1,000.00 | | | | $1,017.11 | | | | $7.82 | |
| I | | Actual | | | 0.56% | | | | $1,000.00 | | | | $981.00 | | | | $2.76 | |
| | Hypothetical (h) | | | 0.56% | | | | $1,000.00 | | | | $1,022.08 | | | | $2.82 | |
| R1 | | Actual | | | 1.56% | | | | $1,000.00 | | | | $976.09 | | | | $7.66 | |
| | Hypothetical (h) | | | 1.56% | | | | $1,000.00 | | | | $1,017.11 | | | | $7.82 | |
| R2 | | Actual | | | 1.06% | | | | $1,000.00 | | | | $978.47 | | | | $5.21 | |
| | Hypothetical (h) | | | 1.06% | | | | $1,000.00 | | | | $1,019.59 | | | | $5.32 | |
| R3 | | Actual | | | 0.81% | | | | $1,000.00 | | | | $979.62 | | | | $3.99 | |
| | Hypothetical (h) | | | 0.81% | | | | $1,000.00 | | | | $1,020.84 | | | | $4.07 | |
| R4 | | Actual | | | 0.56% | | | | $1,000.00 | | | | $980.88 | | | | $2.76 | |
| | Hypothetical (h) | | | 0.56% | | | | $1,000.00 | | | | $1,022.08 | | | | $2.82 | |
| R6 | | Actual | | | 0.45% | | | | $1,000.00 | | | | $981.42 | | | | $2.22 | |
| | Hypothetical (h) | | | 0.45% | | | | $1,000.00 | | | | $1,022.63 | | | | $2.26 | |
| 529A | | Actual | | | 0.83% | | | | $1,000.00 | | | | $979.43 | | | | $4.08 | |
| | Hypothetical (h) | | | 0.83% | | | | $1,000.00 | | | | $1,020.74 | | | | $4.17 | |
| 529B | | Actual | | | 0.98% | | | | $1,000.00 | | | | $978.71 | | | | $4.82 | |
| | Hypothetical (h) | | | 0.98% | | | | $1,000.00 | | | | $1,019.99 | | | | $4.92 | |
| 529C | | Actual | | | 1.61% | | | | $1,000.00 | | | | $975.72 | | | | $7.91 | |
| | Hypothetical (h) | | | 1.61% | | | | $1,000.00 | | | | $1,016.86 | | | | $8.07 | |
| (h) | 5% class return per year before expenses. |
| (p) | “Expenses Paid During Period” are equal to each class’s annualized expense ratio, as shown above, multiplied by the average account value over the period, multiplied by 182/366 (to reflect theone-half year period). Expenses paid do not include any applicable sales charges (loads). If these transaction costs had been included, your costs would have been higher. |
Notes to Expense Table
For the period from October 1, 2019 through February 29, 2020, the distribution fee for Class 529B was not imposed. Had the distribution fee been imposed throughout the entire six month period, the annualized expense ratio, the actual expenses paid during the period, and the hypothetical expenses paid during the period would have been approximately 1.60%, $7.87, and $8.02 for Class 529B. See Note 3 in the Notes to Financial Statements for additional information.
4
Expense Table – continued
Each class with a Rule12b-1 service fee is subject to a rebate of a portion of such fee. Such rebates are included in the expense ratios above. For Class 529A shares, this rebate reduced the expense ratio above by 0.03%. See Note 3 in the Notes to Financial Statements for additional information.
5
PORTFOLIO OF INVESTMENTS
2/29/20 (unaudited)
The Portfolio of Investments is a complete list of all securities owned by your fund. It is categorized by broad-based asset classes.
| | | | | | | | |
| | |
| Issuer | | Shares/Par | | | Value ($) | |
| Common Stocks - 98.4% | | | | | | |
| Aerospace - 7.5% | | | | | | |
| Honeywell International, Inc. | | | 7,136,754 | | | $ | 1,157,367,396 | |
| Lockheed Martin Corp. | | | 1,439,434 | | | | 532,403,454 | |
| Northrop Grumman Corp. | | | 3,394,161 | | | | 1,116,135,903 | |
| United Technologies Corp. | | | 4,914,407 | | | | 641,772,410 | |
| | | | | | | | |
| | | | | | | $ | 3,447,679,163 | |
| Alcoholic Beverages - 1.5% | | | | | | |
| Diageo PLC | | | 19,013,779 | | | $ | 673,376,101 | |
| | |
| Apparel Manufacturers - 0.1% | | | | | | |
| Hanesbrands, Inc. | | | 2,535,133 | | | $ | 33,565,161 | |
| | |
| Automotive - 1.0% | | | | | | |
| Aptiv PLC | | | 4,843,840 | | | $ | 378,352,343 | |
| Lear Corp. | | | 669,982 | | | | 74,501,998 | |
| | | | | | | | |
| | | | | | | $ | 452,854,341 | |
| Broadcasting - 0.1% | | | | | | |
| Omnicom Group, Inc. | | | 737,122 | | | $ | 51,067,812 | |
| | |
| Brokerage & Asset Managers - 2.8% | | | | | | |
| BlackRock, Inc. | | | 1,004,232 | | | $ | 464,969,458 | |
| NASDAQ, Inc. | | | 5,629,768 | | | | 577,332,709 | |
| T. Rowe Price Group, Inc. | | | 2,087,222 | | | | 246,313,068 | |
| | | | | | | | |
| | | | | | | $ | 1,288,615,235 | |
| Business Services - 7.1% | | | | | | |
| Accenture PLC, “A” | | | 6,696,704 | | | $ | 1,209,357,776 | |
| Cognizant Technology Solutions Corp., “A” | | | 3,170,671 | | | | 193,188,984 | |
| Equifax, Inc. | | | 3,108,009 | | | | 441,461,598 | |
| Fidelity National Information Services, Inc. | | | 4,909,565 | | | | 685,964,422 | |
| Fiserv, Inc. (a) | | | 6,705,612 | | | | 733,325,728 | |
| | | | | | | | |
| | | | | | | $ | 3,263,298,508 | |
| Cable TV - 2.8% | | | | | | |
| Comcast Corp., “A” | | | 32,103,316 | | | $ | 1,297,937,066 | |
| | |
| Chemicals - 1.7% | | | | | | |
| PPG Industries, Inc. | | | 7,599,535 | | | $ | 793,771,431 | |
6
Portfolio of Investments (unaudited) – continued
| | | | | | | | |
| | |
| Issuer | | Shares/Par | | | Value ($) | |
| Common Stocks - continued | | | | | | |
| Conglomerates - 0.3% | | | | | | |
| Gardner Denver Holdings, Inc. (a) | | | 3,562,444 | | | $ | 116,812,527 | |
| | |
| Construction - 2.6% | | | | | | |
| Masco Corp. | | | 3,859,349 | | | $ | 159,468,301 | |
| Sherwin-Williams Co. | | | 984,130 | | | | 508,549,177 | |
| Stanley Black & Decker, Inc. | | | 3,550,354 | | | | 510,185,870 | |
| | | | | | | | |
| | | | | | | $ | 1,178,203,348 | |
| Consumer Products - 1.2% | | | | | | |
| Colgate-Palmolive Co. | | | 1,385,747 | | | $ | 93,634,925 | |
| Kimberly-Clark Corp. | | | 1,266,130 | | | | 166,103,595 | |
| Procter & Gamble Co. | | | 901,357 | | | | 102,060,653 | |
| Reckitt Benckiser Group PLC | | | 2,696,822 | | | | 199,063,377 | |
| | | | | | | | |
| | | | | | | $ | 560,862,550 | |
| Electrical Equipment - 1.0% | | | | | | |
| Johnson Controls International PLC | | | 13,175,902 | | | $ | 481,842,736 | |
| | |
| Electronics - 3.4% | | | | | | |
| Analog Devices, Inc. | | | 2,781,428 | | | $ | 303,314,723 | |
| NXP Semiconductors N.V. | | | 2,689,365 | | | | 305,753,907 | |
| Texas Instruments, Inc. | | | 8,588,346 | | | | 980,273,813 | |
| | | | | | | | |
| | | | | | | $ | 1,589,342,443 | |
| Energy - Independent - 1.7% | | | | | | |
| ConocoPhillips | | | 6,616,690 | | | $ | 320,380,130 | |
| EOG Resources, Inc. | | | 4,418,426 | | | | 279,509,629 | |
| Pioneer Natural Resources Co. | | | 1,332,661 | | | | 163,624,117 | |
| | | | | | | | |
| | | | | | | $ | 763,513,876 | |
| Energy - Integrated - 1.5% | | | | | | |
| Chevron Corp. | | | 3,161,761 | | | $ | 295,118,772 | |
| Suncor Energy, Inc. | | | 14,246,731 | | | | 392,614,326 | |
| | | | | | | | |
| | | | | | | $ | 687,733,098 | |
| Food & Beverages - 3.7% | | | | | | |
| Archer Daniels Midland Co. | | | 6,161,464 | | | $ | 231,979,119 | |
| Danone S.A. | | | 2,741,434 | | | | 194,078,358 | |
| J.M. Smucker Co. | | | 1,633,323 | | | | 168,215,936 | |
| Nestle S.A. | | | 8,007,632 | | | | 829,646,342 | |
| PepsiCo, Inc. | | | 2,023,191 | | | | 267,121,908 | |
| | | | | | | | |
| | | | | | | $ | 1,691,041,663 | |
7
Portfolio of Investments (unaudited) – continued
| | | | | | | | |
| | |
| Issuer | | Shares/Par | | | Value ($) | |
| Common Stocks - continued | | | | | | |
| Health Maintenance Organizations - 2.2% | | | | | | |
| Cigna Corp. | | | 5,580,296 | | | $ | 1,020,859,350 | |
| | |
| Insurance - 8.2% | | | | | | |
| Aon PLC | | | 5,787,585 | | | $ | 1,203,817,680 | |
| Chubb Ltd. | | | 6,901,740 | | | | 1,000,959,352 | |
| Marsh & McLennan Cos., Inc. | | | 7,353,380 | | | | 768,869,413 | |
| Travelers Cos., Inc. | | | 6,713,840 | | | | 804,385,170 | |
| | | | | | | | |
| | | | | | | $ | 3,778,031,615 | |
| Leisure & Toys - 0.1% | | | | | | |
| Harley-Davidson, Inc. | | | 1,449,111 | | | $ | 44,154,412 | |
| | |
| Machinery & Tools - 3.9% | | | | | | |
| Eaton Corp. PLC | | | 6,554,834 | | | $ | 594,654,540 | |
| Illinois Tool Works, Inc. | | | 4,869,492 | | | | 817,003,368 | |
| Ingersoll Rand, Inc. (a) | | | 4,020,363 | | | | 401,975,114 | |
| | | | | | | | |
| | | | | | | $ | 1,813,633,022 | |
| Major Banks - 10.4% | | | | | | |
| Bank of New York Mellon Corp. | | | 6,498,617 | | | $ | 259,294,818 | |
| Goldman Sachs Group, Inc. | | | 3,753,474 | | | | 753,584,975 | |
| JPMorgan Chase & Co. | | | 18,332,920 | | | | 2,128,635,341 | |
| PNC Financial Services Group, Inc. | | | 4,779,497 | | | | 604,128,421 | |
| State Street Corp. | | | 5,464,282 | | | | 372,172,247 | |
| Wells Fargo & Co. | | | 16,794,199 | | | | 686,043,029 | |
| | | | | | | | |
| | | | | | | $ | 4,803,858,831 | |
| Medical & Health Technology & Services - 0.7% | | | | | | |
| McKesson Corp. | | | 2,460,001 | | | $ | 344,055,740 | |
| | |
| Medical Equipment - 7.2% | | | | | | |
| Abbott Laboratories | | | 7,678,587 | | | $ | 591,481,556 | |
| Danaher Corp. | | | 5,024,048 | | | | 726,376,860 | |
| Medtronic PLC | | | 13,189,981 | | | | 1,327,835,387 | |
| Thermo Fisher Scientific, Inc. | | | 2,251,966 | | | | 654,871,713 | |
| | | | | | | | |
| | | | | | | $ | 3,300,565,516 | |
| Other Banks & Diversified Financials - 7.3% | | | | | | |
| American Express Co. | | | 3,918,763 | | | $ | 430,789,617 | |
| Citigroup, Inc. | | | 17,519,734 | | | | 1,111,802,320 | |
| Moody’s Corp. | | | 1,362,144 | | | | 326,955,424 | |
| Truist Financial Corp. | | | 13,617,923 | | | | 628,330,967 | |
| U.S. Bancorp | | | 19,081,380 | | | | 886,139,287 | |
| | | | | | | | |
| | | | | | | $ | 3,384,017,615 | |
8
Portfolio of Investments (unaudited) – continued
| | | | | | | | |
| | |
| Issuer | | Shares/Par | | | Value ($) | |
| Common Stocks - continued | | | | | | |
| Pharmaceuticals - 7.0% | | | | | | |
| Johnson & Johnson | | | 11,956,587 | | | $ | 1,607,921,820 | |
| Merck & Co., Inc. | | | 6,452,387 | | | | 493,994,749 | |
| Novartis AG | | | 1,258,950 | | | | 105,687,893 | |
| Pfizer, Inc. | | | 23,869,199 | | | | 797,708,631 | |
| Roche Holding AG | | | 719,750 | | | | 234,598,542 | |
| | | | | | | | |
| | | | | | | $ | 3,239,911,635 | |
| Railroad & Shipping - 1.9% | | | | | | |
| Canadian National Railway Co. | | | 3,142,966 | | | $ | 266,869,243 | |
| Union Pacific Corp. | | | 3,675,671 | | | | 587,408,983 | |
| | | | | | | | |
| | | | | | | $ | 854,278,226 | |
| Real Estate - 0.4% | | | | | | |
| Public Storage, Inc., REIT | | | 812,405 | | | $ | 169,890,134 | |
| | |
| Specialty Chemicals - 0.7% | | | | | | |
| Corteva, Inc. | | | 2,022,847 | | | $ | 55,021,439 | |
| DuPont de Nemours, Inc. | | | 6,324,718 | | | | 271,330,402 | |
| | | | | | | | |
| | | | | | | $ | 326,351,841 | |
| Telephone Services - 0.5% | | | | | | |
| Verizon Communications, Inc. | | | 3,961,301 | | | $ | 214,544,062 | |
| | |
| Tobacco - 1.5% | | | | | | |
| Altria Group, Inc. | | | 3,919,448 | | | $ | 158,228,116 | |
| Philip Morris International, Inc. | | | 6,491,575 | | | | 531,465,245 | |
| | | | | | | | |
| | | | | | | $ | 689,693,361 | |
| Utilities - Electric Power - 6.4% | | | | | | |
| Duke Energy Corp. | | | 12,723,239 | | | $ | 1,166,721,016 | |
| FirstEnergy Corp. | | | 14,501,492 | | | | 645,751,439 | |
| Southern Co. | | | 15,056,216 | | | | 908,793,198 | |
| Xcel Energy, Inc. | | | 3,906,934 | | | | 243,480,127 | |
| | | | | | | | |
| | | | | | | $ | 2,964,745,780 | |
| Total Common Stocks (Identified Cost, $28,601,898,465) | | | $ | 45,320,108,199 | |
| | |
| Investment Companies (h) - 1.2% | | | | | | |
| Money Market Funds - 1.2% | | | | | | |
MFS Institutional Money Market Portfolio, 1.61% (v)
(Identified Cost, $539,882,345) | | | 539,867,592 | | | $ | 539,921,579 | |
| | |
| Other Assets, Less Liabilities - 0.4% | | | | | 185,497,945 | |
| Net Assets - 100.0% | | | | | | $ | 46,045,527,723 | |
9
Portfolio of Investments (unaudited) – continued
| (a) | Non-income producing security. |
| (h) | An affiliated issuer, which may be considered one in which the fund owns 5% or more of the outstanding voting securities, or a company which is under common control. At period end, the aggregate values of the fund’s investments in affiliated issuers and in unaffiliated issuers were $539,921,579 and $45,320,108,199, respectively. |
| (v) | Affiliated issuer that is available only to investment companies managed by MFS. The rate quoted for the MFS Institutional Money Market Portfolio is the annualizedseven-day yield of the fund at period end. |
The following abbreviations are used in this report and are defined:
| REIT | | Real Estate Investment Trust |
See Notes to Financial Statements
10
Financial Statements
STATEMENT OF ASSETS AND LIABILITIES
At 2/29/20 (unaudited)
This statement represents your fund’s balance sheet, which details the assets and liabilities comprising the total value of the fund.
| | | | |
| Assets | | | | |
Investments in unaffiliated issuers, at value (identified cost, $28,601,898,465) | | | $45,320,108,199 | |
Investments in affiliated issuers, at value (identified cost, $539,882,345) | | | 539,921,579 | |
Cash | | | 3,781,648 | |
Receivables for | | | | |
Investments sold | | | 387,763,495 | |
Fund shares sold | | | 135,966,999 | |
Dividends | | | 136,708,835 | |
Other assets | | | 123,219 | |
Total assets | | | $46,524,373,974 | |
| |
| Liabilities | | | | |
Payables for | | | | |
Distributions | | | $1,090 | |
Investments purchased | | | 320,082,701 | |
Fund shares reacquired | | | 138,931,137 | |
Payable to affiliates | | | | |
Investment adviser | | | 1,692,405 | |
Administrative services fee | | | 4,666 | |
Shareholder servicing costs | | | 17,066,461 | |
Distribution and service fees | | | 258,288 | |
Program manager fees | | | 138 | |
Payable for independent Trustees’ compensation | | | 16,375 | |
Accrued expenses and other liabilities | | | 792,990 | |
Total liabilities | | | $478,846,251 | |
Net assets | | | $46,045,527,723 | |
| |
| Net assets consist of | | | | |
Paid-in capital | | | $29,076,747,325 | |
Total distributable earnings (loss) | | | 16,968,780,398 | |
Net assets | | | $46,045,527,723 | |
Shares of beneficial interest outstanding | | | 1,157,845,908 | |
11
Statement of Assets and Liabilities (unaudited) – continued
| | | | | | | | | | | | |
| | | |
| | | Net assets | | | Shares
outstanding | | | Net asset value
per share (a) | |
Class A | | | $6,321,147,834 | | | | 159,293,235 | | | | $39.68 | |
Class B | | | 68,907,847 | | | | 1,746,055 | | | | 39.46 | |
Class C | | | 790,794,786 | | | | 20,187,206 | | | | 39.17 | |
Class I | | | 19,494,984,071 | | | | 488,256,803 | | | | 39.93 | |
Class R1 | | | 18,567,554 | | | | 477,918 | | | | 38.85 | |
Class R2 | | | 369,749,323 | | | | 9,420,896 | | | | 39.25 | |
Class R3 | | | 1,979,607,917 | | | | 50,092,750 | | | | 39.52 | |
Class R4 | | | 2,423,846,422 | | | | 61,071,034 | | | | 39.69 | |
Class R6 | | | 14,545,313,565 | | | | 366,468,617 | | | | 39.69 | |
Class 529A | | | 27,161,232 | | | | 690,524 | | | | 39.33 | |
Class 529B | | | 552,199 | | | | 14,192 | | | | 38.91 | |
Class 529C | | | 4,894,973 | | | | 126,678 | | | | 38.64 | |
| (a) | Maximum offering price per share was equal to the net asset value per share for all share classes, except for Classes A and 529A, for which the maximum offering prices per share were $42.10 [100 / 94.25 x $39.68] and $41.73 [100 / 94.25 x $39.33], respectively. On sales of $50,000 or more, the maximum offering prices of Class A and Class 529A shares are reduced. A contingent deferred sales charge may be imposed on redemptions of Class A, Class B, Class C, Class 529B, and Class 529C shares. Redemption price per share was equal to the net asset value per share for Classes I, R1, R2, R3, R4, R6, and 529A. |
See Notes to Financial Statements
12
Financial Statements
STATEMENT OF OPERATIONS
Six months ended 2/29/20 (unaudited)
This statement describes how much your fund earned in investment income and accrued in expenses. It also describes any gains and/or losses generated by fund operations.
| | | | |
| Net investment income (loss) | | | | |
Income | | | | |
Dividends | | | $558,671,430 | |
Dividends from affiliated issuers | | | 4,334,245 | |
Income on securities loaned | | | 1,442,310 | |
Other | | | 290,009 | |
Interest | | | 54 | |
Foreign taxes withheld | | | (1,174,903 | ) |
Total investment income | | | $563,563,145 | |
Expenses | | | | |
Management fee | | | $113,127,639 | |
Distribution and service fees | | | 17,422,823 | |
Shareholder servicing costs | | | 18,283,215 | |
Program manager fees | | | 8,719 | |
Administrative services fee | | | 275,671 | |
Independent Trustees’ compensation | | | 111,536 | |
Custodian fee | | | 343,045 | |
Shareholder communications | | | 857,509 | |
Audit and tax fees | | | 35,844 | |
Legal fees | | | 207,974 | |
Miscellaneous | | | 595,837 | |
Total expenses | | | $151,269,812 | |
Reduction of expenses by investment adviser and distributor | | | (2,585,436 | ) |
Net expenses | | | $148,684,376 | |
Net investment income (loss) | | | $414,878,769 | |
| |
| Realized and unrealized gain (loss) | | | | |
Realized gain (loss) (identified cost basis) | | | | |
Unaffiliated issuers | | | $268,757,253 | |
Affiliated issuers | | | (46,442 | ) |
Foreign currency | | | 134,286 | |
Net realized gain (loss) | | | $268,845,097 | |
Change in unrealized appreciation or depreciation | | | | |
Unaffiliated issuers | | | $(1,537,444,159 | ) |
Affiliated issuers | | | (4,442 | ) |
Translation of assets and liabilities in foreign currencies | | | 413,824 | |
Net unrealized gain (loss) | | | $(1,537,034,777 | ) |
Net realized and unrealized gain (loss) | | | $(1,268,189,680 | ) |
Change in net assets from operations | | | $(853,310,911 | ) |
See Notes to Financial Statements
13
Financial Statements
STATEMENTS OF CHANGES IN NET ASSETS
These statements describe the increases and/or decreases in net assets resulting from operations, any distributions, and any shareholder transactions.
| | | | | | | | |
| Change in net assets | | Six months ended
2/29/20
(unaudited) | | | Year ended
8/31/19 | |
| | |
| From operations | | | | | | | | |
Net investment income (loss) | | | $414,878,769 | | | | $1,023,614,003 | |
Net realized gain (loss) | | | 268,845,097 | | | | 748,154,368 | |
Net unrealized gain (loss) | | | (1,537,034,777 | ) | | | 492,230,726 | |
Change in net assets from operations | | | $(853,310,911 | ) | | | $2,263,999,097 | |
Total distributions to shareholders | | | $(1,051,822,355 | ) | | | $(1,629,458,929 | ) |
Change in net assets from fund share transactions | | | $166,569,626 | | | | $(1,485,669,529 | ) |
Total change in net assets | | | $(1,738,563,640 | ) | | | $(851,129,361 | ) |
| | |
| Net assets | | | | | | | | |
At beginning of period | | | 47,784,091,363 | | | | 48,635,220,724 | |
At end of period | | | $46,045,527,723 | | | | $47,784,091,363 | |
See Notes to Financial Statements
14
Financial Statements
FINANCIAL HIGHLIGHTS
The financial highlights table is intended to help you understand the fund’s financial performance for the semiannual period and the past 5 fiscal years. Certain information reflects financial results for a single fund share. The total returns in the table represent the rate that an investor would have earned (or lost) on an investment in the fund share class (assuming reinvestment of all distributions) held for the entire period.
| | | | | | | | | | | | | | | | | | | | | | | | |
| | | Six months
ended 2/29/20 | | | Year ended | |
| Class A | | 8/31/19 | | | 8/31/18 | | | 8/31/17 | | | 8/31/16 | | | 8/31/15 | |
| | | (unaudited) | | | | | | | | | | | | | | | | |
Net asset value, beginning
of period | | | $41.31 | | | | $40.82 | | | | $39.00 | | | | $35.93 | | | | $33.38 | | | | $34.70 | |
| | | |
| Income (loss) from investment operations | | | | | | | | | | | | | |
Net investment income
(loss) (d) | | | $0.31 | | | | $0.79 | | | | $0.59 | | | | $0.66 | (c) | | | $0.54 | | | | $0.63 | |
Net realized and
unrealized gain (loss) | | | (1.07 | ) | | | 1.03 | | | | 3.04 | | | | 3.65 | | | | 3.81 | | | | (0.36 | ) |
Total from investment
operations | | | $(0.76 | ) | | | $1.82 | | | | $3.63 | | | | $4.31 | | | | $4.35 | | | | $0.27 | |
| | | |
| Less distributions declared to shareholders | | | | | | | | | | | | | |
From net investment
income | | | $(0.32 | ) | | | $(0.79 | ) | | | $(0.60 | ) | | | $(0.62 | ) | | | $(0.56 | ) | | | $(0.67 | ) |
From net realized gain | | | (0.55 | ) | | | (0.54 | ) | | | (1.21 | ) | | | (0.62 | ) | | | (1.24 | ) | | | (0.92 | ) |
Total distributions declared
to shareholders | | | $(0.87 | ) | | | $(1.33 | ) | | | $(1.81 | ) | | | $(1.24 | ) | | | $(1.80 | ) | | | $(1.59 | ) |
Net asset value, end of period (x) | | | $39.68 | | | | $41.31 | | | | $40.82 | | | | $39.00 | | | | $35.93 | | | | $33.38 | |
Total return (%) (r)(s)(t)(x) | | | (2.03 | )(n) | | | 4.85 | | | | 9.42 | | | | 12.24 | (c) | | | 13.55 | | | | 0.68 | |
| | | |
Ratios (%) (to average net assets)
and Supplemental data: | | | | | | | | | | | | | |
Expenses before expense
reductions (f) | | | 0.82 | (a) | | | 0.83 | | | | 0.82 | | | | 0.86 | (c) | | | 0.90 | | | | 0.90 | |
Expenses after expense
reductions (f) | | | 0.81 | (a) | | | 0.82 | | | | 0.81 | | | | 0.84 | (c) | | | 0.86 | | | | 0.86 | |
Net investment income
(loss) | | | 1.45 | (a) | | | 2.00 | | | | 1.46 | | | | 1.77 | (c) | | | 1.60 | | | | 1.80 | |
Portfolio turnover | | | 7 | (n) | | | 11 | | | | 11 | | | | 14 | | | | 12 | | | | 12 | |
Net assets at end of period
(000 omitted) | | | $6,321,148 | | | | $6,520,132 | | | | $6,736,296 | | | | $6,344,965 | | | | $9,033,842 | | | | $8,478,761 | |
See Notes to Financial Statements
15
Financial Highlights – continued
| | | | | | | | | | | | | | | | | | | | | | | | |
| | | Six months
ended 2/29/20 | | | Year ended | |
| Class B | | 8/31/19 | | | 8/31/18 | | | 8/31/17 | | | 8/31/16 | | | 8/31/15 | |
| | | (unaudited) | | | | | | | | | | | | | | | | |
Net asset value, beginning
of period | | | $41.09 | | | | $40.59 | | | | $38.76 | | | | $35.72 | | | | $33.19 | | | | $34.50 | |
| | | |
| Income (loss) from investment operations | | | | | | | | | | | | | |
Net investment income
(loss) (d) | | | $0.15 | | | | $0.49 | | | | $0.28 | | | | $0.37 | (c) | | | $0.28 | | | | $0.37 | |
Net realized and
unrealized gain (loss) | | | (1.08 | ) | | | 1.03 | | | | 3.04 | | | | 3.64 | | | | 3.79 | | | | (0.35 | ) |
Total from investment
operations | | | $(0.93 | ) | | | $1.52 | | | | $3.32 | | | | $4.01 | | | | $4.07 | | | | $0.02 | |
| | | |
| Less distributions declared to shareholders | | | | | | | | | | | | | |
From net investment
income | | | $(0.15 | ) | | | $(0.48 | ) | | | $(0.28 | ) | | | $(0.35 | ) | | | $(0.30 | ) | | | $(0.41 | ) |
From net realized gain | | | (0.55 | ) | | | (0.54 | ) | | | (1.21 | ) | | | (0.62 | ) | | | (1.24 | ) | | | (0.92 | ) |
Total distributions declared
to shareholders | | | $(0.70 | ) | | | $(1.02 | ) | | | $(1.49 | ) | | | $(0.97 | ) | | | $(1.54 | ) | | | $(1.33 | ) |
Net asset value, end of
period (x) | | | $39.46 | | | | $41.09 | | | | $40.59 | | | | $38.76 | | | | $35.72 | | | | $33.19 | |
Total return (%) (r)(s)(t)(x) | | | (2.42 | )(n) | | | 4.08 | | | | 8.62 | | | | 11.40 | (c) | | | 12.68 | | | | (0.06 | ) |
| | | |
Ratios (%) (to average net assets)
and Supplemental data: | | | | | | | | | | | | | |
Expenses before expense
reductions (f) | | | 1.57 | (a) | | | 1.58 | | | | 1.57 | | | | 1.61 | (c) | | | 1.65 | | | | 1.65 | |
Expenses after expense
reductions (f) | | | 1.56 | (a) | | | 1.57 | | | | 1.56 | | | | 1.59 | (c) | | | 1.61 | | | | 1.61 | |
Net investment income
(loss) | | | 0.69 | (a) | | | 1.24 | | | | 0.71 | | | | 0.99 | (c) | | | 0.85 | | | | 1.05 | |
Portfolio turnover | | | 7 | (n) | | | 11 | | | | 11 | | | | 14 | | | | 12 | | | | 12 | |
Net assets at end of period
(000 omitted) | | | $68,908 | | | | $84,737 | | | | $111,494 | | | | $137,361 | | | | $154,742 | | | | $154,205 | |
See Notes to Financial Statements
16
Financial Highlights – continued
| | | | | | | | | | | | | | | | | | | | | | | | |
| | | Six months
ended 2/29/20 | | | Year ended | |
| Class C | | 8/31/19 | | | 8/31/18 | | | 8/31/17 | | | 8/31/16 | | | 8/31/15 | |
| | | (unaudited) | | | | | | | | | | | | | | | | |
Net asset value, beginning
of period | | | $40.80 | | | | $40.31 | | | | $38.52 | | | | $35.50 | | | | $33.00 | | | | $34.33 | |
| | | |
| Income (loss) from investment operations | | | | | | | | | | | | | |
Net investment income
(loss) (d) | | | $0.15 | | | | $0.49 | | | | $0.28 | | | | $0.37 | (c) | | | $0.28 | | | | $0.37 | |
Net realized and
unrealized gain (loss) | | | (1.07 | ) | | | 1.03 | | | | 3.01 | | | | 3.62 | | | | 3.77 | | | | (0.36 | ) |
Total from investment
operations | | | $(0.92 | ) | | | $1.52 | | | | $3.29 | | | | $3.99 | | | | $4.05 | | | | $0.01 | |
| | | |
| Less distributions declared to shareholders | | | | | | | | | | | | | |
From net investment
income | | | $(0.16 | ) | | | $(0.49 | ) | | | $(0.29 | ) | | | $(0.35 | ) | | | $(0.31 | ) | | | $(0.42 | ) |
From net realized gain | | | (0.55 | ) | | | (0.54 | ) | | | (1.21 | ) | | | (0.62 | ) | | | (1.24 | ) | | | (0.92 | ) |
Total distributions declared
to shareholders | | | $(0.71 | ) | | | $(1.03 | ) | | | $(1.50 | ) | | | $(0.97 | ) | | | $(1.55 | ) | | | $(1.34 | ) |
Net asset value, end of
period (x) | | | $39.17 | | | | $40.80 | | | | $40.31 | | | | $38.52 | | | | $35.50 | | | | $33.00 | |
Total return (%) (r)(s)(t)(x) | | | (2.42 | )(n) | | | 4.10 | | | | 8.58 | | | | 11.43 | (c) | | | 12.69 | | | | (0.09 | ) |
| | | |
Ratios (%) (to average net assets)
and Supplemental data: | | | | | | | | | | | | | |
Expenses before expense
reductions (f) | | | 1.57 | (a) | | | 1.58 | | | | 1.57 | | | | 1.61 | (c) | | | 1.65 | | | | 1.65 | |
Expenses after expense
reductions (f) | | | 1.56 | (a) | | | 1.57 | | | | 1.56 | | | | 1.59 | (c) | | | 1.61 | | | | 1.61 | |
Net investment income
(loss) | | | 0.69 | (a) | | | 1.24 | | | | 0.71 | | | | 0.99 | (c) | | | 0.85 | | | | 1.06 | |
Portfolio turnover | | | 7 | (n) | | | 11 | | | | 11 | | | | 14 | | | | 12 | | | | 12 | |
Net assets at end of period
(000 omitted) | | | $790,795 | | | | $881,020 | | | | $1,050,477 | | | | $1,389,685 | | | | $1,538,605 | | | | $1,335,968 | |
See Notes to Financial Statements
17
Financial Highlights – continued
| | | | | | | | | | | | | | | | | | | | | | | | |
| | | Six months
ended 2/29/20 | | | Year ended | |
| Class I | | 8/31/19 | | | 8/31/18 | | | 8/31/17 | | | 8/31/16 | | | 8/31/15 | |
| | | (unaudited) | | | | | | | | | | | | | | | | |
Net asset value, beginning
of period | | | $41.56 | | | | $41.06 | | | | $39.22 | | | | $36.13 | | | | $33.56 | | | | $34.88 | |
| | | |
| Income (loss) from investment operations | | | | | | | | | | | | | |
Net investment income
(loss) (d) | | | $0.37 | | | | $0.90 | | | | $0.70 | | | | $0.74 | (c) | | | $0.63 | | | | $0.72 | |
Net realized and
unrealized gain (loss) | | | (1.08 | ) | | | 1.02 | | | | 3.05 | | | | 3.70 | | | | 3.82 | | | | (0.36 | ) |
Total from investment
operations | | | $(0.71 | ) | | | $1.92 | | | | $3.75 | | | | $4.44 | | | | $4.45 | | | | $0.36 | |
| | | |
| Less distributions declared to shareholders | | | | | | | | | | | | | |
From net investment
income | | | $(0.37 | ) | | | $(0.88 | ) | | | $(0.70 | ) | | | $(0.73 | ) | | | $(0.64 | ) | | | $(0.76 | ) |
From net realized gain | | | (0.55 | ) | | | (0.54 | ) | | | (1.21 | ) | | | (0.62 | ) | | | (1.24 | ) | | | (0.92 | ) |
Total distributions declared
to shareholders | | | $(0.92 | ) | | | $(1.42 | ) | | | $(1.91 | ) | | | $(1.35 | ) | | | $(1.88 | ) | | | $(1.68 | ) |
Net asset value, end of
period (x) | | | $39.93 | | | | $41.56 | | | | $41.06 | | | | $39.22 | | | | $36.13 | | | | $33.56 | |
Total return (%) (r)(s)(t)(x) | | | (1.90 | )(n) | | | 5.11 | | | | 9.69 | | | | 12.54 | (c) | | | 13.83 | | | | 0.93 | |
| | | |
Ratios (%) (to average net assets)
and Supplemental data: | | | | | | | | | | | | | |
Expenses before expense
reductions (f) | | | 0.57 | (a) | | | 0.58 | | | | 0.57 | | | | 0.61 | (c) | | | 0.65 | | | | 0.65 | |
Expenses after expense
reductions (f) | | | 0.56 | (a) | | | 0.57 | | | | 0.57 | | | | 0.59 | (c) | | | 0.61 | | | | 0.61 | |
Net investment income
(loss) | | | 1.70 | (a) | | | 2.25 | | | | 1.72 | | | | 1.98 | (c) | | | 1.84 | | | | 2.06 | |
Portfolio turnover | | | 7 | (n) | | | 11 | | | | 11 | | | | 14 | | | | 12 | | | | 12 | |
Net assets at end of period
(000 omitted) | | | $19,494,984 | | | | $20,076,773 | | | | $20,727,676 | | | | $19,624,016 | | | | $17,134,836 | | | | $13,888,395 | |
See Notes to Financial Statements
18
Financial Highlights – continued
| | | | | | | | | | | | | | | | | | | | | | | | |
| | | Six months
ended 2/29/20 | | | Year ended | |
| Class R1 | | 8/31/19 | | | 8/31/18 | | | 8/31/17 | | | 8/31/16 | | | 8/31/15 | |
| | | (unaudited) | | | | | | | | | | | | | | | | |
Net asset value, beginning
of period | | | $40.47 | | | | $40.01 | | | | $38.25 | | | | $35.27 | | | | $32.79 | | | | $34.11 | |
| | | |
| Income (loss) from investment operations | | | | | | | | | | | | | |
Net investment income
(loss) (d) | | | $0.15 | | | | $0.48 | | | | $0.28 | | | | $0.36 | (c) | | | $0.28 | | | | $0.36 | |
Net realized and
unrealized gain (loss) | | | (1.06 | ) | | | 1.02 | | | | 2.99 | | | | 3.60 | | | | 3.74 | | | | (0.34 | ) |
Total from investment
operations | | | $(0.91 | ) | | | $1.50 | | | | $3.27 | | | | $3.96 | | | | $4.02 | | | | $0.02 | |
| | | |
| Less distributions declared to shareholders | | | | | | | | | | | | | |
From net investment
income | | | $(0.16 | ) | | | $(0.50 | ) | | | $(0.30 | ) | | | $(0.36 | ) | | | $(0.30 | ) | | | $(0.42 | ) |
From net realized gain | | | (0.55 | ) | | | (0.54 | ) | | | (1.21 | ) | | | (0.62 | ) | | | (1.24 | ) | | | (0.92 | ) |
Total distributions declared
to shareholders | | | $(0.71 | ) | | | $(1.04 | ) | | | $(1.51 | ) | | | $(0.98 | ) | | | $(1.54 | ) | | | $(1.34 | ) |
Net asset value, end of
period (x) | | | $38.85 | | | | $40.47 | | | | $40.01 | | | | $38.25 | | | | $35.27 | | | | $32.79 | |
Total return (%) (r)(s)(t)(x) | | | (2.42 | )(n) | | | 4.08 | | | | 8.61 | | | | 11.40 | (c) | | | 12.69 | | | | (0.07 | ) |
| | | |
Ratios (%) (to average net assets)
and Supplemental data: | | | | | | | | | | | | | |
Expenses before expense
reductions (f) | | | 1.57 | (a) | | | 1.58 | | | | 1.57 | | | | 1.61 | (c) | | | 1.65 | | | | 1.65 | |
Expenses after expense
reductions (f) | | | 1.56 | (a) | | | 1.57 | | | | 1.56 | | | | 1.59 | (c) | | | 1.61 | | | | 1.61 | |
Net investment income
(loss) | | | 0.69 | (a) | | | 1.24 | | | | 0.72 | | | | 0.99 | (c) | | | 0.85 | | | | 1.06 | |
Portfolio turnover | | | 7 | (n) | | | 11 | | | | 11 | | | | 14 | | | | 12 | | | | 12 | |
Net assets at end of period
(000 omitted) | | | $18,568 | | | | $21,820 | | | | $24,791 | | | | $26,663 | | | | $27,096 | | | | $27,860 | |
See Notes to Financial Statements
19
Financial Highlights – continued
| | | | | | | | | | | | | | | | | | | | | | | | |
| | | Six months
ended 2/29/20 | | | Year ended | |
| Class R2 | | 8/31/19 | | | 8/31/18 | | | 8/31/17 | | | 8/31/16 | | | 8/31/15 | |
| | | (unaudited) | | | | | | | | | | | | | | | | |
Net asset value, beginning
of period | | | $40.87 | | | | $40.39 | | | | $38.60 | | | | $35.59 | | | | $33.08 | | | | $34.40 | |
| | | |
| Income (loss) from investment operations | | | | | | | | | | | | | |
Net investment income
(loss) (d) | | | $0.25 | | | | $0.68 | | | | $0.48 | | | | $0.55 | (c) | | | $0.45 | | | | $0.54 | |
Net realized and
unrealized gain (loss) | | | (1.06 | ) | | | 1.03 | | | | 3.02 | | | | 3.62 | | | | 3.78 | | | | (0.35 | ) |
Total from investment
operations | | | $(0.81 | ) | | | $1.71 | | | | $3.50 | | | | $4.17 | | | | $4.23 | | | | $0.19 | |
| | | |
| Less distributions declared to shareholders | | | | | | | | | | | | | |
From net investment
income | | | $(0.26 | ) | | | $(0.69 | ) | | | $(0.50 | ) | | | $(0.54 | ) | | | $(0.48 | ) | | | $(0.59 | ) |
From net realized gain | | | (0.55 | ) | | | (0.54 | ) | | | (1.21 | ) | | | (0.62 | ) | | | (1.24 | ) | | | (0.92 | ) |
Total distributions declared
to shareholders | | | $(0.81 | ) | | | $(1.23 | ) | | | $(1.71 | ) | | | $(1.16 | ) | | | $(1.72 | ) | | | $(1.51 | ) |
Net asset value, end of
period (x) | | | $39.25 | | | | $40.87 | | | | $40.39 | | | | $38.60 | | | | $35.59 | | | | $33.08 | |
Total return (%) (r)(s)(t)(x) | | | (2.15 | )(n) | | | 4.60 | | | | 9.15 | | | | 11.95 | (c) | | | 13.27 | | | | 0.43 | |
| | | |
Ratios (%) (to average net assets)
and Supplemental data: | | | | | | | | | | | | | |
Expenses before expense
reductions (f) | | | 1.07 | (a) | | | 1.08 | | | | 1.07 | | | | 1.11 | (c) | | | 1.15 | | | | 1.15 | |
Expenses after expense
reductions (f) | | | 1.06 | (a) | | | 1.07 | | | | 1.07 | | | | 1.09 | (c) | | | 1.11 | | | | 1.11 | |
Net investment income
(loss) | | | 1.19 | (a) | | | 1.73 | | | | 1.21 | | | | 1.49 | (c) | | | 1.35 | | | | 1.54 | |
Portfolio turnover | | | 7 | (n) | | | 11 | | | | 11 | | | | 14 | | | | 12 | | | | 12 | |
Net assets at end of period
(000 omitted) | | | $369,749 | | | | $437,221 | | | | $550,200 | | | | $614,044 | | | | $567,665 | | | | $521,592 | |
See Notes to Financial Statements
20
Financial Highlights – continued
| | | | | | | | | | | | | | | | | | | | | | | | |
| | | Six months
ended 2/29/20 | | | Year ended | |
| Class R3 | | 8/31/19 | | | 8/31/18 | | | 8/31/17 | | | 8/31/16 | | | 8/31/15 | |
| | | (unaudited) | | | | | | | | | | | | | | | | |
Net asset value, beginning
of period | | | $41.15 | | | | $40.66 | | | | $38.85 | | | | $35.81 | | | | $33.28 | | | | $34.60 | |
| | | |
| Income (loss) from investment operations | | | | | | | | | | | | | |
Net investment income
(loss) (d) | | | $0.31 | | | | $0.79 | | | | $0.59 | | | | $0.65 | (c) | | | $0.54 | | | | $0.63 | |
Net realized and
unrealized gain (loss) | | | (1.07 | ) | | | 1.03 | | | | 3.03 | | | | 3.64 | | | | 3.79 | | | | (0.35 | ) |
Total from investment
operations | | | $(0.76 | ) | | | $1.82 | | | | $3.62 | | | | $4.29 | | | | $4.33 | | | | $0.28 | |
| | | |
| Less distributions declared to shareholders | | | | | | | | | | | | | |
From net investment
income | | | $(0.32 | ) | | | $(0.79 | ) | | | $(0.60 | ) | | | $(0.63 | ) | | | $(0.56 | ) | | | $(0.68 | ) |
From net realized gain | | | (0.55 | ) | | | (0.54 | ) | | | (1.21 | ) | | | (0.62 | ) | | | (1.24 | ) | | | (0.92 | ) |
Total distributions declared
to shareholders | | | $(0.87 | ) | | | $(1.33 | ) | | | $(1.81 | ) | | | $(1.25 | ) | | | $(1.80 | ) | | | $(1.60 | ) |
Net asset value, end of
period (x) | | | $39.52 | | | | $41.15 | | | | $40.66 | | | | $38.85 | | | | $35.81 | | | | $33.28 | |
Total return (%) (r)(s)(t)(x) | | | (2.04 | )(n) | | | 4.87 | | | | 9.43 | | | | 12.23 | (c) | | | 13.54 | | | | 0.69 | |
| | | |
Ratios (%) (to average net assets)
and Supplemental data: | | | | | | | | | | | | | |
Expenses before expense
reductions (f) | | | 0.82 | (a) | | | 0.83 | | | | 0.82 | | | | 0.86 | (c) | | | 0.90 | | | | 0.90 | |
Expenses after expense
reductions (f) | | | 0.81 | (a) | | | 0.82 | | | | 0.82 | | | | 0.84 | (c) | | | 0.86 | | | | 0.86 | |
Net investment income
(loss) | | | 1.44 | (a) | | | 1.99 | | | | 1.47 | | | | 1.74 | (c) | | | 1.60 | | | | 1.80 | |
Portfolio turnover | | | 7 | (n) | | | 11 | | | | 11 | | | | 14 | | | | 12 | | | | 12 | |
Net assets at end of period
(000 omitted) | | | $1,979,608 | | | | $2,096,743 | | | | $2,259,562 | | | | $2,030,023 | | | | $1,903,910 | | | | $1,571,281 | |
See Notes to Financial Statements
21
Financial Highlights – continued
| | | | | | | | | | | | | | | | | | | | | | | | |
| | | Six months
ended 2/29/20 | | | Year ended | |
| Class R4 | | 8/31/19 | | | 8/31/18 | | | 8/31/17 | | | 8/31/16 | | | 8/31/15 | |
| | | (unaudited) | | | | | | | | | | | | | | | | |
Net asset value, beginning
of period | | | $41.32 | | | | $40.82 | | | | $39.00 | | | | $35.94 | | | | $33.40 | | | | $34.72 | |
| | | |
| Income (loss) from investment operations | | | | | | | | | | | | | |
Net investment income
(loss) (d) | | | $0.36 | | | | $0.89 | | | | $0.69 | | | | $0.74 | (c) | | | $0.62 | | | | $0.72 | |
Net realized and
unrealized gain (loss) | | | (1.07 | ) | | | 1.03 | | | | 3.04 | | | | 3.67 | | | | 3.80 | | | | (0.36 | ) |
Total from investment
operations | | | $(0.71 | ) | | | $1.92 | | | | $3.73 | | | | $4.41 | | | | $4.42 | | | | $0.36 | |
| | | |
| Less distributions declared to shareholders | | | | | | | | | | | | | |
From net investment
income | | | $(0.37 | ) | | | $(0.88 | ) | | | $(0.70 | ) | | | $(0.73 | ) | | | $(0.64 | ) | | | $(0.76 | ) |
From net realized gain | | | (0.55 | ) | | | (0.54 | ) | | | (1.21 | ) | | | (0.62 | ) | | | (1.24 | ) | | | (0.92 | ) |
Total distributions declared
to shareholders | | | $(0.92 | ) | | | $(1.42 | ) | | | $(1.91 | ) | | | $(1.35 | ) | | | $(1.88 | ) | | | $(1.68 | ) |
Net asset value, end of
period (x) | | | $39.69 | | | | $41.32 | | | | $40.82 | | | | $39.00 | | | | $35.94 | | | | $33.40 | |
Total return (%) (r)(s)(t)(x) | | | (1.91 | )(n) | | | 5.14 | | | | 9.70 | | | | 12.52 | (c) | | | 13.80 | | | | 0.93 | |
| | | |
Ratios (%) (to average net assets)
and Supplemental data: | | | | | | | | | | | | | |
Expenses before expense
reductions (f) | | | 0.57 | (a) | | | 0.58 | | | | 0.57 | | | | 0.61 | (c) | | | 0.65 | | | | 0.65 | |
Expenses after expense
reductions (f) | | | 0.56 | (a) | | | 0.57 | | | | 0.57 | | | | 0.59 | (c) | | | 0.61 | | | | 0.61 | |
Net investment income
(loss) | | | 1.69 | (a) | | | 2.24 | | | | 1.72 | | | | 1.99 | (c) | | | 1.85 | | | | 2.05 | |
Portfolio turnover | | | 7 | (n) | | | 11 | | | | 11 | | | | 14 | | | | 12 | | | | 12 | |
Net assets at end of period
(000 omitted) | | | $2,423,846 | | | | $2,916,674 | | | | $3,201,331 | | | | $3,060,883 | | | | $3,233,421 | | | | $2,787,041 | |
See Notes to Financial Statements
22
Financial Highlights – continued
| | | | | | | | | | | | | | | | | | | | | | | | |
| | | Six months
ended 2/29/20 | | | Year ended | |
| Class R6 | | 8/31/19 | | | 8/31/18 | | | 8/31/17 | | | 8/31/16 | | | 8/31/15 | |
| | | (unaudited) | | | | | | | | | | | | | | | | |
Net asset value, beginning
of period | | | $41.32 | | | | $40.83 | | | | $39.01 | | | | $35.94 | | | | $33.40 | | | | $34.72 | |
| | | |
| Income (loss) from investment operations | | | | | | | | | | | | | |
Net investment income
(loss) (d) | | | $0.39 | | | | $0.93 | | | | $0.73 | | | | $0.76 | (c) | | | $0.66 | | | | $0.76 | |
Net realized and
unrealized gain (loss) | | | (1.08 | ) | | | 1.02 | | | | 3.04 | | | | 3.69 | | | | 3.80 | | | | (0.36 | ) |
Total from investment
operations | | | $(0.69 | ) | | | $1.95 | | | | $3.77 | | | | $4.45 | | | | $4.46 | | | | $0.40 | |
| | | |
| Less distributions declared to shareholders | | | | | | | | | | | | | |
From net investment
income | | | $(0.39 | ) | | | $(0.92 | ) | | | $(0.74 | ) | | | $(0.76 | ) | | | $(0.68 | ) | | | $(0.80 | ) |
From net realized gain | | | (0.55 | ) | | | (0.54 | ) | | | (1.21 | ) | | | (0.62 | ) | | | (1.24 | ) | | | (0.92 | ) |
Total distributions declared to shareholders | | | $(0.94 | ) | | | $(1.46 | ) | | | $(1.95 | ) | | | $(1.38 | ) | | | $(1.92 | ) | | | $(1.72 | ) |
Net asset value, end of
period (x) | | | $39.69 | | | | $41.32 | | | | $40.83 | | | | $39.01 | | | | $35.94 | | | | $33.40 | |
Total return (%) (r)(s)(t)(x) | | | (1.86 | )(n) | | | 5.22 | | | | 9.81 | | | | 12.66 | (c) | | | 13.93 | | | | 1.04 | |
| | | |
Ratios (%) (to average net assets)
and Supplemental data: | | | | | | | | | | | | | |
Expenses before expense
reductions (f) | | | 0.46 | (a) | | | 0.48 | | | | 0.47 | | | | 0.51 | (c) | | | 0.54 | | | | 0.54 | |
Expenses after expense
reductions (f) | | | 0.45 | (a) | | | 0.47 | | | | 0.47 | | | | 0.49 | (c) | | | 0.50 | | | | 0.50 | |
Net investment income
(loss) | | | 1.80 | (a) | | | 2.35 | | | | 1.83 | | | | 2.04 | (c) | | | 1.95 | | | | 2.17 | |
Portfolio turnover | | | 7 | (n) | | | 11 | | | | 11 | | | | 14 | | | | 12 | | | | 12 | |
Net assets at end of period
(000 omitted) | | | $14,545,314 | | | | $14,716,194 | | | | $13,941,823 | | | | $10,957,734 | | | | $6,218,954 | | | | $4,846,172 | |
See Notes to Financial Statements
23
Financial Highlights – continued
| | | | | | | | | | | | | | | | | | | | | | | | |
| | | Six months
ended 2/29/20 | | | Year ended | |
| Class 529A | | 8/31/19 | | | 8/31/18 | | | 8/31/17 | | | 8/31/16 | | | 8/31/15 | |
| | | (unaudited) | | | | | | | | | | | | | | | | |
Net asset value, beginning
of period | | | $40.96 | | | | $40.48 | | | | $38.69 | | | | $35.67 | | | | $33.15 | | | | $34.48 | |
| | | |
| Income (loss) from investment operations | | | | | | | | | | | | | |
Net investment income
(loss) (d) | | | $0.30 | | | | $0.78 | | | | $0.58 | | | | $0.63 | (c) | | | $0.53 | | | | $0.63 | |
Net realized and
unrealized gain (loss) | | | (1.07 | ) | | | 1.02 | | | | 3.02 | | | | 3.64 | | | | 3.79 | | | | (0.36 | ) |
Total from investment
operations | | | $(0.77 | ) | | | $1.80 | | | | $3.60 | | | | $4.27 | | | | $4.32 | | | | $0.27 | |
| | | |
| Less distributions declared to shareholders | | | | | | | | | | | | | |
From net investment
income | | | $(0.31 | ) | | | $(0.78 | ) | | | $(0.60 | ) | | | $(0.63 | ) | | | $(0.56 | ) | | | $(0.68 | ) |
From net realized gain | | | (0.55 | ) | | | (0.54 | ) | | | (1.21 | ) | | | (0.62 | ) | | | (1.24 | ) | | | (0.92 | ) |
Total distributions declared
to shareholders | | | $(0.86 | ) | | | $(1.32 | ) | | | $(1.81 | ) | | | $(1.25 | ) | | | $(1.80 | ) | | | $(1.60 | ) |
Net asset value, end of
period (x) | | | $39.33 | | | | $40.96 | | | | $40.48 | | | | $38.69 | | | | $35.67 | | | | $33.15 | |
Total return (%) (r)(s)(t)(x) | | | (2.06 | )(n) | | | 4.85 | | | | 9.40 | | | | 12.21 | (c) | | | 13.55 | | | | 0.67 | |
| | | |
Ratios (%) (to average net assets)
and Supplemental data: | | | | | | | | | | | | | |
Expenses before expense
reductions (f) | | | 0.87 | (a) | | | 0.88 | | | | 0.89 | | | | 0.96 | (c) | | | 1.00 | | | | 1.00 | |
Expenses after expense
reductions (f) | | | 0.83 | (a) | | | 0.84 | | | | 0.83 | | | | 0.85 | (c) | | | 0.86 | | | | 0.86 | |
Net investment income
(loss) | | | 1.42 | (a) | | | 1.98 | | | | 1.45 | | | | 1.71 | (c) | | | 1.59 | | | | 1.82 | |
Portfolio turnover | | | 7 | (n) | | | 11 | | | | 11 | | | | 14 | | | | 12 | | | | 12 | |
Net assets at end of period
(000 omitted) | | | $27,161 | | | | $27,149 | | | | $25,416 | | | | $22,490 | | | | $18,625 | | | | $16,543 | |
See Notes to Financial Statements
24
Financial Highlights – continued
| | | | | | | | | | | | | | | | | | | | | | | | |
| | | Six months
ended 2/29/20 | | | Year ended | |
| Class 529B | | 8/31/19 | | | 8/31/18 | | | 8/31/17 | | | 8/31/16 | | | 8/31/15 | |
| | | (unaudited) | | | | | | | | | | | | | | | | |
Net asset value, beginning
of period | | | $40.46 | | | | $40.05 | | | | $38.23 | | | | $35.27 | | | | $32.78 | | | | $34.08 | |
| | | |
| Income (loss) from investment operations | | | | | | | | | | | | | |
Net investment income
(loss) (d) | | | $0.27 | | | | $0.63 | | | | $0.43 | | | | $0.47 | (c) | | | $0.29 | | | | $0.47 | |
Net realized and
unrealized gain (loss) | | | (1.06 | ) | | | 1.00 | | | | 3.00 | | | | 3.61 | | | | 3.73 | | | | (0.34 | ) |
Total from investment
operations | | | $(0.79 | ) | | | $1.63 | | | | $3.43 | | | | $4.08 | | | | $4.02 | | | | $0.13 | |
| | | |
| Less distributions declared to shareholders | | | | | | | | | | | | | |
From net investment
income | | | $(0.21 | ) | | | $(0.68 | ) | | | $(0.40 | ) | | | $(0.50 | ) | | | $(0.29 | ) | | | $(0.51 | ) |
From net realized gain | | | (0.55 | ) | | | (0.54 | ) | | | (1.21 | ) | | | (0.62 | ) | | | (1.24 | ) | | | (0.92 | ) |
Total distributions declared
to shareholders | | | $(0.76 | ) | | | $(1.22 | ) | | | $(1.61 | ) | | | $(1.12 | ) | | | $(1.53 | ) | | | $(1.43 | ) |
Net asset value, end of
period (x) | | | $38.91 | | | | $40.46 | | | | $40.05 | | | | $38.23 | | | | $35.27 | | | | $32.78 | |
Total return (%) (r)(s)(t)(x) | | | (2.13 | )(n) | | | 4.46 | | | | 9.05 | | | | 11.78 | (c) | | | 12.70 | | | | 0.27 | |
| | | |
Ratios (%) (to average net assets)
and Supplemental data: | | | | | | | | | | | | | |
Expenses before expense
reductions (f) | | | 0.99 | (a) | | | 1.22 | | | | 1.22 | | | | 1.34 | (c) | | | 1.68 | | | | 1.37 | |
Expenses after expense
reductions (f) | | | 0.98 | (a) | | | 1.20 | | | | 1.19 | | | | 1.26 | (c) | | | 1.58 | | | | 1.27 | |
Net investment income
(loss) | | | 1.26 | (a) | | | 1.61 | | | | 1.10 | | | | 1.28 | (c) | | | 0.87 | | | | 1.38 | |
Portfolio turnover | | | 7 | (n) | | | 11 | | | | 11 | | | | 14 | | | | 12 | | | | 12 | |
Net assets at end of period
(000 omitted) | | | $552 | | | | $680 | | | | $835 | | | | $908 | | | | $941 | | | | $888 | |
See Notes to Financial Statements
25
Financial Highlights – continued
| | | | | | | | | | | | | | | | | | | | | | | | |
| | | Six months
ended 2/29/20 | | | Year ended | |
| Class 529C | | 8/31/19 | | | 8/31/18 | | | 8/31/17 | | | 8/31/16 | | | 8/31/15 | |
| | | (unaudited) | | | | | | | | | | | | | | | | |
Net asset value, beginning
of period | | | $40.26 | | | | $39.81 | | | | $38.07 | | | | $35.11 | | | | $32.66 | | | | $34.00 | |
| | | |
| Income (loss) from investment operations | | | | | | | | | | | | | |
Net investment income
(loss) (d) | | | $0.14 | | | | $0.46 | | | | $0.26 | | | | $0.34 | (c) | | | $0.26 | | | | $0.35 | |
Net realized and
unrealized gain (loss) | | | (1.05 | ) | | | 1.01 | | | | 2.97 | | | | 3.59 | | | | 3.73 | | | | (0.36 | ) |
Total from investment
operations | | | $(0.91 | ) | | | $1.47 | | | | $3.23 | | | | $3.93 | | | | $3.99 | | | | $(0.01 | ) |
| | | |
| Less distributions declared to shareholders | | | | | | | | | | | | | |
From net investment
income | | | $(0.16 | ) | | | $(0.48 | ) | | | $(0.28 | ) | | | $(0.35 | ) | | | $(0.30 | ) | | | $(0.41 | ) |
From net realized gain | | | (0.55 | ) | | | (0.54 | ) | | | (1.21 | ) | | | (0.62 | ) | | | (1.24 | ) | | | (0.92 | ) |
Total distributions declared
to shareholders | | | $(0.71 | ) | | | $(1.02 | ) | | | $(1.49 | ) | | | $(0.97 | ) | | | $(1.54 | ) | | | $(1.33 | ) |
Net asset value, end of
period (x) | | | $38.64 | | | | $40.26 | | | | $39.81 | | | | $38.07 | | | | $35.11 | | | | $32.66 | |
Total return (%) (r)(s)(t)(x) | | | (2.43 | )(n) | | | 4.04 | | | | 8.54 | | | | 11.38 | (c) | | | 12.64 | | | | (0.14 | ) |
| | | |
Ratios (%) (to average net assets)
and Supplemental data: | | | | | | | | | | | | | |
Expenses before expense
reductions (f) | | | 1.62 | (a) | | | 1.63 | | | | 1.64 | | | | 1.71 | (c) | | | 1.75 | | | | 1.75 | |
Expenses after expense
reductions (f) | | | 1.61 | (a) | | | 1.61 | | | | 1.61 | | | | 1.63 | (c) | | | 1.65 | | | | 1.66 | |
Net investment income
(loss) | | | 0.65 | (a) | | | 1.19 | | | | 0.67 | | | | 0.93 | (c) | | | 0.80 | | | | 1.03 | |
Portfolio turnover | | | 7 | (n) | | | 11 | | | | 11 | | | | 14 | | | | 12 | | | | 12 | |
Net assets at end of period
(000 omitted) | | | $4,895 | | | | $4,947 | | | | $5,320 | | | | $5,924 | | | | $5,381 | | | | $4,434 | |
See Notes to Financial Statements
26
Financial Highlights – continued
| (c) | Amount reflects aone-time reimbursement of expenses by the custodian (or former custodian) without which net investment income and performance would be lower and expenses would be higher. |
| (d) | Per share data is based on average shares outstanding. |
| (f) | Ratios do not reflect reductions from fees paid indirectly, if applicable. |
| (r) | Certain expenses have been reduced without which performance would have been lower. |
| (s) | From time to time the fund may receive proceeds from litigation settlements, without which performance would be lower. |
| (t) | Total returns do not include any applicable sales charges. |
| (x) | The net asset values and total returns have been calculated on net assets which include adjustments made in accordance with U.S. generally accepted accounting principles required at period end for financial reporting purposes. |
See Notes to Financial Statements
27
NOTES TO FINANCIAL STATEMENTS
(unaudited)
(1) Business and Organization
MFS Value Fund (the fund) is a diversified series of MFS Series Trust I (the trust). The trust is organized as a Massachusetts business trust and is registered under the Investment Company Act of 1940, as amended, as anopen-end management investment company.
The fund is an investment company and accordingly follows the investment company accounting and reporting guidance of the Financial Accounting Standards Board (FASB) Accounting Standards Codification Topic 946 Financial Services – Investment Companies.
(2) Significant Accounting Policies
General– The preparation of financial statements in conformity with U.S. generally accepted accounting principles requires management to make estimates and assumptions that affect the reported amounts of assets and liabilities, and disclosure of contingent assets and liabilities at the date of the financial statements and the reported amounts of increases and decreases in net assets from operations during the reporting period. Actual results could differ from those estimates. In the preparation of these financial statements, management has evaluated subsequent events occurring after the date of the fund’s Statement of Assets and Liabilities through the date that the financial statements were issued.
In March 2020, the FASB issued Accounting Standards Update2020-04, Reference Rate Reform (Topic 848) – Facilitation of the Effects of Reference Rate Reform on Financial Reporting (“ASU2020-04”), which provides optional, temporary relief with respect to the financial reporting of contracts subject to certain types of modifications due to the planned discontinuation of the London Interbank Offered Rate (LIBOR) and other IBOR-based reference rates as of the end of 2021. The temporary relief provided by ASU2020-04 is effective for certain reference rate-related contract modifications that occur during the period from March 12, 2020 through December 31, 2022. Management is evaluating the impact of ASU2020-04 on the fund’s investments, derivatives, debt and other contracts that will undergo reference rate-related modifications as a result of the reference rate reform.
Balance Sheet Offsetting– The fund’s accounting policy with respect to balance sheet offsetting is that, absent an event of default by the counterparty or a termination of the agreement, the International Swaps and Derivatives Association (ISDA) Master Agreement, or similar agreement, does not result in an offset of reported amounts of financial assets and financial liabilities in the Statement of Assets and Liabilities across transactions between the fund and the applicable counterparty. The fund’s right to setoff may be restricted or prohibited by the bankruptcy or insolvency laws of the particular jurisdiction to which a specific master netting agreement counterparty is subject. Balance sheet offsetting disclosures, to the extent applicable to the fund, have been included in the fund’s Significant Accounting Policies note under the captions for each of the fund’sin-scope financial instruments and transactions.
Investment Valuations– Equity securities, including restricted equity securities, are generally valued at the last sale or official closing price on their primary market or
28
Notes to Financial Statements (unaudited) – continued
exchange as provided by a third-party pricing service. Equity securities, for which there were no sales reported that day, are generally valued at the last quoted daily bid quotation on their primary market or exchange as provided by a third-party pricing service. Short-term instruments with a maturity at issuance of 60 days or less may be valued at amortized cost, which approximates market value.Open-end investment companies are generally valued at net asset value per share. Securities and other assets generally valued on the basis of information from a third-party pricing service may also be valued at a broker/dealer bid quotation. In determining values, third-party pricing services can utilize both transaction data and market information such as yield, quality, coupon rate, maturity, type of issue, trading characteristics, and other market data. The values of foreign securities and other assets and liabilities expressed in foreign currencies are converted to U.S. dollars using the mean of bid and asked prices for rates provided by a third-party pricing service.
The Board of Trustees has delegated primary responsibility for determining or causing to be determined the value of the fund’s investments (including any fair valuation) to the adviser pursuant to valuation policies and procedures approved by the Board. If the adviser determines that reliable market quotations are not readily available, investments are valued at fair value as determined in good faith by the adviser in accordance with such procedures under the oversight of the Board of Trustees. Under the fund’s valuation policies and procedures, market quotations are not considered to be readily available for most types of debt instruments and floating rate loans and many types of derivatives. These investments are generally valued at fair value based on information from third-party pricing services. In addition, investments may be valued at fair value if the adviser determines that an investment’s value has been materially affected by events occurring after the close of the exchange or market on which the investment is principally traded (such as foreign exchange or market) and prior to the determination of the fund’s net asset value, or after the halt of trading of a specific security where trading does not resume prior to the close of the exchange or market on which the security is principally traded. Events that occur after foreign markets close (such as developments in foreign markets and significant movements in the U.S. markets) and prior to the determination of the fund’s net asset value may be deemed to have a material effect on the value of securities traded in foreign markets. Accordingly, the fund’s foreign equity securities may often be valued at fair value. The adviser generally relies on third-party pricing services or other information (such as the correlation with price movements of similar securities in the same or other markets; the type, cost and investment characteristics of the security; the business and financial condition of the issuer; and trading and other market data) to assist in determining whether to fair value and at what value to fair value an investment. The value of an investment for purposes of calculating the fund’s net asset value can differ depending on the source and method used to determine value. When fair valuation is used, the value of an investment used to determine the fund’s net asset value may differ from quoted or published prices for the same investment. There can be no assurance that the fund could obtain the fair value assigned to an investment if it were to sell the investment at the same time at which the fund determines its net asset value per share.
Various inputs are used in determining the value of the fund’s assets or liabilities. These inputs are categorized into three broad levels. In certain cases, the inputs used to
29
Notes to Financial Statements (unaudited) – continued
measure fair value may fall into different levels of the fair value hierarchy. In such cases, an investment’s level within the fair value hierarchy is based on the lowest level of input that is significant to the fair value measurement. The fund’s assessment of the significance of a particular input to the fair value measurement in its entirety requires judgment, and considers factors specific to the investment. Level 1 includes unadjusted quoted prices in active markets for identical assets or liabilities. Level 2 includes other significant observable market-based inputs (including quoted prices for similar securities, interest rates, prepayment speed, and credit risk). Level 3 includes unobservable inputs, which may include the adviser’s own assumptions in determining the fair value of investments. The following is a summary of the levels used as of February 29, 2020 in valuing the fund’s assets or liabilities:
| | | | | | | | | | | | | | | | |
| | | | |
| Financial Instruments | | Level 1 | | | Level 2 | | | Level 3 | | | Total | |
| Equity Securities: | | | | | | | | | | | | | | | | |
United States | | | $41,716,444,996 | | | | $401,975,114 | | | | $— | | | | $42,118,420,110 | |
Switzerland | | | — | | | | 1,169,932,777 | | | | — | | | | 1,169,932,777 | |
United Kingdom | | | — | | | | 872,439,478 | | | | — | | | | 872,439,478 | |
Canada | | | 659,483,569 | | | | — | | | | — | | | | 659,483,569 | |
Netherlands | | | 305,753,907 | | | | — | | | | — | | | | 305,753,907 | |
France | | | — | | | | 194,078,358 | | | | — | | | | 194,078,358 | |
| Mutual Funds | | | 539,921,579 | | | | — | | | | — | | | | 539,921,579 | |
| Total | | | $43,221,604,051 | | | | $2,638,425,727 | | | | $— | | | | $45,860,029,778 | |
For further information regarding security characteristics, see the Portfolio of Investments.
Foreign Currency Translation– Purchases and sales of foreign investments, income, and expenses are converted into U.S. dollars based upon currency exchange rates prevailing on the respective dates of such transactions or on the reporting date for foreign denominated receivables and payables. Gains and losses attributable to foreign currency exchange rates on sales of securities are recorded for financial statement purposes as net realized gains and losses on investments. Gains and losses attributable to foreign exchange rate movements on receivables, payables, income and expenses are recorded for financial statement purposes as foreign currency transaction gains and losses. That portion of both realized and unrealized gains and losses on investments that results from fluctuations in foreign currency exchange rates is not separately disclosed.
Security Loans – Under its Securities Lending Agency Agreement with the fund, State Street Bank and Trust Company, as lending agent, loans the securities of the fund to certain qualified institutions (the “Borrowers”) approved by the fund. Security loans can be terminated at the discretion of either the lending agent or the fund and the related securities must be returned within the earlier of the standard trade settlement period for such securities or within three business days. The loans are collateralized by cash and/or U.S. Treasury and federal agency obligations in an amount typically at least equal to the market value of the securities loaned. On loans collateralized by cash, the cash collateral is invested in a money market fund. The market value of the loaned securities is determined at the close of business of the fund and any additional required collateral is delivered to the fund on the next business day. The lending agent provides
30
Notes to Financial Statements (unaudited) – continued
the fund with indemnification against Borrower default. In the event of Borrower default, the lending agent will, for the benefit of the fund, either purchase securities identical to those loaned or, when such purchase is commercially impracticable, pay the fund the market value of the loaned securities. In return, the lending agent assumes the fund’s rights to the related collateral. If the collateral value is less than the cost to purchase identical securities, the lending agent is responsible for the shortfall, but only to the extent that such shortfall is not due to a decline in collateral value resulting from collateral reinvestment for which the fund bears the risk of loss. A portion of the income generated upon investment of the collateral is remitted to the Borrowers, and the remainder is allocated between the fund and the lending agent. On loans collateralized by U.S. Treasury and/or federal agency obligations, a fee is received from the Borrower, and is allocated between the fund and the lending agent. Income from securities lending is separately reported in the Statement of Operations. The dividend and interest income earned on the securities loaned is accounted for in the same manner as other dividend and interest income. At February 29, 2020, there were no securities on loan or collateral outstanding.
Indemnifications– Under the fund’s organizational documents, its officers and Trustees may be indemnified against certain liabilities and expenses arising out of the performance of their duties to the fund. Additionally, in the normal course of business, the fund enters into agreements with service providers that may contain indemnification clauses. The fund’s maximum exposure under these agreements is unknown as this would involve future claims that may be made against the fund that have not yet occurred.
Investment Transactions and Income– Investment transactions are recorded on the trade date. Dividends received in cash are recorded on theex-dividend date. Certain dividends from foreign securities will be recorded when the fund is informed of the dividend if such information is obtained subsequent to theex-dividend date. Dividend and interest payments received in additional securities are recorded on theex-dividend orex-interest date in an amount equal to the value of the security on such date.
The fund may receive proceeds from litigation settlements. Any proceeds received from litigation involving portfolio holdings are reflected in the Statement of Operations in realized gain/loss if the security has been disposed of by the fund or in unrealized gain/loss if the security is still held by the fund. Any other proceeds from litigation not related to portfolio holdings are reflected as other income in the Statement of Operations.
Tax Matters and Distributions– The fund intends to qualify as a regulated investment company, as defined under Subchapter M of the Internal Revenue Code, and to distribute all of its taxable income, including realized capital gains. As a result, no provision for federal income tax is required. The fund’s federal tax returns, when filed, will remain subject to examination by the Internal Revenue Service for a three year period. Management has analyzed the fund’s tax positions taken on federal and state tax returns for all open tax years and does not believe that there are any uncertain tax positions that require recognition of a tax liability. Foreign taxes, if any, have been accrued by the fund in the accompanying financial statements in accordance with the applicable foreign tax law. Foreign income taxes may be withheld by certain countries
31
Notes to Financial Statements (unaudited) – continued
in which the fund invests. Additionally, capital gains realized by the fund on securities issued in or by certain foreign countries may be subject to capital gains tax imposed by those countries.
Distributions to shareholders are recorded on theex-dividend date. Income and capital gain distributions are determined in accordance with income tax regulations, which may differ from U.S. generally accepted accounting principles. Certain capital accounts in the financial statements are periodically adjusted for permanent differences in order to reflect their tax character. These adjustments have no impact on net assets or net asset value per share. Temporary differences which arise from recognizing certain items of income, expense, gain or loss in different periods for financial statement and tax purposes will reverse at some time in the future.
Book/tax differences primarily relate to wash sale loss deferrals, treating a portion of the proceeds from redemptions as a distribution for tax purposes, and redemptionsin-kind.
The tax character of distributions made during the current period will be determined at fiscal year end. The tax character of distributions declared to shareholders for the last fiscal year is as follows:
| | | | |
| |
| | | Year ended
8/31/19 | |
Ordinary income (including any
short-term capital gains) | | | $1,031,454,957 | |
| Long-term capital gains | | | 598,003,972 | |
| |
| Total distributions | | | $1,629,458,929 | |
The federal tax cost and the tax basis components of distributable earnings were as follows:
| | | | |
| |
| As of 2/29/20 | | | |
| |
| Cost of investments | | | $29,320,102,748 | |
| Gross appreciation | | | 17,090,005,789 | |
| |
| Gross depreciation | | | (550,078,759 | ) |
| Net unrealized appreciation (depreciation) | | | $16,539,927,030 | |
| |
| As of 8/31/19 | | | |
| |
| Undistributed ordinary income | | | 144,928,850 | |
| Undistributed long-term capital gain | | | 636,255,955 | |
| Other temporary differences | | | (19,045 | ) |
| Net unrealized appreciation (depreciation) | | | 18,092,747,904 | |
The aggregate cost above includes prior fiscal year end tax adjustments, if applicable.
Multiple Classes of Shares of Beneficial Interest– The fund offers multiple classes of shares, which differ in their respective distribution, service, and program manager fees. The fund’s income, realized and unrealized gain (loss), and common expenses are allocated to shareholders based on the daily net assets of each class. Dividends are declared separately for each class. Differences in per share dividend rates are generally due to differences in separate class expenses. Class B and Class 529B shares will
32
Notes to Financial Statements (unaudited) – continued
convert to Class A and Class 529A shares, respectively, approximately eight years after purchase. Class C and Class 529C shares will convert to Class A and Class 529A shares, respectively, approximately ten years after purchase. The fund’s distributions declared to shareholders as reported in the Statements of Changes in Net Assets are presented by class as follows:
| | | | | | | | |
| | | Six months
ended
2/29/20 | | | Year
ended
8/31/19 | |
| Class A | | | $137,026,527 | | | | $212,127,405 | |
| Class B | | | 1,351,042 | | | | 2,506,594 | |
| Class C | | | 14,673,978 | | | | 24,795,233 | |
| Class I | | | 441,950,374 | | | | 694,992,844 | |
| Class R1 | | | 352,923 | | | | 603,582 | |
| Class R2 | | | 8,167,311 | | | | 14,982,779 | |
| Class R3 | | | 44,639,775 | | | | 70,153,680 | |
| Class R4 | | | 62,567,628 | | | | 105,158,843 | |
| Class R6 | | | 340,412,315 | | | | 503,130,979 | |
| Class 529A | | | 578,650 | | | | 852,206 | |
| Class 529B | | | 12,135 | | | | 24,362 | |
| Class 529C | | | 89,697 | | | | 130,422 | |
| Total | | | $1,051,822,355 | | | | $1,629,458,929 | |
(3) Transactions with Affiliates
Investment Adviser– The fund has an investment advisory agreement with MFS to provide overall investment management and related administrative services and facilities to the fund. The management fee is computed daily and paid monthly at the following annual rates based on the fund’s average daily net assets:
| | | | |
| Up to $7.5 billion | | | 0.60 | % |
| In excess of $7.5 billion and up to $10 billion | | | 0.53 | % |
| In excess of $10 billion and up to $20 billion | | | 0.50 | % |
| In excess of $20 billion and up to $25 billion | | | 0.45 | % |
| In excess of $25 billion and up to $30 billion | | | 0.42 | % |
| In excess of $30 billion and up to $35 billion | | | 0.40 | % |
| In excess of $35 billion and up to $40 billion | | | 0.38 | % |
| In excess of $40 billion and up to $45 billion | | | 0.36 | % |
| In excess of $45 billion and up to $50 billion | | | 0.35 | % |
| In excess of $50 billion and up to $60 billion | | | 0.34 | % |
| In excess of $60 billion | | | 0.33 | % |
MFS has agreed in writing to reduce its management fee by a specified amount if certain MFS mutual fund assets exceed thresholds agreed to by MFS and the fund’s Board of Trustees. For the six months ended February 29, 2020, this management fee reduction amounted to $2,540,281, which is included in the reduction of total expenses in the Statement of Operations. The management fee incurred for the six months ended February 29, 2020 was equivalent to an annual effective rate of 0.44% of the fund’s average daily net assets.
33
Notes to Financial Statements (unaudited) – continued
Distributor– MFS Fund Distributors, Inc. (MFD), a wholly-owned subsidiary of MFS, as distributor, received $691,314 and $7,617 for the six months ended February 29, 2020, as its portion of the initial sales charge on sales of Class A and Class 529A shares of the fund, respectively.
The Board of Trustees has adopted a distribution plan for certain share classes pursuant to Rule12b-1 of the Investment Company Act of 1940.
The fund’s distribution plan provides that the fund will pay MFD for services provided by MFD and financial intermediaries in connection with the distribution and servicing of certain share classes. One component of the plan is a distribution fee paid to MFD and another component of the plan is a service fee paid to MFD. MFD may subsequently pay all, or a portion, of the distribution and/or service fees to financial intermediaries.
Distribution Plan Fee Table:
| | | | | | | | | | | | | | | | | | | | |
| | | | | |
| | | Distribution
Fee Rate (d) | | | Service
Fee Rate (d) | | | Total
Distribution
Plan (d) | | | Annual
Effective
Rate (e) | | | Distribution
and Service
Fee | |
| Class A | | | — | | | | 0.25% | | | | 0.25% | | | | 0.25% | | | | $8,565,641 | |
| Class B | | | 0.75% | | | | 0.25% | | | | 1.00% | | | | 1.00% | | | | 414,894 | |
| Class C | | | 0.75% | | | | 0.25% | | | | 1.00% | | | | 1.00% | | | | 4,441,947 | |
| Class R1 | | | 0.75% | | | | 0.25% | | | | 1.00% | | | | 1.00% | | | | 106,723 | |
| Class R2 | | | 0.25% | | | | 0.25% | | | | 0.50% | | | | 0.50% | | | | 1,075,962 | |
| Class R3 | | | — | | | | 0.25% | | | | 0.25% | | | | 0.25% | | | | 2,753,730 | |
| Class 529A | | | — | | | | 0.25% | | | | 0.25% | | | | 0.22% | | | | 36,116 | |
| Class 529B | | | 0.75% | | | | 0.25% | | | | 1.00% | | | | 0.37% | | | | 1,271 | |
| Class 529C | | | 0.75% | | | | 0.25% | | | | 1.00% | | | | 1.00% | | | | 26,539 | |
| Total Distribution and Service Fees | | | | | | | | $17,422,823 | |
| (d) | In accordance with the distribution plan for certain classes, the fund pays distribution and/or service fees equal to these annual percentage rates of each class’s average daily net assets. The distribution and service fee rates disclosed by class represent the current rates in effect at the end of the reporting period. Any rate changes, if applicable, are detailed below. |
| (e) | The annual effective rates represent actual fees incurred under the distribution plan for the six months ended February 29, 2020 based on each class’s average daily net assets. MFD has voluntarily agreed to rebate a portion of each class’s 0.25% service fee attributable to accounts for which MFD retains the 0.25% service fee except for accounts attributable to MFS or its affiliates’ seed money. For the six months ended February 29, 2020, this rebate amounted to $39,040, $591, $978, $22, $324, $153, $4,013, $12, and $22 for Class A, Class B, Class C, Class R1, Class R2, Class R3, Class 529A, Class 529B, and Class 529C, respectively, and is included in the reduction of total expenses in the Statement of Operations. For the period from October 1, 2019 through February 29, 2020, the 0.75% distribution fee was not imposed for Class 529B shares due to the sales charge limitations contained in Financial Industry Regulatory Authority (“FINRA”) Rule 2341. |
Certain Class A shares are subject to a contingent deferred sales charge (CDSC) in the event of a shareholder redemption within 18 months of purchase. Class B and Class 529B shares are subject to a CDSC in the event of a shareholder redemption within six years of purchase. Class C and Class 529C shares are subject to a CDSC in
34
Notes to Financial Statements (unaudited) – continued
the event of a shareholder redemption within 12 months of purchase. All contingent deferred sales charges are paid to MFD and during the six months ended February 29, 2020, were as follows:
| | | | |
| |
| | | Amount | |
| Class A | | | $24,151 | |
| Class B | | | 24,132 | |
| Class C | | | 16,046 | |
| Class 529B | | | 8 | |
| Class 529C | | | 62 | |
The fund has entered into and may from time to time enter into contracts with program managers and other parties which administer the tuition programs through which an investment in the fund’s 529 share classes is made. The fund has entered into an agreement with MFD pursuant to which MFD receives an annual fee of up to 0.05% of the average daily net assets attributable to each 529 share class. The services provided by MFD, or a third party with which MFD contracts, include recordkeeping and tax reporting and account services, as well as services designed to maintain the program’s compliance with the Internal Revenue Code and other regulatory requirements. Program manager fees for the six months ended February 29, 2020, were as follows:
| | | | |
| |
| | | Fee | |
| Class 529A | | | $7,223 | |
| Class 529B | | | 169 | |
| Class 529C | | | 1,327 | |
| Total Program Manager Fees | | | $8,719 | |
Shareholder Servicing Agent– MFS Service Center, Inc. (MFSC), a wholly-owned subsidiary of MFS, receives a fee from the fund for its services as shareholder servicing agent calculated as a percentage of the average daily net assets of the fund as determined periodically under the supervision of the fund’s Board of Trustees. For the six months ended February 29, 2020, the fee was $371,673, which equated to 0.0015% annually of the fund’s average daily net assets. MFSC also receives payment from the fund forout-of-pocket expenses,sub-accounting and other shareholder servicing costs which may be paid to affiliated and unaffiliated service providers. Class R6 shares do not incursub-accounting fees. For the six months ended February 29, 2020, theseout-of-pocket expenses,sub-accounting and other shareholder servicing costs amounted to $17,911,542.
Administrator– MFS provides certain financial, legal, shareholder communications, compliance, and other administrative services to the fund. Under an administrative services agreement, the fund reimburses MFS the costs incurred to provide these services. The fund is charged an annual fixed amount of $17,500 plus a fee based on average daily net assets. The administrative services fee incurred for the six months ended February 29, 2020 was equivalent to an annual effective rate of 0.0011% of the fund’s average daily net assets.
Trustees’ and Officers’ Compensation– The fund pays compensation to independent Trustees in the form of a retainer, attendance fees, and additional compensation to Board and Committee chairpersons. The fund does not pay
35
Notes to Financial Statements (unaudited) – continued
compensation directly to Trustees or officers of the fund who are also officers of the investment adviser, all of whom receive remuneration from MFS for their services to the fund. Certain officers and Trustees of the fund are officers or directors of MFS, MFD, and MFSC.
Other –The fund invests in the MFS Institutional Money Market Portfolio which is managed by MFS and seeks current income consistent with preservation of capital and liquidity. This money market fund does not pay a management fee to MFS but does incur investment and operating costs.
The fund is permitted to engage in purchase and sale transactions with funds and accounts for which MFS serves as investment adviser orsub-adviser (“cross-trades”) pursuant to a policy adopted by the Board of Trustees. This policy has been designed to ensure that cross-trades conducted by the fund comply with Rule17a-7 under the Investment Company Act of 1940. During the six months ended February 29, 2020, the fund engaged in sale transactions pursuant to this policy, which amounted to $19,211,977. The sales transactions resulted in net realized gains of $8,531,011.
The adviser has voluntarily undertaken to reimburse the fund from its own resources on a quarterly basis for the cost of investment research embedded in the cost of the fund’s securities trades. This agreement may be rescinded at any time. For the six months ended February 29, 2020, this reimbursement amounted to $290,009, which is included in “Other” income in the Statement of Operations.
(4) Portfolio Securities
For the six months ended February 29, 2020, purchases and sales of investments, other than short-term obligations, aggregated $3,206,010,306 and $3,754,155,530, respectively.
(5) Shares of Beneficial Interest
The fund’s Declaration of Trust permits the Trustees to issue an unlimited number of full and fractional shares of beneficial interest. Transactions in fund shares were as follows:
| | | | | | | | | | | | | | | | |
| | | Six months ended
2/29/20 | | | Year ended
8/31/19 | |
| | | | |
| | | Shares | | | Amount | | | Shares | | | Amount | |
| Shares sold | | | | | | | | | | | | | | | | |
Class A | | | 13,849,647 | | | | $599,938,409 | | | | 24,411,847 | | | | $961,411,776 | |
Class B | | | 9,113 | | | | 397,684 | | | | 109,994 | | | | 4,271,448 | |
Class C | | | 1,581,397 | | | | 67,723,419 | | | | 2,602,286 | | | | 100,772,015 | |
Class I | | | 53,544,160 | | | | 2,339,006,761 | | | | 101,624,206 | | | | 4,014,273,147 | |
Class R1 | | | 37,195 | | | | 1,588,182 | | | | 105,084 | | | | 4,054,356 | |
Class R2 | | | 541,333 | | | | 23,261,470 | | | | 1,393,443 | | | | 54,090,884 | |
Class R3 | | | 5,645,577 | | | | 242,787,118 | | | | 8,683,642 | | | | 336,653,144 | |
Class R4 | | | 5,467,308 | | | | 238,743,014 | | | | 10,512,327 | | | | 416,155,664 | |
Class R6 | | | 40,348,553 | | | | 1,756,904,319 | | | | 74,625,324 | | | | 2,951,676,391 | |
Class 529A | | | 51,172 | | | | 2,209,861 | | | | 100,457 | | | | 3,921,061 | |
Class 529B | | | 477 | | | | 20,562 | | | | 954 | | | | 37,532 | |
Class 529C | | | 13,299 | | | | 561,214 | | | | 20,871 | | | | 805,355 | |
| | | 121,089,231 | | | | $5,273,142,013 | | | | 224,190,435 | | | | $8,848,122,773 | |
36
Notes to Financial Statements (unaudited) – continued
| | | | | | | | | | | | | | | | |
| | | Six months ended
2/29/20 | | | Year ended
8/31/19 | |
| | | | |
| | | Shares | | | Amount | | | Shares | | | Amount | |
Shares issued to shareholders in
reinvestment of distributions | |
Class A | | | 2,561,681 | | | | $111,977,228 | | | | 4,662,710 | | | | $173,102,129 | |
Class B | | | 29,007 | | | | 1,267,596 | | | | 64,869 | | | | 2,361,216 | |
Class C | | | 252,196 | | | | 10,936,662 | | | | 522,160 | | | | 18,897,156 | |
Class I | | | 8,060,188 | | | | 353,953,947 | | | | 14,708,512 | | | | 550,689,358 | |
Class R1 | | | 8,209 | | | | 352,923 | | | | 16,758 | | | | 603,573 | |
Class R2 | | | 183,798 | | | | 7,956,327 | | | | 389,696 | | | | 14,250,967 | |
Class R3 | | | 1,025,207 | | | | 44,637,165 | | | | 1,897,634 | | | | 70,152,285 | |
Class R4 | | | 1,398,967 | | | | 61,059,046 | | | | 2,733,062 | | | | 101,624,334 | |
Class R6 | | | 7,117,548 | | | | 310,627,037 | | | | 12,268,131 | | | | 457,296,101 | |
Class 529A | | | 13,351 | | | | 578,650 | | | | 23,109 | | | | 851,636 | |
Class 529B | | | 282 | | | | 12,135 | | | | 675 | | | | 24,362 | |
Class 529C | | | 2,096 | | | | 89,697 | | | | 3,642 | | | | 130,422 | |
| | | 20,652,530 | | | | $903,448,413 | | | | 37,290,958 | | | | $1,389,983,539 | |
| | | | |
| Shares reacquired | | | | | | | | | | | | | | | | |
Class A | | | (14,933,487 | ) | | | $(647,470,846 | ) | | | (36,282,831 | ) | | | $(1,436,501,478 | ) |
Class B | | | (354,393 | ) | | | (15,371,408 | ) | | | (859,557 | ) | | | (33,877,544 | ) |
Class C | | | (3,242,535 | ) | | | (138,505,186 | ) | | | (7,585,556 | ) | | | (295,149,445 | ) |
Class I | | | (56,381,853 | ) | | | (2,454,402,274 | ) | | | (138,135,941 | ) | | | (5,477,840,045 | ) |
Class R1 | | | (106,729 | ) | | | (4,512,436 | ) | | | (202,277 | ) | | | (7,851,973 | ) |
Class R2 | | | (2,002,061 | ) | | | (85,677,642 | ) | | | (4,707,159 | ) | | | (184,847,134 | ) |
Class R3 | | | (7,534,070 | ) | | | (326,041,558 | ) | | | (15,196,245 | ) | | | (597,739,263 | ) |
Class R4 | | | (16,385,031 | ) | | | (720,343,700 | ) | | | (21,071,772 | ) | | | (822,107,531 | ) |
Class R6 | | | (37,116,439 | ) | | | (1,615,461,718 | ) | | | (72,236,188 | ) | | | (2,862,769,021 | ) |
Class 529A | | | (36,819 | ) | | | (1,593,651 | ) | | | (88,534 | ) | | | (3,526,656 | ) |
Class 529B | | | (3,368 | ) | | | (145,306 | ) | | | (5,685 | ) | | | (222,222 | ) |
Class 529C | | | (11,606 | ) | | | (495,075 | ) | | | (35,246 | ) | | | (1,343,529 | ) |
| | | (138,108,391 | ) | | | $(6,010,020,800 | ) | | | (296,406,991 | ) | | | $(11,723,775,841 | ) |
| | | | |
| Net change | | | | | | | | | | | | | | | | |
Class A | | | 1,477,841 | | | | $64,444,791 | | | | (7,208,274 | ) | | | $(301,987,573 | ) |
Class B | | | (316,273 | ) | | | (13,706,128 | ) | | | (684,694 | ) | | | (27,244,880 | ) |
Class C | | | (1,408,942 | ) | | | (59,845,105 | ) | | | (4,461,110 | ) | | | (175,480,274 | ) |
Class I | | | 5,222,495 | | | | 238,558,434 | | | | (21,803,223 | ) | | | (912,877,540 | ) |
Class R1 | | | (61,325 | ) | | | (2,571,331 | ) | | | (80,435 | ) | | | (3,194,044 | ) |
Class R2 | | | (1,276,930 | ) | | | (54,459,845 | ) | | | (2,924,020 | ) | | | (116,505,283 | ) |
Class R3 | | | (863,286 | ) | | | (38,617,275 | ) | | | (4,614,969 | ) | | | (190,933,834 | ) |
Class R4 | | | (9,518,756 | ) | | | (420,541,640 | ) | | | (7,826,383 | ) | | | (304,327,533 | ) |
Class R6 | | | 10,349,662 | | | | 452,069,638 | | | | 14,657,267 | | | | 546,203,471 | |
Class 529A | | | 27,704 | | | | 1,194,860 | | | | 35,032 | | | | 1,246,041 | |
Class 529B | | | (2,609 | ) | | | (112,609 | ) | | | (4,056 | ) | | | (160,328 | ) |
Class 529C | | | 3,789 | | | | 155,836 | | | | (10,733 | ) | | | (407,752 | ) |
| | | 3,633,370 | | | | $166,569,626 | | | | (34,925,598 | ) | | | $(1,485,669,529 | ) |
37
Notes to Financial Statements (unaudited) – continued
Class T shares were not publicly available for sale during the period. Please see the fund’s prospectus for details.
Effective June 1, 2019, purchases of the fund’s Class B and Class 529B shares are closed to new and existing investors subject to certain exceptions. Please see the fund’s prospectus for details.
The fund is one of several mutual funds in which certain MFS funds may invest. The MFS funds do not invest in the underlying funds for the purpose of exercising management or control. At the end of the period, the MFS Growth Allocation Fund was the owner of record of approximately 1% of the value of outstanding voting shares of the fund. In addition, the MFS Aggressive Growth Allocation Fund, the MFS Conservative Allocation Fund, the MFS Lifetime 2020 Fund, the MFS Lifetime 2025 Fund, the MFS Lifetime 2030 Fund, the MFS Lifetime 2035 Fund, the MFS Lifetime 2040 Fund, the MFS Lifetime 2045 Fund, the MFS Lifetime 2050 Fund, the MFS Lifetime 2055 Fund, the MFS Lifetime 2060 Fund, the MFS Lifetime Income Fund, the MFS Managed Wealth Fund, and the MFS Moderate Allocation Fund were each the owners of record of less than 1% of the value of outstanding voting shares of the fund.
(6) Line of Credit
The fund and certain other funds managed by MFS participate in a $1.25 billion unsecured committed line of credit, subject to a $1 billion sublimit, provided by a syndicate of banks under a credit agreement. Borrowings may be made for temporary financing needs. Interest is charged to each fund, based on its borrowings, generally at a rate equal to the highest of one month LIBOR, the Federal Funds Effective Rate and the Overnight Bank Funding Rate, plus an agreed upon spread. A commitment fee, based on the average daily, unused portion of the committed line of credit, is allocated among the participating funds. In addition, the fund and other funds managed by MFS have established unsecured uncommitted borrowing arrangements with certain banks for temporary financing needs. Interest is charged to each fund, based on its borrowings, at rates equal to customary reference rates plus an agreed upon spread. For the six months ended February 29, 2020, the fund’s commitment fee and interest expense were $128,393 and $0, respectively, and are included in “Miscellaneous” expense in the Statement of Operations.
(7) Investments in Affiliated Issuers
An affiliated issuer may be considered one in which the fund owns 5% or more of the outstanding voting securities, or a company which is under common control. For the purposes of this report, the following were affiliated issuers:
| | | | | | | | | | | | | | | | | | | | | | | | |
| | | | | | |
| Affiliated Issuers | | Beginning
Value | | | Purchases | | | Sales
Proceeds | | | Realized
Gain (Loss) | | | Change in
Unrealized
Appreciation or
Depreciation | | | Ending
Value | |
| MFS Institutional Money Market Portfolio | | | $453,132,119 | | | | $2,102,705,818 | | | | $2,015,865,474 | | | | $(46,442 | ) | | | $(4,442 | ) | | | $539,921,579 | |
| | | | | | |
| Affiliated Issuers | | | | | | | | | | | | | | Dividend
Income | | | Capital Gain
Distributions | |
| MFS Institutional Money Market Portfolio | | | | | | | | $4,334,245 | | | | $— | |
38
Notes to Financial Statements (unaudited) – continued
(8) RedemptionsIn-Kind
On November 16, 2018, the fund recorded a redemptionin-kind of portfolio securities and cash that was valued at $96,466,346. The redeeming shareholder generally receives a pro rata share of the securities held by the fund. The distribution of such securities generated a realized gain of $51,529,296 for the fund, which is included in Net realized gain (loss) in the Statement of Operations. For tax purposes, no gains or losses were recognized.
(9) Impacts of COVID-19
The pandemic related to the global spread of novel coronavirus disease (COVID-19), which was first detected in December 2019, has resulted in significant disruptions to global business activity and the global economy, as well as the economies of individual countries, the financial performance of individual companies and sectors, and the securities and commodities markets in general. This pandemic, the full effects of which are still unknown, has resulted in substantial market volatility and may have adversely impacted the prices and liquidity of the fund’s investments and the fund’s performance during the period February 29, 2020 through April 16, 2020, the date that these financial statements were issued.
39
PROXY VOTING POLICIES AND INFORMATION
MFS votes proxies on behalf of the fund pursuant to proxy voting policies and procedures that are available without charge, upon request, by calling1-800-225-2606, by visitingmfs.com/proxyvoting, or by visiting the SEC’s Web site athttp://www.sec.gov.
Information regarding how the fund voted proxies relating to portfolio securities during the most recent twelve-month period ended June 30 is available by August 31 of each year without charge by visitingmfs.com/proxyvoting, or by visiting the SEC’s Web site athttp://www.sec.gov.
QUARTERLY PORTFOLIO DISCLOSURE
The fund files a complete schedule of portfolio holdings with the SEC for the first and third quarters of each fiscal year as an exhibit to its reports onForm N-PORT. The fund’s Form N-PORT reports are available on the SEC’s website athttp://www.sec.gov.A shareholder can obtain the portfolio holdings report for the first and third quarters of the fund’s fiscal year atmfs.com/openendfunds by choosing the fund’s name and then selecting the “Resources” tab and clicking on “Prospectus and Reports”.
FURTHER INFORMATION
From time to time, MFS may post important information about the fund or the MFS funds on the MFS web site (mfs.com). This information is available athttps://www.mfs.com/en-us/what-we-do/announcements.html or atmfs.com/openendfunds by choosing the fund’s name.
INFORMATION ABOUT FUND CONTRACTS AND LEGAL CLAIMS
The fund has entered into contractual arrangements with an investment adviser, administrator, distributor, shareholder servicing agent, 529 program manager (if applicable), and custodian who each provide services to the fund. Unless expressly stated otherwise, shareholders are not parties to, or intended beneficiaries of these contractual arrangements, and these contractual arrangements are not intended to create any shareholder right to enforce them against the service providers or to seek any remedy under them against the service providers, either directly or on behalf of the fund.
Under the Trust’s By-Laws and Declaration of Trust, any claims asserted against or on behalf of the MFS Funds, including claims against Trustees and Officers, must be brought in state and federal courts located within the Commonwealth of Massachusetts.
PROVISION OF FINANCIAL REPORTS AND SUMMARY PROSPECTUSES
The fund produces financial reports every six months and updates its summary prospectus and prospectus annually. To avoid sending duplicate copies of materials to households, only one copy of the fund’s annual and semiannual report and summary prospectus may be mailed to shareholders having the same last name and residential address on the fund’s records. However, any shareholder may contact MFSC (please see back cover for address and telephone number) to request that copies of these reports and summary prospectuses be sent personally to that shareholder.
40
Save paper with eDelivery.

| MFS® will send you prospectuses, |
reports, and proxies directly viae-mail so you will get information faster with less mailbox clutter.
To sign up:
1. Go to mfs.com.
2. Log in via MFS® Access.
3. Select eDelivery.
If you own your MFS fund shares through a financial institution or a retirement plan, MFS® TALK, MFS® Access, or eDelivery may not be available to you.
CONTACT
WEB SITE
mfs.com
MFS TALK
1-800-637-8255
24 hours a day
ACCOUNT SERVICE AND LITERATURE
Shareholders
1-800-225-2606
Financial advisors
1-800-343-2829
Retirement plan services
1-800-637-1255
MAILING ADDRESS
MFS Service Center, Inc.
P.O. Box 219341
Kansas City, MO 64121-9341
OVERNIGHT MAIL
MFS Service Center, Inc.
Suite 219341
430 W 7th Street
Kansas City, MO 64105-1407
During the period covered by this report, the Registrant has not amended any provision in its Code of Ethics (the “Code”) that relates to an element of the Code’s definitions enumerated in paragraph (b) of Item 2 of this FormN-CSR. During the period covered by this report, the Registrant did not grant a waiver, including an implicit waiver, from any provision of the Code.
| ITEM 3. | AUDIT COMMITTEE FINANCIAL EXPERT. |
Not applicable for semi-annual reports.
| ITEM 4. | PRINCIPAL ACCOUNTANT FEES AND SERVICES. |
Not applicable for semi-annual reports.
| ITEM 5. | AUDIT COMMITTEE OF LISTED REGISTRANTS. |
Not applicable to the Registrant.
A schedule of investments for each series of the Registrant is included as part of the report to shareholders of such series under Item 1 of this FormN-CSR.
| ITEM 7. | DISCLOSURE OF PROXY VOTING POLICIES AND PROCEDURES FORCLOSED-END MANAGEMENT INVESTMENT COMPANIES. |
Not applicable to the Registrant.
| ITEM 8. | PORTFOLIO MANAGERS OFCLOSED-END MANAGEMENT INVESTMENT COMPANIES. |
Not applicable to the Registrant.
| ITEM 9. | PURCHASES OF EQUITY SECURITIES BYCLOSED-END MANAGEMENT INVESTMENT COMPANY AND AFFILIATED PURCHASERS. |
Not applicable to the Registrant.
| ITEM 10. | SUBMISSION OF MATTERS TO A VOTE OF SECURITY HOLDERS. |
There were no material changes to the procedures by which shareholders may send recommendations to the Board for nominees to the Registrant’s Board since the Registrant last provided disclosure as to such procedures in response to the requirements of Item 407 (c)(2)(iv) of RegulationS-K or this Item.
| ITEM 11. | CONTROLS AND PROCEDURES. |
| (a) | Based upon their evaluation of the effectiveness of the registrant’s disclosure controls and procedures (as defined in Rule30a-3(c) under the Investment Company Act of 1940 (the “Act”)) as conducted within 90 days of the filing date of this report on FormN-CSR, the registrant’s principal financial officer and principal executive officer have concluded that those disclosure controls and procedures provide reasonable assurance that the material information required to be disclosed by the registrant on this report is recorded, processed, summarized and reported within the time periods specified in the Securities and Exchange Commission’s rules and forms. |
| (b) | There were no changes in the registrant’s internal controls over financial reporting (as defined in Rule30a-3(d) under the Act) that occurred during the period covered by the report that have materially affected, or are reasonably likely to materially affect, the registrant’s internal control over financial reporting. |
| ITEM 12. | DISCLOSURE OF SECURITIES LENDING ACTIVITIES FORCLOSED-END MANAGEMENT INVESTMENT COMPANIES. |
Not applicable to the Registrant.
| (a) | File the exhibits listed below as part of this form. Letter or number the exhibits in the sequence indicated. |
| | (1) | Any code of ethics, or amendment thereto, that is the subject of the disclosure required by Item 2, to the extent that the registrant intends to satisfy the Item 2 requirements through filing of an exhibit. Not applicable. |
| | (2) | A separate certification for each principal executive officer and principal financial officer of the registrant as required by Rule30a-2(a) under the Act (17 CFR270.30a-2): Attached hereto asEX-99.302CERT. |
| | (3) | Any written solicitation to purchase securities under Rule23c-1 under the Act (17 CFR270.23c-1) sent or given during the period covered by the report by or on behalf of the registrant to 10 or more persons. Not applicable. |
| | (4) | Change in the registrant’s independent public accountant. Not applicable. |
| (b) | If the report is filed under Section 13(a) or 15(d) of the Exchange Act, provide the certifications required by Rule30a-2(b) under the Act (17 CFR270.30a-2(b)), Rule13a-14(b) or Rule15d-14(b) under the Exchange Act (17 CFR240.13a-14(b) or240.15d-14(b)) and Section 1350 of Chapter 63 of Title 18 of the United States Code (18 U.S.C. 1350) as an exhibit. A certification furnished pursuant to this paragraph will not be deemed “filed” for the purposes of Section 18 of the Exchange Act (15 U.S.C. 78r), |
| | or otherwise subject to the liability of that section. Such certification will not be deemed to be incorporated by reference into any filing under the Securities Act of 1933 or the Exchange Act, except to the extent that the registrant specifically incorporates it by reference: Attached hereto asEX-99.906CERT. |
Notice
A copy of the Amended and Restated Declaration of Trust, as amended, of the Registrant is on file with the Secretary of State of The Commonwealth of Massachusetts and notice is hereby given that this instrument is executed on behalf of the Registrant by an officer of the Registrant as an officer and not individually and the obligations of or arising out of this instrument are not binding upon any of the Trustees or shareholders individually, but are binding only upon the assets and property of the respective constituent series of the Registrant.
SIGNATURES
Pursuant to the requirements of the Securities Exchange Act of 1934 and the Investment Company Act of 1940, the registrant has duly caused this report to be signed on its behalf by the undersigned, thereunto duly authorized.
(Registrant) MFS SERIES TRUST I
| | |
| By (Signature and Title)* | | DAVID L. DILORENZO |
| | David L. DiLorenzo, President |
Date: April 16, 2020
Pursuant to the requirements of the Securities Exchange Act of 1934 and the Investment Company Act of 1940, this report has been signed below by the following persons on behalf of the registrant and in the capacities and on the dates indicated.
| | |
| By (Signature and Title)* | | DAVID L. DILORENZO |
| | David L. DiLorenzo, President (Principal Executive Officer) |
Date: April 16, 2020
| | |
| By (Signature and Title)* | | JAMES O. YOST |
| | James O. Yost, Treasurer (Principal Financial Officer and Accounting Officer) |
Date: April 16, 2020
| * | Print name and title of each signing officer under his or her signature. |