UNITED STATES
SECURITIES AND EXCHANGE COMMISSION
Washington, D.C. 20549
FORMN-CSR
CERTIFIED SHAREHOLDER REPORT OF
REGISTERED MANAGEMENT INVESTMENT COMPANIES
Investment Company Act file number811-04777
MFS SERIES TRUST I
(Exact name of registrant as specified in charter)
111 Huntington Avenue, Boston, Massachusetts 02199
(Address of principal executive offices) (Zip code)
Christopher R. Bohane
Massachusetts Financial Services Company
111 Huntington Avenue
Boston, Massachusetts 02199
(Name and address of agents for service)
Registrant’s telephone number, including area code: (617)954-5000
Date of fiscal year end: August 31
Date of reporting period: February 28, 2019
| ITEM 1. | REPORTS TO STOCKHOLDERS. |
Semiannual Report
February 28, 2019

MFS® Core Equity Fund

Beginning on January 1, 2021, as permitted by regulations adopted by the U.S. Securities and Exchange Commission, paper copies of the fund’s annual and semiannual shareholder reports will no longer be sent by mail, unless you specifically request paper copies of the reports. Instead, the complete reports will be made available on the fund’s Web site (funds.mfs.com), and you will be notified by mail each time a report is posted and provided with a Web site link to access the report.
If you are already signed up to receive shareholder reports by email, you will not be affected by this change and you need not take any action. You may sign up to receive shareholder reports and other communications from the fund by email by contacting your financial intermediary (such as a broker-dealer or bank) or, if you hold your shares directly with the fund, by calling 1-800-225-2606 or by logging on to MFS Access at mfs.com.
Beginning on January 1, 2019, you may elect to receive all future reports in paper free of charge. Contact your financial intermediary to request that you continue to receive paper copies of your shareholder reports. If you invest directly with the fund, you can call 1-800-225-2606 or send an email request to orderliterature@mfs.com to let the fund know that you wish to continue receiving paper copies of your shareholder reports. Your election to receive reports in paper will apply to all funds held in your account if you invest through your financial intermediary or all funds held with the MFS fund complex if you invest directly.
RGI-SEM
MFS® Core Equity Fund
CONTENTS
The report is prepared for the general information of shareholders.
It is authorized for distribution to prospective investors only when preceded or accompanied by a current prospectus.
NOT FDIC INSURED• MAY LOSE VALUE• NO BANK GUARANTEE

LETTER FROM THE EXECUTIVE CHAIRMAN
Dear Shareholders:
Markets experienced a bout of volatility in late 2018 as a result of higher interest rates, international trade friction and geopolitical uncertainty surrounding issues such as
Brexit. But concern over those issues dissipated in the early months of 2019 due to a more dovish posture by the U.S. Federal Reserve, progress toward a trade pact between the United States and China, and a consensus forming in the British Parliament against ano-deal Brexit. Over the past year, U.S. equities have outperformed their global peers due in part to fiscal stimulus undertaken in late 2017 and early 2019, which helped maintain healthy levels of U.S. economic output against a backdrop of slowing global growth, though returns, on average, have been modest.
Globally, inflation remains largely subdued thanks in part to stable
oil prices, though tight labor markets are keeping investors on the lookout for its potential reappearance. Rising incomes in many developed and emerging markets are supportive of gains in consumption, though a challenging backdrop for global trade has weighed on manufacturing in most regions. Should the U.S. and China reach a comprehensive trade agreement, sentiment could improve later this year.
As a global investment manager with nearly a century of expertise, MFS® firmly believes active risk management offers downside mitigation and may help improve investment outcomes. We built our active investment platform with this belief in mind. Our long-term perspective influences nearly every aspect of our business, ensuring that our investment decisions align with the investing time horizons of our clients.
Respectfully,

Robert J. Manning
Executive Chairman
MFS Investment Management
April 16, 2019
The opinions expressed in this letter are subject to change and may not be relied upon for investment advice. No forecasts can be guaranteed.
1
PORTFOLIO COMPOSITION
Portfolio structure

| | | | |
| Top ten holdings | | | | |
| Apple, Inc. | | | 3.7% | |
| Amazon.com, Inc. | | | 2.9% | |
| Alphabet, Inc., “A” | | | 2.9% | |
| Microsoft Corp. | | | 2.5% | |
| American Tower Corp., REIT | | | 2.1% | |
| Aon PLC | | | 2.0% | |
| Chevron Corp. | | | 2.0% | |
| Pfizer, Inc. | | | 1.8% | |
| Mastercard, Inc., “A” | | | 1.8% | |
| Salesforce.com, Inc. | | | 1.7% | |
| | | | |
| Global equity sectors (k) | | | | |
| Technology | | | 24.7% | |
| Financial Services | | | 18.2% | |
| Capital Goods | | | 13.6% | |
| Health Care (s) | | | 13.6% | |
| Consumer Cyclicals | | | 12.1% | |
| Energy | | | 8.0% | |
| Consumer Staples | | | 5.1% | |
| Telecommunications/Cable Television (s) | | | 3.4% | |
| (k) | The sectors set forth above and the associated portfolio composition are based on MFS’ own custom sector classification methodology. |
| (s) | Includes securities sold short. |
Cash & Cash Equivalents includes any cash, investments in money market funds, short-term securities, and other assets less liabilities. Please see the Statement of Assets and Liabilities for additional information related to the fund’s cash position and other assets and liabilities.
Percentages are based on net assets as of February 28, 2019.
The portfolio is actively managed and current holdings may be different.
2
EXPENSE TABLE
Fund expenses borne by the shareholders during the period, September 1, 2018 through February 28, 2019
As a shareholder of the fund, you incur two types of costs: (1) transaction costs, including sales charges (loads) on certain purchase or redemption payments, and (2) ongoing costs, including management fees; distribution and service(12b-1) fees; and other fund expenses. This example is intended to help you understand your ongoing costs (in dollars) of investing in the fund and to compare these costs with the ongoing costs of investing in other mutual funds.
The example is based on an investment of $1,000 invested at the beginning of the period and held for the entire period September 1, 2018 through February 28, 2019.
Actual Expenses
The first line for each share class in the following table provides information about actual account values and actual expenses. You may use the information in this line, together with the amount you invested, to estimate the expenses that you paid over the period. Simply divide your account value by $1,000 (for example, an $8,600 account value divided by $1,000 = 8.6), then multiply the result by the number in the first line under the heading entitled “Expenses Paid During Period” to estimate the expenses you paid on your account during this period.
Hypothetical Example for Comparison Purposes
The second line for each share class in the following table provides information about hypothetical account values and hypothetical expenses based on the fund’s actual expense ratio and an assumed rate of return of 5% per year before expenses, which is not the fund’s actual return. The hypothetical account values and expenses may not be used to estimate the actual ending account balance or expenses you paid for the period. You may use this information to compare the ongoing costs of investing in the fund and other funds. To do so, compare this 5% hypothetical example with the 5% hypothetical examples that appear in the shareholder reports of the other funds.
Please note that the expenses shown in the table are meant to highlight your ongoing costs only and do not reflect any transactional costs, such as sales charges (loads). Therefore, the second line for each share class in the table is useful in comparing ongoing costs only, and will not help you determine the relative total costs of owning different funds. In addition, if these transactional costs were included, your costs would have been higher.
3
Expense Table – continued
| | | | | | | | | | | | | | | | | | |
Share
Class | | | | Annualized
Expense
Ratio | | | Beginning
Account Value
9/01/18 | | | Ending
Account Value
2/28/19 | | | Expenses
Paid During
Period (p)
9/01/18-2/28/19 | |
| A | | Actual | | | 0.97% | | | | $1,000.00 | | | | $979.23 | | | | $4.76 | |
| | Hypothetical (h) | | | 0.97% | | | | $1,000.00 | | | | $1,019.98 | | | | $4.86 | |
| B | | Actual | | | 1.72% | | | | $1,000.00 | | | | $975.56 | | | | $8.43 | |
| | Hypothetical (h) | | | 1.72% | | | | $1,000.00 | | | | $1,016.27 | | | | $8.60 | |
| C | | Actual | | | 1.73% | | | | $1,000.00 | | | | $975.61 | | | | $8.47 | |
| | Hypothetical (h) | | | 1.73% | | | | $1,000.00 | | | | $1,016.22 | | | | $8.65 | |
| I | | Actual | | | 0.73% | | | | $1,000.00 | | | | $980.32 | | | | $3.58 | |
| | Hypothetical (h) | | | 0.73% | | | | $1,000.00 | | | | $1,021.17 | | | | $3.66 | |
| R1 | | Actual | | | 1.73% | | | | $1,000.00 | | | | $975.60 | | | | $8.47 | |
| | Hypothetical (h) | | | 1.73% | | | | $1,000.00 | | | | $1,016.22 | | | | $8.65 | |
| R2 | | Actual | | | 1.22% | | | | $1,000.00 | | | | $977.73 | | | | $5.98 | |
| | Hypothetical (h) | | | 1.22% | | | | $1,000.00 | | | | $1,018.74 | | | | $6.11 | |
| R3 | | Actual | | | 0.98% | | | | $1,000.00 | | | | $978.80 | | | | $4.81 | |
| | Hypothetical (h) | | | 0.98% | | | | $1,000.00 | | | | $1,019.93 | | | | $4.91 | |
| R4 | | Actual | | | 0.73% | | | | $1,000.00 | | | | $980.25 | | | | $3.58 | |
| | Hypothetical (h) | | | 0.73% | | | | $1,000.00 | | | | $1,021.17 | | | | $3.66 | |
| R6 | | Actual | | | 0.65% | | | | $1,000.00 | | | | $980.87 | | | | $3.19 | |
| | Hypothetical (h) | | | 0.65% | | | | $1,000.00 | | | | $1,021.57 | | | | $3.26 | |
| (h) | 5% class return per year before expenses. |
| (p) | “Expenses Paid During Period” are equal to each class’s annualized expense ratio, as shown above, multiplied by the average account value over the period, multiplied by 181/365 (to reflect theone-half year period). Expenses paid do not include any applicable sales charges (loads). If these transaction costs had been included, your costs would have been higher. |
Notes to Expense Table
Expense ratios include 0.02% of investment related expenses from short sales (See Note 2 of the Notes to Financial Statements). Each class with a Rule12b-1 service fee is subject to a rebate of a portion of such fee. Such rebates are included in the expense ratios above. For Class A, Class B, and Class R2 shares, this rebate reduced the expense ratios above by 0.01%. See Note 3 in the Notes to Financial Statements for additional information.
4
PORTFOLIO OF INVESTMENTS
2/28/19 (unaudited)
The Portfolio of Investments is a complete list of all securities owned by your fund. It is categorized by broad-based asset classes.
| | | | | | | | |
| Common Stocks - 99.0% | | | | | | | | |
| | |
| Issuer | | Shares/Par | | | Value ($) | |
| Aerospace - 3.7% | | | | | | | | |
| Boeing Co. | | | 51,814 | | | $ | 22,796,088 | |
| CACI International, Inc., “A” (a) | | | 31,815 | | | | 5,798,602 | |
| Curtiss-Wright Corp. | | | 35,414 | | | | 4,366,192 | |
| FLIR Systems, Inc. | | | 36,416 | | | | 1,873,603 | |
| Honeywell International, Inc. | | | 134,756 | | | | 20,761,857 | |
| Northrop Grumman Corp. | | | 63,481 | | | | 18,406,951 | |
| United Technologies Corp. | | | 112,999 | | | | 14,200,584 | |
| | | | | | | | |
| | | | | | | $ | 88,203,877 | |
| Alcoholic Beverages - 0.4% | | | | | | | | |
| Constellation Brands, Inc., “A” | | | 51,943 | | | $ | 8,786,678 | |
| | |
| Apparel Manufacturers - 0.8% | | | | | | | | |
| NIKE, Inc., “B” | | | 137,310 | | | $ | 11,771,586 | |
| Skechers USA, Inc., “A” (a) | | | 181,209 | | | | 6,094,059 | |
| | | | | | | | |
| | | | | | | $ | 17,865,645 | |
| Automotive - 0.7% | | | | | | | | |
| Copart, Inc. (a) | | | 93,544 | | | $ | 5,488,227 | |
| Lear Corp. | | | 46,163 | | | | 7,020,007 | |
| Stoneridge, Inc. (a) | | | 119,687 | | | | 3,539,145 | |
| | | | | | | | |
| | | | | | | $ | 16,047,379 | |
| Biotechnology - 1.1% | | | | | | | | |
| Biogen, Inc. (a) | | | 60,353 | | | $ | 19,796,387 | |
| Illumina, Inc. (a) | | | 18,367 | | | | 5,744,647 | |
| | | | | | | | |
| | | | | | | $ | 25,541,034 | |
| Broadcasting - 0.4% | | | | | | | | |
| Netflix, Inc. (a) | | | 28,741 | | | $ | 10,292,152 | |
| | |
| Brokerage & Asset Managers - 2.4% | | | | | | | | |
| Blackstone Group LP | | | 391,652 | | | $ | 13,077,260 | |
| HealthEquity, Inc. (a) | | | 38,844 | | | | 3,126,165 | |
| Invesco Ltd. | | | 253,771 | | | | 4,910,469 | |
| TD Ameritrade Holding Corp. | | | 380,148 | | | | 21,413,737 | |
| TMX Group Ltd. | | | 218,295 | | | | 13,705,333 | |
| | | | | | | | |
| | | | | | | $ | 56,232,964 | |
5
Portfolio of Investments (unaudited) – continued
| | | | | | | | |
| | |
| Issuer | | Shares/Par | | | Value ($) | |
| Common Stocks - continued | | | | | | | | |
| Business Services - 4.6% | | | | | | | | |
| Amdocs Ltd. | | | 86,287 | | | $ | 4,794,968 | |
| CarGurus, Inc. (a) | | | 218,915 | | | | 9,354,238 | |
| Cognizant Technology Solutions Corp., “A” | | | 148,415 | | | | 10,534,497 | |
| DXC Technology Co. | | | 130,748 | | | | 8,611,063 | |
| Equinix, Inc., REIT | | | 16,981 | | | | 7,191,453 | |
| Fidelity National Information Services, Inc. | | | 103,164 | | | | 11,157,187 | |
| First Data Corp. (a) | | | 215,255 | | | | 5,411,511 | |
| FleetCor Technologies, Inc. (a) | | | 58,911 | | | | 13,742,758 | |
| Global Payments, Inc. | | | 84,460 | | | | 11,011,895 | |
| Grand Canyon Education, Inc. (a) | | | 76,463 | | | | 8,845,240 | |
| Total System Services, Inc. | | | 62,461 | | | | 5,896,318 | |
| Verisk Analytics, Inc., “A” | | | 93,495 | | | | 11,820,573 | |
| | | | | | | | |
| | | | | | | $ | 108,371,701 | |
| Cable TV - 1.0% | | | | | | | | |
| Altice USA, Inc. | | | 605,599 | | | $ | 13,208,114 | |
| Comcast Corp., “A” | | | 255,709 | | | | 9,888,267 | |
| | | | | | | | |
| | | | | | | $ | 23,096,381 | |
| Chemicals - 2.0% | | | | | | | | |
| CF Industries Holdings, Inc. | | | 157,254 | | | $ | 6,636,119 | |
| DowDuPont, Inc. | | | 245,572 | | | | 13,071,797 | |
| FMC Corp. | | | 77,927 | | | | 6,974,466 | |
| Ingevity Corp. (a) | | | 42,844 | | | | 4,936,486 | |
| PPG Industries, Inc. | | | 144,277 | | | | 16,154,696 | |
| | | | | | | | |
| | | | | | | $ | 47,773,564 | |
| Computer Software - 6.6% | | | | | | | | |
| 8x8, Inc. (a) | | | 460,676 | | | $ | 9,061,497 | |
| Adobe Systems, Inc. (a) | | | 109,012 | | | | 28,615,650 | |
| Cadence Design Systems, Inc. (a) | | | 173,558 | | | | 9,936,196 | |
| DocuSign, Inc. (a) | | | 127,209 | | | | 7,015,576 | |
| Microsoft Corp. | | | 527,143 | | | | 59,055,830 | |
| Salesforce.com, Inc. (a) | | | 251,652 | | | | 41,182,850 | |
| | | | | | | | |
| | | | | | | $ | 154,867,599 | |
| Computer Software - Systems - 4.3% | | | | | | | | |
| Apple, Inc. (s) | | | 504,324 | | | $ | 87,323,701 | |
| Pluralsight, Inc., “A” (a) | | | 153,932 | | | | 5,004,329 | |
| Rapid7, Inc. (a) | | | 201,749 | | | | 9,286,506 | |
| | | | | | | | |
| | | | | | | $ | 101,614,536 | |
6
Portfolio of Investments (unaudited) – continued
| | | | | | | | |
| | |
| Issuer | | Shares/Par | | | Value ($) | |
| Common Stocks - continued | | | | | | | | |
| Construction - 0.8% | | | | | | | | |
| Toll Brothers, Inc. | | | 225,197 | | | $ | 8,017,013 | |
| Vulcan Materials Co. | | | 98,936 | | | | 11,027,407 | |
| | | | | | | | |
| | | | | | | $ | 19,044,420 | |
| Consumer Products - 1.4% | | | | | | | | |
| Colgate-Palmolive Co. | | | 174,358 | | | $ | 11,484,962 | |
| Kimberly-Clark Corp. | | | 81,430 | | | | 9,513,467 | |
| Procter & Gamble Co. | | | 116,071 | | | | 11,438,797 | |
| | | | | | | | |
| | | | | | | $ | 32,437,226 | |
| Consumer Services - 1.1% | | | | | | | | |
| Bookings Holdings, Inc. (a) | | | 10,770 | | | $ | 18,277,121 | |
| Bright Horizons Family Solutions, Inc. (a) | | | 53,093 | | | | 6,583,532 | |
| | | | | | | | |
| | | | | | | $ | 24,860,653 | |
| Containers - 0.5% | | | | | | | | |
| Berry Global Group, Inc. (a) | | | 165,501 | | | $ | 8,683,837 | |
| Sealed Air Corp. | | | 96,964 | | | | 4,229,570 | |
| | | | | | | | |
| | | | | | | $ | 12,913,407 | |
| Electrical Equipment - 2.3% | | | | | | | | |
| AMETEK, Inc. | | | 227,745 | | | $ | 18,123,947 | |
| Fortive Corp. | | | 105,494 | | | | 8,605,146 | |
| HD Supply Holdings, Inc. (a) | | | 164,450 | | | | 7,072,994 | |
| Resideo Technologies, Inc. (a) | | | 21,565 | | | | 554,221 | |
| Sensata Technologies Holding PLC (a) | | | 186,835 | | | | 9,478,140 | |
| TE Connectivity Ltd. | | | 84,827 | | | | 6,963,448 | |
| WESCO International, Inc. (a) | | | 60,792 | | | | 3,310,124 | |
| | | | | | | | |
| | | | | | | $ | 54,108,020 | |
| Electronics - 3.2% | | | | | | | | |
| Analog Devices, Inc. | | | 232,832 | | | $ | 24,903,711 | |
| Applied Materials, Inc. | | | 59,135 | | | | 2,267,236 | |
| IPG Photonics Corp. (a) | | | 14,610 | | | | 2,264,988 | |
| Marvell Technology Group Ltd. | | | 488,197 | | | | 9,739,530 | |
| Mellanox Technologies Ltd. (a) | | | 29,671 | | | | 3,187,852 | |
| Monolithic Power Systems, Inc. | | | 16,475 | | | | 2,209,462 | |
| Silicon Laboratories, Inc. (a) | | | 39,581 | | | | 3,206,853 | |
| Texas Instruments, Inc. | | | 263,999 | | | | 27,925,814 | |
| | | | | | | | |
| | | | | | | $ | 75,705,446 | |
| Energy - Independent - 1.8% | | | | | | | | |
| Concho Resources, Inc. | | | 49,317 | | | $ | 5,424,870 | |
| Diamondback Energy, Inc. | | | 21,193 | | | | 2,181,395 | |
7
Portfolio of Investments (unaudited) – continued
| | | | | | | | |
| | |
| Issuer | | Shares/Par | | | Value ($) | |
| Common Stocks - continued | | | | | | | | |
| Energy - Independent - continued | | | | | | | | |
| EOG Resources, Inc. | | | 139,269 | | | $ | 13,091,286 | |
| Hess Corp. | | | 147,616 | | | | 8,539,586 | |
| Marathon Petroleum Corp. | | | 180,169 | | | | 11,172,280 | |
| Parsley Energy, Inc., “A” (a) | | | 96,282 | | | | 1,746,555 | |
| | | | | | | | |
| | | | | | | $ | 42,155,972 | |
| Energy - Integrated - 2.0% | | | | | | | | |
| Chevron Corp. | | | 384,867 | | | $ | 46,022,396 | |
| | |
| Engineering - Construction - 0.2% | | | | | | | | |
| KBR, Inc. | | | 218,467 | | | $ | 4,316,908 | |
| | |
| Food & Beverages - 2.7% | | | | | | | | |
| Archer Daniels Midland Co. | | | 107,010 | | | $ | 4,547,925 | |
| Coca-Cola Co. | | | 221,063 | | | | 10,022,996 | |
| Hostess Brands, Inc. (a) | | | 413,313 | | | | 5,017,620 | |
| J.M. Smucker Co. | | | 41,845 | | | | 4,431,804 | |
| Mondelez International, Inc. | | | 332,853 | | | | 15,697,347 | |
| PepsiCo, Inc. | | | 199,023 | | | | 23,015,020 | |
| | | | | | | | |
| | | | | | | $ | 62,732,712 | |
| Gaming & Lodging - 0.9% | | | | | | | | |
| Hilton Worldwide Holdings, Inc. | | | 195,591 | | | $ | 16,253,612 | |
| Marriott International, Inc., “A” | | | 32,318 | | | | 4,048,476 | |
| | | | | | | | |
| | | | | | | $ | 20,302,088 | |
| General Merchandise - 1.3% | | | | | | | | |
| Dollar General Corp. | | | 142,194 | | | $ | 16,844,301 | |
| Dollar Tree, Inc. (a) | | | 141,479 | | | | 13,628,672 | |
| | | | | | | | |
| | | | | | | $ | 30,472,973 | |
| Health Maintenance Organizations - 1.6% | | | | | | | | |
| Cigna Corp. | | | 120,859 | | | $ | 21,082,644 | |
| Humana Inc. | | | 57,336 | | | | 16,343,053 | |
| | | | | | | | |
| | | | | | | $ | 37,425,697 | |
| Insurance - 4.3% | | | | | | | | |
| Aon PLC | | | 274,797 | | | $ | 47,135,930 | |
| Assurant, Inc. | | | 87,559 | | | | 9,017,701 | |
| Athene Holding Ltd. (a) | | | 107,022 | | | | 4,767,830 | |
| Chubb Ltd. | | | 157,108 | | | | 21,036,761 | |
| Everest Re Group Ltd. | | | 18,889 | | | | 4,270,992 | |
| Hartford Financial Services Group, Inc. | | | 325,478 | | | | 16,065,594 | |
| | | | | | | | |
| | | | | | | $ | 102,294,808 | |
8
Portfolio of Investments (unaudited) – continued
| | | | | | | | |
| | |
| Issuer | | Shares/Par | | | Value ($) | |
| Common Stocks - continued | | | | | | | | |
| Internet - 4.5% | | | | | | | | |
| Alphabet, Inc., “A” (a)(s) | | | 60,475 | | | $ | 68,128,111 | |
| Facebook, Inc., “A” (a) | | | 242,647 | | | | 39,175,358 | |
| | | | | | | | |
| | | | | | | $ | 107,303,469 | |
| Leisure & Toys - 0.9% | | | | | | | | |
| Brunswick Corp. | | | 97,714 | | | $ | 5,153,436 | |
| Electronic Arts, Inc. (a) | | | 165,418 | | | | 15,843,736 | |
| | | | | | | | |
| | | | | | | $ | 20,997,172 | |
| Machinery & Tools - 1.3% | | | | | | | | |
| Flowserve Corp. | | | 158,927 | | | $ | 7,057,948 | |
| IDEX Corp. | | | 32,134 | | | | 4,630,509 | |
| ITT, Inc. | | | 79,138 | | | | 4,571,011 | |
| Roper Technologies, Inc. | | | 42,421 | | | | 13,729,557 | |
| | | | | | | | |
| | | | | | | $ | 29,989,025 | |
| Major Banks - 2.0% | | | | | | | | |
| Goldman Sachs Group, Inc. | | | 131,885 | | | $ | 25,941,779 | |
| PNC Financial Services Group, Inc. | | | 104,593 | | | | 13,180,810 | |
| State Street Corp. | | | 109,792 | | | | 7,890,751 | |
| | | | | | | | |
| | | | | | | $ | 47,013,340 | |
| Medical & Health Technology & Services - 1.5% | | | | | | | | |
| Guardant Health, Inc. (a) | | | 21,203 | | | $ | 1,412,968 | |
| HCA Healthcare, Inc. | | | 85,645 | | | | 11,908,081 | |
| ICON PLC (a) | | | 37,312 | | | | 5,222,934 | |
| IDEXX Laboratories, Inc. (a) | | | 18,075 | | | | 3,814,367 | |
| McKesson Corp. | | | 55,384 | | | | 7,042,629 | |
| Walgreens Boots Alliance, Inc. | | | 97,069 | | | | 6,910,342 | |
| | | | | | | | |
| | | | | | | $ | 36,311,321 | |
| Medical Equipment - 3.4% | | | | | | | | |
| Boston Scientific Corp. (a) | | | 362,420 | | | $ | 14,540,290 | |
| Danaher Corp. | | | 74,338 | | | | 9,442,413 | |
| Medtronic PLC | | | 304,560 | | | | 27,562,680 | |
| PerkinElmer, Inc. | | | 121,903 | | | | 11,478,386 | |
| STERIS PLC | | | 96,987 | | | | 11,731,548 | |
| West Pharmaceutical Services, Inc. | | | 59,749 | | | | 6,258,708 | |
| | | | | | | | |
| | | | | | | $ | 81,014,025 | |
| Metals & Mining - 0.2% | | | | | | | | |
| Teck Resources Ltd., “B” | | | 160,534 | | | $ | 3,602,383 | |
9
Portfolio of Investments (unaudited) – continued
| | | | | | | | |
| | |
| Issuer | | Shares/Par | | | Value ($) | |
| Common Stocks - continued | | | | | | | | |
| Natural Gas - Pipeline - 0.4% | | | | | | | | |
| Enterprise Products Partners LP | | | 231,262 | | | $ | 6,394,395 | |
| Equitrans Midstream Corp. | | | 202,402 | | | | 3,570,371 | |
| | | | | | | | |
| | | | | | | $ | 9,964,766 | |
| Network & Telecom - 1.4% | | | | | | | | |
| Cisco Systems, Inc. | | | 578,254 | | | $ | 29,936,210 | |
| Interxion Holding N.V. (a) | | | 56,744 | | | | 3,716,732 | |
| | | | | | | | |
| | | | | | | $ | 33,652,942 | |
| Oil Services - 0.7% | | | | | | | | |
| Apergy Corp. (a) | | | 80,048 | | | $ | 3,360,415 | |
| Cactus, Inc., “A” (a) | | | 115,315 | | | | 4,181,322 | |
| Core Laboratories N.V. | | | 44,611 | | | | 2,891,239 | |
| Patterson-UTI Energy, Inc. | | | 326,609 | | | | 4,330,835 | |
| Schlumberger Ltd. | | | 56,964 | | | | 2,509,834 | |
| | | | | | | | |
| | | | | | | $ | 17,273,645 | |
| Other Banks & Diversified Financials - 6.8% | | | | | | | | |
| Bank OZK | | | 283,211 | | | $ | 9,289,321 | |
| BB&T Corp. | | | 375,928 | | | | 19,161,050 | |
| Citigroup, Inc. | | | 533,108 | | | | 34,108,250 | |
| EuroDekania Ltd. (u) | | | 580,280 | | | | 69,304 | |
| Mastercard, Inc., “A” | | | 189,398 | | | | 42,570,988 | |
| Prosperity Bancshares, Inc. | | | 40,578 | | | | 3,021,032 | |
| Signature Bank | | | 115,767 | | | | 15,716,528 | |
| U.S. Bancorp | | | 493,462 | | | | 25,507,051 | |
| Wintrust Financial Corp. | | | 146,718 | | | | 10,808,715 | |
| | | | | | | | |
| | | | | | | $ | 160,252,239 | |
| Pharmaceuticals - 6.1% | | | | | | | | |
| Elanco Animal Health, Inc. (a)(l) | | | 601,517 | | | $ | 18,189,874 | |
| Eli Lilly & Co. | | | 151,871 | | | | 19,179,789 | |
| Johnson & Johnson | | | 274,284 | | | | 37,478,166 | |
| Pfizer, Inc. | | | 987,963 | | | | 42,828,196 | |
| Zoetis, Inc. | | | 279,119 | | | | 26,301,383 | |
| | | | | | | | |
| | | | | | | $ | 143,977,408 | |
| Pollution Control - 0.4% | | | | | | | | |
| Evoqua Water Technologies LLC (a) | | | 304,797 | | | $ | 4,139,144 | |
| Waste Connections, Inc. | | | 76,138 | | | | 6,349,909 | |
| | | | | | | | |
| | | | | | | $ | 10,489,053 | |
10
Portfolio of Investments (unaudited) – continued
| | | | | | | | |
| | |
| Issuer | | Shares/Par | | | Value ($) | |
| Common Stocks - continued | | | | | | | | |
| Railroad & Shipping - 1.3% | | | | | | | | |
| Canadian Pacific Railway Ltd. | | | 77,229 | | | $ | 15,946,244 | |
| Kansas City Southern Co. | | | 128,990 | | | | 14,013,474 | |
| | | | | | | | |
| | | | | | | $ | 29,959,718 | |
| Real Estate - 2.7% | | | | | | | | |
| Industrial Logistics Properties Trust, REIT | | | 465,357 | | | $ | 9,707,347 | |
| Life Storage, Inc., REIT | | | 22,842 | | | | 2,229,379 | |
| Medical Properties Trust, Inc., REIT | | | 1,373,065 | | | | 25,030,975 | |
| STORE Capital Corp., REIT | | | 334,143 | | | | 10,849,623 | |
| Sun Communities, Inc., REIT | | | 31,155 | | | | 3,538,274 | |
| W.P. Carey, Inc., REIT | | | 170,147 | | | | 12,568,759 | |
| | | | | | | | |
| | | | | | | $ | 63,924,357 | |
| Restaurants - 1.5% | | | | | | | | |
| Aramark | | | 186,206 | | | $ | 5,642,042 | |
| Starbucks Corp. | | | 336,870 | | | | 23,668,486 | |
| U.S. Foods Holding Corp. (a) | | | 184,100 | | | | 6,487,684 | |
| | | | | | | | |
| | | | | | | $ | 35,798,212 | |
| Specialty Chemicals - 0.2% | | | | | | | | |
| Univar, Inc. (a) | | | 203,842 | | | $ | 4,608,868 | |
| | |
| Specialty Stores - 5.2% | | | | | | | | |
| Amazon.com, Inc. (a)(s) | | | 42,212 | | | $ | 69,220,504 | |
| Costco Wholesale Corp. | | | 85,191 | | | | 18,634,679 | |
| Floor & Decor Holdings, Inc. (a) | | | 251,600 | | | | 9,354,488 | |
| Ross Stores, Inc. | | | 181,018 | | | | 17,165,937 | |
| Tractor Supply Co. | | | 98,222 | | | | 9,365,468 | |
| | | | | | | | |
| | | | | | | $ | 123,741,076 | |
| Telecommunications - Wireless - 2.1% | | | | | | | | |
| American Tower Corp., REIT | | | 276,655 | | | $ | 48,732,778 | |
| | |
| Telephone Services - 0.6% | | | | | | | | |
| Verizon Communications, Inc. | | | 249,551 | | | $ | 14,204,443 | |
| | |
| Tobacco - 0.6% | | | | | | | | |
| Philip Morris International, Inc. | | | 174,432 | | | $ | 15,165,118 | |
| | |
| Utilities - Electric Power - 3.1% | | | | | | | | |
| American Electric Power Co., Inc. | | | 129,627 | | | $ | 10,519,231 | |
| Avangrid, Inc. | | | 99,376 | | | | 4,804,830 | |
| CenterPoint Energy, Inc. | | | 226,115 | | | | 6,815,106 | |
| CMS Energy Corp. | | | 157,800 | | | | 8,584,320 | |
11
Portfolio of Investments (unaudited) – continued
| | | | | | | | |
| | |
| Issuer | | Shares/Par | | | Value ($) | |
| Common Stocks - continued | | | | | | | | |
| Utilities - Electric Power - continued | | | | | | | | |
| Evergy, Inc. | | | 129,882 | | | $ | 7,261,703 | |
| Exelon Corp. | | | 223,436 | | | | 10,856,755 | |
| NextEra Energy, Inc. | | | 75,626 | | | | 14,196,513 | |
| Xcel Energy, Inc. | | | 170,618 | | | | 9,360,103 | |
| | | | | | | | |
| | | | | | | $ | 72,398,561 | |
| Total Common Stocks (Identified Cost, $1,880,983,457) | | | $ | 2,333,860,155 | |
| | |
| Convertible Preferred Stocks - 0.1% | | | | | | | | |
| Natural Gas - Distribution - 0.1% | | | | | | | | |
| South Jersey Industries, Inc. (Identified Cost, $1,879,350) | | | 37,587 | | | $ | 1,822,969 | |
| | |
| Investment Companies (h) - 0.8% | | | | | | | | |
| Money Market Funds - 0.8% | | | | | | | | |
MFS Institutional Money Market Portfolio, 2.49% (v)
(Identified Cost, $19,795,559) | | | 19,797,011 | | | $ | 19,797,011 | |
| | |
| Collateral for Securities Loaned - 0.7% | | | | | | | | |
| State Street Navigator Securities Lending Government Money Market Portfolio, 2.43% (j) (Identified Cost, $15,537,524) | | | 15,537,524 | | | $ | 15,537,524 | |
| | |
| Securities Sold Short - (0.4)% | | | | | | | | |
| Medical & Health Technology & Services - (0.2)% | | | | | | | | |
| Healthcare Services Group, Inc. | | | (85,694 | ) | | $ | (3,271,797 | ) |
| | |
| Telecommunications - Wireless - (0.2)% | | | | | | | | |
| Crown Castle International Corp., REIT | | | (44,300 | ) | | $ | (5,260,625 | ) |
Total Securities Sold Short
(Proceeds Received, $7,128,701) | | | | | | $ | (8,532,422 | ) |
| | |
| Other Assets, Less Liabilities - (0.2)% | | | | | | | (4,601,686 | ) |
| Net Assets - 100.0% | | | | | | $ | 2,357,883,551 | |
| (a) | Non-income producing security. |
| (h) | An affiliated issuer, which may be considered one in which the fund owns 5% or more of the outstanding voting securities, or a company which is under common control. At period end, the aggregate values of the fund’s investments in affiliated issuers and in unaffiliated issuers were $19,797,011 and $2,351,220,648, respectively. |
| (j) | The rate quoted is the annualizedseven-day yield of the fund at period end. |
| (l) | A portion of this security is on loan. See Note 2 for additional information. |
| (s) | Security or a portion of the security was pledged to cover collateral requirements for securities sold short. |
| (u) | The security was valued using significant unobservable inputs and is considered level 3 under the fair value hierarchy. For further information about the fund’s level 3 holdings, please see Note 2 in the Notes to Financial Statements. |
12
Portfolio of Investments (unaudited) – continued
| (v) | Affiliated issuer that is available only to investment companies managed by MFS. The rate quoted for the MFS Institutional Money Market Portfolio is the annualizedseven-day yield of the fund at period end. |
The following abbreviations are used in this report and are defined:
| PLC | | Public Limited Company |
| REIT | | Real Estate Investment Trust |
At February 28, 2019, the fund had cash collateral of $3,474,344 and other liquid securities with an aggregate value of $10,168,175 to cover any collateral or margin obligations for securities sold short. Restricted cash and/or deposits with brokers in the Statement of Assets and Liabilities are comprised of cash collateral.
See Notes to Financial Statements
13
Financial Statements
STATEMENT OF ASSETS AND LIABILITIES
At 2/28/19 (unaudited)
This statement represents your fund’s balance sheet, which details the assets and liabilities comprising the total value of the fund.
| | | | |
| Assets | | | | |
Investments in unaffiliated issuers, at value, including $15,405,072 of securities on loan (identified cost, $1,898,400,331) | | | $2,351,220,648 | |
Investments in affiliated issuers, at value (identified cost, $19,795,559) | | | 19,797,011 | |
Deposits with brokers for | | | | |
Securities sold short | | | 3,474,344 | |
Receivables for | | | | |
Investments sold | | | 13,078,501 | |
Fund shares sold | | | 8,032,390 | |
Interest and dividends | | | 3,878,509 | |
Other assets | | | 7,997 | |
Total assets | | | $2,399,489,400 | |
| |
| Liabilities | | | | |
Payable to custodian | | | $6,300 | |
Payables for | | | | |
Dividends on securities sold short | | | 16,817 | |
Securities sold short, at value (proceeds received, $7,128,701) | | | 8,532,422 | |
Investments purchased | | | 15,705,882 | |
Fund shares reacquired | | | 1,149,628 | |
Collateral for securities loaned, at value | | | 15,537,524 | |
Payable to affiliates | | | | |
Investment adviser | | | 74,525 | |
Shareholder servicing costs | | | 477,701 | |
Distribution and service fees | | | 16,397 | |
Payable for independent Trustees’ compensation | | | 10,451 | |
Accrued expenses and other liabilities | | | 78,202 | |
Total liabilities | | | $41,605,849 | |
Net assets | | | $2,357,883,551 | |
| |
| Net assets consist of | | | | |
Paid-in capital | | | $1,878,852,963 | |
Total distributable earnings (loss) | | | 479,030,588 | |
Net assets | | | $2,357,883,551 | |
Shares of beneficial interest outstanding | | | 76,462,116 | |
14
Statement of Assets and Liabilities (unaudited) – continued
| | | | | | | | | | | | |
| | | |
| | | Net assets | | | Shares
outstanding | | | Net asset value
per share (a) | |
Class A | | | $1,209,405,757 | | | | 39,943,806 | | | | $30.28 | |
Class B | | | 24,569,766 | | | | 929,266 | | | | 26.44 | |
Class C | | | 64,495,915 | | | | 2,471,562 | | | | 26.10 | |
Class I | | | 342,839,071 | | | | 10,671,714 | | | | 32.13 | |
Class R1 | | | 3,043,826 | | | | 116,726 | | | | 26.08 | |
Class R2 | | | 13,019,173 | | | | 440,884 | | | | 29.53 | |
Class R3 | | | 40,215,584 | | | | 1,331,900 | | | | 30.19 | |
Class R4 | | | 24,117,641 | | | | 789,908 | | | | 30.53 | |
Class R6 | | | 636,176,818 | | | | 19,766,350 | | | | 32.18 | |
| (a) | Maximum offering price per share was equal to the net asset value per share for all share classes, except for Class A, for which the maximum offering price per share was $32.13 [100 / 94.25 x $30.28]. On sales of $50,000 or more, the maximum offering price of Class A shares is reduced. A contingent deferred sales charge may be imposed on redemptions of Class A, Class B, and Class C shares. Redemption price per share was equal to the net asset value per share for Classes I, R1, R2, R3, R4, and R6. |
See Notes to Financial Statements
15
Financial Statements
STATEMENT OF OPERATIONS
Six months ended 2/28/19 (unaudited)
This statement describes how much your fund earned in investment income and accrued in expenses. It also describes any gains and/or losses generated by fund operations.
| | | | |
| Net investment income (loss) | | | | |
Income | | | | |
Dividends | | | $18,719,606 | |
Dividends from affiliated issuers | | | 416,399 | |
Other | | | 120,989 | |
Income on securities loaned | | | 111,457 | |
Foreign taxes withheld | | | (46,590 | ) |
Total investment income | | | $19,321,861 | |
Expenses | | | | |
Management fee | | | $6,122,526 | |
Distribution and service fees | | | 1,916,578 | |
Shareholder servicing costs | | | 929,803 | |
Administrative services fee | | | 146,166 | |
Independent Trustees’ compensation | | | 10,138 | |
Custodian fee | | | 50,775 | |
Shareholder communications | | | 55,538 | |
Audit and tax fees | | | 28,586 | |
Legal fees | | | 8,259 | |
Dividend and interest expense on securities sold short | | | 189,426 | |
Interest expense and fees | | | 6,078 | |
Miscellaneous | | | 129,919 | |
Total expenses | | | $9,593,792 | |
Reduction of expenses by investment adviser and distributor | | | (144,928 | ) |
Net expenses | | | $9,448,864 | |
Net investment income (loss) | | | $9,872,997 | |
| |
| Realized and unrealized gain (loss) | | | | |
Realized gain (loss) (identified cost basis) | | | | |
Unaffiliated issuers | | | $20,732,230 | |
Affiliated issuers | | | (9,437 | ) |
Foreign currency | | | 151 | |
Net realized gain (loss) | | | $20,722,944 | |
Change in unrealized appreciation or depreciation | | | | |
Unaffiliated issuers | | | $(67,058,694 | ) |
Affiliated issuers | | | (2,318 | ) |
Securities sold short | | | (30,384 | ) |
Translation of assets and liabilities in foreign currencies | | | 115 | |
Net unrealized gain (loss) | | | $(67,091,281 | ) |
Net realized and unrealized gain (loss) | | | $(46,368,337 | ) |
Change in net assets from operations | | | $(36,495,340 | ) |
See Notes to Financial Statements
16
Financial Statements
STATEMENTS OF CHANGES IN NET ASSETS
These statements describe the increases and/or decreases in net assets resulting from operations, any distributions, and any shareholder transactions.
| | | | | | | | |
| Change in net assets | | Six months ended
2/28/19
(unaudited) | | | Year ended
8/31/18 | |
| | |
| From operations | | | | | | | | |
Net investment income (loss) | | | $9,872,997 | | | | $12,999,055 | |
Net realized gain (loss) | | | 20,722,944 | | | | 202,361,180 | |
Net unrealized gain (loss) | | | (67,091,281 | ) | | | 132,966,174 | |
Change in net assets from operations | | | $(36,495,340 | ) | | | $348,326,409 | |
Total distributions to shareholders (a) | | | $(199,800,134 | ) | | | $(118,520,157 | ) |
Change in net assets from fund share transactions | | | $420,157,187 | | | | $249,008,217 | |
Total change in net assets | | | $183,861,713 | | | | $478,814,469 | |
| | |
| Net assets | | | | | | | | |
At beginning of period | | | 2,174,021,838 | | | | 1,695,207,369 | |
At end of period (b) | | | $2,357,883,551 | | | | $2,174,021,838 | |
| (a) | Distributions from net investment income and from net realized gain are no longer required to be separately disclosed. See Note 2. For the year ended August 31, 2018, distributions from net investment income and from net realized gain were $10,130,006 and $108,390,151, respectively. |
| (b) | Parenthetical disclosure of undistributed net investment income is no longer required. See Note 2. For the year ended August 31, 2018, end of period net assets included undistributed net investment income of $12,453,901. |
See Notes to Financial Statements
17
Financial Statements
FINANCIAL HIGHLIGHTS
The financial highlights table is intended to help you understand the fund’s financial performance for the semiannual period and the past 5 fiscal years. Certain information reflects financial results for a single fund share. The total returns in the table represent the rate that an investor would have earned (or lost) on an investment in the fund share class (assuming reinvestment of all distributions) held for the entire period.
| | | | | | | | | | | | | | | | | | | | | | | | |
| | | Six months
ended
2/28/19 | | | Year ended | |
| Class A | | 8/31/18 | | | 8/31/17 | | | 8/31/16 | | | 8/31/15 | | | 8/31/14 | |
| | | (unaudited) | | | | | | | | | | | | | | | | |
Net asset value, beginning of period | | | $34.18 | | | | $30.46 | | | | $26.72 | | | | $27.19 | | | | $29.19 | | | | $23.82 | |
| | | |
| Income (loss) from investment operations | | | | | | | | | | | | | |
Net investment income (loss) (d) | | | $0.13 | | | | $0.20 | | | | $0.18 | (c) | | | $0.18 | | | | $0.15 | | | | $0.13 | |
Net realized and unrealized
gain (loss) | | | (1.05 | ) | | | 5.63 | | | | 4.53 | | | | 2.08 | | | | 0.13 | | | | 5.41 | |
Total from investment operations | | | $(0.92 | ) | | | $5.83 | | | | $4.71 | | | | $2.26 | | | | $0.28 | | | | $5.54 | |
| | | |
| Less distributions declared to shareholders | | | | | | | | | | | | | |
From net investment income | | | $(0.16 | ) | | | $(0.17 | ) | | | $(0.16 | ) | | | $(0.14 | ) | | | $(0.13 | ) | | | $(0.17 | ) |
From net realized gain | | | (2.82 | ) | | | (1.94 | ) | | | (0.81 | ) | | | (2.59 | ) | | | (2.15 | ) | | | — | |
Total distributions declared to
shareholders | | | $(2.98 | ) | | | $(2.11 | ) | | | $(0.97 | ) | | | $(2.73 | ) | | | $(2.28 | ) | | | $(0.17 | ) |
Net asset value, end of period (x) | | | $30.28 | | | | $34.18 | | | | $30.46 | | | | $26.72 | | | | $27.19 | | | | $29.19 | |
Total return (%) (r)(s)(t)(x) | | | (2.08 | )(n) | | | 19.89 | | | | 18.11 | (c) | | | 9.09 | | | | 0.98 | | | | 23.33 | |
| | | |
Ratios (%) (to average net assets)
and Supplemental data: | | | | | | | | | | | | | |
Expenses before expense
reductions (f) | | | 0.99 | (a) | | | 1.00 | | | | 1.03 | (c) | | | 1.07 | | | | 1.05 | | | | 1.05 | |
Expenses after expense
reductions (f) | | | 0.97 | (a) | | | 0.99 | | | | 1.01 | (c) | | | 1.05 | | | | 1.04 | | | | 1.04 | |
Net investment income (loss) | | | 0.83 | (a) | | | 0.62 | | | | 0.63 | (c) | | | 0.70 | | | | 0.52 | | | | 0.49 | |
Portfolio turnover | | | 24 | (n) | | | 42 | | | | 46 | | | | 68 | | | | 53 | | | | 48 | |
Net assets at end of period
(000 omitted) | | | $1,209,406 | | | | $1,184,976 | | | | $992,736 | | | | $959,812 | | | | $963,167 | | | | $1,002,028 | |
| | | |
| Supplemental Ratios (%): | | | | | | | | | | | | | |
Ratio of expenses to average net
assets after expense reductions
excluding short sale expenses
and interest expense and fees (f) | | | 0.96 | (a) | | | 0.97 | | | | 1.00 | (c) | | | 1.04 | | | | 1.03 | | | | 1.04 | |
See Notes to Financial Statements
18
Financial Highlights – continued
| | | | | | | | | | | | | | | | | | | | | | | | |
| | | Six months
ended
2/28/19 | | | Year ended | |
| Class B | | 8/31/18 | | | 8/31/17 | | | 8/31/16 | | | 8/31/15 | | | 8/31/14 | |
| | | (unaudited) | | | | | | | | | | | | | | | | |
Net asset value, beginning of period | | | $30.19 | | | | $27.17 | | | | $23.96 | | | | $24.70 | | | | $26.78 | | | | $21.88 | |
| | | |
| Income (loss) from investment operations | | | | | | | | | | | | | |
Net investment income (loss) (d) | | | $0.01 | | | | $(0.04 | ) | | | $(0.03 | )(c) | | | $(0.02 | ) | | | $(0.06 | ) | | | $(0.06 | ) |
Net realized and unrealized
gain (loss) | | | (0.94 | ) | | | 5.00 | | | | 4.05 | | | | 1.87 | | | | 0.13 | | | | 4.96 | |
Total from investment operations | | | $(0.93 | ) | | | $4.96 | | | | $4.02 | | | | $1.85 | | | | $0.07 | | | | $4.90 | |
| | | |
| Less distributions declared to shareholders | | | | | | | | | | | | | |
From net investment income | | | $— | | | | $— | | | | $— | | | | $— | | | | $— | | | | $— | |
From net realized gain | | | (2.82 | ) | | | (1.94 | ) | | | (0.81 | ) | | | (2.59 | ) | | | (2.15 | ) | | | — | |
Total distributions declared to
shareholders | | | $(2.82 | ) | | | $(1.94 | ) | | | $(0.81 | ) | | | $(2.59 | ) | | | $(2.15 | ) | | | $— | |
Net asset value, end of period (x) | | | $26.44 | | | | $30.19 | | | | $27.17 | | | | $23.96 | | | | $24.70 | | | | $26.78 | |
Total return (%) (r)(s)(t)(x) | | | (2.44 | )(n) | | | 19.01 | | | | 17.21 | (c) | | | 8.24 | | | | 0.25 | | | | 22.39 | |
| | | |
Ratios (%) (to average net assets)
and Supplemental data: | | | | | | | | | | | | | |
Expenses before expense
reductions (f) | | | 1.74 | (a) | | | 1.75 | | | | 1.78 | (c) | | | 1.82 | | | | 1.80 | | | | 1.80 | |
Expenses after expense
reductions (f) | | | 1.72 | (a) | | | 1.74 | | | | 1.77 | (c) | | | 1.81 | | | | 1.80 | | | | 1.80 | |
Net investment income (loss) | | | 0.06 | (a) | | | (0.14 | ) | | | (0.12 | )(c) | | | (0.07 | ) | | | (0.23 | ) | | | (0.26 | ) |
Portfolio turnover | | | 24 | (n) | | | 42 | | | | 46 | | | | 68 | | | | 53 | | | | 48 | |
Net assets at end of period
(000 omitted) | | | $24,570 | | | | $26,993 | | | | $27,139 | | | | $30,324 | | | | $34,126 | | | | $40,536 | |
| | | |
| Supplemental Ratios (%): | | | | | | | | | | | | | |
Ratio of expenses to average net
assets after expense reductions
excluding short sale expenses
and interest expense and fees (f) | | | 1.71 | (a) | | | 1.72 | | | | 1.75 | (c) | | | 1.79 | | | | 1.79 | | | | 1.80 | |
See Notes to Financial Statements
19
Financial Highlights – continued
| | | | | | | | | | | | | | | | | | | | | | | | |
| | | Six months
ended
2/28/19 | | | Year ended | |
| Class C | | 8/31/18 | | | 8/31/17 | | | 8/31/16 | | | 8/31/15 | | | 8/31/14 | |
| | | (unaudited) | | | | | | | | | | | | | | | | |
Net asset value, beginning of period | | | $29.84 | | | | $26.88 | | | | $23.71 | | | | $24.47 | | | | $26.55 | | | | $21.72 | |
| | | |
| Income (loss) from investment operations | | | | | | | | | | | | | |
Net investment income (loss) (d) | | | $0.01 | | | | $(0.05 | ) | | | $(0.03 | )(c) | | | $(0.01 | ) | | | $(0.06 | ) | | | $(0.06 | ) |
Net realized and unrealized
gain (loss) | | | (0.93 | ) | | | 4.95 | | | | 4.01 | | | | 1.84 | | | | 0.13 | | | | 4.92 | |
Total from investment operations | | | $(0.92 | ) | | | $4.90 | | | | $3.98 | | | | $1.83 | | | | $0.07 | | | | $4.86 | |
| | | |
| Less distributions declared to shareholders | | | | | | | | | | | | | |
From net investment income | | | $— | | | | $— | | | | $— | | | | $— | | | | $— | | | | $(0.03 | ) |
From net realized gain | | | (2.82 | ) | | | (1.94 | ) | | | (0.81 | ) | | | (2.59 | ) | | | (2.15 | ) | | | — | |
Total distributions declared to
shareholders | | | $(2.82 | ) | | | $(1.94 | ) | | | $(0.81 | ) | | | $(2.59 | ) | | | $(2.15 | ) | | | $(0.03 | ) |
Net asset value, end of period (x) | | | $26.10 | | | | $29.84 | | | | $26.88 | | | | $23.71 | | | | $24.47 | | | | $26.55 | |
Total return (%) (r)(s)(t)(x) | | | (2.44 | )(n) | | | 18.98 | | | | 17.22 | (c) | | | 8.24 | | | | 0.26 | | | | 22.38 | |
| | | |
Ratios (%) (to average net assets)
and Supplemental data: | | | | | | | | | | | | | |
Expenses before expense
reductions (f) | | | 1.74 | (a) | | | 1.75 | | | | 1.78 | (c) | | | 1.82 | | | | 1.80 | | | | 1.80 | |
Expenses after expense
reductions (f) | | | 1.73 | (a) | | | 1.74 | | | | 1.77 | (c) | | | 1.81 | | | | 1.80 | | | | 1.80 | |
Net investment income (loss) | | | 0.09 | (a) | | | (0.17 | ) | | | (0.12 | )(c) | | | (0.05 | ) | | | (0.23 | ) | | | (0.26 | ) |
Portfolio turnover | | | 24 | (n) | | | 42 | | | | 46 | | | | 68 | | | | 53 | | | | 48 | |
Net assets at end of period
(000 omitted) | | | $64,496 | | | | $56,413 | | | | $89,946 | | | | $89,160 | | | | $88,020 | | | | $89,702 | |
| | | |
| Supplemental Ratios (%): | | | | | | | | | | | | | |
Ratio of expenses to average net
assets after expense reductions
excluding short sale expenses
and interest expense and fees (f) | | | 1.71 | (a) | | | 1.72 | | | | 1.75 | (c) | | | 1.79 | | | | 1.79 | | | | 1.80 | |
See Notes to Financial Statements
20
Financial Highlights – continued
| | | | | | | | | | | | | | | | | | | | | | | | |
| | | Six months
ended
2/28/19 | | | Year ended | |
| Class I | | 8/31/18 | | | 8/31/17 | | | 8/31/16 | | | 8/31/15 | | | 8/31/14 | |
| | | (unaudited) | | | | | | | | | | | | | | | | |
Net asset value, beginning of period | | | $36.12 | | | | $32.07 | | | | $28.10 | | | | $28.44 | | | | $30.43 | | | | $24.82 | |
| | | |
| Income (loss) from investment operations | | | | | | | | | | | | | |
Net investment income (loss) (d) | | | $0.18 | | | | $0.30 | | | | $0.26 | (c) | | | $0.29 | | | | $0.23 | | | | $0.21 | |
Net realized and unrealized
gain (loss) | | | (1.11 | ) | | | 5.93 | | | | 4.76 | | | | 2.15 | | | | 0.13 | | | | 5.62 | |
Total from investment operations | | | $(0.93 | ) | | | $6.23 | | | | $5.02 | | | | $2.44 | | | | $0.36 | | | | $5.83 | |
| | | |
| Less distributions declared to shareholders | | | | | | | | | | | | | |
From net investment income | | | $(0.24 | ) | | | $(0.24 | ) | | | $(0.24 | ) | | | $(0.19 | ) | | | $(0.20 | ) | | | $(0.22 | ) |
From net realized gain | | | (2.82 | ) | | | (1.94 | ) | | | (0.81 | ) | | | (2.59 | ) | | | (2.15 | ) | | | — | |
Total distributions declared to
shareholders | | | $(3.06 | ) | | | $(2.18 | ) | | | $(1.05 | ) | | | $(2.78 | ) | | | $(2.35 | ) | | | $(0.22 | ) |
Net asset value, end of period (x) | | | $32.13 | | | | $36.12 | | | | $32.07 | | | | $28.10 | | | | $28.44 | | | | $30.43 | |
Total return (%) (r)(s)(t)(x) | | | (1.97 | )(n) | | | 20.21 | | | | 18.38 | (c) | | | 9.36 | | | | 1.23 | | | | 23.61 | |
| | | |
Ratios (%) (to average net assets)
and Supplemental data: | | | | | | | | | | | | | |
Expenses before expense
reductions (f) | | | 0.74 | (a) | | | 0.75 | | | | 0.78 | (c) | | | 0.81 | | | | 0.80 | | | | 0.80 | |
Expenses after expense
reductions (f) | | | 0.73 | (a) | | | 0.74 | | | | 0.77 | (c) | | | 0.80 | | | | 0.80 | | | | 0.80 | |
Net investment income (loss) | | | 1.11 | (a) | | | 0.88 | | | | 0.88 | (c) | | | 1.07 | | | | 0.77 | | | | 0.73 | |
Portfolio turnover | | | 24 | (n) | | | 42 | | | | 46 | | | | 68 | | | | 53 | | | | 48 | |
Net assets at end of period
(000 omitted) | | | $342,839 | | | | $246,779 | | | | $122,055 | | | | $61,739 | | | | $49,768 | | | | $45,089 | |
| | | |
| Supplemental Ratios (%): | | | | | | | | | | | | | |
Ratio of expenses to average net
assets after expense reductions
excluding short sale expenses
and interest expense and fees (f) | | | 0.71 | (a) | | | 0.73 | | | | 0.75 | (c) | | | 0.79 | | | | 0.79 | | | | 0.80 | |
See Notes to Financial Statements
21
Financial Highlights – continued
| | | | | | | | | | | | | | | | | | | | | | | | |
| | | Six months
ended
2/28/19 | | | Year ended | |
| Class R1 | | 8/31/18 | | | 8/31/17 | | | 8/31/16 | | | 8/31/15 | | | 8/31/14 | |
| | | (unaudited) | | | | | | | | | | | | | | | | |
Net asset value, beginning of period | | | $29.82 | | | | $26.86 | | | | $23.70 | | | | $24.45 | | | | $26.54 | | | | $21.69 | |
| | | |
| Income (loss) from investment operations | | | | | | | | | | | | | |
Net investment income (loss) (d) | | | $0.01 | | | | $(0.04 | ) | | | $(0.03 | )(c) | | | $(0.02 | ) | | | $(0.06 | ) | | | $(0.06 | ) |
Net realized and unrealized
gain (loss) | | | (0.93 | ) | | | 4.94 | | | | 4.00 | | | | 1.86 | | | | 0.12 | | | | 4.91 | |
Total from investment operations | | | $(0.92 | ) | | | $4.90 | | | | $3.97 | | | | $1.84 | | | | $0.06 | | | | $4.85 | |
| | | |
| Less distributions declared to shareholders | | | | | | | | | | | | | |
From net investment income | | | $— | | | | $— | | | | $— | | | | $— | | | | $— | | | | $(0.00 | )(w) |
From net realized gain | | | (2.82 | ) | | | (1.94 | ) | | | (0.81 | ) | | | (2.59 | ) | | | (2.15 | ) | | | — | |
Total distributions declared to
shareholders | | | $(2.82 | ) | | | $(1.94 | ) | | | $(0.81 | ) | | | $(2.59 | ) | | | $(2.15 | ) | | | $(0.00 | )(w) |
Net asset value, end of period (x) | | | $26.08 | | | | $29.82 | | | | $26.86 | | | | $23.70 | | | | $24.45 | | | | $26.54 | |
Total return (%) (r)(s)(t)(x) | | | (2.44 | )(n) | | | 19.00 | | | | 17.19 | (c) | | | 8.29 | | | | 0.22 | | | | 22.38 | |
| | | |
Ratios (%) (to average net assets)
and Supplemental data: | | | | | | | | | | | | | |
Expenses before expense
reductions (f) | | | 1.74 | (a) | | | 1.75 | | | | 1.78 | (c) | | | 1.82 | | | | 1.80 | | | | 1.80 | |
Expenses after expense
reductions (f) | | | 1.73 | (a) | | | 1.74 | | | | 1.77 | (c) | | | 1.81 | | | | 1.80 | | | | 1.80 | |
Net investment income (loss) | | | 0.06 | (a) | | | (0.14 | ) | | | (0.13 | )(c) | | | (0.09 | ) | | | (0.23 | ) | | | (0.26 | ) |
Portfolio turnover | | | 24 | (n) | | | 42 | | | | 46 | | | | 68 | | | | 53 | | | | 48 | |
Net assets at end of period
(000 omitted) | | | $3,044 | | | | $3,448 | | | | $3,103 | | | | $2,935 | | | | $3,625 | | | | $4,132 | |
| | | |
| Supplemental Ratios (%): | | | | | | | | | | | | | |
Ratio of expenses to average net
assets after expense reductions
excluding short sale expenses
and interest expense and fees (f) | | | 1.71 | (a) | | | 1.73 | | | | 1.75 | (c) | | | 1.80 | | | | 1.79 | | | | 1.80 | |
See Notes to Financial Statements
22
Financial Highlights – continued
| | | | | | | | | | | | | | | | | | | | | | | | |
| | | Six months
ended
2/28/19 | | | Year ended | |
| Class R2 | | 8/31/18 | | | 8/31/17 | | | 8/31/16 | | | 8/31/15 | | | 8/31/14 | |
| | | (unaudited) | | | | | | | | | | | | | | | | |
Net asset value, beginning of period | | | $33.33 | | | | $29.75 | | | | $26.12 | | | | $26.62 | | | | $28.59 | | | | $23.35 | |
| | | |
| Income (loss) from investment operations | | | | | | | | | | | | | |
Net investment income (loss) (d) | | | $0.08 | | | | $0.11 | | | | $0.10 | (c) | | | $0.11 | | | | $0.07 | | | | $0.06 | |
Net realized and unrealized
gain (loss) | | | (1.02 | ) | | | 5.50 | | | | 4.43 | | | | 2.04 | | | | 0.14 | | | | 5.29 | |
Total from investment operations | | | $(0.94 | ) | | | $5.61 | | | | $4.53 | | | | $2.15 | | | | $0.21 | | | | $5.35 | |
| | | |
| Less distributions declared to shareholders | | | | | | | | | | | | | |
From net investment income | | | $(0.04 | ) | | | $(0.09 | ) | | | $(0.09 | ) | | | $(0.06 | ) | | | $(0.03 | ) | | | $(0.11 | ) |
From net realized gain | | | (2.82 | ) | | | (1.94 | ) | | | (0.81 | ) | | | (2.59 | ) | | | (2.15 | ) | | | — | |
Total distributions declared to
shareholders | | | $(2.86 | ) | | | $(2.03 | ) | | | $(0.90 | ) | | | $(2.65 | ) | | | $(2.18 | ) | | | $(0.11 | ) |
Net asset value, end of period (x) | | | $29.53 | | | | $33.33 | | | | $29.75 | | | | $26.12 | | | | $26.62 | | | | $28.59 | |
Total return (%) (r)(s)(t)(x) | | | (2.23 | )(n) | | | 19.61 | | | | 17.80 | (c) | | | 8.82 | | | | 0.75 | | | | 22.96 | |
| | | |
Ratios (%) (to average net assets)
and Supplemental data: | | | | | | | | | | | | | |
Expenses before expense
reductions (f) | | | 1.24 | (a) | | | 1.25 | | | | 1.28 | (c) | | | 1.32 | | | | 1.30 | | | | 1.30 | |
Expenses after expense
reductions (f) | | | 1.22 | (a) | | | 1.24 | | | | 1.27 | (c) | | | 1.31 | | | | 1.30 | | | | 1.30 | |
Net investment income (loss) | | | 0.56 | (a) | | | 0.35 | | | | 0.38 | (c) | | | 0.46 | | | | 0.27 | | | | 0.24 | |
Portfolio turnover | | | 24 | (n) | | | 42 | | | | 46 | | | | 68 | | | | 53 | | | | 48 | |
Net assets at end of period
(000 omitted) | | | $13,019 | | | | $15,202 | | | | $16,508 | | | | $15,932 | | | | $16,332 | | | | $19,434 | |
| | | |
| Supplemental Ratios (%): | | | | | | | | | | | | | |
Ratio of expenses to average net
assets after expense reductions
excluding short sale expenses
and interest expense and fees (f) | | | 1.21 | (a) | | | 1.22 | | | | 1.25 | (c) | | | 1.29 | | | | 1.29 | | | | 1.30 | |
See Notes to Financial Statements
23
Financial Highlights – continued
| | | | | | | | | | | | | | | | | | | | | | | | |
| | | Six months
ended
2/28/19 | | | Year ended | |
| Class R3 | | 8/31/18 | | | 8/31/17 | | | 8/31/16 | | | 8/31/15 | | | 8/31/14 | |
| | | (unaudited) | | | | | | | | | | | | | | | | |
Net asset value, beginning of period | | | $34.11 | | | | $30.33 | | | | $26.61 | | | | $27.10 | | | | $29.10 | | | | $23.75 | |
| | | |
| Income (loss) from investment operations | | | | | | | | | | | | | |
Net investment income (loss) (d) | | | $0.12 | | | | $0.20 | | | | $0.17 | (c) | | | $0.18 | | | | $0.15 | | | | $0.13 | |
Net realized and unrealized
gain (loss) | | | (1.05 | ) | | | 5.61 | | | | 4.52 | | | | 2.06 | | | | 0.13 | | | | 5.39 | |
Total from investment operations | | | $(0.93 | ) | | | $5.81 | | | | $4.69 | | | | $2.24 | | | | $0.28 | | | | $5.52 | |
| | | |
| Less distributions declared to shareholders | | | | | | | | | | | | | |
From net investment income | | | $(0.17 | ) | | | $(0.09 | ) | | | $(0.16 | ) | | | $(0.14 | ) | | | $(0.13 | ) | | | $(0.17 | ) |
From net realized gain | | | (2.82 | ) | | | (1.94 | ) | | | (0.81 | ) | | | (2.59 | ) | | | (2.15 | ) | | | — | |
Total distributions declared to
shareholders | | | $(2.99 | ) | | | $(2.03 | ) | | | $(0.97 | ) | | | $(2.73 | ) | | | $(2.28 | ) | | | $(0.17 | ) |
Net asset value, end of period (x) | | | $30.19 | | | | $34.11 | | | | $30.33 | | | | $26.61 | | | | $27.10 | | | | $29.10 | |
Total return (%) (r)(s)(t)(x) | | | (2.12 | )(n) | | | 19.91 | | | | 18.10 | (c) | | | 9.06 | | | | 0.99 | | | | 23.32 | |
| | | |
Ratios (%) (to average net assets)
and Supplemental data: | | | | | | | | | | | | | |
Expenses before expense
reductions (f) | | | 0.99 | (a) | | | 1.00 | | | | 1.02 | (c) | | | 1.07 | | | | 1.05 | | | | 1.05 | |
Expenses after expense
reductions (f) | | | 0.98 | (a) | | | 0.99 | | | | 1.02 | (c) | | | 1.06 | | | | 1.05 | | | | 1.05 | |
Net investment income (loss) | | | 0.83 | (a) | | | 0.61 | | | | 0.62 | (c) | | | 0.71 | | | | 0.52 | | | | 0.49 | |
Portfolio turnover | | | 24 | (n) | | | 42 | | | | 46 | | | | 68 | | | | 53 | | | | 48 | |
Net assets at end of period
(000 omitted) | | | $40,216 | | | | $34,916 | | | | $28,075 | | | | $77,217 | | | | $65,775 | | | | $68,977 | |
| | | |
| Supplemental Ratios (%): | | | | | | | | | | | | | |
Ratio of expenses to average net
assets after expense reductions
excluding short sale expenses
and interest expense and fees (f) | | | 0.96 | (a) | | | 0.98 | | | | 1.00 | (c) | | | 1.04 | | | | 1.04 | | | | 1.05 | |
See Notes to Financial Statements
24
Financial Highlights – continued
| | | | | | | | | | | | | | | | | | | | | | | | |
| | | Six months
ended
2/28/19 | | | Year ended | |
| Class R4 | | 8/31/18 | | | 8/31/17 | | | 8/31/16 | | | 8/31/15 | | | 8/31/14 | |
| | | (unaudited) | | | | | | | | | | | | | | | | |
Net asset value, beginning of period | | | $34.48 | | | | $30.71 | | | | $26.93 | | | | $27.39 | | | | $29.40 | | | | $23.99 | |
| | | |
| Income (loss) from investment operations | | | | | | | | | | | | | |
Net investment income (loss) (d) | | | $0.16 | | | | $0.28 | | | | $0.25 | (c) | | | $0.23 | | | | $0.22 | | | | $0.20 | |
Net realized and unrealized
gain (loss) | | | (1.06 | ) | | | 5.67 | | | | 4.57 | | | | 2.11 | | | | 0.12 | | | | 5.44 | |
Total from investment operations | | | $(0.90 | ) | | | $5.95 | | | | $4.82 | | | | $2.34 | | | | $0.34 | | | | $5.64 | |
| | | |
| Less distributions declared to shareholders | | | | | | | | | | | | | |
From net investment income | | | $(0.23 | ) | | | $(0.24 | ) | | | $(0.23 | ) | | | $(0.21 | ) | | | $(0.20 | ) | | | $(0.23 | ) |
From net realized gain | | | (2.82 | ) | | | (1.94 | ) | | | (0.81 | ) | | | (2.59 | ) | | | (2.15 | ) | | | — | |
Total distributions declared to
shareholders | | | $(3.05 | ) | | | $(2.18 | ) | | | $(1.04 | ) | | | $(2.80 | ) | | | $(2.35 | ) | | | $(0.23 | ) |
Net asset value, end of period (x) | | | $30.53 | | | | $34.48 | | | | $30.71 | | | | $26.93 | | | | $27.39 | | | | $29.40 | |
Total return (%) (r)(s)(t)(x) | | | (1.98 | )(n) | | | 20.18 | | | | 18.40 | (c) | | | 9.36 | | | | 1.22 | | | | 23.62 | |
| | | |
Ratios (%) (to average net assets)
and Supplemental data: | | | | | | | | | | | | | |
Expenses before expense
reductions (f) | | | 0.74 | (a) | | | 0.75 | | | | 0.78 | (c) | | | 0.82 | | | | 0.80 | | | | 0.81 | |
Expenses after expense
reductions (f) | | | 0.73 | (a) | | | 0.74 | | | | 0.77 | (c) | | | 0.81 | | | | 0.80 | | | | 0.80 | |
Net investment income (loss) | | | 1.05 | (a) | | | 0.86 | | | | 0.87 | (c) | | | 0.90 | | | | 0.76 | | | | 0.72 | |
Portfolio turnover | | | 24 | (n) | | | 42 | | | | 46 | | | | 68 | | | | 53 | | | | 48 | |
Net assets at end of period
(000 omitted) | | | $24,118 | | | | $27,707 | | | | $22,494 | | | | $15,799 | | | | $21,159 | | | | $19,706 | |
| | | |
| Supplemental Ratios (%): | | | | | | | | | | | | | |
Ratio of expenses to average net
assets after expense reductions
excluding short sale expenses
and interest expense and fees (f) | | | 0.71 | (a) | | | 0.73 | | | | 0.76 | (c) | | | 0.79 | | | | 0.79 | | | | 0.80 | |
See Notes to Financial Statements
25
Financial Highlights – continued
| | | | | | | | | | | | | | | | | | | | | | | | |
| | | Six months
ended
2/28/19 | | | Year ended | |
| Class R6 | | 8/31/18 | | | 8/31/17 | | | 8/31/16 | | | 8/31/15 | | | 8/31/14 | |
| | | (unaudited) | | | | | | | | | | | | | | | | |
Net asset value, beginning of period | | | $36.18 | | | | $32.12 | | | | $28.13 | | | | $28.49 | | | | $30.47 | | | | $24.84 | |
| | | |
| Income (loss) from investment operations | | | | | | | | | | | | | |
Net investment income (loss) (d) | | | $0.19 | | | | $0.32 | | | | $0.29 | (c) | | | $0.58 | | | | $0.24 | | | | $0.23 | |
Net realized and unrealized
gain (loss) | | | (1.11 | ) | | | 5.95 | | | | 4.77 | | | | 1.89 | | | | 0.15 | | | | 5.64 | |
Total from investment operations | | | $(0.92 | ) | | | $6.27 | | | | $5.06 | | | | $2.47 | | | | $0.39 | | | | $5.87 | |
| | | |
| Less distributions declared to shareholders | | | | | | | | | | | | | |
From net investment income | | | $(0.26 | ) | | | $(0.27 | ) | | | $(0.27 | ) | | | $(0.24 | ) | | | $(0.22 | ) | | | $(0.24 | ) |
From net realized gain | | | (2.82 | ) | | | (1.94 | ) | | | (0.81 | ) | | | (2.59 | ) | | | (2.15 | ) | | | — | |
Total distributions declared to
shareholders | | | $(3.08 | ) | | | $(2.21 | ) | | | $(1.07 | ) | | | $(2.83 | ) | | | $(2.37 | ) | | | $(0.24 | ) |
Net asset value, end of period (x) | | | $32.18 | | | | $36.18 | | | | $32.12 | | | | $28.13 | | | | $28.49 | | | | $30.47 | |
Total return (%) (r)(s)(t)(x) | | | (1.94 | )(n) | | | 20.29 | | | | 18.49 | (c) | | | 9.46 | | | | 1.34 | | | | 23.73 | |
| | | |
Ratios (%) (to average net assets)
and Supplemental data: | | | | | | | | | | | | | |
Expenses before expense
reductions (f) | | | 0.66 | (a) | | | 0.67 | | | | 0.69 | (c) | | | 0.70 | | | | 0.71 | | | | 0.71 | |
Expenses after expense
reductions (f) | | | 0.65 | (a) | | | 0.66 | | | | 0.68 | (c) | | | 0.69 | | | | 0.70 | | | | 0.71 | |
Net investment income (loss) | | | 1.16 | (a) | | | 0.95 | | | | 0.97 | (c) | | | 2.10 | | | | 0.82 | | | | 0.80 | |
Portfolio turnover | | | 24 | (n) | | | 42 | | | | 46 | | | | 68 | | | | 53 | | | | 48 | |
Net assets at end of period
(000 omitted) | | | $636,177 | | | | $577,588 | | | | $393,153 | | | | $300,078 | | | | $6,198 | | | | $2,492 | |
| | | |
| Supplemental Ratios (%): | | | | | | | | | | | | | |
Ratio of expenses to average net
assets after expense reductions
excluding short sale expenses
and interest expense and fees (f) | | | 0.63 | (a) | | | 0.65 | | | | 0.66 | (c) | | | 0.68 | | | | 0.69 | | | | 0.71 | |
See Notes to Financial Statements
26
Financial Highlights – continued
| (c) | Amount reflects aone-time reimbursement of expenses by the custodian (or former custodian) without which net investment income and performance would be lower and expenses would be higher. |
| (d) | Per share data is based on average shares outstanding. |
| (f) | Ratios do not reflect reductions from fees paid indirectly, if applicable. |
| (r) | Certain expenses have been reduced without which performance would have been lower. |
| (s) | From time to time the fund may receive proceeds from litigation settlements, without which performance would be lower. Excluding the effect of the proceeds received from anon-recurring litigation settlement against Household International, Inc., the total return for the year ended August 31, 2017 would have been lower by approximately 0.85%. |
| (t) | Total returns do not include any applicable sales charges. |
| (w) | Per share amount was less than $0.01. |
| (x) | The net asset values and total returns have been calculated on net assets which include adjustments made in accordance with U.S. generally accepted accounting principles required at period end for financial reporting purposes. |
See Notes to Financial Statements
27
NOTES TO FINANCIAL STATEMENTS
(unaudited)
(1) Business and Organization
MFS Core Equity Fund (the fund) is a diversified series of MFS Series Trust I (the trust). The trust is organized as a Massachusetts business trust and is registered under the Investment Company Act of 1940, as amended, as anopen-end management investment company.
The fund is an investment company and accordingly follows the investment company accounting and reporting guidance of the Financial Accounting Standards Board (FASB) Accounting Standards Codification Topic 946 Financial Services – Investment Companies.
(2) Significant Accounting Policies
General– The preparation of financial statements in conformity with U.S. generally accepted accounting principles requires management to make estimates and assumptions that affect the reported amounts of assets and liabilities, and disclosure of contingent assets and liabilities at the date of the financial statements and the reported amounts of increases and decreases in net assets from operations during the reporting period. Actual results could differ from those estimates. In the preparation of these financial statements, management has evaluated subsequent events occurring after the date of the fund’s Statement of Assets and Liabilities through the date that the financial statements were issued.
In August 2018, the Securities and Exchange Commission (SEC) released its Final Rule on Disclosure Update and Simplification (the “Final Rule”) which is intended to simplify an issuer’s disclosure compliance efforts by removing redundant or outdated disclosure requirements without significantly altering the mix of information provided to investors. Effective with the current reporting period, the fund adopted the Final Rule with the impacts being that the fund is no longer required to present the components of distributable earnings on the Statement of Assets and Liabilities or the sources of distributions to shareholders and the amount of undistributed net investment income on the Statements of Changes in Net Assets.
Balance Sheet Offsetting– The fund’s accounting policy with respect to balance sheet offsetting is that, absent an event of default by the counterparty or a termination of the agreement, the International Swaps and Derivatives Association (ISDA) Master Agreement, or similar agreement, does not result in an offset of reported amounts of financial assets and financial liabilities in the Statement of Assets and Liabilities across transactions between the fund and the applicable counterparty. The fund’s right to setoff may be restricted or prohibited by the bankruptcy or insolvency laws of the particular jurisdiction to which a specific master netting agreement counterparty is subject. Balance sheet offsetting disclosures, to the extent applicable to the fund, have been included in the fund’s Significant Accounting Policies note under the captions for each of the fund’sin-scope financial instruments and transactions.
Investment Valuations– Equity securities, including restricted equity securities and equity securities sold short, are generally valued at the last sale or official closing price on their primary market or exchange as provided by a third-party pricing service. Equity securities, for which there were no sales reported that day, are generally valued at the
28
Notes to Financial Statements (unaudited) – continued
last quoted daily bid quotation on their primary market or exchange as provided by a third-party pricing service. Equity securities sold short, for which there were no sales reported for that day, are generally valued at the last quoted daily ask quotation on their primary market or exchange as provided by a third-party pricing service.Short-term instruments with a maturity at issuance of 60 days or less may be valued at amortized cost, which approximates market value.Open-end investment companies are generally valued at net asset value per share. Securities and other assets generally valued on the basis of information from a third-party pricing service may also be valued at a broker/dealer bid quotation. In determining values, third-party pricing services can utilize both transaction data and market information such as yield, quality, coupon rate, maturity, type of issue, trading characteristics, and other market data. The values of foreign securities and other assets and liabilities expressed in foreign currencies are converted to U.S. dollars using the mean of bid and asked prices for rates provided by a third-party pricing service.
The Board of Trustees has delegated primary responsibility for determining or causing to be determined the value of the fund’s investments (including any fair valuation) to the adviser pursuant to valuation policies and procedures approved by the Board. If the adviser determines that reliable market quotations are not readily available, investments are valued at fair value as determined in good faith by the adviser in accordance with such procedures under the oversight of the Board of Trustees. Under the fund’s valuation policies and procedures, market quotations are not considered to be readily available for most types of debt instruments and floating rate loans and many types of derivatives. These investments are generally valued at fair value based on information from third-party pricing services. In addition, investments may be valued at fair value if the adviser determines that an investment’s value has been materially affected by events occurring after the close of the exchange or market on which the investment is principally traded (such as foreign exchange or market) and prior to the determination of the fund’s net asset value, or after the halting of trading of a specific security where trading does not resume prior to the close of the exchange or market on which the security is principally traded. Events that occur on a frequent basis after foreign markets close (such as developments in foreign markets and significant movements in the U.S. markets) and prior to the determination of the fund’s net asset value may be deemed to have a material effect on the value of securities traded in foreign markets. Accordingly, the fund’s foreign equity securities may often be valued at fair value. The adviser generally relies on third-party pricing services or other information (such as the correlation with price movements of similar securities in the same or other markets; the type, cost and investment characteristics of the security; the business and financial condition of the issuer; and trading and other market data) to assist in determining whether to fair value and at what value to fair value an investment. The value of an investment for purposes of calculating the fund’s net asset value can differ depending on the source and method used to determine value. When fair valuation is used, the value of an investment used to determine the fund’s net asset value may differ from quoted or published prices for the same investment. There can be no assurance that the fund could obtain the fair value assigned to an investment if it were to sell the investment at the same time at which the fund determines its net asset value per share.
29
Notes to Financial Statements (unaudited) – continued
Various inputs are used in determining the value of the fund’s assets or liabilities. These inputs are categorized into three broad levels. In certain cases, the inputs used to measure fair value may fall into different levels of the fair value hierarchy. In such cases, an investment’s level within the fair value hierarchy is based on the lowest level of input that is significant to the fair value measurement. The fund’s assessment of the significance of a particular input to the fair value measurement in its entirety requires judgment, and considers factors specific to the investment. Level 1 includes unadjusted quoted prices in active markets for identical assets or liabilities. Level 2 includes other significant observable market-based inputs (including quoted prices for similar securities, interest rates, prepayment speed, and credit risk). Level 3 includes unobservable inputs, which may include the adviser’s own assumptions in determining the fair value of investments. The following is a summary of the levels used as of February 28, 2019 in valuing the fund’s assets or liabilities:
| | | | | | | | | | | | | | | | |
| | | | |
| Financial Instruments | | Level 1 | | | Level 2 | | | Level 3 | | | Total | |
| Equity Securities | | | $2,335,613,820 | | | | $— | | | | $69,304 | | | | $2,335,683,124 | |
| Mutual Funds | | | 35,334,535 | | | | — | | | | — | | | | 35,334,535 | |
| Total | | | $2,370,948,355 | | | | $— | | | | $69,304 | | | | $2,371,017,659 | |
| | | | |
| Short Sales | | | $(8,532,422 | ) | | | $— | | | | $— | | | | $(8,532,422 | ) |
For further information regarding security characteristics, see the Portfolio of Investments.
The following is a reconciliation of level 3 assets for which significant unobservable inputs were used to determine fair value. The table presents the activity of level 3 securities held at the beginning and the end of the period.
| | | | |
| |
| | | Equity Securities | |
| Balance as of 8/31/18 | | | $73,250 | |
Change in unrealized appreciation or depreciation | | | (3,946 | ) |
| Balance as of 2/28/19 | | | $69,304 | |
The net change in unrealized appreciation or depreciation from investments held as level 3 at February 28, 2019 is $(3,946). At February 28, 2019, the fund held one level 3 security.
Foreign Currency Translation– Purchases and sales of foreign investments, income, and expenses are converted into U.S. dollars based upon currency exchange rates prevailing on the respective dates of such transactions or on the reporting date for foreign denominated receivables and payables. Gains and losses attributable to foreign currency exchange rates on sales of securities are recorded for financial statement purposes as net realized gains and losses on investments. Gains and losses attributable to foreign exchange rate movements on receivables, payables, income and expenses are recorded for financial statement purposes as foreign currency transaction gains and losses. That portion of both realized and unrealized gains and losses on investments that results from fluctuations in foreign currency exchange rates is not separately disclosed.
Short Sales– The fund entered into short sales whereby it sells a security it does not own in anticipation of a decline in the value of that security. The fund will realize a gain
30
Notes to Financial Statements (unaudited) – continued
if the security price decreases and a loss if the security price increases between the date of the short sale and the date on which the fund replaces the borrowed security. Losses from short sales can exceed the proceeds of the security sold; and they can also exceed the potential loss from an ordinary buy and sell transaction. The amount of any premium, dividends, or interest the fund may be required to pay in connection with a short sale will be recognized as a fund expense. During the six months ended February 28, 2019, this expense amounted to $189,426. The fund segregates cash or marketable securities in an amount that, when combined with the amount of proceeds from the short sale deposited with the broker, at least equals the current market value of the security sold short.
Security Loans– Under its Securities Lending Agency Agreement with the fund, State Street Bank and Trust Company, as lending agent, loans the securities of the fund to certain qualified institutions (the “Borrowers”) approved by the fund. Security loans can be terminated at the discretion of either the lending agent or the fund and the related securities must be returned within the earlier of the standard trade settlement period for such securities or within three business days. The loans are collateralized by cash and/or U.S. Treasury and federal agency obligations in an amount typically at least equal to the market value of the securities loaned. On loans collateralized by cash, the cash collateral is invested in a money market fund. The market value of the loaned securities is determined at the close of business of the fund and any additional required collateral is delivered to the fund on the next business day. The lending agent provides the fund with indemnification against Borrower default. In the event of Borrower default, the lending agent will, for the benefit of the fund, either purchase securities identical to those loaned or, when such purchase is commercially impracticable, pay the fund the market value of the loaned securities. In return, the lending agent assumes the fund’s rights to the related collateral. If the collateral value is less than the cost to purchase identical securities, the lending agent is responsible for the shortfall, but only to the extent that such shortfall is not due to a decline in collateral value resulting from collateral reinvestment for which the fund bears the risk of loss. At period end, the fund had investment securities on loan, all of which were classified as equity securities in the fund’s Portfolio of Investments, with a fair value of $15,405,072. The fair value of the fund’s investment securities on loan and a related liability of $15,537,524 for cash collateral received on securities loaned are both presented gross in the Statement of Assets and Liabilities. The collateral on securities loaned exceeded the value of securities on loan at period end. The liability for cash collateral for securities loaned is carried at fair value, which is categorized as level 2 within the fair value hierarchy. A portion of the income generated upon investment of the collateral is remitted to the Borrowers, and the remainder is allocated between the fund and the lending agent. On loans collateralized by U.S. Treasury and/or federal agency obligations, a fee is received from the Borrower, and is allocated between the fund and the lending agent. Income from securities lending is separately reported in the Statement of Operations. The dividend and interest income earned on the securities loaned is accounted for in the same manner as other dividend and interest income.
Indemnifications– Under the fund’s organizational documents, its officers and Trustees may be indemnified against certain liabilities and expenses arising out of the performance of their duties to the fund. Additionally, in the normal course of business,
31
Notes to Financial Statements (unaudited) – continued
the fund enters into agreements with service providers that may contain indemnification clauses. The fund’s maximum exposure under these agreements is unknown as this would involve future claims that may be made against the fund that have not yet occurred.
Investment Transactions and Income– Investment transactions are recorded on the trade date. Dividends received in cash are recorded on theex-dividend date. Certain dividends from foreign securities will be recorded when the fund is informed of the dividend if such information is obtained subsequent to theex-dividend date. Dividend payments received in additional securities are recorded on theex-dividend date in an amount equal to the value of the security on such date.
The fund may receive proceeds from litigation settlements. Any proceeds received from litigation involving portfolio holdings are reflected in the Statement of Operations in realized gain/loss if the security has been disposed of by the fund or in unrealized gain/loss if the security is still held by the fund. Any other proceeds from litigation not related to portfolio holdings are reflected as other income in the Statement of Operations.
Tax Matters and Distributions– The fund intends to qualify as a regulated investment company, as defined under Subchapter M of the Internal Revenue Code, and to distribute all of its taxable income, including realized capital gains. As a result, no provision for federal income tax is required. The fund’s federal tax returns, when filed, will remain subject to examination by the Internal Revenue Service for a three year period. Management has analyzed the fund’s tax positions taken on federal and state tax returns for all open tax years and does not believe that there are any uncertain tax positions that require recognition of a tax liability. Foreign taxes, if any, have been accrued by the fund in the accompanying financial statements in accordance with the applicable foreign tax law. Foreign income taxes may be withheld by certain countries in which the fund invests. Additionally, capital gains realized by the fund on securities issued in or by certain foreign countries may be subject to capital gains tax imposed by those countries.
Distributions to shareholders are recorded on theex-dividend date. Income and capital gain distributions are determined in accordance with income tax regulations, which may differ from U.S. generally accepted accounting principles. Certain capital accounts in the financial statements are periodically adjusted for permanent differences in order to reflect their tax character. These adjustments have no impact on net assets or net asset value per share. Temporary differences which arise from recognizing certain items of income, expense, gain or loss in different periods for financial statement and tax purposes will reverse at some time in the future. Distributions in excess of net investment income or net realized gains are temporary overdistributions for financial statement purposes resulting from differences in the recognition or classification of income or distributions for financial statement and tax purposes.
Book/tax differences primarily relate to wash sale loss deferrals and treating a portion of the proceeds from redemptions as a distribution for tax purposes.
32
Notes to Financial Statements (unaudited) – continued
The tax character of distributions made during the current period will be determined at fiscal year end. The tax character of distributions declared to shareholders for the last fiscal year is as follows:
| | | | |
| |
| | | Year ended
8/31/18 | |
Ordinary income (including any
short-term capital gains) | | | $63,295,048 | |
| Long-term capital gains | | | 55,225,109 | |
| Total distributions | | | $118,520,157 | |
The federal tax cost and the tax basis components of distributable earnings were as follows:
| | | | |
| |
| As of 2/28/19 | | | |
| |
| Cost of investments | | | $1,921,672,422 | |
| Gross appreciation | | | 492,593,544 | |
| |
| Gross depreciation | | | (43,248,307 | ) |
| Net unrealized appreciation (depreciation) | | | $449,345,237 | |
| |
| As of 8/31/18 | | | |
| |
| Undistributed ordinary income | | | 26,916,872 | |
| Undistributed long-term capital gain | | | 172,760,670 | |
| Other temporary differences | | | 615,608 | |
| Net unrealized appreciation (depreciation) | | | 515,032,912 | |
The aggregate cost above includes prior fiscal year end tax adjustments, if applicable.
Multiple Classes of Shares of Beneficial Interest– The fund offers multiple classes of shares, which differ in their respective distribution and service fees. The fund’s income, realized and unrealized gain (loss), and common expenses are allocated to shareholders based on the daily net assets of each class. Dividends are declared separately for each class. Differences in per share dividend rates are generally due to differences in separate class expenses. Class B shares will convert to Class A shares approximately eight years after purchase. Class C shares will convert to Class A shares
33
Notes to Financial Statements (unaudited) – continued
approximately ten years after purchase. The fund’s distributions declared to shareholders as reported in the Statements of Changes in Net Assets are presented by class as follows:
| | | | | | | | | | | | | | | | |
| | | From net investment
income | | | From net realized
gain | |
| | | | |
| | | Six months
ended
2/28/19 | | | Year
ended
8/31/18 | | | Six months
ended
2/28/19 | | | Year
ended
8/31/18 | |
| Class A | | | $5,730,310 | | | | $5,294,029 | | | | $100,135,888 | | | | $61,975,380 | |
| Class B | | | — | | | | — | | | | 2,489,868 | | | | 1,817,848 | |
| Class C | | | — | | | | — | | | | 5,804,466 | | | | 6,378,072 | |
| Class I | | | 2,052,976 | | | | 1,130,413 | | | | 23,830,597 | | | | 8,961,582 | |
| Class R1 | | | — | | | | — | | | | 326,330 | | | | 223,893 | |
| Class R2 | | | 16,997 | | | | 49,766 | | | | 1,200,797 | | | | 1,036,306 | |
| Class R3 | | | 194,379 | | | | 88,607 | | | | 3,241,648 | | | | 1,845,694 | |
| Class R4 | | | 189,751 | | | | 177,188 | | | | 2,279,557 | | | | 1,420,076 | |
| Class R6 | | | 4,415,385 | | | | 3,390,003 | | | | 47,891,185 | | | | 24,731,300 | |
| Total | | | $12,599,798 | | | | $10,130,006 | | | | $187,200,336 | | | | $108,390,151 | |
(3) Transactions with Affiliates
Investment Adviser– The fund has an investment advisory agreement with MFS to provide overall investment management and related administrative services and facilities to the fund. The management fee is computed daily and paid monthly at the following annual rates based on the fund’s average daily net assets:
| | | | |
| Up to $500 million | | | 0.65 | % |
| In excess of $500 million and up to $2.5 billion | | | 0.55 | % |
| In excess of $2.5 billion | | | 0.50 | % |
MFS has agreed in writing to reduce its management fee by a specified amount if certain MFS mutual fund assets exceed thresholds agreed to by MFS and the fund’s Board of Trustees. For the six months ended February 28, 2019, this management fee reduction amounted to $105,749, which is included in the reduction of total expenses in the Statement of Operations. The management fee incurred for the six months ended February 28, 2019 was equivalent to an annual effective rate of 0.56% of the fund’s average daily net assets.
Distributor– MFS Fund Distributors, Inc. (MFD), a wholly-owned subsidiary of MFS, as distributor, received $190,859 for the six months ended February 28, 2019, as its portion of the initial sales charge on sales of Class A shares of the fund.
The Board of Trustees has adopted a distribution plan for certain share classes pursuant to Rule12b-1 of the Investment Company Act of 1940.
The fund’s distribution plan provides that the fund will pay MFD for services provided by MFD and financial intermediaries in connection with the distribution and servicing of certain share classes. One component of the plan is a distribution fee paid to MFD and another component of the plan is a service fee paid to MFD. MFD may subsequently pay all, or a portion, of the distribution and/or service fees to financial intermediaries.
34
Notes to Financial Statements (unaudited) – continued
Distribution Plan Fee Table:
| | | | | | | | | | | | | | | | | | | | |
| | | | | |
| | | Distribution
Fee Rate (d) | | | Service
Fee Rate (d) | | | Total
Distribution
Plan (d) | | | Annual
Effective
Rate (e) | | | Distribution
and Service
Fee | |
| Class A | | | — | | | | 0.25% | | | | 0.25% | | | | 0.24% | | | | $1,415,477 | |
| Class B | | | 0.75% | | | | 0.25% | | | | 1.00% | | | | 0.99% | | | | 123,246 | |
| Class C | | | 0.75% | | | | 0.25% | | | | 1.00% | | | | 1.00% | | | | 286,178 | |
| Class R1 | | | 0.75% | | | | 0.25% | | | | 1.00% | | | | 1.00% | | | | 15,695 | |
| Class R2 | | | 0.25% | | | | 0.25% | | | | 0.50% | | | | 0.49% | | | | 33,190 | |
| Class R3 | | | — | | | | 0.25% | | | | 0.25% | | | | 0.25% | | | | 42,792 | |
| Total Distribution and Service Fees | | | | $1,916,578 | |
| (d) | In accordance with the distribution plan for certain classes, the fund pays distribution and/or service fees equal to these annual percentage rates of each class’s average daily net assets. The distribution and service fee rates disclosed by class represent the current rates in effect at the end of the reporting period. Any rate changes, if applicable, are detailed below. |
| (e) | The annual effective rates represent actual fees incurred under the distribution plan for the six months ended February 28, 2019 based on each class’s average daily net assets. MFD has voluntarily agreed to rebate a portion of each class’s 0.25% service fee attributable to accounts for which MFD retains the 0.25% service fee except for accounts attributable to MFS or its affiliates’ seed money. For the six months ended February 28, 2019, this rebate amounted to $37,713, $718, $308, and $440 for Class A, Class B, Class C, and Class R2, respectively, and is included in the reduction of total expenses in the Statement of Operations. |
Certain Class A shares are subject to a contingent deferred sales charge (CDSC) in the event of a shareholder redemption within 18 months of purchase. Class B shares are subject to a CDSC in the event of a shareholder redemption within six years of purchase. Class C shares are subject to a CDSC in the event of a shareholder redemption within 12 months of purchase. All contingent deferred sales charges are paid to MFD and during the six months ended February 28, 2019, were as follows:
| | | | |
| |
| | | Amount | |
| Class A | | | $7,322 | |
| Class B | | | 5,915 | |
| Class C | | | 3,085 | |
Shareholder Servicing Agent– MFS Service Center, Inc. (MFSC), a wholly-owned subsidiary of MFS, receives a fee from the fund for its services as shareholder servicing agent calculated as a percentage of the average daily net assets of the fund as determined periodically under the supervision of the fund’s Board of Trustees. For the six months ended February 28, 2019, the fee was $173,761, which equated to 0.0163% annually of the fund’s average daily net assets. MFSC also receives payment from the fund forout-of-pocket expenses,sub-accounting and other shareholder servicing costs which may be paid to affiliated and unaffiliated service providers. Class R6 shares do not incursub-accounting fees. For the six months ended February 28, 2019, theseout-of-pocket expenses,sub-accounting and other shareholder servicing costs amounted to $756,042.
Administrator– MFS provides certain financial, legal, shareholder communications, compliance, and other administrative services to the fund. Under an administrative services agreement, the fund reimburses MFS the costs incurred to provide these
35
Notes to Financial Statements (unaudited) – continued
services. The fund is charged an annual fixed amount of $17,500 plus a fee based on average daily net assets. The administrative services fee incurred for the six months ended February 28, 2019 was equivalent to an annual effective rate of 0.0137% of the fund’s average daily net assets.
Trustees’ and Officers’ Compensation– The fund pays compensation to independent Trustees in the form of a retainer, attendance fees, and additional compensation to Board and Committee chairpersons. The fund does not pay compensation directly to Trustees or officers of the fund who are also officers of the investment adviser, all of whom receive remuneration for their services to the fund from MFS. Certain officers and Trustees of the fund are officers or directors of MFS, MFD, and MFSC.
Prior to December 31, 2001, the fund had an unfunded defined benefit plan (“DB plan”) for independent Trustees. As of December 31, 2001, the Board took action to terminate the DB plan with respect to then-current and any future independent Trustees, such that the DB plan covers only certain of those former independent Trustees who retired on or before December 31, 2001. Effective January 1, 2002, accrued benefits under the DB plan for then-current independent Trustees who continued were credited to an unfunded retirement deferral plan (the “Retirement Deferral plan”), which was established for and exists solely with respect to these credited amounts, and is not available for other deferrals by these or other independent Trustees. Although the Retirement Deferral plan is unfunded, amounts deferred under the plan are periodically adjusted for investment experience as if they had been invested in shares of the fund. The DB plan resulted in a pension expense of $1,796 and the Retirement Deferral plan, which terminated on December 31, 2018, resulted in a net decrease in expense of $5,905. Both amounts are included in “Independent Trustees’ compensation” in the Statement of Operations for the six months ended February 28, 2019. The liability for deferred retirement benefits payable to those former independent Trustees under the DB plan amounted to $10,440 at February 28, 2019, and is included in “Payable for independent Trustees’ compensation” in the Statement of Assets and Liabilities.
Other– This fund and certain other funds managed by MFS (the funds) have entered into a service agreement (the ISO Agreement) which provides for payment of fees solely by the funds to Tarantino LLC in return for the provision of services of an Independent Senior Officer (ISO) for the funds. Frank L. Tarantino serves as the ISO and is an officer of the funds and the sole member of Tarantino LLC. The funds can terminate the ISO Agreement with Tarantino LLC at any time under the terms of the ISO Agreement. For the six months ended February 28, 2019, the fee paid by the fund under this agreement was $1,816 and is included in “Miscellaneous” expense in the Statement of Operations. MFS has agreed to bear all expenses associated with office space, other administrative support, and supplies provided to the ISO.
The fund invests in the MFS Institutional Money Market Portfolio which is managed by MFS and seeks current income consistent with preservation of capital and liquidity. This money market fund does not pay a management fee to MFS.
The fund is permitted to engage in purchase and sale transactions with funds and accounts for which MFS serves as investment adviser orsub-adviser (“cross-trades”)
36
Notes to Financial Statements (unaudited) – continued
pursuant to a policy adopted by the Board of Trustees. This policy has been designed to ensure that cross- trades conducted by the fund comply with Rule17a-7 under the Investment Company Act of 1940. During the six months ended February 28, 2019, the fund engaged in purchase and sale transactions pursuant to this policy, which amounted to $979,790 and $384,288, respectively. The sales transactions resulted in net realized gains (losses) of $60,348.
The adviser has voluntarily undertaken to reimburse the fund from its own resources on a quarterly basis for the cost of investment research embedded in the cost of the fund’s securities trades. This agreement may be rescinded at any time. For the six months ended February 28, 2019, this reimbursement amounted to $67,904, which is included in “Other” income in the Statement of Operations.
(4) Portfolio Securities
For the six months ended February 28, 2019, purchases and sales of investments, other than short sales, and short-term obligations, aggregated $748,569,809 and $508,585,513, respectively.
(5) Shares of Beneficial Interest
The fund’s Declaration of Trust permits the Trustees to issue an unlimited number of full and fractional shares of beneficial interest. Transactions in fund shares were as follows:
| | | | | | | | | | | | | | | | |
| | | Six months ended
2/28/19 | | | Year ended
8/31/18 | |
| | | | |
| | | Shares | | | Amount | | | Shares | | | Amount | |
| Shares sold | | | | | | | | | | | | | | | | |
Class A | | | 4,225,337 | | | | $128,171,039 | | | | 5,491,477 | | | | $174,636,099 | |
Class B | | | 80,724 | | | | 2,203,868 | | | | 105,996 | | | | 3,002,223 | |
Class C | | | 658,742 | | | | 16,871,268 | | | | 543,749 | | | | 15,277,509 | |
Class I | | | 5,860,848 | | | | 186,607,819 | | | | 4,501,467 | | | | 152,069,519 | |
Class R1 | | | 10,289 | | | | 270,596 | | | | 16,033 | | | | 450,900 | |
Class R2 | | | 67,904 | | | | 2,012,152 | | | | 78,215 | | | | 2,431,816 | |
Class R3 | | | 372,970 | | | | 11,406,407 | | | | 382,260 | | | | 12,171,048 | |
Class R4 | | | 62,024 | | | | 1,919,278 | | | | 125,527 | | | | 4,042,161 | |
Class R6 | | | 3,660,179 | | | | 119,311,022 | | | | 4,974,501 | | | | 168,636,329 | |
| | | 14,999,017 | | | | $468,773,449 | | | | 16,219,225 | | | | $532,717,604 | |
| | |
Shares issued to shareholders in
reinvestment of distributions | | | | | | | | | |
Class A | | | 3,617,906 | | | | $102,242,033 | | | | 2,102,570 | | | | $64,696,076 | |
Class B | | | 98,656 | | | | 2,438,781 | | | | 65,187 | | | | 1,780,902 | |
Class C | | | 228,301 | | | | 5,570,537 | | | | 229,209 | | | | 6,190,943 | |
Class I | | | 818,315 | | | | 24,524,913 | | | | 297,420 | | | | 9,651,266 | |
Class R1 | | | 13,385 | | | | 326,330 | | | | 8,295 | | | | 223,888 | |
Class R2 | | | 42,497 | | | | 1,172,074 | | | | 34,320 | | | | 1,031,307 | |
Class R3 | | | 121,888 | | | | 3,436,027 | | | | 63,007 | | | | 1,934,301 | |
Class R4 | | | 86,084 | | | | 2,452,539 | | | | 51,558 | | | | 1,597,264 | |
Class R6 | | | 1,640,473 | | | | 49,246,989 | | | | 790,253 | | | | 25,675,328 | |
| | | 6,667,505 | | | | $191,410,223 | | | | 3,641,819 | | | | $112,781,275 | |
37
Notes to Financial Statements (unaudited) – continued
| | | | | | | | | | | | | | | | |
| | | Six months ended
2/28/19 | | | Year ended
8/31/18 | |
| | | | |
| | | Shares | | | Amount | | | Shares | | | Amount | |
| Shares reacquired | | | | | | | | | | | | | | | | |
Class A | | | (2,564,024 | ) | | | $(77,019,444 | ) | | | (5,525,286 | ) | | | $(176,652,711 | ) |
Class B | | | (144,070 | ) | | | (3,793,108 | ) | | | (276,080 | ) | | | (7,828,387 | ) |
Class C | | | (305,892 | ) | | | (7,739,235 | ) | | | (2,229,182 | ) | | | (61,364,135 | ) |
Class I | | | (2,839,877 | ) | | | (87,756,829 | ) | | | (1,772,545 | ) | | | (59,813,814 | ) |
Class R1 | | | (22,578 | ) | | | (557,317 | ) | | | (24,215 | ) | | | (679,704 | ) |
Class R2 | | | (125,661 | ) | | | (3,671,098 | ) | | | (211,365 | ) | | | (6,644,813 | ) |
Class R3 | | | (186,672 | ) | | | (5,724,193 | ) | | | (347,308 | ) | | | (11,021,902 | ) |
Class R4 | | | (161,687 | ) | | | (4,771,345 | ) | | | (106,173 | ) | | | (3,416,345 | ) |
Class R6 | | | (1,496,924 | ) | | | (48,993,916 | ) | | | (2,043,451 | ) | | | (69,068,851 | ) |
| | | (7,847,385 | ) | | | $(240,026,485 | ) | | | (12,535,605 | ) | | | $(396,490,662 | ) |
| | | | |
| Net change | | | | | | | | | | | | | | | | |
Class A | | | 5,279,219 | | | | $153,393,628 | | | | 2,068,761 | | | | $62,679,464 | |
Class B | | | 35,310 | | | | 849,541 | | | | (104,897 | ) | | | (3,045,262 | ) |
Class C | | | 581,151 | | | | 14,702,570 | | | | (1,456,224 | ) | | | (39,895,683 | ) |
Class I | | | 3,839,286 | | | | 123,375,903 | | | | 3,026,342 | | | | 101,906,971 | |
Class R1 | | | 1,096 | | | | 39,609 | | | | 113 | | | | (4,916 | ) |
Class R2 | | | (15,260 | ) | | | (486,872 | ) | | | (98,830 | ) | | | (3,181,690 | ) |
Class R3 | | | 308,186 | | | | 9,118,241 | | | | 97,959 | | | | 3,083,447 | |
Class R4 | | | (13,579 | ) | | | (399,528 | ) | | | 70,912 | | | | 2,223,080 | |
Class R6 | | | 3,803,728 | | | | 119,564,095 | | | | 3,721,303 | | | | 125,242,806 | |
| | | 13,819,137 | | | | $420,157,187 | | | | 7,325,439 | | | | $249,008,217 | |
Class T shares were not publicly available for sale during the period. Please see the fund’s prospectus for details.
Effective June 1, 2019, purchases of the fund’s Class B shares are closed to new and existing investors subject to certain exceptions. Please see the fund’s prospectus for details.
(6) Line of Credit
The fund and certain other funds managed by MFS participate in a $1.25 billion unsecured committed line of credit, subject to a $1 billion sublimit, provided by a syndication of banks under a credit agreement. Borrowings may be made for temporary financing needs. Interest is charged to each fund, based on its borrowings, generally at a rate equal to the higher of the Overnight Bank Funding rate or daily one month LIBOR plus an agreed upon spread. A commitment fee, based on the average daily, unused portion of the committed line of credit, is allocated among the participating funds. In addition, the fund and other funds managed by MFS have established unsecured uncommitted borrowing arrangements with certain banks for temporary financing needs. Interest is charged to each fund, based on its borrowings, at a rate equal to the Overnight Bank Funding rate plus an agreed upon spread. For the six months ended February 28, 2019, the fund’s commitment fee and interest expense were $6,042 and $0, respectively, and are included in “Interest expense and fees” in the Statement of Operations.
38
Notes to Financial Statements (unaudited) – continued
(7) Investments in Affiliated Issuers
An affiliated issuer may be considered one in which the fund owns 5% or more of the outstanding voting securities, or a company which is under common control. For the purposes of this report, the fund assumes the following to be affiliated issuers:
| | | | | | | | | | | | | | | | | | | | |
| | | | | |
| Affiliated Issuers | | | | | Beginning
Shares/Par
Amount | | | Acquisitions
Shares/Par
Amount | | | Dispositions
Shares/Par
Amount | | | Ending
Shares/Par
Amount | |
MFS Institutional Money
Market Portfolio | | | | 30,298,308 | | | | 343,076,553 | | | | (353,577,850 | ) | | | 19,797,011 | |
| | | | | |
| Affiliated Issuers | | Realized
Gain (Loss) | | | Change in
Unrealized
Appreciation/
Depreciation | | | Capital Gain
Distributions | | | Dividend
Income | | | Ending
Value | |
| MFS Institutional Money Market Portfolio | | | $(9,437 | ) | | | $(2,318 | ) | | | $— | | | | $416,399 | | | | $19,797,011 | |
39
PROXY VOTING POLICIES AND INFORMATION
MFS votes proxies on behalf of the fund pursuant to proxy voting policies and procedures that are available without charge, upon request, by calling1-800-225-2606, by visitingmfs.com/proxyvoting, or by visiting the SEC’s Web site athttp://www.sec.gov.
Information regarding how the fund voted proxies relating to portfolio securities during the most recent twelve-month period ended June 30 is available by August 31 of each year without charge by visitingmfs.com/proxyvoting, or by visiting the SEC’s Web site athttp://www.sec.gov.
QUARTERLY PORTFOLIO DISCLOSURE
The fund files a complete schedule of portfolio holdings with the SEC for the first and third quarters of each fiscal year on Form N-Q. The fund’s Form N-Q is available on the SEC’s website athttp://www.sec.gov.A shareholder can obtain the portfolio holdings report for the first and third quarters of the fund’s fiscal year atmfs.com/openendfundsby choosing the fund’s name and then selecting the “Resources” tab and clicking on “Prospectus and Reports”.
FURTHER INFORMATION
From time to time, MFS may post important information about the fund or the MFS funds on the MFS web site (mfs.com). This information is available athttps://www.mfs.com/en-us/what-we-do/announcements.html or atmfs.com/openendfunds by choosing the fund’s name.
INFORMATION ABOUT FUND CONTRACTS AND LEGAL CLAIMS
The fund has entered into contractual arrangements with an investment adviser, administrator, distributor, shareholder servicing agent, 529 program manager (if applicable), and custodian who each provide services to the fund. Unless expressly stated otherwise, shareholders are not parties to, or intended beneficiaries of these contractual arrangements, and these contractual arrangements are not intended to create any shareholder right to enforce them against the service providers or to seek any remedy under them against the service providers, either directly or on behalf of the fund.
Under the Trust’s By-Laws and Declaration of Trust, any claims asserted against or on behalf of the MFS Funds, including claims against Trustees and Officers, must be brought in state and federal courts located within the Commonwealth of Massachusetts.
PROVISION OF FINANCIAL REPORTS AND SUMMARY PROSPECTUSES
The fund produces financial reports every six months and updates its summary prospectus and prospectus annually. To avoid sending duplicate copies of materials to households, only one copy of the fund’s annual and semiannual report and summary prospectus may be mailed to shareholders having the same last name and residential address on the fund’s records. However, any shareholder may contact MFSC (please see back cover for address and telephone number) to request that copies of these reports and summary prospectuses be sent personally to that shareholder.
40
Save paper with eDelivery.

| MFS® will send you prospectuses, |
reports, and proxies directly viae-mail so you will get information faster with less mailbox clutter.
To sign up:
1. Go to mfs.com.
2. Log in via MFS® Access.
3. Select eDelivery.
If you own your MFS fund shares through a financial institution or a retirement plan, MFS® TALK, MFS® Access, or eDelivery may not be available to you.
CONTACT
WEB SITE
mfs.com
MFS TALK
1-800-637-8255
24 hours a day
ACCOUNT SERVICE AND LITERATURE
Shareholders
1-800-225-2606
Financial advisors
1-800-343-2829
Retirement plan services
1-800-637-1255
MAILING ADDRESS
MFS Service Center, Inc.
P.O. Box 219341
Kansas City, MO 64121-9341
OVERNIGHT MAIL
MFS Service Center, Inc.
Suite 219341
430 W 7th Street
Kansas City, MO 64105-1407
Semiannual Report
February 28, 2019

MFS® Low Volatility Global Equity Fund

Beginning on January 1, 2021, as permitted by regulations adopted by the U.S. Securities and Exchange Commission, paper copies of the fund’s annual and semiannual shareholder reports will no longer be sent by mail, unless you specifically request paper copies of the reports. Instead, the complete reports will be made available on the fund’s Web site (funds.mfs.com), and you will be notified by mail each time a report is posted and provided with a Web site link to access the report.
If you are already signed up to receive shareholder reports by email, you will not be affected by this change and you need not take any action. You may sign up to receive shareholder reports and other communications from the fund by email by contacting your financial intermediary (such as a broker-dealer or bank) or, if you hold your shares directly with the fund, by calling 1-800-225-2606 or by logging on to MFS Access at mfs.com.
Beginning on January 1, 2019, you may elect to receive all future reports in paper free of charge. Contact your financial intermediary to request that you continue to receive paper copies of your shareholder reports. If you invest directly with the fund, you can call 1-800-225-2606 or send an email request to orderliterature@mfs.com to let the fund know that you wish to continue receiving paper copies of your shareholder reports. Your election to receive reports in paper will apply to all funds held in your account if you invest through your financial intermediary or all funds held with the MFS fund complex if you invest directly.
LVO-SEM
MFS® Low Volatility Global Equity Fund
CONTENTS
The report is prepared for the general information of shareholders.
It is authorized for distribution to prospective investors only when preceded or accompanied by a current prospectus.
NOT FDIC INSURED• MAY LOSE VALUE• NO BANK GUARANTEE

LETTER FROM THE EXECUTIVE CHAIRMAN
Dear Shareholders:
Markets experienced a bout of volatility in late 2018 as a result of higher interest rates, international trade friction and geopolitical uncertainty surrounding issues such as
Brexit. But concern over those issues dissipated in the early months of 2019 due to a more dovish posture by the U.S. Federal Reserve, progress toward a trade pact between the United States and China, and a consensus forming in the British Parliament against ano-deal Brexit. Over the past year, U.S. equities have outperformed their global peers due in part to fiscal stimulus undertaken in late 2017 and early 2019, which helped maintain healthy levels of U.S. economic output against a backdrop of slowing global growth, though returns, on average, have been modest.
Globally, inflation remains largely subdued thanks in part to stable
oil prices, though tight labor markets are keeping investors on the lookout for its potential reappearance. Rising incomes in many developed and emerging markets are supportive of gains in consumption, though a challenging backdrop for global trade has weighed on manufacturing in most regions. Should the U.S. and China reach a comprehensive trade agreement, sentiment could improve later this year.
As a global investment manager with nearly a century of expertise, MFS® firmly believes active risk management offers downside mitigation and may help improve investment outcomes. We built our active investment platform with this belief in mind. Our long-term perspective influences nearly every aspect of our business, ensuring that our investment decisions align with the investing time horizons of our clients.
Respectfully,

Robert J. Manning
Executive Chairman
MFS Investment Management
April 16, 2019
The opinions expressed in this letter are subject to change and may not be relied upon for investment advice. No forecasts can be guaranteed.
1
PORTFOLIO COMPOSITION
Portfolio structure

| | | | |
| Top ten holdings | |
| Johnson & Johnson | | | 2.6% | |
| Roche Holding AG | | | 2.5% | |
| STORE Capital Corp., REIT | | | 2.2% | |
| Terumo Corp. | | | 2.2% | |
| Adobe Systems, Inc. | | | 2.1% | |
| Taiwan Semiconductor Manufacturing Co. Ltd., ADR | | | 2.1% | |
| NICE Systems Ltd., ADR | | | 2.1% | |
| Pfizer, Inc. | | | 2.1% | |
| Walgreens Boots Alliance, Inc. | | | 1.9% | |
| ABC-MART, Inc. | | | 1.8% | |
|
Equity sectors (k) | |
| Financial Services | | | 16.7% | |
| Health Care | | | 16.4% | |
| Utilities & Communications | | | 15.3% | |
| Consumer Staples | | | 12.3% | |
| Technology | | | 8.4% | |
| Retailing | | | 6.1% | |
| Leisure | | | 6.1% | |
| Industrial Goods & Services | | | 3.6% | |
| Special Products & Services | | | 3.3% | |
| Basic Materials | | | 2.1% | |
| Energy | | | 1.5% | |
| Autos & Housing | | | 1.3% | |
| Transportation | | | 1.3% | |
| | | | |
| Issuer country weightings (x) | |
| United States | | | 48.6% | |
| Japan | | | 11.5% | |
| Canada | | | 7.8% | |
| Switzerland | | | 6.3% | |
| Hong Kong | | | 3.9% | |
| United Kingdom | | | 3.7% | |
| Germany | | | 2.6% | |
| Taiwan | | | 2.1% | |
| Israel | | | 2.1% | |
| Other Countries | | | 11.4% | |
|
| Currency exposure weightings (y) | |
| United States Dollar | | | 57.2% | |
| Japanese Yen | | | 11.5% | |
| Swiss Franc | | | 6.3% | |
| Euro | | | 4.6% | |
| British Pound Sterling | | | 3.7% | |
| Hong Kong Dollar | | | 3.0% | |
| New Taiwan Dollar | | | 2.1% | |
| Israeli Shekel | | | 2.1% | |
| Malaysian Ringgit | | | 1.8% | |
| Other Currencies | | | 7.7% | |
2
Portfolio Composition – continued
| (k) | The sectors set forth above and the associated portfolio composition are based on MFS’ own custom sector classification methodology. |
| (x) | Represents the portfolio’s exposure to issuer countries as a percentage of a portfolio’s net assets. For purposes of this presentation, United States includes Cash & Cash Equivalents. |
| (y) | Represents the portfolio’s exposure to a particular currency as a percentage of a portfolio’s net assets. For purposes of this presentation, United States Dollar includes Cash & Cash Equivalents. |
Cash & Cash Equivalents includes any cash, investments in money market funds, short-term securities, and other assets less liabilities. Please see the Statement of Assets and Liabilities for additional information related to the fund’s cash position and other assets and liabilities.
Percentages are based on net assets as of February 28, 2019.
The portfolio is actively managed and current holdings may be different.
3
EXPENSE TABLE
Fund expenses borne by the shareholders during the period, September 1, 2018 through February 28, 2019
As a shareholder of the fund, you incur two types of costs: (1) transaction costs, including sales charges (loads) on certain purchase or redemption payments, and (2) ongoing costs, including management fees; distribution and service(12b-1) fees; and other fund expenses. This example is intended to help you understand your ongoing costs (in dollars) of investing in the fund and to compare these costs with the ongoing costs of investing in other mutual funds.
The example is based on an investment of $1,000 invested at the beginning of the period and held for the entire period September 1, 2018 through February 28, 2019.
Actual Expenses
The first line for each share class in the following table provides information about actual account values and actual expenses. You may use the information in this line, together with the amount you invested, to estimate the expenses that you paid over the period. Simply divide your account value by $1,000 (for example, an $8,600 account value divided by $1,000 = 8.6), then multiply the result by the number in the first line under the heading entitled “Expenses Paid During Period” to estimate the expenses you paid on your account during this period.
Hypothetical Example for Comparison Purposes
The second line for each share class in the following table provides information about hypothetical account values and hypothetical expenses based on the fund’s actual expense ratio and an assumed rate of return of 5% per year before expenses, which is not the fund’s actual return. The hypothetical account values and expenses may not be used to estimate the actual ending account balance or expenses you paid for the period. You may use this information to compare the ongoing costs of investing in the fund and other funds. To do so, compare this 5% hypothetical example with the 5% hypothetical examples that appear in the shareholder reports of the other funds.
Please note that the expenses shown in the table are meant to highlight your ongoing costs only and do not reflect any transactional costs, such as sales charges (loads). Therefore, the second line for each share class in the table is useful in comparing ongoing costs only, and will not help you determine the relative total costs of owning different funds. In addition, if these transactional costs were included, your costs would have been higher.
4
Expense Table – continued
| | | | | | | | | | | | | | | | | | |
Share
Class | | | | Annualized
Expense
Ratio | | | Beginning
Account Value
9/01/18 | | | Ending
Account Value
2/28/19 | | | Expenses
Paid During
Period (p)
9/01/18-2/28/19 | |
| A | | Actual | | | 0.98% | | | | $1,000.00 | | | | $1,016.00 | | | | $4.90 | |
| | Hypothetical (h) | | | 0.98% | | | | $1,000.00 | | | | $1,019.93 | | | | $4.91 | |
| B | | Actual | | | 1.74% | | | | $1,000.00 | | | | $1,012.47 | | | | $8.68 | |
| | Hypothetical (h) | | | 1.74% | | | | $1,000.00 | | | | $1,016.17 | | | | $8.70 | |
| C | | Actual | | | 1.74% | | | | $1,000.00 | | | | $1,012.83 | | | | $8.68 | |
| | Hypothetical (h) | | | 1.74% | | | | $1,000.00 | | | | $1,016.17 | | | | $8.70 | |
| I | | Actual | | | 0.74% | | | | $1,000.00 | | | | $1,017.20 | | | | $3.70 | |
| | Hypothetical (h) | | | 0.74% | | | | $1,000.00 | | | | $1,021.12 | | | | $3.71 | |
| R1 | | Actual | | | 1.74% | | | | $1,000.00 | | | | $1,012.55 | | | | $8.68 | |
| | Hypothetical (h) | | | 1.74% | | | | $1,000.00 | | | | $1,016.17 | | | | $8.70 | |
| R2 | | Actual | | | 1.24% | | | | $1,000.00 | | | | $1,014.47 | | | | $6.19 | |
| | Hypothetical (h) | | | 1.24% | | | | $1,000.00 | | | | $1,018.65 | | | | $6.21 | |
| R3 | | Actual | | | 0.99% | | | | $1,000.00 | | | | $1,016.55 | | | | $4.95 | |
| | Hypothetical (h) | | | 0.99% | | | | $1,000.00 | | | | $1,019.89 | | | | $4.96 | |
| R4 | | Actual | | | 0.74% | | | | $1,000.00 | | | | $1,017.18 | | | | $3.70 | |
| | Hypothetical (h) | | | 0.74% | | | | $1,000.00 | | | | $1,021.12 | | | | $3.71 | |
| R6 | | Actual | | | 0.67% | | | | $1,000.00 | | | | $1,017.58 | | | | $3.35 | |
| | Hypothetical (h) | | | 0.67% | | | | $1,000.00 | | | | $1,021.47 | | | | $3.36 | |
| (h) | 5% class return per year before expenses. |
| (p) | “Expenses Paid During Period” are equal to each class’s annualized expense ratio, as shown above, multiplied by the average account value over the period, multiplied by 181/365 (to reflect theone-half year period). Expenses paid do not include any applicable sales charges (loads). If these transaction costs had been included, your costs would have been higher. |
Notes to Expense Table
Each class with a Rule12b-1 service fee is subject to a rebate of a portion of such fee. Such rebates are included in the expense ratios above and are outside of the expense limitation arrangement. For Class A shares, this rebate reduced the expense ratio above by 0.01%. See Note 3 in the Notes to Financial Statements for additional information.
5
PORTFOLIO OF INVESTMENTS
2/28/19 (unaudited)
The Portfolio of Investments is a complete list of all securities owned by your fund. It is categorized by broad-based asset classes.
| | | | | | | | |
| Common Stocks - 94.4% | | | | | | | | |
| | |
| Issuer | | Shares/Par | | | Value ($) | |
| Aerospace - 1.6% | | | | | | | | |
| Lockheed Martin Corp. | | | 13,624 | | | $ | 4,215,402 | |
| | |
| Airlines - 0.5% | | | | | | | | |
| Malaysia Airports Holdings Berhad | | | 627,800 | | | $ | 1,261,312 | |
| | |
| Apparel Manufacturers - 0.5% | | | | | | | | |
| Gildan Activewear, Inc. | | | 36,654 | | | $ | 1,307,448 | |
| | |
| Automotive - 0.8% | | | | | | | | |
| USS Co. Ltd. | | | 117,300 | | | $ | 2,134,162 | |
| | |
| Broadcasting - 0.7% | | | | | | | | |
| Publicis Groupe S.A. | | | 33,793 | | | $ | 1,873,075 | |
| | |
| Business Services - 3.3% | | | | | | | | |
| Auto Trader Group PLC | | | 202,974 | | | $ | 1,280,654 | |
| Forrester Research, Inc. | | | 59,216 | | | | 2,972,643 | |
| Infosys Technologies Ltd., ADR | | | 398,275 | | | | 4,269,508 | |
| | | | | | | | |
| | | | | | | $ | 8,522,805 | |
| Cable TV - 0.3% | | | | | | | | |
| Comcast Corp., “A” | | | 23,137 | | | $ | 894,708 | |
| | |
| Computer Software - 2.1% | | | | | | | | |
| Adobe Systems, Inc. (a) | | | 21,087 | | | $ | 5,535,338 | |
| | |
| Computer Software - Systems - 2.1% | | | | | | | | |
| NICE Systems Ltd., ADR (a) | | | 45,627 | | | $ | 5,369,842 | |
| | |
| Construction - 0.5% | | | | | | | | |
| Owens Corning | | | 25,309 | | | $ | 1,263,678 | |
| | |
| Consumer Products - 2.4% | | | | | | | | |
| Kimberly-Clark Corp. | | | 18,478 | | | $ | 2,158,785 | |
| L’Oréal | | | 4,333 | | | | 1,093,649 | |
| Procter & Gamble Co. | | | 29,706 | | | | 2,927,526 | |
| | | | | | | | |
| | | | | | | $ | 6,179,960 | |
6
Portfolio of Investments (unaudited) – continued
| | | | | | | | |
| | |
| Issuer | | Shares/Par | | | Value ($) | |
| Common Stocks - continued | | | | | | | | |
| Electronics - 3.5% | | | | | | | | |
| Kyocera Corp. | | | 62,400 | | | $ | 3,437,836 | |
| Taiwan Semiconductor Manufacturing Co. Ltd., ADR | | | 140,918 | | | | 5,502,848 | |
| | | | | | | | |
| | | | | | | $ | 8,940,684 | |
| Energy - Independent - 0.7% | | | | | | | | |
| Occidental Petroleum Corp. | | | 27,107 | | | $ | 1,793,128 | |
| | |
| Energy - Integrated - 0.8% | | | | | | | | |
| Royal Dutch Shell PLC, “B” | | | 67,833 | | | $ | 2,127,347 | |
| | |
| Food & Beverages - 7.6% | | | | | | | | |
| Archer Daniels Midland Co. | | | 25,533 | | | $ | 1,085,153 | |
| General Mills, Inc. | | | 55,008 | | | | 2,592,527 | |
| Marine Harvest (l) | | | 106,894 | | | | 2,466,021 | |
| Mondelez International, Inc. | | | 32,253 | | | | 1,521,051 | |
| Nestle S.A. | | | 47,801 | | | | 4,327,737 | |
| PepsiCo, Inc. | | | 38,938 | | | | 4,502,790 | |
| Sligro Food Group N.V. | | | 35,785 | | | | 1,343,220 | |
| Toyo Suisan Kaisha Ltd. | | | 50,400 | | | | 1,867,420 | |
| | | | | | | | |
| | | | | | | $ | 19,705,919 | |
| Food & Drug Stores - 3.4% | | | | | | | | |
| Dairy Farm International Holdings Ltd. | | | 264,900 | | | $ | 2,368,206 | |
| Lawson, Inc. | | | 44,800 | | | | 2,712,959 | |
| Seven & I Holdings Co. Ltd. | | | 21,600 | | | | 948,373 | |
| Tesco PLC | | | 323,558 | | | | 969,881 | |
| Wesfarmers Ltd. | | | 76,866 | | | | 1,809,137 | |
| | | | | | | | |
| | | | | | | $ | 8,808,556 | |
| Gaming & Lodging - 2.1% | | | | | | | | |
| Crown Resorts Ltd. | | | 266,916 | | | $ | 2,169,801 | |
| Genting Berhad | | | 1,805,400 | | | | 3,272,052 | |
| | | | | | | | |
| | | | | | | $ | 5,441,853 | |
| Health Maintenance Organizations - 1.8% | | | | | | | | |
| Cigna Corp. | | | 12,704 | | | $ | 2,216,086 | |
| Humana Inc. | | | 8,587 | | | | 2,447,638 | |
| | | | | | | | |
| | | | | | | $ | 4,663,724 | |
| Insurance - 4.0% | | | | | | | | |
| Beazley PLC | | | 263,949 | | | $ | 1,916,735 | |
| Everest Re Group Ltd. | | | 15,301 | | | | 3,459,709 | |
| Swiss Life Holding AG | | | 5,090 | | | | 2,218,476 | |
7
Portfolio of Investments (unaudited) – continued
| | | | | | | | |
| | |
| Issuer | | Shares/Par | | | Value ($) | |
| Common Stocks - continued | | | | | | | | |
| Insurance - continued | | | | | | | | |
| Travelers Cos., Inc. | | | 7,739 | | | $ | 1,028,591 | |
| Zurich Insurance Group AG | | | 5,390 | | | | 1,782,175 | |
| | | | | | | | |
| | | | | | | $ | 10,405,686 | |
| Internet - 0.7% | | | | | | | | |
| Alphabet, Inc., “A” (a) | | | 1,680 | | | $ | 1,892,604 | |
| | |
| Machinery & Tools - 0.4% | | | | | | | | |
| Doosan Bobcat, Inc. | | | 39,447 | | | $ | 1,118,840 | |
| | |
| Major Banks - 2.2% | | | | | | | | |
| Bank of Nova Scotia | | | 21,214 | | | $ | 1,178,650 | |
| PNC Financial Services Group, Inc. | | | 9,829 | | | | 1,238,651 | |
| Royal Bank of Canada | | | 29,040 | | | | 2,270,347 | |
| Sumitomo Mitsui Trust Holdings | | | 24,300 | | | | 919,766 | |
| | | | | | | | |
| | | | | | | $ | 5,607,414 | |
| | |
| Medical & Health Technology & Services - 1.9% | | | | | | | | |
| Walgreens Boots Alliance, Inc. | | | 68,908 | | | $ | 4,905,561 | |
| | |
| Medical Equipment - 2.6% | | | | | | | | |
| EssilorLuxottica | | | 9,069 | | | $ | 1,098,088 | |
| Terumo Corp. | | | 91,800 | | | | 5,616,795 | |
| | | | | | | | |
| | | | | | | $ | 6,714,883 | |
| | |
| Natural Gas - Distribution - 0.5% | | | | | | | | |
| Tokyo Gas Co. Ltd. | | | 48,700 | | | $ | 1,339,124 | |
| | |
| Natural Gas - Pipeline - 0.9% | | | | | | | | |
| Enbridge, Inc. | | | 66,080 | | | $ | 2,444,299 | |
| | |
| Other Banks & Diversified Financials - 3.1% | | | | | | | | |
| Bangkok Bank Public Co. Ltd. | | | 148,500 | | | $ | 1,008,457 | |
| Credicorp Ltd. | | | 10,655 | | | | 2,590,124 | |
| Komercni Banka A.S. | | | 42,247 | | | | 1,773,626 | |
| U.S. Bancorp | | | 50,288 | | | | 2,599,387 | |
| | | | | | | | |
| | | | | | | $ | 7,971,594 | |
| Pharmaceuticals - 10.1% | | | | | | | | |
| Eli Lilly & Co. | | | 20,236 | | | $ | 2,555,604 | |
| Johnson & Johnson | | | 48,813 | | | | 6,669,808 | |
| Merck & Co., Inc. | | | 46,071 | | | | 3,745,112 | |
| Novartis AG | | | 16,587 | | | | 1,513,031 | |
8
Portfolio of Investments (unaudited) – continued
| | | | | | | | |
| | |
| Issuer | | Shares/Par | | | Value ($) | |
| Common Stocks - continued | | | | | | | | |
| Pharmaceuticals - continued | | | | | | | | |
| Pfizer, Inc. | | | 123,309 | | | $ | 5,345,445 | |
| Roche Holding AG | | | 23,268 | | | | 6,464,823 | |
| | | | | | | | |
| | | | | | | $ | 26,293,823 | |
| Pollution Control - 1.6% | | | | | | | | |
| Waste Connections, Inc. | | | 49,175 | | | $ | 4,101,195 | |
| | |
| Precious Metals & Minerals - 1.1% | | | | | | | | |
| Franco-Nevada Corp. | | | 39,101 | | | $ | 2,945,760 | |
| | |
| Railroad & Shipping - 0.8% | | | | | | | | |
| Canadian National Railway Co. | | | 22,856 | | | $ | 1,962,873 | |
| | |
| Real Estate - 7.5% | | | | | | | | |
| AvalonBay Communities, Inc., REIT | | | 18,166 | | | $ | 3,535,649 | |
| Grand City Properties S.A. | | | 173,035 | | | | 4,074,144 | |
| Life Storage, Inc., REIT | | | 18,143 | | | | 1,770,757 | |
| Public Storage, Inc., REIT | | | 7,558 | | | | 1,598,441 | |
| STORE Capital Corp., REIT | | | 177,921 | | | | 5,777,095 | |
| Sun Communities, Inc., REIT | | | 22,712 | | | | 2,579,402 | |
| | | | | | | | |
| | | | | | | $ | 19,335,488 | |
| Restaurants - 2.9% | | | | | | | | |
| McDonald’s Corp. | | | 19,973 | | | $ | 3,671,836 | |
| Starbucks Corp. | | | 55,071 | | | | 3,869,289 | |
| | | | | | | | |
| | | | | | | $ | 7,541,125 | |
| Specialty Chemicals - 1.0% | | | | | | | | |
| Symrise AG | | | 28,792 | | | $ | 2,537,427 | |
| | |
| Specialty Stores - 2.2% | | | | | | | | |
| ABC-MART, Inc. | | | 82,400 | | | $ | 4,716,386 | |
| Home Depot, Inc. | | | 5,682 | | | | 1,051,966 | |
| | | | | | | | |
| | | | | | | $ | 5,768,352 | |
| Telecommunications - Wireless - 2.8% | | | | | | | | |
| Advanced Info Service Public Co. Ltd. | | | 256,900 | | | $ | 1,483,722 | |
| KDDI Corp. | | | 147,000 | | | | 3,545,593 | |
| Vodafone Group PLC | | | 1,248,389 | | | | 2,223,409 | |
| | | | | | | | |
| | | | | | | $ | 7,252,724 | |
| Telephone Services - 4.0% | | | | | | | | |
| HKT Trust and HKT Ltd. | | | 2,229,000 | | | $ | 3,481,326 | |
| TELUS Corp. | | | 111,974 | | | | 4,066,896 | |
9
Portfolio of Investments (unaudited) – continued
| | | | | | | | |
| | |
| Issuer | | Shares/Par | | | Value ($) | |
| Common Stocks - continued | | | | | | | | |
| Telephone Services - continued | | | | | | | | |
| Verizon Communications, Inc. | | | 48,299 | | | $ | 2,749,179 | |
| | | | | | | | |
| | | | | | | $ | 10,297,401 | |
| Tobacco - 2.3% | | | | | | | | |
| Altria Group, Inc. | | | 44,628 | | | $ | 2,338,953 | |
| Imperial Tobacco Group PLC | | | 31,180 | | | | 1,038,232 | |
| Japan Tobacco, Inc. | | | 98,300 | | | | 2,498,398 | |
| | | | | | | | |
| | | | | | | $ | 5,875,583 | |
| Utilities - Electric Power - 7.1% | | | | | | | | |
| American Electric Power Co., Inc. | | | 30,700 | | | $ | 2,491,305 | |
| Avangrid, Inc. | | | 34,618 | | | | 1,673,780 | |
| CEZ A.S. | | | 37,849 | | | | 917,112 | |
| CLP Holdings Ltd. | | | 362,500 | | | | 4,294,723 | |
| Duke Energy Corp. | | | 11,661 | | | | 1,045,525 | |
| Evergy, Inc. | | | 42,738 | | | | 2,389,481 | |
| WEC Energy Group, Inc. | | | 34,921 | | | | 2,663,774 | |
| Xcel Energy, Inc. | | | 51,559 | | | | 2,828,527 | |
| | | | | | | | |
| | | | | | | $ | 18,304,227 | |
| Total Common Stocks (Identified Cost, $218,400,943) | | | | | | $ | 244,654,924 | |
| | |
| Investment Companies (h) - 1.1% | | | | | | | | |
| Money Market Funds - 1.1% | | | | | | | | |
MFS Institutional Money Market Portfolio, 2.49% (v)
(Identified Cost, $2,724,122) | | | 2,724,290 | | | $ | 2,724,290 | |
| | |
| Collateral for Securities Loaned - 0.9% | | | | | | | | |
| State Street Navigator Securities Lending Government Money Market Portfolio, 2.43% (j) (Identified Cost, $2,272,643) | | | 2,272,643 | | | $ | 2,272,643 | |
| | |
| Other Assets, Less Liabilities - 3.6% | | | | | | | 9,400,401 | |
| Net Assets - 100.0% | | | | | | $ | 259,052,258 | |
| (a) | Non-income producing security. |
| (h) | An affiliated issuer, which may be considered one in which the fund owns 5% or more of the outstanding voting securities, or a company which is under common control. At period end, the aggregate values of the fund’s investments in affiliated issuers and in unaffiliated issuers were $2,724,290 and $246,927,567, respectively. |
| (j) | The rate quoted is the annualizedseven-day yield of the fund at period end. |
| (l) | A portion of this security is on loan. See Note 2 for additional information. |
| (v) | Affiliated issuer that is available only to investment companies managed by MFS. The rate quoted for the MFS Institutional Money Market Portfolio is the annualizedseven-day yield of the fund at period end. |
10
Portfolio of Investments (unaudited) – continued
The following abbreviations are used in this report and are defined:
| ADR | | American Depositary Receipt |
| PLC | | Public Limited Company |
| REIT | | Real Estate Investment Trust |
See Notes to Financial Statements
11
Financial Statements
STATEMENT OF ASSETS AND LIABILITIES
At 2/28/19 (unaudited)
This statement represents your fund’s balance sheet, which details the assets and liabilities comprising the total value of the fund.
| | | | |
| Assets | | | | |
Investments in unaffiliated issuers, at value, including $2,137,330 of securities on loan (identified cost, $220,673,586) | | | $246,927,567 | |
Investments in affiliated issuers, at value (identified cost, $2,724,122) | | | 2,724,290 | |
Foreign currency, at value (identified cost, $21) | | | 21 | |
Receivables for | | | | |
Fund shares sold | | | 12,501,818 | |
Interest and dividends | | | 866,999 | |
Other assets | | | 1,029 | |
Total assets | | | $263,021,724 | |
| |
| Liabilities | | | | |
Payables for | | | | |
Investments purchased | | | $1,524,845 | |
Fund shares reacquired | | | 107,591 | |
Collateral for securities loaned, at value | | | 2,272,643 | |
Payable to affiliates | | | | |
Investment adviser | | | 6,182 | |
Shareholder servicing costs | | | 23,783 | |
Distribution and service fees | | | 167 | |
Payable for independent Trustees’ compensation | | | 13 | |
Deferred country tax expense payable | | | 6,785 | |
Accrued expenses and other liabilities | | | 27,457 | |
Total liabilities | | | $3,969,466 | |
Net assets | | | $259,052,258 | |
| |
| Net assets consist of | | | | |
Paid-in capital | | | $233,611,495 | |
Total distributable earnings (loss) | | | 25,440,763 | |
Net assets | | | $259,052,258 | |
Shares of beneficial interest outstanding | | | 19,304,706 | |
12
Statement of Assets and Liabilities (unaudited) – continued
| | | | | | | | | | | | |
| | | |
| | | Net assets | | | Shares
outstanding | | | Net asset value
per share (a) | |
Class A | | | $14,944,686 | | | | 1,113,499 | | | | $13.42 | |
Class B | | | 389,700 | | | | 29,236 | | | | 13.33 | |
Class C | | | 2,086,193 | | | | 156,671 | | | | 13.32 | |
Class I | | | 168,056,261 | | | | 12,519,378 | | | | 13.42 | |
Class R1 | | | 75,346 | | | | 5,628 | | | | 13.39 | |
Class R2 | | | 67,301 | | | | 5,014 | | | | 13.42 | |
Class R3 | | | 67,874 | | | | 5,051 | | | | 13.44 | |
Class R4 | | | 68,479 | | | | 5,101 | | | | 13.42 | |
Class R6 | | | 73,296,418 | | | | 5,465,128 | | | | 13.41 | |
| (a) | Maximum offering price per share was equal to the net asset value per share for all share classes, except for Class A, for which the maximum offering price per share was $14.24 [100 / 94.25 x $13.42]. On sales of $50,000 or more, the maximum offering price of Class A shares is reduced. A contingent deferred sales charge may be imposed on redemptions of Class A, Class B, and Class C shares. Redemption price per share was equal to the net asset value per share for Classes I, R1, R2, R3, R4, and R6. |
See Notes to Financial Statements
13
Financial Statements
STATEMENT OF OPERATIONS
Six months ended 2/28/19 (unaudited)
This statement describes how much your fund earned in investment income and accrued in expenses. It also describes any gains and/or losses generated by fund operations.
| | | | |
| Net investment income (loss) | | | | |
Income | | | | |
Dividends | | | $2,566,951 | |
Dividends from affiliated issuers | | | 25,451 | |
Other | | | 9,530 | |
Income on securities loaned | | | 2,909 | |
Foreign taxes withheld | | | (91,227 | ) |
Total investment income | | | $2,513,614 | |
Expenses | | | | |
Management fee | | | $570,134 | |
Distribution and service fees | | | 25,372 | |
Shareholder servicing costs | | | 51,434 | |
Administrative services fee | | | 19,123 | |
Independent Trustees’ compensation | | | 2,505 | |
Custodian fee | | | 25,498 | |
Shareholder communications | | | 13,617 | |
Audit and tax fees | | | 27,376 | |
Legal fees | | | 778 | |
Registration fees | | | 62,153 | |
Miscellaneous | | | 15,718 | |
Total expenses | | | $813,708 | |
Reduction of expenses by investment adviser and distributor | | | (44,284 | ) |
Net expenses | | | $769,424 | |
Net investment income (loss) | | | $1,744,190 | |
| |
| Realized and unrealized gain (loss) | | | | |
Realized gain (loss) (identified cost basis) | | | | |
Unaffiliated issuers (net of $54 country tax) | | | $2,021,799 | |
Affiliated issuers | | | 91 | |
Foreign currency | | | (1,079 | ) |
Net realized gain (loss) | | | $2,020,811 | |
Change in unrealized appreciation or depreciation | | | | |
Unaffiliated issuers (net of $1,616 decrease in deferred country tax) | | | $2,007,295 | |
Affiliated issuers | | | 51 | |
Translation of assets and liabilities in foreign currencies | | | (3,834 | ) |
Net unrealized gain (loss) | | | $2,003,512 | |
Net realized and unrealized gain (loss) | | | $4,024,323 | |
Change in net assets from operations | | | $5,768,513 | |
See Notes to Financial Statements
14
Financial Statements
STATEMENTS OF CHANGES IN NET ASSETS
These statements describe the increases and/or decreases in net assets resulting from operations, any distributions, and any shareholder transactions.
| | | | | | | | |
| Change in net assets | | Six months ended
2/28/19
(unaudited) | | | Year ended
8/31/18 | |
| | |
| From operations | | | | | | | | |
Net investment income (loss) | | | $1,744,190 | | | | $3,736,632 | |
Net realized gain (loss) | | | 2,020,811 | | | | 4,752,570 | |
Net unrealized gain (loss) | | | 2,003,512 | | | | 8,115,677 | |
Change in net assets from operations | | | $5,768,513 | | | | $16,604,879 | |
Total distributions to shareholders (a) | | | $(7,925,983 | ) | | | $(3,747,865 | ) |
Change in net assets from fund share transactions | | | $66,036,084 | | | | $3,967,302 | |
Total change in net assets | | | $63,878,614 | | | | $16,824,316 | |
| | |
| Net assets | | | | | | | | |
At beginning of period | | | 195,173,644 | | | | 178,349,328 | |
At end of period (b) | | | $259,052,258 | | | | $195,173,644 | |
| (a) | Distributions from net investment income and from net realized gain are no longer required to be separately disclosed. See Note 2. For the year ended August 31, 2018, distributions from net investment income were $3,747,865. |
| (b) | Parenthetical disclosure of undistributed net investment income is no longer required. See Note 2. For the year ended August 31, 2018, end of period net assets included undistributed net investment income of $985,825. |
See Notes to Financial Statements
15
Financial Statements
FINANCIAL HIGHLIGHTS
The financial highlights table is intended to help you understand the fund’s financial performance for the semiannual period and the past 5 fiscal years (or life of a particular share class, if shorter). Certain information reflects financial results for a single fund share. The total returns in the table represent the rate that an investor would have earned (or lost) on an investment in the fund share class (assuming reinvestment of all distributions) held for the entire period.
| | | | | | | | | | | | | | | | | | | | | | | | |
| | | Six months
ended
2/28/19
| | | Year ended | |
| Class A | | 8/31/18 | | | 8/31/17 | | | 8/31/16 | | | 8/31/15 | | | 8/31/14 (c) | |
| | | (unaudited) | | | | | | | | | | | | | | | | |
Net asset value, beginning of period | | | $13.73 | | | | $12.82 | | | | $11.87 | | | | $10.75 | | | | $10.92 | | | | $10.00 | |
| | | |
| Income (loss) from investment operations | | | | | | | | | | | | | |
Net investment income (loss) (d) | | | $0.10 | | | | $0.23 | | | | $0.19 | | | | $0.18 | | | | $0.19 | | | | $0.15 | |
Net realized and unrealized
gain (loss) | | | 0.09 | | | | 0.92 | | | | 0.91 | | | | 1.11 | | | | (0.22 | ) | | | 0.86 | |
Total from investment operations | | | $0.19 | | | | $1.15 | | | | $1.10 | | | | $1.29 | | | | $(0.03 | ) | | | $1.01 | |
| | | |
| Less distributions declared to shareholders | | | | | | | | | | | | | |
From net investment income | | | $(0.11 | ) | | | $(0.24 | ) | | | $(0.15 | ) | | | $(0.17 | ) | | | $(0.12 | ) | | | $(0.09 | ) |
From net realized gain | | | (0.39 | ) | | | — | | | | — | | | | — | | | | (0.02 | ) | | | — | |
Total distributions declared to
shareholders | | | $(0.50 | ) | | | $(0.24 | ) | | | $(0.15 | ) | | | $(0.17 | ) | | | $(0.14 | ) | | | $(0.09 | ) |
Net asset value, end of period (x) | | | $13.42 | | | | $13.73 | | | | $12.82 | | | | $11.87 | | | | $10.75 | | | | $10.92 | |
Total return (%) (r)(s)(t)(x) | | | 1.60 | (n) | | | 9.09 | | | | 9.36 | | | | 12.12 | | | | (0.36 | ) | | | 10.13 | (n) |
| | | |
Ratios (%) (to average net assets)
and Supplemental data: | | | | | | | | | | | | | |
Expenses before expense
reductions (f) | | | 1.03 | (a) | | | 1.06 | | | | 1.23 | | | | 1.51 | | | | 1.88 | | | | 5.81 | (a) |
Expenses after expense
reductions (f) | | | 0.98 | (a) | | | 0.97 | | | | 1.17 | | | | 1.19 | | | | 1.23 | | | | 1.22 | (a) |
Net investment income (loss) | | | 1.47 | (a) | | | 1.75 | | | | 1.55 | | | | 1.56 | | | | 1.65 | | | | 1.86 | (a) |
Portfolio turnover | | | 17 | (n) | | | 41 | | | | 24 | | | | 28 | | | | 61 | | | | 28 | (n) |
Net assets at end of period
(000 omitted) | | | $14,945 | | | | $9,102 | | | | $9,215 | | | | $7,473 | | | | $3,981 | | | | $800 | |
See Notes to Financial Statements
16
Financial Highlights – continued
| | | | | | | | | | | | | | | | | | | | | | | | |
| | | Six months
ended
2/28/19 | | | Year ended | |
| Class B | | 8/31/18 | | | 8/31/17 | | | 8/31/16 | | | 8/31/15 | | | 8/31/14 (c) | |
| | | (unaudited) | | | | | | | | | | | | | | | | |
Net asset value, beginning of period | | | $13.63 | | | | $12.73 | | | | $11.79 | | | | $10.70 | | | | $10.91 | | | | $10.00 | |
| | | |
| Income (loss) from investment operations | | | | | | | | | | | | | |
Net investment income (loss) (d) | | | $0.04 | | | | $0.13 | | | | $0.09 | | | | $0.07 | | | | $0.08 | | | | $0.06 | |
Net realized and unrealized
gain (loss) | | | 0.10 | | | | 0.91 | | | | 0.91 | | | | 1.12 | | | | (0.20 | ) | | | 0.89 | |
Total from investment operations | | | $0.14 | | | | $1.04 | | | | $1.00 | | | | $1.19 | | | | $(0.12 | ) | | | $0.95 | |
| | | |
| Less distributions declared to shareholders | | | | | | | | | | | | | |
From net investment income | | | $(0.05 | ) | | | $(0.14 | ) | | | $(0.06 | ) | | | $(0.10 | ) | | | $(0.07 | ) | | | $(0.04 | ) |
From net realized gain | | | (0.39 | ) | | | — | | | | — | | | | — | | | | (0.02 | ) | | | — | |
Total distributions declared to
shareholders | | | $(0.44 | ) | | | $(0.14 | ) | | | $(0.06 | ) | | | $(0.10 | ) | | | $(0.09 | ) | | | $(0.04 | ) |
Net asset value, end of period (x) | | | $13.33 | | | | $13.63 | | | | $12.73 | | | | $11.79 | | | | $10.70 | | | | $10.91 | |
Total return (%) (r)(s)(t)(x) | | | 1.25 | (n) | | | 8.25 | | | | 8.48 | | | | 11.16 | | | | (1.16 | ) | | | 9.50 | (n) |
| | | |
Ratios (%) (to average net assets)
and Supplemental data: | | | | | | | | | | | | | |
Expenses before expense
reductions (f) | | | 1.78 | (a) | | | 1.81 | | | | 1.98 | | | | 2.33 | | | | 2.68 | | | | 6.87 | (a) |
Expenses after expense
reductions (f) | | | 1.74 | (a) | | | 1.74 | | | | 1.96 | | | | 1.98 | | | | 2.01 | | | | 2.07 | (a) |
Net investment income (loss) | | | 0.68 | (a) | | | 1.02 | | | | 0.73 | | | | 0.65 | | | | 0.74 | | | | 0.80 | (a) |
Portfolio turnover | | | 17 | (n) | | | 41 | | | | 24 | | | | 28 | | | | 61 | | | | 28 | (n) |
Net assets at end of period
(000 omitted) | | | $390 | | | | $380 | | | | $350 | | | | $341 | | | | $446 | | | | $116 | |
See Notes to Financial Statements
17
Financial Highlights – continued
| | | | | | | | | | | | | | | | | | | | | | | | |
| | | Six months
ended 2/28/19 | | | Year ended | |
| Class C | | 8/31/18 | | | 8/31/17 | | | 8/31/16 | | | 8/31/15 | | | 8/31/14 (c) | |
| | | (unaudited) | | | | | | | | | | | | | | | | |
Net asset value, beginning of period | | | $13.62 | | | | $12.71 | | | | $11.78 | | | | $10.69 | | | | $10.91 | | | | $10.00 | |
| | | |
| Income (loss) from investment operations | | | | | | | | | | | | | |
Net investment income (loss) (d) | | | $0.04 | | | | $0.13 | | | | $0.09 | | | | $0.08 | | | | $0.10 | | | | $0.06 | |
Net realized and unrealized
gain (loss) | | | 0.10 | | | | 0.92 | | | | 0.91 | | | | 1.11 | | | | (0.23 | ) | | | 0.89 | |
Total from investment operations | | | $0.14 | | | | $1.05 | | | | $1.00 | �� | | | $1.19 | | | | $(0.13 | ) | | | $0.95 | |
| | | |
| Less distributions declared to shareholders | | | | | | | | | | | | | |
From net investment income | | | $(0.05 | ) | | | $(0.14 | ) | | | $(0.07 | ) | | | $(0.10 | ) | | | $(0.07 | ) | | | $(0.04 | ) |
From net realized gain | | | (0.39 | ) | | | — | | | | — | | | | — | | | | (0.02 | ) | | | — | |
Total distributions declared to
shareholders | | | $(0.44 | ) | | | $(0.14 | ) | | | $(0.07 | ) | | | $(0.10 | ) | | | $(0.09 | ) | | | $(0.04 | ) |
Net asset value, end of period (x) | | | $13.32 | | | | $13.62 | | | | $12.71 | | | | $11.78 | | | | $10.69 | | | | $10.91 | |
Total return (%) (r)(s)(t)(x) | | | 1.28 | (n) | | | 8.28 | | | | 8.49 | | | | 11.22 | | | | (1.23 | ) | | | 9.50 | (n) |
| | |
Ratios (%) (to average net assets)
and Supplemental data: | | | | | | | | | |
Expenses before expense
reductions (f) | | | 1.78 | (a) | | | 1.81 | | | | 1.98 | | | | 2.23 | | | | 2.66 | | | | 6.85 | (a) |
Expenses after expense
reductions (f) | | | 1.74 | (a) | | | 1.74 | | | | 1.96 | | | | 1.99 | | | | 2.00 | | | | 2.07 | (a) |
Net investment income (loss) | | | 0.63 | (a) | | | 1.01 | | | | 0.76 | | | | 0.74 | | | | 0.89 | | | | 0.82 | (a) |
Portfolio turnover | | | 17 | (n) | | | 41 | | | | 24 | | | | 28 | | | | 61 | | | | 28 | (n) |
Net assets at end of period
(000 omitted) | | | $2,086 | | | | $1,773 | | | | $1,924 | | | | $1,554 | | | | $453 | | | | $130 | |
See Notes to Financial Statements
18
Financial Highlights – continued
| | | | | | | | | | | | | | | | | | | | | | | | |
| | | Six months
ended 2/28/19 | | | Year ended | |
| Class I | | 8/31/18 | | | 8/31/17 | | | 8/31/16 | | | 8/31/15 | | | 8/31/14 (c) | |
| | | (unaudited) | | | | | | | | | | | | | | | | |
Net asset value, beginning of period | | | $13.73 | | | | $12.82 | | | | $11.87 | | | | $10.76 | | | | $10.93 | | | | $10.00 | |
| | | |
| Income (loss) from investment operations | | | | | | | | | | | | | |
Net investment income (loss) (d) | | | $0.11 | | | | $0.27 | | | | $0.23 | | | | $0.21 | | | | $0.24 | | | | $0.14 | |
Net realized and unrealized
gain (loss) | | | 0.09 | | | | 0.91 | | | | 0.90 | | | | 1.10 | | | | (0.25 | ) | | | 0.89 | |
Total from investment operations | | | $0.20 | | | | $1.18 | | | | $1.13 | | | | $1.31 | | | | $(0.01 | ) | | | $1.03 | |
| | | |
| Less distributions declared to shareholders | | | | | | | | | | | | | |
From net investment income | | | $(0.12 | ) | | | $(0.27 | ) | | | $(0.18 | ) | | | $(0.20 | ) | | | $(0.14 | ) | | | $(0.10 | ) |
From net realized gain | | | (0.39 | ) | | | — | | | | — | | | | — | | | | (0.02 | ) | | | — | |
Total distributions declared to
shareholders | | | $(0.51 | ) | | | $(0.27 | ) | | | $(0.18 | ) | | | $(0.20 | ) | | | $(0.16 | ) | | | $(0.10 | ) |
Net asset value, end of period (x) | | | $13.42 | | | | $13.73 | | | | $12.82 | | | | $11.87 | | | | $10.76 | | | | $10.93 | |
Total return (%) (r)(s)(t)(x) | | | 1.72 | (n) | | | 9.34 | | | | 9.59 | | | | 12.34 | | | | (0.18 | ) | | | 10.29 | (n) |
| | | |
Ratios (%) (to average net assets)
and Supplemental data: | | | | | | | | | | | | | |
Expenses before expense
reductions (f) | | | 0.78 | (a) | | | 0.81 | | | | 0.94 | | | | 1.17 | | | | 1.63 | | | | 5.85 | (a) |
Expenses after expense
reductions (f) | | | 0.74 | (a) | | | 0.74 | | | | 0.90 | | | | 0.98 | | | | 1.00 | | | | 1.07 | (a) |
Net investment income (loss) | | | 1.69 | (a) | | | 2.03 | | | | 1.87 | | | | 1.86 | | | | 2.10 | | | | 1.81 | (a) |
Portfolio turnover | | | 17 | (n) | | | 41 | | | | 24 | | | | 28 | | | | 61 | | | | 28 | (n) |
Net assets at end of period
(000 omitted) | | | $168,056 | | | | $114,259 | | | | $97,952 | | | | $10,669 | | | | $2,685 | | | | $138 | |
See Notes to Financial Statements
19
Financial Highlights – continued
| | | | | | | | | | | | | | | | | | | | | | | | |
| | | Six months
ended 2/28/19 | | | Year ended | |
| Class R1 | | 8/31/18 | | | 8/31/17 | | | 8/31/16 | | | 8/31/15 | | | 8/31/14 (c) | |
| | | (unaudited) | | | | | | | | | | | | | | | | |
Net asset value, beginning of period | | | $13.69 | | | | $12.78 | | | | $11.84 | | | | $10.70 | | | | $10.91 | | | | $10.00 | |
| | | |
| Income (loss) from investment operations | | | | | | | | | | | | | |
Net investment income (loss) (d) | | | $0.04 | | | | $0.14 | | | | $0.09 | | | | $0.08 | | | | $0.07 | | | | $0.06 | |
Net realized and unrealized
gain (loss) | | | 0.10 | | | | 0.91 | | | | 0.91 | | | | 1.12 | | | | (0.19 | ) | | | 0.89 | |
Total from investment operations | | | $0.14 | | | | $1.05 | | | | $1.00 | | | | $1.20 | | | | $(0.12 | ) | | | $0.95 | |
| | | |
| Less distributions declared to shareholders | | | | | | | | | | | | | |
From net investment income | | | $(0.05 | ) | | | $(0.14 | ) | | | $(0.06 | ) | | | $(0.06 | ) | | | $(0.07 | ) | | | $(0.04 | ) |
From net realized gain | | | (0.39 | ) | | | — | | | | — | | | | — | | | | (0.02 | ) | | | — | |
Total distributions declared to
shareholders | | | $(0.44 | ) | | | $(0.14 | ) | | | $(0.06 | ) | | | $(0.06 | ) | | | $(0.09 | ) | | | $(0.04 | ) |
Net asset value, end of period (x) | | | $13.39 | | | | $13.69 | | | | $12.78 | | | | $11.84 | | | | $10.70 | | | | $10.91 | |
Total return (%) (r)(s)(t)(x) | | | 1.25 | (n) | | | 8.29 | | | | 8.47 | | | | 11.24 | | | | (1.22 | ) | | | 9.50 | (n) |
| | | |
Ratios (%) (to average net assets)
and Supplemental data: | | | | | | | | | | | | | |
Expenses before expense
reductions (f) | | | 1.78 | (a) | | | 1.81 | | | | 1.98 | | | | 2.31 | | | | 2.69 | | | | 6.89 | (a) |
Expenses after expense
reductions (f) | | | 1.74 | (a) | | | 1.74 | | | | 1.96 | | | | 1.99 | | | | 2.01 | | | | 2.07 | (a) |
Net investment income (loss) | | | 0.67 | (a) | | | 1.03 | | | | 0.75 | | | | 0.69 | | | | 0.66 | | | | 0.79 | (a) |
Portfolio turnover | | | 17 | (n) | | | 41 | | | | 24 | | | | 28 | | | | 61 | | | | 28 | (n) |
Net assets at end of period
(000 omitted) | | | $75 | | | | $74 | | | | $68 | | | | $56 | | | | $108 | | | | $109 | |
See Notes to Financial Statements
20
Financial Highlights – continued
| | | | | | | | | | | | | | | | | | | | | | | | |
| | | Six months
ended 2/28/19 | | | Year ended | |
| Class R2 | | 8/31/18 | | | 8/31/17 | | | 8/31/16 | | | 8/31/15 | | | 8/31/14 (c) | |
| | | (unaudited) | | | | | | | | | | | | | | | | |
Net asset value, beginning of period | | | $13.73 | | | | $12.81 | | | | $11.87 | | | | $10.74 | | | | $10.92 | | | | $10.00 | |
| | | |
| Income (loss) from investment operations | | | | | | | | | | | | | |
Net investment income (loss) (d) | | | $0.08 | | | | $0.20 | | | | $0.15 | | | | $0.13 | | | | $0.13 | | | | $0.10 | |
Net realized and unrealized
gain (loss) | | | 0.09 | | | | 0.92 | | | | 0.90 | | | | 1.13 | | | | (0.20 | ) | | | 0.89 | |
Total from investment operations | | | $0.17 | | | | $1.12 | | | | $1.05 | | | | $1.26 | | | | $(0.07 | ) | | | $0.99 | |
| | | |
| Less distributions declared to shareholders | | | | | | | | | | | | | |
From net investment income | | | $(0.09 | ) | | | $(0.20 | ) | | | $(0.11 | ) | | | $(0.13 | ) | | | $(0.09 | ) | | | $(0.07 | ) |
From net realized gain | | | (0.39 | ) | | | — | | | | — | | | | — | | | | (0.02 | ) | | | — | |
Total distributions declared to
shareholders | | | $(0.48 | ) | | | $(0.20 | ) | | | $(0.11 | ) | | | $(0.13 | ) | | | $(0.11 | ) | | | $(0.07 | ) |
Net asset value, end of period (x) | | | $13.42 | | | | $13.73 | | | | $12.81 | | | | $11.87 | | | | $10.74 | | | | $10.92 | |
Total return (%) (r)(s)(t)(x) | | | 1.45 | (n) | | | 8.87 | | | | 8.94 | | | | 11.83 | | | | (0.71 | ) | | | 9.89 | (n) |
| | | |
Ratios (%) (to average net assets)
and Supplemental data: | | | | | | | | | | | | | |
Expenses before expense
reductions (f) | | | 1.28 | (a) | | | 1.31 | | | | 1.49 | | | | 1.79 | | | | 2.19 | | | | 6.39 | (a) |
Expenses after expense
reductions (f) | | | 1.24 | (a) | | | 1.24 | | | | 1.47 | | | | 1.49 | | | | 1.51 | | | | 1.57 | (a) |
Net investment income (loss) | | | 1.17 | (a) | | | 1.52 | | | | 1.24 | | | | 1.20 | | | | 1.16 | | | | 1.29 | (a) |
Portfolio turnover | | | 17 | (n) | | | 41 | | | | 24 | | | | 28 | | | | 61 | | | | 28 | (n) |
Net assets at end of period
(000 omitted) | | | $67 | | | | $66 | | | | $61 | | | | $72 | | | | $112 | | | | $110 | |
See Notes to Financial Statements
21
Financial Highlights – continued
| | | | | | | | | | | | | | | | | | | | | | | | |
| | | Six months
ended 2/28/19 | | | Year ended | |
| Class R3 | | 8/31/18 | | | 8/31/17 | | | 8/31/16 | | | 8/31/15 | | | 8/31/14 (c) | |
| | | (unaudited) | | | | | | | | | | | | | | | | |
Net asset value, beginning of period | | | $13.74 | | | | $12.82 | | | | $11.88 | | | | $10.76 | | | | $10.92 | | | | $10.00 | |
| | | |
| Income (loss) from investment operations | | | | | | | | | | | | | |
Net investment income (loss) (d) | | | $0.09 | | | | $0.22 | | | | $0.19 | | | | $0.16 | | | | $0.16 | | | | $0.12 | |
Net realized and unrealized
gain (loss) | | | 0.10 | | | | 0.93 | | | | 0.90 | | | | 1.12 | | | | (0.19 | ) | | | 0.88 | |
Total from investment operations | | | $0.19 | | | | $1.15 | | | | $1.09 | | | | $1.28 | | | | $(0.03 | ) | | | $1.00 | |
| | | |
| Less distributions declared to shareholders | | | | | | | | | | | | | |
From net investment income | | | $(0.10 | ) | | | $(0.23 | ) | | | $(0.15 | ) | | | $(0.16 | ) | | | $(0.11 | ) | | | $(0.08 | ) |
From net realized gain | | | (0.39 | ) | | | — | | | | — | | | | — | | | | (0.02 | ) | | | — | |
Total distributions declared to
shareholders | | | $(0.49 | ) | | | $(0.23 | ) | | | $(0.15 | ) | | | $(0.16 | ) | | | $(0.13 | ) | | | $(0.08 | ) |
Net asset value, end of period (x) | | | $13.44 | | | | $13.74 | | | | $12.82 | | | | $11.88 | | | | $10.76 | | | | $10.92 | |
Total return (%) (r)(s)(t)(x) | | | 1.65 | (n) | | | 9.11 | | | | 9.24 | | | | 12.05 | | | | (0.34 | ) | | | 10.04 | (n) |
| | | |
Ratios (%) (to average net assets)
and Supplemental data: | | | | | | | | | | | | | |
Expenses before expense
reductions (f) | | | 1.03 | (a) | | | 1.05 | | | | 1.21 | | | | 1.56 | | | | 1.94 | | | | 6.14 | (a) |
Expenses after expense
reductions (f) | | | 0.99 | (a) | | | 0.99 | | | | 1.18 | | | | 1.24 | | | | 1.26 | | | | 1.32 | (a) |
Net investment income (loss) | | | 1.42 | (a) | | | 1.69 | | | | 1.55 | | | | 1.44 | | | | 1.41 | | | | 1.54 | (a) |
Portfolio turnover | | | 17 | (n) | | | 41 | | | | 24 | | | | 28 | | | | 61 | | | | 28 | (n) |
Net assets at end of period
(000 omitted) | | | $68 | | | | $67 | | | | $151 | | | | $56 | | | | $110 | | | | $110 | |
See Notes to Financial Statements
22
Financial Highlights – continued
| | | | | | | | | | | | | | | | | | | | | | | | |
| | | Six months
ended 2/28/19 | | | Year ended | |
| Class R4 | | 8/31/18 | | | 8/31/17 | | | 8/31/16 | | | 8/31/15 | | | 8/31/14 (c) | |
| | | (unaudited) | | | | | | | | | | | | | | | | |
Net asset value, beginning of period | | | $13.73 | | | | $12.82 | | | | $11.87 | | | | $10.76 | | | | $10.93 | | | | $10.00 | |
| | | |
| Income (loss) from investment operations | | | | | | | | | | | | | |
Net investment income (loss) (d) | | | $0.11 | | | | $0.27 | | | | $0.21 | | | | $0.19 | | | | $0.19 | | | | $0.14 | |
Net realized and unrealized
gain (loss) | | | 0.09 | | | | 0.91 | | | | 0.92 | | | | 1.12 | | | | (0.20 | ) | | | 0.89 | |
Total from investment operations | | | $0.20 | | | | $1.18 | | | | $1.13 | | | | $1.31 | | | | $(0.01 | ) | | | $1.03 | |
| | | |
| Less distributions declared to shareholders | | | | | | | | | | | | | |
From net investment income | | | $(0.12 | ) | | | $(0.27 | ) | | | $(0.18 | ) | | | $(0.20 | ) | | | $(0.14 | ) | | | $(0.10 | ) |
From net realized gain | | | (0.39 | ) | | | — | | | | — | | | | — | | | | (0.02 | ) | | | — | |
Total distributions declared to
shareholders | | | $(0.51 | ) | | | $(0.27 | ) | | | $(0.18 | ) | | | $(0.20 | ) | | | $(0.16 | ) | | | $(0.10 | ) |
Net asset value, end of period (x) | | | $13.42 | | | | $13.73 | | | | $12.82 | | | | $11.87 | | | | $10.76 | | | | $10.93 | |
Total return (%) (r)(s)(t)(x) | | | 1.72 | (n) | | | 9.34 | | | | 9.58 | | | | 12.32 | | | | (0.18 | ) | | | 10.29 | (n) |
| | | |
Ratios (%) (to average net assets)
and Supplemental data: | | | | | | | | | | | | | |
Expenses before expense
reductions (f) | | | 0.78 | (a) | | | 0.81 | | | | 0.98 | | | | 1.31 | | | | 1.69 | | | | 5.89 | (a) |
Expenses after expense
reductions (f) | | | 0.74 | (a) | | | 0.74 | | | | 0.96 | | | | 0.99 | | | | 1.02 | | | | 1.07 | (a) |
Net investment income (loss) | | | 1.67 | (a) | | | 2.02 | | | | 1.74 | | | | 1.69 | | | | 1.66 | | | | 1.79 | (a) |
Portfolio turnover | | | 17 | (n) | | | 41 | | | | 24 | | | | 28 | | | | 61 | | | | 28 | (n) |
Net assets at end of period
(000 omitted) | | | $68 | | | | $67 | | | | $62 | | | | $56 | | | | $110 | | | | $110 | |
See Notes to Financial Statements
23
Financial Highlights – continued
| | | | | | | | | | | | | | | | | | | | | | | | |
| | | Six months
ended 2/28/19 | | | Year ended | |
| Class R6 | | 8/31/18 | | | 8/31/17 | | | 8/31/16 | | | 8/31/15 | | | 8/31/14 (c) | |
| | | (unaudited) | | | | | | | | | | | | | | | | |
Net asset value, beginning of period | | | $13.72 | | | | $12.81 | | | | $11.86 | | | | $10.76 | | | | $10.92 | | | | $10.00 | |
| | | |
| Income (loss) from investment operations | | | | | | | | | | | | | |
Net investment income (loss) (d) | | | $0.11 | | | | $0.27 | | | | $0.21 | | | | $0.20 | | | | $0.20 | | | | $0.14 | |
Net realized and unrealized
gain (loss) | | | 0.10 | | | | 0.92 | | | | 0.92 | | | | 1.11 | | | | (0.20 | ) | | | 0.88 | |
Total from investment operations | | | $0.21 | | | | $1.19 | | | | $1.13 | | | | $1.31 | | | | $0.00 | | | | $1.02 | |
| | | |
| Less distributions declared to shareholders | | | | | | | | | | | | | |
From net investment income | | | $(0.13 | ) | | | $(0.28 | ) | | | $(0.18 | ) | | | $(0.21 | ) | | | $(0.14 | ) | | | $(0.10 | ) |
From net realized gain | | | (0.39 | ) | | | — | | | | — | | | | — | | | | (0.02 | ) | | | — | |
Total distributions declared to
shareholders | | | $(0.52 | ) | | | $(0.28 | ) | | | $(0.18 | ) | | | $(0.21 | ) | | | $(0.16 | ) | | | $(0.10 | ) |
Net asset value, end of period (x) | | | $13.41 | | | | $13.72 | | | | $12.81 | | | | $11.86 | | | | $10.76 | | | | $10.92 | |
Total return (%) (r)(s)(t)(x) | | | 1.76 | (n) | | | 9.42 | | | | 9.63 | | | | 12.37 | | | | (0.09 | ) | | | 10.21 | (n) |
| | | |
Ratios (%) (to average net assets)
and Supplemental data: | | | | | | | | | | | | | |
Expenses before expense
reductions (f) | | | 0.72 | (a) | | | 0.74 | | | | 0.94 | | | | 1.21 | | | | 1.63 | | | | 5.88 | (a) |
Expenses after expense
reductions (f) | | | 0.67 | (a) | | | 0.67 | | | | 0.92 | | | | 0.93 | | | | 0.97 | | | | 1.06 | (a) |
Net investment income (loss) | | | 1.74 | (a) | | | 2.08 | | | | 1.77 | | | | 1.76 | | | | 1.79 | | | | 1.80 | (a) |
Portfolio turnover | | | 17 | (n) | | | 41 | | | | 24 | | | | 28 | | | | 61 | | | | 28 | (n) |
Net assets at end of period
(000 omitted) | | | $73,296 | | | | $69,385 | | | | $68,569 | | | | $45,799 | | | | $27,802 | | | | $5,966 | |
| (c) | For the period from the commencement of the fund’s investment operations, December 5, 2013, through the stated period end. |
| (d) | Per share data is based on average shares outstanding. |
| (f) | Ratios do not reflect reductions from fees paid indirectly, if applicable. |
| (r) | Certain expenses have been reduced without which performance would have been lower. |
| (s) | From time to time the fund may receive proceeds from litigation settlements, without which performance would be lower. |
| (t) | Total returns do not include any applicable sales charges. |
| (x) | The net asset values and total returns have been calculated on net assets which include adjustments made in accordance with U.S. generally accepted accounting principles required at period end for financial reporting purposes. |
See Notes to Financial Statements
24
NOTES TO FINANCIAL STATEMENTS
(unaudited)
(1) Business and Organization
MFS Low Volatility Global Equity Fund (the fund) is a diversified series of MFS Series Trust I (the trust). The trust is organized as a Massachusetts business trust and is registered under the Investment Company Act of 1940, as amended, as anopen-end management investment company.
The fund is an investment company and accordingly follows the investment company accounting and reporting guidance of the Financial Accounting Standards Board (FASB) Accounting Standards Codification Topic 946 Financial Services – Investment Companies.
(2) Significant Accounting Policies
General– The preparation of financial statements in conformity with U.S. generally accepted accounting principles requires management to make estimates and assumptions that affect the reported amounts of assets and liabilities, and disclosure of contingent assets and liabilities at the date of the financial statements and the reported amounts of increases and decreases in net assets from operations during the reporting period. Actual results could differ from those estimates. In the preparation of these financial statements, management has evaluated subsequent events occurring after the date of the fund’s Statement of Assets and Liabilities through the date that the financial statements were issued. The fund invests in foreign securities, including securities of emerging market issuers. Investments in foreign securities are vulnerable to the effects of changes in the relative values of the local currency and the U.S. dollar and to the effects of changes in each country’s market, economic, industrial, political, regulatory, geopolitical, and other conditions. Investments in emerging markets can involve additional and greater risks than the risks associated with investments in developed foreign markets. Emerging markets can have less developed markets, greater custody and operational risk, less developed legal, regulatory, and accounting systems, and greater political, social, and economic instability than developed markets.
In August 2018, the Securities and Exchange Commission (SEC) released its Final Rule on Disclosure Update and Simplification (the “Final Rule”) which is intended to simplify an issuer’s disclosure compliance efforts by removing redundant or outdated disclosure requirements without significantly altering the mix of information provided to investors. Effective with the current reporting period, the fund adopted the Final Rule with the impacts being that the fund is no longer required to present the components of distributable earnings on the Statement of Assets and Liabilities or the sources of distributions to shareholders and the amount of undistributed net investment income on the Statements of Changes in Net Assets.
Balance Sheet Offsetting– The fund’s accounting policy with respect to balance sheet offsetting is that, absent an event of default by the counterparty or a termination of the agreement, the International Swaps and Derivatives Association (ISDA) Master Agreement, or similar agreement, does not result in an offset of reported amounts of financial assets and financial liabilities in the Statement of Assets and Liabilities across transactions between the fund and the applicable counterparty. The fund’s right to setoff may be restricted or prohibited by the bankruptcy or insolvency laws of the particular jurisdiction to which a specific master netting agreement counterparty is
25
Notes to Financial Statements (unaudited) – continued
subject. Balance sheet offsetting disclosures, to the extent applicable to the fund, have been included in the fund’s Significant Accounting Policies note under the captions for each of the fund’sin-scope financial instruments and transactions.
Investment Valuations– Equity securities, including restricted equity securities, are generally valued at the last sale or official closing price on their primary market or exchange as provided by a third-party pricing service. Equity securities, for which there were no sales reported that day, are generally valued at the last quoted daily bid quotation on their primary market or exchange as provided by a third-party pricing service. Short-term instruments with a maturity at issuance of 60 days or less may be valued at amortized cost, which approximates market value.Open-end investment companies are generally valued at net asset value per share. Securities and other assets generally valued on the basis of information from a third-party pricing service may also be valued at a broker/dealer bid quotation. In determining values, third-party pricing services can utilize both transaction data and market information such as yield, quality, coupon rate, maturity, type of issue, trading characteristics, and other market data. The values of foreign securities and other assets and liabilities expressed in foreign currencies are converted to U.S. dollars using the mean of bid and asked prices for rates provided by a third-party pricing service.
The Board of Trustees has delegated primary responsibility for determining or causing to be determined the value of the fund’s investments (including any fair valuation) to the adviser pursuant to valuation policies and procedures approved by the Board. If the adviser determines that reliable market quotations are not readily available, investments are valued at fair value as determined in good faith by the adviser in accordance with such procedures under the oversight of the Board of Trustees. Under the fund’s valuation policies and procedures, market quotations are not considered to be readily available for most types of debt instruments and floating rate loans and many types of derivatives. These investments are generally valued at fair value based on information from third-party pricing services. In addition, investments may be valued at fair value if the adviser determines that an investment’s value has been materially affected by events occurring after the close of the exchange or market on which the investment is principally traded (such as foreign exchange or market) and prior to the determination of the fund’s net asset value, or after the halting of trading of a specific security where trading does not resume prior to the close of the exchange or market on which the security is principally traded. Events that occur on a frequent basis after foreign markets close (such as developments in foreign markets and significant movements in the U.S. markets) and prior to the determination of the fund’s net asset value may be deemed to have a material effect on the value of securities traded in foreign markets. Accordingly, the fund’s foreign equity securities may often be valued at fair value. The adviser generally relies on third-party pricing services or other information (such as the correlation with price movements of similar securities in the same or other markets; the type, cost and investment characteristics of the security; the business and financial condition of the issuer; and trading and other market data) to assist in determining whether to fair value and at what value to fair value an investment. The value of an investment for purposes of calculating the fund’s net asset value can differ depending on the source and method used to determine value. When fair valuation is used, the value of an investment used to determine the fund’s net asset value may differ from
26
Notes to Financial Statements (unaudited) – continued
quoted or published prices for the same investment. There can be no assurance that the fund could obtain the fair value assigned to an investment if it were to sell the investment at the same time at which the fund determines its net asset value per share.
Various inputs are used in determining the value of the fund’s assets or liabilities. These inputs are categorized into three broad levels. In certain cases, the inputs used to measure fair value may fall into different levels of the fair value hierarchy. In such cases, an investment’s level within the fair value hierarchy is based on the lowest level of input that is significant to the fair value measurement. The fund’s assessment of the significance of a particular input to the fair value measurement in its entirety requires judgment, and considers factors specific to the investment. Level 1 includes unadjusted quoted prices in active markets for identical assets or liabilities. Level 2 includes other significant observable market-based inputs (including quoted prices for similar securities, interest rates, prepayment speed, and credit risk). Level 3 includes unobservable inputs, which may include the adviser’s own assumptions in determining the fair value of investments. The following is a summary of the levels used as of February 28, 2019 in valuing the fund’s assets or liabilities:
| | | | | | | | | | | | | | | | |
| | | | |
| Financial Instruments | | Level 1 | | | Level 2 | | | Level 3 | | | Total | |
| Equity Securities | | | $244,654,924 | | | | $— | | | | $— | | | | $244,654,924 | |
| Mutual Funds | | | 4,996,933 | | | | — | | | | — | | | | 4,996,933 | |
| Total | | | $249,651,857 | | | | $— | | | | $— | | | | $249,651,857 | |
For further information regarding security characteristics, see the Portfolio of Investments.
Foreign Currency Translation– Purchases and sales of foreign investments, income, and expenses are converted into U.S. dollars based upon currency exchange rates prevailing on the respective dates of such transactions or on the reporting date for foreign denominated receivables and payables. Gains and losses attributable to foreign currency exchange rates on sales of securities are recorded for financial statement purposes as net realized gains and losses on investments. Gains and losses attributable to foreign exchange rate movements on receivables, payables, income and expenses are recorded for financial statement purposes as foreign currency transaction gains and losses. That portion of both realized and unrealized gains and losses on investments that results from fluctuations in foreign currency exchange rates is not separately disclosed.
Security Loans– Under its Securities Lending Agency Agreement with the fund, State Street Bank and Trust Company, as lending agent, loans the securities of the fund to certain qualified institutions (the “Borrowers”) approved by the fund. Security loans can be terminated at the discretion of either the lending agent or the fund and the related securities must be returned within the earlier of the standard trade settlement period for such securities or within three business days. The loans are collateralized by cash and/or U.S. Treasury and federal agency obligations in an amount typically at least equal to the market value of the securities loaned. On loans collateralized by cash, the cash collateral is invested in a money market fund. The market value of the loaned securities is determined at the close of business of the fund and any additional required collateral is delivered to the fund on the next business day. The lending agent provides the fund with indemnification against Borrower default. In the event of Borrower
27
Notes to Financial Statements (unaudited) – continued
default, the lending agent will, for the benefit of the fund, either purchase securities identical to those loaned or, when such purchase is commercially impracticable, pay the fund the market value of the loaned securities. In return, the lending agent assumes the fund’s rights to the related collateral. If the collateral value is less than the cost to purchase identical securities, the lending agent is responsible for the shortfall, but only to the extent that such shortfall is not due to a decline in collateral value resulting from collateral reinvestment for which the fund bears the risk of loss. At period end, the fund had investment securities on loan, all of which were classified as equity securities in the fund’s Portfolio of Investments, with a fair value of $2,137,330. The fair value of the fund’s investment securities on loan and a related liability of $2,272,643 for cash collateral received on securities loaned are both presented gross in the Statement of Assets and Liabilities. The collateral on securities loaned exceeded the value of securities on loan at period end. The liability for cash collateral for securities loaned is carried at fair value, which is categorized as level 2 within the fair value hierarchy. A portion of the income generated upon investment of the collateral is remitted to the Borrowers, and the remainder is allocated between the fund and the lending agent. On loans collateralized by U.S. Treasury and/or federal agency obligations, a fee is received from the Borrower, and is allocated between the fund and the lending agent. Income from securities lending is separately reported in the Statement of Operations. The dividend and interest income earned on the securities loaned is accounted for in the same manner as other dividend and interest income.
Indemnifications– Under the fund’s organizational documents, its officers and Trustees may be indemnified against certain liabilities and expenses arising out of the performance of their duties to the fund. Additionally, in the normal course of business, the fund enters into agreements with service providers that may contain indemnification clauses. The fund’s maximum exposure under these agreements is unknown as this would involve future claims that may be made against the fund that have not yet occurred.
Investment Transactions and Income– Investment transactions are recorded on the trade date. Dividends received in cash are recorded on theex-dividend date. Certain dividends from foreign securities will be recorded when the fund is informed of the dividend if such information is obtained subsequent to theex-dividend date. Dividend payments received in additional securities are recorded on theex-dividend date in an amount equal to the value of the security on such date.
The fund may receive proceeds from litigation settlements. Any proceeds received from litigation involving portfolio holdings are reflected in the Statement of Operations in realized gain/loss if the security has been disposed of by the fund or in unrealized gain/loss if the security is still held by the fund. Any other proceeds from litigation not related to portfolio holdings are reflected as other income in the Statement of Operations.
Tax Matters and Distributions– The fund intends to qualify as a regulated investment company, as defined under Subchapter M of the Internal Revenue Code, and to distribute all of its taxable income, including realized capital gains. As a result, no provision for federal income tax is required. The fund’s federal tax returns, when filed, will remain subject to examination by the Internal Revenue Service for a three year period. Management has analyzed the fund’s tax positions taken on federal and
28
Notes to Financial Statements (unaudited) – continued
state tax returns for all open tax years and does not believe that there are any uncertain tax positions that require recognition of a tax liability. Foreign taxes, if any, have been accrued by the fund in the accompanying financial statements in accordance with the applicable foreign tax law. Foreign income taxes may be withheld by certain countries in which the fund invests. Additionally, capital gains realized by the fund on securities issued in or by certain foreign countries may be subject to capital gains tax imposed by those countries.
Distributions to shareholders are recorded on theex-dividend date. Income and capital gain distributions are determined in accordance with income tax regulations, which may differ from U.S. generally accepted accounting principles. Certain capital accounts in the financial statements are periodically adjusted for permanent differences in order to reflect their tax character. These adjustments have no impact on net assets or net asset value per share. Temporary differences which arise from recognizing certain items of income, expense, gain or loss in different periods for financial statement and tax purposes will reverse at some time in the future. Distributions in excess of net investment income or net realized gains are temporary overdistributions for financial statement purposes resulting from differences in the recognition or classification of income or distributions for financial statement and tax purposes.
Book/tax differences primarily relate to passive foreign investment companies, wash sale loss deferrals, and treating a portion of the proceeds from redemptions as a distribution for tax purposes.
The tax character of distributions made during the current period will be determined at fiscal year end. The tax character of distributions declared to shareholders for the last fiscal year is as follows:
| | | | |
| |
| | | Year ended
8/31/18 | |
Ordinary income (including any
short-term capital gains) | | | $3,747,865 | |
The federal tax cost and the tax basis components of distributable earnings were as follows:
| | | | |
| |
| As of 2/28/19 | | | |
| |
| Cost of investments | | | $225,056,745 | |
| Gross appreciation | | | 28,462,021 | |
| |
| Gross depreciation | | | (3,866,909 | ) |
| Net unrealized appreciation (depreciation) | | | $24,595,112 | |
| |
| As of 8/31/18 | | | |
| |
| Undistributed ordinary income | | | 1,006,678 | |
| Undistributed long-term capital gain | | | 4,032,438 | |
| Other temporary differences | | | (30,765 | ) |
| Net unrealized appreciation (depreciation) | | | 22,589,882 | |
The aggregate cost above includes prior fiscal year end tax adjustments, if applicable.
Multiple Classes of Shares of Beneficial Interest– The fund offers multiple classes of shares, which differ in their respective distribution and service fees. The fund’s
29
Notes to Financial Statements (unaudited) – continued
income, realized and unrealized gain (loss), and common expenses are allocated to shareholders based on the daily net assets of each class. Dividends are declared separately for each class. Differences in per share dividend rates are generally due to differences in separate class expenses. Class B shares will convert to Class A shares approximately eight years after purchase. Class C shares will convert to Class A shares approximately ten years after purchase. The fund’s distributions declared to shareholders as reported in the Statements of Changes in Net Assets are presented by class as follows:
| | | | | | | | | | | | | | | | |
| | | From net investment
income | | | From net realized
gain | |
| | | | |
| | | Six months
ended
2/28/19 | | | Year
ended
8/31/18 | | | Six months
ended
2/28/19 | | | Year
ended
8/31/18 | |
| Class A | | | $76,556 | | | | $171,679 | | | | $316,380 | | | | $— | |
| Class B | | | 1,405 | | | | 4,005 | | | | 10,247 | | | | — | |
| Class C | | | 7,115 | | | | 19,587 | | | | 55,646 | | | | — | |
| Class I | | | 1,068,981 | | | | 2,142,583 | | | | 3,717,214 | | | | — | |
| Class R1 | | | 283 | | | | 760 | | | | 2,099 | | | | — | |
| Class R2 | | | 421 | | | | 979 | | | | 1,872 | | | | — | |
| Class R3 | | | 508 | | | | 1,496 | | | | 1,886 | | | | — | |
| Class R4 | | | 599 | | | | 1,310 | | | | 1,902 | | | | — | |
| Class R6 | | | 649,873 | | | | 1,405,466 | | | | 2,012,996 | | | | — | |
| Total | | | $1,805,741 | | | | $3,747,865 | | | | $6,120,242 | | | | $— | |
(3) Transactions with Affiliates
Investment Adviser– The fund has an investment advisory agreement with MFS to provide overall investment management and related administrative services and facilities to the fund. The management fee is computed daily and paid monthly at the following annual rates based on the fund’s average daily net assets:
| | | | |
| Up to $1 billion | | | 0.55 | % |
| In excess of $1 billion and up to $2.5 billion | | | 0.525 | % |
| In excess of $2.5 billion | | | 0.50 | % |
MFS has agreed in writing to reduce its management fee by a specified amount if certain MFS mutual fund assets exceed thresholds agreed to by MFS and the fund’s Board of Trustees. For the six months ended February 28, 2019, this management fee reduction amounted to $10,266, which is included in the reduction of total expenses in the Statement of Operations. The management fee incurred for the six months ended February 28, 2019 was equivalent to an annual effective rate of 0.54% of the fund’s average daily net assets.
The investment adviser has agreed in writing to pay a portion of the fund’s total annual operating expenses, excluding interest, taxes, extraordinary expenses, brokerage and transaction costs, and investment-related expenses, such that total fund operating expenses do not exceed the following rates annually of each class’s average daily net assets:
| | | | | | | | | | | | | | | | | | | | | | | | | | | | | | | | |
| Classes | |
| | | | | | | | |
| A | | B | | | C | | | I | | | R1 | | | R2 | | | R3 | | | R4 | | | R6 | |
| 0.99% | | | 1.74% | | | | 1.74% | | | | 0.74% | | | | 1.74% | | | | 1.24% | | | | 0.99% | | | | 0.74% | | | | 0.68% | |
30
Notes to Financial Statements (unaudited) – continued
This written agreement will continue until modified by the fund’s Board of Trustees, but such agreement will continue at least until December 31, 2019. For the six months ended February 28, 2019, this reduction amounted to $33,459, which is included in the reduction of total expenses in the Statement of Operations.
Distributor– MFS Fund Distributors, Inc. (MFD), a wholly-owned subsidiary of MFS, as distributor, received $1,917 for the six months ended February 28, 2019, as its portion of the initial sales charge on sales of Class A shares of the fund.
The Board of Trustees has adopted a distribution plan for certain share classes pursuant to Rule12b-1 of the Investment Company Act of 1940.
The fund’s distribution plan provides that the fund will pay MFD for services provided by MFD and financial intermediaries in connection with the distribution and servicing of certain share classes. One component of the plan is a distribution fee paid to MFD and another component of the plan is a service fee paid to MFD. MFD may subsequently pay all, or a portion, of the distribution and/or service fees to financial intermediaries.
Distribution Plan Fee Table:
| | | | | | | | | | | | | | | | | | | | |
| | | | | |
| | | Distribution
Fee Rate (d) | | | Service
Fee Rate (d) | | | Total
Distribution
Plan (d) | | | Annual
Effective
Rate (e) | | | Distribution
and Service
Fee | |
| Class A | | | — | | | | 0.25% | | | | 0.25% | | | | 0.24% | | | | $13,430 | |
| Class B | | | 0.75% | | | | 0.25% | | | | 1.00% | | | | 1.00% | | | | 1,833 | |
| Class C | | | 0.75% | | | | 0.25% | | | | 1.00% | | | | 1.00% | | | | 9,506 | |
| Class R1 | | | 0.75% | | | | 0.25% | | | | 1.00% | | | | 1.00% | | | | 360 | |
| Class R2 | | | 0.25% | | | | 0.25% | | | | 0.50% | | | | 0.50% | | | | 162 | |
| Class R3 | | | — | | | | 0.25% | | | | 0.25% | | | | 0.25% | | | | 81 | |
| Total Distribution and Service Fees | | | | | | | | | | | | $25,372 | |
| (d) | In accordance with the distribution plan for certain classes, the fund pays distribution and/or service fees equal to these annual percentage rates of each class’s average daily net assets. The distribution and service fee rates disclosed by class represent the current rates in effect at the end of the reporting period. Any rate changes, if applicable, are detailed below. |
| (e) | The annual effective rates represent actual fees incurred under the distribution plan for the six months ended February 28, 2019 based on each class’s average daily net assets. MFD has voluntarily agreed to rebate a portion of each class’s 0.25% service fee attributable to accounts for which MFD retains the 0.25% service fee except for accounts attributable to MFS or its affiliates’ seed money. For the six months ended February 28, 2019, this rebate amounted to $559 for Class A and is included in the reduction of total expenses in the Statement of Operations. |
Certain Class A shares are subject to a contingent deferred sales charge (CDSC) in the event of a shareholder redemption within 18 months of purchase. Class B shares are subject to a CDSC in the event of a shareholder redemption within six years of purchase. Class C shares are subject to a CDSC in the event of a shareholder redemption within 12 months of purchase. All contingent deferred sales charges are paid to MFD and during the six months ended February 28, 2019, were as follows:
| | | | |
| |
| | | Amount | |
| Class A | | | $45 | |
| Class B | | | 735 | |
| Class C | | | 8 | |
31
Notes to Financial Statements (unaudited) – continued
Shareholder Servicing Agent– MFS Service Center, Inc. (MFSC), a wholly-owned subsidiary of MFS, receives a fee from the fund for its services as shareholder servicing agent calculated as a percentage of the average daily net assets of the fund as determined periodically under the supervision of the fund’s Board of Trustees. For the six months ended February 28, 2019, the fee was $2,966, which equated to 0.0029% annually of the fund’s average daily net assets. MFSC also receives payment from the fund forout-of-pocket expenses,sub-accounting and other shareholder servicing costs which may be paid to affiliated and unaffiliated service providers. Class R6 shares do not incursub-accounting fees. For the six months ended February 28, 2019, theseout-of-pocket expenses,sub-accounting and other shareholder servicing costs amounted to $48,468.
Administrator– MFS provides certain financial, legal, shareholder communications, compliance, and other administrative services to the fund. Under an administrative services agreement, the fund reimburses MFS the costs incurred to provide these services. The fund is charged an annual fixed amount of $17,500 plus a fee based on average daily net assets. The administrative services fee incurred for the six months ended February 28, 2019 was equivalent to an annual effective rate of 0.0184% of the fund’s average daily net assets.
Trustees’ and Officers’ Compensation– The fund pays compensation to independent Trustees in the form of a retainer, attendance fees, and additional compensation to Board and Committee chairpersons. The fund does not pay compensation directly to Trustees or officers of the fund who are also officers of the investment adviser, all of whom receive remuneration for their services to the fund from MFS. Certain officers and Trustees of the fund are officers or directors of MFS, MFD, and MFSC.
Other– This fund and certain other funds managed by MFS (the funds) have entered into a service agreement (the ISO Agreement) which provides for payment of fees solely by the funds to Tarantino LLC in return for the provision of services of an Independent Senior Officer (ISO) for the funds. Frank L. Tarantino serves as the ISO and is an officer of the funds and the sole member of Tarantino LLC. The funds can terminate the ISO Agreement with Tarantino LLC at any time under the terms of the ISO Agreement. For the six months ended February 28, 2019, the fee paid by the fund under this agreement was $163 and is included in “Miscellaneous” expense in the Statement of Operations. MFS has agreed to bear all expenses associated with office space, other administrative support, and supplies provided to the ISO.
The fund invests in the MFS Institutional Money Market Portfolio which is managed by MFS and seeks current income consistent with preservation of capital and liquidity. This money market fund does not pay a management fee to MFS.
On September 20, 2017, MFS redeemed 2,847 shares of Class I for an aggregate amount of $36,499. On March 19, 2018, MFS redeemed 7,343 shares of Class I for an aggregate amount of $96,564. On September 25, 2018, MFS purchased 1,971 shares of Class I for an aggregate amount of $27,339.
At February 28, 2019, MFS held approximately 88% of the outstanding shares of Class R1 and 100% of the outstanding shares of Class R2, Class R3, and Class R4, respectively.
32
Notes to Financial Statements (unaudited) – continued
The fund is permitted to engage in purchase and sale transactions with funds and accounts for which MFS serves as investment adviser orsub-adviser (“cross-trades”) pursuant to a policy adopted by the Board of Trustees. This policy has been designed to ensure that cross-trades conducted by the fund comply with Rule17a-7 under the Investment Company Act of 1940. During the six months ended February 28, 2019, the fund engaged in purchase transactions pursuant to this policy, which amounted to $204,060.
The adviser has voluntarily undertaken to reimburse the fund from its own resources on a quarterly basis for the cost of investment research embedded in the cost of the fund’s securities trades. This agreement may be rescinded at any time. For the six months ended February 28, 2019, this reimbursement amounted to $9,530, which is included in “Other” income in the Statement of Operations.
(4) Portfolio Securities
For the six months ended February 28, 2019, purchases and sales of investments, other than short-term obligations, aggregated $82,751,471 and $35,440,232, respectively.
(5) Shares of Beneficial Interest
The fund’s Declaration of Trust permits the Trustees to issue an unlimited number of full and fractional shares of beneficial interest. Transactions in fund shares were as follows:
| | | | | | | | | | | | | | | | |
| | | Six months ended
2/28/19 | | | Year ended
8/31/18 | |
| | | | |
| | | Shares | | | Amount | | | Shares | | | Amount | |
| Shares sold | | | | | | | | | | | | | | | | |
Class A | | | 596,649 | | | | $7,725,432 | | | | 166,465 | | | | $2,195,559 | |
Class B | | | 2,586 | | | | 32,913 | | | | 2,431 | | | | 32,218 | |
Class C | | | 65,761 | | | | 826,740 | | | | 44,846 | | | | 588,231 | |
Class I | | | 4,704,698 | | | | 61,544,222 | | | | 3,081,326 | | | | 40,706,123 | |
Class R1 | | | 15 | | | | 200 | | | | 59 | | | | 768 | |
Class R6 | | | 429,702 | | | | 5,606,653 | | | | 1,110,058 | | | | 14,524,680 | |
| | | 5,799,411 | | | | $75,736,160 | | | | 4,405,185 | | | | $58,047,579 | |
| | | | |
Shares issued to shareholders in
reinvestment of distributions | | | | | | | | | | | | | | | | |
Class A | | | 31,362 | | | | $392,058 | | | | 13,140 | | | | $171,513 | |
Class B | | | 939 | | | | 11,652 | | | | 307 | | | | 4,005 | |
Class C | | | 4,933 | | | | 61,086 | | | | 1,495 | | | | 19,416 | |
Class I | | | 370,565 | | | | 4,639,213 | | | | 157,587 | | | | 2,054,501 | |
Class R1 | | | 191 | | | | 2,382 | | | | 58 | | | | 760 | |
Class R2 | | | 183 | | | | 2,293 | | | | 75 | | | | 979 | |
Class R3 | | | 191 | | | | 2,394 | | | | 115 | | | | 1,496 | |
Class R4 | | | 199 | | | | 2,501 | | | | 101 | | | | 1,310 | |
Class R6 | | | 205,213 | | | | 2,572,330 | | | | 104,523 | | | | 1,360,917 | |
| | | 613,776 | | | | $7,685,909 | | | | 277,401 | | | | $3,614,897 | |
33
Notes to Financial Statements (unaudited) – continued
| | | | | | | | | | | | | | | | |
| | | Six months ended
2/28/19 | | | Year ended
8/31/18 | |
| | | | |
| | | Shares | | | Amount | | | Shares | | | Amount | |
| Shares reacquired | | | | | | | | | | | | | | | | |
Class A | | | (177,510 | ) | | | $(2,313,359 | ) | | | (235,675 | ) | | | $(3,097,154 | ) |
Class B | | | (2,135 | ) | | | (27,635 | ) | | | (2,369 | ) | | | (30,922 | ) |
Class C | | | (44,204 | ) | | | (569,498 | ) | | | (67,494 | ) | | | (885,022 | ) |
Class I | | | (876,794 | ) | | | (11,608,710 | ) | | | (2,560,046 | ) | | | (33,731,533 | ) |
Class R1 | | | (1 | ) | | | (9 | ) | | | (1 | ) | | | (18 | ) |
Class R3 | | | — | | | | — | | | | (7,000 | ) | | | (90,368 | ) |
Class R6 | | | (227,025 | ) | | | (2,866,774 | ) | | | (1,511,756 | ) | | | (19,860,157 | ) |
| | | (1,327,669 | ) | | | $(17,385,985 | ) | | | (4,384,341 | ) | | | $(57,695,174 | ) |
| | | | |
| Net change | | | | | | | | | | | | | | | | |
Class A | | | 450,501 | | | | $5,804,131 | | | | (56,070 | ) | | | $(730,082 | ) |
Class B | | | 1,390 | | | | 16,930 | | | | 369 | | | | 5,301 | |
Class C | | | 26,490 | | | | 318,328 | | | | (21,153 | ) | | | (277,375 | ) |
Class I | | | 4,198,469 | | | | 54,574,725 | | | | 678,867 | | | | 9,029,091 | |
Class R1 | | | 205 | | | | 2,573 | | | | 116 | | | | 1,510 | |
Class R2 | | | 183 | | | | 2,293 | | | | 75 | | | | 979 | |
Class R3 | | | 191 | | | | 2,394 | | | | (6,885 | ) | | | (88,872 | ) |
Class R4 | | | 199 | | | | 2,501 | | | | 101 | | | | 1,310 | |
Class R6 | | | 407,890 | | | | 5,312,209 | | | | (297,175 | ) | | | (3,974,560 | ) |
| | | 5,085,518 | | | | $66,036,084 | | | | 298,245 | | | | $3,967,302 | |
Class T shares were not publicly available for sale during the period. Please see the fund’s prospectus for details.
Effective June 1, 2019, purchases of the fund’s Class B shares are closed to new and existing investors subject to certain exceptions. Please see the fund’s prospectus for details.
(6) Line of Credit
The fund and certain other funds managed by MFS participate in a $1.25 billion unsecured committed line of credit, subject to a $1 billion sublimit, provided by a syndication of banks under a credit agreement. Borrowings may be made for temporary financing needs. Interest is charged to each fund, based on its borrowings, generally at a rate equal to the higher of the Overnight Bank Funding rate or daily one month LIBOR plus an agreed upon spread. A commitment fee, based on the average daily, unused portion of the committed line of credit, is allocated among the participating funds. In addition, the fund and other funds managed by MFS have established unsecured uncommitted borrowing arrangements with certain banks for temporary financing needs. Interest is charged to each fund, based on its borrowings, at a rate equal to the Overnight Bank Funding rate plus an agreed upon spread. For the six months ended February 28, 2019, the fund’s commitment fee and interest expense were $548 and $0, respectively, and are included in “Miscellaneous” expense in the Statement of Operations.
34
Notes to Financial Statements (unaudited) – continued
(7) Investments in Affiliated Issuers
An affiliated issuer may be considered one in which the fund owns 5% or more of the outstanding voting securities, or a company which is under common control. For the purposes of this report, the fund assumes the following to be affiliated issuers:
| | | | | | | | | | | | | | | | | | | | |
| | | | | |
| Affiliated Issuers | | | | | Beginning
Shares/Par
Amount | | | Acquisitions
Shares/Par
Amount | | | Dispositions
Shares/Par
Amount | | | Ending
Shares/Par
Amount | |
| MFS Institutional Money Market Portfolio | | | | | | | 1,215,317 | | | | 39,544,690 | | | | (38,035,717 | ) | | | 2,724,290 | |
| | | | | |
| Affiliated Issuers | | Realized
Gain (Loss) | | | Change in
Unrealized
Appreciation/
Depreciation | | | Capital Gain
Distributions | | | Dividend
Income | | | Ending
Value | |
| MFS Institutional Money Market Portfolio | | | $91 | | | | $51 | | | | $— | | | | $25,451 | | | | $2,724,290 | |
35
PROXY VOTING POLICIES AND INFORMATION
MFS votes proxies on behalf of the fund pursuant to proxy voting policies and procedures that are available without charge, upon request, by calling1-800-225-2606, by visitingmfs.com/proxyvoting, or by visiting the SEC’s Web site athttp://www.sec.gov.
Information regarding how the fund voted proxies relating to portfolio securities during the most recent twelve-month period ended June 30 is available by August 31 of each year without charge by visitingmfs.com/proxyvoting, or by visiting the SEC’s Web site athttp://www.sec.gov.
QUARTERLY PORTFOLIO DISCLOSURE
The fund files a complete schedule of portfolio holdings with the SEC for the first and third quarters of each fiscal year on Form N-Q. The fund’s Form N-Q is available on the SEC’s website athttp://www.sec.gov.A shareholder can obtain the portfolio holdings report for the first and third quarters of the fund’s fiscal year atmfs.com/openendfundsby choosing the fund’s name and then selecting the “Resources” tab and clicking on “Prospectus and Reports”.
FURTHER INFORMATION
From time to time, MFS may post important information about the fund or the MFS funds on the MFS web site (mfs.com). This information is available athttps://www.mfs.com/en-us/what-we-do/announcements.html or atmfs.com/openendfunds by choosing the fund’s name.
INFORMATION ABOUT FUND CONTRACTS AND LEGAL CLAIMS
The fund has entered into contractual arrangements with an investment adviser, administrator, distributor, shareholder servicing agent, 529 program manager (if applicable), and custodian who each provide services to the fund. Unless expressly stated otherwise, shareholders are not parties to, or intended beneficiaries of these contractual arrangements, and these contractual arrangements are not intended to create any shareholder right to enforce them against the service providers or to seek any remedy under them against the service providers, either directly or on behalf of the fund.
Under the Trust’s By-Laws and Declaration of Trust, any claims asserted against or on behalf of the MFS Funds, including claims against Trustees and Officers, must be brought in state and federal courts located within the Commonwealth of Massachusetts.
PROVISION OF FINANCIAL REPORTS AND SUMMARY PROSPECTUSES
The fund produces financial reports every six months and updates its summary prospectus and prospectus annually. To avoid sending duplicate copies of materials to households, only one copy of the fund’s annual and semiannual report and summary prospectus may be mailed to shareholders having the same last name and residential address on the fund’s records. However, any shareholder may contact MFSC (please see back cover for address and telephone number) to request that copies of these reports and summary prospectuses be sent personally to that shareholder.
36
Save paper with eDelivery.

| MFS® will send you prospectuses, |
reports, and proxies directly viae-mail so you will get information faster with less mailbox clutter.
To sign up:
1. Go to mfs.com.
2. Log in via MFS® Access.
3. Select eDelivery.
If you own your MFS fund shares through a financial institution or a retirement plan, MFS® TALK, MFS® Access, or eDelivery may not be available to you.
CONTACT
WEB SITE
mfs.com
MFS TALK
1-800-637-8255
24 hours a day
ACCOUNT SERVICE AND LITERATURE
Shareholders
1-800-225-2606
Financial advisors
1-800-343-2829
Retirement plan services
1-800-637-1255
MAILING ADDRESS
MFS Service Center, Inc.
P.O. Box 219341
Kansas City, MO 64121-9341
OVERNIGHT MAIL
MFS Service Center, Inc.
Suite 219341
430 W 7th Street
Kansas City, MO 64105-1407
Semiannual Report
February 28, 2019

MFS® Low Volatility Equity Fund

Beginning on January 1, 2021, as permitted by regulations adopted by the U.S. Securities and Exchange Commission, paper copies of the fund’s annual and semiannual shareholder reports will no longer be sent by mail, unless you specifically request paper copies of the reports. Instead, the complete reports will be made available on the fund’s Web site (funds.mfs.com), and you will be notified by mail each time a report is posted and provided with a Web site link to access the report.
If you are already signed up to receive shareholder reports by email, you will not be affected by this change and you need not take any action. You may sign up to receive shareholder reports and other communications from the fund by email by contacting your financial intermediary (such as a broker-dealer or bank) or, if you hold your shares directly with the fund, by calling 1-800-225-2606 or by logging on to MFS Access at mfs.com.
Beginning on January 1, 2019, you may elect to receive all future reports in paper free of charge. Contact your financial intermediary to request that you continue to receive paper copies of your shareholder reports. If you invest directly with the fund, you can call 1-800-225-2606 or send an email request to orderliterature@mfs.com to let the fund know that you wish to continue receiving paper copies of your shareholder reports. Your election to receive reports in paper will apply to all funds held in your account if you invest through your financial intermediary or all funds held with the MFS fund complex if you invest directly.
LVU-SEM
MFS® Low Volatility Equity Fund
CONTENTS
The report is prepared for the general information of shareholders.
It is authorized for distribution to prospective investors only when preceded or accompanied by a current prospectus.
NOT FDIC INSURED• MAY LOSE VALUE• NO BANK GUARANTEE

LETTER FROM THE EXECUTIVE CHAIRMAN
Dear Shareholders:
Markets experienced a bout of volatility in late 2018 as a result of higher interest rates, international trade friction and geopolitical uncertainty surrounding issues such as
Brexit. But concern over those issues dissipated in the early months of 2019 due to a more dovish posture by the U.S. Federal Reserve, progress toward a trade pact between the United States and China, and a consensus forming in the British Parliament against ano-deal Brexit. Over the past year, U.S. equities have outperformed their global peers due in part to fiscal stimulus undertaken in late 2017 and early 2019, which helped maintain healthy levels of U.S. economic output against a backdrop of slowing global growth, though returns, on average, have been modest.
Globally, inflation remains largely subdued thanks in part to stable
oil prices, though tight labor markets are keeping investors on the lookout for its potential reappearance. Rising incomes in many developed and emerging markets are supportive of gains in consumption, though a challenging backdrop for global trade has weighed on manufacturing in most regions. Should the U.S. and China reach a comprehensive trade agreement, sentiment could improve later this year.
As a global investment manager with nearly a century of expertise, MFS® firmly believes active risk management offers downside mitigation and may help improve investment outcomes. We built our active investment platform with this belief in mind. Our long-term perspective influences nearly every aspect of our business, ensuring that our investment decisions align with the investing time horizons of our clients.
Respectfully,

Robert J. Manning
Executive Chairman
MFS Investment Management
April 16, 2019
The opinions expressed in this letter are subject to change and may not be relied upon for investment advice. No forecasts can be guaranteed.
1
PORTFOLIO COMPOSITION
Portfolio structure

| | | | |
| Top ten holdings | | | | |
| Waste Connections, Inc. | | | 3.1% | |
| Eli Lilly & Co. | | | 3.1% | |
| PepsiCo, Inc. | | | 3.0% | |
| Johnson & Johnson | | | 2.5% | |
| Cisco Systems, Inc. | | | 2.4% | |
| Amdocs Ltd. | | | 2.4% | |
| Costco Wholesale Corp. | | | 2.3% | |
| Alphabet, Inc., “A” | | | 2.3% | |
| Procter & Gamble Co. | | | 2.0% | |
| STORE Capital Corp., REIT | | | 1.9% | |
| | | | |
| Equity sectors (k) | | | | |
| Financial Services | | | 21.5% | |
| Health Care | | | 18.0% | |
| Technology | | | 10.6% | |
| Industrial Goods & Services | | | 10.4% | |
| Consumer Staples | | | 9.6% | |
| Utilities & Communications | | | 8.9% | |
| Special Products & Services | | | 6.2% | |
| Leisure | | | 5.0% | |
| Basic Materials | | | 3.2% | |
| Retailing | | | 3.0% | |
| Energy | | | 2.4% | |
| (k) | The sectors set forth above and the associated portfolio composition are based on MFS’ own custom sector classification methodology. |
Cash & Cash Equivalents includes any cash, investments in money market funds, short-term securities, and other assets less liabilities. Please see the Statement of Assets and Liabilities for additional information related to the fund’s cash position and other assets and liabilities.
Percentages are based on net assets as of February 28, 2019.
The portfolio is actively managed and current holdings may be different.
2
EXPENSE TABLE
Fund expenses borne by the shareholders during the period, September 1, 2018 through February 28, 2019
As a shareholder of the fund, you incur two types of costs: (1) transaction costs, including sales charges (loads) on certain purchase or redemption payments, and (2) ongoing costs, including management fees; distribution and service(12b-1) fees; and other fund expenses. This example is intended to help you understand your ongoing costs (in dollars) of investing in the fund and to compare these costs with the ongoing costs of investing in other mutual funds.
The example is based on an investment of $1,000 invested at the beginning of the period and held for the entire period September 1, 2018 through February 28, 2019.
Actual Expenses
The first line for each share class in the following table provides information about actual account values and actual expenses. You may use the information in this line, together with the amount you invested, to estimate the expenses that you paid over the period. Simply divide your account value by $1,000 (for example, an $8,600 account value divided by $1,000 = 8.6), then multiply the result by the number in the first line under the heading entitled “Expenses Paid During Period” to estimate the expenses you paid on your account during this period.
Hypothetical Example for Comparison Purposes
The second line for each share class in the following table provides information about hypothetical account values and hypothetical expenses based on the fund’s actual expense ratio and an assumed rate of return of 5% per year before expenses, which is not the fund’s actual return. The hypothetical account values and expenses may not be used to estimate the actual ending account balance or expenses you paid for the period. You may use this information to compare the ongoing costs of investing in the fund and other funds. To do so, compare this 5% hypothetical example with the 5% hypothetical examples that appear in the shareholder reports of the other funds.
Please note that the expenses shown in the table are meant to highlight your ongoing costs only and do not reflect any transactional costs, such as sales charges (loads). Therefore, the second line for each share class in the table is useful in comparing ongoing costs only, and will not help you determine the relative total costs of owning different funds. In addition, if these transactional costs were included, your costs would have been higher.
3
Expense Table – continued
| | | | | | | | | | | | | | | | | | |
Share
Class | | | | Annualized
Expense Ratio | | | Beginning
Account Value
9/01/18 | | | Ending Account Value
2/28/19 | | | Expenses Paid During Period (p) 9/01/18-2/28/19 | |
| A | | Actual | | | 0.89% | | | | $1,000.00 | | | | $1,025.35 | | | | $4.47 | |
| | Hypothetical (h) | | | 0.89% | | | | $1,000.00 | | | | $1,020.38 | | | | $4.46 | |
| B | | Actual | | | 1.64% | | | | $1,000.00 | | | | $1,021.94 | | | | $8.22 | |
| | Hypothetical (h) | | | 1.64% | | | | $1,000.00 | | | | $1,016.66 | | | | $8.20 | |
| C | | Actual | | | 1.64% | | | | $1,000.00 | | | | $1,021.40 | | | | $8.22 | |
| | Hypothetical (h) | | | 1.64% | | | | $1,000.00 | | | | $1,016.66 | | | | $8.20 | |
| I | | Actual | | | 0.64% | | | | $1,000.00 | | | | $1,026.68 | | | | $3.22 | |
| | Hypothetical (h) | | | 0.64% | | | | $1,000.00 | | | | $1,021.62 | | | | $3.21 | |
| R1 | | Actual | | | 1.64% | | | | $1,000.00 | | | | $1,021.16 | | | | $8.22 | |
| | Hypothetical (h) | | | 1.64% | | | | $1,000.00 | | | | $1,016.66 | | | | $8.20 | |
| R2 | | Actual | | | 1.14% | | | | $1,000.00 | | | | $1,023.82 | | | | $5.72 | |
| | Hypothetical (h) | | | 1.14% | | | | $1,000.00 | | | | $1,019.14 | | | | $5.71 | |
| R3 | | Actual | | | 0.89% | | | | $1,000.00 | | | | $1,025.20 | | | | $4.47 | |
| | Hypothetical (h) | | | 0.89% | | | | $1,000.00 | | | | $1,020.38 | | | | $4.46 | |
| R4 | | Actual | | | 0.64% | | | | $1,000.00 | | | | $1,026.65 | | | | $3.22 | |
| | Hypothetical (h) | | | 0.64% | | | | $1,000.00 | | | | $1,021.62 | | | | $3.21 | |
| R6 | | Actual | | | 0.55% | | | | $1,000.00 | | | | $1,027.16 | | | | $2.76 | |
| | Hypothetical (h) | | | 0.55% | | | | $1,000.00 | | | | $1,022.07 | | | | $2.76 | |
| (h) | 5% class return per year before expenses. |
| (p) | “Expenses Paid During Period” are equal to each class’s annualized expense ratio, as shown above, multiplied by the average account value over the period, multiplied by 181/365 (to reflect theone-half year period). Expenses paid do not include any applicable sales charges (loads). If these transaction costs had been included, your costs would have been higher. |
4
PORTFOLIO OF INVESTMENTS
2/28/19 (unaudited)
The Portfolio of Investments is a complete list of all securities owned by your fund. It is categorized by broad-based asset classes.
| | | | | | | | |
| Common Stocks - 98.8% | | | | | | | | |
| | |
| Issuer | | Shares/Par | | | Value ($) | |
| Aerospace - 5.9% | | | | | | | | |
| Boeing Co. | | | 2,753 | | | $ | 1,211,210 | |
| CACI International, Inc., “A” (a) | | | 5,448 | | | | 992,952 | |
| Honeywell International, Inc. | | | 13,575 | | | | 2,091,500 | |
| Lockheed Martin Corp. | | | 4,572 | | | | 1,414,623 | |
| Northrop Grumman Corp. | | | 5,907 | | | | 1,712,794 | |
| United Technologies Corp. | | | 6,861 | | | | 862,222 | |
| | | | | | | | |
| | | | | | | $ | 8,285,301 | |
| Alcoholic Beverages - 1.2% | | | | | | | | |
| Constellation Brands, Inc., “A” | | | 10,409 | | | $ | 1,760,786 | |
| | |
| Brokerage & Asset Managers - 1.6% | | | | | | | | |
| CME Group, Inc. | | | 12,092 | | | $ | 2,199,656 | |
| | |
| Business Services - 3.8% | | | | | | | | |
| Amdocs Ltd. | | | 59,809 | | | $ | 3,323,586 | |
| CoStar Group, Inc. (a) | | | 1,794 | | | | 820,809 | |
| FleetCor Technologies, Inc. (a) | | | 2,902 | | | | 676,979 | |
| Total System Services, Inc. | | | 6,386 | | | | 602,838 | |
| | | | | | | | |
| | | | | | | $ | 5,424,212 | |
| Cable TV - 0.7% | | | | | | | | |
| Comcast Corp., “A” | | | 23,922 | | | $ | 925,064 | |
| | |
| Chemicals - 0.6% | | | | | | | | |
| Eastman Chemical Co. | | | 10,129 | | | $ | 837,567 | |
| | |
| Computer Software - 3.3% | | | | | | | | |
| Adobe Systems, Inc. (a) | | | 7,072 | | | $ | 1,856,400 | |
| Microsoft Corp. | | | 17,715 | | | | 1,984,612 | |
| Oracle Corp. | | | 15,770 | | | | 822,090 | |
| | | | | | | | |
| | | | | | | $ | 4,663,102 | |
| Consumer Products - 2.0% | | | | | | | | |
| Procter & Gamble Co. | | | 28,068 | | | $ | 2,766,101 | |
| | |
| Consumer Services - 2.4% | | | | | | | | |
| Bookings Holdings, Inc. (a) | | | 614 | | | $ | 1,041,983 | |
| Bright Horizons Family Solutions, Inc. (a) | | | 18,498 | | | | 2,293,752 | |
| | | | | | | | |
| | | | | | | $ | 3,335,735 | |
5
Portfolio of Investments (unaudited) – continued
| | | | | | | | |
| | |
| Issuer | | Shares/Par | | | Value ($) | |
| Common Stocks - continued | | | | | | | | |
| Containers - 0.6% | | | | | | | | |
| Berry Global Group, Inc. (a) | | | 15,866 | | | $ | 832,489 | |
| | |
| Electronics - 1.3% | | | | | | | | |
| Texas Instruments, Inc. | | | 17,737 | | | $ | 1,876,220 | |
| | |
| Energy - Independent - 1.0% | | | | | | | | |
| Occidental Petroleum Corp. | | | 12,914 | | | $ | 854,261 | |
| Phillips 66 | | | 5,465 | | | | 526,608 | |
| | | | | | | | |
| | | | | | | $ | 1,380,869 | |
| Energy - Integrated - 1.4% | | | | | | | | |
| Exxon Mobil Corp. | | | 25,114 | | | $ | 1,984,759 | |
| | |
| Food & Beverages - 5.0% | | | | | | | | |
| General Mills, Inc. | | | 37,968 | | | $ | 1,789,432 | |
| Mondelez International, Inc. | | | 21,671 | | | | 1,022,004 | |
| PepsiCo, Inc. | | | 36,531 | | | | 4,224,445 | |
| | | | | | | | |
| | | | | | | $ | 7,035,881 | |
| Gaming & Lodging - 0.9% | | | | | | | | |
| Carnival Corp. | | | 22,329 | | | $ | 1,289,723 | |
| | |
| Health Maintenance Organizations - 3.9% | | | | | | | | |
| Cigna Corp. | | | 9,506 | | | $ | 1,658,226 | |
| Humana Inc. | | | 6,751 | | | | 1,924,305 | |
| UnitedHealth Group, Inc. | | | 7,667 | | | | 1,857,101 | |
| | | | | | | | |
| | | | | | | $ | 5,439,632 | |
| Insurance - 8.5% | | | | | | | | |
| Allstate Corp. | | | 8,640 | | | $ | 815,443 | |
| Aon PLC | | | 10,027 | | | | 1,719,931 | |
| Chubb Ltd. | | | 6,687 | | | | 895,389 | |
| Everest Re Group Ltd. | | | 11,238 | | | | 2,541,024 | |
| Hartford Financial Services Group, Inc. | | | 26,571 | | | | 1,311,545 | |
| Loews Corp. | | | 34,846 | | | | 1,659,367 | |
| MetLife, Inc. | | | 18,937 | | | | 855,763 | |
| Progressive Corp. | | | 12,868 | | | | 938,077 | |
| Prudential Financial, Inc. | | | 6,323 | | | | 606,060 | |
| Travelers Cos., Inc. | | | 4,252 | | | | 565,133 | |
| | | | | | | | |
| | | | | | | $ | 11,907,732 | |
| Internet - 2.8% | | | | | | | | |
| Alphabet, Inc., “A” (a) | | | 2,886 | | | $ | 3,251,224 | |
| Alphabet, Inc., “C” (a) | | | 672 | | | | 752,586 | |
| | | | | | | | |
| | | | | | | $ | 4,003,810 | |
6
Portfolio of Investments (unaudited) – continued
| | | | | | | | |
| | |
| Issuer | | Shares/Par | | | Value ($) | |
| Common Stocks - continued | | | | | | | | |
| Machinery & Tools - 1.4% | | | | | | | | |
| AGCO Corp. | | | 11,784 | | | $ | 796,363 | |
| Eaton Corp. PLC | | | 14,116 | | | | 1,126,033 | |
| | | | | | | | |
| | | | | | | $ | 1,922,396 | |
| Major Banks - 0.5% | | | | | | | | |
| PNC Financial Services Group, Inc. | | | 5,764 | | | $ | 726,379 | |
| | |
| Medical & Health Technology & Services - 1.6% | | | | | | | | |
| HCA Healthcare, Inc. | | | 11,096 | | | $ | 1,542,788 | |
| Walgreens Boots Alliance, Inc. | | | 9,668 | | | | 688,265 | |
| | | | | | | | |
| | | | | | | $ | 2,231,053 | |
| Medical Equipment - 5.6% | | | | | | | | |
| Danaher Corp. | | | 17,136 | | | $ | 2,176,615 | |
| Medtronic PLC | | | 22,016 | | | | 1,992,448 | |
| STERIS PLC | | | 17,765 | | | | 2,148,854 | |
| Stryker Corp. | | | 4,817 | | | | 908,053 | |
| Varian Medical Systems, Inc. (a) | | | 4,524 | | | | 607,844 | |
| | | | | | | | |
| | | | | | | $ | 7,833,814 | |
| Network & Telecom - 3.1% | | | | | | | | |
| Cisco Systems, Inc. | | | 64,922 | | | $ | 3,361,012 | |
| Motorola Solutions, Inc. | | | 6,719 | | | | 961,623 | |
| | | | | | | | |
| | | | | | | $ | 4,322,635 | |
| Other Banks & Diversified Financials - 3.5% | | | | | | | | |
| M&T Bank Corp. | | | 6,606 | | | $ | 1,143,234 | |
| Mastercard, Inc., “A” | | | 8,008 | | | | 1,799,958 | |
| U.S. Bancorp | | | 14,369 | | | | 742,734 | |
| Visa, Inc., “A” | | | 8,437 | | | | 1,249,689 | |
| | | | | | | | |
| | | | | | | $ | 4,935,615 | |
| Pharmaceuticals - 7.0% | | | | | | | | |
| Eli Lilly & Co. | | | 34,692 | | | $ | 4,381,253 | |
| Johnson & Johnson | | | 25,533 | | | | 3,488,829 | |
| Pfizer, Inc. | | | 29,326 | | | | 1,271,282 | |
| Zoetis, Inc. | | | 8,345 | | | | 786,349 | |
| | | | | | | | |
| | | | | | | $ | 9,927,713 | |
| Pollution Control - 3.1% | | | | | | | | |
| Waste Connections, Inc. | | | 53,115 | | | $ | 4,429,791 | |
| | |
| Real Estate - 7.4% | | | | | | | | |
| AvalonBay Communities, Inc., REIT | | | 9,405 | | | $ | 1,830,495 | |
| Extra Space Storage, Inc., REIT | | | 11,126 | | | | 1,067,428 | |
7
Portfolio of Investments (unaudited) – continued
| | | | | | | | |
| | |
| Issuer | | Shares/Par | | | Value ($) | |
| Common Stocks - continued | | | | | | | | |
| Real Estate - continued | | | | | | | | |
| Mid-America Apartment Communities, Inc., REIT | | | 9,456 | | | $ | 979,452 | |
| Public Storage, Inc., REIT | | | 10,052 | | | | 2,125,898 | |
| STORE Capital Corp., REIT | | | 80,957 | | | | 2,628,674 | |
| Sun Communities, Inc., REIT | | | 16,273 | | | | 1,848,125 | |
| | | | | | | | |
| | | | | | | $ | 10,480,072 | |
| Restaurants - 3.4% | | | | | | | | |
| Aramark | | | 18,413 | | | $ | 557,914 | |
| McDonald’s Corp. | | | 9,259 | | | | 1,702,174 | |
| Starbucks Corp. | | | 36,369 | | | | 2,555,286 | |
| | | | | | | | |
| | | | | | | $ | 4,815,374 | |
| Specialty Chemicals - 2.1% | | | | | | | | |
| Ecolab, Inc. | | | 13,096 | | | $ | 2,212,046 | |
| Linde PLC | | | 3,926 | | | | 680,140 | |
| | | | | | | | |
| | | | | | | $ | 2,892,186 | |
| Specialty Stores - 3.0% | | | | | | | | |
| Costco Wholesale Corp. | | | 15,025 | | | $ | 3,286,568 | |
| Home Depot, Inc. | | | 5,227 | | | | 967,727 | |
| | | | | | | | |
| | | | | | | $ | 4,254,295 | |
| Telephone Services - 0.9% | | | | | | | | |
| Verizon Communications, Inc. | | | 23,494 | | | $ | 1,337,278 | |
| | |
| Tobacco - 1.4% | | | | | | | | |
| Altria Group, Inc. | | | 37,027 | | | $ | 1,940,585 | |
| | |
| Utilities - Electric Power - 7.9% | | | | | | | | |
| American Electric Power Co., Inc. | | | 8,312 | | | $ | 674,519 | |
| DTE Energy Co. | | | 13,847 | | | | 1,710,935 | |
| Duke Energy Corp. | | | 17,160 | | | | 1,538,566 | |
| Evergy, Inc. | | | 14,477 | | | | 809,409 | |
| Exelon Corp. | | | 16,598 | | | | 806,497 | |
| NextEra Energy, Inc. | | | 13,498 | | | | 2,533,845 | |
| WEC Energy Group, Inc. | | | 11,216 | | | | 855,556 | |
| Xcel Energy, Inc. | | | 40,844 | | | | 2,240,702 | |
| | | | | | | | |
| | | | | | | $ | 11,170,029 | |
| Total Common Stocks (Identified Cost, $118,994,827) | | | | | | $ | 139,167,854 | |
8
Portfolio of Investments (unaudited) – continued
| | | | | | | | |
| Investment Companies (h) - 0.5% | | | | | | | | |
| | |
| Issuer | | Shares/Par | | | Value ($) | |
| Money Market Funds - 0.5% | | | | | | | | |
MFS Institutional Money Market Portfolio, 2.49% (v)
(Identified Cost, $722,429) | | | 722,501 | | | $ | 722,500 | |
| | |
| Other Assets, Less Liabilities - 0.7% | | | | | | | 1,013,206 | |
| Net Assets - 100.0% | | | | | | $ | 140,903,560 | |
| (a) | Non-income producing security. |
| (h) | An affiliated issuer, which may be considered one in which the fund owns 5% or more of the outstanding voting securities, or a company which is under common control. At period end, the aggregate values of the fund’s investments in affiliated issuers and in unaffiliated issuers were $722,500 and $139,167,854, respectively. |
| (v) | Affiliated issuer that is available only to investment companies managed by MFS. The rate quoted for the MFS Institutional Money Market Portfolio is the annualizedseven-day yield of the fund at period end. |
The following abbreviations are used in this report and are defined:
| PLC | | Public Limited Company |
| REIT | | Real Estate Investment Trust |
See Notes to Financial Statements
9
Financial Statements
STATEMENT OF ASSETS AND LIABILITIES
At 2/28/19 (unaudited)
This statement represents your fund’s balance sheet, which details the assets and liabilities comprising the total value of the fund.
| | | | |
| Assets | | | | |
Investments in unaffiliated issuers, at value (identified cost, $118,994,827) | | | $139,167,854 | |
Investments in affiliated issuers, at value (identified cost, $722,429) | | | 722,500 | |
Receivables for | | | | |
Fund shares sold | | | 817,702 | |
Dividends | | | 277,715 | |
Receivable from investment adviser | | | 15,957 | |
Other assets | | | 56,562 | |
Total assets | | | $141,058,290 | |
| |
| Liabilities | | | | |
Payables for | | | | |
Fund shares reacquired | | | $76,214 | |
Payable to affiliates | | | | |
Shareholder servicing costs | | | 32,584 | |
Distribution and service fees | | | 1,805 | |
Payable for independent Trustees’ compensation | | | 13 | |
Accrued expenses and other liabilities | | | 44,114 | |
Total liabilities | | | $154,730 | |
Net assets | | | $140,903,560 | |
| |
| Net assets consist of | | | | |
Paid-in capital | | | $120,814,528 | |
Total distributable earnings (loss) | | | 20,089,032 | |
Net assets | | | $140,903,560 | |
Shares of beneficial interest outstanding | | | 9,513,129 | |
10
Statement of Assets and Liabilities (unaudited) – continued
| | | | | | | | | | | | |
| | | |
| | | Net assets | | | Shares
outstanding | | | Net asset value
per share (a) | |
| Class A | | | $56,538,991 | | | | 3,816,821 | | | | $14.81 | |
| Class B | | | 2,370,290 | | | | 160,313 | | | | 14.79 | |
| Class C | | | 17,704,115 | | | | 1,201,134 | | | | 14.74 | |
| Class I | | | 51,354,623 | | | | 3,463,561 | | | | 14.83 | |
| Class R1 | | | 141,458 | | | | 9,542 | | | | 14.82 | |
| Class R2 | | | 168,813 | | | | 11,346 | | | | 14.88 | |
| Class R3 | | | 69,538 | | | | 4,678 | | | | 14.86 | |
| Class R4 | | | 67,910 | | | | 4,576 | | | | 14.84 | |
| Class R6 | | | 12,487,822 | | | | 841,158 | | | | 14.85 | |
| (a) | Maximum offering price per share was equal to the net asset value per share for all share classes, except for Class A, for which the maximum offering price per share was $15.71 [100 / 94.25 x $14.81]. On sales of $50,000 or more, the maximum offering price of Class A shares is reduced. A contingent deferred sales charge may be imposed on redemptions of Class A, Class B, and Class C shares. Redemption price per share was equal to the net asset value per share for Classes I, R1, R2, R3, R4, and R6. |
See Notes to Financial Statements
11
Financial Statements
STATEMENT OF OPERATIONS
Six months ended 2/28/19 (unaudited)
This statement describes how much your fund earned in investment income and accrued in expenses. It also describes any gains and/or losses generated by fund operations.
| | | | |
| Net investment income (loss) | | | | |
Income | | | | |
Dividends | | | $1,220,650 | |
Dividends from affiliated issuers | | | 12,183 | |
Other | | | 1,079 | |
Foreign taxes withheld | | | (2,208 | ) |
Total investment income | | | $1,231,704 | |
Expenses | | | | |
Management fee | | | $267,889 | |
Distribution and service fees | | | 141,270 | |
Shareholder servicing costs | | | 54,533 | |
Administrative services fee | | | 12,537 | |
Independent Trustees’ compensation | | | 1,361 | |
Custodian fee | | | 4,904 | |
Shareholder communications | | | 9,603 | |
Audit and tax fees | | | 24,977 | |
Legal fees | | | 386 | |
Registration fees | | | 63,714 | |
Miscellaneous | | | 14,015 | |
Total expenses | | | $595,189 | |
Reduction of expenses by investment adviser and distributor | | | (115,165 | ) |
Net expenses | | | $480,024 | |
Net investment income (loss) | | | $751,680 | |
| |
| Realized and unrealized gain (loss) | | | | |
Realized gain (loss) (identified cost basis) | | | | |
Unaffiliated issuers | | | $486,317 | |
Affiliated issuers | | | 718 | |
Foreign currency | | | (14 | ) |
Net realized gain (loss) | | | $487,021 | |
Change in unrealized appreciation or depreciation | | | | |
Unaffiliated issuers | | | $3,803,177 | |
Affiliated issuers | | | 1 | |
Net unrealized gain (loss) | | | $3,803,178 | |
Net realized and unrealized gain (loss) | | | $4,290,199 | |
Change in net assets from operations | | | $5,041,879 | |
See Notes to Financial Statements
12
Financial Statements
STATEMENTS OF CHANGES IN NET ASSETS
These statements describe the increases and/or decreases in net assets resulting from operations, any distributions, and any shareholder transactions.
| | | | | | | | |
| Change in net assets | | Six months ended
2/28/19
(unaudited) | | | Year ended
8/31/18 | |
| | |
| From operations | | | | | | | | |
Net investment income (loss) | | | $751,680 | | | | $1,091,038 | |
Net realized gain (loss) | | | 487,021 | | | | 4,031,706 | |
Net unrealized gain (loss) | | | 3,803,178 | | | | 5,142,582 | |
Change in net assets from operations | | | $5,041,879 | | | | $10,265,326 | |
Total distributions to shareholders (a) | | | $(3,866,719 | ) | | | $(2,244,387 | ) |
Change in net assets from fund share transactions | | | $42,590,272 | | | | $6,417,123 | |
Total change in net assets | | | $43,765,432 | | | | $14,438,062 | |
| | |
| Net assets | | | | | | | | |
At beginning of period | | | 97,138,128 | | | | 82,700,066 | |
At end of period (b) | | | $140,903,560 | | | | $97,138,128 | |
| (a) | Distributions from net investment income and from net realized gain are no longer required to be separately disclosed. See Note 2. For the year ended August 31, 2018, distributions from net investment income and from net realized gain were $1,093,232 and $1,151,155, respectively. |
| (b) | Parenthetical disclosure of undistributed net investment income is no longer required. See Note 2. For the year ended August 31, 2018, end of period net assets included undistributed net investment income of $177,561. |
See Notes to Financial Statements
13
Financial Statements
FINANCIAL HIGHLIGHTS
The financial highlights table is intended to help you understand the fund’s financial performance for the semiannual period and the past 5 fiscal years (or life of a particular share class, if shorter). Certain information reflects financial results for a single fund share. The total returns in the table represent the rate that an investor would have earned (or lost) on an investment in the fund share class (assuming reinvestment of all distributions) held for the entire period.
| | | | | | | | | | | | | | | | | | | | | | | | |
| | | Six months
ended
2/28/19
| | | Year ended | |
| Class A | | 8/31/18 | | | 8/31/17 | | | 8/31/16 | | | 8/31/15 | | | 8/31/14 (c) | |
| | | (unaudited) | | | | | | | | | | | | | | | | |
Net asset value, beginning of period | | | $15.05 | | | | $13.77 | | | | $12.56 | | | | $11.12 | | | | $10.82 | | | | $10.00 | |
| |
| Income (loss) from investment operations | | | | | |
Net investment income (loss) (d) | | | $0.10 | | | | $0.18 | | | | $0.16 | | | | $0.15 | | | | $0.14 | | | | $0.11 | |
Net realized and unrealized
gain (loss) | | | 0.22 | | | | 1.47 | | | | 1.23 | | | | 1.49 | | | | 0.30 | (g) | | | 0.77 | |
Total from investment operations | | | $0.32 | | | | $1.65 | | | | $1.39 | | | | $1.64 | | | | $0.44 | | | | $0.88 | |
| |
| Less distributions declared to shareholders | | | | | |
From net investment income | | | $(0.10 | ) | | | $(0.18 | ) | | | $(0.15 | ) | | | $(0.11 | ) | | | $(0.13 | ) | | | $(0.06 | ) |
From net realized gain | | | (0.46 | ) | | | (0.19 | ) | | | (0.03 | ) | | | (0.09 | ) | | | (0.01 | ) | | | — | |
Total distributions declared to
shareholders | | | $(0.56 | ) | | | $(0.37 | ) | | | $(0.18 | ) | | | $(0.20 | ) | | | $(0.14 | ) | | | $(0.06 | ) |
Net asset value, end of period (x) | | | $14.81 | | | | $15.05 | | | | $13.77 | | | | $12.56 | | | | $11.12 | | | | $10.82 | |
Total return (%) (r)(s)(t)(x) | | | 2.54 | (n) | | | 12.14 | | | | 11.18 | | | | 14.87 | | | | 4.01 | | | | 8.82 | (n) |
| | |
Ratios (%) (to average net assets)
and Supplemental data: | | | | | | | | | |
Expenses before expense
reductions (f) | | | 1.11 | (a) | | | 1.16 | | | | 1.33 | | | | 1.65 | | | | 2.72 | | | | 4.45 | (a) |
Expenses after expense reductions (f) | | | 0.89 | (a) | | | 0.88 | | | | 1.16 | | | | 1.19 | | | | 1.18 | | | | 1.15 | (a) |
Net investment income (loss) | | | 1.42 | (a) | | | 1.25 | | | | 1.19 | | | | 1.25 | | | | 1.22 | | | | 1.40 | (a) |
Portfolio turnover | | | 16 | (n) | | | 30 | | | | 36 | | | | 38 | | | | 33 | | | | 30 | (n) |
Net assets at end of period
(000 omitted) | | | $56,539 | | | | $41,177 | | | | $39,568 | | | | $29,508 | | | | $11,267 | | | | $1,154 | |
See Notes to Financial Statements
14
Financial Highlights – continued
| | | | | | | | | | | | | | | | | | | | | | | | |
| | | Six months
ended 2/28/19 | | | Year ended | |
| Class B | | 8/31/18 | | | 8/31/17 | | | 8/31/16 | | | 8/31/15 | | | 8/31/14 (c) | |
| | | (unaudited) | | | | | | | | | | | | | | | | |
Net asset value, beginning of period | | | $15.02 | | | | $13.74 | | | | $12.53 | | | | $11.10 | | | | $10.81 | | | | $10.00 | |
| | |
| Income (loss) from investment operations | | | | | | | | | |
Net investment income (loss) (d) | | | $0.05 | | | | $0.07 | | | | $0.06 | | | | $0.06 | | | | $0.05 | | | | $0.04 | |
Net realized and unrealized
gain (loss) | | | 0.23 | | | | 1.47 | | | | 1.23 | | | | 1.48 | | | | 0.30 | (g) | | | 0.78 | |
Total from investment operations | | | $0.28 | | | | $1.54 | | | | $1.29 | | | | $1.54 | | | | $0.35 | | | | $0.82 | |
| | |
| Less distributions declared to shareholders | | | | | | | | | |
From net investment income | | | $(0.05 | ) | | | $(0.07 | ) | | | $(0.05 | ) | | | $(0.02 | ) | | | $(0.05 | ) | | | $(0.01 | ) |
From net realized gain | | | (0.46 | ) | | | (0.19 | ) | | | (0.03 | ) | | | (0.09 | ) | | | (0.01 | ) | | | — | |
Total distributions declared to
shareholders | | | $(0.51 | ) | | | $(0.26 | ) | | | $(0.08 | ) | | | $(0.11 | ) | | | $(0.06 | ) | | | $(0.01 | ) |
Net asset value, end of period (x) | | | $14.79 | | | | $15.02 | | | | $13.74 | | | | $12.53 | | | | $11.10 | | | | $10.81 | |
Total return (%) (r)(s)(t)(x) | | | 2.19 | (n) | | | 11.32 | | | | 10.36 | | | | 13.96 | | | | 3.20 | | | | 8.23 | (n) |
| | |
Ratios (%) (to average net assets)
and Supplemental data: | | | | | | | | | |
Expenses before expense
reductions (f) | | | 1.86 | (a) | | | 1.91 | | | | 2.08 | | | | 2.42 | | | | 3.79 | | | | 5.75 | (a) |
Expenses after expense reductions (f) | | | 1.64 | (a) | | | 1.64 | | | | 1.92 | | | | 1.95 | | | | 1.95 | | | | 1.93 | (a) |
Net investment income (loss) | | | 0.65 | (a) | | | 0.50 | | | | 0.43 | | | | 0.49 | | | | 0.43 | | | | 0.46 | (a) |
Portfolio turnover | | | 16 | (n) | | | 30 | | | | 36 | | | | 38 | | | | 33 | | | | 30 | (n) |
Net assets at end of period
(000 omitted) | | | $2,370 | | | | $2,211 | | | | $2,081 | | | | $1,885 | | | | $717 | | | | $170 | |
See Notes to Financial Statements
15
Financial Highlights – continued
| | | | | | | | | | | | | | | | | | | | | | | | |
| | | Six months ended
2/28/19 | | | Year ended | |
| Class C | | 8/31/18 | | | 8/31/17 | | | 8/31/16 | | | 8/31/15 | | | 8/31/14 (c) | |
| | | (unaudited) | | | | | | | | | | | | | | | | |
Net asset value, beginning of period | | | $14.98 | | | | $13.70 | | | | $12.50 | | | | $11.09 | | | | $10.80 | | | | $10.00 | |
| | |
| Income (loss) from investment operations | | | | | | | | | |
Net investment income (loss) (d) | | | $0.05 | | | | $0.07 | | | | $0.06 | | | | $0.06 | | | | $0.05 | | | | $0.04 | |
Net realized and unrealized
gain (loss) | | | 0.22 | | | | 1.48 | | | | 1.23 | | | | 1.48 | | | | 0.30 | (g) | | | 0.79 | |
Total from investment operations | | | $0.27 | | | | $1.55 | | | | $1.29 | | | | $1.54 | | | | $0.35 | | | | $0.83 | |
| | |
| Less distributions declared to shareholders | | | | | | | | | |
From net investment income | | | $(0.05 | ) | | | $(0.08 | ) | | | $(0.06 | ) | | | $(0.04 | ) | | | $(0.05 | ) | | | $(0.03 | ) |
From net realized gain | | | (0.46 | ) | | | (0.19 | ) | | | (0.03 | ) | | | (0.09 | ) | | | (0.01 | ) | | | — | |
Total distributions declared to
shareholders | | | $(0.51 | ) | | | $(0.27 | ) | | | $(0.09 | ) | | | $(0.13 | ) | | | $(0.06 | ) | | | $(0.03 | ) |
Net asset value, end of period (x) | | | $14.74 | | | | $14.98 | | | | $13.70 | | | | $12.50 | | | | $11.09 | | | | $10.80 | |
Total return (%) (r)(s)(t)(x) | | | 2.14 | (n) | | | 11.36 | | | | 10.36 | | | | 13.91 | | | | 3.23 | | | | 8.27 | (n) |
| | |
Ratios (%) (to average net assets)
and Supplemental data: | | | | | | | | | |
Expenses before expense
reductions (f) | | | 1.86 | (a) | | | 1.91 | | | | 2.08 | | | | 2.31 | | | | 3.73 | | | | 5.39 | (a) |
Expenses after expense reductions (f) | | | 1.64 | (a) | | | 1.64 | | | | 1.92 | | | | 1.95 | | | | 1.95 | | | | 1.93 | (a) |
Net investment income (loss) | | | 0.65 | (a) | | | 0.50 | | | | 0.43 | | | | 0.48 | | | | 0.43 | | | | 0.48 | (a) |
Portfolio turnover | | | 16 | (n) | | | 30 | | | | 36 | | | | 38 | | | | 33 | | | | 30 | (n) |
Net assets at end of period
(000 omitted) | | | $17,704 | | | | $13,942 | | | | $12,422 | | | | $9,977 | | | | $1,564 | | | | $421 | |
See Notes to Financial Statements
16
Financial Highlights – continued
| | | | | | | | | | | | | | | | | | | | | | | | |
| | | Six months
ended 2/28/19 | | | Year ended | |
| Class I | | 8/31/18 | | | 8/31/17 | | | 8/31/16 | | | 8/31/15 | | | 8/31/14 (c) | |
| | | (unaudited) | | | | | | | | | | | | | | | | |
Net asset value, beginning of period | | | $15.07 | | | | $13.78 | | | | $12.57 | | | | $11.14 | | | | $10.84 | | | | $10.00 | |
| | | |
| Income (loss) from investment operations | | | | | | | | | | | | | |
Net investment income (loss) (d) | | | $0.12 | | | | $0.21 | | | | $0.19 | | | | $0.18 | | | | $0.16 | | | | $0.11 | |
Net realized and unrealized
gain (loss) | | | 0.22 | | | | 1.49 | | | | 1.23 | | | | 1.48 | | | | 0.30 | (g) | | | 0.80 | |
Total from investment operations | | | $0.34 | | | | $1.70 | | | | $1.42 | | | | $1.66 | | | | $0.46 | | | | $0.91 | |
| | |
| Less distributions declared to shareholders | | | | | | | | | |
From net investment income | | | $(0.12 | ) | | | $(0.22 | ) | | | $(0.18 | ) | | | $(0.14 | ) | | | $(0.15 | ) | | | $(0.07 | ) |
From net realized gain | | | (0.46 | ) | | | (0.19 | ) | | | (0.03 | ) | | | (0.09 | ) | | | (0.01 | ) | | | — | |
Total distributions declared to
shareholders | | | $(0.58 | ) | | | $(0.41 | ) | | | $(0.21 | ) | | | $(0.23 | ) | | | $(0.16 | ) | | | $(0.07 | ) |
Net asset value, end of period (x) | | | $14.83 | | | | $15.07 | | | | $13.78 | | | | $12.57 | | | | $11.14 | | | | $10.84 | |
Total return (%) (r)(s)(t)(x) | | | 2.67 | (n) | | | 12.49 | | | | 11.44 | | | | 15.05 | | | | 4.20 | | | | 9.09 | (n) |
| | |
Ratios (%) (to average net assets)
and Supplemental data: | | | | | | | | | |
Expenses before expense
reductions (f) | | | 0.85 | (a) | | | 0.91 | | | | 1.07 | | | | 1.20 | | | | 2.53 | | | | 4.72 | (a) |
Expenses after expense reductions (f) | | | 0.64 | (a) | | | 0.64 | | | | 0.92 | | | | 0.95 | | | | 0.95 | | | | 0.93 | (a) |
Net investment income (loss) | | | 1.65 | (a) | | | 1.50 | | | | 1.47 | | | | 1.51 | | | | 1.36 | | | | 1.43 | (a) |
Portfolio turnover | | | 16 | (n) | | | 30 | | | | 36 | | | | 38 | | | | 33 | | | | 30 | (n) |
Net assets at end of period
(000 omitted) | | | $51,355 | | | | $30,751 | | | | $21,814 | | | | $16,123 | | | | $964 | | | | $177 | |
See Notes to Financial Statements
17
Financial Highlights – continued
| | | | | | | | | | | | | | | | | | | | | | | | |
| | | Six months
ended 2/28/19 | | | Year ended | |
| Class R1 | | 8/31/18 | | | 8/31/17 | | | 8/31/16 | | | 8/31/15 | | | 8/31/14 (c) | |
| | | (unaudited) | | | | | | | | | | | | | | | | |
Net asset value, beginning of period | | | $15.06 | | | | $13.77 | | | | $12.57 | | | | $11.12 | | | | $10.82 | | | | $10.00 | |
| | |
| Income (loss) from investment operations | | | | | | | | | |
Net investment income (loss) (d) | | | $0.05 | | | | $0.07 | | | | $0.05 | | | | $0.06 | | | | $0.04 | | | | $0.03 | |
Net realized and unrealized
gain (loss) | | | 0.21 | | | | 1.48 | | | | 1.24 | | | | 1.49 | | | | 0.31 | (g) | | | 0.80 | |
Total from investment operations | | | $0.26 | | | | $1.55 | | | | $1.29 | | | | $1.55 | | | | $0.35 | | | | $0.83 | |
| | |
| Less distributions declared to shareholders | | | | | | | | | |
From net investment income | | | $(0.04 | ) | | | $(0.07 | ) | | | $(0.06 | ) | | | $(0.01 | ) | | | $(0.04 | ) | | | $(0.01 | ) |
From net realized gain | | | (0.46 | ) | | | (0.19 | ) | | | (0.03 | ) | | | (0.09 | ) | | | (0.01 | ) | | | — | |
Total distributions declared to
shareholders | | | $(0.50 | ) | | | $(0.26 | ) | | | $(0.09 | ) | | | $(0.10 | ) | | | $(0.05 | ) | | | $(0.01 | ) |
Net asset value, end of period (x) | | | $14.82 | | | | $15.06 | | | | $13.77 | | | | $12.57 | | | | $11.12 | | | | $10.82 | |
Total return (%) (r)(s)(t)(x) | | | 2.12 | (n) | | | 11.36 | | | | 10.33 | | | | 13.96 | | | | 3.18 | | | | 8.30 | (n) |
| | |
Ratios (%) (to average net assets)
and Supplemental data: | | | | | | | | | |
Expenses before expense
reductions (f) | | | 1.86 | (a) | | | 1.91 | | | | 2.07 | | | | 2.56 | | | | 4.18 | | | | 5.92 | (a) |
Expenses after expense reductions (f) | | | 1.64 | (a) | | | 1.64 | | | | 1.91 | | | | 1.95 | | | | 1.95 | | | | 1.93 | (a) |
Net investment income (loss) | | | 0.64 | (a) | | | 0.49 | | | | 0.41 | | | | 0.48 | | | | 0.39 | | | | 0.40 | (a) |
Portfolio turnover | | | 16 | (n) | | | 30 | | | | 36 | | | | 38 | | | | 33 | | | | 30 | (n) |
Net assets at end of period
(000 omitted) | | | $141 | | | | $136 | | | | $108 | | | | $57 | | | | $112 | | | | $108 | |
See Notes to Financial Statements
18
Financial Highlights – continued
| | | | | | | | | | | | | | | | | | | | | | | | |
| | | Six months
ended 2/28/19 | | | Year ended | |
| Class R2 | | 8/31/18 | | | 8/31/17 | | | 8/31/16 | | | 8/31/15 | | | 8/31/14 (c) | |
| | | (unaudited) | | | | | | | | | | | | | | | | |
Net asset value, beginning of period | | | $15.12 | | | | $13.83 | | | | $12.61 | | | | $11.13 | | | | $10.83 | | | | $10.00 | |
| | |
| Income (loss) from investment operations | | | | | | | | | |
Net investment income (loss) (d) | | | $0.08 | | | | $0.14 | | | | $0.12 | | | | $0.12 | | | | $0.10 | | | | $0.07 | |
Net realized and unrealized
gain (loss) | | | 0.22 | | | | 1.49 | | | | 1.25 | | | | 1.49 | | | | 0.30 | (g) | | | 0.80 | |
Total from investment operations | | | $0.30 | | | | $1.63 | | | | $1.37 | | | | $1.61 | | | | $0.40 | | | | $0.87 | |
| | |
| Less distributions declared to shareholders | | | | | | | | | |
From net investment income | | | $(0.08 | ) | | | $(0.15 | ) | | | $(0.12 | ) | | | $(0.04 | ) | | | $(0.09 | ) | | | $(0.04 | ) |
From net realized gain | | | (0.46 | ) | | | (0.19 | ) | | | (0.03 | ) | | | (0.09 | ) | | | (0.01 | ) | | | — | |
Total distributions declared to
shareholders | | | $(0.54 | ) | | | $(0.34 | ) | | | $(0.15 | ) | | | $(0.13 | ) | | | $(0.10 | ) | | | $(0.04 | ) |
Net asset value, end of period (x) | | | $14.88 | | | | $15.12 | | | | $13.83 | | | | $12.61 | | | | $11.13 | | | | $10.83 | |
Total return (%) (r)(s)(t)(x) | | | 2.38 | (n) | | | 11.93 | | | | 10.93 | | | | 14.57 | | | | 3.69 | | | | 8.69 | (n) |
| | |
Ratios (%) (to average net assets)
and Supplemental data: | | | | | | | | | |
Expenses before expense
reductions (f) | | | 1.36 | (a) | | | 1.42 | | | | 1.58 | | | | 2.07 | | | | 3.68 | | | | 5.42 | (a) |
Expenses after expense reductions (f) | | | 1.14 | (a) | | | 1.14 | | | | 1.42 | | | | 1.45 | | | | 1.45 | | | | 1.43 | (a) |
Net investment income (loss) | | | 1.15 | (a) | | | 1.01 | | | | 0.91 | | | | 0.98 | | | | 0.89 | | | | 0.90 | (a) |
Portfolio turnover | | | 16 | (n) | | | 30 | | | | 36 | | | | 38 | | | | 33 | | | | 30 | (n) |
Net assets at end of period
(000 omitted) | | | $169 | | | | $156 | | | | $74 | | | | $53 | | | | $113 | | | | $109 | |
See Notes to Financial Statements
19
Financial Highlights – continued
| | | | | | | | | | | | | | | | | | | | | | | | |
| | | Six months ended
2/28/19 | | | Year ended | |
| Class R3 | | 8/31/18 | | | 8/31/17 | | | 8/31/16 | | | 8/31/15 | | | 8/31/14 (c) | |
| | | (unaudited) | | | | | | | | | | | | | | | | |
Net asset value, beginning of period | | | $15.10 | | | | $13.81 | | | | $12.59 | | | | $11.14 | | | | $10.83 | | | | $10.00 | |
| | |
| Income (loss) from investment operations | | | | | | | | | |
Net investment income (loss) (d) | | | $0.10 | | | | $0.18 | | | | $0.15 | | | | $0.15 | | | | $0.13 | | | | $0.09 | |
Net realized and unrealized
gain (loss) | | | 0.22 | | | | 1.48 | | | | 1.25 | | | | 1.48 | | | | 0.31 | (g) | | | 0.79 | |
Total from investment operations | | | $0.32 | | | | $1.66 | | | | $1.40 | | | �� | $1.63 | | | | $0.44 | | | | $0.88 | |
| | |
| Less distributions declared to shareholders | | | | | | | | | |
From net investment income | | | $(0.10 | ) | | | $(0.18 | ) | | | $(0.15 | ) | | | $(0.09 | ) | | | $(0.12 | ) | | | $(0.05 | ) |
From net realized gain | | | (0.46 | ) | | | (0.19 | ) | | | (0.03 | ) | | | (0.09 | ) | | | (0.01 | ) | | | — | |
Total distributions declared to
shareholders | | | $(0.56 | ) | | | $(0.37 | ) | | | $(0.18 | ) | | | $(0.18 | ) | | | $(0.13 | ) | | | $(0.05 | ) |
Net asset value, end of period (x) | | | $14.86 | | | | $15.10 | | | | $13.81 | | | | $12.59 | | | | $11.14 | | | | $10.83 | |
Total return (%) (r)(s)(t)(x) | | | 2.52 | (n) | | | 12.18 | | | | 11.22 | | | | 14.72 | | | | 4.04 | | | | 8.84 | (n) |
| | |
Ratios (%) (to average net assets)
and Supplemental data: | | | | | | | | | |
Expenses before expense
reductions (f) | | | 1.10 | (a) | | | 1.16 | | | | 1.33 | | | | 1.82 | | | | 3.43 | | | | 5.17 | (a) |
Expenses after expense reductions (f) | | | 0.89 | (a) | | | 0.89 | | | | 1.17 | | | | 1.20 | | | | 1.20 | | | | 1.18 | (a) |
Net investment income (loss) | | | 1.40 | (a) | | | 1.25 | | | | 1.18 | | | | 1.23 | | | | 1.14 | | | | 1.15 | (a) |
Portfolio turnover | | | 16 | (n) | | | 30 | | | | 36 | | | | 38 | | | | 33 | | | | 30 | (n) |
Net assets at end of period
(000 omitted) | | | $70 | | | | $67 | | | | $59 | | | | $53 | | | | $113 | | | | $109 | |
See Notes to Financial Statements
20
Financial Highlights – continued
| | | | | | | | | | | | | | | | | | | | | | | | |
| | | Six months
ended 2/28/19 | | | Year ended | |
| Class R4 | | 8/31/18 | | | 8/31/17 | | | 8/31/16 | | | 8/31/15 | | | 8/31/14 (c) | |
| | | (unaudited) | | | | | | | | | | | | | | | | |
Net asset value, beginning of period | | | $15.08 | | | | $13.79 | | | | $12.58 | | | | $11.14 | | | | $10.84 | | | | $10.00 | |
| | |
| Income (loss) from investment operations | | | | | | | | | |
Net investment income (loss) (d) | | | $0.12 | | | | $0.21 | | | | $0.19 | | | | $0.17 | | | | $0.16 | | | | $0.11 | |
Net realized and unrealized
gain (loss) | | | 0.22 | | | | 1.49 | | | | 1.23 | | | | 1.49 | | | | 0.30 | (g) | | | 0.80 | |
Total from investment operations | | | $0.34 | | | | $1.70 | | | | $1.42 | | | | $1.66 | | | | $0.46 | | | | $0.91 | |
| | |
| Less distributions declared to shareholders | | | | | | | | | |
From net investment income | | | $(0.12 | ) | | | $(0.22 | ) | | | $(0.18 | ) | | | $(0.13 | ) | | | $(0.15 | ) | | | $(0.07 | ) |
From net realized gain | | | (0.46 | ) | | | (0.19 | ) | | | (0.03 | ) | | | (0.09 | ) | | | (0.01 | ) | | | — | |
Total distributions declared to
shareholders | | | $(0.58 | ) | | | $(0.41 | ) | | | $(0.21 | ) | | | $(0.22 | ) | | | $(0.16 | ) | | | $(0.07 | ) |
Net asset value, end of period (x) | | | $14.84 | | | | $15.08 | | | | $13.79 | | | | $12.58 | | | | $11.14 | | | | $10.84 | |
Total return (%) (r)(s)(t)(x) | | | 2.66 | (n) | | | 12.48 | | | | 11.42 | | | | 15.08 | | | | 4.20 | | | | 9.09 | (n) |
| | |
Ratios (%) (to average net assets)
and Supplemental data: | | | | | | | | | |
Expenses before expense
reductions (f) | | | 0.85 | (a) | | | 0.91 | | | | 1.08 | | | | 1.57 | | | | 3.18 | | | | 4.92 | (a) |
Expenses after expense reductions (f) | | | 0.64 | (a) | | | 0.64 | | | | 0.92 | | | | 0.95 | | | | 0.95 | | | | 0.93 | (a) |
Net investment income (loss) | | | 1.65 | (a) | | | 1.50 | | | | 1.42 | | | | 1.48 | | | | 1.39 | | | | 1.40 | (a) |
Portfolio turnover | | | 16 | (n) | | | 30 | | | | 36 | | | | 38 | | | | 33 | | | | 30 | (n) |
Net assets at end of period
(000 omitted) | | | $68 | | | | $66 | | | | $59 | | | | $53 | | | | $114 | | | | $109 | |
See Notes to Financial Statements
21
Financial Highlights – continued
| | | | | | | | | | | | | | | | | | | | | | | | |
| | | Six months ended
2/28/19 | | | Year ended | |
| Class R6 | | 8/31/18 | | | 8/31/17 | | | 8/31/16 | | | 8/31/15 | | | 8/31/14 (c) | |
| | | (unaudited) | | | | | | | | | | | | | | | | |
Net asset value, beginning of period | | | $15.09 | | | | $13.80 | | | | $12.58 | | | | $11.14 | | | | $10.84 | | | | $10.00 | |
| | |
| Income (loss) from investment operations | | | | | | | | | |
Net investment income (loss) (d) | | | $0.13 | | | | $0.23 | | | | $0.18 | | | | $0.18 | | | | $0.16 | | | | $0.11 | |
Net realized and unrealized
gain (loss) | | | 0.22 | | | | 1.48 | | | | 1.27 | | | | 1.50 | | | | 0.30 | (g) | | | 0.80 | |
Total from investment operations | | | $0.35 | | | | $1.71 | | | | $1.45 | | | | $1.68 | | | | $0.46 | | | | $0.91 | |
| | |
| Less distributions declared to shareholders | | | | | | | | | |
From net investment income | | | $(0.13 | ) | | | $(0.23 | ) | | | $(0.20 | ) | | | $(0.15 | ) | | | $(0.15 | ) | | | $(0.07 | ) |
From net realized gain | | | (0.46 | ) | | | (0.19 | ) | | | (0.03 | ) | | | (0.09 | ) | | | (0.01 | ) | | | — | |
Total distributions declared to
shareholders | | | $(0.59 | ) | | | $(0.42 | ) | | | $(0.23 | ) | | | $(0.24 | ) | | | $(0.16 | ) | | | $(0.07 | ) |
Net asset value, end of period (x) | | | $14.85 | | | | $15.09 | | | | $13.80 | | | | $12.58 | | | | $11.14 | | | | $10.84 | |
Total return (%) (r)(s)(t)(x) | | | 2.72 | (n) | | | 12.57 | | | | 11.61 | | | | 15.21 | | | | 4.22 | | | | 9.11 | (n) |
| | |
Ratios (%) (to average net assets)
and Supplemental data: | | | | | | | | | |
Expenses before expense
reductions (f) | | | 0.77 | (a) | | | 0.82 | | | | 0.97 | | | | 1.36 | | | | 3.14 | | | | 4.90 | (a) |
Expenses after expense reductions (f) | | | 0.55 | (a) | | | 0.54 | | | | 0.78 | | | | 0.88 | | | | 0.91 | | | | 0.91 | (a) |
Net investment income (loss) | | | 1.76 | (a) | | | 1.60 | | | | 1.38 | | | | 1.53 | | | | 1.43 | | | | 1.42 | (a) |
Portfolio turnover | | | 16 | (n) | | | 30 | | | | 36 | | | | 38 | | | | 33 | | | | 30 | (n) |
Net assets at end of period
(000 omitted) | | | $12,488 | | | | $8,632 | | | | $6,515 | | | | $1,693 | | | | $1,593 | | | | $1,527 | |
| (c) | For the period from the commencement of the fund’s investment operations, December 5, 2013, through the stated period end. |
| (d) | Per share data is based on average shares outstanding. |
| (f) | Ratios do not reflect reductions from fees paid indirectly, if applicable. |
| (g) | The per share amount varies from the net realized and unrealized gain/loss for the period because of the timing of sales of fund shares and the per share amount of realized and unrealized gains and losses at such time. |
| (r) | Certain expenses have been reduced without which performance would have been lower. |
| (s) | From time to time the fund may receive proceeds from litigation settlements, without which performance would be lower. |
| (t) | Total returns do not include any applicable sales charges. |
| (x) | The net asset values and total returns have been calculated on net assets which include adjustments made in accordance with U.S. generally accepted accounting principles required at period end for financial reporting purposes. |
See Notes to Financial Statements
22
NOTES TO FINANCIAL STATEMENTS
(unaudited)
(1) Business and Organization
MFS Low Volatility Equity Fund (the fund) is a diversified series of MFS Series Trust I (the trust). The trust is organized as a Massachusetts business trust and is registered under the Investment Company Act of 1940, as amended, as anopen-end management investment company.
The fund is an investment company and accordingly follows the investment company accounting and reporting guidance of the Financial Accounting Standards Board (FASB) Accounting Standards Codification Topic 946 Financial Services – Investment Companies.
(2) Significant Accounting Policies
General – The preparation of financial statements in conformity with U.S. generally accepted accounting principles requires management to make estimates and assumptions that affect the reported amounts of assets and liabilities, and disclosure of contingent assets and liabilities at the date of the financial statements and the reported amounts of increases and decreases in net assets from operations during the reporting period. Actual results could differ from those estimates. In the preparation of these financial statements, management has evaluated subsequent events occurring after the date of the fund’s Statement of Assets and Liabilities through the date that the financial statements were issued.
In August 2018, the Securities and Exchange Commission (SEC) released its Final Rule on Disclosure Update and Simplification (the “Final Rule”) which is intended to simplify an issuer’s disclosure compliance efforts by removing redundant or outdated disclosure requirements without significantly altering the mix of information provided to investors. Effective with the current reporting period, the fund adopted the Final Rule with the impacts being that the fund is no longer required to present the components of distributable earnings on the Statement of Assets and Liabilities or the sources of distributions to shareholders and the amount of undistributed net investment income on the Statements of Changes in Net Assets.
Balance Sheet Offsetting– The fund’s accounting policy with respect to balance sheet offsetting is that, absent an event of default by the counterparty or a termination of the agreement, the International Swaps and Derivatives Association (ISDA) Master Agreement, or similar agreement, does not result in an offset of reported amounts of financial assets and financial liabilities in the Statement of Assets and Liabilities across transactions between the fund and the applicable counterparty. The fund’s right to setoff may be restricted or prohibited by the bankruptcy or insolvency laws of the particular jurisdiction to which a specific master netting agreement counterparty is subject. Balance sheet offsetting disclosures, to the extent applicable to the fund, have been included in the fund’s Significant Accounting Policies note under the captions for each of the fund’sin-scope financial instruments and transactions.
Investment Valuations– Equity securities, including restricted equity securities, are generally valued at the last sale or official closing price on their primary market or exchange as provided by a third-party pricing service. Equity securities, for which there were no sales reported that day, are generally valued at the last quoted daily bid
23
Notes to Financial Statements (unaudited) – continued
quotation on their primary market or exchange as provided by a third-party pricing service. Short-term instruments with a maturity at issuance of 60 days or less may be valued at amortized cost, which approximates market value.Open-end investment companies are generally valued at net asset value per share. Securities and other assets generally valued on the basis of information from a third-party pricing service may also be valued at a broker/dealer bid quotation. In determining values, third-party pricing services can utilize both transaction data and market information such as yield, quality, coupon rate, maturity, type of issue, trading characteristics, and other market data.
The Board of Trustees has delegated primary responsibility for determining or causing to be determined the value of the fund’s investments (including any fair valuation) to the adviser pursuant to valuation policies and procedures approved by the Board. If the adviser determines that reliable market quotations are not readily available, investments are valued at fair value as determined in good faith by the adviser in accordance with such procedures under the oversight of the Board of Trustees. Under the fund’s valuation policies and procedures, market quotations are not considered to be readily available for most types of debt instruments and floating rate loans and many types of derivatives. These investments are generally valued at fair value based on information from third-party pricing services. In addition, investments may be valued at fair value if the adviser determines that an investment’s value has been materially affected by events occurring after the close of the exchange or market on which the investment is principally traded (such as foreign exchange or market) and prior to the determination of the fund’s net asset value, or after the halting of trading of a specific security where trading does not resume prior to the close of the exchange or market on which the security is principally traded. Events that occur on a frequent basis after foreign markets close (such as developments in foreign markets and significant movements in the U.S. markets) and prior to the determination of the fund’s net asset value may be deemed to have a material effect on the value of securities traded in foreign markets. Accordingly, the fund’s foreign equity securities may often be valued at fair value. The adviser generally relies on third-party pricing services or other information (such as the correlation with price movements of similar securities in the same or other markets; the type, cost and investment characteristics of the security; the business and financial condition of the issuer; and trading and other market data) to assist in determining whether to fair value and at what value to fair value an investment. The value of an investment for purposes of calculating the fund’s net asset value can differ depending on the source and method used to determine value. When fair valuation is used, the value of an investment used to determine the fund’s net asset value may differ from quoted or published prices for the same investment. There can be no assurance that the fund could obtain the fair value assigned to an investment if it were to sell the investment at the same time at which the fund determines its net asset value per share.
Various inputs are used in determining the value of the fund’s assets or liabilities. These inputs are categorized into three broad levels. In certain cases, the inputs used to measure fair value may fall into different levels of the fair value hierarchy. In such cases, an investment’s level within the fair value hierarchy is based on the lowest level of input that is significant to the fair value measurement. The fund’s assessment of the significance of a particular input to the fair value measurement in its entirety requires judgment, and considers factors specific to the investment. Level 1 includes unadjusted
24
Notes to Financial Statements (unaudited) – continued
quoted prices in active markets for identical assets or liabilities. Level 2 includes other significant observable market-based inputs (including quoted prices for similar securities, interest rates, prepayment speed, and credit risk). Level 3 includes unobservable inputs, which may include the adviser’s own assumptions in determining the fair value of investments. The following is a summary of the levels used as of February 28, 2019 in valuing the fund’s assets or liabilities:
| | | | | | | | | | | | | | | | |
| | | | |
| Financial Instruments | | Level 1 | | | Level 2 | | | Level 3 | | | Total | |
| Equity Securities | | | $139,167,854 | | | | $— | | | | $— | | | | $139,167,854 | |
| Mutual Funds | | | 722,500 | | | | — | | | | — | | | | 722,500 | |
| Total | | | $139,890,354 | | | | $— | | | | $— | | | | $139,890,354 | |
For further information regarding security characteristics, see the Portfolio of Investments.
Indemnifications– Under the fund’s organizational documents, its officers and Trustees may be indemnified against certain liabilities and expenses arising out of the performance of their duties to the fund. Additionally, in the normal course of business, the fund enters into agreements with service providers that may contain indemnification clauses. The fund’s maximum exposure under these agreements is unknown as this would involve future claims that may be made against the fund that have not yet occurred.
Investment Transactions and Income– Investment transactions are recorded on the trade date. Dividends received in cash are recorded on theex-dividend date. Certain dividends from foreign securities will be recorded when the fund is informed of the dividend if such information is obtained subsequent to theex-dividend date. Dividend payments received in additional securities are recorded on theex-dividend date in an amount equal to the value of the security on such date.
The fund may receive proceeds from litigation settlements. Any proceeds received from litigation involving portfolio holdings are reflected in the Statement of Operations in realized gain/loss if the security has been disposed of by the fund or in unrealized gain/loss if the security is still held by the fund. Any other proceeds from litigation not related to portfolio holdings are reflected as other income in the Statement of Operations.
Tax Matters and Distributions– The fund intends to qualify as a regulated investment company, as defined under Subchapter M of the Internal Revenue Code, and to distribute all of its taxable income, including realized capital gains. As a result, no provision for federal income tax is required. The fund’s federal tax returns, when filed, will remain subject to examination by the Internal Revenue Service for a three year period. Management has analyzed the fund’s tax positions taken on federal and state tax returns for all open tax years and does not believe that there are any uncertain tax positions that require recognition of a tax liability. Foreign taxes, if any, have been accrued by the fund in the accompanying financial statements in accordance with the applicable foreign tax law. Foreign income taxes may be withheld by certain countries in which the fund invests. Additionally, capital gains realized by the fund on securities issued in or by certain foreign countries may be subject to capital gains tax imposed by those countries.
25
Notes to Financial Statements (unaudited) – continued
Distributions to shareholders are recorded on theex-dividend date. Income and capital gain distributions are determined in accordance with income tax regulations, which may differ from U.S. generally accepted accounting principles. Certain capital accounts in the financial statements are periodically adjusted for permanent differences in order to reflect their tax character. These adjustments have no impact on net assets or net asset value per share. Temporary differences which arise from recognizing certain items of income, expense, gain or loss in different periods for financial statement and tax purposes will reverse at some time in the future. Distributions in excess of net investment income or net realized gains are temporary overdistributions for financial statement purposes resulting from differences in the recognition or classification of income or distributions for financial statement and tax purposes.
Book/tax differences primarily relate to wash sale loss deferrals and treating a portion of the proceeds from redemptions as a distribution for tax purposes.
The tax character of distributions made during the current period will be determined at fiscal year end. The tax character of distributions declared to shareholders for the last fiscal year is as follows:
| | | | |
| |
| | | Year ended 8/31/18 | |
Ordinary income (including any
short-term capital gains) | | | $1,498,316 | |
| Long-term capital gains | | | 746,071 | |
| |
| Total distributions | | | $2,244,387 | |
The federal tax cost and the tax basis components of distributable earnings were as follows:
| | | | |
| |
| As of 2/28/19 | | | |
| |
| Cost of investments | | | $119,991,517 | |
| Gross appreciation | | | 21,304,798 | |
| |
| Gross depreciation | | | (1,405,961 | ) |
| Net unrealized appreciation (depreciation) | | | $19,898,837 | |
| |
| As of 8/31/18 | | | |
| |
| Undistributed ordinary income | | | 546,973 | |
| Undistributed long-term capital gain | | | 2,261,900 | |
| Net unrealized appreciation (depreciation) | | | 16,104,999 | |
The aggregate cost above includes prior fiscal year end tax adjustments, if applicable.
Multiple Classes of Shares of Beneficial Interest– The fund offers multiple classes of shares, which differ in their respective distribution and service fees. The fund’s income, realized and unrealized gain (loss), and common expenses are allocated to shareholders based on the daily net assets of each class. Dividends are declared separately for each class. Differences in per share dividend rates are generally due to differences in separate class expenses. Class B shares will convert to Class A shares approximately eight years after purchase. Class C shares will convert to Class A shares
26
Notes to Financial Statements (unaudited) – continued
approximately ten years after purchase. The fund’s distributions declared to shareholders as reported in the Statements of Changes in Net Assets are presented by class as follows:
| | | | | | | | | | | | | | | | |
| | | From net investment
income | | | From net realized
gain | |
| | | | |
| | | Six months
ended
2/28/19 | | | Year
ended
8/31/18 | | | Six months
ended
2/28/19 | | | Year
ended
8/31/18 | |
| Class A | | | $294,609 | | | | $504,110 | | | | $1,358,525 | | | | $520,876 | |
| Class B | | | 6,739 | | | | 11,146 | | | | 69,284 | | | | 28,574 | |
| Class C | | | 44,801 | | | | 69,236 | | | | 451,966 | | | | 170,155 | |
| Class I | | | 255,458 | | | | 381,889 | | | | 1,003,335 | | | | 330,158 | |
| Class R1 | | | 409 | | | | 597 | | | | 4,207 | | | | 1,471 | |
| Class R2 | | | 870 | | | | 1,117 | | | | 4,849 | | | | 1,003 | |
| Class R3 | | | 454 | | | | 781 | | | | 2,048 | | | | 799 | |
| Class R4 | | | 533 | | | | 932 | | | | 2,022 | | | | 798 | |
| Class R6 | | | 77,703 | | | | 123,424 | | | | 288,907 | | | | 97,321 | |
| Total | | | $681,576 | | | | $1,093,232 | | | | $3,185,143 | | | | $1,151,155 | |
(3) Transactions with Affiliates
Investment Adviser��� The fund has an investment advisory agreement with MFS to provide overall investment management and related administrative services and facilities to the fund. The management fee is computed daily and paid monthly at the following annual rates based on the fund’s average daily net assets:
| | | | |
| Up to $1 billion | | | 0.50 | % |
| In excess of $1 billion and up to $2.5 billion | | | 0.475 | % |
| In excess of $2.5 billion | | | 0.45 | % |
MFS has agreed in writing to reduce its management fee by a specified amount if certain MFS mutual fund assets exceed thresholds agreed to by MFS and the fund’s Board of Trustees. For the six months ended February 28, 2019, this management fee reduction amounted to $5,307, which is included in the reduction of total expenses in the Statement of Operations. The management fee incurred for the six months ended February 28, 2019 was equivalent to an annual effective rate of 0.49% of the fund’s average daily net assets.
The investment adviser has agreed in writing to pay a portion of the fund’s total annual operating expenses, excluding interest, taxes, extraordinary expenses, brokerage and transaction costs, and investment-related expenses, such that total fund operating expenses do not exceed the following rates annually of each class’s average daily net assets:
| | | | | | | | | | | | | | | | | | | | | | | | | | | | | | | | |
| Classes | |
| | | | | | | | |
| A | | B | | | C | | | I | | | R1 | | | R2 | | | R3 | | | R4 | | | R6 | |
| 0.89% | | | 1.64% | | | | 1.64% | | | | 0.64% | | | | 1.64% | | | | 1.14% | | | | 0.89% | | | | 0.64% | | | | 0.57% | |
This written agreement will continue until modified by the fund’s Board of Trustees, but such agreement will continue at least until December 31, 2019. For the six months ended February 28, 2019, this reduction amounted to $109,398, which is included in the reduction of total expenses in the Statement of Operations.
27
Notes to Financial Statements (unaudited) – continued
Distributor– MFS Fund Distributors, Inc. (MFD), a wholly-owned subsidiary of MFS, as distributor, received $31,797 for the six months ended February 28, 2019, as its portion of the initial sales charge on sales of Class A shares of the fund.
The Board of Trustees has adopted a distribution plan for certain share classes pursuant to Rule12b-1 of the Investment Company Act of 1940.
The fund’s distribution plan provides that the fund will pay MFD for services provided by MFD and financial intermediaries in connection with the distribution and servicing of certain share classes. One component of the plan is a distribution fee paid to MFD and another component of the plan is a service fee paid to MFD. MFD may subsequently pay all, or a portion, of the distribution and/or service fees to financial intermediaries.
Distribution Plan Fee Table:
| | | | | | | | | | | | | | | | | | | | |
| | | | | |
| | | Distribution
Fee Rate (d) | | | Service
Fee Rate (d) | | | Total
Distribution
Plan (d) | | | Annual
Effective
Rate (e) | | | Distribution
and Service
Fee | |
| Class A | | | — | | | | 0.25% | | | | 0.25% | | | | 0.25% | | | | $55,773 | |
| Class B | | | 0.75% | | | | 0.25% | | | | 1.00% | | | | 1.00% | | | | 10,955 | |
| Class C | | | 0.75% | | | | 0.25% | | | | 1.00% | | | | 1.00% | | | | 73,403 | |
| Class R1 | | | 0.75% | | | | 0.25% | | | | 1.00% | | | | 1.00% | | | | 669 | |
| Class R2 | | | 0.25% | | | | 0.25% | | | | 0.50% | | | | 0.50% | | | | 388 | |
| Class R3 | | | — | | | | 0.25% | | | | 0.25% | | | | 0.25% | | | | 82 | |
| Total Distribution and Service Fees | | | | | | | | | | | | | | | | $141,270 | |
| (d) | In accordance with the distribution plan for certain classes, the fund pays distribution and/or service fees equal to these annual percentage rates of each class’s average daily net assets. The distribution and service fee rates disclosed by class represent the current rates in effect at the end of the reporting period. Any rate changes, if applicable, are detailed below. |
| (e) | The annual effective rates represent actual fees incurred under the distribution plan for the six months ended February 28, 2019 based on each class’s average daily net assets. MFD has voluntarily agreed to rebate a portion of each class’s 0.25% service fee attributable to accounts for which MFD retains the 0.25% service fee except for accounts attributable to MFS or its affiliates’ seed money. For the six months ended February 28, 2019, this rebate amounted to $438, $7, and $15 for Class A, Class B, and Class C, respectively, and is included in the reduction of total expenses in the Statement of Operations. |
Certain Class A shares are subject to a contingent deferred sales charge (CDSC) in the event of a shareholder redemption within 18 months of purchase. Class B shares are subject to a CDSC in the event of a shareholder redemption within six years of purchase. Class C shares are subject to a CDSC in the event of a shareholder redemption within 12 months of purchase. All contingent deferred sales charges are paid to MFD and during the six months ended February 28, 2019, were as follows:
| | | | |
| |
| | | Amount | |
| Class A | | | $548 | |
| Class B | | | 1,140 | |
| Class C | | | 1,344 | |
Shareholder Servicing Agent– MFS Service Center, Inc. (MFSC), a wholly-owned subsidiary of MFS, receives a fee from the fund for its services as shareholder servicing agent calculated as a percentage of the average daily net assets of the fund as determined periodically under the supervision of the fund’s Board of Trustees. For the
28
Notes to Financial Statements (unaudited) – continued
six months ended February 28, 2019, the fee was $6,832, which equated to 0.0127% annually of the fund’s average daily net assets. MFSC also receives payment from the fund forout-of-pocket expenses,sub-accounting and other shareholder servicing costs which may be paid to affiliated and unaffiliated service providers. Class R6 shares do not incursub-accounting fees. For the six months ended February 28, 2019, theseout-of-pocket expenses,sub-accounting and other shareholder servicing costs amounted to $47,701.
Administrator– MFS provides certain financial, legal, shareholder communications, compliance, and other administrative services to the fund. Under an administrative services agreement, the fund reimburses MFS the costs incurred to provide these services. The fund is charged an annual fixed amount of $17,500 plus a fee based on average daily net assets. The administrative services fee incurred for the six months ended February 28, 2019 was equivalent to an annual effective rate of 0.0234% of the fund’s average daily net assets.
Trustees’ and Officers’ Compensation– The fund pays compensation to independent Trustees in the form of a retainer, attendance fees, and additional compensation to Board and Committee chairpersons. The fund does not pay compensation directly to Trustees or officers of the fund who are also officers of the investment adviser, all of whom receive remuneration for their services to the fund from MFS. Certain officers and Trustees of the fund are officers or directors of MFS, MFD, and MFSC.
Other– This fund and certain other funds managed by MFS (the funds) have entered into a service agreement (the ISO Agreement) which provides for payment of fees solely by the funds to Tarantino LLC in return for the provision of services of an Independent Senior Officer (ISO) for the funds. Frank L. Tarantino serves as the ISO and is an officer of the funds and the sole member of Tarantino LLC. The funds can terminate the ISO Agreement with Tarantino LLC at any time under the terms of the ISO Agreement. For the six months ended February 28, 2019, the fee paid by the fund under this agreement was $81 and is included in “Miscellaneous” expense in the Statement of Operations. MFS has agreed to bear all expenses associated with office space, other administrative support, and supplies provided to the ISO.
The fund invests in the MFS Institutional Money Market Portfolio which is managed by MFS and seeks current income consistent with preservation of capital and liquidity. This money market fund does not pay a management fee to MFS.
On March 19, 2018, MFS redeemed 5,613 shares of Class I for an aggregate amount of $80,258. On December 14, 2018, MFS redeemed 4,446 shares of Class R6 for an aggregate amount of $64,462.
At February 28, 2019, MFS held approximately 51%, 97%, and 100% of the outstanding shares of Class R1, Class R3, and Class R4, respectively.
The adviser has voluntarily undertaken to reimburse the fund from its own resources on a quarterly basis for the cost of investment research embedded in the cost of the fund’s securities trades. This agreement may be rescinded at any time. For the six months ended February 28, 2019, this reimbursement amounted to $1,079, which is included in “Other” income in the Statement of Operations.
29
Notes to Financial Statements (unaudited) – continued
(4) Portfolio Securities
For the six months ended February 28, 2019, purchases and sales of investments, other than short-term obligations, aggregated $55,657,463 and $17,126,483, respectively.
(5) Shares of Beneficial Interest
The fund’s Declaration of Trust permits the Trustees to issue an unlimited number of full and fractional shares of beneficial interest. Transactions in fund shares were as follows:
| | | | | | | | | | | | | | | | |
| | | Six months ended
2/28/19 | | | Year ended
8/31/18 | |
| | | | |
| | | Shares | | | Amount | | | Shares | | | Amount | |
| Shares sold | | | | | | | | | | | | | | | | |
Class A | | | 1,275,896 | | | | $18,067,544 | | | | 669,556 | | | | $9,561,155 | |
Class B | | | 15,816 | | | | 227,525 | | | | 29,684 | | | | 427,651 | |
Class C | | | 329,445 | | | | 4,643,063 | | | | 254,161 | | | | 3,630,483 | |
Class I | | | 2,047,225 | | | | 28,684,292 | | | | 941,779 | | | | 13,506,029 | |
Class R1 | | | 146 | | | | 2,159 | | | | 1,117 | | | | 16,060 | |
Class R2 | | | 585 | | | | 8,494 | | | | 5,348 | | | | 75,258 | |
Class R3 | | | 54 | | | | 798 | | | | 65 | | | | 920 | |
Class R6 | | | 309,844 | | | | 4,445,481 | | | | 244,878 | | | | 3,490,016 | |
| | | 3,979,011 | | | | $56,079,356 | | | | 2,146,588 | | | | $30,707,572 | |
| | | | |
| Shares issued to shareholders in reinvestment of distributions | | | | | | | | | | | | | | | | |
Class A | | | 122,670 | | | | $1,645,848 | | | | 72,060 | | | | $1,023,057 | |
Class B | | | 5,467 | | | | 72,962 | | | | 2,787 | | | | 39,720 | |
Class C | | | 37,316 | | | | 496,504 | | | | 16,826 | | | | 239,073 | |
Class I | | | 93,626 | | | | 1,258,670 | | | | 50,159 | | | | 711,948 | |
Class R1 | | | 345 | | | | 4,616 | | | | 145 | | | | 2,068 | |
Class R2 | | | 425 | | | | 5,718 | | | | 149 | | | | 2,120 | |
Class R3 | | | 186 | | | | 2,501 | | | | 111 | | | | 1,580 | |
Class R4 | | | 189 | | | | 2,554 | | | | 122 | | | | 1,730 | |
Class R6 | | | 22,239 | | | | 299,421 | | | | 12,749 | | | | 181,160 | |
| | | 282,463 | | | | $3,788,794 | | | | 155,108 | | | | $2,202,456 | |
| | | | |
| Shares reacquired | | | | | | | | | | | | | | | | |
Class A | | | (316,915 | ) | | | $(4,527,286 | ) | | | (880,860 | ) | | | $(12,579,954 | ) |
Class B | | | (8,159 | ) | | | (118,608 | ) | | | (36,802 | ) | | | (524,433 | ) |
Class C | | | (96,385 | ) | | | (1,391,845 | ) | | | (247,019 | ) | | | (3,512,395 | ) |
Class I | | | (717,936 | ) | | | (10,322,336 | ) | | | (534,310 | ) | | | (7,611,482 | ) |
Class R1 | | | (8 | ) | | | (116 | ) | | | (37 | ) | | | (528 | ) |
Class R2 | | | (6 | ) | | | (91 | ) | | | (523 | ) | | | (7,503 | ) |
Class R3 | | | — | | | | (5 | ) | | | (1 | ) | | | (9 | ) |
Class R6 | | | (62,992 | ) | | | (917,591 | ) | | | (157,753 | ) | | | (2,256,601 | ) |
| | | (1,202,401 | ) | | | $(17,277,878 | ) | | | (1,857,305 | ) | | | $(26,492,905 | ) |
30
Notes to Financial Statements (unaudited) – continued
| | | | | | | | | | | | | | | | |
| | | Six months ended
2/28/19 | | | Year ended
8/31/18 | |
| | | | |
| | | Shares | | | Amount | | | Shares | | | Amount | |
| Net change | | | | | | | | | | | | | | | | |
Class A | | | 1,081,651 | | | | $15,186,106 | | | | (139,244 | ) | | | $(1,995,742 | ) |
Class B | | | 13,124 | | | | 181,879 | | | | (4,331 | ) | | | (57,062 | ) |
Class C | | | 270,376 | | | | 3,747,722 | | | | 23,968 | | | | 357,161 | |
Class I | | | 1,422,915 | | | | 19,620,626 | | | | 457,628 | | | | 6,606,495 | |
Class R1 | | | 483 | | | | 6,659 | | | | 1,225 | | | | 17,600 | |
Class R2 | | | 1,004 | | | | 14,121 | | | | 4,974 | | | | 69,875 | |
Class R3 | | | 240 | | | | 3,294 | | | | 175 | | | | 2,491 | |
Class R4 | | | 189 | | | | 2,554 | | | | 122 | | | | 1,730 | |
Class R6 | | | 269,091 | | | | 3,827,311 | | | | 99,874 | | | | 1,414,575 | |
| | | 3,059,073 | | | | $42,590,272 | | | | 444,391 | | | | $6,417,123 | |
Class T shares were not publicly available for sale during the period. Please see the fund’s prospectus for details.
Effective June 1, 2019, purchases of the fund’s Class B shares are closed to new and existing investors subject to certain exceptions. Please see the fund’s prospectus for details.
(6) Line of Credit
The fund and certain other funds managed by MFS participate in a $1.25 billion unsecured committed line of credit, subject to a $1 billion sublimit, provided by a syndication of banks under a credit agreement. Borrowings may be made for temporary financing needs. Interest is charged to each fund, based on its borrowings, generally at a rate equal to the higher of the Overnight Bank Funding rate or daily one month LIBOR plus an agreed upon spread. A commitment fee, based on the average daily, unused portion of the committed line of credit, is allocated among the participating funds. In addition, the fund and other funds managed by MFS have established unsecured uncommitted borrowing arrangements with certain banks for temporary financing needs. Interest is charged to each fund, based on its borrowings, at a rate equal to the Overnight Bank Funding rate plus an agreed upon spread. For the six months ended February 28, 2019, the fund’s commitment fee and interest expense were $270 and $0, respectively, and are included in “Miscellaneous” expense in the Statement of Operations.
31
Notes to Financial Statements (unaudited) – continued
(7) Investments in Affiliated Issuers
An affiliated issuer may be considered one in which the fund owns 5% or more of the outstanding voting securities, or a company which is under common control. For the purposes of this report, the fund assumes the following to be affiliated issuers:
| | | | | | | | | | | | | | | | | | | | |
| | | | |
| Affiliated Issuers | | | Beginning
Shares/Par
Amount | | | Acquisitions
Shares/Par
Amount | | | Dispositions
Shares/Par
Amount | | | Ending
Shares/Par
Amount | |
MFS Institutional Money
Market Portfolio | | | | 778,538 | | | | 31,057,077 | | | | (31,113,114 | ) | | | 722,501 | |
| | | | | |
| Affiliated Issuers | | Realized
Gain (Loss) | | | Change in
Unrealized
Appreciation/
Depreciation | | | Capital Gain
Distributions | | | Dividend
Income | | | Ending
Value | |
MFS Institutional Money
Market Portfolio | | | $718 | | | | $1 | | | | $— | | | | $12,183 | | | | $722,500 | |
32
PROXY VOTING POLICIES AND INFORMATION
MFS votes proxies on behalf of the fund pursuant to proxy voting policies and procedures that are available without charge, upon request, by calling1-800-225-2606, by visitingmfs.com/proxyvoting, or by visiting the SEC’s Web site athttp://www.sec.gov.
Information regarding how the fund voted proxies relating to portfolio securities during the most recent twelve-month period ended June 30 is available by August 31 of each year without charge by visitingmfs.com/proxyvoting, or by visiting the SEC’s Web site athttp://www.sec.gov.
QUARTERLY PORTFOLIO DISCLOSURE
The fund files a complete schedule of portfolio holdings with the SEC for the first and third quarters of each fiscal year on Form N-Q. The fund’s Form N-Q is available on the SEC’s website athttp://www.sec.gov.A shareholder can obtain the portfolio holdings report for the first and third quarters of the fund’s fiscal year atmfs.com/openendfundsby choosing the fund’s name and then selecting the “Resources” tab and clicking on “Prospectus and Reports”.
FURTHER INFORMATION
From time to time, MFS may post important information about the fund or the MFS funds on the MFS web site (mfs.com). This information is available athttps://www.mfs.com/en-us/what-we-do/announcements.html or atmfs.com/openendfunds by choosing the fund’s name.
INFORMATION ABOUT FUND CONTRACTS AND LEGAL CLAIMS
The fund has entered into contractual arrangements with an investment adviser, administrator, distributor, shareholder servicing agent, 529 program manager (if applicable), and custodian who each provide services to the fund. Unless expressly stated otherwise, shareholders are not parties to, or intended beneficiaries of these contractual arrangements, and these contractual arrangements are not intended to create any shareholder right to enforce them against the service providers or to seek any remedy under them against the service providers, either directly or on behalf of the fund.
Under the Trust’s By-Laws and Declaration of Trust, any claims asserted against or on behalf of the MFS Funds, including claims against Trustees and Officers, must be brought in state and federal courts located within the Commonwealth of Massachusetts.
PROVISION OF FINANCIAL REPORTS AND SUMMARY PROSPECTUSES
The fund produces financial reports every six months and updates its summary prospectus and prospectus annually. To avoid sending duplicate copies of materials to households, only one copy of the fund’s annual and semiannual report and summary prospectus may be mailed to shareholders having the same last name and residential address on the fund’s records. However, any shareholder may contact MFSC (please see back cover for address and telephone number) to request that copies of these reports and summary prospectuses be sent personally to that shareholder.
33
Save paper with eDelivery.

| MFS® will send you prospectuses, |
reports, and proxies directly viae-mail so you will get information faster with less mailbox clutter.
To sign up:
1. Go to mfs.com.
2. Log in via MFS® Access.
3. Select eDelivery.
If you own your MFS fund shares through a financial institution or a retirement plan, MFS® TALK, MFS® Access, or eDelivery may not be available to you.
CONTACT
WEB SITE
mfs.com
MFS TALK
1-800-637-8255
24 hours a day
ACCOUNT SERVICE AND LITERATURE
Shareholders
1-800-225-2606
Financial advisors
1-800-343-2829
Retirement plan services
1-800-637-1255
MAILING ADDRESS
MFS Service Center, Inc.
P.O. Box 219341
Kansas City, MO 64121-9341
OVERNIGHT MAIL
MFS Service Center, Inc.
Suite 219341
430 W 7th Street
Kansas City, MO 64105-1407
Semiannual Report
February 28, 2019

MFS® New Discovery Fund

Beginning on January 1, 2021, as permitted by regulations adopted by the U.S. Securities and Exchange Commission, paper copies of the fund’s annual and semiannual shareholder reports will no longer be sent by mail, unless you specifically request paper copies of the reports. Instead, the complete reports will be made available on the fund’s Web site (funds.mfs.com), and you will be notified by mail each time a report is posted and provided with a Web site link to access the report.
If you are already signed up to receive shareholder reports by email, you will not be affected by this change and you need not take any action. You may sign up to receive shareholder reports and other communications from the fund by email by contacting your financial intermediary (such as a broker-dealer or bank) or, if you hold your shares directly with the fund, by calling 1-800-225-2606 or by logging on to MFS Access at mfs.com.
Beginning on January 1, 2019, you may elect to receive all future reports in paper free of charge. Contact your financial intermediary to request that you continue to receive paper copies of your shareholder reports. If you invest directly with the fund, you can call 1-800-225-2606 or send an email request to orderliterature@mfs.com to let the fund know that you wish to continue receiving paper copies of your shareholder reports. Your election to receive reports in paper will apply to all funds held in your account if you invest through your financial intermediary or all funds held with the MFS fund complex if you invest directly.
NDF-SEM
MFS® New Discovery Fund
CONTENTS
The report is prepared for the general information of shareholders.
It is authorized for distribution to prospective investors only when preceded or accompanied by a current prospectus.
NOT FDIC INSURED• MAY LOSE VALUE• NO BANK GUARANTEE

LETTER FROM THE EXECUTIVE CHAIRMAN
Dear Shareholders:
Markets experienced a bout of volatility in late 2018 as a result of higher interest rates, international trade friction and geopolitical uncertainty surrounding issues such as
Brexit. But concern over those issues dissipated in the early months of 2019 due to a more dovish posture by the U.S. Federal Reserve, progress toward a trade pact between the United States and China, and a consensus forming in the British Parliament against ano-deal Brexit. Over the past year, U.S. equities have outperformed their global peers due in part to fiscal stimulus undertaken in late 2017 and early 2019, which helped maintain healthy levels of U.S. economic output against a backdrop of slowing global growth, though returns, on average, have been modest.
Globally, inflation remains largely subdued thanks in part to stable
oil prices, though tight labor markets are keeping investors on the lookout for its potential reappearance. Rising incomes in many developed and emerging markets are supportive of gains in consumption, though a challenging backdrop for global trade has weighed on manufacturing in most regions. Should the U.S. and China reach a comprehensive trade agreement, sentiment could improve later this year.
As a global investment manager with nearly a century of expertise, MFS® firmly believes active risk management offers downside mitigation and may help improve investment outcomes. We built our active investment platform with this belief in mind. Our long-term perspective influences nearly every aspect of our business, ensuring that our investment decisions align with the investing time horizons of our clients.
Respectfully,

Robert J. Manning
Executive Chairman
MFS Investment Management
April 16, 2019
The opinions expressed in this letter are subject to change and may not be relied upon for investment advice. No forecasts can be guaranteed.
1
PORTFOLIO COMPOSITION
Portfolio structure
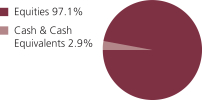
| | | | |
| Top ten holdings | | | | |
| Berry Plastics Group, Inc. | | | 1.8% | |
| Planet Fitness, Inc. | | | 1.6% | |
| Bright Horizons Family Solutions, Inc. | | | 1.5% | |
| Ferro Corp. | | | 1.5% | |
| Performance Food Group Co. | | | 1.4% | |
| PerkinElmer, Inc. | | | 1.4% | |
| Steris PLC | | | 1.4% | |
| CACI International, Inc., “A” | | | 1.4% | |
| Summit Materials, Inc., “A” | | | 1.4% | |
| FLIR Systems, Inc. | | | 1.3% | |
| | | | |
| GICS equity sectors | | | | |
| Information Technology | | | 27.9% | |
| Health Care | | | 24.2% | |
| Industrials | | | 11.9% | |
| Consumer Discretionary | | | 9.2% | |
| Materials | | | 7.8% | |
| Financials | | | 7.2% | |
| Real Estate | | | 3.0% | |
| Communication Services | | | 2.7% | |
| Energy | | | 1.8% | |
| Consumer Staples | | | 1.4% | |
Cash & Cash Equivalents includes any cash, investments in money market funds, short-term securities, and other assets less liabilities. Please see the Statement of Assets and Liabilities for additional information related to the fund’s cash position and other assets and liabilities.
The Global Industry Classification Standard (GICS®) was developed by and/or is the exclusive property of MSCI, Inc. and S&P Global Market Intelligence Inc. (“S&P Global Market Intelligence”). GICS is a service mark of MSCI and S&P Global Market Intelligence and has been licensed for use by MFS.
Percentages are based on net assets as of February 28, 2019.
The portfolio is actively managed and current holdings may be different.
2
EXPENSE TABLE
Fund expenses borne by the shareholders during the period, September 1, 2018 through February 28, 2019
As a shareholder of the fund, you incur two types of costs: (1) transaction costs, including sales charges (loads) on certain purchase or redemption payments, and (2) ongoing costs, including management fees; distribution and service(12b-1) fees; and other fund expenses. This example is intended to help you understand your ongoing costs (in dollars) of investing in the fund and to compare these costs with the ongoing costs of investing in other mutual funds.
The example is based on an investment of $1,000 invested at the beginning of the period and held for the entire period September 1, 2018 through February 28, 2019.
Actual Expenses
The first line for each share class in the following table provides information about actual account values and actual expenses. You may use the information in this line, together with the amount you invested, to estimate the expenses that you paid over the period. Simply divide your account value by $1,000 (for example, an $8,600 account value divided by $1,000 = 8.6), then multiply the result by the number in the first line under the heading entitled “Expenses Paid During Period” to estimate the expenses you paid on your account during this period.
Hypothetical Example for Comparison Purposes
The second line for each share class in the following table provides information about hypothetical account values and hypothetical expenses based on the fund’s actual expense ratio and an assumed rate of return of 5% per year before expenses, which is not the fund’s actual return. The hypothetical account values and expenses may not be used to estimate the actual ending account balance or expenses you paid for the period. You may use this information to compare the ongoing costs of investing in the fund and other funds. To do so, compare this 5% hypothetical example with the 5% hypothetical examples that appear in the shareholder reports of the other funds.
Please note that the expenses shown in the table are meant to highlight your ongoing costs only and do not reflect any transactional costs, such as sales charges (loads). Therefore, the second line for each share class in the table is useful in comparing ongoing costs only, and will not help you determine the relative total costs of owning different funds. In addition, if these transactional costs were included, your costs would have been higher.
3
Expense Table – continued
| | | | | | | | | | | | | | | | | | |
Share
Class | | | | Annualized
Expense Ratio | | | Beginning
Account Value
9/01/18 | | | Ending
Account Value 2/28/19 | | | Expenses
Paid During
Period (p) 9/01/18-2/28/19 | |
| A | | Actual | | | 1.29% | | | | $1,000.00 | | | | $969.56 | | | | $6.30 | |
| | Hypothetical (h) | | | 1.29% | | | | $1,000.00 | | | | $1,018.40 | | | | $6.46 | |
| B | | Actual | | | 2.04% | | | | $1,000.00 | | | | $965.98 | | | | $9.94 | |
| | Hypothetical (h) | | | 2.04% | | | | $1,000.00 | | | | $1,014.68 | | | | $10.19 | |
| C | | Actual | | | 2.05% | | | | $1,000.00 | | | | $965.95 | | | | $9.99 | |
| | Hypothetical (h) | | | 2.05% | | | | $1,000.00 | | | | $1,014.63 | | | | $10.24 | |
| I | | Actual | | | 1.05% | | | | $1,000.00 | | | | $970.94 | | | | $5.13 | |
| | Hypothetical (h) | | | 1.05% | | | | $1,000.00 | | | | $1,019.59 | | | | $5.26 | |
| R1 | | Actual | | | 2.05% | | | | $1,000.00 | | | | $966.16 | | | | $9.99 | |
| | Hypothetical (h) | | | 2.05% | | | | $1,000.00 | | | | $1,014.63 | | | | $10.24 | |
| R2 | | Actual | | | 1.55% | | | | $1,000.00 | | | | $968.46 | | | | $7.57 | |
| | Hypothetical (h) | | | 1.55% | | | | $1,000.00 | | | | $1,017.11 | | | | $7.75 | |
| R3 | | Actual | | | 1.30% | | | | $1,000.00 | | | | $969.48 | | | | $6.35 | |
| | Hypothetical (h) | | | 1.30% | | | | $1,000.00 | | | | $1,018.35 | | | | $6.51 | |
| R4 | | Actual | | | 1.05% | | | | $1,000.00 | | | | $970.60 | | | | $5.13 | |
| | Hypothetical (h) | | | 1.05% | | | | $1,000.00 | | | | $1,019.59 | | | | $5.26 | |
| R6 | | Actual | | | 0.95% | | | | $1,000.00 | | | | $971.50 | | | | $4.64 | |
| | Hypothetical (h) | | | 0.95% | | | | $1,000.00 | | | | $1,020.08 | | | | $4.76 | |
| (h) | 5% class return per year before expenses. |
| (p) | “Expenses Paid During Period” are equal to each class’s annualized expense ratio, as shown above, multiplied by the average account value over the period, multiplied by 181/365 (to reflect theone-half year period). Expenses paid do not include any applicable sales charges (loads). If these transaction costs had been included, your costs would have been higher. |
Notes to Expense Table
Each class with a Rule12b-1 service fee is subject to a rebate of a portion of such fee. Such rebates are included in the expense ratios above. For Class A shares this rebate reduced the expense ratio above by 0.01%. See Note 3 in the Notes to Financial Statements for additional information.
4
PORTFOLIO OF INVESTMENTS
2/28/19 (unaudited)
The Portfolio of Investments is a complete list of all securities owned by your fund. It is categorized by broad-based asset classes.
| | | | | | | | |
| Common Stocks - 97.1% | | | | | | | | |
| | |
| Issuer | | Shares/Par | | | Value ($) | |
| Aerospace - 4.6% | | | | | | | | |
| CACI International, Inc., “A” (a) | | | 99,745 | | | $ | 18,179,524 | |
| Cubic Corp. | | | 211,208 | | | | 13,031,534 | |
| Curtiss-Wright Corp. | | | 98,274 | | | | 12,116,201 | |
| FLIR Systems, Inc. | | | 347,210 | | | | 17,863,954 | |
| | | | | | | | |
| | | | | | | $ | 61,191,213 | |
| Apparel Manufacturers - 1.0% | | | | | | | | |
| Skechers USA, Inc., “A” (a) | | | 387,053 | | | $ | 13,016,592 | |
| | |
| Automotive - 4.0% | | | | | | | | |
| Hella KGaA Hueck & Co. | | | 181,624 | | | $ | 8,222,207 | |
| KAR Auction Services, Inc. | | | 239,984 | | | | 11,315,246 | |
| Stoneridge, Inc. (a) | | | 574,220 | | | | 16,979,685 | |
| WABCO Holdings, Inc. (a) | | | 121,127 | | | | 16,658,596 | |
| | | | | | | | |
| | | | | | | $ | 53,175,734 | |
| Biotechnology - 5.2% | | | | | | | | |
| Aimmune Therapeutics, Inc. (a) | | | 268,054 | | | $ | 6,457,421 | |
| Alder Biopharmaceuticals, Inc. (a) | | | 588,954 | | | | 7,550,390 | |
| Amicus Therapeutics, Inc. (a) | | | 632,467 | | | | 7,652,851 | |
| Bio-Techne Corp. | | | 77,675 | | | | 15,061,182 | |
| Immunomedics, Inc. (a) | | | 298,015 | | | | 4,696,716 | |
| Morphosys AG, ADR (a) | | | 268,909 | | | | 6,919,029 | |
| Neurocrine Biosciences, Inc. (a) | | | 64,864 | | | | 5,010,744 | |
| Spark Therapeutics, Inc. (a) | | | 107,486 | | | | 12,178,164 | |
| Tricida, Inc. (a) | | | 170,145 | | | | 3,935,454 | |
| | | | | | | | |
| | | | | | | $ | 69,461,951 | |
| Brokerage & Asset Managers - 3.6% | | | | | | | | |
| Hamilton Lane, Inc., “A” | | | 270,530 | | | $ | 12,628,341 | |
| HealthEquity, Inc. (a) | | | 131,009 | | | | 10,543,604 | |
| TMX Group Ltd. | | | 237,305 | | | | 14,898,848 | |
| WisdomTree Investments, Inc. | | | 1,331,260 | | | | 10,357,203 | |
| | | | | | | | |
| | | | | | | $ | 48,427,996 | |
| Business Services - 4.8% | | | | | | | | |
| CarGurus, Inc. (a) | | | 207,074 | | | $ | 8,848,272 | |
| CoStar Group, Inc. (a) | | | 11,253 | | | | 5,148,585 | |
| Endava PLC, ADR (a) | | | 468,071 | | | | 13,836,179 | |
| EVO Payments, Inc., “A” (a) | | | 342,252 | | | | 9,144,973 | |
5
Portfolio of Investments (unaudited) – continued
| | | | | | | | |
| | |
| Issuer | | Shares/Par | | | Value ($) | |
| Common Stocks - continued | | | | | | | | |
| Business Services - continued | | | | | | | | |
| Global Payments, Inc. | | | 74,326 | | | $ | 9,690,624 | |
| WNS (Holdings) Ltd., ADR (a) | | | 311,939 | | | | 16,470,379 | |
| | | | | | | | |
| | | | | | | $ | 63,139,012 | |
| Chemicals - 1.0% | | | | | | | | |
| Ingevity Corp. (a) | | | 118,256 | | | $ | 13,625,456 | |
| | |
| Computer Software - 8.4% | | | | | | | | |
| 8x8, Inc. (a) | | | 267,210 | | | $ | 5,256,021 | |
| Avalara, Inc. (a) | | | 239,456 | | | | 12,501,998 | |
| Cadence Design Systems, Inc. (a) | | | 92,574 | | | | 5,299,862 | |
| DocuSign, Inc. (a) | | | 198,981 | | | | 10,973,802 | |
| Eventbrite, Inc. (a)(l) | | | 285,486 | | | | 8,444,676 | |
| Everbridge, Inc. (a) | | | 217,313 | | | | 15,366,202 | |
| Okta, Inc. (a) | | | 72,415 | | | | 6,146,585 | |
| Paylocity Holding Corp. (a) | | | 171,319 | | | | 15,002,405 | |
| RingCentral, Inc. (a) | | | 82,760 | | | | 8,713,800 | |
| Zendesk, Inc. (a) | | | 218,267 | | | | 17,247,458 | |
| Zuora, Inc., “A” (a) | | | 254,904 | | | | 6,056,519 | |
| | | | | | | | |
| | | | | | | $ | 111,009,328 | |
| Computer Software - Systems - 6.7% | | | | | | | | |
| Box, Inc. (a) | | | 660,135 | | | $ | 13,361,132 | |
| Five9, Inc. (a) | | | 129,991 | | | | 6,894,723 | |
| NICE Systems Ltd., ADR (a) | | | 41,452 | | | | 4,878,486 | |
| Pluralsight, Inc., “A” (a) | | | 206,006 | | | | 6,697,255 | |
| Proofpoint, Inc. (a) | | | 107,176 | | | | 12,656,414 | |
| Q2 Holdings, Inc. (a) | | | 231,480 | | | | 15,930,453 | |
| Rapid7, Inc. (a) | | | 352,255 | | | | 16,214,298 | |
| RealPage, Inc. (a) | | | 202,853 | | | | 12,416,632 | |
| | | | | | | | |
| | | | | | | $ | 89,049,393 | |
| Construction - 3.6% | | | | | | | | |
| Foundation Building Materials, Inc. (a) | | | 673,457 | | | $ | 7,488,842 | |
| GMS, Inc. (a) | | | 314,186 | | | | 6,142,336 | |
| Lennox International, Inc. | | | 67,408 | | | | 16,531,812 | |
| Summit Materials, Inc., “A” (a) | | | 1,055,042 | | | | 17,935,714 | |
| | | | | | | | |
| | | | | | | $ | 48,098,704 | |
| Consumer Services - 4.0% | | | | | | | | |
| Bright Horizons Family Solutions, Inc. (a) | | | 164,158 | | | $ | 20,355,592 | |
| MakeMyTrip Ltd. (a) | | | 418,772 | | | | 11,821,934 | |
| Planet Fitness, Inc. (a) | | | 356,350 | | | | 20,946,253 | |
| | | | | | | | |
| | | | | | | $ | 53,123,779 | |
6
Portfolio of Investments (unaudited) – continued
| | | | | | | | |
| | |
| Issuer | | Shares/Par | | | Value ($) | |
| Common Stocks - continued | | | | | | | | |
| Containers - 1.8% | | | | | | | | |
| Berry Global Group, Inc. (a) | | | 466,516 | | | $ | 24,478,095 | |
| | |
| Electrical Equipment - 1.8% | | | | | | | | |
| CTS Corp. | | | 304,638 | | | $ | 9,784,973 | |
| Littlefuse, Inc. | | | 73,811 | | | | 14,252,166 | |
| | | | | | | | |
| | | | | | | $ | 24,037,139 | |
| Electronics - 2.9% | | | | | | | | |
| Brooks Automation, Inc. | | | 300,408 | | | $ | 9,646,101 | |
| IPG Photonics Corp. (a) | | | 45,754 | | | | 7,093,242 | |
| Monolithic Power Systems, Inc. | | | 45,561 | | | | 6,110,186 | |
| nLIGHT, Inc. (a) | | | 264,898 | | | | 5,666,168 | |
| Silicon Laboratories, Inc. (a) | | | 118,437 | | | | 9,595,766 | |
| | | | | | | | |
| | | | | | | $ | 38,111,463 | |
| Entertainment - 1.4% | | | | | | | | |
| Live Nation, Inc. (a) | | | 115,482 | | | $ | 6,531,662 | |
| Manchester United PLC, “A” | | | 570,087 | | | | 11,481,552 | |
| | | | | | | | |
| | | | | | | $ | 18,013,214 | |
| Forest & Paper Products - 0.7% | | | | | | | | |
| Trex Co., Inc. (a) | | | 123,380 | | | $ | 9,247,331 | |
| | |
| General Merchandise - 0.6% | | | | | | | | |
| Ollie’s Bargain Outlet Holdings, Inc. (a) | | | 87,186 | | | $ | 7,691,549 | |
| | |
| Machinery & Tools - 1.8% | | | | | | | | |
| Gardner Denver Holdings, Inc. (a) | | | 267,963 | | | $ | 7,194,806 | |
| Gates Industrial Corp. PLC (a) | | | 349,129 | | | | 5,620,977 | |
| Ritchie Bros. Auctioneers, Inc. | | | 288,686 | | | | 10,825,725 | |
| | | | | | | | |
| | | | | | | $ | 23,641,508 | |
| Medical & Health Technology & Services - 5.9% | | | | | | | | |
| Charles River Laboratories International, Inc. (a) | | | 98,583 | | | $ | 14,015,545 | |
| Guardant Health, Inc. (a) | | | 109,643 | | | | 7,306,610 | |
| ICON PLC (a) | | | 124,760 | | | | 17,463,905 | |
| Medidata Solutions, Inc. (a) | | | 166,670 | | | | 12,503,583 | |
| Syneos Health, Inc. (a) | | | 262,860 | | | | 10,979,662 | |
| Teladoc Health, Inc. (a)(l) | | | 245,235 | | | | 15,783,325 | |
| | | | | | | | |
| | | | | | | $ | 78,052,630 | |
| Medical Equipment - 9.4% | | | | | | | | |
| Inspire Medical Systems, Inc. (a) | | | 79,231 | | | $ | 4,912,322 | |
| iRhythm Technologies, Inc. (a) | | | 77,482 | | | | 7,422,001 | |
7
Portfolio of Investments (unaudited) – continued
| | | | | | | | |
| | |
| Issuer | | Shares/Par | | | Value ($) | |
| Common Stocks - continued | | | | | | | | |
| Medical Equipment - continued | | | | | | | | |
| Masimo Corp. (a) | | | 127,397 | | | $ | 16,724,678 | |
| Merit Medical Systems, Inc. (a) | | | 223,507 | | | | 12,456,045 | |
| Mesa Laboratories, Inc. | | | 46,629 | | | | 10,728,867 | |
| OptiNose, Inc. (a)(l) | | | 550,586 | | | | 4,085,348 | |
| PerkinElmer, Inc. | | | 200,747 | | | | 18,902,337 | |
| Quidel Corp. (a) | | | 213,904 | | | | 14,023,546 | |
| Senseonics Holdings, Inc. (a)(l) | | | 1,461,727 | | | | 4,370,564 | |
| STERIS PLC | | | 151,404 | | | | 18,313,828 | |
| West Pharmaceutical Services, Inc. | | | 128,333 | | | | 13,442,882 | |
| | | | | | | | |
| | | | | | | $ | 125,382,418 | |
| Network & Telecom - 1.6% | | | | | | | | |
| Interxion Holding N.V. (a) | | | 219,896 | | | $ | 14,403,188 | |
| Switch, Inc. | | | 747,978 | | | | 6,455,050 | |
| | | | | | | | |
| | | | | | | $ | 20,858,238 | |
| Oil Services - 1.5% | | | | | | | | |
| Core Laboratories N.V. | | | 136,674 | | | $ | 8,857,842 | |
| Liberty Oilfield Services, Inc. | | | 194,871 | | | | 3,191,987 | |
| Patterson-UTI Energy, Inc. | | | 625,037 | | | | 8,287,991 | |
| | | | | | | | |
| | | | | | | $ | 20,337,820 | |
| Other Banks & Diversified Financials - 4.4% | | | | | | | | |
| Bank OZK | | | 340,595 | | | $ | 11,171,516 | |
| Haymaker Acquisition Corp. (a) | | | 513,864 | | | | 5,256,829 | |
| Legacytextas Financial Group, Inc. | | | 315,469 | | | | 13,164,521 | |
| Signature Bank | | | 103,055 | | | | 13,990,747 | |
| Wintrust Financial Corp. | | | 193,861 | | | | 14,281,740 | |
| | | | | | | | |
| | | | | | | $ | 57,865,353 | |
| Pharmaceuticals - 3.6% | | | | | | | | |
| Aquestive Therapeutics, Inc. (a) | | | 302,573 | | | $ | 2,435,713 | |
| Aratana Therapeutics, Inc. (a) | | | 1,012,522 | | | | 4,070,338 | |
| Collegium Pharmaceutical, Inc. (a) | | | 373,235 | | | | 6,565,204 | |
| Elanco Animal Health, Inc. (a)(l) | | | 197,047 | | | | 5,958,701 | |
| Forty Seven, Inc. (a) | | | 197,921 | | | | 3,305,281 | |
| GW Pharmaceuticals PLC, ADR (a) | | | 45,629 | | | | 7,848,644 | |
| Orchard RX Ltd., ADR (a) | | | 278,205 | | | | 4,771,216 | |
| PetIQ, Inc. (a) | | | 275,025 | | | | 8,281,003 | |
| Principia Biopharma, Inc. (a) | | | 145,800 | | | | 5,164,236 | |
| | | | | | | | |
| | | | | | | $ | 48,400,336 | |
| Pollution Control - 0.8% | | | | | | | | |
| EvoquaWater Technologies LLC (a) | | | 809,415 | | | $ | 10,991,856 | |
8
Portfolio of Investments (unaudited) – continued
| | | | | | | | |
| | |
| Issuer | | Shares/Par | | | Value ($) | |
| Common Stocks - continued | | | | | | | | |
| Railroad & Shipping - 0.2% | | | | | | | | |
| StealthGas, Inc. (a) | | | 1,008,631 | | | $ | 3,267,964 | |
| | |
| Real Estate - 3.0% | | | | | | | | |
| Big Yellow Group PLC, REIT | | | 575,245 | | | $ | 7,480,980 | |
| Industrial Logistics Properties Trust, REIT | | | 700,381 | | | | 14,609,947 | |
| STAG Industrial, Inc., REIT | | | 633,966 | | | | 17,548,179 | |
| | | | | | | | |
| | | | | | | $ | 39,639,106 | |
| Restaurants - 1.4% | | | | | | | | |
| Performance Food Group Co. (a) | | | 493,148 | | | $ | 19,000,992 | |
| | |
| Special Products & Services - 1.0% | | | | | | | | |
| Boyd Group Income Fund, IEU | | | 147,033 | | | $ | 13,615,594 | |
| | |
| Specialty Chemicals - 4.6% | | | | | | | | |
| Axalta Coating Systems Ltd. (a) | | | 636,537 | | | $ | 17,014,634 | |
| Ferro Corp. (a) | | | 999,253 | | | | 19,375,516 | |
| Ferroglobe PLC | | | 1,020,417 | | | | 2,806,147 | |
| RPM International, Inc. | | | 157,226 | | | | 9,098,668 | |
| Univar, Inc. (a) | | | 537,395 | | | | 12,150,501 | |
| | | | | | | | |
| | | | | | | $ | 60,445,466 | |
| Specialty Stores - 1.8% | | | | | | | | |
| Floor & Decor Holdings, Inc. (a) | | | 242,288 | | | $ | 9,008,268 | |
| Hudson Ltd., “A” (a) | | | 974,541 | | | | 14,520,661 | |
| | | | | | | | |
| | | | | | | $ | 23,528,929 | |
| Total Common Stocks (Identified Cost, $1,031,659,283) | | | | | | $ | 1,289,926,159 | |
| | |
| Investment Companies (h) - 3.1% | | | | | | | | |
| Money Market Funds - 3.1% | | | | | | | | |
MFS Institutional Money Market Portfolio, 2.49% (v)
(Identified Cost, $41,776,213) | | | 41,782,397 | | | $ | 41,782,397 | |
| | |
| Collateral for Securities Loaned - 0.6% | | | | | | | | |
| State Street Navigator Securities Lending Government Money Market Portfolio, 2.43% (j) (Identified Cost, $7,390,332) | | | 7,390,332 | | | $ | 7,390,332 | |
| | |
| Other Assets, Less Liabilities - (0.8)% | | | | | | | (10,628,993 | ) |
| Net Assets - 100.0% | | | | | | $ | 1,328,469,895 | |
| (a) | Non-income producing security. |
| (h) | An affiliated issuer, which may be considered one in which the fund owns 5% or more of the outstanding voting securities, or a company which is under common control. At period end, the aggregate values of the fund’s investments in affiliated issuers and in unaffiliated issuers were $41,782,397 and $1,297,316,491, respectively. |
9
Portfolio of Investments (unaudited) – continued
| (j) | The rate quoted is the annualizedseven-day yield of the fund at period end. |
| (l) | A portion of this security is on loan. See Note 2 for additional information. |
| (v) | Affiliated issuer that is available only to investment companies managed by MFS. The rate quoted for the MFS Institutional Money Market Portfolio is the annualizedseven-day yield of the fund at period end. |
The following abbreviations are used in this report and are defined:
| ADR | | American Depositary Receipt |
| IEU | | International Equity Unit |
| PLC | | Public Limited Company |
| REIT | | Real Estate Investment Trust |
See Notes to Financial Statements
10
Financial Statements
STATEMENT OF ASSETS AND LIABILITIES
At 2/28/19 (unaudited)
This statement represents your fund’s balance sheet, which details the assets and liabilities comprising the total value of the fund.
| | | | |
| Assets | | | | |
Investments in unaffiliated issuers, at value, including $18,296,626 of securities on loan (identified cost, $1,039,049,615) | | | $1,297,316,491 | |
Investments in affiliated issuers, at value (identified cost, $41,776,213) | | | 41,782,397 | |
Receivables for | | | | |
Investments sold | | | 8,361,707 | |
Fund shares sold | | | 1,742,563 | |
Interest and dividends | | | 536,529 | |
Other assets | | | 4,632 | |
Total assets | | | $1,349,744,319 | |
| |
| Liabilities | | | | |
Payable to custodian | | | $6,300 | |
Payables for | | | | |
Investments purchased | | | 7,480,918 | |
Fund shares reacquired | | | 5,908,074 | |
Collateral for securities loaned, at value (c) | | | 7,390,332 | |
Payable to affiliates | | | | |
Investment adviser | | | 64,301 | |
Shareholder servicing costs | | | 329,208 | |
Distribution and service fees | | | 10,774 | |
Payable for independent Trustees’ compensation | | | 2,146 | |
Accrued expenses and other liabilities | | | 82,371 | |
Total liabilities | | | $21,274,424 | |
Net assets | | | $1,328,469,895 | |
| |
| Net assets consist of | | | | |
Paid-in capital | | | $1,075,262,354 | |
Total distributable earnings (loss) | | | 253,207,541 | |
Net assets | | | $1,328,469,895 | |
Shares of beneficial interest outstanding | | | 49,425,348 | |
| (c) | Non-cash collateral is not included. |
11
Statement of Assets and Liabilities (unaudited) – continued
| | | | | | | | | | | | |
| | | |
| | | Net assets | | | Shares
outstanding | | | Net asset value
per share (a) | |
Class A | | | $498,575,011 | | | | 19,306,851 | | | | $25.82 | |
Class B | | | 20,382,881 | | | | 1,045,770 | | | | 19.49 | |
Class C | | | 59,792,867 | | | | 3,059,341 | | | | 19.54 | |
Class I | | | 144,705,764 | | | | 4,941,776 | | | | 29.28 | |
Class R1 | | | 4,934,884 | | | | 255,735 | | | | 19.30 | |
Class R2 | | | 33,498,510 | | | | 1,404,269 | | | | 23.85 | |
Class R3 | | | 48,764,481 | | | | 1,891,336 | | | | 25.78 | |
Class R4 | | | 10,170,702 | | | | 369,104 | | | | 27.56 | |
Class R6 | | | 507,644,795 | | | | 17,151,166 | | | | 29.60 | |
| (a) | Maximum offering price per share was equal to the net asset value per share for all share classes, except for Class A, for which the maximum offering price per share was $27.40 [100 / 94.25 x $25.82]. On sales of $50,000 or more, the maximum offering price of Class A shares is reduced. A contingent deferred sales charge may be imposed on redemptions of Class A, Class B, and Class C shares. Redemption price per share was equal to the net asset value per share for Classes I, R1, R2, R3, R4, and R6. |
See Notes to Financial Statements
12
Financial Statements
STATEMENT OF OPERATIONS
Six months ended 2/28/19 (unaudited)
This statement describes how much your fund earned in investment income and accrued in expenses. It also describes any gains and/or losses generated by fund operations.
| | | | |
| Net investment income (loss) | | | | |
Income | | | | |
Dividends | | | $3,486,849 | |
Dividends from affiliated issuers | | | 482,388 | |
Income on securities loaned | | | 63,456 | |
Other | | | 57,279 | |
Foreign taxes withheld | | | (104,277 | ) |
Total investment income | | | $3,985,695 | |
Expenses | | | | |
Management fee | | | $5,405,868 | |
Distribution and service fees | | | 1,133,853 | |
Shareholder servicing costs | | | 537,472 | |
Administrative services fee | | | 86,272 | |
Independent Trustees’ compensation | | | 10,468 | |
Custodian fee | | | 34,361 | |
Shareholder communications | | | 51,601 | |
Audit and tax fees | | | 29,438 | |
Legal fees | | | 5,188 | |
Miscellaneous | | | 108,849 | |
Total expenses | | | $7,403,370 | |
Reduction of expenses by investment adviser and distributor | | | (75,137 | ) |
Net expenses | | | $7,328,233 | |
Net investment income (loss) | | | $(3,342,538 | ) |
| |
| Realized and unrealized gain (loss) | | | | |
Realized gain (loss) (identified cost basis) | | | | |
Unaffiliated issuers | | | $50,996,389 | |
Affiliated issuers | | | 1,017 | |
Foreign currency | | | (3,982 | ) |
Net realized gain (loss) | | | $50,993,424 | |
Change in unrealized appreciation or depreciation | | | | |
Unaffiliated issuers | | | $(92,469,432 | ) |
Affiliated issuers | | | (1,783 | ) |
Translation of assets and liabilities in foreign currencies | | | 310 | |
Net unrealized gain (loss) | | | $(92,470,905 | ) |
Net realized and unrealized gain (loss) | | | $(41,477,481 | ) |
Change in net assets from operations | | | $(44,820,019 | ) |
See Notes to Financial Statements
13
Financial Statements
STATEMENTS OF CHANGES IN NET ASSETS
These statements describe the increases and/or decreases in net assets resulting from operations, any distributions, and any shareholder transactions.
| | | | | | | | |
| Change in net assets | | Six months ended
2/28/19
(unaudited) | | | Year ended 8/31/18 | |
| | |
| From operations | | | | | | | | |
Net investment income (loss) | | | $(3,342,538 | ) | | | $(8,559,359 | ) |
Net realized gain (loss) | | | 50,993,424 | | | | 249,291,803 | |
Net unrealized gain (loss) | | | (92,470,905 | ) | | | 126,094,358 | |
Change in net assets from operations | | | $(44,820,019 | ) | | | $366,826,802 | |
Total distributions to shareholders (a) | | | $(230,450,032 | ) | | | $(110,787,326 | ) |
Change in net assets from fund share transactions | | | $223,590,392 | | | | $(26,394,220 | ) |
Total change in net assets | | | $(51,679,659 | ) | | | $229,645,256 | |
| | |
| Net assets | | | | | | | | |
At beginning of period | | | 1,380,149,554 | | | | 1,150,504,298 | |
At end of period (b) | | | $1,328,469,895 | | | | $1,380,149,554 | |
| (a) | Distributions from net investment income and from net realized gain are no longer required to be separately disclosed. See Note 2. For the year ended August 31, 2018, distributions from net realized gain were $110,787,326. |
| (b) | Parenthetical disclosure of accumulated net investment loss is no longer required. See Note 2. For the year ended August 31, 2018, end of period net assets included accumulated net investment loss of $1,660. |
See Notes to Financial Statements
14
Financial Statements
FINANCIAL HIGHLIGHTS
The financial highlights table is intended to help you understand the fund’s financial performance for the semiannual period and the past 5 fiscal years. Certain information reflects financial results for a single fund share. The total returns in the table represent the rate that an investor would have earned (or lost) on an investment in the fund share class (assuming reinvestment of all distributions) held for the entire period.
| | | | | | | | | | | | | | | | | | | | | | | | |
| | | Six months
ended
2/28/19
| | | Year ended | |
| Class A | | 8/31/18 | | | 8/31/17 | | | 8/31/16 | | | 8/31/15 | | | 8/31/14 | |
| | | (unaudited) | | | | | | | | | | | | | | | | |
Net asset value, beginning of period | | | $33.30 | | | | $27.27 | | | | $24.11 | | | | $23.69 | | | | $25.49 | | | | $25.86 | |
| | | |
| Income (loss) from investment operations | | | | | | | | | | | | | |
Net investment income (loss) (d) | | | $(0.09 | ) | | | $(0.23 | ) | | | $(0.18 | )(c) | | | $(0.11 | ) | | | $(0.20 | ) | | | $(0.22 | ) |
Net realized and unrealized
gain (loss) | | | (1.78 | ) | | | 9.07 | | | | 3.92 | | | | 0.53 | | | | 0.22 | | | | 2.30 | |
Total from investment operations | | | $(1.87 | ) | | | $8.84 | | | | $3.74 | | | | $0.42 | | | | $0.02 | | | | $2.08 | |
| | | |
| Less distributions declared to shareholders | | | | | | | | | | | | | |
From net realized gain | | | $(5.61 | ) | | | $(2.81 | ) | | | $(0.58 | ) | | | $— | | | | $(1.82 | ) | | | $(2.45 | ) |
Net asset value, end of period (x) | | | $25.82 | | | | $33.30 | | | | $27.27 | | | | $24.11 | | | | $23.69 | | | | $25.49 | |
Total return (%) (r)(s)(t)(x) | | | (3.04 | )(n) | | | 34.98 | | | | 15.83 | (c) | | | 1.77 | | | | 0.47 | | | | 8.01 | |
| | | |
Ratios (%) (to average net assets)
and Supplemental data: | | | | | | | | | | | | | |
Expenses before expense reductions (f) | | | 1.31 | (a) | | | 1.33 | | | | 1.35 | (c) | | | 1.36 | | | | 1.36 | | | | 1.33 | |
Expenses after expense reductions (f) | | | 1.29 | (a) | | | 1.31 | | | | 1.33 | (c) | | | 1.34 | | | | 1.31 | | | | 1.27 | |
Net investment income (loss) | | | (0.64 | )(a) | | | (0.80 | ) | | | (0.70 | )(c) | | | (0.50 | ) | | | (0.81 | ) | | | (0.83 | ) |
Portfolio turnover | | | 36 | (n) | | | 67 | | | | 53 | | | | 49 | | | | 56 | | | | 98 | |
Net assets at end of period
(000 omitted) | | | $498,575 | | | | $525,698 | | | | $394,878 | | | | $400,997 | | | | $457,437 | | | | $620,802 | |
See Notes to Financial Statements
15
Financial Highlights – continued
| | | | | | | | | | | | | | | | | | | | | | | | |
| | | Six months
ended 2/28/19 | | | Year ended | |
| Class B | | 8/31/18 | | | 8/31/17 | | | 8/31/16 | | | 8/31/15 | | | 8/31/14 | |
| | | (unaudited) | | | | | | | | | | | | | | | | |
Net asset value, beginning of period | | | $26.86 | | | | $22.65 | | | | $20.27 | | | | $20.07 | | | | $22.04 | | | | $22.83 | |
| | | |
| Income (loss) from investment operations | | | | | | | | | | | | | |
Net investment income (loss) (d) | | | $(0.15 | ) | | | $(0.37 | ) | | | $(0.30 | )(c) | | | $(0.24 | ) | | | $(0.32 | ) | | | $(0.36 | ) |
Net realized and unrealized
gain (loss) | | | (1.61 | ) | | | 7.39 | | | | 3.26 | | | | 0.44 | | | | 0.17 | | | | 2.02 | |
Total from investment operations | | | $(1.76 | ) | | | $7.02 | | | | $2.96 | | | | $0.20 | | | | $(0.15 | ) | | | $1.66 | |
| | | |
| Less distributions declared to shareholders | | | | | | | | | | | | | |
From net realized gain | | | $(5.61 | ) | | | $(2.81 | ) | | | $(0.58 | ) | | | $— | | | | $(1.82 | ) | | | $(2.45 | ) |
Net asset value, end of period (x) | | | $19.49 | | | | $26.86 | | | | $22.65 | | | | $20.27 | | | | $20.07 | | | | $22.04 | |
Total return (%) (r)(s)(t)(x) | | | (3.40 | )(n) | | | 34.00 | | | | 14.97 | (c) | | | 1.00 | | | | (0.27 | ) | | | 7.18 | |
| | | |
Ratios (%) (to average net assets)
and Supplemental data: | | | | | | | | | | | | | |
Expenses before expense reductions (f) | | | 2.06 | (a) | | | 2.08 | | | | 2.10 | (c) | | | 2.11 | | | | 2.11 | | | | 2.08 | |
Expenses after expense reductions (f) | | | 2.04 | (a) | | | 2.06 | | | | 2.08 | (c) | | | 2.09 | | | | 2.06 | | | | 2.02 | |
Net investment income (loss) | | | (1.40 | )(a) | | | (1.55 | ) | | | (1.45 | )(c) | | | (1.26 | ) | | | (1.57 | ) | | | (1.58 | ) |
Portfolio turnover | | | 36 | (n) | | | 67 | | | | 53 | | | | 49 | | | | 56 | | | | 98 | |
Net assets at end of period
(000 omitted) | | | $20,383 | | | | $23,424 | | | | $20,143 | | | | $22,906 | | | | $27,455 | | | | $34,971 | |
| | |
| | | Six months
ended
2/28/19 | | | Year ended | |
| Class C | | 8/31/18 | | | 8/31/17 | | | 8/31/16 | | | 8/31/15 | | | 8/31/14 | |
| | | (unaudited) | | | | | | | | | | | | | | | | |
Net asset value, beginning of period | | | $26.91 | | | | $22.70 | | | | $20.31 | | | | $20.11 | | | | $22.08 | | | | $22.86 | |
| | | |
| Income (loss) from investment operations | | | | | | | | | | | | | |
Net investment income (loss) (d) | | | $(0.15 | ) | | | $(0.37 | ) | | | $(0.31 | )(c) | | | $(0.24 | ) | | | $(0.32 | ) | | | $(0.36 | ) |
Net realized and unrealized
gain (loss) | | | (1.61 | ) | | | 7.39 | | | | 3.28 | | | | 0.44 | | | | 0.17 | | | | 2.03 | |
Total from investment operations | | | $(1.76 | ) | | | $7.02 | | | | $2.97 | | | | $0.20 | | | | $(0.15 | ) | | | $1.67 | |
| | | |
| Less distributions declared to shareholders | | | | | | | | | | | | | |
From net realized gain | | | $(5.61 | ) | | | $(2.81 | ) | | | $(0.58 | ) | | | $— | | | | $(1.82 | ) | | | $(2.45 | ) |
Net asset value, end of period (x) | | | $19.54 | | | | $26.91 | | | | $22.70 | | | | $20.31 | | | | $20.11 | | | | $22.08 | |
Total return (%) (r)(s)(t)(x) | | | (3.41 | )(n) | | | 33.92 | | | | 14.99 | (c) | | | 0.99 | | | | (0.28 | ) | | | 7.22 | |
| | | |
Ratios (%) (to average net assets)
and Supplemental data: | | | | | | | | | | | | | |
Expenses before expense reductions (f) | | | 2.06 | (a) | | | 2.08 | | | | 2.10 | (c) | | | 2.11 | | | | 2.11 | | | | 2.08 | |
Expenses after expense reductions (f) | | | 2.05 | (a) | | | 2.07 | | | | 2.09 | (c) | | | 2.09 | | | | 2.06 | | | | 2.02 | |
Net investment income (loss) | | | (1.40 | )(a) | | | (1.55 | ) | | | (1.45 | )(c) | | | (1.27 | ) | | | (1.57 | ) | | | (1.59 | ) |
Portfolio turnover | | | 36 | (n) | | | 67 | | | | 53 | | | | 49 | | | | 56 | | | | 98 | |
Net assets at end of period
(000 omitted) | | | $59,793 | | | | $69,498 | | | | $76,724 | | | | $85,370 | | | | $105,686 | | | | $141,293 | |
See Notes to Financial Statements
16
Financial Highlights – continued
| | | | | | | | | | | | | | | | | | | | | | | | |
| | | Six months
ended 2/28/19 | | | Year ended | |
| Class I | | 8/31/18 | | | 8/31/17 | | | 8/31/16 | | | 8/31/15 | | | 8/31/14 | |
| | | (unaudited) | | | | | | | | | | | | | | | | |
Net asset value, beginning of period | | | $36.82 | | | | $29.81 | | | | $26.24 | | | | $25.72 | | | | $27.44 | | | | $27.61 | |
| | | |
| Income (loss) from investment operations | | | | | | | | | | | | | |
Net investment income (loss) (d) | | | $(0.06 | ) | | | $(0.18 | ) | | | $(0.12 | )(c) | | | $(0.07 | ) | | | $(0.14 | ) | | | $(0.17 | ) |
Net realized and unrealized
gain (loss) | | | (1.87 | ) | | | 10.00 | | | | 4.27 | | | | 0.59 | | | | 0.24 | | | | 2.45 | |
Total from investment operations | | | $(1.93 | ) | | | $9.82 | | | | $4.15 | | | | $0.52 | | | | $0.10 | | | | $2.28 | |
| | | |
| Less distributions declared to shareholders | | | | | | | | | | | | | |
From net realized gain | | | $(5.61 | ) | | | $(2.81 | ) | | | $(0.58 | ) | | | $— | | | | $(1.82 | ) | | | $(2.45 | ) |
Net asset value, end of period (x) | | | $29.28 | | | | $36.82 | | | | $29.81 | | | | $26.24 | | | | $25.72 | | | | $27.44 | |
Total return (%) (r)(s)(t)(x) | | | (2.91 | )(n) | | | 35.31 | | | | 16.12 | (c) | | | 2.02 | | | | 0.74 | | | | 8.25 | |
| | | |
Ratios (%) (to average net assets)
and Supplemental data: | | | | | | | | | | | | | |
Expenses before expense reductions (f) | | | 1.06 | (a) | | | 1.08 | | | | 1.10 | (c) | | | 1.12 | | | | 1.11 | | | | 1.08 | |
Expenses after expense reductions (f) | | | 1.05 | (a) | | | 1.07 | | | | 1.09 | (c) | | | 1.09 | | | | 1.06 | | | | 1.02 | |
Net investment income (loss) | | | (0.40 | )(a) | | | (0.55 | ) | | | (0.45 | )(c) | | | (0.30 | ) | | | (0.55 | ) | | | (0.59 | ) |
Portfolio turnover | | | 36 | (n) | | | 67 | | | | 53 | | | | 49 | | | | 56 | | | | 98 | |
Net assets at end of period
(000 omitted) | | | $144,706 | | | | $180,591 | | | | $106,459 | | | | $101,635 | | | | $166,513 | | | | $483,893 | |
| | |
| | | Six months
ended 2/28/19 | | | Year ended | |
| Class R1 | | 8/31/18 | | | 8/31/17 | | | 8/31/16 | | | 8/31/15 | | | 8/31/14 | |
| | | (unaudited) | | | | | | | | | | | | | | | | |
Net asset value, beginning of period | | | $26.66 | | | | $22.50 | | | | $20.15 | | | | $19.94 | | | | $21.91 | | | | $22.71 | |
| | | |
| Income (loss) from investment operations | | | | | | | | | | | | | |
Net investment income (loss) (d) | | | $(0.14 | ) | | �� | $(0.37 | ) | | | $(0.30 | )(c) | | | $(0.23 | ) | | | $(0.32 | ) | | | $(0.36 | ) |
Net realized and unrealized
gain (loss) | | | (1.61 | ) | | | 7.34 | | | | 3.23 | | | | 0.44 | | | | 0.17 | | | | 2.01 | |
Total from investment operations | | | $(1.75 | ) | | | $6.97 | | | | $2.93 | | | | $0.21 | | | | $(0.15 | ) | | | $1.65 | |
| | | |
| Less distributions declared to shareholders | | | | | | | | | | | | | |
From net realized gain | | | $(5.61 | ) | | | $(2.81 | ) | | | $(0.58 | ) | | | $— | | | | $(1.82 | ) | | | $(2.45 | ) |
Net asset value, end of period (x) | | | $19.30 | | | | $26.66 | | | | $22.50 | | | | $20.15 | | | | $19.94 | | | | $21.91 | |
Total return (%) (r)(s)(t)(x) | | | (3.38 | )(n) | | | 34.01 | | | | 14.91 | (c) | | | 1.05 | | | | (0.28 | ) | | | 7.17 | |
| | | |
Ratios (%) (to average net assets)
and Supplemental data: | | | | | | | | | | | | | |
Expenses before expense reductions (f) | | | 2.06 | (a) | | | 2.08 | | | | 2.10 | (c) | | | 2.11 | | | | 2.11 | | | | 2.08 | |
Expenses after expense reductions (f) | | | 2.05 | (a) | | | 2.07 | | | | 2.09 | (c) | | | 2.09 | | | | 2.06 | | | | 2.02 | |
Net investment income (loss) | | | (1.40 | )(a) | | | (1.55 | ) | | | (1.45 | )(c) | | | (1.26 | ) | | | (1.57 | ) | | | (1.59 | ) |
Portfolio turnover | | | 36 | (n) | | | 67 | | | | 53 | | | | 49 | | | | 56 | | | | 98 | |
Net assets at end of period
(000 omitted) | | | $4,935 | | | | $5,342 | | | | $4,377 | | | | $5,647 | | | | $6,573 | | | | $8,490 | |
See Notes to Financial Statements
17
Financial Highlights – continued
| | | | | | | | | | | | | | | | | | | | | | | | |
| | | Six months
ended 2/28/19 | | | Year ended | |
| Class R2 | | 8/31/18 | | | 8/31/17 | | | 8/31/16 | | | 8/31/15 | | | 8/31/14 | |
| | | (unaudited) | | | | | | | | | | | | | | | | |
Net asset value, beginning of period | | | $31.31 | | | | $25.85 | | | | $22.95 | | | | $22.60 | | | | $24.46 | | | | $24.97 | |
| | | |
| Income (loss) from investment operations | | | | | | | | | | | | | |
Net investment income (loss) (d) | | | $(0.11 | ) | | | $(0.29 | ) | | | $(0.23 | )(c) | | | $(0.17 | ) | | | $(0.25 | ) | | | $(0.27 | ) |
Net realized and unrealized
gain (loss) | | | (1.74 | ) | | | 8.56 | | | | 3.71 | | | | 0.52 | | | | 0.21 | | | | 2.21 | |
Total from investment operations | | | $(1.85 | ) | | | $8.27 | | | | $3.48 | | | | $0.35 | | | | $(0.04 | ) | | | $1.94 | |
| | | |
| Less distributions declared to shareholders | | | | | | | | | | | | | |
From net realized gain | | | $(5.61 | ) | | | $(2.81 | ) | | | $(0.58 | ) | | | $— | | | | $(1.82 | ) | | | $(2.45 | ) |
Net asset value, end of period (x) | | | $23.85 | | | | $31.31 | | | | $25.85 | | | | $22.95 | | | | $22.60 | | | | $24.46 | |
Total return (%) (r)(s)(t)(x) | | | (3.18 | )(n) | | | 34.68 | | | | 15.50 | (c) | | | 1.55 | | | | 0.23 | | | | 7.72 | |
| | | |
Ratios (%) (to average net assets)
and Supplemental data: | | | | | | | | | | | | | |
Expenses before expense reductions (f) | | | 1.56 | (a) | | | 1.58 | | | | 1.60 | (c) | | | 1.62 | | | | 1.61 | | | | 1.58 | |
Expenses after expense reductions (f) | | | 1.55 | (a) | | | 1.57 | | | | 1.59 | (c) | | | 1.59 | | | | 1.56 | | | | 1.52 | |
Net investment income (loss) | | | (0.90 | )(a) | | | (1.05 | ) | | | (0.95 | )(c) | | | (0.82 | ) | | | (1.07 | ) | | | (1.09 | ) |
Portfolio turnover | | | 36 | (n) | | | 67 | | | | 53 | | | | 49 | | | | 56 | | | | 98 | |
Net assets at end of period
(000 omitted) | | | $33,499 | | | | $36,272 | | | | $29,130 | | | | $35,890 | | | | $57,077 | | | | $66,923 | |
| | |
| | | Six months
ended 2/28/19 | | | Year ended | |
| Class R3 | | 8/31/18 | | | 8/31/17 | | | 8/31/16 | | | 8/31/15 | | | 8/31/14 | |
| | | (unaudited) | | | | | | | | | | | | | | | | |
Net asset value, beginning of period | | | $33.26 | | | | $27.24 | | | | $24.09 | | | | $23.67 | | | | $25.47 | | | | $25.84 | |
| | | |
| Income (loss) from investment operations | | | | | | | | | | | | | |
Net investment income (loss) (d) | | | $(0.09 | ) | | | $(0.24 | ) | | | $(0.17 | )(c) | | | $(0.12 | ) | | | $(0.20 | ) | | | $(0.22 | ) |
Net realized and unrealized
gain (loss) | | | (1.78 | ) | | | 9.07 | | | | 3.90 | | | | 0.54 | | | | 0.22 | | | | 2.30 | |
Total from investment operations | | | $(1.87 | ) | | | $8.83 | | | | $3.73 | | | | $0.42 | | | | $0.02 | | | | $2.08 | |
| | | |
| Less distributions declared to shareholders | | | | | | | | | | | | | |
From net realized gain | | | $(5.61 | ) | | | $(2.81 | ) | | | $(0.58 | ) | | | $— | | | | $(1.82 | ) | | | $(2.45 | ) |
Net asset value, end of period (x) | | | $25.78 | | | | $33.26 | | | | $27.24 | | | | $24.09 | | | | $23.67 | | | | $25.47 | |
Total return (%) (r)(s)(t)(x) | | | (3.05 | )(n) | | | 34.98 | | | | 15.81 | (c) | | | 1.77 | | | | 0.47 | | | | 8.02 | |
| | | |
Ratios (%) (to average net assets)
and Supplemental data: | | | | | | | | | | | | | |
Expenses before expense reductions (f) | | | 1.31 | (a) | | | 1.33 | | | | 1.35 | (c) | | | 1.37 | | | | 1.36 | | | | 1.33 | |
Expenses after expense reductions (f) | | | 1.30 | (a) | | | 1.32 | | | | 1.34 | (c) | | | 1.34 | | | | 1.31 | | | | 1.27 | |
Net investment income (loss) | | | (0.65 | )(a) | | | (0.80 | ) | | | (0.70 | )(c) | | | (0.55 | ) | | | (0.82 | ) | | | (0.84 | ) |
Portfolio turnover | | | 36 | (n) | | | 67 | | | | 53 | | | | 49 | | | | 56 | | | | 98 | |
Net assets at end of period
(000 omitted) | | | $48,764 | | | | $50,895 | | | | $42,346 | | | | $57,593 | | | | $89,659 | | | | $150,359 | |
See Notes to Financial Statements
18
Financial Highlights – continued
| | | | | | | | | | | | | | | | | | | | | | | | |
| | | Six months
ended 2/28/19 | | | Year ended | |
| Class R4 | | 8/31/18 | | | 8/31/17 | | | 8/31/16 | | | 8/31/15 | | | 8/31/14 | |
| | | (unaudited) | | | | | | | | | | | | | | | | |
Net asset value, beginning of period | | | $35.05 | | | | $28.48 | | | | $25.09 | | | | $24.60 | | | | $26.33 | | | | $26.57 | |
| | | |
| Income (loss) from investment operations | | | | | | | | | | | | | |
Net investment income (loss) (d) | | | $(0.06 | ) | | | $(0.15 | ) | | | $(0.12 | )(c) | | | $(0.07 | ) | | | $(0.14 | ) | | | $(0.16 | ) |
Net realized and unrealized
gain (loss) | | | (1.82 | ) | | | 9.53 | | | | 4.09 | | | | 0.56 | | | | 0.23 | | | | 2.37 | |
Total from investment operations | | | $(1.88 | ) | | | $9.38 | | | | $3.97 | | | | $0.49 | | | | $0.09 | | | | $2.21 | |
| | | |
| Less distributions declared to shareholders | | | | | | | | | | | | | |
From net realized gain | | | $(5.61 | ) | | | $(2.81 | ) | | | $(0.58 | ) | | | $— | | | | $(1.82 | ) | | | $(2.45 | ) |
Net asset value, end of period (x) | | | $27.56 | | | | $35.05 | | | | $28.48 | | | | $25.09 | | | | $24.60 | | | | $26.33 | |
Total return (%) (r)(s)(t)(x) | | | (2.90 | )(n) | | | 35.42 | | | | 16.14 | (c) | | | 1.99 | | | | 0.73 | | | | 8.31 | |
| | | |
Ratios (%) (to average net assets)
and Supplemental data: | | | | | | | | | | | | | |
Expenses before expense reductions (f) | | | 1.06 | (a) | | | 1.08 | | | | 1.10 | (c) | | | 1.12 | | | | 1.11 | | | | 1.08 | |
Expenses after expense reductions (f) | | | 1.05 | (a) | | | 1.07 | | | | 1.09 | (c) | | | 1.09 | | | | 1.06 | | | | 1.02 | |
Net investment income (loss) | | | (0.40 | )(a) | | | (0.51 | ) | | | (0.45 | )(c) | | | (0.32 | ) | | | (0.57 | ) | | | (0.59 | ) |
Portfolio turnover | | | 36 | (n) | | | 67 | | | | 53 | | | | 49 | | | | 56 | | | | 98 | |
Net assets at end of period
(000 omitted) | | | $10,171 | | | | $10,612 | | | | $83,186 | | | | $91,974 | | | | $142,857 | | | | $229,964 | |
| | |
| | | Six months
ended 2/28/19 | | | Year ended | |
| Class R6 | | 8/31/18 | | | 8/31/17 | | | 8/31/16 | | | 8/31/15 | | | 8/31/14 | |
| | | (unaudited) | | | | | | | | | | | | | | | | |
Net asset value, beginning of period | | | $37.13 | | | | $30.01 | | | | $26.38 | | | | $25.83 | | | | $27.52 | | | | $27.64 | |
| | | |
| Income (loss) from investment operations | | | | | | | | | | | | | |
Net investment income (loss) (d) | | | $(0.04 | ) | | | $(0.14 | ) | | | $(0.09 | )(c) | | | $(0.03 | ) | | | $(0.12 | ) | | | $(0.13 | ) |
Net realized and unrealized
gain (loss) | | | (1.88 | ) | | | 10.07 | | | | 4.30 | | | | 0.58 | | | | 0.25 | | | | 2.46 | |
Total from investment operations | | | $(1.92 | ) | | | $9.93 | | | | $4.21 | | | | $0.55 | | | | $0.13 | | | | $2.33 | |
| | | |
| Less distributions declared to shareholders | | | | | | | | | | | | | |
From net realized gain | | | $(5.61 | ) | | | $(2.81 | ) | | | $(0.58 | ) | | | $— | | | | $(1.82 | ) | | | $(2.45 | ) |
Net asset value, end of period (x) | | | $29.60 | | | | $37.13 | | | | $30.01 | | | | $26.38 | | | | $25.83 | | | | $27.52 | |
Total return (%) (r)(s)(t)(x) | | | (2.85 | )(n) | | | 35.45 | | | | 16.26 | (c) | | | 2.13 | | | | 0.85 | | | | 8.43 | |
| | | |
Ratios (%) (to average net assets)
and Supplemental data: | | | | | | | | | | | | | |
Expenses before expense reductions (f) | | | 0.96 | (a) | | | 0.97 | | | | 0.98 | (c) | | | 0.99 | | | | 0.98 | | | | 0.97 | |
Expenses after expense reductions (f) | | | 0.95 | (a) | | | 0.96 | | | | 0.97 | (c) | | | 0.97 | | | | 0.93 | | | | 0.91 | |
Net investment income (loss) | | | (0.30 | )(a) | | | (0.44 | ) | | | (0.34 | )(c) | | | (0.11 | ) | | | (0.44 | ) | | | (0.48 | ) |
Portfolio turnover | | | 36 | (n) | | | 67 | | | | 53 | | | | 49 | | | | 56 | | | | 98 | |
Net assets at end of period
(000 omitted) | | | $507,645 | | | | $477,818 | | | | $385,440 | | | | $320,645 | | | | $313,080 | | | | $319,139 | |
See Notes to Financial Statements
19
Financial Highlights – continued
| (c) | Amount reflects aone-time reimbursement of expenses by the custodian (or former custodian) without which net investment income and performance would be lower and expenses would be higher. |
| (d) | Per share data is based on average shares outstanding. |
| (f) | Ratios do not reflect reductions from fees paid indirectly, if applicable. |
| (r) | Certain expenses have been reduced without which performance would have been lower. |
| (s) | From time to time the fund may receive proceeds from litigation settlements, without which performance would be lower. |
| (t) | Total returns do not include any applicable sales charges. |
| (x) | The net asset values and total returns have been calculated on net assets which include adjustments made in accordance with U.S. generally accepted accounting principles required at period end for financial reporting purposes. |
See Notes to Financial Statements
20
NOTES TO FINANCIAL STATEMENTS
(unaudited)
(1) Business and Organization
MFS New Discovery Fund (the fund) is a diversified series of MFS Series Trust I (the trust). The trust is organized as a Massachusetts business trust and is registered under the Investment Company Act of 1940, as amended, as anopen-end management investment company.
The fund is an investment company and accordingly follows the investment company accounting and reporting guidance of the Financial Accounting Standards Board (FASB) Accounting Standards Codification Topic 946 Financial Services – Investment Companies.
(2) Significant Accounting Policies
General– The preparation of financial statements in conformity with U.S. generally accepted accounting principles requires management to make estimates and assumptions that affect the reported amounts of assets and liabilities, and disclosure of contingent assets and liabilities at the date of the financial statements and the reported amounts of increases and decreases in net assets from operations during the reporting period. Actual results could differ from those estimates. In the preparation of these financial statements, management has evaluated subsequent events occurring after the date of the fund’s Statement of Assets and Liabilities through the date that the financial statements were issued. The fund will generally focus on securities of small size companies which may be more volatile than those of larger companies.
In August 2018, the Securities and Exchange Commission (SEC) released its Final Rule on Disclosure Update and Simplification (the “Final Rule”) which is intended to simplify an issuer’s disclosure compliance efforts by removing redundant or outdated disclosure requirements without significantly altering the mix of information provided to investors. Effective with the current reporting period, the fund adopted the Final Rule with the impacts being that the fund is no longer required to present the components of distributable earnings on the Statement of Assets and Liabilities or the sources of distributions to shareholders and the amount of undistributed net investment income on the Statements of Changes in Net Assets.
Balance Sheet Offsetting– The fund’s accounting policy with respect to balance sheet offsetting is that, absent an event of default by the counterparty or a termination of the agreement, the International Swaps and Derivatives Association (ISDA) Master Agreement, or similar agreement, does not result in an offset of reported amounts of financial assets and financial liabilities in the Statement of Assets and Liabilities across transactions between the fund and the applicable counterparty. The fund’s right to setoff may be restricted or prohibited by the bankruptcy or insolvency laws of the particular jurisdiction to which a specific master netting agreement counterparty is subject. Balance sheet offsetting disclosures, to the extent applicable to the fund, have been included in the fund’s Significant Accounting Policies note under the captions for each of the fund’sin-scope financial instruments and transactions.
Investment Valuations– Equity securities, including restricted equity securities, are generally valued at the last sale or official closing price on their primary market or exchange as provided by a third-party pricing service. Equity securities, for which there
21
Notes to Financial Statements (unaudited) – continued
were no sales reported that day, are generally valued at the last quoted daily bid quotation on their primary market or exchange as provided by a third-party pricing service. Short-term instruments with a maturity at issuance of 60 days or less may be valued at amortized cost, which approximates market value.Open-end investment companies are generally valued at net asset value per share. Securities and other assets generally valued on the basis of information from a third-party pricing service may also be valued at a broker/dealer bid quotation. In determining values, third-party pricing services can utilize both transaction data and market information such as yield, quality, coupon rate, maturity, type of issue, trading characteristics, and other market data. The values of foreign securities and other assets and liabilities expressed in foreign currencies are converted to U.S. dollars using the mean of bid and asked prices for rates provided by a third-party pricing service.
The Board of Trustees has delegated primary responsibility for determining or causing to be determined the value of the fund’s investments (including any fair valuation) to the adviser pursuant to valuation policies and procedures approved by the Board. If the adviser determines that reliable market quotations are not readily available, investments are valued at fair value as determined in good faith by the adviser in accordance with such procedures under the oversight of the Board of Trustees. Under the fund’s valuation policies and procedures, market quotations are not considered to be readily available for most types of debt instruments and floating rate loans and many types of derivatives. These investments are generally valued at fair value based on information from third-party pricing services. In addition, investments may be valued at fair value if the adviser determines that an investment’s value has been materially affected by events occurring after the close of the exchange or market on which the investment is principally traded (such as foreign exchange or market) and prior to the determination of the fund’s net asset value, or after the halting of trading of a specific security where trading does not resume prior to the close of the exchange or market on which the security is principally traded. Events that occur on a frequent basis after foreign markets close (such as developments in foreign markets and significant movements in the U.S. markets) and prior to the determination of the fund’s net asset value may be deemed to have a material effect on the value of securities traded in foreign markets. Accordingly, the fund’s foreign equity securities may often be valued at fair value. The adviser generally relies on third-party pricing services or other information (such as the correlation with price movements of similar securities in the same or other markets; the type, cost and investment characteristics of the security; the business and financial condition of the issuer; and trading and other market data) to assist in determining whether to fair value and at what value to fair value an investment. The value of an investment for purposes of calculating the fund’s net asset value can differ depending on the source and method used to determine value. When fair valuation is used, the value of an investment used to determine the fund’s net asset value may differ from quoted or published prices for the same investment. There can be no assurance that the fund could obtain the fair value assigned to an investment if it were to sell the investment at the same time at which the fund determines its net asset value per share.
Various inputs are used in determining the value of the fund’s assets or liabilities. These inputs are categorized into three broad levels. In certain cases, the inputs used to measure fair value may fall into different levels of the fair value hierarchy. In such cases,
22
Notes to Financial Statements (unaudited) – continued
an investment’s level within the fair value hierarchy is based on the lowest level of input that is significant to the fair value measurement. The fund’s assessment of the significance of a particular input to the fair value measurement in its entirety requires judgment, and considers factors specific to the investment. Level 1 includes unadjusted quoted prices in active markets for identical assets or liabilities. Level 2 includes other significant observable market-based inputs (including quoted prices for similar securities, interest rates, prepayment speed, and credit risk). Level 3 includes unobservable inputs, which may include the adviser’s own assumptions in determining the fair value of investments. The following is a summary of the levels used as of February 28, 2019 in valuing the fund’s assets or liabilities:
| | | | | | | | | | | | | | | | |
| | | | |
| Financial Instruments | | Level 1 | | | Level 2 | | | Level 3 | | | Total | |
| Equity Securities | | | $1,289,926,159 | | | | $— | | | | $— | | | | $1,289,926,159 | |
| Mutual Funds | | | 49,172,729 | | | | — | | | | — | | | | 49,172,729 | |
| Total | | | $1,339,098,888 | | | | $— | | | | $— | | | | $1,339,098,888 | |
For further information regarding security characteristics, see the Portfolio of Investments.
Foreign Currency Translation– Purchases and sales of foreign investments, income, and expenses are converted into U.S. dollars based upon currency exchange rates prevailing on the respective dates of such transactions or on the reporting date for foreign denominated receivables and payables. Gains and losses attributable to foreign currency exchange rates on sales of securities are recorded for financial statement purposes as net realized gains and losses on investments. Gains and losses attributable to foreign exchange rate movements on receivables, payables, income and expenses are recorded for financial statement purposes as foreign currency transaction gains and losses. That portion of both realized and unrealized gains and losses on investments that results from fluctuations in foreign currency exchange rates is not separately disclosed.
Security Loans– Under its Securities Lending Agency Agreement with the fund, State Street Bank and Trust Company, as lending agent, loans the securities of the fund to certain qualified institutions (the “Borrowers”) approved by the fund. Security loans can be terminated at the discretion of either the lending agent or the fund and the related securities must be returned within the earlier of the standard trade settlement period for such securities or within three business days. The loans are collateralized by cash and/or U.S. Treasury and federal agency obligations in an amount typically at least equal to the market value of the securities loaned. On loans collateralized by cash, the cash collateral is invested in a money market fund. The market value of the loaned securities is determined at the close of business of the fund and any additional required collateral is delivered to the fund on the next business day. The lending agent provides the fund with indemnification against Borrower default. In the event of Borrower default, the lending agent will, for the benefit of the fund, either purchase securities identical to those loaned or, when such purchase is commercially impracticable, pay the fund the market value of the loaned securities. In return, the lending agent assumes the fund’s rights to the related collateral. If the collateral value is less than the cost to purchase identical securities, the lending agent is responsible for the shortfall, but only to the extent that such shortfall is not due to a decline in collateral value resulting from
23
Notes to Financial Statements (unaudited) – continued
collateral reinvestment for which the fund bears the risk of loss. At period end, the fund had investment securities on loan, all of which were classified as equity securities in the fund’s Portfolio of Investments, with a fair value of $18,296,626. The fair value of the fund’s investment securities on loan and a related liability of $7,390,332 for cash collateral received on securities loaned are both presented gross in the Statement of Assets and Liabilities. Additionally, these loans were collateralized by U.S. Treasury Obligations of $12,081,231 held by the lending agent. The collateral on securities loaned exceeded the value of securities on loan at period end. The liability for cash collateral for securities loaned is carried at fair value, which is categorized as level 2 within the fair value hierarchy. A portion of the income generated upon investment of the collateral is remitted to the Borrowers, and the remainder is allocated between the fund and the lending agent. On loans collateralized by U.S. Treasury and/or federal agency obligations, a fee is received from the Borrower, and is allocated between the fund and the lending agent. Income from securities lending is separately reported in the Statement of Operations. The dividend and interest income earned on the securities loaned is accounted for in the same manner as other dividend and interest income.
Indemnifications– Under the fund’s organizational documents, its officers and Trustees may be indemnified against certain liabilities and expenses arising out of the performance of their duties to the fund. Additionally, in the normal course of business, the fund enters into agreements with service providers that may contain indemnification clauses. The fund’s maximum exposure under these agreements is unknown as this would involve future claims that may be made against the fund that have not yet occurred.
Investment Transactions and Income– Investment transactions are recorded on the trade date. Dividends received in cash are recorded on theex-dividend date. Certain dividends from foreign securities will be recorded when the fund is informed of the dividend if such information is obtained subsequent to theex-dividend date. Dividend payments received in additional securities are recorded on theex-dividend date in an amount equal to the value of the security on such date.
The fund may receive proceeds from litigation settlements. Any proceeds received from litigation involving portfolio holdings are reflected in the Statement of Operations in realized gain/loss if the security has been disposed of by the fund or in unrealized gain/loss if the security is still held by the fund. Any other proceeds from litigation not related to portfolio holdings are reflected as other income in the Statement of Operations.
Tax Matters and Distributions– The fund intends to qualify as a regulated investment company, as defined under Subchapter M of the Internal Revenue Code, and to distribute all of its taxable income, including realized capital gains. As a result, no provision for federal income tax is required. The fund’s federal tax returns, when filed, will remain subject to examination by the Internal Revenue Service for a three year period. Management has analyzed the fund’s tax positions taken on federal and state tax returns for all open tax years and does not believe that there are any uncertain tax positions that require recognition of a tax liability. Foreign taxes, if any, have been accrued by the fund in the accompanying financial statements in accordance with the applicable foreign tax law. Foreign income taxes may be withheld by certain
24
Notes to Financial Statements (unaudited) – continued
countries in which the fund invests. Additionally, capital gains realized by the fund on securities issued in or by certain foreign countries may be subject to capital gains tax imposed by those countries.
Distributions to shareholders are recorded on theex-dividend date. Income and capital gain distributions are determined in accordance with income tax regulations, which may differ from U.S. generally accepted accounting principles. Certain capital accounts in the financial statements are periodically adjusted for permanent differences in order to reflect their tax character. These adjustments have no impact on net assets or net asset value per share. Temporary differences which arise from recognizing certain items of income, expense, gain or loss in different periods for financial statement and tax purposes will reverse at some time in the future. Distributions in excess of net investment income or net realized gains are temporary overdistributions for financial statement purposes resulting from differences in the recognition or classification of income or distributions for financial statement and tax purposes.
Book/tax differences primarily relate to wash sale loss deferrals and treating a portion of the proceeds from redemptions as a distribution for tax purposes.
The tax character of distributions made during the current period will be determined at fiscal year end. The tax character of distributions declared to shareholders for the last fiscal year is as follows:
| | | | |
| |
| | | Year ended
8/31/18 | |
Ordinary income (including any
short-term capital gains) | | | $33,500,079 | |
| Long-term capital gains | | | 77,287,247 | |
| |
| Total distributions | | | $110,787,326 | |
The federal tax cost and the tax basis components of distributable earnings were as follows:
| | | | |
| |
| As of 2/28/19 | | | |
| |
| Cost of investments | | | $1,082,345,143 | |
| Gross appreciation | | | 317,119,840 | |
| |
| Gross depreciation | | | (60,366,095 | ) |
| Net unrealized appreciation (depreciation) | | | $256,753,745 | |
| |
| As of 8/31/18 | | | |
| |
| Undistributed ordinary income | | | 67,686,679 | |
| Undistributed long-term capital gain | | | 111,567,716 | |
| Other temporary differences | | | (1,763 | ) |
| Net unrealized appreciation (depreciation) | | | 349,224,960 | |
The aggregate cost above includes prior fiscal year end tax adjustments, if applicable.
Multiple Classes of Shares of Beneficial Interest– The fund offers multiple classes of shares, which differ in their respective distribution and service fees. The fund’s income, realized and unrealized gain (loss), and common expenses are allocated to shareholders based on the daily net assets of each class. Dividends are declared
25
Notes to Financial Statements (unaudited) – continued
separately for each class. Differences in per share dividend rates are generally due to differences in separate class expenses. Class B shares will convert to Class A shares approximately eight years after purchase. Class C shares will convert to Class A shares approximately ten years after purchase. The fund’s distributions declared to shareholders as reported in the Statements of Changes in Net Assets are presented by class as follows:
| | | | | | | | |
| | | From net realized
gain | |
| | |
| | | Six months
ended
2/28/19 | | | Year
ended
8/31/18 | |
| Class A | | | $88,854,670 | | | | $37,646,733 | |
| Class B | | | 4,829,407 | | | | 2,381,568 | |
| Class C | | | 13,810,640 | | | | 9,115,914 | |
| Class I | | | 26,484,311 | | | | 10,159,237 | |
| Class R1 | | | 1,085,473 | | | | 533,248 | |
| Class R2 | | | 6,518,565 | | | | 3,004,285 | |
| Class R3 | | | 8,385,161 | | | | 4,128,606 | |
| Class R4 | | | 1,643,025 | | | | 7,995,727 | |
| Class R6 | | | 78,838,780 | | | | 34,950,101 | |
| Class 529A | | | — | | | | 634,438 | |
| Class 529B | | | — | | | | 39,739 | |
| Class 529C | | | — | | | | 197,730 | |
| Total | | | $230,450,032 | | | | $110,787,326 | |
Effective March 15, 2018, all Class 529A, Class 529B, and Class 529C shares were redeemed, and these share classes were terminated effective April 27, 2018.
(3) Transactions with Affiliates
Investment Adviser– The fund has an investment advisory agreement with MFS to provide overall investment management and related administrative services and facilities to the fund. The management fee is computed daily and paid monthly at the following annual rates based on the fund’s average daily net assets:
| | | | |
| Up to $1 billion | | | 0.90 | % |
| In excess of $1 billion and up to $2.5 billion | | | 0.80 | % |
| In excess of $2.5 billion and up to $5 billion | | | 0.75 | % |
| In excess of $5 billion | | | 0.70 | % |
MFS has agreed in writing to reduce its management fee by a specified amount if certain MFS mutual fund assets exceed thresholds agreed to by MFS and the fund’s Board of Trustees. For the six months ended February 28, 2019, this management fee reduction amounted to $60,807, which is included in the reduction of total expenses in the Statement of Operations. The management fee incurred for the six months ended February 28, 2019 was equivalent to an annual effective rate of 0.87% of the fund’s average daily net assets.
Distributor– MFS Fund Distributors, Inc. (MFD), a wholly-owned subsidiary of MFS, as distributor, received $97,901 for the six months ended February 28, 2019, as its portion of the initial sales charge on sales of Class A shares of the fund.
26
Notes to Financial Statements (unaudited) – continued
The Board of Trustees has adopted a distribution plan for certain share classes pursuant to Rule12b-1 of the Investment Company Act of 1940.
The fund’s distribution plan provides that the fund will pay MFD for services provided by MFD and financial intermediaries in connection with the distribution and servicing of certain share classes. One component of the plan is a distribution fee paid to MFD and another component of the plan is a service fee paid to MFD. MFD may subsequently pay all, or a portion, of the distribution and/or service fees to financial intermediaries.
Distribution Plan Fee Table:
| | | | | | | | | | | | | | | | | | | | |
| | | | | |
| | | Distribution
Fee Rate (d) | | | Service
Fee Rate (d) | | | Total
Distribution
Plan (d) | | | Annual
Effective
Rate (e) | | | Distribution
and Service
Fee | |
| Class A | | | — | | | | 0.25% | | | | 0.25% | | | | 0.24% | | | | $583,145 | |
| Class B | | | 0.75% | | | | 0.25% | | | | 1.00% | | | | 1.00% | | | | 100,413 | |
| Class C | | | 0.75% | | | | 0.25% | | | | 1.00% | | | | 1.00% | | | | 291,424 | |
| Class R1 | | | 0.75% | | | | 0.25% | | | | 1.00% | | | | 1.00% | | | | 23,022 | |
| Class R2 | | | 0.25% | | | | 0.25% | | | | 0.50% | | | | 0.50% | | | | 79,992 | |
| Class R3 | | | — | | | | 0.25% | | | | 0.25% | | | | 0.25% | | | | 55,857 | |
| Total Distribution and Service Fees | | | | | | | | | | | | | | | | $1,133,853 | |
| (d) | In accordance with the distribution plan for certain classes, the fund pays distribution and/or service fees equal to these annual percentage rates of each class’s average daily net assets. The distribution and service fee rates disclosed by class represent the current rates in effect at the end of the reporting period. Any rate changes, if applicable, are detailed below. |
| (e) | The annual effective rates represent actual fees incurred under the distribution plan for the six months ended February 28, 2019 based on each class’s average daily net assets. MFD has voluntarily agreed to rebate a portion of each class’s 0.25% service fee attributable to accounts for which MFD retains the 0.25% service fee except for accounts attributable to MFS or its affiliates’ seed money. For the six months ended February 28, 2019, this rebate amounted to $13,708, $389, $94, and $139 for Class A, Class B, Class C, and Class R2, respectively, and is included in the reduction of total expenses in the Statement of Operations. |
Certain Class A shares are subject to a contingent deferred sales charge (CDSC) in the event of a shareholder redemption within 18 months of purchase. Class B shares are subject to a CDSC in the event of a shareholder redemption within six years of purchase. Class C shares are subject to a CDSC in the event of a shareholder redemption within 12 months of purchase. All contingent deferred sales charges are paid to MFD and during the six months ended February 28, 2019, were as follows:
| | | | |
| |
| | | Amount | |
| Class A | | | $4,069 | |
| Class B | | | 6,540 | |
| Class C | | | 1,720 | |
Shareholder Servicing Agent– MFS Service Center, Inc. (MFSC), a wholly-owned subsidiary of MFS, receives a fee from the fund for its services as shareholder servicing agent calculated as a percentage of the average daily net assets of the fund as determined periodically under the supervision of the fund’s Board of Trustees. For the six months ended February 28, 2019, the fee was $80,609, which equated to 0.0131% annually of the fund’s average daily net assets. MFSC also receives payment from the fund forout-of-pocket expenses,sub-accounting and other shareholder
27
Notes to Financial Statements (unaudited) – continued
servicing costs which may be paid to affiliated and unaffiliated service providers. Class R6 shares do not incursub-accounting fees. For the six months ended February 28, 2019, theseout-of-pocket expenses,sub-accounting and other shareholder servicing costs amounted to $456,863.
Administrator– MFS provides certain financial, legal, shareholder communications, compliance, and other administrative services to the fund. Under an administrative services agreement, the fund reimburses MFS the costs incurred to provide these services. The fund is charged an annual fixed amount of $17,500 plus a fee based on average daily net assets. The administrative services fee incurred for the six months ended February 28, 2019 was equivalent to an annual effective rate of 0.0141% of the fund’s average daily net assets.
Trustees’ and Officers’ Compensation– The fund pays compensation to independent Trustees in the form of a retainer, attendance fees, and additional compensation to Board and Committee chairpersons. The fund does not pay compensation directly to Trustees or officers of the fund who are also officers of the investment adviser, all of whom receive remuneration for their services to the fund from MFS. Certain officers and Trustees of the fund are officers or directors of MFS, MFD, and MFSC.
Prior to December 31, 2001, the fund had an unfunded defined benefit plan (“DB plan”) for independent Trustees. As of December 31, 2001, the Board took action to terminate the DB plan with respect to then-current and any future independent Trustees, such that the DB plan covers only certain of those former independent Trustees who retired on or before December 31, 2001. The DB plan resulted in a pension expense of $370 and is included in “Independent Trustees’ compensation” in the Statement of Operations for the six months ended February 28, 2019. The liability for deferred retirement benefits payable to those former independent Trustees under the DB plan amounted to $1,478 at February 28, 2019, and is included in “Payable for independent Trustees’ compensation” in the Statement of Assets and Liabilities.
Other– This fund and certain other funds managed by MFS (the funds) have entered into a service agreement (the ISO Agreement) which provides for payment of fees solely by the funds to Tarantino LLC in return for the provision of services of an Independent Senior Officer (ISO) for the funds. Frank L. Tarantino serves as the ISO and is an officer of the funds and the sole member of Tarantino LLC. The funds can terminate the ISO Agreement with Tarantino LLC at any time under the terms of the ISO Agreement. For the six months ended February 28, 2019, the fee paid by the fund under this agreement was $1,083 and is included in “Miscellaneous” expense in the Statement of Operations. MFS has agreed to bear all expenses associated with office space, other administrative support, and supplies provided to the ISO.
The fund invests in the MFS Institutional Money Market Portfolio which is managed by MFS and seeks current income consistent with preservation of capital and liquidity. This money market fund does not pay a management fee to MFS.
On September 20, 2017, MFS purchased 206 shares of Class I for an aggregate amount of $6,234. On March 15, 2018, MFS redeemed 5 shares of Class 529A and 3 shares of Class 529C for an aggregate amount of $225.
28
Notes to Financial Statements (unaudited) – continued
The fund is permitted to engage in purchase and sale transactions with funds and accounts for which MFS serves as investment adviser orsub-adviser (“cross-trades”) pursuant to a policy adopted by the Board of Trustees. This policy has been designed to ensure that cross-trades conducted by the fund comply with Rule17a-7 under the Investment Company Act of 1940. During the six months ended February 28, 2019, the fund engaged in purchase and sale transactions pursuant to this policy, which amounted to $66,250 and $1,178,732, respectively. The sales transactions resulted in net realized gains (losses) of $196,431.
The adviser has voluntarily undertaken to reimburse the fund from its own resources on a quarterly basis for the cost of investment research embedded in the cost of the fund’s securities trades. This agreement may be rescinded at any time. For the six months ended February 28, 2019, this reimbursement amounted to $54,379, which is included in “Other” income in the Statement of Operations.
(4) Portfolio Securities
For the six months ended February 28, 2019, purchases and sales of investments, other than short-term obligations, aggregated $441,606,098 and $439,482,330, respectively.
(5) Shares of Beneficial Interest
The fund’s Declaration of Trust permits the Trustees to issue an unlimited number of full and fractional shares of beneficial interest. Transactions in fund shares were as follows:
| | | | | | | | | | | | | | | | |
| | | Six months ended
2/28/19 | | | Year ended
8/31/18 | |
| | | | |
| | | Shares | | | Amount | | | Shares | | | Amount | |
| Shares sold | | | | | | | | | | | | | | | | |
Class A | | | 2,063,651 | | | | $54,138,142 | | | | 3,389,604 | | | | $100,467,972 | |
Class B | | | 82,103 | | | | 1,706,439 | | | | 90,601 | | | | 2,186,645 | |
Class C | | | 320,594 | | | | 6,323,281 | | | | 357,900 | | | | 8,620,852 | |
Class I | | | 1,106,020 | | | | 32,751,382 | | | | 2,247,120 | | | | 73,044,188 | |
Class R1 | | | 24,179 | | | | 520,832 | | | | 38,681 | | | | 921,436 | |
Class R2 | | | 167,256 | | | | 4,081,640 | | | | 290,264 | | | | 8,099,954 | |
Class R3 | | | 221,789 | | | | 5,845,289 | | | | 348,471 | | | | 10,380,772 | |
Class R4 | | | 51,290 | | | | 1,418,653 | | | | 261,111 | | | | 7,820,768 | |
Class R6 | | | 2,704,077 | | | | 81,362,326 | | | | 2,345,137 | | | | 76,446,348 | |
Class 529A | | | — | | | | — | | | | 22,321 | | | | 605,974 | |
Class 529B | | | — | | | | — | | | | 1,000 | | | | 21,980 | |
Class 529C | | | — | | | | — | | | | 2,215 | | | | 49,439 | |
| | | 6,740,959 | | | | $188,147,984 | | | | 9,394,425 | | | | $288,666,328 | |
29
Notes to Financial Statements (unaudited) – continued
| | | | | | | | | | | | | | | | |
| | | Six months ended
2/28/19 | | | Year ended
8/31/18 | |
| | | | |
| | | Shares | | | Amount | | | Shares | | | Amount | |
Shares issued to shareholders in
reinvestment of distributions | | | | | | | | | | | | | | | | |
Class A | | | 3,869,394 | | | | $86,751,808 | | | | 1,371,460 | | | | $36,549,397 | |
Class B | | | 272,250 | | | | 4,614,640 | | | | 104,219 | | | | 2,252,175 | |
Class C | | | 703,090 | | | | 11,952,526 | | | | 375,674 | | | | 8,137,106 | |
Class I | | | 930,538 | | | | 23,644,963 | | | | 300,810 | | | | 8,849,833 | |
Class R1 | | | 64,689 | | | | 1,085,473 | | | | 24,860 | | | | 533,248 | |
Class R2 | | | 284,154 | | | | 5,887,667 | | | | 106,349 | | | | 2,669,351 | |
Class R3 | | | 374,505 | | | | 8,385,161 | | | | 155,094 | | | | 4,128,606 | |
Class R4 | | | 68,717 | | | | 1,643,025 | | | | 285,766 | | | | 7,995,727 | |
Class R6 | | | 2,885,648 | | | | 74,103,434 | | | | 1,114,183 | | | | 33,035,531 | |
Class 529A | | | — | | | | — | | | | 24,629 | | | | 634,438 | |
Class 529B | | | — | | | | — | | | | 1,907 | | | | 39,739 | |
Class 529C | | | — | | | | — | | | | 9,493 | | | | 197,730 | |
| | | 9,452,985 | | | | $218,068,697 | | | | 3,874,444 | | | | $105,022,881 | |
| | | | |
| Shares reacquired | | | | | | | | | | | | | | | | |
Class A | | | (2,413,216 | ) | | | $(60,732,104 | ) | | | (3,454,451 | ) | | | $(99,851,899 | ) |
Class B | | | (180,722 | ) | | | (3,480,528 | ) | | | (211,885 | ) | | | (5,017,707 | ) |
Class C | | | (546,747 | ) | | | (11,084,379 | ) | | | (1,531,753 | ) | | | (36,294,111 | ) |
Class I | | | (1,998,870 | ) | | | (55,527,023 | ) | | | (1,214,737 | ) | | | (39,308,831 | ) |
Class R1 | | | (33,541 | ) | | | (713,114 | ) | | | (57,620 | ) | | | (1,354,392 | ) |
Class R2 | | | (205,771 | ) | | | (4,797,871 | ) | | | (364,708 | ) | | | (10,084,972 | ) |
Class R3 | | | (235,308 | ) | | | (6,328,794 | ) | | | (527,813 | ) | | | (15,387,872 | ) |
Class R4 | | | (53,688 | ) | | | (1,568,502 | ) | | | (3,165,421 | ) | | | (91,120,045 | ) |
Class R6 | | | (1,306,227 | ) | | | (38,393,974 | ) | | | (3,435,661 | ) | | | (111,773,314 | ) |
Class 529A | | | — | | | | — | | | | (270,125 | ) | | | (7,574,319 | ) |
Class 529B | | | — | | | | — | | | | (17,737 | ) | | | (403,021 | ) |
Class 529C | | | — | | | | — | | | | (84,478 | ) | | | (1,912,946 | ) |
| | | (6,974,090 | ) | | | $(182,626,289 | ) | | | (14,336,389 | ) | | | $(420,083,429 | ) |
| | | | |
| Net change | | | | | | | | | | | | | | | | |
Class A | | | 3,519,829 | | | | $80,157,846 | | | | 1,306,613 | | | | $37,165,470 | |
Class B | | | 173,631 | | | | 2,840,551 | | | | (17,065 | ) | | | (578,887 | ) |
Class C | | | 476,937 | | | | 7,191,428 | | | | (798,179 | ) | | | (19,536,153 | ) |
Class I | | | 37,688 | | | | 869,322 | | | | 1,333,193 | | | | 42,585,190 | |
Class R1 | | | 55,327 | | | | 893,191 | | | | 5,921 | | | | 100,292 | |
Class R2 | | | 245,639 | | | | 5,171,436 | | | | 31,905 | | | | 684,333 | |
Class R3 | | | 360,986 | | | | 7,901,656 | | | | (24,248 | ) | | | (878,494 | ) |
Class R4 | | | 66,319 | | | | 1,493,176 | | | | (2,618,544 | ) | | | (75,303,550 | ) |
Class R6 | | | 4,283,498 | | | | 117,071,786 | | | | 23,659 | | | | (2,291,435 | ) |
Class 529A | | | — | | | | — | | | | (223,175 | ) | | | (6,333,907 | ) |
Class 529B | | | — | | | | — | | | | (14,830 | ) | | | (341,302 | ) |
Class 529C | | | — | | | | — | | | | (72,770 | ) | | | (1,665,777 | ) |
| | | 9,219,854 | | | | $223,590,392 | | | | (1,067,520 | ) | | | $(26,394,220 | ) |
30
Notes to Financial Statements (unaudited) – continued
Effective March 15, 2018, all Class 529A, Class 529B, and Class 529C shares were redeemed, and these share classes were terminated effective April 27, 2018.
Class T shares were not publicly available for sale during the period. Please see the fund’s prospectus for details.
Effective June 1, 2019, purchases of the fund’s Class B shares are closed to new and existing investors subject to certain exceptions. Please see the fund’s prospectus for details.
The fund is one of several mutual funds in which certain MFS funds may invest. The MFS funds do not invest in the underlying funds for the purpose of exercising management or control. At the end of the period, the MFS Growth Allocation Fund, the MFS Moderate Allocation Fund, the MFS Aggressive Growth Allocation Fund, and the MFS Conservative Allocation Fund were the owners of record of approximately 7%, 6%, 3%, and 2%, respectively, of the value of outstanding voting shares of the fund. In addition, the MFS Lifetime 2020 Fund, the MFS Lifetime 2025 Fund, the MFS Lifetime 2030 Fund, the MFS Lifetime 2035 Fund, the MFS Lifetime 2040 Fund, the MFS Lifetime 2045 Fund, the MFS Lifetime 2050 Fund, the MFS Lifetime 2055 Fund, the MFS Lifetime 2060 Fund, and the MFS Lifetime Income Fund were each the owners of record of less than 1% of the value of outstanding voting shares of the fund.
(6) Line of Credit
The fund and certain other funds managed by MFS participate in a $1.25 billion unsecured committed line of credit, subject to a $1 billion sublimit, provided by a syndication of banks under a credit agreement. Borrowings may be made for temporary financing needs. Interest is charged to each fund, based on its borrowings, generally at a rate equal to the higher of the Overnight Bank Funding rate or daily one month LIBOR plus an agreed upon spread. A commitment fee, based on the average daily, unused portion of the committed line of credit, is allocated among the participating funds. In addition, the fund and other funds managed by MFS have established unsecured uncommitted borrowing arrangements with certain banks for temporary financing needs. Interest is charged to each fund, based on its borrowings, at a rate equal to the Overnight Bank Funding rate plus an agreed upon spread. For the six months ended February 28, 2019, the fund’s commitment fee and interest expense were $3,802 and $0, respectively, and are included in “Miscellaneous” expense in the Statement of Operations.
31
Notes to Financial Statements (unaudited) – continued
(7) Investments in Affiliated Issuers
An affiliated issuer may be considered one in which the fund owns 5% or more of the outstanding voting securities, or a company which is under common control. For the purposes of this report, the fund assumes the following to be affiliated issuers:
| | | | | | | | | | | | | | | | | | |
| | | | | |
| Affiliated Issuers | | | | Beginning
Shares/Par
Amount | | | Acquisitions
Shares/Par
Amount | | | Dispositions
Shares/Par
Amount | | | Ending
Shares/Par
Amount | |
| MFS Institutional Money Market Portfolio | | | | | 51,685,542 | | | | 180,159,189 | | | | (190,062,334 | ) | | | 41,782,397 | |
| | | | | |
| Affiliated Issuers | | Realized Gain (Loss) | | Change in
Unrealized
Appreciation/
Depreciation | | | Capital Gain
Distributions | | | Dividend
Income | | | Ending Value | |
| MFS Institutional Money Market Portfolio | | $1,017 | | | $(1,783 | ) | | | $— | | | | $482,388 | | | | $41,782,397 | |
32
PROXY VOTING POLICIES AND INFORMATION
MFS votes proxies on behalf of the fund pursuant to proxy voting policies and procedures that are available without charge, upon request, by calling1-800-225-2606, by visitingmfs.com/proxyvoting, or by visiting the SEC’s Web site athttp://www.sec.gov.
Information regarding how the fund voted proxies relating to portfolio securities during the most recent twelve-month period ended June 30 is available by August 31 of each year without charge by visitingmfs.com/proxyvoting, or by visiting the SEC’s Web site athttp://www.sec.gov.
QUARTERLY PORTFOLIO DISCLOSURE
The fund files a complete schedule of portfolio holdings with the SEC for the first and third quarters of each fiscal year on Form N-Q. The fund’s Form N-Q is available on the SEC’s website athttp://www.sec.gov.A shareholder can obtain the portfolio holdings report for the first and third quarters of the fund’s fiscal year atmfs.com/openendfundsby choosing the fund’s name and then selecting the “Resources” tab and clicking on “Prospectus and Reports”.
FURTHER INFORMATION
From time to time, MFS may post important information about the fund or the MFS funds on the MFS web site (mfs.com). This information is available athttps://www.mfs.com/en-us/what-we-do/announcements.html or atmfs.com/openendfunds by choosing the fund’s name.
INFORMATION ABOUT FUND CONTRACTS AND LEGAL CLAIMS
The fund has entered into contractual arrangements with an investment adviser, administrator, distributor, shareholder servicing agent, 529 program manager (if applicable), and custodian who each provide services to the fund. Unless expressly stated otherwise, shareholders are not parties to, or intended beneficiaries of these contractual arrangements, and these contractual arrangements are not intended to create any shareholder right to enforce them against the service providers or to seek any remedy under them against the service providers, either directly or on behalf of the fund.
Under the Trust’s By-Laws and Declaration of Trust, any claims asserted against or on behalf of the MFS Funds, including claims against Trustees and Officers, must be brought in state and federal courts located within the Commonwealth of Massachusetts.
PROVISION OF FINANCIAL REPORTS AND SUMMARY PROSPECTUSES
The fund produces financial reports every six months and updates its summary prospectus and prospectus annually. To avoid sending duplicate copies of materials to households, only one copy of the fund’s annual and semiannual report and summary prospectus may be mailed to shareholders having the same last name and residential address on the fund’s records. However, any shareholder may contact MFSC (please see back cover for address and telephone number) to request that copies of these reports and summary prospectuses be sent personally to that shareholder.
33
Save paper with eDelivery.

| MFS® will send you prospectuses, |
reports, and proxies directly viae-mail so you will get information faster with less mailbox clutter.
To sign up:
1. Go to mfs.com.
2. Log in via MFS® Access.
3. Select eDelivery.
If you own your MFS fund shares through a financial institution or a retirement plan, MFS® TALK, MFS® Access, or eDelivery may not be available to you.
CONTACT
WEB SITE
mfs.com
MFS TALK
1-800-637-8255
24 hours a day
ACCOUNT SERVICE AND LITERATURE
Shareholders
1-800-225-2606
Financial advisors
1-800-343-2829
Retirement plan services
1-800-637-1255
MAILING ADDRESS
MFS Service Center, Inc.
P.O. Box 219341
Kansas City, MO 64121-9341
OVERNIGHT MAIL
MFS Service Center, Inc.
Suite 219341
430 W 7th Street
Kansas City, MO 64105-1407
Semiannual Report
February 28, 2019

MFS® Research International Fund

Beginning on January 1, 2021, as permitted by regulations adopted by the U.S. Securities and Exchange Commission, paper copies of the fund’s annual and semiannual shareholder reports will no longer be sent by mail, unless you specifically request paper copies of the reports. Instead, the complete reports will be made available on the fund’s Web site (funds.mfs.com), and you will be notified by mail each time a report is posted and provided with a Web site link to access the report.
If you are already signed up to receive shareholder reports by email, you will not be affected by this change and you need not take any action. You may sign up to receive shareholder reports and other communications from the fund by email by contacting your financial intermediary (such as a broker-dealer or bank) or, if you hold your shares directly with the fund, by calling 1-800-225-2606 or by logging on to MFS Access at mfs.com.
Beginning on January 1, 2019, you may elect to receive all future reports in paper free of charge. Contact your financial intermediary to request that you continue to receive paper copies of your shareholder reports. If you invest directly with the fund, you can call 1-800-225-2606 or send an email request to orderliterature@mfs.com to let the fund know that you wish to continue receiving paper copies of your shareholder reports. Your election to receive reports in paper will apply to all funds held in your account if you invest through your financial intermediary or all funds held with the MFS fund complex if you invest directly.
RIF-SEM
MFS® Research International Fund
CONTENTS
The report is prepared for the general information of shareholders.
It is authorized for distribution to prospective investors only when preceded or accompanied by a current prospectus.
NOT FDIC INSURED• MAY LOSE VALUE• NO BANK GUARANTEE

LETTER FROM THE EXECUTIVE CHAIRMAN
Dear Shareholders:
Markets experienced a bout of volatility in late 2018 as a result of higher interest rates, international trade friction and geopolitical uncertainty surrounding issues such as
Brexit. But concern over those issues dissipated in the early months of 2019 due to a more dovish posture by the U.S. Federal Reserve, progress toward a trade pact between the United States and China, and a consensus forming in the British Parliament against ano-deal Brexit. Over the past year, U.S. equities have outperformed their global peers due in part to fiscal stimulus undertaken in late 2017 and early 2019, which helped maintain healthy levels of U.S. economic output against a backdrop of slowing global growth, though returns, on average, have been modest.
Globally, inflation remains largely subdued thanks in part to stable
oil prices, though tight labor markets are keeping investors on the lookout for its potential reappearance. Rising incomes in many developed and emerging markets are supportive of gains in consumption, though a challenging backdrop for global trade has weighed on manufacturing in most regions. Should the U.S. and China reach a comprehensive trade agreement, sentiment could improve later this year.
As a global investment manager with nearly a century of expertise, MFS® firmly believes active risk management offers downside mitigation and may help improve investment outcomes. We built our active investment platform with this belief in mind. Our long-term perspective influences nearly every aspect of our business, ensuring that our investment decisions align with the investing time horizons of our clients.
Respectfully,

Robert J. Manning
Executive Chairman
MFS Investment Management
April 16, 2019
The opinions expressed in this letter are subject to change and may not be relied upon for investment advice. No forecasts can be guaranteed.
1
PORTFOLIO COMPOSITION
Portfolio structure

| | | | |
| Top ten holdings | |
| Nestle S.A. | | | 3.0% | |
| Roche Holding AG | | | 2.8% | |
| Linde AG | | | 2.2% | |
| AIA Group Ltd. | | | 2.0% | |
| Schneider Electric S.A. | | | 1.9% | |
| Novo Nordisk A.S., “B” | | | 1.8% | |
| LVMH Moet Hennessy Louis Vuitton SE | | | 1.8% | |
| BP PLC | | | 1.6% | |
| Bayer AG | | | 1.6% | |
| UBS AG | | | 1.5% | |
|
| Global equity sectors (k) | |
| Financial Services | | | 22.8% | |
| Capital Goods | | | 22.8% | |
| Health Care | | | 10.8% | |
| Technology | | | 10.5% | |
| Consumer Staples | | | 9.7% | |
| Energy | | | 9.5% | |
| Consumer Cyclicals | | | 8.7% | |
| Telecommunications/Cable Television | | | 4.0% | |
| | | | |
| Issuer country weightings (x) | |
| Japan | | | 17.9% | |
| Switzerland | | | 12.5% | |
| United Kingdom | | | 12.4% | |
| France | | | 10.2% | |
| United States | | | 8.8% | |
| Germany | | | 8.1% | |
| Hong Kong | | | 3.8% | |
| Australia | | | 3.3% | |
| Spain | | | 2.6% | |
| Other Countries | | | 20.4% | |
|
| Currency exposure weightings (y) | |
| Euro | | | 32.0% | |
| Japanese Yen | | | 17.9% | |
| Swiss Franc | | | 12.5% | |
| British Pound Sterling | | | 11.5% | |
| United States Dollar | | | 8.0% | |
| Hong Kong Dollar | | | 4.4% | |
| Australian Dollar | | | 3.3% | |
| Canadian Dollar | | | 2.6% | |
| Danish Krone | | | 1.8% | |
| Other Currencies | | | 6.0% | |
| (k) | The sectors set forth above and the associated portfolio composition are based on MFS’ own custom sector classification methodology. |
| (x) | Represents the portfolio’s exposure to issuer countries as a percentage of a portfolio’s net assets. For purposes of this presentation, United States includes Cash & Cash Equivalents. |
2
Portfolio Composition – continued
| (y) | Represents the portfolio’s exposure to a particular currency as a percentage of a portfolio’s net assets. For purposes of this presentation, United States Dollar includes Cash & Cash Equivalents. |
Cash & Cash Equivalents includes any cash, investments in money market funds, short-term securities, and other assets less liabilities. Please see the Statement of Assets and Liabilities for additional information related to the fund’s cash position and other assets and liabilities.
Percentages are based on net assets as of February 28, 2019.
The portfolio is actively managed and current holdings may be different.
3
EXPENSE TABLE
Fund expenses borne by the shareholders during the period, September 1, 2018 through February 28, 2019
As a shareholder of the fund, you incur two types of costs: (1) transaction costs, including sales charges (loads) on certain purchase or redemption payments, and (2) ongoing costs, including management fees; distribution and service(12b-1) fees; and other fund expenses. This example is intended to help you understand your ongoing costs (in dollars) of investing in the fund and to compare these costs with the ongoing costs of investing in other mutual funds.
The example is based on an investment of $1,000 invested at the beginning of the period and held for the entire period September 1, 2018 through February 28, 2019.
Actual Expenses
The first line for each share class in the following table provides information about actual account values and actual expenses. You may use the information in this line, together with the amount you invested, to estimate the expenses that you paid over the period. Simply divide your account value by $1,000 (for example, an $8,600 account value divided by $1,000 = 8.6), then multiply the result by the number in the first line under the heading entitled “Expenses Paid During Period” to estimate the expenses you paid on your account during this period.
Hypothetical Example for Comparison Purposes
The second line for each share class in the following table provides information about hypothetical account values and hypothetical expenses based on the fund’s actual expense ratio and an assumed rate of return of 5% per year before expenses, which is not the fund’s actual return. The hypothetical account values and expenses may not be used to estimate the actual ending account balance or expenses you paid for the period. You may use this information to compare the ongoing costs of investing in the fund and other funds. To do so, compare this 5% hypothetical example with the 5% hypothetical examples that appear in the shareholder reports of the other funds.
Please note that the expenses shown in the table are meant to highlight your ongoing costs only and do not reflect any transactional costs, such as sales charges (loads). Therefore, the second line for each share class in the table is useful in comparing ongoing costs only, and will not help you determine the relative total costs of owning different funds. In addition, if these transactional costs were included, your costs would have been higher.
4
Expense Table – continued
| | | | | | | | | | | | | | | | | | |
Share
Class | | | | Annualized
Expense
Ratio | | | Beginning
Account Value
9/01/18 | | | Ending
Account Value
2/28/19 | | | Expenses
Paid During
Period (p)
9/01/18-2/28/19 | |
| A | | Actual | | | 1.08% | | | | $1,000.00 | | | | $957.62 | | | | $5.24 | |
| | Hypothetical (h) | | | 1.08% | | | | $1,000.00 | | | | $1,019.44 | | | | $5.41 | |
| B | | Actual | | | 1.83% | | | | $1,000.00 | | | | $953.38 | | | | $8.86 | |
| | Hypothetical (h) | | | 1.83% | | | | $1,000.00 | | | | $1,015.72 | | | | $9.15 | |
| C | | Actual | | | 1.83% | | | | $1,000.00 | | | | $954.08 | | | | $8.87 | |
| | Hypothetical (h) | | | 1.83% | | | | $1,000.00 | | | | $1,015.72 | | | | $9.15 | |
| I | | Actual | | | 0.83% | | | | $1,000.00 | | | | $958.44 | | | | $4.03 | |
| | Hypothetical (h) | | | 0.83% | | | | $1,000.00 | | | | $1,020.68 | | | | $4.16 | |
| R1 | | Actual | �� | | 1.83% | | | | $1,000.00 | | | | $953.68 | | | | $8.86 | |
| | Hypothetical (h) | | | 1.83% | | | | $1,000.00 | | | | $1,015.72 | | | | $9.15 | |
| R2 | | Actual | | | 1.33% | | | | $1,000.00 | | | | $955.93 | | | | $6.45 | |
| | Hypothetical (h) | | | 1.33% | | | | $1,000.00 | | | | $1,018.20 | | | | $6.66 | |
| R3 | | Actual | | | 1.08% | | | | $1,000.00 | | | | $957.32 | | | | $5.24 | |
| | Hypothetical (h) | | | 1.08% | | | | $1,000.00 | | | | $1,019.44 | | | | $5.41 | |
| R4 | | Actual | | | 0.83% | | | | $1,000.00 | | | | $958.30 | | | | $4.03 | |
| | Hypothetical (h) | | | 0.83% | | | | $1,000.00 | | | | $1,020.68 | | | | $4.16 | |
| R6 | | Actual | | | 0.73% | | | | $1,000.00 | | | | $959.14 | | | | $3.55 | |
| | Hypothetical (h) | | | 0.73% | | | | $1,000.00 | | | | $1,021.17 | | | | $3.66 | |
| 529A | | Actual | | | 1.12% | | | | $1,000.00 | | | | $957.11 | | | | $5.43 | |
| | Hypothetical (h) | | | 1.12% | | | | $1,000.00 | | | | $1,019.24 | | | | $5.61 | |
| 529B | | Actual | | | 1.88% | | | | $1,000.00 | | | | $953.46 | | | | $9.11 | |
| | Hypothetical (h) | | | 1.88% | | | | $1,000.00 | | | | $1,015.47 | | | | $9.39 | |
| 529C | | Actual | | | 1.88% | | | | $1,000.00 | | | | $953.25 | | | | $9.10 | |
| | Hypothetical (h) | | | 1.88% | | | | $1,000.00 | | | | $1,015.47 | | | | $9.39 | |
| (h) | 5% class return per year before expenses. |
| (p) | “Expenses Paid During Period” are equal to each class’s annualized expense ratio, as shown above, multiplied by the average account value over the period, multiplied by 181/365 (to reflect theone-half year period). Expenses paid do not include any applicable sales charges (loads). If these transaction costs had been included, your costs would have been higher. |
Notes to Expense Table
Each class with a Rule12b-1 service fee is subject to a rebate of a portion of such fee. Such rebates are included in the expense ratios above. For Class 529A and Class 529C shares, this rebate reduced the expense ratios above by 0.02% and 0.01%, respectively. See Note 3 in the Notes to Financial Statements for additional information.
5
PORTFOLIO OF INVESTMENTS
2/28/19 (unaudited)
The Portfolio of Investments is a complete list of all securities owned by your fund. It is categorized by broad-based asset classes.
| | | | | | | | |
| Common Stocks - 98.8% | | | | | | | | |
| | |
| Issuer | | Shares/Par | | | Value ($) | |
| Airlines - 0.9% | | | | | | | | |
| Aena S.A. | | | 304,818 | | | $ | 54,399,591 | |
| Malaysia Airports Holdings Berhad | | | 10,602,000 | | | | 21,300,465 | |
| | | | | | | | |
| | | | | | | $ | 75,700,056 | |
| Alcoholic Beverages - 0.4% | | | | | | | | |
| Ambev S.A., ADR | | | 7,185,047 | | | $ | 32,548,263 | |
| | |
| Apparel Manufacturers - 2.8% | | | | | | | | |
| Adidas AG | | | 345,744 | | | $ | 84,001,682 | |
| LVMH Moet Hennessy Louis Vuitton SE | | | 417,558 | | | | 143,435,229 | |
| | | | | | | | |
| | | | | | | $ | 227,436,911 | |
| Automotive - 2.1% | | | | | | | | |
| Koito Manufacturing Co. Ltd. | | | 1,456,900 | | | $ | 84,173,830 | |
| USS Co. Ltd. | | | 4,621,500 | | | | 84,083,811 | |
| | | | | | | | |
| | | | | | | $ | 168,257,641 | |
| Brokerage & Asset Managers - 1.6% | | | | | | | | |
| Euronext N.V. (a) | | | 837,329 | | | $ | 51,097,299 | |
| TMX Group Ltd. | | | 1,284,895 | | | | 80,670,257 | |
| | | | | | | | |
| | | | | | | $ | 131,767,556 | |
| Business Services - 2.0% | | | | | | | | |
| Cerved Information Solutions S.p.A. | | | 1,992,727 | | | $ | 18,371,004 | |
| Cognizant Technology Solutions Corp., “A” | | | 1,295,855 | | | | 91,979,788 | |
| Nomura Research Institute Ltd. | | | 1,305,400 | | | | 53,052,187 | |
| | | | | | | | |
| | | | | | | $ | 163,402,979 | |
| Computer Software - 1.2% | | | | | | | | |
| Cadence Design Systems, Inc. (a) | | | 488,989 | | | $ | 27,994,620 | |
| Check Point Software Technologies Ltd. (a) | | | 546,175 | | | | 66,797,203 | |
| | | | | | | | |
| | | | | | | $ | 94,791,823 | |
| Computer Software - Systems - 2.8% | | | | | | | | |
| Amadeus IT Group S.A. | | | 902,994 | | | $ | 67,994,680 | |
| Constellation Software, Inc. | | | 37,953 | | | | 32,409,229 | |
| EPAM Systems, Inc. (a) | | | 515,532 | | | | 83,402,767 | |
| Hitachi Ltd. | | | 1,444,500 | | | | 43,219,015 | |
| | | | | | | | |
| | | | | | | $ | 227,025,691 | |
6
Portfolio of Investments (unaudited) – continued
| | | | | | | | |
| | |
| Issuer | | Shares/Par | | | Value ($) | |
| Common Stocks - continued | | | | | | | | |
| Conglomerates - 0.5% | | | | | | | | |
| Melrose Industries PLC | | | 16,251,642 | | | $ | 37,484,771 | |
| | |
| Construction - 2.0% | | | | | | | | |
| Techtronic Industries Co. Ltd. | | | 12,190,500 | | | $ | 81,453,769 | |
| Toto Ltd. | | | 2,076,400 | | | | 78,518,154 | |
| | | | | | | | |
| | | | | | | $ | 159,971,923 | |
| Consumer Products - 3.0% | | | | | | | | |
| Kao Corp. | | | 813,600 | | | $ | 61,488,058 | |
| L’Oréal | | | 357,644 | | | | 90,269,352 | |
| Reckitt Benckiser Group PLC | | | 1,256,788 | | | | 96,132,449 | |
| | | | | | | | |
| | | | | | | $ | 247,889,859 | |
| Containers - 1.0% | | | | | | | | |
| Brambles Ltd. | | | 9,880,120 | | | $ | 82,419,545 | |
| | |
| Electrical Equipment - 3.0% | | | | | | | | |
| Legrand S.A. | | | 1,274,777 | | | $ | 84,099,670 | |
| Schneider Electric S.A. | | | 2,051,527 | | | | 159,658,626 | |
| | | | | | | | |
| | | | | | | $ | 243,758,296 | |
| Electronics - 2.8% | | | | | | | | |
| Mellanox Technologies Ltd. (a) | | | 549,693 | | | $ | 59,059,016 | |
| Samsung Electronics Co. Ltd. | | | 939,423 | | | | 37,670,470 | |
| Silicon Motion Technology Corp., ADR | | | 550,186 | | | | 22,601,641 | |
| Taiwan Semiconductor Manufacturing Co. Ltd. | | | 14,676,326 | | | | 113,971,436 | |
| | | | | | | | |
| | | | | | | $ | 233,302,563 | |
| Energy - Independent - 1.7% | | | | | | | | |
| Cairn Energy PLC (a) | | | 15,527,686 | | | $ | 41,808,136 | |
| Caltex Australia Ltd. | | | 2,588,850 | | | | 52,521,073 | |
| Oil Search Ltd. | | | 6,989,182 | | | | 41,496,597 | |
| | | | | | | | |
| | | | | | | $ | 135,825,806 | |
| Energy - Integrated - 3.4% | | | | | | | | |
| BP PLC | | | 18,633,658 | | | $ | 132,075,602 | |
| Eni S.p.A. | | | 4,313,179 | | | | 74,404,742 | |
| Galp Energia SGPS S.A., “B” | | | 4,554,985 | | | | 74,762,766 | |
| | | | | | | | |
| | | | | | | $ | 281,243,110 | |
| Food & Beverages - 4.0% | | | | | | | | |
| Danone S.A. | | | 1,165,322 | | | $ | 87,920,069 | |
| Nestle S.A. | | | 2,692,817 | | | | 243,798,351 | |
| | | | | | | | |
| | | | | | | $ | 331,718,420 | |
7
Portfolio of Investments (unaudited) – continued
| | | | | | | | |
| | |
| Issuer | | Shares/Par | | | Value ($) | |
| Common Stocks - continued | | | | | | | | |
| Food & Drug Stores - 1.7% | | | | | | | | |
| Sundrug Co. Ltd. | | | 2,117,300 | | | $ | 64,773,633 | |
| Tesco PLC | | | 23,915,080 | | | | 71,686,654 | |
| | | | | | | | |
| | | | | | | $ | 136,460,287 | |
| Gaming & Lodging - 0.4% | | | | | | | | |
| Paddy Power Betfair PLC | | | 433,946 | | | $ | 34,706,517 | |
| | |
| Insurance - 6.1% | | | | | | | | |
| AIA Group Ltd. | | | 16,408,400 | | | $ | 164,089,226 | |
| Aon PLC | | | 706,861 | | | | 121,247,867 | |
| Hiscox Ltd. | | | 3,607,358 | | | | 76,506,043 | |
| Swiss Re Ltd. | | | 548,742 | | | | 54,332,633 | |
| Zurich Insurance Group AG | | | 260,534 | | | | 86,144,201 | |
| | | | | | | | |
| | | | | | | $ | 502,319,970 | |
| Internet - 1.2% | | | | | | | | |
| NAVER Corp. | | | 441,882 | | | $ | 52,254,207 | |
| Scout24 AG | | | 858,686 | | | | 45,221,759 | |
| | | | | | | | |
| | | | | | | $ | 97,475,966 | |
| Machinery & Tools - 4.6% | | | | | | | | |
| Daikin Industries Ltd. | | | 1,000,200 | | | $ | 108,486,233 | |
| GEA Group AG | | | 2,091,779 | | | | 50,131,698 | |
| Kubota Corp. | | | 6,322,100 | | | | 85,219,174 | |
| Ritchie Bros. Auctioneers, Inc. | | | 1,270,380 | | | | 47,052,184 | |
| Schindler Holding AG | | | 366,317 | | | | 82,802,580 | |
| | | | | | | | |
| | | | | | | $ | 373,691,869 | |
| Major Banks - 5.0% | | | | | | | | |
| Bankia S.A. | | | 3,430,268 | | | $ | 10,476,215 | |
| Barclays PLC | | | 35,463,525 | | | | 77,215,996 | |
| BNP Paribas | | | 2,255,116 | | | | 115,569,693 | |
| Mitsubishi UFJ Financial Group, Inc. | | | 16,465,200 | | | | 85,188,004 | |
| UBS AG | | | 9,759,237 | | | | 124,184,470 | |
| | | | | | | | |
| | | | | | | $ | 412,634,378 | |
| Medical & Health Technology & Services - 0.5% | | | | | | | | |
| Sonic Healthcare Ltd. | | | 2,620,751 | | | $ | 44,839,807 | |
| | |
| Medical Equipment - 2.7% | | | | | | | | |
| EssilorLuxottica | | | 852,958 | | | $ | 103,277,423 | |
| Terumo Corp. | | | 1,915,200 | | | | 117,181,752 | |
| | | | | | | | |
| | | | | | | $ | 220,459,175 | |
8
Portfolio of Investments (unaudited) – continued
| | | | | | | | |
| | |
| Issuer | | Shares/Par | | | Value ($) | |
| Common Stocks - continued | | | | | | | | |
| Metals & Mining - 1.3% | | | | | | | | |
| Rio Tinto Ltd. | | | 1,856,325 | | | $ | 106,758,218 | |
| | |
| Natural Gas - Distribution - 0.6% | | | | | | | | |
| China Resources Gas Group Ltd. | | | 10,572,000 | | | $ | 45,925,692 | |
| | |
| Natural Gas - Pipeline - 1.2% | | | | | | | | |
| APA Group | | | 6,637,174 | | | $ | 47,127,885 | |
| Enbridge, Inc. | | | 1,494,436 | | | | 55,282,605 | |
| | | | | | | | |
| | | | | | | $ | 102,410,490 | |
| Network & Telecom - 0.5% | | | | | | | | |
| LM Ericsson Telephone Co., “B” | | | 4,462,823 | | | $ | 40,849,616 | |
| | |
| Other Banks & Diversified Financials - 7.5% | | | | | | | | |
| Aeon Financial Service Co. Ltd. | | | 4,311,600 | | | $ | 84,673,148 | |
| AIB Group PLC | | | 18,654,890 | | | | 87,761,756 | |
| HDFC Bank Ltd. | | | 3,295,716 | | | | 96,265,651 | |
| Intesa Sanpaolo S.p.A. | | | 44,025,230 | | | | 108,615,865 | |
| Julius Baer Group Ltd. | | | 1,966,364 | | | | 85,881,275 | |
| KBC Groep N.V. | | | 1,285,050 | | | | 95,184,558 | |
| Mastercard, Inc., “A” | | | 264,542 | | | | 59,461,105 | |
| | | | | | | | |
| | | | | | | $ | 617,843,358 | |
| Pharmaceuticals - 7.6% | | | | | | | | |
| Bayer AG | | | 1,630,132 | | | $ | 130,312,659 | |
| Novo Nordisk A.S., “B” | | | 3,004,923 | | | | 147,443,644 | |
| Roche Holding AG | | | 833,012 | | | | 231,445,546 | |
| Santen Pharmaceutical Co. Ltd. | | | 7,393,600 | | | | 115,084,520 | |
| | | | | | | | |
| | | | | | | $ | 624,286,369 | |
| Printing & Publishing - 1.3% | | | | | | | | |
| RELX Group PLC | | | 4,738,265 | | | $ | 108,814,744 | |
| | |
| Real Estate - 2.5% | | | | | | | | |
| Grand City Properties S.A. | | | 4,214,308 | | | $ | 99,226,734 | |
| LEG Immobilien AG | | | 913,384 | | | | 101,981,179 | |
| | | | | | | | |
| | | | | | | $ | 201,207,913 | |
| Restaurants - 0.6% | | | | | | | | |
| Yum China Holdings, Inc. | | | 1,124,623 | | | $ | 46,919,272 | |
| | |
| Specialty Chemicals - 7.9% | | | | | | | | |
| Akzo Nobel N.V. | | | 1,269,672 | | | $ | 115,145,080 | |
| Croda International PLC | | | 1,645,252 | | | | 104,984,652 | |
9
Portfolio of Investments (unaudited) – continued
| | | | | | | | |
| | |
| Issuer | | Shares/Par | | | Value ($) | |
| Common Stocks - continued | | | | | | | | |
| Specialty Chemicals - continued | | | | | | | | |
| Kansai Paint Co. Ltd. | | | 1,994,300 | | | $ | 36,624,340 | |
| Linde PLC | | | 1,038,096 | | | | 180,423,437 | |
| Nitto Denko Corp. | | | 809,400 | | | | 43,147,668 | |
| Sika AG | | | 572,268 | | | | 77,407,124 | |
| Symrise AG | | | 1,000,769 | | | | 88,197,350 | |
| | | | | | | | |
| | | | | | | $ | 645,929,651 | |
| Specialty Stores - 1.0% | | | | | | | | |
| Dufry AG | | | 352,641 | | | $ | 35,756,995 | |
| Just Eat PLC (a) | | | 5,007,524 | | | | 49,573,856 | |
| | | | | | | | |
| | | | | | | $ | 85,330,851 | |
| Telecommunications - Wireless - 3.4% | | | | | | | | |
| Advanced Info Service Public Co. Ltd. | | | 8,441,100 | | | $ | 48,751,454 | |
| KDDI Corp. | | | 4,232,500 | | | | 102,086,541 | |
| SoftBank Corp. | | | 1,109,400 | | | | 102,315,812 | |
| Tele2 AB, “B” | | | 2,230,822 | | | | 29,382,795 | |
| | | | | | | | |
| | | | | | | $ | 282,536,602 | |
| Telephone Services - 0.5% | | | | | | | | |
| Hellenic Telecommunications Organization S.A. | | | 3,341,389 | | | $ | 42,377,369 | |
| | |
| Tobacco - 2.2% | | | | | | | | |
| British American Tobacco PLC | | | 3,036,665 | | | $ | 111,103,541 | |
| Japan Tobacco, Inc. | | | 2,718,200 | | | | 69,085,907 | |
| | | | | | | | |
| | | | | | | $ | 180,189,448 | |
| Trucking - 0.6% | | | | | | | | |
| Yamato Holdings Co. Ltd. | | | 1,790,600 | | | $ | 46,570,218 | |
| | |
| Utilities - Electric Power - 2.7% | | | | | | | | |
| CLP Holdings Ltd. | | | 5,913,500 | | | $ | 70,060,257 | |
| E.ON AG | | | 5,629,687 | | | | 62,017,742 | |
| Iberdrola S.A. (a) | | | 10,191,558 | | | | 85,227,188 | |
| | | | | | | | |
| | | | | | | $ | 217,305,187 | |
| Total Common Stocks (Identified Cost, $7,496,498,632) | | | | | | $ | 8,092,388,180 | |
| | |
| Investment Companies (h) - 0.8% | | | | | | | | |
| Money Market Funds - 0.8% | | | | | | | | |
MFS Institutional Money Market Portfolio, 2.49% (v)
(Identified Cost, $67,119,082) | | | 67,119,531 | | | $ | 67,119,531 | |
| | |
| Other Assets, Less Liabilities - 0.4% | | | | | | | 33,280,817 | |
| Net Assets - 100.0% | | | | | | $ | 8,192,788,528 | |
10
Portfolio of Investments (unaudited) – continued
| (a) | Non-income producing security. |
| (h) | An affiliated issuer, which may be considered one in which the fund owns 5% or more of the outstanding voting securities, or a company which is under common control. At period end, the aggregate values of the fund’s investments in affiliated issuers and in unaffiliated issuers were $67,119,531 and $8,092,388,180, respectively. |
| (v) | Affiliated issuer that is available only to investment companies managed by MFS. The rate quoted for the MFS Institutional Money Market Portfolio is the annualizedseven-day yield of the fund at period end. |
The following abbreviations are used in this report and are defined:
| ADR | | American Depositary Receipt |
| PLC | | Public Limited Company |
See Notes to Financial Statements
11
Financial Statements
STATEMENT OF ASSETS AND LIABILITIES
At 2/28/19 (unaudited)
This statement represents your fund’s balance sheet, which details the assets and liabilities comprising the total value of the fund.
| | | | |
| Assets | | | | |
Investments in unaffiliated issuers, at value (identified cost, $7,496,498,632) | | | $8,092,388,180 | |
Investments in affiliated issuers, at value (identified cost, $67,119,082) | | | 67,119,531 | |
Foreign currency, at value (identified cost, $2,245,775) | | | 2,246,853 | |
Receivables for | | | | |
Investments sold | | | 13,802,588 | |
Fund shares sold | | | 3,047,766 | |
Dividends | | | 24,174,853 | |
Other assets | | | 24,840 | |
Total assets | | | $8,202,804,611 | |
| |
| Liabilities | | | | |
Payable to custodian | | | $201,459 | |
Payables for | | | | |
Investments purchased | | | 1,649,849 | |
Fund shares reacquired | | | 6,371,339 | |
Payable to affiliates | | | | |
Investment adviser | | | 312,807 | |
Shareholder servicing costs | | | 321,385 | |
Distribution and service fees | | | 13,502 | |
Program manager fees | | | 42 | |
Payable for independent Trustees’ compensation | | | 3,506 | |
Deferred country tax expense payable | | | 435,516 | |
Accrued expenses and other liabilities | | | 706,678 | |
Total liabilities | | | $10,016,083 | |
Net assets | | | $8,192,788,528 | |
| |
| Net assets consist of | | | | |
Paid-in capital | | | $7,959,172,063 | |
Total distributable earnings (loss) | | | 233,616,465 | |
Net assets | | | $8,192,788,528 | |
Shares of beneficial interest outstanding | | | 471,423,812 | |
12
Statement of Assets and Liabilities (unaudited) – continued
| | | | | | | | | | | | |
| | | |
| | | Net assets | | | Shares
outstanding | | | Net asset value
per share (a) | |
Class A | | | $640,342,454 | | | | 36,700,549 | | | | $17.45 | |
Class B | | | 3,872,999 | | | | 229,537 | | | | 16.87 | |
Class C | | | 25,557,039 | | | | 1,554,852 | | | | 16.44 | |
Class I | | | 587,301,738 | | | | 32,502,152 | | | | 18.07 | |
Class R1 | | | 1,684,847 | | | | 104,505 | | | | 16.12 | |
Class R2 | | | 106,016,059 | | | | 6,290,323 | | | | 16.85 | |
Class R3 | | | 69,061,662 | | | | 4,000,460 | | | | 17.26 | |
Class R4 | | | 52,999,741 | | | | 3,033,936 | | | | 17.47 | |
Class R6 | | | 6,690,526,535 | | | | 386,089,467 | | | | 17.33 | |
Class 529A | | | 12,051,645 | | | | 704,950 | | | | 17.10 | |
Class 529B | | | 323,491 | | | | 20,050 | | | | 16.13 | |
Class 529C | | | 3,050,318 | | | | 193,031 | | | | 15.80 | |
| (a) | Maximum offering price per share was equal to the net asset value per share for all share classes, except for Classes A and 529A, for which the maximum offering prices per share were $18.51 [100 / 94.25 x $17.45] and $18.14 [100 / 94.25 x $17.10], respectively. On sales of $50,000 or more, the maximum offering prices of Class A and Class 529A shares are reduced. A contingent deferred sales charge may be imposed on redemptions of Class A, Class B, Class C, Class 529B, and Class 529C shares. Redemption price per share was equal to the net asset value per share for Classes I, R1, R2, R3, R4, R6, and 529A. |
See Notes to Financial Statements
13
Financial Statements
STATEMENT OF OPERATIONS
Six months ended 2/28/19 (unaudited)
This statement describes how much your fund earned in investment income and accrued in expenses. It also describes any gains and/or losses generated by fund operations.
| | | | |
| Net investment income (loss) | | | | |
Income | | | | |
Dividends | | | $67,671,381 | |
Dividends from affiliated issuers | | | 972,055 | |
Income on securities loaned | | | 33,793 | |
Other | | | 8,743 | |
Foreign taxes withheld | | | (5,501,954 | ) |
Total investment income | | | $63,184,018 | |
Expenses | | | | |
Management fee | | | $27,158,964 | |
Distribution and service fees | | | 1,324,157 | |
Shareholder servicing costs | | | 896,339 | |
Program manager fees | | | 3,732 | |
Administrative services fee | | | 282,542 | |
Independent Trustees’ compensation | | | 39,373 | |
Custodian fee | | | 623,204 | |
Shareholder communications | | | 152,306 | |
Audit and tax fees | | | 35,511 | |
Legal fees | | | 35,638 | |
Miscellaneous | | | 223,043 | |
Total expenses | | | $30,774,809 | |
Reduction of expenses by investment adviser and distributor | | | (389,237 | ) |
Net expenses | | | $30,385,572 | |
Net investment income (loss) | | | $32,798,446 | |
| |
| Realized and unrealized gain (loss) | | | | |
Realized gain (loss) (identified cost basis) | | | | |
Unaffiliated issuers (net of $45,302 country tax) | | | $(119,953,611 | ) |
Affiliated issuers | | | 14,183 | |
Foreign currency | | | (555,812 | ) |
Net realized gain (loss) | | | $(120,495,240 | ) |
Change in unrealized appreciation or depreciation | | | | |
Unaffiliated issuers (net of $766,427 decrease in deferred country tax) | | | $(226,110,314 | ) |
Affiliated issuers | | | (7,418 | ) |
Translation of assets and liabilities in foreign currencies | | | (380,883 | ) |
Net unrealized gain (loss) | | | $(226,498,615 | ) |
Net realized and unrealized gain (loss) | | | $(346,993,855 | ) |
Change in net assets from operations | | | $(314,195,409 | ) |
See Notes to Financial Statements
14
Financial Statements
STATEMENTS OF CHANGES IN NET ASSETS
These statements describe the increases and/or decreases in net assets resulting from operations, any distributions, and any shareholder transactions.
| | | | | | | | |
| Change in net assets | | Six months ended
2/28/19
(unaudited) | | | Year ended
8/31/18 | |
| | |
| From operations | | | | | | | | |
Net investment income (loss) | | | $32,798,446 | | | | $137,220,315 | |
Net realized gain (loss) | | | (120,495,240 | ) | | | 404,682,579 | |
Net unrealized gain (loss) | | | (226,498,615 | ) | | | (18,262,607 | ) |
Change in net assets from operations | | | $(314,195,409 | ) | | | $523,640,287 | |
Total distributions to shareholders (a) | | | $(399,506,930 | ) | | | $(107,400,473 | ) |
Change in net assets from fund share transactions | | | $491,912,615 | | | | $617,169,873 | |
Total change in net assets | | | $(221,789,724 | ) | | | $1,033,409,687 | |
| | |
| Net assets | | | | | | | | |
At beginning of period | | | 8,414,578,252 | | | | 7,381,168,565 | |
At end of period (b) | | | $8,192,788,528 | | | | $8,414,578,252 | |
| (a) | Distributions from net investment income and from net realized gain are no longer required to be separately disclosed. See Note 2. For the year ended August 31, 2018, distributions from net investment income were $107,400,473. |
| (b) | Parenthetical disclosure of undistributed net investment income is no longer required. See Note 2. For the year ended August 31, 2018, end of period net assets included undistributed net investment income of $140,407,506. |
See Notes to Financial Statements
15
Financial Statements
FINANCIAL HIGHLIGHTS
The financial highlights table is intended to help you understand the fund’s financial performance for the semiannual period and the past 5 fiscal years. Certain information reflects financial results for a single fund share. The total returns in the table represent the rate that an investor would have earned (or lost) on an investment in the fund share class (assuming reinvestment of all distributions) held for the entire period.
| | | | | | | | | | | | | | | | | | | | | | | | |
| | | Six months
ended 2/28/19 | | | Year ended | |
| Class A | | 8/31/18 | | | 8/31/17 | | | 8/31/16 | | | 8/31/15 | | | 8/31/14 | |
| | | (unaudited) | | | | | | | | | | | | | | | | |
Net asset value, beginning of period | | | $19.19 | | | | $18.16 | | | | $15.83 | | | | $16.34 | | | | $18.06 | | | | $16.25 | |
| | | |
| Income (loss) from investment operations | | | | | | | | | | | | | |
Net investment income (loss) (d) | | | $0.05 | | | | $0.26 | | | | $0.20 | (c) | | | $0.25 | | | | $0.26 | | | | $0.40 | |
Net realized and unrealized gain
(loss) | | | (0.94 | ) | | | 0.97 | | | | 2.39 | | | | (0.50 | ) | | | (1.60 | ) | | | 1.64 | |
Total from investment operations | | | $(0.89 | ) | | | $1.23 | | | | $2.59 | | | | $(0.25 | ) | | | $(1.34 | ) | | | $2.04 | |
| | | |
| Less distributions declared to shareholders | | | | | | | | | | | | | |
From net investment income | | | $(0.72 | ) | | | $(0.20 | ) | | | $(0.26 | ) | | | $(0.26 | ) | | | $(0.38 | ) | | | $(0.23 | ) |
From net realized gain | | | (0.13 | ) | | | — | | | | — | | | | — | | | | — | | | | — | |
Total distributions declared to
shareholders | | | $(0.85 | ) | | | $(0.20 | ) | | | $(0.26 | ) | | | $(0.26 | ) | | | $(0.38 | ) | | | $(0.23 | ) |
Net asset value, end of period (x) | | | $17.45 | | | | $19.19 | | | | $18.16 | | | | $15.83 | | | | $16.34 | | | | $18.06 | |
Total return (%) (r)(s)(t)(x) | | | (4.24 | )(n) | | | 6.79 | | | | 16.66 | (c) | | | (1.50 | ) | | | (7.44 | ) | | | 12.60 | |
| | | |
Ratios (%) (to average net assets)
and Supplemental data: | | | | | | | | | | | | | |
Expenses before expense
reductions (f) | | | 1.09 | (a) | | | 1.09 | | | | 1.12 | (c) | | | 1.14 | | | | 1.13 | | | | 1.13 | |
Expenses after expense
reductions (f) | | | 1.08 | (a) | | | 1.08 | | | | 1.10 | (c) | | | 1.11 | | | | 1.09 | | | | 1.11 | |
Net investment income (loss) | | | 0.55 | (a)(l) | | | 1.37 | | | | 1.25 | (c) | | | 1.62 | | | | 1.53 | | | | 2.24 | |
Portfolio turnover | | | 13 | (n) | | | 25 | | | | 33 | | | | 40 | | | | 28 | | | | 27 | |
Net assets at end of period
(000 omitted) | | | $640,342 | | | | $686,128 | | | | $693,538 | | | | $971,630 | | | | $1,178,013 | | | | $1,184,927 | |
See Notes to Financial Statements
16
Financial Highlights – continued
| | | | | | | | | | | | | | | | | | | | | | | | |
| | | Six months
ended 2/28/19 | | | Year ended | |
| Class B | | 8/31/18 | | | 8/31/17 | | | 8/31/16 | | | 8/31/15 | | | 8/31/14 | |
| | | (unaudited) | | | | | | | | | | | | | | | | |
Net asset value, beginning of period | | | $18.48 | | | | $17.48 | | | | $15.21 | | | | $15.65 | | | | $17.26 | | | | $15.52 | |
| | | |
| Income (loss) from investment operations | | | | | | | | | | | | | |
Net investment income (loss) (d) | | | $(0.02 | ) | | | $0.10 | | | | $0.10 | (c) | | | $0.12 | | | | $0.12 | | | | $0.25 | |
Net realized and unrealized gain
(loss) | | | (0.90 | ) | | | 0.95 | | | | 2.28 | | | | (0.47 | ) | | | (1.52 | ) | | | 1.57 | |
Total from investment operations | | | $(0.92 | ) | | | $1.05 | | | | $2.38 | | | | $(0.35 | ) | | | $(1.40 | ) | | | $1.82 | |
| | | |
| Less distributions declared to shareholders | | | | | | | | | | | | | |
From net investment income | | | $(0.56 | ) | | | $(0.05 | ) | | | $(0.11 | ) | | | $(0.09 | ) | | | $(0.21 | ) | | | $(0.08 | ) |
From net realized gain | | | (0.13 | ) | | | — | | | | — | | | | — | | | | — | | | | — | |
Total distributions declared to
shareholders | | | $(0.69 | ) | | | $(0.05 | ) | | | $(0.11 | ) | | | $(0.09 | ) | | | $(0.21 | ) | | | $(0.08 | ) |
Net asset value, end of period (x) | | | $16.87 | | | | $18.48 | | | | $17.48 | | | | $15.21 | | | | $15.65 | | | | $17.26 | |
Total return (%) (r)(s)(t)(x) | | | (4.66 | )(n) | | | 6.01 | | | | 15.77 | (c) | | | (2.20 | ) | | | (8.15 | ) | | | 11.77 | |
| | | |
Ratios (%) (to average net assets)
and Supplemental data: | | | | | | | | | | | | | |
Expenses before expense
reductions (f) | | | 1.84 | (a) | | | 1.84 | | | | 1.87 | (c) | | | 1.89 | | | | 1.88 | | | | 1.88 | |
Expenses after expense
reductions (f) | | | 1.83 | (a) | | | 1.82 | | | | 1.85 | (c) | | | 1.86 | | | | 1.84 | | | | 1.86 | |
Net investment income (loss) | | | (0.21 | )(a)(l) | | | 0.55 | | | | 0.61 | (c) | | | 0.82 | | | | 0.70 | | | | 1.46 | |
Portfolio turnover | | | 13 | (n) | | | 25 | | | | 33 | | | | 40 | | | | 28 | | | | 27 | |
Net assets at end of period
(000 omitted) | | | $3,873 | | | | $4,922 | | | | $6,228 | | | | $7,967 | | | | $11,228 | | | | $16,932 | |
See Notes to Financial Statements
17
Financial Highlights – continued
| | | | | | | | | | | | | | | | | | | | | | | | |
| | | Six months
ended 2/28/19 | | | Year ended | |
| Class C | | 8/31/18 | | | 8/31/17 | | | 8/31/16 | | | 8/31/15 | | | 8/31/14 | |
| | | (unaudited) | | | | | | | | | | | | | | | | |
Net asset value, beginning of period | | | $17.99 | | | | $17.03 | | | | $14.85 | | | | $15.31 | | | | $16.93 | | | | $15.26 | |
| | | |
| Income (loss) from investment operations | | | | | | | | | | | | | |
Net investment income (loss) (d) | | | $(0.02 | ) | | | $0.08 | | | | $0.10 | (c) | | | $0.12 | | | | $0.12 | | | | $0.25 | |
Net realized and unrealized gain
(loss) | | | (0.86 | ) | | | 0.94 | | | | 2.21 | | | | (0.45 | ) | | | (1.50 | ) | | | 1.54 | |
Total from investment operations | | | $(0.88 | ) | | | $1.02 | | | | $2.31 | | | | $(0.33 | ) | | | $(1.38 | ) | | | $1.79 | |
| | | |
| Less distributions declared to shareholders | | | | | | | | | | | | | |
From net investment income | | | $(0.54 | ) | | | $(0.06 | ) | | | $(0.13 | ) | | | $(0.13 | ) | | | $(0.24 | ) | | | $(0.12 | ) |
From net realized gain | | | (0.13 | ) | | | — | | | | — | | | | — | | | | — | | | | — | |
Total distributions declared to
shareholders | | | $(0.67 | ) | | | $(0.06 | ) | | | $(0.13 | ) | | | $(0.13 | ) | | | $(0.24 | ) | | | $(0.12 | ) |
Net asset value, end of period (x) | | | $16.44 | | | | $17.99 | | | | $17.03 | | | | $14.85 | | | | $15.31 | | | | $16.93 | |
Total return (%) (r)(s)(t)(x) | | | (4.59 | )(n) | | | 5.97 | | | | 15.74 | (c) | | | (2.16 | ) | | | (8.17 | ) | | | 11.74 | |
| | | |
Ratios (%) (to average net assets)
and Supplemental data: | | | | | | | | | | | | | |
Expenses before expense
reductions (f) | | | 1.84 | (a) | | | 1.84 | | | | 1.87 | (c) | | | 1.89 | | | | 1.88 | | | | 1.88 | |
Expenses after expense
reductions (f) | | | 1.83 | (a) | | | 1.83 | | | | 1.85 | (c) | | | 1.86 | | | | 1.84 | | | | 1.86 | |
Net investment income (loss) | | | (0.19 | )(a)(l) | | | 0.44 | | | | 0.64 | (c) | | | 0.85 | | | | 0.76 | | | | 1.50 | |
Portfolio turnover | | | 13 | (n) | | | 25 | | | | 33 | | | | 40 | | | | 28 | | | | 27 | |
Net assets at end of period
(000 omitted) | | | $25,557 | | | | $27,800 | | | | $48,570 | | | | $62,124 | | | | $77,442 | | | | $91,487 | |
See Notes to Financial Statements
18
Financial Highlights – continued
| | | | | | | | | | | | | | | | | | | | | | | | |
| | | Six months
ended 2/28/19 | | | Year ended | |
| Class I | | 8/31/18 | | | 8/31/17 | | | 8/31/16 | | | 8/31/15 | | | 8/31/14 | |
| | | (unaudited) | | | | | | | | | | | | | | | | |
Net asset value, beginning of period | | | $19.87 | | | | $18.79 | | | | $16.38 | | | | $16.90 | | | | $18.66 | | | | $16.78 | |
| | | |
| Income (loss) from investment operations | | | | | | | | | | | | | |
Net investment income (loss) (d) | | | $0.07 | | | | $0.26 | | | | $0.30 | (c) | | | $0.30 | | | | $0.32 | | | | $0.46 | |
Net realized and unrealized gain
(loss) | | | (0.98 | ) | | | 1.06 | | | | 2.42 | | | | (0.51 | ) | | | (1.66 | ) | | | 1.69 | |
Total from investment operations | | | $(0.91 | ) | | | $1.32 | | | | $2.72 | | | | $(0.21 | ) | | | $(1.34 | ) | | | $2.15 | |
| | | |
| Less distributions declared to shareholders | | | | | | | | | | | | | |
From net investment income | | | $(0.76 | ) | | | $(0.24 | ) | | | $(0.31 | ) | | | $(0.31 | ) | | | $(0.42 | ) | | | $(0.27 | ) |
From net realized gain | | | (0.13 | ) | | | — | | | | — | | | | — | | | | — | | | | — | |
Total distributions declared to
shareholders | | | $(0.89 | ) | | | $(0.24 | ) | | | $(0.31 | ) | | | $(0.31 | ) | | | $(0.42 | ) | | | $(0.27 | ) |
Net asset value, end of period (x) | | | $18.07 | | | | $19.87 | | | | $18.79 | | | | $16.38 | | | | $16.90 | | | | $18.66 | |
Total return (%) (r)(s)(t)(x) | | | (4.16 | )(n) | | | 7.05 | | | | 16.95 | (c) | | | (1.24 | ) | | | (7.19 | ) | | | 12.89 | |
| | | |
Ratios (%) (to average net assets)
and Supplemental data: | | | | | | | | | | | | | |
Expenses before expense
reductions (f) | | | 0.84 | (a) | | | 0.84 | | | | 0.87 | (c) | | | 0.89 | | | | 0.88 | | | | 0.88 | |
Expenses after expense
reductions (f) | | | 0.83 | (a) | | | 0.83 | | | | 0.86 | (c) | | | 0.86 | | | | 0.84 | | | | 0.86 | |
Net investment income (loss) | | | 0.79 | (a)(l) | | | 1.31 | | | | 1.79 | (c) | | | 1.86 | | | | 1.80 | | | | 2.51 | |
Portfolio turnover | | | 13 | (n) | | | 25 | | | | 33 | | | | 40 | | | | 28 | | | | 27 | |
Net assets at end of period
(000 omitted) | | | $587,302 | | | | $658,193 | | | | $1,099,134 | | | | $2,187,011 | | | | $2,410,936 | | | | $2,194,432 | |
See Notes to Financial Statements
19
Financial Highlights – continued
| | | | | | | | | | | | | | | | | | | | | | | | |
| | | Six months
ended 2/28/19 | | | Year ended | |
| Class R1 | | 8/31/18 | | | 8/31/17 | | | 8/31/16 | | | 8/31/15 | | | 8/31/14 | |
| | | (unaudited) | | | | | | | | | | | | | | | | |
Net asset value, beginning of period | | | $17.72 | | | | $16.80 | | | | $14.63 | | | | $15.08 | | | | $16.69 | | | | $15.02 | |
| | | |
| Income (loss) from investment operations | | | | | | | | | | | | | |
Net investment income (loss) (d) | | | $(0.02 | ) | | | $0.11 | | | | $0.09 | (c) | | | $0.11 | | | | $0.11 | | | | $0.24 | |
Net realized and unrealized gain
(loss) | | | (0.86 | ) | | | 0.90 | | | | 2.20 | | | | (0.44 | ) | | | (1.47 | ) | | | 1.52 | |
Total from investment operations | | | $(0.88 | ) | | | $1.01 | | | | $2.29 | | | | $(0.33 | ) | | | $(1.36 | ) | | | $1.76 | |
| | | |
| Less distributions declared to shareholders | | | | | | | | | | | | | |
From net investment income | | | $(0.59 | ) | | | $(0.09 | ) | | | $(0.12 | ) | | | $(0.12 | ) | | | $(0.25 | ) | | | $(0.09 | ) |
From net realized gain | | | (0.13 | ) | | | — | | | | — | | | | — | | | | — | | | | — | |
Total distributions declared to
shareholders | | | $(0.72 | ) | | | $(0.09 | ) | | | $(0.12 | ) | | | $(0.12 | ) | | | $(0.25 | ) | | | $(0.09 | ) |
Net asset value, end of period (x) | | | $16.12 | | | | $17.72 | | | | $16.80 | | | | $14.63 | | | | $15.08 | | | | $16.69 | |
Total return (%) (r)(s)(t)(x) | | | (4.63 | )(n) | | | 5.99 | | | | 15.79 | (c) | | | (2.19 | ) | | | (8.18 | ) | | | 11.73 | |
| | | |
Ratios (%) (to average net assets)
and Supplemental data: | | | | | | | | | | | | | |
Expenses before expense
reductions (f) | | | 1.84 | (a) | | | 1.84 | | | | 1.87 | (c) | | | 1.89 | | | | 1.88 | | | | 1.88 | |
Expenses after expense
reductions (f) | | | 1.83 | (a) | | | 1.83 | | | | 1.85 | (c) | | | 1.86 | | | | 1.84 | | | | 1.86 | |
Net investment income (loss) | | | (0.23 | )(a)(l) | | | 0.60 | | | | 0.61 | (c) | | | 0.78 | | | | 0.72 | | | | 1.47 | |
Portfolio turnover | | | 13 | (n) | | | 25 | | | | 33 | | | | 40 | | | | 28 | | | | 27 | |
Net assets at end of period
(000 omitted) | | | $1,685 | | | | $2,153 | | | | $2,089 | | | | $2,418 | | | | $3,509 | | | | $4,243 | |
See Notes to Financial Statements
20
Financial Highlights – continued
| | | | | | | | | | | | | | | | | | | | | | | | |
| | | Six months
ended 2/28/19 | | | Year ended | |
| Class R2 | | 8/31/18 | | | 8/31/17 | | | 8/31/16 | | | 8/31/15 | | | 8/31/14 | |
| | | (unaudited) | | | | | | | | | | | | | | | | |
Net asset value, beginning of period | | | $18.53 | | | | $17.55 | | | | $15.31 | | | | $15.80 | | | | $17.48 | | | | $15.75 | |
| | | |
| Income (loss) from investment operations | | | | | | | | | | | | | |
Net investment income (loss) (d) | | | $0.02 | | | | $0.19 | | | | $0.17 | (c) | | | $0.21 | | | | $0.22 | | | | $0.36 | |
Net realized and unrealized gain
(loss) | | | (0.91 | ) | | | 0.95 | | | | 2.30 | | | | (0.48 | ) | | | (1.56 | ) | | | 1.57 | |
Total from investment operations | | | $(0.89 | ) | | | $1.14 | | | | $2.47 | | | | $(0.27 | ) | | | $(1.34 | ) | | | $1.93 | |
| | | |
| Less distributions declared to shareholders | | | | | | | | | | | | | |
From net investment income | | | $(0.66 | ) | | | $(0.16 | ) | | | $(0.23 | ) | | | $(0.22 | ) | | | $(0.34 | ) | | | $(0.20 | ) |
From net realized gain | | | (0.13 | ) | | | — | | | | — | | | | — | | | | — | | | | — | |
Total distributions declared to
shareholders | | | $(0.79 | ) | | | $(0.16 | ) | | | $(0.23 | ) | | | $(0.22 | ) | | | $(0.34 | ) | | | $(0.20 | ) |
Net asset value, end of period (x) | | | $16.85 | | | | $18.53 | | | | $17.55 | | | | $15.31 | | | | $15.80 | | | | $17.48 | |
Total return (%) (r)(s)(t)(x) | | | (4.41 | )(n) | | | 6.49 | | | | 16.37 | (c) | | | (1.69 | ) | | | (7.69 | ) | | | 12.32 | |
| | | |
Ratios (%) (to average net assets)
and Supplemental data: | | | | | | | | | | | | | |
Expenses before expense
reductions (f) | | | 1.34 | (a) | | | 1.34 | | | | 1.37 | (c) | | | 1.39 | | | | 1.38 | | | | 1.38 | |
Expenses after expense
reductions (f) | | | 1.33 | (a) | | | 1.33 | | | | 1.35 | (c) | | | 1.36 | | | | 1.34 | | | | 1.36 | |
Net investment income (loss) | | | 0.29 | (a)(l) | | | 1.04 | | | | 1.10 | (c) | | | 1.38 | | | | 1.29 | | | | 2.06 | |
Portfolio turnover | | | 13 | (n) | | | 25 | | | | 33 | | | | 40 | | | | 28 | | | | 27 | |
Net assets at end of period
(000 omitted) | | | $106,016 | | | | $121,197 | | | | $132,988 | | | | $152,133 | | | | $169,812 | | | | $182,466 | |
See Notes to Financial Statements
21
Financial Highlights – continued
| | | | | | | | | | | | | | | | | | | | | | | | |
| | | Six months
ended 2/28/19 | | | Year ended | |
| Class R3 | | 8/31/18 | | | 8/31/17 | | | 8/31/16 | | | 8/31/15 | | | 8/31/14 | |
| | | (unaudited) | | | | | | | | | | | | | | | | |
Net asset value, beginning of period | | | $18.99 | | | | $17.98 | | | | $15.67 | | | | $16.16 | | | | $17.86 | | | | $16.08 | |
| | | |
| Income (loss) from investment operations | | | | | | | | | | | | | |
Net investment income (loss) (d) | | | $0.05 | | | | $0.25 | | | | $0.22 | (c) | | | $0.24 | | | | $0.25 | | | | $0.40 | |
Net realized and unrealized gain
(loss) | | | (0.94 | ) | | | 0.96 | | | | 2.35 | | | | (0.48 | ) | | | (1.58 | ) | | | 1.61 | |
Total from investment operations | | | $(0.89 | ) | | | $1.21 | | | | $2.57 | | | | $(0.24 | ) | | | $(1.33 | ) | | | $2.01 | |
| | | |
| Less distributions declared to shareholders | | | | | | | | | | | | | |
From net investment income | | | $(0.71 | ) | | | $(0.20 | ) | | | $(0.26 | ) | | | $(0.25 | ) | | | $(0.37 | ) | | | $(0.23 | ) |
From net realized gain | | | (0.13 | ) | | | — | | | | — | | | | — | | | | — | | | | — | |
Total distributions declared to
shareholders | | | $(0.84 | ) | | | $(0.20 | ) | | | $(0.26 | ) | | | $(0.25 | ) | | | $(0.37 | ) | | | $(0.23 | ) |
Net asset value, end of period (x) | | | $17.26 | | | | $18.99 | | | | $17.98 | | | | $15.67 | | | | $16.16 | | | | $17.86 | |
Total return (%) (r)(s)(t)(x) | | | (4.27 | )(n) | | | 6.75 | | | | 16.67 | (c) | | | (1.47 | ) | | | (7.44 | ) | | | 12.56 | |
| | | |
Ratios (%) (to average net assets)
and Supplemental data: | | | | | | | | | | | | | |
Expenses before expense
reductions (f) | | | 1.09 | (a) | | | 1.09 | | | | 1.12 | (c) | | | 1.14 | | | | 1.13 | | | | 1.13 | |
Expenses after expense
reductions (f) | | | 1.08 | (a) | | | 1.08 | | | | 1.10 | (c) | | | 1.11 | | | | 1.09 | | | | 1.11 | |
Net investment income (loss) | | | 0.54 | (a)(l) | | | 1.31 | | | | 1.37 | (c) | | | 1.59 | | | | 1.46 | | | | 2.28 | |
Portfolio turnover | | | 13 | (n) | | | 25 | | | | 33 | | | | 40 | | | | 28 | | | | 27 | |
Net assets at end of period
(000 omitted) | | | $69,062 | | | | $82,289 | | | | $91,653 | | | | $126,980 | | | | $165,656 | | | | $229,232 | |
See Notes to Financial Statements
22
Financial Highlights – continued
| | | | | | | | | | | | | | | | | | | | | | | | |
| | | Six months
ended 2/28/19 | | | Year ended | |
| Class R4 | | 8/31/18 | | | 8/31/17 | | | 8/31/16 | | | 8/31/15 | | | 8/31/14 | |
| | | (unaudited) | | | | | | | | | | | | | | | | |
Net asset value, beginning of period | | | $19.25 | | | | $18.21 | | | | $15.86 | | | | $16.36 | | | | $18.09 | | | | $16.27 | |
| | | |
| Income (loss) from investment operations | | | | | | | | | | | | | |
Net investment income (loss) (d) | | | $0.07 | | | | $0.30 | | | | $0.28 | (c) | | | $0.30 | | | | $0.29 | | | | $0.45 | |
Net realized and unrealized gain
(loss) | | | (0.95 | ) | | | 0.98 | | | | 2.35 | | | | (0.50 | ) | | | (1.60 | ) | | | 1.63 | |
Total from investment operations | | | $(0.88 | ) | | | $1.28 | | | | $2.63 | | | | $(0.20 | ) | | | $(1.31 | ) | | | $2.08 | |
| | | |
| Less distributions declared to shareholders | | | | | | | | | | | | | |
From net investment income | | | $(0.77 | ) | | | $(0.24 | ) | | | $(0.28 | ) | | | $(0.30 | ) | | | $(0.42 | ) | | | $(0.26 | ) |
From net realized gain | | | (0.13 | ) | | | — | | | | — | | | | — | | | | — | | | | — | |
Total distributions declared to
shareholders | | | $(0.90 | ) | | | $(0.24 | ) | | | $(0.28 | ) | | | $(0.30 | ) | | | $(0.42 | ) | | | $(0.26 | ) |
Net asset value, end of period (x) | | | $17.47 | | | | $19.25 | | | | $18.21 | | | | $15.86 | | | | $16.36 | | | | $18.09 | |
Total return (%) (r)(s)(t)(x) | | | (4.17 | )(n) | | | 7.07 | | | | 16.92 | (c) | | | (1.20 | ) | | | (7.26 | ) | | | 12.87 | |
| | | |
Ratios (%) (to average net assets)
and Supplemental data: | | | | | | | | | | | | | |
Expenses before expense
reductions (f) | | | 0.84 | (a) | | | 0.84 | | | | 0.87 | (c) | | | 0.89 | | | | 0.88 | | | | 0.88 | |
Expenses after expense
reductions (f) | | | 0.83 | (a) | | | 0.83 | | | | 0.86 | (c) | | | 0.86 | | | | 0.85 | | | | 0.86 | |
Net investment income (loss) | | | 0.79 | (a)(l) | | | 1.57 | | | | 1.73 | (c) | | | 1.93 | | | | 1.70 | | | | 2.54 | |
Portfolio turnover | | | 13 | (n) | | | 25 | | | | 33 | | | | 40 | | | | 28 | | | | 27 | |
Net assets at end of period
(000 omitted) | | | $53,000 | | | | $58,578 | | | | $63,884 | | | | $148,243 | | | | $343,475 | | | | $546,069 | |
See Notes to Financial Statements
23
Financial Highlights – continued
| | | | | | | | | | | | | | | | | | | | | | | | |
| | | Six months
ended 2/28/19 | | | Year ended | |
| Class R6 | | 8/31/18 | | | 8/31/17 | | | 8/31/16 | | | 8/31/15 | | | 8/31/14 | |
| | | (unaudited) | | | | | | | | | | | | | | | | |
Net asset value, beginning of period | | | $19.11 | | | | $18.10 | | | | $15.79 | | | | $16.30 | | | | $18.02 | | | | $16.21 | |
| | | |
| Income (loss) from investment operations | | | | | | | | | | | | | |
Net investment income (loss) (d) | | | $0.08 | | | | $0.34 | | | | $0.28 | (c) | | | $0.31 | | | | $0.32 | | | | $0.46 | |
Net realized and unrealized gain
(loss) | | | (0.94 | ) | | | 0.95 | | | | 2.36 | | | | (0.50 | ) | | | (1.60 | ) | | | 1.64 | |
Total from investment operations | | | $(0.86 | ) | | | $1.29 | | | | $2.64 | | | | $(0.19 | ) | | | $(1.28 | ) | | | $2.10 | |
| | | |
| Less distributions declared to shareholders | | | | | | | | | | | | | |
From net investment income | | | $(0.79 | ) | | | $(0.28 | ) | | | $(0.33 | ) | | | $(0.32 | ) | | | $(0.44 | ) | | | $(0.29 | ) |
From net realized gain | | | (0.13 | ) | | | — | | | | — | | | | — | | | | — | | | | — | |
Total distributions declared to
shareholders | | | $(0.92 | ) | | | $(0.28 | ) | | | $(0.33 | ) | | | $(0.32 | ) | | | $(0.44 | ) | | | $(0.29 | ) |
Net asset value, end of period (x) | | | $17.33 | | | | $19.11 | | | | $18.10 | | | | $15.79 | | | | $16.30 | | | | $18.02 | |
Total return (%) (r)(s)(t)(x) | | | (4.09 | )(n) | | | 7.12 | | | | 17.07 | (c) | | | (1.13 | ) | | | (7.13 | ) | | | 13.01 | |
| | | |
Ratios (%) (to average net assets)
and Supplemental data: | | | | | | | | | | | | | |
Expenses before expense
reductions (f) | | | 0.74 | (a) | | | 0.74 | | | | 0.77 | (c) | | | 0.79 | | | | 0.79 | | | | 0.79 | |
Expenses after expense
reductions (f) | | | 0.73 | (a) | | | 0.73 | | | | 0.76 | (c) | | | 0.76 | | | | 0.75 | | | | 0.77 | |
Net investment income (loss) | | | 0.90 | (a)(l) | | | 1.80 | | | | 1.72 | (c) | | | 2.02 | | | | 1.88 | | | | 2.62 | |
Portfolio turnover | | | 13 | (n) | | | 25 | | | | 33 | | | | 40 | | | | 28 | | | | 27 | |
Net assets at end of period
(000 omitted) | | | $6,690,527 | | | | $6,756,773 | | | | $5,228,377 | | | | $2,766,544 | | | | $3,010,863 | | | | $2,955,339 | |
See Notes to Financial Statements
24
Financial Highlights – continued
| | | | | | | | | | | | | | | | | | | | | | | | |
| | | Six months
ended 2/28/19 | | | Year ended | |
| Class 529A | | 8/31/18 | | | 8/31/17 | | | 8/31/16 | | | 8/31/15 | | | 8/31/14 | |
| | | (unaudited) | | | | | | | | | | | | | | | | |
Net asset value, beginning of period | | | $18.83 | | | | $17.84 | | | | $15.61 | | | | $16.12 | | | | $17.81 | | | | $16.03 | |
| | | |
| Income (loss) from investment operations | | | | | | | | | | | | | |
Net investment income (loss) (d) | | | $0.04 | | | | $0.26 | | | | $0.23 | (c) | | | $0.19 | | | | $0.26 | | | | $0.39 | |
Net realized and unrealized gain
(loss) | | | (0.92 | ) | | | 0.95 | | | | 2.31 | | | | (0.44 | ) | | | (1.58 | ) | | | 1.62 | |
Total from investment operations | | | $(0.88 | ) | | | $1.21 | | | | $2.54 | | | | $(0.25 | ) | | | $(1.32 | ) | | | $2.01 | |
| | | |
| Less distributions declared to shareholders | | | | | | | | | | | | | |
From net investment income | | | $(0.72 | ) | | | $(0.22 | ) | | | $(0.31 | ) | | | $(0.26 | ) | | | $(0.37 | ) | | | $(0.23 | ) |
From net realized gain | | | (0.13 | ) | | | — | | | | — | | | | — | | | | — | | | | — | |
Total distributions declared to
shareholders | | | $(0.85 | ) | | | $(0.22 | ) | | | $(0.31 | ) | | | $(0.26 | ) | | | $(0.37 | ) | | | $(0.23 | ) |
Net asset value, end of period (x) | | | $17.10 | | | | $18.83 | | | | $17.84 | | | | $15.61 | | | | $16.12 | | | | $17.81 | |
Total return (%) (r)(s)(t)(x) | | | (4.29 | )(n) | | | 6.78 | | | | 16.60 | (c) | | | (1.52 | ) | | | (7.43 | ) | | | 12.57 | |
| | | |
Ratios (%) (to average net assets)
and Supplemental data: | | | | | | | | | | | | | |
Expenses before expense
reductions (f) | | | 1.14 | (a) | | | 1.15 | | | | 1.22 | (c) | | | 1.23 | | | | 1.23 | | | | 1.23 | |
Expenses after expense
reductions (f) | | | 1.12 | (a) | | | 1.11 | | | | 1.13 | (c) | | | 1.13 | | | | 1.12 | | | | 1.14 | |
Net investment income (loss) | | | 0.52 | (a)(l) | | | 1.37 | | | | 1.39 | (c) | | | 1.22 | | | | 1.51 | | | | 2.22 | |
Portfolio turnover | | | 13 | (n) | | | 25 | | | | 33 | | | | 40 | | | | 28 | | | | 27 | |
Net assets at end of period
(000 omitted) | | | $12,052 | | | | $12,615 | | | | $10,464 | | | | $9,101 | | | | $2,419 | | | | $2,428 | |
See Notes to Financial Statements
25
Financial Highlights – continued
| | | | | | | | | | | | | | | | | | | | | | | | |
| | | Six months
ended
2/28/19
| | | Year ended | |
| Class 529B | | 8/31/18 | | | 8/31/17 | | | 8/31/16 | | | 8/31/15 | | | 8/31/14 | |
| | | (unaudited) | | | | | | | | | | | | | | | | |
Net asset value, beginning of period | | | $17.72 | | | | $16.79 | | | | $14.78 | | | | $15.19 | | | | $16.80 | | | | $15.14 | |
| | | |
| Income (loss) from investment operations | | | | | | | | | | | | | |
Net investment income (loss) (d) | | | $(0.02 | ) | | | $0.10 | | | | $0.09 | (c) | | | $0.05 | | | | $0.10 | | | | $0.25 | |
Net realized and unrealized gain
(loss) | | | (0.87 | ) | | | 0.90 | | | | 2.18 | | | | (0.39 | ) | | | (1.47 | ) | | | 1.52 | |
Total from investment operations | | | $(0.89 | ) | | | $1.00 | | | | $2.27 | | | | $(0.34 | ) | | | $(1.37 | ) | | | $1.77 | |
| | | |
| Less distributions declared to shareholders | | | | | | | | | | | | | |
From net investment income | | | $(0.57 | ) | | | $(0.07 | ) | | | $(0.26 | ) | | | $(0.07 | ) | | | $(0.24 | ) | | | $(0.11 | ) |
From net realized gain | | | (0.13 | ) | | | — | | | | — | | | | — | | | | — | | | | — | |
Total distributions declared to
shareholders | | | $(0.70 | ) | | | $(0.07 | ) | | | $(0.26 | ) | | | $(0.07 | ) | | | $(0.24 | ) | | | $(0.11 | ) |
Net asset value, end of period (x) | | | $16.13 | | | | $17.72 | | | | $16.79 | | | | $14.78 | | | | $15.19 | | | | $16.80 | |
Total return (%) (r)(s)(t)(x) | | | (4.65 | )(n) | | | 5.94 | | | | 15.68 | (c) | | | (2.25 | ) | | | (8.17 | ) | | | 11.71 | |
| | | |
Ratios (%) (to average net assets)
and Supplemental data: | | | | | | | | | | | | | |
Expenses before expense
reductions (f) | | | 1.89 | (a) | | | 1.90 | | | | 1.97 | (c) | | | 1.98 | | | | 1.98 | | | | 1.98 | |
Expenses after expense
reductions (f) | | | 1.88 | (a) | | | 1.88 | | | | 1.90 | (c) | | | 1.90 | | | | 1.89 | | | | 1.91 | |
Net investment income (loss) | | | (0.26 | )(a)(l) | | | 0.56 | | | | 0.58 | (c) | | | 0.37 | | | | 0.63 | | | | 1.49 | |
Portfolio turnover | | | 13 | (n) | | | 25 | | | | 33 | | | | 40 | | | | 28 | | | | 27 | |
Net assets at end of period
(000 omitted) | | | $323 | | | | $358 | | | | $386 | | | | $434 | | | | $138 | | | | $192 | |
See Notes to Financial Statements
26
Financial Highlights – continued
| | | | | | | | | | | | | | | | | | | | | | | | |
| | | Six months ended 2/28/19 | | | Year ended | |
| Class 529C | | 8/31/18 | | | 8/31/17 | | | 8/31/16 | | | 8/31/15 | | | 8/31/14 | |
| | | (unaudited) | | | | | | | | | | | | | | | | |
Net asset value, beginning of period | | | $17.38 | | | | $16.51 | | | | $14.53 | | | | $15.01 | | | | $16.61 | | | | $14.98 | |
| | | |
| Income (loss) from investment operations | | | | | | | | | | | | | |
Net investment income (loss) (d) | | | $(0.02 | ) | | | $0.09 | | | | $0.10 | (c) | | �� | $0.07 | | | | $0.11 | | | | $0.23 | |
Net realized and unrealized gain
(loss) | | | (0.85 | ) | | | 0.89 | | | | 2.15 | | | | (0.41 | ) | | | (1.46 | ) | | | 1.52 | |
Total from investment operations | | | $(0.87 | ) | | | $0.98 | | | | $2.25 | | | | $(0.34 | ) | | | $(1.35 | ) | | | $1.75 | |
| | | |
| Less distributions declared to shareholders | | | | | | | | | | | | | |
From net investment income | | | $(0.58 | ) | | | $(0.11 | ) | | | $(0.27 | ) | | | $(0.14 | ) | | | $(0.25 | ) | | | $(0.12 | ) |
From net realized gain | | | (0.13 | ) | | | — | | | | — | | | | — | | | | — | | | | — | |
Total distributions declared to
shareholders | | | $(0.71 | ) | | | $(0.11 | ) | | | $(0.27 | ) | | | $(0.14 | ) | | | $(0.25 | ) | | | $(0.12 | ) |
Net asset value, end of period (x) | | | $15.80 | | | | $17.38 | | | | $16.51 | | | | $14.53 | | | | $15.01 | | | | $16.61 | |
Total return (%) (r)(s)(t)(x) | | | (4.68 | )(n) | | | 5.93 | | | | 15.78 | (c) | | | (2.28 | ) | | | (8.17 | ) | | | 11.68 | |
| | | |
Ratios (%) (to average net assets)
and Supplemental data: | | | | | | | | | | | | | |
Expenses before expense
reductions (f) | | | 1.89 | (a) | | | 1.90 | | | | 1.97 | (c) | | | 1.99 | | | | 1.98 | | | | 1.98 | |
Expenses after expense
reductions (f) | | | 1.88 | (a) | | | 1.87 | | | | 1.89 | (c) | | | 1.90 | | | | 1.89 | | | | 1.91 | |
Net investment income (loss) | | | (0.25 | )(a)(l) | | | 0.53 | | | | 0.63 | (c) | | | 0.47 | | | | 0.72 | | | | 1.43 | |
Portfolio turnover | | | 13 | (n) | | | 25 | | | | 33 | | | | 40 | | | | 28 | | | | 27 | |
Net assets at end of period
(000 omitted) | | | $3,050 | | | | $3,572 | | | | $3,856 | | | | $3,298 | | | | $980 | | | | $1,098 | |
| (c) | Amount reflects aone-time reimbursement of expenses by the custodian (or former custodian) without which net investment income and performance would be lower and expenses would be higher. |
| (d) | Per share data is based on average shares outstanding. |
| (f) | Ratios do not reflect reductions from fees paid indirectly, if applicable. |
| (l) | Recognition of net investment income by the fund may be affected by the timing of the declaration of dividends by companies in which the fund invests and the actual annual net investment income ratio may differ. |
| (r) | Certain expenses have been reduced without which performance would have been lower. |
| (s) | From time to time the fund may receive proceeds from litigation settlements, without which performance would be lower. |
| (t) | Total returns do not include any applicable sales charges. |
| (x) | The net asset values and total returns have been calculated on net assets which include adjustments made in accordance with U.S. generally accepted accounting principles required at period end for financial reporting purposes. |
See Notes to Financial Statements
27
NOTES TO FINANCIAL STATEMENTS
(unaudited)
(1) Business and Organization
MFS Research International Fund (the fund) is a diversified series of MFS Series Trust I (the trust). The trust is organized as a Massachusetts business trust and is registered under the Investment Company Act of 1940, as amended, as anopen-end management investment company.
The fund is an investment company and accordingly follows the investment company accounting and reporting guidance of the Financial Accounting Standards Board (FASB) Accounting Standards Codification Topic 946 Financial Services – Investment Companies.
(2) Significant Accounting Policies
General– The preparation of financial statements in conformity with U.S. generally accepted accounting principles requires management to make estimates and assumptions that affect the reported amounts of assets and liabilities, and disclosure of contingent assets and liabilities at the date of the financial statements and the reported amounts of increases and decreases in net assets from operations during the reporting period. Actual results could differ from those estimates. In the preparation of these financial statements, management has evaluated subsequent events occurring after the date of the fund’s Statement of Assets and Liabilities through the date that the financial statements were issued. The fund invests in foreign securities. Investments in foreign securities are vulnerable to the effects of changes in the relative values of the local currency and the U.S. dollar and to the effects of changes in each country’s market, economic, industrial, political, regulatory, geopolitical, and other conditions.
In August 2018, the Securities and Exchange Commission (SEC) released its Final Rule on Disclosure Update and Simplification (the “Final Rule”) which is intended to simplify an issuer’s disclosure compliance efforts by removing redundant or outdated disclosure requirements without significantly altering the mix of information provided to investors. Effective with the current reporting period, the fund adopted the Final Rule with the impacts being that the fund is no longer required to present the components of distributable earnings on the Statement of Assets and Liabilities or the sources of distributions to shareholders and the amount of undistributed net investment income on the Statements of Changes in Net Assets.
Balance Sheet Offsetting– The fund’s accounting policy with respect to balance sheet offsetting is that, absent an event of default by the counterparty or a termination of the agreement, the International Swaps and Derivatives Association (ISDA) Master Agreement, or similar agreement, does not result in an offset of reported amounts of financial assets and financial liabilities in the Statement of Assets and Liabilities across transactions between the fund and the applicable counterparty. The fund’s right to setoff may be restricted or prohibited by the bankruptcy or insolvency laws of the particular jurisdiction to which a specific master netting agreement counterparty is subject. Balance sheet offsetting disclosures, to the extent applicable to the fund, have been included in the fund’s Significant Accounting Policies note under the captions for each of the fund’sin-scope financial instruments and transactions.
28
Notes to Financial Statements (unaudited) – continued
Investment Valuations– Equity securities, including restricted equity securities, are generally valued at the last sale or official closing price on their primary market or exchange as provided by a third-party pricing service. Equity securities, for which there were no sales reported that day, are generally valued at the last quoted daily bid quotation on their primary market or exchange as provided by a third-party pricing service. Short-term instruments with a maturity at issuance of 60 days or less may be valued at amortized cost, which approximates market value.Open-end investment companies are generally valued at net asset value per share. Securities and other assets generally valued on the basis of information from a third-party pricing service may also be valued at a broker/dealer bid quotation. In determining values, third-party pricing services can utilize both transaction data and market information such as yield, quality, coupon rate, maturity, type of issue, trading characteristics, and other market data. The values of foreign securities and other assets and liabilities expressed in foreign currencies are converted to U.S. dollars using the mean of bid and asked prices for rates provided by a third-party pricing service.
The Board of Trustees has delegated primary responsibility for determining or causing to be determined the value of the fund’s investments (including any fair valuation) to the adviser pursuant to valuation policies and procedures approved by the Board. If the adviser determines that reliable market quotations are not readily available, investments are valued at fair value as determined in good faith by the adviser in accordance with such procedures under the oversight of the Board of Trustees. Under the fund’s valuation policies and procedures, market quotations are not considered to be readily available for most types of debt instruments and floating rate loans and many types of derivatives. These investments are generally valued at fair value based on information from third-party pricing services. In addition, investments may be valued at fair value if the adviser determines that an investment’s value has been materially affected by events occurring after the close of the exchange or market on which the investment is principally traded (such as foreign exchange or market) and prior to the determination of the fund’s net asset value, or after the halting of trading of a specific security where trading does not resume prior to the close of the exchange or market on which the security is principally traded. Events that occur on a frequent basis after foreign markets close (such as developments in foreign markets and significant movements in the U.S. markets) and prior to the determination of the fund’s net asset value may be deemed to have a material effect on the value of securities traded in foreign markets. Accordingly, the fund’s foreign equity securities may often be valued at fair value. The adviser generally relies on third-party pricing services or other information (such as the correlation with price movements of similar securities in the same or other markets; the type, cost and investment characteristics of the security; the business and financial condition of the issuer; and trading and other market data) to assist in determining whether to fair value and at what value to fair value an investment. The value of an investment for purposes of calculating the fund’s net asset value can differ depending on the source and method used to determine value. When fair valuation is used, the value of an investment used to determine the fund’s net asset value may differ from quoted or published prices for the same investment. There can be no assurance that the fund could obtain the fair value assigned to an investment if it were to sell the investment at the same time at which the fund determines its net asset value per share.
29
Notes to Financial Statements (unaudited) – continued
Various inputs are used in determining the value of the fund’s assets or liabilities. These inputs are categorized into three broad levels. In certain cases, the inputs used to measure fair value may fall into different levels of the fair value hierarchy. In such cases, an investment’s level within the fair value hierarchy is based on the lowest level of input that is significant to the fair value measurement. The fund’s assessment of the significance of a particular input to the fair value measurement in its entirety requires judgment, and considers factors specific to the investment. Level 1 includes unadjusted quoted prices in active markets for identical assets or liabilities. Level 2 includes other significant observable market-based inputs (including quoted prices for similar securities, interest rates, prepayment speed, and credit risk). Level 3 includes unobservable inputs, which may include the adviser’s own assumptions in determining the fair value of investments. The following is a summary of the levels used as of February 28, 2019 in valuing the fund’s assets or liabilities:
| | | | | | | | | | | | | | | | |
| | | | |
| Financial Instruments | | Level 1 | | | Level 2 | | | Level 3 | | | Total | |
| Equity Securities | | | $8,092,388,180 | | | | $— | | | | $— | | | | $8,092,388,180 | |
| Mutual Funds | | | 67,119,531 | | | | — | | | | — | | | | 67,119,531 | |
| Total | | | $8,159,507,711 | | | | $— | | | | $— | | | | $8,159,507,711 | |
For further information regarding security characteristics, see the Portfolio of Investments.
Foreign Currency Translation– Purchases and sales of foreign investments, income, and expenses are converted into U.S. dollars based upon currency exchange rates prevailing on the respective dates of such transactions or on the reporting date for foreign denominated receivables and payables. Gains and losses attributable to foreign currency exchange rates on sales of securities are recorded for financial statement purposes as net realized gains and losses on investments. Gains and losses attributable to foreign exchange rate movements on receivables, payables, income and expenses are recorded for financial statement purposes as foreign currency transaction gains and losses. That portion of both realized and unrealized gains and losses on investments that results from fluctuations in foreign currency exchange rates is not separately disclosed.
Security Loans– Under its Securities Lending Agency Agreement with the fund, State Street Bank and Trust Company, as lending agent, loans the securities of the fund to certain qualified institutions (the “Borrowers”) approved by the fund. Security loans can be terminated at the discretion of either the lending agent or the fund and the related securities must be returned within the earlier of the standard trade settlement period for such securities or within three business days. The loans are collateralized by cash and/or U.S. Treasury and federal agency obligations in an amount typically at least equal to the market value of the securities loaned. On loans collateralized by cash, the cash collateral is invested in a money market fund. The market value of the loaned securities is determined at the close of business of the fund and any additional required collateral is delivered to the fund on the next business day. The lending agent provides the fund with indemnification against Borrower default. In the event of Borrower default, the lending agent will, for the benefit of the fund, either purchase securities identical to those loaned or, when such purchase is commercially impracticable, pay the fund the market value of the loaned securities. In return, the lending agent assumes
30
Notes to Financial Statements (unaudited) – continued
the fund’s rights to the related collateral. If the collateral value is less than the cost to purchase identical securities, the lending agent is responsible for the shortfall, but only to the extent that such shortfall is not due to a decline in collateral value resulting from collateral reinvestment for which the fund bears the risk of loss. A portion of the income generated upon investment of the collateral is remitted to the Borrowers, and the remainder is allocated between the fund and the lending agent. On loans collateralized by U.S. Treasury and/or federal agency obligations, a fee is received from the Borrower, and is allocated between the fund and the lending agent. Income from securities lending is separately reported in the Statement of Operations. The dividend and interest income earned on the securities loaned is accounted for in the same manner as other dividend and interest income. At February 28, 2019, there were no securities on loan or collateral outstanding.
Indemnifications– Under the fund’s organizational documents, its officers and Trustees may be indemnified against certain liabilities and expenses arising out of the performance of their duties to the fund. Additionally, in the normal course of business, the fund enters into agreements with service providers that may contain indemnification clauses. The fund’s maximum exposure under these agreements is unknown as this would involve future claims that may be made against the fund that have not yet occurred.
Investment Transactions and Income– Investment transactions are recorded on the trade date. Dividends received in cash are recorded on theex-dividend date. Certain dividends from foreign securities will be recorded when the fund is informed of the dividend if such information is obtained subsequent to theex-dividend date. Dividend payments received in additional securities are recorded on theex-dividend date in an amount equal to the value of the security on such date.
The fund may receive proceeds from litigation settlements. Any proceeds received from litigation involving portfolio holdings are reflected in the Statement of Operations in realized gain/loss if the security has been disposed of by the fund or in unrealized gain/loss if the security is still held by the fund. Any other proceeds from litigation not related to portfolio holdings are reflected as other income in the Statement of Operations.
Tax Matters and Distributions– The fund intends to qualify as a regulated investment company, as defined under Subchapter M of the Internal Revenue Code, and to distribute all of its taxable income, including realized capital gains. As a result, no provision for federal income tax is required. The fund’s federal tax returns, when filed, will remain subject to examination by the Internal Revenue Service for a three year period. Management has analyzed the fund’s tax positions taken on federal and state tax returns for all open tax years and does not believe that there are any uncertain tax positions that require recognition of a tax liability. Foreign taxes, if any, have been accrued by the fund in the accompanying financial statements in accordance with the applicable foreign tax law. Foreign income taxes may be withheld by certain countries in which the fund invests. Additionally, capital gains realized by the fund on securities issued in or by certain foreign countries may be subject to capital gains tax imposed by those countries.
31
Notes to Financial Statements (unaudited) – continued
Distributions to shareholders are recorded on theex-dividend date. Income and capital gain distributions are determined in accordance with income tax regulations, which may differ from U.S. generally accepted accounting principles. Certain capital accounts in the financial statements are periodically adjusted for permanent differences in order to reflect their tax character. These adjustments have no impact on net assets or net asset value per share. Temporary differences which arise from recognizing certain items of income, expense, gain or loss in different periods for financial statement and tax purposes will reverse at some time in the future. Distributions in excess of net investment income or net realized gains are temporary overdistributions for financial statement purposes resulting from differences in the recognition or classification of income or distributions for financial statement and tax purposes.
Book/tax differences primarily relate to passive foreign investment companies, wash sale loss deferrals, and treating a portion of the proceeds from redemptions as a distribution for tax purposes.
The tax character of distributions made during the current period will be determined at fiscal year end. The tax character of distributions declared to shareholders for the last fiscal year is as follows:
| | | | |
| |
| | | Year ended
8/31/18 | |
Ordinary income (including any
short-term capital gains) | | | $107,400,473 | |
The federal tax cost and the tax basis components of distributable earnings were as follows:
| | | | |
| |
| As of 2/28/19 | | | |
| |
| Cost of investments | | | $7,578,411,841 | |
| Gross appreciation | | | 1,160,701,245 | |
| |
| Gross depreciation | | | (579,605,375 | ) |
| Net unrealized appreciation (depreciation) | | | $581,095,870 | |
| |
| As of 8/31/18 | | | |
| |
| Undistributed ordinary income | | | 140,949,366 | |
| Other temporary differences | | | (415,872 | ) |
| Net unrealized appreciation (depreciation) | | | 806,785,310 | |
The aggregate cost above includes prior fiscal year end tax adjustments, if applicable.
Multiple Classes of Shares of Beneficial Interest– The fund offers multiple classes of shares, which differ in their respective distribution, service, and program manager fees. The fund’s income, realized and unrealized gain (loss), and common expenses are allocated to shareholders based on the daily net assets of each class. Dividends are declared separately for each class. Differences in per share dividend rates are generally due to differences in separate class expenses. Class B and Class 529B shares will convert to Class A and Class 529A shares, respectively, approximately eight years after purchase. Class C and Class 529C shares will convert to Class A and Class 529A shares,
32
Notes to Financial Statements (unaudited) – continued
respectively, approximately ten years after purchase. The fund’s distributions declared to shareholders as reported in the Statements of Changes in Net Assets are presented by class as follows:
| | | | | | | | | | | | | | | | |
| | | From net investment
income | | | From net realized
gain | |
| | | | |
| | | Six months
ended
2/28/19 | | | Year
ended
8/31/18 | | | Six months
ended
2/28/19 | | | Year
ended
8/31/18 | |
| Class A | | | $25,901,069 | | | | $7,325,996 | | | | $4,647,196 | | | | $— | |
| Class B | | | 137,137 | | | | 16,831 | | | | 31,746 | | | | — | |
| Class C | | | 790,024 | | | | 151,470 | | | | 190,635 | | | | — | |
| Class I | | | 24,754,668 | | | | 14,314,497 | | | | 4,190,792 | | | | — | |
| Class R1 | | | 69,066 | | | | 10,568 | | | | 15,219 | | | | — | |
| Class R2 | | | 4,169,222 | | | | 1,118,075 | | | | 813,076 | | | | — | |
| Class R3 | | | 2,863,469 | | | | 992,523 | | | | 518,390 | | | | — | |
| Class R4 | | | 2,230,773 | | | | 791,803 | | | | 376,275 | | | | — | |
| Class R6 | | | 280,916,284 | | | | 82,520,374 | | | | 46,180,904 | | | | — | |
| Class 529A | | | 471,755 | | | | 130,984 | | | | 85,101 | | | | — | |
| Class 529B | | | 11,248 | | | | 1,445 | | | | 2,533 | | | | — | |
| Class 529C | | | 114,606 | | | | 25,907 | | | | 25,742 | | | | — | |
| Total | | | $342,429,321 | | | | $107,400,473 | | | | $57,077,609 | | | | $— | |
(3) Transactions with Affiliates
Investment Adviser– The fund has an investment advisory agreement with MFS to provide overall investment management and related administrative services and facilities to the fund. The management fee is computed daily and paid monthly at the following annual rates based on the fund’s average daily net assets:
| | | | |
| Up to $1 billion | | | 0.90 | % |
| In excess of $1 billion and up to $2 billion | | | 0.80 | % |
| In excess of $2 billion and up to $5 billion | | | 0.70 | % |
| In excess of $5 billion and up to $10 billion | | | 0.60 | % |
| In excess of $10 billion | | | 0.55 | % |
MFS has agreed in writing to reduce its management fee by a specified amount if certain MFS mutual fund assets exceed thresholds agreed to by MFS and the fund’s Board of Trustees. For the six months ended February 28, 2019, this management fee reduction amounted to $382,619, which is included in the reduction of total expenses in the Statement of Operations. The management fee incurred for the six months ended February 28, 2019 was equivalent to an annual effective rate of 0.69% of the fund’s average daily net assets.
Distributor– MFS Fund Distributors, Inc. (MFD), a wholly-owned subsidiary of MFS, as distributor, received $29,192 and $2,384 for the six months ended February 28, 2019, as its portion of the initial sales charge on sales of Class A and Class 529A shares of the fund, respectively.
The Board of Trustees has adopted a distribution plan for certain share classes pursuant to Rule12b-1 of the Investment Company Act of 1940.
33
Notes to Financial Statements (unaudited) – continued
The fund’s distribution plan provides that the fund will pay MFD for services provided by MFD and financial intermediaries in connection with the distribution and servicing of certain share classes. One component of the plan is a distribution fee paid to MFD and another component of the plan is a service fee paid to MFD. MFD may subsequently pay all, or a portion, of the distribution and/or service fees to financial intermediaries.
Distribution Plan Fee Table:
| | | | | | | | | | | | | | | | | | | | |
| | | | | |
| | | Distribution
Fee Rate (d) | | | Service
Fee Rate (d) | | | Total
Distribution
Plan (d) | | | Annual
Effective
Rate (e) | | | Distribution
and Service
Fee | |
| Class A | | | — | | | | 0.25% | | | | 0.25% | | | | 0.25% | | | | $780,393 | |
| Class B | | | 0.75% | | | | 0.25% | | | | 1.00% | | | | 1.00% | | | | 20,723 | |
| Class C | | | 0.75% | | | | 0.25% | | | | 1.00% | | | | 1.00% | | | | 124,440 | |
| Class R1 | | | 0.75% | | | | 0.25% | | | | 1.00% | | | | 1.00% | | | | 9,286 | |
| Class R2 | | | 0.25% | | | | 0.25% | | | | 0.50% | | | | 0.50% | | | | 267,527 | |
| Class R3 | | | — | | | | 0.25% | | | | 0.25% | | | | 0.25% | | | | 90,049 | |
| Class 529A | | | — | | | | 0.25% | | | | 0.25% | | | | 0.23% | | | | 14,303 | |
| Class 529B | | | 0.75% | | | | 0.25% | | | | 1.00% | | | | 1.00% | | | | 1,603 | |
| Class 529C | | | 0.75% | | | | 0.25% | | | | 1.00% | | | | 0.99% | | | | 15,833 | |
| Total Distribution and Service Fees | | | | | | | | | | | | $1,324,157 | |
| (d) | In accordance with the distribution plan for certain classes, the fund pays distribution and/or service fees equal to these annual percentage rates of each class’s average daily net assets. The distribution and service fee rates disclosed by class represent the current rates in effect at the end of the reporting period. Any rate changes, if applicable, are detailed below. |
| (e) | The annual effective rates represent actual fees incurred under the distribution plan for the six months ended February 28, 2019 based on each class’s average daily net assets. MFD has voluntarily agreed to rebate a portion of each class’s 0.25% service fee attributable to accounts for which MFD retains the 0.25% service fee except for accounts attributable to MFS or its affiliates’ seed money. For the six months ended February 28, 2019, this rebate amounted to $5,043, $82, $63, $367, $1, $967, and $95 for Class A, Class B, Class C, Class R2, Class R3, Class 529A, and Class 529C, respectively, and is included in the reduction of total expenses in the Statement of Operations. |
Certain Class A shares are subject to a contingent deferred sales charge (CDSC) in the event of a shareholder redemption within 18 months of purchase. Class B and Class 529B shares are subject to a CDSC in the event of a shareholder redemption within six years of purchase. Class C and Class 529C shares are subject to a CDSC in the event of a shareholder redemption within 12 months of purchase. All contingent deferred sales charges are paid to MFD and during the six months ended February 28, 2019, were as follows:
| | | | |
| |
| | | Amount | |
| Class A | �� | | $2,183 | |
| Class B | | | 2,715 | |
| Class C | | | 971 | |
| Class 529B | | | — | |
| Class 529C | | | 19 | |
The fund has entered into and may from time to time enter into contracts with program managers and other parties which administer the tuition programs through
34
Notes to Financial Statements (unaudited) – continued
which an investment in the fund’s 529 share classes is made. The fund has entered into an agreement with MFD pursuant to which MFD receives an annual fee of up to 0.05% of the average daily net assets attributable to each 529 share class. The services provided by MFD, or a third party with which MFD contracts, include recordkeeping and tax reporting and account services, as well as services designed to maintain the program’s compliance with the Internal Revenue Code and other regulatory requirements. Program manager fees for the six months ended February 28, 2019, were as follows:
| | | | |
| |
| | | Fee | |
| Class 529A | | | $2,860 | |
| Class 529B | | | 80 | |
| Class 529C | | | 792 | |
| Total Program Manager Fees | | | $3,732 | |
Shareholder Servicing Agent– MFS Service Center, Inc. (MFSC), a wholly-owned subsidiary of MFS, receives a fee from the fund for its services as shareholder servicing agent calculated as a percentage of the average daily net assets of the fund as determined periodically under the supervision of the fund’s Board of Trustees. For the six months ended February 28, 2019, the fee was $78,609, which equated to 0.0020% annually of the fund’s average daily net assets. MFSC also receives payment from the fund forout-of-pocket expenses,sub-accounting and other shareholder servicing costs which may be paid to affiliated and unaffiliated service providers. Class R6 shares do not incursub-accounting fees. For the six months ended February 28, 2019, theseout-of-pocket expenses,sub-accounting and other shareholder servicing costs amounted to $817,730.
Administrator– MFS provides certain financial, legal, shareholder communications, compliance, and other administrative services to the fund. Under an administrative services agreement, the fund reimburses MFS the costs incurred to provide these services. The fund is charged an annual fixed amount of $17,500 plus a fee based on average daily net assets. The administrative services fee incurred for the six months ended February 28, 2019 was equivalent to an annual effective rate of 0.0073% of the fund’s average daily net assets.
Trustees’ and Officers’ Compensation– The fund pays compensation to independent Trustees in the form of a retainer, attendance fees, and additional compensation to Board and Committee chairpersons. The fund does not pay compensation directly to Trustees or officers of the fund who are also officers of the investment adviser, all of whom receive remuneration for their services to the fund from MFS. Certain officers and Trustees of the fund are officers or directors of MFS, MFD, and MFSC.
Prior to December 31, 2001, the fund had an unfunded defined benefit plan (“DB plan”) for independent Trustees. As of December 31, 2001, the Board took action to terminate the DB plan with respect to then-current and any future independent Trustees, such that the DB plan covers only certain of those former independent Trustees who retired on or before December 31, 2001. The DB plan resulted in a pension expense of $143 and is included in “Independent Trustees’ compensation” in the Statement of Operations for the six months ended February 28, 2019. The liability
35
Notes to Financial Statements (unaudited) – continued
for deferred retirement benefits payable to those former independent Trustees under the DB plan amounted to $461 at February 28, 2019, and is included in “Payable for independent Trustees’ compensation” in the Statement of Assets and Liabilities.
Other– This fund and certain other funds managed by MFS (the funds) have entered into a service agreement (the ISO Agreement) which provides for payment of fees solely by the funds to Tarantino LLC in return for the provision of services of an Independent Senior Officer (ISO) for the funds. Frank L. Tarantino serves as the ISO and is an officer of the funds and the sole member of Tarantino LLC. The funds can terminate the ISO Agreement with Tarantino LLC at any time under the terms of the ISO Agreement. For the six months ended February 28, 2019, the fee paid by the fund under this agreement was $7,059 and is included in “Miscellaneous” expense in the Statement of Operations. MFS has agreed to bear all expenses associated with office space, other administrative support, and supplies provided to the ISO.
The fund invests in the MFS Institutional Money Market Portfolio which is managed by MFS and seeks current income consistent with preservation of capital and liquidity. This money market fund does not pay a management fee to MFS.
The fund is permitted to engage in purchase and sale transactions with funds and accounts for which MFS serves as investment adviser orsub-adviser (“cross-trades”) pursuant to a policy adopted by the Board of Trustees. This policy has been designed to ensure that cross-trades conducted by the fund comply with Rule17a-7 under the Investment Company Act of 1940. During the six months ended February 28, 2019, the fund engaged in purchase and sale transactions pursuant to this policy, which amounted to $7,599,775 and $3,950,171, respectively. The sales transactions resulted in net realized gains (losses) of $(1,691,184).
(4) Portfolio Securities
For the six months ended February 28, 2019, purchases and sales of investments, other than short-term obligations, aggregated $1,189,668,160 and $1,001,325,218, respectively.
36
Notes to Financial Statements (unaudited) – continued
(5) Shares of Beneficial Interest
The fund’s Declaration of Trust permits the Trustees to issue an unlimited number of full and fractional shares of beneficial interest. Transactions in fund shares were as follows:
| | | | | | | | | | | | | | | | |
| | | Six months ended
2/28/19 | | | Year ended
8/31/18 | |
| | | | |
| | | Shares | | | Amount | | | Shares | | | Amount | |
| Shares sold | | | | | | | | | | | | | | | | |
Class A | | | 4,261,851 | | | | $71,453,637 | | | | 7,069,268 | | | | $134,383,066 | |
Class B | | | 4,431 | | | | 72,174 | | | | 13,876 | | | | 255,158 | |
Class C | | | 334,037 | | | | 5,067,676 | | | | 218,850 | | | | 3,929,096 | |
Class I | | | 5,612,752 | | | | 98,846,775 | | | | 10,911,336 | | | | 215,968,481 | |
Class R1 | | | 5,811 | | | | 94,399 | | | | 17,274 | | | | 312,093 | |
Class R2 | | | 410,817 | | | | 6,853,235 | | | | 2,824,542 | | | | 52,534,049 | |
Class R3 | | | 252,029 | | | | 4,318,744 | | | | 727,392 | | | | 13,825,352 | |
Class R4 | | | 314,213 | | | | 5,354,004 | | | | 660,938 | | | | 12,682,200 | |
Class R6 | | | 55,895,763 | | | | 950,278,880 | | | | 97,088,940 | | | | 1,858,939,244 | |
Class 529A | | | 58,051 | | | | 965,758 | | | | 142,814 | | | | 2,703,844 | |
Class 529B | | | 519 | | | | 8,158 | | | | 1,799 | | | | 32,223 | |
Class 529C | | | 6,760 | | | | 105,317 | | | | 25,705 | | | | 446,045 | |
| | | 67,157,034 | | | | $1,143,418,757 | | | | 119,702,734 | | | | $2,296,010,851 | |
| | | |
Shares issued to shareholders in
reinvestment of distributions | | | | | | | | | | | | | |
Class A | | | 1,384,984 | | | | $22,173,601 | | | | 278,096 | | | | $5,278,247 | |
Class B | | | 8,845 | | | | 137,183 | | | | 776 | | | | 14,248 | |
Class C | | | 44,618 | | | | 674,185 | | | | 6,372 | | | | 113,995 | |
Class I | | | 1,213,492 | | | | 20,107,565 | | | | 370,149 | | | | 7,262,325 | |
Class R1 | | | 5,660 | | | | 83,875 | | | | 597 | | | | 10,519 | |
Class R2 | | | 310,892 | | | | 4,809,494 | | | | 58,080 | | | | 1,066,343 | |
Class R3 | | | 213,501 | | | | 3,381,859 | | | | 52,822 | | | | 992,523 | |
Class R4 | | | 160,956 | | | | 2,578,518 | | | | 41,572 | | | | 789,876 | |
Class R6 | | | 19,346,528 | | | | 307,416,337 | | | | 4,368,877 | | | | 82,397,020 | |
Class 529A | | | 35,487 | | | | 556,785 | | | | 7,033 | | | | 130,963 | |
Class 529B | | | 929 | | | | 13,781 | | | | 82 | | | | 1,445 | |
Class 529C | | | 9,666 | | | | 140,348 | | | | 1,499 | | | | 25,907 | |
| | | 22,735,558 | | | | $362,073,531 | | | | 5,185,955 | | | | $98,083,411 | |
37
Notes to Financial Statements (unaudited) – continued
| | | | | | | | | | | | | | | | |
| | | Six months ended
2/28/19 | | | Year ended
8/31/18 | |
| | | | |
| | | Shares | | | Amount | | | Shares | | | Amount | |
| Shares reacquired | | | | | | | | | | | | | |
Class A | | | (4,692,794 | ) | | | $(78,853,420 | ) | | | (9,782,601 | ) | | | $(185,844,596 | ) |
Class B | | | (50,150 | ) | | | (830,576 | ) | | | (104,573 | ) | | | (1,939,229 | ) |
Class C | | | (368,866 | ) | | | (5,841,476 | ) | | | (1,532,236 | ) | | | (27,742,773 | ) |
Class I | | | (7,450,610 | ) | | | (131,557,195 | ) | | | (36,650,383 | ) | | | (733,359,445 | ) |
Class R1 | | | (28,433 | ) | | | (441,969 | ) | | | (20,748 | ) | | | (370,130 | ) |
Class R2 | | | (971,629 | ) | | | (16,024,230 | ) | | | (3,921,714 | ) | | | (72,878,654 | ) |
Class R3 | | | (797,368 | ) | | | (13,573,619 | ) | | | (1,546,205 | ) | | | (29,443,847 | ) |
Class R4 | | | (484,975 | ) | | | (8,350,781 | ) | | | (1,167,421 | ) | | | (22,319,483 | ) |
Class R6 | | | (42,678,849 | ) | | | (756,621,567 | ) | | | (36,858,067 | ) | | | (700,719,685 | ) |
Class 529A | | | (58,717 | ) | | | (1,008,967 | ) | | | (66,288 | ) | | | (1,251,041 | ) |
Class 529B | | | (1,593 | ) | | | (25,651 | ) | | | (4,676 | ) | | | (82,960 | ) |
Class 529C | | | (28,950 | ) | | | (450,222 | ) | | | (55,236 | ) | | | (972,546 | ) |
| | | (57,612,934 | ) | | | $(1,013,579,673 | ) | | | (91,710,148 | ) | | | $(1,776,924,389 | ) |
| | | |
| Net change | | | | | | | | | | | | | |
Class A | | | 954,041 | | | | $14,773,818 | | | | (2,435,237 | ) | | | $(46,183,283 | ) |
Class B | | | (36,874 | ) | | | (621,219 | ) | | | (89,921 | ) | | | (1,669,823 | ) |
Class C | | | 9,789 | | | | (99,615 | ) | | | (1,307,014 | ) | | | (23,699,682 | ) |
Class I | | | (624,366 | ) | | | (12,602,855 | ) | | | (25,368,898 | ) | | | (510,128,639 | ) |
Class R1 | | | (16,962 | ) | | | (263,695 | ) | | | (2,877 | ) | | | (47,518 | ) |
Class R2 | | | (249,920 | ) | | | (4,361,501 | ) | | | (1,039,092 | ) | | | (19,278,262 | ) |
Class R3 | | | (331,838 | ) | | | (5,873,016 | ) | | | (765,991 | ) | | | (14,625,972 | ) |
Class R4 | | | (9,806 | ) | | | (418,259 | ) | | | (464,911 | ) | | | (8,847,407 | ) |
Class R6 | | | 32,563,442 | | | | 501,073,650 | | | | 64,599,750 | | | | 1,240,616,579 | |
Class 529A | | | 34,821 | | | | 513,576 | | | | 83,559 | | | | 1,583,766 | |
Class 529B | | | (145 | ) | | | (3,712 | ) | | | (2,795 | ) | | | (49,292 | ) |
Class 529C | | | (12,524 | ) | | | (204,557 | ) | | | (28,032 | ) | | | (500,594 | ) |
| | | 32,279,658 | | | | $491,912,615 | | | | 33,178,541 | | | | $617,169,873 | |
Class T shares were not publicly available for sale during the period. Please see the fund’s prospectus for details.
Effective June 1, 2019, purchases of the fund’s Class B and Class 529B shares are closed to new and existing investors subject to certain exceptions. Please see the fund’s prospectus for details.
The fund is one of several mutual funds in which certain MFS funds may invest. The MFS funds do not invest in the underlying funds for the purpose of exercising management or control. At the end of the period, the MFS International Diversification Fund, the MFS Growth Allocation Fund, the MFS Moderate Allocation Fund, the MFS Aggressive Growth Allocation Fund, and the MFS Conservative Allocation Fund were the owners of record of approximately 56%, 4%, 4%, 2%, and 1%, respectively, of the value of outstanding voting shares of the fund. In addition, the MFS Lifetime 2020 Fund, the MFS Lifetime 2025 Fund, the MFS Lifetime 2030 Fund, the MFS Lifetime 2035 Fund, the MFS Lifetime 2040 Fund, the MFS Lifetime 2045 Fund, the MFS
38
Notes to Financial Statements (unaudited) – continued
Lifetime 2050 Fund, the MFS Lifetime 2055 Fund, the MFS Lifetime 2060 Fund, and the MFS Lifetime Income Fund were each the owners of record of less than 1% of the value of outstanding voting shares of the fund.
(6) Line of Credit
The fund and certain other funds managed by MFS participate in a $1.25 billion unsecured committed line of credit, subject to a $1 billion sublimit, provided by a syndication of banks under a credit agreement. Borrowings may be made for temporary financing needs. Interest is charged to each fund, based on its borrowings, generally at a rate equal to the higher of the Overnight Bank Funding rate or daily one month LIBOR plus an agreed upon spread. A commitment fee, based on the average daily, unused portion of the committed line of credit, is allocated among the participating funds. In addition, the fund and other funds managed by MFS have established unsecured uncommitted borrowing arrangements with certain banks for temporary financing needs. Interest is charged to each fund, based on its borrowings, at a rate equal to the Overnight Bank Funding rate plus an agreed upon spread. For the six months ended February 28, 2019, the fund’s commitment fee and interest expense were $24,630 and $0, respectively, and are included in “Miscellaneous” expense in the Statement of Operations.
(7) Investments in Affiliated Issuers
An affiliated issuer may be considered one in which the fund owns 5% or more of the outstanding voting securities, or a company which is under common control. For the purposes of this report, the fund assumes the following to be affiliated issuers:
| | | | | | | | | | | | | | | | | | | | |
| | | | | |
| Affiliated Issuers | | | | | Beginning
Shares/Par
Amount | | | Acquisitions
Shares/Par
Amount | | | Dispositions
Shares/Par
Amount | | | Ending
Shares/Par
Amount | |
| MFS Institutional Money Market Portfolio | | | | | | | 78,815,546 | | | | 884,617,055 | | | | (896,313,070 | ) | | | 67,119,531 | |
| | | | | |
| Affiliated Issuers | | Realized
Gain (Loss) | | | Change in
Unrealized
Appreciation/
Depreciation | | | Capital Gain
Distributions | | | Dividend
Income | | | Ending
Value | |
| MFS Institutional Money Market Portfolio | | | $14,183 | | | | $(7,418 | ) | | | $— | | | | $972,055 | | | | $67,119,531 | |
39
PROXY VOTING POLICIES AND INFORMATION
MFS votes proxies on behalf of the fund pursuant to proxy voting policies and procedures that are available without charge, upon request, by calling1-800-225-2606, by visitingmfs.com/proxyvoting, or by visiting the SEC’s Web site athttp://www.sec.gov.
Information regarding how the fund voted proxies relating to portfolio securities during the most recent twelve-month period ended June 30 is available by August 31 of each year without charge by visitingmfs.com/proxyvoting, or by visiting the SEC’s Web site athttp://www.sec.gov.
QUARTERLY PORTFOLIO DISCLOSURE
The fund files a complete schedule of portfolio holdings with the SEC for the first and third quarters of each fiscal year on Form N-Q. The fund’s Form N-Q is available on the SEC’s website athttp://www.sec.gov.A shareholder can obtain the portfolio holdings report for the first and third quarters of the fund’s fiscal year atmfs.com/openendfundsby choosing the fund’s name and then selecting the “Resources” tab and clicking on “Prospectus and Reports”.
FURTHER INFORMATION
From time to time, MFS may post important information about the fund or the MFS funds on the MFS web site (mfs.com). This information is available athttps://www.mfs.com/en-us/what-we-do/announcements.html or atmfs.com/openendfunds by choosing the fund’s name.
INFORMATION ABOUT FUND CONTRACTS AND LEGAL CLAIMS
The fund has entered into contractual arrangements with an investment adviser, administrator, distributor, shareholder servicing agent, 529 program manager (if applicable), and custodian who each provide services to the fund. Unless expressly stated otherwise, shareholders are not parties to, or intended beneficiaries of these contractual arrangements, and these contractual arrangements are not intended to create any shareholder right to enforce them against the service providers or to seek any remedy under them against the service providers, either directly or on behalf of the fund.
Under the Trust’s By-Laws and Declaration of Trust, any claims asserted against or on behalf of the MFS Funds, including claims against Trustees and Officers, must be brought in state and federal courts located within the Commonwealth of Massachusetts.
PROVISION OF FINANCIAL REPORTS AND SUMMARY PROSPECTUSES
The fund produces financial reports every six months and updates its summary prospectus and prospectus annually. To avoid sending duplicate copies of materials to households, only one copy of the fund’s annual and semiannual report and summary prospectus may be mailed to shareholders having the same last name and residential address on the fund’s records. However, any shareholder may contact MFSC (please see back cover for address and telephone number) to request that copies of these reports and summary prospectuses be sent personally to that shareholder.
40
Save paper with eDelivery.

| MFS® will send you prospectuses, |
reports, and proxies directly viae-mail so you will get information faster with less mailbox clutter.
To sign up:
1. Go to mfs.com.
2. Log in via MFS® Access.
3. Select eDelivery.
If you own your MFS fund shares through a financial institution or a retirement plan, MFS® TALK, MFS® Access, or eDelivery may not be available to you.
CONTACT
WEB SITE
mfs.com
MFS TALK
1-800-637-8255
24 hours a day
ACCOUNT SERVICE AND LITERATURE
Shareholders
1-800-225-2606
Financial advisors
1-800-343-2829
Retirement plan services
1-800-637-1255
MAILING ADDRESS
MFS Service Center, Inc.
P.O. Box 219341
Kansas City, MO 64121-9341
OVERNIGHT MAIL
MFS Service Center, Inc.
Suite 219341
430 W 7th Street
Kansas City, MO 64105-1407
Semiannual Report
February 28, 2019

MFS® Technology Fund

Beginning on January 1, 2021, as permitted by regulations adopted by the U.S. Securities and Exchange Commission, paper copies of the fund’s annual and semiannual shareholder reports will no longer be sent by mail, unless you specifically request paper copies of the reports. Instead, the complete reports will be made available on the fund’s Web site (funds.mfs.com), and you will be notified by mail each time a report is posted and provided with a Web site link to access the report.
If you are already signed up to receive shareholder reports by email, you will not be affected by this change and you need not take any action. You may sign up to receive shareholder reports and other communications from the fund by email by contacting your financial intermediary (such as a broker-dealer or bank) or, if you hold your shares directly with the fund, by calling 1-800-225-2606 or by logging on to MFS Access at mfs.com.
Beginning on January 1, 2019, you may elect to receive all future reports in paper free of charge. Contact your financial intermediary to request that you continue to receive paper copies of your shareholder reports. If you invest directly with the fund, you can call 1-800-225-2606 or send an email request to orderliterature@mfs.com to let the fund know that you wish to continue receiving paper copies of your shareholder reports. Your election to receive reports in paper will apply to all funds held in your account if you invest through your financial intermediary or all funds held with the MFS fund complex if you invest directly.
SCT-SEM
MFS® Technology Fund
CONTENTS
The report is prepared for the general information of shareholders.
It is authorized for distribution to prospective investors only when preceded or accompanied by a current prospectus.
NOT FDIC INSURED• MAY LOSE VALUE• NO BANK GUARANTEE

LETTER FROM THE EXECUTIVE CHAIRMAN
Dear Shareholders:
Markets experienced a bout of volatility in late 2018 as a result of higher interest rates, international trade friction and geopolitical uncertainty surrounding issues such as
Brexit. But concern over those issues dissipated in the early months of 2019 due to a more dovish posture by the U.S. Federal Reserve, progress toward a trade pact between the United States and China, and a consensus forming in the British Parliament against ano-deal Brexit. Over the past year, U.S. equities have outperformed their global peers due in part to fiscal stimulus undertaken in late 2017 and early 2019, which helped maintain healthy levels of U.S. economic output against a backdrop of slowing global growth, though returns, on average, have been modest.
Globally, inflation remains largely subdued thanks in part to stable
oil prices, though tight labor markets are keeping investors on the lookout for its potential reappearance. Rising incomes in many developed and emerging markets are supportive of gains in consumption, though a challenging backdrop for global trade has weighed on manufacturing in most regions. Should the U.S. and China reach a comprehensive trade agreement, sentiment could improve later this year.
As a global investment manager with nearly a century of expertise, MFS® firmly believes active risk management offers downside mitigation and may help improve investment outcomes. We built our active investment platform with this belief in mind. Our long-term perspective influences nearly every aspect of our business, ensuring that our investment decisions align with the investing time horizons of our clients.
Respectfully,

Robert J. Manning
Executive Chairman
MFS Investment Management
April 16, 2019
The opinions expressed in this letter are subject to change and may not be relied upon for investment advice. No forecasts can be guaranteed.
1
PORTFOLIO COMPOSITION
Portfolio structure
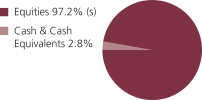
| | | | |
| Top ten holdings | |
| Alphabet, Inc., “A” | | | 10.1% | |
| Amazon.com, Inc. | | | 8.2% | |
| Facebook, Inc., “A” | | | 6.0% | |
| Microsoft Corp. | | | 4.7% | |
| Salesforce.com, Inc. | | | 4.6% | |
| Visa, Inc., “A” | | | 4.4% | |
| Mastercard, Inc., “A” | | | 3.9% | |
| Adobe Systems, Inc. | | | 3.9% | |
| DXC Technology Co. | | | 2.6% | |
| PayPal Holdings, Inc. | | | 2.5% | |
| | | | |
| Top five industries | | | | |
| Business Services | | | 19.7% | |
| Internet | | | 19.1% | |
| Computer Software | | | 18.0% | |
| Other Banks and Financial Institutions | | | 8.3% | |
| Specialty Stores | | | 8.2% | |
| (s) | Includes securities sold short. |
Cash & Cash Equivalents includes any cash, investments in money market funds, short-term securities, and other assets less liabilities. Please see the Statement of Assets and Liabilities for additional information related to the fund’s cash position and other assets and liabilities.
Percentages are based on net assets as of February 28, 2019.
The portfolio is actively managed and current holdings may be different.
2
EXPENSE TABLE
Fund expenses borne by the shareholders during the period, September 1, 2018 through February 28, 2019
As a shareholder of the fund, you incur two types of costs: (1) transaction costs, including sales charges (loads) on certain purchase or redemption payments, and (2) ongoing costs, including management fees; distribution and service(12b-1) fees; and other fund expenses. This example is intended to help you understand your ongoing costs (in dollars) of investing in the fund and to compare these costs with the ongoing costs of investing in other mutual funds.
The example is based on an investment of $1,000 invested at the beginning of the period and held for the entire period September 1, 2018 through February 28, 2019.
Actual Expenses
The first line for each share class in the following table provides information about actual account values and actual expenses. You may use the information in this line, together with the amount you invested, to estimate the expenses that you paid over the period. Simply divide your account value by $1,000 (for example, an $8,600 account value divided by $1,000 = 8.6), then multiply the result by the number in the first line under the heading entitled “Expenses Paid During Period” to estimate the expenses you paid on your account during this period.
Hypothetical Example for Comparison Purposes
The second line for each share class in the following table provides information about hypothetical account values and hypothetical expenses based on the fund’s actual expense ratio and an assumed rate of return of 5% per year before expenses, which is not the fund’s actual return. The hypothetical account values and expenses may not be used to estimate the actual ending account balance or expenses you paid for the period. You may use this information to compare the ongoing costs of investing in the fund and other funds. To do so, compare this 5% hypothetical example with the 5% hypothetical examples that appear in the shareholder reports of the other funds.
Please note that the expenses shown in the table are meant to highlight your ongoing costs only and do not reflect any transactional costs, such as sales charges (loads). Therefore, the second line for each share class in the table is useful in comparing ongoing costs only, and will not help you determine the relative total costs of owning different funds. In addition, if these transactional costs were included, your costs would have been higher.
3
Expense Table – continued
| | | | | | | | | | | | | | | | | | |
Share
Class | | | | Annualized
Expense
Ratio | | | Beginning
Account Value
9/01/18 | | | Ending
Account Value
2/28/19 | | | Expenses
Paid During
Period (p)
9/01/18-2/28/19 | |
| A | | Actual | | | 1.17% | | | | $1,000.00 | | | | $949.35 | | | | $5.65 | |
| | Hypothetical (h) | | | 1.17% | | | | $1,000.00 | | | | $1,018.99 | | | | $5.86 | |
| B | | Actual | | | 1.92% | | | | $1,000.00 | | | | $945.74 | | | | $9.26 | |
| | Hypothetical (h) | | | 1.92% | | | | $1,000.00 | | | | $1,015.27 | | | | $9.59 | |
| C | | Actual | | | 1.92% | | | | $1,000.00 | | | | $945.90 | | | | $9.26 | |
| | Hypothetical (h) | | | 1.92% | | | | $1,000.00 | | | | $1,015.27 | | | | $9.59 | |
| I | | Actual | | | 0.92% | | | | $1,000.00 | | | | $950.33 | | | | $4.45 | |
| | Hypothetical (h) | | | 0.92% | | | | $1,000.00 | | | | $1,020.23 | | | | $4.61 | |
| R1 | | Actual | | | 1.93% | | | | $1,000.00 | | | | $945.78 | | | | $9.31 | |
| | Hypothetical (h) | | | 1.93% | | | | $1,000.00 | | | | $1,015.22 | | | | $9.64 | |
| R2 | | Actual | | | 1.42% | | | | $1,000.00 | | | | $948.03 | | | | $6.86 | |
| | Hypothetical (h) | | | 1.42% | | | | $1,000.00 | | | | $1,017.75 | | | | $7.10 | |
| R3 | | Actual | | | 1.17% | | | | $1,000.00 | | | | $949.33 | | | | $5.65 | |
| | Hypothetical (h) | | | 1.17% | | | | $1,000.00 | | | | $1,018.99 | | | | $5.86 | |
| R4 | | Actual | | | 0.93% | | | | $1,000.00 | | | | $950.47 | | | | $4.50 | |
| | Hypothetical (h) | | | 0.93% | | | | $1,000.00 | | | | $1,020.18 | | | | $4.66 | |
| R6 | | Actual | | | 0.83% | | | | $1,000.00 | | | | $951.04 | | | | $4.02 | |
| | Hypothetical (h) | | | 0.83% | | | | $1,000.00 | | | | $1,020.68 | | | | $4.16 | |
| (h) | 5% class return per year before expenses. |
| (p) | “Expenses Paid During Period” are equal to each class’s annualized expense ratio, as shown above, multipliedby the average account value over the period, multiplied by 181/365 (to reflect theone-half year period). Expenses paid do not include any applicable sales charges (loads). If these transaction costs had been included, your costs would have been higher. |
Notes to Expense Table
Expense ratios include 0.02% of investment related expenses from short sales (See Note 2 of the Notes to Financial Statements).
Each class with a Rule12b-1 service fee is subject to a rebate of a portion of such fee. Such rebates are included in the expense ratios above. For Class A shares, this rebate reduced the expense ratio above by 0.01%. See Note 3 in the Notes to Financial Statements for additional information.
4
PORTFOLIO OF INVESTMENTS
2/28/19 (unaudited)
The Portfolio of Investments is a complete list of all securities owned by your fund. It is categorized by broad-based asset classes.
| | | | | | | | |
| Common Stocks - 97.6% | | | | | | | | |
| | |
| Issuer | | Shares/Par | | | Value ($) | |
| Aerospace - 3.2% | | | | | | | | |
| CACI International, Inc., “A” (a) | | | 16,595 | | | $ | 3,024,605 | |
| FLIR Systems, Inc. | | | 175,366 | | | | 9,022,580 | |
| Harris Corp. | | | 86,201 | | | | 14,217,131 | |
| Northrop Grumman Corp. | | | 38,778 | | | | 11,244,069 | |
| | | | | | | | |
| | | | | | | $ | 37,508,385 | |
| Biotechnology - 1.6% | | | | | | | | |
| Bio-Techne Corp. | | | 67,543 | | | $ | 13,096,588 | |
| Illumina, Inc. (a) | | | 17,850 | | | | 5,582,944 | |
| | | | | | | | |
| | | | | | | $ | 18,679,532 | |
| Broadcasting - 0.3% | | | | | | | | |
| Netflix, Inc. (a) | | | 9,487 | | | $ | 3,397,295 | |
| | |
| Brokerage & Asset Managers - 1.0% | | | | | | | | |
| NASDAQ, Inc. | | | 131,403 | | | $ | 12,032,573 | |
| | |
| Business Services - 19.7% | | | | | | | | |
| Cognizant Technology Solutions Corp., “A” | | | 192,140 | | | $ | 13,638,097 | |
| Dropbox, Inc. (a) | | | 240,737 | | | | 5,743,985 | |
| DXC Technology Co. | | | 468,874 | | | | 30,880,042 | |
| Endava PLC, ADR (a) | | | 304,801 | | | | 9,009,918 | |
| Fidelity National Information Services, Inc. | | | 175,145 | | | | 18,941,932 | |
| First Data Corp. (a) | | | 344,417 | | | | 8,658,643 | |
| Fiserv, Inc. (a) | | | 271,609 | | | | 23,002,566 | |
| FleetCor Technologies, Inc. (a) | | | 58,184 | | | | 13,573,164 | |
| Global Payments, Inc. | | | 195,947 | | | | 25,547,570 | |
| Grand Canyon Education, Inc. (a) | | | 99,880 | | | | 11,554,118 | |
| PayPal Holdings, Inc. (a) | | | 303,740 | | | | 29,787,782 | |
| Total System Services, Inc. | | | 228,273 | | | | 21,548,971 | |
| TransUnion | | | 136,638 | | | | 8,821,349 | |
| Verisk Analytics, Inc., “A” | | | 73,596 | | | | 9,304,742 | |
| | | | | | | | |
| | | | | | | $ | 230,012,879 | |
| Cable TV - 0.7% | | | | | | | | |
| Altice USA, Inc. | | | 367,408 | | | $ | 8,013,168 | |
| | |
| Computer Software - 18.0% | | | | | | | | |
| Adobe Systems, Inc. (a) | | | 173,295 | | | $ | 45,489,938 | |
| Autodesk, Inc. (a) | | | 103,301 | | | | 16,839,096 | |
5
Portfolio of Investments (unaudited) – continued
| | | | | | | | |
| | |
| Issuer | | Shares/Par | | | Value ($) | |
| Common Stocks - continued | | | | | | | | |
| Computer Software - continued | | | | | | | | |
| DocuSign, Inc. (a) | | | 82,922 | | | $ | 4,573,148 | |
| Eventbrite, Inc. (a)(l) | | | 195,361 | | | | 5,778,778 | |
| Microsoft Corp. | | | 489,192 | | | | 54,804,180 | |
| PTC, Inc. (a) | | | 105,609 | | | | 9,802,627 | |
| Red Hat, Inc. (a) | | | 24,458 | | | | 4,466,031 | |
| RingCentral, Inc. (a) | | | 70,673 | | | | 7,441,160 | |
| Salesforce.com, Inc. (a) | | | 330,141 | | | | 54,027,575 | |
| Zendesk, Inc. (a) | | | 94,822 | | | | 7,492,834 | |
| | | | | | | | |
| | | | | | | $ | 210,715,367 | |
| Computer Software - Systems - 8.2% | | | | | | | | |
| Apple, Inc. | | | 159,016 | | | $ | 27,533,620 | |
| Constellation Software, Inc. | | | 15,081 | | | | 12,878,128 | |
| EPAM Systems, Inc. (a) | | | 37,757 | | | | 6,108,327 | |
| HubSpot, Inc. (a) | | | 40,572 | | | | 6,831,513 | |
| New Relic, Inc. (a) | | | 61,509 | | | | 6,504,577 | |
| Pluralsight, Inc., “A” (a) | | | 231,874 | | | | 7,538,224 | |
| Presidio, Inc. | | | 677,082 | | | | 11,259,874 | |
| Rapid7, Inc. (a) | | | 47,796 | | | | 2,200,050 | |
| ServiceNow, Inc. (a) | | | 61,021 | | | | 14,610,868 | |
| | | | | | | | |
| | | | | | | $ | 95,465,181 | |
| Electrical Equipment - 2.3% | | | | | | | | |
| Amphenol Corp., “A” | | | 134,771 | | | $ | 12,664,431 | |
| TE Connectivity Ltd. | | | 174,769 | | | | 14,346,787 | |
| | | | | | | | |
| | | | | | | $ | 27,011,218 | |
| Electronics - 3.2% | | | | | | | | |
| Applied Materials, Inc. | | | 424,170 | | | $ | 16,262,678 | |
| Microchip Technology, Inc. | | | 242,301 | | | | 21,048,688 | |
| Silicon Laboratories, Inc. (a) | | | 6,803 | | | | 551,179 | |
| | | | | | | | |
| | | | | | | $ | 37,862,545 | |
| Internet - 19.1% | | | | | | | | |
| Alibaba Group Holding Ltd., ADR (a) | | | 45,488 | | | $ | 8,325,669 | |
| Alphabet, Inc., “A” (a)(s) | | | 105,350 | | | | 118,682,042 | |
| Facebook, Inc., “A” (a)(s) | | | 433,276 | | | | 69,952,410 | |
| GoDaddy, Inc. (a) | | | 193,901 | | | | 14,474,710 | |
| Spotify Technology S.A. (a) | | | 38,836 | | | | 5,442,477 | |
| Wix.com Ltd. (a) | | | 62,809 | | | | 6,861,883 | |
| | | | | | | | |
| | | | | | | $ | 223,739,191 | |
6
Portfolio of Investments (unaudited) – continued
| | | | | | | | |
| | |
| Issuer | | Shares/Par | | | Value ($) | |
| Common Stocks - continued | | | | | | | | |
| Leisure��& Toys - 2.0% | | | | | | | | |
| Activision Blizzard, Inc. | | | 208,388 | | | $ | 8,781,470 | |
| Electronic Arts, Inc. (a) | | | 154,045 | | | | 14,754,430 | |
| | | | | | | | |
| | | | | | | $ | 23,535,900 | |
| Medical & Health Technology & Services - 0.7% | | | | | | | | |
| Guardant Health, Inc. (a) | | | 118,577 | | | $ | 7,901,971 | |
| | |
| Medical Equipment - 0.2% | | | | | | | | |
| Senseonics Holdings, Inc. (a)(l) | | | 707,031 | | | $ | 2,114,023 | |
| | |
| Other Banks & Diversified Financials - 8.3% | | | | | | | | |
| Mastercard, Inc., “A” | | | 202,730 | | | $ | 45,567,622 | |
| Visa, Inc., “A” | | | 351,680 | | | | 52,090,842 | |
| | | | | | | | |
| | | | | | | $ | 97,658,464 | |
| Printing & Publishing - 0.9% | | | | | | | | |
| IHS Markit Ltd. (a) | | | 206,327 | | | $ | 10,970,407 | |
| | |
| Specialty Stores - 8.2% | | | | | | | | |
| Amazon.com, Inc. (a)(s) | | | 58,538 | | | $ | 95,992,369 | |
| Total Common Stocks (Identified Cost, $677,143,417) | | | | | | $ | 1,142,610,468 | |
| | |
| Investment Companies (h) - 2.5% | | | | | | | | |
| Money Market Funds - 2.5% | | | | | | | | |
MFS Institutional Money Market Portfolio, 2.49% (v)
(Identified Cost, $28,759,426) | | | 28,762,000 | | | $ | 28,762,000 | |
| | |
| Collateral for Securities Loaned - 0.1% | | | | | | | | |
| State Street Navigator Securities Lending Government Money Market Portfolio, 2.43% (j) (Identified Cost, $1,328,412) | | | 1,328,412 | | | $ | 1,328,412 | |
| | |
| Securities Sold Short - (0.4)% | | | | | | | | |
| Network & Telecom - (0.4)% | | | | | | | | |
| Fortinet, Inc. (Proceeds Received, $3,935,099) | | | (54,558 | ) | | $ | (4,735,089 | ) |
| | |
| Other Assets, Less Liabilities - 0.2% | | | | | | | 2,818,933 | |
| Net Assets - 100.0% | | | | | | $ | 1,170,784,724 | |
| (a) | Non-income producing security. |
| (h) | An affiliated issuer, which may be considered one in which the fund owns 5% or more of the outstanding voting securities, or a company which is under common control. At period end, the aggregate values of the fund’s investments in affiliated issuers and in unaffiliated issuers were $28,762,000 and $1,143,938,880, respectively. |
| (j) | The rate quoted is the annualizedseven-day yield of the fund at period end. |
7
Portfolio of Investments (unaudited) – continued
| (l) | A portion of this security is on loan. See Note 2 for additional information. |
| (s) | Security or a portion of the security was pledged to cover collateral requirements for securities sold short and/or certain derivative transactions. |
| (v) | Affiliated issuer that is available only to investment companies managed by MFS. The rate quoted for the MFS Institutional Money Market Portfolio is the annualizedseven-day yield of the fund at period end. |
The following abbreviations are used in this report and are defined:
| ADR | | American Depositary Receipt |
| PLC | | Public Limited Company |
At February 28, 2019, the fund had cash collateral of $3,618,272 and other liquid securities with an aggregate value of $4,269,660 to cover any collateral or margin obligations for securities sold short and certain derivative contracts. Restricted cash and/or deposits with brokers in the Statement of Assets and Liabilities are comprised of cash collateral.
See Notes to Financial Statements
8
Financial Statements
STATEMENT OF ASSETS AND LIABILITIES
At 2/28/19 (unaudited)
This statement represents your fund’s balance sheet, which details the assets and liabilities comprising the total value of the fund.
| | | | |
| Assets | | | | |
Investments in unaffiliated issuers, at value, including $1,387,739 of securities on loan (identified cost, $678,471,829) | | | $1,143,938,880 | |
Investments in affiliated issuers, at value (identified cost, $28,759,426) | | | 28,762,000 | |
Deposits with brokers for | | | | |
Securities sold short | | | 3,618,272 | |
Receivables for | | | | |
Fund shares sold | | | 2,045,132 | |
Interest and dividends | | | 661,811 | |
Other assets | | | 4,416 | |
Total assets | | | $1,179,030,511 | |
| |
| Liabilities | | | | |
Payable to custodian | | | $234,211 | |
Payables for | | | | |
Securities sold short, at value (proceeds received, $3,935,099) | | | 4,735,089 | |
Fund shares reacquired | | | 1,563,480 | |
Collateral for securities loaned, at value (c) | | | 1,328,412 | |
Payable to affiliates | | | | |
Investment adviser | | | 47,957 | |
Shareholder servicing costs | | | 277,720 | |
Distribution and service fees | | | 15,222 | |
Payable for independent Trustees’ compensation | | | 467 | |
Accrued expenses and other liabilities | | | 43,229 | |
Total liabilities | | | $8,245,787 | |
Net assets | | | $1,170,784,724 | |
| |
| Net assets consist of | | | | |
Paid-in capital | | | $697,125,642 | |
Total distributable earnings (loss) | | | 473,659,082 | |
Net assets | | | $1,170,784,724 | |
Shares of beneficial interest outstanding | | | 28,359,629 | |
| (c) | Non-cash collateral is not included. |
9
Statement of Assets and Liabilities (unaudited) – continued
| | | | | | | | | | | | |
| | | |
| | | Net assets | | | Shares
outstanding | | | Net asset value
per share (a) | |
Class A | | | $442,129,732 | | | | 10,720,186 | | | | $41.24 | |
Class B | | | 41,138,128 | | | | 1,164,896 | | | | 35.31 | |
Class C | | | 121,926,271 | | | | 3,460,043 | | | | 35.24 | |
Class I | | | 289,346,471 | | | | 6,542,940 | | | | 44.22 | |
Class R1 | | | 5,496,971 | | | | 156,326 | | | | 35.16 | |
Class R2 | | | 27,534,145 | | | | 702,556 | | | | 39.19 | |
Class R3 | | | 73,630,381 | | | | 1,786,186 | | | | 41.22 | |
Class R4 | | | 22,794,881 | | | | 529,829 | | | | 43.02 | |
Class R6 | | | 146,787,744 | | | | 3,296,667 | | | | 44.53 | |
| (a) | Maximum offering price per share was equal to the net asset value per share for all share classes, except for Class A, for which the maximum offering price per share was $43.76 [100 / 94.25 x $41.24]. On sales of $50,000 or more, the maximum offering price of Class A shares is reduced. A contingent deferred sales charge may be imposed on redemptions of Class A, Class B, and Class C shares. Redemption price per share was equal to the net asset value per share for Classes I, R1, R2, R3, R4, and R6. |
See Notes to Financial Statements
10
Financial Statements
STATEMENT OF OPERATIONS
Six months ended 2/28/19 (unaudited)
This statement describes how much your fund earned in investment income and accrued in expenses. It also describes any gains and/or losses generated by fund operations.
| | | | |
| Net investment income (loss) | | | | |
Income | | | | |
Dividends | | | $2,583,165 | |
Dividends from affiliated issuers | | | 301,020 | |
Other | | | 136,541 | |
Income on securities loaned | | | 18,123 | |
Foreign taxes withheld | | | (4,534 | ) |
Total investment income | | | $3,034,315 | |
Expenses | | | | |
Management fee | | | $4,112,649 | |
Distribution and service fees | | | 1,489,704 | |
Shareholder servicing costs | | | 569,141 | |
Administrative services fee | | | 78,198 | |
Independent Trustees’ compensation | | | 7,786 | |
Custodian fee | | | 33,341 | |
Shareholder communications | | | 34,877 | |
Audit and tax fees | | | 29,519 | |
Legal fees | | | 4,540 | |
Dividend and interest expense on securities sold short | | | 127,579 | |
Interest expense and fees | | | 3,652 | |
Miscellaneous | | | 101,436 | |
Total expenses | | | $6,592,422 | |
Reduction of expenses by investment adviser and distributor | | | (66,792 | ) |
Net expenses | | | $6,525,630 | |
Net investment income (loss) | | | $(3,491,315 | ) |
| |
| Realized and unrealized gain (loss) | | | | |
Realized gain (loss) (identified cost basis) | | | | |
Unaffiliated issuers | | | $22,343,802 | |
Affiliated issuers | | | 1,827 | |
Securities sold short | | | (2,890,137 | ) |
Foreign currency | | | (61 | ) |
Net realized gain (loss) | | | $19,455,431 | |
Change in unrealized appreciation or depreciation | | | | |
Unaffiliated issuers | | | $(84,501,932 | ) |
Affiliated issuers | | | (58 | ) |
Securities sold short | | | 2,903,127 | |
Net unrealized gain (loss) | | | $(81,598,863 | ) |
Net realized and unrealized gain (loss) | | | $(62,143,432 | ) |
Change in net assets from operations | | | $(65,634,747 | ) |
See Notes to Financial Statements
11
Financial Statements
STATEMENTS OF CHANGES IN NET ASSETS
These statements describe the increases and/or decreases in net assets resulting from operations, any distributions, and any shareholder transactions.
| | | | | | | | |
| | | Six months ended
2/28/19
(unaudited) | | | Year ended
8/31/18 | |
| Change in net assets | | | | | | |
| | |
| From operations | | | | | | | | |
Net investment income (loss) | | | $(3,491,315 | ) | | | $(6,927,690 | ) |
Net realized gain (loss) | | | 19,455,431 | | | | 62,489,446 | |
Net unrealized gain (loss) | | | (81,598,863 | ) | | | 230,387,318 | |
Change in net assets from operations | | | $(65,634,747 | ) | | | $285,949,074 | |
Total distributions to shareholders (a) | | | $(51,440,197 | ) | | | $(34,022,224 | ) |
Change in net assets from fund share transactions | | | $50,911,644 | | | | $123,938,358 | |
Total change in net assets | | | $(66,163,300 | ) | | | $375,865,208 | |
| | |
| Net assets | | | | | | | | |
At beginning of period | | | 1,236,948,024 | | | | 861,082,816 | |
At end of period (b) | | | $1,170,784,724 | | | | $1,236,948,024 | |
| (a) | Distributions from net investment income and from net realized gain are no longer required to be separately disclosed. See Note 2. For the year ended August 31, 2018, distributions from net realized gain were $34,022,224. |
| (b) | Parenthetical disclosure of accumulated net investment loss is no longer required. See Note 2. For the year ended August 31, 2018, end of period net assets included accumulated net investment loss of $510. |
See Notes to Financial Statements
12
Financial Statements
FINANCIAL HIGHLIGHTS
The financial highlights table is intended to help you understand the fund’s financial performance for the semiannual period and the past 5 fiscal years. Certain information reflects financial results for a single fund share. The total returns in the table represent the rate that an investor would have earned (or lost) on an investment in the fund share class (assuming reinvestment of all distributions) held for the entire period.
| | | | | | | | | | | | | | | | | | | | | | | | |
| | | Six months
ended 2/28/19 | | | Year ended | |
| Class A | | 8/31/18 | | | 8/31/17 | | | 8/31/16 | | | 8/31/15 | | | 8/31/14 | |
| | | (unaudited) | | | | | | | | | | | | | | | | |
Net asset value, beginning of period | | | $45.65 | | | | $35.67 | | | | $28.27 | | | | $24.62 | | | | $24.47 | | | | $19.41 | |
| | | |
| Income (loss) from investment operations | | | | | | | | | | | | | |
Net investment income (loss) (d) | | | $(0.12 | ) | | | $(0.26 | ) | | | $(0.19 | )(c) | | | $(0.12 | ) | | | $(0.15 | ) | | | $(0.13 | ) |
Net realized and unrealized
gain (loss) | | | (2.40 | ) | | | 11.61 | | | | 8.13 | | | | 4.76 | | | | 1.15 | | | | 5.19 | |
Total from investment operations | | | $(2.52 | ) | | | $11.35 | | | | $7.94 | | | | $4.64 | | | | $1.00 | | | | $5.06 | |
| | | |
| Less distributions declared to shareholders | | | | | | | | | | | | | |
From net realized gain | | | $(1.89 | ) | | | $(1.37 | ) | | | $(0.54 | ) | | | $(0.99 | ) | | | $(0.85 | ) | | | $— | |
Net asset value, end of period (x) | | | $41.24 | | | | $45.65 | | | | $35.67 | | | | $28.27 | | | | $24.62 | | | | $24.47 | |
Total return (%) (r)(s)(t)(x) | | | (5.07 | )(n) | | | 32.79 | | | | 28.58 | (c) | | | 19.20 | | | | 4.18 | | | | 26.07 | |
| | | |
Ratios (%) (to average net assets)
and Supplemental data: | | | | | | | | | | | | | |
Expenses before expense
reductions (f) | | | 1.19 | (a) | | | 1.24 | | | | 1.24 | (c) | | | 1.27 | | | | 1.30 | | | | 1.33 | |
Expenses after expense
reductions (f) | | | 1.17 | (a) | | | 1.22 | | | | 1.23 | (c) | | | 1.26 | | | | 1.29 | | | | 1.32 | |
Net investment income (loss) | | | (0.62 | )(a) | | | (0.66 | ) | | | (0.63 | )(c) | | | (0.48 | ) | | | (0.60 | ) | | | (0.58 | ) |
Portfolio turnover | | | 16 | (n) | | | 30 | | | | 43 | | | | 30 | | | | 43 | | | | 38 | |
Net assets at end of period
(000 omitted) | | | $442,130 | | | | $484,477 | | | | $359,698 | | | | $320,898 | | | | $199,313 | | | | $171,020 | |
| | | |
| Supplemental Ratios (%): | | | | | | | | | | | | | |
Ratio of expenses to average net
assets after expense reductions
excluding short sale expenses
and interest expense and fees (f) | | | 1.15 | (a) | | | 1.16 | | | | 1.19 | (c) | | | 1.24 | | | | 1.27 | | | | 1.28 | |
See Notes to Financial Statements
13
Financial Highlights – continued
| | | | | | | | | | | | | | | | | | | | | | | | |
| | | Six months
ended 2/28/19 | | | Year ended | |
| Class B | | 8/31/18 | | | 8/31/17 | | | 8/31/16 | | | 8/31/15 | | | 8/31/14 | |
| | | (unaudited) | | | | | | | | | | | | | | | | |
Net asset value, beginning of period | | | $39.55 | | | | $31.31 | | | | $25.06 | | | | $22.09 | | | | $22.20 | | | | $17.75 | |
| | | |
| Income (loss) from investment operations | | | | | | | | | | | | | |
Net investment income (loss) (d) | | | $(0.24 | ) | | | $(0.49 | ) | | | $(0.38 | )(c) | | | $(0.28 | ) | | | $(0.30 | ) | | | $(0.27 | ) |
Net realized and unrealized
gain (loss) | | | (2.11 | ) | | | 10.10 | | | | 7.17 | | | | 4.24 | | | | 1.04 | | | | 4.72 | |
Total from investment operations | | | $(2.35 | ) | | | $9.61 | | | | $6.79 | | | | $3.96 | | | | $0.74 | | | | $4.45 | |
| | | |
| Less distributions declared to shareholders | | | | | | | | | | | | | |
From net realized gain | | | $(1.89 | ) | | | $(1.37 | ) | | | $(0.54 | ) | | | $(0.99 | ) | | | $(0.85 | ) | | | $— | |
Net asset value, end of period (x) | | | $35.31 | | | | $39.55 | | | | $31.31 | | | | $25.06 | | | | $22.09 | | | | $22.20 | |
Total return (%) (r)(s)(t)(x) | | | (5.43 | )(n) | | | 31.77 | | | | 27.64 | (c) | | | 18.29 | | | | 3.41 | | | | 25.07 | |
| | | |
Ratios (%) (to average net assets)
and Supplemental data: | | | | | | | | | | | | | |
Expenses before expense
reductions (f) | | | 1.94 | (a) | | | 1.99 | | | | 1.99 | (c) | | | 2.02 | | | | 2.05 | | | | 2.08 | |
Expenses after expense
reductions (f) | | | 1.92 | (a) | | | 1.98 | | | | 1.98 | (c) | | | 2.01 | | | | 2.04 | | | | 2.07 | |
Net investment income (loss) | | | (1.38 | )(a) | | | (1.41 | ) | | | (1.38 | )(c) | | | (1.22 | ) | | | (1.35 | ) | | | (1.34 | ) |
Portfolio turnover | | | 16 | (n) | | | 30 | | | | 43 | | | | 30 | | | | 43 | | | | 38 | |
Net assets at end of period
(000 omitted) | | | $41,138 | | | | $45,337 | | | | $34,396 | | | | $25,990 | | | | $18,791 | | | | $16,190 | |
| | | |
| Supplemental Ratios (%): | | | | | | | | | | | | | |
Ratio of expenses to average net
assets after expense reductions
excluding short sale expenses
and interest expense and fees (f) | | | 1.90 | (a) | | | 1.92 | | | | 1.94 | (c) | | | 1.99 | | | | 2.02 | | | | 2.03 | |
See Notes to Financial Statements
14
Financial Highlights – continued
| | | | | | | | | | | | | | | | | | | | | | | | |
| | | Six months
ended 2/28/19 | | | Year ended | |
| Class C | | 8/31/18 | | | 8/31/17 | | | 8/31/16 | | | 8/31/15 | | | 8/31/14 | |
| | | (unaudited) | | | | | | | | | | | | | | | | |
Net asset value, beginning of period | | | $39.47 | | | | $31.24 | | | | $25.01 | | | | $22.05 | | | | $22.16 | | | | $17.71 | |
| | | |
| Income (loss) from investment operations | | | | | | | | | | | | | |
Net investment income (loss) (d) | | | $(0.24 | ) | | | $(0.49 | ) | | | $(0.38 | )(c) | | | $(0.28 | ) | | | $(0.30 | ) | | | $(0.28 | ) |
Net realized and unrealized
gain (loss) | | | (2.10 | ) | | | 10.09 | | | | 7.15 | | | | 4.23 | | | | 1.04 | | | | 4.73 | |
Total from investment operations | | | $(2.34 | ) | | | $9.60 | | | | $6.77 | | | | $3.95 | | | | $0.74 | | | | $4.45 | |
| | | |
| Less distributions declared to shareholders | | | | | | | | | | | | | |
From net realized gain | | | $(1.89 | ) | | | $(1.37 | ) | | | $(0.54 | ) | | | $(0.99 | ) | | | $(0.85 | ) | | | $— | |
Net asset value, end of period (x) | | | $35.24 | | | | $39.47 | | | | $31.24 | | | | $25.01 | | | | $22.05 | | | | $22.16 | |
Total return (%) (r)(s)(t)(x) | | | (5.41 | )(n) | | | 31.81 | | | | 27.62 | (c) | | | 18.28 | | | | 3.42 | | | | 25.13 | |
| | | |
Ratios (%) (to average net assets)
and Supplemental data: | | | | | | | | | | | | | |
Expenses before expense
reductions (f) | | | 1.94 | (a) | | | 1.98 | | | | 1.99 | (c) | | | 2.02 | | | | 2.05 | | | | 2.07 | |
Expenses after expense
reductions (f) | | | 1.92 | (a) | | | 1.97 | | | | 1.98 | (c) | | | 2.01 | | | | 2.04 | | | | 2.07 | |
Net investment income (loss) | | | (1.37 | )(a) | | | (1.41 | ) | | | (1.38 | )(c) | | | (1.23 | ) | | | (1.35 | ) | | | (1.34 | ) |
Portfolio turnover | | | 16 | (n) | | | 30 | | | | 43 | | | | 30 | | | | 43 | | | | 38 | |
Net assets at end of period
(000 omitted) | | | $121,926 | | | | $128,707 | | | | $101,656 | | | | $73,071 | | | | $43,037 | | | | $35,998 | |
| | | |
| Supplemental Ratios (%): | | | | | | | | | | | | | |
Ratio of expenses to average net
assets after expense reductions
excluding short sale expenses
and interest expense and fees (f) | | | 1.90 | (a) | | | 1.92 | | | | 1.94 | (c) | | | 2.00 | | | | 2.02 | | | | 2.03 | |
See Notes to Financial Statements
15
Financial Highlights – continued
| | | | | | | | | | | | | | | | | | | | | | | | |
| | | Six months
ended 2/28/19 | | | Year ended | |
| Class I | | 8/31/18 | | | 8/31/17 | | | 8/31/16 | | | 8/31/15 | | | 8/31/14 | |
| | | (unaudited) | | | | | | | | | | | | | | | | |
Net asset value, beginning of period | | | $48.74 | | | | $37.90 | | | | $29.93 | | | | $25.96 | | | | $25.69 | | | | $20.33 | |
| | | |
| Income (loss) from investment operations | | | | | | | | | | | | | |
Net investment income (loss) (d) | | | $(0.08 | ) | | | $(0.18 | ) | | | $(0.13 | )(c) | | | $(0.07 | ) | | | $(0.09 | ) | | | $(0.08 | ) |
Net realized and unrealized
gain (loss) | | | (2.55 | ) | | | 12.39 | | | | 8.64 | | | | 5.03 | | | | 1.21 | | | | 5.44 | |
Total from investment operations | | | $(2.63 | ) | | | $12.21 | | | | $8.51 | | | | $4.96 | | | | $1.12 | | | | $5.36 | |
| | | |
| Less distributions declared to shareholders | | | | | | | | | | | | | |
From net realized gain | | | $(1.89 | ) | | | $(1.37 | ) | | | $(0.54 | ) | | | $(0.99 | ) | | | $(0.85 | ) | | | $— | |
Net asset value, end of period (x) | | | $44.22 | | | | $48.74 | | | | $37.90 | | | | $29.93 | | | | $25.96 | | | | $25.69 | |
Total return (%) (r)(s)(t)(x) | | | (4.97 | )(n) | | | 33.14 | | | | 28.91 | (c) | | | 19.45 | | | | 4.45 | | | | 26.36 | |
| | | |
Ratios (%) (to average net assets)
and Supplemental data: | | | | | | | | | | | | | |
Expenses before expense
reductions (f) | | | 0.93 | (a) | | | 0.99 | | | | 0.99 | (c) | | | 1.02 | | | | 1.05 | | | | 1.08 | |
Expenses after expense
reductions (f) | | | 0.92 | (a) | | | 0.98 | | | | 0.98 | (c) | | | 1.01 | | | | 1.04 | | | | 1.07 | |
Net investment income (loss) | | | (0.38 | )(a) | | | (0.41 | ) | | | (0.39 | )(c) | | | (0.24 | ) | | | (0.35 | ) | | | (0.35 | ) |
Portfolio turnover | | | 16 | (n) | | | 30 | | | | 43 | | | | 30 | | | | 43 | | | | 38 | |
Net assets at end of period
(000 omitted) | | | $289,346 | | | | $303,359 | | | | $174,275 | | | | $96,700 | | | | $56,619 | | | | $40,359 | |
| | | |
| Supplemental Ratios (%): | | | | | | | | | | | | | |
Ratio of expenses to average net
assets after expense reductions
excluding short sale expenses
and interest expense and fees (f) | | | 0.90 | (a) | | | 0.92 | | | | 0.95 | (c) | | | 1.00 | | | | 1.02 | | | | 1.04 | |
See Notes to Financial Statements
16
Financial Highlights – continued
| | | | | | | | | | | | | | | | | | | | | | | | |
| | | Six months
ended 2/28/19 | | | Year ended | |
| Class R1 | | 8/31/18 | | | 8/31/17 | | | 8/31/16 | | | 8/31/15 | | | 8/31/14 | |
| | | (unaudited) | | | | | | | | | | | | | | | | |
Net asset value, beginning of period | | | $39.39 | | | | $31.18 | | | | $24.96 | | | | $22.01 | | | | $22.12 | | | | $17.68 | |
| | | |
| Income (loss) from investment operations | | | | | | | | | | | | | |
Net investment income (loss) (d) | | | $(0.23 | ) | | | $(0.49 | ) | | | $(0.38 | )(c) | | | $(0.28 | ) | | | $(0.30 | ) | | | $(0.27 | ) |
Net realized and unrealized
gain (loss) | | | (2.11 | ) | | | 10.07 | | | | 7.14 | | | | 4.22 | | | | 1.04 | | | | 4.71 | |
Total from investment operations | | | $(2.34 | ) | | | $9.58 | | | | $6.76 | | | | $3.94 | | | | $0.74 | | | | $4.44 | |
| | | |
| Less distributions declared to shareholders | | | | | | | | | | | | | |
From net realized gain | | | $(1.89 | ) | | | $(1.37 | ) | | | $(0.54 | ) | | | $(0.99 | ) | | | $(0.85 | ) | | | $— | |
Net asset value, end of period (x) | | | $35.16 | | | | $39.39 | | | | $31.18 | | | | $24.96 | | | | $22.01 | | | | $22.12 | |
Total return (%) (r)(s)(t)(x) | | | (5.42 | )(n) | | | 31.80 | | | | 27.63 | (c) | | | 18.27 | | | | 3.43 | | | | 25.11 | |
| | | |
Ratios (%) (to average net assets)
and Supplemental data: | | | | | | | | | | | | | |
Expenses before expense
reductions (f) | | | 1.94 | (a) | | | 1.99 | | | | 1.99 | (c) | | | 2.02 | | | | 2.05 | | | | 2.08 | |
Expenses after expense
reductions (f) | | | 1.93 | (a) | | | 1.98 | | | | 1.98 | (c) | | | 2.01 | | | | 2.04 | | | | 2.07 | |
Net investment income (loss) | | | (1.37 | )(a) | | | (1.41 | ) | | | (1.38 | )(c) | | | (1.22 | ) | | | (1.36 | ) | | | (1.34 | ) |
Portfolio turnover | | | 16 | (n) | | | 30 | | | | 43 | | | | 30 | | | | 43 | | | | 38 | |
Net assets at end of period
(000 omitted) | | | $5,497 | | | | $5,534 | | | | $4,256 | | | | $3,073 | | | | $2,516 | | | | $2,033 | |
| | | |
| Supplemental Ratios (%): | | | | | | | | | | | | | |
Ratio of expenses to average net
assets after expense reductions
excluding short sale expenses
and interest expense and fees (f) | | | 1.90 | (a) | | | 1.92 | | | | 1.95 | (c) | | | 1.99 | | | | 2.02 | | | | 2.04 | |
See Notes to Financial Statements
17
Financial Highlights – continued
| | | | | | | | | | | | | | | | | | | | | | | | |
| | | Six months
ended 2/28/19 | | | Year ended | |
| Class R2 | | 8/31/18 | | | 8/31/17 | | | 8/31/16 | | | 8/31/15 | | | 8/31/14 | |
| | | (unaudited) | | | | | | | | | | | | | | | | |
Net asset value, beginning of period | | | $43.55 | | | | $34.17 | | | | $27.17 | | | | $23.76 | | | | $23.70 | | | | $18.85 | |
| | | |
| Income (loss) from investment operations | | | | | | | | | | | | | |
Net investment income (loss) (d) | | | $(0.17 | ) | | | $(0.35 | ) | | | $(0.26 | )(c) | | | $(0.18 | ) | | | $(0.20 | ) | | | $(0.18 | ) |
Net realized and unrealized
gain (loss) | | | (2.30 | ) | | | 11.10 | | | | 7.80 | | | | 4.58 | | | | 1.11 | | | | 5.03 | |
Total from investment operations | | | $(2.47 | ) | | | $10.75 | | | | $7.54 | | | | $4.40 | | | | $0.91 | | | | $4.85 | |
| | | |
| Less distributions declared to shareholders | | | | | | | | | | | | | |
From net realized gain | | | $(1.89 | ) | | | $(1.37 | ) | | | $(0.54 | ) | | | $(0.99 | ) | | | $(0.85 | ) | | | $— | |
Net asset value, end of period (x) | | | $39.19 | | | | $43.55 | | | | $34.17 | | | | $27.17 | | | | $23.76 | | | | $23.70 | |
Total return (%) (r)(s)(t)(x) | | | (5.20 | )(n) | | | 32.46 | | | | 28.27 | (c) | | | 18.88 | | | | 3.93 | | | | 25.73 | |
| | | |
Ratios (%) (to average net assets)
and Supplemental data: | | | | | | | | | | | | | |
Expenses before expense
reductions (f) | | | 1.43 | (a) | | | 1.48 | | | | 1.49 | (c) | | | 1.52 | | | | 1.55 | | | | 1.58 | |
Expenses after expense
reductions (f) | | | 1.42 | (a) | | | 1.48 | | | | 1.49 | (c) | | | 1.51 | | | | 1.54 | | | | 1.58 | |
Net investment income (loss) | | | (0.87 | )(a) | | | (0.91 | ) | | | (0.89 | )(c) | | | (0.72 | ) | | | (0.84 | ) | | | (0.83 | ) |
Portfolio turnover | | | 16 | (n) | | | 30 | | | | 43 | | | | 30 | | | | 43 | | | | 38 | |
Net assets at end of period
(000 omitted) | | | $27,534 | | | | $28,071 | | | | $23,625 | | | | $17,031 | | | | $14,946 | | | | $17,123 | |
| | | |
| Supplemental Ratios (%): | | | | | | | | | | | | | |
Ratio of expenses to average net
assets after expense reductions
excluding short sale expenses
and interest expense and fees (f) | | | 1.40 | (a) | | | 1.42 | | | | 1.45 | (c) | | | 1.49 | | | | 1.52 | | | | 1.54 | |
See Notes to Financial Statements
18
Financial Highlights – continued
| | | | | | | | | | | | | | | | | | | | | | | | |
| | | Six months
ended 2/28/19 | | | Year ended | |
| Class R3 | | 8/31/18 | | | 8/31/17 | | | 8/31/16 | | | 8/31/15 | | | 8/31/14 | |
| | | (unaudited) | | | | | | | | | | | | | | | | |
Net asset value, beginning of period | | | $45.63 | | | | $35.66 | | | | $28.26 | | | | $24.61 | | | | $24.46 | | | | $19.41 | |
| | | |
| Income (loss) from investment operations | | | | | | | | | | | | | |
Net investment income (loss) (d) | | | $(0.12 | ) | | | $(0.27 | ) | | | $(0.20 | )(c) | | | $(0.13 | ) | | | $(0.15 | ) | | | $(0.13 | ) |
Net realized and unrealized
gain (loss) | | | (2.40 | ) | | | 11.61 | | | | 8.14 | | | | 4.77 | | | | 1.15 | | | | 5.18 | |
Total from investment operations | | | $(2.52 | ) | | | $11.34 | | | | $7.94 | | | | $4.64 | | | | $1.00 | | | | $5.05 | |
| | | |
| Less distributions declared to shareholders | | | | | | | | | | | | | |
From net realized gain | | | $(1.89 | ) | | | $(1.37 | ) | | | $(0.54 | ) | | | $(0.99 | ) | | | $(0.85 | ) | | | $— | |
Net asset value, end of period (x) | | | $41.22 | | | | $45.63 | | | | $35.66 | | | | $28.26 | | | | $24.61 | | | | $24.46 | |
Total return (%) (r)(s)(t)(x) | | | (5.07 | )(n) | | | 32.77 | | | | 28.59 | (c) | | | 19.21 | | | | 4.18 | | | | 26.02 | |
| | | |
Ratios (%) (to average net assets)
and Supplemental data: | | | | | | | | | | | | | |
Expenses before expense
reductions (f) | | | 1.18 | (a) | | | 1.24 | | | | 1.24 | (c) | | | 1.27 | | | | 1.30 | | | | 1.33 | |
Expenses after expense
reductions (f) | | | 1.17 | (a) | | | 1.23 | | | | 1.23 | (c) | | | 1.26 | | | | 1.29 | | | | 1.32 | |
Net investment income (loss) | | | (0.63 | )(a) | | | (0.66 | ) | | | (0.65 | )(c) | | | (0.49 | ) | | | (0.60 | ) | | | (0.59 | ) |
Portfolio turnover | | | 16 | (n) | | | 30 | | | | 43 | | | | 30 | | | | 43 | | | | 38 | |
Net assets at end of period
(000 omitted) | | | $73,630 | | | | $79,534 | | | | $53,199 | | | | $20,180 | | | | $9,732 | | | | $10,626 | |
| | | |
| Supplemental Ratios (%): | | | | | | | | | | | | | |
Ratio of expenses to average net
assets after expense reductions
excluding short sale expenses
and interest expense and fees (f) | | | 1.15 | (a) | | | 1.17 | | | | 1.20 | (c) | | | 1.25 | | | | 1.27 | | | | 1.29 | |
See Notes to Financial Statements
19
Financial Highlights – continued
| | | | | | | | | | | | | | | | | | | | | | | | |
| | | Six months
ended 2/28/19 | | | Year ended | |
| Class R4 | | 8/31/18 | | | 8/31/17 | | | 8/31/16 | | | 8/31/15 | | | 8/31/14 | |
| | | (unaudited) | | | | | | | | | | | | | | | | |
Net asset value, beginning of period | | | $47.47 | | | | $36.95 | | | | $29.19 | | | | $25.34 | | | | $25.10 | | | | $19.86 | |
| | | |
| Income (loss) from investment operations | | | | | | | | | | | | | |
Net investment income (loss) (d) | | | $(0.08 | ) | | | $(0.17 | ) | | | $(0.13 | )(c) | | | $(0.06 | ) | | | $(0.09 | ) | | | $(0.08 | ) |
Net realized and unrealized
gain (loss) | | | (2.48 | ) | | | 12.06 | | | | 8.43 | | | | 4.90 | | | | 1.18 | | | | 5.32 | |
Total from investment operations | | | $(2.56 | ) | | | $11.89 | | | | $8.30 | | | | $4.84 | | | | $1.09 | | | | $5.24 | |
| | | |
| Less distributions declared to shareholders | | | | | | | | | | | | | |
From net realized gain | | | $(1.89 | ) | | | $(1.37 | ) | | | $(0.54 | ) | | | $(0.99 | ) | | | $(0.85 | ) | | | $— | |
Net asset value, end of period (x) | | | $43.02 | | | | $47.47 | | | | $36.95 | | | | $29.19 | | | | $25.34 | | | | $25.10 | |
Total return (%) (r)(s)(t)(x) | | | (4.95 | )(n) | | | 33.12 | | | | 28.92 | (c) | | | 19.45 | | | | 4.44 | | | | 26.38 | |
| | | |
Ratios (%) (to average net assets)
and Supplemental data: | | | | | | | | | | | | | |
Expenses before expense
reductions (f) | | | 0.93 | (a) | | | 0.99 | | | | 0.99 | (c) | | | 1.02 | | | | 1.05 | | | | 1.07 | |
Expenses after expense
reductions (f) | | | 0.93 | (a) | | | 0.98 | | | | 0.99 | (c) | | | 1.01 | | | | 1.04 | | | | 1.07 | |
Net investment income (loss) | | | (0.37 | )(a) | | | (0.41 | ) | | | (0.39 | )(c) | | | (0.24 | ) | | | (0.37 | ) | | | (0.34 | ) |
Portfolio turnover | | | 16 | (n) | | | 30 | | | | 43 | | | | 30 | | | | 43 | | | | 38 | |
Net assets at end of period
(000 omitted) | | | $22,795 | | | | $23,004 | | | | $14,443 | | | | $8,141 | | | | $2,234 | | | | $1,403 | |
| | | |
| Supplemental Ratios (%): | | | | | | | | | | | | | |
Ratio of expenses to average net
assets after expense reductions
excluding short sale expenses
and interest expense and fees (f) | | | 0.90 | (a) | | | 0.92 | | | | 0.95 | (c) | | | 1.00 | | | | 1.02 | | | | 1.04 | |
See Notes to Financial Statements
20
Financial Highlights – continued
| | | | | | | | | | | | | | | | | | | | | | | | |
| | | Six months
ended 2/28/19 | | | Year ended | |
| Class R6 | | 8/31/18 | | | 8/31/17 | | | 8/31/16 | | | 8/31/15 | | | 8/31/14 | |
| | | (unaudited) | | | | | | | | | | | | | | | | |
Net asset value, beginning of period | | | $49.03 | | | | $38.09 | | | | $30.05 | | | | $26.03 | | | | $25.73 | | | | $20.34 | |
| | | |
| Income (loss) from investment operations | | | | | | | | | | | | | |
Net investment income (loss) (d) | | | $(0.06 | ) | | | $(0.13 | ) | | | $(0.10 | )(c) | | | $(0.04 | ) | | | $(0.07 | ) | | | $(0.07 | ) |
Net realized and unrealized
gain (loss) | | | (2.55 | ) | | | 12.44 | | | | 8.68 | | | | 5.05 | | | | 1.22 | | | | 5.46 | |
Total from investment operations | | | $(2.61 | ) | | | $12.31 | | | | $8.58 | | | | $5.01 | | | | $1.15 | | | | $5.39 | |
| | | |
| Less distributions declared to shareholders | | | | | | | | | | | | | |
From net realized gain | | | $(1.89 | ) | | | $(1.37 | ) | | | $(0.54 | ) | | | $(0.99 | ) | | | $(0.85 | ) | | | $— | |
Net asset value, end of period (x) | | | $44.53 | | | | $49.03 | | | | $38.09 | | | | $30.05 | | | | $26.03 | | | | $25.73 | |
Total return (%) (r)(s)(t)(x) | | | (4.90 | )(n) | | | 33.24 | | | | 29.03 | (c) | | | 19.59 | | | | 4.57 | | | | 26.50 | |
| | | |
Ratios (%) (to average net assets)
and Supplemental data: | | | | | | | | | | | | | |
Expenses before expense
reductions (f) | | | 0.84 | (a) | | | 0.89 | | | | 0.90 | (c) | | | 0.92 | | | | 0.95 | | | | 0.97 | |
Expenses after expense
reductions (f) | | | 0.83 | (a) | | | 0.88 | | | | 0.89 | (c) | | | 0.91 | | | | 0.94 | | | | 0.96 | |
Net investment income (loss) | | | (0.28 | )(a) | | | (0.31 | ) | | | (0.30 | )(c) | | | (0.13 | ) | | | (0.27 | ) | | | (0.28 | ) |
Portfolio turnover | | | 16 | (n) | | | 30 | | | | 43 | | | | 30 | | | | 43 | | | | 38 | |
Net assets at end of period
(000 omitted) | | | $146,788 | | | | $138,924 | | | | $95,534 | | | | $33,411 | | | | $7,079 | | | | $2,429 | |
| | | |
| Supplemental Ratios (%): | | | | | | | | | | | | | |
Ratio of expenses to average net
assets after expense reductions
excluding short sale expenses
and interest expense and fees (f) | | | 0.81 | (a) | | | 0.82 | | | | 0.85 | (c) | | | 0.90 | | | | 0.92 | | | | 0.95 | |
| (c) | Amount reflects aone-time reimbursement of expenses by the custodian (or former custodian) without which net investment income and performance would be lower and expenses would be higher. |
| (d) | Per share data is based on average shares outstanding. |
| (f) | Ratios do not reflect reductions from fees paid indirectly, if applicable. |
| (r) | Certain expenses have been reduced without which performance would have been lower. |
| (s) | From time to time the fund may receive proceeds from litigation settlements, without which performance would be lower. |
| (t) | Total returns do not include any applicable sales charges. |
| (x) | The net asset values and total returns have been calculated on net assets which include adjustments made in accordance with U.S. generally accepted accounting principles required at period end for financial reporting purposes. |
See Notes to Financial Statements
21
NOTES TO FINANCIAL STATEMENTS
(unaudited)
(1) Business and Organization
MFS Technology Fund (the fund) is anon-diversified series of MFS Series Trust I (the trust). The trust is organized as a Massachusetts business trust and is registered under the Investment Company Act of 1940, as amended, as anopen-end management investment company.
The fund is an investment company and accordingly follows the investment company accounting and reporting guidance of the Financial Accounting Standards Board (FASB) Accounting Standards Codification Topic 946 Financial Services – Investment Companies.
(2) Significant Accounting Policies
General– The preparation of financial statements in conformity with U.S. generally accepted accounting principles requires management to make estimates and assumptions that affect the reported amounts of assets and liabilities, and disclosure of contingent assets and liabilities at the date of the financial statements and the reported amounts of increases and decreases in net assets from operations during the reporting period. Actual results could differ from those estimates. In the preparation of these financial statements, management has evaluated subsequent events occurring after the date of the fund’s Statement of Assets and Liabilities through the date that the financial statements were issued. The fund invests primarily in securities of issuers in the technology industry. Issuers in a single industry can react similarly to market, currency, political, economic, regulatory, geopolitical, and other conditions. The value of stocks in the technology sector can be very volatile due to the rapid pace of product change, technological developments, and other factors.
In August 2018, the Securities and Exchange Commission (SEC) released its Final Rule on Disclosure Update and Simplification (the “Final Rule”) which is intended to simplify an issuer’s disclosure compliance efforts by removing redundant or outdated disclosure requirements without significantly altering the mix of information provided to investors. Effective with the current reporting period, the fund adopted the Final Rule with the impacts being that the fund is no longer required to present the components of distributable earnings on the Statement of Assets and Liabilities or the sources of distributions to shareholders and the amount of undistributed net investment income on the Statements of Changes in Net Assets.
Balance Sheet Offsetting– The fund’s accounting policy with respect to balance sheet offsetting is that, absent an event of default by the counterparty or a termination of the agreement, the International Swaps and Derivatives Association (ISDA) Master Agreement, or similar agreement, does not result in an offset of reported amounts of financial assets and financial liabilities in the Statement of Assets and Liabilities across transactions between the fund and the applicable counterparty. The fund’s right to setoff may be restricted or prohibited by the bankruptcy or insolvency laws of the particular jurisdiction to which a specific master netting agreement counterparty is subject. Balance sheet offsetting disclosures, to the extent applicable to the fund, have been included in the fund’s Significant Accounting Policies note under the captions for each of the fund’sin-scope financial instruments and transactions.
22
Notes to Financial Statements (unaudited) – continued
Investment Valuations– Equity securities, including restricted equity securities and equity securities sold short, are generally valued at the last sale or official closing price on their primary market or exchange as provided by a third-party pricing service. Equity securities, for which there were no sales reported that day, are generally valued at the last quoted daily bid quotation on their primary market or exchange as provided by a third-party pricing service. Equity securities sold short, for which there were no sales reported for that day, are generally valued at the last quoted daily ask quotation on their primary market or exchange as provided by a third-party pricing service.Short-term instruments with a maturity at issuance of 60 days or less may be valued at amortized cost, which approximates market value.Open-end investment companies are generally valued at net asset value per share. Securities and other assets generally valued on the basis of information from a third-party pricing service may also be valued at a broker/dealer bid quotation. In determining values, third-party pricing services can utilize both transaction data and market information such as yield, quality, coupon rate, maturity, type of issue, trading characteristics, and other market data. The values of foreign securities and other assets and liabilities expressed in foreign currencies are converted to U.S. dollars using the mean of bid and asked prices for rates provided by a third-party pricing service.
The Board of Trustees has delegated primary responsibility for determining or causing to be determined the value of the fund’s investments (including any fair valuation) to the adviser pursuant to valuation policies and procedures approved by the Board. If the adviser determines that reliable market quotations are not readily available, investments are valued at fair value as determined in good faith by the adviser in accordance with such procedures under the oversight of the Board of Trustees. Under the fund’s valuation policies and procedures, market quotations are not considered to be readily available for most types of debt instruments and floating rate loans and many types of derivatives. These investments are generally valued at fair value based on information from third-party pricing services. In addition, investments may be valued at fair value if the adviser determines that an investment’s value has been materially affected by events occurring after the close of the exchange or market on which the investment is principally traded (such as foreign exchange or market) and prior to the determination of the fund’s net asset value, or after the halting of trading of a specific security where trading does not resume prior to the close of the exchange or market on which the security is principally traded. Events that occur on a frequent basis after foreign markets close (such as developments in foreign markets and significant movements in the U.S. markets) and prior to the determination of the fund’s net asset value may be deemed to have a material effect on the value of securities traded in foreign markets. Accordingly, the fund’s foreign equity securities may often be valued at fair value. The adviser generally relies on third-party pricing services or other information (such as the correlation with price movements of similar securities in the same or other markets; the type, cost and investment characteristics of the security; the business and financial condition of the issuer; and trading and other market data) to assist in determining whether to fair value and at what value to fair value an investment. The value of an investment for purposes of calculating the fund’s net asset value can differ depending on the source and method used to determine value. When fair valuation is used, the value of an investment used to determine the fund’s net asset value may differ from
23
Notes to Financial Statements (unaudited) – continued
quoted or published prices for the same investment. There can be no assurance that the fund could obtain the fair value assigned to an investment if it were to sell the investment at the same time at which the fund determines its net asset value per share.
Various inputs are used in determining the value of the fund’s assets or liabilities. These inputs are categorized into three broad levels. In certain cases, the inputs used to measure fair value may fall into different levels of the fair value hierarchy. In such cases, an investment’s level within the fair value hierarchy is based on the lowest level of input that is significant to the fair value measurement. The fund’s assessment of the significance of a particular input to the fair value measurement in its entirety requires judgment, and considers factors specific to the investment. Level 1 includes unadjusted quoted prices in active markets for identical assets or liabilities. Level 2 includes other significant observable market-based inputs (including quoted prices for similar securities, interest rates, prepayment speed, and credit risk). Level 3 includes unobservable inputs, which may include the adviser’s own assumptions in determining the fair value of investments. The following is a summary of the levels used as of February 28, 2019 in valuing the fund’s assets or liabilities:
| | | | | | | | | | | | | | | | |
| | | | |
| Financial Instruments | | Level 1 | | | Level 2 | | | Level 3 | | | Total | |
| Equity Securities | | | $1,142,610,468 | | | | $— | | | | $— | | | | $1,142,610,468 | |
| Mutual Funds | | | 30,090,412 | | | | — | | | | — | | | | 30,090,412 | |
| Total | | | $1,172,700,880 | | | | $— | | | | $— | | | | $1,172,700,880 | |
| | | | |
| Securities Sold Short | | | $(4,735,089 | ) | | | $— | | | | $— | | | | $(4,735,089 | ) |
For further information regarding security characteristics, see the Portfolio of Investments.
Foreign Currency Translation– Purchases and sales of foreign investments, income, and expenses are converted into U.S. dollars based upon currency exchange rates prevailing on the respective dates of such transactions or on the reporting date for foreign denominated receivables and payables. Gains and losses attributable to foreign currency exchange rates on sales of securities are recorded for financial statement purposes as net realized gains and losses on investments. Gains and losses attributable to foreign exchange rate movements on receivables, payables, income and expenses are recorded for financial statement purposes as foreign currency transaction gains and losses. That portion of both realized and unrealized gains and losses on investments that results from fluctuations in foreign currency exchange rates is not separately disclosed.
Short Sales– The fund entered into short sales whereby it sells a security it does not own in anticipation of a decline in the value of that security. The fund will realize a gain if the security price decreases and a loss if the security price increases between the date of the short sale and the date on which the fund replaces the borrowed security. Losses from short sales can exceed the proceeds of the security sold; and they can also exceed the potential loss from an ordinary buy and sell transaction. The amount of any premium, dividends, or interest the fund may be required to pay in connection with a short sale will be recognized as a fund expense. During the six months ended February 28, 2019, this expense amounted to $127,579. The fund segregates cash or marketable securities in an amount that, when combined with the amount of proceeds
24
Notes to Financial Statements (unaudited) – continued
from the short sale deposited with the broker, at least equals the current market value of the security sold short.
Security Loans– Under its Securities Lending Agency Agreement with the fund, State Street Bank and Trust Company, as lending agent, loans the securities of the fund to certain qualified institutions (the “Borrowers”) approved by the fund. Security loans can be terminated at the discretion of either the lending agent or the fund and the related securities must be returned within the earlier of the standard trade settlement period for such securities or within three business days. The loans are collateralized by cash and/or U.S. Treasury and federal agency obligations in an amount typically at least equal to the market value of the securities loaned. On loans collateralized by cash, the cash collateral is invested in a money market fund. The market value of the loaned securities is determined at the close of business of the fund and any additional required collateral is delivered to the fund on the next business day. The lending agent provides the fund with indemnification against Borrower default. In the event of Borrower default, the lending agent will, for the benefit of the fund, either purchase securities identical to those loaned or, when such purchase is commercially impracticable, pay the fund the market value of the loaned securities. In return, the lending agent assumes the fund’s rights to the related collateral. If the collateral value is less than the cost to purchase identical securities, the lending agent is responsible for the shortfall, but only to the extent that such shortfall is not due to a decline in collateral value resulting from collateral reinvestment for which the fund bears the risk of loss. At period end, the fund had investment securities on loan, all of which were classified as equity securities in the fund’s Portfolio of Investments, with a fair value of $1,387,739. The fair value of the fund’s investment securities on loan and a related liability of $1,328,412 for cash collateral received on securities loaned are both presented gross in the Statement of Assets and Liabilities. Additionally, these loans were collateralized by U.S. Treasury Obligations of $97,301 held by the lending agent. The collateral on securities loaned exceeded the value of securities on loan at period end. The liability for cash collateral for securities loaned is carried at fair value, which is categorized as level 2 within the fair value hierarchy. A portion of the income generated upon investment of the collateral is remitted to the Borrowers, and the remainder is allocated between the fund and the lending agent. On loans collateralized by U.S. Treasury and/or federal agency obligations, a fee is received from the Borrower, and is allocated between the fund and the lending agent. Income from securities lending is separately reported in the Statement of Operations. The dividend and interest income earned on the securities loaned is accounted for in the same manner as other dividend and interest income.
Indemnifications– Under the fund’s organizational documents, its officers and Trustees may be indemnified against certain liabilities and expenses arising out of the performance of their duties to the fund. Additionally, in the normal course of business, the fund enters into agreements with service providers that may contain indemnification clauses. The fund’s maximum exposure under these agreements is unknown as this would involve future claims that may be made against the fund that have not yet occurred.
Investment Transactions and Income– Investment transactions are recorded on the trade date. Dividends received in cash are recorded on theex-dividend date. Certain dividends from foreign securities will be recorded when the fund is informed of the
25
Notes to Financial Statements (unaudited) – continued
dividend if such information is obtained subsequent to theex-dividend date. Dividend payments received in additional securities are recorded on theex-dividend date in an amount equal to the value of the security on such date.
The fund may receive proceeds from litigation settlements. Any proceeds received from litigation involving portfolio holdings are reflected in the Statement of Operations in realized gain/loss if the security has been disposed of by the fund or in unrealized gain/loss if the security is still held by the fund. Any other proceeds from litigation not related to portfolio holdings are reflected as other income in the Statement of Operations.
Tax Matters and Distributions– The fund intends to qualify as a regulated investment company, as defined under Subchapter M of the Internal Revenue Code, and to distribute all of its taxable income, including realized capital gains. As a result, no provision for federal income tax is required. The fund’s federal tax returns, when filed, will remain subject to examination by the Internal Revenue Service for a three year period. Management has analyzed the fund’s tax positions taken on federal and state tax returns for all open tax years and does not believe that there are any uncertain tax positions that require recognition of a tax liability. Foreign taxes, if any, have been accrued by the fund in the accompanying financial statements in accordance with the applicable foreign tax law. Foreign income taxes may be withheld by certain countries in which the fund invests. Additionally, capital gains realized by the fund on securities issued in or by certain foreign countries may be subject to capital gains tax imposed by those countries.
Distributions to shareholders are recorded on theex-dividend date. Income and capital gain distributions are determined in accordance with income tax regulations, which may differ from U.S. generally accepted accounting principles. Certain capital accounts in the financial statements are periodically adjusted for permanent differences in order to reflect their tax character. These adjustments have no impact on net assets or net asset value per share. Temporary differences which arise from recognizing certain items of income, expense, gain or loss in different periods for financial statement and tax purposes will reverse at some time in the future. Distributions in excess of net investment income or net realized gains are temporary overdistributions for financial statement purposes resulting from differences in the recognition or classification of income or distributions for financial statement and tax purposes.
Book/tax differences primarily relate to wash sale loss deferrals, straddle loss deferrals, and treating a portion of the proceeds from redemptions as a distribution for tax purposes.
The tax character of distributions made during the current period will be determined at fiscal year end. The tax character of distributions declared to shareholders for the last fiscal year is as follows:
| | | | |
| |
| | | Year ended
8/31/18 | |
Ordinary income (including any
short-term capital gains) | | | $10,346,187 | |
| Long-term capital gains | | | 23,676,037 | |
| |
| Total distributions | | | $34,022,224 | |
26
Notes to Financial Statements (unaudited) – continued
The federal tax cost and the tax basis components of distributable earnings were as follows:
| | | | |
| |
| As of 2/28/19 | | | |
| |
| Cost of investments | | | $708,360,329 | |
| Gross appreciation | | | 468,324,728 | |
| |
| Gross depreciation | | | (8,719,266 | ) |
| Net unrealized appreciation (depreciation) | | | $459,605,462 | |
| |
| As of 8/31/18 | | | |
| |
| Undistributed ordinary income | | | 8,438,597 | |
| Undistributed long-term capital gain | | | 41,091,614 | |
| Other temporary differences | | | (510 | ) |
| Net unrealized appreciation (depreciation) | | | 541,204,325 | |
The aggregate cost above includes prior fiscal year end tax adjustments, if applicable.
Multiple Classes of Shares of Beneficial Interest– The fund offers multiple classes of shares, which differ in their respective distribution and service fees. The fund’s income, realized and unrealized gain (loss), and common expenses are allocated to shareholders based on the daily net assets of each class. Dividends are declared separately for each class. Differences in per share dividend rates are generally due to differences in separate class expenses. Class B shares will convert to Class A shares approximately eight years after purchase. Class C shares will convert to Class A shares approximately ten years after purchase. The fund’s distributions declared to shareholders as reported in the Statements of Changes in Net Assets are presented by class as follows:
| | | | | | | | |
| | | From net realized gain | |
| | |
| | | Six months
ended
2/28/19 | | | Year
ended
8/31/18 | |
| Class A | | | $20,061,820 | | | | $13,806,022 | |
| Class B | | | 2,165,547 | | | | 1,454,317 | |
| Class C | | | 6,237,227 | | | | 4,487,570 | |
| Class I | | | 11,628,427 | | | | 6,827,614 | |
| Class R1 | | | 267,264 | | | | 182,847 | |
| Class R2 | | | 1,292,150 | | | | 964,012 | |
| Class R3 | | | 3,217,992 | | | | 2,088,034 | |
| Class R4 | | | 875,507 | | | | 546,050 | |
| Class R6 | | | 5,694,263 | | | | 3,665,758 | |
| Total | | | $51,440,197 | | | | $34,022,224 | |
(3) Transactions with Affiliates
Investment Adviser– The fund has an investment advisory agreement with MFS to provide overall investment management and related administrative services and
27
Notes to Financial Statements (unaudited) – continued
facilities to the fund. The management fee is computed daily and paid monthly at the following annual rates based on the fund’s average daily net assets:
| | | | |
| Up to $1 billion | | | 0.75 | % |
| In excess of $1 billion | | | 0.70 | % |
MFS has agreed in writing to reduce its management fee by a specified amount if certain MFS mutual fund assets exceed thresholds agreed to by MFS and the fund’s Board of Trustees. For the six months ended February 28, 2019, this management fee reduction amounted to $54,744, which is included in the reduction of total expenses in the Statement of Operations. The management fee incurred for the six months ended February 28, 2019 was equivalent to an annual effective rate of 0.73% of the fund’s average daily net assets.
Distributor– MFS Fund Distributors, Inc. (MFD), a wholly-owned subsidiary of MFS, as distributor, received $101,824 for the six months ended February 28, 2019, as its portion of the initial sales charge on sales of Class A shares of the fund.
The Board of Trustees has adopted a distribution plan for certain share classes pursuant to Rule12b-1 of the Investment Company Act of 1940.
The fund’s distribution plan provides that the fund will pay MFD for services provided by MFD and financial intermediaries in connection with the distribution and servicing of certain share classes. One component of the plan is a distribution fee paid to MFD and another component of the plan is a service fee paid to MFD. MFD may subsequently pay all, or a portion, of the distribution and/or service fees to financial intermediaries.
Distribution Plan Fee Table:
| | | | | | | | | | | | | | | | | | | | |
| | | | | |
| | | Distribution
Fee Rate (d) | | | Service
Fee Rate (d) | | | Total
Distribution
Plan (d) | | | Annual
Effective
Rate (e) | | | Distribution
and Service
Fee | |
| Class A | | | — | | | | 0.25% | | | | 0.25% | | | | 0.24% | | | | $536,602 | |
| Class B | | | 0.75% | | | | 0.25% | | | | 1.00% | | | | 1.00% | | | | 199,576 | |
| Class C | | | 0.75% | | | | 0.25% | | | | 1.00% | | | | 1.00% | | | | 576,641 | |
| Class R1 | | | 0.75% | | | | 0.25% | | | | 1.00% | | | | 1.00% | | | | 25,094 | |
| Class R2 | | | 0.25% | | | | 0.25% | | | | 0.50% | | | | 0.50% | | | | 63,963 | |
| Class R3 | | | — | | | | 0.25% | | | | 0.25% | | | | 0.25% | | | | 87,828 | |
| Total Distribution and Service Fees | | | | | | | | | | | | $1,489,704 | |
| (d) | In accordance with the distribution plan for certain classes, the fund pays distribution and/or service fees equal to these annual percentage rates of each class’s average daily net assets. The distribution and service fee rates disclosed by class represent the current rates in effect at the end of the reporting period. Any rate changes, if applicable, are detailed below. |
| (e) | The annual effective rates represent actual fees incurred under the distribution plan for the six months ended February 28, 2019 based on each class’s average daily net assets. MFD has voluntarily agreed to rebate a portion of each class’s 0.25% service fee attributable to accounts for which MFD retains the 0.25% service fee except for accounts attributable to MFS or its affiliates’ seed money. For the six months ended February 28, 2019, this rebate amounted to $11,621, $234, $183, and $10 for Class A, Class B, Class C, and Class R2, respectively, and is included in the reduction of total expenses in the Statement of Operations. |
Certain Class A shares are subject to a contingent deferred sales charge (CDSC) in the event of a shareholder redemption within 18 months of purchase. Class B shares are
28
Notes to Financial Statements (unaudited) – continued
subject to a CDSC in the event of a shareholder redemption within six years of purchase. Class C shares are subject to a CDSC in the event of a shareholder redemption within 12 months of purchase. All contingent deferred sales charges are paid to MFD and during the six months ended February 28, 2019, were as follows:
| | | | |
| |
| | | Amount | |
| Class A | | | $2,968 | |
| Class B | | | 19,102 | |
| Class C | | | 7,919 | |
Shareholder Servicing Agent– MFS Service Center, Inc. (MFSC), a wholly-owned subsidiary of MFS, receives a fee from the fund for its services as shareholder servicing agent calculated as a percentage of the average daily net assets of the fund as determined periodically under the supervision of the fund’s Board of Trustees. For the six months ended February 28, 2019, the fee was $67,858, which equated to 0.0123% annually of the fund’s average daily net assets. MFSC also receives payment from the fund forout-of-pocket expenses,sub-accounting and other shareholder servicing costs which may be paid to affiliated and unaffiliated service providers. Class R6 shares do not incursub-accounting fees. For the six months ended February 28, 2019, theseout-of-pocket expenses,sub-accounting and other shareholder servicing costs amounted to $501,283.
Administrator– MFS provides certain financial, legal, shareholder communications, compliance, and other administrative services to the fund. Under an administrative services agreement, the fund reimburses MFS the costs incurred to provide these services. The fund is charged an annual fixed amount of $17,500 plus a fee based on average daily net assets. The administrative services fee incurred for the six months ended February 28, 2019 was equivalent to an annual effective rate of 0.0142% of the fund’s average daily net assets.
Trustees’ and Officers’ Compensation– The fund pays compensation to independent Trustees in the form of a retainer, attendance fees, and additional compensation to Board and Committee chairpersons. The fund does not pay compensation directly to Trustees or officers of the fund who are also officers of the investment adviser, all of whom receive remuneration for their services to the fund from MFS. Certain officers and Trustees of the fund are officers or directors of MFS, MFD, and MFSC.
Prior to December 31, 2001, the fund had an unfunded defined benefit plan (“DB plan”) for independent Trustees. As of December 31, 2001, the Board took action to terminate the DB plan with respect to then-current and any future independent Trustees, such that the DB plan covers only certain of those former independent Trustees who retired on or before December 31, 2001. The DB plan resulted in a pension expense of $141 and is included in “Independent Trustees’ compensation” in the Statement of Operations for the six months ended February 28, 2019. The liability for deferred retirement benefits payable to those former independent Trustees under the DB plan amounted to $457 at February 28, 2019, and is included in “Payable for independent Trustees’ compensation” in the Statement of Assets and Liabilities.
Other– This fund and certain other funds managed by MFS (the funds) have entered into a service agreement (the ISO Agreement) which provides for payment of fees
29
Notes to Financial Statements (unaudited) – continued
solely by the funds to Tarantino LLC in return for the provision of services of an Independent Senior Officer (ISO) for the funds. Frank L. Tarantino serves as the ISO and is an officer of the funds and the sole member of Tarantino LLC. The funds can terminate the ISO Agreement with Tarantino LLC at any time under the terms of the ISO Agreement. For the six months ended February 28, 2019, the fee paid by the fund under this agreement was $966 and is included in “Miscellaneous” expense in the Statement of Operations. MFS has agreed to bear all expenses associated with office space, other administrative support, and supplies provided to the ISO.
The fund invests in the MFS Institutional Money Market Portfolio which is managed by MFS and seeks current income consistent with preservation of capital and liquidity. This money market fund does not pay a management fee to MFS.
The adviser has voluntarily undertaken to reimburse the fund from its own resources on a quarterly basis for the cost of investment research embedded in the cost of the fund’s securities trades. This agreement may be rescinded at any time. For the six months ended February 28, 2019, this reimbursement amounted to $51,529, which is included in “Other” income in the Statement of Operations.
(4) Portfolio Securities
For the six months ended February 28, 2019, purchases and sales of investments, other than short sales and short-term obligations, aggregated $180,663,759 and $203,990,214, respectively.
(5) Shares of Beneficial Interest
The fund’s Declaration of Trust permits the Trustees to issue an unlimited number of full and fractional shares of beneficial interest. Transactions in fund shares were as follows:
| | | | | | | | | | | | | | | | |
| | | Six months ended
2/28/19 | | | Year ended
8/31/18 | |
| | | | |
| | | Shares | | | Amount | | | Shares | | | Amount | |
| Shares sold | | | | | | | | | | | | | | | | |
Class A | | | 1,100,313 | | | | $44,500,186 | | | | 2,690,325 | | | | $108,662,252 | |
Class B | | | 84,998 | | | | 3,006,701 | | | | 261,237 | | | | 9,196,477 | |
Class C | | | 376,897 | | | | 13,109,432 | | | | 950,938 | | | | 33,466,725 | |
Class I | | | 1,559,378 | | | | 66,815,041 | | | | 2,958,330 | | | | 128,312,062 | |
Class R1 | | | 25,341 | | | | 854,446 | | | | 60,302 | | | | 2,103,398 | |
Class R2 | | | 182,783 | | | | 7,037,207 | | | | 260,110 | | | | 9,845,066 | |
Class R3 | | | 331,240 | | | | 13,330,947 | | | | 775,526 | | | | 31,215,720 | |
Class R4 | | | 121,548 | | | | 4,864,881 | | | | 218,412 | | | | 9,129,215 | |
Class R6 | | | 759,263 | | | | 32,545,872 | | | | 1,371,227 | | | | 58,758,765 | |
| | | 4,541,761 | | | | $186,064,713 | | | | 9,546,407 | | | | $390,689,680 | |
30
Notes to Financial Statements (unaudited) – continued
| | | | | | | | | | | | | | | | |
| | | Six months ended
2/28/19 | | | Year ended
8/31/18 | |
| | | | |
| | | Shares | | | Amount | | | Shares | | | Amount | |
Shares issued to shareholders in
reinvestment of distributions | | | | | | | | | | | | | | | | |
Class A | | | 520,760 | | | | $19,351,436 | | | | 360,827 | | | | $13,188,223 | |
Class B | | | 67,267 | | | | 2,143,805 | | | | 45,085 | | | | 1,435,497 | |
Class C | | | 179,366 | | | | 5,703,832 | | | | 130,689 | | | | 4,151,976 | |
Class I | | | 255,108 | | | | 10,158,414 | | | | 150,118 | | | | 5,847,113 | |
Class R1 | | | 8,390 | | | | 266,220 | | | | 5,742 | | | | 182,089 | |
Class R2 | | | 32,936 | | | | 1,163,614 | | | | 24,374 | | | | 851,394 | |
Class R3 | | | 86,645 | | | | 3,217,992 | | | | 57,144 | | | | 2,088,034 | |
Class R4 | | | 18,432 | | | | 714,074 | | | | 11,457 | | | | 434,687 | |
Class R6 | | | 113,449 | | | | 4,548,175 | | | | 74,971 | | | | 2,935,862 | |
| | | 1,282,353 | | | | $47,267,562 | | | | 860,407 | | | | $31,114,875 | |
| | | | |
| Shares reacquired | | | | | | | | | | | | | | | | |
Class A | | | (1,512,667 | ) | | | $(59,062,800 | ) | | | (2,523,190 | ) | | | $(99,736,743 | ) |
Class B | | | (133,557 | ) | | | (4,491,579 | ) | | | (258,851 | ) | | | (8,881,072 | ) |
Class C | | | (356,806 | ) | | | (12,158,294 | ) | | | (1,074,694 | ) | | | (37,302,290 | ) |
Class I | | | (1,496,090 | ) | | | (63,963,578 | ) | | | (1,482,125 | ) | | | (62,341,899 | ) |
Class R1 | | | (17,882 | ) | | | (595,562 | ) | | | (62,046 | ) | | | (2,178,877 | ) |
Class R2 | | | (157,774 | ) | | | (6,104,381 | ) | | | (331,292 | ) | | | (12,646,255 | ) |
Class R3 | | | (374,564 | ) | | | (14,909,159 | ) | | | (581,770 | ) | | | (23,285,213 | ) |
Class R4 | | | (94,702 | ) | | | (3,793,231 | ) | | | (136,161 | ) | | | (5,632,477 | ) |
Class R6 | | | (409,322 | ) | | | (17,342,047 | ) | | | (1,121,142 | ) | | | (45,861,371 | ) |
| | | (4,553,364 | ) | | | $(182,420,631 | ) | | | (7,571,271 | ) | | | $(297,866,197 | ) |
| | | | |
| Net change | | | | | | | | | | | | | | | | |
Class A | | | 108,406 | | | | $4,788,822 | | | | 527,962 | | | | $22,113,732 | |
Class B | | | 18,708 | | | | 658,927 | | | | 47,471 | | | | 1,750,902 | |
Class C | | | 199,457 | | | | 6,654,970 | | | | 6,933 | | | | 316,411 | |
Class I | | | 318,396 | | | | 13,009,877 | | | | 1,626,323 | | | | 71,817,276 | |
Class R1 | | | 15,849 | | | | 525,104 | | | | 3,998 | | | | 106,610 | |
Class R2 | | | 57,945 | | | | 2,096,440 | | | | (46,808 | ) | | | (1,949,795 | ) |
Class R3 | | | 43,321 | | | | 1,639,780 | | | | 250,900 | | | | 10,018,541 | |
Class R4 | | | 45,278 | | | | 1,785,724 | | | | 93,708 | | | | 3,931,425 | |
Class R6 | | | 463,390 | | | | 19,752,000 | | | | 325,056 | | | | 15,833,256 | |
| | | 1,270,750 | | | | $50,911,644 | | | | 2,835,543 | | | | $123,938,358 | |
Class T shares were not publicly available for sale during the period. Please see the fund’s prospectus for details.
Effective June 1, 2019, purchases of the fund’s Class B shares are closed to new and existing investors subject to certain exceptions. Please see the fund’s prospectus for details.
31
Notes to Financial Statements (unaudited) – continued
(6) Line of Credit
The fund and certain other funds managed by MFS participate in a $1.25 billion unsecured committed line of credit, subject to a $1 billion sublimit, provided by a syndication of banks under a credit agreement. Borrowings may be made for temporary financing needs. Interest is charged to each fund, based on its borrowings, generally at a rate equal to the higher of the Overnight Bank Funding rate or daily one month LIBOR plus an agreed upon spread. A commitment fee, based on the average daily, unused portion of the committed line of credit, is allocated among the participating funds. In addition, the fund and other funds managed by MFS have established unsecured uncommitted borrowing arrangements with certain banks for temporary financing needs. Interest is charged to each fund, based on its borrowings, at a rate equal to the Overnight Bank Funding rate plus an agreed upon spread. For the six months ended February 28, 2019, the fund’s commitment fee and interest expense were $3,362 and $0, respectively, and are included in “Interest expense and fees” in the Statement of Operations.
(7) Investments in Affiliated Issuers
An affiliated issuer may be considered one in which the fund owns 5% or more of the outstanding voting securities, or a company which is under common control. For the purposes of this report, the fund assumes the following to be affiliated issuers:
| | | | | | | | | | | | | | | | | | | | |
| | | | | |
| Affiliated Issuers | | | | | Beginning
Shares/Par
Amount | | | Acquisitions
Shares/Par
Amount | | | Dispositions
Shares/Par
Amount | | | Ending
Shares/Par
Amount | |
| MFS Institutional Money Market Portfolio | | | | | | | 26,383,831 | | | | 114,177,932 | | | | (111,799,763 | ) | | | 28,762,000 | |
| | | | | |
| Affiliated Issuers | | Realized
Gain (Loss) | | | Change in
Unrealized
Appreciation/
Depreciation | | | Capital Gain
Distributions | | | Dividend
Income | | | Ending
Value | |
| MFS Institutional Money Market Portfolio | | | $1,827 | | | | $(58 | ) | | | $— | | | | $301,020 | | | | $28,762,000 | |
32
PROXY VOTING POLICIES AND INFORMATION
MFS votes proxies on behalf of the fund pursuant to proxy voting policies and procedures that are available without charge, upon request, by calling1-800-225-2606, by visitingmfs.com/proxyvoting, or by visiting the SEC’s Web site athttp://www.sec.gov.
Information regarding how the fund voted proxies relating to portfolio securities during the most recent twelve-month period ended June 30 is available by August 31 of each year without charge by visitingmfs.com/proxyvoting, or by visiting the SEC’s Web site athttp://www.sec.gov.
QUARTERLY PORTFOLIO DISCLOSURE
The fund files a complete schedule of portfolio holdings with the SEC for the first and third quarters of each fiscal year on Form N-Q. The fund’s Form N-Q is available on the SEC’s website athttp://www.sec.gov.A shareholder can obtain the portfolio holdings report for the first and third quarters of the fund’s fiscal year atmfs.com/openendfundsby choosing the fund’s name and then selecting the “Resources” tab and clicking on “Prospectus and Reports”.
FURTHER INFORMATION
From time to time, MFS may post important information about the fund or the MFS funds on the MFS web site (mfs.com). This information is available athttps://www.mfs.com/en-us/what-we-do/announcements.html or atmfs.com/openendfunds by choosing the fund’s name.
INFORMATION ABOUT FUND CONTRACTS AND LEGAL CLAIMS
The fund has entered into contractual arrangements with an investment adviser, administrator, distributor, shareholder servicing agent, 529 program manager (if applicable), and custodian who each provide services to the fund. Unless expressly stated otherwise, shareholders are not parties to, or intended beneficiaries of these contractual arrangements, and these contractual arrangements are not intended to create any shareholder right to enforce them against the service providers or to seek any remedy under them against the service providers, either directly or on behalf of the fund.
Under the Trust’s By-Laws and Declaration of Trust, any claims asserted against or on behalf of the MFS Funds, including claims against Trustees and Officers, must be brought in state and federal courts located within the Commonwealth of Massachusetts.
PROVISION OF FINANCIAL REPORTS AND SUMMARY PROSPECTUSES
The fund produces financial reports every six months and updates its summary prospectus and prospectus annually. To avoid sending duplicate copies of materials to households, only one copy of the fund’s annual and semiannual report and summary prospectus may be mailed to shareholders having the same last name and residential address on the fund’s records. However, any shareholder may contact MFSC (please see back cover for address and telephone number) to request that copies of these reports and summary prospectuses be sent personally to that shareholder.
33
Save paper with eDelivery.

| MFS® will send you prospectuses, |
reports, and proxies directly viae-mail so you will get information faster with less mailbox clutter.
To sign up:
1. Go to mfs.com.
2. Log in via MFS® Access.
3. Select eDelivery.
If you own your MFS fund shares through a financial institution or a retirement plan, MFS® TALK, MFS® Access, or eDelivery may not be available to you.
CONTACT
WEB SITE
mfs.com
MFS TALK
1-800-637-8255
24 hours a day
ACCOUNT SERVICE AND LITERATURE
Shareholders
1-800-225-2606
Financial advisors
1-800-343-2829
Retirement plan services
1-800-637-1255
MAILING ADDRESS
MFS Service Center, Inc.
P.O. Box 219341
Kansas City, MO 64121-9341
OVERNIGHT MAIL
MFS Service Center, Inc.
Suite 219341
430 W 7th Street
Kansas City, MO 64105-1407
Semiannual Report
February 28, 2019

MFS® U.S. Government Cash Reserve Fund

Beginning on January 1, 2021, as permitted by regulations adopted by the U.S. Securities and Exchange Commission, paper copies of the fund’s annual and semiannual shareholder reports will no longer be sent by mail, unless you specifically request paper copies of the reports. Instead, the complete reports will be made available on the fund’s Web site (funds.mfs.com), and you will be notified by mail each time a report is posted and provided with a Web site link to access the report.
If you are already signed up to receive shareholder reports by email, you will not be affected by this change and you need not take any action. You may sign up to receive shareholder reports and other communications from the fund by email by contacting your financial intermediary (such as a broker-dealer or bank) or, if you hold your shares directly with the fund, by calling 1-800-225-2606 or by logging on to MFS Access at mfs.com.
Beginning on January 1, 2019, you may elect to receive all future reports in paper free of charge. Contact your financial intermediary to request that you continue to receive paper copies of your shareholder reports. If you invest directly with the fund, you can call 1-800-225-2606 or send an email request to orderliterature@mfs.com to let the fund know that you wish to continue receiving paper copies of your shareholder reports. Your election to receive reports in paper will apply to all funds held in your account if you invest through your financial intermediary or all funds held with the MFS fund complex if you invest directly.
LMM-SEM
MFS® U.S. Government Cash Reserve Fund
CONTENTS
The report is prepared for the general information of shareholders.
It is authorized for distribution to prospective investors only when preceded or accompanied by a current prospectus.
NOT FDIC INSURED• MAY LOSE VALUE• NO BANK GUARANTEE

LETTER FROM THE EXECUTIVE CHAIRMAN
Dear Shareholders:
Markets experienced a bout of volatility in late 2018 as a result of higher interest rates, international trade friction and geopolitical uncertainty surrounding issues such as
Brexit. But concern over those issues dissipated in the early months of 2019 due to a more dovish posture by the U.S. Federal Reserve, progress toward a trade pact between the United States and China, and a consensus forming in the British Parliament against ano-deal Brexit. Over the past year, U.S. equities have outperformed their global peers due in part to fiscal stimulus undertaken in late 2017 and early 2019, which helped maintain healthy levels of U.S. economic output against a backdrop of slowing global growth, though returns, on average, have been modest.
Globally, inflation remains largely subdued thanks in part to stable
oil prices, though tight labor markets are keeping investors on the lookout for its potential reappearance. Rising incomes in many developed and emerging markets are supportive of gains in consumption, though a challenging backdrop for global trade has weighed on manufacturing in most regions. Should the U.S. and China reach a comprehensive trade agreement, sentiment could improve later this year.
As a global investment manager with nearly a century of expertise, MFS® firmly believes active risk management offers downside mitigation and may help improve investment outcomes. We built our active investment platform with this belief in mind. Our long-term perspective influences nearly every aspect of our business, ensuring that our investment decisions align with the investing time horizons of our clients.
Respectfully,

Robert J. Manning
Executive Chairman
MFS Investment Management
April 16, 2019
The opinions expressed in this letter are subject to change and may not be relied upon for investment advice. No forecasts can be guaranteed.
1
PORTFOLIO COMPOSITION
Portfolio structure (u)
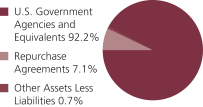
| | | | |
Composition including fixed income
credit quality (a)(u) | |
| A-1+ | | | 11.2% | |
| A-1 | | | 88.1% | |
| Other Assets Less Liabilities | | | 0.7% | |
| | | | |
| Maturity breakdown (u) | | | | |
| 0 - 7 days | | | 29.4% | |
| 8 - 29 days | | | 26.2% | |
| 30 - 59 days | | | 40.5% | |
| 60 - 89 days | | | 3.2% | |
| Other Assets Less Liabilities | | | 0.7% | |
| (a) | Ratings are assigned to portfolio securities utilizing ratings from Moody’s, Fitch, and Standard & Poor’s rating agencies and applying the following hierarchy: If all three agencies provide a rating, the middle rating (after dropping the highest and lowest ratings) is assigned; if two of the three agencies rate a security, the lower of the two is assigned. Ratings are shown in the S&P scale. All ratings are subject to change. The fund did not hold unrated securities. The fund is not rated by these agencies. |
| (u) | For purposes of this presentation, accrued interest, where applicable, is included. |
Percentages are based on net assets as of February 28, 2019.
The portfolio is actively managed and current holdings may be different.
2
EXPENSE TABLE
Fund expenses borne by the shareholders during the period, September 1, 2018 through February 28, 2019
As a shareholder of the fund, you incur two types of costs: (1) transaction costs, including sales charges (loads) on certain purchase or redemption payments, and (2) ongoing costs, including management fees; distribution and service(12b-1) fees; and other fund expenses. This example is intended to help you understand your ongoing costs (in dollars) of investing in the fund and to compare these costs with the ongoing costs of investing in other mutual funds.
The example is based on an investment of $1,000 invested at the beginning of the period and held for the entire period September 1, 2018 through February 28, 2019.
Actual Expenses
The first line for each share class in the following table provides information about actual account values and actual expenses. You may use the information in this line, together with the amount you invested, to estimate the expenses that you paid over the period. Simply divide your account value by $1,000 (for example, an $8,600 account value divided by $1,000 = 8.6), then multiply the result by the number in the first line under the heading entitled “Expenses Paid During Period” to estimate the expenses you paid on your account during this period.
Hypothetical Example for Comparison Purposes
The second line for each share class in the following table provides information about hypothetical account values and hypothetical expenses based on the fund’s actual expense ratio and an assumed rate of return of 5% per year before expenses, which is not the fund’s actual return. The hypothetical account values and expenses may not be used to estimate the actual ending account balance or expenses you paid for the period. You may use this information to compare the ongoing costs of investing in the fund and other funds. To do so, compare this 5% hypothetical example with the 5% hypothetical examples that appear in the shareholder reports of the other funds.
Please note that the expenses shown in the table are meant to highlight your ongoing costs only and do not reflect any transactional costs, such as sales charges (loads). Therefore, the second line for each share class in the table is useful in comparing ongoing costs only, and will not help you determine the relative total costs of owning different funds. In addition, if these transactional costs were included, your costs would have been higher.
3
Expense Table – continued
| | | | | | | | | | | | | | | | | | |
Share
Class | | | | Annualized
Expense
Ratio | | | Beginning
Account Value
9/01/18 | | | Ending
Account Value
2/28/19 | | | Expenses
Paid During
Period (p)
9/01/18-2/28/19 | |
| A | | Actual | | | 0.71% | | | | $1,000.00 | | | | $1,007.59 | | | | $3.53 | |
| | Hypothetical (h) | | | 0.71% | | | | $1,000.00 | | | | $1,021.27 | | | | $3.56 | |
| B | | Actual | | | 0.71% | | | | $1,000.00 | | | | $1,007.59 | | | | $3.53 | |
| | Hypothetical (h) | | | 0.71% | | | | $1,000.00 | | | | $1,021.27 | | | | $3.56 | |
| C | | Actual | | | 0.71% | | | | $1,000.00 | | | | $1,007.59 | | | | $3.53 | |
| | Hypothetical (h) | | | 0.71% | | | | $1,000.00 | | | | $1,021.27 | | | | $3.56 | |
| I | | Actual (i) | | | 0.70% | | | | $1,000.00 | | | | $1,006.99 | | | | $3.16 | |
| | Hypothetical (h) | | | 0.70% | | | | $1,000.00 | | | | $1,021.32 | | | | $3.51 | |
| R1 | | Actual | | | 0.71% | | | | $1,000.00 | | | | $1,007.56 | | | | $3.53 | |
| | Hypothetical (h) | | | 0.71% | | | | $1,000.00 | | | | $1,021.27 | | | | $3.56 | |
| R2 | | Actual | | | 0.71% | | | | $1,000.00 | | | | $1,007.56 | | | | $3.53 | |
| | Hypothetical (h) | | | 0.71% | | | | $1,000.00 | | | | $1,021.27 | | | | $3.56 | |
| R3 | | Actual | | | 0.70% | | | | $1,000.00 | | | | $1,007.56 | | | | $3.48 | |
| | Hypothetical (h) | | | 0.70% | | | | $1,000.00 | | | | $1,021.32 | | | | $3.51 | |
| R4 | | Actual | | | 0.71% | | | | $1,000.00 | | | | $1,007.56 | | | | $3.53 | |
| | Hypothetical (h) | | | 0.71% | | | | $1,000.00 | | | | $1,021.27 | | | | $3.56 | |
| R6 | | Actual (i) | | | 0.63% | | | | $1,000.00 | | | | $1,007.31 | | | | $2.84 | |
| | Hypothetical (h) | | | 0.63% | | | | $1,000.00 | | | | $1,021.67 | | | | $3.16 | |
| 529A | | Actual | | | 0.75% | | | | $1,000.00 | | | | $1,007.34 | | | | $3.73 | |
| | Hypothetical (h) | | | 0.75% | | | | $1,000.00 | | | | $1,021.08 | | | | $3.76 | |
| 529B | | Actual | | | 0.76% | | | | $1,000.00 | | | | $1,007.34 | | | | $3.78 | |
| | Hypothetical (h) | | | 0.76% | | | | $1,000.00 | | | | $1,021.03 | | | | $3.81 | |
| 529C | | Actual | | | 0.75% | | | | $1,000.00 | | | | $1,007.34 | | | | $3.73 | |
| | Hypothetical (h) | | | 0.75% | | | | $1,000.00 | | | | $1,021.08 | | | | $3.76 | |
| (h) | 5% class return per year before expenses. |
| (i) | For the period from the class inception, September 18, 2018, through the stated period end. |
| (p) | “Expenses Paid During Period” are equal to each class’s annualized expense ratio, as shown above, multiplied by the average account value over the period, multiplied by 181/365 (to reflect theone-half year period), except for Actual Expenses of Class I and Class R6, which are multiplied by 164/365 (to reflect the period from the commencement of the classes’ investment operations, September 18, 2018, through February 28, 2019). For Hypothetical Expenses paid, it is assumed that Class I and Class R6 were in existence for the entire six month period ended February 28, 2019. Expenses paid do not include any applicable sales charges (loads). If these transaction costs had been included, your costs would have been higher. |
4
PORTFOLIO OF INVESTMENTS
2/28/19 (unaudited)
The Portfolio of Investments is a complete list of all securities owned by your fund. It is categorized by broad-based asset classes.
| | | | | | | | |
| U.S. Government Agencies and Equivalents (y) - 92.2% | | | | | |
| | |
| Issuer | | Shares/Par | | | Value ($) | |
| Fannie Mae, 2.338%, due 3/06/2019 | | $ | 5,600,000 | | | $ | 5,598,211 | |
| Fannie Mae, 2.339%, due 3/12/2019 | | | 5,800,000 | | | | 5,795,924 | |
| Fannie Mae, 2.339%, due 3/13/2019 | | | 5,000,000 | | | | 4,996,167 | |
| Fannie Mae, 2.399%, due 3/26/2019 | | | 9,000,000 | | | | 8,985,250 | |
| Fannie Mae, 2.384%, due 4/01/2019 | | | 9,471,000 | | | | 9,451,875 | |
| Fannie Mae, 2.399%, due 4/08/2019 | | | 6,000,000 | | | | 5,985,053 | |
| Fannie Mae, 2.4%, due 4/15/2019 | | | 3,000,000 | | | | 2,991,150 | |
| Federal Farm Credit Bank, 2.437%, due 3/04/2019 | | | 2,500,000 | | | | 2,499,502 | |
| Federal Farm Credit Bank, 2.432%, due 3/08/2019 | | | 10,200,000 | | | | 10,195,260 | |
| Federal Farm Credit Bank, 2.411%, due 3/11/2019 | | | 7,100,000 | | | | 7,095,326 | |
| Federal Farm Credit Bank, 2.401%, due 3/18/2019 | | | 5,000,000 | | | | 4,994,428 | |
| Federal Farm Credit Bank, 2.432%, due 3/19/2019 | | | 100,000 | | | | 99,880 | |
| Federal Farm Credit Bank, 2.401%, due 3/20/2019 | | | 6,000,000 | | | | 5,992,527 | |
| Federal Farm Credit Bank, 2.423%, due 4/09/2019 | | | 5,300,000 | | | | 5,286,335 | |
| Federal Farm Credit Bank, 2.444%, due 4/09/2019 | | | 9,100,000 | | | | 9,076,340 | |
| Federal Home Loan Bank, 2.428%, due 3/01/2019 | | | 4,500,000 | | | | 4,500,000 | |
| Federal Home Loan Bank, 2.374%, due 3/04/2019 | | | 5,533,000 | | | | 5,531,921 | |
| Federal Home Loan Bank, 2.428%, due 3/13/2019 | | | 9,000,000 | | | | 8,992,830 | |
| Federal Home Loan Bank, 2.365%, due 3/14/2019 | | | 2,050,000 | | | | 2,048,275 | |
| Federal Home Loan Bank, 2.417%, due 3/21/2019 | | | 8,900,000 | | | | 8,888,232 | |
| Federal Home Loan Bank, 2.42%, due 4/11/2019 | | | 1,000,000 | | | | 997,289 | |
| Federal Home Loan Bank, 2.434%, due 4/11/2019 | | | 6,000,000 | | | | 5,983,668 | |
| Federal Home Loan Bank, 2.447%, due 4/12/2019 | | | 8,000,000 | | | | 7,977,553 | |
| Freddie Mac, 2.34%, due 3/05/2019 | | | 7,100,000 | | | | 7,098,186 | |
| Freddie Mac, 2.383%, due 4/03/2019 | | | 9,200,000 | | | | 9,180,266 | |
| Freddie Mac, 2.383%, due 4/04/2019 | | | 9,200,000 | | | | 9,179,668 | |
| Freddie Mac, 2.395%, due 4/17/2019 | | | 4,650,000 | | | | 4,635,734 | |
| Freddie Mac, 4.852%, due 4/17/2019 | | | 5,995,000 | | | | 5,976,372 | |
| Freddie Mac, 2.438%, due 4/24/2019 | | | 3,500,000 | | | | 3,487,453 | |
| Freddie Mac, 2.446%, due 5/13/2019 | | | 5,300,000 | | | | 5,274,228 | |
| U.S. Treasury Bill, 2.426%, due 3/01/2019 | �� | | 6,000,000 | | | | 6,000,000 | |
| U.S. Treasury Bill, 2.378%, due 3/05/2019 | | | 5,600,000 | | | | 5,598,532 | |
| U.S. Treasury Bill, 2.36%, due 3/07/2019 | | | 2,200,000 | | | | 2,199,140 | |
| U.S. Treasury Bill, 2.452%, due 4/02/2019 | | | 9,100,000 | | | | 9,080,991 | |
| U.S. Treasury Bill, 2.435%, due 5/16/2019 | | | 1,850,000 | | | | 1,840,646 | |
Total U.S. Government Agencies and Equivalents,
at Amortized Cost and Value | | | | | | $ | 203,514,212 | |
5
Portfolio of Investments (unaudited) – continued
| | | | | | | | |
| Repurchase Agreements - 7.1% | | | | | | | | |
| | |
| Issuer | | Shares/Par | | | Value ($) | |
| Goldman Sachs Repurchase Agreement, 2.55%, dated 2/28/2019, due 3/01/2019, total to be received $11,647,825 (secured by U.S. Treasury and Federal Agency obligations valued at $11,879,962 in a jointly traded account) | | $ | 11,647,000 | | | $ | 11,647,000 | |
| JPMorgan Chase & Co. Repurchase Agreement, 2.6%, dated 2/28/2019, due 3/01/2019, total to be received $4,000,289 (secured by U.S. Treasury and Federal Agency obligations valued at $4,080,308 in a jointly traded account) | | | 4,000,000 | | | | 4,000,000 | |
| Total Repurchase Agreements, at Cost and Value | | | | | | $ | 15,647,000 | |
| | |
| Other Assets, Less Liabilities - 0.7% | | | | | | | 1,457,169 | |
| Net Assets - 100.0% | | | | | | $ | 220,618,381 | |
| (y) | The rate shown represents an annualized yield at time of purchase. |
See Notes to Financial Statements
6
Financial Statements
STATEMENT OF ASSETS AND LIABILITIES
At 2/28/19 (unaudited)
This statement represents your fund’s balance sheet, which details the assets and liabilities comprising the total value of the fund.
| | | | |
| Assets | | | | |
Investments in unaffiliated issuers, at cost and value | | | $219,161,212 | |
Receivables for | | | | |
Fund shares sold | | | 2,277,786 | |
Interest | | | 1,114 | |
Other assets | | | 1,089 | |
Total assets | | | $221,441,201 | |
| |
| Liabilities | | | | |
Payable to custodian | | | $257 | |
Payables for | | | | |
Distributions | | | 4,252 | |
Fund shares reacquired | | | 730,556 | |
Payable to affiliates | | | | |
Investment adviser | | | 4,920 | |
Shareholder servicing costs | | | 74,983 | |
Program manager fees | | | 69 | |
Payable for independent Trustees’ compensation | | | 4,777 | |
Accrued expenses and other liabilities | | | 3,006 | |
Total liabilities | | | $822,820 | |
Net assets | | | $220,618,381 | |
| |
| Net assets consist of | | | | |
Paid-in capital | | | $220,626,103 | |
Total distributable earnings (loss) | | | (7,722 | ) |
Net assets | | | $220,618,381 | |
Shares of beneficial interest outstanding | | | 220,848,386 | |
7
Statement of Assets and Liabilities (unaudited) – continued
| | | | | | | | | | | | |
| | | |
| | | Net assets | | | Shares
outstanding | | | Net asset value
per share | |
Class A | | | $101,074,739 | | | | 101,180,844 | | | | $1.00 | |
Class B | | | 10,630,528 | | | | 10,641,699 | | | | 1.00 | |
Class C | | | 20,145,517 | | | | 20,166,906 | | | | 1.00 | |
Class I | | | 75,294 | | | | 75,372 | | | | 1.00 | |
Class R1 | | | 8,138,762 | | | | 8,147,494 | | | | 1.00 | |
Class R2 | | | 34,337,686 | | | | 34,373,833 | | | | 1.00 | |
Class R3 | | | 18,196,777 | | | | 18,214,294 | | | | 1.00 | |
Class R4 | | | 2,751,861 | | | | 2,754,736 | | | | 1.00 | |
Class R6 | | | 50,314 | | | | 50,367 | | | | 1.00 | |
Class 529A | | | 18,082,926 | | | | 18,101,474 | | | | 1.00 | |
Class 529B | | | 244,069 | | | | 244,325 | | | | 1.00 | |
Class 529C | | | 6,889,908 | | | | 6,897,042 | | | | 1.00 | |
A contingent deferred sales charge may be imposed on redemptions of Class A, Class B, Class C, Class 529B, and Class 529C shares. Redemption price per share was equal to the net asset value per share for Classes I, R1, R2, R3, R4, R6, and 529A.
See Notes to Financial Statements
8
Financial Statements
STATEMENT OF OPERATIONS
Six months ended 2/28/19 (unaudited)
This statement describes how much your fund earned in investment income and accrued in expenses. It also describes any gains and/or losses generated by fund operations.
| | | | |
| Net investment income (loss) | | | | |
Income | | | | |
Interest | | | $2,487,885 | |
Expenses | | | | |
Management fee | | | $445,439 | |
Distribution and service fees | | | 489,862 | |
Shareholder servicing costs | | | 199,882 | |
Program manager fees | | | 5,737 | |
Administrative services fee | | | 20,066 | |
Independent Trustees’ compensation | | | 4,456 | |
Custodian fee | | | 9,428 | |
Shareholder communications | | | 10,101 | |
Audit and tax fees | | | 19,703 | |
Legal fees | | | 1,068 | |
Registration fees | | | 66,957 | |
Miscellaneous | | | 18,985 | |
Total expenses | | | $1,291,684 | |
Reduction of expenses by investment adviser and distributor | | | (500,887 | ) |
Net expenses | | | $790,797 | |
Net investment income (loss) | | | $1,697,088 | |
Realized gain (loss) (identified cost basis) | | | | |
Unaffiliated issuers | | | $2 | |
Change in net assets from operations | | | $1,697,090 | |
See Notes to Financial Statements
9
Financial Statements
STATEMENTS OF CHANGES IN NET ASSETS
These statements describe the increases and/or decreases in net assets resulting from operations, any distributions, and any shareholder transactions.
| | | | | | | | |
| Change in net assets | | Six months ended
2/28/19
(unaudited) | | | Year ended
8/31/18 | |
| | |
| From operations | | | | | | | | |
Net investment income (loss) | | | $1,697,088 | | | | $1,815,726 | |
Net realized gain (loss) | | | 2 | | | | — | |
Change in net assets from operations | | | $1,697,090 | | | | $1,815,726 | |
Total distributions to shareholders (a) | | | $(1,697,088 | ) | | | $(1,815,726 | ) |
Change in net assets from fund share transactions | | | $(4,123,715 | ) | | | $(56,291,230 | ) |
Total change in net assets | | | $(4,123,713 | ) | | | $(56,291,230 | ) |
| | |
| Net assets | | | | | | | | |
At beginning of period | | | 224,742,094 | | | | 281,033,324 | |
At end of period (b) | | | $220,618,381 | | | | $224,742,094 | |
| (a) | Distributions from net investment income and from net realized gain are no longer required to be separately disclosed. See Note 2. For the year ended August 31, 2018, distributions from net investment income were $1,815,726. |
| (b) | Parenthetical disclosure of accumulated distributions in excess of net investment income is no longer required. See Note 2. For the year ended August 31, 2018, end of period net assets included accumulated distributions in excess of net investment income of $7,719. |
See Notes to Financial Statements
10
Financial Statements
FINANCIAL HIGHLIGHTS
The financial highlights table is intended to help you understand the fund’s financial performance for the semiannual period and the past 5 fiscal years (or life of a particular share class, if shorter). Certain information reflects financial results for a single fund share. The total returns in the table represent the rate that an investor would have earned (or lost) on an investment in the fund share class (assuming reinvestment of all distributions) held for the entire period.
| | | | | | | | | | | | | | | | | | | | | | | | |
| | | Six months
ended 2/28/19 | | | Year ended | |
| Class A | | 8/31/18 | | | 8/31/17 | | | 8/31/16 | | | 8/31/15 | | | 8/31/14 | |
| | | (unaudited) | | | | | | | | | | | | | | | | |
Net asset value, beginning of period | | | $1.00 | | | | $1.00 | | | | $1.00 | | | | $1.00 | | | | $1.00 | | | | $1.00 | |
| | | |
| Income (loss) from investment operations | | | | | | | | | | | | | |
Net investment income (loss) (d) | | | $0.01 | | | | $0.01 | | | | $0.00 | (c)(w) | | | $0.00 | | | | $0.00 | | | | $0.00 | |
Net realized and unrealized
gain (loss) | | | 0.00 | (w) | | | — | | | | (0.00 | )(w) | | | — | | | | 0.00 | (w) | | | 0.00 | (w) |
Total from investment operations | | | $0.01 | | | | $0.01 | | | | $0.00 | (w) | | | $0.00 | | | | $0.00 | (w) | | | $0.00 | (w) |
| | | |
| Less distributions declared to shareholders | | | | | | | | | | | | | |
From net investment income | | | $(0.01 | ) | | | $(0.01 | ) | | | $(0.00 | )(w) | | | $— | | | | $— | | | | $— | |
Net asset value, end of period | | | $1.00 | | | | $1.00 | | | | $1.00 | | | | $1.00 | | | | $1.00 | | | | $1.00 | |
Total return (%) (r)(t) | | | 0.76 | (n) | | | 0.76 | | | | 0.08 | (c) | | | 0.00 | | | | 0.00 | (w) | | | 0.00 | (w) |
| | | |
Ratios (%) (to average net assets)
and Supplemental data: | | | | | | | | | | | | | |
Expenses before expense reductions (f) | | | 0.96 | (a) | | | 0.94 | | | | 0.91 | (c) | | | 0.91 | | | | 0.92 | | | | 0.90 | |
Expenses after expense reductions (f) | | | 0.71 | (a) | | | 0.68 | | | | 0.50 | (c) | | | 0.23 | | | | 0.07 | | | | 0.09 | |
Net investment income (loss) | | | 1.53 | (a) | | | 0.76 | | | | 0.08 | (c) | | | 0.00 | | | | 0.00 | | | | 0.00 | |
Net assets at end of period
(000 omitted) | | | $101,075 | | | | $100,463 | | | | $105,859 | | | | $120,740 | | | | $122,085 | | | | $124,550 | |
See Notes to Financial Statements
11
Financial Highlights – continued
| | | | | | | | | | | | | | | | | | | | | | | | |
| | | Six months
ended 2/28/19 | | | Year ended | |
| Class B | | 8/31/18 | | | 8/31/17 | | | 8/31/16 | | | 8/31/15 | | | 8/31/14 | |
| | | (unaudited) | | | | | | | | | | | | | | | | |
Net asset value, beginning of period | | | $1.00 | | | | $1.00 | | | | $1.00 | | | | $1.00 | | | | $1.00 | | | | $1.00 | |
| | | |
| Income (loss) from investment operations | | | | | | | | | | | | | |
Net investment income (loss) (d) | | | $0.01 | | | | $0.01 | | | | $0.00 | (c)(w) | | | $0.00 | | | | $0.00 | | | | $0.00 | |
Net realized and unrealized
gain (loss) | | | 0.00 | (w) | | | — | | | | (0.00 | )(w) | | | — | | | | 0.00 | (w) | | | 0.00 | (w) |
Total from investment operations | | | $0.01 | | | | $0.01 | | | | $0.00 | (w) | | | $0.00 | | | | $0.00 | (w) | | | $0.00 | (w) |
| | | |
| Less distributions declared to shareholders | | | | | | | | | | | | | |
From net investment income | | | $(0.01 | ) | | | $(0.01 | ) | | | $(0.00 | )(w) | | | $— | | | | $— | | | | $— | |
Net asset value, end of period | | | $1.00 | | | | $1.00 | | | | $1.00 | | | | $1.00 | | | | $1.00 | | | | $1.00 | |
Total return (%) (r)(t) | | | 0.76 | (n) | | | 0.76 | | | | 0.08 | (c) | | | 0.00 | | | | 0.00 | (w) | | | 0.00 | (w) |
| | | |
Ratios (%) (to average net assets)
and Supplemental data: | | | | | | | | | | | | | |
Expenses before expense reductions (f) | | | 1.72 | (a) | | | 1.69 | | | | 1.66 | (c) | | | 1.66 | | | | 1.67 | | | | 1.65 | |
Expenses after expense reductions (f) | | | 0.71 | (a) | | | 0.68 | | | | 0.51 | (c) | | | 0.23 | | | | 0.07 | | | | 0.10 | |
Net investment income (loss) | | | 1.53 | (a) | | | 0.72 | | | | 0.07 | (c) | | | 0.00 | | | | 0.00 | | | | 0.00 | |
Net assets at end of period
(000 omitted) | | | $10,631 | | | | $11,664 | | | | $17,338 | | | | $18,096 | | | | $18,831 | | | | $22,982 | |
| | |
| | | Six months
ended 2/28/19 | | | Year ended | |
| Class C | | 8/31/18 | | | 8/31/17 | | | 8/31/16 | | | 8/31/15 | | | 8/31/14 | |
| | | (unaudited) | | | | | | | | | | | | | | | | |
Net asset value, beginning of period | | | $1.00 | | | | $1.00 | | | | $1.00 | | | | $1.00 | | | | $1.00 | | | | $1.00 | |
| | | |
| Income (loss) from investment operations | | | | | | | | | | | | | |
Net investment income (loss) (d) | | | $0.01 | | | | $0.01 | | | | $0.00 | (c)(w) | | | $0.00 | | | | $0.00 | | | | $0.00 | |
Net realized and unrealized
gain (loss) | | | 0.00 | (w) | | | — | | | | (0.00 | )(w) | | | — | | | | 0.00 | (w) | | | 0.00 | (w) |
Total from investment operations | | | $0.01 | | | | $0.01 | | | | $0.00 | (w) | | | $0.00 | | | | $0.00 | (w) | | | $0.00 | (w) |
| | | |
| Less distributions declared to shareholders | | | | | | | | | | | | | |
From net investment income | | | $(0.01 | ) | | | $(0.01 | ) | | | $(0.00 | )(w) | | | $— | | | | $— | | | | $— | |
Net asset value, end of period | | | $1.00 | | | | $1.00 | | | | $1.00 | | | | $1.00 | | | | $1.00 | | | | $1.00 | |
Total return (%) (r)(t) | | | 0.76 | (n) | | | 0.76 | | | | 0.08 | (c) | | | 0.00 | | | | 0.00 | (w) | | | 0.00 | (w) |
| | | |
Ratios (%) (to average net assets)
and Supplemental data: | | | | | | | | | | | | | |
Expenses before expense reductions (f) | | | 1.72 | (a) | | | 1.69 | | | | 1.66 | (c) | | | 1.66 | | | | 1.67 | | | | 1.65 | |
Expenses after expense reductions (f) | | | 0.71 | (a) | | | 0.68 | | | | 0.50 | (c) | | | 0.24 | | | | 0.07 | | | | 0.10 | |
Net investment income (loss) | | | 1.54 | (a) | | | 0.68 | | | | 0.07 | (c) | | | 0.00 | | | | 0.00 | | | | 0.00 | |
Net assets at end of period
(000 omitted) | | | $20,146 | | | | $18,451 | | | | $38,458 | | | | $48,749 | | | | $42,522 | | | | $45,662 | |
See Notes to Financial Statements
12
Financial Highlights – continued
| | | | | | | | | | | | | | | | | | | | | | | | |
| | | | | | |
| Class I | | | | | | | | | | | | | | | | | Six months
ended 2/28/19 (i) (unaudited) | |
Net asset value, beginning of period | | | | | | | | | | | | | | | | | | | | | | | $1.00 | |
| | | |
| Income (loss) from investment operations | | | | | | | | | | | | | |
Net investment income (loss) (d) | | | | | | | | | | | | | | | | | | | | | | | $0.01 | |
Net realized and unrealized gain (loss) | | | | | | | | | | | | | | | | | | | | | | | 0.00 | (w) |
Total from investment operations | | | | | | | | | | | | | | | | | | | | | | | $0.01 | |
| | | |
| Less distributions declared to shareholders | | | | | | | | | | | | | |
From net investment income | | | | | | | | | | | | | | | | | | | | | | | $(0.01 | ) |
Net asset value, end of period | | | | | | | | | | | | | | | | | | | | | | | $1.00 | |
Total return (%) (r)(t) | | | | | | | | | | | | | | | | | | | | | | | 0.70 | (n) |
| | | |
Ratios (%) (to average net assets)
and Supplemental data: | | | | | | | | | | | | | |
Expenses before expense reductions (f) | | | | | | | | | | | | | | | | | | | | | | | 0.71 | (a) |
Expenses after expense reductions (f) | | | | | | | | | | | | | | | | | | | | | | | 0.70 | (a) |
Net investment income (loss) | | | | | | | | | | | | | | | | | | | | | | | 1.57 | (a) |
Net assets at end of period (000 omitted) | | | | | | | | | | | | | | | | | | | | | | | $75 | |
| | | | | | | | | | | | | | | | | | | | | | | | |
| | | Six months
ended 2/28/19 | | | Year ended | |
| Class R1 | | 8/31/18 | | | 8/31/17 | | | 8/31/16 | | | 8/31/15 | | | 8/31/14 | |
| | | (unaudited) | | | | | | | | | | | | | | | | |
Net asset value, beginning of period | | | $1.00 | | | | $1.00 | | | | $1.00 | | | | $1.00 | | | | $1.00 | | | | $1.00 | |
| | | |
| Income (loss) from investment operations | | | | | | | | | | | | | |
Net investment income (loss) (d) | | | $0.01 | | | | $0.01 | | | | $0.00 | (c)(w) | | | $0.00 | | | | $0.00 | | | | $0.00 | |
Net realized and unrealized
gain (loss) | | | 0.00 | (w) | | | — | | | | (0.00 | )(w) | | | — | | | | 0.00 | (w) | | | 0.00 | (w) |
Total from investment operations | | | $0.01 | | | | $0.01 | | | | $0.00 | (w) | | | $0.00 | | | | $0.00 | (w) | | | $0.00 | (w) |
| | | |
| Less distributions declared to shareholders | | | | | | | | | | | | | |
From net investment income | | | $(0.01 | ) | | | $(0.01 | ) | | | $(0.00 | )(w) | | | $— | | | | $— | | | | $— | |
Net asset value, end of period | | | $1.00 | | | | $1.00 | | | | $1.00 | | | | $1.00 | | | | $1.00 | | | | $1.00 | |
Total return (%) (r)(t) | | | 0.76 | (n) | | | 0.76 | | | | 0.08 | (c) | | | 0.00 | | | | 0.00 | (w) | | | 0.00 | (w) |
| | | |
Ratios (%) (to average net assets)
and Supplemental data: | | | | | | | | | | | | | |
Expenses before expense reductions (f) | | | 1.72 | (a) | | | 1.69 | | | | 1.66 | (c) | | | 1.66 | | | | 1.67 | | | | 1.65 | |
Expenses after expense reductions (f) | | | 0.71 | (a) | | | 0.68 | | | | 0.50 | (c) | | | 0.23 | | | | 0.07 | | | | 0.09 | |
Net investment income (loss) | | | 1.53 | (a) | | | 0.72 | | | | 0.07 | (c) | | | 0.00 | | | | 0.00 | | | | 0.00 | |
Net assets at end of period
(000 omitted) | | | $8,139 | | | | $8,305 | | | | $12,236 | | | | $14,569 | | | | $14,363 | | | | $16,819 | |
See Notes to Financial Statements
13
Financial Highlights – continued
| | | | | | | | | | | | | | | | | | | | | | | | |
| | | Six months
ended 2/28/19 | | | Year ended | |
| Class R2 | | 8/31/18 | | | 8/31/17 | | | 8/31/16 | | | 8/31/15 | | | 8/31/14 | |
| | | (unaudited) | | | | | | | | | | | | | | | | |
Net asset value, beginning of period | | | $1.00 | | | | $1.00 | | | | $1.00 | | | | $1.00 | | | | $1.00 | | | | $1.00 | |
| | | |
| Income (loss) from investment operations | | | | | | | | | | | | | |
Net investment income (loss) (d) | | | $0.01 | | | | $0.01 | | | | $0.00 | (c)(w) | | | $0.00 | | | | $0.00 | | | | $0.00 | |
Net realized and unrealized
gain (loss) | | | 0.00 | (w) | | | — | | | | (0.00 | )(w) | | | — | | | | 0.00 | (w) | | | 0.00 | (w) |
Total from investment operations | | | $0.01 | | | | $0.01 | | | | $0.00 | (w) | | | $0.00 | | | | $0.00 | (w) | | | $0.00 | (w) |
| | | |
| Less distributions declared to shareholders | | | | | | | | | | | | | |
From net investment income | | | $(0.01 | ) | | | $(0.01 | ) | | | $(0.00 | )(w) | | | $— | | | | $— | | | | $— | |
Net asset value, end of period | | | $1.00 | | | | $1.00 | | | | $1.00 | | | | $1.00 | | | | $1.00 | | | | $1.00 | |
Total return (%) (r)(t) | | | 0.76 | (n) | | | 0.76 | | | | 0.08 | (c) | | | 0.00 | | | | 0.00 | (w) | | | 0.00 | (w) |
| | | |
Ratios (%) (to average net assets)
and Supplemental data: | | | | | | | | | | | | | |
Expenses before expense reductions (f) | | | 1.22 | (a) | | | 1.19 | | | | 1.16 | (c) | | | 1.16 | | | | 1.17 | | | | 1.15 | |
Expenses after expense reductions (f) | | | 0.71 | (a) | | | 0.68 | | | | 0.51 | (c) | | | 0.23 | | | | 0.07 | | | | 0.09 | |
Net investment income (loss) | | | 1.53 | (a) | | | 0.73 | | | | 0.08 | (c) | | | 0.00 | | | | 0.00 | | | | 0.00 | |
Net assets at end of period
(000 omitted) | | | $34,338 | | | | $34,993 | | | | $48,184 | | | | $51,537 | | | | $53,058 | | | | $57,634 | |
| | |
| | | Six months
ended 2/28/19 | | | Year ended | |
| Class R3 | | 8/31/18 | | | 8/31/17 | | | 8/31/16 | | | 8/31/15 | | | 8/31/14 | |
| | | (unaudited) | | | | | | | | | | | | | | | | |
Net asset value, beginning of period | | | $1.00 | | | | $1.00 | | | | $1.00 | | | | $1.00 | | | | $1.00 | | | | $1.00 | |
| | | |
| Income (loss) from investment operations | | | | | | | | | | | | | |
Net investment income (loss) (d) | | | $0.01 | | | | $0.01 | | | | $0.00 | (c)(w) | | | $0.00 | | | | $0.00 | | | | $0.00 | |
Net realized and unrealized
gain (loss) | | | 0.00 | (w) | | | — | | | | (0.00 | )(w) | | | — | | | | 0.00 | (w) | | | 0.00 | (w) |
Total from investment operations | | | $0.01 | | | | $0.01 | | | | $0.00 | (w) | | | $0.00 | | | | $0.00 | (w) | | | $0.00 | (w) |
| | | |
| Less distributions declared to shareholders | | | | | | | | | | | | | |
From net investment income | | | $(0.01 | ) | | | $(0.01 | ) | | | $(0.00 | )(w) | | | $— | | | | $— | | | | $— | |
Net asset value, end of period | | | $1.00 | | | | $1.00 | | | | $1.00 | | | | $1.00 | | | | $1.00 | | | | $1.00 | |
Total return (%) (r)(t) | | | 0.76 | (n) | | | 0.76 | | | | 0.08 | (c) | | | 0.00 | | | | 0.00 | (w) | | | 0.00 | (w) |
| | | |
Ratios (%) (to average net assets)
and Supplemental data: | | | | | | | | | | | | | |
Expenses before expense reductions (f) | | | 0.96 | (a) | | | 0.94 | | | | 0.91 | (c) | | | 0.91 | | | | 0.92 | | | | 0.90 | |
Expenses after expense reductions (f) | | | 0.70 | (a) | | | 0.68 | | | | 0.51 | (c) | | | 0.23 | | | | 0.07 | | | | 0.09 | |
Net investment income (loss) | | | 1.51 | (a) | | | 0.73 | | | | 0.08 | (c) | | | 0.00 | | | | 0.00 | | | | 0.00 | |
Net assets at end of period
(000 omitted) | | | $18,197 | | | | $26,227 | | | | $35,196 | | | | $37,650 | | | | $44,872 | | | | $53,916 | |
See Notes to Financial Statements
14
Financial Highlights – continued
| | | | | | | | | | | | | | | | | | | | | | | | |
| | | Six months
ended 2/28/19 | | | Year ended | |
| Class R4 | | 8/31/18 | | | 8/31/17 | | | 8/31/16 | | | 8/31/15 | | | 8/31/14 | |
| | | (unaudited) | | | | | | | | | | | | | | | | |
Net asset value, beginning of period | | | $1.00 | | | | $1.00 | | | | $1.00 | | | | $1.00 | | | | $1.00 | | | | $1.00 | |
| | | |
| Income (loss) from investment operations | | | | | | | | | | | | | |
Net investment income (loss) (d) | | | $0.01 | | | | $0.01 | | | | $0.00 | (c)(w) | | | $0.00 | | | | $0.00 | | | | $0.00 | |
Net realized and unrealized
gain (loss) | | | 0.00 | (w) | | | — | | | | (0.00 | )(w) | | | — | | | | 0.00 | (w) | | | 0.00 | (w) |
Total from investment operations | | | $0.01 | | | | $0.01 | | | | $0.00 | (w) | | | $0.00 | | | | $0.00 | (w) | | | $0.00 | (w) |
| | | |
| Less distributions declared to shareholders | | | | | | | | | | | | | |
From net investment income | | | $(0.01 | ) | | | $(0.01 | ) | | | $(0.00 | )(w) | | | $— | | | | $— | | | | $— | |
Net asset value, end of period | | | $1.00 | | | | $1.00 | | | | $1.00 | | | | $1.00 | | | | $1.00 | | | | $1.00 | |
Total return (%) (r)(t) | | | 0.76 | (n) | | | 0.76 | | | | 0.08 | (c) | | | 0.00 | | | | 0.00 | (w) | | | 0.00 | (w) |
| | | |
Ratios (%) (to average net assets)
and Supplemental data: | | | | | | | | | | | | | |
Expenses before expense reductions (f) | | | 0.71 | (a) | | | 0.69 | | | | 0.67 | (c) | | | 0.66 | | | | 0.67 | | | | 0.65 | |
Expenses after expense reductions (f) | | | 0.71 | (a) | | | 0.68 | | | | 0.52 | (c) | | | 0.23 | | | | 0.07 | | | | 0.09 | |
Net investment income (loss) | | | 1.53 | (a) | | | 0.74 | | | | 0.08 | (c) | | | 0.00 | | | | 0.00 | | | | 0.00 | |
Net assets at end of period
(000 omitted) | | | $2,752 | | | | $2,729 | | | | $3,250 | | | | $3,077 | | | | $3,034 | | | | $2,907 | |
| | | | | | | | | | | | | | | | | | | | | | | | |
| | | | | | |
| Class R6 | | | | | | | | | | | | | | | | | Six months
ended 2/28/19 (i) (unaudited) | |
Net asset value, beginning of period | | | | | | | | | | | | | | | | | | | | | | | $1.00 | |
| | | |
| Income (loss) from investment operations | | | | | | | | | | | | | |
Net investment income (loss) (d) | | | | | | | | | | | | | | | | | | | | | | | $0.01 | |
Net realized and unrealized gain (loss) | | | | | | | | | | | | | | | | | | | | | | | 0.00 | (w) |
Total from investment operations | | | | | | | | | | | | | | | | | | | | | | | $0.01 | |
| | | |
| Less distributions declared to shareholders | | | | | | | | | | | | | |
From net investment income | | | | | | | | | | | | | | | | | | | | | | | $(0.01 | ) |
Net asset value, end of period | | | | | | | | | | | | | | | | | | | | | | | $1.00 | |
Total return (%) (r)(t) | | | | | | | | | | | | | | | | | | | | | | | 0.73 | (n) |
| | | |
Ratios (%) (to average net assets)
and Supplemental data: | | | | | | | | | | | | | |
Expenses before expense reductions (f) | | | | | | | | | | | | | | | | | | | | | | | 0.64 | (a) |
Expenses after expense reductions (f) | | | | | | | | | | | | | | | | | | | | | | | 0.63 | (a) |
Net investment income (loss) | | | | | | | | | | | | | | | | | | | | | | | 1.63 | (a) |
Net assets at end of period (000 omitted) | | | | | | | | | | | | | | | | | | | | | | | $50 | |
See Notes to Financial Statements
15
Financial Highlights – continued
| | | | | | | | | | | | | | | | | | | | | | | | |
| | | Six months
ended 2/28/19 | | | Year ended | |
| Class 529A | | 8/31/18 | | | 8/31/17 | | | 8/31/16 | | | 8/31/15 | | | 8/31/14 | |
| | | (unaudited) | | | | | | | | | | | | | | | | |
Net asset value, beginning of period | | | $1.00 | | | | $1.00 | | | | $1.00 | | | | $1.00 | | | | $1.00 | | | | $1.00 | |
| | | |
| Income (loss) from investment operations | | | | | | | | | | | | | |
Net investment income (loss) (d) | | | $0.01 | | | | $0.01 | | | | $0.00 | (c)(w) | | | $0.00 | | | | $0.00 | | | | $0.00 | |
Net realized and unrealized
gain (loss) | | | 0.00 | (w) | | | — | | | | (0.00 | )(w) | | | — | | | | 0.00 | (w) | | | 0.00 | (w) |
Total from investment operations | | | $0.01 | | | | $0.01 | | | | $0.00 | (w) | | | $0.00 | | | | $0.00 | (w) | | | $0.00 | (w) |
| | | |
| Less distributions declared to shareholders | | | | | | | | | | | | | |
From net investment income | | | $(0.01 | ) | | | $(0.01 | ) | | | $(0.00 | )(w) | | | $— | | | | $— | | | | $— | |
Net asset value, end of period | | | $1.00 | | | | $1.00 | | | | $1.00 | | | | $1.00 | | | | $1.00 | | | | $1.00 | |
Total return (%) (r)(t) | | | 0.73 | (n) | | | 0.71 | | | | 0.06 | (c) | | | 0.00 | | | | 0.00 | (w) | | | 0.00 | (w) |
| | | |
Ratios (%) (to average net assets)
and Supplemental data: | | | | | | | | | | | | | |
Expenses before expense reductions (f) | | | 1.01 | (a) | | | 1.00 | | | | 1.01 | (c) | | | 1.00 | | | | 1.02 | | | | 1.00 | |
Expenses after expense reductions (f) | | | 0.75 | (a) | | | 0.73 | | | | 0.53 | (c) | | | 0.23 | | | | 0.07 | | | | 0.09 | |
Net investment income (loss) | | | 1.48 | (a) | | | 0.73 | | | | 0.06 | (c) | | | 0.00 | | | | 0.00 | | | | 0.00 | |
Net assets at end of period
(000 omitted) | | | $18,083 | | | | $15,197 | | | | $13,208 | | | | $12,841 | | | | $11,383 | | | | $10,927 | |
| | |
| | | Six months
ended 2/28/19 | | | Year ended | |
| Class 529B | | 8/31/18 | | | 8/31/17 | | | 8/31/16 | | | 8/31/15 | | | 8/31/14 | |
| | | (unaudited) | | | | | | | | | | | | | | | | |
Net asset value, beginning of period | | | $1.00 | | | | $1.00 | | | | $1.00 | | | | $1.00 | | | | $1.00 | | | | $1.00 | |
| | | |
| Income (loss) from investment operations | | | | | | | | | | | | | |
Net investment income (loss) (d) | | | $0.01 | | | | $0.01 | | | | $0.00 | (c)(w) | | | $0.00 | | | | $0.00 | | | | $0.00 | |
Net realized and unrealized
gain (loss) | | | 0.00 | (w) | | | — | | | | (0.00 | )(w) | | | — | | | | 0.00 | (w) | | | 0.00 | (w) |
Total from investment operations | | | $0.01 | | | | $0.01 | | | | $0.00 | (w) | | | $0.00 | | | | $0.00 | (w) | | | $0.00 | (w) |
| | | |
| Less distributions declared to shareholders | | | | | | | | | | | | | |
From net investment income | | | $(0.01 | ) | | | $(0.01 | ) | | | $(0.00 | )(w) | | | $— | | | | $— | | | | $— | |
Net asset value, end of period | | | $1.00 | | | | $1.00 | | | | $1.00 | | | | $1.00 | | | | $1.00 | | | | $1.00 | |
Total return (%) (r)(t) | | | 0.73 | (n) | | | 0.71 | | | | 0.06 | (c) | | | 0.00 | | | | 0.00 | (w) | | | 0.00 | (w) |
| | | |
Ratios (%) (to average net assets)
and Supplemental data: | | | | | | | | | | | | | |
Expenses before expense reductions (f) | | | 1.77 | (a) | | | 1.75 | | | | 1.76 | (c) | | | 1.76 | | | | 1.77 | | | | 1.75 | |
Expenses after expense reductions (f) | | | 0.76 | (a) | | | 0.73 | | | | 0.53 | (c) | | | 0.22 | | | | 0.07 | | | | 0.10 | |
Net investment income (loss) | | | 1.47 | (a) | | | 0.71 | | | | 0.06 | (c) | | | 0.00 | | | | 0.00 | | | | 0.00 | |
Net assets at end of period
(000 omitted) | | | $244 | | | | $293 | | | | $348 | | | | $355 | | | | $440 | | | | $531 | |
See Notes to Financial Statements
16
Financial Highlights – continued
| | | | | | | | | | | | | | | | | | | | | | | | |
| | | Six months
ended 2/28/19 | | | Year ended | |
| Class 529C | | 8/31/18 | | | 8/31/17 | | | 8/31/16 | | | 8/31/15 | | | 8/31/14 | |
| | | (unaudited) | | | | | | | | | | | | | | | | |
Net asset value, beginning of period | | | $1.00 | | | | $1.00 | | | | $1.00 | | | | $1.00 | | | | $1.00 | | | | $1.00 | |
| | | |
| Income (loss) from investment operations | | | | | | | | | | | | | |
Net investment income (loss) (d) | | | $0.01 | | | | $0.01 | | | | $0.00 | (c)(w) | | | $0.00 | | | | $0.00 | | | | $0.00 | |
Net realized and unrealized
gain (loss) | | | 0.00 | (w) | | | — | | | | (0.00 | )(w) | | | — | | | | 0.00 | (w) | | | 0.00 | (w) |
Total from investment operations | | | $0.01 | | | | $0.01 | | | | $0.00 | (w) | | | $0.00 | | | | $0.00 | (w) | | | $0.00 | (w) |
| | | |
| Less distributions declared to shareholders | | | | | | | | | | | | | |
From net investment income | | | $(0.01 | ) | | | $(0.01 | ) | | | $(0.00 | )(w) | | | $— | | | | $— | | | | $— | |
Net asset value, end of period | | | $1.00 | | | | $1.00 | | | | $1.00 | | | | $1.00 | | | | $1.00 | | | | $1.00 | |
Total return (%) (r)(t) | | | 0.73 | (n) | | | 0.71 | | | | 0.06 | (c) | | | 0.00 | | | | 0.00 | (w) | | | 0.00 | (w) |
| | | |
Ratios (%) (to average net assets)
and Supplemental data: | | | | | | | | | | | | | |
Expenses before expense reductions (f) | | | 1.76 | (a) | | | 1.75 | | | | 1.76 | (c) | | | 1.76 | | | | 1.77 | | | | 1.75 | |
Expenses after expense reductions (f) | | | 0.75 | (a) | | | 0.73 | | | | 0.54 | (c) | | | 0.24 | | | | 0.07 | | | | 0.09 | |
Net investment income (loss) | | | 1.48 | (a) | | | 0.70 | | | | 0.06 | (c) | | | 0.00 | | | | 0.00 | | | | 0.00 | |
Net assets at end of period
(000 omitted) | | | $6,890 | | | | $6,419 | | | | $6,957 | | | | $6,728 | | | | $5,866 | | | | $6,240 | |
| (c) | Amount reflects aone-time reimbursement of expenses by the custodian (or former custodian) without which net investment income and performance would be lower and expenses would be higher. |
| (d) | Per share data is based on average shares outstanding. |
| (f) | Ratios do not reflect reductions from fees paid indirectly, if applicable. |
| (i) | For Class I and Class R6, the period is from the class inception, September 18, 2018, through the stated period end. |
| (r) | Certain expenses have been reduced without which performance would have been lower. |
| (t) | Total returns do not include any applicable sales charges. |
| (w) | Per share amount was less than $0.01 and total return or ratio was less than 0.01%, as applicable. |
See Notes to Financial Statements
17
NOTES TO FINANCIAL STATEMENTS
(unaudited)
(1) Business and Organization
MFS U.S. Government Cash Reserve Fund (the fund) is a diversified series of MFS Series Trust I (the trust). The trust is organized as a Massachusetts business trust and is registered under the Investment Company Act of 1940, as amended, as anopen-end management investment company.
The fund is an investment company and accordingly follows the investment company accounting and reporting guidance of the Financial Accounting Standards Board (FASB) Accounting Standards Codification Topic 946 Financial Services – Investment Companies.
(2) Significant Accounting Policies
General – The preparation of financial statements in conformity with U.S. generally accepted accounting principles requires management to make estimates and assumptions that affect the reported amounts of assets and liabilities, and disclosure of contingent assets and liabilities at the date of the financial statements and the reported amounts of increases and decreases in net assets from operations during the reporting period. Actual results could differ from those estimates. In the preparation of these financial statements, management has evaluated subsequent events occurring after the date of the fund’s Statement of Assets and Liabilities through the date that the financial statements were issued.
In August 2018, the Securities and Exchange Commission (SEC) released its Final Rule on Disclosure Update and Simplification (the “Final Rule”) which is intended to simplify an issuer’s disclosure compliance efforts by removing redundant or outdated disclosure requirements without significantly altering the mix of information provided to investors. Effective with the current reporting period, the fund adopted the Final Rule with the impacts being that the fund is no longer required to present the components of distributable earnings on the Statement of Assets and Liabilities or the sources of distributions to shareholders and the amount of undistributed net investment income on the Statements of Changes in Net Assets.
Balance Sheet Offsetting – The fund’s accounting policy with respect to balance sheet offsetting is that, absent an event of default by the counterparty or a termination of the agreement, the International Swaps and Derivatives Association (ISDA) Master Agreement, or similar agreement, does not result in an offset of reported amounts of financial assets and financial liabilities in the Statement of Assets and Liabilities across transactions between the fund and the applicable counterparty. The fund’s right to setoff may be restricted or prohibited by the bankruptcy or insolvency laws of the particular jurisdiction to which a specific master netting agreement counterparty is subject. Balance sheet offsetting disclosures, to the extent applicable to the fund, have been included in the fund’s Significant Accounting Policies note under the captions for each of the fund’sin-scope financial instruments and transactions.
Investment Valuations – Pursuant to procedures approved by the Board of Trustees, investments held by the fund are generally valued at amortized cost, which approximates market value. Amortized cost involves valuing an instrument at its cost as
18
Notes to Financial Statements (unaudited) – continued
adjusted for amortization of premium or accretion of discount rather than its current market value. The amortized cost value of an instrument can be different from the market value of an instrument.
Various inputs are used in determining the value of the fund’s assets or liabilities. These inputs are categorized into three broad levels. In certain cases, the inputs used to measure fair value may fall into different levels of the fair value hierarchy. In such cases, an investment’s level within the fair value hierarchy is based on the lowest level of input that is significant to the fair value measurement. The fund’s assessment of the significance of a particular input to the fair value measurement in its entirety requires judgment, and considers factors specific to the investment. Level 1 includes unadjusted quoted prices in active markets for identical assets or liabilities. Level 2 includes other significant observable market-based inputs (including quoted prices for similar securities, interest rates, prepayment speed, and credit risk). Level 3 includes unobservable inputs, which may include the adviser’s own assumptions in determining the fair value of investments. The following is a summary of the levels used as of February 28, 2019 in valuing the fund’s assets or liabilities:
| | | | | | | | | | | | | | | | |
| | | | |
| Financial Instruments | | Level 1 | | | Level 2 | | | Level 3 | | | Total | |
| Short-Term Securities | | | $— | | | | $219,161,212 | | | | $— | | | | $219,161,212 | |
For further information regarding security characteristics, see the Portfolio of Investments.
Repurchase Agreements– The fund enters into repurchase agreements under the terms of Master Repurchase Agreements with approved counterparties. Each repurchase agreement is recorded at cost. The fund requires that the securities collateral in a repurchase transaction be transferred to a custodian. The fund monitors, on a daily basis, the value of the collateral to ensure that its value, including accrued interest, is greater than amounts owed to the fund under each such repurchase agreement. Upon an event of default under a Master Repurchase Agreement, thenon-defaulting party may close out all transactions traded under such agreement and net amounts owed under each transaction to one net amount payable by one party to the other. Absent an event of default, the Master Repurchase Agreement does not result in an offset of reported amounts of assets and liabilities in the Statement of Assets and Liabilities across transactions between the fund and the applicable counterparty. The fund and other funds managed by MFS may utilize a joint trading account for the purpose of entering into one or more repurchase agreements. At February 28, 2019, the fund had investments in repurchase agreements with a gross value of $15,647,000 included in investments in unaffiliated issuers in the Statement of Assets and Liabilities. The value of the related collateral exceeded the value of the repurchase agreements at period end.
Indemnifications– Under the fund’s organizational documents, its officers and Trustees may be indemnified against certain liabilities and expenses arising out of the performance of their duties to the fund. Additionally, in the normal course of business, the fund enters into agreements with service providers that may contain indemnification clauses. The fund’s maximum exposure under these agreements is unknown as this would involve future claims that may be made against the fund that have not yet occurred.
19
Notes to Financial Statements (unaudited) – continued
Investment Transactions and Income– Investment transactions are recorded on the trade date. Interest income is recorded on the accrual basis. All premium and discount is amortized or accreted for financial statement purposes in accordance with U.S. generally accepted accounting principles.
Tax Matters and Distributions– The fund intends to qualify as a regulated investment company, as defined under Subchapter M of the Internal Revenue Code, and to distribute all of its taxable income, including realized capital gains. As a result, no provision for federal income tax is required. The fund’s federal tax returns, when filed, will remain subject to examination by the Internal Revenue Service for a three year period. Management has analyzed the fund’s tax positions taken on federal and state tax returns for all open tax years and does not believe that there are any uncertain tax positions that require recognition of a tax liability.
Distributions to shareholders are recorded on theex-dividend date. Income and capital gain distributions are determined in accordance with income tax regulations, which may differ from U.S. generally accepted accounting principles. Certain capital accounts in the financial statements are periodically adjusted for permanent differences in order to reflect their tax character. These adjustments have no impact on net assets or net asset value per share. Temporary differences which arise from recognizing certain items of income, expense, gain or loss in different periods for financial statement and tax purposes will reverse at some time in the future. Distributions in excess of net investment income or net realized gains are temporary overdistributions for financial statement purposes resulting from differences in the recognition or classification of income or distributions for financial statement and tax purposes.
During the year ended August 31, 2018, there were no significant adjustments due to differences between book and tax accounting.
The tax character of distributions made during the current period will be determined at fiscal year end. The tax character of distributions declared to shareholders for the last fiscal year is as follows:
| | | | |
| |
| | | Year ended
8/31/18 | |
| Ordinary income (including anyshort-term capital gains) | | | $1,815,726 | |
The federal tax cost and the tax basis components of distributable earnings were as follows:
| | | | |
| |
| As of 2/28/19 | | | |
| |
| Cost of investments | | | $219,161,212 | |
| |
| As of 8/31/18 | | | |
| |
| Undistributed ordinary income | | | 964 | |
| Capital loss carryforwards | | | (5 | ) |
| Other temporary differences | | | (8,683 | ) |
The aggregate cost above includes prior fiscal year end tax adjustments, if applicable.
20
Notes to Financial Statements (unaudited) – continued
As of August 31, 2018, the fund had capital loss carryforwards available to offset future realized gains. These net capital losses may be carried forward indefinitely and their character is retained as short-term and/or long-term losses. Such losses are characterized as follows:
Multiple Classes of Shares of Beneficial Interest– The fund offers multiple classes of shares, which differ in their respective distribution, service, and program manager fees. The fund’s income and common expenses are allocated to shareholders based on the value of settled shares outstanding of each class. The fund’s realized and unrealized gain (loss) are allocated to shareholders based on the daily net assets of each class. Dividends are declared separately for each class. Differences in per share dividend rates are generally due to differences in separate class expenses. Class B and Class 529B shares will convert to Class A and Class 529A shares, respectively, approximately eight years after purchase. Class C and Class 529C shares will convert to Class A and Class 529A shares, respectively, approximately ten years after purchase. The fund’s distributions declared to shareholders as reported in the Statements of Changes in Net Assets are presented by class as follows:
| | | | | | | | |
| | | From net investment
income | |
| | |
| | | Six months
ended
2/28/19 (i) | | | Year
ended
8/31/18 | |
| Class A | | | $779,747 | | | | $762,528 | |
| Class B | | | 83,604 | | | | 105,124 | |
| Class C | | | 152,793 | | | | 199,742 | |
| Class I | | | 371 | | | | — | |
| Class R1 | | | 62,470 | | | | 68,974 | |
| Class R2 | | | 266,390 | | | | 288,493 | |
| Class R3 | | | 160,731 | | | | 218,089 | |
| Class R4 | | | 20,744 | | | | 21,305 | |
| Class R6 | | | 367 | | | | — | |
| Class 529A | | | 120,155 | | | | 100,631 | |
| Class 529B | | | 1,966 | | | | 2,240 | |
| Class 529C | | | 47,750 | | | | 48,600 | |
| Total | | | $1,697,088 | | | | $1,815,726 | |
| (i) | For Class I and Class R6, the period is from the class inception, September 18, 2018, through the stated period end. |
(3) Transactions with Affiliates
Investment Adviser– The fund has an investment advisory agreement with MFS to provide overall investment management and related administrative services and facilities to the fund. The management fee is computed daily and paid monthly at an annual rate of 0.40% of the fund’s average daily net assets.
MFS has also agreed in writing to reduce its management fee by a specified amount if certain MFS mutual fund assets exceed thresholds agreed to by MFS and the fund’s Board of Trustees. For the six months ended February 28, 2019, this management fee
21
Notes to Financial Statements (unaudited) – continued
reduction amounted to $11,025, which is included in the reduction of total expenses in the Statement of Operations. The management fee incurred for the six months ended February 28, 2019 was equivalent to an annual effective rate of 0.39% of the fund’s average daily net assets.
Distributor– The Board of Trustees has adopted a distribution plan for certain share classes pursuant to Rule12b-1 of the Investment Company Act of 1940.
The fund’s distribution plan provides that the fund will pay MFS Fund Distributors, Inc. (MFD), a wholly-owned subsidiary of MFS, for services provided by MFD and financial intermediaries in connection with the distribution and servicing of certain share classes. One component of the plan is a distribution fee paid to MFD and another component of the plan is a service fee paid to MFD. MFD may subsequently pay all, or a portion, of the distribution and/or service fees to financial intermediaries.
Distribution Plan Fee Table:
| | | | | | | | | | | | | | | | | | | | |
| | | | | |
| | | Distribution
Fee Rate (d) | | | Service
Fee Rate (d) | | | Total
Distribution
Plan (d) | | | Annual
Effective
Rate (e) | | | Distribution
and Service
Fee | |
| Class A | | | — | | | | 0.25% | | | | 0.25% | | | | 0.00% | | | | $127,239 | |
| Class B | | | 0.75% | | | | 0.25% | | | | 1.00% | | | | 0.00% | | | | 54,690 | |
| Class C | | | 0.75% | | | | 0.25% | | | | 1.00% | | | | 0.00% | | | | 99,320 | |
| Class R1 | | | 0.75% | | | | 0.25% | | | | 1.00% | | | | 0.00% | | | | 40,907 | |
| Class R2 | | | 0.25% | | | | 0.25% | | | | 0.50% | | | | 0.00% | | | | 87,136 | |
| Class R3 | | | — | | | | 0.25% | | | | 0.25% | | | | 0.00% | | | | 26,664 | |
| Class 529A | | | — | | | | 0.25% | | | | 0.25% | | | | 0.00% | | | | 20,278 | |
| Class 529B | | | 0.75% | | | | 0.25% | | | | 1.00% | | | | 0.00% | | | | 1,337 | |
| Class 529C | | | 0.75% | | | | 0.25% | | | | 1.00% | | | | 0.00% | | | | 32,291 | |
| Total Distribution and Service Fees | | | | | | | | | | | | $489,862 | |
| (d) | In accordance with the distribution plan for certain classes, the fund pays distribution and/or service fees equal to these annual percentage rates of each class’s average daily net assets. The distribution and service fee rates disclosed by class represent the current rates in effect at the end of the reporting period. Any rate changes, if applicable, are detailed below. |
| (e) | The annual effective rates represent actual fees incurred under the distribution plan for the six months ended February 28, 2019 based on each class’s average daily net assets. MFD has agreed in writing to waive any distribution and/or service fees for Class A, Class B, Class C, Class R1, Class R2, Class R3, Class 529A, Class 529B, and Class 529C. This written agreement will continue until modified by the fund’s Board of Trustees, but such agreement will continue until at least December 31, 2019. These reductions, for the six months ended February 28, 2019, for Class A, Class B, Class C, Class R1, Class R2, Class R3, Class 529A, Class 529B, and Class 529C amounted to $127,239, $54,690, $99,320, $40,907, $87,136, $26,664, $20,278, $1,337, and $32,291, respectively, and are included in the reduction of total expenses in the Statement of Operations. |
Certain Class A shares are subject to a contingent deferred sales charge (CDSC) in the event of a shareholder redemption within 18 months of purchase. Class B and Class 529B shares are subject to a CDSC in the event of a shareholder redemption within six years of purchase. Class C and Class 529C shares are subject to a CDSC in
22
Notes to Financial Statements (unaudited) – continued
the event of a shareholder redemption within 12 months of purchase. All contingent deferred sales charges are paid to MFD and during the six months ended February 28, 2019, were as follows:
| | | | |
| |
| | | Amount | |
| Class A | | | $28,849 | |
| Class B | | | 19,738 | |
| Class C | | | 2,658 | |
| Class 529B | | | 465 | |
| Class 529C | | | 215 | |
The fund has entered into and may from time to time enter into contracts with program managers and other parties which administer the tuition programs through which an investment in the fund’s 529 share classes is made. The fund has entered into an agreement with MFD pursuant to which MFD receives an annual fee of up to 0.05% of the average daily net assets attributable to each 529 share class. The services provided by MFD, or a third party with which MFD contracts, include recordkeeping and tax reporting and account services, as well as services designed to maintain the program’s compliance with the Internal Revenue Code and other regulatory requirements. Program manager fees for the six months ended February 28, 2019, were as follows:
| | | | |
| |
| | | Fee | |
| Class 529A | | | $4,056 | |
| Class 529B | | | 67 | |
| Class 529C | | | 1,614 | |
| Total Program Manager Fees | | | $5,737 | |
Shareholder Servicing Agent– MFS Service Center, Inc. (MFSC), a wholly-owned subsidiary of MFS, receives a fee from the fund for its services as shareholder servicing agent calculated as a percentage of the average daily net assets of the fund as determined periodically under the supervision of the fund’s Board of Trustees. For the six months ended February 28, 2019, the fee was $70,287, which equated to 0.0631% annually of the fund’s average daily net assets. MFSC also receives payment from the fund forout-of-pocket expenses,sub-accounting and other shareholder servicing costs which may be paid to affiliated and unaffiliated service providers. Class R6 shares do not incursub-accounting fees. For the six months ended February 28, 2019, theseout-of-pocket expenses,sub-accounting and other shareholder servicing costs amounted to $129,595.
Administrator– MFS provides certain financial, legal, shareholder communications, compliance, and other administrative services to the fund. Under an administrative services agreement, the fund reimburses MFS the costs incurred to provide these services. The fund is charged an annual fixed amount of $17,500 plus a fee based on average daily net assets. The administrative services fee incurred for the six months ended February 28, 2019 was equivalent to an annual effective rate of 0.0180% of the fund’s average daily net assets.
Trustees’ and Officers’ Compensation– The fund pays compensation to independent Trustees in the form of a retainer, attendance fees, and additional compensation to Board and Committee chairpersons. The fund does not pay
23
Notes to Financial Statements (unaudited) – continued
compensation directly to Trustees or officers of the fund who are also officers of the investment adviser, all of whom receive remuneration for their services to the fund from MFS. Certain officers and Trustees of the fund are officers or directors of MFS, MFD, and MFSC.
Prior to December 31, 2001, the fund had an unfunded defined benefit plan (“DB plan”) for independent Trustees. As of December 31, 2001, the Board took action to terminate the DB plan with respect to then-current and any future independent Trustees, such that the DB plan covers only certain of those former independent Trustees who retired on or before December 31, 2001. The DB plan resulted in a pension expense of $780 and is included in “Independent Trustees’ compensation” in the Statement of Operations for the six months ended February 28, 2019. The liability for deferred retirement benefits payable to those former independent Trustees under the DB plan amounted to $4,545 at February 28, 2019, and is included in “Payable for independent Trustees’ compensation” in the Statement of Assets and Liabilities.
Other– This fund and certain other funds managed by MFS (the funds) have entered into a service agreement (the ISO Agreement) which provides for payment of fees solely by the funds to Tarantino LLC in return for the provision of services of an Independent Senior Officer (ISO) for the funds. Frank L. Tarantino serves as the ISO and is an officer of the funds and the sole member of Tarantino LLC. The funds can terminate the ISO Agreement with Tarantino LLC at any time under the terms of the ISO Agreement. For the six months ended February 28, 2019, the fee paid by the fund under this agreement was $192 and is included in “Miscellaneous” expense in the Statement of Operations. MFS has agreed to bear all expenses associated with office space, other administrative support, and supplies provided to the ISO.
On September 17, 2018, MFS purchased 50,000 shares of Class I for an aggregate amount of $50,000 and 50,000 shares of Class R6 for an aggregate amount of $50,000 as an initial investment in the class.
At February 28, 2019, MFS held approximately 100%, 96%, and 67% of the outstanding shares of Class R6, Class R4, and Class I, respectively.
24
Notes to Financial Statements (unaudited) – continued
(4) Shares of Beneficial Interest
The fund’s Declaration of Trust permits the Trustees to issue an unlimited number of full and fractional shares of beneficial interest. The number of shares sold, reinvested and reacquired corresponds to the net proceeds from the sale of shares, reinvestment of distributions and cost of shares reacquired, respectively, since shares are sold and reacquired at $1.00 per share. Transactions in fund shares were as follows:
| | | | | | | | |
| | | Six months ended
2/28/19 (i) | | | Year ended
8/31/18 | |
| Shares sold | | | | | | | | |
Class A | | | 39,782,684 | | | | 50,403,828 | |
Class B | | | 3,223,380 | | | | 5,082,750 | |
Class C | | | 12,115,818 | | | | 16,082,381 | |
Class I | | | 75,000 | | | | — | |
Class R1 | | | 1,111,771 | | | | 2,510,582 | |
Class R2 | | | 6,316,145 | | | | 9,654,540 | |
Class R3 | | | 5,358,172 | | | | 9,589,275 | |
Class R4 | | | 6,753 | | | | 88,457 | |
Class R6 | | | 50,000 | | | | — | |
Class 529A | | | 6,551,590 | | | | 8,912,193 | |
Class 529B | | | 46,623 | | | | 203,096 | |
Class 529C | | | 2,161,169 | | | | 3,549,891 | |
| | | 76,799,105 | | | | 106,076,993 | |
| | |
Shares issued to shareholders in
reinvestment of distributions | | | | | | | | |
Class A | | | 755,713 | | | | 738,779 | |
Class B | | | 78,350 | | | | 99,285 | |
Class C | | | 147,798 | | | | 190,726 | |
Class I | | | 372 | | | | — | |
Class R1 | | | 62,429 | | | | 68,975 | |
Class R2 | | | 265,818 | | | | 288,942 | |
Class R3 | | | 161,280 | | | | 218,049 | |
Class R4 | | | 20,749 | | | | 21,171 | |
Class R6 | | | 367 | | | | — | |
Class 529A | | | 119,680 | | | | 100,031 | |
Class 529B | | | 1,955 | | | | 2,210 | |
Class 529C | | | 47,413 | | | | 48,180 | |
| | | 1,661,924 | | | | 1,776,348 | |
25
Notes to Financial Statements (unaudited) – continued
| | | | | | | | |
| | | Six months ended
2/28/19 (i) | | | Year ended
8/31/18 | |
| Shares reacquired | | | | | | | | |
Class A | | | (39,923,963 | ) | | | (56,520,250 | ) |
Class B | | | (4,336,384 | ) | | | (10,860,547 | ) |
Class C | | | (10,567,170 | ) | | | (36,291,473 | ) |
Class R1 | | | (1,340,468 | ) | | | (6,511,979 | ) |
Class R2 | | | (7,235,972 | ) | | | (23,138,962 | ) |
Class R3 | | | (13,559,214 | ) | | | (18,779,075 | ) |
Class R4 | | | (5,001 | ) | | | (629,737 | ) |
Class 529A | | | (3,782,087 | ) | | | (7,018,022 | ) |
Class 529B | | | (97,123 | ) | | | (260,288 | ) |
Class 529C | | | (1,737,362 | ) | | | (4,134,238 | ) |
| | | (82,584,744 | ) | | | (164,144,571 | ) |
| | |
| Net change | | | | | | | | |
Class A | | | 614,434 | | | | (5,377,643 | ) |
Class B | | | (1,034,654 | ) | | | (5,678,512 | ) |
Class C | | | 1,696,446 | | | | (20,018,366 | ) |
Class I | | | 75,372 | | | | — | |
Class R1 | | | (166,268 | ) | | | (3,932,422 | ) |
Class R2 | | | (654,009 | ) | | | (13,195,480 | ) |
Class R3 | | | (8,039,762 | ) | | | (8,971,751 | ) |
Class R4 | | | 22,501 | | | | (520,109 | ) |
Class R6 | | | 50,367 | | | | — | |
Class 529A | | | 2,889,183 | | | | 1,994,202 | |
Class 529B | | | (48,545 | ) | | | (54,982 | ) |
Class 529C | | | 471,220 | | | | (536,167 | ) |
| | | (4,123,715 | ) | | | (56,291,230 | ) |
| (i) | For Class I and Class R6, the period is from the class inception, September 18, 2018, through the stated period end. |
Effective June 1, 2019, purchases of the fund’s Class B and Class 529B shares are closed to new and existing investors subject to certain exceptions. Please see the fund’s prospectus for details.
(5) Line of Credit
The fund and certain other funds managed by MFS participate in a $1.25 billion unsecured committed line of credit, subject to a $1 billion sublimit, provided by a syndication of banks under a credit agreement. Borrowings may be made for temporary financing needs. Interest is charged to each fund, based on its borrowings, generally at a rate equal to the higher of the Overnight Bank Funding rate or daily one month LIBOR plus an agreed upon spread. A commitment fee, based on the average daily, unused portion of the committed line of credit, is allocated among the participating funds. In addition, the fund and other funds managed by MFS have established unsecured uncommitted borrowing arrangements with certain banks for temporary financing needs. Interest is charged to each fund, based on its borrowings, at a rate equal to the Overnight Bank Funding rate plus an agreed upon spread. For the six months ended February 28, 2019, the fund’s commitment fee and interest expense were $681 and $0, respectively, and are included in “Miscellaneous” expense in the Statement of Operations.
26
PROXY VOTING POLICIES AND INFORMATION
MFS votes proxies on behalf of the fund pursuant to proxy voting policies and procedures that are available without charge, upon request, by calling1-800-225-2606, by visitingmfs.com/proxyvoting, or by visiting the SEC’s Web site athttp://www.sec.gov.
Information regarding how the fund voted proxies relating to portfolio securities during the most recent twelve-month period ended June 30 is available by August 31 of each year without charge by visitingmfs.com/proxyvoting, or by visiting the SEC’s Web site athttp://www.sec.gov.
QUARTERLY PORTFOLIO DISCLOSURE
The fund files a complete schedule of portfolio holdings with the SEC for the first and third quarters of each fiscal year on Form N-Q. The fund’s Form N-Q is available on the SEC’s website athttp://www.sec.gov.A shareholder can obtain the portfolio holdings report for the first and third quarters of the fund’s fiscal year atmfs.com/openendfundsby choosing the fund’s name and then selecting the “Resources” tab and clicking on “Prospectus and Reports”.
FURTHER INFORMATION
From time to time, MFS may post important information about the fund or the MFS funds on the MFS web site (mfs.com). This information is available athttps://www.mfs.com/en-us/what-we-do/announcements.html or atmfs.com/openendfunds by choosing the fund’s name.
INFORMATION ABOUT FUND CONTRACTS AND LEGAL CLAIMS
The fund has entered into contractual arrangements with an investment adviser, administrator, distributor, shareholder servicing agent, 529 program manager (if applicable), and custodian who each provide services to the fund. Unless expressly stated otherwise, shareholders are not parties to, or intended beneficiaries of these contractual arrangements, and these contractual arrangements are not intended to create any shareholder right to enforce them against the service providers or to seek any remedy under them against the service providers, either directly or on behalf of the fund.
Under the Trust’s By-Laws and Declaration of Trust, any claims asserted against or on behalf of the MFS Funds, including claims against Trustees and Officers, must be brought in state and federal courts located within the Commonwealth of Massachusetts.
PROVISION OF FINANCIAL REPORTS AND SUMMARY PROSPECTUSES
The fund produces financial reports every six months and updates its summary prospectus and prospectus annually. To avoid sending duplicate copies of materials to households, only one copy of the fund’s annual and semiannual report and summary prospectus may be mailed to shareholders having the same last name and residential address on the fund’s records. However, any shareholder may contact MFSC (please see back cover for address and telephone number) to request that copies of these reports and summary prospectuses be sent personally to that shareholder.
27
Save paper with eDelivery.

| MFS® will send you prospectuses, |
reports, and proxies directly viae-mail so you will get information faster with less mailbox clutter.
To sign up:
1. Go to mfs.com.
2. Log in via MFS® Access.
3. Select eDelivery.
If you own your MFS fund shares through a financial institution or a retirement plan, MFS® TALK, MFS® Access, or eDelivery may not be available to you.
CONTACT
WEB SITE
mfs.com
MFS TALK
1-800-637-8255
24 hours a day
ACCOUNT SERVICE AND LITERATURE
Shareholders
1-800-225-2606
Financial advisors
1-800-343-2829
Retirement plan services
1-800-637-1255
MAILING ADDRESS
MFS Service Center, Inc.
P.O. Box 219341
Kansas City, MO 64121-9341
OVERNIGHT MAIL
MFS Service Center, Inc.
Suite 219341
430 W 7th Street
Kansas City, MO 64105-1407
Semiannual Report
February 28, 2019

MFS® Value Fund

Beginning on January 1, 2021, as permitted by regulations adopted by the U.S. Securities and Exchange Commission, paper copies of the fund’s annual and semiannual shareholder reports will no longer be sent by mail, unless you specifically request paper copies of the reports. Instead, the complete reports will be made available on the fund’s Web site (funds.mfs.com), and you will be notified by mail each time a report is posted and provided with a Web site link to access the report.
If you are already signed up to receive shareholder reports by email, you will not be affected by this change and you need not take any action. You may sign up to receive shareholder reports and other communications from the fund by email by contacting your financial intermediary (such as a broker-dealer or bank) or, if you hold your shares directly with the fund, by calling 1-800-225-2606 or by logging on to MFS Access at mfs.com.
Beginning on January 1, 2019, you may elect to receive all future reports in paper free of charge. Contact your financial intermediary to request that you continue to receive paper copies of your shareholder reports. If you invest directly with the fund, you can call 1-800-225-2606 or send an email request to orderliterature@mfs.com to let the fund know that you wish to continue receiving paper copies of your shareholder reports. Your election to receive reports in paper will apply to all funds held in your account if you invest through your financial intermediary or all funds held with the MFS fund complex if you invest directly.
EIF-SEM
MFS® Value Fund
CONTENTS
The report is prepared for the general information of shareholders.
It is authorized for distribution to prospective investors only when preceded or accompanied by a current prospectus.
NOT FDIC INSURED• MAY LOSE VALUE• NO BANK GUARANTEE

LETTER FROM THE EXECUTIVE CHAIRMAN
Dear Shareholders:
Markets experienced a bout of volatility in late 2018 as a result of higher interest rates, international trade friction and geopolitical uncertainty surrounding issues such as
Brexit. But concern over those issues dissipated in the early months of 2019 due to a more dovish posture by the U.S. Federal Reserve, progress toward a trade pact between the United States and China, and a consensus forming in the British Parliament against ano-deal Brexit. Over the past year, U.S. equities have outperformed their global peers due in part to fiscal stimulus undertaken in late 2017 and early 2019, which helped maintain healthy levels of U.S. economic output against a backdrop of slowing global growth, though returns, on average, have been modest.
Globally, inflation remains largely subdued thanks in part to stable
oil prices, though tight labor markets are keeping investors on the lookout for its potential reappearance. Rising incomes in many developed and emerging markets are supportive of gains in consumption, though a challenging backdrop for global trade has weighed on manufacturing in most regions. Should the U.S. and China reach a comprehensive trade agreement, sentiment could improve later this year.
As a global investment manager with nearly a century of expertise, MFS® firmly believes active risk management offers downside mitigation and may help improve investment outcomes. We built our active investment platform with this belief in mind. Our long-term perspective influences nearly every aspect of our business, ensuring that our investment decisions align with the investing time horizons of our clients.
Respectfully,

Robert J. Manning
Executive Chairman
MFS Investment Management
April 16, 2019
The opinions expressed in this letter are subject to change and may not be relied upon for investment advice. No forecasts can be guaranteed.
1
PORTFOLIO COMPOSITION
Portfolio structure
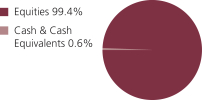
| | | | |
| Top ten holdings | |
| JPMorgan Chase & Co. | | | 4.4% | |
| Johnson & Johnson | | | 3.6% | |
| Accenture PLC, “A” | | | 3.0% | |
| Wells Fargo & Co. | | | 2.8% | |
| Medtronic PLC | | | 2.7% | |
| Comcast Corp., “A” | | | 2.6% | |
| Philip Morris International, Inc. | | | 2.5% | |
| Pfizer, Inc. | | | 2.5% | |
| U.S. Bancorp | | | 2.2% | |
| Aon PLC | | | 2.1% | |
| | | | |
| GICS equity sectors | |
| Financials | | | 28.1% | |
| Health Care | | | 17.2% | |
| Industrials | | | 16.4% | |
| Consumer Staples | | | 10.0% | |
| Information Technology | | | 9.2% | |
| Communication Services | | | 4.8% | |
| Energy | | | 4.3% | |
| Utilities | | | 4.0% | |
| Materials | | | 3.4% | |
| Consumer Discretionary | | | 1.6% | |
| Real Estate | | | 0.4% | |
Cash & Cash Equivalents includes any cash, investments in money market funds,short-term securities, and other assets less liabilities. Please see the Statement of Assets and Liabilities for additional information related to the fund’s cash position and other assets and liabilities.
The Global Industry Classification Standard (GICS®) was developed by and/or is the exclusive property of MSCI, Inc. and S&P Global Market Intelligence Inc. (“S&P Global Market Intelligence”). GICS is a service mark of MSCI and S&P Global Market Intelligence and has been licensed for use by MFS.
Percentages are based on net assets as of February 28, 2019.
The portfolio is actively managed and current holdings may be different.
2
EXPENSE TABLE
Fund expenses borne by the shareholders during the period, September 1, 2018 through February 28, 2019
As a shareholder of the fund, you incur two types of costs: (1) transaction costs, including sales charges (loads) on certain purchase or redemption payments, and (2) ongoing costs, including management fees; distribution and service(12b-1) fees; and other fund expenses. This example is intended to help you understand your ongoing costs (in dollars) of investing in the fund and to compare these costs with the ongoing costs of investing in other mutual funds.
The example is based on an investment of $1,000 invested at the beginning of the period and held for the entire period September 1, 2018 through February 28, 2019.
Actual Expenses
The first line for each share class in the following table provides information about actual account values and actual expenses. You may use the information in this line, together with the amount you invested, to estimate the expenses that you paid over the period. Simply divide your account value by $1,000 (for example, an $8,600 account value divided by $1,000 = 8.6), then multiply the result by the number in the first line under the heading entitled “Expenses Paid During Period” to estimate the expenses you paid on your account during this period.
Hypothetical Example for Comparison Purposes
The second line for each share class in the following table provides information about hypothetical account values and hypothetical expenses based on the fund’s actual expense ratio and an assumed rate of return of 5% per year before expenses, which is not the fund’s actual return. The hypothetical account values and expenses may not be used to estimate the actual ending account balance or expenses you paid for the period. You may use this information to compare the ongoing costs of investing in the fund and other funds. To do so, compare this 5% hypothetical example with the 5% hypothetical examples that appear in the shareholder reports of the other funds.
Please note that the expenses shown in the table are meant to highlight your ongoing costs only and do not reflect any transactional costs, such as sales charges (loads). Therefore, the second line for each share class in the table is useful in comparing ongoing costs only, and will not help you determine the relative total costs of owning different funds. In addition, if these transactional costs were included, your costs would have been higher.
3
Expense Table – continued
| | | | | | | | | | | | | | | | | | |
Share
Class | | | | Annualized
Expense
Ratio | | | Beginning
Account Value
9/01/18 | | | Ending
Account Value
2/28/19 | | | Expenses
Paid During
Period (p)
9/01/18-2/28/19 | |
| A | | Actual | | | 0.81% | | | | $1,000.00 | | | | $991.73 | | | | $4.00 | |
| | Hypothetical (h) | | | 0.81% | | | | $1,000.00 | | | | $1,020.78 | | | | $4.06 | |
| B | | Actual | | | 1.56% | | | | $1,000.00 | | | | $987.94 | | | | $7.69 | |
| | Hypothetical (h) | | | 1.56% | | | | $1,000.00 | | | | $1,017.06 | | | | $7.80 | |
| C | | Actual | | | 1.57% | | | | $1,000.00 | | | | $987.95 | | | | $7.74 | |
| | Hypothetical (h) | | | 1.57% | | | | $1,000.00 | | | | $1,017.01 | | | | $7.85 | |
| I | | Actual | | | 0.57% | | | | $1,000.00 | | | | $992.89 | | | | $2.82 | |
| | Hypothetical (h) | | | 0.57% | | | | $1,000.00 | | | | $1,021.97 | | | | $2.86 | |
| R1 | | Actual | | | 1.57% | | | | $1,000.00 | | | | $987.91 | | | | $7.74 | |
| | Hypothetical (h) | | | 1.57% | | | | $1,000.00 | | | | $1,017.01 | | | | $7.85 | |
| R2 | | Actual | | | 1.06% | | | | $1,000.00 | | | | $990.45 | | | | $5.23 | |
| | Hypothetical (h) | | | 1.06% | | | | $1,000.00 | | | | $1,019.54 | | | | $5.31 | |
| R3 | | Actual | | | 0.82% | | | | $1,000.00 | | | | $991.69 | | | | $4.05 | |
| | Hypothetical (h) | | | 0.82% | | | | $1,000.00 | | | | $1,020.73 | | | | $4.11 | |
| R4 | | Actual | | | 0.57% | | | | $1,000.00 | | | | $992.85 | | | | $2.82 | |
| | Hypothetical (h) | | | 0.57% | | | | $1,000.00 | | | | $1,021.97 | | | | $2.86 | |
| R6 | | Actual | | | 0.47% | | | | $1,000.00 | | | | $993.18 | | | | $2.32 | |
| | Hypothetical (h) | | | 0.47% | | | | $1,000.00 | | | | $1,022.46 | | | | $2.36 | |
| 529A | | Actual | | | 0.84% | | | | $1,000.00 | | | | $991.59 | | | | $4.15 | |
| | Hypothetical (h) | | | 0.84% | | | | $1,000.00 | | | | $1,020.63 | | | | $4.21 | |
| 529B | | Actual | | | 0.79% | | | | $1,000.00 | | | | $991.67 | | | | $3.90 | |
| | Hypothetical (h) | | | 0.79% | | | | $1,000.00 | | | | $1,020.88 | | | | $3.96 | |
| 529C | | Actual | | | 1.61% | | | | $1,000.00 | | | | $987.68 | | | | $7.93 | |
| | Hypothetical (h) | | | 1.61% | | | | $1,000.00 | | | | $1,016.81 | | | | $8.05 | |
| (h) | 5% class return per year before expenses. |
| (p) | “Expenses Paid During Period” are equal to each class’s annualized expense ratio, as shown above, multiplied by the average account value over the period, multiplied by 181/365 (to reflect theone-half year period). Expenses paid do not include any applicable sales charges (loads). If these transaction costs had been included, your costs would have been higher. |
Notes to Expense Table
For the period from September 1, 2018 through February 28, 2019, the distribution fee for Class 529B was not imposed. Had the distribution fee been imposed throughout the entire six month period, the annualized expense ratio, the actual expenses paid during the period, and the hypothetical expenses paid during the period would have been approximately 1.61%, $7.95, and $8.05 for Class 529B. See Note 3 in the Notes to Financial Statements for additional information.
4
Expense Table – continued
Each class with a Rule 12b-1 service fee is subject to a rebate of a portion of such fee. Such rebates are included in the expense ratios above. For Class 529A, Class 529B, and Class 529C shares, this rebate reduced the expense ratios above by 0.03%, 0.01%, and 0.01%, respectively. See Note 3 in the Notes to Financial Statements for additional information
5
PORTFOLIO OF INVESTMENTS
2/28/19 (unaudited)
The Portfolio of Investments is a complete list of all securities owned by your fund. It is categorized by broad-based asset classes.
| | | | | | | | |
| Common Stocks - 99.4% | | | | | | | | |
| | |
| Issuer | | Shares/Par | | | Value ($) | |
| Aerospace - 5.6% | | | | | | | | |
| Honeywell International, Inc. | | | 5,987,477 | | | $ | 922,490,581 | |
| Lockheed Martin Corp. | | | 927,279 | | | | 286,909,395 | |
| Northrop Grumman Corp. | | | 2,858,264 | | | | 828,782,230 | |
| United Technologies Corp. | | | 4,300,779 | | | | 540,478,897 | |
| | | | | | | | |
| | | | | | | $ | 2,578,661,103 | |
| Alcoholic Beverages - 1.3% | | | | | | | | |
| Diageo PLC | | | 15,796,456 | | | $ | 610,425,567 | |
| | |
| Apparel Manufacturers - 0.4% | | | | | | | | |
| Hanesbrands, Inc. | | | 9,321,798 | | | $ | 173,292,225 | |
| | |
| Automotive - 1.2% | | | | | | | | |
| Aptiv PLC | | | 4,981,486 | | | $ | 414,011,301 | |
| Harley-Davidson, Inc. | | | 1,490,289 | | | | 55,319,528 | |
| Lear Corp. | | | 689,021 | | | | 104,779,424 | |
| | | | | | | | |
| | | | | | | $ | 574,110,253 | |
| Broadcasting - 1.7% | | | | | | | | |
| Interpublic Group of Companies, Inc. | | | 9,487,959 | | | $ | 218,507,696 | |
| Omnicom Group, Inc. | | | 7,623,035 | | | | 577,063,749 | |
| | | | | | | | |
| | | | | | | $ | 795,571,445 | |
| Brokerage & Asset Managers - 2.6% | | | | | | | | |
| BlackRock, Inc. | | | 1,032,769 | | | $ | 457,743,876 | |
| NASDAQ, Inc. | | | 5,789,747 | | | | 530,167,133 | |
| T. Rowe Price Group, Inc. | | | 2,146,534 | | | | 215,576,410 | |
| | | | | | | | |
| | | | | | | $ | 1,203,487,419 | |
| Business Services - 7.3% | | | | | | | | |
| Accenture PLC, “A” | | | 8,513,865 | | | $ | 1,373,967,534 | |
| Amdocs Ltd. | | | 1,723,648 | | | | 95,783,119 | |
| Cognizant Technology Solutions Corp., “A” | | | 3,260,771 | | | | 231,449,526 | |
| DXC Technology Co. | | | 2,908,946 | | | | 191,583,184 | |
| Equifax, Inc. | | | 3,196,328 | | | | 350,029,879 | |
| Fidelity National Information Services, Inc. | | | 5,049,079 | | | | 546,057,894 | |
| Fiserv, Inc. (a) | | | 6,896,163 | | | | 584,036,044 | |
| | | | | | | | |
| | | | | | | $ | 3,372,907,180 | |
| Cable TV - 2.6% | | | | | | | | |
| Comcast Corp., “A” | | | 31,269,128 | | | $ | 1,209,177,180 | |
6
Portfolio of Investments (unaudited) – continued
| | | | | | | | |
| | |
| Issuer | | Shares/Par | | | Value ($) | |
| Common Stocks - continued | | | | | | | | |
| Chemicals - 3.4% | | | | | | | | |
| 3M Co. | | | 2,604,664 | | | $ | 540,181,267 | |
| DowDuPont, Inc. | | | 2,717,439 | | | | 144,649,278 | |
| PPG Industries, Inc. | | | 7,815,488 | | | | 875,100,191 | |
| | | | | | | | |
| | | | | | | $ | 1,559,930,736 | |
| Construction - 1.9% | | | | | | | | |
| Sherwin-Williams Co. | | | 1,012,095 | | | $ | 438,439,554 | |
| Stanley Black & Decker, Inc. | | | 3,197,181 | | | | 423,402,680 | |
| | | | | | | | |
| | | | | | | $ | 861,842,234 | |
| Consumer Products - 1.2% | | | | | | | | |
| Colgate-Palmolive Co. | | | 1,425,125 | | | $ | 93,872,984 | |
| Kimberly-Clark Corp. | | | 1,302,109 | | | | 152,125,394 | |
| Procter & Gamble Co. | | | 926,970 | | | | 91,352,894 | |
| Reckitt Benckiser Group PLC | | | 2,773,457 | | | | 212,143,348 | |
| | | | | | | | |
| | | | | | | $ | 549,494,620 | |
| Containers - 0.2% | | | | | | | | |
| Crown Holdings, Inc. (a) | | | 1,821,590 | | | $ | 98,894,121 | |
| | |
| Electrical Equipment - 1.9% | | | | | | | | |
| HD Supply Holdings, Inc. (a) | | | 2,302,735 | | | $ | 99,040,632 | |
| Johnson Controls International PLC | | | 22,543,150 | | | | 795,096,901 | |
| | | | | | | | |
| | | | | | | $ | 894,137,533 | |
| Electronics - 2.7% | | | | | | | | |
| Analog Devices, Inc. | | | 3,396,206 | | | $ | 363,258,194 | |
| Texas Instruments, Inc. | | | 8,343,875 | | | | 882,615,097 | |
| | | | | | | | |
| | | | | | | $ | 1,245,873,291 | |
| Energy - Independent - 1.5% | | | | | | | | |
| EOG Resources, Inc. | | | 4,203,866 | | | $ | 395,163,404 | |
| Occidental Petroleum Corp. | | | 4,327,048 | | | | 286,234,225 | |
| | | | | | | | |
| | | | | | | $ | 681,397,629 | |
| Energy - Integrated - 1.6% | | | | | | | | |
| Chevron Corp. | | | 3,251,608 | | | $ | 388,827,285 | |
| Exxon Mobil Corp. | | | 4,653,140 | | | | 367,737,654 | |
| | | | | | | | |
| | | | | | | $ | 756,564,939 | |
| Food & Beverages - 4.4% | | | | | | | | |
| Archer Daniels Midland Co. | | | 5,221,915 | | | $ | 221,931,387 | |
| Danone S.A. | | | 2,819,337 | | | | 212,710,568 | |
| General Mills, Inc. | | | 9,539,439 | | | | 449,593,760 | |
| J.M. Smucker Co. | | | 1,679,736 | | | | 177,900,840 | |
7
Portfolio of Investments (unaudited) – continued
| | | | | | | | |
| | |
| Issuer | | Shares/Par | | | Value ($) | |
| Common Stocks - continued | | | | | | | | |
| Food & Beverages - continued | | | | | | | | |
| Nestle S.A. | | | 8,235,183 | | | $ | 745,585,027 | |
| PepsiCo, Inc. | | | 2,080,683 | | | | 240,610,182 | |
| | | | | | | | |
| | | | | | | $ | 2,048,331,764 | |
| Health Maintenance Organizations - 1.5% | | | | | | | | |
| Cigna Corp. | | | 3,913,681 | | | $ | 682,702,514 | |
| | |
| Insurance - 6.9% | | | | | | | | |
| Aon PLC | | | 5,615,232 | | | $ | 963,180,745 | |
| Chubb Ltd. | | | 6,588,801 | | | | 882,240,454 | |
| MetLife, Inc. | | | 9,268,069 | | | | 418,824,038 | |
| Travelers Cos., Inc. | | | 6,904,625 | | | | 917,693,709 | |
| | | | | | | | |
| | | | | | | $ | 3,181,938,946 | |
| Machinery & Tools - 3.6% | | | | | | | | |
| Eaton Corp. PLC | | | 6,741,101 | | | $ | 537,737,627 | |
| Illinois ToolWorks, Inc. | | | 4,661,275 | | | | 671,596,502 | |
| Ingersoll-Rand Co. PLC, “A” | | | 4,134,609 | | | | 436,449,326 | |
| | | | | | | | |
| | | | | | | $ | 1,645,783,455 | |
| Major Banks - 12.2% | | | | | | | | |
| Bank of New York Mellon Corp. | | | 10,424,870 | | | $ | 547,097,178 | |
| Goldman Sachs Group, Inc. | | | 3,860,135 | | | | 759,288,554 | |
| JPMorgan Chase & Co. | | | 19,647,039 | | | | 2,050,364,990 | |
| PNC Financial Services Group, Inc. | | | 4,915,314 | | | | 619,427,870 | |
| State Street Corp. | | | 5,619,558 | | | | 403,877,633 | |
| Wells Fargo & Co. | | | 25,789,004 | | | | 1,286,613,410 | |
| | | | | | | | |
| | | | | | | $ | 5,666,669,635 | |
| Medical & Health Technology & Services - 0.7% | | | | | | | | |
| McKesson Corp. | | | 2,529,906 | | | $ | 321,702,847 | |
| | |
| Medical Equipment - 7.0% | | | | | | | | |
| Abbott Laboratories | | | 7,896,787 | | | $ | 612,948,607 | |
| Danaher Corp. | | | 6,277,373 | | | | 797,351,918 | |
| Medtronic PLC | | | 13,564,796 | | | | 1,227,614,038 | |
| Thermo Fisher Scientific, Inc. | | | 2,315,959 | | | | 601,153,478 | |
| | | | | | | | |
| | | | | | | $ | 3,239,068,041 | |
| Oil Services - 1.2% | | | | | | | | |
| Schlumberger Ltd. | | | 12,977,840 | | | $ | 571,803,630 | |
| | |
| Other Banks & Diversified Financials - 5.7% | | | | | | | | |
| American Express Co. | | | 3,188,929 | | | $ | 343,575,210 | |
| BB&T Corp. | | | 5,922,586 | | | | 301,874,208 | |
8
Portfolio of Investments (unaudited) – continued
| | | | | | | | |
| | |
| Issuer | | Shares/Par | | | Value ($) | |
| Common Stocks - continued | | | | | | | | |
| Other Banks & Diversified Financials - continued | | | | | | | | |
| Citigroup, Inc. | | | 15,052,212 | | | $ | 963,040,524 | |
| U.S. Bancorp | | | 19,623,611 | | | | 1,014,344,453 | |
| | | | | | | | |
| | | | | | | $ | 2,622,834,395 | |
| Pharmaceuticals - 8.0% | | | | | | | | |
| Johnson & Johnson | | | 12,296,354 | | | $ | 1,680,173,811 | |
| Merck & Co., Inc. | | | 6,635,743 | | | | 539,419,548 | |
| Novartis AG | | | 1,294,725 | | | | 118,102,063 | |
| Pfizer, Inc. | | | 26,656,951 | | | | 1,155,578,826 | |
| Roche Holding AG | | | 740,203 | | | | 205,659,328 | |
| | | | | | | | |
| | | | | | | $ | 3,698,933,576 | |
| Printing & Publishing - 0.7% | | | | | | | | |
| Moody’s Corp. | | | 1,987,761 | | | $ | 344,121,184 | |
| | |
| Railroad & Shipping - 1.9% | | | | | | | | |
| Canadian National Railway Co. | | | 3,232,278 | | | $ | 277,588,035 | |
| Union Pacific Corp. | | | 3,575,898 | | | | 599,678,094 | |
| | | | | | | | |
| | | | | | | $ | 877,266,129 | |
| Real Estate - 0.4% | | | | | | | | |
| Public Storage, Inc., REIT | | | 835,490 | | | $ | 176,697,780 | |
| | |
| Telephone Services - 0.5% | | | | | | | | |
| Verizon Communications, Inc. | | | 4,073,869 | | | $ | 231,884,624 | |
| | |
| Tobacco - 3.1% | | | | | | | | |
| Altria Group, Inc. | | | 4,903,604 | | | $ | 256,997,885 | |
| Philip Morris International, Inc. | | | 13,492,405 | | | | 1,173,029,691 | |
| | | | | | | | |
| | | | | | | $ | 1,430,027,576 | |
| Trucking - 0.6% | | | | | | | | |
| United Parcel Service, Inc., “B” | | | 2,384,335 | | | $ | 262,753,717 | |
| | |
| Utilities - Electric Power - 3.9% | | | | | | | | |
| Duke Energy Corp. | | | 9,441,564 | | | $ | 846,530,628 | |
| FirstEnergy Corp. | | | 4,095,127 | | | | 166,876,425 | |
| Southern Co. | | | 11,851,759 | | | | 588,913,905 | |
| Xcel Energy, Inc. | | | 4,017,956 | | | | 220,425,066 | |
| | | | | | | | |
| | | | | | | $ | 1,822,746,024 | |
| Total Common Stocks (Identified Cost, $29,438,009,204) | | | $ | 45,991,033,312 | |
9
Portfolio of Investments (unaudited) – continued
| | | | | | | | |
| Investment Companies (h) - 0.4% | | | | | | | | |
| | |
| Issuer | | Shares/Par | | | Value ($) | |
| Money Market Funds - 0.4% | | | | | | | | |
MFS Institutional Money Market Portfolio, 2.49% (v)
(Identified Cost, $211,027,208) | | | 211,052,122 | | | $ | 211,052,122 | |
| | |
| Other Assets, Less Liabilities - 0.2% | | | | | | | 78,582,632 | |
| Net Assets - 100.0% | | | | | | $ | 46,280,668,066 | |
| (a) | Non-income producing security. |
| (h) | An affiliated issuer, which may be considered one in which the fund owns 5% or more of the outstanding voting securities, or a company which is under common control. At period end, the aggregate values of the fund’s investments in affiliated issuers and in unaffiliated issuers were $211,052,122 and $45,991,033,312, respectively. |
| (v) | Affiliated issuer that is available only to investment companies managed by MFS. The rate quoted for the MFS Institutional Money Market Portfolio is the annualizedseven-day yield of the fund at period end. |
The following abbreviations are used in this report and are defined:
| PLC | | Public Limited Company |
| REIT | | Real Estate Investment Trust |
See Notes to Financial Statements
10
Financial Statements
STATEMENT OF ASSETS AND LIABILITIES
At 2/28/19 (unaudited)
This statement represents your fund’s balance sheet, which details the assets and liabilities comprising the total value of the fund.
| | | | |
| Assets | | | | |
Investments in unaffiliated issuers, at value (identified cost, $29,438,009,204) | | | $45,991,033,312 | |
Investments in affiliated issuers, at value (identified cost, $211,027,208) | | | 211,052,122 | |
Receivables for | | | | |
Investments sold | | | 19,366,640 | |
Fund shares sold | | | 42,090,179 | |
Dividends | | | 131,368,431 | |
Other assets | | | 142,935 | |
Total assets | | | $46,395,053,619 | |
| |
| Liabilities | | | | |
Payable to custodian | | | $87,300 | |
Payables for | | | | |
Investments purchased | | | 35,020,376 | |
Fund shares reacquired | | | 66,614,724 | |
Payable to affiliates | | | | |
Investment adviser | | | 1,148,399 | |
Shareholder servicing costs | | | 9,995,033 | |
Distribution and service fees | | | 180,810 | |
Program manager fees | | | 87 | |
Payable for independent Trustees’ compensation | | | 11,916 | |
Accrued expenses and other liabilities | | | 1,326,908 | |
Total liabilities | | | $114,385,553 | |
Net assets | | | $46,280,668,066 | |
| |
| Net assets consist of | | | | |
Paid-in capital | | | $29,416,385,442 | |
Total distributable earnings (loss) | | | 16,864,282,624 | |
Net assets | | | $46,280,668,066 | |
Shares of beneficial interest outstanding | | | 1,169,309,480 | |
11
Statement of Assets and Liabilities (unaudited) – continued
| | | | | | | | | | | | |
| | | |
| | | Net assets | | | Shares
outstanding | | | Net asset value
per share (a) | |
Class A | | | $6,375,875,636 | | | | 161,394,361 | | | | $39.50 | |
Class B | | | 95,177,796 | | | | 2,422,060 | | | | 39.30 | |
Class C | | | 937,451,488 | | | | 24,023,355 | | | | 39.02 | |
Class I | | | 19,642,764,893 | | | | 494,340,679 | | | | 39.74 | |
Class R1 | | | 22,427,007 | | | | 579,272 | | | | 38.72 | |
Class R2 | | | 474,373,880 | | | | 12,136,212 | | | | 39.09 | |
Class R3 | | | 2,125,227,708 | | | | 54,012,445 | | | | 39.35 | |
Class R4 | | | 2,836,190,224 | | | | 71,795,587 | | | | 39.50 | |
Class R6 | | | 13,739,536,836 | | | | 347,795,430 | | | | 39.50 | |
Class 529A | | | 26,076,449 | | | | 665,707 | | | | 39.17 | |
Class 529B | | | 762,671 | | | | 19,681 | | | | 38.75 | |
Class 529C | | | 4,803,478 | | | | 124,691 | | | | 38.52 | |
| (a) | Maximum offering price per share was equal to the net asset value per share for all share classes, except for Classes A and 529A, for which the maximum offering prices per share were $41.91 [100 / 94.25 x $39.50] and $41.56 [100 / 94.25 x $39.17], respectively. On sales of $50,000 or more, the maximum offering prices of Class A and Class 529A shares are reduced. A contingent deferred sales charge may be imposed on redemptions of Class A, Class B, Class C, Class 529B, and Class 529C shares. Redemption price per share was equal to the net asset value per share for Classes I, R1, R2, R3, R4, R6, and 529A. |
See Notes to Financial Statements
12
Financial Statements
STATEMENT OF OPERATIONS
Six months ended 2/28/19 (unaudited)
This statement describes how much your fund earned in investment income and accrued in expenses. It also describes any gains and/or losses generated by fund operations.
| | | | |
| Net investment income (loss) | | | | |
Income | | | | |
Dividends | | | $564,356,868 | |
Dividends from affiliated issuers | | | 4,898,653 | |
Other | | | 307,154 | |
Foreign taxes withheld | | | (338,541 | ) |
Total investment income | | | $569,224,134 | |
Expenses | | | | |
Management fee | | | $104,604,736 | |
Distribution and service fees | | | 17,061,351 | |
Shareholder servicing costs | | | 16,656,344 | |
Program manager fees | | | 7,512 | |
Administrative services fee | | | 282,542 | |
Independent Trustees’ compensation | | | 94,948 | |
Custodian fee | | | 327,548 | |
Shareholder communications | | | 848,685 | |
Audit and tax fees | | | 35,654 | |
Legal fees | | | 204,785 | |
Miscellaneous | | | 672,592 | |
Total expenses | | | $140,796,697 | |
Reduction of expenses by investment adviser and distributor | | | (2,285,135 | ) |
Net expenses | | | $138,511,562 | |
Net investment income (loss) | | | $430,712,572 | |
| |
| Realized and unrealized gain (loss) | | | | |
Realized gain (loss) (identified cost basis) | | | | |
Unaffiliated issuers | | | $359,450,503 | |
Affiliated issuers | | | 11,062 | |
Foreign currency | | | (391,748 | ) |
Net realized gain (loss) | | | $359,069,817 | |
Change in unrealized appreciation or depreciation | | | | |
Unaffiliated issuers | | | $(1,210,234,118 | ) |
Affiliated issuers | | | (24,169 | ) |
Translation of assets and liabilities in foreign currencies | | | (360,063 | ) |
Net unrealized gain (loss) | | | $(1,210,618,350 | ) |
Net realized and unrealized gain (loss) | | | $(851,548,533 | ) |
Change in net assets from operations | | | $(420,835,961 | ) |
See Notes to Financial Statements
13
Financial Statements
STATEMENTS OF CHANGES IN NET ASSETS
These statements describe the increases and/or decreases in net assets resulting from operations, any distributions, and any shareholder transactions.
| | | | | | | | |
| Change in net assets | | Six months ended
2/28/19
(unaudited) | | | Year ended
8/31/18 | |
| | |
| From operations | | | | | | | | |
Net investment income (loss) | | | $430,712,572 | | | | $788,166,589 | |
Net realized gain (loss) | | | 359,069,817 | | | | 1,173,543,965 | |
Net unrealized gain (loss) | | | (1,210,618,350 | ) | | | 2,302,666,965 | |
Change in net assets from operations | | | $(420,835,961 | ) | | | $4,264,377,519 | |
Total distributions to shareholders (a) | | | $(1,065,088,935 | ) | | | $(2,172,546,240 | ) |
Change in net assets from fund share transactions | | | $(868,627,762 | ) | | | $2,328,693,215 | |
Total change in net assets | | | $(2,354,552,658 | ) | | | $4,420,524,494 | |
| | |
| Net assets | | | | | | | | |
At beginning of period | | | 48,635,220,724 | | | | 44,214,696,230 | |
At end of period (b) | | | $46,280,668,066 | | | | $48,635,220,724 | |
| (a) | Distributions from net investment income and from net realized gain are no longer required to be separately disclosed. See Note 2. For the year ended August 31, 2018, distributions from net investment income and from net realized gain were $793,759,240 and $1,378,787,000, respectively. |
| (b) | Parenthetical disclosure of undistributed net investment income is no longer required. See Note 2. For the year ended August 31, 2018, end of period net assets included undistributed net investment income of $127,744,500. |
See Notes to Financial Statements
14
Financial Statements
FINANCIAL HIGHLIGHTS
The financial highlights table is intended to help you understand the fund’s financial performance for the semiannual period and the past 5 fiscal years. Certain information reflects financial results for a single fund share. The total returns in the table represent the rate that an investor would have earned (or lost) on an investment in the fund share class (assuming reinvestment of all distributions) held for the entire period.
| | | | | | | | | | | | | | | | | | | | | | | | |
| | | Six months
ended
2/28/19 | | | Year ended | |
| Class A | | 8/31/18 | | | 8/31/17 | | | 8/31/16 | | | 8/31/15 | | | 8/31/14 | |
| | | (unaudited) | | | | | | | | | | | | | | | | |
Net asset value, beginning
of period | | | $40.82 | | | | $39.00 | | | | $35.93 | | | | $33.38 | | | | $34.70 | | | | $29.81 | |
| | | |
| Income (loss) from investment operations | | | | | | | | | | | | | |
Net investment income
(loss) (d) | | | $0.33 | | | | $0.59 | | | | $0.66 | (c) | | | $0.54 | | | | $0.63 | | | | $0.69 | |
Net realized and
unrealized gain (loss) | | | (0.77 | ) | | | 3.04 | | | | 3.65 | | | | 3.81 | | | | (0.36 | ) | | | 5.41 | |
Total from investment
operations | | | $(0.44 | ) | | | $3.63 | | | | $4.31 | | | | $4.35 | | | | $0.27 | | | | $6.10 | |
| | | |
| Less distributions declared to shareholders | | | | | | | | | | | | | |
From net investment
income | | | $(0.34 | ) | | | $(0.60 | ) | | | $(0.62 | ) | | | $(0.56 | ) | | | $(0.67 | ) | | | $(0.63 | ) |
From net realized gain | | | (0.54 | ) | | | (1.21 | ) | | | (0.62 | ) | | | (1.24 | ) | | | (0.92 | ) | | | (0.58 | ) |
Total distributions declared
to shareholders | | | $(0.88 | ) | | | $(1.81 | ) | | | $(1.24 | ) | | | $(1.80 | ) | | | $(1.59 | ) | | | $(1.21 | ) |
Net asset value, end of period (x) | | | $39.50 | | | | $40.82 | | | | $39.00 | | | | $35.93 | | | | $33.38 | | | | $34.70 | |
Total return (%) (r)(s)(t)(x) | | | (0.85 | )(n) | | | 9.42 | | | | 12.24 | (c) | | | 13.55 | | | | 0.68 | | | | 20.78 | |
| | | |
Ratios (%) (to average net assets)
and Supplemental data: | | | | | | | | | | | | | |
Expenses before expense
reductions (f) | | | 0.83 | (a) | | | 0.82 | | | | 0.86 | (c) | | | 0.90 | | | | 0.90 | | | | 0.90 | |
Expenses after expense
reductions (f) | | | 0.81 | (a) | | | 0.81 | | | | 0.84 | (c) | | | 0.86 | | | | 0.86 | | | | 0.88 | |
Net investment income
(loss) | | | 1.70 | (a) | | | 1.46 | | | | 1.77 | (c) | | | 1.60 | | | | 1.80 | | | | 2.10 | |
Portfolio turnover | | | 5 | (n) | | | 11 | | | | 14 | | | | 12 | | | | 12 | | | | 13 | |
Net assets at end of period
(000 omitted) | | | $6,375,876 | | | | $6,736,296 | | | | $6,344,965 | | | | $9,033,842 | | | | $8,478,761 | | | | $9,448,535 | |
See Notes to Financial Statements
15
Financial Highlights – continued
| | | | | | | | | | | | | | | | | | | | | | | | |
| | | Six months
ended
2/28/19 | | | Year ended | |
| Class B | | 8/31/18 | | | 8/31/17 | | | 8/31/16 | | | 8/31/15 | | | 8/31/14 | |
| | | (unaudited) | | | | | | | | | | | | | | | | |
Net asset value, beginning
of period | | | $40.59 | | | | $38.76 | | | | $35.72 | | | | $33.19 | | | | $34.50 | | | | $29.64 | |
| | | |
| Income (loss) from investment operations | | | | | | | | | | | | | |
Net investment income
(loss) (d) | | | $0.18 | | | | $0.28 | | | | $0.37 | (c) | | | $0.28 | | | | $0.37 | | | | $0.44 | |
Net realized and
unrealized gain (loss) | | | (0.75 | ) | | | 3.04 | | | | 3.64 | | | | 3.79 | | | | (0.35 | ) | | | 5.38 | |
Total from investment
operations | | | $(0.57 | ) | | | $3.32 | | | | $4.01 | | | | $4.07 | | | | $0.02 | | | | $5.82 | |
| | | |
| Less distributions declared to shareholders | | | | | | | | | | | | | |
From net investment
income | | | $(0.18 | ) | | | $(0.28 | ) | | | $(0.35 | ) | | | $(0.30 | ) | | | $(0.41 | ) | | | $(0.38 | ) |
From net realized gain | | | (0.54 | ) | | | (1.21 | ) | | | (0.62 | ) | | | (1.24 | ) | | | (0.92 | ) | | | (0.58 | ) |
Total distributions declared
to shareholders | | | $(0.72 | ) | | | $(1.49 | ) | | | $(0.97 | ) | | | $(1.54 | ) | | | $(1.33 | ) | | | $(0.96 | ) |
Net asset value, end of
period (x) | | | $39.30 | | | | $40.59 | | | | $38.76 | | | | $35.72 | | | | $33.19 | | | | $34.50 | |
Total return (%) (r)(s)(t)(x) | | | (1.21 | )(n) | | | 8.62 | | | | 11.40 | (c) | | | 12.68 | | | | (0.06 | ) | | | 19.89 | |
| | | |
Ratios (%) (to average net assets)
and Supplemental data: | | | | | | | | | | | | | |
Expenses before expense
reductions (f) | | | 1.58 | (a) | | | 1.57 | | | | 1.61 | (c) | | | 1.65 | | | | 1.65 | | | | 1.65 | |
Expenses after expense
reductions (f) | | | 1.56 | (a) | | | 1.56 | | | | 1.59 | (c) | | | 1.61 | | | | 1.61 | | | | 1.63 | |
Net investment income
(loss) | | | 0.94 | (a) | | | 0.71 | | | | 0.99 | (c) | | | 0.85 | | | | 1.05 | | | | 1.35 | |
Portfolio turnover | | | 5 | (n) | | | 11 | | | | 14 | | | | 12 | | | | 12 | | | | 13 | |
Net assets at end of period
(000 omitted) | | | $95,178 | | | | $111,494 | | | | $137,361 | | | | $154,742 | | | | $154,205 | | | | $179,284 | |
See Notes to Financial Statements
16
Financial Highlights – continued
| | | | | | | | | | | | | | | | | | | | | | | | |
| | | Six months
ended
2/28/19 | | | Year ended | |
| Class C | | 8/31/18 | | | 8/31/17 | | | 8/31/16 | | | 8/31/15 | | | 8/31/14 | |
| | | (unaudited) | | | | | | | | | | | | | | | | |
Net asset value, beginning
of period | | | $40.31 | | | | $38.52 | | | | $35.50 | | | | $33.00 | | | | $34.33 | | | | $29.50 | |
| | | |
| Income (loss) from investment operations | | | | | | | | | | | | | |
Net investment income
(loss) (d) | | | $0.18 | | | | $0.28 | | | | $0.37 | (c) | | | $0.28 | | | | $0.37 | | | | $0.44 | |
Net realized and
unrealized gain (loss) | | | (0.75 | ) | | | 3.01 | | | | 3.62 | | | | 3.77 | | | | (0.36 | ) | | | 5.36 | |
Total from investment
operations | | | $(0.57 | ) | | | $3.29 | | | | $3.99 | | | | $4.05 | | | | $0.01 | | | | $5.80 | |
| | | |
| Less distributions declared to shareholders | | | | | | | | | | | | | |
From net investment
income | | | $(0.18 | ) | | | $(0.29 | ) | | | $(0.35 | ) | | | $(0.31 | ) | | | $(0.42 | ) | | | $(0.39 | ) |
From net realized gain | | | (0.54 | ) | | | (1.21 | ) | | | (0.62 | ) | | | (1.24 | ) | | | (0.92 | ) | | | (0.58 | ) |
Total distributions declared
to shareholders | | | $(0.72 | ) | | | $(1.50 | ) | | | $(0.97 | ) | | | $(1.55 | ) | | | $(1.34 | ) | | | $(0.97 | ) |
Net asset value, end of
period (x) | | | $39.02 | | | | $40.31 | | | | $38.52 | | | | $35.50 | | | | $33.00 | | | | $34.33 | |
Total return (%) (r)(s)(t)(x) | | | (1.20 | )(n) | | | 8.58 | | | | 11.43 | (c) | | | 12.69 | | | | (0.09 | ) | | | 19.92 | |
| | | |
Ratios (%) (to average net assets)
and Supplemental data: | | | | | | | | | | | | | |
Expenses before expense
reductions (f) | | | 1.58 | (a) | | | 1.57 | | | | 1.61 | (c) | | | 1.65 | | | | 1.65 | | | | 1.65 | |
Expenses after expense
reductions (f) | | | 1.57 | (a) | | | 1.56 | | | | 1.59 | (c) | | | 1.61 | | | | 1.61 | | | | 1.63 | |
Net investment income
(loss) | | | 0.94 | (a) | | | 0.71 | | | | 0.99 | (c) | | | 0.85 | | | | 1.06 | | | | 1.35 | |
Portfolio turnover | | | 5 | (n) | | | 11 | | | | 14 | | | | 12 | | | | 12 | | | | 13 | |
Net assets at end of period
(000 omitted) | | | $937,451 | | | | $1,050,477 | | | | $1,389,685 | | | | $1,538,605 | | | | $1,335,968 | | | | $1,359,860 | |
See Notes to Financial Statements
17
Financial Highlights – continued
| | | | | | | | | | | | | | | | | | | | | | | | |
| | | Six months
ended 2/28/19 | | | Year ended | |
| Class I | | 8/31/18 | | | 8/31/17 | | | 8/31/16 | | | 8/31/15 | | | 8/31/14 | |
| | | (unaudited) | | | | | | | | | | | | | | | | |
Net asset value, beginning
of period | | | $41.06 | | | | $39.22 | | | | $36.13 | | | | $33.56 | | | | $34.88 | | | | $29.96 | |
| | | |
| Income (loss) from investment operations | | | | | | | | | | | | | |
Net investment income
(loss) (d) | | | $0.38 | | | | $0.70 | | | | $0.74 | (c) | | | $0.63 | | | | $0.72 | | | | $0.78 | |
Net realized and
unrealized gain (loss) | | | (0.77 | ) | | | 3.05 | | | | 3.70 | | | | 3.82 | | | | (0.36 | ) | | | 5.43 | |
Total from investment
operations | | | $(0.39 | ) | | | $3.75 | | | | $4.44 | | | | $4.45 | | | | $0.36 | | | | $6.21 | |
| | | |
| Less distributions declared to shareholders | | | | | | | | | | | | | |
From net investment
income | | | $(0.39 | ) | | | $(0.70 | ) | | | $(0.73 | ) | | | $(0.64 | ) | | | $(0.76 | ) | | | $(0.71 | ) |
From net realized gain | | | (0.54 | ) | | | (1.21 | ) | | | (0.62 | ) | | | (1.24 | ) | | | (0.92 | ) | | | (0.58 | ) |
Total distributions declared
to shareholders | | | $(0.93 | ) | | | $(1.91 | ) | | | $(1.35 | ) | | | $(1.88 | ) | | | $(1.68 | ) | | | $(1.29 | ) |
Net asset value, end of
period (x) | | | $39.74 | | | | $41.06 | | | | $39.22 | | | | $36.13 | | | | $33.56 | | | | $34.88 | |
Total return (%) (r)(s)(t)(x) | | | (0.71 | )(n) | | | 9.69 | | | | 12.54 | (c) | | | 13.83 | | | | 0.93 | | | | 21.07 | |
| | | |
Ratios (%) (to average net assets)
and Supplemental data: | | | | | | | | | | | | | |
Expenses before expense
reductions (f) | | | 0.57 | (a) | | | 0.57 | | | | 0.61 | (c) | | | 0.65 | | | | 0.65 | | | | 0.65 | |
Expenses after expense
reductions (f) | | | 0.57 | (a) | | | 0.57 | | | | 0.59 | (c) | | | 0.61 | | | | 0.61 | | | | 0.63 | |
Net investment income
(loss) | | | 1.95 | (a) | | | 1.72 | | | | 1.98 | (c) | | | 1.84 | | | | 2.06 | | | | 2.35 | |
Portfolio turnover | | | 5 | (n) | | | 11 | | | | 14 | | | | 12 | | | | 12 | | | | 13 | |
Net assets at end of period
(000 omitted) | | | $19,642,765 | | | | $20,727,676 | | | | $19,624,016 | | | | $17,134,836 | | | | $13,888,395 | | | | $13,905,910 | |
See Notes to Financial Statements
18
Financial Highlights – continued
| | | | | | | | | | | | | | | | | | | | | | | | |
| | | Six months
ended
2/28/19 | | | Year ended | |
| Class R1 | | 8/31/18 | | | 8/31/17 | | | 8/31/16 | | | 8/31/15 | | | 8/31/14 | |
| | | (unaudited) | | | | | | | | | | | | | | | | |
Net asset value, beginning
of period | | | $40.01 | | | | $38.25 | | | | $35.27 | | | | $32.79 | | | | $34.11 | | | | $29.32 | |
| | | |
| Income (loss) from investment operations | | | | | | | | | | | | | |
Net investment income
(loss) (d) | | | $0.18 | | | | $0.28 | | | | $0.36 | (c) | | | $0.28 | | | | $0.36 | | | | $0.43 | |
Net realized and
unrealized gain (loss) | | | (0.75 | ) | | | 2.99 | | | | 3.60 | | | | 3.74 | | | | (0.34 | ) | | | 5.33 | |
Total from investment
operations | | | $(0.57 | ) | | | $3.27 | | | | $3.96 | | | | $4.02 | | | | $0.02 | | | | $5.76 | |
| | | |
| Less distributions declared to shareholders | | | | | | | | | | | | | |
From net investment
income | | | $(0.18 | ) | | | $(0.30 | ) | | | $(0.36 | ) | | | $(0.30 | ) | | | $(0.42 | ) | | | $(0.39 | ) |
From net realized gain | | | (0.54 | ) | | | (1.21 | ) | | | (0.62 | ) | | | (1.24 | ) | | | (0.92 | ) | | | (0.58 | ) |
Total distributions declared
to shareholders | | | $(0.72 | ) | | | $(1.51 | ) | | | $(0.98 | ) | | | $(1.54 | ) | | | $(1.34 | ) | | | $(0.97 | ) |
Net asset value, end of
period (x) | | | $38.72 | | | | $40.01 | | | | $38.25 | | | | $35.27 | | | | $32.79 | | | | $34.11 | |
Total return (%) (r)(s)(t)(x) | | | (1.21 | )(n) | | | 8.61 | | | | 11.40 | (c) | | | 12.69 | | | | (0.07 | ) | | | 19.88 | |
| | | |
Ratios (%) (to average net assets)
and Supplemental data: | | | | | | | | | | | | | |
Expenses before expense
reductions (f) | | | 1.58 | (a) | | | 1.57 | | | | 1.61 | (c) | | | 1.65 | | | | 1.65 | | | | 1.65 | |
Expenses after expense
reductions (f) | | | 1.57 | (a) | | | 1.56 | | | | 1.59 | (c) | | | 1.61 | | | | 1.61 | | | | 1.63 | |
Net investment income
(loss) | | | 0.95 | (a) | | | 0.72 | | | | 0.99 | (c) | | | 0.85 | | | | 1.06 | | | | 1.33 | |
Portfolio turnover | | | 5 | (n) | | | 11 | | | | 14 | | | | 12 | | | | 12 | | | | 13 | |
Net assets at end of period
(000 omitted) | | | $22,427 | | | | $24,791 | | | | $26,663 | | | | $27,096 | | | | $27,860 | | | | $33,390 | |
See Notes to Financial Statements
19
Financial Highlights – continued
| | | | | | | | | | | | | | | | | | | | | | | | |
| | | Six months
ended 2/28/19 | | | Year ended | |
| Class R2 | | 8/31/18 | | | 8/31/17 | | | 8/31/16 | | | 8/31/15 | | | 8/31/14 | |
| | | (unaudited) | | | | | | | | | | | | | | | | |
Net asset value, beginning
of period | | | $40.39 | | | | $38.60 | | | | $35.59 | | | | $33.08 | | | | $34.40 | | | | $29.56 | |
| | | |
| Income (loss) from investment operations | | | | | | | | | | | | | |
Net investment income
(loss) (d) | | | $0.27 | | | | $0.48 | | | | $0.55 | (c) | | | $0.45 | | | | $0.54 | | | | $0.60 | |
Net realized and
unrealized gain (loss) | | | (0.75 | ) | | | 3.02 | | | | 3.62 | | | | 3.78 | | | | (0.35 | ) | | | 5.36 | |
Total from investment
operations | | | $(0.48 | ) | | | $3.50 | | | | $4.17 | | | | $4.23 | | | | $0.19 | | | | $5.96 | |
| | | |
| Less distributions declared to shareholders | | | | | | | | | | | | | |
From net investment
income | | | $(0.28 | ) | | | $(0.50 | ) | | | $(0.54 | ) | | | $(0.48 | ) | | | $(0.59 | ) | | | $(0.54 | ) |
From net realized gain | | | (0.54 | ) | | | (1.21 | ) | | | (0.62 | ) | | | (1.24 | ) | | | (0.92 | ) | | | (0.58 | ) |
Total distributions declared
to shareholders | | | $(0.82 | ) | | | $(1.71 | ) | | | $(1.16 | ) | | | $(1.72 | ) | | | $(1.51 | ) | | | $(1.12 | ) |
Net asset value, end of
period (x) | | | $39.09 | | | | $40.39 | | | | $38.60 | | | | $35.59 | | | | $33.08 | | | | $34.40 | |
Total return (%) (r)(s)(t)(x) | | | (0.96 | )(n) | | | 9.15 | | | | 11.95 | (c) | | | 13.27 | | | | 0.43 | | | | 20.48 | |
| | | |
Ratios (%) (to average net assets)
and Supplemental data: | | | | | | | | | | | | | |
Expenses before expense
reductions (f) | | | 1.07 | (a) | | | 1.07 | | | | 1.11 | (c) | | | 1.15 | | | | 1.15 | | | | 1.15 | |
Expenses after expense
reductions (f) | | | 1.06 | (a) | | | 1.07 | | | | 1.09 | (c) | | | 1.11 | | | | 1.11 | | | | 1.13 | |
Net investment income
(loss) | | | 1.44 | (a) | | | 1.21 | | | | 1.49 | (c) | | | 1.35 | | | | 1.54 | | | | 1.84 | |
Portfolio turnover | | | 5 | (n) | | | 11 | | | | 14 | | | | 12 | | | | 12 | | | | 13 | |
Net assets at end of period
(000 omitted) | | | $474,374 | | | | $550,200 | | | | $614,044 | | | | $567,665 | | | | $521,592 | | | | $607,340 | |
See Notes to Financial Statements
20
Financial Highlights – continued
| | | | | | | | | | | | | | | | | | | | | | | | |
| | | Six months
ended 2/28/19 | | | Year ended | |
| Class R3 | | 8/31/18 | | | 8/31/17 | | | 8/31/16 | | | 8/31/15 | | | 8/31/14 | |
| | | (unaudited) | | | | | | | | | | | | | | | | |
Net asset value, beginning
of period | | | $40.66 | | | | $38.85 | | | | $35.81 | | | | $33.28 | | | | $34.60 | | | | $29.73 | |
| | | |
| Income (loss) from investment operations | | | | | | | | | | | | | |
Net investment income
(loss) (d) | | | $0.32 | | | | $0.59 | | | | $0.65 | (c) | | | $0.54 | | | | $0.63 | | | | $0.69 | |
Net realized and
unrealized gain (loss) | | | (0.75 | ) | | | 3.03 | | | | 3.64 | | | | 3.79 | | | | (0.35 | ) | | | 5.39 | |
Total from investment
operations | | | $(0.43 | ) | | | $3.62 | | | | $4.29 | | | | $4.33 | | | | $0.28 | | | | $6.08 | |
| | | |
| Less distributions declared to shareholders | | | | | | | | | | | | | |
From net investment
income | | | $(0.34 | ) | | | $(0.60 | ) | | | $(0.63 | ) | | | $(0.56 | ) | | | $(0.68 | ) | | | $(0.63 | ) |
From net realized gain | | | (0.54 | ) | | | (1.21 | ) | | | (0.62 | ) | | | (1.24 | ) | | | (0.92 | ) | | | (0.58 | ) |
Total distributions declared
to shareholders | | | $(0.88 | ) | | | $(1.81 | ) | | | $(1.25 | ) | | | $(1.80 | ) | | | $(1.60 | ) | | | $(1.21 | ) |
Net asset value, end of
period (x) | | | $39.35 | | | | $40.66 | | | | $38.85 | | | | $35.81 | | | | $33.28 | | | | $34.60 | |
Total return (%) (r)(s)(t)(x) | | | (0.83 | )(n) | | | 9.43 | | | | 12.23 | (c) | | | 13.54 | | | | 0.69 | | | | 20.77 | |
| | | |
Ratios (%) (to average net assets)
and Supplemental data: | | | | | | | | | | | | | |
Expenses before expense
reductions (f) | | | 0.82 | (a) | | | 0.82 | | | | 0.86 | (c) | | | 0.90 | | | | 0.90 | | | | 0.90 | |
Expenses after expense
reductions (f) | | | 0.82 | (a) | | | 0.82 | | | | 0.84 | (c) | | | 0.86 | | | | 0.86 | | | | 0.87 | |
Net investment income
(loss) | | | 1.70 | (a) | | | 1.47 | | | | 1.74 | (c) | | | 1.60 | | | | 1.80 | | | | 2.11 | |
Portfolio turnover | | | 5 | (n) | | | 11 | | | | 14 | | | | 12 | | | | 12 | | | | 13 | |
Net assets at end of period
(000 omitted) | | | $2,125,228 | | | | $2,259,562 | | | | $2,030,023 | | | | $1,903,910 | | | | $1,571,281 | | | | $1,559,863 | |
See Notes to Financial Statements
21
Financial Highlights – continued
| | | | | | | | | | | | | | | | | | | | | | | | |
| | | Six months
ended
2/28/19 | | | Year ended | |
| Class R4 | | 8/31/18 | | | 8/31/17 | | | 8/31/16 | | | 8/31/15 | | | 8/31/14 | |
| | | (unaudited) | | | | | | | | | | | | | | | | |
Net asset value, beginning
of period | | | $40.82 | | | | $39.00 | | | | $35.94 | | | | $33.40 | | | | $34.72 | | | | $29.82 | |
| | | |
| Income (loss) from investment operations | | | | | | | | | | | | | |
Net investment income
(loss) (d) | | | $0.37 | | | | $0.69 | | | | $0.74 | (c) | | | $0.62 | | | | $0.72 | | | | $0.77 | |
Net realized and
unrealized gain (loss) | | | (0.76 | ) | | | 3.04 | | | | 3.67 | | | | 3.80 | | | | (0.36 | ) | | | 5.42 | |
Total from investment
operations | | | $(0.39 | ) | | | $3.73 | | | | $4.41 | | | | $4.42 | | | | $0.36 | | | | $6.19 | |
| | | |
| Less distributions declared to shareholders | | | | | | | | | | | | | |
From net investment
income | | | $(0.39 | ) | | | $(0.70 | ) | | | $(0.73 | ) | | | $(0.64 | ) | | | $(0.76 | ) | | | $(0.71 | ) |
From net realized gain | | | (0.54 | ) | | | (1.21 | ) | | | (0.62 | ) | | | (1.24 | ) | | | (0.92 | ) | | | (0.58 | ) |
Total distributions declared
to shareholders | | | $(0.93 | ) | | | $(1.91 | ) | | | $(1.35 | ) | | | $(1.88 | ) | | | $(1.68 | ) | | | $(1.29 | ) |
Net asset value, end of
period (x) | | | $39.50 | | | | $40.82 | | | | $39.00 | | | | $35.94 | | | | $33.40 | | | | $34.72 | |
Total return (%) (r)(s)(t)(x) | | | (0.72 | )(n) | | | 9.70 | | | | 12.52 | (c) | | | 13.80 | | | | 0.93 | | | | 21.11 | |
| | | |
Ratios (%) (to average net assets)
and Supplemental data: | | | | | | | | | | | | | |
Expenses before expense
reductions (f) | | | 0.57 | (a) | | | 0.57 | | | | 0.61 | (c) | | | 0.65 | | | | 0.65 | | | | 0.65 | |
Expenses after expense
reductions (f) | | | 0.57 | (a) | | | 0.57 | | | | 0.59 | (c) | | | 0.61 | | | | 0.61 | | | | 0.63 | |
Net investment income
(loss) | | | 1.95 | (a) | | | 1.72 | | | | 1.99 | (c) | | | 1.85 | | | | 2.05 | | | | 2.34 | |
Portfolio turnover | | | 5 | (n) | | | 11 | | | | 14 | | | | 12 | | | | 12 | | | | 13 | |
Net assets at end of period
(000 omitted) | | | $2,836,190 | | | | $3,201,331 | | | | $3,060,883 | | | | $3,233,421 | | | | $2,787,041 | | | | $3,283,133 | |
See Notes to Financial Statements
22
Financial Highlights – continued
| | | | | | | | | | | | | | | | | | | | | | | | |
| | | Six months
ended
2/28/19 | | | Year ended | |
| Class R6 | | 8/31/18 | | | 8/31/17 | | | 8/31/16 | | | 8/31/15 | | | 8/31/14 | |
| | | (unaudited) | | | | | | | | | | | | | | | | |
Net asset value, beginning
of period | | | $40.83 | | | | $39.01 | | | | $35.94 | | | | $33.40 | | | | $34.72 | | | | $29.82 | |
| | | |
| Income (loss) from investment operations | | | | | | | | | | | | | |
Net investment income
(loss) (d) | | | $0.39 | | | | $0.73 | | | | $0.76 | (c) | | | $0.66 | | | | $0.76 | | | | $0.82 | |
Net realized and
unrealized gain (loss) | | | (0.77 | ) | | | 3.04 | | | | 3.69 | | | | 3.80 | | | | (0.36 | ) | | | 5.40 | |
Total from investment
operations | | | $(0.38 | ) | | | $3.77 | | | | $4.45 | | | | $4.46 | | | | $0.40 | | | | $6.22 | |
| | | |
| Less distributions declared to shareholders | | | | | | | | | | | | | |
From net investment
income | | | $(0.41 | ) | | | $(0.74 | ) | | | $(0.76 | ) | | | $(0.68 | ) | | | $(0.80 | ) | | | $(0.74 | ) |
From net realized gain | | | (0.54 | ) | | | (1.21 | ) | | | (0.62 | ) | | | (1.24 | ) | | | (0.92 | ) | | | (0.58 | ) |
Total distributions declared
to shareholders | | | $(0.95 | ) | | | $(1.95 | ) | | | $(1.38 | ) | | | $(1.92 | ) | | | $(1.72 | ) | | | $(1.32 | ) |
Net asset value, end of
period (x) | | | $39.50 | | | | $40.83 | | | | $39.01 | | | | $35.94 | | | | $33.40 | | | | $34.72 | |
Total return (%) (r)(s)(t)(x) | | | (0.68 | )(n) | | | 9.81 | | | | 12.66 | (c) | | | 13.93 | | | | 1.04 | | | | 21.23 | |
| | | |
Ratios (%) (to average net assets)
and Supplemental data: | | | | | | | | | | | | | |
Expenses before expense
reductions (f) | | | 0.48 | (a) | | | 0.47 | | | | 0.51 | (c) | | | 0.54 | | | | 0.54 | | | | 0.55 | |
Expenses after expense
reductions (f) | | | 0.47 | (a) | | | 0.47 | | | | 0.49 | (c) | | | 0.50 | | | | 0.50 | | | | 0.53 | |
Net investment income
(loss) | | | 2.05 | (a) | | | 1.83 | | | | 2.04 | (c) | | | 1.95 | | | | 2.17 | | | | 2.48 | |
Portfolio turnover | | | 5 | (n) | | | 11 | | | | 14 | | | | 12 | | | | 12 | | | | 13 | |
Net assets at end of period
(000 omitted) | | | $13,739,537 | | | | $13,941,823 | | | | $10,957,734 | | | | $6,218,954 | | | | $4,846,172 | | | | $3,996 | |
See Notes to Financial Statements
23
Financial Highlights – continued
| | | | | | | | | | | | | | | | | | | | | | | | |
| | | Six months
ended 2/28/19 | | | Year ended | |
| Class 529A | | 8/31/18 | | | 8/31/17 | | | 8/31/16 | | | 8/31/15 | | | 8/31/14 | |
| | | (unaudited) | | | | | | | | | | | | | | | | |
Net asset value, beginning
of period | | | $40.48 | | | | $38.69 | | | | $35.67 | | | | $33.15 | | | | $34.48 | | | | $29.62 | |
| | | |
| Income (loss) from investment operations | | | | | | | | | | | | | |
Net investment income
(loss) (d) | | | $0.32 | | | | $0.58 | | | | $0.63 | (c) | | | $0.53 | | | | $0.63 | | | | $0.69 | |
Net realized and
unrealized gain (loss) | | | (0.76 | ) | | | 3.02 | | | | 3.64 | | | | 3.79 | | | | (0.36 | ) | | | 5.38 | |
Total from investment
operations | | | $(0.44 | ) | | | $3.60 | | | | $4.27 | | | | $4.32 | | | | $0.27 | | | | $6.07 | |
| | | |
| Less distributions declared to shareholders | | | | | | | | | | | | | |
From net investment
income | | | $(0.33 | ) | | | $(0.60 | ) | | | $(0.63 | ) | | | $(0.56 | ) | | | $(0.68 | ) | | | $(0.63 | ) |
From net realized gain | | | (0.54 | ) | | | (1.21 | ) | | | (0.62 | ) | | | (1.24 | ) | | | (0.92 | ) | | | (0.58 | ) |
Total distributions declared
to shareholders | | | $(0.87 | ) | | | $(1.81 | ) | | | $(1.25 | ) | | | $(1.80 | ) | | | $(1.60 | ) | | | $(1.21 | ) |
Net asset value, end of
period (x) | | | $39.17 | | | | $40.48 | | | | $38.69 | | | | $35.67 | | | | $33.15 | | | | $34.48 | |
Total return (%) (r)(s)(t)(x) | | | (0.84 | )(n) | | | 9.40 | | | | 12.21 | (c) | | | 13.55 | | | | 0.67 | | | | 20.84 | |
| | | |
Ratios (%) (to average net assets)
and Supplemental data: | | | | | | | | | | | | | |
Expenses before expense
reductions (f) | | | 0.88 | (a) | | | 0.89 | | | | 0.96 | (c) | | | 1.00 | | | | 1.00 | | | | 1.00 | |
Expenses after expense
reductions (f) | | | 0.84 | (a) | | | 0.83 | | | | 0.85 | (c) | | | 0.86 | | | | 0.86 | | | | 0.87 | |
Net investment income
(loss) | | | 1.68 | (a) | | | 1.45 | | | | 1.71 | (c) | | | 1.59 | | | | 1.82 | | | | 2.11 | |
Portfolio turnover | | | 5 | (n) | | | 11 | | | | 14 | | | | 12 | | | | 12 | | | | 13 | |
Net assets at end of period
(000 omitted) | | | $26,076 | | | | $25,416 | | | | $22,490 | | | | $18,625 | | | | $16,543 | | | | $14,547 | |
See Notes to Financial Statements
24
Financial Highlights – continued
| | | | | | | | | | | | | | | | | | | | | | | | |
| | | Six months
ended 2/28/19 | | | Year ended | |
| Class 529B | | 8/31/18 | | | 8/31/17 | | | 8/31/16 | | | 8/31/15 | | | 8/31/14 | |
| | | (unaudited) | | | | | | | | | | | | | | | | |
Net asset value, beginning
of period | | | $40.05 | | | | $38.23 | | | | $35.27 | | | | $32.78 | | | | $34.08 | | | | $29.29 | |
| | | |
| Income (loss) from investment operations | | | | | | | | | | | | | |
Net investment income
(loss) (d) | | | $0.32 | | | | $0.43 | | | | $0.47 | (c) | | | $0.29 | | | | $0.47 | | | | $0.42 | |
Net realized and
unrealized gain (loss) | | | (0.75 | ) | | | 3.00 | | | | 3.61 | | | | 3.73 | | | | (0.34 | ) | | | 5.32 | |
Total from investment
operations | | | $(0.43 | ) | | | $3.43 | | | | $4.08 | | | | $4.02 | | | | $0.13 | | | | $5.74 | |
| | | |
| Less distributions declared to shareholders | | | | | | | | | | | | | |
From net investment
income | | | $(0.33 | ) | | | $(0.40 | ) | | | $(0.50 | ) | | | $(0.29 | ) | | | $(0.51 | ) | | | $(0.37 | ) |
From net realized gain | | | (0.54 | ) | | | (1.21 | ) | | | (0.62 | ) | | | (1.24 | ) | | | (0.92 | ) | | | (0.58 | ) |
Total distributions declared
to shareholders | | | $(0.87 | ) | | | $(1.61 | ) | | | $(1.12 | ) | | | $(1.53 | ) | | | $(1.43 | ) | | | $(0.95 | ) |
Net asset value, end of
period (x) | | | $38.75 | | | | $40.05 | | | | $38.23 | | | | $35.27 | | | | $32.78 | | | | $34.08 | |
Total return (%) (r)(s)(t)(x) | | | (0.83 | )(n) | | | 9.05 | | | | 11.78 | (c) | | | 12.70 | | | | 0.27 | | | | 19.85 | |
| | | |
Ratios (%) (to average net assets)
and Supplemental data: | | | | | | | | | | | | | |
Expenses before expense
reductions (f) | | | 0.81 | (a) | | | 1.22 | | | | 1.34 | (c) | | | 1.68 | | | | 1.37 | | | | 1.75 | |
Expenses after expense
reductions (f) | | | 0.79 | (a) | | | 1.19 | | | | 1.26 | (c) | | | 1.58 | | | | 1.27 | | | | 1.67 | |
Net investment income
(loss) | | | 1.72 | (a) | | | 1.10 | | | | 1.28 | (c) | | | 0.87 | | | | 1.38 | | | | 1.30 | |
Portfolio turnover | | | 5 | (n) | | | 11 | | | | 14 | | | | 12 | | | | 12 | | | | 13 | |
Net assets at end of period
(000 omitted) | | | $763 | | | | $835 | | | | $908 | | | | $941 | | | | $888 | | | | $1,026 | |
See Notes to Financial Statements
25
Financial Highlights – continued
| | | | | | | | | | | | | | | | | | | | | | | | |
| | | Six months
ended 2/28/19 | | | Year ended | |
| Class 529C | | 8/31/18 | | | 8/31/17 | | | 8/31/16 | | | 8/31/15 | | | 8/31/14 | |
| | | (unaudited) | | | | | | | | | | | | | | | | |
Net asset value, beginning
of period | | | $39.81 | | | | $38.07 | | | | $35.11 | | | | $32.66 | | | | $34.00 | | | | $29.23 | |
| | | |
| Income (loss) from investment operations | | | | | | | | | | | | | |
Net investment income
(loss) (d) | | | $0.17 | | | | $0.26 | | | | $0.34 | (c) | | | $0.26 | | | | $0.35 | | | | $0.41 | |
Net realized and
unrealized gain (loss) | | | (0.75 | ) | | | 2.97 | | | | 3.59 | | | | 3.73 | | | | (0.36 | ) | | | 5.32 | |
Total from investment
operations | | | $(0.58 | ) | | | $3.23 | | | | $3.93 | | | | $3.99 | | | | $(0.01 | ) | | | $5.73 | |
| | | |
| Less distributions declared to shareholders | | | | | | | | | | | | | |
From net investment
income | | | $(0.17 | ) | | | $(0.28 | ) | | | $(0.35 | ) | | | $(0.30 | ) | | | $(0.41 | ) | | | $(0.38 | ) |
From net realized gain | | | (0.54 | ) | | | (1.21 | ) | | | (0.62 | ) | | | (1.24 | ) | | | (0.92 | ) | | | (0.58 | ) |
Total distributions declared
to shareholders | | | $(0.71 | ) | | | $(1.49 | ) | | | $(0.97 | ) | | | $(1.54 | ) | | | $(1.33 | ) | | | $(0.96 | ) |
Net asset value, end of
period (x) | | | $38.52 | | | | $39.81 | | | | $38.07 | | | | $35.11 | | | | $32.66 | | | | $34.00 | |
Total return (%) (r)(s)(t)(x) | | | (1.23 | )(n) | | | 8.54 | | | | 11.38 | (c) | | | 12.64 | | | | (0.14 | ) | | | 19.85 | |
| | | |
Ratios (%) (to average net assets)
and Supplemental data: | | | | | | | | | | | | | |
Expenses before expense
reductions (f) | | | 1.63 | (a) | | | 1.64 | | | | 1.71 | (c) | | | 1.75 | | | | 1.75 | | | | 1.75 | |
Expenses after expense
reductions (f) | | | 1.61 | (a) | | | 1.61 | | | | 1.63 | (c) | | | 1.65 | | | | 1.66 | | | | 1.67 | |
Net investment income
(loss) | | | 0.90 | (a) | | | 0.67 | | | | 0.93 | (c) | | | 0.80 | | | | 1.03 | | | | 1.28 | |
Portfolio turnover | | | 5 | (n) | | | 11 | | | | 14 | | | | 12 | | | | 12 | | | | 13 | |
Net assets at end of period
(000 omitted) | | | $4,803 | | | | $5,320 | | | | $5,924 | | | | $5,381 | | | | $4,434 | | | | $3,981 | |
| (c) | Amount reflects aone-time reimbursement of expenses by the custodian (or former custodian) without which net investment income and performance would be lower and expenses would be higher. |
| (d) | Per share data is based on average shares outstanding. |
| (f) | Ratios do not reflect reductions from fees paid indirectly, if applicable. |
| (r) | Certain expenses have been reduced without which performance would have been lower. |
| (s) | From time to time the fund may receive proceeds from litigation settlements, without which performance would be lower. |
| (t) | Total returns do not include any applicable sales charges. |
| (x) | The net asset values and total returns have been calculated on net assets which include adjustments made in accordance with U.S. generally accepted accounting principles required at period end for financial reporting purposes. |
See Notes to Financial Statements
26
NOTES TO FINANCIAL STATEMENTS
(unaudited)
(1) Business and Organization
MFS Value Fund (the fund) is a diversified series of MFS Series Trust I (the trust). The trust is organized as a Massachusetts business trust and is registered under the Investment Company Act of 1940, as amended, as anopen-end management investment company.
The fund is an investment company and accordingly follows the investment company accounting and reporting guidance of the Financial Accounting Standards Board (FASB) Accounting Standards Codification Topic 946 Financial Services – Investment Companies.
(2) Significant Accounting Policies
General– The preparation of financial statements in conformity with U.S. generally accepted accounting principles requires management to make estimates and assumptions that affect the reported amounts of assets and liabilities, and disclosure of contingent assets and liabilities at the date of the financial statements and the reported amounts of increases and decreases in net assets from operations during the reporting period. Actual results could differ from those estimates. In the preparation of these financial statements, management has evaluated subsequent events occurring after the date of the fund’s Statement of Assets and Liabilities through the date that the financial statements were issued.
In August 2018, the Securities and Exchange Commission (SEC) released its Final Rule on Disclosure Update and Simplification (the “Final Rule”) which is intended to simplify an issuer’s disclosure compliance efforts by removing redundant or outdated disclosure requirements without significantly altering the mix of information provided to investors. Effective with the current reporting period, the fund adopted the Final Rule with the impacts being that the fund is no longer required to present the components of distributable earnings on the Statement of Assets and Liabilities or the sources of distributions to shareholders and the amount of undistributed net investment income on the Statements of Changes in Net Assets.
Balance Sheet Offsetting– The fund’s accounting policy with respect to balance sheet offsetting is that, absent an event of default by the counterparty or a termination of the agreement, the International Swaps and Derivatives Association (ISDA) Master Agreement, or similar agreement, does not result in an offset of reported amounts of financial assets and financial liabilities in the Statement of Assets and Liabilities across transactions between the fund and the applicable counterparty. The fund’s right to setoff may be restricted or prohibited by the bankruptcy or insolvency laws of the particular jurisdiction to which a specific master netting agreement counterparty is subject. Balance sheet offsetting disclosures, to the extent applicable to the fund, have been included in the fund’s Significant Accounting Policies note under the captions for each of the fund’sin-scope financial instruments and transactions.
Investment Valuations– Equity securities, including restricted equity securities, are generally valued at the last sale or official closing price on their primary market or exchange as provided by a third-party pricing service. Equity securities, for which there were no sales reported that day, are generally valued at the last quoted daily bid
27
Notes to Financial Statements (unaudited) – continued
quotation on their primary market or exchange as provided by a third-party pricing service. Short-term instruments with a maturity at issuance of 60 days or less may be valued at amortized cost, which approximates market value.Open-end investment companies are generally valued at net asset value per share. Securities and other assets generally valued on the basis of information from a third-party pricing service may also be valued at a broker/dealer bid quotation. In determining values, third-party pricing services can utilize both transaction data and market information such as yield, quality, coupon rate, maturity, type of issue, trading characteristics, and other market data. The values of foreign securities and other assets and liabilities expressed in foreign currencies are converted to U.S. dollars using the mean of bid and asked prices for rates provided by a third-party pricing service.
The Board of Trustees has delegated primary responsibility for determining or causing to be determined the value of the fund’s investments (including any fair valuation) to the adviser pursuant to valuation policies and procedures approved by the Board. If the adviser determines that reliable market quotations are not readily available, investments are valued at fair value as determined in good faith by the adviser in accordance with such procedures under the oversight of the Board of Trustees. Under the fund’s valuation policies and procedures, market quotations are not considered to be readily available for most types of debt instruments and floating rate loans and many types of derivatives. These investments are generally valued at fair value based on information from third-party pricing services. In addition, investments may be valued at fair value if the adviser determines that an investment’s value has been materially affected by events occurring after the close of the exchange or market on which the investment is principally traded (such as foreign exchange or market) and prior to the determination of the fund’s net asset value, or after the halting of trading of a specific security where trading does not resume prior to the close of the exchange or market on which the security is principally traded. Events that occur on a frequent basis after foreign markets close (such as developments in foreign markets and significant movements in the U.S. markets) and prior to the determination of the fund’s net asset value may be deemed to have a material effect on the value of securities traded in foreign markets. Accordingly, the fund’s foreign equity securities may often be valued at fair value. The adviser generally relies on third-party pricing services or other information (such as the correlation with price movements of similar securities in the same or other markets; the type, cost and investment characteristics of the security; the business and financial condition of the issuer; and trading and other market data) to assist in determining whether to fair value and at what value to fair value an investment. The value of an investment for purposes of calculating the fund’s net asset value can differ depending on the source and method used to determine value. When fair valuation is used, the value of an investment used to determine the fund’s net asset value may differ from quoted or published prices for the same investment. There can be no assurance that the fund could obtain the fair value assigned to an investment if it were to sell the investment at the same time at which the fund determines its net asset value per share.
Various inputs are used in determining the value of the fund’s assets or liabilities. These inputs are categorized into three broad levels. In certain cases, the inputs used to measure fair value may fall into different levels of the fair value hierarchy. In such cases, an investment’s level within the fair value hierarchy is based on the lowest level of
28
Notes to Financial Statements (unaudited) – continued
input that is significant to the fair value measurement. The fund’s assessment of the significance of a particular input to the fair value measurement in its entirety requires judgment, and considers factors specific to the investment. Level 1 includes unadjusted quoted prices in active markets for identical assets or liabilities. Level 2 includes other significant observable market-based inputs (including quoted prices for similar securities, interest rates, prepayment speed, and credit risk). Level 3 includes unobservable inputs, which may include the adviser’s own assumptions in determining the fair value of investments. The following is a summary of the levels used as of February 28, 2019 in valuing the fund’s assets or liabilities:
| | | | | | | | | | | | | | | | |
| | | | |
| Financial Instruments | | Level 1 | | | Level 2 | | | Level 3 | | | Total | |
| Equity Securities | | | $45,991,033,312 | | | | $— | | | | $— | | | | $45,991,033,312 | |
| Mutual Funds | | | 211,052,122 | | | | — | | | | — | | | | 211,052,122 | |
| Total | | | $46,202,085,434 | | | | $— | | | | $— | | | | $46,202,085,434 | |
For further information regarding security characteristics, see the Portfolio of Investments.
Foreign Currency Translation – Purchases and sales of foreign investments, income, and expenses are converted into U.S. dollars based upon currency exchange rates prevailing on the respective dates of such transactions or on the reporting date for foreign denominated receivables and payables. Gains and losses attributable to foreign currency exchange rates on sales of securities are recorded for financial statement purposes as net realized gains and losses on investments. Gains and losses attributable to foreign exchange rate movements on receivables, payables, income and expenses are recorded for financial statement purposes as foreign currency transaction gains and losses. That portion of both realized and unrealized gains and losses on investments that results from fluctuations in foreign currency exchange rates is not separately disclosed.
Indemnifications – Under the fund’s organizational documents, its officers and Trustees may be indemnified against certain liabilities and expenses arising out of the performance of their duties to the fund. Additionally, in the normal course of business, the fund enters into agreements with service providers that may contain indemnification clauses. The fund’s maximum exposure under these agreements is unknown as this would involve future claims that may be made against the fund that have not yet occurred.
Investment Transactions and Income – Investment transactions are recorded on the trade date. Dividends received in cash are recorded on theex-dividend date. Certain dividends from foreign securities will be recorded when the fund is informed of the dividend if such information is obtained subsequent to theex-dividend date. Dividend payments received in additional securities are recorded on theex-dividend date in an amount equal to the value of the security on such date.
The fund may receive proceeds from litigation settlements. Any proceeds received from litigation involving portfolio holdings are reflected in the Statement of Operations in realized gain/loss if the security has been disposed of by the fund or in unrealized gain/loss if the security is still held by the fund. Any other proceeds from litigation not related to portfolio holdings are reflected as other income in the Statement of Operations.
29
Notes to Financial Statements (unaudited) – continued
Tax Matters and Distributions – The fund intends to qualify as a regulated investment company, as defined under Subchapter M of the Internal Revenue Code, and to distribute all of its taxable income, including realized capital gains. As a result, no provision for federal income tax is required. The fund’s federal tax returns, when filed, will remain subject to examination by the Internal Revenue Service for a three year period. Management has analyzed the fund’s tax positions taken on federal and state tax returns for all open tax years and does not believe that there are any uncertain tax positions that require recognition of a tax liability. Foreign taxes, if any, have been accrued by the fund in the accompanying financial statements in accordance with the applicable foreign tax law. Foreign income taxes may be withheld by certain countries in which the fund invests. Additionally, capital gains realized by the fund on securities issued in or by certain foreign countries may be subject to capital gains tax imposed by those countries.
Distributions to shareholders are recorded on theex-dividend date. Income and capital gain distributions are determined in accordance with income tax regulations, which may differ from U.S. generally accepted accounting principles. Certain capital accounts in the financial statements are periodically adjusted for permanent differences in order to reflect their tax character. These adjustments have no impact on net assets or net asset value per share. Temporary differences which arise from recognizing certain items of income, expense, gain or loss in different periods for financial statement and tax purposes will reverse at some time in the future. Distributions in excess of net investment income or net realized gains are temporary overdistributions for financial statement purposes resulting from differences in the recognition or classification of income or distributions for financial statement and tax purposes.
Book/tax differences primarily relate to wash sale loss deferrals, treating a portion of the proceeds from redemptions as a distribution for tax purposes, and redemptionsin-kind.
The tax character of distributions made during the current period will be determined at fiscal year end. The tax character of distributions declared to shareholders for the last fiscal year is as follows:
| | | | |
| |
| | | Year ended
8/31/18 | |
| Ordinary income (including anyshort-term capital gains) | | | $929,534,546 | |
| Long-term capital gains | | | 1,243,011,694 | |
| |
| Total distributions | | | $2,172,546,240 | |
30
Notes to Financial Statements (unaudited) – continued
The federal tax cost and the tax basis components of distributable earnings were as follows:
| | | | |
| |
| As of 2/28/19 | | | |
| |
| Cost of investments | | | $29,804,234,800 | |
| Gross appreciation | | | 17,106,598,176 | |
| |
| Gross depreciation | | | (708,747,542 | ) |
| Net unrealized appreciation (depreciation) | | | $16,397,850,634 | |
| |
| As of 8/31/18 | | | |
| |
| Undistributed ordinary income | | | 153,495,142 | |
| Undistributed long-term capital gain | | | 588,463,265 | |
| Other temporary differences | | | 140,192 | |
| Net unrealized appreciation (depreciation) | | | 17,608,108,921 | |
The aggregate cost above includes prior fiscal year end tax adjustments, if applicable.
Multiple Classes of Shares of Beneficial Interest– The fund offers multiple classes of shares, which differ in their respective distribution, service, and program manager fees. The fund’s income, realized and unrealized gain (loss), and common expenses are allocated to shareholders based on the daily net assets of each class. Dividends are declared separately for each class. Differences in per share dividend rates are generally due to differences in separate class expenses. Class B and Class 529B shares will convert to Class A and Class 529A shares, respectively, approximately eight years after purchase. Class C and Class 529C shares will convert to Class A and Class 529A shares, respectively, approximately ten years after purchase. The fund’s distributions declared to shareholders as reported in the Statements of Changes in Net Assets are presented by class as follows:
| | | | | | | | | | | | | | | | |
| | | From net investment
income | | | From net realized
gain | |
| | | | |
| | | Six months
ended
2/28/19 | | | Year
ended
8/31/18 | | | Six months
ended
2/28/19 | | | Year
ended
8/31/18 | |
| Class A | | | $54,196,358 | | | | $96,760,816 | | | | $86,260,498 | | | | $186,688,046 | |
| Class B | | | 454,211 | | | | 885,026 | | | | 1,376,715 | | | | 3,950,558 | |
| Class C | | | 4,492,802 | | | | 9,179,928 | | | | 13,384,014 | | | | 41,974,501 | |
| Class I | | | 191,307,322 | | | | 356,095,252 | | | | 262,695,181 | | | | 602,257,349 | |
| Class R1 | | | 107,515 | | | | 205,831 | | | | 315,686 | | | | 825,125 | |
| Class R2 | | | 3,623,407 | | | | 7,432,906 | | | | 6,747,943 | | | | 18,360,568 | |
| Class R3 | | | 18,023,814 | | | | 33,116,822 | | | | 28,625,706 | | | | 65,139,368 | |
| Class R4 | | | 29,430,223 | | | | 57,058,987 | | | | 40,361,046 | | | | 99,811,881 | |
| Class R6 | | | 139,461,804 | | | | 232,612,347 | | | | 183,561,996 | | | | 358,857,685 | |
| Class 529A | | | 210,206 | | | | 360,191 | | | | 342,700 | | | | 706,810 | |
| Class 529B | | | 6,741 | | | | 9,004 | | | | 10,937 | | | | 28,292 | |
| Class 529C | | | 22,730 | | | | 42,130 | | | | 69,380 | | | | 186,817 | |
| Total | | | $441,337,133 | | | | $793,759,240 | | | | $623,751,802 | | | | $1,378,787,000 | |
31
Notes to Financial Statements (unaudited) – continued
(3) Transactions with Affiliates
Investment Adviser– The fund has an investment advisory agreement with MFS to provide overall investment management and related administrative services and facilities to the fund. The management fee is computed daily and paid monthly at the following annual rates based on the fund’s average daily net assets:
| | | | |
| Up to $7.5 billion | | | 0.60 | % |
| In excess of $7.5 billion and up to $10 billion | | | 0.53 | % |
| In excess of $10 billion and up to $20 billion | | | 0.50 | % |
| In excess of $20 billion and up to $25 billion | | | 0.45 | % |
| In excess of $25 billion and up to $30 billion | | | 0.42 | % |
| In excess of $30 billion and up to $35 billion | | | 0.40 | % |
| In excess of $35 billion and up to $40 billion | | | 0.38 | % |
| In excess of $40 billion and up to $45 billion | | | 0.36 | % |
| In excess of $45 billion and up to $50 billion | | | 0.35 | % |
| In excess of $50 billion | | | 0.34 | % |
MFS has also agreed in writing to reduce its management fee by a specified amount if certain MFS mutual fund assets exceed thresholds agreed to by MFS and the fund’s Board of Trustees. For the six months ended February 28, 2019, this management fee reduction amounted to $2,241,184, which is included in the reduction of total expenses in the Statement of Operations. The management fee incurred for the six months ended February 28, 2019 was equivalent to an annual effective rate of 0.45% of the fund’s average daily net assets.
Distributor– MFS Fund Distributors, Inc. (MFD), a wholly-owned subsidiary of MFS, as distributor, received $522,736 and $529,711 for the six months ended February 28, 2019, as its portion of the initial sales charge on sales of Class A and Class 529A shares of the fund, respectively.
The Board of Trustees has adopted a distribution plan for certain share classes pursuant to Rule12b-1 of the Investment Company Act of 1940.
The fund’s distribution plan provides that the fund will pay MFD for services provided by MFD and financial intermediaries in connection with the distribution and servicing of certain share classes. One component of the plan is a distribution fee paid to MFD and another component of the plan is a service fee paid to MFD. MFD may subsequently pay all, or a portion, of the distribution and/or service fees to financial intermediaries.
32
Notes to Financial Statements (unaudited) – continued
Distribution Plan Fee Table:
| | | | | | | | | | | | | | | | | | | | |
| | | | | |
| | | Distribution
Fee Rate (d) | | | Service
Fee Rate (d) | | | Total
Distribution
Plan (d) | | | Annual
Effective
Rate (e) | | | Distribution
and Service
Fee | |
| Class A | | | — | | | | 0.25% | | | | 0.25% | | | | 0.25% | | | | $7,803,318 | |
| Class B | | | 0.75% | | | | 0.25% | | | | 1.00% | | | | 1.00% | | | | 496,360 | |
| Class C | | | 0.75% | | | | 0.25% | | | | 1.00% | | | | 1.00% | | | | 4,761,750 | |
| Class R1 | | | 0.75% | | | | 0.25% | | | | 1.00% | | | | 1.00% | | | | 112,279 | |
| Class R2 | | | 0.25% | | | | 0.25% | | | | 0.50% | | | | 0.50% | | | | 1,229,960 | |
| Class R3 | | | — | | | | 0.25% | | | | 0.25% | | | | 0.25% | | | | 2,602,105 | |
| Class 529A | | | — | | | | 0.25% | | | | 0.25% | | | | 0.22% | | | | 30,500 | |
| Class 529B | | | 0.75% | | | | 0.25% | | | | 1.00% | | | | 0.17% | | | | 694 | |
| Class 529C | | | 0.75% | | | | 0.25% | | | | 1.00% | | | | 0.99% | | | | 24,385 | |
| Total Distribution and Service Fees | | | | | | | | | | | | $17,061,351 | |
| (d) | In accordance with the distribution plan for certain classes, the fund pays distribution and/or service fees equal to these annual percentage rates of each class’s average daily net assets. The distribution and service fee rates disclosed by class represent the current rates in effect at the end of the reporting period. Any rate changes, if applicable, are detailed below. |
| (e) | The annual effective rates represent actual fees incurred under the distribution plan for the six months ended February 28, 2019 based on each class’s average daily net assets. MFD has voluntarily agreed to rebate a portion of each class’s 0.25% service fee attributable to accounts for which MFD retains the 0.25% service fee except for accounts attributable to MFS or its affiliates’ seed money. For the six months ended February 28, 2019, this rebate amounted to $37,129, $658, $1,152, $448, $734, $3,675, $27, and $128 for Class A, Class B, Class C, Class R2, Class R3, Class 529A, Class 529B, and Class 529C, respectively, and is included in the reduction of total expenses in the Statement of Operations. For the six months ended February 28, 2019, the 0.75% distribution fee was not imposed for Class 529B shares due to the sales charge limitations contained in Financial Industry Regulatory Authority (“FINRA”) Rule 2341. |
Certain Class A shares are subject to a contingent deferred sales charge (CDSC) in the event of a shareholder redemption within 18 months of purchase. Class B and Class 529B shares are subject to a CDSC in the event of a shareholder redemption within six years of purchase. Class C and Class 529C shares are subject to a CDSC in the event of a shareholder redemption within 12 months of purchase. All contingent deferred sales charges are paid to MFD and during the six months ended February 28, 2019, were as follows:
| | | | |
| |
| | | Amount | |
| Class A | | | $46,657 | |
| Class B | | | 50,084 | |
| Class C | | | 37,399 | |
| Class 529B | | | — | |
| Class 529C | | | 88 | |
During the six months ended February 28, 2019, to meet the requirements of FINRA Rule 2341, MFD returned $254 of the CDSC collected in the prior fiscal year for Class 529B which had the effect of further reducing the annual effective distribution fee rate for this class by 0.07%.
The fund has entered into and may from time to time enter into contracts with program managers and other parties which administer the tuition programs through
33
Notes to Financial Statements (unaudited) – continued
which an investment in the fund’s 529 share classes is made. The fund has entered into an agreement with MFD pursuant to which MFD receives an annual fee of up to 0.05% of the average daily net assets attributable to each 529 share class. The services provided by MFD, or a third party with which MFD contracts, include recordkeeping and tax reporting and account services, as well as services designed to maintain the program’s compliance with the Internal Revenue Code and other regulatory requirements. Program manager fees for the six months ended February 28, 2019, were as follows:
| | | | |
| |
| | | Fee | |
| Class 529A | | | $6,100 | |
| Class 529B | | | 192 | |
| Class 529C | | | 1,220 | |
| Total Program Manager Fees | | | $7,512 | |
Shareholder Servicing Agent– MFS Service Center, Inc. (MFSC), a wholly-owned subsidiary of MFS, receives a fee from the fund for its services as shareholder servicing agent calculated as a percentage of the average daily net assets of the fund as determined periodically under the supervision of the fund’s Board of Trustees. For the six months ended February 28, 2019, the fee was $673,357, which equated to 0.0030% annually of the fund’s average daily net assets. MFSC also receives payment from the fund forout-of-pocket expenses,sub-accounting and other shareholder servicing costs which may be paid to affiliated and unaffiliated service providers. Class R6 shares do not incursub-accounting fees. For the six months ended February 28, 2019, theseout-of-pocket expenses,sub-accounting and other shareholder servicing costs amounted to $15,982,987.
Administrator – MFS provides certain financial, legal, shareholder communications, compliance, and other administrative services to the fund. Under an administrative services agreement, the fund reimburses MFS the costs incurred to provide these services. The fund is charged an annual fixed amount of $17,500 plus a fee based on average daily net assets. The administrative services fee incurred for the six months ended February 28, 2019 was equivalent to an annual effective rate of 0.0012% of the fund’s average daily net assets.
Trustees’ and Officers’ Compensation – The fund pays compensation to independent Trustees in the form of a retainer, attendance fees, and additional compensation to Board and Committee chairpersons. The fund does not pay compensation directly to Trustees or officers of the fund who are also officers of the investment adviser, all of whom receive remuneration for their services to the fund from MFS. Certain officers and Trustees of the fund are officers or directors of MFS, MFD, and MFSC.
Prior to December 31, 2001, the fund had an unfunded defined benefit plan (“DB plan”) for independent Trustees. As of December 31, 2001, the Board took action to terminate the DB plan with respect to then-current and any future independent Trustees, such that the DB plan covers only certain of those former independent Trustees who retired on or before December 31, 2001. The DB plan resulted in a pension expense of $342 and is included in “Independent Trustees’ compensation” in the Statement of Operations for the six months ended February 28, 2019. The liability for deferred retirement benefits payable to those former independent Trustees under
34
Notes to Financial Statements (unaudited) – continued
the DB plan amounted to $1,330 at February 28, 2019, and is included in “Payable for independent Trustees’ compensation” in the Statement of Assets and Liabilities.
Other – This fund and certain other funds managed by MFS (the funds) have entered into a service agreement (the ISO Agreement) which provides for payment of fees solely by the funds to Tarantino LLC in return for the provision of services of an Independent Senior Officer (ISO) for the funds. Frank L. Tarantino serves as the ISO and is an officer of the funds and the sole member of Tarantino LLC. The funds can terminate the ISO Agreement with Tarantino LLC at any time under the terms of the ISO Agreement. For the six months ended February 28, 2019, the fee paid by the fund under this agreement was $40,224 and is included in “Miscellaneous” expense in the Statement of Operations. MFS has agreed to bear all expenses associated with office space, other administrative support, and supplies provided to the ISO.
The fund invests in the MFS Institutional Money Market Portfolio which is managed by MFS and seeks current income consistent with preservation of capital and liquidity. This money market fund does not pay a management fee to MFS.
The fund is permitted to engage in purchase and sale transactions with funds and accounts for which MFS serves as investment adviser orsub-adviser (“cross-trades”) pursuant to a policy adopted by the Board of Trustees. This policy has been designed to ensure that cross-trades conducted by the fund comply with Rule17a-7 under the Investment Company Act of 1940. During the six months ended February 28, 2019, the fund engaged in sale transactions pursuant to this policy, which amounted to $4,590,524. The sales transactions resulted in net realized gains (losses) of $(12,325).
The adviser has voluntarily undertaken to reimburse the fund from its own resources on a quarterly basis for the cost of investment research embedded in the cost of the fund’s securities trades. This agreement may be rescinded at any time. For the six months ended February 28, 2019, this reimbursement amounted to $307,154, which is included in “Other” income in the Statement of Operations.
(4) Portfolio Securities
For the six months ended February 28, 2019, purchases and sales of investments, other than short-term obligations, aggregated $2,334,771,714 and $3,536,889,029, respectively.
35
Notes to Financial Statements (unaudited) – continued
(5) Shares of Beneficial Interest
The fund’s Declaration of Trust permits the Trustees to issue an unlimited number of full and fractional shares of beneficial interest. Transactions in fund shares were as follows:
| | | | | | | | | | | | | | | | |
| | | Six months ended
2/28/19 | | | Year ended
8/31/18 | |
| | | | |
| | | Shares | | | Amount | | | Shares | | | Amount | |
| Shares sold | | | | | | | | | | | | | | | | |
Class A | | | 12,203,536 | | | | $465,134,113 | | | | 44,076,293 | | | | $1,757,559,480 | |
Class B | | | 74,450 | | | | 2,846,000 | | | | 176,038 | | | | 7,050,932 | |
Class C | | | 1,557,005 | | | | 58,707,978 | | | | 3,349,289 | | | | 133,548,102 | |
Class I | | | 55,086,034 | | | | 2,110,797,554 | | | | 127,402,197 | | | | 5,159,868,065 | |
Class R1 | | | 55,823 | | | | 2,106,316 | | | | 156,785 | | | | 6,192,764 | |
Class R2 | | | 780,079 | | | | 29,428,073 | | | | 2,355,417 | | | | 93,706,489 | |
Class R3 | | | 5,516,873 | | | | 208,160,399 | | | | 16,357,394 | | | | 659,298,107 | |
Class R4 | | | 4,565,112 | | | | 174,850,771 | | | | 22,870,513 | | | | 926,126,695 | |
Class R6 | | | 36,210,669 | | | | 1,385,813,961 | | | | 116,249,017 | | | | 4,676,874,449 | |
Class 529A | | | 62,861 | | | | 2,397,555 | | | | 107,287 | | | | 4,273,598 | |
Class 529B | | | 427 | | | | 16,662 | | | | 2,465 | | | | 97,445 | |
Class 529C | | | 9,580 | | | | 359,553 | | | | 15,016 | | | | 592,294 | |
| | | 116,122,449 | | | | $4,440,618,935 | | | | 333,117,711 | | | | $13,425,188,420 | |
| | | |
| Shares issued to shareholders in reinvestment of distributions | | | | | | | | | | | | | |
Class A | | | 3,215,308 | | | | $114,675,143 | | | | 6,053,234 | | | | $243,649,001 | |
Class B | | | 49,105 | | | | 1,725,633 | | | | 112,004 | | | | 4,510,553 | |
Class C | | | 391,954 | | | | 13,683,630 | | | | 1,035,498 | | | | 41,436,539 | |
Class I | | | 9,990,393 | | | | 359,286,262 | | | | 18,342,158 | | | | 741,412,732 | |
Class R1 | | | 12,216 | | | | 423,191 | | | | 25,985 | | | | 1,030,956 | |
Class R2 | | | 279,291 | | | | 9,838,049 | | | | 604,456 | | | | 24,126,659 | |
Class R3 | | | 1,312,960 | | | | 46,649,419 | | | | 2,450,848 | | | | 98,255,320 | |
Class R4 | | | 1,880,224 | | | | 67,229,746 | | | | 3,751,509 | | | | 150,843,900 | |
Class R6 | | | 8,206,098 | | | | 293,540,487 | | | | 13,711,952 | | | | 550,598,803 | |
Class 529A | | | 15,643 | | | | 552,799 | | | | 26,729 | | | | 1,066,973 | |
Class 529B | | | 506 | | | | 17,678 | | | | 943 | | | | 37,287 | |
Class 529C | | | 2,673 | | | | 92,110 | | | | 5,793 | | | | 228,919 | |
| | | 25,356,371 | | | | $907,714,147 | | | | 46,121,109 | | | | $1,857,197,642 | |
36
Notes to Financial Statements (unaudited) – continued
| | | | | | | | | | | | | | | | |
| | | Six months ended
2/28/19 | | | Year ended
8/31/18 | |
| | | | |
| | | Shares | | | Amount | | | Shares | | | Amount | |
| Shares reacquired | | | | | | | | | | | | | | | | |
Class A | | | (19,048,151 | ) | | | $(735,481,661 | ) | | | (47,805,299 | ) | | | $(1,924,584,307 | ) |
Class B | | | (448,517 | ) | | | (17,190,415 | ) | | | (1,084,583 | ) | | | (43,543,928 | ) |
Class C | | | (3,982,862 | ) | | | (150,396,635 | ) | | | (14,408,676 | ) | | | (567,501,368 | ) |
Class I | | | (75,573,279 | ) | | | (2,914,209,585 | ) | | | (141,304,181 | ) | | | (5,715,110,426 | ) |
Class R1 | | | (108,445 | ) | | | (4,092,579 | ) | | | (260,226 | ) | | | (10,260,995 | ) |
Class R2 | | | (2,545,004 | ) | | | (97,811,797 | ) | | | (5,245,661 | ) | | | (209,097,090 | ) |
Class R3 | | | (8,388,393 | ) | | | (322,122,035 | ) | | | (15,484,603 | ) | | | (621,317,976 | ) |
Class R4 | | | (13,065,922 | ) | | | (496,852,286 | ) | | | (26,680,448 | ) | | | (1,076,351,548 | ) |
Class R6 | | | (38,083,025 | ) | | | (1,476,361,156 | ) | | | (69,399,253 | ) | | | (2,780,507,602 | ) |
Class 529A | | | (40,585 | ) | | | (1,580,972 | ) | | | (87,482 | ) | | | (3,498,874 | ) |
Class 529B | | | (2,109 | ) | | | (78,487 | ) | | | (6,300 | ) | | | (247,228 | ) |
Class 529C | | | (21,184 | ) | | | (783,236 | ) | | | (42,795 | ) | | | (1,671,505 | ) |
| | | (161,307,476 | ) | | | $(6,216,960,844 | ) | | | (321,809,507 | ) | | | $(12,953,692,847 | ) |
| | | | |
| Net change | | | | | | | | | | | | | | | | |
Class A | | | (3,629,307 | ) | | | $(155,672,405 | ) | | | 2,324,228 | | | | $76,624,174 | |
Class B | | | (324,962 | ) | | | (12,618,782 | ) | | | (796,541 | ) | | | (31,982,443 | ) |
Class C | | | (2,033,903 | ) | | | (78,005,027 | ) | | | (10,023,889 | ) | | | (392,516,727 | ) |
Class I | | | (10,496,852 | ) | | | (444,125,769 | ) | | | 4,440,174 | | | | 186,170,371 | |
Class R1 | | | (40,406 | ) | | | (1,563,072 | ) | | | (77,456 | ) | | | (3,037,275 | ) |
Class R2 | | | (1,485,634 | ) | | | (58,545,675 | ) | | | (2,285,788 | ) | | | (91,263,942 | ) |
Class R3 | | | (1,558,560 | ) | | | (67,312,217 | ) | | | 3,323,639 | | | | 136,235,451 | |
Class R4 | | | (6,620,586 | ) | | | (254,771,769 | ) | | | (58,426 | ) | | | 619,047 | |
Class R6 | | | 6,333,742 | | | | 202,993,292 | | | | 60,561,716 | | | | 2,446,965,650 | |
Class 529A | | | 37,919 | | | | 1,369,382 | | | | 46,534 | | | | 1,841,697 | |
Class 529B | | | (1,176 | ) | | | (44,147 | ) | | | (2,892 | ) | | | (112,496 | ) |
Class 529C | | | (8,931 | ) | | | (331,573 | ) | | | (21,986 | ) | | | (850,292 | ) |
| | | (19,828,656 | ) | | | $(868,627,762 | ) | | | 57,429,313 | | | | $2,328,693,215 | |
Class T shares were not publicly available for sale during the period. Please see the fund’s prospectus for details.
Effective June 1, 2019, purchases of the fund’s Class B and Class 529B shares are closed to new and existing investors subject to certain exceptions. Please see the fund’s prospectus for details.
The fund is one of several mutual funds in which certain MFS funds may invest. The MFS funds do not invest in the underlying funds for the purpose of exercising management or control. At the end of the period, the MFS Growth Allocation Fund was the owner of record of approximately 1% of the value of outstanding voting shares of the fund. In addition, the MFS Aggressive Growth Allocation Fund, the MFS Conservative Allocation Fund, the MFS Lifetime Income Fund, the MFS Lifetime 2020 Fund, the MFS Lifetime 2025 Fund, the MFS Lifetime 2030 Fund, the MFS Lifetime 2035 Fund, the MFS Lifetime 2040 Fund, the MFS Lifetime 2045 Fund, the MFS Lifetime 2050 Fund, the MFS Lifetime 2055 Fund, the MFS Lifetime 2060 Fund, the
37
Notes to Financial Statements (unaudited) – continued
MFS Managed Wealth Fund, and the MFS Moderate Allocation Fund were each the owners of record of less than 1% of the value of outstanding voting shares of the fund.
(6) Line of Credit
The fund and certain other funds managed by MFS participate in a $1.25 billion unsecured committed line of credit, subject to a $1 billion sublimit, provided by a syndication of banks under a credit agreement. Borrowings may be made for temporary financing needs. Interest is charged to each fund, based on its borrowings, generally at a rate equal to the higher of the Overnight Bank Funding rate or daily one month LIBOR plus an agreed upon spread. A commitment fee, based on the average daily, unused portion of the committed line of credit, is allocated among the participating funds. In addition, the fund and other funds managed by MFS have established unsecured uncommitted borrowing arrangements with certain banks for temporary financing needs. Interest is charged to each fund, based on its borrowings, at a rate equal to the Overnight Bank Funding rate plus an agreed upon spread. For the six months ended February 28, 2019, the fund’s commitment fee and interest expense were $140,185 and $0, respectively, and are included in “Miscellaneous” expense in the Statement of Operations.
(7) Investments in Affiliated Issuers
An affiliated issuer may be considered one in which the fund owns 5% or more of the outstanding voting securities, or a company which is under common control. For the purposes of this report, the fund assumes the following to be affiliated issuers:
| | | | | | | | | | | | | | | | | | | | |
| | | | | |
| Affiliated Issuers | | | | | Beginning
Shares/Par
Amount | | | Acquisitions
Shares/Par
Amount | | | Dispositions
Shares/Par
Amount | | | Ending
Shares/Par
Amount | |
| MFS Institutional Money Market Portfolio | | | | | | | 372,957,411 | | | | 2,495,606,194 | | | | (2,657,511,483 | ) | | | 211,052,122 | |
| | | | | |
| Affiliated Issuers | | Realized
Gain (Loss) | | | Change in
Unrealized
Appreciation/
Depreciation | | | Capital Gain
Distributions | | | Dividend
Income | | | Ending
Value | |
| MFS Institutional Money Market Portfolio | | | $11,062 | | | | $(24,169 | ) | | | $— | | | | $4,898,653 | | | | $211,052,122 | |
(8) RedemptionsIn-Kind
On November 16, 2018, the fund recorded a redemptionin-kind of portfolio securities and cash that was valued at $96,466,346. The redeeming shareholder generally receives a pro rata share of the securities held by the fund. The distribution of such securities generated a realized gain of $51,529,296 for the fund, which is included in Net realized gain (loss) in the Statement of Operations. For tax purposes, no gains or losses were recognized.
38
PROXY VOTING POLICIES AND INFORMATION
MFS votes proxies on behalf of the fund pursuant to proxy voting policies and procedures that are available without charge, upon request, by calling1-800-225-2606, by visitingmfs.com/proxyvoting, or by visiting the SEC’s Web site athttp://www.sec.gov.
Information regarding how the fund voted proxies relating to portfolio securities during the most recent twelve-month period ended June 30 is available by August 31 of each year without charge by visitingmfs.com/proxyvoting, or by visiting the SEC’s Web site athttp://www.sec.gov.
QUARTERLY PORTFOLIO DISCLOSURE
The fund files a complete schedule of portfolio holdings with the SEC for the first and third quarters of each fiscal year on Form N-Q. The fund’s Form N-Q is available on the SEC’s website athttp://www.sec.gov.A shareholder can obtain the portfolio holdings report for the first and third quarters of the fund’s fiscal year atmfs.com/openendfundsby choosing the fund’s name and then selecting the “Resources” tab and clicking on “Prospectus and Reports”.
FURTHER INFORMATION
From time to time, MFS may post important information about the fund or the MFS funds on the MFS web site (mfs.com). This information is available athttps://www.mfs.com/en-us/what-we-do/announcements.html or atmfs.com/openendfunds by choosing the fund’s name.
INFORMATION ABOUT FUND CONTRACTS AND LEGAL CLAIMS
The fund has entered into contractual arrangements with an investment adviser, administrator, distributor, shareholder servicing agent, 529 program manager (if applicable), and custodian who each provide services to the fund. Unless expressly stated otherwise, shareholders are not parties to, or intended beneficiaries of these contractual arrangements, and these contractual arrangements are not intended to create any shareholder right to enforce them against the service providers or to seek any remedy under them against the service providers, either directly or on behalf of the fund.
Under the Trust’s By-Laws and Declaration of Trust, any claims asserted against or on behalf of the MFS Funds, including claims against Trustees and Officers, must be brought in state and federal courts located within the Commonwealth of Massachusetts.
PROVISION OF FINANCIAL REPORTS AND SUMMARY PROSPECTUSES
The fund produces financial reports every six months and updates its summary prospectus and prospectus annually. To avoid sending duplicate copies of materials to households, only one copy of the fund’s annual and semiannual report and summary prospectus may be mailed to shareholders having the same last name and residential address on the fund’s records. However, any shareholder may contact MFSC (please see back cover for address and telephone number) to request that copies of these reports and summary prospectuses be sent personally to that shareholder.
39
Save paper with eDelivery.

| MFS® will send you prospectuses, |
reports, and proxies directly viae-mail so you will get information faster with less mailbox clutter.
To sign up:
1. Go to mfs.com.
2. Log in via MFS® Access.
3. Select eDelivery.
If you own your MFS fund shares through a financial institution or a retirement plan, MFS® TALK, MFS® Access, or eDelivery may not be available to you.
CONTACT
WEB SITE
mfs.com
MFS TALK
1-800-637-8255
24 hours a day
ACCOUNT SERVICE AND LITERATURE
Shareholders
1-800-225-2606
Financial advisors
1-800-343-2829
Retirement plan services
1-800-637-1255
MAILING ADDRESS
MFS Service Center, Inc.
P.O. Box 219341
Kansas City, MO 64121-9341
OVERNIGHT MAIL
MFS Service Center, Inc.
Suite 219341
430 W 7th Street
Kansas City, MO 64105-1407
During the period covered by this report, the Registrant has not amended any provision in its Code of Ethics (the “Code”) that relates to an element of the Code’s definitions enumerated in paragraph (b) of Item 2 of this FormN-CSR. During the period covered by this report, the Registrant did not grant a waiver, including an implicit waiver, from any provision of the Code.
| ITEM 3. | AUDIT COMMITTEE FINANCIAL EXPERT. |
Not applicable for semi-annual reports.
| ITEM 4. | PRINCIPAL ACCOUNTANT FEES AND SERVICES. |
Not applicable for semi-annual reports.
| ITEM 5. | AUDIT COMMITTEE OF LISTED REGISTRANTS. |
Not applicable to the Registrant.
A schedule of investments for each series of the Registrant is included as part of the report to shareholders of such series under Item 1 of this FormN-CSR.
| ITEM 7. | DISCLOSURE OF PROXY VOTING POLICIES AND PROCEDURES FORCLOSED-END MANAGEMENT INVESTMENT COMPANIES. |
Not applicable to the Registrant.
| ITEM 8. | PORTFOLIO MANAGERS OFCLOSED-END MANAGEMENT INVESTMENT COMPANIES. |
Not applicable to the Registrant.
| ITEM 9. | PURCHASES OF EQUITY SECURITIES BYCLOSED-END MANAGEMENT INVESTMENT COMPANY AND AFFILIATED PURCHASERS. |
Not applicable to the Registrant.
| ITEM 10. | SUBMISSION OF MATTERS TO A VOTE OF SECURITY HOLDERS. |
There were no material changes to the procedures by which shareholders may send recommendations to the Board for nominees to the Registrant’s Board since the Registrant last provided disclosure as to such procedures in response to the requirements of Item 407 (c)(2)(iv) of RegulationS-K or this Item.
| ITEM 11. | CONTROLS AND PROCEDURES. |
| (a) | Based upon their evaluation of the effectiveness of the registrant’s disclosure controls and procedures (as defined in Rule30a-3(c) under the Investment Company Act of 1940 (the “Act”)) as conducted within 90 days of the filing date of this report onForm N-CSR, the registrant’s principal financial officer and principal executive officer have concluded that those disclosure controls and procedures provide reasonable assurance that the material information required to be disclosed by the registrant on this report is recorded, processed, summarized and reported within the time periods specified in the Securities and Exchange Commission’s rules and forms. |
| (b) | There were no changes in the registrant’s internal controls over financial reporting (as defined in Rule30a-3(d) under the Act) that occurred during the second fiscal quarter of the period covered by the report that have materially affected, or are reasonably likely to materially affect, the registrant’s internal control over financial reporting. |
| ITEM 12. | DISCLOSURE OF SECURITIES LENDING ACTIVITIES FORCLOSED-END MANAGEMENT INVESTMENT COMPANIES. |
Not applicable to the Registrant.
| (a) | File the exhibits listed below as part of this form. Letter or number the exhibits in the sequence indicated. |
| | (1) | Any code of ethics, or amendment thereto, that is the subject of the disclosure required by Item 2, to the extent that the registrant intends to satisfy the Item 2 requirements through filing of an exhibit. Not applicable. |
| | (2) | A separate certification for each principal executive officer and principal financial officer of the registrant as required by Rule30a-2(a) under the Act (17 CFR270.30a-2): Attached hereto asEX-99.302CERT. |
| | (3) | Any written solicitation to purchase securities under Rule23c-1 under the Act (17 CFR270.23c-1) sent or given during the period covered by the report by or on behalf of the registrant to 10 or more persons. Not applicable. |
| | (4) | Change in the registrant’s independent public accountant. Not applicable. |
| (b) | If the report is filed under Section 13(a) or 15(d) of the Exchange Act, provide the certifications required by Rule30a-2(b) under the Act (17 CFR270.30a-2(b)), Rule13a-14(b) or Rule15d-14(b) under the Exchange Act (17 CFR240.13a-14(b) or240.15d-14(b)) and Section 1350 of Chapter 63 of Title 18 of the United States Code (18 U.S.C. 1350) as an exhibit. A certification furnished pursuant to this paragraph will not be deemed “filed” for the purposes of Section 18 of the Exchange Act (15 U.S.C. 78r), or otherwise subject to the liability of that section. Such certification will not be deemed to be incorporated by reference into any filing under the Securities Act of 1933 or the Exchange Act, except to the extent that the registrant specifically incorporates it by reference. Attached hereto as EX-99.906CERT. |
Notice
A copy of the Amended and Restated Declaration of Trust, as amended, of the Registrant is on file with the Secretary of State of The Commonwealth of Massachusetts and notice is hereby given that this instrument is executed on behalf of the Registrant by an officer of the Registrant as an officer and not individually and the obligations of or arising out of this instrument are not binding upon any of the Trustees or shareholders individually, but are binding only upon the assets and property of the respective constituent series of the Registrant.
SIGNATURES
Pursuant to the requirements of the Securities Exchange Act of 1934 and the Investment Company Act of 1940, the registrant has duly caused this report to be signed on its behalf by the undersigned, thereunto duly authorized.
(Registrant) MFS SERIES TRUST I
| | |
| By (Signature and Title)* | | DAVID L. DILORENZO |
| | David L. DiLorenzo, President |
Date: April 16, 2019
Pursuant to the requirements of the Securities Exchange Act of 1934 and the Investment Company Act of 1940, this report has been signed below by the following persons on behalf of the registrant and in the capacities and on the dates indicated.
| | |
| By (Signature and Title)* | | DAVID L. DILORENZO |
| | David L. DiLorenzo, President (Principal Executive Officer) |
Date: April 16, 2019
| | |
| By (Signature and Title)* | | JAMES O. YOST |
| | James O. Yost, Treasurer (Principal Financial Officer and Accounting Officer) |
Date: April 16, 2019
| * | Print name and title of each signing officer under his or her signature. |