UNITED STATES
SECURITIES AND EXCHANGE COMMISSION
Washington, D.C. 20549
FORM N-CSR
CERTIFIED SHAREHOLDER REPORT OF
REGISTERED MANAGEMENT INVESTMENT COMPANIES
Investment Company Act file number 811-04777
MFS SERIES TRUST I
(Exact name of registrant as specified in charter)
111 Huntington Avenue, Boston, Massachusetts 02199
(Address of principal executive offices) (Zip code)
Christopher R. Bohane
Massachusetts Financial Services Company
111 Huntington Avenue
Boston, Massachusetts 02199
(Name and address of agents for service)
Registrant’s telephone number, including area code: (617) 954-5000
Date of fiscal year end: August 31
Date of reporting period: February 28, 2017
| ITEM 1. | REPORTS TO STOCKHOLDERS. |
SEMIANNUAL REPORT
February 28, 2017

MFS® CORE EQUITY FUND

RGI-SEM
MFS® CORE EQUITY FUND
CONTENTS
The report is prepared for the general information of shareholders.
It is authorized for distribution to prospective investors only when preceded or accompanied by a current prospectus.
NOT FDIC INSURED • MAY LOSE VALUE • NO BANK GUARANTEE

LETTER FROM THE EXECUTIVE CHAIRMAN
Dear Shareholders:
Despite June’s unexpected vote by the United Kingdom to leave the European Union and the surprising result in November’s U.S. presidential election, most markets have
proved resilient. U.S. share prices quickly reversed post-Brexit declines, and indices reached new highs following the November elections. U.S. bond yields rose after Donald Trump’s victory on hopes that his proposed policy mix of lower taxes, increased spending on infrastructure and a lower regulatory burden on businesses will lift both U.S. economic growth and inflation. However, interest rates in most developed markets remain very low, with major central banks maintaining extremely accommodative monetary policies to reinvigorate slow-growing economies against a backdrop of still-low inflation. Even after the rise in yields following the election, interest rates remain low by historical standards.
Globally, economic growth has shown signs of recovery of late, led by the United States and the eurozone. Despite better growth, there are few immediate signs of worrisome inflation. Emerging market economies are recovering at a somewhat slower pace amid fears that restrictive U.S. trade policies could further hamper the already slow pace of global trade growth. Looking ahead, markets will have to contend with a series of European elections during 2017, which, depending on the outcome, could further call into question the future direction of the European Union.
At MFS®, we believe in a patient, long-term approach to investing. Viewing investments with a long lens makes it possible to filter out short-term market noise and focus on achieving solid risk-adjusted returns over a full market cycle.
In our view, such an approach, along with the professional guidance of a financial advisor, will help you reach your investment objectives.
Respectfully,

Robert J. Manning
Executive Chairman
MFS Investment Management
April 13, 2017
The opinions expressed in this letter are subject to change and may not be relied upon for investment advice. No forecasts can be guaranteed.
1
PORTFOLIO COMPOSITION
Portfolio structure

| | | | |
| Top ten holdings | | | | |
| Citigroup, Inc. | | | 2.5% | |
| Alphabet, Inc., “A” | | | 2.2% | |
| Chevron Corp. | | | 2.1% | |
| Facebook, Inc., “A” | | | 2.0% | |
| Aon PLC | | | 1.7% | |
| Broadcom Corp. | | | 1.7% | |
| Pfizer, Inc. | | | 1.4% | |
| Salesforce.com, Inc. | | | 1.4% | |
| Texas Instruments, Inc. | | | 1.4% | |
| U.S. Bancorp | | | 1.4% | |
| | | | |
| Equity sectors | | | | |
| Financial Services | | | 19.5% | |
| Technology | | | 17.6% | |
| Health Care | | | 13.5% | |
| Industrial Goods & Services | | | 7.9% | |
| Consumer Staples | | | 6.9% | |
| Utilities & Communications (s) | | | 6.5% | |
| Retailing | | | 6.3% | |
| Energy | | | 5.5% | |
| Leisure | | | 5.1% | |
| Special Products & Services | | | 3.8% | |
| Basic Materials | | | 3.7% | |
| Autos & Housing | | | 1.8% | |
| Transportation | | | 1.4% | |
| (s) | Includes securities sold short. |
Cash & Cash Equivalents includes any cash, investments in money market funds, short-term securities, and other assets less liabilities. Please see the Statement of Assets and Liabilities for additional information related to the fund’s cash position and other assets and liabilities.
Percentages are based on net assets as of 2/28/17.
The portfolio is actively managed and current holdings may be different.
2
EXPENSE TABLE
Fund expenses borne by the shareholders during the period, September 1, 2016 through February 28, 2017
As a shareholder of the fund, you incur two types of costs: (1) transaction costs, including sales charges (loads) on certain purchase or redemption payments, and (2) ongoing costs, including management fees; distribution and service (12b-1) fees; and other fund expenses. This example is intended to help you understand your ongoing costs (in dollars) of investing in the fund and to compare these costs with the ongoing costs of investing in other mutual funds.
The example is based on an investment of $1,000 invested at the beginning of the period and held for the entire period September 1, 2016 through February 28, 2017.
Actual Expenses
The first line for each share class in the following table provides information about actual account values and actual expenses. You may use the information in this line, together with the amount you invested, to estimate the expenses that you paid over the period. Simply divide your account value by $1,000 (for example, an $8,600 account value divided by $1,000 = 8.6), then multiply the result by the number in the first line under the heading entitled “Expenses Paid During Period” to estimate the expenses you paid on your account during this period.
Hypothetical Example for Comparison Purposes
The second line for each share class in the following table provides information about hypothetical account values and hypothetical expenses based on the fund’s actual expense ratio and an assumed rate of return of 5% per year before expenses, which is not the fund’s actual return. The hypothetical account values and expenses may not be used to estimate the actual ending account balance or expenses you paid for the period. You may use this information to compare the ongoing costs of investing in the fund and other funds. To do so, compare this 5% hypothetical example with the 5% hypothetical examples that appear in the shareholder reports of the other funds.
Please note that the expenses shown in the table are meant to highlight your ongoing costs only and do not reflect any transactional costs, such as sales charges (loads). Therefore, the second line for each share class in the table is useful in comparing ongoing costs only, and will not help you determine the relative total costs of owning different funds. In addition, if these transactional costs were included, your costs would have been higher.
3
Expense Table – continued
| | | | | | | | | | | | | | | | | | |
Share
Class | | | | Annualized
Expense
Ratio | | | Beginning
Account Value
9/01/16 | | | Ending
Account Value
2/28/17 | | | Expenses
Paid During
Period (p)
9/01/16-2/28/17 | |
| A | | Actual | | | 1.01% | | | | $1,000.00 | | | | $1,095.41 | | | | $5.25 | |
| | Hypothetical (h) | | | 1.01% | | | | $1,000.00 | | | | $1,019.79 | | | | $5.06 | |
| B | | Actual | | | 1.76% | | | | $1,000.00 | | | | $1,090.99 | | | | $9.12 | |
| | Hypothetical (h) | | | 1.76% | | | | $1,000.00 | | | | $1,016.07 | | | | $8.80 | |
| C | | Actual | | | 1.76% | | | | $1,000.00 | | | | $1,091.11 | | | | $9.13 | |
| | Hypothetical (h) | | | 1.76% | | | | $1,000.00 | | | | $1,016.07 | | | | $8.80 | |
| I | | Actual | | | 0.76% | | | | $1,000.00 | | | | $1,096.33 | | | | $3.95 | |
| | Hypothetical (h) | | | 0.76% | | | | $1,000.00 | | | | $1,021.03 | | | | $3.81 | |
| R1 | | Actual | | | 1.76% | | | | $1,000.00 | | | | $1,090.71 | | | | $9.12 | |
| | Hypothetical (h) | | | 1.76% | | | | $1,000.00 | | | | $1,016.07 | | | | $8.80 | |
| R2 | | Actual | | | 1.26% | | | | $1,000.00 | | | | $1,093.64 | | | | $6.54 | |
| | Hypothetical (h) | | | 1.26% | | | | $1,000.00 | | | | $1,018.55 | | | | $6.31 | |
| R3 | | Actual | | | 1.01% | | | | $1,000.00 | | | | $1,095.32 | | | | $5.25 | |
| | Hypothetical (h) | | | 1.01% | | | | $1,000.00 | | | | $1,019.79 | | | | $5.06 | |
| R4 | | Actual | | | 0.76% | | | | $1,000.00 | | | | $1,096.50 | | | | $3.95 | |
| | Hypothetical (h) | | | 0.76% | | | | $1,000.00 | | | | $1,021.03 | | | | $3.81 | |
| R6 | | Actual | | | 0.67% | | | | $1,000.00 | | | | $1,097.07 | | | | $3.48 | |
| | Hypothetical (h) | | | 0.67% | | | | $1,000.00 | | | | $1,021.47 | | | | $3.36 | |
| (h) | 5% class return per year before expenses. |
| (p) | “Expenses Paid During Period” are equal to each class’s annualized expense ratio, as shown above, multiplied by the average account value over the period, multiplied by 181/365 (to reflect the one-half year period). Expenses paid do not include any applicable sales charges (loads). If these transaction costs had been included, your costs would have been higher. |
Notes to Expense Table
Expense ratios include 0.01% of investment related expenses from short sales (See Note 2 of the Notes to Financial Statements). Each class with a Rule 12b-1 service fee is subject to a rebate of a portion of such fee. Such rebates are included in the expense ratios above. For Class A, this rebate reduced the expense ratio above by 0.01%. See Note 3 in the Notes to Financial Statements for additional information. Expense ratios reflect a one-time Reimbursement of Expenses by Custodian of 0.01% (See Note 2 of the Notes to Financial Statements).
4
PORTFOLIO OF INVESTMENTS
2/28/17 (unaudited)
The Portfolio of Investments is a complete list of all securities owned by your fund. It is categorized by broad-based asset classes.
| | | | | | | | |
| Common Stocks - 99.7% | | | | | | | | |
| Issuer | | Shares/Par | | | Value ($) | |
| Aerospace - 3.6% | | | | | | | | |
| Honeywell International, Inc. | | | 169,203 | | | $ | 21,065,766 | |
| L3 Technologies, Inc. | | | 33,004 | | | | 5,555,233 | |
| Leidos Holdings, Inc. | | | 81,183 | | | | 4,327,054 | |
| Northrop Grumman Corp. | | | 52,622 | | | | 13,002,370 | |
| Orbital ATK, Inc. | | | 18,140 | | | | 1,676,499 | |
| Textron, Inc. | | | 88,109 | | | | 4,167,556 | |
| United Technologies Corp. | | | 61,877 | | | | 6,964,256 | |
| | | | | | | | |
| | | | $ | 56,758,734 | |
| Alcoholic Beverages - 0.7% | | | | | | | | |
| Constellation Brands, Inc., “A” | | | 39,643 | | | $ | 6,295,705 | |
| Molson Coors Brewing Co. | | | 44,775 | | | | 4,494,962 | |
| | | | | | | | |
| | | | $ | 10,790,667 | |
| Apparel Manufacturers - 1.2% | | | | | | | | |
| Hanesbrands, Inc. | | | 323,123 | | | $ | 6,465,691 | |
| NIKE, Inc., “B” | | | 227,239 | | | | 12,988,981 | |
| | | | | | | | |
| | | | $ | 19,454,672 | |
| Automotive - 0.9% | | | | | | | | |
| Delphi Automotive PLC | | | 95,724 | | | $ | 7,287,468 | |
| Harman International Industries, Inc. | | | 29,903 | | | | 3,337,773 | |
| Magna International, Inc. | | | 89,158 | | | | 3,821,312 | |
| | | | | | | | |
| | | | | | | $ | 14,446,553 | |
| Biotechnology - 2.3% | | | | | | | | |
| Biogen, Inc. (a) | | | 48,563 | | | $ | 14,015,282 | |
| Celgene Corp. (a) | | | 173,441 | | | | 21,421,698 | |
| Illumina, Inc. (a) | | | 9,499 | | | | 1,590,133 | |
| | | | | | | | |
| | | | $ | 37,027,113 | |
| Broadcasting - 2.0% | | | | | | | | |
| Interpublic Group of Companies, Inc. | | | 216,092 | | | $ | 5,207,817 | |
| Time Warner, Inc. | | | 155,935 | | | | 15,314,376 | |
| Twenty-First Century Fox, Inc. | | | 352,281 | | | | 10,540,248 | |
| | | | | | | | |
| | | | $ | 31,062,441 | |
| Brokerage & Asset Managers - 1.1% | | | | | | | | |
| Blackstone Group LP | | | 386,102 | | | $ | 11,405,453 | |
| NASDAQ, Inc. | | | 92,608 | | | | 6,585,355 | |
| | | | | | | | |
| | | | $ | 17,990,808 | |
5
Portfolio of Investments (unaudited) – continued
| | | | | | | | |
| Issuer | | Shares/Par | | | Value ($) | |
| Common Stocks - continued | | | | | | | | |
| Business Services - 2.1% | | | | | | | | |
| Amdocs Ltd. | | | 58,635 | | | $ | 3,556,213 | |
| Cognizant Technology Solutions Corp., “A” (a) | | | 144,412 | | | | 8,559,299 | |
| Fidelity National Information Services, Inc. | | | 106,657 | | | | 8,774,671 | |
| Global Payments, Inc. | | | 82,317 | | | | 6,559,842 | |
| Total System Services, Inc. | | | 44,491 | | | | 2,423,870 | |
| Travelport Worldwide Ltd. | | | 157,561 | | | | 2,001,025 | |
| Zendesk, Inc. (a) | | | 43,874 | | | | 1,194,689 | |
| | | | | | | | |
| | | | $ | 33,069,609 | |
| Cable TV - 1.1% | | | | | | | | |
| Comcast Corp., “A” | | | 482,786 | | | $ | 18,065,852 | |
| | |
| Chemicals - 2.4% | | | | | | | | |
| Agrium, Inc. | | | 42,818 | | | $ | 4,128,027 | |
| Celanese Corp. | | | 44,166 | | | | 3,938,282 | |
| E.I. du Pont de Nemours & Co. | | | 69,228 | | | | 5,437,167 | |
| FMC Corp. | | | 75,362 | | | | 4,342,358 | |
| Ingevity Corp. (a) | | | 66,983 | | | | 3,615,073 | |
| Monsanto Co. | | | 69,893 | | | | 7,955,920 | |
| PPG Industries, Inc. | | | 80,864 | | | | 8,282,900 | |
| | | | | | | | |
| | | | $ | 37,699,727 | |
| Computer Software - 3.2% | | | | | | | | |
| Adobe Systems, Inc. (a) | | | 131,864 | | | $ | 15,604,786 | |
| Microsoft Corp. | | | 190,537 | | | | 12,190,557 | |
| Salesforce.com, Inc. (a) | | | 278,325 | | | | 22,641,739 | |
| | | | | | | | |
| | | | $ | 50,437,082 | |
| Computer Software - Systems - 2.4% | | | | | | | | |
| Apple, Inc. | | | 141,465 | | | $ | 19,379,290 | |
| Hewlett Packard Enterprise | | | 234,057 | | | | 5,341,181 | |
| NCR Corp. (a) | | | 96,720 | | | | 4,649,330 | |
| SS&C Technologies Holdings, Inc. | | | 242,748 | | | | 8,501,035 | |
| Versum Materials, Inc. (a) | | | 9,772 | | | | 296,189 | |
| | | | | | | | |
| | | | $ | 38,167,025 | |
| Construction - 0.9% | | | | | | | | |
| Sherwin-Williams Co. | | | 44,264 | | | $ | 13,657,215 | |
| | |
| Consumer Products - 1.9% | | | | | | | | |
| Coty, Inc., “A” | | | 320,761 | | | $ | 6,023,892 | |
| Estee Lauder Cos., Inc., “A” | | | 70,549 | | | | 5,844,985 | |
| Newell Brands, Inc. | | | 97,188 | | | | 4,765,128 | |
| Procter & Gamble Co. | | | 143,017 | | | | 13,024,558 | |
| | | | | | | | |
| | | | $ | 29,658,563 | |
6
Portfolio of Investments (unaudited) – continued
| | | | | | | | |
| Issuer | | Shares/Par | | | Value ($) | |
| Common Stocks - continued | | | | | | | | |
| Consumer Services - 1.7% | | | | | | | | |
| Bright Horizons Family Solutions, Inc. (a) | | | 80,486 | | | $ | 5,562,387 | |
| Nord Anglia Education, Inc. (a) | | | 207,269 | | | | 4,864,603 | |
| Priceline Group, Inc. (a) | | | 6,031 | | | | 10,398,228 | |
| ServiceMaster Global Holdings, Inc. (a) | | | 142,220 | | | | 5,664,623 | |
| | | | | | | | |
| | | | $ | 26,489,841 | |
| Containers - 0.7% | | | | | | | | |
| Berry Plastics Group, Inc. (a) | | | 95,827 | | | $ | 4,822,973 | |
| CCL Industries, Inc. | | | 17,552 | | | | 3,730,692 | |
| Graphic Packaging Holding Co. | | | 236,768 | | | | 3,160,853 | |
| | | | | | | | |
| | | | $ | 11,714,518 | |
| Electrical Equipment - 1.4% | | | | | | | | |
| AMETEK, Inc. | | | 202,344 | | | $ | 10,920,506 | |
| Johnson Controls International PLC | | | 192,193 | | | | 8,060,574 | |
| WESCO International, Inc. (a) | | | 48,210 | | | | 3,350,595 | |
| | | | | | | | |
| | | | $ | 22,331,675 | |
| Electronics - 5.4% | | | | | | | | |
| Analog Devices, Inc. | | | 135,761 | | | $ | 11,122,899 | |
| Applied Materials, Inc. | | | 189,493 | | | | 6,863,436 | |
| Broadcom Corp. | | | 125,474 | | | | 26,466,231 | |
| Mellanox Technologies Ltd. (a) | | | 176,766 | | | | 8,555,474 | |
| NVIDIA Corp. | | | 102,229 | | | | 10,374,199 | |
| Texas Instruments, Inc. | | | 292,792 | | | | 22,433,723 | |
| | | | | | | | |
| | | | $ | 85,815,962 | |
| Energy - Independent - 2.4% | | | | | | | | |
| Concho Resources, Inc. (a) | | | 33,118 | | | $ | 4,386,479 | |
| Energen Corp. (a) | | | 19,926 | | | | 1,046,115 | |
| EOG Resources, Inc. | | | 69,116 | | | | 6,703,561 | |
| EQT Corp. | | | 15,552 | | | | 931,409 | |
| Hess Corp. | | | 145,406 | | | | 7,479,685 | |
| Noble Energy, Inc. | | | 58,323 | | | | 2,123,540 | |
| Parsley Energy, Inc., “A” (a) | | | 53,768 | | | | 1,634,010 | |
| PDC Energy, Inc. (a) | | | 10,836 | | | | 732,405 | |
| Phillips 66 | | | 80,334 | | | | 6,281,315 | |
| Pioneer Natural Resources Co. | | | 33,129 | | | | 6,161,000 | |
| | | | | | | | |
| | | | $ | 37,479,519 | |
| Energy - Integrated - 2.1% | | | | | | | | |
| Chevron Corp. (s) | | | 290,035 | | | $ | 32,628,938 | |
| | |
| Engineering - Construction - 0.1% | | | | | | | | |
| KBR, Inc. | | | 84,898 | | | $ | 1,277,715 | |
7
Portfolio of Investments (unaudited) – continued
| | | | | | | | |
| Issuer | | Shares/Par | | | Value ($) | |
| Common Stocks - continued | | | | | | | | |
| Food & Beverages - 3.3% | | | | | | | | |
| Archer Daniels Midland Co. | | | 33,748 | | | $ | 1,585,144 | |
| Blue Buffalo Pet Products, Inc. (a) | | | 92,084 | | | | 2,250,533 | |
| Cal-Maine Foods, Inc. (l) | | | 92,532 | | | | 3,511,589 | |
| Mead Johnson Nutrition Co., “A” | | | 23,907 | | | | 2,098,796 | |
| Mondelez International, Inc. | | | 250,244 | | | | 10,990,716 | |
| Monster Beverage Corp. (a) | | | 144,731 | | | | 5,997,653 | |
| PepsiCo, Inc. | | | 150,577 | | | | 16,620,689 | |
| Snyders-Lance, Inc. | | | 56,059 | | | | 2,218,815 | |
| TreeHouse Foods, Inc. (a) | | | 75,144 | | | | 6,393,252 | |
| | | | | | | | |
| | | | $ | 51,667,187 | |
| Food & Drug Stores - 0.9% | | | | | | | | |
| Casey’s General Stores, Inc. | | | 26,667 | | | $ | 3,055,505 | |
| CVS Health Corp. | | | 129,335 | | | | 10,421,814 | |
| | | | | | | | |
| | | | $ | 13,477,319 | |
| Gaming & Lodging - 0.3% | | | | | | | | |
| Marriott International, Inc., “A” | | | 56,478 | | | $ | 4,913,021 | |
| | |
| General Merchandise - 1.7% | | | | | | | | |
| Costco Wholesale Corp. | | | 78,724 | | | $ | 13,948,318 | |
| Dollar Tree, Inc. (a) | | | 88,074 | | | | 6,753,514 | |
| Five Below, Inc. (a) | | | 158,323 | | | | 6,103,352 | |
| | | | | | | | |
| | | | $ | 26,805,184 | |
| Health Maintenance Organizations - 1.4% | | | | | | | | |
| Cigna Corp. | | | 41,941 | | | $ | 6,245,015 | |
| UnitedHealth Group, Inc. | | | 99,173 | | | | 16,401,231 | |
| | | | | | | | |
| | | | $ | 22,646,246 | |
| Insurance - 3.3% | | | | | | | | |
| American International Group, Inc. | | | 189,984 | | | $ | 12,143,777 | |
| Aon PLC | | | 231,709 | | | | 26,797,146 | |
| Chubb Ltd. | | | 95,746 | | | | 13,229,225 | |
| | | | | | | | |
| | | | $ | 52,170,148 | |
| Internet - 5.4% | | | | | | | | |
| Alphabet, Inc., “A” (a)(s) | | | 41,737 | | | $ | 35,264,843 | |
| Alphabet, Inc., “C” (a) | | | 10,549 | | | | 8,684,042 | |
| Facebook, Inc., “A” (a) | | | 231,953 | | | | 31,438,910 | |
| LogMeIn, Inc. | | | 108,182 | | | | 9,925,699 | |
| | | | | | | | |
| | | | $ | 85,313,494 | |
8
Portfolio of Investments (unaudited) – continued
| | | | | | | | |
| Issuer | | Shares/Par | | | Value ($) | |
| Common Stocks - continued | | | | | | | | |
| Machinery & Tools - 2.3% | | | | | | | | |
| Illinois Tool Works, Inc. | | | 51,265 | | | $ | 6,767,493 | |
| IPG Photonics Corp. (a) | | | 43,106 | | | | 5,099,440 | |
| ITT, Inc. | | | 97,928 | | | | 4,012,110 | |
| Roper Technologies, Inc. | | | 73,784 | | | | 15,435,613 | |
| SPX FLOW, Inc. (a) | | | 125,247 | | | | 4,258,398 | |
| | | | | | | | |
| | | | $ | 35,573,054 | |
| Major Banks - 2.9% | | | | | | | | |
| Bank of America Corp. | | | 703,859 | | | $ | 17,371,240 | |
| Morgan Stanley | | | 311,597 | | | | 14,230,635 | |
| PNC Financial Services Group, Inc. | | | 116,560 | | | | 14,829,929 | |
| | | | | | | | |
| | | | $ | 46,431,804 | |
| Medical & Health Technology & Services - 1.4% | | | | | | | | |
| athenahealth, Inc. (a) | | | 22,879 | | | $ | 2,698,120 | |
| Healthcare Services Group, Inc. | | | 50,994 | | | | 2,110,132 | |
| Henry Schein, Inc. (a) | | | 24,090 | | | | 4,132,880 | |
| LifePoint Health, Inc. (a) | | | 50,087 | | | | 3,208,072 | |
| McKesson Corp. | | | 50,856 | | | | 7,635,011 | |
| MEDNAX, Inc. (a) | | | 29,987 | | | | 2,134,775 | |
| | | | | | | | |
| | | | $ | 21,918,990 | |
| Medical Equipment - 4.4% | | | | | | | | |
| CONMED Corp. | | | 34,429 | | | $ | 1,432,935 | |
| Danaher Corp. | | | 62,348 | | | | 5,333,871 | |
| DexCom, Inc. (a) | | | 22,520 | | | | 1,760,163 | |
| Edwards Lifesciences Corp. (a) | | | 100,950 | | | | 9,493,338 | |
| Medtronic PLC | | | 226,033 | | | | 18,288,330 | |
| Obalon Therapeutics, Inc. (a) | | | 141,182 | | | | 1,315,816 | |
| PerkinElmer, Inc. | | | 86,376 | | | | 4,686,762 | |
| Steris PLC | | | 52,228 | | | | 3,662,750 | |
| Stryker Corp. | | | 98,496 | | | | 12,662,646 | |
| Zimmer Biomet Holdings, Inc. | | | 87,570 | | | | 10,252,696 | |
| | | | | | | | |
| | | | $ | 68,889,307 | |
| Metals & Mining - 0.3% | | | | | | | | |
| First Quantum Minerals Ltd. | | | 130,286 | | | $ | 1,355,634 | |
| Lundin Mining Corp. | | | 549,708 | | | | 3,306,857 | |
| | | | | | | | |
| | | | $ | 4,662,491 | |
| Natural Gas - Distribution - 0.3% | | | | | | | | |
| New Jersey Resources Corp. | | | 99,716 | | | $ | 3,928,810 | |
| Sempra Energy | | | 7,714 | | | | 850,777 | |
| | | | | | | | |
| | | | $ | 4,779,587 | |
9
Portfolio of Investments (unaudited) – continued
| | | | | | | | |
| Issuer | | Shares/Par | | | Value ($) | |
| Common Stocks - continued | | | | | | | | |
| Natural Gas - Pipeline - 0.7% | | | | | | | | |
| Cheniere Energy, Inc. (a) | | | 183,995 | | | $ | 8,840,960 | |
| Enterprise Products Partners LP | | | 85,023 | | | | 2,383,195 | |
| | | | | | | | |
| | | | $ | 11,224,155 | |
| Network & Telecom - 1.2% | | | | | | | | |
| Cisco Systems, Inc. | | | 153,571 | | | $ | 5,249,057 | |
| Ixia (a) | | | 246,710 | | | | 4,835,516 | |
| Motorola Solutions, Inc. | | | 103,749 | | | | 8,193,059 | |
| | | | | | | | |
| | | | $ | 18,277,632 | |
| Oil Services - 1.0% | | | | | | | | |
| Forum Energy Technologies, Inc. (a) | | | 84,937 | | | $ | 1,843,133 | |
| Keane Group, Inc. (a)(l) | | | 65,888 | | | | 1,154,358 | |
| Oil States International, Inc. (a) | | | 35,601 | | | | 1,310,117 | |
| Schlumberger Ltd. | | | 150,716 | | | | 12,111,538 | |
| | | | | | | | |
| | | | $ | 16,419,146 | |
| Other Banks & Diversified Financials - 8.6% | | | | | | | | |
| Bank of The Ozarks, Inc. | | | 122,455 | | | $ | 6,701,962 | |
| Citigroup, Inc. (s) | | | 661,802 | | | | 39,582,378 | |
| Discover Financial Services | | | 228,219 | | | | 16,235,500 | |
| EuroDekania Ltd. | | | 580,280 | | | | 94,518 | |
| First Republic Bank | | | 53,577 | | | | 5,027,130 | |
| Northern Trust Corp. | | | 71,435 | | | | 6,239,847 | |
| Signature Bank (a) | | | 28,735 | | | | 4,526,050 | |
| Texas Capital Bancshares, Inc. (a) | | | 35,264 | | | | 3,143,786 | |
| U.S. Bancorp | | | 403,108 | | | | 22,170,940 | |
| Visa, Inc., “A” | | | 216,154 | | | | 19,008,583 | |
| Wintrust Financial Corp. | | | 105,580 | | | | 7,781,246 | |
| Zions Bancorporation | | | 113,407 | | | | 5,091,974 | |
| | | | | | | | |
| | | | $ | 135,603,914 | |
| Pharmaceuticals - 4.0% | | | | | | | | |
| Allergan PLC | | | 54,445 | | | $ | 13,329,225 | |
| Eli Lilly & Co. | | | 142,862 | | | | 11,830,402 | |
| Pfizer, Inc. | | | 668,718 | | | | 22,816,658 | |
| Zoetis, Inc. | | | 274,924 | | | | 14,656,198 | |
| | | | | | | | |
| | | | $ | 62,632,483 | |
| Pollution Control - 0.5% | | | | | | | | |
| Clean Harbors, Inc. (a) | | | 70,126 | | | $ | 4,064,503 | |
| Waste Connections, Inc. | | | 48,184 | | | | 4,210,800 | |
| | | | | | | | |
| | | | $ | 8,275,303 | |
10
Portfolio of Investments (unaudited) – continued
| | | | | | | | |
| Issuer | | Shares/Par | | | Value ($) | |
| Common Stocks - continued | | | | | | | | |
| Railroad & Shipping - 1.2% | | | | | | | | |
| Canadian Pacific Railway Ltd. | | | 55,764 | | | $ | 8,224,075 | |
| Union Pacific Corp. | | | 104,809 | | | | 11,313,083 | |
| | | | | | | | |
| | | | $ | 19,537,158 | |
| Real Estate - 3.6% | | | | | | | | |
| Gramercy Property Trust, REIT | | | 265,897 | | | $ | 7,434,480 | |
| Life Storage, Inc., REIT | | | 79,727 | | | | 7,066,204 | |
| Medical Properties Trust, Inc., REIT | | | 1,495,973 | | | | 20,075,958 | |
| Store Capital Corp., REIT | | | 273,492 | | | | 6,812,686 | |
| Sun Communities, Inc., REIT | | | 59,366 | | | | 4,917,286 | |
| Tanger Factory Outlet Centers, Inc., REIT | | | 197,071 | | | | 6,674,795 | |
| Washington Prime Group, Inc., REIT | | | 351,389 | | | | 3,257,376 | |
| | | | | | | | |
| | | | $ | 56,238,785 | |
| Restaurants - 1.6% | | | | | | | | |
| Aramark | | | 182,155 | | | $ | 6,510,220 | |
| Panera Bread Co., “A” (a) | | | 25,077 | | | | 5,787,772 | |
| Starbucks Corp. | | | 236,304 | | | | 13,438,608 | |
| | | | | | | | |
| | | | $ | 25,736,600 | |
| Specialty Chemicals - 0.3% | | | | | | | | |
| Univar, Inc. (a) | | | 150,156 | | | $ | 4,835,023 | |
| | |
| Specialty Stores - 2.5% | | | | | | | | |
| Amazon.com, Inc. (a) | | | 17,345 | | | $ | 14,657,219 | |
| Express, Inc. (a) | | | 426,551 | | | | 4,794,433 | |
| Lululemon Athletica, Inc. (a) | | | 42,056 | | | | 2,744,575 | |
| Michaels Co., Inc. (a) | | | 200,319 | | | | 4,024,409 | |
| Ross Stores, Inc. | | | 63,250 | | | | 4,337,685 | |
| Tractor Supply Co. | | | 65,047 | | | | 4,612,483 | |
| Urban Outfitters, Inc. (a) | | | 196,606 | | | | 5,117,654 | |
| | | | | | | | |
| | | | $ | 40,288,458 | |
| Telecommunications - Wireless - 2.2% | | | | | | | | |
| American Tower Corp., REIT | | | 186,302 | | | $ | 21,385,607 | |
| SBA Communications Corp., REIT (a) | | | 111,292 | | | | 12,884,275 | |
| | | | | | | | |
| | | | $ | 34,269,882 | |
| Telephone Services - 0.9% | | | | | | | | |
| Verizon Communications, Inc. | | | 279,775 | | | $ | 13,885,233 | |
| | |
| Tobacco - 1.0% | | | | | | | | |
| Philip Morris International, Inc. | | | 147,991 | | | $ | 16,182,816 | |
11
Portfolio of Investments (unaudited) – continued
| | | | | | | | |
| Issuer | | Shares/Par | | | Value ($) | |
| Common Stocks - continued | | | | | | | | |
| Trucking - 0.2% | | | | | | | | |
| Swift Transportation Co. (a) | | | 144,528 | | | $ | 3,139,148 | |
| | |
| Utilities - Electric Power - 2.7% | | | | | | | | |
| Alliant Energy Corp. | | | 81,207 | | | $ | 3,206,052 | |
| American Electric Power Co., Inc. | | | 76,781 | | | | 5,142,024 | |
| CMS Energy Corp. | | | 109,167 | | | | 4,860,115 | |
| Exelon Corp. | | | 145,364 | | | | 5,336,312 | |
| NextEra Energy, Inc. | | | 60,556 | | | | 7,932,836 | |
| PG&E Corp. | | | 81,258 | | | | 5,423,972 | |
| PNM Resources, Inc. | | | 95,055 | | | | 3,450,497 | |
| Xcel Energy, Inc. | | | 164,260 | | | | 7,179,805 | |
| | | | | | | | |
| | | | $ | 42,531,613 | |
| Total Common Stocks (Identified Cost, $1,249,747,769) | | | | | | $ | 1,574,349,410 | |
| | |
| Money Market Funds - 0.6% | | | | | | | | |
MFS Institutional Money Market Portfolio, 0.64% (v)
(Identified Cost, $8,348,873) | | | 8,348,873 | | | $ | 8,348,873 | |
| | |
| Collateral for Securities Loaned - 0.1% | | | | | | | | |
| State Street Navigator Securities Lending Government Money Market Portfolio, 0.50% (j) (Identified Cost, $1,645,446) | | | 1,645,446 | | | $ | 1,645,446 | |
| Total Investments (Identified Cost, $1,259,742,088) | | | | | | $ | 1,584,343,729 | |
| | |
| Securities Sold Short - (0.3)% | | | | | | | | |
| Telecommunications - Wireless - (0.3)% | | | | | | | | |
Crown Castle International Corp., REIT
(Proceeds Received $3,678,192) | | | (44,300 | ) | | $ | (4,143,379 | ) |
| | |
| Other Assets, Less Liabilities - (0.1)% | | | | | | | (1,532,420 | ) |
| Net Assets - 100.0% | | | | | | $ | 1,578,667,930 | |
| (a) | Non-income producing security. |
| (j) | The rate quoted is the annualized seven-day yield of the fund at period end. |
| (l) | A portion of this security is on loan. |
| (s) | Security or a portion of the security was pledged to cover collateral requirements for securities sold short. |
| (v) | Underlying affiliated fund that is available only to investment companies managed by MFS. The rate quoted for the MFS Institutional Money Market Portfolio is the annualized seven-day yield of the fund at period end. |
The following abbreviations are used in this report and are defined:
| PLC | | Public Limited Company |
| REIT | | Real Estate Investment Trust |
At February 28, 2017, the fund had cash collateral of $50,084 and other liquid securities with an aggregate value of $3,837,112 to cover any commitments for securities sold short. Cash collateral is comprised of “Deposits with brokers” on the Statement of Assets and Liabilities.
See Notes to Financial Statements
12
Financial Statements
STATEMENT OF ASSETS AND LIABILITIES
At 2/28/17 (unaudited)
This statement represents your fund’s balance sheet, which details the assets and liabilities comprising the total value of the fund.
| | | | |
| Assets | | | | |
Investments | | | | |
Non-affiliated issuers, at value (identified cost, $1,251,393,215) | | | $1,575,994,856 | |
Underlying affiliated funds, at value (identified cost, $8,348,873) | | | 8,348,873 | |
Total investments, at value, including $1,578,224 of securities on loan (identified cost, $1,259,742,088) | | | $1,584,343,729 | |
Cash | | | 21,407 | |
Foreign currency, at value (identified cost, $14) | | | 14 | |
Deposits with brokers | | | 50,084 | |
Receivables for | | | | |
Investments sold | | | 785,536 | |
Fund shares sold | | | 2,664,237 | |
Interest and dividends | | | 1,699,059 | |
Other assets | | | 6,785 | |
Total assets | | | $1,589,570,851 | |
| Liabilities | | | | |
Payables for | | | | |
Securities sold short, at value (proceeds received, $3,678,192) | | | $4,143,379 | |
Investments purchased | | | 787,962 | |
Fund shares reacquired | | | 3,666,405 | |
Collateral for securities loaned, at value | | | 1,645,446 | |
Payable to affiliates | | | | |
Investment adviser | | | 51,217 | |
Shareholder servicing costs | | | 478,087 | |
Distribution and service fees | | | 16,352 | |
Payable for independent Trustees’ compensation | | | 60,003 | |
Accrued expenses and other liabilities | | | 54,070 | |
Total liabilities | | | $10,902,921 | |
Net assets | | | $1,578,667,930 | |
| Net assets consist of | | | | |
Paid-in capital | | | $1,189,954,279 | |
Unrealized appreciation (depreciation) on investments and translation of assets and liabilities in foreign currencies | | | 324,136,454 | |
Accumulated net realized gain (loss) on investments and foreign currency | | | 58,935,554 | |
Undistributed net investment income | | | 5,641,643 | |
Net assets | | | $1,578,667,930 | |
Shares of beneficial interest outstanding | | | 55,685,949 | |
13
Statement of Assets and Liabilities (unaudited) – continued
| | | | | | | | | | | | |
| | | Net assets | | | Shares
outstanding | | | Net asset value
per share (a) | |
Class A | | | $951,288,905 | | | | 33,678,630 | | | | $28.25 | |
Class B | | | 28,680,728 | | | | 1,133,893 | | | | 25.29 | |
Class C | | | 92,984,280 | | | | 3,716,227 | | | | 25.02 | |
Class I | | | 131,617,917 | | | | 4,430,833 | | | | 29.71 | |
Class R1 | | | 3,092,775 | | | | 123,689 | | | | 25.00 | |
Class R2 | | | 15,434,767 | | | | 558,781 | | | | 27.62 | |
Class R3 | | | 29,147,469 | | | | 1,036,288 | | | | 28.13 | |
Class R4 | | | 20,157,300 | | | | 708,697 | | | | 28.44 | |
Class R6 | | | 306,263,789 | | | | 10,298,911 | | | | 29.74 | |
| (a) | Maximum offering price per share was equal to the net asset value per share for all share classes, except for Class A, for which the maximum offering price per share was $29.97 [100 / 94.25 x $28.25]. On sales of $50,000 or more, the maximum offering price of Class A shares is reduced. A contingent deferred sales charge may be imposed on redemptions of Class A, Class B, and Class C shares. Redemption price per share was equal to the net asset value per share for Classes I, R1, R2, R3, R4, and R6. |
See Notes to Financial Statements
14
Financial Statements
STATEMENT OF OPERATIONS
Six months ended 2/28/17 (unaudited)
This statement describes how much your fund earned in investment income and accrued in expenses. It also describes any gains and/or losses generated by fund operations.
| | | | |
| Net investment income | |
Income | | | | |
Dividends | | | $13,219,897 | |
Dividends from underlying affiliated funds | | | 32,766 | |
Other | | | 14,783 | |
Interest | | | 10,565 | |
Foreign taxes withheld | | | (19,473 | ) |
Total investment income | | | $13,258,538 | |
Expenses | | | | |
Management fee | | | $4,447,534 | |
Distribution and service fees | | | 1,880,466 | |
Shareholder servicing costs | | | 929,495 | |
Administrative services fee | | | 120,763 | |
Independent Trustees’ compensation | | | 20,668 | |
Custodian fee | | | 38,285 | |
Reimbursement of custodian expenses | | | (96,938 | ) |
Shareholder communications | | | 53,336 | |
Audit and tax fees | | | 27,446 | |
Legal fees | | | 6,593 | |
Dividend and interest expense on securities sold short | | | 90,436 | |
Miscellaneous | | | 102,651 | |
Total expenses | | | $7,620,735 | |
Reduction of expenses by investment adviser and distributor | | | (81,330 | ) |
Net expenses | | | $7,539,405 | |
Net investment income | | | $5,719,133 | |
| Realized and unrealized gain (loss) on investments and foreign currency | |
Realized gain (loss) (identified cost basis) | | | | |
Investments: | | | | |
Non-affiliated issuers | | | $64,541,852 | |
Underlying affiliated funds | | | 542 | |
Foreign currency | | | (1,628 | ) |
Net realized gain (loss) on investments and foreign currency | | | $64,540,766 | |
Change in unrealized appreciation (depreciation) | | | | |
Investments | | | $70,562,816 | |
Securities sold short | | | (85,055 | ) |
Translation of assets and liabilities in foreign currencies | | | 6 | |
Net unrealized gain (loss) on investments and foreign currency translation | | | $70,477,767 | |
Net realized and unrealized gain (loss) on investments and foreign currency | | | $135,018,533 | |
Change in net assets from operations | | | $140,737,666 | |
See Notes to Financial Statements
15
Financial Statements
STATEMENTS OF CHANGES IN NET ASSETS
These statements describe the increases and/or decreases in net assets resulting from operations, any distributions, and any shareholder transactions.
| | | | | | | | |
| Change in net assets | | Six months ended
2/28/17 (unaudited) | | | Year ended
8/31/16 | |
| From operations | | | | | | | | |
Net investment income | | | $5,719,133 | | | | $9,712,129 | |
Net realized gain (loss) on investments and foreign currency | | | 64,540,766 | | | | 46,889,142 | |
Net unrealized gain (loss) on investments and foreign currency translation | | | 70,477,767 | | | | 63,937,563 | |
Change in net assets from operations | | | $140,737,666 | | | | $120,538,834 | |
| Distributions declared to shareholders | | | | | | | | |
From net investment income | | | $(9,436,060 | ) | | | $(5,821,876 | ) |
From net realized gain on investments | | | (45,657,546 | ) | | | (119,401,189 | ) |
Total distributions declared to shareholders | | | $(55,093,606 | ) | | | $(125,223,065 | ) |
Change in net assets from fund share transactions | | | $(59,972,258 | ) | | | $309,510,191 | |
Total change in net assets | | | $25,671,802 | | | | $304,825,960 | |
| Net assets | | | | | | | | |
At beginning of period | | | 1,552,996,128 | | | | 1,248,170,168 | |
At end of period (including undistributed net investment income of $5,641,643 and $9,358,570, respectively) | | | $1,578,667,930 | | | | $1,552,996,128 | |
See Notes to Financial Statements
16
Financial Statements
FINANCIAL HIGHLIGHTS
The financial highlights table is intended to help you understand the fund’s financial performance for the semiannual period and the past 5 fiscal years (or life of a particular share class, if shorter). Certain information reflects financial results for a single fund share. The total returns in the table represent the rate by which an investor would have earned (or lost) on an investment in the fund share class (assuming reinvestment of all distributions) held for the entire period.
| | | | | | | | | | | | | | | | | | | | | | | | |
| | | Six months
ended
2/28/17 (unaudited) | | | Years ended 8/31 | |
| Class A | | | 2016 | | | 2015 | | | 2014 | | | 2013 | | | 2012 | |
| | | | | | | | | | | | | | | | | |
Net asset value, beginning of period | | | $26.72 | | | | $27.19 | | | | $29.19 | | | | $23.82 | | | | $19.68 | | | | $17.20 | |
| Income (loss) from investment operations | | | | | | | | | | | | | |
Net investment income (d) | | | $0.10 | (c) | | | $0.18 | | | | $0.15 | | | | $0.13 | | | | $0.18 | | | | $0.11 | |
Net realized and unrealized gain (loss) on investments and foreign currency | | | 2.40 | | | | 2.08 | | | | 0.13 | | | | 5.41 | | | | 4.07 | | | | 2.47 | |
Total from investment operations | | | $2.50 | | | | $2.26 | | | | $0.28 | | | | $5.54 | | | | $4.25 | | | | $2.58 | |
| Less distributions declared to shareholders | | | | | | | | | | | | | |
From net investment income | | | $(0.16 | ) | | | $(0.14 | ) | | | $(0.13 | ) | | | $(0.17 | ) | | | $(0.11 | ) | | | $(0.10 | ) |
From net realized gain on investments | | | (0.81 | ) | | | (2.59 | ) | | | (2.15 | ) | | | — | | | | — | | | | — | |
Total distributions declared to shareholders | | | $(0.97 | ) | | | $(2.73 | ) | | | $(2.28 | ) | | | $(0.17 | ) | | | $(0.11 | ) | | | $(0.10 | ) |
Net asset value, end of period (x) | | | $28.25 | | | | $26.72 | | | | $27.19 | | | | $29.19 | | | | $23.82 | | | | $19.68 | |
Total return (%) (r)(s)(t)(x) | | | 9.54 | (c)(n) | | | 9.09 | | | | 0.98 | | | | 23.33 | | | | 21.69 | | | | 15.10 | |
Ratios (%) (to average net assets)
and Supplemental data: | | | | | | | | | | | | | | | | | | | | | |
Expenses before expense reductions (f) | | | 1.02 | (a)(c) | | | 1.07 | | | | 1.05 | | | | 1.05 | | | | 1.11 | | | | 1.15 | |
Expenses after expense reductions (f) | | | 1.01 | (a)(c) | | | 1.05 | | | | 1.04 | | | | 1.04 | | | | 1.11 | | | | 1.15 | |
Net investment income | | | 0.73 | (a)(c) | | | 0.70 | | | | 0.52 | | | | 0.49 | | | | 0.81 | | | | 0.61 | |
Portfolio turnover | | | 30 | (n) | | | 68 | | | | 53 | | | | 48 | | | | 58 | | | | 65 | |
Net assets at end of period (000 omitted) | | | $951,289 | | | | $959,812 | | | | $963,167 | | | | $1,002,028 | | | | $873,139 | | | | $686,616 | |
| Supplemental Ratios (%): | | | | | | | | | | | | | | | | | | | | | |
Ratio of expenses to average net assets after expense reductions excluding short sale expenses and interest expense and fees (f) | | | 1.00 | (a)(c) | | | 1.04 | | | | 1.03 | | | | 1.04 | | | | 1.10 | | | | 1.15 | |
See Notes to Financial Statements
17
Financial Highlights – continued
| | | | | | | | | | | | | | | | | | | | | | | | |
| | | Six months
ended
2/28/17 (unaudited) | | | Years ended 8/31 | |
| Class B | | | 2016 | | | 2015 | | | 2014 | | | 2013 | | | 2012 | |
| | | | | | | | | | | | | | | | | |
Net asset value, beginning of period | | | $23.96 | | | | $24.70 | | | | $26.78 | | | | $21.88 | | | | $18.11 | | | | $15.86 | |
| Income (loss) from investment operations | | | | | | | | | |
Net investment income (loss) (d) | | | $(0.00 | )(c)(w) | | | $(0.02 | ) | | | $(0.06 | ) | | | $(0.06 | ) | | | $0.01 | | | | $(0.02 | ) |
Net realized and unrealized gain (loss) on investments and foreign currency | | | 2.14 | | | | 1.87 | | | | 0.13 | | | | 4.96 | | | | 3.76 | | | | 2.27 | |
Total from investment operations | | | $2.14 | | | | $1.85 | | | | $0.07 | | | | $4.90 | | | | $3.77 | | | | $2.25 | |
| Less distributions declared to shareholders | | | | | | | | | | | | | |
From net realized gain on investments | | | $(0.81 | ) | | | $(2.59 | ) | | | $(2.15 | ) | | | $— | | | | $— | | | | $— | |
Net asset value, end of period (x) | | | $25.29 | | | | $23.96 | | | | $24.70 | | | | $26.78 | | | | $21.88 | | | | $18.11 | |
Total return (%) (r)(s)(t)(x) | | | 9.10 | (c)(n) | | | 8.24 | | | | 0.25 | | | | 22.39 | | | | 20.82 | | | | 14.19 | |
Ratios (%) (to average net assets)
and Supplemental data: | | | | | | | | | | | | | | | | | | | | | |
Expenses before expense reductions (f) | | | 1.77 | (a)(c) | | | 1.82 | | | | 1.80 | | | | 1.80 | | | | 1.86 | | | | 1.91 | |
Expenses after expense reductions (f) | | | 1.76 | (a)(c) | | | 1.81 | | | | 1.80 | | | | 1.80 | | | | 1.86 | | | | 1.90 | |
Net investment income (loss) | | | (0.03 | )(a)(c) | | | (0.07 | ) | | | (0.23 | ) | | | (0.26 | ) | | | 0.07 | | | | (0.14 | ) |
Portfolio turnover | | | 30 | (n) | | | 68 | | | | 53 | | | | 48 | | | | 58 | | | | 65 | |
Net assets at end of period (000 omitted) | | | $28,681 | | | | $30,324 | | | | $34,126 | | | | $40,536 | | | | $40,495 | | | | $43,320 | |
| Supplemental Ratios (%): | | | | | | | | | | | | | | | | | | | | | |
Ratio of expenses to average net assets after expense reductions excluding short sale expenses and interest expense and fees (f) | | | 1.75 | (a)(c) | | | 1.79 | | | | 1.79 | | | | 1.80 | | | | 1.86 | | | | 1.90 | |
See Notes to Financial Statements
18
Financial Highlights – continued
| | | | | | | | | | | | | | | | | | | | | | | | |
| | | Six months
ended
2/28/17 (unaudited) | | | Years ended 8/31 | |
| Class C | | | 2016 | | | 2015 | | | 2014 | | | 2013 | | | 2012 | |
| | | | | | | | | | | | | | | | | |
Net asset value, beginning of period | | | $23.71 | | | | $24.47 | | | | $26.55 | | | | $21.72 | | | | $17.98 | | | | $15.74 | |
| Income (loss) from investment operations | | | | | | | | | | | | | |
Net investment income (loss) (d) | | | $(0.00 | )(c)(w) | | | $(0.01 | ) | | | $(0.06 | ) | | | $(0.06 | ) | | | $0.01 | | | | $(0.02 | ) |
Net realized and unrealized gain (loss) on investments and foreign currency | | | 2.12 | | | | 1.84 | | | | 0.13 | | | | 4.92 | | | | 3.73 | | | | 2.26 | |
Total from investment operations | | | $2.12 | | | | $1.83 | | | | $0.07 | | | | $4.86 | | | | $3.74 | | | | $2.24 | |
| Less distributions declared to shareholders | | | | | | | | | | | | | |
From net investment income | | | $— | | | | $— | | | | $— | | | | $(0.03 | ) | | | $— | | | | $— | |
From net realized gain on investments | | | (0.81 | ) | | | (2.59 | ) | | | (2.15 | ) | | | — | | | | — | | | | — | |
Total distributions declared to shareholders | | | $(0.81 | ) | | | $(2.59 | ) | | | $(2.15 | ) | | | $(0.03 | ) | | | $— | | | | $— | |
Net asset value, end of period (x) | | | $25.02 | | | | $23.71 | | | | $24.47 | | | | $26.55 | | | | $21.72 | | | | $17.98 | |
Total return (%) (r)(s)(t)(x) | | | 9.11 | (c)(n) | | | 8.24 | | | | 0.26 | | | | 22.38 | | | | 20.80 | | | | 14.23 | |
Ratios (%) (to average net assets)
and Supplemental data: | | | | | | | | | | | | | | | | | | | | | |
Expenses before expense reductions (f) | | | 1.77 | (a)(c) | | | 1.82 | | | | 1.80 | | | | 1.80 | | | | 1.86 | | | | 1.90 | |
Expenses after expense reductions (f) | | | 1.76 | (a)(c) | | | 1.81 | | | | 1.80 | | | | 1.80 | | | | 1.86 | | | | 1.90 | |
Net investment income (loss) | | | (0.02 | )(a)(c) | | | (0.05 | ) | | | (0.23 | ) | | | (0.26 | ) | | | 0.06 | | | | (0.14 | ) |
Portfolio turnover | | | 30 | (n) | | | 68 | | | | 53 | | | | 48 | | | | 58 | | | | 65 | |
Net assets at end of period (000 omitted) | | | $92,984 | | | | $89,160 | | | | $88,020 | | | | $89,702 | | | | $78,777 | | | | $64,258 | |
| Supplemental Ratios (%): | | | | | | | | | | | | | | | | | | | | | |
Ratio of expenses to average net assets after expense reductions excluding short sale expenses and interest expense and fees (f) | | | 1.75 | (a)(c) | | | 1.79 | | | | 1.79 | | | | 1.80 | | | | 1.86 | | | | 1.90 | |
See Notes to Financial Statements
19
Financial Highlights – continued
| | | | | | | | | | | | | | | | | | | | | | | | |
| | | Six months
ended
2/28/17 (unaudited) | | | Years ended 8/31 | |
| Class I | | | 2016 | | | 2015 | | | 2014 | | | 2013 | | | 2012 | |
| | | | | | | | | | | | | | | | | |
Net asset value, beginning of period | | | $28.10 | | | | $28.44 | | | | $30.43 | | | | $24.82 | | | | $20.49 | | | | $17.91 | |
| Income (loss) from investment operations | | | | | | | | | | | | | |
Net investment income (d) | | | $0.14 | (c) | | | $0.29 | | | | $0.23 | | | | $0.21 | | | | $0.24 | | | | $0.16 | |
Net realized and unrealized gain (loss) on investments and foreign currency | | | 2.52 | | | | 2.15 | | | | 0.13 | | | | 5.62 | | | | 4.25 | | | | 2.57 | |
Total from investment operations | | | $2.66 | | | | $2.44 | | | | $0.36 | | | | $5.83 | | | | $4.49 | | | | $2.73 | |
| Less distributions declared to shareholders | | | | | | | | | | | | | |
From net investment income | | | $(0.24 | ) | | | $(0.19 | ) | | | $(0.20 | ) | | | $(0.22 | ) | | | $(0.16 | ) | | | $(0.15 | ) |
From net realized gain on investments | | | (0.81 | ) | | | (2.59 | ) | | | (2.15 | ) | | | — | | | | — | | | | — | |
Total distributions declared to shareholders | | | $(1.05 | ) | | | $(2.78 | ) | | | $(2.35 | ) | | | $(0.22 | ) | | | $(0.16 | ) | | | $(0.15 | ) |
Net asset value, end of period (x) | | | $29.71 | | | | $28.10 | | | | $28.44 | | | | $30.43 | | | | $24.82 | | | | $20.49 | |
Total return (%) (r)(s)(x) | | | 9.67 | (c)(n) | | | 9.36 | | | | 1.23 | | | | 23.61 | | | | 22.03 | | | | 15.36 | |
Ratios (%) (to average net assets)
and Supplemental data: | | | | | | | | | | | | | | | | | | | | | |
Expenses before expense reductions (f) | | | 0.77 | (a)(c) | | | 0.81 | | | | 0.80 | | | | 0.80 | | | | 0.86 | | | | 0.90 | |
Expenses after expense reductions (f) | | | 0.76 | (a)(c) | | | 0.80 | | | | 0.80 | | | | 0.80 | | | | 0.86 | | | | 0.90 | |
Net investment income | | | 1.00 | (a)(c) | | | 1.07 | | | | 0.77 | | | | 0.73 | | | | 1.05 | | | | 0.86 | |
Portfolio turnover | | | 30 | (n) | | | 68 | | | | 53 | | | | 48 | | | | 58 | | | | 65 | |
Net assets at end of period (000 omitted) | | | $131,618 | | | | $61,739 | | | | $49,768 | | | | $45,089 | | | | $29,812 | | | | $20,441 | |
| Supplemental Ratios (%): | | | | | | | | | | | | | | | | | | | | | |
Ratio of expenses to average net assets after expense reductions excluding short sale expenses and interest expense and fees (f) | | | 0.75 | (a)(c) | | | 0.79 | | | | 0.79 | | | | 0.80 | | | | 0.86 | | | | 0.90 | |
See Notes to Financial Statements
20
Financial Highlights – continued
| | | | | | | | | | | | | | | | | | | | | | | | |
| | | Six months
ended
2/28/17 (unaudited) | | | Years ended 8/31 | |
| Class R1 | | | 2016 | | | 2015 | | | 2014 | | | 2013 | | | 2012 | |
| | | | | | | | | | | | | | | | | |
Net asset value, beginning of period | | | $23.70 | | | | $24.45 | | | | $26.54 | | | | $21.69 | | | | $17.95 | | | | $15.72 | |
| Income (loss) from investment operations | | | | | | | | | | | | | |
Net investment income (loss) (d) | | | $(0.00 | )(c)(w) | | | $(0.02 | ) | | | $(0.06 | ) | | | $(0.06 | ) | | | $0.02 | | | | $(0.02 | ) |
Net realized and unrealized gain (loss) on investments and foreign currency | | | 2.11 | | | | 1.86 | | | | 0.12 | | | | 4.91 | | | | 3.72 | | | | 2.25 | |
Total from investment operations | | | $2.11 | | | | $1.84 | | | | $0.06 | | | | $4.85 | | | | $3.74 | | | | $2.23 | |
| Less distributions declared to shareholders | | | | | | | | | | | | | |
From net investment income | | | $— | | | | $— | | | | $— | | | | $(0.00 | )(w) | | | $— | | | | $— | |
From net realized gain on investments | | | (0.81 | ) | | | (2.59 | ) | | | (2.15 | ) | | | — | | | | — | | | | — | |
Total distributions declared to shareholders | | | $(0.81 | ) | | | $(2.59 | ) | | | $(2.15 | ) | | | $(0.00 | )(w) | | | $— | | | | $— | |
Net asset value, end of period (x) | | | $25.00 | | | | $23.70 | | | | $24.45 | | | | $26.54 | | | | $21.69 | | | | $17.95 | |
Total return (%) (r)(s)(x) | | | 9.07 | (c)(n) | | | 8.29 | | | | 0.22 | | | | 22.38 | | | | 20.84 | | | | 14.19 | |
Ratios (%) (to average net assets)
and Supplemental data: | | | | | | | | | | | | | | | | | | | | | |
Expenses before expense reductions (f) | | | 1.77 | (a)(c) | | | 1.82 | | | | 1.80 | | | | 1.80 | | | | 1.86 | | | | 1.90 | |
Expenses after expense reductions (f) | | | 1.76 | (a)(c) | | | 1.81 | | | | 1.80 | | | | 1.80 | | | | 1.86 | | | | 1.90 | |
Net investment income (loss) | | | (0.03 | )(a)(c) | | | (0.09 | ) | | | (0.23 | ) | | | (0.26 | ) | | | 0.08 | | | | (0.14 | ) |
Portfolio turnover | | | 30 | (n) | | | 68 | | | | 53 | | | | 48 | | | | 58 | | | | 65 | |
Net assets at end of period (000 omitted) | | | $3,093 | | | | $2,935 | | | | $3,625 | | | | $4,132 | | | | $3,839 | | | | $4,098 | |
| Supplemental Ratios (%): | | | | | | | | | | | | | | | | | | | | | |
Ratio of expenses to average net assets after expense reductions excluding short sale expenses and interest expense and fees (f) | | | 1.75 | (a)(c) | | | 1.80 | | | | 1.79 | | | | 1.80 | | | | 1.85 | | | | 1.90 | |
See Notes to Financial Statements
21
Financial Highlights – continued
| | | | | | | | | | | | | | | | | | | | | | | | |
| | | Six months
ended
2/28/17 (unaudited) | | | Years ended 8/31 | |
| Class R2 | | | 2016 | | | 2015 | | | 2014 | | | 2013 | | | 2012 | |
| | | | | | | | | | | | | | | | | |
Net asset value, beginning of period | | | $26.12 | | | | $26.62 | | | | $28.59 | | | | $23.35 | | | | $19.28 | | | | $16.86 | |
| Income (loss) from investment operations | | | | | | | | | | | | | |
Net investment income (d) | | | $0.06 | (c) | | | $0.11 | | | | $0.07 | | | | $0.06 | | | | $0.12 | | | | $0.06 | |
Net realized and unrealized gain (loss) on investments and foreign currency | | | 2.34 | | | | 2.04 | | | | 0.14 | | | | 5.29 | | | | 4.00 | | | | 2.42 | |
Total from investment operations | | | $2.40 | | | | $2.15 | | | | $0.21 | | | | $5.35 | | | | $4.12 | | | | $2.48 | |
| Less distributions declared to shareholders | | | | | | | | | | | | | |
From net investment income | | | $(0.09 | ) | | | $(0.06 | ) | | | $(0.03 | ) | | | $(0.11 | ) | | | $(0.05 | ) | | | $(0.06 | ) |
From net realized gain on investments | | | (0.81 | ) | | | (2.59 | ) | | | (2.15 | ) | | | — | | | | — | | | | — | |
Total distributions declared to shareholders | | | $(0.90 | ) | | | $(2.65 | ) | | | $(2.18 | ) | | | $(0.11 | ) | | | $(0.05 | ) | | | $(0.06 | ) |
Net asset value, end of period (x) | | | $27.62 | | | | $26.12 | | | | $26.62 | | | | $28.59 | | | | $23.35 | | | | $19.28 | |
Total return (%) (r)(s)(x) | | | 9.36 | (c)(n) | | | 8.82 | | | | 0.75 | | | | 22.96 | | | | 21.44 | | | | 14.74 | |
Ratios (%) (to average net assets)
and Supplemental data: | | | | | | | | | | | | | | | | | | | | | |
Expenses before expense reductions (f) | | | 1.27 | (a)(c) | | | 1.32 | | | | 1.30 | | | | 1.30 | | | | 1.36 | | | | 1.40 | |
Expenses after expense reductions (f) | | | 1.26 | (a)(c) | | | 1.31 | | | | 1.30 | | | | 1.30 | | | | 1.36 | | | | 1.40 | |
Net investment income | | | 0.48 | (a)(c) | | | 0.46 | | | | 0.27 | | | | 0.24 | | | | 0.56 | | | | 0.36 | |
Portfolio turnover | | | 30 | (n) | | | 68 | | | | 53 | | | | 48 | | | | 58 | | | | 65 | |
Net assets at end of period (000 omitted) | | | $15,435 | | | | $15,932 | | | | $16,332 | | | | $19,434 | | | | $19,625 | | | | $17,369 | |
| Supplemental Ratios (%): | | | | | | | | | | | | | | | | | | | | | |
Ratio of expenses to average net assets after expense reductions excluding short sale expenses and interest expense and fees (f) | | | 1.25 | (a)(c) | | | 1.29 | | | | 1.29 | | | | 1.30 | | | | 1.36 | | | | 1.40 | |
See Notes to Financial Statements
22
Financial Highlights – continued
| | | | | | | | | | | | | | | | | | | | | | | | |
| | | Six months
ended
2/28/17 (unaudited) | | | Years ended 8/31 | |
| Class R3 | | | 2016 | | | 2015 | | | 2014 | | | 2013 | | | 2012 | |
| | | | | | | | | | | | | | | | | |
Net asset value, beginning of period | | | $26.61 | | | | $27.10 | | | | $29.10 | | | | $23.75 | | | | $19.63 | | | | $17.16 | |
| Income (loss) from investment operations | | | | | | | | | | | | | |
Net investment income (d) | | | $0.09 | (c) | | | $0.18 | | | | $0.15 | | | | $0.13 | | | | $0.18 | | | | $0.11 | |
Net realized and unrealized gain (loss) on investments and foreign currency | | | 2.40 | | | | 2.06 | | | | 0.13 | | | | 5.39 | | | | 4.05 | | | | 2.47 | |
Total from investment operations | | | $2.49 | | | | $2.24 | | | | $0.28 | | | | $5.52 | | | | $4.23 | | | | $2.58 | |
| Less distributions declared to shareholders | | | | | | | | | | | | | |
From net investment income | | | $(0.16 | ) | | | $(0.14 | ) | | | $(0.13 | ) | | | $(0.17 | ) | | | $(0.11 | ) | | | $(0.11 | ) |
From net realized gain on investments | | | (0.81 | ) | | | (2.59 | ) | | | (2.15 | ) | | | — | | | | — | | | | — | |
Total distributions declared to shareholders | | | $(0.97 | ) | | | $(2.73 | ) | | | $(2.28 | ) | | | $(0.17 | ) | | | $(0.11 | ) | | | $(0.11 | ) |
Net asset value, end of period (x) | | | $28.13 | | | | $26.61 | | | | $27.10 | | | | $29.10 | | | | $23.75 | | | | $19.63 | |
Total return (%) (r)(s)(x) | | | 9.53 | (c)(n) | | | 9.06 | | | | 0.99 | | | | 23.32 | | | | 21.68 | | | | 15.12 | |
Ratios (%) (to average net assets)
and Supplemental data: | | | | | | | | | | | | | | | | | | | | | |
Expenses before expense reductions (f) | | | 1.02 | (a)(c) | | | 1.07 | | | | 1.05 | | | | 1.05 | | | | 1.11 | | | | 1.15 | |
Expenses after expense reductions (f) | | | 1.01 | (a)(c) | | | 1.06 | | | | 1.05 | | | | 1.05 | | | | 1.11 | | | | 1.15 | |
Net investment income | | | 0.69 | (a)(c) | | | 0.71 | | | | 0.52 | | | | 0.49 | | | | 0.81 | | | | 0.61 | |
Portfolio turnover | | | 30 | (n) | | | 68 | | | | 53 | | | | 48 | | | | 58 | | | | 65 | |
Net assets at end of period (000 omitted) | | | $29,147 | | | | $77,217 | | | | $65,775 | | | | $68,977 | | | | $58,381 | | | | $46,833 | |
| Supplemental Ratios (%): | | | | | | | | | | | | | | | | | | | | | |
Ratio of expenses to average net assets after expense reductions excluding short sale expenses and interest expense and fees (f) | | | 1.00 | (a)(c) | | | 1.04 | | | | 1.04 | | | | 1.05 | | | | 1.10 | | | | 1.15 | |
See Notes to Financial Statements
23
Financial Highlights – continued
| | | | | | | | | | | | | | | | | | | | | | | | |
| | | Six months
ended
2/28/17 (unaudited) | | | Years ended 8/31 | |
| Class R4 | | | 2016 | | | 2015 | | | 2014 | | | 2013 | | | 2012 | |
| | | | | | | | | | | | | | | | | |
Net asset value, beginning of period | | | $26.93 | | | | $27.39 | | | | $29.40 | | | | $23.99 | | | | $19.81 | | | | $17.32 | |
| Income (loss) from investment operations | | | | | | | | | | | | | |
Net investment income (d) | | | $0.13 | (c) | | | $0.23 | | | | $0.22 | | | | $0.20 | | | | $0.23 | | | | $0.16 | |
Net realized and unrealized gain (loss) on investments and foreign currency | | | 2.42 | | | | 2.11 | | | | 0.12 | | | | 5.44 | | | | 4.11 | | | | 2.48 | |
Total from investment operations | | | $2.55 | | | | $2.34 | | | | $0.34 | | | | $5.64 | | | | $4.34 | | | | $2.64 | |
| Less distributions declared to shareholders | | | | | | | | | | | | | |
From net investment income | | | $(0.23 | ) | | | $(0.21 | ) | | | $(0.20 | ) | | | $(0.23 | ) | | | $(0.16 | ) | | | $(0.15 | ) |
From net realized gain on investments | | | (0.81 | ) | | | (2.59 | ) | | | (2.15 | ) | | | — | | | | — | | | | — | |
Total distributions declared to shareholders | | | $(1.04 | ) | | | $(2.80 | ) | | | $(2.35 | ) | | | $(0.23 | ) | | | $(0.16 | ) | | | $(0.15 | ) |
Net asset value, end of period (x) | | | $28.44 | | | | $26.93 | | | | $27.39 | | | | $29.40 | | | | $23.99 | | | | $19.81 | |
Total return (%) (r)(s)(x) | | | 9.65 | (c)(n) | | | 9.36 | | | | 1.22 | | | | 23.62 | | | | 22.03 | | | | 15.36 | |
| Ratios (%) (to average net assets) and Supplemental data: | | | | | | | | | | | | | | | | | | | | | |
Expenses before expense reductions (f) | | | 0.77 | (a)(c) | | | 0.82 | | | | 0.80 | | | | 0.81 | | | | 0.86 | | | | 0.91 | |
Expenses after expense reductions (f) | | | 0.76 | (a)(c) | | | 0.81 | | | | 0.80 | | | | 0.80 | | | | 0.86 | | | | 0.90 | |
Net investment income | | | 0.97 | (a)(c) | | | 0.90 | | | | 0.76 | | | | 0.72 | | | | 1.04 | | | | 0.86 | |
Portfolio turnover | | | 30 | (n) | | | 68 | | | | 53 | | | | 48 | | | | 58 | | | | 65 | |
Net assets at end of period (000 omitted) | | | $20,157 | | | | $15,799 | | | | $21,159 | | | | $19,706 | | | | $6,165 | | | | $1,871 | |
| Supplemental Ratios (%): | | | | | | | | | | | | | | | | | | | | | |
Ratio of expenses to average net assets after expense reductions excluding short sale expenses and interest expense and fees (f) | | | 0.75 | (a)(c) | | | 0.79 | | | | 0.79 | | | | 0.80 | | | | 0.86 | | | | 0.90 | |
See Notes to Financial Statements
24
Financial Highlights – continued
| | | | | | | | | | | | | | | | | | | | |
| | | Six months
ended
2/28/17 (unaudited) | | | Years ended 8/31 | |
| Class R6 | | | 2016 | | | 2015 | | | 2014 | | | 2013 (i) | |
| | | | | | | | | | | | | | |
Net asset value, beginning of period | | | $28.13 | | | | $28.49 | | | | $30.47 | | | | $24.84 | | | | $21.02 | |
| Income (loss) from investment operations | | | | | | | | | |
Net investment income (d) | | | $0.15 | (c) | | | $0.58 | | | | $0.24 | | | | $0.23 | | | | $0.22 | |
Net realized and unrealized gain (loss) on investments and foreign currency | | | 2.53 | | | | 1.89 | | | | 0.15 | | | | 5.64 | | | | 3.60 | |
Total from investment operations | | | $2.68 | | | | $2.47 | | | | $0.39 | | | | $5.87 | | | | $3.82 | |
| Less distributions declared to shareholders | | | | | | | | | |
From net investment income | | | $(0.26 | ) | | | $(0.24 | ) | | | $(0.22 | ) | | | $(0.24 | ) | | | $— | |
From net realized gain on investments | | | (0.81 | ) | | | (2.59 | ) | | | (2.15 | ) | | | — | | | | — | |
Total distributions declared to shareholders | | | $(1.07 | ) | | | $(2.83 | ) | | | $(2.37 | ) | | | $(0.24 | ) | | | $— | |
Net asset value, end of period (x) | | | $29.74 | | | | $28.13 | | | | $28.49 | | | | $30.47 | | | | $24.84 | |
Total return (%) (r)(s)(x) | | | 9.71 | (c)(n) | | | 9.46 | | | | 1.34 | | | | 23.73 | | | | 18.17 | (n) |
| Ratios (%) (to average net assets) and Supplemental data: | | | | | | | | | | | | | | | | | |
Expenses before expense reductions (f) | | | 0.67 | (a)(c) | | | 0.70 | | | | 0.71 | | | | 0.71 | | | | 0.76 | (a) |
Expenses after expense reductions (f) | | | 0.67 | (a)(c) | | | 0.69 | | | | 0.70 | | | | 0.71 | | | | 0.76 | (a) |
Net investment income | | | 1.07 | (a)(c) | | | 2.10 | | | | 0.82 | | | | 0.80 | | | | 1.39 | (a) |
Portfolio turnover | | | 30 | (n) | | | 68 | | | | 53 | | | | 48 | | | | 58 | |
Net assets at end of period (000 omitted) | | | $306,264 | | | | $300,078 | | | | $6,198 | | | | $2,492 | | | | $119 | |
| Supplemental Ratios (%): | | | | | | | | | | | | | | | | | |
Ratio of expenses to average net assets after expense reductions excluding short sale expenses and interest expense and fees (f) | | | 0.65 | (a)(c) | | | 0.68 | | | | 0.69 | | | | 0.71 | | | | 0.75 | (a) |
| (c) | Amount reflects a one-time reimbursement of expenses by the custodian (or former custodian) without which net investment income and performance would be lower and expenses would be higher. See Note 2 in the Notes to Financial Statements for additional information. |
| (d) | Per share data is based on average shares outstanding. |
| (f) | Ratios do not reflect reductions from fees paid indirectly, if applicable. |
| (i) | For the period from the class inception, January 2, 2013, through the stated period end. |
| (r) | Certain expenses have been reduced without which performance would have been lower. |
| (s) | From time to time the fund may receive proceeds from litigation settlements, without which performance would be lower. |
| (t) | Total returns do not include any applicable sales charges. |
| (w) | Per share amount was less than $0.01. |
| (x) | The net asset values and total returns have been calculated on net assets which include adjustments made in accordance with U.S. generally accepted accounting principles required at period end for financial reporting purposes. |
See Notes to Financial Statements
25
NOTES TO FINANCIAL STATEMENTS
(unaudited)
(1) Business and Organization
MFS Core Equity Fund (the fund) is a diversified series of MFS Series Trust I (the trust). The trust is organized as a Massachusetts business trust and is registered under the Investment Company Act of 1940, as amended, as an open-end management investment company.
The fund is an investment company and accordingly follows the investment company accounting and reporting guidance of the Financial Accounting Standards Board (FASB) Accounting Standards Codification Topic 946 Financial Services – Investment Companies.
(2) Significant Accounting Policies
General – The preparation of financial statements in conformity with U.S. generally accepted accounting principles requires management to make estimates and assumptions that affect the reported amounts of assets and liabilities, and disclosure of contingent assets and liabilities at the date of the financial statements and the reported amounts of increases and decreases in net assets from operations during the reporting period. Actual results could differ from those estimates. In the preparation of these financial statements, management has evaluated subsequent events occurring after the date of the fund’s Statement of Assets and Liabilities through the date that the financial statements were issued.
In October 2016, the Securities and Exchange Commission (SEC) released its Final Rule on Investment Company Reporting Modernization (the “Rule”). The Rule, which introduces two new regulatory reporting forms for investment companies – Form N-PORT and Form N-CEN – also contains amendments to Regulation S-X which impact financial statement presentation, particularly the presentation of derivative investments. Although still evaluating the impacts of the Rule, management believes that many of the Regulation S-X amendments are consistent with the fund’s current financial statement presentation and expects that the fund will be able to comply with the Rule’s Regulation S-X amendments by the August 1, 2017 compliance date.
Balance Sheet Offsetting – The fund’s accounting policy with respect to balance sheet offsetting is that, absent an event of default by the counterparty or a termination of the agreement, the International Swaps and Derivatives Association (ISDA) Master Agreement does not result in an offset of reported amounts of financial assets and financial liabilities in the Statement of Assets and Liabilities across transactions between the fund and the applicable counterparty. The fund’s right to setoff may be restricted or prohibited by the bankruptcy or insolvency laws of the particular jurisdiction to which a specific master netting agreement counterparty is subject. Balance sheet offsetting disclosures, to the extent applicable to the fund, have been included in the fund’s Significant Accounting Policies note under the captions for each of the fund’s in-scope financial instruments and transactions.
Investment Valuations – Equity securities, including restricted equity securities, are generally valued at the last sale or official closing price on their primary market or exchange as provided by a third-party pricing service. Equity securities, for which there were no sales reported that day, are generally valued at the last quoted daily bid
26
Notes to Financial Statements (unaudited) – continued
quotation on their primary market or exchange as provided by a third-party pricing service. Equity securities held short, for which there were no sales reported for that day, are generally valued at the last quoted daily ask quotation on their primary market or exchange as provided by a third-party pricing service. Short-term instruments with a maturity at issuance of 60 days or less may be valued at amortized cost, which approximates market value. Open-end investment companies are generally valued at net asset value per share. Securities and other assets generally valued on the basis of information from a third-party pricing service may also be valued at a broker/dealer bid quotation. Values obtained from third-party pricing services can utilize both transaction data and market information such as yield, quality, coupon rate, maturity, type of issue, trading characteristics, and other market data. The values of foreign securities and other assets and liabilities expressed in foreign currencies are converted to U.S. dollars using the mean of bid and asked prices for rates provided by a third-party pricing service.
The Board of Trustees has delegated primary responsibility for determining or causing to be determined the value of the fund’s investments (including any fair valuation) to the adviser pursuant to valuation policies and procedures approved by the Board. If the adviser determines that reliable market quotations are not readily available, investments are valued at fair value as determined in good faith by the adviser in accordance with such procedures under the oversight of the Board of Trustees. Under the fund’s valuation policies and procedures, market quotations are not considered to be readily available for most types of debt instruments and floating rate loans and many types of derivatives. These investments are generally valued at fair value based on information from third-party pricing services. In addition, investments may be valued at fair value if the adviser determines that an investment’s value has been materially affected by events occurring after the close of the exchange or market on which the investment is principally traded (such as foreign exchange or market) and prior to the determination of the fund’s net asset value, or after the halting of trading of a specific security where trading does not resume prior to the close of the exchange or market on which the security is principally traded. Events that occur on a frequent basis after foreign markets close (such as developments in foreign markets and significant movements in the U.S. markets) and prior to the determination of the fund’s net asset value may be deemed to have a material effect on the value of securities traded in foreign markets. Accordingly, the fund’s foreign equity securities may often be valued at fair value. The adviser generally relies on third-party pricing services or other information (such as the correlation with price movements of similar securities in the same or other markets; the type, cost and investment characteristics of the security; the business and financial condition of the issuer; and trading and other market data) to assist in determining whether to fair value and at what value to fair value an investment. The value of an investment for purposes of calculating the fund’s net asset value can differ depending on the source and method used to determine value. When fair valuation is used, the value of an investment used to determine the fund’s net asset value may differ from quoted or published prices for the same investment. There can be no assurance that the fund could obtain the fair value assigned to an investment if it were to sell the investment at the same time at which the fund determines its net asset value per share.
27
Notes to Financial Statements (unaudited) – continued
Various inputs are used in determining the value of the fund’s assets or liabilities. These inputs are categorized into three broad levels. In certain cases, the inputs used to measure fair value may fall into different levels of the fair value hierarchy. In such cases, an investment’s level within the fair value hierarchy is based on the lowest level of input that is significant to the fair value measurement. The fund’s assessment of the significance of a particular input to the fair value measurement in its entirety requires judgment, and considers factors specific to the investment. Level 1 includes unadjusted quoted prices in active markets for identical assets or liabilities. Level 2 includes other significant observable market-based inputs (including quoted prices for similar securities, interest rates, prepayment speed, and credit risk). Level 3 includes unobservable inputs, which may include the adviser’s own assumptions in determining the fair value of investments. The following is a summary of the levels used as of February 28, 2017 in valuing the fund’s assets or liabilities:
| | | | | | | | | | | | | | | | |
| Investments at Value | | Level 1 | | | Level 2 | | | Level 3 | | | Total | |
| Equity Securities: | | | | | | | | | | | | | | | | |
United States | | | $1,540,612,894 | | | | $— | | | | $— | | | | $1,540,612,894 | |
Canada | | | 28,777,395 | | | | — | | | | — | | | | 28,777,395 | |
Hong Kong | | | 4,864,603 | | | | — | | | | — | | | | 4,864,603 | |
Cayman Islands | | | — | | | | — | | | | 94,518 | | | | 94,518 | |
| Mutual Funds | | | 9,994,319 | | | | — | | | | — | | | | 9,994,319 | |
| Total Investments | | | $1,584,249,211 | | | | $— | | | | $94,518 | | | | $1,584,343,729 | |
| Short Sales | | | $(4,143,379 | ) | | | $— | | | | $— | | | | $(4,143,379 | ) |
For further information regarding security characteristics, see the Portfolio of Investments.
The following is a reconciliation of level 3 assets for which significant unobservable inputs were used to determine fair value. The fund’s policy is to recognize transfers between the levels as of the end of the period. The table presents the activity of level 3 securities held at the beginning and the end of the period.
| | | | |
| | | Equity Securities | |
| Balance as of 8/31/16 | | | $106,800 | |
Change in unrealized appreciation (depreciation) | | | (12,282 | ) |
| Balance as of 2/28/17 | | | $94,518 | |
The net change in unrealized appreciation (depreciation) from investments still held as level 3 at February 28, 2017 is $(12,282). At February 28, 2017, the fund held one level 3 security.
Foreign Currency Translation – Purchases and sales of foreign investments, income, and expenses are converted into U.S. dollars based upon currency exchange rates prevailing on the respective dates of such transactions or on the reporting date for foreign denominated receivables and payables. Gains and losses attributable to foreign currency exchange rates on sales of securities are recorded for financial statement purposes as net realized gains and losses on investments. Gains and losses attributable to foreign exchange rate movements on receivables, payables, income and expenses are recorded for financial statement purposes as foreign currency transaction gains and
28
Notes to Financial Statements (unaudited) – continued
losses. That portion of both realized and unrealized gains and losses on investments that results from fluctuations in foreign currency exchange rates is not separately disclosed.
Short Sales – The fund entered into short sales whereby it sells a security it does not own in anticipation of a decline in the value of that security. The fund will realize a gain if the security price decreases and a loss if the security price increases between the date of the short sale and the date on which the fund replaces the borrowed security. Losses from short sales can exceed the proceeds of the security sold; and they can also exceed the potential loss from an ordinary buy and sell transaction. The amount of any premium, dividends, or interest the fund may be required to pay in connection with a short sale will be recognized as a fund expense. During the six months ended February 28, 2017, this expense amounted to $90,436. The fund segregates cash or marketable securities in an amount that, when combined with the amount of proceeds from the short sale deposited with the broker, at least equals the current market value of the security sold short.
Security Loans – Under its Securities Lending Agency Agreement with the fund, State Street Bank and Trust Company (“State Street”), as lending agent, loans the securities of the fund to certain qualified institutions (the “Borrowers”) approved by the fund. Security loans can be terminated at the discretion of either the lending agent or the fund and the related securities must be returned within the earlier of the standard trade settlement period for such securities or within three business days. The loans are collateralized by cash and/or U.S. Treasury and federal agency obligations in an amount typically at least equal to the market value of the securities loaned. On loans collateralized by cash, the cash collateral is invested in a money market fund. The market value of the loaned securities is determined at the close of business of the fund and any additional required collateral is delivered to the fund on the next business day. State Street provides the fund with indemnification against Borrower default. In the event of Borrower default, State Street will, for the benefit of the fund, either purchase securities identical to those loaned or, when such purchase is commercially impracticable, pay the fund the market value of the loaned securities. In return, State Street assumes the fund’s rights to the related collateral. If the collateral value is less than the cost to purchase identical securities, State Street is responsible for the shortfall, but only to the extent that such shortfall is not due to a decline in collateral value resulting from collateral reinvestment for which the fund bears the risk of loss. At period end, the fund had investment securities on loan, all of which were classified as equity securities in the fund’s Portfolio of Investments, with a fair value of $1,578,224. The fair value of the fund’s investment securities on loan and a related liability of $1,645,446 for cash collateral received on securities loaned are both presented gross in the Statement of Assets and Liabilities. The collateral received on securities loaned exceeded the value of securities on loan at period end. The liability for cash collateral for securities loaned is carried at fair value, which is categorized as level 2 within the fair value hierarchy. A portion of the income generated upon investment of the collateral is remitted to the Borrowers, and the remainder is allocated between the fund and the lending agent. On loans collateralized by U.S. Treasury and/or federal agency obligations, a fee is received from the Borrower, and is allocated between the fund and the lending agent. Income from securities lending is included in “Interest”
29
Notes to Financial Statements (unaudited) – continued
income in the Statement of Operations. The dividend and interest income earned on the securities loaned is accounted for in the same manner as other dividend and interest income.
Indemnifications – Under the fund’s organizational documents, its officers and Trustees may be indemnified against certain liabilities and expenses arising out of the performance of their duties to the fund. Additionally, in the normal course of business, the fund enters into agreements with service providers that may contain indemnification clauses. The fund’s maximum exposure under these agreements is unknown as this would involve future claims that may be made against the fund that have not yet occurred.
Investment Transactions and Income – Investment transactions are recorded on the trade date. Interest income is recorded on the accrual basis. Dividends received in cash are recorded on the ex-dividend date. Certain dividends from foreign securities will be recorded when the fund is informed of the dividend if such information is obtained subsequent to the ex-dividend date. Dividend and interest payments received in additional securities are recorded on the ex-dividend or ex-interest date in an amount equal to the value of the security on such date.
The fund may receive proceeds from litigation settlements. Any proceeds received from litigation involving portfolio holdings are reflected in the Statement of Operations in realized gain/loss if the security has been disposed of by the fund or in unrealized gain/loss if the security is still held by the fund. Any other proceeds from litigation not related to portfolio holdings are reflected as other income in the Statement of Operations.
Reimbursement of Expenses by Custodian – In December 2015, the fund’s custodian (or former custodian), State Street Bank and Trust Company, announced that it intended to reimburse its asset servicing clients for expense amounts that it billed in error during the period 1998 through 2015. The amount of this one-time reimbursement attributable to the fund is reflected as “Reimbursement of custodian expenses” in the Statement of Operations.
Tax Matters and Distributions – The fund intends to qualify as a regulated investment company, as defined under Subchapter M of the Internal Revenue Code, and to distribute all of its taxable income, including realized capital gains. As a result, no provision for federal income tax is required. The fund’s federal tax returns, when filed, will remain subject to examination by the Internal Revenue Service for a three year period. Management has analyzed the fund’s tax positions taken on federal and state tax returns for all open tax years and does not believe that there are any uncertain tax positions that require recognition of a tax liability. Foreign taxes, if any, have been accrued by the fund in the accompanying financial statements in accordance with the applicable foreign tax law. Foreign income taxes may be withheld by certain countries in which the fund invests. Additionally, capital gains realized by the fund on securities issued in or by certain foreign countries may be subject to capital gains tax imposed by those countries.
Distributions to shareholders are recorded on the ex-dividend date. Income and capital gain distributions are determined in accordance with income tax regulations, which may differ from U.S. generally accepted accounting principles. Certain capital accounts
30
Notes to Financial Statements (unaudited) – continued
in the financial statements are periodically adjusted for permanent differences in order to reflect their tax character. These adjustments have no impact on net assets or net asset value per share. Temporary differences which arise from recognizing certain items of income, expense, gain or loss in different periods for financial statement and tax purposes will reverse at some time in the future. Distributions in excess of net investment income or net realized gains are temporary overdistributions for financial statement purposes resulting from differences in the recognition or classification of income or distributions for financial statement and tax purposes.
Book/tax differences primarily relate to wash sale loss deferrals, treating a portion of the proceeds from redemptions as a distribution for tax purposes and partnership adjustments.
The tax character of distributions made during the current period will be determined at fiscal year end. The tax character of distributions declared to shareholders for the last fiscal year is as follows:
| | | | |
| | | 8/31/16 | |
| Ordinary income (including any short-term capital gains) | | | $31,546,985 | |
| Long-term capital gains | | | 93,676,080 | |
| Total distributions | | | $125,223,065 | |
The federal tax cost and the tax basis components of distributable earnings were as follows:
| | | | |
| As of 2/28/17 | | | |
| Cost of investments | | | $1,265,085,656 | |
| Gross appreciation | | | 340,827,387 | |
| Gross depreciation | | | (21,569,314 | ) |
| Net unrealized appreciation (depreciation) | | | $319,258,073 | |
| |
| As of 8/31/16 | | | |
| Undistributed ordinary income | | | 9,435,240 | |
| Undistributed long-term capital gain | | | 45,591,036 | |
| Other temporary differences | | | (652,031 | ) |
| Net unrealized appreciation (depreciation) | | | 248,695,346 | |
The aggregate cost above includes prior fiscal year end tax adjustments, if applicable.
Multiple Classes of Shares of Beneficial Interest – The fund offers multiple classes of shares, which differ in their respective distribution and service fees. The fund’s income, realized and unrealized gain (loss), and common expenses are allocated to shareholders based on the daily net assets of each class. Dividends are declared separately for each class. Differences in per share dividend rates are generally due to differences in separate class expenses. Class B shares will convert to Class A shares
31
Notes to Financial Statements (unaudited) – continued
approximately eight years after purchase. The fund’s distributions declared to shareholders as reported in the Statements of Changes in Net Assets are presented by class as follows:
| | | | | | | | | | | | | | | | |
| | | From net investment
income | | | From net realized gain on
investments | |
| | | Six months
ended
2/28/17 | | | Year
ended
8/31/16 | | | Six months
ended
2/28/17 | | | Year
ended
8/31/16 | |
| Class A | | | $5,449,582 | | | | $4,837,428 | | | | $27,694,526 | | | | $90,892,526 | |
| Class B | | | — | | | | — | | | | 945,376 | | | | 3,440,854 | |
| Class C | | | — | | | | — | | | | 2,955,565 | | | | 9,325,733 | |
| Class I | | | 754,521 | | | | 201,876 | | | | 2,519,538 | | | | 2,740,510 | |
| Class R1 | | | — | | | | — | | | | 96,384 | | | | 335,219 | |
| Class R2 | | | 52,754 | | | | 34,231 | | | | 473,485 | | | | 1,562,467 | |
| Class R3 | | | 410,529 | | | | 378,052 | | | | 2,119,784 | | | | 6,813,962 | |
| Class R4 | | | 134,267 | | | | 159,292 | | | | 482,870 | | | | 1,970,391 | |
| Class R6 | | | 2,634,407 | | | | 210,997 | | | | 8,370,018 | | | | 2,319,527 | |
| Total | | | $9,436,060 | | | | $5,821,876 | | | | $45,657,546 | | | | $119,401,189 | |
(3) Transactions with Affiliates
Investment Adviser – The fund has an investment advisory agreement with MFS to provide overall investment management and related administrative services and facilities to the fund. For the period September 1, 2016 to December 28, 2016, the management fee was computed daily and paid monthly at the following annual rates:
| | | | |
| First $500 million of average daily net assets | | | 0.65 | % |
| Average daily net assets in excess of $500 million | | | 0.55 | % |
The investment adviser had agreed in writing to reduce its management fee to 0.50% of average daily net assets in excess of $2.5 billion. This written agreement terminated on December 28, 2016. For the period September 1, 2016 to December 28, 2016, the fund’s average daily net assets did not exceed $2.5 billion and therefore, the management fee was not reduced in accordance with this agreement.
Effective December 29, 2016, the management fee is computed daily and paid monthly at the following annual rates:
| | | | |
| First $500 million of average daily net assets | | | 0.65 | % |
| Next $2 billion of average daily net assets | | | 0.55 | % |
| Average daily net assets in excess of $2.5 billion | | | 0.50 | % |
MFS has agreed in writing to reduce its management fee by a specified amount if certain MFS mutual fund assets exceed thresholds agreed to by MFS and the fund’s Board of Trustees. For the six months ended February 28, 2017, this management fee reduction amounted to $55,819, which is included in the reduction of total expenses in the Statement of Operations. The management fee incurred for the six months ended February 28, 2017 was equivalent to an annual effective rate of 0.57% of the fund’s average daily net assets.
Distributor – MFS Fund Distributors, Inc. (MFD), a wholly-owned subsidiary of MFS, as distributor, received $113,668 for the six months ended February 28, 2017, as its portion of the initial sales charge on sales of Class A shares of the fund.
32
Notes to Financial Statements (unaudited) – continued
The Board of Trustees has adopted a distribution plan for certain share classes pursuant to Rule 12b-1 of the Investment Company Act of 1940.
The fund’s distribution plan provides that the fund will pay MFD for services provided by MFD and financial intermediaries in connection with the distribution and servicing of certain share classes. One component of the plan is a distribution fee paid to MFD and another component of the plan is a service fee paid to MFD. MFD may subsequently pay all, or a portion, of the distribution and/or service fees to financial intermediaries.
Distribution Plan Fee Table:
| | | | | | | | | | | | | | | | | | | | |
| | | Distribution
Fee Rate (d) | | | Service
Fee Rate (d) | | | Total
Distribution
Plan (d) | | | Annual
Effective
Rate (e) | | | Distribution
and Service
Fee | |
| Class A | | | — | | | | 0.25% | | | | 0.25% | | | | 0.24% | | | | $1,161,856 | |
| Class B | | | 0.75% | | | | 0.25% | | | | 1.00% | | | | 1.00% | | | | 142,882 | |
| Class C | | | 0.75% | | | | 0.25% | | | | 1.00% | | | | 1.00% | | | | 440,213 | |
| Class R1 | | | 0.75% | | | | 0.25% | | | | 1.00% | | | | 1.00% | | | | 14,517 | |
| Class R2 | | | 0.25% | | | | 0.25% | | | | 0.50% | | | | 0.50% | | | | 38,228 | |
| Class R3 | | | — | | | | 0.25% | | | | 0.25% | | | | 0.25% | | | | 82,770 | |
| Total Distribution and Service Fees | | | | $1,880,466 | |
| (d) | In accordance with the distribution plan for certain classes, the fund pays distribution and/or service fees equal to these annual percentage rates of each class’s average daily net assets. The distribution and service fee rates disclosed by class represent the current rates in effect at the end of the reporting period. Any rate changes, if applicable, are detailed below. |
| (e) | The annual effective rates represent actual fees incurred under the distribution plan for the six months ended February 28, 2017 based on each class’s average daily net assets. MFD has voluntarily agreed to rebate a portion of each class’s 0.25% service fee attributable to accounts for which MFD retains the 0.25% service fee except for accounts attributable to MFS or its affiliates’ seed money. For the six months ended February 28, 2017, this rebate amounted to $24,258, $153, and $1,100 for Class A, Class B, and Class C, respectively, and is included in the reduction of total expenses in the Statement of Operations. |
Certain Class A shares are subject to a contingent deferred sales charge (CDSC) in the event of a shareholder redemption within 18 months of purchase. Class C shares are subject to a CDSC in the event of a shareholder redemption within 12 months of purchase. Class B shares are subject to a CDSC in the event of a shareholder redemption within six years of purchase. All contingent deferred sales charges are paid to MFD and during the six months ended February 28, 2017, were as follows:
| | | | |
| | | Amount | |
| Class A | | | $3,685 | |
| Class B | | | 19,543 | |
| Class C | | | 3,540 | |
Shareholder Servicing Agent – MFS Service Center, Inc. (MFSC), a wholly-owned subsidiary of MFS, receives a fee from the fund for its services as shareholder servicing agent calculated as a percentage of the average daily net assets of the fund as determined periodically under the supervision of the fund’s Board of Trustees. For the six months ended February 28, 2017, the fee was $192,474, which equated to 0.0252% annually of the fund’s average daily net assets. MFSC also receives payment from the fund for out-of-pocket expenses, sub-accounting and other shareholder
33
Notes to Financial Statements (unaudited) – continued
servicing costs which may be paid to affiliated and unaffiliated service providers. Class R6 shares do not incur sub-accounting fees. For the six months ended February 28, 2017, these out-of-pocket expenses, sub-accounting and other shareholder servicing costs amounted to $737,021.
Administrator – MFS provides certain financial, legal, shareholder communications, compliance, and other administrative services to the fund. Under an administrative services agreement, the fund reimburses MFS the costs incurred to provide these services. The fund is charged an annual fixed amount of $17,500 plus a fee based on average daily net assets. The administrative services fee incurred for the six months ended February 28, 2017 was equivalent to an annual effective rate of 0.0158% of the fund’s average daily net assets.
Trustees’ and Officers’ Compensation – The fund pays compensation to independent Trustees in the form of a retainer, attendance fees, and additional compensation to Board and Committee chairpersons. The fund does not pay compensation directly to Trustees or officers of the fund who are also officers of the investment adviser, all of whom receive remuneration for their services to the fund from MFS. Certain officers and Trustees of the fund are officers or directors of MFS, MFD, and MFSC.
Prior to December 31, 2001, the fund had an unfunded defined benefit plan (“DB plan”) for independent Trustees. As of December 31, 2001, the Board took action to terminate the DB plan with respect to then-current and any future independent Trustees, such that the DB plan covers only certain of those former independent Trustees who retired on or before December 31, 2001. Effective January 1, 2002, accrued benefits under the DB plan for then-current independent Trustees who continued were credited to an unfunded retirement deferral plan (the “Retirement Deferral plan”), which was established for and exists solely with respect to these credited amounts, and is not available for other deferrals by these or other independent Trustees. Although the Retirement Deferral plan is unfunded, amounts deferred under the plan are periodically adjusted for investment experience as if they had been invested in shares of the fund. The DB plan resulted in a pension expense of $2,404 and the Retirement Deferral plan resulted in an expense of $3,461. Both amounts are included in “Independent Trustees’ compensation” in the Statement of Operations for the six months ended February 28, 2017. The liability for deferred retirement benefits payable to certain independent Trustees under both plans amounted to $59,990 at February 28, 2017, and is included in “Payable for independent Trustees’ compensation” in the Statement of Assets and Liabilities.
Other – This fund and certain other funds managed by MFS (the funds) have entered into a service agreement (the ISO Agreement) which provides for payment of fees solely by the funds to Tarantino LLC in return for the provision of services of an Independent Senior Officer (ISO) for the funds. Frank L. Tarantino serves as the ISO and is an officer of the funds and the sole member of Tarantino LLC. The funds can terminate the ISO Agreement with Tarantino LLC at any time under the terms of the ISO Agreement. For the six months ended February 28, 2017, the fee paid by the fund under this agreement was $1,423 and is included in “Miscellaneous” expense in the Statement of Operations. MFS has agreed to bear all expenses associated with office space, other administrative support, and supplies provided to the ISO.
34
Notes to Financial Statements (unaudited) – continued
The fund invests in the MFS Institutional Money Market Portfolio which is managed by MFS and seeks current income consistent with preservation of capital and liquidity. This money market fund does not pay a management fee to MFS.
The fund is permitted to engage in purchase and sale transactions (“cross-trades”) with funds and accounts for which MFS serves as investment adviser or sub-adviser pursuant to a policy adopted by the Board of Trustees. This policy has been designed to ensure that cross-trades conducted by the fund comply with Rule 17a-7 under the Investment Company Act of 1940. Under this policy, cross-trades are effected at current market prices with no remuneration paid in connection with the transaction. During the six months ended February 28, 2017, the fund engaged in purchase and sale transactions pursuant to this policy, which amounted to $4,115,863 and $3,829,724, respectively. The sales transactions resulted in net realized gains (losses) of $488,043.
On September 9, 2015, MFS redeemed 5,198 shares of Class R6 for an aggregate amount of $145,960.
On March 16, 2016, MFS redeemed 5,080 shares of Class I for an aggregate amount of $130,053.
(4) Portfolio Securities
For the six months ended February 28, 2017, purchases and sales of investments, other than short sales, and short-term obligations, aggregated $461,006,995 and $567,464,673, respectively.
(5) Shares of Beneficial Interest
The fund’s Declaration of Trust permits the Trustees to issue an unlimited number of full and fractional shares of beneficial interest. Transactions in fund shares were as follows:
| | | | | | | | | | | | | | | | |
| | | Six months ended
2/28/17 | | | Year ended
8/31/16 | |
| | | Shares | | | Amount | | | Shares | | | Amount | |
| Shares sold | | | | | | | | | | | | | | | | |
Class A | | | 1,683,375 | | | | $45,501,294 | | | | 3,602,883 | | | | $91,608,281 | |
Class B | | | 54,067 | | | | 1,309,207 | | | | 99,638 | | | | 2,294,543 | |
Class C | | | 211,358 | | | | 5,064,925 | | | | 444,615 | | | | 10,149,560 | |
Class I | | | 3,033,445 | | | | 86,554,283 | | | | 1,937,682 | | | | 51,360,121 | |
Class R1 | | | 12,490 | | | | 295,762 | | | | 18,909 | | | | 430,724 | |
Class R2 | | | 54,645 | | | | 1,451,114 | | | | 110,868 | | | | 2,776,509 | |
Class R3 | | | 118,662 | | | | 3,191,898 | | | | 645,573 | | | | 16,350,991 | |
Class R4 | | | 150,196 | | | | 4,045,058 | | | | 139,594 | | | | 3,632,945 | |
Class R6 | | | 624,239 | | | | 17,760,775 | | | | 13,414,972 | | | | 362,811,859 | |
| | | 5,942,477 | | | | $165,174,316 | | | | 20,414,734 | | | | $541,415,533 | |
35
Notes to Financial Statements (unaudited) – continued
| | | | | | | | | | | | | | | | |
| | | Six months ended
2/28/17 | | | Year ended
8/31/16 | |
| | | Shares | | | Amount | | | Shares | | | Amount | |
| Shares issued to shareholders in reinvestment of distributions | | | | | | | | | | | | | | | | |
Class A | | | 1,190,197 | | | | $31,992,477 | | | | 3,680,296 | | | | $91,308,144 | |
Class B | | | 38,514 | | | | 928,598 | | | | 149,513 | | | | 3,344,607 | |
Class C | | | 111,646 | | | | 2,662,764 | | | | 384,993 | | | | 8,519,904 | |
Class I | | | 109,935 | | | | 3,106,763 | | | | 100,168 | | | | 2,608,371 | |
Class R1 | | | 4,043 | | | | 96,384 | | | | 15,155 | | | | 335,219 | |
Class R2 | | | 18,727 | | | | 492,514 | | | | 61,784 | | | | 1,500,738 | |
Class R3 | | | 94,520 | | | | 2,530,313 | | | | 291,057 | | | | 7,192,014 | |
Class R4 | | | 22,806 | | | | 617,137 | | | | 85,323 | | | | 2,129,683 | |
Class R6 | | | 347,084 | | | | 9,815,545 | | | | 19,790 | | | | 515,529 | |
| | | 1,937,472 | | | | $52,242,495 | | | | 4,788,079 | | | | $117,454,209 | |
| | | | |
| Shares reacquired | | | | | | | | | | | | | | | | |
Class A | | | (5,113,857 | ) | | | $(138,040,820 | ) | | | (6,784,949 | ) | | | $(173,381,880 | ) |
Class B | | | (224,223 | ) | | | (5,409,392 | ) | | | (365,426 | ) | | | (8,386,396 | ) |
Class C | | | (367,047 | ) | | | (8,765,389 | ) | | | (666,933 | ) | | | (15,103,026 | ) |
Class I | | | (909,692 | ) | | | (25,774,677 | ) | | | (1,590,445 | ) | | | (42,872,281 | ) |
Class R1 | | | (16,694 | ) | | | (394,411 | ) | | | (58,470 | ) | | | (1,365,455 | ) |
Class R2 | | | (124,597 | ) | | | (3,300,831 | ) | | | (176,105 | ) | | | (4,439,122 | ) |
Class R3 | | | (2,078,144 | ) | | | (56,201,525 | ) | | | (462,335 | ) | | | (11,719,670 | ) |
Class R4 | | | (50,930 | ) | | | (1,405,175 | ) | | | (410,675 | ) | | | (10,249,449 | ) |
Class R6 | | | (1,340,528 | ) | | | (38,096,849 | ) | | | (2,984,209 | ) | | | (81,842,272 | ) |
| | | (10,225,712 | ) | | | $(277,389,069 | ) | | | (13,499,547 | ) | | | $(349,359,551 | ) |
| | | | |
| Net change | | | | | | | | | | | | | | | | |
Class A | | | (2,240,285 | ) | | | $(60,547,049 | ) | | | 498,230 | | | | $9,534,545 | |
Class B | | | (131,642 | ) | | | (3,171,587 | ) | | | (116,275 | ) | | | (2,747,246 | ) |
Class C | | | (44,043 | ) | | | (1,037,700 | ) | | | 162,675 | | | | 3,566,438 | |
Class I | | | 2,233,688 | | | | 63,886,369 | | | | 447,405 | | | | 11,096,211 | |
Class R1 | | | (161 | ) | | | (2,265 | ) | | | (24,406 | ) | | | (599,512 | ) |
Class R2 | | | (51,225 | ) | | | (1,357,203 | ) | | | (3,453 | ) | | | (161,875 | ) |
Class R3 | | | (1,864,962 | ) | | | (50,479,314 | ) | | | 474,295 | | | | 11,823,335 | |
Class R4 | | | 122,072 | | | | 3,257,020 | | | | (185,758 | ) | | | (4,486,821 | ) |
Class R6 | | | (369,205 | ) | | | (10,520,529 | ) | | | 10,450,553 | | | | 281,485,116 | |
| | | (2,345,763 | ) | | | $(59,972,258 | ) | | | 11,703,266 | | | | $309,510,191 | |
(6) Line of Credit
The fund and certain other funds managed by MFS participate in a $1.25 billion unsecured committed line of credit, subject to a $1 billion sublimit, provided by a syndication of banks under a credit agreement. Borrowings may be made for temporary financing needs. Interest is charged to each fund, based on its borrowings, generally at a rate equal to the higher of the Overnight Federal Reserve funds rate or daily one month LIBOR plus an agreed upon spread. A commitment fee, based on the average daily, unused portion of the committed line of credit, is allocated among the
36
Notes to Financial Statements (unaudited) – continued
participating funds at the end of each calendar quarter. In addition, the fund and other funds managed by MFS have established unsecured uncommitted borrowing arrangements with certain banks for temporary financing needs. Interest is charged to each fund, based on its borrowings, at a rate equal to the Overnight Federal Reserve funds rate plus an agreed upon spread. For the six months ended February 28, 2017, the fund’s commitment fee and interest expense were $5,032 and $0, respectively, and are included in “Miscellaneous” expense in the Statement of Operations.
(7) Transactions in Underlying Affiliated Funds-Affiliated Issuers
An affiliated issuer may be considered one in which the fund owns 5% or more of the outstanding voting securities, or a company which is under common control. For the purposes of this report, the fund assumes the following to be an affiliated issuer:
| | | | | | | | | | | | | | | | |
| Underlying Affiliated Fund | | Beginning
Shares/Par
Amount | | | Acquisitions
Shares/Par
Amount | | | Dispositions
Shares/Par
Amount | | | Ending
Shares/Par
Amount | |
MFS Institutional Money
Market Portfolio | | | 10,178,267 | | | | 140,851,671 | | | | (142,681,065 | ) | | | 8,348,873 | |
| | | | |
| Underlying Affiliated Fund | | Realized
Gain (Loss) | | | Capital Gain
Distributions | | | Dividend
Income | | | Ending
Value | |
MFS Institutional Money
Market Portfolio | | | $542 | | | | $— | | | | $32,766 | | | | $8,348,873 | |
37
PROXY VOTING POLICIES AND INFORMATION
MFS votes proxies on behalf of the fund pursuant to proxy voting policies and procedures that are available without charge, upon request, by calling 1-800-225-2606, by visiting mfs.com (once you have selected “Individual Investor” as your role, click on “Individual Investor Home” in the top navigation and then select “Learn More About Proxy Voting” under the “I want to…” header on the left hand column of the page), or by visiting the SEC’s Web site at http://www.sec.gov.
Information regarding how the fund voted proxies relating to portfolio securities during the most recent twelve-month period ended June 30 is available by August 31 of each year without charge by visiting mfs.com (once you have selected “Individual Investor” as your role, click on “Individual Investor Home” in the top navigation and then select “Learn More About Proxy Voting” under the “I want to…” header on the left hand column of the page), or by visiting the SEC’s Web site at http://www.sec.gov.
QUARTERLY PORTFOLIO DISCLOSURE
The fund will file a complete schedule of portfolio holdings with the Securities and Exchange Commission (the Commission) for the first and third quarters of each fiscal year on Form N-Q. A shareholder can obtain the quarterly portfolio holdings report at mfs.com. The fund’s Form N-Q is also available on the EDGAR database on the Commission’s Internet Web site at http://www.sec.gov, and may be reviewed and copied at the:
Public Reference Room
Securities and Exchange Commission
100 F Street, NE, Room 1580
Washington, D.C. 20549
Information on the operation of the Public Reference Room may be obtained by calling the Commission at 1-800-SEC-0330. Copies of the fund’s Form N-Q also may be obtained, upon payment of a duplicating fee, by electronic request at the following e-mail address: publicinfo@sec.gov or by writing the Public Reference Section at the above address.
FURTHER INFORMATION
From time to time, MFS may post important information about the fund or the MFS funds on the MFS web site (mfs.com). This information is available on mfs.com by following these steps once you have selected “Individual Investor” as your role: (1) Click on the “Individual Investor Home” in the top navigation and then select the “Announcements” option within the “Market Outlooks” drop down, or (2) Click on “Products & Services” and “Mutual Funds” and then choose the fund’s name in the “Select a fund” menu.
38
INFORMATION ABOUT FUND CONTRACTS AND LEGAL CLAIMS
The fund has entered into contractual arrangements with an investment adviser, administrator, distributor, shareholder servicing agent, 529 program manager (if applicable), and custodian who each provide services to the fund. Unless expressly stated otherwise, shareholders are not parties to, or intended beneficiaries of these contractual arrangements, and these contractual arrangements are not intended to create any shareholder right to enforce them against the service providers or to seek any remedy under them against the service providers, either directly or on behalf of the fund.
Under the Trust’s By-Laws and Declaration of Trust, any claims asserted against or on behalf of the MFS Funds, including claims against Trustees and Officers, must be brought in state and federal courts located within the Commonwealth of Massachusetts.
PROVISION OF FINANCIAL REPORTS AND SUMMARY PROSPECTUSES
The fund produces financial reports every six months and updates its summary prospectus and prospectus annually. To avoid sending duplicate copies of materials to households, only one copy of the fund’s annual and semiannual report and summary prospectus may be mailed to shareholders having the same last name and residential address on the fund’s records. However, any shareholder may contact MFSC (please see back cover for address and telephone number) to request that copies of these reports and summary prospectuses be sent personally to that shareholder.
39
Save paper with eDelivery.

| MFS® will send you prospectuses, |
reports, and proxies directly via e-mail so you will get information faster with less mailbox clutter.
To sign up:
1. Go to mfs.com.
2. Log in via MFS® Access.
3. Select eDelivery.
If you own your MFS fund shares through a financial institution or a retirement plan, MFS® TALK, MFS® Access, or eDelivery may not be available to you.
CONTACT
WEB SITE
mfs.com
MFS TALK
1-800-637-8255
24 hours a day
ACCOUNT SERVICE AND LITERATURE
Shareholders
1-800-225-2606
Financial advisors
1-800-343-2829
Retirement plan services
1-800-637-1255
MAILING ADDRESS
MFS Service Center, Inc.
P.O. Box 55824
Boston, MA 02205-5824
OVERNIGHT MAIL
MFS Service Center, Inc.
c/o Boston Financial Data Services
30 Dan Road
Canton, MA 02021-2809
SEMIANNUAL REPORT
February 28, 2017

MFS® LOW VOLATILITY GLOBAL EQUITY FUND

LVO-SEM
MFS® LOW VOLATILITY GLOBAL EQUITY FUND
CONTENTS
The report is prepared for the general information of shareholders.
It is authorized for distribution to prospective investors only when preceded or accompanied by a current prospectus.
NOT FDIC INSURED • MAY LOSE VALUE • NO BANK GUARANTEE

LETTER FROM THE EXECUTIVE CHAIRMAN
Dear Shareholders:
Despite June’s unexpected vote by the United Kingdom to leave the European Union and the surprising result in November’s U.S. presidential election, most markets have
proved resilient. U.S. share prices quickly reversed post-Brexit declines, and indices reached new highs following the November elections. U.S. bond yields rose after Donald Trump’s victory on hopes that his proposed policy mix of lower taxes, increased spending on infrastructure and a lower regulatory burden on businesses will lift both U.S. economic growth and inflation. However, interest rates in most developed markets remain very low, with major central banks maintaining extremely accommodative monetary policies to reinvigorate slow-growing economies against a backdrop of still-low inflation. Even after the rise in yields following the election, interest rates remain low by historical standards.
Globally, economic growth has shown signs of recovery of late, led by the United States and the eurozone. Despite better growth, there are few immediate signs of worrisome inflation. Emerging market economies are recovering at a somewhat slower pace amid fears that restrictive U.S. trade policies could further hamper the already slow pace of global trade growth. Looking ahead, markets will have to contend with a series of European elections during 2017, which, depending on the outcome, could further call into question the future direction of the European Union.
At MFS®, we believe in a patient, long-term approach to investing. Viewing investments with a long lens makes it possible to filter out short-term market noise and focus on achieving solid risk-adjusted returns over a full market cycle.
In our view, such an approach, along with the professional guidance of a financial advisor, will help you reach your investment objectives.
Respectfully,

Robert J. Manning
Executive Chairman
MFS Investment Management
April 13, 2017
The opinions expressed in this letter are subject to change and may not be relied upon for investment advice. No forecasts can be guaranteed.
1
PORTFOLIO COMPOSITION
Portfolio structure

| | | | |
| Top ten holdings | | | | |
| Taiwan Semiconductor Manufacturing Co. Ltd., ADR | | | 3.4% | |
| Johnson & Johnson | | | 3.0% | |
| General Mills, Inc. | | | 2.8% | |
| Roche Holding AG | | | 2.4% | |
| Ross Stores, Inc. | | | 2.3% | |
| Validus Holdings Ltd. | | | 2.2% | |
| McDonald’s Corp. | | | 2.1% | |
| Integra LifeSciences Holdings Corp. | | | 1.9% | |
| Fisher & Paykel Healthcare Corp. Ltd. | | | 1.9% | |
| Lockheed Martin Corp. | | | 1.7% | |
|
| Equity sectors | |
| Financial Services | | | 19.1% | |
| Utilities & Communications | | | 17.5% | |
| Health Care | | | 14.7% | |
| Consumer Staples | | | 13.5% | |
| Technology | | | 10.3% | |
| Retailing | | | 8.1% | |
| Leisure | | | 3.5% | |
| Energy | | | 3.0% | |
| Autos & Housing | | | 2.8% | |
| Basic Materials | | | 2.6% | |
| Industrial Goods & Services | | | 2.3% | |
| Special Products & Services | | | 0.8% | |
| Transportation | | | 0.7% | |
| | | | |
| Issuer country weightings (x) | |
| United States | | | 50.8% | |
| Japan | | | 9.4% | |
| Canada | | | 7.5% | |
| Switzerland | | | 6.7% | |
| United Kingdom | | | 4.4% | |
| Hong Kong | | | 4.0% | |
| Taiwan | | | 3.4% | |
| Germany | | | 2.4% | |
| New Zealand | | | 1.9% | |
| Other Countries | | | 9.5% | |
|
| Currency exposure weightings (y) | |
| United States Dollar | | | 59.8% | |
| Japanese Yen | | | 9.4% | |
| Swiss Franc | | | 6.7% | |
| British Pound Sterling | | | 4.4% | |
| Taiwan Dollar | | | 3.4% | |
| Euro | | | 3.1% | |
| Hong Kong Dollar | | | 2.9% | |
| New Zealand Dollar | | | 1.9% | |
| Israeli Shekel | | | 1.4% | |
| Other Currencies | | | 7.0% | |
2
Portfolio Composition – continued
| (x) | Represents the portfolio’s exposure to issuer countries as a percentage of a portfolio’s net assets. For purposes of this presentation, United States includes Cash & Cash Equivalents. |
| (y) | Represents the portfolio’s exposure to a particular currency as a percentage of a portfolio’s net assets. For purposes of this presentation, United States Dollar includes Cash & Cash Equivalents. |
Cash & Cash Equivalents includes any cash, investments in money market funds, short-term securities, and other assets less liabilities. Please see the Statement of Assets and Liabilities for additional information related to the fund’s cash position and other assets and liabilities.
Percentages are based on net assets as of 2/28/17.
The portfolio is actively managed and current holdings may be different.
3
EXPENSE TABLE
Fund expenses borne by the shareholders during the period, September 1, 2016 through February 28, 2017
As a shareholder of the fund, you incur two types of costs: (1) transaction costs, including sales charges (loads) on certain purchase or redemption payments, and (2) ongoing costs, including management fees; distribution and service (12b-1) fees; and other fund expenses. This example is intended to help you understand your ongoing costs (in dollars) of investing in the fund and to compare these costs with the ongoing costs of investing in other mutual funds.
The example is based on an investment of $1,000 invested at the beginning of the period and held for the entire period September 1, 2016 through February 28, 2017.
Actual Expenses
The first line for each share class in the following table provides information about actual account values and actual expenses. You may use the information in this line, together with the amount you invested, to estimate the expenses that you paid over the period. Simply divide your account value by $1,000 (for example, an $8,600 account value divided by $1,000 = 8.6), then multiply the result by the number in the first line under the heading entitled “Expenses Paid During Period” to estimate the expenses you paid on your account during this period.
Hypothetical Example for Comparison Purposes
The second line for each share class in the following table provides information about hypothetical account values and hypothetical expenses based on the fund’s actual expense ratio and an assumed rate of return of 5% per year before expenses, which is not the fund’s actual return. The hypothetical account values and expenses may not be used to estimate the actual ending account balance or expenses you paid for the period. You may use this information to compare the ongoing costs of investing in the fund and other funds. To do so, compare this 5% hypothetical example with the 5% hypothetical examples that appear in the shareholder reports of the other funds.
Please note that the expenses shown in the table are meant to highlight your ongoing costs only and do not reflect any transactional costs, such as sales charges (loads). Therefore, the second line for each share class in the table is useful in comparing ongoing costs only, and will not help you determine the relative total costs of owning different funds. In addition, if these transactional costs were included, your costs would have been higher.
4
Expense Table – continued
| | | | | | | | | | | | |
Share
Class | | | | Annualized
Expense
Ratio | | Beginning
Account Value
9/01/16 | | Ending
Account Value
2/28/17 | | Expenses
Paid During
Period (p)
9/01/16-2/28/17 | |
| A | | Actual | | 1.19% | | $1,000.00 | | $1,017.47 | | | $5.95 | |
| | Hypothetical (h) | | 1.19% | | $1,000.00 | | $1,018.89 | | | $5.96 | |
| B | | Actual | | 1.99% | | $1,000.00 | | $1,013.09 | | | $9.93 | |
| | Hypothetical (h) | | 1.99% | | $1,000.00 | | $1,014.93 | | | $9.94 | |
| C | | Actual | | 1.99% | | $1,000.00 | | $1,013.88 | | | $9.94 | |
| | Hypothetical (h) | | 1.99% | | $1,000.00 | | $1,014.93 | | | $9.94 | |
| I | | Actual | | 0.99% | | $1,000.00 | | $1,018.58 | | | $4.95 | |
| | Hypothetical (h) | | 0.99% | | $1,000.00 | | $1,019.89 | | | $4.96 | |
| R1 | | Actual | | 1.99% | | $1,000.00 | | $1,014.06 | | | $9.94 | |
| | Hypothetical (h) | | 1.99% | | $1,000.00 | | $1,014.93 | | | $9.94 | |
| R2 | | Actual | | 1.49% | | $1,000.00 | | $1,015.88 | | | $7.45 | |
| | Hypothetical (h) | | 1.49% | | $1,000.00 | | $1,017.41 | | | $7.45 | |
| R3 | | Actual | | 1.24% | | $1,000.00 | | $1,017.18 | | | $6.20 | |
| | Hypothetical (h) | | 1.24% | | $1,000.00 | | $1,018.65 | | | $6.21 | |
| R4 | | Actual | | 0.99% | | $1,000.00 | | $1,018.54 | | | $4.95 | |
| | Hypothetical (h) | | 0.99% | | $1,000.00 | | $1,019.89 | | | $4.96 | |
| R6 | | Actual | | 0.95% | | $1,000.00 | | $1,018.78 | | | $4.76 | |
| | Hypothetical (h) | | 0.95% | | $1,000.00 | | $1,020.08 | | | $4.76 | |
| (h) | 5% class return per year before expenses. |
| (p) | “Expenses Paid During Period” are equal to each class’s annualized expense ratio, as shown above, multiplied by the average account value over the period, multiplied by 181/365 (to reflect the one-half year period). Expenses paid do not include any applicable sales charges (loads). If these transaction costs had been included, your costs would have been higher. |
Notes to Expense Table
Each class with a Rule 12b-1 service fee is subject to a rebate of a portion of such fee. Such rebates are included in the expense ratios above and are outside of the expense limitation arrangement. For Class A shares, this rebate reduced the expense ratio above by 0.05%. See Note 3 in the Notes to Financial Statements for additional information.
5
PORTFOLIO OF INVESTMENTS
2/28/17 (unaudited)
The Portfolio of Investments is a complete list of all securities owned by your fund. It is categorized by broad-based asset classes.
| | | | | | | | |
| Common Stocks - 98.9% | | | | | | | | |
| Issuer | | Shares/Par | | | Value ($) | |
| Aerospace - 1.7% | | | | | | | | |
| Lockheed Martin Corp. | | | 5,815 | | | $ | 1,550,163 | |
| | |
| Alcoholic Beverages - 0.4% | | | | | | | | |
| AmBev S.A. | | | 63,147 | | | $ | 362,116 | |
| | |
| Apparel Manufacturers - 0.4% | | | | | | | | |
| Gildan Activewear, Inc. | | | 15,650 | | | $ | 397,197 | |
| | |
| Automotive - 2.3% | | | | | | | | |
| Kia Motors Corp. | | | 37,483 | | | $ | 1,267,941 | |
| USS Co. Ltd. | | | 50,500 | | | | 864,854 | |
| | | | | | | | |
| | | | $ | 2,132,795 | |
| Business Services - 0.8% | | | | | | | | |
| Forrester Research, Inc. | | | 19,464 | | | $ | 710,436 | |
| | |
| Cable TV - 0.7% | | | | | | | | |
| Charter Communications, Inc., “A” (a) | | | 2,076 | | | $ | 670,673 | |
| | |
| Chemicals - 0.6% | | | | | | | | |
| Monsanto Co. | | | 4,910 | | | $ | 558,905 | |
| | |
| Computer Software - 1.3% | | | | | | | | |
| Adobe Systems, Inc. (a) | | | 9,955 | | | $ | 1,178,075 | |
| | |
| Computer Software - Systems - 1.5% | | | | | | | | |
| NICE Systems Ltd., ADR | | | 19,483 | | | $ | 1,329,715 | |
| | |
| Construction - 0.5% | | | | | | | | |
| Owens Corning | | | 7,747 | | | $ | 453,122 | |
| | |
| Consumer Products - 3.4% | | | | | | | | |
| Colgate-Palmolive Co. | | | 8,801 | | | $ | 642,297 | |
| Kimberly-Clark Corp. | | | 8,731 | | | | 1,157,294 | |
| Procter & Gamble Co. | | | 13,777 | | | | 1,254,671 | |
| | | | | | | | |
| | | | $ | 3,054,262 | |
6
Portfolio of Investments (unaudited) – continued
| | | | | | | | |
| Issuer | | Shares/Par | | | Value ($) | |
| Common Stocks - continued | | | | | | | | |
| Electronics - 4.8% | | | | | | | | |
| Kyocera Corp. | | | 23,900 | | | $ | 1,314,293 | |
| Taiwan Semiconductor Manufacturing Co. Ltd., ADR | | | 97,564 | | | | 3,070,339 | |
| | | | | | | | |
| | | | $ | 4,384,632 | |
| Energy - Independent - 0.6% | | | | | | | | |
| Occidental Petroleum Corp. | | | 8,634 | | | $ | 565,959 | |
| | |
| Energy - Integrated - 2.3% | | | | | | | | |
| Exxon Mobil Corp. | | | 15,495 | | | $ | 1,260,053 | |
| Royal Dutch Shell PLC, “B” | | | 32,386 | | | | 873,447 | |
| | | | | | | | |
| | | | $ | 2,133,500 | |
| Food & Beverages - 8.5% | | | | | | | | |
| General Mills, Inc. | | | 42,740 | | | $ | 2,580,214 | |
| Marine Harvest | | | 34,001 | | | | 594,566 | |
| Mondelez International, Inc. | | | 13,770 | | | | 604,778 | |
| Nestle S.A. | | | 20,408 | | | | 1,508,731 | |
| Pinnacle Foods, Inc. | | | 9,195 | | | | 525,310 | |
| Sligro Food Group N.V. | | | 17,563 | | | | 651,962 | |
| Toyo Suisan Kaisha Ltd. | | | 35,700 | | | | 1,309,217 | |
| | | | | | | | |
| | | | $ | 7,774,778 | |
| Food & Drug Stores - 3.3% | | | | | | | | |
| CVS Health Corp. | | | 8,932 | | | $ | 719,741 | |
| Dairy Farm International Holdings Ltd. | | | 114,100 | | | | 973,273 | |
| Lawson, Inc. | | | 11,100 | | | | 765,722 | |
| METRO, Inc., “A” | | | 18,245 | | | | 532,020 | |
| | | | | | | | |
| | | | $ | 2,990,756 | |
| Insurance - 7.4% | | | | | | | | |
| AXIS Capital Holdings Ltd. | | | 5,516 | | | $ | 382,259 | |
| Beazley PLC | | | 116,721 | | | | 628,576 | |
| Everest Re Group Ltd. | | | 1,767 | | | | 415,492 | |
| Intact Financial Corp. | | | 13,435 | | | | 958,990 | |
| Swiss Life Holding AG | | | 2,174 | | | | 684,009 | |
| Travelers Cos., Inc. | | | 4,024 | | | | 491,894 | |
| Validus Holdings Ltd. | | | 35,487 | | | | 2,046,180 | |
| XL Group Ltd. | | | 11,929 | | | | 483,005 | |
| Zurich Insurance Group AG | | | 2,303 | | | | 635,856 | |
| | | | | | | | |
| | | | $ | 6,726,261 | |
| Internet - 1.8% | | | | | | | | |
| Alphabet, Inc., “A” (a) | | | 718 | | | $ | 606,660 | |
| Facebook, Inc., “A” (a) | | | 7,935 | | | | 1,075,510 | |
| | | | | | | | |
| | | | $ | 1,682,170 | |
7
Portfolio of Investments (unaudited) – continued
| | | | | | | | |
| Issuer | | Shares/Par | | | Value ($) | |
| Common Stocks - continued | | | | | | | | |
| Machinery & Tools - 0.7% | | | | | | | | |
| Schindler Holding AG | | | 3,084 | | | $ | 589,870 | |
| | |
| Major Banks - 2.7% | | | | | | | | |
| Bank of Nova Scotia | | | 9,058 | | | $ | 527,085 | |
| HSBC Holdings PLC, ADR | | | 28,919 | | | | 1,165,436 | |
| Royal Bank of Canada | | | 11,148 | | | | 810,125 | |
| | | | | | | | |
| | | | $ | 2,502,646 | |
| Medical & Health Technology & Services - 1.0% | | | | | | | | |
| Express Scripts Holding Co. (a) | | | 13,348 | | | $ | 943,036 | |
| | |
| Medical Equipment - 5.6% | | | | | | | | |
| Abbott Laboratories | | | 10,374 | | | $ | 467,660 | |
| Fisher & Paykel Healthcare Corp. Ltd. | | | 269,198 | | | | 1,766,460 | |
| Integra LifeSciences Holdings Corp. (a) | | | 41,467 | | | | 1,772,300 | |
| Terumo Corp. | | | 32,700 | | | | 1,133,709 | |
| | | | | | | | |
| | | | $ | 5,140,129 | |
| Natural Gas - Distribution - 0.6% | | | | | | | | |
| Osaka Gas Co. Ltd. | | | 133,000 | | | $ | 512,845 | |
| | |
| Natural Gas - Pipeline - 1.3% | | | | | | | | |
| Enbridge, Inc. | | | 28,214 | | | $ | 1,180,756 | |
| | |
| Network & Telecom - 0.9% | | | | | | | | |
| VTech Holdings Ltd. | | | 74,300 | | | $ | 838,434 | |
| | |
| Other Banks & Diversified Financials - 4.1% | | | | | | | | |
| Banco de Oro Unibank, Inc. | | | 160,140 | | | $ | 368,340 | |
| Credicorp Ltd. | | | 5,256 | | | | 865,243 | |
| DBS Group Holdings Ltd. | | | 56,900 | | | | 760,480 | |
| Discover Financial Services | | | 16,495 | | | | 1,173,454 | |
| Sydbank A.S. | | | 16,389 | | | | 567,099 | |
| | | | | | | | |
| | | | $ | 3,734,616 | |
| Pharmaceuticals - 8.1% | | | | | | | | |
| Johnson & Johnson | | | 22,297 | | | $ | 2,724,916 | |
| Merck & Co., Inc. | | | 22,347 | | | | 1,471,997 | |
| Novartis AG | | | 7,084 | | | | 552,980 | |
| Pfizer, Inc. | | | 13,019 | | | | 444,208 | |
| Roche Holding AG | | | 9,039 | | | | 2,202,263 | |
| | | | | | | | |
| | | | $ | 7,396,364 | |
8
Portfolio of Investments (unaudited) – continued
| | | | | | | | |
| Issuer | | Shares/Par | | | Value ($) | |
| Common Stocks - continued | | | | | | | | |
| Railroad & Shipping - 0.8% | | | | | | | | |
| Canadian National Railway Co. | | | 9,757 | | | $ | 680,746 | |
| | |
| Real Estate - 4.9% | | | | | | | | |
| AvalonBay Communities, Inc., REIT | | | 7,757 | | | $ | 1,425,581 | |
| Grand City Properties S.A. | | | 73,885 | | | | 1,407,753 | |
| Public Storage, Inc., REIT | | | 3,227 | | | | 734,013 | |
| Starwood Property Trust, Inc., REIT | | | 18,916 | | | | 432,420 | |
| Store Capital Corp., REIT | | | 20,372 | | | | 507,467 | |
| | | | | | | | |
| | | | $ | 4,507,234 | |
| Restaurants - 2.7% | | | | | | | | |
| McDonald’s Corp. | | | 14,733 | | | $ | 1,880,667 | |
| Whitbread PLC | | | 13,045 | | | | 619,149 | |
| | | | | | | | |
| | | | $ | 2,499,816 | |
| Specialty Chemicals - 1.9% | | | | | | | | |
| PTT Global Chemical PLC | | | 491,000 | | | $ | 1,002,242 | |
| Symrise AG | | | 12,388 | | | | 770,501 | |
| | | | | | | | |
| | | | $ | 1,772,743 | |
| Specialty Stores - 4.4% | | | | | | | | |
| ABC-MART, Inc. | | | 19,600 | | | $ | 1,181,112 | |
| Home Depot, Inc. | | | 4,612 | | | | 668,325 | |
| Ross Stores, Inc. | | | 30,957 | | | | 2,123,031 | |
| | | | | | | | |
| | | | $ | 3,972,468 | |
| Telecommunications - Wireless - 3.5% | | | | | | | | |
| KDDI Corp. | | | 56,200 | | | $ | 1,470,219 | |
| SBA Communications Corp., REIT (a) | | | 8,779 | | | | 1,016,345 | |
| Vodafone Group PLC | | | 287,553 | | | | 720,400 | |
| | | | | | | | |
| | | | $ | 3,206,964 | |
| Telephone Services - 4.3% | | | | | | | | |
| BCE, Inc. | | | 8,731 | | | $ | 381,021 | |
| HKT Trust and HKT Ltd. | | | 408,000 | | | | 544,498 | |
| TDC A.S. (a) | | | 103,357 | | | | 556,198 | |
| TELUS Corp. | | | 42,360 | | | | 1,377,971 | |
| Verizon Communications, Inc. | | | 20,623 | | | | 1,023,519 | |
| | | | | | | | |
| | | | $ | 3,883,207 | |
| Tobacco - 1.2% | | | | | | | | |
| Altria Group, Inc. | | | 10,086 | | | $ | 755,643 | |
| British American Tobacco | | | 34,200 | | | | 373,581 | |
| | | | | | | | |
| | | | $ | 1,129,224 | |
9
Portfolio of Investments (unaudited) – continued
| | | | | | | | |
| Issuer | | Shares/Par | | | Value ($) | |
| Common Stocks - continued | | | | | | | | |
| Utilities - Electric Power - 7.9% | | | | | | | | |
| Alliant Energy Corp. | | | 24,640 | | | $ | 972,787 | |
| American Electric Power Co., Inc. | | | 13,109 | | | | 877,910 | |
| CLP Holdings Ltd. | | | 126,500 | | | | 1,286,526 | |
| Dominion Resources, Inc. | | | 7,787 | | | | 604,583 | |
| Duke Energy Corp. | | | 4,415 | | | | 364,458 | |
| PG&E Corp. | | | 20,115 | | | | 1,342,676 | |
| WEC Energy Group, Inc. | | | 14,909 | | | | 898,565 | |
| Xcel Energy, Inc. | | | 20,790 | | | | 908,731 | |
| | | | | | | | |
| | | | $ | 7,256,236 | |
| Total Common Stocks (Identified Cost, $83,124,210) | | | $ | 90,402,849 | |
| | |
| Money Market Funds - 1.0% | | | | | | | | |
MFS Institutional Money Market Portfolio, 0.64% (v)
(Identified Cost, $882,791) | | | 882,794 | | | $ | 882,794 | |
| Total Investments (Identified Cost, $84,007,001) | | | $ | 91,285,643 | |
| |
| Other Assets, Less Liabilities - 0.1% | | | | 129,708 | |
| Net Assets - 100.0% | | | $ | 91,415,351 | |
| (a) | Non-income producing security. |
| (v) | Underlying affiliated fund that is available only to investment companies managed by MFS. The rate quoted for the MFS Institutional Money Market Portfolio is the annualized seven-day yield of the fund at period end. |
The following abbreviations are used in this report and are defined:
| ADR | | American Depositary Receipt |
| PLC | | Public Limited Company |
| REIT | | Real Estate Investment Trust |
See Notes to Financial Statements
10
Financial Statements
STATEMENT OF ASSETS AND LIABILITIES
At 2/28/17 (unaudited)
This statement represents your fund’s balance sheet, which details the assets and liabilities comprising the total value of the fund.
| | | | |
| Assets | | | | |
Investments | | | | |
Non-affiliated issuers, at value (identified cost, $83,124,210) | | | $90,402,849 | |
Underlying affiliated funds, at value (identified cost, $882,791) | | | 882,794 | |
Total investments, at value (identified cost, $84,007,001) | | | $91,285,643 | |
Receivables for | | | | |
Fund shares sold | | | 79,355 | |
Dividends | | | 235,766 | |
Receivable from distributor | | | 314 | |
Other assets | | | 51,832 | |
Total assets | | | $91,652,910 | |
| Liabilities | | | | |
Payable for fund shares reacquired | | | $156,710 | |
Payable to affiliates | | | | |
Investment adviser | | | 3,466 | |
Shareholder servicing costs | | | 4,474 | |
Payable for independent Trustees’ compensation | | | 15 | |
Deferred country tax expense payable | | | 21,941 | |
Accrued expenses and other liabilities | | | 50,953 | |
Total liabilities | | | $237,559 | |
Net assets | | | $91,415,351 | |
| Net assets consist of | | | | |
Paid-in capital | | | $85,433,108 | |
Unrealized appreciation (depreciation) on investments and translation of assets and liabilities in foreign currencies (net of $21,941 deferred country tax) | | | 7,257,412 | |
Accumulated net realized gain (loss) on investments and foreign currency | | | (1,405,839 | ) |
Undistributed net investment income | | | 130,670 | |
Net assets | | | $91,415,351 | |
Shares of beneficial interest outstanding | | | 7,617,303 | |
11
Statement of Assets and Liabilities (unaudited) – continued
| | | | | | | | | | | | |
| | | Net assets | | | Shares
outstanding | | | Net asset value
per share (a) | |
Class A | | | $7,888,835 | | | | 656,876 | | | | $12.01 | |
Class B | | | 274,633 | | | | 23,014 | | | | 11.93 | |
Class C | | | 1,859,638 | | | | 156,018 | | | | 11.92 | |
Class I | | | 30,292,529 | | | | 2,522,846 | | | | 12.01 | |
Class R1 | | | 56,377 | | | | 4,703 | | | | 11.99 | |
Class R2 | | | 75,208 | | | | 6,263 | | | | 12.01 | |
Class R3 | | | 56,995 | | | | 4,742 | | | | 12.02 | |
Class R4 | | | 57,215 | | | | 4,764 | | | | 12.01 | |
Class R6 | | | 50,853,921 | | | | 4,238,077 | | | | 12.00 | |
Shares outstanding are rounded for presentation purposes.
| (a) | Maximum offering price per share was equal to the net asset value per share for all share classes, except for Class A, for which the maximum offering price per share was $12.74 [100 / 94.25 x $12.01]. On sales of $50,000 or more, the maximum offering price of Class A shares is reduced. A contingent deferred sales charge may be imposed on redemptions of Class A, Class B, and Class C shares. Redemption price per share was equal to the net asset value per share for Classes I, R1, R2, R3, R4, and R6. |
See Notes to Financial Statements
12
Financial Statements
STATEMENT OF OPERATIONS
Six months ended 2/28/17 (unaudited)
This statement describes how much your fund earned in investment income and accrued in expenses. It also describes any gains and/or losses generated by fund operations.
| | | | |
| Net investment income | |
Income | | | | |
Dividends | | | $861,645 | |
Dividends from underlying affiliated funds | | | 2,301 | |
Foreign taxes withheld | | | (31,627 | ) |
Total investment income | | | $832,319 | |
Expenses | | | | |
Management fee | | | $248,899 | |
Distribution and service fees | | | 19,667 | |
Shareholder servicing costs | | | 10,445 | |
Administrative services fee | | | 10,731 | |
Independent Trustees’ compensation | | | 862 | |
Custodian fee | | | 16,511 | |
Shareholder communications | | | 4,972 | |
Audit and tax fees | | | 26,392 | |
Legal fees | | | 261 | |
Registration fees | | | 61,459 | |
Miscellaneous | | | 8,592 | |
Total expenses | | | $408,791 | |
Reduction of expenses by investment adviser and distributor | | | (21,200 | ) |
Net expenses | | | $387,591 | |
Net investment income | | | $444,728 | |
| Realized and unrealized gain (loss) on investments and foreign currency | |
| Realized gain (loss) (identified cost basis) | | | | |
Investments: | | | | |
Non-affiliated issuers | | | $115,181 | |
Underlying affiliated funds | | | (1 | ) |
Foreign currency | | | (2,548 | ) |
Net realized gain (loss) on investments and foreign currency | | | $112,632 | |
Change in unrealized appreciation (depreciation) | | | | |
Investments (net of $20,341 increase in deferred country tax) | | | $1,326,855 | |
Translation of assets and liabilities in foreign currencies | | | 740 | |
Net unrealized gain (loss) on investments and foreign currency translation | | | $1,327,595 | |
Net realized and unrealized gain (loss) on investments and foreign currency | | | $1,440,227 | |
Change in net assets from operations | | | $1,884,955 | |
See Notes to Financial Statements
13
Financial Statements
STATEMENTS OF CHANGES IN NET ASSETS
These statements describe the increases and/or decreases in net assets resulting from operations, any distributions, and any shareholder transactions.
| | | | | | | | |
| Change in net assets | | Six months ended
2/28/17 (unaudited) | | | Year ended
8/31/16 | |
| From operations | | | | | | | | |
Net investment income | | | $444,728 | | | | $885,961 | |
Net realized gain (loss) on investments and foreign currency | | | 112,632 | | | | (893,725 | ) |
Net unrealized gain (loss) on investments and foreign currency translation | | | 1,327,595 | | | | 6,082,464 | |
Change in net assets from operations | | | $1,884,955 | | | | $6,074,700 | |
| Distributions declared to shareholders | | | | | | | | |
From net investment income | | | $(488,036 | ) | | | $(882,213 | ) |
Change in net assets from fund share transactions | | | $23,942,631 | | | | $25,075,711 | |
Total change in net assets | | | $25,339,550 | | | | $30,268,198 | |
| Net assets | | | | | | | | |
At beginning of period | | | 66,075,801 | | | | 35,807,603 | |
At end of period (including undistributed net investment income of $130,670 and $173,978, respectively) | | | $91,415,351 | | | | $66,075,801 | |
See Notes to Financial Statements
14
Financial Statements
FINANCIAL HIGHLIGHTS
The financial highlights table is intended to help you understand the fund’s financial performance for the semiannual period and the past 5 fiscal years (or life of a particular share class, if shorter). Certain information reflects financial results for a single fund share. The total returns in the table represent the rate by which an investor would have earned (or lost) on an investment in the fund share class (assuming reinvestment of all distributions) held for the entire period.
| | | | | | | | | | | | | | | | |
| | | Six months
ended
2/28/17 | | | Years ended 8/31 | | | Period
ended 8/31/14 (c) | |
| Class A | | | 2016 | | | 2015 | | |
| | | (unaudited) | | | | | | | | | | |
Net asset value, beginning of period | | | $11.87 | | | | $10.75 | | | | $10.92 | | | | $10.00 | |
| Income (loss) from investment operations | |
Net investment income (d) | | | $0.06 | | | | $0.18 | | | | $0.19 | | | | $0.15 | |
Net realized and unrealized gain (loss) on
investments and foreign currency | | | 0.15 | | | | 1.11 | | | | (0.22 | ) | | | 0.86 | |
Total from investment operations | | | $0.21 | | | | $1.29 | | | | $(0.03 | ) | | | $1.01 | |
| Less distributions declared to shareholders | |
From net investment income | | | $(0.07 | ) | | | $(0.17 | ) | | | $(0.12 | ) | | | $(0.09 | ) |
From net realized gain on investments | | | — | | | | — | | | | (0.02 | ) | | | — | |
Total distributions declared to shareholders | | | $(0.07 | ) | | | $(0.17 | ) | | | $(0.14 | ) | | | $(0.09 | ) |
Net asset value, end of period (x) | | | $12.01 | | | | $11.87 | | | | $10.75 | | | | $10.92 | |
Total return (%) (r)(s)(t)(x) | | | 1.75 | (n) | | | 12.12 | | | | (0.36 | ) | | | 10.13 | (n) |
Ratios (%) (to average net assets)
and Supplemental data: | | | | | | | | | | | | | | | | |
Expenses before expense reductions (f) | | | 1.30 | (a) | | | 1.51 | | | | 1.88 | | | | 5.81 | (a) |
Expenses after expense reductions (f) | | | 1.19 | (a) | | | 1.19 | | | | 1.23 | | | | 1.22 | (a) |
Net investment income | | | 1.00 | (a)(l) | | | 1.56 | | | | 1.65 | | | | 1.86 | (a) |
Portfolio turnover | | | 17 | (n) | | | 28 | | | | 61 | | | | 28 | (n) |
Net assets at end of period (000 omitted) | | | $7,889 | | | | $7,473 | | | | $3,981 | | | | $800 | |
See Notes to Financial Statements
15
Financial Highlights – continued
| | | | | | | | | | | | | | | | |
| | | Six months
ended
2/28/17 | | | Years ended 8/31 | | | Period
ended 8/31/14 (c) | |
| Class B | | | 2016 | | | 2015 | | |
| | | (unaudited) | | | | | | | | | | |
Net asset value, beginning of period | | | $11.79 | | | | $10.70 | | | | $10.91 | | | | $10.00 | |
| Income (loss) from investment operations | |
Net investment income (d) | | | $0.01 | | | | $0.07 | | | | $0.08 | | | | $0.06 | |
Net realized and unrealized gain (loss) on
investments and foreign currency | | | 0.14 | | | | 1.12 | | | | (0.20 | ) | | | 0.89 | |
Total from investment operations | | | $0.15 | | | | $1.19 | | | | $(0.12 | ) | | | $0.95 | |
| Less distributions declared to shareholders | |
From net investment income | | | $(0.01 | ) | | | $(0.10 | ) | | | $(0.07 | ) | | | $(0.04 | ) |
From net realized gain on investments | | | — | | | | — | | | | (0.02 | ) | | | — | |
Total distributions declared to shareholders | | | $(0.01 | ) | | | $(0.10 | ) | | | $(0.09 | ) | | | $(0.04 | ) |
Net asset value, end of period (x) | | | $11.93 | | | | $11.79 | | | | $10.70 | | | | $10.91 | |
Total return (%) (r)(s)(t)(x) | | | 1.31 | (n) | | | 11.16 | | | | (1.16 | ) | | | 9.50 | (n) |
Ratios (%) (to average net assets)
and Supplemental data: | |
Expenses before expense reductions (f) | | | 2.05 | (a) | | | 2.33 | | | | 2.68 | | | | 6.87 | (a) |
Expenses after expense reductions (f) | | | 1.99 | (a) | | | 1.98 | | | | 2.01 | | | | 2.07 | (a) |
Net investment income | | | 0.20 | (a)(l) | | | 0.65 | | | | 0.74 | | | | 0.80 | (a) |
Portfolio turnover | | | 17 | (n) | | | 28 | | | | 61 | | | | 28 | (n) |
Net assets at end of period (000 omitted) | | | $275 | | | | $341 | | | | $446 | | | | $116 | |
See Notes to Financial Statements
16
Financial Highlights – continued
| | | | | | | | | | | | | | | | |
| | | Six months
ended
2/28/17 | | | Years ended 8/31 | | | Period
ended 8/31/14 (c) | |
| Class C | | | 2016 | | | 2015 | | |
| | | (unaudited) | | | | | | | | | | |
Net asset value, beginning of period | | | $11.78 | | | | $10.69 | | | | $10.91 | | | | $10.00 | |
| Income (loss) from investment operations | |
Net investment income (d) | | | $0.01 | | | | $0.08 | | | | $0.10 | | | | $0.06 | |
Net realized and unrealized gain (loss) on
investments and foreign currency | | | 0.15 | | | | 1.11 | | | | (0.23 | ) | | | 0.89 | |
Total from investment operations | | | $0.16 | | | | $1.19 | | | | $(0.13 | ) | | | $0.95 | |
| Less distributions declared to shareholders | |
From net investment income | | | $(0.02 | ) | | | $(0.10 | ) | | | $(0.07 | ) | | | $(0.04 | ) |
From net realized gain on investments | | | — | | | | — | | | | (0.02 | ) | | | — | |
Total distributions declared to shareholders | | | $(0.02 | ) | | | $(0.10 | ) | | | $(0.09 | ) | | | $(0.04 | ) |
Net asset value, end of period (x) | | | $11.92 | | | | $11.78 | | | | $10.69 | | | | $10.91 | |
Total return (%) (r)(s)(t)(x) | | | 1.39 | (n) | | | 11.22 | | | | (1.23 | ) | | | 9.50 | (n) |
Ratios (%) (to average net assets)
and Supplemental data: | |
Expenses before expense reductions (f) | | | 2.05 | (a) | | | 2.23 | | | | 2.66 | | | | 6.85 | (a) |
Expenses after expense reductions (f) | | | 1.99 | (a) | | | 1.99 | | | | 2.00 | | | | 2.07 | (a) |
Net investment income | | | 0.20 | (a)(l) | | | 0.74 | | | | 0.89 | | | | 0.82 | (a) |
Portfolio turnover | | | 17 | (n) | | | 28 | | | | 61 | | | | 28 | (n) |
Net assets at end of period (000 omitted) | | | $1,860 | | | | $1,554 | | | | $453 | | | | $130 | |
See Notes to Financial Statements
17
Financial Highlights – continued
| | | | | | | | | | | | | | | | |
| | | Six months
ended
2/28/17
(unaudited) | | | Years ended 8/31 | | | Period
ended 8/31/14 (c) | |
| Class I | | | 2016 | | | 2015 | | |
| | | | | | | | | | | |
Net asset value, beginning of period | | | $11.87 | | | | $10.76 | | | | $10.93 | | | | $10.00 | |
| Income (loss) from investment operations | |
Net investment income (d) | | | $0.07 | | | | $0.21 | | | | $0.24 | | | | $0.14 | |
Net realized and unrealized gain (loss) on
investments and foreign currency | | | 0.15 | | | | 1.10 | | | | (0.25 | ) | | | 0.89 | |
Total from investment operations | | | $0.22 | | | | $1.31 | | | | $(0.01 | ) | | | $1.03 | |
| Less distributions declared to shareholders | |
From net investment income | | | $(0.08 | ) | | | $(0.20 | ) | | | $(0.14 | ) | | | $(0.10 | ) |
From net realized gain on investments | | | — | | | | — | | | | (0.02 | ) | | | — | |
Total distributions declared to shareholders | | | $(0.08 | ) | | | $(0.20 | ) | | | $(0.16 | ) | | | $(0.10 | ) |
Net asset value, end of period (x) | | | $12.01 | | | | $11.87 | | | | $10.76 | | | | $10.93 | |
Total return (%) (r)(s)(x) | | | 1.86 | (n) | | | 12.34 | | | | (0.18 | ) | | | 10.29 | (n) |
Ratios (%) (to average net assets)
and Supplemental data: | |
Expenses before expense reductions (f) | | | 1.04 | (a) | | | 1.17 | | | | 1.63 | | | | 5.85 | (a) |
Expenses after expense reductions (f) | | | 0.99 | (a) | | | 0.98 | | | | 1.00 | | | | 1.07 | (a) |
Net investment income | | | 1.15 | (a)(l) | | | 1.86 | | | | 2.10 | | | | 1.81 | (a) |
Portfolio turnover | | | 17 | (n) | | | 28 | | | | 61 | | | | 28 | (n) |
Net assets at end of period (000 omitted) | | | $30,293 | | | | $10,669 | | | | $2,685 | | | | $138 | |
See Notes to Financial Statements
18
Financial Highlights – continued
| | | | | | | | | | | | | | | | |
| | | Six months
ended
2/28/17 | | | Years ended 8/31 | | | Period
ended 8/31/14 (c) | |
| Class R1 | | | 2016 | | | 2015 | | |
| | | (unaudited) | | | | | | | | | | |
Net asset value, beginning of period | | | $11.84 | | | | $10.70 | | | | $10.91 | | | | $10.00 | |
| Income (loss) from investment operations | |
Net investment income (d) | | | $0.01 | | | | $0.08 | | | | $0.07 | | | | $0.06 | |
Net realized and unrealized gain (loss) on
investments and foreign currency | | | 0.16 | | | | 1.12 | | | | (0.19 | ) | | | 0.89 | |
Total from investment operations | | | $0.17 | | | | $1.20 | | | | $(0.12 | ) | | | $0.95 | |
| Less distributions declared to shareholders | |
From net investment income | | | $(0.02 | ) | | | $(0.06 | ) | | | $(0.07 | ) | | | $(0.04 | ) |
From net realized gain on investments | | | — | | | | — | | | | (0.02 | ) | | | — | |
Total distributions declared to shareholders | | | $(0.02 | ) | | | $(0.06 | ) | | | $(0.09 | ) | | | $(0.04 | ) |
Net asset value, end of period (x) | | | $11.99 | | | | $11.84 | | | | $10.70 | | | | $10.91 | |
Total return (%) (r)(s)(x) | | | 1.41 | (n) | | | 11.24 | | | | (1.22 | ) | | | 9.50 | (n) |
Ratios (%) (to average net assets)
and Supplemental data: | |
Expenses before expense reductions (f) | | | 2.04 | (a) | | | 2.31 | | | | 2.69 | | | | 6.89 | (a) |
Expenses after expense reductions (f) | | | 1.99 | (a) | | | 1.99 | | | | 2.01 | | | | 2.07 | (a) |
Net investment income | | | 0.20 | (a)(l) | | | 0.69 | | | | 0.66 | | | | 0.79 | (a) |
Portfolio turnover | | | 17 | (n) | | | 28 | | | | 61 | | | | 28 | (n) |
Net assets at end of period (000 omitted) | | | $56 | | | | $56 | | | | $108 | | | | $109 | |
See Notes to Financial Statements
19
Financial Highlights – continued
| | | | | | | | | | | | | | | | |
| | | Six months
ended
2/28/17 | | | Years ended 8/31 | | | Period
ended 8/31/14 (c) | |
| Class R2 | | | 2016 | | | 2015 | | |
| | | (unaudited) | | | | | | | | | | |
Net asset value, beginning of period | | | $11.87 | | | | $10.74 | | | | $10.92 | | | | $10.00 | |
| Income (loss) from investment operations | |
Net investment income (d) | | | $0.04 | | | | $0.13 | | | | $0.13 | | | | $0.10 | |
Net realized and unrealized gain (loss) on
investments and foreign currency | | | 0.15 | | | | 1.13 | | | | (0.20 | ) | | | 0.89 | |
Total from investment operations | | | $0.19 | | | | $1.26 | | | | $(0.07 | ) | | | $0.99 | |
| Less distributions declared to shareholders | |
From net investment income | | | $(0.05 | ) | | | $(0.13 | ) | | | $(0.09 | ) | | | $(0.07 | ) |
From net realized gain on investments | | | — | | | | — | | | | (0.02 | ) | | | — | |
Total distributions declared to shareholders | | | $(0.05 | ) | | | $(0.13 | ) | | | $(0.11 | ) | | | $(0.07 | ) |
Net asset value, end of period (x) | | | $12.01 | | | | $11.87 | | | | $10.74 | | | | $10.92 | |
Total return (%) (r)(s)(x) | | | 1.59 | (n) | | | 11.83 | | | | (0.71 | ) | | | 9.89 | (n) |
Ratios (%) (to average net assets)
and Supplemental data: | |
Expenses before expense reductions (f) | | | 1.54 | (a) | | | 1.79 | | | | 2.19 | | | | 6.39 | (a) |
Expenses after expense reductions (f) | | | 1.49 | (a) | | | 1.49 | | | | 1.51 | | | | 1.57 | (a) |
Net investment income | | | 0.69 | (a)(l) | | | 1.20 | | | | 1.16 | | | | 1.29 | (a) |
Portfolio turnover | | | 17 | (n) | | | 28 | | | | 61 | | | | 28 | (n) |
Net assets at end of period (000 omitted) | | | $75 | | | | $72 | | | | $112 | | | | $110 | |
See Notes to Financial Statements
20
Financial Highlights – continued
| | | | | | | | | | | | | | | | |
| | | Six months
ended
2/28/17 | | | Years ended 8/31 | | | Period
ended 8/31/14 (c) | |
| Class R3 | | | 2016 | | | 2015 | | |
| | | (unaudited) | | | | | | | | | | |
Net asset value, beginning of period | | | $11.88 | | | | $10.76 | | | | $10.92 | | | | $10.00 | |
| Income (loss) from investment operations | |
Net investment income (d) | | | $0.05 | | | | $0.16 | | | | $0.16 | | | | $0.12 | |
Net realized and unrealized gain (loss) on
investments and foreign currency | | | 0.15 | | | | 1.12 | | | | (0.19 | ) | | | 0.88 | |
Total from investment operations | | | $0.20 | | | | $1.28 | | | | $(0.03 | ) | | | $1.00 | |
| Less distributions declared to shareholders | |
From net investment income | | | $(0.06 | ) | | | $(0.16 | ) | | | $(0.11 | ) | | | $(0.08 | ) |
From net realized gain on investments | | | — | | | | — | | | | (0.02 | ) | | | — | |
Total distributions declared to shareholders | | | $(0.06 | ) | | | $(0.16 | ) | | | $(0.13 | ) | | | $(0.08 | ) |
Net asset value, end of period (x) | | | $12.02 | | | | $11.88 | | | | $10.76 | | | | $10.92 | |
Total return (%) (r)(s)(x) | | | 1.72 | (n) | | | 12.05 | | | | (0.34 | ) | | | 10.04 | (n) |
Ratios (%) (to average net assets)
and Supplemental data: | |
Expenses before expense reductions (f) | | | 1.29 | (a) | | | 1.56 | | | | 1.94 | | | | 6.14 | (a) |
Expenses after expense reductions (f) | | | 1.24 | (a) | | | 1.24 | | | | 1.26 | | | | 1.32 | (a) |
Net investment income | | | 0.95 | (a)(l) | | | 1.44 | | | | 1.41 | | | | 1.54 | (a) |
Portfolio turnover | | | 17 | (n) | | | 28 | | | | 61 | | | | 28 | (n) |
Net assets at end of period (000 omitted) | | | $57 | | | | $56 | | | | $110 | | | | $110 | |
See Notes to Financial Statements
21
Financial Highlights – continued
| | | | | | | | | | | | | | | | |
| | | Six months
ended
2/28/17
(unaudited) | | | Years ended 8/31 | | | Period
ended 8/31/14 (c) | |
| Class R4 | | | 2016 | | | 2015 | | |
| | | | | | | | | | | |
Net asset value, beginning of period | | | $11.87 | | | | $10.76 | | | | $10.93 | | | | $10.00 | |
| Income (loss) from investment operations | | | | | | | | | | | | | |
Net investment income (d) | | | $0.07 | | | | $0.19 | | | | $0.19 | | | | $0.14 | |
Net realized and unrealized gain (loss) on
investments and foreign currency | | | 0.15 | | | | 1.12 | | | | (0.20 | ) | | | 0.89 | |
Total from investment operations | | | $0.22 | | | | $1.31 | | | | $(0.01 | ) | | | $1.03 | |
| Less distributions declared to shareholders | | | | | | | | | | | | | |
From net investment income | | | $(0.08 | ) | | | $(0.20 | ) | | | $(0.14 | ) | | | $(0.10 | ) |
From net realized gain on investments | | | — | | | | — | | | | (0.02 | ) | | | — | |
Total distributions declared to shareholders | | | $(0.08 | ) | | | $(0.20 | ) | | | $(0.16 | ) | | | $(0.10 | ) |
Net asset value, end of period (x) | | | $12.01 | | | | $11.87 | | | | $10.76 | | | | $10.93 | |
Total return (%) (r)(s)(x) | | | 1.85 | (n) | | | 12.32 | | | | (0.18 | ) | | | 10.29 | (n) |
Ratios (%) (to average net assets)
and Supplemental data: | | | | | | | | | | | | | | | | |
Expenses before expense reductions (f) | | | 1.04 | (a) | | | 1.31 | | | | 1.69 | | | | 5.89 | (a) |
Expenses after expense reductions (f) | | | 0.99 | (a) | | | 0.99 | | | | 1.02 | | | | 1.07 | (a) |
Net investment income | | | 1.20 | (a)(l) | | | 1.69 | | | | 1.66 | | | | 1.79 | (a) |
Portfolio turnover | | | 17 | (n) | | | 28 | | | | 61 | | | | 28 | (n) |
Net assets at end of period (000 omitted) | | | $57 | | | | $56 | | | | $110 | | | | $110 | |
See Notes to Financial Statements
22
Financial Highlights – continued
| | | | | | | | | | | | | | | | |
| | | Six months
ended
2/28/17
(unaudited) | | | Years ended 8/31 | | | Period
ended 8/31/14 (c) | |
| Class R6 | | | 2016 | | | 2015 | | |
| | | | | | | | | | | |
Net asset value, beginning of period | | | $11.86 | | | | $10.76 | | | | $10.92 | | | | $10.00 | |
| Income (loss) from investment operations | | | | | | | | | | | | | |
Net investment income (d) | | | $0.07 | | | | $0.20 | | | | $0.20 | | | | $0.14 | |
Net realized and unrealized gain (loss) on
investments and foreign currency | | | 0.15 | | | | 1.11 | | | | (0.20 | ) | | | 0.88 | |
Total from investment operations | | | $0.22 | | | | $1.31 | | | | $— | | | | $1.02 | |
| Less distributions declared to shareholders | | | | | | | | | | | | | |
From net investment income | | | $(0.08 | ) | | | $(0.21 | ) | | | $(0.14 | ) | | | $(0.10 | ) |
From net realized gain on investments | | | — | | | | — | | | | (0.02 | ) | | | — | |
Total distributions declared to shareholders | | | $(0.08 | ) | | | $(0.21 | ) | | | $(0.16 | ) | | | $(0.10 | ) |
Net asset value, end of period (x) | | | $12.00 | | | | $11.86 | | | | $10.76 | | | | $10.92 | |
Total return (%) (r)(s)(x) | | | 1.88 | (n) | | | 12.37 | | | | (0.09 | ) | | | 10.21 | (n) |
Ratios (%) (to average net assets)
and Supplemental data: | | | | | | | | | | | | | | | | |
Expenses before expense reductions (f) | | | 1.00 | (a) | | | 1.21 | | | | 1.63 | | | | 5.88 | (a) |
Expenses after expense reductions (f) | | | 0.95 | (a) | | | 0.93 | | | | 0.97 | | | | 1.06 | (a) |
Net investment income | | | 1.24 | (a)(l) | | | 1.76 | | | | 1.79 | | | | 1.80 | (a) |
Portfolio turnover | | | 17 | (n) | | | 28 | | | | 61 | | | | 28 | (n) |
Net assets at end of period (000 omitted) | | | $50,854 | | | | $45,799 | | | | $27,802 | | | | $5,966 | |
| (c) | For the period from the commencement of the fund’s investment operations, December 5, 2013, through the stated period end. |
| (d) | Per share data is based on average shares outstanding. |
| (f) | Ratios do not reflect reductions from fees paid indirectly, if applicable. |
| (l) | Recognition of net investment income by the fund may be affected by the timing of the declaration of dividends by companies in which the fund invests and the actual annual net investment income ratio may differ. |
| (r) | Certain expenses have been reduced without which performance would have been lower. |
| (s) | From time to time the fund may receive proceeds from litigation settlements, without which performance would be lower. |
| (t) | Total returns do not include any applicable sales charges. |
| (x) | The net asset values and total returns have been calculated on net assets which include adjustments made in accordance with U.S. generally accepted accounting principles required at period end for financial reporting purposes. |
See Notes to Financial Statements
23
NOTES TO FINANCIAL STATEMENTS
(unaudited)
(1) Business and Organization
MFS Low Volatility Global Equity Fund (the fund) is a diversified series of MFS Series Trust I (the trust). The trust is organized as a Massachusetts business trust and is registered under the Investment Company Act of 1940, as amended, as an open-end management investment company.
The fund is an investment company and accordingly follows the investment company accounting and reporting guidance of the Financial Accounting Standards Board (FASB) Accounting Standards Codification Topic 946 Financial Services – Investment Companies.
(2) Significant Accounting Policies
General – The preparation of financial statements in conformity with U.S. generally accepted accounting principles requires management to make estimates and assumptions that affect the reported amounts of assets and liabilities, and disclosure of contingent assets and liabilities at the date of the financial statements and the reported amounts of increases and decreases in net assets from operations during the reporting period. Actual results could differ from those estimates. In the preparation of these financial statements, management has evaluated subsequent events occurring after the date of the fund’s Statement of Assets and Liabilities through the date that the financial statements were issued. The fund invests in foreign securities. Investments in foreign securities are vulnerable to the effects of changes in the relative values of the local currency and the U.S. dollar and to the effects of changes in each country’s legal, political, and economic environment.
In October 2016, the Securities and Exchange Commission (SEC) released its Final Rule on Investment Company Reporting Modernization (the “Rule”). The Rule, which introduces two new regulatory reporting forms for investment companies – Form N-PORT and Form N-CEN – also contains amendments to Regulation S-X which impact financial statement presentation, particularly the presentation of derivative investments. Although still evaluating the impacts of the Rule, management believes that many of the Regulation S-X amendments are consistent with the fund’s current financial statement presentation and expects that the fund will be able to comply with the Rule’s Regulation S-X amendments by the August 1, 2017 compliance date.
Balance Sheet Offsetting – The fund’s accounting policy with respect to balance sheet offsetting is that, absent an event of default by the counterparty or a termination of the agreement, the International Swaps and Derivatives Association (ISDA) Master Agreement does not result in an offset of reported amounts of financial assets and financial liabilities in the Statement of Assets and Liabilities across transactions between the fund and the applicable counterparty. The fund’s right to setoff may be restricted or prohibited by the bankruptcy or insolvency laws of the particular jurisdiction to which a specific master netting agreement counterparty is subject. Balance sheet offsetting disclosures, to the extent applicable to the fund, have been included in the fund’s Significant Accounting Policies note under the captions for each of the fund’s in-scope financial instruments and transactions.
24
Notes to Financial Statements (unaudited) – continued
Investment Valuations – Equity securities, including restricted equity securities, are generally valued at the last sale or official closing price on their primary market or exchange as provided by a third-party pricing service. Equity securities, for which there were no sales reported that day, are generally valued at the last quoted daily bid quotation on their primary market or exchange as provided by a third-party pricing service. Short-term instruments with a maturity at issuance of 60 days or less may be valued at amortized cost, which approximates market value. Open-end investment companies are generally valued at net asset value per share. Securities and other assets generally valued on the basis of information from a third-party pricing service may also be valued at a broker/dealer bid quotation. Values obtained from third-party pricing services can utilize both transaction data and market information such as yield, quality, coupon rate, maturity, type of issue, trading characteristics, and other market data. The values of foreign securities and other assets and liabilities expressed in foreign currencies are converted to U.S. dollars using the mean of bid and asked prices for rates provided by a third-party pricing service.
The Board of Trustees has delegated primary responsibility for determining or causing to be determined the value of the fund’s investments (including any fair valuation) to the adviser pursuant to valuation policies and procedures approved by the Board. If the adviser determines that reliable market quotations are not readily available, investments are valued at fair value as determined in good faith by the adviser in accordance with such procedures under the oversight of the Board of Trustees. Under the fund’s valuation policies and procedures, market quotations are not considered to be readily available for most types of debt instruments and floating rate loans and many types of derivatives. These investments are generally valued at fair value based on information from third-party pricing services. In addition, investments may be valued at fair value if the adviser determines that an investment’s value has been materially affected by events occurring after the close of the exchange or market on which the investment is principally traded (such as foreign exchange or market) and prior to the determination of the fund’s net asset value, or after the halting of trading of a specific security where trading does not resume prior to the close of the exchange or market on which the security is principally traded. Events that occur on a frequent basis after foreign markets close (such as developments in foreign markets and significant movements in the U.S. markets) and prior to the determination of the fund’s net asset value may be deemed to have a material effect on the value of securities traded in foreign markets. Accordingly, the fund’s foreign equity securities may often be valued at fair value. The adviser generally relies on third-party pricing services or other information (such as the correlation with price movements of similar securities in the same or other markets; the type, cost and investment characteristics of the security; the business and financial condition of the issuer; and trading and other market data) to assist in determining whether to fair value and at what value to fair value an investment. The value of an investment for purposes of calculating the fund’s net asset value can differ depending on the source and method used to determine value. When fair valuation is used, the value of an investment used to determine the fund’s net asset value may differ from quoted or published prices for the same investment. There can be no assurance that the fund could obtain the fair value assigned to an investment if it were to sell the investment at the same time at which the fund determines its net asset value per share.
25
Notes to Financial Statements (unaudited) – continued
Various inputs are used in determining the value of the fund’s assets or liabilities. These inputs are categorized into three broad levels. In certain cases, the inputs used to measure fair value may fall into different levels of the fair value hierarchy. In such cases, an investment’s level within the fair value hierarchy is based on the lowest level of input that is significant to the fair value measurement. The fund’s assessment of the significance of a particular input to the fair value measurement in its entirety requires judgment, and considers factors specific to the investment. Level 1 includes unadjusted quoted prices in active markets for identical assets or liabilities. Level 2 includes other significant observable market-based inputs (including quoted prices for similar securities, interest rates, prepayment speed, and credit risk). Level 3 includes unobservable inputs, which may include the adviser’s own assumptions in determining the fair value of investments. The following is a summary of the levels used as of February 28, 2017 in valuing the fund’s assets or liabilities:
| | | | | | | | | | | | | | | | |
| Investments at Value | | Level 1 | | | Level 2 | | | Level 3 | | | Total | |
| Equity Securities: | | | | | | | | | | | | | | | | |
United States | | | $45,466,983 | | | | $— | | | | $— | | | | $45,466,983 | |
Japan | | | 8,551,971 | | | | — | | | | — | | | | 8,551,971 | |
Canada | | | 6,845,911 | | | | — | | | | — | | | | 6,845,911 | |
Switzerland | | | 6,173,709 | | | | — | | | | — | | | | 6,173,709 | |
United Kingdom | | | 4,007,008 | | | | — | | | | — | | | | 4,007,008 | |
Hong Kong | | | 3,642,731 | | | | — | | | | — | | | | 3,642,731 | |
Taiwan | | | 3,070,339 | | | | — | | | | — | | | | 3,070,339 | |
Germany | | | 2,178,254 | | | | — | | | | — | | | | 2,178,254 | |
New Zealand | | | 1,766,460 | | | | — | | | | — | | | | 1,766,460 | |
Other Countries | | | 7,697,241 | | | | 1,002,242 | | | | — | | | | 8,699,483 | |
| Mutual Funds | | | 882,794 | | | | — | | | | — | | | | 882,794 | |
| Total Investments | | | $90,283,401 | | | | $1,002,242 | | | | $— | | | | $91,285,643 | |
For further information regarding security characteristics, see the Portfolio of Investments.
Of the level 1 investments presented above, equity investments amounting to $958,990 would have been considered level 2 investments at the beginning of the period. The primary reason for changes in the classifications between levels 1 and 2 occurs when foreign equity securities are fair valued using other observable market-based inputs in place of the closing exchange price due to events occurring after the close of the exchange or market on which the investment is principally traded. The fund’s foreign equity securities may often be valued using other observable market-based inputs. The fund’s policy is to recognize transfers between the levels as of the end of the period.
Foreign Currency Translation – Purchases and sales of foreign investments, income, and expenses are converted into U.S. dollars based upon currency exchange rates prevailing on the respective dates of such transactions or on the reporting date for foreign denominated receivables and payables. Gains and losses attributable to foreign currency exchange rates on sales of securities are recorded for financial statement purposes as net realized gains and losses on investments. Gains and losses attributable to foreign exchange rate movements on receivables, payables, income and expenses
26
Notes to Financial Statements (unaudited) – continued
are recorded for financial statement purposes as foreign currency transaction gains and losses. That portion of both realized and unrealized gains and losses on investments that results from fluctuations in foreign currency exchange rates is not separately disclosed.
Indemnifications – Under the fund’s organizational documents, its officers and Trustees may be indemnified against certain liabilities and expenses arising out of the performance of their duties to the fund. Additionally, in the normal course of business, the fund enters into agreements with service providers that may contain indemnification clauses. The fund’s maximum exposure under these agreements is unknown as this would involve future claims that may be made against the fund that have not yet occurred.
Investment Transactions and Income – Investment transactions are recorded on the trade date. Dividends received in cash are recorded on the ex-dividend date. Certain dividends from foreign securities will be recorded when the fund is informed of the dividend if such information is obtained subsequent to the ex-dividend date. Dividend payments received in additional securities are recorded on the ex-dividend date in an amount equal to the value of the security on such date.
The fund may receive proceeds from litigation settlements. Any proceeds received from litigation involving portfolio holdings are reflected in the Statement of Operations in realized gain/loss if the security has been disposed of by the fund or in unrealized gain/loss if the security is still held by the fund. Any other proceeds from litigation not related to portfolio holdings are reflected as other income in the Statement of Operations.
Tax Matters and Distributions – The fund intends to qualify as a regulated investment company, as defined under Subchapter M of the Internal Revenue Code, and to distribute all of its taxable income, including realized capital gains. As a result, no provision for federal income tax is required. The fund’s federal tax returns, when filed, will remain subject to examination by the Internal Revenue Service for a three year period. Management has analyzed the fund’s tax positions taken on federal and state tax returns for all open tax years and does not believe that there are any uncertain tax positions that require recognition of a tax liability. Foreign taxes, if any, have been accrued by the fund in the accompanying financial statements in accordance with the applicable foreign tax law. Foreign income taxes may be withheld by certain countries in which the fund invests. Additionally, capital gains realized by the fund on securities issued in or by certain foreign countries may be subject to capital gains tax imposed by those countries.
Distributions to shareholders are recorded on the ex-dividend date. Income and capital gain distributions are determined in accordance with income tax regulations, which may differ from U.S. generally accepted accounting principles. Certain capital accounts in the financial statements are periodically adjusted for permanent differences in order to reflect their tax character. These adjustments have no impact on net assets or net asset value per share. Temporary differences which arise from recognizing certain items of income, expense, gain or loss in different periods for financial statement and tax purposes will reverse at some time in the future. Distributions in excess of net investment income or net realized gains are temporary overdistributions for financial
27
Notes to Financial Statements (unaudited) – continued
statement purposes resulting from differences in the recognition or classification of income or distributions for financial statement and tax purposes.
Book/tax differences primarily relate to wash sale loss deferrals.
The tax character of distributions made during the current period will be determined at fiscal year end. The tax character of distributions declared to shareholders for the last fiscal year is as follows:
| | | | |
| | | 8/31/16 | |
Ordinary income (including any
short-term capital gains) | | | $882,213 | |
The federal tax cost and the tax basis components of distributable earnings were as follows:
| | | | |
| As of 2/28/17 | | | |
| Cost of investments | | | $84,298,130 | |
| Gross appreciation | | | 8,412,491 | |
| Gross depreciation | | | (1,424,978 | ) |
| Net unrealized appreciation (depreciation) | | | $6,987,513 | |
| |
| As of 8/31/16 | | | |
| Undistributed ordinary income | | | 173,978 | |
| Capital loss carryforwards | | | (1,227,342 | ) |
| Other temporary differences | | | (1,629 | ) |
| Net unrealized appreciation (depreciation) | | | 5,640,317 | |
The aggregate cost above includes prior fiscal year end tax adjustments, if applicable.
As of August 31, 2016, the fund had capital loss carryforwards available to offset future realized gains. These net capital losses may be carried forward indefinitely and their character is retained as short-term and/or long-term losses. Such losses are characterized as follows:
| | | | |
| Short-Term | | | $(860,950 | ) |
| Long-Term | | | (366,392 | ) |
| Total | | | $(1,277,342 | ) |
Multiple Classes of Shares of Beneficial Interest – The fund offers multiple classes of shares, which differ in their respective distribution and service fees. The fund’s income, realized and unrealized gain (loss), and common expenses are allocated to shareholders based on the daily net assets of each class. Dividends are declared separately for each class. Differences in per share dividend rates are generally due to differences in separate class expenses. Class B shares will convert to Class A shares
28
Notes to Financial Statements (unaudited) – continued
approximately eight years after purchase. The fund’s distributions declared to shareholders as reported in the Statements of Changes in Net Assets are presented by class as follows:
| | | | | | | | |
| | | From net investment
income | |
| | | Six months
ended
2/28/17 | | | Year
ended
8/31/16 | |
| Class A | | | $41,696 | | | | $82,410 | |
| Class B | | | 347 | | | | 3,365 | |
| Class C | | | 3,355 | | | | 6,103 | |
| Class I | | | 127,627 | | | | 84,191 | |
| Class R1 | | | 75 | | | | 279 | |
| Class R2 | | | 289 | | | | 699 | |
| Class R3 | | | 294 | | | | 763 | |
| Class R4 | | | 369 | | | | 928 | |
| Class R6 | | | 313,984 | | | | 703,475 | |
| Total | | | $488,036 | | | | $882,213 | |
(3) Transactions with Affiliates
Investment Adviser – The fund has an investment advisory agreement with MFS to provide overall investment management and related administrative services and facilities to the fund. The management fee is computed daily and paid monthly at the following annual rates:
| | | | |
| First $1 billion of average daily net assets | | | 0.65 | % |
| Next $1.5 billion of average daily net assets | | | 0.60 | % |
| Average daily net assets in excess of $2.5 billion | | | 0.55 | % |
MFS has agreed in writing to reduce its management fee by a specified amount if certain MFS mutual fund assets exceed thresholds agreed to by MFS and the fund’s Board of Trustees. For the six months ended February 28, 2017, this management fee reduction amounted to $2,805, which is included in the reduction of total expenses in the Statement of Operations. The management fee incurred for the six months ended February 28, 2017 was equivalent to an annual effective rate of 0.64% of the fund’s average daily net assets.
The investment adviser has agreed in writing to pay a portion of the fund’s total annual operating expenses, excluding interest, taxes, extraordinary expenses, brokerage and transaction costs, and investment-related expenses, such that total fund operating expenses do not exceed the following rates annually of each class’s average daily net assets:
| | | | | | | | | | | | | | | | | | | | | | | | | | | | | | | | |
| Classes | |
| A | | B | | | C | | | I | | | R1 | | | R2 | | | R3 | | | R4 | | | R6 | |
| 1.24% | | | 1.99% | | | | 1.99% | | | | 0.99% | | | | 1.99% | | | | 1.49% | | | | 1.24% | | | | 0.99% | | | | 0.95% | |
This written agreement will continue until modified by the fund’s Board of Trustees, but such agreement will continue at least until December 31, 2017. For the six months ended February 28, 2017, this reduction amounted to $16,699, which is included in the reduction of total expenses in the Statement of Operations.
29
Notes to Financial Statements (unaudited) – continued
Distributor – MFS Fund Distributors, Inc. (MFD), a wholly-owned subsidiary of MFS, as distributor, received $3,332 for the six months ended February 28, 2017, as its portion of the initial sales charge on sales of Class A shares of the fund.
The Board of Trustees has adopted a distribution plan for certain share classes pursuant to Rule 12b-1 of the Investment Company Act of 1940.
The fund’s distribution plan provides that the fund will pay MFD for services provided by MFD and financial intermediaries in connection with the distribution and servicing of certain share classes. One component of the plan is a distribution fee paid to MFD and another component of the plan is a service fee paid to MFD. MFD may subsequently pay all, or a portion, of the distribution and/or service fees to financial intermediaries.
Distribution Plan Fee Table:
| | | | | | | | | | | | | | | | | | | | |
| | | Distribution
Fee Rate (d) | | | Service
Fee Rate (d) | | | Total Distribution Plan (d) | | | Annual Effective Rate (e) | | | Distribution and Service Fee | |
| Class A | | | — | | | | 0.25% | | | | 0.25% | | | | 0.20% | | | | $9,240 | |
| Class B | | | 0.75% | | | | 0.25% | | | | 1.00% | | | | 1.00% | | | | 1,457 | |
| Class C | | | 0.75% | | | | 0.25% | | | | 1.00% | | | | 1.00% | | | | 8,453 | |
| Class R1 | | | 0.75% | | | | 0.25% | | | | 1.00% | | | | 1.00% | | | | 271 | |
| Class R2 | | | 0.25% | | | | 0.25% | | | | 0.50% | | | | 0.50% | | | | 178 | |
| Class R3 | | | — | | | | 0.25% | | | | 0.25% | | | | 0.25% | | | | 68 | |
| Total Distribution and Service Fees | | | | $19,667 | |
| (d) | In accordance with the distribution plan for certain classes, the fund pays distribution and/or service fees equal to these annual percentage rates of each class’s average daily net assets. The distribution and service fee rates disclosed by class represent the current rates in effect at the end of the reporting period. Any rate changes, if applicable, are detailed below. |
| (e) | The annual effective rates represent actual fees incurred under the distribution plan for the six months ended February 28, 2017 based on each class’s average daily net assets. MFD has voluntarily agreed to rebate a portion of each class’s 0.25% service fee attributable to accounts for which MFD retains the 0.25% service fee except for accounts attributable to MFS or its affiliates’ seed money. For the six months ended February 28, 2017, this rebate amounted to $1,692 and $4 for Class A and Class B, respectively, and is included in the reduction of total expenses in the Statement of Operations. |
Certain Class A shares are subject to a contingent deferred sales charge (CDSC) in the event of a shareholder redemption within 18 months of purchase. Class C shares are subject to a CDSC in the event of a shareholder redemption within 12 months of purchase. Class B shares are subject to a CDSC in the event of a shareholder redemption within six years of purchase. All contingent deferred sales charges are paid to MFD and during the six months ended February 28, 2017, were as follows:
| | | | |
| | | Amount | |
| Class A | | | $— | |
| Class B | | | 1,682 | |
| Class C | | | 736 | |
Shareholder Servicing Agent – MFS Service Center, Inc. (MFSC), a wholly-owned subsidiary of MFS, receives a fee from the fund for its services as shareholder servicing agent calculated as a percentage of the average daily net assets of the fund as
30
Notes to Financial Statements (unaudited) – continued
determined periodically under the supervision of the fund’s Board of Trustees. For the six months ended February 28, 2017, the fee was $2,813, which equated to 0.0073% annually of the fund’s average daily net assets. MFSC also receives payment from the fund for out-of-pocket expenses, sub-accounting and other shareholder servicing costs which may be paid to affiliated and unaffiliated service providers. Class R6 shares do not incur sub-accounting fees. For the six months ended February 28, 2017, these out-of-pocket expenses, sub-accounting and other shareholder servicing costs amounted to $7,632.
Administrator – MFS provides certain financial, legal, shareholder communications, compliance, and other administrative services to the fund. Under an administrative services agreement, the fund reimburses MFS the costs incurred to provide these services. The fund is charged an annual fixed amount of $17,500 plus a fee based on average daily net assets. The administrative services fee incurred for the six months ended February 28, 2017 was equivalent to an annual effective rate of 0.0280% of the fund’s average daily net assets.
Trustees’ and Officers’ Compensation – The fund pays compensation to independent Trustees in the form of a retainer, attendance fees, and additional compensation to Board and Committee chairpersons. The fund does not pay compensation directly to Trustees or officers of the fund who are also officers of the investment adviser, all of whom receive remuneration for their services to the fund from MFS. Certain officers and Trustees of the fund are officers or directors of MFS, MFD, and MFSC.
Other – This fund and certain other funds managed by MFS (the funds) have entered into a service agreement (the ISO Agreement) which provides for payment of fees solely by the funds to Tarantino LLC in return for the provision of services of an Independent Senior Officer (ISO) for the funds. Frank L. Tarantino serves as the ISO and is an officer of the funds and the sole member of Tarantino LLC. The funds can terminate the ISO Agreement with Tarantino LLC at any time under the terms of the ISO Agreement. For the six months ended February 28, 2017, the fee paid by the fund under this agreement was $64 and is included in “Miscellaneous” expense in the Statement of Operations. MFS has agreed to bear all expenses associated with office space, other administrative support, and supplies provided to the ISO.
The fund invests in the MFS Institutional Money Market Portfolio which is managed by MFS and seeks current income consistent with preservation of capital and liquidity. This money market fund does not pay a management fee to MFS.
On September 9, 2015, MFS redeemed 10,205, 5,442, 5,439, 10,229, 5,436, 5,504, 5,545, 5,584, and 52,729 shares of Class A, Class B, Class C, Class I, Class R1, Class R2, Class R3, Class R4, and Class R6, respectively, for an aggregate amount of $1,123,336.
At February 28, 2017, MFS held approximately 76% of the outstanding shares of Class R2 and 100% of the outstanding shares of Class R1, Class R3, and Class R4, respectively.
(4) Portfolio Securities
For the six months ended February 28, 2017, purchases and sales of investments, other than short-term obligations, aggregated $37,349,594 and $12,841,368, respectively.
31
Notes to Financial Statements (unaudited) – continued
(5) Shares of Beneficial Interest
The fund’s Declaration of Trust permits the Trustees to issue an unlimited number of full and fractional shares of beneficial interest. Transactions in fund shares were as follows:
| | | | | | | | | | | | | | | | |
| | | Six months ended
2/28/17 | | | Year ended
8/31/16 | |
| | | Shares | | | Amount | | | Shares | | | Amount | |
| Shares sold | | | | | | | | | | | | | | | | |
Class A | | | 97,955 | | | | $1,142,592 | | | | 352,011 | | | | $3,943,532 | |
Class B | | | 1,759 | | | | 20,307 | | | | 12,746 | | | | 140,632 | |
Class C | | | 41,703 | | | | 485,875 | | | | 102,284 | | | | 1,183,608 | |
Class I | | | 1,737,145 | | | | 20,307,921 | | | | 755,196 | | | | 8,502,164 | |
Class R2 | | | 180 | | | | 2,100 | | | | 1,057 | | | | 12,124 | |
Class R6 | | | 436,299 | | | | 5,116,801 | | | | 1,420,824 | | | | 15,709,877 | |
| | | 2,315,041 | | | | $27,075,596 | | | | 2,644,118 | | | | $29,491,937 | |
| | | | |
| Shares issued to shareholders in reinvestment of distributions | | | | | | | | | | | | | | | | |
Class A | | | 3,569 | | | | $41,696 | | | | 7,402 | | | | $82,410 | |
Class B | | | 30 | | | | 347 | | | | 310 | | | | 3,365 | |
Class C | | | 287 | | | | 3,335 | | | | 545 | | | | 6,065 | |
Class I | | | 8,501 | | | | 99,141 | | | | 7,364 | | | | 82,896 | |
Class R1 | | | 6 | | | | 75 | | | | 25 | | | | 279 | |
Class R2 | | | 25 | | | | 289 | | | | 63 | | | | 699 | |
Class R3 | | | 25 | | | | 294 | | | | 69 | | | | 763 | |
Class R4 | | | 31 | | | | 369 | | | | 84 | | | | 928 | |
Class R6 | | | 26,006 | | | | 303,656 | | | | 61,837 | | | | 682,663 | |
| | | 38,480 | | | | $449,202 | | | | 77,699 | | | | $860,068 | |
| | | | |
| Shares reacquired | | | | | | | | | | | | | | | | |
Class A | | | (74,328 | ) | | | $(863,631 | ) | | | (100,064 | ) | | | $(1,122,184 | ) |
Class B | | | (7,683 | ) | | | (90,273 | ) | | | (25,828 | ) | | | (281,688 | ) |
Class C | | | (17,875 | ) | | | (204,007 | ) | | | (13,294 | ) | | | (142,347 | ) |
Class I | | | (121,902 | ) | | | (1,413,498 | ) | | | (112,934 | ) | | | (1,224,321 | ) |
Class R1 | | | — | | | | — | | | | (5,436 | ) | | | (57,295 | ) |
Class R2 | | | — | | | | — | | | | (5,504 | ) | | | (58,232 | ) |
Class R3 | | | — | | | | — | | | | (5,545 | ) | | | (58,721 | ) |
Class R4 | | | — | | | | — | | | | (5,584 | ) | | | (59,190 | ) |
Class R6 | | | (86,288 | ) | | | (1,010,758 | ) | | | (204,768 | ) | | | (2,272,316 | ) |
| | | (308,076 | ) | | | $(3,582,167 | ) | | | (478,957 | ) | | | $(5,276,294 | ) |
32
Notes to Financial Statements (unaudited) – continued
| | | | | | | | | | | | | | | | |
| | | Six months ended
2/28/17 | | | Year ended
8/31/16 | |
| | | Shares | | | Amount | | | Shares | | | Amount | |
| Net change | | | | | | | | | | | | | | | | |
Class A | | | 27,196 | | | | $320,657 | | | | 259,349 | | | | $2,903,758 | |
Class B | | | (5,894 | ) | | | (69,619 | ) | | | (12,772 | ) | | | (137,691 | ) |
Class C | | | 24,115 | | | | 285,203 | | | | 89,535 | | | | 1,047,326 | |
Class I | | | 1,623,744 | | | | 18,993,564 | | | | 649,626 | | | | 7,360,739 | |
Class R1 | | | 6 | | | | 75 | | | | (5,411 | ) | | | (57,016 | ) |
Class R2 | | | 205 | | | | 2,389 | | | | (4,384 | ) | | | (45,409 | ) |
Class R3 | | | 25 | | | | 294 | | | | (5,476 | ) | | | (57,958 | ) |
Class R4 | | | 31 | | | | 369 | | | | (5,500 | ) | | | (58,262 | ) |
Class R6 | | | 376,017 | | | | 4,409,699 | | | | 1,277,893 | | | | 14,120,224 | |
| | | 2,045,445 | | | | $23,942,631 | | | | 2,242,860 | | | | $25,075,711 | |
(6) Line of Credit
The fund and certain other funds managed by MFS participate in a $1.25 billion unsecured committed line of credit, subject to a $1 billion sublimit, provided by a syndication of banks under a credit agreement. Borrowings may be made for temporary financing needs. Interest is charged to each fund, based on its borrowings, generally at a rate equal to the higher of the Overnight Federal Reserve funds rate or daily one month LIBOR plus an agreed upon spread. A commitment fee, based on the average daily, unused portion of the committed line of credit, is allocated among the participating funds at the end of each calendar quarter. In addition, the fund and other funds managed by MFS have established unsecured uncommitted borrowing arrangements with certain banks for temporary financing needs. Interest is charged to each fund, based on its borrowings, at a rate equal to the Overnight Federal Reserve funds rate plus an agreed upon spread. For the six months ended February 28, 2017, the fund’s commitment fee and interest expense were $208 and $0, respectively, and are included in “Miscellaneous” expense in the Statement of Operations.
(7) Transactions in Underlying Affiliated Funds-Affiliated Issuers
An affiliated issuer may be considered one in which the fund owns 5% or more of the outstanding voting securities, or a company which is under common control. For the purposes of this report, the fund assumes the following to be an affiliated issuer:
| | | | | | | | | | | | | | | | |
| Underlying Affiliated Fund | | Beginning
Shares/Par
Amount | | | Acquisitions
Shares/Par
Amount | | | Dispositions
Shares/Par
Amount | | | Ending
Shares/Par
Amount | |
MFS Institutional Money
Market Portfolio | | | 1,086,952 | | | | 20,161,722 | | | | (20,365,880 | ) | | | 882,794 | |
| | | | |
| Underlying Affiliated Fund | | Realized
Gain (Loss) | | | Capital Gain
Distributions | | | Dividend
Income | | | Ending
Value | |
MFS Institutional Money
Market Portfolio | | | $(1 | ) | | | $— | | | | $2,301 | | | | $882,794 | |
33
PROXY VOTING POLICIES AND INFORMATION
MFS votes proxies on behalf of the fund pursuant to proxy voting policies and procedures that are available without charge, upon request, by calling 1-800-225-2606, by visiting mfs.com (once you have selected “Individual Investor” as your role, click on “Individual Investor Home” in the top navigation and then select “Learn More About Proxy Voting” under the “I want to…” header on the left hand column of the page), or by visiting the SEC’s Web site at http://www.sec.gov.
Information regarding how the fund voted proxies relating to portfolio securities during the most recent twelve-month period ended June 30 is available by August 31 of each year without charge by visiting mfs.com (once you have selected “Individual Investor” as your role, click on “Individual Investor Home” in the top navigation and then select “Learn More About Proxy Voting” under the “I want to…” header on the left hand column of the page), or by visiting the SEC’s Web site at http://www.sec.gov.
QUARTERLY PORTFOLIO DISCLOSURE
The fund will file a complete schedule of portfolio holdings with the Securities and Exchange Commission (the Commission) for the first and third quarters of each fiscal year on Form N-Q. A shareholder can obtain the quarterly portfolio holdings report at mfs.com. The fund’s Form N-Q is also available on the EDGAR database on the Commission’s Internet Web site at http://www.sec.gov, and may be reviewed and copied at the:
Public Reference Room
Securities and Exchange Commission
100 F Street, NE, Room 1580
Washington, D.C. 20549
Information on the operation of the Public Reference Room may be obtained by calling the Commission at 1-800-SEC-0330. Copies of the fund’s Form N-Q also may be obtained, upon payment of a duplicating fee, by electronic request at the following e-mail address: publicinfo@sec.gov or by writing the Public Reference Section at the above address.
FURTHER INFORMATION
From time to time, MFS may post important information about the fund or the MFS funds on the MFS web site (mfs.com). This information is available on mfs.com by following these steps once you have selected “Individual Investor” as your role: (1) Click on the “Individual Investor Home” in the top navigation and then select the “Announcements” option within the “Market Outlooks” drop down, or (2) Click on “Products & Services” and “Mutual Funds” and then choose the fund’s name in the “Select a fund” menu.
34
INFORMATION ABOUT FUND CONTRACTS AND LEGAL CLAIMS
The fund has entered into contractual arrangements with an investment adviser, administrator, distributor, shareholder servicing agent, 529 program manager (if applicable), and custodian who each provide services to the fund. Unless expressly stated otherwise, shareholders are not parties to, or intended beneficiaries of these contractual arrangements, and these contractual arrangements are not intended to create any shareholder right to enforce them against the service providers or to seek any remedy under them against the service providers, either directly or on behalf of the fund.
Under the Trust’s By-Laws and Declaration of Trust, any claims asserted against or on behalf of the MFS Funds, including claims against Trustees and Officers, must be brought in state and federal courts located within the Commonwealth of Massachusetts.
PROVISION OF FINANCIAL REPORTS AND SUMMARY PROSPECTUSES
The fund produces financial reports every six months and updates its summary prospectus and prospectus annually. To avoid sending duplicate copies of materials to households, only one copy of the fund’s annual and semiannual report and summary prospectus may be mailed to shareholders having the same last name and residential address on the fund’s records. However, any shareholder may contact MFSC (please see back cover for address and telephone number) to request that copies of these reports and summary prospectuses be sent personally to that shareholder.
35
Save paper with eDelivery.

| MFS® will send you prospectuses, |
reports, and proxies directly via e-mail so you will get information faster with less mailbox clutter.
To sign up:
1. Go to mfs.com.
2. Log in via MFS® Access.
3. Select eDelivery.
If you own your MFS fund shares through a financial institution or a retirement plan, MFS® TALK, MFS® Access, or eDelivery may not be available to you.
CONTACT
WEB SITE
mfs.com
MFS TALK
1-800-637-8255
24 hours a day
ACCOUNT SERVICE AND LITERATURE
Shareholders
1-800-225-2606
Financial advisors
1-800-343-2829
Retirement plan services
1-800-637-1255
MAILING ADDRESS
MFS Service Center, Inc.
P.O. Box 55824
Boston, MA 02205-5824
OVERNIGHT MAIL
MFS Service Center, Inc.
c/o Boston Financial Data Services
30 Dan Road
Canton, MA 02021-2809
SEMIANNUAL REPORT
February 28, 2017

MFS® LOW VOLATILITY EQUITY FUND

LVU-SEM
MFS® LOW VOLATILITY EQUITY FUND
CONTENTS
The report is prepared for the general information of shareholders.
It is authorized for distribution to prospective investors only when preceded or accompanied by a current prospectus.
NOT FDIC INSURED • MAY LOSE VALUE • NO BANK GUARANTEE

LETTER FROM THE EXECUTIVE CHAIRMAN
Dear Shareholders:
Despite June’s unexpected vote by the United Kingdom to leave the European Union and the surprising result in November’s U.S. presidential election, most markets have
proved resilient. U.S. share prices quickly reversed post-Brexit declines, and indices reached new highs following the November elections. U.S. bond yields rose after Donald Trump’s victory on hopes that his proposed policy mix of lower taxes, increased spending on infrastructure and a lower regulatory burden on businesses will lift both U.S. economic growth and inflation. However, interest rates in most developed markets remain very low, with major central banks maintaining extremely accommodative monetary policies to reinvigorate slow-growing economies against a backdrop of still-low inflation. Even after the rise in yields following the election, interest rates remain low by historical standards.
Globally, economic growth has shown signs of recovery of late, led by the United States and the eurozone. Despite better growth, there are few immediate signs of worrisome inflation. Emerging market economies are recovering at a somewhat slower pace amid fears that restrictive U.S. trade policies could further hamper the already slow pace of global trade growth. Looking ahead, markets will have to contend with a series of European elections during 2017, which, depending on the outcome, could further call into question the future direction of the European Union.
At MFS®, we believe in a patient, long-term approach to investing. Viewing investments with a long lens makes it possible to filter out short-term market noise and focus on achieving solid risk-adjusted returns over a full market cycle.
In our view, such an approach, along with the professional guidance of a financial advisor, will help you reach your investment objectives.
Respectfully,

Robert J. Manning
Executive Chairman
MFS Investment Management
April 13, 2017
The opinions expressed in this letter are subject to change and may not be relied upon for investment advice. No forecasts can be guaranteed.
1
PORTFOLIO COMPOSITION
Portfolio structure

| | | | |
| Top ten holdings | | | | |
| Johnson & Johnson | | | 2.1% | |
| Facebook, Inc., “A” | | | 2.1% | |
| Eli Lilly & Co. | | | 2.0% | |
| PepsiCo, Inc. | | | 2.0% | |
| Costco Wholesale Corp. | | | 1.9% | |
| McDonald’s Corp. | | | 1.9% | |
| Alphabet, Inc., “A” | | | 1.9% | |
| Merck & Co., Inc. | | | 1.7% | |
| Citigroup, Inc. | | | 1.7% | |
| Wal-Mart Stores, Inc. | | | 1.7% | |
| | | | |
| Equity sectors | | | | |
| Financial Services | | | 20.1% | |
| Health Care | | | 15.3% | |
| Consumer Staples | | | 10.2% | |
| Technology | | | 10.0% | |
| Industrial Goods & Services | | | 8.5% | |
| Utilities & Communications | | | 8.5% | |
| Retailing | | | 6.4% | |
| Leisure | | | 4.6% | |
| Energy | | | 4.0% | |
| Special Products & Services | | | 2.0% | |
| Transportation | | | 1.3% | |
| Autos & Housing | | | 0.5% | |
| Basic Materials | | | 0.4% | |
Cash & Cash Equivalents includes any cash, investments in money market funds, short-term securities, and other assets less liabilities. Please see the Statement of Assets and Liabilities for additional information related to the fund’s cash position and other assets and liabilities.
Percentages are based on net assets as of 2/28/17.
The portfolio is actively managed and current holdings may be different.
2
EXPENSE TABLE
Fund expenses borne by the shareholders during the period,
September 1, 2016 through February 28, 2017
As a shareholder of the fund, you incur two types of costs: (1) transaction costs, including sales charges (loads) on certain purchase or redemption payments, and (2) ongoing costs, including management fees; distribution and service (12b-1) fees; and other fund expenses. This example is intended to help you understand your ongoing costs (in dollars) of investing in the fund and to compare these costs with the ongoing costs of investing in other mutual funds.
The example is based on an investment of $1,000 invested at the beginning of the period and held for the entire period September 1, 2016 through February 28, 2017.
Actual Expenses
The first line for each share class in the following table provides information about actual account values and actual expenses. You may use the information in this line, together with the amount you invested, to estimate the expenses that you paid over the period. Simply divide your account value by $1,000 (for example, an $8,600 account value divided by $1,000 = 8.6), then multiply the result by the number in the first line under the heading entitled “Expenses Paid During Period” to estimate the expenses you paid on your account during this period.
Hypothetical Example for Comparison Purposes
The second line for each share class in the following table provides information about hypothetical account values and hypothetical expenses based on the fund’s actual expense ratio and an assumed rate of return of 5% per year before expenses, which is not the fund’s actual return. The hypothetical account values and expenses may not be used to estimate the actual ending account balance or expenses you paid for the period. You may use this information to compare the ongoing costs of investing in the fund and other funds. To do so, compare this 5% hypothetical example with the 5% hypothetical examples that appear in the shareholder reports of the other funds.
Please note that the expenses shown in the table are meant to highlight your ongoing costs only and do not reflect any transactional costs, such as sales charges (loads). Therefore, the second line for each share class in the table is useful in comparing ongoing costs only, and will not help you determine the relative total costs of owning different funds. In addition, if these transactional costs were included, your costs would have been higher.
3
Expense Table – continued
| | | | | | | | | | | | | | | | | | |
Share
Class | | | | Annualized
Expense Ratio | | | Beginning
Account Value
9/01/16 | | | Ending Account Value
2/28/17 | | | Expenses Paid During Period (p) 9/01/16-2/28/17 | |
| A | | Actual | | | 1.19% | | | | $1,000.00 | | | | $1,063.53 | | | | $6.09 | |
| | Hypothetical (h) | | | 1.19% | | | | $1,000.00 | | | | $1,018.89 | | | | $5.96 | |
| B | | Actual | | | 1.95% | | | | $1,000.00 | | | | $1,059.46 | | | | $9.96 | |
| | Hypothetical (h) | | | 1.95% | | | | $1,000.00 | | | | $1,015.12 | | | | $9.74 | |
| C | | Actual | | | 1.95% | | | | $1,000.00 | | | | $1,059.82 | | | | $9.96 | |
| | Hypothetical (h) | | | 1.95% | | | | $1,000.00 | | | | $1,015.12 | | | | $9.74 | |
| I | | Actual | | | 0.95% | | | | $1,000.00 | | | | $1,064.77 | | | | $4.86 | |
| | Hypothetical (h) | | | 0.95% | | | | $1,000.00 | | | | $1,020.08 | | | | $4.76 | |
| R1 | | Actual | | | 1.95% | | | | $1,000.00 | | | | $1,059.25 | | | | $9.96 | |
| | Hypothetical (h) | | | 1.95% | | | | $1,000.00 | | | | $1,015.12 | | | | $9.74 | |
| R2 | | Actual | | | 1.45% | | | | $1,000.00 | | | | $1,062.61 | | | | $7.42 | |
| | Hypothetical (h) | | | 1.45% | | | | $1,000.00 | | | | $1,017.60 | | | | $7.25 | |
| R3 | | Actual | | | 1.20% | | | | $1,000.00 | | | | $1,064.11 | | | | $6.14 | |
| | Hypothetical (h) | | | 1.20% | | | | $1,000.00 | | | | $1,018.84 | | | | $6.01 | |
| R4 | | Actual | | | 0.95% | | | | $1,000.00 | | | | $1,064.76 | | | | $4.86 | |
| | Hypothetical (h) | | | 0.95% | | | | $1,000.00 | | | | $1,020.08 | | | | $4.76 | |
| R6 | | Actual | | | 0.85% | | | | $1,000.00 | | | | $1,065.31 | | | | $4.35 | |
| | Hypothetical (h) | | | 0.85% | | | | $1,000.00 | | | | $1,020.58 | | | | $4.26 | |
| (h) | 5% class return per year before expenses. |
| (p) | “Expenses Paid During Period” are equal to each class’s annualized expense ratio, as shown above, multiplied by the average account value over the period, multiplied by 181/365 (to reflect the one-half year period). Expenses paid do not include any applicable sales charges (loads). If these transaction costs had been included, your costs would have been higher. |
Notes to Expense Table
Each class with a Rule 12b-1 service fee is subject to a rebate of a portion of such fee. Such rebates are included in the expense ratios above and are outside of the expense limitation arrangement. For Class A shares, this rebate reduced the expense ratio above by 0.01%. See Note 3 in the Notes to Financial Statements for additional information.
4
PORTFOLIO OF INVESTMENTS
2/28/17 (unaudited)
The Portfolio of Investments is a complete list of all securities owned by your fund. It is categorized by broad-based asset classes.
| | | | | | | | |
| Common Stocks - 91.8% | | | | | | | | |
| Issuer | | Shares/Par | | | Value ($) | |
| Aerospace - 3.6% | | | | | | | | |
| General Dynamics Corp. | | | 2,066 | | | $ | 392,152 | |
| Honeywell International, Inc. | | | 4,777 | | | | 594,737 | |
| Lockheed Martin Corp. | | | 2,197 | | | | 585,676 | |
| Northrop Grumman Corp. | | | 2,316 | | | | 572,260 | |
| United Technologies Corp. | | | 3,880 | | | | 436,694 | |
| | | | | | | | |
| | | | | | | $ | 2,581,519 | |
| Alcoholic Beverages - 1.0% | | | | | | | | |
| Constellation Brands, Inc., “A” | | | 4,630 | | | $ | 735,290 | |
| | |
| Brokerage & Asset Managers - 0.3% | | | | | | | | |
| Intercontinental Exchange, Inc. | | | 4,412 | | | $ | 252,058 | |
| | |
| Business Services - 1.6% | | | | | | | | |
| Amdocs Ltd. | | | 18,557 | | | $ | 1,125,482 | |
| | |
| Cable TV - 0.7% | | | | | | | | |
| Comcast Corp., “A” | | | 13,532 | | | $ | 506,367 | |
| | |
| Computer Software - 1.4% | | | | | | | | |
| Intuit, Inc. | | | 5,676 | | | $ | 711,997 | |
| Oracle Corp. | | | 5,916 | | | | 251,962 | |
| | | | | | | | |
| | | | | | | $ | 963,959 | |
| Computer Software - Systems - 1.9% | | | | | | | | |
| Apple, Inc. | | | 6,275 | | | $ | 859,612 | |
| International Business Machines Corp. | | | 2,695 | | | | 484,615 | |
| | | | | | | | |
| | | | | | | $ | 1,344,227 | |
| Construction - 0.5% | | | | | | | | |
| Toll Brothers, Inc. (a) | | | 10,071 | | | $ | 343,824 | |
| | |
| Consumer Products - 1.9% | | | | | | | | |
| Colgate-Palmolive Co. | | | 4,799 | | | $ | 350,231 | |
| Procter & Gamble Co. | | | 11,076 | | | | 1,008,691 | |
| | | | | | | | |
| | | | | | | $ | 1,358,922 | |
| Consumer Services - 0.4% | | | | | | | | |
| Bright Horizons Family Solutions, Inc. (a) | | | 3,746 | | | $ | 258,886 | |
5
Portfolio of Investments (unaudited) – continued
| | | | | | | | |
| Issuer | | Shares/Par | | | Value ($) | |
| Common Stocks - continued | | | | | | | | |
| Electrical Equipment - 1.7% | | | | | | | | |
| Johnson Controls International PLC | | | 16,795 | | | $ | 704,382 | |
| MSC Industrial Direct Co., Inc., “A” | | | 4,671 | | | | 469,856 | |
| | | | | | | | |
| | | | | | | $ | 1,174,238 | |
| Electronics - 1.1% | | | | | | | | |
| Texas Instruments, Inc. | | | 10,033 | | | $ | 768,728 | |
| | |
| Energy - Independent - 0.7% | | | | | | | | |
| Occidental Petroleum Corp. | | | 7,306 | | | $ | 478,908 | |
| | |
| Energy - Integrated - 2.3% | | | | | | | | |
| Chevron Corp. | | | 5,676 | | | $ | 638,550 | |
| Exxon Mobil Corp. | | | 11,795 | | | | 959,169 | |
| | | | | | | | |
| | | | | | | $ | 1,597,719 | |
| Food & Beverages - 5.7% | | | | | | | | |
| Coca-Cola Co. | | | 11,265 | | | $ | 472,679 | |
| Dr Pepper Snapple Group, Inc. | | | 3,406 | | | | 318,257 | |
| General Mills, Inc. | | | 18,612 | | | | 1,123,606 | |
| Mondelez International, Inc. | | | 7,173 | | | | 315,038 | |
| PepsiCo, Inc. | | | 12,505 | | | | 1,380,302 | |
| Pinnacle Foods, Inc. | | | 6,921 | | | | 395,397 | |
| | | | | | | | |
| | | | $ | 4,005,279 | |
| Food & Drug Stores - 0.6% | | | | | | | | |
| CVS Health Corp. | | | 5,264 | | | $ | 424,173 | |
| | |
| General Merchandise - 4.2% | | | | | | | | |
| Costco Wholesale Corp. | | | 7,727 | | | $ | 1,369,070 | |
| Target Corp. | | | 7,528 | | | | 442,421 | |
| Wal-Mart Stores, Inc. | | | 16,756 | | | | 1,188,503 | |
| | | | | | | | |
| | | | $ | 2,999,994 | |
| Health Maintenance Organizations - 1.5% | | | | | | | | |
| Aetna, Inc. | | | 2,853 | | | $ | 367,352 | |
| UnitedHealth Group, Inc. | | | 4,338 | | | | 717,418 | |
| | | | | | | | |
| | | | $ | 1,084,770 | |
| Insurance - 7.6% | | | | | | | | |
| American International Group, Inc. | | | 6,386 | | | $ | 408,193 | |
| Everest Re Group Ltd. | | | 4,995 | | | | 1,174,524 | |
| Hartford Financial Services Group, Inc. | | | 15,032 | | | | 734,914 | |
| Loews Corp. | | | 12,434 | | | | 584,149 | |
| Markel Corp. (a) | | | 931 | | | | 912,129 | |
6
Portfolio of Investments (unaudited) – continued
| | | | | | | | |
| Issuer | | Shares/Par | | | Value ($) | |
| Common Stocks - continued | | | | | | | | |
| Insurance - continued | | | | | | | | |
| MetLife, Inc. | | | 9,132 | | | $ | 478,882 | |
| Travelers Cos., Inc. | | | 3,877 | | | | 473,924 | |
| Validus Holdings Ltd. | | | 11,089 | | | | 639,392 | |
| | | | | | | | |
| | | | $ | 5,406,107 | |
| Internet - 4.0% | | | | | | | | |
| Alphabet, Inc., “A” (a) | | | 1,562 | | | $ | 1,319,781 | |
| Facebook, Inc., “A” (a) | | | 10,961 | | | | 1,485,654 | |
| | | | | | | | |
| | | | $ | 2,805,435 | |
| Machinery & Tools - 0.7% | | | | | | | | |
| Cummins, Inc. | | | 3,527 | | | $ | 523,724 | |
| | |
| Major Banks - 1.2% | | | | | | | | |
| Goldman Sachs Group, Inc. | | | 1,640 | | | $ | 406,818 | |
| PNC Financial Services Group, Inc. | | | 3,261 | | | | 414,897 | |
| | | | | | | | |
| | | | $ | 821,715 | |
| Medical & Health Technology & Services - 1.3% | | | | | | | | |
| Henry Schein, Inc. (a) | | | 3,818 | | | $ | 655,016 | |
| MEDNAX, Inc. (a) | | | 3,515 | | | | 250,233 | |
| | | | | | | | |
| | | | $ | 905,249 | |
| Medical Equipment - 5.8% | | | | | | | | |
| Abbott Laboratories | | | 18,565 | | | $ | 836,910 | |
| Becton, Dickinson and Co. | | | 1,713 | | | | 313,565 | |
| Cooper Cos., Inc. | | | 2,589 | | | | 515,573 | |
| Danaher Corp. | | | 3,521 | | | | 301,222 | |
| Medtronic PLC | | | 12,455 | | | | 1,007,734 | |
| Steris PLC | | | 7,271 | | | | 509,915 | |
| Stryker Corp. | | | 2,256 | | | | 290,031 | |
| Zimmer Biomet Holdings, Inc. | | | 3,092 | | | | 362,011 | |
| | | | | | | | |
| | | | $ | 4,136,961 | |
| Network & Telecom - 1.7% | |
| Cisco Systems, Inc. | | | 28,962 | | | $ | 989,921 | |
| Motorola Solutions, Inc. | | | 2,979 | | | | 235,252 | |
| | | | | | | | |
| | | | $ | 1,225,173 | |
| Oil Services - 1.1% | | | | | | | | |
| Schlumberger Ltd. | | | 9,688 | | | $ | 778,528 | |
| | |
| Other Banks & Diversified Financials - 4.3% | | | | | | | | |
| Citigroup, Inc. | | | 20,006 | | | $ | 1,196,559 | |
| M&T Bank Corp. | | | 3,737 | | | | 623,967 | |
7
Portfolio of Investments (unaudited) – continued
| | | | | | | | |
| Issuer | | Shares/Par | | | Value ($) | |
| Common Stocks - continued | | | | | | | | |
| Other Banks & Diversified Financials - continued | | | | | | | | |
| Mastercard, Inc., “A” | | | 4,530 | | | $ | 500,384 | |
| U.S. Bancorp | | | 8,128 | | | | 447,040 | |
| Visa, Inc., “A” | | | 3,537 | | | | 311,044 | |
| | | | | | | | |
| | | | $ | 3,078,994 | |
| Pharmaceuticals - 6.7% | | | | | | | | |
| Eli Lilly & Co. | | | 16,768 | | | $ | 1,388,558 | |
| Johnson & Johnson | | | 12,383 | | | | 1,513,326 | |
| Merck & Co., Inc. | | | 18,623 | | | | 1,226,697 | |
| Pfizer, Inc. | | | 10,360 | | | | 353,483 | |
| Zoetis, Inc. | | | 4,719 | | | | 251,570 | |
| | | | | | | | |
| | | | $ | 4,733,634 | |
| Pollution Control - 2.5% | | | | | | | | |
| Republic Services, Inc. | | | 11,986 | | | $ | 742,533 | |
| Waste Connections, Inc. | | | 11,474 | | | | 1,002,713 | |
| | | | | | | | |
| | | | $ | 1,745,246 | |
| Railroad & Shipping - 1.3% | | | | | | | | |
| Kansas City Southern Co. | | | 10,384 | | | $ | 920,334 | |
| | |
| Real Estate - 6.6% | | | | | | | | |
| AvalonBay Communities, Inc., REIT | | | 3,711 | | | $ | 682,008 | |
| Equity Lifestyle Properties, Inc., REIT | | | 6,156 | | | | 490,141 | |
| Mid-America Apartment Communities, Inc., REIT | | | 5,348 | | | | 549,400 | |
| Public Storage, Inc., REIT | | | 3,869 | | | | 880,043 | |
| Simon Property Group, Inc., REIT | | | 1,776 | | | | 327,494 | |
| Starwood Property Trust, Inc., REIT | | | 48,438 | | | | 1,107,293 | |
| Store Capital Corp., REIT | | | 11,787 | | | | 293,614 | |
| Sun Communities, Inc., REIT | | | 3,864 | | | | 320,055 | |
| | | | | | | | |
| | | | $ | 4,650,048 | |
| Restaurants - 3.9% | | | | | | | | |
| Brinker International, Inc. | | | 21,044 | | | $ | 888,899 | |
| McDonald’s Corp. | | | 10,696 | | | | 1,365,344 | |
| Starbucks Corp. | | | 9,191 | | | | 522,692 | |
| | | | | | | | |
| | | | $ | 2,776,935 | |
| Specialty Chemicals - 0.4% | | | | | | | | |
| Praxair, Inc. | | | 2,219 | | | $ | 263,417 | |
| | |
| Specialty Stores - 1.6% | | | | | | | | |
| AutoZone, Inc. (a) | | | 926 | | | $ | 682,045 | |
| Home Depot, Inc. | | | 2,956 | | | | 428,354 | |
| | | | | | | | |
| | | | $ | 1,110,399 | |
8
Portfolio of Investments (unaudited) – continued
| | | | | | | | |
| Issuer | | Shares/Par | | | Value ($) | |
| Common Stocks - continued | | | | | | | | |
| Telephone Services - 1.1% | | | | | | | | |
| Verizon Communications, Inc. | | | 16,241 | | | $ | 806,041 | |
|
| Tobacco - 1.6% | |
| Altria Group, Inc. | | | 6,948 | | | $ | 520,544 | |
| Philip Morris International, Inc. | | | 5,400 | | | | 590,490 | |
| | | | | | | | |
| | | | $ | 1,111,034 | |
| Utilities - Electric Power - 7.3% | | | | | | | | |
| Alliant Energy Corp. | | | 20,165 | | | $ | 796,114 | |
| American Electric Power Co., Inc. | | | 5,742 | | | | 384,542 | |
| Consolidated Edison, Inc. | | | 3,177 | | | | 244,756 | |
| Dominion Resources, Inc. | | | 11,464 | | | | 890,065 | |
| DTE Energy Co. | | | 3,017 | | | | 305,863 | |
| Exelon Corp. | | | 9,132 | | | | 335,236 | |
| FirstEnergy Corp. | | | 15,946 | | | | 517,129 | |
| NextEra Energy, Inc. | | | 5,686 | | | | 744,866 | |
| Pinnacle West Capital Corp. | | | 3,406 | | | | 279,939 | |
| WEC Energy Group, Inc. | | | 5,163 | | | | 311,174 | |
| Xcel Energy, Inc. | | | 8,549 | | | | 373,677 | |
| | | | | | | | |
| | | | $ | 5,183,361 | |
| Total Common Stocks (Identified Cost, $57,096,555) | | | $ | 64,986,678 | |
| | |
| Money Market Funds - 1.5% | | | | | | | | |
MFS Institutional Money Market Portfolio, 0.64% (v)
(Identified Cost, $1,053,617) | | | 1,053,620 | | | $ | 1,053,620 | |
| Total Investments (Identified Cost, $58,150,172) | | | $ | 66,040,298 | |
| |
| Other Assets, Less Liabilities - 6.7% | | | | 4,733,476 | |
| Net Assets - 100.0% | | | $ | 70,773,774 | |
| (a) | Non-income producing security. |
| (v) | Underlying affiliated fund that is available only to investment companies managed by MFS. The rate quoted for the MFS Institutional Money Market Portfolio is the annualized seven-day yield of the fund at period end. |
The following abbreviations are used in this report and are defined:
| PLC | | Public Limited Company |
| REIT | | Real Estate Investment Trust |
See Notes to Financial Statements
9
Financial Statements
STATEMENT OF ASSETS AND LIABILITIES
At 2/28/17 (unaudited)
This statement represents your fund’s balance sheet, which details the assets and liabilities comprising the total value of the fund.
| | | | |
| Assets | | | | |
Investments | | | | |
Non-affiliated issuers, at value (identified cost, $57,096,555) | | | $64,986,678 | |
Underlying affiliated funds, at value (identified cost, $1,053,617) | | | 1,053,620 | |
Total investments, at value (identified cost, $58,150,172) | | | $66,040,298 | |
Receivables for | | | | |
Fund shares sold | | | 7,439,425 | |
Dividends | | | 105,126 | |
Receivable from investment adviser | | | 7,182 | |
Other assets | | | 48,928 | |
Total assets | | | $73,640,959 | |
| Liabilities | | | | |
Payables for | | | | |
Investments purchased | | | $2,516,192 | |
Fund shares reacquired | | | 304,178 | |
Payable to affiliates | | | | |
Shareholder servicing costs | | | 14,012 | |
Distribution and service fees | | | 663 | |
Payable for independent Trustees’ compensation | | | 13 | |
Accrued expenses and other liabilities | | | 32,127 | |
Total liabilities | | | $2,867,185 | |
Net assets | | | $70,773,774 | |
| Net assets consist of | | | | |
Paid-in capital | | | $62,579,738 | |
Unrealized appreciation (depreciation) on investments | | | 7,890,126 | |
Accumulated net realized gain (loss) on investments | | | 223,112 | |
Undistributed net investment income | | | 80,798 | |
Net assets | | | $70,773,774 | |
Shares of beneficial interest outstanding | | | 5,348,553 | |
10
Statement of Assets and Liabilities (unaudited) – continued
| | | | | | | | | | | | |
| | | Net assets | | | Shares
outstanding | | | Net asset value
per share (a) | |
Class A | | | $34,149,253 | | | | 2,579,527 | | | | $13.24 | |
Class B | | | 1,936,320 | | | | 146,551 | | | | 13.21 | |
Class C | | | 11,516,404 | | | | 873,786 | | | | 13.18 | |
Class I | | | 21,492,692 | | | | 1,622,114 | | | | 13.25 | |
Class R1 | | | 60,376 | | | | 4,556 | | | | 13.25 | |
Class R2 | | | 55,995 | | | | 4,211 | | | | 13.30 | |
Class R3 | | | 56,078 | | | | 4,223 | | | | 13.28 | |
Class R4 | | | 56,201 | | | | 4,238 | | | | 13.26 | |
Class R6 | | | 1,450,455 | | | | 109,347 | | | | 13.26 | |
| (a) | Maximum offering price per share was equal to the net asset value per share for all share classes, except for Class A, for which the maximum offering price per share was $14.05 [100 / 94.25 x $13.24]. On sales of $50,000 or more, the maximum offering price of Class A shares is reduced. A contingent deferred sales charge may be imposed on redemptions of Class A, Class B, and Class C shares. Redemption price per share was equal to the net asset value per share for Classes I, R1, R2, R3, R4, and R6. |
See Notes to Financial Statements
11
Financial Statements
STATEMENT OF OPERATIONS
Six months ended 2/28/17 (unaudited)
This statement describes how much your fund earned in investment income and accrued in expenses. It also describes any gains and/or losses generated by fund operations.
| | | | |
| Net investment income | | | | |
Income | | | | |
Dividends | | | $686,100 | |
Dividends from underlying affiliated funds | | | 2,077 | |
Foreign taxes withheld | | | (249 | ) |
Total investment income | | | $687,928 | |
Expenses | | | | |
Management fee | | | $181,465 | |
Distribution and service fees | | | 99,577 | |
Shareholder servicing costs | | | 37,592 | |
Administrative services fee | | | 9,506 | |
Independent Trustees’ compensation | | | 840 | |
Custodian fee | | | 3,938 | |
Shareholder communications | | | 7,654 | |
Audit and tax fees | | | 24,002 | |
Legal fees | | | 191 | |
Registration fees | | | 62,881 | |
Miscellaneous | | | 8,039 | |
Total expenses | | | $435,685 | |
Reduction of expenses by investment adviser and distributor | | | (50,793 | ) |
Net expenses | | | $384,892 | |
Net investment income | | | $303,036 | |
| Realized and unrealized gain (loss) on investments | | | | |
Realized gain (loss) (identified cost basis) | | | | |
Investments: | | | | |
Non-affiliated issuers | | | $701,909 | |
Underlying affiliated funds | | | (4 | ) |
Net realized gain (loss) on investments | | | $701,905 | |
Change in unrealized appreciation (depreciation) on investments | | | $2,873,504 | |
Net realized and unrealized gain (loss) on investments | | | $3,575,409 | |
Change in net assets from operations | | | $3,878,445 | |
See Notes to Financial Statements
12
Financial Statements
STATEMENTS OF CHANGES IN NET ASSETS
These statements describe the increases and/or decreases in net assets resulting from operations, any distributions, and any shareholder transactions.
| | | | | | | | |
| Change in net assets | | Six months ended 2/28/17 (unaudited) | | | Year ended 8/31/16 | |
| From operations | | | | | | | | |
Net investment income | | | $303,036 | | | | $424,103 | |
Net realized gain (loss) on investments | | | 701,905 | | | | (287,502 | ) |
Net unrealized gain (loss) on investments | | | 2,873,504 | | | | 5,042,099 | |
Change in net assets from operations | | | $3,878,445 | | | | $5,178,700 | |
| Distributions declared to shareholders | | | | | | | | |
From net investment income | | | $(376,486 | ) | | | $(300,213 | ) |
From net realized gain on investments | | | (134,785 | ) | | | (135,911 | ) |
Total distributions declared to shareholders | | | $(511,271 | ) | | | $(436,124 | ) |
Change in net assets from fund share transactions | | | $8,004,527 | | | | $38,103,303 | |
Total change in net assets | | | $11,371,701 | | | | $42,845,879 | |
| Net assets | | | | | | | | |
At beginning of period | | | 59,402,073 | | | | 16,556,194 | |
At end of period (including undistributed net investment income of $80,798 and $154,248, respectively) | | | $70,773,774 | | | | $59,402,073 | |
See Notes to Financial Statements
13
Financial Statements
FINANCIAL HIGHLIGHTS
The financial highlights table is intended to help you understand the fund’s financial performance for the semiannual period and the past 5 fiscal years (or life of a particular share class, if shorter). Certain information reflects financial results for a single fund share. The total returns in the table represent the rate by which an investor would have earned (or lost) on an investment in the fund share class (assuming reinvestment of all distributions) held for the entire period.
| | | | | | | | | | | | | | | | |
| | | Six months
ended
2/28/17 | | | Years ended 8/31 | | | Period
ended 8/31/14 (c) | |
| Class A | | | 2016 | | | 2015 | | |
| | | (unaudited) | | | | | | | | | | |
Net asset value, beginning of period | | | $12.56 | | | | $11.12 | | | | $10.82 | | | | $10.00 | |
| Income (loss) from investment operations | | | | | |
Net investment income (d) | | | $0.07 | | | | $0.15 | | | | $0.14 | | | | $0.11 | |
Net realized and unrealized gain (loss) on investments and foreign currency | | | 0.72 | | | | 1.49 | | | | 0.30 | (g) | | | 0.77 | |
Total from investment operations | | | $0.79 | | | | $1.64 | | | | $0.44 | | | | $0.88 | |
| Less distributions declared to shareholders | | | | | |
From net investment income | | | $(0.08 | ) | | | $(0.11 | ) | | | $(0.13 | ) | | | $(0.06 | ) |
From net realized gain on investments | | | (0.03 | ) | | | (0.09 | ) | | | (0.01 | ) | | | — | |
Total distributions declared to shareholders | | | $(0.11 | ) | | | $(0.20 | ) | | | $(0.14 | ) | | | $(0.06 | ) |
Net asset value, end of period (x) | | | $13.24 | | | | $12.56 | | | | $11.12 | | | | $10.82 | |
Total return (%) (r)(s)(t)(x) | | | 6.35 | (n) | | | 14.87 | | | | 4.01 | | | | 8.82 | (n) |
Ratios (%) (to average net assets)
and Supplemental data: | | | | | |
Expenses before expense reductions (f) | | | 1.36 | (a) | | | 1.65 | | | | 2.72 | | | | 4.45 | (a) |
Expenses after expense reductions (f) | | | 1.19 | (a) | | | 1.19 | | | | 1.18 | | | | 1.15 | (a) |
Net investment income | | | 1.08 | (a) | | | 1.25 | | | | 1.22 | | | | 1.40 | (a) |
Portfolio turnover | | | 20 | (n) | | | 38 | | | | 33 | | | | 30 | (n) |
Net assets at end of period (000 omitted) | | | $34,149 | | | | $29,508 | | | | $11,267 | | | | $1,154 | |
See Notes to Financial Statements
14
Financial Highlights – continued
| | | | | | | | | | | | | | | | |
| | | Six months
ended
2/28/17 | | | Years ended 8/31 | | | Period
ended 8/31/14 (c) | |
| Class B | | | 2016 | | | 2015 | | |
| | | (unaudited) | | | | | | | | | | |
Net asset value, beginning of period | | | $12.53 | | | | $11.10 | | | | $10.81 | | | | $10.00 | |
| Income (loss) from investment operations | | | | | |
Net investment income (d) | | | $0.02 | | | | $0.06 | | | | $0.05 | | | | $0.04 | |
Net realized and unrealized gain (loss) on investments and foreign currency | | | 0.72 | | | | 1.48 | | | | 0.30 | (g) | | | 0.78 | |
Total from investment operations | | | $0.74 | | | | $1.54 | | | | $0.35 | | | | $0.82 | |
| Less distributions declared to shareholders | | | | | |
From net investment income | | | $(0.03 | ) | | | $(0.02 | ) | | | $(0.05 | ) | | | $(0.01 | ) |
From net realized gain on investments | | | (0.03 | ) | | | (0.09 | ) | | | (0.01 | ) | | | — | |
Total distributions declared to shareholders | | | $(0.06 | ) | | | $(0.11 | ) | | | $(0.06 | ) | | | $(0.01 | ) |
Net asset value, end of period (x) | | | $13.21 | | | | $12.53 | | | | $11.10 | | | | $10.81 | |
Total return (%) (r)(s)(t)(x) | | | 5.95 | (n) | | | 13.96 | | | | 3.20 | | | | 8.23 | (n) |
Ratios (%) (to average net assets)
and Supplemental data: | | | | | |
Expenses before expense reductions (f) | | | 2.11 | (a) | | | 2.42 | | | | 3.79 | | | | 5.75 | (a) |
Expenses after expense reductions (f) | | | 1.95 | (a) | | | 1.95 | | | | 1.95 | | | | 1.93 | (a) |
Net investment income | | | 0.32 | (a) | | | 0.49 | | | | 0.43 | | | | 0.46 | (a) |
Portfolio turnover | | | 20 | (n) | | | 38 | | | | 33 | | | | 30 | (n) |
Net assets at end of period (000 omitted) | | | $1,936 | | | | $1,885 | | | | $717 | | | | $170 | |
See Notes to Financial Statements
15
Financial Highlights – continued
| | | | | | | | | | | | | | | | |
| | | Six months
ended
2/28/17 | | | Years ended 8/31 | | | Period
ended 8/31/14 (c) | |
| Class C | | | 2016 | | | 2015 | | |
| | | (unaudited) | | | | | | | | | | |
Net asset value, beginning of period | | | $12.50 | | | | $11.09 | | | | $10.80 | | | | $10.00 | |
| Income (loss) from investment operations | | | | | |
Net investment income (d) | | | $0.02 | | | | $0.06 | | | | $0.05 | | | | $0.04 | |
Net realized and unrealized gain (loss) on investments and foreign currency | | | 0.73 | | | | 1.48 | | | | 0.30 | (g) | | | 0.79 | |
Total from investment operations | | | $0.75 | | | | $1.54 | | | | $0.35 | | | | $0.83 | |
| Less distributions declared to shareholders | | | | | |
From net investment income | | | $(0.04 | ) | | | $(0.04 | ) | | | $(0.05 | ) | | | $(0.03 | ) |
From net realized gain on investments | | | (0.03 | ) | | | (0.09 | ) | | | (0.01 | ) | | | — | |
Total distributions declared to shareholders | | | $(0.07 | ) | | | $(0.13 | ) | | | $(0.06 | ) | | | $(0.03 | ) |
Net asset value, end of period (x) | | | $13.18 | | | | $12.50 | | | | $11.09 | | | | $10.80 | |
Total return (%) (r)(s)(t)(x) | | | 5.98 | (n) | | | 13.91 | | | | 3.23 | | | | 8.27 | (n) |
Ratios (%) (to average net assets)
and Supplemental data: | | | | | |
Expenses before expense reductions (f) | | | 2.11 | (a) | | | 2.31 | | | | 3.73 | | | | 5.39 | (a) |
Expenses after expense reductions (f) | | | 1.95 | (a) | | | 1.95 | | | | 1.95 | | | | 1.93 | (a) |
Net investment income | | | 0.31 | (a) | | | 0.48 | | | | 0.43 | | | | 0.48 | (a) |
Portfolio turnover | | | 20 | (n) | | | 38 | | | | 33 | | | | 30 | (n) |
Net assets at end of period (000 omitted) | | | $11,516 | | | | $9,977 | | | | $1,564 | | | | $421 | |
See Notes to Financial Statements
16
Financial Highlights – continued
| | | | | | | | | | | | | | | | |
| | | Six months
ended
2/28/17 | | | Years ended 8/31 | | | Period
ended 8/31/14 (c) | |
| Class I | | | 2016 | | | 2015 | | |
| | | (unaudited) | | | | | | | | | | |
Net asset value, beginning of period | | | $12.57 | | | | $11.14 | | | | $10.84 | | | | $10.00 | |
| Income (loss) from investment operations | | | | | |
Net investment income (d) | | | $0.08 | | | | $0.18 | | | | $0.16 | | | | $0.11 | |
Net realized and unrealized gain (loss) on investments and foreign currency | | | 0.73 | | | | 1.48 | | | | 0.30 | (g) | | | 0.80 | |
Total from investment operations | | | $0.81 | | | | $1.66 | | | | $0.46 | | | | $0.91 | |
| Less distributions declared to shareholders | | | | | |
From net investment income | | | $(0.10 | ) | | | $(0.14 | ) | | | $(0.15 | ) | | | $(0.07 | ) |
From net realized gain on investments | | | (0.03 | ) | | | (0.09 | ) | | | (0.01 | ) | | | — | |
Total distributions declared to shareholders | | | $(0.13 | ) | | | $(0.23 | ) | | | $(0.16 | ) | | | $(0.07 | ) |
Net asset value, end of period (x) | | | $13.25 | | | | $12.57 | | | | $11.14 | | | | $10.84 | |
Total return (%) (r)(s)(x) | | | 6.48 | (n) | | | 15.05 | | | | 4.20 | | | | 9.09 | (n) |
Ratios (%) (to average net assets)
and Supplemental data: | | | | | |
Expenses before expense reductions (f) | | | 1.11 | (a) | | | 1.20 | | | | 2.53 | | | | 4.72 | (a) |
Expenses after expense reductions (f) | | | 0.95 | (a) | | | 0.95 | | | | 0.95 | | | | 0.93 | (a) |
Net investment income | | | 1.34 | (a) | | | 1.51 | | | | 1.36 | | | | 1.43 | (a) |
Portfolio turnover | | | 20 | (n) | | | 38 | | | | 33 | | | | 30 | (n) |
Net assets at end of period (000 omitted) | | | $21,493 | | | | $16,123 | | | | $964 | | | | $177 | |
See Notes to Financial Statements
17
Financial Highlights – continued
| | | | | | | | | | | | | | | | |
| | | Six months
ended
2/28/17 | | | Years ended 8/31 | | | Period
ended 8/31/14 (c) | |
| Class R1 | | | 2016 | | | 2015 | | |
| | | (unaudited) | | | | | | | | | | |
Net asset value, beginning of period | | | $12.57 | | | | $11.12 | | | | $10.82 | | | | $10.00 | |
| Income (loss) from investment operations | | | | | |
Net investment income (d) | | | $0.02 | | | | $0.06 | | | | $0.04 | | | | $0.03 | |
Net realized and unrealized gain (loss) on investments and foreign currency | | | 0.72 | | | | 1.49 | | | | 0.31 | (g) | | | 0.80 | |
Total from investment operations | | | $0.74 | | | | $1.55 | | | | $0.35 | | | | $0.83 | |
| Less distributions declared to shareholders | | | | | |
From net investment income | | | $(0.03 | ) | | | $(0.01 | ) | | | $(0.04 | ) | | | $(0.01 | ) |
From net realized gain on investments | | | (0.03 | ) | | | (0.09 | ) | | | (0.01 | ) | | | — | |
Total distributions declared to shareholders | | | $(0.06 | ) | | | $(0.10 | ) | | | $(0.05 | ) | | | $(0.01 | ) |
Net asset value, end of period (x) | | | $13.25 | | | | $12.57 | | | | $11.12 | | | | $10.82 | |
Total return (%) (r)(s)(x) | | | 5.92 | (n) | | | 13.96 | | | | 3.18 | | | | 8.30 | (n) |
Ratios (%) (to average net assets)
and Supplemental data: | | | | | |
Expenses before expense reductions (f) | | | 2.11 | (a) | | | 2.56 | | | | 4.18 | | | | 5.92 | (a) |
Expenses after expense reductions (f) | | | 1.95 | (a) | | | 1.95 | | | | 1.95 | | | | 1.93 | (a) |
Net investment income | | | 0.32 | (a) | | | 0.48 | | | | 0.39 | | | | 0.40 | (a) |
Portfolio turnover | | | 20 | (n) | | | 38 | | | | 33 | | | | 30 | (n) |
Net assets at end of period (000 omitted) | | | $60 | | | | $57 | | | | $112 | | | | $108 | |
See Notes to Financial Statements
18
Financial Highlights – continued
| | | | | | | | | | | | | | | | |
| | | Six months
ended
2/28/17 | | | Years ended 8/31 | | | Period
ended 8/31/14 (c) | |
| Class R2 | | | 2016 | | | 2015 | | |
| | | (unaudited) | | | | | | | | | | |
Net asset value, beginning of period | | | $12.61 | | | | $11.13 | | | | $10.83 | | | | $10.00 | |
| Income (loss) from investment operations | | | | | |
Net investment income (d) | | | $0.05 | | | | $0.12 | | | | $0.10 | | | | $0.07 | |
Net realized and unrealized gain (loss) on investments and foreign currency | | | 0.74 | | | | 1.49 | | | | 0.30 | (g) | | | 0.80 | |
Total from investment operations | | | $0.79 | | | | $1.61 | | | | $0.40 | | | | $0.87 | |
| Less distributions declared to shareholders | | | | | |
From net investment income | | | $(0.07 | ) | | | $(0.04 | ) | | | $(0.09 | ) | | | $(0.04 | ) |
From net realized gain on investments | | | (0.03 | ) | | | (0.09 | ) | | | (0.01 | ) | | | — | |
Total distributions declared to shareholders | | | $(0.10 | ) | | | $(0.13 | ) | | | $(0.10 | ) | | | $(0.04 | ) |
Net asset value, end of period (x) | | | $13.30 | | | | $12.61 | | | | $11.13 | | | | $10.83 | |
Total return (%) (r)(s)(x) | | | 6.26 | (n) | | | 14.57 | | | | 3.69 | | | | 8.69 | (n) |
Ratios (%) (to average net assets)
and Supplemental data: | | | | | |
Expenses before expense reductions (f) | | | 1.61 | (a) | | | 2.07 | | | | 3.68 | | | | 5.42 | (a) |
Expenses after expense reductions (f) | | | 1.45 | (a) | | | 1.45 | | | | 1.45 | | | | 1.43 | (a) |
Net investment income | | | 0.82 | (a) | | | 0.98 | | | | 0.89 | | | | 0.90 | (a) |
Portfolio turnover | | | 20 | (n) | | | 38 | | | | 33 | | | | 30 | (n) |
Net assets at end of period (000 omitted) | | | $56 | | | | $53 | | | | $113 | | | | $109 | |
See Notes to Financial Statements
19
Financial Highlights – continued
| | | | | | | | | | | | | | | | |
| | | Six months
ended
2/28/17 | | | Years ended 8/31 | | | Period
ended 8/31/14 (c) | |
| Class R3 | | | 2016 | | | 2015 | | |
| | | (unaudited) | | | | | | | | | | |
Net asset value, beginning of period | | | $12.59 | | | | $11.14 | | | | $10.83 | | | | $10.00 | |
| Income (loss) from investment operations | | | | | |
Net investment income (d) | | | $0.07 | | | | $0.15 | | | | $0.13 | | | | $0.09 | |
Net realized and unrealized gain (loss) on investments and foreign currency | | | 0.73 | | | | 1.48 | | | | 0.31 | (g) | | | 0.79 | |
Total from investment operations | | | $0.80 | | | | $1.63 | | | | $0.44 | | | | $0.88 | |
| Less distributions declared to shareholders | | | | | |
From net investment income | | | $(0.08 | ) | | | $(0.09 | ) | | | $(0.12 | ) | | | $(0.05 | ) |
From net realized gain on investments | | | (0.03 | ) | | | (0.09 | ) | | | (0.01 | ) | | | — | |
Total distributions declared to shareholders | | | $(0.11 | ) | | | $(0.18 | ) | | | $(0.13 | ) | | | $(0.05 | ) |
Net asset value, end of period (x) | | | $13.28 | | | | $12.59 | | | | $11.14 | | | | $10.83 | |
Total return (%) (r)(s)(x) | | | 6.41 | (n) | | | 14.72 | | | | 4.04 | | | | 8.84 | (n) |
Ratios (%) (to average net assets)
and Supplemental data: | | | | | |
Expenses before expense reductions (f) | | | 1.36 | (a) | | | 1.82 | | | | 3.43 | | | | 5.17 | (a) |
Expenses after expense reductions (f) | | | 1.20 | (a) | | | 1.20 | | | | 1.20 | | | | 1.18 | (a) |
Net investment income | | | 1.07 | (a) | | | 1.23 | | | | 1.14 | | | | 1.15 | (a) |
Portfolio turnover | | | 20 | (n) | | | 38 | | | | 33 | | | | 30 | (n) |
Net assets at end of period (000 omitted) | | | $56 | | | | $53 | | | | $113 | | | | $109 | |
See Notes to Financial Statements
20
Financial Highlights – continued
| | | | | | | | | | | | | | | | |
| | | Six months
ended
2/28/17 | | | Years ended 8/31 | | | Period
ended 8/31/14 (c) | |
| Class R4 | | | 2016 | | | 2015 | | |
| | | (unaudited) | | | | | | | | | | |
Net asset value, beginning of period | | | $12.58 | | | | $11.14 | | | | $10.84 | | | | $10.00 | |
| Income (loss) from investment operations | | | | | |
Net investment income (d) | | | $0.08 | | | | $0.17 | | | | $0.16 | | | | $0.11 | |
Net realized and unrealized gain (loss) on investments and foreign currency | | | 0.73 | | | | 1.49 | | | | 0.30 | (g) | | | 0.80 | |
Total from investment operations | | | $0.81 | | | | $1.66 | | | | $0.46 | | | | $0.91 | |
| Less distributions declared to shareholders | | | | | |
From net investment income | | | $(0.10 | ) | | | $(0.13 | ) | | | $(0.15 | ) | | | $(0.07 | ) |
From net realized gain on investments | | | (0.03 | ) | | | (0.09 | ) | | | (0.01 | ) | | | — | |
Total distributions declared to shareholders | | | $(0.13 | ) | | | $(0.22 | ) | | | $(0.16 | ) | | | $(0.07 | ) |
Net asset value, end of period (x) | | | $13.26 | | | | $12.58 | | | | $11.14 | | | | $10.84 | |
Total return (%) (r)(s)(x) | | | 6.48 | (n) | | | 15.08 | | | | 4.20 | | | | 9.09 | (n) |
Ratios (%) (to average net assets)
and Supplemental data: | | | | | |
Expenses before expense reductions (f) | | | 1.11 | (a) | | | 1.57 | | | | 3.18 | | | | 4.92 | (a) |
Expenses after expense reductions (f) | | | 0.95 | (a) | | | 0.95 | | | | 0.95 | | | | 0.93 | (a) |
Net investment income | | | 1.32 | (a) | | | 1.48 | | | | 1.39 | | | | 1.40 | (a) |
Portfolio turnover | | | 20 | (n) | | | 38 | | | | 33 | | | | 30 | (n) |
Net assets at end of period (000 omitted) | | | $56 | | | | $53 | | | | $114 | | | | $109 | |
See Notes to Financial Statements
21
Financial Highlights – continued
| | | | | | | | | | | | | | | | |
| | | Six months
ended
2/28/17 | | | Years ended 8/31 | | | Period
ended 8/31/14 (c) | |
| Class R6 | | | 2016 | | | 2015 | | |
| | | (unaudited) | | | | | | | | | | |
Net asset value, beginning of period | | | $12.58 | | | | $11.14 | | | | $10.84 | | | | $10.00 | |
| Income (loss) from investment operations | | | | | |
Net investment income (d) | | | $0.09 | | | | $0.18 | | | | $0.16 | | | | $0.11 | |
Net realized and unrealized gain (loss) on investments and foreign currency | | | 0.73 | | | | 1.50 | | | | 0.30 | (g) | | | 0.80 | |
Total from investment operations | | | $0.82 | | | | $1.68 | | | | $0.46 | | | | $0.91 | |
| Less distributions declared to shareholders | | | | | |
From net investment income | | | $(0.11 | ) | | | $(0.15 | ) | | | $(0.15 | ) | | | $(0.07 | ) |
From net realized gain on investments | | | (0.03 | ) | | | (0.09 | ) | | | (0.01 | ) | | | — | |
Total distributions declared to shareholders | | | $(0.14 | ) | | | $(0.24 | ) | | | $(0.16 | ) | | | $(0.07 | ) |
Net asset value, end of period (x) | | | $13.26 | | | | $12.58 | | | | $11.14 | | | | $10.84 | |
Total return (%) (r)(s)(x) | | | 6.53 | (n) | | | 15.21 | | | | 4.22 | | | | 9.11 | (n) |
Ratios (%) (to average net assets)
and Supplemental data: | | | | | |
Expenses before expense reductions (f) | | | 1.01 | (a) | | | 1.36 | | | | 3.14 | | | | 4.90 | (a) |
Expenses after expense reductions (f) | | | 0.85 | (a) | | | 0.88 | | | | 0.91 | | | | 0.91 | (a) |
Net investment income | | | 1.40 | (a) | | | 1.53 | | | | 1.43 | | | | 1.42 | (a) |
Portfolio turnover | | | 20 | (n) | | | 38 | | | | 33 | | | | 30 | (n) |
Net assets at end of period (000 omitted) | | | $1,450 | | | | $1,693 | | | | $1,593 | | | | $1,527 | |
| (c) | For the period from the commencement of the fund’s investment operations, December 5, 2013, through the stated period end. |
| (d) | Per share data is based on average shares outstanding. |
| (f) | Ratios do not reflect reductions from fees paid indirectly, if applicable. |
| (g) | The per share amount varies from the net realized and unrealized gain/loss for the period because of the timing of sales of fund shares and the per share amount of realized and unrealized gains and losses at such time. |
| (r) | Certain expenses have been reduced without which performance would have been lower. |
| (s) | From time to time the fund may receive proceeds from litigation settlements, without which performance would be lower. |
| (t) | Total returns do not include any applicable sales charges. |
| (x) | The net asset values and total returns have been calculated on net assets which include adjustments made in accordance with U.S. generally accepted accounting principles required at period end for financial reporting purposes. |
See Notes to Financial Statements
22
NOTES TO FINANCIAL STATEMENTS
(unaudited)
(1) Business and Organization
MFS Low Volatility Equity Fund (the fund) is a diversified series of MFS Series Trust I (the trust). The trust is organized as a Massachusetts business trust and is registered under the Investment Company Act of 1940, as amended, as an open-end management investment company.
The fund is an investment company and accordingly follows the investment company accounting and reporting guidance of the Financial Accounting Standards Board (FASB) Accounting Standards Codification Topic 946 Financial Services – Investment Companies.
(2) Significant Accounting Policies
General – The preparation of financial statements in conformity with U.S. generally accepted accounting principles requires management to make estimates and assumptions that affect the reported amounts of assets and liabilities, and disclosure of contingent assets and liabilities at the date of the financial statements and the reported amounts of increases and decreases in net assets from operations during the reporting period. Actual results could differ from those estimates. In the preparation of these financial statements, management has evaluated subsequent events occurring after the date of the fund’s Statement of Assets and Liabilities through the date that the financial statements were issued.
In October 2016, the Securities and Exchange Commission (SEC) released its Final Rule on Investment Company Reporting Modernization (the “Rule”). The Rule, which introduces two new regulatory reporting forms for investment companies – Form N-PORT and Form N-CEN – also contains amendments to Regulation S-X which impact financial statement presentation, particularly the presentation of derivative investments. Although still evaluating the impacts of the Rule, management believes that many of the Regulation S-X amendments are consistent with the fund’s current financial statement presentation and expects that the fund will be able to comply with the Rule’s Regulation S-X amendments by the August 1, 2017 compliance date.
Balance Sheet Offsetting – The fund’s accounting policy with respect to balance sheet offsetting is that, absent an event of default by the counterparty or a termination of the agreement, the International Swaps and Derivatives Association (ISDA) Master Agreement does not result in an offset of reported amounts of financial assets and financial liabilities in the Statement of Assets and Liabilities across transactions between the fund and the applicable counterparty. The fund’s right to setoff may be restricted or prohibited by the bankruptcy or insolvency laws of the particular jurisdiction to which a specific master netting agreement counterparty is subject. Balance sheet offsetting disclosures, to the extent applicable to the fund, have been included in the fund’s Significant Accounting Policies note under the captions for each of the fund’s in-scope financial instruments and transactions.
Investment Valuations – Equity securities, including restricted equity securities, are generally valued at the last sale or official closing price on their primary market or exchange as provided by a third-party pricing service. Equity securities, for which there were no sales reported that day, are generally valued at the last quoted daily bid
23
Notes to Financial Statements (unaudited) – continued
quotation on their primary market or exchange as provided by a third-party pricing service. Short-term instruments with a maturity at issuance of 60 days or less may be valued at amortized cost, which approximates market value. Open-end investment companies are generally valued at net asset value per share. Securities and other assets generally valued on the basis of information from a third-party pricing service may also be valued at a broker/dealer bid quotation. Values obtained from third-party pricing services can utilize both transaction data and market information such as yield, quality, coupon rate, maturity, type of issue, trading characteristics, and other market data.
The Board of Trustees has delegated primary responsibility for determining or causing to be determined the value of the fund’s investments (including any fair valuation) to the adviser pursuant to valuation policies and procedures approved by the Board. If the adviser determines that reliable market quotations are not readily available, investments are valued at fair value as determined in good faith by the adviser in accordance with such procedures under the oversight of the Board of Trustees. Under the fund’s valuation policies and procedures, market quotations are not considered to be readily available for most types of debt instruments and floating rate loans and many types of derivatives. These investments are generally valued at fair value based on information from third-party pricing services. In addition, investments may be valued at fair value if the adviser determines that an investment’s value has been materially affected by events occurring after the close of the exchange or market on which the investment is principally traded (such as foreign exchange or market) and prior to the determination of the fund’s net asset value, or after the halting of trading of a specific security where trading does not resume prior to the close of the exchange or market on which the security is principally traded. Events that occur on a frequent basis after foreign markets close (such as developments in foreign markets and significant movements in the U.S. markets) and prior to the determination of the fund’s net asset value may be deemed to have a material effect on the value of securities traded in foreign markets. Accordingly, the fund’s foreign equity securities may often be valued at fair value. The adviser generally relies on third-party pricing services or other information (such as the correlation with price movements of similar securities in the same or other markets; the type, cost and investment characteristics of the security; the business and financial condition of the issuer; and trading and other market data) to assist in determining whether to fair value and at what value to fair value an investment. The value of an investment for purposes of calculating the fund’s net asset value can differ depending on the source and method used to determine value. When fair valuation is used, the value of an investment used to determine the fund’s net asset value may differ from quoted or published prices for the same investment. There can be no assurance that the fund could obtain the fair value assigned to an investment if it were to sell the investment at the same time at which the fund determines its net asset value per share.
Various inputs are used in determining the value of the fund’s assets or liabilities. These inputs are categorized into three broad levels. In certain cases, the inputs used to measure fair value may fall into different levels of the fair value hierarchy. In such cases, an investment’s level within the fair value hierarchy is based on the lowest level of input that is significant to the fair value measurement. The fund’s assessment of the significance of a particular input to the fair value measurement in its entirety requires judgment, and considers factors specific to the investment. Level 1 includes unadjusted
24
Notes to Financial Statements (unaudited) – continued
quoted prices in active markets for identical assets or liabilities. Level 2 includes other significant observable market-based inputs (including quoted prices for similar securities, interest rates, prepayment speed, and credit risk). Level 3 includes unobservable inputs, which may include the adviser’s own assumptions in determining the fair value of investments. The following is a summary of the levels used as of February 28, 2017 in valuing the fund’s assets or liabilities:
| | | | | | | | | | | | | | | | |
| Investments at Value | | Level 1 | | | Level 2 | | | Level 3 | | | Total | |
| Equity Securities | | | $64,986,678 | | | | $— | | | | $— | | | | $64,986,678 | |
| Mutual Funds | | | 1,053,620 | | | | — | | | | — | | | | 1,053,620 | |
| Total Investments | | | $66,040,298 | | | | $— | | | | $— | | | | $66,040,298 | |
For further information regarding security characteristics, see the Portfolio of Investments.
Indemnifications – Under the fund’s organizational documents, its officers and Trustees may be indemnified against certain liabilities and expenses arising out of the performance of their duties to the fund. Additionally, in the normal course of business, the fund enters into agreements with service providers that may contain indemnification clauses. The fund’s maximum exposure under these agreements is unknown as this would involve future claims that may be made against the fund that have not yet occurred.
Investment Transactions and Income – Investment transactions are recorded on the trade date. Dividends received in cash are recorded on the ex-dividend date. Certain dividends from foreign securities will be recorded when the fund is informed of the dividend if such information is obtained subsequent to the ex-dividend date. Dividend payments received in additional securities are recorded on the ex-dividend date in an amount equal to the value of the security on such date.
The fund may receive proceeds from litigation settlements. Any proceeds received from litigation involving portfolio holdings are reflected in the Statement of Operations in realized gain/loss if the security has been disposed of by the fund or in unrealized gain/loss if the security is still held by the fund. Any other proceeds from litigation not related to portfolio holdings are reflected as other income in the Statement of Operations.
Tax Matters and Distributions – The fund intends to qualify as a regulated investment company, as defined under Subchapter M of the Internal Revenue Code, and to distribute all of its taxable income, including realized capital gains. As a result, no provision for federal income tax is required. The fund’s federal tax returns, when filed, will remain subject to examination by the Internal Revenue Service for a three year period. Management has analyzed the fund’s tax positions taken on federal and state tax returns for all open tax years and does not believe that there are any uncertain tax positions that require recognition of a tax liability.
Distributions to shareholders are recorded on the ex-dividend date. Income and capital gain distributions are determined in accordance with income tax regulations, which may differ from U.S. generally accepted accounting principles. Certain capital accounts in the financial statements are periodically adjusted for permanent differences in order to reflect their tax character. These adjustments have no impact on net assets or net
25
Notes to Financial Statements (unaudited) – continued
asset value per share. Temporary differences which arise from recognizing certain items of income, expense, gain or loss in different periods for financial statement and tax purposes will reverse at some time in the future. Distributions in excess of net investment income or net realized gains are temporary overdistributions for financial statement purposes resulting from differences in the recognition or classification of income or distributions for financial statement and tax purposes.
Book/tax differences primarily relate to wash sale loss deferrals.
The tax character of distributions made during the current period will be determined at fiscal year end. The tax character of distributions declared to shareholders for the last fiscal year is as follows:
| | | | |
| | | 8/31/16 | |
Ordinary income (including any
short-term capital gains) | | | $349,626 | |
| Long-term capital gains | | | 86,498 | |
| Total distributions | | | $436,124 | |
The federal tax cost and the tax basis components of distributable earnings were as follows:
| | | | |
| As of 2/28/17 | | | |
| Cost of investments | | | $58,355,511 | |
| Gross appreciation | | | 8,173,891 | |
| Gross depreciation | | | (489,104 | ) |
| Net unrealized appreciation (depreciation) | | | $7,684,787 | |
| |
| As of 8/31/16 | | | |
| Undistributed ordinary income | | | 154,248 | |
| Capital loss carryforwards | | | (138,669 | ) |
| Net unrealized appreciation (depreciation) | | | 4,811,283 | |
The aggregate cost above includes prior fiscal year end tax adjustments, if applicable.
As of August 31, 2016, the fund had capital loss carryforwards available to offset future realized gains. These net capital losses may be carried forward indefinitely and their character is retained as short-term and/or long-term losses. Such losses are characterized as follows:
Multiple Classes of Shares of Beneficial Interest – The fund offers multiple classes of shares, which differ in their respective distribution and service fees. The fund’s income, realized and unrealized gain (loss), and common expenses are allocated to shareholders based on the daily net assets of each class. Dividends are declared separately for each class. Differences in per share dividend rates are generally due to differences in separate class expenses. Class B shares will convert to Class A shares
26
Notes to Financial Statements (unaudited) – continued
approximately eight years after purchase. The fund’s distributions declared to shareholders as reported in the Statements of Changes in Net Assets are presented by class as follows:
| | | | | | | | | | | | | | | | |
| | | From net investment
income | | | From net realized gain on
investments | |
| | | Six months
ended
2/28/17 | | | Year
ended
8/31/16 | | | Six months
ended
2/28/17 | | | Year
ended
8/31/16 | |
| Class A | | | $208,499 | | | | $179,229 | | | | $72,819 | | | | $101,633 | |
| Class B | | | 5,009 | | | | 1,944 | | | | 4,185 | | | | 6,272 | |
| Class C | | | 29,179 | | | | 13,239 | | | | 22,638 | | | | 14,761 | |
| Class I | | | 119,915 | | | | 90,805 | | | | 31,512 | | | | 6,457 | |
| Class R1 | | | 152 | | | | 32 | | | | 129 | | | | 390 | |
| Class R2 | | | 277 | | | | 198 | | | | 119 | | | | 390 | |
| Class R3 | | | 348 | | | | 400 | | | | 120 | | | | 390 | |
| Class R4 | | | 419 | | | | 605 | | | | 120 | | | | 391 | |
| Class R6 | | | 12,688 | | | | 13,761 | | | | 3,143 | | | | 5,227 | |
| Total | | | $376,486 | | | | $300,213 | | | | $134,785 | | | | $135,911 | |
(3) Transactions with Affiliates
Investment Adviser – The fund has an investment advisory agreement with MFS to provide overall investment management and related administrative services and facilities to the fund. The management fee is computed daily and paid monthly at the following annual rates:
| | | | |
| First $1 billion of average daily net assets | | | 0.60 | % |
| Next $1.5 billion of average daily net assets | | | 0.55 | % |
| Average daily net assets in excess of $2.5 billion | | | 0.50 | % |
MFS has agreed in writing to reduce its management fee by a specified amount if certain MFS mutual fund assets exceed thresholds agreed to by MFS and the fund’s Board of Trustees. For the six months ended February 28, 2017, this management fee reduction amounted to $2,211, which is included in the reduction of total expenses in the Statement of Operations. The management fee incurred for the six months ended February 28, 2017 was equivalent to an annual effective rate of 0.59% of the fund’s average daily net assets.
The investment adviser has agreed in writing to pay a portion of the fund’s total annual operating expenses, excluding interest, taxes, extraordinary expenses, brokerage and transaction costs, and investment-related expenses, such that total fund operating expenses do not exceed the following rates annually of each class’s average daily net assets:
| | | | | | | | | | | | | | | | | | | | | | | | | | | | | | | | |
| Classes | |
| A | | B | | | C | | | I | | | R1 | | | R2 | | | R3 | | | R4 | | | R6 | |
| 1.20% | | | 1.95% | | | | 1.95% | | | | 0.95% | | | | 1.95% | | | | 1.45% | | | | 1.20% | | | | 0.95% | | | | 0.91% | |
This written agreement will continue until modified by the fund’s Board of Trustees, but such agreement will continue at least until December 31, 2017. For the six months ended February 28, 2017, this reduction amounted to $46,904, which is included in the reduction of total expenses in the Statement of Operations.
27
Notes to Financial Statements (unaudited) – continued
Distributor – MFS Fund Distributors, Inc. (MFD), a wholly-owned subsidiary of MFS, as distributor, received $19,050 for the six months ended February 28, 2017, as its portion of the initial sales charge on sales of Class A shares of the fund.
The Board of Trustees has adopted a distribution plan for certain share classes pursuant to Rule 12b-1 of the Investment Company Act of 1940.
The fund’s distribution plan provides that the fund will pay MFD for services provided by MFD and financial intermediaries in connection with the distribution and servicing of certain share classes. One component of the plan is a distribution fee paid to MFD and another component of the plan is a service fee paid to MFD. MFD may subsequently pay all, or a portion, of the distribution and/or service fees to financial intermediaries.
Distribution Plan Fee Table:
| | | | | | | | | | | | | | | | | | | | |
| | | Distribution
Fee Rate (d) | | | Service Fee Rate (d) | | | Total
Distribution
Plan (d) | | | Annual
Effective
Rate (e) | | | Distribution
and Service
Fee | |
| Class A | | | — | | | | 0.25% | | | | 0.25% | | | | 0.24% | | | | $39,004 | |
| Class B | | | 0.75% | | | | 0.25% | | | | 1.00% | | | | 1.00% | | | | 9,266 | |
| Class C | | | 0.75% | | | | 0.25% | | | | 1.00% | | | | 1.00% | | | | 50,826 | |
| Class R1 | | | 0.75% | | | | 0.25% | | | | 1.00% | | | | 1.00% | | | | 283 | |
| Class R2 | | | 0.25% | | | | 0.25% | | | | 0.50% | | | | 0.50% | | | | 132 | |
| Class R3 | | | — | | | | 0.25% | | | | 0.25% | | | | 0.25% | | | | 66 | |
| Total Distribution and Service Fees | | | | $99,577 | |
| (d) | In accordance with the distribution plan for certain classes, the fund pays distribution and/or service fees equal to these annual percentage rates of each class’s average daily net assets. The distribution and service fee rates disclosed by class represent the current rates in effect at the end of the reporting period. Any rate changes, if applicable, are detailed below. |
| (e) | The annual effective rates represent actual fees incurred under the distribution plan for the six months ended February 28, 2017 based on each class’s average daily net assets. MFD has voluntarily agreed to rebate a portion of each class’s 0.25% service fee attributable to accounts for which MFD retains the 0.25% service fee except for accounts attributable to MFS or its affiliates’ seed money. For the six months ended February 28, 2017, this rebate amounted to $1,674 and $4 for Class A and Class B, respectively, and is included in the reduction of total expenses in the Statement of Operations. |
Certain Class A shares are subject to a contingent deferred sales charge (CDSC) in the event of a shareholder redemption within 18 months of purchase. Class C shares are subject to a CDSC in the event of a shareholder redemption within 12 months of purchase. Class B shares are subject to a CDSC in the event of a shareholder redemption within six years of purchase. All contingent deferred sales charges are paid to MFD and during the six months ended February 28, 2017, were as follows:
| | | | |
| | | Amount | |
| Class A | | | $9 | |
| Class B | | | 5,696 | |
| Class C | | | 2,669 | |
Shareholder Servicing Agent – MFS Service Center, Inc. (MFSC), a wholly-owned subsidiary of MFS, receives a fee from the fund for its services as shareholder servicing agent calculated as a percentage of the average daily net assets of the fund as
28
Notes to Financial Statements (unaudited) – continued
determined periodically under the supervision of the fund’s Board of Trustees. For the six months ended February 28, 2017, the fee was $3,998, which equated to 0.0132% annually of the fund’s average daily net assets. MFSC also receives payment from the fund for out-of-pocket expenses, sub-accounting and other shareholder servicing costs which may be paid to affiliated and unaffiliated service providers. Class R6 shares do not incur sub-accounting fees. For the six months ended February 28, 2017, these out-of-pocket expenses, sub-accounting and other shareholder servicing costs amounted to $33,594.
Administrator – MFS provides certain financial, legal, shareholder communications, compliance, and other administrative services to the fund. Under an administrative services agreement, the fund reimburses MFS the costs incurred to provide these services. The fund is charged an annual fixed amount of $17,500 plus a fee based on average daily net assets. The administrative services fee incurred for the six months ended February 28, 2017 was equivalent to an annual effective rate of 0.0314% of the fund’s average daily net assets.
Trustees’ and Officers’ Compensation – The fund pays compensation to independent Trustees in the form of a retainer, attendance fees, and additional compensation to Board and Committee chairpersons. The fund does not pay compensation directly to Trustees or officers of the fund who are also officers of the investment adviser, all of whom receive remuneration for their services to the fund from MFS. Certain officers and Trustees of the fund are officers or directors of MFS, MFD, and MFSC.
Other – This fund and certain other funds managed by MFS (the funds) have entered into a service agreement (the ISO Agreement) which provides for payment of fees solely by the funds to Tarantino LLC in return for the provision of services of an Independent Senior Officer (ISO) for the funds. Frank L. Tarantino serves as the ISO and is an officer of the funds and the sole member of Tarantino LLC. The funds can terminate the ISO Agreement with Tarantino LLC at any time under the terms of the ISO Agreement. For the six months ended February 28, 2017, the fee paid by the fund under this agreement was $58 and is included in “Miscellaneous” expense in the Statement of Operations. MFS has agreed to bear all expenses associated with office space, other administrative support, and supplies provided to the ISO.
The fund invests in the MFS Institutional Money Market Portfolio which is managed by MFS and seeks current income consistent with preservation of capital and liquidity. This money market fund does not pay a management fee to MFS.
On September 9, 2015, MFS redeemed 10,176, 5,557, 10,076, 5,716, 5,552, 5,633, 5,676, 5,715, and 129,501 shares of Class A, Class B, Class C, Class I, Class R1, Class R2, Class R3, Class R4, and Class R6, respectively, for an aggregate amount of $2,018,148. On June 29, 2016, MFS redeemed 4,546, 4,559, 363, 371, and 379 shares, respectively, of Class B, Class I, Class R2, Class R3, and Class R4, for an aggregate amount of $125,049.
At February 28, 2017, MFS held approximately 100% of the outstanding shares of Class R1, Class R2, Class R3, and Class R4, respectively.
29
Notes to Financial Statements (unaudited) – continued
(4) Portfolio Securities
For the six months ended February 28, 2017, purchases and sales of investments, other than short-term obligations, aggregated $15,486,396 and $12,130,696, respectively.
(5) Shares of Beneficial Interest
The fund’s Declaration of Trust permits the Trustees to issue an unlimited number of full and fractional shares of beneficial interest. Transactions in fund shares were as follows:
| | | | | | | | | | | | | | | | |
| | | Six months ended
2/28/17 | | | Year ended
8/31/16 | |
| | | Shares | | | Amount | | | Shares | | | Amount | |
| Shares sold | | | | | | | | | | | | | | | | |
Class A | | | 796,257 | | | | $10,021,081 | | | | 2,092,547 | | | | $24,894,676 | |
Class B | | | 17,170 | | | | 215,804 | | | | 113,015 | | | | 1,323,803 | |
Class C | | | 156,041 | | | | 1,964,619 | | | | 747,875 | | | | 8,945,844 | |
Class I | | | 1,094,339 | | | | 14,076,405 | | | | 1,514,125 | | | | 17,745,563 | |
Class R6 | | | 25,050 | | | | 313,883 | | | | 148,602 | | | | 1,724,717 | |
| | | 2,088,857 | | | | $26,591,792 | | | | 4,616,164 | | | | $54,634,603 | |
| | | | |
| Shares issued to shareholders in reinvestment of distributions | | | | | | | | | | | | | | | | |
Class A | | | 22,246 | | | | $280,945 | | | | 24,005 | | | | $280,852 | |
Class B | | | 727 | | | | 9,194 | | | | 712 | | | | 8,216 | |
Class C | | | 4,079 | | | | 51,466 | | | | 2,377 | | | | 27,828 | |
Class I | | | 12,005 | | | | 151,427 | | | | 8,111 | | | | 97,262 | |
Class R1 | | | 22 | | | | 281 | | | | 37 | | | | 422 | |
Class R2 | | | 32 | | | | 396 | | | | 50 | | | | 588 | |
Class R3 | | | 37 | | | | 468 | | | | 68 | | | | 790 | |
Class R4 | | | 42 | | | | 539 | | | | 86 | | | | 996 | |
Class R6 | | | 142 | | | | 1,794 | | | | 304 | | | | 3,550 | |
| | | 39,332 | | | | $496,510 | | | | 35,750 | | | | $420,504 | |
| | | | |
| Shares reacquired | | | | | | | | | | | | | | | | |
Class A | | | (589,200 | ) | | | $(7,437,481 | ) | | | (779,292 | ) | | | $(9,522,556 | ) |
Class B | | | (21,827 | ) | | | (275,595 | ) | | | (27,799 | ) | | | (327,879 | ) |
Class C | | | (84,482 | ) | | | (1,049,808 | ) | | | (93,160 | ) | | | (1,097,562 | ) |
Class I | | | (767,131 | ) | | | (9,694,673 | ) | | | (325,884 | ) | | | (3,977,164 | ) |
Class R1 | | | — | | | | — | | | | (5,552 | ) | | | (60,905 | ) |
Class R2 | | | — | | | | — | | | | (5,996 | ) | | | (66,317 | ) |
Class R3 | | | — | | | | — | | | | (6,047 | ) | | | (66,925 | ) |
Class R4 | | | — | | | | — | | | | (6,094 | ) | | | (67,506 | ) |
Class R6 | | | (50,459 | ) | | | (626,218 | ) | | | (157,202 | ) | | | (1,764,990 | ) |
| | | (1,513,099 | ) | | | $(19,083,775 | ) | | | (1,407,026 | ) | | | $(16,951,804 | ) |
30
Notes to Financial Statements (unaudited) – continued
| | | | | | | | | | | | | | | | |
| | | Six months ended
2/28/17 | | | Year ended
8/31/16 | |
| | | Shares | | | Amount | | | Shares | | | Amount | |
| Net change | | | | | | | | | | | | | | | | |
Class A | | | 229,303 | | | | $2,864,545 | | | | 1,337,260 | | | | $15,652,972 | |
Class B | | | (3,930 | ) | | | (50,597 | ) | | | 85,928 | | | | 1,004,140 | |
Class C | | | 75,638 | | | | 966,277 | | | | 657,092 | | | | 7,876,110 | |
Class I | | | 339,213 | | | | 4,533,159 | | | | 1,196,352 | | | | 13,865,661 | |
Class R1 | | | 22 | | | | 281 | | | | (5,515 | ) | | | (60,483 | ) |
Class R2 | | | 32 | | | | 396 | | | | (5,946 | ) | | | (65,729 | ) |
Class R3 | | | 37 | | | | 468 | | | | (5,979 | ) | | | (66,135 | ) |
Class R4 | | | 42 | | | | 539 | | | | (6,008 | ) | | | (66,510 | ) |
Class R6 | | | (25,267 | ) | | | (310,541 | ) | | | (8,296 | ) | | | (36,723 | ) |
| | | 615,090 | | | | $8,004,527 | | | | 3,244,888 | | | | $38,103,303 | |
(6) Line of Credit
The fund and certain other funds managed by MFS participate in a $1.25 billion unsecured committed line of credit, subject to a $1 billion sublimit, provided by a syndication of banks under a credit agreement. Borrowings may be made for temporary financing needs. Interest is charged to each fund, based on its borrowings, generally at a rate equal to the higher of the Overnight Federal Reserve funds rate or daily one month LIBOR plus an agreed upon spread. A commitment fee, based on the average daily, unused portion of the committed line of credit, is allocated among the participating funds at the end of each calendar quarter. In addition, the fund and other funds managed by MFS have established unsecured uncommitted borrowing arrangements with certain banks for temporary financing needs. Interest is charged to each fund, based on its borrowings, at a rate equal to the Overnight Federal Reserve funds rate plus an agreed upon spread. For the six months ended February 28, 2017, the fund’s commitment fee and interest expense were $194 and $0, respectively, and are included in “Miscellaneous” expense in the Statement of Operations.
(7) Transactions in Underlying Affiliated Funds-Affiliated Issuers
An affiliated issuer may be considered one in which the fund owns 5% or more of the outstanding voting securities, or a company which is under common control. For the purposes of this report, the fund assumes the following to be an affiliated issuer:
| | | | | | | | | | | | | | | | |
| Underlying Affiliated Fund | | Beginning
Shares/Par
Amount | | | Acquisitions
Shares/Par
Amount | | | Dispositions
Shares/Par
Amount | | | Ending
Shares/Par
Amount | |
MFS Institutional Money
Market Portfolio | | | 379,373 | | | | 12,072,190 | | | | (11,397,943 | ) | | | 1,053,620 | |
| | | | |
| Underlying Affiliated Fund | | Realized
Gain (Loss) | | | Capital Gain
Distributions | | | Dividend
Income | | | Ending
Value | |
MFS Institutional Money
Market Portfolio | | | $(4 | ) | | | $— | | | | $2,077 | | | | $1,053,620 | |
31
PROXY VOTING POLICIES AND INFORMATION
MFS votes proxies on behalf of the fund pursuant to proxy voting policies and procedures that are available without charge, upon request, by calling 1-800-225-2606, by visiting mfs.com (once you have selected “Individual Investor” as your role, click on “Individual Investor Home” in the top navigation and then select “Learn More About Proxy Voting” under the “I want to…” header on the left hand column of the page), or by visiting the SEC’s Web site at http://www.sec.gov.
Information regarding how the fund voted proxies relating to portfolio securities during the most recent twelve-month period ended June 30 is available by August 31 of each year without charge by visiting mfs.com (once you have selected “Individual Investor” as your role, click on “Individual Investor Home” in the top navigation and then select “Learn More About Proxy Voting” under the “I want to…” header on the left hand column of the page), or by visiting the SEC’s Web site at http://www.sec.gov.
QUARTERLY PORTFOLIO DISCLOSURE
The fund will file a complete schedule of portfolio holdings with the Securities and Exchange Commission (the Commission) for the first and third quarters of each fiscal year on Form N-Q. A shareholder can obtain the quarterly portfolio holdings report at mfs.com. The fund’s Form N-Q is also available on the EDGAR database on the Commission’s Internet Web site at http://www.sec.gov, and may be reviewed and copied at the:
Public Reference Room
Securities and Exchange Commission
100 F Street, NE, Room 1580
Washington, D.C. 20549
Information on the operation of the Public Reference Room may be obtained by calling the Commission at 1-800-SEC-0330. Copies of the fund’s Form N-Q also may be obtained, upon payment of a duplicating fee, by electronic request at the following e-mail address: publicinfo@sec.gov or by writing the Public Reference Section at the above address.
FURTHER INFORMATION
From time to time, MFS may post important information about the fund or the MFS funds on the MFS web site (mfs.com). This information is available on mfs.com by following these steps once you have selected “Individual Investor” as your role: (1) Click on the “Individual Investor Home” in the top navigation and then select the “Announcements” option within the “Market Outlooks” drop down, or (2) Click on “Products & Services” and “Mutual Funds” and then choose the fund’s name in the “Select a fund” menu.
32
INFORMATION ABOUT FUND CONTRACTS AND LEGAL CLAIMS
The fund has entered into contractual arrangements with an investment adviser, administrator, distributor, shareholder servicing agent, 529 program manager (if applicable), and custodian who each provide services to the fund. Unless expressly stated otherwise, shareholders are not parties to, or intended beneficiaries of these contractual arrangements, and these contractual arrangements are not intended to create any shareholder right to enforce them against the service providers or to seek any remedy under them against the service providers, either directly or on behalf of the fund.
Under the Trust’s By-Laws and Declaration of Trust, any claims asserted against or on behalf of the MFS Funds, including claims against Trustees and Officers, must be brought in state and federal courts located within the Commonwealth of Massachusetts.
PROVISION OF FINANCIAL REPORTS AND SUMMARY PROSPECTUSES
The fund produces financial reports every six months and updates its summary prospectus and prospectus annually. To avoid sending duplicate copies of materials to households, only one copy of the fund’s annual and semiannual report and summary prospectus may be mailed to shareholders having the same last name and residential address on the fund’s records. However, any shareholder may contact MFSC (please see back cover for address and telephone number) to request that copies of these reports and summary prospectuses be sent personally to that shareholder.
33
Save paper with eDelivery.

| MFS® will send you prospectuses, |
reports, and proxies directly via e-mail so you will get information faster with less mailbox clutter.
To sign up:
1. Go to mfs.com.
2. Log in via MFS® Access.
3. Select eDelivery.
If you own your MFS fund shares through a financial institution or a retirement plan, MFS® TALK, MFS® Access, or eDelivery may not be available to you.
CONTACT
WEB SITE
mfs.com
MFS TALK
1-800-637-8255
24 hours a day
ACCOUNT SERVICE AND LITERATURE
Shareholders
1-800-225-2606
Financial advisors
1-800-343-2829
Retirement plan services
1-800-637-1255
MAILING ADDRESS
MFS Service Center, Inc.
P.O. Box 55824
Boston, MA 02205-5824
OVERNIGHT MAIL
MFS Service Center, Inc.
c/o Boston Financial Data Services
30 Dan Road
Canton, MA 02021-2809
SEMIANNUAL REPORT
February 28, 2017

MFS® NEW DISCOVERY FUND

NDF-SEM
MFS® NEW DISCOVERY FUND
CONTENTS
The report is prepared for the general information of shareholders. It is authorized for distribution to prospective investors only when preceded or accompanied by a current prospectus.
NOT FDIC INSURED • MAY LOSE VALUE • NO BANK GUARANTEE

LETTER FROM THE EXECUTIVE CHAIRMAN
Dear Shareholders:
Despite June’s unexpected vote by the United Kingdom to leave the European Union and the surprising result in November’s U.S. presidential election, most markets have
proved resilient. U.S. share prices quickly reversed post-Brexit declines, and indices reached new highs following the November elections. U.S. bond yields rose after Donald Trump’s victory on hopes that his proposed policy mix of lower taxes, increased spending on infrastructure and a lower regulatory burden on businesses will lift both U.S. economic growth and inflation. However, interest rates in most developed markets remain very low, with major central banks maintaining extremely accommodative monetary policies to reinvigorate slow-growing economies against a backdrop of still-low inflation. Even after the rise in yields following the election, interest rates remain low by historical standards.
Globally, economic growth has shown signs of recovery of late, led by the United States and the eurozone. Despite better growth, there are few immediate signs of worrisome inflation. Emerging market economies are recovering at a somewhat slower pace amid fears that restrictive U.S. trade policies could further hamper the already slow pace of global trade growth. Looking ahead, markets will have to contend with a series of European elections during 2017, which, depending on the outcome, could further call into question the future direction of the European Union.
At MFS®, we believe in a patient, long-term approach to investing. Viewing investments with a long lens makes it possible to filter out short-term market noise and focus on achieving solid risk-adjusted returns over a full market cycle.
In our view, such an approach, along with the professional guidance of a financial advisor, will help you reach your investment objectives.
Respectfully,

Robert J. Manning
Executive Chairman
MFS Investment Management
April 13, 2017
The opinions expressed in this letter are subject to change and may not be relied upon for investment advice. No forecasts can be guaranteed.
1
PORTFOLIO COMPOSITION
Portfolio structure

| | | | |
| Top ten holdings | | | | |
| Bright Horizons Family Solutions, Inc. | | | 2.9% | |
| Berry Plastics Group, Inc. | | | 2.0% | |
| SS&C Technologies Holdings, Inc. | | | 1.8% | |
| Live Nation, Inc. | | | 1.5% | |
| Healthcare Services Group, Inc. | | | 1.5% | |
| NICE Systems Ltd., ADR | | | 1.5% | |
| Axalta Coating Systems Ltd. | | | 1.5% | |
| GMS, Inc. | | | 1.4% | |
| Steris PLC | | | 1.4% | |
| Cadence Design Systems, Inc. | | | 1.4% | |
| | | | |
| Equity sectors | | | | |
| Technology | | | 20.0% | |
| Health Care | | | 19.3% | |
| Special Products & Services | | | 11.2% | |
| Basic Materials | | | 9.3% | |
| Leisure | | | 8.0% | |
| Industrial Goods & Services | | | 7.3% | |
| Financial Services | | | 7.0% | |
| Autos & Housing | | | 6.8% | |
| Retailing | | | 3.2% | |
| Consumer Staples | | | 2.9% | |
| Energy | | | 1.8% | |
| Transportation | | | 1.0% | |
Cash & Cash Equivalents includes any cash, investments in money market funds, short-term securities, and other assets less liabilities. Please see the Statement of Assets and Liabilities for additional information related to the fund’s cash position and other assets and liabilities.
Percentages are based on net assets as of 2/28/17.
The portfolio is actively managed and current holdings may be different.
2
EXPENSE TABLE
Fund expenses borne by the shareholders during the period, September 1, 2016 through February 28, 2017
As a shareholder of the fund, you incur two types of costs: (1) transaction costs, including sales charges (loads) on certain purchase or redemption payments, and (2) ongoing costs, including management fees; distribution and service (12b-1) fees; and other fund expenses. This example is intended to help you understand your ongoing costs (in dollars) of investing in the fund and to compare these costs with the ongoing costs of investing in other mutual funds.
The example is based on an investment of $1,000 invested at the beginning of the period and held for the entire period September 1, 2016 through February 28, 2017.
Actual Expenses
The first line for each share class in the following table provides information about actual account values and actual expenses. You may use the information in this line, together with the amount you invested, to estimate the expenses that you paid over the period. Simply divide your account value by $1,000 (for example, an $8,600 account value divided by $1,000 = 8.6), then multiply the result by the number in the first line under the heading entitled “Expenses Paid During Period” to estimate the expenses you paid on your account during this period.
Hypothetical Example for Comparison Purposes
The second line for each share class in the following table provides information about hypothetical account values and hypothetical expenses based on the fund’s actual expense ratio and an assumed rate of return of 5% per year before expenses, which is not the fund’s actual return. The hypothetical account values and expenses may not be used to estimate the actual ending account balance or expenses you paid for the period. You may use this information to compare the ongoing costs of investing in the fund and other funds. To do so, compare this 5% hypothetical example with the 5% hypothetical examples that appear in the shareholder reports of the other funds.
Please note that the expenses shown in the table are meant to highlight your ongoing costs only and do not reflect any transactional costs, such as sales charges (loads). Therefore, the second line for each share class in the table is useful in comparing ongoing costs only, and will not help you determine the relative total costs of owning different funds. In addition, if these transactional costs were included, your costs would have been higher.
3
Expense Table – continued
| | | | | | | | | | | | | | | | | | |
Share
Class | | | | Annualized
Expense Ratio | | | Beginning
Account Value
9/01/16 | | | Ending
Account Value 2/28/17 | | | Expenses
Paid During Period (p) 9/01/16-2/28/17 | |
| A | | Actual | | | 1.33% | | | | $1,000.00 | | | | $1,066.59 | | | | $6.81 | |
| | Hypothetical (h) | | | 1.33% | | | | $1,000.00 | | | | $1,018.20 | | | | $6.66 | |
| B | | Actual | | | 2.08% | | | | $1,000.00 | | | | $1,062.89 | | | | $10.64 | |
| | Hypothetical (h) | | | 2.08% | | | | $1,000.00 | | | | $1,014.48 | | | | $10.39 | |
| C | | Actual | | | 2.09% | | | | $1,000.00 | | | | $1,062.76 | | | | $10.69 | |
| | Hypothetical (h) | | | 2.09% | | | | $1,000.00 | | | | $1,014.43 | | | | $10.44 | |
| I | | Actual | | | 1.09% | | | | $1,000.00 | | | | $1,067.68 | | | | $5.59 | |
| | Hypothetical (h) | | | 1.09% | | | | $1,000.00 | | | | $1,019.39 | | | | $5.46 | |
| R1 | | Actual | | | 2.09% | | | | $1,000.00 | | | | $1,062.26 | | | | $10.69 | |
| | Hypothetical (h) | | | 2.09% | | | | $1,000.00 | | | | $1,014.43 | | | | $10.44 | |
| R2 | | Actual | | | 1.59% | | | | $1,000.00 | | | | $1,064.72 | | | | $8.14 | |
| | Hypothetical (h) | | | 1.59% | | | | $1,000.00 | | | | $1,016.91 | | | | $7.95 | |
| R3 | | Actual | | | 1.34% | | | | $1,000.00 | | | | $1,066.24 | | | | $6.87 | |
| | Hypothetical (h) | | | 1.34% | | | | $1,000.00 | | | | $1,018.15 | | | | $6.71 | |
| R4 | | Actual | | | 1.09% | | | | $1,000.00 | | | | $1,068.00 | | | | $5.59 | |
| | Hypothetical (h) | | | 1.09% | | | | $1,000.00 | | | | $1,019.39 | | | | $5.46 | |
| R6 | | Actual | | | 0.96% | | | | $1,000.00 | | | | $1,068.46 | | | | $4.92 | |
| | Hypothetical (h) | | | 0.96% | | | | $1,000.00 | | | | $1,020.03 | | | | $4.81 | |
| 529A | | Actual | | | 1.37% | | | | $1,000.00 | | | | $1,066.02 | | | | $7.02 | |
| | Hypothetical (h) | | | 1.37% | | | | $1,000.00 | | | | $1,018.00 | | | | $6.85 | |
| 529B | | Actual | | | 2.13% | | | | $1,000.00 | | | | $1,061.78 | | | | $10.89 | |
| | Hypothetical (h) | | | 2.13% | | | | $1,000.00 | | | | $1,014.23 | | | | $10.64 | |
| 529C | | Actual | | | 2.13% | | | | $1,000.00 | | | | $1,062.32 | | | | $10.89 | |
| | Hypothetical (h) | | | 2.13% | | | | $1,000.00 | | | | $1,014.23 | | | | $10.64 | |
| (h) | 5% class return per year before expenses. |
| (p) | “Expenses Paid During Period” are equal to each class’s annualized expense ratio, as shown above, multiplied by the average account value over the period, multiplied by 181/365 (to reflect the one-half year period). Expenses paid do not include any applicable sales charges (loads). If these transaction costs had been included, your costs would have been higher. |
Notes to Expense Table:
Each class with a Rule 12b-1 service fee is subject to a rebate of a portion of such fee. Such rebates are included in the expense ratios above. For Class A, Class 529A, and Class 529B shares, this rebate reduced the expense ratios above by 0.01%, 0.02%, and 0.01%, respectively. See Note 3 in the Notes to Financial Statements for additional information. Expense ratios reflect a one-time Reimbursement of Expenses by Custodian of 0.01% (See Note 2 of the Notes to Financial Statements).
4
PORTFOLIO OF INVESTMENTS
2/28/17 (unaudited)
The Portfolio of Investments is a complete list of all securities owned by your fund. It is categorized by broad-based asset classes.
| | | | | | | | |
| Common Stocks - 97.8% | | | | | | | | |
| Issuer | | Shares/Par | | | Value ($) | |
| Aerospace - 1.7% | | | | | | | | |
| HEICO Corp. | | | 78,894 | | | $ | 6,481,142 | |
| Leidos Holdings, Inc. | | | 228,444 | | | | 12,176,065 | |
| | | | | | | | |
| | | | $ | 18,657,207 | |
| Automotive - 1.5% | | | | | | | | |
| Fenix Parts, Inc. (a)(h) | | | 1,338,451 | | | $ | 2,676,902 | |
| Kar Auction Services, Inc. | | | 316,343 | | | | 14,178,493 | |
| | | | | | | | |
| | | | | | | $ | 16,855,395 | |
| Biotechnology - 4.2% | | | | | | | | |
| ACADIA Pharmaceuticals, Inc. (a) | | | 110,073 | | | $ | 4,194,882 | |
| Alder Biopharmaceuticals, Inc. (a) | | | 91,481 | | | | 2,090,341 | |
| Amicus Therapeutics, Inc. (a) | | | 603,432 | | | | 3,916,274 | |
| Bio-Techne Corp. | | | 66,903 | | | | 7,113,127 | |
| Exact Sciences Corp. (a)(l) | | | 204,914 | | | | 4,409,749 | |
| MiMedx Group, Inc. (a)(l) | | | 489,329 | | | | 4,193,550 | |
| Neurocrine Biosciences, Inc. (a) | | | 76,944 | | | | 3,397,847 | |
| Seattle Genetics, Inc. (a) | | | 52,536 | | | | 3,448,988 | |
| Spark Therapeutics, Inc. (a) | | | 70,353 | | | | 4,487,114 | |
| Tesaro, Inc. (a) | | | 41,288 | | | | 7,777,421 | |
| VTV Therapeutics, Inc. (a) | | | 275,016 | | | | 1,658,346 | |
| | | | | | | | |
| | | | | | | $ | 46,687,639 | |
| Brokerage & Asset Managers - 0.7% | | | | | | | | |
| NASDAQ, Inc. | | | 112,836 | | | $ | 8,023,768 | |
| | |
| Business Services - 6.0% | | | | | | | | |
| CoStar Group, Inc. (a) | | | 38,607 | | | $ | 7,844,170 | |
| Foundation Building Materials, Inc. (a) | | | 320,034 | | | | 5,229,356 | |
| Global Payments, Inc. | | | 139,912 | | | | 11,149,587 | |
| Travelport Worldwide Ltd. | | | 609,880 | | | | 7,745,476 | |
| Tyler Technologies, Inc. (a) | | | 40,763 | | | | 6,181,709 | |
| Ultimate Software Group, Inc. (a) | | | 44,920 | | | | 8,687,079 | |
| WNS (Holdings) Ltd., ADR (a) | | | 282,195 | | | | 7,972,009 | |
| Zendesk, Inc. (a) | | | 442,241 | | | | 12,042,222 | |
| | | | | | | | |
| | | | | | | $ | 66,851,608 | |
| Chemicals - 1.6% | | | | | | | | |
| FMC Corp. | | | 118,544 | | | $ | 6,830,505 | |
| Ingevity Corp. (a) | | | 209,976 | | | | 11,332,405 | |
| | | | | | | | |
| | | | | | | $ | 18,162,910 | |
5
Portfolio of Investments (unaudited) – continued
| | | | | | | | |
| Issuer | | Shares/Par | | | Value ($) | |
| Common Stocks - continued | | | | | | | | |
| Computer Software - 7.2% | | | | | | | | |
| 2U, Inc. (a) | | | 283,020 | | | $ | 10,344,381 | |
| Aspen Technology, Inc. (a) | | | 198,220 | | | | 11,524,511 | |
| Cadence Design Systems, Inc. (a) | | | 502,965 | | | | 15,541,619 | |
| Paylocity Holding Corp. (a) | | | 273,679 | | | | 9,649,922 | |
| PTC, Inc. (a) | | | 108,254 | | | | 5,833,808 | |
| Sabre Corp. | | | 616,891 | | | | 13,516,082 | |
| SecureWorks Corp. (a) | | | 511,565 | | | | 5,340,739 | |
| Twilio, Inc., “A” (a)(l) | | | 287,205 | | | | 9,110,143 | |
| | | | | | | | |
| | | | | | | $ | 80,861,205 | |
| Computer Software - Systems - 7.1% | | | | | | | | |
| Kinaxis, Inc. (a) | | | 99,106 | | | $ | 5,400,762 | |
| New Relic, Inc. (a) | | | 279,729 | | | | 9,840,866 | |
| NICE Systems Ltd., ADR | | | 249,054 | | | | 16,997,936 | |
| Proofpoint, Inc. (a) | | | 95,778 | | | | 7,544,433 | |
| Q2 Holdings, Inc. (a) | | | 400,289 | | | | 14,390,390 | |
| Rapid7, Inc. (a) | | | 383,645 | | | | 5,812,222 | |
| SS&C Technologies Holdings, Inc. | | | 565,166 | | | | 19,792,113 | |
| | | | | | | | |
| | | | | | | $ | 79,778,722 | |
| Construction - 5.3% | | | | | | | | |
| GMS, Inc. (a) | | | 525,841 | | | $ | 15,817,297 | |
| Lennox International, Inc. | | | 52,868 | | | | 8,703,130 | |
| Pool Corp. | | | 63,129 | | | | 7,241,528 | |
| Siteone Landscape Supply, Inc. (a) | | | 379,903 | | | | 14,895,997 | |
| Summit Materials, Inc., “A” (a) | | | 384,457 | | | | 9,184,678 | |
| Techtronic Industries Co. Ltd. | | | 1,013,500 | | | | 3,629,481 | |
| | | | | | | | |
| | | | | | | $ | 59,472,111 | |
| Consumer Products - 0.3% | | | | | | | | |
| E.L.F. Beauty, Inc. (a) | | | 108,222 | | | $ | 2,997,749 | |
| | |
| Consumer Services - 4.1% | | | | | | | | |
| Bright Horizons Family Solutions, Inc. (a) | | | 464,380 | | | $ | 32,093,302 | |
| Carriage Services, Inc. | | | 220,291 | | | | 5,676,899 | |
| Nord Anglia Education, Inc. (a) | | | 325,624 | | | | 7,642,395 | |
| | | | | | | | |
| | | | | | | $ | 45,412,596 | |
| Containers - 2.0% | | | | | | | | |
| Berry Plastics Group, Inc. (a) | | | 433,723 | | | $ | 21,829,279 | |
| | |
| Electrical Equipment - 0.5% | | | | | | | | |
| WESCO International, Inc. (a) | | | 83,476 | | | $ | 5,801,582 | |
6
Portfolio of Investments (unaudited) – continued
| | | | | | | | |
| Issuer | | Shares/Par | | | Value ($) | |
| Common Stocks - continued | | | | | | | | |
| Electronics - 4.3% | | | | | | | | |
| Inphi Corp. (a) | | | 238,312 | | | $ | 11,186,365 | |
| Mellanox Technologies Ltd. (a) | | | 94,475 | | | | 4,572,590 | |
| Mercury Systems, Inc. (a) | | | 234,613 | | | | 8,765,142 | |
| Monolithic Power Systems, Inc. | | | 135,540 | | | | 11,923,454 | |
| Silicon Laboratories, Inc. (a) | | | 166,748 | | | | 11,255,490 | |
| | | | | | | | |
| | | | | | | $ | 47,703,041 | |
| Engineering - Construction - 0.5% | | | | | | | | |
| Team, Inc. (a) | | | 158,548 | | | $ | 5,446,124 | |
| | |
| Entertainment - 1.6% | | | | | | | | |
| Live Nation, Inc. (a) | | | 609,819 | | | $ | 17,324,958 | |
| | |
| Food & Beverages - 2.6% | | | | | | | | |
| Blue Buffalo Pet Products, Inc. (a) | | | 238,726 | | | $ | 5,834,463 | |
| Cal-Maine Foods, Inc. (l) | | | 168,430 | | | | 6,391,919 | |
| Flex Pharma, Inc. (a) | | | 222,918 | | | | 929,568 | |
| Greencore Group PLC | | | 2,357,247 | | | | 7,593,276 | |
| Snyders-Lance, Inc. | | | 221,176 | | | | 8,754,146 | |
| | | | | | | | |
| | | | | | | $ | 29,503,372 | |
| Gaming & Lodging - 0.4% | | | | | | | | |
| Vail Resorts, Inc. | | | 26,204 | | | $ | 4,747,641 | |
| | |
| General Merchandise - 1.5% | | | | | | | | |
| Five Below, Inc. (a) | | | 311,922 | | | $ | 12,024,593 | |
| Ollie’s Bargain Outlet Holdings, Inc. (a) | | | 140,604 | | | | 4,407,935 | |
| | | | | | | | |
| | | | | | | $ | 16,432,528 | |
| Internet - 1.3% | | | | | | | | |
| LogMeIn, Inc. | | | 163,639 | | | $ | 15,013,878 | |
| | |
| Machinery & Tools - 3.5% | | | | | | | | |
| Allison Transmission Holdings, Inc. | | | 282,844 | | | $ | 10,176,727 | |
| Ritchie Bros. Auctioneers, Inc. | | | 346,356 | | | | 11,668,734 | |
| SPX FLOW, Inc. (a) | | | 251,337 | | | | 8,545,458 | |
| WABCO Holdings, Inc. (a) | | | 81,607 | | | | 9,162,834 | |
| | | | | | | | |
| | | | | | | $ | 39,553,753 | |
| Medical & Health Technology & Services - 4.9% | | | | | | | | |
| Capital Senior Living Corp. (a) | | | 421,058 | | | $ | 7,073,774 | |
| Healthcare Services Group, Inc. | | | 415,061 | | | | 17,175,224 | |
| INC Research Holdings, Inc., “A” (a) | | | 176,835 | | | | 7,718,848 | |
| MEDNAX, Inc. (a) | | | 133,674 | | | | 9,516,252 | |
7
Portfolio of Investments (unaudited) – continued
| | | | | | | | |
| Issuer | | Shares/Par | | | Value ($) | |
| Common Stocks - continued | | | | | | | | |
| Medical & Health Technology & Services - continued | | | | | | | | |
| Medpace Holdings, Inc. (a) | | | 189,291 | | | $ | 5,479,974 | |
| Teladoc, Inc. (a)(l) | | | 359,183 | | | | 7,919,985 | |
| | | | | | | | |
| | | | | | | $ | 54,884,057 | |
| Medical Equipment - 8.8% | | | | | | | | |
| DexCom, Inc. (a) | | | 82,505 | | | $ | 6,448,591 | |
| Insulet Corp. (a) | | | 126,917 | | | | 5,528,505 | |
| Integra LifeSciences Holdings Corp. (a) | | | 145,108 | | | | 6,201,916 | |
| iRhythm Technologies, Inc. (a)(l) | | | 128,253 | | | | 4,940,306 | |
| Masimo Corp. (a) | | | 117,387 | | | | 10,607,089 | |
| Merit Medical Systems, Inc. (a) | | | 304,606 | | | | 9,381,865 | |
| Nevro Corp. (a) | | | 57,806 | | | | 5,548,798 | |
| NxStage Medical, Inc. (a) | | | 312,345 | | | | 8,920,573 | |
| Obalon Therapeutics, Inc. (a) | | | 287,124 | | | | 2,675,996 | |
| PerkinElmer, Inc. | | | 243,550 | | | | 13,215,023 | |
| Steris PLC | | | 224,485 | | | | 15,743,133 | |
| VWR Corp. (a) | | | 344,843 | | | | 9,690,088 | |
| | | | | | | | |
| | | | | | | $ | 98,901,883 | |
| Oil Services - 2.3% | | | | | | | | |
| Forum Energy Technologies, Inc. (a) | | | 334,781 | | | $ | 7,264,748 | |
| Keane Group, Inc. (a)(l) | | | 257,392 | | | | 4,509,508 | |
| NOW, Inc. (a) | | | 194,194 | | | | 3,716,873 | |
| Patterson-UTI Energy, Inc. | | | 159,240 | | | | 4,398,209 | |
| U.S. Silica Holdings, Inc. | | | 119,577 | | | | 6,047,009 | |
| | | | | | | | |
| | | | | | | $ | 25,936,347 | |
| Other Banks & Diversified Financials - 4.2% | | | | | | | | |
| Bank of The Ozarks, Inc. | | | 191,997 | | | $ | 10,507,996 | |
| Element Fleet Management Corp. | | | 893,272 | | | | 9,462,684 | |
| Texas Capital Bancshares, Inc. (a) | | | 104,807 | | | | 9,343,544 | |
| Webster Financial Corp. | | | 169,728 | | | | 9,323,159 | |
| Wintrust Financial Corp. | | | 106,485 | | | | 7,847,945 | |
| | | | | | | | |
| | | | | | | $ | 46,485,328 | |
| Pharmaceuticals - 1.4% | | | | | | | | |
| Aratana Therapeutics, Inc. (a) | | | 608,472 | | | $ | 4,022,000 | |
| Collegium Pharmaceutical, Inc. (a) | | | 325,799 | | | | 4,320,095 | |
| MediWound Ltd. (a) | | | 309,012 | | | | 1,838,621 | |
| TherapeuticsMD, Inc. (a)(l) | | | 931,109 | | | | 5,847,365 | |
| | | | | | | | |
| | | | | | | $ | 16,028,081 | |
| Pollution Control - 1.1% | | | | | | | | |
| Clean Harbors, Inc. (a) | | | 209,556 | | | $ | 12,145,866 | |
8
Portfolio of Investments (unaudited) – continued
| | | | | | | | |
| Issuer | | Shares/Par | | | Value ($) | |
| Common Stocks - continued | | | | | | | | |
| Railroad & Shipping - 0.4% | | | | | | | | |
| StealthGas, Inc. (a) | | | 976,797 | | | $ | 4,297,907 | |
| | |
| Real Estate - 2.1% | | | | | | | | |
| Big Yellow Group PLC, REIT | | | 458,482 | | | $ | 4,158,714 | |
| Life Storage, Inc., REIT | | | 109,146 | | | | 9,673,610 | |
| Tanger Factory Outlet Centers, Inc., REIT | | | 282,080 | | | | 9,554,050 | |
| | | | | | | | |
| | | | | | | $ | 23,386,374 | |
| Restaurants - 6.0% | | | | | | | | |
| Dave & Buster’s, Inc. (a) | | | 184,872 | | | $ | 10,572,830 | |
| Domino’s Pizza Group PLC | | | 1,556,943 | | | | 7,418,623 | |
| Dunkin Brands Group, Inc. | | | 140,996 | | | | 7,756,190 | |
| Panera Bread Co., “A” (a) | | | 25,972 | | | | 5,994,338 | |
| Performance Food Group Co. (a) | | | 481,254 | | | | 11,357,594 | |
| U.S. Foods Holding Corp. (a) | | | 422,754 | | | | 11,646,873 | |
| Wingstop, Inc. | | | 222,703 | | | | 5,857,089 | |
| Zoe’s Kitchen, Inc. (a)(l) | | | 377,491 | | | | 6,764,639 | |
| | | | | | | | |
| | | | | | | $ | 67,368,176 | |
| Special Products & Services - 1.2% | | | | | | | | |
| Boyd Group Income Fund, IEU | | | 172,043 | | | $ | 11,174,635 | |
| Nexeo Solutions Holdings LLC (a)(z) | | | 233,087 | | | | 2,349,517 | |
| | | | | | | | |
| | | | | | | $ | 13,524,152 | |
| Specialty Chemicals - 5.2% | | | | | | | | |
| Axalta Coating Systems Ltd. (a) | | | 558,999 | | | $ | 16,272,461 | |
| Ferroglobe PLC | | | 560,615 | | | | 6,049,036 | |
| Ferroglobe R&W Trust (a) | | | 733,041 | | | | 0 | |
| Nexeo Solutions, Inc., EU (a) | | | 707,014 | | | | 7,126,701 | |
| PolyOne Corp. | | | 191,742 | | | | 6,457,871 | |
| RPM International, Inc. | | | 225,882 | | | | 12,037,252 | |
| Univar, Inc. (a) | | | 313,850 | | | | 10,105,970 | |
| | | | | | | | |
| | | | | | | $ | 58,049,291 | |
| Specialty Stores - 1.7% | | | | | | | | |
| Citi Trends, Inc. | | | 387,235 | | | $ | 6,455,207 | |
| Michaels Co., Inc. (a) | | | 397,504 | | | | 7,985,855 | |
| Urban Outfitters, Inc. (a) | | | 179,001 | | | | 4,659,396 | |
| | | | | | | | |
| | | | | | | $ | 19,100,458 | |
| Trucking - 0.6% | | | | | | | | |
| Swift Transportation Co. (a) | | | 308,458 | | | $ | 6,699,702 | |
| Total Common Stocks (Identified Cost, $908,618,158) | | | $ | 1,093,924,688 | |
9
Portfolio of Investments (unaudited) – continued
| | | | | | | | |
| Money Market Funds - 1.2% | | | | | | | | |
| Issuer | | Shares/Par | | | Value ($) | |
MFS Institutional Money Market Portfolio, 0.64% (v)
(Identified Cost, $13,155,882) | | | 13,155,882 | | | $ | 13,155,882 | |
| | |
| Collateral for Securities Loaned - 2.3% | | | | | | | | |
| State Street Navigator Securities Lending Government Money Market Portfolio, 0.50% (j) (Identified Cost, $25,865,535) | | | 25,865,535 | | | $ | 25,865,535 | |
| Total Investments (Identified Cost, $947,639,575) | | | $ | 1,132,946,105 | |
| |
| Other Assets, Less Liabilities - (1.3)% | | | | (14,916,526 | ) |
| Net Assets - 100.0% | | | $ | 1,118,029,579 | |
| (a) | Non-income producing security. |
| (h) | Affiliated issuers are those in which the fund’s holdings of an issuer represent 5% or more of the outstanding voting securities of the issuer. |
| (j) | The rate quoted is the annualized seven-day yield of the fund at period end. |
| (l) | A portion of this security is on loan. |
| (v) | Underlying affiliated fund that is available only to investment companies managed by MFS. The rate quoted for the MFS Institutional Money Market Portfolio is the annualized seven-day yield of the fund at period end. |
| (z) | Restricted securities are not registered under the Securities Act of 1933 and are subject to legal restrictions on resale. These securities generally may be resold in transactions exempt from registration or to the public if the securities are subsequently registered. Disposal of these securities may involve time-consuming negotiations and prompt sale at an acceptable price may be difficult. The fund holds the following restricted securities: |
| | | | | | | | | | |
| Restricted Securities | | Acquisition
Date | | Cost | | | Value | |
| Nexeo Solutions Holdings LLC | | 5/06/16 | | | $2,330,870 | | | | $2,349,517 | |
| % of Net assets | | | | 0.2% | |
The following abbreviations are used in this report and are defined:
| ADR | | American Depositary Receipt |
| IEU | | International Equity Unit |
| PLC | | Public Limited Company |
| REIT | | Real Estate Investment Trust |
See Notes to Financial Statements
10
Financial Statements
STATEMENT OF ASSETS AND LIABILITIES
At 2/28/17 (unaudited)
This statement represents your fund’s balance sheet, which details the assets and liabilities comprising the total value of the fund.
| | | | |
| Assets | | | | |
Investments | | | | |
Non-affiliated issuers, at value (identified cost, $923,618,466) | | | $1,117,113,321 | |
Underlying affiliated funds, at value (identified cost, $13,155,882) | | | 13,155,882 | |
Other affiliated issuers, at value (identified cost, $10,865,227) | | | 2,676,902 | |
Total investments, at value, including $25,750,225 of securities on loan (identified cost, $947,639,575) | | | $1,132,946,105 | |
Receivables for | | | | |
Investments sold | | | 15,569,175 | |
Fund shares sold | | | 2,355,422 | |
Interest and dividends | | | 511,910 | |
Other assets | | | 4,665 | |
Total assets | | | $1,151,387,277 | |
| Liabilities | | | | |
Payables for | | | | |
Investments purchased | | | $4,860,716 | |
Fund shares reacquired | | | 2,131,946 | |
Collateral for securities loaned, at value (c) | | | 25,865,535 | |
Payable to affiliates | | | | |
Investment adviser | | | 55,595 | |
Shareholder servicing costs | | | 366,944 | |
Distribution and service fees | | | 10,985 | |
Program manager fees | | | 19 | |
Payable for independent Trustees’ compensation | | | 3,337 | |
Accrued expenses and other liabilities | | | 62,621 | |
Total liabilities | | | $33,357,698 | |
Net assets | | | $1,118,029,579 | |
| Net assets consist of | | | | |
Paid-in capital | | | $914,460,121 | |
Unrealized appreciation (depreciation) on investments and translation of assets and liabilities in foreign currencies | | | 185,305,022 | |
Accumulated net realized gain (loss) on investments and foreign currency | | | 22,726,856 | |
Accumulated net investment loss | | | (4,462,420 | ) |
Net assets | | | $1,118,029,579 | |
Shares of beneficial interest outstanding | | | 43,711,334 | |
11
Statement of Assets and Liabilities (unaudited) – continued
| | | | | | | | | | | | |
| | | Net assets | | | Shares
outstanding | | | Net asset value
per share (a) | |
Class A | | | $376,620,569 | | | | 15,000,748 | | | | $25.11 | |
Class B | | | 20,177,394 | | | | 963,800 | | | | 20.94 | |
Class C | | | 80,480,652 | | | | 3,837,045 | | | | 20.97 | |
Class I | | | 150,247,459 | | | | 5,481,075 | | | | 27.41 | |
Class R1 | | | 4,914,358 | | | | 236,290 | | | | 20.80 | |
Class R2 | | | 33,171,443 | | | | 1,391,803 | | | | 23.83 | |
Class R3 | | | 53,908,600 | | | | 2,149,455 | | | | 25.08 | |
Class R4 | | | 79,529,600 | | | | 3,037,271 | | | | 26.18 | |
Class R6 | | | 311,911,572 | | | | 11,309,121 | | | | 27.58 | |
Class 529A | | | 5,316,607 | | | | 218,321 | | | | 24.35 | |
Class 529B | | | 297,443 | | | | 14,671 | | | | 20.27 | |
Class 529C | | | 1,453,882 | | | | 71,734 | | | | 20.27 | |
| (a) | Maximum offering price per share was equal to the net asset value per share for all share classes, except for Classes A and 529A, for which the maximum offering prices per share were $26.64 [100 / 94.25 x $25.11] and $25.84 [100 / 94.25 x $24.35], respectively. On sales of $50,000 or more, the maximum offering prices of Class A and Class 529A shares are reduced. A contingent deferred sales charge may be imposed on redemptions of Class A, Class B, Class C, Class 529B, and Class 529C shares. Redemption price per share was equal to the net asset value per share for Classes I, R1, R2, R3, R4, R6, and 529A. |
| (c) | Non-cash collateral is not included. |
See Notes to Financial Statements
12
Financial Statements
STATEMENT OF OPERATIONS
Six months ended 2/28/17 (unaudited)
This statement describes how much your fund earned in investment income and accrued in expenses. It also describes any gains and/or losses generated by fund operations.
| | | | |
| Net investment loss | | | | |
Income | | | | |
Dividends | | | $3,145,859 | |
Income on securities loaned | | | 438,153 | |
Dividends from underlying affiliated funds | | | 38,371 | |
Other | | | 7,797 | |
Foreign taxes withheld | | | (50,215 | ) |
Total investment income | | | $3,579,965 | |
Expenses | | | | |
Management fee | | | $4,883,303 | |
Distribution and service fees | | | 1,176,244 | |
Shareholder servicing costs | | | 677,659 | |
Program manager fees | | | 3,391 | |
Administrative services fee | | | 87,527 | |
Independent Trustees’ compensation | | | 14,281 | |
Custodian fee | | | 36,284 | |
Reimbursement of custodian expenses | | | (75,313 | ) |
Shareholder communications | | | 51,008 | |
Audit and tax fees | | | 28,493 | |
Legal fees | | | 5,881 | |
Miscellaneous | | | 90,066 | |
Total expenses | | | $6,978,824 | |
Reduction of expenses by investment adviser and distributor | | | (82,613 | ) |
Net expenses | | | $6,896,211 | |
Net investment loss | | | $(3,316,246) | |
| Realized and unrealized gain (loss) on investments and foreign currency | |
Realized gain (loss) (identified cost basis) | | | | |
Investments: | | | | |
Non-affiliated issuers | | | $42,130,689 | |
Underlying affiliated funds | | | 20 | |
Foreign currency | | | (8,026 | ) |
Net realized gain (loss) on investments and foreign currency | | | $42,122,683 | |
Change in unrealized appreciation (depreciation) | | | | |
Investments | | | $32,089,953 | |
Translation of assets and liabilities in foreign currencies | | | (1,247 | ) |
Net unrealized gain (loss) on investments and foreign currency translation | | | $32,088,706 | |
Net realized and unrealized gain (loss) on investments and foreign currency | | | $74,211,389 | |
Change in net assets from operations | | | $70,895,143 | |
See Notes to Financial Statements
13
Financial Statements
STATEMENTS OF CHANGES IN NET ASSETS
These statements describe the increases and/or decreases in net assets resulting from operations, any distributions, and any shareholder transactions.
| | | | | | | | |
| Change in net assets | | Six months ended 2/28/17 (unaudited) | | | Year ended 8/31/16 | |
| From operations | | | | | | | | |
Net investment loss | | | $(3,316,246 | ) | | | $(5,354,613 | ) |
Net realized gain (loss) on investments and foreign currency | | | 42,122,683 | | | | 18,100,820 | |
Net unrealized gain (loss) on investments and foreign currency translation | | | 32,088,706 | | | | (5,221,249 | ) |
Change in net assets from operations | | | $70,895,143 | | | | $7,524,958 | |
| Distributions declared to shareholders | | | | | | | | |
From net realized gain on investments | | | $(25,588,520 | ) | | | $— | |
Change in net assets from fund share transactions | | | $(56,667,182 | ) | | | $(251,345,128 | ) |
Total change in net assets | | | $(11,360,559 | ) | | | $(243,820,170 | ) |
| Net assets | | | | | | | | |
At beginning of period | | | 1,129,390,138 | | | | 1,373,210,308 | |
At end of period (including accumulated net investment loss of $4,462,420 and $1,146,174, respectively) | | | $1,118,029,579 | | | | $1,129,390,138 | |
See Notes to Financial Statements
14
Financial Statements
FINANCIAL HIGHLIGHTS
The financial highlights table is intended to help you understand the fund’s financial performance for the semiannual period and the past 5 fiscal years (or life of a particular share class, if shorter). Certain information reflects financial results for a single fund share. The total returns in the table represent the rate by which an investor would have earned (or lost) on an investment in the fund share class (assuming reinvestment of all distributions) held for the entire period.
| | | | | | | | | | | | | | | | | | | | | | | | |
| | | Six months
ended
2/28/17 | | | Years ended 8/31 | |
| Class A | | | 2016 | | | 2015 | | | 2014 | | | 2013 | | | 2012 | |
| | | (unaudited) | | | | | | | | | | | | | | | | |
Net asset value, beginning of period | | | $24.11 | | | | $23.69 | | | | $25.49 | | | | $25.86 | | | | $20.17 | | | | $22.63 | |
| Income (loss) from investment operations | | | | | | | | | | | | | |
Net investment loss (d) | | | $(0.08 | )(c) | | | $(0.11 | ) | | | $(0.20 | ) | | | $(0.22 | ) | | | $(0.14 | ) | | | $(0.16 | ) |
Net realized and unrealized gain
(loss) on investments and
foreign currency | | | 1.66 | | | | 0.53 | | | | 0.22 | | | | 2.30 | | | | 5.83 | | | | 1.80 | |
Total from investment operations | | | $1.58 | | | | $0.42 | | | | $0.02 | | | | $2.08 | | | | $5.69 | | | | $1.64 | |
| Less distributions declared to shareholders | | | | | | | | | | | | | |
From net realized gain on
investments | | | $(0.58 | ) | | | $— | | | | $(1.82 | ) | | | $(2.45 | ) | | | $— | | | | $(4.10 | ) |
Net asset value, end of period (x) | | | $25.11 | | | | $24.11 | | | | $23.69 | | | | $25.49 | | | | $25.86 | | | | $20.17 | |
Total return (%) (r)(s)(t)(x) | | | 6.66 | (c)(n) | | | 1.77 | | | | 0.47 | | | | 8.01 | | | | 28.21 | | | | 9.88 | |
Ratios (%) (to average net assets)
and Supplemental data: | | | | | | | | | |
Expenses before expense
reductions (f) | | | 1.35 | (a)(c) | | | 1.36 | | | | 1.36 | | | | 1.33 | | | | 1.35 | | | | 1.39 | |
Expenses after expense reductions (f) | | | 1.33 | (a)(c) | | | 1.34 | | | | 1.31 | | | | 1.27 | | | | 1.31 | | | | 1.35 | |
Net investment loss | | | (0.68 | )(a)(c) | | | (0.50 | ) | | | (0.81 | ) | | | (0.83 | ) | | | (0.59 | ) | | | (0.83 | ) |
Portfolio turnover | | | 24 | (n) | | | 49 | | | | 56 | | | | 98 | | | | 96 | | | | 128 | |
Net assets at end of period
(000 omitted) | | | $376,621 | | | | $400,997 | | | | $457,437 | | | | $620,802 | | | | $866,006 | | | | $529,749 | |
See Notes to Financial Statements
15
Financial Highlights – continued
| | | | | | | | | | | | | | | | | | | | | | | | |
| | | Six months
ended
2/28/17 | | | Years ended 8/31 | |
| Class B | | | 2016 | | | 2015 | | | 2014 | | | 2013 | | | 2012 | |
| | | (unaudited) | | | | | | | | | | | | | | | | |
Net asset value, beginning of period | | | $20.27 | | | | $20.07 | | | | $22.04 | | | | $22.83 | | | | $17.94 | | | | $20.73 | |
| Income (loss) from investment operations | | | | | | | | | |
Net investment loss (d) | | | $(0.14 | )(c) | | | $(0.24 | ) | | | $(0.32 | ) | | | $(0.36 | ) | | | $(0.27 | ) | | | $(0.28 | ) |
Net realized and unrealized gain
(loss) on investments and
foreign currency | | | 1.39 | | | | 0.44 | | | | 0.17 | | | | 2.02 | | | | 5.16 | | | | 1.59 | |
Total from investment operations | | | $1.25 | | | | $0.20 | | | | $(0.15 | ) | | | $1.66 | | | | $4.89 | | | | $1.31 | |
| Less distributions declared to shareholders | | | | | | | | | |
From net realized gain on
investments | | | $(0.58 | ) | | | $— | | | | $(1.82 | ) | | | $(2.45 | ) | | | $— | | | | $(4.10 | ) |
Net asset value, end of period (x) | | | $20.94 | | | | $20.27 | | | | $20.07 | | | | $22.04 | | | | $22.83 | | | | $17.94 | |
Total return (%) (r)(s)(t)(x) | | | 6.29 | (c)(n) | | | 1.00 | | | | (0.27 | ) | | | 7.18 | | | | 27.26 | | | | 9.08 | |
Ratios (%) (to average net assets)
and Supplemental data: | | | | | | | | | |
Expenses before expense
reductions (f) | | | 2.10 | (a)(c) | | | 2.11 | | | | 2.11 | | | | 2.08 | | | | 2.10 | | | | 2.14 | |
Expenses after expense reductions (f) | | | 2.08 | (a)(c) | | | 2.09 | | | | 2.06 | | | | 2.02 | | | | 2.06 | | | | 2.10 | |
Net investment loss | | | (1.43 | )(a)(c) | | | (1.26 | ) | | | (1.57 | ) | | | (1.58 | ) | | | (1.34 | ) | | | (1.59 | ) |
Portfolio turnover | | | 24 | (n) | | | 49 | | | | 56 | | | | 98 | | | | 96 | | | | 128 | |
Net assets at end of period
(000 omitted) | | | $20,177 | | | | $22,906 | | | | $27,455 | | | | $34,971 | | | | $37,952 | | | | $30,308 | |
See Notes to Financial Statements
16
Financial Highlights – continued
| | | | | | | | | | | | | | | | | | | | | | | | |
| | | Six months
ended
2/28/17 | | | Years ended 8/31 | |
| Class C | | | 2016 | | | 2015 | | | 2014 | | | 2013 | | | 2012 | |
| | | (unaudited) | | | | | | | | | | | | | | | | |
Net asset value, beginning of period | | | $20.31 | | | | $20.11 | | | | $22.08 | | | | $22.86 | | | | $17.96 | | | | $20.76 | |
| Income (loss) from investment operations | | | | | | | | | |
Net investment loss (d) | | | $(0.14 | )(c) | | | $(0.24 | ) | | | $(0.32 | ) | | | $(0.36 | ) | | | $(0.27 | ) | | | $(0.28 | ) |
Net realized and unrealized gain
(loss) on investments and
foreign currency | | | 1.38 | | | | 0.44 | | | | 0.17 | | | | 2.03 | | | | 5.17 | | | | 1.58 | |
Total from investment operations | | | $1.24 | | | | $0.20 | | | | $(0.15 | ) | | | $1.67 | | | | $4.90 | | | | $1.30 | |
| Less distributions declared to shareholders | | | | | | | | | |
From net realized gain on
investments | | | $(0.58 | ) | | | $— | | | | $(1.82 | ) | | | $(2.45 | ) | | | $— | | | | $(4.10 | ) |
Net asset value, end of period (x) | | | $20.97 | | | | $20.31 | | | | $20.11 | | | | $22.08 | | | | $22.86 | | | | $17.96 | |
Total return (%) (r)(s)(t)(x) | | | 6.23 | (c)(n) | | | 0.99 | | | | (0.28 | ) | | | 7.22 | | | | 27.28 | | | | 9.01 | |
Ratios (%) (to average net assets)
and Supplemental data: | | | | | | | | | |
Expenses before expense
reductions (f) | | | 2.10 | (a)(c) | | | 2.11 | | | | 2.11 | | | | 2.08 | | | | 2.10 | | | | 2.14 | |
Expenses after expense reductions (f) | | | 2.09 | (a)(c) | | | 2.09 | | | | 2.06 | | | | 2.02 | | | | 2.06 | | | | 2.10 | |
Net investment loss | | | (1.43 | )(a)(c) | | | (1.27 | ) | | | (1.57 | ) | | | (1.59 | ) | | | (1.35 | ) | | | (1.59 | ) |
Portfolio turnover | | | 24 | (n) | | | 49 | | | | 56 | | | | 98 | | | | 96 | | | | 128 | |
Net assets at end of period
(000 omitted) | | | $80,481 | | | | $85,370 | | | | $105,686 | | | | $141,293 | | | | $136,913 | | | | $91,138 | |
See Notes to Financial Statements
17
Financial Highlights – continued
| | | | | | | | | | | | | | | | | | | | | | | | |
| | | Six months
ended
2/28/17 | | | Years ended 8/31 | |
| Class I | | | 2016 | | | 2015 | | | 2014 | | | 2013 | | | 2012 | |
| | | (unaudited) | | | | | | | | | | | | | | | | |
Net asset value, beginning of period | | | $26.24 | | | | $25.72 | | | | $27.44 | | | | $27.61 | | | | $21.48 | | | | $23.77 | |
| Income (loss) from investment operations | | | | | | | | | |
Net investment loss (d) | | | $(0.06 | )(c) | | | $(0.07 | ) | | | $(0.14 | ) | | | $(0.17 | ) | | | $(0.09 | ) | | | $(0.12 | ) |
Net realized and unrealized gain
(loss) on investments and
foreign currency | | | 1.81 | | | | 0.59 | | | | 0.24 | | | | 2.45 | | | | 6.22 | | | | 1.93 | |
Total from investment operations | | | $1.75 | | | | $0.52 | | | | $0.10 | | | | $2.28 | | | | $6.13 | | | | $1.81 | |
| Less distributions declared to shareholders | | | | | | | | | |
From net realized gain on
investments | | | $(0.58 | ) | | | $— | | | | $(1.82 | ) | | | $(2.45 | ) | | | $— | | | | $(4.10 | ) |
Net asset value, end of period (x) | | | $27.41 | | | | $26.24 | | | | $25.72 | | | | $27.44 | | | | $27.61 | | | | $21.48 | |
Total return (%) (r)(s)(x) | | | 6.77 | (c)(n) | | | 2.02 | | | | 0.74 | | | | 8.25 | | | | 28.54 | | | | 10.16 | |
Ratios (%) (to average net assets)
and Supplemental data: | | | | | | | | | |
Expenses before expense
reductions (f) | | | 1.10 | (a)(c) | | | 1.12 | | | | 1.11 | | | | 1.08 | | | | 1.10 | | | | 1.15 | |
Expenses after expense reductions (f) | | | 1.09 | (a)(c) | | | 1.09 | | | | 1.06 | | | | 1.02 | | | | 1.06 | | | | 1.10 | |
Net investment loss | | | (0.43 | )(a)(c) | | | (0.30 | ) | | | (0.55 | ) | | | (0.59 | ) | | | (0.36 | ) | | | (0.59 | ) |
Portfolio turnover | | | 24 | (n) | | | 49 | | | | 56 | | | | 98 | | | | 96 | | | | 128 | |
Net assets at end of period
(000 omitted) | | | $150,247 | | | | $101,635 | | | | $166,513 | | | | $483,893 | | | | $368,806 | | | | $170,830 | |
See Notes to Financial Statements
18
Financial Highlights – continued
| | | | | | | | | | | | | | | | | | | | | | | | |
| | | Six months
ended
2/28/17 | | | Years ended 8/31 | |
| Class R1 | | | 2016 | | | 2015 | | | 2014 | | | 2013 | | | 2012 | |
| | | (unaudited) | | | | | | | | | | | | | | | | |
Net asset value, beginning of period | | | $20.15 | | | | $19.94 | | | | $21.91 | | | | $22.71 | | | | $17.84 | | | | $20.65 | |
| Income (loss) from investment operations | | | | | | | | | |
Net investment loss (d) | | | $(0.14 | )(c) | | | $(0.23 | ) | | | $(0.32 | ) | | | $(0.36 | ) | | | $(0.27 | ) | | | $(0.28 | ) |
Net realized and unrealized gain
(loss) on investments and
foreign currency | | | 1.37 | | | | 0.44 | | | | 0.17 | | | | 2.01 | | | | 5.14 | | | | 1.57 | |
Total from investment operations | | | $1.23 | | | | $0.21 | | | | $(0.15 | ) | | | $1.65 | | | | $4.87 | | | | $1.29 | |
| Less distributions declared to shareholders | | | | | | | | | |
From net realized gain on
investments | | | $(0.58 | ) | | | $— | | | | $(1.82 | ) | | | $(2.45 | ) | | | $— | | | | $(4.10 | ) |
Net asset value, end of period (x) | | | $20.80 | | | | $20.15 | | | | $19.94 | | | | $21.91 | | | | $22.71 | | | | $17.84 | |
Total return (%) (r)(s)(x) | | | 6.23 | (c)(n) | | | 1.05 | | | | (0.28 | ) | | | 7.17 | | | | 27.30 | | | | 9.00 | |
Ratios (%) (to average net assets)
and Supplemental data: | | | | | | | | | |
Expenses before expense
reductions (f) | | | 2.10 | (a)(c) | | | 2.11 | | | | 2.11 | | | | 2.08 | | | | 2.10 | | | | 2.14 | |
Expenses after expense reductions (f) | | | 2.09 | (a)(c) | | | 2.09 | | | | 2.06 | | | | 2.02 | | | | 2.06 | | | | 2.10 | |
Net investment loss | | | (1.43 | )(a)(c) | | | (1.26 | ) | | | (1.57 | ) | | | (1.59 | ) | | | (1.34 | ) | | | (1.59 | ) |
Portfolio turnover | | | 24 | (n) | | | 49 | | | | 56 | | | | 98 | | | | 96 | | | | 128 | |
Net assets at end of period
(000 omitted) | | | $4,914 | | | | $5,647 | | | | $6,573 | | | | $8,490 | | | | $8,972 | | | | $7,506 | |
See Notes to Financial Statements
19
Financial Highlights – continued
| | | | | | | | | | | | | | | | | | | | | | | | |
| | | Six months
ended
2/28/17 | | | Years ended 8/31 | |
| Class R2 | | | 2016 | | | 2015 | | | 2014 | | | 2013 | | | 2012 | |
| | | (unaudited) | | | | | | | | | | | | | | | | |
Net asset value, beginning of period | | | $22.95 | | | | $22.60 | | | | $24.46 | | | | $24.97 | | | | $19.52 | | | | $22.09 | |
| Income (loss) from investment operations | | | | | | | | | |
Net investment loss (d) | | | $(0.11 | )(c) | | | $(0.17 | ) | | | $(0.25 | ) | | | $(0.27 | ) | | | $(0.19 | ) | | | $(0.21 | ) |
Net realized and unrealized gain
(loss) on investments and
foreign currency | | | 1.57 | | | | 0.52 | | | | 0.21 | | | | 2.21 | | | | 5.64 | | | | 1.74 | |
Total from investment operations | | | $1.46 | | | | $0.35 | | | | $(0.04 | ) | | | $1.94 | | | | $5.45 | | | | $1.53 | |
| Less distributions declared to shareholders | | | | | | | | | |
From net realized gain on
investments | | | $(0.58 | ) | | | $— | | | | $(1.82 | ) | | | $(2.45 | ) | | | $— | | | | $(4.10 | ) |
Net asset value, end of period (x) | | | $23.83 | | | | $22.95 | | | | $22.60 | | | | $24.46 | | | | $24.97 | | | | $19.52 | |
Total return (%) (r)(s)(x) | | | 6.47 | (c)(n) | | | 1.55 | | | | 0.23 | | | | 7.72 | | | | 27.92 | | | | 9.58 | |
Ratios (%) (to average net assets)
and Supplemental data: | | | | | | | | | |
Expenses before expense
reductions (f) | | | 1.60 | (a)(c) | | | 1.62 | | | | 1.61 | | | | 1.58 | | | | 1.60 | | | | 1.64 | |
Expenses after expense reductions (f) | | | 1.59 | (a)(c) | | | 1.59 | | | | 1.56 | | | | 1.52 | | | | 1.56 | | | | 1.60 | |
Net investment loss | | | (0.93 | )(a)(c) | | | (0.82 | ) | | | (1.07 | ) | | | (1.09 | ) | | | (0.85 | ) | | | (1.09 | ) |
Portfolio turnover | | | 24 | (n) | | | 49 | | | | 56 | | | | 98 | | | | 96 | | | | 128 | |
Net assets at end of period
(000 omitted) | | | $33,171 | | | | $35,890 | | | | $57,077 | | | | $66,923 | | | | $60,501 | | | | $35,599 | |
See Notes to Financial Statements
20
Financial Highlights – continued
| | | | | | | | | | | | | | | | | | | | | | | | |
| | | Six months
ended
2/28/17 | | | Years ended 8/31 | |
| Class R3 | | | 2016 | | | 2015 | | | 2014 | | | 2013 | | | 2012 | |
| | | (unaudited) | | | | | | | | | | | | | | | | |
Net asset value, beginning of period | | | $24.09 | | | | $23.67 | | | | $25.47 | | | | $25.84 | | | | $20.15 | | | | $22.62 | |
| Income (loss) from investment operations | | | | | | | | | |
Net investment loss (d) | | | $(0.08 | )(c) | | | $(0.12 | ) | | | $(0.20 | ) | | | $(0.22 | ) | | | $(0.14 | ) | | | $(0.16 | ) |
Net realized and unrealized gain
(loss) on investments and
foreign currency | | | 1.65 | | | | 0.54 | | | | 0.22 | | | | 2.30 | | | | 5.83 | | | | 1.79 | |
Total from investment operations | | | $1.57 | | | | $0.42 | | | | $0.02 | | | | $2.08 | | | | $5.69 | | | | $1.63 | |
| Less distributions declared to shareholders | | | | | | | | | |
From net realized gain on
investments | | | $(0.58 | ) | | | $— | | | | $(1.82 | ) | | | $(2.45 | ) | | | $— | | | | $(4.10 | ) |
Net asset value, end of period (x) | | | $25.08 | | | | $24.09 | | | | $23.67 | | | | $25.47 | | | | $25.84 | | | | $20.15 | |
Total return (%) (r)(s)(x) | | | 6.62 | (c)(n) | | | 1.77 | | | | 0.47 | | | | 8.02 | | | | 28.24 | | | | 9.84 | |
Ratios (%) (to average net assets)
and Supplemental data: | | | | | | | | | |
Expenses before expense
reductions (f) | | | 1.35 | (a)(c) | | | 1.37 | | | | 1.36 | | | | 1.33 | | | | 1.35 | | | | 1.39 | |
Expenses after expense reductions (f) | | | 1.34 | (a)(c) | | | 1.34 | | | | 1.31 | | | | 1.27 | | | | 1.31 | | | | 1.35 | |
Net investment loss | | | (0.68 | )(a)(c) | | | (0.55 | ) | | | (0.82 | ) | | | (0.84 | ) | | | (0.60 | ) | | | (0.83 | ) |
Portfolio turnover | | | 24 | (n) | | | 49 | | | | 56 | | | | 98 | | | | 96 | | | | 128 | |
Net assets at end of period
(000 omitted) | | | $53,909 | | | | $57,593 | | | | $89,659 | | | | $150,359 | | | | $110,562 | | | | $61,125 | |
See Notes to Financial Statements
21
Financial Highlights – continued
| | | | | | | | | | | | | | | | | | | | | | | | |
| | | Six months
ended
2/28/17 | | | Years ended 8/31 | |
| Class R4 | | | 2016 | | | 2015 | | | 2014 | | | 2013 | | | 2012 | |
| | | (unaudited) | | | | | | | | | | | | | | | | |
Net asset value, beginning of period | | | $25.09 | | | | $24.60 | | | | $26.33 | | | | $26.57 | | | | $20.67 | | | | $23.04 | |
| Income (loss) from investment operations | | | | | | | | | |
Net investment loss (d) | | | $(0.05 | )(c) | | | $(0.07 | ) | | | $(0.14 | ) | | | $(0.16 | ) | | | $(0.08 | ) | | | $(0.12 | ) |
Net realized and unrealized gain
(loss) on investments and
foreign currency | | | 1.72 | | | | 0.56 | | | | 0.23 | | | | 2.37 | | | | 5.98 | | | | 1.85 | |
Total from investment operations | | | $1.67 | | | | $0.49 | | | | $0.09 | | | | $2.21 | | | | $5.90 | | | | $1.73 | |
| Less distributions declared to shareholders | | | | | | | | | |
From net realized gain on
investments | | | $(0.58 | ) | | | $— | | | | $(1.82 | ) | | | $(2.45 | ) | | | $— | | | | $(4.10 | ) |
Net asset value, end of period (x) | | | $26.18 | | | | $25.09 | | | | $24.60 | | | | $26.33 | | | | $26.57 | | | | $20.67 | |
Total return (%) (r)(s)(x) | | | 6.76 | (c)(n) | | | 1.99 | | | | 0.73 | | | | 8.31 | | | | 28.54 | | | | 10.13 | |
Ratios (%) (to average net assets)
and Supplemental data: | | | | | | | | | |
Expenses before expense
reductions (f) | | | 1.10 | (a)(c) | | | 1.12 | | | | 1.11 | | | | 1.08 | | | | 1.10 | | | | 1.14 | |
Expenses after expense reductions (f) | | | 1.09 | (a)(c) | | | 1.09 | | | | 1.06 | | | | 1.02 | | | | 1.06 | | | | 1.10 | |
Net investment loss | | | (0.43 | )(a)(c) | | | (0.32 | ) | | | (0.57 | ) | | | (0.59 | ) | | | (0.35 | ) | | | (0.58 | ) |
Portfolio turnover | | | 24 | (n) | | | 49 | | | | 56 | | | | 98 | | | | 96 | | | | 128 | |
Net assets at end of period
(000 omitted) | | | $79,530 | | | | $91,974 | | | | $142,857 | | | | $229,964 | | | | $197,884 | | | | $141,694 | |
See Notes to Financial Statements
22
Financial Highlights – continued
| | | | | | | | | | | | | | | | | | | | | | | | |
| | | Six months
ended
2/28/17 | | | Years ended 8/31 | |
| Class R6 | | | 2016 | | | 2015 | | | 2014 | | | 2013 | | | 2012 (i) | |
| | | (unaudited) | | | | | | | | | | | | | | | | |
Net asset value, beginning of period | | | $26.38 | | | | $25.83 | | | | $27.52 | | | | $27.64 | | | | $21.48 | | | | $19.73 | |
| Income (loss) from investment operations | | | | | | | | | |
Net investment loss (d) | | | $(0.04 | )(c) | | | $(0.03 | ) | | | $(0.12 | ) | | | $(0.13 | ) | | | $(0.06 | ) | | | $(0.03 | ) |
Net realized and unrealized gain
(loss) on investments and
foreign currency | | | 1.82 | | | | 0.58 | | | | 0.25 | | | | 2.46 | | | | 6.22 | | | | 1.78 | |
Total from investment operations | | | $1.78 | | | | $0.55 | | | | $0.13 | | | | $2.33 | | | | $6.16 | | | | $1.75 | |
| Less distributions declared to shareholders | | | | | | | | | |
From net realized gain on
investments | | | $(0.58 | ) | | | $— | | | | $(1.82 | ) | | | $(2.45 | ) | | | $— | | | | $— | |
Net asset value, end of period (x) | | | $27.58 | | | | $26.38 | | | | $25.83 | | | | $27.52 | | | | $27.64 | | | | $21.48 | |
Total return (%) (r)(s)(x) | | | 6.85 | (c)(n) | | | 2.13 | | | | 0.85 | | | | 8.43 | | | | 28.68 | | | | 8.87 | (n) |
Ratios (%) (to average net assets)
and Supplemental data: | | | | | | | | | |
Expenses before expense
reductions (f) | | | 0.97 | (a)(c) | | | 0.99 | | | | 0.98 | | | | 0.97 | | | | 0.99 | | | | 1.07 | (a) |
Expenses after expense reductions (f) | | | 0.96 | (a)(c) | | | 0.97 | | | | 0.93 | | | | 0.91 | | | | 0.96 | | | | 1.05 | (a) |
Net investment loss | | | (0.30 | )(a)(c) | | | (0.11 | ) | | | (0.44 | ) | | | (0.48 | ) | | | (0.24 | ) | | | (0.49 | )(a) |
Portfolio turnover | | | 24 | (n) | | | 49 | | | | 56 | | | | 98 | | | | 96 | | | | 128 | |
Net assets at end of period
(000 omitted) | | | $311,912 | | | | $320,645 | | | | $313,080 | | | | $319,139 | | | | $244,655 | | | | $174,681 | |
See Notes to Financial Statements
23
Financial Highlights – continued
| | | | | | | | | | | | | | | | | | | | | | | | |
| | | Six months
ended
2/28/17 | | | Years ended 8/31 | |
| Class 529A | | | 2016 | | | 2015 | | | 2014 | | | 2013 | | | 2012 | |
| | | (unaudited) | | | | | | | | | | | | | | | | |
Net asset value, beginning of period | | | $23.41 | | | | $23.01 | | | | $24.82 | | | | $25.25 | | | | $19.70 | | | | $22.22 | |
| Income (loss) from investment operations | | | | | | | | | |
Net investment loss (d) | | | $(0.08 | )(c) | | | $(0.11 | ) | | | $(0.20 | ) | | | $(0.22 | ) | | | $(0.14 | ) | | | $(0.17 | ) |
Net realized and unrealized gain
(loss) on investments and
foreign currency | | | 1.60 | | | | 0.51 | | | | 0.21 | | | | 2.24 | | | | 5.69 | | | | 1.75 | |
Total from investment operations | | | $1.52 | | | | $0.40 | | | | $0.01 | | | | $2.02 | | | | $5.55 | | | | $1.58 | |
| Less distributions declared to shareholders | | | | | | | | | |
From net realized gain on
investments | | | $(0.58 | ) | | | $— | | | | $(1.82 | ) | | | $(2.45 | ) | | | $— | | | | $(4.10 | ) |
Net asset value, end of period (x) | | | $24.35 | | | | $23.41 | | | | $23.01 | | | | $24.82 | | | | $25.25 | | | | $19.70 | |
Total return (%) (r)(s)(t)(x) | | | 6.60 | (c)(n) | | | 1.74 | | | | 0.44 | | | | 7.97 | | | | 28.17 | | | | 9.80 | |
Ratios (%) (to average net assets)
and Supplemental data: | | | | | | | | | |
Expenses before expense
reductions (f) | | | 1.45 | (a)(c) | | | 1.46 | | | | 1.46 | | | | 1.43 | | | | 1.45 | | | | 1.49 | |
Expenses after expense reductions (f) | | | 1.37 | (a)(c) | | | 1.37 | | | | 1.34 | | | | 1.30 | | | | 1.34 | | | | 1.40 | |
Net investment loss | | | (0.71 | )(a)(c) | | | (0.50 | ) | | | (0.85 | ) | | | (0.86 | ) | | | (0.62 | ) | | | (0.89 | ) |
Portfolio turnover | | | 24 | (n) | | | 49 | | | | 56 | | | | 98 | | | | 96 | | | | 128 | |
Net assets at end of period
(000 omitted) | | | $5,317 | | | | $5,075 | | | | $5,149 | | | | $5,150 | | | | $4,519 | | | | $3,304 | |
See Notes to Financial Statements
24
Financial Highlights – continued
| | | | | | | | | | | | | | | | | | | | | | | | |
| | | Six months
ended
2/28/17 | | | Years ended 8/31 | |
| Class 529B | | | 2016 | | | 2015 | | | 2014 | | | 2013 | | | 2012 | |
| | | (unaudited) | | | | | | | | | | | | | | | | |
Net asset value, beginning of period | | | $19.66 | | | | $19.47 | | | | $21.44 | | | | $22.27 | | | | $17.51 | | | | $20.35 | |
| Income (loss) from investment operations | | | | | | | | | |
Net investment loss (d) | | | $(0.14 | )(c) | | | $(0.23 | ) | | | $(0.32 | ) | | | $(0.36 | ) | | | $(0.28 | ) | | | $(0.28 | ) |
Net realized and unrealized gain
(loss) on investments and
foreign currency | | | 1.33 | | | | 0.42 | | | | 0.17 | | | | 1.98 | | | | 5.04 | | | | 1.54 | |
Total from investment operations | | | $1.19 | | | | $0.19 | | | | $(0.15 | ) | | | $1.62 | | | | $4.76 | | | | $1.26 | |
| Less distributions declared to shareholders | | | | | | | | | |
From net realized gain on
investments | | | $(0.58 | ) | | | $— | | | | $(1.82 | ) | | | $(2.45 | ) | | | $— | | | | $(4.10 | ) |
Net asset value, end of period (x) | | | $20.27 | | | | $19.66 | | | | $19.47 | | | | $21.44 | | | | $22.27 | | | | $17.51 | |
Total return (%) (r)(s)(t)(x) | | | 6.18 | (c)(n) | | | 0.98 | | | | (0.28 | ) | | | 7.18 | | | | 27.18 | | | | 8.99 | |
Ratios (%) (to average net assets)
and Supplemental data: | | | | | | | | | |
Expenses before expense
reductions (f) | | | 2.20 | (a)(c) | | | 2.21 | | | | 2.21 | | | | 2.18 | | | | 2.20 | | | | 2.24 | |
Expenses after expense reductions (f) | | | 2.13 | (a)(c) | | | 2.12 | | | | 2.09 | | | | 2.06 | | | | 2.10 | | | | 2.15 | |
Net investment loss | | | (1.47 | )(a)(c) | | | (1.28 | ) | | | (1.60 | ) | | | (1.62 | ) | | | (1.39 | ) | | | (1.64 | ) |
Portfolio turnover | | | 24 | (n) | | | 49 | | | | 56 | | | | 98 | | | | 96 | | | | 128 | |
Net assets at end of period
(000 omitted) | | | $297 | | | | $306 | | | | $341 | | | | $348 | | | | $300 | | | | $217 | |
See Notes to Financial Statements
25
Financial Highlights – continued
| | | | | | | | | | | | | | | | | | | | | | | | |
| | | Six months
ended
2/28/17 | | | Years ended 8/31 | |
| Class 529C | | | 2016 | | | 2015 | | | 2014 | | | 2013 | | | 2012 | |
| | | (unaudited) | | | | | | | | | | | | | | | | |
Net asset value, beginning of period | | | $19.65 | | | | $19.46 | | | | $21.44 | | | | $22.28 | | | | $17.52 | | | | $20.36 | |
| Income (loss) from investment operations | | | | | | | | | |
Net investment loss (d) | | | $(0.14 | )(c) | | | $(0.23 | ) | | | $(0.33 | ) | | | $(0.36 | ) | | | $(0.28 | ) | | | $(0.28 | ) |
Net realized and unrealized gain
(loss) on investments and
foreign currency | | | 1.34 | | | | 0.42 | | | | 0.17 | | | | 1.97 | | | | 5.04 | | | | 1.54 | |
Total from investment operations | | | $1.20 | | | | $0.19 | | | | $(0.16 | ) | | | $1.61 | | | | $4.76 | | | | $1.26 | |
| Less distributions declared to shareholders | | | | | | | | | |
From net realized gain on
investments | | | $(0.58 | ) | | | $— | | | | $(1.82 | ) | | | $(2.45 | ) | | | $— | | | | $(4.10 | ) |
Net asset value, end of period (x) | | | $20.27 | | | | $19.65 | | | | $19.46 | | | | $21.44 | | | | $22.28 | | | | $17.52 | |
Total return (%) (r)(s)(t)(x) | | | 6.23 | (c)(n) | | | 0.98 | | | | (0.34 | ) | | | 7.13 | | | | 27.17 | | | | 8.98 | |
Ratios (%) (to average net assets)
and Supplemental data: | | | | | | | | | |
Expenses before expense
reductions (f) | | | 2.20 | (a)(c) | | | 2.21 | | | | 2.21 | | | | 2.18 | | | | 2.20 | | | | 2.24 | |
Expenses after expense reductions (f) | | | 2.13 | (a)(c) | | | 2.14 | | | | 2.11 | | | | 2.07 | | | | 2.11 | | | | 2.15 | |
Net investment loss | | | (1.48 | )(a)(c) | | | (1.28 | ) | | | (1.62 | ) | | | (1.63 | ) | | | (1.39 | ) | | | (1.64 | ) |
Portfolio turnover | | | 24 | (n) | | | 49 | | | | 56 | | | | 98 | | | | 96 | | | | 128 | |
Net assets at end of period
(000 omitted) | | | $1,454 | | | | $1,351 | | | | $1,383 | | | | $1,223 | | | | $1,454 | | | | $906 | |
| (c) | Amount reflects a one-time reimbursement of expenses by the custodian (or former custodian) without which net investment income and performance would be lower and expenses would be higher. See Note 2 in the Notes to Financial Statements for additional information. |
| (d) | Per share data is based on average shares outstanding. |
| (f) | Ratios do not reflect reductions from fees paid indirectly, if applicable. |
| (i) | For the period from the class inception, June 1, 2012, through the stated period end. |
| (r) | Certain expenses have been reduced without which performance would have been lower. |
| (s) | From time to time the fund may receive proceeds from litigation settlements, without which performance would be lower. |
| (t) | Total returns do not include any applicable sales charges. |
| (x) | The net asset values and total returns have been calculated on net assets which include adjustments made in accordance with U.S. generally accepted accounting principles required at period end for financial reporting purposes. |
See Notes to Financial Statements
26
NOTES TO FINANCIAL STATEMENTS
(unaudited)
(1) Business and Organization
MFS New Discovery Fund (the fund) is a diversified series of MFS Series Trust I (the trust). The trust is organized as a Massachusetts business trust and is registered under the Investment Company Act of 1940, as amended, as an open-end management investment company.
The fund is an investment company and accordingly follows the investment company accounting and reporting guidance of the Financial Accounting Standards Board (FASB) Accounting Standards Codification Topic 946 Financial Services – Investment Companies.
(2) Significant Accounting Policies
General – The preparation of financial statements in conformity with U.S. generally accepted accounting principles requires management to make estimates and assumptions that affect the reported amounts of assets and liabilities, and disclosure of contingent assets and liabilities at the date of the financial statements and the reported amounts of increases and decreases in net assets from operations during the reporting period. Actual results could differ from those estimates. In the preparation of these financial statements, management has evaluated subsequent events occurring after the date of the fund’s Statement of Assets and Liabilities through the date that the financial statements were issued. The fund will generally focus on securities of small size companies which may be more volatile than those of larger companies.
In October 2016, the Securities and Exchange Commission (SEC) released its Final Rule on Investment Company Reporting Modernization (the “Rule”). The Rule, which introduces two new regulatory reporting forms for investment companies – Form N-PORT and Form N-CEN – also contains amendments to Regulation S-X which impact financial statement presentation, particularly the presentation of derivative investments. Although still evaluating the impacts of the Rule, management believes that many of the Regulation S-X amendments are consistent with the fund’s current financial statement presentation and expects that the fund will be able to comply with the Rule’s Regulation S-X amendments by the August 1, 2017 compliance date.
Balance Sheet Offsetting – The fund’s accounting policy with respect to balance sheet offsetting is that, absent an event of default by the counterparty or a termination of the agreement, the International Swaps and Derivatives Association (ISDA) Master Agreement does not result in an offset of reported amounts of financial assets and financial liabilities in the Statement of Assets and Liabilities across transactions between the fund and the applicable counterparty. The fund’s right to setoff may be restricted or prohibited by the bankruptcy or insolvency laws of the particular jurisdiction to which a specific master netting agreement counterparty is subject. Balance sheet offsetting disclosures, to the extent applicable to the fund, have been included in the fund’s Significant Accounting Policies note under the captions for each of the fund’s in-scope financial instruments and transactions.
Investment Valuations – Equity securities, including restricted equity securities, are generally valued at the last sale or official closing price on their primary market or exchange as provided by a third-party pricing service. Equity securities, for which there
27
Notes to Financial Statements (unaudited) – continued
were no sales reported that day, are generally valued at the last quoted daily bid quotation on their primary market or exchange as provided by a third-party pricing service. Short-term instruments with a maturity at issuance of 60 days or less may be valued at amortized cost, which approximates market value. Open-end investment companies are generally valued at net asset value per share. Securities and other assets generally valued on the basis of information from a third-party pricing service may also be valued at a broker/dealer bid quotation. Values obtained from third-party pricing services can utilize both transaction data and market information such as yield, quality, coupon rate, maturity, type of issue, trading characteristics, and other market data. The values of foreign securities and other assets and liabilities expressed in foreign currencies are converted to U.S. dollars using the mean of bid and asked prices for rates provided by a third-party pricing service.
The Board of Trustees has delegated primary responsibility for determining or causing to be determined the value of the fund’s investments (including any fair valuation) to the adviser pursuant to valuation policies and procedures approved by the Board. If the adviser determines that reliable market quotations are not readily available, investments are valued at fair value as determined in good faith by the adviser in accordance with such procedures under the oversight of the Board of Trustees. Under the fund’s valuation policies and procedures, market quotations are not considered to be readily available for most types of debt instruments and floating rate loans and many types of derivatives. These investments are generally valued at fair value based on information from third-party pricing services. In addition, investments may be valued at fair value if the adviser determines that an investment’s value has been materially affected by events occurring after the close of the exchange or market on which the investment is principally traded (such as foreign exchange or market) and prior to the determination of the fund’s net asset value, or after the halting of trading of a specific security where trading does not resume prior to the close of the exchange or market on which the security is principally traded. Events that occur on a frequent basis after foreign markets close (such as developments in foreign markets and significant movements in the U.S. markets) and prior to the determination of the fund’s net asset value may be deemed to have a material effect on the value of securities traded in foreign markets. Accordingly, the fund’s foreign equity securities may often be valued at fair value. The adviser generally relies on third-party pricing services or other information (such as the correlation with price movements of similar securities in the same or other markets; the type, cost and investment characteristics of the security; the business and financial condition of the issuer; and trading and other market data) to assist in determining whether to fair value and at what value to fair value an investment. The value of an investment for purposes of calculating the fund’s net asset value can differ depending on the source and method used to determine value. When fair valuation is used, the value of an investment used to determine the fund’s net asset value may differ from quoted or published prices for the same investment. There can be no assurance that the fund could obtain the fair value assigned to an investment if it were to sell the investment at the same time at which the fund determines its net asset value per share.
Various inputs are used in determining the value of the fund’s assets or liabilities. These inputs are categorized into three broad levels. In certain cases, the inputs used to measure fair value may fall into different levels of the fair value hierarchy. In such cases,
28
Notes to Financial Statements (unaudited) – continued
an investment’s level within the fair value hierarchy is based on the lowest level of input that is significant to the fair value measurement. The fund’s assessment of the significance of a particular input to the fair value measurement in its entirety requires judgment, and considers factors specific to the investment. Level 1 includes unadjusted quoted prices in active markets for identical assets or liabilities. Level 2 includes other significant observable market-based inputs (including quoted prices for similar securities, interest rates, prepayment speed, and credit risk). Level 3 includes unobservable inputs, which may include the adviser’s own assumptions in determining the fair value of investments. The following is a summary of the levels used as of February 28, 2017 in valuing the fund’s assets or liabilities:
| | | | | | | | | | | | | | | | |
| Investments at Value | | Level 1 | | | Level 2 | | | Level 3 | | | Total | |
| Equity Securities: | | | | | | | | | | | | | | | | |
United States | | | $985,192,693 | | | | $9,476,218 | | | | $0 | | | | $994,668,911 | |
Canada | | | 37,706,814 | | | | — | | | | — | | | | 37,706,814 | |
United Kingdom | | | 19,170,613 | | | | — | | | | — | | | | 19,170,613 | |
Israel | | | 18,836,557 | | | | — | | | | — | | | | 18,836,557 | |
Hong Kong | | | 11,271,877 | | | | — | | | | — | | | | 11,271,877 | |
India | | | 7,972,009 | | | | — | | | | — | | | | 7,972,009 | |
Greece | | | 4,297,907 | | | | — | | | | — | | | | 4,297,907 | |
| Mutual Funds | | | 39,021,417 | | | | — | | | | — | | | | 39,021,417 | |
| Total Investments | | | $1,123,469,887 | | | | $9,476,218 | | | | $0 | | | | $1,132,946,105 | |
For further information regarding security characteristics, see the Portfolio of Investments.
The following is a reconciliation of level 3 assets for which significant unobservable inputs were used to determine fair value. The fund’s policy is to recognize transfers between the levels as of the end of the period. The table presents the activity of level 3 securities held at the beginning and the end of the period.
| | | | |
| | | Equity Securities | |
| Balance as of 8/31/16 | | | $— | |
Received as part of corporate action | | | 0 | |
| Balance as of 2/28/17 | | | $0 | |
The net change in unrealized appreciation (depreciation) from investments held as level 3 at February 28, 2017 is $0. At February 28, 2017, the fund held 1 level 3 security.
Foreign Currency Translation – Purchases and sales of foreign investments, income, and expenses are converted into U.S. dollars based upon currency exchange rates prevailing on the respective dates of such transactions or on the reporting date for foreign denominated receivables and payables. Gains and losses attributable to foreign currency exchange rates on sales of securities are recorded for financial statement purposes as net realized gains and losses on investments. Gains and losses attributable to foreign exchange rate movements on receivables, payables, income and expenses are recorded for financial statement purposes as foreign currency transaction gains and losses. That portion of both realized and unrealized gains and losses on investments that results from fluctuations in foreign currency exchange rates is not separately disclosed.
29
Notes to Financial Statements (unaudited) – continued
Security Loans – Under its Securities Lending Agency Agreement with the fund, State Street Bank and Trust Company (“State Street”), as lending agent, loans the securities of the fund to certain qualified institutions (the “Borrowers”) approved by the fund. Security loans can be terminated at the discretion of either the lending agent or the fund and the related securities must be returned within the earlier of the standard trade settlement period for such securities or within three business days. The loans are collateralized by cash and/or U.S. Treasury and federal agency obligations in an amount typically at least equal to the market value of the securities loaned. On loans collateralized by cash, the cash collateral is invested in a money market fund. The market value of the loaned securities is determined at the close of business of the fund and any additional required collateral is delivered to the fund on the next business day. State Street provides the fund with indemnification against Borrower default. In the event of Borrower default, State Street will, for the benefit of the fund, either purchase securities identical to those loaned or, when such purchase is commercially impracticable, pay the fund the market value of the loaned securities. In return, State Street assumes the fund’s rights to the related collateral. If the collateral value is less than the cost to purchase identical securities, State Street is responsible for the shortfall, but only to the extent that such shortfall is not due to a decline in collateral value resulting from collateral reinvestment for which the fund bears the risk of loss. At period end, the fund had investment securities on loan, all of which were classified as equity securities in the fund’s Portfolio of Investments, with a fair value of $25,750,225. The fair value of the fund’s investment securities on loan and a related liability of $25,865,535 for cash collateral received on securities loaned are both presented gross in the Statement of Assets and Liabilities. Additionally, these loans were collateralized by U.S. Treasury Obligations of $1,060,911. The collateral received on securities loaned exceeded the value of securities on loan at period end. The liability for cash collateral for securities loaned is carried at fair value, which is categorized as level 2 within the fair value hierarchy. A portion of the income generated upon investment of the collateral is remitted to the Borrowers, and the remainder is allocated between the fund and the lending agent. On loans collateralized by U.S. Treasury and/or federal agency obligations, a fee is received from the Borrower, and is allocated between the fund and the lending agent. Income from securities lending is separately reported in the Statement of Operations. The dividend and interest income earned on the securities loaned is accounted for in the same manner as other dividend and interest income.
Indemnifications – Under the fund’s organizational documents, its officers and Trustees may be indemnified against certain liabilities and expenses arising out of the performance of their duties to the fund. Additionally, in the normal course of business, the fund enters into agreements with service providers that may contain indemnification clauses. The fund’s maximum exposure under these agreements is unknown as this would involve future claims that may be made against the fund that have not yet occurred.
Investment Transactions and Income – Investment transactions are recorded on the trade date. Dividends received in cash are recorded on the ex-dividend date. Certain dividends from foreign securities will be recorded when the fund is informed of the dividend if such information is obtained subsequent to the ex-dividend date. Dividend
30
Notes to Financial Statements (unaudited) – continued
payments received in additional securities are recorded on the ex-dividend date in an amount equal to the value of the security on such date.
The fund may receive proceeds from litigation settlements. Any proceeds received from litigation involving portfolio holdings are reflected in the Statement of Operations in realized gain/loss if the security has been disposed of by the fund or in unrealized gain/loss if the security is still held by the fund. Any other proceeds from litigation not related to portfolio holdings are reflected as other income in the Statement of Operations.
Reimbursement of Expenses by Custodian – In December 2015, the fund’s custodian (or former custodian), State Street Bank and Trust Company, announced that it intended to reimburse its asset servicing clients for expense amounts that it billed in error during the period 1998 through 2015. The amount of this one-time reimbursement attributable to the fund is reflected as “Reimbursement of custodian expenses” in the Statement of Operations.
Tax Matters and Distributions – The fund intends to qualify as a regulated investment company, as defined under Subchapter M of the Internal Revenue Code, and to distribute all of its taxable income, including realized capital gains. As a result, no provision for federal income tax is required. The fund’s federal tax returns, when filed, will remain subject to examination by the Internal Revenue Service for a three year period. Management has analyzed the fund’s tax positions taken on federal and state tax returns for all open tax years and does not believe that there are any uncertain tax positions that require recognition of a tax liability. Foreign taxes, if any, have been accrued by the fund in the accompanying financial statements in accordance with the applicable foreign tax law. Foreign income taxes may be withheld by certain countries in which the fund invests. Additionally, capital gains realized by the fund on securities issued in or by certain foreign countries may be subject to capital gains tax imposed by those countries.
Distributions to shareholders are recorded on the ex-dividend date. Income and capital gain distributions are determined in accordance with income tax regulations, which may differ from U.S. generally accepted accounting principles. Certain capital accounts in the financial statements are periodically adjusted for permanent differences in order to reflect their tax character. These adjustments have no impact on net assets or net asset value per share. Temporary differences which arise from recognizing certain items of income, expense, gain or loss in different periods for financial statement and tax purposes will reverse at some time in the future. Distributions in excess of net investment income or net realized gains are temporary overdistributions for financial statement purposes resulting from differences in the recognition or classification of income or distributions for financial statement and tax purposes.
Book/tax differences primarily relate to net operating losses and wash sale loss deferrals.
The tax character of distributions made during the current period will be determined at fiscal year end. The fund declared no distributions for the year ended August 31, 2016.
31
Notes to Financial Statements (unaudited) – continued
The federal tax cost and the tax basis components of distributable earnings were as follows:
| | | | |
| As of 2/28/17 | | | |
| Cost of investments | | | $950,930,835 | |
| Gross appreciation | | | 234,572,004 | |
| Gross depreciation | | | (52,556,734 | ) |
| Net unrealized appreciation (depreciation) | | | $182,015,270 | |
| |
| As of 8/31/16 | | | |
| Undistributed long-term capital gain | | | 9,483,953 | |
| Late year ordinary loss deferral | | | (1,143,596 | ) |
| Other temporary differences | | | (2,839 | ) |
| Net unrealized appreciation (depreciation) | | | 149,925,317 | |
The aggregate cost above includes prior fiscal year end tax adjustments, if applicable.
Multiple Classes of Shares of Beneficial Interest – The fund offers multiple classes of shares, which differ in their respective distribution, service, and program manager fees. The fund’s income, realized and unrealized gain (loss), and common expenses are allocated to shareholders based on the daily net assets of each class. Dividends are declared separately for each class. Differences in per share dividend rates are generally due to differences in separate class expenses. Class B and Class 529B shares will convert to Class A and Class 529A shares, respectively, approximately eight years after purchase. The fund’s distributions declared to shareholders as reported in the Statements of Changes in Net Assets are presented by class as follows:
| | | | | | | | |
| | | From net realized gain on
investments | |
| | | Six months
ended
2/28/17 | | | Year
ended
8/31/16 | |
| Class A | | | $9,172,596 | | | | $— | |
| Class B | | | 584,795 | | | | — | |
| Class C | | | 2,281,782 | | | | — | |
| Class I | | | 2,526,174 | | | | — | |
| Class R1 | | | 140,626 | | | | — | |
| Class R2 | | | 824,816 | | | | — | |
| Class R3 | | | 1,269,935 | | | | — | |
| Class R4 | | | 1,800,361 | | | | — | |
| Class R6 | | | 6,811,530 | | | | — | |
| Class 529A | | | 128,020 | | | | — | |
| Class 529B | | | 8,528 | | | | — | |
| Class 529C | | | 39,357 | | | | — | |
| Total | | | $25,588,520 | | | | $— | |
(3) Transactions with Affiliates
Investment Adviser – The fund has an investment advisory agreement with MFS to provide overall investment management and related administrative services and
32
Notes to Financial Statements (unaudited) – continued
facilities to the fund. For the period from September 1, 2016 through December 28, 2016, the management fee was computed daily and paid monthly at an annual rate of 0.90% of the fund’s average daily net assets. The investment adviser had agreed in writing to reduce its management fee to 0.80% of average daily net assets in excess of $1 billion up to $2.5 billion, 0.75% of average daily net assets in excess of $2.5 billion up to $5 billion, and 0.70% of average daily net assets in excess of $5 billion. This written agreement terminated on December 28, 2016. For the period from September 1, 2016 through December 28, 2016, this management fee reduction amounted to $30,628, which is included in the reduction of total expenses in the Statement of Operations. Effective December 29, 2016, the management fee is computed daily and paid monthly at an annual rate of 0.90% of average daily net assets up to $1 billion, 0.80% of average daily net assets in excess of $1 billion up to $2.5 billion, 0.75% of average daily net assets in excess of $2.5 billion up to $5 billion, and 0.70% of average daily net assets in excess of $5 billion. MFS has also agreed in writing to reduce its management fee by a specified amount if certain MFS mutual fund assets exceed thresholds agreed to by MFS and the fund’s Board of Trustees. For the six months ended February 28, 2017, this management fee reduction amounted to $39,792, which is included in the reduction of total expenses in the Statement of Operations. The management fee incurred for the six months ended February 28, 2017 was equivalent to an annual effective rate of 0.88% of the fund’s average daily net assets.
Distributor – MFS Fund Distributors, Inc. (MFD), a wholly-owned subsidiary of MFS, as distributor, received $64,967 and $1,665 for the six months ended February 28, 2017, as its portion of the initial sales charge on sales of Class A and Class 529A shares of the fund, respectively.
The Board of Trustees has adopted a distribution plan for certain share classes pursuant to Rule 12b-1 of the Investment Company Act of 1940.
The fund’s distribution plan provides that the fund will pay MFD for services provided by MFD and financial intermediaries in connection with the distribution and servicing of certain share classes. One component of the plan is a distribution fee paid to MFD and another component of the plan is a service fee paid to MFD. MFD may subsequently pay all, or a portion, of the distribution and/or service fees to financial intermediaries.
Distribution Plan Fee Table:
| | | | | | | | | | | | | | | | | | | | |
| | | Distribution
Fee Rate (d) | | | Service
Fee Rate (d) | | | Total
Distribution
Plan (d) | | | Annual
Effective
Rate (e) | | | Distribution
and Service
Fee | |
| Class A | | | — | | | | 0.25% | | | | 0.25% | | | | 0.24% | | | | $479,945 | |
| Class B | | | 0.75% | | | | 0.25% | | | | 1.00% | | | | 1.00% | | | | 102,875 | |
| Class C | | | 0.75% | | | | 0.25% | | | | 1.00% | | | | 1.00% | | | | 403,142 | |
| Class R1 | | | 0.75% | | | | 0.25% | | | | 1.00% | | | | 1.00% | | | | 25,472 | |
| Class R2 | | | 0.25% | | | | 0.25% | | | | 0.50% | | | | 0.50% | | | | 83,006 | |
| Class R3 | | | — | | | | 0.25% | | | | 0.25% | | | | 0.25% | | | | 67,182 | |
| Class 529A | | | — | | | | 0.25% | | | | 0.25% | | | | 0.23% | | | | 6,429 | |
| Class 529B | | | 0.75% | | | | 0.25% | | | | 1.00% | | | | 0.99% | | | | 1,442 | |
| Class 529C | | | 0.75% | | | | 0.25% | | | | 1.00% | | | | 1.00% | | | | 6,751 | |
| Total Distribution and Service Fees | | | | | | | | | | | | | | | | $1,176,244 | |
33
Notes to Financial Statements (unaudited) – continued
| (d) | In accordance with the distribution plan for certain classes, the fund pays distribution and/or service fees equal to these annual percentage rates of each class’s average daily net assets. The distribution and service fee rates disclosed by class represent the current rates in effect at the end of the reporting period. Any rate changes, if applicable, are detailed below. |
| (e) | The annual effective rates represent actual fees incurred under the distribution plan for the six months ended February 28, 2017 based on each class’s average daily net assets. MFD has voluntarily agreed to rebate a portion of each class’s 0.25% service fee attributable to accounts for which MFD retains the 0.25% service fee except for accounts attributable to MFS or its affiliates’ seed money. For the six months ended February 28, 2017, this rebate amounted to $9,514, $295, $109, $544, $17, and $18 for Class A, Class B, Class C, Class 529A, Class 529B, and Class 529C, respectively, and is included in the reduction of total expenses in the Statement of Operations. |
Certain Class A shares are subject to a contingent deferred sales charge (CDSC) in the event of a shareholder redemption within 18 months of purchase. Class C and Class 529C shares are subject to a CDSC in the event of a shareholder redemption within 12 months of purchase. Class B and Class 529B shares are subject to a CDSC in the event of a shareholder redemption within six years of purchase. All contingent deferred sales charges are paid to MFD and during the six months ended February 28, 2017, were as follows:
| | | | |
| | | Amount | |
| Class A | | | $3,694 | |
| Class B | | | 61,790 | |
| Class C | | | 3,908 | |
| Class 529B | | | — | |
| Class 529C | | | 49 | |
The fund has entered into and may from time to time enter into contracts with program managers and other parties which administer the tuition programs through which an investment in the fund’s 529 share classes is made. The fund has entered into an agreement with MFD pursuant to which MFD receives an annual fee of up to 0.10% of the average daily net assets attributable to each 529 share class. MFD has agreed to waive a portion of this fee in an amount equal to 0.05% of the average daily net assets for each 529 share class. This waiver agreement will expire on December 31, 2017, unless MFD elects to extend the waiver. For the six months ended February 28, 2017, this waiver amounted to $1,696 and is included in the reduction of total expenses in the Statement of Operations. The program manager fee incurred for the six months ended February 28, 2017 was equivalent to an annual effective rate of 0.05% of the average daily net assets attributable to each 529 share class. The services provided by MFD, or a third party with which MFD contracts, include recordkeeping and tax reporting and account services, as well as services designed to maintain the program’s compliance with the Internal Revenue Code and other regulatory requirements. Program manager fees and waivers for the six months ended February 28, 2017, were as follows:
| | | | | | | | |
| | | Fee | | | Waiver | |
| Class 529A | | $ | 2,572 | | | $ | 1,286 | |
| Class 529B | | | 144 | | | | 72 | |
| Class 529C | | | 675 | | | | 338 | |
| Total Program Manager Fees and Waivers | | $ | 3,391 | | | $ | 1,696 | |
34
Notes to Financial Statements (unaudited) – continued
Shareholder Servicing Agent – MFS Service Center, Inc. (MFSC), a wholly-owned subsidiary of MFS, receives a fee from the fund for its services as shareholder servicing agent calculated as a percentage of the average daily net assets of the fund as determined periodically under the supervision of the fund’s Board of Trustees. For the six months ended February 28, 2017, the fee was $97,076, which equated to 0.0178% annually of the fund’s average daily net assets. MFSC also receives payment from the fund for out-of-pocket expenses, sub-accounting and other shareholder servicing costs which may be paid to affiliated and unaffiliated service providers. Class R6 shares do not incur sub-accounting fees. For the six months ended February 28, 2017, these out-of-pocket expenses, sub-accounting and other shareholder servicing costs amounted to $580,583.
Administrator – MFS provides certain financial, legal, shareholder communications, compliance, and other administrative services to the fund. Under an administrative services agreement, the fund reimburses MFS the costs incurred to provide these services. The fund is charged an annual fixed amount of $17,500 plus a fee based on average daily net assets. The administrative services fee incurred for the six months ended February 28, 2017 was equivalent to an annual effective rate of 0.0161% of the fund’s average daily net assets.
Trustees’ and Officers’ Compensation – The fund pays compensation to independent Trustees in the form of a retainer, attendance fees, and additional compensation to Board and Committee chairpersons. The fund does not pay compensation directly to Trustees or officers of the fund who are also officers of the investment adviser, all of whom receive remuneration for their services to the fund from MFS. Certain officers and Trustees of the fund are officers or directors of MFS, MFD, and MFSC.
Prior to December 31, 2001, the fund had an unfunded defined benefit plan (“DB plan”) for independent Trustees. As of December 31, 2001, the Board took action to terminate the DB plan with respect to then-current and any future independent Trustees, such that the DB plan covers only certain of those former independent Trustees who retired on or before December 31, 2001. The DB plan resulted in a pension expense of $282 and is included in “Independent Trustees’ compensation” in the Statement of Operations for the six months ended February 28, 2017. The liability for deferred retirement benefits payable to certain independent Trustees under the DB plan amounted to $2,307 at February 28, 2017, and is included in “Payable for independent Trustees’ compensation” in the Statement of Assets and Liabilities.
Other – This fund and certain other funds managed by MFS (the funds) have entered into a service agreement (the ISO Agreement) which provides for payment of fees solely by the funds to Tarantino LLC in return for the provision of services of an Independent Senior Officer (ISO) for the funds. Frank L. Tarantino serves as the ISO and is an officer of the funds and the sole member of Tarantino LLC. The funds can terminate the ISO Agreement with Tarantino LLC at any time under the terms of the ISO Agreement. For the six months ended February 28, 2017, the fee paid by the fund under this agreement was $1,048 and is included in “Miscellaneous” expense in the Statement of Operations. MFS has agreed to bear all expenses associated with office space, other administrative support, and supplies provided to the ISO.
35
Notes to Financial Statements (unaudited) – continued
The fund invests in the MFS Institutional Money Market Portfolio which is managed by MFS and seeks current income consistent with preservation of capital and liquidity. This money market fund does not pay a management fee to MFS.
On March 16, 2016, MFS purchased 613 shares of Class I for an aggregate amount of $13,712.
The fund is permitted to engage in purchase and sale transactions (“cross-trades”) with funds and accounts for which MFS serves as investment adviser or sub-adviser pursuant to a policy adopted by the Board of Trustees. This policy has been designed to ensure that cross-trades conducted by the fund comply with Rule 17a-7 under the Investment Company Act of 1940. Under this policy, cross-trades are effected at current market prices with no remuneration paid in connection with the transaction. During the six months ended February 28, 2017, the fund engaged in purchase transactions pursuant to this policy, which amounted to $915,839.
(4) Portfolio Securities
For the six months ended February 28, 2017, purchases and sales of investments, other than short-term obligations, aggregated $259,581,100 and $353,174,473, respectively.
(5) Shares of Beneficial Interest
The fund’s Declaration of Trust permits the Trustees to issue an unlimited number of full and fractional shares of beneficial interest. Transactions in fund shares were as follows:
| | | | | | | | | | | | | | | | |
| | | Six months ended
2/28/17 | | | Year ended
8/31/16 | |
| | | Shares | | | Amount | | | Shares | | | Amount | |
| Shares sold | | | | | | | | | | | | | | | | |
Class A | | | 1,292,086 | | | | $31,615,857 | | | | 2,581,507 | | | | $57,106,656 | |
Class B | | | 46,132 | | | | 935,041 | | | | 125,615 | | | | 2,323,055 | |
Class C | | | 230,982 | | | | 4,711,401 | | | | 359,925 | | | | 6,744,890 | |
Class I | | | 2,600,397 | | | | 69,320,513 | | | | 982,521 | | | | 24,084,261 | |
Class R1 | | | 22,692 | | | | 459,212 | | | | 48,011 | | | | 889,588 | |
Class R2 | | | 114,586 | | | | 2,640,384 | | | | 353,539 | | | | 7,402,869 | |
Class R3 | | | 154,159 | | | | 3,735,298 | | | | 774,467 | | | | 16,847,480 | |
Class R4 | | | 258,957 | | | | 6,521,335 | | | | 959,951 | | | | 21,770,461 | |
Class R6 | | | 426,825 | | | | 11,217,202 | | | | 2,833,166 | | | | 68,078,944 | |
Class 529A | | | 22,359 | | | | 522,077 | | | | 32,930 | | | | 704,960 | |
Class 529B | | | 1,125 | | | | 22,183 | | | | 1,023 | | | | 18,604 | |
Class 529C | | | 5,013 | | | | 99,004 | | | | 13,002 | | | | 227,071 | |
| | | 5,175,313 | | | | $131,799,507 | | | | 9,065,657 | | | | $206,198,839 | |
36
Notes to Financial Statements (unaudited) – continued
| | | | | | | | | | | | | | | | |
| | | Six months ended
2/28/17 | | | Year ended
8/31/16 | |
| | | Shares | | | Amount | | | Shares | | | Amount | |
| Shares issued to shareholders in reinvestment of distributions | | | | | | | | | | | | | | | | |
Class A | | | 349,553 | | | | $8,459,181 | | | | — | | | | $— | |
Class B | | | 26,112 | | | | 527,716 | | | | — | | | | — | |
Class C | | | 93,973 | | | | 1,902,954 | | | | — | | | | — | |
Class I | | | 77,460 | | | | 2,044,932 | | | | — | | | | — | |
Class R1 | | | 7,003 | | | | 140,626 | | | | — | | | | — | |
Class R2 | | | 32,149 | | | | 738,792 | | | | — | | | | — | |
Class R3 | | | 52,542 | | | | 1,269,935 | | | | — | | | | — | |
Class R4 | | | 71,379 | | | | 1,800,181 | | | | — | | | | — | |
Class R6 | | | 240,953 | | | | 6,399,723 | | | | — | | | | — | |
Class 529A | | | 5,455 | | | | 128,020 | | | | — | | | | — | |
Class 529B | | | 436 | | | | 8,528 | | | | — | | | | — | |
Class 529C | | | 2,011 | | | | 39,357 | | | | — | | | | — | |
| | | 959,026 | | | | $23,459,945 | | | | — | | | | $— | |
| | | | |
| Shares reacquired | | | | | | | | | | | | | | | | |
Class A | | | (3,271,694 | ) | | | $(80,001,858 | ) | | | (5,259,274 | ) | | | $(116,373,210 | ) |
Class B | | | (238,221 | ) | | | (4,819,762 | ) | | | (363,736 | ) | | | (6,790,055 | ) |
Class C | | | (690,912 | ) | | | (14,031,535 | ) | | | (1,412,784 | ) | | | (26,258,340 | ) |
Class I | | | (1,069,810 | ) | | | (28,164,752 | ) | | | (3,583,416 | ) | | | (86,864,306 | ) |
Class R1 | | | (73,709 | ) | | | (1,481,116 | ) | | | (97,262 | ) | | | (1,799,822 | ) |
Class R2 | | | (319,018 | ) | | | (7,305,029 | ) | | | (1,314,576 | ) | | | (27,633,057 | ) |
Class R3 | | | (448,214 | ) | | | (10,790,876 | ) | | | (2,171,692 | ) | | | (48,293,221 | ) |
Class R4 | | | (958,428 | ) | | | (24,106,204 | ) | | | (3,102,929 | ) | | | (71,687,353 | ) |
Class R6 | | | (1,511,930 | ) | | | (40,475,053 | ) | | | (2,801,968 | ) | | | (70,638,112 | ) |
Class 529A | | | (26,264 | ) | | | (622,636 | ) | | | (39,969 | ) | | | (879,960 | ) |
Class 529B | | | (2,471 | ) | | | (48,686 | ) | | | (2,953 | ) | | | (53,513 | ) |
Class 529C | | | (4,027 | ) | | | (79,127 | ) | | | (15,307 | ) | | | (273,018 | ) |
| | | (8,614,698 | ) | | | $(211,926,634 | ) | | | (20,165,866 | ) | | | $(457,543,967 | ) |
| | | | |
| Net change | | | | | | | | | | | | | | | | |
Class A | | | (1,630,055 | ) | | | $(39,926,820 | ) | | | (2,677,767 | ) | | | $(59,266,554 | ) |
Class B | | | (165,977 | ) | | | (3,357,005 | ) | | | (238,121 | ) | | | (4,467,000 | ) |
Class C | | | (365,957 | ) | | | (7,417,180 | ) | | | (1,052,859 | ) | | | (19,513,450 | ) |
Class I | | | 1,608,047 | | | | 43,200,693 | | | | (2,600,895 | ) | | | (62,780,045 | ) |
Class R1 | | | (44,014 | ) | | | (881,278 | ) | | | (49,251 | ) | | | (910,234 | ) |
Class R2 | | | (172,283 | ) | | | (3,925,853 | ) | | | (961,037 | ) | | | (20,230,188 | ) |
Class R3 | | | (241,513 | ) | | | (5,785,643 | ) | | | (1,397,225 | ) | | | (31,445,741 | ) |
Class R4 | | | (628,092 | ) | | | (15,784,688 | ) | | | (2,142,978 | ) | | | (49,916,892 | ) |
Class R6 | | | (844,152 | ) | | | (22,858,128 | ) | | | 31,198 | | | | (2,559,168 | ) |
Class 529A | | | 1,550 | | | | 27,461 | | | | (7,039 | ) | | | (175,000 | ) |
Class 529B | | | (910 | ) | | | (17,975 | ) | | | (1,930 | ) | | | (34,909 | ) |
Class 529C | | | 2,997 | | | | 59,234 | | | | (2,305 | ) | | | (45,947 | ) |
| | | (2,480,359 | ) | | | $(56,667,182 | ) | | | (11,100,209 | ) | | | $(251,345,128 | ) |
The fund is one of several mutual funds in which certain MFS funds may invest. The MFS funds do not invest in the underlying funds for the purpose of exercising
37
Notes to Financial Statements (unaudited) – continued
management or control. At the end of the period, the MFS Growth Allocation Fund, the MFS Moderate Allocation Fund, the MFS Aggressive Growth Allocation Fund, and the MFS Conservative Allocation Fund were the owners of record of approximately 9%, 8%, 4%, and 3%, respectively, of the value of outstanding voting shares of the fund. In addition, the MFS Lifetime Income Fund, the MFS Lifetime 2020 Fund, the MFS Lifetime 2025 Fund, the MFS Lifetime 2030 Fund, the MFS Lifetime 2035 Fund, the MFS Lifetime 2040 Fund, the MFS Lifetime 2045 Fund, the MFS Lifetime 2050 Fund, the MFS Lifetime 2055 Fund, and the MFS Lifetime 2060 Fund were each the owners of record of less than 1% of the value of outstanding voting shares of the fund.
(6) Line of Credit
The fund and certain other funds managed by MFS participate in a $1.25 billion unsecured committed line of credit, subject to a $1 billion sublimit, provided by a syndication of banks under a credit agreement. Borrowings may be made for temporary financing needs. Interest is charged to each fund, based on its borrowings, generally at a rate equal to the higher of the Overnight Federal Reserve funds rate or daily one month LIBOR plus an agreed upon spread. A commitment fee, based on the average daily, unused portion of the committed line of credit, is allocated among the participating funds at the end of each calendar quarter. In addition, the fund and other funds managed by MFS have established unsecured uncommitted borrowing arrangements with certain banks for temporary financing needs. Interest is charged to each fund, based on its borrowings, at a rate equal to the Overnight Federal Reserve funds rate plus an agreed upon spread. For the six months ended February 28, 2017, the fund’s commitment fee and interest expense were $4,045 and $0, respectively, and are included in “Miscellaneous” expense in the Statement of Operations.
(7) Transactions in Underlying Affiliated Funds-Affiliated Issuers
An affiliated issuer may be considered one in which the fund owns 5% or more of the outstanding voting securities, or a company which is under common control. For the purposes of this report, the fund assumes the following to be affiliated issuers:
| | | | | | | | | | | | | | | | |
| Underlying Affiliated Fund | | Beginning
Shares/Par
Amount | | | Acquisitions
Shares/Par
Amount | | | Dispositions
Shares/Par
Amount | | | Ending
Shares/Par
Amount | |
MFS Institutional Money
Market Portfolio | | | 15,910,051 | | | | 156,714,270 | | | | (159,468,439 | ) | | | 13,155,882 | |
| | | | |
| Underlying Affiliated Fund | | Realized
Gain (Loss) | | | Capital Gain
Distributions | | | Dividend
Income | | | Ending
Value | |
MFS Institutional Money
Market Portfolio | | | $20 | | | | $— | | | | $38,371 | | | | $13,155,882 | |
| | | | |
| Other Affiliated Issuers | | Beginning
Shares/Par
Amount | | | Acquisitions
Shares/Par
Amount | | | Dispositions
Shares/Par
Amount | | | Ending
Shares/Par
Amount | |
| Fenix Parts, Inc. | | | 1,338,451 | | | | — | | | | — | | | | 1,338,451 | |
| | | | |
| Other Affiliated Issuers | | Realized
Gain (Loss) | | | Capital Gain
Distributions | | | Dividend
Income | | | Ending
Value | |
| Fenix Parts, Inc. | | | $— | | | | $— | | | | $— | | | | $2,676,902 | |
38
PROXY VOTING POLICIES AND INFORMATION
MFS votes proxies on behalf of the fund pursuant to proxy voting policies and procedures that are available without charge, upon request, by calling 1-800-225-2606, by visiting mfs.com (once you have selected “Individual Investor” as your role, click on “Individual Investor Home” in the top navigation and then select “Learn More About Proxy Voting” under the “I want to…” header on the left hand column of the page), or by visiting the SEC’s Web site at http://www.sec.gov.
Information regarding how the fund voted proxies relating to portfolio securities during the most recent twelve-month period ended June 30 is available by August 31 of each year without charge by visiting mfs.com (once you have selected “Individual Investor” as your role, click on “Individual Investor Home” in the top navigation and then select “Learn More About Proxy Voting” under the “I want to…” header on the left hand column of the page), or by visiting the SEC’s Web site at http://www.sec.gov.
QUARTERLY PORTFOLIO DISCLOSURE
The fund will file a complete schedule of portfolio holdings with the Securities and Exchange Commission (the Commission) for the first and third quarters of each fiscal year on Form N-Q. A shareholder can obtain the quarterly portfolio holdings report at mfs.com. The fund’s Form N-Q is also available on the EDGAR database on the Commission’s Internet Web site at http://www.sec.gov, and may be reviewed and copied at the:
Public Reference Room
Securities and Exchange Commission
100 F Street, NE, Room 1580
Washington, D.C. 20549
Information on the operation of the Public Reference Room may be obtained by calling the Commission at 1-800-SEC-0330. Copies of the fund’s Form N-Q also may be obtained, upon payment of a duplicating fee, by electronic request at the following e-mail address: publicinfo@sec.gov or by writing the Public Reference Section at the above address.
FURTHER INFORMATION
From time to time, MFS may post important information about the fund or the MFS funds on the MFS web site (mfs.com). This information is available on mfs.com by following these steps once you have selected “Individual Investor” as your role: (1) Click on the “Individual Investor Home” in the top navigation and then select the “Announcements” option within the “Market Outlooks” drop down, or (2) Click on “Products & Services” and “Mutual Funds” and then choose the fund’s name in the “Select a fund” menu.
39
INFORMATION ABOUT FUND CONTRACTS AND LEGAL CLAIMS
The fund has entered into contractual arrangements with an investment adviser, administrator, distributor, shareholder servicing agent, 529 program manager (if applicable), and custodian who each provide services to the fund. Unless expressly stated otherwise, shareholders are not parties to, or intended beneficiaries of these contractual arrangements, and these contractual arrangements are not intended to create any shareholder right to enforce them against the service providers or to seek any remedy under them against the service providers, either directly or on behalf of the fund.
Under the Trust’s By-Laws and Declaration of Trust, any claims asserted against or on behalf of the MFS Funds, including claims against Trustees and Officers, must be brought in state and federal courts located within the Commonwealth of Massachusetts.
PROVISION OF FINANCIAL REPORTS AND SUMMARY PROSPECTUSES
The fund produces financial reports every six months and updates its summary prospectus and prospectus annually. To avoid sending duplicate copies of materials to households, only one copy of the fund’s annual and semiannual report and summary prospectus may be mailed to shareholders having the same last name and residential address on the fund’s records. However, any shareholder may contact MFSC (please see back cover for address and telephone number) to request that copies of these reports and summary prospectuses be sent personally to that shareholder.
40
Save paper with eDelivery.

| MFS® will send you prospectuses, |
reports, and proxies directly via e-mail so you will get information faster with less mailbox clutter.
To sign up:
1. Go to mfs.com.
2. Log in via MFS® Access.
3. Select eDelivery.
If you own your MFS fund shares through a financial institution or a retirement plan, MFS® TALK, MFS® Access, or eDelivery may not be available to you.
CONTACT
WEB SITE
mfs.com
MFS TALK
1-800-637-8255
24 hours a day
ACCOUNT SERVICE AND LITERATURE
Shareholders
1-800-225-2606
Financial advisors
1-800-343-2829
Retirement plan services
1-800-637-1255
MAILING ADDRESS
MFS Service Center, Inc.
P.O. Box 55824
Boston, MA 02205-5824
OVERNIGHT MAIL
MFS Service Center, Inc.
c/o Boston Financial Data Services
30 Dan Road
Canton, MA 02021-2809
SEMIANNUAL REPORT
February 28, 2017

MFS® RESEARCH
INTERNATIONAL FUND

RIF-SEM
MFS® RESEARCH INTERNATIONAL FUND
CONTENTS
The report is prepared for the general information of shareholders.
It is authorized for distribution to prospective investors only when preceded or accompanied by a current prospectus.
NOT FDIC INSURED • MAY LOSE VALUE • NO BANK GUARANTEE

LETTER FROM THE EXECUTIVE CHAIRMAN
Dear Shareholders:
Despite June’s unexpected vote by the United Kingdom to leave the European Union and the surprising result in November’s U.S. presidential election, most markets have
proved resilient. U.S. share prices quickly reversed post-Brexit declines, and indices reached new highs following the November elections. U.S. bond yields rose after Donald Trump’s victory on hopes that his proposed policy mix of lower taxes, increased spending on infrastructure and a lower regulatory burden on businesses will lift both U.S. economic growth and inflation. However, interest rates in most developed markets remain very low, with major central banks maintaining extremely accommodative monetary policies to reinvigorate slow-growing economies against a backdrop of still-low inflation. Even after the rise in yields following the election, interest rates remain low by historical standards.
Globally, economic growth has shown signs of recovery of late, led by the United States and the eurozone. Despite better growth, there are few immediate signs of worrisome inflation. Emerging market economies are recovering at a somewhat slower pace amid fears that restrictive U.S. trade policies could further hamper the already slow pace of global trade growth. Looking ahead, markets will have to contend with a series of European elections during 2017, which, depending on the outcome, could further call into question the future direction of the European Union.
At MFS®, we believe in a patient, long-term approach to investing. Viewing investments with a long lens makes it possible to filter out short-term market noise and focus on achieving solid risk-adjusted returns over a full market cycle.
In our view, such an approach, along with the professional guidance of a financial advisor, will help you reach your investment objectives.
Respectfully,

Robert J. Manning
Executive Chairman
MFS Investment Management
April 13, 2017
The opinions expressed in this letter are subject to change and may not be relied upon for investment advice. No forecasts can be guaranteed.
1
PORTFOLIO COMPOSITION
Portfolio structure

| | | | |
| Top ten holdings | | | | |
| Nestle S.A. | | | 3.4% | |
| Novartis AG | | | 3.1% | |
| Roche Holding AG | | | 3.1% | |
| Bayer AG | | | 2.3% | |
| Schneider Electric S.A. | | | 1.9% | |
| AIA Group Ltd. | | | 1.8% | |
| KDDI Corp. | | | 1.7% | |
| UBS AG | | | 1.7% | |
| Reckitt Benckiser Group PLC | | | 1.6% | |
| Danone S.A. | | | 1.6% | |
| |
| Global equity sectors | | | | |
| Financial Services | | | 24.2% | |
| Capital Goods | | | 23.5% | |
| Health Care | | | 10.8% | |
| Consumer Staples | | | 9.6% | |
| Technology | | | 9.3% | |
| Consumer Cyclicals | | | 8.5% | |
| Energy | | | 8.2% | |
| Telecommunications/Cable Television | | | 4.8% | |
| | | | |
| Issuer country weightings (x) | |
| Japan | | | 19.4% | |
| Switzerland | | | 16.6% | |
| United Kingdom | | | 13.3% | |
| France | | | 8.5% | |
| United States | | | 7.4% | |
| Germany | | | 6.9% | |
| Australia | | | 4.2% | |
| Italy | | | 3.7% | |
| Netherlands | | | 3.7% | |
| Other Countries | | | 16.3% | |
|
| Currency exposure weightings (y) | |
| Euro | | | 26.2% | |
| Japanese Yen | | | 19.4% | |
| Swiss Franc | | | 16.6% | |
| British Pound Sterling | | | 13.8% | |
| United States Dollar | | | 8.4% | |
| Australian Dollar | | | 4.2% | |
| Hong Kong Dollar | | | 3.3% | |
| South Korean Won | | | 1.4% | |
| Canadian Dollar | | | 1.1% | |
| Other Currencies | | | 5.6% | |
| (x) | Represents the portfolio’s exposure to issuer countries as a percentage of a portfolio’s net assets. For purposes of this presentation, United States includes Cash & Cash Equivalents. |
| (y) | Represents the portfolio’s exposure to a particular currency as a percentage of a portfolio’s net assets. For purposes of this presentation, United States Dollar includes Cash & Cash Equivalents. |
2
Portfolio Composition – continued
Cash & Cash Equivalents includes any cash, investments in money market funds, short-term securities, and other assets less liabilities. Please see the Statement of Assets and Liabilities for additional information related to the fund’s cash position and other assets and liabilities.
Percentages are based on net assets as of 2/28/17.
The portfolio is actively managed and current holdings may be different.
3
EXPENSE TABLE
Fund expenses borne by the shareholders during the period, September 1, 2016 through February 28, 2017
As a shareholder of the fund, you incur two types of costs: (1) transaction costs, including sales charges (loads) on certain purchase or redemption payments, and (2) ongoing costs, including management fees; distribution and service (12b-1) fees; and other fund expenses. This example is intended to help you understand your ongoing costs (in dollars) of investing in the fund and to compare these costs with the ongoing costs of investing in other mutual funds.
The example is based on an investment of $1,000 invested at the beginning of the period and held for the entire period September 1, 2016 through February 28, 2017.
Actual Expenses
The first line for each share class in the following table provides information about actual account values and actual expenses. You may use the information in this line, together with the amount you invested, to estimate the expenses that you paid over the period. Simply divide your account value by $1,000 (for example, an $8,600 account value divided by $1,000 = 8.6), then multiply the result by the number in the first line under the heading entitled “Expenses Paid During Period” to estimate the expenses you paid on your account during this period.
Hypothetical Example for Comparison Purposes
The second line for each share class in the following table provides information about hypothetical account values and hypothetical expenses based on the fund’s actual expense ratio and an assumed rate of return of 5% per year before expenses, which is not the fund’s actual return. The hypothetical account values and expenses may not be used to estimate the actual ending account balance or expenses you paid for the period. You may use this information to compare the ongoing costs of investing in the fund and other funds. To do so, compare this 5% hypothetical example with the 5% hypothetical examples that appear in the shareholder reports of the other funds.
Please note that the expenses shown in the table are meant to highlight your ongoing costs only and do not reflect any transactional costs, such as sales charges (loads). Therefore, the second line for each share class in the table is useful in comparing ongoing costs only, and will not help you determine the relative total costs of owning different funds. In addition, if these transactional costs were included, your costs would have been higher.
4
Expense Table – continued
| | | | | | | | | | | | | | | | | | |
Share
Class | | | | Annualized
Expense
Ratio | | | Beginning
Account Value
9/01/16 | | | Ending
Account Value
2/28/17 | | | Expenses
Paid During
Period (p)
9/01/16-2/28/17 | |
| A | | Actual | | | 1.11% | | | | $1,000.00 | | | | $1,018.81 | | | | $5.56 | |
| | Hypothetical (h) | | | 1.11% | | | | $1,000.00 | | | | $1,019.29 | | | | $5.56 | |
| B | | Actual | | | 1.86% | | | | $1,000.00 | | | | $1,014.66 | | | | $9.29 | |
| | Hypothetical (h) | | | 1.86% | | | | $1,000.00 | | | | $1,015.57 | | | | $9.30 | |
| C | | Actual | | | 1.86% | | | | $1,000.00 | | | | $1,014.70 | | | | $9.29 | |
| | Hypothetical (h) | | | 1.86% | | | | $1,000.00 | | | | $1,015.57 | | | | $9.30 | |
| I | | Actual | | | 0.86% | | | | $1,000.00 | | | | $1,020.08 | | | | $4.31 | |
| | Hypothetical (h) | | | 0.86% | | | | $1,000.00 | | | | $1,020.53 | | | | $4.31 | |
| R1 | | Actual | | | 1.86% | | | | $1,000.00 | | | | $1,015.20 | | | | $9.29 | |
| | Hypothetical (h) | | | 1.86% | | | | $1,000.00 | | | | $1,015.57 | | | | $9.30 | |
| R2 | | Actual | | | 1.36% | | | | $1,000.00 | | | | $1,017.13 | | | | $6.80 | |
| | Hypothetical (h) | | | 1.36% | | | | $1,000.00 | | | | $1,018.05 | | | | $6.80 | |
| R3 | | Actual | | | 1.11% | | | | $1,000.00 | | | | $1,018.71 | | | | $5.56 | |
| | Hypothetical (h) | | | 1.11% | | | | $1,000.00 | | | | $1,019.29 | | | | $5.56 | |
| R4 | | Actual | | | 0.86% | | | | $1,000.00 | | | | $1,019.64 | | | | $4.31 | |
| | Hypothetical (h) | | | 0.86% | | | | $1,000.00 | | | | $1,020.53 | | | | $4.31 | |
| R6 | | Actual | | | 0.76% | | | | $1,000.00 | | | | $1,020.65 | | | | $3.81 | |
| | Hypothetical (h) | | | 0.76% | | | | $1,000.00 | | | | $1,021.03 | | | | $3.81 | |
| 529A | | Actual | | | 1.14% | | | | $1,000.00 | | | | $1,018.26 | | | | $5.70 | |
| | Hypothetical (h) | | | 1.14% | | | | $1,000.00 | | | | $1,019.14 | | | | $5.71 | |
| 529B | | Actual | | | 1.91% | | | | $1,000.00 | | | | $1,014.90 | | | | $9.54 | |
| | Hypothetical (h) | | | 1.91% | | | | $1,000.00 | | | | $1,015.32 | | | | $9.54 | |
| 529C | | Actual | | | 1.90% | | | | $1,000.00 | | | | $1,014.70 | | | | $9.49 | |
| | Hypothetical (h) | | | 1.90% | | | | $1,000.00 | | | | $1,015.37 | | | | $9.49 | |
| (h) | 5% class return per year before expenses. |
| (p) | “Expenses Paid During Period” are equal to each class’s annualized expense ratio, as shown above, multiplied by the average account value over the period, multiplied by 181/365 (to reflect the one-half year period). Expenses paid do not include any applicable sales charges (loads). If these transaction costs had been included, your costs would have been higher. |
Notes to Expense Table
Each class with a Rule 12b-1 service fee is subject to a rebate of a portion of such fee. Such rebates are included in the expense ratios above. For Class 529A and Class 529C shares, this rebate reduced the expense ratio above by 0.03% and 0.01%, respectively. See Note 3 in the Notes to Financial Statements for additional information. Expense ratios reflect a one-time Reimbursement of Expenses by Custodian of 0.01% (See Note 2 of the Notes to Financial Statements).
5
PORTFOLIO OF INVESTMENTS
2/28/17 (unaudited)
The Portfolio of Investments is a complete list of all securities owned by your fund. It is categorized by broad-based asset classes.
| | | | | | | | |
| Common Stocks - 98.9% | | | | | | | | |
| Issuer | | Shares/Par | | | Value ($) | |
| Airlines - 0.4% | | | | | | | | |
| Aena S.A. | | | 180,891 | | | $ | 25,870,837 | |
| | |
| Alcoholic Beverages - 0.5% | | | | | | | | |
| AmBev S.A., ADR | | | 5,894,947 | | | $ | 33,542,248 | |
| | |
| Apparel Manufacturers - 1.3% | | | | | | | | |
| LVMH Moet Hennessy Louis Vuitton SE | | | 417,179 | | | $ | 83,729,173 | |
| | |
| Automotive - 3.5% | | | | | | | | |
| GKN PLC | | | 21,135,567 | | | $ | 94,387,641 | |
| Koito Manufacturing Co. Ltd. | | | 1,101,000 | | | | 56,742,979 | |
| USS Co. Ltd. | | | 4,643,800 | | | | 79,528,873 | |
| | | | | | | | |
| | | | | | | $ | 230,659,493 | |
| Broadcasting - 1.1% | | | | | | | | |
| WPP PLC | | | 2,909,599 | | | $ | 68,488,847 | |
| | |
| Business Services - 3.3% | | | | | | | | |
| Amadeus IT Holding S.A. | | | 1,119,036 | | | $ | 52,049,647 | |
| Cerved Information Solutions S.p.A. | | | 1,840,583 | | | | 16,437,764 | |
| Cognizant Technology Solutions Corp., “A” (a) | | | 1,545,104 | | | | 91,578,314 | |
| Mitsubishi Corp. | | | 1,104,000 | | | | 24,906,209 | |
| Nomura Research, Inc. | | | 808,500 | | | | 27,922,738 | |
| | | | | | | | |
| | | | | | | $ | 212,894,672 | |
| Chemicals - 0.5% | | | | | | | | |
| Orica Ltd. | | | 2,510,939 | | | $ | 35,210,758 | |
| | |
| Computer Software - 0.8% | | | | | | | | |
| Check Point Software Technologies Ltd. (a) | | | 504,840 | | | $ | 49,933,724 | |
| | |
| Computer Software - Systems - 0.4% | | | | | | | | |
| EPAM Systems, Inc. (a) | | | 366,566 | | | $ | 26,990,255 | |
| | |
| Construction - 1.8% | | | | | | | | |
| Techtronic Industries Co. Ltd. | | | 12,951,000 | | | $ | 46,379,291 | |
| Toto Ltd. | | | 1,877,000 | | | | 72,259,780 | |
| | | | | | | | |
| | | | | | | $ | 118,639,071 | |
6
Portfolio of Investments (unaudited) – continued
| | | | | | | | |
| Issuer | | Shares/Par | | | Value ($) | |
| Common Stocks - continued | | | | | | | | |
| Consumer Products - 2.9% | | | | | | | | |
| L’Oréal | | | 461,908 | | | $ | 85,904,531 | |
| Reckitt Benckiser Group PLC | | | 1,158,219 | | | | 105,071,964 | |
| | | | | | | | |
| | | | | | | $ | 190,976,495 | |
| Containers - 1.2% | | | | | | | | |
| Brambles Ltd. | | | 10,681,733 | | | $ | 76,245,971 | |
| | |
| Electrical Equipment - 2.4% | | | | | | | | |
| Legrand S.A. | | | 523,378 | | | $ | 29,508,700 | |
| Schneider Electric S.A. | | | 1,845,707 | | | | 124,926,737 | |
| | | | | | | | |
| | | | | | | $ | 154,435,437 | |
| Electronics - 3.2% | | | | | | | | |
| Broadcom Corp. | | | 236,980 | | | $ | 49,986,191 | |
| Mellanox Technologies Ltd. (a) | | | 806,594 | | | | 39,039,150 | |
| Samsung Electronics Co. Ltd. | | | 29,370 | | | | 49,921,857 | |
| Taiwan Semiconductor Manufacturing Co. Ltd. | | | 10,859,326 | | | | 66,372,486 | |
| | | | | | | | |
| | | | | | | $ | 205,319,684 | |
| Energy - Independent - 1.7% | | | | | | | | |
| Cairn Energy PLC (a) | | | 8,561,313 | | | $ | 23,615,613 | |
| Galp Energia SGPS S.A., “B” | | | 3,355,418 | | | | 49,375,173 | |
| Oil Search Ltd. | | | 7,000,198 | | | | 37,462,025 | |
| | | | | | | | |
| | | | | | | $ | 110,452,811 | |
| Energy - Integrated - 2.7% | | | | | | | | |
| BP PLC | | | 16,693,864 | | | $ | 93,951,004 | |
| Eni S.p.A. | | | 5,107,821 | | | | 78,570,956 | |
| | | | | | | | |
| | | | | | | $ | 172,521,960 | |
| Food & Beverages - 5.0% | | | | | | | | |
| Danone S.A. | | | 1,585,186 | | | $ | 105,059,836 | |
| Nestle S.A. | | | 3,001,335 | | | | 221,883,929 | |
| | | | | | | | |
| | | | | | | $ | 326,943,765 | |
| Food & Drug Stores - 1.2% | | | | | | | | |
| Clicks Group Ltd. | | | 1,714,432 | | | $ | 16,794,703 | |
| Sundrug Co. Ltd. | | | 888,600 | | | | 58,451,680 | |
| | | | | | | | |
| | | | | | | $ | 75,246,383 | |
| Gaming & Lodging - 0.5% | | | | | | | | |
| Paddy Power Betfair PLC | | | 325,793 | | | $ | 35,675,975 | |
| | |
| General Merchandise - 0.4% | | | | | | | | |
| PriceSmart, Inc. | | | 329,026 | | | $ | 29,085,898 | |
7
Portfolio of Investments (unaudited) – continued
| | | | | | | | |
| Issuer | | Shares/Par | | | Value ($) | |
| Common Stocks - continued | | | | | | | | |
| Insurance - 6.4% | | | | | | | | |
| AIA Group Ltd. | | | 18,208,400 | | | $ | 115,050,048 | |
| AMP Ltd. | | | 13,243,139 | | | | 49,549,156 | |
| Aon PLC | | | 614,367 | | | | 71,051,544 | |
| Hiscox Ltd. | | | 3,147,845 | | | | 42,419,207 | |
| Swiss Re Ltd. | | | 585,818 | | | | 52,378,609 | |
| Zurich Insurance Group AG | | | 307,636 | | | | 84,937,983 | |
| | | | | | | | |
| | | | | | | $ | 415,386,547 | |
| Internet - 1.5% | | | | | | | | |
| Alibaba Group Holding Ltd., ADR (a) | | | 560,236 | | | $ | 57,648,284 | |
| NAVER Corp. | | | 56,993 | | | | 39,112,596 | |
| | | | | | | | |
| | | | | | | $ | 96,760,880 | |
| Machinery & Tools - 4.8% | | | | | | | | |
| Daikin Industries Ltd. | | | 907,300 | | | $ | 86,130,709 | |
| GEA Group AG | | | 1,512,312 | | | | 58,862,717 | |
| Kubota Corp. | | | 5,791,700 | | | | 92,150,641 | |
| Schindler Holding AG | | | 375,996 | | | | 72,702,169 | |
| | | | | | | | |
| | | | | | | $ | 309,846,236 | |
| Major Banks - 6.8% | | | | | | | | |
| Barclays PLC | | | 27,610,936 | | | $ | 77,601,250 | |
| BNP Paribas | | | 1,418,398 | | | | 82,841,099 | |
| Lloyds Banking Group PLC | | | 107,994,123 | | | | 92,020,916 | |
| Sumitomo Mitsui Financial Group, Inc. | | | 2,054,900 | | | | 80,059,614 | |
| UBS AG | | | 7,017,589 | | | | 108,091,902 | |
| | | | | | | | |
| | | | | | | $ | 440,614,781 | |
| Medical Equipment - 0.3% | | | | | | | | |
| Terumo Corp. | | | 530,200 | | | $ | 18,382,029 | |
| | |
| Metals & Mining - 1.7% | | | | | | | | |
| Iluka Resources Ltd. | | | 5,798,075 | | | $ | 30,139,707 | |
| Rio Tinto Ltd. | | | 2,007,377 | | | | 82,123,467 | |
| | | | | | | | |
| | | | | | | $ | 112,263,174 | |
| Natural Gas - Distribution - 1.3% | | | | | | | | |
| China Resources Gas Group Ltd. | | | 13,490,000 | | | $ | 41,184,738 | |
| Engie | | | 3,511,487 | | | | 42,929,579 | |
| | | | | | | | |
| | | | | | | $ | 84,114,317 | |
| Natural Gas - Pipeline - 1.3% | | | | | | | | |
| APA Group | | | 6,991,586 | | | $ | 45,349,403 | |
| Enbridge, Inc. | | | 901,104 | | | | 37,924,796 | |
| | | | | | | | |
| | | | | | | $ | 83,274,199 | |
8
Portfolio of Investments (unaudited) – continued
| | | | | | | | |
| Issuer | | Shares/Par | | | Value ($) | |
| Common Stocks - continued | | | | | | | | |
| Network & Telecom - 0.2% | | | | | | | | |
| LM Ericsson Telephone Co., “B” | | | 2,180,772 | | | $ | 14,193,645 | |
| | |
| Oil Services - 0.3% | | | | | | | | |
| TechnipFMC PLC (a) | | | 651,135 | | | $ | 21,001,329 | |
| | |
| Other Banks & Diversified Financials - 8.7% | | | | | | | | |
| ABN AMRO Group N.V., GDR | | | 1,784,551 | | | $ | 40,835,931 | |
| Aeon Credit Service Co. Ltd. | | | 4,094,800 | | | | 79,238,909 | |
| DnB NOR A.S.A. | | | 3,845,321 | | | | 63,068,126 | |
| Element Fleet Management Corp. | | | 3,242,949 | | | | 34,353,480 | |
| HDFC Bank Ltd., ADR | | | 877,047 | | | | 62,875,499 | |
| Intesa Sanpaolo S.p.A. | | | 37,111,062 | | | | 86,493,967 | |
| Julius Baer Group Ltd. | | | 920,769 | | | | 45,059,786 | |
| KBC Groep N.V. | | | 1,181,321 | | | | 72,261,081 | |
| Mastercard, Inc., “A” | | | 727,518 | | | | 80,361,638 | |
| | | | | | | | |
| | | | | | | $ | 564,548,417 | |
| Pharmaceuticals - 10.5% | | | | | | | | |
| Bayer AG | | | 1,348,997 | | | $ | 148,343,352 | |
| Novartis AG | | | 2,615,699 | | | | 204,182,607 | |
| Roche Holding AG | | | 819,696 | | | | 199,710,869 | |
| Santen Pharmaceutical Co. Ltd. | | | 6,596,200 | | | | 94,529,191 | |
| Shionogi & Co. Ltd. | | | 751,800 | | | | 36,791,993 | |
| | | | | | | | |
| | | | | | | $ | 683,558,012 | |
| Printing & Publishing - 1.5% | | | | | | | | |
| RELX N.V. | | | 5,583,316 | | | $ | 98,957,314 | |
| | |
| Real Estate - 2.3% | | | | | | | | |
| LEG Immobilien AG | | | 1,073,337 | | | $ | 88,454,437 | |
| Mitsui Fudosan Co. Ltd. | | | 2,798,000 | | | | 63,334,496 | |
| | | | | | | | |
| | | | | | | $ | 151,788,933 | |
| Restaurants - 0.5% | | | | | | | | |
| Yum China Holdings, Inc. (a) | | | 1,283,586 | | | $ | 34,130,552 | |
| | |
| Specialty Chemicals - 6.6% | | | | | | | | |
| Akzo Nobel N.V. | | | 1,458,786 | | | $ | 97,841,622 | |
| Croda International PLC | | | 1,681,028 | | | | 73,173,515 | |
| Linde AG | | | 617,731 | | | | 100,355,904 | |
| Nippon Paint Holdings Co. Ltd. | | | 1,372,300 | | | | 44,279,563 | |
| Sika AG | | | 10,715 | | | | 60,330,886 | |
| Symrise AG | | | 834,474 | | | | 51,902,065 | |
| | | | | | | | |
| | | | | | | $ | 427,883,555 | |
9
Portfolio of Investments (unaudited) – continued
| | | | | | | | |
| Issuer | | Shares/Par | | | Value ($) | |
| Common Stocks - continued | | | | | | | | |
| Specialty Stores - 1.6% | | | | | | | | |
| Dufry AG (a) | | | 216,753 | | | $ | 31,271,479 | |
| Esprit Holdings Ltd. (a) | | | 15,607,100 | | | | 14,776,976 | |
| Just Eat PLC (a) | | | 4,238,768 | | | | 26,324,681 | |
| Ryohin Keikaku Co. Ltd. | | | 138,200 | | | | 29,215,808 | |
| | | | | | | | |
| | | | $ | 101,588,944 | |
| Telecommunications - Wireless - 4.1% | | | | | | | | |
| Advanced Info Service PLC | | | 8,414,200 | | | $ | 40,497,503 | |
| KDDI Corp. | | | 4,194,700 | | | | 109,735,398 | |
| SoftBank Corp. | | | 953,300 | | | | 70,955,491 | |
| Vodafone Group PLC | | | 16,978,109 | | | | 42,534,861 | |
| | | | | | | | |
| | | | $ | 263,723,253 | |
| Telephone Services - 0.7% | | | | | | | | |
| BT Group PLC | | | 10,049,891 | | | $ | 40,790,711 | |
| Com Hem Holding AB | | | 613,323 | | | | 6,876,154 | |
| | | | | | | | |
| | | | $ | 47,666,865 | |
| Tobacco - 1.1% | | | | | | | | |
| Japan Tobacco, Inc. | | | 2,106,900 | | | $ | 70,458,172 | |
| | |
| Trucking - 1.0% | | | | | | | | |
| Yamato Holdings Co. Ltd. | | | 2,999,400 | | | $ | 65,530,529 | |
| | |
| Utilities - Electric Power - 0.9% | | | | | | | | |
| Enel S.p.A. | | | 14,121,834 | | | $ | 60,620,608 | |
| Total Common Stocks (Identified Cost, $6,408,749,378) | | | $ | 6,429,155,748 | |
| | |
| Money Market Funds - 0.8% | | | | | | | | |
MFS Institutional Money Market Portfolio, 0.64% (v)
(Identified Cost, $54,931,586) | | | 54,931,283 | | | $ | 54,931,283 | |
| Total Investments (Identified Cost, $6,463,680,964) | | | $ | 6,484,087,031 | |
| |
| Other Assets, Less Liabilities - 0.3% | | | | 17,075,220 | |
| Net Assets - 100.0% | | | $ | 6,501,162,251 | |
| (a) | Non-income producing security. |
| (v) | Underlying affiliated fund that is available only to investment companies managed by MFS. The rate quoted for the MFS Institutional Money Market Portfolio is the annualized seven-day yield of the fund at period end. |
The following abbreviations are used in this report and are defined:
| ADR | | American Depositary Receipt |
| GDR | | Global Depositary Receipt |
| PLC | | Public Limited Company |
See Notes to Financial Statements
10
Financial Statements
STATEMENT OF ASSETS AND LIABILITIES
At 2/28/17 (unaudited)
This statement represents your fund’s balance sheet, which details the assets and liabilities comprising the total value of the fund.
| | | | |
| Assets | | | | |
Investments | | | | |
Non-affiliated issuers, at value (identified cost, $6,408,749,378) | | | $6,429,155,748 | |
Underlying affiliated funds, at value (identified cost, $54,931,586) | | | 54,931,283 | |
Total investments, at value (identified cost, $6,463,680,964) | | | $6,484,087,031 | |
Foreign currency, at value (identified cost, $164,270) | | | 160,963 | |
Receivables for | | | | |
Investments sold | | | 12,844,018 | |
Fund shares sold | | | 16,169,919 | |
Interest and dividends | | | 20,059,986 | |
Other assets | | | 24,912 | |
Total assets | | | $6,533,346,829 | |
| Liabilities | | | | |
Payables for | | | | |
Investments purchased | | | $11,012,476 | |
Fund shares reacquired | | | 19,141,863 | |
Payable to affiliates | | | | |
Investment adviser | | | 258,390 | |
Shareholder servicing costs | | | 1,103,546 | |
Distribution and service fees | | | 18,464 | |
Program manager fees | | | 36 | |
Payable for independent Trustees’ compensation | | | 2,634 | |
Accrued expenses and other liabilities | | | 647,169 | |
Total liabilities | | | $32,184,578 | |
Net assets | | | $6,501,162,251 | |
| Net assets consist of | | | | |
Paid-in capital | | | $6,901,358,011 | |
Unrealized appreciation (depreciation) on investments and translation of assets and liabilities in foreign currencies | | | 20,133,510 | |
Accumulated net realized gain (loss) on investments and foreign currency | | | (432,829,170 | ) |
Undistributed net investment income | | | 12,499,900 | |
Net assets | | | $6,501,162,251 | |
Shares of beneficial interest outstanding | | | 406,847,926 | |
11
Statement of Assets and Liabilities (unaudited) – continued
| | | | | | | | | | | | |
| | | Net assets | | | Shares
outstanding | | | Net asset value
per share (a) | |
Class A | | | $761,532,445 | | | | 48,002,748 | | | | $15.86 | |
Class B | | | 6,605,993 | | | | 431,071 | | | | 15.32 | |
Class C | | | 53,877,157 | | | | 3,608,480 | | | | 14.93 | |
Class I | | | 2,277,368,062 | | | | 138,936,511 | | | | 16.39 | |
Class R1 | | | 2,004,748 | | | | 136,102 | | | | 14.73 | |
Class R2 | | | 144,173,198 | | | | 9,395,934 | | | | 15.34 | |
Class R3 | | | 100,035,018 | | | | 6,370,922 | | | | 15.70 | |
Class R4 | | | 107,884,041 | | | | 6,792,031 | | | | 15.88 | |
Class R6 | | | 3,034,659,496 | | | | 192,320,562 | | | | 15.78 | |
Class 529A | | | 9,278,943 | | | | 595,398 | | | | 15.58 | |
Class 529B | | | 371,113 | | | | 25,199 | | | | 14.73 | |
Class 529C | | | 3,372,037 | | | | 232,968 | | | | 14.47 | |
| (a) | Maximum offering price per share was equal to the net asset value per share for all share classes, except for Classes A and 529A, for which the maximum offering prices per share were $16.83 [100 / 94.25 x $15.86] and $16.53 [100 / 94.25 x $15.58], respectively. On sales of $50,000 or more, the maximum offering prices of Class A and Class 529A shares are reduced. A contingent deferred sales charge may be imposed on redemptions of Class A, Class B, Class C, Class 529B, and Class 529C shares. Redemption price per share was equal to the net asset value per share for Classes I, R1, R2, R3, R4, R6, and 529A. |
See Notes to Financial Statements
12
Financial Statements
STATEMENT OF OPERATIONS
Six months ended 2/28/17 (unaudited)
This statement describes how much your fund earned in investment income and accrued in expenses. It also describes any gains and/or losses generated by fund operations.
| | | | |
| Net investment income | | | | |
Income | | | | |
Dividends | | | $43,547,795 | |
Interest | | | 307,673 | |
Dividends from underlying affiliated funds | | | 126,512 | |
Other | | | 15,694 | |
Foreign taxes withheld | | | (2,454,229 | ) |
Total investment income | | | $41,543,445 | |
Expenses | | | | |
Management fee | | | $23,475,083 | |
Distribution and service fees | | | 1,962,043 | |
Shareholder servicing costs | | | 1,993,523 | |
Program manager fees | | | 6,311 | |
Administrative services fee | | | 305,706 | |
Independent Trustees’ compensation | | | 53,240 | |
Custodian fee | | | 520,230 | |
Reimbursement of custodian expenses | | | (222,629 | ) |
Shareholder communications | | | 205,352 | |
Audit and tax fees | | | 52,241 | |
Legal fees | | | 33,112 | |
Miscellaneous | | | 219,748 | |
Total expenses | | | $28,603,960 | |
Reduction of expenses by investment adviser and distributor | | | (691,562 | ) |
Net expenses | | | $27,912,398 | |
Net investment income | | | $13,631,047 | |
| Realized and unrealized gain (loss) on investments and foreign currency | |
Realized gain (loss) (identified cost basis) | | | | |
Investments: | | | | |
Non-affiliated issuers (net of $1,425 country tax) | | | $129,877,006 | |
Underlying affiliated funds | | | (5,403 | ) |
Foreign currency | | | (3,416,627 | ) |
Net realized gain (loss) on investments and foreign currency | | | $126,454,976 | |
Change in unrealized appreciation (depreciation) | | | | |
Investments | | | $(13,471,839 | ) |
Translation of assets and liabilities in foreign currencies | | | (116,640 | ) |
Net unrealized gain (loss) on investments and foreign currency translation | | | $(13,588,479 | ) |
Net realized and unrealized gain (loss) on investments and foreign currency | | | $112,866,497 | |
Change in net assets from operations | | | $126,497,544 | |
See Notes to Financial Statements
13
Financial Statements
STATEMENTS OF CHANGES IN NET ASSETS
These statements describe the increases and/or decreases in net assets resulting from operations, any distributions, and any shareholder transactions.
| | | | | | | | |
| Change in net assets | | Six months ended
2/28/17 (unaudited) | | | Year ended
8/31/16 | |
| From operations | | | | | | | | |
Net investment income | | | $13,631,047 | | | | $123,556,405 | |
Net realized gain (loss) on investments and foreign currency | | | 126,454,976 | | | | (194,900,147 | ) |
Net unrealized gain (loss) on investments and foreign currency translation | | | (13,588,479 | ) | | | (41,757,937 | ) |
Change in net assets from operations | | | $126,497,544 | | | | $(113,101,679 | ) |
| Distributions declared to shareholders | | | | | | | | |
From net investment income | | | $(123,095,420 | ) | | | $(126,270,222 | ) |
Change in net assets from fund share transactions | | | $59,877,225 | | | | $(697,216,021 | ) |
Total change in net assets | | | $63,279,349 | | | | $(936,587,922 | ) |
| Net assets | | | | | | | | |
At beginning of period | | | 6,437,882,902 | | | | 7,374,470,824 | |
At end of period (including undistributed net investment income of $12,499,900 and $121,964,273, respectively) | | | $6,501,162,251 | | | | $6,437,882,902 | |
See Notes to Financial Statements
14
Financial Statements
FINANCIAL HIGHLIGHTS
The financial highlights table is intended to help you understand the fund’s financial performance for the semiannual period and the past 5 fiscal years. Certain information reflects financial results for a single fund share. The total returns in the table represent the rate by which an investor would have earned (or lost) on an investment in the fund share class (assuming reinvestment of all distributions) held for the entire period.
| | | | | | | | | | | | | | | | | | | | | | | | |
| | | Six months
ended
2/28/17
| | | Years ended 8/31 | |
| Class A | | | 2016 | | | 2015 | | | 2014 | | | 2013 | | | 2012 | |
| | | (unaudited) | | | | | | | | | | | | | | | | |
Net asset value, beginning of
period | | | $15.83 | | | | $16.34 | | | | $18.06 | | | | $16.25 | | | | $14.25 | | | | $14.66 | |
| Income (loss) from investment operations | | | | | | | | | | | | | |
Net investment income (d) | | | $0.02 | (c) | | | $0.25 | | | | $0.26 | | | | $0.40 | | | | $0.26 | | | | $0.28 | |
Net realized and unrealized
gain (loss) on
investments and foreign
currency | | | 0.27 | | | | (0.50 | ) | | | (1.60 | ) | | | 1.64 | | | | 2.01 | | | | (0.45 | ) |
Total from investment
operations | | | $0.29 | | | | $(0.25 | ) | | | $(1.34 | ) | | | $2.04 | | | | $2.27 | | | | $(0.17 | ) |
| Less distributions declared to shareholders | | | | | | | | | | | | | |
From net investment income | | | $(0.26 | ) | | | $(0.26 | ) | | | $(0.38 | ) | | | $(0.23 | ) | | | $(0.27 | ) | | | $(0.24 | ) |
Net asset value, end of
period (x) | | | $15.86 | | | | $15.83 | | | | $16.34 | | | | $18.06 | | | | $16.25 | | | | $14.25 | |
Total return (%) (r)(s)(t)(x) | | | 1.88 | (c)(n) | | | (1.50 | ) | | | (7.44 | ) | | | 12.60 | | | | 16.08 | | | | (1.03 | ) |
Ratios (%) (to average net assets) and Supplemental data: | | | | | | | | | | | | | |
Expenses before expense
reductions (f) | | | 1.13 | (a)(c) | | | 1.14 | | | | 1.13 | | | | 1.13 | | | | 1.18 | | | | 1.21 | |
Expenses after expense
reductions (f) | | | 1.11 | (a)(c) | | | 1.11 | | | | 1.09 | | | | 1.11 | | | | 1.18 | | | | 1.21 | |
Net investment income | | | 0.20 | (a)(c)(m) | | | 1.62 | | | | 1.53 | | | | 2.24 | | | | 1.65 | | | | 2.02 | |
Portfolio turnover | | | 17 | (n) | | | 40 | | | | 28 | | | | 27 | | | | 32 | | | | 37 | |
Net assets at end of period
(000 omitted) | | | $761,532 | | | | $971,630 | | | | $1,178,013 | | | | $1,184,927 | | | | $1,108,795 | | | | $970,501 | |
See Notes to Financial Statements
15
Financial Highlights – continued
| | | | | | | | | | | | | | | | | | | | | | | | |
| | | Six months
ended
2/28/17
| | | Years ended 8/31 | |
| Class B | | | 2016 | | | 2015 | | | 2014 | | | 2013 | | | 2012 | |
| | | (unaudited) | | | | | | | | | | | | | | | | |
Net asset value, beginning of
period | | | $15.21 | | | | $15.65 | | | | $17.26 | | | | $15.52 | | | | $13.59 | | | | $13.96 | |
| Income (loss) from investment operations | | | | | | | | | | | | | |
Net investment income (loss) (d) | | | $(0.04 | )(c) | | | $0.12 | | | | $0.12 | | | | $0.25 | | | | $0.12 | | | | $0.16 | |
Net realized and unrealized
gain (loss) on
investments and foreign
currency | | | 0.26 | | | | (0.47 | ) | | | (1.52 | ) | | | 1.57 | | | | 1.94 | | | | (0.42 | ) |
Total from investment
operations | | | $0.22 | | | | $(0.35 | ) | | | $(1.40 | ) | | | $1.82 | | | | $2.06 | | | | $(0.26 | ) |
| Less distributions declared to shareholders | | | | | | | | | | | | | |
From net investment income | | | $(0.11 | ) | | | $(0.09 | ) | | | $(0.21 | ) | | | $(0.08 | ) | | | $(0.13 | ) | | | $(0.11 | ) |
Net asset value, end of
period (x) | | | $15.32 | | | | $15.21 | | | | $15.65 | | | | $17.26 | | | | $15.52 | | | | $13.59 | |
Total return (%) (r)(s)(t)(x) | | | 1.47 | (c)(n) | | | (2.20 | ) | | | (8.15 | ) | | | 11.77 | | | | 15.27 | | | | (1.82 | ) |
Ratios (%) (to average net assets) and Supplemental data: | | | | | | | | | | | | | |
Expenses before expense
reductions (f) | | | 1.88 | (a)(c) | | | 1.89 | | | | 1.88 | | | | 1.88 | | | | 1.93 | | | | 1.96 | |
Expenses after expense
reductions (f) | | | 1.86 | (a)(c) | | | 1.86 | | | | 1.84 | | | | 1.86 | | | | 1.93 | | | | 1.96 | |
Net investment income (loss) | | | (0.53 | )(a)(c)(m) | | | 0.82 | | | | 0.70 | | | | 1.46 | | | | 0.83 | | | | 1.19 | |
Portfolio turnover | | | 17 | (n) | | | 40 | | | | 28 | | | | 27 | | | | 32 | | | | 37 | |
Net assets at end of period
(000 omitted) | | | $6,606 | | | | $7,967 | | | | $11,228 | | | | $16,932 | | | | $19,751 | | | | $23,369 | |
See Notes to Financial Statements
16
Financial Highlights – continued
| | | | | | | | | | | | | | | | | | | | | | | | |
| | | Six months
ended
2/28/17 | | | Years ended 8/31 | |
| Class C | | | 2016 | | | 2015 | | | 2014 | | | 2013 | | | 2012 | |
| | | (unaudited) | | | | | | | | | | | | | | | | |
Net asset value, beginning of
period | | | $14.85 | | | | $15.31 | | | | $16.93 | | | | $15.26 | | | | $13.39 | | | | $13.78 | |
| Income (loss) from investment operations | | | | | | | | | | | | | |
Net investment income (loss) (d) | | | $(0.04 | )(c) | | | $0.12 | | | | $0.12 | | | | $0.25 | | | | $0.13 | | | | $0.16 | |
Net realized and unrealized
gain (loss) on
investments and foreign
currency | | | 0.25 | | | | (0.45 | ) | | | (1.50 | ) | | | 1.54 | | | | 1.90 | | | | (0.42 | ) |
Total from investment
operations | | | $0.21 | | | | $(0.33 | ) | | | $(1.38 | ) | | | $1.79 | | | | $2.03 | | | | $(0.26 | ) |
| Less distributions declared to shareholders | | | | | | | | | | | | | |
From net investment income | | | $(0.13 | ) | | | $(0.13 | ) | | | $(0.24 | ) | | | $(0.12 | ) | | | $(0.16 | ) | | | $(0.13 | ) |
Net asset value, end of
period (x) | | | $14.93 | | | | $14.85 | | | | $15.31 | | | | $16.93 | | | | $15.26 | | | | $13.39 | |
Total return (%) (r)(s)(t)(x) | | | 1.47 | (c)(n) | | | (2.16 | ) | | | (8.17 | ) | | | 11.74 | | | | 15.22 | | | | (1.80 | ) |
Ratios (%) (to average net assets) and Supplemental data: | | | | | | | | | | | | | |
Expenses before expense
reductions (f) | | | 1.88 | (a)(c) | | | 1.89 | | | | 1.88 | | | | 1.88 | | | | 1.93 | | | | 1.96 | |
Expenses after expense
reductions (f) | | | 1.86 | (a)(c) | | | 1.86 | | | | 1.84 | | | | 1.86 | | | | 1.93 | | | | 1.96 | |
Net investment income (loss) | | | (0.54 | )(a)(c)(m) | | | 0.85 | | | | 0.76 | | | | 1.50 | | | | 0.87 | | | | 1.23 | |
Portfolio turnover | | | 17 | (n) | | | 40 | | | | 28 | | | | 27 | | | | 32 | | | | 37 | |
Net assets at end of period
(000 omitted) | | | $53,877 | | | | $62,124 | | | | $77,442 | | | | $91,487 | | | | $86,793 | | | | $84,133 | |
See Notes to Financial Statements
17
Financial Highlights – continued
| | | | | | | | | | | | | | | | | | | | | | | | |
| | | Six months
ended
2/28/17 | | | Years ended 8/31 | |
| Class I | | | 2016 | | | 2015 | | | 2014 | | | 2013 | | | 2012 | |
| | | (unaudited) | | | | | | | | | | | | | | | | |
Net asset value, beginning of
period | | | $16.38 | | | | $16.90 | | | | $18.66 | | | | $16.78 | | | | $14.71 | | | | $15.15 | |
| Income (loss) from investment operations | | | | | | | | | | | | | |
Net investment income (d) | | | $0.04 | (c) | | | $0.30 | | | | $0.32 | | | | $0.46 | | | | $0.31 | | | | $0.35 | |
Net realized and unrealized
gain (loss) on
investments and foreign
currency | | | 0.28 | | | | (0.51 | ) | | | (1.66 | ) | | | 1.69 | | | | 2.06 | | | | (0.49 | ) |
Total from investment
operations | | | $0.32 | | | | $(0.21 | ) | | | $(1.34 | ) | | | $2.15 | | | | $2.37 | | | | $(0.14 | ) |
| Less distributions declared to shareholders | | | | | | | | | | | | | |
From net investment income | | | $(0.31 | ) | | | $(0.31 | ) | | | $(0.42 | ) | | | $(0.27 | ) | | | $(0.30 | ) | | | $(0.30 | ) |
Net asset value, end of
period (x) | | | $16.39 | | | | $16.38 | | | | $16.90 | | | | $18.66 | | | | $16.78 | | | | $14.71 | |
Total return (%) (r)(s)(x) | | | 2.01 | (c)(n) | | | (1.24 | ) | | | (7.19 | ) | | | 12.89 | | | | 16.32 | | | | (0.82 | ) |
Ratios (%) (to average net assets) and Supplemental data: | | | | | | | | | | | | | |
Expenses before expense
reductions (f) | | | 0.88 | (a)(c) | | | 0.89 | | | | 0.88 | | | | 0.88 | | | | 0.93 | | | | 0.96 | |
Expenses after expense
reductions (f) | | | 0.86 | (a)(c) | | | 0.86 | | | | 0.84 | | | | 0.86 | | | | 0.93 | | | | 0.96 | |
Net investment income | | | 0.45 | (a)(c)(m) | | | 1.86 | | | | 1.80 | | | | 2.51 | | | | 1.89 | | | | 2.45 | |
Portfolio turnover | | | 17 | (n) | | | 40 | | | | 28 | | | | 27 | | | | 32 | | | | 37 | |
Net assets at end of period
(000 omitted) | | | $2,277,368 | | | | $2,187,011 | | | | $2,410,936 | | | | $2,194,432 | | | | $1,834,498 | | | | $1,143,621 | |
See Notes to Financial Statements
18
Financial Highlights – continued
| | | | | | | | | | | | | | | | | | | | | | | | |
| | | Six months
ended
2/28/17 | | | Years ended 8/31 | |
| Class R1 | | | 2016 | | | 2015 | | | 2014 | | | 2013 | | | 2012 | |
| | | (unaudited) | | | | | | | | | | | | | | | | |
Net asset value, beginning of
period | | | $14.63 | | | | $15.08 | | | | $16.69 | | | | $15.02 | | | | $13.17 | | | | $13.57 | |
| Income (loss) from investment operations | | | | | | | | | | | | | |
Net investment income (loss) (d) | | | $(0.04 | )(c) | | | $0.11 | | | | $0.11 | | | | $0.24 | | | | $0.12 | | | | $0.15 | |
Net realized and unrealized
gain (loss) on
investments and foreign
currency | | | 0.26 | | | | (0.44 | ) | | | (1.47 | ) | | | 1.52 | | | | 1.87 | | | | (0.40 | ) |
Total from investment
operations | | | $0.22 | | | | $(0.33 | ) | | | $(1.36 | ) | | | $1.76 | | | | $1.99 | | | | $(0.25 | ) |
| Less distributions declared to shareholders | | | | | | | | | | | | | |
From net investment income | | | $(0.12 | ) | | | $(0.12 | ) | | | $(0.25 | ) | | | $(0.09 | ) | | | $(0.14 | ) | | | $(0.15 | ) |
Net asset value, end of
period (x) | | | $14.73 | | | | $14.63 | | | | $15.08 | | | | $16.69 | | | | $15.02 | | | | $13.17 | |
Total return (%) (r)(s)(x) | | | 1.52 | (c)(n) | | | (2.19 | ) | | | (8.18 | ) | | | 11.73 | | | | 15.24 | | | | (1.80 | ) |
Ratios (%) (to average net assets) and Supplemental data: | | | | | | | | | | | | | |
Expenses before expense
reductions (f) | | | 1.88 | (a)(c) | | | 1.89 | | | | 1.88 | | | | 1.88 | | | | 1.93 | | | | 1.96 | |
Expenses after expense
reductions (f) | | | 1.86 | (a)(c) | | | 1.86 | | | | 1.84 | | | | 1.86 | | | | 1.93 | | | | 1.96 | |
Net investment income (loss) | | | (0.53 | )(a)(c)(m) | | | 0.78 | | | | 0.72 | | | | 1.47 | | | | 0.85 | | | | 1.18 | |
Portfolio turnover | | | 17 | (n) | | | 40 | | | | 28 | | | | 27 | | | | 32 | | | | 37 | |
Net assets at end of period
(000 omitted) | | | $2,005 | | | | $2,418 | | | | $3,509 | | | | $4,243 | | | | $4,034 | | | | $4,914 | |
See Notes to Financial Statements
19
Financial Highlights – continued
| | | | | | | | | | | | | | | | | | | | | | | | |
| | | Six months
ended
2/28/17 | | | Years ended 8/31 | |
| Class R2 | | | 2016 | | | 2015 | | | 2014 | | | 2013 | | | 2012 | |
| | | (unaudited) | | | | | | | | | | | | | | | | |
Net asset value, beginning of
period | | | $15.31 | | | | $15.80 | | | | $17.48 | | | | $15.75 | | | | $13.83 | | | | $14.26 | |
| Income (loss) from investment operations | | | | | | | | | | | | | |
Net investment income (loss) (d) | | | $(0.00 | )(c)(w) | | | $0.21 | | | | $0.22 | | | | $0.36 | | | | $0.21 | | | | $0.24 | |
Net realized and unrealized
gain (loss) on
investments and foreign
currency | | | 0.26 | | | | (0.48 | ) | | | (1.56 | ) | | | 1.57 | | | | 1.95 | | | | (0.44 | ) |
Total from investment
operations | | | $0.26 | | | | $(0.27 | ) | | | $(1.34 | ) | | | $1.93 | | | | $2.16 | | | | $(0.20 | ) |
| Less distributions declared to shareholders | | | | | | | | | | | | | |
From net investment income | | | $(0.23 | ) | | | $(0.22 | ) | | | $(0.34 | ) | | | $(0.20 | ) | | | $(0.24 | ) | | | $(0.23 | ) |
Net asset value, end of
period (x) | | | $15.34 | | | | $15.31 | | | | $15.80 | | | | $17.48 | | | | $15.75 | | | | $13.83 | |
Total return (%) (r)(s)(x) | | | 1.71 | (c)(n) | | | (1.69 | ) | | | (7.69 | ) | | | 12.32 | | | | 15.79 | | | | (1.32 | ) |
Ratios (%) (to average net assets) and Supplemental data: | | | | | | | | | | | | | |
Expenses before expense
reductions (f) | | | 1.38 | (a)(c) | | | 1.39 | | | | 1.38 | | | | 1.38 | | | | 1.43 | | | | 1.46 | |
Expenses after expense
reductions (f) | | | 1.36 | (a)(c) | | | 1.36 | | | | 1.34 | | | | 1.36 | | | | 1.43 | | | | 1.46 | |
Net investment income (loss) | | | (0.05 | )(a)(c)(m) | | | 1.38 | | | | 1.29 | | | | 2.06 | | | | 1.41 | | | | 1.78 | |
Portfolio turnover | | | 17 | (n) | | | 40 | | | | 28 | | | | 27 | | | | 32 | | | | 37 | |
Net assets at end of period
(000 omitted) | | | $144,173 | | | | $152,133 | | | | $169,812 | | | | $182,466 | | | | $136,444 | | | | $107,567 | |
See Notes to Financial Statements
20
Financial Highlights – continued
| | | | | | | | | | | | | | | | | | | | | | | | |
| | | Six months
ended
2/28/17 | | | Years ended 8/31 | |
| Class R3 | | | 2016 | | | 2015 | | | 2014 | | | 2013 | | | 2012 | |
| | | (unaudited) | | | | | | | | | | | | | | | | |
Net asset value, beginning of
period | | | $15.67 | | | | $16.16 | | | | $17.86 | | | | $16.08 | | | | $14.10 | | | | $14.53 | |
| Income (loss) from investment operations | | | | | | | | | | | | | |
Net investment income (d) | | | $0.02 | (c) | | | $0.24 | | | | $0.25 | | | | $0.40 | | | | $0.25 | | | | $0.28 | |
Net realized and unrealized
gain (loss) on
investments and foreign
currency | | | 0.27 | | | | (0.48 | ) | | | (1.58 | ) | | | 1.61 | | | | 2.00 | | | | (0.45 | ) |
Total from investment
operations | | | $0.29 | | | | $(0.24 | ) | | | $(1.33 | ) | | | $2.01 | | | | $2.25 | | | | $(0.17 | ) |
| Less distributions declared to shareholders | | | | | | | | | | | | | |
From net investment income | | | $(0.26 | ) | | | $(0.25 | ) | | | $(0.37 | ) | | | $(0.23 | ) | | | $(0.27 | ) | | | $(0.26 | ) |
Net asset value, end of
period (x) | | | $15.70 | | | | $15.67 | | | | $16.16 | | | | $17.86 | | | | $16.08 | | | | $14.10 | |
Total return (%) (r)(s)(x) | | | 1.87 | (c)(n) | | | (1.47 | ) | | | (7.44 | ) | | | 12.56 | | | | 16.13 | | | | (1.06 | ) |
Ratios (%) (to average net assets) and Supplemental data: | | | | | | | | | | | | | |
Expenses before expense
reductions (f) | | | 1.13 | (a)(c) | | | 1.14 | | | | 1.13 | | | | 1.13 | | | | 1.18 | | | | 1.21 | |
Expenses after expense
reductions (f) | | | 1.11 | (a)(c) | | | 1.11 | | | | 1.09 | | | | 1.11 | | | | 1.18 | | | | 1.21 | |
Net investment income | | | 0.23 | (a)(c)(m) | | | 1.59 | | | | 1.46 | | | | 2.28 | | | | 1.63 | | | | 2.05 | |
Portfolio turnover | | | 17 | (n) | | | 40 | | | | 28 | | | | 27 | | | | 32 | | | | 37 | |
Net assets at end of period
(000 omitted) | | | $100,035 | | | | $126,980 | | | | $165,656 | | | | $229,232 | | | | $195,358 | | | | $168,989 | |
See Notes to Financial Statements
21
Financial Highlights – continued
| | | | | | | | | | | | | | | | | | | | | | | | |
| | | Six months
ended
2/28/17 | | | Years ended 8/31 | |
| Class R4 | | | 2016 | | | 2015 | | | 2014 | | | 2013 | | | 2012 | |
| | | (unaudited) | | | | | | | | | | | | | | | | |
Net asset value, beginning of
period | | | $15.86 | | | | $16.36 | | | | $18.09 | | | | $16.27 | | | | $14.26 | | | | $14.70 | |
| Income (loss) from investment operations | | | | | | | | | | | | | |
Net investment income (d) | | | $0.04 | (c) | | | $0.30 | | | | $0.29 | | | | $0.45 | | | | $0.25 | | | | $0.32 | |
Net realized and unrealized
gain (loss) on
investments and foreign
currency | | | 0.26 | | | | (0.50 | ) | | | (1.60 | ) | | | 1.63 | | | | 2.06 | | | | (0.46 | ) |
Total from investment
operations | | | $0.30 | | | | $(0.20 | ) | | | $(1.31 | ) | | | $2.08 | | | | $2.31 | | | | $(0.14 | ) |
| Less distributions declared to shareholders | | | | | | | | | | | | | |
From net investment income | | | $(0.28 | ) | | | $(0.30 | ) | | | $(0.42 | ) | | | $(0.26 | ) | | | $(0.30 | ) | | | $(0.30 | ) |
Net asset value, end of
period (x) | | | $15.88 | | | | $15.86 | | | | $16.36 | | | | $18.09 | | | | $16.27 | | | | $14.26 | |
Total return (%) (r)(s)(x) | | | 1.96 | (c)(n) | | | (1.20 | ) | | | (7.26 | ) | | | 12.87 | | | | 16.42 | | | | (0.84 | ) |
Ratios (%) (to average net assets) and Supplemental data: | | | | | | | | | | | | | |
Expenses before expense
reductions (f) | | | 0.88 | (a)(c) | | | 0.89 | | | | 0.88 | | | | 0.88 | | | | 0.93 | | | | 0.96 | |
Expenses after expense
reductions (f) | | | 0.86 | (a)(c) | | | 0.86 | | | | 0.85 | | | | 0.86 | | | | 0.93 | | | | 0.96 | |
Net investment income | | | 0.50 | (a)(c)(m) | | | 1.93 | | | | 1.70 | | | | 2.54 | | | | 1.60 | | | | 2.28 | |
Portfolio turnover | | | 17 | (n) | | | 40 | | | | 28 | | | | 27 | | | | 32 | | | | 37 | |
Net assets at end of period
(000 omitted) | | | $107,884 | | | | $148,243 | | | | $343,475 | | | | $546,069 | | | | $470,915 | | | | $825,288 | |
See Notes to Financial Statements
22
Financial Highlights – continued
| | | | | | | | | | | | | | | | | | | | | | | | |
| | | Six months
ended
2/28/17 | | | Years ended 8/31 | |
| Class R6 (y) | | | 2016 | | | 2015 | | | 2014 | | | 2013 | | | 2012 | |
| | | (unaudited) | | | | | | | | | | | | | | | | |
Net asset value, beginning of
period | | | $15.79 | | | | $16.30 | | | | $18.02 | | | | $16.21 | | | | $14.20 | | | | $14.63 | |
| Income (loss) from investment operations | | | | | | | | | | | | | |
Net investment income (d) | | | $0.04 | (c) | | | $0.31 | | | | $0.32 | | | | $0.46 | | | | $0.33 | | | | $0.17 | |
Net realized and unrealized
gain (loss) on
investments and foreign
currency | | | 0.28 | | | | (0.50 | ) | | | (1.60 | ) | | | 1.64 | | | | 1.99 | | | | (0.31 | )(g) |
Total from investment
operations | | | $0.32 | | | | $(0.19 | ) | | | $(1.28 | ) | | | $2.10 | | | | $2.32 | | | | $(0.14 | ) |
| Less distributions declared to shareholders | | | | | | | | | | | | | |
From net investment income | | | $(0.33 | ) | | | $(0.32 | ) | | | $(0.44 | ) | | | $(0.29 | ) | | | $(0.31 | ) | | | $(0.29 | ) |
Net asset value, end of
period (x) | | | $15.78 | | | | $15.79 | | | | $16.30 | | | | $18.02 | | | | $16.21 | | | | $14.20 | |
Total return (%) (r)(s)(x) | | | 2.07 | (c)(n) | | | (1.13 | ) | | | (7.13 | ) | | | 13.01 | | | | 16.50 | | | | (0.85 | ) |
Ratios (%) (to average net assets) and Supplemental data: | | | | | | | | | | | | | |
Expenses before expense
reductions (f) | | | 0.78 | (a)(c) | | | 0.79 | | | | 0.79 | | | | 0.79 | | | | 0.81 | | | | 0.89 | |
Expenses after expense
reductions (f) | | | 0.76 | (a)(c) | | | 0.76 | | | | 0.75 | | | | 0.77 | | | | 0.81 | | | | 0.89 | |
Net investment income | | | 0.54 | (a)(c)(m) | | | 2.02 | | | | 1.88 | | | | 2.62 | | | | 2.09 | | | | 1.20 | (l) |
Portfolio turnover | | | 17 | (n) | | | 40 | | | | 28 | | | | 27 | | | | 32 | | | | 37 | |
Net assets at end of period
(000 omitted) | | | $3,034,659 | | | | $2,766,544 | | | | $3,010,863 | | | | $2,955,339 | | | | $2,331,325 | | | | $1,433,832 | |
See Notes to Financial Statements
23
Financial Highlights – continued
| | | | | | | | | | | | | | | | | | | | | | | | |
| | | Six months
ended
2/28/17 | | | Years ended 8/31 | |
| Class 529A | | | 2016 | | | 2015 | | | 2014 | | | 2013 | | | 2012 | |
| | | (unaudited) | | | | | | | | | | | | | | | | |
Net asset value, beginning of
period | | | $15.61 | | | | $16.12 | | | | $17.81 | | | | $16.03 | | | | $14.06 | | | | $14.49 | |
| Income (loss) from investment operations | | | | | | | | | | | | | |
Net investment income (d) | | | $0.01 | (c) | | | $0.19 | | | | $0.26 | | | | $0.39 | | | | $0.25 | | | | $0.27 | |
Net realized and unrealized
gain (loss) on
investments and foreign
currency | | | 0.27 | | | | (0.44 | ) | | | (1.58 | ) | | | 1.62 | | | | 1.98 | | | | (0.45 | ) |
Total from investment
operations | | | $0.28 | | | | $(0.25 | ) | | | $(1.32 | ) | | | $2.01 | | | | $2.23 | | | | $(0.18 | ) |
| Less distributions declared to shareholders | | | | | | | | | | | | | |
From net investment income | | | $(0.31 | ) | | | $(0.26 | ) | | | $(0.37 | ) | | | $(0.23 | ) | | | $(0.26 | ) | | | $(0.25 | ) |
Net asset value, end of
period (x) | | | $15.58 | | | | $15.61 | | | | $16.12 | | | | $17.81 | | | | $16.03 | | | | $14.06 | |
Total return (%) (r)(s)(t)(x) | | | 1.83 | (c)(n) | | | (1.52 | ) | | | (7.43 | ) | | | 12.57 | | | | 16.05 | | | | (1.15 | ) |
Ratios (%) (to average net assets) and Supplemental data: | | | | | | | | | | | | | |
Expenses before expense
reductions (f) | | | 1.23 | (a)(c) | | | 1.23 | | | | 1.23 | | | | 1.23 | | | | 1.28 | | | | 1.31 | |
Expenses after expense
reductions (f) | | | 1.14 | (a)(c) | | | 1.13 | | | | 1.12 | | | | 1.14 | | | | 1.21 | | | | 1.26 | |
Net investment income | | | 0.17 | (a)(c)(m) | | | 1.22 | | | | 1.51 | | | | 2.22 | | | | 1.62 | | | | 1.96 | |
Portfolio turnover | | | 17 | (n) | | | 40 | | | | 28 | | | | 27 | | | | 32 | | | | 37 | |
Net assets at end of period
(000 omitted) | | | $9,279 | | | | $9,101 | | | | $2,419 | | | | $2,428 | | | | $2,105 | | | | $1,762 | |
See Notes to Financial Statements
24
Financial Highlights – continued
| | | | | | | | | | | | | | | | | | | | | | | | |
| | | Six months
ended
2/28/17 | | | Years ended 8/31 | |
| Class 529B | | | 2016 | | | 2015 | | | 2014 | | | 2013 | | | 2012 | |
| | | (unaudited) | | | | | | | | | | | | | | | | |
Net asset value, beginning of
period | | | $14.78 | | | | $15.19 | | | | $16.80 | | | | $15.14 | | | | $13.25 | | | | $13.57 | |
| Income (loss) from investment operations | | | | | | | | | | | | | |
Net investment income (loss) (d) | | | $(0.04 | )(c) | | | $0.05 | | | | $0.10 | | | | $0.25 | | | | $0.12 | | | | $0.13 | |
Net realized and unrealized
gain (loss) on
investments and foreign
currency | | | 0.25 | | | | (0.39 | ) | | | (1.47 | ) | | | 1.52 | | | | 1.88 | | | | (0.38 | ) |
Total from investment
operations | | | $0.21 | | | | $(0.34 | ) | | | $(1.37 | ) | | | $1.77 | | | | $2.00 | | | | $(0.25 | ) |
| Less distributions declared to shareholders | | | | | | | | | | | | | |
From net investment income | | | $(0.26 | ) | | | $(0.07 | ) | | | $(0.24 | ) | | | $(0.11 | ) | | | $(0.11 | ) | | | $(0.07 | ) |
Net asset value, end of
period (x) | | | $14.73 | | | | $14.78 | | | | $15.19 | | | | $16.80 | | | | $15.14 | | | | $13.25 | |
Total return (%) (r)(s)(t)(x) | | | 1.49 | (c)(n) | | | (2.25 | ) | | | (8.17 | ) | | | 11.71 | | | | 15.15 | | | | (1.84 | ) |
Ratios (%) (to average net assets) and Supplemental data: | | | | | | | | | | | | | |
Expenses before expense
reductions (f) | | | 1.98 | (a)(c) | | | 1.98 | | | | 1.98 | | | | 1.98 | | | | 2.03 | | | | 2.06 | |
Expenses after expense
reductions (f) | | | 1.91 | (a)(c) | | | 1.90 | | | | 1.89 | | | | 1.91 | | | | 1.98 | | | | 2.01 | |
Net investment income (loss) | | | (0.59 | )(a)(c)(m) | | | 0.37 | | | | 0.63 | | | | 1.49 | | | | 0.82 | | | | 1.03 | |
Portfolio turnover | | | 17 | (n) | | | 40 | | | | 28 | | | | 27 | | | | 32 | | | | 37 | |
Net assets at end of period
(000 omitted) | | | $371 | | | | $434 | | | | $138 | | | | $192 | | | | $188 | | | | $199 | |
See Notes to Financial Statements
25
Financial Highlights – continued
| | | | | | | | | | | | | | | | | | | | | | | | |
| | | Six months
ended
2/28/17 | | | Years ended 8/31 | |
| Class 529C | | | 2016 | | | 2015 | | | 2014 | | | 2013 | | | 2012 | |
| | | (unaudited) | | | | | | | | | | | | | | | | |
Net asset value, beginning of
period | | | $14.53 | | | | $15.01 | | | | $16.61 | | | | $14.98 | | | | $13.17 | | | | $13.56 | |
| Income (loss) from investment operations | | | | | | | | | | | | | |
Net investment income (loss) (d) | | | $(0.04 | )(c) | | | $0.07 | | | | $0.11 | | | | $0.23 | | | | $0.12 | | | | $0.15 | |
Net realized and unrealized
gain (loss) on
investments and foreign
currency | | | 0.25 | | | | (0.41 | ) | | | (1.46 | ) | | | 1.52 | | | | 1.86 | | | | (0.41 | ) |
Total from investment
operations | | | $0.21 | | | | $(0.34 | ) | | | $(1.35 | ) | | | $1.75 | | | | $1.98 | | | | $(0.26 | ) |
| Less distributions declared to shareholders | | | | | | | | | | | | | |
From net investment income | | | $(0.27 | ) | | | $(0.14 | ) | | | $(0.25 | ) | | | $(0.12 | ) | | | $(0.17 | ) | | | $(0.13 | ) |
Net asset value, end of
period (x) | | | $14.47 | | | | $14.53 | | | | $15.01 | | | | $16.61 | | | | $14.98 | | | | $13.17 | |
Total return (%) (r)(s)(t)(x) | | | 1.47 | (c)(n) | | | (2.28 | ) | | | (8.17 | ) | | | 11.68 | | | | 15.17 | | | | (1.83 | ) |
Ratios (%) (to average net assets) and Supplemental data: | | | | | | | | | | | | | |
Expenses before expense
reductions (f) | | | 1.98 | (a)(c) | | | 1.99 | | | | 1.98 | | | | 1.98 | | | | 2.03 | | | | 2.06 | |
Expenses after expense
reductions (f) | | | 1.90 | (a)(c) | | | 1.90 | | | | 1.89 | | | | 1.91 | | | | 1.98 | | | | 2.01 | |
Net investment income (loss) | | | (0.60 | )(a)(c)(m) | | | 0.47 | | | | 0.72 | | | | 1.43 | | | | 0.81 | | | | 1.19 | |
Portfolio turnover | | | 17 | (n) | | | 40 | | | | 28 | | | | 27 | | | | 32 | | | | 37 | |
Net assets at end of period
(000 omitted) | | | $3,372 | | | | $3,298 | | | | $980 | | | | $1,098 | | | | $950 | | | | $914 | |
See Notes to Financial Statements
26
Financial Highlights – continued
| (c) | Amount reflects a one-time reimbursement of expenses by the custodian (or former custodian) without which net investment income and performance would be lower and expenses would be higher. See Note 2 in the Notes to Financial Statements for additional information. |
| (d) | Per share data is based on average shares outstanding. |
| (f) | Ratios do not reflect reductions from fees paid indirectly, if applicable. |
| (g) | The per share amount varies from the net realized and unrealized gain/loss for the period because of the timing of sales of fund shares and the per share amount of realized and unrealized gains and losses at such time. |
| (l) | The net investment income ratio does not vary by the class specific expense differential because of the timing of sales of fund shares and the allocation of fund level income at such time. |
| (m) | Recognition of net investment income by the fund may be affected by the timing of the declaration of dividends by companies in which the fund invests and the actual annual net investment income ratio may differ. |
| (r) | Certain expenses have been reduced without which performance would have been lower. |
| (s) | From time to time the fund may receive proceeds from litigation settlements, without which performance would be lower. |
| (t) | Total returns do not include any applicable sales charges. |
| (w) | Per share amount was less than $0.01. |
| (x) | The net asset values and total returns have been calculated on net assets which include adjustments made in accordance with U.S. generally accepted accounting principles required at period end for financial reporting purposes. |
| (y) | On May 10, 2012, sales of Class W shares (including exchanges) were suspended. On May 11, 2012, certain Class W shares were automatically converted to Class I shares. Shareholders of certain Class W shares became shareholders of Class I and received Class I shares with a total net asset value equal to their Class W shares at the time of the conversion. On May 30, 2012, remaining Class W shares, which represented MFS seed money, were redesignated Class R5. On June 1, 2012, Class R5 shares were offered for sale to the public. Effective August 26, 2016, Class R5 shares were renamed Class R6 shares. Class R6 shares do not pay a 12b-1 distribution fee or sub-accounting costs. |
See Notes to Financial Statements
27
NOTES TO FINANCIAL STATEMENTS
(unaudited)
(1) Business and Organization
MFS Research International Fund (the fund) is a diversified series of MFS Series Trust I (the trust). The trust is organized as a Massachusetts business trust and is registered under the Investment Company Act of 1940, as amended, as an open-end management investment company.
The fund is an investment company and accordingly follows the investment company accounting and reporting guidance of the Financial Accounting Standards Board (FASB) Accounting Standards Codification Topic 946 Financial Services – Investment Companies.
(2) Significant Accounting Policies
General – The preparation of financial statements in conformity with U.S. generally accepted accounting principles requires management to make estimates and assumptions that affect the reported amounts of assets and liabilities, and disclosure of contingent assets and liabilities at the date of the financial statements and the reported amounts of increases and decreases in net assets from operations during the reporting period. Actual results could differ from those estimates. In the preparation of these financial statements, management has evaluated subsequent events occurring after the date of the fund’s Statement of Assets and Liabilities through the date that the financial statements were issued. The fund invests in foreign securities. Investments in foreign securities are vulnerable to the effects of changes in the relative values of the local currency and the U.S. dollar and to the effects of changes in each country’s legal, political, and economic environment.
In October 2016, the Securities and Exchange Commission (SEC) released its Final Rule on Investment Company Reporting Modernization (the “Rule”). The Rule, which introduces two new regulatory reporting forms for investment companies – Form N-PORT and Form N-CEN – also contains amendments to Regulation S-X which impact financial statement presentation, particularly the presentation of derivative investments. Although still evaluating the impacts of the Rule, management believes that many of the Regulation S-X amendments are consistent with the fund’s current financial statement presentation and expects that the fund will be able to comply with the Rule’s Regulation S-X amendments by the August 1, 2017 compliance date.
Balance Sheet Offsetting – The fund’s accounting policy with respect to balance sheet offsetting is that, absent an event of default by the counterparty or a termination of the agreement, the International Swaps and Derivatives Association (ISDA) Master Agreement does not result in an offset of reported amounts of financial assets and financial liabilities in the Statement of Assets and Liabilities across transactions between the fund and the applicable counterparty. The fund’s right to setoff may be restricted or prohibited by the bankruptcy or insolvency laws of the particular jurisdiction to which a specific master netting agreement counterparty is subject. Balance sheet offsetting disclosures, to the extent applicable to the fund, have been included in the fund’s Significant Accounting Policies note under the captions for each of the fund’s in-scope financial instruments and transactions.
28
Notes to Financial Statements (unaudited) – continued
Investment Valuations – Equity securities, including restricted equity securities, are generally valued at the last sale or official closing price on their primary market or exchange as provided by a third-party pricing service. Equity securities, for which there were no sales reported that day, are generally valued at the last quoted daily bid quotation on their primary market or exchange as provided by a third-party pricing service. Short-term instruments with a maturity at issuance of 60 days or less may be valued at amortized cost, which approximates market value. Open-end investment companies are generally valued at net asset value per share. Securities and other assets generally valued on the basis of information from a third-party pricing service may also be valued at a broker/dealer bid quotation. Values obtained from third-party pricing services can utilize both transaction data and market information such as yield, quality, coupon rate, maturity, type of issue, trading characteristics, and other market data. The values of foreign securities and other assets and liabilities expressed in foreign currencies are converted to U.S. dollars using the mean of bid and asked prices for rates provided by a third-party pricing service.
The Board of Trustees has delegated primary responsibility for determining or causing to be determined the value of the fund’s investments (including any fair valuation) to the adviser pursuant to valuation policies and procedures approved by the Board. If the adviser determines that reliable market quotations are not readily available, investments are valued at fair value as determined in good faith by the adviser in accordance with such procedures under the oversight of the Board of Trustees. Under the fund’s valuation policies and procedures, market quotations are not considered to be readily available for most types of debt instruments and floating rate loans and many types of derivatives. These investments are generally valued at fair value based on information from third-party pricing services. In addition, investments may be valued at fair value if the adviser determines that an investment’s value has been materially affected by events occurring after the close of the exchange or market on which the investment is principally traded (such as foreign exchange or market) and prior to the determination of the fund’s net asset value, or after the halting of trading of a specific security where trading does not resume prior to the close of the exchange or market on which the security is principally traded. Events that occur on a frequent basis after foreign markets close (such as developments in foreign markets and significant movements in the U.S. markets) and prior to the determination of the fund’s net asset value may be deemed to have a material effect on the value of securities traded in foreign markets. Accordingly, the fund’s foreign equity securities may often be valued at fair value. The adviser generally relies on third-party pricing services or other information (such as the correlation with price movements of similar securities in the same or other markets; the type, cost and investment characteristics of the security; the business and financial condition of the issuer; and trading and other market data) to assist in determining whether to fair value and at what value to fair value an investment. The value of an investment for purposes of calculating the fund’s net asset value can differ depending on the source and method used to determine value. When fair valuation is used, the value of an investment used to determine the fund’s net asset value may differ from quoted or published prices for the same investment. There can be no assurance that the fund could obtain the fair value assigned to an investment if it were to sell the investment at the same time at which the fund determines its net asset value per share.
29
Notes to Financial Statements (unaudited) – continued
Various inputs are used in determining the value of the fund’s assets or liabilities. These inputs are categorized into three broad levels. In certain cases, the inputs used to measure fair value may fall into different levels of the fair value hierarchy. In such cases, an investment’s level within the fair value hierarchy is based on the lowest level of input that is significant to the fair value measurement. The fund’s assessment of the significance of a particular input to the fair value measurement in its entirety requires judgment, and considers factors specific to the investment. Level 1 includes unadjusted quoted prices in active markets for identical assets or liabilities. Level 2 includes other significant observable market-based inputs (including quoted prices for similar securities, interest rates, prepayment speed, and credit risk). Level 3 includes unobservable inputs, which may include the adviser’s own assumptions in determining the fair value of investments. The following is a summary of the levels used as of February 28, 2017 in valuing the fund’s assets or liabilities:
| | | | | | | | | | | | | | | | |
| Investments at Value | | Level 1 | | | Level 2 | | | Level 3 | | | Total | |
| Equity Securities: | | | | | | | | | | | | | | | | |
Japan | | | $1,260,604,802 | | | | $— | | | | $— | | | | $1,260,604,802 | |
Switzerland | | | 1,080,550,218 | | | | — | | | | — | | | | 1,080,550,218 | |
United Kingdom | | | 862,503,677 | | | | — | | | | — | | | | 862,503,677 | |
France | | | 554,899,655 | | | | — | | | | — | | | | 554,899,655 | |
Germany | | | 447,918,475 | | | | — | | | | — | | | | 447,918,475 | |
United States | | | 409,094,318 | | | | — | | | | — | | | | 409,094,318 | |
Australia | | | 273,957,020 | | | | — | | | | — | | | | 273,957,020 | |
Italy | | | 242,123,294 | | | | — | | | | — | | | | 242,123,294 | |
Netherlands | | | 237,634,869 | | | | — | | | | — | | | | 237,634,869 | |
Other Countries | | | 993,496,934 | | | | 66,372,486 | | | | — | | | | 1,059,869,420 | |
| Mutual Funds | | | 54,931,283 | | | | — | | | | — | | | | 54,931,283 | |
| Total Investments | | | $6,417,714,545 | | | | $66,372,486 | | | | $— | | | | $6,484,087,031 | |
For further information regarding security characteristics, see the Portfolio of Investments.
Of the level 2 investments presented above, equity investments amounting to $66,372,486 would have been considered level 1 investments at the beginning of the period. The primary reason for changes in the classifications between levels 1 and 2 occurs when foreign equity securities are fair valued using other observable market-based inputs in place of the closing exchange price due to events occurring after the close of the exchange or market on which the investment is principally traded. The fund’s foreign equity securities may often be valued using other observable market-based inputs. The fund’s policy is to recognize transfers between the levels as of the end of the period.
Foreign Currency Translation – Purchases and sales of foreign investments, income, and expenses are converted into U.S. dollars based upon currency exchange rates prevailing on the respective dates of such transactions or on the reporting date for foreign denominated receivables and payables. Gains and losses attributable to foreign currency exchange rates on sales of securities are recorded for financial statement purposes as net realized gains and losses on investments. Gains and losses attributable to foreign exchange rate movements on receivables, payables, income and expenses
30
Notes to Financial Statements (unaudited) – continued
are recorded for financial statement purposes as foreign currency transaction gains and losses. That portion of both realized and unrealized gains and losses on investments that results from fluctuations in foreign currency exchange rates is not separately disclosed.
Security Loans – Under its Securities Lending Agency Agreement with the fund, State Street Bank and Trust Company (“State Street”), as lending agent, loans the securities of the fund to certain qualified institutions (the “Borrowers”) approved by the fund. Security loans can be terminated at the discretion of either the lending agent or the fund and the related securities must be returned within the earlier of the standard trade settlement period for such securities or within three business days. The loans are collateralized by cash and/or U.S. Treasury and federal agency obligations in an amount typically at least equal to the market value of the securities loaned. On loans collateralized by cash, the cash collateral is invested in a money market fund. The market value of the loaned securities is determined at the close of business of the fund and any additional required collateral is delivered to the fund on the next business day. State Street provides the fund with indemnification against Borrower default. In the event of Borrower default, State Street will, for the benefit of the fund, either purchase securities identical to those loaned or, when such purchase is commercially impracticable, pay the fund the market value of the loaned securities. In return, State Street assumes the fund’s rights to the related collateral. If the collateral value is less than the cost to purchase identical securities, State Street is responsible for the shortfall, but only to the extent that such shortfall is not due to a decline in collateral value resulting from collateral reinvestment for which the fund bears the risk of loss. A portion of the income generated upon investment of the collateral is remitted to the Borrowers, and the remainder is allocated between the fund and the lending agent. On loans collateralized by U.S. Treasury and/or federal agency obligations, a fee is received from the Borrower, and is allocated between the fund and the lending agent. Income from securities lending is included in “Interest” income in the Statement of Operations. The dividend and interest income earned on the securities loaned is accounted for in the same manner as other dividend and interest income. At February 28, 2017, there were no securities on loan or collateral outstanding.
Indemnifications – Under the fund’s organizational documents, its officers and Trustees may be indemnified against certain liabilities and expenses arising out of the performance of their duties to the fund. Additionally, in the normal course of business, the fund enters into agreements with service providers that may contain indemnification clauses. The fund’s maximum exposure under these agreements is unknown as this would involve future claims that may be made against the fund that have not yet occurred.
Investment Transactions and Income – Investment transactions are recorded on the trade date. Interest income is recorded on the accrual basis. Dividends received in cash are recorded on the ex-dividend date. Certain dividends from foreign securities will be recorded when the fund is informed of the dividend if such information is obtained subsequent to the ex-dividend date. Dividend and interest payments received in additional securities are recorded on the ex-dividend or ex-interest date in an amount equal to the value of the security on such date.
31
Notes to Financial Statements (unaudited) – continued
The fund may receive proceeds from litigation settlements. Any proceeds received from litigation involving portfolio holdings are reflected in the Statement of Operations in realized gain/loss if the security has been disposed of by the fund or in unrealized gain/loss if the security is still held by the fund. Any other proceeds from litigation not related to portfolio holdings are reflected as other income in the Statement of Operations.
Reimbursement of Expenses by Custodian – In December 2015, the fund’s custodian (or former custodian), State Street Bank and Trust Company, announced that it intended to reimburse its asset servicing clients for expense amounts that it billed in error during the period 1998 through 2015. The amount of this one-time reimbursement attributable to the fund is reflected as “Reimbursement of custodian expenses” in the Statement of Operations.
Tax Matters and Distributions – The fund intends to qualify as a regulated investment company, as defined under Subchapter M of the Internal Revenue Code, and to distribute all of its taxable income, including realized capital gains. As a result, no provision for federal income tax is required. The fund’s federal tax returns, when filed, will remain subject to examination by the Internal Revenue Service for a three year period. Management has analyzed the fund’s tax positions taken on federal and state tax returns for all open tax years and does not believe that there are any uncertain tax positions that require recognition of a tax liability. Foreign taxes, if any, have been accrued by the fund in the accompanying financial statements in accordance with the applicable foreign tax law. Foreign income taxes may be withheld by certain countries in which the fund invests. Additionally, capital gains realized by the fund on securities issued in or by certain foreign countries may be subject to capital gains tax imposed by those countries.
Distributions to shareholders are recorded on the ex-dividend date. Income and capital gain distributions are determined in accordance with income tax regulations, which may differ from U.S. generally accepted accounting principles. Certain capital accounts in the financial statements are periodically adjusted for permanent differences in order to reflect their tax character. These adjustments have no impact on net assets or net asset value per share. Temporary differences which arise from recognizing certain items of income, expense, gain or loss in different periods for financial statement and tax purposes will reverse at some time in the future. Distributions in excess of net investment income or net realized gains are temporary overdistributions for financial statement purposes resulting from differences in the recognition or classification of income or distributions for financial statement and tax purposes.
Book/tax differences primarily relate to wash sale loss deferrals.
The tax character of distributions made during the current period will be determined at fiscal year end. The tax character of distributions declared to shareholders for the last fiscal year is as follows:
| | | | |
| | | 8/31/16 | |
Ordinary income (including any
short-term capital gains) | | | $126,270,222 | |
32
Notes to Financial Statements (unaudited) – continued
The federal tax cost and the tax basis components of distributable earnings were as follows:
| | | | |
| As of 2/28/17 | | | |
| Cost of investments | | | $6,490,282,713 | |
| Gross appreciation | | | 532,182,206 | |
| Gross depreciation | | | (538,377,888 | ) |
| Net unrealized appreciation (depreciation) | | | $(6,195,682 | ) |
| |
| As of 8/31/16 | | | |
| Undistributed ordinary income | | | 123,092,929 | |
| Capital loss carryforwards | | | (268,624,124 | ) |
| Post-October capital loss deferral | | | (264,058,273 | ) |
| Other temporary differences | | | (1,284,573 | ) |
| Net unrealized appreciation (depreciation) | | | 7,276,157 | |
The aggregate cost above includes prior fiscal year end tax adjustments, if applicable.
Under the Regulated Investment Company Modernization Act of 2010 (the “Act”), net capital losses recognized for fund fiscal years beginning after August 31, 2011 may be carried forward indefinitely, and their character is retained as short-term and/or long-term losses (“post-enactment losses”). Previously, net capital losses were carried forward for eight years and treated as short-term losses (“pre-enactment losses”). As a transition rule, the Act requires that all post-enactment net capital losses be used before pre-enactment net capital losses.
As of August 31, 2016, the fund had capital loss carryforwards available to offset future realized gains. Such pre-enactment losses expire as follows:
Multiple Classes of Shares of Beneficial Interest – The fund offers multiple classes of shares, which differ in their respective distribution, service, and program manager fees. The fund’s income, realized and unrealized gain (loss), and common expenses are allocated to shareholders based on the daily net assets of each class. Dividends are declared separately for each class. Differences in per share dividend rates are generally due to differences in separate class expenses. Class B and Class 529B shares will convert to Class A and Class 529A shares, respectively, approximately eight years after
33
Notes to Financial Statements (unaudited) – continued
purchase. The fund’s distributions declared to shareholders as reported in the Statements of Changes in Net Assets are presented by class as follows:
| | | | | | | | |
| | | From net investment
income | |
| | | Six months
ended
2/28/17 | | | Year
ended
8/31/16 | |
| Class A | | | $14,801,129 | | | | $18,519,876 | |
| Class B | | | 52,252 | | | | 64,227 | |
| Class C | | | 520,875 | | | | 617,527 | |
| Class I | | | 42,606,302 | | | | 44,201,313 | |
| Class R1 | | | 17,739 | | | | 24,774 | |
| Class R2 | | | 2,122,150 | | | | 2,349,821 | |
| Class R3 | | | 1,806,343 | | | | 2,419,727 | |
| Class R4 | | | 2,074,905 | | | | 6,237,275 | |
| Class R6 | | | 58,847,369 | | | | 51,787,408 | |
| Class 529A | | | 178,025 | | | | 38,977 | |
| Class 529B | | | 7,154 | | | | 507 | |
| Class 529C | | | 61,177 | | | | 8,790 | |
| Total | | | $123,095,420 | | | | $126,270,222 | |
(3) Transactions with Affiliates
Investment Adviser – The fund has an investment advisory agreement with MFS to provide overall investment management and related administrative services and facilities to the fund. For the period from September 1, 2016 through December 28, 2016, the management fee was computed daily and paid monthly at the following annual rates:
| | | | |
| First $1 billion of average daily net assets | | | 0.90 | % |
| Next $1 billion of average daily net assets | | | 0.80 | % |
| Average daily net assets in excess of $2 billion | | | 0.70 | % |
The investment adviser had agreed in writing to reduce its management fee to 0.60% of average daily net assets in excess of $5 billion up to $10 billion and 0.55% of average net assets in excess of $10 billion. This written agreement terminated on December 28, 2016. For the period from September 1, 2016 through December 28, 2016, this management fee reduction amounted to $451,215, which is included in the reduction of total expenses in the Statement of Operations.
Effective December 29, 2016, the management fee is computed daily and paid monthly at the following annual rates:
| | | | |
| First $1 billion of average daily net assets | | | 0.90 | % |
| Average daily net assets in excess of $1 billion up to $2 billion | | | 0.80 | % |
| Average daily net assets in excess of $2 billion up to $5 billion | | | 0.70 | % |
| Average daily net assets in excess of $5 billion up to $10 billion | | | 0.60 | % |
| Average daily net assets in excess of $10 billion | | | 0.55 | % |
MFS has also agreed in writing to reduce its management fee by a specified amount if certain MFS mutual fund assets exceed thresholds agreed to by MFS and the fund’s
34
Notes to Financial Statements (unaudited) – continued
Board of Trustees. For the six months ended February 28, 2017, this management fee reduction amounted to $232,029, which is included in the reduction of total expenses in the Statement of Operations. The management fee incurred for the six months ended February 28, 2017 was equivalent to an annual effective rate of 0.72% of the fund’s average daily net assets.
Distributor – MFS Fund Distributors, Inc. (MFD), a wholly-owned subsidiary of MFS, as distributor, received $23,670 and $2,654 for the six months ended February 28, 2017, as its portion of the initial sales charge on sales of Class A and Class 529A shares of the fund, respectively.
The Board of Trustees has adopted a distribution plan for certain share classes pursuant to Rule 12b-1 of the Investment Company Act of 1940.
The fund’s distribution plan provides that the fund will pay MFD for services provided by MFD and financial intermediaries in connection with the distribution and servicing of certain share classes. One component of the plan is a distribution fee paid to MFD and another component of the plan is a service fee paid to MFD. MFD may subsequently pay all, or a portion, of the distribution and/or service fees to financial intermediaries.
Distribution Plan Fee Table:
| | | | | | | | | | | | | | | | | | | | |
| | | Distribution
Fee Rate (d) | | | Service
Fee Rate (d) | | | Total
Distribution Plan (d) | | | Annual
Effective Rate (e) | | | Distribution
and Service
Fee | |
| Class A | | | — | | | | 0.25% | | | | 0.25% | | | | 0.25% | | | | $1,102,277 | |
| Class B | | | 0.75% | | | | 0.25% | | | | 1.00% | | | | 1.00% | | | | 35,801 | |
| Class C | | | 0.75% | | | | 0.25% | | | | 1.00% | | | | 1.00% | | | | 284,523 | |
| Class R1 | | | 0.75% | | | | 0.25% | | | | 1.00% | | | | 1.00% | | | | 10,960 | |
| Class R2 | | | 0.25% | | | | 0.25% | | | | 0.50% | | | | 0.50% | | | | 360,140 | |
| Class R3 | | | — | | | | 0.25% | | | | 0.25% | | | | 0.25% | | | | 138,788 | |
| Class 529A | | | — | | | | 0.25% | | | | 0.25% | | | | 0.22% | | | | 11,186 | |
| Class 529B | | | 0.75% | | | | 0.25% | | | | 1.00% | | | | 1.00% | | | | 2,005 | |
| Class 529C | | | 0.75% | | | | 0.25% | | | | 1.00% | | | | 0.99% | | | | 16,363 | |
| Total Distribution and Service Fees | | | | | | | | $1,962,043 | |
| (d) | In accordance with the distribution plan for certain classes, the fund pays distribution and/or service fees equal to these annual percentage rates of each class’s average daily net assets. The distribution and service fee rates disclosed by class represent the current rates in effect at the end of the reporting period. Any rate changes, if applicable, are detailed below. |
| (e) | The annual effective rates represent actual fees incurred under the distribution plan for the six months ended February 28, 2017 based on each class’s average daily net assets. MFD has voluntarily agreed to rebate a portion of each class’s 0.25% service fee attributable to accounts for which MFD retains the 0.25% service fee except for accounts attributable to MFS or its affiliates’ seed money. For the six months ended February 28, 2017, this rebate amounted to $3,697, $31, $63, $12, $4, $1,172, $1, and $183 for Class A, Class B, Class C, Class R2, Class R3, Class 529A, Class 529B, and Class 529C, respectively, and is included in the reduction of total expenses in the Statement of Operations. |
Certain Class A shares are subject to a contingent deferred sales charge (CDSC) in the event of a shareholder redemption within 18 months of purchase. Class C and Class 529C shares are subject to a CDSC in the event of a shareholder redemption within 12 months of purchase. Class B and Class 529B shares are subject to a CDSC in
35
Notes to Financial Statements (unaudited) – continued
the event of a shareholder redemption within six years of purchase. All contingent deferred sales charges are paid to MFD and during the six months ended February 28, 2017, were as follows:
| | | | |
| | | Amount | |
| Class A | | | $1,082 | |
| Class B | | | 4,776 | |
| Class C | | | 1,306 | |
| Class 529B | | | — | |
| Class 529C | | | 50 | |
The fund has entered into and may from time to time enter into contracts with program managers and other parties which administer the tuition programs through which an investment in the fund’s 529 share classes is made. The fund has entered into an agreement with MFD pursuant to which MFD receives an annual fee of up to 0.10% of the average daily net assets attributable to each 529 share class. MFD has agreed to waive a portion of this fee in an amount equal to 0.05% of the average daily net assets for each 529 share class. This waiver agreement will expire on December 31, 2017, unless MFD elects to extend the waiver. For the six months ended February 28, 2017, this waiver amounted to $3,155 and is included in the reduction of total expenses in the Statement of Operations. The program manager fee incurred for the six months ended February 28, 2017 was equivalent to an annual effective rate of 0.05% of the average daily net assets attributable to each 529 share class. The services provided by MFD, or a third party with which MFD contracts, include recordkeeping and tax reporting and account services, as well as services designed to maintain the program’s compliance with the Internal Revenue Code and other regulatory requirements. Program manager fees and waivers for the six months ended February 28, 2017, were as follows:
| | | | | | | | |
| | | Fee | | | Waiver | |
| Class 529A | | | $4,474 | | | | $2,237 | |
| Class 529B | | | 201 | | | | 100 | |
| Class 529C | | | 1,636 | | | | 818 | |
| Total Program Manager Fees and Waivers | | | $6,311 | | | | $3,155 | |
Shareholder Servicing Agent – MFS Service Center, Inc. (MFSC), a wholly-owned subsidiary of MFS, receives a fee from the fund for its services as shareholder servicing agent calculated as a percentage of the average daily net assets of the fund as determined periodically under the supervision of the fund’s Board of Trustees. For the six months ended February 28, 2017, the fee was $116,887, which equated to 0.0037% annually of the fund’s average daily net assets. MFSC also receives payment from the fund for out-of-pocket expenses, sub-accounting and other shareholder servicing costs which may be paid to affiliated and unaffiliated service providers. Class R6 shares do not incur sub-accounting fees. For the six months ended February 28, 2017, these out-of-pocket expenses, sub-accounting and other shareholder servicing costs amounted to $1,876,636.
Administrator – MFS provides certain financial, legal, shareholder communications, compliance, and other administrative services to the fund. Under an administrative services agreement, the fund reimburses MFS the costs incurred to provide these
36
Notes to Financial Statements (unaudited) – continued
services. The fund is charged an annual fixed amount of $17,500 plus a fee based on average daily net assets. The administrative services fee incurred for the six months ended February 28, 2017 was equivalent to an annual effective rate of 0.0096% of the fund’s average daily net assets.
Trustees’ and Officers’ Compensation – The fund pays compensation to independent Trustees in the form of a retainer, attendance fees, and additional compensation to Board and Committee chairpersons. The fund does not pay compensation directly to Trustees or officers of the fund who are also officers of the investment adviser, all of whom receive remuneration for their services to the fund from MFS. Certain officers and Trustees of the fund are officers or directors of MFS, MFD, and MFSC.
Prior to December 31, 2001, the fund had an unfunded defined benefit plan (“DB plan”) for independent Trustees. As of December 31, 2001, the Board took action to terminate the DB plan with respect to then-current and any future independent Trustees, such that the DB plan covers only certain of those former independent Trustees who retired on or before December 31, 2001. The DB plan resulted in a pension expense of $118 and is included in “Independent Trustees’ compensation” in the Statement of Operations for the six months ended February 28, 2017. The liability for deferred retirement benefits payable to certain independent Trustees under the DB plan amounted to $698 at February 28, 2017, and is included in “Payable for independent Trustees’ compensation” in the Statement of Assets and Liabilities.
Other – This fund and certain other funds managed by MFS (the funds) have entered into a service agreement (the ISO Agreement) which provides for payment of fees solely by the funds to Tarantino LLC in return for the provision of services of an Independent Senior Officer (ISO) for the funds. Frank L. Tarantino serves as the ISO and is an officer of the funds and the sole member of Tarantino LLC. The funds can terminate the ISO Agreement with Tarantino LLC at any time under the terms of the ISO Agreement. For the six months ended February 28, 2017, the fee paid by the fund under this agreement was $6,120 and is included in “Miscellaneous” expense in the Statement of Operations. MFS has agreed to bear all expenses associated with office space, other administrative support, and supplies provided to the ISO.
The fund invests in the MFS Institutional Money Market Portfolio which is managed by MFS and seeks current income consistent with preservation of capital and liquidity. This money market fund does not pay a management fee to MFS.
On March 16, 2016, MFS purchased 1,975 shares of Class I for an aggregate amount of $30,679.
The fund is permitted to engage in purchase and sale transactions (“cross-trades”) with funds and accounts for which MFS serves as investment adviser or sub-adviser pursuant to a policy adopted by the Board of Trustees. This policy has been designed to ensure that cross-trades conducted by the fund comply with Rule 17a-7 under the Investment Company Act of 1940. Under this policy, cross-trades are effected at current market prices with no remuneration paid in connection with the transaction. During the six months ended February 28, 2017, the fund engaged in purchase and sale transactions pursuant to this policy, which amounted to $14,993,786 and $4,100,474, respectively. The sales transactions resulted in net realized gains (losses) of $565,828.
37
Notes to Financial Statements (unaudited) – continued
(4) Portfolio Securities
For the six months ended February 28, 2017, purchases and sales of investments, other than short-term obligations, aggregated $1,066,798,091 and $1,120,363,832, respectively.
(5) Shares of Beneficial Interest
The fund’s Declaration of Trust permits the Trustees to issue an unlimited number of full and fractional shares of beneficial interest. Transactions in fund shares were as follows:
| | | | | | | | | | | | | | | | |
| | | Six months ended
2/28/17 | | | Year ended
8/31/16 | |
| | | |
| | | Shares | | | Amount | | | Shares | | | Amount | |
| Shares sold | | | | | | | | | | | | | | | | |
Class A | | | 6,211,481 | | | | $97,306,584 | | | | 21,545,595 | | | | $328,659,059 | |
Class B | | | 14,630 | | | | 220,030 | | | | 48,030 | | | | 723,144 | |
Class C | | | 116,206 | | | | 1,703,692 | | | | 430,840 | | | | 6,267,357 | |
Class I | | | 25,244,595 | | | | 411,596,757 | | | | 35,918,662 | | | | 572,047,523 | |
Class R1 | | | 7,783 | | | | 112,818 | | | | 23,930 | | | | 338,866 | |
Class R2 | | | 797,595 | | | | 11,996,945 | | | | 1,950,959 | | | | 29,032,110 | |
Class R3 | | | 744,529 | | | | 11,517,620 | | | | 1,552,694 | | | | 23,658,689 | |
Class R4 | | | 593,552 | | | | 9,291,124 | | | | 4,587,268 | | | | 70,247,582 | |
Class R6 | | | 23,016,317 | | | | 357,968,325 | | | | 27,737,532 | | | | 423,125,363 | |
Class 529A | | | 42,574 | | | | 653,908 | | | | 494,224 | | | | 7,503,100 | |
Class 529B | | | 825 | | | | 11,978 | | | | 25,855 | | | | 372,212 | |
Class 529C | | | 22,699 | | | | 323,108 | | | | 181,957 | | | | 2,575,360 | |
| | | 56,812,786 | | | | $902,702,889 | | | | 94,497,546 | | | | $1,464,550,365 | |
| | | | |
| Shares issued to shareholders in reinvestment of distributions | | | | | | | | | | | | | | | | |
Class A | | | 753,070 | | | | $11,612,342 | | | | 967,727 | | | | $15,135,244 | |
Class B | | | 2,923 | | | | 43,611 | | | | 3,595 | | | | 54,285 | |
Class C | | | 22,145 | | | | 321,994 | | | | 24,676 | | | | 363,730 | |
Class I | | | 2,119,423 | | | | 33,762,412 | | | | 2,154,640 | | | | 34,797,443 | |
Class R1 | | | 1,232 | | | | 17,670 | | | | 1,698 | | | | 24,674 | |
Class R2 | | | 135,578 | | | | 2,022,831 | | | | 148,079 | | | | 2,243,401 | |
Class R3 | | | 118,371 | | | | 1,806,343 | | | | 156,313 | | | | 2,419,727 | |
Class R4 | | | 134,339 | | | | 2,072,857 | | | | 394,308 | | | | 6,166,970 | |
Class R6 | | | 3,829,739 | | | | 58,709,900 | | | | 3,318,907 | | | | 51,642,198 | |
Class 529A | | | 11,741 | | | | 177,872 | | | | 2,497 | | | | 38,505 | |
Class 529B | | | 499 | | | | 7,154 | | | | 35 | | | | 507 | |
Class 529C | | | 4,342 | | | | 61,177 | | | | 609 | | | | 8,790 | |
| | | 7,133,402 | | | | $110,616,163 | | | | 7,173,084 | | | | $112,895,474 | |
38
Notes to Financial Statements (unaudited) – continued
| | | | | | | | | | | | | | | | |
| | | Six months ended
2/28/17 | | | Year ended
8/31/16 | |
| | | |
| | | Shares | | | Amount | | | Shares | | | Amount | |
| Shares reacquired | | | | | | | | | | | | | | | | |
Class A | | | (20,323,865 | ) | | | $(318,802,169 | ) | | | (33,256,347 | ) | | | $(505,503,605 | ) |
Class B | | | (110,328 | ) | | | (1,649,954 | ) | | | (245,306 | ) | | | (3,634,091 | ) |
Class C | | | (714,415 | ) | | | (10,456,052 | ) | | | (1,328,603 | ) | | | (19,307,729 | ) |
Class I | | | (21,932,135 | ) | | | (354,340,566 | ) | | | (47,251,025 | ) | | | (747,130,180 | ) |
Class R1 | | | (38,193 | ) | | | (549,957 | ) | | | (92,952 | ) | | | (1,312,230 | ) |
Class R2 | | | (1,475,472 | ) | | | (22,381,970 | ) | | | (2,907,635 | ) | | | (43,313,201 | ) |
Class R3 | | | (2,595,191 | ) | | | (40,283,809 | ) | | | (3,856,903 | ) | | | (58,609,686 | ) |
Class R4 | | | (3,284,805 | ) | | | (51,869,429 | ) | | | (16,622,063 | ) | | | (263,940,004 | ) |
Class R6 | | | (9,732,095 | ) | | | (152,085,183 | ) | | | (40,593,179 | ) | | | (630,552,683 | ) |
Class 529A | | | (42,034 | ) | | | (645,710 | ) | | | (63,717 | ) | | | (975,004 | ) |
Class 529B | | | (5,515 | ) | | | (80,348 | ) | | | (5,596 | ) | | | (82,184 | ) |
Class 529C | | | (20,981 | ) | | | (296,680 | ) | | | (20,939 | ) | | | (301,263 | ) |
| | | (60,275,029 | ) | | | $(953,441,827 | ) | | | (146,244,265 | ) | | | $(2,274,661,860 | ) |
| | | | |
| Net change | | | | | | | | | | | | | | | | |
Class A | | | (13,359,314 | ) | | | $(209,883,243 | ) | | | (10,743,025 | ) | | | $(161,709,302 | ) |
Class B | | | (92,775 | ) | | | (1,386,313 | ) | | | (193,681 | ) | | | (2,856,662 | ) |
Class C | | | (576,064 | ) | | | (8,430,366 | ) | | | (873,087 | ) | | | (12,676,642 | ) |
Class I | | | 5,431,883 | | | | 91,018,603 | | | | (9,177,723 | ) | | | (140,285,214 | ) |
Class R1 | | | (29,178 | ) | | | (419,469 | ) | | | (67,324 | ) | | | (948,690 | ) |
Class R2 | | | (542,299 | ) | | | (8,362,194 | ) | | | (808,597 | ) | | | (12,037,690 | ) |
Class R3 | | | (1,732,291 | ) | | | (26,959,846 | ) | | | (2,147,896 | ) | | | (32,531,270 | ) |
Class R4 | | | (2,556,914 | ) | | | (40,505,448 | ) | | | (11,640,487 | ) | | | (187,525,452 | ) |
Class R6 | | | 17,113,961 | | | | 264,593,042 | | | | (9,536,740 | ) | | | (155,785,122 | ) |
Class 529A | | | 12,281 | | | | 186,070 | | | | 433,004 | | | | 6,566,601 | |
Class 529B | | | (4,191 | ) | | | (61,216 | ) | | | 20,294 | | | | 290,535 | |
Class 529C | | | 6,060 | | | | 87,605 | | | | 161,627 | | | | 2,282,887 | |
| | | 3,671,159 | | | | $59,877,225 | | | | (44,573,635 | ) | | | $(697,216,021 | ) |
The fund is one of several mutual funds in which certain MFS funds may invest. The MFS funds do not invest in the underlying funds for the purpose of exercising management or control. At the end of the period, the MFS International Diversification Fund, the MFS Moderate Allocation Fund, the MFS Growth Allocation Fund, the MFS Aggressive Growth Allocation Fund, and the MFS Conservative Allocation Fund were the owners of record of approximately 29%, 5%, 5%, 2%, and 2%, respectively, of the value of outstanding voting shares of the fund. In addition, the MFS Lifetime 2020 Fund, the MFS Lifetime 2025 Fund, the MFS Lifetime 2030 Fund, the MFS Lifetime 2035 Fund, the MFS Lifetime 2040 Fund, the MFS Lifetime 2045 Fund, the MFS Lifetime 2050 Fund, the MFS Lifetime 2055 Fund, the MFS Lifetime 2060 Fund, and the MFS Lifetime Income Fund were each the owners of record of less than 1% of the value of outstanding voting shares of the fund.
39
Notes to Financial Statements (unaudited) – continued
(6) Line of Credit
The fund and certain other funds managed by MFS participate in a $1.25 billion unsecured committed line of credit, subject to a $1 billion sublimit, provided by a syndication of banks under a credit agreement. Borrowings may be made for temporary financing needs. Interest is charged to each fund, based on its borrowings, generally at a rate equal to the higher of the Overnight Federal Reserve funds rate or daily one month LIBOR plus an agreed upon spread. A commitment fee, based on the average daily, unused portion of the committed line of credit, is allocated among the participating funds at the end of each calendar quarter. In addition, the fund and other funds managed by MFS have established unsecured uncommitted borrowing arrangements with certain banks for temporary financing needs. Interest is charged to each fund, based on its borrowings, at a rate equal to the Overnight Federal Reserve funds rate plus an agreed upon spread. For the six months ended February 28, 2017, the fund’s commitment fee and interest expense were $22,868 and $0, respectively, and are included in “Miscellaneous” expense in the Statement of Operations.
(7) Transactions in Underlying Affiliated Funds-Affiliated Issuers
An affiliated issuer may be considered one in which the fund owns 5% or more of the outstanding voting securities, or a company which is under common control. For the purposes of this report, the fund assumes the following to be an affiliated issuer:
| | | | | | | | | | | | | | | | |
| Underlying Affiliated Fund | | Beginning
Shares/Par
Amount | | | Acquisitions
Shares/Par
Amount | | | Dispositions
Shares/Par
Amount | | | Ending
Shares/Par
Amount | |
| MFS Institutional Money Market Portfolio | | | 41,698,907 | | | | 535,485,753 | | | | (522,253,377 | ) | | | 54,931,283 | |
| | | | |
| Underlying Affiliated Fund | | Realized
Gain (Loss) | | | Capital Gain
Distributions | | | Dividend
Income | | | Ending
Value | |
| MFS Institutional Money Market Portfolio | | | $(5,403 | ) | | | $— | | | | $126,512 | | | | $54,931,283 | |
40
PROXY VOTING POLICIES AND INFORMATION
MFS votes proxies on behalf of the fund pursuant to proxy voting policies and procedures that are available without charge, upon request, by calling 1-800-225-2606, by visiting mfs.com (once you have selected “Individual Investor” as your role, click on “Individual Investor Home” in the top navigation and then select “Learn More About Proxy Voting” under the “I want to…” header on the left hand column of the page), or by visiting the SEC’s Web site at http://www.sec.gov.
Information regarding how the fund voted proxies relating to portfolio securities during the most recent twelve-month period ended June 30 is available by August 31 of each year without charge by visiting mfs.com (once you have selected “Individual Investor” as your role, click on “Individual Investor Home” in the top navigation and then select “Learn More About Proxy Voting” under the “I want to…” header on the left hand column of the page), or by visiting the SEC’s Web site at http://www.sec.gov.
QUARTERLY PORTFOLIO DISCLOSURE
The fund will file a complete schedule of portfolio holdings with the Securities and Exchange Commission (the Commission) for the first and third quarters of each fiscal year on Form N-Q. A shareholder can obtain the quarterly portfolio holdings report at mfs.com. The fund’s Form N-Q is also available on the EDGAR database on the Commission’s Internet Web site at http://www.sec.gov, and may be reviewed and copied at the:
Public Reference Room
Securities and Exchange Commission
100 F Street, NE, Room 1580
Washington, D.C. 20549
Information on the operation of the Public Reference Room may be obtained by calling the Commission at 1-800-SEC-0330. Copies of the fund’s Form N-Q also may be obtained, upon payment of a duplicating fee, by electronic request at the following e-mail address: publicinfo@sec.gov or by writing the Public Reference Section at the above address.
FURTHER INFORMATION
From time to time, MFS may post important information about the fund or the MFS funds on the MFS web site (mfs.com). This information is available on mfs.com by following these steps once you have selected “Individual Investor” as your role: (1) Click on the “Individual Investor Home” in the top navigation and then select the “Announcements” option within the “Market Outlooks” drop down, or (2) Click on “Products & Services” and “Mutual Funds” and then choose the fund’s name in the “Select a fund” menu.
41
INFORMATION ABOUT FUND CONTRACTS AND LEGAL CLAIMS
The fund has entered into contractual arrangements with an investment adviser, administrator, distributor, shareholder servicing agent, 529 program manager (if applicable), and custodian who each provide services to the fund. Unless expressly stated otherwise, shareholders are not parties to, or intended beneficiaries of these contractual arrangements, and these contractual arrangements are not intended to create any shareholder right to enforce them against the service providers or to seek any remedy under them against the service providers, either directly or on behalf of the fund.
Under the Trust’s By-Laws and Declaration of Trust, any claims asserted against or on behalf of the MFS Funds, including claims against Trustees and Officers, must be brought in state and federal courts located within the Commonwealth of Massachusetts.
PROVISION OF FINANCIAL REPORTS AND SUMMARY PROSPECTUSES
The fund produces financial reports every six months and updates its summary prospectus and prospectus annually. To avoid sending duplicate copies of materials to households, only one copy of the fund’s annual and semiannual report and summary prospectus may be mailed to shareholders having the same last name and residential address on the fund’s records. However, any shareholder may contact MFSC (please see back cover for address and telephone number) to request that copies of these reports and summary prospectuses be sent personally to that shareholder.
42
Save paper with eDelivery.

| MFS® will send you prospectuses, |
reports, and proxies directly via e-mail so you will get information faster with less mailbox clutter.
To sign up:
1. Go to mfs.com.
2. Log in via MFS® Access.
3. Select eDelivery.
If you own your MFS fund shares through a financial institution or a retirement plan, MFS® TALK, MFS® Access, or eDelivery may not be available to you.
CONTACT
WEB SITE
mfs.com
MFS TALK
1-800-637-8255
24 hours a day
ACCOUNT SERVICE AND LITERATURE
Shareholders
1-800-225-2606
Financial advisors
1-800-343-2829
Retirement plan services
1-800-637-1255
MAILING ADDRESS
MFS Service Center, Inc.
P.O. Box 55824
Boston, MA 02205-5824
OVERNIGHT MAIL
MFS Service Center, Inc.
c/o Boston Financial Data Services
30 Dan Road
Canton, MA 02021-2809
SEMIANNUAL REPORT
February 28, 2017

MFS® TECHNOLOGY FUND

SCT-SEM
MFS® TECHNOLOGY FUND
CONTENTS
The report is prepared for the general information of shareholders.
It is authorized for distribution to prospective investors only when preceded or accompanied by a current prospectus.
NOT FDIC INSURED • MAY LOSE VALUE • NO BANK GUARANTEE

LETTER FROM THE EXECUTIVE CHAIRMAN
Dear Shareholders:
Despite June’s unexpected vote by the United Kingdom to leave the European Union and the surprising result in November’s U.S. presidential election, most markets have
proved resilient. U.S. share prices quickly reversed post-Brexit declines, and indices reached new highs following the November elections. U.S. bond yields rose after Donald Trump’s victory on hopes that his proposed policy mix of lower taxes, increased spending on infrastructure and a lower regulatory burden on businesses will lift both U.S. economic growth and inflation. However, interest rates in most developed markets remain very low, with major central banks maintaining extremely accommodative monetary policies to reinvigorate slow-growing economies against a backdrop of still-low inflation. Even after the rise in yields following the election, interest rates remain low by historical standards.
Globally, economic growth has shown signs of recovery of late, led by the United States and the eurozone. Despite better growth, there are few immediate signs of worrisome inflation. Emerging market economies are recovering at a somewhat slower pace amid fears that restrictive U.S. trade policies could further hamper the already slow pace of global trade growth. Looking ahead, markets will have to contend with a series of European elections during 2017, which, depending on the outcome, could further call into question the future direction of the European Union.
At MFS®, we believe in a patient, long-term approach to investing. Viewing investments with a long lens makes it possible to filter out short-term market noise and focus on achieving solid risk-adjusted returns over a full market cycle.
In our view, such an approach, along with the professional guidance of a financial advisor, will help you reach your investment objectives.
Respectfully,

Robert J. Manning
Executive Chairman
MFS Investment Management
April 13, 2017
The opinions expressed in this letter are subject to change and may not be relied upon for investment advice. No forecasts can be guaranteed.
1
PORTFOLIO COMPOSITION
Portfolio structure (i)
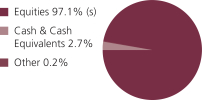
| | | | |
| Top ten holdings (i) | | | | |
| Alphabet, Inc., “A” | | | 11.8% | |
| Facebook, Inc., “A” | | | 6.9% | |
| Amazon.com, Inc. | | | 6.6% | |
| Microsoft Corp. | | | 5.5% | |
| Visa, Inc., “A” | | | 3.7% | |
| Salesforce.com, Inc. | | | 3.5% | |
| Adobe Systems, Inc. | | | 3.5% | |
| Microchip Technology, Inc. | | | 3.3% | |
| Apple, Inc. | | | 3.0% | |
| NXP Semiconductors N.V. | | | 2.9% | |
| | | | |
| Top five industries (i) | | | | |
| Internet | | | 21.4% | |
| Computer Software | | | 13.7% | |
| Electronics | | | 12.4% | |
| Business Services | | | 10.2% | |
| Computer Software-Systems (s) | | | 9.2% | |
| (i) | For purposes of this presentation, the components include the value of securities, less any securities sold short, and reflect the impact of the equivalent exposure of derivative positions. These amounts may be negative from time to time. Equivalent exposure is a calculated amount that translates the derivative position into a reasonable approximation of the amount of the underlying asset that the portfolio would have to hold at a given point in time to have the same price sensitivity that results from the portfolio’s ownership of the derivative contract. When dealing with derivatives, equivalent exposure is a more representative measure of the potential impact of a position on portfolio performance than value. |
| (s) | Includes securities sold short. |
Cash & Cash Equivalents includes any cash, investments in money market funds, short-term securities, and other assets less liabilities. Please see the Statement of Assets and Liabilities for additional information related to the fund’s cash position and other assets and liabilities.
Other includes equivalent exposure from currency derivatives and/or any offsets to derivative positions.
Percentages are based on net assets as of 2/28/17 and may not agree with the Portfolio of Investments due to the equivalent exposure of equity options.
The portfolio is actively managed and current holdings may be different.
2
EXPENSE TABLE
Fund expenses borne by the shareholders during the period, September 1, 2016 through February 28, 2017
As a shareholder of the fund, you incur two types of costs: (1) transaction costs, including sales charges (loads) on certain purchase or redemption payments, and (2) ongoing costs, including management fees; distribution and service (12b-1) fees; and other fund expenses. This example is intended to help you understand your ongoing costs (in dollars) of investing in the fund and to compare these costs with the ongoing costs of investing in other mutual funds.
The example is based on an investment of $1,000 invested at the beginning of the period and held for the entire period September 1, 2016 through February 28, 2017.
Actual Expenses
The first line for each share class in the following table provides information about actual account values and actual expenses. You may use the information in this line, together with the amount you invested, to estimate the expenses that you paid over the period. Simply divide your account value by $1,000 (for example, an $8,600 account value divided by $1,000 = 8.6), then multiply the result by the number in the first line under the heading entitled “Expenses Paid During Period” to estimate the expenses you paid on your account during this period.
Hypothetical Example for Comparison Purposes
The second line for each share class in the following table provides information about hypothetical account values and hypothetical expenses based on the fund’s actual expense ratio and an assumed rate of return of 5% per year before expenses, which is not the fund’s actual return. The hypothetical account values and expenses may not be used to estimate the actual ending account balance or expenses you paid for the period. You may use this information to compare the ongoing costs of investing in the fund and other funds. To do so, compare this 5% hypothetical example with the 5% hypothetical examples that appear in the shareholder reports of the other funds.
Please note that the expenses shown in the table are meant to highlight your ongoing costs only and do not reflect any transactional costs, such as sales charges (loads). Therefore, the second line for each share class in the table is useful in comparing ongoing costs only, and will not help you determine the relative total costs of owning different funds. In addition, if these transactional costs were included, your costs would have been higher.
3
Expense Table – continued
| | | | | | | | | | | | | | | | | | |
Share
Class | | | | Annualized
Expense Ratio | | | Beginning
Account Value
9/01/16 | | | Ending Account Value
2/28/17 | | | Expenses Paid During
Period (p) 9/01/16-2/28/17 | |
| A | | Actual | | | 1.25% | | | | $1,000.00 | | | | $1,089.38 | | | | $6.48 | |
| | Hypothetical (h) | | | 1.25% | | | | $1,000.00 | | | | $1,018.60 | | | | $6.26 | |
| B | | Actual | | | 2.00% | | | | $1,000.00 | | | | $1,085.64 | | | | $10.34 | |
| | Hypothetical (h) | | | 2.00% | | | | $1,000.00 | | | | $1,014.88 | | | | $9.99 | |
| C | | Actual | | | 2.00% | | | | $1,000.00 | | | | $1,085.40 | | | | $10.34 | |
| | Hypothetical (h) | | | 2.00% | | | | $1,000.00 | | | | $1,014.88 | | | | $9.99 | |
| I | | Actual | | | 1.00% | | | | $1,000.00 | | | | $1,090.78 | | | | $5.18 | |
| | Hypothetical (h) | | | 1.00% | | | | $1,000.00 | | | | $1,019.84 | | | | $5.01 | |
| R1 | | Actual | | | 2.00% | | | | $1,000.00 | | | | $1,085.58 | | | | $10.34 | |
| | Hypothetical (h) | | | 2.00% | | | | $1,000.00 | | | | $1,014.88 | | | | $9.99 | |
| R2 | | Actual | | | 1.50% | | | | $1,000.00 | | | | $1,088.21 | | | | $7.77 | |
| | Hypothetical (h) | | | 1.50% | | | | $1,000.00 | | | | $1,017.36 | | | | $7.50 | |
| R3 | | Actual | | | 1.26% | | | | $1,000.00 | | | | $1,089.41 | | | | $6.53 | |
| | Hypothetical (h) | | | 1.26% | | | | $1,000.00 | | | | $1,018.55 | | | | $6.31 | |
| R4 | | Actual | | | 1.01% | | | | $1,000.00 | | | | $1,091.03 | | | | $5.24 | |
| | Hypothetical (h) | | | 1.01% | | | | $1,000.00 | | | | $1,019.79 | | | | $5.06 | |
| R6 | | Actual | | | 0.91% | | | | $1,000.00 | | | | $1,091.42 | | | | $4.72 | |
| | Hypothetical (h) | | | 0.91% | | | | $1,000.00 | | | | $1,020.28 | | | | $4.56 | |
| (h) | 5% class return per year before expenses. |
| (p) | “Expenses Paid During Period” are equal to each class’s annualized expense ratio, as shown above, multiplied by the average account value over the period, multiplied by 181/365 (to reflect the one-half year period). Expenses paid do not include any applicable sales charges (loads). If these transaction costs had been included, your costs would have been higher. |
Notes to Expense Table
Expense ratios include 0.06% of investment related expenses from short sales (See Note 2 of the Notes to Financial Statements).
Expense ratios reflect a one-time Reimbursement of Expenses by Custodian of 0.01% (See Note 2 of the Notes to Financial Statements).
4
PORTFOLIO OF INVESTMENTS
2/28/17 (unaudited)
The Portfolio of Investments is a complete list of all securities owned by your fund. It is categorized by broad-based asset classes.
| | | | | | | | |
| Common Stocks - 98.3% | | | | | | | | |
| Issuer | | Shares/Par | | | Value ($) | |
| Aerospace - 1.7% | | | | | | | | |
| Harris Corp. | | | 27,055 | | | $ | 2,973,345 | |
| Leidos Holdings, Inc. | | | 89,468 | | | | 4,768,644 | |
| Northrop Grumman Corp. | | | 17,210 | | | | 4,252,419 | |
| | | | | | | | |
| | | | $ | 11,994,408 | |
| Broadcasting - 1.0% | | | | | | | | |
| Time Warner, Inc. | | | 73,500 | | | $ | 7,218,435 | |
| | |
| Brokerage & Asset Managers - 1.9% | | | | | | | | |
| Intercontinental Exchange, Inc. | | | 83,707 | | | $ | 4,782,181 | |
| NASDAQ, Inc. | | | 124,428 | | | | 8,848,075 | |
| | | | | | | | |
| | | | $ | 13,630,256 | |
| Business Services - 10.2% | | | | | | | | |
| Cognizant Technology Solutions Corp., “A” (a) | | | 243,042 | | | $ | 14,405,099 | |
| Equifax, Inc. | | | 35,926 | | | | 4,710,258 | |
| Fidelity National Information Services, Inc. | | | 166,540 | | | | 13,701,246 | |
| First Data Corp. (a) | | | 235,103 | | | | 3,785,158 | |
| Fiserv, Inc. (a) | | | 86,472 | | | | 9,978,869 | |
| FleetCor Technologies, Inc. (a) | | | 56,026 | | | | 9,524,420 | |
| Global Payments, Inc. | | | 139,376 | | | | 11,106,873 | |
| Ringcentral, Inc. (a) | | | 96,700 | | | | 2,581,890 | |
| Verisk Analytics, Inc., “A” (a) | | | 36,945 | | | | 3,063,479 | |
| | | | | | | | |
| | | | $ | 72,857,292 | |
| Cable TV - 1.5% | | | | | | | | |
| Charter Communications, Inc., “A” (a) | | | 11,907 | | | $ | 3,846,675 | |
| Comcast Corp., “A” | | | 184,552 | | | | 6,905,936 | |
| | | | | | | | |
| | | | $ | 10,752,611 | |
| Computer Software - 13.7% | | | | | | | | |
| Adobe Systems, Inc. (a) | | | 208,653 | | | $ | 24,691,996 | |
| Akamai Technologies, Inc. (a) | | | 28,504 | | | | 1,784,350 | |
| Cadence Design Systems, Inc. (a) | | | 176,919 | | | | 5,466,797 | |
| Microsoft Corp. | | | 612,443 | | | | 39,184,103 | |
| PTC, Inc. (a) | | | 19,760 | | | | 1,064,866 | |
| Salesforce.com, Inc. (a) | | | 303,801 | | | | 24,714,211 | |
| Twilio, Inc., “A” (a)(l) | | | 26,197 | | | | 830,969 | |
| | | | | | | | |
| | | | $ | 97,737,292 | |
5
Portfolio of Investments (unaudited) – continued
| | | | | | | | |
| Issuer | | Shares/Par | | | Value ($) | |
| Common Stocks - continued | | | | | | | | |
| Computer Software - Systems - 10.1% | | | | | | | | |
| Apple, Inc. | | | 156,154 | | | $ | 21,391,536 | |
| Constellation Software, Inc. | | | 19,314 | | | | 9,066,616 | |
| EPAM Systems, Inc. (a) | | | 24,697 | | | | 1,818,440 | |
| Hewlett Packard Enterprise | | | 790,712 | | | | 18,044,048 | |
| NICE Systems Ltd., ADR | | | 49,731 | | | | 3,394,141 | |
| ServiceNow, Inc. (a) | | | 60,078 | | | | 5,221,980 | |
| SS&C Technologies Holdings, Inc. | | | 182,098 | | | | 6,377,072 | |
| Vantiv, Inc., “A” (a) | | | 65,750 | | | | 4,298,735 | |
| Verint Systems, Inc. (a) | | | 52,700 | | | | 1,989,425 | |
| | | | | | | | |
| | | | $ | 71,601,993 | |
| Consumer Services - 1.9% | | | | | | | | |
| Priceline Group, Inc. (a) | | | 7,810 | | | $ | 13,465,455 | |
|
| Electrical Equipment - 1.2% | |
| Amphenol Corp., “A” | | | 123,382 | | | $ | 8,539,268 | |
| | |
| Electronics - 12.4% | | | | | | | | |
| Applied Materials, Inc. | | | 303,128 | | | $ | 10,979,296 | |
| Broadcom Corp. | | | 91,331 | | | | 19,264,448 | |
| Coherent, Inc. (a) | | | 31,866 | | | | 5,818,094 | |
| Mercury Systems, Inc. (a) | | | 85,464 | | | | 3,192,935 | |
| Microchip Technology, Inc. | | | 326,575 | | | | 23,683,219 | |
| NXP Semiconductors N.V. (a) | | | 200,515 | | | | 20,614,947 | |
| Silicon Laboratories, Inc. (a) | | | 71,898 | | | | 4,853,115 | |
| | | | | | | | |
| | | | $ | 88,406,054 | |
| Entertainment - 0.8% | | | | | | | | |
| Netflix, Inc. (a) | | | 40,573 | | | $ | 5,766,640 | |
| | |
| Internet - 21.5% | | | | | | | | |
| Alibaba Group Holding Ltd., ADR (a) | | | 112,744 | | | $ | 11,601,358 | |
| Alphabet, Inc., “A” (a)(s) | | | 99,286 | | | | 83,889,720 | |
| Facebook, Inc., “A” (a)(s) | | | 364,365 | | | | 49,386,032 | |
| Godaddy, Inc. (a) | | | 87,376 | | | | 3,219,806 | |
| LogMeIn, Inc. | | | 57,259 | | | | 5,253,513 | |
| | | | | | | | |
| | | | $ | 153,350,429 | |
| Leisure & Toys - 2.9% | | | | | | | | |
| Activision Blizzard, Inc. | | | 215,692 | | | $ | 9,734,180 | |
| Electronic Arts, Inc. (a) | | | 124,870 | | | | 10,801,255 | |
| | | | | | | | |
| | | | $ | 20,535,435 | |
6
Portfolio of Investments (unaudited) – continued
| | | | | | | | |
| Issuer | | Shares/Par | | | Value ($) | |
| Common Stocks - continued | | | | | | | | |
| Network & Telecom - 2.4% | | | | | | | | |
| Cisco Systems, Inc. | | | 493,832 | | | $ | 16,879,178 | |
| | |
| Other Banks & Diversified Financials - 6.4% | | | | | | | | |
| Mastercard, Inc., “A” | | | 172,063 | | | $ | 19,006,079 | |
| Visa, Inc., “A” | | | 302,977 | | | | 26,643,797 | |
| | | | | | | | |
| | | | $ | 45,649,876 | |
| Printing & Publishing - 0.5% | | | | | | | | |
| IHS Markit Ltd. (a) | | | 85,804 | | | $ | 3,414,999 | |
| | |
| Specialty Stores - 6.6% | | | | | | | | |
| Amazon.com, Inc. (a)(s) | | | 55,826 | | | $ | 47,175,206 | |
| | |
| Telecommunications - Wireless - 1.6% | | | | | | | | |
| American Tower Corp., REIT | | | 41,374 | | | $ | 4,749,321 | |
| SBA Communications Corp., REIT (a) | | | 53,805 | | | | 6,229,005 | |
| | | | | | | | |
| | | | $ | 10,978,326 | |
| Total Common Stocks (Identified Cost, $484,308,136) | | | $ | 699,953,153 | |
| | |
| Issuer/Expiration Date/Strike Price | | Number
of
Contracts | | | | |
| Put Options Purchased - 0.0% | | | | | | | | |
| Consumer Services - 0.0% | | | | | | | | |
| Tripadvisor, Inc. - March 2017 @ $49 | | | 179 | | | $ | 119,930 | |
| | |
| Internet - 0.0% | | | | | | | | |
| WebMD Health Corp. - March 2017 @ $55 | | | 180 | | | $ | 59,400 | |
| Total Put Options Purchased (Premiums Paid, $196,769) | | | $ | 179,330 | |
| | |
| Issuer | | Shares/Par | | | | |
| Money Market Funds - 2.6% | | | | | | | | |
MFS Institutional Money Market Portfolio, 0.64% (v)
(Identified Cost, $18,278,957) | | | 18,279,189 | | | $ | 18,279,189 | |
| | |
| Collateral for Securities Loaned - 0.1% | | | | | | | | |
| State Street Navigator Securities Lending Government Money Market Portfolio, 0.50% (j) (Identified Cost, $772,276) | | | 772,276 | | | $ | 772,276 | |
| Total Investments (Identified Cost, $503,556,138) | | | $ | 719,183,948 | |
7
Portfolio of Investments (unaudited) – continued
| | | | | | | | |
| Securities Sold Short - (1.0)% | | | | | | | | |
| Issuer | | Shares/Par | | | Value ($) | |
| Computer Software - Systems - (0.9)% | | | | | | | | |
| International Business Machines Corp. | | | (27,415 | ) | | $ | (4,929,765 | ) |
| Splunk, Inc. (a) | | | (19,700 | ) | | | (1,216,081 | ) |
| | | | | | | | |
| | | | $ | (6,145,846 | ) |
| Electrical Equipment - (0.1)% | | | | | | | | |
| Belden, Inc. | | | (14,908 | ) | | $ | (1,053,250 | ) |
| Total Securities Sold Short (Proceeds Received, $6,224,935) | | | $ | (7,199,096 | ) |
| |
| Other Assets, Less Liabilities - 0.0% | | | | 90,342 | |
| Net Assets - 100.0% | | | $ | 712,075,194 | |
| (a) | Non-income producing security. |
| (j) | The rate quoted is the annualized seven-day yield of the fund at period end. |
| (l) | A portion of this security is on loan. |
| (s) | Security or a portion of the security was pledged to cover collateral requirements for securities sold short and certain derivative transactions. |
| (v) | Underlying affiliated fund that is available only to investment companies managed by MFS. The rate quoted for the MFS Institutional Money Market Portfolio is the annualized seven-day yield of the fund at period end. |
The following abbreviations are used in this report and are defined:
| ADR | | American Depositary Receipt |
| REIT | | Real Estate Investment Trust |
At February 28, 2017, the fund had cash collateral of $220,177 and other liquid securities with an aggregate value of $12,770,738 to cover any commitments for securities sold short. Cash collateral is comprised of “Deposits with brokers” on the Statement of Assets and Liabilities.
See Notes to Financial Statements
8
Financial Statements
STATEMENT OF ASSETS AND LIABILITIES
At 2/28/17 (unaudited)
This statement represents your fund’s balance sheet, which details the assets and liabilities comprising the total value of the fund.
| | | | |
| Assets | | | | |
Investments | | | | |
Non-affiliated issuers, at value (identified cost, $485,277,181) | | | $700,904,759 | |
Underlying affiliated funds, at value (identified cost, $18,278,957) | | | 18,279,189 | |
Total investments, at value, including $731,241 of securities on loan
(identified cost, $503,556,138) | | | $719,183,948 | |
Deposits with brokers | | | 220,177 | |
Receivables for | | | | |
Investments sold | | | 1,138,103 | |
Fund shares sold | | | 1,997,255 | |
Interest and dividends | | | 492,050 | |
Other assets | | | 3,210 | |
Total assets | | | $723,034,743 | |
| Liabilities | | | | |
Payables for | | | | |
Dividends on securities sold short | | | $38,381 | |
Securities sold short, at value (proceeds received, $6,224,935) | | | 7,199,096 | |
Investments purchased | | | 805,225 | |
Fund shares reacquired | | | 1,900,149 | |
Collateral for securities loaned, at value | | | 772,276 | |
Payable to affiliates | | | | |
Investment adviser | | | 29,732 | |
Shareholder servicing costs | | | 194,064 | |
Distribution and service fees | | | 10,720 | |
Payable for independent Trustees’ compensation | | | 705 | |
Accrued expenses and other liabilities | | | 9,201 | |
Total liabilities | | | $10,959,549 | |
Net assets | | | $712,075,194 | |
| Net assets consist of | | | | |
Paid-in capital | | | $495,861,701 | |
Unrealized appreciation (depreciation) on investments | | | 214,653,649 | |
Accumulated net realized gain (loss) on investments and foreign currency | | | 5,202,810 | |
Accumulated net investment loss | | | (3,642,966 | ) |
Net assets | | | $712,075,194 | |
Shares of beneficial interest outstanding | | | 23,697,553 | |
9
Statement of Assets And Liabilities (unaudited) – continued
| | | | | | | | | | | | |
| | | Net assets | | | Shares
outstanding | | | Net asset value
per share (a) | |
Class A | | | $322,690,218 | | | | 10,676,645 | | | | $30.22 | |
Class B | | | 28,990,151 | | | | 1,088,792 | | | | 26.63 | |
Class C | | | 84,628,103 | | | | 3,184,677 | | | | 26.57 | |
Class I | | | 139,992,715 | | | | 4,364,729 | | | | 32.07 | |
Class R1 | | | 3,257,811 | | | | 122,839 | | | | 26.52 | |
Class R2 | | | 19,098,284 | | | | 658,810 | | | | 28.99 | |
Class R3 | | | 33,928,607 | | | | 1,122,983 | | | | 30.21 | |
Class R4 | | | 11,491,867 | | | | 367,484 | | | | 31.27 | |
Class R6 | | | 67,997,438 | | | | 2,110,594 | | | | 32.22 | |
| (a) | Maximum offering price per share was equal to the net asset value per share for all share classes, except for Class A, for which the maximum offering price per share was $32.06 [100 / 94.25 x $30.22]. On sales of $50,000 or more, the maximum offering price of Class A shares is reduced. A contingent deferred sales charge may be imposed on redemptions of Class A, Class B, and Class C shares. Redemption price per share was equal to the net asset value per share for Classes I, R1, R2, R3, R4, and R6. |
See Notes to Financial Statements
10
Financial Statements
STATEMENT OF OPERATIONS
Six months ended 2/28/17 (unaudited)
This statement describes how much your fund earned in investment income and accrued in expenses. It also describes any gains and/or losses generated by fund operations.
| | | | |
| Net investment loss | | | | |
Income | | | | |
Dividends | | | $2,362,278 | |
Dividends from underlying affiliated funds | | | 38,198 | |
Interest | | | 53,395 | |
Other | | | 1,421 | |
Foreign taxes withheld | | | (6,610 | ) |
Total investment income | | | $2,448,682 | |
Expenses | | | | |
Management fee | | | $2,412,412 | |
Distribution and service fees | | | 1,014,995 | |
Shareholder servicing costs | | | 421,374 | |
Administrative services fee | | | 53,726 | |
Independent Trustees’ compensation | | | 6,197 | |
Custodian fee | | | 18,188 | |
Reimbursement of custodian expenses | | | (25,973 | ) |
Shareholder communications | | | 31,697 | |
Audit and tax fees | | | 28,357 | |
Legal fees | | | 2,423 | |
Dividend and interest expense on securities sold short | | | 184,549 | |
Miscellaneous | | | 96,203 | |
Total expenses | | | $4,244,148 | |
Reduction of expenses by investment adviser and distributor | | | (29,791 | ) |
Net expenses | | | $4,214,357 | |
Net investment loss | | | $(1,765,675 | ) |
| Realized and unrealized gain (loss) on investments and foreign currency | |
Realized gain (loss) (identified cost basis) | | | | |
Investments: | | | | |
Non-affiliated issuers | | | $14,064,537 | |
Underlying affiliated funds | | | 1 | |
Written options | | | 291,947 | |
Securities sold short | | | (1,506,927 | ) |
Foreign currency | | | (11,973 | ) |
Net realized gain (loss) on investments and foreign currency | | | $12,837,585 | |
Change in unrealized appreciation (depreciation) | | | | |
Investments | | | $46,975,548 | |
Written options | | | (59,505 | ) |
Securities sold short | | | (974,161 | ) |
Net unrealized gain (loss) on investments | | | $45,941,882 | |
Net realized and unrealized gain (loss) on investments | | | $58,779,467 | |
Change in net assets from operations | | | $57,013,792 | |
See Notes to Financial Statements
11
Financial Statements
STATEMENTS OF CHANGES IN NET ASSETS
These statements describe the increases and/or decreases in net assets resulting from operations, any distributions, and any shareholder transactions.
| | | | | | | | |
| Change in net assets | | Six months ended 2/28/17 (unaudited) | | | Year ended 8/31/16 | |
| From operations | | | | | | | | |
Net investment loss | | | $(1,765,675 | ) | | | $(2,648,809 | ) |
Net realized gain (loss) on investments and foreign currency | | | 12,837,585 | | | | 8,521,898 | |
Net unrealized gain (loss) on investments | | | 45,941,882 | | | | 74,439,807 | |
Change in net assets from operations | | | $57,013,792 | | | | $80,312,896 | |
| Distributions declared to shareholders | | | | | | | | |
From net realized gain on investments | | | $(12,086,828 | ) | | | $(17,116,057 | ) |
Change in net assets from fund share transactions | | | $68,653,388 | | | | $181,028,652 | |
Total change in net assets | | | $113,580,352 | | | | $244,225,491 | |
| Net assets | | | | | | | | |
At beginning of period | | | 598,494,842 | | | | 354,269,351 | |
At end of period (including accumulated net investment loss of $3,642,966 and $1,877,291, respectively) | | | $712,075,194 | | | | $598,494,842 | |
See Notes to Financial Statements
12
Financial Statements
FINANCIAL HIGHLIGHTS
The financial highlights table is intended to help you understand the fund’s financial performance for the semiannual period and the past 5 fiscal years (or life of a particular share class, if shorter). Certain information reflects financial results for a single fund share. The total returns in the table represent the rate by which an investor would have earned (or lost) on an investment in the fund share class (assuming reinvestment of all distributions) held for the entire period.
| | | | | | | | | | | | | | | | | | | | | | | | |
| | | Six months
ended
2/28/17 (unaudited) | | | Years ended 8/31 | |
| Class A | | | 2016 | | | 2015 | | | 2014 | | | 2013 | | | 2012 | |
| | | | | | | | | | | | | | | | | |
Net asset value, beginning of
period | | | $28.27 | | | | $24.62 | | | | $24.47 | | | | $19.41 | | | | $16.80 | | | | $14.50 | |
| Income (loss) from investment operations | | | | | | | | | | | | | |
Net investment loss (d) | | | $(0.07 | )(c) | | | $(0.12 | ) | | | $(0.15 | ) | | | $(0.13 | ) | | | $(0.12 | ) | | | $(0.17 | ) |
Net realized and unrealized
gain (loss) on investments
and foreign currency | | | 2.56 | | | | 4.76 | | | | 1.15 | | | | 5.19 | | | | 2.73 | | | | 2.47 | |
Total from investment operations | | | $2.49 | | | | $4.64 | | | | $1.00 | | | | $5.06 | | | | $2.61 | | | | $2.30 | |
| Less distributions declared to shareholders | | | | | | | | | | | | | |
From net realized gain on
investments | | | $(0.54 | ) | | | $(0.99 | ) | | | $(0.85 | ) | | | $— | | | | $— | | | | $— | |
Net asset value, end of period (x) | | | $30.22 | | | | $28.27 | | | | $24.62 | | | | $24.47 | | | | $19.41 | | | | $16.80 | |
Total return (%) (r)(s)(t)(x) | | | 8.94 | (c)(n) | | | 19.20 | | | | 4.18 | | | | 26.07 | | | | 15.54 | | | | 15.86 | |
Ratios (%) (to average net assets)
and Supplemental data: | | | | | | | | | | | | | |
Expenses before expense
reductions (f) | | | 1.26 | (a)(c) | | | 1.27 | | | | 1.30 | | | | 1.33 | | | | 1.55 | | | | 1.45 | |
Expenses after expense
reductions (f) | | | 1.25 | (a)(c) | | | 1.26 | | | | 1.29 | | | | 1.32 | | | | 1.54 | | | | 1.45 | |
Net investment loss | | | (0.50 | )(a)(c) | | | (0.48 | ) | | | (0.60 | ) | | | (0.58 | ) | | | (0.70 | ) | | | (1.08 | ) |
Portfolio turnover | | | 20 | (n) | | | 30 | | | | 43 | | | | 38 | | | | 54 | | | | 68 | |
Net assets at end of period
(000 omitted) | | | $322,690 | | | | $320,898 | | | | $199,313 | | | | $171,020 | | | | $141,147 | | | | $143,595 | |
| Supplemental Ratios (%): | | | | | | | | | | | | | |
Ratio of expenses to average net
assets after expense reductions
excluding short sale expenses and interest expense and fees (f) | | | 1.19 | (a)(c) | | | 1.24 | | | | 1.27 | | | | 1.28 | | | | 1.36 | | | | 1.38 | |
See Notes to Financial Statements
13
Financial Highlights – continued
| | | | | | | | | | | | | | | | | | | | | | | | |
| | | Six months
ended
2/28/17 (unaudited) | | | Years ended 8/31 | |
| Class B | | | 2016 | | | 2015 | | | 2014 | | | 2013 | | | 2012 | |
| | | | | | | | | | | | | | | | | |
Net asset value, beginning of
period | | | $25.06 | | | | $22.09 | | | | $22.20 | | | | $17.75 | | | | $15.48 | | | | $13.45 | |
| Income (loss) from investment operations | | | | | | | | | | | | | |
Net investment loss (d) | | | $(0.16 | )(c) | | | $(0.28 | ) | | | $(0.30 | ) | | | $(0.27 | ) | | | $(0.23 | ) | | | $(0.27 | ) |
Net realized and unrealized
gain (loss) on investments
and foreign currency | | | 2.27 | | | | 4.24 | | | | 1.04 | | | | 4.72 | | | | 2.50 | | | | 2.30 | |
Total from investment operations | | | $2.11 | | | | $3.96 | | | | $0.74 | | | | $4.45 | | | | $2.27 | | | | $2.03 | |
| Less distributions declared to shareholders | | | | | | | | | | | | | |
From net realized gain on
investments | | | $(0.54 | ) | | | $(0.99 | ) | | | $(0.85 | ) | | | $— | | | | $— | | | | $— | |
Net asset value, end of period (x) | | | $26.63 | | | | $25.06 | | | | $22.09 | | | | $22.20 | | | | $17.75 | | | | $15.48 | |
Total return (%) (r)(s)(t)(x) | | | 8.56 | (c)(n) | | | 18.29 | | | | 3.41 | | | | 25.07 | | | | 14.66 | | | | 15.09 | |
Ratios (%) (to average net assets)
and Supplemental data: | | | | | | | | | |
Expenses before expense
reductions (f) | | | 2.01 | (a)(c) | | | 2.02 | | | | 2.05 | | | | 2.08 | | | | 2.30 | | | | 2.20 | |
Expenses after expense
reductions (f) | | | 2.00 | (a)(c) | | | 2.01 | | | | 2.04 | | | | 2.07 | | | | 2.29 | | | | 2.20 | |
Net investment loss | | | (1.24 | )(a)(c) | | | (1.22 | ) | | | (1.35 | ) | | | (1.34 | ) | | | (1.44 | ) | | | (1.83 | ) |
Portfolio turnover | | | 20 | (n) | | | 30 | | | | 43 | | | | 38 | | | | 54 | | | | 68 | |
Net assets at end of period
(000 omitted) | | | $28,990 | | | | $25,990 | | | | $18,791 | | | | $16,190 | | | | $13,009 | | | | $12,911 | |
| Supplemental Ratios (%): | | | | | | | | | | | | | |
Ratio of expenses to average net
assets after expense reductions
excluding short sale expenses
and interest expense and fees (f) | | | 1.94 | (a)(c) | | | 1.99 | | | | 2.02 | | | | 2.03 | | | | 2.12 | | | | 2.13 | |
See Notes to Financial Statements
14
Financial Highlights – continued
| | | | | | | | | | | | | | | | | | | | | | | | |
| | | Six months
ended
2/28/17 (unaudited) | | | Years ended 8/31 | |
| Class C | | | 2016 | | | 2015 | | | 2014 | | | 2013 | | | 2012 | |
| | | | | | | | | | | | | | | | | |
Net asset value, beginning of
period | | | $25.01 | | | | $22.05 | | | | $22.16 | | | | $17.71 | | | | $15.45 | | | | $13.43 | |
| Income (loss) from investment operations | | | | | | | | | |
Net investment loss (d) | | | $(0.16 | )(c) | | | $(0.28 | ) | | | $(0.30 | ) | | | $(0.28 | ) | | | $(0.24 | ) | | | $(0.27 | ) |
Net realized and unrealized
gain (loss) on investments
and foreign currency | | | 2.26 | | | | 4.23 | | | | 1.04 | | | | 4.73 | | | | 2.50 | | | | 2.29 | |
Total from investment operations | | | $2.10 | | | | $3.95 | | | | $0.74 | | | | $4.45 | | | | $2.26 | | | | $2.02 | |
| Less distributions declared to shareholders | | | | | | | | | |
From net realized gain on
investments | | | $(0.54 | ) | | | $(0.99 | ) | | | $(0.85 | ) | | | $— | | | | $— | | | | $— | |
Net asset value, end of period (x) | | | $26.57 | | | | $25.01 | | | | $22.05 | | | | $22.16 | | | | $17.71 | | | | $15.45 | |
Total return (%) (r)(s)(t)(x) | | | 8.54 | (c)(n) | | | 18.28 | | | | 3.42 | | | | 25.13 | | | | 14.63 | | | | 15.04 | |
Ratios (%) (to average net assets)
and Supplemental data: | | | | | | | | | |
Expenses before expense
reductions (f) | | | 2.01 | (a)(c) | | | 2.02 | | | | 2.05 | | | | 2.07 | | | | 2.30 | | | | 2.20 | |
Expenses after expense
reductions (f) | | | 2.00 | (a)(c) | | | 2.01 | | | | 2.04 | | | | 2.07 | | | | 2.30 | | | | 2.20 | |
Net investment loss | | | (1.24 | )(a)(c) | | | (1.23 | ) | | | (1.35 | ) | | | (1.34 | ) | | | (1.45 | ) | | | (1.83 | ) |
Portfolio turnover | | | 20 | (n) | | | 30 | | | | 43 | | | | 38 | | | | 54 | | | | 68 | |
Net assets at end of period
(000 omitted) | | | $84,628 | | | | $73,071 | | | | $43,037 | | | | $35,998 | | | | $25,026 | | | | $23,940 | |
| Supplemental Ratios (%): | | | | | | | | | |
Ratio of expenses to average net
assets after expense reductions
excluding short sale expenses
and interest expense and fees (f) | | | 1.95 | (a)(c) | | | 2.00 | | | | 2.02 | | | | 2.03 | | | | 2.12 | | | | 2.13 | |
See Notes to Financial Statements
15
Financial Highlights – continued
| | | | | | | | | | | | | | | | | | | | | | | | |
| | | Six months
ended
2/28/17 (unaudited) | | | Years ended 8/31 | |
| Class I | | | 2016 | | | 2015 | | | 2014 | | | 2013 | | | 2012 | |
| | | | | | | | | | | | | | | | | |
Net asset value, beginning of period | | | $29.93 | | | | $25.96 | | | | $25.69 | | | | $20.33 | | | | $17.56 | | | | $15.11 | |
| Income (loss) from investment operations | | | | | | | | | |
Net investment loss (d) | | | $(0.03 | )(c) | | | $(0.07 | ) | | | $(0.09 | ) | | | $(0.08 | ) | | | $(0.08 | ) | | | $(0.14 | ) |
Net realized and unrealized
gain (loss) on investments
and foreign currency | | | 2.71 | | | | 5.03 | | | | 1.21 | | | | 5.44 | | | | 2.85 | | | | 2.59 | |
Total from investment operations | | | $2.68 | | | | $4.96 | | | | $1.12 | | | | $5.36 | | | | $2.77 | | | | $2.45 | |
| Less distributions declared to shareholders | | | | | | | | | |
From net realized gain on
investments | | | $(0.54 | ) | | | $(0.99 | ) | | | $(0.85 | ) | | | $— | | | | $— | | | | $— | |
Net asset value, end of period (x) | | | $32.07 | | | | $29.93 | | | | $25.96 | | | | $25.69 | | | | $20.33 | | | | $17.56 | |
Total return (%) (r)(s)(x) | | | 9.08 | (c)(n) | | | 19.45 | | | | 4.45 | | | | 26.36 | | | | 15.77 | | | | 16.21 | |
Ratios (%) (to average net assets)
and Supplemental data: | | | | | | | | | |
Expenses before expense
reductions (f) | | | 1.01 | (a)(c) | | | 1.02 | | | | 1.05 | | | | 1.08 | | | | 1.30 | | | | 1.20 | |
Expenses after expense
reductions (f) | | | 1.00 | (a)(c) | | | 1.01 | | | | 1.04 | | | | 1.07 | | | | 1.30 | | | | 1.20 | |
Net investment loss | | | (0.21 | )(a)(c) | | | (0.24 | ) | | | (0.35 | ) | | | (0.35 | ) | | | (0.45 | ) | | | (0.83 | ) |
Portfolio turnover | | | 20 | (n) | | | 30 | | | | 43 | | | | 38 | | | | 54 | | | | 68 | |
Net assets at end of period
(000 omitted) | | | $139,993 | | | | $96,700 | | | | $56,619 | | | | $40,359 | | | | $30,615 | | | | $21,898 | |
| Supplemental Ratios (%): | | | | | | | | | |
Ratio of expenses to average net
assets after expense reductions
excluding short sale expenses
and interest expense and fees (f) | | | 0.95 | (a)(c) | | | 1.00 | | | | 1.02 | | | | 1.04 | | | | 1.12 | | | | 1.12 | |
See Notes to Financial Statements
16
Financial Highlights – continued
| | | | | | | | | | | | | | | | | | | | | | | | |
| | | Six months
ended
2/28/17 (unaudited) | | | Years ended 8/31 | |
| Class R1 | | | 2016 | | | 2015 | | | 2014 | | | 2013 | | | 2012 | |
| | | | | | | | | | | | | | | | | |
Net asset value, beginning of
period | | | $24.96 | | | | $22.01 | | | | $22.12 | | | | $17.68 | | | | $15.42 | | | | $13.41 | |
| Income (loss) from investment operations | | | | | | | | | |
Net investment loss (d) | | | $(0.16 | )(c) | | | $(0.28 | ) | | | $(0.30 | ) | | | $(0.27 | ) | | | $(0.23 | ) | | | $(0.26 | ) |
Net realized and unrealized
gain (loss) on investments
and foreign currency | | | 2.26 | | | | 4.22 | | | | 1.04 | | | | 4.71 | | | | 2.49 | | | | 2.27 | |
Total from investment operations | | | $2.10 | | | | $3.94 | | | | $0.74 | | | | $4.44 | | | | $2.26 | | | | $2.01 | |
| Less distributions declared to shareholders | | | | | | | | | |
From net realized gain on
investments | | | $(0.54 | ) | | | $(0.99 | ) | | | $(0.85 | ) | | | $— | | | | $— | | | | $— | |
Net asset value, end of period (x) | | | $26.52 | | | | $24.96 | | | | $22.01 | | | | $22.12 | | | | $17.68 | | | | $15.42 | |
Total return (%) (r)(s)(x) | | | 8.56 | (c)(n) | | | 18.27 | | | | 3.43 | | | | 25.11 | | | | 14.66 | | | | 14.99 | |
Ratios (%) (to average net assets)
and Supplemental data: | | | | | | | | | |
Expenses before expense
reductions (f) | | | 2.01 | (a)(c) | | | 2.02 | | | | 2.05 | | | | 2.08 | | | | 2.30 | | | | 2.21 | |
Expenses after expense
reductions (f) | | | 2.00 | (a)(c) | | | 2.01 | | | | 2.04 | | | | 2.07 | | | | 2.30 | | | | 2.21 | |
Net investment loss | | | (1.24 | )(a)(c) | | | (1.22 | ) | | | (1.36 | ) | | | (1.34 | ) | | | (1.45 | ) | | | (1.82 | ) |
Portfolio turnover | | | 20 | (n) | | | 30 | | | | 43 | | | | 38 | | | | 54 | | | | 68 | |
Net assets at end of period
(000 omitted) | | | $3,258 | | | | $3,073 | | | | $2,516 | | | | $2,033 | | | | $1,542 | | | | $1,666 | |
| Supplemental Ratios (%): | | | | | | | | | |
Ratio of expenses to average net
assets after expense reductions
excluding short sale expenses
and interest expense and fees (f) | | | 1.95 | (a)(c) | | | 1.99 | | | | 2.02 | | | | 2.04 | | | | 2.12 | | | | 2.13 | |
See Notes to Financial Statements
17
Financial Highlights – continued
| | | | | | | | | | | | | | | | | | | | | | | | |
| | | Six months
ended
2/28/17 (unaudited) | | | Years ended 8/31 | |
| Class R2 | | | 2016 | | | 2015 | | | 2014 | | | 2013 | | | 2012 | |
| | | | | | | | | | | | | | | | | |
Net asset value, beginning of
period | | | $27.17 | | | | $23.76 | | | | $23.70 | | | | $18.85 | | | | $16.36 | | | | $14.15 | |
| Income (loss) from investment operations | | | | | | | | | |
Net investment loss (d) | | | $(0.10 | )(c) | | | $(0.18 | ) | | | $(0.20 | ) | | | $(0.18 | ) | | | $(0.16 | ) | | | $(0.20 | ) |
Net realized and unrealized
gain (loss) on investments
and foreign currency | | | 2.46 | | | | 4.58 | | | | 1.11 | | | | 5.03 | | | | 2.65 | | | | 2.41 | |
Total from investment operations | | | $2.36 | | | | $4.40 | | | | $0.91 | | | | $4.85 | | | | $2.49 | | | | $2.21 | |
| Less distributions declared to shareholders | | | | | | | | | |
From net realized gain on
investments | | | $(0.54 | ) | | | $(0.99 | ) | | | $(0.85 | ) | | | $— | | | | $— | | | | $— | |
Net asset value, end of period (x) | | | $28.99 | | | | $27.17 | | | | $23.76 | | | | $23.70 | | | | $18.85 | | | | $16.36 | |
Total return (%) (r)(s)(x) | | | 8.82 | (c)(n) | | | 18.88 | | | | 3.93 | | | | 25.73 | | | | 15.22 | | | | 15.62 | |
Ratios (%) (to average net assets)
and Supplemental data: | | | | | | | | | |
Expenses before expense
reductions (f) | | | 1.51 | (a)(c) | | | 1.52 | | | | 1.55 | | | | 1.58 | | | | 1.79 | | | | 1.70 | |
Expenses after expense
reductions (f) | | | 1.50 | (a)(c) | | | 1.51 | | | | 1.54 | | | | 1.58 | | | | 1.79 | | | | 1.70 | |
Net investment loss | | | (0.74 | )(a)(c) | | | (0.72 | ) | | | (0.84 | ) | | | (0.83 | ) | | | (0.94 | ) | | | (1.33 | ) |
Portfolio turnover | | | 20 | (n) | | | 30 | | | | 43 | | | | 38 | | | | 54 | | | | 68 | |
Net assets at end of period
(000 omitted) | | | $19,098 | | | | $17,031 | | | | $14,946 | | | | $17,123 | | | | $15,890 | | | | $17,748 | |
| Supplemental Ratios (%): | | | | | | | | | |
Ratio of expenses to average net
assets after expense reductions
excluding short sale expenses
and interest expense and fees (f) | | | 1.45 | (a)(c) | | | 1.49 | | | | 1.52 | | | | 1.54 | | | | 1.62 | | | | 1.63 | |
See Notes to Financial Statements
18
Financial Highlights – continued
| | | | | | | | | | | | | | | | | | | | | | | | |
| | | Six months
ended
2/28/17 (unaudited) | | | Years ended 8/31 | |
| Class R3 | | | 2016 | | | 2015 | | | 2014 | | | 2013 | | | 2012 | |
| | | | | | | | | | | | | | | | | |
Net asset value, beginning of
period | | | $28.26 | | | | $24.61 | | | | $24.46 | | | | $19.41 | | | | $16.80 | | | | $14.49 | |
| Income (loss) from investment operations | | | | | | | | | |
Net investment loss (d) | | | $(0.07 | )(c) | | | $(0.13 | ) | | | $(0.15 | ) | | | $(0.13 | ) | | | $(0.12 | ) | | | $(0.17 | ) |
Net realized and unrealized
gain (loss) on investments
and foreign currency | | | 2.56 | | | | 4.77 | | | | 1.15 | | | | 5.18 | | | | 2.73 | | | | 2.48 | |
Total from investment operations | | | $2.49 | | | | $4.64 | | | | $1.00 | | | | $5.05 | | | | $2.61 | | | | $2.31 | |
| Less distributions declared to shareholders | | | | | | | | | |
From net realized gain on
investments | | | $(0.54 | ) | | | $(0.99 | ) | | | $(0.85 | ) | | | $— | | | | $— | | | | $— | |
Net asset value, end of period (x) | | | $30.21 | | | | $28.26 | | | | $24.61 | | | | $24.46 | | | | $19.41 | | | | $16.80 | |
Total return (%) (r)(s)(x) | | | 8.94 | (c)(n) | | | 19.21 | | | | 4.18 | | | | 26.02 | | | | 15.54 | | | | 15.94 | |
Ratios (%) (to average net assets)
and Supplemental data: | | | | | | | | | |
Expenses before expense
reductions (f) | | | 1.26 | (a)(c) | | | 1.27 | | | | 1.30 | | | | 1.33 | | | | 1.55 | | | | 1.45 | |
Expenses after expense
reductions (f) | | | 1.26 | (a)(c) | | | 1.26 | | | | 1.29 | | | | 1.32 | | | | 1.55 | | | | 1.45 | |
Net investment loss | | | (0.49 | )(a)(c) | | | (0.49 | ) | | | (0.60 | ) | | | (0.59 | ) | | | (0.70 | ) | | | (1.08 | ) |
Portfolio turnover | | | 20 | (n) | | | 30 | | | | 43 | | | | 38 | | | | 54 | | | | 68 | |
Net assets at end of period
(000 omitted) | | | $33,929 | | | | $20,180 | | | | $9,732 | | | | $10,626 | | | | $8,863 | | | | $8,720 | |
| Supplemental Ratios (%): | | | | | | | | | |
Ratio of expenses to average net
assets after expense reductions
excluding short sale expenses
and interest expense and fees (f) | | | 1.20 | (a)(c) | | | 1.25 | | | | 1.27 | | | | 1.29 | | | | 1.37 | | | | 1.38 | |
See Notes to Financial Statements
19
Financial Highlights – continued
| | | | | | | | | | | | | | | | | | | | | | | | |
| | | Six months
ended
2/28/17 (unaudited) | | | Years ended 8/31 | |
| Class R4 | | | 2016 | | | 2015 | | | 2014 | | | 2013 | | | 2012 | |
| | | | | | | | | | | | | | | | | |
Net asset value, beginning of
period | | | $29.19 | | | | $25.34 | | | | $25.10 | | | | $19.86 | | | | $17.15 | | | | $14.76 | |
| Income (loss) from investment operations | | | | | | | | | |
Net investment loss (d) | | | $(0.03 | )(c) | | | $(0.06 | ) | | | $(0.09 | ) | | | $(0.08 | ) | | | $(0.08 | ) | | | $(0.14 | ) |
Net realized and unrealized
gain (loss) on investments
and foreign currency | | | 2.65 | | | | 4.90 | | | | 1.18 | | | | 5.32 | | | | 2.79 | | | | 2.53 | |
Total from investment operations | | | $2.62 | | | | $4.84 | | | | $1.09 | | | | $5.24 | | | | $2.71 | | | | $2.39 | |
| Less distributions declared to shareholders | | | | | | | | | |
From net realized gain on
investments | | | $(0.54 | ) | | | $(0.99 | ) | | | $(0.85 | ) | | | $— | | | | $— | | | | $— | |
Net asset value, end of period (x) | | | $31.27 | | | | $29.19 | | | | $25.34 | | | | $25.10 | | | | $19.86 | | | | $17.15 | |
Total return (%) (r)(s)(x) | | | 9.10 | (c)(n) | | | 19.45 | | | | 4.44 | | | | 26.38 | | | | 15.80 | | | | 16.19 | |
Ratios (%) (to average net assets)
and Supplemental data: | | | | | | | | | |
Expenses before expense
reductions (f) | | | 1.01 | (a)(c) | | | 1.02 | | | | 1.05 | | | | 1.07 | | | | 1.29 | | | | 1.20 | |
Expenses after expense
reductions (f) | | | 1.01 | (a)(c) | | | 1.01 | | | | 1.04 | | | | 1.07 | | | | 1.29 | | | | 1.20 | |
Net investment loss | | | (0.24 | )(a)(c) | | | (0.24 | ) | | | (0.37 | ) | | | (0.34 | ) | | | (0.45 | ) | | | (0.84 | ) |
Portfolio turnover | | | 20 | (n) | | | 30 | | | | 43 | | | | 38 | | | | 54 | | | | 68 | |
Net assets at end of period
(000 omitted) | | | $11,492 | | | | $8,141 | | | | $2,234 | | | | $1,403 | | | | $1,269 | | | | $823 | |
| Supplemental Ratios (%): | | | | | | | | | |
Ratio of expenses to average net
assets after expense reductions
excluding short sale expenses
and interest expense and fees (f) | | | 0.95 | (a)(c) | | | 1.00 | | | | 1.02 | | | | 1.04 | | | | 1.12 | | | | 1.12 | |
See Notes to Financial Statements
20
Financial Highlights – continued
| | | | | | | | | | | | | | | | | | | | |
| | | Six months
ended
2/28/17
(unaudited) | | | Years ended 8/31 | |
| Class R6 | | | 2016 | | | 2015 | | | 2014 | | | 2013 (i) | |
| | | | | | | | | | | | | | |
Net asset value, beginning of period | | | $30.05 | | | | $26.03 | | | | $25.73 | | | | $20.34 | | | | $17.68 | |
| Income (loss) from investment operations | | | | | | | | | |
Net investment income (loss) (d) | | | $(0.02 | )(c) | | | $(0.04 | ) | | | $(0.07 | ) | | | $(0.07 | ) | | | $(0.04 | ) |
Net realized and unrealized gain
(loss) on investments and
foreign currency | | | 2.73 | | | | 5.05 | | | | 1.22 | | | | 5.46 | | | | 2.70 | |
Total from investment operations | | | $2.71 | | | | $5.01 | | | | $1.15 | | | | $5.39 | | | | $2.66 | |
| Less distributions declared to shareholders | | | | | | | | | |
From net realized gain on
investments | | | $(0.54 | ) | | | $(0.99 | ) | | | $(0.85 | ) | | | $— | | | | $— | |
Net asset value, end of period (x) | | | $32.22 | | | | $30.05 | | | | $26.03 | | | | $25.73 | | | | $20.34 | |
Total return (%) (r)(s)(x) | | | 9.14 | (c)(n) | | | 19.59 | | | | 4.57 | | | | 26.50 | | | | 15.05 | (n) |
Ratios (%) (to average net assets)
and Supplemental data: | | | | | | | | | |
Expenses before expense reductions (f) | | | 0.92 | (a)(c) | | | 0.92 | | | | 0.95 | | | | 0.97 | | | | 1.13 | (a) |
Expenses after expense reductions (f) | | | 0.91 | (a)(c) | | | 0.91 | | | | 0.94 | | | | 0.96 | | | | 1.13 | (a) |
Net investment income (loss) | | | (0.15 | )(a)(c) | | | (0.13 | ) | | | (0.27 | ) | | | (0.28 | ) | | | (0.35 | )(a) |
Portfolio turnover | | | 20 | (n) | | | 30 | | | | 43 | | | | 38 | | | | 54 | |
Net assets at end of period
(000 omitted) | | | $67,997 | | | | $33,411 | | | | $7,079 | | | | $2,429 | | | | $116 | |
| Supplemental Ratios (%): | | | | | | | | | |
Ratio of expenses to average net
assets after expense reductions
excluding short sale expenses and
interest expense and fees (f) | | | 0.85 | (a)(c) | | | 0.90 | | | | 0.92 | | | | 0.95 | | | | 1.01 | (a) |
| (c) | Amount reflects a one-time reimbursement of expenses by the custodian (or former custodian) without which net investment income and performance would be lower and expenses would be higher. See Note 2 in the Notes to Financial Statements for additional information. |
| (d) | Per share data is based on average shares outstanding. |
| (f) | Ratios do not reflect reductions from fees paid indirectly, if applicable. |
| (i) | For the period from the class’s inception, January 2, 2013, through the stated period end. |
| (r) | Certain expenses have been reduced without which performance would have been lower. |
| (s) | From time to time the fund may receive proceeds from litigation settlements, without which performance would be lower. |
| (t) | Total returns do not include any applicable sales charges. |
| (x) | The net asset values and total returns have been calculated on net assets which include adjustments made in accordance with U.S. generally accepted accounting principles required at period end for financial reporting purposes. |
See Notes to Financial Statements
21
NOTES TO FINANCIAL STATEMENTS
(unaudited)
(1) Business and Organization
MFS Technology Fund (the fund) is a non-diversified series of MFS Series Trust I (the trust). The trust is organized as a Massachusetts business trust and is registered under the Investment Company Act of 1940, as amended, as an open-end management investment company.
The fund is an investment company and accordingly follows the investment company accounting and reporting guidance of the Financial Accounting Standards Board (FASB) Accounting Standards Codification Topic 946 Financial Services – Investment Companies.
(2) Significant Accounting Policies
General – The preparation of financial statements in conformity with U.S. generally accepted accounting principles requires management to make estimates and assumptions that affect the reported amounts of assets and liabilities, and disclosure of contingent assets and liabilities at the date of the financial statements and the reported amounts of increases and decreases in net assets from operations during the reporting period. Actual results could differ from those estimates. In the preparation of these financial statements, management has evaluated subsequent events occurring after the date of the fund’s Statement of Assets and Liabilities through the date that the financial statements were issued. The fund invests primarily in securities of issuers in the technology industry. Issuers in a single industry can react similarly to market, economic, political and regulatory conditions and developments.
In October 2016, the Securities and Exchange Commission (SEC) released its Final Rule on Investment Company Reporting Modernization (the “Rule”). The Rule, which introduces two new regulatory reporting forms for investment companies – Form N-PORT and Form N-CEN – also contains amendments to Regulation S-X which impact financial statement presentation, particularly the presentation of derivative investments. Although still evaluating the impacts of the Rule, management believes that many of the Regulation S-X amendments are consistent with the fund’s current financial statement presentation and expects that the fund will be able to comply with the Rule’s Regulation S-X amendments by the August 1, 2017 compliance date.
Balance Sheet Offsetting – The fund’s accounting policy with respect to balance sheet offsetting is that, absent an event of default by the counterparty or a termination of the agreement, the International Swaps and Derivatives Association (ISDA) Master Agreement does not result in an offset of reported amounts of financial assets and financial liabilities in the Statement of Assets and Liabilities across transactions between the fund and the applicable counterparty. The fund’s right to setoff may be restricted or prohibited by the bankruptcy or insolvency laws of the particular jurisdiction to which a specific master netting agreement counterparty is subject. Balance sheet offsetting disclosures, to the extent applicable to the fund, have been included in the fund’s Significant Accounting Policies note under the captions for each of the fund’s in-scope financial instruments and transactions.
Investment Valuations – Equity securities, including restricted equity securities, are generally valued at the last sale or official closing price on their primary market or
22
Notes to Financial Statements (unaudited) – continued
exchange as provided by a third-party pricing service. Equity securities, for which there were no sales reported that day, are generally valued at the last quoted daily bid quotation on their primary market or exchange as provided by a third-party pricing service. Equity securities held short, for which there were no sales reported for that day, are generally valued at the last quoted daily ask quotation on their primary market or exchange as provided by a third-party pricing service. Short-term instruments with a maturity at issuance of 60 days or less may be valued at amortized cost, which approximates market value. Exchange-traded options are generally valued at the last sale or official closing price on their primary exchange as provided by a third-party pricing service. Exchange-traded options for which there were no sales reported that day are generally valued at the last daily bid quotation on their primary exchange as provided by a third-party pricing service. Options not traded on an exchange are generally valued at a broker/dealer bid quotation. Foreign currency options are generally valued at valuations provided by a third-party pricing service. Open-end investment companies are generally valued at net asset value per share. Securities and other assets generally valued on the basis of information from a third-party pricing service may also be valued at a broker/dealer bid quotation. Values obtained from third-party pricing services can utilize both transaction data and market information such as yield, quality, coupon rate, maturity, type of issue, trading characteristics, and other market data. The values of foreign securities and other assets and liabilities expressed in foreign currencies are converted to U.S. dollars using the mean of bid and asked prices for rates provided by a third-party pricing service.
The Board of Trustees has delegated primary responsibility for determining or causing to be determined the value of the fund’s investments (including any fair valuation) to the adviser pursuant to valuation policies and procedures approved by the Board. If the adviser determines that reliable market quotations are not readily available, investments are valued at fair value as determined in good faith by the adviser in accordance with such procedures under the oversight of the Board of Trustees. Under the fund’s valuation policies and procedures, market quotations are not considered to be readily available for most types of debt instruments and floating rate loans and many types of derivatives. These investments are generally valued at fair value based on information from third-party pricing services. In addition, investments may be valued at fair value if the adviser determines that an investment’s value has been materially affected by events occurring after the close of the exchange or market on which the investment is principally traded (such as foreign exchange or market) and prior to the determination of the fund’s net asset value, or after the halting of trading of a specific security where trading does not resume prior to the close of the exchange or market on which the security is principally traded. Events that occur on a frequent basis after foreign markets close (such as developments in foreign markets and significant movements in the U.S. markets) and prior to the determination of the fund’s net asset value may be deemed to have a material effect on the value of securities traded in foreign markets. Accordingly, the fund’s foreign equity securities may often be valued at fair value. The adviser generally relies on third-party pricing services or other information (such as the correlation with price movements of similar securities in the same or other markets; the type, cost and investment characteristics of the security; the business and financial condition of the issuer; and trading and other market data) to assist in determining
23
Notes to Financial Statements (unaudited) – continued
whether to fair value and at what value to fair value an investment. The value of an investment for purposes of calculating the fund’s net asset value can differ depending on the source and method used to determine value. When fair valuation is used, the value of an investment used to determine the fund’s net asset value may differ from quoted or published prices for the same investment. There can be no assurance that the fund could obtain the fair value assigned to an investment if it were to sell the investment at the same time at which the fund determines its net asset value per share.
Various inputs are used in determining the value of the fund’s assets or liabilities. These inputs are categorized into three broad levels. In certain cases, the inputs used to measure fair value may fall into different levels of the fair value hierarchy. In such cases, an investment’s level within the fair value hierarchy is based on the lowest level of input that is significant to the fair value measurement. The fund’s assessment of the significance of a particular input to the fair value measurement in its entirety requires judgment, and considers factors specific to the investment. Level 1 includes unadjusted quoted prices in active markets for identical assets or liabilities. Level 2 includes other significant observable market-based inputs (including quoted prices for similar securities, interest rates, prepayment speed, and credit risk). Level 3 includes unobservable inputs, which may include the adviser’s own assumptions in determining the fair value of investments. The following is a summary of the levels used as of February 28, 2017 in valuing the fund’s assets or liabilities:
| | | | | | | | | | | | | | | | |
| Investments at Value | | Level 1 | | | Level 2 | | | Level 3 | | | Total | |
| Equity Securities: | | | | | | | | | | | | | | | | |
United States | | | $655,335,492 | | | | $119,930 | | | | $— | | | | $655,455,422 | |
Netherlands | | | 20,614,947 | | | | — | | | | — | | | | 20,614,947 | |
China | | | 11,601,357 | | | | — | | | | — | | | | 11,601,357 | |
Canada | | | 9,066,616 | | | | — | | | | — | | | | 9,066,616 | |
Israel | | | 3,394,141 | | | | — | | | | — | | | | 3,394,141 | |
| Mutual Funds | | | 19,051,465 | | | | — | | | | — | | | | 19,051,465 | |
| Total Investments | | | $719,064,018 | | | | $119,930 | | | | $— | | | | $719,183,948 | |
| Short Sales | | | $(7,199,096 | ) | | | $— | | | | $— | | | | $(7,199,096 | ) |
For further information regarding security characteristics, see the Portfolio of Investments.
Foreign Currency Translation – Purchases and sales of foreign investments, income, and expenses are converted into U.S. dollars based upon currency exchange rates prevailing on the respective dates of such transactions or on the reporting date for foreign denominated receivables and payables. Gains and losses attributable to foreign currency exchange rates on sales of securities are recorded for financial statement purposes as net realized gains and losses on investments. Gains and losses attributable to foreign exchange rate movements on receivables, payables, income and expenses are recorded for financial statement purposes as foreign currency transaction gains and losses. That portion of both realized and unrealized gains and losses on investments that results from fluctuations in foreign currency exchange rates is not separately disclosed.
24
Notes to Financial Statements (unaudited) – continued
Derivatives – The fund uses derivatives for different purposes, primarily to increase or decrease exposure to a particular market or segment of the market, or security, to increase or decrease interest rate or currency exposure, or as alternatives to direct investments. Derivatives are used for hedging or non-hedging purposes. While hedging can reduce or eliminate losses, it can also reduce or eliminate gains. When the fund uses derivatives as an investment to increase market exposure, or for hedging purposes, gains and losses from derivative instruments may be substantially greater than the derivative’s original cost.
The derivative instruments used by the fund were purchased options and written options. The fund’s period end purchased options, as presented in the Portfolio of Investments, generally are indicative of the volume of purchased options held during the period. The volume of written options held during the period is reflected in the written option activity table.
The following table presents, by major type of derivative contract, the fair value, on a gross basis, of the asset and liability components of derivatives held by the fund at February 28, 2017 as reported in the Statement of Assets and Liabilities:
| | | | | | | | | | |
| | | | | Fair Value (a) | |
| Risk | | Derivative Contracts | | Asset Derivatives | | | Liability Derivatives | |
| Equity | | Purchased Equity Options | | | $179,330 | | | | $— | |
| (a) | The value of purchased options outstanding is included in total investments, at value, within the fund’s Statement of Assets and Liabilities. |
The following table presents, by major type of derivative contract, the realized gain (loss) on derivatives held by the fund for the six months ended February 28, 2017 as reported in the Statement of Operations:
| | | | | | | | |
| Risk | | Investments
(Purchased
Options) | | | Written
Options | |
| Equity | | | $(462,834 | ) | | | $291,947 | |
The following table presents, by major type of derivative contract, the change in unrealized appreciation (depreciation) on derivatives held by the fund for the six months ended February 28, 2017 as reported in the Statement of Operations:
| | | | | | | | |
| Risk | | Investments
(Purchased
Options) | | | Written
Options | |
| Equity | | | $50,167 | | | | $(59,505 | ) |
Derivative counterparty credit risk is managed through formal evaluation of the creditworthiness of all potential counterparties. On certain, but not all, uncleared derivatives, the fund attempts to reduce its exposure to counterparty credit risk whenever possible by entering into an ISDA Master Agreement on a bilateral basis. The ISDA Master Agreement gives each party to the agreement the right to terminate all transactions traded under such agreement if there is a certain deterioration in the credit quality of the other party. Upon an event of default or a termination of the ISDA Master Agreement, the non-defaulting party has the right to close out all transactions traded under such agreement and to net amounts owed under each agreement to one
25
Notes to Financial Statements (unaudited) – continued
net amount payable by one party to the other. This right to close out and net payments across all transactions traded under the ISDA Master Agreement could result in a reduction of the fund’s credit risk to such counterparty equal to any amounts payable by the fund under the applicable transactions, if any.
Collateral and margin requirements differ by type of derivative. Margin requirements are set by the clearing broker and the clearing house for cleared derivatives (e.g., futures contracts, cleared swaps, and exchange-traded options) while collateral terms are contract specific for uncleared derivatives (e.g., forward foreign currency exchange contracts, uncleared swap agreements, and uncleared options). For derivatives traded under an ISDA Master Agreement, which contains a collateral support annex, the collateral requirements are netted across all transactions traded under such agreement and one amount is posted from one party to the other to collateralize such obligations. Cash that has been segregated to cover the fund’s collateral or margin obligations under derivative contracts, if any, will be reported separately in the Statement of Assets and Liabilities as “Restricted cash” or “Deposits with brokers.” Securities pledged as collateral or margin for the same purpose, if any, are noted in the Portfolio of Investments. The fund may be required to make payments of interest on uncovered collateral or margin obligations with the broker. Any such payments are included in “Miscellaneous” expense in the Statement of Operations.
Written Options – In exchange for a premium, the fund wrote call options on securities for which it anticipated the price would decline and also wrote put options on securities for which it anticipated the price would increase. At the time the option was written, the fund believed the premium received exceeded the potential loss that could result from adverse price changes in the options’ underlying securities. In a written option, the fund as the option writer grants the buyer the right to purchase from, or sell to, the fund a specified number of shares or units of a particular security, currency or index at a specified price within a specified period of time.
The premium received is initially recorded as a liability in the Statement of Assets and Liabilities. The option is subsequently marked-to-market daily with the difference between the premium received and the market value of the written option being recorded as unrealized appreciation or depreciation. When a written option expires, the fund realizes a gain equal to the amount of the premium received. The difference between the premium received and the amount paid on effecting a closing transaction is considered a realized gain or loss. When a written call option is exercised, the premium received is offset against the proceeds to determine the realized gain or loss. When a written put option is exercised, the premium reduces the cost basis of the security purchased by the fund.
At the initiation of the written option contract, for exchange traded options, the fund is required to deposit securities or cash as collateral with the custodian for the benefit of the broker or directly with the clearing broker, based on the type of option. For uncleared options, the fund may post collateral subject to the terms of an ISDA Master Agreement as generally described above if the market value of the options contract moves against it. The fund, as writer of an option, may have no control over whether the underlying securities may be sold (call) or purchased (put) and, as a result, bears the market risk of an unfavorable change in the price of the securities underlying the written option. Losses from writing options can exceed the premium received and can
26
Notes to Financial Statements (unaudited) – continued
exceed the potential loss from an ordinary buy and sell transaction. Although the fund’s market risk may be significant, the maximum counterparty credit risk to the fund is equal to the market value of any collateral posted to the broker. For uncleared options, this risk is mitigated in cases where there is an ISDA Master Agreement between the fund and the counterparty providing for netting as described above.
The following table represents the written option activity in the fund during the six months ended February 28, 2017:
| | | | | | | | |
| | | Number of
Contracts | | | Premiums
Received | |
| Outstanding, beginning of period | | | 5,208 | | | | $279,246 | |
| Options written | | | 24,297 | | | | 1,513,976 | |
| Options closed | | | (9,215 | ) | | | (702,787 | ) |
| Options exercised | | | (3,213 | ) | | | (77,614 | ) |
| Options expired | | | (17,077 | ) | | | (1,012,821 | ) |
| Outstanding, end of period | | | — | | | | $— | |
Purchased Options – The fund purchased call and put options for a premium. Purchased call and put options entitle the holder to buy and sell a specified number of shares or units of a particular security, currency or index at a specified price at a specified date or within a specified period of time. Purchasing call options may hedge against an anticipated increase in the dollar cost of securities or currency to be acquired or increase the fund’s exposure to an underlying instrument. Purchasing put options may hedge against an anticipated decline in the value of portfolio securities or currency or decrease the fund’s exposure to an underlying instrument.
The premium paid is initially recorded as an investment in the Statement of Assets and Liabilities. That investment is subsequently marked-to-market daily with the difference between the premium paid and the market value of the purchased option being recorded as unrealized appreciation or depreciation. Premiums paid for purchased call and put options which have expired are treated as realized losses on investments in the Statement of Operations. Upon the exercise or closing of a purchased call option, the premium paid is added to the cost of the security or financial instrument purchased. Upon the exercise or closing of a purchased put option, the premium paid is offset against the proceeds on the sale of the underlying security or financial instrument in order to determine the realized gain or loss on investments.
Whether or not the option is exercised, the fund’s maximum risk of loss from purchasing an option is the amount of premium paid. All option contracts involve credit risk if the counterparty to the option contract fails to perform. For uncleared options, this risk is mitigated in cases where there is an ISDA Master Agreement between the fund and the counterparty providing for netting as described above and, where applicable, by the posting of collateral by the counterparty to the fund to cover the fund’s exposure to the counterparty under such ISDA Master Agreement.
Short Sales – The fund entered into short sales whereby it sells a security it does not own in anticipation of a decline in the value of that security. The fund will realize a gain if the security price decreases and a loss if the security price increases between the date of the short sale and the date on which the fund replaces the borrowed security. Losses from short sales can exceed the proceeds of the security sold; and they can also exceed
27
Notes to Financial Statements (unaudited) – continued
the potential loss from an ordinary buy and sell transaction. The amount of any premium, dividends, or interest the fund may be required to pay in connection with a short sale will be recognized as a fund expense. During the six months ended February 28, 2017, this expense amounted to $184,549. The fund segregates cash or marketable securities in an amount that, when combined with the amount of proceeds from the short sale deposited with the broker, at least equals the current market value of the security sold short.
Security Loans – Under its Securities Lending Agency Agreement with the fund, State Street Bank and Trust Company (“State Street”), as lending agent, loans the securities of the fund to certain qualified institutions (the “Borrowers”) approved by the fund. Security loans can be terminated at the discretion of either the lending agent or the fund and the related securities must be returned within the earlier of the standard trade settlement period for such securities or within three business days. The loans are collateralized by cash and/or U.S. Treasury and federal agency obligations in an amount typically at least equal to the market value of the securities loaned. On loans collateralized by cash, the cash collateral is invested in a money market fund. The market value of the loaned securities is determined at the close of business of the fund and any additional required collateral is delivered to the fund on the next business day. State Street provides the fund with indemnification against Borrower default. In the event of Borrower default, State Street will, for the benefit of the fund, either purchase securities identical to those loaned or, when such purchase is commercially impracticable, pay the fund the market value of the loaned securities. In return, State Street assumes the fund’s rights to the related collateral. If the collateral value is less than the cost to purchase identical securities, State Street is responsible for the shortfall, but only to the extent that such shortfall is not due to a decline in collateral value resulting from collateral reinvestment for which the fund bears the risk of loss. At period end, the fund had investment securities on loan, all of which were classified as equity securities in the fund’s Portfolio of Investments, with a fair value of $731,241. The fair value of the fund’s investment securities on loan and a related liability of $772,276 for cash collateral received on securities loaned are both presented gross in the Statement of Assets and Liabilities. The collateral received on securities loaned exceeded the value of securities on loan at period end. The liability for cash collateral for securities loaned is carried at fair value, which is categorized as level 2 within the fair value hierarchy. A portion of the income generated upon investment of the collateral is remitted to the Borrowers, and the remainder is allocated between the fund and the lending agent. On loans collateralized by U.S. Treasury and/or federal agency obligations, a fee is received from the Borrower, and is allocated between the fund and the lending agent. Income from securities lending is included in “Interest” income in the Statement of Operations. The dividend and interest income earned on the securities loaned is accounted for in the same manner as other dividend and interest income.
Indemnifications – Under the fund’s organizational documents, its officers and Trustees may be indemnified against certain liabilities and expenses arising out of the performance of their duties to the fund. Additionally, in the normal course of business, the fund enters into agreements with service providers that may contain indemnification
28
Notes to Financial Statements (unaudited) – continued
clauses. The fund’s maximum exposure under these agreements is unknown as this would involve future claims that may be made against the fund that have not yet occurred.
Investment Transactions and Income – Investment transactions are recorded on the trade date. Interest income is recorded on the accrual basis. Dividends received in cash are recorded on the ex-dividend date. Certain dividends from foreign securities will be recorded when the fund is informed of the dividend if such information is obtained subsequent to the ex-dividend date. Dividend and interest payments received in additional securities are recorded on the ex-dividend or ex-interest date in an amount equal to the value of the security on such date.
The fund may receive proceeds from litigation settlements. Any proceeds received from litigation involving portfolio holdings are reflected in the Statement of Operations in realized gain/loss if the security has been disposed of by the fund or in unrealized gain/loss if the security is still held by the fund. Any other proceeds from litigation not related to portfolio holdings are reflected as other income in the Statement of Operations.
Reimbursement of Expenses by Custodian – In December 2015, the fund’s custodian (or former custodian), State Street Bank and Trust Company, announced that it intended to reimburse its asset servicing clients for expense amounts that it billed in error during the period 1998 through 2015. The amount of this one-time reimbursement attributable to the fund is reflected as “Reimbursement of custodian expenses” in the Statement of Operations.
Tax Matters and Distributions – The fund intends to qualify as a regulated investment company, as defined under Subchapter M of the Internal Revenue Code, and to distribute all of its taxable income, including realized capital gains. As a result, no provision for federal income tax is required. The fund’s federal tax returns, when filed, will remain subject to examination by the Internal Revenue Service for a three year period. Management has analyzed the fund’s tax positions taken on federal and state tax returns for all open tax years and does not believe that there are any uncertain tax positions that require recognition of a tax liability. Foreign taxes, if any, have been accrued by the fund in the accompanying financial statements in accordance with the applicable foreign tax law. Foreign income taxes may be withheld by certain countries in which the fund invests. Additionally, capital gains realized by the fund on securities issued in or by certain foreign countries may be subject to capital gains tax imposed by those countries.
Distributions to shareholders are recorded on the ex-dividend date. Income and capital gain distributions are determined in accordance with income tax regulations, which may differ from U.S. generally accepted accounting principles. Certain capital accounts in the financial statements are periodically adjusted for permanent differences in order to reflect their tax character. These adjustments have no impact on net assets or net asset value per share. Temporary differences which arise from recognizing certain items of income, expense, gain or loss in different periods for financial statement and tax purposes will reverse at some time in the future. Distributions in excess of net investment income or net realized gains are temporary overdistributions for financial
29
Notes to Financial Statements (unaudited) – continued
statement purposes resulting from differences in the recognition or classification of income or distributions for financial statement and tax purposes.
Book/tax differences primarily relate to net operating losses, wash sale loss deferrals, straddle loss deferrals and treating a portion of the proceeds from redemptions as a distribution for tax purposes.
The tax character of distributions made during the current period will be determined at fiscal year end. The tax character of distributions declared to shareholders for the last fiscal year is as follows:
| | | | |
| | | 8/31/16 | |
| Long-term capital gains | | | $17,116,057 | |
The federal tax cost and the tax basis components of distributable earnings were as follows:
| | | | |
| As of 2/28/17 | | | |
| Cost of investments | | | $504,864,993 | |
| Gross appreciation | | | 214,497,860 | |
| Gross depreciation | | | (178,905 | ) |
| Net unrealized appreciation (depreciation) | | | $214,318,955 | |
| |
| As of 8/31/16 | | | |
| Undistributed long-term capital gain | | | 10,233,403 | |
| Late year ordinary loss deferral | | | (1,876,522 | ) |
| Other temporary differences | | | (4,413,759 | ) |
| Net unrealized appreciation (depreciation) | | | 167,343,407 | |
The aggregate cost above includes prior fiscal year end tax adjustments, if applicable.
Multiple Classes of Shares of Beneficial Interest – The fund offers multiple classes of shares, which differ in their respective distribution and service fees. The fund’s income, realized and unrealized gain (loss), and common expenses are allocated to shareholders based on the daily net assets of each class. Dividends are declared separately for each class. Differences in per share dividend rates are generally due to differences in separate class expenses. Class B shares will convert to Class A shares
30
Notes to Financial Statements (unaudited) – continued
approximately eight years after purchase. The fund’s distributions declared to shareholders as reported in the Statements of Changes in Net Assets are presented by class as follows:
| | | | | | | | |
| | | From net realized gain on
investments | |
| | | Six months
ended
2/28/17 | | | Year
ended
8/31/16 | |
| Class A | | | $6,042,407 | | | | $9,437,848 | |
| Class B | | | 564,793 | | | | 911,554 | |
| Class C | | | 1,649,827 | | | | 2,147,972 | |
| Class I | | | 1,747,655 | | | | 2,507,391 | |
| Class R1 | | | 62,501 | | | | 127,045 | |
| Class R2 | | | 357,143 | | | | 631,886 | |
| Class R3 | | | 493,168 | | | | 425,776 | |
| Class R4 | | | 176,204 | | | | 74,453 | |
| Class R6 | | | 993,130 | | | | 852,132 | |
| Total | | | $12,086,828 | | | | $17,116,057 | |
(3) Transactions with Affiliates
Investment Adviser – The fund has an investment advisory agreement with MFS to provide overall investment management and related administrative services and facilities to the fund. The management fee is computed daily and paid monthly at the following annual rates:
| | | | |
| First $1 billion of average daily net assets | | | 0.75 | % |
| Average daily net assets in excess of $1 billion | | | 0.70 | % |
MFS has agreed in writing to reduce its management fee by a specified amount if certain MFS mutual fund assets exceed thresholds agreed to by MFS and the fund’s Board of Trustees. For the six months ended February 28, 2017, this management fee reduction amounted to $23,527, which is included in the reduction of total expenses in the Statement of Operations. The management fee incurred for the six months ended February 28, 2017 was equivalent to an annual effective rate of 0.74% of the fund’s average daily net assets.
Distributor – MFS Fund Distributors, Inc. (MFD), a wholly-owned subsidiary of MFS, as distributor, received $95,240 for the six months ended February 28, 2017, as its portion of the initial sales charge on sales of Class A shares of the fund.
The Board of Trustees has adopted a distribution plan for certain share classes pursuant to Rule 12b-1 of the Investment Company Act of 1940.
The fund’s distribution plan provides that the fund will pay MFD for services provided by MFD and financial intermediaries in connection with the distribution and servicing of certain share classes. One component of the plan is a distribution fee paid to MFD and another component of the plan is a service fee paid to MFD. MFD may subsequently pay all, or a portion, of the distribution and/or service fees to financial intermediaries.
31
Notes to Financial Statements (unaudited) – continued
Distribution Plan Fee Table:
| | | | | | | | | | | | | | | | | | | | |
| | | Distribution
Fee Rate (d) | | | Service
Fee Rate (d) | | | Total
Distribution
Plan (d) | | | Annual
Effective
Rate (e) | | | Distribution
and Service
Fee | |
| Class A | | | — | | | | 0.25% | | | | 0.25% | | | | 0.25% | | | | $406,713 | |
| Class B | | | 0.75% | | | | 0.25% | | | | 1.00% | | | | 1.00% | | | | 133,506 | |
| Class C | | | 0.75% | | | | 0.25% | | | | 1.00% | | | | 1.00% | | | | 384,449 | |
| Class R1 | | | 0.75% | | | | 0.25% | | | | 1.00% | | | | 1.00% | | | | 15,149 | |
| Class R2 | | | 0.25% | | | | 0.25% | | | | 0.50% | | | | 0.50% | | | | 44,372 | |
| Class R3 | | | — | | | | 0.25% | | | | 0.25% | | | | 0.25% | | | | 30,806 | |
| Total Distribution and Service Fees | | | | | | | | | | | | | | | | $1,014,995 | |
| (d) | In accordance with the distribution plan for certain classes, the fund pays distribution and/or service fees equal to these annual percentage rates of each class’s average daily net assets. The distribution and service fee rates disclosed by class represent the current rates in effect at the end of the reporting period. Any rate changes, if applicable, are detailed below. |
| (e) | The annual effective rates represent actual fees incurred under the distribution plan for the six months ended February 28, 2017 based on each class’s average daily net assets. MFD has voluntarily agreed to rebate a portion of each class’s 0.25% service fee except for accounts attributable to MFS or its affiliates’ seed money. For the six months ended February 28, 2017, this rebate amounted to $5,842, $124, and $298 for Class A, Class B, and Class C, respectively, and is included in the reduction of total expenses in the Statement of Operations. |
Certain Class A shares are subject to a contingent deferred sales charge (CDSC) in the event of a shareholder redemption within 18 months of purchase. Class C shares are subject to a CDSC in the event of a shareholder redemption within 12 months of purchase. Class B shares are subject to a CDSC in the event of a shareholder redemption within six years of purchase. All contingent deferred sales charges are paid to MFD and during the six months ended February 28, 2017, were as follows:
| | | | |
| | | Amount | |
| Class A | | | $1,765 | |
| Class B | | | 15,731 | |
| Class C | | | 11,971 | |
Shareholder Servicing Agent – MFS Service Center, Inc. (MFSC), a wholly-owned subsidiary of MFS, receives a fee from the fund for its services as shareholder servicing agent calculated as a percentage of the average daily net assets of the fund as determined periodically under the supervision of the fund’s Board of Trustees. For the six months ended February 28, 2017, the fee was $76,815, which equated to 0.0239% annually of the fund’s average daily net assets. MFSC also receives payment from the fund for out-of-pocket expenses, sub-accounting and other shareholder servicing costs which may be paid to affiliated and unaffiliated service providers. Class R6 shares do not incur sub-accounting fees. For the six months ended February 28, 2017, these out-of-pocket expenses, sub-accounting and other shareholder servicing costs amounted to $344,559.
Administrator – MFS provides certain financial, legal, shareholder communications, compliance, and other administrative services to the fund. Under an administrative services agreement, the fund reimburses MFS the costs incurred to provide these services. The fund is charged an annual fixed amount of $17,500 plus a fee based on
32
Notes to Financial Statements (unaudited) – continued
average daily net assets. The administrative services fee incurred for the six months ended February 28, 2017 was equivalent to an annual effective rate of 0.0167% of the fund’s average daily net assets.
Trustees’ and Officers’ Compensation – The fund pays compensation to independent Trustees in the form of a retainer, attendance fees, and additional compensation to Board and Committee chairpersons. The fund does not pay compensation directly to Trustees or officers of the fund who are also officers of the investment adviser, all of whom receive remuneration for their services to the fund from MFS. Certain officers and Trustees of the fund are officers or directors of MFS, MFD, and MFSC.
Prior to December 31, 2001, the fund had an unfunded defined benefit plan (“DB plan”) for independent Trustees. As of December 31, 2001, the Board took action to terminate the DB plan with respect to then-current and any future independent Trustees, such that the DB plan covers only certain of those former independent Trustees who retired on or before December 31, 2001. The DB plan resulted in a pension expense of $117 and is included in “Independent Trustees’ compensation” in the Statement of Operations for the six months ended February 28, 2017. The liability for deferred retirement benefits payable to certain independent Trustees under the DB plan amounted to $692 at February 28, 2017, and is included in “Payable for independent Trustees’ compensation” in the Statement of Assets and Liabilities.
Other – This fund and certain other funds managed by MFS (the funds) have entered into a service agreement (the ISO Agreement) which provides for payment of fees solely by the funds to Tarantino LLC in return for the provision of services of an Independent Senior Officer (ISO) for the funds. Frank L. Tarantino serves as the ISO and is an officer of the funds and the sole member of Tarantino LLC. The funds can terminate the ISO Agreement with Tarantino LLC at any time under the terms of the ISO Agreement. For the six months ended February 28, 2017, the fee paid by the fund under this agreement was $575 and is included in “Miscellaneous” expense in the Statement of Operations. MFS has agreed to bear all expenses associated with office space, other administrative support, and supplies provided to the ISO.
The fund invests in the MFS Institutional Money Market Portfolio which is managed by MFS and seeks current income consistent with preservation of capital and liquidity. This money market fund does not pay a management fee to MFS.
On September 9, 2015, MFS redeemed 5,844 shares of Class R6 for an aggregate amount of $151,886. On March 16, 2016, MFS redeemed 6,339 shares of Class I for an aggregate amount of $167,466.
The fund is permitted to engage in purchase and sale transactions (“cross-trades”) with funds and accounts for which MFS serves as investment adviser or sub-adviser pursuant to a policy adopted by the Board of Trustees. This policy has been designed to ensure that cross-trades conducted by the fund comply with Rule 17a-7 under the Investment Company Act of 1940. Under this policy, cross-trades are effected at current market prices with no remuneration paid in connection with the transaction. During the six months ended February 28, 2017, the fund engaged in sale transactions pursuant to this policy, which amounted to $856,271. The sales transactions resulted in net realized gains (losses) of $55,203.
33
Notes to Financial Statements (unaudited) – continued
(4) Portfolio Securities
For the six months ended February 28, 2017, purchases and sales of investments, other than purchased option transactions, short sales, and short-term obligations, aggregated $189,877,010 and $130,326,916, respectively.
(5) Shares of Beneficial Interest
The fund’s Declaration of Trust permits the Trustees to issue an unlimited number of full and fractional shares of beneficial interest. Transactions in fund shares were as follows:
| | | | | | | | | | | | | | | | |
| | | Six months ended
2/28/17 | | | Year ended
8/31/16 | |
| | | Shares | | | Amount | | | Shares | | | Amount | |
| Shares sold | | | | | | | | | | | | | | | | |
Class A | | | 2,079,238 | | | | $59,231,474 | | | | 5,650,212 | | | | $146,107,339 | |
Class B | | | 143,418 | | | | 3,629,784 | | | | 340,869 | | | | 7,842,383 | |
Class C | | | 547,460 | | | | 13,820,824 | | | | 1,326,858 | | | | 30,532,344 | |
Class I | | | 2,311,691 | | | | 71,193,167 | | | | 3,469,595 | | | | 95,301,998 | |
Class R1 | | | 26,849 | | | | 678,600 | | | | 59,793 | | | | 1,366,106 | |
Class R2 | | | 158,661 | | | | 4,344,547 | | | | 316,198 | | | | 7,917,738 | |
Class R3 | | | 592,377 | | | | 16,921,231 | | | | 433,184 | | | | 11,179,724 | |
Class R4 | | | 124,964 | | | | 3,701,559 | | | | 269,057 | | | | 7,406,114 | |
Class R6 | | | 1,258,691 | | | | 38,284,309 | | | | 1,008,817 | | | | 26,942,479 | |
| | | 7,243,349 | | | | $211,805,495 | | | | 12,874,583 | | | | $334,596,225 | |
| | | | |
| Shares issued to shareholders in reinvestment of distributions | | | | | | | | | | | | | | | | |
Class A | | | 206,974 | | | | $5,813,901 | | | | 351,762 | | | | $9,145,810 | |
Class B | | | 22,405 | | | | 555,187 | | | | 38,326 | | | | 888,406 | |
Class C | | | 59,252 | | | | 1,465,308 | | | | 80,131 | | | | 1,853,426 | |
Class I | | | 42,956 | | | | 1,279,665 | | | | 65,685 | | | | 1,805,022 | |
Class R1 | | | 2,532 | | | | 62,501 | | | | 5,502 | | | | 127,045 | |
Class R2 | | | 11,665 | | | | 314,359 | | | | 24,051 | | | | 602,249 | |
Class R3 | | | 17,563 | | | | 493,168 | | | | 16,376 | | | | 425,776 | |
Class R4 | | | 4,712 | | | | 136,848 | | | | 2,777 | | | | 74,453 | |
Class R6 | | | 23,250 | | | | 695,648 | | | | 10,949 | | | | 301,867 | |
| | | 391,309 | | | | $10,816,585 | | | | 595,559 | | | | $15,224,054 | |
| | | | |
| Shares reacquired | | | | | | | | | | | | | | | | |
Class A | | | (2,961,754 | ) | | | $(85,775,824 | ) | | | (2,744,468 | ) | | | $(70,029,661 | ) |
Class B | | | (114,211 | ) | | | (2,900,479 | ) | | | (192,697 | ) | | | (4,444,263 | ) |
Class C | | | (343,727 | ) | | | (8,697,136 | ) | | | (437,124 | ) | | | (10,007,638 | ) |
Class I | | | (1,220,860 | ) | | | (36,435,728 | ) | | | (2,485,635 | ) | | | (64,260,422 | ) |
Class R1 | | | (29,644 | ) | | | (745,448 | ) | | | (56,516 | ) | | | (1,271,891 | ) |
Class R2 | | | (138,389 | ) | | | (3,824,390 | ) | | | (342,465 | ) | | | (8,463,244 | ) |
Class R3 | | | (201,091 | ) | | | (5,784,459 | ) | | | (130,805 | ) | | | (3,377,690 | ) |
Class R4 | | | (41,059 | ) | | | (1,221,647 | ) | | | (81,123 | ) | | | (2,055,904 | ) |
Class R6 | | | (283,312 | ) | | | (8,583,581 | ) | | | (179,822 | ) | | | (4,880,914 | ) |
| | | (5,334,047 | ) | | | $(153,968,692 | ) | | | (6,650,655 | ) | | | $(168,791,627 | ) |
34
Notes to Financial Statements (unaudited) – continued
| | | | | | | | | | | | | | | | |
| | | Six months ended
2/28/17 | | | Year ended
8/31/16 | |
| | | Shares | | | Amount | | | Shares | | | Amount | |
| Net change | | | | | | | | | | | | | | | | |
Class A | | | (675,542 | ) | | | $(20,730,449 | ) | | | 3,257,506 | | | | $85,223,488 | |
Class B | | | 51,612 | | | | 1,284,492 | | | | 186,498 | | | | 4,286,526 | |
Class C | | | 262,985 | | | | 6,588,996 | | | | 969,865 | | | | 22,378,132 | |
Class I | | | 1,133,787 | | | | 36,037,104 | | | | 1,049,645 | | | | 32,846,598 | |
Class R1 | | | (263 | ) | | | (4,347 | ) | | | 8,779 | | | | 221,260 | |
Class R2 | | | 31,937 | | | | 834,516 | | | | (2,216 | ) | | | 56,743 | |
Class R3 | | | 408,849 | | | | 11,629,940 | | | | 318,755 | | | | 8,227,810 | |
Class R4 | | | 88,617 | | | | 2,616,760 | | | | 190,711 | | | | 5,424,663 | |
Class R6 | | | 998,629 | | | | 30,396,376 | | | | 839,944 | | | | 22,363,432 | |
| | | 2,300,611 | | | | $68,653,388 | | | | 6,819,487 | | | | $181,028,652 | |
(6) Line of Credit
The fund and certain other funds managed by MFS participate in a $1.25 billion unsecured committed line of credit, subject to a $1 billion sublimit, provided by a syndication of banks under a credit agreement. Borrowings may be made for temporary financing needs. Interest is charged to each fund, based on its borrowings, generally at a rate equal to the higher of the Overnight Federal Reserve funds rate or daily one month LIBOR plus an agreed upon spread. A commitment fee, based on the average daily, unused portion of the committed line of credit, is allocated among the participating funds at the end of each calendar quarter. In addition, the fund and other funds managed by MFS have established unsecured uncommitted borrowing arrangements with certain banks for temporary financing needs. Interest is charged to each fund, based on its borrowings, at a rate equal to the Overnight Federal Reserve funds rate plus an agreed upon spread. For the six months ended February 28, 2017, the fund’s commitment fee and interest expense were $1,898 and $0, respectively, and are included in “Miscellaneous” expense in the Statement of Operations.
(7) Transactions in Underlying Affiliated Funds-Affiliated Issuers
An affiliated issuer may be considered one in which the fund owns 5% or more of the outstanding voting securities, or a company which is under common control. For the purposes of this report, the fund assumes the following to be an affiliated issuer:
| | | | | | | | | | | | | | | | |
| Underlying Affiliated Fund | | Beginning
Shares/Par
Amount | | | Acquisitions
Shares/Par
Amount | | | Dispositions
Shares/Par
Amount | | | Ending
Shares/Par
Amount | |
MFS Institutional Money
Market Portfolio | | | 16,566,726 | | | | 114,081,546 | | | | (112,369,083 | ) | | | 18,279,189 | |
| | | | |
| Underlying Affiliated Fund | | Realized
Gain (Loss) | | | Capital Gain
Distributions | | | Dividend
Income | | | Ending
Value | |
MFS Institutional Money
Market Portfolio | | | $1 | | | | $— | | | | $38,198 | | | | $18,279,189 | |
35
PROXY VOTING POLICIES AND INFORMATION
MFS votes proxies on behalf of the fund pursuant to proxy voting policies and procedures that are available without charge, upon request, by calling 1-800-225-2606, by visiting mfs.com (once you have selected “Individual Investor” as your role, click on “Individual Investor Home” in the top navigation and then select “Learn More About Proxy Voting” under the “I want to…” header on the left hand column of the page), or by visiting the SEC’s Web site at http://www.sec.gov.
Information regarding how the fund voted proxies relating to portfolio securities during the most recent twelve-month period ended June 30 is available by August 31 of each year without charge by visiting mfs.com (once you have selected “Individual Investor” as your role, click on “Individual Investor Home” in the top navigation and then select “Learn More About Proxy Voting” under the “I want to…” header on the left hand column of the page), or by visiting the SEC’s Web site at http://www.sec.gov.
QUARTERLY PORTFOLIO DISCLOSURE
The fund will file a complete schedule of portfolio holdings with the Securities and Exchange Commission (the Commission) for the first and third quarters of each fiscal year on Form N-Q. A shareholder can obtain the quarterly portfolio holdings report at mfs.com. The fund’s Form N-Q is also available on the EDGAR database on the Commission’s Internet Web site at http://www.sec.gov, and may be reviewed and copied at the:
Public Reference Room
Securities and Exchange Commission
100 F Street, NE, Room 1580
Washington, D.C. 20549
Information on the operation of the Public Reference Room may be obtained by calling the Commission at 1-800-SEC-0330. Copies of the fund’s Form N-Q also may be obtained, upon payment of a duplicating fee, by electronic request at the following e-mail address: publicinfo@sec.gov or by writing the Public Reference Section at the above address.
FURTHER INFORMATION
From time to time, MFS may post important information about the fund or the MFS funds on the MFS web site (mfs.com). This information is available on mfs.com by following these steps once you have selected “Individual Investor” as your role: (1) Click on the “Individual Investor Home” in the top navigation and then select the “Announcements” option within the “Market Outlooks” drop down, or (2) Click on “Products & Services” and “Mutual Funds” and then choose the fund’s name in the “Select a fund” menu.
36
INFORMATION ABOUT FUND CONTRACTS AND LEGAL CLAIMS
The fund has entered into contractual arrangements with an investment adviser, administrator, distributor, shareholder servicing agent, 529 program manager (if applicable), and custodian who each provide services to the fund. Unless expressly stated otherwise, shareholders are not parties to, or intended beneficiaries of these contractual arrangements, and these contractual arrangements are not intended to create any shareholder right to enforce them against the service providers or to seek any remedy under them against the service providers, either directly or on behalf of the fund.
Under the Trust’s By-Laws and Declaration of Trust, any claims asserted against or on behalf of the MFS Funds, including claims against Trustees and Officers, must be brought in state and federal courts located within the Commonwealth of Massachusetts.
PROVISION OF FINANCIAL REPORTS AND SUMMARY PROSPECTUSES
The fund produces financial reports every six months and updates its summary prospectus and prospectus annually. To avoid sending duplicate copies of materials to households, only one copy of the fund’s annual and semiannual report and summary prospectus may be mailed to shareholders having the same last name and residential address on the fund’s records. However, any shareholder may contact MFSC (please see back cover for address and telephone number) to request that copies of these reports and summary prospectuses be sent personally to that shareholder.
37
Save paper with eDelivery.

| MFS® will send you prospectuses, |
reports, and proxies directly via e-mail so you will get information faster with less mailbox clutter.
To sign up:
1. Go to mfs.com.
2. Log in via MFS® Access.
3. Select eDelivery.
If you own your MFS fund shares through a financial institution or a retirement plan, MFS® TALK, MFS® Access, or eDelivery may not be available to you.
CONTACT
WEB SITE
mfs.com
MFS TALK
1-800-637-8255
24 hours a day
ACCOUNT SERVICE AND LITERATURE
Shareholders
1-800-225-2606
Financial advisors
1-800-343-2829
Retirement plan services
1-800-637-1255
MAILING ADDRESS
MFS Service Center, Inc.
P.O. Box 55824
Boston, MA 02205-5824
OVERNIGHT MAIL
MFS Service Center, Inc.
c/o Boston Financial Data Services
30 Dan Road
Canton, MA 02021-2809
SEMIANNUAL REPORT
February 28, 2017

MFS® U.S. GOVERNMENT CASH RESERVE FUND

LMM-SEM
MFS® U.S. GOVERNMENT CASH RESERVE FUND
CONTENTS
The report is prepared for the general information of shareholders.
It is authorized for distribution to prospective investors only when preceded or accompanied by a current prospectus.
NOT FDIC INSURED • MAY LOSE VALUE • NO BANK GUARANTEE

LETTER FROM THE EXECUTIVE CHAIRMAN
Dear Shareholders:
Despite June’s unexpected vote by the United Kingdom to leave the European Union and the surprising result in November’s U.S. presidential election, most markets have
proved resilient. U.S. share prices quickly reversed post-Brexit declines, and indices reached new highs following the November elections. U.S. bond yields rose after Donald Trump’s victory on hopes that his proposed policy mix of lower taxes, increased spending on infrastructure and a lower regulatory burden on businesses will lift both U.S. economic growth and inflation. However, interest rates in most developed markets remain very low, with major central banks maintaining extremely accommodative monetary policies to reinvigorate slow-growing economies against a backdrop of still-low inflation. Even after the rise in yields following the election, interest rates remain low by historical standards.
Globally, economic growth has shown signs of recovery of late, led by the United States and the eurozone. Despite better growth, there are few immediate signs of worrisome inflation. Emerging market economies are recovering at a somewhat slower pace amid fears that restrictive U.S. trade policies could further hamper the already slow pace of global trade growth. Looking ahead, markets will have to contend with a series of European elections during 2017, which, depending on the outcome, could further call into question the future direction of the European Union.
At MFS®, we believe in a patient, long-term approach to investing. Viewing investments with a long lens makes it possible to filter out short-term market noise and focus on achieving solid risk-adjusted returns over a full market cycle.
In our view, such an approach, along with the professional guidance of a financial advisor, will help you reach your investment objectives.
Respectfully,

Robert J. Manning
Executive Chairman
MFS Investment Management
April 13, 2017
The opinions expressed in this letter are subject to change and may not be relied upon for investment advice. No forecasts can be guaranteed.
1
PORTFOLIO COMPOSITION
Portfolio structure (u)
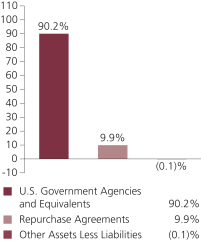
| | | | |
Composition including fixed income
credit quality (a)(u) | |
| A-1+ | | | 18.7% | |
| A-1 | | | 71.5% | |
| A-2 | | | 9.9% | |
| Not Rated | | | 0.0% | |
| Other Assets Less Liabilities | | | (0.1)% | |
| | | | |
| Maturity breakdown (u) | |
| 0 - 7 days | | | 24.8% | |
| 8 - 29 days | | | 37.6% | |
| 30 - 59 days | | | 22.6% | |
| 60 - 89 days | | | 9.9% | |
| 90 - 365 days | | | 5.2% | |
| Other Assets Less Liabilities | | | (0.1)% | |
| (a) | Ratings are assigned to portfolio securities utilizing ratings from Moody’s, Fitch, and Standard & Poor’s rating agencies and applying the following hierarchy: If all three agencies provide a rating, the middle rating (after dropping the highest and lowest ratings) is assigned; if two of the three agencies rate a security, the lower of the two is assigned. Ratings are shown in the S&P scale. All ratings are subject to change. The fund is not rated by these agencies. |
| (u) | For purposes of this presentation, accrued interest, where applicable, is included. |
From time to time Other Assets Less Liabilities may be negative due to timing of cash receipts.
Percentages are based on net assets as of 2/28/17.
The portfolio is actively managed and current holdings may be different.
2
EXPENSE TABLE
Fund expenses borne by the shareholders during the period, September 1, 2016 through February 28, 2017
As a shareholder of the fund, you incur two types of costs: (1) transaction costs, including sales charges (loads) on certain purchase or redemption payments, and (2) ongoing costs, including management fees; distribution and service (12b-1) fees; and other fund expenses. This example is intended to help you understand your ongoing costs (in dollars) of investing in the fund and to compare these costs with the ongoing costs of investing in other mutual funds.
The example is based on an investment of $1,000 invested at the beginning of the period and held for the entire period September 1, 2016 through February 28, 2017.
Actual Expenses
The first line for each share class in the following table provides information about actual account values and actual expenses. You may use the information in this line, together with the amount you invested, to estimate the expenses that you paid over the period. Simply divide your account value by $1,000 (for example, an $8,600 account value divided by $1,000 = 8.6), then multiply the result by the number in the first line under the heading entitled “Expenses Paid During Period” to estimate the expenses you paid on your account during this period.
Hypothetical Example for Comparison Purposes
The second line for each share class in the following table provides information about hypothetical account values and hypothetical expenses based on the fund’s actual expense ratio and an assumed rate of return of 5% per year before expenses, which is not the fund’s actual return. The hypothetical account values and expenses may not be used to estimate the actual ending account balance or expenses you paid for the period. You may use this information to compare the ongoing costs of investing in the fund and other funds. To do so, compare this 5% hypothetical example with the 5% hypothetical examples that appear in the shareholder reports of the other funds.
Please note that the expenses shown in the table are meant to highlight your ongoing costs only and do not reflect any transactional costs, such as sales charges (loads). Therefore, the second line for each share class in the table is useful in comparing ongoing costs only, and will not help you determine the relative total costs of owning different funds. In addition, if these transactional costs were included, your costs would have been higher.
3
Expense Table – continued
| | | | | | | | | | | | | | | | | | |
Share
Class | | | | Annualized
Expense Ratio | | | Beginning
Account Value
9/01/16 | | | Ending Account Value
2/28/17 | | | Expenses
Paid During Period (p) 9/01/16-2/28/17 | |
| A | | Actual | | | 0.36% | | | | $1,000.00 | | | | $1,000.08 | | | | $1.79 | |
| | Hypothetical (h) | | | 0.36% | | | | $1,000.00 | | | | $1,023.01 | | | | $1.81 | |
| B | | Actual | | | 0.36% | | | | $1,000.00 | | | | $1,000.05 | | | | $1.79 | |
| | Hypothetical (h) | | | 0.36% | | | | $1,000.00 | | | | $1,023.01 | | | | $1.81 | |
| C | | Actual | | | 0.36% | | | | $1,000.00 | | | | $1,000.05 | | | | $1.79 | |
| | Hypothetical (h) | | | 0.36% | | | | $1,000.00 | | | | $1,023.01 | | | | $1.81 | |
| R1 | | Actual | | | 0.36% | | | | $1,000.00 | | | | $1,000.05 | | | | $1.79 | |
| | Hypothetical (h) | | | 0.36% | | | | $1,000.00 | | | | $1,023.01 | | | | $1.81 | |
| R2 | | Actual | | | 0.36% | | | | $1,000.00 | | | | $1,000.07 | | | | $1.79 | |
| | Hypothetical (h) | | | 0.36% | | | | $1,000.00 | | | | $1,023.01 | | | | $1.81 | |
| R3 | | Actual | | | 0.35% | | | | $1,000.00 | | | | $1,000.08 | | | | $1.74 | |
| | Hypothetical (h) | | | 0.35% | | | | $1,000.00 | | | | $1,023.06 | | | | $1.76 | |
| R4 | | Actual | | | 0.36% | | | | $1,000.00 | | | | $1,000.08 | | | | $1.79 | |
| | Hypothetical (h) | | | 0.36% | | | | $1,000.00 | | | | $1,023.01 | | | | $1.81 | |
| 529A | | Actual | | | 0.36% | | | | $1,000.00 | | | | $1,000.08 | | | | $1.79 | |
| | Hypothetical (h) | | | 0.36% | | | | $1,000.00 | | | | $1,023.01 | | | | $1.81 | |
| 529B | | Actual | | | 0.36% | | | | $1,000.00 | | | | $1,000.05 | | | | $1.79 | |
| | Hypothetical (h) | | | 0.36% | | | | $1,000.00 | | | | $1,023.01 | | | | $1.81 | |
| 529C | | Actual | | | 0.36% | | | | $1,000.00 | | | | $1,000.05 | | | | $1.79 | |
| | Hypothetical (h) | | | 0.36% | | | | $1,000.00 | | | | $1,023.01 | | | | $1.81 | |
| (h) | 5% class return per year before expenses. |
| (p) | “Expenses Paid During Period” are equal to each class’s annualized expense ratio, as shown above, multiplied by the average account value over the period, multiplied by 181/365 (to reflect the one-half year period). Expenses paid do not include any applicable sales charges (loads). If these transaction costs had been included, your costs would have been higher. |
Notes to Expense Table
As more fully disclosed in footnote 3 to the financial statements, the expense ratios reported above include additional expense reductions to avoid a negative yield.
Expense ratios reflect a one-time Reimbursement of Expenses by Custodian of 0.02% (See Note 2 of the Notes to Financial Statements).
4
PORTFOLIO OF INVESTMENTS
2/28/17 (unaudited)
The Portfolio of Investments is a complete list of all securities owned by your fund. It is categorized by broad-based asset classes.
| | | | | | | | |
| U.S. Government Agencies and Equivalents (y) - 90.2% | | | | | |
| Issuer | | Shares/Par | | | Value ($) | |
| Fannie Mae, 0.501%, due 3/08/2017 | | $ | 13,000,000 | | | $ | 12,998,752 | |
| Fannie Mae, 0.487%, due 3/14/2017 | | | 10,843,000 | | | | 10,841,121 | |
| Fannie Mae, 0.512%, due 3/15/2017 | | | 5,233,000 | | | | 5,231,972 | |
| Fannie Mae, 0.477%, due 3/20/2017 | | | 10,000,000 | | | | 9,997,519 | |
| Fannie Mae, 0.477%, due 3/21/2017 | | | 9,164,000 | | | | 9,161,607 | |
| Fannie Mae, 0.507%, due 3/22/2017 | | | 12,700,000 | | | | 12,696,296 | |
| Fannie Mae, 0.497%, due 4/05/2017 | | | 12,372,000 | | | | 12,366,106 | |
| Fannie Mae, 0.513%, due 4/12/2017 | | | 12,865,000 | | | | 12,857,420 | |
| Federal Farm Credit Bank, 0.487%, due 3/23/2017 | | | 8,000,000 | | | | 7,997,653 | |
| Federal Farm Credit Bank, 0.497%, due 3/28/2017 | | | 7,226,000 | | | | 7,223,344 | |
| Federal Farm Credit Bank, 0.497%, due 4/03/2017 | | | 3,742,000 | | | | 3,740,319 | |
| Federal Farm Credit Bank, 0.497%, due 4/04/2017 | | | 8,000,000 | | | | 7,996,298 | |
| Federal Farm Credit Bank, 0.538%, due 5/11/2017 | | | 9,000,000 | | | | 8,990,593 | |
| Federal Farm Credit Bank, 0.554%, due 6/06/2017 | | | 5,000,000 | | | | 4,992,658 | |
| Federal Farm Credit Bank, 0.554%, due 6/08/2017 | | | 2,000,000 | | | | 1,997,003 | |
| Federal Home Loan Bank, 0.482%, due 3/01/2017 | | | 4,917,000 | | | | 4,917,000 | |
| Federal Home Loan Bank, 0.497%, due 3/07/2017 | | | 1,032,000 | | | | 1,031,916 | |
| Federal Home Loan Bank, 0.507%, due 3/09/2017 | | | 12,700,000 | | | | 12,698,589 | |
| Federal Home Loan Bank, 0.528%, due 3/09/2017 | | | 7,676,000 | | | | 7,675,113 | |
| Federal Home Loan Bank, 0.512%, due 3/10/2017 | | | 12,725,000 | | | | 12,723,393 | |
| Federal Home Loan Bank, 0.507%, due 3/13/2017 | | | 7,267,000 | | | | 7,265,789 | |
| Federal Home Loan Bank, 0.538%, due 3/30/2017 | | | 11,639,000 | | | | 11,634,031 | |
| Federal Home Loan Bank, 0.507%, due 4/04/2017 | | | 250,000 | | | | 249,882 | |
| Federal Home Loan Bank, 0.512%, due 4/10/2017 | | | 250,000 | | | | 249,860 | |
| Federal Home Loan Bank, 0.538%, due 4/20/2017 | | | 8,000,000 | | | | 7,994,111 | |
| Freddie Mac, 0.497%, due 3/03/2017 | | | 1,015,000 | | | | 1,014,972 | |
| Freddie Mac, 0.476%, due 3/06/2017 | | | 12,535,000 | | | | 12,534,183 | |
| Freddie Mac, 0.502%, due 4/13/2017 | | | 2,106,000 | | | | 2,104,755 | |
| Freddie Mac, 0.517%, due 4/13/2017 | | | 4,002,000 | | | | 3,999,562 | |
| Freddie Mac, 0.515%, due 4/21/2017 | | | 3,484,000 | | | | 3,481,493 | |
| U.S. Treasury Bill, 0.487%, due 3/02/2017 | | | 13,060,000 | | | | 13,059,826 | |
| U.S. Treasury Bill, 0.528%, due 4/06/2017 | | | 9,000,000 | | | | 8,995,320 | |
| U.S. Treasury Bill, 0.485%, due 4/20/2017 | | | 4,949,000 | | | | 4,945,718 | |
| U.S. Treasury Bill, 0.518%, due 5/04/2017 | | | 9,000,000 | | | | 8,991,840 | |
| U.S. Treasury Bill, 0.518%, due 5/18/2017 | | | 12,465,000 | | | | 12,451,226 | |
| U.S. Treasury Bill, 0.6%, due 7/13/2017 | | | 8,840,000 | | | | 8,820,586 | |
Total U.S. Government Agencies and Equivalents,
at Amortized Cost and Value | | | | | | $ | 275,927,826 | |
5
Portfolio of Investments (unaudited) – continued
| | | | | | | | |
| Repurchase Agreements - 9.9% | | | | | | | | |
| Issuer | | Shares/Par | | | Value ($) | |
| Goldman Sachs Repurchase Agreement, 0.52%, dated 2/28/2017, due 3/01/2017, total to be received $25,372,366 (secured by U.S. Federal Agency obligations valued at $25,879,440 in a jointly traded account), at Cost and Value | | $ | 25,372,000 | | | $ | 25,372,000 | |
| JPMorgan Chase & Co. Repurchase Agreement, 0.51%, dated 2/28/2017, due 3/1/2017, total to be received $5,000,071 (secured by U.S. Federal Agency obligations valued at $5,013,427 in a jointly traded account), at Cost and Value | | | 5,000,000 | | | | 5,000,000 | |
| Total Repurchase Agreements, at Cost and Value | | | $ | 30,372,000 | |
| Total Investments, at Amortized Cost and Value | | | $ | 306,299,826 | |
| |
| Other Assets, Less Liabilities - (0.1)% | | | | (404,341 | ) |
| Net Assets - 100.0% | | | $ | 305,895,485 | |
| (y) | The rate shown represents an annualized yield at time of purchase. |
See Notes to Financial Statements
6
Financial Statements
STATEMENT OF ASSETS AND LIABILITIES
At 2/28/17 (unaudited)
This statement represents your fund’s balance sheet, which details the assets and liabilities comprising the total value of the fund.
| | | | |
| Assets | | | | |
Investments, at amortized cost and value | | | $306,299,826 | |
| Cash | | | 395 | |
| Receivables for | | | | |
Fund shares sold | | | 437,856 | |
Interest | | | 437 | |
| Other assets | | | 1,731 | |
| Total assets | | | $306,740,245 | |
| Liabilities | | | | |
| Payable for fund shares reacquired | | | $696,565 | |
| Payable to affiliates | | | | |
Investment adviser | | | 4,462 | |
Shareholder servicing costs | | | 112,496 | |
| Payable for independent Trustees’ compensation | | | 7,475 | |
| Accrued expenses and other liabilities | | | 23,762 | |
| Total liabilities | | | $844,760 | |
| Net assets | | | $305,895,485 | |
| Net assets consist of | | | | |
| Paid-in capital | | | $306,088,924 | |
| Accumulated net realized gain (loss) on investments | | | (184,395 | ) |
| Accumulated distributions in excess of net investment income | | | (9,044 | ) |
| Net assets | | | $305,895,485 | |
| Shares of beneficial interest outstanding | | | 306,125,492 | |
| | | | | | | | | | | | |
| | | Net assets | | | Shares
outstanding | | | Net asset value
per share | |
| Class A | | | $120,197,165 | | | | 120,284,961 | | | | $1.00 | |
| Class B | | | 22,109,830 | | | | 22,128,657 | | | | 1.00 | |
| Class C | | | 45,000,499 | | | | 45,033,709 | | | | 1.00 | |
| Class R1 | | | 11,777,539 | | | | 11,786,729 | | | | 1.00 | |
| Class R2 | | | 49,699,092 | | | | 49,736,818 | | | | 1.00 | |
| Class R3 | | | 33,685,948 | | | | 33,712,847 | | | | 1.00 | |
| Class R4 | | | 3,279,461 | | | | 3,281,876 | | | | 1.00 | |
| Class 529A | | | 12,802,733 | | | | 12,811,653 | | | | 1.00 | |
| Class 529B | | | 355,325 | | | | 355,651 | | | | 1.00 | |
| Class 529C | | | 6,987,893 | | | | 6,992,591 | | | | 1.00 | |
A contingent deferred sales charge may be imposed on redemptions of Class A, Class B, Class C, Class 529B, and Class 529C shares. Redemption price per share was equal to the net asset value per share for Classes R1, R2, R3, R4, and 529A.
See Notes to Financial Statements
7
Financial Statements
STATEMENT OF OPERATIONS
Six months ended 2/28/17 (unaudited)
This statement describes how much your fund earned in investment income and accrued in expenses. It also describes any gains and/or losses generated by fund operations.
| | | | |
| Net investment income | |
Income | | | | |
Interest | | | $588,777 | |
Other | | | 4,873 | |
Total investment income | | | $593,650 | |
Expenses | | | | |
Management fee | | | $637,402 | |
Distribution and service fees | | | 797,415 | |
Shareholder servicing costs | | | 260,421 | |
Program manager fees | | | 10,074 | |
Administrative services fee | | | 29,079 | |
Independent Trustees’ compensation | | | 5,908 | |
Custodian fee | | | 10,091 | |
Reimbursement of custodian expenses | | | (25,151 | ) |
Shareholder communications | | | 9,495 | |
Audit and tax fees | | | 17,871 | |
Legal fees | | | 1,601 | |
Miscellaneous | | | 74,062 | |
Total expenses | | | $1,828,268 | |
Reduction of expenses by investment adviser and distributor | | | (1,258,303 | ) |
Net expenses | | | $569,965 | |
Net investment income | | | $23,685 | |
Net realized gain (loss) on investments | | | $(5 | ) |
Change in net assets from operations | | | $23,680 | |
See Notes to Financial Statements
8
Financial Statements
STATEMENTS OF CHANGES IN NET ASSETS
These statements describe the increases and/or decreases in net assets resulting from operations, any distributions, and any shareholder transactions.
| | | | | | | | |
| | | Six months ended
2/28/17
(unaudited) | | | Year ended
8/31/16 | |
| Change in net assets | | | | | | |
| From operations | | | | | | | | |
Net investment income | | | $23,685 | | | | $0 | |
| Net realized gain (loss) on investments | | | (5 | ) | | | — | |
Change in net assets from operations | | | $23,680 | | | | $0 | |
| Distributions declared to shareholders | | | | | | | | |
| From net investment income | | | $(23,685 | ) | | | $— | |
Change in net assets from fund share transactions | | | $(8,446,058 | ) | | | $(2,111,675 | ) |
Total change in net assets | | | $(8,446,063 | ) | | | $(2,111,675 | ) |
| Net assets | | | | | | | | |
At beginning of period | | | 314,341,548 | | | | 316,453,223 | |
At end of period (including accumulated distributions in excess of net investment income of $9,044 and accumulated net investment loss $9,044, respectively) | | | $305,895,485 | | | | $314,341,548 | |
See Notes to Financial Statements
9
Financial Statements
FINANCIAL HIGHLIGHTS
The financial highlights table is intended to help you understand the fund’s financial performance for the semiannual period and the past 5 fiscal years (or life of a particular share class, if shorter). Certain information reflects financial results for a single fund share. The total returns in the table represent the rate by which an investor would have earned (or lost) on an investment in the fund share class (assuming reinvestment of all distributions) held for the entire period.
| | | | | | | | | | | | | | | | | | | | | | | | |
| | | Six months
ended
2/28/17
(unaudited) | | | Years ended 8/31 | |
| Class A | | | 2016 | | | 2015 | | | 2014 | | | 2013 | | | 2012 | |
| | | | | | | | | | | | | | | | | |
Net asset value, beginning of period | | | $1.00 | | | | $1.00 | | | | $1.00 | | | | $1.00 | | | | $1.00 | | | | $1.00 | |
| Income (loss) from investment operations | | | | | | | | | | | | | |
Net investment income (d) | | | $0.00 | (c)(w) | | | $0.00 | | | | $0.00 | | | | $0.00 | | | | $0.00 | | | | $0.00 | |
Net realized and unrealized gain
(loss) on investments | | | (0.00 | )(w) | | | $— | | | | 0.00 | (w) | | | 0.00 | (w) | | | $— | | | | $— | |
Total from investment operations | | | $0.00 | (w) | | | $0.00 | | | | $0.00 | (w) | | | $0.00 | (w) | | | $0.00 | | | | $0.00 | |
| Less distributions declared to shareholders | | | | | | | | | | | | | |
From net investment income | | | $(0.00 | )(w) | | | $— | | | | $— | | | | $— | | | | $— | | | | $— | |
Net asset value, end of period | | | $1.00 | | | | $1.00 | | | | $1.00 | | | | $1.00 | | | | $1.00 | | | | $1.00 | |
Total return (%) (r)(t) | | | 0.01 | (c)(n) | | | 0.00 | | | | 0.00 | (w) | | | 0.00 | (w) | | | 0.00 | | | | 0.00 | |
Ratios (%) (to average net assets)
and Supplemental data: | | | | | | | | | | | | | |
Expenses before expense reductions (f) | | | 0.89 | (a)(c) | | | 0.91 | | | | 0.92 | | | | 0.90 | | | | 0.93 | | | | 0.93 | |
Expenses after expense reductions (f) | | | 0.36 | (a)(c) | | | 0.23 | | | | 0.07 | | | | 0.09 | | | | 0.15 | | | | 0.13 | |
Net investment income | | | 0.02 | (a)(c) | | | 0.00 | | | | 0.00 | | | | 0.00 | | | | 0.00 | | | | 0.00 | |
Net assets at end of period
(000 omitted) | | | $120,197 | | | | $120,740 | | | | $122,085 | | | | $124,550 | | | | $145,062 | | | | $126,283 | |
See Notes to Financial Statements
10
Financial Highlights – continued
| | | | | | | | | | | | | | | | | | | | | | | | |
| | | Six months
ended
2/28/17
(unaudited) | | | Years ended 8/31 | |
| Class B | | | 2016 | | | 2015 | | | 2014 | | | 2013 | | | 2012 | |
| | | | | | | | | | | | | | | | | |
Net asset value, beginning of period | | | $1.00 | | | | $1.00 | | | | $1.00 | | | | $1.00 | | | | $1.00 | | | | $1.00 | |
| Income (loss) from investment operations | | | | | | | | | | | | | |
Net investment income (d) | | | $0.00 | (c)(w) | | | $0.00 | | | | $0.00 | | | | $0.00 | | | | $0.00 | | | | $0.00 | |
Net realized and unrealized gain
(loss) on investments | | | (0.00 | )(w) | | | — | | | | 0.00 | (w) | | | 0.00 | (w) | | | — | | | | — | |
Total from investment operations | | | $0.00 | (w) | | | $0.00 | | | | $0.00 | (w) | | | $0.00 | (w) | | | $0.00 | | | | $0.00 | |
| Less distributions declared to shareholders | | | | | | | | | | | | | |
From net investment income | | | $(0.00 | )(w) | | | $— | | | | $— | | | | $— | | | | $— | | | | $— | |
Net asset value, end of period | | | $1.00 | | | | $1.00 | | | | $1.00 | | | | $1.00 | | | | $1.00 | | | | $1.00 | |
Total return (%) (r)(t) | | | 0.01 | (c)(n) | | | 0.00 | | | | 0.00 | (w) | | | 0.00 | (w) | | | 0.00 | | | | 0.00 | |
Ratios (%) (to average net assets)
and Supplemental data: | | | | | | | | | | | | | |
Expenses before expense reductions (f) | | | 1.64 | (a)(c) | | | 1.66 | | | | 1.67 | | | | 1.65 | | | | 1.68 | | | | 1.68 | |
Expenses after expense reductions (f) | | | 0.36 | (a)(c) | | | 0.23 | | | | 0.07 | | | | 0.10 | | | | 0.15 | | | | 0.12 | |
Net investment income | | | 0.01 | (a)(c) | | | 0.00 | | | | 0.00 | | | | 0.00 | | | | 0.00 | | | | 0.00 | |
Net assets at end of period
(000 omitted) | | | $22,110 | | | | $18,096 | | | | $18,831 | | | | $22,982 | | | | $30,833 | | | | $35,098 | |
| | |
| | | Six months
ended
2/28/17
(unaudited) | | | Years ended 8/31 | |
| Class C | | | 2016 | | | 2015 | | | 2014 | | | 2013 | | | 2012 | |
| | | | | | | | | | | | | | | | | |
Net asset value, beginning of period | | | $1.00 | | | | $1.00 | | | | $1.00 | | | | $1.00 | | | | $1.00 | | | | $1.00 | |
| Income (loss) from investment operations | | | | | | | | | | | | | |
Net investment income (d) | | | $0.00 | (c)(w) | | | $0.00 | | | | $0.00 | | | | $0.00 | | | | $0.00 | | | | $0.00 | |
Net realized and unrealized gain
(loss) on investments | | | (0.00 | )(w) | | | — | | | | 0.00 | (w) | | | 0.00 | (w) | | | — | | | | — | |
Total from investment operations | | | $0.00 | (w) | | | $0.00 | | | | $0.00 | (w) | | | $0.00 | (w) | | | $0.00 | | | | $0.00 | |
| Less distributions declared to shareholders | | | | | | | | | | | | | |
From net investment income | | | $(0.00 | )(w) | | | $— | | | | $— | | | | $— | | | | $— | | | | $— | |
Net asset value, end of period | | | $1.00 | | | | $1.00 | | | | $1.00 | | | | $1.00 | | | | $1.00 | | | | $1.00 | |
Total return (%) (r)(t) | | | 0.01 | (c)(n) | | | 0.00 | | | | 0.00 | (w) | | | 0.00 | (w) | | | 0.00 | | | | 0.00 | |
Ratios (%) (to average net assets)
and Supplemental data: | | | | | | | | | | | | | |
Expenses before expense reductions (f) | | | 1.64 | (a)(c) | | | 1.66 | | | | 1.67 | | | | 1.65 | | | | 1.68 | | | | 1.68 | |
Expenses after expense reductions (f) | | | 0.36 | (a)(c) | | | 0.24 | | | | 0.07 | | | | 0.10 | | | | 0.15 | | | | 0.13 | |
Net investment income | | | 0.01 | (a)(c) | | | 0.00 | | | | 0.00 | | | | 0.00 | | | | 0.00 | | | | 0.00 | |
Net assets at end of period
(000 omitted) | | | $45,000 | | | | $48,749 | | | | $42,522 | | | | $45,662 | | | | $58,363 | | | | $49,851 | |
See Notes to Financial Statements
11
Financial Highlights – continued
| | | | | | | | | | | | | | | | | | | | | | | | |
| | | Six months
ended
2/28/17
(unaudited) | | | Years ended 8/31 | |
| Class R1 | | | 2016 | | | 2015 | | | 2014 | | | 2013 | | | 2012 | |
| | | | | | | | | | | | | | | | | |
Net asset value, beginning of period | | | $1.00 | | | | $1.00 | | | | $1.00 | | | | $1.00 | | | | $1.00 | | | | $1.00 | |
| Income (loss) from investment operations | | | | | | | | | | | | | |
Net investment income (d) | | | $0.00 | (c)(w) | | | $0.00 | | | | $0.00 | | | | $0.00 | | | | $0.00 | | | | $0.00 | |
Net realized and unrealized gain
(loss) on investments | | | (0.00 | )(w) | | | — | | | | 0.00 | (w) | | | 0.00 | (w) | | | — | | | | — | |
Total from investment operations | | | $0.00 | (w) | | | $0.00 | | | | $0.00 | (w) | | | $0.00 | (w) | | | $0.00 | | | | $0.00 | |
| Less distributions declared to shareholders | | | | | | | | | | | | | |
From net investment income | | | $(0.00 | )(w) | | | $— | | | | $— | | | | $— | | | | $— | | | | $— | |
Net asset value, end of period | | | $1.00 | | | | $1.00 | | | | $1.00 | | | | $1.00 | | | | $1.00 | | | | $1.00 | |
Total return (%) (r) | | | 0.01 | (c)(n) | | | 0.00 | | | | 0.00 | (w) | | | 0.00 | (w) | | | 0.00 | | | | 0.00 | |
Ratios (%) (to average net assets)
and Supplemental data: | | | | | | | | | | | | | |
Expenses before expense reductions (f) | | | 1.64 | (a)(c) | | | 1.66 | | | | 1.67 | | | | 1.65 | | | | 1.68 | | | | 1.68 | |
Expenses after expense reductions (f) | | | 0.36 | (a)(c) | | | 0.23 | | | | 0.07 | | | | 0.09 | | | | 0.15 | | | | 0.13 | |
Net investment income | | | 0.01 | (a)(c) | | | 0.00 | | | | 0.00 | | | | 0.00 | | | | 0.00 | | | | 0.00 | |
Net assets at end of period
(000 omitted) | | | $11,778 | | | | $14,569 | | | | $14,363 | | | | $16,819 | | | | $21,080 | | | | $24,361 | |
| | |
| | | Six months
ended
2/28/17
(unaudited) | | | Years ended 8/31 | |
| Class R2 | | | 2016 | | | 2015 | | | 2014 | | | 2013 | | | 2012 | |
| | | | | | | | | | | | | | | | | |
Net asset value, beginning of period | | | $1.00 | | | | $1.00 | | | | $1.00 | | | | $1.00 | | | | $1.00 | | | | $1.00 | |
| Income (loss) from investment operations | | | | | | | | | | | | | |
Net investment income (d) | | | $0.00 | (c)(w) | | | $0.00 | | | | $0.00 | | | | $0.00 | | | | $0.00 | | | | $0.00 | |
Net realized and unrealized gain
(loss) on investments | | | (0.00 | )(w) | | | — | | | | 0.00 | (w) | | | 0.00 | (w) | | | — | | | | — | |
Total from investment operations | | | $0.00 | (w) | | | $0.00 | | | | $0.00 | (w) | | | $0.00 | (w) | | | $0.00 | | | | $0.00 | |
| Less distributions declared to shareholders | | | | | | | | | | | | | |
From net investment income | | | $(0.00 | )(w) | | | $— | | | | $— | | | | $— | | | | $— | | | | $— | |
Net asset value, end of period | | | $1.00 | | | | $1.00 | | | | $1.00 | | | | $1.00 | | | | $1.00 | | | | $1.00 | |
Total return (%) (r) | | | 0.01 | (c)(n) | | | 0.00 | | | | 0.00 | (w) | | | 0.00 | (w) | | | 0.00 | | | | 0.00 | |
Ratios (%) (to average net assets)
and Supplemental data: | | | | | | | | | | | | | |
Expenses before expense reductions (f) | | | 1.14 | (a)(c) | | | 1.16 | | | | 1.17 | | | | 1.15 | | | | 1.18 | | | | 1.18 | |
Expenses after expense reductions (f) | | | 0.36 | (a)(c) | | | 0.23 | | | | 0.07 | | | | 0.09 | | | | 0.15 | | | | 0.13 | |
Net investment income | | | 0.01 | (a)(c) | | | 0.00 | | | | 0.00 | | | | 0.00 | | | | 0.00 | | | | 0.00 | |
Net assets at end of period
(000 omitted) | | | $49,699 | | | | $51,537 | | | | $53,058 | | | | $57,634 | | | | $74,406 | | | | $83,723 | |
See Notes to Financial Statements
12
Financial Highlights – continued
| | | | | | | | | | | | | | | | | | | | | | | | |
| | | Six months
ended
2/28/17
(unaudited) | | | Years ended 8/31 | |
| Class R3 | | | 2016 | | | 2015 | | | 2014 | | | 2013 | | | 2012 | |
| | | | | | | | | | | | | | | | | |
Net asset value, beginning of period | | | $1.00 | | | | $1.00 | | | | $1.00 | | | | $1.00 | | | | $1.00 | | | | $1.00 | |
| Income (loss) from investment operations | | | | | | | | | | | | | |
Net investment income (d) | | | $0.00 | (c)(w) | | | $0.00 | | | | $0.00 | | | | $0.00 | | | | $0.00 | | | | $0.00 | |
Net realized and unrealized gain
(loss) on investments | | | (0.00 | )(w) | | | — | | | | 0.00 | (w) | | | 0.00 | (w) | | | — | | | | — | |
Total from investment operations | | | $0.00 | (w) | | | $0.00 | | | | $0.00 | (w) | | | $0.00 | (w) | | | $0.00 | | | | $0.00 | |
| Less distributions declared to shareholders | | | | | | | | | | | | | |
From net investment income | | | $(0.00 | )(w) | | | $— | | | | $— | | | | $— | | | | $— | | | | $— | |
Net asset value, end of period | | | $1.00 | | | | $1.00 | | | | $1.00 | | | | $1.00 | | | | $1.00 | | | | $1.00 | |
Total return (%) (r) | | | 0.01 | (c)(n) | | | 0.00 | | | | 0.00 | (w) | | | 0.00 | (w) | | | 0.00 | | | | 0.00 | |
Ratios (%) (to average net assets)
and Supplemental data: | | | | | | | | | | | | | |
Expenses before expense reductions (f) | | | 0.89 | (a)(c) | | | 0.91 | | | | 0.92 | | | | 0.90 | | | | 0.93 | | | | 0.93 | |
Expenses after expense reductions (f) | | | 0.35 | (a)(c) | | | 0.23 | | | | 0.07 | | | | 0.09 | | | | 0.15 | | | | 0.13 | |
Net investment income | | | 0.02 | (a)(c) | | | 0.00 | | | | 0.00 | | | | 0.00 | | | | 0.00 | | | | 0.00 | |
Net assets at end of period
(000 omitted) | | | $33,686 | | | | $37,650 | | | | $44,872 | | | | $53,916 | | | | $64,925 | | | | $79,029 | |
| | |
| | | Six months
ended
2/28/17
(unaudited) | | | Years ended 8/31 | |
| Class R4 | | | 2016 | | | 2015 | | | 2014 | | | 2013 | | | 2012 | |
| | | | | | | | | | | | | | | | | |
Net asset value, beginning of period | | | $1.00 | | | | $1.00 | | | | $1.00 | | | | $1.00 | | | | $1.00 | | | | $1.00 | |
| Income (loss) from investment operations | | | | | | | | | | | | | |
Net investment income (d) | | | $0.00 | (c)(w) | | | $0.00 | | | | $0.00 | | | | $0.00 | | | | $0.00 | | | | $0.00 | |
Net realized and unrealized gain
(loss) on investments | | | (0.00 | )(w) | | | — | | | | 0.00 | (w) | | | 0.00 | (w) | | | — | | | | — | |
Total from investment operations | | | $0.00 | (w) | | | $0.00 | | | | $0.00 | (w) | | | $0.00 | (w) | | | $0.00 | | | | $0.00 | |
| Less distributions declared to shareholders | | | | | | | | | | | | | |
From net investment income | | | $(0.00 | )(w) | | | $— | | | | $— | | | | $— | | | | $— | | | | $— | |
Net asset value, end of period | | | $1.00 | | | | $1.00 | | | | $1.00 | | | | $1.00 | | | | $1.00 | | | | $1.00 | |
Total return (%) (r) | | | 0.01 | (c)(n) | | | 0.00 | | | | 0.00 | (w) | | | 0.00 | (w) | | | 0.00 | | | | 0.00 | |
Ratios (%) (to average net assets)
and Supplemental data: | | | | | | | | | | | | | |
Expenses before expense reductions (f) | | | 0.64 | (a)(c) | | | 0.66 | | | | 0.67 | | | | 0.65 | | | | 0.68 | | | | 0.69 | |
Expenses after expense reductions (f) | | | 0.36 | (a)(c) | | | 0.23 | | | | 0.07 | | | | 0.09 | | | | 0.15 | | | | 0.12 | |
Net investment income | | | 0.02 | (a)(c) | | | 0.00 | | | | 0.00 | | | | 0.00 | | | | 0.00 | | | | 0.00 | |
Net assets at end of period
(000 omitted) | | | $3,279 | | | | $3,077 | | | | $3,034 | | | | $2,907 | | | | $820 | | | | $810 | |
See Notes to Financial Statements
13
Financial Highlights – continued
| | | | | | | | | | | | | | | | | | | | | | | | |
| | | Six months
ended
2/28/17
(unaudited) | | | Years ended 8/31 | |
| Class 529A | | | 2016 | | | 2015 | | | 2014 | | | 2013 | | | 2012 | |
| | | | | | | | | | | | | | | | | |
Net asset value, beginning of period | | | $1.00 | | | | $1.00 | | | | $1.00 | | | | $1.00 | | | | $1.00 | | | | $1.00 | |
| Income (loss) from investment operations | | | | | | | | | | | | | |
Net investment income (d) | | | $0.00 | (c)(w) | | | $0.00 | | | | $0.00 | | | | $0.00 | | | | $0.00 | | | | $0.00 | |
Net realized and unrealized gain
(loss) on investments | | | (0.00 | )(w) | | | — | | | | 0.00 | (w) | | | 0.00 | (w) | | | — | | | | — | |
Total from investment operations | | | $0.00 | (w) | | | $0.00 | | | | $0.00 | (w) | | | $0.00 | (w) | | | $0.00 | | | | $0.00 | |
| Less distributions declared to shareholders | | | | | | | | | | | | | |
From net investment income | | | $(0.00 | )(w) | | | $— | | | | $— | | | | $— | | | | $— | | | | $— | |
Net asset value, end of period | | | $1.00 | | | | $1.00 | | | | $1.00 | | | | $1.00 | | | | $1.00 | | | | $1.00 | |
Total return (%) (r) | | | 0.01 | (c)(n) | | | 0.00 | | | | 0.00 | (w) | | | 0.00 | (w) | | | 0.00 | | | | 0.00 | |
Ratios (%) (to average net assets)
and Supplemental data: | | | | | | | | | | | | | |
Expenses before expense reductions (f) | | | 0.99 | (a)(c) | | | 1.00 | | | | 1.02 | | | | 1.00 | | | | 1.03 | | | | 1.03 | |
Expenses after expense reductions (f) | | | 0.36 | (a)(c) | | | 0.23 | | | | 0.07 | | | | 0.09 | | | | 0.15 | | | | 0.13 | |
Net investment income | | | 0.02 | (a)(c) | | | 0.00 | | | | 0.00 | | | | 0.00 | | | | 0.00 | | | | 0.00 | |
Net assets at end of period
(000 omitted) | | | $12,803 | | | | $12,841 | | | | $11,383 | | | | $10,927 | | | | $10,897 | | | | $10,330 | |
| | |
| | | Six months
ended
2/28/17
(unaudited) | | | Years ended 8/31 | |
| Class 529B | | | 2016 | | | 2015 | | | 2014 | | | 2013 | | | 2012 | |
| | | | | | | | | | | | | | | | | |
Net asset value, beginning of period | | | $1.00 | | | | $1.00 | | | | $1.00 | | | | $1.00 | | | | $1.00 | | | | $1.00 | |
| Income (loss) from investment operations | | | | | | | | | | | | | |
Net investment income (d) | | | $0.00 | (c)(w) | | | $0.00 | | | | $0.00 | | | | $0.00 | | | | $0.00 | | | | $0.00 | |
Net realized and unrealized gain
(loss) on investments | | | (0.00 | )(w) | | | — | | | | 0.00 | (w) | | | 0.00 | (w) | | | — | | | | — | |
Total from investment operations | | | $0.00 | (w) | | | $0.00 | | | | $0.00 | (w) | | | $0.00 | (w) | | | $0.00 | | | | $0.00 | |
| Less distributions declared to shareholders | | | | | | | | | | | | | |
From net investment income | | | $(0.00 | )(w) | | | $— | | | | $— | | | | $— | | | | $— | | | | $— | |
Net asset value, end of period | | | $1.00 | | | | $1.00 | | | | $1.00 | | | | $1.00 | | | | $1.00 | | | | $1.00 | |
Total return (%) (r) | | | 0.01 | (c)(n) | | | 0.00 | | | | 0.00 | (w) | | | 0.00 | (w) | | | 0.00 | | | | 0.00 | |
Ratios (%) (to average net assets)
and Supplemental data: | | | | | | | | | | | | | |
Expenses before expense reductions (f) | | | 1.74 | (a)(c) | | | 1.76 | | | | 1.77 | | | | 1.75 | | | | 1.78 | | | | 1.78 | |
Expenses after expense reductions (f) | | | 0.36 | (a)(c) | | | 0.22 | | | | 0.07 | | | | 0.10 | | | | 0.15 | | | | 0.12 | |
Net investment income | | | 0.01 | (a)(c) | | | 0.00 | | | | 0.00 | | | | 0.00 | | | | 0.00 | | | | 0.00 | |
Net assets at end of period
(000 omitted) | | | $355 | | | | $355 | | | | $440 | | | | $531 | | | | $676 | | | | $665 | |
See Notes to Financial Statements
14
Financial Highlights – continued
| | | | | | | | | | | | | | | | | | | | | | | | |
| | | Six months
ended
2/28/17
(unaudited) | | | Years ended 8/31 | |
| Class 529C | | | 2016 | | | 2015 | | | 2014 | | | 2013 | | | 2012 | |
| | | | | | | | | | | | | | | | | |
Net asset value, beginning of period | | | $1.00 | | | | $1.00 | | | | $1.00 | | | | $1.00 | | | | $1.00 | | | | $1.00 | |
| Income (loss) from investment operations | | | | | | | | | | | | | |
Net investment income (d) | | | $0.00 | (c)(w) | | | $0.00 | | | | $0.00 | | | | $0.00 | | | | $0.00 | | | | $0.00 | |
Net realized and unrealized gain
(loss) on investments | | | (0.00 | )(w) | | | — | | | | 0.00 | (w) | | | 0.00 | (w) | | | — | | | | — | |
Total from investment operations | | | $0.00 | (w) | | | $0.00 | | | | $0.00 | (w) | | | $0.00 | (w) | | | $0.00 | | | | $0.00 | |
| Less distributions declared to shareholders | | | | | | | | | | | | | |
From net investment income | | | $(0.00 | )(w) | | | $— | | | | $— | | | | $— | | | | $— | | | | $— | |
Net asset value, end of period | | | $1.00 | | | | $1.00 | | | | $1.00 | | | | $1.00 | | | | $1.00 | | | | $1.00 | |
Total return (%) (r) | | | 0.01 | (c)(n) | | | 0.00 | | | | 0.00 | (w) | | | 0.00 | (w) | | | 0.00 | | | | 0.00 | |
Ratios (%) (to average net assets)
and Supplemental data: | | | | | | | | | | | | | |
Expenses before expense reductions (f) | | | 1.74 | (a)(c) | | | 1.76 | | | | 1.77 | | | | 1.75 | | | | 1.78 | | | | 1.78 | |
Expenses after expense reductions (f) | | | 0.36 | (a)(c) | | | 0.24 | | | | 0.07 | | | | 0.09 | | | | 0.15 | | | | 0.13 | |
Net investment income | | | 0.01 | (a)(c) | | | 0.00 | | | | 0.00 | | | | 0.00 | | | | 0.00 | | | | 0.00 | |
Net assets at end of period
(000 omitted) | | | $6,998 | | | | $6,728 | | | | $5,866 | | | | $6,240 | | | | $6,072 | | | | $5,020 | |
| (c) | Amount reflects a one-time reimbursement of expenses by the custodian (or former custodian) without which net investment income and performance would be lower and expenses would be higher. See Note 2 in the Notes to Financial Statements for additional information. |
| (d) | Per share data is based on average shares outstanding. |
| (f) | Ratios do not reflect reductions from fees paid indirectly, if applicable. |
| (r) | Certain expenses have been reduced without which performance would have been lower. |
| (t) | Total returns do not include any applicable sales charges. |
| (w) | Per share amount was less than $0.01 and total return or ratio was less than 0.01%, as applicable. |
See Notes to Financial Statements
15
NOTES TO FINANCIAL STATEMENTS
(unaudited)
(1) Business and Organization
MFS U.S. Government Cash Reserve Fund (the fund) is a diversified series of MFS Series Trust I (the trust). The trust is organized as a Massachusetts business trust and is registered under the Investment Company Act of 1940, as amended, as an open-end management investment company.
The fund is an investment company and accordingly follows the investment company accounting and reporting guidance of the Financial Accounting Standards Board (FASB) Accounting Standards Codification Topic 946 Financial Services – Investment Companies.
(2) Significant Accounting Policies
General – The preparation of financial statements in conformity with U.S. generally accepted accounting principles requires management to make estimates and assumptions that affect the reported amounts of assets and liabilities, and disclosure of contingent assets and liabilities at the date of the financial statements and the reported amounts of increases and decreases in net assets from operations during the reporting period. Actual results could differ from those estimates. In the preparation of these financial statements, management has evaluated subsequent events occurring after the date of the fund’s Statement of Assets and Liabilities through the date that the financial statements were issued.
In October 2016, the Securities and Exchange Commission (SEC) released its Final Rule on Investment Company Reporting Modernization (the “Rule”). The Rule, which introduces two new regulatory reporting forms for investment companies – Form N-PORT and Form N-CEN – also contains amendments to Regulation S-X which impact financial statement presentation, particularly the presentation of derivative investments. Although still evaluating the impacts of the Rule, management believes that many of the Regulation S-X amendments are consistent with the fund’s current financial statement presentation and expects that the fund will be able to comply with the Rule’s Regulation S-X amendments by the August 1, 2017 compliance date.
Balance Sheet Offsetting – The fund’s accounting policy with respect to balance sheet offsetting is that, absent an event of default by the counterparty or a termination of the agreement, the International Swaps and Derivatives Association (ISDA) Master Agreement does not result in an offset of reported amounts of financial assets and financial liabilities in the Statement of Assets and Liabilities across transactions between the fund and the applicable counterparty. The fund’s right to setoff may be restricted or prohibited by the bankruptcy or insolvency laws of the particular jurisdiction to which a specific master netting agreement counterparty is subject. Balance sheet offsetting disclosures, to the extent applicable to the fund, have been included in the fund’s Significant Accounting Policies note under the captions for each of the fund’s in-scope financial instruments and transactions.
Investment Valuations – Pursuant to procedures approved by the Board of Trustees, investments held by the fund are generally valued at amortized cost, which approximates market value. Amortized cost involves valuing an instrument at its cost as
16
Notes to Financial Statements (unaudited) – continued
adjusted for amortization of premium or accretion of discount rather than its current market value. The amortized cost value of an instrument can be different from the market value of an instrument.
Various inputs are used in determining the value of the fund’s assets or liabilities. These inputs are categorized into three broad levels. In certain cases, the inputs used to measure fair value may fall into different levels of the fair value hierarchy. In such cases, an investment’s level within the fair value hierarchy is based on the lowest level of input that is significant to the fair value measurement. The fund’s assessment of the significance of a particular input to the fair value measurement in its entirety requires judgment, and considers factors specific to the investment. Level 1 includes unadjusted quoted prices in active markets for identical assets or liabilities. Level 2 includes other significant observable market-based inputs (including quoted prices for similar securities, interest rates, prepayment speed, and credit risk). Level 3 includes unobservable inputs, which may include the adviser’s own assumptions in determining the fair value of investments. The following is a summary of the levels used as of February 28, 2017 in valuing the fund’s assets or liabilities:
| | | | | | | | | | | | | | | | |
| Investments at Value | | Level 1 | | | Level 2 | | | Level 3 | | | Total | |
| Short-Term Securities | | | $— | | | | $306,299,826 | | | | $— | | | | $306,299,826 | |
For further information regarding security characteristics, see the Portfolio of Investments.
Repurchase Agreements – The fund enters into repurchase agreements under the terms of Master Repurchase Agreements with approved counterparties. Each repurchase agreement is recorded at cost. The fund requires that the securities collateral in a repurchase transaction be transferred to a custodian. The fund monitors, on a daily basis, the value of the collateral to ensure that its value, including accrued interest, is greater than amounts owed to the fund under each such repurchase agreement. Upon an event of default under a Master Repurchase Agreement, the non-defaulting party may close out all transactions traded under such agreement and net amounts owed under each transaction to one net amount payable by one party to the other. Absent an event of default, the Master Repurchase Agreement does not result in an offset of reported amounts of assets and liabilities in the Statement of Assets and Liabilities across transactions between the fund and the applicable counterparty. The fund and other funds managed by MFS may utilize a joint trading account for the purpose of entering into one or more repurchase agreements. At period end, the fund had investments in repurchase agreements with a gross value of $30,372,000 included in “Investments” in the Statement of Assets and Liabilities. The value of the related collateral exceeded the value of the repurchase agreements at period end.
Indemnifications – Under the fund’s organizational documents, its officers and Trustees may be indemnified against certain liabilities and expenses arising out of the performance of their duties to the fund. Additionally, in the normal course of business, the fund enters into agreements with service providers that may contain indemnification clauses. The fund’s maximum exposure under these agreements is unknown as this would involve future claims that may be made against the fund that have not yet occurred.
17
Notes to Financial Statements (unaudited) – continued
Investment Transactions and Income – Investment transactions are recorded on the trade date. Interest income is recorded on the accrual basis. All premium and discount is amortized or accreted for financial statement purposes in accordance with U.S. generally accepted accounting principles.
Reimbursement of Expenses by Custodian – In December 2015, the fund’s custodian (or former custodian), State Street Bank and Trust Company, announced that it intended to reimburse its asset servicing clients for expense amounts that it billed in error during the period 1998 through 2015. The amount of this one-time reimbursement attributable to the fund is reflected as “Reimbursement of custodian expenses” in the Statement of Operations.
Tax Matters and Distributions – The fund intends to qualify as a regulated investment company, as defined under Subchapter M of the Internal Revenue Code, and to distribute all of its taxable income, including realized capital gains. As a result, no provision for federal income tax is required. The fund’s federal tax returns, when filed, will remain subject to examination by the Internal Revenue Service for a three year period. Management has analyzed the fund’s tax positions taken on federal and state tax returns for all open tax years and does not believe that there are any uncertain tax positions that require recognition of a tax liability.
Distributions to shareholders are recorded on the ex-dividend date. Income and capital gain distributions are determined in accordance with income tax regulations, which may differ from U.S. generally accepted accounting principles. Certain capital accounts in the financial statements are periodically adjusted for permanent differences in order to reflect their tax character. These adjustments have no impact on net assets or net asset value per share. Temporary differences which arise from recognizing certain items of income, expense, gain or loss in different periods for financial statement and tax purposes will reverse at some time in the future. Distributions in excess of net investment income or net realized gains are temporary overdistributions for financial statement purposes resulting from differences in the recognition or classification of income or distributions for financial statement and tax purposes.
During the year ended August 31, 2016, there were no significant adjustments due to differences between book and tax accounting.
The tax character of distributions made during the current period will be determined at fiscal year end. The fund declared no distributions for the year ended August 31, 2016.
The federal tax cost and the tax basis components of distributable earnings were as follows:
| | | | |
| As of 2/28/17 | | | |
| Cost of investments | | | $306,299,826 | |
| |
| As of 8/31/16 | | | |
| Capital loss carryforwards | | | (184,390 | ) |
| Late year ordinary loss deferral | | | (1,050 | ) |
| Other temporary differences | | | (7,994 | ) |
The aggregate cost above includes prior fiscal year end tax adjustments, if applicable.
18
Notes to Financial Statements (unaudited) – continued
Under the Regulated Investment Company Modernization Act of 2010 (the “Act”), net capital losses recognized for fund fiscal years beginning after August 31, 2011 may be carried forward indefinitely, and their character is retained as short-term and/or long-term losses (“post-enactment losses”). Previously, net capital losses were carried forward for eight years and treated as short-term losses (“pre-enactment losses”). As a transition rule, the Act requires that all post-enactment net capital losses be used before pre-enactment net capital losses.
As of August 31, 2016, the fund had capital loss carryforwards available to offset future realized gains. Such pre-enactment losses expire as follows:
Multiple Classes of Shares of Beneficial Interest – The fund offers multiple classes of shares, which differ in their respective distribution, service, and program manager fees. The fund’s income, realized and unrealized gain (loss), and common expenses are allocated to shareholders based on the daily net assets of each class. Dividends are declared separately for each class. Differences in per share dividend rates are generally due to differences in separate class expenses. Class B and Class 529B shares will convert to Class A and Class 529A shares, respectively, approximately eight years after purchase. The fund’s distributions declared to shareholders as reported in the Statements of Changes in Net Assets are presented by class as follows:
| | | | | | | | |
| | | From net investment
income | |
| | | Six months
ended
2/28/17
| | | Year
ended
8/31/16 | |
| Class A | | | $10,672 | | | | $— | |
| Class B | | | 1,296 | | | | — | |
| Class C | | | 2,765 | | | | — | |
| Class R1 | | | 712 | | | | — | |
| Class R2 | | | 3,733 | | | | — | |
| Class R3 | | | 2,758 | | | | — | |
| Class R4 | | | 253 | | | | — | |
| Class 529A | | | 1,083 | | | | — | |
| Class 529B | | | 21 | | | | — | |
| Class 529C | | | 392 | | | | — | |
| Total | | | $23,685 | | | | $— | |
(3) Transactions with Affiliates
Investment Adviser – The fund has an investment advisory agreement with MFS to provide overall investment management and related administrative services and facilities to the fund. The management fee is computed daily and paid monthly at an annual rate of 0.40% of the fund’s average daily net assets.
During the six months ended February 28, 2017, MFS voluntarily waived receipt of $439,222 of the fund’s management fee in order to avoid a negative yield, which is included in the reduction of total expenses in the Statement of Operations. MFS has also agreed in writing to reduce its management fee by a specified amount if certain MFS mutual fund assets exceed thresholds agreed to by MFS and the fund’s Board of
19
Notes to Financial Statements (unaudited) – continued
Trustees. For the six months ended February 28, 2017, this management fee reduction amounted to $11,592, which is included in the reduction of total expenses in the Statement of Operations. For the six months ended February 28, 2017, these waivers had the effect of reducing the management fee by 0.28% of average daily net assets on an annualized basis. The management fee incurred for the six months ended February 28, 2017 was equivalent to an annual effective rate of 0.12% of the fund’s average daily net assets.
Distributor – The Board of Trustees has adopted a distribution plan for certain share classes pursuant to Rule 12b-1 of the Investment Company Act of 1940.
The fund’s distribution plan provides that the fund will pay MFD for services provided by MFD and financial intermediaries in connection with the distribution and servicing of certain share classes. One component of the plan is a distribution fee paid to MFD and another component of the plan is a service fee paid to MFD. MFD may subsequently pay all, or a portion, of the distribution and/or service fees to financial intermediaries.
Distribution Plan Fee Table:
| | | | | | | | | | | | | | | | | | | | |
| | | Distribution
Fee Rate (d) | | | Service
Fee Rate (d) | | | Total
Distribution
Plan (d) | | | Annual
Effective
Rate (e) | | | Distribution
and Service
Fee | |
| Class A | | | — | | | | 0.25% | | | | 0.25% | | | | 0.00% | | | | $156,023 | |
| Class B | | | 0.75% | | | | 0.25% | | | | 1.00% | | | | 0.00% | | | | 109,292 | |
| Class C | | | 0.75% | | | | 0.25% | | | | 1.00% | | | | 0.00% | | | | 241,600 | |
| Class R1 | | | 0.75% | | | | 0.25% | | | | 1.00% | | | | 0.00% | | | | 63,768 | |
| Class R2 | | | 0.25% | | | | 0.25% | | | | 0.50% | | | | 0.00% | | | | 129,244 | |
| Class R3 | | | — | | | | 0.25% | | | | 0.25% | | | | 0.00% | | | | 45,015 | |
| Class 529A | | | — | | | | 0.25% | | | | 0.25% | | | | 0.00% | | | | 16,092 | |
| Class 529B | | | 0.75% | | | | 0.25% | | | | 1.00% | | | | 0.00% | | | | 1,874 | |
| Class 529C | | | 0.75% | | | | 0.25% | | | | 1.00% | | | | 0.00% | | | | 34,507 | |
| Total Distribution and Service Fees | | | | $797,415 | |
| (d) | In accordance with the distribution plan for certain classes, the fund pays distribution and/or service fees equal to these annual percentage rates of each class’s average daily net assets. The distribution and service fee rates disclosed by class represent the current rates in effect at the end of the reporting period. Any rate changes, if applicable, are detailed below. |
| (e) | The annual effective rates represent actual fees incurred under the distribution plan for the six months ended February 28, 2017 based on each class’s average daily net assets. MFD has agreed in writing to waive the Class A and Class 529A service fee. This written agreement will continue until modified by the fund’s Board of Trustees, but such agreement will continue until at least December 31, 2017. These reductions, for the six months ended February 28, 2017, for Class A and Class 529A amounted to $156,023 and $16,092, respectively, and are included in the reduction of total expenses in the Statement of Operations. During the six months ended February 28, 2017, MFD also voluntarily waived a receipt of $625,300 of the fund’s distribution and service fees to ensure the fund avoids a negative yield for Class B, Class C, Class R1, Class R2, Class R3, Class 529B, and Class 529C shares. This amount is included in the reduction of total expenses in the Statement of Operations. |
Certain Class A shares acquired through an exchange may be subject to a contingent deferred sales charge (CDSC) upon redemption depending on when the shares exchanged were originally purchased. Class C and Class 529C shares are subject to a CDSC in the event of a shareholder redemption within 12 months of purchase. Class B
20
Notes to Financial Statements (unaudited) – continued
and Class 529B shares are subject to a CDSC in the event of a shareholder redemption within six years of purchase. All contingent deferred sales charges are paid to MFD and during the six months ended February 28, 2017, were as follows:
| | | | |
| | | Amount | |
| Class A | | | $131 | |
| Class B | | | 31,484 | |
| Class C | | | 7,299 | |
| Class 529B | | | — | |
| Class 529C | | | 884 | |
The fund has entered into and may from time to time enter into contracts with program managers and other parties which administer the tuition programs through which an investment in the fund’s 529 share classes is made. The fund has entered into an agreement with MFD pursuant to which MFD receives an annual fee of up to 0.10% of the average daily net assets attributable to each 529 share class. MFD has agreed to waive a portion of this fee in an amount equal to 0.05% of the average daily net assets for each 529 share class. This waiver agreement will expire on December 31, 2017, unless MFD elects to extend the waiver. For the six months ended February 28, 2017, this waiver amounted to $5,037 and is included in the reduction of total expenses in the Statement of Operations. In addition, MFS voluntarily waived receipt of $5,037 of the fund’s program manager fees in order to avoid a negative yield for Class 529A, Class 529B, and Class 529C shares. This voluntary waiver had the effect of reducing the program manager fee by 0.05% of average daily net assets attributable to Class 529A, Class 529B, and Class 529C shares on an annualized basis. The program manager fee incurred for the six months ended February 28, 2017 was equivalent to an annual effective rate of 0.00% of the average daily net assets attributable to each 529 share class. The services provided by MFD, or a third party with which MFD contracts, include recordkeeping and tax reporting and account services, as well as services designed to maintain the program’s compliance with the Internal Revenue Code and other regulatory requirements. Program manager fees and waivers for the six months ended February 28, 2017, were as follows:
| | | | | | | | |
| | | Fee | | | Waiver | |
| Class 529A | | | $6,436 | | | | $6,436 | |
| Class 529B | | | 187 | | | | 187 | |
| Class 529C | | | 3,451 | | | | 3451 | |
| Total Program Manager Fees and Waivers | | | $10,074 | | | | $10,074 | |
Shareholder Servicing Agent – MFS Service Center, Inc. (MFSC), a wholly-owned subsidiary of MFS, receives a fee from the fund for its services as shareholder servicing agent calculated as a percentage of the average daily net assets of the fund as determined periodically under the supervision of the fund’s Board of Trustees. For the six months ended February 28, 2017, the fee was $84,647, which equated to 0.0531% annually of the fund’s average daily net assets. MFSC also receives payment from the fund for out-of-pocket expenses, sub-accounting and other shareholder servicing costs which may be paid to affiliated and unaffiliated service providers. For the six months ended February 28, 2017, these out-of-pocket expenses, sub-accounting and other shareholder servicing costs amounted to $175,774.
21
Notes to Financial Statements (unaudited) – continued
Administrator – MFS provides certain financial, legal, shareholder communications, compliance, and other administrative services to the fund. Under an administrative services agreement, the fund reimburses MFS the costs incurred to provide these services. The fund is charged an annual fixed amount of $17,500 plus a fee based on average daily net assets. The administrative services fee incurred for the six months ended February 28, 2017 was equivalent to an annual effective rate of 0.0182% of the fund’s average daily net assets.
Trustees’ and Officers’ Compensation – The fund pays compensation to independent Trustees in the form of a retainer, attendance fees, and additional compensation to Board and Committee chairpersons. The fund does not pay compensation directly to Trustees or officers of the fund who are also officers of the investment adviser, all of whom receive remuneration for their services to the fund from MFS. Certain officers and Trustees of the fund are officers or directors of MFS, MFD, and MFSC.
Prior to December 31, 2001, the fund had an unfunded defined benefit plan (“DB plan”) for independent Trustees. As of December 31, 2001, the Board took action to terminate the DB plan with respect to then-current and any future independent Trustees, such that the DB plan covers only certain of those former independent Trustees who retired on or before December 31, 2001. The DB plan resulted in a pension expense of $637 and is included in “Independent Trustees’ compensation” in the Statement of Operations for the six months ended February 28, 2017. The liability for deferred retirement benefits payable to certain independent Trustees under the DB plan amounted to $7,223 at February 28, 2017, and is included in “Payable for independent Trustees’ compensation” in the Statement of Assets and Liabilities.
Other – This fund and certain other funds managed by MFS (the funds) have entered into a service agreement (the ISO Agreement) which provides for payment of fees solely by the funds to Tarantino LLC in return for the provision of services of an Independent Senior Officer (ISO) for the funds. Frank L. Tarantino serves as the ISO and is an officer of the funds and the sole member of Tarantino LLC. The funds can terminate the ISO Agreement with Tarantino LLC at any time under the terms of the ISO Agreement. For the six months ended February 28, 2017, the fee paid by the fund under this agreement was $300 and is included in “Miscellaneous” expense in the Statement of Operations. MFS has agreed to bear all expenses associated with office space, other administrative support, and supplies provided to the ISO.
On September 9, 2015, MFS redeemed 48, 125, 134, 40 and 18 shares each, of Class B, Class R3, Class R4, Class 529A and Class 529C respectively for the aggregate amount of $365. At February 28, 2017, MFS held approximately 79% of the outstanding shares of Class R4.
22
Notes to Financial Statements (unaudited) – continued
(4) Shares of Beneficial Interest
The fund’s Declaration of Trust permits the Trustees to issue an unlimited number of full and fractional shares of beneficial interest. Transactions in fund shares were as follows:
| | | | | | | | | | | | | | | | |
| | | Six months ended
2/28/17 | | | Year ended
8/31/16 | |
| | | Shares | | | Amount | | | Shares | | | Amount | |
| Shares sold | | | | | | | | | | | | | | | | |
Class A | | | 36,267,579 | | | | $36,267,579 | | | | 61,984,342 | | | | $61,984,346 | |
Class B | | | 10,589,529 | | | | 10,589,528 | | | | 15,009,346 | | | | 15,009,346 | |
Class C | | | 17,720,369 | | | | 17,720,369 | | | | 45,857,815 | | | | 45,857,814 | |
Class R1 | | | 1,326,504 | | | | 1,326,505 | | | | 5,028,966 | | | | 5,028,966 | |
Class R2 | | | 7,500,253 | | | | 7,500,253 | | | | 16,235,866 | | | | 16,235,866 | |
Class R3 | | | 7,657,752 | | | | 7,657,753 | | | | 15,034,388 | | | | 15,034,388 | |
Class R4 | | | 271,029 | | | | 271,031 | | | | 253,380 | | | | 253,379 | |
Class 529A | | | 3,304,601 | | | | 3,304,602 | | | | 7,049,714 | | | | 7,049,715 | |
Class 529B | | | 98,328 | | | | 98,328 | | | | 269,487 | | | | 269,487 | |
Class 529C | | | 2,245,733 | | | | 2,245,733 | | | | 4,478,950 | | | | 4,478,949 | |
| | | 86,981,677 | | | | $86,981,681 | | | | 171,202,254 | | | | $171,202,256 | |
| | | | |
| Shares issued to shareholders in reinvestment of distributions | | | | | | | | | | | | | | | | |
Class A | | | 10,294 | | | | $10,294 | | | | — | | | | $— | |
Class B | | | 1,277 | | | | 1,277 | | | | — | | | | — | |
Class C | | | 2,670 | | | | 2,670 | | | | — | | | | — | |
Class R1 | | | 712 | | | | 712 | | | | — | | | | — | |
Class R2 | | | 3,733 | | | | 3,733 | | | | — | | | | — | |
Class R3 | | | 2,758 | | | | 2,758 | | | | — | | | | — | |
Class R4 | | | 253 | | | | 253 | | | | — | | | | — | |
Class 529A | | | 1,056 | | | | 1,056 | | | | — | | | | — | |
Class 529B | | | 21 | | | | 21 | | | | — | | | | — | |
Class 529C | | | 391 | | | | 391 | | | | — | | | | — | |
| | | 23,165 | | | | $23,165 | | | | — | | | | $— | |
| | | | |
| Shares reacquired | | | | | | | | | | | | | | | | |
Class A | | | (36,818,975 | ) | | | $(36,818,975 | ) | | | (63,330,188 | ) | | | $(63,330,188 | ) |
Class B | | | (6,573,501 | ) | | | (6,573,503 | ) | | | (15,744,830 | ) | | | (15,744,833 | ) |
Class C | | | (21,473,147 | ) | | | (21,473,147 | ) | | | (39,626,535 | ) | | | (39,626,535 | ) |
Class R1 | | | (4,120,423 | ) | | | (4,120,423 | ) | | | (4,822,357 | ) | | | (4,822,357 | ) |
Class R2 | | | (9,341,807 | ) | | | (9,341,807 | ) | | | (17,757,982 | ) | | | (17,757,982 | ) |
Class R3 | | | (11,625,886 | ) | | | (11,625,886 | ) | | | (22,261,502 | ) | | | (22,261,502 | ) |
Class R4 | | | (69,095 | ) | | | (69,096 | ) | | | (209,426 | ) | | | (209,426 | ) |
Class 529A | | | (3,343,376 | ) | | | (3,343,376 | ) | | | (5,591,127 | ) | | | (5,591,127 | ) |
Class 529B | | | (98,381 | ) | | | (98,381 | ) | | | (353,733 | ) | | | (353,733 | ) |
Class 529C | | | (1,986,310 | ) | | | (1,986,310 | ) | | | (3,616,248 | ) | | | (3,616,248 | ) |
| | | (95,450,901 | ) | | | $(95,450,904 | ) | | | (173,313,928 | ) | | | $(173,313,931 | ) |
23
Notes to Financial Statements (unaudited) – continued
| | | | | | | | | | | | | | | | |
| | | Six months ended
2/28/17 | | | Year ended
8/31/16 | |
| | | Shares | | | Amount | | | Shares | | | Amount | |
| Net change | | | | | | | | | | | | | | | | |
Class A | | | (541,102 | ) | | | $(541,102 | ) | | | (1,345,846 | ) | | | $(1,345,842 | ) |
Class B | | | 4,017,305 | | | | 4,017,302 | | | | (735,484 | ) | | | (735,487 | ) |
Class C | | | (3,750,108 | ) | | | (3,750,108 | ) | | | 6,231,280 | | | | 6,231,279 | |
Class R1 | | | (2,793,207 | ) | | | (2,793,206 | ) | | | 206,609 | | | | 206,609 | |
Class R2 | | | (1,837,821 | ) | | | (1,837,821 | ) | | | (1,522,116 | ) | | | (1,522,116 | ) |
Class R3 | | | (3,965,376 | ) | | | (3,965,375 | ) | �� | | (7,227,114 | ) | | | (7,227,114 | ) |
Class R4 | | | 202,187 | | | | 202,188 | | | | 43,954 | | | | 43,953 | |
Class 529A | | | (37,719 | ) | | | (37,718 | ) | | | 1,458,587 | | | | 1,458,588 | |
Class 529B | | | (32 | ) | | | (32 | ) | | | (84,246 | ) | | | (84,246 | ) |
Class 529C | | | 259,814 | | | | 259,814 | | | | 862,702 | | | | 862,701 | |
| | | (8,446,059 | ) | | | $(8,446,058 | ) | | | (2,111,674 | ) | | | $(2,111,675 | ) |
(5) Line of Credit
The fund and certain other funds managed by MFS participate in a $1.25 billion unsecured committed line of credit, subject to a $1 billion sublimit, provided by a syndication of banks under a credit agreement. Borrowings may be made for temporary financing needs. Interest is charged to each fund, based on its borrowings, generally at a rate equal to the higher of the Overnight Federal Reserve funds rate or daily one month LIBOR plus an agreed upon spread. A commitment fee, based on the average daily, unused portion of the committed line of credit, is allocated among the participating funds at the end of each calendar quarter. In addition, the fund and other funds managed by MFS have established unsecured uncommitted borrowing arrangements with certain banks for temporary financing needs. Interest is charged to each fund, based on its borrowings, at a rate equal to the Overnight Federal Reserve funds rate plus an agreed upon spread. For the six months ended February 28, 2017, the fund’s commitment fee and interest expense were $1,113 and $0, respectively, and are included in “Miscellaneous” expense in the Statement of Operations.
24
PROXY VOTING POLICIES AND INFORMATION
MFS votes proxies on behalf of the fund pursuant to proxy voting policies and procedures that are available without charge, upon request, by calling 1-800-225-2606, by visiting mfs.com (once you have selected “Individual Investor” as your role, click on “Individual Investor Home” in the top navigation and then select “Learn More About Proxy Voting” under the “I want to…” header on the left hand column of the page), or by visiting the SEC’s Web site at http://www.sec.gov.
Information regarding how the fund voted proxies relating to portfolio securities during the most recent twelve-month period ended June 30 is available by August 31 of each year without charge by visiting mfs.com (once you have selected “Individual Investor” as your role, click on “Individual Investor Home” in the top navigation and then select “Learn More About Proxy Voting” under the “I want to…” header on the left hand column of the page), or by visiting the SEC’s Web site at http://www.sec.gov.
QUARTERLY PORTFOLIO DISCLOSURE
The fund will file a complete schedule of portfolio holdings with the Securities and Exchange Commission (the Commission) for the first and third quarters of each fiscal year on Form N-Q. A shareholder can obtain the quarterly portfolio holdings report at mfs.com. The fund’s Form N-Q is also available on the EDGAR database on the Commission’s Internet Web site at http://www.sec.gov, and may be reviewed and copied at the:
Public Reference Room
Securities and Exchange Commission
100 F Street, NE, Room 1580
Washington, D.C. 20549
Information on the operation of the Public Reference Room may be obtained by calling the Commission at 1-800-SEC-0330. Copies of the fund’s Form N-Q also may be obtained, upon payment of a duplicating fee, by electronic request at the following e-mail address: publicinfo@sec.gov or by writing the Public Reference Section at the above address.
FURTHER INFORMATION
From time to time, MFS may post important information about the fund or the MFS funds on the MFS web site (mfs.com). This information is available on mfs.com by following these steps once you have selected “Individual Investor” as your role: (1) Click on the “Individual Investor Home” in the top navigation and then select the “Announcements” option within the “Market Outlooks” drop down, or (2) Click on “Products & Services” and “Mutual Funds” and then choose the fund’s name in the “Select a fund” menu.
25
INFORMATION ABOUT FUND CONTRACTS AND LEGAL CLAIMS
The fund has entered into contractual arrangements with an investment adviser, administrator, distributor, shareholder servicing agent, 529 program manager (if applicable), and custodian who each provide services to the fund. Unless expressly stated otherwise, shareholders are not parties to, or intended beneficiaries of these contractual arrangements, and these contractual arrangements are not intended to create any shareholder right to enforce them against the service providers or to seek any remedy under them against the service providers, either directly or on behalf of the fund.
Under the Trust’s By-Laws and Declaration of Trust, any claims asserted against or on behalf of the MFS Funds, including claims against Trustees and Officers, must be brought in state and federal courts located within the Commonwealth of Massachusetts.
PROVISION OF FINANCIAL REPORTS AND SUMMARY PROSPECTUSES
The fund produces financial reports every six months and updates its summary prospectus and prospectus annually. To avoid sending duplicate copies of materials to households, only one copy of the fund’s annual and semiannual report and summary prospectus may be mailed to shareholders having the same last name and residential address on the fund’s records. However, any shareholder may contact MFSC (please see back cover for address and telephone number) to request that copies of these reports and summary prospectuses be sent personally to that shareholder.
26
Save paper with eDelivery.

| MFS® will send you prospectuses, |
reports, and proxies directly via e-mail so you will get information faster with less mailbox clutter.
To sign up:
1. Go to mfs.com.
2. Log in via MFS® Access.
3. Select eDelivery.
If you own your MFS fund shares through a financial institution or a retirement plan, MFS® TALK, MFS® Access, or eDelivery may not be available to you.
CONTACT
WEB SITE
mfs.com
MFS TALK
1-800-637-8255
24 hours a day
ACCOUNT SERVICE AND LITERATURE
Shareholders
1-800-225-2606
Financial advisors
1-800-343-2829
Retirement plan services
1-800-637-1255
MAILING ADDRESS
MFS Service Center, Inc.
P.O. Box 55824
Boston, MA 02205-5824
OVERNIGHT MAIL
MFS Service Center, Inc.
c/o Boston Financial Data Services
30 Dan Road
Canton, MA 02021-2809
SEMIANNUAL REPORT
February 28, 2017

MFS® VALUE FUND

EIF-SEM
MFS® VALUE FUND
CONTENTS
The report is prepared for the general information of shareholders.
It is authorized for distribution to prospective investors only when preceded or accompanied by a current prospectus.
NOT FDIC INSURED • MAY LOSE VALUE • NO BANK GUARANTEE

LETTER FROM THE EXECUTIVE CHAIRMAN
Dear Shareholders:
Despite June’s unexpected vote by the United Kingdom to leave the European Union and the surprising result in November’s U.S. presidential election, most markets have
proved resilient. U.S. share prices quickly reversed post-Brexit declines, and indices reached new highs following the November elections. U.S. bond yields rose after Donald Trump’s victory on hopes that his proposed policy mix of lower taxes, increased spending on infrastructure and a lower regulatory burden on businesses will lift both U.S. economic growth and inflation. However, interest rates in most developed markets remain very low, with major central banks maintaining extremely accommodative monetary policies to reinvigorate slow-growing economies against a backdrop of still-low inflation. Even after the rise in yields following the election, interest rates remain low by historical standards.
Globally, economic growth has shown signs of recovery of late, led by the United States and the eurozone. Despite better growth, there are few immediate signs of worrisome inflation. Emerging market economies are recovering at a somewhat slower pace amid fears that restrictive U.S. trade policies could further hamper the already slow pace of global trade growth. Looking ahead, markets will have to contend with a series of European elections during 2017, which, depending on the outcome, could further call into question the future direction of the European Union.
At MFS®, we believe in a patient, long-term approach to investing. Viewing investments with a long lens makes it possible to filter out short-term market noise and focus on achieving solid risk-adjusted returns over a full market cycle.
In our view, such an approach, along with the professional guidance of a financial advisor, will help you reach your investment objectives.
Respectfully,

Robert J. Manning
Executive Chairman
MFS Investment Management
April 13, 2017
The opinions expressed in this letter are subject to change and may not be relied upon for investment advice. No forecasts can be guaranteed.
1
PORTFOLIO COMPOSITION
Portfolio structure

| | | | |
| Top ten holdings | |
| JPMorgan Chase & Co. | | | 4.7% | |
| Philip Morris International, Inc. | | | 3.7% | |
| Wells Fargo & Co. | | | 3.5% | |
| Johnson & Johnson | | | 3.4% | |
| Accenture PLC, “A” | | | 2.6% | |
| Goldman Sachs Group, Inc. | | | 2.4% | |
| U.S. Bancorp | | | 2.4% | |
| Medtronic PLC | | | 2.4% | |
| Pfizer, Inc. | | | 2.2% | |
| 3M Co. | | | 2.0% | |
| | | | |
| Equity sectors | |
| Financial Services | | | 29.1% | |
| Health Care | | | 15.2% | |
| Consumer Staples | | | 11.2% | |
| Industrial Goods & Services | | | 9.6% | |
| Basic Materials | | | 5.4% | |
| Special Products & Services | | | 5.0% | |
| Leisure | | | 5.0% | |
| Energy | | | 4.6% | |
| Technology | | | 2.9% | |
| Transportation | | | 2.7% | |
| Retailing | | | 2.7% | |
| Autos & Housing | | | 2.6% | |
| Utilities & Communications | | | 2.4% | |
Cash & Cash Equivalents includes any cash, investments in money market funds, short-term securities, and other assets less liabilities. Please see the Statement of Assets and Liabilities for additional information related to the fund’s cash position and other assets and liabilities.
Percentages are based on net assets as of 2/28/17.
The portfolio is actively managed and current holdings may be different.
2
EXPENSE TABLE
Fund expenses borne by the shareholders during the period, September 1, 2016 through February 28, 2017
As a shareholder of the fund, you incur two types of costs: (1) transaction costs, including sales charges (loads) on certain purchase or redemption payments, and (2) ongoing costs, including management fees; distribution and service (12b-1) fees; and other fund expenses. This example is intended to help you understand your ongoing costs (in dollars) of investing in the fund and to compare these costs with the ongoing costs of investing in other mutual funds.
The example is based on an investment of $1,000 invested at the beginning of the period and held for the entire period September 1, 2016 through February 28, 2017.
Actual Expenses
The first line for each share class in the following table provides information about actual account values and actual expenses. You may use the information in this line, together with the amount you invested, to estimate the expenses that you paid over the period. Simply divide your account value by $1,000 (for example, an $8,600 account value divided by $1,000 = 8.6), then multiply the result by the number in the first line under the heading entitled “Expenses Paid During Period” to estimate the expenses you paid on your account during this period.
Hypothetical Example for Comparison Purposes
The second line for each share class in the following table provides information about hypothetical account values and hypothetical expenses based on the fund’s actual expense ratio and an assumed rate of return of 5% per year before expenses, which is not the fund’s actual return. The hypothetical account values and expenses may not be used to estimate the actual ending account balance or expenses you paid for the period. You may use this information to compare the ongoing costs of investing in the fund and other funds. To do so, compare this 5% hypothetical example with the 5% hypothetical examples that appear in the shareholder reports of the other funds.
Please note that the expenses shown in the table are meant to highlight your ongoing costs only and do not reflect any transactional costs, such as sales charges (loads). Therefore, the second line for each share class in the table is useful in comparing ongoing costs only, and will not help you determine the relative total costs of owning different funds. In addition, if these transactional costs were included, your costs would have been higher.
3
Expense Table – continued
| | | | | | | | | | | | | | | | | | |
Share
Class | | | | Annualized
Expense
Ratio | | | Beginning
Account Value
9/01/16 | | | Ending
Account Value
2/28/17 | | | Expenses
Paid During
Period (p)
9/01/16-2/28/17 | |
| A | | Actual | | | 0.84% | | | | $1,000.00 | | | | $1,084.70 | | | | $4.34 | |
| | Hypothetical (h) | | | 0.84% | | | | $1,000.00 | | | | $1,020.63 | | | | $4.21 | |
| B | | Actual | | | 1.59% | | | | $1,000.00 | | | | $1,080.85 | | | | $8.20 | |
| | Hypothetical (h) | | | 1.59% | | | | $1,000.00 | | | | $1,016.91 | | | | $7.95 | |
| C | | Actual | | | 1.59% | | | | $1,000.00 | | | | $1,080.91 | | | | $8.20 | |
| | Hypothetical (h) | | | 1.59% | | | | $1,000.00 | | | | $1,016.91 | | | | $7.95 | |
| I | | Actual | | | 0.59% | | | | $1,000.00 | | | | $1,086.24 | | | | $3.05 | |
| | Hypothetical (h) | | | 0.59% | | | | $1,000.00 | | | | $1,021.87 | | | | $2.96 | |
| R1 | | Actual | | | 1.59% | | | | $1,000.00 | | | | $1,080.53 | | | | $8.20 | |
| | Hypothetical (h) | | | 1.59% | | | | $1,000.00 | | | | $1,016.91 | | | | $7.95 | |
| R2 | | Actual | | | 1.09% | | | | $1,000.00 | | | | $1,083.30 | | | | $5.63 | |
| | Hypothetical (h) | | | 1.09% | | | | $1,000.00 | | | | $1,019.39 | | | | $5.46 | |
| R3 | | Actual | | | 0.84% | | | | $1,000.00 | | | | $1,084.74 | | | | $4.34 | |
| | Hypothetical (h) | | | 0.84% | | | | $1,000.00 | | | | $1,020.63 | | | | $4.21 | |
| R4 | | Actual | | | 0.59% | | | | $1,000.00 | | | | $1,086.13 | | | | $3.05 | |
| | Hypothetical (h) | | | 0.59% | | | | $1,000.00 | | | | $1,021.87 | | | | $2.96 | |
| R6 | | Actual | | | 0.49% | | | | $1,000.00 | | | | $1,086.67 | | | | $2.54 | |
| | Hypothetical (h) | | | 0.49% | | | | $1,000.00 | | | | $1,022.36 | | | | $2.46 | |
| 529A | | Actual | | | 0.85% | | | | $1,000.00 | | | | $1,084.75 | | | | $4.39 | |
| | Hypothetical (h) | | | 0.85% | | | | $1,000.00 | | | | $1,020.58 | | | | $4.26 | |
| 529B | | Actual | | | 0.88% | | | | $1,000.00 | | | | $1,084.75 | | | | $4.55 | |
| | Hypothetical (h) | | | 0.88% | | | | $1,000.00 | | | | $1,020.43 | | | | $4.41 | |
| 529C | | Actual | | | 1.63% | | | | $1,000.00 | | | | $1,080.22 | | | | $8.41 | |
| | Hypothetical (h) | | | 1.63% | | | | $1,000.00 | | | | $1,016.71 | | | | $8.15 | |
| (h) | 5% class return per year before expenses. |
| (p) | “Expenses Paid During Period” are equal to each class’s annualized expense ratio, as shown above, multiplied by the average account value over the period, multiplied by 181/365 (to reflect the one-half year period). Expenses paid do not include any applicable sales charges (loads). If these transaction costs had been included, your costs would have been higher. |
Notes to Expense Table
Each class with a Rule 12b-1 service fee is subject to a rebate of a portion of such fee. Such rebates are included in the expense ratios above. For Class 529A, Class 529B, and Class 529C shares, this rebate reduced the expense ratios above by 0.04%, 0.01%, and 0.01%, respectively. See Note 3 in the Notes to Financial Statements for additional information.
4
PORTFOLIO OF INVESTMENTS
2/28/17 (unaudited)
The Portfolio of Investments is a complete list of all securities owned by your fund. It is categorized by broad-based asset classes.
| | | | | | | | |
| Common Stocks - 98.4% | | | | | | | | |
| Issuer | | Shares/Par | | | Value ($) | |
| Aerospace - 5.2% | | | | | | | | |
| Honeywell International, Inc. | | | 6,371,202 | | | $ | 793,214,647 | |
| Lockheed Martin Corp. | | | 1,888,737 | | | | 503,499,509 | |
| Northrop Grumman Corp. | | | 1,835,629 | | | | 453,565,570 | |
| United Technologies Corp. | | | 4,245,573 | | | | 477,839,241 | |
| | | | | | | | |
| | | | $ | 2,228,118,967 | |
| Alcoholic Beverages - 1.0% | | | | | | | | |
| Diageo PLC | | | 15,436,027 | | | $ | 434,408,148 | |
| | |
| Apparel Manufacturers - 0.4% | | | | | | | | |
| Hanesbrands, Inc. | | | 8,217,897 | | | $ | 164,440,119 | |
| | |
| Automotive - 1.4% | | | | | | | | |
| Delphi Automotive PLC | | | 5,210,790 | | | $ | 396,697,443 | |
| Harley-Davidson, Inc. | | | 3,508,447 | | | | 197,806,242 | |
| | | | | | | | |
| | | | $ | 594,503,685 | |
| Broadcasting - 2.8% | | | | | | | | |
| Interpublic Group of Companies, Inc. | | | 6,683,352 | | | $ | 161,068,783 | |
| Omnicom Group, Inc. | | | 6,963,695 | | | | 592,610,445 | |
| Time Warner, Inc. | | | 3,680,240 | | | | 361,436,370 | |
| Walt Disney Co. | | | 898,559 | | | | 98,922,360 | |
| | | | | | | | |
| | | | $ | 1,214,037,958 | |
| Brokerage & Asset Managers - 2.7% | | | | | | | | |
| BlackRock, Inc. | | | 1,013,198 | | | $ | 392,573,697 | |
| Franklin Resources, Inc. | | | 5,292,004 | | | | 227,767,852 | |
| NASDAQ, Inc. | | | 6,362,193 | | | | 452,415,544 | |
| T. Rowe Price Group, Inc. | | | 1,118,337 | | | | 79,636,778 | |
| | | | | | | | |
| | | | $ | 1,152,393,871 | |
| Business Services - 5.0% | | | | | | | | |
| Accenture PLC, “A” | | | 8,962,582 | | | $ | 1,097,916,295 | |
| Amdocs Ltd. | | | 1,689,978 | | | | 102,497,166 | |
| Cognizant Technology Solutions Corp., “A” (a) | | | 2,680,157 | | | | 158,852,905 | |
| Equifax, Inc. | | | 1,429,051 | | | | 187,362,877 | |
| Fidelity National Information Services, Inc. | | | 4,950,054 | | | | 407,240,943 | |
| Fiserv, Inc. (a) | | | 1,690,662 | | | | 195,102,395 | |
| | | | | | | | |
| | | | $ | 2,148,972,581 | |
5
Portfolio of Investments (unaudited) – continued
| | | | | | | | |
| Issuer | | Shares/Par | | | Value ($) | |
| Common Stocks - continued | | | | | | | | |
| Cable TV - 1.3% | | | | | | | | |
| Comcast Corp., “A” | | | 15,047,692 | | | $ | 563,084,635 | |
| | |
| Chemicals - 4.9% | | | | | | | | |
| 3M Co. | | | 4,534,479 | | | $ | 845,000,162 | |
| E.I. du Pont de Nemours & Co. | | | 3,956,195 | | | | 310,719,555 | |
| Monsanto Co. | | | 1,435,542 | | | | 163,407,746 | |
| PPG Industries, Inc. | | | 7,662,972 | | | | 784,918,222 | |
| | | | | | | | |
| | | | $ | 2,104,045,685 | |
| Computer Software - 0.6% | | | | | | | | |
| Oracle Corp. | | | 6,328,569 | | | $ | 269,533,754 | |
| | |
| Computer Software - Systems - 0.7% | | | | | | | | |
| International Business Machines Corp. | | | 1,703,241 | | | $ | 306,276,797 | |
| | |
| Construction - 1.2% | | | | | | | | |
| Sherwin-Williams Co. | | | 992,918 | | | $ | 306,354,920 | |
| Stanley Black & Decker, Inc. | | | 1,767,844 | | | | 224,781,365 | |
| | | | | | | | |
| | | | $ | 531,136,285 | |
| Consumer Products - 1.0% | | | | | | | | |
| Coty, Inc., “A” | | | 9,344,135 | | | $ | 175,482,855 | |
| Newell Brands, Inc. | | | 1,485,860 | | | | 72,851,716 | |
| Procter & Gamble Co. | | | 1,884,400 | | | | 171,612,308 | |
| | | | | | | | |
| | | | $ | 419,946,879 | |
| Containers - 0.5% | | | | | | | | |
| Crown Holdings, Inc. (a) | | | 3,603,019 | | | $ | 193,085,788 | |
| | |
| Electrical Equipment - 2.0% | | | | | | | | |
| Johnson Controls International PLC | | | 18,150,944 | | | $ | 761,250,591 | |
| Pentair PLC | | | 1,464,096 | | | | 85,005,414 | |
| | | | | | | | |
| | | | $ | 846,256,005 | |
| Electronics - 1.6% | | | | | | | | |
| Texas Instruments, Inc. | | | 8,649,962 | | | $ | 662,760,088 | |
| | |
| Energy - Independent - 1.7% | | | | | | | | |
| EOG Resources, Inc. | | | 4,146,420 | | | $ | 402,161,276 | |
| Occidental Petroleum Corp. | | | 4,898,288 | | | | 321,082,778 | |
| | | | | | | | |
| | | | $ | 723,244,054 | |
6
Portfolio of Investments (unaudited) – continued
| | | | | | | | |
| Issuer | | Shares/Par | | | Value ($) | |
| Common Stocks - continued | | | | | | | | |
| Energy - Integrated - 1.8% | | | | | | | | |
| Chevron Corp. | | | 3,402,758 | | | $ | 382,810,275 | |
| Exxon Mobil Corp. | | | 4,869,440 | | | | 395,982,861 | |
| | | | | | | | |
| | | | $ | 778,793,136 | |
| Food & Beverages - 4.9% | | | | | | | | |
| Archer Daniels Midland Co. | | | 6,390,719 | | | $ | 300,172,071 | |
| Danone S.A. | | | 2,611,498 | | | | 173,079,722 | |
| General Mills, Inc. | | | 6,294,507 | | | | 379,999,388 | |
| J.M. Smucker Co. | | | 1,602,175 | | | | 227,076,263 | |
| Mead Johnson Nutrition Co., “A” | | | 1,441,796 | | | | 126,575,271 | |
| Nestle S.A. | | | 8,803,414 | | | | 650,822,412 | |
| PepsiCo, Inc. | | | 2,228,010 | | | | 245,927,744 | |
| | | | | | | | |
| | | | $ | 2,103,652,871 | |
| Food & Drug Stores - 1.6% | | | | | | | | |
| CVS Health Corp. | | | 8,604,453 | | | $ | 693,346,823 | |
| | |
| General Merchandise - 0.4% | | | | | | | | |
| Target Corp. | | | 2,776,082 | | | $ | 163,150,339 | |
| | |
| Health Maintenance Organizations - 0.7% | | | | | | | | |
| Cigna Corp. | | | 1,519,116 | | | $ | 226,196,372 | |
| UnitedHealth Group, Inc. | | | 365,193 | | | | 60,395,618 | |
| | | | | | | | |
| | | | $ | 286,591,990 | |
| Insurance - 7.6% | | | | | | | | |
| Aon PLC | | | 5,489,980 | | | $ | 634,916,187 | |
| Chubb Ltd. | | | 5,886,535 | | | | 813,342,541 | |
| MetLife, Inc. | | | 11,386,946 | | | | 597,131,448 | |
| Prudential Financial, Inc. | | | 3,474,067 | | | | 384,023,366 | |
| Travelers Cos., Inc. | | | 6,771,392 | | | | 827,734,958 | |
| | | | | | | | |
| | | | $ | 3,257,148,500 | |
| Machinery & Tools - 2.4% | | | | | | | | |
| Eaton Corp. PLC | | | 5,187,201 | | | $ | 373,374,728 | |
| Illinois Tool Works, Inc. | | | 3,017,465 | | | | 398,335,555 | |
| Ingersoll-Rand Co. Ltd., “A” | | | 2,900,056 | | | | 230,148,444 | |
| | | | | | | | |
| | | | $ | 1,001,858,727 | |
| Major Banks - 13.8% | | | | | | | | |
| Bank of New York Mellon Corp. | | | 9,522,334 | | | $ | 448,882,825 | |
| Goldman Sachs Group, Inc. | | | 4,154,442 | | | | 1,030,550,883 | |
| JPMorgan Chase & Co. | | | 22,088,729 | | | | 2,001,680,622 | |
| PNC Financial Services Group, Inc. | | | 4,500,964 | | | | 572,657,650 | |
7
Portfolio of Investments (unaudited) – continued
| | | | | | | | |
| Issuer | | Shares/Par | | | Value ($) | |
| Common Stocks - continued | | | | | | | | |
| Major Banks - continued | | | | | | | | |
| State Street Corp. | | | 4,265,268 | | | $ | 339,984,512 | |
| Wells Fargo & Co. | | | 25,655,232 | | | | 1,484,924,828 | |
| | | | | | | | |
| | | | $ | 5,878,681,320 | |
| Medical & Health Technology & Services - 1.2% | | | | | | | | |
| Express Scripts Holding Co. (a) | | | 3,250,050 | | | $ | 229,616,033 | |
| McKesson Corp. | | | 1,901,149 | | | | 285,419,499 | |
| | | | | | | | |
| | | | $ | 515,035,532 | |
| Medical Equipment - 6.1% | | | | | | | | |
| Abbott Laboratories | | | 14,417,393 | | | $ | 649,936,076 | |
| Danaher Corp. | | | 5,430,124 | | | | 464,547,108 | |
| Medtronic PLC | | | 12,573,167 | | | | 1,017,294,942 | |
| Thermo Fisher Scientific, Inc. | | | 3,096,583 | | | | 488,269,207 | |
| | | | | | | | |
| | | | $ | 2,620,047,333 | |
| Oil Services - 1.1% | | | | | | | | |
| Schlumberger Ltd. | | | 5,957,863 | | | $ | 478,773,871 | |
| | |
| Other Banks & Diversified Financials - 5.1% | | | | | | | | |
| American Express Co. | | | 5,076,939 | | | $ | 406,459,736 | |
| Citigroup, Inc. | | | 12,317,658 | | | | 736,719,125 | |
| U.S. Bancorp | | | 18,526,344 | | | | 1,018,948,920 | |
| | | | | | | | |
| | | | $ | 2,162,127,781 | |
| Pharmaceuticals - 7.2% | | | | | | | | |
| Johnson & Johnson | | | 11,964,934 | | | $ | 1,462,234,584 | |
| Merck & Co., Inc. | | | 7,476,337 | | | | 492,466,318 | |
| Novartis AG | | | 1,265,183 | | | | 98,760,738 | |
| Pfizer, Inc. | | | 27,736,298 | | | | 946,362,488 | |
| Roche Holding AG | | | 363,005 | | | | 88,442,598 | |
| | | | | | | | |
| | | | $ | 3,088,266,726 | |
| Printing & Publishing - 0.9% | | | | | | | | |
| Moody’s Corp. | | | 2,510,176 | | | $ | 279,558,301 | |
| S&P Global, Inc. | | | 686,623 | | | | 88,897,080 | |
| | | | | | | | |
| | | | $ | 368,455,381 | |
| Railroad & Shipping - 1.3% | | | | | | | | |
| Canadian National Railway Co. | | | 3,171,031 | | | $ | 221,242,833 | |
| Union Pacific Corp. | | | 2,911,317 | | | | 314,247,557 | |
| | | | | | | | |
| | | | $ | 535,490,390 | |
| Specialty Stores - 0.3% | | | | | | | | |
| Advance Auto Parts, Inc. | | | 794,521 | | | $ | 124,429,934 | |
8
Portfolio of Investments (unaudited) – continued
| | | | | | | | |
| Issuer | | Shares/Par | | | Value ($) | |
| Common Stocks - continued | | | | | | | | |
| Telephone Services - 1.2% | | | | | | | | |
| Verizon Communications, Inc. | | | 10,581,406 | | | $ | 525,155,180 | |
| | |
| Tobacco - 4.3% | | | | | | | | |
| Altria Group, Inc. | | | 3,429,130 | | | $ | 256,910,420 | |
| Philip Morris International, Inc. | | | 14,290,664 | | | | 1,562,684,108 | |
| | | | | | | | |
| | | | $ | 1,819,594,528 | |
| Trucking - 1.4% | | | | | | | | |
| United Parcel Service, Inc., “B” | | | 5,771,489 | | | $ | 610,392,677 | |
| | |
| Utilities - Electric Power - 1.1% | | | | | | | | |
| Duke Energy Corp. | | | 4,331,701 | | | $ | 357,581,918 | |
| Xcel Energy, Inc. | | | 2,996,924 | | | | 130,995,548 | |
| | | | | | | | |
| | | | $ | 488,577,466 | |
Total Common Stocks
(Identified Cost, $27,015,014,534) | | | | | | $ | 42,055,815,804 | |
| | |
| Money Market Funds - 1.4% | | | | | | | | |
MFS Institutional Money Market Portfolio, 0.64% (v)
(Identified Cost, $580,332,949) | | | 580,336,597 | | | $ | 580,336,597 | |
| Total Investments (Identified Cost, $27,595,347,483) | | | | | | $ | 42,636,152,401 | |
| |
| Other Assets, Less Liabilities - 0.2% | | | | 96,674,110 | |
| Net Assets - 100.0% | | | $ | 42,732,826,511 | |
| (a) | Non-income producing security. |
| (v) | Underlying affiliated fund that is available only to investment companies managed by MFS. The rate quoted for the MFS Institutional Money Market Portfolio is the annualized seven-day yield of the fund at period end. |
The following abbreviations are used in this report and are defined:
| PLC | | Public Limited Company |
See Notes to Financial Statements
9
Financial Statements
STATEMENT OF ASSETS AND LIABILITIES
At 2/28/17 (unaudited)
This statement represents your fund’s balance sheet, which details the assets and liabilities comprising the total value of the fund.
| | | | |
| Assets | | | | |
Investments | | | | |
Non-affiliated issuers, at value (identified cost, $27,015,014,534) | | | $42,055,815,804 | |
Underlying affiliated funds, at value (identified cost, $580,332,949) | | | 580,336,597 | |
Total investments, at value (identified cost, $27,595,347,483) | | | $42,636,152,401 | |
Cash | | | 451,615 | |
Receivables for | | | | |
Investments sold | | | 115,299,712 | |
Fund shares sold | | | 101,087,084 | |
Dividends | | | 109,589,284 | |
Other assets | | | 145,254 | |
Total assets | | | $42,962,725,350 | |
| Liabilities | | | | |
Payables for | | | | |
Investments purchased | | | $128,230,903 | |
Fund shares reacquired | | | 90,352,671 | |
Payable to affiliates | | | | |
Investment adviser | | | 1,087,581 | |
Shareholder servicing costs | | | 9,309,833 | |
Distribution and service fees | | | 246,953 | |
Program manager fees | | | 77 | |
Payable for independent Trustees’ compensation | | | 2,082 | |
Accrued expenses and other liabilities | | | 668,739 | |
Total liabilities | | | $229,898,839 | |
Net assets | | | $42,732,826,511 | |
| Net assets consist of | | | | |
Paid-in capital | | | $27,279,449,863 | |
Unrealized appreciation (depreciation) on investments and translation of assets and liabilities in foreign currencies | | | 15,040,329,173 | |
Accumulated net realized gain (loss) on investments and foreign currency | | | 311,068,994 | |
Undistributed net investment income | | | 101,978,481 | |
Net assets | | | $42,732,826,511 | |
Shares of beneficial interest outstanding | | | 1,124,467,033 | |
10
Statement of Assets and Liabilities (unaudited) – continued
| | | | | | | | | | | | |
| | | Net assets | | | Shares
outstanding | | | Net asset value
per share (a) | |
Class A | | | $8,255,008,017 | | | | 217,637,177 | | | | $37.93 | |
Class B | | | 151,063,593 | | | | 4,005,022 | | | | 37.72 | |
Class C | | | 1,564,426,292 | | | | 41,743,727 | | | | 37.48 | |
Class I | | | 19,643,990,449 | | | | 514,951,585 | | | | 38.15 | |
Class R1 | | | 28,478,731 | | | | 765,098 | | | | 37.22 | |
Class R2 | | | 637,763,663 | | | | 16,980,391 | | | | 37.56 | |
Class R3 | | | 2,013,679,751 | | | | 53,270,890 | | | | 37.80 | |
Class R4 | | | 3,209,370,026 | | | | 84,586,210 | | | | 37.94 | |
Class R6 | | | 7,200,866,895 | | | | 189,775,589 | | | | 37.94 | |
Class 529A | | | 21,219,629 | | | | 563,662 | | | | 37.65 | |
Class 529B | | | 930,139 | | | | 24,965 | | | | 37.26 | |
Class 529C | | | 6,029,326 | | | | 162,717 | | | | 37.05 | |
| (a) | Maximum offering price per share was equal to the net asset value per share for all share classes, except for Classes A and 529A, for which the maximum offering prices per share were $40.24 [100 / 94.25 x $37.93] and $39.95 [100 / 94.25 x $37.65], respectively. On sales of $50,000 or more, the maximum offering prices of Class A and Class 529A shares are reduced. A contingent deferred sales charge may be imposed on redemptions of Class A, Class B, Class C, Class 529B, and Class 529C shares. Redemption price per share was equal to the net asset value per share for Classes I, R1, R2, R3, R4, R6, and 529A. |
See Notes to Financial Statements
11
Financial Statements
STATEMENT OF OPERATIONS
Six months ended 2/28/17 (unaudited)
This statement describes how much your fund earned in investment income and accrued in expenses. It also describes any gains and/or losses generated by fund operations.
| | | | |
| Net investment income | |
Income | | | | |
Dividends | | | $576,689,185 | |
Dividends from underlying affiliated funds | | | 1,199,112 | |
Interest | | | 1,386,440 | |
Other | | | 12,675 | |
Foreign taxes withheld | | | (274,718 | ) |
Total investment income | | | $579,012,694 | |
Expenses | | | | |
Management fee | | | $100,733,655 | |
Distribution and service fees | | | 22,965,410 | |
Shareholder servicing costs | | | 18,400,252 | |
Program manager fees | | | 12,885 | |
Administrative services fee | | | 305,706 | |
Independent Trustees’ compensation | | | 132,538 | |
Custodian fee | | | 292,121 | |
Reimbursement of custodian expenses | | | (93,469 | ) |
Shareholder communications | | | 840,645 | |
Audit and tax fees | | | 34,431 | |
Legal fees | | | 178,006 | |
Miscellaneous | | | 821,965 | |
Total expenses | | | $144,624,145 | |
Reduction of expenses by investment adviser and distributor | | | (7,116,697 | ) |
Net expenses | | | $137,507,448 | |
Net investment income | | | $441,505,246 | |
| Realized and unrealized gain (loss) on investments and foreign currency | |
Realized gain (loss) (identified cost basis) | | | | |
Investments: | | | | |
Non-affiliated issuers | | | $620,895,120 | |
Underlying affiliated funds | | | (890 | ) |
Foreign currency | | | (250,181 | ) |
Net realized gain (loss) on investments and foreign currency | | | $620,644,049 | |
Change in unrealized appreciation (depreciation) | | | | |
Investments | | | $2,307,037,395 | |
Translation of assets and liabilities in foreign currencies | | | (334,468 | ) |
Net unrealized gain (loss) on investments and foreign currency translation | | | $2,306,702,927 | |
Net realized and unrealized gain (loss) on investments and foreign currency | | | $2,927,346,976 | |
Change in net assets from operations | | | $3,368,852,222 | |
See Notes to Financial Statements
12
Financial Statements
STATEMENTS OF CHANGES IN NET ASSETS
These statements describe the increases and/or decreases in net assets resulting from operations, any distributions, and any shareholder transactions.
| | | | | | | | |
| Change in net assets | | Six months ended
2/28/17 (unaudited) | | | Year ended
8/31/16 | |
| From operations | | | | | | | | |
Net investment income | | | $441,505,246 | | | | $619,545,994 | |
Net realized gain (loss) on investments and foreign currency | | | 620,644,049 | | | | 862,550,534 | |
Net unrealized gain (loss) on investments and foreign currency translation | | | 2,306,702,927 | | | | 3,214,917,617 | |
Change in net assets from operations | | | $3,368,852,222 | | | | $4,697,014,145 | |
| Distributions declared to shareholders | | | | | | | | |
From net investment income | | | $(449,871,289 | ) | | | $(631,287,372 | ) |
From net realized gain on investments | | | (686,739,617 | ) | | | (1,243,632,740 | ) |
Total distributions declared to shareholders | | | $(1,136,610,906 | ) | | | $(1,874,920,112 | ) |
Change in net assets from fund share transactions | | | $662,568,061 | | | | $3,382,783,869 | |
Total change in net assets | | | $2,894,809,377 | | | | $6,204,877,902 | |
| Net assets | | | | | | | | |
At beginning of period | | | 39,838,017,134 | | | | 33,633,139,232 | |
At end of period (including undistributed net investment income of $101,978,481 and $110,344,524, respectively) | | | $42,732,826,511 | | | | $39,838,017,134 | |
See Notes to Financial Statements
13
Financial Statements
FINANCIAL HIGHLIGHTS
The financial highlights table is intended to help you understand the fund’s financial performance for the semiannual period and the past 5 fiscal years (or life of a particular share class, if shorter). Certain information reflects financial results for a single fund share. The total returns in the table represent the rate by which an investor would have earned (or lost) on an investment in the fund share class (assuming reinvestment of all distributions) held for the entire period.
| | | | | | | | | | | | | | | | | | | | | | | | |
| | | Six months
ended
2/28/17
(unaudited) | | | Years ended 8/31 | |
| Class A | | | 2016 | | | 2015 | | | 2014 | | | 2013 | | | 2012 | |
| | | | | | | | | | | | | | | | | |
Net asset value, beginning
of period | | | $35.93 | | | | $33.38 | | | | $34.70 | | | | $29.81 | | | | $24.90 | | | | $21.83 | |
| Income (loss) from investment operations | | | | | | | | | | | | | |
Net investment income (d) | | | $0.36 | (c) | | | $0.54 | | | | $0.63 | | | | $0.69 | | | | $0.50 | | | | $0.43 | |
Net realized and unrealized gain (loss)
on investments and
foreign currency | | | 2.64 | | | | 3.81 | | | | (0.36 | ) | | | 5.41 | | | | 5.08 | | | | 3.05 | |
Total from investment
operations | | | $3.00 | | | | $4.35 | | | | $0.27 | | | | $6.10 | | | | $5.58 | | | | $3.48 | |
| Less distributions declared to shareholders | | | | | | | | | | | | | |
From net investment
income | | | $(0.38 | ) | | | $(0.56 | ) | | | $(0.67 | ) | | | $(0.63 | ) | | | $(0.48 | ) | | | $(0.41 | ) |
From net realized gain
on investments | | | (0.62 | ) | | | (1.24 | ) | | | (0.92 | ) | | | (0.58 | ) | | | (0.19 | ) | | | — | |
Total distributions declared
to shareholders | | | $(1.00 | ) | | | $(1.80 | ) | | | $(1.59 | ) | | | $(1.21 | ) | | | $(0.67 | ) | | | $(0.41 | ) |
Net asset value, end of
period (x) | | | $37.93 | | | | $35.93 | | | | $33.38 | | | | $34.70 | | | | $29.81 | | | | $24.90 | |
Total return (%) (r)(s)(t)(x) | | | 8.47 | (c)(n) | | | 13.55 | | | | 0.68 | | | | 20.78 | | | | 22.75 | | | | 16.16 | |
Ratios (%) (to average net assets)
and Supplemental data: | | | | | | | | | |
Expenses before expense
reductions (f) | | | 0.88 | (a)(c) | | | 0.90 | | | | 0.90 | | | | 0.90 | | | | 0.93 | | | | 0.95 | |
Expenses after expense
reductions (f) | | | 0.84 | (a)(c) | | | 0.86 | | | | 0.86 | | | | 0.88 | | | | 0.92 | | | | 0.93 | |
Net investment income | | | 2.04 | (a)(c) | | | 1.60 | | | | 1.80 | | | | 2.10 | | | | 1.80 | | | | 1.86 | |
Portfolio turnover | | | 8 | (n) | | | 12 | | | | 12 | | | | 13 | | | | 12 | | | | 14 | |
Net assets at end of period
(000 omitted) | | | $8,255,008 | | | | $9,033,842 | | | | $8,478,761 | | | | $9,448,535 | | | | $8,058,858 | | | | $6,628,244 | |
See Notes to Financial Statements
14
Financial Highlights – continued
| | | | | | | | | | | | | | | | | | | | | | | | |
| | | Six months
ended
2/28/17
(unaudited) | | | Years ended 8/31 | |
| Class B | | | 2016 | | | 2015 | | | 2014 | | | 2013 | | | 2012 | |
| | | | | | | | | | | | | | | | | |
Net asset value, beginning
of period | | | $35.72 | | | | $33.19 | | | | $34.50 | | | | $29.64 | | | | $24.76 | | | | $21.70 | |
| Income (loss) from investment operations | | | | | | | | | | | | | |
Net investment income (d) | | | $0.23 | (c) | | | $0.28 | | | | $0.37 | | | | $0.44 | | | | $0.29 | | | | $0.26 | |
Net realized and
unrealized gain (loss)
on investments and
foreign currency | | | 2.62 | | | | 3.79 | | | | (0.35 | ) | | | 5.38 | | | | 5.05 | | | | 3.03 | |
Total from investment
operations | | | $2.85 | | | | $4.07 | | | | $0.02 | | | | $5.82 | | | | $5.34 | | | | $3.29 | |
| Less distributions declared to shareholders | | | | | | | | | | | | | |
From net investment
income | | | $(0.23 | ) | | | $(0.30 | ) | | | $(0.41 | ) | | | $(0.38 | ) | | | $(0.27 | ) | | | $(0.23 | ) |
From net realized gain
on investments | | | (0.62 | ) | | | (1.24 | ) | | | (0.92 | ) | | | (0.58 | ) | | | (0.19 | ) | | | — | |
Total distributions declared
to shareholders | | | $(0.85 | ) | | | $(1.54 | ) | | | $(1.33 | ) | | | $(0.96 | ) | | | $(0.46 | ) | | | $(0.23 | ) |
Net asset value, end of
period (x) | | | $37.72 | | | | $35.72 | | | | $33.19 | | | | $34.50 | | | | $29.64 | | | | $24.76 | |
Total return (%) (r)(s)(t)(x) | | | 8.08 | (c)(n) | | | 12.68 | | | | (0.06 | ) | | | 19.89 | | | | 21.82 | | | | 15.28 | |
Ratios (%) (to average net assets)
and Supplemental data: | | | | | | | | | |
Expenses before expense
reductions (f) | | | 1.62 | (a)(c) | | | 1.65 | | | | 1.65 | | | | 1.65 | | | | 1.68 | | | | 1.70 | |
Expenses after expense
reductions (f) | | | 1.59 | (a)(c) | | | 1.61 | | | | 1.61 | | | | 1.63 | | | | 1.67 | | | | 1.68 | |
Net investment income | | | 1.29 | (a)(c) | | | 0.85 | | | | 1.05 | | | | 1.35 | | | | 1.05 | | | | 1.11 | |
Portfolio turnover | | | 8 | (n) | | | 12 | | | | 12 | | | | 13 | | | | 12 | | | | 14 | |
Net assets at end of period
(000 omitted) | | | $151,064 | | | | $154,742 | | | | $154,205 | | | | $179,284 | | | | $169,208 | | | | $167,949 | |
See Notes to Financial Statements
15
Financial Highlights – continued
| | | | | | | | | | | | | | | | | | | | | | | | |
| | | Six months
ended
2/28/17
(unaudited) | | | Years ended 8/31 | |
| Class C | | | 2016 | | | 2015 | | | 2014 | | | 2013 | | | 2012 | |
| | | | | | | | | | | | | | | | | |
Net asset value, beginning
of period | | | $35.50 | | | | $33.00 | | | | $34.33 | | | | $29.50 | | | | $24.65 | | | | $21.62 | |
| Income (loss) from investment operations | | | | | | | | | | | | | |
Net investment income (d) | | | $0.23 | (c) | | | $0.28 | | | | $0.37 | | | | $0.44 | | | | $0.29 | | | | $0.25 | |
Net realized and
unrealized gain (loss)
on investments and
foreign currency | | | 2.61 | | | | 3.77 | | | | (0.36 | ) | | | 5.36 | | | | 5.03 | | | | 3.02 | |
Total from investment
operations | | | $2.84 | | | | $4.05 | | | | $0.01 | | | | $5.80 | | | | $5.32 | | | | $3.27 | |
| Less distributions declared to shareholders | | | | | | | | | | | | | |
From net investment
income | | | $(0.24 | ) | | | $(0.31 | ) | | | $(0.42 | ) | | | $(0.39 | ) | | | $(0.28 | ) | | | $(0.24 | ) |
From net realized gain
on investments | | | (0.62 | ) | | | (1.24 | ) | | | (0.92 | ) | | | (0.58 | ) | | | (0.19 | ) | | | — | |
Total distributions declared
to shareholders | | | $(0.86 | ) | | | $(1.55 | ) | | | $(1.34 | ) | | | $(0.97 | ) | | | $(0.47 | ) | | | $(0.24 | ) |
Net asset value, end of
period (x) | | | $37.48 | | | | $35.50 | | | | $33.00 | | | | $34.33 | | | | $29.50 | | | | $24.65 | |
Total return (%) (r)(s)(t)(x) | | | 8.09 | (c)(n) | | | 12.69 | | | | (0.09 | ) | | | 19.92 | | | | 21.83 | | | | 15.23 | |
Ratios (%) (to average net assets)
and Supplemental data: | | | | | | | | | |
Expenses before expense
reductions (f) | | | 1.62 | (a)(c) | | | 1.65 | | | | 1.65 | | | | 1.65 | | | | 1.68 | | | | 1.69 | |
Expenses after expense
reductions (f) | | | 1.59 | (a)(c) | | | 1.61 | | | | 1.61 | | | | 1.63 | | | | 1.67 | | | | 1.68 | |
Net investment income | | | 1.30 | (a)(c) | | | 0.85 | | | | 1.06 | | | | 1.35 | | | | 1.05 | | | | 1.11 | |
Portfolio turnover | | | 8 | (n) | | | 12 | | | | 12 | | | | 13 | | | | 12 | | | | 14 | |
Net assets at end of period
(000 omitted) | | | $1,564,426 | | | | $1,538,605 | | | | $1,335,968 | | | | $1,359,860 | | | | $1,090,690 | | | | $906,572 | |
See Notes to Financial Statements
16
Financial Highlights – continued
| | | | | | | | | | | | | | | | | | | | | | | | |
| | | Six months
ended
2/28/17
(unaudited) | | | Years ended 8/31 | |
| Class I | | | 2016 | | | 2015 | | | 2014 | | | 2013 | | | 2012 | |
| | | | | | | | | | | | | | | | | |
Net asset value, beginning of period | | | $36.13 | | | | $33.56 | | | | $34.88 | | | | $29.96 | | | | $25.02 | | | | $21.94 | |
| Income (loss) from investment operations | | | | | | | | | | | | | |
Net investment income (d) | | | $0.42 | (c) | | | $0.63 | | | | $0.72 | | | | $0.78 | | | | $0.57 | | | | $0.49 | |
Net realized and
unrealized gain (loss)
on investments and
foreign currency | | | 2.65 | | | | 3.82 | | | | (0.36 | ) | | | 5.43 | | | | 5.10 | | | | 3.06 | |
Total from investment
operations | | | $3.07 | | | | $4.45 | | | | $0.36 | | | | $6.21 | | | | $5.67 | | | | $3.55 | |
| Less distributions declared to shareholders | | | | | | | | | | | | | |
From net investment
income | | | $(0.43 | ) | | | $(0.64 | ) | | | $(0.76 | ) | | | $(0.71 | ) | | | $(0.54 | ) | | | $(0.47 | ) |
From net realized gain
on investments | | | (0.62 | ) | | | (1.24 | ) | | | (0.92 | ) | | | (0.58 | ) | | | (0.19 | ) | | | — | |
Total distributions declared to shareholders | | | $(1.05 | ) | | | $(1.88 | ) | | | $(1.68 | ) | | | $(1.29 | ) | | | $(0.73 | ) | | | $(0.47 | ) |
Net asset value, end of
period (x) | | | $38.15 | | | | $36.13 | | | | $33.56 | | | | $34.88 | | | | $29.96 | | | | $25.02 | |
Total return (%) (r)(s)(x) | | | 8.62 | (c)(n) | | | 13.83 | | | | 0.93 | | | | 21.07 | | | | 23.06 | | | | 16.42 | |
Ratios (%) (to average net assets)
and Supplemental data: | | | | | | | | | |
Expenses before expense
reductions (f) | | | 0.62 | (a)(c) | | | 0.65 | | | | 0.65 | | | | 0.65 | | | | 0.68 | | | | 0.70 | |
Expenses after expense
reductions (f) | | | 0.59 | (a)(c) | | | 0.61 | | | | 0.61 | | | | 0.63 | | | | 0.67 | | | | 0.68 | |
Net investment income | | | 2.31 | (a)(c) | | | 1.84 | | | | 2.06 | | | | 2.35 | | | | 2.05 | | | | 2.11 | |
Portfolio turnover | | | 8 | (n) | | | 12 | | | | 12 | | | | 13 | | | | 12 | | | | 14 | |
Net assets at end of period
(000 omitted) | | | $19,643,990 | | | | $17,134,836 | | | | $13,888,395 | | | | $13,905,910 | | | | $10,568,573 | | | | $7,472,693 | |
See Notes to Financial Statements
17
Financial Highlights – continued
| | | | | | | | | | | | | | | | | | | | | | | | |
| | | Six months
ended
2/28/17
(unaudited) | | | Years ended 8/31 | |
| Class R1 | | | 2016 | | | 2015 | | | 2014 | | | 2013 | | | 2012 | |
| | | | | | | | | | | | | | | | | |
Net asset value, beginning
of period | | | $35.27 | | | | $32.79 | | | | $34.11 | | | | $29.32 | | | | $24.50 | | | | $21.48 | |
| Income (loss) from investment operations | | | | | | | | | | | | | |
Net investment income (d) | | | $0.23 | (c) | | | $0.28 | | | | $0.36 | | | | $0.43 | | | | $0.29 | | | | $0.25 | |
Net realized and
unrealized gain (loss)
on investments and
foreign currency | | | 2.58 | | | | 3.74 | | | | (0.34 | ) | | | 5.33 | | | | 5.00 | | | | 3.01 | |
Total from investment
operations | | | $2.81 | | | | $4.02 | | | | $0.02 | | | | $5.76 | | | | $5.29 | | | | $3.26 | |
| Less distributions declared to shareholders | | | | | | | | | | | | | |
From net investment
income | | | $(0.24 | ) | | | $(0.30 | ) | | | $(0.42 | ) | | | $(0.39 | ) | | | $(0.28 | ) | | | $(0.24 | ) |
From net realized gain
on investments | | | (0.62 | ) | | | (1.24 | ) | | | (0.92 | ) | | | (0.58 | ) | | | (0.19 | ) | | | — | |
Total distributions declared
to shareholders | | | $(0.86 | ) | | | $(1.54 | ) | | | $(1.34 | ) | | | $(0.97 | ) | | | $(0.47 | ) | | | $(0.24 | ) |
Net asset value, end of
period (x) | | | $37.22 | | | | $35.27 | | | | $32.79 | | | | $34.11 | | | | $29.32 | | | | $24.50 | |
Total return (%) (r)(s)(x) | | | 8.05 | (c)(n) | | | 12.69 | | | | (0.07 | ) | | | 19.88 | | | | 21.83 | | | | 15.29 | |
Ratios (%) (to average net assets)
and Supplemental data: | | | | | | | | | |
Expenses before expense
reductions (f) | | | 1.62 | (a)(c) | | | 1.65 | | | | 1.65 | | | | 1.65 | | | | 1.68 | | | | 1.69 | |
Expenses after expense
reductions (f) | | | 1.59 | (a)(c) | | | 1.61 | | | | 1.61 | | | | 1.63 | | | | 1.67 | | | | 1.68 | |
Net investment income | | | 1.32 | (a)(c) | | | 0.85 | | | | 1.06 | | | | 1.33 | | | | 1.06 | | | | 1.10 | |
Portfolio turnover | | | 8 | (n) | | | 12 | | | | 12 | | | | 13 | | | | 12 | | | | 14 | |
Net assets at end of period
(000 omitted) | | | $28,479 | | | | $27,096 | | | | $27,860 | | | | $33,390 | | | | $33,485 | | | | $32,389 | |
See Notes to Financial Statements
18
Financial Highlights – continued
| | | | | | | | | | | | | | | | | | | | | | | | |
| | | Six months
ended
2/28/17
(unaudited) | | | Years ended 8/31 | |
| Class R2 | | | 2016 | | | 2015 | | | 2014 | | | 2013 | | | 2012 | |
| | | | | | | | | | | | | | | | | |
Net asset value, beginning
of period | | | $35.59 | | | | $33.08 | | | | $34.40 | | | | $29.56 | | | | $24.69 | | | | $21.66 | |
| Income (loss) from investment operations | | | | | | | | | | | | | |
Net investment income (d) | | | $0.32 | (c) | | | $0.45 | | | | $0.54 | | | | $0.60 | | | | $0.43 | | | | $0.37 | |
Net realized and
unrealized gain (loss)
on investments and
foreign currency | | | 2.60 | | | | 3.78 | | | | (0.35 | ) | | | 5.36 | | | | 5.04 | | | | 3.01 | |
Total from investment
operations | | | $2.92 | | | | $4.23 | | | | $0.19 | | | | $5.96 | | | | $5.47 | | | | $3.38 | |
| Less distributions declared to shareholders | | | | | | | | | | | | | |
From net investment
income | | | $(0.33 | ) | | | $(0.48 | ) | | | $(0.59 | ) | | | $(0.54 | ) | | | $(0.41 | ) | | | $(0.35 | ) |
From net realized gain
on investments | | | (0.62 | ) | | | (1.24 | ) | | | (0.92 | ) | | | (0.58 | ) | | | (0.19 | ) | | | — | |
Total distributions declared
to shareholders | | | $(0.95 | ) | | | $(1.72 | ) | | | $(1.51 | ) | | | $(1.12 | ) | | | $(0.60 | ) | | | $(0.35 | ) |
Net asset value, end of
period (x) | | | $37.56 | | | | $35.59 | | | | $33.08 | | | | $34.40 | | | | $29.56 | | | | $24.69 | |
Total return (%) (r)(s)(x) | | | 8.33 | (c)(n) | | | 13.27 | | | | 0.43 | | | | 20.48 | | | | 22.47 | | | | 15.80 | |
Ratios (%) (to average net assets)
and Supplemental data: | | | | | | | | | |
Expenses before expense
reductions (f) | | | 1.12 | (a)(c) | | | 1.15 | | | | 1.15 | | | | 1.15 | | | | 1.18 | | | | 1.20 | |
Expenses after expense
reductions (f) | | | 1.09 | (a)(c) | | | 1.11 | | | | 1.11 | | | | 1.13 | | | | 1.17 | | | | 1.18 | |
Net investment income | | | 1.82 | (a)(c) | | | 1.35 | | | | 1.54 | | | | 1.84 | | | | 1.55 | | | | 1.61 | |
Portfolio turnover | | | 8 | (n) | | | 12 | | | | 12 | | | | 13 | | | | 12 | | | | 14 | |
Net assets at end of period
(000 omitted) | | | $637,764 | | | | $567,665 | | | | $521,592 | | | | $607,340 | | | | $572,590 | | | | $517,005 | |
See Notes to Financial Statements
19
Financial Highlights – continued
| | | | | | | | | | | | | | | | | | | | | | | | |
| | | Six months
ended
2/28/17
(unaudited) | | | Years ended 8/31 | |
| Class R3 | | | 2016 | | | 2015 | | | 2014 | | | 2013 | | | 2012 | |
| | | | | | | | | | | | | | | | | |
Net asset value, beginning
of period | | | $35.81 | | | | $33.28 | | | | $34.60 | | | | $29.73 | | | | $24.83 | | | | $21.78 | |
| Income (loss) from investment operations | | | | | | | | | | | | | |
Net investment income (d) | | | $0.37 | (c) | | | $0.54 | | | | $0.63 | | | | $0.69 | | | | $0.50 | | | | $0.43 | |
Net realized and
unrealized gain (loss)
on investments and
foreign currency | | | 2.62 | | | | 3.79 | | | | (0.35 | ) | | | 5.39 | | | | 5.07 | | | | 3.03 | |
Total from investment
operations | | | $2.99 | | | | $4.33 | | | | $0.28 | | | | $6.08 | | | | $5.57 | | | | $3.46 | |
| Less distributions declared to shareholders | | | | | | | | | | | | | |
From net investment
income | | | $(0.38 | ) | | | $(0.56 | ) | | | $(0.68 | ) | | | $(0.63 | ) | | | $(0.48 | ) | | | $(0.41 | ) |
From net realized gain
on investments | | | (0.62 | ) | | | (1.24 | ) | | | (0.92 | ) | | | (0.58 | ) | | | (0.19 | ) | | | — | |
Total distributions declared
to shareholders | | | $(1.00 | ) | | | $(1.80 | ) | | | $(1.60 | ) | | | $(1.21 | ) | | | $(0.67 | ) | | | $(0.41 | ) |
Net asset value, end of
period (x) | | | $37.80 | | | | $35.81 | | | | $33.28 | | | | $34.60 | | | | $29.73 | | | | $24.83 | |
Total return (%) (r)(s)(x) | | | 8.47 | (c)(n) | | | 13.54 | | | | 0.69 | | | | 20.77 | | | | 22.77 | | | | 16.11 | |
Ratios (%) (to average net assets)
and Supplemental data: | | | | | | | | | |
Expenses before expense
reductions (f) | | | 0.87 | (a)(c) | | | 0.90 | | | | 0.90 | | | | 0.90 | | | | 0.93 | | | | 0.95 | |
Expenses after expense
reductions (f) | | | 0.84 | (a)(c) | | | 0.86 | | | | 0.86 | | | | 0.87 | | | | 0.91 | | | | 0.93 | |
Net investment income | | | 2.07 | (a)(c) | | | 1.60 | | | | 1.80 | | | | 2.11 | | | | 1.80 | | | | 1.86 | |
Portfolio turnover | | | 8 | (n) | | | 12 | | | | 12 | | | | 13 | | | | 12 | | | | 14 | |
Net assets at end of period
(000 omitted) | | | $2,013,680 | | | | $1,903,910 | | | | $1,571,281 | | | | $1,559,863 | | | | $1,299,126 | | | | $1,022,504 | |
See Notes to Financial Statements
20
Financial Highlights – continued
| | | | | | | | | | | | | | | | | | | | | | | | |
| | | Six months
ended
2/28/17
(unaudited) | | | Years ended 8/31 | |
| Class R4 | | | 2016 | | | 2015 | | | 2014 | | | 2013 | | | 2012 | |
| | | | | | | | | | | | | | | | | |
Net asset value, beginning
of period | | | $35.94 | | | | $33.40 | | | | $34.72 | | | | $29.82 | | | | $24.90 | | | | $21.84 | |
| Income (loss) from investment operations | | | | | | | | | | | | | |
Net investment income (d) | | | $0.41 | (c) | | | $0.62 | | | | $0.72 | | | | $0.77 | | | | $0.57 | | | | $0.49 | |
Net realized and
unrealized gain (loss)
on investments and
foreign currency | | | 2.64 | | | | 3.80 | | | | (0.36 | ) | | | 5.42 | | | | 5.08 | | | | 3.04 | |
Total from investment
operations | | | $3.05 | | | | $4.42 | | | | $0.36 | | | | $6.19 | | | | $5.65 | | | | $3.53 | |
| Less distributions declared to shareholders | | | | | | | | | | | | | |
From net investment
income | | | $(0.43 | ) | | | $(0.64 | ) | | | $(0.76 | ) | | | $(0.71 | ) | | | $(0.54 | ) | | | $(0.47 | ) |
From net realized gain
on investments | | | (0.62 | ) | | | (1.24 | ) | | | (0.92 | ) | | | (0.58 | ) | | | (0.19 | ) | | | — | |
Total distributions declared
to shareholders | | | $(1.05 | ) | | | $(1.88 | ) | | | $(1.68 | ) | | | $(1.29 | ) | | | $(0.73 | ) | | | $(0.47 | ) |
Net asset value, end of
period (x) | | | $37.94 | | | | $35.94 | | | | $33.40 | | | | $34.72 | | | | $29.82 | | | | $24.90 | |
Total return (%) (r)(s)(x) | | | 8.61 | (c)(n) | | | 13.80 | | | | 0.93 | | | | 21.11 | | | | 23.09 | | | | 16.40 | |
Ratios (%) (to average net assets)
and Supplemental data: | | | | | | | | | |
Expenses before expense
reductions (f) | | | 0.63 | (a)(c) | | | 0.65 | | | | 0.65 | | | | 0.65 | | | | 0.68 | | | | 0.70 | |
Expenses after expense
reductions (f) | | | 0.59 | (a)(c) | | | 0.61 | | | | 0.61 | | | | 0.63 | | | | 0.67 | | | | 0.68 | |
Net investment income | | | 2.30 | (a)(c) | | | 1.85 | | | | 2.05 | | | | 2.34 | | | | 2.07 | | | | 2.10 | |
Portfolio turnover | | | 8 | (n) | | | 12 | | | | 12 | | | | 13 | | | | 12 | | | | 14 | |
Net assets at end of period
(000 omitted) | | | $3,209,370 | | | | $3,233,421 | | | | $2,787,041 | | | | $3,283,133 | | | | $2,892,340 | | | | $2,907,088 | |
See Notes to Financial Statements
21
Financial Highlights – continued
| | | | | | | | | | | | | | | | | | | | | | | | |
| | | Six months
ended
2/28/17
| | | Years ended 8/31 | |
| Class R6 (y) | | | 2016 | | | 2015 | | | 2014 | | | 2013 | | | 2012 | |
| | | (unaudited) | | | | | | | | | | | | | | | | |
Net asset value, beginning
of period | | | $35.94 | | | | $33.40 | | | | $34.72 | | | | $29.82 | | | | $24.90 | | | | $21.81 | |
| Income (loss) from investment operations | | | | | | | | | | | | | |
Net investment income (d) | | | $0.43 | (c) | | | $0.66 | | | | $0.76 | | | | $0.82 | | | | $0.60 | | | | $0.46 | |
Net realized and
unrealized gain (loss)
on investments and
foreign currency | | | 2.63 | | | | 3.80 | | | | (0.36 | ) | | | 5.40 | | | | 5.07 | | | | 3.08 | |
Total from investment
operations | | | $3.06 | | | | $4.46 | | | | $0.40 | | | | $6.22 | | | | $5.67 | | | | $3.54 | |
| Less distributions declared to shareholders | | | | | | | | | | | | | |
From net investment
income | | | $(0.44 | ) | | | $(0.68 | ) | | | $(0.80 | ) | | | $(0.74 | ) | | | $(0.56 | ) | | | $(0.45 | ) |
From net realized gain
on investments | | | (0.62 | ) | | | (1.24 | ) | | | (0.92 | ) | | | (0.58 | ) | | | (0.19 | ) | | | — | |
Total distributions declared
to shareholders | | | $(1.06 | ) | | | $(1.92 | ) | | | $(1.72 | ) | | | $(1.32 | ) | | | $(0.75 | ) | | | $(0.45 | ) |
Net asset value, end of
period (x) | | | $37.94 | | | | $35.94 | | | | $33.40 | | | | $34.72 | | | | $29.82 | | | | $24.90 | |
Total return (%) (r)(s)(x) | | | 8.67 | (c)(n) | | | 13.93 | | | | 1.04 | | | | 21.23 | | | | 23.18 | | | | 16.48 | |
Ratios (%) (to average net assets)
and Supplemental data: | | | | | | | | | |
Expenses before expense
reductions (f) | | | 0.52 | (a)(c) | | | 0.54 | | | | 0.54 | | | | 0.55 | | | | 0.57 | | | | 0.77 | |
Expenses after expense
reductions (f) | | | 0.49 | (a)(c) | | | 0.50 | | | | 0.50 | | | | 0.53 | | | | 0.56 | | | | 0.76 | |
Net investment income | | | 2.41 | (a)(c) | | | 1.95 | | | | 2.17 | | | | 2.48 | | | | 2.12 | | | | 1.98 | |
Portfolio turnover | | | 8 | (n) | | | 12 | | | | 12 | | | | 13 | | | | 12 | | | | 14 | |
Net assets at end of period
(000 omitted) | | | $7,200,867 | | | | $6,218,954 | | | | $4,846,172 | | | | $3,995,830 | | | | $2,362,012 | | | | $940,695 | |
See Notes to Financial Statements
22
Financial Highlights – continued
| | | | | | | | | | | | | | | | | | | | | | | | |
| | | Six months
ended
2/28/17
(unaudited) | | | Years ended 8/31 | |
| Class 529A | | | 2016 | | | 2015 | | | 2014 | | | 2013 | | | 2012 | |
| | | | | | | | | | | | | | | | | |
Net asset value, beginning
of period | | | $35.67 | | | | $33.15 | | | | $34.48 | | | | $29.62 | | | | $24.74 | | | | $21.70 | |
| Income (loss) from investment operations | | | | | | | | | | | | | |
Net investment income (d) | | | $0.37 | (c) | | | $0.53 | | | | $0.63 | | | | $0.69 | | | | $0.49 | | | | $0.42 | |
Net realized and
unrealized gain (loss)
on investments and
foreign currency | | | 2.61 | | | | 3.79 | | | | (0.36 | ) | | | 5.38 | | | | 5.05 | | | | 3.02 | |
Total from investment
operations | | | $2.98 | | | | $4.32 | | | | $0.27 | | | | $6.07 | | | | $5.54 | | | | $3.44 | |
| Less distributions declared to shareholders | | | | | | | | | | | | | |
From net investment
income | | | $(0.38 | ) | | | $(0.56 | ) | | | $(0.68 | ) | | | $(0.63 | ) | | | $(0.47 | ) | | | $(0.40 | ) |
From net realized gain
on investments | | | (0.62 | ) | | | (1.24 | ) | | | (0.92 | ) | | | (0.58 | ) | | | (0.19 | ) | | | — | |
Total distributions declared
to shareholders | | | $(1.00 | ) | | | $(1.80 | ) | | | $(1.60 | ) | | | $(1.21 | ) | | | $(0.66 | ) | | | $(0.40 | ) |
Net asset value, end of
period (x) | | | $37.65 | | | | $35.67 | | | | $33.15 | | | | $34.48 | | | | $29.62 | | | | $24.74 | |
Total return (%) (r)(s)(t)(x) | | | 8.47 | (c)(n) | | | 13.55 | | | | 0.67 | | | | 20.84 | | | | 22.73 | | | | 16.06 | |
Ratios (%) (to average net assets)
and Supplemental data: | | | | | | | | | |
Expenses before expense
reductions (f) | | | 0.97 | (a)(c) | | | 1.00 | | | | 1.00 | | | | 1.00 | | | | 1.03 | | | | 1.05 | |
Expenses after expense
reductions (f) | | | 0.85 | (a)(c) | | | 0.86 | | | | 0.86 | | | | 0.87 | | | | 0.93 | | | | 0.98 | |
Net investment income | | | 2.06 | (a)(c) | | | 1.59 | | | | 1.82 | | | | 2.11 | | | | 1.79 | | | | 1.80 | |
Portfolio turnover | | | 8 | (n) | | | 12 | | | | 12 | | | | 13 | | | | 12 | | | | 14 | |
Net assets at end of period
(000 omitted) | | | $21,220 | | | | $18,625 | | | | $16,543 | | | | $14,547 | | | | $10,899 | | | | $8,195 | |
See Notes to Financial Statements
23
Financial Highlights – continued
| | | | | | | | | | | | | | | | | | | | | | | | |
| | | Six months
ended
2/28/17
(unaudited) | | | Years ended 8/31 | |
| Class 529B | | | 2016 | | | 2015 | | | 2014 | | | 2013 | | | 2012 | |
| | | | | | | | | | | | | | | | | |
Net asset value, beginning
of period | | | $35.27 | | | | $32.78 | | | | $34.08 | | | | $29.29 | | | | $24.48 | | | | $21.45 | |
| Income (loss) from investment operations | | | | | | | | | | | | | |
Net investment income (d) | | | $0.34 | (c) | | | $0.29 | | | | $0.47 | | | | $0.42 | | | | $0.27 | | | | $0.24 | |
Net realized and
unrealized gain (loss)
on investments and
foreign currency | | | 2.61 | | | | 3.73 | | | | (0.34 | ) | | | 5.32 | | | | 4.99 | | | | 3.01 | |
Total from investment
operations | | | $2.95 | | | | $4.02 | | | | $0.13 | | | | $5.74 | | | | $5.26 | | | | $3.25 | |
| Less distributions declared to shareholders | | | | | | | | | | | | | |
From net investment
income | | | $(0.34 | ) | | | $(0.29 | ) | | | $(0.51 | ) | | | $(0.37 | ) | | | $(0.26 | ) | | | $(0.22 | ) |
From net realized gain
on investments | | | (0.62 | ) | | | (1.24 | ) | | | (0.92 | ) | | | (0.58 | ) | | | (0.19 | ) | | | — | |
Total distributions declared
to shareholders | | | $(0.96 | ) | | | $(1.53 | ) | | | $(1.43 | ) | | | $(0.95 | ) | | | $(0.45 | ) | | | $(0.22 | ) |
Net asset value, end of
period (x) | | | $37.26 | | | | $35.27 | | | | $32.78 | | | | $34.08 | | | | $29.29 | | | | $24.48 | |
Total return (%) (r)(s)(t)(x) | | | 8.48 | (c)(n) | | | 12.70 | | | | 0.27 | | | | 19.85 | | | | 21.74 | | | | 15.27 | |
Ratios (%) (to average net assets)
and Supplemental data: | | | | | | | | | |
Expenses before expense
reductions (f) | | | 0.97 | (a)(c) | | | 1.68 | | | | 1.37 | | | | 1.75 | | | | 1.78 | | | | 1.79 | |
Expenses after expense
reductions (f) | | | 0.88 | (a)(c) | | | 1.58 | | | | 1.27 | | | | 1.67 | | | | 1.71 | | | | 1.73 | |
Net investment income | | | 1.95 | (a)(c) | | | 0.87 | | | | 1.38 | | | | 1.30 | | | | 1.00 | | | | 1.05 | |
Portfolio turnover | | | 8 | (n) | | | 12 | | | | 12 | | | | 13 | | | | 12 | | | | 14 | |
Net assets at end of period
(000 omitted) | | | $930 | | | | $941 | | | | $888 | | | | $1,026 | | | | $1,013 | | | | $963 | |
See Notes to Financial Statements
24
Financial Highlights – continued
| | | | | | | | | | | | | | | | | | | | | | | | |
| | | Six months
ended
2/28/17 (unaudited) | | | Years ended 8/31 | |
| Class 529C | | | 2016 | | | 2015 | | | 2014 | | | 2013 | | | 2012 | |
| | | | | | | | | | | | | | | | | |
Net asset value, beginning
of period | | | $35.11 | | | | $32.66 | | | | $34.00 | | | | $29.23 | | | | $24.43 | | | | $21.43 | |
| Income (loss) from investment operations | | | | | | | | | | | | | |
Net investment income (d) | | | $0.22 | (c) | | | $0.26 | | | | $0.35 | | | | $0.41 | | | | $0.27 | | | | $0.24 | |
Net realized and
unrealized gain (loss)
on investments and
foreign currency | | | 2.57 | | | | 3.73 | | | | (0.36 | ) | | | 5.32 | | | | 4.99 | | | | 2.99 | |
Total from investment
operations | | | $2.79 | | | | $3.99 | | | | $(0.01 | ) | | | $5.73 | | | | $5.26 | | | | $3.23 | |
| Less distributions declared to shareholders | | | | | | | | | | | | | |
From net investment
income | | | $(0.23 | ) | | | $(0.30 | ) | | | $(0.41 | ) | | | $(0.38 | ) | | | $(0.27 | ) | | | $(0.23 | ) |
From net realized gain
on investments | | | (0.62 | ) | | | (1.24 | ) | | | (0.92 | ) | | | (0.58 | ) | | | (0.19 | ) | | | — | |
Total distributions declared
to shareholders | | | $(0.85 | ) | | | $(1.54 | ) | | | $(1.33 | ) | | | $(0.96 | ) | | | $(0.46 | ) | | | $(0.23 | ) |
Net asset value, end of
period (x) | | | $37.05 | | | | $35.11 | | | | $32.66 | | | | $34.00 | | | | $29.23 | | | | $24.43 | |
Total return (%) (r)(s)(t)(x) | | | 8.05 | (c)(n) | | | 12.64 | | | | (0.14 | ) | | | 19.85 | | | | 21.80 | | | | 15.18 | |
Ratios (%) (to average net assets)
and Supplemental data: | | | | | | | | | |
Expenses before expense
reductions (f) | | | 1.72 | (a)(c) | | | 1.75 | | | | 1.75 | | | | 1.75 | | | | 1.78 | | | | 1.79 | |
Expenses after expense
reductions (f) | | | 1.63 | (a)(c) | | | 1.65 | | | | 1.66 | | | | 1.67 | | | | 1.72 | | | | 1.73 | |
Net investment income | | | 1.26 | (a)(c) | | | 0.80 | | | | 1.03 | | | | 1.28 | | | | 1.00 | | | | 1.06 | |
Portfolio turnover | | | 8 | (n) | | | 12 | | | | 12 | | | | 13 | | | | 12 | | | | 14 | |
Net assets at end of period
(000 omitted) | | | $6,029 | | | | $5,381 | | | | $4,434 | | | | $3,981 | | | | $3,387 | | | | $2,610 | |
See Notes to Financial Statements
25
Financial Highlights – continued
| (c) | Amount reflects a one-time reimbursement of expenses by the custodian (or former custodian) without which net investment income and performance would be lower and expenses would be higher. See Note 2 in the Notes to Financial Statements for additional information. |
| (d) | Per share data is based on average shares outstanding. |
| (f) | Ratios do not reflect reductions from fees paid indirectly, if applicable. |
| (r) | Certain expenses have been reduced without which performance would have been lower. |
| (s) | From time to time the fund may receive proceeds from litigation settlements, without which performance would be lower. |
| (t) | Total returns do not include any applicable sales charges. |
| (x) | The net asset values and total returns have been calculated on net assets which include adjustments made in accordance with U.S. generally accepted accounting principles required at period end for financial reporting purposes. |
| (y) | On May 10, 2012, sales of Class W shares (including exchanges) were suspended. On May 11, 2012, certain Class W shares were automatically converted to Class I shares. Shareholders of certain Class W shares became shareholders of Class I and received Class I shares with a total net asset value equal to their Class W shares at the time of the conversion. On May 30, 2012, remaining Class W shares, which represented MFS seed money, were redesignated Class R5. On June 1, 2012, Class R5 shares were offered for sale to the public. Effective August 26, 2016, Class R5 shares were renamed Class R6 shares. |
See Notes to Financial Statements
26
NOTES TO FINANCIAL STATEMENTS
(unaudited)
(1) Business and Organization
MFS Value Fund (the fund) is a diversified series of MFS Series Trust I (the trust). The trust is organized as a Massachusetts business trust and is registered under the Investment Company Act of 1940, as amended, as an open-end management investment company.
The fund is an investment company and accordingly follows the investment company accounting and reporting guidance of the Financial Accounting Standards Board (FASB) Accounting Standards Codification Topic 946 Financial Services – Investment Companies.
(2) Significant Accounting Policies
General – The preparation of financial statements in conformity with U.S. generally accepted accounting principles requires management to make estimates and assumptions that affect the reported amounts of assets and liabilities, and disclosure of contingent assets and liabilities at the date of the financial statements and the reported amounts of increases and decreases in net assets from operations during the reporting period. Actual results could differ from those estimates. In the preparation of these financial statements, management has evaluated subsequent events occurring after the date of the fund’s Statement of Assets and Liabilities through the date that the financial statements were issued.
In October 2016, the Securities and Exchange Commission (SEC) released its Final Rule on Investment Company Reporting Modernization (the “Rule”). The Rule, which introduces two new regulatory reporting forms for investment companies – Form N-PORT and Form N-CEN – also contains amendments to Regulation S-X which impact financial statement presentation, particularly the presentation of derivative investments. Although still evaluating the impacts of the Rule, management believes that many of the Regulation S-X amendments are consistent with the fund’s current financial statement presentation and expects that the fund will be able to comply with the Rule’s Regulation S-X amendments by the August 1, 2017 compliance date.
Balance Sheet Offsetting – The fund’s accounting policy with respect to balance sheet offsetting is that, absent an event of default by the counterparty or a termination of the agreement, the International Swaps and Derivatives Association (ISDA) Master Agreement does not result in an offset of reported amounts of financial assets and financial liabilities in the Statement of Assets and Liabilities across transactions between the fund and the applicable counterparty. The fund’s right to setoff may be restricted or prohibited by the bankruptcy or insolvency laws of the particular jurisdiction to which a specific master netting agreement counterparty is subject. Balance sheet offsetting disclosures, to the extent applicable to the fund, have been included in the fund’s Significant Accounting Policies note under the captions for each of the fund’s in-scope financial instruments and transactions.
Investment Valuations – Equity securities, including restricted equity securities, are generally valued at the last sale or official closing price on their primary market or exchange as provided by a third-party pricing service. Equity securities, for which there were no sales reported that day, are generally valued at the last quoted daily bid
27
Notes to Financial Statements (unaudited) – continued
quotation on their primary market or exchange as provided by a third-party pricing service. Short-term instruments with a maturity at issuance of 60 days or less may be valued at amortized cost, which approximates market value. Open-end investment companies are generally valued at net asset value per share. Securities and other assets generally valued on the basis of information from a third-party pricing service may also be valued at a broker/dealer bid quotation. Values obtained from third-party pricing services can utilize both transaction data and market information such as yield, quality, coupon rate, maturity, type of issue, trading characteristics, and other market data. The values of foreign securities and other assets and liabilities expressed in foreign currencies are converted to U.S. dollars using the mean of bid and asked prices for rates provided by a third-party pricing service.
The Board of Trustees has delegated primary responsibility for determining or causing to be determined the value of the fund’s investments (including any fair valuation) to the adviser pursuant to valuation policies and procedures approved by the Board. If the adviser determines that reliable market quotations are not readily available, investments are valued at fair value as determined in good faith by the adviser in accordance with such procedures under the oversight of the Board of Trustees. Under the fund’s valuation policies and procedures, market quotations are not considered to be readily available for most types of debt instruments and floating rate loans and many types of derivatives. These investments are generally valued at fair value based on information from third-party pricing services. In addition, investments may be valued at fair value if the adviser determines that an investment’s value has been materially affected by events occurring after the close of the exchange or market on which the investment is principally traded (such as foreign exchange or market) and prior to the determination of the fund’s net asset value, or after the halting of trading of a specific security where trading does not resume prior to the close of the exchange or market on which the security is principally traded. Events that occur on a frequent basis after foreign markets close (such as developments in foreign markets and significant movements in the U.S. markets) and prior to the determination of the fund’s net asset value may be deemed to have a material effect on the value of securities traded in foreign markets. Accordingly, the fund’s foreign equity securities may often be valued at fair value. The adviser generally relies on third-party pricing services or other information (such as the correlation with price movements of similar securities in the same or other markets; the type, cost and investment characteristics of the security; the business and financial condition of the issuer; and trading and other market data) to assist in determining whether to fair value and at what value to fair value an investment. The value of an investment for purposes of calculating the fund’s net asset value can differ depending on the source and method used to determine value. When fair valuation is used, the value of an investment used to determine the fund’s net asset value may differ from quoted or published prices for the same investment. There can be no assurance that the fund could obtain the fair value assigned to an investment if it were to sell the investment at the same time at which the fund determines its net asset value per share.
Various inputs are used in determining the value of the fund’s assets or liabilities. These inputs are categorized into three broad levels. In certain cases, the inputs used to measure fair value may fall into different levels of the fair value hierarchy. In such cases, an investment’s level within the fair value hierarchy is based on the lowest level of
28
Notes to Financial Statements (unaudited) – continued
input that is significant to the fair value measurement. The fund’s assessment of the significance of a particular input to the fair value measurement in its entirety requires judgment, and considers factors specific to the investment. Level 1 includes unadjusted quoted prices in active markets for identical assets or liabilities. Level 2 includes other significant observable market-based inputs (including quoted prices for similar securities, interest rates, prepayment speed, and credit risk). Level 3 includes unobservable inputs, which may include the adviser’s own assumptions in determining the fair value of investments. The following is a summary of the levels used as of February 28, 2017 in valuing the fund’s assets or liabilities:
| | | | | | | | | | | | | | | | |
| Investments at Value | | Level 1 | | | Level 2 | | | Level 3 | | | Total | |
| Equity Securities | | | $42,055,815,804 | | | | $— | | | | $— | | | | $42,055,815,804 | |
| Mutual Funds | | | 580,336,597 | | | | — | | | | — | | | | 580,336,597 | |
| Total Investments | | | $42,636,152,401 | | | | $— | | | | $— | | | | $42,636,152,401 | |
For further information regarding security characteristics, see the Portfolio of Investments.
Foreign Currency Translation – Purchases and sales of foreign investments, income, and expenses are converted into U.S. dollars based upon currency exchange rates prevailing on the respective dates of such transactions or on the reporting date for foreign denominated receivables and payables. Gains and losses attributable to foreign currency exchange rates on sales of securities are recorded for financial statement purposes as net realized gains and losses on investments. Gains and losses attributable to foreign exchange rate movements on receivables, payables, income and expenses are recorded for financial statement purposes as foreign currency transaction gains and losses. That portion of both realized and unrealized gains and losses on investments that results from fluctuations in foreign currency exchange rates is not separately disclosed.
Security Loans – Under its Securities Lending Agency Agreement with the fund, State Street Bank and Trust Company (“State Street”), as lending agent, loans the securities of the fund to certain qualified institutions (the “Borrowers”) approved by the fund. Security loans can be terminated at the discretion of either the lending agent or the fund and the related securities must be returned within the earlier of the standard trade settlement period for such securities or within three business days. The loans are collateralized by cash and/or U.S. Treasury and federal agency obligations in an amount typically at least equal to the market value of the securities loaned. On loans collateralized by cash, the cash collateral is invested in a money market fund. The market value of the loaned securities is determined at the close of business of the fund and any additional required collateral is delivered to the fund on the next business day. State Street provides the fund with indemnification against Borrower default. In the event of Borrower default, State Street will, for the benefit of the fund, either purchase securities identical to those loaned or, when such purchase is commercially impracticable, pay the fund the market value of the loaned securities. In return, State Street assumes the fund’s rights to the related collateral. If the collateral value is less than the cost to purchase identical securities, State Street is responsible for the shortfall, but only to the extent that such shortfall is not due to a decline in collateral value resulting from collateral reinvestment for which the fund bears the risk of loss.
29
Notes to Financial Statements (unaudited) – continued
A portion of the income generated upon investment of the collateral is remitted to the Borrowers, and the remainder is allocated between the fund and the lending agent. On loans collateralized by U.S. Treasury and/or federal agency obligations, a fee is received from the Borrower, and is allocated between the fund and the lending agent. Income from securities lending is included in “Interest” income in the Statement of Operations. The dividend and interest income earned on the securities loaned is accounted for in the same manner as other dividend and interest income. At February 28, 2017, there were no securities on loan or collateral outstanding.
Indemnifications – Under the fund’s organizational documents, its officers and Trustees may be indemnified against certain liabilities and expenses arising out of the performance of their duties to the fund. Additionally, in the normal course of business, the fund enters into agreements with service providers that may contain indemnification clauses. The fund’s maximum exposure under these agreements is unknown as this would involve future claims that may be made against the fund that have not yet occurred.
Investment Transactions and Income – Investment transactions are recorded on the trade date. Interest income is recorded on the accrual basis. Dividends received in cash are recorded on the ex-dividend date. Certain dividends from foreign securities will be recorded when the fund is informed of the dividend if such information is obtained subsequent to the ex-dividend date. Dividend and interest payments received in additional securities are recorded on the ex-dividend or ex-interest date in an amount equal to the value of the security on such date.
The fund may receive proceeds from litigation settlements. Any proceeds received from litigation involving portfolio holdings are reflected in the Statement of Operations in realized gain/loss if the security has been disposed of by the fund or in unrealized gain/loss if the security is still held by the fund. Any other proceeds from litigation not related to portfolio holdings are reflected as other income in the Statement of Operations.
Reimbursement of Expenses by Custodian – In December 2015, the fund’s custodian (or former custodian), State Street Bank and Trust Company, announced that it intended to reimburse its asset servicing clients for expense amounts that it billed in error during the period 1998 through 2015. The amount of this one-time reimbursement attributable to the fund is reflected as “Reimbursement of custodian expenses” in the Statement of Operations.
Tax Matters and Distributions – The fund intends to qualify as a regulated investment company, as defined under Subchapter M of the Internal Revenue Code, and to distribute all of its taxable income, including realized capital gains. As a result, no provision for federal income tax is required. The fund’s federal tax returns, when filed, will remain subject to examination by the Internal Revenue Service for a three year period. Management has analyzed the fund’s tax positions taken on federal and state tax returns for all open tax years and does not believe that there are any uncertain tax positions that require recognition of a tax liability. Foreign taxes, if any, have been accrued by the fund in the accompanying financial statements in accordance with the applicable foreign tax law. Foreign income taxes may be withheld by certain countries
30
Notes to Financial Statements (unaudited) – continued
in which the fund invests. Additionally, capital gains realized by the fund on securities issued in or by certain foreign countries may be subject to capital gains tax imposed by those countries.
Distributions to shareholders are recorded on the ex-dividend date. Income and capital gain distributions are determined in accordance with income tax regulations, which may differ from U.S. generally accepted accounting principles. Certain capital accounts in the financial statements are periodically adjusted for permanent differences in order to reflect their tax character. These adjustments have no impact on net assets or net asset value per share. Temporary differences which arise from recognizing certain items of income, expense, gain or loss in different periods for financial statement and tax purposes will reverse at some time in the future. Distributions in excess of net investment income or net realized gains are temporary overdistributions for financial statement purposes resulting from differences in the recognition or classification of income or distributions for financial statement and tax purposes.
Book/tax differences primarily relate to wash sale loss deferrals and treating a portion of the proceeds from redemptions as a distribution for tax purposes.
The tax character of distributions made during the current period will be determined at fiscal year end. The tax character of distributions declared to shareholders for the last fiscal year is as follows:
| | | | |
| | | 8/31/16 | |
Ordinary income (including any
short-term capital gains) | | | $675,250,066 | |
| Long-term capital gains | | | 1,199,670,046 | |
| Total distributions | | | $1,874,920,112 | |
The federal tax cost and the tax basis components of distributable earnings were as follows:
| | | | |
| As of 2/28/17 | | | |
| Cost of investments | | | $27,776,052,178 | |
| Gross appreciation | | | 15,027,372,500 | |
| Gross depreciation | | | (167,272,277 | ) |
| Net unrealized appreciation (depreciation) | | | $14,860,100,223 | |
| |
| As of 8/31/16 | | | |
| Undistributed ordinary income | | | 110,346,835 | |
| Undistributed long-term capital gain | | | 566,285,959 | |
| Post-October capital loss deferral | | | (8,416,702 | ) |
| Other temporary differences | | | (143,588 | ) |
| Net unrealized appreciation (depreciation) | | | 12,553,062,828 | |
The aggregate cost above includes prior fiscal year end tax adjustments, if applicable.
Multiple Classes of Shares of Beneficial Interest – The fund offers multiple classes of shares, which differ in their respective distribution, service, and program manager fees. The fund’s income, realized and unrealized gain (loss), and common expenses are
31
Notes to Financial Statements (unaudited) – continued
allocated to shareholders based on the daily net assets of each class. Dividends are declared separately for each class. Differences in per share dividend rates are generally due to differences in separate class expenses. Class B and Class 529B shares will convert to Class A and Class 529A shares, respectively, approximately eight years after purchase.
| | | | | | | | | | | | | | | | |
| | | From net investment
income | | | From net realized gain on
investments | |
| | | Six months
ended
2/28/17 | | | Year
ended
8/31/16 | | | Six months
ended
2/28/17 | | | Year
ended
8/31/16 | |
| Class A | | | $90,109,546 | | | | $143,652,211 | | | | $145,815,548 | | | | $317,518,220 | |
| Class B | | | 968,569 | | | | 1,365,556 | | | | 2,559,725 | | | | 5,620,466 | |
| Class C | | | 10,081,449 | | | | 13,003,027 | | | | 26,261,814 | | | | 50,501,471 | |
| Class I | | | 207,465,855 | | | | 279,002,684 | | | | 303,900,025 | | | | 516,393,410 | |
| Class R1 | | | 170,403 | | | | 242,154 | | | | 444,176 | | | | 980,245 | |
| Class R2 | | | 5,380,053 | | | | 7,506,322 | | | | 10,120,565 | | | | 19,304,965 | |
| Class R3 | | | 19,884,080 | | | | 27,575,912 | | | | 32,531,493 | | | | 60,955,804 | |
| Class R4 | | | 38,119,359 | | | | 55,632,088 | | | | 55,201,840 | | | | 102,703,354 | |
| Class R6 | | | 77,444,343 | | | | 102,970,243 | | | | 109,454,646 | | | | 168,819,722 | |
| Class 529A | | | 202,890 | | | | 285,400 | | | | 337,406 | | | | 629,492 | |
| Class 529B | | | 8,374 | | | | 8,069 | | | | 15,161 | | | | 32,356 | |
| Class 529C | | | 36,368 | | | | 43,706 | | | | 97,218 | | | | 173,235 | |
| Total | | | $449,871,289 | | | | $631,287,372 | | | | $686,739,617 | | | | $1,243,632,740 | |
(3) Transactions with Affiliates
Investment Adviser – The fund has an investment advisory agreement with MFS to provide overall investment management and related administrative services and facilities to the fund. For the period September 1, 2016 to December 28, 2016, the management fee was computed daily and paid monthly at the following annual rates:
| | | | |
| First $7.5 billion of average daily net assets | | | 0.60 | % |
| Next $2.5 billion of average daily net assets | | | 0.53 | % |
| Average daily net assets in excess of $10 billion | | | 0.50 | % |
The investment adviser had agreed in writing to reduce its management fee to 0.45% of average daily net assets in excess of $20 billion up to $25 billion, 0.42% of average daily net assets in excess of $25 billion up to $30 billion, 0.40% of average daily net assets in excess of $30 billion up to $35 billion, 0.38% of average daily net assets in excess of $35 billion up to $40 billion, and 0.36% of average daily nets assets in excess of $40 billion. This written agreement terminated on December 28, 2016. For the period September 1, 2016 to December 28, 2016, this management fee reduction amounted to $5,603,206, which is included in the reduction of total expenses in the Statement of Operations.
32
Notes to Financial Statements (unaudited) – continued
Effective December 29, 2016, the management fee is computed daily and paid monthly at the following annual rates:
| | | | |
| First $7.5 billion of average daily net assets | | | 0.60% | |
| Next $2.5 billion of average daily net assets | | | 0.53% | |
| Next $10 billion of average daily net assets | | | 0.50% | |
| Next $5 billion of average daily net assets | | | 0.45% | |
| Next $5 billion of average daily net assets | | | 0.42% | |
| Next $5 billion of average daily net assets | | | 0.40% | |
| Next $5 billion of average daily net assets | | | 0.38% | |
| Average daily net assets in excess of $40 billion | | | 0.36% | |
MFS has also agreed in writing to reduce its management fee by a specified amount if certain MFS mutual fund assets exceed thresholds agreed to by MFS and the fund’s Board of Trustees. For the six months ended February 28, 2017, this management fee reduction amounted to $1,461,606, which is included in the reduction of total expenses in the Statement of Operations. The management fee incurred for the six months ended February 28, 2017 was equivalent to an annual effective rate of 0.47% of the fund’s average daily net assets.
Distributor – MFS Fund Distributors, Inc. (MFD), a wholly-owned subsidiary of MFS, as distributor, received $1,055,846 and $8,047 for the six months ended February 28, 2017, as its portion of the initial sales charge on sales of Class A and Class 529A shares of the fund, respectively.
The Board of Trustees has adopted a distribution plan for certain share classes pursuant to Rule 12b-1 of the Investment Company Act of 1940.
The fund’s distribution plan provides that the fund will pay MFD for services provided by MFD and financial intermediaries in connection with the distribution and servicing of certain share classes. One component of the plan is a distribution fee paid to MFD and another component of the plan is a service fee paid to MFD. MFD may subsequently pay all, or a portion, of the distribution and/or service fees to financial intermediaries.
Distribution Plan Fee Table:
| | | | | | | | | | | | | | | | | | | | |
| | | Distribution
Fee Rate (d) | | | Service
Fee Rate (d) | | | Total
Distribution
Plan (d) | | | Annual
Effective
Rate (e) | | | Distribution
and Service
Fee | |
| Class A | | | — | | | | 0.25% | | | | 0.25% | | | | 0.25% | | | | $10,663,038 | |
| Class B | | | 0.75% | | | | 0.25% | | | | 1.00% | | | | 1.00% | | | | 741,500 | |
| Class C | | | 0.75% | | | | 0.25% | | | | 1.00% | | | | 1.00% | | | | 7,545,246 | |
| Class R1 | | | 0.75% | | | | 0.25% | | | | 1.00% | | | | 1.00% | | | | 132,874 | |
| Class R2 | | | 0.25% | | | | 0.25% | | | | 0.50% | | | | 0.50% | | | | 1,458,912 | |
| Class R3 | | | — | | | | 0.25% | | | | 0.25% | | | | 0.25% | | | | 2,371,014 | |
| Class 529A | | | — | | | | 0.25% | | | | 0.25% | | | | 0.21% | | | | 24,229 | |
| Class 529B | | | 0.75% | | | | 0.25% | | | | 1.00% | | | | 0.24% | | | | 1,106 | |
| Class 529C | | | 0.75% | | | | 0.25% | | | | 1.00% | | | | 0.99% | | | | 27,491 | |
| Total Distribution and Service Fees | | | | $22,965,410 | |
| (d) | In accordance with the distribution plan for certain classes, the fund pays distribution and/or service fees equal to these annual percentage rates of each class’s average daily net assets. The |
33
Notes to Financial Statements (unaudited) – continued
| | distribution and service fee rates disclosed by class represent the current rates in effect at the end of the reporting period. Any rate changes, if applicable, are detailed below. |
| (e) | The annual effective rates represent actual fees incurred under the distribution plan for the six months ended February 28, 2017 based on each class’s average daily net assets. MFD has voluntarily agreed to rebate a portion of each class’s 0.25% service fee attributable to accounts for which MFD retains the 0.25% service fee except for accounts attributable to MFS or its affiliates’ seed money. For the six months ended February 28, 2017, this rebate amounted to $39,492, $399, $993, $790, $3,570, $37, and $162 for Class A, Class B, Class C, Class R3, Class 529A, Class 529B, and Class 529C, respectively, and is included in the reduction of total expenses in the Statement of Operations. For the six months ended February 28, 2017, the 0.75% distribution fee was not imposed for Class 529B shares. |
Certain Class A shares are subject to a contingent deferred sales charge (CDSC) in the event of a shareholder redemption within 18 months of purchase. Class C and Class 529C shares are subject to a CDSC in the event of a shareholder redemption within 12 months of purchase. Class B and Class 529B shares are subject to a CDSC in the event of a shareholder redemption within six years of purchase. All contingent deferred sales charges are paid to MFD and during the six months ended February 28, 2017, were as follows:
| | | | |
| | | Amount | |
| Class A | | | $27,411 | |
| Class B | | | 114,194 | |
| Class C | | | 85,846 | |
| Class 529B | | | — | |
| Class 529C | | | 22 | |
The fund has entered into and may from time to time enter into contracts with program managers and other parties which administer the tuition programs through which an investment in the fund’s 529 share classes is made. The fund has entered into an agreement with MFD pursuant to which MFD receives an annual fee of up to 0.10% of the average daily net assets attributable to each 529 share class. MFD has agreed to waive a portion of this fee in an amount equal to 0.05% of the average daily net assets for each 529 share class. This waiver agreement will expire on December 31, 2017, unless MFD elects to extend the waiver. For the six months ended February 28, 2017, this waiver amounted to $6,442 and is included in the reduction of total expenses in the Statement of Operations. The program manager fee incurred for the six months ended February 28, 2017 was equivalent to an annual effective rate of 0.05% of the average daily net assets attributable to each 529 share class. The services provided by MFD, or a third party with which MFD contracts, include recordkeeping and tax reporting and account services, as well as services designed to maintain the program’s compliance with the Internal Revenue Code and other regulatory requirements. Program manager fees and waivers for the six months ended February 28, 2017, were as follows:
| | | | | | | | |
| | | Fee | | | Waiver | |
| Class 529A | | | $9,692 | | | | $4,846 | |
| Class 529B | | | 443 | | | | 221 | |
| Class 529C | | | 2,750 | | | | 1,375 | |
| Total Program Manager Fees and Waivers | | | $12,885 | | | | $6,442 | |
34
Notes to Financial Statements (unaudited) – continued
Shareholder Servicing Agent – MFS Service Center, Inc. (MFSC), a wholly-owned subsidiary of MFS, receives a fee from the fund for its services as shareholder servicing agent calculated as a percentage of the average daily net assets of the fund as determined periodically under the supervision of the fund’s Board of Trustees. For the six months ended February 28, 2017, the fee was $866,549, which equated to 0.0043% annually of the fund’s average daily net assets. MFSC also receives payment from the fund for out-of-pocket expenses, sub-accounting and other shareholder servicing costs which may be paid to affiliated and unaffiliated service providers. Class R6 shares do not incur sub-accounting fees. For the six months ended February 28, 2017, these out-of-pocket expenses, sub-accounting and other shareholder servicing costs amounted to $17,533,703.
Administrator – MFS provides certain financial, legal, shareholder communications, compliance, and other administrative services to the fund. Under an administrative services agreement, the fund reimburses MFS the costs incurred to provide these services. The fund is charged an annual fixed amount of $17,500 plus a fee based on average daily net assets. The administrative services fee incurred for the six months ended February 28, 2017 was equivalent to an annual effective rate of 0.0015% of the fund’s average daily net assets.
Trustees’ and Officers’ Compensation – The fund pays compensation to independent Trustees in the form of a retainer, attendance fees, and additional compensation to Board and Committee chairpersons. The fund does not pay compensation directly to Trustees or officers of the fund who are also officers of the investment adviser, all of whom receive remuneration for their services to the fund from MFS. Certain officers and Trustees of the fund are officers or directors of MFS, MFD, and MFSC.
Prior to December 31, 2001, the fund had an unfunded defined benefit plan (“DB plan”) for independent Trustees. As of December 31, 2001, the Board took action to terminate the DB plan with respect to then-current and any future independent Trustees, such that the DB plan covers only certain of those former independent Trustees who retired on or before December 31, 2001. The DB plan resulted in a pension expense of $263 and is included in “Independent Trustees’ compensation” in the Statement of Operations for the six months ended February 28, 2017. The liability for deferred retirement benefits payable to certain independent Trustees under the DB plan amounted to $2,070 at February 28, 2017, and is included in “Payable for independent Trustees’ compensation” in the Statement of Assets and Liabilities.
Other – This fund and certain other funds managed by MFS (the funds) have entered into a service agreement (the ISO Agreement) which provides for payment of fees solely by the funds to Tarantino LLC in return for the provision of services of an Independent Senior Officer (ISO) for the funds. Frank L. Tarantino serves as the ISO and is an officer of the funds and the sole member of Tarantino LLC. The funds can terminate the ISO Agreement with Tarantino LLC at any time under the terms of the ISO Agreement. For the six months ended February 28, 2017, the fee paid by the fund under this agreement was $37,053 and is included in “Miscellaneous” expense in the Statement of Operations. MFS has agreed to bear all expenses associated with office space, other administrative support, and supplies provided to the ISO.
35
Notes to Financial Statements (unaudited) – continued
The fund invests in the MFS Institutional Money Market Portfolio which is managed by MFS and seeks current income consistent with preservation of capital and liquidity. This money market fund does not pay a management fee to MFS.
On September 9, 2015, MFS redeemed 26 shares of Class R6 for an aggregate amount of $856. On March 16, 2016, MFS redeemed 40,429 shares of Class I for an aggregate amount of $1,341,422.
The fund is permitted to engage in purchase and sale transactions (“cross-trades”) with funds and accounts for which MFS serves as investment adviser or sub-adviser pursuant to a policy adopted by the Board of Trustees. This policy has been designed to ensure that cross-trades conducted by the fund comply with Rule 17a-7 under the Investment Company Act of 1940. Under this policy, cross-trades are effected at current market prices with no remuneration paid in connection with the transaction. During the six months ended February 28, 2017, the fund engaged in purchase and sale transactions pursuant to this policy, which amounted to $23,770,523 and $18,851,696, respectively. The sales transactions resulted in net realized gains (losses) of $(514,726).
(4) Portfolio Securities
For the six months ended February 28, 2017, purchases and sales of investments other than short-term obligations, aggregated $3,367,765,410 and $3,297,258,727, respectively.
(5) Shares of Beneficial Interest
The fund’s Declaration of Trust permits the Trustees to issue an unlimited number of full and fractional shares of beneficial interest. Transactions in fund shares were as follows:
| | | | | | | | | | | | | | | | |
| | | Six months ended
2/28/17 | | | Year ended
8/31/16 | |
| | | Shares | | | Amount | | | Shares | | | Amount | |
| Shares sold | | | | | | | | | | | | | | | | |
Class A | | | 27,122,551 | | | | $982,066,761 | | | | 56,768,963 | | | | $1,904,117,260 | |
Class B | | | 260,267 | | | | 9,347,865 | | | | 519,166 | | | | 17,360,213 | |
Class C | | | 3,500,596 | | | | 125,107,129 | | | | 8,152,513 | | | | 270,588,495 | |
Class I | | | 105,971,010 | | | | 3,862,815,285 | | | | 145,431,576 | | | | 4,938,317,915 | |
Class R1 | | | 185,495 | | | | 6,623,134 | | | | 163,031 | | | | 5,375,906 | |
Class R2 | | | 2,785,854 | | | | 99,103,707 | | | | 3,849,909 | | | | 128,332,720 | |
Class R3 | | | 8,644,333 | | | | 311,112,996 | | | | 18,949,088 | | | | 639,478,504 | |
Class R4 | | | 9,520,549 | | | | 343,157,964 | | | | 27,256,586 | | | | 905,372,336 | |
Class R6 | | | 37,919,462 | | | | 1,364,152,167 | | | | 57,025,963 | | | | 1,914,833,944 | |
Class 529A | | | 64,715 | | | | 2,319,543 | | | | 94,052 | | | | 3,127,505 | |
Class 529B | | | 4,212 | | | | 149,293 | | | | 4,894 | | | | 156,788 | |
Class 529C | | | 18,798 | | | | 665,747 | | | | 43,845 | | | | 1,439,715 | |
| | | 195,997,842 | | | | $7,106,621,591 | | | | 318,259,586 | | | | $10,728,501,301 | |
36
Notes to Financial Statements (unaudited) – continued
| | | | | | | | | | | | | | | | |
| | | Six months ended
2/28/17 | | | Year ended
8/31/16 | |
| | | Shares | | | Amount | | | Shares | | | Amount | |
Shares issued to shareholders in
reinvestment of distributions | |
Class A | | | 5,833,188 | | | | $212,577,873 | | | | 12,787,124 | | | | $421,657,414 | |
Class B | | | 88,659 | | | | 3,227,021 | | | | 193,930 | | | | 6,372,721 | |
Class C | | | 709,789 | | | | 25,664,124 | | | | 1,327,523 | | | | 43,374,651 | |
Class I | | | 10,291,114 | | | | 376,871,895 | | | | 17,177,750 | | | | 569,272,041 | |
Class R1 | | | 17,112 | | | | 614,579 | | | | 37,672 | | | | 1,222,399 | |
Class R2 | | | 401,998 | | | | 14,528,598 | | | | 779,535 | | | | 25,481,542 | |
Class R3 | | | 1,442,767 | | | | 52,415,331 | | | | 2,693,294 | | | | 88,531,682 | |
Class R4 | | | 2,438,665 | | | | 88,803,652 | | | | 4,591,727 | | | | 151,372,851 | |
Class R6 | | | 4,683,787 | | | | 170,564,293 | | | | 7,489,730 | | | | 246,831,433 | |
Class 529A | | | 14,930 | | | | 540,296 | | | | 27,903 | | | | 913,451 | |
Class 529B | | | 656 | | | | 23,535 | | | | 1,246 | | | | 40,425 | |
Class 529C | | | 3,735 | | | | 133,586 | | | | 6,711 | | | | 216,941 | |
| | | 25,926,400 | | | | $945,964,783 | | | | 47,114,145 | | | | $1,555,287,551 | |
| | | | |
| Shares reacquired | | | | | | | | | | | | | | | | |
Class A | | | (66,759,725 | ) | | | $(2,415,084,276 | ) | | | (72,124,211 | ) | | | $(2,423,599,803 | ) |
Class B | | | (675,641 | ) | | | (24,237,520 | ) | | | (1,027,622 | ) | | | (34,444,392 | ) |
Class C | | | (5,803,303 | ) | | | (207,456,416 | ) | | | (6,623,806 | ) | | | (220,702,727 | ) |
Class I | | | (75,530,533 | ) | | | (2,745,302,500 | ) | | | (102,196,743 | ) | | | (3,464,029,826 | ) |
Class R1 | | | (205,837 | ) | | | (7,276,297 | ) | | | (282,106 | ) | | | (9,326,974 | ) |
Class R2 | | | (2,159,659 | ) | | | (76,972,106 | ) | | | (4,445,949 | ) | | | (148,071,701 | ) |
Class R3 | | | (9,981,952 | ) | | | (358,401,134 | ) | | | (15,692,059 | ) | | | (518,179,133 | ) |
Class R4 | | | (17,331,683 | ) | | | (626,855,975 | ) | | | (25,344,379 | ) | | | (855,036,285 | ) |
Class R6 | | | (25,841,827 | ) | | | (926,353,793 | ) | | | (36,595,792 | ) | | | (1,223,113,334 | ) |
Class 529A | | | (38,141 | ) | | | (1,384,810 | ) | | | (98,814 | ) | | | (3,186,555 | ) |
Class 529B | | | (6,569 | ) | | | (232,383 | ) | | | (6,559 | ) | | | (219,387 | ) |
Class 529C | | | (13,062 | ) | | | (461,103 | ) | | | (33,065 | ) | | | (1,094,866 | ) |
| | | (204,347,932 | ) | | | $(7,390,018,313 | ) | | | (264,471,105 | ) | | | $(8,901,004,983 | ) |
| | | | |
| Net change | | | | | | | | | | | | | | | | |
Class A | | | (33,803,986 | ) | | | $(1,220,439,642 | ) | | | (2,568,124 | ) | | | $(97,825,129 | ) |
Class B | | | (326,715 | ) | | | (11,662,634 | ) | | | (314,526 | ) | | | (10,711,458 | ) |
Class C | | | (1,592,918 | ) | | | (56,685,163 | ) | | | 2,856,230 | | | | 93,260,419 | |
Class I | | | 40,731,591 | | | | 1,494,384,680 | | | | 60,412,583 | | | | 2,043,560,130 | |
Class R1 | | | (3,230 | ) | | | (38,584 | ) | | | (81,403 | ) | | | (2,728,669 | ) |
Class R2 | | | 1,028,193 | | | | 36,660,199 | | | | 183,495 | | | | 5,742,561 | |
Class R3 | | | 105,148 | | | | 5,127,193 | | | | 5,950,323 | | | | 209,831,053 | |
Class R4 | | | (5,372,469 | ) | | | (194,894,359 | ) | | | 6,503,934 | | | | 201,708,902 | |
Class R6 | | | 16,761,422 | | | | 608,362,667 | | | | 27,919,901 | | | | 938,552,043 | |
Class 529A | | | 41,504 | | | | 1,475,029 | | | | 23,141 | | | | 854,401 | |
Class 529B | | | (1,701 | ) | | | (59,555 | ) | | | (419 | ) | | | (22,174 | ) |
Class 529C | | | 9,471 | | | | 338,230 | | | | 17,491 | | | | 561,790 | |
| | | 17,576,310 | | | | $662,568,061 | | | | 100,902,626 | | | | $3,382,783,869 | |
37
Notes to Financial Statements (unaudited) – continued
The fund is one of several mutual funds in which certain MFS funds may invest. The MFS funds do not invest in the underlying funds for the purpose of exercising management or control. At the end of the period, the MFS Growth Allocation Fund and the MFS Moderate Allocation Fund were each the owners of record of approximately 1% of the value of outstanding voting shares of the fund. In addition, the MFS Aggressive Growth Allocation Fund, the MFS Conservative Allocation Fund, the MFS Lifetime Income Fund, the MFS Lifetime 2020 Fund, the MFS Lifetime 2025 Fund, the MFS Lifetime 2030 Fund, the MFS Lifetime 2035 Fund, the MFS Lifetime 2040 Fund, the MFS Lifetime 2045 Fund, the MFS Lifetime 2050 Fund, the MFS Lifetime 2055 Fund, the MFS Lifetime 2060 Fund, and the MFS Managed Wealth Fund were each the owners of record of less than 1% of the value of outstanding voting shares of the fund.
(6) Line of Credit
The fund and certain other funds managed by MFS participate in a $1.25 billion unsecured committed line of credit, subject to a $1 billion sublimit, provided by a syndication of banks under a credit agreement. Borrowings may be made for temporary financing needs. Interest is charged to each fund, based on its borrowings, generally at a rate equal to the higher of the Overnight Federal Reserve funds rate or daily one month LIBOR plus an agreed upon spread. A commitment fee, based on the average daily, unused portion of the committed line of credit, is allocated among the participating funds at the end of each calendar quarter. In addition, the fund and other funds managed by MFS have established unsecured uncommitted borrowing arrangements with certain banks for temporary financing needs. Interest is charged to each fund, based on its borrowings, at a rate equal to the Overnight Federal Reserve funds rate plus an agreed upon spread. For the six months ended February 28, 2017, the fund’s commitment fee and interest expense were $132,440 and $0, respectively, and are included in “Miscellaneous” expense in the Statement of Operations.
(7) Transactions in Underlying Affiliated Funds-Affiliated Issuers
An affiliated issuer may be considered one in which the fund owns 5% or more of the outstanding voting securities, or a company which is under common control. For the purposes of this report, the fund assumes the following to be an affiliated issuer:
| | | | | | | | | | | | | | | | |
| Underlying Affiliated Fund | | Beginning
Shares/Par
Amount | | | Acquisitions
Shares/Par
Amount | | | Dispositions
Shares/Par
Amount | | | Ending
Shares/Par
Amount | |
MFS Institutional Money
Market Portfolio | | | 640,928,994 | | | | 2,680,201,955 | | | | (2,740,794,352 | ) | | | 580,336,597 | |
| | | | |
| Underlying Affiliated Fund | | Realized
Gain (Loss) | | | Capital Gain
Distributions | | | Dividend
Income | | | Ending
Value | |
MFS Institutional Money
Market Portfolio | | | $(890 | ) | | | $— | | | | $1,199,112 | | | | $580,336,597 | |
(8) Redemption In-Kind
On September 23, 2016, the fund recorded redemption proceeds for a redemption in-kind of portfolio securities and cash that were valued at $279,982,234. The redeeming shareholder generally receives a pro rata share of the securities held by the fund. The distribution of such securities generated a realized gain of $136,075,237 for the fund.
38
PROXY VOTING POLICIES AND INFORMATION
MFS votes proxies on behalf of the fund pursuant to proxy voting policies and procedures that are available without charge, upon request, by calling 1-800-225-2606, by visiting mfs.com (once you have selected “Individual Investor” as your role, click on “Individual Investor Home” in the top navigation and then select “Learn More About Proxy Voting” under the “I want to…” header on the left hand column of the page), or by visiting the SEC’s Web site at http://www.sec.gov.
Information regarding how the fund voted proxies relating to portfolio securities during the most recent twelve-month period ended June 30 is available by August 31 of each year without charge by visiting mfs.com (once you have selected “Individual Investor” as your role, click on “Individual Investor Home” in the top navigation and then select “Learn More About Proxy Voting” under the “I want to…” header on the left hand column of the page), or by visiting the SEC’s Web site at http://www.sec.gov.
QUARTERLY PORTFOLIO DISCLOSURE
The fund will file a complete schedule of portfolio holdings with the Securities and Exchange Commission (the Commission) for the first and third quarters of each fiscal year on Form N-Q. A shareholder can obtain the quarterly portfolio holdings report at mfs.com. The fund’s Form N-Q is also available on the EDGAR database on the Commission’s Internet Web site at http://www.sec.gov, and may be reviewed and copied at the:
Public Reference Room
Securities and Exchange Commission
100 F Street, NE, Room 1580
Washington, D.C. 20549
Information on the operation of the Public Reference Room may be obtained by calling the Commission at 1-800-SEC-0330. Copies of the fund’s Form N-Q also may be obtained, upon payment of a duplicating fee, by electronic request at the following e-mail address: publicinfo@sec.gov or by writing the Public Reference Section at the above address.
FURTHER INFORMATION
From time to time, MFS may post important information about the fund or the MFS funds on the MFS web site (mfs.com). This information is available on mfs.com by following these steps once you have selected “Individual Investor” as your role: (1) Click on the “Individual Investor Home” in the top navigation and then select the “Announcements” option within the “Market Outlooks” drop down, or (2) Click on “Products & Services” and “Mutual Funds” and then choose the fund’s name in the “Select a fund” menu.
39
INFORMATION ABOUT FUND CONTRACTS AND LEGAL CLAIMS
The fund has entered into contractual arrangements with an investment adviser, administrator, distributor, shareholder servicing agent, 529 program manager (if applicable), and custodian who each provide services to the fund. Unless expressly stated otherwise, shareholders are not parties to, or intended beneficiaries of these contractual arrangements, and these contractual arrangements are not intended to create any shareholder right to enforce them against the service providers or to seek any remedy under them against the service providers, either directly or on behalf of the fund.
Under the Trust’s By-Laws and Declaration of Trust, any claims asserted against or on behalf of the MFS Funds, including claims against Trustees and Officers, must be brought in state and federal courts located within the Commonwealth of Massachusetts.
PROVISION OF FINANCIAL REPORTS AND SUMMARY PROSPECTUSES
The fund produces financial reports every six months and updates its summary prospectus and prospectus annually. To avoid sending duplicate copies of materials to households, only one copy of the fund’s annual and semiannual report and summary prospectus may be mailed to shareholders having the same last name and residential address on the fund’s records. However, any shareholder may contact MFSC (please see back cover for address and telephone number) to request that copies of these reports and summary prospectuses be sent personally to that shareholder.
40
Save paper with eDelivery.

| MFS® will send you prospectuses, |
reports, and proxies directly via e-mail so you will get information faster with less mailbox clutter.
To sign up:
1. Go to mfs.com.
2. Log in via MFS® Access.
3. Select eDelivery.
If you own your MFS fund shares through a financial institution or a retirement plan, MFS® TALK, MFS® Access, or eDelivery may not be available to you.
CONTACT
WEB SITE
mfs.com
MFS TALK
1-800-637-8255
24 hours a day
ACCOUNT SERVICE AND LITERATURE
Shareholders
1-800-225-2606
Financial advisors
1-800-343-2829
Retirement plan services
1-800-637-1255
MAILING ADDRESS
MFS Service Center, Inc.
P.O. Box 55824
Boston, MA 02205-5824
OVERNIGHT MAIL
MFS Service Center, Inc.
c/o Boston Financial Data Services
30 Dan Road
Canton, MA 02021-2809
Effective January 1, 2017, the Code of Ethics (the “Code”) was amended to (i) clarify that the term “for profit” company as used in Section II.B of the Code excludes the investment adviser and its subsidiaries and pooled investment vehicles sponsored by the investment adviser or its subsidiaries, (ii) align the Code’s provisions regarding receipt of gifts and entertainment in Section II.B of the Code with the gifts and entertainment policy of the Funds’ investment adviser, and (iii) make other administrative changes. During the period covered by this report, the Registrant did not grant a waiver, including an implicit waiver, from any provision of the Code.
A copy of the amended Code effective as of January 1, 2017 is filed as an exhibit to this Form N-CSR.
| ITEM 3. | AUDIT COMMITTEE FINANCIAL EXPERT. |
Not applicable for semi-annual reports.
| ITEM 4. | PRINCIPAL ACCOUNTANT FEES AND SERVICES. |
Not applicable for semi-annual reports.
| ITEM 5. | AUDIT COMMITTEE OF LISTED REGISTRANTS. |
Not applicable to the Registrant.
A schedule of investments for each series of the Registrant is included as part of the report to shareholders of such series under Item 1 of this Form N-CSR.
| ITEM 7. | DISCLOSURE OF PROXY VOTING POLICIES AND PROCEDURES FOR CLOSED-END MANAGEMENT INVESTMENT COMPANIES. |
Not applicable to the Registrant.
| ITEM 8. | PORTFOLIO MANAGERS OF CLOSED-END MANAGEMENT INVESTMENT COMPANIES. |
Not applicable to the Registrant.
| ITEM 9. | PURCHASES OF EQUITY SECURITIES BY CLOSED-END MANAGEMENT INVESTMENT COMPANY AND AFFILIATED PURCHASERS. |
Not applicable to the Registrant.
| ITEM 10. | SUBMISSION OF MATTERS TO A VOTE OF SECURITY HOLDERS. |
There were no material changes to the procedures by which shareholders may send recommendations to the Board for nominees to the Registrant’s Board since the Registrant last provided disclosure as to such procedures in response to the requirements of Item 407 (c)(2)(iv) of Regulation S-K or this Item.
| ITEM 11. | CONTROLS AND PROCEDURES. |
| (a) | Based upon their evaluation of the effectiveness of the registrant’s disclosure controls and procedures (as defined in Rule 30a-3(c) under the Investment Company Act of 1940 (the “Act”)) as conducted within 90 days of the filing date of this report on Form N-CSR, the registrant’s principal financial officer and principal executive officer have concluded that those disclosure controls and procedures provide reasonable assurance that the material information required to be disclosed by the registrant on this report is recorded, processed, summarized and reported within the time periods specified in the Securities and Exchange Commission’s rules and forms. |
| (b) | There were no changes in the registrant’s internal controls over financial reporting (as defined in Rule 30a-3(d) under the Act) that occurred during the second fiscal quarter of the period covered by the report that have materially affected, or are reasonably likely to materially affect, the registrant’s internal control over financial reporting. |
| (a) | File the exhibits listed below as part of this form. Letter or number the exhibits in the sequence indicated. |
| | (1) | Any code of ethics, or amendment thereto, that is the subject of the disclosure required by Item 2, to the extent that the registrant intends to satisfy the Item 2 requirements through filing of an exhibit. Attached hereto. |
| | (2) | A separate certification for each principal executive officer and principal financial officer of the registrant as required by Rule 30a-2(a) under the Act (17 CFR 270.30a-2): Attached hereto. |
| (b) | If the report is filed under Section 13(a) or 15(d) of the Exchange Act, provide the certifications required by Rule 30a-2(b) under the Act (17 CFR 270.30a-2(b)), Rule 13a-14(b) or Rule 15d-14(b) under the Exchange Act (17 CFR 240.13a-14(b) or 240.15d-14(b)) and Section 1350 of Chapter 63 of Title 18 of the United States Code (18 U.S.C. 1350) as an exhibit. A certification furnished pursuant to this paragraph will not be deemed “filed” for the purposes of Section 18 of the Exchange Act (15 U.S.C. 78r), or otherwise subject to the liability of that section. Such certification will not be deemed to be incorporated by reference into any filing under the Securities Act of 1933 or the Exchange Act, except to the extent that the registrant specifically incorporates it by reference: Attached hereto. |
Notice
A copy of the Amended and Restated Declaration of Trust, as amended, of the Registrant is on file with the Secretary of State of The Commonwealth of Massachusetts and notice is hereby given that this instrument is executed on behalf of the Registrant by an officer of the Registrant as an officer and not individually and the obligations of or arising out of this instrument are not binding upon any of the Trustees or shareholders individually, but are binding only upon the assets and property of the respective constituent series of the Registrant.
SIGNATURES
Pursuant to the requirements of the Securities Exchange Act of 1934 and the Investment Company Act of 1940, the registrant has duly caused this report to be signed on its behalf by the undersigned, thereunto duly authorized.
(Registrant) MFS SERIES TRUST I
| | |
| By (Signature and Title)* | | DAVID L. DILORENZO |
| | David L. DiLorenzo, President |
Date: April 13, 2017
Pursuant to the requirements of the Securities Exchange Act of 1934 and the Investment Company Act of 1940, this report has been signed below by the following persons on behalf of the registrant and in the capacities and on the dates indicated.
| | |
| By (Signature and Title)* | | DAVID L. DILORENZO |
| | David L. DiLorenzo, President (Principal Executive Officer) |
Date: April 13, 2017
| | |
| By (Signature and Title)* | | JAMES O. YOST |
| | James O. Yost, Treasurer (Principal Financial Officer and Accounting Officer) |
Date: April 13, 2017
| * | Print name and title of each signing officer under his or her signature. |