UNITED STATES
SECURITIES AND EXCHANGE COMMISSION
Washington, D.C. 20549
FORM N-CSR
CERTIFIED SHAREHOLDER REPORT OF
REGISTERED MANAGEMENT INVESTMENT COMPANIES
Investment Company Act file number 811-04777
MFS SERIES TRUST I
(Exact name of registrant as specified in charter)
111 Huntington Avenue, Boston, Massachusetts 02199
(Address of principal executive offices) (Zip code)
Susan S. Newton
Massachusetts Financial Services Company
111 Huntington Avenue
Boston, Massachusetts 02199
(Name and address of agents for service)
Registrant’s telephone number, including area code: (617) 954-5000
Date of fiscal year end: August 31
Date of reporting period: February 28, 2015
| ITEM 1. | REPORTS TO STOCKHOLDERS. |
SEMIANNUAL REPORT
February 28, 2015

MFS® CORE EQUITY FUND

RGI-SEM
MFS® CORE EQUITY FUND
CONTENTS
The report is prepared for the general information of shareholders.
It is authorized for distribution to prospective investors only when preceded or accompanied by a current prospectus.
NOT FDIC INSURED Ÿ MAY LOSE VALUE Ÿ NO BANK GUARANTEE

LETTER FROM THE CHAIRMAN
Dear Shareholders:
Lower oil prices continue to influence markets in different ways. Among those economies hurt, oil-exporters such as Russia and Venezuela have been hit particularly hard, along with U.S. regions that have close oil industry ties.
The U.S. economic recovery remains solid. The labor market is strong, interest rates are historically low and reduced energy prices have helped to stimulate consumer spending.
Economic reports early in 2015 indicate that the eurozone is on a more solid footing, with confidence boosted by the launch of European Central Bank quantitative easing.
In Asia, the Chinese economy continues to raise concerns, with the People’s Bank of China implementing stimulus programs to counter a steady decline in growth rates.
As always, active risk management is integral to how we at MFS® manage your investments. We use a collaborative process, sharing insights across asset classes, regions and economic sectors. Our global investment team uses a diversified, multidisciplined, long-term approach.
Applying proven principles, such as asset allocation and diversification, can best serve investors over the long term. We are confident that this approach can help you as you work with your financial advisors to reach your goals in the years ahead.
Respectfully,

Robert J. Manning
Chairman
MFS Investment Management
April 14, 2015
The opinions expressed in this letter are subject to change and may not be relied upon for investment advice. No forecasts can be guaranteed.
1
PORTFOLIO COMPOSITION
Portfolio structure

| | | | |
| Top ten holdings | | | | |
| Apple, Inc. | | | 2.9% | |
| Hess Corp. | | | 1.8% | |
| Actavis PLC | | | 1.7% | |
| JPMorgan Chase & Co. | | | 1.6% | |
| Visa, Inc., “A” | | | 1.6% | |
| Wells Fargo & Co. | | | 1.6% | |
| American International Group, Inc. | | | 1.6% | |
| Twenty-First Century Fox, Inc. | | | 1.2% | |
| CVS Health Corp. | | | 1.2% | |
| Honeywell International, Inc. | | | 1.2% | |
| | | | |
| Equity sectors | | | | |
| Financial Services | | | 17.5% | |
| Technology | | | 15.9% | |
| Health Care | | | 14.7% | |
| Industrial Goods & Services | | | 7.6% | |
| Retailing | | | 7.3% | |
| Energy | | | 6.9% | |
| Consumer Staples | | | 6.6% | |
| Utilities & Communications | | | 5.4% | |
| Leisure (s) | | | 4.9% | |
| Basic Materials | | | 4.4% | |
| Special Products & Services | | | 4.1% | |
| Transportation | | | 2.1% | |
| Autos & Housing | | | 1.7% | |
| (s) | Includes securities sold short. |
Cash & Other can include cash, other assets less liabilities, offsets to derivative positions, and short-term securities.
Percentages are based on net assets as of 2/28/15.
The portfolio is actively managed and current holdings may be different.
2
EXPENSE TABLE
Fund expenses borne by the shareholders during the period, September 1, 2014 through February 28, 2015
As a shareholder of the fund, you incur two types of costs: (1) transaction costs, including sales charges (loads) on certain purchase or redemption payments, and (2) ongoing costs, including management fees; distribution and service (12b-1) fees; and other fund expenses. This example is intended to help you understand your ongoing costs (in dollars) of investing in the fund and to compare these costs with the ongoing costs of investing in other mutual funds.
The example is based on an investment of $1,000 invested at the beginning of the period and held for the entire period September 1, 2014 through February 28, 2015.
Actual Expenses
The first line for each share class in the following table provides information about actual account values and actual expenses. You may use the information in this line, together with the amount you invested, to estimate the expenses that you paid over the period. Simply divide your account value by $1,000 (for example, an $8,600 account value divided by $1,000 = 8.6), then multiply the result by the number in the first line under the heading entitled “Expenses Paid During Period” to estimate the expenses you paid on your account during this period.
Hypothetical Example for Comparison Purposes
The second line for each share class in the following table provides information about hypothetical account values and hypothetical expenses based on the fund’s actual expense ratio and an assumed rate of return of 5% per year before expenses, which is not the fund’s actual return. The hypothetical account values and expenses may not be used to estimate the actual ending account balance or expenses you paid for the period. You may use this information to compare the ongoing costs of investing in the fund and other funds. To do so, compare this 5% hypothetical example with the 5% hypothetical examples that appear in the shareholder reports of the other funds.
Please note that the expenses shown in the table are meant to highlight your ongoing costs only and do not reflect any transactional costs, such as sales charges (loads). Therefore, the second line for each share class in the table is useful in comparing ongoing costs only, and will not help you determine the relative total costs of owning different funds. In addition, if these transactional costs were included, your costs would have been higher.
3
Expense Table – continued
| | | | | | | | | | | | | | | | | | |
Share
Class | | | | Annualized Expense Ratio | | | Beginning Account Value 9/01/14 | | | Ending Account Value 2/28/15 | | | Expenses Paid During Period (p) 9/01/14-2/28/15 | |
| A | | Actual | | | 1.04% | | | | $1,000.00 | | | | $1,062.93 | | | | $5.32 | |
| | Hypothetical (h) | | | 1.04% | | | | $1,000.00 | | | | $1,019.64 | | | | $5.21 | |
| B | | Actual | | | 1.80% | | | | $1,000.00 | | | | $1,058.97 | | | | $9.19 | |
| | Hypothetical (h) | | | 1.80% | | | | $1,000.00 | | | | $1,015.87 | | | | $9.00 | |
| C | | Actual | | | 1.79% | | | | $1,000.00 | | | | $1,059.11 | | | | $9.14 | |
| | Hypothetical (h) | | | 1.79% | | | | $1,000.00 | | | | $1,015.92 | | | | $8.95 | |
| I | | Actual | | | 0.80% | | | | $1,000.00 | | | | $1,064.27 | | | | $4.09 | |
| | Hypothetical (h) | | | 0.80% | | | | $1,000.00 | | | | $1,020.83 | | | | $4.01 | |
| R1 | | Actual | | | 1.80% | | | | $1,000.00 | | | | $1,058.76 | | | | $9.19 | |
| | Hypothetical (h) | | | 1.80% | | | | $1,000.00 | | | | $1,015.87 | | | | $9.00 | |
| R2 | | Actual | | | 1.30% | | | | $1,000.00 | | | | $1,061.66 | | | | $6.65 | |
| | Hypothetical (h) | | | 1.30% | | | | $1,000.00 | | | | $1,018.35 | | | | $6.51 | |
| R3 | | Actual | | | 1.05% | | | | $1,000.00 | | | | $1,062.80 | | | | $5.37 | |
| | Hypothetical (h) | | | 1.05% | | | | $1,000.00 | | | | $1,019.59 | | | | $5.26 | |
| R4 | | Actual | | | 0.80% | | | | $1,000.00 | | | | $1,063.96 | | | | $4.09 | |
| | Hypothetical (h) | | | 0.80% | | | | $1,000.00 | | | | $1,020.83 | | | | $4.01 | |
| R5 | | Actual | | | 0.70% | | | | $1,000.00 | | | | $1,064.63 | | | | $3.58 | |
| | Hypothetical (h) | | | 0.70% | | | | $1,000.00 | | | | $1,021.32 | | | | $3.51 | |
| (h) | 5% class return per year before expenses. |
| (p) | “Expenses Paid During Period” are equal to each class’s annualized expense ratio, as shown above, multiplied by the average account value over the period, multiplied by 181/365 (to reflect the one-half year period). Expenses paid do not include any applicable sales charges (loads). If these transaction costs had been included, your costs would have been higher. |
Notes to Expense Table
Each class with a Rule 12b-1 service fee is subject to a rebate of a portion of such fee. Such rebates are included in the expense ratios above. For Class A shares, this rebate reduced the expense ratio above by 0.01%. See Note 3 in the Notes to Financial Statements for additional information.
4
PORTFOLIO OF INVESTMENTS
2/28/15 (unaudited)
The Portfolio of Investments is a complete list of all securities owned by your fund. It is categorized by broad-based asset classes.
| | | | | | | | |
| Common Stocks - 99.3% | | | | | | | | |
| Issuer | | Shares/Par | | | Value ($) | |
| | | | | | | | |
| Aerospace - 3.6% | | | | | | | | |
| Honeywell International, Inc. | | | 154,688 | | | $ | 15,898,833 | |
| Northrop Grumman Corp. | | | 62,066 | | | | 10,284,957 | |
| Precision Castparts Corp. | | | 21,980 | | | | 4,754,274 | |
| Textron, Inc. | | | 55,069 | | | | 2,440,107 | |
| United Technologies Corp. | | | 125,451 | | | | 15,293,731 | |
| | | | | | | | |
| | | | | | | $ | 48,671,902 | |
| Alcoholic Beverages - 0.3% | | | | | | | | |
| Constellation Brands, Inc., “A” (a) | | | 35,941 | | | $ | 4,123,152 | |
| | |
| Apparel Manufacturers - 0.5% | | | | | | | | |
| PVH Corp. | | | 41,364 | | | $ | 4,406,507 | |
| VF Corp. | | | 33,207 | | | | 2,545,649 | |
| | | | | | | | |
| | | | | | | $ | 6,952,156 | |
| Automotive - 0.8% | | | | | | | | |
| Delphi Automotive PLC | | | 67,355 | | | $ | 5,310,268 | |
| Harley-Davidson, Inc. | | | 78,639 | | | | 4,999,081 | |
| | | | | | | | |
| | | | | | | $ | 10,309,349 | |
| Biotechnology - 2.4% | | | | | | | | |
| Alexion Pharmaceuticals, Inc. (a) | | | 49,380 | | | $ | 8,906,671 | |
| AMAG Pharmaceuticals, Inc. (a) | | | 131,800 | | | | 6,488,514 | |
| Biogen Idec, Inc. (a) | | | 29,389 | | | | 12,037,441 | |
| Exact Sciences Corp. (a)(l) | | | 25,454 | | | | 571,951 | |
| Illumina, Inc. (a) | | | 3,350 | | | | 654,791 | |
| MiMedx Group, Inc. (a) | | | 76,132 | | | | 787,966 | |
| Puma Biotechnology, Inc. (a) | | | 16,356 | | | | 3,483,992 | |
| | | | | | | | |
| | | | | | | $ | 32,931,326 | |
| Broadcasting - 2.0% | | | | | | | | |
| Time Warner, Inc. | | | 137,542 | | | $ | 11,259,188 | |
| Twenty-First Century Fox, Inc. | | | 465,917 | | | | 16,307,095 | |
| | | | | | | | |
| | | | | | | $ | 27,566,283 | |
| Brokerage & Asset Managers - 2.4% | | | | | | | | |
| Affiliated Managers Group, Inc. (a) | | | 13,060 | | | $ | 2,826,445 | |
| BlackRock, Inc. | | | 33,348 | | | | 12,386,114 | |
| Franklin Resources, Inc. | | | 180,909 | | | | 9,738,331 | |
| NASDAQ OMX Group, Inc. | | | 156,176 | | | | 7,833,788 | |
| | | | | | | | |
| | | | | | | $ | 32,784,678 | |
5
Portfolio of Investments (unaudited) – continued
| | | | | | | | |
| Issuer | | Shares/Par | | | Value ($) | |
| | | | | | | | |
| Common Stocks - continued | | | | | | | | |
| Business Services - 2.6% | | | | | | | | |
| Accenture PLC, “A” | | | 56,421 | | | $ | 5,079,583 | |
| Bright Horizons Family Solutions, Inc. (a) | | | 160,148 | | | | 8,119,504 | |
| Equifax, Inc. | | | 31,849 | | | | 2,973,741 | |
| Fidelity National Information Services, Inc. | | | 98,172 | | | | 6,635,445 | |
| FleetCor Technologies, Inc. (a) | | | 17,524 | | | | 2,688,707 | |
| Gartner, Inc. (a) | | | 82,833 | | | | 6,884,251 | |
| Global Payments, Inc. | | | 26,242 | | | | 2,410,590 | |
| | | | | | | | |
| | | | | | | $ | 34,791,821 | |
| Cable TV - 1.3% | | | | | | | | |
| Charter Communications, Inc., “A” (a) | | | 32,991 | | | $ | 5,958,175 | |
| Comcast Corp., “Special A” | | | 68,562 | | | | 4,041,387 | |
| Time Warner Cable, Inc. | | | 46,740 | | | | 7,200,297 | |
| | | | | | | | |
| | | | | | | $ | 17,199,859 | |
| Chemicals - 1.5% | | | | | | | | |
| Agrium, Inc. | | | 41,368 | | | $ | 4,777,787 | |
| E.I. du Pont de Nemours & Co. | | | 124,282 | | | | 9,675,354 | |
| LyondellBasell Industries N.V., “A” | | | 66,253 | | | | 5,691,795 | |
| | | | | | | | |
| | | | | | | $ | 20,144,936 | |
| Computer Software - 3.7% | | | | | | | | |
| Adobe Systems, Inc. (a) | | | 115,428 | | | $ | 9,130,355 | |
| Check Point Software Technologies Ltd. (a) | | | 80,903 | | | | 6,754,591 | |
| Intuit, Inc. | | | 38,886 | | | | 3,796,440 | |
| Oracle Corp. | | | 234,456 | | | | 10,273,862 | |
| Qlik Technologies, Inc. (a) | | | 172,362 | | | | 5,591,423 | |
| Salesforce.com, Inc. (a) | | | 217,906 | | | | 15,118,318 | |
| | | | | | | | |
| | | | | | | $ | 50,664,989 | |
| Computer Software - Systems - 4.8% | | | | | | | | |
| Apple, Inc. (s) | | | 306,294 | | | $ | 39,346,527 | |
| EMC Corp. | | | 434,008 | | | | 12,560,192 | |
| Hewlett-Packard Co. | | | 70,164 | | | | 2,444,514 | |
| NCR Corp. (a) | | | 132,717 | | | | 3,903,207 | |
| Sabre Corp. | | | 130,249 | | | | 2,834,218 | |
| SS&C Technologies Holdings, Inc. | | | 72,893 | | | | 4,423,147 | |
| | | | | | | | |
| | | | | | | $ | 65,511,805 | |
| Construction - 1.0% | | | | | | | | |
| Fortune Brands Home & Security, Inc. | | | 124,836 | | | $ | 5,782,404 | |
| Pool Corp. | | | 7,213 | | | | 498,923 | |
| Sherwin-Williams Co. | | | 23,887 | | | | 6,812,572 | |
| | | | | | | | |
| | | | | | | $ | 13,093,899 | |
6
Portfolio of Investments (unaudited) – continued
| | | | | | | | |
| Issuer | | Shares/Par | | | Value ($) | |
| | | | | | | | |
| Common Stocks - continued | | | | | | | | |
| Consumer Products - 2.2% | | | | | | | | |
| Colgate-Palmolive Co. | | | 124,021 | | | $ | 8,783,167 | |
| Estee Lauder Cos., Inc., “A” | | | 36,336 | | | | 3,003,897 | |
| Newell Rubbermaid, Inc. | | | 152,609 | | | | 5,996,008 | |
| Procter & Gamble Co. | | | 146,222 | | | | 12,447,879 | |
| | | | | | | | |
| | | | | | | $ | 30,230,951 | |
| Consumer Services - 1.5% | | | | | | | | |
| Nord Anglia Education, Inc. (a) | | | 290,309 | | | $ | 6,215,516 | |
| Priceline Group, Inc. (a) | | | 11,681 | | | | 14,455,004 | |
| | | | | | | | |
| | | | | | | $ | 20,670,520 | |
| Containers - 0.1% | | | | | | | | |
| Crown Holdings, Inc. (a) | | | 34,913 | | | $ | 1,850,389 | |
| | |
| Electrical Equipment - 2.1% | | | | | | | | |
| Advanced Drainage Systems, Inc. | | | 211,830 | | | $ | 5,751,185 | |
| AMETEK, Inc. | | | 138,219 | | | | 7,344,958 | |
| Danaher Corp. | | | 140,959 | | | | 12,302,902 | |
| W.W. Grainger, Inc. | | | 12,696 | | | | 3,007,809 | |
| | | | | | | | |
| | | | | | | $ | 28,406,854 | |
| Electronics - 3.7% | | | | | | | | |
| Avago Technologies Ltd. | | | 93,315 | | | $ | 11,908,860 | |
| Broadcom Corp., “A” | | | 151,570 | | | | 6,855,511 | |
| Freescale Semiconductor Ltd. (a) | | | 57,791 | | | | 2,086,833 | |
| KLA-Tencor Corp. | | | 58,266 | | | | 3,784,668 | |
| Mellanox Technologies Ltd. (a) | | | 91,587 | | | | 4,363,205 | |
| Rubicon Technology, Inc. (a)(l) | | | 233,726 | | | | 1,019,045 | |
| Skyworks Solutions, Inc. | | | 45,105 | | | | 3,957,964 | |
| Texas Instruments, Inc. | | | 249,257 | | | | 14,656,312 | |
| Ultratech, Inc. (a) | | | 88,502 | | | | 1,596,576 | |
| | | | | | | | |
| | | | | | | $ | 50,228,974 | |
| Energy - Independent - 3.3% | | | | | | | | |
| Anadarko Petroleum Corp. | | | 71,624 | | | $ | 6,032,890 | |
| Concho Resources, Inc. (a) | | | 16,404 | | | | 1,786,724 | |
| Energy XXI (Bermuda) Ltd. (l) | | | 80,076 | | | | 380,361 | |
| EOG Resources, Inc. | | | 65,372 | | | | 5,865,176 | |
| Goodrich Petroleum Corp. (a)(l) | | | 130,695 | | | | 585,514 | |
| Memorial Resource Development Corp. (a) | | | 155,791 | | | | 3,195,273 | |
| Noble Energy, Inc. | | | 56,350 | | | | 2,661,411 | |
| PDC Energy, Inc. (a) | | | 14,771 | | | | 763,365 | |
| Pioneer Natural Resources Co. | | | 18,913 | | | | 2,884,611 | |
| Rice Energy, Inc. (a) | | | 45,600 | | | | 892,848 | |
7
Portfolio of Investments (unaudited) – continued
| | | | | | | | |
| Issuer | | Shares/Par | | | Value ($) | |
| | | | | | | | |
| Common Stocks - continued | | | | | | | | |
| Energy - Independent - continued | | | | | | | | |
| Rosetta Resources, Inc. (a) | | | 39,246 | | | $ | 695,832 | |
| Sanchez Energy Corp. (a)(l) | | | 39,475 | | | | 528,965 | |
| Targa Resources Corp. | | | 22,960 | | | | 2,286,357 | |
| Valero Energy Corp. | | | 256,910 | | | | 15,848,778 | |
| | | | | | | | |
| | | | | | | $ | 44,408,105 | |
| Energy - Integrated - 2.5% | | | | | | | | |
| Chevron Corp. (s) | | | 82,960 | | | $ | 8,850,173 | |
| Hess Corp. (s) | | | 329,550 | | | | 24,742,614 | |
| | | | | | | | |
| | | | | | | $ | 33,592,787 | |
| Food & Beverages - 2.9% | | | | | | | | |
| Coca-Cola Co. | | | 328,349 | | | $ | 14,217,512 | |
| General Mills, Inc. | | | 106,745 | | | | 5,741,814 | |
| Mondelez International, Inc. | | | 201,009 | | | | 7,424,267 | |
| Pinnacle Foods, Inc. | | | 109,212 | | | | 3,964,396 | |
| Snyders-Lance, Inc. | | | 90,017 | | | | 2,777,024 | |
| WhiteWave Foods Co., “A” (a) | | | 120,062 | | | | 4,916,539 | |
| | | | | | | | |
| | | | | | | $ | 39,041,552 | |
| Food & Drug Stores - 1.3% | | | | | | | | |
| CVS Health Corp. | | | 156,746 | | | $ | 16,281,207 | |
| Fairway Group Holdings Corp. (a)(l) | | | 367,443 | | | | 2,046,658 | |
| | | | | | | | |
| | | | | | | $ | 18,327,865 | |
| Gaming & Lodging - 0.8% | | | | | | | | |
| La Quinta Holdings, Inc. (a) | | | 107,826 | | | $ | 2,394,815 | |
| Wynn Resorts Ltd. | | | 59,491 | | | | 8,477,468 | |
| | | | | | | | |
| | | | | | | $ | 10,872,283 | |
| General Merchandise - 1.4% | | | | | | | | |
| Dollar Tree, Inc. (a) | | | 52,032 | | | $ | 4,145,910 | |
| Five Below, Inc. (a) | | | 93,897 | | | | 2,979,821 | |
| Kohl’s Corp. | | | 81,482 | | | | 6,013,372 | |
| Target Corp. | | | 67,850 | | | | 5,212,916 | |
| | | | | | | | |
| | | | | | | $ | 18,352,019 | |
| Health Maintenance Organizations - 1.2% | | | | | | | | |
| UnitedHealth Group, Inc. | | | 137,715 | | | $ | 15,648,555 | |
| | |
| Insurance - 2.5% | | | | | | | | |
| American International Group, Inc. | | | 384,742 | | | $ | 21,287,775 | |
| MetLife, Inc. | | | 252,465 | | | | 12,832,796 | |
| | | | | | | | |
| | | | | | | $ | 34,120,571 | |
8
Portfolio of Investments (unaudited) – continued
| | | | | | | | |
| Issuer | | Shares/Par | | | Value ($) | |
| | | | | | | | |
| Common Stocks - continued | | | | | | | | |
| Internet - 3.0% | | | | | | | | |
| Facebook, Inc., “A “ (a) | | | 139,494 | | | $ | 11,015,841 | |
| Google, Inc., “A” (a) | | | 25,406 | | | | 14,294,178 | |
| Google, Inc., “C” (a) | | | 18,694 | | | | 10,438,730 | |
| LinkedIn Corp., “A” (a) | | | 20,980 | | | | 5,605,856 | |
| | | | | | | | |
| | | | | | | $ | 41,354,605 | |
| Machinery & Tools - 1.9% | | | | | | | | |
| Colfax Corp. (a) | | | 100,094 | | | $ | 5,272,952 | |
| IPG Photonics Corp. (a) | | | 51,361 | | | | 4,925,520 | |
| Joy Global, Inc. | | | 70,306 | | | | 3,115,962 | |
| Roper Industries, Inc. | | | 73,965 | | | | 12,394,315 | |
| | | | | | | | |
| | | | | | | $ | 25,708,749 | |
| Major Banks - 4.1% | | | | | | | | |
| Goldman Sachs Group, Inc. | | | 63,196 | | | $ | 11,993,969 | |
| JPMorgan Chase & Co. | | | 361,955 | | | | 22,180,602 | |
| Wells Fargo & Co. | | | 391,471 | | | | 21,448,696 | |
| | | | | | | | |
| | | | | | | $ | 55,623,267 | |
| Medical & Health Technology & Services - 1.1% | | | | | | | | |
| Cerner Corp. (a) | | | 28,479 | | | $ | 2,052,197 | |
| Express Scripts Holding Co. (a) | | | 66,371 | | | | 5,627,597 | |
| Healthcare Services Group, Inc. | | | 72,870 | | | | 2,446,246 | |
| McKesson Corp. | | | 21,011 | | | | 4,805,216 | |
| | | | | | | | |
| | | | | | | $ | 14,931,256 | |
| Medical Equipment - 4.3% | | | | | | | | |
| Abbott Laboratories | | | 225,751 | | | $ | 10,693,825 | |
| AtriCure, Inc. (a) | | | 89,720 | | | | 1,586,250 | |
| Cepheid, Inc. (a) | | | 31,261 | | | | 1,776,875 | |
| Cooper Cos., Inc. | | | 33,946 | | | | 5,566,126 | |
| DENTSPLY International, Inc. | | | 47,076 | | | | 2,495,499 | |
| DexCom, Inc. (a) | | | 25,666 | | | | 1,558,953 | |
| Heartware International, Inc. (a) | | | 9,293 | | | | 792,042 | |
| Inovalon Holdings, Inc., “A” (a) | | | 4,070 | | | | 126,414 | |
| Medtronic PLC | | | 189,707 | | | | 14,719,366 | |
| OraSure Technologies, Inc. (a) | | | 75,737 | | | | 542,277 | |
| STERIS Corp. | | | 15,178 | | | | 979,285 | |
| Stryker Corp. | | | 123,350 | | | | 11,687,413 | |
| TearLab Corp. (a)(l) | | | 289,159 | | | | 751,813 | |
| Thermo Fisher Scientific, Inc. | | | 39,243 | | | | 5,101,590 | |
| | | | | | | | |
| | | | | | | $ | 58,377,728 | |
9
Portfolio of Investments (unaudited) – continued
| | | | | | | | |
| Issuer | | Shares/Par | | | Value ($) | |
| | | | | | | | |
| Common Stocks - continued | | | | | | | | |
| Metals & Mining - 0.3% | | | | | | | | |
| First Quantum Minerals Ltd. | | | 124,679 | | | $ | 1,580,803 | |
| Lundin Mining Corp. (a) | | | 531,117 | | | | 2,315,485 | |
| | | | | | | | |
| | | | | | | $ | 3,896,288 | |
| Natural Gas - Pipeline - 0.5% | | | | | | | | |
| Williams Cos., Inc. | | | 88,793 | | | $ | 4,354,409 | |
| Williams Partners LP | | | 50,629 | | | | 2,589,167 | |
| | | | | | | | |
| | | | | | | $ | 6,943,576 | |
| Network & Telecom - 0.6% | | | | | | | | |
| Cisco Systems, Inc. | | | 228,259 | | | $ | 6,735,923 | |
| Ixia (a) | | | 178,290 | | | | 2,028,940 | |
| | | | | | | | |
| | | | | | | $ | 8,764,863 | |
| Oil Services - 1.1% | | | | | | | | |
| Forum Energy Technologies, Inc. (a) | | | 33,435 | | | $ | 652,986 | |
| Halliburton Co. | | | 65,958 | | | | 2,832,237 | |
| Schlumberger Ltd. | | | 138,525 | | | | 11,658,264 | |
| | | | | | | | |
| | | | | | | $ | 15,143,487 | |
| Other Banks & Diversified Financials - 5.0% | | | | | | | | |
| American Express Co. | | | 180,203 | | | $ | 14,702,763 | |
| BB&T Corp. | | | 113,481 | | | | 4,317,952 | |
| Discover Financial Services | | | 249,152 | | | | 15,193,289 | |
| EuroDekania Ltd. | | | 580,280 | | | | 211,043 | |
| PrivateBancorp, Inc. | | | 191,778 | | | | 6,660,450 | |
| Texas Capital Bancshares, Inc. (a) | | | 92,500 | | | | 4,294,775 | |
| Visa, Inc., “A” | | | 81,660 | | | | 22,155,175 | |
| | | | | | | | |
| | | | | | | $ | 67,535,447 | |
| Pharmaceuticals - 5.7% | | | | | | | | |
| Actavis PLC (a) | | | 77,466 | | | $ | 22,570,494 | |
| Bristol-Myers Squibb Co. | | | 210,016 | | | | 12,794,175 | |
| Eli Lilly & Co. | | | 149,535 | | | | 10,492,871 | |
| Endo International PLC (a) | | | 105,692 | | | | 9,047,235 | |
| Merck & Co., Inc. | | | 111,328 | | | | 6,517,141 | |
| Valeant Pharmaceuticals International, Inc. (a) | | | 79,301 | | | | 15,660,361 | |
| | | | | | | | |
| | | | | | | $ | 77,082,277 | |
| Railroad & Shipping - 1.5% | | | | | | | | |
| Canadian Pacific Railway Ltd. | | | 43,021 | | | $ | 8,071,600 | |
| Union Pacific Corp. | | | 101,574 | | | | 12,215,289 | |
| | | | | | | | |
| | | | | | | $ | 20,286,889 | |
10
Portfolio of Investments (unaudited) – continued
| | | | | | | | |
| Issuer | | Shares/Par | | | Value ($) | |
| | | | | | | | |
| Common Stocks - continued | | | | | | | | |
| Real Estate - 3.5% | | | | | | | | |
| Equity Lifestyle Properties, Inc., REIT | | | 140,730 | | | $ | 7,581,125 | |
| Gramercy Property Trust, Inc., REIT | | | 650,891 | | | | 4,588,782 | |
| Medical Properties Trust, Inc., REIT | | | 542,183 | | | | 8,208,651 | |
| Mid-America Apartment Communities, Inc., REIT | | | 134,668 | | | | 9,759,390 | |
| Plum Creek Timber Co. Inc., REIT | | | 191,270 | | | | 8,308,769 | |
| Tanger Factory Outlet Centers, Inc., REIT | | | 244,741 | | | | 8,676,068 | |
| | | | | | | | |
| | | | | | | $ | 47,122,785 | |
| Restaurants - 1.0% | | | | | | | | |
| Domino’s Pizza, Inc. | | | 40,159 | | | $ | 4,077,343 | |
| YUM! Brands, Inc. | | | 121,021 | | | | 9,816,013 | |
| | | | | | | | |
| | | | | | | $ | 13,893,356 | |
| Specialty Chemicals - 2.5% | | | | | | | | |
| Albemarle Corp. | | | 132,656 | | | $ | 7,504,350 | |
| Amira Nature Foods Ltd. (a)(l) | | | 72,290 | | | | 748,924 | |
| Axalta Coating Systems Ltd. (a) | | | 291,858 | | | | 8,288,767 | |
| Ecolab, Inc. | | | 89,953 | | | | 10,393,170 | |
| W.R. Grace & Co. (a) | | | 71,446 | | | | 7,083,871 | |
| | | | | | | | |
| | | | | | | $ | 34,019,082 | |
| Specialty Stores - 4.1% | | | | | | | | |
| American Eagle Outfitters, Inc. | | | 364,689 | | | $ | 5,459,394 | |
| AutoZone, Inc. (a) | | | 9,790 | | | | 6,291,837 | |
| Bed Bath & Beyond, Inc. (a) | | | 96,229 | | | | 7,184,457 | |
| Burlington Stores, Inc. (a) | | | 140,302 | | | | 7,796,582 | |
| Express, Inc. (a) | | | 269,133 | | | | 3,719,418 | |
| L Brands, Inc. | | | 56,032 | | | | 5,147,100 | |
| Ross Stores, Inc. | | | 78,822 | | | | 8,340,156 | |
| Sally Beauty Holdings, Inc. (a) | | | 122,801 | | | | 4,116,290 | |
| Urban Outfitters, Inc. (a) | | | 192,763 | | | | 7,510,046 | |
| | | | | | | | |
| | | | | | | $ | 55,565,280 | |
| Telecommunications - Wireless - 1.4% | | | | | | | | |
| American Tower Corp., REIT | | | 150,098 | | | $ | 14,880,716 | |
| SBA Communications Corp. (a) | | | 34,562 | | | | 4,310,227 | |
| | | | | | | | |
| | | | | | | $ | 19,190,943 | |
| Telephone Services - 0.9% | | | | | | | | |
| RigNet, Inc. (a) | | | 93,716 | | | $ | 2,963,300 | |
| Verizon Communications, Inc. | | | 176,863 | | | | 8,745,875 | |
| | | | | | | | |
| | | | | | | $ | 11,709,175 | |
11
Portfolio of Investments (unaudited) – continued
| | | | | | | | |
| Issuer | | Shares/Par | | | Value ($) | |
| | | | | | | | |
| Common Stocks - continued | | | | | | | | |
| Tobacco - 1.2% | | | | | | | | |
| Altria Group, Inc. | | | 148,317 | | | $ | 8,348,764 | |
| Philip Morris International, Inc. | | | 96,505 | | | | 8,006,055 | |
| | | | | | | | |
| | | | | | | $ | 16,354,819 | |
| Trucking - 0.6% | | | | | | | | |
| Swift Transportation Co. (a) | | | 276,914 | | | $ | 7,831,128 | |
| | |
| Utilities - Electric Power - 2.6% | | | | | | | | |
| American Electric Power Co., Inc. | | | 89,289 | | | $ | 5,141,261 | |
| Calpine Corp. (a) | | | 153,376 | | | | 3,251,571 | |
| CMS Energy Corp. | | | 159,241 | | | | 5,594,136 | |
| Dominion Resources, Inc. | | | 47,722 | | | | 3,440,279 | |
| Edison International | | | 72,111 | | | | 4,633,132 | |
| Exelon Corp. | | | 123,469 | | | | 4,188,060 | |
| NextEra Energy, Inc. | | | 41,065 | | | | 4,248,585 | |
| NRG Energy, Inc. | | | 86,965 | | | | 2,085,421 | |
| Pattern Energy Group, Inc. | | | 87,741 | | | | 2,440,955 | |
| | | | | | | | |
| | | | | | | $ | 35,023,400 | |
| Total Common Stocks (Identified Cost, $1,026,839,472) | | | | | | $ | 1,346,855,980 | |
| | |
| Money Market Funds - 0.7% | | | | | | | | |
MFS Institutional Money Market Portfolio, 0.1%,
at Cost and Net Asset Value (v) | | | 9,385,602 | | | $ | 9,385,602 | |
| | |
| Collateral for Securities Loaned - 0.2% | | | | | | | | |
Navigator Securities Lending Prime Portfolio, 0.17%,
at Cost and Net Asset Value (j) | | | 3,001,002 | | | $ | 3,001,002 | |
| Total Investments (Identified Cost, $1,039,226,076) | | | | | | $ | 1,359,242,584 | |
| | |
| Securities Sold Short - (0.2)% | | | | | | | | |
| Gaming & Lodging - (0.2)% | | | | | | | | |
| Marriott International, Inc., “A” (Proceeds Received $2,063,501) | | | (30,725 | ) | | $ | (2,553,248 | ) |
| | |
| Other Assets, Less Liabilities - (0.0)% | | | | | | | (151,581 | ) |
| Net Assets - 100.0% | | | | | | $ | 1,356,537,755 | |
| (a) | Non-income producing security. |
| (j) | The rate quoted is the annualized seven-day yield of the fund at period end. |
| (l) | A portion of this security is on loan. |
| (s) | Security or a portion of the security was pledged to cover collateral requirements for securities sold short and certain derivative transactions. |
| (v) | Underlying affiliated fund that is available only to investment companies managed by MFS. The rate quoted for the MFS Institutional Money Market Portfolio is the annualized seven-day yield of the fund at period end. |
12
Portfolio of Investments (unaudited) – continued
At February 28, 2015, the fund had cash collateral of $7,548 and other liquid securities with an aggregate value of $4,654,836 to cover any commitments for securities sold short and/or certain derivative contracts. Cash collateral is comprised of “Deposits with brokers” on the Statement of Assets and Liabilities.
The following abbreviations are used in this report and are defined:
| PLC | | Public Limited Company |
| REIT | | Real Estate Investment Trust |
See notes to financial statements
13
Financial Statements
STATEMENT OF ASSETS AND LIABILITIES
At 2/28/15 (unaudited)
This statement represents your fund’s balance sheet, which details the assets and liabilities comprising the total value of the fund.
| | | | |
| Assets | | | | |
Investments- | | | | |
Non-affiliated issuers, at value (identified cost, $1,029,840,474) | | | $1,349,856,982 | |
Underlying affiliated funds, at cost and value | | | 9,385,602 | |
Total investments, at value, including $2,917,816 of securities on loan
(identified cost, $1,039,226,076) | | | $1,359,242,584 | |
Cash | | | 53 | |
Deposits with brokers | | | 7,548 | |
Receivables for | | | | |
Investments sold | | | 17,378,908 | |
Fund shares sold | | | 1,326,209 | |
Interest and dividends | | | 1,847,050 | |
Other assets | | | 6,627 | |
Total assets | | | $1,379,808,979 | |
| Liabilities | | | | |
Payables for | | | | |
Dividends on securities sold short | | | $6,145 | |
Securities sold short, at value (proceeds received, $2,063,501) | | | 2,553,248 | |
Investments purchased | | | 15,465,125 | |
Fund shares reacquired | | | 1,505,961 | |
Collateral for securities loaned, at value | | | 3,001,002 | |
Payable to affiliates | | | | |
Investment adviser | | | 60,285 | |
Shareholder servicing costs | | | 499,998 | |
Distribution and service fees | | | 30,205 | |
Payable for independent Trustees’ compensation | | | 84,660 | |
Accrued expenses and other liabilities | | | 64,595 | |
Total liabilities | | | $23,271,224 | |
Net assets | | | $1,356,537,755 | |
| Net assets consist of | | | | |
Paid-in capital | | | $970,720,899 | |
Unrealized appreciation (depreciation) on investments and translation of assets and liabilities in foreign currencies | | | 319,526,761 | |
Accumulated net realized gain (loss) on investments and foreign currency | | | 62,536,766 | |
Undistributed net investment income | | | 3,753,329 | |
Net assets | | | $1,356,537,755 | |
Shares of beneficial interest outstanding | | | 47,841,961 | |
14
Statement of Assets and Liabilities (unaudited) – continued
| | | | | | | | | | | | |
| | | Net assets | | | Shares
outstanding | | | Net asset value
per share (a) | |
Class A | | | $1,049,597,394 | | | | 36,678,634 | | | | $28.62 | |
Class B | | | 39,318,229 | | | | 1,507,079 | | | | 26.09 | |
Class C | | | 93,990,731 | | | | 3,636,652 | | | | 25.85 | |
Class I | | | 52,490,570 | | | | 1,755,802 | | | | 29.90 | |
Class R1 | | | 4,500,047 | | | | 174,210 | | | | 25.83 | |
Class R2 | | | 19,057,382 | | | | 679,343 | | | | 28.05 | |
Class R3 | | | 73,716,433 | | | | 2,584,579 | | | | 28.52 | |
Class R4 | | | 21,396,708 | | | | 743,122 | | | | 28.79 | |
Class R5 | | | 2,470,261 | | | | 82,540 | | | | 29.93 | |
| (a) | Maximum offering price per share was equal to the net asset value per share for all share classes, except for Class A, for which the maximum offering price per share was $30.37 [100 / 94.25 x $28.62]. On sales of $50,000 or more, the maximum offering price of Class A shares is reduced. A contingent deferred sales charge may be imposed on redemptions of Class A, Class B, and Class C shares. Redemption price per share was equal to the net asset value per share for Classes I, R1, R2, R3, R4, and R5. |
See notes to financial statements
15
Financial Statements
STATEMENT OF OPERATIONS
Six months ended 2/28/15 (unaudited)
This statement describes how much your fund earned in investment income and accrued in expenses. It also describes any gains and/or losses generated by fund operations.
| | | | |
| Net investment income | | | | |
Income | | | | |
Dividends | | | $10,772,536 | |
Interest | | | 169,875 | |
Dividends from underlying affiliated funds | | | 7,564 | |
Foreign taxes withheld | | | (12,981 | ) |
Total investment income | | | $10,936,994 | |
Expenses | | | | |
Management fee | | | $3,759,130 | |
Distribution and service fees | | | 2,023,710 | |
Shareholder servicing costs | | | 990,265 | |
Administrative services fee | | | 108,381 | |
Independent Trustees’ compensation | | | 17,191 | |
Custodian fee | | | 60,603 | |
Shareholder communications | | | 50,305 | |
Audit and tax fees | | | 26,663 | |
Legal fees | | | 5,586 | |
Dividend and interest expense on securities sold short | | | 24,386 | |
Miscellaneous | | | 86,031 | |
Total expenses | | | $7,152,251 | |
Fees paid indirectly | | | (24 | ) |
Reduction of expenses by investment adviser and distributor | | | (69,163 | ) |
Net expenses | | | $7,083,064 | |
Net investment income | | | $3,853,930 | |
| Realized and unrealized gain (loss) on investments and foreign currency | | | | |
Realized gain (loss) (identified cost basis) | | | | |
Investments | | | $70,691,093 | |
Securities sold short | | | (51,451 | ) |
Foreign currency | | | (813 | ) |
Net realized gain (loss) on investments and foreign currency | | | $70,638,829 | |
Change in unrealized appreciation (depreciation) | | | | |
Investments | | | $5,801,151 | |
Securities sold short | | | (405,761 | ) |
Translation of assets and liabilities in foreign currencies | | | (39 | ) |
Net unrealized gain (loss) on investments and foreign currency translation | | | $5,395,351 | |
Net realized and unrealized gain (loss) on investments and foreign currency | | | $76,034,180 | |
Change in net assets from operations | | | $79,888,110 | |
See notes to financial statements
16
Financial Statements
STATEMENTS OF CHANGES IN NET ASSETS
These statements describe the increases and/or decreases in net assets resulting from operations, any distributions, and any shareholder transactions.
| | | | | | | | |
| Change in net assets | | Six months ended
2/28/15
(unaudited) | | | Year ended
8/31/14 | |
| From operations | | | | | | | | |
Net investment income | | | $3,853,930 | | | | $5,110,168 | |
Net realized gain (loss) on investments and foreign currency | | | 70,638,829 | | | | 105,521,459 | |
Net unrealized gain (loss) on investments and foreign currency translation | | | 5,395,351 | | | | 142,264,064 | |
Change in net assets from operations | | | $79,888,110 | | | | $252,895,691 | |
| Distributions declared to shareholders | | | | | | | | |
From net investment income | | | $(5,098,135 | ) | | | $(7,149,277 | ) |
From net realized gain on investments | | | (95,270,510 | ) | | | — | |
Total distributions declared to shareholders | | | $(100,368,645 | ) | | | $(7,149,277 | ) |
Change in net assets from fund share transactions | | | $84,920,626 | | | | $(64,001,160 | ) |
Total change in net assets | | | $64,440,091 | | | | $181,745,254 | |
| Net assets | | | | | | | | |
At beginning of period | | | 1,292,097,664 | | | | 1,110,352,410 | |
At end of period (including undistributed net investment income of $3,753,329 and $4,997,534, respectively) | | | $1,356,537,755 | | | | $1,292,097,664 | |
See notes to financial statements
17
Financial Statements
FINANCIAL HIGHLIGHTS
The financial highlights table is intended to help you understand the fund’s financial performance for the semiannual period and the past 5 fiscal years (or life of a particular share class, if shorter). Certain information reflects financial results for a single fund share. The total returns in the table represent the rate by which an investor would have earned (or lost) on an investment in the fund share class (assuming reinvestment of all distributions) held for the entire period.
| | | | | | | | | | | | | | | | | | | | | | | | |
| | | Six months
ended
2/28/15
(unaudited) | | | Years ended 8/31 | |
| Class A | | | 2014 | | | 2013 | | | 2012 | | | 2011 | | | 2010 | |
| | | | | | | | | | | | | | | | | |
Net asset value, beginning
of period | | | $29.19 | | | | $23.82 | | | | $19.68 | | | | $17.20 | | | | $14.62 | | | | $13.87 | |
| Income (loss) from investment operations | | | | | | | | | | | | | |
Net investment income (d) | | | $0.09 | | | | $0.13 | | | | $0.18 | | | | $0.11 | | | | $0.11 | | | | $0.10 | |
Net realized and unrealized
gain (loss) on investments
and foreign currency | | | 1.62 | | | | 5.41 | | | | 4.07 | | | | 2.47 | | | | 2.58 | | | | 0.77 | |
Total from investment operations | | | $1.71 | | | | $5.54 | | | | $4.25 | | | | $2.58 | | | | $2.69 | | | | $0.87 | |
| Less distributions declared to shareholders | | | | | | | | | | | | | |
From net investment income | | | $(0.13 | ) | | | $(0.17 | ) | | | $(0.11 | ) | | | $(0.10 | ) | | | $(0.11 | ) | | | $(0.12 | ) |
From net realized gain on
investments | | | (2.15 | ) | | | — | | | | — | | | | — | | | | — | | | | — | |
Total distributions declared to
shareholders | | | $(2.28 | ) | | | $(0.17 | ) | | | $(0.11 | ) | | | $(0.10 | ) | | | $(0.11 | ) | | | $(0.12 | ) |
Net asset value, end of period (x) | | | $28.62 | | | | $29.19 | | | | $23.82 | | | | $19.68 | | | | $17.20 | | | | $14.62 | |
Total return (%) (r)(s)(t)(x) | | | 6.29 | (n) | | | 23.33 | | | | 21.69 | | | | 15.10 | | | | 18.39 | | | | 6.27 | |
Ratios (%) (to average net assets)
and Supplemental data: | | | | | | | | | |
Expenses before expense
reductions (f) | | | 1.05 | (a) | | | 1.05 | | | | 1.11 | | | | 1.15 | | | | 1.18 | | | | 1.24 | |
Expenses after expense
reductions (f) | | | 1.04 | (a) | | | 1.04 | | | | 1.11 | | | | 1.15 | | | | 1.18 | | | | 1.23 | |
Net investment income | | | 0.67 | (a) | | | 0.49 | | | | 0.81 | | | | 0.61 | | | | 0.60 | | | | 0.68 | |
Portfolio turnover | | | 31 | (n) | | | 48 | | | | 58 | | | | 65 | | | | 66 | | | | 77 | |
Net assets at end of period
(000 omitted) | | | $1,049,597 | | | | $1,002,028 | | | | $873,139 | | | | $686,616 | | | | $612,504 | | | | $547,296 | |
| Supplemental Ratios (%): | | | | | | | | | | | | | |
Ratio of expenses to average
net assets after expense
reductions excluding short sale
dividend and interest expense (f) | | | 1.04 | (a) | | | 1.04 | | | | 1.10 | | | | 1.15 | | | | 1.17 | | | | 1.22 | |
See notes to financial statements
18
Financial Highlights – continued
| | | | | | | | | | | | | | | | | | | | | | | | |
| | | Six months
ended
2/28/15 (unaudited) | | | Years ended 8/31 | |
| Class B | | | 2014 | | | 2013 | | | 2012 | | | 2011 | | | 2010 | |
| | | | | | | | | | | | | | | | | |
Net asset value, beginning
of period | | | $26.78 | | | | $21.88 | | | | $18.11 | | | | $15.86 | | | | $13.50 | | | | $12.80 | |
| Income (loss) from investment operations | | | | | | | | | | | | | | | | | |
Net investment income (loss) (d) | | | $(0.01 | ) | | | $(0.06 | ) | | | $0.01 | | | | $(0.02 | ) | | | $(0.02 | ) | | | $(0.01 | ) |
Net realized and unrealized
gain (loss) on investments
and foreign currency | | | 1.47 | | | | 4.96 | | | | 3.76 | | | | 2.27 | | | | 2.38 | | | | 0.71 | |
Total from investment operations | | | $1.46 | | | | $4.90 | | | | $3.77 | | | | $2.25 | | | | $2.36 | | | | $0.70 | |
| Less distributions declared to shareholders | | | | | | | | | | | | | | | | | |
From net investment income | | | $— | | | | $— | | | | $— | | | | $— | | | | $— | | | | $(0.00 | )(w) |
From net realized gain on
investments | | | (2.15 | ) | | | — | | | | — | | | | — | | | | — | | | | — | |
Total distributions declared to
shareholders | | | $(2.15 | ) | | | $— | | | | $— | | | | $— | | | | $— | | | | $(0.00 | )(w) |
Net asset value, end of period (x) | | | $26.09 | | | | $26.78 | | | | $21.88 | | | | $18.11 | | | | $15.86 | | | | $13.50 | |
Total return (%) (r)(s)(t)(x) | | | 5.90 | (n) | | | 22.39 | | | | 20.82 | | | | 14.19 | | | | 17.48 | | | | 5.49 | |
Ratios (%) (to average net assets)
and Supplemental data: | | | | | | | | | | | | | | | | | |
Expenses before expense
reductions (f) | | | 1.80 | (a) | | | 1.80 | | | | 1.86 | | | | 1.91 | | | | 1.93 | | | | 1.99 | |
Expenses after expense
reductions (f) | | | 1.80 | (a) | | | 1.80 | | | | 1.86 | | | | 1.90 | | | | 1.93 | | | | 1.98 | |
Net investment income (loss) | | | (0.09 | )(a) | | | (0.26 | ) | | | 0.07 | | | | (0.14 | ) | | | (0.15 | ) | | | (0.06 | ) |
Portfolio turnover | | | 31 | (n) | | | 48 | | | | 58 | | | | 65 | | | | 66 | | | | 77 | |
Net assets at end of period
(000 omitted) | | | $39,318 | | | | $40,536 | | | | $40,495 | | | | $43,320 | | | | $49,181 | | | | $55,327 | |
| Supplemental Ratios (%): | | | | | | | | | | | | | | | | | | | | | |
Ratio of expenses to average
net assets after expense
reductions excluding short sale
dividend and interest expense (f) | | | 1.79 | (a) | | | 1.80 | | | | 1.86 | | | | 1.90 | | | | 1.92 | | | | 1.97 | |
See notes to financial statements
19
Financial Highlights – continued
| | | | | | | | | | | | | | | | | | | | | | | | |
| | | Six months
ended
2/28/15
(unaudited) | | | Years ended 8/31 | |
| Class C | | | 2014 | | | 2013 | | | 2012 | | | 2011 | | | 2010 | |
| | | | | | | | | | | | | | | | | |
Net asset value, beginning
of period | | | $26.55 | | | | $21.72 | | | | $17.98 | | | | $15.74 | | | | $13.39 | | | | $12.75 | |
| Income (loss) from investment operations | | | | | | | | | | | | | | | | | |
Net investment income (loss) (d) | | | $(0.01 | ) | | | $(0.06 | ) | | | $0.01 | | | | $(0.02 | ) | | | $(0.02 | ) | | | $(0.01 | ) |
Net realized and unrealized
gain (loss) on investments
and foreign currency | | | 1.46 | | | | 4.92 | | | | 3.73 | | | | 2.26 | | | | 2.37 | | | | 0.70 | |
Total from investment operations | | | $1.45 | | | | $4.86 | | | | $3.74 | | | | $2.24 | | | | $2.35 | | | | $0.69 | |
| Less distributions declared to shareholders | | | | | | | | | | | | | | | | | |
From net investment income | | | $— | | | | $(0.03 | ) | | | $— | | | | $— | | | | $— | | | | $(0.05 | ) |
From net realized gain on
investments | | | (2.15 | ) | | | — | | | | — | | | | — | | | | — | | | | — | |
Total distributions declared to
shareholders | | | $(2.15 | ) | | | $(0.03 | ) | | | $— | | | | $— | | | | $— | | | | $(0.05 | ) |
Net asset value, end of period (x) | | | $25.85 | | | | $26.55 | | | | $21.72 | | | | $17.98 | | | | $15.74 | | | | $13.39 | |
Total return (%) (r)(s)(t)(x) | | | 5.91 | (n) | | | 22.38 | | | | 20.80 | | | | 14.23 | | | | 17.55 | | | | 5.40 | |
Ratios (%) (to average net assets)
and Supplemental data: | | | | | | | | | | | | | | | | | |
Expenses before expense
reductions (f) | | | 1.80 | (a) | | | 1.80 | | | | 1.86 | | | | 1.90 | | | | 1.93 | | | | 1.99 | |
Expenses after expense
reductions (f) | | | 1.79 | (a) | | | 1.80 | | | | 1.86 | | | | 1.90 | | | | 1.93 | | | | 1.98 | |
Net investment income (loss) | | | (0.08 | )(a) | | | (0.26 | ) | | | 0.06 | | | | (0.14 | ) | | | (0.15 | ) | | | (0.07 | ) |
Portfolio turnover | | | 31 | (n) | | | 48 | | | | 58 | | | | 65 | | | | 66 | | | | 77 | |
Net assets at end of period
(000 omitted) | | | $93,991 | | | | $89,702 | | | | $78,777 | | | | $64,258 | | | | $62,249 | | | | $59,265 | |
| Supplemental Ratios (%): | | | | | | | | | | | | | | | | | | | | | | | | |
Ratio of expenses to average
net assets after expense
reductions excluding short sale
dividend and interest expense (f) | | | 1. | 79(a) | | | 1.80 | | | | 1.86 | | | | 1.90 | | | | 1.92 | | | | 1.97 | |
See notes to financial statements
20
Financial Highlights – continued
| | | | | | | | | | | | | | | | | | | | | | | | |
| | | Six months
ended
2/28/15
(unaudited) | | | Years ended 8/31 | |
| Class I | | | 2014 | | | 2013 | | | 2012 | | | 2011 | | | 2010 | |
| | | | | | | | | | | | | | | | | |
Net asset value, beginning
of period | | | $30.43 | | | | $24.82 | | | | $20.49 | | | | $17.91 | | | | $15.21 | | | | $14.43 | |
| Income (loss) from investment operations | | | | | | | | | | | | | | | | | |
Net investment income (d) | | | $0.13 | | | | $0.21 | | | | $0.24 | | | | $0.16 | | | | $0.15 | | | | $0.15 | |
Net realized and unrealized
gain (loss) on investments
and foreign currency | | | 1.69 | | | | 5.62 | | | | 4.25 | | | | 2.57 | | | | 2.70 | | | | 0.79 | |
Total from investment operations | | | $1.82 | | | | $5.83 | | | | $4.49 | | | | $2.73 | | | | $2.85 | | | | $0.94 | |
| Less distributions declared to shareholders | | | | | | | | | | | | | | | | | |
From net investment income | | | $(0.20 | ) | | | $(0.22 | ) | | | $(0.16 | ) | | | $(0.15 | ) | | | $(0.15 | ) | | | $(0.16 | ) |
From net realized gain on
investments | | | (2.15 | ) | | | — | | | | — | | | | — | | | | — | | | | — | |
Total distributions declared to
shareholders | | | $(2.35 | ) | | | $(0.22 | ) | | | $(0.16 | ) | | | $(0.15 | ) | | | $(0.15 | ) | | | $(0.16 | ) |
Net asset value, end of period (x) | | | $29.90 | | | | $30.43 | | | | $24.82 | | | | $20.49 | | | | $17.91 | | | | $15.21 | |
Total return (%) (r)(s)(x) | | | 6.43 | (n) | | | 23.61 | | | | 22.03 | | | | 15.36 | | | | 18.73 | | | | 6.47 | |
Ratios (%) (to average net assets)
and Supplemental data: | | | | | | | | | | | | | | | | | |
Expenses before expense
reductions (f) | | | 0.80 | (a) | | | 0.80 | | | | 0.86 | | | | 0.90 | | | | 0.93 | | | | 0.99 | |
Expenses after expense
reductions (f) | | | 0.80 | (a) | | | 0.80 | | | | 0.86 | | | | 0.90 | | | | 0.93 | | | | 0.98 | |
Net investment income | | | 0.92 | (a) | | | 0.73 | | | | 1.05 | | | | 0.86 | | | | 0.83 | | | | 0.93 | |
Portfolio turnover | | | 31 | (n) | | | 48 | | | | 58 | | | | 65 | | | | 66 | | | | 77 | |
Net assets at end of period
(000 omitted) | | | $52,491 | | | | $45,089 | | | | $29,812 | | | | $20,441 | | | | $17,250 | | | | $16,291 | |
| Supplemental Ratios (%): | | | | | | | | | | | | | | | | | |
Ratio of expenses to average
net assets after expense
reductions excluding short sale
dividend and interest expense (f) | | | 0.79 | (a) | | | 0.80 | | | | 0.86 | | | | 0.90 | | | | 0.92 | | | | 0.97 | |
See notes to financial statements
21
Financial Highlights – continued
| | | | | | | | | | | | | | | | | | | | | | | | |
| | | Six months
ended
2/28/15
(unaudited) | | | Years ended 8/31 | |
| Class R1 | | | 2014 | | | 2013 | | | 2012 | | | 2011 | | | 2010 | |
| | | | | | | | | | | | | | | | | |
Net asset value, beginning
of period | | | $26.54 | | | | $21.69 | | | | $17.95 | | | | $15.72 | | | | $13.38 | | | | $12.75 | |
| Income (loss) from investment operations | | | | | | | | | | | | | | | | | |
Net investment income (loss) (d) | | | $(0.01 | ) | | | $(0.06 | ) | | | $0.02 | | | | $(0.02 | ) | | | $(0.02 | ) | | | $(0.01 | ) |
Net realized and unrealized
gain (loss) on investments
and foreign currency | | | 1.45 | | | | 4.91 | | | | 3.72 | | | | 2.25 | | | | 2.37 | | | | 0.70 | |
Total from investment operations | | | $1.44 | | | | $4.85 | | | | $3.74 | | | | $2.23 | | | | $2.35 | | | | $0.69 | |
| Less distributions declared to shareholders | | | | | | | | | | | | | | | | | |
From net investment income | | | $— | | | | $(0.00 | )(w) | | | $— | | | | $— | | | | $(0.01 | ) | | | $(0.06 | ) |
From net realized gain on
investments | | | (2.15 | ) | | | — | | | | — | | | | — | | | | — | | | | — | |
Total distributions declared to
shareholders | | | $(2.15 | ) | | | $(0.00 | )(w) | | | $— | | | | $— | | | | $(0.01 | ) | | | $(0.06 | ) |
Net asset value, end of period (x) | | | $25.83 | | | | $26.54 | | | | $21.69 | | | | $17.95 | | | | $15.72 | | | | $13.38 | |
Total return (%) (r)(s)(x) | | | 5.88 | (n) | | | 22.38 | | | | 20.84 | | | | 14.19 | | | | 17.56 | | | | 5.43 | |
Ratios (%) (to average net assets)
and Supplemental data: | | | | | | | | | | | | | | | | | |
Expenses before expense
reductions (f) | | | 1.80 | (a) | | | 1.80 | | | | 1.86 | | | | 1.90 | | | | 1.93 | | | | 1.99 | |
Expenses after expense
reductions (f) | | | 1.80 | (a) | | | 1.80 | | | | 1.86 | | | | 1.90 | | | | 1.93 | | | | 1.98 | |
Net investment income (loss) | | | (0.09 | )(a) | | | (0.26 | ) | | | 0.08 | | | | (0.14 | ) | | | (0.15 | ) | | | (0.07 | ) |
Portfolio turnover | | | 31 | (n) | | | 48 | | | | 58 | | | | 65 | | | | 66 | | | | 77 | |
Net assets at end of period
(000 omitted) | | | $4,500 | | | | $4,132 | | | | $3,839 | | | | $4,098 | | | | $3,904 | | | | $3,688 | |
| Supplemental Ratios (%): | | | | | | | | | | | | | | | | | | | | | | | | |
Ratio of expenses to average
net assets after expense
reductions excluding short sale
dividend and interest expense (f) | | | 1.79 | (a) | | | 1.80 | | | | 1.85 | | | | 1.90 | | | | 1.92 | | | | 1.97 | |
See notes to financial statements
22
Financial Highlights – continued
| | | | | | | | | | | | | | | | | | | | | | | | |
| | | Six months
ended
2/28/15
(unaudited) | | | Years ended 8/31 | |
| Class R2 | | | 2014 | | | 2013 | | | 2012 | | | 2011 | | | 2010 | |
| | | | | | | | | | | | | | | | | |
Net asset value, beginning
of period | | | $28.59 | | | | $23.35 | | | | $19.28 | | | | $16.86 | | | | $14.33 | | | | $13.62 | |
| Income (loss) from investment operations | | | | | | | | | | | | | | | | | |
Net investment income (d) | | | $0.06 | | | | $0.06 | | | | $0.12 | | | | $0.06 | | | | $0.06 | | | | $0.06 | |
Net realized and unrealized
gain (loss) on investments
and foreign currency | | | 1.58 | | | | 5.29 | | | | 4.00 | | | | 2.42 | | | | 2.54 | | | | 0.75 | |
Total from investment operations | | | $1.64 | | | | $5.35 | | | | $4.12 | | | | $2.48 | | | | $2.60 | | | | $0.81 | |
| Less distributions declared to shareholders | | | | | | | | | | | | | | | | | |
From net investment income | | | $(0.03 | ) | | | $(0.11 | ) | | | $(0.05 | ) | | | $(0.06 | ) | | | $(0.07 | ) | | | $(0.10 | ) |
From net realized gain on
investments | | | (2.15 | ) | | | — | | | | — | | | | — | | | | — | | | | — | |
Total distributions declared to
shareholders | | | $(2.18 | ) | | | $(0.11 | ) | | | $(0.05 | ) | | | $(0.06 | ) | | | $(0.07 | ) | | | $(0.10 | ) |
Net asset value, end of period (x) | | | $28.05 | | | | $28.59 | | | | $23.35 | | | | $19.28 | | | | $16.86 | | | | $14.33 | |
Total return (%) (r)(s)(x) | | | 6.17 | (n) | | | 22.96 | | | | 21.44 | | | | 14.74 | | | | 18.14 | | | | 5.97 | |
Ratios (%) (to average net assets)
and Supplemental data: | | | | | | | | | | | | | | | | | |
Expenses before expense
reductions (f) | | | 1.30 | (a) | | | 1.30 | | | | 1.36 | | | | 1.40 | | | | 1.43 | | | | 1.49 | |
Expenses after expense
reductions (f) | | | 1.30 | (a) | | | 1.30 | | | | 1.36 | | | | 1.40 | | | | 1.43 | | | | 1.48 | |
Net investment income | | | 0.41 | (a) | | | 0.24 | | | | 0.56 | | | | 0.36 | | | | 0.35 | | | | 0.43 | |
Portfolio turnover | | | 31 | (n) | | | 48 | | | | 58 | | | | 65 | | | | 66 | | | | 77 | |
Net assets at end of period
(000 omitted) | | | $19,057 | | | | $19,434 | | | | $19,625 | | | | $17,369 | | | | $16,424 | | | | $14,013 | |
| Supplemental Ratios (%): | | | | | | | | | | | | | | | | | | | | | | | | |
Ratio of expenses to average
net assets after expense
reductions excluding short sale
dividend and interest expense (f) | | | 1.29 | (a) | | | 1.30 | | | | 1.36 | | | | 1.40 | | | | 1.42 | | | | 1.47 | |
See notes to financial statements
23
Financial Highlights – continued
| | | | | | | | | | | | | | | | | | | | | | | | |
| | | Six months
ended
2/28/15
(unaudited) | | | Years ended 8/31 | |
| Class R3 | | | 2014 | | | 2013 | | | 2012 | | | 2011 | | | 2010 | |
| | | | | | | | | | | | | | | | | |
Net asset value, beginning
of period | | | $29.10 | | | | $23.75 | | | | $19.63 | | | | $17.16 | | | | $14.59 | | | | $13.85 | |
| Income (loss) from investment operations | | | | | | | | | | | | | | | | | |
Net investment income (d) | | | $0.09 | | | | $0.13 | | | | $0.18 | | | | $0.11 | | | | $0.11 | | | | $0.10 | |
Net realized and unrealized
gain (loss) on investments
and foreign currency | | | 1.61 | | | | 5.39 | | | | 4.05 | | | | 2.47 | | | | 2.57 | | | | 0.77 | |
Total from investment operations | | | $1.70 | | | | $5.52 | | | | $4.23 | | | | $2.58 | | | | $2.68 | | | | $0.87 | |
| Less distributions declared to shareholders | | | | | | | | | | | | | | | | | |
From net investment income | | | $(0.13 | ) | | | $(0.17 | ) | | | $(0.11 | ) | | | $(0.11 | ) | | | $(0.11 | ) | | | $(0.13 | ) |
From net realized gain on
investments | | | (2.15 | ) | | | — | | | | — | | | | — | | | | — | | | | — | |
Total distributions declared to
shareholders | | | $(2.28 | ) | | | $(0.17 | ) | | | $(0.11 | ) | | | $(0.11 | ) | | | $(0.11 | ) | | | $(0.13 | ) |
Net asset value, end of period (x) | | | $28.52 | | | | $29.10 | | | | $23.75 | | | | $19.63 | | | | $17.16 | | | | $14.59 | |
Total return (%) (r)(s)(x) | | | 6.28 | (n) | | | 23.32 | | | | 21.68 | | | | 15.12 | | | | 18.38 | | | | 6.25 | |
Ratios (%) (to average net assets)
and Supplemental data: | | | | | | | | | | | | | | | | | |
Expenses before expense
reductions (f) | | | 1.05 | (a) | | | 1.05 | | | | 1.11 | | | | 1.15 | | | | 1.18 | | | | 1.24 | |
Expenses after expense
reductions (f) | | | 1.05 | (a) | | | 1.05 | | | | 1.11 | | | | 1.15 | | | | 1.18 | | | | 1.23 | |
Net investment income | | | 0.67 | (a) | | | 0.49 | | | | 0.81 | | | | 0.61 | | | | 0.60 | | | | 0.68 | |
Portfolio turnover | | | 31 | (n) | | | 48 | | | | 58 | | | | 65 | | | | 66 | | | | 77 | |
Net assets at end of period
(000 omitted) | | | $73,716 | | | | $68,977 | | | | $58,381 | | | | $46,833 | | | | $32,277 | | | | $26,573 | |
| Supplemental Ratios (%): | | | | | | | | | | | | | | | | | |
Ratio of expenses to average
net assets after expense
reductions excluding short sale
dividend and interest expense (f) | | | 1.04 | (a) | | | 1.05 | | | | 1.10 | | | | 1.15 | | | | 1.17 | | | | 1.22 | |
See notes to financial statements
24
Financial Highlights – continued
| | | | | | | | | | | | | | | | | | | | | | | | |
| | | Six months
ended
2/28/15
(unaudited) | | | Years ended 8/31 | |
| Class R4 | | | 2014 | | | 2013 | | | 2012 | | | 2011 | | | 2010 | |
| | | | | | | | | | | | | | | | | |
Net asset value, beginning
of period | | | $29.40 | | | | $23.99 | | | | $19.81 | | | | $17.32 | | | | $14.72 | | | | $13.98 | |
| Income (loss) from investment operations | | | | | | | | | | | | | | | | | |
Net investment income (d) | | | $0.13 | | | | $0.20 | | | | $0.23 | | | | $0.16 | | | | $0.13 | | | | $0.14 | |
Net realized and unrealized
gain (loss) on investments
and foreign currency | | | 1.61 | | | | 5.44 | | | | 4.11 | | | | 2.48 | | | | 2.62 | | | | 0.76 | |
Total from investment operations | | | $1.74 | | | | $5.64 | | | | $4.34 | | | | $2.64 | | | | $2.75 | | | | $0.90 | |
| Less distributions declared to shareholders | | | | | | | | | | | | | | | | | |
From net investment income | | | $(0.20 | ) | | | $(0.23 | ) | | | $(0.16 | ) | | | $(0.15 | ) | | | $(0.15 | ) | | | $(0.16 | ) |
From net realized gain on
investments | | | (2.15 | ) | | | — | | | | — | | | | — | | | | — | | | | — | |
Total distributions declared to
shareholders | | | $(2.35 | ) | | | $(0.23 | ) | | | $(0.16 | ) | | | $(0.15 | ) | | | $(0.15 | ) | | | $(0.16 | ) |
Net asset value, end of period (x) | | | $28.79 | | | | $29.40 | | | | $23.99 | | | | $19.81 | | | | $17.32 | | | | $14.72 | |
Total return (%) (r)(s)(x) | | | 6.40 | (n) | | | 23.62 | | | | 22.03 | | | | 15.36 | | | | 18.68 | | | | 6.40 | |
Ratios (%) (to average net assets)
and Supplemental data: | | | | | | | | | | | | | | | | | |
Expenses before expense
reductions (f) | | | 0.80 | (a) | | | 0.81 | | | | 0.86 | | | | 0.91 | | | | 0.92 | | | | 0.98 | |
Expenses after expense
reductions (f) | | | 0.80 | (a) | | | 0.80 | | | | 0.86 | | | | 0.90 | | | | 0.92 | | | | 0.97 | |
Net investment income | | | 0.92 | (a) | | | 0.72 | | | | 1.04 | | | | 0.86 | | | | 0.75 | | | | 0.92 | |
Portfolio turnover | | | 31 | (n) | | | 48 | | | | 58 | | | | 65 | | | | 66 | | | | 77 | |
Net assets at end of period
(000 omitted) | | | $21,397 | | | | $19,706 | | | | $6,165 | | | | $1,871 | | | | $1,367 | | | | $408 | |
| Supplemental Ratios (%): | | | | | | | | | | | | | | | | | |
Ratio of expenses to average
net assets after expense
reductions excluding short sale
dividend and interest expense (f) | | | 0.79(a | ) | | | 0.80 | | | | 0.86 | | | | 0.90 | | | | 0.91 | | | | 0.97 | |
See notes to financial statements
25
Financial Highlights – continued
| | | | | | | | | | | | |
| | | Six months
ended
2/28/15
(unaudited) | | | Years ended 8/31 | |
| Class R5 | | | 2014 | | | 2013 (i) | |
| | | | | | | | | |
Net asset value, beginning of period | | | $30.47 | | | | $24.84 | | | | $21.02 | |
| Income (loss) from investment operations | | | | | | | | | | | | |
Net investment income (d) | | | $0.15 | | | | $0.23 | | | | $0.22 | |
Net realized and unrealized gain (loss) on investments
and foreign currency | | | 1.68 | | | | 5.64 | | | | 3.60 | |
Total from investment operations | | | $1.83 | | | | $5.87 | | | | $3.82 | |
| Less distributions declared to shareholders | | | | | | | | | | | | |
From net investment income | | | $(0.22 | ) | | | $(0.24 | ) | | | $— | |
From net realized gain on investments | | | (2.15 | ) | | | — | | | | — | |
Total distributions declared to shareholders | | | $(2.37 | ) | | | $(0.24 | ) | | | $— | |
Net asset value, end of period (x) | | | $29.93 | | | | $30.47 | | | | $24.84 | |
Total return (%) (r)(s)(x) | | | 6.46 | (n) | | | 23.73 | | | | 18.17 | (n) |
Ratios (%) (to average net assets)
and Supplemental data: | | | | | | | | | | | | |
Expenses before expense reductions (f) | | | 0.71 | (a) | | | 0.71 | | | | 0.76 | (a) |
Expenses after expense reductions (f) | | | 0.70 | (a) | | | 0.71 | | | | 0.76 | (a) |
Net investment income | | | 1.01 | (a) | | | 0.80 | | | | 1.39 | (a) |
Portfolio turnover | | | 31 | (n) | | | 48 | | | | 58 | |
Net assets at end of period (000 omitted) | | | $2,470 | | | | $2,492 | | | | $119 | |
| Supplemental Ratios (%): | | | | | | | | | | | | |
Ratio of expenses to average net assets after expense
reductions excluding short sale dividend and interest
expense (f) | | | 0.70 | (a) | | | 0.71 | | | | 0.75 | (a) |
| (d) | Per share data is based on average shares outstanding. |
| (f) | Ratios do not reflect reductions from fees paid indirectly, if applicable. |
| (i) | For the period from the class inception, January 2, 2013, through the stated period end. |
| (r) | Certain expenses have been reduced without which performance would have been lower. |
| (s) | From time to time the fund may receive proceeds from litigation settlements, without which performance would be lower. |
| (t) | Total returns do not include any applicable sales charges. |
| (w) | Per share amount was less than $0.01. |
| (x) | The net asset values per share and total returns have been calculated on net assets which include adjustments made in accordance with U.S. generally accepted accounting principles required at period end for financial reporting purposes. |
See notes to financial statements
26
NOTES TO FINANCIAL STATEMENTS
(unaudited)
(1) Business and Organization
MFS Core Equity Fund (the fund) is a diversified series of MFS Series Trust I (the trust). The trust is organized as a Massachusetts business trust and is registered under the Investment Company Act of 1940, as amended, as an open-end management investment company.
The fund is an investment company and accordingly follows the investment company accounting and reporting guidance of the Financial Accounting Standards Board (FASB) Accounting Standards Codification Topic 946 Financial Services – Investment Companies.
(2) Significant Accounting Policies
General – The preparation of financial statements in conformity with U.S. generally accepted accounting principles requires management to make estimates and assumptions that affect the reported amounts of assets and liabilities, and disclosure of contingent assets and liabilities at the date of the financial statements and the reported amounts of increases and decreases in net assets from operations during the reporting period. Actual results could differ from those estimates. In the preparation of these financial statements, management has evaluated subsequent events occurring after the date of the fund’s Statement of Assets and Liabilities through the date that the financial statements were issued.
In June 2014, FASB issued Accounting Standards Update 2014-11, Transfers and Servicing (Topic 860) – Repurchase-to-Maturity Transactions, Repurchase Financings, and Disclosures (“ASU 2014-11”). ASU 2014-11 changes the accounting for repurchase-to-maturity transactions (i.e., repurchase agreements that settle at the same time as the maturity of the transferred financial asset) and enhances the required disclosures for repurchase agreements and other similar transactions. Although still evaluating the potential impacts of ASU 2014-11 to the fund, management expects that the impact of the fund’s adoption will be limited to additional financial statement disclosures which would first be effective for interim reporting periods beginning after March 15, 2015.
Balance Sheet Offsetting – The fund’s accounting policy with respect to balance sheet offsetting is that, absent an event of default by the counterparty or a termination of the agreement, the International Swaps and Derivatives Association (ISDA) Master Agreement does not result in an offset of reported amounts of financial assets and financial liabilities in the Statement of Assets and Liabilities across transactions between the fund and the applicable counterparty. The fund’s right to setoff may be restricted or prohibited by the bankruptcy or insolvency laws of the particular jurisdiction to which a specific master netting agreement counterparty is subject. Balance sheet offsetting disclosures, to the extent applicable to the fund, have been included in the fund’s Significant Accounting Policies note under the captions for each of the fund’s in-scope financial instruments and transactions.
Investment Valuations – Equity securities, including restricted equity securities, are generally valued at the last sale or official closing price as provided by a third-party
27
Notes to Financial Statements (unaudited) – continued
pricing service on the market or exchange on which they are primarily traded. Equity securities, for which there were no sales reported that day, are generally valued at the last quoted daily bid quotation as provided by a third-party pricing service on the market or exchange on which such securities are primarily traded. Equity securities held short, for which there were no sales reported for that day, are generally valued at the last quoted daily ask quotation as provided by a third-party pricing service on the market or exchange on which such securities are primarily traded. Short-term instruments with a maturity at issuance of 60 days or less may be valued at amortized cost, which approximates market value. Open-end investment companies are generally valued at net asset value per share. Securities and other assets generally valued on the basis of information from a third-party pricing service may also be valued at a broker/dealer bid quotation. Values obtained from third-party pricing services can utilize both transaction data and market information such as yield, quality, coupon rate, maturity, type of issue, trading characteristics, and other market data. The values of foreign securities and other assets and liabilities expressed in foreign currencies are converted to U.S. dollars using the mean of bid and asked prices for rates provided by a third-party pricing service.
The Board of Trustees has delegated primary responsibility for determining or causing to be determined the value of the fund’s investments (including any fair valuation) to the adviser pursuant to valuation policies and procedures approved by the Board. If the adviser determines that reliable market quotations are not readily available, investments are valued at fair value as determined in good faith by the adviser in accordance with such procedures under the oversight of the Board of Trustees. Under the fund’s valuation policies and procedures, market quotations are not considered to be readily available for most types of debt instruments and floating rate loans and many types of derivatives. These investments are generally valued at fair value based on information from third-party pricing services. In addition, investments may be valued at fair value if the adviser determines that an investment’s value has been materially affected by events occurring after the close of the exchange or market on which the investment is principally traded (such as foreign exchange or market) and prior to the determination of the fund’s net asset value, or after the halting of trading of a specific security where trading does not resume prior to the close of the exchange or market on which the security is principally traded. Events that occur on a frequent basis after foreign markets close (such as developments in foreign markets and significant movements in the U.S. markets) and prior to the determination of the fund’s net asset value may be deemed to have a material effect on the value of securities traded in foreign markets. Accordingly, the fund’s foreign equity securities may often be valued at fair value. The adviser generally relies on third-party pricing services or other information (such as the correlation with price movements of similar securities in the same or other markets; the type, cost and investment characteristics of the security; the business and financial condition of the issuer; and trading and other market data) to assist in determining whether to fair value and at what value to fair value an investment. The value of an investment for purposes of calculating the fund’s net asset value can differ depending on the source and method used to determine value. When fair valuation is used, the value of an investment used to determine the fund’s net asset value may differ from quoted or published prices for the same investment. There can be no assurance that
28
Notes to Financial Statements (unaudited) – continued
the fund could obtain the fair value assigned to an investment if it were to sell the investment at the same time at which the fund determines its net asset value per share.
Various inputs are used in determining the value of the fund’s assets or liabilities. These inputs are categorized into three broad levels. In certain cases, the inputs used to measure fair value may fall into different levels of the fair value hierarchy. In such cases, an investment’s level within the fair value hierarchy is based on the lowest level of input that is significant to the fair value measurement. The fund’s assessment of the significance of a particular input to the fair value measurement in its entirety requires judgment, and considers factors specific to the investment. Level 1 includes unadjusted quoted prices in active markets for identical assets or liabilities. Level 2 includes other significant observable market-based inputs (including quoted prices for similar securities, interest rates, prepayment speed, and credit risk). Level 3 includes unobservable inputs, which may include the adviser’s own assumptions in determining the fair value of investments. The following is a summary of the levels used as of February 28, 2015 in valuing the fund’s assets or liabilities:
| | | | | | | | | | | | | | | | |
| Investments at Value | | Level 1 | | | Level 2 | | | Level 3 | | | Total | |
| Equity Securities: | | | | | | | | | | | | | | | | |
United States | | | $1,300,519,870 | | | | $— | | | | $— | | | | $1,300,519,870 | |
Canada | | | 32,406,036 | | | | — | | | | — | | | | 32,406,036 | |
Israel | | | 6,754,591 | | | | — | | | | — | | | | 6,754,591 | |
Hong Kong | | | 6,215,516 | | | | — | | | | — | | | | 6,215,516 | |
United Arab Emirates | | | 748,924 | | | | — | | | | — | | | | 748,924 | |
Cayman Islands | | | — | | | | — | | | | 211,043 | | | | 211,043 | |
| Mutual Funds | | | 12,386,604 | | | | — | | | | — | | | | 12,386,604 | |
| Total Investments | | | $1,359,031,541 | | | | $— | | | | $211,043 | | | | $1,359,242,584 | |
| Short Sales | | | $(2,553,248 | ) | | | $— | | | | $— | | | | $(2,553,248 | ) |
For further information regarding security characteristics, see the Portfolio of Investments.
The following is a reconciliation of level 3 assets for which significant unobservable inputs were used to determine fair value. The fund’s policy is to recognize transfers between the levels as of the end of the period. The table presents the activity of level 3 securities held at the beginning and the end of the period.
| | | | |
| | | Equity Securities | |
| Balance as of 8/31/14 | | | $274,485 | |
Change in unrealized appreciation (depreciation) | | | (63,442 | ) |
| Balance as of 2/28/15 | | | $211,043 | |
The net change in unrealized appreciation (depreciation) from investments still held as level 3 at February 28, 2015 is $(63,442). At February 28, 2015, the fund held one level 3 security.
Foreign Currency Translation – Purchases and sales of foreign investments, income, and expenses are converted into U.S. dollars based upon currency exchange rates prevailing on the respective dates of such transactions or on the reporting date for foreign denominated receivables and payables. Gains and losses attributable to foreign currency exchange rates on sales of securities are recorded for financial statement
29
Notes to Financial Statements (unaudited) – continued
purposes as net realized gains and losses on investments. Gains and losses attributable to foreign exchange rate movements on receivables, payables, income and expenses are recorded for financial statement purposes as foreign currency transaction gains and losses. That portion of both realized and unrealized gains and losses on investments that results from fluctuations in foreign currency exchange rates is not separately disclosed.
Short Sales – The fund entered into short sales whereby it sells a security it does not own in anticipation of a decline in the value of that security. The fund will realize a gain if the security price decreases and a loss if the security price increases between the date of the short sale and the date on which the fund replaces the borrowed security. Losses from short sales can exceed the proceeds of the security sold; and they can also exceed the potential loss from an ordinary buy and sell transaction. The amount of any premium, dividends, or interest the fund may be required to pay in connection with a short sale will be recognized as a fund expense. During the six months ended February 28, 2015, this expense amounted to $24,386. The fund segregates cash or marketable securities in an amount that, when combined with the amount of proceeds from the short sale deposited with the broker, at least equals the current market value of the security sold short.
Security Loans – Under its Securities Lending Agency Agreement with the fund, State Street Bank and Trust Company (“State Street”), as lending agent, loans the securities of the fund to certain qualified institutions (the “Borrowers”) approved by the fund. The loans are collateralized by cash and/or U.S. Treasury and federal agency obligations in an amount typically at least equal to the market value of the securities loaned. On loans collateralized by cash, the cash collateral is invested in a money market fund. The market value of the loaned securities is determined at the close of business of the fund and any additional required collateral is delivered to the fund on the next business day. State Street provides the fund with indemnification against Borrower default. In the event of Borrower default, State Street will for the benefit of the fund either purchase securities identical to those loaned or, when such purchase is commercially impracticable, pay the fund the market value of the loaned securities. In return, State Street assumes the fund’s rights to the related collateral. If the collateral value is less than the cost to purchase identical securities, State Street is responsible for the shortfall, but only to the extent that such shortfall is not due to a decline in collateral value resulting from collateral reinvestment for which the fund bears the risk of loss. At period end, the fund had investment securities on loan with a fair value of $2,917,816 and a related liability of $3,001,002 for cash collateral received on securities loaned, both of which are presented gross in the Statement of Assets and Liabilities. The collateral received on securities loaned exceeded the value of securities on loan at period end. The liability for cash collateral for securities loaned is carried at fair value, which is categorized as level 2 within the fair value hierarchy. A portion of the income generated upon investment of the collateral is remitted to the Borrowers, and the remainder is allocated between the fund and the lending agent. On loans collateralized by U.S. Treasury and/or federal agency obligations, a fee is received from the Borrower, and is allocated between the fund and the lending agent. Income from securities
30
Notes to Financial Statements (unaudited) – continued
lending is included in “Interest” income in the Statement of Operations. The dividend and interest income earned on the securities loaned is accounted for in the same manner as other dividend and interest income.
Indemnifications – Under the fund’s organizational documents, its officers and Trustees may be indemnified against certain liabilities and expenses arising out of the performance of their duties to the fund. Additionally, in the normal course of business, the fund enters into agreements with service providers that may contain indemnification clauses. The fund’s maximum exposure under these agreements is unknown as this would involve future claims that may be made against the fund that have not yet occurred.
Investment Transactions and Income – Investment transactions are recorded on the trade date. Interest income is recorded on the accrual basis. Dividends received in cash are recorded on the ex-dividend date. Certain dividends from foreign securities will be recorded when the fund is informed of the dividend if such information is obtained subsequent to the ex-dividend date. Dividend and interest payments received in additional securities are recorded on the ex-dividend or ex-interest date in an amount equal to the value of the security on such date.
The fund may receive proceeds from litigation settlements. Any proceeds received from litigation involving portfolio holdings are reflected in the Statement of Operations in realized gain/loss if the security has been disposed of by the fund or in unrealized gain/loss if the security is still held by the fund. Any other proceeds from litigation not related to portfolio holdings are reflected as other income in the Statement of Operations.
Fees Paid Indirectly – The fund’s custody fee may be reduced according to an arrangement that measures the value of cash deposited with the custodian by the fund. This amount, for the six months ended February 28, 2015, is shown as a reduction of total expenses in the Statement of Operations.
Tax Matters and Distributions – The fund intends to qualify as a regulated investment company, as defined under Subchapter M of the Internal Revenue Code, and to distribute all of its taxable income, including realized capital gains. As a result, no provision for federal income tax is required. The fund’s federal tax returns, when filed, will remain subject to examination by the Internal Revenue Service for a three year period. Management has analyzed the fund’s tax positions taken on federal and state tax returns for all open tax years and does not believe that there are any uncertain tax positions that require recognition of a tax liability. Foreign taxes, if any, have been accrued by the fund in the accompanying financial statements in accordance with the applicable foreign tax law. Foreign income taxes may be withheld by certain countries in which the fund invests. Additionally, capital gains realized by the fund on securities issued in or by certain foreign countries may be subject to capital gains tax imposed by those countries.
Distributions to shareholders are recorded on the ex-dividend date. Income and capital gain distributions are determined in accordance with income tax regulations, which may differ from U.S. generally accepted accounting principles. Certain capital accounts in the financial statements are periodically adjusted for permanent differences in order to reflect their tax character. These adjustments have no impact on net assets or
31
Notes to Financial Statements (unaudited) – continued
net asset value per share. Temporary differences which arise from recognizing certain items of income, expense, gain or loss in different periods for financial statement and tax purposes will reverse at some time in the future. Distributions in excess of net investment income or net realized gains are temporary overdistributions for financial statement purposes resulting from differences in the recognition or classification of income or distributions for financial statement and tax purposes.
Book/tax differences primarily relate to wash sale loss deferrals, straddle loss deferrals, and treating a portion of the proceeds from redemptions as a distribution for tax purposes.
The tax character of distributions made during the current period will be determined at fiscal year end. The tax character of distributions declared to shareholders for the last fiscal year is as follows:
| | | | |
| | | 8/31/14 | |
Ordinary income (including any
short-term capital gains) | | | $7,149,277 | |
The federal tax cost and the tax basis components of distributable earnings were as follows:
| | | | |
| As of 2/28/15 | | | |
| Cost of investments | | | $1,040,674,994 | |
| Gross appreciation | | | 346,463,498 | |
| Gross depreciation | | | (27,895,908 | ) |
| Net unrealized appreciation (depreciation) | | | $318,567,590 | |
| |
| As of 8/31/14 | | | |
| Undistributed ordinary income | | | 40,337,229 | |
| Undistributed long-term capital gain | | | 60,026,109 | |
| Capital loss carryforwards | | | (6,399,816 | ) |
| Other temporary differences | | | (432,570 | ) |
| Net unrealized appreciation (depreciation) | | | 312,766,439 | |
The aggregate cost above includes prior fiscal year end tax adjustments, if applicable.
Under the Regulated Investment Company Modernization Act of 2010 (the “Act”), net capital losses recognized for fund fiscal years beginning after August 31, 2011, may be carried forward indefinitely, and their character is retained as short-term and/or long-term losses (“post-enactment losses”). Previously, net capital losses were carried forward for eight years and treated as short-term losses (“pre-enactment losses”). As a transition rule, the Act requires that all post-enactment net capital losses be used before pre-enactment net capital losses.
As of August 31, 2014, the fund had capital loss carryforwards available to offset future realized gains. Such pre-enactment losses expire as follows:
The availability of $6,399,816 of the capital loss carryforwards, which were acquired on July 24, 2009 in connection with the MFS Endeavor Fund merger, may be limited in a given year.
32
Notes to Financial Statements (unaudited) – continued
Multiple Classes of Shares of Beneficial Interest – The fund offers multiple classes of shares, which differ in their respective distribution and service fees. The fund’s income, realized and unrealized gain (loss), and common expenses are allocated to shareholders based on the daily net assets of each class. Dividends are declared separately for each class. Differences in per share dividend rates are generally due to differences in separate class expenses. Class B shares will convert to Class A shares approximately eight years after purchase. The fund’s distributions declared to shareholders as reported in the Statements of Changes in Net Assets are presented by class as follows:
| | | | | | | | | | | | | | | | |
| | | From net investment
income | | | From net realized gain on
investments | |
| | | Six months
ended
2/28/15 | | | Year
ended
8/31/14 | | | Six months
ended
2/28/15 | | | Year
ended
8/31/14 | |
| Class A | | | $4,295,673 | | | | $6,151,825 | | | | $73,002,676 | | | | $— | |
| Class B | | | — | | | | — | | | | 3,135,634 | | | | — | |
| Class C | | | — | | | | 97,951 | | | | 7,201,066 | | | | — | |
| Class I | | | 325,586 | | | | 313,713 | | | | 3,509,320 | | | | — | |
| Class R1 | | | — | | | | 485 | | | | 336,539 | | | | — | |
| Class R2 | | | 18,884 | | | | 88,902 | | | | 1,366,894 | | | | — | |
| Class R3 | | | 301,920 | | | | 423,237 | | | | 5,094,315 | | | | — | |
| Class R4 | | | 137,694 | | | | 72,032 | | | | 1,445,918 | | | | — | |
| Class R5 | | | 18,378 | | | | 1,132 | | | | 178,148 | | | | — | |
| Total | | | $5,098,135 | | | | $7,149,277 | | | | $95,270,510 | | | | $— | |
(3) Transactions with Affiliates
Investment Adviser – The fund has an investment advisory agreement with MFS to provide overall investment management and related administrative services and facilities to the fund. The management fee is computed daily and paid monthly at the following annual rates:
| | | | |
| First $500 million of average daily net assets | | | 0.65 | % |
| Average daily net assets in excess of $500 million | | | 0.55 | % |
The investment adviser has agreed in writing to reduce its management fee to 0.50% of average daily net in excess of $2.5 billion. This written agreement will continue until modified by the fund’s Board of Trustees, but such agreement will continue at least until December 31, 2015. For the six months ended February 28, 2015, the fund’s average daily net assets did not exceed $2.5 billion and therefore, the management fee was not reduced in accordance with this agreement. MFS has also agreed in writing to reduce its management fee by a specified amount if certain MFS mutual fund assets exceed thresholds agreed to by MFS and the fund’s Board of Trustees. For the six months ended February 28, 2014, this management fee reduction amounted to $38,982, which is included in the reduction of total expenses in the Statement of Operations. The management fee incurred for the six months ended February 28, 2015 was equivalent to an annual effective rate of 0.58% of the fund’s average daily net assets.
33
Notes to Financial Statements (unaudited) – continued
Distributor – MFS Fund Distributors, Inc. (MFD), a wholly-owned subsidiary of MFS, as distributor, received $154,993 for the six months ended February 28, 2015, as its portion of the initial sales charge on sales of Class A shares of the fund.
The Board of Trustees has adopted a distribution plan for certain share classes pursuant to Rule 12b-1 of the Investment Company Act of 1940.
The fund’s distribution plan provides that the fund will pay MFD for services provided by MFD and financial intermediaries in connection with the distribution and servicing of certain share classes. One component of the plan is a distribution fee paid to MFD and another component of the plan is a service fee paid to MFD. MFD may subsequently pay all, or a portion, of the distribution and/or service fees to financial intermediaries.
Distribution Plan Fee Table:
| | | | | | | | | | | | | | | | | | | | |
| | | Distribution
Fee Rate (d) | | | Service
Fee Rate (d) | | | Total
Distribution
Plan (d) | | | Annual
Effective
Rate (e) | | | Distribution
and Service
Fee | |
| Class A | | | — | | | | 0.25% | | | | 0.25% | | | | 0.24% | | | | $1,234,442 | |
| Class B | | | 0.75% | | | | 0.25% | | | | 1.00% | | | | 1.00% | | | | 194,246 | |
| Class C | | | 0.75% | | | | 0.25% | | | | 1.00% | | | | 1.00% | | | | 442,617 | |
| Class R1 | | | 0.75% | | | | 0.25% | | | | 1.00% | | | | 1.00% | | | | 20,835 | |
| Class R2 | | | 0.25% | | | | 0.25% | | | | 0.50% | | | | 0.50% | | | | 45,636 | |
| Class R3 | | | — | | | | 0.25% | | | | 0.25% | | | | 0.25% | | | | 85,934 | |
| Total Distribution and Service Fees | | | | $2,023,710 | |
| (d) | In accordance with the distribution plan for certain classes, the fund pays distribution and/or service fees equal to these annual percentage rates of each class’s average daily net assets. The distribution and service fee rates disclosed by class represent the current rates in effect at the end of the reporting period. Any rate changes, if applicable, are detailed below. |
| (e) | The annual effective rates represent actual fees incurred under the distribution plan for the six months ended February 28, 2015 based on each class’s average daily net assets. MFD has voluntarily agreed to rebate a portion of each class’s 0.25% service fee attributable to accounts for which MFD retains the 0.25% service fee except for accounts attributable to MFS or its affiliates’ seed money. For the six months ended February 28, 2015, this rebate amounted to $28,384, $270, $1,035, and $65 for Class A, Class B, Class C, and Class R3, respectively, and is included in the reduction of total expenses in the Statement of Operations. |
Certain Class A shares are subject to a contingent deferred sales charge (CDSC) in the event of a shareholder redemption within 18 months of purchase. Class C shares are subject to a CDSC in the event of a shareholder redemption within 12 months of purchase. Class B shares are subject to a CDSC in the event of a shareholder redemption within six years of purchase. All contingent deferred sales charges are paid to MFD and during the six months ended February 28, 2015, were as follows:
| | | | |
| | | Amount | |
| Class A | | | $324 | |
| Class B | | | 16,723 | |
| Class C | | | 1,307 | |
Shareholder Servicing Agent – MFS Service Center, Inc. (MFSC), a wholly-owned subsidiary of MFS, receives a fee from the fund for its services as shareholder servicing agent calculated as a percentage of the average daily net assets of the fund as
34
Notes to Financial Statements (unaudited) – continued
determined periodically under the supervision of the fund’s Board of Trustees. For the six months ended February 28, 2015, the fee was $242,831, which equated to 0.0380% annually of the fund’s average daily net assets. MFSC also receives payment from the fund for out-of-pocket expenses, sub-accounting and other shareholder servicing costs which may be paid to affiliated and unaffiliated service providers. Class R5 shares do not incur sub-accounting fees. For the six months ended February 28, 2015, these out-of-pocket expenses, sub-accounting and other shareholder servicing costs amounted to $747,434.
Administrator – MFS provides certain financial, legal, shareholder communications, compliance, and other administrative services to the fund. Under an administrative services agreement, the fund reimburses MFS the costs incurred to provide these services. The fund is charged an annual fixed amount of $17,500 plus a fee based on average daily net assets. The administrative services fee incurred for the six months ended February 28, 2015 was equivalent to an annual effective rate of 0.0170% of the fund’s average daily net assets.
Trustees’ and Officers’ Compensation – The fund pays compensation to independent Trustees in the form of a retainer, attendance fees, and additional compensation to Board and Committee chairpersons. The fund does not pay compensation directly to Trustees or officers of the fund who are also officers of the investment adviser, all of whom receive remuneration for their services to the fund from MFS. Certain officers and Trustees of the fund are officers or directors of MFS, MFD, and MFSC.
Prior to December 31, 2001, the fund had an unfunded defined benefit plan (“DB plan”) for independent Trustees. As of December 31, 2001, the Board took action to terminate the DB plan with respect to then-current and any future independent Trustees, such that the DB plan covers only certain of those former independent Trustees who retired on or before December 31, 2001. Effective January 1, 2002, accrued benefits under the DB plan for then-current independent Trustees who continued were credited to an unfunded retirement deferral plan (the “Retirement Deferral plan”), which was established for and exists solely with respect to these credited amounts, and is not available for other deferrals by these or other independent Trustees. Although the Retirement Deferral plan is unfunded, amounts deferred under the plan are periodically adjusted for investment experience as if they had been invested in shares of the fund. The DB plan resulted in a pension expense of $1,908 and the Retirement Deferral plan resulted in an expense of $2,544. Both amounts are included in independent Trustees’ compensation for the six months ended February 28, 2015. The liability for deferred retirement benefits payable to certain independent Trustees under both plans amounted to $84,650 at February 28, 2015, and is included in “Payable for independent Trustees’ compensation” in the Statement of Assets and Liabilities.
Other – Effective November 1, 2014, this fund and certain other funds managed by MFS (the funds) have entered into a service agreement (the ISO Agreement) which provides for payment of fees solely by the funds to Tarantino LLC in return for the provision of services of an Independent Senior Officer (ISO) for the funds. Frank L. Tarantino serves as the ISO and is an officer of the funds and the sole member of
35
Notes to Financial Statements (unaudited) – continued
Tarantino LLC. The funds can terminate the ISO Agreement with Tarantino LLC at any time under the terms of the ISO Agreement. Prior to November 1, 2014, the funds had entered into a service agreement (the Compliance Officer Agreement) which provided for payment of fees by the funds to Tarantino LLC in return for the provision of services of an Independent Chief Compliance Officer (ICCO) for the funds. Prior to November 1, 2014, Frank L. Tarantino served as the ICCO. Effective October 31, 2014, Mr. Tarantino resigned as ICCO and the Compliance Officer Agreement between the funds and Tarantino LLC was terminated. For the six months ended February 28, 2015, the aggregate fees paid by the fund under these agreements were $2,462 and are included in “Miscellaneous” expense in the Statement of Operations. MFS had agreed to reimburse the fund for a portion of the payments made by the fund for the services under the Compliance Officer Agreement in the amount of $427, which is included in the reduction of total expenses in the Statement of Operations. Additionally, MFS has agreed to bear all expenses associated with office space, other administrative support, and supplies provided to the ICCO and ISO.
The fund invests in the MFS Institutional Money Market Portfolio which is managed by MFS and seeks current income consistent with preservation of capital and liquidity. Income earned on this investment is included in “Dividends from underlying affiliated funds” in the Statement of Operations. This money market fund does not pay a management fee to MFS.
(4) Portfolio Securities
For the six months ended February 28, 2015, purchases and sales of investments, other than short sales, and short-term obligations, aggregated $399,633,016 and $414,747,913, respectively.
(5) Shares of Beneficial Interest
The fund’s Declaration of Trust permits the Trustees to issue an unlimited number of full and fractional shares of beneficial interest. Transactions in fund shares were as follows:
| | | | | | | | | | | | | | | | |
| | | Six months ended
2/28/15 | | | Year ended
8/31/14 | |
| | | Shares | | | Amount | | | Shares | | | Amount | |
| Shares sold | | | | | | | | | | | | | | | | |
Class A | | | 2,283,684 | | | | $63,964,132 | | | | 3,726,575 | | | | $98,779,253 | |
Class B | | | 75,363 | | | | 1,932,953 | | | | 128,799 | | | | 3,156,038 | |
Class C | | | 256,080 | | | | 6,494,772 | | | | 320,385 | | | | 7,756,813 | |
Class I | | | 254,497 | | | | 7,523,476 | | | | 489,647 | | | | 13,383,291 | |
Class R1 | | | 14,558 | | | | 362,924 | | | | 25,142 | | | | 616,104 | |
Class R2 | | | 56,526 | | | | 1,570,654 | | | | 114,651 | | | | 3,009,148 | |
Class R3 | | | 175,825 | | | | 4,938,682 | | | | 388,156 | | | | 10,206,825 | |
Class R4 | | | 88,004 | | | | 2,518,443 | | | | 568,620 | | | | 15,584,037 | |
Class R5 | | | 3,152 | | | | 94,529 | | | | 80,363 | | | | 2,205,958 | |
| | | 3,207,689 | | | | $89,400,565 | | | | 5,842,338 | | | | $154,697,467 | |
36
Notes to Financial Statements (unaudited) – continued
| | | | | | | | | | | | | | | | |
| | | Six months ended
2/28/15 | | | Year ended
8/31/14 | |
| | | Shares | | | Amount | | | Shares | | | Amount | |
Shares issued to shareholders in
reinvestment of distributions | | | | | | | | | | | | | | | | |
Class A | | | 2,710,272 | | | | $73,339,956 | | | | 219,909 | | | | $5,744,030 | |
Class B | | | 123,690 | | | | 3,056,391 | | | | — | | | | — | |
Class C | | | 267,888 | | | | 6,557,903 | | | | 3,671 | | | | 87,708 | |
Class I | | | 127,373 | | | | 3,598,289 | | | | 10,378 | | | | 282,064 | |
Class R1 | | | 13,757 | | | | 336,495 | | | | 20 | | | | 485 | |
Class R2 | | | 49,416 | | | | 1,311,498 | | | | 3,341 | | | | 85,652 | |
Class R3 | | | 200,083 | | | | 5,396,235 | | | | 16,253 | | | | 423,237 | |
Class R4 | | | 58,200 | | | | 1,583,612 | | | | 2,743 | | | | 72,032 | |
Class R5 | | | 6,949 | | | | 196,526 | | | | 41 | | | | 1,122 | |
| | | 3,557,628 | | | | $95,376,905 | | | | 256,356 | | | | $6,696,330 | |
| | | | |
| Shares reacquired | | | | | | | | | | | | | | | | |
Class A | | | (2,647,567 | ) | | | $(74,611,581 | ) | | | (6,266,489 | ) | | | $(167,777,284 | ) |
Class B | | | (205,693 | ) | | | (5,291,893 | ) | | | (465,704 | ) | | | (11,473,848 | ) |
Class C | | | (266,040 | ) | | | (6,757,065 | ) | | | (572,495 | ) | | | (13,987,990 | ) |
Class I | | | (107,943 | ) | | | (3,132,131 | ) | | | (219,406 | ) | | | (6,160,376 | ) |
Class R1 | | | (9,826 | ) | | | (249,028 | ) | | | (46,483 | ) | | | (1,136,563 | ) |
Class R2 | | | (106,236 | ) | | | (2,874,397 | ) | | | (278,899 | ) | | | (7,430,972 | ) |
Class R3 | | | (161,727 | ) | | | (4,538,970 | ) | | | (491,785 | ) | | | (13,044,811 | ) |
Class R4 | | | (73,443 | ) | | | (2,133,567 | ) | | | (158,003 | ) | | | (4,285,803 | ) |
Class R5 | | | (9,362 | ) | | | (268,212 | ) | | | (3,403 | ) | | | (97,310 | ) |
| | | (3,587,837 | ) | | | $(99,856,844 | ) | | | (8,502,667 | ) | | | $(225,394,957 | ) |
| | | | |
| Net change | | | | | | | | | | | | | | | | |
Class A | | | 2,346,389 | | | | $62,692,507 | | | | (2,320,005 | ) | | | $(63,254,001 | ) |
Class B | | | (6,640 | ) | | | (302,549 | ) | | | (336,905 | ) | | | (8,317,810 | ) |
Class C | | | 257,928 | | | | 6,295,610 | | | | (248,439 | ) | | | (6,143,469 | ) |
Class I | | | 273,927 | | | | 7,989,634 | | | | 280,619 | | | | 7,504,979 | |
Class R1 | | | 18,489 | | | | 450,391 | | | | (21,321 | ) | | | (519,974 | ) |
Class R2 | | | (294 | ) | | | 7,755 | | | | (160,907 | ) | | | (4,336,172 | ) |
Class R3 | | | 214,181 | | | | 5,795,947 | | | | (87,376 | ) | | | (2,414,749 | ) |
Class R4 | | | 72,761 | | | | 1,968,488 | | | | 413,360 | | | | 11,370,266 | |
Class R5 | | | 739 | | | | 22,843 | | | | 77,001 | | | | 2,109,770 | |
| | | 3,177,480 | | | | $84,920,626 | | | | (2,403,973 | ) | | | $(64,001,160 | ) |
(6) Line of Credit
The fund and certain other funds managed by MFS participate in a $1.1 billion unsecured committed line of credit, subject to a $1 billion sublimit, provided by a syndication of banks under a credit agreement. Borrowings may be made for temporary financing needs. Interest is charged to each fund, based on its borrowings, generally at a rate equal to the higher of the Federal Reserve funds rate or one month LIBOR plus an agreed upon spread. A commitment fee, based on the average daily, unused portion of the committed line of credit, is allocated among the participating
37
Notes to Financial Statements (unaudited) – continued
funds at the end of each calendar quarter. In addition, the fund and other funds managed by MFS have established unsecured uncommitted borrowing arrangements with certain banks for temporary financing needs. Interest is charged to each fund, based on its borrowings, at a rate equal to the Federal Reserve funds rate plus an agreed upon spread. For the six months ended February 28, 2015, the fund’s commitment fee and interest expense were $2,277 and $0, respectively, and are included in “Miscellaneous” expense in the Statement of Operations. The period-end carrying value of the outstanding borrowings under this agreement on the fund’s Statement of Assets and Liabilities approximates its fair value which would have been considered level 2 under the fair value hierarchy disclosure if the liability were carried at fair value.
(7) Transactions in Underlying Affiliated Funds-Affiliated Issuers
An affiliated issuer may be considered one in which the fund owns 5% or more of the outstanding voting securities, or a company which is under common control. For the purposes of this report, the fund assumes the following to be an affiliated issuer:
| | | | | | | | | | | | | | | | |
| Underlying Affiliated Fund | | Beginning
Shares/Par
Amount | | | Acquisitions
Shares/Par
Amount | | | Dispositions
Shares/Par
Amount | | | Ending
Shares/Par
Amount | |
| MFS Institutional Money Market Portfolio | | | 4,714,652 | | | | 103,657,791 | | | | (98,986,841 | ) | | | 9,385,602 | |
| | | | |
| Underlying Affiliated Fund | | Realized
Gain (Loss) | | | Capital Gain
Distributions | | | Dividend
Income | | | Ending
Value | |
| MFS Institutional Money Market Portfolio | | | $— | | | | $— | | | | $7,564 | | | | $9,385,602 | |
38
PROXY VOTING POLICIES AND INFORMATION
MFS votes proxies on behalf of the fund pursuant to proxy voting policies and procedures that are available without charge, upon request, by calling 1-800-225-2606, by visiting the Proxy Voting section of mfs.com or by visiting the SEC’s Web site at http://www.sec.gov.
Information regarding how the fund voted proxies relating to portfolio securities during the most recent twelve-month period ended June 30 is available without charge by visiting the Proxy Voting section of mfs.com or by visiting the SEC’s Web site at http://www.sec.gov.
QUARTERLY PORTFOLIO DISCLOSURE
The fund will file a complete schedule of portfolio holdings with the Securities and Exchange Commission (the Commission) for the first and third quarters of each fiscal year on Form N-Q. A shareholder can obtain the quarterly portfolio holdings report at mfs.com. The fund’s Form N-Q is also available on the EDGAR database on the Commission’s Internet Web site at http://www.sec.gov, and may be reviewed and copied at the:
Public Reference Room
Securities and Exchange Commission
100 F Street, NE, Room 1580
Washington, D.C. 20549
Information on the operation of the Public Reference Room may be obtained by calling the Commission at 1-800-SEC-0330. Copies of the fund’s Form N-Q also may be obtained, upon payment of a duplicating fee, by electronic request at the following e-mail address: publicinfo@sec.gov or by writing the Public Reference Section at the above address.
FURTHER INFORMATION
From time to time, MFS may post important information about the fund or the MFS funds on the MFS web site (mfs.com). This information is available by visiting the “Market Commentary” and “Announcements” sub sections in the “Market Outlooks” section of mfs.com or by clicking on the fund’s name under “Mutual Funds” in the “Products” section of mfs.com.
PROVISION OF FINANCIAL REPORTS AND SUMMARY PROSPECTUSES
The fund produces financial reports every six months and updates its summary prospectus and prospectus annually. To avoid sending duplicate copies of materials to households, only one copy of the fund’s annual and semiannual report and summary prospectus may be mailed to shareholders having the same last name and residential address on the fund’s records. However, any shareholder may contact MFSC (please see back cover for address and telephone number) to request that copies of these reports and summary prospectuses be sent personally to that shareholder.
39
Save paper with eDelivery.

| MFS® will send you prospectuses, |
reports, and proxies directly via e-mail so you will get information faster with less mailbox clutter.
To sign up:
1. Go to mfs.com.
2. Log in via MFS® Access.
3. Select eDelivery.
If you own your MFS fund shares through a financial institution or a retirement plan, MFS® TALK, MFS® Access, or eDelivery may not be available to you.
CONTACT
WEB SITE
mfs.com
MFS TALK
1-800-637-8255
24 hours a day
ACCOUNT SERVICE AND LITERATURE
Shareholders
1-800-225-2606
Financial advisors
1-800-343-2829
Retirement plan services
1-800-637-1255
MAILING ADDRESS
MFS Service Center, Inc.
P.O. Box 55824
Boston, MA 02205-5824
OVERNIGHT MAIL
MFS Service Center, Inc.
c/o Boston Financial Data Services
30 Dan Road
Canton, MA 02021-2809
SEMIANNUAL REPORT
February 28, 2015

MFS® GLOBAL LEADERS FUND

GLD-SEM
MFS® GLOBAL LEADERS FUND
CONTENTS
The report is prepared for the general information of shareholders.
It is authorized for distribution to prospective investors only when preceded or accompanied by a current prospectus.
NOT FDIC INSURED Ÿ MAY LOSE VALUE Ÿ NO BANK GUARANTEE

LETTER FROM THE CHAIRMAN
Dear Shareholders:
Lower oil prices continue to influence markets in different ways. Among those economies hurt, oil-exporters such as Russia and Venezuela have been hit particularly hard, along with U.S. regions that have close oil industry ties.
The U.S. economic recovery remains solid. The labor market is strong, interest rates are historically low and reduced energy prices have helped to stimulate consumer spending.
Economic reports early in 2015 indicate that the eurozone is on a more solid footing, with confidence boosted by the launch of European Central Bank quantitative easing.
In Asia, the Chinese economy continues to raise concerns, with the People’s Bank of China implementing stimulus programs to counter a steady decline in growth rates.
As always, active risk management is integral to how we at MFS® manage your investments. We use a collaborative process, sharing insights across asset classes, regions and economic sectors. Our global investment team uses a diversified, multidisciplined, long-term approach.
Applying proven principles, such as asset allocation and diversification, can best serve investors over the long term. We are confident that this approach can help you as you work with your financial advisors to reach your goals in the years ahead.
Respectfully,

Robert J. Manning
Chairman
MFS Investment Management
April 14, 2015
The opinions expressed in this letter are subject to change and may not be relied upon for investment advice. No forecasts can be guaranteed.
1
PORTFOLIO COMPOSITION
Portfolio structure
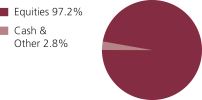
| | | | |
| Top ten holdings | | | | |
| Nestle S.A. | | | 3.8% | |
| Time Warner, Inc. | | | 3.1% | |
| Pernod Ricard S.A. | | | 3.0% | |
| YUM! Brands, Inc. | | | 3.0% | |
| Visa, Inc., “A” | | | 3.0% | |
| Danone S.A. | | | 3.0% | |
| Urban Outfitters, Inc. | | | 2.9% | |
| Danaher Corp. | | | 2.9% | |
| 3M Co. | | | 2.9% | |
| Burberry Group PLC | | | 2.8% | |
| |
| Equity sectors | | | | |
| Consumer Staples | | | 40.3% | |
| Retailing | | | 23.2% | |
| Leisure | | | 16.7% | |
| Industrial Goods & Services | | | 5.3% | |
| Financial Services | | | 4.3% | |
| Basic Materials | | | 2.9% | |
| Technology | | | 2.7% | |
| Special Products & Services | | | 1.8% | |
| | | | |
| Issuer country weightings (x) | |
| United States | | | 42.9% | |
| France | | | 18.9% | |
| United Kingdom | | | 13.0% | |
| Switzerland | | | 6.6% | |
| Japan | | | 4.1% | |
| Germany | | | 2.7% | |
| Brazil | | | 2.7% | |
| Netherlands | | | 2.0% | |
| China | | | 1.7% | |
| Other Countries | | | 5.4% | |
|
| Currency exposure weightings (y) | |
| United States Dollar | | | 42.9% | |
| Euro | | | 24.8% | |
| British Pound Sterling | | | 13.0% | |
| Swiss Franc | | | 6.6% | |
| Japanese Yen | | | 4.1% | |
| Hong Kong Dollar | | | 3.1% | |
| Brazilian Real | | | 2.7% | |
| Swedish Krona | | | 1.5% | |
| Danish Krone | | | 1.3% | |
| (x) | Represents the portfolio’s exposure to issuer countries as a percentage of a portfolio’s net assets. For purposes of this presentation, United States includes Cash & Other. |
| (y) | Represents the portfolio’s exposure to a particular currency as a percentage of a portfolio’s net assets. For purposes of this presentation, United States Dollar includes Cash & Other. |
Cash & Other can include cash, other assets less liabilities, offsets to derivative positions, and short-term securities.
Percentages are based on net assets as of 2/28/15.
The portfolio is actively managed and current holdings may be different.
2
EXPENSE TABLE
Fund expenses borne by the shareholders during the period, September 1, 2014 through February 28, 2015
As a shareholder of the fund, you incur two types of costs: (1) transaction costs, including sales charges (loads) on certain purchase or redemption payments, and (2) ongoing costs, including management fees; distribution and service (12b-1) fees; and other fund expenses. This example is intended to help you understand your ongoing costs (in dollars) of investing in the fund and to compare these costs with the ongoing costs of investing in other mutual funds.
The example is based on an investment of $1,000 invested at the beginning of the period and held for the entire period September 1, 2014 through February 28, 2015.
Actual Expenses
The first line for each share class in the following table provides information about actual account values and actual expenses. You may use the information in this line, together with the amount you invested, to estimate the expenses that you paid over the period. Simply divide your account value by $1,000 (for example, an $8,600 account value divided by $1,000 = 8.6), then multiply the result by the number in the first line under the heading entitled “Expenses Paid During Period” to estimate the expenses you paid on your account during this period.
Hypothetical Example for Comparison Purposes
The second line for each share class in the following table provides information about hypothetical account values and hypothetical expenses based on the fund’s actual expense ratio and an assumed rate of return of 5% per year before expenses, which is not the fund’s actual return. The hypothetical account values and expenses may not be used to estimate the actual ending account balance or expenses you paid for the period. You may use this information to compare the ongoing costs of investing in the fund and other funds. To do so, compare this 5% hypothetical example with the 5% hypothetical examples that appear in the shareholder reports of the other funds.
Please note that the expenses shown in the table are meant to highlight your ongoing costs only and do not reflect any transactional costs, such as sales charges (loads). Therefore, the second line for each share class in the table is useful in comparing ongoing costs only, and will not help you determine the relative total costs of owning different funds. In addition, if these transactional costs were included, your costs would have been higher.
3
Expense Table – continued
| | | | | | | | | | | | | | | | | | |
Share
Class | | | | Annualized
Expense
Ratio | | | Beginning
Account Value
9/01/14 | | | Ending
Account Value
2/28/15 | | | Expenses
Paid During
Period (p)
9/01/14-2/28/15 | |
| A | | Actual | | | 1.45% | | | | $1,000.00 | | | | $1,041.37 | | | | $7.34 | |
| | Hypothetical (h) | | | 1.45% | | | | $1,000.00 | | | | $1,017.60 | | | | $7.25 | |
| B | | Actual | | | 2.20% | | | | $1,000.00 | | | | $1,037.88 | | | | $11.12 | |
| | Hypothetical (h) | | | 2.20% | | | | $1,000.00 | | | | $1,013.88 | | | | $10.99 | |
| C | | Actual | | | 2.20% | | | | $1,000.00 | | | | $1,037.88 | | | | $11.12 | |
| | Hypothetical (h) | | | 2.20% | | | | $1,000.00 | | | | $1,013.88 | | | | $10.99 | |
| I | | Actual | | | 1.20% | | | | $1,000.00 | | | | $1,042.52 | | | | $6.08 | |
| | Hypothetical (h) | | | 1.20% | | | | $1,000.00 | | | | $1,018.84 | | | | $6.01 | |
| (h) | 5% class return per year before expenses. |
| (p) | “Expenses Paid During Period” are equal to each class’s annualized expense ratio, as shown above, multiplied by the average account value over the period, multiplied by 181/365 (to reflect the one-half year period). Expenses paid do not include any applicable sales charges (loads). If these transaction costs had been included, your costs would have been higher. |
4
PORTFOLIO OF INVESTMENTS
2/28/15 (unaudited)
The Portfolio of Investments is a complete list of all securities owned by your fund. It is categorized by broad-based asset classes.
| | | | | | | | |
| Common Stocks - 97.2% | | | | | | | | |
| Issuer | | Shares/Par | | | Value ($) | |
| Alcoholic Beverages - 10.9% | | | | | | | | |
| AmBev S.A. | | | 24,052 | | | $ | 155,390 | |
| Carlsberg A.S., “B” | | | 2,086 | | | | 178,463 | |
| Diageo PLC | | | 12,159 | | | | 363,326 | |
| Pernod Ricard S.A. | | | 3,474 | | | | 411,889 | |
| SABMiller PLC | | | 6,663 | | | | 378,035 | |
| | | | | | | | |
| | | | $ | 1,487,103 | |
| Apparel Manufacturers - 14.1% | | | | | | | | |
| Burberry Group PLC | | | 13,412 | | | $ | 387,619 | |
| Compagnie Financiere Richemont S.A. | | | 2,329 | | | | 205,209 | |
| Global Brands Group Holding Ltd. (a) | | | 796,000 | | | | 136,502 | |
| Kering S.A. | | | 1,745 | | | | 355,399 | |
| Li & Fung Ltd. | | | 50,000 | | | | 51,123 | |
| LVMH Moet Hennessy Louis Vuitton S.A. | | | 2,095 | | | | 384,249 | |
| NIKE, Inc., “B” | | | 2,464 | | | | 239,304 | |
| Tod’s S.p.A. | | | 1,682 | | | | 171,566 | |
| | | | | | | | |
| | | | $ | 1,930,971 | |
| Broadcasting - 9.7% | | | | | | | | |
| Nippon Television Holdings, Inc. | | | 11,100 | | | $ | 183,631 | |
| Publicis Groupe S.A. | | | 4,245 | | | | 346,159 | |
| Time Warner, Inc. | | | 5,169 | | | | 423,134 | |
| Twenty-First Century Fox, Inc. | | | 10,781 | | | | 377,335 | |
| | | | | | | | |
| | | | $ | 1,330,259 | |
| Business Services - 1.8% | | | | | | | | |
| Accenture PLC, “A” | | | 2,710 | | | $ | 243,981 | |
| | |
| Chemicals - 2.8% | | | | | | | | |
| 3M Co. | | | 2,329 | | | $ | 392,786 | |
| | |
| Computer Software - 2.7% | | | | | | | | |
| SAP AG | | | 5,257 | | | $ | 369,678 | |
| | |
| Consumer Products - 14.3% | | | | | | | | |
| Colgate-Palmolive Co. | | | 4,806 | | | $ | 340,361 | |
| L’Oreal S.A. | | | 1,952 | | | | 354,417 | |
| Newell Rubbermaid, Inc. | | | 7,368 | | | | 289,489 | |
| Procter & Gamble Co. | | | 4,146 | | | | 352,949 | |
5
Portfolio of Investments (unaudited) – continued
| | | | | | | | |
| Issuer | | Shares/Par | | | Value ($) | |
| Common Stocks - continued | | | | | | | | |
| Consumer Products - continued | | | | | | | | |
| Reckitt Benckiser Group PLC | | | 3,838 | | | $ | 347,223 | |
| Unilever N.V. | | | 6,188 | | | | 269,370 | |
| | | | | | | | |
| | | | $ | 1,953,809 | |
| Electrical Equipment - 5.3% | | | | | | | | |
| Danaher Corp. | | | 4,513 | | | $ | 393,895 | |
| Schneider Electric S.A. | | | 4,118 | | | | 331,702 | |
| | | | | | | | |
| | | | $ | 725,597 | |
| Food & Beverages - 10.0% | | | | | | | | |
| Danone S.A. | | | 5,819 | | | $ | 405,878 | |
| M. Dias Branco S.A. Industria e Comercio de Alimentos | | | 7,244 | | | | 211,802 | |
| Nestle S.A. | | | 6,589 | | | | 514,209 | |
| Want Want China Holdings Ltd. | | | 213,000 | | | | 234,811 | |
| | | | | | | | |
| | | | $ | 1,366,700 | |
| | |
| Gaming & Lodging - 1.3% | | | | | | | | |
| InterContinental Hotels Group PLC | | | 4,270 | | | $ | 174,694 | |
| | |
| General Merchandise - 1.6% | | | | | | | | |
| Target Corp. | | | 2,810 | | | $ | 215,892 | |
| | |
| Other Banks & Diversified Financials - 4.3% | | | | | | | | |
| Julius Baer Group Ltd. | | | 4,063 | | | $ | 187,562 | |
| Visa, Inc., “A” | | | 1,499 | | | | 406,694 | |
| | | | | | | | |
| | | | $ | 594,256 | |
| Restaurants - 5.7% | | | | | | | | |
| McDonald’s Corp. | | | 3,841 | | | $ | 379,875 | |
| YUM! Brands, Inc. | | | 5,015 | | | | 406,767 | |
| | | | | | | | |
| | | | $ | 786,642 | |
| Specialty Stores - 7.5% | | | | | | | | |
| AutoZone, Inc. (a) | | | 543 | | | $ | 348,975 | |
| L Brands, Inc. | | | 3,037 | | | | 278,979 | |
| Urban Outfitters, Inc. (a) | | | 10,343 | | | | 402,963 | |
| | | | | | | | |
| | | | $ | 1,030,917 | |
| Tobacco - 5.2% | | | | | | | | |
| Imperial Tobacco Group PLC | | | 2,682 | | | $ | 132,210 | |
| Japan Tobacco, Inc. | | | 11,900 | | | | 375,229 | |
| Swedish Match AB | | | 6,442 | | | | 202,988 | |
| | | | | | | | |
| | | | $ | 710,427 | |
| Total Common Stocks (Identified Cost, $11,322,181) | | | | | | $ | 13,313,712 | |
6
Portfolio of Investments (unaudited) – continued
| | | | | | | | |
| Money Market Funds - 2.7% | | | | | | | | |
| Issuer | | Shares/Par | | | Value ($) | |
MFS Institutional Money Market Portfolio, 0.1%,
at Cost and Net Asset Value (v) | | | 379,786 | | | $ | 379,786 | |
| Total Investments (Identified Cost, $11,701,967) | | | $ | 13,693,498 | |
| |
| Other Assets, Less Liabilities - 0.1% | | | | 9,137 | |
| Net Assets - 100.0% | | | $ | 13,702,635 | |
| (a) | Non-income producing security. |
| (v) | Underlying affiliated fund that is available only to investment companies managed by MFS. The rate quoted for the MFS Institutional Money Market Portfolio is the annualized seven-day yield of the fund at period end. |
The following abbreviations are used in this report and are defined:
| PLC | | Public Limited Company |
See notes to financial statements
7
Financial Statements
STATEMENT OF ASSETS AND LIABILITIES
At 2/28/15 (unaudited)
This statement represents your fund’s balance sheet, which details the assets and liabilities comprising the total value of the fund.
| | | | |
| Assets | | | | |
Investments- | | | | |
Non-affiliated issuers, at value (identified cost, $11,322,181) | | | $13,313,712 | |
| Underlying affiliated funds, at cost and value | | | 379,786 | |
| Total investments, at value (identified cost, $11,701,967) | | | $13,693,498 | |
Receivables for | | | | |
Fund shares sold | | | 10,954 | |
Dividends | | | 38,688 | |
Receivable from investment adviser | | | 11,333 | |
| Other assets | | | 213 | |
| Total assets | | | $13,754,686 | |
| Liabilities | | | | |
Payable for fund shares reacquired | | | $4,444 | |
Payable to affiliates | | | | |
Shareholder servicing costs | | | 4,273 | |
Distribution and service fees | | | 360 | |
Payable for independent Trustees’ compensation | | | 11 | |
| Accrued expenses and other liabilities | | | 42,963 | |
| Total liabilities | | | $52,051 | |
| Net assets | | | $13,702,635 | |
| Net assets consist of | | | | |
Paid-in capital | | | $11,682,772 | |
Unrealized appreciation (depreciation) on investments and translation of assets and liabilities in foreign currencies | | | 1,990,963 | |
Accumulated net realized gain (loss) on investments and foreign currency | | | 722 | |
| Undistributed net investment income | | | 28,178 | |
| Net assets | | | $13,702,635 | |
| Shares of beneficial interest outstanding | | | 972,813 | |
| | | | | | | | | | | | |
| | | Net assets | | | Shares
outstanding | | | Net asset value
per share (a) | |
Class A | | | $8,346,964 | | | | 591,408 | | | | $14.11 | |
Class B | | | 501,880 | | | | 36,135 | | | | 13.89 | |
Class C | | | 1,823,667 | | | | 131,321 | | | | 13.89 | |
Class I | | | 3,030,124 | | | | 213,949 | | | | 14.16 | |
| (a) | Maximum offering price per share was equal to the net asset value per share for all share classes, except for Class A, for which the maximum offering price per share was $14.97 [100 / 94.25 x $14.11]. On sales of $50,000 or more, the maximum offering price of Class A shares is reduced. A contingent deferred sales charge may be imposed on redemptions of Class A, Class B, and Class C shares. Redemption price per share was equal to the net asset value per share for Class I. |
See notes to financial statements
8
Financial Statements
STATEMENT OF OPERATIONS
Six months ended 2/28/15 (unaudited)
This statement describes how much your fund earned in investment income and accrued in expenses. It also describes any gains and/or losses generated by fund operations.
| | | | |
| Net investment income | | | | |
Income | | | | |
Dividends | | | $136,687 | |
Dividends from underlying affiliated funds | | | 130 | |
Foreign taxes withheld | | | (9,202 | ) |
Total investment income | | | $127,615 | |
Expenses | | | | |
Management fee | | | $58,343 | |
Distribution and service fees | | | 20,934 | |
Shareholder servicing costs | | | 8,700 | |
Administrative services fee | | | 8,679 | |
Independent Trustees’ compensation | | | 596 | |
Custodian fee | | | 7,534 | |
Shareholder communications | | | 5,451 | |
Audit and tax fees | | | 26,081 | |
Legal fees | | | 58 | |
Registration fees | | | 25,124 | |
Miscellaneous | | | 5,478 | |
Total expenses | | | $166,978 | |
Reduction of expenses by investment adviser and distributor | | | (68,300 | ) |
Net expenses | | | $98,678 | |
Net investment income | | | $28,937 | |
Realized and unrealized gain (loss) on investments and
foreign currency | | | | |
Realized gain (loss) (identified cost basis) | | | | |
Investments | | | $200,506 | |
Foreign currency | | | (3,004 | ) |
Net realized gain (loss) on investments and foreign currency | | | $197,502 | |
Change in unrealized appreciation (depreciation) | | | | |
Investments | | | $278,737 | |
Translation of assets and liabilities in foreign currencies | | | (296 | ) |
Net unrealized gain (loss) on investments and foreign currency translation | | | $278,441 | |
Net realized and unrealized gain (loss) on investments and foreign currency | | | $475,943 | |
Change in net assets from operations | | | $504,880 | |
See notes to financial statements
9
Financial Statements
STATEMENTS OF CHANGES IN NET ASSETS
These statements describe the increases and/or decreases in net assets resulting from operations, any distributions, and any shareholder transactions.
| | | | | | | | |
| Change in net assets | | Six months ended
2/28/15 (unaudited) | | | Year ended
8/31/14 | |
| From operations | | | | | | | | |
Net investment income | | | $28,937 | | | | $74,290 | |
Net realized gain (loss) on investments and foreign currency | | | 197,502 | | | | 249,780 | |
Net unrealized gain (loss) on investments and foreign currency translation | | | 278,441 | | | | 577,585 | |
Change in net assets from operations | | | $504,880 | | | | $901,655 | |
| Distributions declared to shareholders | | | | | | | | |
From net investment income | | | $(50,007 | ) | | | $(68,001 | ) |
From net realized gain on investments | | | (409,274 | ) | | | (810,506 | ) |
Total distributions declared to shareholders | | | $(459,281 | ) | | | $(878,507 | ) |
Change in net assets from fund share transactions | | | $(93,130 | ) | | | $3,114,847 | |
Total change in net assets | | | $(47,531 | ) | | | $3,137,995 | |
| Net assets | | | | | | | | |
At beginning of period | | | 13,750,166 | | | | 10,612,171 | |
At end of period (including undistributed net investment income of $28,178 and $49,248, respectively) | | | $13,702,635 | | | | $13,750,166 | |
See notes to financial statements
10
Financial Statements
FINANCIAL HIGHLIGHTS
The financial highlights table is intended to help you understand the fund’s financial performance for the semiannual period and the past 5 fiscal years (or life of a particular share class, if shorter). Certain information reflects financial results for a single fund share. The total returns in the table represent the rate by which an investor would have earned (or lost) on an investment in the fund share class (assuming reinvestment of all distributions) held for the entire period.
| | | | | | | | | | | | | | | | |
| | | Six months
ended
2/28/15
(unaudited) | | | Years ended 8/31 | | | Period ended 8/31/12 (c) | |
| Class A | | | 2014 | | | 2013 | | |
| | | | | | | | | | | |
Net asset value, beginning of period | | | $14.04 | | | | $13.95 | | | | $12.16 | | | | $10.00 | |
| Income (loss) from investment operations | |
Net investment income (d) | | | $0.04 | | | | $0.09 | | | | $0.07 | | | | $0.20 | |
Net realized and unrealized gain (loss)
on investments and foreign currency | | | 0.51 | | | | 1.04 | | | | 1.91 | | | | 1.96 | |
Total from investment operations | | | $0.55 | | | | $1.13 | | | | $1.98 | | | | $2.16 | |
| Less distributions declared to shareholders | |
From net investment income | | | $(0.05 | ) | | | $(0.08 | ) | | | $(0.06 | ) | | | $— | |
From net realized gain on investments | | | (0.43 | ) | | | (0.96 | ) | | | (0.13 | ) | | | — | |
Total distributions declared to shareholders | | | $(0.48 | ) | | | $(1.04 | ) | | | $(0.19 | ) | | | $— | |
Net asset value, end of period (x) | | | $14.11 | | | | $14.04 | | | | $13.95 | | | | $12.16 | |
Total return (%) (r)(s)(t)(x) | | | 4.14 | (n) | | | 8.30 | | | | 16.39 | | | | 21.60 | (n) |
Ratios (%) (to average net assets)
and Supplemental data: | |
Expenses before expense reductions (f) | | | 2.50 | (a) | | | 2.48 | | | | 2.89 | | | | 6.60 | (a) |
Expenses after expense reductions (f) | | | 1.45 | (a) | | | 1.45 | | | | 1.45 | | | | 1.45 | (a) |
Net investment income | | | 0.52 | (a) | | | 0.64 | | | | 0.55 | (l) | | | 1.83 | (a)(l) |
Portfolio turnover | | | 9 | (n) | | | 17 | | | | 82 | | | | 19 | (n) |
Net assets at end of period (000 omitted) | | | $8,347 | | | | $8,639 | | | | $6,632 | | | | $8,331 | |
See notes to financial statements
11
Financial Highlights – continued
| | | | | | | | | | | | | | | | |
| | | Six months
ended
2/28/15 (unaudited) | | | Years ended 8/31 | | | Period ended 8/31/12 (c) | |
| Class B | | | 2014 | | | 2013 | | |
| | | | | | | | | | | |
Net asset value, beginning of period | | | $13.82 | | | | $13.81 | | | | $12.07 | | | | $10.00 | |
| Income (loss) from investment operations | |
Net investment income (loss) (d) | | | $(0.02 | ) | | | $(0.02 | ) | | | $0.01 | | | | $(0.01 | ) |
Net realized and unrealized gain (loss)
on investments and foreign currency | | | 0.52 | | | | 1.03 | | | | 1.86 | | | | 2.08 | |
Total from investment operations | | | $0.50 | | | | $1.01 | | | | $1.87 | | | | $2.07 | |
| Less distributions declared to shareholders | |
From net investment income | | | $— | | | | $(0.04 | ) | | | $— | | | | $— | |
From net realized gain on investments | | | (0.43 | ) | | | (0.96 | ) | | | (0.13 | ) | | | — | |
Total distributions declared to shareholders | | | $(0.43 | ) | | | $(1.00 | ) | | | $(0.13 | ) | | | $— | |
Net asset value, end of period (x) | | | $13.89 | | | | $13.82 | | | | $13.81 | | | | $12.07 | |
Total return (%) (r)(s)(t)(x) | | | 3.79 | (n) | | | 7.48 | | | | 15.55 | | | | 20.70 | (n) |
Ratios (%) (to average net assets)
and Supplemental data: | |
Expenses before expense reductions (f) | | | 3.26 | (a) | | | 3.23 | | | | 3.96 | | | | 5.96 | (a) |
Expenses after expense reductions (f) | | | 2.20 | (a) | | | 2.20 | | | | 2.21 | | | | 2.20 | (a) |
Net investment income (loss) | | | (0.23 | )(a) | | | (0.12 | ) | | | 0.09 | | | | (0.10 | )(a) |
Portfolio turnover | | | 9 | (n) | | | 17 | | | | 82 | | | | 19 | (n) |
Net assets at end of period (000 omitted) | | | $502 | | | | $486 | | | | $364 | | | | $131 | |
See notes to financial statements
12
Financial Highlights – continued
| | | | | | | | | | | | | | | | |
| | | Six months
ended
2/28/15 (unaudited) | | | Years ended 8/31 | | | Period ended 8/31/12 (c) | |
| Class C | | | 2014 | | | 2013 | | |
| | | | | | | | | | | |
Net asset value, beginning of period | | | $13.82 | | | | $13.81 | | | | $12.07 | | | | $10.00 | |
| Income (loss) from investment operations | |
Net investment income (loss) (d) | | | $(0.01 | ) | | | $(0.01 | ) | | | $0.02 | | | | $(0.01 | ) |
Net realized and unrealized gain (loss)
on investments and foreign currency | | | 0.51 | | | | 1.02 | | | | 1.85 | | | | 2.08 | |
Total from investment operations | | | $0.50 | | | | $1.01 | | | | $1.87 | | | | $2.07 | |
| Less distributions declared to shareholders | |
From net investment income | | | $— | | | | $(0.04 | ) | | | $(0.00 | )(w) | | | $— | |
From net realized gain on investments | | | (0.43 | ) | | | (0.96 | ) | | | (0.13 | ) | | | — | |
Total distributions declared to shareholders | | | $(0.43 | ) | | | $(1.00 | ) | | | $(0.13 | ) | | | $— | |
Net asset value, end of period (x) | | | $13.89 | | | | $13.82 | | | | $13.81 | | | | $12.07 | |
Total return (%) (r)(s)(t)(x) | | | 3.79 | (n) | | | 7.50 | | | | 15.57 | | | | 20.70 | (n) |
Ratios (%) (to average net assets)
and Supplemental data: | |
Expenses before expense reductions (f) | | | 3.25 | (a) | | | 3.22 | | | | 4.02 | | | | 5.96 | (a) |
Expenses after expense reductions (f) | | | 2.20 | (a) | | | 2.20 | | | | 2.21 | | | | 2.20 | (a) |
Net investment income (loss) | | | (0.22 | )(a) | | | (0.08 | ) | | | 0.16 | | | | (0.07 | )(a) |
Portfolio turnover | | | 9 | (n) | | | 17 | | | | 82 | | | | 19 | (n) |
Net assets at end of period (000 omitted) | | | $1,824 | | | | $1,712 | | | | $927 | | | | $133 | |
See notes to financial statements
13
Financial Highlights – continued
| | | | | | | | | | | | | | | | |
| | | Six months
ended
2/28/15 (unaudited) | | | Years ended 8/31 | | | Period ended 8/31/12 (c) | |
| Class I | | | 2014 | | | 2013 | | |
| | | | | | | | | | | |
Net asset value, beginning of period | | | $14.11 | | | | $14.00 | | | | $12.18 | | | | $10.00 | |
| Income (loss) from investment operations | |
Net investment income (d) | | | $0.05 | | | | $0.12 | | | | $0.14 | | | | $0.09 | |
Net realized and unrealized gain (loss)
on investments and foreign currency | | | 0.52 | | | | 1.05 | | | | 1.88 | | | | 2.09 | |
Total from investment operations | | | $0.57 | | | | $1.17 | | | | $2.02 | | | | $2.18 | |
| Less distributions declared to shareholders | |
From net investment income | | | $(0.09 | ) | | | $(0.10 | ) | | | $(0.07 | ) | | | $— | |
From net realized gain on investments | | | (0.43 | ) | | | (0.96 | ) | | | (0.13 | ) | | | — | |
Total distributions declared to shareholders | | | $(0.52 | ) | | | $(1.06 | ) | | | $(0.20 | ) | | | $— | |
Net asset value, end of period (x) | | | $14.16 | | | | $14.11 | | | | $14.00 | | | | $12.18 | |
Total return (%) (r)(s)(x) | | | 4.25 | (n) | | | 8.57 | | | | 16.72 | | | | 21.80 | (n) |
Ratios (%) (to average net assets)
and Supplemental data: | |
Expenses before expense reductions (f) | | | 2.25 | (a) | | | 2.24 | | | | 2.86 | | | | 4.94 | (a) |
Expenses after expense reductions (f) | | | 1.20 | (a) | | | 1.20 | | | | 1.21 | | | | 1.20 | (a) |
Net investment income | | | 0.77 | (a) | | | 0.85 | | | | 1.03 | | | | 0.90 | (a) |
Portfolio turnover | | | 9 | (n) | | | 17 | | | | 82 | | | | 19 | (n) |
Net assets at end of period (000 omitted) | | | $3,030 | | | | $2,913 | | | | $2,690 | | | | $2,193 | |
| (c) | For the period from the commencement of the fund’s investment operations, September 28, 2011, through the stated period end. |
| (d) | Per share data is based on average shares outstanding. |
| (f) | Ratios do not reflect reductions from fees paid indirectly, if applicable. |
| (l) | The net investment income ratio does not vary by the class specific expense differential because of the timing of sales of fund shares and the allocation of fund level income at such time. |
| (r) | Certain expenses have been reduced without which performance would have been lower. |
| (s) | From time to time the fund may receive proceeds from litigation settlements, without which performance would be lower. |
| (t) | Total returns do not include any applicable sales charges. |
| (w) | Per share amount was less than $0.01. |
| (x) | The net asset values per share and total returns have been calculated on net assets which include adjustments made in accordance with U.S. generally accepted accounting principles required at period end for financial reporting purposes. |
See notes to financial statements
14
NOTES TO FINANCIAL STATEMENTS
(unaudited)
(1) Business and Organization
MFS Global Leaders Fund (the fund) is a diversified series of MFS Series Trust I (the trust). Prior to September 29, 2014, the fund was a non-diversified series of the trust. The trust is organized as a Massachusetts business trust and is registered under the Investment Company Act of 1940, as amended, as an open-end management investment company.
The fund is an investment company and accordingly follows the investment company accounting and reporting guidance of the Financial Accounting Standards Board (FASB) Accounting Standards Codification Topic 946 Financial Services – Investment Companies.
(2) Significant Accounting Policies
General – The preparation of financial statements in conformity with U.S. generally accepted accounting principles requires management to make estimates and assumptions that affect the reported amounts of assets and liabilities, and disclosure of contingent assets and liabilities at the date of the financial statements and the reported amounts of increases and decreases in net assets from operations during the reporting period. Actual results could differ from those estimates. In the preparation of these financial statements, management has evaluated subsequent events occurring after the date of the fund’s Statement of Assets and Liabilities through the date that the financial statements were issued. The fund invests in foreign securities. Investments in foreign securities are vulnerable to the effects of changes in the relative values of the local currency and the U.S. dollar and to the effects of changes in each country’s legal, political, and economic environment.
In June 2014, FASB issued Accounting Standards Update 2014-11, Transfers and Servicing (Topic 860) – Repurchase-to-Maturity Transactions, Repurchase Financings, and Disclosures (“ASU 2014-11”). ASU 2014-11 changes the accounting for repurchase-to-maturity transactions (i.e., repurchase agreements that settle at the same time as the maturity of the transferred financial asset) and enhances the required disclosures for repurchase agreements and other similar transactions. Although still evaluating the potential impacts of ASU 2014-11 to the fund, management expects that the impact of the fund’s adoption will be limited to additional financial statement disclosures which would first be effective for interim reporting periods beginning after March 15, 2015.
Balance Sheet Offsetting – The fund’s accounting policy with respect to balance sheet offsetting is that, absent an event of default by the counterparty or a termination of the agreement, the International Swaps and Derivatives Association (ISDA) Master Agreement does not result in an offset of reported amounts of financial assets and financial liabilities in the Statement of Assets and Liabilities across transactions between the fund and the applicable counterparty. The fund’s right to setoff may be restricted or prohibited by the bankruptcy or insolvency laws of the particular jurisdiction to which a specific master netting agreement counterparty is subject. Balance sheet offsetting disclosures, to the extent applicable to the fund, have been included in the fund’s Significant Accounting Policies note under the captions for each of the fund’s in-scope financial instruments and transactions.
15
Notes to Financial Statements (unaudited) – continued
Investment Valuations – Equity securities, including restricted equity securities, are generally valued at the last sale or official closing price as provided by a third-party pricing service on the market or exchange on which they are primarily traded. Equity securities, for which there were no sales reported that day, are generally valued at the last quoted daily bid quotation as provided by a third-party pricing service on the market or exchange on which such securities are primarily traded. Short-term instruments with a maturity at issuance of 60 days or less may be valued at amortized cost, which approximates market value. Open-end investment companies are generally valued at net asset value per share. Securities and other assets generally valued on the basis of information from a third-party pricing service may also be valued at a broker/dealer bid quotation. Values obtained from third-party pricing services can utilize both transaction data and market information such as yield, quality, coupon rate, maturity, type of issue, trading characteristics, and other market data. The values of foreign securities and other assets and liabilities expressed in foreign currencies are converted to U.S. dollars using the mean of bid and asked prices for rates provided by a third-party pricing service.
The Board of Trustees has delegated primary responsibility for determining or causing to be determined the value of the fund’s investments (including any fair valuation) to the adviser pursuant to valuation policies and procedures approved by the Board. If the adviser determines that reliable market quotations are not readily available, investments are valued at fair value as determined in good faith by the adviser in accordance with such procedures under the oversight of the Board of Trustees. Under the fund’s valuation policies and procedures, market quotations are not considered to be readily available for most types of debt instruments and floating rate loans and many types of derivatives. These investments are generally valued at fair value based on information from third-party pricing services. In addition, investments may be valued at fair value if the adviser determines that an investment’s value has been materially affected by events occurring after the close of the exchange or market on which the investment is principally traded (such as foreign exchange or market) and prior to the determination of the fund’s net asset value, or after the halting of trading of a specific security where trading does not resume prior to the close of the exchange or market on which the security is principally traded. Events that occur on a frequent basis after foreign markets close (such as developments in foreign markets and significant movements in the U.S. markets) and prior to the determination of the fund’s net asset value may be deemed to have a material effect on the value of securities traded in foreign markets. Accordingly, the fund’s foreign equity securities may often be valued at fair value. The adviser generally relies on third-party pricing services or other information (such as the correlation with price movements of similar securities in the same or other markets; the type, cost and investment characteristics of the security; the business and financial condition of the issuer; and trading and other market data) to assist in determining whether to fair value and at what value to fair value an investment. The value of an investment for purposes of calculating the fund’s net asset value can differ depending on the source and method used to determine value. When fair valuation is used, the value of an investment used to determine the fund’s net asset value may differ from quoted or published prices for the same investment. There can be no assurance that
16
Notes to Financial Statements (unaudited) – continued
the fund could obtain the fair value assigned to an investment if it were to sell the investment at the same time at which the fund determines its net asset value per share.
Various inputs are used in determining the value of the fund’s assets or liabilities. These inputs are categorized into three broad levels. In certain cases, the inputs used to measure fair value may fall into different levels of the fair value hierarchy. In such cases, an investment’s level within the fair value hierarchy is based on the lowest level of input that is significant to the fair value measurement. The fund’s assessment of the significance of a particular input to the fair value measurement in its entirety requires judgment, and considers factors specific to the investment. Level 1 includes unadjusted quoted prices in active markets for identical assets or liabilities. Level 2 includes other significant observable market-based inputs (including quoted prices for similar securities, interest rates, prepayment speed, and credit risk). Level 3 includes unobservable inputs, which may include the adviser’s own assumptions in determining the fair value of investments. The following is a summary of the levels used as of February 28, 2015 in valuing the fund’s assets or liabilities:
| | | | | | | | | | | | | | | | |
| Investments at Value | | Level 1 | | | Level 2 | | | Level 3 | | | Total | |
| Equity Securities | | | $13,313,712 | | | | $— | | | | $— | | | | $13,313,712 | |
| Mutual Funds | | | 379,786 | | | | — | | | | — | | | | 379,786 | |
| Total Investments | | | $13,693,498 | | | | $— | | | | $— | | | | $13,693,498 | |
For further information regarding security characteristics, see the Portfolio of Investments.
Foreign Currency Translation – Purchases and sales of foreign investments, income, and expenses are converted into U.S. dollars based upon currency exchange rates prevailing on the respective dates of such transactions or on the reporting date for foreign denominated receivables and payables. Gains and losses attributable to foreign currency exchange rates on sales of securities are recorded for financial statement purposes as net realized gains and losses on investments. Gains and losses attributable to foreign exchange rate movements on receivables, payables, income and expenses are recorded for financial statement purposes as foreign currency transaction gains and losses. That portion of both realized and unrealized gains and losses on investments that results from fluctuations in foreign currency exchange rates is not separately disclosed.
Indemnifications – Under the fund’s organizational documents, its officers and Trustees may be indemnified against certain liabilities and expenses arising out of the performance of their duties to the fund. Additionally, in the normal course of business, the fund enters into agreements with service providers that may contain indemnification clauses. The fund’s maximum exposure under these agreements is unknown as this would involve future claims that may be made against the fund that have not yet occurred.
Investment Transactions and Income – Investment transactions are recorded on the trade date. Dividends received in cash are recorded on the ex-dividend date. Certain dividends from foreign securities will be recorded when the fund is informed of the dividend if such information is obtained subsequent to the ex-dividend date. Dividend payments received in additional securities are recorded on the ex-dividend date in an amount equal to the value of the security on such date.
17
Notes to Financial Statements (unaudited) – continued
The fund may receive proceeds from litigation settlements. Any proceeds received from litigation involving portfolio holdings are reflected in the Statement of Operations in realized gain/loss if the security has been disposed of by the fund or in unrealized gain/loss if the security is still held by the fund. Any other proceeds from litigation not related to portfolio holdings are reflected as other income in the Statement of Operations.
Fees Paid Indirectly – The fund’s custody fee may be reduced according to an arrangement that measures the value of cash deposited with the custodian by the fund. For the six months ended February 28, 2015, custody fees were not reduced.
Tax Matters and Distributions – The fund intends to qualify as a regulated investment company, as defined under Subchapter M of the Internal Revenue Code, and to distribute all of its taxable income, including realized capital gains. As a result, no provision for federal income tax is required. The fund’s federal tax returns, when filed, will remain subject to examination by the Internal Revenue Service for a three year period. Management has analyzed the fund’s tax positions taken on federal and state tax returns for all open tax years and does not believe that there are any uncertain tax positions that require recognition of a tax liability. Foreign taxes, if any, have been accrued by the fund in the accompanying financial statements in accordance with the applicable foreign tax law. Foreign income taxes may be withheld by certain countries in which the fund invests. Additionally, capital gains realized by the fund on securities issued in or by certain foreign countries may be subject to capital gains tax imposed by those countries.
Distributions to shareholders are recorded on the ex-dividend date. Income and capital gain distributions are determined in accordance with income tax regulations, which may differ from U.S. generally accepted accounting principles. Certain capital accounts in the financial statements are periodically adjusted for permanent differences in order to reflect their tax character. These adjustments have no impact on net assets or net asset value per share. Temporary differences which arise from recognizing certain items of income, expense, gain or loss in different periods for financial statement and tax purposes will reverse at some time in the future. Distributions in excess of net investment income or net realized gains are temporary overdistributions for financial statement purposes resulting from differences in the recognition or classification of income or distributions for financial statement and tax purposes.
Book/tax differences primarily relate to passive foreign investment companies, wash sale loss deferrals, and treating a portion of the proceeds from redemptions as a distribution for tax purposes.
The tax character of distributions made during the current period will be determined at fiscal year end. The tax character of distributions declared to shareholders for the last fiscal year is as follows:
| | | | |
| | | 8/31/14 | |
Ordinary income (including any
short-term capital gains) | | | $795,002 | |
| Long-term capital gains | | | 83,505 | |
| Total distributions | | | $878,507 | |
18
Notes to Financial Statements (unaudited) – continued
The federal tax cost and the tax basis components of distributable earnings were as follows:
| | | | |
| As of 2/28/15 | | | |
| Cost of investments | | | $11,725,172 | |
| Gross appreciation | | | 2,254,970 | |
| Gross depreciation | | | (286,644 | ) |
| Net unrealized appreciation (depreciation) | | | $1,968,326 | |
| |
| As of 8/31/14 | | | |
| Undistributed ordinary income | | | 138,864 | |
| Undistributed long-term capital gain | | | 146,442 | |
| Other temporary differences | | | (631 | ) |
| Net unrealized appreciation (depreciation) | | | 1,689,589 | |
The aggregate cost above includes prior fiscal year end tax adjustments, if applicable.
Multiple Classes of Shares of Beneficial Interest – The fund offers multiple classes of shares, which differ in their respective distribution and service fees. The fund’s income, realized and unrealized gain (loss), and common expenses are allocated to shareholders based on the daily net assets of each class. Dividends are declared separately for each class. Differences in per share dividend rates are generally due to differences in separate class expenses. Class B shares will convert to Class A shares approximately eight years after purchase. The fund’s distributions declared to shareholders as reported in the Statements of Changes in Net Assets are presented by class as follows:
| | | | | | | | | | | | | | | | |
| | | From net investment
income | | | From net realized gain on
investments | |
| | | Six months
ended
2/28/15 | | | Year
ended
8/31/14 | | | Six months
ended
2/28/15 | | | Year
ended
8/31/14 | |
| Class A | | | $31,148 | | | | $43,141 | | | | $247,860 | | | | $505,890 | |
| Class B | | | — | | | | 1,474 | | | | 15,312 | | | | 32,256 | |
| Class C | | | — | | | | 4,066 | | | | 56,700 | | | | 87,699 | |
| Class I | | | 18,859 | | | | 19,320 | | | | 89,402 | | | | 184,661 | |
| Total | | | $50,007 | | | | $68,001 | | | | $409,274 | | | | $810,506 | |
(3) Transactions with Affiliates
Investment Adviser – The fund has an investment advisory agreement with MFS to provide overall investment management and related administrative services and facilities to the fund. The management fee is computed daily and paid monthly at the following annual rates:
| | | | |
| First $1 billion of average daily net assets | | | 0.90 | % |
| Next $1.5 billion of average daily net assets | | | 0.75 | % |
| Average daily net assets in excess of $2.5 billion | | | 0.65 | % |
MFS has agreed in writing to reduce its management fee by a specified amount if certain MFS mutual fund assets exceed thresholds agreed to by MFS and the fund’s Board of Trustees. For the six months ended February 28, 2015, this management fee
19
Notes to Financial Statements (unaudited) – continued
reduction amounted to $395, which is included in the reduction of total expenses in the Statement of Operations. The management fee incurred for the six months ended February 28, 2015 was equivalent to an annual effective rate of 0.89% of the fund’s average daily net assets.
The investment adviser has agreed in writing to pay a portion of the fund’s total annual operating expenses, excluding interest, taxes, extraordinary expenses, brokerage and transaction costs, and investment-related expenses, such that total fund operating expenses do not exceed the following rates annually of each class’s average daily net assets:
| | | | | | | | | | | | | | |
| Class A | | | Class B | | | Class C | | | Class I | |
| | 1.45% | | | | 2.20 | % | | | 2.20 | % | | | 1.20 | % |
This written agreement will continue until modified by the fund’s Board of Trustees, but such agreement will continue at least until December 31, 2015. For the six months ended February 28, 2015, this reduction amounted to $67,891, which is included in the reduction of total expenses in the Statement of Operations.
Distributor – MFS Fund Distributors, Inc. (MFD), a wholly-owned subsidiary of MFS, as distributor, received $3,243 for the six months ended February 28, 2015, as its portion of the initial sales charge on sales of Class A shares of the fund, respectively.
The Board of Trustees has adopted a distribution plan for certain share classes pursuant to Rule 12b-1 of the Investment Company Act of 1940.
The fund’s distribution plan provides that the fund will pay MFD for services provided by MFD and financial intermediaries in connection with the distribution and servicing of certain share classes. One component of the plan is a distribution fee paid to MFD and another component of the plan is a service fee paid to MFD. MFD may subsequently pay all, or a portion, of the distribution and/or service fees to financial intermediaries.
Distribution Plan Fee Table:
| | | | | | | | | | | | | | | | | | | | |
| | | Distribution Fee Rate (d) | | | Service Fee Rate (d) | | | Total Distribution Plan (d) | | | Annual Effective Rate (e) | | | Distribution and Service Fee | |
| Class A | | | — | | | | 0.25% | | | | 0.25% | | | | 0.25% | | | | $9,868 | |
| Class B | | | 0.75% | | | | 0.25% | | | | 1.00% | | | | 1.00% | | | | 2,389 | |
| Class C | | | 0.75% | | | | 0.25% | | | | 1.00% | | | | 1.00% | | | | 8,677 | |
| Total Distribution and Service Fees | | | | $20,934 | |
| (d) | In accordance with the distribution plan for certain classes, the fund pays distribution and/or service fees equal to these annual percentage rates of each class’s average daily net assets. The distribution and service fee rates disclosed by class represent the current rates in effect at the end of the reporting period. Any rate changes, if applicable, are detailed below. |
| (e) | The annual effective rates represent actual fees incurred under the distribution plan for the six months ended February 28, 2015 based on each class’s average daily net assets. MFD has voluntarily agreed to rebate a portion of each class’s 0.25% service fee attributable to accounts for which MFD retains the 0.25% service fee except for accounts attributable to MFS or its affiliates’ seed money. For the six months ended February 28, 2015, this rebate amounted to $10 for Class A and is included in the reduction of total expenses in the Statement of Operations. |
20
Notes to Financial Statements (unaudited) – continued
Certain Class A shares are subject to a contingent deferred sales charge (CDSC) in the event of a shareholder redemption within 18 months of purchase. Class C shares are subject to a CDSC in the event of a shareholder redemption within 12 months of purchase. Class B shares are subject to a CDSC in the event of a shareholder redemption within six years of purchase. All contingent deferred sales charges are paid to MFD and during the six months ended February 28, 2015, were as follows:
| | | | |
| | | Amount | |
| Class A | | | $— | |
| Class B | | | 43 | |
| Class C | | | 116 | |
Shareholder Servicing Agent – MFS Service Center, Inc. (MFSC), a wholly-owned subsidiary of MFS, receives a fee from the fund for its services as shareholder servicing agent calculated as a percentage of the average daily net assets of the fund as determined periodically under the supervision of the fund’s Board of Trustees. For the six months ended February 28, 2015, the fee was $1,680, which equated to 0.0259% annually of the fund’s average daily net assets. MFSC also receives payment from the fund for out-of-pocket expenses, sub-accounting and other shareholder servicing costs which may be paid to affiliated and unaffiliated service providers. For the six months ended February 28, 2015, these out-of-pocket expenses, sub-accounting and other shareholder servicing costs amounted to $7,020.
Administrator – MFS provides certain financial, legal, shareholder communications, compliance, and other administrative services to the fund. Under an administrative services agreement, the fund reimburses MFS the costs incurred to provide these services. The fund is charged an annual fixed amount of $17,500 plus a fee based on average daily net assets. The administrative services fee incurred for the six months ended February 28, 2015 was equivalent to an annual effective rate of 0.1339% of the fund’s average daily net assets.
Trustees’ and Officers’ Compensation – The fund pays compensation to independent Trustees in the form of a retainer, attendance fees, and additional compensation to Board and Committee chairpersons. The fund does not pay compensation directly to Trustees or officers of the fund who are also officers of the investment adviser, all of whom receive remuneration for their services to the fund from MFS. Certain officers and Trustees of the fund are officers or directors of MFS, MFD, and MFSC.
Other – Effective November 1, 2014, this fund and certain other funds managed by MFS (the funds) have entered into a service agreement (the ISO Agreement) which provides for payment of fees solely by the funds to Tarantino LLC in return for the provision of services of an Independent Senior Officer (ISO) for the funds. Frank L. Tarantino serves as the ISO and is an officer of the funds and the sole member of Tarantino LLC. The funds can terminate the ISO Agreement with Tarantino LLC at any time under the terms of the ISO Agreement. Prior to November 1, 2014, the funds had entered into a service agreement (the Compliance Officer Agreement) which provided for payment of fees by the funds to Tarantino LLC in return for the provision of services of an Independent Chief Compliance Officer (ICCO) for the funds. Prior to November 1, 2014, Frank L. Tarantino served as the ICCO. Effective October 31, 2014, Mr. Tarantino
21
Notes to Financial Statements (unaudited) – continued
resigned as ICCO and the Compliance Officer Agreement between the funds and Tarantino LLC was terminated. For the six months ended February 28, 2015, the aggregate fees paid by the fund under these agreements were $26 and are included in “Miscellaneous” expense in the Statement of Operations. MFS had agreed to reimburse the fund for a portion of the payments made by the fund for the services under the Compliance Officer Agreement in the amount of $4, which is included in the reduction of total expenses in the Statement of Operations. Additionally, MFS has agreed to bear all expenses associated with office space, other administrative support, and supplies provided to the ICCO and ISO.
The fund invests in the MFS Institutional Money Market Portfolio which is managed by MFS and seeks current income consistent with preservation of capital and liquidity. Income earned on this investment is included in “Dividends from underlying affiliated funds” in the Statement of Operations. This money market fund does not pay a management fee to MFS.
On September 11, 2013, MFS redeemed 10,143 shares of Class A for an aggregate amount of $147,378. At February 28, 2015, MFS held approximately 96% of the outstanding shares of Class I.
(4) Portfolio Securities
For the six months ended February 28, 2015, purchases and sales of investments, other than short-term obligations, aggregated $1,102,927 and $1,514,761, respectively.
(5) Shares of Beneficial Interest
The fund’s Declaration of Trust permits the Trustees to issue an unlimited number of full and fractional shares of beneficial interest. Transactions in fund shares were as follows:
| | | | | | | | | | | | | | | | |
| | | Six months ended
2/28/15 | | | Year ended
8/31/14 | |
| | | Shares | | | Amount | | | Shares | | | Amount | |
| Shares sold | | | | | | | | | | | | | | | | |
Class A | | | 78,356 | | | | $1,077,474 | | | | 255,307 | | | | $3,612,305 | |
Class B | | | 849 | | | | 11,353 | | | | 11,692 | | | | 169,040 | |
Class C | | | 9,962 | | | | 133,910 | | | | 70,847 | | | | 990,306 | |
Class I | | | 368 | | | | 5,000 | | | | 1,341 | | | | 19,082 | |
| | | 89,535 | | | | $1,227,737 | | | | 339,187 | | | | $4,790,733 | |
| | | | |
| Shares issued to shareholders in reinvestment of distributions | | | | | | | | | | | | | | | | |
Class A | | | 20,283 | | | | $274,026 | | | | 39,229 | | | | $537,433 | |
Class B | | | 1,115 | | | | 14,846 | | | | 2,406 | | | | 32,621 | |
Class C | | | 4,136 | | | | 55,051 | | | | 6,502 | | | | 88,100 | |
Class I | | | 7,990 | | | | 108,261 | | | | 14,846 | | | | 203,981 | |
| | | 33,524 | | | | $452,184 | | | | 62,983 | | | | $862,135 | |
22
Notes to Financial Statements (unaudited) – continued
| | | | | | | | | | | | | | | | |
| | | Six months ended
2/28/15 | | | Year ended
8/31/14 | |
| | | Shares | | | Amount | | | Shares | | | Amount | |
| Shares reacquired | | | | | | | | | | | | | | | | |
Class A | | | (122,386 | ) | | | $(1,659,480 | ) | | | (154,628 | ) | | | $(2,164,259 | ) |
Class B | | | (987 | ) | | | (13,408 | ) | | | (5,284 | ) | | | (74,272 | ) |
Class C | | | (6,630 | ) | | | (88,530 | ) | | | (20,627 | ) | | | (273,867 | ) |
Class I | | | (857 | ) | | | (11,633 | ) | | | (1,869 | ) | | | (25,623 | ) |
| | | (130,860 | ) | | | $(1,773,051 | ) | | | (182,408 | ) | | | $(2,538,021 | ) |
| | | | |
| Net change | | | | | | | | | | | | | | | | |
Class A | | | (23,747 | ) | | | $(307,980 | ) | | | 139,908 | | | | $1,985,479 | |
Class B | | | 977 | | | | 12,791 | | | | 8,814 | | | | 127,389 | |
Class C | | | 7,468 | | | | 100,431 | | | | 56,722 | | | | 804,539 | |
Class I | | | 7,501 | | | | 101,628 | | | | 14,318 | | | | 197,440 | |
| | | (7,801 | ) | | | $(93,130 | ) | | | 219,762 | | | | $3,114,847 | |
(6) Line of Credit
The fund and certain other funds managed by MFS participate in a $1.1 billion unsecured committed line of credit, subject to a $1 billion sublimit, provided by a syndication of banks under a credit agreement. Borrowings may be made for temporary financing needs. Interest is charged to each fund, based on its borrowings, generally at a rate equal to the higher of the Federal Reserve funds rate or one month LIBOR plus an agreed upon spread. A commitment fee, based on the average daily, unused portion of the committed line of credit, is allocated among the participating funds at the end of each calendar quarter. In addition, the fund and other funds managed by MFS have established unsecured uncommitted borrowing arrangements with certain banks for temporary financing needs. Interest is charged to each fund, based on its borrowings, at a rate equal to the Federal Reserve funds rate plus an agreed upon spread. For the six months ended February 28, 2015, the fund’s commitment fee and interest expense were $25 and $0, respectively, and are included in “Miscellaneous” expense in the Statement of Operations.
(7) Transactions in Underlying Affiliated Funds-Affiliated Issuers
An affiliated issuer may be considered one in which the fund owns 5% or more of the outstanding voting securities, or a company which is under common control. For the purposes of this report, the fund assumes the following to be an affiliated issuer:
| | | | | | | | | | | | | | | | |
| Underlying Affiliated Fund | | Beginning Shares/Par Amount | | | Acquisitions Shares/Par Amount | | | Dispositions Shares/Par Amount | | | Ending Shares/Par Amount | |
MFS Institutional Money
Market Portfolio | | | 541,652 | | | | 1,509,944 | | | | (1,671,810 | ) | | | 379,786 | |
| | | | |
| Underlying Affiliated Fund | | Realized Gain (Loss) | | | Capital Gain Distributions | | | Dividend Income | | | Ending Value | |
MFS Institutional Money
Market Portfolio | | | $— | | | | $— | | | | $130 | | | | $379,786 | |
23
PROXY VOTING POLICIES AND INFORMATION
MFS votes proxies on behalf of the fund pursuant to proxy voting policies and procedures that are available without charge, upon request, by calling 1-800-225-2606, by visiting the Proxy Voting section of mfs.com or by visiting the SEC’s Web site at http://www.sec.gov.
Information regarding how the fund voted proxies relating to portfolio securities during the most recent twelve-month period ended June 30 is available without charge by visiting the Proxy Voting section of mfs.com or by visiting the SEC’s Web site at http://www.sec.gov.
QUARTERLY PORTFOLIO DISCLOSURE
The fund will file a complete schedule of portfolio holdings with the Securities and Exchange Commission (the Commission) for the first and third quarters of each fiscal year on Form N-Q. A shareholder can obtain the quarterly portfolio holdings report at mfs.com. The fund’s Form N-Q is also available on the EDGAR database on the Commission’s Internet Web site at http://www.sec.gov, and may be reviewed and copied at the:
Public Reference Room
Securities and Exchange Commission
100 F Street, NE, Room 1580
Washington, D.C. 20549
Information on the operation of the Public Reference Room may be obtained by calling the Commission at 1-800-SEC-0330. Copies of the fund’s Form N-Q also may be obtained, upon payment of a duplicating fee, by electronic request at the following e-mail address: publicinfo@sec.gov or by writing the Public Reference Section at the above address.
FURTHER INFORMATION
From time to time, MFS may post important information about the fund or the MFS funds on the MFS web site (mfs.com). This information is available by visiting the “Market Commentary” and “Announcements” sub sections in the “Market Outlooks” section of mfs.com or by clicking on the fund’s name under “Mutual Funds” in the “Products” section of mfs.com.
PROVISION OF FINANCIAL REPORTS AND SUMMARY PROSPECTUSES
The fund produces financial reports every six months and updates its summary prospectus and prospectus annually. To avoid sending duplicate copies of materials to households, only one copy of the fund’s annual and semiannual report and summary prospectus may be mailed to shareholders having the same last name and residential address on the fund’s records. However, any shareholder may contact MFSC (please see back cover for address and telephone number) to request that copies of these reports and summary prospectuses be sent personally to that shareholder.
24
Save paper with eDelivery.

| MFS® will send you prospectuses, |
reports, and proxies directly via e-mail so you will get information faster with less mailbox clutter.
To sign up:
1. Go to mfs.com.
2. Log in via MFS® Access.
3. Select eDelivery.
If you own your MFS fund shares through a financial institution or a retirement plan, MFS® TALK, MFS® Access, or eDelivery may not be available to you.
CONTACT
WEB SITE
mfs.com
MFS TALK
1-800-637-8255
24 hours a day
ACCOUNT SERVICE AND LITERATURE
Shareholders
1-800-225-2606
Financial advisors
1-800-343-2829
Retirement plan services
1-800-637-1255
MAILING ADDRESS
MFS Service Center, Inc.
P.O. Box 55824
Boston, MA 02205-5824
OVERNIGHT MAIL
MFS Service Center, Inc.
c/o Boston Financial Data Services
30 Dan Road
Canton, MA 02021-2809
SEMIANNUAL REPORT
February 28, 2015

MFS® LOW VOLATILITY GLOBAL EQUITY FUND

LVO-SEM
MFS® LOW VOLATILITY GLOBAL EQUITY FUND
CONTENTS
The report is prepared for the general information of shareholders.
It is authorized for distribution to prospective investors only when preceded or accompanied by a current prospectus.
NOT FDIC INSURED Ÿ MAY LOSE VALUE Ÿ NO BANK GUARANTEE

LETTER FROM THE CHAIRMAN
Dear Shareholders:
Lower oil prices continue to influence markets in different ways. Among those economies hurt, oil-exporters such as Russia and Venezuela have been hit particularly hard, along with U.S. regions that have close oil industry ties.
The U.S. economic recovery remains solid. The labor market is strong, interest rates are historically low and reduced energy prices have helped to stimulate consumer spending.
Economic reports early in 2015 indicate that the eurozone is on a more solid footing, with confidence boosted by the launch of European Central Bank quantitative easing.
In Asia, the Chinese economy continues to raise concerns, with the People’s Bank of China implementing stimulus programs to counter a steady decline in growth rates.
As always, active risk management is integral to how we at MFS® manage your investments. We use a collaborative process, sharing insights across asset classes, regions and economic sectors. Our global investment team uses a diversified, multidisciplined, long-term approach.
Applying proven principles, such as asset allocation and diversification, can best serve investors over the long term. We are confident that this approach can help you as you work with your financial advisors to reach your goals in the years ahead.
Respectfully,

Robert J. Manning
Chairman
MFS Investment Management
April 14, 2015
The opinions expressed in this letter are subject to change and may not be relied upon for investment advice. No forecasts can be guaranteed.
1
PORTFOLIO COMPOSITION
Portfolio structure

| | | | |
| Top ten holdings | | | | |
| Taiwan Semiconductor Manufacturing Co. Ltd., ADR | | | 3.6% | |
| General Mills, Inc. | | | 3.3% | |
| Discover Financial Services | | | 2.6% | |
| Roche Holding AG | | | 2.4% | |
| Johnson & Johnson | | | 2.2% | |
| Santen Pharmaceutical Co. Ltd. | | | 2.2% | |
| Cheung Kong Infrastructure Holdings Ltd. | | | 2.2% | |
| Exxon Mobil Corp. | | | 2.1% | |
| Royal Dutch Shell PLC, “B” | | | 2.0% | |
| Ross Stores, Inc. | | | 1.8% | |
| |
| Equity sectors | | | | |
| Utilities & Communications | | | 16.8% | |
| Financial Services | | | 14.5% | |
| Consumer Staples | | | 13.9% | |
| Health Care | | | 13.4% | |
| Technology | | | 10.2% | |
| Retailing | | | 9.3% | |
| Leisure | | | 6.5% | |
| Energy | | | 5.4% | |
| Industrial Goods & Services | | | 2.3% | |
| Autos & Housing | | | 2.1% | |
| Transportation | | | 1.9% | |
| Basic Materials | | | 1.7% | |
| Special Products & Services | | | 0.8% | |
| | | | |
| Issuer country weightings (x) | |
| United States | | | 43.1% | |
| Japan | | | 12.4% | |
| Hong Kong | | | 6.0% | |
| United Kingdom | | | 5.9% | |
| Switzerland | | | 5.4% | |
| Taiwan | | | 5.1% | |
| Canada | | | 4.2% | |
| Israel | | | 2.9% | |
| China | | | 2.5% | |
| Other Countries | | | 12.5% | |
|
| Currency exposure weightings (y) | |
| United States Dollar | | | 48.5% | |
| Japanese Yen | | | 12.4% | |
| Hong Kong Dollar | | | 8.1% | |
| British Pound Sterling | | | 5.9% | |
| Swiss Franc | | | 5.4% | |
| Taiwan Dollar | | | 5.1% | |
| Euro | | | 4.5% | |
| Israeli Shekel | | | 2.9% | |
| Malaysian Ringgit | | | 1.6% | |
| Other Currencies | | | 5.6% | |
2
Portfolio Composition – continued
| (x) | Represents the portfolio’s exposure to issuer countries as a percentage of a portfolio’s net assets. For purposes of this presentation, United States includes Cash & Other. |
| (y) | Represents the portfolio’s exposure to a particular currency as a percentage of a portfolio’s net assets. For purposes of this presentation, United States Dollar includes Cash & Other. |
Cash & Other can include cash, other assets less liabilities, offsets to derivative positions, and short-term securities.
Percentages are based on net assets as of 2/28/15.
The portfolio is actively managed and current holdings may be different.
3
EXPENSE TABLE
Fund expenses borne by the shareholders during the period, September 1, 2014 through February 28, 2015
As a shareholder of the fund, you incur two types of costs: (1) transaction costs, including sales charges (loads) on certain purchase or redemption payments, and (2) ongoing costs, including management fees; distribution and service (12b-1) fees; and other fund expenses. This example is intended to help you understand your ongoing costs (in dollars) of investing in the fund and to compare these costs with the ongoing costs of investing in other mutual funds.
The example is based on an investment of $1,000 invested at the beginning of the period and held for the entire period September 1, 2014 through February 28, 2015.
Actual Expenses
The first line for each share class in the following table provides information about actual account values and actual expenses. You may use the information in this line, together with the amount you invested, to estimate the expenses that you paid over the period. Simply divide your account value by $1,000 (for example, an $8,600 account value divided by $1,000 = 8.6), then multiply the result by the number in the first line under the heading entitled “Expenses Paid During Period” to estimate the expenses you paid on your account during this period.
Hypothetical Example for Comparison Purposes
The second line for each share class in the following table provides information about hypothetical account values and hypothetical expenses based on the fund’s actual expense ratio and an assumed rate of return of 5% per year before expenses, which is not the fund’s actual return. The hypothetical account values and expenses may not be used to estimate the actual ending account balance or expenses you paid for the period. You may use this information to compare the ongoing costs of investing in the fund and other funds. To do so, compare this 5% hypothetical example with the 5% hypothetical examples that appear in the shareholder reports of the other funds.
Please note that the expenses shown in the table are meant to highlight your ongoing costs only and do not reflect any transactional costs, such as sales charges (loads). Therefore, the second line for each share class in the table is useful in comparing ongoing costs only, and will not help you determine the relative total costs of owning different funds. In addition, if these transactional costs were included, your costs would have been higher.
4
Expense Table – continued
| | | | | | | | | | | | | | | | | | |
Share
Class | | | | Annualized
Expense
Ratio | | | Beginning
Account Value
9/01/14 | | | Ending
Account Value
2/28/15 | | | Expenses
Paid During
Period (p)
9/01/14-2/28/15 | |
| A | | Actual | | | 1.25% | | | | $1,000.00 | | | | $1,055.97 | | | | $6.37 | |
| | Hypothetical (h) | | | 1.25% | | | | $1,000.00 | | | | $1,018.60 | | | | $6.26 | |
| B | | Actual | | | 2.03% | | | | $1,000.00 | | | | $1,051.99 | | | | $10.33 | |
| | Hypothetical (h) | | | 2.03% | | | | $1,000.00 | | | | $1,014.73 | | | | $10.14 | |
| C | | Actual | | | 2.02% | | | | $1,000.00 | | | | $1,051.99 | | | | $10.28 | |
| | Hypothetical (h) | | | 2.02% | | | | $1,000.00 | | | | $1,014.78 | | | | $10.09 | |
| I | | Actual | | | 1.00% | | | | $1,000.00 | | | | $1,057.68 | | | | $5.10 | |
| | Hypothetical (h) | | | 1.00% | | | | $1,000.00 | | | | $1,019.84 | | | | $5.01 | |
| R1 | | Actual | | | 2.03% | | | | $1,000.00 | | | | $1,051.99 | | | | $10.33 | |
| | Hypothetical (h) | | | 2.03% | | | | $1,000.00 | | | | $1,014.73 | | | | $10.14 | |
| R2 | | Actual | | | 1.53% | | | | $1,000.00 | | | | $1,054.69 | | | | $7.79 | |
| | Hypothetical (h) | | | 1.53% | | | | $1,000.00 | | | | $1,017.21 | | | | $7.65 | |
| R3 | | Actual | | | 1.28% | | | | $1,000.00 | | | | $1,055.41 | | | | $6.52 | |
| | Hypothetical (h) | | | 1.28% | | | | $1,000.00 | | | | $1,018.45 | | | | $6.41 | |
| R4 | | Actual | | | 1.03% | | | | $1,000.00 | | | | $1,056.74 | | | | $5.25 | |
| | Hypothetical (h) | | | 1.03% | | | | $1,000.00 | | | | $1,019.69 | | | | $5.16 | |
| R5 | | Actual | | | 1.01% | | | | $1,000.00 | | | | $1,056.67 | | | | $5.15 | |
| | Hypothetical (h) | | | 1.01% | | | | $1,000.00 | | | | $1,019.79 | | | | $5.06 | |
| (h) | 5% class return per year before expenses. |
| (p) | “Expenses Paid During Period” are equal to each class’s annualized expense ratio, as shown above, multiplied by the average account value over the period, multiplied by 181/365 (to reflect the one-half year period). Expenses paid do not include any applicable sales charges (loads). If these transaction costs had been included, your costs would have been higher. |
Notes to Expense Table
Each class with a Rule 12b-1 service fee is subject to a rebate of a portion of such fee. Such rebates are included in the expense ratios above and are outside of the expense limitation arrangement. For Class A shares, this rebate reduced the expense ratio above by 0.01%. See Note 3 in the Notes to Financial Statements for additional information.
Changes to the fund’s fee arrangements occurred during the six month period. Had these fee changes been in effect throughout the entire six month period, the annualized expense ratios, the actual expenses paid during the period and the hypothetical expenses paid during the period would have been approximately 1.20%, $6.12 and $6.01 for Class A, 1.96%, $9.97 and $9.79 for Class B, 1.96%, $9.97 and $9.79 for Class C, 0.96%, $4.90 and $4.81 for Class I, 1.96%, $9.97 and $9.79 for Class R1, 1.46%, $7.44 and $7.30 for Class R2, 1.21%, $6.17 and $6.06 for Class R3, 0.96%, $4.90 and $4.81 for Class R4, and 0.95%, $4.84 and $4.76 for Class R5, respectively. For further information about the fund’s fee arrangements and changes to those fee arrangements, please see Note 3 in the Notes to Financial Statements.
5
PORTFOLIO OF INVESTMENTS
2/28/15 (unaudited)
The Portfolio of Investments is a complete list of all securities owned by your fund. It is categorized by broad-based asset classes.
| | | | | | | | |
| Common Stocks - 98.8% | | | | | | | | |
| Issuer | | Shares/Par | | | Value ($) | |
| | | | | | | | |
| Aerospace - 1.6% | | | | | | | | |
| Lockheed Martin Corp. | | | 3,502 | | | $ | 700,571 | |
| | |
| Airlines - 1.1% | | | | | | | | |
| Copa Holdings S.A., “A” | | | 2,261 | | | $ | 257,483 | |
| Southwest Airlines Co. | | | 4,955 | | | | 214,254 | |
| | | | | | | | |
| | | | | | | $ | 471,737 | |
| Automotive - 1.4% | | | | | | | | |
| USS Co. Ltd. | | | 34,100 | | | $ | 602,611 | |
| | |
| Biotechnology - 0.5% | | | | | | | | |
| Amgen, Inc. | | | 1,248 | | | $ | 196,835 | |
| | |
| Broadcasting - 1.2% | | | | | | | | |
| Television Broadcasts Ltd. | | | 81,500 | | | $ | 521,735 | |
| | |
| Business Services - 0.8% | | | | | | | | |
| Forrester Research, Inc. | | | 9,163 | | | $ | 344,712 | |
| | |
| Cable TV - 1.6% | | | | | | | | |
| Liberty Global PLC, “A” (a) | | | 6,959 | | | $ | 376,204 | |
| Time Warner Cable, Inc. | | | 2,072 | | | | 319,192 | |
| | | | | | | | |
| | | | | | | $ | 695,396 | |
| Chemicals - 0.7% | | | | | | | | |
| Monsanto Co. | | | 2,311 | | | $ | 278,314 | |
| | |
| Computer Software - 0.9% | | | | | | | | |
| Dassault Systems S.A. | | | 5,560 | | | $ | 389,057 | |
| | |
| Computer Software - Systems - 1.8% | | | | | | | | |
| EMC Corp. | | | 7,600 | | | $ | 219,944 | |
| NICE Systems Ltd., ADR | | | 9,172 | | | | 535,370 | |
| | | | | | | | |
| | | | | | | $ | 755,314 | |
| Construction - 0.7% | | | | | | | | |
| Geberit AG | | | 813 | | | $ | 289,605 | |
6
Portfolio of Investments (unaudited) – continued
| | | | | | | | |
| Issuer | | Shares/Par | | | Value ($) | |
| | | | | | | | |
| Common Stocks - continued | | | | | | | | |
| Consumer Products - 5.0% | | | | | | | | |
| Colgate-Palmolive Co. | | | 2,913 | | | $ | 206,299 | |
| Kimberly-Clark Corp. | | | 4,111 | | | | 450,812 | |
| Kobayashi Pharmaceutical Co. Ltd. | | | 8,400 | | | | 575,799 | |
| Procter & Gamble Co. | | | 7,919 | | | | 674,144 | |
| Uni-Charm Corp. | | | 9,000 | | | | 248,991 | |
| | | | | | | | |
| | | | | | | $ | 2,156,045 | |
| Electronics - 6.1% | | | | | | | | |
| Kyocera Corp. | | | 8,100 | | | $ | 409,046 | |
| Siliconware Precision Industries Co. Ltd., ADR | | | 72,744 | | | | 643,784 | |
| Taiwan Semiconductor Manufacturing Co. Ltd., ADR | | | 62,660 | | | | 1,537,050 | |
| | | | | | | | |
| | | | | | | $ | 2,589,880 | |
| Energy - Independent - 0.7% | | | | | | | | |
| Occidental Petroleum Corp. | | | 4,064 | | | $ | 316,504 | |
| | |
| Energy - Integrated - 4.7% | | | | | | | | |
| China Petroleum & Chemical Corp. | | | 266,000 | | | $ | 222,930 | |
| Exxon Mobil Corp. | | | 10,147 | | | | 898,415 | |
| Royal Dutch Shell PLC, “B” | | | 25,595 | | | | 871,500 | |
| | | | | | | | |
| | | | | | | $ | 1,992,845 | |
| Food & Beverages - 7.6% | | | | | | | | |
| Chr. Hansen Holding A.S. | | | 8,678 | | | $ | 388,847 | |
| General Mills, Inc. | | | 26,582 | | | | 1,429,846 | |
| Mondelez International, Inc. | | | 6,483 | | | | 239,450 | |
| Nestle S.A. | | | 4,745 | | | | 370,303 | |
| Sligro Food Group N.V. | | | 6,548 | | | | 266,466 | |
| Toyo Suisan Kaisha Ltd. | | | 11,000 | | | | 392,644 | |
| Want Want China Holdings Ltd., ADR | | | 3,036 | | | | 168,012 | |
| | | | | | | | |
| | | | | | | $ | 3,255,568 | |
| Food & Drug Stores - 6.0% | | | | | | | | |
| CVS Health Corp. | | | 3,025 | | | $ | 314,207 | |
| Dairy Farm International Holdings Ltd. | | | 22,500 | | | | 196,200 | |
| Kroger Co. | | | 5,912 | | | | 420,639 | |
| Lawson, Inc. | | | 10,200 | | | | 666,784 | |
| METRO, Inc., “A” | | | 8,582 | | | | 238,355 | |
| Sun Art Retail Group Ltd. | | | 463,500 | | | | 415,942 | |
| Sundrug Co. Ltd. | | | 6,700 | | | | 329,329 | |
| | | | | | | | |
| | | | | | | $ | 2,581,456 | |
| Gaming & Lodging - 0.9% | | | | | | | | |
| Paddy Power PLC | | | 5,145 | | | $ | 388,920 | |
7
Portfolio of Investments (unaudited) – continued
| | | | | | | | |
| Issuer | | Shares/Par | | | Value ($) | |
| | | | | | | | |
| Common Stocks - continued | | | | | | | | |
| Insurance - 4.2% | | | | | | | | |
| Beazley Group PLC | | | 51,683 | | | $ | 230,835 | |
| Catlin Group Ltd. | | | 43,200 | | | | 456,523 | |
| Intact Financial Corp. | | | 6,326 | | | | 455,183 | |
| Suncorp-Metway Ltd. | | | 42,890 | | | | 468,529 | |
| Travelers Cos., Inc. | | | 1,897 | | | | 203,814 | |
| | | | | | | | |
| | | | | | | $ | 1,814,884 | |
| Internet - 0.6% | | | | | | | | |
| Google, Inc., “A” (a) | | | 438 | | | $ | 246,432 | |
| | |
| Machinery & Tools - 0.6% | | | | | | | | |
| Schindler Holding AG | | | 1,593 | | | $ | 258,663 | |
| | |
| Major Banks - 4.8% | | | | | | | | |
| Bank of Nova Scotia | | | 4,264 | | | $ | 227,911 | |
| BOC Hong Kong Holdings Ltd. | | | 156,000 | | | | 550,117 | |
| HSBC Holdings PLC, ADR | | | 10,627 | | | | 474,177 | |
| Royal Bank of Canada | | | 3,155 | | | | 197,566 | |
| Sumitomo Mitsui Financial Group, Inc. | | | 10,200 | | | | 405,826 | |
| Wells Fargo & Co. | | | 3,452 | | | | 189,135 | |
| | | | | | | | |
| | | | | | | $ | 2,044,732 | |
| Medical & Health Technology & Services - 1.2% | | | | | | | | |
| Express Scripts Holding Co. (a) | | | 6,285 | | | $ | 532,905 | |
| | |
| Medical Equipment - 1.9% | | | | | | | | |
| Abbott Laboratories | | | 4,886 | | | $ | 231,450 | |
| Fisher & Paykel Healthcare Corp. Ltd. | | | 109,583 | | | | 567,787 | |
| | | | | | | | |
| | | | | | | $ | 799,237 | |
| Natural Gas - Distribution - 0.6% | | | | | | | | |
| Osaka Gas Co. Ltd. | | | 62,000 | | | $ | 255,722 | |
| | |
| Network & Telecom - 0.9% | | | | | | | | |
| VTech Holdings Ltd. | | | 26,900 | | | $ | 383,949 | |
| | |
| Other Banks & Diversified Financials - 3.9% | | | | | | | | |
| China Construction Bank | | | 302,000 | | | $ | 251,154 | |
| Credicorp Ltd. | | | 1,962 | | | | 284,922 | |
| Discover Financial Services | | | 18,390 | | | | 1,121,422 | |
| | | | | | | | |
| | | | | | | $ | 1,657,498 | |
| Pharmaceuticals - 9.9% | | | | | | | | |
| Johnson & Johnson | | | 9,172 | | | $ | 940,222 | |
| Merck & Co., Inc. | | | 7,341 | | | | 429,742 | |
8
Portfolio of Investments (unaudited) – continued
| | | | | | | | |
| Issuer | | Shares/Par | | | Value ($) | |
| | | | | | | | |
| Common Stocks - continued | | | | | | | | |
| Pharmaceuticals - continued | | | | | | | | |
| Novartis AG | | | 3,324 | | | $ | 339,774 | |
| Roche Holding AG | | | 3,838 | | | | 1,041,878 | |
| Santen Pharmaceutical Co. Ltd. | | | 14,000 | | | | 937,429 | |
| Teva Pharmaceutical Industries Ltd., ADR | | | 9,255 | | | | 527,720 | |
| | | | | | | | |
| | | | | | | $ | 4,216,765 | |
| Railroad & Shipping - 0.7% | | | | | | | | |
| Canadian National Railway Co. | | | 4,593 | | | $ | 317,560 | |
| | |
| Real Estate - 1.6% | | | | | | | | |
| Grand City Properties S.A. (a) | | | 12,787 | | | $ | 212,207 | |
| IGB Trust, REIT | | | 461,800 | | | | 172,983 | |
| Public Storage, Inc., REIT | | | 1,519 | | | | 299,577 | |
| | | | | | | | |
| | | | | | | $ | 684,767 | |
| Restaurants - 2.8% | | | | | | | | |
| McDonald’s Corp. | | | 6,934 | | | $ | 685,773 | |
| Whitbread PLC | | | 6,117 | | | | 496,268 | |
| | | | | | | | |
| | | | | | | $ | 1,182,041 | |
| Specialty Chemicals - 1.1% | | | | | | | | |
| Symrise AG | | | 7,269 | | | $ | 462,358 | |
| | |
| Specialty Stores - 3.2% | | | | | | | | |
| Home Depot, Inc. | | | 3,452 | | | $ | 396,117 | |
| Inditex | | | 7,014 | | | | 220,440 | |
| Ross Stores, Inc. | | | 7,287 | | | | 771,037 | |
| | | | | | | | |
| | | | | | | $ | 1,387,594 | |
| Telecommunications - Wireless - 5.1% | | | | | | | | |
| Advanced Info Service PLC | | | 73,400 | | | $ | 528,989 | |
| American Tower Corp., REIT | | | 2,673 | | | | 265,001 | |
| Crown Castle International Corp, REIT | | | 4,557 | | | | 393,315 | |
| KDDI Corp. | | | 6,700 | | | | 464,309 | |
| SBA Communications Corp. (a) | | | 4,373 | | | | 545,357 | |
| | | | | | | | |
| | | | | | | $ | 2,196,971 | |
| Telephone Services - 3.5% | | | | | | | | |
| BCE, Inc. | | | 4,111 | | | $ | 180,103 | |
| Bezeq - The Israel Telecommunication Corp. Ltd. | | | 120,170 | | | | 192,709 | |
| DiGi.Com Berhad | | | 300,000 | | | | 528,579 | |
| TDC A.S. | | | 26,874 | | | | 212,585 | |
| TELUS Corp. | | | 5,670 | | | | 201,625 | |
| Verizon Communications, Inc. | | | 3,452 | | | | 170,701 | |
| | | | | | | | |
| | | | | | | $ | 1,486,302 | |
9
Portfolio of Investments (unaudited) – continued
| | | | | | | | |
| Issuer | | Shares/Par | | | Value ($) | |
| | | | | | | | |
| Common Stocks - continued | | | | | | | | |
| Tobacco - 1.3% | | | | | | | | |
| Altria Group, Inc. | | | 4,747 | | | $ | 267,209 | |
| Lorillard, Inc. | | | 4,202 | | | | 287,501 | |
| | | | | | | | |
| | | | | | | $ | 554,710 | |
| Utilities - Electric Power - 7.6% | | | | | | | | |
| Alliant Energy Corp. | | | 3,155 | | | $ | 200,658 | |
| American Electric Power Co., Inc. | | | 6,172 | | | | 355,384 | |
| Calpine Corp. (a) | | | 13,974 | | | | 296,249 | |
| Cheung Kong Infrastructure Holdings Ltd. | | | 109,000 | | | | 929,672 | |
| Consolidated Edison, Inc. | | | 4,264 | | | | 269,229 | |
| Dominion Resources, Inc. | | | 2,518 | | | | 181,523 | |
| Duke Energy Corp. | | | 3,311 | | | | 260,079 | |
| PG&E Corp. | | | 9,469 | | | | 508,769 | |
| Xcel Energy, Inc. | | | 7,511 | | | | 264,988 | |
| | | | | | | | |
| | | | $ | 3,266,551 | |
| Total Common Stocks (Identified Cost, $40,015,066) | | | $ | 42,276,746 | |
| | |
| Money Market Funds - 1.4% | | | | | | | | |
MFS Institutional Money Market Portfolio, 0.1%,
at Cost and Net Asset Value (v) | | | 598,704 | | | $ | 598,704 | |
| Total Investments (Identified Cost, $40,613,770) | | | $ | 42,875,450 | |
| |
| Other Assets, Less Liabilities - (0.2)% | | | | (65,148 | ) |
| Net Assets - 100.0% | | | $ | 42,810,302 | |
| (a) | Non-income producing security. |
| (v) | Underlying affiliated fund that is available only to investment companies managed by MFS. The rate quoted for the MFS Institutional Money Market Portfolio is the annualized seven-day yield of the fund at period end. |
The following abbreviations are used in this report and are defined:
| ADR | | American Depositary Receipt |
| PLC | | Public Limited Company |
| REIT | | Real Estate Investment Trust |
See notes to financial statements
10
Financial Statements
STATEMENT OF ASSETS AND LIABILITIES
At 2/28/15 (unaudited)
This statement represents your fund’s balance sheet, which details the assets and liabilities comprising the total value of the fund.
| | | | |
| Assets | | | | |
Investments- | | | | |
Non-affiliated issuers, at value (identified cost, $40,015,066) | | | $42,276,746 | |
Underlying affiliated funds, at cost and value | | | 598,704 | |
Total investments, at value (identified cost, $40,613,770) | | | $42,875,450 | |
Cash | | | 62,375 | |
Foreign currency, at value (identified cost, $4,479) | | | 4,454 | |
Receivables for | | | | |
Fund shares sold | | | 203,685 | |
Dividends | | | 125,134 | |
Receivable from investment adviser | | | 11,249 | |
Other assets | | | 49,329 | |
Total assets | | | $43,331,676 | |
| Liabilities | | | | |
Payable for investments purchased | | | $489,237 | |
Payable to affiliates | | | | |
Shareholder servicing costs | | | 344 | |
Distribution and service fees | | | 167 | |
Payable for independent Trustees’ compensation | | | 8 | |
Accrued expenses and other liabilities | | | 31,618 | |
Total liabilities | | | $521,374 | |
Net assets | | | $42,810,302 | |
| Net assets consist of | | | | |
Paid-in capital | | | $40,493,496 | |
Unrealized appreciation (depreciation) on investments and translation of assets and liabilities in foreign currencies | | | 2,261,256 | |
Accumulated distributions in excess of net realized gain on investments and foreign currency | | | (50,494 | ) |
Undistributed net investment income | | | 106,044 | |
Net assets | | | $42,810,302 | |
Shares of beneficial interest outstanding | | | 3,721,942 | |
11
Statement of Assets and Liabilities (unaudited) – continued
| | | | | | | | | | | | |
| | | Net assets | | | Shares outstanding | | | Net asset value per share (a) | |
Class A | | | $9,497,385 | | | | 826,040 | | | | $11.50 | |
Class B | | | 141,970 | | | | 12,397 | | | | 11.45 | |
Class C | | | 255,089 | | | | 22,278 | | | | 11.45 | |
Class I | | | 2,492,820 | | | | 216,547 | | | | 11.51 | |
Class R1 | | | 115,101 | | | | 10,051 | | | | 11.45 | |
Class R2 | | | 115,815 | | | | 10,078 | | | | 11.49 | |
Class R3 | | | 116,173 | | | | 10,099 | | | | 11.50 | |
Class R4 | | | 116,531 | | | | 10,126 | | | | 11.51 | |
Class R5 | | | 29,959,418 | | | | 2,604,326 | | | | 11.50 | |
| (a) | Maximum offering price per share was equal to the net asset value per share for all share classes, except for Class A, for which the maximum offering price per share was $12.20 [100 / 94.25 x $11.50]. On sales of $50,000 or more, the maximum offering price of Class A shares is reduced. A contingent deferred sales charge may be imposed on redemptions of Class A, Class B, and Class C shares. Redemption price per share was equal to the net asset value per share for Classes I, R1, R2, R3, R4, and R5. |
See notes to financial statements
12
Financial Statements
STATEMENT OF OPERATIONS
Six months ended 2/28/15 (unaudited)
This statement describes how much your fund earned in investment income and accrued in expenses. It also describes any gains and/or losses generated by fund operations.
| | | | |
| Net investment income | | | | |
Income | | | | |
Dividends | | | $319,050 | |
Dividends from underlying affiliated funds | | | 465 | |
Foreign taxes withheld | | | (9,932 | ) |
Total investment income | | | $309,583 | |
Expenses | | | | |
Management fee | | | $137,075 | |
Distribution and service fees | | | 9,859 | |
Shareholder servicing costs | | | 2,322 | |
Administrative services fee | | | 8,679 | |
Independent Trustees’ compensation | | | 614 | |
Custodian fee | | | 17,189 | |
Shareholder communications | | | 3,865 | |
Audit and tax fees | | | 25,740 | |
Legal fees | | | 18 | |
Registration fees | | | 56,579 | |
Miscellaneous | | | 6,373 | |
Total expenses | | | $268,313 | |
Fees paid indirectly | | | (3 | ) |
Reduction of expenses by investment adviser and distributor | | | (104,323 | ) |
Net expenses | | | $163,987 | |
Net investment income | | | $145,596 | |
| Realized and unrealized gain (loss) on investments and foreign currency | |
Realized gain (loss) (identified cost basis) | | | | |
Investments | | | $(38,361 | ) |
Foreign currency | | | (11,937 | ) |
Net realized gain (loss) on investments and foreign currency | | | $(50,298 | ) |
Change in unrealized appreciation (depreciation) | | | | |
Investments | | | $2,091,619 | |
Translation of assets and liabilities in foreign currencies | | | (387 | ) |
Net unrealized gain (loss) on investments and foreign currency translation | | | $2,091,232 | |
Net realized and unrealized gain (loss) on investments and foreign currency | | | $2,040,934 | |
Change in net assets from operations | | | $2,186,530 | |
See notes to financial statements
13
Financial Statements
STATEMENTS OF CHANGES IN NET ASSETS
These statements describe the increases and/or decreases in net assets resulting from operations, any distributions, and any shareholder transactions.
| | | | | | | | |
| | | Six months ended 2/28/15 | | | Period ended 8/31/14 (c) | |
| Change in net assets | | (unaudited) | | | | |
| From operations | | | | | | | | |
Net investment income | | | $145,596 | | | | $31,198 | |
Net realized gain (loss) on investments and foreign currency | | | (50,298 | ) | | | 44,888 | |
Net unrealized gain (loss) on investments and foreign currency translation | | | 2,091,232 | | | | 170,024 | |
Change in net assets from operations | | | $2,186,530 | | | | $246,110 | |
| Distributions declared to shareholders | | | | | | | | |
From net investment income | | | $(48,293 | ) | | | $(21,333 | ) |
From net realized gain on investments | | | (47,180 | ) | | | — | |
Total distributions declared to shareholders | | | $(95,473 | ) | | | $(21,333 | ) |
Change in net assets from fund share transactions | | | $33,128,875 | | | | $7,365,593 | |
Total change in net assets | | | $35,219,932 | | | | $7,590,370 | |
| Net assets | | | | | | | | |
At beginning of period | | | 7,590,370 | | | | — | |
At end of period (including undistributed net investment income of $106,044 and $8,741, respectively) | | | $42,810,302 | | | | $7,590,370 | |
| (c) | For the period from the commencement of the fund’s investment operations, December 5, 2013, through the stated period end. |
See notes to financial statements
14
Financial Statements
FINANCIAL HIGHLIGHTS
The financial highlights table is intended to help you understand the fund’s financial performance for the semiannual period and the past 5 fiscal years (or life of a particular share class, if shorter). Certain information reflects financial results for a single fund share. The total returns in the table represent the rate by which an investor would have earned (or lost) on an investment in the fund share class (assuming reinvestment of all distributions) held for the entire period.
| | | | | | | | |
| Class A | | Six months
ended
2/28/15 | | | Period ended
8/31/14 (c) | |
| | | (unaudited) | | | | |
Net asset value, beginning of period | | | $10.92 | | | | $10.00 | |
| Income (loss) from investment operations | | | | | | | | |
Net investment income (d) | | | $0.04 | | | | $0.15 | |
Net realized and unrealized gain (loss) on investments
and foreign currency | | | 0.57 | | | | 0.86 | |
Total from investment operations | | | $0.61 | | | | $1.01 | |
| Less distributions declared to shareholders | | | | | | | | |
From net investment income | | | $(0.01 | ) | | | $(0.09 | ) |
From net realized gain on investments | | | (0.02 | ) | | | — | |
Total distributions declared to shareholders | | | $(0.03 | ) | | | $(0.09 | ) |
Net asset value, end of period (x) | | | $11.50 | | | | $10.92 | |
Total return (%) (r)(s)(t)(x) | | | 5.60 | (n) | | | 10.13 | (n) |
Ratios (%) (to average net assets)
and Supplemental data: | | | | | | | | |
Expenses before expense reductions (f) | | | 1.89 | (a) | | | 5.81 | (a) |
Expenses after expense reductions (f) | | | 1.25 | (a) | | | 1.22 | (a) |
Net investment income | | | 0.80 | (a) | | | 1.86 | (a) |
Portfolio turnover | | | 24 | (n) | | | 28 | (n) |
Net assets at end of period (000 omitted) | | | $9,497 | | | | $800 | |
See notes to financial statements
15
Financial Highlights – continued
| | | | | | | | |
| Class B | | Six months
ended
2/28/15 | | | Period ended
8/31/14 (c) | |
| | | (unaudited) | | | | |
Net asset value, beginning of period | | | $10.91 | | | | $10.00 | |
| Income (loss) from investment operations | | | | | | | | |
Net investment income (d) | | | $(0.00 | )(w) | | | $0.06 | |
Net realized and unrealized gain (loss) on investments
and foreign currency | | | 0.56 | | | | 0.89 | |
Total from investment operations | | | $0.56 | | | | $0.95 | |
| Less distributions declared to shareholders | | | | | | | | |
From net investment income | | | $(0.00 | )(w) | | | $(0.04 | ) |
From net realized gain on investments | | | (0.02 | ) | | | — | |
Total distributions declared to shareholders | | | $(0.02 | ) | | | $(0.04 | ) |
Net asset value, end of period (x) | | | $11.45 | | | | $10.91 | |
Total return (%) (r)(s)(t)(x) | | | 5.10 | (n) | | | 9.50 | (n) |
Ratios (%) (to average net assets)
and Supplemental data: | | | | | | | | |
Expenses before expense reductions (f) | | | 2.74 | (a) | | | 6.87 | (a) |
Expenses after expense reductions (f) | | | 2.03 | (a) | | | 2.07 | (a) |
Net investment income (loss) | | | (0.07 | )(a) | | | 0.80 | (a) |
Portfolio turnover | | | 24 | (n) | | | 28 | (n) |
Net assets at end of period (000 omitted) | | | $142 | | | | $116 | |
See notes to financial statements
16
Financial Highlights – continued
| | | | | | | | |
| Class C | | Six months
ended
2/28/15 | | | Period ended
8/31/14 (c) | |
| | | (unaudited) | | | | |
Net asset value, beginning of period | | | $10.91 | | | | $10.00 | |
| Income (loss) from investment operations | | | | | | | | |
Net investment income (d) | | | $0.00 | (w) | | | $0.06 | |
Net realized and unrealized gain (loss) on investments
and foreign currency | | | 0.56 | | | | 0.89 | |
Total from investment operations | | | $0.56 | | | | $0.95 | |
| Less distributions declared to shareholders | | | | | | | | |
From net investment income | | | $(0.00 | )(w) | | | $(0.04 | ) |
From net realized gain on investments | | | (0.02 | ) | | | — | |
Total distributions declared to shareholders | | | $(0.02 | ) | | | $(0.04 | ) |
Net asset value, end of period (x) | | | $11.45 | | | | $10.91 | |
Total return (%) (r)(s)(t)(x) | | | 5.10 | (n) | | | 9.50 | (n) |
Ratios (%) (to average net assets)
and Supplemental data: | | | | | | | | |
Expenses before expense reductions (f) | | | 2.72 | (a) | | | 6.85 | (a) |
Expenses after expense reductions (f) | | | 2.02 | (a) | | | 2.07 | (a) |
Net investment income | | | 0.03 | (a) | | | 0.82 | (a) |
Portfolio turnover | | | 24 | (n) | | | 28 | (n) |
Net assets at end of period (000 omitted) | | | $255 | | | | $130 | |
See notes to financial statements
17
Financial Highlights – continued
| | | | | | | | |
| Class I | | Six months
ended
2/28/15 | | | Period ended
8/31/14 (c) | |
| | | (unaudited) | | | | |
Net asset value, beginning of period | | | $10.93 | | | | $10.00 | |
| Income (loss) from investment operations | | | | | | | | |
Net investment income (d) | | | $0.07 | | | | $0.14 | |
Net realized and unrealized gain (loss) on investments
and foreign currency | | | 0.55 | | | | 0.89 | |
Total from investment operations | | | $0.62 | | | | $1.03 | |
| Less distributions declared to shareholders | | | | | | | | |
From net investment income | | | $(0.02 | ) | | | $(0.10 | ) |
From net realized gain on investments | | | (0.02 | ) | | | — | |
Total distributions declared to shareholders | | | $(0.04 | ) | | | $(0.10 | ) |
Net asset value, end of period (x) | | | $11.51 | | | | $10.93 | |
Total return (%) (r)(s)(x) | | | 5.67 | (n) | | | 10.29 | (n) |
Ratios (%) (to average net assets)
and Supplemental data: | | | | | | | | |
Expenses before expense reductions (f) | | | 1.64 | (a) | | | 5.85 | (a) |
Expenses after expense reductions (f) | | | 1.00 | (a) | | | 1.07 | (a) |
Net investment income | | | 1.29 | (a) | | | 1.81 | (a) |
Portfolio turnover | | | 24 | (n) | | | 28 | (n) |
Net assets at end of period (000 omitted) | | | $2,493 | | | | $138 | |
See notes to financial statements
18
Financial Highlights – continued
| | | | | | | | |
| Class R1 | | Six months
ended
2/28/15 | | | Period ended
8/31/14 (c) | |
| | | (unaudited) | | | | |
Net asset value, beginning of period | | | $10.91 | | | | $10.00 | |
| Income (loss) from investment operations | | | | | | | | |
Net investment income (d) | | | $(0.00 | )(w) | | | $0.06 | |
Net realized and unrealized gain (loss) on investments
and foreign currency | | | 0.56 | | | | 0.89 | |
Total from investment operations | | | $0.56 | | | | $0.95 | |
| Less distributions declared to shareholders | | | | | | | | |
From net investment income | | | $(0.00 | )(w) | | | $(0.04 | ) |
From net realized gain on investments | | | (0.02 | ) | | | — | |
Total distributions declared to shareholders | | | $(0.02 | ) | | | $(0.04 | ) |
Net asset value, end of period (x) | | | $11.45 | | | | $10.91 | |
Total return (%) (r)(s)(x) | | | 5.10 | (n) | | | 9.50 | (n) |
Ratios (%) (to average net assets)
and Supplemental data: | | | | | | | | |
Expenses before expense reductions (f) | | | 2.76 | (a) | | | 6.89 | (a) |
Expenses after expense reductions (f) | | | 2.03 | (a) | | | 2.07 | (a) |
Net investment income (loss) | | | (0.07 | )(a) | | | 0.79 | (a) |
Portfolio turnover | | | 24 | (n) | | | 28 | (n) |
Net assets at end of period (000 omitted) | | | $115 | | | | $109 | |
See notes to financial statements
19
Financial Highlights – continued
| | | | | | | | |
| Class R2 | | Six months
ended
2/28/15 | | | Period ended
8/31/14 (c) | |
| | | (unaudited) | | | | |
Net asset value, beginning of period | | | $10.92 | | | | $10.00 | |
| Income (loss) from investment operations | | | | | | | | |
Net investment income (d) | | | $0.02 | | | | $0.10 | |
Net realized and unrealized gain (loss) on investments
and foreign currency | | | 0.57 | | | | 0.89 | |
Total from investment operations | | | $0.59 | | | | $0.99 | |
| Less distributions declared to shareholders | | | | | | | | |
From net investment income | | | $(0.00 | )(w) | | | $(0.07 | ) |
From net realized gain on investments | | | (0.02 | ) | | | — | |
Total distributions declared to shareholders | | | $(0.02 | ) | | | $(0.07 | ) |
Net asset value, end of period (x) | | | $11.49 | | | | $10.92 | |
Total return (%) (r)(s)(x) | | | 5.37 | (n) | | | 9.89 | (n) |
Ratios (%) (to average net assets)
and Supplemental data: | | | | | | | | |
Expenses before expense reductions (f) | | | 2.26 | (a) | | | 6.39 | (a) |
Expenses after expense reductions (f) | | | 1.53 | (a) | | | 1.57 | (a) |
Net investment income | | | 0.43 | (a) | | | 1.29 | (a) |
Portfolio turnover | | | 24 | (n) | | | 28 | (n) |
Net assets at end of period (000 omitted) | | | $116 | | | | $110 | |
See notes to financial statements
20
Financial Highlights – continued
| | | | | | | | |
| Class R3 | | Six months
ended
2/28/15 | | | Period ended
8/31/14 (c) | |
| | | (unaudited) | | | | |
Net asset value, beginning of period | | | $10.92 | | | | $10.00 | |
| Income (loss) from investment operations | | | | | | | | |
Net investment income (d) | | | $0.04 | | | | $0.12 | |
Net realized and unrealized gain (loss) on investments
and foreign currency | | | 0.57 | | | | 0.88 | |
Total from investment operations | | | $0.61 | | | | $1.00 | |
| Less distributions declared to shareholders | | | | | | | | |
From net investment income | | | $(0.01 | ) | | | $(0.08 | ) |
From net realized gain on investments | | | (0.02 | ) | | | — | |
Total distributions declared to shareholders | | | $(0.03 | ) | | | $(0.08 | ) |
Net asset value, end of period (x) | | | $11.50 | | | | $10.92 | |
Total return (%) (r)(s)(x) | | | 5.54 | (n) | | | 10.04 | (n) |
Ratios (%) (to average net assets)
and Supplemental data: | | | | | | | | |
Expenses before expense reductions (f) | | | 2.01 | (a) | | | 6.14 | (a) |
Expenses after expense reductions (f) | | | 1.28 | (a) | | | 1.32 | (a) |
Net investment income | | | 0.68 | (a) | | | 1.54 | (a) |
Portfolio turnover | | | 24 | (n) | | | 28 | (n) |
Net assets at end of period (000 omitted) | | | $116 | | | | $110 | |
See notes to financial statements
21
Financial Highlights – continued
| | | | | | | | |
| Class R4 | | Six months
ended
2/28/15 | | | Period ended
8/31/14 (c) | |
| | | (unaudited) | | | | |
Net asset value, beginning of period | | | $10.93 | | | | $10.00 | |
| Income (loss) from investment operations | | | | | | | | |
Net investment income (d) | | | $0.05 | | | | $0.14 | |
Net realized and unrealized gain (loss) on investments
and foreign currency | | | 0.57 | | | | 0.89 | |
Total from investment operations | | | $0.62 | | | | $1.03 | |
| Less distributions declared to shareholders | | | | | | | | |
From net investment income | | | $(0.02 | ) | | | $(0.10 | ) |
From net realized gain on investments | | | (0.02 | ) | | | — | |
Total distributions declared to shareholders | | | $(0.04 | ) | | | $(0.10 | ) |
Net asset value, end of period (x) | | | $11.51 | | | | $10.93 | |
Total return (%) (r)(s)(x) | | | 5.67 | (n) | | | 10.29 | (n) |
Ratios (%) (to average net assets)
and Supplemental data: | | | | | | | | |
Expenses before expense reductions (f) | | | 1.76 | (a) | | | 5.89 | (a) |
Expenses after expense reductions (f) | | | 1.03 | (a) | | | 1.07 | (a) |
Net investment income | | | 0.93 | (a) | | | 1.79 | (a) |
Portfolio turnover | | | 24 | (n) | | | 28 | (n) |
Net assets at end of period (000 omitted) | | | $117 | | | | $110 | |
See notes to financial statements
22
Financial Highlights – continued
| | | | | | | | |
| Class R5 | | Six months
ended
2/28/15 | | | Period ended
8/31/14 (c) | |
| | | (unaudited) | | | | |
Net asset value, beginning of period | | | $10.92 | | | | $10.00 | |
| Income (loss) from investment operations | | | | | | | | |
Net investment income (d) | | | $0.05 | | | | $0.14 | |
Net realized and unrealized gain (loss) on investments
and foreign currency | | | 0.57 | | | | 0.88 | |
Total from investment operations | | | $0.62 | | | | $1.02 | |
| Less distributions declared to shareholders | | | | | | | | |
From net investment income | | | $(0.02 | ) | | | $(0.10 | ) |
From net realized gain on investments | | | (0.02 | ) | | | — | |
Total distributions declared to shareholders | | | $(0.04 | ) | | | $(0.10 | ) |
Net asset value, end of period (x) | | | $11.50 | | | | $10.92 | |
Total return (%) (r)(s)(x) | | | 5.67 | (n) | | | 10.21 | (n) |
Ratios (%) (to average net assets)
and Supplemental data: | | | | | | | | |
Expenses before expense reductions (f) | | | 1.71 | (a) | | | 5.88 | (a) |
Expenses after expense reductions (f) | | | 1.01 | (a) | | | 1.06 | (a) |
Net investment income | | | 1.00 | (a) | | | 1.80 | (a) |
Portfolio turnover | | | 24 | (n) | | | 28 | (n) |
Net assets at end of period (000 omitted) | | | $29,959 | | | | $5,966 | |
| (c) | For the period from the commencement of the fund’s investment operations, December 5, 2013, through the stated period end. |
| (d) | Per share data is based on average shares outstanding. |
| (f) | Ratios do not reflect reductions from fees paid indirectly, if applicable. |
| (r) | Certain expenses have been reduced without which performance would have been lower. |
| (s) | From time to time the fund may receive proceeds from litigation settlements, without which performance would be lower. |
| (t) | Total returns do not include any applicable sales charges. |
| (w) | Per share amount was less than $0.01. |
| (x) | The net asset values per share and total returns have been calculated on net asset values which include adjustments made in accordance with U.S. generally accepted accounting principles required at period end for financial reporting purposes. |
See notes to financial statements
23
NOTES TO FINANCIAL STATEMENTS
(unaudited)
(1) Business and Organization
MFS Low Volatility Global Equity Fund (the fund) is a diversified series of MFS Series Trust I (the trust). The trust is organized as a Massachusetts business trust and is registered under the Investment Company Act of 1940, as amended, as an open-end management investment company.
The fund is an investment company and accordingly follows the investment company accounting and reporting guidance of the Financial Accounting Standards Board (FASB) Accounting Standards Codification Topic 946 Financial Services – Investment Companies.
(2) Significant Accounting Policies
General – The preparation of financial statements in conformity with U.S. generally accepted accounting principles requires management to make estimates and assumptions that affect the reported amounts of assets and liabilities, and disclosure of contingent assets and liabilities at the date of the financial statements and the reported amounts of increases and decreases in net assets from operations during the reporting period. Actual results could differ from those estimates. In the preparation of these financial statements, management has evaluated subsequent events occurring after the date of the fund’s Statement of Assets and Liabilities through the date that the financial statements were issued. The fund invests in foreign securities, including securities of emerging market issuers. Investments in foreign securities are vulnerable to the effects of changes in the relative values of the local currency and the U.S. dollar and to the effects of changes in each country’s legal, political, and economic environment. The markets of emerging markets countries are generally more volatile than the markets of developed countries with more mature economies. All of the risks of investing in foreign securities previously described are heightened when investing in emerging markets countries.
In June 2014, FASB issued Accounting Standards Update 2014-11, Transfers and Servicing (Topic 860) – Repurchase-to-Maturity Transactions, Repurchase Financings, and Disclosures (“ASU 2014-11”). ASU 2014-11 changes the accounting for repurchase-to-maturity transactions (i.e., repurchase agreements that settle at the same time as the maturity of the transferred financial asset) and enhances the required disclosures for repurchase agreements and other similar transactions. Although still evaluating the potential impacts of ASU 2014-11 to the fund, management expects that the impact of the fund’s adoption will be limited to additional financial statement disclosures which would first be effective for interim reporting periods beginning after March 15, 2015.
Balance Sheet Offsetting – The fund’s accounting policy with respect to balance sheet offsetting is that, absent an event of default by the counterparty or a termination of the agreement, the International Swaps and Derivatives Association (ISDA) Master Agreement does not result in an offset of reported amounts of financial assets and financial liabilities in the Statement of Assets and Liabilities across transactions between the fund and the applicable counterparty. The fund’s right to setoff may be restricted or prohibited by the bankruptcy or insolvency laws of the particular jurisdiction to
24
Notes to Financial Statements (unaudited) – continued
which a specific master netting agreement counterparty is subject. Balance sheet offsetting disclosures, to the extent applicable to the fund, have been included in the fund’s Significant Accounting Policies note under the captions for each of the fund’s in-scope financial instruments and transactions.
Investment Valuations – Equity securities, including restricted equity securities, are generally valued at the last sale or official closing price as provided by a third-party pricing service on the market or exchange on which they are primarily traded. Equity securities, for which there were no sales reported that day, are generally valued at the last quoted daily bid quotation as provided by a third-party pricing service on the market or exchange on which such securities are primarily traded. Short-term instruments with a maturity at issuance of 60 days or less may be valued at amortized cost, which approximates market value. Open-end investment companies are generally valued at net asset value per share. Securities and other assets generally valued on the basis of information from a third-party pricing service may also be valued at a broker/dealer bid quotation. Values obtained from third-party pricing services can utilize both transaction data and market information such as yield, quality, coupon rate, maturity, type of issue, trading characteristics, and other market data. The values of foreign securities and other assets and liabilities expressed in foreign currencies are converted to U.S. dollars using the mean of bid and asked prices for rates provided by a third-party pricing service.
The Board of Trustees has delegated primary responsibility for determining or causing to be determined the value of the fund’s investments (including any fair valuation) to the adviser pursuant to valuation policies and procedures approved by the Board. If the adviser determines that reliable market quotations are not readily available, investments are valued at fair value as determined in good faith by the adviser in accordance with such procedures under the oversight of the Board of Trustees. Under the fund’s valuation policies and procedures, market quotations are not considered to be readily available for most types of debt instruments and floating rate loans and many types of derivatives. These investments are generally valued at fair value based on information from third-party pricing services. In addition, investments may be valued at fair value if the adviser determines that an investment’s value has been materially affected by events occurring after the close of the exchange or market on which the investment is principally traded (such as foreign exchange or market) and prior to the determination of the fund’s net asset value, or after the halting of trading of a specific security where trading does not resume prior to the close of the exchange or market on which the security is principally traded. Events that occur on a frequent basis after foreign markets close (such as developments in foreign markets and significant movements in the U.S. markets) and prior to the determination of the fund’s net asset value may be deemed to have a material effect on the value of securities traded in foreign markets. Accordingly, the fund’s foreign equity securities may often be valued at fair value. The adviser generally relies on third-party pricing services or other information (such as the correlation with price movements of similar securities in the same or other markets; the type, cost and investment characteristics of the security; the business and financial condition of the issuer; and trading and other market data) to assist in determining whether to fair value and at what value to fair value an investment. The value of an investment for purposes of calculating the fund’s net asset value can differ depending
25
Notes to Financial Statements (unaudited) – continued
on the source and method used to determine value. When fair valuation is used, the value of an investment used to determine the fund’s net asset value may differ from quoted or published prices for the same investment. There can be no assurance that the fund could obtain the fair value assigned to an investment if it were to sell the investment at the same time at which the fund determines its net asset value per share.
Various inputs are used in determining the value of the fund’s assets or liabilities. These inputs are categorized into three broad levels. In certain cases, the inputs used to measure fair value may fall into different levels of the fair value hierarchy. In such cases, an investment’s level within the fair value hierarchy is based on the lowest level of input that is significant to the fair value measurement. The fund’s assessment of the significance of a particular input to the fair value measurement in its entirety requires judgment, and considers factors specific to the investment. Level 1 includes unadjusted quoted prices in active markets for identical assets or liabilities. Level 2 includes other significant observable market-based inputs (including quoted prices for similar securities, interest rates, prepayment speed, and credit risk). Level 3 includes unobservable inputs, which may include the adviser’s own assumptions in determining the fair value of investments. The following is a summary of the levels used as of February 28, 2015 in valuing the fund’s assets or liabilities:
| | | | | | | | | | | | | | | | |
| Investments at Value | | Level 1 | | | Level 2 | | | Level 3 | | | Total | |
| Equity Securities: | | | | | | | | | | | | | | | | |
United States | | | $17,913,931 | | | | $— | | | | $— | | | | $17,913,931 | |
Japan | | | 5,288,490 | | | | — | | | | — | | | | 5,288,490 | |
Hong Kong | | | 2,581,673 | | | | — | | | | — | | | | 2,581,673 | |
United Kingdom | | | 2,529,303 | | | | — | | | | — | | | | 2,529,303 | |
Switzerland | | | 2,300,223 | | | | — | | | | — | | | | 2,300,223 | |
Taiwan | | | 2,180,834 | | | | — | | | | — | | | | 2,180,834 | |
Canada | | | 1,363,120 | | | | 455,183 | | | | — | | | | 1,818,303 | |
Israel | | | 1,255,799 | | | | — | | | | — | | | | 1,255,799 | |
China | | | 1,058,038 | | | | — | | | | — | | | | 1,058,038 | |
Other Countries | | | 4,821,163 | | | | 528,989 | | | | — | | | | 5,350,152 | |
| Mutual Funds | | | 598,704 | | | | — | | | | — | | | | 598,704 | |
| Total Investments | | | $41,891,278 | | | | $984,172 | | | | $— | | | | $42,875,450 | |
For further information regarding security characteristics, see the Portfolio of Investments.
Of the level 2 investments presented above, equity investments amounting to $455,183 would have been considered level 1 investments at the beginning of the period. The primary reason for changes in the classifications between levels 1 and 2 occurs when foreign equity securities are fair valued using other observable market-based inputs in place of the closing exchange price due to events occurring after the close of the exchange or market on which the investment is principally traded. The fund’s foreign equity securities may often be valued at fair value. The fund’s policy is to recognize transfers between the levels as of the end of the period.
Foreign Currency Translation – Purchases and sales of foreign investments, income, and expenses are converted into U.S. dollars based upon currency exchange rates prevailing on the respective dates of such transactions or on the reporting date for
26
Notes to Financial Statements (unaudited) – continued
foreign denominated receivables and payables. Gains and losses attributable to foreign currency exchange rates on sales of securities are recorded for financial statement purposes as net realized gains and losses on investments. Gains and losses attributable to foreign exchange rate movements on receivables, payables, income and expenses are recorded for financial statement purposes as foreign currency transaction gains and losses. That portion of both realized and unrealized gains and losses on investments that results from fluctuations in foreign currency exchange rates is not separately disclosed.
Indemnifications – Under the fund’s organizational documents, its officers and Trustees may be indemnified against certain liabilities and expenses arising out of the performance of their duties to the fund. Additionally, in the normal course of business, the fund enters into agreements with service providers that may contain indemnification clauses. The fund’s maximum exposure under these agreements is unknown as this would involve future claims that may be made against the fund that have not yet occurred.
Investment Transactions and Income – Investment transactions are recorded on the trade date. Dividends received in cash are recorded on the ex-dividend date. Certain dividends from foreign securities will be recorded when the fund is informed of the dividend if such information is obtained subsequent to the ex-dividend date. Dividend payments received in additional securities are recorded on the ex-dividend date in an amount equal to the value of the security on such date.
The fund may receive proceeds from litigation settlements. Any proceeds received from litigation involving portfolio holdings are reflected in the Statement of Operations in realized gain/loss if the security has been disposed of by the fund or in unrealized gain/loss if the security is still held by the fund. Any other proceeds from litigation not related to portfolio holdings are reflected as other income in the Statement of Operations.
Fees Paid Indirectly – The fund’s custody fee may be reduced according to an arrangement that measures the value of cash deposited with the custodian by the fund. This amount, for the six months ended February 28, 2015, is shown as a reduction of total expenses in the Statement of Operations.
Tax Matters and Distributions – The fund intends to qualify as a regulated investment company, as defined under Subchapter M of the Internal Revenue Code, and to distribute all of its taxable income, including realized capital gains. As a result, no provision for federal income tax is required. The fund’s federal tax returns, when filed, will remain subject to examination by the Internal Revenue Service for a three year period. Management has analyzed the fund’s tax positions taken on federal and state tax returns for all open tax years and does not believe that there are any uncertain tax positions that require recognition of a tax liability. Foreign taxes, if any, have been accrued by the fund in the accompanying financial statements in accordance with the applicable foreign tax law. Foreign income taxes may be withheld by certain countries in which the fund invests. Additionally, capital gains realized by the fund on securities issued in or by certain foreign countries may be subject to capital gains tax imposed by those countries.
27
Notes to Financial Statements (unaudited) – continued
Distributions to shareholders are recorded on the ex-dividend date. Income and capital gain distributions are determined in accordance with income tax regulations, which may differ from U.S. generally accepted accounting principles. Certain capital accounts in the financial statements are periodically adjusted for permanent differences in order to reflect their tax character. These adjustments have no impact on net assets or net asset value per share. Temporary differences which arise from recognizing certain items of income, expense, gain or loss in different periods for financial statement and tax purposes will reverse at some time in the future. Distributions in excess of net investment income or net realized gains are temporary overdistributions for financial statement purposes resulting from differences in the recognition or classification of income or distributions for financial statement and tax purposes.
During the period ended August 31, 2014, there were no significant adjustments due to differences between book and tax accounting.
The tax character of distributions made during the current period will be determined at fiscal year end. The tax character of distributions declared to shareholders for the last fiscal period is as follows:
| | | | |
| | | 8/31/14 | |
Ordinary income (including any
short-term capital gains) | | | $21,333 | |
The federal tax cost and the tax basis components of distributable earnings were as follows:
| | | | |
| As of 2/28/15 | | | |
| Cost of investments | | | $40,613,960 | |
| Gross appreciation | | | 2,929,706 | |
| Gross depreciation | | | (668,216 | ) |
| Net unrealized appreciation (depreciation) | | | $2,261,490 | |
| |
| As of 8/31/14 | | | |
| Undistributed ordinary income | | | 55,915 | |
| Other temporary differences | | | (37 | ) |
| Net unrealized appreciation (depreciation) | | | 169,871 | |
The aggregate cost above includes prior fiscal year end tax adjustments, if applicable.
Multiple Classes of Shares of Beneficial Interest – The fund offers multiple classes of shares, which differ in their respective distribution and service fees. The fund’s income, realized and unrealized gain (loss), and common expenses are allocated to shareholders based on the daily net assets of each class. Dividends are declared separately for each class. Differences in per share dividend rates are generally due to differences in separate class expenses. Class B shares will convert to Class A shares
28
Notes to Financial Statements (unaudited) – continued
approximately eight years after purchase. The fund’s distributions declared to shareholders as reported in the Statements of Changes in Net Assets are presented by class as follows:
| | | | | | | | | | | | | | | | |
| | | From net investment
income | | | From net realized gain on
investments | |
| | | Six months
ended
2/28/15 | | | Period
ended
8/31/14 (c) | | | Six months
ended
2/28/15 | | | Period
ended
8/31/14 (c) | |
| Class A | | | $5,994 | | | | $2,891 | | | | $12,199 | | | | $— | |
| Class B | | | — | | | | 389 | | | | 202 | | | | — | |
| Class C | | | — | | | | 403 | | | | 208 | | | | — | |
| Class I | | | 1,186 | | | | 1,071 | | | | 1,445 | | | | — | |
| Class R1 | | | — | | | | 389 | | | | 160 | | | | — | |
| Class R2 | | | — | | | | 673 | | | | 160 | | | | — | |
| Class R3 | | | 81 | | | | 816 | | | | 160 | | | | — | |
| Class R4 | | | 223 | | | | 959 | | | | 161 | | | | — | |
| Class R5 | | | 40,809 | | | | 13,742 | | | | 32,485 | | | | — | |
| Total | | | $48,293 | | | | $21,333 | | | | $47,180 | | | | $— | |
| (c) | For the period from the commencement of the fund’s investment operations, December 5, 2013, through the stated period end. |
(3) Transactions with Affiliates
Investment Adviser – The fund has an investment advisory agreement with MFS to provide overall investment management and related administrative services and facilities to the fund. The management fee is computed daily and paid monthly at the following annual rates:
| | | | |
| First $1 billion of average daily net assets | | | 0.90 | % |
| Next $1.5 billion of average daily net assets | | | 0.75 | % |
| Average daily net assets in excess of $2.5 billion | | | 0.65 | % |
The investment adviser had agreed in writing to reduce its management fee to 0.75% of average daily net assets for the first $1 billion, and 0.70% of average daily net assets in excess of $1 billion. This written agreement expired on December 28, 2014. For the period September 1, 2014 through December 28, 2014, this management fee reduction amounted to $12,751, which is included in the reduction of total expenses in the Statement of Operations. Effective December 29, 2014, the investment adviser has agreed in writing to reduce its management fee to 0.65% of average daily net assets. This written agreement will continue until modified by the fund’s Board of Trustees, but such agreement will continue at least until December 31, 2015. For the period December 29, 2014 through February 28, 2015, this management fee reduction amounted to $16,826, which is included in the reduction of total expenses in the Statement of Operations. MFS has also agreed in writing to reduce its management fee by a specified amount if certain MFS mutual fund assets exceed thresholds agreed to by MFS and the fund’s Board of Trustees. For the six months ended February 28, 2015, this management fee reduction amounted to $947, which is included in the reduction of total expenses in the Statement of Operations. The management fee incurred for the six months ended February 28, 2015 was equivalent to an annual effective rate of 0.70% of the fund’s average daily net assets.
29
Notes to Financial Statements (unaudited) – continued
The investment adviser had agreed in writing to pay a portion of the fund’s total annual operating expenses, excluding interest, taxes, extraordinary expenses, brokerage and transaction costs, and investment-related expenses, such that total fund operating expenses do not exceed the following rates annually of each class’s average daily net assets:
| | | | | | | | | | | | | | | | | | | | | | | | | | | | | | | | | | |
| Classes | |
| A | | | B | | | C | | | I | | | R1 | | | R2 | | | R3 | | | R4 | | | R5 | |
| | 1.35% | | | | 2.10% | | | | 2.10% | | | | 1.10% | | | | 2.10% | | | | 1.60% | | | | 1.35% | | | | 1.10% | | | | 1.06% | |
This written agreement expired on December 28, 2014. For the period September 1, 2014 through December 28, 2014, this reduction amounted to $46,218, which is included in the reduction of total expenses in the Statement of Operations. Effective December 29, 2014, the investment adviser has agreed in writing to pay a portion of the fund’s total annual operating expenses, excluding interest, taxes, extraordinary expenses, brokerage and transaction costs, and investment-related expenses, such that total fund operating expenses do not exceed the following rates annually of each class’s average daily net assets:
| | | | | | | | | | | | | | | | | | | | | | | | | | | | | | | | | | |
| Classes | |
| A | | | B | | | C | | | I | | | R1 | | | R2 | | | R3 | | | R4 | | | R5 | |
| | 1.24% | | | | 1.99% | | | | 1.99% | | | | 0.99% | | | | 1.99% | | | | 1.49% | | | | 1.24% | | | | 0.99% | | | | 0.95% | |
This written agreement will continue until modified by the fund’s Board of Trustees, but such agreement will continue at least until December 31, 2015. For the period December 29, 2014 through February 28, 2015, this reduction amounted to $27,334, which is included in the reduction of total expenses in the Statement of Operations.
Distributor – MFS Fund Distributors, Inc. (MFD), a wholly-owned subsidiary of MFS, as distributor, received $2,995 for the six months ended February 28, 2015, as its portion of the initial sales charge on sales of Class A shares of the fund.
The Board of Trustees has adopted a distribution plan for certain share classes pursuant to Rule 12b-1 of the Investment Company Act of 1940.
The fund’s distribution plan provides that the fund will pay MFD for services provided by MFD and financial intermediaries in connection with the distribution and servicing of certain share classes. One component of the plan is a distribution fee paid to MFD and another component of the plan is a service fee paid to MFD. MFD may subsequently pay all, or a portion, of the distribution and/or service fees to financial intermediaries.
Distribution Plan Fee Table:
| | | | | | | | | | | | | | | | | | | | |
| | | Distribution
Fee Rate (d) | | | Service
Fee Rate (d) | | | Total
Distribution
Plan (d) | | | Annual
Effective
Rate (e) | | | Distribution
and Service
Fee | |
| Class A | | | — | | | | 0.25% | | | | 0.25% | | | | 0.24% | | | | $7,417 | |
| Class B | | | 0.75% | | | | 0.25% | | | | 1.00% | | | | 1.00% | | | | 643 | |
| Class C | | | 0.75% | | | | 0.25% | | | | 1.00% | | | | 1.00% | | | | 843 | |
| Class R1 | | | 0.75% | | | | 0.25% | | | | 1.00% | | | | 1.00% | | | | 545 | |
| Class R2 | | | 0.25% | | | | 0.25% | | | | 0.50% | | | | 0.50% | | | | 274 | |
| Class R3 | | | — | | | | 0.25% | | | | 0.25% | | | | 0.25% | | | | 137 | |
| Total Distribution and Service Fees | | | | $9,859 | |
30
Notes to Financial Statements (unaudited) – continued
| (d) | In accordance with the distribution plan for certain classes, the fund pays distribution and/or service fees equal to these annual percentage rates of each class’s average daily net assets. The distribution and service fee rates disclosed by class represent the current rates in effect at the end of the reporting period. Any rate changes, if applicable, are detailed below. |
| (e) | MFD has voluntarily agreed to rebate a portion of each class’s 0.25% service fee attributable to accounts for which MFD retains the 0.25% service fee except for accounts attributable to MFS or its affiliates’ seed money. For the six months ended February 28, 2015, this rebate amounted to $243 for Class A, and is included in the reduction of total expenses in the Statement of Operations. |
Certain Class A shares are subject to a contingent deferred sales charge (CDSC) in the event of a shareholder redemption within 18 months of purchase. Class C shares are subject to a CDSC in the event of a shareholder redemption within 12 months of purchase. Class B shares are subject to a CDSC in the event of a shareholder redemption within six years of purchase. All contingent deferred sales charges are paid to MFD and during the six months ended February 28, 2015, were as follows:
Shareholder Servicing Agent – MFS Service Center, Inc. (MFSC), a wholly-owned subsidiary of MFS, receives a fee from the fund for its services as shareholder servicing agent calculated as a percentage of the average daily net assets of the fund as determined periodically under the supervision of the fund’s Board of Trustees. For the six months ended February 28, 2015, the fee was $1,758, which equated to 0.0115% annually of the fund’s average daily net assets. MFSC also receives payment from the fund for out-of-pocket expenses, sub-accounting and other shareholder servicing costs which may be paid to affiliated and unaffiliated service providers. Class R5 shares do not incur sub-accounting fees. For the six months ended February 28, 2015, these out-of-pocket expenses, sub-accounting and other shareholder servicing costs amounted to $564.
Administrator – MFS provides certain financial, legal, shareholder communications, compliance, and other administrative services to the fund. Under an administrative services agreement, the fund reimburses MFS the costs incurred to provide these services. The fund is charged an annual fixed amount of $17,500 plus a fee based on average daily net assets. The administrative services fee incurred for the six months ended February 28, 2015 was equivalent to an annual effective rate of 0.0570% of the fund’s average daily net assets.
Trustees’ and Officers’ Compensation – The fund pays compensation to independent Trustees in the form of a retainer, attendance fees, and additional compensation to Board and Committee chairpersons. The fund does not pay compensation directly to Trustees or officers of the fund who are also officers of the investment adviser, all of whom receive remuneration for their services to the fund from MFS. Certain officers and Trustees of the fund are officers or directors of MFS, MFD, and MFSC.
Other – Effective November 1, 2014, this fund and certain other funds managed by MFS (the funds) have entered into a service agreement (the ISO Agreement) which provides for payment of fees solely by the funds to Tarantino LLC in return for the
31
Notes to Financial Statements (unaudited) – continued
provision of services of an Independent Senior Officer (ISO) for the funds. Frank L. Tarantino serves as the ISO and is an officer of the funds and the sole member of Tarantino LLC. The funds can terminate the ISO Agreement with Tarantino LLC at any time under the terms of the ISO Agreement. Prior to November 1, 2014, the funds had entered into a service agreement (the Compliance Officer Agreement) which provided for payment of fees by the funds to Tarantino LLC in return for the provision of services of an Independent Chief Compliance Officer (ICCO) for the funds. Prior to November 1, 2014, Frank L. Tarantino served as the ICCO. Effective October 31, 2014, Mr. Tarantino resigned as ICCO and the Compliance Officer Agreement between the funds and Tarantino LLC was terminated. For the six months ended February 28, 2015, the aggregate fees paid by the fund under these agreements were $34 and are included in “Miscellaneous” expense in the Statement of Operations. MFS had agreed to reimburse the fund for a portion of the payments made by the fund for the services under the Compliance Officer Agreement in the amount of $4, which is included in the reduction of total expenses in the Statement of Operations. Additionally, MFS has agreed to bear all expenses associated with office space, other administrative support, and supplies provided to the ICCO and ISO.
The fund invests in the MFS Institutional Money Market Portfolio which is managed by MFS and seeks current income consistent with preservation of capital and liquidity. Income earned on this investment is included in “Dividends from underlying affiliated funds” in the Statement of Operations. This money market fund does not pay a management fee to MFS.
On December 5, 2013, MFS purchased 140,000 shares of Class R5 and 10,000 shares of Class A, Class B, Class C, Class I, Class R1, Class R2, Class R3, and Class R4 for an aggregate amount of $2,200,000.
At February 28, 2015, MFS held approximately 81% of the outstanding shares of Class B, and 100% of the outstanding shares each of Class R1, Class R2, Class R3, and Class R4.
(4) Portfolio Securities
For the six months ended February 28, 2015, purchases and sales of investments, other than short-term obligations, aggregated $43,690,109 and $6,593,311, respectively.
32
Notes to Financial Statements (unaudited) – continued
(5) Shares of Beneficial Interest
The fund’s Declaration of Trust permits the Trustees to issue an unlimited number of full and fractional shares of beneficial interest. Transactions in fund shares were as follows:
| | | | | | | | | | | | | | | | |
| | | Six months ended
2/28/15 | | | Period ended
8/31/14 (c) | |
| | | Shares | | | Amount | | | Shares | | | Amount | |
| Shares sold | | | | | | | | | | | | | | | | |
Class A | | | 773,432 | | | | $8,504,643 | | | | 74,023 | | | | $777,936 | |
Class B | | | 2,041 | | | | 22,501 | | | | 10,644 | | | | 106,935 | |
Class C | | | 10,303 | | | | 112,616 | | | | 11,922 | | | | 120,556 | |
Class I | | | 203,803 | | | | 2,261,646 | | | | 12,538 | | | | 127,000 | |
Class R1 | | | — | | | | — | | | | 10,000 | | | | 100,000 | |
Class R2 | | | — | | | | — | | | | 10,000 | | | | 100,000 | |
Class R3 | | | — | | | | — | | | | 10,000 | | | | 100,000 | |
Class R4 | | | — | | | | — | | | | 10,000 | | | | 100,000 | |
Class R5 | | | 2,051,360 | | | | 22,383,452 | | | | 544,945 | | | | 5,822,000 | |
| | | 3,040,939 | | | | $33,284,858 | | | | 694,072 | | | | $7,354,427 | |
| | | | |
| Shares issued to shareholders in reinvestment of distributions | | | | | | | | | | | | | | | | |
Class A | | | 1,657 | | | | $18,193 | | | | 272 | | | | $2,891 | |
Class B | | | 18 | | | | 202 | | | | 37 | | | | 389 | |
Class C | | | 19 | | | | 208 | | | | 38 | | | | 403 | |
Class I | | | 240 | | | | 2,631 | | | | 101 | | | | 1,071 | |
Class R1 | | | 14 | | | | 160 | | | | 37 | | | | 389 | |
Class R2 | | | 15 | | | | 160 | | | | 63 | | | | 673 | |
Class R3 | | | 22 | | | | 241 | | | | 77 | | | | 816 | |
Class R4 | | | 35 | | | | 384 | | | | 91 | | | | 959 | |
Class R5 | | | 6,721 | | | | 73,294 | | | | 1,300 | | | | 13,742 | |
| | | 8,741 | | | | $95,473 | | | | 2,016 | | | | $21,333 | |
| | | | |
| Shares reacquired | | | | | | | | | | | | | | | | |
Class A | | | (22,321 | ) | | | $(246,134 | ) | | | (1,023 | ) | | | $(10,146 | ) |
Class B | | | (343 | ) | | | (3,816 | ) | | | — | | | | — | |
Class C | | | (2 | ) | | | (24 | ) | | | (2 | ) | | | (21 | ) |
Class I | | | (135 | ) | | | (1,482 | ) | | | — | | | | — | |
| | | (22,801 | ) | | | $(251,456 | ) | | | (1,025 | ) | | | $(10,167 | ) |
33
Notes to Financial Statements (unaudited) – continued
| | | | | | | | | | | | | | | | |
| | | Six months ended
2/28/15 | | | Period ended
8/31/14 (c) | |
| | | Shares | | | Amount | | | Shares | | | Amount | |
| Net change | | | | | | | | | | | | | | | | |
Class A | | | 752,768 | | | | $8,276,702 | | | | 73,272 | | | | $770,681 | |
Class B | | | 1,716 | | | | 18,887 | | | | 10,681 | | | | 107,324 | |
Class C | | | 10,320 | | | | 112,800 | | | | 11,958 | | | | 120,938 | |
Class I | | | 203,908 | | | | 2,262,795 | | | | 12,639 | | | | 128,071 | |
Class R1 | | | 14 | | | | 160 | | | | 10,037 | | | | 100,389 | |
Class R2 | | | 15 | | | | 160 | | | | 10,063 | | | | 100,673 | |
Class R3 | | | 22 | | | | 241 | | | | 10,077 | | | | 100,816 | |
Class R4 | | | 35 | | | | 384 | | | | 10,091 | | | | 100,959 | |
Class R5 | | | 2,058,081 | | | | 22,456,746 | | | | 546,245 | | | | 5,835,742 | |
| | | 3,026,879 | | | | $33,128,875 | | | | 695,063 | | | | $7,365,593 | |
| (c) | For the period from the commencement of the fund’s investment operations, December 5, 2013, through the stated period end. |
(6) Line of Credit
The fund and certain other funds managed by MFS participate in a $1.1 billion unsecured committed line of credit, subject to a $1 billion sublimit, provided by a syndication of banks under a credit agreement. Borrowings may be made for temporary financing needs. Interest is charged to each fund, based on its borrowings, generally at a rate equal to the higher of the Federal Reserve funds rate or one month LIBOR plus an agreed upon spread. A commitment fee, based on the average daily, unused portion of the committed line of credit, is allocated among the participating funds at the end of each calendar quarter. In addition, the fund and other funds managed by MFS have established unsecured uncommitted borrowing arrangements with certain banks for temporary financing needs. Interest is charged to each fund, based on its borrowings, at a rate equal to the Federal Reserve funds rate plus an agreed upon spread. For the six months ended February 28, 2015, the fund’s commitment fee and interest expense were $10 and $0, respectively, and are included in “Miscellaneous” expense in the Statement of Operations.
(7) Transactions in Underlying Affiliated Funds-Affiliated Issuers
An affiliated issuer may be considered one in which the fund owns 5% or more of the outstanding voting securities, or a company which is under common control. For the purposes of this report, the fund assumes the following to be an affiliated issuer:
| | | | | | | | | | | | | | | | |
| Underlying Affiliated Fund | | Beginning
Shares/Par
Amount | | | Acquisitions
Shares/Par
Amount | | | Dispositions
Shares/Par
Amount | | | Ending
Shares/Par
Amount | |
MFS Institutional Money
Market Portfolio | | | 128,237 | | | | 34,406,157 | | | | (33,935,690 | ) | | | 598,704 | |
| | | | |
| Underlying Affiliated Fund | | Realized
Gain (Loss) | | | Capital Gain
Distributions | | | Dividend
Income | | | Ending
Value | |
MFS Institutional Money
Market Portfolio | | | $— | | | | $— | | | | $465 | | | | $598,704 | |
34
PROXY VOTING POLICIES AND INFORMATION
MFS votes proxies on behalf of the fund pursuant to proxy voting policies and procedures that are available without charge, upon request, by calling 1-800-225-2606, by visiting the Proxy Voting section of mfs.com or by visiting the SEC’s Web site at http://www.sec.gov.
Information regarding how the fund voted proxies relating to portfolio securities during the most recent twelve-month period ended June 30 is available without charge by visiting the Proxy Voting section of mfs.com or by visiting the SEC’s Web site at http://www.sec.gov.
QUARTERLY PORTFOLIO DISCLOSURE
The fund will file a complete schedule of portfolio holdings with the Securities and Exchange Commission (the Commission) for the first and third quarters of each fiscal year on Form N-Q. A shareholder can obtain the quarterly portfolio holdings report at mfs.com. The fund’s Form N-Q is also available on the EDGAR database on the Commission’s Internet Web site at http://www.sec.gov, and may be reviewed and copied at the:
Public Reference Room
Securities and Exchange Commission
100 F Street, NE, Room 1580
Washington, D.C. 20549
Information on the operation of the Public Reference Room may be obtained by calling the Commission at 1-800-SEC-0330. Copies of the fund’s Form N-Q also may be obtained, upon payment of a duplicating fee, by electronic request at the following e-mail address: publicinfo@sec.gov or by writing the Public Reference Section at the above address.
FURTHER INFORMATION
From time to time, MFS may post important information about the fund or the MFS funds on the MFS web site (mfs.com). This information is available by visiting the “Market Commentary” and “Announcements” sub sections in the “Market Outlooks” section of mfs.com or by clicking on the fund’s name under “Mutual Funds” in the “Products” section of mfs.com.
PROVISION OF FINANCIAL REPORTS AND SUMMARY PROSPECTUSES
The fund produces financial reports every six months and updates its summary prospectus and prospectus annually. To avoid sending duplicate copies of materials to households, only one copy of the fund’s annual and semiannual report and summary prospectus may be mailed to shareholders having the same last name and residential address on the fund’s records. However, any shareholder may contact MFSC (please see back cover for address and telephone number) to request that copies of these reports and summary prospectuses be sent personally to that shareholder.
35
Save paper with eDelivery.

| MFS® will send you prospectuses, |
reports, and proxies directly via e-mail so you will get information faster with less mailbox clutter.
To sign up:
1. Go to mfs.com.
2. Log in via MFS® Access.
3. Select eDelivery.
If you own your MFS fund shares through a financial institution or a retirement plan, MFS® TALK, MFS® Access, or eDelivery may not be available to you.
CONTACT
WEB SITE
mfs.com
MFS TALK
1-800-637-8255
24 hours a day
ACCOUNT SERVICE AND LITERATURE
Shareholders
1-800-225-2606
Financial advisors
1-800-343-2829
Retirement plan services
1-800-637-1255
MAILING ADDRESS
MFS Service Center, Inc.
P.O. Box 55824
Boston, MA 02205-5824
OVERNIGHT MAIL
MFS Service Center, Inc.
c/o Boston Financial Data Services
30 Dan Road
Canton, MA 02021-2809
SEMIANNUAL REPORT
February 28, 2015

MFS® LOW VOLATILITY EQUITY FUND

LVU-SEM
MFS® LOW VOLATILITY EQUITY FUND
CONTENTS
The report is prepared for the general information of shareholders.
It is authorized for distribution to prospective investors only when preceded or accompanied by a current prospectus.
NOT FDIC INSURED Ÿ MAY LOSE VALUE Ÿ NO BANK GUARANTEE

LETTER FROM THE CHAIRMAN
Dear Shareholders:
Lower oil prices continue to influence markets in different ways. Among those economies hurt, oil-exporters such as Russia and Venezuela have been hit particularly hard, along with U.S. regions that have close oil industry ties.
The U.S. economic recovery remains solid. The labor market is strong, interest rates are historically low and reduced energy prices have helped to stimulate consumer spending.
Economic reports early in 2015 indicate that the eurozone is on a more solid footing, with confidence boosted by the launch of European Central Bank quantitative easing.
In Asia, the Chinese economy continues to raise concerns, with the People’s Bank of China implementing stimulus programs to counter a steady decline in growth rates.
As always, active risk management is integral to how we at MFS® manage your investments. We use a collaborative process, sharing insights across asset classes, regions and economic sectors. Our global investment team uses a diversified, multidisciplined, long-term approach.
Applying proven principles, such as asset allocation and diversification, can best serve investors over the long term. We are confident that this approach can help you as you work with your financial advisors to reach your goals in the years ahead.
Respectfully,

Robert J. Manning
Chairman
MFS Investment Management
April 14, 2015
The opinions expressed in this letter are subject to change and may not be relied upon for investment advice. No forecasts can be guaranteed.
1
PORTFOLIO COMPOSITION
Portfolio structure

| | | | |
| Top ten holdings | | | | |
| Eli Lilly & Co. | | | 2.9% | |
| Procter & Gamble Co. | | | 2.8% | |
| Public Storage, Inc., REIT | | | 2.8% | |
| M&T Bank Corp. | | | 2.7% | |
| Visa, Inc., “A” | | | 2.6% | |
| Exxon Mobil Corp. | | | 2.6% | |
| Merck & Co., Inc. | | | 2.5% | |
| Johnson & Johnson | | | 2.5% | |
| McDonald’s Corp. | | | 2.4% | |
| Google, Inc., “A” | | | 2.3% | |
| | | | |
| Equity sectors | | | | |
| Financial Services | | | 20.3% | |
| Health Care | | | 14.3% | |
| Consumer Staples | | | 13.6% | |
| Technology | | | 12.3% | |
| Utilities & Communications | | | 10.2% | |
| Retailing | | | 8.3% | |
| Industrial Goods & Services | | | 5.8% | |
| Energy | | | 5.2% | |
| Leisure | | | 3.4% | |
| Special Products & Services | | | 2.8% | |
| Basic Materials | | | 1.0% | |
| Autos & Housing | | | 0.5% | |
| Transportation | | | 0.4% | |
Cash & Other can include cash, other assets less liabilities, offsets to derivative positions, and short-term securities.
Percentages are based on net assets as of 2/28/15.
The portfolio is actively managed and current holdings may be different.
2
EXPENSE TABLE
Fund expenses borne by the shareholders during the period, September 1, 2014 through February 28, 2015
As a shareholder of the fund, you incur two types of costs: (1) transaction costs, including sales charges (loads) on certain purchase or redemption payments, and (2) ongoing costs, including management fees; distribution and service (12b-1) fees; and other fund expenses. This example is intended to help you understand your ongoing costs (in dollars) of investing in the fund and to compare these costs with the ongoing costs of investing in other mutual funds.
The example is based on an investment of $1,000 invested at the beginning of the period and held for the entire period September 1, 2014 through February 28, 2015.
Actual Expenses
The first line for each share class in the following table provides information about actual account values and actual expenses. You may use the information in this line, together with the amount you invested, to estimate the expenses that you paid over the period. Simply divide your account value by $1,000 (for example, an $8,600 account value divided by $1,000 = 8.6), then multiply the result by the number in the first line under the heading entitled “Expenses Paid During Period” to estimate the expenses you paid on your account during this period.
Hypothetical Example for Comparison Purposes
The second line for each share class in the following table provides information about hypothetical account values and hypothetical expenses based on the fund’s actual expense ratio and an assumed rate of return of 5% per year before expenses, which is not the fund’s actual return. The hypothetical account values and expenses may not be used to estimate the actual ending account balance or expenses you paid for the period. You may use this information to compare the ongoing costs of investing in the fund and other funds. To do so, compare this 5% hypothetical example with the 5% hypothetical examples that appear in the shareholder reports of the other funds.
Please note that the expenses shown in the table are meant to highlight your ongoing costs only and do not reflect any transactional costs, such as sales charges (loads). Therefore, the second line for each share class in the table is useful in comparing ongoing costs only, and will not help you determine the relative total costs of owning different funds. In addition, if these transactional costs were included, your costs would have been higher.
3
Expense Table – continued
| | | | | | | | | | | | | | | | | | |
Share
Class | | | | Annualized
Expense
Ratio | | | Beginning
Account Value
9/01/14 | | | Ending
Account Value
2/28/15 | | | Expenses
Paid During
Period (p)
9/01/14-2/28/15 | |
| A | | Actual | | | 1.18% | | | | $1,000.00 | | | | $1,074.36 | | | | $6.07 | |
| | Hypothetical (h) | | | 1.18% | | | | $1,000.00 | | | | $1,018.94 | | | | $5.91 | |
| B | | Actual | | | 1.94% | | | | $1,000.00 | | | | $1,070.75 | | | | $9.96 | |
| | Hypothetical (h) | | | 1.94% | | | | $1,000.00 | | | | $1,015.17 | | | | $9.69 | |
| C | | Actual | | | 1.94% | | | | $1,000.00 | | | | $1,070.65 | | | | $9.96 | |
| | Hypothetical (h) | | | 1.94% | | | | $1,000.00 | | | | $1,015.17 | | | | $9.69 | |
| I | | Actual | | | 0.94% | | | | $1,000.00 | | | | $1,075.30 | | | | $4.84 | |
| | Hypothetical (h) | | | 0.94% | | | | $1,000.00 | | | | $1,020.13 | | | | $4.71 | |
| R1 | | Actual | | | 1.94% | | | | $1,000.00 | | | | $1,069.89 | | | | $9.96 | |
| | Hypothetical (h) | | | 1.94% | | | | $1,000.00 | | | | $1,015.17 | | | | $9.69 | |
| R2 | | Actual | | | 1.44% | | | | $1,000.00 | | | | $1,072.60 | | | | $7.40 | |
| | Hypothetical (h) | | | 1.44% | | | | $1,000.00 | | | | $1,017.65 | | | | $7.20 | |
| R3 | | Actual | | | 1.19% | | | | $1,000.00 | | | | $1,074.92 | | | | $6.12 | |
| | Hypothetical (h) | | | 1.19% | | | | $1,000.00 | | | | $1,018.89 | | | | $5.96 | |
| R4 | | Actual | | | 0.94% | | | | $1,000.00 | | | | $1,075.32 | | | | $4.84 | |
| | Hypothetical (h) | | | 0.94% | | | | $1,000.00 | | | | $1,020.13 | | | | $4.71 | |
| R5 | | Actual | | | 0.91% | | | | $1,000.00 | | | | $1,075.36 | | | | $4.68 | |
| | Hypothetical (h) | | | 0.91% | | | | $1,000.00 | | | | $1,020.28 | | | | $4.56 | |
| (h) | 5% class return per year before expenses. |
| (p) | “Expenses Paid During Period” are equal to each class’s annualized expense ratio, as shown above, multiplied by the average account value over the period, multiplied by 181/365 (to reflect the one-half year period). Expenses paid do not include any applicable sales charges (loads). If these transaction costs had been included, your costs would have been higher. |
Notes to Expense Table
Each class with a Rule 12b-1 service fee is subject to a rebate of a portion of such fee. Such rebates are included in the expense ratios above and are outside of the expense limitation arrangement. For Class A shares, this rebate reduced the expense ratio above by 0.01%. See Note 3 in the Notes to Financial Statements for additional information.
4
PORTFOLIO OF INVESTMENTS
2/28/15 (unaudited)
The Portfolio of Investments is a complete list of all securities owned by your fund. It is categorized by broad-based asset classes.
| | | | | | | | |
| Common Stocks - 98.1% | | | | | | | | |
| Issuer | | Shares/Par | | | Value ($) | |
| | | | | | | | |
| Aerospace - 3.5% | | | | | | | | |
| General Dynamics Corp. | | | 629 | | | $ | 87,285 | |
| Honeywell International, Inc. | | | 1,480 | | | | 152,114 | |
| Lockheed Martin Corp. | | | 406 | | | | 81,220 | |
| United Technologies Corp. | | | 1,181 | | | | 143,976 | |
| | | | | | | | |
| | | | $ | 464,595 | |
| Automotive - 0.5% | | | | | | | | |
| Delphi Automotive PLC | | | 772 | | | $ | 60,864 | |
| | |
| Business Services - 2.8% | | | | | | | | |
| Amdocs Ltd. | | | 2,729 | | | $ | 143,273 | |
| Automatic Data Processing, Inc. | | | 2,609 | | | | 231,784 | |
| | | | | | | | |
| | | | $ | 375,057 | |
| Cable TV - 0.4% | | | | | | | | |
| Time Warner Cable, Inc. | | | 378 | | | $ | 58,231 | |
| | |
| Chemicals - 0.5% | | | | | | | | |
| 3M Co. | | | 399 | | | $ | 67,291 | |
| | |
| Computer Software - 2.7% | | | | | | | | |
| Adobe Systems, Inc. (a) | | | 754 | | | $ | 59,641 | |
| Intuit, Inc. | | | 1,400 | | | | 136,682 | |
| Microsoft Corp. | | | 2,359 | | | | 103,442 | |
| Oracle Corp. | | | 1,363 | | | | 59,727 | |
| | | | | | | | |
| | | | $ | 359,492 | |
| Computer Software - Systems - 1.4% | | | | | | | | |
| EMC Corp. | | | 1,853 | | | $ | 53,626 | |
| International Business Machines Corp. | | | 818 | | | | 132,467 | |
| | | | | | | | |
| | | | $ | 186,093 | |
| Consumer Products - 4.6% | | | | | | | | |
| Colgate-Palmolive Co. | | | 2,732 | | | $ | 193,480 | |
| Kimberly-Clark Corp. | | | 391 | | | | 42,877 | |
| Procter & Gamble Co. | | | 4,439 | | | | 377,892 | |
| | | | | | | | |
| | | | $ | 614,249 | |
5
Portfolio of Investments (unaudited) – continued
| | | | | | | | |
| Issuer | | Shares/Par | | | Value ($) | |
| Common Stocks - continued | | | | | | | | |
| Electrical Equipment - 0.9% | | | | | | | | |
| Danaher Corp. | | | 649 | | | $ | 56,645 | |
| TE Connectivity Ltd. | | | 789 | | | | 56,911 | |
| | | | | | | | |
| | | | $ | 113,556 | |
| Electronics - 4.4% | | | | | | | | |
| Analog Devices, Inc. | | | 1,011 | | | $ | 59,184 | |
| Intel Corp. | | | 4,787 | | | | 159,168 | |
| Microchip Technology, Inc. | | | 4,565 | | | | 234,048 | |
| Texas Instruments, Inc. | | | 2,271 | | | | 133,535 | |
| | | | | | | | |
| | | | $ | 585,935 | |
| Energy - Integrated - 4.6% | | | | | | | | |
| Chevron Corp. | | | 2,492 | | | $ | 265,847 | |
| Exxon Mobil Corp. | | | 3,867 | | | | 342,384 | |
| | | | | | | | |
| | | | $ | 608,231 | |
| Food & Beverages - 6.1% | | | | | | | | |
| Bunge Ltd. | | | 522 | | | $ | 42,689 | |
| Coca-Cola Co. | | | 2,810 | | | | 121,673 | |
| Dr Pepper Snapple Group, Inc. | | | 1,040 | | | | 81,942 | |
| General Mills, Inc. | | | 4,649 | | | | 250,070 | |
| McCormick & Co., Inc. | | | 975 | | | | 73,496 | |
| Mondelez International, Inc. | | | 1,400 | | | | 51,709 | |
| PepsiCo, Inc. | | | 1,875 | | | | 185,588 | |
| | | | | | | | |
| | | | $ | 807,167 | |
| Food & Drug Stores - 2.3% | | | | | | | | |
| CVS Health Corp. | | | 665 | | | $ | 69,074 | |
| Kroger Co. | | | 3,337 | | | | 237,428 | |
| | | | | | | | |
| | | | $ | 306,502 | |
| Gaming & Lodging - 0.5% | | | | | | | | |
| Norwegian Cruise Line Holdings Ltd. (a) | | | 1,451 | | | $ | 71,563 | |
| | |
| General Merchandise - 4.6% | | | | | | | | |
| Costco Wholesale Corp. | | | 1,377 | | | $ | 202,364 | |
| Macy’s, Inc. | | | 800 | | | | 50,976 | |
| Target Corp. | | | 975 | | | | 74,909 | |
| Wal-Mart Stores, Inc. | | | 3,304 | | | | 277,305 | |
| | | | | | | | |
| | | | $ | 605,554 | |
| Health Maintenance Organizations - 1.3% | | | | | | | | |
| Aetna, Inc. | | | 557 | | | $ | 55,449 | |
| Health Net, Inc. (a) | | | 1,088 | | | | 62,397 | |
6
Portfolio of Investments (unaudited) – continued
| | | | | | | | |
| Issuer | | Shares/Par | | | Value ($) | |
| | | | | | | | |
| Common Stocks - continued | | | | | | | | |
| Health Maintenance Organizations - continued | | | | | | | | |
| UnitedHealth Group, Inc. | | | 526 | | | $ | 59,769 | |
| | | | | | | | |
| | | | $ | 177,615 | |
| Insurance - 6.8% | | | | | | | | |
| American International Group, Inc. | | | 1,348 | | | $ | 74,585 | |
| Chubb Corp. | | | 572 | | | | 57,457 | |
| Everest Re Group Ltd. | | | 1,457 | | | | 258,516 | |
| Loews Corp. | | | 1,321 | | | | 54,174 | |
| MetLife, Inc. | | | 991 | | | | 50,373 | |
| PartnerRe Ltd. | | | 1,228 | | | | 140,606 | |
| Travelers Cos., Inc. | | | 1,204 | | | | 129,358 | |
| Validus Holdings Ltd. | | | 3,361 | | | | 139,952 | |
| | | | | | | | |
| | | | $ | 905,021 | |
| Internet - 2.3% | | | | | | | | |
| Google, Inc., “A” (a) | | | 541 | | | $ | 304,383 | |
| | |
| Major Banks - 1.9% | | | | | | | | |
| Goldman Sachs Group, Inc. | | | 308 | | | $ | 58,455 | |
| PNC Financial Services Group, Inc. | | | 800 | | | | 73,568 | |
| Wells Fargo & Co. | | | 2,137 | | | | 117,086 | |
| | | | | | | | |
| | | | $ | 249,109 | |
| Medical & Health Technology & Services - 1.9% | | | | | | | | |
| AmerisourceBergen Corp. | | | 1,501 | | | $ | 154,243 | |
| McKesson Corp. | | | 458 | | | | 104,745 | |
| | | | | | | | |
| | | | $ | 258,988 | |
| Medical Equipment - 2.8% | | | | | | | | |
| Abbott Laboratories | | | 3,673 | | | $ | 173,990 | |
| Becton, Dickinson and Co. | | | 522 | | | | 76,588 | |
| Zimmer Holdings, Inc. | | | 959 | | | | 115,454 | |
| | | | | | | | |
| | | | $ | 366,032 | |
| Natural Gas - Distribution - 0.4% | | | | | | | | |
| Sempra Energy | | | 452 | | | $ | 48,906 | |
|
| Network & Telecom - 1.5% | |
| Cisco Systems, Inc. | | | 5,287 | | | $ | 156,019 | |
| Qualcomm, Inc. | | | 665 | | | | 48,219 | |
| | | | | | | | |
| | | | $ | 204,238 | |
| Oil Services - 0.6% | | | | | | | | |
| Schlumberger Ltd. | | | 997 | | | $ | 83,908 | |
7
Portfolio of Investments (unaudited) – continued
| | | | | | | | |
| Issuer | | Shares/Par | | | Value ($) | |
| | | | | | | | |
| Common Stocks - continued | | | | | | | | |
| Other Banks & Diversified Financials - 7.0% | | | | | | | | |
| American Express Co. | | | 869 | | | $ | 70,902 | |
| Discover Financial Services | | | 1,463 | | | | 89,214 | |
| East West Bancorp, Inc. | | | 1,781 | | | | 71,151 | |
| M&T Bank Corp. | | | 2,963 | | | | 358,523 | |
| Visa, Inc., “A” | | | 1,265 | | | | 343,207 | |
| | | | | | | | |
| | | | $ | 932,997 | |
| Pharmaceuticals - 8.3% | | | | | | | | |
| Eli Lilly & Co. | | | 5,414 | | | $ | 379,900 | |
| Johnson & Johnson | | | 3,215 | | | | 329,570 | |
| Merck & Co., Inc. | | | 5,766 | | | | 337,542 | |
| Pfizer, Inc. | | | 1,582 | | | | 54,294 | |
| | | | | | | | |
| | | | $ | 1,101,306 | |
| Pollution Control - 1.4% | | | | | | | | |
| Stericycle, Inc. (a) | | | 1,059 | | | $ | 142,933 | |
| Waste Management, Inc. | | | 912 | | | | 49,686 | |
| | | | | | | | |
| | | | $ | 192,619 | |
| Real Estate - 4.6% | | | | | | | | |
| Federal Realty Investment Trust, REIT | | | 933 | | | $ | 132,514 | |
| Public Storage, Inc., REIT | | | 1,880 | | | | 370,774 | |
| Simon Property Group, Inc., REIT | | | 540 | | | | 102,794 | |
| | | | | | | | |
| | | | $ | 606,082 | |
| Restaurants - 2.4% | | | | | | | | |
| McDonald’s Corp. | | | 3,252 | | | $ | 321,623 | |
| | |
| Specialty Chemicals - 0.5% | | | | | | | | |
| Praxair, Inc. | | | 516 | | | $ | 65,996 | |
| | |
| Specialty Stores - 1.4% | | | | | | | | |
| AutoZone, Inc. (a) | | | 156 | | | $ | 100,258 | |
| O’Reilly Automotive, Inc. (a) | | | 443 | | | | 92,202 | |
| | | | | | | | |
| | | | $ | 192,460 | |
| Telecommunications - Wireless - 0.7% | | | | | | | | |
| American Tower Corp., REIT | | | 900 | | | $ | 89,226 | |
| | |
| Telephone Services - 2.3% | | | | | | | | |
| AT&T, Inc. | | | 2,687 | | | $ | 92,863 | |
| Verizon Communications, Inc. | | | 4,265 | | | | 210,904 | |
| | | | | | | | |
| | | | $ | 303,767 | |
8
Portfolio of Investments (unaudited) – continued
| | | | | | | | |
| Issuer | | Shares/Par | | | Value ($) | |
| | | | | | | | |
| Common Stocks - continued | | | | | | | | |
| Tobacco - 2.9% | | | | | | | | |
| Altria Group, Inc. | | | 1,335 | | | $ | 75,147 | |
| Lorillard, Inc. | | | 2,530 | | | | 173,103 | |
| Philip Morris International, Inc. | | | 1,646 | | | | 136,552 | |
| | | | | | | | |
| | | | $ | 384,802 | |
| Trucking - 0.4% | | | | | | | | |
| United Parcel Service, Inc., “B” | | | 483 | | | $ | 49,136 | |
| | |
| Utilities - Electric Power - 6.9% | | | | | | | | |
| Alliant Energy Corp. | | | 877 | | | $ | 55,777 | |
| American Electric Power Co., Inc. | | | 1,748 | | | | 100,650 | |
| Consolidated Edison, Inc. | | | 841 | | | | 53,101 | |
| Dominion Resources, Inc. | | | 1,213 | | | | 87,445 | |
| Duke Energy Corp. | | | 830 | | | | 65,197 | |
| ITC Holdings Corp. | | | 1,249 | | | | 48,374 | |
| MGE Energy, Inc. | | | 1,888 | | | | 81,354 | |
| NextEra Energy, Inc. | | | 1,197 | | | | 123,842 | |
| OGE Energy Corp. | | | 4,856 | | | | 157,869 | |
| Pinnacle West Capital Corp. | | | 800 | | | | 51,264 | |
| Southern Co. | | | 1,954 | | | | 89,474 | |
| | | | | | | | |
| | | | $ | 914,347 | |
| Total Common Stocks (Identified Cost, $12,382,581) | | | $ | 13,036,941 | |
| | |
| Money Market Funds - 1.3% | | | | | | | | |
MFS Institutional Money Market Portfolio, 0.1%,
at Cost and Net Asset Value (v) | | | 167,148 | | | $ | 167,148 | |
| Total Investments (Identified Cost, $12,549,729) | | | $ | 13,204,089 | |
| |
| Other Assets, Less Liabilities - 0.6% | | | | 84,203 | |
| Net Assets - 100.0% | | | $ | 13,288,292 | |
| (a) | Non-income producing security. |
| (v) | Underlying affiliated fund that is available only to investment companies managed by MFS. The rate quoted for the MFS Institutional Money Market Portfolio is the annualized seven-day yield of the fund at period end. |
The following abbreviations are used in this report and are defined:
| PLC | | Public Limited Company |
| REIT | | Real Estate Investment Trust |
See notes to financial statements
9
Financial Statements
STATEMENT OF ASSETS AND LIABILITIES
At 2/28/15 (unaudited)
This statement represents your fund’s balance sheet, which details the assets and liabilities comprising the total value of the fund.
| | | | |
| Assets | | | | |
Investments- | | | | |
Non-affiliated issuers, at value (identified cost, $12,382,581) | | | $13,036,941 | |
Underlying affiliated funds, at cost and value | | | 167,148 | |
Total investments, at value (identified cost, $12,549,729) | | | $13,204,089 | |
Receivables for | | | | |
Fund shares sold | | | 26,289 | |
Dividends | | | 33,588 | |
Receivable from investment adviser | | | 12,757 | |
Other assets | | | 38,623 | |
Total assets | | | $13,315,346 | |
| Liabilities | | | | |
Payable for fund shares reacquired | | | $852 | |
Payable to affiliates | | | | |
Shareholder servicing costs | | | 628 | |
Distribution and service fees | | | 231 | |
Payable for independent Trustees’ compensation | | | 9 | |
Accrued expenses and other liabilities | | | 25,334 | |
Total liabilities | | | $27,054 | |
Net assets | | | $13,288,292 | |
| Net assets consist of | | | | |
Paid-in capital | | | $12,608,557 | |
Unrealized appreciation (depreciation) on investments | | | 654,360 | |
Accumulated distributions in excess of net realized gain on investments | | | (4,718 | ) |
Undistributed net investment income | | | 30,093 | |
Net assets | | | $13,288,292 | |
Shares of beneficial interest outstanding | | | 1,150,057 | |
10
Statement of Assets and Liabilities (unaudited) – continued
| | | | | | | | | | | | |
| | | Net assets | | | Shares
outstanding | | | Net asset value
per share (a) | |
Class A | | | $9,059,024 | | | | 784,050 | | | | $11.55 | |
Class B | | | 442,934 | | | | 38,385 | | | | 11.54 | |
Class C | | | 1,202,197 | | | | 104,276 | | | | 11.53 | |
Class I | | | 474,441 | | | | 41,003 | | | | 11.57 | |
Class R1 | | | 115,871 | | | | 10,032 | | | | 11.55 | |
Class R2 | | | 116,596 | | | | 10,085 | | | | 11.56 | |
Class R3 | | | 116,956 | | | | 10,112 | | | | 11.57 | |
Class R4 | | | 117,317 | | | | 10,138 | | | | 11.57 | |
Class R5 | | | 1,642,956 | | | | 141,976 | | | | 11.57 | |
| (a) | Maximum offering price per share was equal to the net asset value per share for all share classes, except for Class A, for which the maximum offering price per share was $12.25 [100 / 94.25 x $11.55]. On sales of $50,000 or more, the maximum offering price of Class A shares is reduced. A contingent deferred sales charge may be imposed on redemptions of Class A, Class B, and Class C shares. Redemption price per share was equal to the net asset value per share for Classes I, R1, R2, R3, R4, and R5. |
See notes to financial statements
11
Financial Statements
STATEMENT OF OPERATIONS
Six months ended 2/28/15 (unaudited)
This statement describes how much your fund earned in investment income and accrued in expenses. It also describes any gains and/or losses generated by fund operations.
| | | | |
| Net investment income | | | | |
Income | | | | |
Dividends | | | $84,978 | |
Dividends from underlying affiliated funds | | | 65 | |
Total investment income | | | $85,043 | |
Expenses | | | | |
Management fee | | | $23,805 | |
Distribution and service fees | | | 9,748 | |
Shareholder servicing costs | | | 1,427 | |
Administrative services fee | | | 8,679 | |
Independent Trustees’ compensation | | | 585 | |
Custodian fee | | | 6,420 | |
Shareholder communications | | | 3,844 | |
Audit and tax fees | | | 18,901 | |
Legal fees | | | 12 | |
Registration fees | | | 50,952 | |
Miscellaneous | | | 5,912 | |
Total expenses | | | $130,285 | |
Reduction of expenses by investment adviser and distributor | | | (91,045 | ) |
Net expenses | | | $39,240 | |
Net investment income | | | $45,803 | |
| Realized and unrealized gain (loss) on investments | | | | |
Realized gain (loss) on investments (identified cost basis) | | | $(2,511 | ) |
Change in unrealized appreciation (depreciation) on investments | | | $428,938 | |
Net realized and unrealized gain (loss) on investments | | | $426,427 | |
Change in net assets from operations | | | $472,230 | |
See notes to financial statements
12
Financial Statements
STATEMENTS OF CHANGES IN NET ASSETS
These statements describe the increases and/or decreases in net assets resulting from operations, any distributions, and any shareholder transactions.
| | | | | | | | |
| Change in net assets | | Six months ended
2/28/15
(unaudited) | | | Period ended
8/31/14 (c) | |
| From operations | | | | | | | | |
Net investment income | | | $45,803 | | | | $26,186 | |
Net realized gain (loss) on investments | | | (2,511 | ) | | | 743 | |
Net unrealized gain (loss) on investments | | | 428,938 | | | | 225,422 | |
Change in net assets from operations | | | $472,230 | | | | $252,351 | |
| Distributions declared to shareholders | | | | | | | | |
From net investment income | | | $(26,449 | ) | | | $(16,493 | ) |
From net realized gain on investments | | | (2,950 | ) | | | — | |
Total distributions declared to shareholders | | | $(29,399 | ) | | | $(16,493 | ) |
Change in net assets from fund share transactions | | | $8,961,940 | | | | $3,647,663 | |
Total change in net assets | | | $9,404,771 | | | | $3,883,521 | |
| Net assets | | | | | | | | |
At beginning of period | | | 3,883,521 | | | | — | |
At end of period (including undistributed net investment income of $30,093 and $10,739, respectively) | | | $13,288,292 | | | | $3,883,521 | |
| (c) | For the period from the commencement of the fund’s investment operations, December 5, 2013, through the stated period end. |
See notes to financial statements
13
Financial Statements
FINANCIAL HIGHLIGHTS
The financial highlights table is intended to help you understand the fund’s financial performance for the semiannual period and the past 5 fiscal years (or life of a particular share class, if shorter). Certain information reflects financial results for a single fund share. The total returns in the table represent the rate by which an investor would have earned (or lost) on an investment in the fund share class (assuming reinvestment of all distributions) held for the entire period.
| | | | | | | | |
| Class A | | Six months ended
2/28/15 | | | Period ended
8/31/14 (c) | |
| | | (unaudited) | | | | |
Net asset value, beginning of period | | | $10.82 | | | | $10.00 | |
| Income (loss) from investment operations | | | | | | | | |
Net investment income (d) | | | $0.09 | | | | $0.11 | |
Net realized and unrealized gain (loss) on investments and
foreign currency | | | 0.71 | | | | 0.77 | |
Total from investment operations | | | $0.80 | | | | $0.88 | |
| Less distributions declared to shareholders | | | | | | | | |
From net investment income | | | $(0.06 | ) | | | $(0.06 | ) |
From net realized gain on investments | | | (0.01 | ) | | | — | |
Total distributions declared to shareholders | | | $(0.07 | ) | | | $(0.06 | ) |
Net asset value, end of period (x) | | | $11.55 | | | | $10.82 | |
Total return (%) (r)(s)(t)(x) | | | 7.44 | (n) | | | 8.82 | (n) |
Ratios (%) (to average net assets)
and Supplemental data: | | | | | | | | |
Expenses before expense reductions (f) | | | 3.75 | (a) | | | 4.45 | (a) |
Expenses after expense reductions (f) | | | 1.18 | (a) | | | 1.15 | (a) |
Net investment income | | | 1.70 | (a) | | | 1.40 | (a) |
Portfolio turnover | | | 12 | (n) | | | 30 | (n) |
Net assets at end of period (000 omitted) | | | $9,059 | | | | $1,154 | |
See notes to financial statements
14
Financial Highlights – continued
| | | | | | | | |
| Class B | | Six months
ended
2/28/15 | | | Period ended
8/31/14 (c) | |
| | | (unaudited) | | | | |
Net asset value, beginning of period | | | $10.81 | | | | $10.00 | |
| Income (loss) from investment operations | | | | | | | | |
Net investment income (d) | | | $0.03 | | | | $0.04 | |
Net realized and unrealized gain (loss) on investments and
foreign currency | | | 0.74 | | | | 0.78 | |
Total from investment operations | | | $0.77 | | | | $0.82 | |
| Less distributions declared to shareholders | | | | | | | | |
From net investment income | | | $(0.03 | ) | | | $(0.01 | ) |
From net realized gain on investments | | | (0.01 | ) | | | — | |
Total distributions declared to shareholders | | | $(0.04 | ) | | | $(0.01 | ) |
Net asset value, end of period (x) | | | $11.54 | | | | $10.81 | |
Total return (%) (r)(s)(t)(x) | | | 7.07 | (n) | | | 8.23 | (n) |
Ratios (%) (to average net assets)
and Supplemental data: | | | | | | | | |
Expenses before expense reductions (f) | | | 4.88 | (a) | | | 5.75 | (a) |
Expenses after expense reductions (f) | | | 1.94 | (a) | | | 1.93 | (a) |
Net investment income | | | 0.61 | (a) | | | 0.46 | (a) |
Portfolio turnover | | | 12 | (n) | | | 30 | (n) |
Net assets at end of period (000 omitted) | | | $443 | | | | $170 | |
See notes to financial statements
15
Financial Highlights – continued
| | | | | | | | |
| Class C | | Six months
ended
2/28/15 | | | Period ended
8/31/14 (c) | |
| | | (unaudited) | | | | |
Net asset value, beginning of period | | | $10.80 | | | | $10.00 | |
| Income (loss) from investment operations | | | | | | | | |
Net investment income (d) | | | $0.04 | | | | $0.04 | |
Net realized and unrealized gain (loss) on investments and
foreign currency | | | 0.73 | | | | 0.79 | |
Total from investment operations | | | $0.77 | | | | $0.83 | |
| Less distributions declared to shareholders | | | | | | | | |
From net investment income | | | $(0.03 | ) | | | $(0.03 | ) |
From net realized gain on investments | | | (0.01 | ) | | | — | |
Total distributions declared to shareholders | | | $(0.04 | ) | | | $(0.03 | ) |
Net asset value, end of period (x) | | | $11.53 | | | | $10.80 | |
Total return (%) (r)(s)(t)(x) | | | 7.07 | (n) | | | 8.27 | (n) |
Ratios (%) (to average net assets)
and Supplemental data: | | | | | | | | |
Expenses before expense reductions (f) | | | 4.89 | (a) | | | 5.39 | (a) |
Expenses after expense reductions (f) | | | 1.94 | (a) | | | 1.93 | (a) |
Net investment income | | | 0.67 | (a) | | | 0.48 | (a) |
Portfolio turnover | | | 12 | (n) | | | 30 | (n) |
Net assets at end of period (000 omitted) | | | $1,202 | | | | $421 | |
See notes to financial statements
16
Financial Highlights – continued
| | | | | | | | |
| Class I | | Six months
ended
2/28/15 | | | Period ended
8/31/14 (c) | |
| | | (unaudited) | | | | |
Net asset value, beginning of period | | | $10.84 | | | | $10.00 | |
| Income (loss) from investment operations | | | | | | | | |
Net investment income (d) | | | $0.09 | | | | $0.11 | |
Net realized and unrealized gain (loss) on investments and
foreign currency | | | 0.73 | | | | 0.80 | |
Total from investment operations | | | $0.82 | | | | $0.91 | |
| Less distributions declared to shareholders | | | | | | | | |
From net investment income | | | $(0.08 | ) | | | $(0.07 | ) |
From net realized gain on investments | | | (0.01 | ) | | | — | |
Total distributions declared to shareholders | | | $(0.09 | ) | | | $(0.07 | ) |
Net asset value, end of period (x) | | | $11.57 | | | | $10.84 | |
Total return (%) (r)(s)(x) | | | 7.53 | (n) | | | 9.09 | (n) |
Ratios (%) (to average net assets)
and Supplemental data: | | | | | | | | |
Expenses before expense reductions (f) | | | 3.89 | (a) | | | 4.72 | (a) |
Expenses after expense reductions (f) | | | 0.94 | (a) | | | 0.93 | (a) |
Net investment income | | | 1.69 | (a) | | | 1.43 | (a) |
Portfolio turnover | | | 12 | (n) | | | 30 | (n) |
Net assets at end of period (000 omitted) | | | $474 | | | | $177 | |
See notes to financial statements
17
Financial Highlights – continued
| | | | | | | | |
| Class R1 | | Six months
ended
2/28/15 | | | Period ended
8/31/14 (c) | |
| | | (unaudited) | | | | |
Net asset value, beginning of period | | | $10.82 | | | | $10.00 | |
| Income (loss) from investment operations | | | | | | | | |
Net investment income (d) | | | $0.03 | | | | $0.03 | |
Net realized and unrealized gain (loss) on investments and
foreign currency | | | 0.73 | | | | 0.80 | |
Total from investment operations | | | $0.76 | | | | $0.83 | |
| Less distributions declared to shareholders | | | | | | | | |
From net investment income | | | $(0.02 | ) | | | $(0.01 | ) |
From net realized gain on investments | | | (0.01 | ) | | | — | |
Total distributions declared to shareholders | | | $(0.03 | ) | | | $(0.01 | ) |
Net asset value, end of period (x) | | | $11.55 | | | | $10.82 | |
Total return (%) (r)(s)(x) | | | 6.99 | (n) | | | 8.30 | (n) |
Ratios (%) (to average net assets)
and Supplemental data: | | | | | | | | |
Expenses before expense reductions (f) | | | 5.24 | (a) | | | 5.92 | (a) |
Expenses after expense reductions (f) | | | 1.94 | (a) | | | 1.93 | (a) |
Net investment income | | | 0.47 | (a) | | | 0.40 | (a) |
Portfolio turnover | | | 12 | (n) | | | 30 | (n) |
Net assets at end of period (000 omitted) | | | $116 | | | | $108 | |
See notes to financial statements
18
Financial Highlights – continued
| | | | | | | | |
| Class R2 | | Six months
ended
2/28/15 | | | Period ended
8/31/14 (c) | |
| | | (unaudited) | | | | |
Net asset value, beginning of period | | | $10.83 | | | | $10.00 | |
| Income (loss) from investment operations | | | | | | | | |
Net investment income (d) | | | $0.05 | | | | $0.07 | |
Net realized and unrealized gain (loss) on investments and
foreign currency | | | 0.74 | | | | 0.80 | |
Total from investment operations | | | $0.79 | | | | $0.87 | |
| Less distributions declared to shareholders | | | | | | | | |
From net investment income | | | $(0.05 | ) | | | $(0.04 | ) |
From net realized gain on investments | | | (0.01 | ) | | | — | |
Total distributions declared to shareholders | | | $(0.06 | ) | | | $(0.04 | ) |
Net asset value, end of period (x) | | | $11.56 | | | | $10.83 | |
Total return (%) (r)(s)(x) | | | 7.26 | (n) | | | 8.69 | (n) |
Ratios (%) (to average net assets)
and Supplemental data: | | | | | | | | |
Expenses before expense reductions (f) | | | 4.74 | (a) | | | 5.42 | (a) |
Expenses after expense reductions (f) | | | 1.44 | (a) | | | 1.43 | (a) |
Net investment income | | | 0.97 | (a) | | | 0.90 | (a) |
Portfolio turnover | | | 12 | (n) | | | 30 | (n) |
Net assets at end of period (000 omitted) | | | $117 | | | | $109 | |
See notes to financial statements
19
Financial Highlights – continued
| | | | | | | | |
| Class R3 | | Six months
ended
2/28/15 | | | Period ended 8/31/14 (c) | |
| | | (unaudited) | | | | |
Net asset value, beginning of period | | | $10.83 | | | | $10.00 | |
| Income (loss) from investment operations | | | | | | | | |
Net investment income (d) | | | $0.07 | | | | $0.09 | |
Net realized and unrealized gain (loss) on investments and
foreign currency | | | 0.74 | | | | 0.79 | |
Total from investment operations | | | $0.81 | | | | $0.88 | |
| Less distributions declared to shareholders | | | | | | | | |
From net investment income | | | $(0.06 | ) | | | $(0.05 | ) |
From net realized gain on investments | | | (0.01 | ) | | | — | |
Total distributions declared to shareholders | | | $(0.07 | ) | | | $(0.05 | ) |
Net asset value, end of period (x) | | | $11.57 | | | | $10.83 | |
Total return (%) (r)(s)(x) | | | 7.49 | (n) | | | 8.84 | (n) |
Ratios (%) (to average net assets)
and Supplemental data: | | | | | | | | |
Expenses before expense reductions (f) | | | 4.49 | (a) | | | 5.17 | (a) |
Expenses after expense reductions (f) | | | 1.19 | (a) | | | 1.18 | (a) |
Net investment income | | | 1.22 | (a) | | | 1.15 | (a) |
Portfolio turnover | | | 12 | (n) | | | 30 | (n) |
Net assets at end of period (000 omitted) | | | $117 | | | | $109 | |
See notes to financial statements
20
Financial Highlights – continued
| | | | | | | | |
| Class R4 | | Six months
ended
2/28/15 | | | Period ended
8/31/14 (c) | |
| | | (unaudited) | | | | |
Net asset value, beginning of period | | | $10.84 | | | | $10.00 | |
| Income (loss) from investment operations | | | | | | | | |
Net investment income (d) | | | $0.08 | | | | $0.11 | |
Net realized and unrealized gain (loss) on investments and
foreign currency | | | 0.74 | | | | 0.80 | |
Total from investment operations | | | $0.82 | | | | $0.91 | |
| Less distributions declared to shareholders | | | | | | | | |
From net investment income | | | $(0.08 | ) | | | $(0.07 | ) |
From net realized gain on investments | | | (0.01 | ) | | | — | |
Total distributions declared to shareholders | | | $(0.09 | ) | | | $(0.07 | ) |
Net asset value, end of period (x) | | | $11.57 | | | | $10.84 | |
Total return (%) (r)(s)(x) | | | 7.53 | (n) | | | 9.09 | (n) |
Ratios (%) (to average net assets)
and Supplemental data: | | | | | | | | |
Expenses before expense reductions (f) | | | 4.24 | (a) | | | 4.92 | (a) |
Expenses after expense reductions (f) | | | 0.94 | (a) | | | 0.93 | (a) |
Net investment income | | | 1.47 | (a) | | | 1.40 | (a) |
Portfolio turnover | | | 12 | (n) | | | 30 | (n) |
Net assets at end of period (000 omitted) | | | $117 | | | | $109 | |
See notes to financial statements
21
Financial Highlights – continued
| | | | | | | | |
| Class R5 | | Six months
ended
2/28/15 | | | Period ended
8/31/14 (c) | |
| | | (unaudited) | | | | |
Net asset value, beginning of period | | | $10.84 | | | | $10.00 | |
| Income (loss) from investment operations | | | | | | | | |
Net investment income (d) | | | $0.08 | | | | $0.11 | |
Net realized and unrealized gain (loss) on investments and
foreign currency | | | 0.74 | | | | 0.80 | |
Total from investment operations | | | $0.82 | | | | $0.91 | |
| Less distributions declared to shareholders | | | | | | | | |
From net investment income | | | $(0.08 | ) | | | $(0.07 | ) |
From net realized gain on investments | | | (0.01 | ) | | | — | |
Total distributions declared to shareholders | | | $(0.09 | ) | | | $(0.07 | ) |
Net asset value, end of period (x) | | | $11.57 | | | | $10.84 | |
Total return (%) (r)(s)(x) | | | 7.54 | (n) | | | 9.11 | (n) |
Ratios (%) (to average net assets)
and Supplemental data: | | | | | | | | |
Expenses before expense reductions (f) | | | 4.20 | (a) | | | 4.90 | (a) |
Expenses after expense reductions (f) | | | 0.91 | (a) | | | 0.91 | (a) |
Net investment income | | | 1.51 | (a) | | | 1.42 | (a) |
Portfolio turnover | | | 12 | (n) | | | 30 | (n) |
Net assets at end of period (000 omitted) | | | $1,643 | | | | $1,527 | |
| (c) | For the period from the commencement of the fund’s investment operations, December 5, 2013, through the stated period end. |
| (d) | Per share data is based on average shares outstanding. |
| (f) | Ratios do not reflect reductions from fees paid indirectly, if applicable. |
| (r) | Certain expenses have been reduced without which performance would have been lower. |
| (s) | From time to time the fund may receive proceeds from litigation settlements, without which performance would be lower. |
| (t) | Total returns do not include any applicable sales charges. |
| (x) | The net asset values per share and total returns have been calculated on net asset values which include adjustments made in accordance with U.S. generally accepted accounting principles required at period end for financial reporting purposes. |
See notes to financial statements
22
NOTES TO FINANCIAL STATEMENTS
(unaudited)
(1) Business and Organization
MFS Low Volatility Equity Fund (the fund) is a diversified series of MFS Series Trust I (the trust). The trust is organized as a Massachusetts business trust and is registered under the Investment Company Act of 1940, as amended, as an open-end management investment company.
The fund is an investment company and accordingly follows the investment company accounting and reporting guidance of the Financial Accounting Standards Board (FASB) Accounting Standards Codification Topic 946 Financial Services – Investment Companies.
(2) Significant Accounting Policies
General – The preparation of financial statements in conformity with U.S. generally accepted accounting principles requires management to make estimates and assumptions that affect the reported amounts of assets and liabilities, and disclosure of contingent assets and liabilities at the date of the financial statements and the reported amounts of increases and decreases in net assets from operations during the reporting period. Actual results could differ from those estimates. In the preparation of these financial statements, management has evaluated subsequent events occurring after the date of the fund’s Statement of Assets and Liabilities through the date that the financial statements were issued.
In June 2014, FASB issued Accounting Standards Update 2014-11, Transfers and Servicing (Topic 860) – Repurchase-to-Maturity Transactions, Repurchase Financings, and Disclosures (“ASU 2014-11”). ASU 2014-11 changes the accounting for repurchase-to-maturity transactions (i.e., repurchase agreements that settle at the same time as the maturity of the transferred financial asset) and enhances the required disclosures for repurchase agreements and other similar transactions. Although still evaluating the potential impacts of ASU 2014-11 to the fund, management expects that the impact of the fund’s adoption will be limited to additional financial statement disclosures which would first be effective for interim reporting periods beginning after March 15, 2015.
Balance Sheet Offsetting – The fund’s accounting policy with respect to balance sheet offsetting is that, absent an event of default by the counterparty or a termination of the agreement, the International Swaps and Derivatives Association (ISDA) Master Agreement does not result in an offset of reported amounts of financial assets and financial liabilities in the Statement of Assets and Liabilities across transactions between the fund and the applicable counterparty. The fund’s right to setoff may be restricted or prohibited by the bankruptcy or insolvency laws of the particular jurisdiction to which a specific master netting agreement counterparty is subject. Balance sheet offsetting disclosures, to the extent applicable to the fund, have been included in the fund’s Significant Accounting Policies note under the captions for each of the fund’s in-scope financial instruments and transactions.
Investment Valuations – Equity securities, including restricted equity securities, are generally valued at the last sale or official closing price as provided by a third-party pricing service on the market or exchange on which they are primarily traded. Equity
23
Notes to Financial Statements (unaudited) – continued
securities, for which there were no sales reported that day, are generally valued at the last quoted daily bid quotation as provided by a third-party pricing service on the market or exchange on which such securities are primarily traded. Short-term instruments with a maturity at issuance of 60 days or less may be valued at amortized cost, which approximates market value. Open-end investment companies are generally valued at net asset value per share. Securities and other assets generally valued on the basis of information from a third-party pricing service may also be valued at a broker/dealer bid quotation. Values obtained from third-party pricing services can utilize both transaction data and market information such as yield, quality, coupon rate, maturity, type of issue, trading characteristics, and other market data.
The Board of Trustees has delegated primary responsibility for determining or causing to be determined the value of the fund’s investments (including any fair valuation) to the adviser pursuant to valuation policies and procedures approved by the Board. If the adviser determines that reliable market quotations are not readily available, investments are valued at fair value as determined in good faith by the adviser in accordance with such procedures under the oversight of the Board of Trustees. Under the fund’s valuation policies and procedures, market quotations are not considered to be readily available for most types of debt instruments and floating rate loans and many types of derivatives. These investments are generally valued at fair value based on information from third-party pricing services. In addition, investments may be valued at fair value if the adviser determines that an investment’s value has been materially affected by events occurring after the close of the exchange or market on which the investment is principally traded (such as foreign exchange or market) and prior to the determination of the fund’s net asset value, or after the halting of trading of a specific security where trading does not resume prior to the close of the exchange or market on which the security is principally traded. Events that occur on a frequent basis after foreign markets close (such as developments in foreign markets and significant movements in the U.S. markets) and prior to the determination of the fund’s net asset value may be deemed to have a material effect on the value of securities traded in foreign markets. Accordingly, the fund’s foreign equity securities may often be valued at fair value. The adviser generally relies on third-party pricing services or other information (such as the correlation with price movements of similar securities in the same or other markets; the type, cost and investment characteristics of the security; the business and financial condition of the issuer; and trading and other market data) to assist in determining whether to fair value and at what value to fair value an investment. The value of an investment for purposes of calculating the fund’s net asset value can differ depending on the source and method used to determine value. When fair valuation is used, the value of an investment used to determine the fund’s net asset value may differ from quoted or published prices for the same investment. There can be no assurance that the fund could obtain the fair value assigned to an investment if it were to sell the investment at the same time at which the fund determines its net asset value per share.
Various inputs are used in determining the value of the fund’s assets or liabilities. These inputs are categorized into three broad levels. In certain cases, the inputs used to measure fair value may fall into different levels of the fair value hierarchy. In such cases, an investment’s level within the fair value hierarchy is based on the lowest level of input that is significant to the fair value measurement. The fund’s assessment of the
24
Notes to Financial Statements (unaudited) – continued
significance of a particular input to the fair value measurement in its entirety requires judgment, and considers factors specific to the investment. Level 1 includes unadjusted quoted prices in active markets for identical assets or liabilities. Level 2 includes other significant observable market-based inputs (including quoted prices for similar securities, interest rates, prepayment speed, and credit risk). Level 3 includes unobservable inputs, which may include the adviser’s own assumptions in determining the fair value of investments. The following is a summary of the levels used as of February 28, 2015 in valuing the fund’s assets or liabilities:
| | | | | | | | | | | | | | | | |
| Investments at Value | | Level 1 | | | Level 2 | | | Level 3 | | | Total | |
| Equity Securities | | | $13,036,941 | | | | $— | | | | $— | | | | $13,036,941 | |
| Mutual Funds | | | 167,148 | | | | — | | | | — | | | | 167,148 | |
| Total Investments | | | $13,204,089 | | | | $— | | | | $— | | | | $13,204,089 | |
For further information regarding security characteristics, see the Portfolio of Investments.
Indemnifications – Under the fund’s organizational documents, its officers and Trustees may be indemnified against certain liabilities and expenses arising out of the performance of their duties to the fund. Additionally, in the normal course of business, the fund enters into agreements with service providers that may contain indemnification clauses. The fund’s maximum exposure under these agreements is unknown as this would involve future claims that may be made against the fund that have not yet occurred.
Investment Transactions and Income – Investment transactions are recorded on the trade date. Dividends received in cash are recorded on the ex-dividend date. Certain dividends from foreign securities will be recorded when the fund is informed of the dividend if such information is obtained subsequent to the ex-dividend date. Dividend payments received in additional securities are recorded on the ex-dividend date in an amount equal to the value of the security on such date.
The fund may receive proceeds from litigation settlements. Any proceeds received from litigation involving portfolio holdings are reflected in the Statement of Operations in realized gain/loss if the security has been disposed of by the fund or in unrealized gain/loss if the security is still held by the fund. Any other proceeds from litigation not related to portfolio holdings are reflected as other income in the Statement of Operations.
Fees Paid Indirectly – The fund’s custody fee may be reduced according to an arrangement that measures the value of cash deposited with the custodian by the fund. For the six months ended February 28, 2015, custody fees were not reduced.
Tax Matters and Distributions – The fund intends to qualify as a regulated investment company, as defined under Subchapter M of the Internal Revenue Code, and to distribute all of its taxable income, including realized capital gains. As a result, no provision for federal income tax is required. The fund’s federal tax returns, when filed, will remain subject to examination by the Internal Revenue Service for a three year period. Management has analyzed the fund’s tax positions taken on federal and state tax returns for all open tax years and does not believe that there are any uncertain tax positions that require recognition of a tax liability.
25
Notes to Financial Statements (unaudited) – continued
Distributions to shareholders are recorded on the ex-dividend date. Income and capital gain distributions are determined in accordance with income tax regulations, which may differ from U.S. generally accepted accounting principles. Certain capital accounts in the financial statements are periodically adjusted for permanent differences in order to reflect their tax character. These adjustments have no impact on net assets or net asset value per share. Temporary differences which arise from recognizing certain items of income, expense, gain or loss in different periods for financial statement and tax purposes will reverse at some time in the future. Distributions in excess of net investment income or net realized gains are temporary overdistributions for financial statement purposes resulting from differences in the recognition or classification of income or distributions for financial statement and tax purposes.
During the period ended August 31, 2014, there were no significant adjustments due to differences between book and tax accounting.
The tax character of distributions made during the current period will be determined at fiscal year end. The tax character of distributions declared to shareholders for the last fiscal period is as follows:
| | | | |
| | | 8/31/14 | |
Ordinary income (including any
short-term capital gains) | | | $16,493 | |
The federal tax cost and the tax basis components of distributable earnings were as follows:
| | | | |
| As of 2/28/15 | | | |
| Cost of investments | | | $12,550,501 | |
| Gross appreciation | | | 740,989 | |
| Gross depreciation | | | (87,401 | ) |
| Net unrealized appreciation (depreciation) | | | $653,588 | |
| |
| As of 8/31/14 | | | |
| Undistributed ordinary income | | | 12,254 | |
| Net unrealized appreciation (depreciation) | | | 224,650 | |
The aggregate cost above includes prior fiscal year end tax adjustments, if applicable.
Multiple Classes of Shares of Beneficial Interest – The fund offers multiple classes of shares, which differ in their respective distribution and service fees. The fund’s income, realized and unrealized gain (loss), and common expenses are allocated to shareholders based on the daily net assets of each class. Dividends are declared separately for each class. Differences in per share dividend rates are generally due to differences in separate class expenses. Class B shares will convert to Class A shares
26
Notes to Financial Statements (unaudited) – continued
approximately eight years after purchase. The fund’s distributions declared to shareholders as reported in the Statements of Changes in Net Assets are presented by class as follows:
| | | | | | | | | | | | | | | | |
| | | From net investment
income | | | From net realized gain on
investments | |
| | | Six months
ended
2/28/15 | | | Period
ended
8/31/14 (c) | | | Six months
ended
2/28/15 | | | Period
ended
8/31/14 (c) | |
| Class A | | | $10,649 | | | | $3,470 | | | | $1,238 | | | | $— | |
| Class B | | | 542 | | | | 140 | | | | 145 | | | | — | |
| Class C | | | 1,229 | | | | 618 | | | | 355 | | | | — | |
| Class I | | | 1,231 | | | | 1,009 | | | | 100 | | | | — | |
| Class R1 | | | 188 | | | | 97 | | | | 61 | | | | — | |
| Class R2 | | | 475 | | | | 379 | | | | 62 | | | | — | |
| Class R3 | | | 619 | | | | 521 | | | | 62 | | | | — | |
| Class R4 | | | 763 | | | | 663 | | | | 62 | | | | — | |
| Class R5 | | | 10,753 | | | | 9,596 | | | | 865 | | | | — | |
| Total | | | $26,449 | | | | $16,493 | | | | $2,950 | | | | $— | |
| (c) | For the period from the commencement of the fund’s investment operations, December 5, 2013, through the stated period end. |
(3) Transactions with Affiliates
Investment Adviser – The fund has an investment advisory agreement with MFS to provide overall investment management and related administrative services and facilities to the fund. The management fee is computed daily and paid monthly at the following annual rates:
| | | | |
| First $1 billion of average daily net assets | | | 0.75 | % |
| Next $1.5 billion of average daily net assets | | | 0.70 | % |
| Average daily net assets in excess of $2.5 billion | | | 0.65 | % |
The investment adviser has agreed in writing to reduce its management fee to 0.60% of average daily net assets for the first $1 billion and 0.55% of average daily net assets in excess of $1 billion. This written agreement will continue until modified by the fund’s Board of Trustees, but such agreement will continue at least until December 31, 2015. For the six months ended February 28, 2015, this management fee reduction amounted to $4,761, which is included in the reduction of total expenses in the Statement of Operations. MFS has also agreed in writing to reduce its management fee by a specified amount if certain MFS mutual fund assets exceed thresholds agreed to by MFS and the fund’s Board of Trustees. For the six months ended February 28, 2015, this management fee reduction amounted to $197, which is included in the reduction of total expenses in the Statement of Operations. The management fee incurred for the six months ended February 28, 2015 was equivalent to an annual effective rate of 0.59% of the fund’s average daily net assets.
The investment adviser has agreed in writing to pay a portion of the fund’s total annual operating expenses, excluding interest, taxes, extraordinary expenses, brokerage and
27
Notes to Financial Statements (unaudited) – continued
transaction costs, and investment-related expenses, such that total fund operating expenses do not exceed the following rates annually of each class’s average daily net assets:
| | | | | | | | | | | | | | | | | | | | | | | | | | | | | | | | | | |
| Classes | |
| A | | | B | | | C | | | I | | | R1 | | | R2 | | | R3 | | | R4 | | | R5 | |
| | 1.20% | | | | 1.95% | | | | 1.95% | | | | 0.95% | | | | 1.95% | | | | 1.45% | | | | 1.20% | | | | 0.95% | | | | 0.91% | |
This written agreement will continue until modified by the fund’s Board of Trustees, but such agreement will continue at least until December 31, 2015. For the six months ended February 28, 2015, this reduction amounted to $85,891, which is included in the reduction of total expenses in the Statement of Operations.
Distributor – MFS Fund Distributors, Inc. (MFD), a wholly-owned subsidiary of MFS, as distributor, received $8,881 for the six months ended February 28, 2015, as its portion of the initial sales charge on sales of Class A shares of the fund.
The Board of Trustees has adopted a distribution plan for certain share classes pursuant to Rule 12b-1 of the Investment Company Act of 1940.
The fund’s distribution plan provides that the fund will pay MFD for services provided by MFD and financial intermediaries in connection with the distribution and servicing of certain share classes. One component of the plan is a distribution fee paid to MFD and another component of the plan is a service fee paid to MFD. MFD may subsequently pay all, or a portion, of the distribution and/or service fees to financial intermediaries.
Distribution Plan Fee Table:
| | | | | | | | | | | | | | | | | | | | |
| | | Distribution Fee Rate (d) | | | Service Fee Rate (d) | | | Total Distribution Plan (d) | | | Annual Effective Rate (e) | | | Distribution and Service Fee | |
| Class A | | | — | | | | 0.25% | | | | 0.25% | | | | 0.24% | | | | $3,920 | |
| Class B | | | 0.75% | | | | 0.25% | | | | 1.00% | | | | 1.00% | | | | 1,483 | |
| Class C | | | 0.75% | | | | 0.25% | | | | 1.00% | | | | 1.00% | | | | 3,376 | |
| Class R1 | | | 0.75% | | | | 0.25% | | | | 1.00% | | | | 1.00% | | | | 552 | |
| Class R2 | | | 0.25% | | | | 0.25% | | | | 0.50% | | | | 0.50% | | | | 278 | |
| Class R3 | | | — | | | | 0.25% | | | | 0.25% | | | | 0.25% | | | | 139 | |
| Total Distribution and Service Fees | | | | $9,748 | |
| (d) | In accordance with the distribution plan for certain classes, the fund pays distribution and/or service fees equal to these annual percentage rates of each class’s average daily net assets. The distribution and service fee rates disclosed by class represent the current rates in effect at the end of the reporting period. Any rate changes, if applicable, are detailed below. |
| (e) | MFD has voluntarily agreed to rebate a portion of each class’s 0.25% service fee attributable to accounts for which MFD retains the 0.25% service fee except for accounts attributable to MFS or its affiliates’ seed money. For the six months ended February 28, 2015, this rebate amounted to $195 for Class A, and is included in the reduction of total expenses in the Statement of Operations. |
Certain Class A shares are subject to a contingent deferred sales charge (CDSC) in the event of a shareholder redemption within 18 months of purchase. Class C shares are subject to a CDSC in the event of a shareholder redemption within 12 months of purchase. Class B shares are subject to a CDSC in the event of a shareholder
28
Notes to Financial Statements (unaudited) – continued
redemption within six years of purchase. All contingent deferred sales charges are paid to MFD and during the six months ended February 28, 2015, were as follows:
Shareholder Servicing Agent – MFS Service Center, Inc. (MFSC), a wholly-owned subsidiary of MFS, receives a fee from the fund for its services as shareholder servicing agent calculated as a percentage of the average daily net assets of the fund as determined periodically under the supervision of the fund’s Board of Trustees. For the six months ended February 28, 2015, the fee was $366, which equated to 0.0115% annually of the fund’s average daily net assets. MFSC also receives payment from the fund for out-of-pocket expenses, sub-accounting and other shareholder servicing costs which may be paid to affiliated and unaffiliated service providers. Class R5 shares do not incur sub-accounting fees. For the six months ended February 28, 2015, these out-of-pocket expenses, sub-accounting and other shareholder servicing costs amounted to $1,061.
Administrator – MFS provides certain financial, legal, shareholder communications, compliance, and other administrative services to the fund. Under an administrative services agreement, the fund reimburses MFS the costs incurred to provide these services. The fund is charged an annual fixed amount of $17,500 plus a fee based on average daily net assets. The administrative services fee incurred for the six months ended February 28, 2015 was equivalent to an annual effective rate of 0.2734% of the fund’s average daily net assets.
Trustees’ and Officers’ Compensation – The fund pays compensation to independent Trustees in the form of a retainer, attendance fees, and additional compensation to Board and Committee chairpersons. The fund does not pay compensation directly to Trustees or officers of the fund who are also officers of the investment adviser, all of whom receive remuneration for their services to the fund from MFS. Certain officers and Trustees of the fund are officers or directors of MFS, MFD, and MFSC.
Other – Effective November 1, 2014, this fund and certain other funds managed by MFS (the funds) have entered into a service agreement (the ISO Agreement) which provides for payment of fees solely by the funds to Tarantino LLC in return for the provision of services of an Independent Senior Officer (ISO) for the funds. Frank L. Tarantino serves as the ISO and is an officer of the funds and the sole member of Tarantino LLC. The funds can terminate the ISO Agreement with Tarantino LLC at any time under the terms of the ISO Agreement. Prior to November 1, 2014, the funds had entered into a service agreement (the Compliance Officer Agreement) which provided for payment of fees by the funds to Tarantino LLC in return for the provision of services of an Independent Chief Compliance Officer (ICCO) for the funds. Prior to November 1, 2014, Frank L. Tarantino served as the ICCO. Effective October 31, 2014, Mr. Tarantino resigned as ICCO and the Compliance Officer Agreement between the funds and Tarantino LLC was terminated. For the six months ended February 28, 2015, the aggregate fees paid by the fund under these agreements were $8 and are included in “Miscellaneous” expense in the Statement of Operations. MFS had agreed to reimburse the fund for a portion of the payments made by the fund for the services
29
Notes to Financial Statements (unaudited) – continued
under the Compliance Officer Agreement in the amount of $1, which is included in the reduction of total expenses in the Statement of Operations. Additionally, MFS has agreed to bear all expenses associated with office space, other administrative support, and supplies provided to the ICCO and ISO.
The fund invests in the MFS Institutional Money Market Portfolio which is managed by MFS and seeks current income consistent with preservation of capital and liquidity. Income earned on this investment is included in “Dividends from underlying affiliated funds” in the Statement of Operations. This money market fund does not pay a management fee to MFS.
On December 5, 2013, MFS purchased 140,000 shares of Class R5 and 10,000 shares of Class A, Class B, Class C, and Class I, Class R1, Class R2, Class R3, Class R4 for an aggregate amount of $2,200,000.
At February 28, 2015, MFS held 100% of the outstanding shares of Class R1, Class R2, Class R3, Class R4, and Class R5.
(4) Portfolio Securities
For the six months ended February 28, 2015, purchases and sales of investments, other than short-term obligations, aggregated $9,561,027 and $777,036, respectively.
(5) Shares of Beneficial Interest
The fund’s Declaration of Trust permits the Trustees to issue an unlimited number of full and fractional shares of beneficial interest. Transactions in fund shares were as follows:
| | | | | | | | | | | | | | | | |
| | | Six months ended
2/28/15 | | | Period ended
8/31/14 (c) | |
| | | Shares | | | Amount | | | Shares | | | Amount | |
| Shares sold | | | | | | | | | | | | | | | | |
Class A | | | 708,542 | | | | $8,033,271 | | | | 110,758 | | | | $1,150,103 | |
Class B | | | 25,523 | | | | 287,330 | | | | 15,774 | | | | 160,956 | |
Class C | | | 65,454 | | | | 735,135 | | | | 38,895 | | | | 404,114 | |
Class I | | | 24,850 | | | | 282,677 | | | | 16,190 | | | | 163,700 | |
Class R1 | | | — | | | | — | | | | 10,000 | | | | 100,000 | |
Class R2 | | | — | | | | — | | | | 10,000 | | | | 100,000 | |
Class R3 | | | — | | | | — | | | | 10,000 | | | | 100,000 | |
Class R4 | | | — | | | | — | | | | 10,000 | | | | 100,000 | |
Class R5 | | | — | | | | — | | | | 140,000 | | | | 1,400,000 | |
| | | 824,369 | | | | $9,338,413 | | | | 361,617 | | | | $3,678,873 | |
30
Notes to Financial Statements (unaudited) – continued
| | | | | | | | | | | | | | | | |
| | | Six months ended
2/28/15 | | | Period ended
8/31/14 (c) | |
| | | Shares | | | Amount | | | Shares | | | Amount | |
Shares issued to shareholders in
reinvestment of distributions | | | | | | | | | | | | | | | | |
Class A | | | 1,077 | | | | $11,887 | | | | 331 | | | | $3,470 | |
Class B | | | 62 | | | | 683 | | | | 13 | | | | 138 | |
Class C | | | 144 | | | | 1,584 | | | | 58 | | | | 618 | |
Class I | | | 121 | | | | 1,331 | | | | 96 | | | | 1,009 | |
Class R1 | | | 23 | | | | 249 | | | | 9 | | | | 97 | |
Class R2 | | | 49 | | | | 537 | | | | 36 | | | | 379 | |
Class R3 | | | 62 | | | | 681 | | | | 50 | | | | 521 | |
Class R4 | | | 75 | | | | 825 | | | | 63 | | | | 663 | |
Class R5 | | | 1,058 | | | | 11,618 | | | | 918 | | | | 9,596 | |
| | | 2,671 | | | | $29,395 | | | | 1,574 | | | | $16,491 | |
| | | | |
| Shares reacquired | | | | | | | | | | | | | | | | |
Class A | | | (32,177 | ) | | | $(366,283 | ) | | | (4,481 | ) | | | $(46,920 | ) |
Class B | | | (2,922 | ) | | | (33,723 | ) | | | (65 | ) | | | (700 | ) |
Class C | | | (267 | ) | | | (2,960 | ) | | | (8 | ) | | | (81 | ) |
Class I | | | (254 | ) | | | (2,902 | ) | | | — | | | | — | |
| | | (35,620 | ) | | | $(405,868 | ) | | | (4,554 | ) | | | $(47,701 | ) |
| | | | |
| Net change | | | | | | | | | | | | | | | | |
Class A | | | 677,442 | | | | $7,678,875 | | | | 106,608 | | | | $1,106,653 | |
Class B | | | 22,663 | | | | 254,290 | | | | 15,722 | | | | 160,394 | |
Class C | | | 65,331 | | | | 733,759 | | | | 38,945 | | | | 404,651 | |
Class I | | | 24,717 | | | | 281,106 | | | | 16,286 | | | | 164,709 | |
Class R1 | | | 23 | | | | 249 | | | | 10,009 | | | | 100,097 | |
Class R2 | | | 49 | | | | 537 | | | | 10,036 | | | | 100,379 | |
Class R3 | | | 62 | | | | 681 | | | | 10,050 | | | | 100,521 | |
Class R4 | | | 75 | | | | 825 | | | | 10,063 | | | | 100,663 | |
Class R5 | | | 1,058 | | | | 11,618 | | | | 140,918 | | | | 1,409,596 | |
| | | 791,420 | | | | $8,961,940 | | | | 358,637 | | | | $3,647,663 | |
| (c) | For the period from the commencement of the fund’s investment operations, December 5, 2013, through the stated period end. |
(6) Line of Credit
The fund and certain other funds managed by MFS participate in a $1.1 billion unsecured committed line of credit, subject to a $1 billion sublimit, provided by a syndication of banks under a credit agreement. Borrowings may be made for temporary financing needs. Interest is charged to each fund, based on its borrowings, generally at a rate equal to the higher of the Federal Reserve funds rate or one month LIBOR plus an agreed upon spread. A commitment fee, based on the average daily, unused portion of the committed line of credit, is allocated among the participating funds at the end of each calendar quarter. In addition, the fund and other funds managed by MFS have established unsecured uncommitted borrowing arrangements with certain banks for temporary financing needs. Interest is charged to each fund,
31
Notes to Financial Statements (unaudited) – continued
based on its borrowings, at a rate equal to the Federal Reserve funds rate plus an agreed upon spread. For the six months ended February 28, 2015, the fund’s commitment fee and interest expense were $6 and $0, respectively, and are included in “Miscellaneous” expense in the Statement of Operations.
(7) Transactions in Underlying Affiliated Funds-Affiliated Issuers
An affiliated issuer may be considered one in which the fund owns 5% or more of the outstanding voting securities, or a company which is under common control. For the purposes of this report, the fund assumes the following to be an affiliated issuer:
| | | | | | | | | | | | | | | | |
| Underlying Affiliated Fund | | Beginning Shares/Par Amount | | | Acquisitions Shares/Par Amount | | | Dispositions Shares/Par Amount | | | Ending Shares/Par Amount | |
| MFS Institutional Money Market Portfolio | | | 132,053 | | | | 4,655,125 | | | | (4,620,030 | ) | | | 167,148 | |
| | | | |
| Underlying Affiliated Fund | | Realized Gain (Loss) | | | Capital Gain Distributions | | | Dividend Income | | | Ending Value | |
| MFS Institutional Money Market Portfolio | | | $— | | | | $— | | | | $65 | | | | $167,148 | |
32
PROXY VOTING POLICIES AND INFORMATION
MFS votes proxies on behalf of the fund pursuant to proxy voting policies and procedures that are available without charge, upon request, by calling 1-800-225-2606, by visiting the Proxy Voting section of mfs.com or by visiting the SEC’s Web site at http://www.sec.gov.
Information regarding how the fund voted proxies relating to portfolio securities during the most recent twelve-month period ended June 30 is available without charge by visiting the Proxy Voting section of mfs.com or by visiting the SEC’s Web site at http://www.sec.gov.
QUARTERLY PORTFOLIO DISCLOSURE
The fund will file a complete schedule of portfolio holdings with the Securities and Exchange Commission (the Commission) for the first and third quarters of each fiscal year on Form N-Q. A shareholder can obtain the quarterly portfolio holdings report at mfs.com. The fund’s Form N-Q is also available on the EDGAR database on the Commission’s Internet Web site at http://www.sec.gov, and may be reviewed and copied at the:
Public Reference Room
Securities and Exchange Commission
100 F Street, NE, Room 1580
Washington, D.C. 20549
Information on the operation of the Public Reference Room may be obtained by calling the Commission at 1-800-SEC-0330. Copies of the fund’s Form N-Q also may be obtained, upon payment of a duplicating fee, by electronic request at the following e-mail address: publicinfo@sec.gov or by writing the Public Reference Section at the above address.
FURTHER INFORMATION
From time to time, MFS may post important information about the fund or the MFS funds on the MFS web site (mfs.com). This information is available by visiting the “Market Commentary” and “Announcements” sub sections in the “Market Outlooks” section of mfs.com or by clicking on the fund’s name under “Mutual Funds” in the “Products” section of mfs.com.
PROVISION OF FINANCIAL REPORTS AND SUMMARY PROSPECTUSES
The fund produces financial reports every six months and updates its summary prospectus and prospectus annually. To avoid sending duplicate copies of materials to households, only one copy of the fund’s annual and semiannual report and summary prospectus may be mailed to shareholders having the same last name and residential address on the fund’s records. However, any shareholder may contact MFSC (please see back cover for address and telephone number) to request that copies of these reports and summary prospectuses be sent personally to that shareholder.
33
Save paper with eDelivery.

| MFS® will send you prospectuses, |
reports, and proxies directly via e-mail so you will get information faster with less mailbox clutter.
To sign up:
1. Go to mfs.com.
2. Log in via MFS® Access.
3. Select eDelivery.
If you own your MFS fund shares through a financial institution or a retirement plan, MFS® TALK, MFS® Access, or eDelivery may not be available to you.
CONTACT
WEB SITE
mfs.com
MFS TALK
1-800-637-8255
24 hours a day
ACCOUNT SERVICE AND LITERATURE
Shareholders
1-800-225-2606
Financial advisors
1-800-343-2829
Retirement plan services
1-800-637-1255
MAILING ADDRESS
MFS Service Center, Inc.
P.O. Box 55824
Boston, MA 02205-5824
OVERNIGHT MAIL
MFS Service Center, Inc.
c/o Boston Financial Data Services
30 Dan Road
Canton, MA 02021-2809
SEMIANNUAL REPORT
February 28, 2015

MFS® NEW DISCOVERY FUND

NDF-SEM
MFS® NEW DISCOVERY FUND
CONTENTS
The report is prepared for the general information of shareholders.
It is authorized for distribution to prospective investors only when preceded or accompanied by a current prospectus.
NOT FDIC INSURED Ÿ MAY LOSE VALUE Ÿ NO BANK GUARANTEE

LETTER FROM THE CHAIRMAN
Dear Shareholders:
Lower oil prices continue to influence markets in different ways. Among those economies hurt, oil-exporters such as Russia and Venezuela have been hit particularly hard, along with U.S. regions that have close oil industry ties.
The U.S. economic recovery remains solid. The labor market is strong, interest rates are historically low and reduced energy prices have helped to stimulate consumer spending.
Economic reports early in 2015 indicate that the eurozone is on a more solid footing, with confidence boosted by the launch of European Central Bank quantitative easing.
In Asia, the Chinese economy continues to raise concerns, with the People’s Bank of China implementing stimulus programs to counter a steady decline in growth rates.
As always, active risk management is integral to how we at MFS® manage your investments. We use a collaborative process, sharing insights across asset classes, regions and economic sectors. Our global investment team uses a diversified, multidisciplined, long-term approach.
Applying proven principles, such as asset allocation and diversification, can best serve investors over the long term. We are confident that this approach can help you as you work with your financial advisors to reach your goals in the years ahead.
Respectfully,

Robert J. Manning
Chairman
MFS Investment Management
April 14, 2015
The opinions expressed in this letter are subject to change and may not be relied upon for investment advice. No forecasts can be guaranteed.
1
PORTFOLIO COMPOSITION
Portfolio structure

| | | | |
| Top ten holdings | | | | |
| Bright Horizons Family Solutions, Inc. | | | 2.1% | |
| Swift Transportation Co. | | | 2.0% | |
| Urban Outfitters, Inc. | | | 1.9% | |
| Citi Trends, Inc. | | | 1.8% | |
| Gartner, Inc. | | | 1.7% | |
| Cvent, Inc. | | | 1.6% | |
| Advanced Drainage Systems, Inc. | | | 1.5% | |
| Healthcare Services Group, Inc. | | | 1.5% | |
| AMAG Pharmaceuticals, Inc. | | | 1.5% | |
| Burlington Stores, Inc. | | | 1.5% | |
| | | | |
| Equity sectors | | | | |
| Health Care | | | 26.7% | |
| Technology | | | 13.0% | |
| Special Products & Services | | | 12.9% | |
| Industrial Goods & Services | | | 9.0% | |
| Retailing | | | 7.7% | |
| Leisure | | | 7.0% | |
| Financial Services | | | 5.4% | |
| Energy | | | 3.9% | |
| Transportation | | | 3.9% | |
| Basic Materials | | | 3.6% | |
| Autos & Housing | | | 3.2% | |
| Consumer Staples | | | 1.5% | |
| Utilities & Communications | | | 0.3% | |
Cash & Other can include cash, other assets less liabilities, offsets to derivative positions, and short-term securities.
Percentages are based on net assets as of 2/28/15.
The portfolio is actively managed and current holdings may be different.
2
EXPENSE TABLE
Fund expenses borne by the shareholders during the period, September 1, 2014 through February 28, 2015
As a shareholder of the fund, you incur two types of costs: (1) transaction costs, including sales charges (loads) on certain purchase or redemption payments, and (2) ongoing costs, including management fees; distribution and service (12b-1) fees; and other fund expenses. This example is intended to help you understand your ongoing costs (in dollars) of investing in the fund and to compare these costs with the ongoing costs of investing in other mutual funds.
The example is based on an investment of $1,000 invested at the beginning of the period and held for the entire period September 1, 2014 through February 28, 2015.
Actual Expenses
The first line for each share class in the following table provides information about actual account values and actual expenses. You may use the information in this line, together with the amount you invested, to estimate the expenses that you paid over the period. Simply divide your account value by $1,000 (for example, an $8,600 account value divided by $1,000 = 8.6), then multiply the result by the number in the first line under the heading entitled “Expenses Paid During Period” to estimate the expenses you paid on your account during this period.
Hypothetical Example for Comparison Purposes
The second line for each share class in the following table provides information about hypothetical account values and hypothetical expenses based on the fund’s actual expense ratio and an assumed rate of return of 5% per year before expenses, which is not the fund’s actual return. The hypothetical account values and expenses may not be used to estimate the actual ending account balance or expenses you paid for the period. You may use this information to compare the ongoing costs of investing in the fund and other funds. To do so, compare this 5% hypothetical example with the 5% hypothetical examples that appear in the shareholder reports of the other funds.
Please note that the expenses shown in the table are meant to highlight your ongoing costs only and do not reflect any transactional costs, such as sales charges (loads). Therefore, the second line for each share class in the table is useful in comparing ongoing costs only, and will not help you determine the relative total costs of owning different funds. In addition, if these transactional costs were included, your costs would have been higher.
3
Expense Table – continued
| | | | | | | | | | | | | | | | | | |
Share
Class | | | | Annualized
Expense
Ratio | | | Beginning
Account Value
9/01/14 | | | Ending
Account Value
2/28/15 | | | Expenses
Paid During
Period (p)
9/01/14-2/28/15 | |
| A | | Actual | | | 1.31% | | | | $1,000.00 | | | | $1,015.71 | | | | $6.55 | |
| | Hypothetical (h) | | | 1.31% | | | | $1,000.00 | | | | $1,018.30 | | | | $6.56 | |
| B | | Actual | | | 2.06% | | | | $1,000.00 | | | | $1,012.16 | | | | $10.28 | |
| | Hypothetical (h) | | | 2.06% | | | | $1,000.00 | | | | $1,014.58 | | | | $10.29 | |
| C | | Actual | | | 2.07% | | | | $1,000.00 | | | | $1,012.13 | | | | $10.33 | |
| | Hypothetical (h) | | | 2.07% | | | | $1,000.00 | | | | $1,014.53 | | | | $10.34 | |
| I | | Actual | | | 1.06% | | | | $1,000.00 | | | | $1,017.18 | | | | $5.30 | |
| | Hypothetical (h) | | | 1.06% | | | | $1,000.00 | | | | $1,019.54 | | | | $5.31 | |
| R1 | | Actual | | | 2.07% | | | | $1,000.00 | | | | $1,012.22 | | | | $10.33 | |
| | Hypothetical (h) | | | 2.07% | | | | $1,000.00 | | | | $1,014.53 | | | | $10.34 | |
| R2 | | Actual | | | 1.57% | | | | $1,000.00 | | | | $1,014.69 | | | | $7.84 | |
| | Hypothetical (h) | | | 1.57% | | | | $1,000.00 | | | | $1,017.01 | | | | $7.85 | |
| R3 | | Actual | | | 1.32% | | | | $1,000.00 | | | | $1,015.73 | | | | $6.60 | |
| | Hypothetical (h) | | | 1.32% | | | | $1,000.00 | | | | $1,018.25 | | | | $6.61 | |
| R4 | | Actual | | | 1.07% | | | | $1,000.00 | | | | $1,017.15 | | | | $5.35 | |
| | Hypothetical (h) | | | 1.07% | | | | $1,000.00 | | | | $1,019.49 | | | | $5.36 | |
| R5 | | Actual | | | 0.93% | | | | $1,000.00 | | | | $1,017.51 | | | | $4.65 | |
| | Hypothetical (h) | | | 0.93% | | | | $1,000.00 | | | | $1,020.18 | | | | $4.66 | |
| 529A | | Actual | | | 1.35% | | | | $1,000.00 | | | | $1,015.30 | | | | $6.75 | |
| | Hypothetical (h) | | | 1.35% | | | | $1,000.00 | | | | $1,018.10 | | | | $6.76 | |
| 529B | | Actual | | | 2.10% | | | | $1,000.00 | | | | $1,012.02 | | | | $10.48 | |
| | Hypothetical (h) | | | 2.10% | | | | $1,000.00 | | | | $1,014.38 | | | | $10.49 | |
| 529C | | Actual | | | 2.12% | | | | $1,000.00 | | | | $1,011.97 | | | | $10.58 | |
| | Hypothetical (h) | | | 2.12% | | | | $1,000.00 | | | | $1,014.28 | | | | $10.59 | |
| (h) | 5% class return per year before expenses. |
| (p) | “Expenses Paid During Period” are equal to each class’s annualized expense ratio, as shown above, multiplied by the average account value over the period, multiplied by 181/365 (to reflect the one-half year period). Expenses paid do not include any applicable sales charges (loads). If these transaction costs had been included, your costs would have been higher. |
Notes to Expense Table
Each class with a Rule 12b-1 service fee is subject to a rebate of a portion of such fee. Such rebates are included in the expense ratios above. For Class A, Class 529A, and Class 529B shares, this rebate reduced the expense ratios above by 0.01%, 0.02%, and 0.02%, respectively. See Note 3 in the Notes to Financial Statements for additional information.
4
PORTFOLIO OF INVESTMENTS
2/28/15 (unaudited)
The Portfolio of Investments is a complete list of all securities owned by your fund. It is categorized by broad-based asset classes.
| | | | | | | | |
| Common Stocks - 98.1% | | | | | | | | |
| Issuer | | Shares/Par | | | Value ($) | |
| Aerospace - 0.8% | | | | | | | | |
| FLIR Systems, Inc. | | | 397,485 | | | $ | 12,830,816 | |
| | |
| Apparel Manufacturers - 0.3% | | | | | | | | |
| Tumi Holdings, Inc. (a) | | | 235,983 | | | $ | 5,519,642 | |
| | |
| Biotechnology - 6.5% | | | | | | | | |
| Alnylam Pharmaceuticals, Inc. (a) | | | 49,251 | | | $ | 5,000,454 | |
| AMAG Pharmaceuticals, Inc. (a) | | | 497,009 | | | | 24,467,753 | |
| Amicus Therapeutics, Inc. (a) | | | 693,291 | | | | 6,073,229 | |
| Exact Sciences Corp. (a)(l) | | | 485,583 | | | | 10,911,050 | |
| Isis Pharmaceuticals, Inc. (a) | | | 306,363 | | | | 21,004,247 | |
| MiMedx Group, Inc. (a) | | | 1,462,003 | | | | 15,131,731 | |
| Novavax, Inc. (a) | | | 589,275 | | | | 5,391,866 | |
| Puma Biotechnology, Inc. (a) | | | 47,541 | | | | 10,126,708 | |
| Spark Therapeutics, Inc. (a) | | | 16,780 | | | | 966,360 | |
| Tesaro, Inc. (a) | | | 209,000 | | | | 11,145,970 | |
| | | | | | | | |
| | | | $ | 110,219,368 | |
| Broadcasting - 1.2% | | | | | | | | |
| Live Nation, Inc. (a) | | | 794,049 | | | $ | 20,319,714 | |
| | |
| Brokerage & Asset Managers - 1.4% | | | | | | | | |
| LPL Financial Holdings, Inc. | | | 200,193 | | | $ | 8,980,658 | |
| NASDAQ OMX Group, Inc. | | | 306,024 | | | | 15,350,164 | |
| | | | | | | | |
| | | | $ | 24,330,822 | |
| Business Services - 8.8% | | | | | | | | |
| Borderfree, Inc. (a) | | | 684,347 | | | $ | 5,276,315 | |
| Bright Horizons Family Solutions, Inc. (a) | | | 694,695 | | | | 35,221,036 | |
| Constant Contact, Inc. (a) | | | 589,339 | | | | 24,357,381 | |
| CoStar Group, Inc. (a) | | | 92,231 | | | | 18,368,726 | |
| Gartner, Inc. (a) | | | 345,255 | | | | 28,694,143 | |
| Global Payments, Inc. | | | 126,262 | | | | 11,598,427 | |
| Ultimate Software Group, Inc. (a) | | | 100,750 | | | | 16,587,984 | |
| Zillow Group, Inc. (a) | | | 63,690 | | | | 7,308,411 | |
| | | | | | | | |
| | | | $ | 147,412,423 | |
| Chemicals - 0.2% | | | | | | | | |
| Marrone Bio Innovations, Inc. (a) | | | 760,770 | | | $ | 2,662,695 | |
5
Portfolio of Investments (unaudited) – continued
| | | | | | | | |
| Issuer | | Shares/Par | | | Value ($) | |
| Common Stocks - continued | | | | | | | | |
| Computer Software - 0.8% | | | | | | | | |
| SolarWinds, Inc. (a) | | | 253,150 | | | $ | 12,842,300 | |
| | |
| Computer Software - Systems - 9.3% | | | | | | | | |
| Cvent, Inc. (a) | | | 922,679 | | | $ | 26,711,557 | |
| Demandware, Inc. (a) | | | 279,950 | | | | 17,690,041 | |
| Exa Corp. (a) | | | 422,625 | | | | 4,162,856 | |
| Fleetmatics Group PLC (a) | | | 440,293 | | | | 18,144,475 | |
| Model N, Inc. (a)(h) | | | 1,429,420 | | | | 17,681,925 | |
| Proofpoint, Inc. (a) | | | 128,380 | | | | 7,271,443 | |
| Sabre Corp. | | | 749,854 | | | | 16,316,823 | |
| SciQuest, Inc. (a) | | | 686,131 | | | | 11,945,541 | |
| ServiceNow, Inc. (a) | | | 219,918 | | | | 16,770,947 | |
| SS&C Technologies Holdings, Inc. | | | 315,500 | | | | 19,144,540 | |
| | | | | | | | |
| | | | $ | 155,840,148 | |
| Construction - 3.2% | | | | | | | | |
| Eagle Materials, Inc. | | | 245,293 | | | $ | 19,255,500 | |
| Lennox International, Inc. | | | 98,196 | | | | 10,237,915 | |
| Pool Corp. | | | 132,656 | | | | 9,175,816 | |
| Trex Co., Inc. (a) | | | 305,520 | | | | 15,382,932 | |
| | | | | | | | |
| | | | $ | 54,052,163 | |
| Consumer Services - 3.7% | | | | | | | | |
| HomeAway, Inc. (a) | | | 250,521 | | | $ | 7,764,898 | |
| MakeMyTrip Ltd. (a) | | | 450,244 | | | | 10,594,241 | |
| Nord Anglia Education, Inc. (a) | | | 899,711 | | | | 19,262,813 | |
| Servicemaster Global Holdings, Inc. (a) | | | 691,993 | | | | 23,936,038 | |
| | | | | | | | |
| | | | $ | 61,557,990 | |
| Electrical Equipment - 3.8% | | | | | | | | |
| Advanced Drainage Systems, Inc. | | | 918,126 | | | $ | 24,927,121 | |
| AMETEK, Inc. | | | 322,294 | | | | 17,126,703 | |
| MSC Industrial Direct Co., Inc., “A” | | | 168,396 | | | | 12,291,224 | |
| TriMas Corp. (a) | | | 303,401 | | | | 9,089,894 | |
| | | | | | | | |
| | | | $ | 63,434,942 | |
| Electronics - 1.7% | | | | | | | | |
| Monolithic Power Systems, Inc. | | | 125,344 | | | $ | 6,609,389 | |
| Silicon Laboratories, Inc. (a) | | | 234,167 | | | | 11,858,217 | |
| Stratasys Ltd. (a) | | | 151,442 | | | | 9,398,491 | |
| | | | | | | | |
| | | | $ | 27,866,097 | |
| Energy - Independent - 2.6% | | | | | | | | |
| Foresight Energy LP | | | 743,420 | | | $ | 12,526,627 | |
| Memorial Resource Development Corp. (a) | | | 457,675 | | | | 9,386,914 | |
6
Portfolio of Investments (unaudited) – continued
| | | | | | | | |
| Issuer | | Shares/Par | | | Value ($) | |
| Common Stocks - continued | | | | | | | | |
| Energy - Independent - continued | | | | | | | | |
| Range Resources Corp. | | | 130,987 | | | $ | 6,489,096 | |
| Rice Energy, Inc. (a) | | | 534,189 | | | | 10,459,421 | |
| Sanchez Energy Corp. (a)(l) | | | 399,334 | | | | 5,351,076 | |
| | | | | | | | |
| | | | $ | 44,213,134 | |
| Engineering - Construction - 1.4% | | | | | | | | |
| Stantec, Inc. | | | 348,243 | | | $ | 8,892,022 | |
| Team, Inc. (a) | | | 382,318 | | | | 14,681,011 | |
| | | | | | | | |
| | | | $ | 23,573,033 | |
| Entertainment - 0.3% | | | | | | | | |
| DHX Media Ltd. | | | 631,995 | | | $ | 4,666,278 | |
| | |
| Food & Beverages - 1.5% | | | | | | | | |
| Flex Pharma, Inc. (a) | | | 153,972 | | | $ | 2,676,803 | |
| Freshpet, Inc. (a)(l) | | | 913,275 | | | | 16,831,658 | |
| Snyders-Lance, Inc. | | | 214,458 | | | | 6,616,029 | |
| | | | | | | | |
| | | | | | | $ | 26,124,490 | |
| Gaming & Lodging - 2.9% | | | | | | | | |
| Diamond Resorts International, Inc. (a) | | | 494,029 | | | $ | 17,118,105 | |
| La Quinta Holdings, Inc. (a) | | | 422,095 | | | | 9,374,730 | |
| Norwegian Cruise Line Holdings Ltd. (a) | | | 457,451 | | | | 22,561,483 | |
| | | | | | | | |
| | | | | | | $ | 49,054,318 | |
| General Merchandise - 1.2% | | | | | | | | |
| Five Below, Inc. (a) | | | 658,545 | | | $ | 20,898,926 | |
| | |
| Internet - 1.3% | | | | | | | | |
| Dealertrack Holdings, Inc. (a) | | | 380,861 | | | $ | 15,146,842 | |
| Pandora Media, Inc. (a) | | | 489,082 | | | | 7,238,414 | |
| | | | | | | | |
| | | | | | | $ | 22,385,256 | |
| Machinery & Tools - 3.0% | | | | | | | | |
| Allison Transmission Holdings, Inc. | | | 522,648 | | | $ | 16,630,659 | |
| IPG Photonics Corp. (a) | | | 218,448 | | | | 20,949,163 | |
| Oshkosh Corp. | | | 73,865 | | | | 3,603,873 | |
| WABCO Holdings, Inc. (a) | | | 83,194 | | | | 9,719,555 | |
| | | | | | | | |
| | | | | | | $ | 50,903,250 | |
| Medical & Health Technology & Services - 7.2% | | | | | | | | |
| Adeptus Health, Inc., “A” (a) | | | 124,989 | | | $ | 5,543,262 | |
| Advisory Board Co. (a) | | | 154,427 | | | | 8,357,589 | |
| Brookdale Senior Living, Inc. (a) | | | 644,235 | | | | 24,165,255 | |
7
Portfolio of Investments (unaudited) – continued
| | | | | | | | |
| Issuer | | Shares/Par | | | Value ($) | |
| Common Stocks - continued | | | | | |
| Medical & Health Technology & Services - continued | | | | | |
| Capital Senior Living Corp. (a) | | | 881,845 | | | $ | 22,046,125 | |
| Healthcare Services Group, Inc. | | | 731,596 | | | | 24,559,678 | |
| HealthStream, Inc. (a) | | | 433,118 | | | | 11,209,094 | |
| IDEXX Laboratories, Inc. (a) | | | 74,877 | | | | 11,742,960 | |
| INC Research Holdings, Inc., “A” (a) | | | 479,880 | | | | 14,362,808 | |
| | | | | | | | |
| | | | | | | $ | 121,986,771 | |
| Medical Equipment - 9.7% | | | | | | | | |
| Align Technology, Inc. (a) | | | 246,222 | | | $ | 14,120,832 | |
| AtriCure, Inc. (a) | | | 198,964 | | | | 3,517,684 | |
| Cardiovascular Systems, Inc. (a) | | | 423,049 | | | | 15,953,178 | |
| Cepheid, Inc. (a) | | | 295,868 | | | | 16,817,137 | |
| DexCom, Inc. (a) | | | 277,590 | | | | 16,860,817 | |
| GenMark Diagnostics, Inc. (a) | | | 637,186 | | | | 8,098,634 | |
| Masimo Corp. (a) | | | 660,830 | | | | 19,474,660 | |
| Nevro Corp. (a) | | | 159,265 | | | | 6,662,055 | |
| Novadaq Technologies, Inc. (a) | | | 635,130 | | | | 10,511,401 | |
| NxStage Medical, Inc. (a) | | | 438,489 | | | | 7,533,241 | |
| PerkinElmer, Inc. | | | 307,781 | | | | 14,465,707 | |
| STERIS Corp. | | | 224,692 | | | | 14,497,128 | |
| Thoratec Corp. (a) | | | 353,228 | | | | 14,383,444 | |
| | | | | | | | |
| | | | | | | $ | 162,895,918 | |
| Metals & Mining - 0.8% | | | | | | | | |
| Globe Specialty Metals, Inc. | | | 829,480 | | | $ | 13,810,842 | |
| | |
| Natural Gas - Pipeline - 0.4% | | | | | | | | |
| StealthGas, Inc. (a) | | | 976,797 | | | $ | 6,007,302 | |
| | |
| Oil Services - 1.3% | | | | | | | | |
| Forum Energy Technologies, Inc. (a) | | | 224,799 | | | $ | 4,390,324 | |
| Frank’s International N.V. | | | 710,338 | | | | 12,615,603 | |
| Patterson-UTI Energy, Inc. | | | 229,216 | | | | 4,282,901 | |
| | | | | | | | |
| | | | | | | $ | 21,288,828 | |
| Other Banks & Diversified Financials - 4.0% | | | | | | | | |
| Air Lease Corp. | | | 363,882 | | | $ | 13,914,848 | |
| Avolon Holdings Ltd. (a) | | | 387,177 | | | | 7,604,156 | |
| CAI International, Inc. (a) | | | 264,498 | | | | 6,422,011 | |
| First Republic Bank | | | 283,308 | | | | 16,148,556 | |
| PrivateBancorp, Inc. | | | 351,933 | | | | 12,222,633 | |
| Texas Capital Bancshares, Inc. (a) | | | 232,619 | | | | 10,800,500 | |
| | | | | | | | |
| | | | | | | $ | 67,112,704 | |
8
Portfolio of Investments (unaudited) – continued
| | | | | | | | |
| Issuer | | Shares/Par | | | Value ($) | |
| Common Stocks - continued | | | | | |
| Pharmaceuticals - 3.2% | | | | | | | | |
| Aratana Therapeutics, Inc. (a) | | | 693,571 | | | $ | 13,358,177 | |
| Intercept Pharmaceuticals, Inc. (a) | | | 44,852 | | | | 9,928,887 | |
| Kythera Biopharmaceuticals, Inc. (a) | | | 216,564 | | | | 8,998,234 | |
| MediWound Ltd. (a) | | | 431,491 | | | | 3,335,425 | |
| Receptos, Inc. (a) | | | 79,797 | | | | 10,105,492 | |
| TherapeuticsMD, Inc. (a) | | | 1,706,775 | | | | 8,653,349 | |
| | | | | | | | |
| | | | | | | $ | 54,379,564 | |
| Railroad & Shipping - 1.4% | | | | | | | | |
| Diana Shipping, Inc. (a) | | | 2,050,892 | | | $ | 14,212,682 | |
| Navios Maritime Holdings, Inc. | | | 2,079,450 | | | | 9,045,608 | |
| | | | | | | | |
| | | | | | | $ | 23,258,290 | |
| Restaurants - 2.6% | | | | | | | | |
| Chuy’s Holdings, Inc. (a) | | | 736,461 | | | $ | 16,548,279 | |
| Domino’s Pizza, Inc. | | | 73,519 | | | | 7,464,384 | |
| Dunkin Brands Group, Inc. | | | 218,955 | | | | 10,260,231 | |
| Zoe’s Kitchen, Inc. (a)(l) | | | 257,119 | | | | 8,821,753 | |
| | | | | | | | |
| | | | | | | $ | 43,094,647 | |
| Special Products & Services - 0.4% | | | | | | | | |
| WL Ross Holding Corp. (a) | | | 707,014 | | | $ | 7,501,065 | |
| | |
| Specialty Chemicals - 2.6% | | | | | | | | |
| Albemarle Corp. | | | 272,096 | | | $ | 15,392,471 | |
| Axalta Coating Systems Ltd. (a) | | | 655,944 | | | | 18,628,810 | |
| PolyOne Corp. | | | 248,227 | | | | 9,864,541 | |
| | | | | | | | |
| | | | | | | $ | 43,885,822 | |
| Specialty Stores - 6.1% | | | | | | | | |
| Boot Barn Holdings, Inc. (a) | | | 168,382 | | | $ | 4,143,881 | |
| Burlington Stores, Inc. (a) | | | 439,584 | | | | 24,427,683 | |
| Citi Trends, Inc. (a)(h) | | | 1,126,996 | | | | 30,034,443 | |
| Lumber Liquidators Holdings, Inc. (a) | | | 256,442 | | | | 13,299,082 | |
| Urban Outfitters, Inc. (a) | | | 807,607 | | | | 31,464,369 | |
| | | | | | | | |
| | | | $ | 103,369,458 | |
| Trucking - 2.5% | | | | | | | | |
| Knight Transportation, Inc. | | | 242,177 | | | $ | 8,006,372 | |
| Swift Transportation Co. (a) | | | 1,191,093 | | | | 33,684,110 | |
| | | | | | | | |
| | | | $ | 41,690,482 | |
| Total Common Stocks (Identified Cost, $1,362,532,821) | | | $ | 1,650,989,498 | |
9
Portfolio of Investments (unaudited) – continued
| | | | | | | | | | | | | | | | |
| Warrants - 0.0% | | | | | | | | | | | | | | | | |
| Issuer | | Strike Price | | | First Exercise | | | Shares/Par | | | Value ($) | |
| Food & Drug Stores - 0.0% | | | | | | | | | | | | | | | | |
| Brasil Pharma S.A. (1 share for 1 warrant) (a) (Identified Cost, $0) | | BRL | 5.50 | | | | 6/25/14 | | | | 731,699 | | | $ | 7,733 | |
|
| Money Market Funds - 1.4% | |
MFS Institutional Money Market Portfolio, 0.1%,
at Cost and Net Asset Value (v) | | | | 23,466,193 | | | $ | 23,466,193 | |
|
| Collateral for Securities Loaned - 0.8% | |
Navigator Securities Lending Prime Portfolio, 0.17%,
at Cost and Net Asset Value (j) | | | | 12,640,650 | | | $ | 12,640,650 | |
| Total Investments (Identified Cost, $1,398,639,664) | | | $ | 1,687,104,074 | |
| |
| Other Assets, Less Liabilities - (0.3)% | | | | (4,981,577 | ) |
| Net Assets - 100.0% | | | $ | 1,682,122,497 | |
| (a) | Non-income producing security. |
| (h) | Affiliated issuers are those in which the fund’s holdings of an issuer represent 5% or more of the outstanding voting securities of the issuer. |
| (j) | The rate quoted is the annualized seven-day yield of the fund at period end. |
| (l) | A portion of this security is on loan. |
| (v) | Underlying affiliated fund that is available only to investment companies managed by MFS. The rate quoted for the MFS Institutional Money Market Portfolio is the annualized seven-day yield of the fund at period end. |
The following abbreviations are used in this report and are defined:
| PLC | | Public Limited Company |
See notes to financial statements
10
Financial Statements
STATEMENT OF ASSETS AND LIABILITIES
At 2/28/15 (unaudited)
This statement represents your fund’s balance sheet, which details the assets and liabilities comprising the total value of the fund.
| | | | |
| Assets | | | | |
Investments- | | | | |
Non-affiliated issuers, at value (identified cost, $1,326,012,869) | | | $1,615,921,513 | |
Underlying affiliated funds, at cost and value | | | 23,466,193 | |
Other affiliated issuers, at value (identified cost, $49,160,602) | | | 47,716,368 | |
Total investments, at value, including $11,993,745 of securities on loan
(identified cost, $1,398,639,664) | | | $1,687,104,074 | |
Receivables for | | | | |
Investments sold | | | 19,029,332 | |
Fund shares sold | | | 1,457,914 | |
Interest and dividends | | | 607,291 | |
Other assets | | | 9,144 | |
Total assets | | | $1,708,207,755 | |
| Liabilities | | | | |
Payables for | | | | |
Investments purchased | | | $7,622,283 | |
Fund shares reacquired | | | 4,864,547 | |
Collateral for securities loaned, at value | | | 12,640,650 | |
Payable to affiliates | | | | |
Investment adviser | | | 112,801 | |
Shareholder servicing costs | | | 715,667 | |
Distribution and service fees | | | 26,768 | |
Program manager fees | | | 29 | |
Payable for independent Trustees’ compensation | | | 4,264 | |
Accrued expenses and other liabilities | | | 98,249 | |
Total liabilities | | | $26,085,258 | |
Net assets | | | $1,682,122,497 | |
| Net assets consist of | | | | |
Paid-in capital | | | $1,539,942,991 | |
Unrealized appreciation (depreciation) on investments and translation of assets and liabilities in foreign currencies | | | 288,464,380 | |
Accumulated net realized gain (loss) on investments and foreign currency | | | (140,214,361 | ) |
Accumulated net investment loss | | | (6,070,513 | ) |
Net assets | | | $1,682,122,497 | |
Shares of beneficial interest outstanding | | | 69,108,391 | |
11
Statement of Assets and Liabilities (unaudited) – continued
| | | | | | | | | | | | |
| | | Net assets | | | Shares
outstanding | | | Net asset value
per share (a) | |
Class A | | | $490,200,526 | | | | 20,466,367 | | | | $23.95 | |
Class B | | | 29,254,983 | | | | 1,436,283 | | | | 20.37 | |
Class C | | | 116,871,780 | | | | 5,727,087 | | | | 20.41 | |
Class I | | | 287,265,480 | | | | 11,060,881 | | | | 25.97 | |
Class R1 | | | 7,751,457 | | | | 382,972 | | | | 20.24 | |
Class R2 | | | 62,589,267 | | | | 2,735,348 | | | | 22.88 | |
Class R3 | | | 131,748,842 | | | | 5,505,689 | | | | 23.93 | |
Class R4 | | | 210,445,058 | | | | 8,473,659 | | | | 24.84 | |
Class R5 | | | 339,069,897 | | | | 13,009,460 | | | | 26.06 | |
Class 529A | | | 5,224,340 | | | | 224,561 | | | | 23.26 | |
Class 529B | | | 339,864 | | | | 17,202 | | | | 19.76 | |
Class 529C | | | 1,361,003 | | | | 68,882 | | | | 19.76 | |
| (a) | Maximum offering price per share was equal to the net asset value per share for all share classes, except for Classes A and 529A, for which the maximum offering prices per share were $25.41 [100 / 94.25 x $23.95] and $24.68 [100 / 94.25 x $23.26], respectively. On sales of $50,000 or more, the maximum offering prices of Class A and Class 529A shares are reduced. A contingent deferred sales charge may be imposed on redemptions of Class A, Class B, Class C, Class 529B, and Class 529C shares. Redemption price per share was equal to the net asset value per share for Classes I, R1, R2, R3, R4, R5, and 529A. |
See notes to financial statements
12
Financial Statements
STATEMENT OF OPERATIONS
Six months ended 2/28/15 (unaudited)
This statement describes how much your fund earned in investment income and accrued in expenses. It also describes any gains and/or losses generated by fund operations.
| | | | |
| Net Investment loss | | | | |
Income | | | | |
Dividends | | | $4,206,077 | |
Income on securities loaned | | | 764,403 | |
Dividends from underlying affiliated funds | | | 4,671 | |
Foreign taxes withheld | | | (27,891 | ) |
Total investment income | | | $4,947,260 | |
Expenses | | | | |
Management fee | | | $7,985,802 | |
Distribution and service fees | | | 1,781,386 | |
Program manager fees | | | 3,218 | |
Shareholder servicing costs | | | 1,238,914 | |
Administrative services fee | | | 148,983 | |
Independent Trustees’ compensation | | | 20,928 | |
Custodian fee | | | 78,112 | |
Shareholder communications | | | 75,055 | |
Audit and tax fees | | | 27,813 | |
Legal fees | | | 9,629 | |
Miscellaneous | | | 106,112 | |
Total expenses | | | $11,475,952 | |
Fees paid indirectly | | | (128 | ) |
Reduction of expenses by investment adviser and distributor | | | (461,947 | ) |
Net expenses | | | $11,013,877 | |
Net investment loss | | | $(6,066,617 | ) |
| Realized and unrealized gain (loss) on investments and foreign currency | |
Realized gain (loss) (identified cost basis) | | | | |
Investments: | | | | |
Non-affiliated issuers | | | $(119,323,467 | ) |
Other affiliated issuers | | | (2,801,881 | ) |
Foreign currency | | | (21,685 | ) |
Net realized gain (loss) on investments and foreign currency | | | $(122,147,033 | ) |
Change in unrealized appreciation (depreciation) | | | | |
Investments | | | $137,692,167 | |
Translation of assets and liabilities in foreign currencies | | | (990 | ) |
Net unrealized gain (loss) on investments and foreign currency translation | | | $137,691,177 | |
Net realized and unrealized gain (loss) on investments and foreign currency | | | $15,544,144 | |
Change in net assets from operations | | | $9,477,527 | |
See notes to financial statements
13
Financial Statements
STATEMENTS OF CHANGES IN NET ASSETS
These statements describe the increases and/or decreases in net assets resulting from operations, any distributions, and any shareholder transactions.
| | | | | | | | |
| Change in net assets | | Six months ended
2/28/15
(unaudited) | | | Year ended
8/31/14 | |
| From operations | | | | | | | | |
Net investment loss | | | $(6,066,617 | ) | | | $(16,765,231 | ) |
Net realized gain (loss) on investments and foreign currency | | | (122,147,033 | ) | | | 306,638,157 | |
Net unrealized gain (loss) on investments and foreign currency translation | | | 137,691,177 | | | | (131,752,340 | ) |
Change in net assets from operations | | | $9,477,527 | | | | $158,120,586 | |
| Distributions declared to shareholders | | | | | | | | |
From net realized gain on investments | | | $(126,855,750 | ) | | | $(182,188,311 | ) |
Change in net assets from fund share transactions | | | $(263,055,803 | ) | | | $48,101,270 | |
Total change in net assets | | | $(380,434,026 | ) | | | $24,033,545 | |
| Net assets | | | | | | | | |
At beginning of period | | | 2,062,556,523 | | | | 2,038,522,978 | |
At end of period (including accumulated net investment loss of $6,070,513 and $3,896, respectively) | | | $1,682,122,497 | | | | $2,062,556,523 | |
See notes to financial statements
14
Financial Statements
FINANCIAL HIGHLIGHTS
The financial highlights table is intended to help you understand the fund’s financial performance for the semiannual period and the past 5 fiscal years (or life of a particular share class, if shorter). Certain information reflects financial results for a single fund share. The total returns in the table represent the rate by which an investor would have earned (or lost) on an investment in the fund share class (assuming reinvestment of all distributions) held for the entire period.
| | | | | | | | | | | | | | | | | | | | | | | | |
| | | Six months
ended
2/28/15 (unaudited) | | | Years ended 8/31 | |
| Class A | | | 2014 | | | 2013 | | | 2012 | | | 2011 | | | 2010 | |
| | | | | | | | | | | | | | | | | |
Net asset value, beginning of period | | | $25.49 | | | | $25.86 | | | | $20.17 | | | | $22.63 | | | | $19.03 | | | | $16.22 | |
| Income (loss) from investment operations | |
Net investment loss (d) | | | $(0.09 | ) | | | $(0.22 | ) | | | $(0.14 | ) | | | $(0.16 | ) | | | $(0.22 | ) | | | $(0.17 | ) |
Net realized and unrealized gain
(loss) on investments and
foreign currency | | | 0.37 | | | | 2.30 | | | | 5.83 | | | | 1.80 | | | | 5.23 | | | | 2.98 | |
Total from investment operations | | | $0.28 | | | | $2.08 | | | | $5.69 | | | | $1.64 | | | | $5.01 | | | | $2.81 | |
| Less distributions declared to shareholders | |
From net realized gain on
investments | | | $(1.82 | ) | | | $(2.45 | ) | | | $— | | | | $(4.10 | ) | | | $(1.41 | ) | | | $— | |
Net asset value, end of period (x) | | | $23.95 | | | | $25.49 | | | | $25.86 | | | | $20.17 | | | | $22.63 | | | | $19.03 | |
Total return (%) (r)(s)(t)(x) | | | 1.57 | (n) | | | 8.01 | | | | 28.21 | | | | 9.88 | | | | 26.13 | | | | 17.32 | |
Ratios (%) (to average net assets)
and Supplemental data: | |
Expenses before expense reductions (f) | | | 1.37 | (a) | | | 1.33 | | | | 1.35 | | | | 1.39 | | | | 1.40 | | | | 1.51 | |
Expenses after expense reductions (f) | | | 1.31 | (a) | | | 1.27 | | | | 1.31 | | | | 1.35 | | | | 1.30 | | | | 1.41 | |
Net investment loss | | | (0.76 | )(a) | | | (0.83 | ) | | | (0.59 | ) | | | (0.83 | ) | | | (0.90 | ) | | | (0.92 | ) |
Portfolio turnover | | | 31 | (n) | | | 98 | | | | 96 | | | | 128 | | | | 205 | | | | 167 | |
Net assets at end of period
(000 omitted) | | | $490,201 | | | | $620,802 | | | | $866,006 | | | | $529,749 | | | | $626,258 | | | | $338,380 | |
See notes to financial statements
15
Financial Highlights – continued
| | | | | | | | | | | | | | | | | | | | | | | | |
| | | Six months
ended
2/28/15 (unaudited) | | | Years ended 8/31 | |
| Class B | | | 2014 | | | 2013 | | | 2012 | | | 2011 | | | 2010 | |
| | | | | | | | | | | | | | | | | |
Net asset value, beginning of period | | | $22.04 | | | | $22.83 | | | | $17.94 | | | | $20.73 | | | | $17.65 | | | | $15.16 | |
| Income (loss) from investment operations | |
Net investment loss (d) | | | $(0.15 | ) | | | $(0.36 | ) | | | $(0.27 | ) | | | $(0.28 | ) | | | $(0.37 | ) | | | $(0.29 | ) |
Net realized and unrealized gain
(loss) on investments and
foreign currency | | | 0.30 | | | | 2.02 | | | | 5.16 | | | | 1.59 | | | | 4.86 | | | | 2.78 | |
Total from investment operations | | | $0.15 | | | | $1.66 | | | | $4.89 | | | | $1.31 | | | | $4.49 | | | | $2.49 | |
| Less distributions declared to shareholders | |
From net realized gain on
investments | | | $(1.82 | ) | | | $(2.45 | ) | | | $— | | | | $(4.10 | ) | | | $(1.41 | ) | | | $— | |
Net asset value, end of period (x) | | | $20.37 | | | | $22.04 | | | | $22.83 | | | | $17.94 | | | | $20.73 | | | | $17.65 | |
Total return (%) (r)(s)(t)(x) | | | 1.22 | (n) | | | 7.18 | | | | 27.26 | | | | 9.08 | | | | 25.18 | | | | 16.42 | |
Ratios (%) (to average net assets)
and Supplemental data: | |
Expenses before expense reductions (f) | | | 2.12 | (a) | | | 2.08 | | | | 2.10 | | | | 2.14 | | | | 2.15 | | | | 2.26 | |
Expenses after expense reductions (f) | | | 2.06 | (a) | | | 2.02 | | | | 2.06 | | | | 2.10 | | | | 2.05 | | | | 2.16 | |
Net investment loss | | | (1.51 | )(a) | | | (1.58 | ) | | | (1.34 | ) | | | (1.59 | ) | | | (1.65 | ) | | | (1.67 | ) |
Portfolio turnover | | | 31 | (n) | | | 98 | | | | 96 | | | | 128 | | | | 205 | | | | 167 | |
Net assets at end of period
(000 omitted) | | | $29,255 | | | | $34,971 | | | | $37,952 | | | | $30,308 | | | | $33,037 | | | | $26,777 | |
See notes to financial statements
16
Financial Highlights – continued
| | | | | | | | | | | | | | | | | | | | | | | | |
| | | Six months
ended
2/28/15 (unaudited) | | | Years ended 8/31 | |
| Class C | | | 2014 | | | 2013 | | | 2012 | | | 2011 | | | 2010 | |
| | | | | | | | | | | | | | | | | |
Net asset value, beginning of period | | | $22.08 | | | | $22.86 | | | | $17.96 | | | | $20.76 | | | | $17.67 | | | | $15.18 | |
| Income (loss) from investment operations | |
Net investment loss (d) | | | $(0.15 | ) | | | $(0.36 | ) | | | $(0.27 | ) | | | $(0.28 | ) | | | $(0.37 | ) | | | $(0.30 | ) |
Net realized and unrealized gain
(loss) on investments and
foreign currency | | | 0.30 | | | | 2.03 | | | | 5.17 | | | | 1.58 | | | | 4.87 | | | | 2.79 | |
Total from investment operations | | | $0.15 | | | | $1.67 | | | | $4.90 | | | | $1.30 | | | | $4.50 | | | | $2.49 | |
| Less distributions declared to shareholders | |
From net realized gain on
investments | | | $(1.82 | ) | | | $(2.45 | ) | | | $— | | | | $(4.10 | ) | | | $(1.41 | ) | | | $— | |
Net asset value, end of period (x) | | | $20.41 | | | | $22.08 | | | | $22.86 | | | | $17.96 | | | | $20.76 | | | | $17.67 | |
Total return (%) (r)(s)(t)(x) | | | 1.21 | (n) | | | 7.22 | | | | 27.28 | | | | 9.01 | | | | 25.21 | | | | 16.40 | |
Ratios (%) (to average net assets)
and Supplemental data: | |
Expenses before expense reductions (f) | | | 2.12 | (a) | | | 2.08 | | | | 2.10 | | | | 2.14 | | | | 2.15 | | | | 2.26 | |
Expenses after expense reductions (f) | | | 2.07 | (a) | | | 2.02 | | | | 2.06 | | | | 2.10 | | | | 2.05 | | | | 2.16 | |
Net investment loss | | | (1.51 | )(a) | | | (1.59 | ) | | | (1.35 | ) | | | (1.59 | ) | | | (1.65 | ) | | | (1.67 | ) |
Portfolio turnover | | | 31 | (n) | | | 98 | | | | 96 | | | | 128 | | | | 205 | | | | 167 | |
Net assets at end of period
(000 omitted) | | | $116,872 | | | | $141,293 | | | | $136,913 | | | | $91,138 | | | | $95,479 | | | | $37,144 | |
See notes to financial statements
17
Financial Highlights – continued
| | | | | | | | | | | | | | | | | | | | | | | | |
| | | Six months
ended
2/28/15 (unaudited) | | | Years ended 8/31 | |
| Class I | | | 2014 | | | 2013 | | | 2012 | | | 2011 | | | 2010 | |
| | | | | | | | | | | | | | | | | |
Net asset value, beginning of period | | | $27.44 | | | | $27.61 | | | | $21.48 | | | | $23.77 | | | | $19.88 | | | | $16.91 | |
| Income (loss) from investment operations | |
Net investment loss (d) | | | $(0.06 | ) | | | $(0.17 | ) | | | $(0.09 | ) | | | $(0.12 | ) | | | $(0.17 | ) | | | $(0.13 | ) |
Net realized and unrealized gain
(loss) on investments and
foreign currency | | | 0.41 | | | | 2.45 | | | | 6.22 | | | | 1.93 | | | | 5.47 | | | | 3.10 | |
Total from investment operations | | | $0.35 | | | | $2.28 | | | | $6.13 | | | | $1.81 | | | | $5.30 | | | | $2.97 | |
| Less distributions declared to shareholders | |
From net realized gain on
investments | | | $(1.82 | ) | | | $(2.45 | ) | | | $— | | | | $(4.10 | ) | | | $(1.41 | ) | | | $— | |
Net asset value, end of period (x) | | | $25.97 | | | | $27.44 | | | | $27.61 | | | | $21.48 | | | | $23.77 | | | | $19.88 | |
Total return (%) (r)(s)(x) | | | 1.72 | (n) | | | 8.25 | | | | 28.54 | | | | 10.16 | | | | 26.48 | | | | 17.56 | |
Ratios (%) (to average net assets)
and Supplemental data: | |
Expenses before expense reductions (f) | | | 1.11 | (a) | | | 1.08 | | | | 1.10 | | | | 1.15 | | | | 1.15 | | | | 1.26 | |
Expenses after expense reductions (f) | | | 1.06 | (a) | | | 1.02 | | | | 1.06 | | | | 1.10 | | | | 1.05 | | | | 1.16 | |
Net investment loss | | | (0.51 | )(a) | | | (0.59 | ) | | | (0.36 | ) | | | (0.59 | ) | | | (0.65 | ) | | | (0.67 | ) |
Portfolio turnover | | | 31 | (n) | | | 98 | | | | 96 | | | | 128 | | | | 205 | | | | 167 | |
Net assets at end of period
(000 omitted) | | | $287,265 | | | | $483,893 | | | | $368,806 | | | | $170,830 | | | | $323,848 | | | | $263,575 | |
See notes to financial statements
18
Financial Highlights – continued
| | | | | | | | | | | | | | | | | | | | | | | | |
| | | Six months
ended
2/28/15 (unaudited) | | | Years ended 8/31 | |
| Class R1 | | | 2014 | | | 2013 | | | 2012 | | | 2011 | | | 2010 | |
| | | | | | | | | | | | | | | | | |
Net asset value, beginning of period | | | $21.91 | | | | $22.71 | | | | $17.84 | | | | $20.65 | | | | $17.58 | | | | $15.10 | |
| Income (loss) from investment operations | |
Net investment loss (d) | | | $(0.15 | ) | | | $(0.36 | ) | | | $(0.27 | ) | | | $(0.28 | ) | | | $(0.37 | ) | | | $(0.29 | ) |
Net realized and unrealized gain
(loss) on investments and
foreign currency | | | 0.30 | | | | 2.01 | | | | 5.14 | | | | 1.57 | | | | 4.85 | | | | 2.77 | |
Total from investment operations | | | $0.15 | | | | $1.65 | | | | $4.87 | | | | $1.29 | | | | $4.48 | | | | $2.48 | |
| Less distributions declared to shareholders | |
From net realized gain on
investments | | | $(1.82 | ) | | | $(2.45 | ) | | | $— | | | | $(4.10 | ) | | | $(1.41 | ) | | | $— | |
Net asset value, end of period (x) | | | $20.24 | | | | $21.91 | | | | $22.71 | | | | $17.84 | | | | $20.65 | | | | $17.58 | |
Total return (%) (r)(s)(x) | | | 1.22 | (n) | | | 7.17 | | | | 27.30 | | | | 9.00 | | | | 25.22 | | | | 16.42 | |
Ratios (%) (to average net assets)
and Supplemental data: | |
Expenses before expense reductions (f) | | | 2.12 | (a) | | | 2.08 | | | | 2.10 | | | | 2.14 | | | | 2.15 | | | | 2.26 | |
Expenses after expense reductions (f) | | | 2.07 | (a) | | | 2.02 | | | | 2.06 | | | | 2.10 | | | | 2.05 | | | | 2.16 | |
Net investment loss | | | (1.51 | )(a) | | | (1.59 | ) | | | (1.34 | ) | | | (1.59 | ) | | | (1.65 | ) | | | (1.67 | ) |
Portfolio turnover | | | 31 | (n) | | | 98 | | | | 96 | | | | 128 | | | | 205 | | | | 167 | |
Net assets at end of period
(000 omitted) | | | $7,751 | | | | $8,490 | | | | $8,972 | | | | $7,506 | | | | $6,904 | | | | $5,253 | |
See notes to financial statements
19
Financial Highlights – continued
| | | | | | | | | | | | | | | | | | | | | | | | |
| | | Six months
ended
2/28/15 (unaudited) | | | Years ended 8/31 | |
| Class R2 | | | 2014 | | | 2013 | | | 2012 | | | 2011 | | | 2010 | |
| | | | | | | | | | | | | | | | | |
Net asset value, beginning of period | | | $24.46 | | | | $24.97 | | | | $19.52 | | | | $22.09 | | | | $18.65 | | | | $15.94 | |
| Income (loss) from investment operations | |
Net investment loss (d) | | | $(0.11 | ) | | | $(0.27 | ) | | | $(0.19 | ) | | | $(0.21 | ) | | | $(0.28 | ) | | | $(0.22 | ) |
Net realized and unrealized gain
(loss) on investments and
foreign currency | | | 0.35 | | | | 2.21 | | | | 5.64 | | | | 1.74 | | | | 5.13 | | | | 2.93 | |
Total from investment operations | | | $0.24 | | | | $1.94 | | | | $5.45 | | | | $1.53 | | | | $4.85 | | | | $2.71 | |
| Less distributions declared to shareholders | |
From net realized gain on
investments | | | $(1.82 | ) | | | $(2.45 | ) | | | $— | | | | $(4.10 | ) | | | $(1.41 | ) | | | $— | |
Net asset value, end of period (x) | | | $22.88 | | | | $24.46 | | | | $24.97 | | | | $19.52 | | | | $22.09 | | | | $18.65 | |
Total return (%) (r)(s)(x) | | | 1.47 | (n) | | | 7.72 | | | | 27.92 | | | | 9.58 | | | | 25.79 | | | | 17.00 | |
Ratios (%) (to average net assets)
and Supplemental data: | |
Expenses before expense reductions (f) | | | 1.62 | (a) | | | 1.58 | | | | 1.60 | | | | 1.64 | | | | 1.65 | | | | 1.76 | |
Expenses after expense reductions (f) | | | 1.57 | (a) | | | 1.52 | | | | 1.56 | | | | 1.60 | | | | 1.55 | | | | 1.66 | |
Net investment loss | | | (1.01 | )(a) | | | (1.09 | ) | | | (0.85 | ) | | | (1.09 | ) | | | (1.15 | ) | | | (1.17 | ) |
Portfolio turnover | | | 31 | (n) | | | 98 | | | | 96 | | | | 128 | | | | 205 | | | | 167 | |
Net assets at end of period
(000 omitted) | | | $62,589 | | | | $66,923 | | | | $60,501 | | | | $35,599 | | | | $24,316 | | | | $13,125 | |
See notes to financial statements
20
Financial Highlights – continued
| | | | | | | | | | | | | | | | | | | | | | | | |
| | | Six months
ended
2/28/15 (unaudited) | | | Years ended 8/31 | |
| Class R3 | | | 2014 | | | 2013 | | | 2012 | | | 2011 | | | 2010 | |
| | | | | | | | | | | | | | | | | |
Net asset value, beginning of period | | | $25.47 | | | | $25.84 | | | | $20.15 | | | | $22.62 | | | | $19.02 | | | | $16.22 | |
| Income (loss) from investment operations | |
Net investment loss (d) | | | $(0.09 | ) | | | $(0.22 | ) | | | $(0.14 | ) | | | $(0.16 | ) | | | $(0.22 | ) | | | $(0.18 | ) |
Net realized and unrealized gain
(loss) on investments and
foreign currency | | | 0.37 | | | | 2.30 | | | | 5.83 | | | | 1.79 | | | | 5.23 | | | | 2.98 | |
Total from investment operations | | | $0.28 | | | | $2.08 | | | | $5.69 | | | | $1.63 | | | | $5.01 | | | | $2.80 | |
| Less distributions declared to shareholders | |
From net realized gain on
investments | | | $(1.82 | ) | | | $(2.45 | ) | | | $— | | | | $(4.10 | ) | | | $(1.41 | ) | | | $— | |
Net asset value, end of period (x) | | | $23.93 | | | | $25.47 | | | | $25.84 | | | | $20.15 | | | | $22.62 | | | | $19.02 | |
Total return (%) (r)(s)(x) | | | 1.57 | (n) | | | 8.02 | | | | 28.24 | | | | 9.84 | | | | 26.14 | | | | 17.26 | |
Ratios (%) (to average net assets)
and Supplemental data: | |
Expenses before expense reductions (f) | | | 1.37 | (a) | | | 1.33 | | | | 1.35 | | | | 1.39 | | | | 1.40 | | | | 1.51 | |
Expenses after expense reductions (f) | | | 1.32 | (a) | | | 1.27 | | | | 1.31 | | | | 1.35 | | | | 1.30 | | | | 1.41 | |
Net investment loss | | | (0.76 | )(a) | | | (0.84 | ) | | | (0.60 | ) | | | (0.83 | ) | | | (0.90 | ) | | | (0.93 | ) |
Portfolio turnover | | | 31 | (n) | | | 98 | | | | 96 | | | | 128 | | | | 205 | | | | 167 | |
Net assets at end of period
(000 omitted) | | | $131,749 | | | | $150,359 | | | | $110,562 | | | | $61,125 | | | | $28,966 | | | | $6,456 | |
See notes to financial statements
21
Financial Highlights – continued
| | | | | | | | | | | | | | | | | | | | | | | | |
| | | Six months
ended
2/28/15 (unaudited) | | | Years ended 8/31 | |
| Class R4 | | | 2014 | | | 2013 | | | 2012 | | | 2011 | | | 2010 | |
| | | | | | | | | | | | | | | | | |
Net asset value, beginning of period | | | $26.33 | | | | $26.57 | | | | $20.67 | | | | $23.04 | | | | $19.31 | | | | $16.42 | |
| Income (loss) from investment operations | |
Net investment loss (d) | | | $(0.06 | ) | | | $(0.16 | ) | | | $(0.08 | ) | | | $(0.12 | ) | | | $(0.16 | ) | | | $(0.13 | ) |
Net realized and unrealized gain
(loss) on investments and
foreign currency | | | 0.39 | | | | 2.37 | | | | 5.98 | | | | 1.85 | | | | 5.30 | | | | 3.02 | |
Total from investment operations | | | $0.33 | | | | $2.21 | | | | $5.90 | | | | $1.73 | | | | $5.14 | | | | $2.89 | |
| Less distributions declared to shareholders | |
From net realized gain on
investments | | | $(1.82 | ) | | | $(2.45 | ) | | | $— | | | | $(4.10 | ) | | | $(1.41 | ) | | | $— | |
Net asset value, end of period (x) | | | $24.84 | | | | $26.33 | | | | $26.57 | | | | $20.67 | | | | $23.04 | | | | $19.31 | |
Total return (%) (r)(s)(x) | | | 1.72 | (n) | | | 8.31 | | | | 28.54 | | | | 10.13 | | | | 26.43 | | | | 17.60 | |
Ratios (%) (to average net assets)
and Supplemental data: | |
Expenses before expense reductions (f) | | | 1.12 | (a) | | | 1.08 | | | | 1.10 | | | | 1.14 | | | | 1.15 | | | | 1.26 | |
Expenses after expense reductions (f) | | | 1.07 | (a) | | | 1.02 | | | | 1.06 | | | | 1.10 | | | | 1.05 | | | | 1.16 | |
Net investment loss | | | (0.51 | )(a) | | | (0.59 | ) | | | (0.35 | ) | | | (0.58 | ) | | | (0.66 | ) | | | (0.67 | ) |
Portfolio turnover | | | 31 | (n) | | | 98 | | | | 96 | | | | 128 | | | | 205 | | | | 167 | |
Net assets at end of period
(000 omitted) | | | $210,445 | | | | $229,964 | | | | $197,884 | | | | $141,694 | | | | $78,534 | | | | $50,147 | |
See notes to financial statements
22
Financial Highlights – continued
| | | | | | | | | | | | | | | | |
| | | Six months
ended
2/28/15 (unaudited) | | | Years ended 8/31 | |
| Class R5 | | | 2014 | | | 2013 | | | 2012 (i) | |
| | | | | | | | | | | |
Net asset value, beginning of period | | | $27.52 | | | | $27.64 | | | | $21.48 | | | | $19.73 | |
| Income (loss) from investment operations | |
Net investment loss (d) | | | $(0.05 | ) | | | $(0.13 | ) | | | $(0.06 | ) | | | $(0.03 | ) |
Net realized and unrealized gain (loss) on investments and foreign currency | | | 0.41 | | | | 2.46 | | | | 6.22 | | | | 1.78 | |
Total from investment operations | | | $0.36 | | | | $2.33 | | | | $6.16 | | | | $1.75 | |
| Less distributions declared to shareholders | |
From net realized gain on investments | | | $(1.82 | ) | | | $(2.45 | ) | | | $— | | | | $— | |
Net asset value, end of period (x) | | | $26.06 | | | | $27.52 | | | | $27.64 | | | | $21.48 | |
Total return (%) (r)(s)(x) | | | 1.75 | (n) | | | 8.43 | | | | 28.68 | | | | 8.87 | (n) |
Ratios (%) (to average net assets)
and Supplemental data: | |
Expenses before expense reductions (f) | | | 0.98 | (a) | | | 0.97 | | | | 0.99 | | | | 1.07 | (a) |
Expenses after expense reductions (f) | | | 0.93 | (a) | | | 0.91 | | | | 0.96 | | | | 1.05 | (a) |
Net investment loss | | | (0.37 | )(a) | | | (0.48 | ) | | | (0.24 | ) | | | (0.49 | )(a) |
Portfolio turnover | | | 31 | (n) | | | 98 | | | | 96 | | | | 128 | |
Net assets at end of period (000 omitted) | | | $339,070 | | | | $319,139 | | | | $244,655 | | | | $174,681 | |
See notes to financial statements
23
Financial Highlights – continued
| | | | | | | | | | | | | | | | | | | | | | | | |
| | | Six months
ended
2/28/15 (unaudited) | | | Years ended 8/31 | |
| Class 529A | | | 2014 | | | 2013 | | | 2012 | | | 2011 | | | 2010 | |
| | | | | | | | | | | | | | | | | |
Net asset value, beginning of period | | | $24.82 | | | | $25.25 | | | | $19.70 | | | | $22.22 | | | | $18.71 | | | | $15.97 | |
| Income (loss) from investment operations | |
Net investment loss (d) | | | $(0.09 | ) | | | $(0.22 | ) | | | $(0.14 | ) | | | $(0.17 | ) | | | $(0.24 | ) | | | $(0.19 | ) |
Net realized and unrealized gain
(loss) on investments and
foreign currency | | | 0.35 | | | | 2.24 | | | | 5.69 | | | | 1.75 | | | | 5.16 | | | | 2.93 | |
Total from investment operations | | | $0.26 | | | | $2.02 | | | | $5.55 | | | | $1.58 | | | | $4.92 | | | | $2.74 | |
| Less distributions declared to shareholders | |
From net realized gain on
investments | | | $(1.82 | ) | | | $(2.45 | ) | | | $— | | | | $(4.10 | ) | | | $(1.41 | ) | | | $— | |
Net asset value, end of period (x) | | | $23.26 | | | | $24.82 | | | | $25.25 | | | | $19.70 | | | | $22.22 | | | | $18.71 | |
Total return (%) (r)(s)(t)(x) | | | 1.53 | (n) | | | 7.97 | | | | 28.17 | | | | 9.80 | | | | 26.09 | | | | 17.16 | |
Ratios (%) (to average net assets)
and Supplemental data: | |
Expenses before expense reductions (f) | | | 1.47 | (a) | | | 1.43 | | | | 1.45 | | | | 1.49 | | | | 1.50 | | | | 1.61 | |
Expenses after expense reductions (f) | | | 1.35 | (a) | | | 1.30 | | | | 1.34 | | | | 1.40 | | | | 1.39 | | | | 1.51 | |
Net investment loss | | | (0.79 | )(a) | | | (0.86 | ) | | | (0.62 | ) | | | (0.89 | ) | | | (0.99 | ) | | | (1.02 | ) |
Portfolio turnover | | | 31 | (n) | | | 98 | | | | 96 | | | | 128 | | | | 205 | | | | 167 | |
Net assets at end of period
(000 omitted) | | | $5,224 | | | | $5,150 | | | | $4,519 | | | | $3,304 | | | | $2,848 | | | | $1,735 | |
See notes to financial statements
24
Financial Highlights – continued
| | | | | | | | | | | | | | | | | | | | | | | | |
| | | Six months
ended
2/28/15 (unaudited) | | | Years ended 8/31 | |
| Class 529B | | | 2014 | | | 2013 | | | 2012 | | | 2011 | | | 2010 | |
| | | | | | | | | | | | | | | | | |
Net asset value, beginning of period | | | $21.44 | | | | $22.27 | | | | $17.51 | | | | $20.35 | | | | $17.36 | | | | $14.92 | |
| Income (loss) from investment operations | |
Net investment loss (d) | | | $(0.15 | ) | | | $(0.36 | ) | | | $(0.28 | ) | | | $(0.28 | ) | | | $(0.38 | ) | | | $(0.31 | ) |
Net realized and unrealized gain
(loss) on investments and
foreign currency | | | 0.29 | | | | 1.98 | | | | 5.04 | | | | 1.54 | | | | 4.78 | | | | 2.75 | |
Total from investment operations | | | $0.14 | | | | $1.62 | | | | $4.76 | | | | $1.26 | | | | $4.40 | | | | $2.44 | |
| Less distributions declared to shareholders | |
From net realized gain on
investments | | | $(1.82 | ) | | | $(2.45 | ) | | | $— | | | | $(4.10 | ) | | | $(1.41 | ) | | | $— | |
Net asset value, end of period (x) | | | $19.76 | | | | $21.44 | | | | $22.27 | | | | $17.51 | | | | $20.35 | | | | $17.36 | |
Total return (%) (r)(s)(t)(x) | | | 1.20 | (n) | | | 7.18 | | | | 27.18 | | | | 8.99 | | | | 25.08 | | | | 16.35 | |
Ratios (%) (to average net assets)
and Supplemental data: | |
Expenses before expense reductions (f) | | | 2.22 | (a) | | | 2.18 | | | | 2.20 | | | | 2.24 | | | | 2.24 | | | | 2.36 | |
Expenses after expense reductions (f) | | | 2.10 | (a) | | | 2.06 | | | | 2.10 | | | | 2.15 | | | | 2.14 | | | | 2.26 | |
Net investment loss | | | (1.54 | )(a) | | | (1.62 | ) | | | (1.39 | ) | | | (1.64 | ) | | | (1.74 | ) | | | (1.77 | ) |
Portfolio turnover | | | 31 | (n) | | | 98 | | | | 96 | | | | 128 | | | | 205 | | | | 167 | |
Net assets at end of period
(000 omitted) | | | $340 | | | | $348 | | | | $300 | | | | $217 | | | | $197 | | | | $204 | |
See notes to financial statements
25
Financial Highlights – continued
| | | | | | | | | | | | | | | | | | | | | | | | |
| | | Six months
ended
2/28/15 (unaudited) | | | Years ended 8/31 | |
| Class 529C | | | 2014 | | | 2013 | | | 2012 | | | 2011 | | | 2010 | |
| | | | | | | | | | | | | | | | | |
Net asset value, beginning of period | | | $21.44 | | | | $22.28 | | | | $17.52 | | | | $20.36 | | | | $17.36 | | | | $14.93 | |
| Income (loss) from investment operations | |
Net investment loss (d) | | | $(0.15 | ) | | | $(0.36 | ) | | | $(0.28 | ) | | | $(0.28 | ) | | | $(0.38 | ) | | | $(0.31 | ) |
Net realized and unrealized gain
(loss) on investments and
foreign currency | | | 0.29 | | | | 1.97 | | | | 5.04 | | | | 1.54 | | | | 4.79 | | | | 2.74 | |
Total from investment operations | | | $0.14 | | | | $1.61 | | | | $4.76 | | | | $1.26 | | | | $4.41 | | | | $2.43 | |
| Less distributions declared to shareholders | |
From net realized gain on
investments | | | $(1.82 | ) | | | $(2.45 | ) | | | $— | | | | $(4.10 | ) | | | $(1.41 | ) | | | $— | |
Net asset value, end of period (x) | | | $19.76 | | | | $21.44 | | | | $22.28 | | | | $17.52 | | | | $20.36 | | | | $17.36 | |
Total return (%) (r)(s)(t)(x) | | | 1.20 | (n) | | | 7.13 | | | | 27.17 | | | | 8.98 | | | | 25.14 | | | | 16.28 | |
Ratios (%) (to average net assets)
and Supplemental data: | |
Expenses before expense reductions (f) | | | 2.22 | (a) | | | 2.18 | | | | 2.20 | | | | 2.24 | | | | 2.25 | | | | 2.36 | |
Expenses after expense reductions (f) | | | 2.12 | (a) | | | 2.07 | | | | 2.11 | | | | 2.15 | | | | 2.14 | | | | 2.26 | |
Net investment loss | | | (1.55 | )(a) | | | (1.63 | ) | | | (1.39 | ) | | | (1.64 | ) | | | (1.74 | ) | | | (1.78 | ) |
Portfolio turnover | | | 31 | (n) | | | 98 | | | | 96 | | | | 128 | | | | 205 | | | | 167 | |
Net assets at end of period
(000 omitted) | | | $1,361 | | | | $1,223 | | | | $1,454 | | | | $906 | | | | $709 | | | | $469 | |
| (d) | Per share data is based on average shares outstanding. |
| (f) | Ratios do not reflect reductions from fees paid indirectly, if applicable. |
| (i) | For the period from the class inception, June 1, 2012, through the stated period end. |
| (r) | Certain expenses have been reduced without which performance would have been lower. |
| (s) | From time to time the fund may receive proceeds from litigation settlements, without which performance would be lower. |
| (t) | Total returns do not include any applicable sales charges. |
| (x) | The net asset values per share and total returns have been calculated on net assets which include adjustments made in accordance with U.S. generally accepted accounting principles required at period end for financial reporting purposes. |
See notes to financial statements
26
NOTES TO FINANCIAL STATEMENTS
(unaudited)
(1) Business and Organization
MFS New Discovery Fund (the fund) is a diversified series of MFS Series Trust I (the trust). The trust is organized as a Massachusetts business trust and is registered under the Investment Company Act of 1940, as amended, as an open-end management investment company.
The fund is an investment company and accordingly follows the investment company accounting and reporting guidance of the Financial Accounting Standards Board (FASB) Accounting Standards Codification Topic 946 Financial Services – Investment Companies.
(2) Significant Accounting Policies
General – The preparation of financial statements in conformity with U.S. generally accepted accounting principles requires management to make estimates and assumptions that affect the reported amounts of assets and liabilities, and disclosure of contingent assets and liabilities at the date of the financial statements and the reported amounts of increases and decreases in net assets from operations during the reporting period. Actual results could differ from those estimates. In the preparation of these financial statements, management has evaluated subsequent events occurring after the date of the fund’s Statement of Assets and Liabilities through the date that the financial statements were issued. The fund will generally focus on securities of small size companies which may be more volatile than those of larger companies.
In June 2014, FASB issued Accounting Standards Update 2014-11, Transfers and Servicing (Topic 860) – Repurchase-to-Maturity Transactions, Repurchase Financings, and Disclosures (“ASU 2014-11”). ASU 2014-11 changes the accounting for repurchase-to-maturity transactions (i.e., repurchase agreements that settle at the same time as the maturity of the transferred financial asset) and enhances the required disclosures for repurchase agreements and other similar transactions. Although still evaluating the potential impacts of ASU 2014-11 to the fund, management expects that the impact of the fund’s adoption will be limited to additional financial statement disclosures which would first be effective for interim reporting periods beginning after March 15, 2015.
Balance Sheet Offsetting – The fund’s accounting policy with respect to balance sheet offsetting is that, absent an event of default by the counterparty or a termination of the agreement, the International Swaps and Derivatives Association (ISDA) Master Agreement does not result in an offset of reported amounts of financial assets and financial liabilities in the Statement of Assets and Liabilities across transactions between the fund and the applicable counterparty. The fund’s right to setoff may be restricted or prohibited by the bankruptcy or insolvency laws of the particular jurisdiction to which a specific master netting agreement counterparty is subject. Balance sheet offsetting disclosures, to the extent applicable to the fund, have been included in the fund’s Significant Accounting Policies note under the captions for each of the fund’s in-scope financial instruments and transactions.
Investment Valuations – Equity securities, including restricted equity securities, are generally valued at the last sale or official closing price as provided by a third-party
27
Notes to Financial Statements (unaudited) – continued
pricing service on the market or exchange on which they are primarily traded. Equity securities, for which there were no sales reported that day, are generally valued at the last quoted daily bid quotation as provided by a third-party pricing service on the market or exchange on which such securities are primarily traded. Short-term instruments with a maturity at issuance of 60 days or less may be valued at amortized cost, which approximates market value. Open-end investment companies are generally valued at net asset value per share. Securities and other assets generally valued on the basis of information from a third-party pricing service may also be valued at a broker/dealer bid quotation. Values obtained from third-party pricing services can utilize both transaction data and market information such as yield, quality, coupon rate, maturity, type of issue, trading characteristics, and other market data. The values of foreign securities and other assets and liabilities expressed in foreign currencies are converted to U.S. dollars using the mean of bid and asked prices for rates provided by a third-party pricing service.
The Board of Trustees has delegated primary responsibility for determining or causing to be determined the value of the fund’s investments (including any fair valuation) to the adviser pursuant to valuation policies and procedures approved by the Board. If the adviser determines that reliable market quotations are not readily available, investments are valued at fair value as determined in good faith by the adviser in accordance with such procedures under the oversight of the Board of Trustees. Under the fund’s valuation policies and procedures, market quotations are not considered to be readily available for most types of debt instruments and floating rate loans and many types of derivatives. These investments are generally valued at fair value based on information from third-party pricing services. In addition, investments may be valued at fair value if the adviser determines that an investment’s value has been materially affected by events occurring after the close of the exchange or market on which the investment is principally traded (such as foreign exchange or market) and prior to the determination of the fund’s net asset value, or after the halting of trading of a specific security where trading does not resume prior to the close of the exchange or market on which the security is principally traded. Events that occur on a frequent basis after foreign markets close (such as developments in foreign markets and significant movements in the U.S. markets) and prior to the determination of the fund’s net asset value may be deemed to have a material effect on the value of securities traded in foreign markets. Accordingly, the fund’s foreign equity securities may often be valued at fair value. The adviser generally relies on third-party pricing services or other information (such as the correlation with price movements of similar securities in the same or other markets; the type, cost and investment characteristics of the security; the business and financial condition of the issuer; and trading and other market data) to assist in determining whether to fair value and at what value to fair value an investment. The value of an investment for purposes of calculating the fund’s net asset value can differ depending on the source and method used to determine value. When fair valuation is used, the value of an investment used to determine the fund’s net asset value may differ from quoted or published prices for the same investment. There can be no assurance that the fund could obtain the fair value assigned to an investment if it were to sell the investment at the same time at which the fund determines its net asset value per share.
28
Notes to Financial Statements (unaudited) – continued
Various inputs are used in determining the value of the fund’s assets or liabilities. These inputs are categorized into three broad levels. In certain cases, the inputs used to measure fair value may fall into different levels of the fair value hierarchy. In such cases, an investment’s level within the fair value hierarchy is based on the lowest level of input that is significant to the fair value measurement. The fund’s assessment of the significance of a particular input to the fair value measurement in its entirety requires judgment, and considers factors specific to the investment. Level 1 includes unadjusted quoted prices in active markets for identical assets or liabilities. Level 2 includes other significant observable market-based inputs (including quoted prices for similar securities, interest rates, prepayment speed, and credit risk). Level 3 includes unobservable inputs, which may include the adviser’s own assumptions in determining the fair value of investments. The following is a summary of the levels used as of February 28, 2015 in valuing the fund’s assets or liabilities:
| | | | | | | | | | | | | | | | |
| Investments at Value | | Level 1 | | | Level 2 | | | Level 3 | | | Total | |
| Equity Securities: | | | | | | | | | | | | | | | | |
United States | | | $1,543,293,440 | | | | $7,501,065 | | | | $— | | | | $1,550,794,505 | |
Greece | | | 29,265,591 | | | | — | | | | — | | | | 29,265,591 | |
Canada | | | 24,069,701 | | | | — | | | | — | | | | 24,069,701 | |
Hong Kong | | | 19,262,813 | | | | — | | | | — | | | | 19,262,813 | |
India | | | 10,594,241 | | | | — | | | | — | | | | 10,594,241 | |
Israel | | | 9,398,491 | | | | — | | | | — | | | | 9,398,491 | |
Ireland | | | 7,604,156 | | | | — | | | | — | | | | 7,604,156 | |
Brazil | | | — | | | | 7,733 | | | | — | | | | 7,733 | |
| Mutual Funds | | | 36,106,843 | | | | — | | | | — | | | | 36,106,843 | |
| Total Investments | | | $1,679,595,276 | | | | $7,508,798 | | | | $— | | | | $1,687,104,074 | |
For further information regarding security characteristics, see the Portfolio of Investments.
Of the level 2 investments presented above, equity investments amounting to $7,501,065 would have been considered level 1 investments at the beginning of the period. The primary reason for changes in the classifications between levels 1 and 2 occurs when foreign equity securities are fair valued using other observable market-based inputs in place of the closing exchange price due to events occurring after the close of the exchange or market on which the investment is principally traded. The fund’s foreign equity securities may often be valued at fair value. The fund’s policy is to recognize transfers between the levels as of the end of the period.
Foreign Currency Translation – Purchases and sales of foreign investments, income, and expenses are converted into U.S. dollars based upon currency exchange rates prevailing on the respective dates of such transactions or on the reporting date for foreign denominated receivables and payables. Gains and losses attributable to foreign currency exchange rates on sales of securities are recorded for financial statement purposes as net realized gains and losses on investments. Gains and losses attributable to foreign exchange rate movements on receivables, payables, income and expenses are recorded for financial statement purposes as foreign currency transaction gains and losses. That portion of both realized and unrealized gains and losses on investments that results from fluctuations in foreign currency exchange rates is not separately disclosed.
29
Notes to Financial Statements (unaudited) – continued
Security Loans – Under its Securities Lending Agency Agreement with the fund, State Street Bank and Trust Company (“State Street”), as lending agent, loans the securities of the fund to certain qualified institutions (the “Borrowers”) approved by the fund. The loans are collateralized by cash and/or U.S. Treasury and federal agency obligations in an amount typically at least equal to the market value of the securities loaned. On loans collateralized by cash, the cash collateral is invested in a money market fund. The market value of the loaned securities is determined at the close of business of the fund and any additional required collateral is delivered to the fund on the next business day. State Street provides the fund with indemnification against Borrower default. In the event of Borrower default, State Street will for the benefit of the fund either purchase securities identical to those loaned or, when such purchase is commercially impracticable, pay the fund the market value of the loaned securities. In return, State Street assumes the fund’s rights to the related collateral. If the collateral value is less than the cost to purchase identical securities, State Street is responsible for the shortfall, but only to the extent that such shortfall is not due to a decline in collateral value resulting from collateral reinvestment for which the fund bears the risk of loss. At period end, the fund had investment securities on loan with a fair value of $11,993,745 and a related liability of $12,640,650 for cash collateral received on securities loaned, both of which are presented gross in the Statement of Assets and Liabilities. The collateral received on securities loaned exceeded the value of securities on loan at period end. The liability for cash collateral for securities loaned is carried at fair value, which is categorized as level 2 within the fair value hierarchy. A portion of the income generated upon investment of the collateral is remitted to the Borrowers, and the remainder is allocated between the fund and the lending agent. On loans collateralized by U.S. Treasury and/or federal agency obligations, a fee is received from the Borrower, and is allocated between the fund and the lending agent. Income from securities lending is separately reported in the Statement of Operations. The dividend and interest income earned on the securities loaned is accounted for in the same manner as other dividend and interest income.
Indemnifications – Under the fund’s organizational documents, its officers and Trustees may be indemnified against certain liabilities and expenses arising out of the performance of their duties to the fund. Additionally, in the normal course of business, the fund enters into agreements with service providers that may contain indemnification clauses. The fund’s maximum exposure under these agreements is unknown as this would involve future claims that may be made against the fund that have not yet occurred.
Investment Transactions and Income – Investment transactions are recorded on the trade date. Dividends received in cash are recorded on the ex-dividend date. Certain dividends from foreign securities will be recorded when the fund is informed of the dividend if such information is obtained subsequent to the ex-dividend date. Dividend payments received in additional securities are recorded on the ex-dividend date in an amount equal to the value of the security on such date.
The fund may receive proceeds from litigation settlements. Any proceeds received from litigation involving portfolio holdings are reflected in the Statement of Operations in realized gain/loss if the security has been disposed of by the fund or in unrealized
30
Notes to Financial Statements (unaudited) – continued
gain/loss if the security is still held by the fund. Any other proceeds from litigation not related to portfolio holdings are reflected as other income in the Statement of Operations.
Fees Paid Indirectly – The fund’s custody fee may be reduced according to an arrangement that measures the value of cash deposited with the custodian by the fund. This amount, for the six months ended February 28, 2015, is shown as a reduction of total expenses in the Statement of Operations.
Tax Matters and Distributions – The fund intends to qualify as a regulated investment company, as defined under Subchapter M of the Internal Revenue Code, and to distribute all of its taxable income, including realized capital gains. As a result, no provision for federal income tax is required. The fund’s federal tax returns, when filed, will remain subject to examination by the Internal Revenue Service for a three year period. Management has analyzed the fund’s tax positions taken on federal and state tax returns for all open tax years and does not believe that there are any uncertain tax positions that require recognition of a tax liability. Foreign taxes, if any, have been accrued by the fund in the accompanying financial statements in accordance with the applicable foreign tax law. Foreign income taxes may be withheld by certain countries in which the fund invests. Additionally, capital gains realized by the fund on securities issued in or by certain foreign countries may be subject to capital gains tax imposed by those countries.
Distributions to shareholders are recorded on the ex-dividend date. Income and capital gain distributions are determined in accordance with income tax regulations, which may differ from U.S. generally accepted accounting principles. Certain capital accounts in the financial statements are periodically adjusted for permanent differences in order to reflect their tax character. These adjustments have no impact on net assets or net asset value per share. Temporary differences which arise from recognizing certain items of income, expense, gain or loss in different periods for financial statement and tax purposes will reverse at some time in the future. Distributions in excess of net investment income or net realized gains are temporary overdistributions for financial statement purposes resulting from differences in the recognition or classification of income or distributions for financial statement and tax purposes.
Book/tax differences primarily relate to wash sale loss deferrals, treating a portion of the proceeds from redemptions as a distribution for tax purposes, and redemptions in-kind.
The tax character of distributions made during the current period will be determined at fiscal year end. The tax character of distributions declared to shareholders for the last fiscal year is as follows:
| | | | |
| | | 8/31/14 | |
Ordinary income (including any
short-term capital gains) | | | $94,156,613 | |
| Long-term capital gains | | | 88,031,698 | |
| Total distributions | | | $182,188,311 | |
31
Notes to Financial Statements (unaudited) – continued
The federal tax cost and the tax basis components of distributable earnings were as follows:
| | | | |
| As of 2/28/15 | | | |
| Cost of investments | | | $1,416,706,623 | |
| Gross appreciation | | | 334,118,752 | |
| Gross depreciation | | | (63,721,301 | ) |
| Net unrealized appreciation (depreciation) | | | $270,397,451 | |
| |
| As of 8/31/14 | | | |
| Undistributed ordinary income | | | 48,232,335 | |
| Undistributed long-term capital gain | | | 78,623,046 | |
| Other temporary differences | | | (2,936 | ) |
| Net unrealized appreciation (depreciation) | | | 132,705,284 | |
The aggregate cost above includes prior fiscal year end tax adjustments, if applicable.
Multiple Classes of Shares of Beneficial Interest – The fund offers multiple classes of shares, which differ in their respective distribution, service, and program manager fees. The fund’s income, realized and unrealized gain (loss), and common expenses are allocated to shareholders based on the daily net assets of each class. Dividends are declared separately for each class. Differences in per share dividend rates are generally due to differences in separate class expenses. Class B and Class 529B shares will convert to Class A and Class 529A shares, respectively, approximately eight years after purchase. The fund’s distributions declared to shareholders as reported in the Statements of Changes in Net Assets are presented by class as follows:
| | | | | | | | |
| | | From net realized gain on
investments | |
| | | Six months
ended
2/28/15 | | | Year
ended
8/31/14 | |
| Class A | | | $37,499,564 | | | | $64,919,407 | |
| Class B | | | 2,602,265 | | | | 4,186,982 | |
| Class C | | | 10,467,996 | | | | 15,593,082 | |
| Class I | | | 23,496,764 | | | | 35,717,827 | |
| Class R1 | | | 677,901 | | | | 937,201 | |
| Class R2 | | | 4,749,388 | | | | 6,122,546 | |
| Class R3 | | | 10,116,834 | | | | 12,790,928 | |
| Class R4 | | | 15,023,639 | | | | 19,003,758 | |
| Class R5 | | | 21,708,105 | | | | 22,264,000 | |
| Class 529A | | | 376,407 | | | | 451,752 | |
| Class 529B | | | 29,302 | | | | 33,273 | |
| Class 529C | | | 107,585 | | | | 167,555 | |
| Total | | | $126,855,750 | | | | $182,188,311 | |
(3) Transactions with Affiliates
Investment Adviser – The fund has an investment advisory agreement with MFS to provide overall investment management and related administrative services and facilities to the fund. The management fee is computed daily and paid monthly at an
32
Notes to Financial Statements (unaudited) – continued
annual rate of 0.90% of the fund’s average daily net assets. The investment adviser has agreed in writing to reduce its management fee to 0.80% of average daily net assets in excess of $1 billion up to $2.5 billion, 0.75% of average daily net assets in excess of $2.5 billion up to $5 billion, and 0.70% of average daily net assets in excess of $5 billion. This written agreement will continue until modified by the fund’s Board of Trustees, but such agreement will continue at least until December 31, 2015. For the six months ended February 28, 2015, this management fee reduction amounted to $391,790, which is included in the reduction of total expenses in the Statement of Operations. MFS has also agreed in writing to reduce its management fee by a specified amount if certain MFS mutual fund assets exceed thresholds agreed to by MFS and the fund’s Board of Trustees. For the six months ended February 28, 2015, this management fee reduction amounted to $53,892, which is included in the reduction of total expenses in the Statement of Operations. The management fee incurred for the six months ended February 28, 2015 was equivalent to an annual effective rate of 0.85% of the fund’s average daily net assets.
Distributor – MFS Fund Distributors, Inc. (MFD), a wholly-owned subsidiary of MFS, as distributor, received $100,314 and $1,300 for the six months ended February 28, 2015, as its portion of the initial sales charge on sales of Class A and Class 529A shares of the fund, respectively.
The Board of Trustees has adopted a distribution plan for certain share classes pursuant to Rule 12b-1 of the Investment Company Act of 1940.
The fund’s distribution plan provides that the fund will pay MFD for services provided by MFD and financial intermediaries in connection with the distribution and servicing of certain share classes. One component of the plan is a distribution fee paid to MFD and another component of the plan is a service fee paid to MFD. MFD may subsequently pay all, or a portion, of the distribution and/or service fees to financial intermediaries.
Distribution Plan Fee Table:
| | | | | | | | | | | | | | | | | | | | |
| | | Distribution
Fee Rate (d) | | | Service
Fee Rate (d) | | | Total
Distribution
Plan (d) | | | Annual
Effective
Rate (e) | | | Distribution
and Service
Fee | |
| Class A | | | — | | | | 0.25% | | | | 0.25% | | | | 0.24% | | | | $642,317 | |
| Class B | | | 0.75% | | | | 0.25% | | | | 1.00% | | | | 1.00% | | | | 151,826 | |
| Class C | | | 0.75% | | | | 0.25% | | | | 1.00% | | | | 1.00% | | | | 612,870 | |
| Class R1 | | | 0.75% | | | | 0.25% | | | | 1.00% | | | | 1.00% | | | | 39,124 | |
| Class R2 | | | 0.25% | | | | 0.25% | | | | 0.50% | | | | 0.50% | | | | 153,005 | |
| Class R3 | | | — | | | | 0.25% | | | | 0.25% | | | | 0.25% | | | | 168,456 | |
| Class 529A | | | — | | | | 0.25% | | | | 0.25% | | | | 0.23% | | | | 6,130 | |
| Class 529B | | | 0.75% | | | | 0.25% | | | | 1.00% | | | | 0.98% | | | | 1,651 | |
| Class 529C | | | 0.75% | | | | 0.25% | | | | 1.00% | | | | 1.00% | | | | 6,007 | |
| Total Distribution and Service Fees | | | | | | | | | | | | $1,781,386 | |
| (d) | In accordance with the distribution plan for certain classes, the fund pays distribution and/or service fees equal to these annual percentage rates of each class’s average daily net assets. The distribution and service fee rates disclosed by class represent the current rates in effect at the end of the reporting period. Any rate changes, if applicable, are detailed below. |
33
Notes to Financial Statements (unaudited) – continued
| (e) | The annual effective rates represent actual fees incurred under the distribution plan for the six months ended February 28, 2015 based on each class’s average daily net assets. MFD has voluntarily agreed to rebate a portion of each class’s 0.25% service fee attributable to accounts for which MFD retains the 0.25% service fee except for accounts attributable to MFS or its affiliates’ seed money. For the six months ended February 28, 2015, this rebate amounted to $12,971, $347, $109, $522, $33, and $9 for Class A, Class B, Class C, Class 529A, Class 529B, and Class 529C, respectively, and is included in the reduction of total expenses in the Statement of Operations. |
Certain Class A shares are subject to a contingent deferred sales charge (CDSC) in the event of a shareholder redemption within 18 months of purchase. Class C and Class 529C shares are subject to a CDSC in the event of a shareholder redemption within 12 months of purchase. Class B and Class 529B shares are subject to a CDSC in the event of a shareholder redemption within six years of purchase. All contingent deferred sales charges are paid to MFD and during the six months ended February 28, 2015, were as follows:
| | | | |
| | | Amount | |
| Class A | | | $1,597 | |
| Class B | | | 57,120 | |
| Class C | | | 18,912 | |
| Class 529B | | | — | |
| Class 529C | | | — | |
The fund has entered into and may from time to time enter into contracts with program managers and other parties which administer the tuition programs through which an investment in the fund’s 529 share classes is made. The fund has entered into an agreement with MFD pursuant to which MFD receives an annual fee of up to 0.10% of the average daily net assets attributable to each 529 share class. MFD has agreed to waive a portion of this fee in an amount equal to 0.05% of the average daily net assets for each 529 share class. This waiver agreement will expire on December 31, 2016, unless MFD elects to extend the waiver. For the six months ended February 28, 2015, this waiver amounted to $1,609 and is included in the reduction of total expenses in the Statement of Operations. The program manager fee incurred for the six months ended February 28, 2015 was equivalent to an annual effective rate of 0.05% of the average daily net assets attributable to each 529 share class. The services provided by MFD, or a third party with which MFD contracts, include recordkeeping and tax reporting and account services, as well as services designed to maintain the program’s compliance with the Internal Revenue Code and other regulatory requirements. Program manager fees and waivers for the six months ended February 28, 2015, were as follows:
| | | | | | | | |
| | | Fee | | | Waiver | |
| Class 529A | | | $2,452 | | | | $1,226 | |
| Class 529B | | | 165 | | | | 83 | |
| Class 529C | | | 601 | | | | 300 | |
| Total Program Manager Fees and Waivers | | | $3,218 | | | | $1,609 | |
Shareholder Servicing Agent – MFS Service Center, Inc. (MFSC), a wholly-owned subsidiary of MFS, receives a fee from the fund for its services as shareholder servicing agent calculated as a percentage of the average daily net assets of the fund as
34
Notes to Financial Statements (unaudited) – continued
determined periodically under the supervision of the fund’s Board of Trustees. For the six months ended February 28, 2015, the fee was $120,919, which equated to 0.0136% annually of the fund’s average daily net assets. MFSC also receives payment from the fund for out-of-pocket expenses, sub-accounting and other shareholder servicing costs which may be paid to affiliated and unaffiliated service providers. Class R5 shares do not incur sub-accounting fees. For the six months ended February 28, 2015, these out-of-pocket expenses, sub-accounting and other shareholder servicing costs amounted to $1,117,995.
Administrator – MFS provides certain financial, legal, shareholder communications, compliance, and other administrative services to the fund. Under an administrative services agreement, the fund reimburses MFS the costs incurred to provide these services. The fund is charged an annual fixed amount of $17,500 plus a fee based on average daily net assets. The administrative services fee incurred for the six months ended February 28, 2015 was equivalent to an annual effective rate of 0.0168% of the fund’s average daily net assets.
Trustees’ and Officers’ Compensation – The fund pays compensation to independent Trustees in the form of a retainer, attendance fees, and additional compensation to Board and Committee chairpersons. The fund does not pay compensation directly to Trustees or officers of the fund who are also officers of the investment adviser, all of whom receive remuneration for their services to the fund from MFS. Certain officers and Trustees of the fund are officers or directors of MFS, MFD, and MFSC.
Prior to December 31, 2001, the fund had an unfunded defined benefit plan (“DB plan”) for independent Trustees. As of December 31, 2001, the Board took action to terminate the DB plan with respect to then-current and any future independent Trustees, such that the DB plan covers only certain of those former independent Trustees who retired on or before December 31, 2001. The DB plan resulted in a pension expense of $175 and is included in independent Trustees’ compensation for the six months ended February 28, 2015. The liability for deferred retirement benefits payable to certain independent Trustees under the DB plan amounted to $3,517 at February 28, 2015, and is included in “Payable for independent Trustees’ compensation” in the Statement of Assets and Liabilities.
Other – Effective November 1, 2014, this fund and certain other funds managed by MFS (the funds) have entered into a service agreement (the ISO Agreement) which provides for payment of fees solely by the funds to Tarantino LLC in return for the provision of services of an Independent Senior Officer (ISO) for the funds. Frank L. Tarantino serves as the ISO and is an officer of the funds and the sole member of Tarantino LLC. The funds can terminate the ISO Agreement with Tarantino LLC at any time under the terms of the ISO Agreement. Prior to November 1, 2014, the funds had entered into a service agreement (the Compliance Officer Agreement) which provided for payment of fees by the funds to Tarantino LLC in return for the provision of services of an Independent Chief Compliance Officer (ICCO) for the funds. Prior to November 1, 2014, Frank L. Tarantino served as the ICCO. Effective October 31, 2014, Mr. Tarantino resigned as ICCO and the Compliance Officer Agreement between the funds and Tarantino LLC was terminated. For the six months ended February 28, 2015, the aggregate fees paid by the fund under these agreements were $3,786 and are
35
Notes to Financial Statements (unaudited) – continued
included in “Miscellaneous” expense in the Statement of Operations. MFS had agreed to reimburse the fund for a portion of the payments made by the fund for the services under the Compliance Officer Agreement in the amount of $665, which is included in the reduction of total expenses in the Statement of Operations. Additionally, MFS has agreed to bear all expenses associated with office space, other administrative support, and supplies provided to the ICCO and ISO.
The fund invests in the MFS Institutional Money Market Portfolio which is managed by MFS and seeks current income consistent with preservation of capital and liquidity. Income earned on this investment is included in “Dividends from underlying affiliated funds” in the Statement of Operations. This money market fund does not pay a management fee to MFS.
On September 11, 2013, MFS redeemed 5,066 shares of Class R5 for an aggregate amount of $148,181.
(4) Portfolio Securities
For the six months ended February 28, 2015, purchases and sales of investments, other than short-term obligations, aggregated $557,506,279 and $985,396,527, respectively.
(5) Shares of Beneficial Interest
The fund’s Declaration of Trust permits the Trustees to issue an unlimited number of full and fractional shares of beneficial interest. Transactions in fund shares were as follows:
| | | | | | | | | | | | | | | | |
| | | Six months ended
2/28/15 | | | Year ended
8/31/14 | |
| | | Shares | | | Amount | | | Shares | | | Amount | |
| Shares sold | | | | | | | | | | | | | | | | |
Class A | | | 1,856,262 | | | | $43,807,805 | | | | 7,663,272 | | | | $202,602,844 | |
Class B | | | 71,009 | | | | 1,434,933 | | | | 302,403 | | | | 6,974,766 | |
Class C | | | 413,787 | | | | 8,286,611 | | | | 1,723,327 | | | | 39,755,016 | |
Class I | | | 2,441,669 | | | | 63,276,676 | | | | 9,806,541 | | | | 275,081,634 | |
Class R1 | | | 38,676 | | | | 780,038 | | | | 106,194 | | | | 2,417,551 | |
Class R2 | | | 321,897 | | | | 7,265,878 | | | | 1,059,827 | | | | 26,814,007 | |
Class R3 | | | 790,802 | | | | 18,768,975 | | | | 3,285,711 | | | | 86,307,510 | |
Class R4 | | | 838,250 | | | | 20,298,931 | | | | 3,655,137 | | | | 99,348,416 | |
Class R5 | | | 1,186,895 | | | | 30,008,316 | | | | 2,964,479 | | | | 81,129,522 | |
Class 529A | | | 14,812 | | | | 336,466 | | | | 47,165 | | | | 1,207,593 | |
Class 529B | | | 931 | | | | 18,513 | | | | 4,218 | | | | 94,274 | |
Class 529C | | | 11,589 | | | | 222,700 | | | | 12,166 | | | | 272,203 | |
| | | 7,986,579 | | | | $194,505,842 | | | | 30,630,440 | | | | $822,005,336 | |
36
Notes to Financial Statements (unaudited) – continued
| | | | | | | | | | | | | | | | |
| | | Six months ended
2/28/15 | | | Year ended
8/31/14 | |
| | | Shares | | | Amount | | | Shares | | | Amount | |
Shares issued to shareholders in
reinvestment of distributions | | | | | | | | | | | | | |
Class A | | | 1,510,896 | | | | $33,904,512 | | | | 2,328,346 | | | | $59,512,523 | |
Class B | | | 119,944 | | | | 2,292,151 | | | | 163,157 | | | | 3,625,353 | |
Class C | | | 419,267 | | | | 8,028,972 | | | | 515,039 | | | | 11,464,768 | |
Class I | | | 673,187 | | | | 16,371,901 | | | | 902,424 | | | | 24,789,597 | |
Class R1 | | | 35,698 | | | | 677,901 | | | | 42,426 | | | | 937,201 | |
Class R2 | | | 201,430 | | | | 4,320,672 | | | | 223,362 | | | | 5,490,231 | |
Class R3 | | | 451,241 | | | | 10,116,834 | | | | 500,819 | | | | 12,790,928 | |
Class R4 | | | 641,547 | | | | 14,922,377 | | | | 718,763 | | | | 18,939,409 | |
Class R5 | | | 889,676 | | | | 21,708,105 | | | | 809,012 | | | | 22,264,000 | |
Class 529A | | | 17,266 | | | | 376,407 | | | | 18,150 | | | | 451,745 | |
Class 529B | | | 1,580 | | | | 29,302 | | | | 1,539 | | | | 33,273 | |
Class 529C | | | 5,800 | | | | 107,585 | | | | 7,745 | | | | 167,520 | |
| | | 4,967,532 | | | | $112,856,719 | | | | 6,230,782 | | | | $160,466,548 | |
| | | | |
| Shares reacquired | | | | | | | | | | | | | | | | |
Class A | | | (7,257,108 | ) | | | $(171,522,847 | ) | | | (19,125,143 | ) | | | $(506,940,419 | ) |
Class B | | | (341,344 | ) | | | (6,929,720 | ) | | | (541,566 | ) | | | (12,107,368 | ) |
Class C | | | (1,505,594 | ) | | | (30,489,616 | ) | | | (1,827,747 | ) | | | (40,779,135 | ) |
Class I | | | (9,685,743 | ) | | | (249,763,573 | ) | | | (6,437,022 | ) | | | (178,077,081 | ) |
Class R1 | | | (78,813 | ) | | | (1,578,677 | ) | | | (156,327 | ) | | | (3,527,623 | ) |
Class R2 | | | (523,456 | ) | | | (11,820,452 | ) | | | (970,658 | ) | | | (24,347,286 | ) |
Class R3 | | | (1,640,274 | ) | | | (38,523,188 | ) | | | (2,161,380 | ) | | | (55,844,205 | ) |
Class R4 | | | (1,741,080 | ) | | | (42,365,041 | ) | | | (3,085,619 | ) | | | (82,182,423 | ) |
Class R5 | | | (665,313 | ) | | | (16,949,392 | ) | | | (1,025,858 | ) | | | (28,960,837 | ) |
Class 529A | | | (15,059 | ) | | | (341,295 | ) | | | (36,759 | ) | | | (920,840 | ) |
Class 529B | | | (1,549 | ) | | | (30,283 | ) | | | (2,976 | ) | | | (65,601 | ) |
Class 529C | | | (5,557 | ) | | | (104,280 | ) | | | (28,105 | ) | | | (617,796 | ) |
| | | (23,460,890 | ) | | | $(570,418,364 | ) | | | (35,399,160 | ) | | | $(934,370,614 | ) |
| | | | |
| Net change | | | | | | | | | | | | | | | | |
Class A | | | (3,889,950 | ) | | | $(93,810,530 | ) | | | (9,133,525 | ) | | | $(244,825,052 | ) |
Class B | | | (150,391 | ) | | | (3,202,636 | ) | | | (76,006 | ) | | | (1,507,249 | ) |
Class C | | | (672,540 | ) | | | (14,174,033 | ) | | | 410,619 | | | | 10,440,649 | |
Class I | | | (6,570,887 | ) | | | (170,114,996 | ) | | | 4,271,943 | | | | 121,794,150 | |
Class R1 | | | (4,439 | ) | | | (120,738 | ) | | | (7,707 | ) | | | (172,871 | ) |
Class R2 | | | (129 | ) | | | (233,902 | ) | | | 312,531 | | | | 7,956,952 | |
Class R3 | | | (398,231 | ) | | | (9,637,379 | ) | | | 1,625,150 | | | | 43,254,233 | |
Class R4 | | | (261,283 | ) | | | (7,143,733 | ) | | | 1,288,281 | | | | 36,105,402 | |
Class R5 | | | 1,411,258 | | | | 34,767,029 | | | | 2,747,633 | | | | 74,432,685 | |
Class 529A | | | 17,019 | | | | 371,578 | | | | 28,556 | | | | 738,498 | |
Class 529B | | | 962 | | | | 17,532 | | | | 2,781 | | | | 61,946 | |
Class 529C | | | 11,832 | | | | 226,005 | | | | (8,194 | ) | | | (178,073 | ) |
| | | (10,506,779 | ) | | | $(263,055,803 | ) | | | 1,462,062 | | | | $48,101,270 | |
37
Notes to Financial Statements (unaudited) – continued
The fund is one of several mutual funds in which certain MFS funds may invest. The MFS funds do not invest in the underlying MFS funds for the purpose of exercising management or control. At the end of the period, the MFS Growth Allocation Fund, the MFS Moderate Allocation Fund, the MFS Aggressive Growth Allocation Fund, and the MFS Conservative Allocation Fund were the owners of record of approximately 6%, 6%, 3%, and 2%, respectively, of the value of outstanding voting shares of the fund. In addition, the MFS Lifetime 2015 Fund, the MFS Lifetime 2020 Fund, the MFS Lifetime 2025 Fund, the MFS Lifetime 2030 Fund, the MFS Lifetime 2035 Fund, the MFS Lifetime 2040 Fund, the MFS Lifetime 2045 Fund, the MFS Lifetime 2050 Fund, the MFS Lifetime 2055 Fund, and the MFS Lifetime Income Fund were each the owners of record of less than 1% of the value of outstanding voting shares of the fund.
(6) Line of Credit
The fund and certain other funds managed by MFS participate in a $1.1 billion unsecured committed line of credit, subject to a $1 billion sublimit, provided by a syndication of banks under a credit agreement. Borrowings may be made for temporary financing needs. Interest is charged to each fund, based on its borrowings, generally at a rate equal to the higher of the Federal Reserve funds rate or one month LIBOR plus an agreed upon spread. A commitment fee, based on the average daily, unused portion of the committed line of credit, is allocated among the participating funds at the end of each calendar quarter. In addition, the fund and other funds managed by MFS have established unsecured uncommitted borrowing arrangements with certain banks for temporary financing needs. Interest is charged to each fund, based on its borrowings, at a rate equal to the Federal Reserve funds rate plus an agreed upon spread. For the six months ended February 28, 2015, the fund’s commitment fee and interest expense were $3,816 and $0, respectively, and are included in “Miscellaneous” expense in the Statement of Operations.
38
Notes to Financial Statements (unaudited) – continued
(7) Transactions in Underlying Affiliated Funds-Affiliated Issuers
An affiliated issuer may be considered one in which the fund owns 5% or more of the outstanding voting securities, or a company which is under common control. For the purposes of this report, the fund assumes the following to be affiliated issuers:
| | | | | | | | | | | | | | | | |
| Underlying Affiliated Fund | | Beginning
Shares/Par
Amount | | | Acquisitions
Shares/Par
Amount | | | Dispositions
Shares/Par
Amount | | | Ending
Shares/Par
Amount | |
| MFS Institutional Money Market Portfolio | | | 1,739,356 | | | | 281,783,286 | | | | (260,056,449 | ) | | | 23,466,193 | |
| | | | |
| Underlying Affiliated Fund | | Realized Gain (Loss) | | | Capital Gain
Distributions | | | Dividend
Income | | | Ending
Value | |
| MFS Institutional Money Market Portfolio | | | $— | | | | $— | | | | $4,671 | | | | $23,466,193 | |
| | | | |
| Other Affiliated Issuers | | Beginning
Shares/Par
Amount | | | Acquisitions
Shares/Par
Amount | | | Dispositions
Shares/Par
Amount | | | Ending
Shares/Par
Amount | |
| Citi Trends, Inc. | | | 1,217,419 | | | | — | | | | (90,423 | ) | | | 1,126,996 | |
| Model N, Inc | | | 1,653,151 | | | | — | | | | (223,731 | ) | | | 1,429,420 | |
| | | | |
| Other Affiliated Issuers | | Realized
Gain (Loss) | | | Capital Gain
Distributions | | | Dividend
Income | | | Ending
Value | |
| Citi Trends, Inc. | | | $(429,558 | ) | | | $— | | | | $— | | | | $30,034,443 | |
| Model N, Inc | | | (2,372,323 | ) | | | — | | | | — | | | | 17,681,925 | |
| | | | | | | | | | | | | | | | |
| | | $(2,801,881 | ) | | | $— | | | | $— | | | | $47,716,368 | |
| | | | | | | | | | | | | | | | |
39
PROXY VOTING POLICIES AND INFORMATION
MFS votes proxies on behalf of the fund pursuant to proxy voting policies and procedures that are available without charge, upon request, by calling 1-800-225-2606, by visiting the Proxy Voting section of mfs.com or by visiting the SEC’s Web site at http://www.sec.gov.
Information regarding how the fund voted proxies relating to portfolio securities during the most recent twelve-month period ended June 30 is available without charge by visiting the Proxy Voting section of mfs.com or by visiting the SEC’s Web site at http://www.sec.gov.
QUARTERLY PORTFOLIO DISCLOSURE
The fund will file a complete schedule of portfolio holdings with the Securities and Exchange Commission (the Commission) for the first and third quarters of each fiscal year on Form N-Q. A shareholder can obtain the quarterly portfolio holdings report at mfs.com. The fund’s Form N-Q is also available on the EDGAR database on the Commission’s Internet Web site at http://www.sec.gov, and may be reviewed and copied at the:
Public Reference Room
Securities and Exchange Commission
100 F Street, NE, Room 1580
Washington, D.C. 20549
Information on the operation of the Public Reference Room may be obtained by calling the Commission at 1-800-SEC-0330. Copies of the fund’s Form N-Q also may be obtained, upon payment of a duplicating fee, by electronic request at the following e-mail address: publicinfo@sec.gov or by writing the Public Reference Section at the above address.
FURTHER INFORMATION
From time to time, MFS may post important information about the fund or the MFS funds on the MFS web site (mfs.com). This information is available by visiting the “Market Commentary” and “Announcements” sub sections in the “Market Outlooks” section of mfs.com or by clicking on the fund’s name under “Mutual Funds” in the “Products” section of mfs.com.
PROVISION OF FINANCIAL REPORTS AND SUMMARY PROSPECTUSES
The fund produces financial reports every six months and updates its summary prospectus and prospectus annually. To avoid sending duplicate copies of materials to households, only one copy of the fund’s annual and semiannual report and summary prospectus may be mailed to shareholders having the same last name and residential address on the fund’s records. However, any shareholder may contact MFSC (please see back cover for address and telephone number) to request that copies of these reports and summary prospectuses be sent personally to that shareholder.
40
Save paper with eDelivery.

| MFS® will send you prospectuses, |
reports, and proxies directly via e-mail so you will get information faster with less mailbox clutter.
To sign up:
1. Go to mfs.com.
2. Log in via MFS® Access.
3. Select eDelivery.
If you own your MFS fund shares through a financial institution or a retirement plan, MFS® TALK, MFS® Access, or eDelivery may not be available to you.
CONTACT
WEB SITE
mfs.com
MFS TALK
1-800-637-8255
24 hours a day
ACCOUNT SERVICE AND LITERATURE
Shareholders
1-800-225-2606
Financial advisors
1-800-343-2829
Retirement plan services
1-800-637-1255
MAILING ADDRESS
MFS Service Center, Inc.
P.O. Box 55824
Boston, MA 02205-5824
OVERNIGHT MAIL
MFS Service Center, Inc.
c/o Boston Financial Data Services
30 Dan Road
Canton, MA 02021-2809
SEMIANNUAL REPORT
February 28, 2015

MFS® RESEARCH INTERNATIONAL FUND

RIF-SEM
MFS® RESEARCH INTERNATIONAL FUND
CONTENTS
The report is prepared for the general information of shareholders.
It is authorized for distribution to prospective investors only when preceded or accompanied by a current prospectus.
NOT FDIC INSURED Ÿ MAY LOSE VALUE Ÿ NO BANK GUARANTEE

LETTER FROM THE CHAIRMAN
Dear Shareholders:
Lower oil prices continue to influence markets in different ways. Among those economies hurt, oil-exporters such as Russia and Venezuela have been hit particularly hard, along with U.S. regions that have close oil industry ties.
The U.S. economic recovery remains solid. The labor market is strong, interest rates are historically low and reduced energy prices have helped to stimulate consumer spending.
Economic reports early in 2015 indicate that the eurozone is on a more solid footing, with confidence boosted by the launch of European Central Bank quantitative easing.
In Asia, the Chinese economy continues to raise concerns, with the People’s Bank of China implementing stimulus programs to counter a steady decline in growth rates.
As always, active risk management is integral to how we at MFS® manage your investments. We use a collaborative process, sharing insights across asset classes, regions and economic sectors. Our global investment team uses a diversified, multidisciplined, long-term approach.
Applying proven principles, such as asset allocation and diversification, can best serve investors over the long term. We are confident that this approach can help you as you work with your financial advisors to reach your goals in the years ahead.
Respectfully,

Robert J. Manning
Chairman
MFS Investment Management
April 14, 2015
The opinions expressed in this letter are subject to change and may not be relied upon for investment advice. No forecasts can be guaranteed.
1
PORTFOLIO COMPOSITION
Portfolio structure

| | | | |
| Top ten holdings | | | | |
| Novartis AG | | | 3.2% | |
| Roche Holding AG | | | 3.1% | |
| Nestle S.A. | | | 2.7% | |
| Royal Dutch Shell PLC, “A” | | | 2.1% | |
| Bayer AG | | | 2.1% | |
| Rio Tinto Ltd. | | | 2.0% | |
| Schneider Electric S.A. | | | 1.9% | |
| DENSO Corp. | | | 1.9% | |
| Westpac Banking Corp. | | | 1.8% | |
| UBS AG | | | 1.8% | |
| |
| Global equity sectors | | | | |
| Financial Services | | | 25.3% | |
| Capital Goods | | | 22.8% | |
| Health Care | | | 11.5% | |
| Consumer Staples | | | 9.3% | |
| Energy | | | 9.1% | |
| Consumer Cyclicals | | | 8.4% | |
| Technology | | | 7.9% | |
| Telecommunications/Cable Television | | | 5.1% | |
| | | | |
| Issuer country weightings (x) | |
| Japan | | | 18.5% | |
| United Kingdom | | | 17.2% | |
| Switzerland | | | 14.2% | |
| France | | | 10.2% | |
| Germany | | | 7.7% | |
| Netherlands | | | 4.5% | |
| United States | | | 4.3% | |
| Hong Kong | | | 4.2% | |
| Australia | | | 3.8% | |
| Other Countries | | | 15.4% | |
|
| Currency exposure weightings (y) | |
| Euro | | | 26.3% | |
| Japanese Yen | | | 18.5% | |
| British Pound Sterling | | | 17.2% | |
| Swiss Franc | | | 14.2% | |
| United States Dollar | | | 5.2% | |
| Hong Kong Dollar | | | 4.7% | |
| Australian Dollar | | | 3.8% | |
| Swedish Krona | | | 3.3% | |
| Taiwan Dollar | | | 2.5% | |
| Other Currencies | | | 4.3% | |
| (x) | Represents the portfolio’s exposure to issuer countries as a percentage of a portfolio’s net assets. For purposes of this presentation, United States includes Cash & Other. |
| (y) | Represents the portfolio’s exposure to a particular currency as a percentage of a portfolio’s net assets. For purposes of this presentation, United States Dollar includes Cash & Other. |
Cash & Other can include cash, other assets less liabilities, offsets to derivative positions, and short-term securities.
Percentages are based on net assets as of 2/28/15.
The portfolio is actively managed and current holdings may be different.
2
EXPENSE TABLE
Fund expenses borne by the shareholders during the period, September 1, 2014 through February 28, 2015
As a shareholder of the fund, you incur two types of costs: (1) transaction costs, including sales charges (loads) on certain purchase or redemption payments, and (2) ongoing costs, including management fees; distribution and service (12b-1) fees; and other fund expenses. This example is intended to help you understand your ongoing costs (in dollars) of investing in the fund and to compare these costs with the ongoing costs of investing in other mutual funds.
The example is based on an investment of $1,000 invested at the beginning of the period and held for the entire period September 1, 2014 through February 28, 2015.
Actual Expenses
The first line for each share class in the following table provides information about actual account values and actual expenses. You may use the information in this line, together with the amount you invested, to estimate the expenses that you paid over the period. Simply divide your account value by $1,000 (for example, an $8,600 account value divided by $1,000 = 8.6), then multiply the result by the number in the first line under the heading entitled “Expenses Paid During Period” to estimate the expenses you paid on your account during this period.
Hypothetical Example for Comparison Purposes
The second line for each share class in the following table provides information about hypothetical account values and hypothetical expenses based on the fund’s actual expense ratio and an assumed rate of return of 5% per year before expenses, which is not the fund’s actual return. The hypothetical account values and expenses may not be used to estimate the actual ending account balance or expenses you paid for the period. You may use this information to compare the ongoing costs of investing in the fund and other funds. To do so, compare this 5% hypothetical example with the 5% hypothetical examples that appear in the shareholder reports of the other funds.
Please note that the expenses shown in the table are meant to highlight your ongoing costs only and do not reflect any transactional costs, such as sales charges (loads). Therefore, the second line for each share class in the table is useful in comparing ongoing costs only, and will not help you determine the relative total costs of owning different funds. In addition, if these transactional costs were included, your costs would have been higher.
3
Expense Table – continued
| | | | | | | | | | | | | | | | | | |
Share
Class | | | | Annualized Expense Ratio | | | Beginning Account Value 9/01/14 | | | Ending Account Value 2/28/15 | | | Expenses Paid During Period (p) 9/01/14-2/28/15 | |
| A | | Actual | | | 1.11% | | | | $1,000.00 | | | | $986.17 | | | | $5.47 | |
| | Hypothetical (h) | | | 1.11% | | | | $1,000.00 | | | | $1,019.29 | | | | $5.56 | |
| B | | Actual | | | 1.86% | | | | $1,000.00 | | | | $982.51 | | | | $9.14 | |
| | Hypothetical (h) | | | 1.86% | | | | $1,000.00 | | | | $1,015.57 | | | | $9.30 | |
| C | | Actual | | | 1.86% | | | | $1,000.00 | | | | $982.47 | | | | $9.14 | |
| | Hypothetical (h) | | | 1.86% | | | | $1,000.00 | | | | $1,015.57 | | | | $9.30 | |
| I | | Actual | | | 0.86% | | | | $1,000.00 | | | | $987.95 | | | | $4.24 | |
| | Hypothetical (h) | | | 0.86% | | | | $1,000.00 | | | | $1,020.53 | | | | $4.31 | |
| R1 | | Actual | | | 1.86% | | | | $1,000.00 | | | | $982.79 | | | | $9.14 | |
| | Hypothetical (h) | | | 1.86% | | | | $1,000.00 | | | | $1,015.57 | | | | $9.30 | |
| R2 | | Actual | | | 1.36% | | | | $1,000.00 | | | | $985.08 | | | | $6.69 | |
| | Hypothetical (h) | | | 1.36% | | | | $1,000.00 | | | | $1,018.05 | | | | $6.80 | |
| R3 | | Actual | | | 1.11% | | | | $1,000.00 | | | | $986.91 | | | | $5.47 | |
| | Hypothetical (h) | | | 1.11% | | | | $1,000.00 | | | | $1,019.29 | | | | $5.56 | |
| R4 | | Actual | | | 0.86% | | | | $1,000.00 | | | | $987.54 | | | | $4.24 | |
| | Hypothetical (h) | | | 0.86% | | | | $1,000.00 | | | | $1,020.53 | | | | $4.31 | |
| R5 | | Actual | | | 0.75% | | | | $1,000.00 | | | | $987.94 | | | | $3.70 | |
| | Hypothetical (h) | | | 0.75% | | | | $1,000.00 | | | | $1,021.08 | | | | $3.76 | |
| 529A | | Actual | | | 1.13% | | | | $1,000.00 | | | | $986.62 | | | | $5.57 | |
| | Hypothetical (h) | | | 1.13% | | | | $1,000.00 | | | | $1,019.19 | | | | $5.66 | |
| 529B | | Actual | | | 1.90% | | | | $1,000.00 | | | | $982.95 | | | | $9.34 | |
| | Hypothetical (h) | | | 1.90% | | | | $1,000.00 | | | | $1,015.37 | | | | $9.49 | |
| 529C | | Actual | | | 1.91% | | | | $1,000.00 | | | | $982.50 | | | | $9.39 | |
| | Hypothetical (h) | | | 1.91% | | | | $1,000.00 | | | | $1,015.32 | | | | $9.54 | |
| (h) | 5% class return per year before expenses. |
| (p) | “Expenses Paid During Period” are equal to each class’s annualized expense ratio, as shown above, multiplied by the average account value over the period, multiplied by 181/365 (to reflect the one-half year period). Expenses paid do not include any applicable sales charges (loads). If these transaction costs had been included, your costs would have been higher. |
Notes to Expense Table
Each class with a Rule 12b-1 service fee is subject to a rebate of a portion of such fee. Such rebates are included in the expense ratios above. For Class 529A shares, this rebate reduced the expense ratio above by 0.03%. See Note 3 in the Notes to Financial Statements for additional information.
4
PORTFOLIO OF INVESTMENTS
2/28/15 (unaudited)
The Portfolio of Investments is a complete list of all securities owned by your fund. It is categorized by broad-based asset classes.
| | | | | | | | |
| Common Stocks - 99.0% | | | | | | | | |
| Issuer | | Shares/Par | | | Value ($) | |
| | | | | | | | |
| Alcoholic Beverages - 1.3% | | | | | | | | |
| Pernod Ricard S.A. | | | 835,582 | | | $ | 99,069,412 | |
| | |
| Apparel Manufacturers - 1.5% | | | | | | | | |
| Global Brands Group Holding Ltd. (a) | | | 88,942,000 | | | $ | 15,252,180 | |
| Li & Fung Ltd. | | | 13,824,000 | | | | 14,134,495 | |
| LVMH Moet Hennessy Louis Vuitton S.A. | | | 448,760 | | | | 82,308,113 | |
| | | | | | | | |
| | | | | | | $ | 111,694,788 | |
| Automotive - 4.4% | | | | | | | | |
| Autoliv, Inc. | | | 715,420 | | | $ | 80,484,750 | |
| DENSO Corp. | | | 2,948,500 | | | | 138,471,666 | |
| Honda Motor Co. Ltd. | | | 3,384,900 | | | | 111,754,755 | |
| | | | | | | | |
| | | | | | | $ | 330,711,171 | |
| Broadcasting - 1.7% | | | | | | | | |
| ProSiebenSat.1 Media AG | | | 719,410 | | | $ | 35,337,927 | |
| WPP PLC | | | 3,766,830 | | | | 89,266,749 | |
| | | | | | | | |
| | | | | | | $ | 124,604,676 | |
| Brokerage & Asset Managers - 0.5% | | | | | | | | |
| Computershare Ltd. | | | 3,651,193 | | | $ | 35,891,279 | |
| | |
| Business Services - 3.3% | | | | | | | | |
| Brenntag AG | | | 444,907 | | | $ | 26,013,877 | |
| Cognizant Technology Solutions Corp., “A” (a) | | | 1,286,771 | | | | 80,403,886 | |
| Compass Group PLC | | | 3,169,532 | | | | 56,370,636 | |
| Mitsubishi Corp. | | | 2,132,100 | | | | 42,606,354 | |
| Nomura Research, Inc. | | | 1,127,900 | | | | 39,458,821 | |
| | | | | | | | |
| | | | | | | $ | 244,853,574 | |
| Computer Software - 0.4% | | | | | | | | |
| Dassault Systems S.A. | | | 442,656 | | | $ | 30,974,502 | |
| | |
| Conglomerates - 1.0% | | | | | | | | |
| Hutchison Whampoa Ltd. | | | 5,144,000 | | | $ | 70,436,680 | |
| | |
| Consumer Products - 2.2% | | | | | | | | |
| L’Oreal S.A. | | | 442,979 | | | $ | 80,429,875 | |
| Reckitt Benckiser Group PLC | | | 947,444 | | | | 85,714,932 | |
| | | | | | | | |
| | | | | | | $ | 166,144,807 | |
5
Portfolio of Investments (unaudited) – continued
| | | | | | | | |
| Issuer | | Shares/Par | | | Value ($) | |
| | | | | | | | |
| Common Stocks - continued | | | | | | | | |
| Electrical Equipment - 3.8% | | | | | | | | |
| Legrand S.A. | | | 425,897 | | | $ | 23,544,045 | |
| Schneider Electric S.A. | | | 1,767,921 | | | | 142,404,675 | |
| Siemens AG | | | 1,011,480 | | | | 112,985,943 | |
| | | | | | | | |
| | | | | | | $ | 278,934,663 | |
| Electronics - 3.1% | | | | | | | | |
| Infineon Technologies AG | | | 4,168,476 | | | $ | 48,256,670 | |
| MediaTek, Inc. | | | 6,105,000 | | | | 91,949,212 | |
| Taiwan Semiconductor Manufacturing Co. Ltd. | | | 19,147,326 | | | | 91,516,067 | |
| | | | | | | | |
| | | | | | | $ | 231,721,949 | |
| Energy - Independent - 2.0% | | | | | | | | |
| Cairn Energy PLC (a) | | | 5,330,831 | | | $ | 16,748,065 | |
| Cenovus Energy, Inc. | | | 820,846 | | | | 14,163,386 | |
| Galp Energia SGPS S.A., “B” | | | 2,341,581 | | | | 27,526,741 | |
| INPEX Corp. | | | 2,683,600 | | | | 31,821,832 | |
| Oil Search Ltd. | | | 4,379,084 | | | | 27,922,027 | |
| Reliance Industries Ltd. | | | 2,206,979 | | | | 30,893,421 | |
| | | | | | | | |
| | | | | | | $ | 149,075,472 | |
| Energy - Integrated - 3.0% | | | | | | | | |
| BG Group PLC | | | 4,389,897 | | | $ | 64,926,973 | |
| Royal Dutch Shell PLC, “A” | | | 4,865,864 | | | | 159,107,715 | |
| | | | | | | | |
| | | | | | | $ | 224,034,688 | |
| Engineering - Construction - 0.6% | | | | | | | | |
| JGC Corp. | | | 2,031,000 | | | $ | 41,664,150 | |
| | |
| Food & Beverages - 4.6% | | | | | | | | |
| Danone S.A. | | | 1,706,624 | | | $ | 119,037,700 | |
| M. Dias Branco S.A. Industria e Comercio de Alimentos | | | 908,965 | | | | 26,576,520 | |
| Nestle S.A. | | | 2,550,909 | | | | 199,074,453 | |
| | | | | | | | |
| | | | | | | $ | 344,688,673 | |
| Food & Drug Stores - 0.6% | | | | | | | | |
| Sundrug Co. Ltd. | | | 893,300 | | | $ | 43,908,915 | |
| | |
| Gaming & Lodging - 0.4% | | | | | | | | |
| Sands China Ltd. | | | 7,215,600 | | | $ | 32,934,351 | |
| | |
| Insurance - 5.0% | | | | | | | | |
| AIA Group Ltd. | | | 21,566,400 | | | $ | 126,938,054 | |
| Hiscox Ltd. | | | 2,813,170 | | | | 34,354,037 | |
| Prudential PLC | | | 3,085,346 | | | | 77,618,198 | |
6
Portfolio of Investments (unaudited) – continued
| | | | | | | | |
| Issuer | | Shares/Par | | | Value ($) | |
| | | | | | | | |
| Common Stocks - continued | | | | | | | | |
| Insurance - continued | | | | | | | | |
| Sony Financial Holdings, Inc. | | | 1,644,800 | | | $ | 24,914,337 | |
| Zurich Insurance Group AG | | | 344,032 | | | | 109,992,084 | |
| | | | | | | | |
| | | | | | | $ | 373,816,710 | |
| Machinery & Tools - 3.6% | | | | | | | | |
| Atlas Copco AB, “A” | | | 4,039,533 | | | $ | 130,290,323 | |
| Joy Global, Inc. | | | 1,004,254 | | | | 44,508,537 | |
| Schindler Holding AG | | | 539,314 | | | | 88,985,254 | |
| | | | | | | | |
| | | | | | | $ | 263,784,114 | |
| Major Banks - 9.5% | | | | | | | | |
| BNP Paribas | | | 1,455,359 | | | $ | 84,834,801 | |
| BOC Hong Kong Holdings Ltd. | | | 10,500,500 | | | | 37,028,891 | |
| HSBC Holdings PLC | | | 14,268,988 | | | | 127,174,503 | |
| Mitsubishi UFJ Financial Group, Inc. | | | 16,148,100 | | | | 104,981,211 | |
| Royal Bank of Scotland Group PLC (a) | | | 13,975,690 | | | | 79,228,466 | |
| Standard Chartered PLC | | | 3,792,931 | | | | 58,030,180 | |
| Sumitomo Mitsui Financial Group, Inc. | | | 2,052,800 | | | | 81,674,413 | |
| Westpac Banking Corp. | | | 4,584,058 | | | | 136,115,382 | |
| | | | | | | | |
| | | | | | | $ | 709,067,847 | |
| Medical Equipment - 0.6% | | | | | | | | |
| Terumo Corp. | | | 1,735,100 | | | $ | 47,864,828 | |
| | |
| Metals & Mining - 2.8% | | | | | | | | |
| Gerdau S.A., ADR | | | 4,807,291 | | | $ | 17,162,029 | |
| Iluka Resources Ltd. | | | 6,626,178 | | | | 40,696,696 | |
| Rio Tinto Ltd. | | | 3,022,221 | | | | 148,934,194 | |
| | | | | | | | |
| | | | | | | $ | 206,792,919 | |
| Natural Gas - Distribution - 2.8% | | | | | | | | |
| Centrica PLC | | | 8,351,576 | | | $ | 31,499,033 | |
| China Resources Gas Group Ltd. | | | 14,844,000 | | | | 36,709,033 | |
| GDF SUEZ | | | 3,301,950 | | | | 73,439,072 | |
| Tokyo Gas Co. Ltd. | | | 10,428,000 | | | | 63,478,952 | |
| | | | | | | | |
| | | | | | | $ | 205,126,090 | |
| Natural Gas - Pipeline - 0.6% | | | | | | | | |
| APA Group | | | 6,148,204 | | | $ | 44,150,669 | |
| | |
| Network & Telecom - 1.1% | | | | | | | | |
| Ericsson, Inc., “B” | | | 6,078,822 | | | $ | 78,819,798 | |
| | |
| Oil Services - 0.3% | | | | | | | | |
| Technip | | | 354,403 | | | $ | 23,089,745 | |
7
Portfolio of Investments (unaudited) – continued
| | | | | | | | |
| Issuer | | Shares/Par | | | Value ($) | |
| | | | | | | | |
| Common Stocks - continued | | | | | | | | |
| Other Banks & Diversified Financials - 9.5% | | | | | | | | |
| Aeon Credit Service Co. Ltd. | | | 1,834,800 | | | $ | 42,102,621 | |
| DBS Group Holdings Ltd. | | | 5,099,100 | | | | 73,221,108 | |
| Erste Group Bank AG | | | 1,390,725 | | | | 36,448,336 | |
| HDFC Bank Ltd., ADR | | | 460,398 | | | | 28,549,280 | |
| ING Groep N.V. (a) | | | 8,425,651 | | | | 125,920,636 | |
| Intesa Sanpaolo S.p.A. | | | 23,931,295 | | | | 79,912,473 | |
| Julius Baer Group Ltd. | | | 1,210,027 | | | | 55,859,116 | |
| Kasikornbank PLC, NVDR | | | 3,910,100 | | | | 26,244,717 | |
| KBC Group N.V. | | | 1,520,494 | | | | 92,255,820 | |
| Sberbank of Russia, ADR | | | 2,879,105 | | | | 14,634,491 | |
| UBS AG | | | 7,476,201 | | | | 131,354,032 | |
| | | | | | | | |
| | | | | | | $ | 706,502,630 | |
| Pharmaceuticals - 10.8% | | | | | | | | |
| Bayer AG | | | 1,059,331 | | | $ | 156,537,948 | |
| Novartis AG | | | 2,325,896 | | | | 237,749,583 | |
| Roche Holding AG | | | 843,077 | | | | 228,864,874 | |
| Santen Pharmaceutical Co. Ltd. | | | 1,686,600 | | | | 112,933,467 | |
| Valeant Pharmaceuticals International, Inc. (a) | | | 349,436 | | | | 69,006,621 | |
| | | | | | | | |
| | | | | | | $ | 805,092,493 | |
| Printing & Publishing - 0.8% | | | | | | | | |
| Reed Elsevier N.V. | | | 2,530,079 | | | $ | 62,854,533 | |
| | |
| Real Estate - 0.8% | | | | | | | | |
| Deutsche Wohnen AG | | | 940,641 | | | $ | 25,931,403 | |
| Intu Properties PLC, REIT | | | 5,895,877 | | | | 32,176,822 | |
| | | | | | | | |
| | | | | | | $ | 58,108,225 | |
| Restaurants - 2.2% | | | | | | | | |
| Whitbread PLC | | | 1,239,731 | | | $ | 100,578,580 | |
| YUM! Brands, Inc. | | | 814,693 | | | | 66,079,749 | |
| | | | | | | | |
| | | | | | | $ | 166,658,329 | |
| Specialty Chemicals - 5.1% | | | | | | | | |
| Akzo Nobel N.V. | | | 1,576,453 | | | $ | 117,138,230 | |
| JSR Corp. | | | 5,001,600 | | | | 91,523,531 | |
| Linde AG | | | 603,716 | | | | 122,821,986 | |
| Symrise AG | | | 741,546 | | | | 47,167,376 | |
| | | | | | | | |
| | | | | | | $ | 378,651,123 | |
| Specialty Stores - 1.1% | | | | | | | | |
| Esprit Holdings Ltd. | | | 15,517,900 | | | $ | 16,046,515 | |
| Hennes & Mauritz AB, “B” | | | 901,547 | | | | 39,340,626 | |
8
Portfolio of Investments (unaudited) – continued
| | | | | | | | |
| Issuer | | Shares/Par | | | Value ($) | |
| | | | | | | | |
| Common Stocks - continued | | | | | | | | |
| Specialty Stores - continued | | | | | | | | |
| Ryohin Keikaku Co. Ltd. | | | 179,600 | | | $ | 23,406,178 | |
| | | | | | | | |
| | | | | | | $ | 78,793,319 | |
| Telecommunications - Wireless - 3.2% | | | | | | | | |
| KDDI Corp. | | | 1,884,600 | | | $ | 130,602,583 | |
| Mobile TeleSystems OJSC (a) | | | 2,981,309 | | | | 12,044,813 | |
| Philippine Long Distance Telephone Co. | | | 305,895 | | | | 21,937,854 | |
| Vodafone Group PLC | | | 22,142,940 | | | | 76,712,026 | |
| | | | | | | | |
| | | | | | | $ | 241,297,276 | |
| Telephone Services - 1.5% | | | | | | | | |
| BT Group PLC | | | 5,204,922 | | | $ | 36,618,333 | |
| Hellenic Telecommunications Organization S.A. (a) | | | 2,277,914 | | | | 22,686,990 | |
| Royal KPN N.V. | | | 8,116,720 | | | | 27,721,367 | |
| TDC A.S. | | | 727,782 | | | | 5,757,078 | |
| Telefonica Brasil S.A., ADR | | | 835,888 | | | | 15,497,364 | |
| | | | | | | | |
| | | | | | | $ | 108,281,132 | |
| Tobacco - 1.1% | | | | | | | | |
| Japan Tobacco, Inc. | | | 2,617,200 | | | $ | 82,525,211 | |
| | |
| Trucking - 1.7% | | | | | | | | |
| Yamato Holdings Co. Ltd. | | | 5,259,600 | | | $ | 123,108,712 | |
| | |
| Utilities - Electric Power - 0.5% | | | | | | | | |
| Canadian Utilities Ltd. | | | 1,055,707 | | | $ | 35,088,894 | |
| Total Common Stocks (Identified Cost, $6,619,182,547) | | | | | | $ | 7,360,818,347 | |
| | |
| Preferred Stocks - 0.4% | | | | | | | | |
| Telephone Services - 0.4% | | | | | | | | |
| Telecom Italia S.p.A. (Identified Cost, $32,334,347) | | | 31,089,030 | | | $ | 30,458,806 | |
| | |
| Money Market Funds - 0.6% | | | | | | | | |
MFS Institutional Money Market Portfolio, 0.1%,
at Cost and Net Asset Value (v) | | | 47,922,248 | | | $ | 47,922,248 | |
| Total Investments (Identified Cost, $6,699,439,142) | | | | | | $ | 7,439,199,401 | |
| | |
| Other Assets, Less Liabilities - (0.0)% | | | | | | | (1,854,402 | ) |
| Net Assets - 100.0% | | | | | | $ | 7,437,344,999 | |
| (a) | Non-income producing security. |
| (v) | Underlying affiliated fund that is available only to investment companies managed by MFS. The rate quoted for the MFS Institutional Money Market Portfolio is the annualized seven-day yield of the fund at period end. |
9
Portfolio of Investments (unaudited) – continued
The following abbreviations are used in this report and are defined:
| ADR | | American Depositary Receipt |
| NVDR | | Non-Voting Depositary Receipt |
| PLC | | Public Limited Company |
| REIT | | Real Estate Investment Trust |
See notes to financial statements
10
Financial Statements
STATEMENT OF ASSETS AND LIABILITIES
At 2/28/15 (unaudited)
This statement represents your fund’s balance sheet, which details the assets and liabilities comprising the total value of the fund.
| | | | |
| Assets | | | | |
Investments- | | | | |
Non-affiliated issuers, at value (identified cost, $6,651,516,894) | | | $7,391,277,153 | |
Underlying affiliated funds, at cost and value | | | 47,922,248 | |
Total investments, at value (identified cost, $6,699,439,142) | | | $7,439,199,401 | |
Foreign currency, at value (identified cost, $921,164) | | | 921,045 | |
Receivables for | | | | |
Investments sold | | | 7,487,613 | |
Fund shares sold | | | 7,342,982 | |
Interest and dividends | | | 13,438,913 | |
Other assets | | | 37,455 | |
Total assets | | | $7,468,427,409 | |
| Liabilities | | | | |
Payables for | | | | |
Investments purchased | | | $12,102,320 | |
Fund shares reacquired | | | 16,455,823 | |
Payable to affiliates | | | | |
Investment adviser | | | 399,152 | |
Shareholder servicing costs | | | 1,353,008 | |
Distribution and service fees | | | 45,375 | |
Program manager fees | | | 15 | |
Payable for independent Trustees’ compensation | | | 1,048 | |
Deferred country tax expense payable | | | 239,513 | |
Accrued expenses and other liabilities | | | 486,156 | |
Total liabilities | | | $31,082,410 | |
Net assets | | | $7,437,344,999 | |
| Net assets consist of | | | | |
Paid-in capital | | | $7,113,719,863 | |
Unrealized appreciation (depreciation) on investments and translation of assets and liabilities in foreign currencies (net of $239,513 deferred country tax) | | | 739,170,347 | |
Accumulated net realized gain (loss) on investments and foreign currency | | | (433,353,730 | ) |
Undistributed net investment income | | | 17,808,519 | |
Net assets | | | $7,437,344,999 | |
Shares of beneficial interest outstanding | | | 424,658,888 | |
11
Statement of Assets and Liabilities (unaudited) – continued
| | | | | | | | | | | | |
| | | Net assets | | | Shares
outstanding | | | Net asset value
per share (a) | |
| Class A | | | $1,276,435,285 | | | | 73,292,351 | | | | $17.42 | |
| Class B | | | 14,105,400 | | | | 842,402 | | | | 16.74 | |
| Class C | | | 85,126,392 | | | | 5,195,574 | | | | 16.38 | |
| Class I | | | 2,140,510,046 | | | | 118,987,453 | | | | 17.99 | |
| Class R1 | | | 3,741,244 | | | | 231,794 | | | | 16.14 | |
| Class R2 | | | 172,291,841 | | | | 10,215,797 | | | | 16.87 | |
| Class R3 | | | 198,439,493 | | | | 11,519,562 | | | | 17.23 | |
| Class R4 | | | 494,310,011 | | | | 28,371,071 | | | | 17.42 | |
| Class R5 | | | 3,048,826,457 | | | | 175,791,053 | | | | 17.34 | |
| Class 529A | | | 2,371,678 | | | | 138,040 | | | | 17.18 | |
| Class 529B | | | 157,284 | | | | 9,676 | | | | 16.26 | |
| Class 529C | | | 1,029,868 | | | | 64,115 | | | | 16.06 | |
| (a) | Maximum offering price per share was equal to the net asset value per share for all share classes, except for Classes A and 529A, for which the maximum offering prices per share were $18.48 [100 / 94.25 x $17.42] and $18.23 [100 / 94.25 x $17.18], respectively. On sales of $50,000 or more, the maximum offering prices of Class A and Class 529A shares are reduced. A contingent deferred sales charge may be imposed on redemptions of Class A, Class B, Class C, Class 529B, and Class 529C shares. Redemption price per share was equal to the net asset value per share for Classes I, R1, R2, R3, R4, R5, and 529A. |
See notes to financial statements
12
Financial Statements
STATEMENT OF OPERATIONS
Six months ended 2/28/15 (unaudited)
This statement describes how much your fund earned in investment income and accrued in expenses. It also describes any gains and/or losses generated by fund operations.
| | | | |
| Net investment income | | | | |
Income | | | | |
Dividends | | | $53,859,074 | |
Interest | | | 1,012,119 | |
Dividends from underlying affiliated funds | | | 34,126 | |
Foreign taxes withheld | | | (4,865,895 | ) |
Total investment income | | | $50,039,424 | |
Expenses | | | | |
Management fee | | | $26,298,063 | |
Distribution and service fees | | | 2,674,759 | |
Program manager fees | | | 1,705 | |
Shareholder servicing costs | | | 2,365,429 | |
Administrative services fee | | | 326,995 | |
Independent Trustees’ compensation | | | 49,477 | |
Custodian fee | | | 738,813 | |
Shareholder communications | | | 137,372 | |
Audit and tax fees | | | 34,945 | |
Legal fees | | | 32,327 | |
Miscellaneous | | | 172,372 | |
Total expenses | | | $32,832,257 | |
Fees paid indirectly | | | (101 | ) |
Reduction of expenses by investment adviser and distributor | | | (1,289,315 | ) |
Net expenses | | | $31,542,841 | |
Net investment income | | | $18,496,583 | |
Realized and unrealized gain (loss) on investments and foreign currency | | | | |
Realized gain (loss) (identified cost basis) | | | | |
Investments (net of $63,910 country tax) | | | $51,455,638 | |
Foreign currency | | | (2,549,472 | ) |
Net realized gain (loss) on investments and foreign currency | | | $48,906,166 | |
Change in unrealized appreciation (depreciation) | | | | |
Investments (net of $202,135 decrease in deferred country tax) | | | $(148,623,298 | ) |
Translation of assets and liabilities in foreign currencies | | | (158,342 | ) |
Net unrealized gain (loss) on investments and foreign currency translation | | | $(148,781,640 | ) |
Net realized and unrealized gain (loss) on investments and foreign currency | | | $(99,875,474 | ) |
Change in net assets from operations | | | $(81,378,891 | ) |
See notes to financial statements
13
Financial Statements
STATEMENTS OF CHANGES IN NET ASSETS
These statements describe the increases and/or decreases in net assets resulting from operations, any distributions, and any shareholder transactions.
| | | | | | | | |
| | | Six months ended
2/28/15 | | | Year ended
8/31/14 | |
| Change in net assets | | (unaudited) | | | | |
| From operations | | | | | | | | |
Net investment income | | | $18,496,583 | | | | $175,860,090 | |
Net realized gain (loss) on investments and foreign currency | | | 48,906,166 | | | | 258,567,787 | |
Net unrealized gain (loss) on investments and foreign currency translation | | | (148,781,640 | ) | | | 373,522,243 | |
Change in net assets from operations | | | $(81,378,891 | ) | | | $807,950,120 | |
| Distributions declared to shareholders | | | | | | | | |
From net investment income | | | $(172,549,524 | ) | | | $(103,250,534 | ) |
Change in net assets from fund share transactions | | | $282,427,767 | | | | $512,989,442 | |
Total change in net assets | | | $28,499,352 | | | | $1,217,689,028 | |
| Net assets | | | | | | | | |
At beginning of period | | | 7,408,845,647 | | | | 6,191,156,619 | |
At end of period (including undistributed net investment income of $17,808,519 and $171,861,460, respectively) | | | $7,437,344,999 | | | | $7,408,845,647 | |
See notes to financial statements
14
Financial Statements
FINANCIAL HIGHLIGHTS
The financial highlights table is intended to help you understand the fund’s financial performance for the semiannual period and the past 5 fiscal years. Certain information reflects financial results for a single fund share. The total returns in the table represent the rate by which an investor would have earned (or lost) on an investment in the fund share class (assuming reinvestment of all distributions) held for the entire period.
| | | | | | | | | | | | | | | | | | | | | | | | |
| | | Six months
ended
2/28/15 (unaudited) | | | Years ended 8/31 | |
| Class A | | | 2014 | | | 2013 | | | 2012 | | | 2011 | | | 2010 | |
| | | | | | | | | | | | | | | | | |
Net asset value, beginning
of period | | | $18.06 | | | | $16.25 | | | | $14.25 | | | | $14.66 | | | | $12.93 | | | | $13.03 | |
| Income (loss) from investment operations | |
Net investment income (d) | | | $0.03 | | | | $0.40 | | | | $0.26 | | | | $0.28 | | | | $0.26 | | | | $0.21 | |
Net realized and unrealized
gain (loss) on investments
and foreign currency | | | (0.29 | ) | | | 1.64 | | | | 2.01 | | | | (0.45 | ) | | | 1.67 | | | | (0.11 | ) |
Total from investment
operations | | | $(0.26 | ) | | | $2.04 | | | | $2.27 | | | | $(0.17 | ) | | | $1.93 | | | | $0.10 | |
| Less distributions declared to shareholders | |
From net investment income | | | $(0.38 | ) | | | $(0.23 | ) | | | $(0.27 | ) | | | $(0.24 | ) | | | $(0.20 | ) | | | $(0.20 | ) |
Net asset value, end of
period (x) | | | $17.42 | | | | $18.06 | | | | $16.25 | | | | $14.25 | | | | $14.66 | | | | $12.93 | |
Total return (%) (r)(s)(t)(x) | | | (1.33 | )(n) | | | 12.60 | | | | 16.08 | | | | (1.03 | ) | | | 14.89 | | | | 0.65 | |
Ratios (%) (to average net assets)
and Supplemental data: | |
Expenses before expense
reductions (f) | | | 1.14 | (a) | | | 1.13 | | | | 1.18 | | | | 1.21 | | | | 1.19 | | | | 1.25 | |
Expenses after expense
reductions (f) | | | 1.11 | (a) | | | 1.11 | | | | 1.18 | | | | 1.21 | | | | 1.19 | | | | 1.25 | |
Net investment income | | | 0.30 | (a)(m) | | | 2.24 | | | | 1.65 | | | | 2.02 | | | | 1.67 | | | | 1.59 | |
Portfolio turnover | | | 12 | (n) | | | 27 | | | | 32 | | | | 37 | | | | 43 | | | | 56 | |
Net assets at end of period
(000 omitted) | | | $1,276,435 | | | | $1,184,927 | | | | $1,108,795 | | | | $970,501 | | | | $1,008,654 | | | | $1,466,337 | |
See notes to financial statements
15
Financial Highlights – continued
| | | | | | | | | | | | | | | | | | | | | | | | |
| | | Six months
ended
2/28/15 (unaudited) | | | Years ended 8/31 | |
| Class B | | | 2014 | | | 2013 | | | 2012 | | | 2011 | | | 2010 | |
| | | | | | | | | | | | | | | | | |
Net asset value, beginning
of period | | | $17.26 | | | | $15.52 | | | | $13.59 | | | | $13.96 | | | | $12.30 | | | | $12.39 | |
| Income (loss) from investment operations | |
Net investment income (loss) (d) | | | $(0.03 | ) | | | $0.25 | | | | $0.12 | | | | $0.16 | | | | $0.11 | | | | $0.09 | |
Net realized and unrealized
gain (loss) on investments
and foreign currency | | | (0.28 | ) | | | 1.57 | | | | 1.94 | | | | (0.42 | ) | | | 1.62 | | | | (0.09 | ) |
Total from investment
operations | | | $(0.31 | ) | | | $1.82 | | | | $2.06 | | | | $(0.26 | ) | | | $1.73 | | | | $— | |
| Less distributions declared to shareholders | |
From net investment income | | | $(0.21 | ) | | | $(0.08 | ) | | | $(0.13 | ) | | | $(0.11 | ) | | | $(0.07 | ) | | | $(0.09 | ) |
Net asset value, end of
period (x) | | | $16.74 | | | | $17.26 | | | | $15.52 | | | | $13.59 | | | | $13.96 | | | | $12.30 | |
Total return (%) (r)(s)(t)(x) | | | (1.75 | )(n) | | | 11.77 | | | | 15.27 | | | | (1.82 | ) | | | 14.02 | | | | (0.09 | ) |
Ratios (%) (to average net assets)
and Supplemental data: | |
Expenses before expense
reductions (f) | | | 1.89 | (a) | | | 1.88 | | | | 1.93 | | | | 1.96 | | | | 1.95 | | | | 1.99 | |
Expenses after expense
reductions (f) | | | 1.86 | (a) | | | 1.86 | | | | 1.93 | | | | 1.96 | | | | 1.94 | | | | 1.99 | |
Net investment income (loss) | | | (0.43 | )(a)(m) | | | 1.46 | | | | 0.83 | | | | 1.19 | | | | 0.76 | | | | 0.71 | |
Portfolio turnover | | | 12 | (n) | | | 27 | | | | 32 | | | | 37 | | | | 43 | | | | 56 | |
Net assets at end of period
(000 omitted) | | | $14,105 | | | | $16,932 | | | | $19,751 | | | | $23,369 | | | | $33,059 | | | | $40,476 | |
See notes to financial statements
16
Financial Highlights – continued
| | | | | | | | | | | | | | | | | | | | | | | | |
| | | Six months
ended
2/28/15 (unaudited) | | | Years ended 8/31 | |
| Class C | | | 2014 | | | 2013 | | | 2012 | | | 2011 | | | 2010 | |
| | | | | | | | | | | | | | | | | |
Net asset value, beginning
of period | | | $16.93 | | | | $15.26 | | | | $13.39 | | | | $13.78 | | | | $12.16 | | | | $12.27 | |
| Income (loss) from investment operations | |
Net investment income (loss) (d) | | | $(0.03 | ) | | | $0.25 | | | | $0.13 | | | | $0.16 | | | | $0.12 | | | | $0.10 | |
Net realized and unrealized
gain (loss) on investments
and foreign currency | | | (0.28 | ) | | | 1.54 | | | | 1.90 | | | | (0.42 | ) | | | 1.59 | | | | (0.10 | ) |
Total from investment
operations | | | $(0.31 | ) | | | $1.79 | | | | $2.03 | | | | $(0.26 | ) | | | $1.71 | | | | $— | |
| Less distributions declared to shareholders | |
From net investment income | | | $(0.24 | ) | | | $(0.12 | ) | | | $(0.16 | ) | | | $(0.13 | ) | | | $(0.09 | ) | | | $(0.11 | ) |
Net asset value, end of
period (x) | | | $16.38 | | | | $16.93 | | | | $15.26 | | | | $13.39 | | | | $13.78 | | | | $12.16 | |
Total return (%) (r)(s)(t)(x) | | | (1.75 | )(n) | | | 11.74 | | | | 15.22 | | | | (1.80 | ) | | | 14.05 | | | | (0.03 | ) |
Ratios (%) (to average net assets)
and Supplemental data: | |
Expenses before expense
reductions (f) | | | 1.89 | (a) | | | 1.88 | | | | 1.93 | | | | 1.96 | | | | 1.95 | | | | 2.00 | |
Expenses after expense
reductions (f) | | | 1.86 | (a) | | | 1.86 | | | | 1.93 | | | | 1.96 | | | | 1.95 | | | | 2.00 | |
Net investment income (loss) | | | (0.44 | )(a)(m) | | | 1.50 | | | | 0.87 | | | | 1.23 | | | | 0.80 | | | | 0.78 | |
Portfolio turnover | | | 12 | (n) | | | 27 | | | | 32 | | | | 37 | | | | 43 | | | | 56 | |
Net assets at end of period
(000 omitted) | | | $85,126 | | | | $91,487 | | | | $86,793 | | | | $84,133 | | | | $99,830 | | | | $101,267 | |
See notes to financial statements
17
Financial Highlights – continued
| | | | | | | | | | | | | | | | | | | | | | | | |
| | | Six months
ended
2/28/15 (unaudited) | | | Years ended 8/31 | |
| Class I | | | 2014 | | | 2013 | | | 2012 | | | 2011 | | | 2010 | |
| | | | | | | | | | | | | | | | | |
Net asset value, beginning
of period | | | $18.66 | | | | $16.78 | | | | $14.71 | | | | $15.15 | | | | $13.35 | | | | $13.44 | |
| Income (loss) from investment operations | |
Net investment income (d) | | | $0.05 | | | | $0.46 | | | | $0.31 | | | | $0.35 | | | | $0.29 | | | | $0.26 | |
Net realized and unrealized
gain (loss) on investments
and foreign currency | | | (0.30 | ) | | | 1.69 | | | | 2.06 | | | | (0.49 | ) | | | 1.74 | | | | (0.12 | ) |
Total from investment
operations | | | $(0.25 | ) | | | $2.15 | | | | $2.37 | | | | $(0.14 | ) | | | $2.03 | | | | $0.14 | |
| Less distributions declared to shareholders | |
From net investment income | | | $(0.42 | ) | | | $(0.27 | ) | | | $(0.30 | ) | | | $(0.30 | ) | | | $(0.23 | ) | | | $(0.23 | ) |
Net asset value, end of
period (x) | | | $17.99 | | | | $18.66 | | | | $16.78 | | | | $14.71 | | | | $15.15 | | | | $13.35 | |
Total return (%) (r)(s)(x) | | | (1.20 | )(n) | | | 12.89 | | | | 16.32 | | | | (0.82 | ) | | | 15.19 | | | | 0.92 | |
Ratios (%) (to average net assets)
and Supplemental data: | |
Expenses before expense
reductions (f) | | | 0.89 | (a) | | | 0.88 | | | | 0.93 | | | | 0.96 | | | | 0.95 | | | | 1.00 | |
Expenses after expense
reductions (f) | | | 0.86 | (a) | | | 0.86 | | | | 0.93 | | | | 0.96 | | | | 0.95 | | | | 1.00 | |
Net investment income | | | 0.56 | (a)(m) | | | 2.51 | | | | 1.89 | | | | 2.45 | | | | 1.86 | | | | 1.90 | |
Portfolio turnover | | | 12 | (n) | | | 27 | | | | 32 | | | | 37 | | | | 43 | | | | 56 | |
Net assets at end of period
(000 omitted) | | | $2,140,510 | | | | $2,194,432 | | | | $1,834,498 | | | | $1,143,621 | | | | $2,484,795 | | | | $1,926,221 | |
See notes to financial statements
18
Financial Highlights – continued
| | | | | | | | | | | | | | | | | | | | | | | | |
| | | Six months
ended
2/28/15 (unaudited) | | | Years ended 8/31 | |
| Class R1 | | | 2014 | | | 2013 | | | 2012 | | | 2011 | | | 2010 | |
| | | | | | | | | | | | | | | | | |
Net asset value, beginning
of period | | | $16.69 | | | | $15.02 | | | | $13.17 | | | | $13.57 | | | | $11.98 | | | | $12.10 | |
| Income (loss) from investment operations | |
Net investment income (loss) (d) | | | $(0.03 | ) | | | $0.24 | | | | $0.12 | | | | $0.15 | | | | $0.12 | | | | $0.10 | |
Net realized and unrealized
gain (loss) on investments
and foreign currency | | | (0.27 | ) | | | 1.52 | | | | 1.87 | | | | (0.40 | ) | | | 1.57 | | | | (0.10 | ) |
Total from investment
operations | | | $(0.30 | ) | | | $1.76 | | | | $1.99 | | | | $(0.25 | ) | | | $1.69 | | | | $— | |
| Less distributions declared to shareholders | |
From net investment income | | | $(0.25 | ) | | | $(0.09 | ) | | | $(0.14 | ) | | | $(0.15 | ) | | | $(0.10 | ) | | | $(0.12 | ) |
Net asset value, end of
period (x) | | | $16.14 | | | | $16.69 | | | | $15.02 | | | | $13.17 | | | | $13.57 | | | | $11.98 | |
Total return (%) (r)(s)(x) | | | (1.72 | )(n) | | | 11.73 | | | | 15.24 | | | | (1.80 | ) | | | 14.09 | | | | (0.09 | ) |
Ratios (%) (to average net assets)
and Supplemental data: | |
Expenses before expense
reductions (f) | | | 1.89 | (a) | | | 1.88 | | | | 1.93 | | | | 1.96 | | | | 1.95 | | | | 2.00 | |
Expenses after expense
reductions (f) | | | 1.86 | (a) | | | 1.86 | | | | 1.93 | | | | 1.96 | | | | 1.95 | | | | 2.00 | |
Net investment income (loss) | | | (0.44 | )(a)(m) | | | 1.47 | | | | 0.85 | | | | 1.18 | | | | 0.84 | | | | 0.77 | |
Portfolio turnover | | | 12 | (n) | | | 27 | | | | 32 | | | | 37 | | | | 43 | | | | 56 | |
Net assets at end of period
(000 omitted) | | | $3,741 | | | | $4,243 | | | | $4,034 | | | | $4,914 | | | | $6,288 | | | | $5,868 | |
See notes to financial statements
19
Financial Highlights – continued
| | | | | | | | | | | | | | | | | | | | | | | | |
| | | Six months
ended
2/28/15 (unaudited) | | | Years ended 8/31 | |
| Class R2 | | | 2014 | | | 2013 | | | 2012 | | | 2011 | | | 2010 | |
| | | | | | | | | | | | | | | | | |
Net asset value, beginning
of period | | | $17.48 | | | | $15.75 | | | | $13.83 | | | | $14.26 | | | | $12.59 | | | | $12.70 | |
| Income (loss) from investment operations | |
Net investment income (d) | | | $0.01 | | | | $0.36 | | | | $0.21 | | | | $0.24 | | | | $0.20 | | | | $0.18 | |
Net realized and unrealized
gain (loss) on investments
and foreign currency | | | (0.28 | ) | | | 1.57 | | | | 1.95 | | | | (0.44 | ) | | | 1.64 | | | | (0.11 | ) |
Total from investment
operations | | | $(0.27 | ) | | | $1.93 | | | | $2.16 | | | | $(0.20 | ) | | | $1.84 | | | | $0.07 | |
| Less distributions declared to shareholders | |
From net investment income | | | $(0.34 | ) | | | $(0.20 | ) | | | $(0.24 | ) | | | $(0.23 | ) | | | $(0.17 | ) | | | $(0.18 | ) |
Net asset value, end of
period (x) | | | $16.87 | | | | $17.48 | | | | $15.75 | | | | $13.83 | | | | $14.26 | | | | $12.59 | |
Total return (%) (r)(s)(x) | | | (1.43 | )(n) | | | 12.32 | | | | 15.79 | | | | (1.32 | ) | | | 14.61 | | | | 0.45 | |
Ratios (%) (to average net assets)
and Supplemental data: | |
Expenses before expense
reductions (f) | | | 1.39 | (a) | | | 1.38 | | | | 1.43 | | | | 1.46 | | | | 1.45 | | | | 1.50 | |
Expenses after expense
reductions (f) | | | 1.36 | (a) | | | 1.36 | | | | 1.43 | | | | 1.46 | | | | 1.45 | | | | 1.50 | |
Net investment income | | | 0.06 | (a)(m) | | | 2.06 | | | | 1.41 | | | | 1.78 | | | | 1.37 | | | | 1.34 | |
Portfolio turnover | | | 12 | (n) | | | 27 | | | | 32 | | | | 37 | | | | 43 | | | | 56 | |
Net assets at end of period
(000 omitted) | | | $172,292 | | | | $182,466 | | | | $136,444 | | | | $107,567 | | | | $91,693 | | | | $72,425 | |
See notes to financial statements
20
Financial Highlights – continued
| | | | | | | | | | | | | | | | | | | | | | | | |
| | | Six months
ended
2/28/15 (unaudited) | | | Years ended 8/31 | |
| Class R3 | | | 2014 | | | 2013 | | | 2012 | | | 2011 | | | 2010 | |
| | | | | | | | | | | | | | | | | |
Net asset value, beginning
of period | | | $17.86 | | | | $16.08 | | | | $14.10 | | | | $14.53 | | | | $12.82 | | | | $12.92 | |
| Income (loss) from investment operations | |
Net investment income (d) | | | $0.03 | | | | $0.40 | | | | $0.25 | | | | $0.28 | | | | $0.23 | | | | $0.21 | |
Net realized and unrealized
gain (loss) on investments
and foreign currency | | | (0.29 | ) | | | 1.61 | | | | 2.00 | | | | (0.45 | ) | | | 1.68 | | | | (0.10 | ) |
Total from investment
operations | | | $(0.26 | ) | | | $2.01 | | | | $2.25 | | | | $(0.17 | ) | | | $1.91 | | | | $0.11 | |
| Less distributions declared to shareholders | |
From net investment income | | | $(0.37 | ) | | | $(0.23 | ) | | | $(0.27 | ) | | | $(0.26 | ) | | | $(0.20 | ) | | | $(0.21 | ) |
Net asset value, end of
period (x) | | | $17.23 | | | | $17.86 | | | | $16.08 | | | | $14.10 | | | | $14.53 | | | | $12.82 | |
Total return (%) (r)(s)(x) | | | (1.31 | )(n) | | | 12.56 | | | | 16.13 | | | | (1.06 | ) | | | 14.88 | | | | 0.72 | |
Ratios (%) (to average net assets)
and Supplemental data: | |
Expenses before expense
reductions (f) | | | 1.14 | (a) | | | 1.13 | | | | 1.18 | | | | 1.21 | | | | 1.20 | | | | 1.25 | |
Expenses after expense
reductions (f) | | | 1.11 | (a) | | | 1.11 | | | | 1.18 | | | | 1.21 | | | | 1.20 | | | | 1.25 | |
Net investment income | | | 0.31 | (a)(m) | | | 2.28 | | | | 1.63 | | | | 2.05 | | | | 1.54 | | | | 1.55 | |
Portfolio turnover | | | 12 | (n) | | | 27 | | | | 32 | | | | 37 | | | | 43 | | | | 56 | |
Net assets at end of period
(000 omitted) | | | $198,439 | | | | $229,232 | | | | $195,358 | | | | $168,989 | | | | $154,869 | | | | $151,073 | |
See notes to financial statements
21
Financial Highlights – continued
| | | | | | | | | | | | | | | | | | | | | | | | |
| | | Six
months
ended
2/28/15 (unaudited) | | | Years ended 8/31 | |
| Class R4 | | | 2014 | | | 2013 | | | 2012 | | | 2011 | | | 2010 | |
| | | | | | | | | | | | | | | | | |
Net asset value, beginning
of period | | | $18.09 | | | | $16.27 | | | | $14.26 | | | | $14.70 | | | | $12.96 | | | | $13.05 | |
| Income (loss) from investment operations | |
Net investment income (d) | | | $0.05 | | | | $0.45 | | | | $0.25 | | | | $0.32 | | | | $0.28 | | | | $0.24 | |
Net realized and unrealized
gain (loss) on investments
and foreign currency | | | (0.30 | ) | | | 1.63 | | | | 2.06 | | | | (0.46 | ) | | | 1.69 | | | | (0.10 | ) |
Total from investment
operations | | | $(0.25 | ) | | | $2.08 | | | | $2.31 | | | | $(0.14 | ) | | | $1.97 | | | | $0.14 | |
| Less distributions declared to shareholders | |
From net investment income | | | $(0.42 | ) | | | $(0.26 | ) | | | $(0.30 | ) | | | $(0.30 | ) | | | $(0.23 | ) | | | $(0.23 | ) |
Net asset value, end of
period (x) | | | $17.42 | | | | $18.09 | | | | $16.27 | | | | $14.26 | | | | $14.70 | | | | $12.96 | |
Total return (%) (r)(s)(x) | | | (1.25 | )(n) | | | 12.87 | | | | 16.42 | | | | (0.84 | ) | | | 15.19 | | | | 0.95 | |
Ratios (%) (to average net assets)
and Supplemental data: | |
Expenses before expense
reductions (f) | | | 0.89 | (a) | | | 0.88 | | | | 0.93 | | | | 0.96 | | | | 0.95 | | | | 1.00 | |
Expenses after expense
reductions (f) | | | 0.86 | (a) | | | 0.86 | | | | 0.93 | | | | 0.96 | | | | 0.95 | | | | 1.00 | |
Net investment income | | | 0.57 | (a)(m) | | | 2.54 | | | | 1.60 | | | | 2.28 | | | | 1.83 | | | | 1.77 | |
Portfolio turnover | | | 12 | (n) | | | 27 | | | | 32 | | | | 37 | | | | 43 | | | | 56 | |
Net assets at end of period
(000 omitted) | | | $494,310 | | | | $546,069 | | | | $470,915 | | | | $825,288 | | | | $561,557 | | | | $482,217 | |
See notes to financial statements
22
Financial Highlights – continued
| | | | | | | | | | | | | | | | | | | | | | | | |
| | | Six
months
ended
2/28/15 (unaudited) | | | Years ended 8/31 | |
| Class R5 (y) | | | 2014 | | | 2013 | | | 2012 | | | 2011 | | | 2010 | |
| | | | | | | | | | | | | | | | | |
Net asset value, beginning
of period | | | $18.02 | | | | $16.21 | | | | $14.20 | | | | $14.63 | | | | $12.90 | | | | $13.00 | |
| Income (loss) from investment operations | |
Net investment income (d) | | | $0.06 | | | | $0.46 | | | | $0.33 | | | | $0.17 | | | | $0.26 | | | | $0.23 | |
Net realized and unrealized
gain (loss) on investments
and foreign currency | | | (0.30 | ) | | | 1.64 | | | | 1.99 | | | | (0.31 | )(g) | | | 1.69 | | | | (0.11 | ) |
Total from investment
operations | | | $(0.24 | ) | | | $2.10 | | | | $2.32 | | | | $(0.14 | ) | | | $1.95 | | | | $0.12 | |
| Less distributions declared to shareholders | |
From net investment income | | | $(0.44 | ) | | | $(0.29 | ) | | | $(0.31 | ) | | | $(0.29 | ) | | | $(0.22 | ) | | | $(0.22 | ) |
Net asset value, end of
period (x) | | | $17.34 | | | | $18.02 | | | | $16.21 | | | | $14.20 | | | | $14.63 | | | | $12.90 | |
Total return (%) (r)(s)(x) | | | (1.21 | )(n) | | | 13.01 | | | | 16.50 | | | | (0.85 | ) | | | 15.07 | | | | 0.81 | |
Ratios (%) (to average net assets)
and Supplemental data: | |
Expenses before expense
reductions (f) | | | 0.79 | (a) | | | 0.79 | | | | 0.81 | | | | 0.89 | | | | 1.05 | | | | 1.10 | |
Expenses after expense
reductions (f) | | | 0.75 | (a) | | | 0.77 | | | | 0.81 | | | | 0.89 | | | | 1.05 | | | | 1.10 | |
Net investment income | | | 0.66 | (a)(m) | | | 2.62 | | | | 2.09 | | | | 1.20 | (l) | | | 1.71 | | | | 1.73 | |
Portfolio turnover | | | 12 | (n) | | | 27 | | | | 32 | | | | 37 | | | | 43 | | | | 56 | |
Net assets at end of period
(000 omitted) | | | $3,048,826 | | | | $2,955,339 | | | | $2,331,325 | | | | $1,433,832 | | | | $26,173 | | | | $24,820 | |
See notes to financial statements
23
Financial Highlights – continued
| | | | | | | | | | | | | | | | | | | | | | | | |
| | | Six months
ended
2/28/15 (unaudited) | | | Years ended 8/31 | |
| Class 529A | | | 2014 | | | 2013 | | | 2012 | | | 2011 | | | 2010 | |
| | | | | | | | | | | | | | | | | |
Net asset value, beginning
of period | | | $17.81 | | | | $16.03 | | | | $14.06 | | | | $14.49 | | | | $12.78 | | | | $12.88 | |
| Income (loss) from investment operations | |
Net investment income (d) | | | $0.02 | | | | $0.39 | | | | $0.25 | | | | $0.27 | | | | $0.22 | | | | $0.20 | |
Net realized and unrealized
gain (loss) on investments
and foreign currency | | | (0.28 | ) | | | 1.62 | | | | 1.98 | | | | (0.45 | ) | | | 1.68 | | | | (0.12 | ) |
Total from investment
operations | | | $(0.26 | ) | | | $2.01 | | | | $2.23 | | | | $(0.18 | ) | | | $1.90 | | | | $0.08 | |
| Less distributions declared to shareholders | |
From net investment income | | | $(0.37 | ) | | | $(0.23 | ) | | | $(0.26 | ) | | | $(0.25 | ) | | | $(0.19 | ) | | | $(0.18 | ) |
Net asset value, end of
period (x) | | | $17.18 | | | | $17.81 | | | | $16.03 | | | | $14.06 | | | | $14.49 | | | | $12.78 | |
Total return (%) (r)(s)(t)(x) | | | (1.34 | )(n) | | | 12.57 | | | | 16.05 | | | | (1.15 | ) | | | 14.80 | | | | 0.54 | |
Ratios (%) (to average net assets)
and Supplemental data: | |
Expenses before expense
reductions (f) | | | 1.24 | (a) | | | 1.23 | | | | 1.28 | | | | 1.31 | | | | 1.30 | | | | 1.35 | |
Expenses after expense
reductions (f) | | | 1.13 | (a) | | | 1.14 | | | | 1.21 | | | | 1.26 | | | | 1.29 | | | | 1.35 | |
Net investment income | | | 0.29 | (a)(m) | | | 2.22 | | | | 1.62 | | | | 1.96 | | | | 1.47 | | | | 1.47 | |
Portfolio turnover | | | 12 | (n) | | | 27 | | | | 32 | | | | 37 | | | | 43 | | | | 56 | |
Net assets at end of period
(000 omitted) | | | $2,372 | | | | $2,428 | | | | $2,105 | | | | $1,762 | | | | $1,747 | | | | $1,512 | |
See notes to financial statements
24
Financial Highlights – continued
| | | | | | | | | | | | | | | | | | | | | | | | |
| | | Six months
ended
2/28/15 (unaudited) | | | Years ended 8/31 | |
| Class 529B | | | 2014 | | | 2013 | | | 2012 | | | 2011 | | | 2010 | |
| | | | | | | | | | | | | | | | | |
Net asset value, beginning
of period | | | $16.80 | | | | $15.14 | | | | $13.25 | | | | $13.57 | | | | $11.99 | | | | $12.11 | |
| Income (loss) from investment operations | |
Net investment income (loss) (d) | | | $(0.04 | ) | | | $0.25 | | | | $0.12 | | | | $0.13 | | | | $0.09 | | | | $0.09 | |
Net realized and unrealized
gain (loss) on investments
and foreign currency | | | (0.26 | ) | | | 1.52 | | | | 1.88 | | | | (0.38 | ) | | | 1.58 | | | | (0.10 | ) |
Total from investment
operations | | | $(0.30 | ) | | | $1.77 | | | | $2.00 | | | | $(0.25 | ) | | | $1.67 | | | | $(0.01 | ) |
| Less distributions declared to shareholders | |
From net investment income | | | $(0.24 | ) | | | $(0.11 | ) | | | $(0.11 | ) | | | $(0.07 | ) | | | $(0.09 | ) | | | $(0.11 | ) |
Net asset value, end of
period (x) | | | $16.26 | | | | $16.80 | | | | $15.14 | | | | $13.25 | | | | $13.57 | | | | $11.99 | |
Total return (%) (r)(s)(t)(x) | | | (1.71 | )(n) | | | 11.71 | | | | 15.15 | | | | (1.84 | ) | | | 13.90 | | | | (0.14 | ) |
Ratios (%) (to average net assets)
and Supplemental data: | |
Expenses before expense
reductions (f) | | | 1.99 | (a) | | | 1.98 | | | | 2.03 | | | | 2.06 | | | | 2.04 | | | | 2.10 | |
Expenses after expense
reductions (f) | | | 1.90 | (a) | | | 1.91 | | | | 1.98 | | | | 2.01 | | | | 2.04 | | | | 2.10 | |
Net investment income (loss) | | | (0.48 | )(a)(m) | | | 1.49 | | | | 0.82 | | | | 1.03 | | | | 0.66 | | | | 0.69 | |
Portfolio turnover | | | 12 | (n) | | | 27 | | | | 32 | | | | 37 | | | | 43 | | | | 56 | |
Net assets at end of period
(000 omitted) | | | $157 | | | | $192 | | | | $188 | | | | $199 | | | | $366 | | | | $461 | |
See notes to financial statements
25
Financial Highlights – continued
| | | | | | | | | | | | | | | | | | | | | | | | |
| | | Six months
ended
2/28/15 (unaudited) | | | Years ended 8/31 | |
| Class 529C | | | 2014 | | | 2013 | | | 2012 | | | 2011 | | | 2010 | |
| | | | | | | | | | | | | | | | | |
Net asset value, beginning
of period | | | $16.61 | | | | $14.98 | | | | $13.17 | | | | $13.56 | | | | $12.00 | | | | $12.12 | |
| Income (loss) from investment operations | |
Net investment income (loss) (d) | | | $(0.04 | ) | | | $0.23 | | | | $0.12 | | | | $0.15 | | | | $0.11 | | | | $0.09 | |
Net realized and unrealized
gain (loss) on investments
and foreign currency | | | (0.26 | ) | | | 1.52 | | | | 1.86 | | | | (0.41 | ) | | | 1.56 | | | | (0.10 | ) |
Total from investment
operations | | | $(0.30 | ) | | | $1.75 | | | | $1.98 | | | | $(0.26 | ) | | | $1.67 | | | | $(0.01 | ) |
| Less distributions declared to shareholders | |
From net investment income | | | $(0.25 | ) | | | $(0.12 | ) | | | $(0.17 | ) | | | $(0.13 | ) | | | $(0.11 | ) | | | $(0.11 | ) |
Net asset value, end of
period (x) | | | $16.06 | | | | $16.61 | | | | $14.98 | | | | $13.17 | | | | $13.56 | | | | $12.00 | |
Total return (%) (r)(s)(t)(x) | | | (1.75 | )(n) | | | 11.68 | | | | 15.17 | | | | (1.83 | ) | | | 13.89 | | | | (0.11 | ) |
Ratios (%) (to average net assets)
and Supplemental data: | |
Expenses before expense
reductions (f) | | | 1.99 | (a) | | | 1.98 | | | | 2.03 | | | | 2.06 | | | | 2.05 | | | | 2.10 | |
Expenses after expense
reductions (f) | | | 1.91 | (a) | | | 1.91 | | | | 1.98 | | | | 2.01 | | | | 2.04 | | | | 2.10 | |
Net investment income (loss) | | | (0.48 | )(a)(m) | | | 1.43 | | | | 0.81 | | | | 1.19 | | | | 0.81 | | | | 0.76 | |
Portfolio turnover | | | 12 | (n) | | | 27 | | | | 32 | | | | 37 | | | | 43 | | | | 56 | |
Net assets at end of period
(000 omitted) | | | $1,030 | | | | $1,098 | | | | $950 | | | | $914 | | | | $906 | | | | $796 | |
See notes to financial statements
26
Financial Highlights – continued
| (d) | Per share data is based on average shares outstanding. |
| (f) | Ratios do not reflect reductions from fees paid indirectly, if applicable. |
| (g) | The per share amount varies from the net realized and unrealized gain/loss for the period because of the timing of sales of fund shares and the per share amount of realized and unrealized gains and losses at such time. |
| (l) | The net investment income ratio does not vary by the class specific expense differential because of the timing of sales of fund shares and the allocation of fund level income at such time. |
| (m) | Recognition of net investment income by the fund may be affected by the timing of the declaration of dividends by companies in which the fund invests and the actual annual net investment income ratio may differ. |
| (r) | Certain expenses have been reduced without which performance would have been lower. |
| (s) | From time to time the fund may receive proceeds from litigation settlements, without which performance would be lower. |
| (t) | Total returns do not include any applicable sales charges. |
| (x) | The net asset values per share and total returns have been calculated on net assets which include adjustments made in accordance with U.S. generally accepted accounting principles required at period end for financial reporting purposes. |
| (y) | On May 10, 2012, sales of Class W shares (including exchanges) were suspended. On May 11, 2012, certain Class W shares were automatically converted to Class I shares. Shareholders of certain Class W shares became shareholders of Class I and received Class I shares with a total net asset value equal to their Class W shares at the time of the conversion. On May 30, 2012, remaining Class W shares, which represented MFS seed money, were redesignated Class R5. Class R5 shares are generally available only to certain eligible retirement plans and to funds distributed by MFD. Class R5 shares do not pay a 12b-1 distribution fee or sub-accounting costs. On June 1, 2012, Class R5 shares were offered for sale to the public. |
See notes to financial statements
27
NOTES TO FINANCIAL STATEMENTS
(unaudited)
(1) Business and Organization
MFS Research International Fund (the fund) is a diversified series of MFS Series Trust I (the trust). The trust is organized as a Massachusetts business trust and is registered under the Investment Company Act of 1940, as amended, as an open-end management investment company.
The fund is an investment company and accordingly follows the investment company accounting and reporting guidance of the Financial Accounting Standards Board (FASB) Accounting Standards Codification Topic 946 Financial Services – Investment Companies.
(2) Significant Accounting Policies
General – The preparation of financial statements in conformity with U.S. generally accepted accounting principles requires management to make estimates and assumptions that affect the reported amounts of assets and liabilities, and disclosure of contingent assets and liabilities at the date of the financial statements and the reported amounts of increases and decreases in net assets from operations during the reporting period. Actual results could differ from those estimates. In the preparation of these financial statements, management has evaluated subsequent events occurring after the date of the fund’s Statement of Assets and Liabilities through the date that the financial statements were issued. The fund invests in foreign securities. Investments in foreign securities are vulnerable to the effects of changes in the relative values of the local currency and the U.S. dollar and to the effects of changes in each country’s legal, political, and economic environment.
In June 2014, FASB issued Accounting Standards Update 2014-11, Transfers and Servicing (Topic 860) – Repurchase-to-Maturity Transactions, Repurchase Financings, and Disclosures (“ASU 2014-11”). ASU 2014-11 changes the accounting for repurchase-to-maturity transactions (i.e., repurchase agreements that settle at the same time as the maturity of the transferred financial asset) and enhances the required disclosures for repurchase agreements and other similar transactions. Although still evaluating the potential impacts of ASU 2014-11 to the fund, management expects that the impact of the fund’s adoption will be limited to additional financial statement disclosures which would first be effective for interim reporting periods beginning after March 15, 2015.
Balance Sheet Offsetting – The fund’s accounting policy with respect to balance sheet offsetting is that, absent an event of default by the counterparty or a termination of the agreement, the International Swaps and Derivatives Association (ISDA) Master Agreement does not result in an offset of reported amounts of financial assets and financial liabilities in the Statement of Assets and Liabilities across transactions between the fund and the applicable counterparty. The fund’s right to setoff may be restricted or prohibited by the bankruptcy or insolvency laws of the particular jurisdiction to which a specific master netting agreement counterparty is subject. Balance sheet offsetting disclosures, to the extent applicable to the fund, have been included in the fund’s Significant Accounting Policies note under the captions for each of the fund’s in-scope financial instruments and transactions.
28
Notes to Financial Statements (unaudited) – continued
Investment Valuations – Equity securities, including restricted equity securities, are generally valued at the last sale or official closing price as provided by a third-party pricing service on the market or exchange on which they are primarily traded. Equity securities, for which there were no sales reported that day, are generally valued at the last quoted daily bid quotation as provided by a third-party pricing service on the market or exchange on which such securities are primarily traded. Short-term instruments with a maturity at issuance of 60 days or less may be valued at amortized cost, which approximates market value. Open-end investment companies are generally valued at net asset value per share. Securities and other assets generally valued on the basis of information from a third-party pricing service may also be valued at a broker/dealer bid quotation. Values obtained from third-party pricing services can utilize both transaction data and market information such as yield, quality, coupon rate, maturity, type of issue, trading characteristics, and other market data. The values of foreign securities and other assets and liabilities expressed in foreign currencies are converted to U.S. dollars using the mean of bid and asked prices for rates provided by a third-party pricing service.
The Board of Trustees has delegated primary responsibility for determining or causing to be determined the value of the fund’s investments (including any fair valuation) to the adviser pursuant to valuation policies and procedures approved by the Board. If the adviser determines that reliable market quotations are not readily available, investments are valued at fair value as determined in good faith by the adviser in accordance with such procedures under the oversight of the Board of Trustees. Under the fund’s valuation policies and procedures, market quotations are not considered to be readily available for most types of debt instruments and floating rate loans and many types of derivatives. These investments are generally valued at fair value based on information from third-party pricing services. In addition, investments may be valued at fair value if the adviser determines that an investment’s value has been materially affected by events occurring after the close of the exchange or market on which the investment is principally traded (such as foreign exchange or market) and prior to the determination of the fund’s net asset value, or after the halting of trading of a specific security where trading does not resume prior to the close of the exchange or market on which the security is principally traded. Events that occur on a frequent basis after foreign markets close (such as developments in foreign markets and significant movements in the U.S. markets) and prior to the determination of the fund’s net asset value may be deemed to have a material effect on the value of securities traded in foreign markets. Accordingly, the fund’s foreign equity securities may often be valued at fair value. The adviser generally relies on third-party pricing services or other information (such as the correlation with price movements of similar securities in the same or other markets; the type, cost and investment characteristics of the security; the business and financial condition of the issuer; and trading and other market data) to assist in determining whether to fair value and at what value to fair value an investment. The value of an investment for purposes of calculating the fund’s net asset value can differ depending on the source and method used to determine value. When fair valuation is used, the value of an investment used to determine the fund’s net asset value may differ from quoted or published prices for the same investment. There can be no assurance that
29
Notes to Financial Statements (unaudited) – continued
the fund could obtain the fair value assigned to an investment if it were to sell the investment at the same time at which the fund determines its net asset value per share.
Various inputs are used in determining the value of the fund’s assets or liabilities. These inputs are categorized into three broad levels. In certain cases, the inputs used to measure fair value may fall into different levels of the fair value hierarchy. In such cases, an investment’s level within the fair value hierarchy is based on the lowest level of input that is significant to the fair value measurement. The fund’s assessment of the significance of a particular input to the fair value measurement in its entirety requires judgment, and considers factors specific to the investment. Level 1 includes unadjusted quoted prices in active markets for identical assets or liabilities. Level 2 includes other significant observable market-based inputs (including quoted prices for similar securities, interest rates, prepayment speed, and credit risk). Level 3 includes unobservable inputs, which may include the adviser’s own assumptions in determining the fair value of investments. The following is a summary of the levels used as of February 28, 2015 in valuing the fund’s assets or liabilities:
| | | | | | | | | | | | | | | | |
| Investments at Value | | Level 1 | | | Level 2 | | | Level 3 | | | Total | |
| Equity Securities: | | | | | | | | | | | | | | | | |
Japan | | | $1,378,802,539 | | | | $— | | | | $— | | | | $1,378,802,539 | |
United Kingdom | | | 1,275,059,442 | | | | — | | | | — | | | | 1,275,059,442 | |
Switzerland | | | 1,051,879,397 | | | | — | | | | — | | | | 1,051,879,397 | |
France | | | 759,131,939 | | | | — | | | | — | | | | 759,131,939 | |
Germany | | | 575,053,131 | | | | — | | | | — | | | | 575,053,131 | |
Netherlands | | | 333,634,766 | | | | — | | | | — | | | | 333,634,766 | |
Hong Kong | | | 312,771,166 | | | | — | | | | — | | | | 312,771,166 | |
Australia | | | 284,776,052 | | | | — | | | | — | | | | 284,776,052 | |
United States | | | 271,476,922 | | | | — | | | | — | | | | 271,476,922 | |
Other Countries | | | 1,045,130,919 | | | | 103,560,880 | | | | — | | | | 1,148,691,799 | |
| Mutual Funds | | | 47,922,248 | | | | — | | | | — | | | | 47,922,248 | |
| Total Investments | | | $7,335,638,521 | | | | $103,560,880 | | | | $— | | | | $7,439,199,401 | |
For further information regarding security characteristics, see the Portfolio of Investments.
Of the level 2 investments presented above, equity investments amounting to $91,516,067 would have been considered level 1 investments at the beginning of the period. Of the level 1 investments presented above, equity investments amounting to $30,893,421 would have been considered level 2 investments at the beginning of the period. The primary reason for changes in the classifications between levels 1 and 2 occurs when foreign equity securities are fair valued using other observable market-based inputs in place of the closing exchange price due to events occurring after the close of the exchange or market on which the investment is principally traded. The fund’s foreign equity securities may often be valued at fair value. The fund’s policy is to recognize transfers between the levels as of the end of the period.
Foreign Currency Translation – Purchases and sales of foreign investments, income, and expenses are converted into U.S. dollars based upon currency exchange rates prevailing on the respective dates of such transactions or on the reporting date for foreign denominated receivables and payables. Gains and losses attributable to foreign
30
Notes to Financial Statements (unaudited) – continued
currency exchange rates on sales of securities are recorded for financial statement purposes as net realized gains and losses on investments. Gains and losses attributable to foreign exchange rate movements on receivables, payables, income and expenses are recorded for financial statement purposes as foreign currency transaction gains and losses. That portion of both realized and unrealized gains and losses on investments that results from fluctuations in foreign currency exchange rates is not separately disclosed.
Security Loans – Under its Securities Lending Agency Agreement with the fund, State Street Bank and Trust Company (“State Street”), as lending agent, loans the securities of the fund to certain qualified institutions (the “Borrowers”) approved by the fund. The loans are collateralized by cash and/or U.S. Treasury and federal agency obligations in an amount typically at least equal to the market value of the securities loaned. On loans collateralized by cash, the cash collateral is invested in a money market fund. The market value of the loaned securities is determined at the close of business of the fund and any additional required collateral is delivered to the fund on the next business day. State Street provides the fund with indemnification against Borrower default. In the event of Borrower default, State Street will for the benefit of the fund either purchase securities identical to those loaned or, when such purchase is commercially impracticable, pay the fund the market value of the loaned securities. In return, State Street assumes the fund’s rights to the related collateral. If the collateral value is less than the cost to purchase identical securities, State Street is responsible for the shortfall, but only to the extent that such shortfall is not due to a decline in collateral value resulting from collateral reinvestment for which the fund bears the risk of loss. A portion of the income generated upon investment of the collateral is remitted to the Borrowers, and the remainder is allocated between the fund and the lending agent. On loans collateralized by U.S. Treasury and/or federal agency obligations, a fee is received from the Borrower, and is allocated between the fund and the lending agent. Income from securities lending is included in “Interest” income in the Statement of Operations. The dividend and interest income earned on the securities loaned is accounted for in the same manner as other dividend and interest income. At February 28, 2015, there were no securities on loan or collateral outstanding.
Indemnifications – Under the fund’s organizational documents, its officers and Trustees may be indemnified against certain liabilities and expenses arising out of the performance of their duties to the fund. Additionally, in the normal course of business, the fund enters into agreements with service providers that may contain indemnification clauses. The fund’s maximum exposure under these agreements is unknown as this would involve future claims that may be made against the fund that have not yet occurred.
Investment Transactions and Income – Investment transactions are recorded on the trade date. Interest income is recorded on the accrual basis. Dividends received in cash are recorded on the ex-dividend date. Certain dividends from foreign securities will be recorded when the fund is informed of the dividend if such information is obtained subsequent to the ex-dividend date. Dividend and interest payments received in additional securities are recorded on the ex-dividend or ex-interest date in an amount equal to the value of the security on such date.
31
Notes to Financial Statements (unaudited) – continued
The fund may receive proceeds from litigation settlements. Any proceeds received from litigation involving portfolio holdings are reflected in the Statement of Operations in realized gain/loss if the security has been disposed of by the fund or in unrealized gain/loss if the security is still held by the fund. Any other proceeds from litigation not related to portfolio holdings are reflected as other income in the Statement of Operations.
Fees Paid Indirectly – The fund’s custody fee may be reduced according to an arrangement that measures the value of cash deposited with the custodian by the fund. This amount, for the six months ended February 28, 2015, is shown as a reduction of total expenses in the Statement of Operations.
Tax Matters and Distributions – The fund intends to qualify as a regulated investment company, as defined under Subchapter M of the Internal Revenue Code, and to distribute all of its taxable income, including realized capital gains. As a result, no provision for federal income tax is required. The fund’s federal tax returns, when filed, will remain subject to examination by the Internal Revenue Service for a three year period. Management has analyzed the fund’s tax positions taken on federal and state tax returns for all open tax years and does not believe that there are any uncertain tax positions that require recognition of a tax liability. Foreign taxes, if any, have been accrued by the fund in the accompanying financial statements in accordance with the applicable foreign tax law. Foreign income taxes may be withheld by certain countries in which the fund invests. Additionally, capital gains realized by the fund on securities issued in or by certain foreign countries may be subject to capital gains tax imposed by those countries.
Distributions to shareholders are recorded on the ex-dividend date. Income and capital gain distributions are determined in accordance with income tax regulations, which may differ from U.S. generally accepted accounting principles. Certain capital accounts in the financial statements are periodically adjusted for permanent differences in order to reflect their tax character. These adjustments have no impact on net assets or net asset value per share. Temporary differences which arise from recognizing certain items of income, expense, gain or loss in different periods for financial statement and tax purposes will reverse at some time in the future. Distributions in excess of net investment income or net realized gains are temporary overdistributions for financial statement purposes resulting from differences in the recognition or classification of income or distributions for financial statement and tax purposes.
Book/tax differences primarily relate to wash sale loss deferrals.
The tax character of distributions made during the current period will be determined at fiscal year end. The tax character of distributions declared to shareholders for the last fiscal year is as follows:
| | | | |
| | | 8/31/14 | |
Ordinary income (including any
short-term capital gains) | | | $103,250,534 | |
32
Notes to Financial Statements (unaudited) – continued
The federal tax cost and the tax basis components of distributable earnings were as follows:
| | | | |
| As of 2/28/15 | | | |
| Cost of investments | | | $6,747,238,569 | |
| Gross appreciation | | | 1,147,910,244 | |
| Gross depreciation | | | (455,949,412 | ) |
| Net unrealized appreciation (depreciation) | | | $691,960,832 | |
| |
| As of 8/31/14 | | | |
| Undistributed ordinary income | | | 172,550,010 | |
| Capital loss carryforwards | | | (434,460,469 | ) |
| Other temporary differences | | | (1,322,255 | ) |
| Net unrealized appreciation (depreciation) | | | 840,786,265 | |
The aggregate cost above includes prior fiscal year end tax adjustments, if applicable.
Under the Regulated Investment Company Modernization Act of 2010 (the “Act”), net capital losses recognized for fund fiscal years beginning after August 31, 2011 may be carried forward indefinitely, and their character is retained as short-term and/or long-term losses (“post-enactment losses”). Previously, net capital losses were carried forward for eight years and treated as short-term losses (“pre-enactment losses”). As a transition rule, the Act requires that all post-enactment net capital losses be used before pre-enactment net capital losses.
As of August 31, 2014, the fund had capital loss carryforwards available to offset future realized gains. Such pre-enactment losses expire as follows:
Multiple Classes of Shares of Beneficial Interest – The fund offers multiple classes of shares, which differ in their respective distribution, service, and program manager fees. The fund’s income, realized and unrealized gain (loss), and common expenses are allocated to shareholders based on the daily net assets of each class. Dividends are declared separately for each class. Differences in per share dividend rates are generally due to differences in separate class expenses. Class B and Class 529B shares will convert to Class A and Class 529A shares, respectively, approximately eight years after purchase.
33
Notes to Financial Statements (unaudited) – continued
The fund’s distributions declared to shareholders as reported in the Statements of Changes in Net Assets are presented by class as follows:
| | | | | | | | |
| | | From net investment
income | |
| | | Six months
ended
2/28/15 | | | Year
ended
8/31/14 | |
| Class A | | | $26,484,236 | | | | $15,702,653 | |
| Class B | | | 190,010 | | | | 102,139 | |
| Class C | | | 1,249,657 | | | | 675,749 | |
| Class I | | | 49,946,711 | | | | 31,156,722 | |
| Class R1 | | | 61,803 | | | | 23,279 | |
| Class R2 | | | 3,461,556 | | | | 1,827,492 | |
| Class R3 | | | 4,609,216 | | | | 2,842,760 | |
| Class R4 | | | 12,429,398 | | | | 7,705,916 | |
| Class R5 | | | 74,050,172 | | | | 43,174,399 | |
| Class 529A | | | 48,384 | | | | 30,527 | |
| Class 529B | | | 2,822 | | | | 1,412 | |
| Class 529C | | | 15,559 | | | | 7,486 | |
| Total | | | $172,549,524 | | | | $103,250,534 | |
(3) Transactions with Affiliates
Investment Adviser – The fund has an investment advisory agreement with MFS to provide overall investment management and related administrative services and facilities to the fund. The management fee is computed daily and paid monthly at the following annual rates:
| | | | |
| First $1 billion of average daily net assets | | | 0.90 | % |
| Next $1 billion of average daily net assets | | | 0.80 | % |
| Average daily net assets in excess of $2 billion | | | 0.70 | % |
The investment adviser has agreed in writing to reduce its management fee to 0.60% of average daily net assets in excess of $5 billion up to $10 billion and 0.55% of average daily net assets in excess of $10 billion. This written agreement will continue until modified by the fund’s Board of Trustees, but such agreement will continue at least until December 31, 2015. For the six months ended February 28, 2015, this management fee reduction amounted to $1,064,890, which is included in the reduction of total expenses in the Statement of Operations. MFS has also agreed in writing to reduce its management fee by a specified amount if certain MFS mutual fund assets exceed thresholds agreed to by MFS and the fund’s Board of Trustees. For the six months ended February 28, 2015, this management fee reduction amounted to $216,127, which is included in the reduction of total expenses in the Statement of Operations. The management fee incurred for the six months ended February 28, 2015 was equivalent to an annual effective rate of 0.71% of the fund’s average daily net assets.
Distributor – MFS Fund Distributors, Inc. (MFD), a wholly-owned subsidiary of MFS, as distributor, received $27,351 and $808 for the six months ended February 28, 2015, as its portion of the initial sales charge on sales of Class A and Class 529A shares of the fund, respectively.
34
Notes to Financial Statements (unaudited) – continued
The Board of Trustees has adopted a distribution plan for certain share classes pursuant to Rule 12b-1 of the Investment Company Act of 1940.
The fund’s distribution plan provides that the fund will pay MFD for services provided by MFD and financial intermediaries in connection with the distribution and servicing of certain share classes. One component of the plan is a distribution fee paid to MFD and another component of the plan is a service fee paid to MFD. MFD may subsequently pay all, or a portion, of the distribution and/or service fees to financial intermediaries.
Distribution Plan Fee Table:
| | | | | | | | | | | | | | | | | | | | |
| | | Distribution
Fee Rate (d) | | | Service
Fee Rate (d) | | | Total
Distribution
Plan (d) | | | Annual
Effective
Rate (e) | | | Distribution
and Service
Fee | |
| Class A | | | — | | | | 0.25% | | | | 0.25% | | | | 0.25% | | | | $1,472,995 | |
| Class B | | | 0.75% | | | | 0.25% | | | | 1.00% | | | | 1.00% | | | | 74,532 | |
| Class C | | | 0.75% | | | | 0.25% | | | | 1.00% | | | | 1.00% | | | | 416,329 | |
| Class R1 | | | 0.75% | | | | 0.25% | | | | 1.00% | | | | 1.00% | | | | 19,276 | |
| Class R2 | | | 0.25% | | | | 0.25% | | | | 0.50% | | | | 0.50% | | | | 424,180 | |
| Class R3 | | | — | | | | 0.25% | | | | 0.25% | | | | 0.25% | | | | 258,796 | |
| Class 529A | | | — | | | | 0.25% | | | | 0.25% | | | | 0.22% | | | | 2,801 | |
| Class 529B | | | 0.75% | | | | 0.25% | | | | 1.00% | | | | 1.00% | | | | 883 | |
| Class 529C | | | 0.75% | | | | 0.25% | | | | 1.00% | | | | 1.00% | | | | 4,967 | |
| Total Distribution and Service Fees | | | | $2,674,759 | |
| (d) | In accordance with the distribution plan for certain classes, the fund pays distribution and/or service fees equal to these annual percentage rates of each class’s average daily net assets. The distribution and service fee rates disclosed by class represent the current rates in effect at the end of the reporting period. Any rate changes, if applicable, are detailed below. |
| (e) | The annual effective rates represent actual fees incurred under the distribution plan for the six months ended February 28, 2015 based on each class’s average daily net assets. MFD has voluntarily agreed to rebate a portion of each class’s 0.25% service fee attributable to accounts for which MFD retains the 0.25% service fee except for accounts attributable to MFS or its affiliates’ seed money. For the six months ended February 28, 2015, this rebate amounted to $4,607, $51, $52, $295, $1, and $4 for Class A, Class B, Class C, Class 529A, Class 529B, and Class 529C, respectively, and is included in the reduction of total expenses in the Statement of Operations. |
Certain Class A shares are subject to a contingent deferred sales charge (CDSC) in the event of a shareholder redemption within 18 months of purchase. Class C and Class 529C shares are subject to a CDSC in the event of a shareholder redemption within 12 months of purchase. Class B and Class 529B shares are subject to a CDSC in the event of a shareholder redemption within six years of purchase. All contingent deferred sales charges are paid to MFD and during the six months ended February 28, 2015, were as follows:
| | | | |
| | | Amount | |
| Class A | | | $190 | |
| Class B | | | 6,199 | |
| Class C | | | 4,205 | |
| Class 529B | | | 4 | |
| Class 529C | | | 39 | |
35
Notes to Financial Statements (unaudited) – continued
The fund has entered into and may from time to time enter into contracts with program managers and other parties which administer the tuition programs through which an investment in the fund’s 529 share classes is made. The fund has entered into an agreement with MFD pursuant to which MFD receives an annual fee of up to 0.10% of the average daily net assets attributable to each 529 share class. MFD has agreed to waive a portion of this fee in an amount equal to 0.05% of the average daily net assets for each 529 share class. This waiver agreement will expire on December 31, 2016, unless MFD elects to extend the waiver. For the six months ended February 28, 2015, this waiver amounted to $853 and is included in the reduction of total expenses in the Statement of Operations. The program manager fee incurred for the six months ended February 28, 2015 was equivalent to an annual effective rate of 0.05% of the average daily net assets attributable to each 529 share class. The services provided by MFD, or a third party with which MFD contracts, include recordkeeping and tax reporting and account services, as well as services designed to maintain the program’s compliance with the Internal Revenue Code and other regulatory requirements. Program manager fees and waivers for the six months ended February 28, 2015, were as follows:
| | | | | | | | |
| | | Fee | | | Waiver | |
| Class 529A | | | $1,120 | | | | $561 | |
| Class 529B | | | 88 | | | | 44 | |
Class 529C | | | 497 | | | | 248 | |
| Total Program Manager Fees and Waivers | | | $1,705 | | | | $853 | |
Shareholder Servicing Agent – MFS Service Center, Inc. (MFSC), a wholly-owned subsidiary of MFS, receives a fee from the fund for its services as shareholder servicing agent calculated as a percentage of the average daily net assets of the fund as determined periodically under the supervision of the fund’s Board of Trustees. For the six months ended February 28, 2015, the fee was $124,093, which equated to 0.0035% annually of the fund’s average daily net assets. MFSC also receives payment from the fund for out-of-pocket expenses, sub-accounting and other shareholder servicing costs which may be paid to affiliated and unaffiliated service providers. Class R5 shares do not incur sub-accounting fees. For the six months ended February 28, 2015, these out-of-pocket expenses, sub-accounting and other shareholder servicing costs amounted to $2,241,336.
Administrator – MFS provides certain financial, legal, shareholder communications, compliance, and other administrative services to the fund. Under an administrative services agreement, the fund reimburses MFS the costs incurred to provide these services. The fund is charged an annual fixed amount of $17,500 plus a fee based on average daily net assets. The administrative services fee incurred for the six months ended February 28, 2015 was equivalent to an annual effective rate of 0.0092% of the fund’s average daily net assets.
Trustees’ and Officers’ Compensation – The fund pays compensation to independent Trustees in the form of a retainer, attendance fees, and additional compensation to Board and Committee chairpersons. The fund does not pay compensation directly to Trustees or officers of the fund who are also officers of the
36
Notes to Financial Statements (unaudited) – continued
investment adviser, all of whom receive remuneration for their services to the fund from MFS. Certain officers and Trustees of the fund are officers or directors of MFS, MFD, and MFSC.
Prior to December 31, 2001, the fund had an unfunded defined benefit plan (“DB plan”) for independent Trustees. As of December 31, 2001, the Board took action to terminate the DB plan with respect to then-current and any future independent Trustees, such that the DB plan covers only certain of those former independent Trustees who retired on or before December 31, 2001. The DB plan resulted in a pension expense of $87 and is included in independent Trustees’ compensation for the six months ended February 28, 2015. The liability for deferred retirement benefits payable to certain independent Trustees under the DB plan amounted to $1,039 at February 28, 2015, and is included in “Payable for independent Trustees’ compensation” in the Statement of Assets and Liabilities.
Other – Effective November 1, 2014, this fund and certain other funds managed by MFS (the funds) have entered into a service agreement (the ISO Agreement) which provides for payment of fees solely by the funds to Tarantino LLC in return for the provision of services of an Independent Senior Officer (ISO) for the funds. Frank L. Tarantino serves as the ISO and is an officer of the funds and the sole member of Tarantino LLC. The funds can terminate the ISO Agreement with Tarantino LLC at any time under the terms of the ISO Agreement. Prior to November 1, 2014, the funds had entered into a service agreement (the Compliance Officer Agreement) which provided for payment of fees by the funds to Tarantino LLC in return for the provision of services of an Independent Chief Compliance Officer (ICCO) for the funds. Prior to November 1, 2014, Frank L. Tarantino served as the ICCO. Effective October 31, 2014, Mr. Tarantino resigned as ICCO and the Compliance Officer Agreement between the funds and Tarantino LLC was terminated. For the six months ended February 28, 2015, the aggregate fees paid by the fund under these agreements were $13,998 and are included in “Miscellaneous” expense in the Statement of Operations. MFS had agreed to reimburse the fund for a portion of the payments made by the fund for the services under the Compliance Officer Agreement in the amount of $2,435, which is included in the reduction of total expenses in the Statement of Operations. Additionally, MFS has agreed to bear all expenses associated with office space, other administrative support, and supplies provided to the ICCO and ISO.
The fund invests in the MFS Institutional Money Market Portfolio which is managed by MFS and seeks current income consistent with preservation of capital and liquidity. Income earned on this investment is included in “Dividends from underlying affiliated funds” in the Statement of Operations. This money market fund does not pay a management fee to MFS.
On September 11, 2013, MFS redeemed 7,903 shares of Class R5 for an aggregate amount of $135,774.
(4) Portfolio Securities
For the six months ended February 28, 2015, purchases and sales of investments, other than short-term obligations, aggregated $1,043,097,633 and $832,034,504, respectively.
37
Notes to Financial Statements (unaudited) – continued
(5) Shares of Beneficial Interest
The fund’s Declaration of Trust permits the Trustees to issue an unlimited number of full and fractional shares of beneficial interest. Transactions in fund shares were as follows:
| | | | | | | | | | | | | | | | |
| | | Six months ended
2/28/15 | | | Year ended
8/31/14 | |
| | | Shares | | | Amount | | | Shares | | | Amount | |
| Shares sold | | | | | | | | | | | | | | | | |
Class A | | | 17,361,089 | | | | $286,706,597 | | | | 11,795,045 | | | | $210,179,639 | |
Class B | | | 34,462 | | | | 560,270 | | | | 73,919 | | | | 1,254,919 | |
Class C | | | 339,060 | | | | 5,399,547 | | | | 779,624 | | | | 12,932,437 | |
Class I | | | 13,490,190 | | | | 236,523,068 | | | | 32,553,405 | | | | 597,030,708 | |
Class R1 | | | 21,852 | | | | 344,525 | | | | 48,002 | | | | 787,268 | |
Class R2 | | | 969,937 | | | | 15,928,793 | | | | 3,262,913 | | | | 55,773,824 | |
Class R3 | | | 1,279,062 | | | | 21,378,047 | | | | 4,217,815 | | | | 73,822,772 | |
Class R4 | | | 2,927,853 | | | | 49,578,738 | | | | 6,760,440 | | | | 120,226,134 | |
Class R5 | | | 11,303,996 | | | | 189,683,439 | | | | 23,987,940 | | | | 423,700,354 | |
Class 529A | | | 11,403 | | | | 191,951 | | | | 20,890 | | | | 363,424 | |
Class 529B | | | 835 | | | | 13,279 | | | | 2,494 | | | | 41,383 | |
Class 529C | | | 4,285 | | | | 66,886 | | | | 10,025 | | | | 164,945 | |
| | | 47,744,024 | | | | $806,375,140 | | | | 83,512,512 | | | | $1,496,277,807 | |
| | | | |
Shares issued to shareholders in
reinvestment of distributions | | | | | | | | | | | | | | | | |
Class A | | | 1,314,652 | | | | $21,665,463 | | | | 740,280 | | | | $12,917,878 | |
Class B | | | 9,844 | | | | 156,227 | | | | 5,142 | | | | 86,227 | |
Class C | | | 43,975 | | | | 682,930 | | | | 21,795 | | | | 358,525 | |
Class I | | | 2,157,499 | | | | 36,699,053 | | | | 1,243,827 | | | | 22,388,889 | |
Class R1 | | | 4,026 | | | | 61,593 | | | | 1,431 | | | | 23,203 | |
Class R2 | | | 205,523 | | | | 3,282,204 | | | | 101,560 | | | | 1,719,409 | |
Class R3 | | | 282,774 | | | | 4,609,216 | | | | 164,702 | | | | 2,842,760 | |
Class R4 | | | 747,936 | | | | 12,325,993 | | | | 428,261 | | | | 7,473,150 | |
Class R5 | | | 4,499,401 | | | | 73,790,177 | | | | 2,485,573 | | | | 43,174,399 | |
Class 529A | | | 2,978 | | | | 48,384 | | | | 1,773 | | | | 30,527 | |
Class 529B | | | 183 | | | | 2,822 | | | | 86 | | | | 1,412 | |
Class 529C | | | 1,022 | | | | 15,559 | | | | 464 | | | | 7,486 | |
| | | 9,269,813 | | | | $153,339,621 | | | | 5,194,894 | | | | $91,023,865 | |
38
Notes to Financial Statements (unaudited) – continued
| | | | | | | | | | | | | | | | |
| | | Six months ended
2/28/15 | | | Year ended
8/31/14 | |
| | | Shares | | | Amount | | | Shares | | | Amount | |
| Shares reacquired | | | | | | | | | | | | | | | | |
Class A | | | (11,000,401 | ) | | | $(184,410,518 | ) | | | (15,156,261 | ) | | | $(270,617,354 | ) |
Class B | | | (183,068 | ) | | | (2,981,950 | ) | | | (370,599 | ) | | | (6,313,790 | ) |
Class C | | | (592,259 | ) | | | (9,394,087 | ) | | | (1,085,852 | ) | | | (18,135,045 | ) |
Class I | | | (14,246,332 | ) | | | (247,843,211 | ) | | | (25,510,410 | ) | | | (468,165,738 | ) |
Class R1 | | | (48,310 | ) | | | (759,001 | ) | | | (63,860 | ) | | | (1,051,501 | ) |
Class R2 | | | (1,397,738 | ) | | | (23,027,042 | ) | | | (1,589,201 | ) | | | (27,401,731 | ) |
Class R3 | | | (2,875,459 | ) | | | (48,030,232 | ) | | | (3,700,880 | ) | | | (65,149,095 | ) |
Class R4 | | | (5,493,806 | ) | | | (92,374,361 | ) | | | (5,948,182 | ) | | | (105,874,108 | ) |
Class R5 | | | (4,041,507 | ) | | | (68,100,106 | ) | | | (6,253,975 | ) | | | (111,106,638 | ) |
Class 529A | | | (12,619 | ) | | | (212,711 | ) | | | (17,644 | ) | | | (308,796 | ) |
Class 529B | | | (2,775 | ) | | | (43,272 | ) | | | (3,584 | ) | | | (59,757 | ) |
Class 529C | | | (7,282 | ) | | | (110,503 | ) | | | (7,843 | ) | | | (128,677 | ) |
| | | (39,901,556 | ) | | | $(677,286,994 | ) | | | (59,708,291 | ) | | | $(1,074,312,230 | ) |
| | | | |
| Net change | | | | | | | | | | | | | | | | |
Class A | | | 7,675,340 | | | | $123,961,542 | | | | (2,620,936 | ) | | | $(47,519,837 | ) |
Class B | | | (138,762 | ) | | | (2,265,453 | ) | | | (291,538 | ) | | | (4,972,644 | ) |
Class C | | | (209,224 | ) | | | (3,311,610 | ) | | | (284,433 | ) | | | (4,844,083 | ) |
Class I | | | 1,401,357 | | | | 25,378,910 | | | | 8,286,822 | | | | 151,253,859 | |
Class R1 | | | (22,432 | ) | | | (352,883 | ) | | | (14,427 | ) | | | (241,030 | ) |
Class R2 | | | (222,278 | ) | | | (3,816,045 | ) | | | 1,775,272 | | | | 30,091,502 | |
Class R3 | | | (1,313,623 | ) | | | (22,042,969 | ) | | | 681,637 | | | | 11,516,437 | |
Class R4 | | | (1,818,017 | ) | | | (30,469,630 | ) | | | 1,240,519 | | | | 21,825,176 | |
Class R5 | | | 11,761,890 | | | | 195,373,510 | | | | 20,219,538 | | | | 355,768,115 | |
Class 529A | | | 1,762 | | | | 27,624 | | | | 5,019 | | | | 85,155 | |
Class 529B | | | (1,757 | ) | | | (27,171 | ) | | | (1,004 | ) | | | (16,962 | ) |
Class 529C | | | (1,975 | ) | | | (28,058 | ) | | | 2,646 | | | | 43,754 | |
| | | 17,112,281 | | | | $282,427,767 | | | | 28,999,115 | | | | $512,989,442 | |
The fund is one of several mutual funds in which certain MFS funds may invest. The MFS funds do not invest in the underlying funds for the purpose of exercising management or control. At the end of the period, the MFS International Diversification Fund, the MFS Moderate Allocation Fund, the MFS Growth Allocation Fund, the MFS Aggressive Growth Allocation Fund, and the MFS Conservative Allocation Fund were the owners of record of approximately 18%, 5%, 5%, 2%, and 2% respectively, of the value of outstanding voting shares of the fund. In addition, the MFS Lifetime 2015 Fund, the MFS Lifetime 2020 Fund, the MFS Lifetime 2025 Fund, the MFS Lifetime 2030 Fund, the MFS Lifetime 2035 Fund, the MFS Lifetime 2040 Fund, the MFS Lifetime 2045 Fund, the MFS Lifetime 2050 Fund, the MFS Lifetime 2055 Fund, and the MFS Lifetime Income Fund were each the owners of record of less than 1% of the value of outstanding voting shares of the fund.
39
Notes to Financial Statements (unaudited) – continued
(6) Line of Credit
The fund and certain other funds managed by MFS participate in a $1.1 billion unsecured committed line of credit, subject to a $1 billion sublimit, provided by a syndication of banks under a credit agreement. Borrowings may be made for temporary financing needs. Interest is charged to each fund, based on its borrowings, generally at a rate equal to the higher of the Federal Reserve funds rate or one month LIBOR plus an agreed upon spread. A commitment fee, based on the average daily, unused portion of the committed line of credit, is allocated among the participating funds at the end of each calendar quarter. In addition, the fund and other funds managed by MFS have established unsecured uncommitted borrowing arrangements with certain banks for temporary financing needs. Interest is charged to each fund, based on its borrowings, at a rate equal to the Federal Reserve funds rate plus an agreed upon spread. For the six months ended February 28, 2015, the fund’s commitment fee and interest expense were $13,340 and $0, respectively, and are included in “Miscellaneous” expense in the Statement of Operations.
(7) Transactions in Underlying Affiliated Funds-Affiliated Issuers
An affiliated issuer may be considered one in which the fund owns 5% or more of the outstanding voting securities, or a company which is under common control. For the purposes of this report, the fund assumes the following to be an affiliated issuer:
| | | | | | | | | | | | | | | | |
| Underlying Affiliated Fund | | Beginning
Shares/Par
Amount | | | Acquisitions
Shares/Par
Amount | | | Dispositions
Shares/Par
Amount | | | Ending
Shares/Par
Amount | |
MFS Institutional Money
Market Portfolio | | | 102,287,398 | | | | 441,403,013 | | | | (495,768,163 | ) | | | 47,922,248 | |
| | | | |
| Underlying Affiliated Fund | | Realized
Gain (Loss) | | | Capital Gain
Distributions | | | Dividend
Income | | | Ending
Value | |
MFS Institutional Money
Market Portfolio | | | $— | | | | $— | | | | $34,126 | | | | $47,922,248 | |
40
PROXY VOTING POLICIES AND INFORMATION
MFS votes proxies on behalf of the fund pursuant to proxy voting policies and procedures that are available without charge, upon request, by calling 1-800-225-2606, by visiting the Proxy Voting section of mfs.com or by visiting the SEC’s Web site at http://www.sec.gov.
Information regarding how the fund voted proxies relating to portfolio securities during the most recent twelve-month period ended June 30 is available without charge by visiting the Proxy Voting section of mfs.com or by visiting the SEC’s Web site at http://www.sec.gov.
QUARTERLY PORTFOLIO DISCLOSURE
The fund will file a complete schedule of portfolio holdings with the Securities and Exchange Commission (the Commission) for the first and third quarters of each fiscal year on Form N-Q. A shareholder can obtain the quarterly portfolio holdings report at mfs.com. The fund’s Form N-Q is also available on the EDGAR database on the Commission’s Internet Web site at http://www.sec.gov, and may be reviewed and copied at the:
Public Reference Room
Securities and Exchange Commission
100 F Street, NE, Room 1580
Washington, D.C. 20549
Information on the operation of the Public Reference Room may be obtained by calling the Commission at 1-800-SEC-0330. Copies of the fund’s Form N-Q also may be obtained, upon payment of a duplicating fee, by electronic request at the following e-mail address: publicinfo@sec.gov or by writing the Public Reference Section at the above address.
FURTHER INFORMATION
From time to time, MFS may post important information about the fund or the MFS funds on the MFS web site (mfs.com). This information is available by visiting the “Market Commentary” and “Announcements” sub sections in the “Market Outlooks” section of mfs.com or by clicking on the fund’s name under “Mutual Funds” in the “Products” section of mfs.com.
PROVISION OF FINANCIAL REPORTS AND SUMMARY PROSPECTUSES
The fund produces financial reports every six months and updates its summary prospectus and prospectus annually. To avoid sending duplicate copies of materials to households, only one copy of the fund’s annual and semiannual report and summary prospectus may be mailed to shareholders having the same last name and residential address on the fund’s records. However, any shareholder may contact MFSC (please see back cover for address and telephone number) to request that copies of these reports and summary prospectuses be sent personally to that shareholder.
41
Save paper with eDelivery.

| MFS® will send you prospectuses, |
reports, and proxies directly via e-mail so you will get information faster with less mailbox clutter.
To sign up:
1. Go to mfs.com.
2. Log in via MFS® Access.
3. Select eDelivery.
If you own your MFS fund shares through a financial institution or a retirement plan, MFS® TALK, MFS® Access, or eDelivery may not be available to you.
CONTACT
WEB SITE
mfs.com
MFS TALK
1-800-637-8255
24 hours a day
ACCOUNT SERVICE AND LITERATURE
Shareholders
1-800-225-2606
Financial advisors
1-800-343-2829
Retirement plan services
1-800-637-1255
MAILING ADDRESS
MFS Service Center, Inc.
P.O. Box 55824
Boston, MA 02205-5824
OVERNIGHT MAIL
MFS Service Center, Inc.
c/o Boston Financial Data Services
30 Dan Road
Canton, MA 02021-2809
SEMIANNUAL REPORT
February 28, 2015

MFS® TECHNOLOGY FUND

SCT-SEM
MFS® TECHNOLOGY FUND
CONTENTS
The report is prepared for the general information of shareholders.
It is authorized for distribution to prospective investors only when preceded or accompanied by a current prospectus.
NOT FDIC INSURED Ÿ MAY LOSE VALUE Ÿ NO BANK GUARANTEE

LETTER FROM THE CHAIRMAN
Dear Shareholders:
Lower oil prices continue to influence markets in different ways. Among those economies hurt, oil-exporters such as Russia and Venezuela have been hit particularly hard, along with U.S. regions that have close oil industry ties.
The U.S. economic recovery remains solid. The labor market is strong, interest rates are historically low and reduced energy prices have helped to stimulate consumer spending.
Economic reports early in 2015 indicate that the eurozone is on a more solid footing, with confidence boosted by the launch of European Central Bank quantitative easing.
In Asia, the Chinese economy continues to raise concerns, with the People’s Bank of China implementing stimulus programs to counter a steady decline in growth rates.
As always, active risk management is integral to how we at MFS® manage your investments. We use a collaborative process, sharing insights across asset classes, regions and economic sectors. Our global investment team uses a diversified, multidisciplined, long-term approach.
Applying proven principles, such as asset allocation and diversification, can best serve investors over the long term. We are confident that this approach can help you as you work with your financial advisors to reach your goals in the years ahead.
Respectfully,

Robert J. Manning
Chairman
MFS Investment Management
April 14, 2015
The opinions expressed in this letter are subject to change and may not be relied upon for investment advice. No forecasts can be guaranteed.
1
PORTFOLIO COMPOSITION
Portfolio structure (i)

| | | | |
| Top ten holdings (i) | | | | |
| Google, Inc., “A” | | | 8.2% | |
| Apple, Inc. | | | 6.1% | |
| Oracle Corp. | | | 4.4% | |
| Facebook, Inc., “A” | | | 4.4% | |
| Visa, Inc., “A” | | | 4.4% | |
| Hewlett-Packard Co. | | | 3.9% | |
| EMC Corp. | | | 3.8% | |
| Salesforce.com, Inc. | | | 3.2% | |
| MasterCard, Inc., “A” | | | 3.2% | |
| Priceline Group, Inc. | | | 3.2% | |
| | | | |
| Top five industries (i) | | | | |
| Internet | | | 21.0% | |
| Computer Software-Systems (s) | | | 18.5% | |
| Computer Software | | | 15.1% | |
| Electronics (s) | | | 8.0% | |
| Other Banks & Diversified Financials | | | 7.6% | |
| (i) | For purposes of this presentation, the components include the value of securities, less any securities sold short, and reflect the impact of the equivalent exposure of derivative positions. These amounts may be negative from time to time. Equivalent exposure is a calculated amount that translates the derivative position into a reasonable approximation of the amount of the underlying asset that the portfolio would have to hold at a given point in time to have the same price sensitivity that results from the portfolio’s ownership of the derivative contract. When dealing with derivatives, equivalent exposure is a more representative measure of the potential impact of a position on portfolio performance than value. |
| (s) | Includes securities sold short. |
Cash & Other can include cash, other assets less liabilities, offsets to derivative positions, and short-term securities.
Percentages are based on net assets as of 2/28/15.
The portfolio is actively managed and current holdings may be different.
2
EXPENSE TABLE
Fund expenses borne by the shareholders during the period, September 1, 2014 through February 28, 2015
As a shareholder of the fund, you incur two types of costs: (1) transaction costs, including sales charges (loads) on certain purchase or redemption payments, and (2) ongoing costs, including management fees; distribution and service (12b-1) fees; and other fund expenses. This example is intended to help you understand your ongoing costs (in dollars) of investing in the fund and to compare these costs with the ongoing costs of investing in other mutual funds.
The example is based on an investment of $1,000 invested at the beginning of the period and held for the entire period September 1, 2014 through February 28, 2015.
Actual Expenses
The first line for each share class in the following table provides information about actual account values and actual expenses. You may use the information in this line, together with the amount you invested, to estimate the expenses that you paid over the period. Simply divide your account value by $1,000 (for example, an $8,600 account value divided by $1,000 = 8.6), then multiply the result by the number in the first line under the heading entitled “Expenses Paid During Period” to estimate the expenses you paid on your account during this period.
Hypothetical Example for Comparison Purposes
The second line for each share class in the following table provides information about hypothetical account values and hypothetical expenses based on the fund’s actual expense ratio and an assumed rate of return of 5% per year before expenses, which is not the fund’s actual return. The hypothetical account values and expenses may not be used to estimate the actual ending account balance or expenses you paid for the period. You may use this information to compare the ongoing costs of investing in the fund and other funds. To do so, compare this 5% hypothetical example with the 5% hypothetical examples that appear in the shareholder reports of the other funds.
Please note that the expenses shown in the table are meant to highlight your ongoing costs only and do not reflect any transactional costs, such as sales charges (loads). Therefore, the second line for each share class in the table is useful in comparing ongoing costs only, and will not help you determine the relative total costs of owning different funds. In addition, if these transactional costs were included, your costs would have been higher.
3
Expense Table – continued
| | | | | | | | | | | | | | | | | | |
Share
Class | | | | Annualized
Expense Ratio | | | Beginning
Account Value
9/01/14 | | | Ending Account Value
2/28/15 | | | Expenses
Paid During
Period (p)
9/01/14-2/28/15 | |
| A | | Actual | | | 1.30% | | | | $1,000.00 | | | | $1,069.28 | | | | $6.67 | |
| | Hypothetical (h) | | | 1.30% | | | | $1,000.00 | | | | $1,018.35 | | | | $6.51 | |
| B | | Actual | | | 2.05% | | | | $1,000.00 | | | | $1,065.50 | | | | $10.50 | |
| | Hypothetical (h) | | | 2.05% | | | | $1,000.00 | | | | $1,014.63 | | | | $10.24 | |
| C | | Actual | | | 2.05% | | | | $1,000.00 | | | | $1,065.62 | | | | $10.50 | |
| | Hypothetical (h) | | | 2.05% | | | | $1,000.00 | | | | $1,014.63 | | | | $10.24 | |
| I | | Actual | | | 1.05% | | | | $1,000.00 | | | | $1,071.11 | | | | $5.39 | |
| | Hypothetical (h) | | | 1.05% | | | | $1,000.00 | | | | $1,019.59 | | | | $5.26 | |
| R1 | | Actual | | | 2.05% | | | | $1,000.00 | | | | $1,065.74 | | | | $10.50 | |
| | Hypothetical (h) | | | 2.05% | | | | $1,000.00 | | | | $1,014.63 | | | | $10.24 | |
| R2 | | Actual | | | 1.55% | | | | $1,000.00 | | | | $1,068.15 | | | | $7.95 | |
| | Hypothetical (h) | | | 1.55% | | | | $1,000.00 | | | | $1,017.11 | | | | $7.75 | |
| R3 | | Actual | | | 1.30% | | | | $1,000.00 | | | | $1,069.73 | | | | $6.67 | |
| | Hypothetical (h) | | | 1.30% | | | | $1,000.00 | | | | $1,018.35 | | | | $6.51 | |
| R4 | | Actual | | | 1.05% | | | | $1,000.00 | | | | $1,070.76 | | | | $5.39 | |
| | Hypothetical (h) | | | 1.05% | | | | $1,000.00 | | | | $1,019.59 | | | | $5.26 | |
| R5 | | Actual | | | 0.96% | | | | $1,000.00 | | | | $1,071.78 | | | | $4.93 | |
| | Hypothetical (h) | | | 0.96% | | | | $1,000.00 | | | | $1,020.03 | | | | $4.81 | |
| (h) | 5% class return per year before expenses. |
| (p) | “Expenses Paid During Period” are equal to each class’s annualized expense ratio, as shown above, multiplied by the average account value over the period, multiplied by 181/365 (to reflect the one-half year period). Expenses paid do not include any applicable sales charges (loads). If these transaction costs had been included, your costs would have been higher. |
Notes to Expense Table
Expense ratios include 0.04% of investment related expenses from short sales (See Note 2 of the Notes to Financial Statements).
Each class with a Rule 12b-1 service fee is subject to a rebate of a portion of such fee. Such rebates are included in the expense ratios above. For Class A shares, this rebate reduced the expense ratio above by 0.01%. See Note 3 in the Notes to Financial Statements for additional information.
4
PORTFOLIO OF INVESTMENTS
2/28/15 (unaudited)
The Portfolio of Investments is a complete list of all securities owned by your fund. It is categorized by broad-based asset classes.
| | | | | | | | |
| Common Stocks - 98.1% | | | | | | | | |
| Issuer | | Shares/Par | | | Value ($) | |
| | | | | | | | |
| Broadcasting - 5.1% | | | | | | | | |
| Discovery Communications, Inc., “C” (a) | | | 72,447 | | | $ | 2,210,355 | |
| Time Warner, Inc. | | | 83,372 | | | | 6,824,832 | |
| Twenty-First Century Fox, Inc. | | | 196,395 | | | | 6,873,825 | |
| Walt Disney Co. | | | 12,939 | | | | 1,346,691 | |
| | | | | | | | |
| | | | $ | 17,255,703 | |
| Brokerage & Asset Managers - 1.3% | | | | | | | | |
| Allied Minds PLC (a) | | | 299,737 | | | $ | 2,753,358 | |
| Intercontinental Exchange, Inc. | | | 7,233 | | | | 1,702,359 | |
| | | | | | | | |
| | | | $ | 4,455,717 | |
| Business Services - 6.7% | | | | | | | | |
| Accenture PLC, “A” | | | 25,197 | | | $ | 2,268,486 | |
| Cognizant Technology Solutions Corp., “A” (a) | | | 73,411 | | | | 4,587,086 | |
| Equifax, Inc. | | | 17,132 | | | | 1,599,615 | |
| Fidelity National Information Services, Inc. | | | 59,715 | | | | 4,036,137 | |
| FleetCor Technologies, Inc. (a) | | | 19,097 | | | | 2,930,053 | |
| Gartner, Inc. (a) | | | 28,023 | | | | 2,328,992 | |
| Global Payments, Inc. | | | 25,092 | | | | 2,304,951 | |
| IHS, Inc., “A” (a) | | | 8,479 | | | | 996,537 | |
| Wex, Inc. (a) | | | 17,899 | | | | 1,915,014 | |
| | | | | | | | |
| | | | $ | 22,966,871 | |
| Cable TV - 0.3% | | | | | | | | |
| Time Warner Cable, Inc. | | | 6,730 | | | $ | 1,036,757 | |
| | |
| Computer Software - 15.3% | | | | | | | | |
| Adobe Systems, Inc. (a) | | | 73,526 | | | $ | 5,815,907 | |
| Intuit, Inc. | | | 31,632 | | | | 3,088,232 | |
| Microsoft Corp. | | | 228,925 | | | | 10,038,361 | |
| Oracle Corp. | | | 346,214 | | | | 15,171,097 | |
| Qlik Technologies, Inc. (a) | | | 67,260 | | | | 2,181,914 | |
| Red Hat, Inc. (a) | | | 67,739 | | | | 4,682,120 | |
| Salesforce.com, Inc. (a) | | | 158,924 | | | | 11,026,147 | |
| | | | | | | | |
| | | | $ | 52,003,778 | |
| Computer Software - Systems - 18.4% | | | | | | | | |
| Apple, Inc. (s) | | | 161,490 | | | $ | 20,745,005 | |
| Benefitfocus, Inc. (a)(l) | | | 15,488 | | | | 504,289 | |
| CDW Corp. | | | 79,824 | | | | 3,003,777 | |
5
Portfolio of Investments (unaudited) – continued
| | | | | | | | |
| Issuer | | Shares/Par | | | Value ($) | |
| | | | | | | | |
| Common Stocks - continued | | | | | | | | |
| Computer Software - Systems - continued | | | | | | | | |
| EMC Corp. | | | 442,153 | | | $ | 12,795,908 | |
| Guidewire Software, Inc. (a) | | | 35,270 | | | | 1,963,128 | |
| Hewlett-Packard Co. (s) | | | 384,614 | | | | 13,399,952 | |
| Hortonworks, Inc. (a) | | | 44,207 | | | | 1,018,087 | |
| Kinaxis, Inc. (a) | | | 43,895 | | | | 877,479 | |
| Qualys, Inc. (a) | | | 38,960 | | | | 1,793,329 | |
| Sabre Corp. | | | 45,361 | | | | 987,055 | |
| ServiceNow, Inc. (a) | | | 25,799 | | | | 1,967,432 | |
| SS&C Technologies Holdings, Inc. | | | 35,570 | | | | 2,158,388 | |
| Vantiv, Inc., “A” (a) | | | 39,838 | | | | 1,473,608 | |
| | | | | | | | |
| | | | $ | 62,687,437 | |
| Consumer Services - 3.2% | | | | | | | | |
| Priceline Group, Inc. (a) | | | 8,732 | | | $ | 10,805,675 | |
| | |
| Electrical Equipment - 2.3% | | | | | | | | |
| Amphenol Corp., “A” | | | 60,056 | | | $ | 3,390,762 | |
| TE Connectivity Ltd. | | | 59,218 | | | | 4,271,394 | |
| | | | | | | | |
| | | | $ | 7,662,156 | |
| Electronics - 8.4% | | | | | | | | |
| Altera Corp. | | | 102,399 | | | $ | 3,789,787 | |
| Avago Technologies Ltd. | | | 17,428 | | | | 2,224,161 | |
| Broadcom Corp., “A” | | | 121,748 | | | | 5,506,662 | |
| Cypress Semiconductor Corp. | | | 125,062 | | | | 1,844,665 | |
| JDS Uniphase Corp. (a) | | | 332,171 | | | | 4,573,995 | |
| Mellanox Technologies Ltd. (a) | | | 43,580 | | | | 2,076,151 | |
| Microchip Technology, Inc. | | | 170,985 | | | | 8,766,401 | |
| | | | | | | | |
| | | | $ | 28,781,822 | |
| Entertainment - 0.6% | | | | | | | | |
| AMC Networks, Inc., “A” (a) | | | 28,103 | | | $ | 2,023,978 | |
| | |
| Internet - 21.0% | | | | | | | | |
| Alibaba Group Holding Ltd., ADR (a) | | | 17,098 | | | $ | 1,455,382 | |
| eBay, Inc. (a) | | | 73,263 | | | | 4,242,660 | |
| Facebook, Inc., “A “ (a) | | | 191,696 | | | | 15,138,233 | |
| Google, Inc., “A” (a)(s) | | | 49,564 | | | | 27,886,193 | |
| Google, Inc., “C” (a) | | | 4,550 | | | | 2,540,720 | |
| LinkedIn Corp., “A” (a) | | | 22,189 | | | | 5,928,901 | |
| Twitter, Inc. (a) | | | 79,512 | | | | 3,822,937 | |
| Yahoo!, Inc. (a) | | | 198,874 | | | | 8,806,141 | |
| Yelp, Inc. (a) | | | 38,193 | | | | 1,833,264 | |
| | | | | | | | |
| | | | $ | 71,654,431 | |
6
Portfolio of Investments (unaudited) – continued
| | | | | | | | |
| Issuer | | Shares/Par | | | Value ($) | |
| | | | | | | | |
| Common Stocks - continued | | | | | | | | |
| Network & Telecom - 3.8% | | | | | | | | |
| Cisco Systems, Inc. | | | 286,903 | | | $ | 8,466,508 | |
| Juniper Networks, Inc. | | | 85,719 | | | | 2,049,541 | |
| Qualcomm, Inc. | | | 33,317 | | | | 2,415,816 | |
| | | | | | | | |
| | | | $ | 12,931,865 | |
| Other Banks & Diversified Financials - 7.6% | | | | | | | | |
| MasterCard, Inc., “A” | | | 121,558 | | | $ | 10,956,023 | |
| Visa, Inc., “A” | | | 55,649 | | | | 15,098,130 | |
| | | | | | | | |
| | | | $ | 26,054,153 | |
| Specialty Stores - 2.9% | | | | | | | | |
| Amazon.com, Inc. (a) | | | 26,422 | | | $ | 10,044,588 | |
| | |
| Telecommunications - Wireless - 1.2% | | | | | | | | |
| American Tower Corp., REIT | | | 26,972 | | | $ | 2,674,004 | |
| SBA Communications Corp. (a) | | | 12,410 | | | | 1,547,651 | |
| | | | | | | | |
| | | | $ | 4,221,655 | |
| Total Common Stocks (Identified Cost, $222,749,590) | | | $ | 334,586,586 | |
| | |
| Collateral for Securities Loaned - 0.1% | | | | | | | | |
Navigator Securities Lending Prime Portfolio, 0.17%,
at Cost and Net Asset Value (j) | | | 361,792 | | | $ | 361,792 | |
| | |
| Issuer/Expiration Date/Strike Price | | Number of
Contracts | | | | |
| Put Options Purchased - 0.1% | | | | | | | | |
| Computer Software - 0.0% | | | | | | | | |
| Commvault Systems Inc. - July 2015 @ $50 | | | 150 | | | $ | 67,500 | |
| | |
| Electronics - 0.0% | | | | | | | | |
| 3d Systems Corp. - March 2015 @ $33 | | | 180 | | | $ | 51,840 | |
|
| Entertainment - 0.1% | |
| Dreamworks Animation SKG Inc. - September 2015 @ $25 | | | 160 | | | $ | 80,000 | |
| Total Put Options Purchased (Premiums Paid, $268,713) | | | $ | 199,340 | |
| | |
| Issuer | | Shares/Par | | | | |
| Money Market Funds - 1.7% | | | | | | | | |
MFS Institutional Money Market Portfolio, 0.1%,
at Cost and Net Asset Value (v) | | | 5,776,075 | | | $ | 5,776,075 | |
| Total Investments (Identified Cost, $229,156,170) | | | $ | 340,923,793 | |
7
Portfolio of Investments (unaudited) – continued
| | | | | | | | |
| Call Options Written - 0.0% | | | | | | | | |
| Issuer/Expiration Date/Strike Price | | Number of
Contracts | | | Value ($) | |
| | | | | | | | |
| Computer Software - Systems - 0.0% | | | | | | | | |
| Hewlett-Packard Co. - March 2015 @ $36 | | | (402 | ) | | $ | (11,658 | ) |
| Hewlett-Packard Co. - March 2015 @ $41 | | | (354 | ) | | | (708 | ) |
| Total Call Options Written (Premiums Received, $16,468) | | | $ | (12,366 | ) |
| | |
| Put Options Written - (0.1)% | | | | | | | | |
| Computer Software - Systems - (0.1)% | | | | | | | | |
| Apple Inc. - March 2015 @ $118 | | | (393 | ) | | $ | (22,008 | ) |
| Apple Inc. - March 2015 @ $125 | | | (236 | ) | | | (45,312 | ) |
| Benefitfocus Inc. - March 2015 @ $30 | | | (369 | ) | | | (31,365 | ) |
| Hewlett-Packard Co. - March 2015 @ $35 | | | (221 | ) | | | (19,448 | ) |
| Splunk Inc. - March 2015 @ $54 | | | (98 | ) | | | (2,940 | ) |
| | | | | | | | |
| | | | $ | (121,073 | ) |
| Electronics - 0.0% | | | | | | | | |
| Avago Technologies Ltd. - March 2015 @ $115 | | | (120 | ) | | $ | (6,000 | ) |
| Avago Technologies Ltd. - March 2015 @ $120 | | | (105 | ) | | | (12,600 | ) |
| Avago Technologies Ltd. - March 2015 @ $95 | | | (121 | ) | | | (22,748 | ) |
| | | | | | | | |
| | | | $ | (41,348 | ) |
| Network & Telecom - 0.0% | | | | | | | | |
| Cisco Systems Inc. - March 2015 @ $29 | | | (516 | ) | | $ | (13,932 | ) |
| Total Put Options Written (Premiums Received, $118,945) | | | $ | (176,353 | ) |
| | |
| Issuer | | Shares/Par | | | | |
| Securities Sold Short - (0.9)% | | | | | | | | |
| Computer Software - Systems - (0.4)% | | | | | | | | |
| Arrow Electronics, Inc. (a) | | | (24,400 | ) | | $ | (1,511,824 | ) |
| | |
| Electronics - (0.5)% | | | | | | | | |
| Linear Technology Corp. | | | (35,500 | ) | | $ | (1,710,568 | ) |
| Total Securities Sold Short (Proceeds Received, $2,833,769) | | | $ | (3,222,392 | ) |
| |
| Other Assets, Less Liabilities - 1.0% | | | | 3,445,784 | |
| Net Assets - 100.0% | | | $ | 340,958,466 | |
| (a) | Non-income producing security. |
| (j) | The rate quoted is the annualized seven-day yield of the fund at period end. |
| (l) | A portion of this security is on loan. |
| (s) | Security or a portion of the security was pledged to cover collateral requirements for securities sold short and/or certain derivative transactions. |
| (v) | Underlying affiliated fund that is available only to investment companies managed by MFS. The rate quoted for the MFS Institutional Money Market Portfolio is the annualized seven-day yield of the fund at period end. |
8
Portfolio of Investments (unaudited) – continued
At February 28, 2015, the fund had cash collateral of $830,323 and other liquid securities with an aggregate value of $7,262,366 to cover any commitments for securities sold short and/or certain derivative contracts. Cash collateral is comprised of “Deposits with brokers” on the Statement of Assets and Liabilities.
The following abbreviations are used in this report and are defined:
| ADR | | American Depositary Receipt |
| PLC | | Public Limited Company |
| REIT | | Real Estate Investment Trust |
See notes to financial statements
9
Financial Statements
STATEMENT OF ASSETS AND LIABILITIES
At 2/28/15 (unaudited)
This statement represents your fund’s balance sheet, which details the assets and liabilities comprising the total value of the fund.
| | | | |
| Assets | | | | |
Investments- | | | | |
Non-affiliated issuers, at value (identified cost, $223,380,095) | | | $335,147,718 | |
Underlying affiliated funds, at cost and value | | | 5,776,075 | |
Total investments, at value, including $368,123 of securities on loan (identified cost, $229,156,170) | | | $340,923,793 | |
Deposits with brokers | | | 830,323 | |
Receivables for | | | | |
Premiums on options written | | | 8,004 | |
Investments sold | | | 5,642,956 | |
Fund shares sold | | | 768,341 | |
Interest and dividends | | | 288,376 | |
Other assets | | | 1,959 | |
Total assets | | | $348,463,752 | |
| Liabilities | | | | |
Payables for | | | | |
Securities sold short, at value (proceeds received, $2,833,769) | | | $3,222,392 | |
Investments purchased | | | 3,274,194 | |
Fund shares reacquired | | | 299,093 | |
Written options outstanding, at value (premiums received, $135,413) | | | 188,719 | |
Collateral for securities loaned, at value | | | 361,792 | |
Payable to affiliates | | | | |
Investment adviser | | | 19,770 | |
Shareholder servicing costs | | | 117,085 | |
Distribution and service fees | | | 9,120 | |
Payable for independent Trustees’ compensation | | | 1,040 | |
Accrued expenses and other liabilities | | | 12,081 | |
Total liabilities | | | $7,505,286 | |
Net assets | | | $340,958,466 | |
| Net assets consist of | | | | |
Paid-in capital | | | $222,357,955 | |
Unrealized appreciation (depreciation) on investments and translation of assets and liabilities in foreign currencies | | | 111,324,861 | |
Accumulated net realized gain (loss) on investments and foreign currency | | | 8,195,937 | |
Accumulated net investment loss | | | (920,287 | ) |
Net assets | | | $340,958,466 | |
Shares of beneficial interest outstanding | | | 13,675,980 | |
10
Statement of Assets and Liabilities (unaudited) – continued
| | | | | | | | | | | | |
| | | Net assets | | | Shares
outstanding | | | Net asset value
per share (a) | |
| Class A | | | $191,700,305 | | | | 7,585,284 | | | | $25.27 | |
| Class B | | | 18,398,075 | | | | 808,369 | | | | 22.76 | |
| Class C | | | 41,140,586 | | | | 1,810,956 | | | | 22.72 | |
| Class I | | | 50,258,290 | | | | 1,888,804 | | | | 26.61 | |
| Class R1 | | | 2,329,143 | | | | 102,714 | | | | 22.68 | |
| Class R2 | | | 18,345,243 | | | | 751,326 | | | | 24.42 | |
| Class R3 | | | 10,072,342 | | | | 398,671 | | | | 25.26 | |
| Class R4 | | | 3,073,871 | | | | 118,323 | | | | 25.98 | |
| Class R5 | | | 5,640,611 | | | | 211,533 | | | | 26.67 | |
| (a) | Maximum offering price per share was equal to the net asset value per share for all share classes, except for Class A, for which the maximum offering price per share was $26.81 [100 / 94.25 x $25.27]. On sales of $50,000 or more, the maximum offering price of Class A shares is reduced. A contingent deferred sales charge may be imposed on redemptions of Class A, Class B, and Class C shares. Redemption price per share was equal to the net asset value per share for Classes I, R1, R2, R3, R4, and R5. |
See notes to financial statements
11
Financial Statements
STATEMENT OF OPERATIONS
Six months ended 2/28/15 (unaudited)
This statement describes how much your fund earned in investment income and accrued in expenses. It also describes any gains and/or losses generated by fund operations.
| | | | |
| Net Investment loss | |
Income | | | | |
Dividends | | | $1,242,855 | |
Interest | | | 7,559 | |
Dividends from underlying affiliated funds | | | 5,470 | |
Total investment income | | | $1,255,884 | |
Expenses | | | | |
Management fee | | | $1,157,236 | |
Distribution and service fees | | | 553,873 | |
Shareholder servicing costs | | | 254,091 | |
Administrative services fee | | | 29,716 | |
Independent Trustees’ compensation | | | 4,703 | |
Custodian fee | | | 19,572 | |
Shareholder communications | | | 19,365 | |
Audit and tax fees | | | 27,705 | |
Legal fees | | | 1,260 | |
Dividend and interest expense on securities sold short | | | 55,484 | |
Miscellaneous | | | 66,751 | |
Total expenses | | | $2,189,756 | |
Fees paid indirectly | | | (50 | ) |
Reduction of expenses by investment adviser and distributor | | | (14,677 | ) |
Net expenses | | | $2,175,029 | |
Net investment loss | | | $(919,145 | ) |
Realized and unrealized gain (loss) on investments and
foreign currency | |
Realized gain (loss) (identified cost basis) | | | | |
Investments | | | $10,446,587 | |
Written options | | | 79,525 | |
Securities sold short | | | (8,562 | ) |
Foreign currency | | | (651 | ) |
Net realized gain (loss) on investments and foreign currency | | | $10,516,899 | |
Change in unrealized appreciation (depreciation) | | | | |
Investments | | | $12,555,702 | |
Written options | | | (60,739 | ) |
Securities sold short | | | (174,392 | ) |
Translation of assets and liabilities in foreign currencies | | | (895 | ) |
Net unrealized gain (loss) on investments and foreign currency translation | | | $12,319,676 | |
Net realized and unrealized gain (loss) on investments and foreign currency | | | $22,836,575 | |
Change in net assets from operations | | | $21,917,430 | |
See notes to financial statements
12
Financial Statements
STATEMENTS OF CHANGES IN NET ASSETS
These statements describe the increases and/or decreases in net assets resulting from operations, any distributions, and any shareholder transactions.
| | | | | | | | |
| | | Six months ended
2/28/15 | | | Year ended
8/31/14 | |
| Change in net assets | | (unaudited) | | | | |
| From operations | | | | | | | | |
Net investment loss | | | $(919,145 | ) | | | $(1,913,552 | ) |
Net realized gain (loss) on investments and foreign currency | | | 10,516,899 | | | | 18,225,243 | |
Net unrealized gain (loss) on investments and foreign currency translation | | | 12,319,676 | | | | 44,993,780 | |
Change in net assets from operations | | | $21,917,430 | | | | $61,305,471 | |
| Distributions declared to shareholders | | | | | | | | |
From net realized gain on investments | | | $(10,909,819 | ) | | | $— | |
Change in net assets from fund share transactions | | | $32,770,089 | | | | $(1,601,290 | ) |
Total change in net assets | | | $43,777,700 | | | | $59,704,181 | |
| Net assets | | | | | | | | |
At beginning of period | | | 297,180,766 | | | | 237,476,585 | |
At end of period (including accumulated net investment loss of $920,287 and $1,142, respectively) | | | $340,958,466 | | | | $297,180,766 | |
See notes to financial statements
13
Financial Statements
FINANCIAL HIGHLIGHTS
The financial highlights table is intended to help you understand the fund’s financial performance for the semiannual period and the past 5 fiscal years (or life of a particular share class, if shorter). Certain information reflects financial results for a single fund share. The total returns in the table represent the rate by which an investor would have earned (or lost) on an investment in the fund share class (assuming reinvestment of all distributions) held for the entire period.
| | | | | | | | | | | | | | | | | | | | | | | | |
| | | Six months
ended
2/28/15
(unaudited) | | | Years ended 8/31 | |
| Class A | | | 2014 | | | 2013 | | | 2012 | | | 2011 | | | 2010 | |
| | | | | | | | | | | | | | | | | |
Net asset value, beginning of period | | | $24.47 | | | | $19.41 | | | | $16.80 | | | | $14.50 | | | | $11.80 | | | | $11.06 | |
| Income (loss) from investment operations | | | | | | | | | | | | | | | | | |
Net investment loss (d) | | | $(0.06 | ) | | | $(0.13 | ) | | | $(0.12 | ) | | | $(0.17 | ) | | | $(0.09 | ) | | | $(0.11 | ) |
Net realized and unrealized gain (loss)
on investments and foreign currency | | | 1.71 | | | | 5.19 | | | | 2.73 | | | | 2.47 | | | | 2.79 | | | | 0.85 | |
Total from investment operations | | | $1.65 | | | | $5.06 | | | | $2.61 | | | | $2.30 | | | | $2.70 | | | | $0.74 | |
| Less distributions declared to shareholders | | | | | | | | | | | | | |
From net realized gain on investments | | | $(0.85 | ) | | | $— | | | | $— | | | | $— | | | | $— | | | | $— | |
Net asset value, end of period (x) | | | $25.27 | | | | $24.47 | | | | $19.41 | | | | $16.80 | | | | $14.50 | | | | $11.80 | |
Total return (%) (r)(s)(t)(x) | | | 6.93 | (n) | | | 26.07 | | | | 15.54 | | | | 15.86 | | | | 22.88 | | | | 6.69 | |
Ratios (%) (to average net assets)
and Supplemental data: | | | | | | | | | | | | | |
Expenses before expense reductions (f) | | | 1.31 | (a) | | | 1.33 | | | | 1.55 | | | | 1.45 | | | | 1.52 | | | | 1.63 | |
Expenses after expense reductions (f) | | | 1.30 | (a) | | | 1.32 | | | | 1.54 | | | | 1.45 | | | | 1.52 | | | | 1.57 | |
Net investment loss | | | (0.49 | )(a) | | | (0.58 | ) | | | (0.70 | ) | | | (1.08 | ) | | | (0.61 | ) | | | (0.91 | ) |
Portfolio turnover | | | 19 | (n) | | | 38 | | | | 54 | | | | 68 | | | | 106 | | | | 182 | |
Net assets at end of period (000 omitted) | | | $191,700 | | | | $171,020 | | | | $141,147 | | | | $143,595 | | | | $96,785 | | | | $82,976 | |
| Supplemental Ratios (%): | | | | | | | | | | | | | | | | | |
Ratio of expenses to average net assets
after expense reductions excluding
short sale dividend and interest
expense (f) | | | 1.26 | (a) | | | 1.28 | | | | 1.36 | | | | 1.38 | | | | 1.43 | | | | 1.53 | |
See notes to financial statements
14
Financial Highlights – continued
| | | | | | | | | | | | | | | | | | | | | | | | |
| | | Six months
ended
2/28/15 (unaudited) | | | Years ended 8/31 | |
| Class B | | | 2014 | | | 2013 | | | 2012 | | | 2011 | | | 2010 | |
| | | | | | | | | | | | | | | | | |
Net asset value, beginning of period | | | $22.20 | | | | $17.75 | | | | $15.48 | | | | $13.45 | | | | $11.03 | | | | $10.42 | |
| Income (loss) from investment operations | | | | | | | | | | | | | | | | | |
Net investment loss (d) | | | $(0.13 | ) | | | $(0.27 | ) | | | $(0.23 | ) | | | $(0.27 | ) | | | $(0.18 | ) | | | $(0.19 | ) |
Net realized and unrealized gain (loss)
on investments and foreign currency | | | 1.54 | | | | 4.72 | | | | 2.50 | | | | 2.30 | | | | 2.60 | | | | 0.80 | |
Total from investment operations | | | $1.41 | | | | $4.45 | | | | $2.27 | | | | $2.03 | | | | $2.42 | | | | $0.61 | |
| Less distributions declared to shareholders | | | | | | | | | | | | | |
From net realized gain on investments | | | $(0.85 | ) | | | $— | | | | $— | | | | $— | | | | $— | | | | $— | |
Net asset value, end of period (x) | | | $22.76 | | | | $22.20 | | | | $17.75 | | | | $15.48 | | | | $13.45 | | | | $11.03 | |
Total return (%) (r)(s)(t)(x) | | | 6.55 | (n) | | | 25.07 | | | | 14.66 | | | | 15.09 | | | | 21.94 | | | | 5.85 | |
Ratios (%) (to average net assets)
and Supplemental data: | | | | | | | | | |
Expenses before expense reductions (f) | | | 2.06 | (a) | | | 2.08 | | | | 2.30 | | | | 2.20 | | | | 2.27 | | | | 2.37 | |
Expenses after expense reductions (f) | | | 2.05 | (a) | | | 2.07 | | | | 2.29 | | | | 2.20 | | | | 2.27 | | | | 2.32 | |
Net investment loss | | | (1.24 | )(a) | | | (1.34 | ) | | | (1.44 | ) | | | (1.83 | ) | | | (1.35 | ) | | | (1.66 | ) |
Portfolio turnover | | | 19 | (n) | | | 38 | | | | 54 | | | | 68 | | | | 106 | | | | 182 | |
Net assets at end of period (000 omitted) | | | $18,398 | | | | $16,190 | | | | $13,009 | | | | $12,911 | | | | $11,365 | | | | $11,849 | |
| Supplemental Ratios (%): | | | | | | | | | | | | | | | | | | | | | | | | |
Ratio of expenses to average net assets
after expense reductions excluding
short sale dividend and interest
expense (f) | | | 2.02 | (a) | | | 2.03 | | | | 2.12 | | | | 2.13 | | | | 2.18 | | | | 2.27 | |
See notes to financial statements
15
Financial Highlights – continued
| | | | | | | | | | | | | | | | | | | | | | | | |
| | | Six months
ended
2/28/15 (unaudited) | | | Years ended 8/31 | |
| Class C | | | 2014 | | | 2013 | | | 2012 | | | 2011 | | | 2010 | |
| | | | | | | | | | | | | | | | | |
Net asset value, beginning of period | | | $22.16 | | | | $17.71 | | | | $15.45 | | | | $13.43 | | | | $11.01 | | | | $10.40 | |
| Income (loss) from investment operations | |
Net investment loss (d) | | | $(0.13 | ) | | | $(0.28 | ) | | | $(0.24 | ) | | | $(0.27 | ) | | | $(0.19 | ) | | | $(0.19 | ) |
Net realized and unrealized gain (loss)
on investments and foreign currency | | | 1.54 | | | | 4.73 | | | | 2.50 | | | | 2.29 | | | | 2.61 | | | | 0.80 | |
Total from investment operations | | | $1.41 | | | | $4.45 | | | | $2.26 | | | | $2.02 | | | | $2.42 | | | | $0.61 | |
| Less distributions declared to shareholders | |
From net realized gain on investments | | | $(0.85 | ) | | | $— | | | | $— | | | | $— | | | | $— | | | | $— | |
Net asset value, end of period (x) | | | $22.72 | | | | $22.16 | | | | $17.71 | | | | $15.45 | | | | $13.43 | | | | $11.01 | |
Total return (%) (r)(s)(t)(x) | | | 6.56 | (n) | | | 25.13 | | | | 14.63 | | | | 15.04 | | | | 21.98 | | | | 5.87 | |
Ratios (%) (to average net assets)
and Supplemental data: | |
Expenses before expense reductions (f) | | | 2.06 | (a) | | | 2.07 | | | | 2.30 | | | | 2.20 | | | | 2.27 | | | | 2.38 | |
Expenses after expense reductions (f) | | | 2.05 | (a) | | | 2.07 | | | | 2.30 | | | | 2.20 | | | | 2.27 | | | | 2.33 | |
Net investment loss | | | (1.24 | )(a) | | | (1.34 | ) | | | (1.45 | ) | | | (1.83 | ) | | | (1.37 | ) | | | (1.66 | ) |
Portfolio turnover | | | 19 | (n) | | | 38 | | | | 54 | | | | 68 | | | | 106 | | | | 182 | |
Net assets at end of period (000 omitted) | | | $41,141 | | | | $35,998 | | | | $25,026 | | | | $23,940 | | | | $19,251 | | | | $16,858 | |
| Supplemental Ratios (%): | | | | | | | | | | | | | | | | | | | | | | | | |
Ratio of expenses to average net assets
after expense reductions excluding
short sale dividend and interest
expense (f) | | | 2.02 | (a) | | | 2.03 | | | | 2.12 | | | | 2.13 | | | | 2.18 | | | | 2.28 | |
See notes to financial statements
16
Financial Highlights – continued
| | | | | | | | | | | | | | | | | | | | | | | | |
| | | Six months
ended
2/28/15 | | | Years ended 8/31 | |
| Class I | | | 2014 | | | 2013 | | | 2012 | | | 2011 | | | 2010 | |
| | | (unaudited) | | | | | | | | | | | | | | | | |
Net asset value, beginning of period | | | $25.69 | | | | $20.33 | | | | $17.56 | | | | $15.11 | | | | $12.26 | | | | $11.47 | |
| Income (loss) from investment operations | | | | | | | | | | | | | | | | | | | | | |
Net investment loss (d) | | | $(0.03 | ) | | | $(0.08 | ) | | | $(0.08 | ) | | | $(0.14 | ) | | | $(0.06 | ) | | | $(0.08 | ) |
Net realized and unrealized gain (loss)
on investments and foreign currency | | | 1.80 | | | | 5.44 | | | | 2.85 | | | | 2.59 | | | | 2.91 | | | | 0.87 | |
Total from investment operations | | | $1.77 | | | | $5.36 | | | | $2.77 | | | | $2.45 | | | | $2.85 | | | | $0.79 | |
| Less distributions declared to shareholders | | | | | | | | | | | | | | | | | | | | | |
From net realized gain on investments | | | $(0.85 | ) | | | $— | | | | $— | | | | $— | | | | $— | | | | $— | |
Net asset value, end of period (x) | | | $26.61 | | | | $25.69 | | | | $20.33 | | | | $17.56 | | | | $15.11 | | | | $12.26 | |
Total return (%) (r)(s)(x) | | | 7.07 | (n) | | | 26.36 | | | | 15.77 | | | | 16.21 | | | | 23.25 | | | | 6.89 | |
Ratios (%) (to average net assets)
and Supplemental data: | | | | | | | | | | | | | | | | | | | | | | | | |
Expenses before expense reductions (f) | | | 1.06 | (a) | | | 1.08 | | | | 1.30 | | | | 1.20 | | | | 1.27 | | | | 1.38 | |
Expenses after expense reductions (f) | | | 1.05 | (a) | | | 1.07 | | | | 1.30 | | | | 1.20 | | | | 1.27 | | | | 1.33 | |
Net investment loss | | | (0.24 | )(a) | | | (0.35 | ) | | | (0.45 | ) | | | (0.83 | ) | | | (0.38 | ) | | | (0.66 | ) |
Portfolio turnover | | | 19 | (n) | | | 38 | | | | 54 | | | | 68 | | | | 106 | | | | 182 | |
Net assets at end of period (000 omitted) | | | $50,258 | | | | $40,359 | | | | $30,615 | | | | $21,898 | | | | $10,833 | | | | $8,873 | |
| Supplemental Ratios (%): | | | | | | | | | | | | | | | | | | | | | | | | |
Ratio of expenses to average net assets
after expense reductions excluding
short sale dividend and interest
expense (f) | | | 1.02 | (a) | | | 1.04 | | | | 1.12 | | | | 1.12 | | | | 1.18 | | | | 1.29 | |
See notes to financial statements
17
Financial Highlights – continued
| | | | | | | | | | | | | | | | | | | | | | | | |
| | | Six months
ended
2/28/15 | | | Years ended 8/31 | |
| Class R1 | | | 2014 | | | 2013 | | | 2012 | | | 2011 | | | 2010 | |
| | | (unaudited) | | | | | | | | | | | | | | | | |
Net asset value, beginning of period | | | $22.12 | | | | $17.68 | | | | $15.42 | | | | $13.41 | | | | $10.99 | | | | $10.39 | |
| Income (loss) from investment operations | |
Net investment loss (d) | | | $(0.13 | ) | | | $(0.27 | ) | | | $(0.23 | ) | | | $(0.26 | ) | | | $(0.19 | ) | | | $(0.19 | ) |
Net realized and unrealized gain (loss)
on investments and foreign currency | | | 1.54 | | | | 4.71 | | | | 2.49 | | | | 2.27 | | | | 2.61 | | | | 0.79 | |
Total from investment operations | | | $1.41 | | | | $4.44 | | | | $2.26 | | | | $2.01 | | | | $2.42 | | | | $0.60 | |
| Less distributions declared to shareholders | |
From net realized gain on investments | | | $(0.85 | ) | | | $— | | | | $— | | | | $— | | | | $— | | | | $— | |
Net asset value, end of period (x) | | | $22.68 | | | | $22.12 | | | | $17.68 | | | | $15.42 | | | | $13.41 | | | | $10.99 | |
Total return (%) (r)(s)(x) | | | 6.57 | (n) | | | 25.11 | | | | 14.66 | | | | 14.99 | | | | 22.02 | | | | 5.77 | |
Ratios (%) (to average net assets)
and Supplemental data: | |
Expenses before expense reductions (f) | | | 2.06 | (a) | | | 2.08 | | | | 2.30 | | | | 2.21 | | | | 2.27 | | | | 2.38 | |
Expenses after expense reductions (f) | | | 2.05 | (a) | | | 2.07 | | | | 2.30 | | | | 2.21 | | | | 2.27 | | | | 2.32 | |
Net investment loss | | | (1.24 | )(a) | | | (1.34 | ) | | | (1.45 | ) | | | (1.82 | ) | | | (1.39 | ) | | | (1.66 | ) |
Portfolio turnover | | | 19 | (n) | | | 38 | | | | 54 | | | | 68 | | | | 106 | | | | 182 | |
Net assets at end of period (000 omitted) | | | $2,329 | | | | $2,033 | | | | $1,542 | | | | $1,666 | | | | $1,831 | | | | $1,421 | |
| Supplemental Ratios (%): | | | | | | | | | | | | | | | | | | | | | | | | |
Ratio of expenses to average net assets
after expense reductions excluding
short sale dividend and interest
expense (f) | | | 2.02 | (a) | | | 2.04 | | | | 2.12 | | | | 2.13 | | | | 2.18 | | | | 2.28 | |
See notes to financial statements
18
Financial Highlights – continued
| | | | | | | | | | | | | | | | | | | | | | | | |
| | | Six months
ended
2/28/15 | | | Years ended 8/31 | |
| Class R2 | | | 2014 | | | 2013 | | | 2012 | | | 2011 | | | 2010 | |
| | | (unaudited) | | | | | | | | | | | | | | | | |
Net asset value, beginning of period | | | $23.70 | | | | $18.85 | | | | $16.36 | | | | $14.15 | | | | $11.54 | | | | $10.85 | |
| Income (loss) from investment operations | |
Net investment loss (d) | | | $(0.09 | ) | | | $(0.18 | ) | | | $(0.16 | ) | | | $(0.20 | ) | | | $(0.12 | ) | | | $(0.14 | ) |
Net realized and unrealized gain (loss)
on investments and foreign currency | | | 1.66 | | | | 5.03 | | | | 2.65 | | | | 2.41 | | | | 2.73 | | | | 0.83 | |
Total from investment operations | | | $1.57 | | | | $4.85 | | | | $2.49 | | | | $2.21 | | | | $2.61 | | | | $0.69 | |
| Less distributions declared to shareholders | |
From net realized gain on investments | | | $(0.85 | ) | | | $— | | | | $— | | | | $— | | | | $— | | | | $— | |
Net asset value, end of period (x) | | | $24.42 | | | | $23.70 | | | | $18.85 | | | | $16.36 | | | | $14.15 | | | | $11.54 | |
Total return (%) (r)(s)(x) | | | 6.81 | (n) | | | 25.73 | | | | 15.22 | | | | 15.62 | | | | 22.62 | | | | 6.36 | |
Ratios (%) (to average net assets)
and Supplemental data: | |
Expenses before expense reductions (f) | | | 1.56 | (a) | | | 1.58 | | | | 1.79 | | | | 1.70 | | | | 1.77 | | | | 1.87 | |
Expenses after expense reductions (f) | | | 1.55 | (a) | | | 1.58 | | | | 1.79 | | | | 1.70 | | | | 1.77 | | | | 1.82 | |
Net investment loss | | | (0.74 | )(a) | | | (0.83 | ) | | | (0.94 | ) | | | (1.33 | ) | | | (0.87 | ) | | | (1.16 | ) |
Portfolio turnover | | | 19 | (n) | | | 38 | | | | 54 | | | | 68 | | | | 106 | | | | 182 | |
Net assets at end of period (000 omitted) | | | $18,345 | | | | $17,123 | | | | $15,890 | | | | $17,748 | | | | $15,911 | | | | $13,501 | |
| Supplemental Ratios (%): | | | | | | | | | | | | | | | | | | | | | | | | |
Ratio of expenses to average net assets
after expense reductions excluding
short sale dividend and interest
expense (f) | | | 1.52 | | | | 1.54 | | | | 1.62 | | | | 1.63 | | | | 1.68 | | | | 1.78 | |
See notes to financial statements
19
Financial Highlights – continued
| | | | | | | | | | | | | | | | | | | | | | | | |
| | | Six months
ended
2/28/15 | | | Years ended 8/31 | |
| Class R3 | | | 2014 | | | 2013 | | | 2012 | | | 2011 | | | 2010 | |
| | | (unaudited) | | | | | | | | | | | | | | | | |
Net asset value, beginning of period | | | $24.46 | | | | $19.41 | | | | $16.80 | | | | $14.49 | | | | $11.79 | | | | $11.06 | |
| Income (loss) from investment operations | |
Net investment loss (d) | | | $(0.06 | ) | | | $(0.13 | ) | | | $(0.12 | ) | | | $(0.17 | ) | | | $(0.09 | ) | | | $(0.11 | ) |
Net realized and unrealized gain (loss)
on investments and foreign currency | | | 1.71 | | | | 5.18 | | | | 2.73 | | | | 2.48 | | | | 2.79 | | | | 0.84 | |
Total from investment operations | | | $1.65 | | | | $5.05 | | | | $2.61 | | | | $2.31 | | | | $2.70 | | | | $0.73 | |
| Less distributions declared to shareholders | |
From net realized gain on investments | | | $(0.85 | ) | | | $— | | | | $— | | | | $— | | | | $— | | | | $— | |
Net asset value, end of period (x) | | | $25.26 | | | | $24.46 | | | | $19.41 | | | | $16.80 | | | | $14.49 | | | | $11.79 | |
Total return (%) (r)(s)(x) | | | 6.93 | (n) | | | 26.02 | | | | 15.54 | | | | 15.94 | | | | 22.90 | | | | 6.60 | |
Ratios (%) (to average net assets)
and Supplemental data: | |
Expenses before expense reductions (f) | | | 1.31 | (a) | | | 1.33 | | | | 1.55 | | | | 1.45 | | | | 1.52 | | | | 1.62 | |
Expenses after expense reductions (f) | | | 1.30 | (a) | | | 1.32 | | | | 1.55 | | | | 1.45 | | | | 1.52 | | | | 1.58 | |
Net investment loss | | | (0.49 | )(a) | | | (0.59 | ) | | | (0.70 | ) | | | (1.08 | ) | | | (0.63 | ) | | | (0.90 | ) |
Portfolio turnover | | | 19 | (n) | | | 38 | | | | 54 | | | | 68 | | | | 106 | | | | 182 | |
Net assets at end of period (000 omitted) | | | $10,072 | | | | $10,626 | | | | $8,863 | | | | $8,720 | | | | $5,949 | | | | $4,589 | |
| Supplemental Ratios (%): | | | | | | | | | | | | | | | | | | | | | | | | |
Ratio of expenses to average net assets
after expense reductions excluding
short sale dividend and interest
expense (f) | | | 1.27 | (a) | | | 1.29 | | | | 1.37 | | | | 1.38 | | | | 1.43 | | | | 1.53 | |
See notes to financial statements
20
Financial Highlights – continued
| | | | | | | | | | | | | | | | | | | | | | | | |
| | | Six months
ended
2/28/15 | | | Years ended 8/31 | |
| Class R4 | | | 2014 | | | 2013 | | | 2012 | | | 2011 | | | 2010 | |
| | | (unaudited) | | | | | | | | | | | | | | | | |
Net asset value, beginning of period | | | $25.10 | | | | $19.86 | | | | $17.15 | | | | $14.76 | | | | $11.98 | | | | $11.21 | |
| Income (loss) from investment operations | |
Net investment loss (d) | | | $(0.03 | ) | | | $(0.08 | ) | | | $(0.08 | ) | | | $(0.14 | ) | | | $(0.05 | ) | | | $(0.08 | ) |
Net realized and unrealized gain (loss)
on investments and foreign currency | | | 1.76 | | | | 5.32 | | | | 2.79 | | | | 2.53 | | | | 2.83 | | | | 0.85 | |
Total from investment operations | | | $1.73 | | | | $5.24 | | | | $2.71 | | | | $2.39 | | | | $2.78 | | | | $0.77 | |
| Less distributions declared to shareholders | |
From net realized gain on investments | | | $(0.85 | ) | | | $— | | | | $— | | | | $— | | | | $— | | | | $— | |
Net asset value, end of period (x) | | | $25.98 | | | | $25.10 | | | | $19.86 | | | | $17.15 | | | | $14.76 | | | | $11.98 | |
Total return (%) (r)(s)(x) | | | 7.08 | (n) | | | 26.38 | | | | 15.80 | | | | 16.19 | | | | 23.21 | | | | 6.87 | |
Ratios (%) (to average net assets)
and Supplemental data: | |
Expenses before expense reductions (f) | | | 1.06 | (a) | | | 1.07 | | | | 1.29 | | | | 1.20 | | | | 1.26 | | | | 1.39 | |
Expenses after expense reductions (f) | | | 1.05 | (a) | | | 1.07 | | | | 1.29 | | | | 1.20 | | | | 1.26 | | | | 1.36 | |
Net investment loss | | | (0.26 | )(a) | | | (0.34 | ) | | | (0.45 | ) | | | (0.84 | ) | | | (0.32 | ) | | | (0.65 | ) |
Portfolio turnover | | | 19 | (n) | | | 38 | | | | 54 | | | | 68 | | | | 106 | | | | 182 | |
Net assets at end of period (000 omitted) | | | $3,074 | | | | $1,403 | | | | $1,269 | | | | $823 | | | | $368 | | | | $445 | |
| Supplemental Ratios (%): | | | | | | | | | | | | | | | | | | | | | | | | |
Ratio of expenses to average net assets
after expense reductions excluding
short sale dividend and interest
expense (f) | | | 1.02 | (a) | | | 1.04 | | | | 1.12 | | | | 1.12 | | | | 1.17 | | | | 1.31 | |
See notes to financial statements
21
Financial Highlights – continued
| | | | | | | | | | | | |
| | | Six months
ended
2/28/15 | | | Years ended 8/31 | |
| Class R5 | | | 2014 | | | 2013 (i) | |
| | | (unaudited) | | | | | | | |
Net asset value, beginning of period | | | $25.73 | | | | $20.34 | | | | $17.68 | |
| Income (loss) from investment operations | | | | | | | | | | | | |
Net investment income (loss) (d) | | | $(0.02 | ) | | | $(0.07 | ) | | | $(0.04 | ) |
Net realized and unrealized gain (loss) on investments and
foreign currency | | | 1.81 | | | | 5.46 | | | | 2.70 | |
Total from investment operations | | | $1.79 | | | | $5.39 | | | | $2.66 | |
| Less distributions declared to shareholders | | | | | | | | | | | | |
From net realized gain on investments | | | $(0.85 | ) | | | $— | | | | $— | |
Net asset value, end of period (x) | | | $26.67 | | | | $25.73 | | | | $20.34 | |
Total return (%) (r)(s)(x) | | | 7.14 | (n) | | | 26.50 | | | | 15.05 | (n) |
Ratios (%) (to average net assets)
and Supplemental data: | | | | | | | | | | | | |
Expenses before expense reductions (f) | | | 0.97 | (a) | | | 0.97 | | | | 1.13 | (a) |
Expenses after expense reductions (f) | | | 0.96 | (a) | | | 0.96 | | | | 1.13 | (a) |
Net investment income (loss) | | | (0.14 | )(a) | | | (0.28 | ) | | | (0.35 | )(a) |
Portfolio turnover | | | 19 | (n) | | | 38 | | | | 54 | |
Net assets at end of period (000 omitted) | | | $5,641 | | | | $2,429 | | | | $116 | |
| Supplemental Ratios (%): | | | | | | | | | | | | |
Ratio of expenses to average net assets after expense reductions
excluding short sale dividend and interest expense (f) | | | 0.93 | (a) | | | 0.95 | | | | 1.01 | (a) |
| (d) | Per share data is based on average shares outstanding. |
| (f) | Ratios do not reflect reductions from fees paid indirectly, if applicable. |
| (i) | For the period from the class’s inception, January 2, 2013, through the stated period end. |
| (r) | Certain expenses have been reduced without which performance would have been lower. |
| (s) | From time to time the fund may receive proceeds from litigation settlements, without which performance would be lower. |
| (t) | Total returns do not include any applicable sales charges. |
| (x) | The net asset values per share and total returns have been calculated on net assets which include adjustments made in accordance with U.S. generally accepted accounting principles required at period end for financial reporting purposes. |
See notes to financial statements
22
NOTES TO FINANCIAL STATEMENTS
(unaudited)
(1) Business and Organization
MFS Technology Fund (the fund) is a non-diversified series of MFS Series Trust I (the trust). The trust is organized as a Massachusetts business trust and is registered under the Investment Company Act of 1940, as amended, as an open-end management investment company.
The fund is an investment company and accordingly follows the investment company accounting and reporting guidance of the Financial Accounting Standards Board (FASB) Accounting Standards Codification Topic 946 Financial Services – Investment Companies.
(2) Significant Accounting Policies
General – The preparation of financial statements in conformity with U.S. generally accepted accounting principles requires management to make estimates and assumptions that affect the reported amounts of assets and liabilities, and disclosure of contingent assets and liabilities at the date of the financial statements and the reported amounts of increases and decreases in net assets from operations during the reporting period. Actual results could differ from those estimates. In the preparation of these financial statements, management has evaluated subsequent events occurring after the date of the fund’s Statement of Assets and Liabilities through the date that the financial statements were issued. The fund invests primarily in securities of issuers in the technology industry. Issuers in a single industry can react similarly to market, economic, political and regulatory conditions and developments.
In June 2014, FASB issued Accounting Standards Update 2014-11, Transfers and Servicing (Topic 860) – Repurchase-to-Maturity Transactions, Repurchase Financings, and Disclosures (“ASU 2014-11”). ASU 2014-11 changes the accounting for repurchase-to-maturity transactions (i.e., repurchase agreements that settle at the same time as the maturity of the transferred financial asset) and enhances the required disclosures for repurchase agreements and other similar transactions. Although still evaluating the potential impacts of ASU 2014-11 to the fund, management expects that the impact of the fund’s adoption will be limited to additional financial statement disclosures which would first be effective for interim reporting periods beginning after March 15, 2015.
Balance Sheet Offsetting – The fund’s accounting policy with respect to balance sheet offsetting is that, absent an event of default by the counterparty or a termination of the agreement, the International Swaps and Derivatives Association (ISDA) Master Agreement does not result in an offset of reported amounts of financial assets and financial liabilities in the Statement of Assets and Liabilities across transactions between the fund and the applicable counterparty. The fund’s right to setoff may be restricted or prohibited by the bankruptcy or insolvency laws of the particular jurisdiction to which a specific master netting agreement counterparty is subject. Balance sheet offsetting disclosures, to the extent applicable to the fund, have been included in the fund’s Significant Accounting Policies note under the captions for each of the fund’s in-scope financial instruments and transactions.
23
Notes to Financial Statements (unaudited) – continued
Investment Valuations – Equity securities, including restricted equity securities, are generally valued at the last sale or official closing price as provided by a third-party pricing service on the market or exchange on which they are primarily traded. Equity securities, for which there were no sales reported that day, are generally valued at the last quoted daily bid quotation as provided by a third-party pricing service on the market or exchange on which such securities are primarily traded. Equity securities held short, for which there were no sales reported for that day, are generally valued at the last quoted daily ask quotation as provided by a third-party pricing service on the market or exchange on which such securities are primarily traded. Short-term instruments with a maturity at issuance of 60 days or less may be valued at amortized cost, which approximates market value. Exchange-traded options are generally valued at the last sale or official closing price as provided by a third-party pricing service on the exchange on which such options are primarily traded. Exchange-traded options for which there were no sales reported that day are generally valued at the last daily bid quotation as provided by a third-party pricing service on the exchange on which such options are primarily traded. Options not traded on an exchange are generally valued at a broker/dealer bid quotation. Foreign currency options are generally valued at valuations provided by a third-party pricing service. Open-end investment companies are generally valued at net asset value per share. Securities and other assets generally valued on the basis of information from a third-party pricing service may also be valued at a broker/dealer bid quotation. Values obtained from third-party pricing services can utilize both transaction data and market information such as yield, quality, coupon rate, maturity, type of issue, trading characteristics, and other market data. The values of foreign securities and other assets and liabilities expressed in foreign currencies are converted to U.S. dollars using the mean of bid and asked prices for rates provided by a third-party pricing service.
The Board of Trustees has delegated primary responsibility for determining or causing to be determined the value of the fund’s investments (including any fair valuation) to the adviser pursuant to valuation policies and procedures approved by the Board. If the adviser determines that reliable market quotations are not readily available, investments are valued at fair value as determined in good faith by the adviser in accordance with such procedures under the oversight of the Board of Trustees. Under the fund’s valuation policies and procedures, market quotations are not considered to be readily available for most types of debt instruments and floating rate loans and many types of derivatives. These investments are generally valued at fair value based on information from third-party pricing services. In addition, investments may be valued at fair value if the adviser determines that an investment’s value has been materially affected by events occurring after the close of the exchange or market on which the investment is principally traded (such as foreign exchange or market) and prior to the determination of the fund’s net asset value, or after the halting of trading of a specific security where trading does not resume prior to the close of the exchange or market on which the security is principally traded. Events that occur on a frequent basis after foreign markets close (such as developments in foreign markets and significant movements in the U.S. markets) and prior to the determination of the fund’s net asset value may be deemed to have a material effect on the value of securities traded in foreign markets. Accordingly, the fund’s foreign equity securities may often be valued at fair value. The
24
Notes to Financial Statements (unaudited) – continued
adviser generally relies on third-party pricing services or other information (such as the correlation with price movements of similar securities in the same or other markets; the type, cost and investment characteristics of the security; the business and financial condition of the issuer; and trading and other market data) to assist in determining whether to fair value and at what value to fair value an investment. The value of an investment for purposes of calculating the fund’s net asset value can differ depending on the source and method used to determine value. When fair valuation is used, the value of an investment used to determine the fund’s net asset value may differ from quoted or published prices for the same investment. There can be no assurance that the fund could obtain the fair value assigned to an investment if it were to sell the investment at the same time at which the fund determines its net asset value per share.
Various inputs are used in determining the value of the fund’s assets or liabilities. These inputs are categorized into three broad levels. In certain cases, the inputs used to measure fair value may fall into different levels of the fair value hierarchy. In such cases, an investment’s level within the fair value hierarchy is based on the lowest level of input that is significant to the fair value measurement. The fund’s assessment of the significance of a particular input to the fair value measurement in its entirety requires judgment, and considers factors specific to the investment. Level 1 includes unadjusted quoted prices in active markets for identical assets or liabilities. Level 2 includes other significant observable market-based inputs (including quoted prices for similar securities, interest rates, prepayment speed, and credit risk). Level 3 includes unobservable inputs, which may include the adviser’s own assumptions in determining the fair value of investments. Other financial instruments are derivative instruments not reflected in total investments, such as written options. The following is a summary of the levels used as of February 28, 2015 in valuing the fund’s assets or liabilities:
| | | | | | | | | | | | | | | | |
| Investments at Value | | Level 1 | | | Level 2 | | | Level 3 | | | Total | |
| Equity Securities: | | | | | | | | | | | | | | | | |
United States | | | $329,552,207 | | | | $147,500 | | | | $— | | | | $329,699,707 | |
United Kingdom | | | 2,753,358 | | | | — | | | | — | | | | 2,753,358 | |
China | | | 1,455,382 | | | | — | | | | — | | | | 1,455,382 | |
Canada | | | 877,479 | | | | — | | | | — | | | | 877,479 | |
| Mutual Funds | | | 6,137,867 | | | | — | | | | — | | | | 6,137,867 | |
| Total Investments | | | $340,776,293 | | | | $147,500 | | | | $— | | | | $340,923,793 | |
| Short Sales | | | $(3,222,392 | ) | | | $— | | | | $— | | | | $(3,222,392 | ) |
| | | | |
| Other Financial Instruments | | | | | | | | | | | | |
| Written Options | | | $(185,779 | ) | | | $(2,940 | ) | | | $— | | | | $(188,719 | ) |
For further information regarding security characteristics, see the Portfolio of Investments.
Foreign Currency Translation – Purchases and sales of foreign investments, income, and expenses are converted into U.S. dollars based upon currency exchange rates prevailing on the respective dates of such transactions or on the reporting date for foreign denominated receivables and payables. Gains and losses attributable to foreign currency exchange rates on sales of securities are recorded for financial statement purposes as net realized gains and losses on investments. Gains and losses attributable to foreign exchange rate movements on receivables, payables, income and expenses
25
Notes to Financial Statements (unaudited) – continued
are recorded for financial statement purposes as foreign currency transaction gains and losses. That portion of both realized and unrealized gains and losses on investments that results from fluctuations in foreign currency exchange rates is not separately disclosed.
Derivatives – The fund uses derivatives for different purposes, primarily to increase or decrease exposure to a particular market or segment of the market, or security, to increase or decrease interest rate or currency exposure, or as alternatives to direct investments. Derivatives are used for hedging or non-hedging purposes. While hedging can reduce or eliminate losses, it can also reduce or eliminate gains. When the fund uses derivatives as an investment to increase market exposure, or for hedging purposes, gains and losses from derivative instruments may be substantially greater than the derivative’s original cost.
The derivative instruments used by the fund were written options and purchased options. The fund’s period end derivatives, as presented in the Portfolio of Investments, generally are indicative of the volume of its derivative activity during the period.
The following table presents, by major type of derivative contract, the fair value, on a gross basis, of the asset and liability components of derivatives held by the fund at February 28, 2015 as reported in the Statement of Assets and Liabilities:
| | | | | | | | | | |
| | | | | Fair Value (a) | |
| Risk | | Derivative Contracts | | Asset Derivatives | | | Liability Derivatives | |
| Equity | | Purchased Equity Options | | | $199,340 | | | | $— | |
| Equity | | Written Equity Options | | | — | | | | (188,719 | ) |
| (a) | The value of purchased options outstanding is included in total investments, at value, within the fund’s Statement of Assets and Liabilities. |
The following table presents, by major type of derivative contract, the realized gain (loss) on derivatives held by the fund for the six months ended February 28, 2015 as reported in the Statement of Operations:
| | | | | | | | |
| Risk | | Investments
(Purchased
Options) | | | Written
Options | |
| Equity | | | $415,538 | | | | $79,525 | |
The following table presents, by major type of derivative contract, the change in unrealized appreciation (depreciation) on derivatives held by the fund for the six months ended February 28, 2015 as reported in the Statement of Operations:
| | | | | | | | |
| Risk | | Investments
(Purchased
Options) | | | Written
Options | |
| Equity | | | $217,317 | | | | $(60,739 | ) |
Derivative counterparty credit risk is managed through formal evaluation of the creditworthiness of all potential counterparties. On certain, but not all, uncleared derivatives, the fund attempts to reduce its exposure to counterparty credit risk whenever possible by entering into an ISDA Master Agreement on a bilateral basis. The ISDA Master Agreement gives each party to the agreement the right to terminate all transactions traded under such agreement if there is a certain deterioration in the
26
Notes to Financial Statements (unaudited) – continued
credit quality of the other party. Upon an event of default or a termination of the ISDA Master Agreement, the non-defaulting party has the right to close out all transactions traded under such agreement and to net amounts owed under each transaction to one net amount payable by one party to the other. This right to close out and net payments across all transactions traded under the ISDA Master Agreement could result in a reduction of the fund’s credit risk to such counterparty equal to any amounts payable by the fund under the applicable transactions, if any.
Collateral and margin requirements differ by type of derivative. Margin requirements are set by the clearing broker and the clearing house for cleared derivatives (i.e., futures contracts, cleared swaps, and exchange-traded options) while collateral terms are contract specific for uncleared derivatives (i.e., forward foreign currency exchange contracts, uncleared swap agreements, and uncleared options). For derivatives traded under an ISDA Master Agreement, which contains a collateral support annex, the collateral requirements are netted across all transactions traded under such agreement and one amount is posted from one party to the other to collateralize such obligations. Cash that has been segregated to cover the fund’s collateral or margin obligations under derivative contracts, if any, will be reported separately in the Statement of Assets and Liabilities as “Restricted cash” or “Deposits with brokers.” Securities pledged as collateral or margin for the same purpose, if any, are noted in the Portfolio of Investments.
Written Options – In exchange for a premium, the fund wrote call options on securities for which it anticipated the price would decline and also wrote put options on securities for which it anticipated the price would increase. At the time the option was written, the fund believed the premium received exceeded the potential loss that could result from adverse price changes in the options’ underlying securities. In a written option, the fund as the option writer grants the buyer the right to purchase from, or sell to, the fund a specified number of shares or units of a particular security, currency or index at a specified price within a specified period of time.
The premium received is initially recorded as a liability in the Statement of Assets and Liabilities. The option is subsequently marked-to-market daily with the difference between the premium received and the market value of the written option being recorded as unrealized appreciation or depreciation. When a written option expires, the fund realizes a gain equal to the amount of the premium received. The difference between the premium received and the amount paid on effecting a closing transaction is considered a realized gain or loss. When a written call option is exercised, the premium received is offset against the proceeds to determine the realized gain or loss. When a written put option is exercised, the premium reduces the cost basis of the security purchased by the fund.
At the initiation of the written option contract, for exchange traded options, the fund is required to deposit securities or cash as collateral with the custodian for the benefit of the broker or directly with the clearing broker, based on the type of option. For uncleared options, the fund may post collateral subject to the terms of an ISDA Master Agreement as generally described above if the market value of the options contract moves against it. The fund, as writer of an option, may have no control over whether the underlying securities may be sold (call) or purchased (put) and, as a result, bears the market risk of an unfavorable change in the price of the securities underlying the
27
Notes to Financial Statements (unaudited) – continued
written option. Losses from writing options can exceed the premium received and can exceed the potential loss from an ordinary buy and sell transaction. Although the fund’s market risk may be significant, the maximum counterparty credit risk to the fund is equal to the market value of any collateral posted to the broker. For uncleared options, this risk is mitigated in cases where there is an ISDA Master Agreement between the fund and the counterparty providing for netting as described above.
The following table represents the written option activity in the fund during the six months ended February 28, 2015:
| | | | | | | | |
| | | Number of
contracts | | | Premiums
received | |
| Outstanding, beginning of period | | | 936 | | | | $39,852 | |
| Options written | | | 29,320 | | | | 1,360,176 | |
| Options closed | | | (5,501 | ) | | | (391,658 | ) |
| Options exercised | | | (1,472 | ) | | | (68,042 | ) |
| Options expired | | | (20,348 | ) | | | (804,915 | ) |
| Outstanding, end of period | | | 2,935 | | | | $135,413 | |
Purchased Options – The fund purchased call and put options for a premium. Purchased call and put options entitle the holder to buy and sell a specified number of shares or units of a particular security, currency or index at a specified price at a specified date or within a specified period of time. Purchasing call options may hedge against an anticipated increase in the dollar cost of securities or currency to be acquired or increase the fund’s exposure to an underlying instrument. Purchasing put options may hedge against an anticipated decline in the value of portfolio securities or currency or decrease the fund’s exposure to an underlying instrument.
The premium paid is initially recorded as an investment in the Statement of Assets and Liabilities. That investment is subsequently marked-to-market daily with the difference between the premium paid and the market value of the purchased option being recorded as unrealized appreciation or depreciation. Premiums paid for purchased call and put options which have expired are treated as realized losses on investments in the Statement of Operations. Upon the exercise or closing of a purchased call option, the premium paid is added to the cost of the security or financial instrument purchased. Upon the exercise or closing of a purchased put option, the premium paid is offset against the proceeds on the sale of the underlying security or financial instrument in order to determine the realized gain or loss on investments.
Whether or not the option is exercised, the fund’s maximum risk of loss from purchasing an option is the amount of premium paid. All option contracts involve credit risk if the counterparty to the option contract fails to perform. For uncleared options, this risk is mitigated in cases where there is an ISDA Master Agreement between the fund and the counterparty providing for netting as described above and, where applicable, by the posting of collateral by the counterparty to the fund to cover the fund’s exposure to the counterparty under such ISDA Master Agreement.
Short Sales – The fund entered into short sales whereby it sells a security it does not own in anticipation of a decline in the value of that security. The fund will realize a gain if the security price decreases and a loss if the security price increases between the date of the short sale and the date on which the fund replaces the borrowed security. Losses
28
Notes to Financial Statements (unaudited) – continued
from short sales can exceed the proceeds of the security sold; and they can also exceed the potential loss from an ordinary buy and sell transaction. The amount of any premium, dividends, or interest the fund may be required to pay in connection with a short sale will be recognized as a fund expense. During the six months ended February 28, 2015, this expense amounted to $55,484. The fund segregates cash or marketable securities in an amount that, when combined with the amount of proceeds from the short sale deposited with the broker, at least equals the current market value of the security sold short.
Security Loans – Under its Securities Lending Agency Agreement with the fund, State Street Bank and Trust Company (“State Street”), as lending agent, loans the securities of the fund to certain qualified institutions (the “Borrowers”) approved by the fund. The loans are collateralized by cash and/or U.S. Treasury and federal agency obligations in an amount typically at least equal to the market value of the securities loaned. On loans collateralized by cash, the cash collateral is invested in a money market fund. The market value of the loaned securities is determined at the close of business of the fund and any additional required collateral is delivered to the fund on the next business day. State Street provides the fund with indemnification against Borrower default. In the event of Borrower default, State Street will for the benefit of the fund either purchase securities identical to those loaned or, when such purchase is commercially impracticable, pay the fund the market value of the loaned securities. In return, State Street assumes the fund’s rights to the related collateral. If the collateral value is less than the cost to purchase identical securities, State Street is responsible for the shortfall, but only to the extent that such shortfall is not due to a decline in collateral value resulting from collateral reinvestment for which the fund bears the risk of loss. At period end, the fund had investment securities on loan with a fair value of $368,123 and a related liability of $361,792 for cash collateral received on securities loaned, both of which are presented gross in the Statement of Assets and Liabilities. The value of the fund’s securities on loan net of the related collateral is $6,331 at period end. The liability for cash collateral for securities loaned is carried at fair value, which is categorized as level 2 within the fair value hierarchy. A portion of the income generated upon investment of the collateral is remitted to the Borrowers, and the remainder is allocated between the fund and the lending agent. On loans collateralized by U.S. Treasury and/or federal agency obligations, a fee is received from the Borrower, and is allocated between the fund and the lending agent. Income from securities lending is included in “Interest” income, separately reported in the Statement of Operations. The dividend and interest income earned on the securities loaned is accounted for in the same manner as other dividend and interest income.
Indemnifications – Under the fund’s organizational documents, its officers and Trustees may be indemnified against certain liabilities and expenses arising out of the performance of their duties to the fund. Additionally, in the normal course of business, the fund enters into agreements with service providers that may contain indemnification clauses. The fund’s maximum exposure under these agreements is unknown as this would involve future claims that may be made against the fund that have not yet occurred.
Investment Transactions and Income – Investment transactions are recorded on the trade date. Interest income is recorded on the accrual basis. Dividends received in cash
29
Notes to Financial Statements (unaudited) – continued
are recorded on the ex-dividend date. Certain dividends from foreign securities will be recorded when the fund is informed of the dividend if such information is obtained subsequent to the ex-dividend date. Dividend and interest payments received in additional securities are recorded on the ex-dividend or ex-interest date in an amount equal to the value of the security on such date.
The fund may receive proceeds from litigation settlements. Any proceeds received from litigation involving portfolio holdings are reflected in the Statement of Operations in realized gain/loss if the security has been disposed of by the fund or in unrealized gain/loss if the security is still held by the fund. Any other proceeds from litigation not related to portfolio holdings are reflected as other income in the Statement of Operations.
Fees Paid Indirectly – The fund’s custody fee may be reduced according to an arrangement that measures the value of cash deposited with the custodian by the fund. This amount, for the six months ended February 28, 2015, is shown as a reduction of total expenses in the Statement of Operations.
Tax Matters and Distributions – The fund intends to qualify as a regulated investment company, as defined under Subchapter M of the Internal Revenue Code, and to distribute all of its taxable income, including realized capital gains. As a result, no provision for federal income tax is required. The fund’s federal tax returns, when filed, will remain subject to examination by the Internal Revenue Service for a three year period. Management has analyzed the fund’s tax positions taken on federal and state tax returns for all open tax years and does not believe that there are any uncertain tax positions that require recognition of a tax liability. Foreign taxes, if any, have been accrued by the fund in the accompanying financial statements in accordance with the applicable foreign tax law. Foreign income taxes may be withheld by certain countries in which the fund invests. Additionally, capital gains realized by the fund on securities issued in or by certain foreign countries may be subject to capital gains tax imposed by those countries.
Distributions to shareholders are recorded on the ex-dividend date. Income and capital gain distributions are determined in accordance with income tax regulations, which may differ from U.S. generally accepted accounting principles. Certain capital accounts in the financial statements are periodically adjusted for permanent differences in order to reflect their tax character. These adjustments have no impact on net assets or net asset value per share. Temporary differences which arise from recognizing certain items of income, expense, gain or loss in different periods for financial statement and tax purposes will reverse at some time in the future. Distributions in excess of net investment income or net realized gains are temporary overdistributions for financial statement purposes resulting from differences in the recognition or classification of income or distributions for financial statement and tax purposes.
Book/tax differences primarily relate to wash sale loss deferrals, straddle loss deferrals, and treating a portion of the proceeds from redemptions as a distribution for tax purposes.
The tax character of distributions made during the current period will be determined at fiscal year end. The fund declared no distributions for the year ended August 31, 2014.
30
Notes to Financial Statements (unaudited) – continued
The federal tax cost and the tax basis components of distributable earnings were as follows:
| | | | |
| As of 2/28/15 | | | |
| Cost of investments | | | $229,651,024 | |
| Gross appreciation | | | 112,162,461 | |
| Gross depreciation | | | (889,692 | ) |
| Net unrealized appreciation (depreciation) | | | $111,272,769 | |
| |
| As of 8/31/14 | | | |
| Undistributed ordinary income | | | $260,665 | |
| Undistributed long-term capital gain | | | 10,649,055 | |
| Other temporary differences | | | (2,033,887 | ) |
| Net unrealized appreciation (depreciation) | | | 98,717,067 | |
The aggregate cost above includes prior fiscal year end tax adjustments, if applicable.
Multiple Classes of Shares of Beneficial Interest – The fund offers multiple classes of shares, which differ in their respective distribution and service fees. The fund’s income, realized and unrealized gain (loss), and common expenses are allocated to shareholders based on the daily net assets of each class. Dividends are declared separately for each class. Differences in per share dividend rates are generally due to differences in separate class expenses. Class B shares will convert to Class A shares approximately eight years after purchase. The fund’s distributions declared to shareholders as reported in the Statements of Changes in Net Assets are presented by class as follows:
| | | | | | | | |
| | | From net realized gain on
investments | |
| | | Six months
ended
2/28/15 | | | Year
ended
8/31/14 | |
| Class A | | | $6,168,354 | | | | $— | |
| Class B | | | 639,076 | | | | — | |
| Class C | | | 1,427,980 | | | | — | |
| Class I | | | 1,439,815 | | | | — | |
| Class R1 | | | 76,932 | | | | — | |
| Class R2 | | | 619,660 | | | | — | |
| Class R3 | | | 328,090 | | | | — | |
| Class R4 | | | 92,251 | | | | — | |
| Class R5 | | | 117,661 | | | | — | |
| Total | | | $10,909,819 | | | | $— | |
(3) Transactions with Affiliates
Investment Adviser – The fund has an investment advisory agreement with MFS to provide overall investment management and related administrative services and facilities to the fund. The management fee is computed daily and paid monthly at the following annual rates:
| | | | |
| First $1 billion of average daily net assets | | | 0.75 | % |
| Average daily net assets in excess of $1 billion | | | 0.70 | % |
31
Notes to Financial Statements (unaudited) – continued
MFS has agreed in writing to reduce its management fee by a specified amount if certain MFS mutual fund assets exceed thresholds agreed to by MFS and the fund’s Board of Trustees. For the six months ended February 28, 2015, this management fee reduction amounted to $9,440, which is included in the reduction of total expenses in the Statement of Operations. The management fee incurred for the six months ended February 28, 2015 was equivalent to an annual effective rate of 0.74% of the fund’s average daily net assets.
Distributor – MFS Fund Distributors, Inc. (MFD), a wholly-owned subsidiary of MFS, as distributor, received $46,904 for the six months ended February 28, 2015, as its portion of the initial sales charge on sales of Class A shares of the fund.
The Board of Trustees has adopted a distribution plan for certain share classes pursuant to Rule 12b-1 of the Investment Company Act of 1940.
The fund’s distribution plan provides that the fund will pay MFD for services provided by MFD and financial intermediaries in connection with the distribution and servicing of certain share classes. One component of the plan is a distribution fee paid to MFD and another component of the plan is a service fee paid to MFD. MFD may subsequently pay all, or a portion, of the distribution and/or service fees to financial intermediaries.
Distribution Plan Fee Table:
| | | | | | | | | | | | | | | | | | | | |
| | | Distribution
Fee Rate (d) | | | Service
Fee Rate (d) | | | Total
Distribution
Plan (d) | | | Annual
Effective
Rate (e) | | | Distribution
and Service
Fee | |
| Class A | | | — | | | | 0.25% | | | | 0.25% | | | | 0.24% | | | | $219,876 | |
| Class B | | | 0.75% | | | | 0.25% | | | | 1.00% | | | | 1.00% | | | | 82,865 | |
| Class C | | | 0.75% | | | | 0.25% | | | | 1.00% | | | | 1.00% | | | | 185,485 | |
| Class R1 | | | 0.75% | | | | 0.25% | | | | 1.00% | | | | 1.00% | | | | 10,157 | |
| Class R2 | | | 0.25% | | | | 0.25% | | | | 0.50% | | | | 0.50% | | | | 42,972 | |
| Class R3 | | | — | | | | 0.25% | | | | 0.25% | | | | 0.25% | | | | 12,518 | |
| Total Distribution and Service Fees | | | | $553,873 | |
| (d) | In accordance with the distribution plan for certain classes, the fund pays distribution and/or service fees equal to these annual percentage rates of each class’s average daily net assets. The distribution and service fee rates disclosed by class represent the current rates in effect at the end of the reporting period. Any rate changes, if applicable, are detailed below. |
| (e) | The annual effective rates represent actual fees incurred under the distribution plan for the six months ended February 28, 2015 based on each class’s average daily net assets. MFD has voluntarily agreed to rebate a portion of each class’s 0.25% service fee except for accounts attributable to MFS or its affiliates’ seed money. For the six months ended February 28, 2015, this rebate amounted to $4,875, $101, and $162, for Class A, Class B, and Class C, respectively, and is included in the reduction of total expenses in the Statement of Operations. |
Certain Class A shares are subject to a contingent deferred sales charge (CDSC) in the event of a shareholder redemption within 18 months of purchase. Class C shares are subject to a CDSC in the event of a shareholder redemption within 12 months of purchase. Class B shares are subject to a CDSC in the event of a shareholder
32
Notes to Financial Statements (unaudited) – continued
redemption within six years of purchase. All contingent deferred sales charges are paid to MFD and during the six months ended February 28, 2015, were as follows:
| | | | |
| | | Amount | |
| Class A | | | $1,028 | |
| Class B | | | 6,064 | |
| Class C | | | 3,732 | |
Shareholder Servicing Agent – MFS Service Center, Inc. (MFSC), a wholly-owned subsidiary of MFS, receives a fee from the fund for its services as shareholder servicing agent calculated as a percentage of the average daily net assets of the fund as determined periodically under the supervision of the fund’s Board of Trustees. For the six months ended February 28, 2015, the fee was $62,741, which equated to 0.0406% annually of the fund’s average daily net assets. MFSC also receives payment from the fund for out-of-pocket expenses, sub-accounting and other shareholder servicing costs which may be paid to affiliated and unaffiliated service providers. Class R5 shares do not incur sub-accounting fees. For the six months ended February 28, 2015, these out-of-pocket expenses, sub-accounting and other shareholder servicing costs amounted to $191,350.
Administrator – MFS provides certain financial, legal, shareholder communications, compliance, and other administrative services to the fund. Under an administrative services agreement, the fund reimburses MFS the costs incurred to provide these services. The fund is charged an annual fixed amount of $17,500 plus a fee based on average daily net assets. The administrative services fee incurred for the six months ended February 28, 2015 was equivalent to an annual effective rate of 0.0192% of the fund’s average daily net assets.
Trustees’ and Officers’ Compensation – The fund pays compensation to independent Trustees in the form of a retainer, attendance fees, and additional compensation to Board and Committee chairpersons. The fund does not pay compensation directly to Trustees or officers of the fund who are also officers of the investment adviser, all of whom receive remuneration for their services to the fund from MFS. Certain officers and Trustees of the fund are officers or directors of MFS, MFD, and MFSC.
Prior to December 31, 2001, the fund had an unfunded defined benefit plan (“DB plan”) for independent Trustees. As of December 31, 2001, the Board took action to terminate the DB plan with respect to then-current and any future independent Trustees, such that the DB plan covers only certain of those former independent Trustees who retired on or before December 31, 2001. The DB plan resulted in a pension expense of $87 and is included in independent Trustees’ compensation for the six months ended February 28, 2015. The liability for deferred retirement benefits payable to certain independent Trustees under the DB plan amounted to $1,034 at February 28, 2015, and is included in “Payable for independent Trustees’ compensation” in the Statement of Assets and Liabilities.
Other – Effective November 1, 2014, this fund and certain other funds managed by MFS (the funds) have entered into a service agreement (the ISO Agreement) which provides for payment of fees solely by the funds to Tarantino LLC in return for the
33
Notes to Financial Statements (unaudited) – continued
provision of services of an Independent Senior Officer (ISO) for the funds. Frank L. Tarantino serves as the ISO and is an officer of the funds and the sole member of Tarantino LLC. The funds can terminate the ISO Agreement with Tarantino LLC at any time under the terms of the ISO Agreement. Prior to November 1, 2014, the funds had entered into a service agreement (the Compliance Officer Agreement) which provided for payment of fees by the funds to Tarantino LLC in return for the provision of services of an Independent Chief Compliance Officer (ICCO) for the funds. Prior to November 1, 2014, Frank L. Tarantino served as the ICCO. Effective October 31, 2014, Mr. Tarantino resigned as ICCO and the Compliance Officer Agreement between the funds and Tarantino LLC was terminated. For the six months ended February 28, 2015, the aggregate fees paid by the fund under these agreements were $579 and are included in “Miscellaneous” expense in the Statement of Operations. MFS had agreed to reimburse the fund for a portion of the payments made by the fund for the services under the Compliance Officer Agreement in the amount of $99, which is included in the reduction of total expenses in the Statement of Operations. Additionally, MFS has agreed to bear all expenses associated with office space, other administrative support, and supplies provided to the ICCO and ISO.
The fund invests in the MFS Institutional Money Market Portfolio which is managed by MFS and seeks current income consistent with preservation of capital and liquidity. Income earned on this investment is included in “Dividends from underlying affiliated funds” in the Statement of Operations. This money market fund does not pay a management fee to MFS.
On September 11, 2013, MFS redeemed 13,238 shares of Class R4 for an aggregate amount of $274,821.
(4) Portfolio Securities
For the six months ended February 28, 2015, purchases and sales of investments, other than purchased option transactions, short sales, and short-term obligations, aggregated $84,988,058 and $57,123,587, respectively.
34
Notes to Financial Statements (unaudited) – continued
(5) Shares of Beneficial Interest
The fund’s Declaration of Trust permits the Trustees to issue an unlimited number of full and fractional shares of beneficial interest. Transactions in fund shares were as follows:
| | | | | | | | | | | | | | | | |
| | | Six months ended
2/28/15 | | | Year ended
8/31/14 | |
| | | Shares | | | Amount | | | Shares | | | Amount | |
| Shares sold | | | | | | | | | | | | | | | | |
Class A | | | 1,075,600 | | | | $26,004,805 | | | | 1,925,678 | | | | $43,258,626 | |
Class B | | | 119,366 | | | | 2,610,615 | | | | 156,272 | | | | 3,221,334 | |
Class C | | | 230,732 | | | | 5,038,653 | | | | 437,949 | | | | 9,054,054 | |
Class I | | | 513,116 | | | | 13,037,927 | | | | 684,731 | | | | 16,296,362 | |
Class R1 | | | 22,141 | | | | 480,649 | | | | 58,654 | | | | 1,191,202 | |
Class R2 | | | 110,612 | | | | 2,586,136 | | | | 268,302 | | | | 5,825,941 | |
Class R3 | | | 60,102 | | | | 1,451,178 | | | | 185,343 | | | | 4,130,801 | |
Class R4 | | | 66,712 | | | | 1,700,723 | | | | 36,448 | | | | 830,516 | |
Class R5 | | | 128,850 | | | | 3,311,248 | | | | 97,026 | | | | 2,314,761 | |
| | | 2,327,231 | | | | $56,221,934 | | | | 3,850,403 | | | | $86,123,597 | |
| | | | |
Shares issued to shareholders in
reinvestment of distributions | | | | | | | | | | | | | | | | |
Class A | | | 247,815 | | | | $5,935,159 | | | | — | | | | $— | |
Class B | | | 28,581 | | | | 617,360 | | | | — | | | | — | |
Class C | | | 55,394 | | | | 1,194,300 | | | | — | | | | — | |
Class I | | | 40,833 | | | | 1,028,984 | | | | — | | | | — | |
Class R1 | | | 3,575 | | | | 76,932 | | | | — | | | | — | |
Class R2 | | | 26,342 | | | | 609,819 | | | | — | | | | — | |
Class R3 | | | 13,705 | | | | 328,090 | | | | — | | | | — | |
Class R4 | | | 3,750 | | | | 92,251 | | | | — | | | | — | |
Class R5 | | | 4,660 | | | | 117,661 | | | | — | | | | — | |
| | | 424,655 | | | | $10,000,556 | | | | — | | | | $— | |
| | | | |
| Shares reacquired | | | | | | | | | | | | | | | | |
Class A | | | (727,714 | ) | | | $(17,600,345 | ) | | | (2,207,242 | ) | | | $(49,633,349 | ) |
Class B | | | (68,860 | ) | | | (1,507,081 | ) | | | (160,079 | ) | | | (3,283,048 | ) |
Class C | | | (99,610 | ) | | | (2,181,489 | ) | | | (226,224 | ) | | | (4,601,607 | ) |
Class I | | | (236,384 | ) | | | (6,008,300 | ) | | | (619,451 | ) | | | (14,855,590 | ) |
Class R1 | | | (14,916 | ) | | | (327,027 | ) | | | (53,964 | ) | | | (1,115,740 | ) |
Class R2 | | | (108,201 | ) | | | (2,531,920 | ) | | | (388,747 | ) | | | (8,456,797 | ) |
Class R3 | | | (109,541 | ) | | | (2,678,957 | ) | | | (207,625 | ) | | | (4,585,001 | ) |
Class R4 | | | (8,027 | ) | | | (199,277 | ) | | | (44,430 | ) | | | (988,142 | ) |
Class R5 | | | (16,384 | ) | | | (418,005 | ) | | | (8,330 | ) | | | (205,613 | ) |
| | | (1,389,637 | ) | | | $(33,452,401 | ) | | | (3,916,092 | ) | | | $(87,724,887 | ) |
35
Notes to Financial Statements (unaudited) – continued
| | | | | | | | | | | | | | | | |
| | | Six months ended
2/28/15 | | | Year ended
8/31/14 | |
| | | Shares | | | Amount | | | Shares | | | Amount | |
| Net change | | | | | | | | | | | | | | | | |
Class A | | | 595,701 | | | | $14,339,619 | | | | (281,564 | ) | | | $(6,374,723 | ) |
Class B | | | 79,087 | | | | 1,720,894 | | | | (3,807 | ) | | | (61,714 | ) |
Class C | | | 186,516 | | | | 4,051,464 | | | | 211,725 | | | | 4,452,447 | |
Class I | | | 317,565 | | | | 8,058,611 | | | | 65,280 | | | | 1,440,772 | |
Class R1 | | | 10,800 | | | | 230,554 | | | | 4,690 | | | | 75,462 | |
Class R2 | | | 28,753 | | | | 664,035 | | | | (120,445 | ) | | | (2,630,856 | ) |
Class R3 | | | (35,734 | ) | | | (899,689 | ) | | | (22,282 | ) | | | (454,200 | ) |
Class R4 | | | 62,435 | | | | 1,593,697 | | | | (7,982 | ) | | | (157,626 | ) |
Class R5 | | | 117,126 | | | | 3,010,904 | | | | 88,696 | | | | 2,109,148 | |
| | | 1,362,249 | | | | $32,770,089 | | | | (65,689 | ) | | | $(1,601,290 | ) |
(6) Line of Credit
The fund and certain other funds managed by MFS participate in a $1.1 billion unsecured committed line of credit, subject to a $1 billion sublimit, provided by a syndication of banks under a credit agreement. Borrowings may be made for temporary financing needs. Interest is charged to each fund, based on its borrowings, generally at a rate equal to the higher of the Federal Reserve funds rate or one month LIBOR plus an agreed upon spread. A commitment fee, based on the average daily, unused portion of the committed line of credit, is allocated among the participating funds at the end of each calendar quarter. In addition, the fund and other funds managed by MFS have established unsecured uncommitted borrowing arrangements with certain banks for temporary financing needs. Interest is charged to each fund, based on its borrowings, at a rate equal to the Federal Reserve funds rate plus an agreed upon spread. For the six months ended February 28, 2015, the fund’s commitment fee and interest expense were $520 and $0, respectively, and are included in “Miscellaneous” expense in the Statement of Operations.
(7) Transactions in Underlying Affiliated Funds-Affiliated Issuers
An affiliated issuer may be considered one in which the fund owns 5% or more of the outstanding voting securities, or a company which is under common control. For the purposes of this report, the fund assumes the following to be an affiliated issuer:
| | | | | | | | | | | | | | | | |
| Underlying Affiliated Fund | | Beginning
Shares/Par
Amount | | | Acquisitions
Shares/Par
Amount | | | Dispositions
Shares/Par
Amount | | | Ending
Shares/Par
Amount | |
MFS Institutional Money
Market Portfolio | | | 11,667,042 | | | | 35,678,075 | | | | (41,579,042 | ) | | | 5,776,075 | |
| | | | |
| Underlying Affiliated Fund | | Realized
Gain (Loss) | | | Capital Gain
Distributions | | | Dividend
Income | | | Ending
Value | |
MFS Institutional Money
Market Portfolio | | | $— | | | | $— | | | | $5,470 | | | | $5,776,075 | |
36
PROXY VOTING POLICIES AND INFORMATION
MFS votes proxies on behalf of the fund pursuant to proxy voting policies and procedures that are available without charge, upon request, by calling 1-800-225-2606, by visiting the Proxy Voting section of mfs.com or by visiting the SEC’s Web site at http://www.sec.gov.
Information regarding how the fund voted proxies relating to portfolio securities during the most recent twelve-month period ended June 30 is available without charge by visiting the Proxy Voting section of mfs.com or by visiting the SEC’s Web site at http://www.sec.gov.
QUARTERLY PORTFOLIO DISCLOSURE
The fund will file a complete schedule of portfolio holdings with the Securities and Exchange Commission (the Commission) for the first and third quarters of each fiscal year on Form N-Q. A shareholder can obtain the quarterly portfolio holdings report at mfs.com. The fund’s Form N-Q is also available on the EDGAR database on the Commission’s Internet Web site at http://www.sec.gov, and may be reviewed and copied at the:
Public Reference Room
Securities and Exchange Commission
100 F Street, NE, Room 1580
Washington, D.C. 20549
Information on the operation of the Public Reference Room may be obtained by calling the Commission at 1-800-SEC-0330. Copies of the fund’s Form N-Q also may be obtained, upon payment of a duplicating fee, by electronic request at the following e-mail address: publicinfo@sec.gov or by writing the Public Reference Section at the above address.
FURTHER INFORMATION
From time to time, MFS may post important information about the fund or the MFS funds on the MFS web site (mfs.com). This information is available by visiting the “Market Commentary” and “Announcements” sub sections in the “Market Outlooks” section of mfs.com or by clicking on the fund’s name under “Mutual Funds” in the “Products” section of mfs.com.
PROVISION OF FINANCIAL REPORTS AND SUMMARY PROSPECTUSES
The fund produces financial reports every six months and updates its summary prospectus and prospectus annually. To avoid sending duplicate copies of materials to households, only one copy of the fund’s annual and semiannual report and summary prospectus may be mailed to shareholders having the same last name and residential address on the fund’s records. However, any shareholder may contact MFSC (please see back cover for address and telephone number) to request that copies of these reports and summary prospectuses be sent personally to that shareholder.
37
Save paper with eDelivery.

| MFS® will send you prospectuses, |
reports, and proxies directly via e-mail so you will get information faster with less mailbox clutter.
To sign up:
1. Go to mfs.com.
2. Log in via MFS® Access.
3. Select eDelivery.
If you own your MFS fund shares through a financial institution or a retirement plan, MFS® TALK, MFS® Access, or eDelivery may not be available to you.
CONTACT
WEB SITE
mfs.com
MFS TALK
1-800-637-8255
24 hours a day
ACCOUNT SERVICE AND LITERATURE
Shareholders
1-800-225-2606
Financial advisors
1-800-343-2829
Retirement plan services
1-800-637-1255
MAILING ADDRESS
MFS Service Center, Inc.
P.O. Box 55824
Boston, MA 02205-5824
OVERNIGHT MAIL
MFS Service Center, Inc.
c/o Boston Financial Data Services
30 Dan Road
Canton, MA 02021-2809
SEMIANNUAL REPORT
February 28, 2015

MFS® U.S. GOVERNMENT CASH RESERVE FUND

LMM-SEM
MFS® U.S. GOVERNMENT CASH RESERVE FUND
CONTENTS
The report is prepared for the general information of shareholders.
It is authorized for distribution to prospective investors only when preceded or accompanied by a current prospectus.
NOT FDIC INSURED Ÿ MAY LOSE VALUE Ÿ NO BANK GUARANTEE

LETTER FROM THE CHAIRMAN
Dear Shareholders:
Lower oil prices continue to influence markets in different ways. Among those economies hurt, oil-exporters such as Russia and Venezuela have been hit particularly hard, along with U.S. regions that have close oil industry ties.
The U.S. economic recovery remains solid. The labor market is strong, interest rates are historically low and reduced energy prices have helped to stimulate consumer spending.
Economic reports early in 2015 indicate that the eurozone is on a more solid footing, with confidence boosted by the launch of European Central Bank quantitative easing.
In Asia, the Chinese economy continues to raise concerns, with the People’s Bank of China implementing stimulus programs to counter a steady decline in growth rates.
As always, active risk management is integral to how we at MFS® manage your investments. We use a collaborative process, sharing insights across asset classes, regions and economic sectors. Our global investment team uses a diversified, multidisciplined, long-term approach.
Applying proven principles, such as asset allocation and diversification, can best serve investors over the long term. We are confident that this approach can help you as you work with your financial advisors to reach your goals in the years ahead.
Respectfully,

Robert J. Manning
Chairman
MFS Investment Management
April 14, 2015
The opinions expressed in this letter are subject to change and may not be relied upon for investment advice. No forecasts can be guaranteed.
1
PORTFOLIO COMPOSITION
Portfolio structure (u)
| | | | |
| Composition including fixed income credit quality (a)(u) | |
| A-1+ | | | 17.4% | |
| A-1 | | | 82.7% | |
| Not Rated | | | 0.0% | |
| Other Assets Less Liabilities | | | (0.1)% | |
| | | | |
| Maturity breakdown (u) | | | | |
| 0 - 7 days | | | 22.0% | |
| 8 - 29 days | | | 15.9% | |
| 30 - 59 days | | | 43.4% | |
| 60 - 89 days | | | 8.2% | |
| 90 - 365 days | | | 10.6% | |
| Other Assets Less Liabilities | | | (0.1)% | |
| (a) | Ratings are assigned to portfolio securities utilizing ratings from Moody’s, Fitch, and Standard & Poor’s rating agencies and applying the following hierarchy: If all three agencies provide a rating, the middle rating (after dropping the highest and lowest ratings) is assigned; if two of the three agencies rate a security, the lower of the two is assigned. Ratings are shown in the S&P scale. All ratings are subject to change. The fund is not rated by these agencies. |
| (u) | For purposes of this presentation, accrued interest, where applicable, is included. |
From time to time Other Assets Less Liabilities may be negative due to timing of cash receipts.
Percentages are based on net assets as of 2/28/15.
The portfolio is actively managed and current holdings may be different.
2
EXPENSE TABLE
Fund expenses borne by the shareholders during the period, September 1, 2014 through February 28, 2015
As a shareholder of the fund, you incur two types of costs: (1) transaction costs, including sales charges (loads) on certain purchase or redemption payments, and (2) ongoing costs, including management fees; distribution and service (12b-1) fees; and other fund expenses. This example is intended to help you understand your ongoing costs (in dollars) of investing in the fund and to compare these costs with the ongoing costs of investing in other mutual funds.
The example is based on an investment of $1,000 invested at the beginning of the period and held for the entire period September 1, 2014 through February 28, 2015.
Actual Expenses
The first line for each share class in the following table provides information about actual account values and actual expenses. You may use the information in this line, together with the amount you invested, to estimate the expenses that you paid over the period. Simply divide your account value by $1,000 (for example, an $8,600 account value divided by $1,000 = 8.6), then multiply the result by the number in the first line under the heading entitled “Expenses Paid During Period” to estimate the expenses you paid on your account during this period.
Hypothetical Example for Comparison Purposes
The second line for each share class in the following table provides information about hypothetical account values and hypothetical expenses based on the fund’s actual expense ratio and an assumed rate of return of 5% per year before expenses, which is not the fund’s actual return. The hypothetical account values and expenses may not be used to estimate the actual ending account balance or expenses you paid for the period. You may use this information to compare the ongoing costs of investing in the fund and other funds. To do so, compare this 5% hypothetical example with the 5% hypothetical examples that appear in the shareholder reports of the other funds.
Please note that the expenses shown in the table are meant to highlight your ongoing costs only and do not reflect any transactional costs, such as sales charges (loads). Therefore, the second line for each share class in the table is useful in comparing ongoing costs only, and will not help you determine the relative total costs of owning different funds. In addition, if these transactional costs were included, your costs would have been higher.
3
Expense Table – continued
| | | | | | | | | | | | | | | | | | |
Share
Class | | | | Annualized
Expense
Ratio | | | Beginning
Account Value
9/01/14 | | | Ending
Account Value
2/28/15 | | | Expenses
Paid During
Period (p)
9/01/14-2/28/15 | |
| A | | Actual | | | 0.06% | | | | $1,000.00 | | | | $1,000.00 | | | | $0.30 | |
| | Hypothetical (h) | | | 0.06% | | | | $1,000.00 | | | | $1,024.50 | | | | $0.30 | |
| B | | Actual | | | 0.06% | | | | $1,000.00 | | | | $1,000.00 | | | | $0.30 | |
| | Hypothetical (h) | | | 0.06% | | | | $1,000.00 | | | | $1,024.50 | | | | $0.30 | |
| C | | Actual | | | 0.06% | | | | $1,000.00 | | | | $1,000.00 | | | | $0.30 | |
| | Hypothetical (h) | | | 0.06% | | | | $1,000.00 | | | | $1,024.50 | | | | $0.30 | |
| R1 | | Actual | | | 0.06% | | | | $1,000.00 | | | | $1,000.00 | | | | $0.30 | |
| | Hypothetical (h) | | | 0.06% | | | | $1,000.00 | | | | $1,024.50 | | | | $0.30 | |
| R2 | | Actual | | | 0.06% | | | | $1,000.00 | | | | $1,000.00 | | | | $0.30 | |
| | Hypothetical (h) | | | 0.06% | | | | $1,000.00 | | | | $1,024.50 | | | | $0.30 | |
| R3 | | Actual | | | 0.06% | | | | $1,000.00 | | | | $1,000.00 | | | | $0.30 | |
| | Hypothetical (h) | | | 0.06% | | | | $1,000.00 | | | | $1,024.50 | | | | $0.30 | |
| R4 | | Actual | | | 0.06% | | | | $1,000.00 | | | | $1,000.00 | | | | $0.30 | |
| | Hypothetical (h) | | | 0.06% | | | | $1,000.00 | | | | $1,024.50 | | | | $0.30 | |
| 529A | | Actual | | | 0.06% | | | | $1,000.00 | | | | $1,000.00 | | | | $0.30 | |
| | Hypothetical (h) | | | 0.06% | | | | $1,000.00 | | | | $1,024.50 | | | | $0.30 | |
| 529B | | Actual | | | 0.06% | | | | $1,000.00 | | | | $1,000.00 | | | | $0.30 | |
| | Hypothetical (h) | | | 0.06% | | | | $1,000.00 | | | | $1,024.50 | | | | $0.30 | |
| 529C | | Actual | | | 0.06% | | | | $1,000.00 | | | | $1,000.00 | | | | $0.30 | |
| | Hypothetical (h) | | | 0.06% | | | | $1,000.00 | | | | $1,024.50 | | | | $0.30 | |
| (h) | 5% class return per year before expenses. |
| (p) | “Expenses Paid During Period” are equal to each class’s annualized expense ratio, as shown above, multiplied by the average account value over the period, multiplied by 181/365 (to reflect the one-half year period). Expenses paid do not include any applicable sales charges (loads). If these transaction costs had been included, your costs would have been higher. |
Notes to Expense Table
As more fully disclosed in footnote 3 to the financial statements, the expense ratios reported above include additional expense reductions to avoid a negative yield.
4
PORTFOLIO OF INVESTMENTS
2/28/15 (unaudited)
The Portfolio of Investments is a complete list of all securities owned by your fund. It is categorized by broad-based asset classes.
| | | | | | | | |
| U.S. Government Agencies and Equivalents (y) - 98.4% | | | | | |
| Issuer | | Shares/Par | | | Value ($) | |
| | | | | | | | |
| Fannie Mae, 0.07%, due 3/03/15 | | $ | 572,000 | | | $ | 571,998 | |
| Federal Home Loan Bank, 0.05%, due 3/02/15 | | | 4,857,000 | | | | 4,856,993 | |
| Federal Home Loan Bank, 0.04%, due 3/03/15 | | | 13,000,000 | | | | 12,999,971 | |
| Federal Home Loan Bank, 0.01%, due 3/04/15 | | | 34,740,000 | | | | 34,739,896 | |
| Federal Home Loan Bank, 0.06%, due 3/04/15 | | | 7,948,000 | | | | 7,947,960 | |
| Federal Home Loan Bank, 0.01%, due 3/09/15 | | | 6,116,000 | | | | 6,115,959 | |
| Federal Home Loan Bank, 0.01%, due 3/11/15 | | | 17,419,000 | | | | 17,418,794 | |
| Federal Home Loan Bank, 0.01%, due 3/18/15 | | | 13,272,000 | | | | 13,271,718 | |
| Federal Home Loan Bank, 0.01%, due 3/20/15 | | | 5,925,000 | | | | 5,924,878 | |
| Federal Home Loan Bank, 0.01%, due 3/25/15 | | | 5,800,000 | | | | 5,799,859 | |
| Federal Home Loan Bank, 0.01%, due 3/27/15 | | | 1,000,000 | | | | 999,968 | |
| Federal Home Loan Bank, 0.01%, due 4/01/15 | | | 28,108,000 | | | | 28,106,669 | |
| Federal Home Loan Bank, 0.075%, due 4/01/15 | | | 13,500,000 | | | | 13,499,128 | |
| Federal Home Loan Bank, 0.01%, due 4/06/15 | | | 16,900,000 | | | | 16,898,929 | |
| Federal Home Loan Bank, 0.08%, due 4/06/15 | | | 13,000,000 | | | | 12,998,960 | |
| Federal Home Loan Bank, 0.01%, due 4/08/15 | | | 12,670,000 | | | | 12,669,131 | |
| Federal Home Loan Bank, 0.01%, due 4/10/15 | | | 17,888,000 | | | | 17,886,807 | |
| Federal Home Loan Bank, 0.09%, due 4/10/15 | | | 5,000,000 | | | | 4,999,500 | |
| Federal Home Loan Bank, 0.01%, due 4/15/15 | | | 11,094,000 | | | | 11,093,168 | |
| Federal Home Loan Bank, 0.01%, due 4/20/15 | | | 2,001,000 | | | | 2,000,819 | |
| Federal Home Loan Bank, 0.09%, due 4/24/15 | | | 7,031,000 | | | | 7,030,051 | |
| Federal Home Loan Bank, 0.01%, due 4/29/15 | | | 12,515,000 | | | | 12,513,769 | |
| Freddie Mac, 0.05%, due 3/03/15 | | | 2,300,000 | | | | 2,299,994 | |
| U.S. Treasury Bill, 0.045%, due 4/02/15 | | | 5,000,000 | | | | 4,999,800 | |
| U.S. Treasury Bill, 0.01%, due 4/23/15 | | | 3,018,000 | | | | 3,017,967 | |
| U.S. Treasury Bill, 0.03%, due 5/07/15 | | | 2,661,000 | | | | 2,660,851 | |
| U.S. Treasury Bill, 0.053%, due 5/07/15 | | | 10,330,000 | | | | 10,328,991 | |
| U.S. Treasury Bill, 0.09%, due 7/09/15 | | | 13,045,000 | | | | 13,040,760 | |
| U.S. Treasury Bill, 0.108%, due 7/23/15 | | | 7,000,000 | | | | 6,996,976 | |
| U.S. Treasury Bill, 0.275%, due 1/07/16 | | | 13,060,000 | | | | 13,028,874 | |
Total U.S. Government Agencies and Equivalents,
at Amortized Cost and Value | | | | | | $ | 306,719,138 | |
5
Portfolio of Investments (unaudited) – continued
| | | | | | | | |
| Repurchase Agreements - 1.7% | | | | | | | | |
| Issuer | | Shares/Par | | | Value ($) | |
| | | | | | | | |
| Merrill Lynch, Pierce, Fenner & Smith, Inc. Repurchase Agreement, 0.05%, dated 2/27/15, due 3/02/15, total to be received $5,298,022 (secured by U.S. Treasury and Federal Agency obligations valued at $5,403,970 in a jointly traded account), at Cost and Value | | $ | 5,298,000 | | | $ | 5,298,000 | |
| Total Investments, at Amortized Cost and Value | | | | | | $ | 312,017,138 | |
| | |
| Other Assets, Less Liabilities - (0.1)% | | | | | | | (235,201 | ) |
| Net Assets - 100.0% | | | | | | $ | 311,781,937 | |
| (y) | The rate shown represents an annualized yield at time of purchase. |
See notes to financial statements
6
Financial Statements
STATEMENT OF ASSETS AND LIABILITIES
At 2/28/15 (unaudited)
This statement represents your fund’s balance sheet, which details the assets and liabilities comprising the total value of the fund.
| | | | |
| Assets | | | | |
Investments, at amortized cost and value | | | $312,017,138 | |
Cash | | | 857 | |
Receivables for | | | | |
Fund shares sold | | | 845,042 | |
Interest | | | 15 | |
Receivable from investment adviser and distributor | | | 109,500 | |
Other assets | | | 1,983 | |
Total assets | | | $312,974,535 | |
| Liabilities | | | | |
Payable for fund shares reacquired | | | $1,004,581 | |
Payable to affiliate for shareholder servicing costs | | | 166,484 | |
Payable for independent Trustees’ compensation | | | 10,472 | |
Accrued expenses and other liabilities | | | 11,061 | |
Total liabilities | | | $1,192,598 | |
Net assets | | | $311,781,937 | |
| Net assets consist of | | | | |
Paid-in capital | | | $312,001,952 | |
Accumulated net realized gain (loss) on investments | | | (207,393 | ) |
Accumulated net investment loss | | | (12,622 | ) |
Net assets | | | $311,781,937 | |
Shares of beneficial interest outstanding | | | 312,011,941 | |
7
Statement of Assets and Liabilities (unaudited) – continued
| | | | | | | | | | | | |
| | | Net assets | | | Shares
outstanding | | | Net asset value
per share | |
Class A | | | $114,996,394 | | | | 115,079,694 | | | | $1.00 | |
Class B | | | 19,574,985 | | | | 19,591,852 | | | | 1.00 | |
Class C | | | 39,470,890 | | | | 39,499,544 | | | | 1.00 | |
Class R1 | | | 15,733,389 | | | | 15,745,042 | | | | 1.00 | |
Class R2 | | | 55,350,624 | | | | 55,391,509 | | | | 1.00 | |
Class R3 | | | 46,837,060 | | | | 46,871,769 | | | | 1.00 | |
Class R4 | | | 2,887,299 | | | | 2,889,451 | | | | 1.00 | |
Class 529A | | | 10,692,526 | | | | 10,699,936 | | | | 1.00 | |
Class 529B | | | 557,400 | | | | 557,856 | | | | 1.00 | |
Class 529C | | | 5,681,370 | | | | 5,685,288 | | | | 1.00 | |
A contingent deferred sales charge may be imposed on redemptions of Class A, Class B, Class C, Class 529B, and Class 529C shares. Redemption price per share was equal to the net asset value per share for Classes R1, R2, R3, R4, and 529A.
See notes to financial statements
8
Financial Statements
STATEMENT OF OPERATIONS
Six months ended 2/28/15 (unaudited)
This statement describes how much your fund earned in investment income and accrued in expenses. It also describes any gains and/or losses generated by fund operations.
| | | | |
| Net investment income | |
Interest income | | | $98,848 | |
Expenses | | | | |
Management fee | | | $655,056 | |
Distribution and service fees | | | 802,937 | |
Program manager fees | | | 8,573 | |
Shareholder servicing costs | | | 306,069 | |
Administrative services fee | | | 31,269 | |
Independent Trustees’ compensation | | | 5,132 | |
Custodian fee | | | 17,691 | |
Shareholder communications | | | 12,176 | |
Audit and tax fees | | | 17,528 | |
Legal fees | | | 1,785 | |
Miscellaneous | | | 62,026 | |
Total expenses | | | $1,920,242 | |
Fees paid indirectly | | | (170 | ) |
Reduction of expenses by investment adviser and distributor | | | (1,821,224 | ) |
Net expenses | | | $98,848 | |
Net investment income | | | $0 | |
Change in net assets from operations | | | $0 | |
See notes to financial statements
9
Financial Statements
STATEMENTS OF CHANGES IN NET ASSETS
These statements describe the increases and/or decreases in net assets resulting from operations, any distributions, and any shareholder transactions.
| | | | | | | | |
| Change in net assets | | Six months ended
2/28/15 (unaudited) | | | Year ended
8/31/14 | |
| From operations | | | | | | | | |
Net investment income | | | $0 | | | | $0 | |
Net realized gain (loss) on investments | | | 0 | | | | 315 | |
Change in net assets from operations | | | $0 | | | | $315 | |
Change in net assets from fund share transactions | | | $(30,383,964 | ) | | | $(70,967,905 | ) |
Total change in net assets | | | $(30,383,964 | ) | | | $(70,967,590 | ) |
| Net assets | | | | | | | | |
At beginning of period | | | 342,165,901 | | | | 413,133,491 | |
At end of period (including accumulated net investment loss of $12,622 and $12,622, respectively) | | | $311,781,937 | | | | $342,165,901 | |
See notes to financial statements
10
Financial Statements
FINANCIAL HIGHLIGHTS
The financial highlights table is intended to help you understand the fund’s financial performance for the semiannual period and the past 5 fiscal years. Certain information reflects financial results for a single fund share. The total returns in the table represent the rate by which an investor would have earned (or lost) on an investment in the fund share class (assuming reinvestment of all distributions) held for the entire period.
| | | | | | | | | | | | | | | | | | | | | | | | |
| | | Six months
ended
2/28/15 (unaudited) | | | Years ended 8/31 | |
| Class A | | | 2014 | | | 2013 | | | 2012 | | | 2011 | | | 2010 | |
| | | | | | | | | | | | | | | | | |
Net asset value, beginning of
period | | | $1.00 | | | | $1.00 | | | | $1.00 | | | | $1.00 | | | | $1.00 | | | | $1.00 | |
| Income (loss) from investment operations | |
Net investment income (d) | | | $0.00 | | | | $0.00 | | | | $0.00 | | | | $0.00 | | | | $0.00 | (w) | | | $0.00 | (w) |
Net realized and unrealized
gain (loss) on investments | | | — | | | | 0.00 | (w) | | | — | | | | — | | | | (0.00 | )(w) | | | 0.00 | (w) |
Total from investment
operations | | | $0.00 | | | | $0.00 | (w) | | | $0.00 | | | | $0.00 | | | | $0.00 | (w) | | | $0.00 | (w) |
| Less distributions declared to shareholders | |
From net investment income | | | $— | | | | $— | | | | $— | | | | $— | | | | $(0.00 | )(w) | | | $(0.00 | )(w) |
From tax return of capital | | | — | | | | — | | | | — | | | | — | | | | (0.00 | )(w) | | | (0.00 | )(w) |
Total distributions declared to
shareholders | | | $— | | | | $— | | | | $— | | | | $— | | | | $(0.00 | )(w) | | | $(0.00 | )(w) |
Net asset value, end of period | | | $1.00 | | | | $1.00 | | | | $1.00 | | | | $1.00 | | | | $1.00 | | | | $1.00 | |
Total return (%) (r)(t) | | | 0.00 | (n) | | | 0.00 | (w) | | | 0.00 | | | | 0.00 | | | | 0.00 | (w) | | | 0.00 | (w) |
Ratios (%) (to average net assets)
and Supplemental data: | |
Expenses before expense
reductions (f) | | | 0.93 | (a) | | | 0.90 | | | | 0.93 | | | | 0.93 | | | | 0.94 | | | | 0.85 | |
Expenses after expense
reductions (f) | | | 0.06 | (a) | | | 0.09 | | | | 0.15 | | | | 0.13 | | | | 0.20 | | | | 0.27 | |
Net investment income | | | 0.00 | (a) | | | 0.00 | | | | 0.00 | | | | 0.00 | | | | 0.00 | (w) | | | 0.00 | (w) |
Net assets at end of period
(000 omitted) | | | $114,996 | | | | $124,550 | | | | $145,062 | | | | $126,283 | | | | $153,634 | | | | $141,832 | |
See notes to financial statements
11
Financial Highlights – continued
| | | | | | | | | | | | | | | | | | | | | | | | |
| | | Six months
ended
2/28/15 (unaudited) | | | Years ended 8/31 | |
| Class B | | | 2014 | | | 2013 | | | 2012 | | | 2011 | | | 2010 | |
| | | | | | | | | | | | | | | | | |
Net asset value, beginning of
period | | | $1.00 | | | | $1.00 | | | | $1.00 | | | | $1.00 | | | | $1.00 | | | | $1.00 | |
| Income (loss) from investment operations | |
Net investment income (d) | | | $0.00 | | | | $0.00 | | | | $0.00 | | | | $0.00 | | | | $0.00 | (w) | | | $0.00 | (w) |
Net realized and unrealized
gain (loss) on investments | | | — | | | | 0.00 | (w) | | | — | | | | — | | | | (0.00 | )(w) | | | 0.00 | (w) |
Total from investment
operations | | | $0.00 | | | | $0.00 | (w) | | | $0.00 | | | | $0.00 | | | | $(0.00 | )(w) | | | $0.00 | (w) |
| Less distributions declared to shareholders | |
From net investment income | | | $— | | | | $— | | | | $— | | | | $— | | | | $— | | | | $(0.00 | )(w) |
From tax return of capital | | | — | | | | — | | | | — | | | | — | | | | — | | | | (0.00 | )(w) |
Total distributions declared to
shareholders | | | $— | | | | $— | | | | $— | | | | $— | | | | $— | | | | $(0.00 | )(w) |
Net asset value, end of period | | | $1.00 | | | | $1.00 | | | | $1.00 | | | | $1.00 | | | | $1.00 | | | | $1.00 | |
Total return (%) (r)(t) | | | 0.00 | (n) | | | 0.00 | (w) | | | 0.00 | | | | 0.00 | | | | 0.00 | (w) | | | 0.00 | (w) |
Ratios (%) (to average net assets)
and Supplemental data: | |
Expenses before expense
reductions (f) | | | 1.68 | (a) | | | 1.65 | | | | 1.68 | | | | 1.68 | | | | 1.69 | | | | 1.69 | |
Expenses after expense
reductions (f) | | | 0.06 | (a) | | | 0.10 | | | | 0.15 | | | | 0.12 | | | | 0.20 | | | | 0.27 | |
Net investment income | | | 0.00 | (a) | | | 0.00 | | | | 0.00 | | | | 0.00 | | | | 0.00 | (w) | | | 0.00 | (w) |
Net assets at end of period
(000 omitted) | | | $19,575 | | | | $22,982 | | | | $30,833 | | | | $35,098 | | | | $50,379 | | | | $66,601 | |
See notes to financial statements
12
Financial Highlights – continued
| | | | | | | | | | | | | | | | | | | | | | | | |
| | | Six months
ended
2/28/15 (unaudited) | | | Years ended 8/31 | |
| Class C | | | 2014 | | | 2013 | | | 2012 | | | 2011 | | | 2010 | |
| | | | | | | | | | | | | | | | | |
Net asset value, beginning of
period | | | $1.00 | | | | $1.00 | | | | $1.00 | | | | $1.00 | | | | $1.00 | | | | $1.00 | |
| Income (loss) from investment operations | |
Net investment income (d) | | | $0.00 | | | | $0.00 | | | | $0.00 | | | | $0.00 | | | | $0.00 | | | | $0.00 | (w) |
Net realized and unrealized
gain (loss) on investments | | | — | | | | 0.00 | (w) | | | — | | | | — | | | | (0.00 | )(w) | | | 0.00 | (w) |
Total from investment
operations | | | $0.00 | | | | $0.00 | (w) | | | $0.00 | | | | $0.00 | | | | $(0.00 | )(w) | | | $0.00 | (w) |
| Less distributions declared to shareholders | |
From net investment income | | | $— | | | | $— | | | | $— | | | | $— | | | | $— | | | | $(0.00 | )(w) |
From tax return of capital | | | — | | | | — | | | | — | | | | — | | | | — | | | | (0.00 | )(w) |
Total distributions declared to
shareholders | | | $— | | | | $— | | | | $— | | | | $— | | | | $— | | | | $— | |
Net asset value, end of period | | | $1.00 | | | | $1.00 | | | | $1.00 | | | | $1.00 | | | | $1.00 | | | | $1.00 | |
Total return (%) (r)(t) | | | 0.00 | (n) | | | 0.00 | (w) | | | 0.00 | | | | 0.00 | | | | 0.00 | (w) | | | 0.00 | (w) |
Ratios (%) (to average net assets)
and Supplemental data: | |
Expenses before expense
reductions (f) | | | 1.68 | (a) | | | 1.65 | | | | 1.68 | | | | 1.68 | | | | 1.69 | | | | 1.69 | |
Expenses after expense
reductions (f) | | | 0.06 | (a) | | | 0.10 | | | | 0.15 | | | | 0.13 | | | | 0.20 | | | | 0.27 | |
Net investment income | | | 0.00 | (a) | | | 0.00 | | | | 0.00 | | | | 0.00 | | | | 0.00 | | | | 0.00 | (w) |
Net assets at end of period
(000 omitted) | | | $39,471 | | | | $45,662 | | | | $58,363 | | | | $49,851 | | | | $61,943 | | | | $50,196 | |
See notes to financial statements
13
Financial Highlights – continued
| | | | | | | | | | | | | | | | | | | | | | | | |
| | | Six months
ended
2/28/15 (unaudited) | | | Years ended 8/31 | |
| Class R1 | | | 2014 | | | 2013 | | | 2012 | | | 2011 | | | 2010 | |
| | | | | | | | | | | | | | | | | |
Net asset value, beginning of
period | | | $1.00 | | | | $1.00 | | | | $1.00 | | | | $1.00 | | | | $1.00 | | | | $1.00 | |
| Income (loss) from investment operations | |
Net investment income (d) | | | $0.00 | | | | $0.00 | | | | $0.00 | | | | $0.00 | | | | $0.00 | | | | $0.00 | (w) |
Net realized and unrealized
gain (loss) on investments | | | — | | | | 0.00 | (w) | | | — | | | | — | | | | (0.00 | )(w) | | | 0.00 | (w) |
Total from investment
operations | | | $0.00 | | | | $0.00 | (w) | | | $0.00 | | | | $0.00 | | | | $(0.00 | )(w) | | | $0.00 | (w) |
| Less distributions declared to shareholders | |
From net investment income | | | $— | | | | $— | | | | $— | | | | $— | | | | $— | | | | $(0.00 | )(w) |
From tax return of capital | | | — | | | | — | | | | — | | | | — | | | | — | | | | (0.00 | )(w) |
Total distributions declared to
shareholders | | | $— | | | | $— | | | | $— | | | | $— | | | | $— | | | | $(0.00 | )(w) |
Net asset value, end of period | | | $1.00 | | | | $1.00 | | | | $1.00 | | | | $1.00 | | | | $1.00 | | | | $1.00 | |
Total return (%) (r) | | | 0.00 | (n) | | | 0.00 | (w) | | | 0.00 | | | | 0.00 | | | | 0.00 | (w) | | | 0.00 | (w) |
Ratios (%) (to average net assets)
and Supplemental data: | |
Expenses before expense
reductions (f) | | | 1.68 | (a) | | | 1.65 | | | | 1.68 | | | | 1.68 | | | | 1.69 | | | | 1.69 | |
Expenses after expense
reductions (f) | | | 0.06 | (a) | | | 0.09 | | | | 0.15 | | | | 0.13 | | | | 0.20 | | | | 0.27 | |
Net investment income | | | 0.00 | (a) | | | 0.00 | | | | 0.00 | | | | 0.00 | | | | 0.00 | | | | 0.00 | (w) |
Net assets at end of period
(000 omitted) | | | $15,733 | | | | $16,819 | | | | $21,080 | | | | $24,361 | | | | $28,705 | | | | $30,233 | |
See notes to financial statements
14
Financial Highlights – continued
| | | | | | | | | | | | | | | | | | | | | | | | |
| | | Six months
ended
2/28/15 (unaudited) | | | Years ended 8/31 | |
| Class R2 | | | 2014 | | | 2013 | | | 2012 | | | 2011 | | | 2010 | |
| | | | | | | | | | | | | | | | | |
Net asset value, beginning of
period | | | $1.00 | | | | $1.00 | | | | $1.00 | | | | $1.00 | | | | $1.00 | | | | $1.00 | |
| Income (loss) from investment operations | |
Net investment income (d) | | | $0.00 | | | | $0.00 | | | | $0.00 | | | | $0.00 | | | | $0.00 | | | | $0.00 | (w) |
Net realized and unrealized
gain (loss) on investments | | | — | | | | 0.00 | (w) | | | — | | | | — | | | | (0.00 | )(w) | | | 0.00 | (w) |
Total from investment
operations | | | $0.00 | | | | $0.00 | (w) | | | $0.00 | | | | $0.00 | | | | $(0.00 | )(w) | | | $0.00 | (w) |
| Less distributions declared to shareholders | |
From net investment income | | | $— | | | | $— | | | | $— | | | | $— | | | | $— | | | | $(0.00 | )(w) |
From tax return of capital | | | — | | | | — | | | | — | | | | — | | | | — | | | | (0.00 | )(w) |
Total distributions declared to
shareholders | | | $— | | | | $— | | | | $— | | | | $— | | | | $— | | | | $(0.00 | )(w) |
Net asset value, end of period | | | $1.00 | | | | $1.00 | | | | $1.00 | | | | $1.00 | | | | $1.00 | | | | $1.00 | |
Total return (%) (r) | | | 0.00 | (n) | | | 0.00 | (w) | | | 0.00 | | | | 0.00 | | | | 0.00 | (w) | | | 0.00 | (w) |
Ratios (%) (to average net assets)
and Supplemental data: | |
Expenses before expense
reductions (f) | | | 1.18 | (a) | | | 1.15 | | | | 1.18 | | | | 1.18 | | | | 1.19 | | | | 1.19 | |
Expenses after expense
reductions (f) | | | 0.06 | (a) | | | 0.09 | | | | 0.15 | | | | 0.13 | | | | 0.20 | | | | 0.27 | |
Net investment income | | | 0.00 | (a) | | | 0.00 | | | | 0.00 | | | | 0.00 | | | | 0.00 | | | | 0.00 | (w) |
Net assets at end of period
(000 omitted) | | | $55,351 | | | | $57,634 | | | | $74,406 | | | | $83,723 | | | | $104,130 | | | | $109,362 | |
See notes to financial statements
15
Financial Highlights – continued
| | | | | | | | | | | | | | | | | | | | | | | | |
| | | Six months
ended
2/28/15 (unaudited) | | | Years ended 8/31 | |
| Class R3 | | | 2014 | | | 2013 | | | 2012 | | | 2011 | | | 2010 | |
| | | | | | | | | | | | | | | | | |
Net asset value, beginning of
period | | | $1.00 | | | | $1.00 | | | | $1.00 | | | | $1.00 | | | | $1.00 | | | | $1.00 | |
| Income (loss) from investment operations | |
Net investment income (d) | | | $0.00 | | | | $0.00 | | | | $0.00 | | | | $0.00 | | | | $0.00 | | | | $0.00 | (w) |
Net realized and unrealized
gain (loss) on investments | | | — | | | | 0.00 | (w) | | | — | | | | — | | | | (0.00 | )(w) | | | 0.00 | (w) |
Total from investment
operations | | | $0.00 | | | | $0.00 | (w) | | | $0.00 | | | | $0.00 | | | | $(0.00 | )(w) | | | $0.00 | (w) |
| Less distributions declared to shareholders | |
From net investment income | | | $— | | | | $— | | | | $— | | | | $— | | | | $— | | | | $(0.00 | )(w) |
From tax return of capital | | | — | | | | — | | | | — | | | | — | | | | — | | | | (0.00 | )(w) |
Total distributions declared to
shareholders | | | $— | | | | $— | | | | $— | | | | $— | | | | $— | | | | $(0.00 | )(w) |
Net asset value, end of period | | | $1.00 | | | | $1.00 | | | | $1.00 | | | | $1.00 | | | | $1.00 | | | | $1.00 | |
Total return (%) (r) | | | 0.00 | (n) | | | 0.00 | (w) | | | 0.00 | | | | 0.00 | | | | 0.00 | (w) | | | 0.00 | (w) |
Ratios (%) (to average net assets)
and Supplemental data: | |
Expenses before expense
reductions (f) | | | 0.93 | (a) | | | 0.90 | | | | 0.93 | | | | 0.93 | | | | 0.94 | | | | 0.94 | |
Expenses after expense
reductions (f) | | | 0.06 | (a) | | | 0.09 | | | | 0.15 | | | | 0.13 | | | | 0.20 | | | | 0.27 | |
Net investment income | | | 0.00 | (a) | | | 0.00 | | | | 0.00 | | | | 0.00 | | | | 0.00 | | | | 0.00 | (w) |
Net assets at end of period
(000 omitted) | | | $46,837 | | | | $53,916 | | | | $64,925 | | | | $79,029 | | | | $85,602 | | | | $90.331 | |
See notes to financial statements
16
Financial Highlights – continued
| | | | | | | | | | | | | | | | | | | | | | | | |
| | | Six months
ended
2/28/15 (unaudited) | | | Years ended 8/31 | |
| Class R4 | | | 2014 | | | 2013 | | | 2012 | | | 2011 | | | 2010 | |
| | | | | | | | | | | | | | | | | |
Net asset value, beginning of
period | | | $1.00 | | | | $1.00 | | | | $1.00 | | | | $1.00 | | | | $1.00 | | | | $1.00 | |
| Income (loss) from investment operations | |
Net investment income (d) | | | $0.00 | | | | $0.00 | | | | $0.00 | | | | $0.00 | | | | $0.00 | (w) | | | $0.00 | (w) |
Net realized and unrealized
gain (loss) on investments | | | — | | | | 0.00 | (w) | | | — | | | | — | | | | (0.00 | )(w) | | | 0.00 | (w) |
Total from investment
operations | | | $0.00 | | | | $0.00 | (w) | | | $0.00 | | | | $0.00 | | | | $0.00 | (w) | | | $0.00 | (w) |
| Less distributions declared to shareholders | |
From net investment income | | | $— | | | | $— | | | | $— | | | | $— | | | | $(0.00 | )(w) | | | $(0.00 | )(w) |
From tax return of capital | | | — | | | | — | | | | — | | | | — | | | | (0.00 | )(w) | | | (0.00 | )(w) |
Total distributions declared to
shareholders | | | $— | | | | $— | | | | $— | | | | $— | | | | $(0.00 | )(w) | | | $(0.00 | )(w) |
Net asset value, end of period | | | $1.00 | | | | $1.00 | | | | $1.00 | | | | $1.00 | | | | $1.00 | | | | $1.00 | |
Total return (%) (r) | | | 0.00 | (n) | | | 0.00 | (w) | | | 0.00 | | | | 0.00 | | | | 0.00 | (w) | | | 0.00 | (w) |
Ratios (%) (to average net assets)
and Supplemental data: | |
Expenses before expense
reductions (f) | | | 0.68 | (a) | | | 0.65 | | | | 0.68 | | | | 0.69 | | | | 0.69 | | | | 0.68 | |
Expenses after expense
reductions (f) | | | 0.06 | (a) | | | 0.09 | | | | 0.15 | | | | 0.12 | | | | 0.20 | | | | 0.27 | |
Net investment income | | | 0.00 | (a) | | | 0.00 | | | | 0.00 | | | | 0.00 | | | | 0.00 | (w) | | | 0.00 | (w) |
Net assets at end of period
(000 omitted) | | | $2,887 | | | | $2,907 | | | | $820 | | | | $810 | | | | $5,743 | | | | $6,172 | |
See notes to financial statements
17
Financial Highlights – continued
| | | | | | | | | | | | | | | | | | | | | | | | |
| | | Six months
ended
2/28/15 (unaudited) | | | Years ended 8/31 | |
| Class 529A | | | 2014 | | | 2013 | | | 2012 | | | 2011 | | | 2010 | |
| | | | | | | | | | | | | | | | | |
Net asset value, beginning of
period | | | $1.00 | | | | $1.00 | | | | $1.00 | | | | $1.00 | | | | $1.00 | | | | $1.00 | |
| Income (loss) from investment operations | |
Net investment income (d) | | | $0.00 | | | | $0.00 | | | | $0.00 | | | | $0.00 | | | | $0.00 | | | | $0.00 | (w) |
Net realized and unrealized
gain (loss) on investments | | | — | | | | 0.00 | (w) | | | — | | | | — | | | | (0.00 | )(w) | | | 0.00 | (w) |
Total from investment
operations | | | $0.00 | | | | $0.00 | (w) | | | $0.00 | | | | $0.00 | | | | $(0.00 | )(w) | | | $0.00 | (w) |
| Less distributions declared to shareholders | |
From net investment income | | | $— | | | | $— | | | | $— | | | | $— | | | | $— | | | | $(0.00 | )(w) |
From tax return of capital | | | — | | | | — | | | | — | | | | — | | | | — | | | | (0.00 | )(w) |
Total distributions declared to
shareholders | | | $— | | | | $— | | | | $— | | | | $— | | | | $— | | | | $(0.00 | )(w) |
Net asset value, end of period | | | $1.00 | | | | $1.00 | | | | $1.00 | | | | $1.00 | | | | $1.00 | | | | $1.00 | |
Total return (%) (r) | | | 0.00 | (n) | | | 0.00 | (w) | | | 0.00 | | | | 0.00 | | | | 0.00 | (w) | | | 0.00 | (w) |
Ratios (%) (to average net assets)
and Supplemental data: | |
Expenses before expense
reductions (f) | | | 1.03 | (a) | | | 1.00 | | | | 1.03 | | | | 1.03 | | | | 1.04 | | | | 1.03 | |
Expenses after expense
reductions (f) | | | 0.06 | (a) | | | 0.09 | | | | 0.15 | | | | 0.13 | | | | 0.20 | | | | 0.27 | |
Net investment income | | | 0.00 | (a) | | | 0.00 | | | | 0.00 | | | | 0.00 | | | | 0.00 | | | | 0.00 | (w) |
Net assets at end of period
(000 omitted) | | | $10,693 | | | | $10,927 | | | | $10,897 | | | | $10,330 | | | | $9,710 | | | | $9,919 | |
See notes to financial statements
18
Financial Highlights – continued
| | | | | | | | | | | | | | | | | | | | | | | | |
| | | Six months
ended
2/28/15 (unaudited) | | | Years ended 8/31 | |
| Class 529B | | | 2014 | | | 2013 | | | 2012 | | | 2011 | | | 2010 | |
| | | | | | | | | | | | | | | | | |
Net asset value, beginning of
period | | | $1.00 | | | | $1.00 | | | | $1.00 | | | | $1.00 | | | | $1.00 | | | | $1.00 | |
| Income (loss) from investment operations | |
Net investment income (d) | | | $0.00 | | | | $0.00 | | | | $0.00 | | | | $0.00 | | | | $0.00 | | | | $0.00 | (w) |
Net realized and unrealized
gain (loss) on investments | | | — | | | | 0.00 | (w) | | | — | | | | — | | | | (0.00 | )(w) | | | 0.00 | (w) |
Total from investment
operations | | | $0.00 | | | | $0.00 | (w) | | | $0.00 | | | | $0.00 | | | | $(0.00 | )(w) | | | $0.00 | (w) |
| Less distributions declared to shareholders | |
From net investment income | | | $— | | | | $— | | | | $— | | | | $— | | | | $— | | | | $(0.00 | )(w) |
From tax return of capital | | | — | | | | — | | | | — | | | | — | | | | — | | | | (0.00 | )(w) |
Total distributions declared to
shareholders | | | $— | | | | $— | | | | $— | | | | $— | | | | $— | | | | $(0.00 | )(w) |
Net asset value, end of period | | | $1.00 | | | | $1.00 | | | | $1.00 | | | | $1.00 | | | | $1.00 | | | | $1.00 | |
Total return (%) (r)(t) | | | 0.00 | (n) | | | 0.00 | (w) | | | 0.00 | | | | 0.00 | | | | 0.00 | (w) | | | 0.00 | (w) |
Ratios (%) (to average net assets)
and Supplemental data: | |
Expenses before expense
reductions (f) | | | 1.78 | (a) | | | 1.75 | | | | 1.78 | | | | 1.78 | | | | 1.79 | | | | 1.79 | |
Expenses after expense
reductions (f) | | | 0.06 | (a) | | | 0.10 | | | | 0.15 | | | | 0.12 | | | | 0.20 | | | | 0.27 | |
Net investment income | | | 0.00 | (a) | | | 0.00 | | | | 0.00 | | | | 0.00 | | | | 0.00 | | | | 0.00 | (w) |
Net assets at end of period
(000 omitted) | | | $557 | | | | $531 | | | | $676 | | | | $665 | | | | $1,073 | | | | $1,613 | |
See notes to financial statements
19
Financial Highlights – continued
| | | | | | | | | | | | | | | | | | | | | | | | |
| | | Six months
ended
2/28/15 (unaudited) | | | Years ended 8/31 | |
| Class 529C | | | 2014 | | | 2013 | | | 2012 | | | 2011 | | | 2010 | |
| | | | | | | | | | | | | | | | | |
Net asset value, beginning of
period | | | $1.00 | | | | $1.00 | | | | $1.00 | | | | $1.00 | | | | $1.00 | | | | $1.00 | |
| Income (loss) from investment operations | |
Net investment income (d) | | | $0.00 | | | | $0.00 | | | | $0.00 | | | | $0.00 | | | | $0.00 | | | | $0.00 | (w) |
Net realized and unrealized
gain (loss) on investments | | | — | | | | 0.00 | (w) | | | — | | | | — | | | | (0.00 | )(w) | | | 0.00 | (w) |
Total from investment
operations | | | $0.00 | | | | $0.00 | (w) | | | $0.00 | | | | $0.00 | | | | $(0.00 | )(w) | | | $0.00 | (w) |
| Less distributions declared to shareholders | |
From net investment income | | | $— | | | | $— | | | | $— | | | | $— | | | | $— | | | | $(0.00 | )(w) |
From tax return of capital | | | — | | | | — | | | | — | | | | — | | | | — | | | | (0.00 | )(w) |
Total distributions declared to
shareholders | | | $— | | | | $— | | | | $— | | | | $— | | | | $— | | | | $(0.00 | )(w) |
Net asset value, end of period | | | $1.00 | | | | $1.00 | | | | $1.00 | | | | $1.00 | | | | $1.00 | | | | $1.00 | |
Total return (%) (r)(t) | | | 0.00 | (n) | | | 0.00 | (w) | | | 0.00 | | | | 0.00 | | | | 0.00 | (w) | | | 0.00 | (w) |
Ratios (%) (to average net assets)
and Supplemental data: | |
Expenses before expense
reductions (f) | | | 1.78 | (a) | | | 1.75 | | | | 1.78 | | | | 1.78 | | | | 1.79 | | | | 1.78 | |
Expenses after expense
reductions (f) | | | 0.06 | (a) | | | 0.09 | | | | 0.15 | | | | 0.13 | | | | 0.20 | | | | 0.27 | |
Net investment income | | | 0.00 | (a) | | | 0.00 | | | | 0.00 | | | | 0.00 | | | | 0.00 | | | | 0.00 | (w) |
Net assets at end of period
(000 omitted) | | | $5,681 | | | | $6,240 | | | | $6,072 | | | | $5,020 | | | | $5,525 | | | | $6,224 | |
| (d) | Per share data is based on average shares outstanding. |
| (f) | Ratios do not reflect reductions from fees paid indirectly, if applicable. |
| (r) | Certain expenses have been reduced without which performance would have been lower. |
| (t) | Total returns do not include any applicable sales charges. |
| (w) | Per share amount was less than $0.01 and total return or ratio was less than 0.01%, as applicable. |
See notes to financial statements
20
NOTES TO FINANCIAL STATEMENTS
(unaudited)
(1) Business and Organization
MFS U.S. Government Cash Reserve Fund (the fund) is a diversified series of MFS Series Trust I (the trust). The trust is organized as a Massachusetts business trust and is registered under the Investment Company Act of 1940, as amended, as an open-end management investment company.
The fund is an investment company and accordingly follows the investment company accounting and reporting guidance of the Financial Accounting Standards Board (FASB) Accounting Standards Codification Topic 946 Financial Services – Investment Companies.
On July 23, 2014, the U.S. Securities and Exchange Commission adopted amendments to its money market fund regulations. At this time, management is evaluating the potential implications of the changes.
(2) Significant Accounting Policies
General – The preparation of financial statements in conformity with U.S. generally accepted accounting principles requires management to make estimates and assumptions that affect the reported amounts of assets and liabilities, and disclosure of contingent assets and liabilities at the date of the financial statements and the reported amounts of increases and decreases in net assets from operations during the reporting period. Actual results could differ from those estimates. In the preparation of these financial statements, management has evaluated subsequent events occurring after the date of the fund’s Statement of Assets and Liabilities through the date that the financial statements were issued.
In June 2014, FASB issued Accounting Standards Update 2014-11, Transfers and Servicing (Topic 860) – Repurchase-to-Maturity Transactions, Repurchase Financings, and Disclosures (“ASU 2014-11”). ASU 2014-11 changes the accounting for repurchase-to-maturity transactions (i.e., repurchase agreements that settle at the same time as the maturity of the transferred financial asset) and enhances the required disclosures for repurchase agreements and other similar transactions. Although still evaluating the potential impacts of ASU 2014-11 to the fund, management expects that the impact of the fund’s adoption will be limited to additional financial statement disclosures which would first be effective for interim reporting periods beginning after March 15, 2015.
Balance Sheet Offsetting – The fund’s accounting policy with respect to balance sheet offsetting is that, absent an event of default by the counterparty or a termination of the agreement, the International Swaps and Derivatives Association (ISDA) Master Agreement does not result in an offset of reported amounts of financial assets and financial liabilities in the Statement of Assets and Liabilities across transactions between the fund and the applicable counterparty. The fund’s right to setoff may be restricted or prohibited by the bankruptcy or insolvency laws of the particular jurisdiction to which a specific master netting agreement counterparty is subject. Balance sheet offsetting disclosures, to the extent applicable to the fund, have been included in the fund’s Significant Accounting Policies note under the captions for each of the fund’s in-scope financial instruments and transactions.
21
Notes to Financial Statements (unaudited) – continued
Investment Valuations – Pursuant to procedures approved by the Board of Trustees, investments held by the fund are generally valued at amortized cost, which approximates market value. Amortized cost involves valuing an instrument at its cost as adjusted for amortization of premium or accretion of discount rather than its current market value. The amortized cost value of an instrument can be different from the market value of an instrument.
Various inputs are used in determining the value of the fund’s assets or liabilities. These inputs are categorized into three broad levels. In certain cases, the inputs used to measure fair value may fall into different levels of the fair value hierarchy. In such cases, an investment’s level within the fair value hierarchy is based on the lowest level of input that is significant to the fair value measurement. The fund’s assessment of the significance of a particular input to the fair value measurement in its entirety requires judgment, and considers factors specific to the investment. Level 1 includes unadjusted quoted prices in active markets for identical assets or liabilities. Level 2 includes other significant observable market-based inputs (including quoted prices for similar securities, interest rates, prepayment speed, and credit risk). Level 3 includes unobservable inputs, which may include the adviser’s own assumptions in determining the fair value of investments. The following is a summary of the levels used as of February 28, 2015 in valuing the fund’s assets or liabilities:
| | | | | | | | | | | | | | | | |
| Investments at Value | | Level 1 | | | Level 2 | | | Level 3 | | | Total | |
| Short Term Securities | | | $— | | | | $312,017,138 | | | | $— | | | | $312,017,138 | |
For further information regarding security characteristics, see the Portfolio of Investments.
Repurchase Agreements – The fund enters into repurchase agreements under the terms of Master Repurchase Agreements with approved counterparties. Each repurchase agreement is recorded at cost. The fund requires that the securities collateral in a repurchase transaction be transferred to a custodian. The fund monitors, on a daily basis, the value of the collateral to ensure that its value, including accrued interest, is greater than amounts owed to the fund under each such repurchase agreement. Upon an event of default under a Master Repurchase Agreement, the non-defaulting party may close out all transactions traded under such agreement and net amounts owed under each transaction to one net amount payable by one party to the other. Absent an event of default, the Master Repurchase Agreement does not result in an offset of reported amounts of assets and liabilities in the Statement of Assets and Liabilities across transactions between the fund and the applicable counterparty. The fund and other funds managed by MFS may utilize a joint trading account for the purpose of entering into one or more repurchase agreements. At period end, the fund had investments in repurchase agreements with a gross value of $5,298,000 included in “Investments” in the Statement of Assets and Liabilities. The value of the related collateral exceeded the value of the repurchase agreements at period end.
Indemnifications – Under the fund’s organizational documents, its officers and Trustees may be indemnified against certain liabilities and expenses arising out of the performance of their duties to the fund. Additionally, in the normal course of business, the fund enters into agreements with service providers that may contain
22
Notes to Financial Statements (unaudited) – continued
indemnification clauses. The fund’s maximum exposure under these agreements is unknown as this would involve future claims that may be made against the fund that have not yet occurred.
Investment Transactions and Income – Investment transactions are recorded on the trade date. Interest income is recorded on the accrual basis. All premium and discount is amortized or accreted for financial statement purposes in accordance with U.S. generally accepted accounting principles.
Fees Paid Indirectly – The fund’s custody fee may be reduced according to an arrangement that measures the value of cash deposited with the custodian by the fund. This amount, for the six months ended February 28, 2015, is shown as a reduction of total expenses in the Statement of Operations.
Tax Matters and Distributions – The fund intends to qualify as a regulated investment company, as defined under Subchapter M of the Internal Revenue Code, and to distribute all of its taxable income, including realized capital gains. As a result, no provision for federal income tax is required. The fund’s federal tax returns, when filed, will remain subject to examination by the Internal Revenue Service for a three year period. Management has analyzed the fund’s tax positions taken on federal and state tax returns for all open tax years and does not believe that there are any uncertain tax positions that require recognition of a tax liability.
Distributions to shareholders are recorded on the ex-dividend date. Income and capital gain distributions are determined in accordance with income tax regulations, which may differ from U.S. generally accepted accounting principles. Certain capital accounts in the financial statements are periodically adjusted for permanent differences in order to reflect their tax character. These adjustments have no impact on net assets or net asset value per share. Temporary differences which arise from recognizing certain items of income, expense, gain or loss in different periods for financial statement and tax purposes will reverse at some time in the future. Distributions in excess of net investment income or net realized gains are temporary overdistributions for financial statement purposes resulting from differences in the recognition or classification of income or distributions for financial statement and tax purposes.
During the year ended August 31, 2014, there were no significant adjustments due to differences between book and tax accounting.
The fund declared no distributions for the current period or for the year ended August 31, 2014.
The federal tax cost and the tax basis components of distributable earnings were as follows:
| | | | |
| As of 2/28/15 | | | |
| Cost of investments | | | $312,017,138 | |
| |
| As of 8/31/14 | | | |
| Capital loss carryforwards | | | (207,393 | ) |
| Late year ordinary loss deferral | | | (1,253 | ) |
| Other temporary differences | | | (11,369 | ) |
The aggregate cost above includes prior fiscal year end tax adjustments, if applicable.
23
Notes to Financial Statements (unaudited) – continued
Under the Regulated Investment Company Modernization Act of 2010 (the “Act”), net capital losses recognized for fund fiscal years beginning after August 31, 2011 may be carried forward indefinitely, and their character is retained as short-term and/or long-term losses (“post-enactment losses”). Previously, net capital losses were carried forward for eight years and treated as short-term losses (“pre-enactment losses”). As a transition rule, the Act requires that all post-enactment net capital losses be used before pre-enactment net capital losses.
As of August 31, 2014, the fund had capital loss carryforwards available to offset future realized gains. Such pre-enactment losses expire as follows:
| | | | |
| 8/31/15 | | | $(14 | ) |
| 8/31/16 | | | (22,989 | ) |
| 8/31/17 | | | (184,390 | ) |
| Total | | | $(207,393 | ) |
Multiple Classes of Shares of Beneficial Interest – The fund offers multiple classes of shares, which differ in their respective distribution, service, and program manager fees. The fund’s income and common expenses are allocated to shareholders based on the value of settled shares outstanding of each class. The fund’s realized and unrealized gain (loss) are allocated to shareholders based on the daily net assets of each class. Dividends are declared separately for each class. Differences in per share dividend rates are generally due to differences in separate class expenses. Class B and Class 529B shares will convert to Class A and Class 529A shares, respectively, approximately eight years after purchase.
(3) Transactions with Affiliates
Investment Adviser – The fund has an investment advisory agreement with MFS to provide overall investment management and related administrative services and facilities to the fund. The management fee is computed daily and paid monthly at an annual rate of 0.40% of the fund’s average daily net assets.
During the six months ended February 28, 2015, MFS voluntarily waived receipt of $645,073 of the fund’s management fee in order to avoid a negative yield. This amount, for the six months ended February 28, 2015, is included in the reduction of total expenses in the Statement of Operations. MFS has also agreed in writing to reduce its management fee by a specified amount if certain MFS mutual fund assets exceed thresholds agreed to by MFS and the fund’s Board of Trustees. For the six months ended February 28, 2015, this management fee reduction amounted to $9,983, which is included in the reduction of total expenses in the Statement of Operations. For the six months ended February 28, 2015, these waivers had the effect of reducing the management fee by 0.40% of average daily net assets on an annualized basis. The management fee incurred for the six months ended February 28, 2015 was equivalent to an annual effective rate of 0.00% of the fund’s average daily net assets.
In order to avoid a negative yield for the six months ended February 28, 2015, MFS voluntarily agreed to reduce certain other expenses in the amount of $354,544, which is included in the reduction of total expenses in the Statement of Operations.
24
Notes to Financial Statements (unaudited) – continued
Distributor – The Board of Trustees has adopted a distribution plan for certain share classes pursuant to Rule 12b-1 of the Investment Company Act of 1940.
The fund’s distribution plan provides that the fund will pay MFS Fund Distributors, Inc. (MFD) for services provided by MFD and financial intermediaries in connection with the distribution and servicing of certain share classes. One component of the plan is a distribution fee paid to MFD and another component of the plan is a service fee paid to MFD. MFD may subsequently pay all, or a portion, of the distribution and/or service fees to financial intermediaries.
Distribution Plan Fee Table:
| | | | | | | | | | | | | | | | | | | | |
| | | Distribution Fee Rate (d) | | | Service Fee Rate (d) | | | Total Distribution Plan (d) | | | Annual Effective Rate (e) | | | Distribution and Service Fee | |
| Class A | | | — | | | | 0.25% | | | | 0.25% | | | | 0.00% | | | | $149,538 | |
| Class B | | | 0.75% | | | | 0.25% | | | | 1.00% | | | | 0.00% | | | | 108,325 | |
| Class C | | | 0.75% | | | | 0.25% | | | | 1.00% | | | | 0.00% | | | | 212,842 | |
| Class R1 | | | 0.75% | | | | 0.25% | | | | 1.00% | | | | 0.00% | | | | 81,282 | |
| Class R2 | | | 0.25% | | | | 0.25% | | | | 0.50% | | | | 0.00% | | | | 141,834 | |
| Class R3 | | | — | | | | 0.25% | | | | 0.25% | | | | 0.00% | | | | 63,337 | |
| Class 529A | | | — | | | | 0.25% | | | | 0.25% | | | | 0.00% | | | | 13,314 | |
| Class 529B | | | 0.75% | | | | 0.25% | | | | 1.00% | | | | 0.00% | | | | 2,826 | |
| Class 529C | | | 0.75% | | | | 0.25% | | | | 1.00% | | | | 0.00% | | | | 29,639 | |
| Total Distribution and Service Fees | | | | $802,937 | |
| (d) | In accordance with the distribution plan for certain classes, the fund pays distribution and/or service fees equal to these annual percentage rates of each class’s average daily net assets. The distribution and service fee rates disclosed by class represent the current rates in effect at the end of the reporting period. Any rate changes, if applicable, are detailed below. |
| (e) | The annual effective rates represent actual fees incurred under the distribution plan for the six months ended February 28, 2015 based on each class’s average daily net assets. MFD has agreed in writing to waive the Class A and Class 529A service fee. This written agreement will continue until modified by the fund’s Board of Trustees, but such agreement will continue until at least December 31, 2015. These reductions, for the six months ended February 28, 2015, for Class A and Class 529A amounted to $149,538 and $13,314, respectively, and are included in the reduction of total expenses in the Statement of Operations. During the six months ended February 28, 2015, MFD also voluntarily waived a receipt of $640,085 of the fund’s distribution and service fees to ensure the fund avoids a negative yield for Class B, Class C, Class R1, Class R2, Class R3, Class 529B, and Class 529C shares. This amount is included in the reduction of total expenses in the Statement of Operations. |
Certain Class A shares acquired through an exchange may be subject to a contingent deferred sales charge (CDSC) upon redemption depending on when the shares exchanged were originally purchased. Class C and Class 529C shares are subject to a CDSC in the event of a shareholder redemption within 12 months of purchase. Class B
25
Notes to Financial Statements (unaudited) – continued
and Class 529B shares are subject to a CDSC in the event of a shareholder redemption within six years of purchase. All contingent deferred sales charges are paid to MFD and during the six months ended February 28, 2015, were as follows:
| | | | |
| | | Amount | |
| Class A | | | $63 | |
| Class B | | | 33,128 | |
| Class C | | | 6,960 | |
| Class 529B | | | — | |
| Class 529C | | | 96 | |
The fund has entered into and may from time to time enter into contracts with program managers and other parties which administer the tuition programs through which an investment in the fund’s 529 share classes is made. The fund has entered into an agreement with MFD pursuant to which MFD receives an annual fee of up to 0.10% of the average daily net assets attributable to each 529 share class. MFD has agreed to waive a portion of this fee in an amount equal to 0.05% of the average daily net assets for each 529 share class. This waiver agreement will expire on December 31, 2016, unless MFD elects to extend the waiver. For the six month’s ended February 28, 2015, this waiver amounted to $4,286 and is included in the reduction of total expenses in the Statement of Operations. In addition, MFS voluntarily waived receipt of $4,286 of the fund’s program manager fees in order to avoid a negative yield for Class 529A, Class 529B, and Class 529C shares. This amount, for the six months ended February 28, 2015, is included in the reduction of total expenses in the Statement of Operations. This voluntary waiver had the effect of reducing the program manager fee by 0.05% of average daily net assets attributable to Class 529A, Class 529B, and Class 529C shares on an annualized basis. The program manager fee incurred for the six months ended February 28, 2015 was equivalent to an annual effective rate of 0.00% of the average daily net assets attributable to each 529 share class. The services provided by MFD, or a third party with which MFD contracts, include recordkeeping and tax reporting and account services, as well as services designed to maintain the program’s compliance with the Internal Revenue Code and other regulatory requirements. Program manager fees and waivers for the six months ended February 28, 2015, were as follows:
| | | | | | | | |
| | | Fee | | | Waiver | |
| Class 529A | | | $5,325 | | | | $5,325 | |
| Class 529B | | | 283 | | | | 283 | |
| Class 529C | | | 2,964 | | | | 2,964 | |
| Total Program Manager Fees and Waivers | | | $8,572 | | | | $8,572 | |
Shareholder Servicing Agent – MFS Service Center, Inc. (MFSC), a wholly-owned subsidiary of MFS, receives a fee from the fund for its services as shareholder servicing agent calculated as a percentage of the average daily net assets of the fund as determined periodically under the supervision of the fund’s Board of Trustees. For the six months ended February 28, 2015, the fee was $100,766, which equated to 0.0615% annually of the fund’s average daily net assets. MFSC also receives payment from the fund for out-of-pocket expenses, sub-accounting and other shareholder servicing costs which may be paid to affiliated and unaffiliated service providers. For
26
Notes to Financial Statements (unaudited) – continued
the six months ended February 28, 2015, these out-of-pocket expenses, sub-accounting and other shareholder servicing costs amounted to $205,303.
Administrator – MFS provides certain financial, legal, shareholder communications, compliance, and other administrative services to the fund. Under an administrative services agreement, the fund reimburses MFS the costs incurred to provide these services. The fund is charged an annual fixed amount of $17,500 plus a fee based on average daily net assets. The administrative services fee incurred for the six months ended February 28, 2015 was equivalent to an annual effective rate of 0.0191% of the fund’s average daily net assets.
Trustees’ and Officers’ Compensation – The fund pays compensation to independent Trustees in the form of a retainer, attendance fees, and additional compensation to Board and Committee chairpersons. The fund does not pay compensation directly to Trustees or officers of the fund who are also officers of the investment adviser, all of whom receive remuneration for their services to the fund from MFS. Certain officers and Trustees of the fund are officers or directors of MFS, MFD, and MFSC.
Prior to December 31, 2001, the fund had an unfunded defined benefit plan (“DB plan”) for independent Trustees. As of December 31, 2001, the Board took action to terminate the DB plan with respect to then-current and any future independent Trustees, such that the DB plan covers only certain of those former independent Trustees who retired on or before December 31, 2001. The DB plan resulted in a pension expense of $505 and is included in independent Trustees’ compensation for the six months ended February 28, 2015. The liability for deferred retirement benefits payable to certain independent Trustees under the DB plan amounted to $10,466 at February 28, 2015, and is included in “Payable for independent Trustees’ compensation” in the Statement of Assets and Liabilities.
Other – Effective November 1, 2014, this fund and certain other funds managed by MFS (the funds) have entered into a service agreement (the ISO Agreement) which provides for payment of fees solely by the funds to Tarantino LLC in return for the provision of services of an Independent Senior Officer (ISO) for the funds. Frank L. Tarantino serves as the ISO and is an officer of the funds and the sole member of Tarantino LLC. The funds can terminate the ISO Agreement with Tarantino LLC at any time under the terms of the ISO Agreement. Prior to November 1, 2014, the funds had entered into a service agreement (the Compliance Officer Agreement) which provided for payment of fees by the funds to Tarantino LLC in return for the provision of services of an Independent Chief Compliance Officer (ICCO) for the funds. Prior to November 1, 2014, Frank L. Tarantino served as the ICCO. Effective October 31, 2014, Mr. Tarantino resigned as ICCO and the Compliance Officer Agreement between the funds and Tarantino LLC was terminated. For the six months ended February 28, 2015, the aggregate fees paid by the fund under these agreements were $658 and are included in “Miscellaneous” expense in the Statement of Operations. MFS had agreed to reimburse the fund for a portion of the payments made by the fund for the services under the Compliance Officer Agreement in the amount of $115, which is included in the reduction of total expenses in the Statement of Operations. Additionally, MFS has agreed to bear all expenses associated with office space, other administrative support, and supplies provided to the ICCO and ISO.
27
Notes to Financial Statements (unaudited) – continued
On October 9, 2013, MFS purchased 2,600,000 shares of Class R4 for an aggregate amount of $2,600,000. At February 28, 2015, MFS held approximately 90% of the outstanding shares of Class R4.
(5) Shares of Beneficial Interest
The fund’s Declaration of Trust permits the Trustees to issue an unlimited number of full and fractional shares of beneficial interest. Transactions in fund shares were as follows:
| | | | | | | | | | | | | | | | |
| | | Six months ended
2/28/15 | | | Year ended
8/31/14 | |
| | | Shares | | | Amount | | | Shares | | | Amount | |
| Shares sold | | | | | | | | | | | | | | | | |
Class A | | | 23,330,963 | | | | $23,330,966 | | | | 68,204,993 | | | | $68,204,998 | |
Class B | | | 4,313,284 | | | | 4,313,285 | | | | 10,789,946 | | | | 10,789,945 | |
Class C | | | 12,574,073 | | | | 12,574,073 | | | | 34,883,605 | | | | 34,883,605 | |
Class R1 | | | 3,027,547 | | | | 3,027,547 | | | | 5,104,049 | | | | 5,104,049 | |
Class R2 | | | 6,261,268 | | | | 6,261,267 | | | | 14,432,020 | | | | 14,432,021 | |
Class R3 | | | 5,355,954 | | | | 5,355,954 | | | | 25,816,000 | | | | 25,816,000 | |
Class R4 | | | 194,885 | | | | 194,884 | | | | 2,901,681 | | | | 2,901,681 | |
Class 529A | | | 2,084,464 | | | | 2,084,464 | | | | 4,546,774 | | | | 4,546,774 | |
Class 529B | | | 112,240 | | | | 112,240 | | | | 329,642 | | | | 329,642 | |
Class 529C | | | 1,232,966 | | | | 1,232,965 | | | | 3,360,364 | | | | 3,360,364 | |
| | | 58,487,644 | | | | $58,487,645 | | | | 170,369,074 | | | | $170,369,079 | |
| | | | |
| Shares reacquired | | | | | | | | | | | | | | | | |
Class A | | | (32,872,208 | ) | | | $(32,872,208 | ) | | | (88,717,004 | ) | | | $(88,717,004 | ) |
Class B | | | (7,750,155 | ) | | | (7,750,157 | ) | | | (18,641,374 | ) | | | (18,641,379 | ) |
Class C | | | (18,765,811 | ) | | | (18,765,811 | ) | | | (47,585,499 | ) | | | (47,585,499 | ) |
Class R1 | | | (4,110,841 | ) | | | (4,110,841 | ) | | | (9,365,466 | ) | | | (9,365,466 | ) |
Class R2 | | | (8,540,560 | ) | | | (8,540,560 | ) | | | (31,204,212 | ) | | | (31,204,212 | ) |
Class R3 | | | (12,430,925 | ) | | | (12,430,925 | ) | | | (36,824,742 | ) | | | (36,824,742 | ) |
Class R4 | | | (214,137 | ) | | | (214,137 | ) | | | (814,201 | ) | | | (814,201 | ) |
Class 529A | | | (2,312,867 | ) | | | (2,312,867 | ) | | | (4,517,477 | ) | | | (4,517,477 | ) |
Class 529B | | | (85,392 | ) | | | (85,392 | ) | | | (474,489 | ) | | | (474,490 | ) |
Class 529C | | | (1,788,711 | ) | | | (1,788,711 | ) | | | (3,192,514 | ) | | | (3,192,514 | ) |
| | | (88,871,607 | ) | | | $(88,871,609 | ) | | | (241,336,978 | ) | | | $(241,336,984 | ) |
| | | | |
| Net change | | | | | | | | | | | | | | | | |
Class A | | | (9,541,245 | ) | | | $(9,541,242 | ) | | | (20,512,011 | ) | | | $(20,512,006 | ) |
Class B | | | (3,436,871 | ) | | | (3,436,872 | ) | | | (7,851,428 | ) | | | (7,851,434 | ) |
Class C | | | (6,191,738 | ) | | | (6,191,738 | ) | | | (12,701,894 | ) | | | (12,701,894 | ) |
Class R1 | | | (1,083,294 | ) | | | (1,083,294 | ) | | | (4,261,417 | ) | | | (4,261,417 | ) |
Class R2 | | | (2,279,292 | ) | | | (2,279,293 | ) | | | (16,772,192 | ) | | | (16,772,191 | ) |
Class R3 | | | (7,074,971 | ) | | | (7,074,971 | ) | | | (11,008,742 | ) | | | (11,008,742 | ) |
Class R4 | | | (19,252 | ) | | | (19,253 | ) | | | 2,087,480 | | | | 2,087,480 | |
Class 529A | | | (228,403 | ) | | | (228,403 | ) | | | 29,297 | | | | 29,297 | |
Class 529B | | | 26,848 | | | | 26,848 | | | | (144,847 | ) | | | (144,848 | ) |
Class 529C | | | (555,745 | ) | | | (555,746 | ) | | | 167,850 | | | | 167,850 | |
| | | (30,383,963 | ) | | | $(30,383,964 | ) | | | (70,967,904 | ) | | | $(70,967,905 | ) |
28
Notes to Financial Statements (unaudited) – continued
(6) Line of Credit
The fund and certain other funds managed by MFS participate in a $1.1 billion unsecured committed line of credit, subject to a $1 billion sublimit, provided by a syndication of banks under a credit agreement. Borrowings may be made for temporary financing needs. Interest is charged to each fund, based on its borrowings, generally at a rate equal to the higher of the Federal Reserve funds rate or one month LIBOR plus an agreed upon spread. A commitment fee, based on the average daily, unused portion of the committed line of credit, is allocated among the participating funds at the end of each calendar quarter. In addition, the fund and other funds managed by MFS have established unsecured uncommitted borrowing arrangements with certain banks for temporary financing needs. Interest is charged to each fund, based on its borrowings, at a rate equal to the Federal Reserve funds rate plus an agreed upon spread. For the six months ended February 28, 2015, the fund’s commitment fee and interest expense were $647 and $0, respectively, and are included in “Miscellaneous” expense in the Statement of Operations.
29
PROXY VOTING POLICIES AND INFORMATION
MFS votes proxies on behalf of the fund pursuant to proxy voting policies and procedures that are available without charge, upon request, by calling 1-800-225-2606, by visiting the Proxy Voting section of mfs.com or by visiting the SEC’s Web site at http://www.sec.gov.
Information regarding how the fund voted proxies relating to portfolio securities during the most recent twelve-month period ended June 30 is available without charge by visiting the Proxy Voting section of mfs.com or by visiting the SEC’s Web site at http://www.sec.gov.
QUARTERLY PORTFOLIO DISCLOSURE
The fund will file a complete schedule of portfolio holdings with the Securities and Exchange Commission (the Commission) for the first and third quarters of each fiscal year on Form N-Q. A shareholder can obtain the quarterly portfolio holdings report at mfs.com. The fund’s Form N-Q is also available on the EDGAR database on the Commission’s Internet Web site at http://www.sec.gov, and may be reviewed and copied at the:
Public Reference Room
Securities and Exchange Commission
100 F Street, NE, Room 1580
Washington, D.C. 20549
Information on the operation of the Public Reference Room may be obtained by calling the Commission at 1-800-SEC-0330. Copies of the fund’s Form N-Q also may be obtained, upon payment of a duplicating fee, by electronic request at the following e-mail address: publicinfo@sec.gov or by writing the Public Reference Section at the above address.
FURTHER INFORMATION
From time to time, MFS may post important information about the fund or the MFS funds on the MFS web site (mfs.com). This information is available by visiting the “Market Commentary” and “Announcements” sub sections in the “Market Outlooks” section of mfs.com or by clicking on the fund’s name under “Mutual Funds” in the “Products” section of mfs.com.
PROVISION OF FINANCIAL REPORTS AND SUMMARY PROSPECTUSES
The fund produces financial reports every six months and updates its summary prospectus and prospectus annually. To avoid sending duplicate copies of materials to households, only one copy of the fund’s annual and semiannual report and summary prospectus may be mailed to shareholders having the same last name and residential address on the fund’s records. However, any shareholder may contact MFSC (please see back cover for address and telephone number) to request that copies of these reports and summary prospectuses be sent personally to that shareholder.
30
Save paper with eDelivery.

| MFS® will send you prospectuses, |
reports, and proxies directly via e-mail so you will get information faster with less mailbox clutter.
To sign up:
1. Go to mfs.com.
2. Log in via MFS® Access.
3. Select eDelivery.
If you own your MFS fund shares through a financial institution or a retirement plan, MFS® TALK, MFS® Access, or eDelivery may not be available to you.
CONTACT
WEB SITE
mfs.com
MFS TALK
1-800-637-8255
24 hours a day
ACCOUNT SERVICE AND LITERATURE
Shareholders
1-800-225-2606
Financial advisors
1-800-343-2829
Retirement plan services
1-800-637-1255
MAILING ADDRESS
MFS Service Center, Inc.
P.O. Box 55824
Boston, MA 02205-5824
OVERNIGHT MAIL
MFS Service Center, Inc.
c/o Boston Financial Data Services
30 Dan Road
Canton, MA 02021-2809
SEMIANNUAL REPORT
February 28, 2015

MFS® VALUE FUND

EIF-SEM
MFS® VALUE FUND
CONTENTS
The report is prepared for the general information of shareholders.
It is authorized for distribution to prospective investors only when preceded or accompanied by a current prospectus.
NOT FDIC INSURED Ÿ MAY LOSE VALUE Ÿ NO BANK GUARANTEE

LETTER FROM THE CHAIRMAN
Dear Shareholders:
Lower oil prices continue to influence markets in different ways. Among those economies hurt, oil-exporters such as Russia and Venezuela have been hit particularly hard, along with U.S. regions that have close oil industry ties.
The U.S. economic recovery remains solid. The labor market is strong, interest rates are historically low and reduced energy prices have helped to stimulate consumer spending.
Economic reports early in 2015 indicate that the eurozone is on a more solid footing, with confidence boosted by the launch of European Central Bank quantitative easing.
In Asia, the Chinese economy continues to raise concerns, with the People’s Bank of China implementing stimulus programs to counter a steady decline in growth rates.
As always, active risk management is integral to how we at MFS® manage your investments. We use a collaborative process, sharing insights across asset classes, regions and economic sectors. Our global investment team uses a diversified, multidisciplined, long-term approach.
Applying proven principles, such as asset allocation and diversification, can best serve investors over the long term. We are confident that this approach can help you as you work with your financial advisors to reach your goals in the years ahead.
Respectfully,

Robert J. Manning
Chairman
MFS Investment Management
April 14, 2015
The opinions expressed in this letter are subject to change and may not be relied upon for investment advice. No forecasts can be guaranteed.
1
PORTFOLIO COMPOSITION
Portfolio structure

| | | | |
| Top ten holdings | | | | |
| JPMorgan Chase & Co. | | | 4.2% | |
| Johnson & Johnson | | | 3.4% | |
| Philip Morris International, Inc. | | | 3.3% | |
| Wells Fargo & Co. | | | 3.2% | |
| Pfizer, Inc. | | | 3.0% | |
| Accenture PLC, “A” | | | 2.4% | |
| Honeywell International, Inc. | | | 2.2% | |
| United Technologies Corp. | | | 2.2% | |
| Lockheed Martin Corp. | | | 2.1% | |
| 3M Co. | | | 2.1% | |
| | | | |
| Equity sectors | | | | |
| Financial Services | | | 25.4% | |
| Health Care | | | 14.4% | |
| Industrial Goods & Services | | | 11.7% | |
| Consumer Staples | | | 11.3% | |
| Leisure | | | 6.6% | |
| Energy | | | 5.6% | |
| Retailing | | | 4.6% | |
| Basic Materials | | | 4.3% | |
| Special Products & Services | | | 3.9% | |
| Technology | | | 3.6% | |
| Utilities & Communications | | | 2.8% | |
| Autos & Housing | | | 2.2% | |
| Transportation | | | 2.1% | |
Cash & Other can include cash, other assets less liabilities, offsets to derivative positions, and short-term securities.
Percentages are based on net assets as of 2/28/15.
The portfolio is actively managed and current holdings may be different.
2
EXPENSE TABLE
Fund expenses borne by the shareholders during the period, September 1, 2014 through February 28, 2015
As a shareholder of the fund, you incur two types of costs: (1) transaction costs, including sales charges (loads) on certain purchase or redemption payments, and (2) ongoing costs, including management fees; distribution and service (12b-1) fees; and other fund expenses. This example is intended to help you understand your ongoing costs (in dollars) of investing in the fund and to compare these costs with the ongoing costs of investing in other mutual funds.
The example is based on an investment of $1,000 invested at the beginning of the period and held for the entire period September 1, 2014 through February 28, 2015.
Actual Expenses
The first line for each share class in the following table provides information about actual account values and actual expenses. You may use the information in this line, together with the amount you invested, to estimate the expenses that you paid over the period. Simply divide your account value by $1,000 (for example, an $8,600 account value divided by $1,000 = 8.6), then multiply the result by the number in the first line under the heading entitled “Expenses Paid During Period” to estimate the expenses you paid on your account during this period.
Hypothetical Example for Comparison Purposes
The second line for each share class in the following table provides information about hypothetical account values and hypothetical expenses based on the fund’s actual expense ratio and an assumed rate of return of 5% per year before expenses, which is not the fund’s actual return. The hypothetical account values and expenses may not be used to estimate the actual ending account balance or expenses you paid for the period. You may use this information to compare the ongoing costs of investing in the fund and other funds. To do so, compare this 5% hypothetical example with the 5% hypothetical examples that appear in the shareholder reports of the other funds.
Please note that the expenses shown in the table are meant to highlight your ongoing costs only and do not reflect any transactional costs, such as sales charges (loads). Therefore, the second line for each share class in the table is useful in comparing ongoing costs only, and will not help you determine the relative total costs of owning different funds. In addition, if these transactional costs were included, your costs would have been higher.
3
Expense Table – continued
| | | | | | | | | | | | | | | | | | |
Share
Class | | | | Annualized
Expense Ratio | | | Beginning
Account Value
9/01/14 | | | Ending Account Value
2/28/15 | | | Expenses Paid During Period (p) 9/01/14-2/28/15 | |
| A | | Actual | | | 0.86% | | | | $1,000.00 | | | | $1,064.00 | | | | $4.40 | |
| | Hypothetical (h) | | | 0.86% | | | | $1,000.00 | | | | $1,020.53 | | | | $4.31 | |
| B | | Actual | | | 1.61% | | | | $1,000.00 | | | | $1,060.14 | | | | $8.22 | |
| | Hypothetical (h) | | | 1.61% | | | | $1,000.00 | | | | $1,016.81 | | | | $8.05 | |
| C | | Actual | | | 1.61% | | | | $1,000.00 | | | | $1,059.96 | | | | $8.22 | |
| | Hypothetical (h) | | | 1.61% | | | | $1,000.00 | | | | $1,016.81 | | | | $8.05 | |
| I | | Actual | | | 0.61% | | | | $1,000.00 | | | | $1,065.39 | | | | $3.12 | |
| | Hypothetical (h) | | | 0.61% | | | | $1,000.00 | | | | $1,021.77 | | | | $3.06 | |
| R1 | | Actual | | | 1.61% | | | | $1,000.00 | | | | $1,060.03 | | | | $8.22 | |
| | Hypothetical (h) | | | 1.61% | | | | $1,000.00 | | | | $1,016.81 | | | | $8.05 | |
| R2 | | Actual | | | 1.11% | | | | $1,000.00 | | | | $1,062.59 | | | | $5.68 | |
| | Hypothetical (h) | | | 1.11% | | | | $1,000.00 | | | | $1,019.29 | | | | $5.56 | |
| R3 | | Actual | | | 0.86% | | | | $1,000.00 | | | | $1,063.95 | | | | $4.40 | |
| | Hypothetical (h) | | | 0.86% | | | | $1,000.00 | | | | $1,020.53 | | | | $4.31 | |
| R4 | | Actual | | | 0.61% | | | | $1,000.00 | | | | $1,065.10 | | | | $3.12 | |
| | Hypothetical (h) | | | 0.61% | | | | $1,000.00 | | | | $1,021.77 | | | | $3.06 | |
| R5 | | Actual | | | 0.51% | | | | $1,000.00 | | | | $1,065.99 | | | | $2.61 | |
| | Hypothetical (h) | | | 0.51% | | | | $1,000.00 | | | | $1,022.27 | | | | $2.56 | |
| 529A | | Actual | | | 0.85% | | | | $1,000.00 | | | | $1,063.93 | | | | $4.35 | |
| | Hypothetical (h) | | | 0.85% | | | | $1,000.00 | | | | $1,020.58 | | | | $4.26 | |
| 529B | | Actual | | | 1.28% | | | | $1,000.00 | | | | $1,061.74 | | | | $6.54 | |
| | Hypothetical (h) | | | 1.28% | | | | $1,000.00 | | | | $1,018.45 | | | | $6.41 | |
| 529C | | Actual | | | 1.65% | | | | $1,000.00 | | | | $1,059.80 | | | | $8.43 | |
| | Hypothetical (h) | | | 1.65% | | | | $1,000.00 | | | | $1,016.61 | | | | $8.25 | |
| (h) | 5% class return per year before expenses. |
| (p) | “Expenses Paid During Period” are equal to each class’s annualized expense ratio, as shown above, multiplied by the average account value over the period, multiplied by 181/365 (to reflect the one-half year period). Expenses paid do not include any applicable sales charges (loads). If these transaction costs had been included, your costs would have been higher. |
Notes to Expense Table
Each class with a Rule 12b-1 service fee is subject to a rebate of a portion of such fee. Such rebates are included in the expense ratios above. For Class 529A and Class 529B shares, this rebate reduced the expense ratios above by 0.05% and 0.01%, respectively. See Note 3 in the Notes to Financial Statements for additional information.
4
PORTFOLIO OF INVESTMENTS
2/28/15 (unaudited)
The Portfolio of Investments is a complete list of all securities owned by your fund. It is categorized by broad-based asset classes.
| | | | | | | | |
| Common Stocks - 98.4% | | | | | | | | |
| Issuer | | Shares/Par | | | Value ($) | |
| | | | | | | | |
| Aerospace - 7.3% | | | | | | | | |
| Honeywell International, Inc. | | | 7,587,691 | | | $ | 779,862,885 | |
| Lockheed Martin Corp. | | | 3,758,550 | | | | 751,897,928 | |
| Northrop Grumman Corp. | | | 1,914,657 | | | | 317,277,811 | |
| United Technologies Corp. | | | 6,317,044 | | | | 770,110,834 | |
| | | | | | | | |
| | | | | | | $ | 2,619,149,458 | |
| Alcoholic Beverages - 1.4% | | | | | | | | |
| Diageo PLC | | | 16,277,377 | | | $ | 486,388,071 | |
| | |
| Automotive - 1.7% | | | | | | | | |
| Delphi Automotive PLC | | | 3,467,749 | | | $ | 273,397,331 | |
| Johnson Controls, Inc. | | | 7,006,535 | | | | 356,002,043 | |
| | | | | | | | |
| | | | | | | $ | 629,399,374 | |
| Broadcasting - 3.3% | | | | | | | | |
| Omnicom Group, Inc. | | | 5,356,340 | | | $ | 426,043,284 | |
| Time Warner, Inc. | | | 3,534,044 | | | | 289,296,842 | |
| Viacom, Inc., “B” | | | 3,053,895 | | | | 213,589,416 | |
| Walt Disney Co. | | | 2,401,544 | | | | 249,952,700 | |
| | | | | | | | |
| | | | | | | $ | 1,178,882,242 | |
| Brokerage & Asset Managers - 3.0% | | | | | | | | |
| BlackRock, Inc. | | | 967,849 | | | $ | 359,478,476 | |
| Franklin Resources, Inc. | | | 7,986,639 | | | | 429,920,777 | |
| NASDAQ OMX Group, Inc. | | | 5,469,076 | | | | 274,328,852 | |
| | | | | | | | |
| | | | | | | $ | 1,063,728,105 | |
| Business Services - 3.9% | | | | | | | | |
| Accenture PLC, “A” | | | 9,402,661 | | | $ | 846,521,570 | |
| Equifax, Inc. | | | 892,239 | | | | 83,308,355 | |
| Fidelity National Information Services, Inc. | | | 2,804,743 | | | | 189,572,579 | |
| Fiserv, Inc. (a) | | | 3,419,715 | | | | 266,977,150 | |
| | | | | | | | |
| | | | | | | $ | 1,386,379,654 | |
| Cable TV - 1.2% | | | | | | | | |
| Comcast Corp., “Special A” | | | 7,180,953 | | | $ | 423,281,275 | |
| | |
| Chemicals - 3.8% | | | | | | | | |
| 3M Co. | | | 4,432,344 | | | $ | 747,514,816 | |
| E.I. du Pont de Nemours & Co. | | | 1,162,279 | | | | 90,483,420 | |
5
Portfolio of Investments (unaudited) – continued
| | | | | | | | |
| Issuer | | Shares/Par | | | Value ($) | |
| | | | | | | | |
| Common Stocks - continued | | | | | | | | |
| Chemicals - continued | | | | | | | | |
| PPG Industries, Inc. | | | 2,242,086 | | | $ | 527,742,203 | |
| | | | | | | | |
| | | | | | | $ | 1,365,740,439 | |
| Computer Software - 1.0% | | | | | | | | |
| Oracle Corp. | | | 8,085,726 | | | $ | 354,316,513 | |
| | |
| Computer Software - Systems - 1.4% | | | | | | | | |
| International Business Machines Corp. | | | 3,014,724 | | | $ | 488,204,405 | |
| | |
| Construction - 0.5% | | | | | | | | |
| Stanley Black & Decker, Inc. | | | 1,688,710 | | | $ | 166,067,741 | |
| | |
| Consumer Products - 0.5% | | | | | | | | |
| Procter & Gamble Co. | | | 2,117,714 | | | $ | 180,280,993 | |
| | |
| Containers - 0.5% | | | | | | | | |
| Crown Holdings, Inc. (a) | | | 3,441,729 | | | $ | 182,411,637 | |
| | |
| Electrical Equipment - 2.8% | | | | | | | | |
| Danaher Corp. | | | 5,286,238 | | | $ | 461,382,853 | |
| Pentair PLC | | | 2,054,767 | | | | 136,580,362 | |
| Tyco International PLC | | | 9,299,823 | | | | 392,638,527 | |
| | | | | | | | |
| | | | | | | $ | 990,601,742 | |
| Electronics - 1.2% | | | | | | | | |
| Texas Instruments, Inc. | | | 7,685,509 | | | $ | 451,907,929 | |
| | |
| Energy - Independent - 1.6% | | | | | | | | |
| EOG Resources, Inc. | | | 2,191,367 | | | $ | 196,609,447 | |
| Occidental Petroleum Corp. | | | 4,675,371 | | | | 364,117,893 | |
| | | | | | | | |
| | | | | | | $ | 560,727,340 | |
| Energy - Integrated - 3.2% | | | | | | | | |
| Chevron Corp. | | | 4,613,639 | | | $ | 492,183,009 | |
| Exxon Mobil Corp. | | | 7,255,395 | | | | 642,392,673 | |
| | | | | | | | |
| | | | | | | $ | 1,134,575,682 | |
| Food & Beverages - 4.3% | | | | | | | | |
| Danone S.A. | | | 3,730,760 | | | $ | 260,221,987 | |
| Dr Pepper Snapple Group, Inc. | | | 953,820 | | | | 75,151,478 | |
| General Mills, Inc. | | | 9,633,168 | | | | 518,168,107 | |
| Kellogg Co. | | | 1,397,388 | | | | 90,103,578 | |
| Nestle S.A. | | | 7,454,454 | | | | 581,750,016 | |
| | | | | | | | |
| | | | | | | $ | 1,525,395,166 | |
6
Portfolio of Investments (unaudited) – continued
| | | | | | | | |
| Issuer | | Shares/Par | | | Value ($) | |
| | | | | | | | |
| Common Stocks - continued | | | | | | | | |
| Food & Drug Stores - 1.9% | | | | | | | | |
| CVS Health Corp. | | | 6,721,182 | | | $ | 698,129,174 | |
| | |
| General Merchandise - 1.9% | | | | | | | | |
| Kohl’s Corp. | | | 1,384,031 | | | $ | 102,141,488 | |
| Target Corp. | | | 7,560,916 | | | | 580,905,176 | |
| | | | | | | | |
| | | | | | | $ | 683,046,664 | |
| Insurance - 7.5% | | | | | | | | |
| ACE Ltd. | | | 3,463,877 | | | $ | 394,916,617 | |
| Aon PLC | | | 4,306,087 | | | | 432,158,891 | |
| Chubb Corp. | | | 2,622,585 | | | | 263,438,663 | |
| MetLife, Inc. | | | 12,094,812 | | | | 614,779,294 | |
| Prudential Financial, Inc. | | | 3,904,464 | | | | 315,675,914 | |
| Travelers Cos., Inc. | | | 6,192,613 | | | | 665,334,341 | |
| | | | | | | | |
| | | | | | | $ | 2,686,303,720 | |
| Leisure & Toys - 0.6% | | | | | | | | |
| Hasbro, Inc. | | | 2,775,715 | | | $ | 172,968,680 | |
| Mattel, Inc. | | | 1,573,713 | | | | 41,420,126 | |
| | | | | | | | |
| | | | | | | $ | 214,388,806 | |
| Machinery & Tools - 1.6% | | | | | | | | |
| Eaton Corp. PLC | | | 4,369,483 | | | $ | 310,276,988 | |
| Illinois Tool Works, Inc. | | | 2,580,970 | | | | 255,154,694 | |
| | | | | | | | |
| | | | | | | $ | 565,431,682 | |
| Major Banks - 12.2% | | | | | | | | |
| Bank of New York Mellon Corp. | | | 10,773,012 | | | $ | 421,655,690 | |
| Goldman Sachs Group, Inc. | | | 3,514,473 | | | | 667,011,831 | |
| JPMorgan Chase & Co. | | | 24,472,727 | | | | 1,499,688,711 | |
| PNC Financial Services Group, Inc. | | | 3,142,325 | | | | 288,968,207 | |
| State Street Corp. | | | 4,298,301 | | | | 320,008,509 | |
| Wells Fargo & Co. | | | 21,110,311 | | | | 1,156,633,940 | |
| | | | | | | | |
| | | | | | | $ | 4,353,966,888 | |
| Medical & Health Technology & Services - 1.0% | | | | | | | | |
| Express Scripts Holding Co. (a) | | | 4,394,003 | | | $ | 372,567,514 | |
| | |
| Medical Equipment - 5.0% | | | | | | | | |
| Abbott Laboratories | | | 9,464,866 | | | $ | 448,350,702 | |
| Medtronic PLC | | | 9,017,338 | | | | 699,655,255 | |
| St. Jude Medical, Inc. | | | 3,673,349 | | | | 244,938,911 | |
| Thermo Fisher Scientific, Inc. | | | 3,026,056 | | | | 393,387,280 | |
| | | | | | | | |
| | | | | | | $ | 1,786,332,148 | |
7
Portfolio of Investments (unaudited) – continued
| | | | | | | | |
| Issuer | | Shares/Par | | | Value ($) | |
| | | | | | | | |
| Common Stocks - continued | | | | | | | | |
| Oil Services - 0.8% | | | | | | | | |
| Baker Hughes, Inc. | | | 1,089,289 | | | $ | 68,091,455 | |
| Schlumberger Ltd. | | | 2,652,832 | | | | 223,262,341 | |
| | | | | | | | |
| | | | | | | $ | 291,353,796 | |
| Other Banks & Diversified Financials - 2.7% | | | | | | | | |
| American Express Co. | | | 2,047,599 | | | $ | 167,063,602 | |
| Citigroup, Inc. | | | 2,332,092 | | | | 122,248,263 | |
| U.S. Bancorp | | | 15,272,892 | | | | 681,323,712 | |
| | | | | | | | |
| | | | | | | $ | 970,635,577 | |
| Pharmaceuticals - 8.3% | | | | | | | | |
| Johnson & Johnson | | | 11,814,211 | | | $ | 1,211,074,770 | |
| Merck & Co., Inc. | | | 8,245,230 | | | | 482,675,764 | |
| Novartis AG | | | 1,200,256 | | | | 122,688,359 | |
| Pfizer, Inc. | | | 31,101,719 | | | | 1,067,410,996 | |
| Roche Holding AG | | | 344,315 | | | | 93,469,053 | |
| | | | | | | | |
| | | | | | | $ | 2,977,318,942 | |
| Printing & Publishing - 0.5% | | | | | | | | |
| McGraw-Hill Cos., Inc. | | | 1,714,857 | | | $ | 176,801,757 | |
| Time, Inc. | | | 375,296 | | | | 8,894,515 | |
| | | | | | | | |
| | | | | | | $ | 185,696,272 | |
| Railroad & Shipping - 0.6% | | | | | | | | |
| Canadian National Railway Co. | | | 3,100,715 | | | $ | 214,383,435 | |
| | |
| Restaurants - 1.0% | | | | | | | | |
| McDonald’s Corp. | | | 3,551,118 | | | $ | 351,205,570 | |
| | |
| Specialty Stores - 0.8% | | | | | | | | |
| Advance Auto Parts, Inc. | | | 1,172,387 | | | $ | 181,637,918 | |
| Bed Bath & Beyond, Inc. (a) | | | 1,240,171 | | | | 92,591,167 | |
| | | | | | | | |
| | | | | | | $ | 274,229,085 | |
| Telecommunications - Wireless - 0.5% | | | | | | | | |
| Vodafone Group PLC | | | 56,741,893 | | | $ | 196,576,677 | |
| | |
| Telephone Services - 2.0% | | | | | | | | |
| AT&T, Inc. | | | 2,858,108 | | | $ | 98,776,212 | |
| Verizon Communications, Inc. | | | 12,450,072 | | | | 615,656,060 | |
| | | | | | | | |
| | | | | | | $ | 714,432,272 | |
| Tobacco - 5.2% | | | | | | | | |
| Altria Group, Inc. | | | 3,542,104 | | | $ | 199,385,034 | |
| Imperial Tobacco Group PLC | | | 1,605,637 | | | | 79,150,125 | |
8
Portfolio of Investments (unaudited) – continued
| | | | | | | | |
| Issuer | | Shares/Par | | | Value ($) | |
| | | | | | | | |
| Common Stocks - continued | | | | | | | | |
| Tobacco - continued | | | | | | | | |
| Lorillard, Inc. | | | 5,736,017 | | | $ | 392,458,283 | |
| Philip Morris International, Inc. | | | 14,340,907 | | | | 1,189,721,645 | |
| | | | | | | | |
| | | | | | | $ | 1,860,715,087 | |
| Trucking - 1.5% | | | | | | | | |
| United Parcel Service, Inc., “B” | | | 5,167,461 | | | $ | 525,685,808 | |
| | |
| Utilities - Electric Power - 0.2% | | | | | | | | |
| Duke Energy Corp. | | | 1,028,017 | | | $ | 80,750,735 | |
Total Common Stocks
(Identified Cost, $22,972,278,998) | | | $ | 35,190,587,618 | |
| | |
| Convertible Preferred Stocks - 0.1% | | | | | | | | |
| Aerospace - 0.1% | | | | | | | | |
United Technologies Corp., 7.5%
(Identified Cost, $18,338,355) | | | 364,100 | | | $ | 23,193,170 | |
| | |
| Money Market Funds - 1.3% | | | | | | | | |
MFS Institutional Money Market Portfolio, 0.1%,
at Cost and Net Asset Value (v) | | | 453,171,032 | | | $ | 453,171,032 | |
| Total Investments (Identified Cost, $23,443,788,385) | | | | | | $ | 35,666,951,820 | |
| | |
| Other Assets, Less Liabilities - 0.2% | | | | | | | 79,610,985 | |
| Net Assets - 100.0% | | | | | | $ | 35,746,562,805 | |
| (a) | Non-income producing security. |
| (v) | Underlying affiliated fund that is available only to investment companies managed by MFS. The rate quoted for the MFS Institutional Money Market Portfolio is the annualized seven-day yield of the fund at period end. |
The following abbreviations are used in this report and are defined:
| PLC | | Public Limited Company |
See notes to financial statements
9
Financial Statements
STATEMENT OF ASSETS AND LIABILITIES
At 2/28/15 (unaudited)
This statement represents your fund’s balance sheet, which details the assets and liabilities comprising the total value of the fund.
| | | | |
| Assets | | | | |
Investments- | | | | |
Non-affiliated issuers, at value (identified cost, $22,990,617,353) | | | $35,213,780,788 | |
Underlying affiliated funds, at cost and value | | | 453,171,032 | |
Total investments, at value (identified cost, $23,443,788,385) | | | $35,666,951,820 | |
Receivables for | | | | |
Fund shares sold | | | 53,247,112 | |
Dividends | | | 99,725,267 | |
Other assets | | | 158,789 | |
Total assets | | | $35,820,082,988 | |
| Liabilities | | | | |
Payable to custodian | | | $9,365 | |
Payable for fund shares reacquired | | | 62,279,567 | |
Payable to affiliates | | | | |
Investment adviser | | | 1,256,511 | |
Shareholder servicing costs | | | 8,684,056 | |
Distribution and service fees | | | 380,071 | |
Program manager fees | | | 93 | |
Payable for independent Trustees’ compensation | | | 3,201 | |
Accrued expenses and other liabilities | | | 907,319 | |
Total liabilities | | | $73,520,183 | |
Net assets | | | $35,746,562,805 | |
| Net assets consist of | | | | |
Paid-in capital | | | $22,915,486,033 | |
Unrealized appreciation (depreciation) on investments and translation of assets and liabilities in foreign currencies | | | 12,222,736,451 | |
Accumulated net realized gain (loss) on investments and foreign currency | | | 418,345,546 | |
Undistributed net investment income | | | 189,994,775 | |
Net assets | | | $35,746,562,805 | |
Shares of beneficial interest outstanding | | | 1,001,768,413 | |
10
Statement of Assets and Liabilities (unaudited) – continued
| | | | | | | | | | | | |
| | | Net assets | | | Shares
outstanding | | | Net asset value
per share (a) | |
Class A | | | $9,378,974,266 | | | | 263,234,379 | | | | $35.63 | |
Class B | | | 176,876,481 | | | | 4,991,938 | | | | 35.43 | |
Class C | | | 1,431,167,365 | | | | 40,611,742 | | | | 35.24 | |
Class I | | | 14,754,142,588 | | | | 411,901,943 | | | | 35.82 | |
Class R1 | | | 33,099,700 | | | | 945,452 | | | | 35.01 | |
Class R2 | | | 576,779,459 | | | | 16,333,741 | | | | 35.31 | |
Class R3 | | | 1,658,961,362 | | | | 46,700,328 | | | | 35.52 | |
Class R4 | | | 3,169,514,077 | | | | 88,922,945 | | | | 35.64 | |
Class R5 | | | 4,544,470,058 | | | | 127,485,793 | | | | 35.65 | |
Class 529A | | | 16,864,794 | | | | 476,540 | | | | 35.39 | |
Class 529B | | | 1,001,188 | | | | 28,570 | | | | 35.04 | |
Class 529C | | | 4,711,467 | | | | 135,042 | | | | 34.89 | |
| (a) | Maximum offering price per share was equal to the net asset value per share for all share classes, except for Classes A and 529A, for which the maximum offering prices per share were $37.80 [100 / 94.25 x $35.63] and $37.55 [100 / 94.25 x $35.39], respectively. On sales of $50,000 or more, the maximum offering prices of Class A and Class 529A shares are reduced. A contingent deferred sales charge may be imposed on redemptions of Class A, Class B, Class C, Class 529B, and Class 529C shares. Redemption price per share was equal to the net asset value per share for Classes I, R1, R2, R3, R4, R5, and 529A. |
See notes to financial statements
11
Financial Statements
STATEMENT OF OPERATIONS
Six months ended 2/28/15 (unaudited)
This statement describes how much your fund earned in investment income and accrued in expenses. It also describes any gains and/or losses generated by fund operations.
| | | | |
| Net investment income | | | | |
Income | | | | |
Dividends | | | $497,666,296 | |
Interest | | | 53,988 | |
Dividends from underlying affiliated funds | | | 174,516 | |
Foreign taxes withheld | | | (227,802 | ) |
Total investment income | | | $497,666,998 | |
Expenses | | | | |
Management fee | | | $90,065,578 | |
Distribution and service fees | | | 22,685,733 | |
Program manager fees | | | 10,172 | |
Shareholder servicing costs | | | 16,644,875 | |
Administrative services fee | | | 326,995 | |
Independent Trustees’ compensation | | | 111,881 | |
Custodian fee | | | 410,925 | |
Shareholder communications | | | 736,502 | |
Audit and tax fees | | | 28,390 | |
Legal fees | | | 142,706 | |
Miscellaneous | | | 603,530 | |
Total expenses | | | $131,767,287 | |
Fees paid indirectly | | | (366 | ) |
Reduction of expenses by investment adviser and distributor | | | (6,648,831 | ) |
Net expenses | | | $125,118,090 | |
Net investment income | | | $372,548,908 | |
| Realized and unrealized gain (loss) on investments and foreign currency | |
Realized gain (loss) (identified cost basis) | | | | |
Investments | | | $725,584,474 | |
Foreign currency | | | (1,359,712 | ) |
Net realized gain (loss) on investments and foreign currency | | | $724,224,762 | |
Change in unrealized appreciation (depreciation) | | | | |
Investments | | | $1,098,521,286 | |
Translation of assets and liabilities in foreign currencies | | | (225,251 | ) |
Net unrealized gain (loss) on investments and foreign currency translation | | | $1,098,296,035 | |
Net realized and unrealized gain (loss) on investments and foreign currency | | | $1,822,520,797 | |
Change in net assets from operations | | | $2,195,069,705 | |
See notes to financial statements
12
Financial Statements
STATEMENTS OF CHANGES IN NET ASSETS
These statements describe the increases and/or decreases in net assets resulting from operations, any distributions, and any shareholder transactions.
| | | | | | | | |
| | | Six months ended
2/28/15 | | | Year ended
8/31/14 | |
| Change in net assets | | (unaudited) | | | | |
| From operations | | | | | | | | |
Net investment income | | | $372,548,908 | | | | $702,164,857 | |
Net realized gain (loss) on investments and foreign currency | | | 724,224,762 | | | | 1,252,691,611 | |
Net unrealized gain (loss) on investments and foreign currency translation | | | 1,098,296,035 | | | | 3,834,435,083 | |
Change in net assets from operations | | | $2,195,069,705 | | | | $5,789,291,551 | |
| Distributions declared to shareholders | | | | | | | | |
From net investment income | | | $(344,380,576 | ) | | | $(632,546,037 | ) |
From net realized gain on investments | | | (905,973,115 | ) | | | (534,397,478 | ) |
Total distributions declared to shareholders | | | $(1,250,353,691 | ) | | | $(1,166,943,515 | ) |
Change in net assets from fund share transactions | | | $409,149,243 | | | | $2,708,168,604 | |
Total change in net assets | | | $1,353,865,257 | | | | $7,330,516,640 | |
| Net assets | | | | | | | | |
At beginning of period | | | 34,392,697,548 | | | | 27,062,180,908 | |
At end of period (including undistributed net investment income of $189,994,775 and $161,826,443, respectively) | | | $35,746,562,805 | | | | $34,392,697,548 | |
See notes to financial statements
13
Financial Statements
FINANCIAL HIGHLIGHTS
The financial highlights table is intended to help you understand the fund’s financial performance for the semiannual period and the past 5 fiscal years. Certain information reflects financial results for a single fund share. The total returns in the table represent the rate by which an investor would have earned (or lost) on an investment in the fund share class (assuming reinvestment of all distributions) held for the entire period.
| | | | | | | | | | | | | | | | | | | | | | | | |
| | | Six months
ended
2/28/15 (unaudited) | | | Years ended 8/31 | |
| Class A | | | 2014 | | | 2013 | | | 2012 | | | 2011 | | | 2010 | |
| | | | | | | | | | | | | | | | | |
Net asset value, beginning
of period | | | $34.70 | | | | $29.81 | | | | $24.90 | | | | $21.83 | | | | $19.46 | | | | $19.39 | |
| Income (loss) from investment operations | |
Net investment income (d) | | | $0.35 | | | | $0.69 | | | | $0.50 | | | | $0.43 | | | | $0.34 | | | | $0.32 | |
Net realized and unrealized
gain (loss) on investments
and foreign currency | | | 1.82 | | | | 5.41 | | | | 5.08 | | | | 3.05 | | | | 2.35 | | | | 0.06 | (g) |
Total from investment
operations | | | $2.17 | | | | $6.10 | | | | $5.58 | | | | $3.48 | | | | $2.69 | | | | $0.38 | |
| Less distributions declared to shareholders | |
From net investment income | | | $(0.32 | ) | | | $(0.63 | ) | | | $(0.48 | ) | | | $(0.41 | ) | | | $(0.32 | ) | | | $(0.31 | ) |
From net realized gain on
investments | | | (0.92 | ) | | | (0.58 | ) | | | (0.19 | ) | | | — | | | | — | | | | — | |
Total distributions declared to
shareholders | | | $(1.24 | ) | | | $(1.21 | ) | | | $(0.67 | ) | | | $(0.41 | ) | | | $(0.32 | ) | | | $(0.31 | ) |
Net asset value, end of
period (x) | | | $35.63 | | | | $34.70 | | | | $29.81 | | | | $24.90 | | | | $21.83 | | | | $19.46 | |
Total return (%) (r)(s)(t)(x) | | | 6.40 | (n) | | | 20.78 | | | | 22.75 | | | | 16.16 | | | | 13.78 | | | | 1.88 | |
Ratios (%) (to average net assets)
and Supplemental data: | |
Expenses before expense
reductions (f) | | | 0.90 | (a) | | | 0.90 | | | | 0.93 | | | | 0.95 | | | | 0.95 | | | | 0.98 | |
Expenses after expense
reductions (f) | | | 0.86 | (a) | | | 0.88 | | | | 0.92 | | | | 0.93 | | | | 0.94 | | | | 0.98 | |
Net investment income | | | 2.03 | (a) | | | 2.10 | | | | 1.80 | | | | 1.86 | | | | 1.49 | | | | 1.54 | |
Portfolio turnover | | | 5 | (n) | | | 13 | | | | 12 | | | | 14 | | | | 17 | | | | 22 | |
Net assets at end of period
(000 omitted) | | | $9,378,974 | | | | $9,448,535 | | | | $8,058,858 | | | | $6,628,244 | | | | $5,086,069 | | | | $4,980,816 | |
See notes to financial statements
14
Financial Highlights – continued
| | | | | | | | | | | | | | | | | | | | | | | | |
| | | Six months
ended
2/28/15 (unaudited) | | | Years ended 8/31 | |
| Class B | | | 2014 | | | 2013 | | | 2012 | | | 2011 | | | 2010 | |
| | | | | | | | | | | | | | | | | |
Net asset value, beginning
of period | | | $34.50 | | | | $29.64 | | | | $24.76 | | | | $21.70 | | | | $19.34 | | | | $19.26 | |
| Income (loss) from investment operations | |
Net investment income (d) | | | $0.22 | | | | $0.44 | | | | $0.29 | | | | $0.26 | | | | $0.16 | | | | $0.16 | |
Net realized and unrealized
gain (loss) on investments
and foreign currency | | | 1.82 | | | | 5.38 | | | | 5.05 | | | | 3.03 | | | | 2.34 | | | | 0.07 | (g) |
Total from investment
operations | | | $2.04 | | | | $5.82 | | | | $5.34 | | | | $3.29 | | | | $2.50 | | | | $0.23 | |
| Less distributions declared to shareholders | |
From net investment income | | | $(0.19 | ) | | | $(0.38 | ) | | | $(0.27 | ) | | | $(0.23 | ) | | | $(0.14 | ) | | | $(0.15 | ) |
From net realized gain on
investments | | | (0.92 | ) | | | (0.58 | ) | | | (0.19 | ) | | | — | | | | — | | | | — | |
Total distributions declared to
shareholders | | | $(1.11 | ) | | | $(0.96 | ) | | | $(0.46 | ) | | | $(0.23 | ) | | | $(0.14 | ) | | | $(0.15 | ) |
Net asset value, end of
period (x) | | | $35.43 | | | | $34.50 | | | | $29.64 | | | | $24.76 | | | | $21.70 | | | | $19.34 | |
Total return (%) (r)(s)(t)(x) | | | 6.01 | (n) | | | 19.89 | | | | 21.82 | | | | 15.28 | | | | 12.92 | | | | 1.14 | |
Ratios (%) (to average net assets)
and Supplemental data: | |
Expenses before expense
reductions (f) | | | 1.65 | (a) | | | 1.65 | | | | 1.68 | | | | 1.70 | | | | 1.70 | | | | 1.73 | |
Expenses after expense
reductions (f) | | | 1.61 | (a) | | | 1.63 | | | | 1.67 | | | | 1.68 | | | | 1.69 | | | | 1.73 | |
Net investment income | | | 1.27 | (a) | | | 1.35 | | | | 1.05 | | | | 1.11 | | | | 0.73 | | | | 0.80 | |
Portfolio turnover | | | 5 | (n) | | | 13 | | | | 12 | | | | 14 | | | | 17 | | | | 22 | |
Net assets at end of period
(000 omitted) | | | $176,876 | | | | $179,284 | | | | $169,208 | | | | $167,949 | | | | $182,654 | | | | $238,473 | |
See notes to financial statements
15
Financial Highlights – continued
| | | | | | | | | | | | | | | | | | | | | | | | |
| | | Six months
ended
2/28/15 (unaudited) | | | Years ended 8/31 | |
| Class C | | | 2014 | | | 2013 | | | 2012 | | | 2011 | | | 2010 | |
| | | | | | | | | | | | | | | | | |
Net asset value, beginning
of period | | | $34.33 | | | | $29.50 | | | | $24.65 | | | | $21.62 | | | | $19.27 | | | | $19.21 | |
| Income (loss) from investment operations | |
Net investment income (d) | | | $0.22 | | | | $0.44 | | | | $0.29 | | | | $0.25 | | | | $0.17 | | | | $0.16 | |
Net realized and unrealized
gain (loss) on investments
and foreign currency | | | 1.80 | | | | 5.36 | | | | 5.03 | | | | 3.02 | | | | 2.33 | | | | 0.06 | (g) |
Total from investment
operations | | | $2.02 | | | | $5.80 | | | | $5.32 | | | | $3.27 | | | | $2.50 | | | | $0.22 | |
| Less distributions declared to shareholders | |
From net investment income | | | $(0.19 | ) | | | $(0.39 | ) | | | $(0.28 | ) | | | $(0.24 | ) | | | $(0.15 | ) | | | $(0.16 | ) |
From net realized gain on
investments | | | (0.92 | ) | | | (0.58 | ) | | | (0.19 | ) | | | — | | | | — | | | | — | |
Total distributions declared to
shareholders | | | $(1.11 | ) | | | $(0.97 | ) | | | $(0.47 | ) | | | $(0.24 | ) | | | $(0.15 | ) | | | $(0.16 | ) |
Net asset value, end of
period (x) | | | $35.24 | | | | $34.33 | | | | $29.50 | | | | $24.65 | | | | $21.62 | | | | $19.27 | |
Total return (%) (r)(s)(t)(x) | | | 6.00 | (n) | | | 19.92 | | | | 21.83 | | | | 15.23 | | | | 12.97 | | | | 1.11 | |
Ratios (%) (to average net assets)
and Supplemental data: | |
Expenses before expense
reductions (f) | | | 1.65 | (a) | | | 1.65 | | | | 1.68 | | | | 1.69 | | | | 1.70 | | | | 1.73 | |
Expenses after expense
reductions (f) | | | 1.61 | (a) | | | 1.63 | | | | 1.67 | | | | 1.68 | | | | 1.69 | | | | 1.73 | |
Net investment income | | | 1.29 | (a) | | | 1.35 | | | | 1.05 | | | | 1.11 | | | | 0.74 | | | | 0.79 | |
Portfolio turnover | | | 5 | (n) | | | 13 | | | | 12 | | | | 14 | | | | 17 | | | | 22 | |
Net assets at end of period
(000 omitted) | | | $1,431,167 | | | | $1,359,860 | | | | $1,090,690 | | | | $906,572 | | | | $871,026 | | | | $832,696 | |
See notes to financial statements
16
Financial Highlights – continued
| | | | | | | | | | | | | | | | | | | | | | | | |
| | | Six months
ended
2/28/15 (unaudited) | | | Years ended 8/31 | |
| Class I | | | 2014 | | | 2013 | | | 2012 | | | 2011 | | | 2010 | |
| | | | | | | | | | | | | | | | | |
Net asset value, beginning
of period | | | $34.88 | | | | $29.96 | | | | $25.02 | | | | $21.94 | | | | $19.55 | | | | $19.48 | |
| Income (loss) from investment operations | |
Net investment income (d) | | | $0.40 | | | | $0.78 | | | | $0.57 | | | | $0.49 | | | | $0.40 | | | | $0.37 | |
Net realized and unrealized
gain (loss) on investments
and foreign currency | | | 1.83 | | | | 5.43 | | | | 5.10 | | | | 3.06 | | | | 2.37 | | | | 0.06 | (g) |
Total from investment
operations | | | $2.23 | | | | $6.21 | | | | $5.67 | | | | $3.55 | | | | $2.77 | | | | $0.43 | |
| Less distributions declared to shareholders | |
From net investment income | | | $(0.37 | ) | | | $(0.71 | ) | | | $(0.54 | ) | | | $(0.47 | ) | | | $(0.38 | ) | | | $(0.36 | ) |
From net realized gain on
investments | | | (0.92 | ) | | | (0.58 | ) | | | (0.19 | ) | | | — | | | | — | | | | — | |
Total distributions declared to
shareholders | | | $(1.29 | ) | | | $(1.29 | ) | | | $(0.73 | ) | | | $(0.47 | ) | | | $(0.38 | ) | | | $(0.36 | ) |
Net asset value, end of
period (x) | | | $35.82 | | | | $34.88 | | | | $29.96 | | | | $25.02 | | | | $21.94 | | | | $19.55 | |
Total return (%) (r)(s)(x) | | | 6.54 | (n) | | | 21.07 | | | | 23.06 | | | | 16.42 | | | | 14.10 | | | | 2.12 | |
Ratios (%) (to average net assets)
and Supplemental data: | |
Expenses before expense
reductions (f) | | | 0.65 | (a) | | | 0.65 | | | | 0.68 | | | | 0.70 | | | | 0.70 | | | | 0.73 | |
Expenses after expense
reductions (f) | | | 0.61 | (a) | | | 0.63 | | | | 0.67 | | | | 0.68 | | | | 0.69 | | | | 0.73 | |
Net investment income | | | 2.29 | (a) | | | 2.35 | | | | 2.05 | | | | 2.11 | | | | 1.75 | | | | 1.79 | |
Portfolio turnover | | | 5 | (n) | | | 13 | | | | 12 | | | | 14 | | | | 17 | | | | 22 | |
Net assets at end of period
(000 omitted) | | | $14,754,143 | | | | $13,905,910 | | | | $10,568,573 | | | | $7,472,693 | | | | $5,272,157 | | | | $3,289,827 | |
See notes to financial statements
17
Financial Highlights – continued
| | | | | | | | | | | | | | | | | | | | | | | | |
| | | Six months
ended
2/28/15 (unaudited) | | | Years ended 8/31 | |
| Class R1 | | | 2014 | | | 2013 | | | 2012 | | | 2011 | | | 2010 | |
| | | | | | | | | | | | | | | | | |
Net asset value, beginning
of period | | | $34.11 | | | | $29.32 | | | | $24.50 | | | | $21.48 | | | | $19.15 | | | | $19.09 | |
| Income (loss) from investment operations | |
Net investment income (d) | | | $0.22 | | | | $0.43 | | | | $0.29 | | | | $0.25 | | | | $0.17 | | | | $0.16 | |
Net realized and unrealized
gain (loss) on investments
and foreign currency | | | 1.79 | | | | 5.33 | | | | 5.00 | | | | 3.01 | | | | 2.32 | | | | 0.06 | (g) |
Total from investment
operations | | | $2.01 | | | | $5.76 | | | | $5.29 | | | | $3.26 | | | | $2.49 | | | | $0.22 | |
| Less distributions declared to shareholders | |
From net investment income | | | $(0.19 | ) | | | $(0.39 | ) | | | $(0.28 | ) | | | $(0.24 | ) | | | $(0.16 | ) | | | $(0.16 | ) |
From net realized gain on
investments | | | (0.92 | ) | | | (0.58 | ) | | | (0.19 | ) | | | — | | | | — | | | | — | |
Total distributions declared to
shareholders | | | $(1.11 | ) | | | $(0.97 | ) | | | $(0.47 | ) | | | $(0.24 | ) | | | $(0.16 | ) | | | $(0.16 | ) |
Net asset value, end of
period (x) | | | $35.01 | | | | $34.11 | | | | $29.32 | | | | $24.50 | | | | $21.48 | | | | $19.15 | |
Total return (%) (r)(s)(x) | | | 6.00 | (n) | | | 19.88 | | | | 21.83 | | | | 15.29 | | | | 12.95 | | | | 1.13 | |
Ratios (%) (to average net assets)
and Supplemental data: | |
Expenses before expense
reductions (f) | | | 1.65 | (a) | | | 1.65 | | | | 1.68 | | | | 1.69 | | | | 1.70 | | | | 1.73 | |
Expenses after expense
reductions (f) | | | 1.61 | (a) | | | 1.63 | | | | 1.67 | | | | 1.68 | | | | 1.69 | | | | 1.73 | |
Net investment income | | | 1.29 | (a) | | | 1.33 | | | | 1.06 | | | | 1.10 | | | | 0.74 | | | | 0.80 | |
Portfolio turnover | | | 5 | (n) | | | 13 | | | | 12 | | | | 14 | | | | 17 | | | | 22 | |
Net assets at end of period
(000 omitted) | | | $33,100 | | | | $33,390 | | | | $33,485 | | | | $32,389 | | | | $33,806 | | | | $32,934 | |
See notes to financial statements
18
Financial Highlights – continued
| | | | | | | | | | | | | | | | | | | | | | | | |
| | | Six months
ended
2/28/15 (unaudited) | | | Years ended 8/31 | |
| Class R2 | | | 2014 | | | 2013 | | | 2012 | | | 2011 | | | 2010 | |
| | | | | | | | | | | | | | | | | |
Net asset value, beginning
of period | | | $34.40 | | | | $29.56 | | | | $24.69 | | | | $21.66 | | | | $19.31 | | | | $19.24 | |
| Income (loss) from investment operations | |
Net investment income (d) | | | $0.30 | | | | $0.60 | | | | $0.43 | | | | $0.37 | | | | $0.28 | | | | $0.26 | |
Net realized and unrealized
gain (loss) on investments
and foreign currency | | | 1.81 | | | | 5.36 | | | | 5.04 | | | | 3.01 | | | | 2.34 | | | | 0.07 | (g) |
Total from investment
operations | | | $2.11 | | | | $5.96 | | | | $5.47 | | | | $3.38 | | | | $2.62 | | | | $0.33 | |
| Less distributions declared to shareholders | |
From net investment income | | | $(0.28 | ) | | | $(0.54 | ) | | | $(0.41 | ) | | | $(0.35 | ) | | | $(0.27 | ) | | | $(0.26 | ) |
From net realized gain on
investments | | | (0.92 | ) | | | (0.58 | ) | | | (0.19 | ) | | | — | | | | — | | | | — | |
Total distributions declared to
shareholders | | | $(1.20 | ) | | | $(1.12 | ) | | | $(0.60 | ) | | | $(0.35 | ) | | | $(0.27 | ) | | | $(0.26 | ) |
Net asset value, end of
period (x) | | | $35.31 | | | | $34.40 | | | | $29.56 | | | | $24.69 | | | | $21.66 | | | | $19.31 | |
Total return (%) (r)(s)(x) | | | 6.26 | (n) | | | 20.48 | | | | 22.47 | | | | 15.80 | | | | 13.51 | | | | 1.66 | |
Ratios (%) (to average net assets)
and Supplemental data: | |
Expenses before expense
reductions (f) | | | 1.15 | (a) | | | 1.15 | | | | 1.18 | | | | 1.20 | | | | 1.20 | | | | 1.23 | |
Expenses after expense
reductions (f) | | | 1.11 | (a) | | | 1.13 | | | | 1.17 | | | | 1.18 | | | | 1.19 | | | | 1.23 | |
Net investment income | | | 1.75 | (a) | | | 1.84 | | | | 1.55 | | | | 1.61 | | | | 1.24 | | | | 1.29 | |
Portfolio turnover | | | 5 | (n) | | | 13 | | | | 12 | | | | 14 | | | | 17 | | | | 22 | |
Net assets at end of period
(000 omitted) | | | $576,779 | | | | $607,340 | | | | $572,590 | | | | $517,005 | | | | $496,236 | | | | $426,938 | |
See notes to financial statements
19
Financial Highlights – continued
| | | | | | | | | | | | | | | | | | | | | | | | |
| | | Six months
ended
2/28/15 (unaudited) | | | Years ended 8/31 | |
| Class R3 | | | 2014 | | | 2013 | | | 2012 | | | 2011 | | | 2010 | |
| | | | | | | | | | | | | | | | | |
Net asset value, beginning
of period | | | $34.60 | | | | $29.73 | | | | $24.83 | | | | $21.78 | | | | $19.41 | | | | $19.34 | |
| Income (loss) from investment operations | |
Net investment income (d) | | | $0.35 | | | | $0.69 | | | | $0.50 | | | | $0.43 | | | | $0.34 | | | | $0.31 | |
Net realized and unrealized
gain (loss) on investments
and foreign currency | | | 1.82 | | | | 5.39 | | | | 5.07 | | | | 3.03 | | | | 2.35 | | | | 0.07 | (g) |
Total from investment
operations | | | $2.17 | | | | $6.08 | | | | $5.57 | | | | $3.46 | | | | $2.69 | | | | $0.38 | |
| Less distributions declared to shareholders | |
From net investment income | | | $(0.33 | ) | | | $(0.63 | ) | | | $(0.48 | ) | | | $(0.41 | ) | | | $(0.32 | ) | | | $(0.31 | ) |
From net realized gain on
investments | | | (0.92 | ) | | | (0.58 | ) | | | (0.19 | ) | | | — | | | | — | | | | — | |
Total distributions declared to
shareholders | | | $(1.25 | ) | | | $(1.21 | ) | | | $(0.67 | ) | | | $(0.41 | ) | | | $(0.32 | ) | | | $(0.31 | ) |
Net asset value, end of
period (x) | | | $35.52 | | | | $34.60 | | | | $29.73 | | | | $24.83 | | | | $21.78 | | | | $19.41 | |
Total return (%) (r)(s)(x) | | | 6.40 | (n) | | | 20.77 | | | | 22.77 | | | | 16.11 | | | | 13.82 | | | | 1.90 | |
Ratios (%) (to average net assets)
and Supplemental data: | |
Expenses before expense
reductions (f) | | | 0.90 | (a) | | | 0.90 | | | | 0.93 | | | | 0.95 | | | | 0.95 | | | | 0.99 | |
Expenses after expense
reductions (f) | | | 0.86 | (a) | | | 0.87 | | | | 0.91 | | | | 0.93 | | | | 0.94 | | | | 0.98 | |
Net investment income | | | 2.03 | (a) | | | 2.11 | | | | 1.80 | | | | 1.86 | | | | 1.49 | | | | 1.53 | |
Portfolio turnover | | | 5 | (n) | | | 13 | | | | 12 | | | | 14 | | | | 17 | | | | 22 | |
Net assets at end of period
(000 omitted) | | | $1,658,961 | | | | $1,559,863 | | | | $1,299,126 | | | | $1,022,504 | | | | $763,670 | | | | $587,645 | |
See notes to financial statements
20
Financial Highlights – continued
| | | | | | | | | | | | | | | | | | | | | | | | |
| | | Six months
ended
2/28/15 (unaudited) | | | Years ended 8/31 | |
| Class R4 | | | 2014 | | | 2013 | | | 2012 | | | 2011 | | | 2010 | |
| | | | | | | | | | | | | | | | | |
Net asset value, beginning
of period | | | $34.72 | | | | $29.82 | | | | $24.90 | | | | $21.84 | | | | $19.47 | | | | $19.39 | |
| Income (loss) from investment operations | |
Net investment income (d) | | | $0.39 | | | | $0.77 | | | | $0.57 | | | | $0.49 | | | | $0.40 | | | | $0.36 | |
Net realized and unrealized
gain (loss) on investments
and foreign currency | | | 1.82 | | | | 5.42 | | | | 5.08 | | | | 3.04 | | | | 2.35 | | | | 0.08 | (g) |
Total from investment
operations | | | $2.21 | | | | $6.19 | | | | $5.65 | | | | $3.53 | | | | $2.75 | | | | $0.44 | |
| Less distributions declared to shareholders | |
From net investment income | | | $(0.37 | ) | | | $(0.71 | ) | | | $(0.54 | ) | | | $(0.47 | ) | | | $(0.38 | ) | | | $(0.36 | ) |
From net realized gain on
investments | | | (0.92 | ) | | | (0.58 | ) | | | (0.19 | ) | | | — | | | | — | | | | — | |
Total distributions declared to
shareholders | | | $(1.29 | ) | | | $(1.29 | ) | | | $(0.73 | ) | | | $(0.47 | ) | | | $(0.38 | ) | | | $(0.36 | ) |
Net asset value, end of
period (x) | | | $35.64 | | | | $34.72 | | | | $29.82 | | | | $24.90 | | | | $21.84 | | | | $19.47 | |
Total return (%) (r)(s)(x) | | | 6.51 | (n) | | | 21.11 | | | | 23.09 | | | | 16.40 | | | | 14.05 | | | | 2.18 | |
Ratios (%) (to average net assets)
and Supplemental data: | |
Expenses before expense
reductions (f) | | | 0.65 | (a) | | | 0.65 | | | | 0.68 | | | | 0.70 | | | | 0.70 | | | | 0.74 | |
Expenses after expense
reductions (f) | | | 0.61 | (a) | | | 0.63 | | | | 0.67 | | | | 0.68 | | | | 0.69 | | | | 0.73 | |
Net investment income | | | 2.25 | (a) | | | 2.34 | | | | 2.07 | | | | 2.10 | | | | 1.74 | | | | 1.77 | |
Portfolio turnover | | | 5 | (n) | | | 13 | | | | 12 | | | | 14 | | | | 17 | | | | 22 | |
Net assets at end of period
(000 omitted) | | | $3,169,514 | | | | $3,283,133 | | | | $2,892,340 | | | | $2,907,088 | | | | $2,036,438 | | | | $1,266,492 | |
See notes to financial statements
21
Financial Highlights – continued
| | | | | | | | | | | | | | | | | | | | | | | | |
| | | Six months
ended
2/28/15 (unaudited) | | | Years ended 8/31 | |
| Class R5 (y) | | | 2014 | | | 2013 | | | 2012 | | | 2011 | | | 2010 | |
| | | | | | | | | | | | | | | | | |
Net asset value, beginning
of period | | | $34.72 | | | | $29.82 | | | | $24.90 | | | | $21.81 | | | | $19.44 | | | | $19.37 | |
| Income (loss) from investment operations | |
Net investment income (d) | | | $0.42 | | | | $0.82 | | | | $0.60 | | | | $0.46 | | | | $0.37 | | | | $0.35 | |
Net realized and unrealized
gain (loss) on investments
and foreign currency | | | 1.82 | | | | 5.40 | | | | 5.07 | | | | 3.08 | | | | 2.35 | | | | 0.06 | (g) |
Total from investment
operations | | | $2.24 | | | | $6.22 | | | | $5.67 | | | | $3.54 | | | | $2.72 | | | | $0.41 | |
| Less distributions declared to shareholders | |
From net investment income | | | $(0.39 | ) | | | $(0.74 | ) | | | $(0.56 | ) | | | $(0.45 | ) | | | $(0.35 | ) | | | $(0.34 | ) |
From net realized gain on
investments | | | (0.92 | ) | | | (0.58 | ) | | | (0.19 | ) | | | — | | | | — | | | | — | |
Total distributions declared to
shareholders | | | $(1.31 | ) | | | $(1.32 | ) | | | $(0.75 | ) | | | $(0.45 | ) | | | $(0.35 | ) | | | $(0.34 | ) |
Net asset value, end of
period (x) | | | $35.65 | | | | $34.72 | | | | $29.82 | | | | $24.90 | | | | $21.81 | | | | $19.44 | |
Total return (%) (r)(s)(x) | | | 6.60 | (n) | | | 21.23 | | | | 23.18 | | | | 16.48 | | | | 13.96 | | | | 2.04 | |
Ratios (%) (to average net assets)
and Supplemental data: | |
Expenses before expense
reductions (f) | | | 0.54 | (a) | | | 0.55 | | | | 0.57 | | | | 0.77 | | | | 0.80 | | | | 0.83 | |
Expenses after expense
reductions (f) | | | 0.51 | (a) | | | 0.53 | | | | 0.56 | | | | 0.76 | | | | 0.79 | | | | 0.83 | |
Net investment income | | | 2.42 | (a) | | | 2.48 | | | | 2.12 | | | | 1.98 | | | | 1.63 | | | | 1.70 | |
Portfolio turnover | | | 5 | (n) | | | 13 | | | | 12 | | | | 14 | | | | 17 | | | | 22 | |
Net assets at end of period
(000 omitted) | | | $4,544,470 | | | | $3,995,830 | | | | $2,362,012 | | | | $940,695 | | | | $1,334,446 | | | | $1,393,429 | |
See notes to financial statements
22
Financial Highlights – continued
| | | | | | | | | | | | | | | | | | | | | | | | |
| | | Six months
ended
2/28/15 (unaudited) | | | Years ended 8/31 | |
| Class 529A | | | 2014 | | | 2013 | | | 2012 | | | 2011 | | | 2010 | |
| | | | | | | | | | | | | | | | | |
Net asset value, beginning
of period | | | $34.48 | | | | $29.62 | | | | $24.74 | | | | $21.70 | | | | $19.34 | | | | $19.28 | |
| Income (loss) from investment operations | |
Net investment income (d) | | | $0.36 | | | | $0.69 | | | | $0.49 | | | | $0.42 | | | | $0.32 | | | | $0.29 | |
Net realized and unrealized
gain (loss) on investments
and foreign currency | | | 1.80 | | | | 5.38 | | | | 5.05 | | | | 3.02 | | | | 2.34 | | | | 0.06 | |
Total from investment
operations | | | $2.16 | | | | $6.07 | | | | $5.54 | | | | $3.44 | | | | $2.66 | | | | $0.35 | |
| Less distributions declared to shareholders | |
From net investment income | | | $(0.33 | ) | | | $(0.63 | ) | | | $(0.47 | ) | | | $(0.40 | ) | | | $(0.30 | ) | | | $(0.29 | ) |
From net realized gain on
investments | | | (0.92 | ) | | | (0.58 | ) | | | (0.19 | ) | | | — | | | | — | | | | — | |
Total distributions declared to
shareholders | | | $(1.25 | ) | | | $(1.21 | ) | | | $(0.66 | ) | | | $(0.40 | ) | | | $(0.30 | ) | | | $(0.29 | ) |
Net asset value, end of
period (x) | | | $35.39 | | | | $34.48 | | | | $29.62 | | | | $24.74 | | | | $21.70 | | | | $19.34 | |
Total return (%) (r)(s)(t)(x) | | | 6.39 | (n) | | | 20.84 | | | | 22.73 | | | | 16.06 | | | | 13.71 | | | | 1.74 | |
Ratios (%) (to average net assets)
and Supplemental data: | |
Expenses before expense
reductions (f) | | | 1.00 | (a) | | | 1.00 | | | | 1.03 | | | | 1.05 | | | | 1.05 | | | | 1.08 | |
Expenses after expense
reductions (f) | | | 0.85 | (a) | | | 0.87 | | | | 0.93 | | | | 0.98 | | | | 1.03 | | | | 1.08 | |
Net investment income | | | 2.09 | (a) | | | 2.11 | | | | 1.79 | | | | 1.80 | | | | 1.40 | | | | 1.44 | |
Portfolio turnover | | | 5 | (n) | | | 13 | | | | 12 | | | | 14 | | | | 17 | | | | 22 | |
Net assets at end of period
(000 omitted) | | | $16,865 | | | | $14,547 | | | | $10,899 | | | | $8,195 | | | | $6,315 | | | | $5,192 | |
See notes to financial statements
23
Financial Highlights – continued
| | | | | | | | | | | | | | | | | | | | | | | | |
| | | Six months
ended
2/28/15 (unaudited) | | | Years ended 8/31 | |
| Class 529B | | | 2014 | | | 2013 | | | 2012 | | | 2011 | | | 2010 | |
| | | | | | | | | | | | | | | | | |
Net asset value, beginning
of period | | | $34.08 | | | | $29.29 | | | | $24.48 | | | | $21.45 | | | | $19.12 | | | | $19.06 | |
| Income (loss) from investment operations | |
Net investment income (d) | | | $0.27 | | | | $0.42 | | | | $0.27 | | | | $0.24 | | | | $0.14 | | | | $0.14 | |
Net realized and unrealized
gain (loss) on investments
and foreign currency | | | 1.80 | | | | 5.32 | | | | 4.99 | | | | 3.01 | | | | 2.32 | | | | 0.06 | (g) |
Total from investment
operations | | | $2.07 | | | | $5.74 | | | | $5.26 | | | | $3.25 | | | | $2.46 | | | | $0.20 | |
| Less distributions declared to shareholders | |
From net investment income | | | $(0.19 | ) | | | $(0.37 | ) | | | $(0.26 | ) | | | $(0.22 | ) | | | $(0.13 | ) | | | $(0.14 | ) |
From net realized gain on
investments | | | (0.92 | ) | | | (0.58 | ) | | | (0.19 | ) | | | — | | | | — | | | | — | |
Total distributions declared to
shareholders | | | $(1.11 | ) | | | $(0.95 | ) | | | $(0.45 | ) | | | $(0.22 | ) | | | $(0.13 | ) | | | $(0.14 | ) |
Net asset value, end of
period (x) | | | $35.04 | | | | $34.08 | | | | $29.29 | | | | $24.48 | | | | $21.45 | | | | $19.12 | |
Total return (%) (r)(s)(t)(x) | | | 6.17 | (n) | | �� | 19.85 | | | | 21.74 | | | | 15.27 | | | | 12.84 | | | | 1.01 | |
Ratios (%) (to average net assets)
and Supplemental data: | |
Expenses before expense
reductions (f) | | | 1.37 | (a) | | | 1.75 | | | | 1.78 | | | | 1.79 | | | | 1.80 | | | | 1.83 | |
Expenses after expense
reductions (f) | | | 1.28 | (a) | | | 1.67 | | | | 1.71 | | | | 1.73 | | | | 1.78 | | | | 1.83 | |
Net investment income | | | 1.59 | (a) | | | 1.30 | | | | 1.00 | | | | 1.05 | | | | 0.64 | | | | 0.70 | |
Portfolio turnover | | | 5 | (n) | | | 13 | | | | 12 | | | | 14 | | | | 17 | | | | 22 | |
Net assets at end of period
(000 omitted) | | | $1,001 | | | | $1,026 | | | | $1,013 | | | | $963 | | | | $1,147 | | | | $1,198 | |
See notes to financial statements
24
Financial Highlights – continued
| | | | | | | | | | | | | | | | | | | | | | | | |
| | | Six months
ended
2/28/15 (unaudited) | | | Years ended 8/31 | |
| Class 529C | | | 2014 | | | 2013 | | | 2012 | | | 2011 | | | 2010 | |
| | | | | | | | | | | | | | | | | |
Net asset value, beginning
of period | | | $34.00 | | | | $29.23 | | | | $24.43 | | | | $21.43 | | | | $19.11 | | | | $19.05 | |
| Income (loss) from investment operations | |
Net investment income (d) | | | $0.22 | | | | $0.41 | | | | $0.27 | | | | $0.24 | | | | $0.15 | | | | $0.14 | |
Net realized and unrealized
gain (loss) on investments
and foreign currency | | | 1.78 | | | | 5.32 | | | | 4.99 | | | | 2.99 | | | | 2.31 | | | | 0.07 | (g) |
Total from investment
operations | | | $2.00 | | | | $5.73 | | | | $5.26 | | | | $3.23 | | | | $2.46 | | | | $0.21 | |
| Less distributions declared to shareholders | |
From net investment income | | | $(0.19 | ) | | | $(0.38 | ) | | | $(0.27 | ) | | | $(0.23 | ) | | | $(0.14 | ) | | | $(0.15 | ) |
From net realized gain on
investments | | | (0.92 | ) | | | (0.58 | ) | | | (0.19 | ) | | | — | | | | — | | | | — | |
Total distributions declared to
shareholders | | | $(1.11 | ) | | | $(0.96 | ) | | | $(0.46 | ) | | | $(0.23 | ) | | | $(0.14 | ) | | | $(0.15 | ) |
Net asset value, end of
period (x) | | | $34.89 | | | | $34.00 | | | | $29.23 | | | | $24.43 | | | | $21.43 | | | | $19.11 | |
Total return (%) (r)(s)(t)(x) | | | 5.98 | (n) | | | 19.85 | | | | 21.80 | | | | 15.18 | | | | 12.82 | | | | 1.06 | |
Ratios (%) (to average net assets)
and Supplemental data: | |
Expenses before expense
reductions (f) | | | 1.75 | (a) | | | 1.75 | | | | 1.78 | | | | 1.79 | | | | 1.80 | | | | 1.83 | |
Expenses after expense
reductions (f) | | | 1.65 | (a) | | | 1.67 | | | | 1.72 | | | | 1.73 | | | | 1.78 | | | | 1.83 | |
Net investment income | | | 1.31 | (a) | | | 1.28 | | | | 1.00 | | | | 1.06 | | | | 0.65 | | | | 0.69 | |
Portfolio turnover | | | 5 | (n) | | | 13 | | | | 12 | | | | 14 | | | | 17 | | | | 22 | |
Net assets at end of period
(000 omitted) | | | $4,711 | | | | $3,981 | | | | $3,387 | | | | $2,610 | | | | $2,438 | | | | $2,180 | |
See notes to financial statements
25
Financial Highlights – continued
| (d) | Per share data is based on average shares outstanding. |
| (f) | Ratios do not reflect reductions from fees paid indirectly, if applicable. |
| (g) | The per share amount varies from the net realized and unrealized gain/loss for the period because of the timing of sales of fund shares and the per share amount of realized and unrealized gains and losses at such time. |
| (r) | Certain expenses have been reduced without which performance would have been lower. |
| (s) | From time to time the fund may receive proceeds from litigation settlements, without which performance would be lower. |
| (t) | Total returns do not include any applicable sales charges. |
| (x) | The net asset values per share and total returns have been calculated on net assets which include adjustments made in accordance with U.S. generally accepted accounting principles required at period end for financial reporting purposes. |
| (y) | On May 10, 2012, sales of Class W shares (including exchanges) were suspended. On May 11, 2012, certain Class W shares were automatically converted to Class I shares. Shareholders of certain Class W shares became shareholders of Class I and received Class I shares with a total net asset value equal to their Class W shares at the time of the conversion. On May 30, 2012, remaining Class W shares, which represented MFS seed money, were redesignated Class R5. Class R5 shares do not pay a 12b-1 distribution fee or sub-accounting costs. On June 1, 2012, Class R5 shares were offered for sale to the public. |
See notes to financial statements
26
NOTES TO FINANCIAL STATEMENTS
(unaudited)
(1) Business and Organization
MFS Value Fund (the fund) is a diversified series of MFS Series Trust I (the trust). The trust is organized as a Massachusetts business trust and is registered under the Investment Company Act of 1940, as amended, as an open-end management investment company.
The fund is an investment company and accordingly follows the investment company accounting and reporting guidance of the Financial Accounting Standards Board (FASB) Accounting Standards Codification Topic 946 Financial Services – Investment Companies.
(2) Significant Accounting Policies
General – The preparation of financial statements in conformity with U.S. generally accepted accounting principles requires management to make estimates and assumptions that affect the reported amounts of assets and liabilities, and disclosure of contingent assets and liabilities at the date of the financial statements and the reported amounts of increases and decreases in net assets from operations during the reporting period. Actual results could differ from those estimates. In the preparation of these financial statements, management has evaluated subsequent events occurring after the date of the fund’s Statement of Assets and Liabilities through the date that the financial statements were issued.
In June 2014, FASB issued Accounting Standards Update 2014-11, Transfers and Servicing (Topic 860) – Repurchase-to-Maturity Transactions, Repurchase Financings, and Disclosures (“ASU 2014-11”). ASU 2014-11 changes the accounting for repurchase-to-maturity transactions (i.e., repurchase agreements that settle at the same time as the maturity of the transferred financial asset) and enhances the required disclosures for repurchase agreements and other similar transactions. Although still evaluating the potential impacts of ASU 2014-11 to the fund, management expects that the impact of the fund’s adoption will be limited to additional financial statement disclosures which would first be effective for interim reporting periods beginning after March 15, 2015.
Balance Sheet Offsetting – The fund’s accounting policy with respect to balance sheet offsetting is that, absent an event of default by the counterparty or a termination of the agreement, the International Swaps and Derivatives Association (ISDA) Master Agreement does not result in an offset of reported amounts of financial assets and financial liabilities in the Statement of Assets and Liabilities across transactions between the fund and the applicable counterparty. The fund’s right to setoff may be restricted or prohibited by the bankruptcy or insolvency laws of the particular jurisdiction to which a specific master netting agreement counterparty is subject. Balance sheet offsetting disclosures, to the extent applicable to the fund, have been included in the fund’s Significant Accounting Policies note under the captions for each of the fund’s in-scope financial instruments and transactions.
Investment Valuations – Equity securities, including restricted equity securities, are generally valued at the last sale or official closing price as provided by a third-party pricing service on the market or exchange on which they are primarily traded. Equity
27
Notes to Financial Statements (unaudited) – continued
securities, for which there were no sales reported that day, are generally valued at the last quoted daily bid quotation as provided by a third-party pricing service on the market or exchange on which such securities are primarily traded. Short-term instruments with a maturity at issuance of 60 days or less may be valued at amortized cost, which approximates market value. Open-end investment companies are generally valued at net asset value per share. Securities and other assets generally valued on the basis of information from a third-party pricing service may also be valued at a broker/dealer bid quotation. Values obtained from third-party pricing services can utilize both transaction data and market information such as yield, quality, coupon rate, maturity, type of issue, trading characteristics, and other market data. The values of foreign securities and other assets and liabilities expressed in foreign currencies are converted to U.S. dollars using the mean of bid and asked prices for rates provided by a third-party pricing service.
The Board of Trustees has delegated primary responsibility for determining or causing to be determined the value of the fund’s investments (including any fair valuation) to the adviser pursuant to valuation policies and procedures approved by the Board. If the adviser determines that reliable market quotations are not readily available, investments are valued at fair value as determined in good faith by the adviser in accordance with such procedures under the oversight of the Board of Trustees. Under the fund’s valuation policies and procedures, market quotations are not considered to be readily available for most types of debt instruments and floating rate loans and many types of derivatives. These investments are generally valued at fair value based on information from third-party pricing services. In addition, investments may be valued at fair value if the adviser determines that an investment’s value has been materially affected by events occurring after the close of the exchange or market on which the investment is principally traded (such as foreign exchange or market) and prior to the determination of the fund’s net asset value, or after the halting of trading of a specific security where trading does not resume prior to the close of the exchange or market on which the security is principally traded. Events that occur on a frequent basis after foreign markets close (such as developments in foreign markets and significant movements in the U.S. markets) and prior to the determination of the fund’s net asset value may be deemed to have a material effect on the value of securities traded in foreign markets. Accordingly, the fund’s foreign equity securities may often be valued at fair value. The adviser generally relies on third-party pricing services or other information (such as the correlation with price movements of similar securities in the same or other markets; the type, cost and investment characteristics of the security; the business and financial condition of the issuer; and trading and other market data) to assist in determining whether to fair value and at what value to fair value an investment. The value of an investment for purposes of calculating the fund’s net asset value can differ depending on the source and method used to determine value. When fair valuation is used, the value of an investment used to determine the fund’s net asset value may differ from quoted or published prices for the same investment. There can be no assurance that the fund could obtain the fair value assigned to an investment if it were to sell the investment at the same time at which the fund determines its net asset value per share.
Various inputs are used in determining the value of the fund’s assets or liabilities. These inputs are categorized into three broad levels. In certain cases, the inputs used to
28
Notes to Financial Statements (unaudited) – continued
measure fair value may fall into different levels of the fair value hierarchy. In such cases, an investment’s level within the fair value hierarchy is based on the lowest level of input that is significant to the fair value measurement. The fund’s assessment of the significance of a particular input to the fair value measurement in its entirety requires judgment, and considers factors specific to the investment. Level 1 includes unadjusted quoted prices in active markets for identical assets or liabilities. Level 2 includes other significant observable market-based inputs (including quoted prices for similar securities, interest rates, prepayment speed, and credit risk). Level 3 includes unobservable inputs, which may include the adviser’s own assumptions in determining the fair value of investments. The following is a summary of the levels used as of February 28, 2015 in valuing the fund’s assets or liabilities:
| | | | | | | | | | | | | | | | |
| Investments at Value | | Level 1 | | | Level 2 | | | Level 3 | | | Total | |
| Equity Securities | | | $35,213,780,788 | | | | $— | | | | $— | | | | $35,213,780,788 | |
| Mutual Funds | | | 453,171,032 | | | | — | | | | — | | | | 453,171,032 | |
| Total Investments | | | $35,666,951,820 | | | | $— | | | | $— | | | | $35,666,951,820 | |
For further information regarding security characteristics, see the Portfolio of Investments.
Foreign Currency Translation – Purchases and sales of foreign investments, income, and expenses are converted into U.S. dollars based upon currency exchange rates prevailing on the respective dates of such transactions or on the reporting date for foreign denominated receivables and payables. Gains and losses attributable to foreign currency exchange rates on sales of securities are recorded for financial statement purposes as net realized gains and losses on investments. Gains and losses attributable to foreign exchange rate movements on receivables, payables, income and expenses are recorded for financial statement purposes as foreign currency transaction gains and losses. That portion of both realized and unrealized gains and losses on investments that results from fluctuations in foreign currency exchange rates is not separately disclosed.
Security Loans – Under its Securities Lending Agency Agreement with the fund, State Street Bank and Trust Company (“State Street”), as lending agent, loans the securities of the fund to certain qualified institutions (the “Borrowers”) approved by the fund. The loans are collateralized by cash and/or U.S. Treasury and federal agency obligations in an amount typically at least equal to the market value of the securities loaned. On loans collateralized by cash, the cash collateral is invested in a money market fund. The market value of the loaned securities is determined at the close of business of the fund and any additional required collateral is delivered to the fund on the next business day. State Street provides the fund with indemnification against Borrower default. In the event of Borrower default, State Street will for the benefit of the fund either purchase securities identical to those loaned or, when such purchase is commercially impracticable, pay the fund the market value of the loaned securities. In return, State Street assumes the fund’s rights to the related collateral. If the collateral value is less than the cost to purchase identical securities, State Street is responsible for the shortfall, but only to the extent that such shortfall is not due to a decline in collateral value resulting from collateral reinvestment for which the fund bears the risk of loss. A portion of the income generated upon investment of the collateral is remitted to the
29
Notes to Financial Statements (unaudited) – continued
Borrowers, and the remainder is allocated between the fund and the lending agent. On loans collateralized by U.S. Treasury and/or federal agency obligations, a fee is received from the Borrower, and is allocated between the fund and the lending agent. Income from securities lending is included in “Interest” income in the Statement of Operations. The dividend and interest income earned on the securities loaned is accounted for in the same manner as other dividend and interest income. At February 28, 2015, there were no securities on loan or collateral outstanding.
Indemnifications – Under the fund’s organizational documents, its officers and Trustees may be indemnified against certain liabilities and expenses arising out of the performance of their duties to the fund. Additionally, in the normal course of business, the fund enters into agreements with service providers that may contain indemnification clauses. The fund’s maximum exposure under these agreements is unknown as this would involve future claims that may be made against the fund that have not yet occurred.
Investment Transactions and Income – Investment transactions are recorded on the trade date. Interest income is recorded on the accrual basis. Dividends received in cash are recorded on the ex-dividend date. Certain dividends from foreign securities will be recorded when the fund is informed of the dividend if such information is obtained subsequent to the ex-dividend date. Dividend and interest payments received in additional securities are recorded on the ex-dividend or ex-interest date in an amount equal to the value of the security on such date.
The fund may receive proceeds from litigation settlements. Any proceeds received from litigation involving portfolio holdings are reflected in the Statement of Operations in realized gain/loss if the security has been disposed of by the fund or in unrealized gain/loss if the security is still held by the fund. Any other proceeds from litigation not related to portfolio holdings are reflected as other income in the Statement of Operations.
Fees Paid Indirectly – The fund’s custody fee may be reduced according to an arrangement that measures the value of cash deposited with the custodian by the fund. This amount, for the six months ended February 28, 2015, is shown as a reduction of total expenses in the Statement of Operations.
Tax Matters and Distributions – The fund intends to qualify as a regulated investment company, as defined under Subchapter M of the Internal Revenue Code, and to distribute all of its taxable income, including realized capital gains. As a result, no provision for federal income tax is required. The fund’s federal tax returns, when filed, will remain subject to examination by the Internal Revenue Service for a three year period. Management has analyzed the fund’s tax positions taken on federal and state tax returns for all open tax years and does not believe that there are any uncertain tax positions that require recognition of a tax liability. Foreign taxes, if any, have been accrued by the fund in the accompanying financial statements in accordance with the applicable foreign tax law. Foreign income taxes may be withheld by certain countries in which the fund invests. Additionally, capital gains realized by the fund on securities issued in or by certain foreign countries may be subject to capital gains tax imposed by those countries.
30
Notes to Financial Statements (unaudited) – continued
Distributions to shareholders are recorded on the ex-dividend date. Income and capital gain distributions are determined in accordance with income tax regulations, which may differ from U.S. generally accepted accounting principles. Certain capital accounts in the financial statements are periodically adjusted for permanent differences in order to reflect their tax character. These adjustments have no impact on net assets or net asset value per share. Temporary differences which arise from recognizing certain items of income, expense, gain or loss in different periods for financial statement and tax purposes will reverse at some time in the future. Distributions in excess of net investment income or net realized gains are temporary overdistributions for financial statement purposes resulting from differences in the recognition or classification of income or distributions for financial statement and tax purposes.
Book/tax differences primarily relate to wash sale loss deferrals, and treating a portion of the proceeds from redemptions as a distribution for tax purposes.
The tax character of distributions made during the current period will be determined at fiscal year end. The tax character of distributions declared to shareholders for the last fiscal year is as follows:
| | | | |
| | | 8/31/14 | |
| Ordinary income (including any short-term capital gains) | | | $760,612,303 | |
| Long-term capital gains | | | 406,331,212 | |
| Total distributions | | | $1,166,943,515 | |
The federal tax cost and the tax basis components of distributable earnings were as follows:
| | | | |
| As of 2/28/15 | | | |
| Cost of investments | | | $23,580,213,946 | |
| Gross appreciation | | | 12,183,166,184 | |
| Gross depreciation | | | (96,428,310 | ) |
| Net unrealized appreciation (depreciation) | | | $12,086,737,874 | |
| |
| As of 8/31/14 | | | |
| Undistributed ordinary income | | | 231,870,445 | |
| Undistributed long-term capital gain | | | 683,583,120 | |
| Capital loss carryforwards | | | (17,104,180 | ) |
| Other temporary differences | | | (205,215 | ) |
| Net unrealized appreciation (depreciation) | | | 10,988,216,588 | |
The aggregate cost above includes prior fiscal year end tax adjustments, if applicable.
Under the Regulated Investment Company Modernization Act of 2010 (the “Act”), net capital losses recognized for fund fiscal years beginning after August 31, 2011 may be carried forward indefinitely, and their character is retained as short-term and/or long-term losses (“post-enactment losses”). Previously, net capital losses were carried forward for eight years and treated as short-term losses (“pre-enactment losses”). As a transition rule, the Act requires that all post-enactment net capital losses be used before pre-enactment net capital losses.
31
Notes to Financial Statements (unaudited) – continued
As of August 31, 2014, the fund had capital loss carryforwards available to offset future realized gains. Such pre-enactment losses expire as follows:
The availability of $17,104,180 of the capital loss carryforwards, which were acquired on July 24, 2009 in connection with the MFS Strategic Value Fund merger, may be limited in a given year.
Multiple Classes of Shares of Beneficial Interest – The fund offers multiple classes of shares, which differ in their respective distribution, service, and program manager fees. The fund’s income, realized and unrealized gain (loss), and common expenses are allocated to shareholders based on the daily net assets of each class. Dividends are declared separately for each class. Differences in per share dividend rates are generally due to differences in separate class expenses. Class B and Class 529B shares will convert to Class A and Class 529A shares, respectively, approximately eight years after purchase. The fund’s distributions declared to shareholders as reported in the Statements of Changes in Net Assets are presented by class as follows:
| | | | | | | | | | | | | | | | |
| | | From net investment
income | | | From net realized gain on
investments | |
| | | Six months
ended
2/28/15 | | | Year
ended
8/31/14 | | | Six months
ended
2/28/15 | | | Year
ended
8/31/14 | |
| Class A | | | $84,751,580 | | | | $173,579,969 | | | | $239,583,600 | | | | $158,274,114 | |
| Class B | | | 953,816 | | | | 2,090,774 | | | | 4,634,261 | | | | 3,249,251 | |
| Class C | | | 7,536,039 | | | | 15,134,051 | | | | 36,311,961 | | | | 21,935,733 | |
| Class I | | | 150,717,849 | | | | 261,803,666 | | | | 373,030,365 | | | | 207,624,418 | |
| Class R1 | | �� | 180,817 | | | | 399,161 | | | | 860,444 | | | | 629,904 | |
| Class R2 | | | 4,827,143 | | | | 10,006,893 | | | | 15,646,860 | | | | 10,778,017 | |
| Class R3 | | | 15,119,709 | | | | 27,923,409 | | | | 42,200,616 | | | | 25,565,924 | |
| Class R4 | | | 34,642,484 | | | | 68,672,815 | | | | 85,489,253 | | | | 55,241,972 | |
| Class R5 | | | 45,482,677 | | | | 72,631,471 | | | | 107,673,294 | | | | 50,791,793 | |
| Class 529A | | | 140,600 | | | | 248,321 | | | | 402,549 | | | | 220,123 | |
| Class 529B | | | 5,584 | | | | 11,886 | | | | 27,726 | | | | 18,765 | |
| Class 529C | | | 22,278 | | | | 43,621 | | | | 112,186 | | | | 67,464 | |
| Total | | | $344,380,576 | | | | $632,546,037 | | | | $905,973,115 | | | | $534,397,478 | |
(3) Transactions with Affiliates
Investment Adviser – The fund has an investment advisory agreement with MFS to provide overall investment management and related administrative services and facilities to the fund. The management fee is computed daily and paid monthly at the following annual rates:
| | | | |
| First $7.5 billion of average daily net assets | | | 0.60 | % |
| Next $2.5 billion of average daily net assets | | | 0.53 | % |
| Average daily net assets in excess of $10 billion | | | 0.50 | % |
The investment adviser has agreed in writing to reduce its management fee to 0.45% of average daily net assets in excess of $20 billion up to $25 billion, 0.42% of average daily net assets in excess of $25 billion up to $30 billion, and 0.40% of average daily net assets in excess of $30 billion. This written agreement will continue until modified
32
Notes to Financial Statements (unaudited) – continued
by the fund’s Board of Trustees, but such agreement will continue at least until December 31, 2015. For the six months ended February 28, 2015, this management fee reduction amounted to $5,540,419, which is included in the reduction of total expenses in the Statement of Operations. MFS has also agreed in writing to reduce its management fee by a specified amount if certain MFS mutual fund assets exceed thresholds agreed to by MFS and the fund’s Board of Trustees. For the six months ended February 28, 2015, this management fee reduction amounted to $1,050,043, which is included in the reduction of total expenses in the Statement of Operations. The management fee incurred for the six months ended February 28, 2015 was equivalent to an annual effective rate of 0.49% of the fund’s average daily net assets.
Distributor – MFS Fund Distributors, Inc. (MFD), a wholly-owned subsidiary of MFS, as distributor, received $1,363,185 and $5,812 for the six months ended February 28, 2015, as its portion of the initial sales charge on sales of Class A and Class 529A shares of the fund, respectively.
The Board of Trustees has adopted a distribution plan for certain share classes pursuant to Rule 12b-1 of the Investment Company Act of 1940.
The fund’s distribution plan provides that the fund will pay MFD for services provided by MFD and financial intermediaries in connection with the distribution and servicing of certain share classes. One component of the plan is a distribution fee paid to MFD and another component of the plan is a service fee paid to MFD. MFD may subsequently pay all, or a portion, of the distribution and/or service fees to financial intermediaries.
Distribution Plan Fee Table:
| | | | | | | | | | | | | | | | | | | | |
| | | Distribution
Fee Rate (d) | | | Service
Fee Rate (d) | | | Total
Distribution
Plan (d) | | | Annual
Effective
Rate (e) | | | Distribution
and Service
Fee | |
| Class A | | | — | | | | 0.25% | | | | 0.25% | | | | 0.25% | | | | $11,339,305 | |
| Class B | | | 0.75% | | | | 0.25% | | | | 1.00% | | | | 1.00% | | | | 874,588 | |
| Class C | | | 0.75% | | | | 0.25% | | | | 1.00% | | | | 1.00% | | | | 6,807,984 | |
| Class R1 | | | 0.75% | | | | 0.25% | | | | 1.00% | | | | 1.00% | | | | 159,249 | |
| Class R2 | | | 0.25% | | | | 0.25% | | | | 0.50% | | | | 0.50% | | | | 1,460,104 | |
| Class R3 | | | — | | | | 0.25% | | | | 0.25% | | | | 0.25% | | | | 2,001,600 | |
| Class 529A | | | — | | | | 0.25% | | | | 0.25% | | | | 0.20% | | | | 18,974 | |
| Class 529B | | | 0.75% | | | | 0.25% | | | | 1.00% | | | | 0.62% | | | | 3,166 | |
| Class 529C | | | 0.75% | | | | 0.25% | | | | 1.00% | | | | 1.00% | | | | 20,763 | |
| Total Distribution and Service Fees | | | | $22,685,733 | |
| (d) | In accordance with the distribution plan for certain classes, the fund pays distribution and/or service fees equal to these annual percentage rates of each class’s average daily net assets. The distribution and service fee rates disclosed by class represent the current rates in effect at the end of the reporting period. Any rate changes, if applicable, are detailed below. |
| (e) | The annual effective rates represent actual fees incurred under the distribution plan for the six months ended February 28, 2015 based on each class’s average daily net assets. MFD has voluntarily agreed to rebate a portion of each class’s 0.25% service fee attributable to accounts for which MFD retains the 0.25% service fee except for accounts attributable to MFS or its affiliates’ seed money. For the six months ended February 28, 2015, this rebate amounted to $35,681, $382, $579, $861, $118, $4,114, $38, and $63 for Class A, Class B, Class C, Class R2, Class R3, Class 529A, Class 529B, and Class 529C, respectively, and is |
33
Notes to Financial Statements (unaudited) – continued
| | included in the reduction of total expenses in the Statement of Operations. For the period December 1, 2014 through February 28, 2015, the 0.75% distribution fee was not imposed for Class 529B shares. |
Certain Class A shares are subject to a contingent deferred sales charge (CDSC) in the event of a shareholder redemption within 18 months of purchase. Class C and Class 529C shares are subject to a CDSC in the event of a shareholder redemption within 12 months of purchase. Class B and Class 529B shares are subject to a CDSC in the event of a shareholder redemption within six years of purchase. All contingent deferred sales charges are paid to MFD and during the six months ended February 28, 2015, were as follows:
| | | | |
| | | Amount | |
| Class A | | | $27,103 | |
| Class B | | | 89,083 | |
| Class C | | | 42,049 | |
| Class 529B | | | 170 | |
| Class 529C | | | 18 | |
The fund has entered into and may from time to time enter into contracts with program managers and other parties which administer the tuition programs through which an investment in the fund’s 529 share classes is made. The fund has entered into an agreement with MFD pursuant to which MFD receives an annual fee of up to 0.10% of the average daily net assets attributable to each 529 share class. MFD has agreed to waive a portion of this fee in an amount equal to 0.05% of the average daily net assets for each 529 share class. This waiver agreement will expire on December 31, 2016, unless MFD elects to extend the waiver. For the six months ended February 28, 2015, this waiver amounted to $5,086 and is included in the reduction of total expenses in the Statement of Operations. The program manager fee incurred for the six months ended February 28, 2015 was equivalent to an annual effective rate of 0.05% of the average daily net assets attributable to each 529 share class. The services provided by MFD, or a third party with which MFD contracts, include recordkeeping and tax reporting and account services, as well as services designed to maintain the program’s compliance with the Internal Revenue Code and other regulatory requirements. Program manager fees and waivers for the six months ended February 28, 2015, were as follows:
| | | | | | | | |
| | | Fee | | | Waiver | |
| Class 529A | | | $7,590 | | | | $3,795 | |
| Class 529B | | | 506 | | | | 253 | |
| Class 529C | | | 2,076 | | | | 1,038 | |
| Total Program Manager Fees and Waivers | | | $10,172 | | | | $5,086 | |
Shareholder Servicing Agent – MFS Service Center, Inc. (MFSC), a wholly-owned subsidiary of MFS, receives a fee from the fund for its services as shareholder servicing agent calculated as a percentage of the average daily net assets of the fund as determined periodically under the supervision of the fund’s Board of Trustees. For the six months ended February 28, 2015, the fee was $793,103, which equated to 0.0046% annually of the fund’s average daily net assets. MFSC also receives payment
34
Notes to Financial Statements (unaudited) – continued
from the fund for out-of-pocket expenses, sub-accounting and other shareholder servicing costs which may be paid to affiliated and unaffiliated service providers. Class R5 shares do not incur sub-accounting fees. For the six months ended February 28, 2015, these out-of-pocket expenses, sub-accounting and other shareholder servicing costs amounted to $15,851,772.
Administrator – MFS provides certain financial, legal, shareholder communications, compliance, and other administrative services to the fund. Under an administrative services agreement, the fund reimburses MFS the costs incurred to provide these services. The fund is charged an annual fixed amount of $17,500 plus a fee based on average daily net assets. The administrative services fee incurred for the six months ended February 28, 2015 was equivalent to an annual effective rate of 0.0019% of the fund’s average daily net assets.
Trustees’ and Officers’ Compensation – The fund pays compensation to independent Trustees in the form of a retainer, attendance fees, and additional compensation to Board and Committee chairpersons. The fund does not pay compensation directly to Trustees or officers of the fund who are also officers of the investment adviser, all of whom receive remuneration for their services to the fund from MFS. Certain officers and Trustees of the fund are officers or directors of MFS, MFD, and MFSC.
Prior to December 31, 2001, the fund had an unfunded defined benefit plan (“DB plan”) for independent Trustees. As of December 31, 2001, the Board took action to terminate the DB plan with respect to then-current and any future independent Trustees, such that the DB plan covers only certain of those former independent Trustees who retired on or before December 31, 2001. The DB plan resulted in a pension expense of $167 and is included in independent Trustees’ compensation for the six months ended February 28, 2015. The liability for deferred retirement benefits payable to certain independent Trustees under the DB plan amounted to $3,145 at February 28, 2015, and is included in “Payable for independent Trustees’ compensation” in the Statement of Assets and Liabilities.
Other – Effective November 1, 2014, this fund and certain other funds managed by MFS (the funds) have entered into a service agreement (the ISO Agreement) which provides for payment of fees solely by the funds to Tarantino LLC in return for the provision of services of an Independent Senior Officer (ISO) for the funds. Frank L. Tarantino serves as the ISO and is an officer of the funds and the sole member of Tarantino LLC. The funds can terminate the ISO Agreement with Tarantino LLC at any time under the terms of the ISO Agreement. Prior to November 1, 2014, the funds had entered into a service agreement (the Compliance Officer Agreement) which provided for payment of fees by the funds to Tarantino LLC in return for the provision of services of an Independent Chief Compliance Officer (ICCO) for the funds. Prior to November 1, 2014, Frank L. Tarantino served as the ICCO. Effective October 31, 2014, Mr. Tarantino resigned as ICCO and the Compliance Officer Agreement between the funds and Tarantino LLC was terminated. For the six months ended February 28, 2015, the aggregate fees paid by the fund under these agreements were $66,131 and are included in “Miscellaneous” expense in the Statement of Operations. MFS had agreed to reimburse the fund for a portion of the payments made by the fund for the services
35
Notes to Financial Statements (unaudited) – continued
under the Compliance Officer Agreement in the amount of $11,447, which is included in the reduction of total expenses in the Statement of Operations. Additionally, MFS has agreed to bear all expenses associated with office space, other administrative support, and supplies provided to the ICCO and ISO.
The fund invests in the MFS Institutional Money Market Portfolio which is managed by MFS and seeks current income consistent with preservation of capital and liquidity. Income earned on this investment is included in “Dividends from underlying affiliated funds” in the Statement of Operations. This money market fund does not pay a management fee to MFS.
On September 11, 2013, MFS redeemed 4,432 shares of Class R5 for an aggregate amount of $137,259.
(4) Portfolio Securities
For the six months ended February 28, 2015, purchases and sales of investments, other than short-term obligations, aggregated $1,814,678,785 and $2,394,036,068, respectively.
(5) Shares of Beneficial Interest
The fund’s Declaration of Trust permits the Trustees to issue an unlimited number of full and fractional shares of beneficial interest. Transactions in fund shares were as follows:
| | | | | | | | | | | | | | | | |
| | | Six months ended
2/28/15 | | | Year ended
8/31/14 | |
| | | Shares | | | Amount | | | Shares | | | Amount | |
| Shares sold | | | | | | | | | | | | | | | | |
Class A | | | 24,101,417 | | | | $834,218,112 | | | | 60,870,511 | | | | $1,998,346,176 | |
Class B | | | 228,065 | | | | 7,862,168 | | | | 554,113 | | | | 18,053,263 | |
Class C | | | 3,073,806 | | | | 105,258,402 | | | | 6,897,860 | | | | 223,711,170 | |
Class I | | | 55,668,538 | | | | 1,938,923,075 | | | | 109,423,187 | | | | 3,625,117,953 | |
Class R1 | | | 121,204 | | | | 4,168,403 | | | | 194,673 | | | | 6,295,259 | |
Class R2 | | | 1,274,463 | | | | 43,827,437 | | | | 3,053,945 | | | | 99,572,053 | |
Class R3 | | | 5,957,507 | | | | 205,726,405 | | | | 12,218,431 | | | | 399,503,879 | |
Class R4 | | | 7,402,672 | | | | 257,205,604 | | | | 23,035,381 | | | | 757,348,601 | |
Class R5 | | | 16,247,539 | | | | 562,797,098 | | | | 41,463,392 | | | | 1,361,664,476 | |
Class 529A | | | 57,496 | | | | 1,995,970 | | | | 80,831 | | | | 2,657,258 | |
Class 529B | | | 1,593 | | | | 54,490 | | | | 3,899 | | | | 125,823 | |
Class 529C | | | 27,274 | | | | 921,702 | | | | 22,400 | | | | 724,788 | |
| | | 114,161,574 | | | | $3,962,958,866 | | | | 257,818,623 | | | | $8,493,120,699 | |
36
Notes to Financial Statements (unaudited) – continued
| | | | | | | | | | | | | | | | |
| | | Six months ended
2/28/15 | | | Year ended
8/31/14 | |
| | | Shares | | | Amount | | | Shares | | | Amount | |
| Shares issued to shareholders in reinvestment of distributions | | | | | | | | | | | | | | | | |
Class A | | | 8,618,516 | | | | $297,472,576 | | | | 9,415,560 | | | | $305,704,358 | |
Class B | | | 147,093 | | | | 5,061,038 | | | | 150,377 | | | | 4,855,668 | |
Class C | | | 847,145 | | | | 28,988,296 | | | | 740,995 | | | | 23,828,112 | |
Class I | | | 10,610,627 | | | | 367,982,666 | | | | 9,622,407 | | | | 314,091,576 | |
Class R1 | | | 30,628 | | | | 1,041,261 | | | | 32,246 | | | | 1,029,065 | |
Class R2 | | | 573,839 | | | | 19,643,660 | | | | 618,578 | | | | 19,902,257 | |
Class R3 | | | 1,665,535 | | | | 57,319,672 | | | | 1,651,963 | | | | 53,489,015 | |
Class R4 | | | 3,341,595 | | | | 115,313,162 | | | | 3,656,123 | | | | 118,701,122 | |
Class R5 | | | 4,072,827 | | | | 140,504,512 | | | | 3,668,044 | | | | 119,290,819 | |
Class 529A | | | 15,833 | | | | 542,911 | | | | 14,540 | | | | 468,444 | |
Class 529B | | | 981 | | | | 33,310 | | | | 961 | | | | 30,651 | |
Class 529C | | | 3,969 | | | | 134,464 | | | | 3,488 | | | | 111,072 | |
| | | 29,928,588 | | | | $1,034,037,528 | | | | 29,575,282 | | | | $961,502,159 | |
| | | | |
| Shares reacquired | | | | | | | | | | | | | | | | |
Class A | | | (41,785,485 | ) | | | $(1,443,390,028 | ) | | | (68,358,836 | ) | | | $(2,261,976,774 | ) |
Class B | | | (579,182 | ) | | | (20,018,251 | ) | | | (1,216,763 | ) | | | (39,918,338 | ) |
Class C | | | (2,924,486 | ) | | | (100,197,846 | ) | | | (4,992,374 | ) | | | (162,937,252 | ) |
Class I | | | (53,041,728 | ) | | | (1,856,880,903 | ) | | | (73,189,862 | ) | | | (2,414,804,530 | ) |
Class R1 | | | (185,313 | ) | | | (6,331,231 | ) | | | (390,185 | ) | | | (12,621,777 | ) |
Class R2 | | | (3,170,658 | ) | | | (109,396,530 | ) | | | (5,389,359 | ) | | | (175,451,679 | ) |
Class R3 | | | (6,003,870 | ) | | | (207,318,572 | ) | | | (12,493,293 | ) | | | (410,560,625 | ) |
Class R4 | | | (16,394,223 | ) | | | (566,522,624 | ) | | | (29,116,657 | ) | | | (960,068,960 | ) |
Class R5 | | | (7,919,780 | ) | | | (276,553,269 | ) | | | (9,245,299 | ) | | | (305,654,695 | ) |
Class 529A | | | (18,725 | ) | | | (646,088 | ) | | | (41,342 | ) | | | (1,358,958 | ) |
Class 529B | | | (4,102 | ) | | | (139,002 | ) | | | (9,354 | ) | | | (303,416 | ) |
Class 529C | | | (13,296 | ) | | | (452,807 | ) | | | (24,670 | ) | | | (797,250 | ) |
| | | (132,040,848 | ) | | | $(4,587,847,151 | ) | | | (204,467,994 | ) | | | $(6,746,454,254 | ) |
| | | | |
| Net change | | | | | | | | | | | | | | | | |
Class A | | | (9,065,552 | ) | | | $(311,699,340 | ) | | | 1,927,235 | | | | $42,073,760 | |
Class B | | | (204,024 | ) | | | (7,095,045 | ) | | | (512,273 | ) | | | (17,009,407 | ) |
Class C | | | 996,465 | | | | 34,048,852 | | | | 2,646,481 | | | | 84,602,030 | |
Class I | | | 13,237,437 | | | | 450,024,838 | | | | 45,855,732 | | | | 1,524,404,999 | |
Class R1 | | | (33,481 | ) | | | (1,121,567 | ) | | | (163,266 | ) | | | (5,297,453 | ) |
Class R2 | | | (1,322,356 | ) | | | (45,925,433 | ) | | | (1,716,836 | ) | | | (55,977,369 | ) |
Class R3 | | | 1,619,172 | | | | 55,727,505 | | | | 1,377,101 | | | | 42,432,269 | |
Class R4 | | | (5,649,956 | ) | | | (194,003,858 | ) | | | (2,425,153 | ) | | | (84,019,237 | ) |
Class R5 | | | 12,400,586 | | | | 426,748,341 | | | | 35,886,137 | | | | 1,175,300,600 | |
Class 529A | | | 54,604 | | | | 1,892,793 | | | | 54,029 | | | | 1,766,744 | |
Class 529B | | | (1,528 | ) | | | (51,202 | ) | | | (4,494 | ) | | | (146,942 | ) |
Class 529C | | | 17,947 | | | | 603,359 | | | | 1,218 | | | | 38,610 | |
| | | 12,049,314 | | | | $409,149,243 | | | | 82,925,911 | | | | $2,708,168,604 | |
37
Notes to Financial Statements (unaudited) – continued
The fund is one of several mutual funds in which certain MFS funds may invest. The MFS funds do not invest in the underlying funds for the purpose of exercising management or control. At the end of the period, the MFS Growth Allocation Fund, the MFS Aggressive Growth Allocation Fund, the MFS Conservative Allocation Fund, and the MFS Moderate Allocation Fund were the owners of record of approximately 2%, 1%, 1%, and 1%, respectively, of the value of outstanding voting shares of the fund. In addition, the MFS Lifetime Income Fund, the MFS Lifetime 2015 Fund, the MFS Lifetime 2020 Fund, the MFS Lifetime 2025 Fund, the MFS Lifetime 2030 Fund, the MFS Lifetime 2035 Fund, the MFS Lifetime 2040 Fund, the MFS Lifetime 2045 Fund, the MFS Lifetime 2050 Fund, and the MFS Lifetime 2055 Fund, were each the owners of record of less than 1% of the value of outstanding voting shares of the fund.
(6) Line of Credit
The fund and certain other funds managed by MFS participate in a $1.1 billion unsecured committed line of credit, subject to a $1 billion sublimit, provided by a syndication of banks under a credit agreement. Borrowings may be made for temporary financing needs. Interest is charged to each fund, based on its borrowings, generally at a rate equal to the higher of the Federal Reserve funds rate or one month LIBOR plus an agreed upon spread. A commitment fee, based on the average daily, unused portion of the committed line of credit, is allocated among the participating funds at the end of each calendar quarter. In addition, the fund and other funds managed by MFS have established unsecured uncommitted borrowing arrangements with certain banks for temporary financing needs. Interest is charged to each fund, based on its borrowings, at a rate equal to the Federal Reserve funds rate plus an agreed upon spread. For the six months ended February 28, 2015, the fund’s commitment fee and interest expense were $60,677 and $0, respectively, and are included in “Miscellaneous” expense in the Statement of Operations.
(7) Transactions in Underlying Affiliated Funds-Affiliated Issuers
An affiliated issuer may be considered one in which the fund owns 5% or more of the outstanding voting securities, or a company which is under common control. For the purposes of this report, the fund assumes the following to be an affiliated issuer:
| | | | | | | | | | | | | | | | |
| Underlying Affiliated Fund | | Beginning
Shares/Par
Amount | | | Acquisitions
Shares/Par
Amount | | | Dispositions
Shares/Par
Amount | | | Ending
Shares/Par
Amount | |
MFS Institutional Money
Market Portfolio | | | 329,051,729 | | | | 1,886,998,787 | | | | (1,762,879,484 | ) | | | 453,171,032 | |
| | | | |
| Underlying Affiliated Fund | | Realized
Gain (Loss) | | | Capital Gain
Distributions | | | Dividend
Income | | | Ending
Value | |
MFS Institutional Money
Market Portfolio | | | $— | | | | $— | | | | $174,516 | | | | $453,171,032 | |
38
PROXY VOTING POLICIES AND INFORMATION
MFS votes proxies on behalf of the fund pursuant to proxy voting policies and procedures that are available without charge, upon request, by calling 1-800-225-2606, by visiting the Proxy Voting section of mfs.com or by visiting the SEC’s Web site at http://www.sec.gov.
Information regarding how the fund voted proxies relating to portfolio securities during the most recent twelve-month period ended June 30 is available without charge by visiting the Proxy Voting section of mfs.com or by visiting the SEC’s Web site at http://www.sec.gov.
QUARTERLY PORTFOLIO DISCLOSURE
The fund will file a complete schedule of portfolio holdings with the Securities and Exchange Commission (the Commission) for the first and third quarters of each fiscal year on Form N-Q. A shareholder can obtain the quarterly portfolio holdings report at mfs.com. The fund’s Form N-Q is also available on the EDGAR database on the Commission’s Internet Web site at http://www.sec.gov, and may be reviewed and copied at the:
Public Reference Room
Securities and Exchange Commission
100 F Street, NE, Room 1580
Washington, D.C. 20549
Information on the operation of the Public Reference Room may be obtained by calling the Commission at 1-800-SEC-0330. Copies of the fund’s Form N-Q also may be obtained, upon payment of a duplicating fee, by electronic request at the following e-mail address: publicinfo@sec.gov or by writing the Public Reference Section at the above address.
FURTHER INFORMATION
From time to time, MFS may post important information about the fund or the MFS funds on the MFS web site (mfs.com). This information is available by visiting the “Market Commentary” and “Announcements” sub sections in the “Market Outlooks” section of mfs.com or by clicking on the fund’s name under “Mutual Funds” in the “Products” section of mfs.com.
PROVISION OF FINANCIAL REPORTS AND SUMMARY PROSPECTUSES
The fund produces financial reports every six months and updates its summary prospectus and prospectus annually. To avoid sending duplicate copies of materials to households, only one copy of the fund’s annual and semiannual report and summary prospectus may be mailed to shareholders having the same last name and residential address on the fund’s records. However, any shareholder may contact MFSC (please see back cover for address and telephone number) to request that copies of these reports and summary prospectuses be sent personally to that shareholder.
39
Save paper with eDelivery.

| MFS® will send you prospectuses, |
reports, and proxies directly via e-mail so you will get information faster with less mailbox clutter.
To sign up:
1. Go to mfs.com.
2. Log in via MFS® Access.
3. Select eDelivery.
If you own your MFS fund shares through a financial institution or a retirement plan, MFS® TALK, MFS® Access, or eDelivery may not be available to you.
CONTACT
WEB SITE
mfs.com
MFS TALK
1-800-637-8255
24 hours a day
ACCOUNT SERVICE AND LITERATURE
Shareholders
1-800-225-2606
Financial advisors
1-800-343-2829
Retirement plan services
1-800-637-1255
MAILING ADDRESS
MFS Service Center, Inc.
P.O. Box 55824
Boston, MA 02205-5824
OVERNIGHT MAIL
MFS Service Center, Inc.
c/o Boston Financial Data Services
30 Dan Road
Canton, MA 02021-2809
During the period covered by this report, the Registrant has not amended any provision in its Code of Ethics (the “Code”) that relates to an element of the Code’s definitions enumerated in paragraph (b) of Item 2 of this Form N-CSR. During the period covered by this report, the Registrant did not grant a waiver, including an implicit waiver, from any provision of the Code.
| ITEM 3. | AUDIT COMMITTEE FINANCIAL EXPERT. |
Not applicable for semi-annual reports.
| ITEM 4. | PRINCIPAL ACCOUNTANT FEES AND SERVICES. |
Not applicable for semi-annual reports.
| ITEM 5. | AUDIT COMMITTEE OF LISTED REGISTRANTS. |
Not applicable to the Registrant.
A schedule of investments for each series of the Registrant is included as part of the report to shareholders of such series under Item 1 of this Form N-CSR.
| ITEM 7. | DISCLOSURE OF PROXY VOTING POLICIES AND PROCEDURES FOR CLOSED-END MANAGEMENT INVESTMENT COMPANIES. |
Not applicable to the Registrant.
| ITEM 8. | PORTFOLIO MANAGERS OF CLOSED-END MANAGEMENT INVESTMENT COMPANIES. |
Not applicable to the Registrant.
| ITEM 9. | PURCHASES OF EQUITY SECURITIES BY CLOSED-END MANAGEMENT INVESTMENT COMPANY AND AFFILIATED PURCHASERS. |
Not applicable to the Registrant.
| ITEM 10. | SUBMISSION OF MATTERS TO A VOTE OF SECURITY HOLDERS. |
There were no material changes to the procedures by which shareholders may send recommendations to the Board for nominees to the Registrant’s Board since the Registrant last provided disclosure as to such procedures in response to the requirements of Item 407 (c)(2)(iv) of Regulation S-K or this Item.
| ITEM 11. | CONTROLS AND PROCEDURES. |
| (a) | Based upon their evaluation of the effectiveness of the registrant’s disclosure controls and procedures (as defined in Rule 30a-3(c) under the Investment Company Act of 1940 (the “Act”)) as conducted within 90 days of the filing date of this report on Form N-CSR, the registrant’s principal financial officer and principal executive officer have concluded that those disclosure controls and procedures provide reasonable assurance that the material information required to be disclosed by the registrant on this report is recorded, processed, summarized and reported within the time periods specified in the Securities and Exchange Commission’s rules and forms. |
| (b) | There were no changes in the registrant’s internal controls over financial reporting (as defined in Rule 30a-3(d) under the Act) that occurred during the second fiscal quarter of the period covered by the report that have materially affected, or are reasonably likely to materially affect, the registrant’s internal control over financial reporting. |
| (a) | File the exhibits listed below as part of this form. Letter or number the exhibits in the sequence indicated. |
| | (1) | Any code of ethics, or amendment thereto, that is the subject of the disclosure required by Item 2, to the extent that the registrant intends to satisfy the Item 2 requirements through filing of an exhibit. |
| | (2) | A separate certification for each principal executive officer and principal financial officer of the registrant as required by Rule 30a-2(a) under the Act (17 CFR 270.30a-2): Attached hereto. |
| (b) | If the report is filed under Section 13(a) or 15(d) of the Exchange Act, provide the certifications required by Rule 30a-2(b) under the Act (17 CFR 270.30a-2(b)), Rule 13a-14(b) or Rule 15d-14(b) under the Exchange Act (17 CFR 240.13a-14(b) or 240.15d-14(b)) and Section 1350 of Chapter 63 of Title 18 of the United States Code (18 U.S.C. 1350) as an exhibit. A certification furnished pursuant to this paragraph will not be deemed “filed” for the purposes of Section 18 of the Exchange Act (15 U.S.C. 78r), or otherwise subject to the liability of that section. Such certification will not be deemed to be incorporated by reference into any filing under the Securities Act of 1933 or the Exchange Act, except to the extent that the registrant specifically incorporates it by reference: Attached hereto. |
Notice
A copy of the Amended and Restated Declaration of Trust, as amended, of the Registrant is on file with the Secretary of State of The Commonwealth of Massachusetts and notice is hereby given that this instrument is executed on behalf of the Registrant by an officer of the Registrant as an officer and not individually and the obligations of or arising out of this instrument are not binding upon any of the Trustees or shareholders individually, but are binding only upon the assets and property of the respective constituent series of the Registrant.
SIGNATURES
Pursuant to the requirements of the Securities Exchange Act of 1934 and the Investment Company Act of 1940, the registrant has duly caused this report to be signed on its behalf by the undersigned, thereunto duly authorized.
(Registrant) MFS SERIES TRUST I
| | |
| By (Signature and Title)* | | ROBIN A. STELMACH |
| | Robin A. Stelmach, President |
Date: April 14, 2015
Pursuant to the requirements of the Securities Exchange Act of 1934 and the Investment Company Act of 1940, this report has been signed below by the following persons on behalf of the registrant and in the capacities and on the dates indicated.
| | |
| By (Signature and Title)* | | ROBIN A. STELMACH |
| | Robin A. Stelmach, President (Principal Executive Officer) |
Date: April 14, 2015
| | |
| By (Signature and Title)* | | DAVID L. DILORENZO |
| | David L. DiLorenzo, Treasurer (Principal Financial Officer and Accounting Officer) |
Date: April 14, 2015
| * | Print name and title of each signing officer under his or her signature. |