UNITED STATES
SECURITIES AND EXCHANGE COMMISSION
Washington, D.C. 20549
FORM N-CSR
CERTIFIED SHAREHOLDER REPORT OF
REGISTERED MANAGEMENT INVESTMENT COMPANIES
Investment Company Act file number 811-04777
MFS SERIES TRUST I
(Exact name of registrant as specified in charter)
111 Huntington Avenue, Boston, Massachusetts 02199
(Address of principal executive offices) (Zip code)
Susan S. Newton
Massachusetts Financial Services Company
111 Huntington Avenue
Boston, Massachusetts 02199
(Name and address of agents for service)
Registrant’s telephone number, including area code: (617) 954-5000
Date of fiscal year end: August 31
Date of reporting period: February 28, 2014
| ITEM 1. | REPORTS TO STOCKHOLDERS. |
SEMIANNUAL REPORT
February 28, 2014

MFS® CASH RESERVE FUND

LMM-SEM
MFS® CASH RESERVE FUND
CONTENTS
The report is prepared for the general information of shareholders. It is authorized for distribution to prospective investors only when preceded or accompanied by a current prospectus.
NOT FDIC INSURED Ÿ MAY LOSE VALUE Ÿ NO BANK GUARANTEE

LETTER FROM THE CHAIRMAN AND CEO
Dear Shareholders:
The U.S. economy appears to have slowed early in 2014 after a strong second half of 2013. Harsh winter weather likely contributed to at least a temporary softening of consumer demand. Looking at the longer term, the pace of U.S. economic growth has
been modest since the recovery began late in 2009. Corporate profits remain healthy overall. A major plus is the removal of a highly confrontational atmosphere in the U.S. Congress, which had clouded business decision-making since 2011.
Globally, recent months have been dominated by volatility, including emerging market currency jitters and rising geopolitical tensions. These add to the possibility of economic uncertainty and financial market unease. However, the eurozone continues to show signs of recovery, while Japan is making progress as it seeks to break free of deflation.
China’s transition toward a more consumer-oriented and less export-driven economy — one with a more stable and sustainable growth rate — could be positive in the long term. However, in the near term, any deceleration in China’s rate of growth could have a ripple effect on its many global trading partners.
In uncertain times such as these, it is particularly important to remember that managing risk should always be a top priority. At MFS®, active risk management is an integral part of our collaborative process. Our global team of investment professionals shares ideas and evaluates opportunities that span continents, investment disciplines and asset classes. Our goal is to build better insights, and ultimately better results, for our clients.
We understand and appreciate the economic challenges investors face, and we believe in the value of maintaining a long-term view and applying proven principles, such as asset allocation and diversification. We are confident that our unique approach can serve investors well as they work with their financial advisors to identify and pursue the most suitable opportunities.
Respectfully,

Robert J. Manning
Chairman and Chief Executive Officer
MFS Investment Management
April 14, 2014
The opinions expressed in this letter are subject to change, may not be relied upon for investment advice, and no forecasts can be guaranteed.
1
PORTFOLIO COMPOSITION
Portfolio structure (u)
| | | | |
| Composition including fixed income credit quality (a)(u) | |
| A-1+ | | | 14.9% | |
| A-1 | | | 84.8% | |
| A-2 | | | 0.6% | |
| Not Rated | | | 0.0% | |
| Other Assets Less Liabilities | | | (0.3)% | |
| | | | |
| Maturity breakdown (u) | | | | |
| 0 - 7 days | | | 9.3% | |
| 8 - 29 days | | | 25.4% | |
| 30 - 59 days | | | 38.1% | |
| 60 - 89 days | | | 17.4% | |
| 90 - 365 days | | | 10.1% | |
| Other Assets Less Liabilities | | | (0.3)% | |
| (a) | Ratings are assigned to portfolio securities utilizing ratings from Moody’s, Fitch, and Standard & Poor’s rating agencies and applying the following hierarchy: If all three agencies provide a rating, the middle rating (after dropping the highest and lowest ratings) is assigned; if two of the three agencies rate a security, the lower of the two is assigned. Ratings are shown in the S&P scale. All ratings are subject to change. The fund is not rated by these agencies. |
| (u) | For purposes of this presentation, accrued interest, where applicable, is included. |
From time to time “Other Assets Less Liabilities” may be negative due to timing of cash receipts.
Percentages are based on net assets as of 2/28/14.
The portfolio is actively managed and current holdings may be different.
2
EXPENSE TABLE
Fund expenses borne by the shareholders during the period, September 1, 2013 through February 28, 2014
As a shareholder of the fund, you incur two types of costs: (1) transaction costs, including sales charges (loads) on certain purchase or redemption payments, and (2) ongoing costs, including management fees; distribution and service (12b-1) fees; and other fund expenses. This example is intended to help you understand your ongoing costs (in dollars) of investing in the fund and to compare these costs with the ongoing costs of investing in other mutual funds.
The example is based on an investment of $1,000 invested at the beginning of the period and held for the entire period September 1, 2013 through February 28, 2014.
Actual Expenses
The first line for each share class in the following table provides information about actual account values and actual expenses. You may use the information in this line, together with the amount you invested, to estimate the expenses that you paid over the period. Simply divide your account value by $1,000 (for example, an $8,600 account value divided by $1,000 = 8.6), then multiply the result by the number in the first line under the heading entitled “Expenses Paid During Period” to estimate the expenses you paid on your account during this period.
Hypothetical Example for Comparison Purposes
The second line for each share class in the following table provides information about hypothetical account values and hypothetical expenses based on the fund’s actual expense ratio and an assumed rate of return of 5% per year before expenses, which is not the fund’s actual return. The hypothetical account values and expenses may not be used to estimate the actual ending account balance or expenses you paid for the period. You may use this information to compare the ongoing costs of investing in the fund and other funds. To do so, compare this 5% hypothetical example with the 5% hypothetical examples that appear in the shareholder reports of the other funds.
Please note that the expenses shown in the table are meant to highlight your ongoing costs only and do not reflect any transactional costs, such as sales charges (loads). Therefore, the second line for each share class in the table is useful in comparing ongoing costs only, and will not help you determine the relative total costs of owning different funds. In addition, if these transactional costs were included, your costs would have been higher.
3
Expense Table – continued
| | | | | | | | | | | | | | | | | | |
Share
Class | | | | Annualized
Expense
Ratio | | | Beginning
Account Value
9/01/13 | | | Ending
Account Value
2/28/14 | | | Expenses
Paid During
Period (p)
9/01/13-2/28/14 | |
| A | | Actual | | | 0.11% | | | | $1,000.00 | | | | $1,000.00 | | | | $0.55 | |
| | Hypothetical (h) | | | 0.11% | | | | $1,000.00 | | | | $1,024.25 | | | | $0.55 | |
| B | | Actual | | | 0.11% | | | | $1,000.00 | | | | $1,000.00 | | | | $0.55 | |
| | Hypothetical (h) | | | 0.11% | | | | $1,000.00 | | | | $1,024.25 | | | | $0.55 | |
| C | | Actual | | | 0.11% | | | | $1,000.00 | | | | $1,000.00 | | | | $0.55 | |
| | Hypothetical (h) | | | 0.11% | | | | $1,000.00 | | | | $1,024.25 | | | | $0.55 | |
| R1 | | Actual | | | 0.11% | | | | $1,000.00 | | | | $1,000.00 | | | | $0.55 | |
| | Hypothetical (h) | | | 0.11% | | | | $1,000.00 | | | | $1,024.25 | | | | $0.55 | |
| R2 | | Actual | | | 0.11% | | | | $1,000.00 | | | | $1,000.00 | | | | $0.55 | |
| | Hypothetical (h) | | | 0.11% | | | | $1,000.00 | | | | $1,024.25 | | | | $0.55 | |
| R3 | | Actual | | | 0.11% | | | | $1,000.00 | | | | $1,000.00 | | | | $0.55 | |
| | Hypothetical (h) | | | 0.11% | | | | $1,000.00 | | | | $1,024.25 | | | | $0.55 | |
| R4 | | Actual | | | 0.11% | | | | $1,000.00 | | | | $1,000.00 | | | | $0.55 | |
| | Hypothetical (h) | | | 0.11% | | | | $1,000.00 | | | | $1,024.25 | | | | $0.55 | |
| 529A | | Actual | | | 0.11% | | | | $1,000.00 | | | | $1,000.00 | | | | $0.55 | |
| | Hypothetical (h) | | | 0.11% | | | | $1,000.00 | | | | $1,024.25 | | | | $0.55 | |
| 529B | | Actual | | | 0.11% | | | | $1,000.00 | | | | $1,000.00 | | | | $0.55 | |
| | Hypothetical (h) | | | 0.11% | | | | $1,000.00 | | | | $1,024.25 | | | | $0.55 | |
| 529C | | Actual | | | 0.11% | | | | $1,000.00 | | | | $1,000.00 | | | | $0.55 | |
| | Hypothetical (h) | | | 0.11% | | | | $1,000.00 | | | | $1,024.25 | | | | $0.55 | |
| (h) | 5% class return per year before expenses. |
| (p) | Expenses Paid During Period are equal to each class’s annualized expense ratio, as shown above, multiplied by the average account value over the period, multiplied by 181/365 (to reflect the one-half year period). Expenses paid do not include any applicable sales charges (loads). If these transaction costs had been included, your costs would have been higher. |
Notes to Expense Table
As more fully disclosed in footnote 3 to the financial statements, the expense ratios reported above include additional expense reductions to avoid a negative yield.
4
PORTFOLIO OF INVESTMENTS
2/28/14 (unaudited)
The Portfolio of Investments is a complete list of all securities owned by your fund. It is categorized by broad-based asset classes.
| | | | | | | | |
| Certificates of Deposit - 18.2% | | | | | | | | |
| Issuer | | Shares/Par | | | Value ($) | |
| | | | | | | | |
| Major Banks - 9.7% | | | | | | | | |
| Bank of Montreal/Chicago Branch, 0.16%, due 4/10/14 | | $ | 15,512,000 | | | $ | 15,512,000 | |
| Bank of Nova Scotia/Houston Branch, 0.16%, due 3/27/14 | | | 6,150,000 | | | | 6,150,000 | |
| Canadian Imperial Bank of Commerce/New York Branch, 0.05%, due 3/05/14 | | | 107,000 | | | | 107,000 | |
| Toronto Dominion Holdings (USA), Inc., 0.105%, due 3/18/14 | | | 3,248,000 | | | | 3,248,000 | |
| Toronto Dominion Holdings (USA), Inc., 0.145%, due 4/04/14 | | | 12,061,000 | | | | 12,061,000 | |
| | | | | | | | |
| | | | | | | $ | 37,078,000 | |
| Other Banks & Diversified Financials - 8.5% | | | | | | | | |
| Mizuho Corporate Bank (USA)/New York Branch, 0.2%, due 4/17/14 | | $ | 15,555,000 | | | $ | 15,555,000 | |
| National Bank of Canada/New York Branch, 0.19%, due 4/22/14 | | | 16,600,000 | | | | 16,600,000 | |
| | | | | | | | |
| | | | | | | $ | 32,155,000 | |
| Total Certificates of Deposit, at Cost and Value | | | $ | 69,233,000 | |
| | |
| Commercial Paper (y) - 49.5% | | | | | | | | |
| Automotive - 5.5% | | | | | | | | |
| American Honda Finance Corp., 0.13%, due 3/07/14 | | $ | 3,604,000 | | | $ | 3,603,924 | |
| American Honda Finance Corp., 0.13%, due 4/22/14 | | | 1,910,000 | | | | 1,909,641 | |
| Toyota Motor Credit Corp., 0.1%, due 4/09/14 | | | 5,790,000 | | | | 5,789,373 | |
| Toyota Motor Credit Corp., 0.14%, due 5/06/14 | | | 2,516,000 | | | | 2,515,354 | |
| Toyota Motor Credit Corp., 0.2%, due 7/30/14 | | | 7,079,000 | | | | 7,073,062 | |
| | | | | | | | |
| | | | | | | $ | 20,891,354 | |
| Business Services - 1.3% | | | | | | | | |
| Cisco Systems, Inc., 0.07%, due 3/19/14 (t) | | $ | 4,877,000 | | | $ | 4,876,829 | |
| | |
| Consumer Products - 8.3% | | | | | | | | |
| Kimberly Clark Worldwide, Inc., 0.05%, due 3/20/14 (t) | | $ | 6,771,000 | | | $ | 6,770,821 | |
| Kimberly Clark Worldwide, Inc., 0.08%, due 3/18/14 (t) | | | 8,550,000 | | | | 8,549,677 | |
| Procter & Gamble Co., 0.1%, due 4/16/14 (t) | | | 6,125,000 | | | | 6,124,217 | |
| Procter & Gamble Co., 0.1%, due 5/09/14 (t) | | | 9,363,000 | | | | 9,361,205 | |
| Reckitt Benckiser Treasury Services PLC, 0.08%, due 3/18/14 (t) | | | 1,000,000 | | | | 999,962 | |
| | | | | | | | |
| | | | | | | $ | 31,805,882 | |
| Electronics - 4.2% | | | | | | | | |
| Emerson Electric Co., 0.11%, due 4/03/14 (t) | | $ | 15,925,000 | | | $ | 15,923,394 | |
| | |
| Financial Institutions - 4.0% | | | | | | | | |
| General Electric Capital Corp., 0.12%, due 5/20/14 | | $ | 15,325,000 | | | $ | 15,320,913 | |
5
Portfolio of Investments (unaudited) – continued
| | | | | | | | |
| Issuer | | Shares/Par | | | Value ($) | |
| | | | | | | | |
| Commercial Paper (y) - continued | | | | | | | | |
| Food & Beverages - 10.2% | | | | | | | | |
| Anheuser-Busch InBev Worldwide, Inc., 0.18%, due 4/28/14 (t) | | $ | 10,019,000 | | | $ | 10,016,094 | |
| Anheuser-Busch InBev Worldwide, Inc., 0.18%, due 5/05/14 (t) | | | 1,689,000 | | | | 1,688,451 | |
| Anheuser-Busch InBev Worldwide, Inc., 0.21%, due 5/21/14 (t) | | | 3,681,000 | | | | 3,679,261 | |
| Coca-Cola Co., 0.16%, due 7/14/14 (t) | | | 6,592,000 | | | | 6,588,045 | |
| Coca-Cola Co., 0.19%, due 6/23/14 (t) | | | 1,225,000 | | | | 1,224,263 | |
| Pepsico Inc., 0.06%, due 4/07/14 (t) | | | 8,604,000 | | | | 8,603,469 | |
| Pepsico Inc., 0.07%, due 4/10/14 (t) | | | 6,866,000 | | | | 6,865,466 | |
| | | | | | | | |
| | | | | | | $ | 38,665,049 | |
| Major Banks - 8.2% | | | | | | | | |
| Bank of Nova Scotia, 0.165%, due 5/27/14 | | $ | 8,000,000 | | | $ | 7,996,810 | |
| Bank of Nova Scotia, 0.195%, due 6/25/14 | | | 1,014,000 | | | | 1,013,363 | |
| Wells Fargo & Co., 0.2%, due 5/02/14 | | | 815,000 | | | | 814,719 | |
| Wells Fargo & Co., 0.2%, due 6/03/14 | | | 7,000,000 | | | | 6,996,344 | |
| Wells Fargo & Co., 0.21%, due 8/13/14 | | | 7,507,000 | | | | 7,499,775 | |
| Westpac Banking Corp., 0.14%, due 3/25/14 (t) | | | 7,093,000 | | | | 7,092,338 | |
| | | | | | | | |
| | | | | | | $ | 31,413,349 | |
| Pharmaceuticals - 7.8% | | | | | | | | |
| Merck & Co., Inc., 0.05%, due 3/19/14 (t) | | $ | 15,321,000 | | | $ | 15,320,617 | |
| Sanofi, 0.09%, due 3/21/14 (t) | | | 14,258,000 | | | | 14,257,287 | |
| | | | | | | | |
| | | | | | | $ | 29,577,904 | |
| Total Commercial Paper, at Amortized Cost and Value | | | | | | $ | 188,474,674 | |
| |
| U.S. Government Agencies and Equivalents (y) - 25.6% | | | | | |
| Federal Home Loan Bank, 0.045%, due 4/09/14 | | $ | 512,000 | | | $ | 511,975 | |
| Federal Home Loan Bank, 0.11%, due 7/02/14 | | | 161,000 | | | | 160,939 | |
| Federal Home Loan Bank, 0.05%, due 3/12/14 | | | 2,281,000 | | | | 2,280,965 | |
| Federal Home Loan Bank, 0.025%, due 3/21/14 | | | 4,340,000 | | | | 4,339,940 | |
| Federal Home Loan Bank, 0.028%, due 3/21/14 | | | 10,737,000 | | | | 10,736,833 | |
| Federal Home Loan Bank, 0.1%, due 3/21/14 | | | 12,000,000 | | | | 11,999,333 | |
| Federal Home Loan Bank, 0.055%, due 4/02/14 | | | 7,518,000 | | | | 7,517,632 | |
| Federal Home Loan Bank, 0.09%, due 4/09/14 | | | 106,000 | | | | 105,990 | |
| Federal Home Loan Bank, 0.06%, due 4/23/14 | | | 4,775,000 | | | | 4,774,578 | |
| Federal Home Loan Bank, 0.08%, due 5/07/14 | | | 8,278,000 | | | | 8,276,768 | |
| Federal Home Loan Bank, 0.1%, due 5/28/14 | | | 100,000 | | | | 99,976 | |
| Federal Home Loan Bank, 0.02%, due 3/05/14 | | | 4,975,000 | | | | 4,974,989 | |
| U.S. Treasury Bill, 0.05%, due 4/17/14 | | | 15,000,000 | | | | 14,999,021 | |
| U.S. Treasury Bill, 0.06%, due 7/31/14 | | | 7,894,000 | | | | 7,892,000 | |
| U.S. Treasury Bill, 0.075%, due 5/01/14 | | | 16,629,000 | | | | 16,626,887 | |
| U.S. Treasury Bill, 0.07%, due 4/24/14 | | | 2,079,000 | | | | 2,078,782 | |
Total U.S. Government Agencies and Equivalents,
at Amortized Cost and Value | | | | | | $ | 97,376,608 | |
6
Portfolio of Investments (unaudited) – continued
| | | | | | | | |
| Floating Rate Demand Notes - 4.3% | | | | | | | | |
| Issuer | | Shares/Par | | | Value ($) | |
| | | | | | | | |
| East Baton Rouge, LA, Pollution Control Rev. (Exxon Mobil Corp.), 0.03%, due 3/03/14 | | $ | 9,700,000 | | | $ | 9,700,000 | |
| Lincoln County, WY, Pollution Control Rev. (Exxon Mobil Corp.), 0.03%, due 3/03/14 | | | 5,300,000 | | | | 5,300,000 | |
| Lincoln County, WY, Pollution Control Rev. (Exxon Mobil Corp.), “A”, 0.03%, due 3/03/14 | | | 1,300,000 | | | | 1,300,000 | |
| Total Floating Rate Demand Notes, at Cost and Value | | | | | | $ | 16,300,000 | |
| | |
| Repurchase Agreements - 2.7% | | | | | | | | |
| Goldman Sachs Repurchase Agreement, 0.04%, dated 2/28/14, due 3/03/14, total to be received $2,117,007 (secured by U.S. Treasury and Federal Agency obligations valued at $2,159,347 in a jointly traded account) | | $ | 2,117,000 | | | $ | 2,117,000 | |
| Merrill Lynch, Pierce, Fenner & Smith, Inc. Repurchase Agreement, 0.04%, dated 2/28/14, due 3/03/14, total to be received $8,178,027 (secured by U.S. Treasury and Federal Agency obligations valued at $8,341,578 in a jointly traded account) | | | 8,178,000 | | | | 8,178,000 | |
| Total Repurchase Agreements, at Cost and Value | | | | | | $ | 10,295,000 | |
| Total Investments, at Amortized Cost and Value | | | | | | $ | 381,679,282 | |
| | |
| Other Assets, Less Liabilities - (0.3)% | | | | | | | (1,101,670 | ) |
| Net Assets - 100.0% | | | | | | $ | 380,577,612 | |
| (t) | Security exempt from registration with the U.S. Securities and Exchange Commission under Section 4(2) of the Securities Act of 1933. |
| (y) | The rate shown represents an annualized yield at time of purchase. |
The following abbreviations are used in this report and are defined:
| PLC | | Public Limited Company |
See Notes to Financial Statements
7
Financial Statements
STATEMENT OF ASSETS AND LIABILITIES
At 2/28/14 (unaudited)
This statement represents your fund’s balance sheet, which details the assets and liabilities comprising the total value of the fund.
| | | | |
| Assets | | | | |
Investments, at amortized cost and value | | | $381,679,282 | |
Cash | | | 753 | |
Receivables for | | | | |
Fund shares sold | | | 744,209 | |
Interest | | | 22,043 | |
Receivable from investment adviser and distributor | | | 91,969 | |
Other assets | | | 2,553 | |
Total assets | | | $382,540,809 | |
| Liabilities | | | | |
Payable for fund shares reacquired | | | $1,668,551 | |
Payable to affiliates | | | | |
Shareholder servicing costs | | | 268,701 | |
Payable for independent Trustees’ compensation | | | 11,990 | |
Accrued expenses and other liabilities | | | 13,955 | |
Total liabilities | | | $1,963,197 | |
Net assets | | | $380,577,612 | |
| Net assets consist of | | | | |
Paid-in capital | | | $380,799,665 | |
Accumulated net realized gain (loss) on investments | | | (207,454 | ) |
Accumulated net investment loss | | | (14,599 | ) |
Net assets | | | $380,577,612 | |
Shares of beneficial interest outstanding | | | 380,807,675 | |
8
Statement of Assets and Liabilities (unaudited) – continued
| | | | | | | | | | | | |
| | | Net assets | | | Shares
outstanding | | | Net asset value
per share | |
Class A | | | $137,471,403 | | | | 137,542,584 | | | | $1.00 | |
Class B | | | 27,504,908 | | | | 27,551,999 | | | | 1.00 | |
Class C | | | 50,368,961 | | | | 50,398,747 | | | | 1.00 | |
Class R1 | | | 17,902,461 | | | | 17,912,101 | | | | 1.00 | |
Class R2 | | | 64,847,481 | | | | 64,884,582 | | | | 1.00 | |
Class R3 | | | 61,346,594 | | | | 61,377,524 | | | | 1.00 | |
Class R4 | | | 2,903,997 | | | | 2,905,712 | | | | 1.00 | |
Class 529A | | | 11,115,644 | | | | 11,117,205 | | | | 1.00 | |
Class 529B | | | 642,549 | | | | 642,864 | | | | 1.00 | |
Class 529C | | | 6,473,614 | | | | 6,474,357 | | | | 1.00 | |
A contingent deferred sales charge may be imposed on redemptions of Class A, Class B, Class C, Class 529B, and Class 529C shares. Redemption price per share was equal to the net asset value per share for Classes R1, R2, R3, R4, and 529A.
See Notes to Financial Statements
9
Financial Statements
STATEMENT OF OPERATIONS
Six months ended 2/28/14 (unaudited)
This statement describes how much your fund earned in investment income and accrued in expenses. It also describes any gains and/or losses generated by fund operations.
| | | | |
| Net investment income | | | | |
Interest income | | | $213,879 | |
Expenses | | | | |
Management fee | | | $805,399 | |
Distribution and service fees | | | 1,001,506 | |
Program manager fees | | | 9,126 | |
Shareholder servicing costs | | | 340,379 | |
Administrative services fee | | | 29,220 | |
Independent Trustees’ compensation | | | 5,029 | |
Custodian fee | | | 19,631 | |
Shareholder communications | | | 12,232 | |
Audit and tax fees | | | 17,235 | |
Legal fees | | | 3,610 | |
Miscellaneous | | | 68,337 | |
Total expenses | | | $2,311,704 | |
Fees paid indirectly | | | (7 | ) |
Reduction of expenses by investment adviser and distributor | | | (2,097,818 | ) |
Net expenses | | | $213,879 | |
Net investment income | | | $0 | |
Net realized gain (loss) on investments | | | $254 | |
Change in net assets from operations | | | $254 | |
See Notes to Financial Statements
10
Financial Statements
STATEMENTS OF CHANGES IN NET ASSETS
These statements describe the increases and/or decreases in net assets resulting from operations, any distributions, and any shareholder transactions.
| | | | | | | | |
| | | Six months ended
2/28/14 | | | Year ended
8/31/13 | |
| Change in net assets | | (unaudited) | | | | |
| From operations | | | | | | | | |
Net investment income | | | $0 | | | | $0 | |
Net realized gain (loss) on investments | | | 254 | | | | 0 | |
Change in net assets from operations | | | $254 | | | | $0 | |
Change in net assets from fund share transactions | | | $(32,556,133 | ) | | | $(2,037,038 | ) |
Total change in net assets | | | $(32,555,879 | ) | | | $(2,037,038 | ) |
| Net assets | | | | | | | | |
| At beginning of period | | | 413,133,491 | | | | 415,170,529 | |
At end of period (including accumulated net investment loss of $14,599 and $14,599, respectively) | | | $380,577,612 | | | | $413,133,491 | |
See Notes to Financial Statements
11
Financial Statements
FINANCIAL HIGHLIGHTS
The financial highlights table is intended to help you understand the fund’s financial performance for the semiannual period and the past 5 fiscal years. Certain information reflects financial results for a single fund share. The total returns in the table represent the rate by which an investor would have earned (or lost) on an investment in the fund share class (assuming reinvestment of all distributions) held for the entire period.
| | | | | | | | | | | | | | | | | | | | | | | | |
| | | Six months ended 2/28/14 | | | Years ended 8/31 | |
| Class A | | | 2013 | | | 2012 | | | 2011 | | | 2010 | | | 2009 | |
| | | (unaudited) | | | | | | | | | | | | | | | | |
Net asset value, beginning of
period | | | $1.00 | | | | $1.00 | | | | $1.00 | | | | $1.00 | | | | $1.00 | | | | $1.00 | |
| Income (loss) from investment operations | | | | | | | | | | | | | | | | | |
Net investment income (d) | | | $0.00 | | | | $0.00 | | | | $0.00 | | | | $0.00 | (w) | | | $0.00 | (w) | | | $0.00 | (w) |
Net realized and unrealized
gain (loss) on investments | | | 0.00 | (w) | | | — | | | | — | | | | (0.00 | )(w) | | | 0.00 | (w) | | | (0.00 | )(w) |
Total from investment operations | | | $0.00 | (w) | | | $0.00 | | | | $0.00 | | | | $0.00 | (w) | | | $0.00 | (w) | | | $0.00 | (w) |
| Less distributions declared to shareholders | | | | | | | | | | | | | | | | | |
From net investment income | | | $— | | | | $— | | | | $— | | | | $(0.00 | )(w) | | | $(0.00 | )(w) | | | $(0.00 | )(w) |
From tax return of capital | | | — | | | | — | | | | — | | | | (0.00 | )(w) | | | (0.00 | )(w) | | | — | |
Total distributions declared to
shareholders | | | $— | | | | $— | | | | $— | | | | $(0.00 | )(w) | | | $(0.00 | )(w) | | | $(0.00 | )(w) |
Net asset value, end of period | | | $1.00 | | | | $1.00 | | | | $1.00 | | | | $1.00 | | | | $1.00 | | | | $1.00 | |
Total return (%) (r)(t) | | | 0.00 | (n) | | | 0.00 | | | | 0.00 | | | | 0.00 | (w) | | | 0.00 | (w) | | | 0.31 | |
Ratios (%) (to average net assets)
and Supplemental data: | | | | | | | | | | | | | | | | | | | | | |
Expenses before expense
reductions (f) | | | 0.90 | (a) | | | 0.93 | | | | 0.93 | | | | 0.94 | | | | 0.85 | | | | 0.72 | |
Expenses after expense
reductions (f) | | | 0.11 | (a) | | | 0.15 | | | | 0.13 | | | | 0.20 | | | | 0.27 | | | | 0.39 | |
Net investment income | | | 0.00 | (a) | | | 0.00 | | | | 0.00 | | | | 0.00 | (w) | | | 0.00 | (w) | | | 0.33 | |
Net assets at end of period
(000 omitted) | | | $137,471 | | | | $145,062 | | | | $126,283 | | | | $153,634 | | | | $141,832 | | | | $173,135 | |
See Notes to Financial Statements
12
Financial Highlights – continued
| | | | | | | | | | | | | | | | | | | | | | | | |
| | | Six months
ended
2/28/14 | | | Years ended 8/31 | |
| Class B | | | 2013 | | | 2012 | | | 2011 | | | 2010 | | | 2009 | |
| | | (unaudited) | | | | | | | | | | | | | | | | |
Net asset value, beginning of
period | | | $1.00 | | | | $1.00 | | | | $1.00 | | | | $1.00 | | | | $1.00 | | | | $1.00 | |
| Income (loss) from investment operations | | | | | | | | | | | | | | | | | |
Net investment income (d) | | | $0.00 | | | | $0.00 | | | | $0.00 | | | | $0.00 | (w) | | | $0.00 | (w) | | | $0.00 | (w) |
Net realized and unrealized
gain (loss) on investments | | | 0.00 | (w) | | | — | | | | — | | | | (0.00 | )(w) | | | 0.00 | (w) | | | (0.00 | )(w) |
Total from investment operations | | | $0.00 | (w) | | | $0.00 | | | | $0.00 | | | | $(0.00 | )(w) | | | $0.00 | (w) | | | $0.00 | |
| Less distributions declared to shareholders | | | | | | | | | | | | | | | | | |
From net investment income | | | $— | | | | $— | | | | $— | | | | $— | | | | $(0.00 | )(w) | | | $(0.00 | )(w) |
From tax return of capital | | | — | | | | — | | | | — | | | | — | | | | (0.00 | )(w) | | | — | |
Total distributions declared to
shareholders | | | $— | | | | $— | | | | $— | | | | $— | | | | $(0.00 | )(w) | | | $(0.00 | )(w) |
Net asset value, end of period | | | $1.00 | | | | $1.00 | | | | $1.00 | | | | $1.00 | | | | $1.00 | | | | $1.00 | |
Total return (%) (r)(t) | | | 0.00 | (n) | | | 0.00 | | | | 0.00 | | | | 0.00 | (w) | | | 0.00 | (w) | | | 0.10 | |
Ratios (%) (to average net assets)
and Supplemental data: | | | | | | | | | | | | | | | | | | | | | |
Expenses before expense
reductions (f) | | | 1.65 | (a) | | | 1.68 | | | | 1.68 | | | | 1.69 | | | | 1.69 | | | | 1.72 | |
Expenses after expense
reductions (f) | | | 0.11 | (a) | | | 0.15 | | | | 0.12 | | | | 0.20 | | | | 0.27 | | | | 0.60 | |
Net investment income | | | 0.00 | (a) | | | 0.00 | | | | 0.00 | | | | 0.00 | (w) | | | 0.00 | (w) | | | 0.08 | |
Net assets at end of period
(000 omitted) | | | $27,505 | | | | $30,833 | | | | $35,098 | | | | $50,379 | | | | $66,601 | | | | $104,696 | |
See Notes to Financial Statements
13
Financial Highlights – continued
| | | | | | | | | | | | | | | | | | | | | | | | |
| | | Six months
ended
2/28/14 | | | Years ended 8/31 | |
| Class C | | | 2013 | | | 2012 | | | 2011 | | | 2010 | | | 2009 | |
| | | (unaudited) | | | | | | | | | | | | | | | | |
Net asset value, beginning of
period | | | $1.00 | | | | $1.00 | | | | $1.00 | | | | $1.00 | | | | $1.00 | | | | $1.00 | |
| Income (loss) from investment operations | | | | | | | | | | | | | | | | | |
Net investment income (d) | | | $0.00 | | | | $0.00 | | | | $0.00 | | | | $0.00 | | | | $0.00 | (w) | | | $0.00 | (w) |
Net realized and unrealized
gain (loss) on investments | | | 0.00 | (w) | | | — | | | | — | | | | (0.00 | )(w) | | | 0.00 | (w) | | | (0.00 | )(w) |
Total from investment operations | | | $0.00 | (w) | | | $0.00 | | | | $0.00 | | | | $(0.00 | )(w) | | | $0.00 | (w) | | | $0.00 | (w) |
| Less distributions declared to shareholders | | | | | | | | | | | | | | | | | |
From net investment income | | | $— | | | | $— | | | | $— | | | | $— | | | | $(0.00 | )(w) | | | $(0.00 | )(w) |
From tax return of capital | | | — | | | | — | | | | — | | | | — | | | | (0.00 | )(w) | | | — | |
Total distributions declared to
shareholders | | | $— | | | | $— | | | | $— | | | | $— | | | | $— | | | | $(0.00 | )(w) |
Net asset value, end of period | | | $1.00 | | | | $1.00 | | | | $1.00 | | | | $1.00 | | | | $1.00 | | | | $1.00 | |
Total return (%) (r)(t) | | | 0.00 | (n) | | | 0.00 | | | | 0.00 | | | | 0.00 | (w) | | | 0.00 | (w) | | | 0.10 | |
Ratios (%) (to average net assets)
and Supplemental data: | | | | | | | | | | | | | | | | | | | | | |
Expenses before expense
reductions (f) | | | 1.65 | (a) | | | 1.68 | | | | 1.68 | | | | 1.69 | | | | 1.69 | | | | 1.72 | |
Expenses after expense
reductions (f) | | | 0.11 | (a) | | | 0.15 | | | | 0.13 | | | | 0.20 | | | | 0.27 | | | | 0.60 | |
Net investment income | | | 0.00 | (a) | | | 0.00 | | | | 0.00 | | | | 0.00 | | | | 0.00 | (w) | | | 0.08 | |
Net assets at end of period
(000 omitted) | | | $50,369 | | | | $58,363 | | | | $49,851 | | | | $61,943 | | | | $50,196 | | | | $70,005 | |
See Notes to Financial Statements
14
Financial Highlights – continued
| | | | | | | | | | | | | | | | | | | | | | | | |
| | | Six months
ended
2/28/14 | | | Years ended 8/31 | |
| Class R1 | | | 2013 | | | 2012 | | | 2011 | | | 2010 | | | 2009 | |
| | | (unaudited) | | | | | | | | | | | | | | | | |
Net asset value, beginning of
period | | | $1.00 | | | | $1.00 | | | | $1.00 | | | | $1.00 | | | | $1.00 | | | | $1.00 | |
| Income (loss) from investment operations | | | | | | | | | | | | | | | | | |
Net investment income (d) | | | $0.00 | | | | $0.00 | | | | $0.00 | | | | $0.00 | | | | $0.00 | (w) | | | $0.00 | (w) |
Net realized and unrealized
gain (loss) on investments | | | 0.00 | (w) | | | — | | | | — | | | | (0.00 | )(w) | | | 0.00 | (w) | | | (0.00 | )(w) |
Total from investment operations | | | $0.00 | (w) | | | $0.00 | | | | $0.00 | | | | $(0.00 | )(w) | | | $0.00 | (w) | | | $0.00 | (w) |
| Less distributions declared to shareholders | | | | | | | | | | | | | | | | | |
From net investment income | | | $— | | | | $— | | | | $— | | | | $— | | | | $(0.00 | )(w) | | | $(0.00 | )(w) |
From tax return of capital | | | — | | | | — | | | | — | | | | — | | | | (0.00 | )(w) | | | — | |
Total distributions declared to
shareholders | | | $— | | | | $— | | | | $— | | | | $— | | | | $(0.00 | )(w) | | | $(0.00 | )(w) |
Net asset value, end of period | | | $1.00 | | | | $1.00 | | | | $1.00 | | | | $1.00 | | | | $1.00 | | | | $1.00 | |
Total return (%) (r) | | | 0.00 | (n) | | | 0.00 | | | | 0.00 | | | | 0.00 | (w) | | | 0.00 | (w) | | | 0.10 | |
Ratios (%) (to average net assets)
and Supplemental data: | | | | | | | | | | | | | | | | | | | | | |
Expenses before expense
reductions (f) | | | 1.65 | (a) | | | 1.68 | | | | 1.68 | | | | 1.69 | | | | 1.69 | | | | 1.72 | |
Expenses after expense
reductions (f) | | | 0.11 | (a) | | | 0.15 | | | | 0.13 | | | | 0.20 | | | | 0.27 | | | | 0.58 | |
Net investment income | | | 0.00 | (a) | | | 0.00 | | | | 0.00 | | | | 0.00 | | | | 0.00 | (w) | | | 0.09 | |
Net assets at end of period
(000 omitted) | | | $17,902 | | | | $21,080 | | | | $24,361 | | | | $28,705 | | | | $30,233 | | | | $29,457 | |
See Notes to Financial Statements
15
Financial Highlights – continued
| | | | | | | | | | | | | | | | | | | | | | | | |
| | | Six months
ended
2/28/14 | | | Years ended 8/31 | |
| Class R2 | | | 2013 | | | 2012 | | | 2011 | | | 2010 | | | 2009 | |
| | | (unaudited) | | | | | | | | | | | | | | | | |
Net asset value, beginning of
period | | | $1.00 | | | | $1.00 | | | | $1.00 | | | | $1.00 | | | | $1.00 | | | | $1.00 | |
| Income (loss) from investment operations | | | | | | | | | | | | | | | | | |
Net investment income (d) | | | $0.00 | | | | $0.00 | | | | $0.00 | | | | $0.00 | | | | $0.00 | (w) | | | $0.00 | (w) |
Net realized and unrealized
gain (loss) on investments | | | 0.00 | (w) | | | — | | | | — | | | | (0.00 | )(w) | | | 0.00 | (w) | | | (0.00 | )(w) |
Total from investment operations | | | $0.00 | (w) | | | $0.00 | | | | $0.00 | | | | $(0.00 | )(w) | | | $0.00 | (w) | | | $(0.00 | )(w) |
| Less distributions declared to shareholders | | | | | | | | | | | | | | | | | |
From net investment income | | | $— | | | | $— | | | | $— | | | | $— | | | | $(0.00 | )(w) | | | $(0.00 | )(w) |
From tax return of capital | | | — | | | | — | | | | — | | | | — | | | | (0.00 | )(w) | | | — | |
Total distributions declared to
shareholders | | | $— | | | | $— | | | | $— | | | | $— | | | | $(0.00 | )(w) | | | $(0.00 | )(w) |
Net asset value, end of period | | | $1.00 | | | | $1.00 | | | | $1.00 | | | | $1.00 | | | | $1.00 | | | | $1.00 | |
Total return (%) (r) | | | 0.00 | (n) | | | 0.00 | | | | 0.00 | | | | 0.00 | (w) | | | 0.00 | (w) | | | 0.17 | |
Ratios (%) (to average net assets)
and Supplemental data: | | | | | | | | | | | | | | | | | | | | | |
Expenses before expense
reductions (f) | | | 1.15 | (a) | | | 1.18 | | | | 1.18 | | | | 1.19 | | | | 1.19 | | | | 1.22 | |
Expenses after expense
reductions (f) | | | 0.11 | (a) | | | 0.15 | | | | 0.13 | | | | 0.20 | | | | 0.27 | | | | 0.51 | |
Net investment income | | | 0.00 | (a) | | | 0.00 | | | | 0.00 | | | | 0.00 | | | | 0.00 | (w) | | | 0.15 | |
Net assets at end of period
(000 omitted) | | | $64,847 | | | | $74,406 | | | | $83,723 | | | | $104,130 | | | | $109,362 | | | | $120,476 | |
See Notes to Financial Statements
16
Financial Highlights – continued
| | | | | | | | | | | | | | | | | | | | | | | | |
| | | Six months
ended
2/28/14 | | | Years ended 8/31 | |
| Class R3 | | | 2013 | | | 2012 | | | 2011 | | | 2010 | | | 2009 | |
| | | (unaudited) | | | | | | | | | | | | | | | | |
Net asset value, beginning of
period | | | $1.00 | | | | $1.00 | | | | $1.00 | | | | $1.00 | | | | $1.00 | | | | $1.00 | |
| Income (loss) from investment operations | | | | | | | | | | | | | | | | | |
Net investment income (d) | | | $0.00 | | | | $0.00 | | | | $0.00 | | | | $0.00 | | | | $0.00 | (w) | | | $0.00 | (w) |
Net realized and unrealized
gain (loss) on investments | | | 0.00 | (w) | | | — | | | | — | | | | (0.00 | )(w) | | | 0.00 | (w) | | | (0.00 | )(w) |
Total from investment operations | | | $0.00 | (w) | | | $0.00 | | | | $0.00 | | | | $(0.00 | )(w) | | | $0.00 | (w) | | | $0.00 | (w) |
| Less distributions declared to shareholders | | | | | | | | | | | | | | | | | |
From net investment income | | | $— | | | | $— | | | | $— | | | | $— | | | | $(0.00 | )(w) | | | $(0.00 | )(w) |
From tax return of capital | | | — | | | | — | | | | — | | | | — | | | | (0.00 | )(w) | | | — | |
Total distributions declared to
shareholders | | | $— | | | | $— | | | | $— | | | | $— | | | | $(0.00 | )(w) | | | $(0.00 | )(w) |
Net asset value, end of period | | | $1.00 | | | | $1.00 | | | | $1.00 | | | | $1.00 | | | | $1.00 | | | | $1.00 | |
Total return (%) (r) | | | 0.00 | (n) | | | 0.00 | | | | 0.00 | | | | 0.00 | (w) | | | 0.00 | (w) | | | 0.23 | |
Ratios (%) (to average net assets)
and Supplemental data: | | | | | | | | | | | | | | | | | | | | | |
Expenses before expense
reductions (f) | | | 0.90 | (a) | | | 0.93 | | | | 0.93 | | | | 0.94 | | | | 0.94 | | | | 0.97 | |
Expenses after expense
reductions (f) | | | 0.11 | (a) | | | 0.15 | | | | 0.13 | | | | 0.20 | | | | 0.27 | | | | 0.45 | |
Net investment income | | | 0.00 | (a) | | | 0.00 | | | | 0.00 | | | | 0.00 | | | | 0.00 | (w) | | | 0.20 | |
Net assets at end of period
(000 omitted) | | | $61,347 | | | | $64,925 | | | | $79,029 | | | | $85,602 | | | | $90,331 | | | | $104,062 | |
See Notes to Financial Statements
17
Financial Highlights – continued
| | | | | | | | | | | | | | | | | | | | | | | | |
| | | Six months
ended
2/28/14 | | | Years ended 8/31 | |
| Class R4 | | | 2013 | | | 2012 | | | 2011 | | | 2010 | | | 2009 | |
| | | (unaudited) | | | | | | | | | | | | | | | | |
Net asset value, beginning of
period | | | $1.00 | | | | $1.00 | | | | $1.00 | | | | $1.00 | | | | $1.00 | | | | $1.00 | |
| Income (loss) from investment operations | | | | | | | | | | | | | | | | | |
Net investment income (d) | | | $0.00 | | | | $0.00 | | | | $0.00 | | | | $0.00 | (w) | | | $0.00 | (w) | | | $0.00 | (w) |
Net realized and unrealized
gain (loss) on investments | | | 0.00 | (w) | | | — | | | | — | | | | (0.00 | )(w) | | | 0.00 | (w) | | | (0.00 | )(w) |
Total from investment operations | | | $0.00 | (w) | | | $0.00 | | | | $0.00 | | | | $0.00 | (w) | | | $0.00 | (w) | | | $0.00 | (w) |
| Less distributions declared to shareholders | | | | | | | | | | | | | | | | | |
From net investment income | | | $— | | | | $— | | | | $— | | | | $(0.00 | )(w) | | | $(0.00 | )(w) | | | $(0.00 | )(w) |
From tax return of capital | | | — | | | | — | | | | — | | | | (0.00 | )(w) | | | (0.00 | )(w) | | | — | |
Total distributions declared to
shareholders | | | $— | | | | $— | | | | $— | | | | $(0.00 | )(w) | | | $(0.00 | )(w) | | | $(0.00 | )(w) |
Net asset value, end of period | | | $1.00 | | | | $1.00 | | | | $1.00 | | | | $1.00 | | | | $1.00 | | | | $1.00 | |
Total return (%) (r) | | | 0.00 | (n) | | | 0.00 | | | | 0.00 | | | | 0.00 | (w) | | | 0.00 | (w) | | | 0.31 | |
Ratios (%) (to average net assets)
and Supplemental data: | | | | | | | | | | | | | | | | | | | | | |
Expenses before expense
reductions (f) | | | 0.64 | (a) | | | 0.68 | | | | 0.69 | | | | 0.69 | | | | 0.68 | | | | 0.72 | |
Expenses after expense
reductions (f) | | | 0.11 | (a) | | | 0.15 | | | | 0.12 | | | | 0.20 | | | | 0.27 | | | | 0.38 | |
Net investment income | | | 0.00 | (a) | | | 0.00 | | | | 0.00 | | | | 0.00 | (w) | | | 0.00 | (w) | | | 0.23 | |
Net assets at end of period
(000 omitted) | | | $2,904 | | | | $820 | | | | $810 | | | | $5,743 | | | | $6,172 | | | | $5,697 | |
See Notes to Financial Statements
18
Financial Highlights �� continued
| | | | | | | | | | | | | | | | | | | | | | | | |
| | | Six months
ended
2/28/14 | | | Years ended 8/31 | |
| Class 529A | | | 2013 | | | 2012 | | | 2011 | | | 2010 | | | 2009 | |
| | | (unaudited) | | | | | | | | | | | | | | | | |
Net asset value, beginning of
period | | | $1.00 | | | | $1.00 | | | | $1.00 | | | | $1.00 | | | | $1.00 | | | | $1.00 | |
| Income (loss) from investment operations | | | | | | | | | | | | | | | | | |
Net investment income (d) | | | $0.00 | | | | $0.00 | | | | $0.00 | | | | $0.00 | | | | $0.00 | (w) | | | $0.00 | (w) |
Net realized and unrealized
gain (loss) on investments | | | 0.00 | (w) | | | — | | | | — | | | | (0.00 | )(w) | | | 0.00 | (w) | | | (0.00 | )(w) |
Total from investment operations | | | $0.00 | (w) | | | $0.00 | | | | $0.00 | | | | $(0.00 | )(w) | | | $0.00 | (w) | | | $0.00 | (w) |
| Less distributions declared to shareholders | | | | | | | | | | | | | | | | | |
From net investment income | | | $— | | | | $— | | | | $— | | | | $— | | | | $(0.00 | )(w) | | | $(0.00 | )(w) |
From tax return of capital | | | — | | | | — | | | | — | | | | — | | | | (0.00 | )(w) | | | — | |
Total distributions declared to
shareholders | | | $— | | | | $— | | | | $— | | | | $— | | | | $(0.00 | )(w) | | | $(0.00 | )(w) |
Net asset value, end of period | | | $1.00 | | | | $1.00 | | | | $1.00 | | | | $1.00 | | | | $1.00 | | | | $1.00 | |
Total return (%) (r) | | | 0.00 | (n) | | | 0.00 | | | | 0.00 | | | | 0.00 | (w) | | | 0.00 | (w) | | | 0.28 | |
Ratios (%) (to average net assets)
and Supplemental data: | | | | | | | | | | | | | | | | | |
Expenses before expense
reductions (f) | | | 1.00 | (a) | | | 1.03 | | | | 1.03 | | | | 1.04 | | | | 1.03 | | | | 1.12 | |
Expenses after expense
reductions (f) | | | 0.11 | (a) | | | 0.15 | | | | 0.13 | | | | 0.20 | | | | 0.27 | | | | 0.40 | |
Net investment income | | | 0.00 | (a) | | | 0.00 | | | | 0.00 | | | | 0.00 | | | | 0.00 | (w) | | | 0.19 | |
Net assets at end of period
(000 omitted) | | | $11,116 | | | | $10,897 | | | | $10,330 | | | | $9,710 | | | | $9,919 | | | | $6,926 | |
See Notes to Financial Statements
19
Financial Highlights – continued
| | | | | | | | | | | | | | | | | | | | | | | | |
| | | Six months
ended
2/28/14 | | | Years ended 8/31 | |
| Class 529B | | | 2013 | | | 2012 | | | 2011 | | | 2010 | | | 2009 | |
| | | (unaudited) | | | | | | | | | | | | | | | | |
Net asset value, beginning of
period | | | $1.00 | | | | $1.00 | | | | $1.00 | | | | $1.00 | | | | $1.00 | | | | $1.00 | |
| Income (loss) from investment operations | | | | | | | | | | | | | | | | | |
Net investment income (d) | | | $0.00 | | | | $0.00 | | | | $0.00 | | | | $0.00 | | | | $0.00 | (w) | | | $0.00 | (w) |
Net realized and unrealized
gain (loss) on investments | | | 0.00 | (w) | | | — | | | | — | | | | (0.00 | )(w) | | | 0.00 | (w) | | | (0.00 | )(w) |
Total from investment operations | | | $0.00 | (w) | | | $0.00 | | | | $0.00 | | | | $(0.00 | )(w) | | | $0.00 | (w) | | | $0.00 | (w) |
| Less distributions declared to shareholders | | | | | | | | | | | | | | | | | | | | | |
From net investment income | | | $— | | | | $— | | | | $— | | | | $— | | | | $(0.00 | )(w) | | | $(0.00 | )(w) |
From tax return of capital | | | — | | | | — | | | | — | | | | — | | | | (0.00 | )(w) | | | — | |
Total distributions declared to
shareholders | | | $— | | | | $— | | | | $— | | | | $— | | | | $(0.00 | )(w) | | | $(0.00 | )(w) |
Net asset value, end of period | | | $1.00 | | | | $1.00 | | | | $1.00 | | | | $1.00 | | | | $1.00 | | | | $1.00 | |
Total return (%) (r)(t) | | | 0.00 | (n) | | | 0.00 | | | | 0.00 | | | | 0.00 | (w) | | | 0.00 | (w) | | | 0.08 | |
Ratios (%) (to average net assets)
and Supplemental data: | | | | | | | | | | | | | | | | | | | | | |
Expenses before expense
reductions (f) | | | 1.75 | (a) | | | 1.78 | | | | 1.78 | | | | 1.79 | | | | 1.79 | | | | 1.83 | |
Expenses after expense
reductions (f) | | | 0.11 | (a) | | | 0.15 | | | | 0.12 | | | | 0.20 | | | | 0.27 | | | | 0.51 | |
Net investment income | | | 0.00 | (a) | | | 0.00 | | | | 0.00 | | | | 0.00 | | | | 0.00 | (w) | | | 0.04 | |
Net assets at end of period
(000 omitted) | | | $643 | | | | $676 | | | | $665 | | | | $1,073 | | | | $1,613 | | | | $1,942 | |
See Notes to Financial Statements
20
Financial Highlights – continued
| | | | | | | | | | | | | | | | | | | | | | | | |
| | | Six months
ended
2/28/14 | | | Years ended 8/31 | |
| Class 529C | | | 2013 | | | 2012 | | | 2011 | | | 2010 | | | 2009 | |
| | | (unaudited) | | | | | | | | | | | | | | | | |
Net asset value, beginning of
period | | | $1.00 | | | | $1.00 | | | | $1.00 | | | | $1.00 | | | | $1.00 | | | | $1.00 | |
| Income (loss) from investment operations | | | | | | | | | | | | | | | | | |
Net investment income (d) | | | $0.00 | | | | $0.00 | | | | $0.00 | | | | $0.00 | | | | $0.00 | (w) | | | $0.00 | (w) |
Net realized and unrealized
gain (loss) on investments | | | 0.00 | (w) | | | — | | | | — | | | | (0.00 | )(w) | | | 0.00 | (w) | | | (0.00 | )(w) |
Total from investment operations | | | $0.00 | (w) | | | $0.00 | | | | $0.00 | | | | $(0.00 | )(w) | | | $0.00 | (w) | | | $0.00 | (w) |
| Less distributions declared to shareholders | | | | | | | | | | | | | | | | | |
From net investment income | | | $— | | | | $— | | | | $— | | | | $— | | | | $(0.00 | )(w) | | | $(0.00 | )(w) |
From tax return of capital | | | — | | | | — | | | | — | | | | — | | | | (0.00 | )(w) | | | — | |
Total distributions declared to
shareholders | | | $— | | | | $— | | | | $— | | | | $— | | | | $(0.00 | )(w) | | | $(0.00 | )(w) |
Net asset value, end of period | | | $1.00 | | | | $1.00 | | | | $1.00 | | | | $1.00 | | | | $1.00 | | | | $1.00 | |
Total return (%) (r)(t) | | | 0.00 | (n) | | | 0.00 | | | | 0.00 | | | | 0.00 | (w) | | | 0.00 | (w) | | | 0.08 | |
Ratios (%) (to average net assets)
and Supplemental data: | | | | | | | | | | | | | | | | | | | | | |
Expenses before expense
reductions (f) | | | 1.75 | (a) | | | 1.78 | | | | 1.78 | | | | 1.79 | | | | 1.78 | | | | 1.83 | |
Expenses after expense
reductions (f) | | | 0.11 | (a) | | | 0.15 | | | | 0.13 | | | | 0.20 | | | | 0.27 | | | | 0.52 | |
Net investment income | | | 0.00 | (a) | | | 0.00 | | | | 0.00 | | | | 0.00 | | | | 0.00 | (w) | | | 0.04 | |
Net assets at end of period
(000 omitted) | | | $6,474 | | | | $6,072 | | | | $5,020 | | | | $5,525 | | | | $6,224 | | | | $4,391 | |
| (d) | Per share data is based on average shares outstanding. |
| (f) | Ratios do not reflect reductions from fees paid indirectly, if applicable. |
| (r) | Certain expenses have been reduced without which performance would have been lower. |
| (t) | Total returns do not include any applicable sales charges. |
| (w) | Per share amount was less than $0.01 and total return or ratio was less than 0.01%, as applicable. |
See Notes to Financial Statements
21
NOTES TO FINANCIAL STATEMENTS
(unaudited)
(1) Business and Organization
MFS Cash Reserve Fund (the fund) is a diversified series of MFS Series Trust I (the trust). The trust is organized as a Massachusetts business trust and is registered under the Investment Company Act of 1940, as amended, as an open-end management investment company.
(2) Significant Accounting Policies
General – The preparation of financial statements in conformity with U.S. generally accepted accounting principles requires management to make estimates and assumptions that affect the reported amounts of assets and liabilities, and disclosure of contingent assets and liabilities at the date of the financial statements and the reported amounts of increases and decreases in net assets from operations during the reporting period. Actual results could differ from those estimates. In the preparation of these financial statements, management has evaluated subsequent events occurring after the date of the fund’s Statement of Assets and Liabilities through the date that the financial statements were issued.
In this reporting period, the fund adopted the disclosure provisions of the Financial Accounting Standards Board (FASB) Accounting Standards Update 2011-11 (“ASU 2011-11”), Balance Sheet (Topic 210) – Disclosures about Offsetting Assets and Liabilities along with the related scope clarification provisions of FASB Accounting Standards Update 2013-01 (“ASU 2013-01”) entitled Balance Sheet (Topic 210) – Clarifying the Scope of Disclosures about Offsetting Assets and Liabilities. ASU 2011-11 is intended to enhance disclosures on the offsetting of financial assets and liabilities by requiring entities to disclose both gross and net information about financial instruments and transactions that are either offset in the statement of financial position or subject to a an enforceable Master Netting Agreement or similar arrangement. ASU 2013-01 limits the scope of ASU 2011-11’s disclosure requirements on offsetting to financial assets and financial liabilities related to derivatives, repurchase and reverse repurchase agreements, and securities lending and securities borrowing transactions. The disclosures required by ASU 2011-11, to the extent applicable to the fund, have been included in the fund’s Significant Accounting Policies note under the captions for each of the fund’s in-scope financial instruments and transactions.
In June 2013, FASB issued Accounting Standards Update 2013-08 (“ASU 2013-08”) Financial Services – Investment Companies (Topic 946) – Amendments to the Scope, Measurement, and Disclosure Requirements which is effective for interim and annual reporting periods in fiscal years that begin after December 15, 2013. ASU 2013-08 sets forth a methodology for determining whether an entity should be characterized as an investment company and prescribes fair value accounting for an investment company’s non-controlling ownership interest in another investment company. FASB has determined that a fund registered under the Investment Company Act of 1940 automatically meets ASU 2013-08’s criteria for an investment company. Although still evaluating the potential impacts of ASU 2013-08 to the fund, management expects that the impact of the fund’s adoption will be limited to additional financial statement disclosures.
22
Notes to Financial Statements (unaudited) – continued
Investment Valuations – Pursuant to procedures approved by the Board of Trustees, investments held by the fund are generally valued at amortized cost, which approximates market value. Amortized cost involves valuing an instrument at its cost as adjusted for amortization of premium or accretion of discount rather than its current market value. The amortized cost value of an instrument can be different from the market value of an instrument.
Various inputs are used in determining the value of the fund’s assets or liabilities. These inputs are categorized into three broad levels. In certain cases, the inputs used to measure fair value may fall into different levels of the fair value hierarchy. In such cases, an investment’s level within the fair value hierarchy is based on the lowest level of input that is significant to the fair value measurement. The fund’s assessment of the significance of a particular input to the fair value measurement in its entirety requires judgment, and considers factors specific to the investment. Level 1 includes unadjusted quoted prices in active markets for identical assets or liabilities. Level 2 includes other significant observable market-based inputs (including quoted prices for similar securities, interest rates, prepayment speed, and credit risk). Level 3 includes unobservable inputs, which may include the adviser’s own assumptions in determining the fair value of investments. The following is a summary of the levels used as of February 28, 2014 in valuing the fund’s assets or liabilities:
| | | | | | | | | | | | | | | | |
| Investments at Value | | Level 1 | | | Level 2 | | | Level 3 | | | Total | |
| Short Term Securities | | | $— | | | | $381,679,282 | | | | $— | | | | $381,679,282 | |
For further information regarding security characteristics, see the Portfolio of Investments.
Repurchase Agreements – The fund enters into repurchase agreements under the terms of Master Repurchase Agreements with approved counterparties. Each repurchase agreement is recorded at cost. The fund requires that the securities collateral in a repurchase transaction be transferred to a custodian. The fund monitors, on a daily basis, the value of the collateral to ensure that its value, including accrued interest, is greater than amounts owed to the fund under each such repurchase agreement. Upon an event of default under a Master Repurchase Agreement, the non-defaulting party may close out all transactions traded under such agreement and net amounts owed under each transaction to one net amount payable by one party to the other. Absent an event of default, the Master Repurchase Agreement does not result in an offset of reported amounts of assets and liabilities in the Statement of Assets and Liabilities across transactions between the fund and the applicable counterparty. The fund and other funds managed by MFS may utilize a joint trading account for the purpose of entering into one or more repurchase agreements. At period end, the fund had investments in repurchase agreements with a gross value of $10,295,000 included in “Investments” in the Statement of Assets and Liabilities. The value of the related collateral exceeded the value of the repurchase agreements at period end.
Indemnifications – Under the fund’s organizational documents, its officers and Trustees may be indemnified against certain liabilities and expenses arising out of the performance of their duties to the fund. Additionally, in the normal course of business, the fund enters into agreements with service providers that may contain
23
Notes to Financial Statements (unaudited) – continued
indemnification clauses. The fund’s maximum exposure under these agreements is unknown as this would involve future claims that may be made against the fund that have not yet occurred.
Investment Transactions and Income – Investment transactions are recorded on the trade date. Interest income is recorded on the accrual basis. All premium and discount is amortized or accreted for financial statement purposes in accordance with U.S. generally accepted accounting principles.
Fees Paid Indirectly – The fund’s custody fee may be reduced according to an arrangement that measures the value of cash deposited with the custodian by the fund. This amount, for the six months ended February 28, 2014, is shown as a reduction of total expenses in the Statement of Operations.
Tax Matters and Distributions – The fund intends to qualify as a regulated investment company, as defined under Subchapter M of the Internal Revenue Code, and to distribute all of its taxable income, including realized capital gains. As a result, no provision for federal income tax is required. The fund’s federal tax returns, when filed, will remain subject to examination by the Internal Revenue Service for a three year period. Management has analyzed the fund’s tax positions taken on federal and state tax returns for all open tax years and does not believe that there are any uncertain tax positions that require recognition of a tax liability.
Distributions to shareholders are recorded on the ex-dividend date. Income and capital gain distributions are determined in accordance with income tax regulations, which may differ from U.S. generally accepted accounting principles. Certain capital accounts in the financial statements are periodically adjusted for permanent differences in order to reflect their tax character. These adjustments have no impact on net assets or net asset value per share. Temporary differences which arise from recognizing certain items of income, expense, gain or loss in different periods for financial statement and tax purposes will reverse at some time in the future. Distributions in excess of net investment income or net realized gains are temporary overdistributions for financial statement purposes resulting from differences in the recognition or classification of income or distributions for financial statement and tax purposes.
Book/tax differences primarily relate to the timing of recognition of certain expenses.
The fund declared no distributions for the current period or for the year ended August 31, 2013.
The federal tax cost and the tax basis components of distributable earnings were as follows:
| | | | |
| As of 2/28/14 | | | |
| Cost of investments | | | $381,679,282 | |
| |
| As of 8/31/13 | | | |
| Capital loss carryforwards | | | (207,708 | ) |
| Late year ordinary loss deferral | | | (1,338 | ) |
| Other temporary differences | | | (13,261 | ) |
The aggregate cost above includes prior fiscal year end tax adjustments, if applicable.
24
Notes to Financial Statements (unaudited) – continued
Under the Regulated Investment Company Modernization Act of 2010 (the “Act”), net capital losses recognized for fund fiscal years beginning after August 31, 2011 may be carried forward indefinitely, and their character is retained as short-term and/or long-term losses (“post-enactment losses”). Previously, net capital losses were carried forward for eight years and treated as short-term losses (“pre-enactment losses”). As a transition rule, the Act requires that all post-enactment net capital losses be used before pre-enactment net capital losses.
As of August 31, 2013 the fund had capital loss carryforwards available to offset future realized gains as follows:
| | | | |
Pre-enactment losses which expire as
follows: | |
| 8/31/15 | | | $(219 | ) |
| 8/31/16 | | | (22,989 | ) |
| 8/31/17 | | | (184,390 | ) |
| Total | | | $(207,598 | ) |
|
Post-enactment losses which are
characterized as follows: | |
| Short Term | | | $(110 | ) |
Multiple Classes of Shares of Beneficial Interest – The fund offers multiple classes of shares, which differ in their respective distribution, service, and program manager fees. The fund’s income and common expenses are allocated to shareholders based on the value of settled shares outstanding of each class. The fund’s realized and unrealized gain (loss) are allocated to shareholders based on the daily net assets of each class. Dividends are declared separately for each class. Differences in per share dividend rates are generally due to differences in separate class expenses. Class B and Class 529B shares will convert to Class A and Class 529A shares, respectively, approximately eight years after purchase.
(3) Transactions with Affiliates
Investment Adviser – The fund has an investment advisory agreement with MFS to provide overall investment management and related administrative services and facilities to the fund. The management fee is computed daily and paid monthly at an annual rate of 0.40% of the fund’s average daily net assets.
During the six months ended February 28, 2014, MFS voluntarily waived receipt of $800,883 of the fund’s management fee in order to avoid a negative yield. This amount, for the six months ended February 28, 2014, is included in the reduction of total expenses in the Statement of Operations. MFS has also agreed in writing to reduce its management fee by a specified amount if certain MFS mutual fund assets exceed thresholds agreed to by MFS and the fund’s Board of Trustees. For the six months ended February 28, 2014, this management fee reduction amounted to $4,516, which is included in the reduction of total expenses in the Statement of Operations. For the six months ended February 28, 2014, these waivers had the effect of reducing the management fee by 0.40% of average daily net assets on an annualized basis. The management fee incurred for the six months ended February 28, 2014 was equivalent to an annual effective rate of 0.00% of the fund’s average daily net assets.
25
Notes to Financial Statements (unaudited) – continued
In order to avoid a negative yield for the six months ended February 28, 2014, MFS voluntarily agreed to reduce certain other expenses in the amount of $281,604, which is included in the reduction of total expenses in the Statement of Operations.
Distributor – The Board of Trustees has adopted a distribution plan for certain class shares pursuant to Rule 12b-1 of the Investment Company Act of 1940.
The fund’s distribution plan provides that the fund will pay MFS Fund Distributors, Inc. (MFD) for services provided by MFD and financial intermediaries in connection with the distribution and servicing of certain share classes. One component of the plan is a distribution fee paid to MFD and another component of the plan is a service fee paid to MFD. MFD may subsequently pay all, or a portion, of the distribution and/or service fees to financial intermediaries.
Distribution Plan Fee Table:
| | | | | | | | | | | | | | | | | | | | |
| | | Distribution Fee Rate (d) | | | Service Fee Rate (d) | | | Total Distribution Plan (d) | | | Annual Effective Rate (e) | | | Distribution and Service Fee | |
| Class A | | | — | | | | 0.25% | | | | 0.25% | | | | 0.00% | | | | $180,527 | |
| Class B | | | 0.75% | | | | 0.25% | | | | 1.00% | | | | 0.00% | | | | 147,208 | |
| Class C | | | 0.75% | | | | 0.25% | | | | 1.00% | | | | 0.00% | | | | 275,065 | |
| Class R1 | | | 0.75% | | | | 0.25% | | | | 1.00% | | | | 0.00% | | | | 95,853 | |
| Class R2 | | | 0.25% | | | | 0.25% | | | | 0.50% | | | | 0.00% | | | | 171,760 | |
| Class R3 | | | — | | | | 0.25% | | | | 0.25% | | | | 0.00% | | | | 81,451 | |
| Class 529A | | | — | | | | 0.25% | | | | 0.25% | | | | 0.00% | | | | 13,875 | |
| Class 529B | | | 0.75% | | | | 0.25% | | | | 1.00% | | | | 0.00% | | | | 3,464 | |
| Class 529C | | | 0.75% | | | | 0.25% | | | | 1.00% | | | | 0.00% | | | | 32,303 | |
| Total Distribution and Service Fees | | | | $1,001,506 | |
| (d) | In accordance with the distribution plan for certain classes, the fund pays distribution and/or service fees equal to these annual percentage rates of each class’s average daily net assets. The distribution and service fee rates disclosed by class represent the current rates in effect at the end of the reporting period. Any rate changes, if applicable, are detailed below. |
| (e) | The annual effective rates represent actual fees incurred under the distribution plan for the six months ended February 28, 2014 based on each class’s average daily net assets. MFD has agreed in writing to waive the Class A and Class 529A service fee. This written agreement will continue until modified by the fund’s Board of Trustees, but such agreement will continue until at least December 31, 2014. These reductions, for the six months ended February 28, 2014, for Class A and Class 529A amounted to $180,527 and $13,875, respectively, and are included in the reduction of total expenses in the Statement of Operations. During the six months ended February 28, 2014, MFD also voluntarily waived a receipt of $807,104 of the fund’s distribution and service fees to ensure the fund avoids a negative yield for Class B, Class C, Class R1, Class R2, Class R3, Class 529B, and Class 529C shares. This amount is included in the reduction of total expenses in the Statement of Operations. |
Certain Class A shares acquired through an exchange may be subject to a contingent deferred sales charge (CDSC) upon redemption depending on when the shares exchanged were originally purchased. Class C and Class 529C shares are subject to a CDSC in the event of a shareholder redemption within 12 months of purchase. Class B and Class 529B shares are subject to a CDSC in the event of a shareholder redemption
26
Notes to Financial Statements (unaudited) – continued
within six years of purchase. All contingent deferred sales charges are paid to MFD and during the six months ended February 28, 2014, were as follows:
| | | | |
| | | Amount | |
| Class A | | | $106 | |
| Class B | | | 41,851 | |
| Class C | | | 14,059 | |
| Class 529B | | | 135 | |
| Class 529C | | | 6 | |
The fund has entered into and may from time to time enter into contracts with program managers and other parties which administer the tuition programs through which an investment in the fund’s 529 share classes is made. The fund has entered into an agreement with MFD pursuant to which MFD receives an annual fee of up to 0.10% of the average daily net assets attributable to each 529 share class. MFD has agreed to waive a portion of this fee in an amount equal to 0.05% of the average daily net assets for each 529 share class. This waiver agreement will expire on December 31, 2014, unless MFD elects to extend the waiver. For the six months ended February 28, 2014, this waiver amounted to $4,563 and is included in the reduction of total expenses in the Statement of Operations. In addition, MFS voluntarily waived receipt of $4,563 of the fund’s program manager fees in order to avoid a negative yield for Class 529A, Class 529B, and Class 529C shares. This amount, for the six months ended February 28, 2014, is included in the reduction of total expenses in the Statement of Operations. This voluntary waiver had the effect of reducing the program manager fee by 0.05% of average daily net assets attributable to Class 529A, Class 529B, and Class 529C shares on an annualized basis. The program manager fee incurred for the six months ended February 28, 2014 was equivalent to an annual effective rate of 0.00% of the average daily net assets attributable to each 529 share class. The services provided by MFD, or a third party with which MFD contracts, include recordkeeping and tax reporting and account services, as well as services designed to maintain the program’s compliance with the Internal Revenue Code and other regulatory requirements. Program manager fees and waivers for the six months ended February 28, 2014, were as follows:
| | | | | | | | |
| | | Fee | | | Waiver | |
| Class 529A | | | $5,550 | | | | $5,500 | |
| Class 529B | | | 346 | | | | 346 | |
| Class 529C | | | 3,230 | | | | 3,230 | |
| Total Program Manager Fees and Waivers | | | $9,126 | | | | $9,126 | |
Shareholder Servicing Agent – MFS Service Center, Inc. (MFSC), a wholly-owned subsidiary of MFS, receives a fee from the fund for its services as shareholder servicing agent calculated as a percentage of the average daily net assets of the fund as determined periodically under the supervision of the fund’s Board of Trustees. For the six months ended February 28, 2014, the fee was $100,054, which equated to 0.0497% annually of the fund’s average daily net assets. MFSC also receives payment from the fund for out-of-pocket expenses, sub-accounting and other shareholder servicing costs which may be paid to affiliated and unaffiliated service providers. For the six months ended February 28, 2014, these out-of-pocket expenses, sub-accounting and other shareholder servicing costs amounted to $240,325.
27
Notes to Financial Statements (unaudited) – continued
Administrator – MFS provides certain financial, legal, shareholder communications, compliance, and other administrative services to the fund. Under an administrative services agreement, the fund partially reimburses MFS the costs incurred to provide these services. The fund is charged an annual fixed amount of $17,500 plus a fee based on average daily net assets. The administrative services fee incurred for the six months ended February 28, 2014 was equivalent to an annual effective rate of 0.0145% of the fund’s average daily net assets.
Trustees’ and Officers’ Compensation – The fund pays compensation to independent Trustees in the form of a retainer, attendance fees, and additional compensation to Board and Committee chairpersons. The fund does not pay compensation directly to Trustees or officers of the fund who are also officers of the investment adviser, all of whom receive remuneration for their services to the fund from MFS. Certain officers and Trustees of the fund are officers or directors of MFS, MFD, and MFSC.
Prior to December 31, 2001, the fund had an unfunded defined benefit plan (“DB plan”) for independent Trustees. As of December 31, 2001, the Board took action to terminate the DB plan with respect to then-current and any future independent Trustees, such that the DB plan covers only certain of those former independent Trustees who retired on or before December 31, 2001. The DB plan resulted in a pension expense of $430 and is included in independent Trustees’ compensation for the six months ended February 28, 2014. The liability for deferred retirement benefits payable to certain independent Trustees under the DB plan amounted to $12,284 at February 28, 2014, and is included in “Payable for independent Trustees’ compensation” in the Statement of Assets and Liabilities.
Other – This fund and certain other funds managed by MFS (the funds) have entered into services agreements (the Agreements) which provide for payment of fees by the funds to Tarantino LLC and Griffin Compliance LLC in return for the provision of services of an Independent Chief Compliance Officer (ICCO) and Assistant ICCO, respectively, for the funds. The ICCO and Assistant ICCO are officers of the funds and the sole members of Tarantino LLC and Griffin Compliance LLC, respectively. The funds can terminate the Agreements with Tarantino LLC and Griffin Compliance LLC at any time under the terms of the Agreements. For the six months ended February 28, 2014, the aggregate fees paid by the fund to Tarantino LLC and Griffin Compliance LLC were $1,362 and are included in “Miscellaneous” expense in the Statement of Operations. MFS has agreed to reimburse the fund for a portion of the payments made by the fund in the amount of $183, which is included in the reduction of total expenses in the Statement of Operations. Additionally, MFS has agreed to bear all expenses associated with office space, other administrative support, and supplies provided to the ICCO and Assistant ICCO.
On October 9, 2013, MFS purchased 2,600,000 shares of Class R4 for an aggregate amount of $2,600,000.
28
Notes to Financial Statements (unaudited) – continued
(4) Shares of Beneficial Interest
The fund’s Declaration of Trust permits the Trustees to issue an unlimited number of full and fractional shares of beneficial interest. Transactions in fund shares were as follows:
| | | | | | | | | | | | | | | | |
| | | Six months ended
2/28/14 | | | Year ended
8/31/13 | |
| | | Shares | | | Amount | | | Shares | | | Amount | |
| Shares sold | | | | | | | | | | | | | | | | |
Class A | | | 43,365,083 | | | | $43,365,085 | | | | 90,857,358 | | | | $90,857,364 | |
Class B | | | 7,182,729 | | | | 7,182,729 | | | | 18,713,001 | | | | 18,713,002 | |
Class C | | | 23,977,477 | | | | 23,977,478 | | | | 50,242,109 | | | | 50,242,109 | |
Class R1 | | | 2,924,708 | | | | 2,924,708 | | | | 8,748,971 | | | | 8,748,971 | |
Class R2 | | | 9,323,661 | | | | 9,323,661 | | | | 22,356,847 | | | | 22,356,847 | |
Class R3 | | | 15,557,593 | | | | 15,557,593 | | | | 20,910,727 | | | | 20,910,725 | |
Class R4 | | | 2,867,508 | | | | 2,867,508 | | | | 373,688 | | | | 373,688 | |
Class 529A | | | 2,392,529 | | | | 2,392,529 | | | | 5,719,574 | | | | 5,719,574 | |
Class 529B | | | 193,938 | | | | 193,938 | | | | 386,062 | | | | 386,062 | |
Class 529C | | | 2,118,938 | | | | 2,118,938 | | | | 3,685,179 | | | | 3,685,179 | |
| | | 109,904,164 | | | | $109,904,167 | | | | 221,993,516 | | | | $221,993,521 | |
| | | | |
| Shares reacquired | | | | | | | | | | | | | | | | |
Class A | | | (50,955,449 | ) | | | $(50,955,449 | ) | | | (72,078,513 | ) | | | $(72,078,513 | ) |
Class B | | | (10,510,881 | ) | | | (10,510,884 | ) | | | (22,978,285 | ) | | | (22,978,292 | ) |
Class C | | | (31,971,906 | ) | | | (31,971,906 | ) | | | (41,729,343 | ) | | | (41,729,343 | ) |
Class R1 | | | (6,102,360 | ) | | | (6,102,360 | ) | | | (12,030,084 | ) | | | (12,030,084 | ) |
Class R2 | | | (18,882,072 | ) | | | (18,882,072 | ) | | | (31,674,198 | ) | | | (31,674,198 | ) |
Class R3 | | | (19,135,551 | ) | | | (19,135,551 | ) | | | (35,015,288 | ) | | | (35,015,288 | ) |
Class R4 | | | (783,019 | ) | | | (783,019 | ) | | | (364,480 | ) | | | (364,479 | ) |
Class 529A | | | (2,174,366 | ) | | | (2,174,366 | ) | | | (5,151,748 | ) | | | (5,151,747 | ) |
Class 529B | | | (226,929 | ) | | | (226,929 | ) | | | (375,895 | ) | | | (375,896 | ) |
Class 529C | | | (1,717,764 | ) | | | (1,717,764 | ) | | | (2,632,719 | ) | | | (2,632,719 | ) |
| | | (142,460,297 | ) | | | $(142,460,300 | ) | | | (224,030,553 | ) | | | $(224,030,559 | ) |
| | | | |
| Net change | | | | | | | | | | | | | | | | |
Class A | | | (7,590,366 | ) | | | $(7,590,364 | ) | | | 18,778,845 | | | | $18,778,851 | |
Class B | | | (3,328,152 | ) | | | (3,328,155 | ) | | | (4,265,284 | ) | | | (4,265,290 | ) |
Class C | | | (7,994,429 | ) | | | (7,994,428 | ) | | | 8,512,766 | | | | 8,512,766 | |
Class R1 | | | (3,177,652 | ) | | | (3,177,652 | ) | | | (3,281,113 | ) | | | (3,281,113 | ) |
Class R2 | | | (9,558,411 | ) | | | (9,558,411 | ) | | | (9,317,351 | ) | | | (9,317,351 | ) |
Class R3 | | | (3,577,958 | ) | | | (3,577,958 | ) | | | (14,104,561 | ) | | | (14,104,563 | ) |
Class R4 | | | 2,084,489 | | | | 2,084,489 | | | | 9,208 | | | | 9,209 | |
Class 529A | | | 218,163 | | | | 218,163 | | | | 567,826 | | | | 567,827 | |
Class 529B | | | (32,991 | ) | | | (32,991 | ) | | | 10,167 | | | | 10,166 | |
Class 529C | | | 401,174 | | | | 401,174 | | | | 1,052,460 | | | | 1,052,460 | |
| | | (32,556,133 | ) | | | $(32,556,133 | ) | | | (2,037,037 | ) | | | $(2,037,038 | ) |
29
Notes to Financial Statements (unaudited) – continued
(5) Line of Credit
The fund and certain other funds managed by MFS participate in a $1.1 billion unsecured committed line of credit, subject to a $1 billion sublimit, provided by a syndication of banks under a credit agreement. Borrowings may be made for temporary financing needs. Interest is charged to each fund, based on its borrowings, generally at a rate equal to the higher of the Federal Reserve funds rate or one month LIBOR plus an agreed upon spread. A commitment fee, based on the average daily, unused portion of the committed line of credit, is allocated among the participating funds at the end of each calendar quarter. In addition, the fund and other funds managed by MFS have established unsecured uncommitted borrowing arrangements with certain banks for temporary financing needs. Interest is charged to each fund, based on its borrowings, at a rate equal to the Federal Reserve funds rate plus an agreed upon spread. For the six months ended February 28, 2014, the fund’s commitment fee and interest expense were $921 and $0, respectively, and are included in “Miscellaneous” expense in the Statement of Operations.
(6) Subsequent Event
On April 8, 2014, the Board of Trustees approved certain changes to the fund’s name and strategy. Effective July 1, 2014, the name of MFS Cash Reserve Fund will change to MFS U.S. Government Cash Reserve Fund and the fund will adopt a non-fundamental investment policy of normally investing at least 80% of its assets in U.S. Government money market instruments and repurchase agreements collateralized by U.S. Government securities.
30
BOARD REVIEW OF INVESTMENT ADVISORY AGREEMENT
A discussion regarding the Board’s most recent review and renewal of the fund’s Investment Advisory Agreement with MFS is available by clicking on the fund’s name under “Mutual Funds” in the “Products” section of the MFS Web site (mfs.com).
PROXY VOTING POLICIES AND INFORMATION
A general description of the MFS funds’ proxy voting policies and procedures is available without charge, upon request, by calling 1-800-225-2606, by visiting the Proxy Voting section of mfs.com or by visiting the SEC’s Web site at http://www.sec.gov.
Information regarding how the fund voted proxies relating to portfolio securities during the most recent twelve-month period ended June 30 is available without charge by visiting the Proxy Voting section of mfs.com or by visiting the SEC’s Web site at http://www.sec.gov.
QUARTERLY PORTFOLIO DISCLOSURE
The fund will file a complete schedule of portfolio holdings with the Securities and Exchange Commission (the Commission) for the first and third quarters of each fiscal year on Form N-Q. A shareholder can obtain the quarterly portfolio holdings report at mfs.com. The fund’s Form N-Q is also available on the EDGAR database on the Commission’s Internet Web site at http://www.sec.gov, and may be reviewed and copied at the:
Public Reference Room
Securities and Exchange Commission
100 F Street, NE, Room 1580
Washington, D.C. 20549
Information on the operation of the Public Reference Room may be obtained by calling the Commission at 1-800-SEC-0330. Copies of the fund’s Form N-Q also may be obtained, upon payment of a duplicating fee, by electronic request at the following e-mail address: publicinfo@sec.gov, or by writing the Public Reference Section at the above address.
FURTHER INFORMATION
From time to time, MFS may post important information about the fund or the MFS funds on the MFS web site (mfs.com). This information is available by visiting the “Commentary & Announcements” and “Market Outlooks” sections of mfs.com or by clicking on the fund’s name under “Mutual Funds” in the “Products” section of mfs.com.
PROVISION OF FINANCIAL REPORTS AND SUMMARY PROSPECTUSES
The fund produces financial reports every six months and updates its summary prospectus and prospectus annually. To avoid sending duplicate copies of materials to households, only one copy of the fund’s annual and semiannual report and summary prospectus may be mailed to shareholders having the same last name and residential address on the fund’s records. However, any shareholder may contact MFSC (please see back cover for address and telephone number) to request that copies of these reports and summary prospectuses be sent personally to that shareholder.
31
Save paper with eDelivery.

| MFS® will send you prospectuses, |
reports, and proxies directly via e-mail so you will get information faster with less mailbox clutter.
To sign up:
1. Go to mfs.com.
2. Log in via MFS® Access.
3. Select eDelivery.
If you own your MFS fund shares through a financial institution or a retirement plan, MFS® TALK, MFS® Access, or eDelivery may not be available to you.
CONTACT
WEB SITE
mfs.com
MFS TALK
1-800-637-8255
24 hours a day
ACCOUNT SERVICE AND LITERATURE
Shareholders
1-800-225-2606
Financial advisors
1-800-343-2829
Retirement plan services
1-800-637-1255
MAILING ADDRESS
MFS Service Center, Inc.
P.O. Box 55824
Boston, MA 02205-5824
OVERNIGHT MAIL
MFS Service Center, Inc.
c/o Boston Financial Data Services
30 Dan Road
Canton, MA 02021-2809
SEMIANNUAL REPORT
February 28, 2014

MFS® CORE EQUITY FUND

RGI-SEM
MFS® CORE EQUITY FUND
CONTENTS
The report is prepared for the general information of shareholders. It is authorized for distribution to prospective investors only when preceded or accompanied by a current prospectus.
NOT FDIC INSURED Ÿ MAY LOSE VALUE Ÿ NO BANK GUARANTEE

LETTER FROM THE CHAIRMAN AND CEO
Dear Shareholders:
The U.S. economy appears to have slowed early in 2014 after a strong second half of 2013. Harsh winter weather likely contributed to at least a temporary softening of consumer demand. Looking at the longer term, the pace of U.S. economic growth has
been modest since the recovery began late in 2009. Corporate profits remain healthy overall. A major plus is the removal of a highly confrontational atmosphere in the U.S. Congress, which had clouded business decision-making since 2011.
Globally, recent months have been dominated by volatility, including emerging market currency jitters and rising geopolitical tensions. These add to the possibility of economic uncertainty and financial market unease. However, the eurozone continues to show signs of recovery, while Japan is making progress as it seeks to break free of deflation.
China’s transition toward a more consumer-oriented and less export-driven economy — one with a more stable and sustainable growth rate — could be positive in the long term. However, in the near term, any deceleration in China’s rate of growth could have a ripple effect on its many global trading partners.
In uncertain times such as these, it is particularly important to remember that managing risk should always be a top priority. At MFS®, active risk management is an integral part of our collaborative process. Our global team of investment professionals shares ideas and evaluates opportunities that span continents, investment disciplines and asset classes. Our goal is to build better insights, and ultimately better results, for our clients.
We understand and appreciate the economic challenges investors face, and we believe in the value of maintaining a long-term view and applying proven principles, such as asset allocation and diversification. We are confident that our unique approach can serve investors well as they work with their financial advisors to identify and pursue the most suitable opportunities.
Respectfully,

Robert J. Manning
Chairman and Chief Executive Officer
MFS Investment Management
April 14, 2014
The opinions expressed in this letter are subject to change, may not be relied upon for investment advice, and no forecasts can be guaranteed.
1
PORTFOLIO COMPOSITION
Portfolio structure (i)
| | | | |
| Top ten holdings (i) | | | | |
| Apple, Inc. | | | 2.1% | |
| Exxon Mobil Corp. | | | 2.0% | |
| Google, Inc., “A” | | | 1.9% | |
| Hewlett-Packard Co. | | | 1.7% | |
| Pfizer, Inc. | | | 1.4% | |
| MetLife, Inc. | | | 1.4% | |
| Hess Corp. | | | 1.3% | |
| Procter & Gamble Co. | | | 1.3% | |
| Verizon Communications, Inc. | | | 1.3% | |
| Wells Fargo & Co. | | | 1.2% | |
| | | | |
| Equity sectors (i) | | | | |
| Financial Services | | | 17.7% | |
| Technology | | | 15.6% | |
| Health Care | | | 13.4% | |
| Energy | | | 8.6% | |
| Industrial Goods & Services | | | 7.4% | |
| Leisure | | | 6.6% | |
| Consumer Staples | | | 6.2% | |
| Retailing | | | 6.1% | |
| Utilities & Communications | | | 5.3% | |
| Special Products & Services | | | 3.9% | |
| Basic Materials | | | 3.8% | |
| Autos & Housing | | | 2.7% | |
| Transportation | | | 2.1% | |
| (i) | For purposes of this presentation, the components include the market value of securities, less any securities sold short, and reflect the impact of the equivalent exposure of derivative positions. These amounts may be negative from time to time. Equivalent exposure is a calculated amount that translates the derivative position into a reasonable approximation of the amount of the underlying asset that the portfolio would have to hold at a given point in time to have the same price sensitivity that results from the portfolio’s ownership of the derivative contract. When dealing with derivatives, equivalent exposure is a more representative measure of the potential impact of a position on portfolio performance than market value. |
Percentages are based on net assets as of 2/28/14.
The portfolio is actively managed and current holdings may be different.
2
EXPENSE TABLE
Fund expenses borne by the shareholders during the period, September 1, 2013 through February 28, 2014
As a shareholder of the fund, you incur two types of costs: (1) transaction costs, including sales charges (loads) on certain purchase or redemption payments, and (2) ongoing costs, including management fees; distribution and service (12b-1) fees; and other fund expenses. This example is intended to help you understand your ongoing costs (in dollars) of investing in the fund and to compare these costs with the ongoing costs of investing in other mutual funds.
The example is based on an investment of $1,000 invested at the beginning of the period and held for the entire period September 1, 2013 through February 28, 2014.
Actual Expenses
The first line for each share class in the following table provides information about actual account values and actual expenses. You may use the information in this line, together with the amount you invested, to estimate the expenses that you paid over the period. Simply divide your account value by $1,000 (for example, an $8,600 account value divided by $1,000 = 8.6), then multiply the result by the number in the first line under the heading entitled “Expenses Paid During Period” to estimate the expenses you paid on your account during this period.
Hypothetical Example for Comparison Purposes
The second line for each share class in the following table provides information about hypothetical account values and hypothetical expenses based on the fund’s actual expense ratio and an assumed rate of return of 5% per year before expenses, which is not the fund’s actual return. The hypothetical account values and expenses may not be used to estimate the actual ending account balance or expenses you paid for the period. You may use this information to compare the ongoing costs of investing in the fund and other funds. To do so, compare this 5% hypothetical example with the 5% hypothetical examples that appear in the shareholder reports of the other funds.
Please note that the expenses shown in the table are meant to highlight your ongoing costs only and do not reflect any transactional costs, such as sales charges (loads). Therefore, the second line for each share class in the table is useful in comparing ongoing costs only, and will not help you determine the relative total costs of owning different funds. In addition, if these transactional costs were included, your costs would have been higher.
3
Expense Table – continued
| | | | | | | | | | | | | | | | | | |
Share Class | | | | Annualized Expense Ratio | | | Beginning Account Value 9/01/13 | | | Ending Account Value 2/28/14 | | | Expenses Paid During Period (p) 9/01/13-2/28/14 | |
| A | | Actual | | | 1.04% | | | | $1,000.00 | | | | $1,162.78 | | | | $5.58 | |
| | Hypothetical (h) | | | 1.04% | | | | $1,000.00 | | | | $1,019.64 | | | | $5.21 | |
| B | | Actual | | | 1.79% | | | | $1,000.00 | | | | $1,158.59 | | | | $9.58 | |
| | Hypothetical (h) | | | 1.79% | | | | $1,000.00 | | | | $1,015.92 | | | | $8.95 | |
| C | | Actual | | | 1.79% | | | | $1,000.00 | | | | $1,158.33 | | | | $9.58 | |
| | Hypothetical (h) | | | 1.79% | | | | $1,000.00 | | | | $1,015.92 | | | | $8.95 | |
| I | | Actual | | | 0.80% | | | | $1,000.00 | | | | $1,163.80 | | | | $4.29 | |
| | Hypothetical (h) | | | 0.80% | | | | $1,000.00 | | | | $1,020.83 | | | | $4.01 | |
| R1 | | Actual | | | 1.79% | | | | $1,000.00 | | | | $1,158.28 | | | | $9.58 | |
| | Hypothetical (h) | | | 1.79% | | | | $1,000.00 | | | | $1,015.92 | | | | $8.95 | |
| R2 | | Actual | | | 1.30% | | | | $1,000.00 | | | | $1,161.23 | | | | $6.97 | |
| | Hypothetical (h) | | | 1.30% | | | | $1,000.00 | | | | $1,018.35 | | | | $6.51 | |
| R3 | | Actual | | | 1.04% | | | | $1,000.00 | | | | $1,162.89 | | | | $5.58 | |
| | Hypothetical (h) | | | 1.04% | | | | $1,000.00 | | | | $1,019.64 | | | | $5.21 | |
| R4 | | Actual | | | 0.80% | | | | $1,000.00 | | | | $1,163.87 | | | | $4.29 | |
| | Hypothetical (h) | | | 0.80% | | | | $1,000.00 | | | | $1,020.83 | | | | $4.01 | |
| R5 | | Actual | | | 0.71% | | | | $1,000.00 | | | | $1,164.61 | | | | $3.81 | |
| | Hypothetical (h) | | | 0.71% | | | | $1,000.00 | | | | $1,021.27 | | | | $3.56 | |
| (h) | 5% class return per year before expenses. |
| (p) | Expenses Paid During Period are equal to each class’s annualized expense ratio, as shown above, multiplied by the average account value over the period, multiplied by 181/365 (to reflect the one-half year period). Expenses paid do not include any applicable sales charges (loads). If these transaction costs had been included, your costs would have been higher. |
Notes to Expense Table
Each class with a Rule 12b-1 service fee is subject to a rebate of a portion of such fee. Such rebates are included in the expense ratios above. For Class A shares, this rebate reduced the expense ratio above by 0.01%. See Note 3 in the Notes to Financial Statements for additional information.
4
PORTFOLIO OF INVESTMENTS
2/28/14 (unaudited)
The Portfolio of Investments is a complete list of all securities owned by your fund. It is categorized by broad-based asset classes.
| | | | | | | | |
| Common Stocks - 99.4% | | | | | | | | |
| Issuer | | Shares/Par | | | Value ($) | |
| | | | | | | | |
| Aerospace - 3.2% | | | | | | | | |
| Honeywell International, Inc. | | | 163,640 | | | $ | 15,454,162 | |
| Precision Castparts Corp. | | | 40,679 | | | | 10,490,301 | |
| United Technologies Corp. | | | 121,660 | | | | 14,236,653 | |
| | | | | | | | |
| | | | $ | 40,181,116 | |
| Alcoholic Beverages - 0.3% | | | | | | | | |
| Constellation Brands, Inc., “A” (a) | | | 44,250 | | | $ | 3,585,578 | |
| | |
| Apparel Manufacturers - 1.4% | | | | | | | | |
| Guess?, Inc. | | | 85,620 | | | $ | 2,597,711 | |
| NIKE, Inc., “B” | | | 74,580 | | | | 5,839,614 | |
| PVH Corp. | | | 40,406 | | | | 5,108,531 | |
| VF Corp. | | | 64,097 | | | | 3,755,443 | |
| | | | | | | | |
| | | | $ | 17,301,299 | |
| Automotive - 1.8% | | | | | | | | |
| Delphi Automotive PLC | | | 135,060 | | | $ | 8,990,944 | |
| General Motors Co. | | | 246,880 | | | | 8,937,056 | |
| Johnson Controls, Inc. | | | 104,330 | | | | 5,153,902 | |
| | | | | | | | |
| | | | $ | 23,081,902 | |
| Biotechnology - 1.3% | | | | | | | | |
| Alexion Pharmaceuticals, Inc. (a) | | | 30,490 | | | $ | 5,390,632 | |
| Biogen Idec, Inc. (a) | | | 31,799 | | | | 10,833,283 | |
| Illumina, Inc. (a) | | | 3,610 | | | | 619,079 | |
| | | | | | | | |
| | | | $ | 16,842,994 | |
| Broadcasting - 3.1% | | | | | | | | |
| RetailMeNot, Inc. (a) | | | 279,100 | | | $ | 11,658,007 | |
| Time Warner, Inc. | | | 90,480 | | | | 6,073,922 | |
| Twenty-First Century Fox, Inc. | | | 436,940 | | | | 14,654,968 | |
| Walt Disney Co. | | | 86,180 | | | | 6,964,206 | |
| | | | | | | | |
| | | | $ | 39,351,103 | |
| Brokerage & Asset Managers - 1.6% | | | | | | | | |
| Affiliated Managers Group, Inc. (a) | | | 11,868 | | | $ | 2,231,777 | |
| BlackRock, Inc. | | | 11,785 | | | | 3,592,539 | |
| Franklin Resources, Inc. | | | 74,117 | | | | 3,946,730 | |
| FXCM, Inc., “A” | | | 109,780 | | | | 1,849,793 | |
| IntercontinentalExchange Group, Inc. | | | 23,890 | | | | 4,989,188 | |
5
Portfolio of Investments (unaudited) – continued
| | | | | | | | |
| Issuer | | Shares/Par | | | Value ($) | |
| | | | | | | | |
| Common Stocks - continued | | | | | | | | |
| Brokerage & Asset Managers - continued | | | | | | | | |
| NASDAQ OMX Group, Inc. | | | 93,763 | | | $ | 3,599,562 | |
| | | | | | | | |
| | | | $ | 20,209,589 | |
| Business Services - 1.7% | | | | | | | | |
| Accenture PLC, “A” | | | 57,270 | | | $ | 4,773,455 | |
| Bright Horizons Family Solutions, Inc. (a) | | | 129,120 | | | | 5,096,366 | |
| Fidelity National Information Services, Inc. | | | 116,510 | | | | 6,479,121 | |
| FleetCor Technologies, Inc. (a) | | | 29,080 | | | | 3,778,364 | |
| Forrester Research, Inc. | | | 57,400 | | | | 2,079,028 | |
| | | | | | | | |
| | | | $ | 22,206,334 | |
| Cable TV - 1.4% | | | | | | | | |
| Comcast Corp., “Special A” | | | 216,720 | | | $ | 10,813,244 | |
| Time Warner Cable, Inc. | | | 47,440 | | | | 6,658,204 | |
| | | | | | | | |
| | | | $ | 17,471,448 | |
| Chemicals - 1.6% | | | | | | | | |
| Agrium, Inc. | | | 41,990 | | | $ | 3,867,570 | |
| Celanese Corp. | | | 94,120 | | | | 5,025,067 | |
| LyondellBasell Industries N.V., “A” | | | 63,790 | | | | 5,618,623 | |
| Monsanto Co. | | | 53,757 | | | | 5,914,345 | |
| | | | | | | | |
| | | | $ | 20,425,605 | |
| Computer Software - 3.9% | | | | | | | | |
| Check Point Software Technologies Ltd. (a) | | | 163,121 | | | $ | 10,997,618 | |
| Citrix Systems, Inc. (a) | | | 87,770 | | | | 5,270,589 | |
| Microsoft Corp. | | | 40,830 | | | | 1,564,197 | |
| Oracle Corp. | | | 211,850 | | | | 8,285,454 | |
| Qlik Technologies, Inc. (a) | | | 256,550 | | | | 7,824,775 | |
| Salesforce.com, Inc. (a) | | | 169,300 | | | | 10,559,241 | |
| Symantec Corp. | | | 213,190 | | | | 4,579,321 | |
| | | | | | | | |
| | | | $ | 49,081,195 | |
| Computer Software - Systems - 5.9% | | | | | | | | |
| Apple, Inc. | | | 50,845 | | | $ | 26,756,673 | |
| EMC Corp. | | | 374,550 | | | | 9,876,884 | |
| Hewlett-Packard Co. | | | 737,930 | | | | 22,049,348 | |
| NCR Corp. (a) | | | 55,190 | | | | 1,879,220 | |
| SS&C Technologies Holdings, Inc. (a) | | | 133,530 | | | | 5,164,940 | |
| Vantiv, Inc., “A” (a) | | | 285,650 | | | | 9,092,240 | |
| | | | | | | | |
| | | | $ | 74,819,305 | |
6
Portfolio of Investments (unaudited) – continued
| | | | | | | | |
| Issuer | | Shares/Par | | | Value ($) | |
| | | | | | | | |
| Common Stocks - continued | | | | | | | | |
| Construction - 0.8% | | | | | | | | |
| Pool Corp. | | | 27,950 | | | $ | 1,633,957 | |
| Sherwin-Williams Co. | | | 45,296 | | | | 9,080,942 | |
| | | | | | | | |
| | | | $ | 10,714,899 | |
| Consumer Products - 2.3% | | | | | | | | |
| Colgate-Palmolive Co. | | | 134,154 | | | $ | 8,428,896 | |
| Newell Rubbermaid, Inc. | | | 121,640 | | | | 3,905,860 | |
| Procter & Gamble Co. | | | 207,960 | | | | 16,358,134 | |
| | | | | | | | |
| | | | $ | 28,692,890 | |
| Consumer Services - 2.0% | | | | | | | | |
| Grand Canyon Education, Inc. (a) | | | 29,070 | | | $ | 1,377,918 | |
| HomeAway, Inc. (a) | | | 161,720 | | | | 7,418,096 | |
| ITT Educational Services, Inc. (a)(l) | | | 82,970 | | | | 2,574,559 | |
| Priceline.com, Inc. (a) | | | 10,778 | | | | 14,537,798 | |
| | | | | | | | |
| | | | $ | 25,908,371 | |
| Containers - 0.5% | | | | | | | | |
| Crown Holdings, Inc. (a) | | | 35,440 | | | $ | 1,595,509 | |
| Packaging Corp. of America | | | 58,940 | | | | 4,296,137 | |
| | | | | | | | |
| | | | $ | 5,891,646 | |
| Electrical Equipment - 1.6% | | | | | | | | |
| AMETEK, Inc. | | | 85,070 | | | $ | 4,529,127 | |
| Danaher Corp. | | | 108,700 | | | | 8,314,463 | |
| Sensata Technologies Holding B.V. (a) | | | 135,390 | | | | 5,502,250 | |
| W.W. Grainger, Inc. | | | 7,484 | | | | 1,908,570 | |
| | | | | | | | |
| | | | $ | 20,254,410 | |
| Electronics - 2.3% | | | | | | | | |
| Altera Corp. | | | 214,430 | | | $ | 7,785,953 | |
| Avago Technologies Ltd. | | | 101,600 | | | | 6,268,720 | |
| KLA-Tencor Corp. | | | 92,790 | | | | 6,045,269 | |
| Microchip Technology, Inc. | | | 200,130 | | | | 9,115,922 | |
| | | | | | | | |
| | | | $ | 29,215,864 | |
| Energy - Independent - 3.8% | | | | | | | | |
| Anadarko Petroleum Corp. | | | 57,120 | | | $ | 4,807,219 | |
| Antero Resources Corp. (a) | | | 29,840 | | | | 1,800,546 | |
| Athlon Energy, Inc. (a) | | | 38,680 | | | | 1,437,349 | |
| Cabot Oil & Gas Corp. | | | 63,770 | | | | 2,231,950 | |
| Clayton Williams Energy, Inc. (a) | | | 6,730 | | | | 652,810 | |
| Concho Resources, Inc. (a) | | | 16,650 | | | | 2,016,815 | |
| CONSOL Energy, Inc. | | | 24,850 | | | | 996,485 | |
7
Portfolio of Investments (unaudited) – continued
| | | | | | | | |
| Issuer | | Shares/Par | | | Value ($) | |
| | | | | | | | |
| Common Stocks - continued | | | | | | | | |
| Energy - Independent - continued | | | | | | | | |
| EOG Resources, Inc. | | | 22,869 | | | $ | 4,331,846 | |
| Goodrich Petroleum Corp. (a) | | | 102,000 | | | | 1,389,240 | |
| Gulfport Energy Corp. (a) | | | 18,920 | | | | 1,250,612 | |
| Marathon Petroleum Corp. | | | 125,810 | | | | 10,568,040 | |
| Noble Energy, Inc. | | | 87,990 | | | | 6,050,192 | |
| PDC Energy, Inc. (a) | | | 21,990 | | | | 1,366,239 | |
| Peabody Energy Corp. | | | 27,100 | | | | 475,876 | |
| Pioneer Natural Resources Co. | | | 31,040 | | | | 6,244,627 | |
| Rice Energy, Inc. (a) | | | 78,810 | | | | 1,891,440 | |
| | | | | | | | |
| | | | $ | 47,511,286 | |
| Energy - Integrated - 3.3% | | | | | | | | |
| Exxon Mobil Corp. (s) | | | 261,482 | | | $ | 25,172,872 | |
| Hess Corp. | | | 207,970 | | | | 16,643,839 | |
| | | | | | | | |
| | | | $ | 41,816,711 | |
| Entertainment - 0.2% | | | | | | | | |
| Cinemark Holdings, Inc. | | | 72,360 | | | $ | 2,128,831 | |
| | |
| Food & Beverages - 2.6% | | | | | | | | |
| Coca-Cola Co. | | | 333,280 | | | $ | 12,731,296 | |
| General Mills, Inc. | | | 111,880 | | | | 5,597,356 | |
| Mead Johnson Nutrition Co., “A” | | | 36,850 | | | | 3,005,118 | |
| Mondelez International, Inc. | | | 236,910 | | | | 8,062,047 | |
| WhiteWave Foods Co., “A” (a) | | | 121,870 | | | | 3,448,921 | |
| | | | | | | | |
| | | | $ | 32,844,738 | |
| Food & Drug Stores - 0.9% | | | | | | | | |
| CVS Caremark Corp. | | | 111,570 | | | $ | 8,160,230 | |
| Fairway Group Holdings Corp. (a) | | | 372,960 | | | | 2,909,088 | |
| | | | | | | | |
| | | | $ | 11,069,318 | |
| Gaming & Lodging - 0.8% | | | | | | | | |
| Wynn Resorts Ltd. | | | 44,018 | | | $ | 10,673,925 | |
| | |
| General Merchandise - 1.5% | | | | | | | | |
| Kohl’s Corp. | | | 126,280 | | | $ | 7,095,673 | |
| Target Corp. | | | 200,480 | | | | 12,538,019 | |
| | | | | | | | |
| | | | $ | 19,633,692 | |
| Health Maintenance Organizations - 0.8% | | | | | | | | |
| Aetna, Inc. | | | 92,630 | | | $ | 6,735,127 | |
| UnitedHealth Group, Inc. | | | 42,770 | | | | 3,304,838 | |
| | | | | | | | |
| | | | $ | 10,039,965 | |
8
Portfolio of Investments (unaudited) – continued
| | | | | | | | |
| Issuer | | Shares/Par | | | Value ($) | |
| | | | | | | | |
| Common Stocks - continued | | | | | | | | |
| Insurance - 3.3% | | | | | | | | |
| ACE Ltd. (s) | | | 89,680 | | | $ | 8,776,982 | |
| American International Group, Inc. | | | 309,100 | | | | 15,383,907 | |
| MetLife, Inc. | | | 340,510 | | | | 17,253,642 | |
| | | | | | | | |
| | | | $ | 41,414,531 | |
| Internet - 3.5% | | | | | | | | |
| ChannelAdvisor Corp. (a) | | | 60,360 | | | $ | 2,739,137 | |
| eBay, Inc. (a) | | | 115,920 | | | | 6,812,618 | |
| Facebook, Inc., “A” (a) | | | 104,850 | | | | 7,178,031 | |
| Google, Inc., “A” (a) | | | 20,253 | | | | 24,620,559 | |
| LinkedIn Corp., “A” (a) | | | 11,638 | | | | 2,374,618 | |
| | | | | | | | |
| | | | $ | 43,724,963 | |
| Machinery & Tools - 2.6% | | | | | | | | |
| Colfax Corp. (a) | | | 46,690 | | | $ | 3,321,060 | |
| Eaton Corp. PLC | | | 117,550 | | | | 8,782,161 | |
| Joy Global, Inc. | | | 117,160 | | | | 6,443,800 | |
| Kennametal, Inc. | | | 74,300 | | | | 3,249,882 | |
| Roper Industries, Inc. | | | 85,714 | | | | 11,624,533 | |
| | | | | | | | |
| | | | $ | 33,421,436 | |
| Major Banks - 4.0% | | | | | | | | |
| Bank of America Corp. | | | 294,410 | | | $ | 4,866,597 | |
| Goldman Sachs Group, Inc. | | | 28,704 | | | | 4,777,781 | |
| JPMorgan Chase & Co. | | | 257,920 | | | | 14,655,014 | |
| Morgan Stanley | | | 157,580 | | | | 4,853,464 | |
| State Street Corp. | | | 82,940 | | | | 5,446,670 | |
| Wells Fargo & Co. | | | 339,320 | | | | 15,751,234 | |
| | | | | | | | |
| | | | $ | 50,350,760 | |
| Medical & Health Technology & Services - 1.3% | | | | | | | | |
| Catamaran Corp. (a) | | | 54,950 | | | $ | 2,477,146 | |
| Cerner Corp. (a) | | | 28,910 | | | | 1,774,207 | |
| Express Scripts Holding Co. (a) | | | 126,670 | | | | 9,539,518 | |
| Henry Schein, Inc. (a) | | | 18,810 | | | | 2,239,142 | |
| | | | | | | | |
| | | | $ | 16,030,013 | |
| Medical Equipment - 4.2% | | | | | | | | |
| Abbott Laboratories | | | 299,410 | | | $ | 11,910,530 | |
| AtriCure, Inc. (a) | | | 85,930 | | | | 1,786,485 | |
| Cooper Cos., Inc. | | | 51,119 | | | | 6,553,967 | |
| Covidien PLC | | | 144,410 | | | | 10,390,300 | |
| DexCom, Inc. (a) | | | 15,580 | | | | 702,658 | |
| Endologix, Inc. (a) | | | 63,710 | | | | 860,085 | |
9
Portfolio of Investments (unaudited) – continued
| | | | | | | | |
| Issuer | | Shares/Par | | | Value ($) | |
| | | | | | | | |
| Common Stocks - continued | | | | | | | | |
| Medical Equipment - continued | | | | | | | | |
| GenMark Diagnostics, Inc. (a) | | | 92,070 | | | $ | 1,147,192 | |
| Heartware International, Inc. (a) | | | 20,930 | | | | 2,009,908 | |
| Sirona Dental Systems, Inc. (a) | | | 22,850 | | | | 1,610,011 | |
| Stryker Corp. | | | 111,300 | | | | 8,930,712 | |
| TearLab Corp. (a) | | | 230,760 | | | | 1,857,618 | |
| Thermo Fisher Scientific, Inc. | | | 39,830 | | | | 4,960,428 | |
| | | | | | | | |
| | | | $ | 52,719,894 | |
| Metals & Mining - 0.4% | | | | | | | | |
| First Quantum Minerals Ltd. | | | 127,810 | | | $ | 2,479,327 | |
| Lundin Mining Corp. (a) | | | 539,090 | | | | 2,565,704 | |
| | | | | | | | |
| | | | $ | 5,045,031 | |
| Natural Gas - Distribution - 0.2% | | | | | | | | |
| Spectra Energy Corp. | | | 78,680 | | | $ | 2,933,190 | |
| | |
| Natural Gas - Pipeline - 0.6% | | | | | | | | |
| Enbridge, Inc. | | | 110,080 | | | $ | 4,655,283 | |
| Kinder Morgan, Inc. | | | 74,760 | | | | 2,381,106 | |
| | | | | | | | |
| | | | $ | 7,036,389 | |
| Network & Telecom - 0.0% | | | | | | | | |
| Qualcomm, Inc. | | | 6,730 | | | $ | 506,702 | |
| | |
| Oil Services - 1.6% | | | | | | | | |
| Cameron International Corp. (a) | | | 112,060 | | | $ | 7,178,564 | |
| Dresser-Rand Group, Inc. (a) | | | 20,530 | | | | 1,115,395 | |
| Halliburton Co. | | | 141,250 | | | | 8,051,250 | |
| Schlumberger Ltd. | | | 39,140 | | | | 3,640,020 | |
| | | | | | | | |
| | | | $ | 19,985,229 | |
| Other Banks & Diversified Financials - 5.7% | | | | | | | | |
| American Express Co. | | | 86,060 | | | $ | 7,855,557 | |
| BB&T Corp. | | | 184,320 | | | | 6,967,296 | |
| Cathay General Bancorp, Inc. | | | 82,960 | | | | 2,108,014 | |
| Citigroup, Inc. | | | 262,560 | | | | 12,768,293 | |
| Discover Financial Services | | | 241,990 | | | | 13,885,386 | |
| EuroDekania Ltd. (z) | | | 580,280 | | | | 540,649 | |
| Fifth Third Bancorp | | | 347,480 | | | | 7,538,579 | |
| PrivateBancorp, Inc. | | | 177,010 | | | | 5,108,509 | |
| Texas Capital Bancshares, Inc. (a) | | | 36,080 | | | | 2,271,236 | |
| Visa, Inc., “A” | | | 58,114 | | | | 13,130,277 | |
| | | | | | | | |
| | | | $ | 72,173,796 | |
10
Portfolio of Investments (unaudited) – continued
| | | | | | | | |
| Issuer | | Shares/Par | | | Value ($) | |
| | | | | | | | |
| Common Stocks - continued | | | | | | | | |
| Pharmaceuticals - 5.8% | | | | | | | | |
| Actavis PLC (a) | | | 41,350 | | | $ | 9,130,907 | |
| Bristol-Myers Squibb Co. | | | 154,750 | | | | 8,320,908 | |
| Endo Health Solutions, Inc. (a) | | | 88,770 | | | | 7,085,621 | |
| Forest Laboratories, Inc. (a) | | | 71,120 | | | | 6,939,178 | |
| Perrigo Co. PLC | | | 36,731 | | | | 6,040,046 | |
| Pfizer, Inc. | | | 548,476 | | | | 17,611,564 | |
| Valeant Pharmaceuticals International, Inc. (a) | | | 97,360 | | | | 14,103,570 | |
| Zoetis, Inc. | | | 151,610 | | | | 4,702,942 | |
| | | | | | | | |
| | | | $ | 73,934,736 | |
| Railroad & Shipping - 1.3% | | | | | | | | |
| Canadian Pacific Railway Ltd. | | | 27,884 | | | $ | 4,377,788 | |
| Diana Shipping, Inc. (a) | | | 181,090 | | | | 2,357,792 | |
| Kansas City Southern Co. | | | 13,658 | | | | 1,282,759 | |
| Union Pacific Corp. | | | 47,497 | | | | 8,567,509 | |
| | | | | | | | |
| | | | $ | 16,585,848 | |
| Real Estate - 3.1% | | | | | | | | |
| Digital Realty Trust, Inc., REIT | | | 119,150 | | | $ | 6,453,164 | |
| Equity Lifestyle Properties, Inc., REIT | | | 182,260 | | | | 7,335,965 | |
| Mid-America Apartment Communities, Inc., REIT | | | 136,690 | | | | 9,245,712 | |
| Public Storage, Inc., REIT | | | 14,720 | | | | 2,487,680 | |
| Tanger Factory Outlet Centers, Inc., REIT | | | 187,870 | | | | 6,445,820 | |
| Weyerhaeuser Co., REIT | | | 238,450 | | | | 7,036,660 | |
| | | | | | | | |
| | | | $ | 39,005,001 | |
| Restaurants - 1.1% | | | | | | | | |
| McDonald’s Corp. | | | 63,451 | | | $ | 6,037,363 | |
| YUM! Brands, Inc. | | | 109,960 | | | | 8,145,837 | |
| | | | | | | | |
| | | | $ | 14,183,200 | |
| Specialty Chemicals - 1.3% | | | | | | | | |
| FMC Corp. | | | 74,710 | | | $ | 5,766,118 | |
| Taminco Corp. (a) | | | 118,850 | | | | 2,700,272 | |
| W.R. Grace & Co. (a) | | | 74,500 | | | | 7,549,830 | |
| | | | | | | | |
| | | | | | | $ | 16,016,220 | |
| Specialty Stores - 2.3% | | | | | | | | |
| AutoZone, Inc. (a) | | | 14,561 | | | $ | 7,840,225 | |
| Bed Bath & Beyond, Inc. (a) | | | 97,680 | | | | 6,624,658 | |
| Children’s Place Retail Stores, Inc. (a) | | | 64,420 | | | | 3,489,631 | |
| Ross Stores, Inc. | | | 90,060 | | | | 6,556,368 | |
| Urban Outfitters, Inc. (a) | | | 137,920 | | | | 5,163,725 | |
| | | | | | | | |
| | | | | | | $ | 29,674,607 | |
11
Portfolio of Investments (unaudited) – continued
| | | | | | | | |
| Issuer | | Shares/Par | | | Value ($) | |
| | | | | | | | |
| Common Stocks - continued | | | | | | | | |
| Telecommunications - Wireless - 0.9% | | | | | | | | |
| American Tower Corp., REIT | | | 133,330 | | | $ | 10,862,395 | |
| | |
| Telephone Services - 1.3% | | | | | | | | |
| Verizon Communications, Inc. | | | 342,230 | | | $ | 16,283,303 | |
| | |
| Tobacco - 1.1% | | | | | | | | |
| Lorillard, Inc. | | | 61,340 | | | $ | 3,009,340 | |
| Philip Morris International, Inc. | | | 129,070 | | | | 10,443,054 | |
| | | | | | | | |
| | | | | | | $ | 13,452,394 | |
| Trucking - 0.8% | | | | | | | | |
| Expeditors International of Washington, Inc. | | | 69,350 | | | $ | 2,740,019 | |
| Swift Transportation Co. (a) | | | 304,190 | | | | 7,410,068 | |
| | | | | | | | |
| | | | | | | $ | 10,150,087 | |
| Utilities - Electric Power - 2.4% | | | | | | | | |
| American Electric Power Co., Inc. | | | 90,630 | | | $ | 4,549,626 | |
| Calpine Corp. (a) | | | 182,850 | | | | 3,483,293 | |
| CMS Energy Corp. | | | 161,637 | | | | 4,595,340 | |
| Dominion Resources, Inc. | | | 40,980 | | | | 2,844,012 | |
| Edison International | | | 73,190 | | | | 3,832,960 | |
| Great Plains Energy, Inc. | | | 145,860 | | | | 3,831,742 | |
| NextEra Energy, Inc. | | | 26,770 | | | | 2,446,510 | |
| NRG Energy, Inc. | | | 88,270 | | | | 2,566,009 | |
| NRG Yield, Inc. | | | 15,030 | | | | 573,845 | |
| PG&E Corp. | | | 27,700 | | | | 1,220,454 | |
| | | | | | | | |
| | | | | | | $ | 29,943,791 | |
| Total Common Stocks (Identified Cost, $966,216,504) | | | | | | $ | 1,256,387,530 | |
| | |
| Issuer/Expiration Date/Strike Price | | Number
of
Contracts | | | | |
| Call Options Purchased - 0.0% | | | | | | | | |
| Business Services - 0.0% | | | | | | | | |
Equinix, Inc. - June 2014 @ $190
(Premiums Paid, $69,952) (a) | | | 64 | | | $ | 71,680 | |
| | |
| Issuer | | Shares/Par | | | | |
| Money Market Funds - 0.6% | | | | | | | | |
MFS Institutional Money Market Portfolio, 0.08%,
at Cost and Net Asset Value (v) | | | 6,960,255 | | | $ | 6,960,255 | |
12
Portfolio of Investments (unaudited) – continued
| | | | | | | | |
| Collateral for Securities Loaned - 0.0% | | | | | | | | |
| Issuer | | Shares/Par | | | Value ($) | |
| | | | | | | | |
Navigator Securities Lending Prime Portfolio, 0.18%,
at Cost and Net Asset Value (j) | | | 447,643 | | | $ | 447,643 | |
| Total Investments (Identified Cost, $973,694,358) | | | $ | 1,263,867,108 | |
| | |
| Other Assets, Less Liabilities - 0.0% | | | | | | | 370,015 | |
| Net Assets - 100.0% | | | | | | $ | 1,264,237,123 | |
| (a) | Non-income producing security. |
| (j) | The rate quoted is the annualized seven-day yield of the fund at period end. |
| (l) | A portion of this security is on loan. |
| (s) | Security or a portion of the security was pledged to cover collateral requirements for securities sold short. At February 28, 2014, the fund had no short sales outstanding. |
| (v) | Underlying affiliated fund that is available only to investment companies managed by MFS. The rate quoted for the MFS Institutional Money Market Portfolio is the annualized seven-day yield of the fund at period end. |
| (z) | Restricted securities are not registered under the Securities Act of 1933 and are subject to legal restrictions on resale. These securities generally may be resold in transactions exempt from registration or to the public if the securities are subsequently registered. Disposal of these securities may involve time-consuming negotiations and prompt sale at an acceptable price may be difficult. The fund holds the following restricted securities: |
| | | | | | | | | | |
| Restricted Securities | | Acquisition
Date | | Cost | | | Value | |
| EuroDekania Ltd. | | 3/08/07-6/25/07 | | | $8,173,430 | | | | $540,649 | |
| % of Net assets | | | | | | | | | 0.0% | |
At February 28, 2014, the fund had cash collateral of $3,244 and other liquid securities with an aggregate value of $527,634 to cover any commitments for securities sold short. Cash collateral is comprised of “Deposits with brokers” in the Statement of Assets and Liabilities.
The following abbreviations are used in this report and are defined:
| PLC | | Public Limited Company |
| REIT | | Real Estate Investment Trust |
See Notes to Financial Statements
13
Financial Statements
STATEMENT OF ASSETS AND LIABILITIES
At 2/28/14 (unaudited)
This statement represents your fund’s balance sheet, which details the assets and liabilities comprising the total value of the fund.
| | | | |
| Assets | | | | |
Investments- | | | | |
Non-affiliated issuers, at value (identified cost, $966,734,103) | | | $1,256,906,853 | |
Underlying affiliated funds, at cost and value | | | 6,960,255 | |
Total investments, at value, including $437,492 of securities on loan
(identified cost, $973,694,358) | | | $1,263,867,108 | |
Deposits with brokers | | | 3,244 | |
Receivables for | | | | |
Investments sold | | | 5,680,763 | |
Fund shares sold | | | 1,509,317 | |
Interest and dividends | | | 1,724,845 | |
Other assets | | | 6,915 | |
Total assets | | | $1,272,792,192 | |
| Liabilities | | | | |
Payables for | | | | |
Investments purchased | | | $5,730,533 | |
Fund shares reacquired | | | 1,503,510 | |
Collateral for securities loaned, at value | | | 447,643 | |
Payable to affiliates | | | | |
Investment adviser | | | 39,008 | |
Shareholder servicing costs | | | 681,290 | |
Distribution and service fees | | | 17,482 | |
Payable for independent Trustees’ compensation | | | 90,820 | |
Accrued expenses and other liabilities | | | 44,783 | |
Total liabilities | | | $8,555,069 | |
Net assets | | | $1,264,237,123 | |
| Net assets consist of | | | | |
Paid-in capital | | | $924,353,396 | |
Unrealized appreciation (depreciation) on investments and translation of assets and liabilities in foreign currencies | | | 290,172,522 | |
Accumulated net realized gain (loss) on investments and foreign currency | | | 46,938,159 | |
Undistributed net investment income | | | 2,773,046 | |
Net assets | | | $1,264,237,123 | |
Shares of beneficial interest outstanding | | | 46,354,621 | |
14
Statement of Assets and Liabilities (unaudited) – continued
| | | | | | | | | | | | |
| | | Net assets | | | Shares outstanding | | | Net asset value
per share (a) | |
Class A | | | $985,293,235 | | | | 35,803,335 | | | | $27.52 | |
Class B | | | 42,389,943 | | | | 1,672,449 | | | | 25.35 | |
Class C | | | 89,398,681 | | | | 3,557,681 | | | | 25.13 | |
Class I | | | 40,387,426 | | | | 1,409,468 | | | | 28.65 | |
Class R1 | | | 4,186,485 | | | | 166,681 | | | | 25.12 | |
Class R2 | | | 22,030,751 | | | | 816,050 | | | | 27.00 | |
Class R3 | | | 68,855,800 | | | | 2,509,472 | | | | 27.44 | |
Class R4 | | | 9,330,047 | | | | 337,024 | | | | 27.68 | |
Class R5 | | | 2,364,755 | | | | 82,461 | | | | 28.68 | |
| (a) | Maximum offering price per share was equal to the net asset value per share for all share classes, except for Class A, for which the maximum offering price per share was $29.20 [100 / 94.25 x $27.52]. On sales of $50,000 or more, the maximum offering price of Class A shares is reduced. A contingent deferred sales charge may be imposed on redemptions of Class A, Class B, and Class C shares. Redemption price per share was equal to the net asset value per share for Classes I, R1, R2, R3, R4, and R5. |
See Notes to Financial Statements
15
Financial Statements
STATEMENT OF OPERATIONS
Six months ended 2/28/14 (unaudited)
This statement describes how much your fund earned in investment income and accrued in expenses. It also describes any gains and/or losses generated by fund operations.
| | | | |
| Net investment income | | | | |
Income | | | | |
Dividends | | | $9,589,306 | |
Interest | | | 6,075 | |
Dividends from underlying affiliated funds | | | 8,589 | |
Foreign taxes withheld | | | (17,559 | ) |
Total investment income | | | $9,586,411 | |
Expenses | | | | |
Management fee | | | $3,543,297 | |
Distribution and service fees | | | 1,953,104 | |
Shareholder servicing costs | | | 928,848 | |
Administrative services fee | | | 75,445 | |
Independent Trustees’ compensation | | | 19,590 | |
Custodian fee | | | 55,975 | |
Shareholder communications | | | 46,304 | |
Audit and tax fees | | | 26,038 | |
Legal fees | | | 5,106 | |
Interest expense on securities sold short | | | 351 | |
Miscellaneous | | | 91,461 | |
Total expenses | | | $6,745,519 | |
Fees paid indirectly | | | (16 | ) |
Reduction of expenses by investment adviser and distributor | | | (44,189 | ) |
Net expenses | | | $6,701,314 | |
Net investment income | | | $2,885,097 | |
| Realized and unrealized gain (loss) on investments and foreign currency | |
Realized gain (loss) (identified cost basis) | | | | |
Investments | | | $57,978,738 | |
Written options | | | 53,455 | |
Foreign currency | | | (1,333 | ) |
Net realized gain (loss) on investments and foreign currency | | | $58,030,860 | |
Change in unrealized appreciation (depreciation) | | | | |
Investments | | | $118,352,080 | |
Written options | | | (47,199 | ) |
Translation of assets and liabilities in foreign currencies | | | 295 | |
Net unrealized gain (loss) on investments and foreign currency translation | | | $118,305,176 | |
Net realized and unrealized gain (loss) on investments and foreign currency | | | $176,336,036 | |
Change in net assets from operations | | | $179,221,133 | |
See Notes to Financial Statements
16
Financial Statements
STATEMENTS OF CHANGES IN NET ASSETS
These statements describe the increases and/or decreases in net assets resulting from operations, any distributions, and any shareholder transactions.
| | | | | | | | |
| Change in net assets | | Six months ended 2/28/14 (unaudited) | | | Year ended 8/31/13 | |
| From operations | | | | | | | | |
Net investment income | | | $2,885,097 | | | | $7,150,590 | |
Net realized gain (loss) on investments and foreign currency | | | 58,030,860 | | | | 100,554,062 | |
Net unrealized gain (loss) on investments and foreign currency translation | | | 118,305,176 | | | | 82,341,558 | |
Change in net assets from operations | | | $179,221,133 | | | | $190,046,210 | |
| Distributions declared to shareholders | | | | | | | | |
From net investment income | | | $(7,149,277 | ) | | | $(4,250,197 | ) |
Change in net assets from fund share transactions | | | $(18,187,143 | ) | | | $39,750,638 | |
Total change in net assets | | | $153,884,713 | | | | $225,546,651 | |
| Net assets | | | | | | | | |
At beginning of period | | | 1,110,352,410 | | | | 884,805,759 | |
At end of period (including undistributed net investment income of $2,773,046 and $7,037,226, respectively) | | | $1,264,237,123 | | | | $1,110,352,410 | |
See Notes to Financial Statements
17
Financial Statements
FINANCIAL HIGHLIGHTS
The financial highlights table is intended to help you understand the fund’s financial performance for the semiannual period and the past 5 fiscal years (or life of a particular share class, if shorter). Certain information reflects financial results for a single fund share. The total returns in the table represent the rate by which an investor would have earned (or lost) on an investment in the fund share class (assuming reinvestment of all distributions) held for the entire period.
| | | | | | | | | | | | | | | | | | | | | | | | |
| | | Six months
ended
2/28/14
(unaudited) | | | Years ended 8/31 | |
| Class A | | | 2013 | | | 2012 | | | 2011 | | | 2010 | | | 2009 | |
| | | | | | | | | | | | | | | | | |
Net asset value, beginning of period | | | $23.82 | | | | $19.68 | | | | $17.20 | | | | $14.62 | | | | $13.87 | | | | $16.75 | |
| Income (loss) from investment operations | | | | | |
Net investment income (d) | | | $0.07 | | | | $0.18 | | | | $0.11 | | | | $0.11 | | | | $0.10 | | | | $0.12 | |
Net realized and unrealized gain
(loss) on investments and
foreign currency | | | 3.80 | | | | 4.07 | | | | 2.47 | | | | 2.58 | | | | 0.77 | | | | (2.92 | ) |
Total from investment operations | | | $3.87 | | | | $4.25 | | | | $2.58 | | | | $2.69 | | | | $0.87 | | | | $(2.80 | ) |
| Less distributions declared to shareholders | | | | | |
From net investment income | | | $(0.17 | ) | | | $(0.11 | ) | | | $(0.10 | ) | | | $(0.11 | ) | | | $(0.12 | ) | | | $(0.08 | ) |
Net asset value, end of period (x) | | | $27.52 | | | | $23.82 | | | | $19.68 | | | | $17.20 | | | | $14.62 | | | | $13.87 | |
Total return (%) (r)(s)(t)(x) | | | 16.28 | (n) | | | 21.69 | | | | 15.10 | | | | 18.39 | | | | 6.27 | | | | (16.55 | ) |
Ratios (%) (to average net assets)
and Supplemental data: | | | | | |
Expenses before expense reductions (f) | | | 1.05 | (a) | | | 1.11 | | | | 1.15 | | | | 1.18 | | | | 1.24 | | | | 1.36 | |
Expenses after expense reductions (f) | | | 1.04 | (a) | | | 1.11 | | | | 1.15 | | | | 1.18 | | | | 1.23 | | | | 1.21 | |
Net investment income | | | 0.56 | (a) | | | 0.81 | | | | 0.61 | | | | 0.60 | | | | 0.68 | | | | 1.03 | |
Portfolio turnover | | | 27 | (n) | | | 58 | | | | 65 | | | | 66 | | | | 77 | | | | 109 | |
Net assets at end of period
(000 omitted) | | | $985,293 | | | | $873,139 | | | | $686,616 | | | | $612,504 | | | | $547,296 | | | | $559,572 | |
| Supplemental Ratios (%): | | | | | |
Ratio of expenses to average net assets
after expense reductions excluding
short sale dividend and interest
expense (f) | | | 1.04 | (a) | | | 1.10 | | | | 1.15 | | | | 1.17 | | | | 1.22 | | | | 1.21 | |
See Notes to Financial Statements
18
Financial Highlights – continued
| | | | | | | | | | | | | | | | | | | | | | | | |
| | | Six months
ended
2/28/14 (unaudited) | | | Years ended 8/31 | |
| Class B | | | 2013 | | | 2012 | | | 2011 | | | 2010 | | | 2009 | |
| | | | | | | | | | | | | | | | | |
Net asset value, beginning of period | | | $21.88 | | | | $18.11 | | | | $15.86 | | | | $13.50 | | | | $12.80 | | | | $15.45 | |
| Income (loss) from investment operations | | | | | |
Net investment income (loss) (d) | | | $(0.02 | ) | | | $0.01 | | | | $(0.02 | ) | | | $(0.02 | ) | | | $(0.01 | ) | | | $0.05 | |
Net realized and unrealized gain
(loss) on investments and
foreign currency | | | 3.49 | | | | 3.76 | | | | 2.27 | | | | 2.38 | | | | 0.71 | | | | (2.70 | ) |
Total from investment operations | | | $3.47 | | | | $3.77 | | | | $2.25 | | | | $2.36 | | | | $0.70 | | | | $(2.65 | ) |
| Less distributions declared to shareholders | | | | | |
From net investment income | | | $— | | | | $— | | | | $— | | | | $— | | | | $(0.00 | )(w) | | | $— | |
Net asset value, end of period (x) | | | $25.35 | | | | $21.88 | | | | $18.11 | | | | $15.86 | | | | $13.50 | | | | $12.80 | |
Total return (%) (r)(s)(t)(x) | | | 15.86 | (n) | | | 20.82 | | | | 14.19 | | | | 17.48 | | | | 5.49 | | | | (17.15 | ) |
Ratios (%) (to average net assets)
and Supplemental data: | | | | | |
Expenses before expense reductions (f) | | | 1.80 | (a) | | | 1.86 | | | | 1.91 | | | | 1.93 | | | | 1.99 | | | | 2.07 | |
Expenses after expense reductions (f) | | | 1.79 | (a) | | | 1.86 | | | | 1.90 | | | | 1.93 | | | | 1.98 | | | | 1.90 | |
Net investment income (loss) | | | (0.20 | )(a) | | | 0.07 | | | | (0.14 | ) | | | (0.15 | ) | | | (0.06 | ) | | | 0.42 | |
Portfolio turnover | | | 27 | (n) | | | 58 | | | | 65 | | | | 66 | | | | 77 | | | | 109 | |
Net assets at end of period
(000 omitted) | | | $42,390 | | | | $40,495 | | | | $43,320 | | | | $49,181 | | | | $55,327 | | | | $79,608 | |
| Supplemental Ratios (%): | | | | | |
Ratio of expenses to average net assets
after expense reductions excluding
short sale dividend and interest
expense (f) | | | 1.79 | (a) | | | 1.86 | | | | 1.90 | | | | 1.92 | | | | 1.97 | | | | 1.90 | |
See Notes to Financial Statements
19
Financial Highlights – continued
| | | | | | | | | | | | | | | | | | | | | | | | |
| | | Six months
ended
2/28/14
(unaudited) | | | Years ended 8/31 | |
| Class C | | | 2013 | | | 2012 | | | 2011 | | | 2010 | | | 2009 | |
| | | | | | | | | | | | | | | | | |
Net asset value, beginning of period | | | $21.72 | | | | $17.98 | | | | $15.74 | | | | $13.39 | | | | $12.75 | | | | $15.38 | |
| Income (loss) from investment operations | | | | | |
Net investment income (loss) (d) | | | $(0.02 | ) | | | $0.01 | | | | $(0.02 | ) | | | $(0.02 | ) | | | $(0.01 | ) | | | $0.04 | |
Net realized and unrealized gain
(loss) on investments and
foreign currency | | | 3.46 | | | | 3.73 | | | | 2.26 | | | | 2.37 | | | | 0.70 | | | | (2.67 | ) |
Total from investment operations | | | $3.44 | | | | $3.74 | | | | $2.24 | | | | $2.35 | | | | $0.69 | | | | $(2.63 | ) |
| Less distributions declared to shareholders | | | | | |
From net investment income | | | $(0.03 | ) | | | $— | | | | $— | | | | $— | | | | $(0.05 | ) | | | $— | |
Net asset value, end of period (x) | | | $25.13 | | | | $21.72 | | | | $17.98 | | | | $15.74 | | | | $13.39 | | | | $12.75 | |
Total return (%) (r)(s)(t)(x) | | | 15.83 | (n) | | | 20.80 | | | | 14.23 | | | | 17.55 | | | | 5.40 | | | | (17.10 | ) |
Ratios (%) (to average net assets)
and Supplemental data: | | | | | |
Expenses before expense reductions (f) | | | 1.80 | (a) | | | 1.86 | | | | 1.90 | | | | 1.93 | | | | 1.99 | | | | 2.06 | |
Expenses after expense reductions (f) | | | 1.79 | (a) | | | 1.86 | | | | 1.90 | | | | 1.93 | | | | 1.98 | | | | 1.91 | |
Net investment income (loss) | | | (0.19 | )(a) | | | 0.06 | | | | (0.14 | ) | | | (0.15 | ) | | | (0.07 | ) | | | 0.34 | |
Portfolio turnover | | | 27 | (n) | | | 58 | | | | 65 | | | | 66 | | | | 77 | | | | 109 | |
Net assets at end of period
(000 omitted) | | | $89,399 | | | | $78,777 | | | | $64,258 | | | | $62,249 | | | | $59,265 | | | | $63,993 | |
| Supplemental Ratios (%): | | | | | |
Ratio of expenses to average net assets
after expense reductions excluding
short sale dividend and interest
expense (f) | | | 1.79 | (a) | | | 1.86 | | | | 1.90 | | | | 1.92 | | | | 1.97 | | | | 1.91 | |
See Notes to Financial Statements
20
Financial Highlights – continued
| | | | | | | | | | | | | | | | | | | | | | | | |
| | | Six months
ended
2/28/14
(unaudited) | | | Years ended 8/31 | |
| Class I | | | 2013 | | | 2012 | | | 2011 | | | 2010 | | | 2009 | |
| | | | | | | | | | | | | | | | | |
Net asset value, beginning of period | | | $24.82 | | | | $20.49 | | | | $17.91 | | | | $15.21 | | | | $14.43 | | | | $17.47 | |
| Income (loss) from investment operations | | | | | |
Net investment income (d) | | | $0.11 | | | | $0.24 | | | | $0.16 | | | | $0.15 | | | | $0.15 | | | | $0.17 | |
Net realized and unrealized gain
(loss) on investments and
foreign currency | | | 3.94 | | | | 4.25 | | | | 2.57 | | | | 2.70 | | | | 0.79 | | | | (3.06 | ) |
Total from investment operations | | | $4.05 | | | | $4.49 | | | | $2.73 | | | | $2.85 | | | | $0.94 | | | | $(2.89 | ) |
| Less distributions declared to shareholders | | | | | |
From net investment income | | | $(0.22 | ) | | | $(0.16 | ) | | | $(0.15 | ) | | | $(0.15 | ) | | | $(0.16 | ) | | | $(0.15 | ) |
Net asset value, end of period (x) | | | $28.65 | | | | $24.82 | | | | $20.49 | | | | $17.91 | | | | $15.21 | | | | $14.43 | |
Total return (%) (r)(s)(x) | | | 16.38 | (n) | | | 22.03 | | | | 15.36 | | | | 18.73 | | | | 6.47 | | | | (16.29 | ) |
Ratios (%) (to average net assets)
and Supplemental data: | | | | | |
Expenses before expense reductions (f) | | | 0.80 | (a) | | | 0.86 | | | | 0.90 | | | | 0.93 | | | | 0.99 | | | | 1.06 | |
Expenses after expense reductions (f) | | | 0.80 | (a) | | | 0.86 | | | | 0.90 | | | | 0.93 | | | | 0.98 | | | | 0.91 | |
Net investment income | | | 0.80 | (a) | | | 1.05 | | | | 0.86 | | | | 0.83 | | | | 0.93 | | | | 1.32 | |
Portfolio turnover | | | 27 | (n) | | | 58 | | | | 65 | | | | 66 | | | | 77 | | | | 109 | |
Net assets at end of period
(000 omitted) | | | $40,387 | | | | $29,812 | | | | $20,441 | | | | $17,250 | | | | $16,291 | | | | $15,766 | |
| Supplemental Ratios (%): | | | | | |
Ratio of expenses to average net assets
after expense reductions excluding
short sale dividend and interest
expense (f) | | | 0.80 | (a) | | | 0.86 | | | | 0.90 | | | | 0.92 | | | | 0.97 | | | | 0.91 | |
See Notes to Financial Statements
21
Financial Highlights – continued
| | | | | | | | | | | | | | | | | | | | | | | | |
| | | Six months
ended
2/28/14 (unaudited) | | | Years ended 8/31 | |
| Class R1 | | | 2013 | | | 2012 | | | 2011 | | | 2010 | | | 2009 | |
| | | | | | | | | | | | | | | | | |
Net asset value, beginning of period | | | $21.69 | | | | $17.95 | | | | $15.72 | | | | $13.38 | | | | $12.75 | | | | $15.39 | |
| Income (loss) from investment operations | | | | | |
Net investment income (loss) (d) | | | $(0.02 | ) | | | $0.02 | | | | $(0.02 | ) | | | $(0.02 | ) | | | $(0.01 | ) | | | $0.04 | |
Net realized and unrealized gain
(loss) on investments and
foreign currency | | | 3.45 | | | | 3.72 | | | | 2.25 | | | | 2.37 | | | | 0.70 | | | | (2.68 | ) |
Total from investment operations | | | $3.43 | | | | $3.74 | | | | $2.23 | | | | $2.35 | | | | $0.69 | | | | $(2.64 | ) |
| Less distributions declared to shareholders | | | | | |
From net investment income | | | $(0.00 | )(w) | | | $— | | | | $— | | | | $(0.01 | ) | | | $(0.06 | ) | | | $— | |
Net asset value, end of period (x) | | | $25.12 | | | | $21.69 | | | | $17.95 | | | | $15.72 | | | | $13.38 | | | | $12.75 | |
Total return (%) (r)(s)(x) | | | 15.83 | (n) | | | 20.84 | | | | 14.19 | | | | 17.56 | | | | 5.43 | | | | (17.15 | ) |
Ratios (%) (to average net assets)
and Supplemental data: | | | | | |
Expenses before expense reductions (f) | | | 1.80 | (a) | | | 1.86 | | | | 1.90 | | | | 1.93 | | | | 1.99 | | | | 2.06 | |
Expenses after expense reductions (f) | | | 1.79 | (a) | | | 1.86 | | | | 1.90 | | | | 1.93 | | | | 1.98 | | | | 1.91 | |
Net investment income (loss) | | | (0.20 | )(a) | | | 0.08 | | | | (0.14 | ) | | | (0.15 | ) | | | (0.07 | ) | | | 0.32 | |
Portfolio turnover | | | 27 | (n) | | | 58 | | | | 65 | | | | 66 | | | | 77 | | | | 109 | |
Net assets at end of period
(000 omitted) | | | $4,186 | | | | $3,839 | | | | $4,098 | | | | $3,904 | | | | $3,688 | | | | $3,735 | |
| Supplemental Ratios (%): | | | | | |
Ratio of expenses to average net assets
after expense reductions excluding
short sale dividend and interest
expense (f) | | | 1.79 | (a) | | | 1.85 | | | | 1.90 | | | | 1.92 | | | | 1.97 | | | | 1.91 | |
See Notes to Financial Statements
22
Financial Highlights – continued
| | | | | | | | | | | | | | | | | | | | | | | | |
| | | Six months
ended
2/28/14 (unaudited) | | | Years ended 8/31 | |
| Class R2 | | | 2013 | | | 2012 | | | 2011 | | | 2010 | | | 2009 | |
| | | | | | | | | | | | | | | | | |
Net asset value, beginning of period | | | $23.35 | | | | $19.28 | | | | $16.86 | | | | $14.33 | | | | $13.62 | | | | $16.45 | |
| Income (loss) from investment operations | | | | | | | | | | | | | | | | | | | | | |
Net investment income (d) | | | $0.04 | | | | $0.12 | | | | $0.06 | | | | $0.06 | | | | $0.06 | | | | $0.10 | |
Net realized and unrealized gain
(loss) on investments and
foreign currency | | | 3.72 | | | | 4.00 | | | | 2.42 | | | | 2.54 | | | | 0.75 | | | | (2.87 | ) |
Total from investment operations | | | $3.76 | | | | $4.12 | | | | $2.48 | | | | $2.60 | | | | $0.81 | | | | $(2.77 | ) |
| Less distributions declared to shareholders | | | | | | | | | | | | | | | | | | | | | |
From net investment income | | | $(0.11 | ) | | | $(0.05 | ) | | | $(0.06 | ) | | | $(0.07 | ) | | | $(0.10 | ) | | | $(0.06 | ) |
Net asset value, end of period (x) | | | $27.00 | | | | $23.35 | | | | $19.28 | | | | $16.86 | | | | $14.33 | | | | $13.62 | |
Total return (%) (r)(s)(x) | | | 16.12 | (n) | | | 21.44 | | | | 14.74 | | | | 18.14 | | | | 5.97 | | | | (16.71 | ) |
Ratios (%) (to average net assets)
and Supplemental data: | | | | | | | | | | | | | | | | | | | | | | | | |
Expenses before expense reductions (f) | | | 1.30 | (a) | | | 1.36 | | | | 1.40 | | | | 1.43 | | | | 1.49 | | | | 1.56 | |
Expenses after expense reductions (f) | | | 1.30 | (a) | | | 1.36 | | | | 1.40 | | | | 1.43 | | | | 1.48 | | | | 1.41 | |
Net investment income | | | 0.30 | (a) | | | 0.56 | | | | 0.36 | | | | 0.35 | | | | 0.43 | | | | 0.82 | |
Portfolio turnover | | | 27 | (n) | | | 58 | | | | 65 | | | | 66 | | | | 77 | | | | 109 | |
Net assets at end of period
(000 omitted) | | | $22,031 | | | | $19,625 | | | | $17,369 | | | | $16,424 | | | | $14,013 | | | | $15,483 | |
| Supplemental Ratios (%): | | | | | | | | | | | | | | | | | | | | | | | | |
Ratio of expenses to average net assets
after expense reductions excluding
short sale dividend and interest
expense (f) | | | 1.30 | | | | 1.36 | | | | 1.40 | | | | 1.42 | | | | 1.47 | | | | 1.41 | |
See Notes to Financial Statements
23
Financial Highlights – continued
| | | | | | | | | | | | | | | | | | | | | | | | |
| | | Six months
ended
2/28/14 (unaudited) | | | Years ended 8/31 | |
| Class R3 | | | 2013 | | | 2012 | | | 2011 | | | 2010 | | | 2009 | |
| | | | | | | | | | | | | | | | | |
Net asset value, beginning of period | | | $23.75 | | | | $19.63 | | | | $17.16 | | | | $14.59 | | | | $13.85 | | | | $16.73 | |
| Income (loss) from investment operations | | | | | | | | | | | | | | | | | | | | | |
Net investment income (d) | | | $0.07 | | | | $0.18 | | | | $0.11 | | | | $0.11 | | | | $0.10 | | | | $0.13 | |
Net realized and unrealized gain
(loss) on investments and
foreign currency | | | 3.79 | | | | 4.05 | | | | 2.47 | | | | 2.57 | | | | 0.77 | | | | (2.91 | ) |
Total from investment operations | | | $3.86 | | | | $4.23 | | | | $2.58 | | | | $2.68 | | | | $0.87 | | | | $(2.78 | ) |
| Less distributions declared to shareholders | | | | | | | | | | | | | | | | | | | | | |
From net investment income | | | $(0.17 | ) | | | $(0.11 | ) | | | $(0.11 | ) | | | $(0.11 | ) | | | $(0.13 | ) | | | $(0.10 | ) |
Net asset value, end of period (x) | | | $27.44 | | | | $23.75 | | | | $19.63 | | | | $17.16 | | | | $14.59 | | | | $13.85 | |
Total return (%) (r)(s)(x) | | | 16.29 | (n) | | | 21.68 | | | | 15.12 | | | | 18.38 | | | | 6.25 | | | | (16.48 | ) |
Ratios (%) (to average net assets)
and Supplemental data: | | | | | | | | | | | | | | | | | | | | | | | | |
Expenses before expense reductions (f) | | | 1.05 | (a) | | | 1.11 | | | | 1.15 | | | | 1.18 | | | | 1.24 | | | | 1.32 | |
Expenses after expense reductions (f) | | | 1.04 | (a) | | | 1.11 | | | | 1.15 | | | | 1.18 | | | | 1.23 | | | | 1.16 | |
Net investment income | | | 0.56 | (a) | | | 0.81 | | | | 0.61 | | | | 0.60 | | | | 0.68 | | | | 1.07 | |
Portfolio turnover | | | 27 | (n) | | | 58 | | | | 65 | | | | 66 | | | | 77 | | | | 109 | |
Net assets at end of period
(000 omitted) | | | $68,856 | | | | $58,381 | | | | $46,833 | | | | $32,277 | | | | $26,573 | | | | $25,741 | |
| Supplemental Ratios (%): | | | | | | | | | | | | | | | | | | | | | | | | |
Ratio of expenses to average net assets
after expense reductions excluding
short sale dividend and interest
expense (f) | | | 1.04 | (a) | | | 1.10 | | | | 1.15 | | | | 1.17 | | | | 1.22 | | | | 1.16 | |
See Notes to Financial Statements
24
Financial Highlights – continued
| | | | | | | | | | | | | | | | | | | | | | | | |
| | | Six months
ended
2/28/14 (unaudited) | | | Years ended 8/31 | |
| Class R4 | | | 2013 | | | 2012 | | | 2011 | | | 2010 | | | 2009 | |
| | | | | | | | | | | | | | | | | |
Net asset value, beginning of period | | | $23.99 | | | | $19.81 | | | | $17.32 | | | | $14.72 | | | | $13.98 | | | | $16.92 | |
| Income (loss) from investment operations | | | | | | | | | | | | | | | | | | | | | |
Net investment income (d) | | | $0.11 | | | | $0.23 | | | | $0.16 | | | | $0.13 | | | | $0.14 | | | | $0.10 | |
Net realized and unrealized gain
(loss) on investments and
foreign currency | | | 3.81 | | | | 4.11 | | | | 2.48 | | | | 2.62 | | | | 0.76 | | | | (2.90 | ) |
Total from investment operations | | | $3.92 | | | | $4.34 | | | | $2.64 | | | | $2.75 | | | | $0.90 | | | | $(2.80 | ) |
| Less distributions declared to shareholders | | | | | | | | | | | | | | | | | | | | | |
From net investment income | | | $(0.23 | ) | | | $(0.16 | ) | | | $(0.15 | ) | | | $(0.15 | ) | | | $(0.16 | ) | | | $(0.14 | ) |
Net asset value, end of period (x) | | | $27.68 | | | | $23.99 | | | | $19.81 | | | | $17.32 | | | | $14.72 | | | | $13.98 | |
Total return (%) (r)(s)(x) | | | 16.39 | (n) | | | 22.03 | | | | 15.36 | | | | 18.68 | | | | 6.40 | | | | (16.28 | ) |
Ratios (%) (to average net assets)
and Supplemental data: | | | | | | | | | | | | | | | | | | | | | |
Expenses before expense reductions (f) | | | 0.80 | (a) | | | 0.86 | | | | 0.91 | | | | 0.92 | | | | 0.98 | | | | 0.96 | |
Expenses after expense reductions (f) | | | 0.80 | (a) | | | 0.86 | | | | 0.90 | | | | 0.92 | | | | 0.97 | | | | 0.95 | |
Net investment income | | | 0.82 | (a) | | | 1.04 | | | | 0.86 | | | | 0.75 | | | | 0.92 | | | | 0.75 | |
Portfolio turnover | | | 27 | (n) | | | 58 | | | | 65 | | | | 66 | | | | 77 | | | | 109 | |
Net assets at end of period
(000 omitted) | | | $9,330 | | | | $6,165 | | | | $1,871 | | | | $1,367 | | | | $408 | | | | $1,633 | |
| Supplemental Ratios (%): | | | | | | | | | | | | | | | | | | | | | | | | |
Ratio of expenses to average net assets
after expense reductions excluding
short sale dividend and interest
expense (f) | | | 0.80 | (a) | | | 0.86 | | | | 0.90 | | | | 0.91 | | | | 0.97 | | | | 0.95 | |
See Notes to Financial Statements
25
Financial Highlights – continued
| | | | | | | | |
| | | Six months
ended
2/28/14 | | | Year ended
8/31/13 (i) | |
| Class R5 | | |
| | | (unaudited) | | | | |
Net asset value, beginning of period | | | $24.84 | | | | $21.02 | |
| Income (loss) from investment operations | | | | | |
Net investment income (d) | | | $0.12 | | | | $0.22 | |
Net realized and unrealized gain (loss) on investments and
foreign currency | | | 3.96 | | | | 3.60 | |
Total from investment operations | | | $4.08 | | | | $3.82 | |
| Less distributions declared to shareholders | | | | | |
From net investment income | | | $(0.24 | ) | | | $— | |
Net asset value, end of period (x) | | | $28.68 | | | | $24.84 | |
Total return (%) (r)(s)(x) | | | 16.46 | (n) | | | 18.17 | (n) |
Ratios (%) (to average net assets)
and Supplemental data: | | | | | | | | |
Expenses before expense reductions (f) | | | 0.71 | (a) | | | 0.76 | (a) |
Expenses after expense reductions (f) | | | 0.71 | (a) | | | 0.76 | (a) |
Net investment income | | | 0.85 | (a) | | | 1.39 | (a) |
Portfolio turnover | | | 27 | (n) | | | 58 | |
Net assets at end of period (000 omitted) | | | $2,365 | | | | $119 | |
| Supplemental Ratios (%): | | | | | | | | |
Ratio of expenses to average net assets after expense reductions
excluding short sale dividend and interest expense (f) | | | 0.71 | (a) | | | 0.75 | (a) |
| (d) | Per share data is based on average shares outstanding. |
| (f) | Ratios do not reflect reductions from fees paid indirectly, if applicable. |
| (i) | For the period from the class inception, January 2, 2013, through the stated period end. |
| (r) | Certain expenses have been reduced without which performance would have been lower. |
| (s) | From time to time the fund may receive proceeds from litigation settlements, without which performance would be lower. Excluding the effect of the proceeds received from a nonrecurring litigation settlement against Enron Corp, the Class A, Class B, Class C, Class I, Class R1, Class R2, Class R3, and Class R4 total returns for the year ended August 31, 2009 would have been lower by approximately 2.41%, 2.40%, 2.42%, 2.40%, 2.40%, 2.36%, 2.40%, and 2.40%, respectively. |
| (t) | Total returns do not include any applicable sales charges. |
| (w) | Per share amount was less than $0.01. |
| (x) | The net asset values per share and total returns have been calculated on net assets which include adjustments made in accordance with U.S. generally accepted accounting principles required at period end for financial reporting purposes. |
See Notes to Financial Statements
26
NOTES TO FINANCIAL STATEMENTS
(unaudited)
(1) Business and Organization
MFS Core Equity Fund (the fund) is a diversified series of MFS Series Trust I (the trust). The trust is organized as a Massachusetts business trust and is registered under the Investment Company Act of 1940, as amended, as an open-end management investment company.
(2) Significant Accounting Policies
General – The preparation of financial statements in conformity with U.S. generally accepted accounting principles requires management to make estimates and assumptions that affect the reported amounts of assets and liabilities, and disclosure of contingent assets and liabilities at the date of the financial statements and the reported amounts of increases and decreases in net assets from operations during the reporting period. Actual results could differ from those estimates. In the preparation of these financial statements, management has evaluated subsequent events occurring after the date of the fund’s Statement of Assets and Liabilities through the date that the financial statements were issued.
In this reporting period, the fund adopted the disclosure provisions of the Financial Accounting Standards Board (FASB) Accounting Standards Update 2011-11 (“ASU 2011-11”), Balance Sheet (Topic 210) – Disclosures about Offsetting Assets and Liabilities along with the related scope clarification provisions of FASB Accounting Standards Update 2013-01 (“ASU 2013-01”) entitled Balance Sheet (Topic 210) – Clarifying the Scope of Disclosures about Offsetting Assets and Liabilities. ASU 2011-11 is intended to enhance disclosures on the offsetting of financial assets and liabilities by requiring entities to disclose both gross and net information about financial instruments and transactions that are either offset in the statement of financial position or subject to a an enforceable Master Netting Agreement or similar arrangement. ASU 2013-01 limits the scope of ASU 2011-11’s disclosure requirements on offsetting to financial assets and financial liabilities related to derivatives, repurchase and reverse repurchase agreements, and securities lending and securities borrowing transactions. The disclosures required by ASU 2011-11, to the extent applicable to the fund, have been included in the fund’s Significant Accounting Policies note under the captions for each of the fund’s in-scope financial instruments and transactions.
In June 2013, FASB issued Accounting Standards Update 2013-08 (“ASU 2013-08”) Financial Services – Investment Companies (Topic 946) – Amendments to the Scope, Measurement, and Disclosure Requirements which is effective for interim and annual reporting periods in fiscal years that begin after December 15, 2013. ASU 2013-08 sets forth a methodology for determining whether an entity should be characterized as an investment company and prescribes fair value accounting for an investment company’s non-controlling ownership interest in another investment company. FASB has determined that a fund registered under the Investment Company Act of 1940 automatically meets ASU 2013-08’s criteria for an investment company. Although still evaluating the potential impacts of ASU 2013-08 to the fund, management expects that the impact of the fund’s adoption will be limited to additional financial statement disclosures.
27
Notes to Financial Statements (unaudited) – continued
Investment Valuations – Equity securities, including restricted equity securities, are generally valued at the last sale or official closing price as provided by a third-party pricing service on the market or exchange on which they are primarily traded. Equity securities, for which there were no sales reported that day, are generally valued at the last quoted daily bid quotation as provided by a third-party pricing service on the market or exchange on which such securities are primarily traded. Short-term instruments with a maturity at issuance of 60 days or less generally are valued at amortized cost, which approximates market value. Exchange-traded options are generally valued at the last sale or official closing price as provided by a third-party pricing service on the exchange on which such options are primarily traded. Exchange-traded options for which there were no sales reported that day are generally valued at the last daily bid quotation as provided by a third-party pricing service on the exchange on which such options are primarily traded. Options not traded on an exchange are generally valued at a broker/dealer bid quotation. Foreign currency options are generally valued at valuations provided by a third-party pricing service. Open-end investment companies are generally valued at net asset value per share. Securities and other assets generally valued on the basis of information from a third-party pricing service may also be valued at a broker/dealer bid quotation. Values obtained from third-party pricing services can utilize both transaction data and market information such as yield, quality, coupon rate, maturity, type of issue, trading characteristics, and other market data. The values of foreign securities and other assets and liabilities expressed in foreign currencies are converted to U.S. dollars using the mean of bid and asked prices for rates provided by a third-party pricing service.
The Board of Trustees has delegated primary responsibility for determining or causing to be determined the value of the fund’s investments (including any fair valuation) to the adviser pursuant to valuation policies and procedures approved by the Board. If the adviser determines that reliable market quotations are not readily available, investments are valued at fair value as determined in good faith by the adviser in accordance with such procedures under the oversight of the Board of Trustees. Under the fund’s valuation policies and procedures, market quotations are not considered to be readily available for most types of debt instruments and floating rate loans and many types of derivatives. These investments are generally valued at fair value based on information from third-party pricing services. In addition, investments may be valued at fair value if the adviser determines that an investment’s value has been materially affected by events occurring after the close of the exchange or market on which the investment is principally traded (such as foreign exchange or market) and prior to the determination of the fund’s net asset value, or after the halting of trading of a specific security where trading does not resume prior to the close of the exchange or market on which the security is principally traded. Events that occur on a frequent basis after foreign markets close (such as developments in foreign markets and significant movements in the U.S. markets) and prior to the determination of the fund’s net asset value may be deemed to have a material effect on the value of securities traded in foreign markets. Accordingly, the fund’s foreign equity securities may often be valued at fair value. The adviser generally relies on third-party pricing services or other information (such as the correlation with price movements of similar securities in the same or other markets; the type, cost and investment characteristics of the security; the business and financial
28
Notes to Financial Statements (unaudited) – continued
condition of the issuer; and trading and other market data) to assist in determining whether to fair value and at what value to fair value an investment. The value of an investment for purposes of calculating the fund’s net asset value can differ depending on the source and method used to determine value. When fair valuation is used, the value of an investment used to determine the fund’s net asset value may differ from quoted or published prices for the same investment. There can be no assurance that the fund could obtain the fair value assigned to an investment if it were to sell the investment at the same time at which the fund determines its net asset value per share.
Various inputs are used in determining the value of the fund’s assets or liabilities. These inputs are categorized into three broad levels. In certain cases, the inputs used to measure fair value may fall into different levels of the fair value hierarchy. In such cases, an investment’s level within the fair value hierarchy is based on the lowest level of input that is significant to the fair value measurement. The fund’s assessment of the significance of a particular input to the fair value measurement in its entirety requires judgment, and considers factors specific to the investment. Level 1 includes unadjusted quoted prices in active markets for identical assets or liabilities. Level 2 includes other significant observable market-based inputs (including quoted prices for similar securities, interest rates, prepayment speed, and credit risk). Level 3 includes unobservable inputs, which may include the adviser’s own assumptions in determining the fair value of investments. The following is a summary of the levels used as of February 28, 2014 in valuing the fund’s assets or liabilities:
| | | | | | | | | | | | | | | | |
| Investments at Value | | Level 1 | | | Level 2 | | | Level 3 | | | Total | |
| Equity Securities: | | | | | | | | | | | | | | | | |
United States | | | $1,208,036,763 | | | | $— | | | | $— | | | | $1,208,036,763 | |
Canada | | | 34,526,388 | | | | — | | | | — | | | | 34,526,388 | |
Israel | | | 10,997,618 | | | | — | | | | — | | | | 10,997,618 | |
Greece | | | 2,357,792 | | | | — | | | | — | | | | 2,357,792 | |
United Kingdom | | | — | | | | — | | | | 540,649 | | | | 540,649 | |
| Mutual Funds | | | 7,407,898 | | | | — | | | | — | | | | 7,407,898 | |
| Total Investments | | | $1,263,326,459 | | | | $— | | | | $540,649 | | | | $1,263,867,108 | |
For further information regarding security characteristics, see the Portfolio of Investments.
The following is a reconciliation of level 3 assets for which significant unobservable inputs were used to determine fair value. The fund’s policy is to recognize transfers between the levels as of the end of the period. The table presents the activity of level 3 securities held at the beginning and the end of the period.
| | | | |
| | | Equity Securities | |
| Balance as of 8/31/13 | | | $638,467 | |
Change in unrealized appreciation (depreciation) | | | (97,818 | ) |
| Balance as of 2/28/14 | | | $540,649 | |
The net change in unrealized appreciation (depreciation) from investments still held as level 3 at February 28, 2014 is $(97,818).
Foreign Currency Translation – Purchases and sales of foreign investments, income, and expenses are converted into U.S. dollars based upon currency exchange rates
29
Notes to Financial Statements (unaudited) – continued
prevailing on the respective dates of such transactions or on the reporting date for foreign denominated receivables and payables. Gains and losses attributable to foreign currency exchange rates on sales of securities are recorded for financial statement purposes as net realized gains and losses on investments. Gains and losses attributable to foreign exchange rate movements on receivables, payables, income and expenses are recorded for financial statement purposes as foreign currency transaction gains and losses. That portion of both realized and unrealized gains and losses on investments that results from fluctuations in foreign currency exchange rates is not separately disclosed.
Derivatives – The fund uses derivatives for different purposes, primarily to increase or decrease exposure to a particular market or segment of the market, or security, to increase or decrease interest rate or currency exposure, or as alternatives to direct investments. Derivatives are used for hedging or non-hedging purposes. While hedging can reduce or eliminate losses, it can also reduce or eliminate gains. When the fund uses derivatives as an investment to increase market exposure, or for hedging purposes, gains and losses from derivative instruments may be substantially greater than the derivative’s original cost.
The derivative instruments used by the fund were written options and purchased options. The fund’s period end derivatives, as presented in the Portfolio of Investments, generally are indicative of the volume of its derivative activity during the period.
The following table presents, by major type of derivative contract, the fair value, on a gross basis, of the asset and liability components of derivatives held by the fund at February 28, 2014 as reported in the Statement of Assets and Liabilities:
| | | | | | |
| | | | | Fair Value (a) | |
| Risk | | Derivative Contracts | | Asset Derivatives | |
| Equity | | Purchased Equity Options | | | $71,680 | |
| (a) | The value of purchased options outstanding is included in total investments, at value, within the fund’s Statement of Assets and Liabilities. |
The following table presents, by major type of derivative contract, the realized gain (loss) on derivatives held by the fund for the six months ended February 28, 2014 as reported in the Statement of Operations:
| | | | | | | | |
| Risk | | Investments
(Purchased
Options) | | | Written
Options | |
| Equity | | | $(52,612 | ) | | | $53,455 | |
The following table presents, by major type of derivative contract, the change in unrealized appreciation (depreciation) on derivatives held by the fund for the six months ended February 28, 2014 as reported in the Statement of Operations:
| | | | | | | | |
| Risk | | Investments
(Purchased
Options) | | | Written
Options | |
| Equity | | | $19,555 | | | | $(47,199 | ) |
Derivative counterparty credit risk is managed through formal evaluation of the creditworthiness of all potential counterparties. On certain, but not all,
30
Notes to Financial Statements (unaudited) – continued
over-the-counter derivatives, the fund attempts to reduce its exposure to counterparty credit risk whenever possible by entering into an International Swaps and Derivatives Association (ISDA) Master Agreement on a bilateral basis with each of the counterparties with whom it undertakes a significant volume of transactions. The ISDA Master Agreement gives each party to the agreement the right to terminate all transactions traded under such agreement if there is a certain deterioration in the credit quality of the other party. Upon an event of default or a termination of the ISDA Master Agreement, the non-defaulting party has the right to close out all transactions traded under such agreement and to net amounts owed under each transaction to one net amount payable by one party to the other. This right to close out and net payments across all transactions traded under the ISDA Master Agreement could result in a reduction of the fund’s credit risk to such counterparty equal to any amounts payable by the fund under the applicable transactions, if any. The fund’s right to setoff may be restricted or prohibited by the bankruptcy or insolvency laws of the particular jurisdiction to which a specific ISDA counterparty is subject.
Collateral and margin requirements differ by type of derivative. Margin requirements are set by the broker or clearing house for cleared derivatives (i.e., futures contracts, cleared swaps, and exchange-traded options) while collateral terms are contract specific for over-the-counter traded derivatives (i.e., forward foreign currency exchange contracts, uncleared swap agreements, and over-the-counter options). For derivatives traded under an ISDA Master Agreement, the collateral requirements are netted across all transactions traded under such agreement and one amount is posted from one party to the other to collateralize such obligations. Cash that has been segregated to cover the fund’s collateral or margin obligations under derivative contracts, if any, will be reported separately in the Statement of Assets and Liabilities as “Restricted cash” or “Deposits with brokers.” Securities pledged as collateral or margin for the same purpose, if any, are noted in the Portfolio of Investments.
The fund’s accounting policy with respect to balance sheet offsetting is that, absent an event of default by the counterparty or a termination of the agreement, the ISDA Master Agreement does not result in an offset of reported amounts of financial assets and financial liabilities in the Statement of Assets and Liabilities across transactions between the fund and the applicable counterparty.
Written Options – In exchange for a premium, the fund wrote call options on securities that it anticipated the price would decline and also wrote put options on securities that it anticipated the price would increase. At the time the option was written, the fund believed the premium received exceeded the potential loss that could result from adverse price changes in the options’ underlying securities. In a written option, the fund as the option writer grants the buyer the right to purchase from, or sell to, the fund a specified number of shares or units of a particular security, currency or index at a specified price within a specified period of time.
The premium received is initially recorded as a liability in the Statement of Assets and Liabilities. The option is subsequently marked-to-market daily with the difference between the premium received and the market value of the written option being recorded as unrealized appreciation or depreciation. When a written option expires, the fund realizes a gain equal to the amount of the premium received. The difference between the premium received and the amount paid on effecting a closing transaction
31
Notes to Financial Statements (unaudited) – continued
is considered a realized gain or loss. When a written call option is exercised, the premium received is offset against the proceeds to determine the realized gain or loss. When a written put option is exercised, the premium reduces the cost basis of the security purchased by the fund.
At the initiation of the written option contract, for exchange traded options, the fund is required to deposit securities or cash as collateral with the custodian for the benefit of the broker. For over-the-counter options, the fund may post collateral subject to the terms of an ISDA Master Agreement as generally described above if the market value of the options contract moves against it. The fund, as writer of an option, may have no control over whether the underlying securities may be sold (call) or purchased (put) and, as a result, bears the market risk of an unfavorable change in the price of the securities underlying the written option. Losses from writing options can exceed the premium received and can exceed the potential loss from an ordinary buy and sell transaction. Although the fund’s market risk may be significant, the maximum counterparty credit risk to the fund is equal to the market value of any collateral posted to the broker. For over-the-counter options, this risk is mitigated in cases where there is an ISDA Master Agreement between the fund and the counterparty providing for netting as described above.
The following table represents the written option activity in the fund during the six months ended February 28, 2014:
| | | | | | | | |
| | | Number of
Contracts | | | Premiums
Received | |
| Outstanding, beginning of period | | | 1,057 | | | | $53,131 | |
| Options written | | | 58 | | | | 11,712 | |
| Options exercised | | | (283 | ) | | | (11,388 | ) |
| Options expired | | | (832 | ) | | | (53,455 | ) |
| Outstanding, end of period | | | — | | | | $— | |
Purchased Options – The fund purchased call options for a premium. Purchased call options entitle the holder to buy a specified number of shares or units of a particular security, currency or index at a specified price at a specified date or within a specified period of time. Purchasing call options may hedge against an anticipated increase in the dollar cost of securities or currency to be acquired or increase the fund’s exposure to an underlying instrument.
The premium paid is initially recorded as an investment in the Statement of Assets and Liabilities. That investment is subsequently marked-to-market daily with the difference between the premium paid and the market value of the purchased option being recorded as unrealized appreciation or depreciation. Premiums paid for purchased call options which have expired are treated as realized losses on investments in the Statement of Operations. Upon the exercise or closing of a purchased call option, the premium paid is added to the cost of the security or financial instrument purchased.
Whether or not the option is exercised, the fund’s maximum risk of loss from purchasing an option is the amount of premium paid. All option contracts involve credit risk if the counterparty to the option contract fails to perform. For over-the-counter options, this risk is mitigated in cases where there is an ISDA Master Agreement between the fund and the counterparty providing for netting as described
32
Notes to Financial Statements (unaudited) – continued
above and for posting of collateral by the counterparty to the fund to cover the fund’s exposure to the counterparty under such ISDA Master Agreement.
Short Sales – The fund entered into short sales whereby it sells a security it does not own in anticipation of a decline in the value of that security. The fund will realize a gain if the security price decreases and a loss if the security price increases between the date of the short sale and the date on which the fund replaces the borrowed security. Losses from short sales can exceed the proceeds of the security sold; and they can also exceed the potential loss from an ordinary buy and sell transaction. The amount of any premium, dividends, or interest the fund may be required to pay in connection with a short sale will be recognized as a fund expense. During the six months ended February 28, 2014, this expense amounted to $351. The fund segregates cash or marketable securities in an amount that, when combined with the amount of proceeds from the short sale deposited with the broker, at least equals the current market value of the security sold short. At February 28, 2014, the fund had no short sales outstanding.
Security Loans – Under its Securities Lending Agency Agreement with the fund, State Street Bank and Trust Company (“State Street”), as lending agent, loans the securities of the fund to certain qualified institutions (the “Borrowers”) approved by the fund. The loans are collateralized by cash and/or U.S. Treasury and federal agency obligations in an amount typically at least equal to the market value of the securities loaned. The market value of the loaned securities is determined at the close of business of the fund and any additional required collateral is delivered to the fund on the next business day. State Street provides the fund with indemnification against Borrower default. In the event of Borrower default, State Street will for the benefit of the fund either purchase securities identical to those loaned or, when such purchase is commercially impracticable, pay the fund the market value of the loaned securities. In return, State Street assumes the fund’s rights to the related collateral. If the collateral value is less than the cost to purchase identical securities, State Street is responsible for the shortfall, but only to the extent that such shortfall is not due to a decline in collateral value resulting from collateral reinvestment for which the fund bears the risk of loss. On loans collateralized by cash, the cash collateral is invested in a money market fund or short-term securities. At period end, the fund had investment securities on loan with a fair value of $437,492 and a related liability of $447,643 for collateral received on securities loaned, both of which are presented gross on the Statement of Assets and Liabilities. Collateral for securities loaned is carried at fair value, which is categorized as level 2 within the fair value hierarchy. The collateral received on securities loaned exceeded the value of securities on loan at period end. A portion of the income generated upon investment of the collateral is remitted to the Borrowers, and the remainder is allocated between the fund and the lending agent. On loans collateralized by U.S. Treasury and/or federal agency obligations, a fee is received from the Borrower, and is allocated between the fund and the lending agent. Income from securities lending is included in “Interest” income in the Statement of Operations. The dividend and interest income earned on the securities loaned is accounted for in the same manner as other dividend and interest income.
Indemnifications – Under the fund’s organizational documents, its officers and Trustees may be indemnified against certain liabilities and expenses arising out of the
33
Notes to Financial Statements (unaudited) – continued
performance of their duties to the fund. Additionally, in the normal course of business, the fund enters into agreements with service providers that may contain indemnification clauses. The fund’s maximum exposure under these agreements is unknown as this would involve future claims that may be made against the fund that have not yet occurred.
Investment Transactions and Income – Investment transactions are recorded on the trade date. Interest income is recorded on the accrual basis. Dividends received in cash are recorded on the ex-dividend date. Certain dividends from foreign securities will be recorded when the fund is informed of the dividend if such information is obtained subsequent to the ex-dividend date. Dividend and interest payments received in additional securities are recorded on the ex-dividend or ex-interest date in an amount equal to the value of the security on such date.
The fund may receive proceeds from litigation settlements. Any proceeds received from litigation involving portfolio holdings are reflected in the Statement of Operations in realized gain/loss if the security has been disposed of by the fund or in unrealized gain/loss if the security is still held by the fund. Any other proceeds from litigation not related to portfolio holdings are reflected as other income in the Statement of Operations.
Fees Paid Indirectly – The fund’s custody fee may be reduced according to an arrangement that measures the value of cash deposited with the custodian by the fund. This amount, for the six months ended February 28, 2014, is shown as a reduction of total expenses in the Statement of Operations.
Tax Matters and Distributions – The fund intends to qualify as a regulated investment company, as defined under Subchapter M of the Internal Revenue Code, and to distribute all of its taxable income, including realized capital gains. As a result, no provision for federal income tax is required. The fund’s federal tax returns, when filed, will remain subject to examination by the Internal Revenue Service for a three year period. Management has analyzed the fund’s tax positions taken on federal and state tax returns for all open tax years and does not believe that there are any uncertain tax positions that require recognition of a tax liability. Foreign taxes, if any, have been accrued by the fund in the accompanying financial statements in accordance with the applicable foreign tax law. Foreign income taxes may be withheld by certain countries in which the fund invests. Additionally, capital gains realized by the fund on securities issued in or by certain foreign countries may be subject to capital gains tax imposed by those countries.
Distributions to shareholders are recorded on the ex-dividend date. Income and capital gain distributions are determined in accordance with income tax regulations, which may differ from U.S. generally accepted accounting principles. Certain capital accounts in the financial statements are periodically adjusted for permanent differences in order to reflect their tax character. These adjustments have no impact on net assets or net asset value per share. Temporary differences which arise from recognizing certain items of income, expense, gain or loss in different periods for financial statement and tax purposes will reverse at some time in the future. Distributions in excess of net investment income or net realized gains are temporary overdistributions for financial
34
Notes to Financial Statements (unaudited) – continued
statement purposes resulting from differences in the recognition or classification of income or distributions for financial statement and tax purposes.
Book/tax differences primarily relate to expiration of capital loss carryforwards and wash sale loss deferrals.
The tax character of distributions made during the current period will be determined at fiscal year end. The tax character of distributions declared to shareholders for the last fiscal year is as follows:
| | | | |
| | | 8/31/13 | |
Ordinary income (including any
short-term capital gains) | | | $4,250,197 | |
The federal tax cost and the tax basis components of distributable earnings were as follows:
| | | | |
| As of 2/28/14 | | | |
| Cost of investments | | | $974,122,232 | |
| Gross appreciation | | | 306,924,133 | |
| Gross depreciation | | | (17,179,257 | ) |
| Net unrealized appreciation (depreciation) | | | $289,744,876 | |
| |
| As of 8/31/13 | | | |
| Undistributed ordinary income | | | 7,148,276 | |
| Capital loss carryforwards | | | (10,472,027 | ) |
| Other temporary differences | | | (257,174 | ) |
| Net unrealized appreciation (depreciation) | | | 171,392,796 | |
The aggregate cost above includes prior fiscal year end tax adjustments, if applicable.
Under the Regulated Investment Company Modernization Act of 2010 (the “Act”), net capital losses recognized for fund fiscal years beginning after August 31, 2011 may be carried forward indefinitely, and their character is retained as short-term and/or long-term losses (“post-enactment losses”). Previously, net capital losses were carried forward for eight years and treated as short-term losses (“pre-enactment losses”). As a transition rule, the Act requires that all post-enactment net capital losses be used before pre-enactment net capital losses.
As of August 31, 2013, the fund had capital loss carryforwards available to offset future realized gains. Such pre-enactment losses expire as follows:
| | | | |
| 8/31/16 | | | $(9,599,724 | ) |
| 8/31/18 | | | (872,303 | ) |
| Total | | | $(10,472,027 | ) |
The availability of $9,599,724 of the capital loss carryforwards, which were acquired on July 24, 2009 in connection with the MFS New Endeavor Fund merger, may be limited in a given year.
Multiple Classes of Shares of Beneficial Interest – The fund offers multiple classes of shares, which differ in their respective distribution and service fees. The fund’s income, realized and unrealized gain (loss), and common expenses are allocated to
35
Notes to Financial Statements (unaudited) – continued
shareholders based on the daily net assets of each class. Dividends are declared separately for each class. Differences in per share dividend rates are generally due to differences in separate class expenses. Class B shares will convert to Class A shares approximately eight years after purchase. The fund’s distributions declared to shareholders as reported in the Statements of Changes in Net Assets are presented by class as follows:
| | | | | | | | |
| | | From net investment
income | |
| | | Six months
ended
2/28/14 | | | Year
ended
8/31/13 | |
| Class A | | | $6,151,825 | | | | $3,763,479 | |
| Class C | | | 97,951 | | | | — | |
| Class I | | | 313,713 | | | | 153,997 | |
| Class R1 | | | 485 | | | | — | |
| Class R2 | | | 88,902 | | | | 46,102 | |
| Class R3 | | | 423,237 | | | | 268,678 | |
| Class R4 | | | 72,032 | | | | 17,941 | |
| Class R5 | | | 1,132 | | | | — | |
| Total | | | $7,149,277 | | | | $4,250,197 | |
(3) Transactions with Affiliates
Investment Adviser – The fund has an investment advisory agreement with MFS to provide overall investment management and related administrative services and facilities to the fund. The management fee is computed daily and paid monthly at the following annual rates:
| | | | |
| First $500 million of average daily net assets | | | 0.65 | % |
| Average daily net assets in excess of $500 million | | | 0.55 | % |
The investment adviser has agreed in writing to reduce its management fee to 0.50% of average daily net assets in excess of $2.5 billion. This written agreement will continue until modified by the fund’s Board of Trustees, but such agreement will continue at least until December 31, 2014. For the six month period ended February 28, 2014, the fund’s average daily net assets did not exceed $2.5 billion and therefore, the management fee was not reduced in accordance with this agreement. MFS has also agreed in writing to reduce its management fee by a specified amount if certain MFS mutual fund assets exceed thresholds agreed to by MFS and the fund’s Board of Trustees. For the six months ended February 28, 2014, this management fee reduction amounted to $13,583, which is included in the reduction of total expenses in the Statement of Operations. The management fee incurred for the six months ended February 28, 2014 was equivalent to an annual effective rate of 0.59% of the fund’s average daily net assets.
For the period September 1, 2013 through December 31, 2013, the investment adviser had agreed in writing to pay a portion of the fund’s total annual operating expenses, exclusive of interest, taxes, extraordinary expenses, brokerage and transaction costs,
36
Notes to Financial Statements (unaudited) – continued
and investment-related expenses, such that total fund operating expenses did not exceed the following rates annually of each class’s average daily net assets:
| | | | | | | | | | | | | | | | | | | | | | | | | | | | | | | | | | |
| Classes | |
| A | | | B | | | C | | | I | | | R1 | | | R2 | | | R3 | | | R4 | | | R5 | |
| | 1.26% | | | | 2.01% | | | | 2.01% | | | | 1.01% | | | | 2.01% | | | | 1.51% | | | | 1.26% | | | | 1.01% | | | | 0.94% | |
This written agreement was terminated on December 31, 2013. For the period September 1, 2013 through December 31, 2013, the fund’s actual expenses did not exceed the limit and therefore, the investment adviser did not pay any portion of the fund’s expenses related to this agreement.
Distributor – MFS Fund Distributors, Inc. (MFD), a wholly-owned subsidiary of MFS, as distributor, received $156,760 for the six months ended February 28, 2014, as its portion of the initial sales charge on sales of Class A shares of the fund.
The Board of Trustees has adopted a distribution plan for certain class shares pursuant to Rule 12b-1 of the Investment Company Act of 1940.
The fund’s distribution plan provides that the fund will pay MFD for services provided by MFD and financial intermediaries in connection with the distribution and servicing of certain share classes. One component of the plan is a distribution fee paid to MFD and another component of the plan is a service fee paid to MFD. MFD may subsequently pay all, or a portion, of the distribution and/or service fees to financial intermediaries.
Distribution Plan Fee Table:
| | | | | | | | | | | | | | | | | | | | |
| | | Distribution
Fee Rate (d) | | | Service
Fee Rate (d) | | | Total
Distribution
Plan (d) | | | Annual
Effective
Rate (e) | | | Distribution
and Service
Fee | |
| Class A | | | — | | | | 0.25% | | | | 0.25% | | | | 0.24% | | | | $1,173,189 | |
| Class B | | | 0.75% | | | | 0.25% | | | | 1.00% | | | | 1.00% | | | | 208,716 | |
| Class C | | | 0.75% | | | | 0.25% | | | | 1.00% | | | | 1.00% | | | | 419,829 | |
| Class R1 | | | 0.75% | | | | 0.25% | | | | 1.00% | | | | 1.00% | | | | 20,019 | |
| Class R2 | | | 0.25% | | | | 0.25% | | | | 0.50% | | | | 0.50% | | | | 51,868 | |
| Class R3 | | | — | | | | 0.25% | | | | 0.25% | | | | 0.25% | | | | 79,483 | |
| Total Distribution and Service Fees | | | | $1,953,104 | |
| (d) | In accordance with the distribution plan for certain classes, the fund pays distribution and/or service fees equal to these annual percentage rates of each class’s average daily net assets. The distribution and service fee rates disclosed by class represent the current rates in effect at the end of the reporting period. Any rate changes, if applicable, are detailed below. |
| (e) | The annual effective rates represent actual fees incurred under the distribution plan for the six months ended February 28, 2014 based on each class’s average daily net assets. MFD has voluntarily agreed to rebate a portion of each class’s 0.25% service fee attributable to accounts for which MFD retains the 0.25% service fee except for accounts attributable to MFS or its affiliates’ seed money. For the six months ended February 28, 2014, this rebate amounted to $27,255, $377, $1,004, and $1,413 for Class A, Class B, Class C, and Class R3, respectively, and is included in the reduction of total expenses in the Statement of Operations. |
Certain Class A shares are subject to a contingent deferred sales charge (CDSC) in the event of a shareholder redemption within 18 months of purchase for shares purchased on or after August 1, 2012, and within 24 months of purchase for shares purchased prior to August 1, 2012. Class C shares are subject to a CDSC in the event of a
37
Notes to Financial Statements (unaudited) – continued
shareholder redemption within 12 months of purchase. Class B shares are subject to a CDSC in the event of a shareholder redemption within six years of purchase. All contingent deferred sales charges are paid to MFD and during the six months ended February 28, 2014, were as follows:
| | | | |
| | | Amount | |
| Class A | | | $2,586 | |
| Class B | | | 16,627 | |
| Class C | | | 3,074 | |
Shareholder Servicing Agent – MFS Service Center, Inc. (MFSC), a wholly-owned subsidiary of MFS, receives a fee from the fund for its services as shareholder servicing agent calculated as a percentage of the average daily net assets of the fund as determined periodically under the supervision of the fund’s Board of Trustees. For the six months ended February 28, 2014, the fee was $241,833, which equated to 0.0403% annually of the fund’s average daily net assets. MFSC also receives payment from the fund for out-of-pocket expenses, sub-accounting and other shareholder servicing costs which may be paid to affiliated and unaffiliated service providers. Class R5 shares do not incur sub-accounting fees. For the six months ended February 28, 2014, these out-of-pocket expenses, sub-accounting and other shareholder servicing costs amounted to $687,015.
Administrator – MFS provides certain financial, legal, shareholder communications, compliance, and other administrative services to the fund. Under an administrative services agreement, the fund partially reimburses MFS the costs incurred to provide these services. The fund is charged an annual fixed amount of $17,500 plus a fee based on average daily net assets. The administrative services fee incurred for the six months ended February 28, 2014 was equivalent to an annual effective rate of 0.0126% of the fund’s average daily net assets.
Trustees’ and Officers’ Compensation – The fund pays compensation to independent Trustees in the form of a retainer, attendance fees, and additional compensation to Board and Committee chairpersons. The fund does not pay compensation directly to Trustees or officers of the fund who are also officers of the investment adviser, all of whom receive remuneration for their services to the fund from MFS. Certain officers and Trustees of the fund are officers or directors of MFS, MFD, and MFSC.
Prior to December 31, 2001, the fund had an unfunded defined benefit plan (“DB plan”) for independent Trustees. As of December 31, 2001, the Board took action to terminate the DB plan with respect to then-current and any future independent Trustees, such that the DB plan covers only certain of those former independent Trustees who retired on or before December 31, 2001. Effective January 1, 2002, accrued benefits under the DB plan for then-current independent Trustees who continued were credited to an unfunded retirement deferral plan (the “Retirement Deferral plan”), which was established for and exists solely with respect to these credited amounts, and is not available for other deferrals by these or other independent Trustees. Although the Retirement Deferral plan is unfunded, amounts deferred under the plan are periodically adjusted for investment experience as if they had been invested in shares of the fund. The DB plan resulted in a pension expense of
38
Notes to Financial Statements (unaudited) – continued
$1,623 and the Retirement Deferral plan resulted in an expense of $7,826. Both amounts are included in independent Trustees’ compensation for the six months ended February 28, 2014. The liability for deferred retirement benefits payable to certain independent Trustees under both plans amounted to $90,820 at February 28, 2014, and is included in “Payable for independent Trustees’ compensation” in the Statement of Assets and Liabilities.
Other – This fund and certain other funds managed by MFS (the funds) have entered into services agreements (the Agreements) which provide for payment of fees by the funds to Tarantino LLC and Griffin Compliance LLC in return for the provision of services of an Independent Chief Compliance Officer (ICCO) and Assistant ICCO, respectively, for the funds. The ICCO and Assistant ICCO are officers of the funds and the sole members of Tarantino LLC and Griffin Compliance LLC, respectively. The funds can terminate the Agreements with Tarantino LLC and Griffin Compliance LLC at any time under the terms of the Agreements. For the six months ended February 28, 2014, the aggregate fees paid by the fund to Tarantino LLC and Griffin Compliance LLC were $3,907 and are included in “Miscellaneous” expense in the Statement of Operations. MFS has agreed to reimburse the fund for a portion of the payments made by the fund in the amount of $557, which is included in the reduction of total expenses in the Statement of Operations. Additionally, MFS has agreed to bear all expenses associated with office space, other administrative support, and supplies provided to the ICCO and Assistant ICCO.
The fund invests in the MFS Institutional Money Market Portfolio which is managed by MFS and seeks current income consistent with preservation of capital and liquidity. Income earned on this investment is included in “Dividends from underlying affiliated funds” in the Statement of Operations. This money market fund does not pay a management fee to MFS.
(4) Portfolio Securities
Purchases and sales of investments, other than purchased option transactions and short-term obligations, aggregated $323,233,642 and $338,916,722, respectively.
39
Notes to Financial Statements (unaudited) – continued
(5) Shares of Beneficial Interest
The fund’s Declaration of Trust permits the Trustees to issue an unlimited number of full and fractional shares of beneficial interest. Transactions in fund shares were as follows:
| | | | | | | | | | | | | | | | |
| | | Six months ended
2/28/14 | | | Year ended
8/31/13 (i) | |
| | | Shares | | | Amount | | | Shares | | | Amount | |
| Shares sold | | | | | | | | | | | | | | | | |
Class A | | | 2,312,167 | | | | $59,496,222 | | | | 7,546,868 | | | | $166,053,426 | |
Class B | | | 71,539 | | | | 1,693,932 | | | | 196,291 | | | | 4,012,467 | |
Class C | | | 212,052 | | | | 5,011,558 | | | | 584,686 | | | | 12,153,640 | |
Class I | | | 313,029 | | | | 8,234,947 | | | | 357,017 | | | | 8,396,899 | |
Class R1 | | | 13,465 | | | | 318,959 | | | | 37,458 | | | | 768,353 | |
Class R2 | | | 64,486 | | | | 1,630,807 | | | | 151,192 | | | | 3,277,836 | |
Class R3 | | | 279,399 | | | | 7,181,700 | | | | 358,175 | | | | 7,872,236 | |
Class R4 | | | 191,087 | | | | 4,925,672 | | | | 197,759 | | | | 4,502,021 | |
Class R5 | | | 78,517 | | | | 2,152,283 | | | | 4,800 | | | | 89,803 | |
| | | 3,535,741 | | | | $90,646,080 | | | | 9,434,246 | | | | $207,126,681 | |
| | | |
Shares issued to shareholders in reinvestment of distributions | | | | | | | | | | | | | |
Class A | | | 219,910 | | | | $5,744,039 | | | | 173,769 | | | | $3,492,749 | |
Class C | | | 3,671 | | | | 87,708 | | | | — | | | | — | |
Class I | | | 10,378 | | | | 282,064 | | | | 6,426 | | | | 134,304 | |
Class R1 | | | 20 | | | | 485 | | | | — | | | | — | |
Class R2 | | | 3,341 | | | | 85,652 | | | | 2,220 | | | | 43,807 | |
Class R3 | | | 16,253 | | | | 423,237 | | | | 13,407 | | | | 268,678 | |
Class R4 | | | 2,743 | | | | 72,032 | | | | 888 | | | | 17,941 | |
Class R5 | | | 41 | | | | 1,122 | | | | — | | | | — | |
| | | 256,357 | | | | $6,696,339 | | | | 196,710 | | | | $3,957,479 | |
| | | |
| Shares reacquired | | | | | | | | | | | | | |
Class A | | | (3,380,992 | ) | | | $(87,499,898 | ) | | | (5,962,394 | ) | | | $(129,142,090 | ) |
Class B | | | (249,714 | ) | | | (5,980,885 | ) | | | (737,297 | ) | | | (14,746,274 | ) |
Class C | | | (285,205 | ) | | | (6,699,500 | ) | | | (531,761 | ) | | | (10,486,616 | ) |
Class I | | | (115,195 | ) | | | (3,146,369 | ) | | | (159,773 | ) | | | (3,592,449 | ) |
Class R1 | | | (23,846 | ) | | | (565,385 | ) | | | (88,685 | ) | | | (1,715,763 | ) |
Class R2 | | | (92,321 | ) | | | (2,336,819 | ) | | | (213,567 | ) | | | (4,451,724 | ) |
Class R3 | | | (243,954 | ) | | | (6,229,590 | ) | | | (300,016 | ) | | | (6,406,822 | ) |
Class R4 | | | (113,807 | ) | | | (3,046,631 | ) | | | (36,085 | ) | | | (791,784 | ) |
Class R5 | | | (897 | ) | | | (24,485 | ) | | | — | | | | — | |
| | | (4,505,931 | ) | | | $(115,529,562 | ) | | | (8,029,578 | ) | | | $(171,333,522 | ) |
40
Notes to Financial Statements (unaudited) – continued
| | | | | | | | | | | | | | | | |
| | | Six months ended
2/28/14 | | | Year ended
8/31/13 (i) | |
| | | Shares | | | Amount | | | Shares | | | Amount | |
| Net change | | | | | | | | | | | | | |
Class A | | | (848,915 | ) | | | $(22,259,637 | ) | | | 1,758,243 | | | | $40,404,085 | |
Class B | | | (178,175 | ) | | | (4,286,953 | ) | | | (541,006 | ) | | | (10,733,807 | ) |
Class C | | | (69,482 | ) | | | (1,600,234 | ) | | | 52,925 | | | | 1,667,024 | |
Class I | | | 208,212 | | | | 5,370,642 | | | | 203,670 | | | | 4,938,754 | |
Class R1 | | | (10,361 | ) | | | (245,941 | ) | | | (51,227 | ) | | | (947,410 | ) |
Class R2 | | | (24,494 | ) | | | (620,360 | ) | | | (60,155 | ) | | | (1,130,081 | ) |
Class R3 | | | 51,698 | | | | 1,375,347 | | | | 71,566 | | | | 1,734,092 | |
Class R4 | | | 80,023 | | | | 1,951,073 | | | | 162,562 | | | | 3,728,178 | |
Class R5 | | | 77,661 | | | | 2,128,920 | | | | 4,800 | | | | 89,803 | |
| | | (713,833 | ) | | | $(18,187,143 | ) | | | 1,601,378 | | | | $39,750,638 | |
| (i) | For Class R5, the period is from inception, January 2, 2013, through the stated period end. |
(6) Line of Credit
The fund and certain other funds managed by MFS participate in a $1.1 billion unsecured committed line of credit, subject to a $1 billion sublimit, provided by a syndication of banks under a credit agreement. Borrowings may be made for temporary financing needs. Interest is charged to each fund, based on its borrowings, generally at a rate equal to the higher of the Federal Reserve funds rate or one month LIBOR plus an agreed upon spread. A commitment fee, based on the average daily, unused portion of the committed line of credit, is allocated among the participating funds at the end of each calendar quarter. In addition, the fund and other funds managed by MFS have established unsecured uncommitted borrowing arrangements with certain banks for temporary financing needs. Interest is charged to each fund, based on its borrowings, at a rate equal to the Federal Reserve funds rate plus an agreed upon spread. For the six months ended February 28, 2014, the fund’s commitment fee and interest expense were $2,491 and $0, respectively, and are included in “Miscellaneous” expense in the Statement of Operations. The period-end carrying value of the outstanding borrowings under this agreement on the fund’s Statement of Assets and Liabilities approximates its fair value which would have been considered level 2 under the fair value hierarchy disclosure if the liability were carried at fair value.
41
Notes to Financial Statements (unaudited) – continued
(7) Transactions in Underlying Affiliated Funds-Affiliated Issuers
An affiliated issuer may be considered one in which the fund owns 5% or more of the outstanding voting securities, or a company which is under common control. For the purposes of this report, the fund assumes the following to be an affiliated issuer:
| | | | | | | | | | | | | | | | |
| Underlying Affiliated Fund | | Beginning Shares/Par
Amount | | | Acquisitions Shares/Par
Amount | | | Dispositions Shares/Par
Amount | | | Ending Shares/Par
Amount | |
MFS Institutional Money
Market Portfolio | | | 10,013,362 | | | | 90,431,847 | | | | (93,484,954 | ) | | | 6,960,255 | |
| | | | |
| Underlying Affiliated Fund | | Realized
Gain (Loss) | | | Capital Gain
Distributions | | | Dividend
Income | | | Ending
Value | |
MFS Institutional Money
Market Portfolio | | | $— | | | | $— | | | | $8,589 | | | | $6,960,255 | |
42
BOARD REVIEW OF INVESTMENT ADVISORY AGREEMENT
A discussion regarding the Board’s most recent review and renewal of the fund’s Investment Advisory Agreement with MFS is available by clicking on the fund’s name under “Mutual Funds” in the “Products” section of the MFS Web site (mfs.com).
PROXY VOTING POLICIES AND INFORMATION
A general description of the MFS funds’ proxy voting policies and procedures is available without charge, upon request, by calling 1-800-225-2606, by visiting the Proxy Voting section of mfs.com or by visiting the SEC’s Web site at http://www.sec.gov.
Information regarding how the fund voted proxies relating to portfolio securities during the most recent twelve-month period ended June 30 is available without charge by visiting the Proxy Voting section of mfs.com or by visiting the SEC’s Web site at http://www.sec.gov.
QUARTERLY PORTFOLIO DISCLOSURE
The fund will file a complete schedule of portfolio holdings with the Securities and Exchange Commission (the Commission) for the first and third quarters of each fiscal year on Form N-Q. A shareholder can obtain the quarterly portfolio holdings report at mfs.com. The fund’s Form N-Q is also available on the EDGAR database on the Commission’s Internet Web site at http://www.sec.gov, and may be reviewed and copied at the:
Public Reference Room
Securities and Exchange Commission
100 F Street, NE, Room 1580
Washington, D.C. 20549
Information on the operation of the Public Reference Room may be obtained by calling the Commission at 1-800-SEC-0330. Copies of the fund’s Form N-Q also may be obtained, upon payment of a duplicating fee, by electronic request at the following e-mail address: publicinfo@sec.gov, or by writing the Public Reference Section at the above address.
FURTHER INFORMATION
From time to time, MFS may post important information about the fund or the MFS funds on the MFS web site (mfs.com). This information is available by visiting the “Commentary & Announcements” and “Market Outlooks” sections of mfs.com or by clicking on the fund’s name under “Mutual Funds” in the “Products” section of mfs.com.
PROVISION OF FINANCIAL REPORTS AND SUMMARY PROSPECTUSES
The fund produces financial reports every six months and updates its summary prospectus and prospectus annually. To avoid sending duplicate copies of materials to households, only one copy of the fund’s annual and semiannual report and summary prospectus may be mailed to shareholders having the same last name and residential address on the fund’s records. However, any shareholder may contact MFSC (please see back cover for address and telephone number) to request that copies of these reports and summary prospectuses be sent personally to that shareholder.
43
Save paper with eDelivery.

| MFS® will send you prospectuses, |
reports, and proxies directly via e-mail so you will get information faster with less mailbox clutter.
To sign up:
1. Go to mfs.com.
2. Log in via MFS® Access.
3. Select eDelivery.
If you own your MFS fund shares through a financial institution or a retirement plan, MFS® TALK, MFS® Access, or eDelivery may not be available to you.
CONTACT
WEB SITE
mfs.com
MFS TALK
1-800-637-8255
24 hours a day
ACCOUNT SERVICE AND LITERATURE
Shareholders
1-800-225-2606
Financial advisors
1-800-343-2829
Retirement plan services
1-800-637-1255
MAILING ADDRESS
MFS Service Center, Inc.
P.O. Box 55824
Boston, MA 02205-5824
OVERNIGHT MAIL
MFS Service Center, Inc.
c/o Boston Financial Data Services
30 Dan Road
Canton, MA 02021-2809
SEMIANNUAL REPORT
February 28, 2014

MFS® GLOBAL LEADERS FUND

GLD-SEM
MFS® GLOBAL LEADERS FUND
CONTENTS
The report is prepared for the general information of shareholders. It is authorized for distribution to prospective investors only when preceded or accompanied by a current prospectus.
NOT FDIC INSURED Ÿ MAY LOSE VALUE Ÿ NO BANK GUARANTEE

LETTER FROM THE CHAIRMAN AND CEO
Dear Shareholders:
The U.S. economy appears to have slowed early in 2014 after a strong second half of 2013. Harsh winter weather likely contributed to at least a temporary softening of consumer demand. Looking at the longer term, the pace of U.S. economic growth has
been modest since the recovery began late in 2009. Corporate profits remain healthy overall. A major plus is the removal of a highly confrontational atmosphere in the U.S. Congress, which had clouded business decision-making since 2011.
Globally, recent months have been dominated by volatility, including emerging market currency jitters and rising geopolitical tensions. These add to the possibility of economic uncertainty and financial market unease. However, the eurozone continues to show signs of recovery, while Japan is making progress as it seeks to break free of deflation.
China’s transition toward a more consumer-oriented and less export-driven economy — one with a more stable and sustainable growth rate — could be positive in the long term. However, in the near term, any deceleration in China’s rate of growth could have a ripple effect on its many global trading partners.
In uncertain times such as these, it is particularly important to remember that managing risk should always be a top priority. At MFS®, active risk management is an integral part of our collaborative process. Our global team of investment professionals shares ideas and evaluates opportunities that span continents, investment disciplines and asset classes. Our goal is to build better insights, and ultimately better results, for our clients.
We understand and appreciate the economic challenges investors face, and we believe in the value of maintaining a long-term view and applying proven principles, such as asset allocation and diversification. We are confident that our unique approach can serve investors well as they work with their financial advisors to identify and pursue the most suitable opportunities.
Respectfully,

Robert J. Manning
Chairman and Chief Executive Officer
MFS Investment Management
April 14, 2014
The opinions expressed in this letter are subject to change, may not be relied upon for investment advice, and no forecasts can be guaranteed.
1
PORTFOLIO COMPOSITION
Portfolio structure
| | | | |
| Top ten holdings | | | | |
| Nestle S.A. | | | 4.2% | |
| Walt Disney Co. | | | 3.6% | |
| Pernod Ricard S.A. | | | 3.4% | |
| SAP AG | | | 3.3% | |
| Groupe Danone | | | 3.2% | |
| McDonald’s Corp. | | | 3.2% | |
| Publicis Groupe S.A. | | | 3.1% | |
| LVMH Moet Hennessy Louis Vuitton S.A. | | | 3.1% | |
| Diageo PLC | | | 3.0% | |
| Japan Tobacco, Inc. | | | 2.9% | |
| |
| Equity sectors | | | | |
| Consumer Staples | | | 39.1% | |
| Retailing | | | 21.7% | |
| Leisure | | | 19.4% | |
| Industrial Goods & Services | | | 5.5% | |
| Financial Services | | | 5.1% | |
| Technology | | | 3.3% | |
| Basic Materials | | | 2.4% | |
| Special Products & Services | | | 1.8% | |
| | | | |
| Issuer country weightings (x) | |
| United States | | | 36.4% | |
| France | | | 18.4% | |
| United Kingdom | | | 13.4% | |
| Switzerland | | | 8.5% | |
| Japan | | | 4.9% | |
| Netherlands | | | 3.8% | |
| Germany | | | 3.3% | |
| Belgium | | | 2.3% | |
| China | | | 2.0% | |
| Other Countries | | | 7.0% | |
|
| Currency exposure weightings (y) | |
| United States Dollar | | | 36.4% | |
| Euro | | | 29.6% | |
| British Pound Sterling | | | 13.4% | |
| Swiss Franc | | | 8.5% | |
| Japanese Yen | | | 4.9% | |
| Hong Kong Dollar | | | 3.6% | |
| Brazilian Real | | | 2.0% | |
| Swedish Krona | | | 1.6% | |
| (x) | Represents the portfolio’s exposure to issuer countries as a percentage of a portfolio’s net assets. For purposes of this presentation, United States includes Cash & Other. |
| (y) | Represents the portfolio’s exposure to a particular currency as a percentage of a portfolio’s net assets. For purposes of this presentation, United States Dollar includes Cash & Other. |
Percentages are based on net assets as of 2/28/14.
The portfolio is actively managed and current holdings may be different.
2
EXPENSE TABLE
Fund expenses borne by the shareholders during the period, September 1, 2013 through February 28, 2014
As a shareholder of the fund, you incur two types of costs: (1) transaction costs, including sales charges (loads) on certain purchase or redemption payments, and (2) ongoing costs, including management fees; distribution and service (12b-1) fees; and other fund expenses. This example is intended to help you understand your ongoing costs (in dollars) of investing in the fund and to compare these costs with the ongoing costs of investing in other mutual funds.
The example is based on an investment of $1,000 invested at the beginning of the period and held for the entire period September 1, 2013 through February 28, 2014.
Actual Expenses
The first line for each share class in the following table provides information about actual account values and actual expenses. You may use the information in this line, together with the amount you invested, to estimate the expenses that you paid over the period. Simply divide your account value by $1,000 (for example, an $8,600 account value divided by $1,000 = 8.6), then multiply the result by the number in the first line under the heading entitled “Expenses Paid During Period” to estimate the expenses you paid on your account during this period.
Hypothetical Example for Comparison Purposes
The second line for each share class in the following table provides information about hypothetical account values and hypothetical expenses based on the fund’s actual expense ratio and an assumed rate of return of 5% per year before expenses, which is not the fund’s actual return. The hypothetical account values and expenses may not be used to estimate the actual ending account balance or expenses you paid for the period. You may use this information to compare the ongoing costs of investing in the fund and other funds. To do so, compare this 5% hypothetical example with the 5% hypothetical examples that appear in the shareholder reports of the other funds.
Please note that the expenses shown in the table are meant to highlight your ongoing costs only and do not reflect any transactional costs, such as sales charges (loads). Therefore, the second line for each share class in the table is useful in comparing ongoing costs only, and will not help you determine the relative total costs of owning different funds. In addition, if these transactional costs were included, your costs would have been higher.
3
Expense Table – continued
| | | | | | | | | | | | | | | | | | |
Share
Class | | | | Annualized
Expense Ratio | | | Beginning
Account Value
9/01/13 | | | Ending Account Value 2/28/14 | | | Expenses Paid During Period (p) 9/01/13-2/28/14 | |
| A | | Actual | | | 1.45% | | | | $1,000.00 | | | | $1,072.23 | | | | $7.45 | |
| | Hypothetical (h) | | | 1.45% | | | | $1,000.00 | | | | $1,017.60 | | | | $7.25 | |
| B | | Actual | | | 2.20% | | | | $1,000.00 | | | | $1,068.63 | | | | $11.28 | |
| | Hypothetical (h) | | | 2.20% | | | | $1,000.00 | | | | $1,013.88 | | | | $10.99 | |
| C | | Actual | | | 2.20% | | | | $1,000.00 | | | | $1,067.95 | | | | $11.28 | |
| | Hypothetical (h) | | | 2.20% | | | | $1,000.00 | | | | $1,013.88 | | | | $10.99 | |
| I | | Actual | | | 1.20% | | | | $1,000.00 | | | | $1,073.37 | | | | $6.17 | |
| | Hypothetical (h) | | | 1.20% | | | | $1,000.00 | | | | $1,018.84 | | | | $6.01 | |
| (h) | 5% class return per year before expenses. |
| (p) | Expenses Paid During Period are equal to each class’s annualized expense ratio, as shown above, multiplied by the average account value over the period, multiplied by 181/365 (to reflect the one-half year period). Expenses paid do not include any applicable sales charges (loads). If these transaction costs had been included, your costs would have been higher. |
4
PORTFOLIO OF INVESTMENTS
2/28/14 (unaudited)
The Portfolio of Investments is a complete list of all securities owned by your fund. It is categorized by broad-based asset classes.
| | | | | | | | |
| Common Stocks - 98.3% | | | | | | | | |
| Issuer | | Shares/Par | | | Value ($) | |
| | | | | | | | |
| Alcoholic Beverages - 12.5% | | | | | | | | |
| Anheuser-Busch InBev N.V. | | | 2,847 | | | $ | 298,462 | |
| Diageo PLC | | | 12,337 | | | | 388,078 | |
| Heineken N.V. | | | 2,480 | | | | 167,700 | |
| Pernod Ricard S.A. | | | 3,755 | | | | 442,060 | |
| SABMiller PLC | | | 6,760 | | | | 331,335 | |
| | | | | | | | |
| | | | | | | $ | 1,627,635 | |
| Apparel Manufacturers - 17.0% | | | | | | | | |
| Burberry Group PLC | | | 12,805 | | | $ | 330,431 | |
| Compagnie Financiere Richemont S.A. | | | 2,363 | | | | 235,360 | |
| Guess?, Inc. | | | 5,100 | | | | 154,734 | |
| Kering S.A. (a) | | | 1,769 | | | | 362,844 | |
| Li & Fung Ltd. | | | 164,000 | | | | 214,706 | |
| LVMH Moet Hennessy Louis Vuitton S.A. | | | 2,157 | | | | 401,490 | |
| NIKE, Inc., “B” | | | 3,646 | | | | 285,482 | |
| Tod’s S.p.A. | | | 1,707 | | | | 233,025 | |
| | | | | | | | |
| | | | | | | $ | 2,218,072 | |
| Broadcasting - 11.4% | | | | | | | | |
| Nippon Television Holdings, Inc. | | | 15,200 | | | $ | 252,860 | |
| Publicis Groupe S.A. | | | 4,238 | | | | 402,460 | |
| Twenty-First Century Fox, Inc. | | | 10,940 | | | | 366,928 | |
| Walt Disney Co. | | | 5,746 | | | | 464,334 | |
| | | | | | | | |
| | | | | | | $ | 1,486,582 | |
| Business Services - 1.8% | | | | | | | | |
| Accenture PLC, “A” | | | 2,750 | | | $ | 229,213 | |
| | |
| Chemicals - 2.4% | | | | | | | | |
| 3M Co. | | | 2,363 | | | $ | 318,367 | |
| | |
| Computer Software - 3.3% | | | | | | | | |
| SAP AG | | | 5,334 | | | $ | 430,855 | |
| | |
| Consumer Products - 7.3% | | | | | | | | |
| Colgate-Palmolive Co. | | | 4,876 | | | $ | 306,359 | |
| Procter & Gamble Co. | | | 4,208 | | | | 331,001 | |
| Reckitt Benckiser Group PLC | | | 3,894 | | | | 320,427 | |
| | | | | | | | |
| | | | | | | $ | 957,787 | |
5
Portfolio of Investments (unaudited) – continued
| | | | | | | | |
| Issuer | | Shares/Par | | | Value ($) | |
| | | | | | | | |
| Common Stocks - continued | | | | | | | | |
| Electrical Equipment - 5.5% | | | | | | | | |
| Danaher Corp. | | | 4,580 | | | $ | 350,324 | |
| Schneider Electric S.A. | | | 4,178 | | | | 373,406 | |
| | | | | | | | |
| | | | | | | $ | 723,730 | |
| Food & Beverages - 14.0% | | | | | | | | |
| Groupe Danone | | | 5,931 | | | $ | 418,988 | |
| M. Dias Branco S.A. Industria e Comercio de Alimentos | | | 7,400 | | | | 258,475 | |
| Nestle S.A. | | | 7,218 | | | | 546,582 | |
| Unilever N.V. | | | 8,513 | | | | 337,592 | |
| Want Want China Holdings Ltd. | | | 171,000 | | | | 260,007 | |
| | | | | | | | |
| | | | | | | $ | 1,821,644 | |
| Gaming & Lodging - 2.0% | | | | | | | | |
| InterContinental Hotels Group PLC | | | 8,097 | | | $ | 263,313 | |
| | |
| General Merchandise - 2.4% | | | | | | | | |
| Target Corp. | | | 5,013 | | | $ | 313,513 | |
| | |
| Other Banks & Diversified Financials - 5.1% | | | | | | | | |
| Julius Baer Group Ltd. | | | 6,983 | | | $ | 327,276 | |
| Visa, Inc., “A” | | | 1,521 | | | | 343,655 | |
| | | | | | | | |
| | | | | | | $ | 670,931 | |
| Restaurants - 5.9% | | | | | | | | |
| McDonald’s Corp. | | | 4,372 | | | $ | 415,996 | |
| YUM! Brands, Inc. | | | 4,860 | | | | 360,029 | |
| | | | | | | | |
| | | | | | | $ | 776,025 | |
| Specialty Stores - 2.3% | | | | | | | | |
| AutoZone, Inc. (a) | | | 555 | | | $ | 298,834 | |
| | |
| Tobacco - 5.4% | | | | | | | | |
| Imperial Tobacco Group PLC | | | 2,722 | | | $ | 111,082 | |
| Japan Tobacco, Inc. | | | 12,100 | | | | 384,271 | |
| Swedish Match AB | | | 6,537 | | | | 206,969 | |
| | | | | | | | |
| | | | | | | $ | 702,322 | |
| Total Common Stocks (Identified Cost, $11,009,043) | | | | | | $ | 12,838,823 | |
6
Portfolio of Investments (unaudited) – continued
| | | | | | | | |
| Money Market Funds - 1.7% | | | | | | | | |
| Issuer | | Shares/Par | | | Value ($) | |
| | | | | | | | |
MFS Institutional Money Market Portfolio, 0.08%,
at Cost and Net Asset Value (v) | | | 217,410 | | | $ | 217,410 | |
| Total Investments (Identified Cost, $11,226,453) | | | | | | $ | 13,056,233 | |
| | |
| Other Assets, Less Liabilities - 0.0% | | | | | | | 1,136 | |
| Net Assets - 100.0% | | | | | | $ | 13,057,369 | |
| (a) | Non-income producing security. |
| (v) | Underlying affiliated fund that is available only to investment companies managed by MFS. The rate quoted for the MFS Institutional Money Market Portfolio is the annualized seven-day yield of the fund at period end. |
The following abbreviations are used in this report and are defined:
| PLC | | Public Limited Company |
See Notes to Financial Statements
7
Financial Statements
STATEMENT OF ASSETS AND LIABILITIES
At 2/28/14 (unaudited)
This statement represents your fund’s balance sheet, which details the assets and liabilities comprising the total value of the fund.
| | | | |
| Assets | | | | |
Investments- | | | | |
Non-affiliated issuers, at value (identified cost, $11,009,043) | | | $12,838,823 | |
Underlying affiliated funds, at cost and value | | | 217,410 | |
Total investments, at value (identified cost, $11,226,453) | | | $13,056,233 | |
Receivables for | | | | |
Fund shares sold | | | 17,949 | |
Interest and dividends | | | 26,697 | |
Receivable from investment adviser | | | 10,954 | |
Other assets | | | 194 | |
Total assets | | | $13,112,027 | |
| Liabilities | | | | |
Payable to affiliates | | | | |
Shareholder servicing costs | | | $3,065 | |
Distribution and service fees | | | 205 | |
Payable for independent Trustees’ compensation | | | 2 | |
Accrued expenses and other liabilities | | | 51,386 | |
Total liabilities | | | $54,658 | |
Net assets | | | $13,057,369 | |
| Net assets consist of | | | | |
Paid-in capital | | | $11,198,393 | |
Unrealized appreciation (depreciation) on investments and translation of assets and liabilities in foreign currencies | | | 1,829,995 | |
Accumulated net realized gain (loss) on investments and foreign currency | | | 41,333 | |
Accumulated distributions in excess of net investment income | | | (12,352 | ) |
Net assets | | | $13,057,369 | |
Shares of beneficial interest outstanding | | | 940,041 | |
| | | | | | | | | | | | |
| | | Net assets | | | Shares
outstanding | | | Net asset value
per share (a) | |
Class A | | | $8,417,428 | | | | 605,452 | | | | $13.90 | |
Class B | | | 504,010 | | | | 36,689 | | | | 13.74 | |
Class C | | | 1,269,832 | | | | 92,471 | | | | 13.73 | |
Class I | | | 2,866,099 | | | | 205,429 | | | | 13.95 | |
| (a) | Maximum offering price per share was equal to the net asset value per share for all share classes, except for Class A, for which the maximum offering price per share was $14.75 [100 / 94.25 x $13.90]. On sales of $50,000 or more, the maximum offering price of Class A shares is reduced. A contingent deferred sales charge may be imposed on redemptions of Class A, Class B, and Class C shares. Redemption price per share was equal to the net asset value per share for Class I. |
See Notes to Financial Statements
8
Financial Statements
STATEMENT OF OPERATIONS
Six months ended 2/28/14 (unaudited)
This statement describes how much your fund earned in investment income and accrued in expenses. It also describes any gains and/or losses generated by fund operations.
| | | | |
| Net investment loss | |
Income | | | | |
Dividends | | | $82,825 | |
Dividends from underlying affiliated funds | | | 235 | |
Foreign taxes withheld | | | (3,940 | ) |
Total investment income | | | $79,120 | |
Expenses | | | | |
Management fee | | | $54,275 | |
Distribution and service fees | | | 17,740 | |
Shareholder servicing costs | | | 6,735 | |
Administrative services fee | | | 8,679 | |
Independent Trustees’ compensation | | | 556 | |
Custodian fee | | | 10,200 | |
Shareholder communications | | | 4,635 | |
Audit and tax fees | | | 25,702 | |
Legal fees | | | 49 | |
Registration fees | | | 23,377 | |
Miscellaneous | | | 5,549 | |
Total expenses | | | $157,497 | |
Reduction of expenses by investment adviser and distributor | | | (67,463 | ) |
Net expenses | | | $90,034 | |
Net investment loss | | | $(10,914 | ) |
| Realized and unrealized gain (loss) on investments and foreign currency | | | | |
Realized gain (loss) (identified cost basis) | | | | |
Investments | | | $89,425 | |
Foreign currency | | | (810 | ) |
Net realized gain (loss) on investments and foreign currency | | | $88,615 | |
Change in unrealized appreciation (depreciation) | | | | |
Investments | | | $694,658 | |
Translation of assets and liabilities in foreign currencies | | | 400 | |
Net unrealized gain (loss) on investments and foreign currency translation | | | $695,058 | |
Net realized and unrealized gain (loss) on investments and foreign currency | | | $783,673 | |
Change in net assets from operations | | | $772,759 | |
See Notes to Financial Statements
9
Financial Statements
STATEMENTS OF CHANGES IN NET ASSETS
These statements describe the increases and/or decreases in net assets resulting from operations, any distributions, and any shareholder transactions.
| | | | | | | | |
Change in net assets | | Six months ended
2/28/14 (unaudited) | | | Year ended
8/31/13 | |
| | |
| From operations | | | | | | | | |
Net investment income (loss) | | | $(10,914 | ) | | | $66,045 | |
Net realized gain (loss) on investments and foreign
currency | | | 88,615 | | | | 864,632 | |
Net unrealized gain (loss) on investments and foreign
currency translation | | | 695,058 | | | | 693,645 | |
Change in net assets from operations | | | $772,759 | | | | $1,624,322 | |
| Distributions declared to shareholders | | | | | | | | |
From net investment income | | | $(68,001 | ) | | | $(60,003 | ) |
From net realized gain on investments | | | (810,506 | ) | | | (128,508 | ) |
Total distributions declared to shareholders | | | $(878,507 | ) | | | $(188,511 | ) |
Change in net assets from fund share transactions | | | $2,550,946 | | | | $(1,612,004 | ) |
Total change in net assets | | | $2,445,198 | | | | $(176,193 | ) |
| Net assets | | | | | | | | |
At beginning of period | | | 10,612,171 | | | | 10,788,364 | |
At end of period (including accumulated distributions in excess of net investment income of $12,352 and undistributed net investment income of $66,563, respectively) | | | $13,057,369 | | | | $10,612,171 | |
See Notes to Financial Statements
10
Financial Statements
FINANCIAL HIGHLIGHTS
The financial highlights table is intended to help you understand the fund’s financial performance for the semiannual period and the past 5 fiscal years (or life of a particular share class, if shorter). Certain information reflects financial results for a single fund share. The total returns in the table represent the rate by which an investor would have earned (or lost) on an investment in the fund share class (assuming reinvestment of all distributions) held for the entire period.
| | | | | | | | | | | | |
| Class A | | Six months
ended
2/28/14 (unaudited) | | | Year
ended
8/31/13 | | | Period
ended
8/31/12 (c) | |
| | | | | | | | |
Net asset value, beginning of period | | | $13.95 | | | | $12.16 | | | | $10.00 | |
| Income (loss) from investment operations | | | | | | | | | | | | |
Net investment income (loss) (d) | | | $(0.01 | ) | | | $0.07 | | | | $0.20 | |
Net realized and unrealized gain (loss) on
investments and foreign currency | | | 1.00 | | | | 1.91 | | | | 1.96 | |
Total from investment operations | | | $0.99 | | | | $1.98 | | | | $2.16 | |
| Less distributions declared to shareholders | | | | | | | | | | | | |
From net investment income | | | $(0.08 | ) | | | $(0.06 | ) | | | $— | |
From net realized gain on investments | | | (0.96 | ) | | | (0.13 | ) | | | — | |
Total distributions declared to shareholders | | | $(1.04 | ) | | | $(0.19 | ) | | | $— | |
Net asset value, end of period (x) | | | $13.90 | | | | $13.95 | | | | $12.16 | |
Total return (%) (r)(s)(t)(x) | | | 7.22 | (n) | | | 16.39 | | | | 21.60 | (n) |
Ratios (%) (to average net assets)
and Supplemental data: | | | | | | | | | | | | |
Expenses before expense reductions (f) | | | 2.57 | (a) | | | 2.89 | | | | 6.60 | (a) |
Expenses after expense reductions (f) | | | 1.45 | (a) | | | 1.45 | | | | 1.45 | (a) |
Net investment income (loss) | | | (0.13 | )(a) | | | 0.55 | (l) | | | 1.83 | (a)(l) |
Portfolio turnover | | | 6 | (n) | | | 82 | | | | 19 | (n) |
Net assets at end of period (000 omitted) | | | $8,417 | | | | $6,632 | | | | $8,331 | |
See Notes to Financial Statements
11
Financial Highlights – continued
| | | | | | | | | | | | |
| Class B | | Six months
ended
2/28/14 (unaudited) | | | Year
ended
8/31/13 | | | Period
ended
8/31/12 (c) | |
| | | | | | | | |
Net asset value, beginning of period | | | $13.81 | | | | $12.07 | | | | $10.00 | |
| Income (loss) from investment operations | | | | | | | | | | | | |
Net investment income (loss) (d) | | | $(0.06 | ) | | | $0.01 | | | | $(0.01 | ) |
Net realized and unrealized gain (loss) on
investments and foreign currency | | | 0.99 | | | | 1.86 | | | | 2.08 | |
Total from investment operations | | | $0.93 | | | | $1.87 | | | | $2.07 | |
| Less distributions declared to shareholders | | | | | | | | | | | | |
From net investment income | | | $(0.04 | ) | | | $— | | | | $— | |
From net realized gain on investments | | | (0.96 | ) | | | (0.13 | ) | | | — | |
Total distributions declared to shareholders | | | $(1.00 | ) | | | $(0.13 | ) | | | $— | |
Net asset value, end of period (x) | | | $13.74 | | | | $13.81 | | | | $12.07 | |
Total return (%) (r)(s)(t)(x) | | | 6.86 | (n) | | | 15.55 | | | | 20.70 | (n) |
Ratios (%) (to average net assets)
and Supplemental data: | | | | | | | | | | | | |
Expenses before expense reductions (f) | | | 3.31 | (a) | | | 3.96 | | | | 5.96 | (a) |
Expenses after expense reductions (f) | | | 2.20 | (a) | | | 2.21 | | | | 2.20 | (a) |
Net investment income (loss) | | | (0.88 | )(a) | | | 0.09 | | | | (0.10 | )(a) |
Portfolio turnover | | | 6 | (n) | | | 82 | | | | 19 | (n) |
Net assets at end of period (000 omitted) | | | $504 | | | | $364 | | | | $131 | |
See Notes to Financial Statements
12
Financial Highlights – continued
| | | | | | | | | | | | |
| Class C | | Six months
ended
2/28/14 (unaudited) | | | Year
ended
8/31/13 | | | Period
ended
8/31/12 (c) | |
| | | | | | | | |
Net asset value, beginning of period | | | $13.81 | | | | $12.07 | | | | $10.00 | |
| Income (loss) from investment operations | | | | | | | | | | | | |
Net investment income (loss) (d) | | | $(0.06 | ) | | | $0.02 | | | | $(0.01 | ) |
Net realized and unrealized gain (loss) on
investments and foreign currency | | | 0.98 | | | | 1.85 | | | | 2.08 | |
Total from investment operations | | | $0.92 | | | | $1.87 | | | | $2.07 | |
| Less distributions declared to shareholders | | | | | | | | | | | | |
From net investment income | | | $(0.04 | ) | | | $(0.00 | )(w) | | | $— | |
From net realized gain on investments | | | (0.96 | ) | | | (0.13 | ) | | | — | |
Total distributions declared to shareholders | | | $(1.00 | ) | | | $(0.13 | ) | | | $— | |
Net asset value, end of period (x) | | | $13.73 | | | | $13.81 | | | | $12.07 | |
Total return (%) (r)(s)(t)(x) | | | 6.80 | (n) | | | 15.57 | | | | 20.70 | (n) |
Ratios (%) (to average net assets)
and Supplemental data: | | | | | | | | | | | | |
Expenses before expense reductions (f) | | | 3.31 | (a) | | | 4.02 | | | | 5.96 | (a) |
Expenses after expense reductions (f) | | | 2.20 | (a) | | | 2.21 | | | | 2.20 | (a) |
Net investment income (loss) | | | (0.89 | )(a) | | | 0.16 | | | | (0.07 | )(a) |
Portfolio turnover | | | 6 | (n) | | | 82 | | | | 19 | (n) |
Net assets at end of period (000 omitted) | | | $1,270 | | | | $927 | | | | $133 | |
See Notes to Financial Statements
13
Financial Highlights – continued
| | | | | | | | | | | | |
| Class I | | Six months
ended
2/28/14 (unaudited) | | | Year
ended
8/31/13 | | | Period
ended
8/31/12 (c) | |
| | | | | | | | |
Net asset value, beginning of period | | | $14.00 | | | | $12.18 | | | | $10.00 | |
| Income (loss) from investment operations | | | | | | | | | | | | |
Net investment income (d) | | | $0.01 | | | | $0.14 | | | | $0.09 | |
Net realized and unrealized gain (loss) on
investments and foreign currency | | | 1.00 | | | | 1.88 | | | | 2.09 | |
Total from investment operations | | | $1.01 | | | | $2.02 | | | | $2.18 | |
| Less distributions declared to shareholders | | | | | | | | | | | | |
From net investment income | | | $(0.10 | ) | | | $(0.07 | ) | | | $— | |
From net realized gain on investments | | | (0.96 | ) | | | (0.13 | ) | | | — | |
Total distributions declared to shareholders | | | $(1.06 | ) | | | $(0.20 | ) | | | $— | |
Net asset value, end of period (x) | | | $13.95 | | | | $14.00 | | | | $12.18 | |
Total return (%) (r)(s)(x) | | | 7.34 | (n) | | | 16.72 | | | | 21.80 | (n) |
Ratios (%) (to average net assets)
and Supplemental data: | | | | | | | | | | | | |
Expenses before expense reductions (f) | | | 2.32 | (a) | | | 2.86 | | | | 4.94 | (a) |
Expenses after expense reductions (f) | | | 1.20 | (a) | | | 1.21 | | | | 1.20 | (a) |
Net investment income | | | 0.10 | (a) | | | 1.03 | | | | 0.90 | (a) |
Portfolio turnover | | | 6 | (n) | | | 82 | | | | 19 | (n) |
Net assets at end of period (000 omitted) | | | $2,866 | | | | $2,690 | | | | $2,193 | |
| (c) | For the period from the commencement of the fund’s investment operations, September 28, 2011, through the stated period end. |
| (d) | Per share data is based on average shares outstanding. |
| (f) | Ratios do not reflect reductions from fees paid indirectly, if applicable. |
| (l) | The net investment income ratio does not vary by the class specific expense differential because of the timing of sales of fund shares and the allocation of fund level income at such time. |
| (r) | Certain expenses have been reduced without which performance would have been lower. |
| (s) | From time to time the fund may receive proceeds from litigation settlements, without which performance would be lower. |
| (t) | Total returns do not include any applicable sales charges. |
| (w) | Per share amount was less than $0.01. |
| (x) | The net asset values per share and total returns have been calculated on net assets which include adjustments made in accordance with U.S. generally accepted accounting principles required at period end for financial reporting purposes. |
See Notes to Financial Statements
14
NOTES TO FINANCIAL STATEMENTS
(unaudited)
(1) Business and Organization
MFS Global Leaders Fund (the fund) is a non-diversified series of MFS Series Trust I (the trust). The trust is organized as a Massachusetts business trust and is registered under the Investment Company Act of 1940, as amended, as an open-end management investment company.
(2) Significant Accounting Policies
General – The preparation of financial statements in conformity with U.S. generally accepted accounting principles requires management to make estimates and assumptions that affect the reported amounts of assets and liabilities, and disclosure of contingent assets and liabilities at the date of the financial statements and the reported amounts of increases and decreases in net assets from operations during the reporting period. Actual results could differ from those estimates. In the preparation of these financial statements, management has evaluated subsequent events occurring after the date of the fund’s Statement of Assets and Liabilities through the date that the financial statements were issued. The fund invests in foreign securities. Investments in foreign securities are vulnerable to the effects of changes in the relative values of the local currency and the U.S. dollar and to the effects of changes in each country’s legal, political, and economic environment.
In this reporting period, the fund adopted the disclosure provisions of the Financial Accounting Standards Board (FASB) Accounting Standards Update 2011-11 (“ASU 2011-11”), Balance Sheet (Topic 210) – Disclosures about Offsetting Assets and Liabilities along with the related scope clarification provisions of FASB Accounting Standards Update 2013-01 (“ASU 2013-01”) entitled Balance Sheet (Topic 210) – Clarifying the Scope of Disclosures about Offsetting Assets and Liabilities. ASU 2011-11 is intended to enhance disclosures on the offsetting of financial assets and liabilities by requiring entities to disclose both gross and net information about financial instruments and transactions that are either offset in the statement of financial position or subject to a an enforceable Master Netting Agreement or similar arrangement. ASU 2013-01 limits the scope of ASU 2011-11’s disclosure requirements on offsetting to financial assets and financial liabilities related to derivatives, repurchase and reverse repurchase agreements, and securities lending and securities borrowing transactions. The disclosures required by ASU 2011-11, to the extent applicable to the fund, have been included in the fund’s Significant Accounting Policies note under the captions for each of the fund’s in-scope financial instruments and transactions.
In June 2013, FASB issued Accounting Standards Update 2013-08 (“ASU 2013-08”) Financial Services – Investment Companies (Topic 946) – Amendments to the Scope, Measurement, and Disclosure Requirements which is effective for interim and annual reporting periods in fiscal years that begin after December 15, 2013. ASU 2013-08 sets forth a methodology for determining whether an entity should be characterized as an investment company and prescribes fair value accounting for an investment company’s non-controlling ownership interest in another investment company. FASB has determined that a fund registered under the Investment Company Act of 1940 automatically meets ASU 2013-08’s criteria for an investment company. Although still
15
Notes to Financial Statements (unaudited) – continued
evaluating the potential impacts of ASU 2013-08 to the fund, management expects that the impact of the fund’s adoption will be limited to additional financial statement disclosures.
Investment Valuations – Equity securities, including restricted equity securities, are generally valued at the last sale or official closing price as provided by a third-party pricing service on the market or exchange on which they are primarily traded. Equity securities, for which there were no sales reported that day, are generally valued at the last quoted daily bid quotation as provided by a third-party pricing service on the market or exchange on which such securities are primarily traded. Short-term instruments with a maturity at issuance of 60 days or less generally are valued at amortized cost, which approximates market value. Open-end investment companies are generally valued at net asset value per share. Securities and other assets generally valued on the basis of information from a third-party pricing service may also be valued at a broker/dealer bid quotation. Values obtained from third-party pricing services can utilize both transaction data and market information such as yield, quality, coupon rate, maturity, type of issue, trading characteristics, and other market data. The values of foreign securities and other assets and liabilities expressed in foreign currencies are converted to U.S. dollars using the mean of bid and asked prices for rates provided by a third-party pricing service.
The Board of Trustees has delegated primary responsibility for determining or causing to be determined the value of the fund’s investments (including any fair valuation) to the adviser pursuant to valuation policies and procedures approved by the Board. If the adviser determines that reliable market quotations are not readily available, investments are valued at fair value as determined in good faith by the adviser in accordance with such procedures under the oversight of the Board of Trustees. Under the fund’s valuation policies and procedures, market quotations are not considered to be readily available for most types of debt instruments and floating rate loans and many types of derivatives. These investments are generally valued at fair value based on information from third-party pricing services. In addition, investments may be valued at fair value if the adviser determines that an investment’s value has been materially affected by events occurring after the close of the exchange or market on which the investment is principally traded (such as foreign exchange or market) and prior to the determination of the fund’s net asset value, or after the halting of trading of a specific security where trading does not resume prior to the close of the exchange or market on which the security is principally traded. Events that occur on a frequent basis after foreign markets close (such as developments in foreign markets and significant movements in the U.S. markets) and prior to the determination of the fund’s net asset value may be deemed to have a material effect on the value of securities traded in foreign markets. Accordingly, the fund’s foreign equity securities may often be valued at fair value. The adviser generally relies on third-party pricing services or other information (such as the correlation with price movements of similar securities in the same or other markets; the type, cost and investment characteristics of the security; the business and financial condition of the issuer; and trading and other market data) to assist in determining whether to fair value and at what value to fair value an investment. The value of an investment for purposes of calculating the fund’s net asset value can differ depending on the source and method used to determine value. When fair valuation is used, the
16
Notes to Financial Statements (unaudited) – continued
value of an investment used to determine the fund’s net asset value may differ from quoted or published prices for the same investment. There can be no assurance that the fund could obtain the fair value assigned to an investment if it were to sell the investment at the same time at which the fund determines its net asset value per share.
Various inputs are used in determining the value of the fund’s assets or liabilities. These inputs are categorized into three broad levels. In certain cases, the inputs used to measure fair value may fall into different levels of the fair value hierarchy. In such cases, an investment’s level within the fair value hierarchy is based on the lowest level of input that is significant to the fair value measurement. The fund’s assessment of the significance of a particular input to the fair value measurement in its entirety requires judgment, and considers factors specific to the investment. Level 1 includes unadjusted quoted prices in active markets for identical assets or liabilities. Level 2 includes other significant observable market-based inputs (including quoted prices for similar securities, interest rates, prepayment speed, and credit risk). Level 3 includes unobservable inputs, which may include the adviser’s own assumptions in determining the fair value of investments. The following is a summary of the levels used as of February 28, 2014 in valuing the fund’s assets or liabilities:
| | | | | | | | | | | | | | | | |
| Investments at Value | | Level 1 | | | Level 2 | | | Level 3 | | | Total | |
| Equity Securities | | | $12,838,823 | | | | $— | | | | $— | | | | $12,838,823 | |
| Mutual Funds | | | 217,410 | | | | — | | | | — | | | | 217,410 | |
| Total Investments | | | $13,056,233 | | | | $— | | | | $— | | | | $13,056,233 | |
For further information regarding security characteristics, see the Portfolio of Investments.
Of the level 1 investments presented above, equity investments amounting to $897,138 would have been considered level 2 investments at the beginning of the period. The primary reason for changes in the classifications between levels 1 and 2 occurs when foreign equity securities are fair valued using other observable market-based inputs in place of the closing exchange price due to events occurring after the close of the exchange or market on which the investment is principally traded. The fund’s foreign equity securities may often be valued at fair value. The fund’s policy is to recognize transfers between the levels as of the end of the period.
Foreign Currency Translation – Purchases and sales of foreign investments, income, and expenses are converted into U.S. dollars based upon currency exchange rates prevailing on the respective dates of such transactions or on the reporting date for foreign denominated receivables and payables. Gains and losses attributable to foreign currency exchange rates on sales of securities are recorded for financial statement purposes as net realized gains and losses on investments. Gains and losses attributable to foreign exchange rate movements on receivables, payables, income and expenses are recorded for financial statement purposes as foreign currency transaction gains and losses. That portion of both realized and unrealized gains and losses on investments that results from fluctuations in foreign currency exchange rates is not separately disclosed.
Indemnifications – Under the fund’s organizational documents, its officers and Trustees may be indemnified against certain liabilities and expenses arising out of the performance of their duties to the fund. Additionally, in the normal course of business,
17
Notes to Financial Statements (unaudited) – continued
the fund enters into agreements with service providers that may contain indemnification clauses. The fund’s maximum exposure under these agreements is unknown as this would involve future claims that may be made against the fund that have not yet occurred.
Investment Transactions and Income – Investment transactions are recorded on the trade date. Dividends received in cash are recorded on the ex-dividend date. Certain dividends from foreign securities will be recorded when the fund is informed of the dividend if such information is obtained subsequent to the ex-dividend date. Dividend payments received in additional securities are recorded on the ex-dividend date in an amount equal to the value of the security on such date.
The fund may receive proceeds from litigation settlements. Any proceeds received from litigation involving portfolio holdings are reflected in the Statement of Operations in realized gain/loss if the security has been disposed of by the fund or in unrealized gain/loss if the security is still held by the fund. Any other proceeds from litigation not related to portfolio holdings are reflected as other income in the Statement of Operations.
Fees Paid Indirectly – The fund’s custody fee may be reduced according to an arrangement that measures the value of cash deposited with the custodian by the fund. For the six months ended February 28, 2014, custody fees were not reduced.
Tax Matters and Distributions – The fund intends to qualify as a regulated investment company, as defined under Subchapter M of the Internal Revenue Code, and to distribute all of its taxable income, including realized capital gains. As a result, no provision for federal income tax is required. The fund’s federal tax returns, when filed, will remain subject to examination by the Internal Revenue Service for a three year period. Management has analyzed the fund’s tax positions taken on federal and state tax returns for all open tax years and does not believe that there are any uncertain tax positions that require recognition of a tax liability. Foreign taxes, if any, have been accrued by the fund in the accompanying financial statements in accordance with the applicable foreign tax law. Foreign income taxes may be withheld by certain countries in which the fund invests. Additionally, capital gains realized by the fund on securities issued in or by certain foreign countries may be subject to capital gains tax imposed by those countries.
Distributions to shareholders are recorded on the ex-dividend date. Income and capital gain distributions are determined in accordance with income tax regulations, which may differ from U.S. generally accepted accounting principles. Certain capital accounts in the financial statements are periodically adjusted for permanent differences in order to reflect their tax character. These adjustments have no impact on net assets or net asset value per share. Temporary differences which arise from recognizing certain items of income, expense, gain or loss in different periods for financial statement and tax purposes will reverse at some time in the future. Distributions in excess of net investment income or net realized gains are temporary overdistributions for financial statement purposes resulting from differences in the recognition or classification of income or distributions for financial statement and tax purposes.
18
Notes to Financial Statements (unaudited) – continued
Book/tax differences primarily relate to passive foreign investment companies, wash sale loss deferrals, and treating a portion of the proceeds from redemptions as a distribution for tax purposes.
The tax character of distributions made during the current period will be determined at fiscal year end. The federal tax cost and the tax basis components of distributable earnings were as follows:
| | | | |
| As of 2/28/14 | | | |
| Cost of investments | | | $11,273,543 | |
| Gross appreciation | | | 1,874,872 | |
| Gross depreciation | | | (92,182 | ) |
| Net unrealized appreciation (depreciation) | | | $1,782,690 | |
| |
| As of 8/31/13 | | | |
| Undistributed ordinary income | | | 794,016 | |
| Undistributed long-term capital gain | | | 83,332 | |
| Other temporary differences | | | (656 | ) |
| Net unrealized appreciation (depreciation) | | | 1,088,032 | |
The aggregate cost above includes prior fiscal year end tax adjustments, if applicable.
Multiple Classes of Shares of Beneficial Interest – The fund offers multiple classes of shares, which differ in their respective distribution and service fees. The fund’s income, realized and unrealized gain (loss), and common expenses are allocated to shareholders based on the daily net assets of each class. Dividends are declared separately for each class. Differences in per share dividend rates are generally due to differences in separate class expenses. Class B shares will convert to Class A shares approximately eight years after purchase. The fund’s distributions declared to shareholders as reported in the Statements of Changes in Net Assets are presented by class as follows:
| | | | | | | | | | | | | | | | |
| | | From net investment
income | | | From net realized gain on
investments | |
| | | Six months
ended
2/28/14 | | | Year
ended
8/31/13 | | | Six months
ended
2/28/14 | | | Year
ended
8/31/13 | |
| Class A | | | $43,141 | | | | $47,256 | | | | $505,890 | | | | $101,361 | |
| Class B | | | 1,474 | | | | — | | | | 32,256 | | | | 1,620 | |
| Class C | | | 4,066 | | | | 30 | | | | 87,699 | | | | 2,914 | |
| Class I | | | 19,320 | | | | 12,717 | | | | 184,661 | | | | 22,613 | |
| Total | | | $68,001 | | | | $60,003 | | | | $810,506 | | | | $128,508 | |
19
Notes to Financial Statements (unaudited) – continued
(3) Transactions with Affiliates
Investment Adviser – The fund has an investment advisory agreement with MFS to provide overall investment management and related administrative services and facilities to the fund. The management fee is computed daily and paid monthly at the following annual rates:
| | | | |
| First $1 billion of average daily net assets | | | 0.90 | % |
| Next $1.5 billion of average daily net assets | | | 0.75 | % |
| Average daily net assets in excess of $2.5 billion | | | 0.65 | % |
MFS has agreed in writing to reduce its management fee by a specified amount if certain MFS mutual fund assets exceed thresholds agreed to by MFS and the fund’s Board of Trustees. For the six months ended February 28, 2014, this management fee reduction amounted to $137, which is included in the reduction of total expenses in the Statement of Operations. The management fee incurred for the six months ended February 28, 2014 was equivalent to an annual effective rate of 0.90% of the fund’s average daily net assets.
The investment adviser has agreed in writing to pay a portion of the fund’s total annual operating expenses, exclusive of interest, taxes, extraordinary expenses, brokerage and transaction costs, and investment-related expenses, such that total fund operating expenses do not exceed the following rates annually fo each class’s average daily net assets.
| | | | | | | | | | | | | | |
| Class A | | | Class B | | | Class C | | | Class I | |
| | 1.45% | | | | 2.20 | % | | | 2.20 | % | | | 1.20 | % |
This written agreement will continue until modified by the fund’s Board of Trustees, but such agreement will continue at least until December 31, 2014. For the six months ended February 28, 2014, this reduction amounted to $67,273 and is included in the reduction of total expenses in the Statement of Operations.
Distributor – MFS Fund Distributors, Inc. (MFD), a wholly-owned subsidiary of MFS, as distributor, received $6,571 for the six months ended February 28, 2014, as its portion of the initial sales charge on sales of Class A shares of the fund.
The Board of Trustees has adopted a distribution plan for certain class shares pursuant to Rule 12b-1 of the Investment Company Act of 1940.
The fund’s distribution plan provides that the fund will pay MFD for services provided by MFD and financial intermediaries in connection with the distribution and servicing of certain share classes. One component of the plan is a distribution fee paid to MFD and another component of the plan is a service fee paid to MFD. MFD may subsequently pay all, or a portion, of the distribution and/or service fees to financial intermediaries.
Distribution Plan Fee Table:
| | | | | | | | | | | | | | | | | | | | |
| | | Distribution
Fee Rate (d) | | | Service
Fee Rate (d) | | | Total
Distribution
Plan (d) | | | Annual
Effective
Rate (e) | | | Distribution
and Service
Fee | |
| Class A | | | — | | | | 0.25% | | | | 0.25% | | | | 0.25% | | | | $9,508 | |
| Class B | | | 0.75% | | | | 0.25% | | | | 1.00% | | | | 1.00% | | | | 2,179 | |
| Class C | | | 0.75% | | | | 0.25% | | | | 1.00% | | | | 1.00% | | | | 6,053 | |
| Total Distribution and Service Fees | | | | $17,740 | |
20
Notes to Financial Statements (unaudited) – continued
| (d) | In accordance with the distribution plan for certain classes, the fund pays distribution and/or service fees equal to these annual percentage rates of each class’s average daily net assets. The distribution and service fee rates disclosed by class represent the current rates in effect at the end of the reporting period. Any rate changes, if applicable, are detailed below. |
| (e) | The annual effective rates represent actual fees incurred under the distribution plan for the six months ended February 28, 2014 based on each class’s average daily net assets. MFD has voluntarily agreed to rebate a portion of each class’s 0.25% service fee attributable to accounts for which MFD retains the 0.25% service fee except for accounts attributable to MFS or its affiliates’ seed money. For the six months ended February 28, 2014, this rebate amounted to $47 for Class A and is reflected as a reduction of total expenses in the Statement of Operations. |
Certain Class A shares are subject to a contingent deferred sales charge (CDSC) in the event of a shareholder redemption within 18 months of purchase for shares purchased on or after August 1, 2012, and within 24 months of purchase for shares purchased prior to August 1, 2012. Class C shares are subject to a CDSC in the event of a shareholder redemption within 12 months of purchase. Class B shares are subject to a CDSC in the event of a shareholder redemption within six years of purchase. All contingent deferred sales charges are paid to MFD and during the six months ended February 28, 2014, were as follows:
| | | | |
| | | Amount | |
| Class A | | | $207 | |
| Class B | | | 220 | |
| Class C | | | 177 | |
Shareholder Servicing Agent – MFS Service Center, Inc. (MFSC), a wholly-owned subsidiary of MFS, receives a fee from the fund for its services as shareholder servicing agent calculated as a percentage of the average daily net assets of the fund as determined periodically under the supervision of the fund’s Board of Trustees. For the six months ended February 28, 2014, the fee was $1,521, which equated to 0.0252% annually of the fund’s average daily net assets. MFSC also receives payment from the fund for out-of-pocket expenses, sub-accounting and other shareholder servicing costs which may be paid to affiliated and unaffiliated service providers. For the six months ended February 28, 2014, these out-of-pocket expenses, sub-accounting and other shareholder servicing costs amounted to $5,214.
Administrator – MFS provides certain financial, legal, shareholder communications, compliance, and other administrative services to the fund. Under an administrative services agreement, the fund partially reimburses MFS the costs incurred to provide these services. The fund is charged an annual fixed amount of $17,500 plus a fee based on average daily net assets. The administrative services fee incurred for the six months ended February 28, 2014 was equivalent to an annual effective rate of 0.1439% of the fund’s average daily net assets.
Trustees’ and Officers’ Compensation – The fund pays compensation to independent Trustees in the form of a retainer, attendance fees, and additional compensation to Board and Committee chairpersons. The fund does not pay compensation directly to Trustees or officers of the fund who are also officers of the investment adviser, all of whom receive remuneration for their services to the fund from MFS. Certain officers and Trustees of the fund are officers or directors of MFS, MFD, and MFSC.
21
Notes to Financial Statements (unaudited) – continued
Other – This fund and certain other funds managed by MFS (the funds) have entered into services agreements (the Agreements) which provide for payment of fees by the funds to Tarantino LLC and Griffin Compliance LLC in return for the provision of services of an Independent Chief Compliance Officer (ICCO) and Assistant ICCO, respectively, for the funds. The ICCO and Assistant ICCO are officers of the funds and the sole members of Tarantino LLC and Griffin Compliance LLC, respectively. The funds can terminate the Agreements with Tarantino LLC and Griffin Compliance LLC at any time under the terms of the Agreements. For the six months ended February 28, 2014, the aggregate fees paid by the fund to Tarantino LLC and Griffin Compliance LLC were $40 and are included in “Miscellaneous” expense in the Statement of Operations. MFS has agreed to reimburse the fund for a portion of the payments made by the fund in the amount of $6, which is included in the reduction of total expenses in the Statement of Operations. Additionally, MFS has agreed to bear all expenses associated with office space, other administrative support, and supplies provided to the ICCO and Assistant ICCO.
The fund invests in the MFS Institutional Money Market Portfolio which is managed by MFS and seeks current income consistent with preservation of capital and liquidity. Income earned on this investment is included in “Dividends from underlying affiliated funds” in the Statement of Operations. This money market fund does not pay a management fee to MFS.
On September 11, 2013, MFS redeemed 10,143 shares of Class A for an aggregate amount of $101,820. At February 28, 2014, MFS held 96% of the outstanding shares of Class I.
(4) Portfolio Securities
Purchases and sales of investments, other than short-term obligations, aggregated $2,579,273 and $746,011, respectively.
(5) Shares of Beneficial Interest
The fund’s Declaration of Trust permits the Trustees to issue an unlimited number of full and fractional shares of beneficial interest. Transactions in fund shares were as follows:
| | | | | | | | | | | | | | | | |
| | | Six months ended
2/28/14 | | | Year ended
8/31/13 | |
| | | Shares | | | Amount | | | Shares | | | Amount | |
| Shares sold | | | | | | | | | | | | | | | | |
Class A | | | 170,492 | | | | $2,420,793 | | | | 491,804 | | | | $6,548,966 | |
Class B | | | 10,972 | | | | 158,940 | | | | 15,708 | | | | 209,931 | |
Class C | | | 37,123 | | | | 522,944 | | | | 56,826 | | | | 739,685 | |
Class I | | | 203 | | | | 3,000 | | | | 9,352 | | | | 130,223 | |
| | | 218,790 | | | | $3,105,677 | | | | 573,690 | | | | $7,628,805 | |
22
Notes to Financial Statements (unaudited) – continued
| | | | | | | | | | | | | | | | |
| | | Six months ended
2/28/14 | | | Year ended
8/31/13 | |
| | | Shares | | | Amount | | | Shares | | | Amount | |
Shares issued to shareholders in
reinvestment of distributions | | | | | | | | | | | | | |
Class A | | | 39,229 | | | | $537,433 | | | | 11,590 | | | | $147,077 | |
Class B | | | 2,406 | | | | 32,621 | | | | 128 | | | | 1,620 | |
Class C | | | 6,502 | | | | 88,100 | | | | 233 | | | | 2,944 | |
Class I | | | 14,845 | | | | 203,980 | | | | 2,778 | | | | 35,330 | |
| | | 62,982 | | | | $862,134 | | | | 14,729 | | | | $186,971 | |
| | | |
| Shares reacquired | | | | | | | | | | | | | |
Class A | | | (79,516 | ) | | | $(1,108,559 | ) | | | (713,390 | ) | | | $(9,410,438 | ) |
Class B | | | (3,033 | ) | | | (43,292 | ) | | | (310 | ) | | | (4,144 | ) |
Class C | | | (18,285 | ) | | | (241,013 | ) | | | (970 | ) | | | (13,198 | ) |
Class I | | | (1,749 | ) | | | (24,001 | ) | | | — | | | | — | |
| | | (102,583 | ) | | | $(1,416,865 | ) | | | (714,670 | ) | | | $(9,427,780 | ) |
| | | |
| Net change | | | | | | | | | | | | | |
Class A | | | 130,205 | | | | $1,849,667 | | | | (209,996 | ) | | | $(2,714,395 | ) |
Class B | | | 10,345 | | | | 148,269 | | | | 15,526 | | | | 207,407 | |
Class C | | | 25,340 | | | | 370,031 | | | | 56,089 | | | | 729,431 | |
Class I | | | 13,299 | | | | 182,979 | | | | 12,130 | | | | 165,553 | |
| | | 179,189 | | | | $2,550,946 | | | | (126,251 | ) | | | $(1,612,004 | ) |
(6) Line of Credit
The fund and certain other funds managed by MFS participate in a $1.1 billion unsecured committed line of credit, subject to a $1 billion sublimit, provided by a syndication of banks under a credit agreement. Borrowings may be made for temporary financing needs. Interest is charged to each fund, based on its borrowings, generally at a rate equal to the higher of the Federal Reserve funds rate or one month LIBOR plus an agreed upon spread. A commitment fee, based on the average daily, unused portion of the committed line of credit, is allocated among the participating funds at the end of each calendar quarter. In addition, the fund and other funds managed by MFS have established unsecured uncommitted borrowing arrangements with certain banks for temporary financing needs. Interest is charged to each fund, based on its borrowings, at a rate equal to the Federal Reserve funds rate plus an agreed upon spread. For the six months ended February 28, 2014, the fund’s commitment fee and interest expense were $24 and $0, respectively, and are included in “Miscellaneous” expense in the Statement of Operations.
23
Notes to Financial Statements (unaudited) – continued
(7) Transactions in Underlying Affiliated Funds-Affiliated Issuers
An affiliated issuer may be considered one in which the fund owns 5% or more of the outstanding voting securities, or a company which is under common control. For the purposes of this report, the fund assumes the following to be an affiliated issuer:
| | | | | | | | | | | | | | | | |
| Underlying Affiliated Fund | | Beginning
Shares/Par
Amount | | | Acquisitions
Shares/Par
Amount | | | Dispositions
Shares/Par
Amount | | | Ending
Shares/Par
Amount | |
MFS Institutional Money
Market Portfolio | | | 466,176 | | | | 2,132,434 | | | | (2,381,200 | ) | | | 217,410 | |
| | | | |
| Underlying Affiliated Fund | | Realized
Gain (Loss) | | | Capital Gain
Distributions | | | Dividend
Income | | | Ending
Value | |
MFS Institutional Money
Market Portfolio | | | $— | | | | $— | | | | $235 | | | | $217,410 | |
24
BOARD REVIEW OF INVESTMENT ADVISORY AGREEMENT
A discussion regarding the Board’s most recent review and renewal of the fund’s Investment Advisory Agreement with MFS is available by clicking on the fund’s name under “Mutual Funds” in the “Products” section of the MFS Web site (mfs.com).
PROXY VOTING POLICIES AND INFORMATION
A general description of the MFS funds’ proxy voting policies and procedures is available without charge, upon request, by calling 1-800-225-2606, by visiting the Proxy Voting section of mfs.com or by visiting the SEC’s Web site at http://www.sec.gov.
Information regarding how the fund voted proxies relating to portfolio securities during the most recent twelve-month period ended June 30 is available without charge by visiting the Proxy Voting section of mfs.com or by visiting the SEC’s Web site at http://www.sec.gov.
QUARTERLY PORTFOLIO DISCLOSURE
The fund will file a complete schedule of portfolio holdings with the Securities and Exchange Commission (the Commission) for the first and third quarters of each fiscal year on Form N-Q. A shareholder can obtain the quarterly portfolio holdings report at mfs.com. The fund’s Form N-Q is also available on the EDGAR database on the Commission’s Internet Web site at http://www.sec.gov, and may be reviewed and copied at the:
Public Reference Room
Securities and Exchange Commission
100 F Street, NE, Room 1580
Washington, D.C. 20549
Information on the operation of the Public Reference Room may be obtained by calling the Commission at 1-800-SEC-0330. Copies of the fund’s Form N-Q also may be obtained, upon payment of a duplicating fee, by electronic request at the following e-mail address: publicinfo@sec.gov, or by writing the Public Reference Section at the above address.
FURTHER INFORMATION
From time to time, MFS may post important information about the fund or the MFS funds on the MFS web site (mfs.com). This information is available by visiting the “Commentary & Announcements” and “Market Outlooks” sections of mfs.com or by clicking on the fund’s name under “Mutual Funds” in the “Products” section of mfs.com.
PROVISION OF FINANCIAL REPORTS AND SUMMARY PROSPECTUSES
The fund produces financial reports every six months and updates its summary prospectus and prospectus annually. To avoid sending duplicate copies of materials to households, only one copy of the fund’s annual and semiannual report and summary prospectus may be mailed to shareholders having the same last name and residential address on the fund’s records. However, any shareholder may contact MFSC (please see back cover for address and telephone number) to request that copies of these reports and summary prospectuses be sent personally to that shareholder.
25
Save paper with eDelivery.

| MFS® will send you prospectuses, |
reports, and proxies directly via e-mail so you will get information faster with less mailbox clutter.
To sign up:
1. Go to mfs.com.
2. Log in via MFS® Access.
3. Select eDelivery.
If you own your MFS fund shares through a financial institution or a retirement plan, MFS® TALK, MFS® Access, or eDelivery may not be available to you.
CONTACT
WEB SITE
mfs.com
MFS TALK
1-800-637-8255
24 hours a day
ACCOUNT SERVICE AND LITERATURE
Shareholders
1-800-225-2606
Financial advisors
1-800-343-2829
Retirement plan services
1-800-637-1255
MAILING ADDRESS
MFS Service Center, Inc.
P.O. Box 55824
Boston, MA 02205-5824
OVERNIGHT MAIL
MFS Service Center, Inc.
c/o Boston Financial Data Services
30 Dan Road
Canton, MA 02021-2809
SEMIANNUAL REPORT
February 28, 2014

MFS® NEW DISCOVERY FUND

NDF-SEM
MFS® NEW DISCOVERY FUND
CONTENTS
The report is prepared for the general information of shareholders. It is authorized for distribution to prospective investors only when preceded or accompanied by a current prospectus.
NOT FDIC INSURED Ÿ MAY LOSE VALUE Ÿ NO BANK GUARANTEE

LETTER FROM THE CHAIRMAN AND CEO
Dear Shareholders:
The U.S. economy appears to have slowed early in 2014 after a strong second half of 2013. Harsh winter weather likely contributed to at least a temporary softening of consumer demand. Looking at the longer term, the pace of U.S. economic growth has
been modest since the recovery began late in 2009. Corporate profits remain healthy overall. A major plus is the removal of a highly confrontational atmosphere in the U.S. Congress, which had clouded business decision-making since 2011.
Globally, recent months have been dominated by volatility, including emerging market currency jitters and rising geopolitical tensions. These add to the possibility of economic uncertainty and financial market unease. However, the eurozone continues to show signs of recovery, while Japan is making progress as it seeks to break free of deflation.
China’s transition toward a more consumer-oriented and less export-driven economy — one with a more stable and sustainable growth rate — could be positive in the long term. However, in the near term, any deceleration in China’s rate of growth could have a ripple effect on its many global trading partners.
In uncertain times such as these, it is particularly important to remember that managing risk should always be a top priority. At MFS®, active risk management is an integral part of our collaborative process. Our global team of investment professionals shares ideas and evaluates opportunities that span continents, investment disciplines and asset classes. Our goal is to build better insights, and ultimately better results, for our clients.
We understand and appreciate the economic challenges investors face, and we believe in the value of maintaining a long-term view and applying proven principles, such as asset allocation and diversification. We are confident that our unique approach can serve investors well as they work with their financial advisors to identify and pursue the most suitable opportunities.
Respectfully,

Robert J. Manning
Chairman and Chief Executive Officer
MFS Investment Management
April 14, 2014
The opinions expressed in this letter are subject to change, may not be relied upon for investment advice, and no forecasts can be guaranteed.
1
PORTFOLIO COMPOSITION
Portfolio structure

| | | | |
| Top ten holdings | | | | |
| CONSOL Energy, Inc. | | | 2.2% | |
| Joy Global, Inc. | | | 2.0% | |
| Silicon Laboratories, Inc. | | | 2.0% | |
| Atwood Oceanics, Inc. | | | 2.0% | |
| Diana Shipping, Inc. | | | 1.9% | |
| IPG Photonics Corp. | | | 1.8% | |
| Allison Transmission Holdings, Inc. | | | 1.7% | |
| Constant Contact, Inc. | | | 1.7% | |
| Qlik Technologies, Inc | | | 1.6% | |
| Cabot Oil & Gas Corp. | | | 1.6% | |
| | | | |
| Equity sectors | | | | |
| Technology | | | 18.5% | |
| Industrial Goods & Services | | | 14.8% | |
| Energy | | | 14.6% | |
| Health Care | | | 12.7% | |
| Special Products & Services | | | 10.3% | |
| Basic Materials | | | 8.2% | |
| Transportation | | | 6.2% | |
| Retailing | | | 5.2% | |
| Leisure | | | 4.1% | |
| Financial Services | | | 2.1% | |
| Autos & Housing | | | 1.5% | |
| Consumer Staples | | | 0.9% | |
| Utilities & Communications | | | 0.4% | |
Percentages are based on net assets as of 2/28/14.
The portfolio is actively managed and current holdings may be different.
2
EXPENSE TABLE
Fund expenses borne by the shareholders during the period, September 1, 2013 through February 28, 2014
As a shareholder of the fund, you incur two types of costs: (1) transaction costs, including sales charges (loads) on certain purchase or redemption payments, and (2) ongoing costs, including management fees; distribution and service (12b-1) fees; and other fund expenses. This example is intended to help you understand your ongoing costs (in dollars) of investing in the fund and to compare these costs with the ongoing costs of investing in other mutual funds.
The example is based on an investment of $1,000 invested at the beginning of the period and held for the entire period September 1, 2013 through February 28, 2014.
Actual Expenses
The first line for each share class in the following table provides information about actual account values and actual expenses. You may use the information in this line, together with the amount you invested, to estimate the expenses that you paid over the period. Simply divide your account value by $1,000 (for example, an $8,600 account value divided by $1,000 = 8.6), then multiply the result by the number in the first line under the heading entitled “Expenses Paid During Period” to estimate the expenses you paid on your account during this period.
Hypothetical Example for Comparison Purposes
The second line for each share class in the following table provides information about hypothetical account values and hypothetical expenses based on the fund’s actual expense ratio and an assumed rate of return of 5% per year before expenses, which is not the fund’s actual return. The hypothetical account values and expenses may not be used to estimate the actual ending account balance or expenses you paid for the period. You may use this information to compare the ongoing costs of investing in the fund and other funds. To do so, compare this 5% hypothetical example with the 5% hypothetical examples that appear in the shareholder reports of the other funds.
Please note that the expenses shown in the table are meant to highlight your ongoing costs only and do not reflect any transactional costs, such as sales charges (loads). Therefore, the second line for each share class in the table is useful in comparing ongoing costs only, and will not help you determine the relative total costs of owning different funds. In addition, if these transactional costs were included, your costs would have been higher.
3
Expense Table – continued
| | | | | | | | | | | | | | | | | | |
Share
Class | | | | Annualized
Expense
Ratio | | | Beginning
Account Value
9/01/13 | | | Ending
Account Value
2/28/14 | | | Expenses Paid During
Period (p) 9/01/13-2/28/14 | |
| A | | Actual | | | 1.25% | | | | $1,000.00 | | | | $1,125.91 | | | | $6.59 | |
| | Hypothetical (h) | | | 1.25% | | | | $1,000.00 | | | | $1,018.60 | | | | $6.26 | |
| B | | Actual | | | 2.00% | | | | $1,000.00 | | | | $1,121.41 | | | | $10.52 | |
| | Hypothetical (h) | | | 2.00% | | | | $1,000.00 | | | | $1,014.88 | | | | $9.99 | |
| C | | Actual | | | 2.00% | | | | $1,000.00 | | | | $1,121.68 | | | | $10.52 | |
| | Hypothetical (h) | | | 2.00% | | | | $1,000.00 | | | | $1,014.88 | | | | $9.99 | |
| I | | Actual | | | 1.00% | | | | $1,000.00 | | | | $1,127.03 | | | | $5.27 | |
| | Hypothetical (h) | | | 1.00% | | | | $1,000.00 | | | | $1,019.84 | | | | $5.01 | |
| R1 | | Actual | | | 2.00% | | | | $1,000.00 | | | | $1,121.64 | | | | $10.52 | |
| | Hypothetical (h) | | | 2.00% | | | | $1,000.00 | | | | $1,014.88 | | | | $9.99 | |
| R2 | | Actual | | | 1.50% | | | | $1,000.00 | | | | $1,124.75 | | | | $7.90 | |
| | Hypothetical (h) | | | 1.50% | | | | $1,000.00 | | | | $1,017.36 | | | | $7.50 | |
| R3 | | Actual | | | 1.25% | | | | $1,000.00 | | | | $1,126.01 | | | | $6.59 | |
| | Hypothetical (h) | | | 1.25% | | | | $1,000.00 | | | | $1,018.60 | | | | $6.26 | |
| R4 | | Actual | | | 1.00% | | | | $1,000.00 | | | | $1,127.50 | | | | $5.28 | |
| | Hypothetical (h) | | | 1.00% | | | | $1,000.00 | | | | $1,019.84 | | | | $5.01 | |
| R5 | | Actual | | | 0.91% | | | | $1,000.00 | | | | $1,128.00 | | | | $4.80 | |
| | Hypothetical (h) | | | 0.91% | | | | $1,000.00 | | | | $1,020.28 | | | | $4.56 | |
| 529A | | Actual | | | 1.28% | | | | $1,000.00 | | | | $1,125.81 | | | | $6.75 | |
| | Hypothetical (h) | | | 1.28% | | | | $1,000.00 | | | | $1,018.45 | | | | $6.41 | |
| 529B | | Actual | | | 2.04% | | | | $1,000.00 | | | | $1,121.78 | | | | $10.73 | |
| | Hypothetical (h) | | | 2.04% | | | | $1,000.00 | | | | $1,014.68 | | | | $10.19 | |
| 529C | | Actual | | | 2.05% | | | | $1,000.00 | | | | $1,121.73 | | | | $10.78 | |
| | Hypothetical (h) | | | 2.05% | | | | $1,000.00 | | | | $1,014.63 | | | | $10.24 | |
| (h) | 5% class return per year before expenses. |
| (p) | Expenses Paid During Period are equal to each class’s annualized expense ratio, as shown above, multiplied by the average account value over the period, multiplied by 181/365 (to reflect the one-half year period). Expenses paid do not include any applicable sales charges (loads). If these transaction costs had been included, your costs would have been higher. |
Notes to Expense Table
Each class with a Rule 12b-1 service fee is subject to a rebate of a portion of such fee. Such rebates are included in the expense ratios above and are outside of the expense limitation arrangement. For Class A, Class 529A, and Class 529B shares, this rebate reduced the expense ratios above by 0.01%, 0.03%, and 0.02%, respectively. See Note 3 in the Notes to Financial Statements for additional information.
4
PORTFOLIO OF INVESTMENTS
2/28/14 (unaudited)
The Portfolio of Investments is a complete list of all securities owned by your fund. It is categorized by broad-based asset classes.
| | | | | | | | |
| Common Stocks - 99.5% | | | | | | | | |
| Issuer | | Shares/Par | | | Value ($) | |
| | | | | | | | |
| Aerospace - 1.1% | | | | | | | | |
| FLIR Systems, Inc. | | | 718,420 | | | $ | 24,526,859 | |
| | |
| Airlines - 0.8% | | | | | | | | |
| Controladora Vuela Compania de Aviacion S.A.B. de C.V., ADR (a) | | | 1,890,772 | | | $ | 17,546,364 | |
| | |
| Apparel Manufacturers - 0.7% | | | | | | | | |
| Vince Holding Corp. (a) | | | 564,760 | | | $ | 15,248,520 | |
| | |
| Automotive - 0.5% | | | | | | | | |
| Dorman Products, Inc. (a) | | | 210,810 | | | $ | 12,146,872 | |
| | |
| Biotechnology - 0.4% | | | | | | | | |
| MiMedx Group, Inc. (a) | | | 1,324,960 | | | $ | 9,473,464 | |
| | |
| Broadcasting - 0.9% | | | | | | | | |
| RetailMeNot, Inc. (a) | | | 464,480 | | | $ | 19,401,330 | |
| | |
| Brokerage & Asset Managers - 1.1% | | | | | | | | |
| LPL Financial Holdings, Inc. | | | 463,405 | | | $ | 24,875,580 | |
| | |
| Business Services - 5.9% | | | | | | | | |
| Bright Horizons Family Solutions, Inc. (a) | | | 866,068 | | | $ | 34,183,704 | |
| Constant Contact, Inc. (a) | | | 1,362,564 | | | | 37,565,889 | |
| Forrester Research, Inc. | | | 279,152 | | | | 10,110,885 | |
| Gartner, Inc. (a) | | | 337,395 | | | | 23,469,196 | |
| Performant Financial Corp. (a) | | | 1,060,923 | | | | 8,391,901 | |
| Xoom Corp. (a) | | | 715,282 | | | | 20,049,354 | |
| | | | | | | | |
| | | | | | | $ | 133,770,929 | |
| Chemicals - 0.1% | | | | | | | | |
| Marrone Bio Innovations, Inc. (a) | | | 188,531 | | | $ | 2,739,355 | |
| | |
| Computer Software - 4.3% | | | | | | | | |
| CommVault Systems, Inc. (a) | | | 435,532 | | | $ | 29,999,444 | |
| Qlik Technologies, Inc. (a) | | | 1,184,864 | | | | 36,138,352 | |
| SolarWinds, Inc. (a) | | | 681,974 | | | | 31,493,559 | |
| | | | | | | | |
| | | | | | | $ | 97,631,355 | |
5
Portfolio of Investments (unaudited) – continued
| | | | | | | | |
| Issuer | | Shares/Par | | | Value ($) | |
| | | | | | | | |
| Common Stocks - continued | | | | | | | | |
| Computer Software - Systems - 6.4% | | | | | | | | |
| Cvent, Inc. (a) | | | 345,714 | | | $ | 13,579,646 | |
| E2open, Inc. (a) | | | 388,870 | | | | 10,806,697 | |
| Exa Corp. (a) | | | 577,650 | | | | 8,901,587 | |
| Fleetmatics Group PLC (a) | | | 657,598 | | | | 24,298,246 | |
| Linx S.A. | | | 426,700 | | | | 7,646,843 | |
| MiX Telematics Ltd., ADR (a) | | | 988,421 | | | | 12,058,736 | |
| Model N, Inc. (a)(h) | | | 1,720,914 | | | | 18,912,845 | |
| SciQuest, Inc. (a) | | | 852,984 | | | | 25,180,088 | |
| SS&C Technologies Holdings, Inc. (a) | | | 461,772 | | | | 17,861,341 | |
| Varonis Systems, Inc. (a) | | | 119,200 | | | | 5,244,800 | |
| | | | | | | | |
| | | | | | | $ | 144,490,829 | |
| Construction - 0.5% | | | | | | | | |
| Eagle Materials, Inc. | | | 134,040 | | | $ | 11,849,136 | |
| | |
| Consumer Services - 4.4% | | | | | | | | |
| Diamond Resorts International, Inc. (a) | | | 1,002,740 | | | $ | 18,239,841 | |
| HomeAway, Inc. (a) | | | 604,918 | | | | 27,747,589 | |
| Kroton Educacional S.A. | | | 1,703,800 | | | | 31,754,370 | |
| MakeMyTrip Ltd. (a) | | | 834,479 | | | | 21,571,282 | |
| | | | | | | | |
| | | | | | | $ | 99,313,082 | |
| Electrical Equipment - 2.2% | | | | | | | | |
| MSC Industrial Direct Co., Inc., “A” | | | 256,783 | | | $ | 22,168,076 | |
| Sensata Technologies Holding B.V. (a) | | | 666,160 | | | | 27,072,742 | |
| | | | | | | | |
| | | | | | | $ | 49,240,818 | |
| Electronics - 5.9% | | | | | | | | |
| Mellanox Technologies Ltd. (a)(l) | | | 723,352 | | | $ | 26,416,815 | |
| Rubicon Technology, Inc. (a)(h)(l) | | | 1,539,797 | | | | 19,878,779 | |
| Silicon Laboratories, Inc. (a) | | | 870,557 | | | | 45,242,847 | |
| Stratasys Ltd. (a) | | | 44,606 | | | | 5,670,761 | |
| Ultratech, Inc. (a) | | | 1,148,195 | | | | 30,105,673 | |
| Universal Display Corp. (a) | | | 217,097 | | | | 7,498,530 | |
| | | | | | | | |
| | | | | | | $ | 134,813,405 | |
| Energy - Independent - 10.2% | | | | | | | | |
| Alpha Natural Resources, Inc. (a) | | | 1,862,350 | | | $ | 10,000,820 | |
| Antero Resources Corp. (a) | | | 395,560 | | | | 23,868,090 | |
| Cabot Oil & Gas Corp. | | | 1,014,231 | | | | 35,498,085 | |
| CONSOL Energy, Inc. | | | 1,255,547 | | | | 50,347,435 | |
| Oasis Petroleum LLC (a) | | | 276,420 | | | | 12,043,619 | |
| Peabody Energy Corp. | | | 1,696,538 | | | | 29,791,207 | |
| Range Resources Corp. | | | 344,498 | | | | 29,644,053 | |
6
Portfolio of Investments (unaudited) – continued
| | | | | | | | |
| Issuer | | Shares/Par | | | Value ($) | |
| | | | | | | | |
| Common Stocks - continued | | | | | | | | |
| Energy - Independent - continued | | | | | | | | |
| Rice Energy, Inc. (a) | | | 1,225,540 | | | $ | 29,412,960 | |
| Walter Energy, Inc. (l) | | | 1,069,813 | | | | 11,543,282 | |
| | | | | | | | |
| | | | | | | $ | 232,149,551 | |
| Engineering - Construction - 0.9% | | | | | | | | |
| Team, Inc. (a) | | | 469,980 | | | $ | 20,321,935 | |
| | |
| Entertainment - 0.1% | | | | | | | | |
| DHX Media Ltd. | | | 640,220 | | | $ | 2,757,924 | |
| | |
| Food & Beverages - 0.9% | | | | | | | | |
| Flowers Foods, Inc. | | | 558,230 | | | $ | 11,482,791 | |
| Grupo Lala S.A.B. de C.V. | | | 4,330,400 | | | | 9,071,773 | |
| | | | | | | | |
| | | | | | | $ | 20,554,564 | |
| Food & Drug Stores - 1.0% | | | | | | | | |
| Brazil Pharma S.A. (a) | | | 5,128,500 | | | $ | 11,482,941 | |
| Fairway Group Holdings Corp. (a) | | | 1,434,073 | | | | 11,185,769 | |
| | | | | | | | |
| | | | | | | $ | 22,668,710 | |
| Furniture & Appliances - 0.5% | | | | | | | | |
| SodaStream International Ltd. (a)(l) | | | 273,307 | | | $ | 10,790,160 | |
| | |
| Gaming & Lodging - 0.7% | | | | | | | | |
| Norwegian Cruise Line Holdings Ltd. (a) | | | 498,412 | | | $ | 17,080,579 | |
| | |
| General Merchandise - 1.1% | | | | | | | | |
| Five Below, Inc. (a) | | | 641,010 | | | $ | 24,704,525 | |
| | |
| Internet - 1.9% | | | | | | | | |
| Millennial Media, Inc. (a)(l) | | | 2,708,145 | | | $ | 16,357,196 | |
| Shutterfly, Inc. (a) | | | 476,871 | | | | 26,018,082 | |
| | | | | | | | |
| | | | | | | $ | 42,375,278 | |
| Machinery & Tools - 10.7% | | | | | | | | |
| Allison Transmission Holdings, Inc. | | | 1,264,041 | | | $ | 37,643,141 | |
| Finning International, Inc. | | | 570,520 | | | | 15,539,495 | |
| IPG Photonics Corp. (a)(l) | | | 579,795 | | | | 41,611,887 | |
| Joy Global, Inc. | | | 825,293 | | | | 45,391,115 | |
| Kennametal, Inc. | | | 405,565 | | | | 17,739,413 | |
| Nordson Corp. | | | 192,240 | | | | 14,064,278 | |
| Polypore International, Inc. (a)(l) | | | 968,170 | | | | 33,508,364 | |
| Proto Labs, Inc. (a) | | | 154,030 | | | | 11,998,937 | |
7
Portfolio of Investments (unaudited) – continued
| | | | | | | | |
| Issuer | | Shares/Par | | | Value ($) | |
| | | | | | | | |
| Common Stocks - continued | | | | | | | | |
| Machinery & Tools - continued | | | | | | | | |
| WABCO Holdings, Inc. (a) | | | 233,835 | | | $ | 23,956,396 | |
| | | | | | | | |
| | | | | | | $ | 241,453,026 | |
| Medical & Health Technology & Services - 4.3% | | | | | | | | |
| Advisory Board Co. (a) | | | 279,899 | | | $ | 17,935,928 | |
| Capital Senior Living Corp. (a) | | | 1,287,080 | | | | 32,717,574 | |
| Healthcare Services Group, Inc. | | | 1,047,125 | | | | 28,199,076 | |
| HealthStream, Inc. (a) | | | 610,080 | | | | 17,582,506 | |
| | | | | | | | |
| | | | | | | $ | 96,435,084 | |
| Medical Equipment - 6.3% | | | | | | | | |
| Cardiovascular Systems, Inc. (a) | | | 739,441 | | | $ | 25,880,435 | |
| Cepheid, Inc. (a) | | | 495,365 | | | | 26,581,286 | |
| Endologix, Inc. (a) | | | 1,641,191 | | | | 22,156,079 | |
| GenMark Diagnostics, Inc. (a) | | | 958,897 | | | | 11,947,857 | |
| Globus Medical, Inc., “A” (a) | | | 713,002 | | | | 16,869,627 | |
| Novadaq Technologies, Inc. (a) | | | 210,972 | | | | 4,303,829 | |
| NxStage Medical, Inc. (a) | | | 805,197 | | | | 11,168,082 | |
| TearLab Corp. (a)(h) | | | 2,181,758 | | | | 17,563,152 | |
| Uroplasty, Inc. (a)(h) | | | 1,474,173 | | | | 6,073,593 | |
| | | | | | | | |
| | | | | | | $ | 142,543,940 | |
| Metals & Mining - 7.2% | | | | | | | | |
| Cameco Corp. | | | 936,850 | | | $ | 22,727,981 | |
| Century Aluminum Co. (a) | | | 1,514,334 | | | | 17,929,715 | |
| Globe Specialty Metals, Inc. | | | 1,301,378 | | | | 25,858,381 | |
| GrafTech International Ltd. (a) | | | 2,503,750 | | | | 24,286,375 | |
| Horsehead Holding Corp. (a) | | | 1,313,908 | | | | 23,348,145 | |
| Iluka Resources Ltd. | | | 2,934,183 | | | | 24,585,997 | |
| Molycorp, Inc. (a)(l) | | | 3,544,441 | | | | 18,501,982 | |
| Uranium Participation Corp. (a) | | | 1,309,350 | | | | 6,976,578 | |
| | | | | | | | |
| | | | | | | $ | 164,215,154 | |
| Natural Gas - Pipeline - 0.4% | | | | | | | | |
| StealthGas, Inc. (a) | | | 834,940 | | | $ | 8,775,219 | |
| | |
| Oil Services - 4.4% | | | | | | | | |
| Atwood Oceanics, Inc. (a) | | | 939,622 | | | $ | 44,528,687 | |
| Dresser-Rand Group, Inc. (a) | | | 414,398 | | | | 22,514,243 | |
| Frank’s International N.V. | | | 1,351,895 | | | | 31,958,798 | |
| | | | | | | | |
| | | | | | | $ | 99,001,728 | |
| Other Banks & Diversified Financials - 0.9% | | | | | | | | |
| First Republic Bank | | | 414,991 | | | $ | 21,567,082 | |
8
Portfolio of Investments (unaudited) – continued
| | | | | | | | |
| Issuer | | Shares/Par | | | Value ($) | |
| | | | | | | | |
| Common Stocks - continued | | | | | | | | |
| Pharmaceuticals - 1.8% | | | | | | | | |
| Aratana Therapeutics, Inc. (a) | | | 287,770 | | | $ | 6,725,185 | |
| Kythera Biopharmaceuticals, Inc. (a) | | | 383,668 | | | | 19,171,890 | |
| TherapeuticsMD, Inc. (a) | | | 2,068,620 | | | | 14,211,419 | |
| | | | | | | | |
| | | | | | | $ | 40,108,494 | |
| Railroad & Shipping - 3.5% | | | | | | | | |
| Diana Shipping, Inc. (a) | | | 3,354,637 | | | $ | 43,677,374 | |
| Navigator Holdings Ltd. (a) | | | 371,615 | | | | 8,974,502 | |
| Navios Maritime Holdings, Inc. | | | 2,821,295 | | | | 27,056,219 | |
| | | | | | | | |
| | | | | | | $ | 79,708,095 | |
| Restaurants - 2.3% | | | | | | | | |
| Arcos Dorados Holdings, Inc. | | | 2,278,169 | | | $ | 20,025,106 | |
| BJ’s Restaurants, Inc. (a) | | | 609,510 | | | | 16,883,427 | |
| Chuy’s Holdings, Inc. (a) | | | 123,850 | | | | 4,930,469 | |
| Dunkin Brands Group, Inc. | | | 219,700 | | | | 11,351,899 | |
| | | | | | | | |
| | | | | | | $ | 53,190,901 | |
| Specialty Chemicals - 0.8% | | | | | | | | |
| Rockwood Holdings, Inc. | | | 224,510 | | | $ | 17,709,349 | |
| | |
| Specialty Stores - 2.5% | | | | | | | | |
| Citi Trends, Inc. (a)(h) | | | 1,234,405 | | | $ | 20,244,246 | |
| Monro Muffler Brake, Inc. | | | 286,944 | | | | 17,121,948 | |
| Tile Shop Holdings, Inc. (a) | | | 1,203,820 | | | | 18,562,904 | |
| | | | | | | | |
| | | | | | | $ | 55,929,098 | |
| Trucking - 1.9% | | | | | | | | |
| Atlas Air Worldwide Holdings, Inc. (a) | | | 362,103 | | | $ | 10,910,163 | |
| Swift Transportation Co. (a) | | | 1,279,873 | | | | 31,177,706 | |
| | | | | | | | |
| | | | | | | $ | 42,087,869 | |
| Total Common Stocks (Identified Cost, $1,944,513,174) | | | $ | 2,253,196,163 | |
| | |
| Money Market Funds - 0.6% | | | | | | | | |
MFS Institutional Money Market Portfolio, 0.08%,
at Cost and Net Asset Value (v) | | | 13,008,328 | | | $ | 13,008,328 | |
| | |
| Collateral for Securities Loaned - 2.6% | | | | | | | | |
Navigator Securities Lending Prime Portfolio, 0.18%,
at Cost and Net Asset Value (j) | | | 59,543,931 | | | $ | 59,543,931 | |
| Total Investments (Identified Cost, $2,017,065,433) | | | | | | $ | 2,325,748,422 | |
| | |
| Other Assets, Less Liabilities - (2.7)% | | | | | | | (61,645,558 | ) |
| Net Assets - 100.0% | | | | | | $ | 2,264,102,864 | |
9
Portfolio of Investments (unaudited) – continued
| (a) | Non-income producing security. |
| (h) | Affiliated issuers are those in which the fund’s holdings of an issuer represent 5% or more of the outstanding voting securities of the issuer. |
| (j) | The rate quoted is the annualized seven-day yield of the fund at period end. |
| (l) | A portion of this security is on loan. |
| (v) | Underlying affiliated fund that is available only to investment companies managed by MFS. The rate quoted for the MFS Institutional Money Market Portfolio is the annualized seven-day yield of the fund at period end. |
The following abbreviations are used in this report and are defined:
| ADR | | American Depositary Receipt |
| PLC | | Public Limited Company |
See Notes to Financial Statements
10
Financial Statements
STATEMENT OF ASSETS AND LIABILITIES
At 2/28/14 (unaudited)
This statement represents your fund’s balance sheet, which details the assets and liabilities comprising the total value of the fund.
| | | | |
| Assets | | | | |
Investments- | | | | |
Non-affiliated issuers, at value (identified cost, $1,897,538,923) | | | $2,230,067,483 | |
Underlying affiliated funds, at cost and value | | | 13,008,328 | |
Other affiliated issuers, at value (identified cost, $106,518,182) | | | 82,672,611 | |
Total investments, at value, including $57,435,737 of securities on loan (identified cost, $2,017,065,433) | | | $2,325,748,422 | |
Cash | | | 63,015 | |
Foreign currency, at value (identified cost, $11,974) | | | 11,989 | |
Receivables for | | | | |
Investments sold | | | 25,703,092 | |
Fund shares sold | | | 5,349,825 | |
Interest and dividends | | | 1,401,658 | |
Other assets | | | 11,953 | |
Total assets | | | $2,358,289,954 | |
| Liabilities | | | | |
Payables for | | | | |
Investments purchased | | | $30,501,798 | |
Fund shares reacquired | | | 2,908,618 | |
Collateral for securities loaned, at value | | | 59,543,931 | |
Payable to affiliates | | | | |
Investment adviser | | | 101,612 | |
Shareholder servicing costs | | | 1,033,669 | |
Distribution and service fees | | | 22,516 | |
Program manager fees | | | 20 | |
Payable for independent Trustees’ compensation | | | 4,297 | |
Accrued expenses and other liabilities | | �� | 70,629 | |
Total liabilities | | | $94,187,090 | |
Net assets | | | $2,264,102,864 | |
| Net assets consist of | | | | |
Paid-in capital | | | $1,828,644,864 | |
Unrealized appreciation (depreciation) on investments and translation of assets and liabilities in foreign currencies | | | 308,682,670 | |
Accumulated net realized gain (loss) on investments and foreign currency | | | 134,233,820 | |
Accumulated net investment loss | | | (7,458,490 | ) |
Net assets | | | $2,264,102,864 | |
Shares of beneficial interest outstanding | | | 84,078,868 | |
11
Statement of Assets and Liabilities (unaudited) – continued
| | | | | | | | | | | | |
| | | Net assets | | | Shares
outstanding | | | Net asset value
per share (a) | |
Class A | | | $755,696,195 | | | | 28,408,814 | | | | $26.60 | |
Class B | | | 43,059,074 | | | | 1,864,797 | | | | 23.09 | |
Class C | | | 166,102,306 | | | | 7,181,346 | | | | 23.13 | |
Class I | | | 500,266,248 | | | | 17,487,613 | | | | 28.61 | |
Class R1 | | | 9,818,804 | | | | 427,687 | | | | 22.96 | |
Class R2 | | | 73,247,816 | | | | 2,865,096 | | | | 25.57 | |
Class R3 | | | 154,597,669 | | | | 5,816,373 | | | | 26.58 | |
Class R4 | | | 261,046,539 | | | | 9,512,627 | | | | 27.44 | |
Class R5 | | | 293,043,737 | | | | 10,223,620 | | | | 28.66 | |
Class 529A | | | 5,185,330 | | | | 200,158 | | | | 25.91 | |
Class 529B | | | 363,768 | | | | 16,193 | | | | 22.46 | |
Class 529C | | | 1,675,378 | | | | 74,544 | | | | 22.48 | |
| (a) | Maximum offering price per share was equal to the net asset value per share for all share classes, except for Classes A and 529A, for which the maximum offering prices per share were $28.22 [100 / 94.25 x $26.6] and $27.49 [100 / 94.25 x $25.91], respectively. On sales of $50,000 or more, the maximum offering prices of Class A and Class 529A shares are reduced. A contingent deferred sales charge may be imposed on redemptions of Class A, Class B, Class C, Class 529B, and Class 529C shares. Redemption price per share was equal to the net asset value per share for Classes I, R1, R2, R3, R4, R5, and 529A. |
See Notes to Financial Statements
12
Financial Statements
STATEMENT OF OPERATIONS
Six months ended 2/28/14 (unaudited)
This statement describes how much your fund earned in investment income and accrued in expenses. It also describes any gains and/or losses generated by fund operations.
| | | | |
| Net investment loss | | | | |
Income | | | | |
Dividends | | | $4,875,875 | |
Income on securities loaned | | | 541,851 | |
Dividends from underlying affiliated funds | | | 13,245 | |
Foreign taxes withheld | | | (50,836 | ) |
Total investment income | | | $5,380,135 | |
Expenses | | | | |
Management fee | | | $9,530,995 | |
Distribution and service fees | | | 2,340,820 | |
Program manager fees | | | 3,410 | |
Shareholder servicing costs | | | 1,122,845 | |
Administrative services fee | | | 128,979 | |
Independent Trustees’ compensation | | | 16,558 | |
Custodian fee | | | 88,596 | |
Shareholder communications | | | 53,306 | |
Audit and tax fees | | | 27,683 | |
Legal fees | | | 7,820 | |
Miscellaneous | | | 125,514 | |
Total expenses | | | $13,446,526 | |
Fees paid indirectly | | | (132 | ) |
Reduction of expenses by investment adviser and distributor | | | (612,502 | ) |
Net expenses | | | $12,833,892 | |
Net investment loss | | | $(7,453,757 | ) |
| Realized and unrealized gain (loss) on investments and foreign currency | |
Realized gain (loss) (identified cost basis) | | | | |
Investments: | | | | |
Non-affiliated issuers | | | $236,303,202 | |
Other affiliated issuers | | | (1,048,754 | ) |
Foreign currency | | | (73,615 | ) |
Net realized gain (loss) on investments and foreign currency | | | $235,180,833 | |
Change in unrealized appreciation (depreciation) | | | | |
Investments | | | $26,157,102 | |
Translation of assets and liabilities in foreign currencies | | | 25 | |
Net unrealized gain (loss) on investments and foreign currency translation | | | $26,157,127 | |
Net realized and unrealized gain (loss) on investments and foreign currency | | | $261,337,960 | |
Change in net assets from operations | | | $253,884,203 | |
See Notes to Financial Statements
13
Financial Statements
STATEMENTS OF CHANGES IN NET ASSETS
These statements describe the increases and/or decreases in net assets resulting from operations, any distributions, and any shareholder transactions.
| | | | | | | | |
| Change in net assets | | Six months ended
2/28/14
(unaudited) | | | Year ended
8/31/13 | |
| From operations | | | | | | | | |
Net investment loss | | | $(7,453,757 | ) | | | $(8,591,721 | ) |
Net realized gain (loss) on investments and foreign currency | | | 235,180,833 | | | | 205,210,073 | |
Net unrealized gain (loss) on investments and foreign currency translation | | | 26,157,127 | | | | 179,463,112 | |
Change in net assets from operations | | | $253,884,203 | | | | $376,081,464 | |
| Distributions declared to shareholders | | | | | | | | |
From net realized gain on investments | | | $(182,188,310 | ) | | | $— | |
Change in net assets from fund share transactions | | | $153,883,993 | | | | $415,383,480 | |
Total change in net assets | | | $225,579,886 | | | | $791,464,944 | |
| Net assets | | | | | | | | |
At beginning of period | | | 2,038,522,978 | | | | 1,247,058,034 | |
At end of period (including accumulated net investment loss of $7,458,490 and $4,733, respectively) | | | $2,264,102,864 | | | | $2,038,522,978 | |
See Notes to Financial Statements
14
Financial Statements
FINANCIAL HIGHLIGHTS
The financial highlights table is intended to help you understand the fund’s financial performance for the semiannual period and the past 5 fiscal years (or life of a particular share class, if shorter). Certain information reflects financial results for a single fund share. The total returns in the table represent the rate by which an investor would have earned (or lost) on an investment in the fund share class (assuming reinvestment of all distributions) held for the entire period.
| | | | | | | | | | | | | | | | | | | | | | | | |
| | | Six months
ended
2/28/14 (unaudited) | | | Years ended 8/31 | |
| Class A | | | 2013 | | | 2012 | | | 2011 | | | 2010 | | | 2009 | |
| | | | | | | | | | | | | | | | | |
Net asset value, beginning of period | | | $25.86 | | | | $20.17 | | | | $22.63 | | | | $19.03 | | | | $16.22 | | | | $17.96 | |
| Income (loss) from investment operations | | | | | | | | | | | | | |
Net investment loss (d) | | | $(0.10 | ) | | | $(0.14 | ) | | | $(0.16 | ) | | | $(0.22 | ) | | | $(0.17 | ) | | | $(0.13 | ) |
Net realized and unrealized gain
(loss) on investments and
foreign currency | | | 3.29 | | | | 5.83 | | | | 1.80 | | | | 5.23 | | | | 2.98 | | | | (1.61 | )(g) |
Total from investment operations | | | $3.19 | | | | $5.69 | | | | $1.64 | | | | $5.01 | | | | $2.81 | | | | $(1.74 | ) |
| Less distributions declared to shareholders | | | | | | | | | | | | | |
From net realized gain on
investments | | | $(2.45 | ) | | | $— | | | | $(4.10 | ) | | | $(1.41 | ) | | | $— | | | | $— | |
Net asset value, end of period (x) | | | $26.60 | | | | $25.86 | | | | $20.17 | | | | $22.63 | | | | $19.03 | | | | $16.22 | |
Total return (%) (r)(s)(t)(x) | | | 12.72 | (n) | | | 28.21 | | | | 9.88 | | | | 26.13 | | | | 17.32 | | | | (9.69 | ) |
Ratios (%) (to average net assets)
and Supplemental data: | | | | | | | | | | | | | |
Expenses before expense reductions (f) | | | 1.31 | (a) | | | 1.35 | | | | 1.39 | | | | 1.40 | | | | 1.51 | | | | 1.70 | |
Expenses after expense reductions (f) | | | 1.25 | (a) | | | 1.31 | | | | 1.35 | | | | 1.30 | | | | 1.41 | | | | 1.60 | |
Net investment loss | | | (0.75 | )(a) | | | (0.59 | ) | | | (0.83 | ) | | | (0.90 | ) | | | (0.92 | ) | | | (1.05 | ) |
Portfolio turnover | | | 39 | (n) | | | 96 | | | | 128 | | | | 205 | | | | 167 | | | | 150 | |
Net assets at end of period
(000 omitted) | | | $755,696 | | | | $866,006 | | | | $529,749 | | | | $626,258 | | | | $338,380 | | | | $248,658 | |
See Notes to Financial Statements
15
Financial Highlights – continued
| | | | | | | | | | | | | | | | | | | | | | | | |
| | | Six months
ended
2/28/14 (unaudited) | | | Years ended 8/31 | |
| Class B | | | 2013 | | | 2012 | | | 2011 | | | 2010 | | | 2009 | |
| | | | | | | | | | | | | | | | | |
Net asset value, beginning of period | | | $22.83 | | | | $17.94 | | | | $20.73 | | | | $17.65 | | | | $15.16 | | | | $16.90 | |
| Income (loss) from investment operations | | | | | | | | | | | | | |
Net investment loss (d) | | | $(0.17 | ) | | | $(0.27 | ) | | | $(0.28 | ) | | | $(0.37 | ) | | | $(0.29 | ) | | | $(0.21 | ) |
Net realized and unrealized gain
(loss) on investments and
foreign currency | | | 2.88 | | | | 5.16 | | | | 1.59 | | | | 4.86 | | | | 2.78 | | | | (1.53 | )(g) |
Total from investment operations | | | $2.71 | | | | $4.89 | | | | $1.31 | | | | $4.49 | | | | $2.49 | | | | $(1.74 | ) |
| Less distributions declared to shareholders | | | | | | | | | | | | | |
From net realized gain on
investments | | | $(2.45 | ) | | | $— | | | | $(4.10 | ) | | | $(1.41 | ) | | | $— | | | | $— | |
Net asset value, end of period (x) | | | $23.09 | | | | $22.83 | | | | $17.94 | | | | $20.73 | | | | $17.65 | | | | $15.16 | |
Total return (%) (r)(s)(t)(x) | | | 12.29 | (n) | | | 27.26 | | | | 9.08 | | | | 25.18 | | | | 16.42 | | | | (10.30 | ) |
Ratios (%) (to average net assets) and Supplemental data: | | | | | | | | | | | | | |
Expenses before expense reductions (f) | | | 2.06 | (a) | | | 2.10 | | | | 2.14 | | | | 2.15 | | | | 2.26 | | | | 2.41 | |
Expenses after expense reductions (f) | | | 2.00 | (a) | | | 2.06 | | | | 2.10 | | | | 2.05 | | | | 2.16 | | | | 2.30 | |
Net investment loss | | | (1.50 | )(a) | | | (1.34 | ) | | | (1.59 | ) | | | (1.65 | ) | | | (1.67 | ) | | | (1.76 | ) |
Portfolio turnover | | | 39 | (n) | | | 96 | | | | 128 | | | | 205 | | | | 167 | | | | 150 | |
Net assets at end of period
(000 omitted) | | | $43,059 | | | | $37,952 | | | | $30,308 | | | | $33,037 | | | | $26,777 | | | | $27,582 | |
See Notes to Financial Statements
16
Financial Highlights – continued
| | | | | | | | | | | | | | | | | | | | | | | | |
| | | Six months
ended
2/28/14 (unaudited) | | | Years ended 8/31 | |
| Class C | | | 2013 | | | 2012 | | | 2011 | | | 2010 | | | 2009 | |
| | | | | | | | | | | | | | | | | |
Net asset value, beginning of period | | | $22.86 | | | | $17.96 | | | | $20.76 | | | | $17.67 | | | | $15.18 | | | | $16.93 | |
| Income (loss) from investment operations | | | | | | | | | | | | | |
Net investment loss (d) | | | $(0.17 | ) | | | $(0.27 | ) | | | $(0.28 | ) | | | $(0.37 | ) | | | $(0.30 | ) | | | $(0.21 | ) |
Net realized and unrealized gain
(loss) on investments and
foreign currency | | | 2.89 | | | | 5.17 | | | | 1.58 | | | | 4.87 | | | | 2.79 | | | | (1.54 | )(g) |
Total from investment operations | | | $2.72 | | | | $4.90 | | | | $1.30 | | | | $4.50 | | | | $2.49 | | | | $(1.75 | ) |
| Less distributions declared to shareholders | | | | | | | | | | | | | |
From net realized gain on
investments | | | $(2.45 | ) | | | $— | | | | $(4.10 | ) | | | $(1.41 | ) | | | $— | | | | $— | |
Net asset value, end of period (x) | | | $23.13 | | | | $22.86 | | | | $17.96 | | | | $20.76 | | | | $17.67 | | | | $15.18 | |
Total return (%) (r)(s)(t)(x) | | | 12.31 | (n) | | | 27.28 | | | | 9.01 | | | | 25.21 | | | | 16.40 | | | | (10.34 | ) |
Ratios (%) (to average net assets) and Supplemental data: | | | | | | | | | | | | | |
Expenses before expense reductions (f) | | | 2.06 | (a) | | | 2.10 | | | | 2.14 | | | | 2.15 | | | | 2.26 | | | | 2.40 | |
Expenses after expense reductions (f) | | | 2.00 | (a) | | | 2.06 | | | | 2.10 | | | | 2.05 | | | | 2.16 | | | | 2.30 | |
Net investment loss | | | (1.49 | )(a) | | | (1.35 | ) | | | (1.59 | ) | | | (1.65 | ) | | | (1.67 | ) | | | (1.75 | ) |
Portfolio turnover | | | 39 | (n) | | | 96 | | | | 128 | | | | 205 | | | | 167 | | | | 150 | |
Net assets at end of period
(000 omitted) | | | $166,102 | | | | $136,913 | | | | $91,138 | | | | $95,479 | | | | $37,144 | | | | $25,431 | |
See Notes to Financial Statements
17
Financial Highlights – continued
| | | | | | | | | | | | | | | | | | | | | | | | |
| | | Six months
ended
2/28/14 (unaudited) | | | Years ended 8/31 | |
| Class I | | | 2013 | | | 2012 | | | 2011 | | | 2010 | | | 2009 | |
| | | | | | | | | | | | | | | | | |
Net asset value, beginning of period | | | $27.61 | | | | $21.48 | | | | $23.77 | | | | $19.88 | | | | $16.91 | | | | $18.67 | |
| Income (loss) from investment operations | | | | | | | | | | | | | |
Net investment loss (d) | | | $(0.07 | ) | | | $(0.09 | ) | | | $(0.12 | ) | | | $(0.17 | ) | | | $(0.13 | ) | | | $(0.10 | ) |
Net realized and unrealized gain
(loss) on investments and
foreign
currency | | | 3.52 | | | | 6.22 | | | | 1.93 | | | | 5.47 | | | | 3.10 | | | | (1.66 | )(g) |
Total from investment operations | | | $3.45 | | | | $6.13 | | | | $1.81 | | | | $5.30 | | | | $2.97 | | | | $(1.76 | ) |
| Less distributions declared to shareholders | | | | | | | | | | | | | |
From net realized gain on
investments | | | $(2.45 | ) | | | $— | | | | $(4.10 | ) | | | $(1.41 | ) | | | $— | | | | $— | |
Net asset value, end of period (x) | | | $28.61 | | | | $27.61 | | | | $21.48 | | | | $23.77 | | | | $19.88 | | | | $16.91 | |
Total return (%) (r)(s)(x) | | | 12.86 | (n) | | | 28.54 | | | | 10.16 | | | | 26.48 | | | | 17.56 | | | | (9.43 | ) |
Ratios (%) (to average net assets) and Supplemental data: | | | | | | | | | | | | | |
Expenses before expense reductions (f) | | | 1.06 | (a) | | | 1.10 | | | | 1.15 | | | | 1.15 | | | | 1.26 | | | | 1.35 | |
Expenses after expense reductions (f) | | | 1.00 | (a) | | | 1.06 | | | | 1.10 | | | | 1.05 | | | | 1.16 | | | | 1.25 | |
Net investment loss | | | (0.49 | )(a) | | | (0.36 | ) | | | (0.59 | ) | | | (0.65 | ) | | | (0.67 | ) | | | (0.71 | ) |
Portfolio turnover | | | 39 | (n) | | | 96 | | | | 128 | | | | 205 | | | | 167 | | | | 150 | |
Net assets at end of period
(000 omitted) | | | $500,266 | | | | $368,806 | | | | $170,830 | | | | $323,848 | | | | $263,575 | | | | $238,410 | |
See Notes to Financial Statements
18
Financial Highlights – continued
| | | | | | | | | | | | | | | | | | | | | | | | |
| | | Six months
ended
2/28/14 (unaudited) | | | Years ended 8/31 | |
| Class R1 | | | 2013 | | | 2012 | | | 2011 | | | 2010 | | | 2009 | |
| | | | | | | | | | | | | | | | | |
Net asset value, beginning of period | | | $22.71 | | | | $17.84 | | | | $20.65 | | | | $17.58 | | | | $15.10 | | | | $16.84 | |
| Income (loss) from investment operations | | | | | | | | | | | | | |
Net investment loss (d) | | | $(0.17 | ) | | | $(0.27 | ) | | | $(0.28 | ) | | | $(0.37 | ) | | | $(0.29 | ) | | | $(0.21 | ) |
Net realized and unrealized gain
(loss) on investments and
foreign currency | | | 2.87 | | | | 5.14 | | | | 1.57 | | | | 4.85 | | | | 2.77 | | | | (1.53 | )(g) |
Total from investment operations | | | $2.70 | | | | $4.87 | | | | $1.29 | | | | $4.48 | | | | $2.48 | | | | $(1.74 | ) |
| Less distributions declared to shareholders | | | | | | | | | | | | | |
From net realized gain on
investments | | | $(2.45 | ) | | | $— | | | | $(4.10 | ) | | | $(1.41 | ) | | | $— | | | | $— | |
Net asset value, end of period (x) | | | $22.96 | | | | $22.71 | | | | $17.84 | | | | $20.65 | | | | $17.58 | | | | $15.10 | |
Total return (%) (r)(s)(x) | | | 12.31 | (n) | | | 27.30 | | | | 9.00 | | | | 25.22 | | | | 16.42 | | | | (10.33 | ) |
Ratios (%) (to average net assets) and Supplemental data: | | | | | | | | | | | | | |
Expenses before expense reductions (f) | | | 2.06 | (a) | | | 2.10 | | | | 2.14 | | | | 2.15 | | | | 2.26 | | | | 2.40 | |
Expenses after expense reductions (f) | | | 2.00 | (a) | | | 2.06 | | | | 2.10 | | | | 2.05 | | | | 2.16 | | | | 2.30 | |
Net investment loss | | | (1.50 | )(a) | | | (1.34 | ) | | | (1.59 | ) | | | (1.65 | ) | | | (1.67 | ) | | | (1.76 | ) |
Portfolio turnover | | | 39 | (n) | | | 96 | | | | 128 | | | | 205 | | | | 167 | | | | 150 | |
Net assets at end of period
(000 omitted) | | | $9,819 | | | | $8,972 | | | | $7,506 | | | | $6,904 | | | | $5,253 | | | | $4,217 | |
See Notes to Financial Statements
19
Financial Highlights – continued
| | | | | | | | | | | | | | | | | | | | | | | | |
| | | Six months
ended
2/28/14 (unaudited) | | | Years ended 8/31 | |
| Class R2 | | | 2013 | | | 2012 | | | 2011 | | | 2010 | | | 2009 | |
| | | | | | | | | | | | | | | | | |
Net asset value, beginning of period | | | $24.97 | | | | $19.52 | | | | $22.09 | | | | $18.65 | | | | $15.94 | | | | $17.68 | |
| Income (loss) from investment operations | | | | | | | | | | | | | |
Net investment loss (d) | | | $(0.13 | ) | | | $(0.19 | ) | | | $(0.21 | ) | | | $(0.28 | ) | | | $(0.22 | ) | | | $(0.16 | ) |
Net realized and unrealized gain
(loss) on investments and
foreign currency | | | 3.18 | | | | 5.64 | | | | 1.74 | | | | 5.13 | | | | 2.93 | | | | (1.58 | )(g) |
Total from investment operations | | | $3.05 | | | | $5.45 | | | | $1.53 | | | | $4.85 | | | | $2.71 | | | | $(1.74 | ) |
| Less distributions declared to shareholders | | | | | | | | | | | | | |
From net realized gain on
investments | | | $(2.45 | ) | | | $— | | | | $(4.10 | ) | | | $(1.41 | ) | | | $— | | | | $— | |
Net asset value, end of period (x) | | | $25.57 | | | | $24.97 | | | | $19.52 | | | | $22.09 | | | | $18.65 | | | | $15.94 | |
Total return (%) (r)(s)(x) | | | 12.61 | (n) | | | 27.92 | | | | 9.58 | | | | 25.79 | | | | 17.00 | | | | (9.84 | ) |
Ratios (%) (to average net assets) and Supplemental data: | | | | | | | | | | | | | |
Expenses before expense reductions (f) | | | 1.56 | (a) | | | 1.60 | | | | 1.64 | | | | 1.65 | | | | 1.76 | | | | 1.90 | |
Expenses after expense reductions (f) | | | 1.50 | (a) | | | 1.56 | | | | 1.60 | | | | 1.55 | | | | 1.66 | | | | 1.80 | |
Net investment loss | | | (0.99 | )(a) | | | (0.85 | ) | | | (1.09 | ) | | | (1.15 | ) | | | (1.17 | ) | | | (1.26 | ) |
Portfolio turnover | | | 39 | (n) | | | 96 | | | | 128 | | | | 205 | | | | 167 | | | | 150 | |
Net assets at end of period
(000 omitted) | | | $73,248 | | | | $60,501 | | | | $35,599 | | | | $24,316 | | | | $13,125 | | | | $11,312 | |
See Notes to Financial Statements
20
Financial Highlights – continued
| | | | | | | | | | | | | | | | | | | | | | | | |
| | | Six months
ended
2/28/14 (unaudited) | | | Years ended 8/31 | |
| Class R3 | | | 2013 | | | 2012 | | | 2011 | | | 2010 | | | 2009 | |
| | | | | | | | | | | | | | | | | |
Net asset value, beginning of period | | | $25.84 | | | | $20.15 | | | | $22.62 | | | | $19.02 | | | | $16.22 | | | | $17.94 | |
| Income (loss) from investment operations | | | | | | | | | | | | | |
Net investment loss (d) | | | $(0.10 | ) | | | $(0.14 | ) | | | $(0.16 | ) | | | $(0.22 | ) | | | $(0.18 | ) | | | $(0.13 | ) |
Net realized and unrealized gain
(loss) on investments and
foreign
currency | | | 3.29 | | | | 5.83 | | | | 1.79 | | | | 5.23 | | | | 2.98 | | | | (1.59 | )(g) |
Total from investment operations | | | $3.19 | | | | $5.69 | | | | $1.63 | | | | $5.01 | | | | $2.80 | | | | $(1.72 | ) |
| Less distributions declared to shareholders | | | | | | | | | | | | | |
From net realized gain on
investments | | | $(2.45 | ) | | | $— | | | | $(4.10 | ) | | | $(1.41 | ) | | | $— | | | | $— | |
Net asset value, end of period (x) | | | $26.58 | | | | $25.84 | | | | $20.15 | | | | $22.62 | | | | $19.02 | | | | $16.22 | |
Total return (%) (r)(s)(x) | | | 12.73 | (n) | | | 28.24 | | | | 9.84 | | | | 26.14 | | | | 17.26 | | | | (9.59 | ) |
Ratios (%) (to average net assets) and Supplemental data: | | | | | | | | | | | | | |
Expenses before expense reductions (f) | | | 1.31 | (a) | | | 1.35 | | | | 1.39 | | | | 1.40 | | | | 1.51 | | | | 1.65 | |
Expenses after expense reductions (f) | | | 1.25 | (a) | | | 1.31 | | | | 1.35 | | | | 1.30 | | | | 1.41 | | | | 1.55 | |
Net investment loss | | | (0.74 | )(a) | | | (0.60 | ) | | | (0.83 | ) | | | (0.90 | ) | | | (0.93 | ) | | | (1.00 | ) |
Portfolio turnover | | | 39 | (n) | | | 96 | | | | 128 | | | | 205 | | | | 167 | | | | 150 | |
Net assets at end of period
(000 omitted) | | | $154,598 | | | | $110,562 | | | | $61,125 | | | | $28,966 | | | | $6,456 | | | | $3,492 | |
See Notes to Financial Statements
21
Financial Highlights – continued
| | | | | | | | | | | | | | | | | | | | | | | | |
| | | Six months
ended
2/28/14 (unaudited) | | | Years ended 8/31 | |
| Class R4 | | | 2013 | | | 2012 | | | 2011 | | | 2010 | | | 2009 | |
| | | | | | | | | | | | | | | | | |
Net asset value, beginning of period | | | $26.57 | | | | $20.67 | | | | $23.04 | | | | $19.31 | | | | $16.42 | | | | $18.13 | |
| Income (loss) from investment operations | | | | | | | | | | | | | |
Net investment loss (d) | | | $(0.07 | ) | | | $(0.08 | ) | | | $(0.12 | ) | | | $(0.16 | ) | | | $(0.13 | ) | | | $(0.10 | ) |
Net realized and unrealized gain
(loss) on investments and
foreign
currency | | | 3.39 | | | | 5.98 | | | | 1.85 | | | | 5.30 | | | | 3.02 | | | | (1.61 | )(g) |
Total from investment operations | | | $3.32 | | | | $5.90 | | | | $1.73 | | | | $5.14 | | | | $2.89 | | | | $(1.71 | ) |
| Less distributions declared to shareholders | | | | | | | | | | | | | |
From net realized gain on
investments | | | $(2.45 | ) | | | $— | | | | $(4.10 | ) | | | $(1.41 | ) | | | $— | | | | $— | |
Net asset value, end of period (x) | | | $27.44 | | | | $26.57 | | | | $20.67 | | | | $23.04 | | | | $19.31 | | | | $16.42 | |
Total return (%) (r)(s)(x) | | | 12.87 | (n) | | | 28.54 | | | | 10.13 | | | | 26.43 | | | | 17.60 | | | | (9.43 | ) |
Ratios (%) (to average net assets) and Supplemental data: | | | | | | | | | | | | | |
Expenses before expense reductions (f) | | | 1.06 | (a) | | | 1.10 | | | | 1.14 | | | | 1.15 | | | | 1.26 | | | | 1.40 | |
Expenses after expense reductions (f) | | | 1.00 | (a) | | | 1.06 | | | | 1.10 | | | | 1.05 | | | | 1.16 | | | | 1.30 | |
Net investment loss | | | (0.49 | )(a) | | | (0.35 | ) | | | (0.58 | ) | | | (0.66 | ) | | | (0.67 | ) | | | (0.76 | ) |
Portfolio turnover | | | 39 | (n) | | | 96 | | | | 128 | | | | 205 | | | | 167 | | | | 150 | |
Net assets at end of period
(000 omitted) | | | $261,047 | | | | $197,884 | | | | $141,694 | | | | $78,534 | | | | $50,147 | | | | $42,974 | |
See Notes to Financial Statements
22
Financial Highlights – continued
| | | | | | | | | | | | |
| | | Six months
ended
2/28/14 (unaudited) | | | Years ended 8/31 | |
| Class R5 | | | 2013 | | | 2012 (i) | |
| | | | | | | | |
Net asset value, beginning of period | | | $27.64 | | | | $21.48 | | | | $19.73 | |
| Income (loss) from investment operations | |
Net investment loss (d) | | | $(0.06 | ) | | | $(0.06 | ) | | | $(0.03 | ) |
Net realized and unrealized gain
(loss) on investments and
foreign currency | | | 3.53 | | | | 6.22 | | | | 1.78 | |
Total from investment operations | | | $3.47 | | | | $6.16 | | | | $1.75 | |
| Less distributions declared to shareholders | |
From net realized gain on investments | | | $(2.45 | ) | | | $— | | | | $— | |
Net asset value, end of period (x) | | | $28.66 | | | | $27.64 | | | | $21.48 | |
Total return (%) (r)(s)(x) | | | 12.92 | (n) | | | 28.68 | | | | 8.87 | (n) |
Ratios (%) (to average net assets) and Supplemental data: | |
Expenses before expense reductions (f) | | | 0.96 | (a) | | | 0.99 | | | | 1.07 | (a) |
Expenses after expense reductions (f) | | | 0.91 | (a) | | | 0.96 | | | | 1.05 | (a) |
Net investment loss | | | (0.40 | )(a) | | | (0.24 | ) | | | (0.49 | )(a) |
Portfolio turnover | | | 39 | (n) | | | 96 | | | | 128 | |
Net assets at end of period
(000 omitted) | | | $293,044 | | | | $244,655 | | | | $174,681 | |
See Notes to Financial Statements
23
Financial Highlights – continued
| | | | | | | | | | | | | | | | | | | | | | | | |
| | | Six months
ended
2/28/14 (unaudited) | | | Years ended 8/31 | |
| Class 529A | | | 2013 | | | 2012 | | | 2011 | | | 2010 | | | 2009 | |
| | | | | | | | | | | | | | | | | |
Net asset value, beginning of period | | | $25.25 | | | | $19.70 | | | | $22.22 | | | | $18.71 | | | | $15.97 | | | | $17.70 | |
| Income (loss) from investment operations | | | | | | | | | | | | | |
Net investment loss (d) | | | $(0.10 | ) | | | $(0.14 | ) | | | $(0.17 | ) | | | $(0.24 | ) | | | $(0.19 | ) | | | $(0.14 | ) |
Net realized and unrealized gain
(loss) on investments and
foreign currency | | | 3.21 | | | | 5.69 | | | | 1.75 | | | | 5.16 | | | | 2.93 | | | | (1.59 | )(g) |
Total from investment operations | | | $3.11 | | | | $5.55 | | | | $1.58 | | | | $4.92 | | | | $2.74 | | | | $(1.73 | ) |
| Less distributions declared to shareholders | | | | | | | | | | | | | |
From net realized gain on
investments | | | $(2.45 | ) | | | $— | | | | $(4.10 | ) | | | $(1.41 | ) | | | $— | | | | $— | |
Net asset value, end of period (x) | | | $25.91 | | | | $25.25 | | | | $19.70 | | | | $22.22 | | | | $18.71 | | | | $15.97 | |
Total return (%) (r)(s)(t)(x) | | | 12.71 | (n) | | | 28.17 | | | | 9.80 | | | | 26.09 | | | | 17.16 | | | | (9.77 | ) |
Ratios (%) (to average net assets) and Supplemental data: | | | | | | | | | | | | | |
Expenses before expense reductions (f) | | | 1.41 | (a) | | | 1.45 | | | | 1.49 | | | | 1.50 | | | | 1.61 | | | | 1.80 | |
Expenses after expense reductions (f) | | | 1.28 | (a) | | | 1.34 | | | | 1.40 | | | | 1.39 | | | | 1.51 | | | | 1.70 | |
Net investment loss | | | (0.77 | )(a) | | | (0.62 | ) | | | (0.89 | ) | | | (0.99 | ) | | | (1.02 | ) | | | (1.15 | ) |
Portfolio turnover | | | 39 | (n) | | | 96 | | | | 128 | | | | 205 | | | | 167 | | | | 150 | |
Net assets at end of period
(000 omitted) | | | $5,185 | | | | $4,519 | | | | $3,304 | | | | $2,848 | | | | $1,735 | | | | $1,444 | |
See Notes to Financial Statements
24
Financial Highlights – continued
| | | | | | | | | | | | | | | | | | | | | | | | |
| | | Six months
ended
2/28/14 (unaudited) | | | Years ended 8/31 | |
| Class 529B | | | 2013 | | | 2012 | | | 2011 | | | 2010 | | | 2009 | |
| | | | | | | | | | | | | | | | | |
Net asset value, beginning of period | | | $22.27 | | | | $17.51 | | | | $20.35 | | | | $17.36 | | | | $14.92 | | | | $16.65 | |
| Income (loss) from investment operations | | | | | | | | | | | | | |
Net investment loss (d) | | | $(0.17 | ) | | | $(0.28 | ) | | | $(0.28 | ) | | | $(0.38 | ) | | | $(0.31 | ) | | | $(0.22 | ) |
Net realized and unrealized gain
(loss) on investments and
foreign currency | | | 2.81 | | | | 5.04 | | | | 1.54 | | | | 4.78 | | | | 2.75 | | | | (1.51 | )(g) |
Total from investment operations | | | $2.64 | | | | $4.76 | | | | $1.26 | | | | $4.40 | | | | $2.44 | | | | $(1.73 | ) |
| Less distributions declared to shareholders | | | | | | | | | | | | | |
From net realized gain on
investments | | | $(2.45 | ) | | | $— | | | | $(4.10 | ) | | | $(1.41 | ) | | | $— | | | | $— | |
Net asset value, end of period (x) | | | $22.46 | | | | $22.27 | | | | $17.51 | | | | $20.35 | | | | $17.36 | | | | $14.92 | |
Total return (%) (r)(s)(t)(x) | | | 12.28 | (n) | | | 27.18 | | | | 8.99 | | | | 25.08 | | | | 16.35 | | | | (10.39 | ) |
Ratios (%) (to average net assets) and Supplemental data: | | | | | | | | | | | | | |
Expenses before expense reductions (f) | | | 2.16 | (a) | | | 2.20 | | | | 2.24 | | | | 2.24 | | | | 2.36 | | | | 2.50 | |
Expenses after expense reductions (f) | | | 2.04 | (a) | | | 2.10 | | | | 2.15 | | | | 2.14 | | | | 2.26 | | | | 2.40 | |
Net investment loss | | | (1.53 | )(a) | | | (1.39 | ) | | | (1.64 | ) | | | (1.74 | ) | | | (1.77 | ) | | | (1.85 | ) |
Portfolio turnover | | | 39 | (n) | | | 96 | | | | 128 | | | | 205 | | | | 167 | | | | 150 | |
Net assets at end of period
(000 omitted) | | | $364 | | | | $300 | | | | $217 | | | | $197 | | | | $204 | | | | $175 | |
See Notes to Financial Statements
25
Financial Highlights – continued
| | | | | | | | | | | | | | | | | | | | | | | | |
| | | Six months
ended
2/28/14 (unaudited) | | | Years ended 8/31 | |
| Class 529C | | | 2013 | | | 2012 | | | 2011 | | | 2010 | | | 2009 | |
| | | | | | | | | | | | | | | | | |
Net asset value, beginning of period | | | $22.28 | | | | $17.52 | | | | $20.36 | | | | $17.36 | | | | $14.93 | | | | $16.66 | |
| Income (loss) from investment operations | | | | | | | | | | | | | |
Net investment loss (d) | | | $(0.18 | ) | | | $(0.28 | ) | | | $(0.28 | ) | | | $(0.38 | ) | | | $(0.31 | ) | | | $(0.22 | ) |
Net realized and unrealized gain
(loss) on investments and
foreign currency | | | 2.83 | | | | 5.04 | | | | 1.54 | | | | 4.79 | | | | 2.74 | | | | (1.51 | )(g) |
Total from investment operations | | | $2.65 | | | | $4.76 | | | | $1.26 | | | | $4.41 | | | | $2.43 | | | | $(1.73 | ) |
| Less distributions declared to shareholders | | | | | | | | | | | | | |
From net realized gain on
investments | | | $(2.45 | ) | | | $— | | | | $(4.10 | ) | | | $(1.41 | ) | | | $— | | | | $— | |
Net asset value, end of period (x) | | | $22.48 | | | | $22.28 | | | | $17.52 | | | | $20.36 | | | | $17.36 | | | | $14.93 | |
Total return (%) (r)(s)(t)(x) | | | 12.32 | (n) | | | 27.17 | | | | 8.98 | | | | 25.14 | | | | 16.28 | | | | (10.38 | ) |
Ratios (%) (to average net assets) and Supplemental data: | | | | | | | | | | | | | |
Expenses before expense reductions (f) | | | 2.16 | (a) | | | 2.20 | | | | 2.24 | | | | 2.25 | | | | 2.36 | | | | 2.48 | |
Expenses after expense reductions (f) | | | 2.05 | (a) | | | 2.11 | | | | 2.15 | | | | 2.14 | | | | 2.26 | | | | 2.38 | |
Net investment loss | | | (1.55 | )(a) | | | (1.39 | ) | | | (1.64 | ) | | | (1.74 | ) | | | (1.78 | ) | | | (1.83 | ) |
Portfolio turnover | | | 39 | (n) | | | 96 | | | | 128 | | | | 205 | | | | 167 | | | | 150 | |
Net assets at end of period
(000 omitted) | | | $1,675 | | | | $1,454 | | | | $906 | | | | $709 | | | | $469 | | | | $393 | |
| (d) | Per share data is based on average shares outstanding. |
| (f) | Ratios do not reflect reductions from fees paid indirectly, if applicable. |
| (g) | The per share amount varies from the net realized and unrealized gain/loss for the period because of the timing of sales of fund shares and the per share amount of realized and unrealized gains and losses at such time. |
| (i) | For the period from the class inception, June 1, 2012, through the stated period end. |
| (r) | Certain expenses have been reduced without which performance would have been lower. |
| (s) | From time to time the fund may receive proceeds from litigation settlements, without which performance would be lower. |
| (t) | Total returns do not include any applicable sales charges. |
| (x) | The net asset values per share and total returns have been calculated on net assets which include adjustments made in accordance with U.S. generally accepted accounting principles required at period end for financial reporting purposes. |
See Notes to Financial Statements
26
NOTES TO FINANCIAL STATEMENTS
(unaudited)
(1) Business and Organization
MFS New Discovery Fund (the fund) is a diversified series of MFS Series Trust I (the trust). The trust is organized as a Massachusetts business trust and is registered under the Investment Company Act of 1940, as amended, as an open-end management investment company.
(2) Significant Accounting Policies
General – The preparation of financial statements in conformity with U.S. generally accepted accounting principles requires management to make estimates and assumptions that affect the reported amounts of assets and liabilities, and disclosure of contingent assets and liabilities at the date of the financial statements and the reported amounts of increases and decreases in net assets from operations during the reporting period. Actual results could differ from those estimates. In the preparation of these financial statements, management has evaluated subsequent events occurring after the date of the fund’s Statement of Assets and Liabilities through the date that the financial statements were issued. The fund will generally focus on securities of small size companies which may be more volatile than those of larger companies.
In this reporting period, the fund adopted the disclosure provisions of the Financial Accounting Standards Board (FASB) Accounting Standards Update 2011-11 (“ASU 2011-11”), Balance Sheet (Topic 210) – Disclosures about Offsetting Assets and Liabilities along with the related scope clarification provisions of FASB Accounting Standards Update 2013-01 (“ASU 2013-01”) entitled Balance Sheet (Topic 210) – Clarifying the Scope of Disclosures about Offsetting Assets and Liabilities. ASU 2011-11 is intended to enhance disclosures on the offsetting of financial assets and liabilities by requiring entities to disclose both gross and net information about financial instruments and transactions that are either offset in the statement of financial position or subject to a an enforceable Master Netting Agreement or similar arrangement. ASU 2013-01 limits the scope of ASU 2011-11’s disclosure requirements on offsetting to financial assets and financial liabilities related to derivatives, repurchase and reverse repurchase agreements, and securities lending and securities borrowing transactions. The disclosures required by ASU 2011-11, to the extent applicable to the fund, have been included in the fund’s Significant Accounting Policies note under the captions for each of the fund’s in-scope financial instruments and transactions.
In June 2013, FASB issued Accounting Standards Update 2013-08 (“ASU 2013-08”) Financial Services – Investment Companies (Topic 946) – Amendments to the Scope, Measurement, and Disclosure Requirements which is effective for interim and annual reporting periods in fiscal years that begin after December 15, 2013. ASU 2013-08 sets forth a methodology for determining whether an entity should be characterized as an investment company and prescribes fair value accounting for an investment company’s non-controlling ownership interest in another investment company. FASB has determined that a fund registered under the Investment Company Act of 1940 automatically meets ASU 2013-08’s criteria for an investment company. Although still evaluating the potential impacts of ASU 2013-08 to the fund, management expects that the impact of the fund’s adoption will be limited to additional financial statement disclosures.
27
Notes to Financial Statements (unaudited) – continued
Investment Valuations – Equity securities, including restricted equity securities, are generally valued at the last sale or official closing price as provided by a third-party pricing service on the market or exchange on which they are primarily traded. Equity securities, for which there were no sales reported that day, are generally valued at the last quoted daily bid quotation as provided by a third-party pricing service on the market or exchange on which such securities are primarily traded. Short-term instruments with a maturity at issuance of 60 days or less generally are valued at amortized cost, which approximates market value. Open-end investment companies are generally valued at net asset value per share. Securities and other assets generally valued on the basis of information from a third-party pricing service may also be valued at a broker/dealer bid quotation. Values obtained from third-party pricing services can utilize both transaction data and market information such as yield, quality, coupon rate, maturity, type of issue, trading characteristics, and other market data. The values of foreign securities and other assets and liabilities expressed in foreign currencies are converted to U.S. dollars using the mean of bid and asked prices for rates provided by a third-party pricing service.
The Board of Trustees has delegated primary responsibility for determining or causing to be determined the value of the fund’s investments (including any fair valuation) to the adviser pursuant to valuation policies and procedures approved by the Board. If the adviser determines that reliable market quotations are not readily available, investments are valued at fair value as determined in good faith by the adviser in accordance with such procedures under the oversight of the Board of Trustees. Under the fund’s valuation policies and procedures, market quotations are not considered to be readily available for most types of debt instruments and floating rate loans and many types of derivatives. These investments are generally valued at fair value based on information from third-party pricing services. In addition, investments may be valued at fair value if the adviser determines that an investment’s value has been materially affected by events occurring after the close of the exchange or market on which the investment is principally traded (such as foreign exchange or market) and prior to the determination of the fund’s net asset value, or after the halting of trading of a specific security where trading does not resume prior to the close of the exchange or market on which the security is principally traded. Events that occur on a frequent basis after foreign markets close (such as developments in foreign markets and significant movements in the U.S. markets) and prior to the determination of the fund’s net asset value may be deemed to have a material effect on the value of securities traded in foreign markets. Accordingly, the fund’s foreign equity securities may often be valued at fair value. The adviser generally relies on third-party pricing services or other information (such as the correlation with price movements of similar securities in the same or other markets; the type, cost and investment characteristics of the security; the business and financial condition of the issuer; and trading and other market data) to assist in determining whether to fair value and at what value to fair value an investment. The value of an investment for purposes of calculating the fund’s net asset value can differ depending on the source and method used to determine value. When fair valuation is used, the value of an investment used to determine the fund’s net asset value may differ from quoted or published prices for the same investment. There can be no assurance that
28
Notes to Financial Statements (unaudited) – continued
the fund could obtain the fair value assigned to an investment if it were to sell the investment at the same time at which the fund determines its net asset value per share.
Various inputs are used in determining the value of the fund’s assets or liabilities. These inputs are categorized into three broad levels. In certain cases, the inputs used to measure fair value may fall into different levels of the fair value hierarchy. In such cases, an investment’s level within the fair value hierarchy is based on the lowest level of input that is significant to the fair value measurement. The fund’s assessment of the significance of a particular input to the fair value measurement in its entirety requires judgment, and considers factors specific to the investment. Level 1 includes unadjusted quoted prices in active markets for identical assets or liabilities. Level 2 includes other significant observable market-based inputs (including quoted prices for similar securities, interest rates, prepayment speed, and credit risk). Level 3 includes unobservable inputs, which may include the adviser’s own assumptions in determining the fair value of investments. The following is a summary of the levels used as of February 28, 2014 in valuing the fund’s assets or liabilities:
| | | | | | | | | | | | | | | | |
| Investments at Value | | Level 1 | | | Level 2 | | | Level 3 | | | Total | |
| Equity Securities | | | $2,253,196,163 | | | | $— | | | | $— | | | | $2,253,196,163 | |
| Mutual Funds | | | 72,552,259 | | | | — | | | | — | | | | 72,552,259 | |
| Total Investments | | | $2,325,748,422 | | | | $— | | | | $— | | | | $2,325,748,422 | |
For further information regarding security characteristics, see the Portfolio of Investments.
Of the level 1 investments presented above, equity investments amounting to $24,585,997 would have been considered level 2 investments at the beginning of the period. The primary reason for changes in the classifications between levels 1 and 2 occurs when foreign equity securities are fair valued using other observable market-based inputs in place of the closing exchange price due to events occurring after the close of the exchange or market on which the investment is principally traded. The fund’s foreign equity securities may often be valued at fair value. The fund’s policy is to recognize transfers between the levels as of the end of the period.
Foreign Currency Translation – Purchases and sales of foreign investments, income, and expenses are converted into U.S. dollars based upon currency exchange rates prevailing on the respective dates of such transactions or on the reporting date for foreign denominated receivables and payables. Gains and losses attributable to foreign currency exchange rates on sales of securities are recorded for financial statement purposes as net realized gains and losses on investments. Gains and losses attributable to foreign exchange rate movements on receivables, payables, income and expenses are recorded for financial statement purposes as foreign currency transaction gains and losses. That portion of both realized and unrealized gains and losses on investments that results from fluctuations in foreign currency exchange rates is not separately disclosed.
Security Loans – Under its Securities Lending Agency Agreement with the fund, State Street Bank and Trust Company (“State Street”), as lending agent, loans the securities of the fund to certain qualified institutions (the “Borrowers”) approved by the fund. The loans are collateralized by cash and/or U.S. Treasury and federal agency obligations in an amount typically at least equal to the market value of the securities loaned. The
29
Notes to Financial Statements (unaudited) – continued
market value of the loaned securities is determined at the close of business of the fund and any additional required collateral is delivered to the fund on the next business day. State Street provides the fund with indemnification against Borrower default. In the event of Borrower default, State Street will for the benefit of the fund either purchase securities identical to those loaned or, when such purchase is commercially impracticable, pay the fund the market value of the loaned securities. In return, State Street assumes the fund’s rights to the related collateral. If the collateral value is less than the cost to purchase identical securities, State Street is responsible for the shortfall, but only to the extent that such shortfall is not due to a decline in collateral value resulting from collateral reinvestment for which the fund bears the risk of loss. On loans collateralized by cash, the cash collateral is invested in a money market fund or short-term securities. At period end, the fund had investment securities on loan with a fair value of $57,435,737 and a related liability of $59,543,931 for collateral received on securities loaned, both of which are presented gross on the Statement of Assets and Liabilities. Collateral for securities loaned is carried at fair value, which is categorized as level 2 within the fair value hierarchy. The collateral received on securities loaned exceeded the value of securities on loan at period end. A portion of the income generated upon investment of the collateral is remitted to the Borrowers, and the remainder is allocated between the fund and the lending agent. On loans collateralized by U.S. Treasury and/or federal agency obligations, a fee is received from the Borrower, and is allocated between the fund and the lending agent. Income from securities lending is separately reported in the Statement of Operations. The dividend and interest income earned on the securities loaned is accounted for in the same manner as other dividend and interest income.
Indemnifications – Under the fund’s organizational documents, its officers and Trustees may be indemnified against certain liabilities and expenses arising out of the performance of their duties to the fund. Additionally, in the normal course of business, the fund enters into agreements with service providers that may contain indemnification clauses. The fund’s maximum exposure under these agreements is unknown as this would involve future claims that may be made against the fund that have not yet occurred.
Investment Transactions and Income – Investment transactions are recorded on the trade date. Dividends received in cash are recorded on the ex-dividend date. Certain dividends from foreign securities will be recorded when the fund is informed of the dividend if such information is obtained subsequent to the ex-dividend date. Dividend payments received in additional securities are recorded on the ex-dividend date in an amount equal to the value of the security on such date.
The fund may receive proceeds from litigation settlements. Any proceeds received from litigation involving portfolio holdings are reflected in the Statement of Operations in realized gain/loss if the security has been disposed of by the fund or in unrealized gain/loss if the security is still held by the fund. Any other proceeds from litigation not related to portfolio holdings are reflected as other income in the Statement of Operations.
Fees Paid Indirectly – The fund’s custody fee may be reduced according to an arrangement that measures the value of cash deposited with the custodian by the
30
Notes to Financial Statements (unaudited) – continued
fund. This amount, for the six months ended February 28, 2014, is shown as a reduction of total expenses in the Statement of Operations.
Tax Matters and Distributions – The fund intends to qualify as a regulated investment company, as defined under Subchapter M of the Internal Revenue Code, and to distribute all of its taxable income, including realized capital gains. As a result, no provision for federal income tax is required. The fund’s federal tax returns, when filed, will remain subject to examination by the Internal Revenue Service for a three year period. Management has analyzed the fund’s tax positions taken on federal and state tax returns for all open tax years and does not believe that there are any uncertain tax positions that require recognition of a tax liability. Foreign taxes, if any, have been accrued by the fund in the accompanying financial statements in accordance with the applicable foreign tax law. Foreign income taxes may be withheld by certain countries in which the fund invests. Additionally, capital gains realized by the fund on securities issued in or by certain foreign countries may be subject to capital gains tax imposed by those countries.
Distributions to shareholders are recorded on the ex-dividend date. Income and capital gain distributions are determined in accordance with income tax regulations, which may differ from U.S. generally accepted accounting principles. Certain capital accounts in the financial statements are periodically adjusted for permanent differences in order to reflect their tax character. These adjustments have no impact on net assets or net asset value per share. Temporary differences which arise from recognizing certain items of income, expense, gain or loss in different periods for financial statement and tax purposes will reverse at some time in the future. Distributions in excess of net investment income or net realized gains are temporary overdistributions for financial statement purposes resulting from differences in the recognition or classification of income or distributions for financial statement and tax purposes.
Book/tax differences primarily relate to wash sale loss deferrals and treating a portion of the proceeds from redemptions as a distribution for tax purposes.
The tax character of distributions made during the current period will be determined at fiscal year end. The fund declared no distributions for the year ended August 31, 2013.
The federal tax cost and the tax basis components of distributable earnings were as follows:
| | | | |
| As of 2/28/14 | | | |
| Cost of investments | | | $2,035,469,500 | |
| Gross appreciation | | | 416,767,365 | |
| Gross depreciation | | | (126,488,443 | ) |
| Net unrealized appreciation (depreciation) | | | $290,278,922 | |
| |
| As of 8/31/13 | | | |
| Undistributed ordinary income | | | 46,692,710 | |
| Undistributed long-term capital gain | | | 52,952,654 | |
| Other temporary differences | | | (5,077 | ) |
| Net unrealized appreciation (depreciation) | | | 264,121,820 | |
The aggregate cost above includes prior fiscal year end tax adjustments, if applicable.
31
Notes to Financial Statements (unaudited) – continued
Multiple Classes of Shares of Beneficial Interest – The fund offers multiple classes of shares, which differ in their respective distribution, service, and program manager fees. The fund’s income, realized and unrealized gain (loss), and common expenses are allocated to shareholders based on the daily net assets of each class. Dividends are declared separately for each class. Differences in per share dividend rates are generally due to differences in separate class expenses. Class B and Class 529B shares will convert to Class A and Class 529A shares, respectively, approximately eight years after purchase. The fund’s distributions declared to shareholders as reported in the Statements of Changes in Net Assets are presented by class as follows:
| | | | | | | | |
| | | From net realized gain on
investments | |
| | | Six months
ended
2/28/14 | | | Year
ended
8/31/13 | |
| Class A | | | $64,919,406 | | | | $— | |
| Class B | | | 4,186,982 | | | | — | |
| Class C | | | 15,593,082 | | | | — | |
| Class I | | | 35,717,827 | | | | — | |
| Class R1 | | | 937,201 | | | | — | |
| Class R2 | | | 6,122,546 | | | | — | |
| Class R3 | | | 12,790,928 | | | | — | |
| Class R4 | | | 19,003,758 | | | | — | |
| Class R5 | | | 22,264,000 | | | | — | |
| Class 529A | | | 451,752 | | | | — | |
| Class 529B | | | 33,273 | | | | — | |
| Class 529C | | | 167,555 | | | | — | |
| Total | | | $182,188,310 | | | | $— | |
(3) Transactions with Affiliates
Investment Adviser – The fund has an investment advisory agreement with MFS to provide overall investment management and related administrative services and facilities to the fund. The management fee is computed daily and paid monthly at an annual rate of 0.90% of the fund’s average daily net assets. The investment adviser has agreed in writing to reduce its management fee to 0.80% of average daily net assets in excess of $1 billion up to $2.5 billion and 0.75% of average daily net assets in excess of $2.5 billion. This written agreement will continue until modified by the fund’s Board of Trustees, but such agreement will continue at least until December 31, 2014. For the six months ended February 28, 2014, this management fee reduction amounted to $563,109, which is included in the reduction of total expenses in the Statement of Operations. MFS has also agreed in writing to reduce its management fee by a specified amount if certain MFS mutual fund assets exceed thresholds agreed to by MFS and the fund’s Board of Trustees. For the six months ended February 28, 2014, this management fee reduction amounted to $23,796, which is included in the reduction of total expenses in the Statement of Operations. The management fee incurred for the six months ended February 28, 2014 was equivalent to an annual effective rate of 0.84% of the fund’s average daily net assets.
32
Notes to Financial Statements (unaudited) – continued
Prior to January 1, 2014, the investment adviser had agreed in writing to pay a portion of the fund’s total annual operating expenses, exclusive of interest, taxes, extraordinary expenses, brokerage and transaction costs, and investment-related expenses, such that total annual fund operating expenses do not exceed the following rates annually of each class’s average daily net assets:
| | | | | | | | | | | | | | | | | | | | | | | | | | | | | | | | | | | | | | | | | | | | |
| Classes | |
| A | | B | | | C | | | I | | | R1 | | | R2 | | | R3 | | | R4 | | | R5 | | | 529A | | | 529B | | | 529C | |
| 1.41% | | | 2.16% | | | | 2.16% | | | | 1.16% | | | | 2.16% | | | | 1.66% | | | | 1.41% | | | | 1.16% | | | | 1.10% | | | | 1.46% | | | | 2.21% | | | | 2.21% | |
This written agreement terminated on December 31, 2013. For the six months ended February 28, 2014, the fund’s actual operating expenses did not exceed the limit and therefore, the investment adviser did not pay any portion of the fund’s expenses related to this agreement.
Distributor – MFS Fund Distributors, Inc. (MFD), a wholly-owned subsidiary of MFS, as distributor, received $138,319 and $1,700 for the six months ended February 28, 2014, as its portion of the initial sales charge on sales of Class A and Class 529A shares of the fund, respectively.
The Board of Trustees has adopted a distribution plan for certain class shares pursuant to Rule 12b-1 of the Investment Company Act of 1940.
The fund’s distribution plan provides that the fund will pay MFD for services provided by MFD and financial intermediaries in connection with the distribution and servicing of certain share classes. One component of the plan is a distribution fee paid to MFD and another component of the plan is a service fee paid to MFD. MFD may subsequently pay all, or a portion, of the distribution and/or service fees to financial intermediaries.
Distribution Plan Fee Table:
| | | | | | | | | | | | | | | | | | | | |
| | | Distribution
Fee Rate (d) | | | Service
Fee Rate (d) | | | Total Distribution Plan (d) | | | Annual Effective Rate (e) | | | Distribution and Service Fee | |
| Class A | | | — | | | | 0.25% | | | | 0.25% | | | | 0.24% | | | | $960,148 | |
| Class B | | | 0.75% | | | | 0.25% | | | | 1.00% | | | | 1.00% | | | | 206,375 | |
| Class C | | | 0.75% | | | | 0.25% | | | | 1.00% | | | | 1.00% | | | | 769,760 | |
| Class R1 | | | 0.75% | | | | 0.25% | | | | 1.00% | | | | 1.00% | | | | 46,823 | |
| Class R2 | | | 0.25% | | | | 0.25% | | | | 0.50% | | | | 0.50% | | | | 167,924 | |
| Class R3 | | | — | | | | 0.25% | | | | 0.25% | | | | 0.25% | | | | 174,045 | |
| Class 529A | | | — | | | | 0.25% | | | | 0.25% | | | | 0.22% | | | | 6,120 | |
| Class 529B | | | 0.75% | | | | 0.25% | | | | 1.00% | | | | 0.98% | | | | 1,642 | |
| Class 529C | | | 0.75% | | | | 0.25% | | | | 1.00% | | | | 1.00% | | | | 7,983 | |
| Total Distribution and Service Fees | | | | $2,340,820 | |
| (d) | In accordance with the distribution plan for certain classes, the fund pays distribution and/or service fees equal to these annual percentage rates of each class’s average daily net assets. The distribution and service fee rates disclosed by class represent the current rates in effect at the end of the reporting period. Any rate changes, if applicable, are detailed below. |
| (e) | The annual effective rates represent actual fees incurred under the distribution plan for the six months ended February 28, 2014 based on each class’s average daily net assets. MFD has voluntarily agreed to rebate a portion of each class’s 0.25% service fee attributable to accounts for which MFD retains the 0.25% service fee except for accounts attributable to MFS or its affiliates’ seed money. For the six months ended February 28, 2014, this rebate |
33
Notes to Financial Statements (unaudited) – continued
| | amounted to $19,882, $236, $120, $1,940, $689, $25, and $1 for Class A, Class B, Class C, Class R3, Class 529A, Class 529B, and Class 529C, respectively, and is included in the reduction of total expenses in the Statement of Operations. |
Certain Class A shares are subject to a contingent deferred sales charge (CDSC) in the event of a shareholder redemption within 18 months of purchase for shares purchased on or after August 1, 2012, and within 24 months of purchase for shares purchased prior to August 1, 2012. Class C and Class 529C shares are subject to a CDSC in the event of a shareholder redemption within 12 months of purchase. Class B and Class 529B shares are subject to a CDSC in the event of a shareholder redemption within six years of purchase. All contingent deferred sales charges are paid to MFD and during the six months ended February 28, 2014, were as follows:
| | | | |
| | | Amount | |
| Class A | | | $2,591 | |
| Class B | | | 22,269 | |
| Class C | | | 11,434 | |
| Class 529B | | | — | |
| Class 529C | | | 100 | |
The fund has entered into and may from time to time enter into contracts with program managers and other parties which administer the tuition programs through which an investment in the fund’s 529 share classes is made. The fund has entered into an agreement with MFD pursuant to which MFD receives an annual fee of up to 0.10% of the average daily net assets attributable to each 529 share class. MFD has agreed to waive a portion of this fee in an amount equal to 0.05% of the average daily net assets for each 529 share class. This waiver agreement will expire on December 31, 2014, unless MFD elects to extend the waiver. For the six months ended February 28, 2014, this waiver amounted to $1,705 and is included in the reduction of total expenses in the Statement of Operations. The program manager fee incurred for the six months ended February 28, 2014 was equivalent to an annual effective rate of 0.05% of the average daily net assets attributable to each 529 share class. The services provided by MFD, or a third party with which MFD contracts, include recordkeeping and tax reporting and account services, as well as services designed to maintain the program’s compliance with the Internal Revenue Code and other regulatory requirements. Program manager fees and waivers for the six months ended February 28, 2014, were as follows:
| | | | | | | | |
| | | Fee | | | Waiver | |
| Class 529A | | | $2,448 | | | | $1,224 | |
| Class 529B | | | 164 | | | | 82 | |
| Class 529C | | | 798 | | | | 399 | |
| Total Program Manager Fees and Waivers | | | $3,410 | | | | $1,705 | |
Shareholder Servicing Agent – MFS Service Center, Inc. (MFSC), a wholly-owned subsidiary of MFS, receives a fee from the fund for its services as shareholder servicing agent calculated as a percentage of the average daily net assets of the fund as determined periodically under the supervision of the fund’s Board of Trustees. For the six months ended February 28, 2014, the fee was $150,777, which equated to 0.0142% annually of the fund’s average daily net assets. MFSC also receives payment
34
Notes to Financial Statements (unaudited) – continued
from the fund for out-of-pocket expenses, sub-accounting and other shareholder servicing costs which may be paid to affiliated and unaffiliated service providers. Class R5 shares do not incur sub-accounting fees. For the six months ended February 28, 2014, these out-of-pocket expenses, sub-accounting and other shareholder servicing costs amounted to $972,068.
Administrator – MFS provides certain financial, legal, shareholder communications, compliance, and other administrative services to the fund. Under an administrative services agreement, the fund partially reimburses MFS the costs incurred to provide these services. The fund is charged an annual fixed amount of $17,500 plus a fee based on average daily net assets. The administrative services fee incurred for the six months ended February 28, 2014 was equivalent to an annual effective rate of 0.0122% of the fund’s average daily net assets.
Trustees’ and Officers’ Compensation – The fund pays compensation to independent Trustees in the form of a retainer, attendance fees, and additional compensation to Board and Committee chairpersons. The fund does not pay compensation directly to Trustees or officers of the fund who are also officers of the investment adviser, all of whom receive remuneration for their services to the fund from MFS. Certain officers and Trustees of the fund are officers or directors of MFS, MFD, and MFSC.
Prior to December 31, 2001, the fund had an unfunded defined benefit plan (“DB plan”) for independent Trustees. As of December 31, 2001, the Board took action to terminate the DB plan with respect to then-current and any future independent Trustees, such that the DB plan covers only certain of those former independent Trustees who retired on or before December 31, 2001. The DB plan resulted in a pension expense of $112 and is included in independent Trustees’ compensation for the six months ended February 28, 2014. The liability for deferred retirement benefits payable to certain independent Trustees under the DB plan amounted to $4,291 at February 28, 2014, and is included in “Payable for independent Trustees’ compensation” in the Statement of Assets and Liabilities.
Other – This fund and certain other funds managed by MFS (the funds) have entered into services agreements (the Agreements) which provide for payment of fees by the funds to Tarantino LLC and Griffin Compliance LLC in return for the provision of services of an Independent Chief Compliance Officer (ICCO) and Assistant ICCO, respectively, for the funds. The ICCO and Assistant ICCO are officers of the funds and the sole members of Tarantino LLC and Griffin Compliance LLC, respectively. The funds can terminate the Agreements with Tarantino LLC and Griffin Compliance LLC at any time under the terms of the Agreements. For the six months ended February 28, 2014, the aggregate fees paid by the fund to Tarantino LLC and Griffin Compliance LLC were $6,960 and are included in “Miscellaneous” expense in the Statement of Operations. MFS has agreed to reimburse the fund for a portion of the payments made by the fund in the amount of $999, which is included in the reduction of total expenses in the Statement of Operations. Additionally, MFS has agreed to bear all expenses associated with office space, other administrative support, and supplies provided to the ICCO and Assistant ICCO.
35
Notes to Financial Statements (unaudited) – continued
The fund invests in the MFS Institutional Money Market Portfolio which is managed by MFS and seeks current income consistent with preservation of capital and liquidity. Income earned on this investment is included in “Dividends from underlying affiliated funds” in the Statement of Operations. This money market fund does not pay a management fee to MFS.
On September 11, 2013, MFS redeemed 5,066 shares of Class R5 for an aggregate amount of $148,181.
(4) Portfolio Securities
Purchases and sales of investments, other than in-kind transactions and short-term obligations, aggregated $964,838,295 and $815,614,350, respectively.
(5) Shares of Beneficial Interest
The fund’s Declaration of Trust permits the Trustees to issue an unlimited number of full and fractional shares of beneficial interest. Transactions in fund shares were as follows:
| | | | | | | | | | | | | | | | |
| | | Six months ended
2/28/14 | | | Year ended
8/31/13 | |
| | | Shares | | | Amount | | | Shares | | | Amount | |
| Shares sold | | | | | | | | | | | | | | | | |
Class A | | | 5,030,019 | | | | $135,651,818 | | | | 13,280,657 | | | | $317,286,546 | |
Class B | | | 214,442 | | | | 5,044,395 | | | | 413,203 | | | | 8,490,226 | |
Class C | | | 1,243,502 | | | | 29,168,629 | | | | 2,088,673 | | | | 43,663,588 | |
Class I | | | 5,690,129 | | | | 162,354,340 | | | | 9,044,050 | | | | 226,138,227 | |
Class R1 | | | 62,495 | | | | 1,458,774 | | | | 119,137 | | | | 2,448,027 | |
Class R2 | | | 662,186 | | | | 17,122,107 | | | | 1,281,338 | | | | 28,806,578 | |
Class R3 | | | 1,974,752 | | | | 53,320,040 | | | | 2,302,409 | | | | 53,724,050 | |
Class R4 | | | 2,430,415 | | | | 67,316,307 | | | | 2,656,356 | | | | 63,852,249 | |
Class R5 | | | 977,486 | | | | 27,842,570 | | | | 1,766,087 | | | | 42,150,539 | |
Class 529A | | | 17,402 | | | | 460,473 | | | | 34,989 | | | | 806,060 | |
Class 529B | | | 2,298 | | | | 52,353 | | | | 3,557 | | | | 69,765 | |
Class 529C | | | 7,929 | | | | 181,828 | | | | 18,424 | | | | 354,241 | |
| | | 18,313,055 | | | | $499,973,634 | | | | 33,008,880 | | | | $787,790,096 | |
| | | | |
Shares issued to shareholders in reinvestment of distributions | | | | | | | | | | | | | | | | |
Class A | | | 2,328,346 | | | | $59,512,523 | | | | — | | | | $— | |
Class B | | | 163,235 | | | | 3,627,076 | | | | — | | | | — | |
Class C | | | 515,039 | | | | 11,464,768 | | | | — | | | | — | |
Class I | | | 902,424 | | | | 24,789,597 | | | | — | | | | — | |
Class R1 | | | 42,426 | | | | 937,201 | | | | — | | | | — | |
Class R2 | | | 223,362 | | | | 5,490,231 | | | | — | | | | — | |
Class R3 | | | 500,819 | | | | 12,790,928 | | | | — | | | | — | |
Class R4 | | | 718,763 | | | | 18,939,409 | | | | — | | | | — | |
Class R5 | | | 809,012 | | | | 22,264,000 | | | | — | | | | — | |
Class 529A | | | 18,151 | | | | 451,745 | | | | — | | | | — | |
Class 529B | | | 1,538 | | | | 33,273 | | | | — | | | | — | |
Class 529C | | | 7,745 | | | | 167,520 | | | | — | | | | — | |
| | | 6,230,860 | | | | $160,468,271 | | | | — | | | | $— | |
36
Notes to Financial Statements (unaudited) – continued
| | | | | | | | | | | | | | | | |
| | | Six months ended
2/28/14 | | | Year ended
8/31/13 | |
| | | Shares | | | Amount | | | Shares | | | Amount | |
| Shares reacquired | | | | | | | | | | | | | | | | |
Class A | | | (12,439,393 | ) | | | $(338,344,202 | ) | | | (6,057,209 | ) | | | $(136,602,612 | ) |
Class B | | | (175,560 | ) | | | (4,103,082 | ) | | | (440,250 | ) | | | (8,819,700 | ) |
Class C | | | (566,203 | ) | | | (13,225,005 | ) | | | (1,172,917 | ) | | | (23,417,729 | ) |
Class I | | | (2,464,765 | ) | | | (70,426,463 | ) | | | (3,638,323 | ) | | | (86,932,110 | ) |
Class R1 | | | (72,352 | ) | | | (1,686,515 | ) | | | (144,665 | ) | | | (2,881,900 | ) |
Class R2 | | | (443,398 | ) | | | (11,504,218 | ) | | | (681,686 | ) | | | (14,889,511 | ) |
Class R3 | | | (937,968 | ) | | | (24,983,332 | ) | | | (1,056,634 | ) | | | (23,946,508 | ) |
Class R4 | | | (1,083,212 | ) | | | (29,783,878 | ) | | | (2,063,176 | ) | | | (48,545,028 | ) |
Class R5 | | | (413,447 | ) | | | (11,964,325 | ) | | | (1,046,242 | ) | | | (25,688,737 | ) |
Class 529A | | | (14,381 | ) | | | (369,819 | ) | | | (23,748 | ) | | | (532,514 | ) |
Class 529B | | | (1,102 | ) | | | (25,969 | ) | | | (2,507 | ) | | | (50,279 | ) |
Class 529C | | | (6,374 | ) | | | (141,104 | ) | | | (4,901 | ) | | | (99,988 | ) |
| | | (18,618,155 | ) | | | $(506,557,912 | ) | | | (16,332,258 | ) | | | $(372,406,616 | ) |
| | | | |
| Net change | | | | | | | | | | | | | | | | |
Class A | | | (5,081,028 | ) | | | $(143,179,861 | ) | | | 7,223,448 | | | | $180,683,934 | |
Class B | | | 202,117 | | | | 4,568,389 | | | | (27,047 | ) | | | (329,474 | ) |
Class C | | | 1,192,338 | | | | 27,408,392 | | | | 915,756 | | | | 20,245,859 | |
Class I | | | 4,127,788 | | | | 116,717,474 | | | | 5,405,727 | | | | 139,206,117 | |
Class R1 | | | 32,569 | | | | 709,460 | | | | (25,528 | ) | | | (433,873 | ) |
Class R2 | | | 442,150 | | | | 11,108,120 | | | | 599,652 | | | | 13,917,067 | |
Class R3 | | | 1,537,603 | | | | 41,127,636 | | | | 1,245,775 | | | | 29,777,542 | |
Class R4 | | | 2,065,966 | | | | 56,471,838 | | | | 593,180 | | | | 15,307,221 | |
Class R5 | | | 1,373,051 | | | | 38,142,245 | | | | 719,845 | | | | 16,461,802 | |
Class 529A | | | 21,172 | | | | 542,399 | | | | 11,241 | | | | 273,546 | |
Class 529B | | | 2,734 | | | | 59,657 | | | | 1,050 | | | | 19,486 | |
Class 529C | | | 9,300 | | | | 208,244 | | | | 13,523 | | | | 254,253 | |
| | | 5,925,760 | | | | $153,883,993 | | | | 16,676,622 | | | | $415,383,480 | |
The fund is one of several mutual funds in which the MFS funds-of-funds may invest. The MFS funds-of-funds do not invest in the underlying MFS funds for the purpose of exercising management or control. At the end of the period, the MFS Growth Allocation Fund, MFS Moderate Allocation Fund, MFS Aggressive Growth Allocation Fund, and MFS Conservative Allocation Fund were the owners of record of approximately 4%, 4%, 2%, and 1%, respectively, of the value of outstanding voting shares of the fund. In addition, the MFS Lifetime 2010 Fund, MFS Lifetime 2015 Fund, MFS Lifetime 2020 Fund, MFS Lifetime 2025 Fund, MFS Lifetime 2030 Fund, MFS Lifetime 2035 Fund, MFS Lifetime 2040 Fund, MFS Lifetime 2045 Fund, MFS Lifetime 2050 Fund, MFS Lifetime 2055 Fund, and MFS Lifetime Retirement Income Fund were each the owners of record of less than 1% of the value of outstanding voting shares of the fund.
37
Notes to Financial Statements (unaudited) – continued
(6) Line of Credit
The fund and certain other funds managed by MFS participate in a $1.1 billion unsecured committed line of credit, subject to a $1 billion sublimit, provided by a syndication of banks under a credit agreement. Borrowings may be made for temporary financing needs. Interest is charged to each fund, based on its borrowings, generally at a rate equal to the higher of the Federal Reserve funds rate or one month LIBOR plus an agreed upon spread. A commitment fee, based on the average daily, unused portion of the committed line of credit, is allocated among the participating funds at the end of each calendar quarter. In addition, the fund and other funds managed by MFS have established unsecured uncommitted borrowing arrangements with certain banks for temporary financing needs. Interest is charged to each fund, based on its borrowings, at a rate equal to the Federal Reserve funds rate plus an agreed upon spread. For the six months ended February 28, 2014, the fund’s commitment fee and interest expense were $4,255 and $0, respectively, and are included in “Miscellaneous” expense in the Statement of Operations.
(7) Transactions in Underlying Affiliated Funds-Affiliated Issuers
An affiliated issuer may be considered one in which the fund owns 5% or more of the outstanding voting securities, or a company which is under common control. For the purposes of this report, the fund assumes the following to be affiliated issuers:
| | | | | | | | | | | | | | | | |
| Underlying Affiliated Fund | | Beginning
Shares/Par
Amount | | | Acquisitions
Shares/Par
Amount | | | Dispositions
Shares/Par
Amount | | | Ending
Shares/Par
Amount | |
MFS Institutional Money
Market Portfolio | | | 11,908,354 | | | | 445,088,790 | | | | (443,988,816 | ) | | | 13,008,328 | |
| | | | |
| Underlying Affiliated Fund | | Realized Gain (Loss) | | | Capital Gain
Distributions | | | Dividend
Income | | | Ending
Value | |
MFS Institutional Money
Market Portfolio | | | $— | | | | $— | | | | $13,245 | | | | $13,008,328 | |
| | | | |
| Other Affiliated Issuers | | Beginning
Shares/Par
Amount | | | Acquisitions
Shares/Par
Amount | | | Dispositions
Shares/Par
Amount | | | Ending
Shares/Par
Amount | |
| Citi Trends, Inc. | | | 1,312,543 | | | | 67,680 | | | | (145,818 | ) | | | 1,234,405 | |
| Model N, Inc. | | | 1,833,988 | | | | 90,590 | | | | (203,664 | ) | | | 1,720,914 | |
| Rubicon Technology, Inc. | | | — | | | | 1,681,460 | | | | (141,663 | ) | | | 1,539,797 | |
| TearLab Corp. | | | — | | | | 2,291,068 | | | | (109,310 | ) | | | 2,181,758 | |
| Uroplasty, Inc. | | | 1,567,473 | | | | 80,840 | | | | (174,140 | ) | | | 1,474,173 | |
| | | | |
| Other Affiliated Issuers | | Realized
Gain (Loss) | | | Capital Gain
Distributions | | | Dividend
Income | | | Ending
Value | |
| Citi Trends, Inc. | | | $278,581 | | | | $— | | | | $— | | | | $20,244,246 | |
| Model N, Inc. | | | (1,241,200 | ) | | | — | | | | — | | | | 18,912,845 | |
| Rubicon Technology, Inc. | | | 126,030 | | | | — | | | | — | | | | 19,878,779 | |
| TearLab Corp. | | | (209,994 | ) | | | — | | | | — | | | | 17,563,152 | |
| Uroplasty, Inc. | | | (2,171 | ) | | | — | | | | — | | | | 6,073,593 | |
| | | | | | | | | | | | | | | | |
| | | $(1,048,754 | ) | | | $— | | | | $— | | | | $82,672,615 | |
| | | | | | | | | | | | | | | | |
38
Notes to Financial Statements (unaudited) – continued
(8) Redemptions In-Kind
On September 27, 2013, the fund recorded redemption proceeds for a distribution in-kind of portfolio securities and cash that were valued at $196,913,535. The redeeming shareholder generally receives a pro rata share of the securities held by the fund. The distribution of such securities generated a realized gain (loss) of $60,096,207 for the fund.
39
BOARD REVIEW OF INVESTMENT ADVISORY AGREEMENT
A discussion regarding the Board’s most recent review and renewal of the fund’s Investment Advisory Agreement with MFS is available by clicking on the fund’s name under “Mutual Funds” in the “Products” section of the MFS Web site (mfs.com).
PROXY VOTING POLICIES AND INFORMATION
A general description of the MFS funds’ proxy voting policies and procedures is available without charge, upon request, by calling 1-800-225-2606, by visiting the Proxy Voting section of mfs.com or by visiting the SEC’s Web site at http://www.sec.gov.
Information regarding how the fund voted proxies relating to portfolio securities during the most recent twelve-month period ended June 30 is available without charge by visiting the Proxy Voting section of mfs.com or by visiting the SEC’s Web site at http://www.sec.gov.
QUARTERLY PORTFOLIO DISCLOSURE
The fund will file a complete schedule of portfolio holdings with the Securities and Exchange Commission (the Commission) for the first and third quarters of each fiscal year on Form N-Q. A shareholder can obtain the quarterly portfolio holdings report at mfs.com. The fund’s Form N-Q is also available on the EDGAR database on the Commission’s Internet Web site at http://www.sec.gov, and may be reviewed and copied at the:
Public Reference Room
Securities and Exchange Commission
100 F Street, NE, Room 1580
Washington, D.C. 20549
Information on the operation of the Public Reference Room may be obtained by calling the Commission at 1-800-SEC-0330. Copies of the fund’s Form N-Q also may be obtained, upon payment of a duplicating fee, by electronic request at the following e-mail address: publicinfo@sec.gov, or by writing the Public Reference Section at the above address.
FURTHER INFORMATION
From time to time, MFS may post important information about the fund or the MFS funds on the MFS web site (mfs.com). This information is available by visiting the “Commentary & Announcements” and “Market Outlooks” sections of mfs.com or by clicking on the fund’s name under “Mutual Funds” in the “Products” section of mfs.com.
PROVISION OF FINANCIAL REPORTS AND SUMMARY PROSPECTUSES
The fund produces financial reports every six months and updates its summary prospectus and prospectus annually. To avoid sending duplicate copies of materials to households, only one copy of the fund’s annual and semiannual report and summary prospectus may be mailed to shareholders having the same last name and residential address on the fund’s records. However, any shareholder may contact MFSC (please see back cover for address and telephone number) to request that copies of these reports and summary prospectuses be sent personally to that shareholder.
40
Save paper with eDelivery.

| MFS® will send you prospectuses, |
reports, and proxies directly via e-mail so you will get information faster with less mailbox clutter.
To sign up:
1. Go to mfs.com.
2. Log in via MFS® Access.
3. Select eDelivery.
If you own your MFS fund shares through a financial institution or a retirement plan, MFS® TALK, MFS® Access, or eDelivery may not be available to you.
CONTACT
WEB SITE
mfs.com
MFS TALK
1-800-637-8255
24 hours a day
ACCOUNT SERVICE AND LITERATURE
Shareholders
1-800-225-2606
Financial advisors
1-800-343-2829
Retirement plan services
1-800-637-1255
MAILING ADDRESS
MFS Service Center, Inc.
P.O. Box 55824
Boston, MA 02205-5824
OVERNIGHT MAIL
MFS Service Center, Inc.
c/o Boston Financial Data Services
30 Dan Road
Canton, MA 02021-2809
SEMIANNUAL REPORT
February 28, 2014

MFS® RESEARCH INTERNATIONAL FUND

RIF-SEM
MFS® RESEARCH INTERNATIONAL FUND
CONTENTS
The report is prepared for the general information of shareholders. It is authorized for distribution to prospective investors only when preceded or accompanied by a current prospectus.
NOT FDIC INSURED Ÿ MAY LOSE VALUE Ÿ NO BANK GUARANTEE

LETTER FROM THE CHAIRMAN AND CEO
Dear Shareholders:
The U.S. economy appears to have slowed early in 2014 after a strong second half of 2013. Harsh winter weather likely contributed to at least a temporary softening of consumer demand. Looking at the longer term, the pace of U.S. economic growth has
been modest since the recovery began late in 2009. Corporate profits remain healthy overall. A major plus is the removal of a highly confrontational atmosphere in the U.S. Congress, which had clouded business decision-making since 2011.
Globally, recent months have been dominated by volatility, including emerging market currency jitters and rising geopolitical tensions. These add to the possibility of economic uncertainty and financial market unease. However, the eurozone continues to show signs of recovery, while Japan is making progress as it seeks to break free of deflation.
China’s transition toward a more consumer-oriented and less export-driven economy — one with a more stable and sustainable growth rate — could be positive in the long term. However, in the near term, any deceleration in China’s rate of growth could have a ripple effect on its many global trading partners.
In uncertain times such as these, it is particularly important to remember that managing risk should always be a top priority. At MFS®, active risk management is an integral part of our collaborative process. Our global team of investment professionals shares ideas and evaluates opportunities that span continents, investment disciplines and asset classes. Our goal is to build better insights, and ultimately better results, for our clients.
We understand and appreciate the economic challenges investors face, and we believe in the value of maintaining a long-term view and applying proven principles, such as asset allocation and diversification. We are confident that our unique approach can serve investors well as they work with their financial advisors to identify and pursue the most suitable opportunities.
Respectfully,

Robert J. Manning
Chairman and Chief Executive Officer
MFS Investment Management
April 14, 2014
The opinions expressed in this letter are subject to change, may not be relied upon for investment advice, and no forecasts can be guaranteed.
1
PORTFOLIO COMPOSITION
Portfolio structure

| | | | |
| Top ten holdings | | | | |
| Novartis AG | | | 3.3% | |
| Royal Dutch Shell PLC, “A” | | | 3.1% | |
| Nestle S.A. | | | 2.8% | |
| HSBC Holdings PLC | | | 2.5% | |
| Rio Tinto Ltd. | | | 2.3% | |
| GlaxoSmithKline PLC | | | 2.0% | |
| Bayer AG | | | 1.9% | |
| KDDI Corp. | | | 1.9% | |
| Schneider Electric S.A. | | | 1.8% | |
| Westpac Banking Corp. | | | 1.8% | |
|
| Global equity sectors | |
| Financial Services | | | 25.1% | |
| Capital Goods | | | 23.2% | |
| Health Care | | | 10.4% | |
| Energy | | | 9.9% | |
| Consumer Staples | | | 8.7% | |
| Consumer Cyclicals | | | 8.1% | |
| Technology | | | 7.7% | |
| Telecommunications/Cable Television | | | 5.0% | |
| | | | |
| Issuer country weightings (x) | |
| Japan | | | 18.8% | |
| United Kingdom | | | 18.1% | |
| Switzerland | | | 12.2% | |
| France | | | 10.5% | |
| Germany | | | 6.8% | |
| Netherlands | | | 4.4% | |
| United States | | | 4.4% | |
| Hong Kong | | | 4.3% | |
| Australia | | | 3.4% | |
| Other Countries | | | 17.1% | |
|
| Currency exposure weightings (y) | |
| Euro | | | 27.5% | |
| Japanese Yen | | | 18.8% | |
| British Pound Sterling | | | 18.1% | |
| Swiss Franc | | | 12.2% | |
| Hong Kong Dollar | | | 5.2% | |
| United States Dollar | | | 4.4% | |
| Australian Dollar | | | 3.4% | |
| Brazilian Real | | | 2.3% | |
| Swedish Krona | | | 2.3% | |
| Other Currencies | | | 5.8% | |
| (x) | Represents the portfolio’s exposure to issuer countries as a percentage of a portfolio’s net assets. For purposes of this presentation, United States includes Cash & Other. |
| (y) | Represents the portfolio’s exposure to a particular currency as a percentage of a portfolio’s net assets. For purposes of this presentation, United States Dollar includes Cash & Other. |
Percentages are based on net assets as of 2/28/14.
The portfolio is actively managed and current holdings may be different.
2
EXPENSE TABLE
Fund expenses borne by the shareholders during the period, September 1, 2013 through February 28, 2014
As a shareholder of the fund, you incur two types of costs: (1) transaction costs, including sales charges (loads) on certain purchase or redemption payments, and (2) ongoing costs, including management fees; distribution and service (12b-1) fees; and other fund expenses. This example is intended to help you understand your ongoing costs (in dollars) of investing in the fund and to compare these costs with the ongoing costs of investing in other mutual funds.
The example is based on an investment of $1,000 invested at the beginning of the period and held for the entire period September 1, 2013 through February 28, 2014.
Actual Expenses
The first line for each share class in the following table provides information about actual account values and actual expenses. You may use the information in this line, together with the amount you invested, to estimate the expenses that you paid over the period. Simply divide your account value by $1,000 (for example, an $8,600 account value divided by $1,000 = 8.6), then multiply the result by the number in the first line under the heading entitled “Expenses Paid During Period” to estimate the expenses you paid on your account during this period.
Hypothetical Example for Comparison Purposes
The second line for each share class in the following table provides information about hypothetical account values and hypothetical expenses based on the fund’s actual expense ratio and an assumed rate of return of 5% per year before expenses, which is not the fund’s actual return. The hypothetical account values and expenses may not be used to estimate the actual ending account balance or expenses you paid for the period. You may use this information to compare the ongoing costs of investing in the fund and other funds. To do so, compare this 5% hypothetical example with the 5% hypothetical examples that appear in the shareholder reports of the other funds.
Please note that the expenses shown in the table are meant to highlight your ongoing costs only and do not reflect any transactional costs, such as sales charges (loads). Therefore, the second line for each share class in the table is useful in comparing ongoing costs only, and will not help you determine the relative total costs of owning different funds. In addition, if these transactional costs were included, your costs would have been higher.
3
Expense Table – continued
| | | | | | | | | | | | | | | | | | |
Share
Class | | | | Annualized
Expense
Ratio | | | Beginning
Account Value
9/01/13 | | | Ending
Account Value
2/28/14 | | | Expenses
Paid During
Period (p)
9/01/13-2/28/14 | |
| A | | Actual | | | 1.11% | | | | $1,000.00 | | | | $1,113.57 | | | | $5.82 | |
| | Hypothetical (h) | | | 1.11% | | | | $1,000.00 | | | | $1,019.29 | | | | $5.56 | |
| B | | Actual | | | 1.86% | | | | $1,000.00 | | | | $1,109.25 | | | | $9.73 | |
| | Hypothetical (h) | | | 1.86% | | | | $1,000.00 | | | | $1,015.57 | | | | $9.30 | |
| C | | Actual | | | 1.86% | | | | $1,000.00 | | | | $1,108.87 | | | | $9.73 | |
| | Hypothetical (h) | | | 1.86% | | | | $1,000.00 | | | | $1,015.57 | | | | $9.30 | |
| I | | Actual | | | 0.86% | | | | $1,000.00 | | | | $1,115.03 | | | | $4.51 | |
| | Hypothetical (h) | | | 0.86% | | | | $1,000.00 | | | | $1,020.53 | | | | $4.31 | |
| R1 | | Actual | | | 1.86% | | | | $1,000.00 | | | | $1,108.61 | | | | $9.72 | |
| | Hypothetical (h) | | | 1.86% | | | | $1,000.00 | | | | $1,015.57 | | | | $9.30 | |
| R2 | | Actual | | | 1.36% | | | | $1,000.00 | | | | $1,112.24 | | | | $7.12 | |
| | Hypothetical (h) | | | 1.36% | | | | $1,000.00 | | | | $1,018.05 | | | | $6.80 | |
| R3 | | Actual | | | 1.11% | | | | $1,000.00 | | | | $1,113.01 | | | | $5.82 | |
| | Hypothetical (h) | | | 1.11% | | | | $1,000.00 | | | | $1,019.29 | | | | $5.56 | |
| R4 | | Actual | | | 0.86% | | | | $1,000.00 | | | | $1,114.38 | | | | $4.51 | |
| | Hypothetical (h) | | | 0.86% | | | | $1,000.00 | | | | $1,020.53 | | | | $4.31 | |
| R5 | | Actual | | | 0.77% | | | | $1,000.00 | | | | $1,115.07 | | | | $4.04 | |
| | Hypothetical (h) | | | 0.77% | | | | $1,000.00 | | | | $1,020.98 | | | | $3.86 | |
| 529A | | Actual | | | 1.13% | | | | $1,000.00 | | | | $1,113.73 | | | | $5.92 | |
| | Hypothetical (h) | | | 1.13% | | | | $1,000.00 | | | | $1,019.19 | | | | $5.66 | |
| 529B | | Actual | | | 1.91% | | | | $1,000.00 | | | | $1,109.17 | | | | $9.99 | |
| | Hypothetical (h) | | | 1.91% | | | | $1,000.00 | | | | $1,015.32 | | | | $9.54 | |
| 529C | | Actual | | | 1.91% | | | | $1,000.00 | | | | $1,108.71 | | | | $9.99 | |
| | Hypothetical (h) | | | 1.91% | | | | $1,000.00 | | | | $1,015.32 | | | | $9.54 | |
| (h) | 5% class return per year before expenses. |
| (p) | Expenses Paid During Period are equal to each class’s annualized expense ratio, as shown above, multiplied by the average account value over the period, multiplied by 181/365 (to reflect the one-half year period). Expenses paid do not include any applicable sales charges (loads). If these transaction costs had been included, your costs would have been higher. |
Notes to Expense Table
Each class with a Rule 12b-1 service fee is subject to a rebate of a portion of such fee. Such rebates are included in the expense ratios above. For Class 529A shares, this rebate reduced the expense ratio above by 0.03%. See Note 3 in the Notes to Financial Statements for additional information.
4
PORTFOLIO OF INVESTMENTS
2/28/14 (unaudited)
The Portfolio of Investments is a complete list of all securities owned by your fund. It is categorized by broad-based asset classes.
| | | | | | | | |
| Common Stocks - 98.1% | | | | | | | | |
| Issuer | | Shares/Par | | | Value ($) | |
| | | | | | | | |
| Alcoholic Beverages - 1.8% | | | | | | | | |
| Heineken N.V. | | | 586,561 | | | $ | 39,663,791 | |
| Pernod Ricard S.A. | | | 799,345 | | | | 94,103,543 | |
| | | | | | | | |
| | | | | | | $ | 133,767,334 | |
| Apparel Manufacturers - 2.1% | | | | | | | | |
| Li & Fung Ltd. | | | 57,748,000 | | | $ | 75,602,848 | |
| LVMH Moet Hennessy Louis Vuitton S.A. | | | 414,931 | | | | 77,232,560 | |
| | | | | | | | |
| | | | | | | $ | 152,835,408 | |
| Automotive - 4.9% | | | | | | | | |
| Autoliv, Inc. | | | 684,399 | | | $ | 65,935,000 | |
| DENSO Corp. | | | 2,364,300 | | | | 126,380,977 | |
| Honda Motor Co. Ltd. | | | 3,238,200 | | | | 116,043,189 | |
| Kia Motors Corp. | | | 902,070 | | | | 46,814,687 | |
| | | | | | | | |
| | | | | | | $ | 355,173,853 | |
| Broadcasting - 1.6% | | | | | | | | |
| Nippon Television Holdings, Inc. | | | 2,349,600 | | | $ | 39,086,890 | |
| Publicis Groupe S.A. | | | 798,722 | | | | 75,850,367 | |
| | | | | | | | |
| | | | | | | $ | 114,937,257 | |
| Brokerage & Asset Managers - 0.4% | | | | | | | | |
| Computershare Ltd. | | | 2,655,510 | | | $ | 28,127,666 | |
| | |
| Business Services - 3.1% | | | | | | | | |
| Cognizant Technology Solutions Corp., “A” (a) | | | 598,850 | | | $ | 62,316,331 | |
| Compass Group PLC | | | 2,987,974 | | | | 47,258,198 | |
| Experian Group Ltd. | | | 2,373,664 | | | | 42,967,820 | |
| Mitsubishi Corp. | | | 2,039,500 | | | | 39,018,439 | |
| Nomura Research, Inc. | | | 1,079,100 | | | | 35,309,060 | |
| | | | | | | | |
| | | | | | | $ | 226,869,848 | |
| Computer Software - 0.4% | | | | | | | | |
| Dassault Systems S.A. | | | 277,379 | | | $ | 31,885,108 | |
| | |
| Conglomerates - 0.9% | | | | | | | | |
| Hutchison Whampoa Ltd. | | | 4,921,000 | | | $ | 66,327,335 | |
| | |
| Consumer Products - 1.0% | | | | | | | | |
| Reckitt Benckiser Group PLC | | | 864,781 | | | $ | 71,160,612 | |
5
Portfolio of Investments (unaudited) – continued
| | | | | | | | |
| Issuer | | Shares/Par | | | Value ($) | |
| | | | | | | | |
| Common Stocks - continued | | | | | | | | |
| Electrical Equipment - 4.0% | | | | | | | | |
| Legrand S.A. | | | 421,393 | | | $ | 26,133,485 | |
| Schneider Electric S.A. | | | 1,466,167 | | | | 131,037,866 | |
| Siemens AG | | | 967,615 | | | | 129,232,591 | |
| | | | | | | | |
| | | | | | | $ | 286,403,942 | |
| Electronics - 2.4% | | | | | | | | |
| Infineon Technologies AG | | | 3,957,319 | | | $ | 44,900,014 | |
| MediaTek, Inc. | | | 5,658,000 | | | | 83,101,525 | |
| Taiwan Semiconductor Manufacturing Co. Ltd. | | | 11,993,326 | | | | 42,970,753 | |
| | | | | | | | |
| | | | | | | $ | 170,972,292 | |
| Energy - Independent - 1.7% | | | | | | | | |
| Cairn Energy PLC (a) | | | 3,329,974 | | | $ | 11,085,508 | |
| Cenovus Energy, Inc. | | | 785,250 | | | | 20,785,404 | |
| Galp Energia SGPS S.A., “B” | | | 992,805 | | | | 16,691,096 | |
| INPEX Corp. | | | 2,567,200 | | | | 32,540,906 | |
| Oil Search Ltd. | | | 2,820,570 | | | | 21,771,484 | |
| Reliance Industries Ltd. | | | 1,604,309 | | | | 20,706,147 | |
| | | | | | | | |
| | | | | | | $ | 123,580,545 | |
| Energy - Integrated - 4.4% | | | | | | | | |
| BG Group PLC | | | 3,510,676 | | | $ | 63,990,804 | |
| Petroleo Brasileiro S.A., ADR | | | 2,945,230 | | | | 32,986,576 | |
| Royal Dutch Shell PLC, “A” | | | 6,152,691 | | | | 224,399,230 | |
| | | | | | | | |
| | | | | | | $ | 321,376,610 | |
| Engineering - Construction - 1.0% | | | | | | | | |
| JGC Corp. | | | 1,943,000 | | | $ | 71,843,461 | |
| | |
| Food & Beverages - 4.8% | | | | | | | | |
| Groupe Danone | | | 1,589,666 | | | $ | 112,300,003 | |
| M. Dias Branco S.A. Industria e Comercio de Alimentos | | | 869,500 | | | | 30,370,850 | |
| Nestle S.A. | | | 2,675,124 | | | | 202,573,347 | |
| �� | | | | | | | |
| | | | | | | $ | 345,244,200 | |
| Food & Drug Stores - 0.6% | | | | | | | | |
| Sundrug Co. Ltd. | | | 854,500 | | | $ | 34,383,192 | |
| Wumart Stores, Inc., “H” | | | 5,678,000 | | | | 6,723,856 | |
| | | | | | | | |
| | | | | | | $ | 41,107,048 | |
| Gaming & Lodging - 1.4% | | | | | | | | |
| Paddy Power PLC | | | 434,075 | | | $ | 36,290,750 | |
| Sands China Ltd. | | | 8,160,800 | | | | 68,247,214 | |
| | | | | | | | |
| | | | | | | $ | 104,537,964 | |
6
Portfolio of Investments (unaudited) – continued
| | | | | | | | |
| Issuer | | Shares/Par | | | Value ($) | |
| | | | | | | | |
| Common Stocks - continued | | | | | | | | |
| Health Maintenance Organizations - 0.2% | | | | | | | | |
| OdontoPrev S.A. | | | 4,197,600 | | | $ | 15,342,118 | |
| | |
| Insurance - 4.7% | | | | | | | | |
| AIA Group Ltd. | | | 20,631,200 | | | $ | 100,888,989 | |
| Delta Lloyd N.V. | | | 1,257,810 | | | | 35,912,378 | |
| Hiscox Ltd. | | | 3,152,787 | | | | 34,422,357 | |
| ING Groep N.V. (a) | | | 5,736,043 | | | | 83,687,575 | |
| Sony Financial Holdings, Inc. | | | 1,573,500 | | | | 25,372,050 | |
| Zurich Insurance Group AG | | | 202,780 | | | | 62,136,680 | |
| | | | | | | | |
| | | | | | | $ | 342,420,029 | |
| Internet - 0.9% | | | | | | | | |
| Yahoo Japan Corp. | | | 9,728,700 | | | $ | 61,658,755 | |
| | |
| Machinery & Tools - 3.1% | | | | | | | | |
| Atlas Copco AB, “A” | | | 3,478,281 | | | $ | 97,703,151 | |
| Joy Global, Inc. | | | 960,700 | | | | 52,838,500 | |
| Schindler Holding AG | | | 515,925 | | | | 77,374,085 | |
| | | | | | | | |
| | | | | | | $ | 227,915,736 | |
| Major Banks - 10.0% | | | | | | | | |
| BNP Paribas | | | 1,320,256 | | | $ | 108,356,920 | |
| HSBC Holdings PLC | | | 17,318,469 | | | | 182,617,155 | |
| Mitsubishi UFJ Financial Group, Inc. | | | 11,477,800 | | | | 66,202,895 | |
| Royal Bank of Scotland Group PLC (a) | | | 15,200,467 | | | | 83,463,526 | |
| Standard Chartered PLC | | | 2,005,206 | | | | 42,476,420 | |
| Sumitomo Mitsui Financial Group, Inc. | | | 2,395,200 | | | | 106,850,820 | |
| Westpac Banking Corp. | | | 4,385,255 | | | | 130,974,156 | |
| | | | | | | | |
| | | | | | | $ | 720,941,892 | |
| Medical & Health Technology & Services - 0.2% | | | | | | | | |
| Kobayashi Pharmaceutical Co. Ltd. | | | 303,300 | | | $ | 17,166,238 | |
| | |
| Medical Equipment - 0.6% | | | | | | | | |
| Sonova Holding AG | | | 301,109 | | | $ | 42,590,062 | |
| | |
| Metals & Mining - 3.4% | | | | | | | | |
| Gerdau S.A., ADR | | | 4,598,810 | | | $ | 28,742,563 | |
| Iluka Resources Ltd. | | | 6,338,817 | | | | 53,113,980 | |
| Rio Tinto Ltd. | | | 2,891,154 | | | | 166,180,535 | |
| | | | | | | | |
| | | | | | | $ | 248,037,078 | |
| Natural Gas - Distribution - 2.6% | | | | | | | | |
| China Resources Gas Group Ltd. | | | 8,932,000 | | | $ | 31,420,917 | |
| GDF SUEZ | | | 2,552,184 | | | | 65,488,489 | |
7
Portfolio of Investments (unaudited) – continued
| | | | | | | | |
| Issuer | | Shares/Par | | | Value ($) | |
| | | | | | | | |
| Common Stocks - continued | | | | | | | | |
| Natural Gas - Distribution - continued | | | | | | | | |
| Snam Rete Gas S.p.A. | | | 7,218,910 | | | $ | 41,092,625 | |
| Tokyo Gas Co. Ltd. | | | 9,975,000 | | | | 49,987,717 | |
| | | | | | | | |
| | | | | | | $ | 187,989,748 | |
| Natural Gas - Pipeline - 0.2% | | | | | | | | |
| APA Group | | | 2,048,601 | | | $ | 12,211,496 | |
| | |
| Network & Telecom - 0.9% | | | | | | | | |
| Ericsson, Inc., “B” | | | 5,279,470 | | | $ | 68,426,061 | |
| | |
| Oil Services - 0.5% | | | | | | | | |
| Technip | | | 350,130 | | | $ | 34,405,028 | |
| | |
| Other Banks & Diversified Financials - 8.6% | | | | | | | | |
| Aeon Credit Service Co. Ltd. | | | 1,173,700 | | | $ | 28,739,908 | |
| DBS Group Holdings Ltd. | | | 4,548,000 | | | | 59,269,483 | |
| Erste Group Bank AG | | | 2,348,810 | | | | 83,353,447 | |
| HDFC Bank Ltd., ADR | | | 972,490 | | | | 32,665,939 | |
| Itau Unibanco Holding S.A., ADR | | | 1,260,951 | | | | 16,795,867 | |
| Julius Baer Group Ltd. | | | 1,210,027 | | | | 56,710,987 | |
| Kasikornbank PLC, NVDR | | | 5,742,400 | | | | 30,010,090 | |
| KBC Group N.V. | | | 1,905,895 | | | | 120,959,933 | |
| Sberbank of Russia, ADR | | | 1,639,352 | | | | 16,901,719 | |
| UBS AG | | | 6,040,196 | | | | 129,594,654 | |
| UniCredit S.p.A. | | | 6,313,932 | | | | 50,242,682 | |
| | | | | | | | |
| | | | | | | $ | 625,244,709 | |
| Pharmaceuticals - 9.4% | | | | | | | | |
| Bayer AG | | | 977,816 | | | $ | 138,882,048 | |
| GlaxoSmithKline PLC | | | 5,201,067 | | | | 145,578,490 | |
| Novartis AG | | | 2,851,770 | | | | 238,160,894 | |
| Roche Holding AG | | | 227,476 | | | | 70,195,550 | |
| Santen Pharmaceutical Co. Ltd. | | | 1,837,100 | | | | 85,834,829 | |
| | | | | | | | |
| | | | | | | $ | 678,651,811 | |
| Printing & Publishing - 0.4% | | | | | | | | |
| Reed Elsevier N.V. | | | 1,400,166 | | | $ | 30,690,476 | |
| | |
| Real Estate - 1.4% | | | | | | | | |
| Deutsche Wohnen AG (a) | | | 1,371,529 | | | $ | 28,216,983 | |
| Mitsubishi Estate Co. Ltd. | | | 2,992,000 | | | | 70,647,303 | |
| | | | | | | | |
| | | | | | | $ | 98,864,286 | |
8
Portfolio of Investments (unaudited) – continued
| | | | | | | | |
| Issuer | | Shares/Par | | | Value ($) | |
| Common Stocks - continued | | | | | | | | |
| Restaurants - 1.3% | | | | | | | | |
| Arcos Dorados Holdings, Inc. | | | 286,760 | | | $ | 2,520,620 | |
| Whitbread PLC | | | 1,185,968 | | | | 89,110,201 | |
| | | | | | | | |
| | | | | | | $ | 91,630,821 | |
| Specialty Chemicals - 4.6% | | | | | | | | |
| Akzo Nobel N.V. | | | 1,524,204 | | | $ | 126,252,598 | |
| Chugoku Marine Paints Ltd. | | | 90,000 | | | | 521,765 | |
| JSR Corp. | | | 2,951,000 | | | | 50,541,348 | |
| Linde AG | | | 577,535 | | | | 119,695,340 | |
| Symrise AG | | | 709,387 | | | | 34,848,558 | |
| | | | | | | | |
| | | | | | | $ | 331,859,609 | |
| Specialty Stores - 0.7% | | | | | | | | |
| Industria de Diseno Textil S.A. | | | 340,692 | | | $ | 49,047,835 | |
| | |
| Telecommunications - Wireless - 3.0% | | | | | | | | |
| KDDI Corp. | | | 2,264,900 | | | $ | 138,003,782 | |
| Turkcell Iletisim Hizmetleri A.S. (a) | | | 1,740,732 | | | | 9,072,835 | |
| Vodafone Group PLC | | | 16,373,164 | | | | 68,270,069 | |
| | | | | | | | |
| | | | | | | $ | 215,346,686 | |
| Telephone Services - 2.1% | | | | | | | | |
| Bezeq - The Israel Telecommunication Corp. Ltd. | | | 7,016,570 | | | $ | 11,429,737 | |
| BT Group PLC | | | 4,979,202 | | | | 34,168,828 | |
| China Unicom (Hong Kong) Ltd. | | | 17,692,000 | | | | 23,572,463 | |
| TDC A.S. | | | 3,304,451 | | | | 32,821,422 | |
| Telecom Italia S.p.A. - Savings Shares | | | 29,740,780 | | | | 26,067,518 | |
| Telefonica Brasil S.A., ADR | | | 1,156,180 | | | | 21,562,757 | |
| | | | | | | | |
| | | | | | | $ | 149,622,725 | |
| Tobacco - 1.1% | | | | | | | | |
| Japan Tobacco, Inc. | | | 2,503,700 | | | $ | 79,512,218 | |
| | |
| Trucking - 1.2% | | | | | | | | |
| Yamato Holdings Co. Ltd. | | | 4,196,600 | | | $ | 86,884,506 | |
| | |
| Utilities - Electric Power - 0.5% | | | | | | | | |
| Canadian Utilities Ltd. | | | 355,450 | | | $ | 12,580,227 | |
| Energias do Brasil S.A. | | | 5,539,900 | | | | 21,098,756 | |
| | | | | | | | |
| | | | | | | $ | 33,678,983 | |
| Total Common Stocks (Identified Cost, $6,038,560,260) | | | $ | 7,096,289,389 | |
9
Portfolio of Investments (unaudited) – continued
| | | | | | | | |
| Money Market Funds - 1.4% | | | | | | | | |
| Issuer | | Shares/Par | | | Value ($) | |
MFS Institutional Money Market Portfolio, 0.08%,
at Cost and Net Asset Value (v) | | | 101,415,944 | | | $ | 101,415,944 | |
| Total Investments (Identified Cost, $6,139,976,204) | | | | | | $ | 7,197,705,333 | |
| | |
| Other Assets, Less Liabilities - 0.5% | | | | | | | 33,584,243 | |
| Net Assets - 100.0% | | | | | | $ | 7,231,289,576 | |
| (a) | Non-income producing security. |
| (v) | Underlying affiliated fund that is available only to investment companies managed by MFS. The rate quoted for the MFS Institutional Money Market Portfolio is the annualized seven-day yield of the fund at period end. |
The following abbreviations are used in this report and are defined:
| ADR | | American Depositary Receipt |
| NVDR | | Non-Voting Depositary Receipt |
| PLC | | Public Limited Company |
See Notes to Financial Statements
10
Financial Statements
STATEMENT OF ASSETS AND LIABILITIES
At 2/28/14 (unaudited)
This statement represents your fund’s balance sheet, which details the assets and liabilities comprising the total value of the fund.
| | | | |
| Assets | | | | |
Investments- | | | | |
Non-affiliated issuers, at value (identified cost, $6,038,560,260) | | | $7,096,289,389 | |
Underlying affiliated funds, at cost and value | | | 101,415,944 | |
Total investments, at value (identified cost, $6,139,976,204) | | | $7,197,705,333 | |
Foreign currency, at value (identified cost, $168,474) | | | 169,229 | |
Receivables for | | | | |
Investments sold | | | 49,951,512 | |
Fund shares sold | | | 13,525,097 | |
Interest and dividends | | | 36,040,597 | |
Other assets | | | 42,331 | |
Total assets | | | $7,297,434,099 | |
| Liabilities | | | | |
Payables for | | | | |
Investments purchased | | | $59,159,730 | |
Fund shares reacquired | | | 3,412,957 | |
Payable to affiliates | | | | |
Investment adviser | | | 273,941 | |
Shareholder servicing costs | | | 2,804,909 | |
Distribution and service fees | | | 29,905 | |
Program manager fees | | | 10 | |
Payable for independent Trustees’ compensation | | | 1,265 | |
Accrued expenses and other liabilities | | | 461,806 | |
Total liabilities | | | $66,144,523 | |
Net assets | | | $7,231,289,576 | |
| Net assets consist of | | | | |
Paid-in capital | | | $6,744,194,467 | |
Unrealized appreciation (depreciation) on investments and translation of assets and liabilities in foreign currencies | | | 1,058,210,738 | |
Accumulated net realized gain (loss) on investments and foreign currency | | | (644,801,964 | ) |
Undistributed net investment income | | | 73,686,335 | |
Net assets | | | $7,231,289,576 | |
Shares of beneficial interest outstanding | | | 402,713,498 | |
11
Statement of Assets and Liabilities (unaudited) – continued
| | | | | | | | | | | | |
| | | Net assets | | | Shares
outstanding | | | Net asset value
per share (a) | |
Class A | | | $1,214,741,506 | | | | 68,030,556 | | | | $17.86 | |
Class B | | | 20,006,042 | | | | 1,167,965 | | | | 17.13 | |
Class C | | | 96,237,747 | | | | 5,728,135 | | | | 16.80 | |
Class I | | | 2,144,747,070 | | | | 116,372,358 | | | | 18.43 | |
Class R1 | | | 4,244,610 | | | | 256,255 | | | | 16.56 | |
Class R2 | | | 170,938,494 | | | | 9,876,956 | | | | 17.31 | |
Class R3 | | | 230,589,215 | | | | 13,055,383 | | | | 17.66 | |
Class R4 | | | 555,656,033 | | | | 31,106,215 | | | | 17.86 | |
Class R5 | | | 2,790,442,428 | | | | 156,905,673 | | | | 17.78 | |
Class 529A | | | 2,424,899 | | | | 137,651 | | | | 17.62 | |
Class 529B | | | 214,087 | | | | 12,835 | | | | 16.68 | |
Class 529C | | | 1,047,445 | | | | 63,516 | | | | 16.49 | |
| (a) | Maximum offering price per share was equal to the net asset value per share for all share classes, except for Classes A and 529A, for which the maximum offering prices per share were $18.95 [100 / 94.25 x $17.86] and $18.69 [100 / 94.25 x $17.62], respectively. On sales of $50,000 or more, the maximum offering prices of Class A and Class 529A shares are reduced. A contingent deferred sales charge may be imposed on redemptions of Class A, Class B, Class C, Class 529B, and Class 529C shares. Redemption price per share was equal to the net asset value per share for Classes I, R1, R2, R3, R4, R5, and 529A. |
See Notes to Financial Statements
12
Financial Statements
STATEMENT OF OPERATIONS
Six months ended 2/28/14 (unaudited)
This statement describes how much your fund earned in investment income and accrued in expenses. It also describes any gains and/or losses generated by fund operations.
| | | | |
| Net investment income | | | | |
Income | | | | |
Dividends | | | $109,808,054 | |
Interest | | | 267,447 | |
Dividends from underlying affiliated funds | | | 29,102 | |
Foreign taxes withheld | | | (4,946,194 | ) |
Total investment income | | | $105,158,409 | |
Expenses | | | | |
Management fee | | | $25,344,471 | |
Distribution and service fees | | | 2,733,178 | |
Program manager fees | | | 1,764 | |
Shareholder servicing costs | | | 2,129,968 | |
Administrative services fee | | | 236,501 | |
Independent Trustees’ compensation | | | 52,714 | |
Custodian fee | | | 620,852 | |
Shareholder communications | | | 98,597 | |
Audit and tax fees | | | 37,014 | |
Legal fees | | | 28,328 | |
Miscellaneous | | | 191,023 | |
Total expenses | | | $31,474,410 | |
Fees paid indirectly | | | (57 | ) |
Reduction of expenses by investment adviser and distributor | | | (551,503 | ) |
Net expenses | | | $30,922,850 | |
Net investment income | | | $74,235,559 | |
| Realized and unrealized gain (loss) on investments and foreign currency | |
Realized gain (loss) (identified cost basis) | | | | |
Investments | | | $99,766,974 | |
Foreign currency | | | (291,849 | ) |
Net realized gain (loss) on investments and foreign currency | | | $99,475,125 | |
Change in unrealized appreciation (depreciation) | | | | |
Investments | | | $542,939,959 | |
Translation of assets and liabilities in foreign currencies | | | 841,035 | |
Net unrealized gain (loss) on investments and foreign currency translation | | | $543,780,994 | |
Net realized and unrealized gain (loss) on investments and foreign currency | | | $643,256,119 | |
Change in net assets from operations | | | $717,491,678 | |
See Notes to Financial Statements
13
Financial Statements
STATEMENTS OF CHANGES IN NET ASSETS
These statements describe the increases and/or decreases in net assets resulting from operations, any distributions, and any shareholder transactions.
| | | | | | | | |
| Change in net assets | | Six months ended
2/28/14 (unaudited) | | | Year ended
8/31/13 | |
| From operations | | | | | | | | |
Net investment income | | | $74,235,559 | | | | $101,775,627 | |
Net realized gain (loss) on investments and foreign currency | | | 99,475,125 | | | | 294,914,718 | |
Net unrealized gain (loss) on investments and foreign currency translation | | | 543,780,994 | | | | 380,101,957 | |
Change in net assets from operations | | | $717,491,678 | | | | $776,792,302 | |
| Distributions declared to shareholders | | | | | | | | |
From net investment income | | | $(103,250,534 | ) | | | $(97,500,392 | ) |
Change in net assets from fund share transactions | | | $425,891,813 | | | | $746,775,414 | |
Total change in net assets | | | $1,040,132,957 | | | | $1,426,067,324 | |
| Net assets | | | | | | | | |
At beginning of period | | | 6,191,156,619 | | | | 4,765,089,295 | |
At end of period (including undistributed net investment income of $73,686,335 and $102,701,310, respectively) | | | $7,231,289,576 | | | | $6,191,156,619 | |
See Notes to Financial Statements
14
Financial Statements
FINANCIAL HIGHLIGHTS
The financial highlights table is intended to help you understand the fund’s financial performance for the semiannual period and the past 5 fiscal years. Certain information reflects financial results for a single fund share. The total returns in the table represent the rate by which an investor would have earned (or lost) on an investment in the fund share class (assuming reinvestment of all distributions) held for the entire period.
| | | | | | | | | | | | | | | | | | | | | | | | |
| | | Six months
ended
2/28/14
(unaudited) | | | Years ended 8/31 | |
| Class A | | | 2013 | | | 2012 | | | 2011 | | | 2010 | | | 2009 | |
| | | | | | | | | | | | | | | | | |
Net asset value, beginning
of period | | | $16.25 | | | | $14.25 | | | | $14.66 | | | | $12.93 | | | | $13.03 | | | | $16.14 | |
| Income (loss) from investment operations | | | | | |
Net investment income (d) | | | $0.17 | | | | $0.26 | | | | $0.28 | | | | $0.26 | | | | $0.21 | | | | $0.22 | |
Net realized and unrealized
gain (loss) on investments
and foreign currency | | | 1.67 | | | | 2.01 | | | | (0.45 | ) | | | 1.67 | | | | (0.11 | ) | | | (2.92 | ) |
Total from investment operations | | | $1.84 | | | | $2.27 | | | | $(0.17 | ) | | | $1.93 | | | | $0.10 | | | | $(2.70 | ) |
| Less distributions declared to shareholders | | | | | |
From net investment income | | | $(0.23 | ) | | | $(0.27 | ) | | | $(0.24 | ) | | | $(0.20 | ) | | | $(0.20 | ) | | | $(0.20 | ) |
From net realized gain on
investments | | | — | | | | — | | | | — | | | | — | | | | — | | | | (0.21 | ) |
Total distributions declared to
shareholders | | | $(0.23 | ) | | | $(0.27 | ) | | | $(0.24 | ) | | | $(0.20 | ) | | | $(0.20 | ) | | | $(0.41 | ) |
Net asset value, end of period (x) | | | $17.86 | | | | $16.25 | | | | $14.25 | | | | $14.66 | | | | $12.93 | | | | $13.03 | |
Total return (%) (r)(s)(t)(x) | | | 11.36 | (n) | | | 16.08 | | | | (1.03 | ) | | | 14.89 | | | | 0.65 | | | | (16.22 | ) |
Ratios (%) (to average net assets)
and Supplemental data: | | | | | |
Expenses before expense
reductions (f) | | | 1.13 | (a) | | | 1.18 | | | | 1.21 | | | | 1.19 | | | | 1.25 | | | | 1.35 | |
Expenses after expense
reductions (f) | | | 1.11 | (a) | | | 1.18 | | | | 1.21 | | | | 1.19 | | | | 1.25 | | | | 1.35 | |
Net investment income | | | 1.91 | (a) | | | 1.65 | | | | 2.02 | | | | 1.67 | | | | 1.59 | | | | 1.95 | |
Portfolio turnover | | | 15 | (n) | | | 32 | | | | 37 | | | | 43 | | | | 56 | | | | 88 | |
Net assets at end of period
(000 omitted) | | | $1,214,742 | | | | $1,108,795 | | | | $970,501 | | | | $1,008,654 | | | | $1,466,337 | | | | $1,254,399 | |
See Notes to Financial Statements
15
Financial Highlights – continued
| | | | | | | | | | | | | | | | | | | | | | | | |
| | | Six months
ended
2/28/14
(unaudited) | | | Years ended 8/31 | |
| Class B | | | 2013 | | | 2012 | | | 2011 | | | 2010 | | | 2009 | |
| | | | | | | | | | | | | | | | | |
Net asset value, beginning
of period | | | $15.52 | | | | $13.59 | | | | $13.96 | | | | $12.30 | | | | $12.39 | | | | $15.34 | |
| Income (loss) from investment operations | | | | | |
Net investment income (d) | | | $0.09 | | | | $0.12 | | | | $0.16 | | | | $0.11 | | | | $0.09 | | | | $0.13 | |
Net realized and unrealized
gain (loss) on investments
and foreign currency | | | 1.60 | | | | 1.94 | | | | (0.42 | ) | | | 1.62 | | | | (0.09 | ) | | | (2.77 | ) |
Total from investment operations | | | $1.69 | | | | $2.06 | | | | $(0.26 | ) | | | $1.73 | | | | $— | | | | $(2.64 | ) |
| Less distributions declared to shareholders | | | | | |
From net investment income | | | $(0.08 | ) | | | $(0.13 | ) | | | $(0.11 | ) | | | $(0.07 | ) | | | $(0.09 | ) | | | $(0.10 | ) |
From net realized gain on
investments | | | — | | | | — | | | | — | | | | — | | | | — | | | | (0.21 | ) |
Total distributions declared to
shareholders | | | $(0.08 | ) | | | $(0.13 | ) | | | $(0.11 | ) | | | $(0.07 | ) | | | $(0.09 | ) | | | $(0.31 | ) |
Net asset value, end of period (x) | | | $17.13 | | | | $15.52 | | | | $13.59 | | | | $13.96 | | | | $12.30 | | | | $12.39 | |
Total return (%) (r)(s)(t)(x) | | | 10.92 | (n) | | | 15.27 | | | | (1.82 | ) | | | 14.02 | | | | (0.09 | ) | | | (16.85 | ) |
Ratios (%) (to average net assets)
and Supplemental data: | | | | | |
Expenses before expense
reductions (f) | | | 1.88 | (a) | | | 1.93 | | | | 1.96 | | | | 1.95 | | | | 1.99 | | | | 2.05 | |
Expenses after expense
reductions (f) | | | 1.86 | (a) | | | 1.93 | | | | 1.96 | | | | 1.94 | | | | 1.99 | | | | 2.05 | |
Net investment income | | | 1.12 | (a) | | | 0.83 | | | | 1.19 | | | | 0.76 | | | | 0.71 | | | | 1.25 | |
Portfolio turnover | | | 15 | (n) | | | 32 | | | | 37 | | | | 43 | | | | 56 | | | | 88 | |
Net assets at end of period
(000 omitted) | | | $20,006 | | | | $19,751 | | | | $23,369 | | | | $33,059 | | | | $40,476 | | | | $55,961 | |
See Notes to Financial Statements
16
Financial Highlights – continued
| | | | | | | | | | | | | | | | | | | | | | | | |
| | | Six months
ended
2/28/14
(unaudited) | | | Years ended 8/31 | |
| Class C | | | 2013 | | | 2012 | | | 2011 | | | 2010 | | | 2009 | |
| | | | | | | | | | | | | | | | | |
Net asset value, beginning
of period | | | $15.26 | | | | $13.39 | | | | $13.78 | | | | $12.16 | | | | $12.27 | | | | $15.23 | |
| Income (loss) from investment operations | | | | | |
Net investment income (d) | | | $0.10 | | | | $0.13 | | | | $0.16 | | | | $0.12 | | | | $0.10 | | | | $0.14 | |
Net realized and unrealized
gain (loss) on investments
and foreign currency | | | 1.56 | | | | 1.90 | | | | (0.42 | ) | | | 1.59 | | | | (0.10 | ) | | | (2.77 | ) |
Total from investment operations | | | $1.66 | | | | $2.03 | | | | $(0.26 | ) | | | $1.71 | | | | $— | | | | $(2.63 | ) |
| Less distributions declared to shareholders | | | | | |
From net investment income | | | $(0.12 | ) | | | $(0.16 | ) | | | $(0.13 | ) | | | $(0.09 | ) | | | $(0.11 | ) | | | $(0.12 | ) |
From net realized gain on
investments | | | — | | | | — | | | | — | | | | — | | | | — | | | | (0.21 | ) |
Total distributions declared to
shareholders | | | $(0.12 | ) | | | $(0.16 | ) | | | $(0.13 | ) | | | $(0.09 | ) | | | $(0.11 | ) | | | $(0.33 | ) |
Net asset value, end of period (x) | | | $16.80 | | | | $15.26 | | | | $13.39 | | | | $13.78 | | | | $12.16 | | | | $12.27 | |
Total return (%) (r)(s)(t)(x) | | | 10.89 | (n) | | | 15.22 | | | | (1.80 | ) | | | 14.05 | | | | (0.03 | ) | | | (16.88 | ) |
Ratios (%) (to average net assets)
and Supplemental data: | | | | | |
Expenses before expense
reductions (f) | | | 1.88 | (a) | | | 1.93 | | | | 1.96 | | | | 1.95 | | | | 2.00 | | | | 2.05 | |
Expenses after expense
reductions (f) | | | 1.86 | (a) | | | 1.93 | | | | 1.96 | | | | 1.95 | | | | 2.00 | | | | 2.05 | |
Net investment income | | | 1.18 | (a) | | | 0.87 | | | | 1.23 | | | | 0.80 | | | | 0.78 | | | | 1.30 | |
Portfolio turnover | | | 15 | (n) | | | 32 | | | | 37 | | | | 43 | | | | 56 | | | | 88 | |
Net assets at end of period
(000 omitted) | | | $96,238 | | | | $86,793 | | | | $84,133 | | | | $99,830 | | | | $101,267 | | | | $110,142 | |
See Notes to Financial Statements
17
Financial Highlights – continued
| | | | | | | | | | | | | | | | | | | | | | | | |
| | | Six months
ended
2/28/14
(unaudited) | | | Years ended 8/31 | |
| Class I | | | 2013 | | | 2012 | | | 2011 | | | 2010 | | | 2009 | |
| | | | | | | | | | | | | | | | | |
Net asset value, beginning
of period | | | $16.78 | | | | $14.71 | | | | $15.15 | | | | $13.35 | | | | $13.44 | | | | $16.65 | |
| Income (loss) from investment operations | | | | | |
Net investment income (d) | | | $0.20 | | | | $0.31 | | | | $0.35 | | | | $0.29 | | | | $0.26 | | | | $0.26 | |
Net realized and unrealized
gain (loss) on investments
and foreign currency | | | 1.72 | | | | 2.06 | | | | (0.49 | ) | | | 1.74 | | | | (0.12 | ) | | | (3.01 | ) |
Total from investment operations | | | $1.92 | | | | $2.37 | | | | $(0.14 | ) | | | $2.03 | | | | $0.14 | | | | $(2.75 | ) |
| Less distributions declared to shareholders | | | | | |
From net investment income | | | $(0.27 | ) | | | $(0.30 | ) | | | $(0.30 | ) | | | $(0.23 | ) | | | $(0.23 | ) | | | $(0.25 | ) |
From net realized gain on
investments | | | — | | | | — | | | | — | | | | — | | | | — | | | | (0.21 | ) |
Total distributions declared to
shareholders | | | $(0.27 | ) | | | $(0.30 | ) | | | $(0.30 | ) | | | $(0.23 | ) | | | $(0.23 | ) | | | $(0.46 | ) |
Net asset value, end of period (x) | | | $18.43 | | | | $16.78 | | | | $14.71 | | | | $15.15 | | | | $13.35 | | | | $13.44 | |
Total return (%) (r)(s)(x) | | | 11.50 | (n) | | | 16.32 | | | | (0.82 | ) | | | 15.19 | | | | 0.92 | | | | (16.00 | ) |
Ratios (%) (to average net assets)
and Supplemental data: | | | | | |
Expenses before expense
reductions (f) | | | 0.88 | (a) | | | 0.93 | | | | 0.96 | | | | 0.95 | | | | 1.00 | | | | 1.05 | |
Expenses after expense
reductions (f) | | | 0.86 | (a) | | | 0.93 | | | | 0.96 | | | | 0.95 | | | | 1.00 | | | | 1.05 | |
Net investment income | | | 2.22 | (a) | | | 1.89 | | | | 2.45 | | | | 1.86 | | | | 1.90 | | | | 2.31 | |
Portfolio turnover | | | 15 | (n) | | | 32 | | | | 37 | | | | 43 | | | | 56 | | | | 88 | |
Net assets at end of period
(000 omitted) | | | $2,144,747 | | | | $1,834,498 | | | | $1,143,621 | | | | $2,484,795 | | | | $1,926,221 | | | | $1,456,884 | |
See Notes to Financial Statements
18
Financial Highlights – continued
| | | | | | | | | | | | | | | | | | | | | | | | |
| | | Six months
ended
2/28/14
(unaudited) | | | Years ended 8/31 | |
| Class R1 | | | 2013 | | | 2012 | | | 2011 | | | 2010 | | | 2009 | |
| | | | | | | | | | | | | | | | | |
Net asset value, beginning
of period | | | $15.02 | | | | $13.17 | | | | $13.57 | | | | $11.98 | | | | $12.10 | | | | $15.05 | |
| Income (loss) from investment operations | | | | | |
Net investment income (d) | | | $0.09 | | | | $0.12 | | | | $0.15 | | | | $0.12 | | | | $0.10 | | | | $0.14 | |
Net realized and unrealized
gain (loss) on investments
and foreign currency | | | 1.54 | | | | 1.87 | | | | (0.40 | ) | | | 1.57 | | | | (0.10 | ) | | | (2.74 | ) |
Total from investment operations | | | $1.63 | | | | $1.99 | | | | $(0.25 | ) | | | $1.69 | | | | $— | | | | $(2.60 | ) |
| Less distributions declared to shareholders | | | | | |
From net investment income | | | $(0.09 | ) | | | $(0.14 | ) | | | $(0.15 | ) | | | $(0.10 | ) | | | $(0.12 | ) | | | $(0.14 | ) |
From net realized gain on
investments | | | — | | | | — | | | | — | | | | — | | | | — | | | | (0.21 | ) |
Total distributions declared to
shareholders | | | $(0.09 | ) | | | $(0.14 | ) | | | $(0.15 | ) | | | $(0.10 | ) | | | $(0.12 | ) | | | $(0.35 | ) |
Net asset value, end of period (x) | | | $16.56 | | | | $15.02 | | | | $13.17 | | | | $13.57 | | | | $11.98 | | | | $12.10 | |
Total return (%) (r)(s)(x) | | | 10.86 | (n) | | | 15.24 | | | | (1.80 | ) | | | 14.09 | | | | (0.09 | ) | | | (16.87 | ) |
Ratios (%) (to average net assets)
and Supplemental data: | | | | | |
Expenses before expense
reductions (f) | | | 1.88 | (a) | | | 1.93 | | | | 1.96 | | | | 1.95 | | | | 2.00 | | | | 2.05 | |
Expenses after expense
reductions (f) | | | 1.86 | (a) | | | 1.93 | | | | 1.96 | | | | 1.95 | | | | 2.00 | | | | 2.05 | |
Net investment income | | | 1.14 | (a) | | | 0.85 | | | | 1.18 | | | | 0.84 | | | | 0.77 | | | | 1.34 | |
Portfolio turnover | | | 15 | (n) | | | 32 | | | | 37 | | | | 43 | | | | 56 | | | | 88 | |
Net assets at end of period
(000 omitted) | | | $4,245 | | | | $4,034 | | | | $4,914 | | | | $6,288 | | | | $5,868 | | | | $6,311 | |
See Notes to Financial Statements
19
Financial Highlights – continued
| | | | | | | | | | | | | | | | | | | | | | | | |
| | | Six months
ended
2/28/14
(unaudited) | | | Years ended 8/31 | |
| Class R2 | | | 2013 | | | 2012 | | | 2011 | | | 2010 | | | 2009 | |
| | | | | | | | | | | | | | | | | |
Net asset value, beginning
of period | | | $15.75 | | | | $13.83 | | | | $14.26 | | | | $12.59 | | | | $12.70 | | | | $15.76 | |
| Income (loss) from investment operations | | | | | |
Net investment income (d) | | | $0.15 | | | | $0.21 | | | | $0.24 | | | | $0.20 | | | | $0.18 | | | | $0.20 | |
Net realized and unrealized
gain (loss) on investments
and foreign currency | | | 1.61 | | | | 1.95 | | | | (0.44 | ) | | | 1.64 | | | | (0.11 | ) | | | (2.87 | ) |
Total from investment operations | | | $1.76 | | | | $2.16 | | | | $(0.20 | ) | | | $1.84 | | | | $0.07 | | | | $(2.67 | ) |
| Less distributions declared to shareholders | | | | | |
From net investment income | | | $(0.20 | ) | | | $(0.24 | ) | | | $(0.23 | ) | | | $(0.17 | ) | | | $(0.18 | ) | | | $(0.18 | ) |
From net realized gain on
investments | | | — | | | | — | | | | — | | | | — | | | | — | | | | (0.21 | ) |
Total distributions declared to
shareholders | | | $(0.20 | ) | | | $(0.24 | ) | | | $(0.23 | ) | | | $(0.17 | ) | | | $(0.18 | ) | | | $(0.39 | ) |
Net asset value, end of period (x) | | | $17.31 | | | | $15.75 | | | | $13.83 | | | | $14.26 | | | | $12.59 | | | | $12.70 | |
Total return (%) (r)(s)(x) | | | 11.22 | (n) | | | 15.79 | | | | (1.32 | ) | | | 14.61 | | | | 0.45 | | | | (16.45 | ) |
Ratios (%) (to average net assets)
and Supplemental data: | | | | | |
Expenses before expense
reductions (f) | | | 1.38 | (a) | | | 1.43 | | | | 1.46 | | | | 1.45 | | | | 1.50 | | | | 1.54 | |
Expenses after expense
reductions (f) | | | 1.36 | (a) | | | 1.43 | | | | 1.46 | | | | 1.45 | | | | 1.50 | | | | 1.54 | |
Net investment income | | | 1.82 | (a) | | | 1.41 | | | | 1.78 | | | | 1.37 | | | | 1.34 | | | | 1.88 | |
Portfolio turnover | | | 15 | (n) | | | 32 | | | | 37 | | | | 43 | | | | 56 | | | | 88 | |
Net assets at end of period
(000 omitted) | | | $170,938 | | | | $136,444 | | | | $107,567 | | | | $91,693 | | | | $72,425 | | | | $60,790 | |
See Notes to Financial Statements
20
Financial Highlights – continued
| | | | | | | | | | | | | | | | | | | | | | | | |
| | | Six months
ended
2/28/14
(unaudited) | | | Years ended 8/31 | |
| Class R3 | | | 2013 | | | 2012 | | | 2011 | | | 2010 | | | 2009 | |
| | | | | | | | | | | | | | | | | |
Net asset value, beginning
of period | | | $16.08 | | | | $14.10 | | | | $14.53 | | | | $12.82 | | | | $12.92 | | | | $16.06 | |
| Income (loss) from investment operations | | | | | |
Net investment income (d) | | | $0.17 | | | | $0.25 | | | | $0.28 | | | | $0.23 | | | | $0.21 | | | | $0.23 | |
Net realized and unrealized
gain (loss) on investments
and foreign currency | | | 1.64 | | | | 2.00 | | | | (0.45 | ) | | | 1.68 | | | | (0.10 | ) | | | (2.93 | ) |
Total from investment operations | | | $1.81 | | | | $2.25 | | | | $(0.17 | ) | | | $1.91 | | | | $0.11 | | | | $(2.70 | ) |
| Less distributions declared to shareholders | | | | | |
From net investment income | | | $(0.23 | ) | | | $(0.27 | ) | | | $(0.26 | ) | | | $(0.20 | ) | | | $(0.21 | ) | | | $(0.23 | ) |
From net realized gain on
investments | | | — | | | | — | | | | — | | | | — | | | | — | | | | (0.21 | ) |
Total distributions declared to
shareholders | | | $(0.23 | ) | | | $(0.27 | ) | | | $(0.26 | ) | | | $(0.20 | ) | | | $(0.21 | ) | | | $(0.44 | ) |
Net asset value, end of period (x) | | | $17.66 | | | | $16.08 | | | | $14.10 | | | | $14.53 | | | | $12.82 | | | | $12.92 | |
Total return (%) (r)(s)(x) | | | 11.30 | (n) | | | 16.13 | | | | (1.06 | ) | | | 14.88 | | | | 0.72 | | | | (16.26 | ) |
Ratios (%) (to average net assets)
and Supplemental data: | | | | | |
Expenses before expense
reductions (f) | | | 1.13 | (a) | | | 1.18 | | | | 1.21 | | | | 1.20 | | | | 1.25 | | | | 1.29 | |
Expenses after expense
reductions (f) | | | 1.11 | (a) | | | 1.18 | | | | 1.21 | | | | 1.20 | | | | 1.25 | | | | 1.29 | |
Net investment income | | | 1.98 | (a) | | | 1.63 | | | | 2.05 | | | | 1.54 | | | | 1.55 | | | | 2.09 | |
Portfolio turnover | | | 15 | (n) | | | 32 | | | | 37 | | | | 43 | | | | 56 | | | | 88 | |
Net assets at end of period
(000 omitted) | | | $230,589 | | | | $195,358 | | | | $168,989 | | | | $154,869 | | | | $151,073 | | | | $133,545 | |
See Notes to Financial Statements
21
Financial Highlights – continued
| | | | | | | | | | | | | | | | | | | | | | | | |
| | | Six months
ended
2/28/14
(unaudited) | | | Years ended 8/31 | |
| Class R4 | | | 2013 | | | 2012 | | | 2011 | | | 2010 | | | 2009 | |
| | | | | | | | | | | | | | | | | |
Net asset value, beginning
of period | | | $16.27 | | | | $14.26 | | | | $14.70 | | | | $12.96 | | | | $13.05 | | | | $16.19 | |
| Income (loss) from investment operations | | | | | |
Net investment income (d) | | | $0.20 | | | | $0.25 | | | | $0.32 | | | | $0.28 | | | | $0.24 | | | | $0.20 | |
Net realized and unrealized
gain (loss) on investments
and foreign currency | | | 1.65 | | | | 2.06 | | | | (0.46 | ) | | | 1.69 | | | | (0.10 | ) | | | (2.88 | ) |
Total from investment operations | | | $1.85 | | | | $2.31 | | | | $(0.14 | ) | | | $1.97 | | | | $0.14 | | | | $(2.68 | ) |
| Less distributions declared to shareholders | | | | | |
From net investment income | | | $(0.26 | ) | | | $(0.30 | ) | | | $(0.30 | ) | | | $(0.23 | ) | | | $(0.23 | ) | | | $(0.25 | ) |
From net realized gain on
investments | | | — | | | | — | | | | — | | | | — | | | | — | | | | (0.21 | ) |
Total distributions declared to
shareholders | | | $(0.26 | ) | | | $(0.30 | ) | | | $(0.30 | ) | | | $(0.23 | ) | | | $(0.23 | ) | | | $(0.46 | ) |
Net asset value, end of period (x) | | | $17.86 | | | | $16.27 | | | | $14.26 | | | | $14.70 | | | | $12.96 | | | | $13.05 | |
Total return (%) (r)(s)(x) | | | 11.44 | (n) | | | 16.42 | | | | (0.84 | ) | | | 15.19 | | | | 0.95 | | | | (16.03 | ) |
Ratios (%) (to average net assets)
and Supplemental data: | | | | | |
Expenses before expense
reductions (f) | | | 0.88 | (a) | | | 0.93 | | | | 0.96 | | | | 0.95 | | | | 1.00 | | | | 1.00 | |
Expenses after expense
reductions (f) | | | 0.86 | (a) | | | 0.93 | | | | 0.96 | | | | 0.95 | | | | 1.00 | | | | 1.00 | |
Net investment income | | | 2.26 | (a) | | | 1.60 | | | | 2.28 | | | | 1.83 | | | | 1.77 | | | | 1.72 | |
Portfolio turnover | | | 15 | (n) | | | 32 | | | | 37 | | | | 43 | | | | 56 | | | | 88 | |
Net assets at end of period
(000 omitted) | | | $555,656 | | | | $470,915 | | | | $825,288 | | | | $561,557 | | | | $482,217 | | | | $476,076 | |
See Notes to Financial Statements
22
Financial Highlights – continued
| | | | | | | | | | | | | | | | | | | | | | | | |
| | | Six months
ended
2/28/14
(unaudited) | | | Years ended 8/31 | |
| Class R5 (y) | | | 2013 | | | 2012 | | | 2011 | | | 2010 | | | 2009 | |
| | | | | | | | | | | | | | | | | |
Net asset value, beginning
of period | | | $16.21 | | | | $14.20 | | | | $14.63 | | | | $12.90 | | | | $13.00 | | | | $16.14 | |
| Income (loss) from investment operations | | | | | |
Net investment income (d) | | | $0.20 | | | | $0.33 | | | | $0.17 | | | | $0.26 | | | | $0.23 | | | | $0.24 | |
Net realized and unrealized
gain (loss) on investments
and foreign currency | | | 1.66 | | | | 1.99 | | | | (0.31 | )(g) | | | 1.69 | | | | (0.11 | ) | | | (2.93 | ) |
Total from investment operations | | | $1.86 | | | | $2.32 | | | | $(0.14 | ) | | | $1.95 | | | | $0.12 | | | | $(2.69 | ) |
| Less distributions declared to shareholders | | | | | |
From net investment income | | | $(0.29 | ) | | | $(0.31 | ) | | | $(0.29 | ) | | | $(0.22 | ) | | | $(0.22 | ) | | | $(0.24 | ) |
From net realized gain on
investments | | | — | | | | — | | | | — | | | | — | | | | — | | | | (0.21 | ) |
Total distributions declared to
shareholders | | | $(0.29 | ) | | | $(0.31 | ) | | | $(0.29 | ) | | | $(0.22 | ) | | | $(0.22 | ) | | | $(0.45 | ) |
Net asset value, end of period (x) | | | $17.78 | | | | $16.21 | | | | $14.20 | | | | $14.63 | | | | $12.90 | | | | $13.00 | |
Total return (%) (r)(s)(x) | | | 11.51 | (n) | | | 16.50 | | | | (0.85 | ) | | | 15.07 | | | | 0.81 | | | | (16.12 | ) |
Ratios (%) (to average net assets)
and Supplemental data: | | | | | |
Expenses before expense
reductions (f) | | | 0.79 | (a) | | | 0.81 | | | | 0.89 | | | | 1.05 | | | | 1.10 | | | | 1.14 | |
Expenses after expense
reductions (f) | | | 0.77 | (a) | | | 0.81 | | | | 0.89 | | | | 1.05 | | | | 1.10 | | | | 1.14 | |
Net investment income | | | 2.33 | (a) | | | 2.09 | | | | 1.20 | (l) | | | 1.71 | | | | 1.73 | | | | 2.25 | |
Portfolio turnover | | | 15 | (n) | | | 32 | | | | 37 | | | | 43 | | | | 56 | | | | 88 | |
Net assets at end of period
(000 omitted) | | | $2,790,442 | | | | $2,331,325 | | | | $1,433,832 | | | | $26,173 | | | | $24,820 | | | | $23,560 | |
See Notes to Financial Statements
23
Financial Highlights – continued
| | | | | | | | | | | | | | | | | | | | | | | | |
| | | Six months
ended
2/28/14
(unaudited) | | | Years ended 8/31 | |
| Class 529A | | | 2013 | | | 2012 | | | 2011 | | | 2010 | | | 2009 | |
| | | | | | | | | | | | | | | | | |
Net asset value, beginning
of period | | | $16.03 | | | | $14.06 | | | | $14.49 | | | | $12.78 | | | | $12.88 | | | | $15.96 | |
| Income (loss) from investment operations | | | | | |
Net investment income (d) | | | $0.17 | | | | $0.25 | | | | $0.27 | | | | $0.22 | | | | $0.20 | | | | $0.21 | |
Net realized and unrealized
gain (loss) on investments
and foreign currency | | | 1.65 | | | | 1.98 | | | | (0.45 | ) | | | 1.68 | | | | (0.12 | ) | | | (2.89 | ) |
Total from investment operations | | | $1.82 | | | | $2.23 | | | | $(0.18 | ) | | | $1.90 | | | | $0.08 | | | | $(2.68 | ) |
| Less distributions declared to shareholders | | | | | |
From net investment income | | | $(0.23 | ) | | | $(0.26 | ) | | | $(0.25 | ) | | | $(0.19 | ) | | | $(0.18 | ) | | | $(0.19 | ) |
From net realized gain on
investments | | | — | | | | — | | | | — | | | | — | | | | — | | | | (0.21 | ) |
Total distributions declared to
shareholders | | | $(0.23 | ) | | | $(0.26 | ) | | | $(0.25 | ) | | | $(0.19 | ) | | | $(0.18 | ) | | | $(0.40 | ) |
Net asset value, end of period (x) | | | $17.62 | | | | $16.03 | | | | $14.06 | | | | $14.49 | | | | $12.78 | | | | $12.88 | |
Total return (%) (r)(s)(t)(x) | | | 11.37 | (n) | | | 16.05 | | | | (1.15 | ) | | | 14.80 | | | | 0.54 | | | | (16.32 | ) |
Ratios (%) (to average net assets)
and Supplemental data: | | | | | |
Expenses before expense
reductions (f) | | | 1.23 | (a) | | | 1.28 | | | | 1.31 | | | | 1.30 | | | | 1.35 | | | | 1.45 | |
Expenses after expense
reductions (f) | | | 1.13 | (a) | | | 1.21 | | | | 1.26 | | | | 1.29 | | | | 1.35 | | | | 1.45 | |
Net investment income | | | 1.94 | (a) | | | 1.62 | | | | 1.96 | | | | 1.47 | | | | 1.47 | | | | 1.90 | |
Portfolio turnover | | | 15 | (n) | | | 32 | | | | 37 | | | | 43 | | | | 56 | | | | 88 | |
Net assets at end of period
(000 omitted) | | | $2,425 | | | | $2,105 | | | | $1,762 | | | | $1,747 | | | | $1,512 | | | | $1,451 | |
See Notes to Financial Statements
24
Financial Highlights – continued
| | | | | | | | | | | | | | | | | | | | | | | | |
| | | Six months
ended
2/28/14
(unaudited) | | | Years ended 8/31 | |
| Class 529B | | | 2013 | | | 2012 | | | 2011 | | | 2010 | | | 2009 | |
| | | | | | | | | | | | | | | | | |
Net asset value, beginning
of period | | | $15.14 | | | | $13.25 | | | | $13.57 | | | | $11.99 | | | | $12.11 | | | | $15.05 | |
| Income (loss) from investment operations | | | | | |
Net investment income (d) | | | $0.09 | | | | $0.12 | | | | $0.13 | | | | $0.09 | | | | $0.09 | | | | $0.12 | |
Net realized and unrealized
gain (loss) on investments
and foreign currency | | | 1.56 | | | | 1.88 | | | | (0.38 | ) | | | 1.58 | | | | (0.10 | ) | | | (2.74 | ) |
Total from investment operations | | | $1.65 | | | | $2.00 | | | | $(0.25 | ) | | | $1.67 | | | | $(0.01 | ) | | | $(2.62 | ) |
| Less distributions declared to shareholders | | | | | |
From net investment income | | | $(0.11 | ) | | | $(0.11 | ) | | | $(0.07 | ) | | | $(0.09 | ) | | | $(0.11 | ) | | | $(0.11 | ) |
From net realized gain on
investments | | | — | | | | — | | | | — | | | | — | | | | — | | | | (0.21 | ) |
Total distributions declared to
shareholders | | | $(0.11 | ) | | | $(0.11 | ) | | | $(0.07 | ) | | | $(0.09 | ) | | | $(0.11 | ) | | | $(0.32 | ) |
Net asset value, end of period (x) | | | $16.68 | | | | $15.14 | | | | $13.25 | | | | $13.57 | | | | $11.99 | | | | $12.11 | |
Total return (%) (r)(s)(t)(x) | | | 10.92 | (n) | | | 15.15 | | | | (1.84 | ) | | | 13.90 | | | | (0.14 | ) | | | (16.99 | ) |
Ratios (%) (to average net assets)
and Supplemental data: | | | | | |
Expenses before expense
reductions (f) | | | 1.98 | (a) | | | 2.03 | | | | 2.06 | | | | 2.04 | | | | 2.10 | | | | 2.15 | |
Expenses after expense
reductions (f) | | | 1.91 | (a) | | | 1.98 | | | | 2.01 | | | | 2.04 | | | | 2.10 | | | | 2.15 | |
Net investment income | | | 1.16 | (a) | | | 0.82 | | | | 1.03 | | | | 0.66 | | | | 0.69 | | | | 1.19 | |
Portfolio turnover | | | 15 | (n) | | | 32 | | | | 37 | | | | 43 | | | | 56 | | | | 88 | |
Net assets at end of period
(000 omitted) | | | $214 | | | | $188 | | | | $199 | | | | $366 | | | | $461 | | | | $449 | |
See Notes to Financial Statements
25
Financial Highlights – continued
| | | | | | | | | | | | | | | | | | | | | | | | |
| | | Six months
ended
2/28/14
(unaudited) | | | Years ended 8/31 | |
| Class 529C | | | 2013 | | | 2012 | | | 2011 | | | 2010 | | | 2009 | |
| | | | | | | | | | | | | | | | | |
Net asset value, beginning
of period | | | $14.98 | | | | $13.17 | | | | $13.56 | | | | $12.00 | | | | $12.12 | | | | $15.06 | |
| Income (loss) from investment operations | | | | | |
Net investment income (d) | | | $0.09 | | | | $0.12 | | | | $0.15 | | | | $0.11 | | | | $0.09 | | | | $0.13 | |
Net realized and unrealized
gain (loss) on investments
and foreign currency | | | 1.54 | | | | 1.86 | | | | (0.41 | ) | | | 1.56 | | | | (0.10 | ) | | | (2.75 | ) |
Total from investment operations | | | $1.63 | | | | $1.98 | | | | $(0.26 | ) | | | $1.67 | | | | $(0.01 | ) | | | $(2.62 | ) |
| Less distributions declared to shareholders | | | | | |
From net investment income | | | $(0.12 | ) | | | $(0.17 | ) | | | $(0.13 | ) | | | $(0.11 | ) | | | $(0.11 | ) | | | $(0.11 | ) |
From net realized gain on
investments | | | — | | | | — | | | | — | | | | — | | | | — | | | | (0.21 | ) |
Total distributions declared to
shareholders | | | $(0.12 | ) | | | $(0.17 | ) | | | $(0.13 | ) | | | $(0.11 | ) | | | $(0.11 | ) | | | $(0.32 | ) |
Net asset value, end of period (x) | | | $16.49 | | | | $14.98 | | | | $13.17 | | | | $13.56 | | | | $12.00 | | | | $12.12 | |
Total return (%) (r)(s)(t)(x) | | | 10.87 | (n) | | | 15.17 | | | | (1.83 | ) | | | 13.89 | | | | (0.11 | ) | | | (16.98 | ) |
Ratios (%) (to average net assets)
and Supplemental data: | | | | | |
Expenses before expense
reductions (f) | | | 1.98 | (a) | | | 2.03 | | | | 2.06 | | | | 2.05 | | | | 2.10 | | | | 2.15 | |
Expenses after expense
reductions (f) | | | 1.91 | (a) | | | 1.98 | | | | 2.01 | | | | 2.04 | | | | 2.10 | | | | 2.15 | |
Net investment income | | | 1.12 | (a) | | | 0.81 | | | | 1.19 | | | | 0.81 | | | | 0.76 | | | | 1.23 | |
Portfolio turnover | | | 15 | (n) | | | 32 | | | | 37 | | | | 43 | | | | 56 | | | | 88 | |
Net assets at end of period
(000 omitted) | | | $1,047 | | | | $950 | | | | $914 | | | | $906 | | | | $796 | | | | $631 | |
See Notes to Financial Statements
26
Financial Highlights – continued
| (d) | Per share data is based on average shares outstanding. |
| (f) | Ratios do not reflect reductions from fees paid indirectly, if applicable. |
| (g) | The per share amount varies from the net realized and unrealized gain/loss for the period because of the timing of sales of fund shares and the per share amount of realized and unrealized gains and losses at such time. |
| (l) | The net investment income ratio does not vary by the class specific expense differential because of the timing of sales of fund shares and the allocation of fund level income at such time. |
| (r) | Certain expenses have been reduced without which performance would have been lower. |
| (s) | From time to time the fund may receive proceeds from litigation settlements, without which performance would be lower. |
| (t) | Total returns do not include any applicable sales charges. |
| (x) | The net asset values per share and total returns have been calculated on net assets which include adjustments made in accordance with U.S. generally accepted accounting principles required at period end for financial reporting purposes. |
| (y) | On May 10, 2012, sales of Class W shares (including exchanges) were suspended. On May 11, 2012, certain Class W shares were automatically converted to Class I shares. Shareholders of certain Class W shares became shareholders of Class I and received Class I shares with a total net asset value equal to their Class W shares at the time of the conversion. On May 30, 2012, remaining Class W shares, which represented MFS seed money, were redesignated Class R5. Class R5 shares are generally available only to certain eligible retirement plans and to funds distributed by MFD. Class R5 shares do not pay a 12b-1 distribution fee or sub-accounting costs. On June 1, 2012, Class R5 shares were offered for sale to the public. |
See Notes to Financial Statements
27
NOTES TO FINANCIAL STATEMENTS
(unaudited)
(1) Business and Organization
MFS Research International Fund (the fund) is a diversified series of MFS Series Trust I (the trust). The trust is organized as a Massachusetts business trust and is registered under the Investment Company Act of 1940, as amended, as an open-end management investment company.
(2) Significant Accounting Policies
General – The preparation of financial statements in conformity with U.S. generally accepted accounting principles requires management to make estimates and assumptions that affect the reported amounts of assets and liabilities, and disclosure of contingent assets and liabilities at the date of the financial statements and the reported amounts of increases and decreases in net assets from operations during the reporting period. Actual results could differ from those estimates. In the preparation of these financial statements, management has evaluated subsequent events occurring after the date of the fund’s Statement of Assets and Liabilities through the date that the financial statements were issued. The fund invests in foreign securities. Investments in foreign securities are vulnerable to the effects of changes in the relative values of the local currency and the U.S. dollar and to the effects of changes in each country’s legal, political, and economic environment.
In this reporting period, the fund adopted the disclosure provisions of the Financial Accounting Standards Board (FASB) Accounting Standards Update 2011-11 (“ASU 2011-11”), Balance Sheet (Topic 210) – Disclosures about Offsetting Assets and Liabilities along with the related scope clarification provisions of FASB Accounting Standards Update 2013-01 (“ASU 2013-01”) entitled Balance Sheet (Topic 210) – Clarifying the Scope of Disclosures about Offsetting Assets and Liabilities. ASU 2011-11 is intended to enhance disclosures on the offsetting of financial assets and liabilities by requiring entities to disclose both gross and net information about financial instruments and transactions that are either offset in the statement of financial position or subject to a an enforceable Master Netting Agreement or similar arrangement. ASU 2013-01 limits the scope of ASU 2011-11’s disclosure requirements on offsetting to financial assets and financial liabilities related to derivatives, repurchase and reverse repurchase agreements, and securities lending and securities borrowing transactions. The disclosures required by ASU 2011-11, to the extent applicable to the fund, have been included in the fund’s Significant Accounting Policies note under the captions for each of the fund’s in-scope financial instruments and transactions.
In June 2013, FASB issued Accounting Standards Update 2013-08 (“ASU 2013-08”) Financial Services – Investment Companies (Topic 946) – Amendments to the Scope, Measurement, and Disclosure Requirements which is effective for interim and annual reporting periods in fiscal years that begin after December 15, 2013. ASU 2013-08 sets forth a methodology for determining whether an entity should be characterized as an investment company and prescribes fair value accounting for an investment company’s non-controlling ownership interest in another investment company. FASB has determined that a fund registered under the Investment Company Act of 1940 automatically meets ASU 2013-08’s criteria for an investment company. Although still
28
Notes to Financial Statements (unaudited) – continued
evaluating the potential impacts of ASU 2013-08 to the fund, management expects that the impact of the fund’s adoption will be limited to additional financial statement disclosures.
Investment Valuations – Equity securities, including restricted equity securities, are generally valued at the last sale or official closing price as provided by a third-party pricing service on the market or exchange on which they are primarily traded. Equity securities, for which there were no sales reported that day, are generally valued at the last quoted daily bid quotation as provided by a third-party pricing service on the market or exchange on which such securities are primarily traded. Short-term instruments with a maturity at issuance of 60 days or less generally are valued at amortized cost, which approximates market value. Open-end investment companies are generally valued at net asset value per share. Securities and other assets generally valued on the basis of information from a third-party pricing service may also be valued at a broker/dealer bid quotation. Values obtained from third-party pricing services can utilize both transaction data and market information such as yield, quality, coupon rate, maturity, type of issue, trading characteristics, and other market data. The values of foreign securities and other assets and liabilities expressed in foreign currencies are converted to U.S. dollars using the mean of bid and asked prices for rates provided by a third-party pricing service.
The Board of Trustees has delegated primary responsibility for determining or causing to be determined the value of the fund’s investments (including any fair valuation) to the adviser pursuant to valuation policies and procedures approved by the Board. If the adviser determines that reliable market quotations are not readily available, investments are valued at fair value as determined in good faith by the adviser in accordance with such procedures under the oversight of the Board of Trustees. Under the fund’s valuation policies and procedures, market quotations are not considered to be readily available for most types of debt instruments and floating rate loans and many types of derivatives. These investments are generally valued at fair value based on information from third-party pricing services. In addition, investments may be valued at fair value if the adviser determines that an investment’s value has been materially affected by events occurring after the close of the exchange or market on which the investment is principally traded (such as foreign exchange or market) and prior to the determination of the fund’s net asset value, or after the halting of trading of a specific security where trading does not resume prior to the close of the exchange or market on which the security is principally traded. Events that occur on a frequent basis after foreign markets close (such as developments in foreign markets and significant movements in the U.S. markets) and prior to the determination of the fund’s net asset value may be deemed to have a material effect on the value of securities traded in foreign markets. Accordingly, the fund’s foreign equity securities may often be valued at fair value. The adviser generally relies on third-party pricing services or other information (such as the correlation with price movements of similar securities in the same or other markets; the type, cost and investment characteristics of the security; the business and financial condition of the issuer; and trading and other market data) to assist in determining whether to fair value and at what value to fair value an investment. The value of an investment for purposes of calculating the fund’s net asset value can differ depending on the source and method used to determine value. When fair valuation is used, the
29
Notes to Financial Statements (unaudited) – continued
value of an investment used to determine the fund’s net asset value may differ from quoted or published prices for the same investment. There can be no assurance that the fund could obtain the fair value assigned to an investment if it were to sell the investment at the same time at which the fund determines its net asset value per share.
Various inputs are used in determining the value of the fund’s assets or liabilities. These inputs are categorized into three broad levels. In certain cases, the inputs used to measure fair value may fall into different levels of the fair value hierarchy. In such cases, an investment’s level within the fair value hierarchy is based on the lowest level of input that is significant to the fair value measurement. The fund’s assessment of the significance of a particular input to the fair value measurement in its entirety requires judgment, and considers factors specific to the investment. Level 1 includes unadjusted quoted prices in active markets for identical assets or liabilities. Level 2 includes other significant observable market-based inputs (including quoted prices for similar securities, interest rates, prepayment speed, and credit risk). Level 3 includes unobservable inputs, which may include the adviser’s own assumptions in determining the fair value of investments. The following is a summary of the levels used as of February 28, 2014 in valuing the fund’s assets or liabilities:
| | | | | | | | | | | | | | | | |
| Investments at Value | | Level 1 | | | Level 2 | | | Level 3 | | | Total | |
| Equity Securities: | | | | | | | | | | | | | | | | |
Japan | | | $1,362,530,247 | | | | $— | | | | $— | | | | $1,362,530,247 | |
United Kingdom | | | 1,307,149,752 | | | | — | | | | — | | | | 1,307,149,752 | |
Switzerland | | | 879,336,259 | | | | — | | | | — | | | | 879,336,259 | |
France | | | 756,793,370 | | | | — | | | | — | | | | 756,793,370 | |
Germany | | | 495,775,535 | | | | — | | | | — | | | | 495,775,535 | |
Netherlands | | | 316,206,819 | | | | — | | | | — | | | | 316,206,819 | |
Hong Kong | | | 311,066,386 | | | | — | | | | — | �� | | | 311,066,386 | |
Australia | | | 246,198,783 | | | | — | | | | — | | | | 246,198,783 | |
United States | | | 181,089,831 | | | | — | | | | — | | | | 181,089,831 | |
Other Countries | | | 1,185,741,917 | | | | 54,400,490 | | | | — | | | | 1,240,142,407 | |
| Mutual Funds | | | 101,415,944 | | | | — | | | | — | | | | 101,415,944 | |
| Total Investments | | | $7,143,304,843 | | | | $54,400,490 | | | | $— | | | | $7,197,705,333 | |
For further information regarding security characteristics, see the Portfolio of Investments.
Of the level 2 investments presented above, equity investments amounting to $11,429,737 would have been considered level 1 investments at the beginning of the period. Of the level 1 investments presented above, equity investments amounting to $1,758,437,904 would have been considered level 2 investments at the beginning of the period. The primary reason for changes in the classifications between levels 1 and 2 occurs when foreign equity securities are fair valued using other observable market-based inputs in place of the closing exchange price due to events occurring after the close of the exchange or market on which the investment is principally traded. The fund’s foreign equity securities may often be valued at fair value. The fund’s policy is to recognize transfers between the levels as of the end of the period.
Foreign Currency Translation – Purchases and sales of foreign investments, income, and expenses are converted into U.S. dollars based upon currency exchange rates
30
Notes to Financial Statements (unaudited) – continued
prevailing on the respective dates of such transactions or on the reporting date for foreign denominated receivables and payables. Gains and losses attributable to foreign currency exchange rates on sales of securities are recorded for financial statement purposes as net realized gains and losses on investments. Gains and losses attributable to foreign exchange rate movements on receivables, payables, income and expenses are recorded for financial statement purposes as foreign currency transaction gains and losses. That portion of both realized and unrealized gains and losses on investments that results from fluctuations in foreign currency exchange rates is not separately disclosed.
Security Loans – Under its Securities Lending Agency Agreement with the fund, State Street Bank and Trust Company (“State Street”), as lending agent, loans the securities of the fund to certain qualified institutions (the “Borrowers”) approved by the fund. The loans are collateralized by cash and/or U.S. Treasury and federal agency obligations in an amount typically at least equal to the market value of the securities loaned. The market value of the loaned securities is determined at the close of business of the fund and any additional required collateral is delivered to the fund on the next business day. State Street provides the fund with indemnification against Borrower default. In the event of Borrower default, State Street will for the benefit of the fund either purchase securities identical to those loaned or, when such purchase is commercially impracticable, pay the fund the market value of the loaned securities. In return, State Street assumes the fund’s rights to the related collateral. If the collateral value is less than the cost to purchase identical securities, State Street is responsible for the shortfall, but only to the extent that such shortfall is not due to a decline in collateral value resulting from collateral reinvestment for which the fund bears the risk of loss. On loans collateralized by cash, the cash collateral is invested in a money market fund or short-term securities. A portion of the income generated upon investment of the collateral is remitted to the Borrowers, and the remainder is allocated between the fund and the lending agent. On loans collateralized by U.S. Treasury and/or federal agency obligations, a fee is received from the Borrower, and is allocated between the fund and the lending agent. Income from securities lending is included in “Interest” income in the Statement of Operations. The dividend and interest income earned on the securities loaned is accounted for in the same manner as other dividend and interest income. At February 28, 2014, there were no securities on loan or collateral outstanding.
Indemnifications – Under the fund’s organizational documents, its officers and Trustees may be indemnified against certain liabilities and expenses arising out of the performance of their duties to the fund. Additionally, in the normal course of business, the fund enters into agreements with service providers that may contain indemnification clauses. The fund’s maximum exposure under these agreements is unknown as this would involve future claims that may be made against the fund that have not yet occurred.
Investment Transactions and Income – Investment transactions are recorded on the trade date. Interest income is recorded on the accrual basis. Dividends received in cash are recorded on the ex-dividend date. Certain dividends from foreign securities will be recorded when the fund is informed of the dividend if such information is obtained
31
Notes to Financial Statements (unaudited) – continued
subsequent to the ex-dividend date. Dividend and interest payments received in additional securities are recorded on the ex-dividend or ex-interest date in an amount equal to the value of the security on such date.
The fund may receive proceeds from litigation settlements. Any proceeds received from litigation involving portfolio holdings are reflected in the Statement of Operations in realized gain/loss if the security has been disposed of by the fund or in unrealized gain/loss if the security is still held by the fund. Any other proceeds from litigation not related to portfolio holdings are reflected as other income in the Statement of Operations.
Fees Paid Indirectly – The fund’s custody fee may be reduced according to an arrangement that measures the value of cash deposited with the custodian by the fund. This amount, for the six months ended February 28, 2014, is shown as a reduction of total expenses in the Statement of Operations.
Tax Matters and Distributions – The fund intends to qualify as a regulated investment company, as defined under Subchapter M of the Internal Revenue Code, and to distribute all of its taxable income, including realized capital gains. As a result, no provision for federal income tax is required. The fund’s federal tax returns, when filed, will remain subject to examination by the Internal Revenue Service for a three year period. Management has analyzed the fund’s tax positions taken on federal and state tax returns for all open tax years and does not believe that there are any uncertain tax positions that require recognition of a tax liability. Foreign taxes, if any, have been accrued by the fund in the accompanying financial statements in accordance with the applicable foreign tax law. Foreign income taxes may be withheld by certain countries in which the fund invests. Additionally, capital gains realized by the fund on securities issued in or by certain foreign countries may be subject to capital gains tax imposed by those countries.
Distributions to shareholders are recorded on the ex-dividend date. Income and capital gain distributions are determined in accordance with income tax regulations, which may differ from U.S. generally accepted accounting principles. Certain capital accounts in the financial statements are periodically adjusted for permanent differences in order to reflect their tax character. These adjustments have no impact on net assets or net asset value per share. Temporary differences which arise from recognizing certain items of income, expense, gain or loss in different periods for financial statement and tax purposes will reverse at some time in the future. Distributions in excess of net investment income or net realized gains are temporary overdistributions for financial statement purposes resulting from differences in the recognition or classification of income or distributions for financial statement and tax purposes.
Book/tax differences primarily relate to passive foreign investment companies and wash sale loss deferrals.
The tax character of distributions made during the current period will be determined at fiscal year end. The tax character of distributions declared to shareholders for the last fiscal year is as follows:
| | | | |
| | | 8/31/13 | |
Ordinary income (including any
short-term capital gains) | | | $97,500,392 | |
32
Notes to Financial Statements (unaudited) – continued
The federal tax cost and the tax basis components of distributable earnings were as follows:
| | | | |
| As of 2/28/14 | | | |
| Cost of investments | | | $6,194,232,655 | |
| Gross appreciation | | | 1,280,319,105 | |
| Gross depreciation | | | (276,846,427 | ) |
| Net unrealized appreciation (depreciation) | | | $1,003,472,678 | |
| |
| As of 8/31/13 | | | |
| Undistributed ordinary income | | | 103,215,727 | |
| Capital loss carryforwards | | | (690,020,638 | ) |
| Other temporary differences | | | (873,843 | ) |
| Net unrealized appreciation (depreciation) | | | 460,532,719 | |
The aggregate cost above includes prior fiscal year end tax adjustments, if applicable.
Under the Regulated Investment Company Modernization Act of 2010 (the “Act”), net capital losses recognized for fund fiscal years beginning after August 31, 2011 may be carried forward indefinitely, and their character is retained as short-term and/or long-term losses (“post-enactment losses”). Previously, net capital losses were carried forward for eight years and treated as short-term losses (“pre-enactment losses”). As a transition rule, the Act requires that all post-enactment net capital losses be used before pre-enactment net capital losses.
As of August 31, 2013 the fund had capital loss carryforwards available to offset future realized gains. Such pre-enactment losses expire as follows:
Multiple Classes of Shares of Beneficial Interest – The fund offers multiple classes of shares, which differ in their respective distribution, service, and program manager fees. The fund’s income, realized and unrealized gain (loss), and common expenses are allocated to shareholders based on the daily net assets of each class. Dividends are declared separately for each class. Differences in per share dividend rates are generally due to differences in separate class expenses. Class B and Class 529B shares will convert to Class A and Class 529A shares, respectively, approximately eight years after
33
Notes to Financial Statements (unaudited) – continued
purchase. The fund’s distributions declared to shareholders as reported in the Statements of Changes in Net Assets are presented by class as follows:
| | | | | | | | |
| | | From net investment
income | |
| | | Six months
ended
2/28/14 | | | Year
ended
8/31/13 | |
| Class A | | | $15,702,653 | | | | $18,082,585 | |
| Class B | | | 102,139 | | | | 216,225 | |
| Class C | | | 675,749 | | | | 914,829 | |
| Class I | | | 31,156,722 | | | | 24,235,060 | |
| Class R1 | | | 23,279 | | | | 49,846 | |
| Class R2 | | | 1,827,492 | | | | 1,877,801 | |
| Class R3 | | | 2,842,760 | | | | 3,284,789 | |
| Class R4 | | | 7,705,916 | | | | 17,572,798 | |
| Class R5 | | | 43,174,399 | | | | 31,219,429 | |
| Class 529A | | | 30,527 | | | | 33,635 | |
| Class 529B | | | 1,412 | | | | 1,468 | |
| Class 529C | | | 7,486 | | | | 11,927 | |
| Total | | | $103,250,534 | | | | $97,500,392 | |
(3) Transactions with Affiliates
Investment Adviser – The fund has an investment advisory agreement with MFS to provide overall investment management and related administrative services and facilities to the fund. The management fee is computed daily and paid monthly at the following annual rates:
| | | | |
| First $1 billion of average daily net assets | | | 0.90 | % |
| Next $1 billion of average daily net assets | | | 0.80 | % |
| Average daily net assets in excess of $2 billion | | | 0.70 | % |
The investment adviser has agreed in writing to reduce its management fee to 0.65% of average daily net assets in excess of $5 billion up to $10 billion, and 0.60% of average daily net assets in excess of $10 billion. This written agreement will continue until modified by the fund’s Board of Trustees, but such agreement will continue at least until December 31, 2014. For the six months ended February 28, 2014, this management fee reduction amounted to $464,331, which is included in the reduction of total expenses in the Statement of Operations. MFS has also agreed in writing to reduce its management fee by a specified amount if certain MFS mutual fund assets exceed thresholds agreed to by MFS and the fund’s Board of Trustees. For the six months ended February 28, 2014, this management fee reduction amounted to $77,228, which is included in the reduction of total expenses in the Statement of Operations. The management fee incurred for the six months ended February 28, 2014 was equivalent to an annual effective rate of 0.73% of the fund’s average daily net assets.
Distributor – MFS Fund Distributors, Inc. (MFD), a wholly-owned subsidiary of MFS, as distributor, received $42,276 and $502 for the six months ended February 28, 2014, as its portion of the initial sales charge on sales of Class A and Class 529A shares of the fund, respectively.
34
Notes to Financial Statements (unaudited) – continued
The Board of Trustees has adopted a distribution plan for certain class shares pursuant to Rule 12b-1 of the Investment Company Act of 1940.
The fund’s distribution plan provides that the fund will pay MFD for services provided by MFD and financial intermediaries in connection with the distribution and servicing of certain share classes. One component of the plan is a distribution fee paid to MFD and another component of the plan is a service fee paid to MFD. MFD may subsequently pay all, or a portion, of the distribution and/or service fees to financial intermediaries.
Distribution Plan Fee Table:
| | | | | | | | | | | | | | | | | | | | |
| | | Distribution
Fee Rate (d) | | | Service Fee Rate (d) | | | Total
Distribution Plan (d) | | | Annual
Effective Rate (e) | | | Distribution
and Service
Fee | |
| Class A | | | — | | | | 0.25% | | | | 0.25% | | | | 0.25% | | | | $1,485,191 | |
| Class B | | | 0.75% | | | | 0.25% | | | | 1.00% | | | | 1.00% | | | | 102,019 | |
| Class C | | | 0.75% | | | | 0.25% | | | | 1.00% | | | | 1.00% | | | | 465,755 | |
| Class R1 | | | 0.75% | | | | 0.25% | | | | 1.00% | | | | 1.00% | | | | 21,056 | |
| Class R2 | | | 0.25% | | | | 0.25% | | | | 0.50% | | | | 0.50% | | | | 382,612 | |
| Class R3 | | | — | | | | 0.25% | | | | 0.25% | | | | 0.25% | | | | 267,551 | |
| Class 529A | | | — | | | | 0.25% | | | | 0.25% | | | | 0.22% | | | | 2,881 | |
| Class 529B | | | 0.75% | | | | 0.25% | | | | 1.00% | | | | 1.00% | | | | 1,008 | |
| Class 529C | | | 0.75% | | | | 0.25% | | | | 1.00% | | | | 1.00% | | | | 5,105 | |
| Total Distribution and Service Fees | | | | | | | | | | | | $2,733,178 | |
| (d) | In accordance with the distribution plan for certain classes, the fund pays distribution and/or service fees equal to these annual percentage rates of each class’s average daily net assets. The distribution and service fee rates disclosed by class represent the current rates in effect at the end of the reporting period. Any rate changes, if applicable, are detailed below. |
| (e) | The annual effective rates represent actual fees incurred under the distribution plan for the six months ended February 28, 2014 based on each class’s average daily net assets. MFD has voluntarily agreed to rebate a portion of each class’s 0.25% service fee attributable to accounts for which MFD retains the 0.25% service fee except for accounts attributable to MFS or its affiliates’ seed money. For the six months ended February 28, 2014, this rebate amounted to $5,106, $72, $52, $399, $312, and $1 for Class A, Class B, Class C, Class R3, Class 529A, and Class 529B, respectively, and is included in the reduction of total expenses in the Statement of Operations. |
Certain Class A shares are subject to a contingent deferred sales charge (CDSC) in the event of a shareholder redemption within 18 months of purchase for shares purchased on or after August 1, 2012, and within 24 months of purchase for shares purchased prior to August 1, 2012. Class C and Class 529C shares are subject to a CDSC in the event of a shareholder redemption within 12 months of purchase. Class B and Class 529B shares are subject to a CDSC in the event of a shareholder redemption within six years of purchase. All contingent deferred sales charges are paid to MFD and during the six months ended February 28, 2014, were as follows:
| | | | |
| | | Amount | |
| Class A | | | $268 | |
| Class B | | | 9,562 | |
| Class C | | | 1,599 | |
| Class 529B | | | — | |
| Class 529C | | | — | |
35
Notes to Financial Statements (unaudited) – continued
The fund has entered into and may from time to time enter into contracts with program managers and other parties which administer the tuition programs through which an investment in the fund’s 529 share classes is made. The fund has entered into an agreement with MFD pursuant to which MFD receives an annual fee of up to 0.10% of the average daily net assets attributable to each 529 share class. MFD has agreed to waive a portion of this fee in an amount equal to 0.05% of the average daily net assets for each 529 share class. This waiver agreement will expire on December 31, 2014, unless MFD elects to extend the waiver. For the six months ended February 28, 2014, this waiver amounted to $881 and is included in the reduction of total expenses in the Statement of Operations. The program manager fee incurred for the six months ended February 28, 2014 was equivalent to an annual effective rate of 0.05% of the average daily net assets attributable to each 529 share class. The services provided by MFD, or a third party with which MFD contracts, include recordkeeping and tax reporting and account services, as well as services designed to maintain the program’s compliance with the Internal Revenue Code and other regulatory requirements. Program manager fees and waivers for the six months ended February 28, 2014, were as follows:
| | | | | | | | |
| | | Fee | | | Waiver | |
| Class 529A | | | $1,153 | | | | $576 | |
| Class 529B | | | 101 | | | | 50 | |
| Class 529C | | | 510 | | | | 255 | |
| Total Program Manager Fees and Waivers | | | $1,764 | | | | $881 | |
Shareholder Servicing Agent – MFS Service Center, Inc. (MFSC), a wholly-owned subsidiary of MFS, receives a fee from the fund for its services as shareholder servicing agent calculated as a percentage of the average daily net assets of the fund as determined periodically under the supervision of the fund’s Board of Trustees. For the six months ended February 28, 2014, the fee was $137,595, which equated to 0.0040% annually of the fund’s average daily net assets. MFSC also receives payment from the fund for out-of-pocket expenses, sub-accounting and other shareholder servicing costs which may be paid to affiliated and unaffiliated service providers. Class R5 shares do not incur sub-accounting fees. For the six months ended February 28, 2014, these out-of-pocket expenses, sub-accounting and other shareholder servicing costs amounted to $1,992,373.
Administrator – MFS provides certain financial, legal, shareholder communications, compliance, and other administrative services to the fund. Under an administrative services agreement, the fund partially reimburses MFS the costs incurred to provide these services. The fund is charged an annual fixed amount of $17,500 plus a fee based on average daily net assets. The administrative services fee incurred for the six months ended February 28, 2014 was equivalent to an annual effective rate of 0.0069% of the fund’s average daily net assets.
Trustees’ and Officers’ Compensation – The fund pays compensation to independent Trustees in the form of a retainer, attendance fees, and additional compensation to Board and Committee chairpersons. The fund does not pay compensation directly to Trustees or officers of the fund who are also officers of the
36
Notes to Financial Statements (unaudited) – continued
investment adviser, all of whom receive remuneration for their services to the fund from MFS. Certain officers and Trustees of the fund are officers or directors of MFS, MFD, and MFSC.
Prior to December 31, 2001, the fund had an unfunded defined benefit plan (“DB plan”) for independent Trustees. As of December 31, 2001, the Board took action to terminate the DB plan with respect to then-current and any future independent Trustees, such that the DB plan covers only certain of those former independent Trustees who retired on or before December 31, 2001. Effective January 1, 2002, accrued benefits under the DB Plan for then-current independent Trustees who continued were credited to an unfunded retirement deferral plan (the “Retirement Deferral plan”), which was established for and exists solely with respect to these credited amounts, and is not available for other deferrals by these or other independent Trustees. Although the Retirement Deferral plan is unfunded, amounts deferred under the plan are periodically adjusted for investment experience as if they had been invested in shares of the fund. The DB plan resulted in a pension expense of $70 and the Retirement Deferral plan resulted in an expense of $1,276. Both amounts are included in independent Trustees’ compensation for the six months ended February 28, 2014. The liability for deferred retirement benefits payable to certain independent Trustees under both plans amounted to $1,260 at February 28, 2014, and is included in “Payable for independent Trustees’ compensation” in the Statement of Assets and Liabilities.
Other – This fund and certain other funds managed by MFS (the funds) have entered into services agreements (the Agreements) which provide for payment of fees by the funds to Tarantino LLC and Griffin Compliance LLC in return for the provision of services of an Independent Chief Compliance Officer (ICCO) and Assistant ICCO, respectively, for the funds. The ICCO and Assistant ICCO are officers of the funds and the sole members of Tarantino LLC and Griffin Compliance LLC, respectively. The funds can terminate the Agreements with Tarantino LLC and Griffin Compliance LLC at any time under the terms of the Agreements. For the six months ended February 28, 2014, the aggregate fees paid by the fund to Tarantino LLC and Griffin Compliance LLC were $22,192 and are included in “Miscellaneous” expense in the Statement of Operations. MFS has agreed to reimburse the fund for a portion of the payments made by the fund in the amount of $3,121, which is included in the reduction of total expenses in the Statement of Operations. Additionally, MFS has agreed to bear all expenses associated with office space, other administrative support, and supplies provided to the ICCO and Assistant ICCO.
The fund invests in the MFS Institutional Money Market Portfolio which is managed by MFS and seeks current income consistent with preservation of capital and liquidity. Income earned on this investment is included in “Dividends from underlying affiliated funds” in the Statement of Operations. This money market fund does not pay a management fee to MFS.
On September 11, 2013, MFS redeemed 7,903 shares of Class R5 for an aggregate amount of $135,774.
37
Notes to Financial Statements (unaudited) – continued
(4) Portfolio Securities
Purchases and sales of investments, other than short-term obligations, aggregated $1,352,734,782 and $1,002,647,034, respectively.
(5) Shares of Beneficial Interest
The fund’s Declaration of Trust permits the Trustees to issue an unlimited number of full and fractional shares of beneficial interest. Transactions in fund shares were as follows:
| | | | | | | | | | | | | | | | |
| | | Six months ended
2/28/14 | | | Year ended
8/31/13 | |
| | | Shares | | | Amount | | | Shares | | | Amount | |
| Shares sold | | | | | | | | | | | | | | | | |
Class A | | | 5,375,115 | | | | $94,273,560 | | | | 16,279,457 | | | | $254,419,782 | |
Class B | | | 43,719 | | | | 734,274 | | | | 113,999 | | | | 1,720,590 | |
Class C | | | 499,844 | | | | 8,213,966 | | | | 856,729 | | | | 12,689,293 | |
Class I | | | 17,808,182 | | | | 322,868,281 | | | | 61,242,598 | | | | 1,017,828,706 | |
Class R1 | | | 24,459 | | | | 396,695 | | | | 60,541 | | | | 876,339 | |
Class R2 | | | 1,861,672 | | | | 31,434,553 | | | | 2,636,872 | | | | 40,136,497 | |
Class R3 | | | 2,485,453 | | | | 42,980,112 | | | | 3,459,308 | | | | 53,661,367 | |
Class R4 | | | 4,153,990 | | | | 73,208,440 | | | | 7,651,892 | | | | 118,459,587 | |
Class R5 | | | 13,189,098 | | | | 230,497,883 | | | | 48,012,029 | | | | 741,180,408 | |
Class 529A | | | 13,692 | | | | 235,565 | | | | 19,927 | | | | 308,135 | |
Class 529B | | | 2,005 | | | | 33,156 | | | | 940 | | | | 13,451 | |
Class 529C | | | 4,775 | | | | 77,726 | | | | 5,559 | | | | 79,642 | |
| | | 45,462,004 | | | | $804,954,211 | | | | 140,339,851 | | | | $2,241,373,797 | |
| | | | |
| Shares issued to shareholders in reinvestment of distributions | | | | | | | | | | | | | | | | |
Class A | | | 740,280 | | | | $12,917,878 | | | | 988,881 | | | | $14,783,775 | |
Class B | | | 5,142 | | | | 86,227 | | | | 12,620 | | | | 181,228 | |
Class C | | | 21,795 | | | | 358,525 | | | | 34,473 | | | | 486,411 | |
Class I | | | 1,243,827 | | | | 22,388,889 | | | | 1,092,849 | | | | 16,840,811 | |
Class R1 | | | 1,431 | | | | 23,203 | | | | 3,550 | | | | 49,310 | |
Class R2 | | | 101,560 | | | | 1,719,409 | | | | 120,670 | | | | 1,752,131 | |
Class R3 | | | 164,702 | | | | 2,842,760 | | | | 222,095 | | | | 3,284,789 | |
Class R4 | | | 428,261 | | | | 7,473,150 | | | | 1,161,239 | | | | 17,348,909 | |
Class R5 | | | 2,485,573 | | | | 43,174,399 | | | | 2,099,491 | | | | 31,219,429 | |
Class 529A | | | 1,773 | | | | 30,527 | | | | 2,280 | | | | 33,635 | |
Class 529B | | | 86 | | | | 1,412 | | | | 103 | | | | 1,468 | |
Class 529C | | | 464 | | | | 7,486 | | | | 861 | | | | 11,927 | |
| | | 5,194,894 | | | | $91,023,865 | | | | 5,739,112 | | | | $85,993,823 | |
38
Notes to Financial Statements (unaudited) – continued
| | | | | | | | | | | | | | | | |
| | | Six months ended
2/28/14 | | | Year ended
8/31/13 | |
| | | Shares | | | Amount | | | Shares | | | Amount | |
| Shares reacquired | | | | | | | | | | | | | | | | |
Class A | | | (6,322,786 | ) | | | $(111,078,527 | ) | | | (17,149,034 | ) | | | $(268,162,272 | ) |
Class B | | | (153,598 | ) | | | (2,594,409 | ) | | | (572,885 | ) | | | (8,623,274 | ) |
Class C | | | (482,735 | ) | | | (7,951,451 | ) | | | (1,487,418 | ) | | | (21,691,721 | ) |
Class I | | | (11,978,925 | ) | | | (216,974,459 | ) | | | (30,802,793 | ) | | | (503,136,411 | ) |
Class R1 | | | (38,288 | ) | | | (625,803 | ) | | | (168,622 | ) | | | (2,424,736 | ) |
Class R2 | | | (749,079 | ) | | | (12,747,362 | ) | | | (1,873,333 | ) | | | (28,103,295 | ) |
Class R3 | | | (1,746,320 | ) | | | (30,227,907 | ) | | | (3,512,663 | ) | | | (54,511,524 | ) |
Class R4 | | | (2,424,605 | ) | | | (42,385,427 | ) | | | (37,734,633 | ) | | | (579,114,162 | ) |
Class R5 | | | (2,578,623 | ) | | | (45,231,287 | ) | | | (7,286,685 | ) | | | (114,338,763 | ) |
Class 529A | | | (9,073 | ) | | | (157,813 | ) | | | (16,241 | ) | | | (255,887 | ) |
Class 529B | | | (1,693 | ) | | | (27,768 | ) | | | (3,651 | ) | | | (52,851 | ) |
Class 529C | | | (5,167 | ) | | | (84,050 | ) | | | (12,369 | ) | | | (177,310 | ) |
| | | (26,490,892 | ) | | | $(470,086,263 | ) | | | (100,620,327 | ) | | | $(1,580,592,206 | ) |
| | | | |
| Net change | | | | | | | | | | | | | | | | |
Class A | | | (207,391 | ) | | | $(3,887,089 | ) | | | 119,304 | | | | $1,041,285 | |
Class B | | | (104,737 | ) | | | (1,773,908 | ) | | | (446,266 | ) | | | (6,721,456 | ) |
Class C | | | 38,904 | | | | 621,040 | | | | (596,216 | ) | | | (8,516,017 | ) |
Class I | | | 7,073,084 | | | | 128,282,711 | | | | 31,532,654 | | | | 531,533,106 | |
Class R1 | | | (12,398 | ) | | | (205,905 | ) | | | (104,531 | ) | | | (1,499,087 | ) |
Class R2 | | | 1,214,153 | | | | 20,406,600 | | | | 884,209 | | | | 13,785,333 | |
Class R3 | | | 903,835 | | | | 15,594,965 | | | | 168,740 | | | | 2,434,632 | |
Class R4 | | | 2,157,646 | | | | 38,296,163 | | | | (28,921,502 | ) | | | (443,305,666 | ) |
Class R5 | | | 13,096,048 | | | | 228,440,995 | | | | 42,824,835 | | | | 658,061,074 | |
Class 529A | | | 6,392 | | | | 108,279 | | | | 5,966 | | | | 85,883 | |
Class 529B | | | 398 | | | | 6,800 | | | | (2,608 | ) | | | (37,932 | ) |
Class 529C | | | 72 | | | | 1,162 | | | | (5,949 | ) | | | (85,741 | ) |
| | | 24,166,006 | | | | $425,891,813 | | | | 45,458,636 | | | | $746,775,414 | |
The fund is one of several mutual funds in which the MFS funds-of-funds may invest. The MFS funds-of-funds do not invest in the underlying funds for the purpose of exercising management or control. At the end of the period, the MFS International Diversification Fund, the MFS Moderate Allocation Fund, the MFS Growth Allocation Fund, the MFS Aggressive Growth Allocation Fund, and the MFS Conservative Allocation Fund were the owners of record of approximately 17%, 5%, 5%, 2%, and 2%, respectively, of the value of outstanding voting shares of the fund. In addition, the MFS Lifetime 2010 Fund, the MFS Lifetime 2015 Fund, the MFS Lifetime 2020 Fund, the MFS Lifetime 2025 Fund, the MFS Lifetime 2030 Fund, the MFS Lifetime 2035 Fund, the MFS Lifetime 2040 Fund, the MFS Lifetime 2045 Fund, the MFS Lifetime 2050 Fund, the MFS Lifetime 2055 Fund, and the MFS Lifetime Retirement Income Fund were each the owners of record of less than 1% of the value of outstanding voting shares of the fund.
39
Notes to Financial Statements (unaudited) – continued
(6) Line of Credit
The fund and certain other funds managed by MFS participate in a $1.1 billion unsecured committed line of credit, subject to a $1 billion sublimit, provided by a syndication of banks under a credit agreement. Borrowings may be made for temporary financing needs. Interest is charged to each fund, based on its borrowings, generally at a rate equal to the higher of the Federal Reserve funds rate or one month LIBOR plus an agreed upon spread. A commitment fee, based on the average daily, unused portion of the committed line of credit, is allocated among the participating funds at the end of each calendar quarter. In addition, the fund and other funds managed by MFS have established unsecured uncommitted borrowing arrangements with certain banks for temporary financing needs. Interest is charged to each fund, based on its borrowings, at a rate equal to the Federal Reserve funds rate plus an agreed upon spread. For the six months ended February 28, 2014, the fund’s commitment fee and interest expense were $13,987 and $0, respectively, and are included in “Miscellaneous” expense in the Statement of Operations.
(7) Transactions in Underlying Affiliated Funds-Affiliated Issuers
An affiliated issuer may be considered one in which the fund owns 5% or more of the outstanding voting securities, or a company which is under common control. For the purposes of this report, the fund assumes the following to be an affiliated issuer:
| | | | | | | | | | | | | | | | |
| Underlying Affiliated Fund | | Beginning
Shares/Par
Amount | | | Acquisitions
Shares/Par
Amount | | | Dispositions
Shares/Par
Amount | | | Ending
Shares/Par
Amount | |
MFS Institutional Money
Market Portfolio | | | 30,851,777 | | | | 600,680,821 | | | | (530,116,654 | ) | | | 101,415,944 | |
| | | | |
| Underlying Affiliated Fund | | Realized
Gain (Loss) | | | Capital Gain
Distributions | | | Dividend
Income | | | Ending
Value | |
MFS Institutional Money
Market Portfolio | | | $— | | | | $— | | | | $29,102 | | | | $101,415,944 | |
40
BOARD REVIEW OF INVESTMENT ADVISORY AGREEMENT
A discussion regarding the Board’s most recent review and renewal of the fund’s Investment Advisory Agreement with MFS is available by clicking on the fund’s name under “Mutual Funds” in the “Products” section of the MFS Web site (mfs.com).
PROXY VOTING POLICIES AND INFORMATION
A general description of the MFS funds’ proxy voting policies and procedures is available without charge, upon request, by calling 1-800-225-2606, by visiting the Proxy Voting section of mfs.com or by visiting the SEC’s Web site at http://www.sec.gov.
Information regarding how the fund voted proxies relating to portfolio securities during the most recent twelve-month period ended June 30 is available without charge by visiting the Proxy Voting section of mfs.com or by visiting the SEC’s Web site at http://www.sec.gov.
QUARTERLY PORTFOLIO DISCLOSURE
The fund will file a complete schedule of portfolio holdings with the Securities and Exchange Commission (the Commission) for the first and third quarters of each fiscal year on Form N-Q. A shareholder can obtain the quarterly portfolio holdings report at mfs.com. The fund’s Form N-Q is also available on the EDGAR database on the Commission’s Internet Web site at http://www.sec.gov, and may be reviewed and copied at the:
Public Reference Room
Securities and Exchange Commission
100 F Street, NE, Room 1580
Washington, D.C. 20549
Information on the operation of the Public Reference Room may be obtained by calling the Commission at 1-800-SEC-0330. Copies of the fund’s Form N-Q also may be obtained, upon payment of a duplicating fee, by electronic request at the following e-mail address: publicinfo@sec.gov, or by writing the Public Reference Section at the above address.
FURTHER INFORMATION
From time to time, MFS may post important information about the fund or the MFS funds on the MFS web site (mfs.com). This information is available by visiting the “Commentary & Announcements” and “Market Outlooks” sections of mfs.com or by clicking on the fund’s name under “Mutual Funds” in the “Products” section of mfs.com.
PROVISION OF FINANCIAL REPORTS AND SUMMARY PROSPECTUSES
The fund produces financial reports every six months and updates its summary prospectus and prospectus annually. To avoid sending duplicate copies of materials to households, only one copy of the fund’s annual and semiannual report and summary prospectus may be mailed to shareholders having the same last name and residential address on the fund’s records. However, any shareholder may contact MFSC (please see back cover for address and telephone number) to request that copies of these reports and summary prospectuses be sent personally to that shareholder.
41
Save paper with eDelivery.

| MFS® will send you prospectuses, |
reports, and proxies directly via e-mail so you will get information faster with less mailbox clutter.
To sign up:
1. Go to mfs.com.
2. Log in via MFS® Access.
3. Select eDelivery.
If you own your MFS fund shares through a financial institution or a retirement plan, MFS® TALK, MFS® Access, or eDelivery may not be available to you.
CONTACT
WEB SITE
mfs.com
MFS TALK
1-800-637-8255
24 hours a day
ACCOUNT SERVICE AND LITERATURE
Shareholders
1-800-225-2606
Financial advisors
1-800-343-2829
Retirement plan services
1-800-637-1255
MAILING ADDRESS
MFS Service Center, Inc.
P.O. Box 55824
Boston, MA 02205-5824
OVERNIGHT MAIL
MFS Service Center, Inc.
c/o Boston Financial Data Services
30 Dan Road
Canton, MA 02021-2809
SEMIANNUAL REPORT
February 28, 2014

MFS® TECHNOLOGY FUND

SCT-SEM
MFS® TECHNOLOGY FUND
CONTENTS
The report is prepared for the general information of shareholders. It is authorized for distribution to prospective investors only when preceded or accompanied by a current prospectus.
NOT FDIC INSURED Ÿ MAY LOSE VALUE Ÿ NO BANK GUARANTEE

LETTER FROM THE CHAIRMAN AND CEO
Dear Shareholders:
The U.S. economy appears to have slowed early in 2014 after a strong second half of 2013. Harsh winter weather likely contributed to at least a temporary softening of consumer demand. Looking at the longer term, the pace of U.S. economic growth has
been modest since the recovery began late in 2009. Corporate profits remain healthy overall. A major plus is the removal of a highly confrontational atmosphere in the U.S. Congress, which had clouded business decision-making since 2011.
Globally, recent months have been dominated by volatility, including emerging market currency jitters and rising geopolitical tensions. These add to the possibility of economic uncertainty and financial market unease. However, the eurozone continues to show signs of recovery, while Japan is making progress as it seeks to break free of deflation.
China’s transition toward a more consumer-oriented and less export-driven economy — one with a more stable and sustainable growth rate — could be positive in the long term. However, in the near term, any deceleration in China’s rate of growth could have a ripple effect on its many global trading partners.
In uncertain times such as these, it is particularly important to remember that managing risk should always be a top priority. At MFS®, active risk management is an integral part of our collaborative process. Our global team of investment professionals shares ideas and evaluates opportunities that span continents, investment disciplines and asset classes. Our goal is to build better insights, and ultimately better results, for our clients.
We understand and appreciate the economic challenges investors face, and we believe in the value of maintaining a long-term view and applying proven principles, such as asset allocation and diversification. We are confident that our unique approach can serve investors well as they work with their financial advisors to identify and pursue the most suitable opportunities.
Respectfully,

Robert J. Manning
Chairman and Chief Executive Officer
MFS Investment Management
April 14, 2014
The opinions expressed in this letter are subject to change, may not be relied upon for investment advice, and no forecasts can be guaranteed.
1
PORTFOLIO COMPOSITION
Portfolio structure (i)
| | | | |
| Top ten holdings (i) | | | | |
| Google, Inc., “A” | | | 10.2% | |
| Apple, Inc. | | | 6.1% | |
| Hewlett-Packard Co. | | | 5.3% | |
| Visa, Inc., “A” | | | 4.4% | |
| Amazon.com, Inc. | | | 4.0% | |
| Oracle Corp. | | | 3.9% | |
| Priceline.com, Inc. | | | 3.8% | |
| Qualcomm, Inc. | | | 3.3% | |
| EMC Corp. | | | 3.2% | |
| eBay, Inc. | | | 3.1% | |
| | | | |
| Top five industries (i) | | | | |
| Internet | | | 20.0% | |
| Computer Software-Systems | | | 17.3% | |
| Computer Software | | | 11.0% | |
| Electronics (s) | | | 8.9% | |
| Other Banks & Diversified Financials | | | 7.5% | |
| (i) | For purposes of this presentation, the components include the market value of securities, less any securities sold short, and reflect the impact of the equivalent exposure of derivative positions. These amounts may be negative from time to time. Equivalent exposure is a calculated amount that translates the derivative position into a reasonable approximation of the amount of the underlying asset that the portfolio would have to hold at a given point in time to have the same price sensitivity that results from the portfolio’s ownership of the derivative contract. When dealing with derivatives, equivalent exposure is a more representative measure of the potential impact of a position on portfolio performance than market value. |
| (s) | Includes securities sold short. |
Percentages are based on net assets as of 2/28/14.
The portfolio is actively managed and current holdings may be different.
2
EXPENSE TABLE
Fund expenses borne by the shareholders during the period, September 1, 2013 through February 28, 2014
As a shareholder of the fund, you incur two types of costs: (1) transaction costs, including sales charges (loads) on certain purchase or redemption payments, and (2) ongoing costs, including management fees; distribution and service (12b-1) fees; and other fund expenses. This example is intended to help you understand your ongoing costs (in dollars) of investing in the fund and to compare these costs with the ongoing costs of investing in other mutual funds.
The example is based on an investment of $1,000 invested at the beginning of the period and held for the entire period September 1, 2013 through February 28, 2014.
Actual Expenses
The first line for each share class in the following table provides information about actual account values and actual expenses. You may use the information in this line, together with the amount you invested, to estimate the expenses that you paid over the period. Simply divide your account value by $1,000 (for example, an $8,600 account value divided by $1,000 = 8.6), then multiply the result by the number in the first line under the heading entitled “Expenses Paid During Period” to estimate the expenses you paid on your account during this period.
Hypothetical Example for Comparison Purposes
The second line for each share class in the following table provides information about hypothetical account values and hypothetical expenses based on the fund’s actual expense ratio and an assumed rate of return of 5% per year before expenses, which is not the fund’s actual return. The hypothetical account values and expenses may not be used to estimate the actual ending account balance or expenses you paid for the period. You may use this information to compare the ongoing costs of investing in the fund and other funds. To do so, compare this 5% hypothetical example with the 5% hypothetical examples that appear in the shareholder reports of the other funds.
Please note that the expenses shown in the table are meant to highlight your ongoing costs only and do not reflect any transactional costs, such as sales charges (loads). Therefore, the second line for each share class in the table is useful in comparing ongoing costs only, and will not help you determine the relative total costs of owning different funds. In addition, if these transactional costs were included, your costs would have been higher.
3
Expense Table – continued
| | | | | | | | | | | | | | | | | | |
Share
Class | | | | Annualized
Expense Ratio | | | Beginning
Account Value
9/01/13 | | | Ending Account Value
2/28/14 | | | Expenses Paid During Period (p) 9/01/13-2/28/14 | |
| A | | Actual | | | 1.36% | | | | $1,000.00 | | | | $1,222.05 | | | | $7.49 | |
| | Hypothetical (h) | | | 1.36% | | | | $1,000.00 | | | | $1,018.05 | | | | $6.80 | |
| B | | Actual | | | 2.11% | | | | $1,000.00 | | | | $1,217.47 | | | | $11.60 | |
| | Hypothetical (h) | | | 2.11% | | | | $1,000.00 | | | | $1,014.33 | | | | $10.54 | |
| C | | Actual | | | 2.11% | | | | $1,000.00 | | | | $1,217.96 | | | | $11.60 | |
| | Hypothetical (h) | | | 2.11% | | | | $1,000.00 | | | | $1,014.33 | | | | $10.54 | |
| I | | Actual | | | 1.11% | | | | $1,000.00 | | | | $1,223.32 | | | | $6.12 | |
| | Hypothetical (h) | | | 1.11% | | | | $1,000.00 | | | | $1,019.29 | | | | $5.56 | |
| R1 | | Actual | | | 2.11% | | | | $1,000.00 | | | | $1,217.76 | | | | $11.60 | |
| | Hypothetical (h) | | | 2.11% | | | | $1,000.00 | | | | $1,014.33 | | | | $10.54 | |
| R2 | | Actual | | | 1.61% | | | | $1,000.00 | | | | $1,220.69 | | | | $8.86 | |
| | Hypothetical (h) | | | 1.61% | | | | $1,000.00 | | | | $1,016.81 | | | | $8.05 | |
| R3 | | Actual | | | 1.36% | | | | $1,000.00 | | | | $1,222.05 | | | | $7.49 | |
| | Hypothetical (h) | | | 1.36% | | | | $1,000.00 | | | | $1,018.05 | | | | $6.80 | |
| R4 | | Actual | | | 1.11% | | | | $1,000.00 | | | | $1,223.57 | | | | $6.12 | |
| | Hypothetical (h) | | | 1.11% | | | | $1,000.00 | | | | $1,019.29 | | | | $5.56 | |
| R5 | | Actual | | | 1.02% | | | | $1,000.00 | | | | $1,224.19 | | | | $5.63 | |
| | Hypothetical (h) | | | 1.02% | | | | $1,000.00 | | | | $1,019.74 | | | | $5.11 | |
| (h) | 5% class return per year before expenses. |
| (p) | Expenses Paid During Period are equal to each class’s annualized expense ratio, as shown above, multiplied by the average account value over the period, multiplied by 181/365 (to reflect the one-half year period). Expenses paid do not include any applicable sales charges (loads). If these transaction costs had been included, your costs would have been higher. |
Notes to Expense Table
Expense ratios include 0.07% of investment related expenses from short sales (See Note 2 of the Notes to Financial Statements).
Each class with a Rule 12b-1 service fee is subject to a rebate of a portion of such fee. Such rebates are included in the expense ratios above. For Class A shares, this rebate reduced the expense ratio above by 0.01%. See Note 3 in the Notes to Financial Statements for additional information.
4
PORTFOLIO OF INVESTMENTS
2/28/14 (unaudited)
The Portfolio of Investments is a complete list of all securities owned by your fund. It is categorized by broad-based asset classes.
| | | | | | | | |
| Common Stocks - 95.9% | | | | | | | | |
| Issuer | | Shares/Par | | | Value ($) | |
| | | | | | | | |
| Broadcasting - 6.2% | | | | | | | | |
| Discovery Communications, Inc., “C” (a) | | | 45,070 | | | $ | 3,476,246 | |
| Time Warner, Inc. | | | 72,140 | | | | 4,842,758 | |
| Twenty-First Century Fox, Inc. | | | 197,960 | | | | 6,639,578 | |
| Viacom, Inc., “B” | | | 10,580 | | | | 928,183 | |
| Walt Disney Co. | | | 27,900 | | | | 2,254,599 | |
| | | | | | | | |
| | | | | | | $ | 18,141,364 | |
| Brokerage & Asset Managers - 1.0% | | | | | | | | |
| IntercontinentalExchange Group, Inc. | | | 13,913 | | | $ | 2,905,591 | |
| | |
| Business Services - 3.8% | | | | | | | | |
| Accenture PLC, “A” | | | 31,130 | | | $ | 2,594,686 | |
| Cognizant Technology Solutions Corp., “A” (a) | | | 22,890 | | | | 2,381,933 | |
| Fidelity National Information Services, Inc. | | | 57,460 | | | | 3,195,351 | |
| FleetCor Technologies, Inc. (a) | | | 14,220 | | | | 1,847,605 | |
| IHS, Inc., “A” (a) | | | 8,340 | | | | 999,799 | |
| | | | | | | | |
| | | | | | | $ | 11,019,374 | |
| Cable TV - 1.1% | | | | | | | | |
| Charter Communications, Inc., “A” (a) | | | 6,825 | | | $ | 865,205 | |
| Time Warner Cable, Inc. | | | 17,760 | | | | 2,492,616 | |
| | | | | | | | |
| | | | | | | $ | 3,357,821 | |
| Computer Software - 11.0% | | | | | | | | |
| Citrix Systems, Inc. (a) | | | 50,710 | | | $ | 3,045,136 | |
| Microsoft Corp. | | | 57,440 | | | | 2,200,526 | |
| Oracle Corp. | | | 293,180 | | | | 11,466,270 | |
| Qlik Technologies, Inc. (a) | | | 70,400 | | | | 2,147,200 | |
| Red Hat, Inc. (a) | | | 17,090 | | | | 1,008,139 | |
| Salesforce.com, Inc. (a) | | | 130,355 | | | | 8,130,241 | |
| Symantec Corp. | | | 101,470 | | | | 2,179,576 | |
| TIBCO Software, Inc. (a) | | | 78,940 | | | | 1,720,103 | |
| | | | | | | | |
| | | | | | | $ | 31,897,191 | |
| Computer Software - Systems - 18.9% | | | | | | | | |
| Apple, Inc. (s) | | | 33,488 | | | $ | 17,622,725 | |
| CDW Corp. | | | 78,508 | | | | 2,054,554 | |
| EMC Corp. | | | 357,930 | | | | 9,438,614 | |
| Fleetmatics Group PLC (a) | | | 41,300 | | | | 1,526,035 | |
| Guidewire Software, Inc. (a) | | | 16,520 | | | | 885,637 | |
5
Portfolio of Investments (unaudited) – continued
| | | | | | | | |
| Issuer | | Shares/Par | | | Value ($) | |
| | | | | | | | |
| Common Stocks - continued | | | | | | | | |
| Computer Software - Systems - continued | | | | | | | | |
| Hewlett-Packard Co. (s) | | | 519,630 | | | $ | 15,526,544 | |
| Ingram Micro, Inc., “A” (a) | | | 59,600 | | | | 1,755,220 | |
| NCR Corp. (a) | | | 29,610 | | | | 1,008,221 | |
| Qualys, Inc. (a) | | | 21,680 | | | | 587,745 | |
| SS&C Technologies Holdings, Inc. (a) | | | 35,570 | | | | 1,375,848 | |
| Teradata Corp. (a) | | | 26,840 | | | | 1,232,493 | |
| Vantiv, Inc., “A” (a) | | | 58,200 | | | | 1,852,506 | |
| Varonis Systems, Inc. (a) | | | 1,830 | | | | 80,520 | |
| | | | | | | | |
| | | | | | | $ | 54,946,662 | |
| Consumer Services - 3.8% | | | | | | | | |
| Priceline.com, Inc. (a) | | | 8,151 | | | $ | 10,994,395 | |
| | |
| Electrical Equipment - 2.5% | | | | | | | | |
| Amphenol Corp., “A” | | | 38,120 | | | $ | 3,355,322 | |
| TE Connectivity Ltd. | | | 50,810 | | | | 2,976,450 | |
| W.W. Grainger, Inc. | | | 4,038 | | | | 1,029,771 | |
| | | | | | | | |
| | | | | | | $ | 7,361,543 | |
| Electronics - 9.9% | | | | | | | | |
| Aeroflex Holding Corp. (a) | | | 117,300 | | | $ | 937,227 | |
| Altera Corp. | | | 196,280 | | | | 7,126,927 | |
| Avago Technologies Ltd. | | | 18,000 | | | | 1,110,600 | |
| Freescale Semiconductor Ltd. (a) | | | 55,060 | | | | 1,252,615 | |
| JDS Uniphase Corp. (a) | | | 540,520 | | | | 7,448,366 | |
| Mellanox Technologies Ltd. (a) | | | 23,070 | | | | 842,516 | |
| Microchip Technology, Inc. | | | 169,040 | | | | 7,699,772 | |
| NXP Semiconductors N.V. (a) | | | 15,450 | | | | 868,754 | |
| Rubicon Technology, Inc. (a) | | | 111,670 | | | | 1,441,660 | |
| | | | | | | | |
| | | | | | | $ | 28,728,437 | |
| Entertainment - 0.9% | | | | | | | | |
| AMC Networks, Inc., “A” (a) | | | 36,430 | | | $ | 2,769,409 | |
| | |
| Internet - 20.0% | | | | | | | | |
| ChannelAdvisor Corp. (a) | | | 16,840 | | | $ | 764,199 | |
| eBay, Inc. (a) | | | 155,310 | | | | 9,127,569 | |
| Facebook, Inc., “A “ (a) | | | 130,620 | | | | 8,942,245 | |
| Google, Inc., “A” (a)(s) | | | 24,420 | | | | 29,686,173 | |
| LinkedIn Corp., “A” (a) | | | 15,534 | | | | 3,169,557 | |
| Twitter, Inc. (a)(l) | | | 11,140 | | | | 611,697 | |
| Yahoo!, Inc. (a) | | | 110,530 | | | | 4,274,195 | |
| Yelp, Inc. (a) | | | 17,400 | | | | 1,642,908 | |
| | | | | | | | |
| | | | | | | $ | 58,218,543 | |
6
Portfolio of Investments (unaudited) – continued
| | | | | | | | |
| Issuer | | Shares/Par | | | Value ($) | |
| Common Stocks - continued | | | | | | | | |
| Network & Telecom - 5.3% | | | | | | | | |
| CommScope Holding Co., Inc. (a) | | | 37,140 | | | $ | 898,417 | |
| Finisar Corp. (a) | | | 42,120 | | | | 998,244 | |
| Juniper Networks, Inc. (a) | | | 147,340 | | | | 3,939,872 | |
| Qualcomm, Inc. | | | 127,750 | | | | 9,618,298 | |
| | | | | | | | |
| | | | | | | $ | 15,454,831 | |
| Other Banks & Diversified Financials - 7.5% | | | | | | | | |
| MasterCard, Inc., “A” | | | 117,180 | | | $ | 9,107,230 | |
| Visa, Inc., “A” | | | 56,615 | | | | 12,791,593 | |
| | | | | | | | |
| | | | | | | $ | 21,898,823 | |
| Specialty Stores - 4.0% | | | | | | | | |
| Amazon.com, Inc. (a) | | | 31,915 | | | $ | 11,556,422 | |
| Total Common Stocks (Identified Cost, $184,194,052) | | | | | | $ | 279,250,406 | |
| | |
| Collateral for Securities Loaned - 0.2% | | | | | | | | |
Navigator Securities Lending Prime Portfolio, 0.18%,
at Cost and Net Asset Value (j) | | | 463,524 | | | $ | 463,524 | |
| | |
| Issuer/Expiration Date/Strike Price | | Number
of
Contracts | | | | |
| Put Options Purchased - 0.2% | | | | | | | | |
| International Business Machines Corp. - July 2014 @ $200 | | | 311 | | | $ | 570,685 | |
| | |
| Electronics - 0.0% | | | | | | | | |
| ASML Holding N.V. - July 2014 @ $98 | | | 54 | | | $ | 71,280 | |
| Total Put Options Purchased (Premiums Paid, $630,312) | | | | | | $ | 641,965 | |
| | |
| Issuer | | Shares/Par | | | | |
| Money Market Funds - 4.6% | | | | | | | | |
MFS Institutional Money Market Portfolio, 0.08%,
at Cost and Net Asset Value (v) | | | 13,368,581 | | | $ | 13,368,581 | |
| Total Investments (Identified Cost, $198,656,469) | | | | | | $ | 293,724,476 | |
| | |
| Issuer/Expiration Date/Strike Price | | Number
of
Contracts | | | | |
| Call Options Written - 0.0% | | | | | | | | |
| Electronics - 0.0% | | | | | | | | |
NXP Semiconductors N.V. - March 2014 @ $58
(Premiums Received, $5,949) | | | (51 | ) | | $ | (5,865 | ) |
7
Portfolio of Investments (unaudited) – continued
| | | | | | | | |
| Securities Sold Short - (1.5)% | | | | | | | | |
| Issuer | | Shares/Par | | | Value ($) | |
| Business Services - (0.2)% | | | | | | | | |
| Wipro Ltd., ADR | | | (42,800 | ) | | $ | (590,640 | ) |
| | |
| Electronics - (0.8)% | | | | | | | | |
| Broadcom Corp., “A” | | | (32,900 | ) | | $ | (977,788 | ) |
| Texas Instruments, Inc. | | | (32,800 | ) | | | (1,474,688 | ) |
| | | | | | | | |
| | | | | | | $ | (2,452,476 | ) |
| Utilities - Electric Power - (0.5)% | | | | | | | | |
| SolarCity Corp. (a) | | | (17,000 | ) | | $ | (1,444,320 | ) |
Total Securities Sold Short
(Proceeds Received, $3,726,270) | | | | | | $ | (4,487,436 | ) |
| | |
| Other Assets, Less Liabilities - 0.6% | | | | | | | 1,920,000 | |
| Net Assets - 100.0% | | | | | | $ | 291,151,175 | |
| (a) | Non-income producing security. |
| (j) | The rate quoted is the annualized seven-day yield of the fund at period end. |
| (l) | A portion of this security is on loan. |
| (s) | Security or a portion of the security was pledged to cover collateral requirements for securities sold short and/or certain derivative transactions. |
| (v) | Underlying affiliated fund that is available only to investment companies managed by MFS. The rate quoted for the MFS Institutional Money Market Portfolio is the annualized seven-day yield of the fund at period end. |
At February 28, 2014, the fund had cash collateral of $4,782,377 and other liquid securities with an aggregate value of $2,698,743 to cover any commitments for securities sold short and/or certain derivative contracts. Cash collateral is comprised of “Deposits with brokers” on the Statement of Assets and Liabilities.
The following abbreviations are used in this report and are defined:
| ADR | | American Depositary Receipt |
| PLC | | Public Limited Company |
See Notes to Financial Statements
8
Financial Statements
STATEMENT OF ASSETS AND LIABILITIES
At 2/28/14 (unaudited)
This statement represents your fund’s balance sheet, which details the assets and liabilities comprising the total value of the fund.
| | | | |
| Assets | | | | |
Investments- | | | | |
Non-affiliated issuers, at value (identified cost, $185,287,888) | | | $280,355,895 | |
Underlying affiliated funds, at cost and value | | | 13,368,581 | |
Total investments, at value, including $446,528 of securities on loan
(identified cost, $198,656,469) | | | $293,724,476 | |
Deposits with brokers | | | 4,782,377 | |
Receivables for | | | | |
Premiums on options written | | | 5,949 | |
Fund shares sold | | | 918,957 | |
Interest and dividends | | | 194,206 | |
Other assets | | | 1,818 | |
Total assets | | | $299,627,783 | |
| Liabilities | | | | |
Payables for | | | | |
Dividends on securities sold short | | | $3,948 | |
Securities sold short, at value (proceeds received, $3,726,270) | | | 4,487,436 | |
Investments purchased | | | 2,867,117 | |
Fund shares reacquired | | | 404,989 | |
Written options outstanding, at value (premiums received, $5,949) | | | 5,865 | |
Collateral for securities loaned, at value | | | 463,524 | |
Payable to affiliates | | | | |
Investment adviser | | | 11,584 | |
Shareholder servicing costs | | | 205,795 | |
Distribution and service fees | | | 4,876 | |
Payable for independent Trustees’ compensation | | | 1,258 | |
Accrued expenses and other liabilities | | | 20,216 | |
Total liabilities | | | $8,476,608 | |
Net assets | | | $291,151,175 | |
| Net assets consist of | | | | |
Paid-in capital | | | $190,767,047 | |
Unrealized appreciation (depreciation) on investments | | | 94,306,925 | |
Accumulated net realized gain (loss) on investments | | | 8,214,681 | |
Accumulated net investment loss | | | (2,137,478 | ) |
Net assets | | | $291,151,175 | |
Shares of beneficial interest outstanding | | | 12,425,999 | |
9
Statement of Assets and Liabilities (unaudited) – continued
| | | | | | | | | | | | |
| | | Net assets | | | Shares
outstanding | | | Net asset value
per share (a) | |
Class A | | | $169,261,593 | | | | 7,134,079 | | | | $23.73 | |
Class B | | | 15,553,223 | | | | 719,786 | | | | 21.61 | |
Class C | | | 32,968,281 | | | | 1,528,421 | | | | 21.57 | |
Class I | | | 39,830,994 | | | | 1,601,147 | | | | 24.88 | |
Class R1 | | | 1,953,313 | | | | 90,718 | | | | 21.53 | |
Class R2 | | | 18,165,826 | | | | 789,534 | | | | 23.01 | |
Class R3 | | | 11,094,997 | | | | 467,748 | | | | 23.72 | |
Class R4 | | | 1,310,880 | | | | 53,931 | | | | 24.31 | |
Class R5 | | | 1,012,068 | | | | 40,635 | | | | 24.91 | |
| (a) | Maximum offering price per share was equal to the net asset value per share for all share classes, except for Class A, for which the maximum offering price per share was $25.18 [100 / 94.25 x $23.73]. On sales of $50,000 or more, the maximum offering price of Class A shares is reduced. A contingent deferred sales charge may be imposed on redemptions of Class A, Class B, and Class C shares. Redemption price per share was equal to the net asset value per share for Classes I, R1, R2, R3, R4, and R5. |
See Notes to Financial Statements
10
Financial Statements
STATEMENT OF OPERATIONS
Six months ended 2/28/14 (unaudited)
This statement describes how much your fund earned in investment income and accrued in expenses. It also describes any gains and/or losses generated by fund operations.
| | | | |
| Net investment loss | | | | |
Income | | | | |
Dividends | | | $1,113,799 | |
Interest | | | 14,386 | |
Dividends from underlying affiliated funds | | | 2,010 | |
Foreign taxes withheld | | | (1,905 | ) |
Total investment income | | | $1,128,290 | |
Expenses | | | | |
Management fee | | | $985,518 | |
Distribution and service fees | | | 469,451 | |
Shareholder servicing costs | | | 233,217 | |
Administrative services fee | | | 21,069 | |
Independent Trustees’ compensation | | | 11,588 | |
Custodian fee | | | 17,696 | |
Shareholder communications | | | 18,488 | |
Audit and tax fees | | | 28,379 | |
Legal fees | | | 1,035 | |
Dividend and interest expense on securities sold short | | | 86,026 | |
Miscellaneous | | | 67,583 | |
Total expenses | | | $1,940,050 | |
Fees paid indirectly | | | (11 | ) |
Reduction of expenses by investment adviser and distributor | | | (7,759 | ) |
Net expenses | | | $1,932,280 | |
Net investment loss | | | $(803,990 | ) |
| Realized and unrealized gain (loss) on investments | | | | |
Realized gain (loss) (identified cost basis) | | | | |
Investments | | | $13,182,724 | |
Written options | | | 611,064 | |
Securities sold short | | | (577,792 | ) |
Net realized gain (loss) on investments | | | $13,215,996 | |
Change in unrealized appreciation (depreciation) | | | | |
Investments | | | $41,178,910 | |
Written options | | | (24,819 | ) |
Securities sold short | | | (858,571 | ) |
Net unrealized gain (loss) on investments | | | $40,295,520 | |
Net realized and unrealized gain (loss) on investments | | | $53,511,516 | |
Change in net assets from operations | | | $52,707,526 | |
See Notes to Financial Statements
11
Financial Statements
STATEMENTS OF CHANGES IN NET ASSETS
These statements describe the increases and/or decreases in net assets resulting from operations, any distributions, and any shareholder transactions.
| | | | | | | | |
| | | Six months ended
2/28/14 | | | Year ended
8/31/13 | |
| Change in net assets | | (unaudited) | | | | |
| From operations | | | | | | | | |
Net investment loss | | | $(803,990 | ) | | | $(1,873,475 | ) |
Net realized gain (loss) on investments and foreign currency | | | 13,215,996 | | | | 1,306,279 | |
Net unrealized gain (loss) on investments | | | 40,295,520 | | | | 32,996,324 | |
Change in net assets from operations | | | $52,707,526 | | | | $32,429,128 | |
Change in net assets from fund share transactions | | | $967,064 | | | | $(26,253,234 | ) |
Total change in net assets | | | $53,674,590 | | | | $6,175,894 | |
| Net assets | | | | | | | | |
At beginning of period | | | 237,476,585 | | | | 231,300,691 | |
At end of period (including accumulated net investment loss of $2,137,478 and $1,333,488, respectively) | | | $291,151,175 | | | | $237,476,585 | |
See Notes to Financial Statements
12
Financial Statements
FINANCIAL HIGHLIGHTS
The financial highlights table is intended to help you understand the fund’s financial performance for the semiannual period and the past 5 fiscal years (or life of a particular share class, if shorter). Certain information reflects financial results for a single fund share. The total returns in the table represent the rate by which an investor would have earned (or lost) on an investment in the fund share class (assuming reinvestment of all distributions) held for the entire period.
| | | | | | | | | | | | | | | | | | | | | | | | |
| | | Six months
ended
2/28/14 (unaudited) | | | Years ended 8/31 | |
| Class A | | | 2013 | | | 2012 | | | 2011 | | | 2010 | | | 2009 | |
| | | | | | | | | | | | | | | | | |
Net asset value, beginning of period | | | $19.41 | | | | $16.80 | | | | $14.50 | | | | $11.80 | | | | $11.06 | | | | $12.46 | |
| Income (loss) from investment operations | | | | | | | | | | | | | | | | | | | | | |
Net investment loss (d) | | | $(0.05 | ) | | | $(0.12 | ) | | | $(0.17 | ) | | | $(0.09 | ) | | | $(0.11 | ) | | | $(0.03 | ) |
Net realized and unrealized gain (loss) on
investments and foreign currency | | | 4.37 | | | | 2.73 | | | | 2.47 | | | | 2.79 | | | | 0.85 | | | | (1.37 | ) |
Total from investment operations | | | $4.32 | | | | $2.61 | | | | $2.30 | | | | $2.70 | | | | $0.74 | | | | $(1.40 | ) |
Net asset value, end of period (x) | | | $23.73 | | | | $19.41 | | | | $16.80 | | | | $14.50 | | | | $11.80 | | | | $11.06 | |
Total return (%) (r)(s)(t)(x) | | | 22.26 | (n) | | | 15.54 | | | | 15.86 | | | | 22.88 | | | | 6.69 | | | | (11.24 | ) |
Ratios (%) (to average net assets)
and Supplemental data: | | | | | | | | | | | | | | | | | | | | | |
Expenses before expense reductions (f) | | | 1.37 | (a) | | | 1.55 | | | | 1.45 | | | | 1.52 | | | | 1.63 | | | | 1.85 | |
Expenses after expense reductions (f) | | | 1.36 | (a) | | | 1.54 | | | | 1.45 | | | | 1.52 | | | | 1.57 | | | | 1.48 | |
Net investment loss | | | (0.50 | )(a) | | | (0.70 | ) | | | (1.08 | ) | | | (0.61 | ) | | | (0.91 | ) | | | (0.34 | ) |
Portfolio turnover | | | 21 | (n) | | | 54 | | | | 68 | | | | 106 | | | | 182 | | | | 226 | |
Net assets at end of period (000 omitted) | | | $169,262 | | | | $141,147 | | | | $143,595 | | | | $96,785 | | | | $82,976 | | | | $86,720 | |
| Supplemental Ratios (%): | | | | | | | | | | | | | | | | | | | | | |
Ratio of expenses to average net assets
after expense reductions excluding short
sale dividend and interest expense (f) | | | 1.29 | (a) | | | 1.36 | | | | 1.38 | | | | 1.43 | | | | 1.53 | | | | 1.44 | |
See Notes to Financial Statements
13
Financial Highlights – continued
| | | | | | | | | | | | | | | | | | | | | | | | |
| | | Six months
ended
2/28/14 (unaudited) | | | Years ended 8/31 | |
| Class B | | | 2013 | | | 2012 | | | 2011 | | | 2010 | | | 2009 | |
| | | | | | | | | | | | | | | | | |
Net asset value, beginning of period | | | $17.75 | | | | $15.48 | | | | $13.45 | | | | $11.03 | | | | $10.42 | | | | $11.82 | |
| Income (loss) from investment operations | | | | | | | | | | | | | | | | | | | | | |
Net investment loss (d) | | | $(0.12 | ) | | | $(0.23 | ) | | | $(0.27 | ) | | | $(0.18 | ) | | | $(0.19 | ) | | | $(0.08 | ) |
Net realized and unrealized gain (loss) on
investments and foreign currency | | | 3.98 | | | | 2.50 | | | | 2.30 | | | | 2.60 | | | | 0.80 | | | | (1.32 | ) |
Total from investment operations | | | $3.86 | | | | $2.27 | | | | $2.03 | | | | $2.42 | | | | $0.61 | | | | $(1.40 | ) |
Net asset value, end of period (x) | | | $21.61 | | | | $17.75 | | | | $15.48 | | | | $13.45 | | | | $11.03 | | | | $10.42 | |
Total return (%) (r)(s)(t)(x) | | | 21.75 | (n) | | | 14.66 | | | | 15.09 | | | | 21.94 | | | | 5.85 | | | | (11.84 | ) |
Ratios (%) (to average net assets)
and Supplemental data: | | | | | | | | | | | | | | | | | | | | | |
Expenses before expense reductions (f) | | | 2.12 | (a) | | | 2.30 | | | | 2.20 | | | | 2.27 | | | | 2.37 | | | | 2.58 | |
Expenses after expense reductions (f) | | | 2.11 | (a) | | | 2.29 | | | | 2.20 | | | | 2.27 | | | | 2.32 | | | | 2.19 | |
Net investment loss | | | (1.25 | )(a) | | | (1.44 | ) | | | (1.83 | ) | | | (1.35 | ) | | | (1.66 | ) | | | (0.98 | ) |
Portfolio turnover | | | 21 | (n) | | | 54 | | | | 68 | | | | 106 | | | | 182 | | | | 226 | |
Net assets at end of period (000 omitted) | | | $15,553 | | | | $13,009 | | | | $12,911 | | | | $11,365 | | | | $11,849 | | | | $15,182 | |
| Supplemental Ratios (%): | | | | | | | | | | | | | | | | | | | | | |
Ratio of expenses to average net assets
after expense reductions excluding short
sale dividend and interest expense (f) | | | 2.05 | (a) | | | 2.12 | | | | 2.13 | | | | 2.18 | | | | 2.27 | | | | 2.15 | |
See Notes to Financial Statements
14
Financial Highlights – continued
| | | | | | | | | | | | | | | | | | | | | | | | |
| | | Six months
ended
2/28/14 (unaudited) | | | Years ended 8/31 | |
| Class C | | | 2013 | | | 2012 | | | 2011 | | | 2010 | | | 2009 | |
| | | | | | | | | | | | | | | | | |
Net asset value, beginning of period | | | $17.71 | | | | $15.45 | | | | $13.43 | | | | $11.01 | | | | $10.40 | | | | $11.80 | |
| Income (loss) from investment operations | | | | | | | | | | | | | | | | | | | | | |
Net investment loss (d) | | | $(0.12 | ) | | | $(0.24 | ) | | | $(0.27 | ) | | | $(0.19 | ) | | | $(0.19 | ) | | | $(0.08 | ) |
Net realized and unrealized gain (loss) on
investments and foreign currency | | | 3.98 | | | | 2.50 | | | | 2.29 | | | | 2.61 | | | | 0.80 | | | | (1.32 | ) |
Total from investment operations | | | $3.86 | | | | $2.26 | | | | $2.02 | | | | $2.42 | | | | $0.61 | | | | $(1.40 | ) |
Net asset value, end of period (x) | | | $21.57 | | | | $17.71 | | | | $15.45 | | | | $13.43 | | | | $11.01 | | | | $10.40 | |
Total return (%) (r)(s)(t)(x) | | | 21.80 | (n) | | | 14.63 | | | | 15.04 | | | | 21.98 | | | | 5.87 | | | | (11.86 | ) |
Ratios (%) (to average net assets)
and Supplemental data: | | | | | | | | | | | | | | | | | | | | | |
Expenses before expense reductions (f) | | | 2.11 | (a) | | | 2.30 | | | | 2.20 | | | | 2.27 | | | | 2.38 | | | | 2.57 | |
Expenses after expense reductions (f) | | | 2.11 | (a) | | | 2.30 | | | | 2.20 | | | | 2.27 | | | | 2.33 | | | | 2.19 | |
Net investment loss | | | (1.25 | )(a) | | | (1.45 | ) | | | (1.83 | ) | | | (1.37 | ) | | | (1.66 | ) | | | (1.00 | ) |
Portfolio turnover | | | 21 | (n) | | | 54 | | | | 68 | | | | 106 | | | | 182 | | | | 226 | |
Net assets at end of period (000 omitted) | | | $32,968 | | | | $25,026 | | | | $23,940 | | | | $19,251 | | | | $16,858 | | | | $15,356 | |
| Supplemental Ratios (%): | | | | | | | | | | | | | | | | | | | | | |
Ratio of expenses to average net assets
after expense reductions excluding short
sale dividend and interest expense (f) | | | 2.05 | (a) | | | 2.12 | | | | 2.13 | | | | 2.18 | | | | 2.28 | | | | 2.15 | |
See Notes to Financial Statements
15
Financial Highlights – continued
| | | | | | | | | | | | | | | | | | | | | | | | |
| | | Six months
ended
2/28/14 (unaudited) | | | Years ended 8/31 | |
| Class I | | | 2013 | | | 2012 | | | 2011 | | | 2010 | | | 2009 | |
| | | | | | | | | | | | | | | | | |
Net asset value, beginning of period | | | $20.33 | | | | $17.56 | | | | $15.11 | | | | $12.26 | | | | $11.47 | | | | $12.88 | |
| Income (loss) from investment operations | | | | | | | | | | | | | | | | | | | | | |
Net investment loss (d) | | | $(0.03 | ) | | | $(0.08 | ) | | | $(0.14 | ) | | | $(0.06 | ) | | | $(0.08 | ) | | | $(0.00 | )(w) |
Net realized and unrealized gain (loss) on
investments and foreign currency | | | 4.58 | | | | 2.85 | | | | 2.59 | | | | 2.91 | | | | 0.87 | | | | (1.41 | ) |
Total from investment operations | | | $4.55 | | | | $2.77 | | | | $2.45 | | | | $2.85 | | | | $0.79 | | | | $(1.41 | ) |
Net asset value, end of period (x) | | | $24.88 | | | | $20.33 | | | | $17.56 | | | | $15.11 | | | | $12.26 | | | | $11.47 | |
Total return (%) (r)(s)(x) | | | 22.38 | (n) | | | 15.77 | | | | 16.21 | | | | 23.25 | | | | 6.89 | | | | (10.95 | ) |
Ratios (%) (to average net assets)
and Supplemental data: | | | | | | | | | | | | | | | | | | | | | |
Expenses before expense reductions (f) | | | 1.12 | (a) | | | 1.30 | | | | 1.20 | | | | 1.27 | | | | 1.38 | | | | 1.56 | |
Expenses after expense reductions (f) | | | 1.11 | (a) | | | 1.30 | | | | 1.20 | | | | 1.27 | | | | 1.33 | | | | 1.19 | |
Net investment loss | | | (0.26 | )(a) | | | (0.45 | ) | | | (0.83 | ) | | | (0.38 | ) | | | (0.66 | ) | | | (0.03 | ) |
Portfolio turnover | | | 21 | (n) | | | 54 | | | | 68 | | | | 106 | | | | 182 | | | | 226 | |
Net assets at end of period (000 omitted) | | | $39,831 | | | | $30,615 | | | | $21,898 | | | | $10,833 | | | | $8,873 | | | | $6,726 | |
| Supplemental Ratios (%): | | | | | | | | | | | | | | | | | | | | | |
Ratio of expenses to average net assets
after expense reductions excluding short
sale dividend and interest expense (f) | | | 1.05 | (a) | | | 1.12 | | | | 1.12 | | | | 1.18 | | | | 1.29 | | | | 1.15 | |
See Notes to Financial Statements
16
Financial Highlights – continued
| | | | | | | | | | | | | | | | | | | | | | | | |
| | | Six months
ended
2/28/14 (unaudited) | | | Years ended 8/31 | |
| Class R1 | | | 2013 | | | 2012 | | | 2011 | | | 2010 | | | 2009 | |
| | | | | | | | | | | | | | | | | |
Net asset value, beginning of period | | | $17.68 | | | | $15.42 | | | | $13.41 | | | | $10.99 | | | | $10.39 | | | | $11.78 | |
| Income (loss) from investment operations | | | | | | | | | | | | | | | | | | | | | |
Net investment loss (d) | | | $(0.12 | ) | | | $(0.23 | ) | | | $(0.26 | ) | | | $(0.19 | ) | | | $(0.19 | ) | | | $(0.08 | ) |
Net realized and unrealized gain (loss) on
investments and foreign currency | | | 3.97 | | | | 2.49 | | | | 2.27 | | | | 2.61 | | | | 0.79 | | | | (1.31 | ) |
Total from investment operations | | | $3.85 | | | | $2.26 | | | | $2.01 | | | | $2.42 | | | | $0.60 | | | | $(1.39 | ) |
Net asset value, end of period (x) | | | $21.53 | | | | $17.68 | | | | $15.42 | | | | $13.41 | | | | $10.99 | | | | $10.39 | |
Total return (%) (r)(s)(x) | | | 21.78 | (n) | | | 14.66 | | | | 14.99 | | | | 22.02 | | | | 5.77 | | | | (11.80 | ) |
Ratios (%) (to average net assets)
and Supplemental data: | | | | | | | | | | | | | | | | | | | | | |
Expenses before expense reductions (f) | | | 2.11 | (a) | | | 2.30 | | | | 2.21 | | | | 2.27 | | | | 2.38 | | | | 2.58 | |
Expenses after expense reductions (f) | | | 2.11 | (a) | | | 2.30 | | | | 2.21 | | | | 2.27 | | | | 2.32 | | | | 2.19 | |
Net investment loss | | | (1.25 | )(a) | | | (1.45 | ) | | | (1.82 | ) | | | (1.39 | ) | | | (1.66 | ) | | | (0.96 | ) |
Portfolio turnover | | | 21 | (n) | | | 54 | | | | 68 | | | | 106 | | | | 182 | | | | 226 | |
Net assets at end of period (000 omitted) | | | $1,953 | | | | $1,542 | | | | $1,666 | | | | $1,831 | | | | $1,421 | | | | $1,585 | |
| Supplemental Ratios (%): | | | | | | | | | | | | | | | | | | | | | |
Ratio of expenses to average net assets
after expense reductions excluding short
sale dividend and interest expense (f) | | | 2.05 | (a) | | | 2.12 | | | | 2.13 | | | | 2.18 | | | | 2.28 | | | | 2.15 | |
See Notes to Financial Statements
17
Financial Highlights – continued
| | | | | | | | | | | | | | | | | | | | | | | | |
| | | Six months
ended
2/28/14 (unaudited) | | | Years ended 8/31 | |
| Class R2 | | | 2013 | | | 2012 | | | 2011 | | | 2010 | | | 2009 | |
| | | | | | | | | | | | | | | | | |
Net asset value, beginning of period | | | $18.85 | | | | $16.36 | | | | $14.15 | | | | $11.54 | | | | $10.85 | | | | $12.25 | |
| Income (loss) from investment operations | | | | | | | | | | | | | | | | | | | | | |
Net investment loss (d) | | | $(0.08 | ) | | | $(0.16 | ) | | | $(0.20 | ) | | | $(0.12 | ) | | | $(0.14 | ) | | | $(0.04 | ) |
Net realized and unrealized gain (loss) on
investments and foreign currency | | | 4.24 | | | | 2.65 | | | | 2.41 | | | | 2.73 | | | | 0.83 | | | | (1.36 | ) |
Total from investment operations | | | $4.16 | | | | $2.49 | | | | $2.21 | | | | $2.61 | | | | $0.69 | | | | $(1.40 | ) |
Net asset value, end of period (x) | | | $23.01 | | | | $18.85 | | | | $16.36 | | | | $14.15 | | | | $11.54 | | | | $10.85 | |
Total return (%) (r)(s)(x) | | | 22.07 | (n) | | | 15.22 | | | | 15.62 | | | | 22.62 | | | | 6.36 | | | | (11.43 | ) |
Ratios (%) (to average net assets)
and Supplemental data: | | | | | | | | | | | | | | | | | | | | | |
Expenses before expense reductions (f) | | | 1.62 | (a) | | | 1.79 | | | | 1.70 | | | | 1.77 | | | | 1.87 | | | | 2.07 | |
Expenses after expense reductions (f) | | | 1.61 | (a) | | | 1.79 | | | | 1.70 | | | | 1.77 | | | | 1.82 | | | | 1.69 | |
Net investment loss | | | (0.76 | )(a) | | | (0.94 | ) | | | (1.33 | ) | | | (0.87 | ) | | | (1.16 | ) | | | (0.50 | ) |
Portfolio turnover | | | 21 | (n) | | | 54 | | | | 68 | | | | 106 | | | | 182 | | | | 226 | |
Net assets at end of period (000 omitted) | | | $18,166 | | | | $15,890 | | | | $17,748 | | | | $15,911 | | | | $13,501 | | | | $13,775 | |
| Supplemental Ratios (%): | | | | | | | | | | | | | | | | | | | | | |
Ratio of expenses to average net assets
after expense reductions excluding short
sale dividend and interest expense (f) | | | 1.55 | (a) | | | 1.62 | | | | 1.63 | | | | 1.68 | | | | 1.78 | | | | 1.65 | |
See Notes to Financial Statements
18
Financial Highlights – continued
| | | | | | | | | | | | | | | | | | | | | | | | |
| | | Six months
ended
2/28/14 (unaudited) | | | Years ended 8/31 | |
| Class R3 | | | 2013 | | | 2012 | | | 2011 | | | 2010 | | | 2009 | |
| | | | | | | | | | | | | | | | | |
Net asset value, beginning of period | | | $19.41 | | | | $16.80 | | | | $14.49 | | | | $11.79 | | | | $11.06 | | | | $12.45 | |
| Income (loss) from investment operations | | | | | | | | | | | | | | | | | | | | | |
Net investment loss (d) | | | $(0.05 | ) | | | $(0.12 | ) | | | $(0.17 | ) | | | $(0.09 | ) | | | $(0.11 | ) | | | $(0.02 | ) |
Net realized and unrealized gain (loss) on
investments and foreign currency | | | 4.36 | | | | 2.73 | | | | 2.48 | | | | 2.79 | | | | 0.84 | | | | (1.37 | ) |
Total from investment operations | | | $4.31 | | | | $2.61 | | | | $2.31 | | | | $2.70 | | | | $0.73 | | | | $(1.39 | ) |
Net asset value, end of period (x) | | | $23.72 | | | | $19.41 | | | | $16.80 | | | | $14.49 | | | | $11.79 | | | | $11.06 | |
Total return (%) (r)(s)(x) | | | 22.21 | (n) | | | 15.54 | | | | 15.94 | | | | 22.90 | | | | 6.60 | | | | (11.16 | ) |
Ratios (%) (to average net assets)
and Supplemental data: | | | | | | | | | | | | | | | | | | | | | |
Expenses before expense reductions (f) | | | 1.37 | (a) | | | 1.55 | | | | 1.45 | | | | 1.52 | | | | 1.62 | | | | 1.82 | |
Expenses after expense reductions (f) | | | 1.36 | (a) | | | 1.55 | | | | 1.45 | | | | 1.52 | | | | 1.58 | | | | 1.44 | |
Net investment loss | | | (0.51 | )(a) | | | (0.70 | ) | | | (1.08 | ) | | | (0.63 | ) | | | (0.90 | ) | | | (0.24 | ) |
Portfolio turnover | | | 21 | (n) | | | 54 | | | | 68 | | | | 106 | | | | 182 | | | | 226 | |
Net assets at end of period (000 omitted) | | | $11,095 | | | | $8,863 | | | | $8,720 | | | | $5,949 | | | | $4,589 | | | | $3,133 | |
| Supplemental Ratios (%): | | | | | | | | | | | | | | | | | | | | | |
Ratio of expenses to average net assets
after expense reductions excluding short
sale dividend and interest expense (f) | | | 1.30 | (a) | | | 1.37 | | | | 1.38 | | | | 1.43 | | | | 1.53 | | | | 1.40 | |
See Notes to Financial Statements
19
Financial Highlights – continued
| | | | | | | | | | | | | | | | | | | | | | | | |
| | | Six months
ended
2/28/14 (unaudited) | | | Years ended 8/31 | |
| Class R4 | | | 2013 | | | 2012 | | | 2011 | | | 2010 | | | 2009 | |
| | | | | | | | | | | | | | | | | |
Net asset value, beginning of period | | | $19.86 | | | | $17.15 | | | | $14.76 | | | | $11.98 | | | | $11.21 | | | | $12.58 | |
| Income (loss) from investment operations | | | | | | | | | | | | | | | | | | | | | |
Net investment loss (d) | | | $(0.03 | ) | | | $(0.08 | ) | | | $(0.14 | ) | | | $(0.05 | ) | | | $(0.08 | ) | | | $(0.00 | )(w) |
Net realized and unrealized gain (loss) on
investments and foreign currency | | | 4.48 | | | | 2.79 | | | | 2.53 | | | | 2.83 | | | | 0.85 | | | | (1.37 | ) |
Total from investment operations | | | $4.45 | | | | $2.71 | | | | $2.39 | | | | $2.78 | | | | $0.77 | | | | $(1.37 | ) |
Net asset value, end of period (x) | | | $24.31 | | | | $19.86 | | | | $17.15 | | | | $14.76 | | | | $11.98 | | | | $11.21 | |
Total return (%) (r)(s)(x) | | | 22.41 | (n) | | | 15.80 | | | | 16.19 | | | | 23.21 | | | | 6.87 | | | | (10.89 | ) |
Ratios (%) (to average net assets)
and Supplemental data: | | | | | | | | | | | | | | | | | | | | | |
Expenses before expense reductions (f) | | | 1.11 | (a) | | | 1.29 | | | | 1.20 | | | | 1.26 | | | | 1.39 | | | | 1.54 | |
Expenses after expense reductions (f) | | | 1.11 | (a) | | | 1.29 | | | | 1.20 | | | | 1.26 | | | | 1.36 | | | | 1.18 | |
Net investment loss | | | (0.23 | )(a) | | | (0.45 | ) | | | (0.84 | ) | | | (0.32 | ) | | | (0.65 | ) | | | (0.02 | ) |
Portfolio turnover | | | 21 | (n) | | | 54 | | | | 68 | | | | 106 | | | | 182 | | | | 226 | |
Net assets at end of period (000 omitted) | | | $1,311 | | | | $1,269 | | | | $823 | | | | $368 | | | | $445 | | | | $153 | |
| Supplemental Ratios (%): | | | | | | | | | | | | | | | | | | | | | |
Ratio of expenses to average net assets
after expense reductions excluding short
sale dividend and interest expense (f) | | | 1.05 | (a) | | | 1.12 | | | | 1.12 | | | | 1.17 | | | | 1.31 | | | | 1.15 | |
See Notes to Financial Statements
20
Financial Highlights – continued
| | | | | | | | |
| Class R5 | | Six months
ended
2/28/14 | | | Year ended
8/31/13 (i) | |
| | | (unaudited) | | | | |
Net asset value, beginning of period | | | $20.34 | | | | $17.68 | |
| Income (loss) from investment operations | | | | | |
Net investment loss (d) | | | $(0.02 | ) | | | $(0.04 | ) |
Net realized and unrealized gain (loss) on investments and
foreign currency | | | 4.59 | | | | 2.70 | |
Total from investment operations | | | $4.57 | | | | $2.66 | |
Net asset value, end of period (x) | | | $24.91 | | | | $20.34 | |
Total return (%) (r)(s)(x) | | | 22.47 | (n) | | | 15.05 | (n) |
Ratios (%) (to average net assets)
and Supplemental data: | | | | | |
Expenses before expense reductions (f) | | | 1.02 | (a) | | | 1.13 | (a) |
Expenses after expense reductions (f) | | | 1.02 | (a) | | | 1.13 | (a) |
Net investment loss | | | (0.13 | )(a) | | | (0.35 | )(a) |
Portfolio turnover | | | 21 | (n) | | | 54 | |
Net assets at end of period (000 omitted) | | | $1,012 | | | | $116 | |
| Supplemental Ratios (%): | | | | | |
Ratio of expenses to average net assets after expense reductions
excluding short sale dividend and interest expense (f) | | | 0.96 | (a) | | | 1.01 | (a) |
| (d) | Per share data is based on average shares outstanding. |
| (f) | Ratios do not reflect reductions from fees paid indirectly, if applicable. |
| (i) | For the period from the class’s inception, January 2, 2013, through the stated period end. |
| (r) | Certain expenses have been reduced without which performance would have been lower. |
| (s) | From time to time the fund may receive proceeds from litigation settlements, without which performance would be lower. |
| (t) | Total returns do not include any applicable sales charges. |
| (w) | Per share amount was less than $0.01. |
| (x) | The net asset values per share and total returns have been calculated on net assets which include adjustments made in accordance with U.S. generally accepted accounting principles required at period end for financial reporting purposes. |
See Notes to Financial Statements
21
NOTES TO FINANCIAL STATEMENTS
(unaudited)
(1) Business and Organization
MFS Technology Fund (the fund) is a non-diversified series of MFS Series Trust I (the trust). The trust is organized as a Massachusetts business trust and is registered under the Investment Company Act of 1940, as amended, as an open-end management investment company.
(2) Significant Accounting Policies
General – The preparation of financial statements in conformity with U.S. generally accepted accounting principles requires management to make estimates and assumptions that affect the reported amounts of assets and liabilities, and disclosure of contingent assets and liabilities at the date of the financial statements and the reported amounts of increases and decreases in net assets from operations during the reporting period. Actual results could differ from those estimates. In the preparation of these financial statements, management has evaluated subsequent events occurring after the date of the fund’s Statement of Assets and Liabilities through the date that the financial statements were issued. The fund invests primarily in securities of issuers in the technology industry. Issuers in a single industry can react similarly to market, economic, political and regulatory conditions and developments.
In this reporting period, the fund adopted the disclosure provisions of the Financial Accounting Standards Board (FASB) Accounting Standards Update 2011-11 (“ASU 2011-11”), Balance Sheet (Topic 210) – Disclosures about Offsetting Assets and Liabilities along with the related scope clarification provisions of FASB Accounting Standards Update 2013-01 (“ASU 2013-01”) entitled Balance Sheet (Topic 210) – Clarifying the Scope of Disclosures about Offsetting Assets and Liabilities. ASU 2011-11 is intended to enhance disclosures on the offsetting of financial assets and liabilities by requiring entities to disclose both gross and net information about financial instruments and transactions that are either offset in the statement of financial position or subject to a an enforceable Master Netting Agreement or similar arrangement. ASU 2013-01 limits the scope of ASU 2011-11’s disclosure requirements on offsetting to financial assets and financial liabilities related to derivatives, repurchase and reverse repurchase agreements, and securities lending and securities borrowing transactions. The disclosures required by ASU 2011-11, to the extent applicable to the fund, have been included in the fund’s Significant Accounting Policies note under the captions for each of the fund’s in-scope financial instruments and transactions.
In June 2013, FASB issued Accounting Standards Update 2013-08 (“ASU 2013-08”) Financial Services – Investment Companies (Topic 946) – Amendments to the Scope, Measurement, and Disclosure Requirements which is effective for interim and annual reporting periods in fiscal years that begin after December 15, 2013. ASU 2013-08 sets forth a methodology for determining whether an entity should be characterized as an investment company and prescribes fair value accounting for an investment company’s non-controlling ownership interest in another investment company. FASB has determined that a fund registered under the Investment Company Act of 1940 automatically meets ASU 2013-08’s criteria for an investment company. Although still
22
Notes to Financial Statements (unaudited) – continued
evaluating the potential impacts of ASU 2013-08 to the fund, management expects that the impact of the fund’s adoption will be limited to additional financial statement disclosures.
Investment Valuations – Equity securities, including restricted equity securities, are generally valued at the last sale or official closing price as provided by a third-party pricing service on the market or exchange on which they are primarily traded. Equity securities for which there were no sales reported that day are generally valued at the last quoted daily bid quotation as provided by a third-party pricing service on the market or exchange on which such securities are primarily traded. Equity securities held short, for which there were no sales reported for that day, are generally valued at the last quoted daily ask quotation as provided by a third-party pricing service on the market or exchange on which such securities are primarily traded. Short-term instruments with a maturity at issuance of 60 days or less generally are valued at amortized cost, which approximates market value. Exchange-traded options are generally valued at the last sale or official closing price as provided by a third-party pricing service on the exchange on which such options are primarily traded. Exchange-traded options for which there were no sales reported that day are generally valued at the last daily bid quotation as provided by a third-party pricing service on the exchange on which such options are primarily traded. Options not traded on an exchange are generally valued at a broker/dealer bid quotation. Foreign currency options are generally valued at valuations provided by a third-party pricing service. Open-end investment companies are generally valued at net asset value per share. Securities and other assets generally valued on the basis of information from a third-party pricing service may also be valued at a broker/dealer bid quotation. Values obtained from third-party pricing services can utilize both transaction data and market information such as yield, quality, coupon rate, maturity, type of issue, trading characteristics, and other market data. The values of foreign securities and other assets and liabilities expressed in foreign currencies are converted to U.S. dollars using the mean of bid and asked prices for rates provided by a third-party pricing service.
The Board of Trustees has delegated primary responsibility for determining or causing to be determined the value of the fund’s investments (including any fair valuation) to the adviser pursuant to valuation policies and procedures approved by the Board. If the adviser determines that reliable market quotations are not readily available, investments are valued at fair value as determined in good faith by the adviser in accordance with such procedures under the oversight of the Board of Trustees. Under the fund’s valuation policies and procedures, market quotations are not considered to be readily available for most types of debt instruments and floating rate loans and many types of derivatives. These investments are generally valued at fair value based on information from third-party pricing services. In addition, investments may be valued at fair value if the adviser determines that an investment’s value has been materially affected by events occurring after the close of the exchange or market on which the investment is principally traded (such as foreign exchange or market) and prior to the determination of the fund’s net asset value, or after the halting of trading of a specific security where trading does not resume prior to the close of the exchange or market on which the security is principally traded. Events that occur on a frequent basis after foreign markets close (such as developments in foreign markets and significant movements in the U.S.
23
Notes to Financial Statements (unaudited) – continued
markets) and prior to the determination of the fund’s net asset value may be deemed to have a material effect on the value of securities traded in foreign markets. Accordingly, the fund’s foreign equity securities may often be valued at fair value. The adviser generally relies on third-party pricing services or other information (such as the correlation with price movements of similar securities in the same or other markets; the type, cost and investment characteristics of the security; the business and financial condition of the issuer; and trading and other market data) to assist in determining whether to fair value and at what value to fair value an investment. The value of an investment for purposes of calculating the fund’s net asset value can differ depending on the source and method used to determine value. When fair valuation is used, the value of an investment used to determine the fund’s net asset value may differ from quoted or published prices for the same investment. There can be no assurance that the fund could obtain the fair value assigned to an investment if it were to sell the investment at the same time at which the fund determines its net asset value per share.
Various inputs are used in determining the value of the fund’s assets or liabilities. These inputs are categorized into three broad levels. In certain cases, the inputs used to measure fair value may fall into different levels of the fair value hierarchy. In such cases, an investment’s level within the fair value hierarchy is based on the lowest level of input that is significant to the fair value measurement. The fund’s assessment of the significance of a particular input to the fair value measurement in its entirety requires judgment, and considers factors specific to the investment. Level 1 includes unadjusted quoted prices in active markets for identical assets or liabilities. Level 2 includes other significant observable market-based inputs (including quoted prices for similar securities, interest rates, prepayment speed, and credit risk). Level 3 includes unobservable inputs, which may include the adviser’s own assumptions in determining the fair value of investments. Other financial instruments are derivative instruments not reflected in total investments, such as written options. The following is a summary of the levels used as of February 28, 2014 in valuing the fund’s assets or liabilities:
| | | | | | | | | | | | | | | | |
| Investments at Value | | Level 1 | | | Level 2 | | | Level 3 | | | Total | |
| Equity Securities | | | $279,892,371 | | | | $— | | | | $— | | | | $279,892,371 | |
| Mutual Funds | | | 13,832,105 | | | | — | | | | — | | | | 13,832,105 | |
| Total Investments | | | $293,724,476 | | | | $— | | | | $— | | | | $293,724,476 | |
| Short Sales | | | $(4,487,436 | ) | | | $— | | | | $— | | | | $(4,487,436 | ) |
| | | | |
| Other Financial Instruments | | | | | | | | | | | | |
| Written Options | | | $(5,865 | ) | | | $— | | | | $— | | | | $(5,865 | ) |
For further information regarding security characteristics, see the Portfolio of Investments.
Foreign Currency Translation – Purchases and sales of foreign investments, income, and expenses are converted into U.S. dollars based upon currency exchange rates prevailing on the respective dates of such transactions or on the reporting date for foreign denominated receivables and payables. Gains and losses attributable to foreign currency exchange rates on sales of securities are recorded for financial statement purposes as net realized gains and losses on investments. Gains and losses attributable to foreign exchange rate movements on receivables, payables, income and expenses are recorded for financial statement purposes as foreign currency transaction gains and
24
Notes to Financial Statements (unaudited) – continued
losses. That portion of both realized and unrealized gains and losses on investments that results from fluctuations in foreign currency exchange rates is not separately disclosed.
Derivatives – The fund uses derivatives for different purposes, primarily to increase or decrease exposure to a particular market or segment of the market, or security, to increase or decrease interest rate or currency exposure, or as alternatives to direct investments. Derivatives are used for hedging or non-hedging purposes. While hedging can reduce or eliminate losses, it can also reduce or eliminate gains. When the fund uses derivatives as an investment to increase market exposure, or for hedging purposes, gains and losses from derivative instruments may be substantially greater than the derivative’s original cost.
The derivative instruments used by the fund were written options and purchased options. The fund’s period end derivatives, as presented in the Portfolio of Investments generally are indicative of the volume of its derivative activity during the period.
The following table presents, by major type of derivative contract, the fair value, on a gross basis, of the asset and liability components of derivatives held by the fund at February 28, 2014 as reported in the Statement of Assets and Liabilities:
| | | | | | | | | | |
| | | | | Fair Value (a) | |
| Risk | | Derivative Contracts | | Asset Derivatives | | | Liability Derivatives | |
| Equity | | Purchased Equity Options | | | $641,965 | | | | $— | |
| Equity | | Written Equity Options | | | — | | | | (5,865 | ) |
| (a) | The value of purchased options outstanding is included in total investments, at value, within the fund’s Statement of Assets and Liabilities. |
The following table presents, by major type of derivative contract, the realized gain (loss) on derivatives held by the fund for the six months ended February 28, 2014 as reported in the Statement of Operations:
| | | | | | | | |
| Risk | | Investments
(Purchased
Options) | | | Written
Options | |
| Equity | | | $466,681 | | | | $611,064 | |
The following table presents, by major type of derivative contract, the change in unrealized appreciation (depreciation) on derivatives held by the fund for the six months ended February 28, 2014 as reported in the Statement of Operations:
| | | | | | | | |
| Risk | | Investments
(Purchased
Options) | | | Written
Options | |
| Equity | | | $11,655 | | | | $(24,819 | ) |
Derivative counterparty credit risk is managed through formal evaluation of the creditworthiness of all potential counterparties. On certain, but not all, over-the-counter derivatives, the fund attempts to reduce its exposure to counterparty credit risk whenever possible by entering into an International Swaps and Derivatives Association (ISDA) Master Agreement on a bilateral basis with each of the counterparties with whom it undertakes a significant volume of transactions. The ISDA Master Agreement gives each party to the agreement the right to terminate all
25
Notes to Financial Statements (unaudited) – continued
transactions traded under such agreement if there is a certain deterioration in the credit quality of the other party. Upon an event of default or a termination of the ISDA Master Agreement, the non-defaulting party has the right to close out all transactions traded under such agreement and to net amounts owed under each transaction to one net amount payable by one party to the other. This right to close out and net payments across all transactions traded under the ISDA Master Agreement could result in a reduction of the fund’s credit risk to such counterparty equal to any amounts payable by the fund under the applicable transactions, if any. The fund’s right to setoff may be restricted or prohibited by the bankruptcy or insolvency laws of the particular jurisdiction to which a specific ISDA counterparty is subject.
Collateral and margin requirements differ by type of derivative. Margin requirements are set by the broker or clearing house for cleared derivatives (i.e., futures contracts, cleared swaps, and exchange-traded options) while collateral terms are contract specific for over-the-counter traded derivatives (i.e., forward foreign currency exchange contracts, uncleared swap agreements, and over-the-counter options). For derivatives traded under an ISDA Master Agreement, the collateral requirements are netted across all transactions traded under such agreement and one amount is posted from one party to the other to collateralize such obligations. Cash that has been segregated to cover the fund’s collateral or margin obligations under derivative contracts, if any, will be reported separately in the Statement of Assets and Liabilities as “Restricted cash” or “Deposits with brokers.” Securities pledged as collateral or margin for the same purpose, if any, are noted in the Portfolio of Investments.
The fund’s accounting policy with respect to balance sheet offsetting is that, absent an event of default by the counterparty or a termination of the agreement, the ISDA Master Agreement does not result in an offset of reported amounts of financial assets and financial liabilities in the Statement of Assets and Liabilities across transactions between the fund and the applicable counterparty.
Written Options – In exchange for a premium, the fund wrote call options on securities that it anticipated the price would decline and also wrote put options on securities that it anticipated the price would increase. At the time the option was written, the fund believed the premium received exceeded the potential loss that could result from adverse price changes in the options’ underlying securities. In a written option, the fund as the option writer grants the buyer the right to purchase from, or sell to, the fund a specified number of shares or units of a particular security, currency or index at a specified price within a specified period of time.
The premium received is initially recorded as a liability in the Statement of Assets and Liabilities. The option is subsequently marked-to-market daily with the difference between the premium received and the market value of the written option being recorded as unrealized appreciation or depreciation. When a written option expires, the fund realizes a gain equal to the amount of the premium received. The difference between the premium received and the amount paid on effecting a closing transaction is considered a realized gain or loss. When a written call option is exercised, the premium received is offset against the proceeds to determine the realized gain or loss. When a written put option is exercised, the premium reduces the cost basis of the security purchased by the fund.
26
Notes to Financial Statements (unaudited) – continued
At the initiation of the written option contract, for exchange traded options, the fund is required to deposit securities or cash as collateral with the custodian for the benefit of the broker. For over-the-counter options, the fund may post collateral subject to the terms of an ISDA Master Agreement as generally described above if the market value of the options contract moves against it. The fund, as writer of an option, may have no control over whether the underlying securities may be sold (call) or purchased (put) and, as a result, bears the market risk of an unfavorable change in the price of the securities underlying the written option. Losses from writing options can exceed the premium received and can exceed the potential loss from an ordinary buy and sell transaction. Although the fund’s market risk may be significant, the maximum counterparty credit risk to the fund is equal to the market value of any collateral posted to the broker. For over-the-counter options, this risk is mitigated in cases where there is an ISDA Master Agreement between the fund and the counterparty providing for netting as described above.
The following table represents the written option activity in the fund during the six months ended February 28, 2014:
| | | | | | | | |
| | | Number of Contracts | | | Premiums
Received | |
| Outstanding, beginning of period | | | 5,582 | | | | $250,473 | |
| Options written | | | 27,574 | | | | 1,540,739 | |
| Options closed | | | (5,542 | ) | | | (522,640 | ) |
| Options exercised | | | (6,402 | ) | | | (329,495 | ) |
| Options expired | | | (21,161 | ) | | | (933,128 | ) |
| Outstanding, end of period | | | 51 | | | | $5,949 | |
Purchased Options – The fund purchased call and put options for a premium. Purchased call and put options entitle the holder to buy and sell a specified number of shares or units of a particular security, currency or index at a specified price at a specified date or within a specified period of time. Purchasing call options may hedge against an anticipated increase in the dollar cost of securities or currency to be acquired or increase the fund’s exposure to an underlying instrument. Purchasing put options may hedge against an anticipated decline in the value of portfolio securities or currency or decrease the fund’s exposure to an underlying instrument.
The premium paid is initially recorded as an investment in the Statement of Assets and Liabilities. That investment is subsequently marked-to-market daily with the difference between the premium paid and the market value of the purchased option being recorded as unrealized appreciation or depreciation. Premiums paid for purchased call and put options which have expired are treated as realized losses on investments in the Statement of Operations. Upon the exercise or closing of a purchased call option, the premium paid is added to the cost of the security or financial instrument purchased. Upon the exercise or closing of a purchased put option, the premium paid is offset against the proceeds on the sale of the underlying security or financial instrument in order to determine the realized gain or loss on investments.
Whether or not the option is exercised, the fund’s maximum risk of loss from purchasing an option is the amount of premium paid. All option contracts involve credit risk if the counterparty to the option contract fails to perform. For
27
Notes to Financial Statements (unaudited) – continued
over-the-counter options, this risk is mitigated in cases where there is an ISDA Master Agreement between the fund and the counterparty providing for netting as described above and for posting of collateral by the counterparty to the fund to cover the fund’s exposure to the counterparty under such ISDA Master Agreement.
Short Sales – The fund entered into short sales whereby it sells a security it does not own in anticipation of a decline in the value of that security. The fund will realize a gain if the security price decreases and a loss if the security price increases between the date of the short sale and the date on which the fund replaces the borrowed security. Losses from short sales can exceed the proceeds of the security sold; and they can also exceed the potential loss from an ordinary buy and sell transaction. The amount of any premium, dividends, or interest the fund may be required to pay in connection with a short sale will be recognized as a fund expense. During the six months ended February 28, 2014, this expense amounted to $86,026. The fund segregates cash or marketable securities in an amount that, when combined with the amount of proceeds from the short sale deposited with the broker, at least equals the current market value of the security sold short.
Security Loans – Under its Securities Lending Agency Agreement with the fund, State Street Bank and Trust Company (“State Street”), as lending agent, loans the securities of the fund to certain qualified institutions (the “Borrowers”) approved by the fund. The loans are collateralized by cash and/or U.S. Treasury and federal agency obligations in an amount typically at least equal to the market value of the securities loaned. The market value of the loaned securities is determined at the close of business of the fund and any additional required collateral is delivered to the fund on the next business day. State Street provides the fund with indemnification against Borrower default. In the event of Borrower default, State Street will for the benefit of the fund either purchase securities identical to those loaned or, when such purchase is commercially impracticable, pay the fund the market value of the loaned securities. In return, State Street assumes the fund’s rights to the related collateral. If the collateral value is less than the cost to purchase identical securities, State Street is responsible for the shortfall, but only to the extent that such shortfall is not due to a decline in collateral value resulting from collateral reinvestment for which the fund bears the risk of loss. On loans collateralized by cash, the cash collateral is invested in a money market fund or short-term securities. At period end, the fund had investment securities on loan with a fair value of $446,528 and a related liability of $463,524 for collateral received on securities loaned, both of which are presented gross on the Statement of Assets and Liabilities. Collateral for securities loaned is carried at fair value, which is categorized as level 2 within the fair value hierarchy. The collateral received on securities loaned exceeded the value of securities on loan at period end. A portion of the income generated upon investment of the collateral is remitted to the Borrowers, and the remainder is allocated between the fund and the lending agent. On loans collateralized by U.S. Treasury and/or federal agency obligations, a fee is received from the Borrower, and is allocated between the fund and the lending agent. Income from securities lending is included in “Interest” income in the Statement of Operations. The dividend and interest income earned on the securities loaned is accounted for in the same manner as other dividend and interest income.
28
Notes to Financial Statements (unaudited) – continued
Indemnifications – Under the fund’s organizational documents, its officers and Trustees may be indemnified against certain liabilities and expenses arising out of the performance of their duties to the fund. Additionally, in the normal course of business, the fund enters into agreements with service providers that may contain indemnification clauses. The fund’s maximum exposure under these agreements is unknown as this would involve future claims that may be made against the fund that have not yet occurred.
Investment Transactions and Income – Investment transactions are recorded on the trade date. Interest income is recorded on the accrual basis. Dividends received in cash are recorded on the ex-dividend date. Certain dividends from foreign securities will be recorded when the fund is informed of the dividend if such information is obtained subsequent to the ex-dividend date. Dividend and interest payments received in additional securities are recorded on the ex-dividend or ex-interest date in an amount equal to the value of the security on such date.
The fund may receive proceeds from litigation settlements. Any proceeds received from litigation involving portfolio holdings are reflected in the Statement of Operations in realized gain/loss if the security has been disposed of by the fund or in unrealized gain/loss if the security is still held by the fund. Any other proceeds from litigation not related to portfolio holdings are reflected as other income in the Statement of Operations.
Fees Paid Indirectly – The fund’s custody fee may be reduced according to an arrangement that measures the value of cash deposited with the custodian by the fund. This amount, for the six months ended February 28, 2014, is shown as a reduction of total expenses in the Statement of Operations.
Tax Matters and Distributions – The fund intends to qualify as a regulated investment company, as defined under Subchapter M of the Internal Revenue Code, and to distribute all of its taxable income, including realized capital gains. As a result, no provision for federal income tax is required. The fund’s federal tax returns, when filed, will remain subject to examination by the Internal Revenue Service for a three year period. Management has analyzed the Fund’s tax positions taken on federal and state tax returns for all open tax years and does not believe that there are any uncertain tax positions that require recognition of a tax liability. Foreign taxes, if any, have been accrued by the fund in the accompanying financial statements in accordance with the applicable foreign tax law. Foreign income taxes may be withheld by certain countries in which the fund invests. Additionally, capital gains realized by the fund on securities issued in or by certain foreign countries may be subject to capital gains tax imposed by those countries.
Distributions to shareholders are recorded on the ex-dividend date. Income and capital gain distributions are determined in accordance with income tax regulations, which may differ from U.S. generally accepted accounting principles. Certain capital accounts in the financial statements are periodically adjusted for permanent differences in order to reflect their tax character. These adjustments have no impact on net assets or net asset value per share. Temporary differences which arise from recognizing certain items of income, expense, gain or loss in different periods for financial statement and tax purposes will reverse at some time in the future. Distributions in excess of net
29
Notes to Financial Statements (unaudited) – continued
investment income or net realized gains are temporary overdistributions for financial statement purposes resulting from differences in the recognition or classification of income or distributions for financial statement and tax purposes.
Book/tax differences primarily relate net operating losses, wash sale loss deferrals, and straddle loss deferrals.
The fund declared no distributions for the current period or for the year ended August 31, 2013.
The federal tax cost and the tax basis components of distributable earnings were as follows:
| | | | |
| As of 2/28/14 | | | |
| Cost of investments | | | $199,288,451 | |
| Gross appreciation | | | 95,024,174 | |
| Gross depreciation | | | (588,149 | ) |
| Net unrealized appreciation (depreciation) | | | $94,436,025 | |
| |
| As of 8/31/13 | | | |
| Capital loss carryforwards | | | (2,831,415 | ) |
| Post-October capital loss deferral | | | (247,331 | ) |
| Late year ordinary loss deferral | | | (1,292,146 | ) |
| Other temporary differences | | | (1,209,620 | ) |
| Net unrealized appreciation (depreciation) | | | 53,257,114 | |
The aggregate cost above includes prior fiscal year end tax adjustments, if applicable.
Under the Regulated Investment Company Modernization Act of 2010 (the “Act”), net capital losses recognized for fund fiscal years beginning after August 31, 2011 may be carried forward indefinitely, and their character is retained as short-term and/or long-term losses (“post-enactment losses”). Previously, net capital losses were carried forward for eight years and treated as short-term losses (“pre-enactment losses”). As a transition rule, the Act requires that all post-enactment net capital losses be used before pre-enactment net capital losses.
As of August 31, 2013, the fund had capital loss carryforwards available to offset future realized gains. Such pre-enactment losses expire as follows:
Multiple Classes of Shares of Beneficial Interest – The fund offers multiple classes of shares, which differ in their respective distribution and service fees. The fund’s income, realized and unrealized gain (loss), and common expenses are allocated to shareholders based on the daily net assets of each class. Dividends are declared separately for each class. Differences in per share dividend rates are generally due to differences in separate class expenses. Class B shares will convert to Class A shares approximately eight years after purchase.
30
Notes to Financial Statements (unaudited) – continued
(3) Transactions with Affiliates
Investment Adviser – The fund has an investment advisory agreement with MFS to provide overall investment management and related administrative services and facilities to the fund. The management fee is computed daily and paid monthly at the following annual rates:
| | | | |
| First $1 billion of average daily net assets | | | 0.75 | % |
| Average daily net assets in excess of $1 billion | | | 0.70 | % |
MFS has agreed in writing to reduce its management fee by a specified amount if certain MFS mutual fund assets exceed thresholds agreed to by MFS and the fund’s Board of Trustees. For the six months ended February 28, 2014, this management fee reduction amounted to $2,985, which is included in the reduction of total expenses in the Statement of Operations. The management fee incurred for the six months ended February 28, 2014 was equivalent to an annual effective rate of 0.75% of the fund’s average daily net assets.
Distributor – MFS Fund Distributors, Inc. (MFD), a wholly-owned subsidiary of MFS, as distributor, received $44,542 for the six months ended February 28, 2014, as its portion of the initial sales charge on sales of Class A shares of the fund.
The Board of Trustees has adopted a distribution plan for certain class shares pursuant to Rule 12b-1 of the Investment Company Act of 1940.
The fund’s distribution plan provides that the fund will pay MFD for services provided by MFD and financial intermediaries in connection with the distribution and servicing of certain share classes. One component of the plan is a distribution fee paid to MFD and another component of the plan is a service fee paid to MFD. MFD may subsequently pay all, or a portion, of the distribution and/or service fees to financial intermediaries.
Distribution Plan Fee Table:
| | | | | | | | | | | | | | | | | | | | |
| | | Distribution
Fee Rate (d) | | | Service
Fee Rate (d) | | | Total
Distribution
Plan (d) | | | Annual
Effective
Rate (e) | | | Distribution
and Service
Fee | |
| Class A | | | — | | | | 0.25% | | | | 0.25% | | | | 0.24% | | | | $194,372 | |
| Class B | | | 0.75% | | | | 0.25% | | | | 1.00% | | | | 1.00% | | | | 70,700 | |
| Class C | | | 0.75% | | | | 0.25% | | | | 1.00% | | | | 1.00% | | | | 140,935 | |
| Class R1 | | | 0.75% | | | | 0.25% | | | | 1.00% | | | | 1.00% | | | | 9,063 | |
| Class R2 | | | 0.25% | | | | 0.25% | | | | 0.50% | | | | 0.50% | | | | 42,276 | |
| Class R3 | | | — | | | | 0.25% | | | | 0.25% | | | | 0.25% | | | | 12,105 | |
| Total Distribution and Service Fees | | | | $469,451 | |
| (d) | In accordance with the distribution plan for certain classes, the fund pays distribution and/or service fees equal to these annual percentage rates of each class’s average daily net assets. The distribution and service fee rates disclosed by class represent the current rates in effect at the end of the reporting period. Any rate changes, if applicable, are detailed below. |
| (e) | The annual effective rates represent actual fees incurred under the distribution plan for the six months ended February 28, 2014 based on each class’s average daily net assets. MFD has voluntarily agreed to rebate a portion of each class’s 0.25% service fee attributable to accounts for which MFD retains the 0.25% service fee except for accounts attributable to MFS or its affiliates’ seed money. For the six months ended February 28, 2014, this rebate amounted to $4,387, $106, $142, and $17 for Class A, Class B, Class C, and R3, respectively, and is included in the reduction of total expenses in the Statement of Operations. |
31
Notes to Financial Statements (unaudited) – continued
Certain Class A shares are subject to a contingent deferred sales charge (CDSC) in the event of a shareholder redemption within 18 months of purchase for shares purchased on or after August 1, 2012, and within 24 months of purchase for shares purchased prior to August 1, 2012. Class C shares are subject to a CDSC in the event of a shareholder redemption within 12 months of purchase. Class B shares are subject to a CDSC in the event of a shareholder redemption within six years of purchase. All contingent deferred sales charges are paid to MFD and during the six months ended February 28, 2014, were as follows:
| | | | |
| | | Amount | |
| Class A | | | $1,010 | |
| Class B | | | 10,217 | |
| Class C | | | 1,570 | |
Shareholder Servicing Agent – MFS Service Center, Inc. (MFSC), a wholly-owned subsidiary of MFS, receives a fee from the fund for its services as shareholder servicing agent calculated as a percentage of the average daily net assets of the fund as determined periodically under the supervision of the fund’s Board of Trustees. For the six months ended February 28, 2014, the fee was $59,536, which equated to 0.0452% annually of the fund’s average daily net assets. MFSC also receives payment from the fund for out-of-pocket expenses, sub-accounting and other shareholder servicing costs which may be paid to affiliated and unaffiliated service providers. Class R5 shares do not incur sub-accounting fees. For the six months ended February 28, 2014, these out-of-pocket expenses, sub-accounting and other shareholder servicing costs amounted to $173,681.
Administrator – MFS provides certain financial, legal, shareholder communications, compliance, and other administrative services to the fund. Under an administrative services agreement, the fund partially reimburses MFS the costs incurred to provide these services. The fund is charged an annual fixed amount of $17,500 plus a fee based on average daily net assets. The administrative services fee incurred for the six months ended February 28, 2014 was equivalent to an annual effective rate of 0.0160% of the fund’s average daily net assets.
Trustees’ and Officers’ Compensation – The fund pays compensation to independent Trustees in the form of a retainer, attendance fees, and additional compensation to Board and Committee chairpersons. The fund does not pay compensation directly to Trustees or officers of the fund who are also officers of the investment adviser, all of whom receive remuneration for their services to the fund from MFS. Certain officers and Trustees of the fund are officers or directors of MFS, MFD, and MFSC.
Prior to December 31, 2001, the fund had an unfunded defined benefit plan (“DB plan”) for independent Trustees. As of December 31, 2001, the Board took action to terminate the DB plan with respect to then-current and any future independent Trustees, such that the DB plan covers only certain of those former independent Trustees who retired on or before December 31, 2001. Effective January 1, 2002, accrued benefits under the DB plan for then-current independent Trustees who continued were credited to an unfunded retirement deferral plan (the “Retirement Deferral plan”), which was established for and exists solely with respect to these
32
Notes to Financial Statements (unaudited) – continued
credited amounts, and is not available for other deferrals by these or other independent Trustees. Although the Retirement Deferral plan is unfunded, amounts deferred under the plan are periodically adjusted for investment experience as if they had been invested in shares of the fund. The DB plan resulted in a pension expense of $69 and the Retirement Deferral plan resulted in an expense of $6,959. Both amounts are included in independent Trustees’ compensation for the six months ended February 28, 2014. The liability for deferred retirement benefits payable to certain independent Trustees under both plans amounted to $1,253 at February 28, 2014, and is included in “Payable for independent Trustees’ compensation” in the Statement of Assets and Liabilities.
Other – This fund and certain other funds managed by MFS (the funds) have entered into services agreements (the Agreements) which provide for payment of fees by the funds to Tarantino LLC and Griffin Compliance LLC in return for the provision of services of an Independent Chief Compliance Officer (ICCO) and Assistant ICCO, respectively, for the funds. The ICCO and Assistant ICCO are officers of the funds and the sole members of Tarantino LLC and Griffin Compliance LLC, respectively. The funds can terminate the Agreements with Tarantino LLC and Griffin Compliance LLC at any time under the terms of the Agreements. For the six months ended February 28, 2014, the aggregate fees paid by the fund to Tarantino LLC and Griffin Compliance LLC were $854 and are included in “Miscellaneous” expense in the Statement of Operations. MFS has agreed to reimburse the fund for a portion of the payments made by the fund in the amount of $122, which is included in the reduction of total expenses in the Statement of Operations. Additionally, MFS has agreed to bear all expenses associated with office space, other administrative support, and supplies provided to the ICCO and Assistant ICCO.
The fund invests in the MFS Institutional Money Market Portfolio which is managed by MFS and seeks current income consistent with preservation of capital and liquidity. Income earned on this investment is included in “Dividends from underlying affiliated funds” in the Statement of Operations. This money market fund does not pay a management fee to MFS.
On December 31, 2012, MFS purchased 5,656 shares of Class R5 for an aggregate amount of $100,000. On September 11, 2013, MFS redeemed 13,238 shares of Class R4 for an aggregate amount of $274,821.
(4) Portfolio Securities
Purchases and sales of investments, other than purchased option transactions short sales, and short-term obligations, aggregated $55,177,979 and $67,933,425, respectively.
33
Notes to Financial Statements (unaudited) – continued
(5) Shares of Beneficial Interest
The fund’s Declaration of Trust permits the Trustees to issue an unlimited number of full and fractional shares of beneficial interest. Transactions in fund shares were as follows:
| | | | | | | | | | | | | | | | |
| | | Six months ended
2/28/14 | | | Year ended
8/31/13 (i) | |
| | | Shares | | | Amount | | | Shares | | | Amount | |
| Shares sold | | | | | | | | | | | | | | | | |
Class A | | | 1,105,970 | | | | $24,056,196 | | | | 1,998,801 | | | | $35,474,800 | |
Class B | | | 72,160 | | | | 1,444,219 | | | | 143,289 | | | | 2,310,258 | |
Class C | | | 218,465 | | | | 4,397,215 | | | | 296,811 | | | | 4,831,432 | |
Class I | | | 312,253 | | | | 7,206,173 | | | | 1,041,965 | | | | 18,680,506 | |
Class R1 | | | 34,946 | | | | 690,298 | | | | 38,814 | | | | 620,331 | |
Class R2 | | | 166,821 | | | | 3,516,977 | | | | 270,131 | | | | 4,615,415 | |
Class R3 | | | 135,150 | | | | 2,960,538 | | | | 163,093 | | | | 2,927,544 | |
Class R4 | | | 21,499 | | | | 481,144 | | | | 35,406 | | | | 647,688 | |
Class R5 | | | 35,943 | | | | 826,626 | | | | 5,711 | | | | 101,001 | |
| | | 2,103,207 | | | | $45,579,386 | | | | 3,994,021 | | | | $70,208,975 | |
| | | | |
| Shares reacquired | | | | | | | | | | | | | | | | |
Class A | | | (1,243,038 | ) | | | $(27,280,948 | ) | | | (3,272,672 | ) | | | $(56,758,621 | ) |
Class B | | | (85,463 | ) | | | (1,709,483 | ) | | | (244,390 | ) | | | (3,969,475 | ) |
Class C | | | (102,759 | ) | | | (1,997,590 | ) | | | (433,533 | ) | | | (7,011,725 | ) |
Class I | | | (217,065 | ) | | | (4,974,766 | ) | | | (783,374 | ) | | | (14,730,202 | ) |
Class R1 | | | (31,452 | ) | | | (636,914 | ) | | | (59,602 | ) | | | (962,229 | ) |
Class R2 | | | (220,305 | ) | | | (4,647,697 | ) | | | (512,114 | ) | | | (8,690,192 | ) |
Class R3 | | | (124,089 | ) | | | (2,663,325 | ) | | | (225,398 | ) | | | (3,998,155 | ) |
Class R4 | | | (31,438 | ) | | | (677,798 | ) | | | (19,529 | ) | | | (341,610 | ) |
Class R5 | | | (1,019 | ) | | | (23,801 | ) | | | — | | | | — | |
| | | (2,056,628 | ) | | | $(44,612,322 | ) | | | (5,550,612 | ) | | | $(96,462,209 | ) |
| | | | |
| Net change | | | | | | | | | | | | | | | | |
Class A | | | (137,068 | ) | | | $(3,224,752 | ) | | | (1,273,871 | ) | | | $(21,283,821 | ) |
Class B | | | (13,303 | ) | | | (265,264 | ) | | | (101,101 | ) | | | (1,659,217 | ) |
Class C | | | 115,706 | | | | 2,399,625 | | | | (136,722 | ) | | | (2,180,293 | ) |
Class I | | | 95,188 | | | | 2,231,407 | | | | 258,591 | | | | 3,950,304 | |
Class R1 | | | 3,494 | | | | 53,384 | | | | (20,788 | ) | | | (341,898 | ) |
Class R2 | | | (53,484 | ) | | | (1,130,720 | ) | | | (241,983 | ) | | | (4,074,777 | ) |
Class R3 | | | 11,061 | | | | 297,213 | | | | (62,305 | ) | | | (1,070,611 | ) |
Class R4 | | | (9,939 | ) | | | (196,654 | ) | | | 15,877 | | | | 306,078 | |
Class R5 | | | 34,924 | | | | 802,825 | | | | 5,711 | | | | 101,001 | |
| | | 46,579 | | | | $967,064 | | | | (1,556,591 | ) | | | $(26,253,234 | ) |
| (i) | For Class R5, the period is from inception, January 2, 2013, through the stated period end. |
(6) Line of Credit
The fund and certain other funds managed by MFS participate in a $1.1 billion unsecured committed line of credit, subject to a $1 billion sublimit, provided by a
34
Notes to Financial Statements (unaudited) – continued
syndication of banks under a credit agreement. Borrowings may be made for temporary financing needs. Interest is charged to each fund, based on its borrowings, generally at a rate equal to the higher of the Federal Reserve funds rate or one month LIBOR plus an agreed upon spread. A commitment fee, based on the average daily, unused portion of the committed line of credit, is allocated among the participating funds at the end of each calendar quarter. In addition, the fund and other funds managed by MFS have established unsecured uncommitted borrowing arrangements with certain banks for temporary financing needs. Interest is charged to each fund, based on its borrowings, at a rate equal to the Federal Reserve funds rate plus an agreed upon spread. For the six months ended February 28, 2014, the fund’s commitment fee and interest expense were $542 and $0, respectively, and are included in “Miscellaneous” expense in the Statement of Operations.
(7) Transactions in Underlying Affiliated Funds-Affiliated Issuers
An affiliated issuer may be considered one in which the fund owns 5% or more of the outstanding voting securities, or a company which is under common control. For the purposes of this report, the fund assumes the following to be an affiliated issuer:
| | | | | | | | | | | | | | | | |
| Underlying Affiliated Fund | | Beginning
Shares/Par
Amount | | | Acquisitions
Shares/Par
Amount | | | Dispositions
Shares/Par
Amount | | | Ending
Shares/Par
Amount | |
MFS Institutional Money
Market Portfolio | | | 5,062,331 | | | | 55,766,608 | | | | (47,460,358 | ) | | | 13,368,581 | |
| | | | |
| Underlying Affiliated Fund | | Realized
Gain (Loss) | | | Capital Gain
Distributions | | | Dividend
Income | | | Ending
Value | |
MFS Institutional Money
Market Portfolio | | | $— | | | | $— | | | | $2,010 | | | | $13,368,581 | |
35
BOARD REVIEW OF INVESTMENT ADVISORY AGREEMENT
A discussion regarding the Board’s most recent review and renewal of the fund’s Investment Advisory Agreement with MFS is available by clicking on the fund’s name under “Mutual Funds” in the “Products” section of the MFS Web site (mfs.com).
PROXY VOTING POLICIES AND INFORMATION
A general description of the MFS funds’ proxy voting policies and procedures is available without charge, upon request, by calling 1-800-225-2606, by visiting the Proxy Voting section of mfs.com or by visiting the SEC’s Web site at http://www.sec.gov.
Information regarding how the fund voted proxies relating to portfolio securities during the most recent twelve-month period ended June 30 is available without charge by visiting the Proxy Voting section of mfs.com or by visiting the SEC’s Web site at http://www.sec.gov.
QUARTERLY PORTFOLIO DISCLOSURE
The fund will file a complete schedule of portfolio holdings with the Securities and Exchange Commission (the Commission) for the first and third quarters of each fiscal year on Form N-Q. A shareholder can obtain the quarterly portfolio holdings report at mfs.com. The fund’s Form N-Q is also available on the EDGAR database on the Commission’s Internet Web site at http://www.sec.gov, and may be reviewed and copied at the:
Public Reference Room
Securities and Exchange Commission
100 F Street, NE, Room 1580
Washington, D.C. 20549
Information on the operation of the Public Reference Room may be obtained by calling the Commission at 1-800-SEC-0330. Copies of the fund’s Form N-Q also may be obtained, upon payment of a duplicating fee, by electronic request at the following e-mail address: publicinfo@sec.gov, or by writing the Public Reference Section at the above address.
FURTHER INFORMATION
From time to time, MFS may post important information about the fund or the MFS funds on the MFS web site (mfs.com). This information is available by visiting the “Commentary & Announcements” and “Market Outlooks” sections of mfs.com or by clicking on the fund’s name under “Mutual Funds” in the “Products” section of mfs.com.
PROVISION OF FINANCIAL REPORTS AND SUMMARY PROSPECTUSES
The fund produces financial reports every six months and updates its summary prospectus and prospectus annually. To avoid sending duplicate copies of materials to households, only one copy of the fund’s annual and semiannual report and summary prospectus may be mailed to shareholders having the same last name and residential address on the fund’s records. However, any shareholder may contact MFSC (please see back cover for address and telephone number) to request that copies of these reports and summary prospectuses be sent personally to that shareholder.
36
Save paper with eDelivery.

| MFS® will send you prospectuses, |
reports, and proxies directly via e-mail so you will get information faster with less mailbox clutter.
To sign up:
1. Go to mfs.com.
2. Log in via MFS® Access.
3. Select eDelivery.
If you own your MFS fund shares through a financial institution or a retirement plan, MFS® TALK, MFS® Access, or eDelivery may not be available to you.
CONTACT
WEB SITE
mfs.com
MFS TALK
1-800-637-8255
24 hours a day
ACCOUNT SERVICE AND LITERATURE
Shareholders
1-800-225-2606
Financial advisors
1-800-343-2829
Retirement plan services
1-800-637-1255
MAILING ADDRESS
MFS Service Center, Inc.
P.O. Box 55824
Boston, MA 02205-5824
OVERNIGHT MAIL
MFS Service Center, Inc.
c/o Boston Financial Data Services
30 Dan Road
Canton, MA 02021-2809
SEMIANNUAL REPORT
February 28, 2014

MFS® VALUE FUND

EIF-SEM
MFS® VALUE FUND
CONTENTS
The report is prepared for the general information of shareholders. It is authorized for distribution to prospective investors only when preceded or accompanied by a current prospectus.
NOT FDIC INSURED Ÿ MAY LOSE VALUE Ÿ NO BANK GUARANTEE

LETTER FROM THE CHAIRMAN AND CEO
Dear Shareholders:
The U.S. economy appears to have slowed early in 2014 after a strong second half of 2013. Harsh winter weather likely contributed to at least a temporary softening of consumer demand. Looking at the longer term, the pace of U.S. economic growth has
been modest since the recovery began late in 2009. Corporate profits remain healthy overall. A major plus is the removal of a highly confrontational atmosphere in the U.S. Congress, which had clouded business decision-making since 2011.
Globally, recent months have been dominated by volatility, including emerging market currency jitters and rising geopolitical tensions. These add to the possibility of economic uncertainty and financial market unease. However, the eurozone continues to show signs of recovery, while Japan is making progress as it seeks to break free of deflation.
China’s transition toward a more consumer-oriented and less export-driven economy — one with a more stable and sustainable growth rate — could be positive in the long term. However, in the near term, any deceleration in China’s rate of growth could have a ripple effect on its many global trading partners.
In uncertain times such as these, it is particularly important to remember that managing risk should always be a top priority. At MFS®, active risk management is an integral part of our collaborative process. Our global team of investment professionals shares ideas and evaluates opportunities that span continents, investment disciplines and asset classes. Our goal is to build better insights, and ultimately better results, for our clients.
We understand and appreciate the economic challenges investors face, and we believe in the value of maintaining a long-term view and applying proven principles, such as asset allocation and diversification. We are confident that our unique approach can serve investors well as they work with their financial advisors to identify and pursue the most suitable opportunities.
Respectfully,

Robert J. Manning
Chairman and Chief Executive Officer
MFS Investment Management
April 14, 2014
The opinions expressed in this letter are subject to change, may not be relied upon for investment advice, and no forecasts can be guaranteed.
1
PORTFOLIO COMPOSITION
Portfolio structure
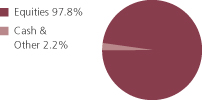
| | | | |
| Top ten holdings | | | | |
| JPMorgan Chase & Co. | | | 3.9% | |
| Philip Morris International, Inc. | | | 3.5% | |
| Johnson & Johnson | | | 3.3% | |
| Pfizer, Inc. | | | 3.2% | |
| Wells Fargo & Co. | | | 3.0% | |
| Lockheed Martin Corp. | | | 2.4% | |
| Exxon Mobil Corp. | | | 2.2% | |
| Accenture PLC, “A” | | | 2.1% | |
| United Technologies Corp. | | | 2.0% | |
| 3M Co. | | | 2.0% | |
| | | | |
| Equity sectors | | | | |
| Financial Services | | | 22.5% | |
| Health Care | | | 14.3% | |
| Consumer Staples | | | 12.5% | |
| Industrial Goods & Services | | | 11.3% | |
| Leisure | | | 7.1% | |
| Energy | | | 5.9% | |
| Retailing | | | 4.7% | |
| Utilities & Communications | | | 4.0% | |
| Technology | | | 4.0% | |
| Basic Materials | | | 3.8% | |
| Special Products & Services | | | 2.9% | |
| Autos & Housing | | | 2.7% | |
| Transportation | | | 2.1% | |
Percentages are based on net assets as of 2/28/14.
The portfolio is actively managed and current holdings may be different.
2
EXPENSE TABLE
Fund expenses borne by the shareholders during the period,
September 1, 2013 through February 28, 2014
As a shareholder of the fund, you incur two types of costs: (1) transaction costs, including sales charges (loads) on certain purchase or redemption payments, and (2) ongoing costs, including management fees; distribution and service (12b-1) fees; and other fund expenses. This example is intended to help you understand your ongoing costs (in dollars) of investing in the fund and to compare these costs with the ongoing costs of investing in other mutual funds.
The example is based on an investment of $1,000 invested at the beginning of the period and held for the entire period September 1, 2013 through February 28, 2014.
Actual Expenses
The first line for each share class in the following table provides information about actual account values and actual expenses. You may use the information in this line, together with the amount you invested, to estimate the expenses that you paid over the period. Simply divide your account value by $1,000 (for example, an $8,600 account value divided by $1,000 = 8.6), then multiply the result by the number in the first line under the heading entitled “Expenses Paid During Period” to estimate the expenses you paid on your account during this period.
Hypothetical Example for Comparison Purposes
The second line for each share class in the following table provides information about hypothetical account values and hypothetical expenses based on the fund’s actual expense ratio and an assumed rate of return of 5% per year before expenses, which is not the fund’s actual return. The hypothetical account values and expenses may not be used to estimate the actual ending account balance or expenses you paid for the period. You may use this information to compare the ongoing costs of investing in the fund and other funds. To do so, compare this 5% hypothetical example with the 5% hypothetical examples that appear in the shareholder reports of the other funds.
Please note that the expenses shown in the table are meant to highlight your ongoing costs only and do not reflect any transactional costs, such as sales charges (loads). Therefore, the second line for each share class in the table is useful in comparing ongoing costs only, and will not help you determine the relative total costs of owning different funds. In addition, if these transactional costs were included, your costs would have been higher.
3
Expense Table – continued
| | | | | | | | | | | | | | | | | | |
Share
Class | | | | Annualized
Expense Ratio | | | Beginning
Account Value
9/01/13 | | | Ending Account Value
2/28/14 | | | Expenses Paid During Period (p) 9/01/13-2/28/14 | |
| A | | Actual | | | 0.88% | | | | $1,000.00 | | | | $1,141.97 | | | | $4.67 | |
| | Hypothetical (h) | | | 0.88% | | | | $1,000.00 | | | | $1,020.43 | | | | $4.41 | |
| B | | Actual | | | 1.62% | | | | $1,000.00 | | | | $1,137.96 | | | | $8.59 | |
| | Hypothetical (h) | | | 1.62% | | | | $1,000.00 | | | | $1,016.76 | | | | $8.10 | |
| C | | Actual | | | 1.63% | | | | $1,000.00 | | | | $1,138.08 | | | | $8.64 | |
| | Hypothetical (h) | | | 1.63% | | | | $1,000.00 | | | | $1,016.71 | | | | $8.15 | |
| I | | Actual | | | 0.63% | | | | $1,000.00 | | | | $1,143.38 | | | | $3.35 | |
| | Hypothetical (h) | | | 0.63% | | | | $1,000.00 | | | | $1,021.67 | | | | $3.16 | |
| R1 | | Actual | | | 1.63% | | | | $1,000.00 | | | | $1,137.80 | | | | $8.64 | |
| | Hypothetical (h) | | | 1.63% | | | | $1,000.00 | | | | $1,016.71 | | | | $8.15 | |
| R2 | | Actual | | | 1.13% | | | | $1,000.00 | | | | $1,140.64 | | | | $6.00 | |
| | Hypothetical (h) | | | 1.13% | | | | $1,000.00 | | | | $1,019.19 | | | | $5.66 | |
| R3 | | Actual | | | 0.87% | | | | $1,000.00 | | | | $1,142.05 | | | | $4.62 | |
| | Hypothetical (h) | | | 0.87% | | | | $1,000.00 | | | | $1,020.48 | | | | $4.36 | |
| R4 | | Actual | | | 0.63% | | | | $1,000.00 | | | | $1,143.37 | | | | $3.35 | |
| | Hypothetical (h) | | | 0.63% | | | | $1,000.00 | | | | $1,021.67 | | | | $3.16 | |
| R5 | | Actual | | | 0.53% | | | | $1,000.00 | | | | $1,144.34 | | | | $2.82 | |
| | Hypothetical (h) | | | 0.53% | | | | $1,000.00 | | | | $1,022.17 | | | | $2.66 | |
| 529A | | Actual | | | 0.87% | | | | $1,000.00 | | | | $1,142.35 | | | | $4.62 | |
| | Hypothetical (h) | | | 0.87% | | | | $1,000.00 | | | | $1,020.48 | | | | $4.36 | |
| 529B | | Actual | | | 1.67% | | | | $1,000.00 | | | | $1,137.64 | | | | $8.85 | |
| | Hypothetical (h) | | | 1.67% | | | | $1,000.00 | | | | $1,016.51 | | | | $8.35 | |
| 529C | | Actual | | | 1.67% | | | | $1,000.00 | | | | $1,137.69 | | | | $8.85 | |
| | Hypothetical (h) | | | 1.67% | | | | $1,000.00 | | | | $1,016.51 | | | | $8.35 | |
| (h) | 5% class return per year before expenses. |
| (p) | Expenses Paid During Period are equal to each class’s annualized expense ratio, as shown above, multiplied by the average account value over the period, multiplied by 181/365 (to reflect the one-half year period). Expenses paid do not include any applicable sales charges (loads). If these transaction costs had been included, your costs would have been higher. |
Notes to Expense Table
Each class with a Rule 12b-1 service fee is subject to a rebate of a portion of such fee. Such rebates are included in the expense ratios above. For Class 529A and Class 529B shares, this rebate reduced the expense ratio above by 0.05%, and 0.01%, respectively. See Note 3 in the Notes to Financial Statements for additional information.
4
PORTFOLIO OF INVESTMENTS
2/28/14 (unaudited)
The Portfolio of Investments is a complete list of all securities owned by your fund. It is categorized by broad-based asset classes.
| | | | | | | | |
| Common Stocks - 97.7% | | | | | | | | |
| Issuer | | Shares/Par | | | Value ($) | |
| | | | | | | | |
| Aerospace - 7.2% | | | | | | | | |
| Honeywell International, Inc. | | | 6,498,610 | | | $ | 613,728,726 | |
| Lockheed Martin Corp. | | | 4,677,699 | | | | 759,190,548 | |
| Northrop Grumman Corp. | | | 2,185,978 | | | | 264,568,917 | |
| United Technologies Corp. | | | 5,601,045 | | | | 655,434,286 | |
| | | | | | | | |
| | | | | | | $ | 2,292,922,477 | |
| Alcoholic Beverages - 1.5% | | | | | | | | |
| Diageo PLC | | | 15,120,065 | | | $ | 475,623,429 | |
| | |
| Automotive - 1.9% | | | | | | | | |
| Delphi Automotive PLC | | | 3,253,453 | | | $ | 216,582,366 | |
| General Motors Co. | | | 1,804,982 | | | | 65,340,348 | |
| Johnson Controls, Inc. | | | 6,855,782 | | | | 338,675,631 | |
| | | | | | | | |
| | | | | | | $ | 620,598,345 | |
| Broadcasting - 3.9% | | | | | | | | |
| Omnicom Group, Inc. | | | 5,241,089 | | | $ | 396,645,616 | |
| Time Warner, Inc. | | | 1,455,680 | | | | 97,719,798 | |
| Viacom, Inc., “B” | | | 3,092,728 | | | | 271,325,027 | |
| Walt Disney Co. | | | 5,797,227 | | | | 468,473,914 | |
| | | | | | | | |
| | | | | | | $ | 1,234,164,355 | |
| Brokerage & Asset Managers - 2.5% | | | | | | | | |
| BlackRock, Inc. | | | 947,024 | | | $ | 288,690,796 | |
| Franklin Resources, Inc. | | | 7,063,472 | | | | 376,129,884 | |
| NASDAQ OMX Group, Inc. | | | 3,259,986 | | | | 125,150,863 | |
| | | | | | | | |
| | | | | | | $ | 789,971,543 | |
| Business Services - 2.9% | | | | | | | | |
| Accenture PLC, “A” | | | 8,028,395 | | | $ | 669,166,723 | |
| Fidelity National Information Services, Inc. | | | 1,683,820 | | | | 93,637,230 | |
| Fiserv, Inc. (a) | | | 3,018,734 | | | | 175,237,509 | |
| | | | | | | | |
| | | | | | | $ | 938,041,462 | |
| Cable TV - 1.0% | | | | | | | | |
| Comcast Corp., “Special A” | | | 6,445,818 | | | $ | 321,614,089 | |
| | |
| Chemicals - 3.3% | | | | | | | | |
| 3M Co. | | | 4,699,379 | | | $ | 633,147,333 | |
| PPG Industries, Inc. | | | 2,193,843 | | | | 433,986,022 | |
| | | | | | | | |
| | | | | | | $ | 1,067,133,355 | |
5
Portfolio of Investments (unaudited) – continued
| | | | | | | | |
| Issuer | | Shares/Par | | | Value ($) | |
| | | | | | | | |
| Common Stocks - continued | | | | | | | | |
| Computer Software - 1.4% | | | | | | | | |
| Oracle Corp. | | | 11,410,697 | | | $ | 446,272,360 | |
| | |
| Computer Software - Systems - 2.1% | | | | | | | | |
| Hewlett-Packard Co. | | | 2,203,005 | | | $ | 65,825,789 | |
| International Business Machines Corp. | | | 3,194,467 | | | | 591,519,454 | |
| | | | | | | | |
| | | | | | | $ | 657,345,243 | |
| Construction - 0.7% | | | | | | | | |
| Stanley Black & Decker, Inc. | | | 2,833,009 | | | $ | 235,253,067 | |
| | |
| Consumer Products - 0.5% | | | | | | | | |
| Procter & Gamble Co. | | | 2,072,140 | | | $ | 162,994,532 | |
| | |
| Containers - 0.4% | | | | | | | | |
| Crown Holdings, Inc. (a) | | | 2,655,650 | | | $ | 119,557,363 | |
| | |
| Electrical Equipment - 2.8% | | | | | | | | |
| Danaher Corp. | | | 5,172,485 | | | $ | 395,643,378 | |
| Pentair Ltd. | | | 1,634,740 | | | | 132,103,339 | |
| Tyco International Ltd. | | | 8,506,455 | | | | 358,802,272 | |
| | | | | | | | |
| | | | | | | $ | 886,548,989 | |
| Electronics - 0.6% | | | | | | | | |
| Intel Corp. | | | 7,171,000 | | | $ | 177,553,960 | |
| | |
| Energy - Independent - 2.2% | | | | | | | | |
| Apache Corp. | | | 1,611,334 | | | $ | 127,762,673 | |
| EOG Resources, Inc. | | | 654,945 | | | | 124,059,682 | |
| Occidental Petroleum Corp. | | | 4,574,775 | | | | 441,557,283 | |
| | | | | | | | |
| | | | | | | $ | 693,379,638 | |
| Energy - Integrated - 3.7% | | | | | | | | |
| Chevron Corp. | | | 4,106,750 | | | $ | 473,631,478 | |
| Exxon Mobil Corp. | | | 7,463,612 | | | | 718,521,927 | |
| | | | | | | | |
| | | | | | | $ | 1,192,153,405 | |
| Food & Beverages - 5.2% | | | | | | | | |
| Coca-Cola Enterprises, Inc. | | | 2,585,230 | | | $ | 121,712,628 | |
| Dr Pepper Snapple Group, Inc. | | | 2,931,150 | | | | 152,742,227 | |
| General Mills, Inc. | | | 9,425,902 | | | | 471,577,877 | |
| Groupe Danone | | | 3,555,079 | | | | 251,144,191 | |
| Kellogg Co. | | | 1,415,154 | | | | 85,885,696 | |
| Nestle S.A. | | | 7,563,732 | | | | 572,762,423 | |
| | | | | | | | |
| | | | | | | $ | 1,655,825,042 | |
6
Portfolio of Investments (unaudited) – continued
| | | | | | | | |
| Issuer | | Shares/Par | | | Value ($) | |
| | | | | | | | |
| Common Stocks - continued | | | | | | | | |
| Food & Drug Stores - 1.8% | | | | | | | | |
| CVS Caremark Corp. | | | 7,886,059 | | | $ | 576,786,355 | |
| | |
| General Merchandise - 1.7% | | | | | | | | |
| Kohl’s Corp. | | | 1,354,252 | | | $ | 76,095,420 | |
| Target Corp. | | | 7,398,228 | | | | 462,685,179 | |
| | | | | | | | |
| | | | | | | $ | 538,780,599 | |
| Insurance - 7.1% | | | | | | | | |
| ACE Ltd. | | | 3,389,349 | | | $ | 331,715,587 | |
| Aon PLC | | | 3,546,726 | | | | 303,599,746 | |
| Chubb Corp. | | | 2,186,119 | | | | 191,241,690 | |
| MetLife, Inc. | | | 11,834,561 | | | | 599,657,206 | |
| Prudential Financial, Inc. | | | 4,386,721 | | | | 371,028,862 | |
| Travelers Cos., Inc. | | | 5,719,288 | | | | 479,505,106 | |
| | | | | | | | |
| | | | | | | $ | 2,276,748,197 | |
| Leisure & Toys - 0.5% | | | | | | | | |
| Hasbro, Inc. | | | 2,811,014 | | | $ | 155,055,532 | |
| | |
| Machinery & Tools - 1.3% | | | | | | | | |
| Eaton Corp. PLC | | | 3,798,180 | | | $ | 283,762,028 | |
| Illinois Tool Works, Inc. | | | 1,660,527 | | | | 136,993,478 | |
| | | | | | | | |
| | | | | | | $ | 420,755,506 | |
| Major Banks - 11.7% | | | | | | | | |
| Bank of New York Mellon Corp. | | | 13,422,477 | | | $ | 429,519,264 | |
| Goldman Sachs Group, Inc. | | | 3,701,037 | | | | 616,037,609 | |
| JPMorgan Chase & Co. | | | 21,892,990 | | | | 1,243,959,692 | |
| PNC Financial Services Group, Inc. | | | 2,769,215 | | | | 226,466,403 | |
| State Street Corp. | | | 4,205,810 | | | | 276,195,543 | |
| Wells Fargo & Co. | | | 20,656,079 | | | | 958,855,187 | |
| | | | | | | | |
| | | | | | | $ | 3,751,033,698 | |
| Medical & Health Technology & Services - 1.3% | | | | | | | | |
| Express Scripts Holding Co. (a) | | | 4,299,460 | | | $ | 323,792,333 | |
| Quest Diagnostics, Inc. | | | 2,060,636 | | | | 109,213,708 | |
| | | | | | | | |
| | | | | | | $ | 433,006,041 | |
| Medical Equipment - 4.7% | | | | | | | | |
| Abbott Laboratories | | | 9,261,213 | | | $ | 368,411,053 | |
| Covidien PLC | | | 2,626,000 | | | | 188,940,700 | |
| Medtronic, Inc. | | | 6,194,870 | | | | 367,107,996 | |
| St. Jude Medical, Inc. | | | 3,594,308 | | | | 241,968,815 | |
| Thermo Fisher Scientific, Inc. | | | 2,817,033 | | | | 350,833,290 | |
| | | | | | | | |
| | | | | | | $ | 1,517,261,854 | |
7
Portfolio of Investments (unaudited) – continued
| | | | | | | | |
| Issuer | | Shares/Par | | | Value ($) | |
| | | | | | | | |
| Common Stocks - continued | | | | | | | | |
| Other Banks & Diversified Financials - 1.2% | | | | | | | | |
| U.S. Bancorp | | | 6,997,160 | | | $ | 287,863,162 | |
| Western Union Co. | | | 5,306,988 | | | | 88,785,909 | |
| | | | | | | | |
| | | | | | | $ | 376,649,071 | |
| Pharmaceuticals - 8.2% | | | | | | | | |
| Johnson & Johnson | | | 11,559,995 | | | $ | 1,064,906,739 | |
| Merck & Co., Inc. | | | 5,841,019 | | | | 332,879,673 | |
| Novartis AG | | | 1,174,430 | | | | 98,080,595 | |
| Pfizer, Inc. | | | 31,509,465 | | | | 1,011,768,921 | |
| Roche Holding AG | | | 336,908 | | | | 103,964,561 | |
| Zoetis, Inc. | | | 280,610 | | | | 8,704,522 | |
| | | | | | | | |
| | | | | | | $ | 2,620,305,011 | |
| Printing & Publishing - 0.7% | | | | | | | | |
| McGraw-Hill Cos., Inc. | | | 1,677,960 | | | $ | 133,666,294 | |
| Moody’s Corp. | | | 1,183,739 | | | | 93,515,381 | |
| | | | | | | | |
| | | | | | | $ | 227,181,675 | |
| Railroad & Shipping - 0.6% | | | | | | | | |
| Canadian National Railway Co. | | | 3,475,922 | | | $ | 196,528,630 | |
| | |
| Restaurants - 1.0% | | | | | | | | |
| McDonald’s Corp. | | | 3,474,709 | | | $ | 330,618,561 | |
| | |
| Specialty Chemicals - 0.1% | | | | | | | | |
| Valspar Corp. | | | 409,010 | | | $ | 30,573,498 | |
| | |
| Specialty Stores - 1.2% | | | | | | | | |
| Advance Auto Parts, Inc. | | | 1,479,630 | | | $ | 188,445,677 | |
| Bed Bath & Beyond, Inc. (a) | | | 769,390 | | | | 52,180,030 | |
| Staples, Inc. | | | 10,537,971 | | | | 143,211,026 | |
| | | | | | | | |
| | | | | | | $ | 383,836,733 | |
| Telecommunications - Wireless - 0.7% | | | | | | | | |
| Vodafone Group PLC | | | 55,520,991 | | | $ | 231,502,102 | |
| | |
| Telephone Services - 2.6% | | | | | | | | |
| AT&T, Inc. | | | 8,886,538 | | | $ | 283,747,158 | |
| Verizon Communications, Inc. | | | 2,677,047 | | | | 126,945,569 | |
| Verizon Communications, Inc. | | | 8,829,220 | | | | 420,094,288 | |
| | | | | | | | |
| | | | | | | $ | 830,787,015 | |
| Tobacco - 5.3% | | | | | | | | |
| Altria Group, Inc. | | | 3,587,145 | | | $ | 130,069,878 | |
| Imperial Tobacco Group PLC | | | 1,571,088 | | | | 64,114,229 | |
8
Portfolio of Investments (unaudited) – continued
| | | | | | | | |
| Issuer | | Shares/Par | | | Value ($) | |
| | | | | | | | |
| Common Stocks - continued | | | | | | | | |
| Tobacco - continued | | | | | | | | |
| Lorillard, Inc. | | | 7,472,603 | | | $ | 366,605,903 | |
| Philip Morris International, Inc. | | | 14,032,322 | | | | 1,135,355,173 | |
| | | | | | | | |
| | | | | | | $ | 1,696,145,183 | |
| Trucking - 1.5% | | | | | | | | |
| United Parcel Service, Inc., “B” | | | 5,056,269 | | | $ | 484,238,882 | |
| | |
| Utilities - Electric Power - 0.7% | | | | | | | | |
| Duke Energy Corp. | | | 1,489,130 | | | $ | 105,549,534 | |
| PPL Corp. | | | 2,286,294 | | | | 73,824,433 | |
| Public Service Enterprise Group, Inc. | | | 1,447,685 | | | | 53,072,132 | |
| | | | | | | | |
| | | | | | | $ | 232,446,099 | |
| Total Common Stocks (Identified Cost, $21,390,756,012) | | | $ | 31,277,192,896 | |
| | |
| Convertible Preferred Stocks - 0.1% | | | | | | | | |
| Aerospace - 0.1% | | | | | | | | |
| United Technologies Corp., 7.5% (Identified Cost, $18,338,355) | | | 364,100 | | | $ | 24,201,727 | |
| | |
| Money Market Funds - 1.4% | | | | | | | | |
MFS Institutional Money Market Portfolio, 0.08%,
at Cost and Net Asset Value (v) | | | 464,971,463 | | | $ | 464,971,463 | |
| Total Investments (Identified Cost, $21,874,065,830) | | | | | | $ | 31,766,366,086 | |
| | |
| Other Assets, Less Liabilities - 0.8% | | | | | | | 246,355,785 | |
| Net Assets - 100.0% | | | | | | $ | 32,012,721,871 | |
| (a) | Non-income producing security. |
| (v) | Underlying affiliated fund that is available only to investment companies managed by MFS. The rate quoted for the MFS Institutional Money Market Portfolio is the annualized seven-day yield of the fund at period end. |
The following abbreviations are used in this report and are defined:
| PLC | | Public Limited Company |
See Notes to Financial Statements
9
Financial Statements
STATEMENT OF ASSETS AND LIABILITIES
At 2/28/14 (unaudited)
This statement represents your fund’s balance sheet, which details the assets and liabilities comprising the total value of the fund.
| | | | |
| Assets | | | | |
Investments- | | | | |
Non-affiliated issuers, at value (identified cost, $21,409,094,367) | | | $31,301,394,623 | |
Underlying affiliated funds, at cost and value | | | 464,971,463 | |
Total investments, at value (identified cost, $21,874,065,830) | | | $31,766,366,086 | |
Receivables for | | | | |
Investments sold | | | 44,800,110 | |
Fund shares sold | | | 127,622,345 | |
Dividends | | | 144,547,230 | |
Other assets | | | 148,043 | |
Total assets | | | $32,083,483,814 | |
| Liabilities | | | | |
Payable for fund shares reacquired | | | $53,924,772 | |
Payable to affiliates | | | | |
Investment adviser | | | 819,830 | |
Shareholder servicing costs | | | 15,063,410 | |
Distribution and service fees | | | 237,317 | |
Program manager fees | | | 49 | |
Payable for independent Trustees’ compensation | | | 3,841 | |
Accrued expenses and other liabilities | | | 712,724 | |
Total liabilities | | | $70,761,943 | |
Net assets | | | $32,012,721,871 | |
| Net assets consist of | | | | |
Paid-in capital | | | $21,535,897,284 | |
Unrealized appreciation (depreciation) on investments and translation of assets and liabilities in foreign currencies | | | 9,892,980,058 | |
Accumulated net realized gain (loss) on investments and foreign currency | | | 323,699,977 | |
Undistributed net investment income | | | 260,144,552 | |
Net assets | | | $32,012,721,871 | |
Shares of beneficial interest outstanding | | | 963,522,629 | |
10
Statement of Assets and Liabilities (unaudited) – continued
| | | | | | | | | | | | |
| | | Net assets | | | Shares
outstanding | | | Net asset value
per share (a) | |
Class A | | | $9,218,370,969 | | | | 277,818,977 | | | | $33.18 | |
Class B | | | 183,382,205 | | | | 5,556,753 | | | | 33.00 | |
Class C | | | 1,283,748,987 | | | | 39,092,627 | | | | 32.84 | |
Class I | | | 12,526,587,010 | | | | 375,605,423 | | | | 33.35 | |
Class R1 | | | 33,105,577 | | | | 1,014,605 | | | | 32.63 | |
Class R2 | | | 602,082,004 | | | | 18,301,116 | | | | 32.90 | |
Class R3 | | | 1,496,073,583 | | | | 45,214,439 | | | | 33.09 | |
Class R4 | | | 3,174,877,562 | | | | 95,646,605 | | | | 33.19 | |
Class R5 | | | 3,476,637,221 | | | | 104,728,656 | | | | 33.20 | |
Class 529A | | | 13,146,493 | | | | 398,694 | | | | 32.97 | |
Class 529B | | | 1,042,439 | | | | 31,973 | | | | 32.60 | |
Class 529C | | | 3,667,821 | | | | 112,761 | | | | 32.53 | |
| (a) | Maximum offering price per share was equal to the net asset value per share for all share classes, except for Classes A and 529A, for which the maximum offering prices per share were $35.20 [100 / 94.25 x $33.18] and $34.98 [100 / 94.25 x $32.97], respectively. On sales of $50,000 or more, the maximum offering prices of Class A and Class 529A shares are reduced. A contingent deferred sales charge may be imposed on redemptions of Class A, Class B, Class C, Class 529B, and Class 529C shares. Redemption price per share was equal to the net asset value per share for Classes I, R1, R2, R3, R4, R5, and 529A. |
See Notes to Financial Statements
11
Financial Statements
STATEMENT OF OPERATIONS
Six months ended 2/28/14 (unaudited)
This statement describes how much your fund earned in investment income and accrued in expenses. It also describes any gains and/or losses generated by fund operations.
| | | | |
| Net investment income | | | | |
Income | | | | |
Dividends | | | $526,816,907 | |
Interest | | | 4,707 | |
Dividends from underlying affiliated funds | | | 173,165 | |
Foreign taxes withheld | | | (1,217,435 | ) |
Total investment income | | | $525,777,344 | |
Expenses | | | | |
Management fee | | | $78,166,322 | |
Distribution and service fees | | | 21,248,275 | |
Program manager fees | | | 8,343 | |
Shareholder servicing costs | | | 13,989,033 | |
Administrative services fee | | | 236,501 | |
Independent Trustees’ compensation | | | 124,459 | |
Custodian fee | | | 348,239 | |
Shareholder communications | | | 659,590 | |
Audit and tax fees | | | 26,860 | |
Legal fees | | | 123,601 | |
Miscellaneous | | | 604,590 | |
Total expenses | | | $115,535,813 | |
Fees paid indirectly | | | (193 | ) |
Reduction of expenses by investment adviser and distributor | | | (2,863,640 | ) |
Net expenses | | | $112,671,980 | |
Net investment income | | | $413,105,364 | |
| Realized and unrealized gain (loss) on investments and foreign currency | |
Realized gain (loss) (identified cost basis) | | | | |
Investments | | | $883,083,315 | |
Foreign currency | | | 263,801 | |
Net realized gain (loss) on investments and foreign currency | | | $883,347,116 | |
Change in unrealized appreciation (depreciation) | | | | |
Investments | | | $2,602,246,365 | |
Translation of assets and liabilities in foreign currencies | | | 728,360 | |
Net unrealized gain (loss) on investments and foreign currency translation | | | $2,602,974,725 | |
Net realized and unrealized gain (loss) on investments and foreign currency | | | $3,486,321,841 | |
Change in net assets from operations | | | $3,899,427,205 | |
See Notes to Financial Statements
12
Financial Statements
STATEMENTS OF CHANGES IN NET ASSETS
These statements describe the increases and/or decreases in net assets resulting from operations, any distributions, and any shareholder transactions.
| | | | | | | | |
Change in net assets | | Six months ended
2/28/14 (unaudited) | | | Year ended
8/31/13 | |
| | |
| From operations | | | | | | | | |
Net investment income | | | $413,105,364 | | | | $456,013,931 | |
Net realized gain (loss) on investments and foreign currency | | | 883,347,116 | | | | 174,130,167 | |
Net unrealized gain (loss) on investments and foreign currency translation | | | 2,602,974,725 | | | | 4,167,786,045 | |
Change in net assets from operations | | | $3,899,427,205 | | | | $4,797,930,143 | |
| Distributions declared to shareholders | | | | | | | | |
From net investment income | | | $(244,715,130 | ) | | | $(430,454,430 | ) |
From net realized gain on investments | | | (534,397,478 | ) | | | (157,367,309 | ) |
Total distributions declared to shareholders | | | $(779,112,608 | ) | | | $(587,821,739 | ) |
Change in net assets from fund share transactions | | | $1,830,226,366 | | | | $2,245,166,320 | |
Total change in net assets | | | $4,950,540,963 | | | | $6,455,274,724 | |
| Net assets | | | | | | | | |
At beginning of period | | | 27,062,180,908 | | | | 20,606,906,184 | |
At end of period (including undistributed net investment income of $260,144,552 and $91,754,318, respectively) | | | $32,012,721,871 | | | | $27,062,180,908 | |
See Notes to Financial Statements
13
Financial Statements
FINANCIAL HIGHLIGHTS
The financial highlights table is intended to help you understand the fund’s financial performance for the semiannual period and the past 5 fiscal years. Certain information reflects financial results for a single fund share. The total returns in the table represent the rate by which an investor would have earned (or lost) on an investment in the fund share class (assuming reinvestment of all distributions) held for the entire period.
| | | | | | | | | | | | | | | | | | | | | | | | |
| | | Six months
ended
2/28/14 | | | Years ended 8/31 | |
| Class A | | | 2013 | | | 2012 | | | 2011 | | | 2010 | | | 2009 | |
| | | (unaudited) | | | | | | | | | | | | | | | | |
Net asset value, beginning of
period | | | $29.81 | | | | $24.90 | | | | $21.83 | | | | $19.46 | | | | $19.39 | | | | $23.75 | |
| Income (loss) from investment operations | | | | | | | | | | | | | | | | | |
Net investment income (d) | | | $0.42 | | | | $0.50 | | | | $0.43 | | | | $0.34 | | | | $0.32 | | | | $0.34 | |
Net realized and unrealized
gain (loss) on investments
and foreign currency | | | 3.78 | | | | 5.08 | | | | 3.05 | | | | 2.35 | | | | 0.06 | (g) | | | (4.35 | ) |
Total from investment
operations | | | $4.20 | | | | $5.58 | | | | $3.48 | | | | $2.69 | | | | $0.38 | | | | $(4.01 | ) |
| Less distributions declared to shareholders | | | | | | | | | | | | | | | | | |
From net investment income | | | $(0.25 | ) | | | $(0.48 | ) | | | $(0.41 | ) | | | $(0.32 | ) | | | $(0.31 | ) | | | $(0.35 | ) |
From net realized gain on
investments | | | (0.58 | ) | | | (0.19 | ) | | | — | | | | — | | | | — | | | | — | |
Total distributions declared to
shareholders | | | $(0.83 | ) | | | $(0.67 | ) | | | $(0.41 | ) | | | $(0.32 | ) | | | $(0.31 | ) | | | $(0.35 | ) |
Net asset value, end of
period (x) | | | $33.18 | | | | $29.81 | | | | $24.90 | | | | $21.83 | | | | $19.46 | | | | $19.39 | |
Total return (%) (r)(s)(t)(x) | | | 14.20 | (n) | | | 22.75 | | | | 16.16 | | | | 13.78 | | | | 1.88 | | | | (16.75 | ) |
Ratios (%) (to average net assets)
and Supplemental data: | | | | | | | | | | | | | | | | | | | | | |
Expenses before expense
reductions (f) | | | 0.90 | (a) | | | 0.93 | | | | 0.95 | | | | 0.95 | | | | 0.98 | | | | 1.09 | |
Expenses after expense
reductions (f) | | | 0.88 | (a) | | | 0.92 | | | | 0.93 | | | | 0.94 | | | | 0.98 | | | | 1.09 | |
Net investment income | | | 2.64 | (a) | | | 1.80 | | | | 1.86 | | | | 1.49 | | | | 1.54 | | | | 1.94 | |
Portfolio turnover | | | 8 | (n) | | | 12 | | | | 14 | | | | 17 | | | | 22 | | | | 33 | |
Net assets at end of period
(000 omitted) | | | $9,218,371 | | | | $8,058,858 | | | | $6,628,244 | | | | $5,086,069 | | | | $4,980,816 | | | | $4,665,411 | |
See Notes to Financial Statements
14
Financial Highlights – continued
| | | | | | | | | | | | | | | | | | | | | | | | |
| | | Six months
ended
2/28/14 | | | Years ended 8/31 | |
| Class B | | | 2013 | | | 2012 | | | 2011 | | | 2010 | | | 2009 | |
| | | (unaudited) | | | | | | | | | | | | | | | | |
Net asset value, beginning of
period | | | $29.64 | | | | $24.76 | | | | $21.70 | | | | $19.34 | | | | $19.26 | | | | $23.59 | |
| Income (loss) from investment operations | | | | | | | | | | | | | | | | | | | | | |
Net investment income (d) | | | $0.30 | | | | $0.29 | | | | $0.26 | | | | $0.16 | | | | $0.16 | | | | $0.22 | |
Net realized and unrealized
gain (loss) on investments
and foreign currency | | | 3.77 | | | | 5.05 | | | | 3.03 | | | | 2.34 | | | | 0.07 | (g) | | | (4.34 | ) |
Total from investment
operations | | | $4.07 | | | | $5.34 | | | | $3.29 | | | | $2.50 | | | | $0.23 | | | | $(4.12 | ) |
| Less distributions declared to shareholders | | | | | | | | | | | | | | | | | |
From net investment income | | | $(0.13 | ) | | | $(0.27 | ) | | | $(0.23 | ) | | | $(0.14 | ) | | | $(0.15 | ) | | | $(0.21 | ) |
From net realized gain on
investments | | | (0.58 | ) | | | (0.19 | ) | | | — | | | | — | | | | — | | | | — | |
Total distributions declared to
shareholders | | | $(0.71 | ) | | | $(0.46 | ) | | | $(0.23 | ) | | | $(0.14 | ) | | | $(0.15 | ) | | | $(0.21 | ) |
Net asset value, end of
period (x) | | | $33.00 | | | | $29.64 | | | | $24.76 | | | | $21.70 | | | | $19.34 | | | | $19.26 | |
Total return (%) (r)(s)(t)(x) | | | 13.80 | (n) | | | 21.82 | | | | 15.28 | | | | 12.92 | | | | 1.14 | | | | (17.36 | ) |
Ratios (%) (to average net assets)
and Supplemental data: | | | | | | | | | | | | | | | | | | | | | |
Expenses before expense
reductions (f) | | | 1.64 | (a) | | | 1.68 | | | | 1.70 | | | | 1.70 | | | | 1.73 | | | | 1.79 | |
Expenses after expense
reductions (f) | | | 1.62 | (a) | | | 1.67 | | | | 1.68 | | | | 1.69 | | | | 1.73 | | | | 1.79 | |
Net investment income | | | 1.87 | (a) | | | 1.05 | | | | 1.11 | | | | 0.73 | | | | 0.80 | | | | 1.26 | |
Portfolio turnover | | | 8 | (n) | | | 12 | | | | 14 | | | | 17 | | | | 22 | | | | 33 | |
Net assets at end of period
(000 omitted) | | | $183,382 | | | | $169,208 | | | | $167,949 | | | | $182,654 | | | | $238,473 | | | | $371,270 | |
See Notes to Financial Statements
15
Financial Highlights – continued
| | | | | | | | | | | | | | | | | | | | | | | | |
| | | Six months
ended
2/28/14 | | | Years ended 8/31 | |
| Class C | | | 2013 | | | 2012 | | | 2011 | | | 2010 | | | 2009 | |
| | | (unaudited) | | | | | | | | | | | | | | | | |
Net asset value, beginning of
period | | | $29.50 | | | | $24.65 | | | | $21.62 | | | | $19.27 | | | | $19.21 | | | | $23.54 | |
| Income (loss) from investment operations | | | | | | | | | | | | | | | | | | | | | |
Net investment income (d) | | | $0.30 | | | | $0.29 | | | | $0.25 | | | | $0.17 | | | | $0.16 | | | | $0.22 | |
Net realized and unrealized
gain (loss) on investments
and foreign currency | | | 3.75 | | | | 5.03 | | | | 3.02 | | | | 2.33 | | | | 0.06 | (g) | | | (4.33 | ) |
Total from investment
operations | | | $4.05 | | | | $5.32 | | | | $3.27 | | | | $2.50 | | | | $0.22 | | | | $(4.11 | ) |
| Less distributions declared to shareholders | | | | | | | | | | | | | | | | | |
From net investment income | | | $(0.13 | ) | | | $(0.28 | ) | | | $(0.24 | ) | | | $(0.15 | ) | | | $(0.16 | ) | | | $(0.22 | ) |
From net realized gain on
investments | | | (0.58 | ) | | | (0.19 | ) | | | — | | | | — | | | | — | | | | — | |
Total distributions declared to
shareholders | | | $(0.71 | ) | | | $(0.47 | ) | | | $(0.24 | ) | | | $(0.15 | ) | | | $(0.16 | ) | | | $(0.22 | ) |
Net asset value, end of
period (x) | | | $32.84 | | | | $29.50 | | | | $24.65 | | | | $21.62 | | | | $19.27 | | | | $19.21 | |
Total return (%) (r)(s)(t)(x) | | | 13.81 | (n) | | | 21.83 | | | | 15.23 | | | | 12.97 | | | | 1.11 | | | | (17.35 | ) |
Ratios (%) (to average net assets)
and Supplemental data: | | | | | | | | | | | | | | | | | | | | | |
Expenses before expense
reductions (f) | | | 1.64 | (a) | | | 1.68 | | | | 1.69 | | | | 1.70 | | | | 1.73 | | | | 1.79 | |
Expenses after expense
reductions (f) | | | 1.63 | (a) | | | 1.67 | | | | 1.68 | | | | 1.69 | | | | 1.73 | | | | 1.79 | |
Net investment income | | | 1.91 | (a) | | | 1.05 | | | | 1.11 | | | | 0.74 | | | | 0.79 | | | | 1.24 | |
Portfolio turnover | | | 8 | (n) | | | 12 | | | | 14 | | | | 17 | | | | 22 | | | | 33 | |
Net assets at end of period
(000 omitted) | | | $1,283,749 | | | | $1,090,690 | | | | $906,572 | | | | $871,026 | | | | $832,696 | | | | $776,373 | |
See Notes to Financial Statements
16
Financial Highlights – continued
| | | | | | | | | | | | | | | | | | | | | | | | |
| | | Six months
ended
2/28/14 | | | Years ended 8/31 | |
| Class I | | | 2013 | | | 2012 | | | 2011 | | | 2010 | | | 2009 | |
| | | (unaudited) | | | | | | | | | | | | | | | | |
Net asset value, beginning of
period | | | $29.96 | | | | $25.02 | | | | $21.94 | | | | $19.55 | | | | $19.48 | | | | $23.87 | |
| Income (loss) from investment operations | | | | | | | | | | | | | | | | | |
Net investment income (d) | | | $0.47 | | | | $0.57 | | | | $0.49 | | | | $0.40 | | | | $0.37 | | | | $0.40 | |
Net realized and unrealized
gain (loss) on investments
and foreign currency | | | 3.79 | | | | 5.10 | | | | 3.06 | | | | 2.37 | | | | 0.06 | (g) | | | (4.38 | ) |
Total from investment
operations | | | $4.26 | | | | $5.67 | | | | $3.55 | | | | $2.77 | | | | $0.43 | | | | $(3.98 | ) |
| Less distributions declared to shareholders | | | | | | | | | | | | | | | | | |
From net investment income | | | $(0.29 | ) | | | $(0.54 | ) | | | $(0.47 | ) | | | $(0.38 | ) | | | $(0.36 | ) | | | $(0.41 | ) |
From net realized gain on
investments | | | (0.58 | ) | | | (0.19 | ) | | | — | | | | — | | | | — | | | | — | |
Total distributions declared to
shareholders | | | $(0.87 | ) | | | $(0.73 | ) | | | $(0.47 | ) | | | $(0.38 | ) | | | $(0.36 | ) | | | $(0.41 | ) |
Net asset value, end of
period (x) | | | $33.35 | | | | $29.96 | | | | $25.02 | | | | $21.94 | | | | $19.55 | | | | $19.48 | |
Total return (%) (r)(s)(x) | | | 14.34 | (n) | | | 23.06 | | | | 16.42 | | | | 14.10 | | | | 2.12 | | | | (16.53 | ) |
Ratios (%) (to average net assets)
and Supplemental data: | | | | | | | | | | | | | | | | | | | | | |
Expenses before expense
reductions (f) | | | 0.65 | (a) | | | 0.68 | | | | 0.70 | | | | 0.70 | | | | 0.73 | | | | 0.79 | |
Expenses after expense
reductions (f) | | | 0.63 | (a) | | | 0.67 | | | | 0.68 | | | | 0.69 | | | | 0.73 | | | | 0.79 | |
Net investment income | | | 2.93 | (a) | | | 2.05 | | | | 2.11 | | | | 1.75 | | | | 1.79 | | | | 2.26 | |
Portfolio turnover | | | 8 | (n) | | | 12 | | | | 14 | | | | 17 | | | | 22 | | | | 33 | |
Net assets at end of period
(000 omitted) | | | $12,526,587 | | | | $10,568,573 | | | | $7,472,693 | | | | $5,272,157 | | | | $3,289,827 | | | | $2,335,922 | |
See Notes to Financial Statements
17
Financial Highlights – continued
| | | | | | | | | | | | | | | | | | | | | | | | |
| | | Six months
ended
2/28/14 | | | Years ended 8/31 | |
| Class R1 | | | 2013 | | | 2012 | | | 2011 | | | 2010 | | | 2009 | |
| | | (unaudited) | | | | | | | | | | | | | | | | |
Net asset value, beginning of
period | | | $29.32 | | | | $24.50 | | | | $21.48 | | | | $19.15 | | | | $19.09 | | | | $23.42 | |
| Income (loss) from investment operations | | | | | | | | | | | | | | | | | |
Net investment income (d) | | | $0.28 | | | | $0.29 | | | | $0.25 | | | | $0.17 | | | | $0.16 | | | | $0.21 | |
Net realized and unrealized
gain (loss) on investments
and foreign currency | | | 3.74 | | | | 5.00 | | | | 3.01 | | | | 2.32 | | | | 0.06 | (g) | | | (4.31 | ) |
Total from investment
operations | | | $4.02 | | | | $5.29 | | | | $3.26 | | | | $2.49 | | | | $0.22 | | | | $(4.10 | ) |
| Less distributions declared to shareholders | | | | | | | | | | | | | | | | | |
From net investment income | | | $(0.13 | ) | | | $(0.28 | ) | | | $(0.24 | ) | | | $(0.16 | ) | | | $(0.16 | ) | | | $(0.23 | ) |
From net realized gain on
investments | | | (0.58 | ) | | | (0.19 | ) | | | — | | | | — | | | | — | | | | — | |
Total distributions declared to
shareholders | | | $(0.71 | ) | | | $(0.47 | ) | | | $(0.24 | ) | | | $(0.16 | ) | | | $(0.16 | ) | | | $(0.23 | ) |
Net asset value, end of
period (x) | | | $32.63 | | | | $29.32 | | | | $24.50 | | | | $21.48 | | | | $19.15 | | | | $19.09 | |
Total return (%) (r)(s)(x) | | | 13.78 | (n) | | | 21.83 | | | | 15.29 | | | | 12.95 | | | | 1.13 | | | | (17.38 | ) |
Ratios (%) (to average net assets)
and Supplemental data: | | | | | | | | | | | | | | | | | | | | | |
Expenses before expense
reductions (f) | | | 1.64 | (a) | | | 1.68 | | | | 1.69 | | | | 1.70 | | | | 1.73 | | | | 1.78 | |
Expenses after expense
reductions (f) | | | 1.63 | (a) | | | 1.67 | | | | 1.68 | | | | 1.69 | | | | 1.73 | | | | 1.78 | |
Net investment income | | | 1.80 | (a) | | | 1.06 | | | | 1.10 | | | | 0.74 | | | | 0.80 | | | | 1.24 | |
Portfolio turnover | | | 8 | (n) | | | 12 | | | | 14 | | | | 17 | | | | 22 | | | | 33 | |
Net assets at end of period
(000 omitted) | | | $33,106 | | | | $33,485 | | | | $32,389 | | | | $33,806 | | | | $32,934 | | | | $30,690 | |
See Notes to Financial Statements
18
Financial Highlights – continued
| | | | | | | | | | | | | | | | | | | | | | | | |
| | | Six months
ended
2/28/14 | | | Years ended 8/31 | |
| Class R2 | | | 2013 | | | 2012 | | | 2011 | | | 2010 | | | 2009 | |
| | | (unaudited) | | | | | | | | | | | | | | | | |
Net asset value, beginning of
period | | | $29.56 | | | | $24.69 | | | | $21.66 | | | | $19.31 | | | | $19.24 | | | | $23.59 | |
| Income (loss) from investment operations | | | | | | | | | | | | | | | | | | | | | |
Net investment income (d) | | | $0.37 | | | | $0.43 | | | | $0.37 | | | | $0.28 | | | | $0.26 | | | | $0.30 | |
Net realized and unrealized
gain (loss) on investments
and foreign currency | | | 3.76 | | | | 5.04 | | | | 3.01 | | | | 2.34 | | | | 0.07 | (g) | | | (4.33 | ) |
Total from investment
operations | | | $4.13 | | | | $5.47 | | | | $3.38 | | | | $2.62 | | | | $0.33 | | | | $(4.03 | ) |
| Less distributions declared to shareholders | | | | | | | | | | | | | | | | | |
From net investment income | | | $(0.21 | ) | | | $(0.41 | ) | | | $(0.35 | ) | | | $(0.27 | ) | | | $(0.26 | ) | | | $(0.32 | ) |
From net realized gain on
investments | | | (0.58 | ) | | | (0.19 | ) | | | — | | | | — | | | | — | | | | — | |
Total distributions declared to
shareholders | | | $(0.79 | ) | | | $(0.60 | ) | | | $(0.35 | ) | | | $(0.27 | ) | | | $(0.26 | ) | | | $(0.32 | ) |
Net asset value, end of
period (x) | | | $32.90 | | | | $29.56 | | | | $24.69 | | | | $21.66 | | | | $19.31 | | | | $19.24 | |
Total return (%) (r)(s)(x) | | | 14.06 | (n) | | | 22.47 | | | | 15.80 | | | | 13.51 | | | | 1.66 | | | | (16.96 | ) |
Ratios (%) (to average net assets)
and Supplemental data: | | | | | | | | | | | | | | | | | | | | | |
Expenses before expense
reductions (f) | | | 1.14 | (a) | | | 1.18 | | | | 1.20 | | | | 1.20 | | | | 1.23 | | | | 1.29 | |
Expenses after expense
reductions (f) | | | 1.13 | (a) | | | 1.17 | | | | 1.18 | | | | 1.19 | | | | 1.23 | | | | 1.28 | |
Net investment income | | | 2.34 | (a) | | | 1.55 | | | | 1.61 | | | | 1.24 | | | | 1.29 | | | | 1.73 | |
Portfolio turnover | | | 8 | (n) | | | 12 | | | | 14 | | | | 17 | | | | 22 | | | | 33 | |
Net assets at end of period
(000 omitted) | | | $602,082 | | | | $572,590 | | | | $517,005 | | | | $496,236 | | | | $426,938 | | | | $286,115 | |
See Notes to Financial Statements
19
Financial Highlights – continued
| | | | | | | | | | | | | | | | | | | | | | | | |
| | | Six months
ended
2/28/14 | | | Years ended 8/31 | |
| Class R3 | | | 2013 | | | 2012 | | | 2011 | | | 2010 | | | 2009 | |
| | | (unaudited) | | | | | | | | | | | | | | | | |
Net asset value, beginning of
period | | | $29.73 | | | | $24.83 | | | | $21.78 | | | | $19.41 | | | | $19.34 | | | | $23.71 | |
| Income (loss) from investment operations | | | | | | | | | | | | | | | | | | | | | |
Net investment income (d) | | | $0.42 | | | | $0.50 | | | | $0.43 | | | | $0.34 | | | | $0.31 | | | | $0.34 | |
Net realized and unrealized
gain (loss) on investments
and foreign currency | | | 3.77 | | | | 5.07 | | | | 3.03 | | | | 2.35 | | | | 0.07 | (g) | | | (4.35 | ) |
Total from investment
operations | | | $4.19 | | | | $5.57 | | | | $3.46 | | | | $2.69 | | | | $0.38 | | | | $(4.01 | ) |
| Less distributions declared to shareholders | | | | | | | | | | | | | | | | | |
From net investment income | | | $(0.25 | ) | | | $(0.48 | ) | | | $(0.41 | ) | | | $(0.32 | ) | | | $(0.31 | ) | | | $(0.36 | ) |
From net realized gain on
investments | | | (0.58 | ) | | | (0.19 | ) | | | — | | | | — | | | | — | | | | — | |
Total distributions declared to
shareholders | | | $(0.83 | ) | | | $(0.67 | ) | | | $(0.41 | ) | | | $(0.32 | ) | | | $(0.31 | ) | | | $(0.36 | ) |
Net asset value, end of
period (x) | | | $33.09 | | | | $29.73 | | | | $24.83 | | | | $21.78 | | | | $19.41 | | | | $19.34 | |
Total return (%) (r)(s)(x) | | | 14.20 | (n) | | | 22.77 | | | | 16.11 | | | | 13.82 | | | | 1.90 | | | | (16.75 | ) |
Ratios (%) (to average net assets)
and Supplemental data: | | | | | | | | | | | | | | | | | | | | | |
Expenses before expense
reductions (f) | | | 0.89 | (a) | | | 0.93 | | | | 0.95 | | | | 0.95 | | | | 0.99 | | | | 1.03 | |
Expenses after expense
reductions (f) | | | 0.87 | (a) | | | 0.91 | | | | 0.93 | | | | 0.94 | | | | 0.98 | | | | 1.03 | |
Net investment income | | | 2.67 | (a) | | | 1.80 | | | | 1.86 | | | | 1.49 | | | | 1.53 | | | | 1.94 | |
Portfolio turnover | | | 8 | (n) | | | 12 | | | | 14 | | | | 17 | | | | 22 | | | | 33 | |
Net assets at end of period
(000 omitted) | | | $1,496,074 | | | | $1,299,126 | | | | $1,022,504 | | | | $763,670 | | | | $587,645 | | | | $341,993 | |
See Notes to Financial Statements
20
Financial Highlights – continued
| | | | | | | | | | | | | | | | | | | | | | | | |
| | | Six months
ended
2/28/14 | | | Years ended 8/31 | |
| Class R4 | | | 2013 | | | 2012 | | | 2011 | | | 2010 | | | 2009 | |
| | | (unaudited) | | | | | | | | | | | | | | | | |
Net asset value, beginning of
period | | | $29.82 | | | | $24.90 | | | | $21.84 | | | | $19.47 | | | | $19.39 | | | | $23.77 | |
| Income (loss) from investment operations | | | | | | | | | | | | | | | | | |
Net investment income (d) | | | $0.46 | | | | $0.57 | | | | $0.49 | | | | $0.40 | | | | $0.36 | | | | $0.37 | |
Net realized and unrealized
gain (loss) on investments
and foreign currency | | | 3.78 | | | | 5.08 | | | | 3.04 | | | | 2.35 | | | | 0.08 | (g) | | | (4.34 | ) |
Total from investment
operations | | | $4.24 | | | | $5.65 | | | | $3.53 | | | | $2.75 | | | | $0.44 | | | | $(3.97 | ) |
| Less distributions declared to shareholders | | | | | | | | | | | | | | | | | |
From net investment income | | | $(0.29 | ) | | | $(0.54 | ) | | | $(0.47 | ) | | | $(0.38 | ) | | | $(0.36 | ) | | | $(0.41 | ) |
From net realized gain on
investments | | | (0.58 | ) | | | (0.19 | ) | | | — | | | | — | | | | — | | | | — | |
Total distributions declared to
shareholders | | | $(0.87 | ) | | | $(0.73 | ) | | | $(0.47 | ) | | | $(0.38 | ) | | | $(0.36 | ) | | | $(0.41 | ) |
Net asset value, end of
period (x) | | | $33.19 | | | | $29.82 | | | | $24.90 | | | | $21.84 | | | | $19.47 | | | | $19.39 | |
Total return (%) (r)(s)(x) | | | 14.34 | (n) | | | 23.09 | | | | 16.40 | | | | 14.05 | | | | 2.18 | | | | (16.56 | ) |
Ratios (%) (to average net assets)
and Supplemental data: | | | | | | | | | | | | | | | | | | | | | |
Expenses before expense
reductions (f) | | | 0.65 | (a) | | | 0.68 | | | | 0.70 | | | | 0.70 | | | | 0.74 | | | | 0.77 | |
Expenses after expense
reductions (f) | | | 0.63 | (a) | | | 0.67 | | | | 0.68 | | | | 0.69 | | | | 0.73 | | | | 0.77 | |
Net investment income | | | 2.88 | (a) | | | 2.07 | | | | 2.10 | | | | 1.74 | | | | 1.77 | | | | 2.10 | |
Portfolio turnover | | | 8 | (n) | | | 12 | | | | 14 | | | | 17 | | | | 22 | | | | 33 | |
Net assets at end of period
(000 omitted) | | | $3,174,878 | | | | $2,892,340 | | | | $2,907,088 | | | | $2,036,438 | | | | $1,266,492 | | | | $652,906 | |
See Notes to Financial Statements
21
Financial Highlights – continued
| | | | | | | | | | | | | | | | | | | | | | | | |
| | | Six months
ended
2/28/14 | | | Years ended 8/31 | |
| Class R5 (y) | | | 2013 | | | 2012 | | | 2011 | | | 2010 | | | 2009 | |
| | | (unaudited) | | | | | | | | | | | | | | | | |
Net asset value, beginning of
period | | | $29.82 | | | | $24.90 | | | | $21.81 | | | | $19.44 | | | | $19.37 | | | | $23.74 | |
| Income (loss) from investment operations | | | | | | | | | | | | | | | | | |
Net investment income (d) | | | $0.50 | | | | $0.60 | | | | $0.46 | | | | $0.37 | | | | $0.35 | | | | $0.37 | |
Net realized and unrealized
gain (loss) on investments
and foreign currency | | | 3.77 | | | | 5.07 | | | | 3.08 | | | | 2.35 | | | | 0.06 | (g) | | | (4.35 | ) |
Total from investment
operations | | | $4.27 | | | | $5.67 | | | | $3.54 | | | | $2.72 | | | | $0.41 | | | | $(3.98 | ) |
| Less distributions declared to shareholders | | | | | | | | | | | | | | | | | |
From net investment income | | | $(0.31 | ) | | | $(0.56 | ) | | | $(0.45 | ) | | | $(0.35 | ) | | | $(0.34 | ) | | | $(0.39 | ) |
From net realized gain on
investments | | | (0.58 | ) | | | (0.19 | ) | | | — | | | | — | | | | — | | | | — | |
Total distributions declared to
shareholders | | | $(0.89 | ) | | | $(0.75 | ) | | | $(0.45 | ) | | | $(0.35 | ) | | | $(0.34 | ) | | | $(0.39 | ) |
Net asset value, end of
period (x) | | | $33.20 | | | | $29.82 | | | | $24.90 | | | | $21.81 | | | | $19.44 | | | | $19.37 | |
Total return (%) (r)(s)(x) | | | 14.43 | (n) | | | 23.18 | | | | 16.48 | | | | 13.96 | | | | 2.04 | | | | (16.61 | ) |
Ratios (%) (to average net assets)
and Supplemental data: | | | | | | | | | | | | | | | | | | | | | |
Expenses before expense
reductions (f) | | | 0.55 | (a) | | | 0.57 | | | | 0.77 | | | | 0.80 | | | | 0.83 | | | | 0.89 | |
Expenses after expense
reductions (f) | | | 0.53 | (a) | | | 0.56 | | | | 0.76 | | | | 0.79 | | | | 0.83 | | | | 0.88 | |
Net investment income | | | 3.16 | (a) | | | 2.12 | | | | 1.98 | | | | 1.63 | | | | 1.70 | | | | 2.12 | |
Portfolio turnover | | | 8 | (n) | | | 12 | | | | 14 | | | | 17 | | | | 22 | | | | 33 | |
Net assets at end of period
(000 omitted) | | | $3,476,637 | | | | $2,362,012 | | | | $940,695 | | | | $1,334,446 | | | | $1,393,429 | | | | $999,969 | |
See Notes to Financial Statements
22
Financial Highlights – continued
| | | | | | | | | | | | | | | | | | | | | | | | |
| | | Six months
ended
2/28/14 | | | Years ended 8/31 | |
| Class 529A | | | 2013 | | | 2012 | | | 2011 | | | 2010 | | | 2009 | |
| | | (unaudited) | | | | | | | | | | | | | | | | |
Net asset value, beginning of
period | | | $29.62 | | | | $24.74 | | | | $21.70 | | | | $19.34 | | | | $19.28 | | | | $23.62 | |
| Income (loss) from investment operations | | | | | | | | | | | | | | | | | |
Net investment income (d) | | | $0.43 | | | | $0.49 | | | | $0.42 | | | | $0.32 | | | | $0.29 | | | | $0.32 | |
Net realized and unrealized
gain (loss) on investments
and foreign currency | | | 3.75 | | | | 5.05 | | | | 3.02 | | | | 2.34 | | | | 0.06 | (g) | | | (4.33 | ) |
Total from investment
operations | | | $4.18 | | | | $5.54 | | | | $3.44 | | | | $2.66 | | | | $0.35 | | | | $(4.01 | ) |
| Less distributions declared to shareholders | | | | | | | | | | | | | | | | | | | | | |
From net investment income | | | $(0.25 | ) | | | $(0.47 | ) | | | $(0.40 | ) | | | $(0.30 | ) | | | $(0.29 | ) | | | $(0.33 | ) |
From net realized gain on
investments | | | (0.58 | ) | | | (0.19 | ) | | | — | | | | — | | | | — | | | | — | |
Total distributions declared to
shareholders | | | $(0.83 | ) | | | $(0.66 | ) | | | $(0.40 | ) | | | $(0.30 | ) | | | $(0.29 | ) | | | $(0.33 | ) |
Net asset value, end of
period (x) | | | $32.97 | | | | $29.62 | | | | $24.74 | | | | $21.70 | | | | $19.34 | | | | $19.28 | |
Total return (%) (r)(s)(t)(x) | | | 14.23 | (n) | | | 22.73 | | | | 16.06 | | | | 13.71 | | | | 1.74 | | | | (16.84 | ) |
Ratios (%) (to average net assets)
and Supplemental data: | | | | | | | | | | | | | | | | | | | | | |
Expenses before expense
reductions (f) | | | 0.99 | (a) | | | 1.03 | | | | 1.05 | | | | 1.05 | | | | 1.08 | | | | 1.19 | |
Expenses after expense
reductions (f) | | | 0.87 | (a) | | | 0.93 | | | | 0.98 | | | | 1.03 | | | | 1.08 | | | | 1.19 | |
Net investment income | | | 2.69 | (a) | | | 1.79 | | | | 1.80 | | | | 1.40 | | | | 1.44 | | | | 1.84 | |
Portfolio turnover | | | 8 | (n) | | | 12 | | | | 14 | | | | 17 | | | | 22 | | | | 33 | |
Net assets at end of period
(000 omitted) | | | $13,146 | | | | $10,899 | | | | $8,195 | | | | $6,315 | | | | $5,192 | | | | $5,008 | |
See Notes to Financial Statements
23
Financial Highlights – continued
| | | | | | | | | | | | | | | | | | | | | | | | |
| | | Six months
ended
2/28/14 | | | Years ended 8/31 | |
| Class 529B | | | 2013 | | | 2012 | | | 2011 | | | 2010 | | | 2009 | |
| | | (unaudited) | | | | | | | | | | | | | | | | |
Net asset value, beginning of
period | | | $29.29 | | | | $24.48 | | | | $21.45 | | | | $19.12 | | | | $19.06 | | | | $23.37 | |
| Income (loss) from investment operations | | | | | | | | | | | | | | | | | |
Net investment income (d) | | | $0.28 | | | | $0.27 | | | | $0.24 | | | | $0.14 | | | | $0.14 | | | | $0.20 | |
Net realized and unrealized
gain (loss) on investments
and foreign currency | | | 3.73 | | | | 4.99 | | | | 3.01 | | | | 2.32 | | | | 0.06 | (g) | | | (4.30 | ) |
Total from investment
operations | | | $4.01 | | | | $5.26 | | | | $3.25 | | | | $2.46 | | | | $0.20 | | | | $(4.10 | ) |
| Less distributions declared to shareholders | | | | | | | | | | | | | | | | | | | | | |
From net investment income | | | $(0.12 | ) | | | $(0.26 | ) | | | $(0.22 | ) | | | $(0.13 | ) | | | $(0.14 | ) | | | $(0.21 | ) |
From net realized gain on
investments | | | (0.58 | ) | | | (0.19 | ) | | | — | | | | — | | | | — | | | | — | |
Total distributions declared to
shareholders | | | $(0.70 | ) | | | $(0.45 | ) | | | $(0.22 | ) | | | $(0.13 | ) | | | $(0.14 | ) | | | $(0.21 | ) |
Net asset value, end of
period (x) | | | $32.60 | | | | $29.29 | | | | $24.48 | | | | $21.45 | | | | $19.12 | | | | $19.06 | |
Total return (%) (r)(s)(t)(x) | | | 13.76 | (n) | | | 21.74 | | | | 15.27 | | | | 12.84 | | | | 1.01 | | | | (17.46 | ) |
Ratios (%) (to average net assets)
and Supplemental data: | | | | | | | | | | | | | | | | | | | | | |
Expenses before expense
reductions (f) | | | 1.74 | (a) | | | 1.78 | | | | 1.79 | | | | 1.80 | | | | 1.83 | | | | 1.89 | |
Expenses after expense
reductions (f) | | | 1.67 | (a) | | | 1.71 | | | | 1.73 | | | | 1.78 | | | | 1.83 | | | | 1.89 | |
Net investment income | | | 1.80 | (a) | | | 1.00 | | | | 1.05 | | | | 0.64 | | | | 0.70 | | | | 1.15 | |
Portfolio turnover | | | 8 | (n) | | | 12 | | | | 14 | | | | 17 | | | | 22 | | | | 33 | |
Net assets at end of period
(000 omitted) | | | $1,042 | | | | $1,013 | | | | $963 | | | | $1,147 | | | | $1,198 | | | | $1,215 | |
See Notes to Financial Statements
24
Financial Highlights – continued
| | | | | | | | | | | | | | | | | | | | | | | | |
| | | Six months
ended
2/28/14 | | | Years ended 8/31 | |
| Class 529C | | | 2013 | | | 2012 | | | 2011 | | | 2010 | | | 2009 | |
| | | (unaudited) | | | | | | | | | | | | | | | | |
Net asset value, beginning of
period | | | $29.23 | | | | $24.43 | | | | $21.43 | | | | $19.11 | | | | $19.05 | | | | $23.35 | |
| Income (loss) from investment operations | | | | | | | | | | | | | | | | | |
Net investment income (d) | | | $0.28 | | | | $0.27 | | | | $0.24 | | | | $0.15 | | | | $0.14 | | | | $0.20 | |
Net realized and unrealized
gain (loss) on investments
and foreign currency | | | 3.72 | | | | 4.99 | | | | 2.99 | | | | 2.31 | | | | 0.07 | (g) | | | (4.30 | ) |
Total from investment
operations | | | $4.00 | | | | $5.26 | | | | $3.23 | | | | $2.46 | | | | $0.21 | | | | $(4.10 | ) |
| Less distributions declared to shareholders | | | | | | | | | | | | | | | | | | | | | |
From net investment income | | | $(0.12 | ) | | | $(0.27 | ) | | | $(0.23 | ) | | | $(0.14 | ) | | | $(0.15 | ) | | | $(0.20 | ) |
From net realized gain on
investments | | | (0.58 | ) | | | (0.19 | ) | | | — | | | | — | | | | — | | | | — | |
Total distributions declared to
shareholders | | | $(0.70 | ) | | | $(0.46 | ) | | | $(0.23 | ) | | | $(0.14 | ) | | | $(0.15 | ) | | | $(0.20 | ) |
Net asset value, end of
period (x) | | | $32.53 | | | | $29.23 | | | | $24.43 | | | | $21.43 | | | | $19.11 | | | | $19.05 | |
Total return (%) (r)(s)(t)(x) | | | 13.77 | (n) | | | 21.80 | | | | 15.18 | | | | 12.82 | | | | 1.06 | | | | (17.45 | ) |
Ratios (%) (to average net assets)
and Supplemental data: | | | | | | | | | | | | | | | | | | | | | |
Expenses before expense
reductions (f) | | | 1.74 | (a) | | | 1.78 | | | | 1.79 | | | | 1.80 | | | | 1.83 | | | | 1.89 | |
Expenses after expense
reductions (f) | | | 1.67 | (a) | | | 1.72 | | | | 1.73 | | | | 1.78 | | | | 1.83 | | | | 1.89 | |
Net investment income | | | 1.80 | (a) | | | 1.00 | | | | 1.06 | | | | 0.65 | | | | 0.69 | | | | 1.15 | |
Portfolio turnover | | | 8 | (n) | | | 12 | | | | 14 | | | | 17 | | | | 22 | | | | 33 | |
Net assets at end of period
(000 omitted) | | | $3,668 | | | | $3,387 | | | | $2,610 | | | | $2,438 | | | | $2,180 | | | | $1,710 | |
See Notes to Financial Statements
25
Financial Highlights – continued
| (d) | Per share data is based on average shares outstanding. |
| (f) | Ratios do not reflect reductions from fees paid indirectly, if applicable. |
| (g) | The per share amount varies from the net realized and unrealized gain/loss for the period because of the timing of sales of fund shares and the per share amount of realized and unrealized gains and losses at such time. |
| (r) | Certain expenses have been reduced without which performance would have been lower. |
| (s) | From time to time the fund may receive proceeds from litigation settlements, without which performance would be lower. |
| (t) | Total returns do not include any applicable sales charges. |
| (x) | The net asset values per share and total returns have been calculated on net assets which include adjustments made in accordance with U.S. generally accepted accounting principles required at period end for financial reporting purposes. |
| (y) | On May 10, 2012, sales of Class W shares (including exchanges) were suspended. On May 11, 2012, certain Class W shares were automatically converted to Class I shares. Shareholders of certain Class W shares became shareholders of Class I and received Class I shares with a total net asset value equal to their Class W shares at the time of the conversion. On May 30, 2012, remaining Class W shares, which represented MFS seed money, were redesignated Class R5. Class R5 shares are generally available only to certain eligible retirement plans and to funds distributed by MFD. Class R5 shares do not pay a 12b-1 distribution fee or sub-accounting costs. On June 1, 2012, Class R5 shares were offered for sale to the public. |
See Notes to Financial Statements
26
NOTES TO FINANCIAL STATEMENTS
(unaudited)
(1) Business and Organization
MFS Value Fund (the fund) is a diversified series of MFS Series Trust I (the trust). The trust is organized as a Massachusetts business trust and is registered under the Investment Company Act of 1940, as amended, as an open-end management investment company.
(2) Significant Accounting Policies
General – The preparation of financial statements in conformity with U.S. generally accepted accounting principles requires management to make estimates and assumptions that affect the reported amounts of assets and liabilities, and disclosure of contingent assets and liabilities at the date of the financial statements and the reported amounts of increases and decreases in net assets from operations during the reporting period. Actual results could differ from those estimates. In the preparation of these financial statements, management has evaluated subsequent events occurring after the date of the fund’s Statement of Assets and Liabilities through the date that the financial statements were issued.
In this reporting period, the fund adopted the disclosure provisions of the Financial Accounting Standards Board (FASB) Accounting Standards Update 2011-11 (“ASU 2011-11”), Balance Sheet (Topic 210) – Disclosures about Offsetting Assets and Liabilities along with the related scope clarification provisions of FASB Accounting Standards Update 2013-01 (“ASU 2013-01”) entitled Balance Sheet (Topic 210) – Clarifying the Scope of Disclosures about Offsetting Assets and Liabilities. ASU 2011-11 is intended to enhance disclosures on the offsetting of financial assets and liabilities by requiring entities to disclose both gross and net information about financial instruments and transactions that are either offset in the statement of financial position or subject to a an enforceable Master Netting Agreement or similar arrangement. ASU 2013-01 limits the scope of ASU 2011-11’s disclosure requirements on offsetting to financial assets and financial liabilities related to derivatives, repurchase and reverse repurchase agreements, and securities lending and securities borrowing transactions. The disclosures required by ASU 2011-11, to the extent applicable to the fund, have been included in the fund’s Significant Accounting Policies note under the captions for each of the fund’s in-scope financial instruments and transactions.
In June 2013, FASB issued Accounting Standards Update 2013-08 (“ASU 2013-08”) Financial Services – Investment Companies (Topic 946) – Amendments to the Scope, Measurement, and Disclosure Requirements which is effective for interim and annual reporting periods in fiscal years that begin after December 15, 2013. ASU 2013-08 sets forth a methodology for determining whether an entity should be characterized as an investment company and prescribes fair value accounting for an investment company’s non-controlling ownership interest in another investment company. FASB has determined that a fund registered under the Investment Company Act of 1940 automatically meets ASU 2013-08’s criteria for an investment company. Although still evaluating the potential impacts of ASU 2013-08 to the fund, management expects that the impact of the fund’s adoption will be limited to additional financial statement disclosures.
27
Notes to Financial Statements (unaudited) – continued
Investment Valuations – Equity securities, including restricted equity securities, are generally valued at the last sale or official closing price as provided by a third-party pricing service on the market or exchange on which they are primarily traded. Equity securities, for which there were no sales reported that day, are generally valued at the last quoted daily bid quotation as provided by a third-party pricing service on the market or exchange on which such securities are primarily traded. Short-term instruments with a maturity at issuance of 60 days or less generally are valued at amortized cost, which approximates market value. Open-end investment companies are generally valued at net asset value per share. Securities and other assets generally valued on the basis of information from a third-party pricing service may also be valued at a broker/dealer bid quotation. Values obtained from third-party pricing services can utilize both transaction data and market information such as yield, quality, coupon rate, maturity, type of issue, trading characteristics, and other market data. The values of foreign securities and other assets and liabilities expressed in foreign currencies are converted to U.S. dollars using the mean of bid and asked prices for rates provided by a third-party pricing service.
The Board of Trustees has delegated primary responsibility for determining or causing to be determined the value of the fund’s investments (including any fair valuation) to the adviser pursuant to valuation policies and procedures approved by the Board. If the adviser determines that reliable market quotations are not readily available, investments are valued at fair value as determined in good faith by the adviser in accordance with such procedures under the oversight of the Board of Trustees. Under the fund’s valuation policies and procedures, market quotations are not considered to be readily available for most types of debt instruments and floating rate loans and many types of derivatives. These investments are generally valued at fair value based on information from third-party pricing services. In addition, investments may be valued at fair value if the adviser determines that an investment’s value has been materially affected by events occurring after the close of the exchange or market on which the investment is principally traded (such as foreign exchange or market) and prior to the determination of the fund’s net asset value, or after the halting of trading of a specific security where trading does not resume prior to the close of the exchange or market on which the security is principally traded. Events that occur on a frequent basis after foreign markets close (such as developments in foreign markets and significant movements in the U.S. markets) and prior to the determination of the fund’s net asset value may be deemed to have a material effect on the value of securities traded in foreign markets. Accordingly, the fund’s foreign equity securities may often be valued at fair value. The adviser generally relies on third-party pricing services or other information (such as the correlation with price movements of similar securities in the same or other markets; the type, cost and investment characteristics of the security; the business and financial condition of the issuer; and trading and other market data) to assist in determining whether to fair value and at what value to fair value an investment. The value of an investment for purposes of calculating the fund’s net asset value can differ depending on the source and method used to determine value. When fair valuation is used, the value of an investment used to determine the fund’s net asset value may differ from quoted or published prices for the same investment. There can be no assurance that
28
Notes to Financial Statements (unaudited) – continued
the fund could obtain the fair value assigned to an investment if it were to sell the investment at the same time at which the fund determines its net asset value per share.
Various inputs are used in determining the value of the fund’s assets or liabilities. These inputs are categorized into three broad levels. In certain cases, the inputs used to measure fair value may fall into different levels of the fair value hierarchy. In such cases, an investment’s level within the fair value hierarchy is based on the lowest level of input that is significant to the fair value measurement. The fund’s assessment of the significance of a particular input to the fair value measurement in its entirety requires judgment, and considers factors specific to the investment. Level 1 includes unadjusted quoted prices in active markets for identical assets or liabilities. Level 2 includes other significant observable market-based inputs (including quoted prices for similar securities, interest rates, prepayment speed, and credit risk). Level 3 includes unobservable inputs, which may include the adviser’s own assumptions in determining the fair value of investments. The following is a summary of the levels used as of February 28, 2014 in valuing the fund’s assets or liabilities:
| | | | | | | | | | | | | | | | |
| Investments at Value | | Level 1 | | | Level 2 | | | Level 3 | | | Total | |
| Equity Securities | | | $31,301,394,623 | | | | $— | | | | $— | | | | $31,301,394,623 | |
| Mutual Funds | | | 464,971,463 | | | | — | | | | — | | | | 464,971,463 | |
| Total Investments | | | $31,766,366,086 | | | | $— | | | | $— | | | | $31,766,366,086 | |
For further information regarding security characteristics, see the Portfolio of Investments.
Foreign Currency Translation – Purchases and sales of foreign investments, income, and expenses are converted into U.S. dollars based upon currency exchange rates prevailing on the respective dates of such transactions or on the reporting date for foreign denominated receivables and payables. Gains and losses attributable to foreign currency exchange rates on sales of securities are recorded for financial statement purposes as net realized gains and losses on investments. Gains and losses attributable to foreign exchange rate movements on receivables, payables, income and expenses are recorded for financial statement purposes as foreign currency transaction gains and losses. That portion of both realized and unrealized gains and losses on investments that results from fluctuations in foreign currency exchange rates is not separately disclosed.
Security Loans – Under its Securities Lending Agency Agreement with the fund, State Street Bank and Trust Company (“State Street”), as lending agent, loans the securities of the fund to certain qualified institutions (the “Borrowers”) approved by the fund. The loans are collateralized by cash and/or U.S. Treasury and federal agency obligations in an amount typically at least equal to the market value of the securities loaned. The market value of the loaned securities is determined at the close of business of the fund and any additional required collateral is delivered to the fund on the next business day. State Street provides the fund with indemnification against Borrower default. In the event of Borrower default, State Street will for the benefit of the fund either purchase securities identical to those loaned or, when such purchase is commercially impracticable, pay the fund the market value of the loaned securities. In return, State Street assumes the fund’s rights to the related collateral. If the collateral value is less than the cost to purchase identical securities, State Street is responsible for the
29
Notes to Financial Statements (unaudited) – continued
shortfall, but only to the extent that such shortfall is not due to a decline in collateral value resulting from collateral reinvestment for which the fund bears the risk of loss. On loans collateralized by cash, the cash collateral is invested in a money market fund or short-term securities. A portion of the income generated upon investment of the collateral is remitted to the Borrowers, and the remainder is allocated between the fund and the lending agent. On loans collateralized by U.S. Treasury and/or federal agency obligations, a fee is received from the Borrower, and is allocated between the fund and the lending agent. Income from securities lending is included in “Interest” income in the Statement of Operations. The dividend and interest income earned on the securities loaned is accounted for in the same manner as other dividend and interest income. At February 28, 2014, there were no securities on loan or collateral outstanding.
Indemnifications – Under the fund’s organizational documents, its officers and Trustees may be indemnified against certain liabilities and expenses arising out of the performance of their duties to the fund. Additionally, in the normal course of business, the fund enters into agreements with service providers that may contain indemnification clauses. The fund’s maximum exposure under these agreements is unknown as this would involve future claims that may be made against the fund that have not yet occurred.
Investment Transactions and Income – Investment transactions are recorded on the trade date. Interest income is recorded on the accrual basis. Dividends received in cash are recorded on the ex-dividend date. Certain dividends from foreign securities will be recorded when the fund is informed of the dividend if such information is obtained subsequent to the ex-dividend date. Dividend and interest payments received in additional securities are recorded on the ex-dividend or ex-interest date in an amount equal to the value of the security on such date.
The fund may receive proceeds from litigation settlements. Any proceeds received from litigation involving portfolio holdings are reflected in the Statement of Operations in realized gain/loss if the security has been disposed of by the fund or in unrealized gain/loss if the security is still held by the fund. Any other proceeds from litigation not related to portfolio holdings are reflected as other income in the Statement of Operations.
Fees Paid Indirectly – The fund’s custody fee may be reduced according to an arrangement that measures the value of cash deposited with the custodian by the fund. This amount, for the six months ended February 28, 2014, is shown as a reduction of total expenses in the Statement of Operations.
Tax Matters and Distributions – The fund intends to qualify as a regulated investment company, as defined under Subchapter M of the Internal Revenue Code, and to distribute all of its taxable income, including realized capital gains. As a result, no provision for federal income tax is required. The fund’s federal tax returns, when filed, will remain subject to examination by the Internal Revenue Service for a three year period. Management has analyzed the fund’s tax positions taken on federal and state tax returns for all open tax years and does not believe that there are any uncertain tax positions that require recognition of a tax liability. Foreign taxes, if any, have been accrued by the fund in the accompanying financial statements in accordance with the
30
Notes to Financial Statements (unaudited) – continued
applicable foreign tax law. Foreign income taxes may be withheld by certain countries in which the fund invests. Additionally, capital gains realized by the fund on securities issued in or by certain foreign countries may be subject to capital gains tax imposed by those countries.
Distributions to shareholders are recorded on the ex-dividend date. Income and capital gain distributions are determined in accordance with income tax regulations, which may differ from U.S. generally accepted accounting principles. Certain capital accounts in the financial statements are periodically adjusted for permanent differences in order to reflect their tax character. These adjustments have no impact on net assets or net asset value per share. Temporary differences which arise from recognizing certain items of income, expense, gain or loss in different periods for financial statement and tax purposes will reverse at some time in the future. Distributions in excess of net investment income or net realized gains are temporary overdistributions for financial statement purposes resulting from differences in the recognition or classification of income or distributions for financial statement and tax purposes.
Book/tax differences primarily relate to wash sale loss deferrals and treating a portion of the proceeds from redemptions as a distribution for tax purposes.
The tax character of distributions made during the current period will be determined at fiscal year end. The tax character of distributions declared to shareholders for the last fiscal year is as follows:
| | | | |
| | | 8/31/13 | |
Ordinary income (including any
short-term capital gains) | | | $430,454,430 | |
| Long-term capital gains | | | 157,367,309 | |
| Total distributions | | | $587,821,739 | |
The federal tax cost and the tax basis components of distributable earnings were as follows:
| | | | |
| As of 2/28/14 | | | |
| Cost of investments | | | $22,029,757,540 | |
| Gross appreciation | | | 9,781,380,842 | |
| Gross depreciation | | | (44,772,296 | ) |
| Net unrealized appreciation (depreciation) | | | $9,736,608,546 | |
| |
| As of 8/31/13 | | | |
| Undistributed ordinary income | | | 201,576,358 | |
| Undistributed long-term capital gain | | | 46,280,507 | |
| Capital loss carryforwards | | | (25,656,270 | ) |
| Other temporary differences | | | (52,786 | ) |
| Net unrealized appreciation (depreciation) | | | 7,134,362,181 | |
The aggregate cost above includes prior fiscal year end tax adjustments, if applicable.
Under the Regulated Investment Company Modernization Act of 2010 (the “Act”), net capital losses recognized for fund fiscal years beginning after August 31, 2011 may be carried forward indefinitely, and their character is retained as short-term and/or
31
Notes to Financial Statements (unaudited) – continued
long-term losses (“post-enactment losses”). Previously, net capital losses were carried forward for eight years and treated as short-term losses (“pre-enactment losses”). As a transition rule, the Act requires that all post-enactment net capital losses be used before pre-enactment net capital losses.
As of August 31, 2013, the fund had capital loss carryforwards available to offset future realized gains. Such pre-enactment losses expire as follows:
The availability of $25,656,270 of the capital loss carryforwards, which were acquired on July 24, 2009 in connection with the MFS Strategic Value Fund merger, may be limited in a given year.
Multiple Classes of Shares of Beneficial Interest – The fund offers multiple classes of shares, which differ in their respective distribution, service, and program manager fees. The fund’s income, realized and unrealized gain (loss), and common expenses are allocated to shareholders based on the daily net assets of each class. Dividends are declared separately for each class. Differences in per share dividend rates are generally due to differences in separate class expenses. Class B and Class 529B shares will convert to Class A and Class 529A shares, respectively, approximately eight years after purchase. The fund’s distributions declared to shareholders as reported in the Statements of Changes in Net Assets are presented by class as follows:
| | | | | | | | | | | | | | | | |
| | | From net investment
income | | | From net realized gain on
investments | |
| | | Six months
ended
2/28/14 | | | Year
ended
8/31/13 | | | Six months
ended
2/28/14 | | | Year
ended
8/31/13 | |
| Class A | | | $67,816,590 | | | | $124,516,423 | | | | $158,274,114 | | | | $49,243,771 | |
| Class B | | | 703,554 | | | | 1,678,264 | | | | 3,249,251 | | | | 1,211,702 | |
| Class C | | | 4,835,320 | | | | 10,011,832 | | | | 21,935,733 | | | | 6,733,945 | |
| Class I | | | 102,647,912 | | | | 176,018,883 | | | | 207,624,418 | | | | 57,935,944 | |
| Class R1 | | | 138,970 | | | | 339,938 | | | | 629,904 | | | | 240,515 | |
| Class R2 | | | 3,910,194 | | | | 8,205,027 | | | | 10,778,017 | | | | 3,801,881 | |
| Class R3 | | | 10,931,812 | | | | 19,969,447 | | | | 25,565,924 | | | | 7,763,177 | |
| Class R4 | | | 27,731,183 | | | | 61,227,720 | | | | 55,241,972 | | | | 22,718,740 | |
| Class R5 | | | 25,886,856 | | | | 28,283,283 | | | | 50,791,793 | | | | 7,624,734 | |
| Class 529A | | | 94,849 | | | | 163,205 | | | | 220,123 | | | | 64,487 | |
| Class 529B | | | 3,893 | | | | 9,739 | | | | 18,765 | | | | 7,173 | |
| Class 529C | | | 13,997 | | | | 30,669 | | | | 67,464 | | | | 21,240 | |
| Total | | | $244,715,130 | | | | $430,454,430 | | | | $534,397,478 | | | | $157,367,309 | |
(3) Transactions with Affiliates
Investment Adviser – The fund has an investment advisory agreement with MFS to provide overall investment management and related administrative services and facilities to the fund. The management fee is computed daily and paid monthly at the following annual rates:
| | | | |
| First $7.5 billion of average daily net assets | | | 0.60 | % |
| Next $2.5 billion of average daily net assets | | | 0.53 | % |
| Average daily net assets in excess of $10 billion | | | 0.50 | % |
32
Notes to Financial Statements (unaudited) – continued
The investment adviser has agreed in writing to reduce its management fee to 0.45% of average daily net assets in excess of $20 billion. This written agreement will continue until modified by the fund’s Board of Trustees, but such agreement will continue at least until December 31, 2014. For the six months ended February 28, 2014, this management fee reduction amounted to $2,442,076, which is included in the reduction of total expenses in the Statement of Operations. MFS has also agreed in writing to reduce its management fee by a specified amount if certain MFS mutual fund assets exceed thresholds agreed to by MFS and the fund’s Board of Trustees. For the six months ended February 28, 2014, this management fee reduction amounted to $336,188, which is included in the reduction of total expenses in the Statement of Operations. The management fee incurred for the six months ended February 28, 2014 was equivalent to an annual effective rate of 0.51% of the fund’s average daily net assets.
Distributor – MFS Fund Distributors, Inc. (MFD), a wholly-owned subsidiary of MFS, as distributor, received $1,414,338 and $4,494 for the six months ended February 28, 2014, as its portion of the initial sales charge on sales of Class A and Class 529A shares of the fund, respectively.
The Board of Trustees has adopted a distribution plan for certain class shares pursuant to Rule 12b-1 of the Investment Company Act of 1940.
The fund’s distribution plan provides that the fund will pay MFD for services provided by MFD and financial intermediaries in connection with the distribution and servicing of certain share classes. One component of the plan is a distribution fee paid to MFD and another component of the plan is a service fee paid to MFD. MFD may subsequently pay all, or a portion, of the distribution and/or service fees to financial intermediaries.
Distribution Plan Fee Table:
| | | | | | | | | | | | | | | | | | | | |
| | | Distribution
Fee Rate (d) | | | Service
Fee Rate (d) | | | Total
Distribution
Plan (d) | | | Annual
Effective
Rate (e) | | | Distribution
and Service
Fee | |
| Class A | | | — | | | | 0.25% | | | | 0.25% | | | | 0.25% | | | | $10,907,709 | |
| Class B | | | 0.75% | | | | 0.25% | | | | 1.00% | | | | 1.00% | | | | 892,993 | |
| Class C | | | 0.75% | | | | 0.25% | | | | 1.00% | | | | 1.00% | | | | 5,985,000 | |
| Class R1 | | | 0.75% | | | | 0.25% | | | | 1.00% | | | | 1.00% | | | | 171,033 | |
| Class R2 | | | 0.25% | | | | 0.25% | | | | 0.50% | | | | 0.50% | | | | 1,488,808 | |
| Class R3 | | | — | | | | 0.25% | | | | 0.25% | | | | 0.25% | | | | 1,764,524 | |
| Class 529A | | | — | | | | 0.25% | | | | 0.25% | | | | 0.20% | | | | 15,076 | |
| Class 529B | | | 0.75% | | | | 0.25% | | | | 1.00% | | | | 0.99% | | | | 5,191 | |
| Class 529C | | | 0.75% | | | | 0.25% | | | | 1.00% | | | | 1.00% | | | | 17,941 | |
| Total Distribution and Service Fees | | | | $21,248,275 | |
| (d) | In accordance with the distribution plan for certain classes, the fund pays distribution and/or service fees equal to these annual percentage rates of each class’s average daily net assets. The distribution and service fee rates disclosed by class represent the current rates in effect at the end of the reporting period. Any rate changes, if applicable, are detailed below. |
| (e) | The annual effective rates represent actual fees incurred under the distribution plan for the six months ended February 28, 2014 based on each class’s average daily net assets. MFD has voluntarily agreed to rebate a portion of each class’s 0.25% service fee attributable to accounts for which MFD retains the 0.25% service fee except for accounts attributable to MFS |
33
Notes to Financial Statements (unaudited) – continued
| | or its affiliates’ seed money. For the six months ended February 28, 2014, this rebate amounted to $33,884, $416, $510, $4, $841, $28,427, $3,281, $36 and $26 for Class A, Class B, Class C, Class R1, Class R2, Class R3, Class 529A, Class 529B, and Class 529C, respectively, and is included in the reduction of total expenses in the Statement of Operations. |
Certain Class A shares are subject to a contingent deferred sales charge (CDSC) in the event of a shareholder redemption within 18 months of purchase for shares purchased on or after August 1, 2012, and within 24 months of purchase for shares purchased prior to August 1, 2012. Class C and Class 529C shares are subject to a CDSC in the event of a shareholder redemption within 12 months of purchase. Class B and Class 529B shares are subject to a CDSC in the event of a shareholder redemption within six years of purchase. All contingent deferred sales charges are paid to MFD and during the six months ended February 28, 2014, were as follows:
| | | | |
| | | Amount | |
| Class A | | | $21,744 | |
| Class B | | | 75,914 | |
| Class C | | | 36,655 | |
| Class 529B | | | — | |
| Class 529C | | | 41 | |
The fund has entered into and may from time to time enter into contracts with program managers and other parties which administer the tuition programs through which an investment in the fund’s 529 share classes is made. The fund has entered into an agreement with MFD pursuant to which MFD receives an annual fee of up to 0.10% of the average daily net assets attributable to each 529 share class. MFD has agreed to waive a portion of this fee in an amount equal to 0.05% of the average daily net assets for each 529 share class. This waiver agreement will expire on December 31, 2014, unless MFD elects to extend the waiver. For the six months ended February 28, 2014, this waiver amounted to $4,172 and is included in the reduction of total expenses in the Statement of Operations. The program manager fee incurred for the six months ended February 28, 2014 was equivalent to an annual effective rate of 0.05% of the average daily net assets attributable to each 529 share class. The services provided by MFD, or a third party with which MFD contracts, include recordkeeping and tax reporting and account services, as well as services designed to maintain the program’s compliance with the Internal Revenue Code and other regulatory requirements. Program manager fees and waivers for the six months ended February 28, 2014, were as follows:
| | | | | | | | |
| | | Fee | | | Waiver | |
| Class 529A | | | $6,030 | | | | $3,015 | |
| Class 529B | | | 519 | | | | 260 | |
| Class 529C | | | 1,794 | | | | 897 | |
| Total Program Manager Fees and Waivers | | | $8,343 | | | | $4,172 | |
Shareholder Servicing Agent – MFS Service Center, Inc. (MFSC), a wholly-owned subsidiary of MFS, receives a fee from the fund for its services as shareholder servicing agent calculated as a percentage of the average daily net assets of the fund as determined periodically under the supervision of the fund’s Board of Trustees. For the six months ended February 28, 2014, the fee was $879,435, which equated to 0.0059% annually of the fund’s average daily net assets. MFSC also receives payment
34
Notes to Financial Statements (unaudited) – continued
from the fund for out-of-pocket expenses, sub-accounting and other shareholder servicing costs which may be paid to affiliated and unaffiliated service providers. Class R5 shares do not incur sub-accounting fees. For the six months ended February 28, 2014, these out-of-pocket expenses, sub-accounting and other shareholder servicing costs amounted to $13,109,598.
Administrator – MFS provides certain financial, legal, shareholder communications, compliance, and other administrative services to the fund. Under an administrative services agreement, the fund partially reimburses MFS the costs incurred to provide these services. The fund is charged an annual fixed amount of $17,500 plus a fee based on average daily net assets. The administrative services fee incurred for the six months ended February 28, 2014 was equivalent to an annual effective rate of 0.0016% of the fund’s average daily net assets.
Trustees’ and Officers’ Compensation – The fund pays compensation to independent Trustees in the form of a retainer, attendance fees, and additional compensation to Board and Committee chairpersons. The fund does not pay compensation directly to Trustees or officers of the fund who are also officers of the investment adviser, all of whom receive remuneration for their services to the fund from MFS. Certain officers and Trustees of the fund are officers or directors of MFS and MFSC.
Prior to December 31, 2001, the fund had an unfunded defined benefit plan (“DB plan”) for independent Trustees. As of December 31, 2001, the Board took action to terminate the DB plan with respect to then-current and any future independent Trustees, such that the DB plan covers only certain of those former independent Trustees who retired on or before December 31, 2001. The DB plan resulted in a pension expense of $111 and is included in independent Trustees’ compensation for the six months ended February 28, 2014. The liability for deferred retirement benefits payable to certain independent Trustees under the DB plan amounted to $3,834 at February 28, 2014, and is included in “Payable for independent Trustees’ compensation” in the Statement of Assets and Liabilities.
Other – This fund and certain other funds managed by MFS (the funds) have entered into services agreements (the Agreements) which provide for payment of fees by the funds to Tarantino LLC and Griffin Compliance LLC in return for the provision of services of an Independent Chief Compliance Officer (ICCO) and Assistant ICCO, respectively, for the funds. The ICCO and Assistant ICCO are officers of the funds and the sole members of Tarantino LLC and Griffin Compliance LLC, respectively. The funds can terminate the Agreements with Tarantino LLC and Griffin Compliance LLC at any time under the terms of the Agreements. For the six months ended February 28, 2014, the aggregate fees paid by the fund to Tarantino LLC and Griffin Compliance LLC were $96,059 and are included in “Miscellaneous” expense in the Statement of Operations. MFS has agreed to reimburse the fund for a portion of the payments made by the fund in the amount of $13,779, which is included in the reduction of total expenses in the Statement of Operations. Additionally, MFS has agreed to bear all expenses associated with office space, other administrative support, and supplies provided to the ICCO and Assistant ICCO.
35
Notes to Financial Statements (unaudited) – continued
The fund invests in the MFS Institutional Money Market Portfolio which is managed by MFS and seeks current income consistent with preservation of capital and liquidity. Income earned on this investment is included in “Dividends from underlying affiliated funds” in the Statement of Operations. This money market fund does not pay a management fee to MFS.
On September 11, 2014, MFS redeemed 4,432 shares of Class R5 for an aggregate amount of $137,259.
(4) Portfolio Securities
Purchases and sales of investments, other than short-term obligations, aggregated $3,589,054,863 and $2,367,945,495, respectively.
(5) Shares of Beneficial Interest
The fund’s Declaration of Trust permits the Trustees to issue an unlimited number of full and fractional shares of beneficial interest. Transactions in fund shares were as follows:
| | | | | | | | | | | | | | | | |
| | | Six months ended
2/28/14 | | | Year ended
8/31/13 | |
| | | Shares | | | Amount | | | Shares | | | Amount | |
| Shares sold | | | | | | | | | | | | | | | | |
Class A | | | 32,051,741 | | | | $1,027,197,064 | | | | 67,116,915 | | | | $1,889,877,634 | |
Class B | | | 324,853 | | | | 10,357,487 | | | | 708,666 | | | | 20,011,073 | |
Class C | | | 3,964,829 | | | | 125,858,218 | | | | 6,158,073 | | | | 172,478,672 | |
Class I | | | 54,780,192 | | | | 1,764,712,357 | | | | 131,671,398 | | | | 3,656,207,857 | |
Class R1 | | | 95,747 | | | | 3,012,349 | | | | 285,909 | | | | 7,814,415 | |
Class R2 | | | 1,506,502 | | | | 47,803,606 | | | | 4,158,241 | | | | 114,058,643 | |
Class R3 | | | 7,179,657 | | | | 230,142,187 | | | | 12,097,117 | | | | 336,373,199 | |
Class R4 | | | 10,977,768 | | | | 351,138,886 | | | | 27,985,159 | | | | 771,830,606 | |
Class R5 | | | 27,659,979 | | | | 894,666,753 | | | | 43,743,094 | | | | 1,209,937,672 | |
Class 529A | | | 43,460 | | | | 1,399,101 | | | | 63,689 | | | | 1,774,775 | |
Class 529B | | | 2,638 | | | | 84,273 | | | | 3,293 | | | | 90,545 | |
Class 529C | | | 10,309 | | | | 327,038 | | | | 23,338 | | | | 635,837 | |
| | | 138,597,675 | | | | $4,456,699,319 | | | | 294,014,892 | | | | $8,181,090,928 | |
| | | |
Shares issued to shareholders in
reinvestment of distributions | | | | | | | | | | | | | |
Class A | | | 6,504,105 | | | | $208,379,606 | | | | 5,951,959 | | | | $157,662,290 | |
Class B | | | 112,546 | | | | 3,600,788 | | | | 100,309 | | | | 2,617,280 | |
Class C | | | 540,819 | | | | 17,216,873 | | | | 403,650 | | | | 10,521,773 | |
Class I | | | 6,472,132 | | | | 208,180,009 | | | | 5,760,185 | | | | 153,740,898 | |
Class R1 | | | 24,316 | | | | 768,874 | | | | 22,442 | | | | 579,636 | |
Class R2 | | | 442,537 | | | | 14,071,132 | | | | 438,901 | | | | 11,500,677 | |
Class R3 | | | 1,142,318 | | | | 36,497,736 | | | | 1,048,279 | | | | 27,727,975 | |
Class R4 | | | 2,487,613 | | | | 79,618,420 | | | | 3,091,705 | | | | 81,724,939 | |
Class R5 | | | 2,395,262 | | | | 76,678,649 | | | | 1,333,660 | | | | 35,908,017 | |
Class 529A | | | 9,920 | | | | 314,972 | | | | 8,630 | | | | 227,628 | |
Class 529B | | | 717 | | | | 22,658 | | | | 653 | | | | 16,883 | |
Class 529C | | | 2,582 | | | | 81,461 | | | | 2,010 | | | | 51,909 | |
| | | 20,134,867 | | | | $645,431,178 | | | | 18,162,383 | | | | $482,279,905 | |
36
Notes to Financial Statements (unaudited) – continued
| | | | | | | | | | | | | | | | |
| | | Six months ended
2/28/14 | | | Year ended
8/31/13 | |
| | | Shares | | | Amount | | | Shares | | | Amount | |
| Shares reacquired | | | | | | | | | | | | | | | | |
Class A | | | (31,109,565 | ) | | | $(999,054,315 | ) | | | (68,940,476 | ) | | | $(1,899,985,019 | ) |
Class B | | | (588,881 | ) | | | (18,873,950 | ) | | | (1,883,982 | ) | | | (51,710,790 | ) |
Class C | | | (2,381,817 | ) | | | (75,606,707 | ) | | | (6,368,042 | ) | | | (172,465,155 | ) |
Class I | | | (38,455,675 | ) | | | (1,234,354,500 | ) | | | (83,338,753 | ) | | | (2,318,973,834 | ) |
Class R1 | | | (247,657 | ) | | | (7,897,938 | ) | | | (488,335 | ) | | | (13,148,405 | ) |
Class R2 | | | (3,020,856 | ) | | | (96,070,679 | ) | | | (6,162,208 | ) | | | (167,459,751 | ) |
Class R3 | | | (6,811,591 | ) | | | (218,743,462 | ) | | | (10,622,008 | ) | | | (294,129,563 | ) |
Class R4 | | | (14,816,830 | ) | | | (474,095,634 | ) | | | (50,807,188 | ) | | | (1,394,609,059 | ) |
Class R5 | | | (4,525,655 | ) | | | (145,779,197 | ) | | | (3,658,419 | ) | | | (104,034,634 | ) |
Class 529A | | | (22,593 | ) | | | (726,113 | ) | | | (35,610 | ) | | | (1,007,941 | ) |
Class 529B | | | (5,974 | ) | | | (191,297 | ) | | | (8,708 | ) | | | (239,427 | ) |
Class 529C | | | (16,007 | ) | | | (510,339 | ) | | | (16,277 | ) | | | (440,935 | ) |
| | | (102,003,101 | ) | | | $(3,271,904,131 | ) | | | (232,330,006 | ) | | | $(6,418,204,513 | ) |
| | | | |
| Net change | | | | | | | | | | | | | | | | |
Class A | | | 7,446,281 | | | | $236,522,355 | | | | 4,128,398 | | | | $147,554,905 | |
Class B | | | (151,482 | ) | | | (4,915,675 | ) | | | (1,075,007 | ) | | | (29,082,437 | ) |
Class C | | | 2,123,831 | | | | 67,468,384 | | | | 193,681 | | | | 10,535,290 | |
Class I | | | 22,796,649 | | | | 738,537,866 | | | | 54,092,830 | | | | 1,490,974,921 | |
Class R1 | | | (127,594 | ) | | | (4,116,715 | ) | | | (179,984 | ) | | | (4,754,354 | ) |
Class R2 | | | (1,071,817 | ) | | | (34,195,941 | ) | | | (1,565,066 | ) | | | (41,900,431 | ) |
Class R3 | | | 1,510,384 | | | | 47,896,461 | | | | 2,523,388 | | | | 69,971,611 | |
Class R4 | | | (1,351,449 | ) | | | (43,338,328 | ) | | | (19,730,324 | ) | | | (541,053,514 | ) |
Class R5 | | | 25,529,586 | | | | 825,566,205 | | | | 41,418,335 | | | | 1,141,811,055 | |
Class 529A | | | 30,787 | | | | 987,960 | | | | 36,709 | | | | 994,462 | |
Class 529B | | | (2,619 | ) | | | (84,366 | ) | | | (4,762 | ) | | | (131,999 | ) |
Class 529C | | | (3,116 | ) | | | (101,840 | ) | | | 9,071 | | | | 246,811 | |
| | | 56,729,441 | | | | $1,830,226,366 | | | | 79,847,269 | | | | $2,245,166,320 | |
The fund is one of several mutual funds in which the MFS funds-of-funds may invest. The MFS funds-of-funds do not invest in the underlying funds for the purpose of exercising management or control. At the end of the period, the MFS Growth Allocation Fund , the MFS Aggresive Growth Allocation Fund, the MFS Conservative Allocation Fund, and the MFS Moderate Allocation Fund were the owners of record of approximately 2%, 1%, 1% and 1%, respectively, of the value of outstanding voting shares of the fund. In addition, the MFS Lifetime Retirement Income Fund, the MFS Lifetime 2010 Fund, the MFS Lifetime 2015 Fund, the MFS Lifetime 2020 Fund, the MFS Lifetime 2025 Fund, the MFS Lifetime 2030 Fund, the MFS Lifetime 2035 Fund, the MFS Lifetime 2040 Fund, the MFS Lifetime 2045 Fund, the MFS Lifetime 2050 Fund, and the MFS Lifetime 2055 Fund were each the owners of record of less than 1% of the value of outstanding voting shares of the fund.
37
Notes to Financial Statements (unaudited) – continued
(6) Line of Credit
The fund and certain other funds managed by MFS participate in a $1.1 billion unsecured committed line of credit, subject to a $1 billion sublimit, provided by a syndication of banks under a credit agreement. Borrowings may be made for temporary financing needs. Interest is charged to each fund, based on its borrowings, generally at a rate equal to the higher of the Federal Reserve funds rate or one month LIBOR plus an agreed upon spread. A commitment fee, based on the average daily, unused portion of the committed line of credit, is allocated among the participating funds at the end of each calendar quarter. In addition, the fund and other funds managed by MFS have established unsecured uncommitted borrowing arrangements with certain banks for temporary financing needs. Interest is charged to each fund, based on its borrowings, at a rate equal to the Federal Reserve funds rate plus an agreed upon spread. For the six months ended February 28, 2014, the fund’s commitment fee and interest expense were $61,107 and $0, respectively, and are included in “Miscellaneous” expense in the Statement of Operations.
(7) Transactions in Underlying Affiliated Funds-Affiliated Issuers
An affiliated issuer may be considered one in which the fund owns 5% or more of the outstanding voting securities, or a company which is under common control. For the purposes of this report, the fund assumes the following to be an affiliated issuer:
| | | | | | | | | | | | | | | | |
| Underlying Affiliated Fund | | Beginning
Shares/Par
Amount | | | Acquisitions
Shares/Par
Amount | | | Dispositions
Shares/Par
Amount | | | Ending
Shares/Par
Amount | |
MFS Institutional Money
Market Portfolio | | | 382,071,026 | | | | 1,965,500,006 | | | | (1,882,599,569 | ) | | | 464,971,463 | |
| | | | |
| Underlying Affiliated Fund | | Realized
Gain (Loss) | | | Capital Gain
Distributions | | | Dividend
Income | | | Ending
Value | |
MFS Institutional Money
Market Portfolio | | | $— | | | | $— | | | | $173,165 | | | | $464,971,463 | |
38
BOARD REVIEW OF INVESTMENT ADVISORY AGREEMENT
A discussion regarding the Board’s most recent review and renewal of the fund’s Investment Advisory Agreement with MFS is available by clicking on the fund’s name under “Mutual Funds” in the “Products” section of the MFS Web site (mfs.com).
PROXY VOTING POLICIES AND INFORMATION
A general description of the MFS funds’ proxy voting policies and procedures is available without charge, upon request, by calling 1-800-225-2606, by visiting the Proxy Voting section of mfs.com or by visiting the SEC’s Web site at http://www.sec.gov.
Information regarding how the fund voted proxies relating to portfolio securities during the most recent twelve-month period ended June 30 is available without charge by visiting the Proxy Voting section of mfs.com or by visiting the SEC’s Web site at http://www.sec.gov.
QUARTERLY PORTFOLIO DISCLOSURE
The fund will file a complete schedule of portfolio holdings with the Securities and Exchange Commission (the Commission) for the first and third quarters of each fiscal year on Form N-Q. A shareholder can obtain the quarterly portfolio holdings report at mfs.com. The fund’s Form N-Q is also available on the EDGAR database on the Commission’s Internet Web site at http://www.sec.gov, and may be reviewed and copied at the:
Public Reference Room
Securities and Exchange Commission
100 F Street, NE, Room 1580
Washington, D.C. 20549
Information on the operation of the Public Reference Room may be obtained by calling the Commission at 1-800-SEC-0330. Copies of the fund’s Form N-Q also may be obtained, upon payment of a duplicating fee, by electronic request at the following e-mail address: publicinfo@sec.gov, or by writing the Public Reference Section at the above address.
FURTHER INFORMATION
From time to time, MFS may post important information about the fund or the MFS funds on the MFS web site (mfs.com). This information is available by visiting the “Commentary & Announcements” and “Market Outlooks” sections of mfs.com or by clicking on the fund’s name under “Mutual Funds” in the “Products” section of mfs.com.
PROVISION OF FINANCIAL REPORTS AND SUMMARY PROSPECTUSES
The fund produces financial reports every six months and updates its summary prospectus and prospectus annually. To avoid sending duplicate copies of materials to households, only one copy of the fund’s annual and semiannual report and summary prospectus may be mailed to shareholders having the same last name and residential address on the fund’s records. However, any shareholder may contact MFSC (please see back cover for address and telephone number) to request that copies of these reports and summary prospectuses be sent personally to that shareholder.
39
Save paper with eDelivery.

| MFS® will send you prospectuses, |
reports, and proxies directly via e-mail so you will get information faster with less mailbox clutter.
To sign up:
1. Go to mfs.com.
2. Log in via MFS® Access.
3. Select eDelivery.
If you own your MFS fund shares through a financial institution or a retirement plan, MFS® TALK, MFS® Access, or eDelivery may not be available to you.
CONTACT
WEB SITE
mfs.com
MFS TALK
1-800-637-8255
24 hours a day
ACCOUNT SERVICE AND LITERATURE
Shareholders
1-800-225-2606
Financial advisors
1-800-343-2829
Retirement plan services
1-800-637-1255
MAILING ADDRESS
MFS Service Center, Inc.
P.O. Box 55824
Boston, MA 02205-5824
OVERNIGHT MAIL
MFS Service Center, Inc.
c/o Boston Financial Data Services
30 Dan Road
Canton, MA 02021-2809
SEMIANNUAL REPORT
February 28, 2014

MFS® LOW VOLATILITY EQUITY FUND

LVU-SEM
MFS® LOW VOLATILITY EQUITY FUND
CONTENTS
The report is prepared for the general information of shareholders. It is authorized for distribution to prospective investors only when preceded or accompanied by a current prospectus.
NOT FDIC INSURED Ÿ MAY LOSE VALUE Ÿ NO BANK GUARANTEE

LETTER FROM THE CHAIRMAN AND CEO
Dear Shareholders:
The U.S. economy appears to have slowed early in 2014 after a strong second half of 2013. Harsh winter weather likely contributed to at least a temporary softening of consumer demand. Looking at the longer term, the pace of U.S. economic growth has
been modest since the recovery began late in 2009. Corporate profits remain healthy overall. A major plus is the removal of a highly confrontational atmosphere in the U.S. Congress, which had clouded business decision-making since 2011.
Globally, recent months have been dominated by volatility, including emerging market currency jitters and rising geopolitical tensions. These add to the possibility of economic uncertainty and financial market unease. However, the eurozone continues to show signs of recovery, while Japan is making progress as it seeks to break free of deflation.
China’s transition toward a more consumer-oriented and less export-driven economy — one with a more stable and sustainable growth rate — could be positive in the long term. However, in the near term, any deceleration in China’s rate of growth could have a ripple effect on its many global trading partners.
In uncertain times such as these, it is particularly important to remember that managing risk should always be a top priority. At MFS®, active risk management is an integral part of our collaborative process. Our global team of investment professionals shares ideas and evaluates opportunities that span continents, investment disciplines and asset classes. Our goal is to build better insights, and ultimately better results, for our clients.
We understand and appreciate the economic challenges investors face, and we believe in the value of maintaining a long-term view and applying proven principles, such as asset allocation and diversification. We are confident that our unique approach can serve investors well as they work with their financial advisors to identify and pursue the most suitable opportunities.
Respectfully,

Robert J. Manning
Chairman and Chief Executive Officer
MFS Investment Management
April 14, 2014
The opinions expressed in this letter are subject to change, may not be relied upon for investment advice, and no forecasts can be guaranteed.
1
PORTFOLIO COMPOSITION
Portfolio structure

| | | | |
| Top ten holdings | | | | |
| Google, Inc., “A” | | | 3.7% | |
| McDonald’s Corp. | | | 3.3% | |
| Everest Re Group Ltd. | | | 3.2% | |
| Exxon Mobil Corp. | | | 3.2% | |
| Lorillard, Inc. | | | 3.1% | |
| Perrigo Co. PLC | | | 3.1% | |
| Henry Schein, Inc | | | 3.0% | |
| Kroger Co. | | | 2.8% | |
| Stericycle, Inc. | | | 2.6% | |
| Wal-Mart Stores, Inc. | | | 2.3% | |
| | | | |
| Equity sectors | | | | |
| Health Care | | | 16.9% | |
| Utilities & Communications | | | 13.9% | |
| Financial Services | | | 13.6% | |
| Consumer Staples | | | 13.5% | |
| Technology | | | 11.9% | |
| Retailing | | | 9.5% | |
| Industrial Goods & Services | | | 6.5% | |
| Energy | | | 5.2% | |
| Leisure | | | 3.8% | |
| Basic Materials | | | 2.1% | |
| Special Products & Services | | | 1.7% | |
| Transportation | | | 0.5% | |
Percentages are based on net assets as of 2/28/14.
The portfolio is actively managed and current holdings may be different.
2
EXPENSE TABLE
Fund expenses borne by the shareholders during the period,
December 5, 2013 through February 28, 2014
As a shareholder of the fund, you incur two types of costs: (1) transaction costs, including sales charges (loads) on certain purchase or redemption payments, and (2) ongoing costs, including management fees; distribution and service (12b-1) fees; and other fund expenses. This example is intended to help you understand your ongoing costs (in dollars) of investing in the fund and to compare these costs with the ongoing costs of investing in other mutual funds.
The example is based on an investment of $1,000 invested at the beginning of the period and held for the entire period December 5, 2013 through February 28, 2014.
Actual Expenses
The first line for each share class in the following table provides information about actual account values and actual expenses. You may use the information in this line, together with the amount you invested, to estimate the expenses that you paid over the period. Simply divide your account value by $1,000 (for example, an $8,600 account value divided by $1,000 = 8.6), then multiply the result by the number in the first line under the heading entitled “Expenses Paid During Period” to estimate the expenses you paid on your account during this period.
Hypothetical Example for Comparison Purposes
The second line for each share class in the following table provides information about hypothetical account values and hypothetical expenses based on the fund’s actual expense ratio and an assumed rate of return of 5% per year before expenses, which is not the fund’s actual return. The hypothetical account values and expenses may not be used to estimate the actual ending account balance or expenses you paid for the period. You may use this information to compare the ongoing costs of investing in the fund and other funds. To do so, compare this 5% hypothetical example with the 5% hypothetical examples that appear in the shareholder reports of the other funds.
Please note that the expenses shown in the table are meant to highlight your ongoing costs only and do not reflect any transactional costs, such as sales charges (loads). Therefore, the second line for each share class in the table is useful in comparing ongoing costs only, and will not help you determine the relative total costs of owning different funds. In addition, if these transactional costs were included, your costs would have been higher.
3
Expense Table – continued
| | | | | | | | | | | | | | | | | | |
Share
Class | | | | Annualized
Expense Ratio | | | Beginning
Account Value
12/05/13 | | | Ending Account Value 2/28/14 | | | Expenses Paid During Period (p)
12/05/13-2/28/14 | |
| A | | Actual | | | 1.17% | | | | $1,000.00 | | | | $1,026.00 | | | | $2.79 | |
| | Hypothetical (h) | | | 1.17% | | | | $1,000.00 | | | | $1,018.99 | | | | $5.86 | |
| B | | Actual | | | 1.95% | | | | $1,000.00 | | | | $1,024.00 | | | | $4.65 | |
| | Hypothetical (h) | | | 1.95% | | | | $1,000.00 | | | | $1,015.12 | | | | $9.74 | |
| C | | Actual | | | 1.95% | | | | $1,000.00 | | | | $1,024.00 | | | | $4.65 | |
| | Hypothetical (h) | | | 1.95% | | | | $1,000.00 | | | | $1,015.12 | | | | $9.74 | |
| I | | Actual | | | 0.95% | | | | $1,000.00 | | | | $1,027.00 | | | | $2.27 | |
| | Hypothetical (h) | | | 0.95% | | | | $1,000.00 | | | | $1,020.08 | | | | $4.76 | |
| R1 | | Actual | | | 1.95% | | | | $1,000.00 | | | | $1,024.00 | | | | $4.65 | |
| | Hypothetical (h) | | | 1.95% | | | | $1,000.00 | | | | $1,015.12 | | | | $9.74 | |
| R2 | | Actual | | | 1.45% | | | | $1,000.00 | | | | $1,025.00 | | | | $3.46 | |
| | Hypothetical (h) | | | 1.45% | | | | $1,000.00 | | | | $1,017.60 | | | | $7.25 | |
| R3 | | Actual | | | 1.20% | | | | $1,000.00 | | | | $1,026.00 | | | | $2.86 | |
| | Hypothetical (h) | | | 1.20% | | | | $1,000.00 | | | | $1,018.84 | | | | $6.01 | |
| R4 | | Actual | | | 0.95% | | | | $1,000.00 | | | | $1,027.00 | | | | $2.27 | |
| | Hypothetical (h) | | | 0.95% | | | | $1,000.00 | | | | $1,020.08 | | | | $4.76 | |
| R5 | | Actual | | | 0.90% | | | | $1,000.00 | | | | $1,027.00 | | | | $2.15 | |
| | Hypothetical (h) | | | 0.90% | | | | $1,000.00 | | | | $1,020.33 | | | | $4.51 | |
| (h) | 5% class return per year before expenses. |
| (p) | Expenses Paid During Period are equal to each class’s annualized expense ratio, as shown above, multiplied by the average account value over the period, multiplied by 86/365 for Actual Expenses (for Hypothetical Expenses, multiplied by 181/365 to reflect the one-half year period). Expenses paid do not include any applicable sales charges (loads). If these transaction costs had been included, your costs would have been higher. For actual expenses paid, the calculation is based on the period from the commencement of the fund’s investment operations, December 5, 2013, through February 28, 2014. For hypothetical expenses paid, it is assumed that the fund was in existence for the entire six month period ended February 28, 2014. |
Notes to Expense Table
Each class with a Rule 12b-1 service fee is subject to a rebate of a portion of such fee. Such rebates are included in the expense ratios above and are outside of the expense limitation arrangement. For Class A shares, this rebate reduced the expense ratio above by 0.03%. See Note 3 in the Notes to Financial Statements for additional information.
4
PORTFOLIO OF INVESTMENTS
2/28/14 (unaudited)
The Portfolio of Investments is a complete list of all securities owned by your fund. It is categorized by broad-based asset classes.
| | | | | | | | |
| Common Stocks - 99.1% | | | | | | | | |
| Issuer | | Shares/Par | | | Value ($) | |
| | | | | | | | |
| Aerospace - 3.9% | | | | | | | | |
| General Dynamics Corp. | | | 170 | | | $ | 18,622 | |
| Honeywell International, Inc. | | | 310 | | | | 29,276 | |
| Lockheed Martin Corp. | | | 110 | | | | 17,853 | |
| United Technologies Corp. | | | 310 | | | | 36,276 | |
| | | | | | | | |
| | | | | | | $ | 102,027 | |
| Biotechnology - 1.0% | | | | | | | | |
| Amgen, Inc. | | | 214 | | | $ | 26,540 | |
| | |
| Business Services - 1.3% | | | | | | | | |
| Automatic Data Processing, Inc. | | | 260 | | | $ | 20,223 | |
| FleetCor Technologies, Inc. (a) | | | 110 | | | | 14,292 | |
| | | | | | | | |
| | | | | | | $ | 34,515 | |
| Chemicals - 0.5% | | | | | | | | |
| 3M Co. | | | 106 | | | $ | 14,281 | |
| | |
| Computer Software - 2.1% | | | | | | | | |
| Intuit, Inc. | | | 370 | | | $ | 28,916 | |
| Microsoft Corp. | | | 300 | | | | 11,493 | |
| Oracle Corp. | | | 360 | | | | 14,080 | |
| | | | | | | | |
| | | | | | | $ | 54,489 | |
| Computer Software - Systems - 2.0% | | | | | | | | |
| International Business Machines Corp. | | | 282 | | | $ | 52,218 | |
| | |
| Consumer Products - 2.7% | | | | | | | | |
| Colgate-Palmolive Co. | | | 468 | | | $ | 29,404 | |
| Kimberly-Clark Corp. | | | 110 | | | | 12,139 | |
| Procter & Gamble Co. | | | 360 | | | | 28,318 | |
| | | | | | | | |
| | | | | | | $ | 69,861 | |
| Consumer Services - 0.4% | | | | | | | | |
| Priceline.com, Inc. (a) | | | 8 | | | $ | 10,791 | |
| | |
| Containers - 0.8% | | | | | | | | |
| Packaging Corp. of America | | | 160 | | | $ | 11,662 | |
| Silgan Holdings, Inc. | | | 210 | | | | 10,124 | |
| | | | | | | | |
| | | | | | | $ | 21,786 | |
5
Portfolio of Investments (unaudited) – continued
| | | | | | | | |
| Issuer | | Shares/Par | | | Value ($) | |
| | | | | | | | |
| Common Stocks - continued | | | | | | | | |
| Electronics - 3.1% | | | | | | | | |
| Intel Corp. | | | 440 | | | $ | 10,894 | |
| KLA-Tencor Corp. | | | 230 | | | | 14,985 | |
| Microchip Technology, Inc. | | | 940 | | | | 42,817 | |
| Xilinx, Inc. | | | 260 | | | | 13,572 | |
| | | | | | | | |
| | | | | | | $ | 82,268 | |
| Energy - Integrated - 5.2% | | | | | | | | |
| Chevron Corp. | | | 457 | | | $ | 52,706 | |
| Exxon Mobil Corp. | | | 860 | | | | 82,792 | |
| | | | | | | | |
| | | | | | | $ | 135,498 | |
| Entertainment - 0.4% | | | | | | | | |
| Regal Entertainment Group, “A” | | | 580 | | | $ | 10,672 | |
| | |
| Food & Beverages - 5.4% | | | | | | | | |
| Bunge Ltd. | | | 150 | | | $ | 11,942 | |
| Coca-Cola Co. | | | 420 | | | | 16,044 | |
| Dr Pepper Snapple Group, Inc. | | | 270 | | | | 14,070 | |
| General Mills, Inc. | | | 1,030 | | | | 51,531 | |
| Hershey Co. | | | 90 | | | | 9,524 | |
| McCormick & Co., Inc. | | | 250 | | | | 16,600 | |
| Mondelez International, Inc. | | | 370 | | | | 12,591 | |
| PepsiCo, Inc. | | | 120 | | | | 9,608 | |
| | | | | | | | |
| | | | | | | $ | 141,910 | |
| Food & Drug Stores - 3.3% | | | | | | | | |
| CVS Caremark Corp. | | | 180 | | | $ | 13,165 | |
| Kroger Co. | | | 1,770 | | | | 74,234 | |
| | | | | | | | |
| | | | | | | $ | 87,399 | |
| General Merchandise - 4.5% | | | | | | | | |
| Costco Wholesale Corp. | | | 260 | | | $ | 30,368 | |
| Macy’s, Inc. | | | 210 | | | | 12,151 | |
| Target Corp. | | | 250 | | | | 15,635 | |
| Wal-Mart Stores, Inc. | | | 790 | | | | 59,013 | |
| | | | | | | | |
| | | | | | | $ | 117,167 | |
| Insurance - 6.5% | | | | | | | | |
| Chubb Corp. | | | 230 | | | $ | 20,120 | |
| Everest Re Group Ltd. | | | 569 | | | | 84,918 | |
| RenaissanceRe Holdings Ltd. | | | 120 | | | | 11,461 | |
| Travelers Cos., Inc. | | | 380 | | | | 31,859 | |
| Validus Holdings Ltd. | | | 590 | | | | 21,718 | |
| | | | | | | | |
| | | | | | | $ | 170,076 | |
6
Portfolio of Investments (unaudited) – continued
| | | | | | | | |
| Issuer | | Shares/Par | | | Value ($) | |
| | | | | | | | |
| Common Stocks - continued | | | | | | | | |
| Internet - 4.2% | | | | | | | | |
| Google, Inc., “A” (a) | | | 80 | | | $ | 97,252 | |
| Yahoo!, Inc. (a) | | | 300 | | | | 11,601 | |
| | | | | | | | |
| | | | | | | $ | 108,853 | |
| Major Banks - 1.2% | | | | | | | | |
| PNC Financial Services Group, Inc. | | | 210 | | | $ | 17,174 | |
| Wells Fargo & Co. | | | 280 | | | | 12,998 | |
| | | | | | | | |
| | | | | | | $ | 30,172 | |
| Medical & Health Technology & Services - 4.0% | | | | | | | | |
| AmerisourceBergen Corp. | | | 400 | | | $ | 27,140 | |
| Henry Schein, Inc. (a) | | | 660 | | | | 78,566 | |
| | | | | | | | |
| | | | | | | $ | 105,706 | |
| Medical Equipment - 2.5% | | | | | | | | |
| Abbott Laboratories | | | 980 | | | $ | 38,984 | |
| Becton, Dickinson & Co. | | | 150 | | | | 17,283 | |
| Zimmer Holdings, Inc. | | | 110 | | | | 10,322 | |
| | | | | | | | |
| | | | | | | $ | 66,589 | |
| Natural Gas - Distribution - 1.2% | | | | | | | | |
| Sempra Energy | | | 130 | | | $ | 12,281 | |
| Spectra Energy Corp. | | | 490 | | | | 18,267 | |
| | | | | | | | |
| | | | | | | $ | 30,548 | |
| Natural Gas - Pipeline - 0.8% | | | | | | | | |
| Kinder Morgan Management LLC (a) | | | 307 | | | $ | 21,486 | |
| | |
| Network & Telecom - 0.5% | | | | | | | | |
| Qualcomm, Inc. | | | 180 | | | $ | 13,552 | |
| | |
| Other Banks & Diversified Financials - 5.4% | | | | | | | | |
| BankUnited, Inc. | | | 680 | | | $ | 22,766 | |
| Discover Financial Services | | | 390 | | | | 22,378 | |
| East West Bancorp, Inc. | | | 300 | | | | 10,707 | |
| Fifth Third Bancorp | | | 630 | | | | 13,668 | |
| MasterCard, Inc., “A” | | | 539 | | | | 41,891 | |
| Visa, Inc., “A” | | | 131 | | | | 29,598 | |
| | | | | | | | |
| | | | | | | $ | 141,008 | |
| Pharmaceuticals - 9.3% | | | | | | | | |
| Eli Lilly & Co. | | | 960 | | | $ | 57,226 | |
| Johnson & Johnson | | | 550 | | | | 50,666 | |
| Merck & Co., Inc. | | | 790 | | | | 45,022 | |
7
Portfolio of Investments (unaudited) – continued
| | | | | | | | |
| Issuer | | Shares/Par | | | Value ($) | |
| | | | | | | | |
| Common Stocks - continued | | | | | | | | |
| Pharmaceuticals - continued | | | | | | | | |
| Perrigo Co. PLC | | | 492 | | | $ | 80,904 | |
| Pfizer, Inc. | | | 340 | | | | 10,917 | |
| | | | | | | | |
| | | | | | | $ | 244,735 | |
| Pollution Control - 2.6% | | | | | | | | |
| Stericycle, Inc. (a) | | | 593 | | | $ | 67,602 | |
| | |
| Real Estate - 0.6% | | | | | | | | |
| Public Storage, Inc., REIT | | | 90 | | | $ | 15,210 | |
| | |
| Restaurants - 3.3% | | | | | | | | |
| McDonald’s Corp. | | | 920 | | | $ | 87,538 | |
| | |
| Specialty Chemicals - 0.7% | | | | | | | | |
| Praxair, Inc. | | | 139 | | | $ | 18,121 | |
| | |
| Specialty Stores - 1.7% | | | | | | | | |
| AutoZone, Inc. (a) | | | 25 | | | $ | 13,461 | |
| O’Reilly Automotive, Inc. (a) | | | 117 | | | | 17,649 | |
| TJX Cos., Inc. | | | 230 | | | | 14,136 | |
| | | | | | | | |
| | | | | | | $ | 45,246 | |
| Telecommunications - Wireless - 0.5% | | | | | | | | |
| American Tower Corp., REIT | | | 150 | | | $ | 12,221 | |
| | |
| Telephone Services - 3.0% | | | | | | | | |
| AT&T, Inc. | | | 720 | | | $ | 22,990 | |
| Verizon Communications, Inc. | | | 1,140 | | | | 54,241 | |
| | | | | | | | |
| | | | | | | $ | 77,231 | |
| Tobacco - 5.5% | | | | | | | | |
| Altria Group, Inc. | | | 350 | | | $ | 12,691 | |
| Lorillard, Inc. | | | 1,650 | | | | 80,949 | |
| Philip Morris International, Inc. | | | 440 | | | | 35,600 | |
| Reynolds American, Inc. | | | 270 | | | | 13,724 | |
| | | | | | | | |
| | | | | | | $ | 142,964 | |
| Trucking - 0.5% | | | | | | | | |
| United Parcel Service, Inc., “B” | | | 140 | | | $ | 13,408 | |
| | |
| Utilities - Electric Power - 8.5% | | | | | | | | |
| Alliant Energy Corp. | | | 230 | | | $ | 12,475 | |
| American Electric Power Co., Inc. | | | 470 | | | | 23,594 | |
| Consolidated Edison, Inc. | | | 170 | | | | 9,529 | |
8
Portfolio of Investments (unaudited) – continued
| | | | | | | | |
| Issuer | | Shares/Par | | | Value ($) | |
| | | | | | | | |
| Common Stocks - continued | | | | | | | | |
| Utilities - Electric Power - continued | | | | | | | | |
| Duke Energy Corp. | | | 150 | | | $ | 10,632 | |
| ITC Holdings Corp. | | | 110 | | | | 11,286 | |
| MGE Energy, Inc. | | | 500 | | | | 19,290 | |
| NextEra Energy, Inc. | | | 310 | | | | 28,331 | |
| OGE Energy Corp. | | | 1,300 | | | | 46,800 | |
| PG&E Corp. | | | 400 | | | | 17,624 | |
| Pinnacle West Capital Corp. | | | 160 | | | | 8,904 | |
| Southern Co. | | | 520 | | | | 22,022 | |
| Wisconsin Energy Corp. | | | 260 | | | | 11,430 | |
| | | | | | | | |
| | | | | | | $ | 221,917 | |
| Total Common Stocks (Identified Cost, $2,526,772) | | | | | | $ | 2,595,605 | |
| | |
| Money Market Funds - 4.1% | | | | | | | | |
MFS Institutional Money Market Portfolio, 0.08%,
at Cost and Net Asset Value (v) | | | 105,881 | | | $ | 105,881 | |
| Total Investments (Identified Cost, $2,632,653) | | | | | | $ | 2,701,486 | |
| | |
| Other Assets, Less Liabilities - (3.2)% | | | | | | | (83,528 | ) |
| Net Assets - 100.0% | | | | | | $ | 2,617,958 | |
| (a) | Non-income producing security. |
| (v) | Underlying affiliated fund that is available only to investment companies managed by MFS. The rate quoted for the MFS Institutional Money Market Portfolio is the annualized seven-day yield of the fund at period end. |
The following abbreviations are used in this report and are defined:
| PLC | | Public Limited Company |
| REIT | | Real Estate Investment Trust |
See Notes to Financial Statements
9
Financial Statements
STATEMENT OF ASSETS AND LIABILITIES
At 2/28/14 (unaudited)
This statement represents your fund’s balance sheet, which details the assets and liabilities comprising the total value of the fund.
| | | | |
| Assets | | | | |
Investments- | | | | |
Non-affiliated issuers, at value (identified cost, $2,526,772) | | | $2,595,605 | |
Underlying affiliated funds, at cost and value | | | 105,881 | |
Total investments, at value (identified cost, $2,632,653) | | | $2,701,486 | |
Cash | | | 57 | |
Receivables for | | | | |
Fund shares sold | | | 52,500 | |
Dividends | | | 7,135 | |
Receivable from investment adviser | | | 17,860 | |
Total assets | | | $2,779,038 | |
| Liabilities | | | | |
Payables for | | | | |
Investments purchased | | | $114,893 | |
Payable to affiliates | | | | |
Shareholder servicing costs | | | 563 | |
Distribution and service fees | | | 19 | |
Payable for independent Trustees’ compensation | | | 79 | |
Accrued expenses and other liabilities | | | 45,526 | |
Total liabilities | | | $161,080 | |
Net assets | | | $2,617,958 | |
| Net assets consist of | | | | |
Paid-in capital | | | $2,553,347 | |
Unrealized appreciation (depreciation) on investments | | | 68,833 | |
Accumulated net realized gain (loss) on investments | | | (10,539 | ) |
Undistributed net investment income | | | 6,317 | |
Net assets | | | $2,617,958 | |
Shares of beneficial interest outstanding | | | 255,127 | |
10
Statement of Assets and Liabilities (unaudited) – continued
| | | | | | | | | | | | |
| | | Net assets | | | Shares
outstanding | | | Net asset value
per share (a) | |
Class A | | | $376,499 | | | | 36,703 | | | | $10.26 | |
Class B | | | 107,618 | | | | 10,507 | | | | 10.24 | |
Class C | | | 173,251 | | | | 16,914 | | | | 10.24 | |
Class I | | | 112,957 | | | | 11,003 | | | | 10.27 | |
Class R1 | | | 102,419 | | | | 10,000 | | | | 10.24 | |
Class R2 | | | 102,540 | | | | 10,000 | | | | 10.25 | |
Class R3 | | | 102,601 | | | | 10,000 | | | | 10.26 | |
Class R4 | | | 102,661 | | | | 10,000 | | | | 10.27 | |
Class R5 | | | 1,437,412 | | | | 140,000 | | | | 10.27 | |
| (a) | Maximum offering price per share was equal to the net asset value per share for all share classes, except for Class A, for which the maximum offering price per share was $10.89 [100 / 94.25 x $10.26]. On sales of $50,000 or more, the maximum offering price of Class A shares is reduced. A contingent deferred sales charge may be imposed on redemptions of Class A, Class B, and Class C shares. Redemption price per share was equal to the net asset value per share for Class I, R1, R2, R3, R4, and R5. |
See Notes to Financial Statements
11
Financial Statements
STATEMENT OF OPERATIONS
Period ended 2/28/14 (c) (unaudited)
This statement describes how much your fund earned in investment income and accrued in expenses. It also describes any gains and/or losses generated by fund operations.
| | | | |
| Net investment income | | | | |
Income | | | | |
Dividends | | | $12,319 | |
Dividends from underlying affiliated funds | | | 31 | |
Total investment income | | | $12,350 | |
Expenses | | | | |
Management fee | | | $4,077 | |
Distribution and service fees | | | 1,030 | |
Shareholder servicing costs | | | 688 | |
Administrative services fee | | | 4,124 | |
Independent Trustees’ compensation | | | 207 | |
Custodian fee | | | 2,592 | |
Shareholder communications | | | 2,336 | |
Audit and tax fees | | | 8,688 | |
Legal fees | | | 283 | |
Registration fees | | | 30,611 | |
Miscellaneous | | | 2,557 | |
Total expenses | | | $57,193 | |
Reduction of expenses by investment adviser and distributor | | | (51,160 | ) |
Net expenses | | | $6,033 | |
Net investment income | | | $6,317 | |
| Realized and unrealized gain (loss) on investments | | | | |
Realized gain (loss) on investments (identified cost basis) | | | $(10,539 | ) |
Change in unrealized appreciation (depreciation) on investments | | | $68,833 | |
Net realized and unrealized gain (loss) on investments | | | $58,294 | |
Change in net assets from operations | | | $64,611 | |
| (c) | For the period from the commencement of the fund’s investment operations, December 5, 2013, through the stated period end. |
See Notes to Financial Statements
12
Financial Statements
STATEMENTS OF CHANGES IN NET ASSETS
This statement describes the increases and/or decreases in net assets resulting from operations, any distributions, and any shareholder transactions.
| | | | |
| Change in net assets | | Period ended
2/28/14 (c)
(unaudited) | |
| From operations | | | | |
Net investment income | | | $6,317 | |
Net realized gain (loss) on investments | | | (10,539 | ) |
Net unrealized gain (loss) on investments | | | 68,833 | |
Change in net assets from operations | | | $64,611 | |
Change in net assets from fund share transactions | | | $2,553,347 | |
Total change in net assets | | | $2,617,958 | |
| Net assets | | | | |
At beginning of period | | | — | |
At end of period (including undistributed net investment income of $6,317) | | | $2,617,958 | |
| (c) | For the period from the commencement of the fund’s investment operations, December 5, 2013, through the stated period end. |
See Notes to Financial Statements
13
Financial Statements
FINANCIAL HIGHLIGHTS
The financial highlights table is intended to help you understand the fund’s financial performance for the semiannual period and the past 5 fiscal years (or life of a particular share class, if shorter). Certain information reflects financial results for a single fund share. The total returns in the table represent the rate by which an investor would have earned (or lost) on an investment in the fund share class (assuming reinvestment of all distributions) held for the entire period.
| | | | |
| Class A | | Period ended
2/28/14 (c) (unaudited) | |
| | |
Net asset value, beginning of period | | | $10.00 | |
| Income (loss) from investment operations | | | | |
Net investment income (d) | | | $0.04 | |
Net realized and unrealized gain (loss) on investments and foreign currency | | | 0.22 | |
Total from investment operations | | | $0.26 | |
Net asset value, end of period (x) | | | $10.26 | |
Total return (%) (r)(s)(t)(x) | | | 2.60 | (n) |
Ratios (%) (to average net assets)
and Supplemental data: | | | | |
Expenses before expense reductions (f) | | | 10.55 | (a) |
Expenses after expense reductions (f) | | | 1.17 | (a) |
Net investment income | | | 1.57 | (a) |
Portfolio turnover | | | 11 | (n) |
Net assets at end of period (000 omitted) | | | $376 | |
| |
| Class B | | Period ended
2/28/14 (c) (unaudited) | |
| | |
Net asset value, beginning of period | | | $10.00 | |
| Income (loss) from investment operations | | | | |
Net investment income (d) | | | $0.01 | |
Net realized and unrealized gain (loss) on investments and foreign currency | | | 0.23 | |
Total from investment operations | | | $0.24 | |
Net asset value, end of period (x) | | | $10.24 | |
Total return (%) (r)(s)(t)(x) | | | 2.40 | (n) |
Ratios (%) (to average net assets)
and Supplemental data: | | | | |
Expenses before expense reductions (f) | | | 11.36 | (a) |
Expenses after expense reductions (f) | | | 1.95 | (a) |
Net investment income | | | 0.28 | (a) |
Portfolio turnover | | | 11 | (n) |
Net assets at end of period (000 omitted) | | | $108 | |
See Notes to Financial Statements
14
Financial Highlights – continued
| | | | |
| Class C | | Period ended
2/28/14 (c) (unaudited) | |
| | |
Net asset value, beginning of period | | | $10.00 | |
| Income (loss) from investment operations | | | | |
Net investment income (d) | | | $0.01 | |
Net realized and unrealized gain (loss) on investments and foreign currency | | | 0.23 | |
Total from investment operations | | | $0.24 | |
Net asset value, end of period (x) | | | $10.24 | |
Total return (%) (r)(s)(t)(x) | | | 2.40 | (n) |
Ratios (%) (to average net assets)
and Supplemental data: | | | | |
Expenses before expense reductions (f) | | | 11.35 | (a) |
Expenses after expense reductions (f) | | | 1.95 | (a) |
Net investment income | | | 0.35 | (a) |
Portfolio turnover | | | 11 | (n) |
Net assets at end of period (000 omitted) | | | $173 | |
| | | | |
| Class I | | Period ended
2/28/14 (c) (unaudited) | |
| | |
Net asset value, beginning of period | | | $10.00 | |
| Income (loss) from investment operations | | | | |
Net investment income (d) | | | $0.03 | |
Net realized and unrealized gain (loss) on investments and foreign currency | | | 0.24 | |
Total from investment operations | | | $0.27 | |
Net asset value, end of period (x) | | | $10.27 | |
Total return (%) (r)(s)(x) | | | 2.70 | (n) |
Ratios (%) (to average net assets)
and Supplemental data: | | | | |
Expenses before expense reductions (f) | | | 10.36 | (a) |
Expenses after expense reductions (f) | | | 0.95 | (a) |
Net investment income | | | 1.31 | (a) |
Portfolio turnover | | | 11 | (n) |
Net assets at end of period (000 omitted) | | | $113 | |
See Notes to Financial Statements
15
Financial Highlights – continued
| | | | |
| Class R1 | | Period ended
2/28/14 (c) (unaudited) | |
| | |
Net asset value, beginning of period | | | $10.00 | |
| Income (loss) from investment operations | | | | |
Net investment income (d) | | | $0.01 | |
Net realized and unrealized gain (loss) on investments and foreign currency | | | 0.23 | |
Total from investment operations | | | $0.24 | |
Net asset value, end of period (x) | | | $10.24 | |
Total return (%) (r)(s)(x) | | | 2.40 | (n) |
Ratios (%) (to average net assets)
and Supplemental data: | | | | |
Expenses before expense reductions (f) | | | 11.36 | (a) |
Expenses after expense reductions (f) | | | 1.95 | (a) |
Net investment income | | | 0.28 | (a) |
Portfolio turnover | | | 11 | (n) |
Net assets at end of period (000 omitted) | | | $102 | |
| | | | |
| Class R2 | | Period ended
2/28/14 (c) (unaudited) | |
| | |
Net asset value, beginning of period | | | $10.00 | |
| Income (loss) from investment operations | | | | |
Net investment income (d) | | | $0.02 | |
Net realized and unrealized gain (loss) on investments and foreign currency | | | 0.23 | |
Total from investment operations | | | $0.25 | |
Net asset value, end of period (x) | | | $10.25 | |
Total return (%) (r)(s)(x) | | | 2.50 | (n) |
Ratios (%) (to average net assets)
and Supplemental data: | | | | |
Expenses before expense reductions (f) | | | 10.86 | (a) |
Expenses after expense reductions (f) | | | 1.45 | (a) |
Net investment income | | | 0.78 | (a) |
Portfolio turnover | | | 11 | (n) |
Net assets at end of period (000 omitted) | | | $103 | |
See Notes to Financial Statements
16
Financial Highlights – continued
| | | | |
| Class R3 | | Period ended
2/28/14 (c) (unaudited) | |
| | |
Net asset value, beginning of period | | | $10.00 | |
| Income (loss) from investment operations | | | | |
Net investment income (d) | | | $0.02 | |
Net realized and unrealized gain (loss) on investments and foreign currency | | | 0.24 | |
Total from investment operations | | | $0.26 | |
Net asset value, end of period (x) | | | $10.26 | |
Total return (%) (r)(s)(x) | | | 2.60 | (n) |
Ratios (%) (to average net assets)
and Supplemental data: | | | | |
Expenses before expense reductions (f) | | | 10.61 | (a) |
Expenses after expense reductions (f) | | | 1.20 | (a) |
Net investment income | | | 1.02 | (a) |
Portfolio turnover | | | 11 | (n) |
Net assets at end of period (000 omitted) | | | $103 | |
| | | | |
| Class R4 | | Period ended
2/28/14 (c) (unaudited) | |
| | |
Net asset value, beginning of period | | | $10.00 | |
| Income (loss) from investment operations | | | | |
Net investment income (d) | | | $0.03 | |
Net realized and unrealized gain (loss) on investments and foreign currency | | | 0.24 | |
Total from investment operations | | | $0.27 | |
Net asset value, end of period (x) | | | $10.27 | |
Total return (%) (r)(s)(x) | | | 2.70 | (n) |
Ratios (%) (to average net assets)
and Supplemental data: | | | | |
Expenses before expense reductions (f) | | | 10.36 | (a) |
Expenses after expense reductions (f) | | | 0.95 | (a) |
Net investment income | | | 1.28 | (a) |
Portfolio turnover | | | 11 | (n) |
Net assets at end of period (000 omitted) | | | $103 | |
See Notes to Financial Statements
17
Financial Highlights – continued
| | | | |
| Class R5 | | Period ended
2/28/14 (c) (unaudited) | |
| | |
Net asset value, beginning of period | | | $10.00 | |
| Income (loss) from investment operations | | | | |
Net investment income (d) | | | $0.03 | |
Net realized and unrealized gain (loss) on investments and foreign currency | | | 0.24 | |
Total from investment operations | | | $0.27 | |
Net asset value, end of period (x) | | | $10.27 | |
Total return (%) (r)(s)(x) | | | 2.70 | (n) |
Ratios (%) (to average net assets)
and Supplemental data: | | | | |
Expenses before expense reductions (f) | | | 10.31 | (a) |
Expenses after expense reductions (f) | | | 0.90 | (a) |
Net investment income | | | 1.32 | (a) |
Portfolio turnover | | | 11 | (n) |
Net assets at end of period (000 omitted) | | | $1,437 | |
| (c) | For the period from the commencement of the fund’s investment operations, December 5, 2013, through the stated period end. |
| (d) | Per share data is based on average shares outstanding. |
| (f) | Ratios do not reflect reductions from fees paid indirectly, if applicable. |
| (r) | Certain expenses have been reduced without which performance would have been lower. |
| (s) | From time to time the fund may receive proceeds from litigation settlements, without which performance would be lower. |
| (t) | Total returns do not include any applicable sales charges. |
| (x) | The net asset values per share and total returns have been calculated on net asset values which include adjustments made in accordance with U.S. generally accepted accounting principles required at period end for financial reporting purposes. |
See Notes to Financial Statements
18
NOTES TO FINANCIAL STATEMENTS
(unaudited)
(1) Business and Organization
MFS Low Volatility Equity Fund (the fund) is a diversified series of MFS Series Trust I (the trust). The trust is organized as a Massachusetts business trust and is registered under the Investment Company Act of 1940, as amended, as an open-end management investment company.
(2) Significant Accounting Policies
General – The preparation of financial statements in conformity with U.S. generally accepted accounting principles requires management to make estimates and assumptions that affect the reported amounts of assets and liabilities, and disclosure of contingent assets and liabilities at the date of the financial statements and the reported amounts of increases and decreases in net assets from operations during the reporting period. Actual results could differ from those estimates. In the preparation of these financial statements, management has evaluated subsequent events occurring after the date of the fund’s Statement of Assets and Liabilities through the date that the financial statements were issued.
In June 2013, FASB issued Accounting Standards Update 2013-08 (“ASU 2013-08”) Financial Services – Investment Companies (Topic 946) – Amendments to the Scope, Measurement, and Disclosure Requirements which is effective for interim and annual reporting periods in fiscal years that begin after December 15, 2013. ASU 2013-08 sets forth a methodology for determining whether an entity should be characterized as an investment company and prescribes fair value accounting for an investment company’s non-controlling ownership interest in another investment company. FASB has determined that a fund registered under the Investment Company Act of 1940 automatically meets ASU 2013-08’s criteria for an investment company. Although still evaluating the potential impacts of ASU 2013-08 to the fund, management expects that the impact of the fund’s adoption will be limited to additional financial statement disclosures.
Investment Valuations – Equity securities, including restricted equity securities, are generally valued at the last sale or official closing price as provided by a third-party pricing service on the market or exchange on which they are primarily traded. Equity securities, for which there were no sales reported that day, are generally valued at the last quoted daily bid quotation as provided by a third-party pricing service on the market or exchange on which such securities are primarily traded. Short-term instruments with a maturity at issuance of 60 days or less generally are valued at amortized cost, which approximates market value. Open-end investment companies are generally valued at net asset value per share. Securities and other assets generally valued on the basis of information from a third-party pricing service may also be valued at a broker/dealer bid quotation. Values obtained from third-party pricing services can utilize both transaction data and market information such as yield, quality, coupon rate, maturity, type of issue, trading characteristics, and other market data.
The Board of Trustees has delegated primary responsibility for determining or causing to be determined the value of the fund’s investments (including any fair valuation) to the adviser pursuant to valuation policies and procedures approved by the Board. If the
19
Notes to Financial Statements (unaudited) – continued
adviser determines that reliable market quotations are not readily available, investments are valued at fair value as determined in good faith by the adviser in accordance with such procedures under the oversight of the Board of Trustees. Under the fund’s valuation policies and procedures, market quotations are not considered to be readily available for most types of debt instruments and floating rate loans and many types of derivatives. These investments are generally valued at fair value based on information from third-party pricing services. In addition, investments may be valued at fair value if the adviser determines that an investment’s value has been materially affected by events occurring after the close of the exchange or market on which the investment is principally traded (such as foreign exchange or market) and prior to the determination of the fund’s net asset value, or after the halting of trading of a specific security where trading does not resume prior to the close of the exchange or market on which the security is principally traded. Events that occur on a frequent basis after foreign markets close (such as developments in foreign markets and significant movements in the U.S. markets) and prior to the determination of the fund’s net asset value may be deemed to have a material effect on the value of securities traded in foreign markets. Accordingly, the fund’s foreign equity securities may often be valued at fair value. The adviser generally relies on third-party pricing services or other information (such as the correlation with price movements of similar securities in the same or other markets; the type, cost and investment characteristics of the security; the business and financial condition of the issuer; and trading and other market data) to assist in determining whether to fair value and at what value to fair value an investment. The value of an investment for purposes of calculating the fund’s net asset value can differ depending on the source and method used to determine value. When fair valuation is used, the value of an investment used to determine the fund’s net asset value may differ from quoted or published prices for the same investment. There can be no assurance that the fund could obtain the fair value assigned to an investment if it were to sell the investment at the same time at which the fund determines its net asset value per share.
Various inputs are used in determining the value of the fund’s assets or liabilities. These inputs are categorized into three broad levels. In certain cases, the inputs used to measure fair value may fall into different levels of the fair value hierarchy. In such cases, an investment’s level within the fair value hierarchy is based on the lowest level of input that is significant to the fair value measurement. The fund’s assessment of the significance of a particular input to the fair value measurement in its entirety requires judgment, and considers factors specific to the investment. Level 1 includes unadjusted quoted prices in active markets for identical assets or liabilities. Level 2 includes other significant observable market-based inputs (including quoted prices for similar securities, interest rates, prepayment speed, and credit risk). Level 3 includes unobservable inputs, which may include the adviser’s own assumptions in determining the fair value of investments. The following is a summary of the levels used as of February 28, 2014 in valuing the fund’s assets or liabilities:
| | | | | | | | | | | | | | | | |
| Investments at Value | | Level 1 | | | Level 2 | | | Level 3 | | | Total | |
| Equity Securities | | | $2,595,605 | | | | $— | | | | $— | | | | $2,595,605 | |
| Mutual Funds | | | 105,881 | | | | — | | | | — | | | | 105,881 | |
| Total Investments | | | $2,701,486 | | | | $— | | | | $— | | | | $2,701,486 | |
20
Notes to Financial Statements (unaudited) – continued
For further information regarding security characteristics, see the Portfolio of Investments.
Indemnifications – Under the fund’s organizational documents, its officers and Trustees may be indemnified against certain liabilities and expenses arising out of the performance of their duties to the fund. Additionally, in the normal course of business, the fund enters into agreements with service providers that may contain indemnification clauses. The fund’s maximum exposure under these agreements is unknown as this would involve future claims that may be made against the fund that have not yet occurred.
Investment Transactions and Income – Investment transactions are recorded on the trade date. Dividends received in cash are recorded on the ex-dividend date. Certain dividends from foreign securities will be recorded when the fund is informed of the dividend if such information is obtained subsequent to the ex-dividend date. Dividend payments received in additional securities are recorded on the ex-dividend date in an amount equal to the value of the security on such date.
The fund may receive proceeds from litigation settlements. Any proceeds received from litigation involving portfolio holdings are reflected in the Statement of Operations in realized gain/loss if the security has been disposed of by the fund or in unrealized gain/loss if the security is still held by the fund. Any other proceeds from litigation not related to portfolio holdings are reflected as other income in the Statement of Operations.
Fees Paid Indirectly – The fund’s custody fee may be reduced according to an arrangement that measures the value of cash deposited with the custodian by the fund. For the period ended February 28, 2014, custody fees were not reduced.
Tax Matters and Distributions – The fund intends to qualify as a regulated investment company, as defined under Subchapter M of the Internal Revenue Code, and to distribute all of its taxable income, including realized capital gains. As a result, no provision for federal income tax is required. The fund’s federal tax returns, when filed, will remain subject to examination by the Internal Revenue Service for a three year period. Management has analyzed the fund’s tax positions taken on federal and state tax returns for all open tax years and does not believe that there are any uncertain tax positions that require recognition of a tax liability.
Distributions to shareholders are recorded on the ex-dividend date. Income and capital gain distributions are determined in accordance with income tax regulations, which may differ from U.S. generally accepted accounting principles. Certain capital accounts in the financial statements are periodically adjusted for permanent differences in order to reflect their tax character. These adjustments have no impact on net assets or net asset value per share. Temporary differences which arise from recognizing certain items of income, expense, gain or loss in different periods for financial statement and tax purposes will reverse at some time in the future. Distributions in excess of net investment income or net realized gains are temporary overdistributions for financial statement purposes resulting from differences in the recognition or classification of income or distributions for financial statement and tax purposes.
21
Notes to Financial Statements (unaudited) – continued
The federal tax cost and the tax basis components of distributable earnings were as follows:
| | | | |
| As of 2/28/14 | | | |
| Cost of investments | | | $2,632,653 | |
| Gross appreciation | | | 99,800 | |
| Gross depreciation | | | (30,967 | ) |
| Net unrealized appreciation (depreciation) | | | $68,833 | |
Multiple Classes of Shares of Beneficial Interest – The fund offers multiple classes of shares, which differ in their respective distribution and service fees. The fund’s income, realized and unrealized gain (loss), and common expenses are allocated to shareholders based on the daily net assets of each class. Dividends are declared separately for each class. Differences in per share dividend rates are generally due to differences in separate class expenses. Class B shares will convert to Class A shares approximately eight years after purchase.
(3) Transactions with Affiliates
Investment Adviser – The fund has an investment advisory agreement with MFS to provide overall investment management and related administrative services and facilities to the fund. The management fee is computed daily and paid monthly at the following annual rates:
| | | | |
| First $1 billion of average daily net assets | | | 0.75 | % |
| Next $1.5 billion of average daily net assets | | | 0.70 | % |
| Average daily net assets in excess of $2.5 billion | | | 0.65 | % |
MFS has agreed in writing to reduce its management fee to 0.60% of the fund’s average daily net assets annually up to $1 billion, and 0.55% of the fund’s average daily net assets annually in excess of $1 billion. This written agreement will remain in effect until modified by the fund’s Board of Trustees, but such agreement will continue until at least December 31, 2014. For the period ended February 28, 2014, this management fee reduction amounted to $815, which is included in the reduction of total expenses in the Statement of Operations. MFS has also agreed in writing to reduce its management fee by a specified amount if certain MFS mutual fund assets exceed thresholds agreed to by MFS and the fund’s Board of Trustees. For the period ended February 28, 2014, this management fee reduction amounted to $14, which is included in the reduction of total expenses in the Statement of Operations. The management fee incurred for the period ended February 28, 2014 was equivalent to an annual effective rate of 0.60% of the fund’s average daily net assets.
The investment adviser has agreed in writing to pay a portion of the fund’s total annual operating expenses, exclusive of interest, taxes, extraordinary expenses, brokerage and transaction costs, and investment-related expenses, such that total fund operating expenses do not exceed the following rates annually of each class’s average daily net assets:
| | | | | | | | | | | | | | | | | | | | | | | | | | | | | | | | | | |
| Classes | |
| A | | | B | | | C | | | I | | | R1 | | | R2 | | | R3 | | | R4 | | | R5 | |
| | 1.20% | | | | 1.95% | | | | 1.95% | | | | 0.95% | | | | 1.95% | | | | 1.45% | | | | 1.20% | | | | 0.95% | | | | 0.91% | |
22
Notes to Financial Statements (unaudited) – continued
This written agreement will continue until modified by the fund’s Board of Trustees, but such agreement will continue at least until December 31, 2014. For the period ended February 28, 2014, this reduction amounted to $50,317 and is included in the reduction of total expenses in the Statement of Operations.
Distributor – MFS Fund Distributors, Inc. (MFD), a wholly-owned subsidiary of MFS, as distributor, received $1,152 for the period ended February 28, 2014, as its portion of the initial sales charge on sales of Class A shares of the fund.
The Board of Trustees has adopted a distribution plan for certain class shares pursuant to Rule 12b-1 of the Investment Company Act of 1940.
The fund’s distribution plan provides that the fund will pay MFD for services provided by MFD and financial intermediaries in connection with the distribution and servicing of certain share classes. One component of the plan is a distribution fee paid to MFD and another component of the plan is a service fee paid to MFD. MFD may subsequently pay all, or a portion, of the distribution and/or service fees to financial intermediaries.
Distribution Plan Fee Table:
| | | | | | | | | | | | | | | | | | | | |
| | | Distribution
Fee Rate (d) | | | Service
Fee Rate (d) | | | Total
Distribution
Plan (d) | | | Annual
Effective
Rate (e) | | | Distribution
and Service
Fee | |
| Class A | | | — | | | | 0.25% | | | | 0.25% | | | | 0.22% | | | | $106 | |
| Class B | | | 0.75% | | | | 0.25% | | | | 1.00% | | | | 1.00% | | | | 236 | |
| Class C | | | 0.75% | | | | 0.25% | | | | 1.00% | | | | 1.00% | | | | 275 | |
| Class R1 | | | 0.75% | | | | 0.25% | | | | 1.00% | | | | 1.00% | | | | 236 | |
| Class R2 | | | 0.25% | | | | 0.25% | | | | 0.50% | | | | 0.50% | | | | 118 | |
| Class R3 | | | — | | | | 0.25% | | | | 0.25% | | | | 0.25% | | | | 59 | |
| Total Distribution and Service Fees | | | | $1,030 | |
| (d) | In accordance with the distribution plan for certain classes, the fund pays distribution and/or service fees equal to these annual percentage rates of each class’s average daily net assets. The distribution and service fee rates disclosed by class represent the current rates in effect at the end of the reporting period. Any rate changes, if applicable, are detailed below. |
| (e) | MFD has voluntarily agreed to rebate a portion of each class’s 0.25% service fee attributable to accounts for which MFD retains the 0.25% service fee except for accounts attributable to MFS or its affiliates’ seed money. For the period ended February 28, 2014, this rebate amounted to $13 for Class A and is included in the reduction of total expenses in the Statement of Operations. |
Certain Class A shares are subject to a contingent deferred sales charge (CDSC) in the event of a shareholder redemption within 18 months of purchase. Class C shares are subject to a CDSC in the event of a shareholder redemption within 12 months of purchase. Class B shares are subject to a CDSC in the event of a shareholder redemption within six years of purchase. There were no contingent deferred sales charges imposed during the period ended February 28, 2014.
Shareholder Servicing Agent – MFS Service Center, Inc. (MFSC), a wholly-owned subsidiary of MFS, receives a fee from the fund for its services as shareholder servicing agent calculated as a percentage of the average daily net assets of the fund as determined periodically under the supervision of the fund’s Board of Trustees. For the period ended February 28, 2014, the fee was $124, which equated to 0.0227% annually of the fund’s average daily net assets. MFSC also receives payment from the
23
Notes to Financial Statements (unaudited) – continued
fund for out-of-pocket expenses, sub-accounting and other shareholder servicing costs which may be paid to affiliated and unaffiliated service providers. Class R5 shares do not incur sub-accounting fees. For the period ended February 28, 2014, these out-of-pocket expenses, sub-accounting and other shareholder servicing costs amounted to $564.
Administrator – MFS provides certain financial, legal, shareholder communications, compliance, and other administrative services to the fund. Under an administrative services agreement, the fund partially reimburses MFS the costs incurred to provide these services. The fund is charged an annual fixed amount of $17,500 plus a fee based on average daily net assets. The administrative services fee incurred for the period ended February 28, 2014 was equivalent to an annual effective rate of 0.7582% of the fund’s average daily net assets.
Trustees’ and Officers’ Compensation – The fund pays compensation to independent Trustees in the form of a retainer, attendance fees, and additional compensation to Board and Committee chairpersons. The fund does not pay compensation directly to Trustees or officers of the fund who are also officers of the investment adviser, all of whom receive remuneration for their services to the fund from MFS. Certain officers and Trustees of the fund are officers or directors of MFS, MFD, and MFSC.
Other – This fund and certain other funds managed by MFS (the funds) have entered into services agreements (the Agreements) which provide for payment of fees by the funds to Tarantino LLC and Griffin Compliance LLC in return for the provision of services of an Independent Chief Compliance Officer (ICCO) and Assistant ICCO, respectively, for the funds. The ICCO and Assistant ICCO are officers of the funds and the sole members of Tarantino LLC and Griffin Compliance LLC, respectively. The funds can terminate the Agreements with Tarantino LLC and Griffin Compliance LLC at any time under the terms of the Agreements. For the period ended February 28, 2014, the aggregate fees paid by the fund to Tarantino LLC and Griffin Compliance LLC were $9 and are included in “Miscellaneous” expense in the Statement of Operations. MFS has agreed to reimburse the fund for a portion of the payments made by the fund in the amount of $1, which is included in the reduction of total expenses in the Statement of Operations. Additionally, MFS has agreed to bear all expenses associated with office space, other administrative support, and supplies provided to the ICCO and Assistant ICCO.
The fund invests in the MFS Institutional Money Market Portfolio which is managed by MFS and seeks current income consistent with preservation of capital and liquidity. Income earned on this investment is included in “Dividends from underlying affiliated funds” in the Statement of Operations. This money market fund does not pay a management fee to MFS.
On December 5, 2013, MFS purchased 140,000 shares of Class R5 and 10,000 shares of Class A, Class B, Class C, Class I, Class R1, Class R2, Class R3, and Class R4 for an aggregate amount of $2,200,000.
At February 28, 2014, MFS held 95%, 59%, and 91% of the outstanding shares of Class B, Class C, and Class I, respectively, and 100% of the outstanding shares each of Class R1, Class R2, Class R3, Class R4, and Class R5.
24
Notes to Financial Statements (unaudited) – continued
(4) Portfolio Securities
Purchases and sales of investments, other than short-term obligations, aggregated $2,786,544 and $249,232, respectively.
(5) Shares of Beneficial Interest
The fund’s Declaration of Trust permits the Trustees to issue an unlimited number of full and fractional shares of beneficial interest. Transactions in fund shares were as follows:
| | | | | | | | |
| | | Period ended
2/28/14 (c) | |
| | | Shares | | | Amount | |
| Shares sold | | | | | | | | |
Class A | | | 36,704 | | | | $368,215 | |
Class B | | | 10,507 | | | | 105,147 | |
Class C | | | 16,914 | | | | 170,000 | |
Class I | | | 11,003 | | | | 110,000 | |
Class R1 | | | 10,000 | | | | 100,000 | |
Class R2 | | | 10,000 | | | | 100,000 | |
Class R3 | | | 10,000 | | | | 100,000 | |
Class R4 | | | 10,000 | | | | 100,000 | |
Class R5 | | | 140,000 | | | | 1,400,000 | |
| | | 255,128 | | | | $2,553,362 | |
| | |
| Shares reacquired | | | | | | | | |
Class A | | | (1 | ) | | | $(15 | ) |
| | |
| Net change | | | | | | | | |
Class A | | | 36,703 | | | | $368,200 | |
Class B | | | 10,507 | | | | 105,147 | |
Class C | | | 16,914 | | | | 170,000 | |
Class I | | | 11,003 | | | | 110,000 | |
Class R1 | | | 10,000 | | | | 100,000 | |
Class R2 | | | 10,000 | | | | 100,000 | |
Class R3 | | | 10,000 | | | | 100,000 | |
Class R4 | | | 10,000 | | | | 100,000 | |
Class R5 | | | 140,000 | | | | 1,400,000 | |
| | | 255,127 | | | | $2,553,347 | |
| (c) | For the period from the commencement of the fund’s investment operations, December 5, 2013, through the stated period end. |
(6) Line of Credit
The fund and other funds managed by MFS have established unsecured uncommitted borrowing arrangements with certain banks for temporary financing needs. Interest is charged to each fund, based on its borrowings, at a rate equal to the Federal Reserve funds rate plus an agreed upon spread.
25
Notes to Financial Statements (unaudited) – continued
(7) Transactions in Underlying Affiliated Funds-Affiliated Issuers
An affiliated issuer may be considered one in which the fund owns 5% or more of the outstanding voting securities, or a company which is under common control. For the purposes of this report, the fund assumes the following to be an affiliated issuer:
| | | | | | | | | | | | | | | | |
| Underlying Affiliated Fund | | Beginning
Shares/Par
Amount | | | Acquisitions
Shares/Par
Amount | | | Dispositions
Shares/Par
Amount | | | Ending
Shares/Par
Amount | |
MFS Institutional Money
Market Portfolio | | | — | | | | 2,460,424 | | | | (2,354,543 | ) | | | 105,881 | |
| | | | |
| Underlying Affiliated Fund | | Realized
Gain (Loss) | | | Capital Gain
Distributions | | | Dividend
Income | | | Ending
Value | |
MFS Institutional Money
Market Portfolio | | | $— | | | | $— | | | | $31 | | | | $105,881 | |
(8) Subsequent Event
The fund, beginning March 27, 2014, and certain other funds managed by MFS participate in a $1.1 billion unsecured committed line of credit, subject to a $1 billion sublimit, provided by a syndication of banks under a credit agreement. Borrowings may be made for temporary financing needs. Interest is charged to each fund, based on its borrowings, generally at a rate equal to the higher of the Federal Reserve funds rate or one month LIBOR plus an agreed upon spread. A commitment fee, based on the average daily, unused portion of the committed line of credit, is allocated among the participating funds at the end of each calendar quarter.
26
BOARD APPROVAL OF INVESTMENT ADVISORY AGREEMENT
The Investment Company Act of 1940 requires that both the full Board of Trustees and a majority of the non-interested (“independent”) Trustees, voting separately, initially approve the Fund’s investment advisory agreement with MFS (the “Agreement”) and, beginning on the second anniversary of the initial effective date of the Agreement, annually approve the continuation of the Agreement. In July 2013 and September 2013, the Board met to consider the initial approval of the Agreement (“the initial review meetings”). The independent Trustees were assisted in their evaluation of the Agreement by independent legal counsel, from whom they received separate legal advice and with whom they met separately from MFS. The independent Trustees were also assisted in this process by the MFS Funds’ Independent Chief Compliance Officer, a full-time senior officer appointed by and reporting to the independent Trustees.
In connection with their deliberations regarding the initial approval of the Agreement, the Trustees, including the independent Trustees, considered such information and factors as they believed, in light of the legal advice furnished to them and their own business judgment, to be relevant. As described below, the Trustees considered the nature, quality, and extent of the various investment advisory, administrative, and shareholder services to be performed by MFS under the Agreement and other arrangements with the Fund.
In connection with their initial review meetings, the Trustees received and relied upon materials that included, among other items: (i) information provided by Lipper Inc., an independent third party, on the Fund’s proposed advisory fees and other expenses and the advisory fees and other expenses of comparable funds identified by Lipper Inc. (the “Lipper expense group”), (ii) information provided by MFS on the fees it charges to other registered funds managed in a similar style to the Fund, and (iii) information as to whether and to what extent applicable expense waivers, reimbursements or fee “breakpoints” would be observed for the Fund. In addition, in connection with the independent Trustees’ meetings in May, June and July, 2013 (the “contract review meetings”) for the purpose of considering whether to approve the continuation of the investment advisory agreements for the other investment companies that the Board oversees (the “MFS Funds”), the independent Trustees received: (i) information provided by MFS on fees it charges to institutional accounts managed in styles similar to other MFS Funds, (ii) information regarding MFS’ financial results and financial condition, including MFS’ and certain of its affiliates’ estimated profitability from services performed for the MFS Funds as a whole, and compared to MFS’ institutional business (iii) MFS’ views regarding the outlook for the mutual fund industry and the strategic business plans of MFS, (iv) descriptions of various functions performed by MFS for the Funds, such as compliance monitoring and portfolio trading practices, and (v) information regarding the overall organization of MFS, including information about MFS’ senior management and other personnel that would provide investment advisory, administrative and other services to the Fund and the other MFS Funds. The comparative fee and expense information prepared and provided by Lipper Inc. was not independently verified and the independent Trustees did not independently verify any information provided to them by MFS.
27
Board Approval of Investment Advisory Agreement – continued
The Trustees’ conclusion as to the initial approval of the Agreement was based on a comprehensive consideration of all information provided to the Trustees and not the result of any single factor. Some of the factors that figured particularly in the Trustees’ deliberations are described below, although individual Trustees may have evaluated the information presented differently from one another, giving different weights to various factors. Because the Fund is newly organized and had not yet commenced investment operations at the time of the initial review meetings, the Fund had no investment performance for the Trustees to review. The Trustees also considered that MFS will observe an expense limitation for the Fund, which may not be changed without the Trustees’ approval.
In assessing the reasonableness of the Fund’s advisory fee, the Trustees considered, among other information, the Fund’s proposed advisory fee and the estimated total expense ratio of the Fund’s Class A shares as a percentage of average daily net assets and the advisory fee and total expense ratios of peer groups of funds based on information provided by Lipper Inc. The Trustees considered that, according to the Lipper data (which takes into account any proposed fee reductions or expense limitations for the Fund), the Fund’s effective advisory fee rate would be lower than the Lipper expense group median and the Fund’s total expense ratio would be approximately at the Lipper expense group median.
The Trustees also considered whether the Fund may benefit from any economies of scale in the management of the Fund in the event of growth in assets of the Fund and/or growth in assets of the MFS Funds as a whole. They noted that the Fund’s proposed advisory fee rate schedule is subject to contractual breakpoints that reduce the Fund’s advisory fee rate on average daily net assets over $1 billion and $2.5 billion, and that MFS has agreed in writing to implement a reduced advisory fee rate on the Fund’s average daily net assets up to $1 billion and to further reduce its advisory fee on the Fund’s average daily net assets over $1 billion, each of which may not be changed without the Trustees’ approval. The Trustees also noted that MFS has agreed in writing to waive a portion of the management fees of certain MFS Funds, including the Fund, if the total combined assets of certain funds within the MFS Funds’ complex increase above agreed upon thresholds (the “group fee waiver”), enabling the Fund’s shareholders to share in the benefits from any economies of scale at the complex level. The group fee waiver is reviewed and renewed annually between the Board and MFS. The Trustees concluded that the proposed breakpoints and the group fee waiver were sufficient to allow the Fund to benefit from economies of scale as its assets and overall complex assets grow.
The Trustees did not consider MFS’ costs and profits with respect to the Fund because the Fund had not yet commenced operations. The Trustees considered information prepared by MFS relating to MFS’ costs and profits with respect to the MFS Funds considered as a group, and other investment companies and institutional accounts advised by MFS, as well as MFS’ methodologies used to determine and allocate its costs to the MFS Funds and other accounts and products for purposes of estimating profitability.
28
Board Approval of Investment Advisory Agreement – continued
After reviewing these and other factors described herein, the Trustees concluded, within the context of their overall conclusions regarding the Agreement, that the advisory fee to be charged to the Fund represents reasonable compensation in light of the services to be provided by MFS to the Fund.
In addition, the Trustees considered MFS’ resources and related efforts to continue to retain, attract and motivate capable personnel to serve the Fund. The Trustees also considered current and developing conditions in the financial services industry, including the presence of large and well-capitalized companies which are spending, and appear to be prepared to continue to spend, substantial sums to engage personnel and to provide services to competing investment companies. In this regard, the Trustees also considered the financial resources of MFS and its ultimate parent, Sun Life Financial Inc. The Trustees also considered the advantages and possible disadvantages to the Fund of having an adviser that also serves other investment companies as well as other accounts.
The Trustees also considered the nature, quality, cost, and extent of administrative, transfer agency, and distribution services to be provided to the Fund by MFS and its affiliates under agreements and plans other than the Agreement, including any 12b-1 fees the Fund will pay to MFS Fund Distributors, Inc., an affiliate of MFS. The Trustees also considered the nature, extent and quality of certain other services MFS may perform or arrange for on the Fund’s behalf, which may include securities lending programs, directed expense payment programs, class action recovery programs, and MFS’ interaction with third-party service providers, principally custodians and sub-custodians. The Trustees concluded that the various non-advisory services to be provided by MFS and its affiliates on behalf of the Fund were satisfactory.
The Trustees also considered benefits to MFS from the use of the Fund’s portfolio brokerage commissions, if applicable, to pay for investment research and various other factors. Additionally, the Trustees considered so-called “fall-out benefits” to MFS such as reputational value derived from serving as investment manager to the Fund.
Based on their evaluation of factors that they deemed to be material, including those factors described above, the Board of Trustees, including the independent Trustees, concluded that the Fund’s Agreement with MFS should be approved for an initial two-year period, commencing upon its effective date, as set forth in the Agreement.
A discussion regarding the Board’s approval of the fund’s Investment Advisory Agreement with MFS is available by clicking on the fund’s name under “Mutual Funds” in the “Products” section of the MFS Web site (mfs.com).
29
PROXY VOTING POLICIES AND INFORMATION
A general description of the MFS funds’ proxy voting policies and procedures is available without charge, upon request, by calling 1-800-225-2606, by visiting the Proxy Voting section of mfs.com or by visiting the SEC’s Web site at http://www.sec.gov.
Information regarding how the fund voted proxies relating to portfolio securities during the most recent twelve-month period ended June 30 is available without charge by visiting the Proxy Voting section of mfs.com or by visiting the SEC’s Web site at http://www.sec.gov.
QUARTERLY PORTFOLIO DISCLOSURE
The fund will file a complete schedule of portfolio holdings with the Securities and Exchange Commission (the Commission) for the first and third quarters of each fiscal year on Form N-Q. A shareholder can obtain the quarterly portfolio holdings report at mfs.com. The fund’s Form N-Q is also available on the EDGAR database on the Commission’s Internet Web site at http://www.sec.gov, and may be reviewed and copied at the:
Public Reference Room
Securities and Exchange Commission
100 F Street, NE, Room 1580
Washington, D.C. 20549
Information on the operation of the Public Reference Room may be obtained by calling the Commission at 1-800-SEC-0330. Copies of the fund’s Form N-Q also may be obtained, upon payment of a duplicating fee, by electronic request at the following e-mail address: publicinfo@sec.gov, or by writing the Public Reference Section at the above address.
FURTHER INFORMATION
From time to time, MFS may post important information about the fund or the MFS funds on the MFS web site (mfs.com). This information is available by visiting the “Commentary & Announcements” and “Market Outlooks” sections of mfs.com or by clicking on the fund’s name under “Mutual Funds” in the “Products” section of mfs.com.
PROVISION OF FINANCIAL REPORTS AND SUMMARY PROSPECTUSES
The fund produces financial reports every six months and updates its summary prospectus and prospectus annually. To avoid sending duplicate copies of materials to households, only one copy of the fund’s annual and semiannual report and summary prospectus may be mailed to shareholders having the same last name and residential address on the fund’s records. However, any shareholder may contact MFSC (please see back cover for address and telephone number) to request that copies of these reports and summary prospectuses be sent personally to that shareholder.
30
Save paper with eDelivery.

| MFS® will send you prospectuses, |
reports, and proxies directly via e-mail so you will get information faster with less mailbox clutter.
To sign up:
1. Go to mfs.com.
2. Log in via MFS® Access.
3. Select eDelivery.
If you own your MFS fund shares through a financial institution or a retirement plan, MFS® TALK, MFS® Access, or eDelivery may not be available to you.
CONTACT
WEB SITE
mfs.com
MFS TALK
1-800-637-8255
24 hours a day
ACCOUNT SERVICE AND LITERATURE
Shareholders
1-800-225-2606
Financial advisors
1-800-343-2829
Retirement plan services
1-800-637-1255
MAILING ADDRESS
MFS Service Center, Inc.
P.O. Box 55824
Boston, MA 02205-5824
OVERNIGHT MAIL
MFS Service Center, Inc.
c/o Boston Financial Data Services
30 Dan Road
Canton, MA 02021-2809
SEMIANNUAL REPORT
February 28, 2014

MFS® LOW VOLATILITY GLOBAL EQUITY FUND

LVO-SEM
MFS® LOW VOLATILITY GLOBAL EQUITY FUND
CONTENTS
The report is prepared for the general information of shareholders. It is authorized for distribution to prospective investors only when preceded or accompanied by a current prospectus.
NOT FDIC INSURED Ÿ MAY LOSE VALUE Ÿ NO BANK GUARANTEE

LETTER FROM THE CHAIRMAN AND CEO
Dear Shareholders:
The U.S. economy appears to have slowed early in 2014 after a strong second half of 2013. Harsh winter weather likely contributed to at least a temporary softening of consumer demand. Looking at the longer term, the pace of U.S. economic growth has
been modest since the recovery began late in 2009. Corporate profits remain healthy overall. A major plus is the removal of a highly confrontational atmosphere in the U.S. Congress, which had clouded business decision-making since 2011.
Globally, recent months have been dominated by volatility, including emerging market currency jitters and rising geopolitical tensions. These add to the possibility of economic uncertainty and financial market unease. However, the eurozone continues to show signs of recovery, while Japan is making progress as it seeks to break free of deflation.
China’s transition toward a more consumer-oriented and less export-driven economy — one with a more stable and sustainable growth rate — could be positive in the long term. However, in the near term, any deceleration in China’s rate of growth could have a ripple effect on its many global trading partners.
In uncertain times such as these, it is particularly important to remember that managing risk should always be a top priority. At MFS®, active risk management is an integral part of our collaborative process. Our global team of investment professionals shares ideas and evaluates opportunities that span continents, investment disciplines and asset classes. Our goal is to build better insights, and ultimately better results, for our clients.
We understand and appreciate the economic challenges investors face, and we believe in the value of maintaining a long-term view and applying proven principles, such as asset allocation and diversification. We are confident that our unique approach can serve investors well as they work with their financial advisors to identify and pursue the most suitable opportunities.
Respectfully,

Robert J. Manning
Chairman and Chief Executive Officer
MFS Investment Management
April 14, 2014
The opinions expressed in this letter are subject to change, may not be relied upon for investment advice, and no forecasts can be guaranteed.
1
PORTFOLIO COMPOSITION
Portfolio structure

| | | | |
| Top ten holdings | | | | |
| OBIC Co. Ltd. | | | 3.6% | |
| Discover Financial Services | | | 3.4% | |
| Lockheed Martin Corp. | | | 3.3% | |
| Kroger Co. | | | 3.3% | |
| General Mills, Inc. | | | 3.3% | |
| Roche Holding AG | | | 2.9% | |
| Amgen, Inc. | | | 2.6% | |
| Exxon Mobil Corp. | | | 2.5% | |
| Taiwan Semiconductor Manufacturing Co. Ltd., ADR | | | 2.5% | |
| Cheung Kong Infrastructure Holdings Ltd. | | | 2.4% | |
| |
| Equity sectors | | | | |
| Financial Services | | | 14.4% | |
| Consumer Staples | | | 14.1% | |
| Health Care | | | 13.8% | |
| Utilities & Communications | | | 12.4% | |
| Retailing | | | 9.0% | |
| Technology | | | 8.8% | |
| Leisure | | | 8.4% | |
| Energy | | | 7.0% | |
| Industrial Goods & Services | | | 3.9% | |
| Special Products & Services | | | 2.2% | |
| Transportation | | | 1.9% | |
| Autos & Housing | | | 1.5% | |
| Basic Materials | | | 1.2% | |
| | | | |
| Issuer country weightings (x) | | | | |
| United States | | | 49.6% | |
| Japan | | | 12.5% | |
| Switzerland | | | 6.9% | |
| Hong Kong | | | 6.5% | |
| United Kingdom | | | 5.8% | |
| Canada | | | 3.2% | |
| China | | | 2.6% | |
| Taiwan | | | 2.5% | |
| Israel | | | 2.3% | |
| Other Countries | | | 8.1% | |
|
| Currency exposure weightings (y) | |
| United States Dollar | | | 53.1% | |
| Japanese Yen | | | 12.5% | |
| Hong Kong Dollar | | | 9.1% | |
| Swiss Franc | | | 6.9% | |
| British Pound Sterling | | | 5.8% | |
| Euro | | | 3.8% | |
| Taiwan Dollar | | | 2.5% | |
| Israeli Shekel | | | 2.3% | |
| Danish Krone | | | 1.6% | |
| Other Currencies | | | 2.4% | |
2
Portfolio Composition – continued
| (x) | Represents the portfolio’s exposure to issuer countries as a percentage of a portfolio’s net assets. For purposes of this presentation, United States includes Cash & Other. |
| (y) | Represents the portfolio’s exposure to a particular currency as a percentage of a portfolio’s net assets. For purposes of this presentation, United States Dollar includes Cash & Other. |
Percentages are based on net assets as of 2/28/14.
The portfolio is actively managed and current holdings may be different.
3
EXPENSE TABLE
Fund expenses borne by the shareholders during the period, December 5, 2013 through February 28, 2014
As a shareholder of the fund, you incur two types of costs: (1) transaction costs, including sales charges (loads) on certain purchase or redemption payments, and
(2) ongoing costs, including management fees; distribution and service (12b-1) fees; and other fund expenses. This example is intended to help you understand your ongoing costs (in dollars) of investing in the fund and to compare these costs with the ongoing costs of investing in other mutual funds.
The example is based on an investment of $1,000 invested at the beginning of the period and held for the entire period December 5, 2013 through February 28, 2014.
Actual Expenses
The first line for each share class in the following table provides information about actual account values and actual expenses. You may use the information in this line, together with the amount you invested, to estimate the expenses that you paid over the period. Simply divide your account value by $1,000 (for example, an $8,600 account value divided by $1,000 = 8.6), then multiply the result by the number in the first line under the heading entitled “Expenses Paid During Period” to estimate the expenses you paid on your account during this period.
Hypothetical Example for Comparison Purposes
The second line for each share class in the following table provides information about hypothetical account values and hypothetical expenses based on the fund’s actual expense ratio and an assumed rate of return of 5% per year before expenses, which is not the fund’s actual return. The hypothetical account values and expenses may not be used to estimate the actual ending account balance or expenses you paid for the period. You may use this information to compare the ongoing costs of investing in the fund and other funds. To do so, compare this 5% hypothetical example with the 5% hypothetical examples that appear in the shareholder reports of the other funds.
Please note that the expenses shown in the table are meant to highlight your ongoing costs only and do not reflect any transactional costs, such as sales charges (loads). Therefore, the second line for each share class in the table is useful in comparing ongoing costs only, and will not help you determine the relative total costs of owning different funds. In addition, if these transactional costs were included, your costs would have been higher.
4
Expense Table – continued
| | | | | | | | | | | | | | | | | | |
Share
Class | | | | Annualized
Expense
Ratio | | | Beginning
Account Value
12/05/13 | | | Ending
Account Value
2/28/14 | | | Expenses
Paid During
Period (p)
12/05/13-2/28/14 | |
| A | | Actual | | | 1.24% | | | | $1,000.00 | | | | $1,044.00 | | | | $2.99 | |
| | Hypothetical (h) | | | 1.24% | | | | $1,000.00 | | | | $1,018.65 | | | | $6.21 | |
| B | | Actual | | | 2.10% | | | | $1,000.00 | | | | $1,042.00 | | | | $5.05 | |
| | Hypothetical (h) | | | 2.10% | | | | $1,000.00 | | | | $1,014.38 | | | | $10.49 | |
| C | | Actual | | | 2.10% | | | | $1,000.00 | | | | $1,042.00 | | | | $5.05 | |
| | Hypothetical (h) | | | 2.10% | | | | $1,000.00 | | | | $1,014.38 | | | | $10.49 | |
| I | | Actual | | | 1.10% | | | | $1,000.00 | | | | $1,045.00 | | | | $2.65 | |
| | Hypothetical (h) | | | 1.10% | | | | $1,000.00 | | | | $1,019.34 | | | | $5.51 | |
| R1 | | Actual | | | 2.10% | | | | $1,000.00 | | | | $1,042.00 | | | | $5.05 | |
| | Hypothetical (h) | | | 2.10% | | | | $1,000.00 | | | | $1,014.38 | | | | $10.49 | |
| R2 | | Actual | | | 1.60% | | | | $1,000.00 | | | | $1,044.00 | | | | $3.85 | |
| | Hypothetical (h) | | | 1.60% | | | | $1,000.00 | | | | $1,016.86 | | | | $8.00 | |
| R3 | | Actual | | | 1.35% | | | | $1,000.00 | | | | $1,044.00 | | | | $3.25 | |
| | Hypothetical (h) | | | 1.35% | | | | $1,000.00 | | | | $1,018.10 | | | | $6.76 | |
| R4 | | Actual | | | 1.10% | | | | $1,000.00 | | | | $1,045.00 | | | | $2.65 | |
| | Hypothetical (h) | | | 1.10% | | | | $1,000.00 | | | | $1,019.34 | | | | $5.51 | |
| R5 | | Actual | | | 1.05% | | | | $1,000.00 | | | | $1,045.00 | | | | $2.53 | |
| | Hypothetical (h) | | | 1.05% | | | | $1,000.00 | | | | $1,019.59 | | | | $5.26 | |
| (h) | 5% class return per year before expenses. |
| (p) | Expenses Paid During Period are equal to each class’s annualized expense ratio, as shown above, multiplied by the average account value over the period, multiplied by 86/365 for Actual Expenses (for Hypothetical Expenses, multiplied by 181/365 to reflect the one-half year period). Expenses paid do not include any applicable sales charges (loads). If these transaction costs had been included, your costs would have been higher. For actual expenses paid, the calculation is based on the period from the commencement of the fund’s investment operations, December 5, 2013, through February 28, 2014. For hypothetical expenses paid, it is assumed that the fund was in existence for the entire six month period ended February 28, 2014. |
Notes to Expense Table
Each class with a Rule 12b-1 service fee is subject to a rebate of a portion of such fee. Such rebates are included in the expense ratios above and are outside of the expense limitation arrangement. For Class A shares, this rebate reduced the expense ratio above by 0.11%. See Note 3 in the Notes to Financial Statements for additional information.
5
PORTFOLIO OF INVESTMENTS
2/28/14 (unaudited)
The Portfolio of Investments is a complete list of all securities owned by your fund. It is categorized by broad-based asset classes.
| | | | | | | | |
| Common Stocks - 98.6% | | | | | | | | |
| Issuer | | Shares/Par | | | Value ($) | |
| | | | | | | | |
| Aerospace - 3.3% | | | | | | | | |
| Lockheed Martin Corp. | | | 500 | | | $ | 81,152 | |
| | |
| Airlines - 1.2% | | | | | | | | |
| Copa Holdings S.A., “A” | | | 135 | | | $ | 18,287 | |
| Southwest Airlines Co. | | | 510 | | | | 11,444 | |
| | | | | | | | |
| | | | | | | $ | 29,731 | |
| Automotive - 0.4% | | | | | | | | |
| General Motors Co. | | | 300 | | | $ | 10,860 | |
| | |
| Biotechnology - 2.6% | | | | | | | | |
| Amgen, Inc. | | | 514 | | | $ | 63,746 | |
| | |
| Broadcasting - 1.2% | | | | | | | | |
| Television Broadcasts Ltd. | | | 4,900 | | | $ | 30,276 | |
| | |
| Business Services - 2.2% | | | | | | | | |
| FleetCor Technologies, Inc. (a) | | | 290 | | | $ | 37,680 | |
| Nomura Research, Inc. | | | 500 | | | | 16,360 | |
| | | | | | | | |
| | | | | | | $ | 54,040 | |
| Cable TV - 4.2% | | | | | | | | |
| DIRECTV, “A” (a) | | | 180 | | | $ | 13,968 | |
| Liberty Global PLC, “A” (a) | | | 430 | | | | 37,217 | |
| Naspers Ltd. | | | 125 | | | | 15,077 | |
| Time Warner Cable, Inc. | | | 130 | | | | 18,246 | |
| Ziggo N.V. | | | 410 | | | | 18,760 | |
| | | | | | | | |
| | | | | | | $ | 103,268 | |
| Chemicals - 0.6% | | | | | | | | |
| Mitsubishi Chemical Holdings Corp. | | | 3,000 | | | $ | 13,531 | |
| | |
| Computer Software - 4.1% | | | | | | | | |
| Dassault Systems S.A. | | | 95 | | | $ | 10,920 | |
| OBIC Co. Ltd. | | | 2,800 | | | | 88,179 | |
| | | | | | | | |
| | | | | | | $ | 99,099 | |
| Computer Software - Systems - 1.1% | | | | | | | | |
| EMC Corp. | | | 450 | | | $ | 11,867 | |
| NICE Systems Ltd., ADR | | | 340 | | | | 13,967 | |
| | | | | | | | |
| | | | | | | $ | 25,834 | |
6
Portfolio of Investments (unaudited) – continued
| | | | | | | | |
| Issuer | | Shares/Par | | | Value ($) | |
| | | | | | | | |
| Common Stocks - continued | | | | | | | | |
| Construction - 0.6% | | | | | | | | |
| Geberit AG | | | 49 | | | $ | 15,410 | |
| | |
| Consumer Products - 3.1% | | | | | | | | |
| Colgate-Palmolive Co. | | | 174 | | | $ | 10,932 | |
| Kimberly-Clark Corp. | | | 250 | | | | 27,588 | |
| Procter & Gamble Co. | | | 480 | | | | 37,757 | |
| | | | | | | | |
| | | | | | | $ | 76,277 | |
| Electronics - 2.5% | | | | | | | | |
| Taiwan Semiconductor Manufacturing Co. Ltd., ADR | | | 3,320 | | | $ | 59,992 | |
| | |
| Energy - Independent - 0.4% | | | | | | | | |
| Dragon Oil PLC | | | 1,040 | | | $ | 10,554 | |
| | |
| Energy - Integrated - 5.7% | | | | | | | | |
| Chevron Corp. | | | 146 | | | $ | 16,838 | |
| China Petroleum & Chemical Corp. | | | 26,000 | | | | 23,083 | |
| Exxon Mobil Corp. | | | 630 | | | | 60,650 | |
| Royal Dutch Shell PLC, “B” | | | 958 | | | | 37,330 | |
| | | | | | | | |
| | | | | | | $ | 137,901 | |
| Food & Beverages - 7.6% | | | | | | | | |
| Chr. Hansen Holding A.S. | | | 518 | | | $ | 21,490 | |
| General Mills, Inc. | | | 1,590 | | | | 79,548 | |
| Mondelez International, Inc. | | | 380 | | | | 12,931 | |
| Nestle S.A. | | | 282 | | | | 21,354 | |
| Sligro Food Group N.V. | | | 392 | | | | 16,070 | |
| Toyo Suisan Kaisha Ltd. | | | 1,000 | | | | 33,605 | |
| | | | | | | | |
| | | | | | | $ | 184,998 | |
| Food & Drug Stores - 6.5% | | | | | | | | |
| CVS Caremark Corp. | | | 190 | | | $ | 13,897 | |
| Kroger Co. | | | 1,900 | | | | 79,686 | |
| Lawson, Inc. | | | 600 | | | | 41,623 | |
| METRO, Inc., “A” | | | 180 | | | | 10,059 | |
| Sundrug Co. Ltd. | | | 300 | | | | 12,071 | |
| | | | | | | | |
| | | | | | | $ | 157,336 | |
| Furniture & Appliances - 0.4% | | | | | | | | |
| Fortune Brands Home & Security, Inc. | | | 230 | | | $ | 10,750 | |
| | |
| Insurance - 3.8% | | | | | | | | |
| Beazley Group PLC | | | 3,081 | | | $ | 13,621 | |
| Catlin Group Ltd. | | | 2,576 | | | | 22,905 | |
7
Portfolio of Investments (unaudited) – continued
| | | | | | | | |
| Issuer | | Shares/Par | | | Value ($) | |
| | | | | | | | |
| Common Stocks - continued | | | | | | | | |
| Insurance - continued | | | | | | | | |
| Intact Financial Corp. | | | 220 | | | $ | 13,233 | |
| Suncorp-Metway Ltd. | | | 3,009 | | | | 32,597 | |
| Travelers Cos., Inc. | | | 110 | | | | 9,222 | |
| | | | | | | | |
| | | | | | | $ | 91,578 | |
| Internet - 1.2% | | | | | | | | |
| Google, Inc., “A” (a) | | | 25 | | | $ | 30,391 | |
| | |
| Machinery & Tools - 0.6% | | | | | | | | |
| Schindler Holding AG | | | 90 | | | $ | 13,671 | |
| | |
| Major Banks - 3.9% | | | | | | | | |
| Bank of Nova Scotia | | | 260 | | | $ | 14,880 | |
| BOC Hong Kong Holdings Ltd. | | | 7,500 | | | | 22,759 | |
| Royal Bank of Canada | | | 190 | | | | 12,358 | |
| Sumitomo Mitsui Financial Group, Inc. | | | 800 | | | | 35,688 | |
| Wells Fargo & Co. | | | 210 | | | | 9,748 | |
| | | | | | | | |
| | | | | | | $ | 95,433 | |
| Medical & Health Technology & Services - 0.4% | | | | | | | | |
| Miraca Holdings, Inc. | | | 200 | | | $ | 9,119 | |
| | |
| Medical Equipment - 0.5% | | | | | | | | |
| Abbott Laboratories | | | 300 | | | $ | 11,934 | |
| | |
| Natural Gas - Distribution - 0.5% | | | | | | | | |
| Osaka Gas Co. Ltd. | | | 3,000 | | | $ | 12,469 | |
| | |
| Oil Services - 0.9% | | | | | | | | |
| Rowan Cos., Inc., “A” (a) | | | 400 | | | $ | 13,344 | |
| Tenaris S.A. | | | 435 | | | | 9,121 | |
| | | | | | | | |
| | | | | | | $ | 22,465 | |
| Other Banks & Diversified Financials - 4.8% | | | | | | | | |
| China Construction Bank | | | 19,000 | | | $ | 13,049 | |
| Discover Financial Services | | | 1,440 | | | | 82,627 | |
| Provident Financial PLC | | | 691 | | | | 21,719 | |
| | | | | | | | |
| | | | | | | $ | 117,395 | |
| Pharmaceuticals - 10.3% | | | | | | | | |
| AstraZeneca PLC | | | 240 | | | $ | 16,413 | |
| Johnson & Johnson | | | 560 | | | | 51,587 | |
| Novartis AG | | | 200 | | | | 16,703 | |
| Pfizer, Inc. | | | 1,670 | | | | 53,624 | |
8
Portfolio of Investments (unaudited) – continued
| | | | | | | | |
| Issuer | | Shares/Par | | | Value ($) | |
| | | | | | | | |
| Common Stocks - continued | | | | | | | | |
| Pharmaceuticals - continued | | | | | | | | |
| Roche Holding AG | | | 229 | | | $ | 70,666 | |
| Teva Pharmaceutical Industries Ltd., ADR | | | 860 | | | | 42,905 | |
| | | | | | | | |
| | | | | | | $ | 251,898 | |
| Railroad & Shipping - 0.7% | | | | | | | | |
| Canadian National Railway Co. | | | 280 | | | $ | 15,831 | |
| | |
| Real Estate - 1.9% | | | | | | | | |
| Allreal Holding AG | | | 130 | | | $ | 18,181 | |
| Champion, REIT | | | 29,000 | | | | 13,004 | |
| Link, REIT | | | 3,500 | | | | 16,259 | |
| | | | | | | | |
| | | | | | | $ | 47,444 | |
| Restaurants - 2.9% | | | | | | | | |
| McDonald’s Corp. | | | 414 | | | $ | 39,392 | |
| Whitbread PLC | | | 403 | | | | 30,280 | |
| | | | | | | | |
| | | | | | | $ | 69,672 | |
| Specialty Chemicals - 0.7% | | | | | | | | |
| Symrise AG | | | 325 | | | $ | 15,966 | |
| | |
| Specialty Stores - 2.5% | | | | | | | | |
| Home Depot, Inc. | | | 210 | | | $ | 17,226 | |
| Industria de Diseno Textil S.A. | | | 83 | | | | 11,949 | |
| Ross Stores, Inc. | | | 440 | | | | 32,032 | |
| | | | | | | | |
| | | | | | | $ | 61,207 | |
| Telecommunications - Wireless - 2.4% | | | | | | | | |
| China Mobile Ltd. | | | 3,000 | | | $ | 28,510 | |
| KDDI Corp. | | | 500 | | | | 30,466 | |
| | | | | | | | |
| | | | | | | $ | 58,976 | |
| Telephone Services - 2.0% | | | | | | | | |
| BCE, Inc. | | | 250 | | | $ | 10,900 | |
| Swisscom AG | | | 20 | | | | 11,848 | |
| TDC A.S. | | | 1,602 | | | | 15,912 | |
| Verizon Communications, Inc. | | | 210 | | | | 9,992 | |
| | | | | | | | |
| | | | | | | $ | 48,652 | |
| Tobacco - 3.4% | | | | | | | | |
| Altria Group, Inc. | | | 290 | | | $ | 10,515 | |
| Japan Tobacco, Inc. | | | 400 | | | | 12,703 | |
| Lorillard, Inc. | | | 500 | | | | 24,530 | |
| Reynolds American, Inc. | | | 200 | | | | 10,166 | |
9
Portfolio of Investments (unaudited) – continued
| | | | | | | | |
| Issuer | | Shares/Par | | | Value ($) | |
| Common Stocks - continued | | | | | | | | |
| Tobacco - continued | | | | | | | | |
| Schweitzer-Mauduit International, Inc. | | | 530 | | | $ | 25,509 | |
| | | | | | | | |
| | | | | | | $ | 83,423 | |
| Utilities - Electric Power - 7.5% | | | | | | | | |
| Alliant Energy Corp. | | | 190 | | | $ | 10,306 | |
| American Electric Power Co., Inc. | | | 360 | | | | 18,072 | |
| Cheung Kong Infrastructure Holdings Ltd. | | | 9,000 | | | | 58,681 | |
| Consolidated Edison, Inc. | | | 260 | | | | 14,573 | |
| Dominion Resources, Inc. | | | 150 | | | | 10,410 | |
| Duke Energy Corp. | | | 200 | | | | 14,176 | |
| Hongkong Electric Holdings Ltd. | | | 2,000 | | | | 16,713 | |
| PG&E Corp. | | | 910 | | | | 40,095 | |
| | | | | | | | |
| | | | | | | $ | 183,026 | |
| Total Common Stocks (Identified Cost, $2,313,434) | | | | | | $ | 2,405,305 | |
| | |
| Money Market Funds - 2.3% | | | | | | | | |
MFS Institutional Money Market Portfolio, 0.08%,
at Cost and Net Asset Value (v) | | | 55,400 | | | $ | 55,400 | |
| Total Investments (Identified Cost, $2,368,834) | | | | | | $ | 2,460,705 | |
| | |
| Other Assets, Less Liabilities - (0.9)% | | | | | | | (21,300 | ) |
| Net Assets - 100.0% | | | | | | $ | 2,439,405 | |
| (a) | Non-income producing security. |
| (v) | Underlying affiliated fund that is available only to investment companies managed by MFS. The rate quoted for the MFS Institutional Money Market Portfolio is the annualized seven-day yield of the fund at period end. |
The following abbreviations are used in this report and are defined:
| ADR | | American Depositary Receipt |
| PLC | | Public Limited Company |
| REIT | | Real Estate Investment Trust |
See Notes to Financial Statements
10
Financial Statements
STATEMENT OF ASSETS AND LIABILITIES
At 2/28/14 (unaudited)
This statement represents your fund’s balance sheet, which details the assets and liabilities comprising the total value of the fund.
| | | | |
| Assets | | | | |
Investments- | | | | |
Non-affiliated issuers, at value (identified cost, $2,313,434) | | | $2,405,305 | |
Underlying affiliated funds, at cost and value | | | 55,400 | |
Total investments, at value (identified cost, $2,368,834) | | | $2,460,705 | |
Foreign currency, at value (identified cost, $640) | | | 641 | |
Receivables for | | | | |
Investments sold | | | 87,605 | |
Fund shares sold | | | 12,500 | |
Dividends | | | 9,682 | |
Receivable from investment adviser | | | 18,607 | |
Receivable from distributor | | | 13 | |
Total assets | | | $2,589,753 | |
| Liabilities | | | | |
Payables for | | | | |
Investments purchased | | | $102,057 | |
Payable to affiliates | | | | |
Shareholder servicing costs | | | 562 | |
Payable for independent Trustees’ compensation | | | 79 | |
Accrued expenses and other liabilities | | | 47,650 | |
Total liabilities | | | $150,348 | |
Net assets | | | $2,439,405 | |
| Net assets consist of | | | | |
Paid-in capital | | | $2,336,769 | |
Unrealized appreciation (depreciation) on investments and translation of assets and liabilities in foreign currencies | | | 91,887 | |
Accumulated net realized gain (loss) on investments and foreign currency | | | 4,218 | |
Undistributed net investment income | | | 6,531 | |
Net assets | | | $2,439,405 | |
Shares of beneficial interest outstanding | | | 233,618 | |
11
Statement of Assets and Liabilities (unaudited) – continued
| | | | | | | | | | | | |
| | | Net assets | | | Shares
outstanding | | | Net asset value
per share (a) | |
Class A | | | $246,570 | | | | 23,618 | | | | $10.44 | |
Class B | | | 104,211 | | | | 10,000 | | | | 10.42 | |
Class C | | | 104,211 | | | | 10,000 | | | | 10.42 | |
Class I | | | 104,456 | | | | 10,000 | | | | 10.45 | |
Class R1 | | | 104,211 | | | | 10,000 | | | | 10.42 | |
Class R2 | | | 104,334 | | | | 10,000 | | | | 10.43 | |
Class R3 | | | 104,396 | | | | 10,000 | | | | 10.44 | |
Class R4 | | | 104,457 | | | | 10,000 | | | | 10.45 | |
Class R5 | | | 1,462,559 | | | | 140,000 | | | | 10.45 | |
| (a) | Maximum offering price per share was equal to the net asset value per share for all share classes, except for Class A, for which the maximum offering price per share was $11.08 [100 / 94.25 x $10.44]. On sales of $50,000 or more, the maximum offering price of Class A shares is reduced. A contingent deferred sales charge may be imposed on redemptions of Class A, Class B, and Class C shares. Redemption price per share was equal to the net asset value per share for Class I, R1, R2, R3, R4, and R5. |
See Notes to Financial Statements
12
Financial Statements
STATEMENT OF OPERATIONS
Period ended 2/28/14 (c) (unaudited)
This statement describes how much your fund earned in investment income and accrued in expenses. It also describes any gains and/or losses generated by fund operations.
| | | | |
| Net investment income | | | | |
Income | | | | |
Dividends | | | $13,624 | |
Dividends from underlying affiliated funds | | | 27 | |
Foreign taxes withheld | | | (291 | ) |
Total investment income | | | $13,360 | |
Expenses | | | | |
Management fee | | | $4,921 | |
Distribution and service fees | | | 1,010 | |
Shareholder servicing costs | | | 688 | |
Administrative services fee | | | 4,124 | |
Independent Trustees’ compensation | | | 207 | |
Custodian fee | | | 4,242 | |
Shareholder communications | | | 2,336 | |
Audit and tax fees | | | 9,162 | |
Legal fees | | | 283 | |
Registration fees | | | 30,611 | |
Miscellaneous | | | 2,558 | |
Total expenses | | | $60,142 | |
Reduction of expenses by investment adviser and distributor | | | (53,313 | ) |
Net expenses | | | $6,829 | |
Net investment income | | | $6,531 | |
| Realized and unrealized gain (loss) on investments and foreign currency | |
Realized gain (loss) (identified cost basis) | | | | |
Investments | | | $6,461 | |
Foreign currency | | | (2,243 | ) |
Net realized gain (loss) on investments and foreign currency | | | $4,218 | |
Change in unrealized appreciation (depreciation) | | | | |
Investments | | | $91,871 | |
Translation of assets and liabilities in foreign currencies | | | 16 | |
Net unrealized gain (loss) on investments and foreign currency translation | | | $91,887 | |
Net realized and unrealized gain (loss) on investments and foreign currency | | | $96,105 | |
Change in net assets from operations | | | $102,636 | |
| (c) | For the period from the commencement of the fund’s investment operations, December 5, 2013, through the stated period end. |
See Notes to Financial Statements
13
Financial Statements
STATEMENTS OF CHANGES IN NET ASSETS
This statement describes the increases and/or decreases in net assets resulting from operations, any distributions, and any shareholder transactions.
| | | | |
| Change in net assets | | Period ended
2/28/14 (c)
(unaudited) | |
| From operations | | | | |
Net investment income | | | $6,531 | |
Net realized gain (loss) on investments and foreign currency | | | 4,218 | |
Net unrealized gain (loss) on investments and foreign currency translation | | | 91,887 | |
Change in net assets from operations | | | $102,636 | |
Change in net assets from fund share transactions | | | $2,336,769 | |
Total change in net assets | | | $2,439,405 | |
| Net assets | | | | |
At beginning of period | | | — | |
At end of period (including undistributed net investment income of $6,531) | | | $2,439,405 | |
| (c) | For the period from the commencement of the fund’s investment operations, December 5, 2013, through the stated period end. |
See Notes to Financial Statements
14
Financial Statements
FINANCIAL HIGHLIGHTS
The financial highlights table is intended to help you understand the fund’s financial performance for the semiannual period and the past 5 fiscal years (or life of a particular share class, if shorter). Certain information reflects financial results for a single fund share. The total returns in the table represent the rate by which an investor would have earned (or lost) on an investment in the fund share class (assuming reinvestment of all distributions) held for the entire period.
| | | | |
| Class A | | Period ended
2/28/14 (c) (unaudited) | |
| | |
Net asset value, beginning of period | | | $10.00 | |
| Income (loss) from investment operations | | | | |
Net investment income (d) | | | $0.03 | |
Net realized and unrealized gain (loss) on investments and foreign currency | | | 0.41 | |
Total from investment operations | | | $0.44 | |
Net asset value, end of period (x) | | | $10.44 | |
Total return (%) (r)(s)(t)(x) | | | 4.40 | (n) |
Ratios (%) (to average net assets)
and Supplemental data: | | | | |
Expenses before expense reductions (f) | | | 11.07 | (a) |
Expenses after expense reductions (f) | | | 1.24 | (a) |
Net investment income | | | 1.33 | (a) |
Portfolio turnover | | | 5 | (n) |
Net assets at end of period (000 omitted) | | | $247 | |
| |
| Class B | | Period ended
2/28/14 (c) (unaudited) | |
| | |
Net asset value, beginning of period | | | $10.00 | |
| Income (loss) from investment operations | | | | |
Net investment income (d) | | | $0.01 | |
Net realized and unrealized gain (loss) on investments and foreign currency | | | 0.41 | |
Total from investment operations | | | $0.42 | |
Net asset value, end of period (x) | | | $10.42 | |
Total return (%) (r)(s)(t)(x) | | | 4.20 | (n) |
Ratios (%) (to average net assets)
and Supplemental data: | | | | |
Expenses before expense reductions (f) | | | 11.83 | (a) |
Expenses after expense reductions (f) | | | 2.10 | (a) |
Net investment income | | | 0.33 | (a) |
Portfolio turnover | | | 5 | (n) |
Net assets at end of period (000 omitted) | | | $104 | |
See Notes to Financial Statements
15
Financial Highlights – continued
| | | | |
| Class C | | Period ended
2/28/14 (c) (unaudited) | |
| | |
Net asset value, beginning of period | | | $10.00 | |
| Income (loss) from investment operations | | | | |
Net investment income (d) | | | $0.01 | |
Net realized and unrealized gain (loss) on investments and foreign currency | | | 0.41 | |
Total from investment operations | | | $0.42 | |
Net asset value, end of period (x) | | | $10.42 | |
Total return (%) (r)(s)(t)(x) | | | 4.20 | (n) |
Ratios (%) (to average net assets)
and Supplemental data: | | | | |
Expenses before expense reductions (f) | | | 11.83 | (a) |
Expenses after expense reductions (f) | | | 2.10 | (a) |
Net investment income | | | 0.33 | (a) |
Portfolio turnover | | | 5 | (n) |
Net assets at end of period (000 omitted) | | | $104 | |
| |
| Class I | | Period ended
2/28/14 (c) (unaudited) | |
| | |
Net asset value, beginning of period | | | $10.00 | |
| Income (loss) from investment operations | | | | |
Net investment income (d) | | | $0.03 | |
Net realized and unrealized gain (loss) on investments and foreign currency | | | 0.42 | |
Total from investment operations | | | $0.45 | |
Net asset value, end of period (x) | | | $10.45 | |
Total return (%) (r)(s)(x) | | | 4.50 | (n) |
Ratios (%) (to average net assets)
and Supplemental data: | | | | |
Expenses before expense reductions (f) | | | 10.84 | (a) |
Expenses after expense reductions (f) | | | 1.10 | (a) |
Net investment income | | | 1.34 | (a) |
Portfolio turnover | | | 5 | (n) |
Net assets at end of period (000 omitted) | | | $104 | |
See Notes to Financial Statements
16
Financial Highlights – continued
| | | | |
| Class R1 | | Period ended
2/28/14 (c) (unaudited) | |
| | |
Net asset value, beginning of period | | | $10.00 | |
| Income (loss) from investment operations | | | | |
Net investment income (d) | | | $0.01 | |
Net realized and unrealized gain (loss) on investments and foreign currency | | | 0.41 | |
Total from investment operations | | | $0.42 | |
Net asset value, end of period (x) | | | $10.42 | |
Total return (%) (r)(s)(x) | | | 4.20 | (n) |
Ratios (%) (to average net assets)
and Supplemental data: | | | | |
Expenses before expense reductions (f) | | | 11.83 | (a) |
Expenses after expense reductions (f) | | | 2.10 | (a) |
Net investment income | | | 0.33 | (a) |
Portfolio turnover | | | 5 | (n) |
Net assets at end of period (000 omitted) | | | $104 | |
| |
| Class R2 | | Period ended
2/28/14 (c) (unaudited) | |
| | |
Net asset value, beginning of period | | | $10.00 | |
| Income (loss) from investment operations | | | | |
Net investment income (d) | | | $0.02 | |
Net realized and unrealized gain (loss) on investments and foreign currency | | | 0.41 | |
Total from investment operations | | | $0.43 | |
Net asset value, end of period (x) | | | $10.43 | |
Total return (%) (r)(s)(x) | | | 4.30 | (n) |
Ratios (%) (to average net assets)
and Supplemental data: | | | | |
Expenses before expense reductions (f) | | | 11.33 | (a) |
Expenses after expense reductions (f) | | | 1.60 | (a) |
Net investment income | | | 0.83 | (a) |
Portfolio turnover | | | 5 | (n) |
Net assets at end of period (000 omitted) | | | $104 | |
See Notes to Financial Statements
17
Financial Highlights – continued
| | | | |
| Class R3 | | Period ended
2/28/14 (c) (unaudited) | |
| | |
Net asset value, beginning of period | | | $10.00 | |
| Income (loss) from investment operations | | | | |
Net investment income (d) | | | $0.03 | |
Net realized and unrealized gain (loss) on investments and foreign currency | | | 0.41 | |
Total from investment operations | | | $0.44 | |
Net asset value, end of period (x) | | | $10.44 | |
Total return (%) (r)(s)(x) | | | 4.40 | (n) |
Ratios (%) (to average net assets)
and Supplemental data: | | | | |
Expenses before expense reductions (f) | | | 11.08 | (a) |
Expenses after expense reductions (f) | | | 1.35 | (a) |
Net investment income | | | 1.07 | (a) |
Portfolio turnover | | | 5 | (n) |
Net assets at end of period (000 omitted) | | | $104 | |
| |
| Class R4 | | Period ended
2/28/14 (c) (unaudited) | |
| | |
Net asset value, beginning of period | | | $10.00 | |
| Income (loss) from investment operations | | | | |
Net investment income (d) | | | $0.03 | |
Net realized and unrealized gain (loss) on investments and foreign currency | | | 0.42 | |
Total from investment operations | | | $0.45 | |
Net asset value, end of period (x) | | | $10.45 | |
Total return (%) (r)(s)(x) | | | 4.50 | (n) |
Ratios (%) (to average net assets)
and Supplemental data: | | | | |
Expenses before expense reductions (f) | | | 10.83 | (a) |
Expenses after expense reductions (f) | | | 1.10 | (a) |
Net investment income | | | 1.33 | (a) |
Portfolio turnover | | | 5 | (n) |
Net assets at end of period (000 omitted) | | | $104 | |
See Notes to Financial Statements
18
Financial Highlights – continued
| | | | |
| Class R5 | | Period ended
2/28/14 (c) (unaudited) | |
| | |
Net asset value, beginning of period | | | $10.00 | |
| Income (loss) from investment operations | | | | |
Net investment income (d) | | | $0.03 | |
Net realized and unrealized gain (loss) on investments and foreign currency | | | 0.42 | |
Total from investment operations | | | $0.45 | |
Net asset value, end of period (x) | | | $10.45 | |
Total return (%) (r)(s)(x) | | | 4.50 | (n) |
Ratios (%) (to average net assets)
and Supplemental data: | | | | |
Expenses before expense reductions (f) | | | 10.79 | (a) |
Expenses after expense reductions (f) | | | 1.05 | (a) |
Net investment income | | | 1.37 | (a) |
Portfolio turnover | | | 5 | (n) |
Net assets at end of period (000 omitted) | | | $1,463 | |
| (c) | For the period from the commencement of the fund’s investment operations, December 5, 2013, through the stated period end. |
| (d) | Per share data is based on average shares outstanding. |
| (f) | Ratios do not reflect reductions from fees paid indirectly, if applicable. |
| (r) | Certain expenses have been reduced without which performance would have been lower. |
| (s) | From time to time the fund may receive proceeds from litigation settlements, without which performance would be lower. |
| (t) | Total returns do not include any applicable sales charges. |
| (x) | The net asset values per share and total returns have been calculated on net asset values which include adjustments made in accordance with U.S. generally accepted accounting principles required at period end for financial reporting purposes. |
See Notes to Financial Statements
19
NOTES TO FINANCIAL STATEMENTS
(unaudited)
(1) Business and Organization
MFS Low Volatility Global Equity Fund (the fund) is a diversified series of MFS Series Trust I (the trust). The trust is organized as a Massachusetts business trust and is registered under the Investment Company Act of 1940, as amended, as an open-end management investment company.
(2) Significant Accounting Policies
General – The preparation of financial statements in conformity with U.S. generally accepted accounting principles requires management to make estimates and assumptions that affect the reported amounts of assets and liabilities, and disclosure of contingent assets and liabilities at the date of the financial statements and the reported amounts of increases and decreases in net assets from operations during the reporting period. Actual results could differ from those estimates. In the preparation of these financial statements, management has evaluated subsequent events occurring after the date of the fund’s Statement of Assets and Liabilities through the date that the financial statements were issued. The fund invests in foreign securities. Investments in foreign securities are vulnerable to the effects of changes in the relative values of the local currency and the U.S. dollar and to the effects of changes in each country’s legal, political, and economic environment.
In June 2013, FASB issued Accounting Standards Update 2013-08 (“ASU 2013-08”) Financial Services – Investment Companies (Topic 946) – Amendments to the Scope, Measurement, and Disclosure Requirements which is effective for interim and annual reporting periods in fiscal years that begin after December 15, 2013. ASU 2013-08 sets forth a methodology for determining whether an entity should be characterized as an investment company and prescribes fair value accounting for an investment company’s non-controlling ownership interest in another investment company. FASB has determined that a fund registered under the Investment Company Act of 1940 automatically meets ASU 2013-08’s criteria for an investment company. Although still evaluating the potential impacts of ASU 2013-08 to the fund, management expects that the impact of the fund’s adoption will be limited to additional financial statement disclosures.
Investment Valuations – Equity securities, including restricted equity securities, are generally valued at the last sale or official closing price as provided by a third-party pricing service on the market or exchange on which they are primarily traded. Equity securities, for which there were no sales reported that day, are generally valued at the last quoted daily bid quotation as provided by a third-party pricing service on the market or exchange on which such securities are primarily traded. Short-term instruments with a maturity at issuance of 60 days or less generally are valued at amortized cost, which approximates market value. Open-end investment companies are generally valued at net asset value per share. Securities and other assets generally valued on the basis of information from a third-party pricing service may also be valued at a broker/dealer bid quotation. Values obtained from third-party pricing services can utilize both transaction data and market information such as yield, quality, coupon rate, maturity, type of issue, trading characteristics, and other market data. The values
20
Notes to Financial Statements (unaudited) – continued
of foreign securities and other assets and liabilities expressed in foreign currencies are converted to U.S. dollars using the mean of bid and asked prices for rates provided by a third-party pricing service.
The Board of Trustees has delegated primary responsibility for determining or causing to be determined the value of the fund’s investments (including any fair valuation) to the adviser pursuant to valuation policies and procedures approved by the Board. If the adviser determines that reliable market quotations are not readily available, investments are valued at fair value as determined in good faith by the adviser in accordance with such procedures under the oversight of the Board of Trustees. Under the fund’s valuation policies and procedures, market quotations are not considered to be readily available for most types of debt instruments and floating rate loans and many types of derivatives. These investments are generally valued at fair value based on information from third-party pricing services. In addition, investments may be valued at fair value if the adviser determines that an investment’s value has been materially affected by events occurring after the close of the exchange or market on which the investment is principally traded (such as foreign exchange or market) and prior to the determination of the fund’s net asset value, or after the halting of trading of a specific security where trading does not resume prior to the close of the exchange or market on which the security is principally traded. Events that occur on a frequent basis after foreign markets close (such as developments in foreign markets and significant movements in the U.S. markets) and prior to the determination of the fund’s net asset value may be deemed to have a material effect on the value of securities traded in foreign markets. Accordingly, the fund’s foreign equity securities may often be valued at fair value. The adviser generally relies on third-party pricing services or other information (such as the correlation with price movements of similar securities in the same or other markets; the type, cost and investment characteristics of the security; the business and financial condition of the issuer; and trading and other market data) to assist in determining whether to fair value and at what value to fair value an investment. The value of an investment for purposes of calculating the fund’s net asset value can differ depending on the source and method used to determine value. When fair valuation is used, the value of an investment used to determine the fund’s net asset value may differ from quoted or published prices for the same investment. There can be no assurance that the fund could obtain the fair value assigned to an investment if it were to sell the investment at the same time at which the fund determines its net asset value per share.
Various inputs are used in determining the value of the fund’s assets or liabilities. These inputs are categorized into three broad levels. In certain cases, the inputs used to measure fair value may fall into different levels of the fair value hierarchy. In such cases, an investment’s level within the fair value hierarchy is based on the lowest level of input that is significant to the fair value measurement. The fund’s assessment of the significance of a particular input to the fair value measurement in its entirety requires judgment, and considers factors specific to the investment. Level 1 includes unadjusted quoted prices in active markets for identical assets or liabilities. Level 2 includes other significant observable market-based inputs (including quoted prices for similar securities, interest rates, prepayment speed, and credit risk). Level 3 includes
21
Notes to Financial Statements (unaudited) – continued
unobservable inputs, which may include the adviser’s own assumptions in determining the fair value of investments. The following is a summary of the levels used as of February 28, 2014 in valuing the fund’s assets or liabilities:
| | | | | | | | | | | | | | | | |
| Investments at Value | | Level 1 | | | Level 2 | | | Level 3 | | | Total | |
| Equity Securities: | | | | | | | | | | | | | | | | |
United States | | | $1,176,225 | | | | $— | | | | $— | | | | $1,176,225 | |
Japan | | | 305,815 | | | | — | | | | — | | | | 305,815 | |
Switzerland | | | 167,833 | | | | — | | | | — | | | | 167,833 | |
Hong Kong | | | 157,692 | | | | — | | | | — | | | | 157,692 | |
United Kingdom | | | 142,269 | | | | — | | | | — | | | | 142,269 | |
Canada | | | 64,028 | | | | 13,233 | | | | — | | | | 77,261 | |
China | | | 64,642 | | | | — | | | | — | | | | 64,642 | |
Taiwan | | | 59,992 | | | | — | | | | — | | | | 59,992 | |
Israel | | | 56,873 | | | | — | | | | — | | | | 56,873 | |
Other Countries | | | 196,703 | | | | — | | | | — | | | | 196,703 | |
| Mutual Funds | | | 55,400 | | | | — | | | | — | | | | 55,400 | |
| Total Investments | | | $2,447,472 | | | | $13,233 | | | | $— | | | | $2,460,705 | |
For further information regarding security characteristics, see the Portfolio of Investments.
Foreign Currency Translation – Purchases and sales of foreign investments, income, and expenses are converted into U.S. dollars based upon currency exchange rates prevailing on the respective dates of such transactions or on the reporting date for foreign denominated receivables and payables. Gains and losses attributable to foreign currency exchange rates on sales of securities are recorded for financial statement purposes as net realized gains and losses on investments. Gains and losses attributable to foreign exchange rate movements on receivables, payables, income and expenses are recorded for financial statement purposes as foreign currency transaction gains and losses. That portion of both realized and unrealized gains and losses on investments that results from fluctuations in foreign currency exchange rates is not separately disclosed.
Indemnifications – Under the fund’s organizational documents, its officers and Trustees may be indemnified against certain liabilities and expenses arising out of the performance of their duties to the fund. Additionally, in the normal course of business, the fund enters into agreements with service providers that may contain indemnification clauses. The fund’s maximum exposure under these agreements is unknown as this would involve future claims that may be made against the fund that have not yet occurred.
Investment Transactions and Income – Investment transactions are recorded on the trade date. Dividends received in cash are recorded on the ex-dividend date. Certain dividends from foreign securities will be recorded when the fund is informed of the dividend if such information is obtained subsequent to the ex-dividend date. Dividend payments received in additional securities are recorded on the ex-dividend date in an amount equal to the value of the security on such date.
The fund may receive proceeds from litigation settlements. Any proceeds received from litigation involving portfolio holdings are reflected in the Statement of Operations in
22
Notes to Financial Statements (unaudited) – continued
realized gain/loss if the security has been disposed of by the fund or in unrealized gain/loss if the security is still held by the fund. Any other proceeds from litigation not related to portfolio holdings are reflected as other income in the Statement of Operations.
Fees Paid Indirectly – The fund’s custody fee may be reduced according to an arrangement that measures the value of cash deposited with the custodian by the fund. For the period ended February 28, 2014, custody fees were not reduced.
Tax Matters and Distributions – The fund intends to qualify as a regulated investment company, as defined under Subchapter M of the Internal Revenue Code, and to distribute all of its taxable income, including realized capital gains. As a result, no provision for federal income tax is required. The fund’s federal tax returns, when filed, will remain subject to examination by the Internal Revenue Service for a three year period. Management has analyzed the fund’s tax positions taken on federal and state tax returns for all open tax years and does not believe that there are any uncertain tax positions that require recognition of a tax liability. Foreign taxes, if any, have been accrued by the fund in the accompanying financial statements in accordance with the applicable foreign tax law. Foreign income taxes may be withheld by certain countries in which the fund invests. Additionally, capital gains realized by the fund on securities issued in or by certain foreign countries may be subject to capital gains tax imposed by those countries.
Distributions to shareholders are recorded on the ex-dividend date. Income and capital gain distributions are determined in accordance with income tax regulations, which may differ from U.S. generally accepted accounting principles. Certain capital accounts in the financial statements are periodically adjusted for permanent differences in order to reflect their tax character. These adjustments have no impact on net assets or net asset value per share. Temporary differences which arise from recognizing certain items of income, expense, gain or loss in different periods for financial statement and tax purposes will reverse at some time in the future. Distributions in excess of net investment income or net realized gains are temporary overdistributions for financial statement purposes resulting from differences in the recognition or classification of income or distributions for financial statement and tax purposes.
The federal tax cost and the tax basis components of distributable earnings were as follows:
| | | | |
| As of 2/28/14 | | | |
| Cost of investments | | | $2,368,835 | |
| Gross appreciation | | | 127,105 | |
| Gross depreciation | | | (35,235 | ) |
| Net unrealized appreciation (depreciation) | | | $91,870 | |
Multiple Classes of Shares of Beneficial Interest – The fund offers multiple classes of shares, which differ in their respective distribution and service fees. The fund’s income, realized and unrealized gain (loss), and common expenses are allocated to shareholders based on the daily net assets of each class. Dividends are declared
23
Notes to Financial Statements (unaudited) – continued
separately for each class. Differences in per share dividend rates are generally due to differences in separate class expenses. Class B shares will convert to Class A shares approximately eight years after purchase.
(3) Transactions with Affiliates
Investment Adviser – The fund has an investment advisory agreement with MFS to provide overall investment management and related administrative services and facilities to the fund. The management fee is computed daily and paid monthly at the following annual rates:
| | | | |
| First $1 billion of average daily net assets | | | 0.90 | % |
| Next $1.5 billion of average daily net assets | | | 0.75 | % |
| Average daily net assets in excess of $2.5 billion | | | 0.65 | % |
MFS has agreed in writing to reduce its management fee to 0.75% of the fund’s average daily net assets annually up to $1 billion, and 0.70% of the fund’s average daily net assets annually in excess of $1 billion. This written agreement will remain in effect until modified by the fund’s Board of Trustees, but such agreement will continue until at least December 31, 2014. For the period ended February 28, 2014, this management fee reduction amounted to $820, which is included in the reduction of total expenses in the Statement of Operations. MFS has also agreed in writing to reduce its management fee by a specified amount if certain MFS mutual fund assets exceed thresholds agreed to by MFS and the fund’s Board of Trustees. For the period ended February 28, 2014, this management fee reduction amounted to $14, which is included in the reduction of total expenses in the Statement of Operations. The management fee incurred for the period ended February 28, 2014 was equivalent to an annual effective rate of 0.75% of the fund’s average daily net assets.
The investment adviser has agreed in writing to pay a portion of the fund’s total annual operating expenses, exclusive of interest, taxes, extraordinary expenses, brokerage and transaction costs, and investment-related expenses, such that total fund operating expenses do not exceed the following rates annually of each class’s average daily net assets:
| | | | | | | | | | | | | | | | | | | | | | | | | | | | | | | | | | |
| Classes | |
| A | | | B | | | C | | | I | | | R1 | | | R2 | | | R3 | | | R4 | | | R5 | |
| | 1.35% | | | | 2.10% | | | | 2.10% | | | | 1.10% | | | | 2.10% | | | | 1.60% | | | | 1.35% | | | | 1.10% | | | | 1.06% | |
This written agreement will continue until modified by the fund’s Board of Trustees, but such agreement will continue at least until December 31, 2014. For the period ended February 28, 2014, this reduction amounted to $52,425 and is included in the reduction of total expenses in the Statement of Operations.
Distributor – MFS Fund Distributors, Inc. (MFD), a wholly-owned subsidiary of MFS, as distributor, received $954 for the period ended February 28, 2014, as its portion of the initial sales charge on sales of Class A shares of the fund.
The Board of Trustees has adopted a distribution plan for certain class shares pursuant to Rule 12b-1 of the Investment Company Act of 1940.
The fund’s distribution plan provides that the fund will pay MFD for services provided by MFD and financial intermediaries in connection with the distribution and servicing of
24
Notes to Financial Statements (unaudited) – continued
certain share classes. One component of the plan is a distribution fee paid to MFD and another component of the plan is a service fee paid to MFD. MFD may subsequently pay all, or a portion, of the distribution and/or service fees to financial intermediaries.
Distribution Plan Fee Table:
| | | | | | | | | | | | | | | | | | | | |
| | | Distribution
Fee Rate (d) | | | Service
Fee Rate (d) | | | Total
Distribution
Plan (d) | | | Annual
Effective
Rate (e) | | | Distribution
and Service
Fee | |
| Class A | | | — | | | | 0.25% | | | | 0.25% | | | | 0.14% | | | | $122 | |
| Class B | | | 0.75% | | | | 0.25% | | | | 1.00% | | | | 1.00% | | | | 237 | |
| Class C | | | 0.75% | | | | 0.25% | | | | 1.00% | | | | 1.00% | | | | 237 | |
| Class R1 | | | 0.75% | | | | 0.25% | | | | 1.00% | | | | 1.00% | | | | 237 | |
| Class R2 | | | 0.25% | | | | 0.25% | | | | 0.50% | | | | 0.50% | | | | 118 | |
| Class R3 | | | — | | | | 0.25% | | | | 0.25% | | | | 0.25% | | | | 59 | |
| Total Distribution and Service Fees | | | | $1,010 | |
| (d) | In accordance with the distribution plan for certain classes, the fund pays distribution and/or service fees equal to these annual percentage rates of each class’s average daily net assets. The distribution and service fee rates disclosed by class represent the current rates in effect at the end of the reporting period. Any rate changes, if applicable, are detailed below. |
| (e) | MFD has voluntarily agreed to rebate a portion of each class’s 0.25% service fee attributable to accounts for which MFD retains the 0.25% service fee except for accounts attributable to MFS or its affiliates’ seed money. For the period ended February 28, 2014, this rebate amounted to $53 for Class A and is included in the reduction of total expenses in the Statement of Operations. |
Certain Class A shares are subject to a contingent deferred sales charge (CDSC) in the event of a shareholder redemption within 18 months of purchase. Class C shares are subject to a CDSC in the event of a shareholder redemption within 12 months of purchase. Class B shares are subject to a CDSC in the event of a shareholder redemption within six years of purchase. There were no contingent deferred sales charges imposed during the period ended February 28, 2014.
Shareholder Servicing Agent – MFS Service Center, Inc. (MFSC), a wholly-owned subsidiary of MFS, receives a fee from the fund for its services as shareholder servicing agent calculated as a percentage of the average daily net assets of the fund as determined periodically under the supervision of the fund’s Board of Trustees. For the period ended February 28, 2014, the fee was $124, which equated to 0.0227% annually of the fund’s average daily net assets. MFSC also receives payment from the fund for out-of-pocket expenses, sub-accounting and other shareholder servicing costs which may be paid to affiliated and unaffiliated service providers. Class R5 shares do not incur sub-accounting fees. For the period ended February 28, 2014, these out-of-pocket expenses, sub-accounting and other shareholder servicing costs amounted to $564.
Administrator – MFS provides certain financial, legal, shareholder communications, compliance, and other administrative services to the fund. Under an administrative services agreement, the fund partially reimburses MFS the costs incurred to provide these services. The fund is charged an annual fixed amount of $17,500 plus a fee
25
Notes to Financial Statements (unaudited) – continued
based on average daily net assets. The administrative services fee incurred for the period ended February 28, 2014 was equivalent to an annual effective rate of 0.7534% of the fund’s average daily net assets.
Trustees’ and Officers’ Compensation – The fund pays compensation to independent Trustees in the form of a retainer, attendance fees, and additional compensation to Board and Committee chairpersons. The fund does not pay compensation directly to Trustees or officers of the fund who are also officers of the investment adviser, all of whom receive remuneration for their services to the fund from MFS. Certain officers and Trustees of the fund are officers or directors of MFS, MFD, and MFSC.
Other – This fund and certain other funds managed by MFS (the funds) have entered into services agreements (the Agreements) which provide for payment of fees by the funds to Tarantino LLC and Griffin Compliance LLC in return for the provision of services of an Independent Chief Compliance Officer (ICCO) and Assistant ICCO, respectively, for the funds. The ICCO and Assistant ICCO are officers of the funds and the sole members of Tarantino LLC and Griffin Compliance LLC, respectively. The funds can terminate the Agreements with Tarantino LLC and Griffin Compliance LLC at any time under the terms of the Agreements. For the period ended February 28, 2014, the aggregate fees paid by the fund to Tarantino LLC and Griffin Compliance LLC were $9 and are included in “Miscellaneous” expense in the Statement of Operations. MFS has agreed to reimburse the fund for a portion of the payments made by the fund in the amount of $1, which is included in the reduction of total expenses in the Statement of Operations. Additionally, MFS has agreed to bear all expenses associated with office space, other administrative support, and supplies provided to the ICCO and Assistant ICCO.
The fund invests in the MFS Institutional Money Market Portfolio which is managed by MFS and seeks current income consistent with preservation of capital and liquidity. Income earned on this investment is included in “Dividends from underlying affiliated funds” in the Statement of Operations. This money market fund does not pay a management fee to MFS.
On December 5, 2013, MFS purchased 140,000 shares of Class R5 and 10,000 shares of Class A, Class B, Class C, Class I, Class R1, Class R2, Class R3, and Class R4 for an aggregate amount of $2,200,000.
At February 28, 2014, MFS held 100% of the outstanding shares each of Class B, Class C, Class I, Class R1, Class R2, Class R3, Class R4, and Class R5.
(4) Portfolio Securities
Purchases and sales of investments, other than short-term obligations, aggregated $2,430,863 and $123,890, respectively.
26
Notes to Financial Statements (unaudited) – continued
(5) Shares of Beneficial Interest
The fund’s Declaration of Trust permits the Trustees to issue an unlimited number of full and fractional shares of beneficial interest. Transactions in fund shares were as follows:
| | | | | | | | |
| | | Period ended
2/28/14 (c) | |
| | | Shares | | | Amount | |
| Shares sold | | | | | | | | |
Class A | | | 24,629 | | | | $246,790 | |
Class B | | | 10,000 | | | | 100,000 | |
Class C | | | 10,000 | | | | 100,000 | |
Class I | | | 10,000 | | | | 100,000 | |
Class R1 | | | 10,000 | | | | 100,000 | |
Class R2 | | | 10,000 | | | | 100,000 | |
Class R3 | | | 10,000 | | | | 100,000 | |
Class R4 | | | 10,000 | | | | 100,000 | |
Class R5 | | | 140,000 | | | | 1,400,000 | |
| | | 234,629 | | | | $2,346,790 | |
| | |
| Shares reacquired | | | | | | | | |
Class A | | | (1,011 | ) | | | $(10,021 | ) |
| | |
| Net change | | | | | | | | |
Class A | | | 23,618 | | | | $236,769 | |
Class B | | | 10,000 | | | | 100,000 | |
Class C | | | 10,000 | | | | 100,000 | |
Class I | | | 10,000 | | | | 100,000 | |
Class R1 | | | 10,000 | | | | 100,000 | |
Class R2 | | | 10,000 | | | | 100,000 | |
Class R3 | | | 10,000 | | | | 100,000 | |
Class R4 | | | 10,000 | | | | 100,000 | |
Class R5 | | | 140,000 | | | | 1,400,000 | |
| | | 233,618 | | | | $2,336,769 | |
| (c) | For the period from the commencement of the fund’s investment operations, December 5, 2013, through the stated period end. |
(6) Line of Credit
The fund and other funds managed by MFS have established unsecured uncommitted borrowing arrangements with certain banks for temporary financing needs. Interest is charged to each fund, based on its borrowings, at a rate equal to the Federal Reserve funds rate plus an agreed upon spread.
27
Notes to Financial Statements (unaudited) – continued
(7) Transactions in Underlying Affiliated Funds-Affiliated Issuers
An affiliated issuer may be considered one in which the fund owns 5% or more of the outstanding voting securities, or a company which is under common control. For the purposes of this report, the fund assumes the following to be an affiliated issuer:
| | | | | | | | | | | | | | | | |
| Underlying Affiliated Fund | | Beginning
Shares/Par
Amount | | | Acquisitions
Shares/Par
Amount | | | Dispositions
Shares/Par
Amount | | | Ending
Shares/Par
Amount | |
MFS Institutional Money
Market Portfolio | | | — | | | | 2,332,301 | | | | (2,276,901 | ) | | | 55,400 | |
| | | | |
| Underlying Affiliated Fund | | Realized
Gain (Loss) | | | Capital Gain
Distributions | | | Dividend
Income | | | Ending
Value | |
MFS Institutional Money
Market Portfolio | | | $— | | | | $— | | | | $27 | | | | $55,400 | |
(8) Subsequent Event
The fund, beginning March 27, 2014, and certain other funds managed by MFS participate in a $1.1 billion unsecured committed line of credit, subject to a $1 billion sublimit, provided by a syndication of banks under a credit agreement. Borrowings may be made for temporary financing needs. Interest is charged to each fund, based on its borrowings, generally at a rate equal to the higher of the Federal Reserve funds rate or one month LIBOR plus an agreed upon spread. A commitment fee, based on the average daily, unused portion of the committed line of credit, is allocated among the participating funds at the end of each calendar quarter.
28
BOARD APPROVAL OF INVESTMENT ADVISORY AGREEMENT
The Investment Company Act of 1940 requires that both the full Board of Trustees and a majority of the non-interested (“independent”) Trustees, voting separately, initially approve the Fund’s investment advisory agreement with MFS (the “Agreement”) and, beginning on the second anniversary of the initial effective date of the Agreement, annually approve the continuation of the Agreement. In July 2013 and September 2013, the Board met to consider the initial approval of the Agreement (“the initial review meetings”). The independent Trustees were assisted in their evaluation of the Agreement by independent legal counsel, from whom they received separate legal advice and with whom they met separately from MFS. The independent Trustees were also assisted in this process by the MFS Funds’ Independent Chief Compliance Officer, a full-time senior officer appointed by and reporting to the independent Trustees.
In connection with their deliberations regarding the initial approval of the Agreement, the Trustees, including the independent Trustees, considered such information and factors as they believed, in light of the legal advice furnished to them and their own business judgment, to be relevant. As described below, the Trustees considered the nature, quality, and extent of the various investment advisory, administrative, and shareholder services to be performed by MFS under the Agreement and other arrangements with the Fund.
In connection with their initial review meetings, the Trustees received and relied upon materials that included, among other items: (i) information provided by Lipper Inc., an independent third party, on the Fund’s proposed advisory fees and other expenses and the advisory fees and other expenses of comparable funds identified by Lipper Inc. (the “Lipper expense group”), (ii) information provided by MFS on the fees it charges to other registered funds managed in a similar style to the Fund, and (iii) information as to whether and to what extent applicable expense waivers, reimbursements or fee “breakpoints” would be observed for the Fund. In addition, in connection with the independent Trustees’ meetings in May, June and July, 2013 (the “contract review meetings”) for the purpose of considering whether to approve the continuation of the investment advisory agreements for the other investment companies that the Board oversees (the “MFS Funds”), the independent Trustees received: (i) information provided by MFS on fees it charges to institutional accounts managed in styles similar to other MFS Funds, (ii) information regarding MFS’ financial results and financial condition, including MFS’ and certain of its affiliates’ estimated profitability from services performed for the MFS Funds as a whole, and compared to MFS’ institutional business (iii) MFS’ views regarding the outlook for the mutual fund industry and the strategic business plans of MFS, (iv) descriptions of various functions performed by MFS for the Funds, such as compliance monitoring and portfolio trading practices, and (v) information regarding the overall organization of MFS, including information about MFS’ senior management and other personnel that would provide investment advisory, administrative and other services to the Fund and the other MFS Funds. The comparative fee and expense information prepared and provided by Lipper Inc. was not independently verified and the independent Trustees did not independently verify any information provided to them by MFS.
29
Board Approval of Investment Advisory Agreement – continued
The Trustees’ conclusion as to the initial approval of the Agreement was based on a comprehensive consideration of all information provided to the Trustees and not the result of any single factor. Some of the factors that figured particularly in the Trustees’ deliberations are described below, although individual Trustees may have evaluated the information presented differently from one another, giving different weights to various factors. Because the Fund is newly organized and had not yet commenced investment operations at the time of the initial review meetings, the Fund had no investment performance for the Trustees to review. The Trustees also considered that MFS will observe an expense limitation for the Fund, which may not be changed without the Trustees’ approval.
In assessing the reasonableness of the Fund’s advisory fee, the Trustees considered, among other information, the Fund’s proposed advisory fee and the estimated total expense ratio of the Fund’s Class A shares as a percentage of average daily net assets and the advisory fee and total expense ratios of peer groups of funds based on information provided by Lipper Inc. The Trustees considered that, according to the Lipper data (which takes into account any proposed fee reductions or expense limitations for the Fund), the Fund’s effective advisory fee rate and total expense ratio would each be lower than the Lipper expense group median.
The Trustees also considered whether the Fund may benefit from any economies of scale in the management of the Fund in the event of growth in assets of the Fund and/or growth in assets of the MFS Funds as a whole. They noted that the Fund’s proposed advisory fee rate schedule is subject to contractual breakpoints that reduce the Fund’s advisory fee rate on average daily net assets over $1 billion and $2.5 billion, and that MFS has agreed in writing to implement a reduced advisory fee rate on the Fund’s average daily net assets up to $1 billion and to further reduce its advisory fee on the Fund’s average daily net assets over $1 billion, each of which may not be changed without the Trustees’ approval. The Trustees also noted that MFS has agreed in writing to waive a portion of the management fees of certain MFS Funds, including the Fund, if the total combined assets of certain funds within the MFS Funds’ complex increase above agreed upon thresholds (the “group fee waiver”), enabling the Fund’s shareholders to share in the benefits from any economies of scale at the complex level. The group fee waiver is reviewed and renewed annually between the Board and MFS. The Trustees concluded that the proposed breakpoints and the group fee waiver were sufficient to allow the Fund to benefit from economies of scale as its assets and overall complex assets grow.
The Trustees did not consider MFS’ costs and profits with respect to the Fund because the Fund had not yet commenced operations. The Trustees considered information prepared by MFS relating to MFS’ costs and profits with respect to the MFS Funds considered as a group, and other investment companies and institutional accounts advised by MFS, as well as MFS’ methodologies used to determine and allocate its costs to the MFS Funds and other accounts and products for purposes of estimating profitability.
After reviewing these and other factors described herein, the Trustees concluded, within the context of their overall conclusions regarding the Agreement, that the advisory fee to be charged to the Fund represents reasonable compensation in light of the services to be provided by MFS to the Fund.
30
Board Approval of Investment Advisory Agreement – continued
In addition, the Trustees considered MFS’ resources and related efforts to continue to retain, attract and motivate capable personnel to serve the Fund. The Trustees also considered current and developing conditions in the financial services industry, including the presence of large and well-capitalized companies which are spending, and appear to be prepared to continue to spend, substantial sums to engage personnel and to provide services to competing investment companies. In this regard, the Trustees also considered the financial resources of MFS and its ultimate parent, Sun Life Financial Inc. The Trustees also considered the advantages and possible disadvantages to the Fund of having an adviser that also serves other investment companies as well as other accounts.
The Trustees also considered the nature, quality, cost, and extent of administrative, transfer agency, and distribution services to be provided to the Fund by MFS and its affiliates under agreements and plans other than the Agreement, including any 12b-1 fees the Fund will pay to MFS Fund Distributors, Inc., an affiliate of MFS. The Trustees also considered the nature, extent and quality of certain other services MFS may perform or arrange for on the Fund’s behalf, which may include securities lending programs, directed expense payment programs, class action recovery programs, and MFS’ interaction with third-party service providers, principally custodians and sub-custodians. The Trustees concluded that the various non-advisory services to be provided by MFS and its affiliates on behalf of the Fund were satisfactory.
The Trustees also considered benefits to MFS from the use of the Fund’s portfolio brokerage commissions, if applicable, to pay for investment research and various other factors. Additionally, the Trustees considered so-called “fall-out benefits” to MFS such as reputational value derived from serving as investment manager to the Fund.
Based on their evaluation of factors that they deemed to be material, including those factors described above, the Board of Trustees, including the independent Trustees, concluded that the Fund’s Agreement with MFS should be approved for an initial two-year period, commencing upon its effective date, as set forth in the Agreement.
A discussion regarding the Board’s approval of the fund’s Investment Advisory Agreement with MFS is available by clicking on the fund’s name under “Mutual Funds” in the “Products” section of the MFS Web site (mfs.com).
31
PROXY VOTING POLICIES AND INFORMATION
A general description of the MFS funds’ proxy voting policies and procedures is available without charge, upon request, by calling 1-800-225-2606, by visiting the Proxy Voting section of mfs.com or by visiting the SEC’s Web site at http://www.sec.gov.
Information regarding how the fund voted proxies relating to portfolio securities during the most recent twelve-month period ended June 30 is available without charge by visiting the Proxy Voting section of mfs.com or by visiting the SEC’s Web site at http://www.sec.gov.
QUARTERLY PORTFOLIO DISCLOSURE
The fund will file a complete schedule of portfolio holdings with the Securities and Exchange Commission (the Commission) for the first and third quarters of each fiscal year on Form N-Q. A shareholder can obtain the quarterly portfolio holdings report at mfs.com. The fund’s Form N-Q is also available on the EDGAR database on the Commission’s Internet Web site at http://www.sec.gov, and may be reviewed and copied at the:
Public Reference Room
Securities and Exchange Commission
100 F Street, NE, Room 1580
Washington, D.C. 20549
Information on the operation of the Public Reference Room may be obtained by calling the Commission at 1-800-SEC-0330. Copies of the fund’s Form N-Q also may be obtained, upon payment of a duplicating fee, by electronic request at the following e-mail address: publicinfo@sec.gov, or by writing the Public Reference Section at the above address.
FURTHER INFORMATION
From time to time, MFS may post important information about the fund or the MFS funds on the MFS web site (mfs.com). This information is available by visiting the “Commentary & Announcements” and “Market Outlooks” sections of mfs.com or by clicking on the fund’s name under “Mutual Funds” in the “Products” section of mfs.com.
PROVISION OF FINANCIAL REPORTS AND SUMMARY PROSPECTUSES
The fund produces financial reports every six months and updates its summary prospectus and prospectus annually. To avoid sending duplicate copies of materials to households, only one copy of the fund’s annual and semiannual report and summary prospectus may be mailed to shareholders having the same last name and residential address on the fund’s records. However, any shareholder may contact MFSC (please see back cover for address and telephone number) to request that copies of these reports and summary prospectuses be sent personally to that shareholder.
32
Save paper with eDelivery.

| MFS® will send you prospectuses, |
reports, and proxies directly via e-mail so you will get information faster with less mailbox clutter.
To sign up:
1. Go to mfs.com.
2. Log in via MFS® Access.
3. Select eDelivery.
If you own your MFS fund shares through a financial institution or a retirement plan, MFS® TALK, MFS® Access, or eDelivery may not be available to you.
CONTACT
WEB SITE
mfs.com
MFS TALK
1-800-637-8255
24 hours a day
ACCOUNT SERVICE AND LITERATURE
Shareholders
1-800-225-2606
Financial advisors
1-800-343-2829
Retirement plan services
1-800-637-1255
MAILING ADDRESS
MFS Service Center, Inc.
P.O. Box 55824
Boston, MA 02205-5824
OVERNIGHT MAIL
MFS Service Center, Inc.
c/o Boston Financial Data Services
30 Dan Road
Canton, MA 02021-2809
During the period covered by this report, the Registrant has not amended any provision in its Code of Ethics (the “Code”) that relates to an element of the Code’s definitions enumerated in paragraph (b) of Item 2 of this Form N-CSR. During the period covered by this report, the Registrant did not grant a waiver, including an implicit waiver, from any provision of the Code.
| ITEM 3. | AUDIT COMMITTEE FINANCIAL EXPERT. |
Not applicable for semi-annual reports.
| ITEM 4. | PRINCIPAL ACCOUNTANT FEES AND SERVICES. |
Not applicable for semi-annual reports.
| ITEM 5. | AUDIT COMMITTEE OF LISTED REGISTRANTS. |
Not applicable to the Registrant.
A schedule of investments for each series of the Registrant is included as part of the report to shareholders of such series under Item 1 of this Form N-CSR.
| ITEM 7. | DISCLOSURE OF PROXY VOTING POLICIES AND PROCEDURES FOR CLOSED-END MANAGEMENT INVESTMENT COMPANIES. |
Not applicable to the Registrant.
| ITEM 8. | PORTFOLIO MANAGERS OF CLOSED-END MANAGEMENT INVESTMENT COMPANIES. |
Not applicable to the Registrant.
| ITEM 9. | PURCHASES OF EQUITY SECURITIES BY CLOSED-END MANAGEMENT INVESTMENT COMPANY AND AFFILIATED PURCHASERS. |
Not applicable to the Registrant.
| ITEM 10. | SUBMISSION OF MATTERS TO A VOTE OF SECURITY HOLDERS. |
There were no material changes to the procedures by which shareholders may send recommendations to the Board for nominees to the Registrant’s Board since the Registrant last provided disclosure as to such procedures in response to the requirements of Item 407 (c)(2)(iv) of Regulation S-K or this Item.
| ITEM 11. | CONTROLS AND PROCEDURES. |
| (a) | Based upon their evaluation of the effectiveness of the registrant’s disclosure controls and procedures (as defined in Rule 30a-3(c) under the Investment Company Act of 1940 (the “Act”)) as conducted within 90 days of the filing date of this report on Form N-CSR, the registrant’s principal financial officer and principal executive officer have concluded that those disclosure controls and procedures provide reasonable assurance that the material information required to be disclosed by the registrant on this report is recorded, processed, summarized and reported within the time periods specified in the Securities and Exchange Commission’s rules and forms. |
| (b) | There were no changes in the registrant’s internal controls over financial reporting (as defined in Rule 30a-3(d) under the Act) that occurred during the second fiscal quarter of the period covered by the report that have materially affected, or are reasonably likely to materially affect, the registrant’s internal control over financial reporting. |
| (a) | File the exhibits listed below as part of this form. Letter or number the exhibits in the sequence indicated. |
| | (1) | Any code of ethics, or amendment thereto, that is the subject of the disclosure required by Item 2, to the extent that the registrant intends to satisfy the Item 2 requirements through filing of an exhibit. |
| | (2) | A separate certification for each principal executive officer and principal financial officer of the registrant as required by Rule 30a-2(a) under the Act (17 CFR 270.30a-2): Attached hereto. |
| (b) | If the report is filed under Section 13(a) or 15(d) of the Exchange Act, provide the certifications required by Rule 30a-2(b) under the Act (17 CFR 270.30a-2(b)), Rule 13a-14(b) or Rule 15d-14(b) under the Exchange Act (17 CFR 240.13a-14(b) or 240.15d-14(b)) and Section 1350 of Chapter 63 of Title 18 of the United States Code (18 U.S.C. 1350) as an exhibit. A certification furnished pursuant to this paragraph will not be deemed “filed” for the purposes of Section 18 of the Exchange Act (15 U.S.C. 78r), or otherwise subject to the liability of that section. Such certification will not be deemed to be incorporated by reference into any filing under the Securities Act of 1933 or the Exchange Act, except to the extent that the registrant specifically incorporates it by reference: Attached hereto. |
Notice
A copy of the Amended and Restated Declaration of Trust, as amended, of the Registrant is on file with the Secretary of State of The Commonwealth of Massachusetts and notice is hereby given that this instrument is executed on behalf of the Registrant by an officer of the Registrant as an officer and not individually and the obligations of or arising out of this instrument are not binding upon any of the Trustees or shareholders individually, but are binding only upon the assets and property of the respective constituent series of the Registrant.
SIGNATURES
Pursuant to the requirements of the Securities Exchange Act of 1934 and the Investment Company Act of 1940, the registrant has duly caused this report to be signed on its behalf by the undersigned, thereunto duly authorized.
(Registrant) MFS SERIES TRUST I
| | |
| By (Signature and Title)* | | JOHN M. CORCORAN |
| | John M. Corcoran, President |
Date: April 14, 2014
Pursuant to the requirements of the Securities Exchange Act of 1934 and the Investment Company Act of 1940, this report has been signed below by the following persons on behalf of the registrant and in the capacities and on the dates indicated.
| | |
| By (Signature and Title)* | | JOHN M. CORCORAN |
| | John M. Corcoran, President (Principal Executive Officer) |
Date: April 14, 2014
| | |
| By (Signature and Title)* | | DAVID L. DILORENZO |
| | David L. DiLorenzo, Treasurer (Principal Financial Officer and Accounting Officer) |
Date: April 14, 2014
| * | Print name and title of each signing officer under his or her signature. |