QuickLinks -- Click here to rapidly navigate through this document
SECURITIES AND EXCHANGE COMMISSION
Washington, D.C. 20549
FORM 8-K
CURRENT REPORT
Pursuant to Section 13 or 15(d) of the
Securities Exchange Act of 1934
Date of Report (Date of earliest event reported):August 8, 2002
New Plan Excel Realty Trust, Inc.
(Exact name of registrant as specified in its charter)
| Maryland (State or other jurisdiction of incorporation) | 1-12244 (Commission File Number) | 33-0160389 (IRS Employer Identification Number) | ||
| 1120 Avenue of the Americas, 12th Floor New York, New York (Address of principal executive offices) | 10036 (Zip Code) | |||
Registrant's telephone number, including area code:
(212) 869-3000
Not applicable
(Former name or former address, if changed since last report)
Item 9. Regulation FD Disclosure
Included herein beginning on page A-1 is a copy of a certain Portfolio Assessment of the Registrant concerning its physical characteristics and market analysis as of August 2002.
Pursuant to the requirements of the Securities Exchange Act of 1934, the Registrant has duly caused this report to be signed on its behalf by the undersigned hereunto duly authorized.
| NEW PLAN EXCEL REALTY TRUST, INC. | |||
Date: August 8, 2002 | By: | /s/ STEVEN F. SIEGEL Steven F. Siegel Executive Vice President, General Counsel and Secretary | |

Portfolio Assessment
Physical Characteristics and Market Analysis
August 2002
Certain statements in this presentation that are not historical fact may constitute forward-looking statements within the meaning of the Private Securities Litigation Reform Act of 1995. Such forward-looking statements involve known and unknown risks, uncertainties and other factors which may cause the actual results, transactions or achievements of the Company to differ materially from historical results or from any results, transactions or achievements expressed or implied by such forward-looking statements, including without limitation: national and local economic conditions; the ability of tenants to pay rent and the effect of bankruptcy laws; the competitive environment in which the Company operates; financing risks, including possible future downgrades in the Company's credit rating; property management risks; acquisition, disposition, development and joint venture risks, including risks that proposed acquisitions are not consummated, developments and redevelopments are not completed on time or on budget and strategies and actions that the Company may not control; potential environmental and other liabilities; and other factors affecting the real estate industry generally. The Company refers you to the documents filed by the Company from time to time with the Securities and Exchange Commission, specifically the section titled "Business-Risk Factors" in the Company's Annual Report on Form 10-K for the year ended December 31, 2001 which discuss these and other factors that could adversely affect the Company's results.
| Portfolio Assessment Physical Characteristics and Market Analysis | August 2002 |
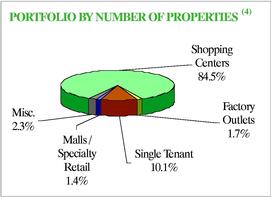
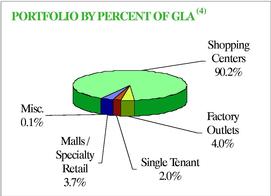
PORTFOLIO BREAKDOWN
| | NUMBER OF PROPERTIES | GLA (SF) | |||
|---|---|---|---|---|---|
| Community and Neighborhood Shopping Centers | 300 | 41,646,755 | |||
| Joint Venture Projects(1,2) | 18 | 2,903,872 | |||
| TOTAL SHOPPING CENTERS | 318 | 44,550,627 | |||
Factory Outlet Centers | 6 | 1,845,735 | |||
| Single Tenant Properties | 36 | 931,505 | |||
| Enclosed Malls / Specialty Retail Properties(2,3) | 5 | 1,693,943 | |||
| Miscellaneous Properties(2) | 8 | 34,760 | |||
| TOTAL | 373 | 49,056,570 | |||
 |  |  |
- (1)
- All projects are community and neighborhood shopping centers. Includes 100 percent of property GLA, not pro rata share.
- (2)
- The remainder of this analysis does not include information on these properties.
- (3)
- Includes no square footage for Clearwater Mall due to the expected demolition and redevelopment of the property and includes expected GLA when redevelopment is complete for The Mall at 163rd Street.
- (4)
- Excludes joint venture projects.
A-2
Community and Neighborhood Shopping Centers
TYPES OF SHOPPING CENTERS(1)
| | NUMBER OF SHOPPING CENTERS | PERCENT OF SHOPPING CENTER GLA | AVERAGE SHOPPING CENTER SIZE (SF) | |||||
|---|---|---|---|---|---|---|---|---|
| COMMUNITY SHOPPING CENTERS | 158 | 71.4 | % | 188,190 | ||||
| Grocery-anchored | 89 | 41.8 | % | 195,795 | ||||
| Non-grocery anchored(2) | 64 | 27.3 | % | 177,764 | ||||
| Non-anchored(3) | 5 | 2.2 | % | 186,268 | ||||
NEIGHBORHOOD SHOPPING CENTERS | 142 | 28.6 | % | 83,893 | ||||
| Grocery-anchored | 87 | 19.1 | % | 91,210 | ||||
| Non-grocery anchored(2) | 36 | 6.7 | % | 77,783 | ||||
| Non-anchored | 19 | 2.8 | % | 61,961 | ||||
| TOTAL | 300 | 100.0 | % | 138,823 | ||||
- (1)
- According to the ICSC: "Neighborhood shopping centers provide convenience shopping for the day-to-day needs of consumers in the immediate neighborhood. These centers are typically anchored by a grocery and average 30,000 to 150,000 square feet. Community shopping centers typically offer a wider range of apparel and other soft goods than the neighborhood shopping center does. Among the more common anchors are grocers, super drugstores and discount department stores. These centers average 100,000 to 350,000 square feet."
- (2)
- The non-grocery anchor is either a major discount department store, a tenant with square footage greater than 10,000 square feet if the shopping center GLA is less than 125,000 square feet or a tenant with square footage greater than 25,000 square feet if the shopping center GLA is greater than 125,000 square feet, or a tenant with square footage greater than 10 percent of the shopping center GLA, but not less than 5,000 square feet.
- (3)
- Four of the five properties are either classified currently as redevelopment properties or are anticipated for redevelopment.
- •
- 176 properties, accounting for approximately 61 percent of New Plan's GLA, are grocery-anchored.
- •
- 100 properties, accounting for approximately 34 percent of New Plan's GLA, are non-grocery anchored.
- •
- 24 properties, accounting for approximately 5 percent of New Plan's GLA, are non-anchored.
A-3
Community and Neighborhood Shopping Centers
GROCER CONCENTRATION
| Grocer | NUMBER OF STORES | TOTAL GLA (SF) | |||
|---|---|---|---|---|---|
| The Kroger Co.(1) | 37 | 2,013,305 | |||
| Winn-Dixie Stores(2) | 16 | 682,129 | |||
| Ahold USA(3) | 11 | 501,803 | |||
| Publix Super Markets | 9 | 391,389 | |||
| Delhaize America(4) | 13 | 390,497 | |||
| Albertsons(5) | 5 | 261,556 | |||
| The Great Atlantic & Pacific Tea Company(6) | 6 | 242,062 | |||
| Safeway(7) | 5 | 230,608 | |||
| Brookshire's(8) | 3 | 192,699 | |||
| H-E-B | 6 | 188,309 | |||
| ShopRite(9) | 3 | 182,775 | |||
| Minyard Food Stores(10) | 5 | 164,951 | |||
| SuperValu(11) | 3 | 120,749 | |||
| Ingles | 3 | 108,000 | |||
| Houchens Industries(12) | 3 | 48,133 | |||
| Wal-Mart Supercenters | 3 | N/A | |||
| Other (includes all grocers with ‹3 stores)(13) | 45 | 1,776,270 | |||
| TOTAL | 176 | 7,495,235 | |||
- (1)
- Includes King Soopers, Kroger, Ralphs and Smith's. Includes one operating Kroger subleased from Albertsons. Excludes GLA from non-owned Ralphs.
- (2)
- Includes Save Rite Grocery Warehouse and Winn-Dixie. Excludes GLA from non-owned Winn-Dixie.
- (3)
- Includes BI-LO, Food Max, Giant, Martin's, Stop & Shop and Tops Market.
- (4)
- Includes Food Lion.
- (5)
- Includes Acme, Albertsons and Max Foods.
- (6)
- Includes A&P, Farmer Jack and Super Fresh. Excludes GLA from non-owned A&P.
- (7)
- Includes Dominick's, Randalls and Vons. Excludes GLA from non-owned Vons.
- (8)
- Includes Super 1 Foods.
- (9)
- Includes Foodarama Supermarkets and Wakefern Food Corporation.
- (10)
- Includes Carnival Food Stores and Minyard Food Stores.
- (11)
- Includes Cub Foods, Save-A-Lot and Scott's Foods.
- (12)
- Includes Save-A-Lot.
- (13)
- Excludes GLA from non-owned Trader Joe's.
Includes only open and operating stores. Does not include single tenant properties. As a result, information presented may differ from the Company's Supplemental Disclosure for the Quarter Ended June 30, 2002.
Specialty grocers are accounted for as within the top three grocers in their markets.
Source: 2002 Market Scope, local media and Company estimates.
- •
- Approximately 77 percent of New Plan grocery-anchored shopping centers are anchored by the #1, #2 or #3 grocer in their market.
- •
- The top five New Plan grocers by GLA account for approximately 53 percent of its total grocery GLA.
A-4
Community and Neighborhood Shopping Centers
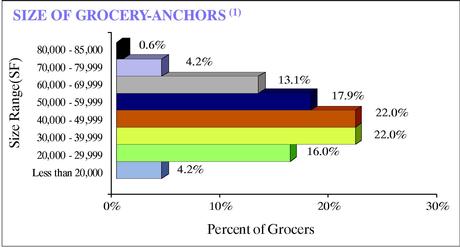
- (1)
- Excludes eight shopping centers that are anchored by either a Wal-Mart Supercenter or non-owned grocer.
- •
- The average grocer in the New Plan portfolio is 44,614 square feet, as compared with the Food Marketing Institute (FMI) defined "typical" grocery size of 44,000 square feet.
COMPARATIVE GROCER SALES
| | | NEW PLAN AVERAGE | CHAIN-WIDE AVERAGE | |||||||||||
|---|---|---|---|---|---|---|---|---|---|---|---|---|---|---|
| | NUMBER OF NEW PLAN STORES | |||||||||||||
| | PER STORE | PER SF | PER STORE | PER SF | ||||||||||
| TOP FIVE GROCERS BY GLA | ||||||||||||||
| The Kroger Co. | 37 | $ | 20,799,188 | $ | 492 | $ | 19,200,000 | $ | 529 | |||||
| Winn-Dixie Stores | 16 | 11,748,456 | 332 | 11,400,000 | 293 | |||||||||
| Ahold USA | 11 | 18,355,927 | 561 | 19,400,000 | 489 | |||||||||
| Publix Super Markets | 9 | 20,259,239 | 579 | 21,300,000 | 535 | |||||||||
| Delhaize America | 13 | 8,136,512 | 352 | 10,400,000 | 359 | |||||||||
| TOTAL GROCERS | 176 | $ | 15,308,028 | $ | 465 | |||||||||
Grocer sales per square foot includes only properties reporting sales data for 2001 and excludes non-comparable stores. Selling area for the New Plan grocers and chain-wide averages is 77 percent of gross floor area as defined by the Food Marketing Institute.
Source: Food Marketing Institute Key Industry Facts, May 2002.
Source: 69th Annual Report of the Grocery Industry, Progressive Grocer, April 2002.
- •
- The 2001 average sales per square foot for New Plan's top five grocers by GLA exceed their chain-wide average sales per square foot by an average of approximately 6 percent.
A-5
Community and Neighborhood Shopping Centers
SHOPPING CENTERS REDEVELOPED / EXPANDED
| PERIOD OF MOST RECENT REDEVELOPMENT / EXPANSION | NUMBER OF SHOPPING CENTERS REDEVELOPED / EXPANDED | PERCENT OF SHOPPING CENTERS | ||||
|---|---|---|---|---|---|---|
| 2000 - Present | 37 | 12.3 | % | |||
| 1995 - 1999 | 66 | 22.0 | % | |||
| 1990 - 1994 | 31 | 10.3 | % | |||
| TOTAL | 134 | 44.7 | % | |||
- •
- Approximately 45 percent of New Plan's shopping centers were redeveloped / expanded in 1990 or later.
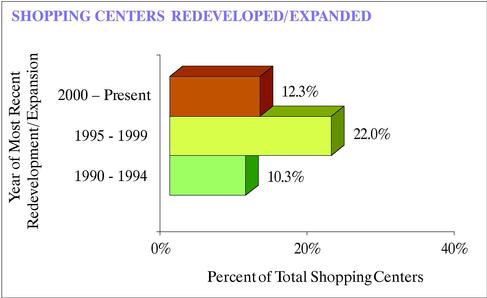
Property is considered redeveloped / expanded if significant building improvements are made or GLA is expanded and the investment is expected to have a significant favorable impact on marketability.
A-6
Community and Neighborhood Shopping Centers
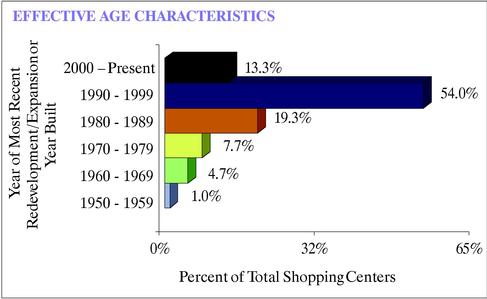
EFFECTIVE AGE BY REGION(1)
| REGION | MEDIAN AGE (YEARS) | AVERAGE AGE (YEARS) | |||
|---|---|---|---|---|---|
| East | 11 | 13 | |||
| Midwest | 10 | 12 | |||
| South | 8 | 11 | |||
| West | 8 | 8 | |||
| OVERALL | 9 | 11 | |||
- (1)
- Effective age is calculated based on the year of the most recent redevelopment / expansion of the property or by year built if no redevelopment / expansion has occurred.
Source: NCREIF Regions.
- •
- Approximately 67 percent of New Plan's shopping centers were redeveloped / expanded or built in 1990 or later.
A-7
Community and Neighborhood Shopping Centers
SUMMARY DEMOGRAPHICS
| | 1-MILE | 3-MILE | 5-MILE | |||||||
|---|---|---|---|---|---|---|---|---|---|---|
| Average Population Density (2001) | 9,424 | 65,108 | 151,033 | |||||||
| % Population Growth (2001 - 2006) | 4.2 | % | 5.0 | % | 5.4 | % | ||||
Average Household Income (2001) | $ | 52,730 | $ | 53,375 | $ | 54,034 | ||||
| Median Household Income (2001) | 43,169 | 43,452 | 43,723 | |||||||
| Per Capita Income (2001) | 20,605 | 20,463 | 20,571 | |||||||
Source: Applied Geographic Solutions.
Source: NCREIF Regions.
 |  |
A-8
Community and Neighborhood Shopping Centers
SHOPPING CENTERS IN MSA / CMSA LOCATIONS(1)
| MSA / CMSA POPULATION | TOTAL MSAs / CMSAs IN U.S. | NUMBER OF SHOPPING CENTERS | PERCENT OF SHOPPING CENTER GLA | |||||
|---|---|---|---|---|---|---|---|---|
| 5,000,000 Or Greater | 9 | 51 | 19.8 | % | ||||
| 4,000,000 - 4,999,999 | 2 | 65 | 16.9 | % | ||||
| 3,000,000 - 3,999,999 | 3 | 8 | 3.2 | % | ||||
| 2,000,000 - 2,999,999 | 9 | 10 | 4.7 | % | ||||
| 1,000,000 - 1,999,999 | 27 | 30 | 10.3 | % | ||||
| 100,000 - 999,999 | 210 | 73 | 25.1 | % | ||||
| 50,000 - 99,999 | 20 | 1 | 0.3 | % | ||||
| Non MSA / CMSA | — | 62 | 19.7 | % | ||||
| TOTAL | 280 | 300 | 100.0 | % | ||||
- (1)
- According to the U.S. Census Bureau "A Metropolitan Statistical Area (MSA) is a geographic entity defined by the federal Office of Management and Budget for use by federal statistical agencies, based on the concept of a core area with a large population nucleus, plus adjacent communities having a high degree of economic and social integration with that core. Qualification of an MSA requires the presence of a city with 50,000 or more inhabitants, or the presence of an Urbanized Area and a total population of at least 100,000 (75,000 in New England). The county or counties containing the largest city and surrounding densely settled territory are central counties of the MSA. Additional outlying counties qualify to be included in the MSA by meeting certain other criteria of metropolitan character, such as a specified minimum population density or percentage of the population that is urban. MSAs in New England are defined in terms of minor civil divisions, following rules concerning commuting and population density. An area becomes a CMSA if it meet s the requirements to qualify as a metropolitan statistical area, has a population of 1,000,000 or more, if component parts are recognized as primary metropolitan statistical areas (PMSAs), and local opinion favors the designation. A PMSA consists of one or more counties (county subdivisions in New England) that have substantial commuting interchange."
Source: U.S. Bureau of Economic Analysis
- •
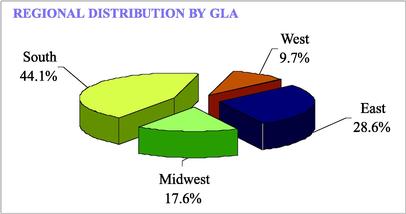
- 238 properties, accounting for approximately 80 percent of New Plan's GLA, are located in MSAs / CMSAs, with 138 properties located in the top 25 MSAs / CMSAs.
- •
- New Plan has a presence in 75 major metropolitan markets encompassing 26 states.
- •
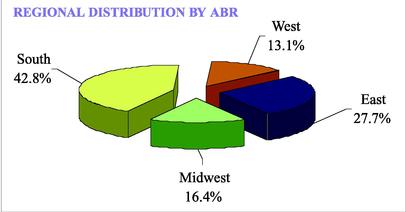
- New Plan's top five states by ABR (Texas, Florida, California, New York, Georgia) account for approximately 37 percent of the nation's GDP.
A-9
Community and Neighborhood Shopping Centers
GLA DISTRIBUTION BY PROJECTED FIVE YEAR POPULATION CHANGE
| PROJECTED TOTAL CHANGE IN POPULATION | PERCENT OF SHOPPING CENTER GLA | |||
|---|---|---|---|---|
| 10.0% Or Greater Increase | 13.8 | % | ||
| 5.0% to 9.9% | 35.6 | % | ||
| 1.0% to 4.9% | 34.6 | % | ||
| 0.9% to -0.9% | 10.6 | % | ||
| -1.0% to -4.9% | 4.7 | % | ||
| -5.0% to -9.9% | 0.7 | % | ||
| -10.0% Or Greater Decrease | 0.0 | % | ||
| TOTAL | 100.0 | % | ||
Source: Applied Geographic Solutions, 5-mile trade area.
- •
- Approximately 84 percent of New Plan's GLA is in areas of projected population growth above 1 percent.
- •
- Approximately 11 percent of New Plan's GLA is in areas where stable population is forecast for the next five years.
A-10
Community and Neighborhood Shopping Centers
2001 MEDIAN HOUSEHOLD INCOMES OF NEW PLAN SHOPPING CENTERS VERSUS STATEWIDE MEDIAN HOUSEHOLD INCOMES
| | STATE | MEDIAN HOUSEHOLD INCOME OF NEW PLAN SHOPPING CENTERS | STATEWIDE MEDIAN HOUSEHOLD INCOME | |||||
|---|---|---|---|---|---|---|---|---|
| 1 | Alabama | $ | 34,340 | $ | 35,056 | |||
| 2 | Arizona | 42,707 | 40,357 | |||||
| 3 | California | 54,622 | 55,059 | |||||
| 4 | Colorado | 56,265 | 44,075 | |||||
| 5 | Florida | 40,316 | 42,009 | |||||
| 6 | Georgia | 41,963 | 44,272 | |||||
| 7 | Illinois | 58,467 | 47,485 | |||||
| 8 | Indiana | 42,013 | 42,391 | |||||
| 9 | Iowa | 46,336 | 37,353 | |||||
| 10 | Kentucky | 40,396 | 33,165 | |||||
| 11 | Louisiana | 27,194 | 29,711 | |||||
| 12 | Maryland | 56,684 | 59,893 | |||||
| 13 | Michigan | 54,280 | 45,132 | |||||
| 14 | Mississippi | 37,498 | 30,064 | |||||
| 15 | Nevada | 45,126 | 45,138 | |||||
| 16 | New Jersey | 62,471 | 64,212 | |||||
| 17 | New Mexico | 38,847 | 34,847 | |||||
| 18 | New York | 44,214 | 52,009 | |||||
| 19 | North Carolina | 37,673 | 41,155 | |||||
| 20 | Ohio | 40,905 | 42,090 | |||||
| 21 | Pennsylvania | 51,154 | 43,252 | |||||
| 22 | South Carolina | 45,788 | 38,955 | |||||
| 23 | Tennessee | 36,856 | 36,674 | |||||
| 24 | Texas | 43,089 | 39,089 | |||||
| 25 | Virginia | 41,009 | 49,984 | |||||
| 26 | West Virginia | 33,671 | 28,992 | |||||
| AVERAGE | $ | 43,723 | $ | 42,401 | ||||
Source: Applied Geographic Solutions, 5-mile trade area.
- •
- The 2001 5-mile median household income for New Plan's shopping centers at $43,723 exceeds the median household income of $42,401 in the 26 states within where the New Plan shopping centers are located.
A-11
Community and Neighborhood Shopping Centers
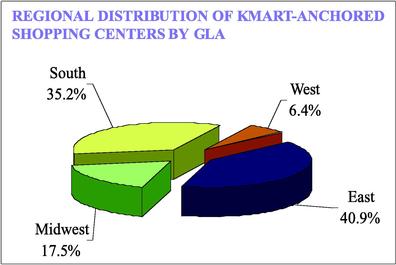
KMART EXPOSURE
| Number Of Kmart-anchored Shopping Centers(1) | 35 | |||
| Total GLA (SF) | 3,262,673 | |||
| Average Store Size | 93,219 | |||
| Total ABR | $ | 13,542,760 | ||
| Average ABR Per SF | $ | 4.15 | ||
| Average Sales Per SF | $ | 169 | ||
| Average ABR / Sales | 2.5 | % | ||
| ABR + Recoveries / Sales | 3.0 | % |
KMART-ANCHORED SHOPPING CENTERS
| Average Occupancy | 97 | % | |
Percent Grocery-anchored | 63 | % | |
| Percent Non-grocery Anchored(2) | 34 | % | |
| Single Tenant Property | 3 | % |
- (1)
- Includes one single tenant property.
- (2)
- Properties have a Kmart anchor plus at least one additional non-grocery anchor.
Analysis reflects ABR adjustments effective July 1, 2002.
Sales per square foot includes Company estimates for Kmart stores not reporting sales data for 2001.
Source: NCREIF Regions.
SUMMARY DEMOGRAPHICS FOR KMART-ANCHORED SHOPPING CENTERS
| | 1-MILE | 3-5-MILE | 5-MILE | |||||||
|---|---|---|---|---|---|---|---|---|---|---|
| Average Population Density (2001) | 7,185 | 45,528 | 100,418 | |||||||
| % Population Growth (2001 - 2006) | 3.8 | % | 4.2 | % | 4.7 | % | ||||
Average Household Income (2001) | $ | 52,142 | $ | 49,859 | $ | 50,842 | ||||
| Median Household Income (2001) | 42,896 | 41,851 | 42,402 | |||||||
| Per Capita Income (2001) | 20,388 | 19,141 | 19,317 | |||||||
A-12
Community and Neighborhood Shopping Centers
WAL-MART-ANCHORED SHOPPING CENTERS
| | NUMBER OF SHOPPING CENTERS | PERCENT OF SHOPPING CENTERS | AVERAGE OCCUPANCY | ||||||
|---|---|---|---|---|---|---|---|---|---|
| NUMBER OF WAL-MART-ANCHORED SHOPPING CENTERS | 29 | 9.7 | % | 95 | % | ||||
| SUPERCENTERS | 8 | 2.7 | % | 96 | % | ||||
| DISCOUNT STORES | 21 | 7.0 | % | 95 | % | ||||
| Grocery-anchored | 13 | ||||||||
| Non-grocery anchored(1) | 2 | ||||||||
| Wal-Mart-anchored only | 6 | ||||||||
- (1)
- Properties have a Wal-Mart anchor plus at least one additional non-grocery anchor.
- •
- Eight of New Plan's 29 Wal-Mart anchors are Wal-Mart Supercenters.
- •
- Of the 29 New Plan shopping centers anchored by Wal-Mart, 22 of the Wal-Mart anchors are owned by New Plan and leased to Wal-Mart.
- •
- Of the 21 New Plan shopping centers anchored by Wal-Mart Discount Stores, 13 are also anchored by a grocer (ten of which are the #1, #2 or #3 grocer in their market) and two are also anchored by another non-grocery anchor.
NON-WAL-MART ANCHORED SHOPPING CENTERS
| | NUMBER OF SHOPPING CENTERS | PERCENT OF SHOPPING CENTERS | AVERAGE OCCUPANCY(2) | ||||||
|---|---|---|---|---|---|---|---|---|---|
| NUMBER OF NON-WAL-MART ANCHORED SHOPPING CENTERS | 271 | 90.3 | % | 89 | % | ||||
| WAL-MART SUPERCENTER IN MARKET AREA | 123 | 41.0 | % | 88 | % | ||||
| Grocery-anchored | 74 | ||||||||
| Non-grocery anchored | 37 | ||||||||
| Non-anchored | 12 | ||||||||
| NO WAL-MART SUPERCENTER IN MARKET AREA | 148 | 49.3 | % | 90 | % | ||||
| Grocery-anchored | 86 | ||||||||
| Non-grocery anchored | 50 | ||||||||
| Non-anchored | 12 | ||||||||
- (2)
- Excludes redevelopment properties.
Market area is defined as 3 miles for shopping centers located in the top 25 MSAs / CMSAs; 5 miles for shopping centers located in non-top 25 MSAs / CMSAs; and 20 miles for shopping centers located in non-metropolitan markets.
- •
- Of the 271 New Plan shopping centers that are not anchored by Wal-Mart, 123 have a Wal-Mart Supercenter in their market area.
- •
- Of the 148 New Plan shopping centers that do not have a Wal-Mart Supercenter in their market area, 86 are anchored by a grocer (65 of which are the #1, #2 or #3 grocer in their market).
- •
- Ten Wal-Mart Neighborhood Markets are located within the market areas of 15 New Plan shopping centers.
A-13
Factory Outlet Centers
GLA BY CENTER
| | GLA (SF) | ||
|---|---|---|---|
| Factory Merchants Barstow | 330,310 | ||
| Factory Merchants Branson | 317,494 | ||
| Factory Merchants Ft. Chiswell | 175,578 | ||
| Factory Outlet Village Osage Beach | 400,428 | ||
| Jackson Outlet Village | 292,563 | ||
| St. Augustine Outlet Center | 329,362 | ||
| TOTAL | 1,845,735 | ||
- •
- The average GLA for the New Plan factory outlet centers is 307,623 square feet, as compared with the 2001 industry average of 211,715 square feet.
- •
- 93 of New Plan's 206 factory outlet tenants have stores in more than one New Plan factory outlet center.
- •
- Sales per square foot at four of New Plan's six factory outlet centers exceed the industry norm of approximately $255 per square foot by an average of 19 percent.
- •
- Jackson Outlet Village was ranked in 2001 among the top 20 factory outlet centers by sales per square foot.
AGE CHARACTERISTICS
| | YEAR BUILT(1) | |
|---|---|---|
| Factory Merchants Barstow | 1994 | |
| Factory Merchants Branson | 1994 | |
| Factory Merchants Ft. Chiswell | 1989 | |
| Factory Outlet Village Osage Beach | 1994 | |
| Jackson Outlet Village | 1999 | |
| St. Augustine Outlet Center | 1994 |
- (1)
- Represents the date of completion of the final phase of construction of the factory outlet center.
Source: VRN, March 2000, May 2002 and August 2002.
- •
- All of New Plan's factory outlet centers were completed since 1990, with the exception of Factory Merchants Ft. Chiswell.
- •
- All New Plan factory outlet centers are located near major interstate highways and/or in or en route to popular tourist destinations.
A-14
Single Tenant Properties
TENANT DIVERSIFICATION
| TENANT | GLA (SF) | NUMBER OF LEASES | CREDIT RATING | ||||
|---|---|---|---|---|---|---|---|
| The Kroger Co. | 234,776 | 7 | BBB- / Baa3 | ||||
| 24 Hour Fitness | 88,748 | 2 | N/R | ||||
| Mad Butcher | 60,842 | 1 | N/R | ||||
| Winn-Dixie Stores | 43,848 | 1 | BB+ / Ba2 | ||||
| Safeway | 41,293 | 1 | BBB / Baa2 | ||||
| Kmart | 40,318 | 1 | WR / Ca | ||||
| Gold's Gym | 36,750 | 1 | N/R | ||||
| Lucky stores | 30,000 | 1 | BBB+ / Baa1 | ||||
| Kindercare | 28,228 | 6 | B+ / Ba3 | ||||
| Rite Aid | 10,069 | 1 | B- / B2 | ||||
| Northern Automotive | 9,671 | 2 | N/R | ||||
| Hardees | 3,800 | 1 | B / B2 | ||||
| Pizza Hut | 3,384 | 1 | BB / Ba1 | ||||
| Other | 299,778 | 10 | N/R | ||||
| TOTAL | 931,505 | 36 | |||||
N/R: No rating available.
Source: NCREIF Regions.
A-15
SIGNATURE
Portfolio Assessment Physical Characteristics and Market Analysis