QuickLinks -- Click here to rapidly navigate through this document
SECURITIES AND EXCHANGE COMMISSION
Washington, D.C. 20549
FORM 8-K
CURRENT REPORT
Pursuant to Section 13 or 15(d) of the
Securities Exchange Act of 1934
Date of Report (Date of earliest event reported):November 12, 2002
New Plan Excel Realty Trust, Inc.
(Exact name of registrant as specified in its charter)
| Maryland (State or other jurisdiction of incorporation) | 1-12244 (Commission File Number) | 33-0160389 (IRS Employer Identification Number) | ||
1120 Avenue of the Americas, 12th Floor New York, New York (Address of principal executive offices) | 10036 (Zip Code) | |||
Registrant's telephone number, including area code:
(212) 869-3000
Not applicable
(Former name or former address, if changed since last report)
Item 9. Regulation FD Disclosure
Included herein beginning on page A-1 is a copy of certain Supplemental Disclosure of the Registrant for the quarter ended September 30, 2002. Included herein beginning on page B-1 is a copy of certain information concerning the Registrant's proposed acquisition of 58 shopping centers.
Pursuant to the requirements of the Securities Exchange Act of 1934, the Registrant has duly caused this report to be signed on its behalf by the undersigned hereunto duly authorized.
| NEW PLAN EXCEL REALTY TRUST, INC. | |||
Date: November 12, 2002 | By: | /s/ STEVEN F. SIEGEL | |
| Steven F. Siegel Executive Vice President, General Counsel and Secretary | |||
[New Plan Excel Realty Trust, Inc. Logo]
New Plan Excel Realty Trust, Inc.
SUPPLEMENTAL DISCLOSURE
Quarter Ended September 30, 2002
Certain statements in this Supplemental Disclosure that are not historical fact may constitute forward-looking statements within the meaning of the Private Securities Litigation Reform Act of 1995. Such forward-looking statements involve known and unknown risks, uncertainties and other factors which may cause the actual results, transactions or achievements of the Company to differ materially from historical results or from any results, transactions or achievements expressed or implied by such forward-looking statements, including without limitation: national and local economic conditions; the ability of tenants to pay rent and the effect of bankruptcy laws; the competitive environment in which the Company operates; financing risks, including possible future downgrades in the Company's credit rating; property management risks; acquisition, disposition, development and joint venture risks, including risks that proposed acquisitions are not consummated, developments and redevelopments are not completed on time or on budget and strategies and actions that the Company may not control; potential environmental and other liabilities; and other factors affecting the real estate industry generally. The Company refers you to the documents filed by the Company from time to time with the Securities and Exchange Commission, specifically the section titled "Business-Risk Factors" in the Company's Annual Report on Form 10-K for the year ended December 31, 2001 which discuss these and other factors that could adversely affect the Company's results.
A-1
New Plan Excel Realty Trust, Inc.
Supplemental Disclosure—Quarter Ended September 30, 2002
Table of Contents
| | page | ||
|---|---|---|---|
| Company Overview/Third Quarter Review | A-2 | ||
| Shareholder Information | A-3 | ||
| Financial Review | |||
| Balance Sheets | A-5 | ||
| Income Statements | A-6 | ||
| Funds from Operations/Funds Available for Distribution/Earnings Before Gains and Losses on Real Estate/Capital Expenditures | A-7 | ||
| Selected Financial Ratios/Data | A-9 | ||
| Summary of Outstanding Debt | A-10 | ||
| Debt Maturity Schedule | A-12 | ||
| Activity Review | |||
| 2002 Portfolio/Property Acquisitions | A-13 | ||
| 2002 Property Dispositions | A-14 | ||
| 2002 Redevelopment/Outparcel Development Activities | A-15 | ||
| Portfolio Review | |||
| Property Type Summary | A-17 | ||
| Properties by State/Region | A-18 | ||
| Same Property NOI Analysis | A-19 | ||
| Top Ten Tenants | A-20 | ||
| New Lease Summary | A-21 | ||
| Lease Expiration Schedule | A-22 | ||
| Property Portfolio | A-23 | ||
| Appendix | |||
| Summary of Joint Venture Projects | A-32 | ||
| Joint Venture Projects—Disposition Activity | A-33 | ||
New Plan Excel Realty Trust, Inc.
Supplemental Disclosure—Quarter-Ended September 30, 2002
Company Overview/Third Quarter Review
New Plan Excel Realty Trust, Inc. is one of the nation's largest real estate companies, focusing on the ownership and management of community and neighborhood shopping centers. The Company operates as a self-administered and self-managed REIT, with a national portfolio of 349 properties and total assets of approximately $3.3 billion. Its properties are strategically located across 32 states and include 297 community and neighborhood shopping centers, primarily high-quality supermarket or name-brand discount chain anchored, with approximately 41.4 million square feet of gross leasable area, and 52 related retail real estate assets, with approximately 4.5 million square feet of gross leasable area.
Third Quarter Review
Financial Review
- •
- On July 15, 2002, the Company redeemed all outstanding shares of its 81/2 percent Series A Cumulative Convertible Preferred Stock. Each outstanding share of Series A stock was redeemed for 1.24384 shares of common stock, resulting in the issuance of approximately 1.9 million shares of common stock at an equivalent of $20.10 per share.
Activity Review
- •
- During the third quarter, the Company sold seven properties for an aggregate of approximately $17.4 million. Properties sold during the quarter include Fairfield Center, a 74,095 square foot shopping center located in Fairfield, Ohio; Belpre Plaza, a 88,426 square foot shopping center located in Belpre, Ohio; Market Central, a 34,000 square foot shopping center located in Dalton, Georgia; Coachella Plaza, a 11,184 square foot shopping center located in Coachella, California; Granville Corners, a 138,352 square foot shopping center located in Oxford, North Carolina; a 9,914 square foot single tenant building located in Dearborne Heights, Michigan; and a 1,500 square foot single tenant building located in Houston, Texas. In total, 13 properties, one outparcel and one land parcel were sold during the first nine months of 2002 for an aggregate of approximately $34.3 million.
Portfolio Review
- •
- At the end of the third quarter, the gross leasable area (GLA) for the Company's community and neighborhood shopping centers, excluding properties under redevelopment, was approximately 90 percent leased and the GLA for the Company's factory outlet centers was approximately 86 percent leased. The GLA for the Company's overall portfolio, excluding properties under redevelopment, was approximately 90 percent leased at September 30, 2002 and when including properties under redevelopment, the GLA for the overall portfolio was approximately 89 percent leased. The average annual base rent (ABR) per leased square foot at September 30, 2002 for the Company's overall portfolio was $8.01. During the quarter, 193 new leases, aggregating approximately 749,000 square feet, were signed at an average ABR of $9.99 per square foot. Also during the quarter, 189 renewal leases, aggregating approximately 655,000 square feet, were signed at an average ABR of $10.25 per square foot, an increase of approximately 5.0 percent over the expiring leases. In total, 397 new leases, aggregating approximately 1.6 million square feet, were signed during the first nine months of 2002 at an average ABR of $10.19 per square foot and 532 renewal leases, aggregating approximately 2.1 million square feet, were signed at an average ABR of $9.24 per square foot, an increase of approximately 6.2 percent over the expiring leases.
A-2
Joint Venture Projects/Notes Receivable
- •
- On July 31, 2002, the Company acquired Superior Marketplace from The Ellman Companies for approximately $13.6 million in cash and the satisfaction of $38.0 million of notes receivable and accrued interest. Included in the acquisition was $10 million of municipal bonds, as well as certain other tax incentive financing. Superior Marketplace is an existing 114,615 square foot grocery-anchored community shopping center located in Superior, Colorado, northwest of Denver. The shopping center is in the later stages of development and is expected to total 295,602 square feet when complete. Tenants include Costco (non-owned), Michaels, Office Max, PetsMart, SuperTarget (non-owned) and T.J. Maxx.
- •
- On July 31, 2002, The Ellman Companies repaid to the Company in full approximately $8.1 million of outstanding notes receivable and accrued interest on Atrium on the Bay.
- •
- During the first nine months of 2002, the Company generated approximately $52.1 million of capital from negotiations with joint venture partners and the repayment of unscheduled debt. In addition, approximately $13.8 million of land parcels were sold during the first nine months of the year at properties where the Company holds either a note receivable or joint venture interest.
Subsequent Events
- •
- Early in the fourth quarter, the Company provided an update on Clearwater Mall in Clearwater, Florida. The property is currently being redeveloped through a joint venture with The Sembler Company as a large, open-air community shopping center, encompassing approximately 740,000 square feet of retail space. On October 11, 2002, New Plan sold individual land parcels accounting for approximately 450,000 square feet of anchor space to Costco, Lowe's and Target. The Company then contributed the remaining mall property to the joint venture. Also on October 11, 2002, the joint venture closed an approximately $36 million construction loan with Wells Fargo. New Plan received approximately $28 million from the land sales and loan transaction and does not anticipate that it will be required to make any additional capital contributions to complete the project.
Shareholder Information
Corporate Headquarters
New Plan Excel Realty Trust, Inc.
1120 Avenue of the Americas
New York, NY 10036
Phone: 212-869-3000
Fax: 212-869-3989
www.newplanexcel.com
Exchange Listing
New York Stock Exchange
Common stock: NXL
Series B preferred stock: NXLprB
Senior Unsecured Debt Ratings
Standard & Poor's: BBB
Moody's: Baa2
A-3
Quarterly Results
The Company expects to announce quarterly results as follows:
Fourth quarter and Year-end 2002: March 6, 2003
First quarter 2003: May 8, 2003
Second quarter 2003: August 7, 2003
Third quarter 2003: October 30, 2003
Transfer Agent and Registrar
Questions about dividend payments, shareholder accounts, replacement or lost certificates, stock transfers and name or address changes should be directed to:
EquiServe Trust Company, N.A.
P.O. Box 43010
Providence, RI 02940-3010
Phone: 800-730-6001
www.equiserve.com
Corporate Communications Department
Shareholders seeking financial and operating information may contact:
Stacy Lipschitz
Vice President—Corporate Communications
Phone: 212-869-3000
Fax: 212-869-3989
E-mail: corporatecommunications@newplanexcel.com
slipschitz@newplanexcel.com
A-4
New Plan Excel Realty Trust, Inc.
Supplemental Disclosure—Quarter Ended September 30, 2002
Balance Sheets
(Unaudited, in thousands)
| | As Of | |||||||||||||
|---|---|---|---|---|---|---|---|---|---|---|---|---|---|---|
| | 09/30/02 | 06/30/02 | 03/31/02 | 12/31/01 | ||||||||||
| Assets: | ||||||||||||||
| Land | $ | 731,480 | $ | 712,391 | $ | 711,673 | $ | 487,280 | ||||||
| Buildings and improvements | 2,599,462 | 2,598,266 | 2,591,388 | 2,142,636 | ||||||||||
| Less: accumulated depreciation and amortization | (310,113 | ) | (294,846 | ) | (281,573 | ) | (265,937 | ) | ||||||
| Net real estate | 3,020,829 | 3,015,811 | 3,021,488 | 2,363,979 | ||||||||||
| Real estate held for sale | 44,743 | 41,019 | 58,873 | 70,659 | ||||||||||
| Cash and cash equivalents | 6,384 | 16,220 | 4,978 | 7,163 | ||||||||||
| Restricted cash(1) | 13,126 | 13,399 | 12,860 | — | ||||||||||
| Marketable securities | 2,098 | 2,206 | 2,080 | 1,887 | ||||||||||
| Receivables | ||||||||||||||
| Trade, net of allowance for doubtful accounts of (September 30, 2002—$14,874, June 30, 2002—$16,076, March 31, 2002—$14,995, December 31, 2001—$15,633) | 46,408 | 49,084 | 44,597 | 43,555 | ||||||||||
| Other | 18,965 | 10,497 | 10,331 | 8,736 | ||||||||||
| Mortgages and notes receivable | 2,939 | 40,014 | 44,496 | 45,360 | ||||||||||
| Prepaid expenses and deferred charges | 24,480 | 23,980 | 16,910 | 15,964 | ||||||||||
| Investments in/advances to unconsolidated ventures(2) | 53,518 | 54,244 | 50,118 | 41,876 | ||||||||||
| Other assets(3) | 21,663 | 20,394 | 24,033 | 23,687 | ||||||||||
| TOTAL ASSETS | $ | 3,255,153 | $ | 3,286,868 | $ | 3,290,764 | $ | 2,622,866 | ||||||
| Liabilities: | ||||||||||||||
| Mortgages payable, including unamortized premium of (September 30, 2002—$5,059, June 30, 2002—$5,336, March 31, 2002—$5,653, December 31, 2001—$6,063) | $ | 504,743 | $ | 508,633 | $ | 523,037 | $ | 241,436 | ||||||
| Notes payable, net of unamortized discount of (September 30, 2002—$2,325, June 30, 2002—$2,428, March 31, 2002—$1,664, December 31, 2001—$1,752) | 783,873 | 781,854 | 613,336 | 613,248 | ||||||||||
| Credit facilities | 185,000 | 205,000 | 365,000 | 95,000 | ||||||||||
| Capital leases | 28,961 | 29,033 | 29,102 | 29,170 | ||||||||||
| Other liabilities(4) | 152,786 | 147,889 | 136,259 | 122,674 | ||||||||||
| Tenant security deposits | 8,213 | 8,041 | 7,751 | 5,833 | ||||||||||
| TOTAL LIABILITIES | 1,663,576 | 1,680,450 | 1,674,485 | 1,107,361 | ||||||||||
| Minority interest in consolidated partnership | 13,966 | 14,203 | 20,167 | 22,267 | ||||||||||
| Stockholders' equity: | ||||||||||||||
| Preferred stock | 8 | 23 | 23 | 23 | ||||||||||
| Common stock | 968 | 950 | 944 | 873 | ||||||||||
| Additional paid-in capital | 1,825,654 | 1,833,128 | 1,821,908 | 1,697,570 | ||||||||||
| Accumulated other comprehensive loss | (979 | ) | (1,887 | ) | (842 | ) | (1,965 | ) | ||||||
| Less: accumulated distributions in excess of net income | (248,040 | ) | (239,999 | ) | (225,921 | ) | (203,263 | ) | ||||||
| TOTAL STOCKHOLDERS' EQUITY | 1,577,611 | 1,592,215 | 1,596,112 | 1,493,238 | ||||||||||
| TOTAL LIABILITIES AND STOCKHOLDERS' EQUITY | $ | 3,255,153 | $ | 3,286,868 | $ | 3,290,764 | $ | 2,622,866 | ||||||
- (1)
- Consists primarily of cash held in escrow accounts as required by the REMIC mortgage payable deed of trust agreement and other loan agreements.
- (2)
- Represents direct equity investments in Benbrooke Ventures, CA New Plan Venture Fund, The Centre at Preston Ridge and Vail Ranch II and outstanding notes receivable related to a joint venture project.
- (3)
- Other assets include: deposits, real estate tax escrow and furniture and fixtures.
- (4)
- Other liabilities include: amounts payable for dividends, real estate taxes, interest, payroll and normal vendor payables.
The above does not purport to disclose all items required under GAAP.
The Company's Form 10-K for the year ended December 31, 2001 and Form 10-Q for the quarters ended September 30, 2002, June 30, 2002 and March 31, 2002 should be read in conjunction with the above information.
A-5
New Plan Excel Realty Trust, Inc.
Supplemental Disclosure—Quarter Ended September 30, 2002
Income Statements
(Unaudited, in thousands, except per share amounts)
| | Three Months Ended | | ||||||||||||||||||||
|---|---|---|---|---|---|---|---|---|---|---|---|---|---|---|---|---|---|---|---|---|---|---|
| | Twelve Months Ended 12/31/01 | |||||||||||||||||||||
| | 09/30/02 | 06/30/02 | 03/31/02 | 09/30/01 | 06/30/01 | 03/31/01 | ||||||||||||||||
| Rental Revenues: | ||||||||||||||||||||||
| Rental income | $ | 87,720 | $ | 85,684 | $ | 73,805 | $ | 65,786 | $ | 64,978 | $ | 64,311 | $ | 263,235 | ||||||||
| Percentage rents | 1,597 | 1,726 | 2,889 | 1,656 | 1,161 | 2,619 | 6,952 | |||||||||||||||
| Expense reimbursements | 19,822 | 21,679 | 16,052 | 14,320 | 14,531 | 13,732 | 59,475 | |||||||||||||||
| TOTAL RENTAL REVENUES | 109,139 | 109,089 | 92,746 | 81,762 | 80,670 | 80,662 | 329,662 | |||||||||||||||
| Rental Operating Expenses: | ||||||||||||||||||||||
| Operating costs | 19,452 | 18,920 | 15,054 | 13,244 | 12,929 | 12,255 | 54,963 | |||||||||||||||
| Real estate and other taxes | 12,817 | 12,322 | 9,845 | 8,631 | 8,459 | 8,571 | 34,918 | |||||||||||||||
| Provision for doubtful accounts | 2,265 | 2,018 | 2,810 | 1,062 | 1,646 | 1,983 | 6,330 | |||||||||||||||
| TOTAL RENTAL OPERATING EXPENSES | 34,534 | 33,260 | 27,709 | 22,937 | 23,034 | 22,809 | 96,211 | |||||||||||||||
| NET OPERATING INCOME | 74,605 | 75,829 | 65,037 | 58,825 | 57,636 | 57,853 | 233,451 | |||||||||||||||
| Other Income: | ||||||||||||||||||||||
| Interest, dividend and other income | 3,042 | 2,701 | 3,049 | 3,181 | 3,678 | 3,793 | 13,990 | |||||||||||||||
| Equity participation in ERT | — | — | — | — | (2,855 | ) | (1,458 | ) | (4,313 | ) | ||||||||||||
| Equity in income of unconsolidated ventures | 1,177 | 838 | 1,718 | 44 | — | — | 985 | |||||||||||||||
| Foreign currency (loss) gain | (397 | ) | 403 | (19 | ) | (369 | ) | 349 | (479 | ) | (560 | ) | ||||||||||
| TOTAL OTHER INCOME | 3,822 | 3,942 | 4,748 | 2,856 | 1,172 | 1,856 | 10,102 | |||||||||||||||
| Other Expenses: | ||||||||||||||||||||||
| Interest expense | 24,617 | 24,046 | 19,708 | 20,141 | 19,727 | 20,907 | 78,533 | |||||||||||||||
| Depreciation and amortization | 17,713 | 18,442 | 15,988 | 14,332 | 13,871 | 13,253 | 56,129 | |||||||||||||||
| Severance costs | — | — | — | — | — | — | 896 | |||||||||||||||
| General and administrative | 4,197 | 5,439 | 3,693 | 2,100 | 2,543 | 2,187 | 10,317 | |||||||||||||||
| TOTAL OTHER EXPENSES | 46,527 | 47,927 | 39,389 | 36,573 | 36,141 | 36,347 | 145,875 | |||||||||||||||
| Income before real estate sales, impairment of real estate and minority interest | 31,900 | 31,844 | 30,396 | 25,108 | 22,667 | 23,362 | 97,678 | |||||||||||||||
| Gain (loss) on sale of real estate | — | 52 | 319 | 700 | 8 | (25 | ) | 1,610 | ||||||||||||||
| Impairment of real estate | — | (217 | ) | (1,533 | ) | (8,774 | ) | (1,135 | ) | (2,239 | ) | (13,107 | ) | |||||||||
| Minority interest in income of consolidated partnership | (74 | ) | (104 | ) | (240 | ) | (215 | ) | (208 | ) | (218 | ) | (848 | ) | ||||||||
| INCOME FROM CONTINUING OPERATIONS | 31,826 | 31,575 | 28,942 | 16,819 | 21,332 | 20,880 | 85,333 | |||||||||||||||
| Discontinued Operations: | ||||||||||||||||||||||
| Results of discontinued operations | 1,207 | 1,389 | 1,075 | 4,742 | 6,449 | 6,323 | 18,329 | |||||||||||||||
| (Loss) gain on sale of discontinued operations | (284 | ) | 1,755 | (133 | ) | 1,500 | — | — | 1,500 | |||||||||||||
| Impairment of real estate held for sale | (2,958 | ) | (3,958 | ) | (7,896 | ) | — | — | — | — | ||||||||||||
| (LOSS) INCOME FROM DISCONTINUED OPERATIONS | (2,035 | ) | (814 | ) | (6,954 | ) | 6,242 | 6,449 | 6,323 | 19,829 | ||||||||||||
| NET INCOME | $ | 29,791 | $ | 30,761 | $ | 21,988 | $ | 23,061 | $ | 27,781 | $ | 27,203 | $ | 105,162 | ||||||||
| Preferred dividends | (4,859 | ) | (5,646 | ) | (5,659 | ) | (5,660 | ) | (5,660 | ) | (5,659 | ) | (22,639 | ) | ||||||||
| Discount on redemption of preferred stock | 6,997 | — | — | — | — | — | — | |||||||||||||||
| NET INCOME AVAILABLE TO COMMON STOCKHOLDERS—BASIC | 31,929 | 25,115 | 16,329 | 17,401 | 22,121 | 21,544 | 82,523 | |||||||||||||||
| Minority interest in income of consolidated partnership | 74 | 104 | 240 | 215 | 208 | 218 | 848 | |||||||||||||||
| NET INCOME AVAILABLE TO COMMON STOCKHOLDERS—DILUTED | $ | 32,003 | $ | 25,219 | $ | 16,569 | $ | 17,616 | $ | 22,329 | $ | 21,762 | $ | 83,371 | ||||||||
| NET INCOME PER COMMON SHARE—BASIC | $ | 0.33 | $ | 0.27 | $ | 0.18 | $ | 0.20 | $ | 0.25 | $ | 0.25 | $ | 0.95 | ||||||||
| NET INCOME PER COMMON SHARE—DILUTED | 0.33 | 0.26 | 0.18 | 0.20 | 0.25 | 0.25 | 0.94 | |||||||||||||||
| Weighted average common shares outstanding—basic | 96,617 | 94,701 | 92,191 | 87,210 | 87,206 | 87,208 | 87,241 | |||||||||||||||
| ERP partnership units | 798 | 894 | 1,116 | 1,235 | 1,235 | 1,235 | 1,231 | |||||||||||||||
| Options | 519 | 621 | 575 | 355 | 313 | 169 | 327 | |||||||||||||||
| �� | ||||||||||||||||||||||
| Weighted average common shares outstanding—diluted | 97,934 | 96,216 | 93,882 | 88,800 | 88,754 | 88,612 | 88,799 | |||||||||||||||
On July 1, 2001, the Company acquired the 5 percent economic interest in ERT Development Corporation (ERT) not previously owned by the Company. As a result, activities of ERT and the Company have been consolidated for GAAP purposes.
The above does not purport to disclose all items required under GAAP.
The Company's Form 10-K for the year ended December 31, 2001 and Form 10-Q for the quarters ended September 30, 2002, June 30, 2002 and March 31, 2002 should be read in conjunction with the above information.
A-6
New Plan Excel Realty Trust, Inc.
Supplemental Disclosure—Quarter Ended September 30, 2002
Funds from Operations/Funds Available for Distribution/Earnings Before Gains and Losses on Real Estate/Capital Expenditures
(In thousands, except per share amounts)
| | Three Months Ended | | ||||||||||||||||||||
|---|---|---|---|---|---|---|---|---|---|---|---|---|---|---|---|---|---|---|---|---|---|---|
| | Twelve Months Ended 12/31/01 | |||||||||||||||||||||
| | 09/30/02 | 06/30/02 | 03/31/02 | 09/30/01 | 06/30/01 | 03/31/01 | ||||||||||||||||
| Funds from Operations: | ||||||||||||||||||||||
| Net income | $ | 29,791 | $ | 30,761 | $ | 21,988 | $ | 23,061 | $ | 27,781 | $ | 27,203 | $ | 105,162 | ||||||||
| Add: | ||||||||||||||||||||||
| Depreciation and amortization | ||||||||||||||||||||||
| Continuing operations real estate assets(1) | 18,040 | 18,783 | 16,296 | 14,382 | 15,309 | 14,735 | 60,308 | |||||||||||||||
| Discontinued operations real estate assets | 79 | 118 | 395 | 3,419 | 2,859 | 2,822 | 9,434 | |||||||||||||||
| Impairment of real estate | ||||||||||||||||||||||
| Impairment of real estate | — | 217 | 1,533 | 8,774 | 1,878 | 2,239 | 13,850 | |||||||||||||||
| Impairment of real estate held for sale | 2,958 | 3,958 | 7,896 | — | — | — | — | |||||||||||||||
| Deduct: | ||||||||||||||||||||||
| Preferred A dividends | — | (787 | ) | (800 | ) | (801 | ) | (801 | ) | (800 | ) | (3,203 | ) | |||||||||
| Preferred B dividends | (3,396 | ) | (3,396 | ) | (3,396 | ) | (3,396 | ) | (3,396 | ) | (3,396 | ) | (13,584 | ) | ||||||||
| Preferred D dividends | (1,463 | ) | (1,463 | ) | (1,463 | ) | (1,463 | ) | (1,463 | ) | (1,463 | ) | (5,852 | ) | ||||||||
| (Gain) loss on sale of real estate(2) | — | (10 | ) | (192 | ) | 63 | 614 | 25 | 88 | |||||||||||||
| Loss (gain) on sale of discontinued operations | 284 | (1,755 | ) | 133 | (1,500 | ) | — | — | (1,500 | ) | ||||||||||||
| FUNDS FROM OPERATIONS—BASIC | 46,293 | 46,426 | 42,390 | 42,539 | 42,781 | 41,365 | 164,703 | |||||||||||||||
| Add: | ||||||||||||||||||||||
| Preferred A dividends | — | 787 | 800 | 801 | 801 | 800 | 3,203 | |||||||||||||||
| Minority interest in income of consolidated partnership | 74 | 104 | 240 | 215 | 208 | 218 | 848 | |||||||||||||||
| FUNDS FROM OPERATIONS—DILUTED | $ | 46,367 | $ | 47,317 | $ | 43,430 | $ | 43,555 | $ | 43,790 | $ | 42,383 | $ | 168,754 | ||||||||
| FUNDS FROM OPERATIONS PER SHARE—BASIC | $ | 0.48 | $ | 0.49 | $ | 0.46 | $ | 0.49 | $ | 0.49 | $ | 0.47 | $ | 1.89 | ||||||||
| FUNDS FROM OPERATIONS PER SHARE—DILUTED | 0.47 | 0.48 | 0.45 | 0.48 | 0.48 | 0.47 | 1.86 | |||||||||||||||
| Weighted average common shares outstanding—basic | 96,617 | 94,701 | 92,191 | 87,210 | 87,206 | 87,208 | 87,241 | |||||||||||||||
| ERP partnership units | 798 | 894 | 1,116 | 1,235 | 1,235 | 1,235 | 1,231 | |||||||||||||||
| Options | 519 | 621 | 575 | 355 | 313 | 169 | 327 | |||||||||||||||
| Dilutive effect of convertible Preferred A | — | 1,856 | 1,874 | 1,874 | 1,874 | 1,874 | 1,874 | |||||||||||||||
| Weighted average common shares outstanding—diluted | 97,934 | 98,072 | 95,756 | 90,674 | 90,628 | 90,486 | 90,673 | |||||||||||||||
| Funds Available for Distribution: | ||||||||||||||||||||||
| Funds from operations—diluted | $ | 46,367 | $ | 47,317 | $ | 43,430 | $ | 43,555 | $ | 43,790 | $ | 42,383 | $ | 168,754 | ||||||||
| Straight line rents | (924 | ) | (1,414 | ) | (503 | ) | (389 | ) | (817 | ) | 29 | (2,244 | ) | |||||||||
| Tenant improvements | (3,445 | ) | (2,845 | ) | (2,408 | ) | (2,743 | ) | (822 | ) | (2,372 | ) | (9,430 | ) | ||||||||
| Leasing commissions | (873 | ) | (882 | ) | (387 | ) | (635 | ) | (255 | ) | (153 | ) | (1,733 | ) | ||||||||
| Building improvements capitalized | (2,994 | ) | (2,603 | ) | (1,865 | ) | (6,547 | ) | (5,613 | ) | (3,747 | ) | (19,311 | ) | ||||||||
| FUNDS AVAILABLE FOR DISTRIBUTION | $ | 38,131 | $ | 39,573 | $ | 38,267 | $ | 33,241 | $ | 36,283 | $ | 36,140 | $ | 136,036 | ||||||||
| FUNDS AVAILABLE FOR DISTRIBUTION PER SHARE—BASIC | $ | 0.39 | $ | 0.42 | $ | 0.42 | $ | 0.38 | $ | 0.42 | $ | 0.41 | $ | 1.56 | ||||||||
| FUNDS AVAILABLE FOR DISTRIBUTION PER SHARE—DILUTED | 0.39 | 0.40 | 0.40 | 0.37 | 0.40 | 0.40 | 1.50 | |||||||||||||||
A-7
New Plan Excel Realty Trust, Inc.
Supplemental Disclosure—Quarter Ended September 30, 2002
Funds from Operations/Funds Available for Distribution/Earnings Before Gains and Losses on Real Estate/Capital Expenditures
(In thousands, except per share amounts)
| | Three Months Ended | | ||||||||||||||||||||
|---|---|---|---|---|---|---|---|---|---|---|---|---|---|---|---|---|---|---|---|---|---|---|
| | Twelve Months Ended 12/31/01 | |||||||||||||||||||||
| | 09/30/02 | 06/30/02 | 03/31/02 | 09/30/01 | 06/30/01 | 03/31/01 | ||||||||||||||||
| Earnings Before Gains and Losses on Real Estate (EBGL): | ||||||||||||||||||||||
| Net income | $ | 29,791 | $ | 30,761 | $ | 21,988 | $ | 23,061 | $ | 27,781 | $ | 27,203 | $ | 105,162 | ||||||||
| Add: | ||||||||||||||||||||||
| Impairment of real estate | ||||||||||||||||||||||
| Impairment of real estate | — | 217 | 1,533 | 8,774 | 1,878 | 2,239 | 13,850 | |||||||||||||||
| Impairment of real estate held for sale | 2,958 | 3,958 | 7,896 | — | — | — | — | |||||||||||||||
| Deduct: | ||||||||||||||||||||||
| (Gain) loss on sale of real estate | — | (52 | ) | (319 | ) | (700 | ) | (8 | ) | 25 | (1,610 | ) | ||||||||||
| Loss (gain) on sale of discontinued operations | 284 | (1,755 | ) | 133 | (1,500 | ) | — | — | (1,500 | ) | ||||||||||||
| EBGL | $ | 33,033 | $ | 33,129 | $ | 31,231 | $ | 29,635 | $ | 29,651 | $ | 29,467 | $ | 115,902 | ||||||||
| EBGL PER SHARE—BASIC | $ | 0.29 | $ | 0.29 | $ | 0.28 | $ | 0.27 | $ | 0.28 | $ | 0.27 | $ | 1.07 | ||||||||
| EBGL PER SHARE—DILUTED | 0.29 | 0.29 | 0.27 | 0.27 | 0.27 | 0.27 | 1.06 | |||||||||||||||
| Dividend per Common share | $ | 0.41250 | $ | 0.41250 | $ | 0.41250 | $ | 0.41250 | $ | 0.41250 | $ | 0.41250 | $ | 1.65000 | ||||||||
| Dividend per Preferred A share | — | 0.53125 | 0.53125 | 0.53125 | 0.53125 | 0.53125 | 2.12500 | |||||||||||||||
| Dividend per Preferred B share | 0.53906 | 0.53906 | 0.53906 | 0.53906 | 0.53906 | 0.53906 | 2.15624 | |||||||||||||||
| Dividend per Preferred D share | 0.97500 | 0.97500 | 0.97500 | 0.97500 | 0.97500 | 0.97500 | 3.90000 | |||||||||||||||
| Common dividends | $ | 39,968 | $ | 39,221 | $ | 38,957 | $ | 35,977 | $ | 35,973 | $ | 36,037 | $ | 143,962 | ||||||||
| Preferred A dividends | — | 787 | 800 | 801 | 801 | 800 | 3,203 | |||||||||||||||
| Preferred B dividends | 3,396 | 3,396 | 3,396 | 3,396 | 3,396 | 3,396 | 13,534 | |||||||||||||||
| Preferred D dividends | 1,463 | 1,463 | 1,463 | 1,463 | 1,463 | 1,463 | 5,852 | |||||||||||||||
| TOTAL DISTRIBUTIONS | $ | 44,827 | $ | 44,867 | $ | 44,616 | $ | 41,637 | $ | 41,633 | $ | 41,696 | $ | 166,551 | ||||||||
| Payout ratio of common dividends/diluted funds from operations(3) | 86 | % | 83 | % | 90 | % | 83 | % | 82 | % | 85 | % | 85 | % | ||||||||
| Payout ratio of common dividends/funds available for distribution(3) | 105 | % | 99 | % | 102 | % | 108 | % | 99 | % | 100 | % | 105 | % | ||||||||
| Capital Expenditures: | ||||||||||||||||||||||
| New development(4) | $ | — | $ | — | $ | — | N/A | N/A | N/A | N/A | ||||||||||||
| Building additions and expansions(5) | 8,025 | 8,317 | 5,727 | N/A | N/A | N/A | N/A | |||||||||||||||
| Building improvements capitalized(6) | 2,994 | 2,603 | 1,865 | $ | 6,547 | $ | 5,613 | $ | 3,747 | $ | 19,311 | |||||||||||
| Tenant improvements | 3,445 | 2,845 | 2,408 | 2,743 | 822 | 2,372 | 9,430 | |||||||||||||||
| Leasing commissions | 873 | 882 | 387 | 635 | 255 | 153 | 1,733 | |||||||||||||||
| TOTAL CAPITAL EXPENDITURES | $ | 15,337 | $ | 14,647 | $ | 10,387 | N/A | N/A | N/A | N/A | ||||||||||||
| Capitalized interest: | $ | 1,171 | $ | 858 | $ | 657 | $ | 750 | $ | 713 | $ | 249 | $ | 2,102 | ||||||||
- (1)
- Includes pro rata share of joint venture projects.
- (2)
- Excludes (gain) loss on sale of land.
- (3)
- Excludes severance costs.
- (4)
- Includes ground-up development.
- (5)
- Revenue-enhancing expenditures.
- (6)
- Nonrevenue-enhancing expenditures such as lighting, painting, parking lots, roofing and signage.
The above does not purport to disclose all items required under GAAP.
The Company's Form 10-K for the year ended December 31, 2001 and Form 10-Q for the quarters ended September 30, 2002, June 30, 2002 and March 31, 2002 should be read in conjunction with the above information.
A-8
New Plan Excel Realty Trust, Inc.
Supplemental Disclosure—Quarter Ended September 30, 2002
Selected Financial Ratios/Data
(In thousands, except per share amounts)
| | Three Months Ended | | ||||||||||||||||||||
|---|---|---|---|---|---|---|---|---|---|---|---|---|---|---|---|---|---|---|---|---|---|---|
| | Twelve Months Ended 12/31/01 | |||||||||||||||||||||
| | 09/30/02 | 06/30/02 | 03/31/02 | 09/30/01 | 06/30/01 | 03/31/01 | ||||||||||||||||
| Debt coverage ratios: | ||||||||||||||||||||||
| Interest coverage ratio (EBITDA /interest expense) | 3.03 | x | 3.11 | x | 3.36 | x | 3.35 | x | 3.43 | x | 3.25 | x | 3.26 | x | ||||||||
| Debt service coverage (EBITDA/(interest expense + scheduled principal payments)) | 2.77 | x | 2.85 | x | 3.02 | x | 3.00 | x | 3.05 | x | 2.91 | x | 2.94 | x | ||||||||
| Fixed charge coverage (EBITDA/(interest expense + scheduled principal payments + preferred dividends)) | 2.36 | x | 2.35 | x | 2.41 | x | 2.40 | x | 2.43 | x | 2.35 | x | 2.36 | x | ||||||||
| Fixed charge coverage (excluding capitalized interest and scheduled principal payments) | 2.64 | x | 2.61 | x | 2.70 | x | 2.70 | x | 2.74 | x | 2.58 | x | 2.61 | x | ||||||||
| Debt/equity ratios: | ||||||||||||||||||||||
| Total debt/total market capitalization | 42.7 | % | 40.4 | % | 41.4 | % | 37.7 | % | 43.1 | % | 42.6 | % | 33.6 | % | ||||||||
| Total debt/total equity market capitalization | 74.4 | % | 67.7 | % | 70.7 | % | 60.5 | % | 75.7 | % | 74.3 | % | 50.6 | % | ||||||||
| Total debt/total book assets | 46.2 | % | 46.4 | % | 46.5 | % | 39.1 | % | 42.2 | % | 42.5 | % | 37.3 | % | ||||||||
| Total debt/undepreciated book value(1) | 42.1 | % | 42.5 | % | 42.8 | % | 35.7 | % | 38.9 | % | 39.3 | % | 33.9 | % | ||||||||
| Overhead ratios: | ||||||||||||||||||||||
| Annualized G&A/total assets | 0.52 | % | 0.66 | % | 0.45 | % | 0.31 | % | 0.35 | % | 0.30 | % | 0.39 | % | ||||||||
| G&A/total revenues (excluding currency change) | 3.70 | % | 4.83 | % | 3.79 | % | 2.47 | % | 3.12 | % | 2.64 | % | 3.03 | % | ||||||||
| Market capitalization calculations: | ||||||||||||||||||||||
| Common shares outstanding | 96,893 | 95,067 | 94,442 | 87,213 | 87,210 | 87,205 | 87,352 | |||||||||||||||
| Preferred A shares outstanding(2) | — | 1,492 | 1,507 | 1,507 | 1,507 | 1,507 | 1,507 | |||||||||||||||
| Preferred B shares outstanding | 6,300 | 6,300 | 6,300 | 6,300 | 6,300 | 6,300 | 6,300 | |||||||||||||||
| Preferred D shares outstanding | 1,500 | 1,500 | 1,500 | 1,500 | 1,500 | 1,500 | 1,500 | |||||||||||||||
| Common stock price end of period | $ | 18.44 | $ | 20.83 | $ | 20.05 | $ | 17.10 | $ | 15.30 | $ | 16.00 | $ | 19.05 | ||||||||
| Preferred A price end of period(2) | — | 25.49 | 26.00 | 25.95 | 23.35 | 24.25 | 25.50 | |||||||||||||||
| Preferred B price end of period | 25.05 | 25.00 | 24.93 | 24.70 | 24.11 | 23.20 | 24.90 | |||||||||||||||
| Preferred D price end of period | 50.00 | 50.00 | 50.00 | 50.00 | 50.00 | 50.00 | 50.00 | |||||||||||||||
| Common market equity at end of period | $ | 1,786,707 | $ | 1,980,246 | $ | 1,893,562 | $ | 1,491,342 | $ | 1,334,313 | $ | 1,395,280 | $ | 1,664,213 | ||||||||
| Preferred market equity at end of period | 232,815 | 270,531 | 271,241 | 269,717 | 262,081 | 257,705 | 270,299 | |||||||||||||||
| Total equity market capitalization | 2,019,522 | 2,250,777 | 2,164,803 | 1,761,059 | 1,596,394 | 1,652,985 | 1,934,512 | |||||||||||||||
| Total debt end of period | 1,502,577 | 1,524,520 | 1,530,475 | 1,065,185 | 1,208,410 | 1,227,502 | 978,854 | |||||||||||||||
| TOTAL MARKET CAPITALIZATION | $ | 3,522,099 | $ | 3,775,297 | $ | 3,695,278 | $ | 2,826,244 | $ | 2,804,804 | $ | 2,880,487 | $ | 2,913,366 | ||||||||
| EBITDA calculation (includes pro rata share of joint venture projects): | ||||||||||||||||||||||
| Net income | $ | 29,791 | $ | 30,761 | $ | 21,988 | $ | 23,061 | $ | 27,781 | $ | 27,203 | $ | 105,162 | ||||||||
| Depreciation and amortization | ||||||||||||||||||||||
| Continuing operations real estate assets | 18,040 | 18,783 | 16,296 | 14,382 | 15,309 | 14,735 | 60,308 | |||||||||||||||
| Discontinued operations real estate assets | 79 | 118 | 395 | 3,419 | 2,859 | 2,822 | 9,434 | |||||||||||||||
| Income taxes | 155 | 150 | 125 | 114 | 174 | 114 | 516 | |||||||||||||||
| Interest expense | ||||||||||||||||||||||
| Continuing operations | 25,269 | 24,639 | 20,345 | 20,141 | 19,727 | 20,907 | 82,078 | |||||||||||||||
| Discontinued operations | — | 37 | 13 | 61 | 55 | 60 | 246 | |||||||||||||||
| (Gain) loss on sale of real estate | — | (52 | ) | (319 | ) | (700 | ) | (8 | ) | 25 | (1,610 | ) | ||||||||||
| Loss (gain) on sale of discontinued operations | 284 | (1,755 | ) | 133 | (1,500 | ) | — | — | (1,500 | ) | ||||||||||||
| Impairment of real estate | ||||||||||||||||||||||
| Impairment of real estate | — | 217 | 1,533 | 8,774 | 1,878 | 2,239 | 13,850 | |||||||||||||||
| Impairment of real estate held for sale | 2,958 | 3,958 | 7,896 | — | — | — | — | |||||||||||||||
| EBITDA | $ | 76,576 | $ | 76,856 | $ | 68,405 | $ | 67,752 | $ | 67,775 | $ | 68,105 | $ | 268,484 | ||||||||
- (1)
- Excludes accumulated depreciation on operating and held for sale assets.
- (2)
- On July 15, 2002, the Company redeemed all Preferred A shares outstanding, resulting in the issuance of approximately 1.9 million shares of common stock at an equivalent of $20.10 per share.
The above does not purport to disclose all items required under GAAP.
The Company's Form 10-K for the year ended December 31, 2001 and Form 10-Q for the quarters ended September 30, 2002, June 30, 2002 and March 31, 2002 should be read in conjunction with the above information.
A-9
New Plan Excel Realty Trust, Inc.
Supplemental Disclosure—Quarter Ended September 30, 2002
Summary of Outstanding Debt
(In thousands)
| | Lender | Outstanding Balance | Actual Interest Rate | Maturity Date | Percent of Total Indebtedness | |||||||
|---|---|---|---|---|---|---|---|---|---|---|---|---|
| Fixed Rate Debt: | ||||||||||||
| Secured Mortgage Indebtedness | ||||||||||||
| Lake Drive Plaza | Aegon USA Realty | $ | 3,359 | 7.200 | % | 04/01/03 | 0.22 | % | ||||
| Roanoke Landing | American Express | 5,547 | 7.200 | % | 04/03/03 | 0.37 | % | |||||
| Hunting Hills | Laureate Realty Services | 3,747 | 8.250 | % | 05/01/03 | 0.25 | % | |||||
| Valley Fair Mall | Lincoln National Life | 15,638 | 7.600 | % | 01/01/04 | 1.04 | % | |||||
| Merchants Park/The Crossing at Fry Road | John Hancock | 21,194 | 7.810 | % | 07/01/04 | 1.42 | % | |||||
| Briggsmore Plaza | AETNA Life Insurance | 491 | 8.288 | % | 08/01/04 | 0.03 | % | |||||
| Genesee Valley Shopping Center | Nationwide Life Insurance | 7,922 | 8.850 | % | 02/10/05 | 0.53 | % | |||||
| Roundtree Place | Nationwide Life Insurance | 6,478 | 8.850 | % | 02/10/05 | 0.43 | % | |||||
| Grant Mills Station | Laureate Realty Services | 6,967 | 8.850 | % | 02/10/05 | 0.47 | % | |||||
| Lagniappe Village Shopping Center | Laureate Realty Services | 5,865 | 8.850 | % | 02/10/05 | 0.39 | % | |||||
| Mist Lake Plaza | Banker Financial | 8,790 | 8.850 | % | 02/10/05 | 0.59 | % | |||||
| Montebello Plaza | Dwyer-Curlett Inc. | 5,432 | 9.625 | % | 03/05/07 | 0.36 | % | |||||
| Crown Point | Capital Market Services | 7,329 | 8.120 | % | 05/01/07 | 0.49 | % | |||||
| Westminster City Center | Wells Fargo Bank, N.A. | 28,812 | 6.690 | % | 02/01/08 | 1.92 | % | |||||
| 41 properties (REMIC) | Wells Fargo Bank Minnesota | 155,408 | 6.670 | % | 06/01/08 | 10.38 | % | |||||
| Brice Park | USG Annuity and Life | 3,680 | 7.875 | % | 02/01/09 | 0.25 | % | |||||
| London Marketplace | Aegon USA Realty | 4,194 | 8.265 | % | 04/01/09 | 0.28 | % | |||||
| Paradise Plaza | CIGNA | 1,995 | 9.150 | % | 04/15/09 | 0.13 | % | |||||
| Perry Marketplace | American Express | 4,589 | 9.000 | % | 04/01/10 | 0.31 | % | |||||
| Saddletree Village Shopping Center | Aegon USA Realty | 1,739 | 8.250 | % | 05/22/10 | 0.12 | % | |||||
| Hampton Village Centre | Orix | 29,464 | 8.530 | % | 06/30/10 | 1.97 | % | |||||
| Greentree | Conning Asset Management | 5,131 | 8.240 | % | 10/01/10 | 0.34 | % | |||||
| Merchant's Central | Conning Asset Management | 6,378 | 8.240 | % | 10/01/10 | 0.43 | % | |||||
| Northside Plaza | Conning Asset Management | 2,240 | 8.240 | % | 10/01/10 | 0.15 | % | |||||
| Habersham Crossing | Conning Asset Management | 3,778 | 8.240 | % | 10/01/10 | 0.25 | % | |||||
| Johnstown Galleria Outparcel | Holliday Fenoglio Fowler | 2,790 | 8.000 | % | 07/11/11 | 0.19 | % | |||||
| Irving West | Protective Life | 2,318 | 8.500 | % | 10/01/11 | 0.15 | % | |||||
| Chapel Square | American National | 1,751 | 9.250 | % | 02/01/13 | 0.12 | % | |||||
| Northgate | State Farm | 6,782 | 8.750 | % | 06/30/13 | 0.45 | % | |||||
| Riverview Plaza | Protective Life | 4,814 | 8.625 | % | 09/01/15 | 0.32 | % | |||||
| Stratford Commons | Protective Life | 5,335 | 8.125 | % | 10/01/15 | 0.36 | % | |||||
| TOTAL FIXED RATE SECURED MORTGAGE INDEBTEDNESS | $ | 369,957 | 7.512 | % | 24.70 | % | ||||||
A-10
New Plan Excel Realty Trust, Inc.
Supplemental Disclosure—Quarter Ended September 30, 2002
Summary of Outstanding Debt
(In thousands)
| | Lender | Outstanding Balance | Actual Interest Rate | Maturity Date | Percent of Total Indebtedness | |||||||
|---|---|---|---|---|---|---|---|---|---|---|---|---|
| Unsecured Notes | ||||||||||||
| 7.33%, 4 Year Unsecured Notes | — | $ | 49,000 | 7.330 | % | 11/20/03 | 3.27 | % | ||||
| 6.88%, 7 Year Unsecured Notes(1) | — | 75,000 | 6.875 | % | 10/15/04 | 5.01 | % | |||||
| 7.75%, 10 Year Unsecured Notes | — | 100,000 | 7.750 | % | 04/06/05 | 6.68 | % | |||||
| 7.35%, 10 Year Unsecured Notes | — | 30,000 | 7.350 | % | 06/15/07 | 2.00 | % | |||||
| 5.88%, 5 Year Unsecured Notes | — | 250,000 | 5.875 | % | 06/15/07 | 16.69 | % | |||||
| 7.40%, 10 Year Unsecured Notes | — | 150,000 | 7.400 | % | 09/15/09 | 10.02 | % | |||||
| 7.97%, 30 Year Unsecured Notes | — | 10,000 | 7.970 | % | 08/14/26 | 0.67 | % | |||||
| 7.65%, 30 Year Unsecured Notes | — | 25,000 | 7.650 | % | 11/02/26 | 1.67 | % | |||||
| 7.68%, 30 Year Unsecured Notes | — | 10,000 | 7.680 | % | 11/02/26 | 0.67 | % | |||||
| 7.68%, 30 Year Unsecured Notes | — | 10,000 | 7.680 | % | 11/02/26 | 0.67 | % | |||||
| 6.90%, 30 Year Unsecured Notes | — | 25,000 | 6.900 | % | 02/15/28 | 1.67 | % | |||||
| 6.90%, 30 Year Unsecured Notes | — | 25,000 | 6.900 | % | 02/15/28 | 1.67 | % | |||||
| 7.50%, 30 Year Unsecured Notes | — | 25,000 | 7.500 | % | 07/30/29 | 1.67 | % | |||||
| TOTAL FIXED RATE UNSECURED NOTES | $ | 784,000 | 6.896 | % | 52.35 | % | ||||||
| CAPITAL LEASES | $ | 28,961 | 7.500 | % | 06/20/31 | 1.93 | % | |||||
| TOTAL FIXED RATE DEBT | $ | 1,182,918 | 7.281 | % | 78.99 | % | ||||||
| Variable Rate Debt(2): | ||||||||||||
| Secured Mortgage Indebtedness | ||||||||||||
| 24 properties (REMIC) | Wells Fargo Bank Minnesota | $ | 110,500 | 3.214 | % | 07/01/03 | 7.38 | % | ||||
| San Dimas Plaza | Tax Exempt Bonds | 8,100 | 2.510 | % | 12/01/05 | 0.54 | % | |||||
| Highland Commons | GE Financial Assurance | 3,996 | 8.250 | % | 12/01/09 | 0.27 | % | |||||
| Lexington Road Plaza | Great Northern Insured Annuity | 7,131 | 8.125 | % | 09/01/11 | 0.48 | % | |||||
| TOTAL VARIABLE RATE SECURED MORTGAGE INDEBTEDNESS | $ | 129,727 | 3.595 | % | 8.66 | % | ||||||
| Unsecured Credit Facilities(3) | ||||||||||||
| $50 Million Term Loan Facility | Fleet National Bank | $ | 50,000 | 2.614 | % | 11/17/02 | 3.34 | % | ||||
| $125 Million Term Loan Facility | Fleet National Bank | 125,000 | 2.614 | % | 03/01/03 | 8.35 | % | |||||
| $350 Million Revolving Credit Facility | Fleet National Bank | 10,000 | 2.764 | % | 04/25/05 | 0.67 | % | |||||
| TOTAL CREDIT FACILITIES | $ | 185,000 | 2.622 | % | 12.35 | % | ||||||
| TOTAL VARIABLE RATE DEBT | $ | 314,727 | 3.023 | % | 21.01 | % | ||||||
| TOTAL DEBT | $ | 1,497,645 | 6.369 | % | 100.00 | % | ||||||
| Net Unamortized Premiums on Mortgages | $ | 5,059 | ||||||||||
| Net Unamortized Discount on Notes | (2,325 | ) | ||||||||||
| Impact of Reverse Swap Agreement with Fleet National Bank on Notes(1) | 2,198 | |||||||||||
| TOTAL DEBT—NET | $ | 1,502,577 | ||||||||||
- (1)
- The Company has entered into a two-year reverse swap agreement with Fleet National Bank related to $50.0 million outstanding under its 6.88%, 7 Year Unsecured Notes maturing October 15, 2004. Under the agreement, Fleet National Bank will pay to the Company the difference between the fixed rate of the swap, 4.357%, and the floating rate option, which is the 6-month LIBOR rate, in arrears.
- (2)
- The Company incurs interest under the 30-day LIBOR rate, which was 1.81% at September 30, 2002.
- (3)
- The Company had entered into a two-year $75 million swap agreement with Fleet National Bank relating to amounts outstanding under its Total Credit Facilities. The agreement effectively fixed the debt at a base rate of 6.67% plus applicable spreads associated with the Company's Total Credit Facilities. The Swap, which expired in October 2002, increased the interest rate for the Company's Total Credit Facilities, Total Variable Rate Debt and Total Debt to 4.4246%, 4.0826% and 6.5959%, respectively.
The above does not purport to disclose all items required under GAAP.
The Company's Form 10-K for the year ended December 31, 2001 and Form 10-Q for the quarters ended September 30, 2002, June 30, 2002 and March 31, 2002 should be read in conjunction with the above information.
A-11
New Plan Excel Realty Trust, Inc.
Supplemental Disclosure—Quarter Ended September 30, 2002
Debt Maturity Schedule
(In thousands)
| | Scheduled Amortization | Scheduled Maturities | Total Debt Maturing | Percent of Debt Maturing | ||||||||
|---|---|---|---|---|---|---|---|---|---|---|---|---|
| 2002 | $ | 3,423 | $ | 50,000 | (1) | $ | 53,423 | 3.57 | % | |||
| 2003 | 10,212 | 296,165 | (2) | 306,377 | 20.46 | % | ||||||
| 2004 | 10,073 | 110,354 | 120,427 | 8.04 | % | |||||||
| 2005 | 9,243 | 158,234 | (3) | 167,477 | 11.18 | % | ||||||
| 2006 | 9,720 | — | 9,720 | 0.65 | % | |||||||
| 2007 | 9,057 | 286,499 | 295,556 | 19.73 | % | |||||||
| 2008 | 7,081 | 167,130 | 174,211 | 11.63 | % | |||||||
| 2009 | 4,985 | 155,331 | 160,316 | 10.70 | % | |||||||
| 2009+ | 37,937 | 172,201 | 210,138 | 14.03 | % | |||||||
| $ | 101,731 | $ | 1,395,914 | $ | 1,497,645 | 100.00 | % | |||||
| Net Unamortized Premiums on Mortgages | $ | 5,059 | ||||||||||
| Net Unamortized Discount on Notes | (2,325 | ) | ||||||||||
| Impact of Reverse Swap Agreement with Fleet National Bank on Notes | 2,198 | |||||||||||
| TOTAL DEBT—NET | $ | 1,502,577 | ||||||||||
Weighted Average Maturity:
| | Fixed Rate Debt | Variable Rate Debt | Total Debt | |||
|---|---|---|---|---|---|---|
| Including capital leases and credit facilities | 7.7 Years | 0.6 Years | 6.2 Years | |||
| Excluding capital leases and credit facilities | 7.2 Years | 0.8 Years | 6.6 Years |
- (1)
- Represents the balance of the $50 Million Term Loan Facility drawn as of September 30, 2002 and maturing November 17, 2002.
- (2)
- Scheduled maturities include $125.0 million representing the balance of the $125 Million Term Loan Facility drawn as of September 30, 2002 and maturing March 1, 2003.
- (3)
- Scheduled maturities include $10.0 million representing the balance of the $350 Million Revolving Credit Facility drawn as of September 30, 2002 and maturing April 25, 2005.
The above does not purport to disclose all items required under GAAP.
The Company's Form 10-K for the year ended December 31, 2001 and Form 10-Q for the quarters ended September 30, 2002, June 30, 2002 and March 31, 2002 should be read in conjunction with the above information.
A-12
New Plan Excel Realty Trust, Inc.
Supplemental Disclosure—Quarter Ended September 30, 2002
2002 Portfolio/Property Acquisitions
| | Property Type(1) | Location | Purchase Date | Purchase Amount | Cap- Rate | Net Operating Income (NOI)(2) | GLA | Percent Leased(3) | Anchor Tenants | Year Built | ||||||||||||
|---|---|---|---|---|---|---|---|---|---|---|---|---|---|---|---|---|---|---|---|---|---|---|
| Portfolio Acquisitions | ||||||||||||||||||||||
| 1Q 2002 | ||||||||||||||||||||||
| 92 Shopping Centers | S | FL, LA, MS, NM, TX | 03/01/02 | $ | 654,000,000 | 10.0 | % | $ | 65,000,000 | 10.4 M SF | 90 | % | Varied | Varied | ||||||||
| Property Acquisitions | ||||||||||||||||||||||
| 3Q 2002 | ||||||||||||||||||||||
| Superior Marketplace(4) | S | Superior, CO | 07/31/02 | $ | 51,600,000 | 9.0 | % | $ | 4,200,000 | 114,615 | 99 | % | Costco, Michaels, Office Max, PetsMart, SuperTarget, T.J. Maxx | 1997 | ||||||||
- (1)
- S—Shopping Center
- (2)
- Projected NOI for the twelve-month period following the closing date of acquisition.
- (3)
- As of closing date of acquisition.
- (4)
- Acquired for approximately $13.6 million in cash and the satisfaction of $38.0 million of notes receivable and accrued interest. Cap-rate and NOI calculated on a stabilized basis and includes TIF and municipal bond financing. Property is in the later stages of development and is expected to total 295,602 square feet when complete.
The above does not purport to disclose all items required under GAAP.
The Company's Form 10-K for the year ended December 31, 2001 and Form 10-Q for the quarters ended September 30, 2002, June 30, 2002 and March 31, 2002 should be read in conjunction with the above information.
A-13
New Plan Excel Realty Trust, Inc.
Supplemental Disclosure—Quarter Ended September 30, 2002
2002 Property Dispositions
| | Property Type(1) | Location | Sale Date | Sale Amount | Book Value | Gain/ (Loss) | Cap- Rate | NOI(2) | GLA/ Acres | Percent Leased(3) | Year Built | ||||||||||||||||
|---|---|---|---|---|---|---|---|---|---|---|---|---|---|---|---|---|---|---|---|---|---|---|---|---|---|---|---|
| 1Q 2002 | |||||||||||||||||||||||||||
| Lucky stores | T | Mesa, AZ | 01/09/02 | $ | 1,050,000 | $ | 1,182,667 | $ | (132,667 | ) | 10.7 | % | $ | 112,192 | 29,827 | 100 | % | 1982 | |||||||||
| Pueblo I | T | Pueblo, CO | 02/04/02 | 700,000 | 508,863 | 191,137 | — | (22,650 | ) | 12,556 | 0 | % | 1977 | ||||||||||||||
| Outparcel, adjacent to Kimball Crossing | O | Kimball, TN | 02/20/02 | 350,000 | 222,956 | 127,044 | — | — | 1.217 acres | — | — | ||||||||||||||||
| Total | $ | 2,100,000 | $ | 1,914,486 | $ | 185,514 | — | $ | 89,542 | 42,383 | |||||||||||||||||
| 2Q 2002 | |||||||||||||||||||||||||||
| Kroger | T | Missouri City, TX | 05/01/02 | $ | 1,625,000 | $ | 1,615,185 | $ | 9,815 | 10.0 | % | $ | 163,036 | 44,183 | 100 | % | 1982 | ||||||||||
| Crossroads Plaza | S | Mt. Pleasant, PA | 06/07/02 | 3,450,000 | 1,681,069 | 1,768,931 | 10.2 | % | 353,286 | 105,783 | 95 | % | 1975 | ||||||||||||||
| Unity Professional Bldg. | M | Fridley, MN | 06/26/02 | 8,350,000 | 8,247,524 | 102,476 | 9.6 | % | 801,655 | 62,518 | 94 | % | 1991 | ||||||||||||||
| Lucky stores | T | Phoenix, AZ | 06/27/02 | 1,355,000 | 1,471,530 | (116,530 | ) | 10.2 | % | 138,559 | 28,217 | 100 | % | 1982 | |||||||||||||
| Land, adjacent to Mist Lake Plaza | L | Lexington, KY | 06/28/02 | 73,250 | 30,803 | 42,447 | — | — | 0.152 acres | — | — | ||||||||||||||||
| Total | $ | 14,853,250 | $ | 13,046,111 | $ | 1,807,139 | — | $ | 1,456,536 | 240,701 | |||||||||||||||||
| 3Q 2002 | |||||||||||||||||||||||||||
| Fairfield Center | S | Fairfield, OH | 07/11/02 | $ | 2,800,000 | $ | 2,687,305 | $ | 112,695 | 6.9 | % | $ | 191,858 | 74,095 | 93 | % | 1978 | ||||||||||
| Belpre Plaza | S | Belpre, OH | 07/15/02 | 400,000 | 430,884 | (30,884 | ) | 10.2 | % | 40,731 | 88,426 | 25 | % | 1969 | |||||||||||||
| Market Central | S | Dalton, GA | 08/09/02 | 3,000,000 | 2,999,614 | 386 | 10.0 | % | 301,150 | 34,000 | 84 | % | 1994 | ||||||||||||||
| Coachella Plaza | S | Coachella, CA | 08/13/02 | 1,800,000 | 1,378,186 | 421,814 | 8.5 | % | 153,802 | 11,184 | 100 | % | 1991 | ||||||||||||||
| Dearborne I | T | Dearborne Hts., MI | 08/21/02 | 600,000 | 1,380,318 | (780,318 | ) | — | (22,621 | ) | 9,914 | 100 | % | 1988 | |||||||||||||
| Westcrest Long Point | T | Houston, TX | 08/21/02 | 150,000 | 51,733 | 98,267 | 15.3 | % | 22,971 | 1,500 | 100 | % | 1968 | ||||||||||||||
| Granville Corners | S | Oxford, NC | 09/27/02 | 8,600,000 | 8,706,395 | (106,395 | ) | 10.1 | % | 870,901 | 138,352 | 99 | % | 1991 | |||||||||||||
| Total | $ | 17,350,000 | $ | 17,634,435 | $ | (284,435 | ) | — | $ | 1,558,792 | 357,471 | ||||||||||||||||
- (1)
- L—Land, M—Miscellaneous Property, O—Outparcel, S—Shopping Center, T—Single Tenant Property
- (2)
- Projected recurring property NOI as of closing date of sale.
- (3)
- As of closing date of sale.
The above does not purport to disclose all items required under GAAP.
The Company's Form 10-K for the year ended December 31, 2001 and Form 10-Q for the quarters ended September 30, 2002, June 30, 2002 and March 31, 2002 should be read in conjunction with the above information.
A-14
New Plan Excel Realty Trust, Inc.
Supplemental Disclosure—Quarter Ended September 30, 2002
2002 Redevelopment/Outparcel Development Activities
| | | | | | | | Construction | | | |||||||||||||||
|---|---|---|---|---|---|---|---|---|---|---|---|---|---|---|---|---|---|---|---|---|---|---|---|---|
| | Location | Year Built | Year Acquired | Project Description | Adjusted GLA | Percent Leased(1) | Expected Start Date | Expected Completion Date | Percent Complete | Expected Total Project Cost | Expected Stabilized Return on Cost | |||||||||||||
| COMMUNITY AND NEIGHBORHOOD SHOPPING CENTERS | ||||||||||||||||||||||||
| Redevelopment Activities | ||||||||||||||||||||||||
| Arapahoe Crossings(2) | Aurora, CO | 1996 | 2001 | Final phase of development | 467,000 | 100 | % | Oct-01 | Nov-02 | 98 | % | — | — | |||||||||||
| Central Avenue Marketplace | Toledo, OH | 1968 | 1990 | Contingent contract entered into with Wal-Mart | 181,279 | 8 | % | Oct-01 | Apr-03 | 30 | % | $ | 4,003,184 | 14.0 | % | |||||||||
| Island Plaza | James Island, SC | 1994 | 1997 | Expansion of Food Lion by 9,000 sq. ft. | 179,531 | 45 | % | Oct-01 | Nov-02 | 70 | % | 1,120,000 | 13.5 | % | ||||||||||
| Bennetts Mills Plaza | Jackson, NJ | 1988 | 1994 | Expansion of Stop & Shop by 25,000 sq. ft. and façade renovation | 132,020 | 98 | % | Dec-01 | Nov-02 | 90 | % | 620,000 | 12.0 | % | ||||||||||
| Dover Park Plaza | Yardville, NJ | 1966 | 2000 | Addition of a new 12,000 sq. ft. CVS and façade renovation | 59,642 | 100 | % | Feb-02 | Nov-02 | 70 | % | 528,000 | 12.0 | % | ||||||||||
| Dillsburg Shopping Center | Dillsburg, PA | 1994 | 1996 | Construction of a new 55,000 sq. ft. Giant, a new 13,813 sq. ft. Eckerd and 8,630 sq. ft. of retail shops pre-leased to Hallmark, H&R Block and a salon | 145,501 | 100 | % | Feb-02 | Dec-02 | 75 | % | 8,500,000 | 13.1 | % | ||||||||||
| Cordele Square | Cordele, GA | 1968 | 1990 | Increased lease commitment by Harvey Foods and Goody's for façade renovation | 128,927 | 95 | % | May-02 | Oct-02 | 90 | % | 450,000 | 12.0 | % | ||||||||||
| Rutland Plaza | St. Petersburg, FL | 1964 | 1996 | Construction of 14,000 sq. ft. of retail shops and facade renovation | 149,812 | 100 | % | Jun-02 | Oct-02 | 85 | % | 665,000 | 14.0 | % | ||||||||||
| Bristol Plaza | Santa Ana, CA | 1972 | 1997 | Conversion of a former grocer into Trader Joe's and Petco and façade renovation | 111,403 | 98 | % | Jul-02 | Mar-03 | 75 | % | 3,917,000 | 12.5 | % | ||||||||||
| Haymarket Square(3) | Des Moines, IA | 1979 | 1995 | Repositioning of shopping center with three new anchors, a 37,164 sq. ft. Nova Cinema, a 29,214 sq. ft. Big Lots and a 11,900 sq. ft. Dollar Tree | 266,525 | 92 | % | Jul-02 | Nov-02 | 35 | % | 1,425,000 | 14.5 | % | ||||||||||
| Paseo del Norte | Albuquerque, NM | 2001 | 2002 | Develop shopping center and replace anchor tenant | 48,000 | 3 | % | Jul-02 | May-03 | 10 | % | 2,613,000 | 12.0 | % | ||||||||||
| Village Plaza | Garland, TX | 1964 | 2002 | Construction of 8,660 sq. ft. of new GLA | 85,241 | 100 | % | Jul-02 | Nov-02 | 80 | % | 820,000 | 12.8 | % | ||||||||||
| Superior Marketplace(3) | Superior, CO | 1997 | 2002 | Completion of Phase I development and Phase II development | 295,602 | 99 | % | Aug-02 | Jun-04 | 12 | % | 20,200,000 | 11.9 | % | ||||||||||
| Regency Park(3) | Jacksonville, FL | 1985 | 1997 | Addition of a 10,867 sq. ft. Party City by combining stores and constructing 4,430 sq. ft. | 333,865 | 94 | % | Aug-02 | Jan-03 | 10 | % | 1,200,000 | 14.0 | % | ||||||||||
| J*Town Center(3) | Jeffersontown, KY | 1959 | 1988 | Phase I of reconfiguration of shopping center with 15,000 sq. ft. of new retail shops | 201,000 | 31 | % | Aug-02 | May-03 | 10 | % | 1,700,000 | 13.2 | % | ||||||||||
| Southwood Plaza(3) | Bowling Green, OH | 1961 | 1990 | Addition of a 6,000 sq. ft. Blockbuster Video and expansion of Big Lots to 33,600 sq. ft. | 81,959 | 86 | % | Aug-02 | Feb-03 | 12 | % | 650,000 | 12.5 | % | ||||||||||
| Kenworthy Crossing | El Paso, TX | 2000 | 2002 | Re-tenanting of former grocery space with Albertsons | 74,171 | 87 | % | Aug-02 | Feb-03 | 10 | % | 5,002,000 | 11.0 | % | ||||||||||
| Parkview East | Pasadena, TX | 1968 | 2002 | Reconfiguration of retail shop space to accommodate two new tenants and facade renovation | 38,169 | 88 | % | Aug-02 | Dec-02 | 50 | % | 1,116,000 | 13.0 | % | ||||||||||
| Laurel Square(3) | Brick, NJ | 1973 | 1992 | Façade renovation with contract rent increases | 246,235 | 96 | % | Sep-02 | Apr-03 | 10 | % | 610,000 | 13.2 | % | ||||||||||
| Old Egypt(3) | Magnolia, TX | 2002 | 2002 | Construction of a new 14,580 sq. ft. Walgreen store | 14,490 | 100 | % | Oct-02 | May-03 | 0 | % | 3,046,000 | 11.0 | % | ||||||||||
| Stein Mart Center | Poway, CA | 1981 | 2001 | Redevelopment of shopping center | 106,832 | 61 | % | — | — | — | — | — | ||||||||||||
| Total | $ | 58,185,184 | ||||||||||||||||||||||
| Outparcel Development Activities | ||||||||||||||||||||||||
| Braes Heights | Houston, TX | 1953 | 2002 | Construction of a new 14,471 sq. ft. Eckerd on outparcel and re-tenanting of former Eckerd space | 101,707 | 96 | % | Jan-02 | Feb-03 | 90 | % | $ | 2,000,000 | 11.0 | % | |||||||||
| Haymarket Mall | Des Moines, IA | 1979 | 1995 | Construction of a 10,000 sq. ft. Famous Footwear on outparcel | 240,315 | 97 | % | Jun-02 | Nov-02 | 30 | % | 877,000 | 12.5 | % | ||||||||||
| Total | $ | 2,877,000 | ||||||||||||||||||||||
A-15
New Plan Excel Realty Trust, Inc.
Supplemental Disclosure—Quarter Ended September 30, 2002
2002 Redevelopment/Outparcel Development Activities
| | | | | | | | Construction | | | |||||||||||||||
|---|---|---|---|---|---|---|---|---|---|---|---|---|---|---|---|---|---|---|---|---|---|---|---|---|
| | Location | Year Built | Year Acquired | Project Description | Adjusted GLA | Percent Leased(1) | Start Date | Completion Date | Percent Complete | Expected Total Project Cost | Expected Stabilized Return on Cost | |||||||||||||
| Completed 2002 Redevelopment/Outparcel Development Activities | ||||||||||||||||||||||||
| Southfield Shopping Center | Southfield, MI | 1970 | 1998 | Façade renovation | 106,948 | 100 | % | Oct-01 | Jan-02 | 100 | % | $ | 533,560 | 15.9 | % | |||||||||
| Eastgate Shopping Center | Louisville, KY | 1987 | 1993 | Expansion of Kroger by 17,548 sq. ft. | 152,855 | 98 | % | May-01 | Mar-02 | 100 | % | 0 | — | |||||||||||
| Greeneville Commons | Greeneville, TN | 1990 | 1992 | Construction of a 5,500 sq. ft. tenant space leased to Hibbett Sports | 228,618 | 99 | % | Sep-01 | Mar-02 | 100 | % | 485,289 | 15.9 | % | ||||||||||
| Hampton Square | Southampton, PA | 1980 | 1998 | Addition of a 37,268 sq. ft. McCaffrey's in existing space | 62,933 | 98 | % | Jul-01 | Apr-02 | 100 | % | 1,200,000 | 27.3 | % | ||||||||||
| Fashion Corner | Saginaw, MI | 1986 | 1995 | Phase II addition of Bed, Bath & Beyond and complete renovation of the shopping center | 188,877 | 62 | % | Jan-02 | Jun-02 | 100 | % | 2,031,000 | 12.4 | % | ||||||||||
| Long Point Square | Houston, TX | 1980 | 2002 | Conversion of a former grocer into multiple tenant space | 74,329 | 75 | % | Jul-01 | Jul-02 | 100 | % | 400,000 | 13.0 | % | ||||||||||
| Coconut Creek | Coconut Creek, FL | 1983 | 2002 | Construction of a new 51,000 sq. ft. Publix and façade renovation | 271,725 | 71 | % | Jul-01 | Aug-02 | 100 | % | 5,700,000 | 10.1 | % | ||||||||||
| Westridge Court | Naperville, IL | 1990 | 1997 | Expansion of Petco by 6,000 sq. ft. | 452,183 | 98 | % | May-02 | Aug-02 | 100 | % | 980,000 | 10.0 | % | ||||||||||
| Rock Prairie Crossing | College Station, TX | 2000 | 2002 | Construction of a 14,471 sq. ft. Eckerd on outparcel | 118,254 | 100 | % | Oct-01 | Aug-02 | 100 | % | 1,300,000 | 12.7 | % | ||||||||||
| J*Town Center | Jeffersontown, KY | 1959 | 1988 | Construction of a 10,055 sq. ft. CVS on outparcel | 201,000 | 31 | % | Jun-02 | Sep-02 | 100 | % | 1,160,000 | 13.0 | % | ||||||||||
| Delhi | Cincinnati, OH | 1973 | 1996 | Façade renovation | 166,317 | 97 | % | Jan-02 | Sep-02 | 100 | % | 479,000 | 13.7 | % | ||||||||||
| Townshire | Bryan, TX | 1957 | 2002 | Construction of a new 62,000 sq. ft. Albertsons and façade renovation | 136,693 | 80 | % | Feb-01 | Sep-02 | 100 | % | 3,800,000 | 12.3 | % | ||||||||||
| Total | $ | 18,068,849 | ||||||||||||||||||||||
| TOTAL 2002 COMMUNITY AND NEIGHBORHOOD SHOPPING CENTERS REDEVELOPMENT/OUTPARCEL DEVELOPMENT ACTIVITIES | $ | 79,131,033 | ||||||||||||||||||||||
| | | | | | | | Construction | | | |||||||||||||||
|---|---|---|---|---|---|---|---|---|---|---|---|---|---|---|---|---|---|---|---|---|---|---|---|---|
| | Location | Year Built | Year Acquired | Project Description | Adjusted GLA | Percent Leased(1) | Expected Start Date | Expected Completion Date | Percent Complete | Expected Total Project Cost | Expected Stabilized Return on Cost | |||||||||||||
| ENCLOSED MALLS/SPECIALTY RETAIL PROPERTIES | ||||||||||||||||||||||||
| Redevelopment Activities(4) | ||||||||||||||||||||||||
| Clearwater Mall(5) | Clearwater, FL | 1973 | 1997 | Redevelopment of enclosed regional mall | 274,521 | — | Jun-02 | Oct-03 | 5 | % | $ | 34,000,000 | 10.5 | % | ||||||||||
| The Mall at 163rd Street | Miami, FL | 1956 | 1998 | Redevelopment of enclosed regional mall; contingent contract entered into with Wal-Mart | 300,000 | 81 | % | Dec-02 | Aug-04 | 0 | % | 20,000,000 | 10.5 | % | ||||||||||
| Total | $ | 54,000,000 | ||||||||||||||||||||||
- (1)
- Includes all leases in force at September 30, 2002, including those that are fully executed, but not yet open, and is based on current GLA, not adjusted GLA.
- (2)
- Final phase of development is expected to cost $7.1 million during 2002, of which approximately $4.8 million has been completed year-to-date.
- (3)
- Indicates project added during 3Q 2002.
- (4)
- Expected total project cost less land sales.
- (5)
- Property contributed to a joint venture in 4Q 2002.
The above does not purport to disclose all items required under GAAP.
The Company's Form 10-K for the year ended December 31, 2001 and Form 10-Q for the quarters ended September 30, 2002, June 30, 2002 and March 31, 2002 should be read in conjunction with the above information.
A-16
New Plan Excel Realty Trust, Inc.
Supplemental Disclosure—Quarter Ended September 30, 2002
Property Type Summary
| | | | | | ABR | Quarterly NOI(1) | |||||||||||||
|---|---|---|---|---|---|---|---|---|---|---|---|---|---|---|---|---|---|---|---|
| | # of Properties | GLA | Percent Leased | Leased GLA | Amount | Percent of Company ABR | Amount | Percent of Company NOI | |||||||||||
| Stabilized Properties | |||||||||||||||||||
| Community and Neighborhood Shopping Centers | 276 | 38,410,260 | 90 | % | 34,700,841 | $ | 261,184,616 | 79.8 | % | $ | 60,836,014 | 80.2 | % | ||||||
| Factory Outlet Centers | 6 | 1,845,947 | 86 | % | 1,593,199 | 25,412,007 | 7.8 | % | 6,073,400 | 8.0 | % | ||||||||
| Single Tenant Properties | 34 | 920,091 | 77 | % | 709,281 | 4,959,899 | 1.5 | % | 1,270,855 | 1.7 | % | ||||||||
| Enclosed Malls/Specialty Retail Properties | 3 | 1,394,303 | 82 | % | 1,148,158 | 13,809,070 | 4.2 | % | 3,233,381 | 4.3 | % | ||||||||
| Miscellaneous Properties | 7 | 34,760 | 100 | % | 34,760 | 293,808 | 0.1 | % | 151,345 | 0.2 | % | ||||||||
| 326 | 42,605,361 | 90 | % | 38,186,239 | $ | 305,659,401 | 93.4 | % | $ | 71,564,995 | 94.3 | % | |||||||
| Redevelopment Properties | |||||||||||||||||||
| Community and Neighborhood Shopping Centers | 21 | 2,995,233 | 81 | % | 2,428,995 | $ | 20,265,881 | 6.2 | % | $ | 4,229,157 | 5.6 | % | ||||||
| Enclosed Malls/Specialty Retail Properties | 2 | 300,000 | 81 | % | 244,424 | 1,324,141 | 0.4 | % | 105,461 | 0.1 | % | ||||||||
| 23 | 3,295,233 | 81 | % | 2,673,419 | $ | 21,590,022 | 6.6 | % | $ | 4,334,618 | 5.7 | % | |||||||
| TOTAL PORTFOLIO | 349 | 45,900,594 | 89 | % | 40,859,658 | $ | 327,249,423 | 100.0 | % | $ | 75,899,613 | 100.0 | % | ||||||
COMMUNITY AND NEIGHBORHOOD SHOPPING CENTERS ANCHOR, NON-ANCHOR TENANT MIX:(2)
| | | | ABR | ||||||||||
|---|---|---|---|---|---|---|---|---|---|---|---|---|---|
| | Leased GLA | Percent of Shopping Centers Leased GLA | Amount | Per Foot | Percent of Shopping Centers ABR | ||||||||
| Anchor Tenants | 22,022,877 | 59.3 | % | $ | 127,073,692 | $ | 5.77 | 45.1 | % | ||||
| Non-anchor Tenants | 15,106,959 | 40.7 | % | 154,376,805 | 10.22 | 54.9 | % | ||||||
| 37,129,836 | 100.0 | % | $ | 281,450,497 | $ | 7.58 | 100.0 | % | |||||
- (1)
- Data includes $1.295 million of Quarterly NOI from properties classified as discontinued operations under SFAS 144.
- (2)
- Anchor tenants include 1) major discount stores, 2) major grocers, 3) tenants with square footage greater than 10,000 square feet if the shopping centers GLA is less than 125,000 square feet and tenants with square footage greater than 25,000 square feet if the shopping center GLA is greater than 125,000 square feet and 4) tenants with square footage greater than 10 percent of the shopping center GLA, but not less than 5,000 square feet.
The above does not purport to disclose all items required under GAAP.
The Company's Form 10-K for the year ended December 31, 2001 and Form 10-Q for the quarters ended September 30, 2002, June 30, 2002 and March 31, 2002 should be read in conjunction with the above information.
A-17
New Plan Excel Realty Trust, Inc.
Supplemental Disclosure—Quarter Ended September 30, 2002
Properties by State/Region
| State | Number of Properties | Percent Leased | GLA | Percent of Scheduled ABR | |||||
|---|---|---|---|---|---|---|---|---|---|
| Alabama | 7 | 90 | % | 760,014 | 1.3 | % | |||
| Arizona | 9 | 88 | % | 1,025,455 | 2.5 | % | |||
| Arkansas | 1 | 100 | % | 60,842 | 0.1 | % | |||
| California | 16 | 90 | % | 2,581,340 | 7.7 | % | |||
| Colorado | 3 | 94 | % | 879,541 | 3.3 | % | |||
| Delaware | 1 | 0 | % | 30,000 | 0.0 | % | |||
| Florida | 24 | 90 | % | 4,279,978 | 11.5 | % | |||
| Georgia | 30 | 89 | % | 2,885,889 | 5.1 | % | |||
| Illinois | 7 | 83 | % | 1,069,753 | 2.7 | % | |||
| Indiana | 13 | 69 | % | 886,528 | 1.1 | % | |||
| Iowa | 3 | 95 | % | 542,458 | 0.7 | % | |||
| Kentucky | 9 | 89 | % | 1,466,285 | 2.6 | % | |||
| Louisiana | 4 | 95 | % | 572,664 | 0.8 | % | |||
| Maryland | 2 | 86 | % | 278,934 | 0.6 | % | |||
| Michigan | 12 | 90 | % | 2,124,910 | 5.0 | % | |||
| Mississippi | 1 | 100 | % | 87,721 | 0.1 | % | |||
| Missouri | 3 | 91 | % | 722,788 | 3.0 | % | |||
| Nebraska | 2 | 100 | % | 9,671 | 0.0 | % | |||
| Nevada | 3 | 75 | % | 587,388 | 1.0 | % | |||
| New Jersey | 8 | 93 | % | 1,157,968 | 4.0 | % | |||
| New Mexico | 2 | 51 | % | 97,600 | 0.1 | % | |||
| New York | 24 | 92 | % | 3,327,532 | 6.3 | % | |||
| North Carolina | 13 | 95 | % | 1,613,688 | 2.7 | % | |||
| Ohio | 17 | 82 | % | 2,808,149 | 4.7 | % | |||
| Oklahoma | 1 | 0 | % | 45,510 | 0.0 | % | |||
| Pennsylvania | 13 | 89 | % | 1,933,743 | 4.1 | % | |||
| South Carolina | 4 | 70 | % | 338,422 | 0.6 | % | |||
| Tennessee | 15 | 98 | % | 1,872,493 | 3.7 | % | |||
| Texas | 86 | 90 | % | 9,379,913 | 20.1 | % | |||
| Utah | 3 | 97 | % | 600,962 | 1.1 | % | |||
| Virginia | 10 | 87 | % | 1,517,517 | 2.8 | % | |||
| West Virginia | 3 | 91 | % | 354,938 | 0.6 | % | |||
| 349 | 89 | % | 45,900,594 | 100 | % | ||||
| Region | |||||||||
| East | 87 | 90 | % | 12,019,027 | 24.4 | % | |||
| Midwest | 57 | 84 | % | 8,164,257 | 17.3 | % | |||
| South | 169 | 91 | % | 19,945,024 | 42.6 | % | |||
| West | 36 | 89 | % | 5,772,286 | 15.7 | % | |||
| 349 | 89 | % | 45,900,594 | 100 | % | ||||
The above does not purport to disclose all items required under GAAP.
The Company's Form 10-K for the year ended December 31, 2001 and Form 10-Q for the quarters ended September 30, 2002, June 30, 2002 and March 31, 2002 should be read in conjunction with the above information.
A-18
New Plan Excel Realty Trust, Inc.
Supplemental Disclosure—Quarter Ended September 30, 2002
Same Property NOI Analysis
(In thousands, except property statistics)
| | Three Months Ended | | Three Months Ended | | Three Months Ended | | |||||||||||||||||||
|---|---|---|---|---|---|---|---|---|---|---|---|---|---|---|---|---|---|---|---|---|---|---|---|---|---|
| | Percent Change | Percent Change | Percent Change | ||||||||||||||||||||||
| | 09/30/02 | 09/30/01 | 06/30/02 | 06/30/01 | 03/31/02 | 03/31/01 | |||||||||||||||||||
| Analysis Specific Property Statistics: | |||||||||||||||||||||||||
| Number of properties included in analysis | 223 | 223 | 230 | 230 | 237 | 237 | |||||||||||||||||||
| Gross leasable area | 29,869,552 | 29,900,114 | 31,195,000 | 31,195,000 | 32,272,672 | 32,272,672 | |||||||||||||||||||
| Percent leased | 90.1 | % | 91.7 | % | -1.6 | % | 89.2 | % | 91.3 | % | -2.1 | % | 89.5 | % | 91.4 | % | -1.9 | % | |||||||
| Termination Fees:(1) | $ | 1,600 | $ | 261 | $ | 32 | $ | 30 | $ | 562 | $ | 659 | |||||||||||||
| Property revenues | $ | 72,989 | $ | 70,988 | 2.8 | % | $ | 76,531 | $ | 75,752 | 1.0 | % | $ | 77,836 | $ | 79,156 | -1.7 | % | |||||||
| Property operating expenses | 22,007 | 19,537 | 12.6 | % | 23,330 | 21,916 | 6.5 | % | 22,413 | 22,892 | -2.1 | % | |||||||||||||
| SAME PROPERTY NOI (GAAP BASIS) | $ | 50,982 | $ | 51,451 | -0.9 | % | $ | 53,201 | $ | 53,836 | -1.2 | % | $ | 55,423 | $ | 56,264 | -1.5 | % | |||||||
| Operating margin (GAAP basis) | 69.8 | % | 72.5 | % | -2.6 | % | 69.5 | % | 71.1 | % | -1.6 | % | 71.2 | % | 71.1 | % | 0.1 | % | |||||||
| Straight-line rent adjustment | 421 | 173 | 143.4 | % | 425 | 753 | -43.6 | % | (136 | ) | (102 | ) | 33.3 | % | |||||||||||
| SAME PROPERTY NOI | $ | 50,561 | $ | 51,278 | -1.4 | % | $ | 52,776 | $ | 53,083 | -0.6 | % | $ | 55,559 | $ | 56,366 | -1.4 | % | |||||||
| Operating margin | 69.3 | % | 72.2 | % | -3.0 | % | 69.0 | % | 70.1 | % | -1.1 | % | 71.4 | % | 71.2 | % | 0.2 | % | |||||||
- (1)
- Excluded from Property revenues.
NOI is defined as Property revenues less Property operating expenses, excluding depreciation and amortization and interest expense. Same store excludes properties that have or are undergoing redevelopment and includes only properties owned for the full quarters.
The above does not purport to disclose all items required under GAAP.
The Company's Form 10-K for the year ended December 31, 2001 and Form 10-Q for the quarters ended September 30, 2002, June 30, 2002 and March 31, 2002 should be read in conjunction with the above information.
A-19
New Plan Excel Realty Trust, Inc.
Supplemental Disclosure—Quarter Ended September 30, 2002
Top Ten Tenants
| | Tenant | Number of Leases | GLA | ABR | ABR as a Percentage of Total Portfolio ABR | |||||||
|---|---|---|---|---|---|---|---|---|---|---|---|---|
| 1 | The Kroger Co.(1) | 42 | 2,131,024 | $ | 14,398,046 | 4.4 | % | |||||
| 2 | Kmart Corporation | 35 | 3,262,674 | 13,542,761 | 4.1 | % | ||||||
| 3 | Wal-Mart Stores | 26 | 2,857,523 | 12,063,607 | 3.7 | % | ||||||
| 4 | Winn-Dixie Stores(2) | 19 | 859,033 | 5,250,077 | 1.6 | % | ||||||
| 5 | Ahold USA(3) | 14 | 665,356 | 4,881,811 | 1.5 | % | ||||||
| 6 | The TJX Companies(4) | 21 | 660,290 | 4,495,444 | 1.4 | % | ||||||
| 7 | J.C. Penney Company(5) | 37 | 683,567 | 4,332,564 | 1.3 | % | ||||||
| 8 | Publix Super Markets | 12 | 578,954 | 3,580,537 | 1.1 | % | ||||||
| 9 | Safeway(6) | 9 | 423,011 | 3,069,978 | 0.9 | % | ||||||
| 10 | Walgreen Co. | 19 | 260,042 | 3,002,553 | 0.9 | % | ||||||
| 234 | 12,381,474 | $ | 68,617,378 | 21.0 | % | |||||||
- (1)
- Includes King Soopers, Kroger, Ralphs and Smith's.
- (2)
- Includes Save Rite Grocery Warehouse and Winn-Dixie.
- (3)
- Includes BI-LO, Food Max, Giant, Martin's, Stop & Shop and Tops Market.
- (4)
- Includes Marshalls and T.J. Maxx.
- (5)
- Includes Eckerd and JCPenney.
- (6)
- Includes Dominick's, Randalls and Vons.
The above does not purport to disclose all items required under GAAP.
The Company's Form 10-K for the year ended December 31, 2001 and Form 10-Q for the quarters ended September 30, 2002, June 30, 2002 and March 31, 2002 should be read in conjunction with the above information.
A-20
New Plan Excel Realty Trust, Inc.
Supplemental Disclosure—Quarter Ended September 30, 2002
New Lease Summary
NEW LEASE SUMMARY
| | Number | GLA | Total New ABR | Tenant Improvements Committed | Leasing Commissions | |||||||||
|---|---|---|---|---|---|---|---|---|---|---|---|---|---|---|
| 1Q 2002 | 71 | 299,355 | $ | 3,068,063 | $ | 1,474,832 | $ | 202,518 | ||||||
| psf | 10.25 | 4.93 | 0.68 | |||||||||||
| 2Q 2002 | 133 | 568,546 | $ | 5,921,995 | $ | 2,299,136 | $ | 480,725 | ||||||
| psf | 10.42 | 4.04 | 0.85 | |||||||||||
| 3Q 2002 | 193 | 748,620 | $ | 7,480,645 | $ | 2,262,256 | $ | 527,991 | ||||||
| psf | 9.99 | 3.02 | 0.71 | |||||||||||
RENEWAL LEASE SUMMARY
| | | | | | Increase/(Decrease) | ||||||||||||
|---|---|---|---|---|---|---|---|---|---|---|---|---|---|---|---|---|---|
| | | | Total Former ABR | Total New ABR | |||||||||||||
| | Number | GLA | Total Dollar | Percent | |||||||||||||
| 1Q 2002 | 143 | 683,503 | $ | 5,218,436 | $ | 5,470,804 | $ | 252,368 | 4.8 | % | |||||||
| psf | 7.63 | 8.00 | 0.37 | ||||||||||||||
| 2Q 2002 | 200 | 748,437 | $ | 6,557,254 | $ | 7,099,740 | $ | 542,486 | 8.3 | % | |||||||
| psf | 8.76 | 9.49 | 0.72 | ||||||||||||||
| 3Q 2002 | 189 | 655,229 | $ | 6,391,971 | $ | 6,714,569 | $ | 322,598 | 5.0 | % | |||||||
| psf | 9.76 | 10.25 | 0.49 | ||||||||||||||
Renewal leases include expiring leases renewed with the same tenant and the exercise of options. All other leases are categorized as new.
Data includes all leases in force at September 30, 2002, June 30, 2002 and March 31, 2002, including those that are fully executed, but not yet open.
The above does not purport to disclose all items required under GAAP.
The Company's Form 10-K for the year ended December 31, 2001 and Form 10-Q for the quarters ended September 30, 2002, June 30, 2002 and March 31, 2002 should be read in conjunction with the above information.
A-21
New Plan Excel Realty Trust, Inc.
Supplemental Disclosure—Quarter Ended September 30, 2002
Lease Expiration Schedule
| | Number of Leases Expiring | Leased GLA | Percent of GLA | ABR Per Foot | Percent of Total ABR | |||||||
|---|---|---|---|---|---|---|---|---|---|---|---|---|
| 2002 | 624 | 1,754,835 | 4.29 | % | $ | 8.18 | 4.38 | % | ||||
| 2003 | 1090 | 4,041,374 | 9.89 | % | 8.75 | 10.81 | % | |||||
| 2004 | 933 | 3,775,262 | 9.24 | % | 9.63 | 11.11 | % | |||||
| 2005 | 815 | 4,632,890 | 11.34 | % | 7.75 | 10.97 | % | |||||
| 2006 | 682 | 4,034,535 | 9.87 | % | 8.50 | 10.48 | % | |||||
| 2007 | 575 | 3,679,847 | 9.01 | % | 8.80 | 9.89 | % | |||||
| 2008 | 163 | 1,550,743 | 3.80 | % | 8.46 | 4.01 | % | |||||
| 2009 | 132 | 2,031,527 | 4.97 | % | 7.67 | 4.76 | % | |||||
| 2010 | 126 | 2,244,839 | 5.49 | % | 7.15 | 4.90 | % | |||||
| 2011 | 110 | 1,859,108 | 4.55 | % | 8.37 | 4.75 | % | |||||
| 2012+ | 401 | 11,254,698 | 27.54 | % | 6.96 | 23.92 | % | |||||
| 5,651 | 40,859,658 | 100.0 | % | $ | 8.01 | 100.0 | % | |||||
Does not assume exercise of renewal options or base rent escalations over lease term.
The above does not purport to disclose all items required under GAAP.
The Company's Form 10-K for the year ended December 31, 2001 and Form 10-Q for the quarters ended September 30, 2002, June 30, 2002 and March 31, 2002 should be read in conjunction with the above information.
A-22
New Plan Excel Realty Trust, Inc.
Supplemental Disclosure—Quarter Ended September 30, 2002
Property Portfolio
| | Property Name | City | State | Year Built | Date Acquired | GLA | Percent Leased(1) | ABR | Anchor Tenant | Anchor Tenant Not Owned | |||||||||||
|---|---|---|---|---|---|---|---|---|---|---|---|---|---|---|---|---|---|---|---|---|---|
| Stabilized Properties | |||||||||||||||||||||
| Community and Neighborhood Shopping Centers | |||||||||||||||||||||
| 1 | Cloverdale Village | Florence | AL | 1986 | 10/27/94 | 59,407 | 100 | % | $ | 381,268 | Winn-Dixie | ||||||||||
| 2 | Riverview Plaza | Gadsden | AL | 1990 | 10/12/95 | 147,621 | 100 | % | 927,155 | Wal-Mart | |||||||||||
| 3 | Grants Mill Station | Irondale | AL | 1991 | 07/01/98 | 226,837 | 65 | % | 895,646 | Wal-Mart | |||||||||||
| 4 | Payton Park | Sylacauga | AL | 1995 | 07/01/98 | 231,820 | 99 | % | 1,403,908 | Wal-Mart | |||||||||||
| 5 | Glendale Galleria | Glendale | AZ | 1991 | 08/01/97 | 119,461 | 99 | % | 1,271,396 | Food 4 Less, Osco Drugs | |||||||||||
| 6 | Kmart Plaza | Mesa | AZ | 1970 | 12/28/90 | 182,933 | 95 | % | 678,671 | Kmart | |||||||||||
| 7 | Southern Village Mesa | Mesa | AZ | 1987 | 08/01/97 | 84,054 | 89 | % | 600,657 | Food City | |||||||||||
| 8 | Sun Valley Plaza | Mesa | AZ | 1981 | 05/31/94 | 107,405 | 50 | % | 472,922 | Family Dollar | |||||||||||
| 9 | Metro Marketplace | Phoenix | AZ | 1988 | 06/21/91 | 252,575 | 83 | % | 2,105,544 | Office Max, Toys R Us | |||||||||||
| 10 | Northmall Centre | Tucson | AZ | 1996 | 12/31/96 | 168,719 | 93 | % | 1,247,950 | Comp USA, JC Penney, Stein Mart | |||||||||||
| 11 | Bakersfield Plaza | Bakersfield | CA | 1970 | 06/20/97 | 213,164 | 90 | % | 1,770,140 | Circuit City, Longs Drugs | Mervyn's | ||||||||||
| 12 | Sony/Kinko | Burbank | CA | 1988 | 05/01/89 | 14,176 | 100 | % | 404,364 | — | |||||||||||
| 13 | Carmen Plaza | Camarillo | CA | 1971 | 06/20/97 | 129,264 | 94 | % | 1,195,843 | 24 Hour Fitness | Trader Joe's | ||||||||||
| 14 | Cudahy Plaza | Cudahy | CA | 1968 | 06/20/97 | 138,430 | 100 | % | 671,040 | Kmart, Pic "N" Save | |||||||||||
| 15 | Arbor Faire | Fresno | CA | 1993 | 04/09/97 | 199,986 | 92 | % | 1,854,902 | Home Depot, PetsMart, Smart & Final | Mervyn's | ||||||||||
| 16 | Broadway Faire | Fresno | CA | 1995 | 04/09/97 | 60,383 | 100 | % | 1,051,758 | United Artists, Wherehouse | |||||||||||
| 17 | Briggsmore Plaza | Modesto | CA | 1974 | 06/20/97 | 98,945 | 100 | % | 766,627 | Grocery Outlet, Macfrugals, Outdoor World | |||||||||||
| 18 | Montebello Plaza | Montebello | CA | 1974 | 06/20/97 | 288,290 | 97 | % | 2,812,458 | 99c Only, Circuit City, Max Foods, Office Depot, Sav-On Drugs | |||||||||||
| 19 | Paradise Plaza | Paradise | CA | 1979 | 06/20/97 | 198,484 | 97 | % | 716,556 | Albertsons, Kmart, Rite Aid | |||||||||||
| 20 | Metro 580 | Pleasanton | CA | 1996 | 09/15/97 | 174,584 | 80 | % | 2,191,707 | Borders, Linens "N Things | Wal-Mart | ||||||||||
| 21 | Rose Pavilion | Pleasanton | CA | 1987 | 02/27/98 | 292,848 | 86 | % | 3,536,343 | Levitz Furniture, Macy's Home Store | |||||||||||
| 22 | San Dimas Plaza | San Dimas | CA | 1986 | 10/07/97 | 119,161 | 98 | % | 1,612,801 | T.J. Maxx | Ralph's, Rite Aid | ||||||||||
| 23 | Vail Ranch Center | Temecula | CA | 1997 | 12/31/97 | 99,204 | 100 | % | 1,033,738 | Rite Aid, Stater Bros. | |||||||||||
| 24 | Westminster City Center | Westminster | CO | 1996 | 12/16/97 | 339,600 | 84 | % | 3,792,814 | Babies R Us, Barnes & Noble, Circuit City, CompUSA, Golfsmith | |||||||||||
| 25 | Brooksville Square | Brooksville | FL | 1987 | 03/28/94 | 191,207 | 99 | % | 1,224,661 | Kmart, Publix, Walgreens | |||||||||||
| 26 | Coconut Creek | Coconut Creek | FL | 1983 | 03/01/02 | 271,725 | 71 | % | 2,209,525 | Beall's, Big Lots, Lady of America Gym, Publix | |||||||||||
| 27 | Northgate S.C. | DeLand | FL | 1993 | 06/30/93 | 186,396 | 100 | % | 1,282,978 | Kmart, Publix | |||||||||||
| 28 | Morse Shores | Ft. Myers | FL | 1983 | 03/01/02 | 169,545 | 97 | % | 1,032,295 | Beall's Outlet, Big Lots, Dollar General, Publix | |||||||||||
| 29 | Eastgate S.C. | Lake Wales | FL | 1994 | 05/20/94 | 102,161 | 7 | % | 54,900 | — | Winn-Dixie | ||||||||||
| 30 | Leesburg Square | Leesburg | FL | 1986 | 12/23/92 | 91,682 | 98 | % | 701,434 | Ryan's Family Steakhouse, Walgreens | |||||||||||
| 31 | Miami Gardens | Miami | FL | 1996 | 10/06/97 | 244,719 | 100 | % | 2,275,216 | Kmart, Ross, Winn-Dixie | |||||||||||
| 32 | Freedom Square | Naples | FL | 1995 | 10/06/97 | 211,839 | 100 | % | 1,685,502 | Kmart, Publix | |||||||||||
| 33 | Southgate | New Port Richey | FL | 1966 | 08/27/97 | 262,911 | 98 | % | 863,998 | Big Lots, Publix | |||||||||||
| 34 | Presidential Plaza | North Lauderdale | FL | 1977 | 04/18/97 | 88,306 | 94 | % | 655,302 | Winn-Dixie | |||||||||||
| 35 | Colonial Marketplace | Orlando | FL | 1986 | 04/01/98 | 128,823 | 99 | % | 994,704 | Office Max | Target | ||||||||||
| 36 | Silver Hills | Orlando | FL | 1985 | 03/01/02 | 108,812 | 83 | % | 401,954 | AutoZone, Buddy's Home, Winn-Dixie | |||||||||||
| 37 | 23rd Street Station | Panama City | FL | 1986 | 07/01/98 | 98,827 | 96 | % | 967,431 | Publix | |||||||||||
| 38 | Riverwood | Port Orange | FL | 1990 | 09/05/97 | 93,506 | 94 | % | 457,222 | Walgreens, Winn-Dixie | |||||||||||
| 39 | Seminole Plaza | Seminole | FL | 1964 | 06/11/98 | 144,011 | 96 | % | 757,651 | Burlington Coat, T.J. Maxx | |||||||||||
| 40 | Eagles Park | St. Petersburg | FL | 1986 | 03/01/02 | 125,571 | 86 | % | 993,894 | Publix | |||||||||||
| 41 | Downtown Publix | Stuart | FL | 1965 | 03/01/02 | 153,196 | 88 | % | 1,257,595 | Beall's Outlet, Publix, Schumacher Music | |||||||||||
A-23
| 42 | Albany Plaza | Albany | GA | 1968 | 05/12/94 | 114,169 | 89 | % | 611,788 | Big Lots, Food Lion | |||||||||||
| 43 | Southgate Plaza | Albany | GA | 1969 | 07/11/90 | 59,816 | 97 | % | 368,505 | OK Beauty Supply, Save-A-Lot | |||||||||||
| 44 | Eastgate Plaza | Americus | GA | 1980 | 07/11/90 | 44,365 | 98 | % | 135,123 | — | |||||||||||
| 45 | Perlis Plaza | Americus | GA | 1972 | 07/11/90 | 165,315 | 95 | % | 856,140 | Belk's, Harveys | |||||||||||
| 46 | Sweetwater Village | Austell | GA | 1985 | 10/27/94 | 66,197 | 95 | % | 427,182 | CVS, Save Rite Grocery Warehouse | |||||||||||
| 47 | Cedar Plaza | Cedartown | GA | 1994 | 10/27/94 | 83,300 | 96 | % | 544,769 | Badcock Furniture, Kroger | |||||||||||
| 48 | Southgate Plaza | Cordele | GA | 1969 | 07/11/90 | 39,262 | 51 | % | 67,947 | Fred's Dollar Store | |||||||||||
| 49 | Habersham Crossing | Cornelia | GA | 1990 | 03/01/96 | 161,278 | 98 | % | 793,412 | B.C. Moore, Wal-Mart | |||||||||||
| 50 | Habersham Village | Cornelia | GA | 1985 | 05/06/92 | 147,182 | 98 | % | 732,383 | Kmart, Winn-Dixie | |||||||||||
| 51 | Covington Gallery | Covington | GA | 1991 | 12/30/93 | 174,857 | 97 | % | 975,929 | Ingles, Kmart | |||||||||||
| 52 | Northside Plaza | Dalton | GA | 1990 | 10/11/95 | 73,931 | 100 | % | 547,940 | BI-LO, Family Dollar | |||||||||||
| 53 | Midway Village | Douglasville | GA | 1989 | 05/01/97 | 73,028 | 100 | % | 523,090 | Save Rite Grocery Warehouse | |||||||||||
| 54 | Westgate | Dublin | GA | 1974 | 07/11/90 | 184,004 | 74 | % | 587,295 | Big Lots, Food Max | |||||||||||
| 55 | Marshalls at Eastlake | Marietta | GA | 1982 | 10/26/98 | 55,193 | 95 | % | 432,148 | Marshalls | |||||||||||
| 56 | New Chastain Corners | Marietta | GA | 1990 | 07/17/97 | 108,380 | 95 | % | 1,063,873 | Kroger | |||||||||||
| 57 | Pavilions at Eastlake | Marietta | GA | 1986 | 03/01/99 | 159,088 | 95 | % | 1,612,976 | Kroger | |||||||||||
| 58 | Village at Southlake | Morrow | GA | 1983 | 04/13/98 | 53,384 | 89 | % | 366,188 | Marshalls | |||||||||||
| 59 | Perry Marketplace | Perry | GA | 1992 | 12/30/92 | 179,973 | 45 | % | 616,317 | Kroger | |||||||||||
| 60 | Creekwood Shopping Center | Rex | GA | 1990 | 05/01/97 | 69,778 | 98 | % | 566,774 | Save Rite Grocery Warehouse | |||||||||||
| 61 | Shops of Riverdale | Riverdale | GA | 1995 | 02/15/96 | 34,255 | 50 | % | 188,852 | — | Wal-Mart | ||||||||||
| 62 | Eisenhower Square | Savannah | GA | 1985 | 07/16/97 | 125,120 | 100 | % | 905,905 | Eisenhower Cinema, Food Lion | |||||||||||
| 63 | Victory Square | Savannah | GA | 1986 | 07/02/92 | 168,514 | 74 | % | 875,183 | Food Lion, Scotty's | |||||||||||
| 64 | Wisteria Village Shopping Center | Snellville | GA | 1985 | 10/11/95 | 164,646 | 93 | % | 962,859 | Kmart | |||||||||||
| 65 | University Commons | Statesboro | GA | 1994 | 07/24/96 | 59,814 | 100 | % | 555,807 | — | |||||||||||
| 66 | Tift-Town | Tifton | GA | 1965 | 07/11/90 | 58,818 | 76 | % | 175,662 | Beall's Outlet, CVS | |||||||||||
| 67 | Westgate | Tifton | GA | 1980 | 07/11/90 | 16,307 | 100 | % | 140,858 | — | |||||||||||
| 68 | Haymarket Mall | Des Moines | IA | 1979 | 05/12/95 | 235,615 | 97 | % | 1,026,677 | Burlington Coat Factory, Hobby Lobby | |||||||||||
| 69 | Southfield Plaza | Bridgeview | IL | 1958 | 12/03/96 | 199,842 | 91 | % | 1,691,547 | Dominick's Foods, Hobby Lobby | |||||||||||
| 70 | Westridge Court | Naperville | IL | 1990 | 07/18/97 | 452,183 | 98 | % | 5,079,077 | Borders, Comp USA, Cub Foods, Linens "N Things, Marshalls, Nova 8 Theatre, Spiegel | |||||||||||
| 71 | Tinley Park Plaza | Tinley Park | IL | 1973 | 09/20/95 | 283,470 | 56 | % | 1,339,138 | T.J. Maxx, Walt's Finer Foods | |||||||||||
| 72 | Columbus Center | Columbus | IN | 1964 | 12/01/88 | 270,227 | 38 | % | 806,927 | — | |||||||||||
| 73 | Jasper Manor | Jasper | IN | 1990 | 02/18/92 | 194,120 | 76 | % | 698,018 | Holiday Foods, Kmart | |||||||||||
| 74 | Valley View Plaza | Marion | IN | 1989 | 03/28/94 | 29,974 | 100 | % | 306,556 | — | Wal-Mart | ||||||||||
| 75 | Town Fair | Princeton | IN | 1991 | 02/09/93 | 113,939 | 100 | % | 481,589 | Goody's, Kmart | |||||||||||
| 76 | Wabash Crossing | Wabash | IN | 1988 | 12/16/93 | 166,992 | 100 | % | 973,963 | Kmart, Scott's Foods | |||||||||||
| 77 | Woodland Plaza | Warsaw | IN | 1989 | 03/28/94 | 31,008 | 100 | % | 268,974 | — | |||||||||||
| 78 | Green River Plaza | Campbellsville | KY | 1989 | 03/08/96 | 190,316 | 99 | % | 1,000,068 | Goody's, Kroger | |||||||||||
| 79 | Kmart Plaza | Elizabethtown | KY | 1992 | 02/04/93 | 130,466 | 98 | % | 775,179 | Kmart, Staples | |||||||||||
| 80 | Highland Commons | Glasgow | KY | 1992 | 03/31/93 | 130,466 | 100 | % | 753,619 | Food Lion, Kmart | |||||||||||
| 81 | Mist Lake Plaza | Lexington | KY | 1993 | 07/01/98 | 217,292 | 96 | % | 1,591,646 | Wal-Mart | |||||||||||
| 82 | London Marketplace | London | KY | 1994 | 03/17/94 | 169,032 | 100 | % | 1,062,099 | Kmart, Kroger |
A-24
| 83 | Eastgate Shopping Center | Louisville | KY | 1987 | 11/10/93 | 152,855 | 98 | % | 1,391,120 | Kroger | |||||||||||
| 84 | Picadilly Square | Louisville | KY | 1973 | 04/25/89 | 96,370 | 84 | % | 351,312 | Big Lots, Save-A-Lot | |||||||||||
| 85 | Lexington Road Plaza | Versailles | KY | 1994 | 04/28/94 | 182,578 | 100 | % | 1,226,339 | Kmart, Kroger | |||||||||||
| 86 | Iberia Plaza | New Iberia | LA | 1983 | 03/01/02 | 132,107 | 98 | % | 624,461 | Stage, Super 1 | |||||||||||
| 87 | Lagniappe Village | New Iberia | LA | 1990 | 07/01/98 | 220,225 | 92 | % | 891,137 | Big Lots | |||||||||||
| 88 | The Pines | Pineville | LA | 1991 | 03/01/02 | 179,039 | 96 | % | 985,675 | Kmart, Super 1 | |||||||||||
| 89 | Liberty Plaza | Randallstown | MD | 1962 | 05/12/95 | 215,574 | 84 | % | 1,488,220 | Marshalls | |||||||||||
| 90 | Rising Sun Towne Centre | Rising Sun | MD | 1998 | 06/04/99 | 63,360 | 94 | % | 575,560 | Martin's | |||||||||||
| 91 | Maple Village | Ann Arbor | MI | 1965 | 10/14/94 | 288,046 | 98 | % | 1,575,654 | Dunham's, Kmart | |||||||||||
| 92 | Farmington Crossroads | Farmington | MI | 1986 | 12/11/95 | 84,310 | 93 | % | 609,988 | Farmer Jack | |||||||||||
| 93 | Delta Center | Lansing | MI | 1985 | 12/12/95 | 186,246 | 99 | % | 1,852,737 | Farmer Jack, Pet Food Warehouse | |||||||||||
| 94 | Hampton Village Centre | Rochester Hills | MI | 1990 | 12/12/95 | 460,353 | 98 | % | 4,512,420 | Farmer Jack, Kohl's, Star Theatre, T.J. Maxx | Target | ||||||||||
| 95 | Fashion Corner | Saginaw | MI | 1986 | 12/12/95 | 188,877 | 62 | % | 1,223,241 | Bed, Bath & Beyond, Best Buy | |||||||||||
| 96 | Hall Road Crossing | Shelby Township | MI | 1985 | 12/12/95 | 175,763 | 100 | % | 1,722,003 | Gander Mountain | |||||||||||
| 97 | Southfield Shopping Center | Southfield | MI | 1970 | 02/12/98 | 106,948 | 100 | % | 1,096,545 | Farmer Jack | Burlington Coats, F&M, Marshalls | ||||||||||
| 98 | Delco Plaza | Sterling Heights | MI | 1973 | 11/14/96 | 154,853 | 100 | % | 782,874 | Babies R Us, Bed, Bath & Beyond, Dunham's | |||||||||||
| 99 | Westland Crossing | Westland | MI | 1986 | 11/16/99 | 141,738 | 71 | % | 1,145,107 | — | Toys R Us | ||||||||||
| 100 | Roundtree Place | Ypsilanti | MI | 1992 | 07/01/98 | 195,413 | 99 | % | 1,276,361 | Busch Grocery, Wal-Mart | |||||||||||
| 101 | Washtenaw Fountain Plaza | Ypsilanti | MI | 1989 | 10/05/92 | 136,103 | 38 | % | 469,065 | — | |||||||||||
| 102 | Jacksonian Plaza | Jackson | MS | 1990 | 03/01/02 | 87,721 | 100 | % | 342,182 | Books-A-Million, Georgia Carpet Outlet, Office Depot | |||||||||||
| 103 | Stanly County Plaza | Albermarle | NC | 1988 | 03/28/94 | 63,637 | 96 | % | 441,911 | Ingles | Wal-Mart | ||||||||||
| 104 | Village Marketplace | Asheboro | NC | 1988 | 04/13/95 | 87,869 | 88 | % | 581,162 | — | |||||||||||
| 105 | Foothills Market | Jonesville | NC | 1988 | 06/05/95 | 49,630 | 94 | % | 280,036 | Food Lion | |||||||||||
| 106 | Chapel Square | Kannapolis | NC | 1992 | 12/01/94 | 45,450 | 94 | % | 337,100 | Food Lion | Wal-Mart | ||||||||||
| 107 | Kinston Pointe | Kinston | NC | 1991 | 07/05/95 | 250,580 | 98 | % | 626,561 | Wal-Mart | |||||||||||
| 108 | Roxboro Square | Roxboro | NC | 1989 | 06/05/95 | 98,980 | 95 | % | 612,307 | Wal-Mart | |||||||||||
| 109 | Siler Crossing | Siler City | NC | 1988 | 06/05/95 | 132,639 | 90 | % | 665,105 | — | |||||||||||
| 110 | Crossroads Center | Statesville | NC | 1991 | 02/27/96 | 340,190 | 99 | % | 2,019,637 | Wal-Mart | |||||||||||
| 111 | Thomasville Crossing | Thomasville | NC | 1996 | 04/18/97 | 78,509 | 94 | % | 617,677 | Lowe's Food | |||||||||||
| 112 | Anson Station | Wadesboro | NC | 1988 | 08/23/95 | 132,353 | 97 | % | 731,107 | Food Lion, Wal-Mart | |||||||||||
| 113 | Roanoke Landing | Williamston | NC | 1991 | 01/02/96 | 156,561 | 99 | % | 1,003,293 | Wal-Mart, Winn-Dixie | Belk's | ||||||||||
| 114 | Wilson Shopping Center | Wilson | NC | 1973 | 05/14/86 | 104,982 | 76 | % | 39,678 | Wilson Flea Market | |||||||||||
| 115 | Stratford Commons | Winston-Salem | NC | 1995 | 12/30/96 | 72,308 | 100 | % | 925,465 | Michaels, Office Max, Wherehouse | |||||||||||
| 116 | Hamilton Plaza-Kmart Plaza | Hamilton | NJ | 1972 | 05/12/94 | 149,060 | 100 | % | 803,819 | Kmart | |||||||||||
| 117 | Middletown Plaza | Middletown | NJ | 1972 | 01/01/75 | 198,068 | 77 | % | 2,111,508 | ShopRite | |||||||||||
| 118 | Tinton Falls Plaza | Tinton Falls | NJ | 1953 | 01/30/98 | 100,582 | 92 | % | 877,625 | Burlington Coat Factory, Lifestyle Fitness | A&P | ||||||||||
| 119 | Socorro | Socorro | NM | 1976 | 03/01/02 | 48,000 | 100 | % | 418,000 | Smith's Food | |||||||||||
| 120 | Galleria Commons | Henderson | NV | 1998 | 06/09/98 | 276,460 | 52 | % | 1,592,522 | Babies R Us, Stein Mart, T.J. Maxx | |||||||||||
| 121 | Renaissance Center East | Las Vegas | NV | 1981 | 10/17/96 | 145,578 | 92 | % | 1,070,230 | Albertsons |
A-25
| 122 | Kietzke Center | Reno | NV | 1974 | 06/20/97 | 165,350 | 98 | % | 721,308 | Mervyn's, Ric's Furniture | |||||||||||
| 123 | University Mall | Canton | NY | 1967 | 01/01/76 | 78,738 | 75 | % | 240,256 | Ames Department Stores, Country Max, Kinney Drug | |||||||||||
| 124 | Cortlandville | Cortland | NY | 1984 | 08/04/87 | 100,300 | 95 | % | 245,963 | Ames Department Stores | |||||||||||
| 125 | Kmart Plaza | De Witt | NY | 1970 | 08/03/93 | 115,500 | 100 | % | 590,575 | Kmart, Office Max | |||||||||||
| 126 | D & F Plaza | Dunkirk | NY | 1967 | 01/01/86 | 190,217 | 90 | % | 855,944 | Big Lots, Quality Markets | |||||||||||
| 127 | Elmira Plaza | Elmira | NY | 1976 | 02/13/89 | 50,803 | 89 | % | 135,728 | Big Lots, Dollar General | |||||||||||
| 128 | Genesee Valley Shopping Center | Geneseo | NY | 1993 | 07/01/98 | 204,609 | 100 | % | 1,453,821 | Wal-Mart, Wegmans | |||||||||||
| 129 | Pyramid Mall | Geneva | NY | 1973 | 08/03/93 | 239,500 | 98 | % | 1,155,939 | Big Lots, Kmart, Tops Market | |||||||||||
| 130 | McKinley Plaza | Hamburg | NY | 1991 | 06/14/92 | 92,795 | 96 | % | 841,555 | T.J. Maxx | |||||||||||
| 131 | Hornell Plaza | Hornell | NY | 1995 | 07/31/98 | 253,703 | 98 | % | 1,794,794 | Wal-Mart, Wegmans | |||||||||||
| 132 | Cayuga Mall | Ithaca | NY | 1969 | 05/12/89 | 205,426 | 98 | % | 1,133,765 | Eckerd, Penn Traffic, T.J. Maxx | |||||||||||
| 133 | Shops at Seneca Mall | Liverpool | NY | 1971 | 08/03/93 | 237,202 | 84 | % | 1,029,814 | Kmart, Price Chopper | |||||||||||
| 134 | Transit Road Plaza | Lockport | NY | 1971 | 08/03/93 | 138,119 | 100 | % | 365,605 | Save-A-Lot | |||||||||||
| 135 | Wallkill Plaza | Middletown | NY | 1986 | 12/12/95 | 203,234 | 94 | % | 1,653,765 | ShopRite | |||||||||||
| 136 | Monroe ShopRite Plaza | Monroe | NY | 1972 | 08/01/97 | 122,394 | 98 | % | 1,218,141 | Eckerd, Lifeplex, ShopRite | |||||||||||
| 137 | Rockland Plaza | Nanuet | NY | 1963 | 01/01/83 | 247,957 | 99 | % | 4,337,729 | Marshalls, Rockbottom | |||||||||||
| 138 | South Plaza | Norwich | NY | 1967 | 04/01/83 | 143,665 | 78 | % | 310,953 | Ames Department Stores, Plaza Lanes, Sav-A-Lot | |||||||||||
| 139 | Westgate Plaza | Oneonta | NY | 1967 | 01/20/84 | 71,952 | 97 | % | 208,280 | Ames Department Stores | |||||||||||
| 140 | Oswego Plaza | Oswego | NY | 1966 | 01/01/77 | 128,087 | 97 | % | 600,015 | Big Lots, JC Penney | |||||||||||
| 141 | Mohawk Acres | Rome | NY | 1965 | 01/20/84 | 155,840 | 74 | % | 618,879 | Applebees | |||||||||||
| 142 | Price Chopper Plaza | Rome | NY | 1988 | 08/03/93 | 78,400 | 80 | % | 394,930 | Price Chopper | |||||||||||
| 143 | Westgate Manor | Rome | NY | 1961 | 01/01/86 | 65,813 | 96 | % | 382,835 | Big Lots, Rome Cinemas | |||||||||||
| 144 | Northland | Watertown | NY | 1962 | 01/01/73 | 122,666 | 77 | % | 342,276 | Ames Department Store | |||||||||||
| 145 | Whitestown Plaza | Whitesboro | NY | 1953 | 04/03/02 | 80,612 | 79 | % | 559,375 | Third Price Sportswear, Victory Markets | |||||||||||
| 146 | Ashland Square | Ashland | OH | 1990 | 10/06/93 | 163,168 | 99 | % | 930,329 | Wal-Mart | |||||||||||
| 147 | Harbor Plaza | Ashtabula | OH | 1988 | 02/20/91 | 51,794 | 75 | % | 284,978 | — | |||||||||||
| 148 | Brentwood Plaza | Cincinnati | OH | 1957 | 05/04/94 | 232,567 | 89 | % | 1,183,207 | — | |||||||||||
| 149 | Delhi | Cincinnati | OH | 1973 | 05/22/96 | 166,317 | 97 | % | 1,437,809 | Big Lots, Kroger | |||||||||||
| 150 | Western Village | Cincinnati | OH | 1960 | 05/04/94 | 138,526 | 93 | % | 635,300 | — | |||||||||||
| 151 | Crown Point | Columbus | OH | 1980 | 07/23/98 | 147,427 | 95 | % | 1,147,778 | Kroger | |||||||||||
| 152 | Greentree Shopping Center | Columbus | OH | 1974 | 07/23/98 | 128,501 | 80 | % | 919,726 | Kroger | |||||||||||
| 153 | South Towne Centre | Dayton | OH | 1972 | 03/27/92 | 308,699 | 99 | % | 2,436,094 | Borders, Burlington Coat Factory, Kmart, Value City Furniture | |||||||||||
| 154 | Heritage Square | Dover | OH | 1959 | 08/31/93 | 231,735 | 63 | % | 810,719 | Bag N Save Foods | |||||||||||
| 155 | Midway Crossing | Elyria | OH | 1986 | 12/11/95 | 138,265 | 88 | % | 857,144 | Dunham's | Kids R Us, Toys R Us | ||||||||||
| 156 | Silver Bridge Plaza | Gallipolis | OH | 1972 | 12/28/86 | 145,481 | 80 | % | 499,646 | Big Lots, Tractor Supply Company | |||||||||||
| 157 | Parkway Plaza | Maumee | OH | 1955 | 09/06/89 | 140,021 | 60 | % | 366,623 | The Pharm | |||||||||||
| 158 | New Boston | New Boston | OH | 1991 | 02/17/93 | 238,711 | 96 | % | 1,355,587 | Festival Foods, Wal-Mart | |||||||||||
| 159 | Market Place | Piqua | OH | 1972 | 11/20/91 | 169,311 | 58 | % | 497,257 | — | |||||||||||
| 160 | Brice Park | Reynoldsburg | OH | 1989 | 03/04/98 | 168,284 | 99 | % | 1,724,471 | Gregg Appliances | |||||||||||
| 161 | Bethel Park | Bethel Park | PA | 1965 | 05/14/97 | 224,069 | 98 | % | 1,331,958 | Ames Department Store, Giant Eagle | |||||||||||
| 162 | Market Street Square | Elizabethtown | PA | 1993 | 10/06/97 | 169,481 | 100 | % | 1,378,379 | Kmart, Weis Markets | |||||||||||
| 163 | Johnstown Galleria Outparcel | Johnstown | PA | 1993 | 07/31/97 | 61,968 | 87 | % | 339,677 | Dunham's, Staples | Builders Square, Toys R Us | ||||||||||
| 164 | New Garden | Kennett Square | PA | 1979 | 06/20/97 | 149,270 | 92 | % | 617,259 | Acme Markets, Big Lots | |||||||||||
| 165 | Stone Mill Plaza | Lancaster | PA | 1988 | 01/06/94 | 94,493 | 95 | % | 883,495 | Giant Food Stores, Rent-To-Own | |||||||||||
| 166 | Ivyridge | Philadelphia | PA | 1963 | 08/02/95 | 112,278 | 78 | % | 878,691 | Super Fresh | |||||||||||
| 167 | Roosevelt Mall | Philadelphia | PA | 1964 | 01/01/64 | 555,819 | 97 | % | 5,422,646 | Strawbridge's | |||||||||||
| 168 | Hampton Square | Southampton | PA | 1980 | 12/29/98 | 62,933 | 98 | % | 638,946 | McCaffrey's |
A-26
| 169 | Shops at Prospect | West Hempfield | PA | 1994 | 07/31/95 | 63,392 | 100 | % | 535,562 | Redner's Markets | Kmart | ||||||||||
| 170 | Circle Center | Hilton Head | SC | 1992 | 03/24/94 | 65,313 | 97 | % | 658,810 | BI-LO | |||||||||||
| 171 | Palmetto Crossroads | Hilton Head | SC | 1990 | 10/18/95 | 40,916 | 94 | % | 302,344 | Food Lion | |||||||||||
| 172 | Remount Village | North Charleston | SC | 1996 | 11/13/96 | 60,238 | 97 | % | 557,371 | BI-LO | |||||||||||
| 173 | Congress Crossing | Athens | TN | 1990 | 11/10/88 | 172,305 | 100 | % | 1,111,703 | BI-LO, Kmart | |||||||||||
| 174 | St. Elmo Central | Chattanooga | TN | 1995 | 08/06/96 | 74,978 | 100 | % | 663,435 | Winn-Dixie | |||||||||||
| 175 | Saddletree Village | Columbia | TN | 1990 | 06/15/98 | 45,800 | 94 | % | 295,354 | Food Lion | |||||||||||
| 176 | West Towne Square | Elizabethton | TN | 1998 | 06/09/98 | 99,224 | 87 | % | 562,028 | Stringer's Restaurant, Winn-Dixie | |||||||||||
| 177 | Greeneville Commons | Greeneville | TN | 1990 | 03/10/92 | 228,618 | 99 | % | 1,459,547 | Kmart, Proffitt's | |||||||||||
| 178 | Hazel Path | Hendersonville | TN | 1989 | 11/27/95 | 67,965 | 84 | % | 424,652 | Food Lion | Wal-Mart | ||||||||||
| 179 | Kimball Crossing | Kimball | TN | 1987 | 11/27/95 | 280,476 | 99 | % | 1,701,930 | Wal-Mart | |||||||||||
| 180 | Chapman-Ford Crossing | Knoxville | TN | 1990 | 12/30/92 | 185,604 | 98 | % | 1,048,861 | Food Lion, Goody's, Wal-Mart | |||||||||||
| 181 | Farrar Place Shopping Center | Manchester | TN | 1989 | 12/15/95 | 43,220 | 100 | % | 354,432 | Food Lion | The Crystal Company | ||||||||||
| 182 | Georgetown Square | Murfreesboro | TN | 1986 | 09/29/93 | 104,117 | 93 | % | 852,580 | Kroger | |||||||||||
| 183 | Apison Crossing | Ooltewah | TN | 1997 | 07/29/97 | 79,048 | 97 | % | 559,121 | Winn-Dixie | |||||||||||
| 184 | Madison Street Station | Shelbyville | TN | 1985 | 10/11/95 | 56,766 | 100 | % | 366,905 | BI-LO | |||||||||||
| 185 | Commerce Central | Tullahoma | TN | 1995 | 08/09/96 | 182,401 | 100 | % | 1,244,045 | Wal-Mart | |||||||||||
| 186 | Merchant's Central | Winchester | TN | 1997 | 12/09/97 | 208,123 | 99 | % | 1,159,560 | Wal-Mart | |||||||||||
| 187 | Palm Plaza | Aransas | TX | 1979 | 03/01/02 | 52,104 | 74 | % | 147,660 | Family Dollar | |||||||||||
| 188 | Bardin Place Center | Arlington | TX | 1993 | 10/06/97 | 303,899 | 97 | % | 2,643,600 | Kmart, Mars, Oshman's | Hobby Lobby | ||||||||||
| 189 | Windsor Village | Austin | TX | 1959 | 03/01/02 | 115,796 | 75 | % | 627,888 | — | |||||||||||
| 190 | Baytown Shopping Center | Baytown | TX | 1987 | 03/01/02 | 95,941 | 96 | % | 920,955 | — | |||||||||||
| 191 | Cedar Bellaire | Bellaire | TX | 1950 | 03/01/02 | 50,967 | 100 | % | 447,290 | H.E.B. Pantry Foods | |||||||||||
| 192 | El Camino | Bellaire | TX | 1972 | 03/01/02 | 71,575 | 100 | % | 350,667 | Davis Food City, Hancock Fabrics | |||||||||||
| 193 | Rice Bellaire | Bellaire | TX | 1961 | 03/01/02 | 20,465 | 100 | % | 450,256 | Walgreens | |||||||||||
| 194 | Brenham Four Corners | Brenham | TX | 1975 | 03/01/02 | 114,571 | 100 | % | 749,921 | Beall's, Eckerd, H.E.B. Pantry Foods | |||||||||||
| 195 | Bryan Square | Bryan | TX | 1966 | 03/01/02 | 55,115 | 100 | % | 178,616 | Kroger | |||||||||||
| 196 | Townshire | Bryan | TX | 1957 | 03/01/02 | 136,693 | 80 | % | 595,171 | Albertsons, Tops Printing | |||||||||||
| 197 | Plantation Plaza | Clute | TX | 1973 | 03/01/02 | 98,429 | 100 | % | 751,661 | Kroger, Walgreens | |||||||||||
| 198 | Culpepper Plaza | College Station | TX | 1976 | 03/01/02 | 206,398 | 91 | % | 1,293,502 | Appletree, Baskins | |||||||||||
| 199 | Rock Prairie Crossing | College Station | TX | 2000 | 03/01/02 | 118,254 | 100 | % | 1,103,422 | Kroger | |||||||||||
| 200 | Carmel Village | Corpus Christi | TX | 1963 | 03/01/02 | 86,678 | 93 | % | 619,838 | Beall's, Tuesday Morning | |||||||||||
| 201 | Five Points | Corpus Christi | TX | 1985 | 03/01/02 | 276,593 | 97 | % | 1,961,084 | Beall's, Hobby Lobby, Melrose Fashion, Sutherland Lumber | |||||||||||
| 202 | Claremont Village | Dallas | TX | 1976 | 03/01/02 | 66,980 | 100 | % | 438,163 | Minyard | |||||||||||
| 203 | Jeff Davis | Dallas | TX | 1975 | 03/01/02 | 69,563 | 100 | % | 437,868 | Blockbuster, Carnival, Family Dollar, Pancho's | |||||||||||
| 204 | Stevens Park Village | Dallas | TX | 1974 | 03/01/02 | 45,672 | 100 | % | 412,003 | O'Reilly's Auto Parts, Minyard | |||||||||||
| 205 | Webb Royal | Dallas | TX | 1961 | 03/01/02 | 108,627 | 97 | % | 693,432 | Minyard, Nothing Over $1.00 | |||||||||||
| 206 | Westmoreland Heights | Dallas | TX | 1952 | 03/01/02 | 108,033 | 92 | % | 520,768 | Malone's | |||||||||||
| 207 | Wynnewood Village | Dallas | TX | 1961 | 03/01/02 | 462,269 | 97 | % | 3,742,181 | Colbert's, Eckerd, Fallas Paredes, Dollar Store, Factory 2-U, Kroger, Macfrugals, Mighty Dollar, Rhoton's Food for Less |
A-27
| 208 | Parktown | Deer Park | TX | 1985 | 03/01/02 | 122,693 | 85 | % | 655,074 | Gerland's, Walgreens | |||||||||||
| 209 | Friendswood Square | Friendswood | TX | 1979 | 03/01/02 | 64,038 | 90 | % | 493,992 | — | |||||||||||
| 210 | Forest Hills | Ft. Worth | TX | 1968 | 03/01/02 | 69,967 | 70 | % | 241,728 | Family Dollar, Fiesta | |||||||||||
| 211 | Meadowbrook | Ft. Worth | TX | 1966 | 03/01/02 | 40,308 | 92 | % | 384,544 | Dollar General, Eckerd, O'Reilly "s Auto Parts | |||||||||||
| 212 | Westcliff | Ft. Worth | TX | 1955 | 03/01/02 | 133,705 | 93 | % | 644,004 | Martin's Hardware, Minyard | |||||||||||
| 213 | North Hills Village | Haltom City | TX | 1960 | 03/01/02 | 43,299 | 83 | % | 172,812 | Ace Hardware, Advantage Rental, Save-A-Lot | |||||||||||
| 214 | Highland Village Town Center | Highland Village | TX | 1996 | 03/01/02 | 99,441 | 94 | % | 1,063,335 | Kroger | |||||||||||
| 215 | Antoine Square | Houston | TX | 1974 | 03/01/02 | 54,512 | 96 | % | 276,468 | Kroger | |||||||||||
| 216 | Bay Forest | Houston | TX | 1980 | 03/01/02 | 71,589 | 100 | % | 665,766 | Kroger | |||||||||||
| 217 | Beltway South | Houston | TX | 1998 | 03/01/02 | 107,174 | 95 | % | 766,888 | Kroger | |||||||||||
| 218 | Braes Heights | Houston | TX | 1953 | 03/01/02 | 100,264 | 96 | % | 1,327,067 | Eckerd | |||||||||||
| 219 | Braes Link | Houston | TX | 1968 | 03/01/02 | 38,997 | 100 | % | 580,928 | Walgreens | |||||||||||
| 220 | Braes Oaks | Houston | TX | 1966 | 03/01/02 | 46,720 | 100 | % | 423,176 | H.E.B. Pantry Foods | |||||||||||
| 221 | Braesgate | Houston | TX | 1972 | 03/01/02 | 91,670 | 100 | % | 612,391 | — | |||||||||||
| 222 | Broadway | Houston | TX | 1971 | 03/01/02 | 74,942 | 91 | % | 291,123 | — | |||||||||||
| 223 | Clear Lake Camino South | Houston | TX | 1964 | 03/01/02 | 101,458 | 83 | % | 726,034 | Hancock Fabrics, H.E.B. Pantry Foods | |||||||||||
| 224 | Edgebrook Plaza | Houston | TX | 1974 | 03/01/02 | 100,170 | 89 | % | 520,013 | Office Depot | |||||||||||
| 225 | Fondren | Houston | TX | 1971 | 03/01/02 | 45,873 | 98 | % | 503,285 | Eckerd, Fiesta Home Furniture | |||||||||||
| 226 | Hearthstone Corners | Houston | TX | 1977 | 03/01/02 | 209,547 | 100 | % | 1,652,574 | Big Lots, Kroger, Powerhouse Gym, Stein Mart | |||||||||||
| 227 | Huntington Village | Houston | TX | 1980 | 03/01/02 | 111,467 | 93 | % | 849,659 | Family Dollar, Foodtown, Twice Blessed | |||||||||||
| 228 | Inwood Forest | Houston | TX | 1985 | 03/01/02 | 77,553 | 100 | % | 749,061 | Randalls | |||||||||||
| 229 | Jester Village | Houston | TX | 1961 | 03/01/02 | 64,442 | 98 | % | 520,061 | H.E.B. Pantry Foods, Walgreens | |||||||||||
| 230 | Jones Plaza | Houston | TX | 1974 | 03/01/02 | 111,255 | 91 | % | 991,550 | 24 Hour Fitness, Hancock Fabrics | |||||||||||
| 231 | Jones Square | Houston | TX | 1977 | 03/01/02 | 169,003 | 99 | % | 1,081,011 | D&D Sporting Goods, Hobby Lobby, King Dollar, Macfrugals, Walgreens | |||||||||||
| 232 | Lazybrook | Houston | TX | 1962 | 03/01/02 | 10,745 | 81 | % | 81,840 | — | |||||||||||
| 233 | Long Point Square | Houston | TX | 1980 | 03/01/02 | 74,329 | 75 | % | 398,620 | Family Dollar, Family Thrift, Hometown Warehouse | |||||||||||
| 234 | Maplewood Mall | Houston | TX | 1962 | 03/01/02 | 94,148 | 88 | % | 484,691 | Cox's Foodrama, Family Dollar | |||||||||||
| 235 | Merchants Park | Houston | TX | 1955 | 03/01/02 | 241,742 | 100 | % | 2,001,004 | Fallas Paredes, Family Thrift, Golden Island, Kroger, Macfrugals, Merchants Bank | |||||||||||
| 236 | Mount Houston Square | Houston | TX | 1974 | 03/01/02 | 173,819 | 60 | % | 733,448 | Fallas Paredes, Walgreens | |||||||||||
| 237 | North 45 Plaza | Houston | TX | 1975 | 03/01/02 | 132,239 | 87 | % | 778,904 | Furr's Cafeteria, Amco Furniture | |||||||||||
| 238 | Northgate | Houston | TX | 1972 | 03/01/02 | 43,244 | 100 | % | 346,305 | Blockbuster, Firestone, OfficeMax | |||||||||||
| 239 | Northshore East | Houston | TX | 1956 | 03/01/02 | 87,206 | 87 | % | 1,060,380 | Office Depot | |||||||||||
| 240 | Northshore West | Houston | TX | 1956 | 03/01/02 | 144,982 | 94 | % | 1,095,020 | Conn Appliances, Factory 2-U, Petco, Sellers Brothers | |||||||||||
| 241 | Northtown Plaza | Houston | TX | 1960 | 03/01/02 | 192,009 | 100 | % | 1,648,087 | China Border, Factory 2-U, Fallas Paredes, Jo-Ann Fabrics, Macfrugals | |||||||||||
| 242 | Northwood | Houston | TX | 1972 | 03/01/02 | 138,914 | 91 | % | 825,122 | Eckerd, Food City | |||||||||||
| 243 | Orange Grove | Houston | TX | 1970 | 03/01/02 | 177,612 | 45 | % | 957,467 | Office Max, Prince's Dollar Store | |||||||||||
| 244 | Pinemont | Houston | TX | 1969 | 03/01/02 | 76,477 | 85 | % | 812,188 | Family Dollar | |||||||||||
| 245 | Sharpstown Office Building | Houston | TX | 1968 | 03/01/02 | 97,558 | 92 | % | 559,600 | Burlington Coat Factory, Hollywood Video | |||||||||||
| 246 | Stella Link | Houston | TX | 1956 | 03/01/02 | 99,727 | 89 | % | 635,688 | Conn's Clearance, Davis Food City | |||||||||||
| 247 | Tanglewilde | Houston | TX | 1972 | 03/01/02 | 87,309 | 98 | % | 787,263 | Cavender's Boot City, Eckerd, Firestone, Party City, Salon In The Park | |||||||||||
| 248 | Tidwell Place | Houston | TX | 1983 | 03/01/02 | 41,630 | 97 | % | 349,980 | Family Dollar, Walgreens |
A-28
| 249 | Westheimer Commons | Houston | TX | 1984 | 03/01/02 | 249,789 | 95 | % | 2,235,567 | Coomers, Hancock Fabrics, Kroger, Marshalls, Michaels, Walgreens, Wherehouse | |||||||||||
| 250 | Irving West | Irving | TX | 1987 | 09/14/93 | 70,056 | 98 | % | 606,654 | — | |||||||||||
| 251 | The Crossing at Fry Road | Katy | TX | 1984 | 03/01/02 | 225,403 | 100 | % | 1,802,378 | Hobby Lobby, Kroger, Stein Mart | |||||||||||
| 252 | Washington Square | Kaufman | TX | 1978 | 03/01/02 | 65,050 | 100 | % | 268,818 | Eckerd, Family Dollar | |||||||||||
| 253 | League City | League City | TX | 1980 | 03/01/02 | 99,021 | 95 | % | 491,349 | Beals (Stage), Family Dollar, H.E.B. Pantry Foods, Jo-Ann Fabrics | |||||||||||
| 254 | Jefferson Park | Mount Pleasant | TX | 1976 | 03/01/02 | 132,441 | 91 | % | 713,155 | Beals (Stage), Super 1 | |||||||||||
| 255 | Crossroads Center | Pasadena | TX | 1980 | 03/01/02 | 135,692 | 99 | % | 1,298,390 | Kroger, Sears Hardware | |||||||||||
| 256 | Parkview West | Pasadena | TX | 1966 | 03/01/02 | 39,939 | 91 | % | 313,103 | — | |||||||||||
| 257 | Pasadena Park | Pasadena | TX | 1971 | 03/01/02 | 163,767 | 50 | % | 504,052 | Macfrugals, Value Mart | |||||||||||
| 258 | Spencer Square | Pasadena | TX | 1974 | 03/01/02 | 195,376 | 88 | % | 2,075,202 | Bushwacker's, Eckerd, Kroger, Petco | |||||||||||
| 259 | Pearland Plaza | Pearland | TX | 1978 | 03/01/02 | 156,661 | 93 | % | 1,044,254 | Kroger, Palais Royal, Petco, Walgreens | |||||||||||
| 260 | Lamar Plaza | Rosenberg | TX | 1975 | 03/01/02 | 154,855 | 37 | % | 234,057 | Dollar General | |||||||||||
| 261 | Klein Square | Spring | TX | 1977 | 03/01/02 | 80,857 | 96 | % | 618,856 | Family Dollar, Foodtown | |||||||||||
| 262 | Keegan's Meadow | Stafford | TX | 1983 | 03/01/02 | 125,298 | 93 | % | 940,577 | 99 Cents Store, Randalls | |||||||||||
| 263 | Texas City Bay | Texas City | TX | 1973 | 03/01/02 | 235,784 | 96 | % | 1,228,879 | China Border, Factory 2-U, Kmart, Kroger | |||||||||||
| 264 | Tomball Parkway Plaza | Tomball | TX | 1984 | 03/01/02 | 133,629 | 97 | % | 882,650 | King Dollar, Palais Royal | Hobby Lobby, TSE Tractor Supply | ||||||||||
| 265 | Village Center | Victoria | TX | 1970 | 03/01/02 | 118,827 | 87 | % | 345,846 | Beals (Stage), Dollar King, Fabric Warehouse, Megaworld, Victoria Office Equipment | |||||||||||
| 266 | Hanover Square | Mechanicsville | VA | 1991 | 01/06/93 | 129,987 | 93 | % | 1,254,769 | Ukrops Supermarket | Kohl's | ||||||||||
| 267 | Victorian Square | Midlothian | VA | 1991 | 03/24/94 | 271,215 | 95 | % | 1,746,153 | Kmart, Kroger | |||||||||||
| 268 | VA-KY Regional S.C. | Norton | VA | 1989 | 12/30/92 | 193,238 | 100 | % | 1,221,933 | Goody's, Ingles, Wal-Mart | |||||||||||
| 269 | Cave Spring Corners | Roanoke | VA | 1969 | 06/05/97 | 171,125 | 51 | % | 515,914 | Kroger | |||||||||||
| 270 | Hunting Hills | Roanoke | VA | 1989 | 04/02/98 | 166,207 | 98 | % | 928,326 | Wal-Mart | |||||||||||
| 271 | Lakeside Plaza | Salem | VA | 1989 | 04/15/99 | 82,033 | 98 | % | 795,923 | CVS, Kroger | |||||||||||
| 272 | Lake Drive Plaza | Vinton | VA | 1976 | 02/12/98 | 148,060 | 100 | % | 1,012,058 | Big Lots, Kroger | |||||||||||
| 273 | Ridgeview Centre | Wise | VA | 1990 | 07/02/92 | 176,690 | 100 | % | 1,171,893 | Food City, Kmart | Belk's | ||||||||||
| 274 | Moundsville Plaza | Moundsville | WV | 1961 | 12/27/88 | 174,663 | 84 | % | 934,665 | Big Lots, Kroger | |||||||||||
| 275 | Grand Central Plaza | Parkersburg | WV | 1986 | 06/08/88 | 74,017 | 100 | % | 414,264 | Office Depot | |||||||||||
| 276 | Kmart Plaza | Vienna | WV | 1975 | 02/25/93 | 106,258 | 96 | % | 523,430 | Kmart | |||||||||||
| TOTAL | 38,410,260 | 90 | % | $ | 261,184,616 | ||||||||||||||||
| Factory Outlet Centers | |||||||||||||||||||||
| 1 | Factory Merchants Barstow | Barstow | CA | 1989 | 11/01/93 | 330,310 | 77 | % | $ | 4,247,964 | Esprit, Gap, Polo, Timberland | ||||||||||
| 2 | St. Augustine Outlet Center | St. Augustine | FL | 1990 | 03/01/92 | 329,362 | 93 | % | 4,834,260 | Calvin Klein, Gap, Mikasa, Reebok, Westpoint Stevens | |||||||||||
| 3 | Factory Merchants Branson | Branson | MO | 1988 | 11/01/93 | 317,706 | 85 | % | 3,435,714 | Dress Barn, Lenox, Westpoint Stevens | |||||||||||
| 4 | Factory Outlet Village Osage Beach | Osage Beach | MO | 1986 | 01/29/93 | 400,428 | 96 | % | 6,333,539 | Gap, Mikasa, Polo, Tommy Hilfiger | |||||||||||
| 5 | Jackson Outlet Village | Jackson | NJ | 1997 | 04/30/97 | 292,563 | 100 | % | 6,009,435 | Brooks Brothers, Gap, Mikasa, Nike, Reebok | |||||||||||
A-29
| 6 | Factory Merchants Ft. Chiswell | Max Meadows | VA | 1989 | 11/01/93 | 175,578 | 47 | % | 551,095 | Polo, Reebok | |||||||||||
| TOTAL | 1,845,947 | 86 | % | $ | 25,412,007 | ||||||||||||||||
| Single Tenant Properties | |||||||||||||||||||||
| 1 | Kroger | Muscle Shoals | AL | 1982 | 08/10/93 | 10,069 | 100 | % | $ | 60,414 | |||||||||||
| 2 | Kroger | Muscle Shoals | AL | 1982 | 08/10/93 | 42,130 | 100 | % | 252,780 | Big Lots | |||||||||||
| 3 | Kroger | Scottsboro | AL | 1982 | 08/10/93 | 42,130 | 100 | % | 217,391 | ||||||||||||
| 4 | Mad Butcher | Pine Bluff | AR | 1981 | 08/10/93 | 60,842 | 100 | % | 288,999 | ||||||||||||
| 5 | 24 Hour Fitness | Phoenix | AZ | 1994 | 05/06/94 | 44,374 | 100 | % | 741,189 | ||||||||||||
| 6 | 24 Hour Fitness | Scottsdale | AZ | 1994 | 08/19/94 | 44,374 | 100 | % | 749,773 | ||||||||||||
| 7 | Doverama at Rodney | Dover | DE | 1959 | 01/01/69 | 30,000 | 0 | % | — | ||||||||||||
| 8 | Gold's Gym | Brandon | FL | 1982 | 08/10/93 | 36,750 | 100 | % | 238,875 | ||||||||||||
| 9 | Albany I | Albany | GA | 1981 | 08/10/93 | 72,900 | 100 | % | 150,380 | ||||||||||||
| 10 | Rite Aid | East Albany | GA | 1982 | 08/10/93 | 10,069 | 100 | % | 54,567 | ||||||||||||
| 11 | Kroger | East Albany | GA | 1982 | 08/10/93 | 34,019 | 100 | % | 197,612 | Harvey Foods | |||||||||||
| 12 | Kmart | Atlantic | IA | 1980 | 01/19/94 | 40,318 | 100 | % | 160,000 | ||||||||||||
| 13 | Decatur I | Decatur | IL | 1983 | 08/10/93 | 29,000 | 0 | % | — | ||||||||||||
| 14 | Kroger | Ottawa | IL | 1982 | 08/10/93 | 44,088 | 100 | % | 278,866 | ||||||||||||
| 15 | Lucky stores | Peoria | IL | 1983 | 08/10/93 | 30,000 | 100 | % | 208,133 | Leath Furniture | |||||||||||
| 16 | Kroger | Waterloo | IL | 1982 | 08/10/93 | 31,170 | 100 | % | 207,135 | Schnuck Markets | |||||||||||
| 17 | Helping Hands | Fort Wayne | IN | 1976 | 12/31/92 | 4,584 | 100 | % | 49,694 | ||||||||||||
| 18 | Hobart I | Hobart | IN | 1983 | 08/10/93 | 29,300 | 0 | % | — | ||||||||||||
| 19 | Kindercare | Indianapolis | IN | 1976 | 12/31/92 | 4,268 | 100 | % | 38,000 | ||||||||||||
| 20 | Kindercare | Indianapolis | IN | 1976 | 12/31/92 | 4,452 | 100 | % | 24,555 | ||||||||||||
| 21 | Kindercare | Indianapolis | IN | 1976 | 12/31/92 | 4,452 | 100 | % | 38,000 | ||||||||||||
| 22 | Kindercare | Indianapolis | IN | 1976 | 12/31/92 | 4,212 | 100 | % | 38,000 | ||||||||||||
| 23 | Michigan City I | Michigan City | IN | 1983 | 08/10/93 | 29,000 | 0 | % | — | ||||||||||||
| 24 | Safeway | West Monroe | LA | 1981 | 08/10/93 | 41,293 | 100 | % | 228,671 | Brookshire's | |||||||||||
| 25 | Kindercare | Kalamazoo | MI | 1990 | 02/06/91 | 6,260 | 100 | % | 77,999 | ||||||||||||
| 26 | High Ridge Daycare | High Ridge | MO | 1980 | 12/31/92 | 4,654 | 100 | % | 28,800 | ||||||||||||
| 27 | Northern Automotive | Grand Island | NE | 1988 | 12/31/92 | 5,671 | 100 | % | 79,140 | Northeast Healthcare | |||||||||||
| 28 | Northern Automotive | Hastings | NE | 1988 | 12/31/92 | 4,000 | 100 | % | 56,658 | Northeast Healthcare | |||||||||||
| 29 | Muskogee I | Muskogee | OK | 1981 | 08/10/93 | 45,510 | 0 | % | — | ||||||||||||
| 30 | Kroger | Clearfield | PA | 1982 | 08/10/93 | 31,170 | 100 | % | 210,000 | Penn Traffic | |||||||||||
| 31 | Hardees | Hanover | PA | 1971 | 07/31/97 | 3,800 | 100 | % | 24,100 | ||||||||||||
| 32 | Winn-Dixie | Chattanooga | TN | 1995 | 03/31/97 | 43,848 | 100 | % | 237,413 | ||||||||||||
| 33 | Yarbrough | El Paso | TX | 1995 | 03/01/02 | 48,000 | 0 | % | — | ||||||||||||
| 34 | Pizza Hut | Harrisonburg | VA | 1969 | 07/31/96 | 3,384 | 100 | % | 22,755 | ||||||||||||
| TOTAL | 920,091 | 77 | % | $ | 4,959,899 | ||||||||||||||||
| Enclosed Malls/Specialty Retail Properties | |||||||||||||||||||||
| 1 | Pointe*Orlando | Orlando | FL | 1997 | 11/30/99 | 457,119 | 80 | % | $ | 9,808,640 | Disney, FAO Schwarz, Foot Locker, Muvico, XS | ||||||||||
| 2 | Laurel Mall | Connellsville | PA | 1970 | 05/15/01 | 336,222 | 58 | % | 513,538 | Ames, Shop "n Save | |||||||||||
| 3 | Valley Fair Mall | West Valley City | UT | 1970 | 12/31/96 | 600,962 | 97 | % | 3,486,893 | JC Penney, Meier & Frank, Mervyn's | |||||||||||
| TOTAL | 1,394,303 | 82 | % | $ | 13,809,070 | ||||||||||||||||
| Miscellaneous Properties | |||||||||||||||||||||
| 1 | Genzyme Corp. | Scottsdale | AZ | 1971 | 12/17/90 | 21,560 | 100 | % | $ | 293,808 | |||||||||||
| 2 | Roxbury Township | Roxbury | NJ | — | 12/31/97 | LAND | — | — | |||||||||||||
| 3 | North Central Avenue | Hartsdale | NY | — | 07/31/72 | LAND | — | — | |||||||||||||
| 4 | Cavitt Office Building | Bryan | TX | 1957 | 03/01/02 | 13,200 | 100 | % | — | ||||||||||||
| 5 | Victoria Crossing | Victoria | TX | — | 03/01/02 | LAND | — | — | |||||||||||||
| 6 | Taylorsville | Salt Lake City | UT | — | 06/01/99 | LAND | — | — | |||||||||||||
A-30
| 7 | Valley Fair Apartments | West Valley City | UT | 1975 | 03/01/97 | APTS | — | — | |||||||||||||
| TOTAL | 34,760 | 100 | % | $ | 293,808 | ||||||||||||||||
| TOTAL STABILIZED PORTFOLIO | 42,605,361 | 90 | % | $ | 305,659,401 | ||||||||||||||||
| Redevelopment Properties | |||||||||||||||||||||
| Community and Neighborhood Shopping Centers | |||||||||||||||||||||
| 1 | Stein Mart Center | Poway | CA | 1981 | 01/11/01 | 112,708 | 61 | % | $ | 435,882 | Motorsports Warehouse, Stein Mart | ||||||||||
| 2 | Bristol Plaza | Santa Ana | CA | 1972 | 06/20/97 | 111,403 | 98 | % | 1,015,409 | Pic "N" Save, Rite Aid | |||||||||||
| 3 | Arapahoe Crossings(2) | Aurora | CO | 1996 | 10/10/01 | 425,326 | 100 | % | 5,418,677 | Borders, King Soopers, Kohl's, Mann Theatre, Marshalls, Old Navy, Ross | |||||||||||
| 4 | Marketplace | Superior | CO | 1997 | 07/31/02 | 114,615 | 99 | % | 1,441,034 | Michaels, Office Max, PetsMart,T.J. Maxx | Costco, SuperTarget | ||||||||||
| 5 | Regency Park | Jacksonville | FL | 1985 | 06/16/97 | 333,948 | 94 | % | 2,529,429 | Babies R Us, Marshalls, Rhodes Furniture | |||||||||||
| 6 | Rutland Plaza | St. Petersburg | FL | 1964 | 11/01/96 | 149,562 | 100 | % | 1,040,610 | Big Lots, Winn-Dixie | |||||||||||
| 7 | Cordele Square | Cordele | GA | 1968 | 07/11/90 | 128,927 | 95 | % | 621,838 | Belk's, Harvey Foods | |||||||||||
| 8 | Haymarket Square | Des Moines | IA | 1979 | 05/12/95 | 266,525 | 92 | % | 1,150,193 | Dahl's Foods, Office Depot | |||||||||||
| 9 | J*Town Center | Jeffersontown | KY | 1959 | 10/21/88 | 196,910 | 31 | % | 443,491 | Save-A-Lot | |||||||||||
| 10 | Laurel Square | Brick | NJ | 1973 | 07/13/92 | 246,235 | 96 | % | 1,728,531 | Kmart, Pathmark | |||||||||||
| 11 | Bennetts Mills Plaza | Jackson | NJ | 1988 | 09/01/94 | 115,238 | 98 | % | 1,122,953 | Countyline Hardware, Stop & Shop | |||||||||||
| 12 | Dover Park Plaza | Yardville | NJ | 1966 | 01/28/00 | 56,222 | 100 | % | 399,418 | — | |||||||||||
| 13 | Paseo del Norte | Albuquerque | NM | 2001 | 03/01/02 | 49,600 | 3 | % | — | — | |||||||||||
| 14 | Southwood Plaza | Bowling Green | OH | 1961 | 05/16/90 | 81,959 | 86 | % | 362,404 | Hallmark, Odd Lots | |||||||||||
| 15 | Central Avenue Marketplace | Toledo | OH | 1968 | 08/14/90 | 157,383 | 8 | % | 12,000 | — | |||||||||||
| 16 | Dillsburg Shopping Center | Dillsburg | PA | 1994 | 10/16/96 | 68,848 | 100 | % | 644,585 | Giant Food Stores | |||||||||||
| 17 | Island Plaza | James Island | SC | 1994 | 10/06/97 | 171,955 | 45 | % | 591,299 | Food Lion | |||||||||||
| 18 | Kenworthy Crossing | El Paso | TX | 2000 | 03/01/02 | 70,969 | 87 | % | 400,450 | — | |||||||||||
| 19 | Village Plaza | Garland | TX | 1964 | 03/01/02 | 84,241 | 100 | % | 688,230 | Truong Nguyen Grocer | |||||||||||
| 20 | Old Egypt | Magnolia | TX | 2002 | 03/01/02 | 14,490 | 100 | % | — | — | |||||||||||
| 21 | Parkview East | Pasadena | TX | 1968 | 03/01/02 | 38,169 | 88 | % | 219,448 | Hancock Fabrics | |||||||||||
| TOTAL | 2,995,233 | 81 | % | $ | 20,265,881 | ||||||||||||||||
| Enclosed Malls/Specialty Retail Properties | |||||||||||||||||||||
| 1 | Clearwater Mall(3) | Clearwater | FL | 1973 | 12/02/97 | — | — | — | — | ||||||||||||
| 2 | The Mall at 163rd Street(4) | Miami | FL | 1956 | 12/31/98 | 300,000 | 81 | % | $ | 1,324,141 | Marshalls | Home Depot | |||||||||
| TOTAL | 300,000 | 81 | % | $ | 1,324,141 | ||||||||||||||||
| TOTAL REDEVELOPMENT PROPERTIES | 3,295,233 | 81 | % | $ | 21,590,022 | ||||||||||||||||
| TOTAL PORTFOLIO | 45,900,594 | 89 | % | $ | 327,249,423 | ||||||||||||||||
- (1)
- Includes all leases in force at September 30, 2002, including those that are fully executed, but not yet open.
- (2)
- In final phase of development.
- (3)
- Property contributed to a joint venture in 4Q 2002. Due to the current demolition of the property, no square footage is presented.
- (4)
- Expected GLA when redevelopment is complete.
The above does not purport to disclose all items required under GAAP.
The Company's Form 10-K for the year ended December 31, 2001 and Form 10-Q for the quarters ended September 30, 2002, June 30, 2002 and March 31, 2002 should be read in conjunction with the above information.
A-31
New Plan Excel Realty Trust, Inc.
Supplemental Disclosure—Quarter Ended September 30, 2002
Summary of Joint Venture Projects
| Property Name | City | State | JV Partner | Equity Investment | Percent Ownership | Economic Structure | Project Bank Debt Outstanding | GLA | Percent Leased(1) | ABR | Anchor Tenants | ||||||||||||||
|---|---|---|---|---|---|---|---|---|---|---|---|---|---|---|---|---|---|---|---|---|---|---|---|---|---|
| Benbrooke Ventures | |||||||||||||||||||||||||
| Rodney Village | Dover | DE | Benbrooke Partners | — | — | — | — | 213,686 | 71 | % | $ | 726,782 | Family Furniture Clearance, Farm Fresh | ||||||||||||
| Fruitland Plaza | Fruitland | MD | Benbrooke Partners | — | — | — | — | 104,095 | 66 | % | 522,202 | Dollar General, Food Lion | |||||||||||||
| Fredricksburg | Spotsylvania | VA | Benbrooke Partners | — | — | — | — | 83,374 | 20 | % | 109,200 | — | |||||||||||||
| Total | $ | 8,516,000 | 50 | % | 8.5% preferred return | $ | — | 401,155 | 59 | % | $ | 1,358,184 | |||||||||||||
| CA New Plan Venture Fund(2) | |||||||||||||||||||||||||
| Stabilized Properties | |||||||||||||||||||||||||
| Ventura Downs | Kissimmee | FL | Major U.S. pension fund | — | — | — | — | 98,191 | 100 | % | $ | 985,567 | Blockbuster, Publix, Walgreens | ||||||||||||
| Flamingo Falls | Pembroke Pines | FL | Major U.S. pension fund | — | — | — | — | 108,565 | 99 | % | 2,062,696 | Eckerd, Fresh Market | |||||||||||||
| Sarasota Village | Sarasota | FL | Major U.S. pension fund | — | — | — | — | 169,310 | 72 | % | 1,013,152 | Gold's Gym, Publix | |||||||||||||
| Atlantic Plaza | Satellite Beach | FL | Major U.S. pension fund | — | — | — | — | 133,070 | 96 | % | 912,816 | Beall's, Publix, Starnet Cinemas | |||||||||||||
| Mableton Walk | Mableton | GA | Major U.S. pension fund | — | — | — | — | 105,742 | 96 | % | 1,015,639 | Piccadilly Cafeteria, Publix | |||||||||||||
| Raymond Road | Jackson | MS | Major U.S. pension fund | — | — | — | — | 62,345 | 83 | % | 337,144 | Kroger | |||||||||||||
| Mint Hill Festival | Charlotte | NC | Major U.S. pension fund | — | — | — | — | 59,047 | 100 | % | 533,917 | Eckerd, Harris Teeter | |||||||||||||
| Ladera | Albuquerque | NM | Major U.S. pension fund | — | — | — | — | 124,584 | 80 | % | 941,724 | Greenbacks, John Brooks | |||||||||||||
| Harwood Central Village | Bedford | TX | Major U.S. pension fund | — | — | — | — | 119,742 | 94 | % | 1,050,591 | Kroger, Petco | |||||||||||||
| Odessa-Winwood Town Center | Odessa | TX | Major U.S. pension fund | — | — | — | — | 309,716 | 100 | % | 1,824,240 | HEB, Michael's, Office Depot, Target | |||||||||||||
| In-Process Development Properties | |||||||||||||||||||||||||
| Marketplace at Wycliffe—Phase 1 | Lake Worth | FL | Major U.S. pension fund | — | — | — | — | 108,729 | 96 | % | — | Blockbuster, Walgreens, Winn-Dixie | |||||||||||||
| Marketplace at Wycliffe—Phase 2 | Lake Worth | FL | Major U.S. pension fund | — | — | — | — | 26,700 | 0 | % | — | — | |||||||||||||
| Spring Valley Crossing | Dallas | TX | Major U.S. pension fund | — | — | — | — | 107,578 | 63 | % | — | Albertson's | |||||||||||||
| Windvale | The Woodlands | TX | Major U.S. pension fund | — | — | — | — | 126,299 | 63 | % | — | Randalls | |||||||||||||
| Total(3) | $ | 5,664,000 | 10 | % | Increased participation after 12% IRR | $ | 86,338,873 | 1,659,618 | 92 | % | $ | 10,677,486 | |||||||||||||
| The Centre At Preston Ridge | |||||||||||||||||||||||||
| Phase 1(4) | Frisco | TX | George Allen/Milton Schaffer | $ | 33,163,000 | 50 | % | 10% preferred return | $ | 70,000,000 | 734,400 | 98 | % | $ | 11,724,000 | Best Buy, DSW Shoe Warehouse, Linens N Things, Marshalls, MJ Design, Old Navy, PetsMart, Ross, Staples, Stein Mart, Target (NAP), T.J. Maxx, Ulta 3 | |||||||||
| Phase 2(5) | Frisco | TX | George Allen/Milton Schaffer | 4,907,000 | 50 | % | 10% preferred return | — | — | — | — | — | |||||||||||||
| Total | $ | 38,070,000 | $ | 70,000,000 | 734,400 | 98 | % | $ | 11,724,000 | ||||||||||||||||
| Vail Ranch II(6)(7) | |||||||||||||||||||||||||
| Vail Ranch II | Temecula | CA | Land Grand Development | $ | 1,268,000 | 50 | % | 12% preferred return | $ | 8,909,000 | 109,200 | 79 | % | $ | 1,074,000 | Powerhouse Gym, Stein Mart | |||||||||
| Investments in/Advances to Unconsolidated Ventures | $ | 53,518,000 | Total New Plan Pro Rata Share(3) | $ | 48,088,387 | 788,339 | 85 | % | $ | 8,145,841 | |||||||||||||||
- (1)
- Includes all leases in force at September 30, 2002, including those that are fully executed, but not yet open.
- (2)
- AEW serves as the advisor for the joint venture partner. Equity investment includes temporary investments.
- (3)
- Percent leased excludes CA New Plan Venture Fund in-process development properties.
- (4)
- The joint venture also owns 30.1 acres of undeveloped land.
- (5)
- The joint venture is comprised of 13.9 acres of undeveloped land. Included in the Company's equity investment balance is approximately $3.5 million of outstanding notes receivable related to the project due to the Company from George Allen/Milton Schaffer in January 2007.
- (6)
- Project data is based on information provided by joint venture partner.
- (7)
- Phase 1 of the project is owned by the Company.
NAP—Anchor tenant not owned
The above does not purport to disclose all items required under GAAP.
The Company's Form 10-K for the year ended December 31, 2001 and Form 10-Q for the quarters ended September 30, 2002, June 30, 2002 and March 31, 2002 should be read in conjunction with the above information.
A-32
New Plan Excel Realty Trust, Inc.
Supplemental Disclosure—Quarter Ended September 30, 2002
Joint Venture Projects—Disposition Activity
| Property Name | Type(1) | Location | Transaction Description | Sale Date | Proceeds Amount | Book Value | Gain/ (Loss) | ||||||||||
|---|---|---|---|---|---|---|---|---|---|---|---|---|---|---|---|---|---|
| 1Q 2002 | |||||||||||||||||
| The Centre at Preston Ridge—Phase 2(2) | L | Frisco, TX | 23.3 acre land sale | 01/18/02 | $ | 13,000,985 | $ | 11,765,000 | $ | 1,235,985 | |||||||
- (1)
- L—Land
- (2)
- Proceeds used to reduce bank debt guaranteed by the Company on the property.
The above does not purport to disclose all items required under GAAP.
The Company's Form 10-K for the year ended December 31, 2001 and Form 10-Q for the quarters ended September 30, 2002, June 30, 2002 and March 31, 2002 should be read in conjunction with the above information.
A-33

Transaction Overview
Acquisition of 58 Shopping Centers
November 12, 2002
Certain statements in this presentation that are not historical fact may constitute forward-looking statements within the meaning of the Private Securities Litigation Reform Act of 1995. Such forward-looking statements involve known and unknown risks, uncertainties and other factors which may cause the actual results, transactions or achievements of the Company to differ materially from historical results or from any results, transactions or achievements expressed or implied by such forward-looking statements, including without limitation: national and local economic conditions; the ability of tenants to pay rent and the effect of bankruptcy laws; the competitive environment in which the Company operates; financing risks, including possible future downgrades in the Company's credit rating; property management risks; acquisition, dispositi on, development and joint venture risks, including risks that proposed acquisitions are not consummated, developments and redevelopments are not completed on time or on budget and strategies and actions that the Company may not control; potential environmental and other liabilities; and other factors affecting the real estate industry generally. The Company refers you to the documents filed by the Company from time to time with the Securities and Exchange Commission, specifically the section titled "Business-Risk Factors" in the Company's Annual Report on Form 10-K for the year ended December 31, 2001 which discuss these and other factors that could adversely affect the Company's results.
B-1
Transaction Overview
- •
- New Plan has entered into a definitive agreement with Equity Investment Group, a private retail focused REIT, to purchase a portfolio of selected assets
- •
- New Plan to acquire 58 community and neighborhood shopping centers (including 3 redevelopment properties) located in 22 states, predominantly in the Central and Eastern regions of the United States
- •
- Purchase Price of approximately $437 million, comprised of the assumption of approximately $152 million of outstanding indebtedness, the issuance of approximately $25 million of DownREIT partnership units and approximately $260 million of cash:
- •
- Stabilized Assets: 55 properties at a 9.8% capitalization rate(1) on 2003 NOI ($54 PSF)
- •
- Redevelopment Assets: 3 properties at a 6.6% capitalization rate on 2003 NOI, 11.0% stabilized capitalization rate
- •
- Total Properties: 58 properties at a 9.5% capitalization rate on 2003 NOI
- (1)
- Capitalization rate includes a $0.20 per square foot reserve for replacements and management fees of 4 percent.
B-2
Pro Forma Portfolio Overview
| (as of 9/30/02) | New Plan Standalone | Acquisition Portfolio | New Plan Pro Forma For Transaction | ||||||||||||||
|---|---|---|---|---|---|---|---|---|---|---|---|---|---|---|---|---|---|
| Shopping Center—Summary Statistics | |||||||||||||||||
Total GLA (Million SF) | 41.4 | 7.9 | 49.3 | ||||||||||||||
Total Number of Shopping Centers | 297 | 58 | 355 | ||||||||||||||
Community Shopping Centers(% of Shopping Centers)(1) | 157 | 53 | % | 33 | 57 | % | 190 | 54 | % | ||||||||
Neighborhood Shopping Centers(% of Shopping Centers)(1) | 140 | 47 | % | 25 | 43 | % | 165 | 46 | % | ||||||||
Total Occupancy(2) | 90 | % | 92 | % | 91 | % | |||||||||||
Average Center Size (SF) | 139,412 | 136,657 | 138,962 | ||||||||||||||
No. of States | 32 | 22 | 37 | ||||||||||||||
Grocery-Anchored(% of Shopping Center GLA) | 171 | 60 | % | 42 | 74 | % | 213 | 62 | % | ||||||||
Grocer Sales Per Square Foot(3) | $ | 467 | $ | 466 | $ | 467 | |||||||||||
Anchored by #1, #2 or #3 Grocer in Market | |||||||||||||||||
| (% of Grocery—Anchored Shopping Centers)(4) | 133 | 78 | % | 36 | 86 | % | 169 | 79 | % | ||||||||
Demographic Information:(5) | |||||||||||||||||
Average Population Density (2002): | |||||||||||||||||
| 3-mile | 68,003 | 56,986 | 66,203 | ||||||||||||||
| 5-mile | 155,681 | 126,532 | 150,919 | ||||||||||||||
| Average Household Income (2002): | |||||||||||||||||
| 3-mile | $ | 54,615 | $ | 52,300 | $ | 54,237 | |||||||||||
| 5-mile | 55,118 | 53,986 | 54,933 | ||||||||||||||
| Per Capita Income (2002): | |||||||||||||||||
| 3-mile | $ | 21,077 | $ | 21,091 | $ | 21,079 | |||||||||||
| 5-mile | 21,110 | 21,742 | 21,213 | ||||||||||||||
- (1)
- New Plan's classification based on ICSC definition (neighborhood shopping centers < 150,000 SF, community shopping centers > 100,000 SF, taking into account other criteria such as acreage, number and types of anchors and primary trade area).
- (2)
- Excludes redevelopment properties.
- (3)
- Grocer sales per square foot includes only properties reporting sales data for 2001 and excludes non-comparable stores. Selling area for grocers is 77 percent of gross floor area as defined by the Food Marketing Institute.
- (4)
- Source: 2002 Market Scope, local media and Company estimates.
- (5)
- Source: Applied Geographic Solutions.
B-3
Age Characteristics(1)
NEW PLAN STANDALONE
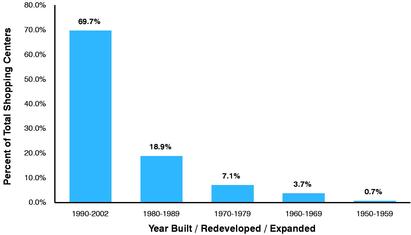
ACQUISITION PORTFOLIO
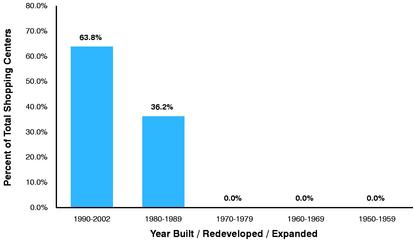
NEW PLAN PRO FORMA FOR TRANSACTION

- (1)
- Property is considered redeveloped/expanded if significant building improvements are made or GLA is expanded and the investment is expected to have a significant favorable impact on marketability.
B-4
Standalone and Pro Forma
ABR & GLA by State
New Plan Standalone—Top 10 States
| State | Number of Properties | GLA | % of GLA | ABR | % of ABR | |||||||
|---|---|---|---|---|---|---|---|---|---|---|---|---|
| Texas | 86 | 9,379,913 | 20.4 | % | $ | 65,746,011 | 20.1 | % | ||||
| Florida | 24 | 4,279,978 | 9.3 | 37,592,217 | 11.5 | |||||||
| California | 16 | 2,581,340 | 5.6 | 25,317,532 | 7.7 | |||||||
| New York | 24 | 3,327,532 | 7.2 | 20,470,938 | 6.3 | |||||||
| Georgia | 30 | 2,885,889 | 6.3 | 16,659,301 | 5.1 | |||||||
| Michigan | 12 | 2,124,910 | 4.6 | 16,343,994 | 5.0 | |||||||
| Ohio | 17 | 2,808,149 | 6.1 | 15,461,071 | 4.7 | |||||||
| Pennsylvania | 13 | 1,933,743 | 4.2 | 13,418,837 | 4.1 | |||||||
| New Jersey | 8 | 1,157,968 | 2.5 | 13,053,290 | 4.0 | |||||||
| Tennessee | 15 | 1,872,493 | 4.1 | 12,041,567 | 3.7 | |||||||
| Total | 245 | 32,351,915 | 70.5 | % | $ | 236,104,757 | 72.1 | % | ||||
Acquisition Portfolio—Top 10 States
| State | Number of Properties | GLA | % of GLA | ABR | % of ABR | |||||||
|---|---|---|---|---|---|---|---|---|---|---|---|---|
| Ohio | 7 | 990,592 | 12.5 | % | $ | 5,816,844 | 11.9 | % | ||||
| Florida | 8 | 889,825 | 11.2 | 5,550,216 | 11.4 | |||||||
| Georgia | 4 | 785,103 | 9.9 | 4,610,736 | 9.5 | |||||||
| Indiana | 5 | 682,250 | 8.6 | 4,028,772 | 8.3 | |||||||
| Virginia | 4 | 366,868 | 4.6 | 3,028,920 | 6.2 | |||||||
| Illinois | 5 | 444,446 | 5.6 | 2,788,740 | 5.7 | |||||||
| North Carolina | 2 | 379,372 | 4.8 | 2,647,236 | 5.4 | |||||||
| Wisconsin | 3 | 466,306 | 5.9 | 2,636,616 | 5.4 | |||||||
| Kentucky | 2 | 333,652 | 4.2 | 2,162,376 | 4.4 | |||||||
| Massachusetts | 2 | 348,917 | 4.4 | 2,038,452 | 4.2 | |||||||
| Total | 42 | 5,687,331 | 71.8 | % | $ | 35,308,908 | 72.5 | % | ||||
New Plan Pro Forma for Transaction—Top 10 States
| State | Number of Properties | GLA | % of GLA | ABR | % of ABR | |||||||
|---|---|---|---|---|---|---|---|---|---|---|---|---|
| Texas | 87 | 9,532,057 | 17.7 | % | $ | 66,577,623 | 17.7 | % | ||||
| Florida | 32 | 5,169,803 | 9.6 | 43,142,433 | 11.5 | |||||||
| California | 16 | 2,581,340 | 4.8 | 25,317,532 | 6.7 | |||||||
| New York | 25 | 3,531,579 | 6.6 | 22,058,166 | 5.9 | |||||||
| Ohio | 24 | 3,798,741 | 7.1 | 21,277,915 | 5.7 | |||||||
| Georgia | 34 | 3,670,992 | 6.8 | 21,270,037 | 5.7 | |||||||
| Michigan | 13 | 2,396,416 | 4.5 | 18,008,658 | 4.8 | |||||||
| Pennsylvania | 14 | 2,079,099 | 3.9 | 14,759,177 | 3.9 | |||||||
| New Jersey | 8 | 1,157,968 | 2.2 | 13,053,290 | 3.5 | |||||||
| Tennessee | 16 | 1,926,084 | 3.6 | 12,451,547 | 3.3 | |||||||
| Total | 269 | 35,844,079 | 66.6 | % | $ | 257,916,377 | 68.6 | % | ||||
Note: Based on New Plan's total portfolio. Data as of September 30, 2002.
B-5
- •
- Pre-transaction, New Plan shopping centers are present in 75 MSAs/CMSAs
- •
- Pro forma for the Transaction, the Company will:
- •
- Increase its market presence to 93 MSAs/CMSAs (a 24% increase)
- •
- Retain a significant concentration in existing core markets
- —
- 54% of GLA to be acquired is in New Plan's existing MSAs/CMSAs
- —
- 26% of GLA to be acquired is in new MSAs/CMSAs, but in markets which can be served by New Plan's current management infrastructure
- —
- 20% of GLA to be acquired is in new, desirable MSAs/CMSAs (Northeast and Midwest)
- •
- 38.7% of New Plan's total GLA remains in Texas, Florida, California and New York, the most productive states in the United States(1)
- (1)
- Source: 2000 Gross State Product data, U.S. Department of Commerce Bureau of Economic Analysis
B-6
Pro Forma Regional Distribution

B-7
Standalone and Pro Forma
Tenant Profile
New Plan Standalone
| Tenant | Number of Leases | GLA | % of GLA | ABR | % of ABR | Credit Rating(1) | |||||||
|---|---|---|---|---|---|---|---|---|---|---|---|---|---|
| The Kroger Co.(2) | 42 | 2,131,024 | 4.6 | % | $ | 14,398,046 | 4.4 | % | BBB- / Baa3 | ||||
| Kmart Corporation(3) | 35 | 3,262,674 | 7.1 | 13,542,761 | 4.1 | WR | |||||||
| Wal-Mart Stores | 26 | 2,857,523 | 6.2 | 12,063,607 | 3.7 | AA / Aa2 | |||||||
| Winn-Dixie Stores(4) | 19 | 859,033 | 1.9 | 5,250,077 | 1.6 | BB+ / Ba2 | |||||||
| Ahold USA(5) | 14 | 665,356 | 1.4 | 4,881,811 | 1.5 | BBB+ / Baa1 | |||||||
| The TJX Companies(6) | 21 | 660,290 | 1.4 | 4,495,444 | 1.4 | A / A3 | |||||||
| J.C. Penney Company(7) | 37 | 683,567 | 1.5 | 4,332,564 | 1.3 | BBB- / Ba3 | |||||||
| Publix Super Markets | 12 | 578,954 | 1.3 | 3,580,537 | 1.1 | NR | |||||||
| Safeway(8) | 9 | 423,011 | 0.9 | 3,069,978 | 0.9 | BBB / Baa2 | |||||||
| Walgreen Co. | 19 | 260,042 | 0.6 | 3,002,553 | 0.9 | A+ / Aa3 | |||||||
| Totals | 234 | 12,381,474 | 27.0 | % | $ | 68,617,378 | 21.0 | % | |||||
Acquisition Portfolio
| Tenant | Number of Leases | GLA | % of GLA | ABR | % of ABR | Credit Rating(1) | |||||||
|---|---|---|---|---|---|---|---|---|---|---|---|---|---|
| Ahold USA(5) | 6 | 316,230 | 4.0 | % | $ | 2,434,440 | 5.0 | % | BBB+ / Baa1 | ||||
| Delhaize America(9) | 6 | 241,279 | 3.0 | 1,530,252 | 3.1 | BBB- / Baa3 | |||||||
| Wal-Mart Stores | 3 | 325,253 | 4.1 | 1,301,964 | 2.7 | AA / Aa2 | |||||||
| The Kroger Co.(2) | 5 | 247,018 | 3.1 | 1,189,968 | 2.4 | BBB- / Baa3 | |||||||
| Circuit City | 4 | 139,453 | 1.8 | 1,114,584 | 2.3 | NR | |||||||
| The TJX Companies(6) | 4 | 163,843 | 2.1 | 989,184 | 2.0 | A / A3 | |||||||
| Winn-Dixie Stores(4) | 2 | 98,228 | 1.2 | 745,212 | 1.5 | BB+ / Ba2 | |||||||
| Big Lots Stores, Inc. | 8 | 218,262 | 2.8 | 730,968 | 1.5 | BBB- / NR | |||||||
| Family Dollar | 15 | 124,870 | 1.6 | 661,704 | 1.4 | NR | |||||||
| Pathmark | 1 | 58,690 | 0.7 | 651,600 | 1.3 | BB- / Ba3 | |||||||
| Totals | 54 | 1,933,126 | 24.4 | % | $ | 11,349,876 | 23.3 | % | |||||
New Plan Pro Forma For Transaction
| Tenant | Number of Leases | GLA | % of GLA | ABR | % of ABR | Credit Rating(1) | |||||||
|---|---|---|---|---|---|---|---|---|---|---|---|---|---|
| The Kroger Co.(2) | 47 | 2,378,042 | 4.4 | % | $ | 15,588,014 | 4.1 | % | BBB- / Baa3 | ||||
| Kmart Corporation(3) | 36 | 3,345,453 | 6.2 | 13,679,945 | 3.6 | WR | |||||||
| Wal-Mart Stores | 29 | 3,182,776 | 5.9 | 13,365,571 | 3.6 | AA / Aa2 | |||||||
| Ahold USA(5) | 20 | 981,586 | 1.8 | 7,316,251 | 1.9 | BBB+ / Baa1 | |||||||
| Winn-Dixie Stores(4) | 21 | 957,261 | 1.8 | 5,995,289 | 1.6 | BB+ / Ba2 | |||||||
| The TJX Companies(6) | 25 | 824,133 | 1.5 | 5,484,628 | 1.5 | A / A3 | |||||||
| J.C. Penney Company(7) | 43 | 769,359 | 1.4 | 4,757,316 | 1.3 | BBB- / Ba3 | |||||||
| Delhaize America(9) | 21 | 692,183 | 1.3 | 4,400,255 | 1.2 | BBB- / Baa3 | |||||||
| Publix Super Markets | 14 | 669,453 | 1.2 | 4,026,757 | 1.1 | NR | |||||||
| Big Lots Stores, Inc. | 35 | 973,556 | 1.8 | 3,534,605 | 0.9 | BBB- / NR | |||||||
| Totals | 291 | 14,773,802 | 27.4 | % | $ | 78,148,631 | 20.8 | % | |||||
Note: Based on New Plan's total portfolio. Data as of September 30, 2002.
- (1)
- Credit Ratings from S&P and Moody's as of November 1, 2002.
- (2)
- Includes King Soopers, Kroger, Ralphs and Smith's.
- (3)
- Kmart filed for bankruptcy protection on January 22, 2002.
- (4)
- Includes Save Rite Grocery Warehouse and Winn-Dixie.
- (5)
- Includes BI-LO, Food Max, Giant, Martin's, Stop & Shop and Tops Market.
- (6)
- Includes Marshalls and T.J. Maxx.
- (7)
- Includes Eckerd and JCPenney.
- (8)
- Includes Dominick's, Randalls and Vons.
- (9)
- Includes Food Lion, Hannaford Bros and Kash n' Karry.
B-8
Conclusions
| New Plan's Objective | | | Rationale for Transaction | | | Result | ||||||
|---|---|---|---|---|---|---|---|---|---|---|---|---|
| Focus on community and neighborhood shopping center business |  | — | Garner economies of scale and scope by expanding in area of expertise | | — | Adds 7.9 million square feet of shopping centers to the portfolio | ||||||
Improve portfolio characteristics through diversified geography and tenant base | | — | Diverse, yet complementary portfolio characteristics | | — | Complementary demographic statistics match levels achieved through the CenterAmerica portfolio acquisition | ||||||
| — | No tenant accounts for more than 4.1% of ABR | |||||||||||
| — | Reduced Kmart exposure | |||||||||||
| — | Increased geographic diversity from 32 to 37 states | |||||||||||
| — | Reduced Texas exposure | |||||||||||
| — | Easily absorbed into existing infrastructure | |||||||||||
Migrate toward optimal long-term capital structure | | — | Improve credit profile | | — | Temporary increase in leverage | ||||||
| — | Asset sales and/or equity issuance will return credit statistics to target range | |||||||||||
Increased shareholder value | | — | Continuation of business plan | | — | Accretive transaction | ||||||
| — | Long term, stable investment vehicle | — | Furthers diversification |
B-9
SIGNATURE
SUPPLEMENTAL DISCLOSURE Quarter Ended September 30, 2002
New Plan Excel Realty Trust, Inc. Supplemental Disclosure—Quarter Ended September 30, 2002 Table of Contents
New Plan Excel Realty Trust, Inc. Supplemental Disclosure—Quarter-Ended September 30, 2002 Company Overview/Third Quarter Review
New Plan Excel Realty Trust, Inc. Supplemental Disclosure—Quarter Ended September 30, 2002 Balance Sheets (Unaudited, in thousands)
New Plan Excel Realty Trust, Inc. Supplemental Disclosure—Quarter Ended September 30, 2002 Income Statements (Unaudited, in thousands, except per share amounts)
New Plan Excel Realty Trust, Inc. Supplemental Disclosure—Quarter Ended September 30, 2002 Funds from Operations/Funds Available for Distribution/Earnings Before Gains and Losses on Real Estate/Capital Expenditures (In thousands, except per share amounts)
New Plan Excel Realty Trust, Inc. Supplemental Disclosure—Quarter Ended September 30, 2002 Funds from Operations/Funds Available for Distribution/Earnings Before Gains and Losses on Real Estate/Capital Expenditures (In thousands, except per share amounts)
New Plan Excel Realty Trust, Inc. Supplemental Disclosure—Quarter Ended September 30, 2002 Selected Financial Ratios/Data (In thousands, except per share amounts)
New Plan Excel Realty Trust, Inc. Supplemental Disclosure—Quarter Ended September 30, 2002 Summary of Outstanding Debt (In thousands)
New Plan Excel Realty Trust, Inc. Supplemental Disclosure—Quarter Ended September 30, 2002 Summary of Outstanding Debt (In thousands)
New Plan Excel Realty Trust, Inc. Supplemental Disclosure—Quarter Ended September 30, 2002 Debt Maturity Schedule (In thousands)
New Plan Excel Realty Trust, Inc. Supplemental Disclosure—Quarter Ended September 30, 2002 Property Type Summary
New Plan Excel Realty Trust, Inc. Supplemental Disclosure—Quarter Ended September 30, 2002 Properties by State/Region
New Plan Excel Realty Trust, Inc. Supplemental Disclosure—Quarter Ended September 30, 2002 Same Property NOI Analysis (In thousands, except property statistics)
New Plan Excel Realty Trust, Inc. Supplemental Disclosure—Quarter Ended September 30, 2002 Top Ten Tenants
New Plan Excel Realty Trust, Inc. Supplemental Disclosure—Quarter Ended September 30, 2002 New Lease Summary
New Plan Excel Realty Trust, Inc. Supplemental Disclosure—Quarter Ended September 30, 2002 Lease Expiration Schedule
New Plan Excel Realty Trust, Inc. Supplemental Disclosure—Quarter Ended September 30, 2002 Property Portfolio
New Plan Excel Realty Trust, Inc. Supplemental Disclosure—Quarter Ended September 30, 2002 Joint Venture Projects—Disposition Activity
Transaction Overview Acquisition of 58 Shopping Centers November 12, 2002