Searchable text section of graphics shown above
[LOGO]
PORTFOLIO ASSESSMENT
Physical Characteristics
and Market Analysis
As of September 30, 2005
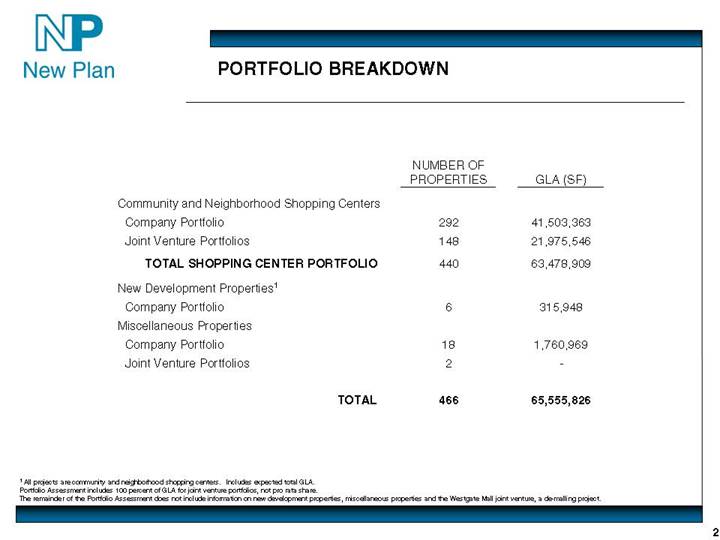
[LOGO] | | PORTFOLIO BREAKDOWN |
| | NUMBER OF | | | |
| | PROPERTIES | | GLA (SF) | |
| | | | | |
Community and Neighborhood Shopping Centers | | | | | |
Company Portfolio | | 292 | | 41,503,363 | |
Joint Venture Portfolios | | 148 | | 21,975,546 | |
| | | | | |
TOTAL SHOPPING CENTER PORTFOLIO | | | 440 | | 63,478,909 | |
| | | | | |
New Development Properties(1) | | | | | |
Company Portfolio | | 6 | | 315,948 | |
Miscellaneous Properties | | | | | |
Company Portfolio | | 18 | | 1,760,969 | |
Joint Venture Portfolios | | 2 | | — | |
| | | | | |
TOTAL | | | 466 | | 65,555,826 | |
(1) All projects are community and neighborhood shopping centers. Includes expected total GLA.
Portfolio Assessment includes 100 percent of GLA for joint venture portfolios, not pro rata share.
The remainder of the Portfolio Assessment does not include information on new development properties, miscellaneous properties and the Westgate Mall joint venture, a de-malling project.
2
TYPES OF SHOPPING CENTERS(1)
TOTAL PORTFOLIO
| | NUMBER OF | | PERCENT OF | | PERCENT OF | | AVERAGE | |
| | SHOPPING | | SHOPPING | | SHOPPING | | SHOPPING | |
| | CENTERS | | CENTERS | | CENTER GLA | | CENTER SIZE (SF) | |
COMMUNITY SHOPPING CENTERS | | 245 | | 55.8 | % | 75.0 | % | 194,223 | |
Grocery-anchored(2) | | 147 | | 33.5 | % | 44.6 | % | 192,643 | |
Non-grocery anchored(3) | | 98 | | 22.3 | % | 30.4 | % | 196,591 | |
| | | | | | | | | |
NEIGHBORHOOD SHOPPING CENTERS | | 194 | | 44.2 | % | 25.0 | % | 81,930 | |
Grocery-anchored(2) | | 118 | | 26.9 | % | 16.6 | % | 106,923 | |
Non-grocery anchored(3) | | 66 | | 15.0 | % | 7.2 | % | 69,573 | |
Non-anchored | | 10 | | 2.3 | % | 1.2 | % | 75,743 | |
| | | | | | | | | |
TOTAL | | 439 | | 100.0 | % | 100.0 | % | 144,599 | |
• Approximately 56 percent of New Plan’s total portfolio is community shopping centers and approximately 44 percent is neighborhood shopping centers.
• 265 properties, accounting for approximately 61 percent of New Plan’s total portfolio GLA, are grocery-anchored. 190 of the 265 grocery-anchored shopping centers have another anchor in addition to the grocer.
(1) According to the ICSC: “Neighborhood shopping centers provide convenience shopping for the day-to-day needs of consumers in the immediate neighborhood. These centers are typically anchored by a grocery and average 30,000 to 150,000 square feet. Community shopping centers typically offer a wider range of apparel and other soft goods than the neighborhood shopping center does. Among the more common anchors are grocers, super drugstores and discount department stores. These centers average 100,000 to 350,000 square feet.”
(2) The property may also have another anchor in addition to the grocer.
(3) The non-grocery anchor is either a major discount store, a tenant with square footage greater than 10,000 square feet if the shopping center GLA is less than 125,000 square feet or a tenant with square footage greater than 25,000 square feet if the shopping center GLA is greater than 125,000 square feet, or a tenant with square footage greater than 10 percent of the shopping center GLA, but not less than 5,000 square feet.
3
TYPES OF SHOPPING CENTERS(1)
COMPANY PORTFOLIO
| | NUMBER OF | | PERCENT OF | | PERCENT OF | | AVERAGE | |
| | SHOPPING | | SHOPPING | | SHOPPING | | SHOPPING | |
| | CENTERS | | CENTERS | | CENTER GLA | | CENTER SIZE (SF) | |
COMMUNITY SHOPPING CENTERS | | 155 | | 53.1 | % | 72.4 | % | 193,833 | |
Grocery-anchored(2) | | 94 | | 32.2 | % | 42.6 | % | 187,876 | |
Non-grocery anchored(3) | | 61 | | 20.9 | % | 29.8 | % | 203,013 | |
| | | | | | | | | |
NEIGHBORHOOD SHOPPING CENTERS | | 137 | | 46.9 | % | 27.6 | % | 83,644 | |
Grocery-anchored(2) | | 80 | | 27.4 | % | 17.8 | % | 106,772 | |
Non-grocery anchored(3) | | 48 | | 16.4 | % | 8.2 | % | 70,880 | |
Non-anchored | | 9 | | 3.1 | % | 1.6 | % | 74,415 | |
| | | | | | | | | |
TOTAL | | 292 | | 100.0 | % | 100.0 | % | 142,135 | |
• Approximately 53 percent of New Plan’s company portfolio is community shopping centers and approximately 47 percent is neighborhood shopping centers.
• 174 properties, accounting for approximately 60 percent of New Plan’s company portfolio GLA, are grocery-anchored. 124 of the 174 grocery-anchored shopping centers have another anchor in addition to the grocer.
(1) According to the ICSC: “Neighborhood shopping centers provide convenience shopping for the day-to-day needs of consumers in the immediate neighborhood. These centers are typically anchored by a grocery and average 30,000 to 150,000 square feet. Community shopping centers typically offer a wider range of apparel and other soft goods than the neighborhood shopping center does. Among the more common anchors are grocers, super drugstores and discount department stores. These centers average 100,000 to 350,000 square feet.”
(2) The property may also have another anchor in addition to the grocer.
(3) The non-grocery anchor is either a major discount store, a tenant with square footage greater than 10,000 square feet if the shopping center GLA is less than 125,000 square feet or a tenant with square footage greater than 25,000 square feet if the shopping center GLA is greater than 125,000 square feet, or a tenant with square footage greater than 10 percent of the shopping center GLA, but not less than 5,000 square feet.
4
TYPES OF SHOPPING CENTERS(1)
JOINT VENTURE PORTFOLIOS
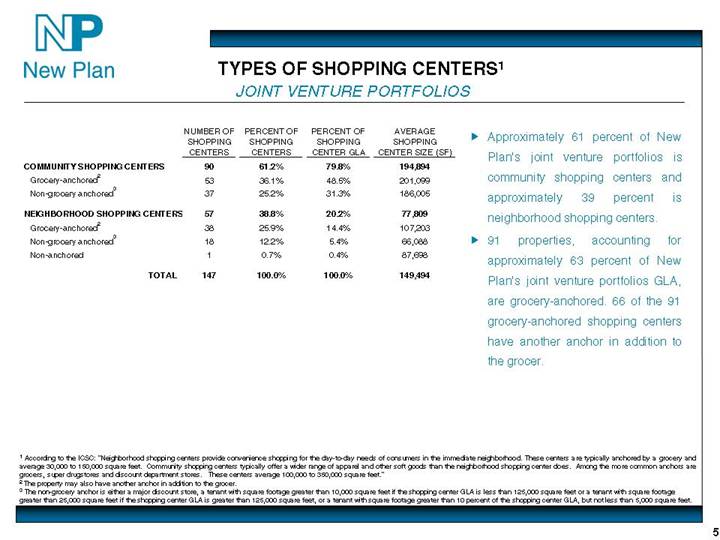
| | NUMBER OF | | PERCENT OF | | PERCENT OF | | AVERAGE | |
| | SHOPPING | | SHOPPING | | SHOPPING | | SHOPPING | |
| | CENTERS | | CENTERS | | CENTER GLA | | CENTER SIZE (SF) | |
COMMUNITY SHOPPING CENTERS | | 90 | | 61.2 | % | 79.8 | % | 194,894 | |
Grocery-anchored(2) | | 53 | | 36.1 | % | 48.5 | % | 201,099 | |
Non-grocery anchored(3) | | 37 | | 25.2 | % | 31.3 | % | 186,005 | |
| | | | | | | | | |
NEIGHBORHOOD SHOPPING CENTERS | | 57 | | 38.8 | % | 20.2 | % | 77,809 | |
Grocery-anchored(2) | | 38 | | 25.9 | % | 14.4 | % | 107,203 | |
Non-grocery anchored(3) | | 18 | | 12.2 | % | 5.4 | % | 66,088 | |
Non-anchored | | 1 | | 0.7 | % | 0.4 | % | 87,698 | |
| | | | | | | | | |
TOTAL | | 147 | | 100.0 | % | 100.0 | % | 149,494 | |
• Approximately 61 percent of New Plan’s joint venture portfolios is community shopping centers and approximately 39 percent is neighborhood shopping centers.
• 91 properties, accounting for approximately 63 percent of New Plan’s joint venture portfolios GLA, are grocery-anchored. 66 of the 91 grocery-anchored shopping centers have another anchor in addition to the grocer.
(1) According to the ICSC: “Neighborhood shopping centers provide convenience shopping for the day-to-day needs of consumers in the immediate neighborhood. These centers are typically anchored by a grocery and average 30,000 to 150,000 square feet. Community shopping centers typically offer a wider range of apparel and other soft goods than the neighborhood shopping center does. Among the more common anchors are grocers, super drugstores and discount department stores. These centers average 100,000 to 350,000 square feet.”
(2) The property may also have another anchor in addition to the grocer.
(3) The non-grocery anchor is either a major discount store, a tenant with square footage greater than 10,000 square feet if the shopping center GLA is less than 125,000 square feet or a tenant with square footage greater than 25,000 square feet if the shopping center GLA is greater than 125,000 square feet, or a tenant with square footage greater than 10 percent of the shopping center GLA, but not less than 5,000 square feet.
5
INVESTING IN REDEVELOPMENT
TOTAL PORTFOLIO
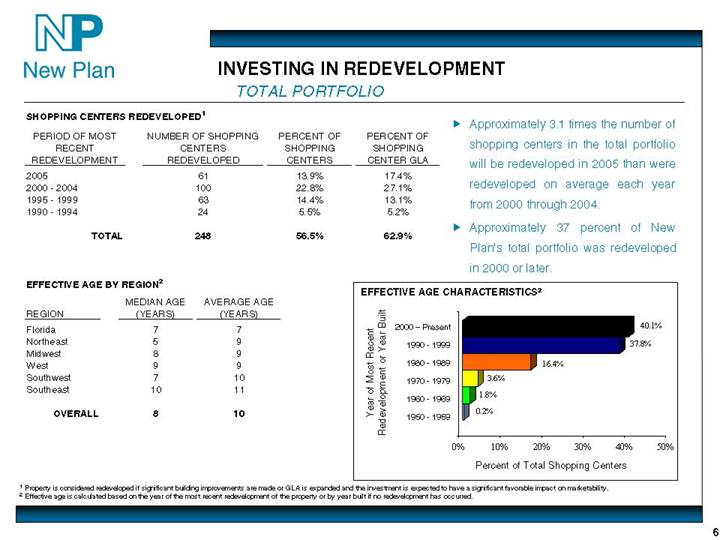
SHOPPING CENTERS REDEVELOPED(1)
PERIOD OF MOST | | NUMBER OF SHOPPING | | PERCENT OF | | PERCENT OF | |
RECENT | | CENTERS | | SHOPPING | | SHOPPING | |
REDEVELOPMENT | | REDEVELOPED | | CENTERS | | CENTER GLA | |
2005 | | 61 | | 13.9 | % | 17.4 | % |
2000 - 2004 | | 100 | | 22.8 | % | 27.1 | % |
1995 - 1999 | | 63 | | 14.4 | % | 13.1 | % |
1990 - 1994 | | 24 | | 5.5 | % | 5.2 | % |
| | | | | | | |
TOTAL | | 248 | | 56.5 | % | 62.9 | % |
• Approximately 3.1 times the number of shopping centers in the total portfolio will be redeveloped in 2005 than were redeveloped on average each year from 2000 through 2004.
• Approximately 37 percent of New Plan’s total portfolio was redeveloped in 2000 or later.
EFFECTIVE AGE BY REGION(2)
| | MEDIAN AGE | | AVERAGE AGE | |
REGION | | (YEARS) | | (YEARS) | |
Florida | | 7 | | 7 | |
Northeast | | 5 | | 9 | |
Midwest | | 8 | | 9 | |
West | | 9 | | 9 | |
Southwest | | 7 | | 10 | |
Southeast | | 10 | | 11 | |
| | | | | |
OVERALL | | 8 | | 10 | |
EFFECTIVE AGE CHARACTERISTICS(2)
[CHART]
(1) Property is considered redeveloped if significant building improvements are made or GLA is expanded and the investment is expected to have a significant favorable impact on marketability.
(2) Effective age is calculated based on the year of the most recent redevelopment of the property or by year built if no redevelopment has occurred.
6
INVESTING IN REDEVELOPMENT
COMPANY PORTFOLIO
SHOPPING CENTERS REDEVELOPED(1)
PERIOD OF MOST | | NUMBER OF SHOPPING | | PERCENT OF | | PERCENT OF | |
RECENT | | CENTERS | | SHOPPING | | SHOPPING | |
REDEVELOPMENT | | REDEVELOPED | | CENTERS | | CENTER GLA | |
2005 | | 45 | | 15.4 | % | 19.1 | % |
2000 - 2004 | | 71 | | 24.3 | % | 27.7 | % |
1995 - 1999 | | 43 | | 14.7 | % | 13.6 | % |
1990 - 1994 | | 19 | | 6.5 | % | 6.0 | % |
| | | | | | | |
TOTAL | | 178 | | 61.0 | % | 66.4 | % |
• Approximately 3.2 times the number of shopping centers in the company portfolio will be redeveloped in 2005 than were redeveloped on average each year from 2000 through 2004.
• Approximately 40 percent of New Plan’s company portfolio was redeveloped in 2000 or later.
EFFECTIVE AGE BY REGION(2)
| | MEDIAN AGE | | AVERAGE AGE | |
REGION | | (YEARS) | | (YEARS) | |
Florida | | 5 | | 7 | |
Midwest | | 6 | | 8 | |
West | | 9 | | 9 | |
Northeast | | 3 | | 9 | |
Southeast | | 10 | | 11 | |
Southwest | | 8 | | 11 | |
| | | | | |
OVERALL | | 8 | | 9 | |
EFFECTIVE AGE CHARACTERISTICS(2)
[CHART]
(1) Property is considered redeveloped if significant building improvements are made or GLA is expanded and the investment is expected to have a significant favorable impact on marketability.
(2) Effective age is calculated based on the year of the most recent redevelopment of the property or by year built if no redevelopment has occurred.
7
INVESTING IN REDEVELOPMENT
JOINT VENTURE PORTFOLIOS
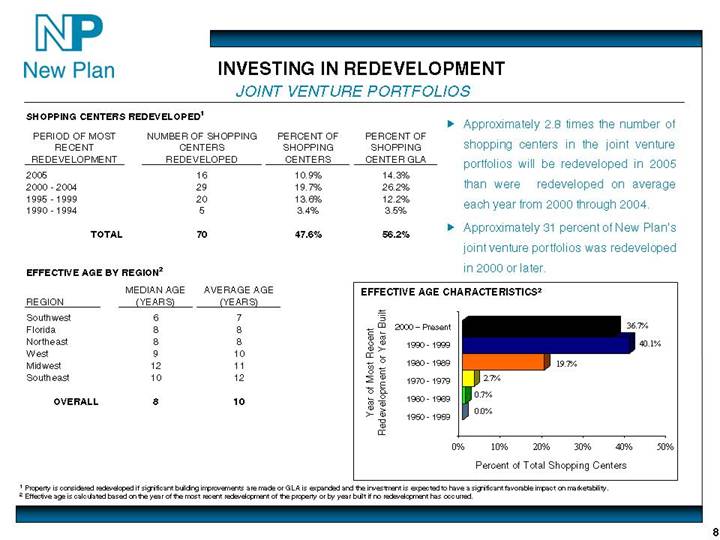
SHOPPING CENTERS REDEVELOPED(1)
PERIOD OF MOST | | NUMBER OF SHOPPING | | PERCENT OF | | PERCENT OF | |
RECENT | | CENTERS | | SHOPPING | | SHOPPING | |
REDEVELOPMENT | | REDEVELOPED | | CENTERS | | CENTER GLA | |
2005 | | 16 | | 10.9 | % | 14.3 | % |
2000 - 2004 | | 29 | | 19.7 | % | 26.2 | % |
1995 - 1999 | | 20 | | 13.6 | % | 12.2 | % |
1990 - 1994 | | 5 | | 3.4 | % | 3.5 | % |
| | | | | | | |
TOTAL | | 70 | | 47.6 | % | 56.2 | % |
• Approximately 2.8 times the number of shopping centers in the joint venture portfolios will be redeveloped in 2005 than were redeveloped on average each year from 2000 through 2004.
• Approximately 31 percent of New Plan’s joint venture portfolios was redeveloped in 2000 or later.
EFFECTIVE AGE BY REGION(2)
| | MEDIAN AGE | | AVERAGE AGE | |
REGION | | (YEARS) | | (YEARS) | |
Southwest | | 6 | | 7 | |
Florida | | 8 | | 8 | |
Northeast | | 8 | | 8 | |
West | | 9 | | 10 | |
Midwest | | 12 | | 11 | |
Southeast | | 10 | | 12 | |
| | | | | |
OVERALL | | 8 | | 10 | |
EFFECTIVE AGE CHARACTERISTICS(2)
[CHART]
(1) Property is considered redeveloped if significant building improvements are made or GLA is expanded and the investment is expected to have a significant favorable impact on marketability.
(2) Effective age is calculated based on the year of the most recent redevelopment of the property or by year built if no redevelopment has occurred.
8
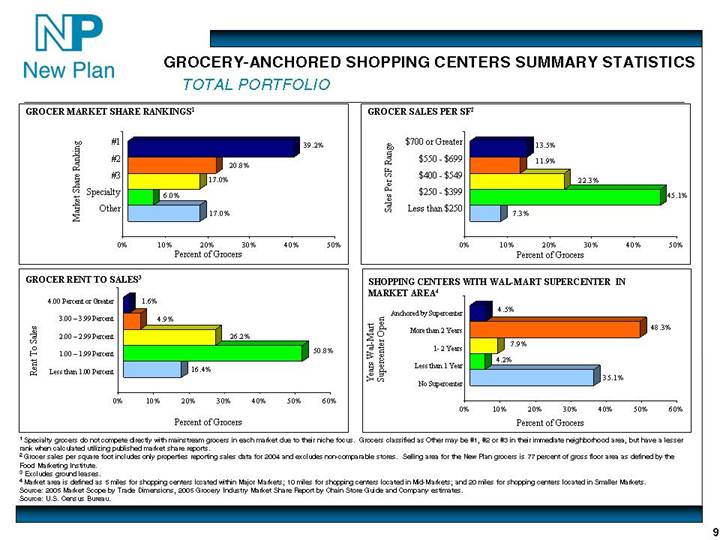
GROCERY-ANCHORED SHOPPING CENTERS SUMMARY STATISTICS
TOTAL PORTFOLIO
GROCER MARKET SHARE RANKINGS(1) | | GROCER SALES PER SF(2) |
[CHART] | | [CHART] |
| | |
GROCER RENT TO SALES(3) | | SHOPPING CENTERS WITH WAL-MART SUPERCENTER IN
MARKET AREA(4) |
[CHART] | | [CHART] |
(1) Specialty grocers do not compete directly with mainstream grocers in each market due to their niche focus. Grocers classified as Other may be #1, #2 or #3 in their immediate neighborhood area, but have a lesser rank when calculated utilizing published market share reports.
(2) Grocer sales per square foot includes only properties reporting sales data for 2004 and excludes non-comparable stores. Selling area for the New Plan grocers is 77 percent of gross floor area as defined by the Food Marketing Institute.
(3) Excludes ground leases.
(4) Market area is defined as 5 miles for shopping centers located within Major Markets; 10 miles for shopping centers located in Mid-Markets; and 20 miles for shopping centers located in Smaller Markets.
Source: 2005 Market Scope by Trade Dimensions, 2005 Grocery Industry Market Share Report by Chain Store Guide and Company estimates.
Source: U.S. Census Bureau.
9
GROCERY-ANCHORED SHOPPING CENTERS SUMMARY STATISTICS
COMPANY PORTFOLIO
GROCER MARKET SHARE RANKINGS(1) | | GROCER SALES PER SF(2) |
[CHART] | | [CHART] |
| | |
GROCER RENT TO SALES(3) | | SHOPPING CENTERS WITH WAL-MART SUPERCENTER IN
MARKET AREA(4) |
[CHART] | | [CHART] |
(1) Specialty grocers do not compete directly with mainstream grocers in each market due to their niche focus. Grocers classified as Other may be #1, #2 or #3 in their immediate neighborhood area, but have a lesser rank when calculated utilizing published market share reports.
(2) Grocer sales per square foot includes only properties reporting sales data for 2004 and excludes non-comparable stores. Selling area for the New Plan grocers is 77 percent of gross floor area as defined by the Food Marketing Institute.
(3) Excludes ground leases.
(4) Market area is defined as 5 miles for shopping centers located within Major Markets; 10 miles for shopping centers located in Mid-Markets; and 20 miles for shopping centers located in Smaller Markets.
Source: 2005 Market Scope by Trade Dimensions, 2005 Grocery Industry Market Share Report by Chain Store Guide and Company estimates.
Source: U.S. Census Bureau.
10
GROCERY-ANCHORED SHOPPING CENTERS SUMMARY STATISTICS
JOINT VENTURE PORTFOLIOS
GROCER MARKET SHARE RANKINGS(1) | | GROCER SALES PER SF(2) |
[CHART] | | [CHART] |
| | |
GROCER RENT TO SALES(3) | | SHOPPING CENTERS WITH WAL-MART SUPERCENTER IN
MARKET AREA(4) |
[CHART] | | [CHART] |
(1) Specialty grocers do not compete directly with mainstream grocers in each market due to their niche focus. Grocers classified as Other may be #1, #2 or #3 in their immediate neighborhood area, but have a lesser rank when calculated utilizing published market share reports.
(2) Grocer sales per square foot includes only properties reporting sales data for 2004 and excludes non-comparable stores. Selling area for the New Plan grocers is 77 percent of gross floor area as defined by the Food Marketing Institute.
(3) Excludes ground leases.
(4) Market area is defined as 5 miles for shopping centers located within Major Markets; 10 miles for shopping centers located in Mid-Markets; and 20 miles for shopping centers located in Smaller Markets.
Source: 2005 Market Scope by Trade Dimensions, 2005 Grocery Industry Market Share Report by Chain Store Guide and Company estimates.
Source: U.S. Census Bureau.
11
GROCER CONCENTRATION
TOTAL PORTFOLIO
GROCER CONCENTRATION
| | NUMBER OF | | TOTAL GLA | | | |
Grocer | | STORES | | (SF) | | CREDIT RATING | |
The Kroger Co.(1) | | 47 | | 2,511,484 | | Baa2 / BBB- / BBB | |
Delhaize America(2) | | 30 | | 988,871 | | Ba1 / BB+ / NR | |
Publix Super Markets(3) | | 21 | | 959,128 | | NR | |
Ahold USA(4) | | 11 | | 681,658 | | Ba2 / BB+ / BB | |
Winn-Dixie Stores(5) | | 11 | | 498,863 | | NR | |
Albertson’s, Inc.(6) | | 9 | | 493,514 | | Baa3 / BBB- / BBB | |
Safeway, Inc.(7) | | 7 | | 413,147 | | Baa2 / BBB- / BBB | |
H. E. Butt Grocery Company(8) | | 7 | | 345,222 | | NR | |
BI-LO/Bruno’s Supermarkets(9) | | 8 | | 331,443 | | NR | |
Wakefern Food Corporation(10) | | 5 | | 286,735 | | NR | |
Brookshire’s(11) | | 4 | | 255,699 | | NR | |
The Great Atlantic & Pacific Tea Company, Inc.(12) | | 6 | | 254,925 | | Caa1 / B- / NR | |
Giant Eagle | | 3 | | 235,740 | | NR | |
Golub Corporation(13) | | 3 | | 202,545 | | NR | |
Minyard Food Stores, Inc.(14) | | 5 | | 164,951 | | NR | |
VG’S Food Center | | 3 | | 157,638 | | NR | |
Lowe’s Food Store | | 3 | | 123,171 | | NR | |
C&S Wholesale Grocers, Inc.(15) | | 3 | | 121,567 | | NR | |
Ingles Markets, Incorporated | | 3 | | 108,000 | | B2 / BB- / NR | |
Davis Food City | | 3 | | 75,651 | | NR | |
Wal-Mart(16) | | 13 | | 40,000 | | Aa2 / AA / AA | |
Trader Joe’s(17) | | 3 | | 21,070 | | NR | |
Other (includes all grocers with < 3 stores)(18) | | 57 | | 2,459,893 | | - | |
| | | | | | | |
TOTAL | | 265 | | 11,730,915 | | | |
• Approximately 83.0 percent of the total portfolio’s grocery-anchored shopping centers are anchored by the #1, #2 or #3 grocer in their market or by a specialty grocer.
• The top five total portfolio grocers by GLA account for approximately 48 percent of its total grocery GLA.
(1) Includes King Soopers, Kroger, and Ralphs. Includes one operating Kroger subleased from Albertsons. Excludes GLA from two non-owned Krogers and Ralphs.
(2) Includes Food Lion, Hannaford Bros., Harvey’s, Kash n’Karry and Shop ‘n Save. Excludes GLA from non-owned Shop ‘n Save.
(3) Includes Publix and Publix Sabor.
(4) Includes Giant Food, Martin’s, Stop & Shop and Tops Markets.
(5) Excludes GLA from non-owned Winn-Dixie.
(6) Includes Acme, Albertsons, Jewel-Osco, Max Foods and Shaw’s.
(7) Includes Dominick’s, Genuardi’s, Randalls and Tom Thumb.
(8) Includes Central Market, H-E-B Food/Drug and H-E-B Pantry.
(9) Includes BI-LO and Food World.
(10) Includes PriceRite and ShopRite.
(11) Includes Super 1 Foods.
(12) Includes A&P, Farmer Jack and Super Fresh. Excludes GLA from non-owned A&P.
(13) Includes Price Chopper.
(14) Includes Carnival Food Stores and Minyard Food Stores.
(15) Includes BI-LO, Food Max and Southern Family Markets.
(16) Includes Neighborhood Markets and Wal-Mart Supercenters. Includes only GLA for Neighborhood Market.
(17) Excludes GLA from non-owned Trader Joe’s.
(18) Excludes GLA from non-owned Costco, Econofoods, Meijer and SuperTarget.
Includes only open and operating stores and stores under construction at community and neighborhood shopping centers. As a result, information presented may differ from the Company’s Supplemental Disclosure for the quarter ended September 30, 2005.
Specialty grocers are accounted for within the top three grocers in their markets. These grocers do not compete directly with mainstream grocers in each market due to their niche focus.
NR denotes no rating.
Source: 2005 Market Scope by Trade Dimensions, 2005 Grocery Industry Market Share Report by Chain Store Guide and Company estimates.
12
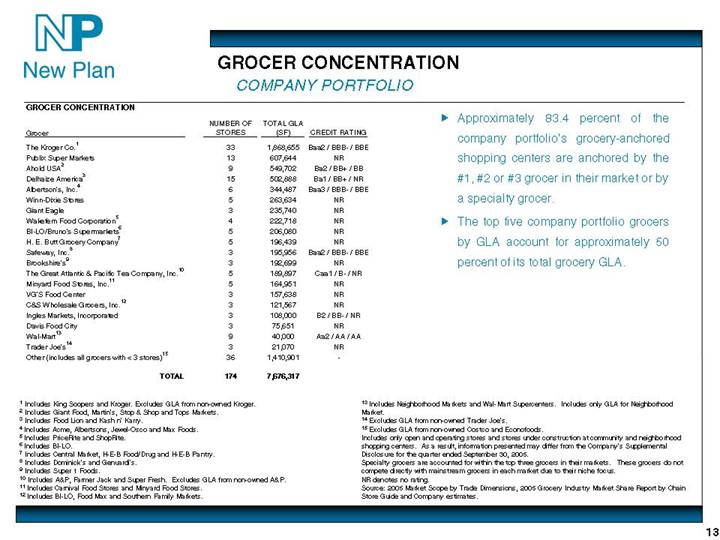
GROCER CONCENTRATION
COMPANY PORTFOLIO
GROCER CONCENTRATION
| | NUMBER OF | | TOTAL GLA | | | |
Grocer | | STORES | | (SF) | | CREDIT RATING | |
The Kroger Co.(1) | | 33 | | 1,868,655 | | Baa2 / BBB- / BBB | |
Publix Super Markets | | 13 | | 607,644 | | NR | |
Ahold USA(2) | | 9 | | 549,702 | | Ba2 / BB+ / BB | |
Delhaize America(3) | | 15 | | 502,888 | | Ba1 / BB+ / NR | |
Albertson’s, Inc.(4) | | 6 | | 344,487 | | Baa3 / BBB- / BBB | |
Winn-Dixie Stores | | 5 | | 263,634 | | NR | |
Giant Eagle | | 3 | | 235,740 | | NR | |
Wakefern Food Corporation(5) | | 4 | | 222,718 | | NR | |
BI-LO/Bruno’s Supermarkets(6) | | 5 | | 206,080 | | NR | |
H. E. Butt Grocery Company(7) | | 5 | | 196,439 | | NR | |
Safeway, Inc.(8) | | 3 | | 195,956 | | Baa2 / BBB- / BBB | |
Brookshire’s(9) | | 3 | | 192,699 | | NR | |
The Great Atlantic & Pacific Tea Company, Inc.(10) | | 5 | | 189,897 | | Caa1 / B- / NR | |
Minyard Food Stores, Inc.(11) | | 5 | | 164,951 | | NR | |
VG’S Food Center | | 3 | | 157,638 | | NR | |
C&S Wholesale Grocers, Inc.(12) | | 3 | | 121,567 | | NR | |
Ingles Markets, Incorporated | | 3 | | 108,000 | | B2 / BB- / NR | |
Davis Food City | | 3 | | 75,651 | | NR | |
Wal-Mart(13) | | 9 | | 40,000 | | Aa2 / AA / AA | |
Trader Joe’s(14) | | 3 | | 21,070 | | NR | |
Other (includes all grocers with < 3 stores)(15) | | 36 | | 1,410,901 | | — | |
| | | | | | | |
TOTAL | | 174 | | 7,676,317 | | | |
• Approximately 83.4 percent of the company portfolio’s grocery-anchored shopping centers are anchored by the #1, #2 or #3 grocer in their market or by a specialty grocer.
• The top five company portfolio grocers by GLA account for approximately 50 percent of its total grocery GLA.
(1) Includes King Soopers and Kroger. Excludes GLA from non-owned Kroger.
(2) Includes Giant Food, Martin’s, Stop & Shop and Tops Markets.
(3) Includes Food Lion and Kash n’Karry.
(4) Includes Acme, Albertsons, Jewel-Osco and Max Foods.
(5) Includes PriceRite and ShopRite.
(6) Includes BI-LO.
(7) Includes Central Market, H-E-B Food/Drug and H-E-B Pantry.
(8) Includes Dominick’s and Genuardi’s.
(9) Includes Super 1 Foods.
(10) Includes A&P, Farmer Jack and Super Fresh. Excludes GLA from non-owned A&P.
(11) Includes Carnival Food Stores and Minyard Food Stores.
(12) Includes BI-LO, Food Max and Southern Family Markets.
(13) Includes Neighborhood Markets and Wal-Mart Supercenters. Includes only GLA for Neighborhood Market.
(14) Excludes GLA from non-owned Trader Joe’s.
(15) Excludes GLA from non-owned Costco and Econofoods.
Includes only open and operating stores and stores under construction at community and neighborhood shopping centers. As a result, information presented may differ from the Company’s Supplemental Disclosure for the quarter ended September 30, 2005.
Specialty grocers are accounted for within the top three grocers in their markets. These grocers do not compete directly with mainstream grocers in each market due to their niche focus.
NR denotes no rating.
Source: 2005 Market Scope by Trade Dimensions, 2005 Grocery Industry Market Share Report by Chain Store Guide and Company estimates.
13
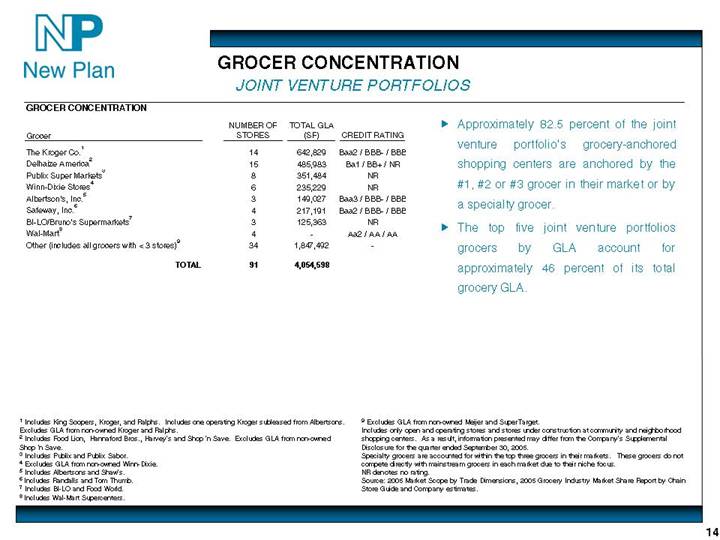
GROCER CONCENTRATION
JOINT VENTURE PORTFOLIOS
GROCER CONCENTRATION
| | NUMBER OF | | TOTAL GLA | | | |
Grocer | | STORES | | (SF) | | CREDIT RATING | |
The Kroger Co.(1) | | 14 | | 642,829 | | Baa2 / BBB- / BBB | |
Delhaize America(2) | | 15 | | 485,983 | | Ba1 / BB+ / NR | |
Publix Super Markets(3) | | 8 | | 351,484 | | NR | |
Winn-Dixie Stores(4) | | 6 | | 235,229 | | NR | |
Albertson’s, Inc.(5) | | 3 | | 149,027 | | Baa3 / BBB- / BBB | |
Safeway, Inc.(6) | | 4 | | 217,191 | | Baa2 / BBB- / BBB | |
BI-LO/Bruno’s Supermarkets(7) | | 3 | | 125,363 | | NR | |
Wal-Mart(8) | | 4 | | — | | Aa2 / AA / AA | |
Other (includes all grocers with < 3 stores)(9) | | 34 | | 1,847,492 | | — | |
| | | | | | | |
TOTAL | | 91 | | 4,054,598 | | | |
• Approximately 82.5 percent of the joint venture portfolio’s grocery-anchored shopping centers are anchored by the #1, #2 or #3 grocer in their market or by a specialty grocer.
• The top five joint venture portfolios grocers by GLA account for approximately 46 percent of its total grocery GLA.
(1) Includes King Soopers, Kroger, and Ralphs. Includes one operating Kroger subleased from Albertsons. Excludes GLA from non-owned Kroger and Ralphs.
(2) Includes Food Lion, Hannaford Bros., Harvey’s and Shop ‘n Save. Excludes GLA from non-owned Shop ‘n Save.
(3) Includes Publix and Publix Sabor.
(4) Excludes GLA from non-owned Winn-Dixie.
(5) Includes Albertsons and Shaw’s.
(6) Includes Randalls and Tom Thumb.
(7) Includes BI-LO and Food World.
(8) Includes Wal-Mart Supercenters.
(9) Excludes GLA from non-owned Meijer and SuperTarget.
Includes only open and operating stores and stores under construction at community and neighborhood shopping centers. As a result, information presented may differ from the Company’s Supplemental Disclosure for the quarter ended September 30, 2005.
Specialty grocers are accounted for within the top three grocers in their markets. These grocers do not compete directly with mainstream grocers in each market due to their niche focus.
NR denotes no rating.
Source: 2005 Market Scope by Trade Dimensions, 2005 Grocery Industry Market Share Report by Chain Store Guide and Company estimates.
14
GROCER SIZE AND SALES
TOTAL PORTFOLIO
SIZE OF GROCERY-ANCHORS(1)
[CHART]
• The average grocer in the New Plan total portfolio is 48,475 square feet, as compared with the Food Marketing Institute defined “typical” grocery size of 45,561 square feet.
COMPARATIVE GROCER SALES
| | NUMBER OF | | AVERAGE NEW | | NEW PLAN AVERAGE SALES | |
| | NEW PLAN | | PLAN STORE | | PER SF | |
| | STORES | | SIZE (SF) | | 2004 | | 2003(2) | |
TOP FIVE GROCERS BY GLA | | | | | | | | | |
The Kroger Co. | | 47 | | 57,079 | | $ | 487 | | $ | 467 | |
Delhaize America | | 30 | | 34,099 | | 344 | | 325 | |
Publix Super Markets | | 21 | | 45,673 | | 544 | | 532 | |
Ahold USA | | 11 | | 61,969 | | 687 | | 544 | |
Winn-Dixie Stores | | 11 | | 49,886 | | 367 | | 336 | |
| | | | | | | | | |
TOTAL GROCERS | | 265 | | 48,475 | | $ | 472 | | $ | 456 | |
• The 2004 average sales per square foot for grocers in the total portfolio increased by approximately 4 percent over 2003.
• The 2004 average sales per square foot for grocers in the total portfolio located in shopping centers that have been redeveloped over the past five years is $501 versus $472 for the total portfolio.
(1) Excludes 23 shopping centers anchored by either a Wal-Mart Supercenter or non-owned grocer.
(2) As reported in the June 30, 2004 Portfolio Assessment.
Grocer sales per square foot includes only properties reporting sales data for 2004 and excludes non-comparable stores. Selling area for the New Plan grocers is 77 percent of gross floor area as defined by the Food Marketing Institute.
Source: Supermarket Facts, Industry Overview 2004 by Food Marketing Institute.
15
GROCER SIZE AND SALES
COMPANY PORTFOLIO
SIZE OF GROCERY-ANCHORS(1)
[CHART]
• The average grocer in the New Plan company portfolio is 47,679 square feet, as compared with the Food Marketing Institute defined “typical” grocery size of 45,561 square feet.
COMPARATIVE GROCER SALES
| | | | | | 2004 NEW | |
| | NUMBER OF | | AVERAGE NEW | | PLAN | |
| | NEW PLAN | | PLAN STORE | | AVERAGE | |
| | STORES | | SIZE (SF) | | SALES PER SF | |
TOP FIVE GROCERS BY GLA | | | | | | | |
The Kroger Co. | | 33 | | 58,395 | | $ | 501 | |
Publix Super Markets | | 13 | | 46,742 | | 555 | |
Ahold USA | | 9 | | 61,078 | | 855 | |
Delhaize America | | 15 | | 33,526 | | 324 | |
Albertson’s, Inc. | | 6 | | 57,415 | | 357 | |
| | | | | | | |
TOTAL GROCERS | | 174 | | 47,679 | | $ | 474 | |
• The 2004 average sales per square foot for grocers in the company portfolio located in shopping centers that have been redeveloped over the past five years is $499 versus $474 for the company portfolio.
(1) Excludes 13 shopping centers anchored by either a Wal-Mart Supercenter or non-owned grocer.
Grocer sales per square foot includes only properties reporting sales data for 2004 and excludes non-comparable stores. Selling area for the New Plan grocers is 77 percent of gross floor area as defined by the Food Marketing Institute.
Source: Supermarket Facts, Industry Overview 2004 by Food Marketing Institute.
16
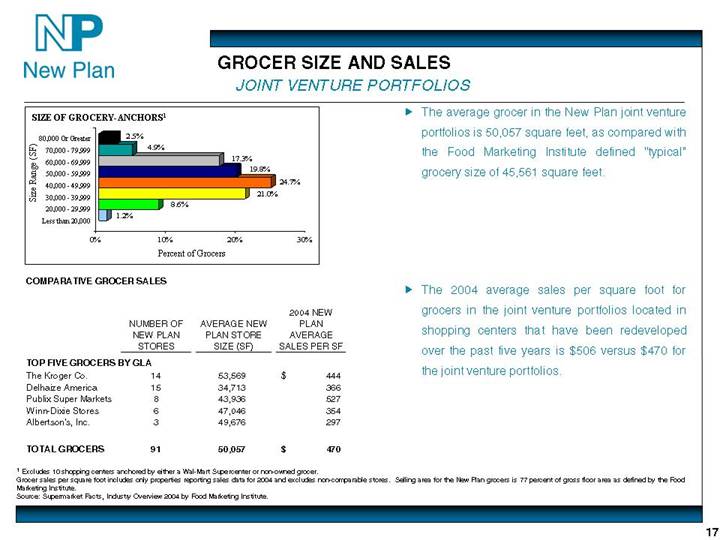
GROCER SIZE AND SALES
JOINT VENTURE PORTFOLIOS
SIZE OF GROCERY-ANCHORS(1)
[CHART]
• The average grocer in the New Plan joint venture portfolios is 50,057 square feet, as compared with the Food Marketing Institute defined “typical” grocery size of 45,561 square feet.
COMPARATIVE GROCER SALES
| | | | | | 2004 NEW | |
| | NUMBER OF | | AVERAGE NEW | | PLAN | |
| | NEW PLAN | | PLAN STORE | | AVERAGE | |
| | STORES | | SIZE (SF) | | SALES PER SF | |
TOP FIVE GROCERS BY GLA | | | | | | | |
The Kroger Co. | | 14 | | 53,569 | | $ | 444 | |
Delhaize America | | 15 | | 34,713 | | 366 | |
Publix Super Markets | | 8 | | 43,936 | | 527 | |
Winn-Dixie Stores | | 6 | | 47,046 | | 354 | |
Albertson’s, Inc. | | 3 | | 49,676 | | 297 | |
| | | | | | | |
TOTAL GROCERS | | 91 | | 50,057 | | $ | 470 | |
• The 2004 average sales per square foot for grocers in the joint venture portfolios located in shopping centers that have been redeveloped over the past five years is $506 versus $470 for the joint venture portfolios.
(1) Excludes 10 shopping centers anchored by either a Wal-Mart Supercenter or non-owned grocer.
Grocer sales per square foot includes only properties reporting sales data for 2004 and excludes non-comparable stores. Selling area for the New Plan grocers is 77 percent of gross floor area as defined by the Food Marketing Institute.
Source: Supermarket Facts, Industry Overview 2004 by Food Marketing Institute.
17
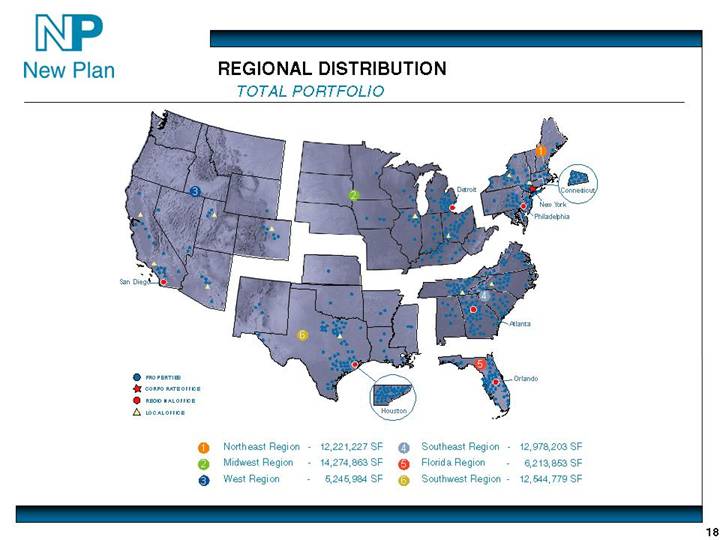
REGIONAL DISTRIBUTION
TOTAL PORTFOLIO
[GRAPHIC]
18
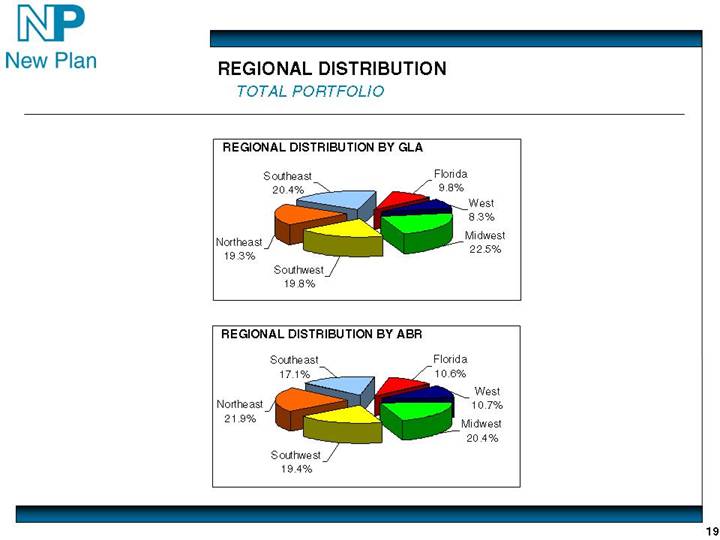
REGIONAL DISTRIBUTION
TOTAL PORTFOLIO
[GRAPHIC]
[GRAPHIC]
19
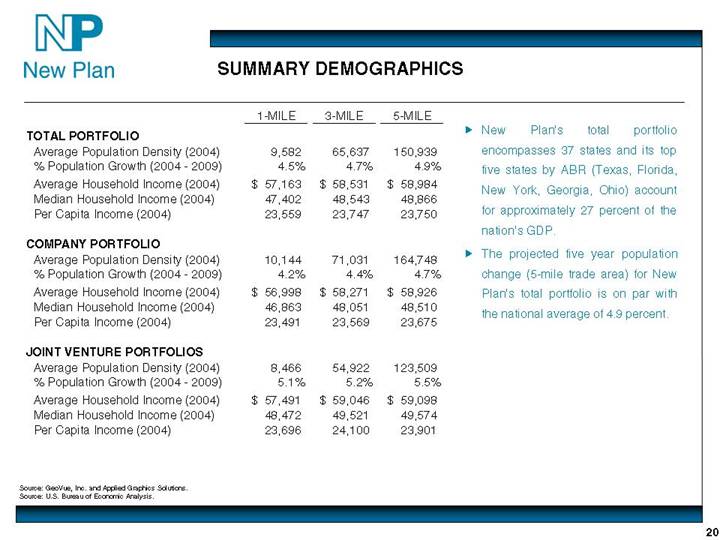
SUMMARY DEMOGRAPHICS
| | 1-MILE | | 3-MILE | | 5-MILE | |
TOTAL PORTFOLIO | | | | | | | |
Average Population Density (2004) | | 9,582 | | 65,637 | | 150,939 | |
% Population Growth (2004 - 2009) | | 4.5 | % | 4.7 | % | 4.9 | % |
Average Household Income (2004) | | $ | 57,163 | | $ | 58,531 | | $ | 58,984 | |
Median Household Income (2004) | | 47,402 | | 48,543 | | 48,866 | |
Per Capita Income (2004) | | 23,559 | | 23,747 | | 23,750 | |
| | | | | | | |
COMPANY PORTFOLIO | | | | | | | |
Average Population Density (2004) | | 10,144 | | 71,031 | | 164,748 | |
% Population Growth (2004 - 2009) | | 4.2 | % | 4.4 | % | 4.7 | % |
Average Household Income (2004) | | $ | 56,998 | | $ | 58,271 | | $ | 58,926 | |
Median Household Income (2004) | | 46,863 | | 48,051 | | 48,510 | |
Per Capita Income (2004) | | 23,491 | | 23,569 | | 23,675 | |
| | | | | | | |
JOINT VENTURE PORTFOLIOS | | | | | | | |
Average Population Density (2004) | | 8,466 | | 54,922 | | 123,509 | |
% Population Growth (2004 - 2009) | | 5.1 | % | 5.2 | % | 5.5 | % |
Average Household Income (2004) | | $ | 57,491 | | $ | 59,046 | | $ | 59,098 | |
Median Household Income (2004) | | 48,472 | | 49,521 | | 49,574 | |
Per Capita Income (2004) | | 23,696 | | 24,100 | | 23,901 | |
• New Plan’s total portfolio encompasses 37 states and its top five states by ABR (Texas, Florida, New York, Georgia, Ohio) account for approximately 27 percent of the nation’s GDP.
• The projected five year population change (5-mile trade area) for New Plan’s total portfolio is on par with the national average of 4.9 percent.
Source: GeoVue, Inc. and Applied Graphics Solutions.
Source: U.S. Bureau of Economic Analysis.
20
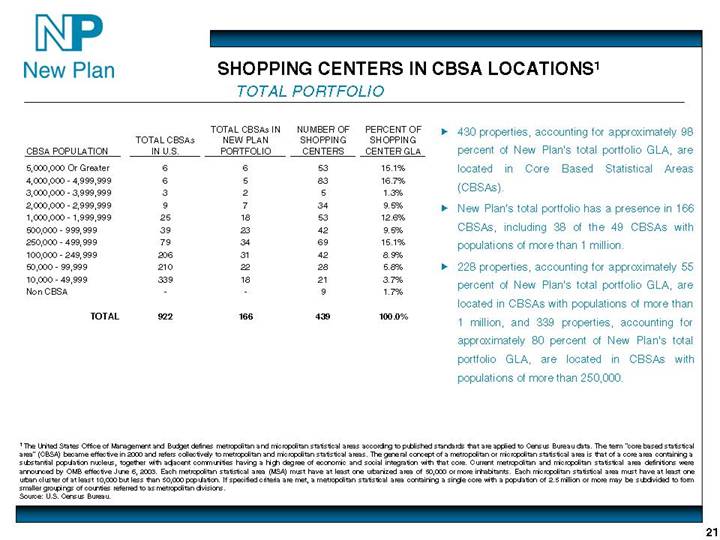
SHOPPING CENTERS IN CBSA LOCATIONS(1)
TOTAL PORTFOLIO
| | | | TOTAL CBSAs IN | | NUMBER OF | | PERCENT OF | |
| | TOTAL CBSAs | | NEW PLAN | | SHOPPING | | SHOPPING | |
CBSA POPULATION | | IN U.S. | | PORTFOLIO | | CENTERS | | CENTER GLA | |
| | | | | | | | | |
5,000,000 Or Greater | | 6 | | 6 | | 53 | | 15.1 | % |
4,000,000 - 4,999,999 | | 6 | | 5 | | 83 | | 16.7 | % |
3,000,000 - 3,999,999 | | 3 | | 2 | | 5 | | 1.3 | % |
2,000,000 - 2,999,999 | | 9 | | 7 | | 34 | | 9.5 | % |
1,000,000 - 1,999,999 | | 25 | | 18 | | 53 | | 12.6 | % |
500,000 - 999,999 | | 39 | | 23 | | 42 | | 9.5 | % |
250,000 - 499,999 | | 79 | | 34 | | 69 | | 15.1 | % |
100,000 - 249,999 | | 206 | | 31 | | 42 | | 8.9 | % |
50,000 - 99,999 | | 210 | | 22 | | 28 | | 5.8 | % |
10,000 - 49,999 | | 339 | | 18 | | 21 | | 3.7 | % |
Non CBSA | | — | | — | | 9 | | 1.7 | % |
| | | | | | | | | |
TOTAL | | 922 | | 166 | | 439 | | 100.0 | % |
• 430 properties, accounting for approximately 98 percent of New Plan’s total portfolio GLA, are located in Core Based Statistical Areas (CBSAs).
• New Plan’s total portfolio has a presence in 166 CBSAs, including 38 of the 49 CBSAs with populations of more than 1 million.
• 228 properties, accounting for approximately 55 percent of New Plan’s total portfolio GLA, are located in CBSAs with populations of more than 1 million, and 339 properties, accounting for approximately 80 percent of New Plan’s total portfolio GLA, are located in CBSAs with populations of more than 250,000.
(1) The United States Office of Management and Budget defines metropolitan and micropolitan statistical areas according to published standards that are applied to Census Bureau data. The term “core based statistical area” (CBSA) became effective in 2000 and refers collectively to metropolitan and micropolitan statistical areas. The general concept of a metropolitan or micropolitan statistical area is that of a core area containing a substantial population nucleus, together with adjacent communities having a high degree of economic and social integration with that core. Current metropolitan and micropolitan statistical area definitions were announced by OMB effective June 6, 2003. Each metropolitan statistical area (MSA) must have at least one urbanized area of 50,000 or more inhabitants. Each micropolitan statistical area must have at least one urban cluster of at least 10,000 but less than 50,000 population. If specified criteria are met, a metropolitan statistical area containing a single core with a population of 2.5 million or more may be subdivided to form smaller groupings of counties referred to as metropolitan divisions.
Source: U.S. Census Bureau.
21
SHOPPING CENTERS IN CBSA LOCATIONS(1)
COMPANY PORTFOLIO
| | | | TOTAL CBSAs IN | | NUMBER OF | | PERCENT OF | |
| | TOTAL CBSAs | | NEW PLAN | | SHOPPING | | SHOPPING | |
CBSA POPULATION | | IN U.S. | | PORTFOLIO | | CENTERS | | CENTER GLA | |
| | | | | | | | | |
5,000,000 Or Greater | | 6 | | 6 | | 43 | | 17.0 | % |
4,000,000 - 4,999,999 | | 6 | | 5 | | 66 | | 19.1 | % |
3,000,000 - 3,999,999 | | 3 | | 1 | | 2 | | 1.0 | % |
2,000,000 - 2,999,999 | | 9 | | 7 | | 25 | | 10.1 | % |
1,000,000 - 1,999,999 | | 25 | | 14 | | 26 | | 8.7 | % |
500,000 - 999,999 | | 39 | | 18 | | 27 | | 10.0 | % |
250,000 - 499,999 | | 79 | | 25 | | 39 | | 13.8 | % |
100,000 - 249,999 | | 206 | | 17 | | 22 | | 7.3 | % |
50,000 - 99,999 | | 210 | | 17 | | 19 | | 6.6 | % |
10,000 - 49,999 | | 339 | | 12 | | 15 | | 3.7 | % |
Non CBSA | | — | | — | | 8 | | 2.5 | % |
| | | | | | | | | |
TOTAL | | 922 | | 122 | | 292 | | 100.0 | % |
• 284 properties, accounting for approximately 97 percent of New Plan’s company portfolio GLA, are located in CBSAs.
• New Plan’s company portfolio has a presence in 122 CBSAs, including 33 of the 49 CBSAs with populations of more than 1 million.
• 162 properties, accounting for approximately 56 percent of New Plan’s company portfolio GLA, are located in CBSAs with populations of more than 1 million, and 228 properties, accounting for approximately 80 percent of New Plan’s company portfolio GLA, are located in CBSAs with populations of more than 250,000.
(1) The United States Office of Management and Budget defines metropolitan and micropolitan statistical areas according to published standards that are applied to Census Bureau data. The term “core based statistical area” (CBSA) became effective in 2000 and refers collectively to metropolitan and micropolitan statistical areas. The general concept of a metropolitan or micropolitan statistical area is that of a core area containing a substantial population nucleus, together with adjacent communities having a high degree of economic and social integration with that core. Current metropolitan and micropolitan statistical area definitions were announced by OMB effective June 6, 2003. Each metropolitan statistical area (MSA) must have at least one urbanized area of 50,000 or more inhabitants. Each micropolitan statistical area must have at least one urban cluster of at least 10,000 but less than 50,000 population. If specified criteria are met, a metropolitan statistical area containing a single core with a population of 2.5 million or more may be subdivided to form smaller groupings of counties referred to as metropolitan divisions.
Source: U.S. Census Bureau.
22
SHOPPING CENTERS IN CBSA LOCATIONS(1)
JOINT VENTURE PORTFOLIOS
| | | | TOTAL CBSAs IN | | NUMBER OF | | PERCENT OF | |
| | TOTAL CBSAs | | NEW PLAN | | SHOPPING | | SHOPPING | |
CBSA POPULATION | | IN U.S. | | PORTFOLIO | | CENTERS | | CENTER GLA | |
| | | | | | | | | |
5,000,000 Or Greater | | 6 | | 5 | | 10 | | 11.5 | % |
4,000,000 - 4,999,999 | | 6 | | 3 | | 17 | | 12.1 | % |
3,000,000 - 3,999,999 | | 3 | | 2 | | 3 | | 1.9 | % |
2,000,000 - 2,999,999 | | 9 | | 3 | | 9 | | 8.3 | % |
1,000,000 - 1,999,999 | | 25 | | 16 | | 27 | | 20.0 | % |
500,000 - 999,999 | | 39 | | 10 | | 15 | | 8.6 | % |
250,000 - 499,999 | | 79 | | 19 | | 30 | | 17.5 | % |
100,000 - 249,999 | | 206 | | 17 | | 20 | | 12.0 | % |
50,000 - 99,999 | | 210 | | 8 | | 9 | | 4.2 | % |
10,000 - 49,999 | | 339 | | 6 | | 6 | | 3.7 | % |
Non CBSA | | — | | — | | 1 | | 0.3 | % |
| | | | | | | | | |
TOTAL | | 922 | | 89 | | 147 | | 100.0 | % |
• 146 properties, accounting for approximately 100 percent of New Plan’s joint venture portfolios GLA, are located in CBSAs.
• New Plan’s joint venture portfolios has a presence in 89 CBSAs, including 29 of the 49 CBSAs with populations of more than 1 million.
• 66 properties, accounting for approximately 54 percent of New Plan’s joint venture portfolios GLA, are located in CBSAs with populations of more than 1 million, and 111 properties, accounting for approximately 80 percent of New Plan’s joint venture portfolios GLA, are located in CBSAs with populations of more than 250,000.
(1) The United States Office of Management and Budget defines metropolitan and micropolitan statistical areas according to published standards that are applied to Census Bureau data. The term “core based statistical area” (CBSA) became effective in 2000 and refers collectively to metropolitan and micropolitan statistical areas. The general concept of a metropolitan or micropolitan statistical area is that of a core area containing a substantial population nucleus, together with adjacent communities having a high degree of economic and social integration with that core. Current metropolitan and micropolitan statistical area definitions were announced by OMB effective June 6, 2003. Each metropolitan statistical area (MSA) must have at least one urbanized area of 50,000 or more inhabitants. Each micropolitan statistical area must have at least one urban cluster of at least 10,000 but less than 50,000 population. If specified criteria are met, a metropolitan statistical area containing a single core with a population of 2.5 million or more may be subdivided to form smaller groupings of counties referred to as metropolitan divisions.
Source: U.S. Census Bureau.
23
MEDIAN HOUSEHOLD INCOME DEMOGRAPHICS
TOTAL PORTFOLIO
2004 MEDIAN HOUSEHOLD INCOMES OF NEW PLAN SHOPPING CENTERS VERSUS
STATEWIDE MEDIAN HOUSEHOLD INCOMES
| | | | | | MEDIAN HOUSEHOLD | | | |
| | | | NUMBER OF | | INCOME OF NEW PLAN | | STATEWIDE MEDIAN | |
| | STATE | | SHOPPING CENTERS | | SHOPPING CENTERS | | HOUSEHOLD INCOME | |
1 | | Alabama | | 5 | | $ | 37,008 | | $ | 36,995 | |
2 | | Arizona | | 5 | | 46,016 | | 44,271 | |
3 | | Arkansas | | 1 | | 42,391 | | 34,799 | |
4 | | California | | 14 | | 55,435 | | 51,239 | |
5 | | Colorado | | 6 | | 61,662 | | 51,599 | |
6 | | Connecticut | | 11 | | 53,144 | | 58,446 | |
7 | | Florida | | 39 | | 42,392 | | 42,071 | |
8 | | Georgia | | 40 | | 46,492 | | 52,744 | |
9 | | Illinois | | 9 | | 57,594 | | 50,757 | |
10 | | Indiana | | 9 | | 42,731 | | 45,181 | |
11 | | Iowa | | 2 | | 53,250 | | 42,621 | |
12 | | Kansas | | 1 | | 41,173 | | 44,338 | |
13 | | Kentucky | | 14 | | 47,758 | | 36,454 | |
14 | | Louisiana | | 5 | | 33,890 | | 35,315 | |
15 | | Maine | | 2 | | 43,193 | | 40,270 | |
16 | | Maryland | | 2 | | 56,627 | | 57,697 | |
17 | | Massachusetts | | 4 | | 48,503 | | 54,375 | |
18 | | Michigan | | 22 | | 60,077 | | 48,325 | |
19 | | Minnesota | | 1 | | 56,594 | | 51,180 | |
20 | | Mississippi | | 2 | | 41,922 | | 33,928 | |
21 | | Nevada | | 3 | | 48,514 | | 49,034 | |
22 | | New Hampshire | | 2 | | 58,621 | | 53,143 | |
23 | | New Jersey | | 6 | | 63,662 | | 59,775 | |
24 | | New Mexico | | 2 | | 48,051 | | 36,989 | |
25 | | New York | | 28 | | 49,240 | | 47,074 | |
26 | | North Carolina | | 21 | | 40,146 | | 42,677 | |
27 | | Ohio | | 24 | | 48,828 | | 44,373 | |
28 | | Oklahoma | | 2 | | 52,910 | | 36,268 | |
29 | | Pennsylvania | | 13 | | 53,803 | | 43,343 | |
30 | | Rhode Island | | 1 | | 61,034 | | 45,606 | |
31 | | South Carolina | | 13 | | 50,005 | | 40,288 | |
32 | | Tennessee | | 22 | | 40,824 | | 39,441 | |
33 | | Texas | | 86 | | 51,741 | | 43,525 | |
34 | | Virginia | | 15 | | 47,279 | | 51,020 | |
35 | | West Virginia | | 3 | | 34,211 | | 31,780 | |
36 | | Wisconsin | | 3 | | 51,520 | | 47,441 | |
37 | | Wyoming | | 1 | | 41,523 | | 41,062 | |
| | AVERAGE | | | | $ | 48,866 | | $ | 45,012 | |
• The average 2004 5-mile median household income for New Plan’s total portfolio at $48,866 exceeds the average median household income of $45,012 in the 37 states where the New Plan shopping centers are located.
Source: GeoVue, Inc. and Applied Graphics Solutions, 5-mile trade area.
24
REGIONAL DISTRIBUTION
COMPANY PORTFOLIO
2004 MEDIAN HOUSEHOLD INCOMES OF NEW PLAN SHOPPING CENTERS VERSUS
STATEWIDE MEDIAN HOUSEHOLD INCOMES
| | | | | | MEDIAN HOUSEHOLD | | | |
| | | | NUMBER OF | | INCOME OF NEW PLAN | | STATEWIDE MEDIAN | |
| | STATE | | SHOPPING CENTERS | | SHOPPING CENTERS | | HOUSEHOLD INCOME | |
1 | | Alabama | | 4 | | $ | 37,181 | | $ | 36,995 | |
2 | | Arizona | | 3 | | 43,296 | | 44,271 | |
3 | | California | | 11 | | 55,775 | | 51,239 | |
4 | | Colorado | | 2 | | 63,586 | | 51,599 | |
5 | | Florida | | 25 | | 40,961 | | 42,071 | |
6 | | Georgia | | 26 | | 45,786 | | 52,744 | |
7 | | Illinois | | 9 | | 57,594 | | 50,757 | |
8 | | Indiana | | 7 | | 41,111 | | 45,181 | |
9 | | Iowa | | 1 | | 53,260 | | 42,621 | |
10 | | Kentucky | | 9 | | 50,926 | | 36,454 | |
11 | | Louisiana | | 3 | | 32,586 | | 35,315 | |
12 | | Maryland | | 2 | | 56,627 | | 57,697 | |
13 | | Massachusetts | | 2 | | 45,984 | | 54,375 | |
14 | | Michigan | | 16 | | 65,024 | | 48,325 | |
15 | | Minnesota | | 1 | | 56,594 | | 51,180 | |
16 | | Nevada | | 2 | | 44,414 | | 49,034 | |
17 | | New Jersey | | 5 | | 65,215 | | 59,775 | |
18 | | New Mexico | | 1 | | 52,912 | | 36,989 | |
19 | | New York | | 19 | | 48,133 | | 47,074 | |
20 | | North Carolina | | 12 | | 35,591 | | 42,677 | |
21 | | Ohio | | 21 | | 48,744 | | 44,373 | |
22 | | Oklahoma | | 1 | | 55,017 | | 36,268 | |
23 | | Pennsylvania | | 9 | | 56,868 | | 43,343 | |
24 | | Rhode Island | | 1 | | 61,034 | | 45,606 | |
25 | | South Carolina | | 7 | | 53,675 | | 40,288 | |
26 | | Tennessee | | 14 | | 38,283 | | 39,441 | |
27 | | Texas | | 68 | | 49,185 | | 43,525 | |
28 | | Virginia | | 9 | | 44,286 | | 51,020 | |
29 | | Wisconsin | | 1 | | 56,103 | | 47,441 | |
30 | | Wyoming | | 1 | | 41,523 | | 41,062 | |
| | AVERAGE | | | | $ | 48,510 | | $ | 45,625 | |
• The average 2004 5-mile median household income for New Plan’s company portfolio at $48,510 exceeds the average median household income of $45,625 in the 30 states where the New Plan shopping centers are located.
Source: GeoVue, Inc. and Applied Graphics Solutions, 5-mile trade area.
25
REGIONAL DISTRIBUTION
JOINT VENTURE PORTFOLIOS
2004 MEDIAN HOUSEHOLD INCOMES OF NEW PLAN SHOPPING CENTERS VERSUS
STATEWIDE MEDIAN HOUSEHOLD INCOMES
| | | | | MEDIAN HOUSEHOLD | | | |
| | | | NUMBER OF | | INCOME OF NEW PLAN | | STATEWIDE MEDIAN | |
| | STATE | | SHOPPING CENTERS | | SHOPPING CENTERS | | HOUSEHOLD INCOME | |
1 | | Alabama | | 1 | | $ | 36,319 | | $ | 36,995 | |
2 | | Arizona | | 2 | | 50,095 | | 44,271 | |
3 | | Arkansas | | 1 | | 42,391 | | 34,799 | |
4 | | California | | 3 | | 54,186 | | 51,239 | |
5 | | Colorado | | 4 | | 60,699 | | 51,599 | |
6 | | Connecticut | | 11 | | 53,144 | | 58,446 | |
7 | | Florida | | 14 | | 44,948 | | 42,071 | |
8 | | Georgia | | 14 | | 47,804 | | 52,744 | |
9 | | Indiana | | 2 | | 48,404 | | 45,181 | |
10 | | Iowa | | 1 | | 53,240 | | 42,621 | |
11 | | Kansas | | 1 | | 41,173 | | 44,338 | |
12 | | Kentucky | | 5 | | 42,054 | | 36,454 | |
13 | | Louisiana | | 2 | | 35,847 | | 35,315 | |
14 | | Maine | | 2 | | 43,193 | | 40,270 | |
15 | | Massachusetts | | 2 | | 51,023 | | 54,375 | |
16 | | Michigan | | 6 | | 46,884 | | 48,325 | |
17 | | Mississippi | | 2 | | 41,922 | | 33,928 | |
18 | | Nevada | | 1 | | 56,714 | | 49,034 | |
19 | | New Hampshire | | 2 | | 58,621 | | 53,143 | |
20 | | New Jersey | | 1 | | 55,894 | | 59,775 | |
21 | | New Mexico | | 1 | | 43,189 | | 36,989 | |
22 | | New York | | 9 | | 51,576 | | 47,074 | |
23 | | North Carolina | | 9 | | 46,220 | | 42,677 | |
24 | | Ohio | | 3 | | 49,416 | | 44,373 | |
25 | | Oklahoma | | 1 | | 50,802 | | 36,268 | |
26 | | Pennsylvania | | 4 | | 46,908 | | 43,343 | |
27 | | South Carolina | | 6 | | 45,723 | | 40,288 | |
28 | | Tennessee | | 8 | | 45,271 | | 39,441 | |
29 | | Texas | | 18 | | 61,397 | | 43,525 | |
30 | | Virginia | | 6 | | 51,768 | | 51,020 | |
31 | | West Virginia | | 3 | | 34,211 | | 31,780 | |
32 | | Wisconsin | | 2 | | 49,228 | | 47,441 | |
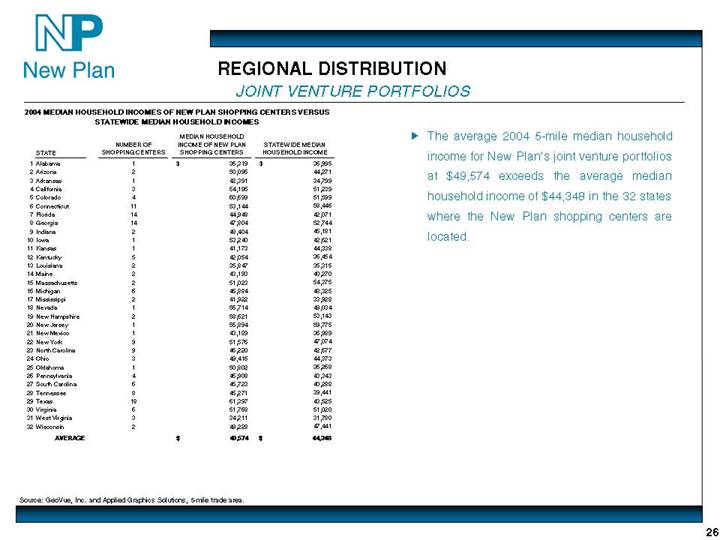
| | AVERAGE | | | | $ | 49,574 | | $ | 44,348 | |
• The average 2004 5-mile median household income for New Plan’s joint venture portfolios at $49,574 exceeds the average median household income of $44,348 in the 32 states where the New Plan shopping centers are located.
Source: GeoVue, Inc. and Applied Graphics Solutions, 5-mile trade area.
26
THE WAL-MART EQUATION
TOTAL PORTFOLIO
WAL-MART-ANCHORED SHOPPING CENTERS
| | NUMBER OF | | PERCENT OF | | AVERAGE | | AVERAGE | |
| | SHOPPING | | SHOPPING | | POPULATION | | HOUSEHOLD | |
| | CENTERS | | CENTERS | | DENSITY | | INCOME | |
NUMBER OF WAL-MART-ANCHORED SHOPPING CENTERS | | 39 | | 8.88 | % | 82,204 | | $ | 54,276 | |
SUPERCENTERS | | 12 | | 2.7 | % | 84,518 | | 49,190 | |
DISCOUNT STORES | | 26 | | 5.9 | % | 79,230 | | 56,305 | |
Grocery-anchored(1) | | 15 | | | | | | | |
Non-grocery anchored(2) | | 7 | | | | | | | |
Wal-Mart-anchored only | | 4 | | | | | | | |
NEIGHBORHOOD MARKETS(3) | | 1 | | 0.2 | % | 131,732 | | 62,570 | |
| | | | | | | | | | |
• 12 of the 39 Wal-Mart anchors are Wal-Mart Supercenters.
• Of the 39 shopping centers anchored by Wal-Mart, 24 of the Wal-Mart anchors are owned by New Plan and leased to Wal-Mart.
• Of the 26 shopping centers anchored by Wal-Mart Discount Stores, 15 are also anchored by a grocer (13 of which are the #1, #2 or #3 grocer in their market or a specialty grocer) and seven are also anchored by another non-grocery anchor.
(1) Includes six shopping centers with a Wal-Mart Supercenter in its market area.
(2) Properties have a Wal-Mart anchor plus at least one additional non-grocery anchor.
(3) Shopping center has Wal-Mart Supercenter in its market area.
Includes only open and operating and under construction Discount Stores, Neighborhood Markets and Supercenters at community and neighborhood shopping centers. As a result, information presented may differ from the Company’s Supplemental Disclosure for the quarter ended September 30, 2005.
Market area is defined as 5 miles for shopping centers located within Major Markets; 10 miles for shopping centers located in Mid-Markets; and 20 miles for shopping centers located in Smaller Markets.
Specialty grocers are accounted for within the top three grocers in their markets. These grocers do not compete directly with mainstream grocers in each market due to their niche focus.
Source: 2005 Market Scope by Trade Dimensions, 2005 Grocery Industry Market Share Report by Chain Store Guide and Company estimates.
Source: GeoVue, Inc. and Applied Graphics Solutions, 5-mile trade area.
27
THE WAL-MART EQUATION
TOTAL PORTFOLIO
NON-WAL-MART ANCHORED SHOPPING CENTERS
| | NUMBER OF | | PERCENT OF | | AVERAGE | | AVERAGE | |
| | SHOPPING | | SHOPPING | | POPULATION | | HOUSEHOLD | |
| | CENTERS | | CENTERS | | DENSITY | | INCOME | |
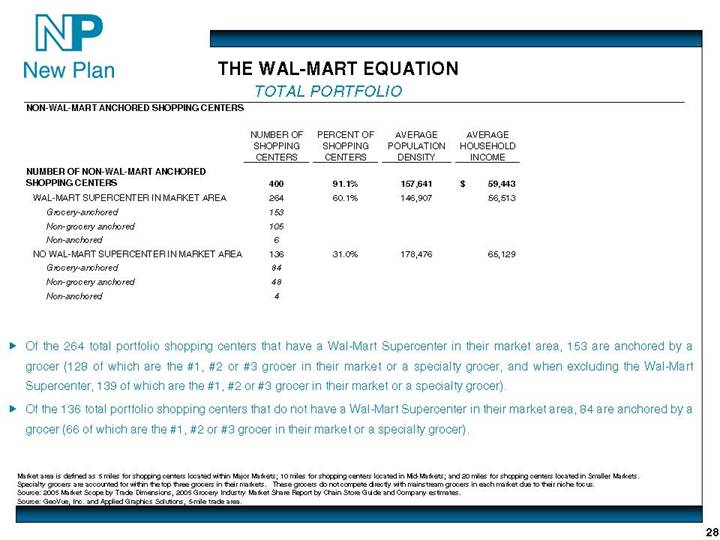
NUMBER OF NON-WAL-MART ANCHORED SHOPPING CENTERS | | 400 | | 91.1 | % | 157,641 | | $ | 59,443 | |
WAL-MART SUPERCENTER IN MARKET AREA | | 264 | | 60.1 | % | 146,907 | | 56,513 | |
Grocery-anchored | | 153 | | | | | | | |
Non-grocery anchored | | 105 | | | | | | | |
Non-anchored | | 6 | | | | | | | |
NO WAL-MART SUPERCENTER IN MARKET AREA | | 136 | | 31.0 | % | 178,476 | | 65,129 | |
Grocery-anchored | | 84 | | | | | | | |
Non-grocery anchored | | 48 | | | | | | | |
Non-anchored | | 4 | | | | | | | |
| | | | | | | | | | |
• Of the 264 total portfolio shopping centers that have a Wal-Mart Supercenter in their market area, 153 are anchored by a grocer (128 of which are the #1, #2 or #3 grocer in their market or a specialty grocer, and when excluding the Wal-Mart Supercenter, 139 of which are the #1, #2 or #3 grocer in their market or a specialty grocer).
• Of the 136 total portfolio shopping centers that do not have a Wal-Mart Supercenter in their market area, 84 are anchored by a grocer (66 of which are the #1, #2 or #3 grocer in their market or a specialty grocer).
Market area is defined as 5 miles for shopping centers located within Major Markets; 10 miles for shopping centers located in Mid-Markets; and 20 miles for shopping centers located in Smaller Markets.
Specialty grocers are accounted for within the top three grocers in their markets. These grocers do not compete directly with mainstream grocers in each market due to their niche focus.
Source: 2005 Market Scope by Trade Dimensions, 2005 Grocery Industry Market Share Report by Chain Store Guide and Company estimates.
Source: GeoVue, Inc. and Applied Graphics Solutions, 5-mile trade area.
28
THE WAL-MART EQUATION
COMPANY PORTFOLIO
NON-WAL-MART ANCHORED SHOPPING CENTERS
| | NUMBER OF | | PERCENT OF | | AVERAGE | | AVERAGE | |
| | SHOPPING | | SHOPPING | | POPULATION | | HOUSEHOLD | |
| | CENTERS | | CENTERS | | DENSITY | | INCOME | |
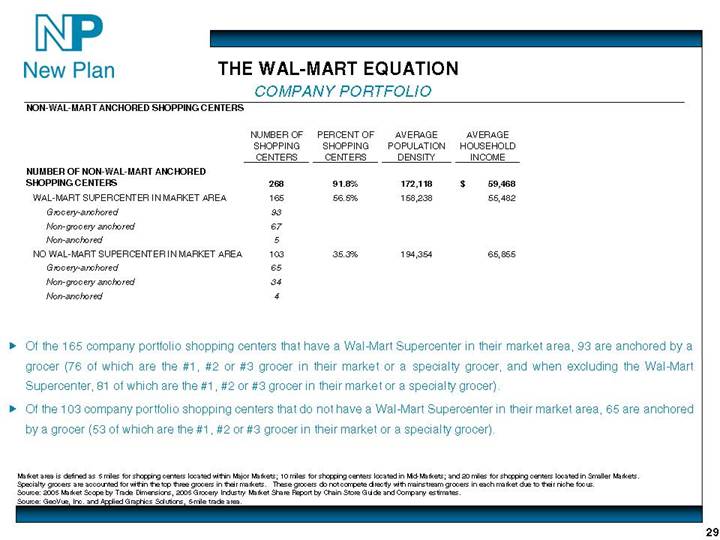
NUMBER OF NON-WAL-MART ANCHORED SHOPPING CENTERS | | 268 | | 91.8 | % | 172,118 | | $ | 59,468 | |
WAL-MART SUPERCENTER IN MARKET AREA | | 165 | | 56.5 | % | 158,238 | | 55,482 | |
Grocery-anchored | | 93 | | | | | | | |
Non-grocery anchored | | 67 | | | | | | | |
Non-anchored | | 5 | | | | | | | |
NO WAL-MART SUPERCENTER IN MARKET AREA | | 103 | | 35.3 | % | 194,354 | | 65,855 | |
Grocery-anchored | | 65 | | | | | | | |
Non-grocery anchored | | 34 | | | | | | | |
Non-anchored | | 4 | | | | | | | |
| | | | | | | | | | |
• Of the 165 company portfolio shopping centers that have a Wal-Mart Supercenter in their market area, 93 are anchored by a grocer (76 of which are the #1, #2 or #3 grocer in their market or a specialty grocer, and when excluding the Wal-Mart Supercenter, 81 of which are the #1, #2 or #3 grocer in their market or a specialty grocer).
• Of the 103 company portfolio shopping centers that do not have a Wal-Mart Supercenter in their market area, 65 are anchored by a grocer (53 of which are the #1, #2 or #3 grocer in their market or a specialty grocer).
Market area is defined as 5 miles for shopping centers located within Major Markets; 10 miles for shopping centers located in Mid-Markets; and 20 miles for shopping centers located in Smaller Markets.
Specialty grocers are accounted for within the top three grocers in their markets. These grocers do not compete directly with mainstream grocers in each market due to their niche focus.
Source: 2005 Market Scope by Trade Dimensions, 2005 Grocery Industry Market Share Report by Chain Store Guide and Company estimates.
Source: GeoVue, Inc. and Applied Graphics Solutions, 5-mile trade area.
29
THE WAL-MART EQUATION
JOINT VENTURE PORTFOLIOS
NON-WAL-MART ANCHORED SHOPPING CENTERS
| | NUMBER OF | | PERCENT OF | | AVERAGE | | AVERAGE | |
| | SHOPPING | | SHOPPING | | POPULATION | | HOUSEHOLD | |
| | CENTERS | | CENTERS | | DENSITY | | INCOME | |
NUMBER OF NON-WAL-MART ANCHORED SHOPPING CENTERS | | 132 | | 89.8 | % | 128,246 | | $ | 59,390 | |
WAL-MART SUPERCENTER IN MARKET AREA | | 99 | | 67.3 | % | 128,023 | | 58,233 | |
Grocery-anchored | | 60 | | | | | | | |
Non-grocery anchored | | 38 | | | | | | | |
Non-anchored | | 1 | | | | | | | |
NO WAL-MART SUPERCENTER IN MARKET AREA | | 33 | | 22.4 | % | 128,917 | | 62,862 | |
Grocery-anchored | | 19 | | | | | | | |
Non-grocery anchored | | 14 | | | | | | | |
Non-anchored | | 0 | | | | | | | |
| | | | | | | | | | |
• Of the 99 joint venture portfolios shopping centers that have a Wal-Mart Supercenter in their market area, 60 are anchored by a grocer (52 of which are the #1, #2 or #3 grocer in their market or a specialty grocer, and when excluding the Wal-Mart Supercenter, 58 of which are the #1, #2 or #3 grocer in their market or a specialty grocer).
• Of the 33 joint venture portfolios shopping centers that do not have a Wal-Mart Supercenter in their market area, 19 are anchored by a grocer (13 of which are the #1, #2 or #3 grocer in their market or a specialty grocer).
Market area is defined as 5 miles for shopping centers located within Major Markets; 10 miles for shopping centers located in Mid-Markets; and 20 miles for shopping centers located in Smaller Markets.
Specialty grocers are accounted for within the top three grocers in their markets. These grocers do not compete directly with mainstream grocers in each market due to their niche focus.
Source: 2005 Market Scope by Trade Dimensions, 2005 Grocery Industry Market Share Report by Chain Store Guide and Company estimates.
Source: GeoVue, Inc. and Applied Graphics Solutions, 5-mile trade area.
30
THE WAL-MART EQUATION
TOTAL PORTFOLIO
GROCERY-ANCHORED SHOPPING CENTERS SALES RELATIVE TO WAL-MART SUPERCENTERS IN MARKET AREA
| | GROCER | |
| | SALES PER SF | |
| | | |
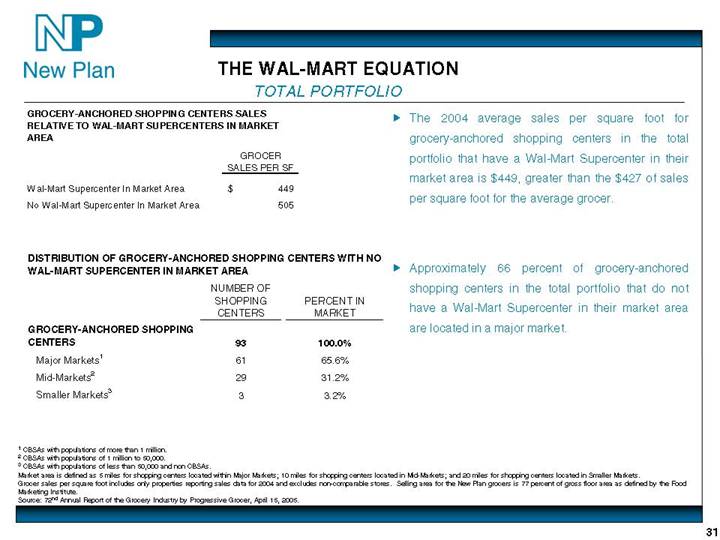
Wal-Mart Supercenter In Market Area | | $ | 449 | |
No Wal-Mart Supercenter In Market Area | | 505 | |
| | | | |
• The 2004 average sales per square foot for grocery-anchored shopping centers in the total portfolio that have a Wal-Mart Supercenter in their market area is $449, greater than the $427 of sales per square foot for the average grocer.
DISTRIBUTION OF GROCERY-ANCHORED SHOPPING CENTERS WITH NO WAL-MART SUPERCENTER IN MARKET AREA
| | NUMBER OF | | | |
| | SHOPPING | | PERCENT IN | |
| | CENTERS | | MARKET | |
GROCERY-ANCHORED SHOPPING CENTERS | | 93 | | 100.0 | % |
Major Markets(1) | | 61 | | 65.6 | % |
Mid-Markets(2) | | 29 | | 31.2 | % |
Smaller Markets(3) | | 3 | | 3.2 | % |
• Approximately 66 percent of grocery-anchored shopping centers in the total portfolio that do not have a Wal-Mart Supercenter in their market area are located in a major market.
(1) CBSAs with populations of more than 1 million.
(2) CBSAs with populations of 1 million to 50,000.
(3) CBSAs with populations of less than 50,000 and non CBSAs.
Market area is defined as 5 miles for shopping centers located within Major Markets; 10 miles for shopping centers located in Mid-Markets; and 20 miles for shopping centers located in Smaller Markets.
Grocer sales per square foot includes only properties reporting sales data for 2004 and excludes non-comparable stores. Selling area for the New Plan grocers is 77 percent of gross floor area as defined by the Food Marketing Institute.
Source: 72nd Annual Report of the Grocery Industry by Progressive Grocer, April 15, 2005.
31
THE WAL-MART EQUATION
COMPANY PORTFOLIO
GROCERY-ANCHORED SHOPPING CENTERS SALES RELATIVE TO WAL-MART SUPERCENTERS IN MARKET AREA
| | GROCER | |
| | SALES PER SF | |
| | | |
Wal-Mart Supercenter In Market Area | | $ | 457 | |
No Wal-Mart Supercenter In Market Area | | 502 | |
| | | | |
• The 2004 average sales per square foot for grocery-anchored shopping centers in the company portfolio that have a Wal-Mart Supercenter in their market area is $457, greater than the $427 of sales per square foot for the average grocer.
DISTRIBUTION OF GROCERY-ANCHORED SHOPPING CENTERS WITH NO WAL-MART SUPERCENTER IN MARKET AREA
| | NUMBER OF | | | |
| | SHOPPING | | PERCENT IN | |
| | CENTERS | | MARKET | |
GROCERY-ANCHORED SHOPPING CENTERS | | 68 | | 100.0 | % |
Major Markets(1) | | 48 | | 70.6 | % |
Mid-Markets(2) | | 17 | | 25.0 | % |
Smaller Markets(3) | | 3 | | 4.4 | % |
• Approximately 71 percent of grocery-anchored shopping centers in the company portfolio that do not have a Wal-Mart Supercenter in their market area are located in a major market.
(1) CBSAs with populations of more than 1 million.
(2) CBSAs with populations of 1 million to 50,000.
(3) CBSAs with populations of less than 50,000 and non CBSAs.
Market area is defined as 5 miles for shopping centers located within Major Markets; 10 miles for shopping centers located in Mid-Markets; and 20 miles for shopping centers located in Smaller Markets.
Grocer sales per square foot includes only properties reporting sales data for 2004 and excludes non-comparable stores. Selling area for the New Plan grocers is 77 percent of gross floor area as defined by the Food Marketing Institute.
Source: 72nd Annual Report of the Grocery Industry by Progressive Grocer, April 15, 2005.
32
THE WAL-MART EQUATION
JOINT VENTURE PORTFOLIOS
GROCERY-ANCHORED SHOPPING CENTERS SALES RELATIVE TO WAL-MART SUPERCENTERS IN MARKET AREA
| | GROCER | |
| | SALES PER SF | |
| | | |
Wal-Mart Supercenter In Market Area | | $ | 438 | |
No Wal-Mart Supercenter In Market Area | | 515 | |
| | | | |
• The 2004 average sales per square foot for grocery-anchored shopping centers in the joint venture portfolios that have a Wal-Mart Supercenter in their market area is $438, greater than the $427 of sales per square foot for the average grocer.
DISTRIBUTION OF GROCERY-ANCHORED SHOPPING CENTERS WITH NO WAL-MART SUPERCENTER IN MARKET AREA
| | NUMBER OF | | | |
| | SHOPPING | | PERCENT IN | |
| | CENTERS | | MARKET | |
GROCERY-ANCHORED SHOPPING CENTERS | | 25 | | 100.0 | % |
Major Markets(1) | | 13 | | 52.0 | % |
Mid-Markets(2) | | 12 | | 48.0 | % |
Smaller Markets(3) | | 0 | | 0.0 | % |
• Approximately 52 percent of grocery-anchored shopping centers in the joint venture portfolios that do not have a Wal-Mart Supercenter in their market area are located in a major market.
(1) CBSAs with populations of more than 1 million.
(2) CBSAs with populations of 1 million to 50,000.
(3) CBSAs with populations of less than 50,000 and non CBSAs.
Market area is defined as 5 miles for shopping centers located within Major Markets; 10 miles for shopping centers located in Mid-Markets; and 20 miles for shopping centers located in Smaller Markets.
Grocer sales per square foot includes only properties reporting sales data for 2004 and excludes non-comparable stores. Selling area for the New Plan grocers is 77 percent of gross floor area as defined by the Food Marketing Institute.
Source: 72nd Annual Report of the Grocery Industry by Progressive Grocer, April 15, 2005.
33
Certain statements in this presentation that are not historical fact may constitute forward-looking statements within the meaning of the Private Securities Litigation Reform Act of 1995. Such forward-looking statements involve known and unknown risks, uncertainties and other factors which may cause the actual results of the Company to differ materially from historical results or from any results expressed or implied by such forward-looking statements, including without limitation: national and local economic, business, real estate and other market conditions; the competitive environment in which the Company operates; financing risks; possible future downgrades in our credit ratings; property ownership / management risks; the level and volatility of interest rates and changes in capitalization rates with respect to the acquisition and disposition of properties; financial stability of tenants; the Company’s ability to maintain its status as a REIT for federal income tax purposes; acquisition, disposition, development and joint venture risks, including risks that developments and redevelopments are not completed on time or on budget and strategies; actions and performance of affiliates that the Company may not control; potential environmental and other liabilities; and other factors affecting the real estate industry generally. The Company refers you to the documents filed by the Company from time to time with the Securities and Exchange Commission, specifically the section titled “Business-Risk Factors” in the Company’s Annual Report on Form 10-K for the year ended December 31, 2004, which discuss these and other factors that could adversely affect the Company’s results.
34

