This page is intentionally left blank.
Barclays Capital U.S. Intermediate Aggregate Bond Index (formerly Lehman Brothers Intermediate U.S. Aggregate Index) is an unmanaged index generally representative of investment-grade issues with maturities between three- and ten-years.
Barclays Capital New York Tax Exempt Index (formerly Lehman Brothers New York Tax Exempt Index) is an unmanaged index composed of investment grade New York tax-exempt securities, all having a $50 million minimum maturity value.
Barclays Capital U.S. Aggregate Bond Index (formerly Lehman Brothers U.S. Aggregate Index) is an unmanaged index generally representative of investment-grade fixed-rate debt issues, including government, corporate, asset-backed, and mortgage-backed securities, with maturities of at least one year.
Gross Domestic Product (“GDP”) is the measure of the market value of the goods and services produced by labor and property in the United States.
Lipper Intermediate Investment-Grade Debt Funds Average is an average of the performance of managed mutual funds that invest at least 65% of their assets in investment-grade debt issues (rated in the top four grades) with dollar-weighted average maturities of five- to ten-years.
Lipper International Large-Cap Value Funds is an average of the performance of managed mutual funds that, by portfolio practice, invest at least 75% of their equity assets in companies strictly outside of the U.S. with market capitalizations (on a three-year weighted basis) above Lipper’s international large-cap floor. International large-cap value funds typically have a below-average price-to-cash flow ratio, price-to-book ratio, and three-year sales-per-share growth value compared to their large-cap-specific subset of the S&P/Citigroup World ex-U.S. BMI.
Lipper Large-Cap Growth Funds Average is an average of managed mutual funds that, by portfolio practice, invest at least 75% of their equity assets in companies with market capitalizations (on a three-year weighted basis) greater than 300% of the dollar-weighted median market capitalization of the middle 1,000 securities of the S&P SuperComposite 1500 Index. Large-cap growth funds typically have an above-average price-to-earnings ratio, price-to-book ratio, and three-year sales-per-share growth value, compared to the S&P 500 Index.
Lipper Large-Cap Core Funds is an average of the performance of managed mutual funds that, by portfolio practice, invest at least 75% of their equity assets in companies with market capitalizations (on a three-year weighted basis) greater than 300% of the dollar-weighted median market capitalization of the middle 1,000 securities of the S&P SuperComposite 1500 Index. Large-cap core funds have more latitude in the companies in which they invest. These funds typically have an average price-to-earnings ratio, price-to-book ratio, and three-year sales-per-share growth value, compared to the S&P 500 Index.
Lipper Mid-Cap Growth Funds Average is an average of the performance of managed mutual of managed mutual funds that, by portfolio practice, invest at least 75% of their equity assets in companies with market capitalizations (on a three-year weighted basis) of less than 300% of the dollar-weighted median market capitalization of the Standard & Poor’s MidCap 400 Index.
Lipper New York Municipal Debt Funds Average is an average of the performance of managed mutual funds that invest at least 65% of their assets in municipal debt issues that are exempt from taxation in New York or a city in New York.
Morgan Stanley Capital International Europe, Australasia and Far East (“MSCI EAFE”) Index is an unmanaged free float-adjusted market capitalization index that is designed to measure the equity market performance of developed markets, excluding the U.S. & Canada.
The Russell Universe - Russell is a recognized leader in consulting, multi-manager investing and institutional investment management. Russell’s consultants advise clients on more than $2 trillion in assets. Russell delivers investment programs to over 2,000 clients in 44 countries. With more than $230 billion in assets in our funds, Russell researchers meet with over 4,000 investment managers around the world to evaluate their investment process.
Russell 1000® Growth Index is an unmanaged index which measures the performance of the large-cap growth segment of the U.S. equity universe. It includes those Russell 1000 companies with higher price-to-book ratios and higher forecasted growth values.
Russell 1000® Value Index is an unmanaged index which measures the performance of the large-cap value segment of the U.S. equity universe. It includes those Russell 1000 companies with lower price-to-book ratios and lower expected growth values.
Russell 2000® Index is an unmanaged index which measures the performance of the small-cap segment of the U.S. equity universe. The Russell 2000 Index is a subset of the Russell 3000® Index representing approximately 10% of the total market capitalization of that index. It includes approximately 2000 of the smallest securities based on a combination of their market cap and current index membership.
Russell 2500™ Growth Index is an unmanaged index which measures the performance of the small- to mid-cap growth segment of the U.S. equity universe. It includes those Russell 2500 companies with higher price-to-book ratios and higher forecasted growth values.
Standard & Poor’s MidCap 400 Index (“S&P MidCap 400”) is an unmanaged index comprised of 400 domestic stocks chosen for market size (median market capitalization of $50 Million to $3.3 billion), liquidity and industry group representation.
Standard & Poor’s 500 Index (“S&P 500”) is an unmanaged index that is widely regarded as a gauge of the U.S. equities market, this index includes 500 leading companies in leading industries of the U.S. economy. The S&P 500 focuses on the large cap segment of the market, with approximately 75% coverage of U.S. equities.
Lipper is an independent mutual fund performance monitor whose results are based on total return and do not reflect a sales charge.
Securities indexes assume reinvestment of all distributions and interest payments and do not take in account brokerage fees or expenses. Securities in the Fund do not match those in the indexes and performance of the Fund will differ. Investors cannot invest directly in an index.
Dear Shareholder,
The difficulties in the markets that I mentioned in my last letter continued for the period covered by this semi-annual financial report. In response, governments around the world announced programs of varying types designed to provide support to key industries and generally promote economic activity.
In the face of these market conditions, investors have seen the value of their portfolios decrease, in some cases dramatically. Even money market funds, which are considered by many to be “safe havens” have not been immune from these conditions. In October 2008, a large U.S.-registered money market fund experienced significant market depreciation of some of its portfolio holdings and announced that its price per share had sunk below $1.00.
The U.S. government has responded to this situation with a number of programs. Several were designed to support the credit markets by encouraging investments in money market instruments. Another program was specifically aimed at supporting investor confidence in money market funds. The U.S. Treasury offered money market funds the opportunity to participate in a temporary guarantee program under which a participating fund would receive financial support from the Treasury if its price per share were to depreciate below $1.00. Most money market funds in the U.S. participated in this program.
The Board of Trustees of the HSBC Investor Funds has actively monitored these developments and, along with the Funds’ adviser, has taken actions designed to support the financial interests of the Funds’ shareholders. For example, most of the HSBC Investor money market funds have participated in the Treasury’s Temporary Guarantee Program. The sole exception was the HSBC Investor U.S. Treasury Money Market Fund, which invests in obligations issued by the U.S. Treasury.
The Board continues to work with the Adviser on evaluating investment options and taking actions designed to benefit the shareholders. We remain committed to managing the HSBC Investor Funds in a prudent manner for long-term performance, while taking advantage of short-term market movements.
For commentary on the Funds’ investment results, please read the portfolio managers’ analysis of current market conditions.
After 22 years of serving as the Chairman of the Funds’ Board of Trustees, I will be stepping down, effective July 1, 2009; however, I will continue as a trustee. Michael Seely, who has also been a trustee of the funds since their inception, will be taking over as chairman on that date. I would like to take this time to thank you for the opportunity to serve as Chairman and for your continuing investments with the HSBC Investor Funds.
Sincerely,
Larry M. Robbins, Chairman, HSBC Investor Funds
| |
1 | HSBC INVESTOR FAMILY OF FUNDS |
|
Commentary From the Investment Manager |
|
|
HSBC Global Asset Management (USA) Inc. |
U.S. Economic Review
Several factors weighed on the U.S. economy during the six-month period between November 1, 2008 and April 30, 2009. Employment continued to decline, causing weakness in consumer spending. The decline in consumer spending also reflected falling prices for goods and services, particularly oil and gas. Consumer spending accounts for more than two-thirds of U.S. economic activity, so slower spending posed a significant threat to economic growth.
Housing values continued to decline in the wake of the subprime mortgage crisis. Foreclosures mounted, forcing financial firms to continue writing down the value of their assets in mortgage-related securities. The federal government responded by designating $1 trillion to help investors buy distressed loans and other assets from U.S. banks. Meanwhile, U.S. automakers struggled with a steep decline in sales and sought a federal bailout in order to avoid bankruptcy.
The Federal Reserve Board acted aggressively as it attempted to ameliorate the credit situation and stimulate the economy. The Fed in December reduced the federal funds rate, its target short-term interest rate, from 1.00% to a range between 0.00% and 0.25% in order to inject liquidity into the financial markets.
In addition, in December, the National Bureau of Economic Research announced that the United States had officially been in a recession since the previous December. The U.S. economy contracted substantially during the period under review: Gross domestic product decreased at annualized rates of 6.3% during the fourth quarter of 2008 and 5.7% in the first quarter of 2009.
Meanwhile, governments across the globe took unprecedented measures to fight the slowdown—the first synchronized global recession since World War II. The G-20, which includes 20 developed and emerging countries with some of the world’s largest economies, agreed on a $1.1 trillion program that the International Monetary Fund would use to help afflicted countries boost economic activity. Both the U.S. and U.K. governments attempted to stimulate lending via quantitative easing, in addition to maintaining target short-term interest rates near zero. Quantitative easing increases the amount of money in circulation by boosting the supply of credit and thus stimulating the flow of money around the economy.
Market Review
Investors during most of this six-month period responded to the uncertain economic environment by fleeing from the perceived risk of stocks and into the perceived safety of high-quality bonds. U.S. stock returns were volatile during this time, as grim economic news and the emerging federal response to the crisis caused traders to react aggressively in response to new data. The U.S. market recovered between early March and the end of April, as investors anticipating improving economic and market conditions sought to capitalize on low valuations. The period ended with the stock market’s best six-week performance since 1938. For the period as a whole the S&P 500 Index1 returned -8.52%, while the small-cap Russell 2000® Index1 lost 8.40%.
Foreign stocks generally posted losses, with the MSCI EAFE Index1 of developed foreign stock markets falling -2.35% during the period under review. Investors sold foreign stocks due to a general aversion to risk, and because of concerns about the repercussions from the turmoil in the credit markets. Emerging markets were mixed during the period. These shares suffered as investors sold assets they perceived to be risky, then rebounded powerfully later in the period as risk aversion decreased and commodity prices rebounded.
The fixed-income markets experienced several distinct environments during the six-month period. The worsening global recession fueled a flight to quality in November as investors sought out the most conservative and secure fixed-income investments—in particular Treasury securities. As the financial crisis began to recede, demand rose for higher-risk fixed-income securities such as corporate and government agency issues. The Barclays Capital U.S. Aggregate Bond Index1, which tracks the broad fixed-income market, returned 7.74% for the six months through April.
| |
1 | For additional information, please refer to the Glossary of Terms. |
| |
HSBC INVESTOR FAMILY OF FUNDS | 2 |
|
Portfolio Reviews |
|
|
HSBC Investor Core Plus Fixed Income Fund |
(Class A Shares, B Shares, C Shares and I Shares)
by Halbis Capital Management (USA) Inc., Broad Markets Fixed Income Team |
The HSBC Investor Core Plus Fixed Income Fund (the “Fund”) seeks to maximize total return, consistent with reasonable risk. The “total return’’ sought by the Fund consists of income earned on investments, plus capital appreciation, if any, which generally arises from decreases in interest rates or improving credit fundamentals for a particular sector or security. The Fund utilizes a two-tier structure, commonly known as a “master-feeder” structure, in which the Fund invest all of its investable assets in the HSBC Investor Core Plus Fixed Income Portfolio (the “Portfolio”). The Portfolio employs Halbis Capital Management (USA) Inc. as subadviser.
Investment Concerns
Bonds offer a relatively stable level of income, although bond prices will fluctuate providing the potential for principal gain or loss. Intermediate-term, higher-quality bonds generally offer less risk and a lower rate of return than longer-term bonds.
The mortgage market in the U.S. recently experienced difficulties that may adversely affect the performance and market value of certain mortgage-related investments.
Market Commentary
For the six-month period ended April 30, 2009, the Class I Shares of the Fund produced a 6.10% total return, and the Class A Shares returned 5.99% (without sales charge). That compared to a total return of 7.74% and 5.87% for the Barclays Capital U.S. Aggregate Bond Index1 and the Lipper Intermediate Investment-Grade Debt Funds Average1, respectively.
Past performance is no guarantee of future results.
Portfolio Performance
The fixed-income markets experienced several distinct environments during the six-month period. The worsening global recession fueled a flight to quality in November as investors sought out the most conservative and secure fixed-income investments—in particular Treasury securities, followed by a significant rally in December. The market came under heavy pressure in February, followed by a strong rally in March and April. As the financial crisis began to recede, demand rose for higher-risk fixed-income securities such as corporate and government agency issues.
The Fund held a relatively heavy weighting in corporate and other non-Treasury bonds. We saw opportunities among such bonds, which we believed were not properly valued in the early part of the period. That focus on corporate bonds and other non-Treasury securities initially weighed on relative performance, but boosted returns against the benchmark as investors became less risk-averse during the second half of the period. The Fund maintained a high credit rating throughout the period, though it did have a modest exposure to securities rated below investment grade.*
We maintained an average maturity that was neutral to that of the benchmark. We focused the Fund’s portfolio largely on intermediate-term securities, which in our estimation offered the most compelling values among corporate issues.*,2
| |
* | Portfolio composition is subject to change. |
| |
1 | For additional information, please refer to the Glossary of Terms. |
| |
2 | The current management team took over management of the Fund on February 1, 2009. |
| |
3 | HSBC INVESTOR FAMILY OF FUNDS |
|
Portfolio Reviews |
|
|
HSBC Investor Core Plus Fixed Income Fund - As of April 30, 2009 |
| | | | | | | | | | | | | | | | | | | | | |
Fund Performance | | | | | | Average Annual Total Return (%) | | Expense
Ratio (%)5 | |
|
As of April 30, 2009 | | Inception
Date | | Six
Months† | | 1
Year | | 5
Year | | 10
Year | | Since
Inception | | Gross | | Net | |
|
HSBC Investor Core Plus Fixed Income Fund Class A1 | | 8/26/96 | | | 0.99 | | | -7.11 | | 1.71 | | 3.68 | | 4.51 | | | 1.46 | | | 0.70 | |
|
|
|
|
|
|
|
|
|
|
|
|
|
|
|
|
|
|
|
|
|
|
HSBC Investor Core Plus Fixed Income Fund Class B2 | | 1/6/98 | | | 1.59 | | | -6.96 | | 1.94 | | 3.72 | | 3.80 | | | 2.21 | | | 1.45 | |
|
|
|
|
|
|
|
|
|
|
|
|
|
|
|
|
|
|
|
|
|
|
HSBC Investor Core Plus Fixed Income Fund Class C3 | | 11/4/98 | | | 4.61 | | | -4.18 | | 1.90 | | 3.41 | | 3.45 | | | 2.21 | | | 1.45 | |
|
|
|
|
|
|
|
|
|
|
|
|
|
|
|
|
|
|
|
|
|
|
HSBC Investor Core Plus Fixed Income Fund Class I** | | 1/9/95 | | | 6.10 | | | -2.23 | | 2.99 | | 4.60 | | 5.90 | | | 0.72 | | | 0.45 | |
|
|
|
|
|
|
|
|
|
|
|
|
|
|
|
|
|
|
|
|
|
|
Barclays Capital U.S. Aggregate Bond Index4 | | — | | | 7.74 | | | 3.84 | | 4.78 | | 5.71 | | N/A | | | N/A | | | N/A | |
|
|
|
|
|
|
|
|
|
|
|
|
|
|
|
|
|
|
|
|
|
|
Lipper Intermediate Investment-Grade Debt Funds Average4 | | — | | | 5.87 | | | -3.13 | | 2.12 | | 3.92 | | N/A | | | N/A | | | N/A | |
|
|
|
|
|
|
|
|
|
|
|
|
|
|
|
|
|
|
|
|
|
|
Past performance does not guarantee future results. The performance data quoted represents past performance and current returns may be lower or higher. Total return figures include change in share price, reinvestment of dividends and capital gains and do not reflect the taxes that a shareholder would pay on fund distributions or on the redemption of fund shares. The investment return and principal value will fluctuate so that an investor’s shares, when redeemed may be worth more or less than the original cost. To obtain performance information current to the most recent month end, please call 1-800-782-8183.
The performance above reflects any fee waivers that have been in effect during the applicable periods, as well as any expense reimbursements that have periodically been made. Absent such waivers and reimbursements, returns would have been lower. Currently, contractual fee waivers are in effect from March 1, 2009 through March 1, 2010.
During the years ended October 31, 2007 and 2008, the Portfolio the Fund invests in received monies related to certain nonrecurring litigation settlements. Without the receipt of this payment, the returns for the applicable periods would have been lower.
| |
** | The Class I Shares of the HSBC Core Plus Fixed Income Fund are part of the Advisor Funds Trust. |
| |
1 | Reflects the maximum sales charge of 4.75%. |
| |
2 | Reflects the applicable contingent deferred sales charge, maximum of 4.00%. |
| |
3 | Reflects the applicable contingent deferred sales charge, maximum of 1.00%. |
| |
4 | For additional information, please refer to the Glossary of Terms. |
| |
5 | Reflects the expense ratio as reported in the prospectus dated February 27, 2009. |
| |
† | Aggregate total return. |
The Fund’s performance is measured against the Barclays Capital U.S. Aggregate Bond Index (formerly Lehman Brothers U.S. Aggregate Index), an unmanaged market value-weighted performance benchmark for investment-grade fixed-rate debt issues, including government, corporate, asset-backed, and mortgage-backed securities, with maturities of at least one-year. The performance of the index does not reflect the deduction of expenses associated with a mutual fund, such as investment management and fund accounting fees. The Fund’s performance reflects the deduction of fees for these value-added services. Investors cannot invest directly in an index.
| |
HSBC INVESTOR FAMILY OF FUNDS | 4 |
|
Portfolio Reviews |
|
|
HSBC Investor Intermediate Duration Fixed Income Fund |
(Class A Shares, B Shares, C Shares and I Shares)
by Halbis Capital Management (USA) Inc., Broad Markets Fixed Income Team |
The HSBC Investor Intermediate Duration Fixed Income Fund (the “Fund”) seeks to maximize total return, consistent with reasonable risk. The “total return’’ sought by the Fund consists of income earned on investments, plus capital appreciation, if any, which generally arises from decreases in interest rates or improving credit fundamentals for a particular sector or security. The Fund utilizes a two tier structure, commonly known as “master-feeder” structure, in which the Fund invests all of its investable assets in the HSBC Investor Intermediate Duration Fixed Income Portfolio (the “Portfolio”). Under normal market conditions, the Portfolio invest at least 80% of its net assets in fixed income securities. The Portfolio expects to maintain an average portfolio duration with respect to fixed income securities of 3 to 6 years. The Portfolio employs Halbis Capital Management (USA) Inc. as subadviser.
Investment Concerns
Bonds offer a relatively stable level of income, although bond prices will fluctuate providing the potential for principal gain or loss. Intermediate-term, higher-quality bonds generally offer less risk than longer-term bonds and a lower rate of return.
The mortgage market in the U.S. recently experienced difficulties that may adversely affect the performance and market value of certain mortgage-related investments.
Market Commentary
The Fund returned 5.53% (without sales charge) for the Class A Shares and 5.64% for the Class I Shares during the six-month period ended April 30, 2009. That compared to a total return of 7.12% and 5.87% for the Barclays Capital U.S. Intermediate Aggregate Bond Index1 and the Lipper Intermediate Investment-Grade Debt Funds Average1.
Past performance is no guarantee of future results.
Portfolio Performance
The fixed-income markets were turbulent to begin the period as the global economic recession continued to worsen. Seeking safety, investors in the fixed-income market favored high-quality securities such as Treasuries. A year-end rally was followed by a significant decline in credit markets in February. A more sustained rally began in March. As the period continued, the financial crisis diminished and investors began seeking higher-risk fixed-income securities such as corporate and government agency issues.
We positioned the Fund with a heavy exposure to corporate and other non-Treasury bonds, as such, securities offered strong yields compared to Treasuries. That strategy dragged on relative performance early in the period, but boosted Class I Share returns against the benchmarks as demand for higher-risk securities increased later in the period. Issues with high credit ratings made up the bulk of the Fund’s portfolio throughout the period, though it did have a modest exposure to securities rated below investment grade.
The Fund’s average maturity was positioned close to that of its benchmark, and its portfolio was focused largely on intermediate-term securities. We believed such securities offered the most compelling values among corporate issues.*,2
| |
* | Portfolio composition is subject to change. |
| |
1 | For additional information, please refer to the Glossary of Terms. |
| |
2 | The current management team took over management of the Fund on February 1, 2009. |
| |
5 | HSBC INVESTOR FAMILY OF FUNDS |
|
Portfolio Reviews |
|
|
HSBC Investor Intermediate Duration Fixed Income Fund - As of April 30, 2009 |
| | | | | | | | | | | | | | | | | | | |
Fund Performance | | | | | | Average Annual
Total Return (%) | | Expense
Ratio (%)5 | |
|
As of April 30, 2009 | | Inception
Date | | Six
Months† | | 1
Year | | 5
Year | | Since
Inception | | Gross | | Net | |
|
HSBC Investor Intermediate Duration Fixed Income Fund Class A1 | | 2/7/01 | | | 0.56 | | | -5.01 | | 2.05 | | 3.28 | | | 1.76 | | | 0.65 | |
|
|
|
|
|
|
|
|
|
|
|
|
|
|
|
|
|
|
|
|
HSBC Investor Intermediate Duration Fixed Income Fund Class B2 | | 2/15/01 | | | 1.12 | | | -4.85 | | 2.28 | | 3.32 | | | 2.51 | | | 1.40 | |
|
|
|
|
|
|
|
|
|
|
|
|
|
|
|
|
|
|
|
|
HSBC Investor Intermediate Duration Fixed Income Fund Class C3 | | 2/13/01 | | | 4.13 | | | -1.97 | | 2.31 | | 3.10 | | | 2.51 | | | 1.40 | |
|
|
|
|
|
|
|
|
|
|
|
|
|
|
|
|
|
|
|
|
HSBC Investor Intermediate Duration Fixed Income Fund Class I | | 1/23/01 | | | 5.64 | | | -0.03 | | 3.31 | | 4.23 | | | 1.51 | | | 0.40 | |
|
|
|
|
|
|
|
|
|
|
|
|
|
|
|
|
|
|
|
|
Barclays Capital U.S. Intermediate Aggregate Bond Index4 | | — | | | 7.12 | | | 4.30 | | 4.74 | | N/A | | | N/A | | | N/A | |
|
|
|
|
|
|
|
|
|
|
|
|
|
|
|
|
|
|
|
|
Lipper Intermediate Investment-Grade Debt Funds Average4 | | — | | | 5.87 | | | -3.13 | | 2.12 | | N/A | | | N/A | | | N/A | |
|
|
|
|
|
|
|
|
|
|
|
|
|
|
|
|
|
|
|
|
Past performance does not guarantee future results. The performance data quoted represents past performance and current returns may be lower or higher. Total return figures include change in share price, reinvestment of dividends and capital gains and do not reflect the taxes that a shareholder would pay on fund distributions or on the redemption of fund shares. The investment return and principal value will fluctuate so that an investor’s shares, when redeemed may be worth more or less than the original cost. To obtain performance information current to the most recent month end, please call 1-800-782-8183.
The performance above reflects any fee waivers that have been in effect during the applicable periods, as well as any expense reimbursements that have periodically been made. Absent such waivers and reimbursements, returns would have been lower. Currently, contractual fee waivers are in effect from March 1, 2009 through March 1, 2010.
During the years ended October 31, 2007 and 2008, the Portfolio the Fund invests in received monies related to certain nonrecurring litigation settlements. Without the receipt of this payment, the returns for applicable periods would have been lower.
| |
1 | Reflects the maximum sales charge of 4.75%. |
| |
2 | Reflects the applicable contingent deferred sales charge, maximum of 4.00%. |
| |
3 | Reflects the applicable contingent deferred sales charge, maximum of 1.00%. |
| |
4 | For additional information, please refer to the Glossary of Terms. |
| |
5 | Reflects the expense ratio as reported in the prospectus dated February 27, 2009. |
| |
† | Aggregate total return. |
The Fund’s performance is measured against the Barclays Capital U.S. Intermediate Aggregate Bond Index (formerly Lehman Brothers Intermediate U.S. Aggregate Index), an unmanaged index generally representative of investment-grade issues with maturities between three- and ten-years. The performance of the index does not reflect the deduction of expenses associated with a mutual fund, such as investment management and fund accounting fees. The Fund’s performance reflects the deduction of fees for these value-added services. Investors cannot invest directly in an index.
| |
HSBC INVESTOR FAMILY OF FUNDS | 6 |
|
Portfolio Reviews |
|
|
HSBC Investor New York Tax-Free Bond Fund |
(Class A Shares, B Shares, C Shares and I Shares)
by Halbis Capital Management (USA) Inc., Broad Markets Fixed Income Team |
The HSBC Investor New York Tax-Free Bond Fund (the “Fund”) seeks to provide shareholders with income exempt from regular federal, New York State and New York City personal income taxes. The Fund employs Halbis Capital Management (USA) Inc. as subadviser.
Investment Concerns
Bonds offer a relatively stable level of income, although bond prices will fluctuate providing the potential for principal gain or loss. Intermediate-term, higher-quality bonds generally offer less risk and a lower rate of return than longer-term bonds.
The Fund’s income may be subject to certain state and local taxes and, depending on your tax status, the federal alternative minimum tax. Regional funds may be subject to additional risks, since the issues they invest in are located in one geographical location.
Market Commentary
The Fund delivered a total return of 6.73% (without sales charge) for Class A Shares and 6.86% for Class I Shares for the six-month period ended April 30, 2009. That compared to 7.73% and 6.51% for the Fund’s benchmarks, the Barclays Capital New York Tax Exempt Index1 and the Lipper New York Municipal Debt Funds Average1, respectively.
Past performance does not guarantee future results.
Portfolio Performance
Factors contributing to performance for the period included an underweight in low- to medium-quality credits, which performed better as risk appetite returned to the marketplace. In addition, the Fund was generally shorter in duration than the benchmark during a period where the long end of the municipal curve rallied from the unexpected return of long-end participants (i.e. hedge funds and insurance companies). In this case, our cautious stance weighed on relative returns.*,2
| |
* | Portfolio composition is subject to change. |
| |
1 | For additional information, please refer to the Glossary of Terms. |
| |
2 | The current management team took over management of the Fund on February 1, 2009. |
| |
7 | HSBC INVESTOR FAMILY OF FUNDS |
|
Portfolio Reviews |
|
|
HSBC Investor New York Tax-Free Bond Fund - As of April 30, 2009 |
| | | | | | | | | | | | | | | | | | | | | | | | | |
Fund Performance | | | | | | Average Annual Total Return (%) | | Expense
Ratio (%)5 | |
|
|
|
|
|
|
|
|
|
|
|
|
|
|
|
|
|
|
As of April 30, 2009 | | Inception
Date | | Six
Months† | | 1
Year | | 5
Year | | 10
Year | | Since
Inception | | Gross | | Net | |
|
|
|
|
|
|
|
|
|
|
|
|
|
|
|
|
|
|
HSBC Investor New York Tax-Free Bond Fund Class A1 | | 5/1/95 | | | 1.66 | | | -1.70 | | | 2.22 | | | 3.30 | | | 4.38 | | | 0.84 | | | 0.84 | | |
|
|
|
|
|
|
|
|
|
|
|
|
|
|
|
|
|
|
|
|
|
|
|
|
|
|
HSBC Investor New York Tax-Free Bond Fund Class B2 | | 1/6/98 | | | 2.35 | | | -1.50 | | | 2.47 | | | 3.34 | | | 3.53 | | | 1.59 | | | 1.59 | | |
|
|
|
|
|
|
|
|
|
|
|
|
|
|
|
|
|
|
|
|
|
|
|
|
|
|
HSBC Investor New York Tax-Free Bond Fund Class C3 | | 11/4/98 | | | 5.22 | | | 1.46 | | | 2.44 | | | 3.02 | | | 3.01 | | | 1.59 | | | 1.59 | | |
|
|
|
|
|
|
|
|
|
|
|
|
|
|
|
|
|
|
|
|
|
|
|
|
|
|
HSBC Investor New York Tax-Free Bond Fund Class I | | 7/1/96 | | | 6.86 | | | 3.49 | | | 3.47 | | | 4.07 | | | 4.78 | | | 0.59 | | | 0.59 | | |
|
|
|
|
|
|
|
|
|
|
|
|
|
|
|
|
|
|
|
|
|
|
|
|
|
|
Barclays Capital New York Tax Exempt Index4 | | — | | | 7.73 | | | 3.34 | | | 4.18 | | | 4.82 | | | N/A | | | N/A | | | N/A | | |
|
|
|
|
|
|
|
|
|
|
|
|
|
|
|
|
|
|
|
|
|
|
|
|
|
|
Lipper New York Municipal Debt Funds Average4 | | — | | | 6.51 | | | -1.48 | | | 2.46 | | | 3.34 | | | N/A | | | N/A | | | N/A | | |
|
|
|
|
|
|
|
|
|
|
|
|
|
|
|
|
|
|
|
|
|
|
|
|
|
|
Past performance does not guarantee future results. The performance data quoted represents past performance and current returns may be lower or higher. Total return figures include change in share price, reinvestment of dividends and capital gains and do not reflect the taxes that a shareholder would pay on fund distributions or on the redemption of fund shares. The investment return and principal value will fluctuate so that an investor’s shares, when redeemed may be worth more or less than the original cost. To obtain performance information current to the most recent month end, please call 1-800-782-8183.
The performance above reflects any fee waivers that have been in effect during the applicable periods, as well as any expense reimbursements that have periodically been made. Absent such waivers and reimbursements, returns would have been lower.
| |
1 | Reflects the maximum sales charge of 4.75%. |
| |
2 | Reflects the applicable contingent deferred sales charge, maximum of 4.00%. |
| |
3 | Reflects the applicable contingent deferred sales charge, maximum of 1.00%. |
| |
4 | For additional information, please refer to the Glossary of Terms. |
| |
5 | Reflects the expense ratio as reported in the prospectus dated February 27, 2009. |
| |
† | Aggregate total return. |
The Fund’s performance is measured against the Barclays Capital New York Tax Exempt Index (formerly Lehman Brothers New York Tax Exempt Index), an unmanaged index composed of investment-grade New York tax-exempt securities, all having a $50 million minimum maturity value. The performance of the index does not reflect the deduction of expenses associated with a mutual fund, such as investment management and fund accounting fees. The Fund’s performance reflects the deduction of fees for these value-added services. Investors cannot invest directly in an index.
| |
HSBC INVESTOR FAMILY OF FUNDS | 8 |
|
Portfolio Reviews |
|
|
HSBC Investor Growth Fund |
(Class A Shares, B Shares, C Shares and I Shares) |
by Clark J. Winslow, Chief Executive Officer/Portfolio Manager |
Justin H. Kelly, CFA, Managing Director/Portfolio Manager |
R. Bart Wear CFA, Managing Director/Portfolio Manager |
The HSBC Investor Growth Fund (the “Fund”) seeks long-term growth of capital. Under normal market conditions, the Fund invests primarily in U.S. and foreign equity securities of high quality companies with market capitalization generally in excess of $2 billion, which the subadviser believes have the potential to generate superior levels of long-term profitability and growth. The Fund utilizes a two tier structure, commonly known as a “master-feeder” structure, in which the Fund invests all of its investable assets in the HSBC Investor Growth Portfolio (the “Portfolio”). The Portfolio employs Winslow Capital Management Inc. as subadviser.
Investment Concerns
Equity securities (stocks) are more volatile and carry more risk than other forms of investments, including investments in high-grade fixed income securities. The net asset value per share of this Fund will fluctuate as the value of the securities in the portfolio changes.
Market Commentary
The Fund returned 1.90% (without sales charge) for the Class A Shares and 1.98% for the Class I Shares for the six-month period ended April 30, 2009. That compared to a -1.52% for the Russell 1000® Growth Index1 and a - -2.35% return for the Lipper Large-Cap Growth Funds Average1.
Past performance does not guarantee future results.
Portfolio Performance
The market experienced a great deal of volatility during the period under review. Stocks fell in November on fears about the health of the financial sector. The market then rebounded on optimism the new administration would take swift action to address the country’s economic and financial problems. But stocks slumped in February after the U.S. Treasury Department announced a financial rescue plan with few details. By early March the Russell 1000® Growth Index1 had declined 18% for the year.
Then some signs of economic recovery began to appear: Consumer sentiment improved; some major banks indicated earnings would be better than expected; and the U.S. Treasury Department provided details on key parts of its financial rescue plan. Stocks rallied strongly, ending the period with the best six-week performance since 1938.
Stock selection in the technology and financials sectors helped the Fund’s Class I Shares outperform its benchmark. Shares of two Internet stocks led performance in the Fund’s technology allocation, while stocks of major credit card companies boosted the returns of the Fund’s financials stake. An overweight position in the financials sector also contributed to outperformance. The Fund’s healthcare and industrials holdings helped relative performance as well. They produced negative returns, in aggregate, but outperformed the respective sectors in the benchmark.*
An underweight position in consumer discretionary stocks held back performance relative to the index. Stock selection within this sector also weighed on relative returns. The Fund’s smaller-than-benchmark stake in energy stocks likewise weighed on relative performance.*
| |
* | Portfolio composition is subject to change. |
| |
1 | For additional information, please refer to the Glossary of Terms. |
| |
9 | HSBC INVESTOR FAMILY OF FUNDS |
|
Portfolio Reviews |
|
|
HSBC Investor Growth Fund - As of April 30, 2009 |
| | | | | | | | | | | | | | | | | | | | | | |
Fund Performance | | | | | | Average Annual
Total Return (%) | | Expense
Ratio (%)6 | |
|
As of April 30, 2009 | | Inception
Date | | Six
Months† | | 1
Year | | 3
Year | | Since
Inception | | Gross | | Net | |
|
|
|
|
|
|
|
|
|
|
|
|
|
|
|
|
HSBC Investor Growth Fund Class A1 | | 5/7/04 | 5 | | -3.24 | | | -34.53 | | | -8.27 | | | -1.20 | | | 1.32 | | | 1.20 | | |
|
|
|
|
|
|
|
|
|
|
|
|
|
|
|
|
|
|
|
|
|
|
|
HSBC Investor Growth Fund Class B2 | | 5/7/04 | 5 | | -2.58 | | | -34.31 | | | -7.92 | | | -0.93 | | | 2.07 | | | 1.95 | | |
|
|
|
|
|
|
|
|
|
|
|
|
|
|
|
|
|
|
|
|
|
|
|
HSBC Investor Growth Fund Class C3 | | 5/7/04 | 5 | | 0.41 | | | -32.27 | | | -7.39 | | | -0.93 | | | 2.07 | | | 1.95 | | |
|
|
|
|
|
|
|
|
|
|
|
|
|
|
|
|
|
|
|
|
|
|
|
HSBC Investor Growth Fund Class I | | 5/7/04 | 5 | | 1.98 | | | -30.93 | | | -6.48 | | | 0.05 | | | 1.07 | | | 0.95 | | |
|
|
|
|
|
|
|
|
|
|
|
|
|
|
|
|
|
|
|
|
|
|
|
Russell 1000® Growth Index4 | | — | | | -1.52 | | | -31.57 | | | -8.49 | | | N/A | | | N/A | | | N/A | | |
|
|
|
|
|
|
|
|
|
|
|
|
|
|
|
|
|
|
|
|
|
|
|
Lipper Large-Cap Growth Funds Average4 | | — | | | -2.35 | | | -33.21 | | | -9.71 | | | N/A | | | N/A | | | N/A | | |
|
|
|
|
|
|
|
|
|
|
|
|
|
|
|
|
|
|
|
|
|
|
|
Past performance does not guarantee future results. The performance data quoted represents past performance and current returns may be lower or higher. Total return figures include change in share price, reinvestment of dividends and capital gains and do not reflect the taxes that a shareholder would pay on fund distributions or on the redemption of fund shares. The investment return and principal value will fluctuate so that an investor’s shares, when redeemed may be worth more or less than the original cost. To obtain performance information current to the most recent month end, please call 1-800-782-8183.
The performance above reflects any fee waivers that have been in effect during the applicable periods, as well as any expense reimbursements that have periodically been made. Absent such waivers and reimbursements, returns would have been lower. Currently, contractual fee waivers are in effect from March 1, 2009 through March 1, 2010.
During the periods ended April 30, 2009 and October 31, 2008, the Portfolio the Fund invests in received monies related to certain nonrecurring litigation settlements. Without the receipt of this payment, the returns for the applicable periods would be lower.
| |
1 | Reflects the maximum sales charge of 5.00%. |
| |
2 | Reflects the applicable contingent deferred sales charge maximum of 4.00%. |
| |
3 | Reflects the applicable contingent deferred sales charge maximum of 1.00%. |
| |
4 | For additional information, please refer to the Glossary of Terms. |
| |
5 | The HSBC Investor Growth Fund was initially offered for purchase effective May 7, 2004, however, no shareholder activity occurred until May 10, 2004. |
| |
6 | Reflects the expense ratio as reported in the prospectus dated February 27, 2009. |
| |
† | Aggregate total return. |
The Fund’s performance is measured against the Russell 1000® Growth Index, an unmanaged index which measures the performance of the large-cap growth segment of the U.S. equity universe. It includes those Russell 1000 companies with higher price-to-book ratios and higher forecasted growth values. The index does not reflect the deduction of expenses associated with a mutual fund, such as investment management and fund accounting fees. The Fund’s performance reflects the deduction of fees for these value-added services. Investors cannot invest directly in an index.
| |
HSBC INVESTOR FAMILY OF FUNDS | 10 |
|
Portfolio Reviews |
|
|
HSBC Investor International Equity Fund |
HSBC Investor Overseas Equity Fund (Class A Shares, B Shares, C Shares, and I Shares) |
by Kevin F. Simms |
Co-CIO International Value Equities and Director of Research – Global and International Value Equities |
AllianceBernstein Investment Research and Management |
The HSBC Investor International Equity Fund and the HSBC Investor Overseas Equity Fund (the “Funds”) seek to provide their shareholders with long-term growth of capital and future income. Under normal market conditions, each Fund invests at least 80% of its net assets in equity securities of companies organized and domiciled in developed nations outside the United States or for which the principal trading market is outside the United States, including Europe, Canada, Australia and the Far East. Each Fund may invest up to 20% of its assets in equity securities of companies in emerging markets. The Funds employ a two-tier fund structure, known as a “master-feeder” structure, in which the Funds invest all of their investable assets in the HSBC Investor International Equity Portfolio (the “Portfolio”). The Portfolio employs AllianceBernstein L.P. (“AllianceBernstein”), a unit of AllianceBernstein Investment Research and Management as subadviser.
Investment Concerns
There are risks associated with investing in foreign companies, such as erratic market conditions, economic and political instability and fluctuations in currency and exchange rates.
Equity securities (stocks) are more volatile and carry more risk than other forms of investments, including investments in high-grade fixed income securities. The net asset value per share of this Fund will fluctuate as the value of the securities in the portfolio changes.
Market Commentary
For the six-month period ended April 30, 2009, the Class I Shares of the HSBC Investor International Equity Fund produced a -4.75% return and the Class A Shares of the HSBC Investor Overseas Equity Fund returned -5.11% (without sales charge). That compared to a total return of -2.35% and -3.69% for the Funds’ benchmarks, the MSCI EAFE Index1 and the Lipper International Large-Cap Value Funds Average1.
Past performance does not guarantee future results.
Portfolio Performance
Investors’ fears about the length and severity of the global economic recession, as well as the extent of the trouble in the global banking system, dominated financial markets from the beginning of the period through late February. This period of sustained weakness contributed to the Fund’s negative performance. In the latter portion of the period under review, investors believed that both the global economy and the global financial system had stabilized, and financial markets worldwide largely recovered from their prior underperformance. International stocks generally followed this trend.
The Fund’s overweight position in energy shares boosted performance relative to its benchmark index, as did stock selection within the sector. Stock selection among financial firms also boosted relative performance. By the period’s end, investors began to discriminate between those financial firms that had a great deal of exposure to significant credit losses and those that did not. The Fund’s holdings among the latter group contributed positively to relative performance.*
The Fund’s overweight position in telecommunications shares hurt relative performance. As investors’ appetite for risk increased at the end of the period, defensive sectors including telecom underperformed. Stock selection in industrial commodities also dragged on relative performance, as the Fund’s limited exposure to metals and mining firms benefiting from renewed economic growth in China, relative to that of the benchmark, hurt returns.*
| |
* | Portfolio composition is subject to change. |
| |
1 | For additional information, please refer to the Glossary of Terms. |
| |
11 | HSBC INVESTOR FAMILY OF FUNDS |
|
Portfolio Reviews |
|
|
HSBC Investor International Equity Fund |
HSBC Investor Overseas Equity Fund - As of April 30, 2009 |
| | | | | | | | | | | | | | | | | | | | | | | | | |
Fund Performance | | | | | | | | Average Annual Total Return (%) | | Expense
Ratio (%)5 | |
|
As of April 30, 2009 | | Inception
Date | | Six
Months† | | 1
Year | | 5
Year | | 10
Year | | Since
Inception | | Gross | | Net | |
|
|
|
|
|
|
|
|
|
|
|
|
|
|
|
|
|
|
HSBC Investor International Equity Fund Class I** | | 1/9/95 | | | -4.39 | | | -48.45 | | | 0.17 | | | 0.62 | | | 4.77 | | | 0.84 | | | 0.84 | | |
|
|
|
|
|
|
|
|
|
|
|
|
|
|
|
|
|
|
|
|
|
|
|
|
|
|
HSBC Investor Overseas Equity Fund Class A1 | | 8/26/96 | | | -9.28 | | | -51.69 | | | -1.78 | | | -0.58 | | | 2.51 | | | 1.81 | | | 1.81 | | |
|
|
|
|
|
|
|
|
|
|
|
|
|
|
|
|
|
|
|
|
|
|
|
|
|
|
HSBC Investor Overseas Equity Fund Class B2 | | 1/6/98 | | | -6.57 | | | -50.32 | | | -1.50 | | | -1.80 | | | 0.37 | | | 2.56 | | | 2.56 | | |
|
|
|
|
|
|
|
|
|
|
|
|
|
|
|
|
|
|
|
|
|
|
|
|
|
|
HSBC Investor Overseas Equity Fund Class C3 | | 11/4/98 | | | -5.53 | | | -49.73 | | | -1.49 | | | -0.83 | | | 0.99 | | | 2.56 | | | 2.56 | | |
|
|
|
|
|
|
|
|
|
|
|
|
|
|
|
|
|
|
|
|
|
|
|
|
|
|
MSCI EAFE Index4 | | — | | | -2.35 | | | -42.42 | | | 1.12 | | | 0.35 | | | N/A | | | N/A | | | N/A | | |
|
|
|
|
|
|
|
|
|
|
|
|
|
|
|
|
|
|
|
|
|
|
|
|
|
|
Lipper International Large-Cap Value Funds Average4 | | — | | | -3.69 | | | -44.08 | | | -0.04 | | | 1.52 | | | N/A | | | N/A | | | N/A | | |
|
|
|
|
|
|
|
|
|
|
|
|
|
|
|
|
|
|
|
|
|
|
|
|
|
|
Past performance does not guarantee future results. The performance data quoted represents past performance and current returns may be lower or higher. Total return figures include change in share price, reinvestment of dividends and capital gains and do not reflect the taxes that a shareholder would pay on fund distributions or on the redemption of fund shares. The investment return and principal value will fluctuate so that an investor’s shares, when redeemed may be worth more or less than the original cost. To obtain performance information current to the most recent month end, please call 1-800-782-8183.
The performance above reflects any fee waivers that have been in effect during the applicable periods, as well as any expense reimbursements that have periodically been made. Absent such waivers and reimbursements, returns would have been lower. Currently, contractual fee waivers are in effect from March 1, 2009 through March 1, 2010.
During March 2007, the Fund received monies related to certain nonrecurring litigation settlements. Without the receipt of this payment, the returns for the applicable periods would have been lower.
| |
** | The Class I Shares represent HSBC Investor International Equity Fund and are part of the Advisor Funds Trust. |
| |
1 | Reflects the maximum sales charge of 5.00%. |
| |
2 | Reflects the applicable contingent deferred sales charge, maximum of 4.00%. |
| |
3 | Reflects the applicable contingent deferred sales charge, maximum of 1.00%. |
| |
4 | For additional information, please refer to the Glossary of Terms. |
| |
5 | Reflects the expense ratio as reported in the prospectus dated February 27, 2009. |
| |
† | Aggregate total return. |
The Fund’s performance is measured against the Morgan Stanley Capital International (“MSCI”) Europe, Australasia and Far East (“EAFE”) Index, an unmanaged free float-adjusted market capitalization index that is designed to measure the equity market performance of developed markets, excluding the U.S. & Canada. The performance of the index does not reflect the deduction of expenses associated with a mutual fund, such as investment management and fund accounting fees. The Funds’ performance reflects the deduction of fees for these value-added services. Investors cannot invest directly in an index.
| |
HSBC INVESTOR FAMILY OF FUNDS | 12 |
|
Portfolio Reviews |
|
|
HSBC Investor Mid-Cap Fund |
(Class A Shares, B Shares, C Shares and Class I Shares) |
by Tony Y. Dong, CFA, Director, Mid-Cap Equity and Senior Portfolio Manager and |
Brian S. Matuszak, CFA, Senior Equity Analyst and |
Andy Y. Mui, CPA, Senior Equity Analyst |
Munder Capital Management |
The HSBC Investor Mid-Cap Fund (the “Fund”) seeks to achieve long-term growth of capital by investing at least 80% of its net assets in equity securities, i.e., common stocks, preferred stocks, convertible securities and rights and warrants of mid-capitalization companies. Mid-capitalization companies are those companies with market capitalization within the range of companies included in the S&P MidCap 400® Index1, or within the range of companies included in the Russell Midcap® Index. The Fund employs Munder Capital Management (“Munder”) as subadviser.
Investment Concerns
Equity securities (stocks) are more volatile and carry more risk than other forms of investments, including investments in high-grade fixed income securities. The net asset value per share of this Fund will fluctuate as the value of the securities in the portfolio changes.
Mid capitalization funds typically carry additional risks since smaller companies generally have a higher risk of failure, and historically, their stocks have experienced a greater degree of market volatility than stocks on average.
Market Commentary
The Fund’s Class A Shares posted a return of -1.91% (without sales charge) and - -1.69% for the Class I Shares for the six-month period ended April 30, 2009. That compares to -0.18% and -0.87% for the Fund’s benchmarks, the S&P MidCap 400 Index1 and the Lipper Mid-Cap Growth Funds Average1.
Past performance does not guarantee future results.
Portfolio Performance
The stock market struggled during the six months under review, though it regained ground late in the period. Mid-cap stocks generally mirrored the market as a whole, falling for much of the period and rebounding in late March and April. Mid-cap growth shares lagged mid-cap value shares, perhaps reflecting investors’ growing skepticism about earnings potential as the economy continued to weaken.
The Fund prefers shares of companies with above-average projected earnings growth. Its heavy weighting in such stocks hurt both absolute and relative performance during the period under review. The portfolio did produce positive absolute returns in five of the 10 economic sectors in which it invests: energy, materials, utilities, information technology, and consumer discretionary. Stock selection in materials particularly boosted absolute performance.*
The health care sector provided the largest drag on performance relative to the benchmark. Shares of a firm that owns and operates psychiatric hospitals and a specialty drug company particularly weighed on performance. Stock selection in consumer discretionary and consumer staples sectors hurt relative performance, in part due to the impact weak consumer spending had on these shares. Meanwhile, the Fund’s overweight position in the telecommunications sector and underweight position in the financial sector boosted performance relative to the benchmark.*
| |
* | Portfolio composition is subject to change. |
| |
1 | For additional information, please refer to the Glossary of Terms. |
| |
13 | HSBC INVESTOR FAMILY OF FUNDS |
|
Portfolio Reviews |
|
|
HSBC Investor Mid-Cap Fund - As of April 30, 2009 |
| | | | | | | | | | | | | | | | | | | | | |
Fund Performance | | | | | | Average Annual Total Return† (%) | | Expense
Ratio (%)5 | |
|
|
|
|
|
|
|
|
|
|
|
|
|
|
|
|
|
|
As of April 30, 2009 | | Inception
Date | | Six
Months† | | 1
Year | | 5
Year | | 10
Year | | Since
Inception | | Gross | | Net | |
|
|
|
|
|
|
|
|
|
|
|
|
|
|
|
|
|
|
HSBC Investor Mid-Cap Fund Class A1 | | 7/1/93 | | | -6.77 | | | -41.11 | | -1.31 | | 1.34 | | 6.77 | | | 1.79 | | | 1.35 | |
|
|
|
|
|
|
|
|
|
|
|
|
|
|
|
|
|
|
|
|
|
|
HSBC Investor Mid-Cap Fund Class B2 | | 7/1/93 | | | -5.64 | | | -40.63 | | -1.05 | | 1.11 | | 6.46 | | | 2.54 | | | 2.10 | |
|
|
|
|
|
|
|
|
|
|
|
|
|
|
|
|
|
|
|
|
|
|
HSBC Investor Mid-Cap Fund Class C3 | | 7/1/93 | | | -2.98 | | | -38.96 | | -1.04 | | 1.17 | | 6.37 | | | 2.54 | | | 2.10 | |
|
|
|
|
|
|
|
|
|
|
|
|
|
|
|
|
|
|
|
|
|
|
HSBC Investor Mid-Cap Fund Class I | | 7/1/93 | | | -1.69 | | | -37.88 | | -0.09 | | 2.09 | | 7.38 | | | 1.54 | | | 1.10 | |
|
|
|
|
|
|
|
|
|
|
|
|
|
|
|
|
|
|
|
|
|
|
S&P MidCap 400 Index4 | | — | | | -0.18 | | | -31.84 | | 0.56 | | 4.86 | | N/A | | | N/A | | | N/A | |
|
|
|
|
|
|
|
|
|
|
|
|
|
|
|
|
|
|
|
|
|
|
Lipper Mid-Cap Growth Funds Average4 | | — | | | -0.87 | | | -36.17 | | -1.25 | | 0.53 | | N/A | | | N/A | | | N/A | |
|
|
|
|
|
|
|
|
|
|
|
|
|
|
|
|
|
|
|
|
|
|
Past performance does not guarantee future results. The performance data quoted represents past performance and current returns may be lower or higher. Total return figures include change in share price, reinvestment of dividends and capital gains and do not reflect the taxes that a shareholder would pay on fund distributions or on the redemption of fund shares. The investment return and principal value will fluctuate so that an investor’s shares, when redeemed may be worth more or less than the original cost. To obtain performance information current to the most recent month end, please call 1-800-782-8183.
The performance above reflects any fee waivers that have been in effect during the applicable periods, as well as any expense reimbursements that have periodically been made. Absent such waivers and reimbursements, returns would have been lower. Currently, contractual fee waivers are in effect from March 1, 2009 through March 1, 2010.
| |
1 | Reflects the maximum sales charge of 5.00%. |
| |
2 | Reflects the applicable contingent deferred sales charge, maximum of 4.00%. |
| |
3 | Reflects the applicable contingent deferred sales charge, maximum of 1.00%. |
| |
4 | For additional information, please refer to the Glossary of Terms. |
| |
5 | Reflects the expense ratio as reported in the prospectus dated February 27, 2009. |
| |
† | Aggregate total return. |
| |
† | For periods prior to July 1, 2000, the performance shown above includes the total return (adjusted for Fund expenses) generated by HSBC Global Asset Management (USA) Inc’s management of a pooled investment vehicle called a collective investment trust (“CIT”) with the same investment objective as the Fund. The assets from that CIT were converted into the HSBC Investor Mid-Cap Fund on July 1, 2000. The CIT was not registered with the Securities & Exchange Commission (SEC) and thus was not subject to certain investment restrictions that are imposed on the Fund. If the CIT had been registered with the SEC, its performance might have been adversely affected. Performance assumes reinvestment of dividends and distributions. |
| |
The Fund’s performance is measured against the S&P MidCap 400 Index, an unmanaged index comprised of 400 domestic stocks chosen for market size (median market capitalization of $50 million to $3.3 billion), liquidity and industry group representation. The performance of the index does not reflect the deduction of expenses associated with a mutual fund, such as investment management and fund accounting fees. The Fund’s performance reflects the deduction of fees for these value-added services. Investors cannot invest directly in an index. |
| |
HSBC INVESTOR FAMILY OF FUNDS | 14 |
|
Portfolio Reviews |
|
|
HSBC Investor Opportunity Fund |
(Class A Shares, B Shares, C Shares and I Shares) |
by William A. Muggia
President–Chief Investment Officer
Westfield Capital Management |
The HSBC Investor Opportunity Fund (the “Fund”) seeks to provide its shareholders with long-term growth of capital by investing in equity securities of small cap companies. The Fund may also invest in bonds, notes, commercial paper, U.S. Government securities, and foreign securities. Small cap companies generally are defined as those that have market capitalizations within the range of market capitalizations represented in the Russell 2500™ Growth Index.1 The Fund may also invest in equity securities of larger, more established companies if they are expected to show increased earnings. The Fund employs a two-tier structure, commonly referred to as “master-feeder” structure, in which the Fund invests all of its investable assets in the HSBC Investor Opportunity Portfolio (the “Portfolio”). The Portfolio employs Westfield Capital Management Company, LLC as subadviser.
Investment Concerns
Equity securities (stocks) are more volatile and carry more risk than other forms of investments, including investments in high-grade fixed income securities. The net asset value per share of this Fund will fluctuate as the value of the securities in the portfolio changes.
Small-capitalization funds typically carry additional risks since smaller companies generally have a higher risk of failure, and historically, their stocks have experienced a greater degree of market volatility than stocks on average.
Market Commentary
For the six-month period ended April 30, 2009, the Class I Shares of the HSBC Investor Opportunity Fund produced a -3.72% return and the Class A Shares of the Fund produced a -3.99% return (without sales charge). The Funds’ benchmarks, the Russell 2500™ Growth Index1 and the Lipper Mid-Cap Growth Funds Average1, returned 0.69% and -0.87%, respectively.
Past performance does not guarantee future results.
Portfolio Performance
The six-month period was punctuated by both periods of negative performance and periods of positive performance. Early in the period, the global recession significantly weighed down stock market performance. However, early signs of an economic recovery began to show toward the end of the period, fueling a broad and relatively strong rally among stocks that continued through April 30.
The Fund’s relative return benefited from a larger-than-benchmark position in the technology sector. Investors sought out higher-risk investments such as technology stocks as the economy improved toward the end of the period, resulting in relatively strong net gains for such stocks during the six months through April. Selection among technology stocks also helped the Fund’s performance relative to its benchmark.
The Fund also benefited in relative terms from its positioning in the energy sector. The subadvisers identified a number of attractive investments in energy sub-sectors such as oil exploration and production, and those holdings helped boost relative performance.*
Stock selection within the financial sector was the largest drag on the Fund’s relative performance during the period. The subadviser focused much of the Fund’s investments among regional banks. Though shares of such firms rebounded late in the period, the Fund’s allocation to shares of regional banks early in the period hurt relative performance. The Fund’s relative performance also suffered from holding a smaller position than its benchmark in the consumer discretionary sector, which was the top-performing sector during the period. Selection of certain media stocks and shares of education services firms also negatively affected relative performance.*
| |
* | Portfolio composition is subject to change. |
| |
1 | For additional information, please refer to the Glossary of Terms. |
| |
15 | HSBC INVESTOR FAMILY OF FUNDS |
|
Portfolio Reviews |
|
|
HSBC Investor Opportunity Fund - As of April 30, 2009 |
|
| | | | | | | | | | | | | | | | | | | | | |
Fund Performance | | | | | | | | Average Annual Total Return (%) | | Expense
Ratio (%)5 | |
|
|
|
|
|
|
|
|
|
|
|
|
|
|
|
|
|
|
|
|
|
|
As of April 30, 2009 | | Inception
Date | | Six
Months† | | 1
Year | | 5
Year | | 10
Year | | Since
Inception | | Gross | | Net | |
|
|
|
|
|
|
|
|
|
|
|
|
|
|
|
|
|
|
HSBC Investor Opportunity Fund Class A1 | | 9/23/96 | | | -8.75 | | | -39.65 | | 1.31 | | 4.38 | | 5.71 | | | 1.82 | | | 1.65 | |
|
|
|
|
|
|
|
|
|
|
|
|
|
|
|
|
|
|
|
|
|
|
HSBC Investor Opportunity Fund Class B2 | | 1/6/98 | | | -7.83 | | | -39.28 | | 1.57 | | 4.44 | | 4.69 | | | 2.57 | | | 2.40 | |
|
|
|
|
|
|
|
|
|
|
|
|
|
|
|
|
|
|
|
|
|
|
HSBC Investor Opportunity Fund Class C3 | | 11/4/98 | | | -5.29 | | | -37.56 | | 1.60 | | 4.12 | | 4.81 | | | 2.57 | | | 2.40 | |
|
|
|
|
|
|
|
|
|
|
|
|
|
|
|
|
|
|
|
|
|
|
HSBC Investor Opportunity Fund Class I** | | 9/3/96 | | | -3.72 | | | -36.07 | | 2.68 | | 5.43 | | 7.35 | | | 0.97 | | | 0.97 | |
|
|
|
|
|
|
|
|
|
|
|
|
|
|
|
|
|
|
|
|
|
|
Russell 2500™ Growth Index4 | | — | | | 0.69 | | | -32.98 | | -0.92 | | 0.86 | | N/A | | | N/A | | | N/A | |
|
|
|
|
|
|
|
|
|
|
|
|
|
|
|
|
|
|
|
|
|
|
Lipper Mid-Cap Growth Funds Average4 | | — | | | -0.87 | | | -36.17 | | -1.25 | | 0.53 | | N/A | | | N/A | | | N/A | |
|
|
|
|
|
|
|
|
|
|
|
|
|
|
|
|
|
|
|
|
|
|
Past performance does not guarantee future results. The performance data quoted represents past performance and current returns may be lower or higher. Total return figures include change in share price, reinvestment of dividends and capital gains and do not reflect the taxes that a shareholder would pay on fund distributions or on the redemption of fund shares. The investment return and principal value will fluctuate so that an investor’s shares, when redeemed may be worth more or less than the original cost. To obtain performance information current to the most recent month end, please call 1-800-782-8183.
The performance above reflects any fee waivers that have been in effect during the applicable periods, as well as any expense reimbursements that have periodically been made. Absent such waivers and reimbursements, returns would have been lower. Currently, contractual fee waivers are in effect from March 1, 2009 through March 1, 2010.
| |
** | The Class I Shares of the HSBC Investor Opportunity Fund are part of the Advisor Funds Trust. |
| |
1 | Reflects the maximum sales charge of 5.00%. |
| |
2 | Reflects the applicable contingent deferred sales charge, maximum of 4.00%. |
| |
3 | Reflects the applicable contingent deferred sales charge, maximum of 1.00%. |
| |
4 | For additional information, please refer to the Glossary of Terms. |
| |
5 | Reflects the expense ratio as reported in the prospectus dated February 27, 2009. |
| |
† | Aggregate total return. |
The Fund’s performance is measured against the Russell 2500™ Growth Index, an unmanaged index which measures the performance of those 2500 securities in The Russell Universe with higher price-to-book ratios and higher forecasted growth values. The performance for the index does not reflect the deduction of expenses associated with a mutual fund, such as investment management and fund accounting fees. The Fund’s performance reflects the deduction of fees for these value-added services. Investors cannot invest directly in an index.
| |
HSBC INVESTOR FAMILY OF FUNDS | 16 |
|
Portfolio Reviews |
|
|
HSBC Investor Value Fund |
(Class A Shares, B Shares, C Shares and I Shares) |
by Jon D. Bosse, CFA
Chief Investment Officer
NWQ Investment Management Co., LLC |
The HSBC Investor Value Fund (the “Fund”) seeks long-term growth of capital and income. Under normal market conditions, the Fund invests primarily in U.S. and foreign companies with large and medium capitalizations that the subadviser believes possess opportunities under appreciated or misperceived by the market. The Fund utilizes a two tier structure, commonly known as a “master-feeder” structure, in which the Fund invests all of its investable assets in the HSBC Investor Value Portfolio (the “Portfolio”). The Portfolio employs NWQ Investment Management Company, LLC (“NWQ”) as subadviser.
Investment Concerns
Value-based investments are subject to the risk that the broad market may not recognize their intrinsic value.
Equity securities (stocks) are more volatile and carry more risk than other forms of investments, including investments in high-grade fixed income securities. The net asset value per share of this Fund will fluctuate as the value of the securities in the Portfolio changes.
Market Commentary
The Fund returned -4.81% (without sales charge) for the Class A Shares and -4.79 for the Class I Shares for the six-month period ended April 30, 2009. That compared to a -13.27% return for the Russell 1000® Value Index1 and a -7.14% return for the Lipper Large-Cap Core Funds Average1.
Past performance does not guarantee future results.
Portfolio Performance
The largest contributors to the Fund’s absolute and relative return were stocks of two gold companies. The shares benefited from a rise in gold prices as well as from improved business fundamentals, particularly for one South Africa-based company. The Fund’s overweight technology position was a positive contributor to both absolute and relative performance, as technology stocks appreciated from their very depressed levels experienced at the beginning of the period. The sub-advisor early in the period sold shares of a large forest products company and purchased stock of a fertilizer firm; those trades also boosted returns.
An underweight position in financial services versus the Russell 1000® Value Index1 helped the Fund’s relative performance. Some of the Fund’s holdings in the sector performed quite poorly, however. In particular, the Fund’s worst performing stock during the period was a money center bank. Concerns about the health of the U.S. and global financial system—and how the system’s problems would affect companies—adversely affected valuations in the sector.
The Fund’s positions in the consumer discretionary, consumer staples and healthcare sectors hurt its performance during the period. Continued economic weakness weighed heavily on these sectors. Uncertainty about the size and scope of the government’s future role in the U.S. healthcare system had a particularly large effect on healthcare stocks during this period.
| |
* | Portfolio composition is subject to change. |
| |
1 | For additional information, please refer to the Glossary of Terms. |
| |
17 | HSBC INVESTOR FAMILY OF FUNDS |
|
Portfolio Reviews |
|
|
HSBC Investor Value Fund - As of April 30, 2009 |
| | | | | | | | | | | | | | | | | | | |
Fund Performance | | | | | | Average Annual
Total Return (%) | | Expense
Ratio (%)6 | |
|
|
|
|
|
|
|
|
|
|
As of April 30, 2009 | | Inception
Date | | Six
Months† | | 1
Year | | 3
Year | | Since
Inception | | Gross | | Net | |
|
|
|
|
|
|
|
|
|
|
|
|
|
|
|
|
|
|
|
|
HSBC Investor Value Fund Class A1 | | 5/7/04 | 5 | | -9.56 | | | -39.71 | | -14.08 | | -2.50 | | | 1.23 | | | 1.20 | |
|
|
|
|
|
|
|
|
|
|
|
|
|
|
|
|
|
|
|
|
HSBC Investor Value Fund Class B2 | | 5/7/04 | 5 | | -9.05 | | | -39.57 | | -13.76 | | -2.24 | | | 1.98 | | | 1.95 | |
|
|
|
|
|
|
|
|
|
|
|
|
|
|
|
|
|
|
|
|
HSBC Investor Value Fund Class C3 | | 5/7/04 | 5 | | -5.31 | | | -37.69 | | -13.30 | | -2.25 | | | 1.98 | | | 1.95 | |
|
|
|
|
|
|
|
|
|
|
|
|
|
|
|
|
|
|
|
|
HSBC Investor Value Fund Class I | | 5/7/04 | 5 | | -4.79 | | | -36.40 | | -12.42 | | -1.25 | | | 0.98 | | | 0.95 | |
|
|
|
|
|
|
|
|
|
|
|
|
|
|
|
|
|
|
|
|
Russell 1000® Value Index4 | | — | | | -13.27 | | | -39.21 | | -13.21 | | N/A | | | N/A | | | N/A | |
|
|
|
|
|
|
|
|
|
|
|
|
|
|
|
|
|
|
|
|
Lipper Large-Cap Core Funds Average4 | | — | | | -7.14 | | | -34.43 | | -10.87 | | N/A | | | N/A | | | N/A | |
|
|
|
|
|
|
|
|
|
|
|
|
|
|
|
|
|
|
|
|
Past performance does not guarantee future results. The performance data quoted represents past performance and current returns may be lower or higher. Total return figures include change in share price, reinvestment of dividends and capital gains and do not reflect the taxes that a shareholder would pay on fund distributions or on the redemption of fund shares. The investment return and principal value will fluctuate so that an investor’s shares, when redeemed may be worth more or less than the original cost. To obtain performance information current to the most recent month end, please call 1-800-782-8183.
The performance above reflects any fee waivers that have been in effect during the applicable periods, as well as any expense reimbursements that have periodically been made. Absent such waivers and reimbursements, returns would have been lower. Currently, contractual fee waivers are in effect from March 1, 2009 through March 1, 2010.
During the periods ended April 30, 2009 and October 31, 2008, the Portfolio the Fund invests in received monies related to certain nonrecurring litigation settlements. Without the receipt of this payment, the returns for the applicable periods would be lower.
| |
1 | Reflects the maximum sales charge of 5.00%. |
| |
2 | Reflects the applicable contingent deferred sales charge, maximum of 4.00%. |
| |
3 | Reflects the applicable contingent deferred sales charge, maximum of 1.00%. |
| |
4 | For additional information, please refer to the Glossary of Terms. |
| |
5 | The HSBC Investor Value Fund was initially offered for purchase effective May 7, 2004, however, no shareholder activity occurred until May 10, 2004. |
| |
6 | Reflects the expense ratio as reported in the prospectus dated February 27, 2009. |
| |
† | Aggregate total return. |
The Fund’s performance is measured against the Russell 1000® Value Index, an unmanaged index which measures the performance of the large-cap value segment of the U.S. equity universe. It includes those Russell 1000 companies with lower price-to-book ratios and lower expected growth values. The performance of the index does not reflect the deduction of expenses associated with a mutual fund, such as investment management and fund accounting fees. The Fund’s performance reflects the deduction of fees for these value-added services. Investors cannot invest directly in an index.
| |
HSBC INVESTOR FAMILY OF FUNDS | 18 |
|
Portfolio Reviews |
|
|
Portfolio Composition* |
April 30, 2009
(Unaudited) |
| | | | |
HSBC Investor New York Tax-Free Bond Fund |
|
|
|
|
|
| | | | |
Investment Allocation | | Percentage of Investments at Value | |
|
|
|
|
Municipal Bonds | | 99.6 | % | |
|
|
|
|
|
Cash and Equivalents | | 0.4 | % | |
|
|
|
|
|
Total | | 100.0 | % | |
|
|
|
|
|
| | | | |
HSBC Investor Mid-Cap Fund | | |
|
|
|
|
|
| | | |
Investment Allocation | | Percentage of Investments at Value | |
|
|
|
|
Health Care | | 10.2 | % | |
|
|
|
|
|
Oil & Gas | | 7.4 | % | |
|
|
|
|
|
Utilities | | 6.6 | % | |
|
|
|
|
|
Commercial Services | | 5.9 | % | |
|
|
|
|
|
Computer Software | | 5.8 | % | |
|
|
|
|
|
Computer Services | | 5.6 | % | |
|
|
|
|
|
Electronic Components &
Semiconductors | | 5.0 | % | |
|
|
|
|
|
Financial Services | | 4.9 | % | |
|
|
|
|
|
Chemicals | | 4.6 | % | |
|
|
|
|
|
Insurance | | 4.1 | % | |
|
|
|
|
|
Retail | | 3.9 | % | |
|
|
|
|
|
Real Estate | | 3.5 | % | |
|
|
|
|
|
Distribution & Wholesale | | 3.3 | % | |
|
|
|
|
|
Industrial Manufacturing | | 3.2 | % | |
|
|
|
|
|
Consumer Products | | 3.2 | % | |
|
|
|
|
|
Food & Beverage | | 3.1 | % | |
|
|
|
|
|
Telecommunications | | 2.1 | % | |
|
|
|
|
|
Business Services | | 2.0 | % | |
|
|
|
|
|
Machinery | | 1.8 | % | |
|
|
|
|
|
Aerospace & Defense | | 1.6 | % | |
|
|
|
|
|
Energy | | 1.6 | % | |
|
|
|
|
|
Environmental Services | | 1.5 | % | |
|
|
|
|
|
Banking | | 1.4 | % | |
|
|
|
|
|
Communications | | 1.2 | % | |
|
|
|
|
|
Biotechnology | | 1.1 | % | |
|
|
|
|
|
Correctional Institutions | | 1.1 | % | |
|
|
|
|
|
Specialty Retail | | 1.0 | % | |
|
|
|
|
|
Leisure | | 1.0 | % | |
|
|
|
|
|
Education | | 0.9 | % | |
|
|
|
|
|
Metal Processors & Fabrication | | 0.8 | % | |
|
|
|
|
|
Transportation | | 0.4 | % | |
|
|
|
|
|
Agricultural Chemicals | | 0.2 | % | |
|
|
|
|
|
Total | | 100.0 | % | |
|
|
|
|
|
| | | | |
HSBC Investor Core Plus Fixed Income Portfolio |
|
|
|
|
|
| | | | |
Investment Allocation | | Percentage of Investments at Value | |
|
|
|
|
|
U.S. Government and Government Agency Obligations | | 36.5 | % | |
|
|
|
|
|
Corporate Obligations | | 29.6 | % | |
|
|
|
|
|
Asset Backed Securities | | 12.2 | % | |
|
|
|
|
|
Cash and Equivalents | | 8.2 | % | |
|
|
|
|
|
Commercial Mortgage Backed Securities | | 6.7 | % | |
|
|
|
|
|
Collateralized Mortgage Obligations | | 4.6 | % | |
|
|
|
|
|
Municipal Bonds | | 1.7 | % | |
|
|
|
|
|
Foreign Bonds | | 0.4 | % | |
|
|
|
|
|
Certificates of Deposit | | 0.1 | % | |
|
|
|
|
|
Total | | 100.0 | % | |
|
|
|
|
|
| | | | |
HSBC Investor Intermediate Duration
Fixed Income Portfolio |
|
|
|
|
|
| | | | |
Investment Allocation | | Percentage of Investments at Value | |
|
|
|
|
U.S. Government and Government Agency Obligations | | 39.6 | % | |
|
|
|
|
|
Corporate Obligations | | 23.8 | % | |
|
|
|
|
|
Cash and Equivalents | | 18.9 | % | |
|
|
|
|
|
Asset Backed Securities | | 8.8 | % | |
|
|
|
|
|
Commercial Mortgage Backed Securities | | 4.4 | % | |
|
|
|
|
|
Collateralized Mortgage Obligations | | 3.7 | % | |
|
|
|
|
|
Certificates of Deposit | | 0.5 | % | |
|
|
|
|
|
Foreign Bonds | | 0.3 | % | |
|
|
|
|
|
Total | | 100.0 | % | |
|
|
|
|
|
| |
* | Portfolio composition is subject to change. |
| |
19 | HSBC INVESTOR FAMILY OF FUNDS |
|
Portfolio Reviews |
|
|
Portfolio Composition* |
April 30, 2009
(Unaudited) |
| | | | |
HSBC Investor Growth Portfolio |
|
|
|
|
|
| | | | |
Investment Allocation | | Percentage of Investments at Value | |
|
|
|
|
Software Services | | 10.4 | % | |
|
|
|
|
|
Telecommunications | | 7.5 | % | |
|
|
|
|
|
Industrial Conglomerates | | 7.0 | % | |
|
|
|
|
|
Investment Management | | 6.4 | % | |
|
|
|
|
|
Medical Products | | 6.0 | % | |
|
|
|
|
|
Credit Card | | 5.6 | % | |
|
|
|
|
|
Communication Equipment | | 5.6 | % | |
|
|
|
|
|
Hardware & Peripherals | | 5.3 | % | |
|
|
|
|
|
Retail | | 5.1 | % | |
|
|
|
|
|
Internet | | 4.5 | % | |
|
|
|
|
|
Medical Services & Distributors | | 4.4 | % | |
|
|
|
|
|
Biotechnology | | 3.8 | % | |
|
|
|
|
|
Travel & Leisure | | 3.2 | % | |
|
|
|
|
|
Business Services | | 3.1 | % | |
|
|
|
|
|
Agriculture | | 3.0 | % | |
|
|
|
|
|
Oil & Gas Exploration & Production | | 3.0 | % | |
|
|
|
|
|
Railroad | | 3.0 | % | |
|
|
|
|
|
Pharmaceuticals | | 2.5 | % | |
|
|
|
|
|
Aerospace & Defense | | 2.4 | % | |
|
|
|
|
|
Retail Pharmacy | | 2.0 | % | |
|
|
|
|
|
Distribution & Wholesale | | 1.8 | % | |
|
|
|
|
|
Transportation | | 1.6 | % | |
|
|
|
|
|
Exchanges | | 1.3 | % | |
|
|
|
|
|
Oil & Gas Drill & Equipment | | 1.2 | % | |
|
|
|
|
|
Cash and Equivalents | | 0.3 | % | |
|
|
|
|
|
Total | | 100.0 | % | |
|
|
|
|
|
| | | | |
HSBC International Equity Portfolio |
|
|
|
|
|
| | | | |
Investment Allocation | | Percentage of Investments at Value | |
|
|
|
|
Europe | | 65.8 | % | |
|
|
|
|
|
Japan | | 17.5 | % | |
|
|
|
|
|
Australia & Far East | | 8.7 | % | |
|
|
|
|
|
Canada | | 5.4 | % | |
|
|
|
|
|
Other | | 1.7 | % | |
|
|
|
|
|
Cash and Equivalents | | 0.9 | % | |
|
|
|
|
|
Total | | 100.0 | % | |
|
|
|
|
|
| | | | |
HSBC Investor Opportunity Portfolio |
|
|
|
|
|
| | | | |
Investment Allocation | | Percentage of Investments at Value | |
|
|
|
|
Computer Software | | 16.3 | % | |
|
|
|
|
|
Oil & Gas | | 11.8 | % | |
|
|
|
|
|
Pharmaceuticals | | 10.7 | % | |
|
|
|
|
|
Retail | | 6.9 | % | |
|
|
|
|
|
Health Care | | 6.5 | % | |
|
|
|
|
|
Industrial Manufacturing | | 6.0 | % | |
|
|
|
|
|
Biotechnology | | 5.8 | % | |
|
|
|
|
|
Diversified Manufacturing Operations | | 5.1 | % | |
|
|
|
|
|
Financial Services | | 4.5 | % | |
|
|
|
|
|
Consumer Products | | 4.4 | % | |
|
|
|
|
|
Telecommunications | | 3.9 | % | |
|
|
|
|
|
Business Services | | 3.1 | % | |
|
|
|
|
|
Electronic Components &
Semiconductors | | 3.0 | % | |
|
|
|
|
|
Cash and Equivalents | | 2.6 | % | |
|
|
|
|
|
Education | | 1.7 | % | |
|
|
|
|
|
Environmental Services | | 1.5 | % | |
|
|
|
|
|
Aerospace & Defense | | 1.4 | % | |
|
|
|
|
|
Internet Related | | 1.4 | % | |
|
|
|
|
|
Insurance | | 1.3 | % | |
|
|
|
|
|
Gaming | | 1.1 | % | |
|
|
|
|
|
Communications | | 1.0 | % | |
|
|
|
|
|
Total | | 100.0 | % | |
|
|
|
|
|
| | | | |
HSBC Investor Value Portfolio |
|
|
|
|
|
| | | | |
Investment Allocation | | Percentage of Investments at Value | |
|
|
|
|
Oil & Gas | | 14.3 | % | |
|
|
|
|
|
Computer Software | | 8.6 | % | |
|
|
|
|
|
Insurance | | 8.0 | % | |
|
|
|
|
|
Metals & Mining | | 8.0 | % | |
|
|
|
|
|
Telecommunications | | 8.0 | % | |
|
|
|
|
|
Pharmaceuticals | | 7.6 | % | |
|
|
|
|
|
Media | | 6.5 | % | |
|
|
|
|
|
Aerospace & Defense | | 5.8 | % | |
|
|
|
|
|
Consumer Products | | 4.2 | % | |
|
|
|
|
|
Tobacco | | 3.9 | % | |
|
|
|
|
|
Business Services | | 3.7 | % | |
|
|
|
|
|
Financial Services | | 3.4 | % | |
|
|
|
|
|
Conglomerates | | 3.0 | % | |
|
|
|
|
|
Energy | | 2.8 | % | |
|
|
|
|
|
Cash and Equivalents | | 2.6 | % | |
|
|
|
|
|
Electronic Components &
Semiconductors | | 2.5 | % | |
|
|
|
|
|
Banking | | 2.4 | % | |
|
|
|
|
|
Transportation | | 2.1 | % | |
|
|
|
|
|
Diversified Manufacturing Operations | | 1.5 | % | |
|
|
|
|
|
Agricultural Chemicals | | 1.1 | % | |
|
|
|
|
|
Total | | 100.0 | % | |
|
|
|
|
|
| |
* | Portfolio composition is subject to change. |
| |
HSBC INVESTOR FAMILY OF FUNDS | 20 |
This page is intentionally left blank.
|
HSBC INVESTOR NEW YORK TAX-FREE BOND FUND |
|
|
Schedule of Portfolio Investments—as of April 30, 2009 (Unaudited) |
| | | | | | | |
Municipal Bonds – 98.8% | | | | | | | |
|
|
|
|
|
|
|
|
| | | | | | | |
| | Principal
Amount ($) | | Value ($) | |
| |
| |
| |
New York – 92.7% | | | | | | | |
Long Island Power Authority Electrical
Systems Revenue, 5.00%, 12/1/22,
Callable 12/1/16 @ 100 | | | 500,000 | | | 514,795 | |
Metropolitan Transportation Authority
Revenue, 5.50%, 1/1/19, (MBIA Insured),
Callable 7/1/12 @ 100 | | | 480,000 | | | 500,770 | |
Metropolitan Transportation Authority
Revenue, 5.00%, 11/15/32, (FSA Insured),
Callable 11/15/12 @ 100 | | | 1,625,000 | | | 1,626,527 | |
Monroe County Airport Authority Revenue,
5.63%, 1/1/10, AMT, (MBIA Insured) | | | 1,240,000 | | | 1,261,526 | |
Monroe County Airport Authority Revenue,
5.75%, 1/1/14, AMT, (MBIA Insured) | | | 750,000 | | | 770,910 | |
New York City GO, 5.00%, 8/1/14 | | | 200,000 | | | 219,990 | |
New York City GO, 5.00%, 8/1/15 | | | 325,000 | | | 355,641 | |
New York City GO, Series C, 5.00%, 8/1/16,
(MBIA Insured), Callable 8/1/15 @ 100 | | | 500,000 | | | 541,445 | |
New York City GO, 5.00%, 8/1/17 | | | 500,000 | | | 543,355 | |
New York City Housing Development Corp.
Revenue, 5.60%, 11/1/19, AMT,
Callable 11/1/09 @ 101 | | | 100,000 | | | 101,513 | |
New York City IDA Civic Facility Revenue,
USTA National Tennis Center, 5.00%,
11/15/19, (FSA Insured), Callable
5/15/13 @ 100 | | | 1,000,000 | | | 1,069,320 | |
New York City IDA Revenue, Queens Baseball
Stadium, 5.00%, 1/1/18, (AMBAC Insured),
Callable 1/1/17 @ 100 | | | 550,000 | | | 537,119 | |
New York City Municipal Water Finance
Authority, 5.00%, 6/15/34, Callable
6/15/13 @ 100 | | | 1,250,000 | | | 1,253,625 | |
New York City Municipal Water Finance
Authority, 5.00%, 6/15/36, Callable
12/15/14 @ 100 | | | 1,000,000 | | | 1,002,370 | |
New York City Municipal Water Finance
Authority, Series CC, 5.13%, 6/15/30,
Callable 6/15/18 @ 100 | | | 1,000,000 | | | 1,013,400 | |
New York City Transitional Finance Authority
Building Aid Revenue, 5.00%, 7/15/18,
(FGIC Insured), Callable 1/15/17 @ 100 | | | 550,000 | | | 579,645 | |
New York City Transitional Finance Authority
Building Aid Revenue, 5.00%, 7/15/36,
(FGIC Insured), Callable 1/15/17 @ 100 | | | 1,000,000 | | | 978,100 | |
New York City Transitional Finance Authority
Revenue, 5.25%, 5/1/17, Callable
5/1/11 @ 100 | | | 400,000 | | | 426,536 | |
New York City Transitional Finance Authority
Revenue, 5.25%, 2/1/29, Callable
2/1/11 @ 100 | | | 1,540,000 | | | 1,599,737 | |
| | | | | | | |
Municipal Bonds, continued | | | | | | | |
|
|
|
|
|
|
|
|
| | | | | | | |
| | Principal
Amount ($) | | Value ($) | |
| |
| |
| |
New York, continued | | | | | | | |
New York City Transitional Finance Authority
Revenue, Series B, 5.00%, 11/1/22, Callable
5/1/17 @ 100 | | | 160,000 | | | 170,730 | |
New York State Dormitory Authority Revenue,
Cornell University, Series A, 5.00%, 7/1/39,
Callable 7/1/19 @ 100 | | | 1,000,000 | | | 1,024,780 | |
New York State Dormitory Authority Revenue,
Department of Health, 5.25%, 7/1/16,
Callable 7/1/14 @ 100 | | | 500,000 | | | 534,800 | |
New York State Dormitory Authority Revenue,
Fashion Institute, 5.25%, 7/1/22,
(FGIC Insured) | | | 1,250,000 | | | 1,300,012 | |
New York State Dormitory Authority Revenue,
Master Boces PG, 5.25%, 8/15/19,
(FSA Insured), Callable 8/15/12 @ 100 | | | 1,000,000 | | | 1,066,180 | |
New York State Dormitory Authority Revenue,
Mental Health, 5.00%, 2/15/15,
(FGIC Insured) | | | 1,245,000 | | | 1,345,322 | |
New York State Dormitory Authority Revenue,
New York University, 5.50%, 7/1/18,
(AMBAC Insured) | | | 500,000 | | | 575,295 | |
New York State Dormitory Authority Revenue,
NYSARC, Inc., 5.25%, 7/1/18,
(FSA Insured), Callable 7/1/12 @ 101 | | | 1,460,000 | | | 1,561,061 | |
New York State Dormitory Authority Revenue,
Sloan Kettering Institute, 5.50%, 7/1/23,
(MBIA Insured) | | | 1,300,000 | | | 1,434,303 | |
New York State Dormitory Authority Revenue,
St. Johns University, 5.00%, 7/1/24,
(MBIA Insured), Callable 7/1/17 @ 100 | | | 1,000,000 | | | 1,021,450 | |
New York State Dormitory Authority Revenue,
State Personal Income Tax Revenue, 5.00%,
3/15/23, Callable 3/15/15 @ 100 | | | 1,000,000 | | | 1,045,140 | |
New York State Dormitory Authority Revenue,
University of Rochester, 5.00%, 7/1/22,
Callable 1/1/17 @100 | | | 500,000 | | | 514,235 | |
New York State Environmental Facilities Corp.,
5.70%, 1/15/14, Callable 7/15/09 @ 101 | | | 215,000 | | | 219,029 | |
New York State Environmental Facilities Corp.,
5.70%, 1/15/14, Pre-refunded
7/15/09 @ 101 | | | 15,000 | | | 15,316 | |
New York State Mortgage Agency Revenue,
5.60%, 10/1/14, AMT, Callable
6/15/09 @ 100.75 | | | 1,000,000 | | | 1,004,320 | |
New York State Municipal Bond Bank Revenue,
5.50%, 12/1/12 | | | 850,000 | | | 935,578 | |
New York State Thruway Authority Revenue,
Personal Income Tax Revenue, 5.00%,
3/15/21, (MBIA Insured), Callable
3/15/13 @ 100 | | | 500,000 | | | 523,715 | |
New York State Thruway Authority Revenue,
Second General Highway & Bridge, 5.00%,
4/1/22, (MBIA Insured), Callable
4/1/14 @ 100 | | | 1,000,000 | | | 1,044,550 | |
| | |
See notes to financial statements. | HSBC INVESTOR FAMILY OF FUNDS | 22 |
|
HSBC INVESTOR NEW YORK TAX-FREE BOND FUND |
|
|
Schedule of Portfolio Investments—as of April 30, 2009 (Unaudited) (continued) |
| | | | | | | |
Municipal Bonds, continued | | | | | | | |
|
|
|
|
|
|
|
|
| | | | | | | |
| | Principal
Amount ($) | | Value ($) | |
| |
| |
| |
New York, continued | | | | | | | |
New York State Urban Development Corp.
Revenue, 5.75%, 4/1/12 | | | 500,000 | | | 550,810 | |
New York State Urban Development Corp.
Revenue, 5.00%, 3/15/21, (FSA Insured),
Callable 3/15/15 @100 | | | 1,000,000 | | | 1,066,440 | |
New York State Urban Development Corp.
Revenue, 5.13%, 1/1/22, Callable
7/1/14 @ 100 | | | 885,000 | | | 907,745 | |
Onondaga County, Water Authority Revenue,
5.00%, 9/15/14, (FSA Insured), Callable
9/15/10 @ 101 | | | 300,000 | | | 317,124 | |
Onondaga County, Water Authority Revenue,
5.00%, 9/15/15, (FSA Insured), Callable
9/15/10 @ 101 | | | 665,000 | | | 701,548 | |
Port Authority of New York & New Jersey
Revenue, 5.00%, 9/1/27, Callable
9/1/13 @ 101 | | | 795,000 | | | 810,073 | |
Port Authority of New York & New Jersey
Revenue, 5.38%, 3/1/28 | | | 1,100,000 | | | 1,173,634 | |
Port Authority of New York & New Jersey
Special Obligation Revenue, 5.75%, 12/1/22,
AMT, (MBIA Insured), Callable
6/29/09 @ 101 | | | 500,000 | | | 414,285 | |
Suffolk County, New York GO, 5.25%, 5/1/15,
(FSA Insured) | | | 100,000 | | | 115,560 | |
Syracuse Industrial Development Agency
Revenue, 5.00%, 1/1/36, AMT, (XLCA
Insured), Callable 1/1/17 @ 100 | | | 1,000,000 | | | 792,010 | |
Tobacco Settlement Financing Corp., 5.50%,
6/1/21, Callable 6/1/13 @ 100 | | | 1,000,000 | | | 1,022,930 | |
Webster, Central School District GO, 5.00%,
6/15/14, (FSA Insured) | | | 500,000 | | | 563,945 | |
Yonkers, New York, 5.00%, 12/1/14,
(MBIA Insured) | | | 750,000 | | | 764,010 | |
| | | | |
|
| |
| | | | | | 39,432,254 | |
| | | | |
|
| |
Puerto Rico – 6.1% | | | | | | | |
Puerto Rico Commonwealth, Highway &
Transportation Authority Grant Antic
Revenue, 5.00%, 9/15/17, (MBIA Insured),
Callable 3/15/14 @ 100 | | | 1,000,000 | | | 1,064,620 | |
Puerto Rico Electric Power Authority Power
Revenue, 5.25%, 7/1/22, (MBIA Insured) | | | 1,000,000 | | | 969,880 | |
Puerto Rico Public Buildings Authority
Revenue, 5.25%, 7/1/33, (Commonwealth
Guaranteed), Pre-refunded 7/1/14 @ 100 | | | 10,000 | | | 11,341 | |
| | | | | | | |
Municipal Bonds, continued | | | | | | | |
|
|
|
|
|
|
|
|
| | | | | | | |
| | Principal
Amount ($) | | Value ($) | |
| |
| |
| |
Puerto Rico, continued | | | | | | | |
Puerto Rico Public Buildings Authority
Revenue, 5.25%, 7/1/33, (Commonwealth
Guaranteed), Callable 7/1/14 @ 100 | | | 690,000 | | | 555,581 | |
| | | | |
|
| |
| | | | | | 2,601,422 | |
| | | | |
|
| |
TOTAL MUNICIPAL BONDS
(COST $41,728,040) | | | | | | 42,033,676 | |
| | | | |
|
| |
| | | | | | | |
Investment Companies – 0.4% | | | | | | | |
|
|
|
|
|
|
|
|
BlackRock Liquidity New York Money Fund,
Portfolio Institutional Shares, 0.51% (a) | | | 179,988 | | | 179,988 | |
Northern Institutional Diversified Assets
Portfolio, Shares Class, 0.44% (a) | | | 92 | | | 92 | |
| | | | |
|
| |
TOTAL INVESTMENT COMPANIES
(COST $180,080) | | | | | | 180,080 | |
| | | | |
|
| |
TOTAL INVESTMENTS
(COST $41,908,120) – 99.2% | | | | | | 42,213,756 | |
| | | | |
|
| |
| | |
|
Percentages indicated are based on net assets of $42,562,761. |
| |
(a) | The rates presented represent the annualized one day yield that was in effect on April 30, 2009. |
| |
| |
AMBAC | — American Municipal Bond Assurance Corp. |
AMT | — Interest on security is subject to federal alternative minimum tax |
FGIC | — Financial Guaranty Insurance Co. |
FSA | — Financial Security Assurance |
GO | — General Obligation |
IDA | — Industrial Development Agency |
MBIA | — Municipal Bond Insurance Association |
XLCA | — XL Capital Assurance |
| | |
23 | HSBC INVESTOR FAMILY OF FUNDS | See notes to financial statements. |
|
HSBC INVESTOR MID-CAP FUND |
|
|
Schedule of Portfolio Investments—as of April 30, 2009 (Unaudited) |
| | | | | | | |
Common Stocks – 93.2% | | | | | | | |
|
|
|
|
|
|
|
|
| | | | | | | |
| | Shares | | Value($) | |
| |
| |
| |
Aerospace & Defense – 1.5% | | | | | | | |
L-3 Communications Holdings, Inc. | | | 2,400 | | | 182,760 | |
| | | | |
|
| |
Agricultural Chemicals – 0.2% | | | | | | | |
Compass Minerals International, Inc. | | | 550 | | | 26,521 | |
| | | | |
|
| |
Banking – 1.3% | | | | | | | |
HDFC Bank Ltd. ADR | | | 975 | | | 72,170 | |
Signature Bank (a) | | | 3,100 | | | 84,289 | |
| | | | |
|
| |
| | | | | | 156,459 | |
| | | | |
|
| |
Biotechnology – 1.0% | | | | | | | |
BioMarin Pharmaceuticals, Inc. (a) | | | 9,900 | | | 127,314 | |
| | | | |
|
| |
Business Services – 1.8% | | | | | | | |
Fiserv, Inc. (a) | | | 3,800 | | | 141,816 | |
Morningstar, Inc. (a) | | | 2,150 | | | 85,291 | |
| | | | |
|
| |
| | | | | | 227,107 | |
| | �� | | |
|
| |
Chemicals – 4.3% | | | | | | | |
Airgas, Inc. | | | 6,700 | | | 288,904 | |
FMC Corp. | | | 4,900 | | | 238,777 | |
| | | | |
|
| |
| | | | | | 527,681 | |
| | | | |
|
| |
Commercial Services – 5.5% | | | | | | | |
Aaron Rents, Inc. | | | 4,500 | | | 151,020 | |
IHS, Inc., Class A (a) | | | 4,200 | | | 173,712 | |
Ritchie Brothers Auctioneers, Inc. ADR | | | 9,075 | | | 203,280 | |
URS Corp. (a) | | | 3,350 | | | 147,601 | |
| | | | |
|
| |
| | | | | | 675,613 | |
| | | | |
|
| |
Communications – 1.1% | | | | | | | |
Discovery Communications, Inc., Class A (a) | | | 3,850 | | | 73,112 | |
Discovery Communications, Inc., Class C (a) | | | 3,900 | | | 68,328 | |
| | | | |
|
| |
| | | | | | 141,440 | |
| | | | |
|
| |
Computer Services – 5.2% | | | | | | | |
Cognizant Technology Solutions Corp. (a) | | | 9,175 | | | 227,448 | |
FactSet Research Systems, Inc. | | | 3,150 | | | 168,809 | |
McAfee, Inc. (a) | | | 6,600 | | | 247,764 | |
| | | | |
|
| |
| | | | | | 644,021 | |
| | | | |
|
| |
Computer Software – 5.4% | | | | | | | |
Akamai Technologies, Inc. (a) | | | 3,850 | | | 84,777 | |
Check Point Software Technologies Ltd. (a) | | | 6,200 | | | 143,654 | |
MICROS Systems, Inc. (a) | | | 5,400 | | | 113,292 | |
Solera Holdings, Inc. (a) | | | 6,700 | | | 152,894 | |
Sybase, Inc. (a) | | | 4,950 | | | 168,102 | |
| | | | |
|
| |
| | | | | | 662,719 | |
| | | | |
|
| |
Consumer Products – 3.0% | | | | | | | |
Church & Dwight Co., Inc. | | | 2,550 | | | 138,745 | |
Gildan Activewear, Inc. (a) | | | 8,175 | | | 93,604 | |
Tupperware Brands Corp. | | | 4,950 | | | 123,899 | |
VF Corp. | | | 300 | | | 17,781 | |
| | | | |
|
| |
| | | | | | 374,029 | |
| | | | |
|
| |
| | | | | | | |
Common Stocks, continued | | | | | | | |
|
|
|
|
|
|
|
|
| | | | | | | |
| | Shares | | Value($) | |
| |
| |
| |
Correctional Institutions – 1.0% | | | | | | | |
Corrections Corp. of America (a) | | | 8,625 | | | 121,871 | |
| | | | |
|
| |
Distribution & Wholesale – 3.1% | | | | | | | |
Genuine Parts Co. | | | 3,450 | | | 117,162 | |
LKQ Corp. (a) | | | 15,625 | | | 265,312 | |
| | | | |
|
| |
| | | | | | 382,474 | |
| | | | |
|
| |
Education – 0.8% | | | | | | | |
New Oriental Education & Technology
Group, Inc. ADR (a) | | | 1,950 | | | 103,311 | |
| | | | |
|
| |
Electronic Components & Semiconductors – 4.6% | | | | | | | |
American Superconductor Corp. (a) | | | 4,800 | | | 123,360 | |
Cree, Inc. (a) | | | 6,700 | | | 183,513 | |
Itron, Inc. (a) | | | 2,400 | | | 110,400 | |
Microchip Technology, Inc. | | | 6,750 | | | 155,250 | |
| | | | |
|
| |
| | | | | | 572,523 | |
| | | | |
|
| |
Energy – 1.5% | | | | | | | |
Core Laboratories N.V. | | | 2,225 | | | 185,187 | |
| | | | |
|
| |
Environmental Services – 1.4% | | | | | | | |
Stericycle, Inc. (a) | | | 3,775 | | | 177,727 | |
| | | | |
|
| |
Financial Services – 4.6% | | | | | | | |
Annaly Capital Management, Inc. | | | 17,750 | | | 249,742 | |
BlackRock, Inc. | | | 650 | | | 95,238 | |
Eaton Vance Corp. | | | 5,475 | | | 149,851 | |
People’s United Financial, Inc. | | | 4,700 | | | 73,414 | |
| | | | |
|
| |
| | | | | | 568,245 | |
| | | | |
|
| |
Food & Beverage – 2.9% | | | | | | | |
Central European Distribution Corp. (a) | | | 3,825 | | | 85,680 | |
Flowers Foods, Inc. | | | 6,525 | | | 150,727 | |
J.M. Smucker Co. (The) | | | 2,950 | | | 116,230 | |
| | | | |
|
| |
| | | | | | 352,637 | |
| | | | |
|
| |
Health Care – 9.5% | | | | | | | |
DaVita, Inc. (a) | | | 3,300 | | | 153,021 | |
Express Scripts, Inc. (a) | | | 2,625 | | | 167,921 | |
Haemonetics Corp. (a) | | | 3,000 | | | 154,890 | |
Hologic, Inc. (a) | | | 4,776 | | | 70,971 | |
Laboratory Corp. of America Holdings (a) | | | 2,325 | | | 149,149 | |
Masimo Corp. (a) | | | 3,200 | | | 92,480 | |
ResMed, Inc. (a) | | | 4,500 | | | 173,025 | |
Techne Corp. | | | 775 | | | 44,346 | |
West Pharmaceutical Services, Inc. | | | 5,150 | | | 168,147 | |
| | | | |
|
| |
| | | | | | 1,173,950 | |
| | | | |
|
| |
Industrial Manufacturing – 3.1% | | | | | | | |
Eaton Corp. | | | 1,500 | | | 65,700 | |
Lincoln Electric Holdings, Inc. | | | 3,000 | | | 133,590 | |
Snap-on, Inc. | | | 1,800 | | | 61,056 | |
Valmont Industries, Inc. | | | 1,900 | | | 121,182 | |
| | | | |
|
| |
| | | | | | 381,528 | |
| | | | |
|
| |
| | |
See notes to financial statements. | HSBC INVESTOR FAMILY OF FUNDS | 24 |
|
HSBC INVESTOR MID-CAP FUND |
|
|
Schedule of Portfolio Investments—as of April 30, 2009 (Unaudited) (continued) |
| | | | | | | |
Common Stocks, continued | | | | | | | |
|
|
|
|
|
|
|
|
| | | | | | | |
| | Shares | | Value($) | |
| |
| |
| |
Insurance – 3.8% | | | | | | | |
Aon Corp. | | | 2,550 | | | 107,610 | |
Axis Capital Holdings Ltd. | | | 7,450 | | | 183,568 | |
Proassurance Corp. (a) | | | 4,100 | | | 180,154 | |
| | | | |
|
| |
| | | | | | 471,332 | |
| | | | |
|
| |
Leisure – 1.0% | | | | | | | |
Penn National Gaming, Inc. (a) | | | 3,500 | | | 119,070 | |
| | | | |
|
| |
Machinery – 1.7% | | | | | | | |
AGCO Corp. (a) | | | 1,950 | | | 47,385 | |
Flowserve Corp. | | | 2,350 | | | 159,565 | |
| | | | |
|
| |
| | | | | | 206,950 | |
| | | | |
|
| |
Metal Processors & Fabrication – 0.7% | | | | | | | |
Kaydon Corp. | | | 2,750 | | | 87,890 | |
| | | | |
|
| |
Oil & Gas – 6.9% | | | | | | | |
Arena Resources, Inc. (a) | | | 2,550 | | | 73,108 | |
Atlas America, Inc. | | | 8,012 | | | 124,667 | |
Denbury Resources, Inc. (a) | | | 5,750 | | | 93,610 | |
Enbridge, Inc. | | | 2,300 | | | 70,955 | |
EQT Corp. | | | 5,675 | | | 190,850 | |
Oceaneering International, Inc. (a) | | | 3,350 | | | 152,659 | |
Oil States International, Inc. (a) | | | 3,275 | | | 61,898 | |
Southwestern Energy Co. (a) | | | 2,450 | | | 87,857 | |
| | | | |
|
| |
| | | | | | 855,604 | |
| | | | |
|
| |
Real Estate – 3.3% | | | | | | | |
Corporate Office Properties Trust | | | 4,000 | | | 122,240 | |
Digital Realty Trust, Inc. | | | 4,850 | | | 174,648 | |
Essex Property Trust, Inc. | | | 1,750 | | | 111,108 | |
| | | | |
|
| |
| | | | | | 407,996 | |
| | | | |
|
| |
Retail – 3.6% | | | | | | | |
Burger King Holdings, Inc. | | | 5,900 | | | 96,406 | |
Guess?, Inc. | | | 4,000 | | | 104,160 | |
O’Reilly Automotive, Inc. (a) | | | 6,300 | | | 244,755 | |
| | | | |
|
| |
| | | | | | 445,321 | |
| | | | |
|
| |
Specialty Retail – 1.0% | | | | | | | |
GameStop Corp., Class A (a) | | | 4,025 | | | 121,394 | |
| | | | |
|
| |
| | | | | | | |
Common Stocks, continued | | | | | | | |
|
|
|
|
|
|
|
|
| | | | | | | |
| | Shares | | Value($) | |
| |
| |
| |
Telecommunications – 1.9% | | | | | | | |
American Tower Corp., Class A (a) | | | 5,500 | | | 174,680 | |
NII Holdings, Inc. (a) | | | 4,050 | | | 65,448 | |
| | | | |
|
| |
| | | | | | 240,128 | |
| | | | |
|
| |
Transportation – 0.3% | | | | | | | |
Kansas City Southern (a) | | | 2,650 | | | 40,413 | |
| | | | |
|
| |
Utilities – 6.2% | | | | | | | |
ITC Holdings Corp. | | | 3,675 | | | 159,973 | |
Northeast Utilities | | | 9,025 | | | 189,705 | |
NorthWestern Corp. | | | 8,350 | | | 174,682 | |
Portland General Electric Co. | | | 6,900 | | | 126,063 | |
Wisconsin Energy Corp. | | | 2,750 | | | 109,890 | |
| | | | |
|
| |
| | | | | | 760,313 | |
| | | | |
|
| |
TOTAL COMMON STOCKS
(COST $12,457,951) | | | | | | 11,521,528 | |
| | | | |
|
| |
| | | | | | | |
Investment Companies – 6.7% | | | | | | | |
|
|
|
|
|
|
|
|
MidCap S&P Depositary Receipt Trust
Series 1 | | | 6,460 | | | 657,240 | |
Northern Institutional Diversified Assets
Portfolio, Shares Class, 0.44% (b) | | | 176,999 | | | 176,999 | |
| | | | |
|
| |
TOTAL INVESTMENT COMPANIES
(COST $738,635) | | | | | | 834,239 | |
| | | | |
|
| |
TOTAL INVESTMENTS
(COST $13,196,586) – 99.9% | | | | | | 12,355,767 | |
| | | | |
|
| |
| | |
|
Percentages indicated are based on net assets of $12,368,130. |
| |
(a) | Represents non-income producing security. |
| |
(b) | The rates presented represent the annualized one day yield that was in effect on April 30, 2009. |
| |
ADR — American Depositary Receipt |
| | |
25 | HSBC INVESTOR FAMILY OF FUNDS | See notes to financial statements. |
This page is intentionally left blank.
|
HSBC INVESTOR FAMILY OF FUNDS |
|
Statements of Assets and Liabilities—as of April 30, 2009 (Unaudited) |
| | | | | | | | | | | | | |
| | Core Plus
Fixed Income
Fund
(Advisor) | | Core Plus
Fixed Income
Fund | | Intermediate
Duration
Fixed Income
Fund | | New York
Tax-Free
Bond Fund | |
| |
Assets: | | | | | | | | | | | | | |
Investments in Affiliated Portfolios | | $ | 47,774,522 | | $ | 8,960,382 | | $ | 12,365,152 | | $ | — | |
Investments in non-affiliates, at value | | | — | | | — | | | — | | | 42,213,756 | |
Interest and dividends receivable | | | — | | | — | | | — | | | 607,851 | |
Receivable for capital shares issued | | | 162,745 | | | 31,094 | | | 28,308 | | | 90,722 | |
Receivable from Investment Adviser | | | 14,826 | | | 8,244 | | | 10,241 | | | — | |
Prepaid expenses and other assets | | | 3,362 | | | 11,664 | | | 2,931 | | | 4,610 | |
| |
|
| |
|
| |
|
| |
|
| |
Total Assets | | | 47,955,455 | | | 9,011,384 | | | 12,406,632 | | | 42,916,939 | |
| |
|
| |
|
| |
|
| |
|
| |
Liabilities: | | | | | | | | | | | | | |
Dividends payable | | | 191,739 | | | 32,803 | | | 34,784 | | | 130,155 | |
Payable for capital shares redeemed | | | 196,046 | | | 69,106 | | | 8,925 | | | 171,630 | |
Accrued expenses and other liabilities: | | | | | | | | | | | | | |
Investment Management | | | — | | | — | | | — | | | 8,739 | |
Administration | | | 870 | | | 162 | | | 224 | | | 1,526 | |
Distribution | | | — | | | 838 | | | 1,332 | | | 2,702 | |
Shareholder Servicing | | | — | | | 1,827 | | | 651 | | | 5,742 | |
Compliance Service | | | 17 | | | 3 | | | 4 | | | 29 | |
Transfer Agent | | | 7,644 | | | 10,428 | | | 7,545 | | | 13,454 | |
Other | | | 23,714 | | | 811 | | | 2,846 | | | 20,201 | |
| |
|
| |
|
| |
|
| |
|
| |
Total Liabilities | | | 420,030 | | | 115,978 | | | 56,311 | | | 354,178 | |
| |
|
| |
|
| |
|
| |
|
| |
Net Assets | | $ | 47,535,425 | | $ | 8,895,406 | | $ | 12,350,321 | | $ | 42,562,761 | |
| |
|
| |
|
| |
|
| |
|
| |
|
Composition of Net Assets: | | | | | | | | | | | | | |
Capital | | $ | 55,222,474 | | $ | 11,151,860 | | $ | 13,543,205 | | $ | 42,316,775 | |
Accumulated net investment income (loss) | | | 72,762 | | | 3,023 | | | 34,470 | | | 576 | |
Accumulated net realized gains (losses) from
investment and foreign currency transactions | | | (1,418,786 | ) | | (915,868 | ) | | (4,996 | ) | | (60,226 | ) |
Unrealized appreciation/depreciation from investments and
foreign currencies | | | (6,341,025 | ) | | (1,343,609 | ) | | (1,222,358 | ) | | 305,636 | |
| |
|
| |
|
| |
|
| |
|
| |
Net Assets | | $ | 47,535,425 | | $ | 8,895,406 | | $ | 12,350,321 | | $ | 42,562,761 | |
| |
|
| |
|
| |
|
| |
|
| |
|
Net Assets: | | | | | | | | | | | | | |
Class A Shares | | $ | — | | $ | 7,545,705 | | $ | 1,787,232 | | $ | 23,565,837 | |
Class B Shares | | | — | | | 1,248,859 | | | 1,180,609 | | | 3,904,283 | |
Class C Shares | | | — | | | 100,842 | | | 201,231 | | | 485,758 | |
Class I Shares | | | 47,535,425 | | | — | | | 9,181,249 | | | 14,606,883 | |
| |
|
| |
|
| |
|
| |
|
| |
| | $ | 47,535,425 | | $ | 8,895,406 | | $ | 12,350,321 | | $ | 42,562,761 | |
| |
|
| |
|
| |
|
| |
|
| |
|
Shares Outstanding ($0.001 par value,
unlimited number of shares authorized): | | | | | | | | | | | | | |
Class A Shares | | | — | | | 802,627 | | | 193,595 | | | 2,168,649 | |
Class B Shares | | | — | | | 132,685 | | | 127,622 | | | 359,593 | |
Class C Shares | | | — | | | 10,747 | | | 21,762 | | | 44,559 | |
Class I Shares | | | 5,171,088 | | | — | | | 993,020 | | | 1,344,046 | |
|
Net Asset Value, Offering Price and
Redemption Price per share: | | | | | | | | | | | | | |
Class A Shares | | $ | — | | $ | 9.40 | | $ | 9.23 | | $ | 10.87 | |
Class B Shares* | | $ | — | | $ | 9.41 | | $ | 9.25 | | $ | 10.86 | |
Class C Shares* | | $ | — | | $ | 9.38 | | $ | 9.25 | | $ | 10.90 | |
Class I Shares | | $ | 9.19 | | $ | — | | $ | 9.25 | | $ | 10.87 | |
Maximum Sales Charge—Class A Shares | | | — | % | | 4.75 | % | | 4.75 | % | | 4.75 | % |
| |
|
| |
|
| |
|
| |
|
| |
Maximum Offering Price per share (Net Asset
Value/(100%-maximum sales charge))—Class A Shares | | $ | — | | $ | 9.87 | | $ | 9.69 | | $ | 11.41 | |
| |
|
| |
|
| |
|
| |
|
| |
Total Investments, at cost | | | | | | | | | | | $ | 41,908,120 | |
| | | | | | | | | | |
|
| |
| |
|
* | Redemption Price per share varies by length of time shares are held. |
| | |
27 | HSBC INVESTOR FAMILY OF FUNDS | See notes to financial statements. |
|
HSBC INVESTOR FAMILY OF FUNDS |
|
Statements of Assets and Liabilities—as of April 30, 2009 (Unaudited) (continued) |
| | | | | | | | | | | | | | | | |
| | Growth
Fund | | International
Equity Fund | | Mid-Cap
Fund | | Opportunity
Fund | | Opportunity
Fund
(Advisor) | |
| |
Assets: | | | | | | | | | | | | | | | | |
Investments in Affiliated Portfolios | | $ | 52,188,306 | | $ | 133,307,368 | | $ | — | | $ | 9,648,262 | | $ | 83,967,965 | |
Investments in non-affiliates, at value | | | — | | | — | | | 12,355,767 | | | — | | | — | |
Interest and dividends receivable | | | — | | | — | | | 3,720 | | | — | | | — | |
Receivable for capital shares issued | | | 10,152 | | | 5,248 | | | 502 | | | 12,393 | | | 59,214 | |
Receivable for investments sold | | | — | | | — | | | 195,980 | | | — | | | — | |
Reclaims receivable | | | — | | | 615,346 | | | — | | | — | | | — | |
Receivable from Investment Adviser | | | 4,988 | | | — | | | 6,204 | | | 5,810 | | | — | |
Prepaid expenses and other assets | | | 37,805 | | | 11,658 | | | 3,966 | | | 16,575 | | | 5,374 | |
| |
|
| |
|
| |
|
| |
|
| |
|
| |
Total Assets | | | 52,241,251 | | | 133,939,620 | | | 12,566,139 | | | 9,683,040 | | | 84,032,553 | |
| |
|
| |
|
| |
|
| |
|
| |
|
| |
Liabilities: | | | | | | | | | | | | | | | | |
Payable for investments purchased | | | — | | | — | | | 158,479 | | | — | | | — | |
Payable for capital shares redeemed | | | 288,025 | | | 119,620 | | | 5,962 | | | 63,889 | | | 19,768 | |
Accrued expenses and other liabilities: | | | | | | | | | | | | | | | | |
Investment Management | | | — | | | — | | | 4,448 | | | — | | | — | |
Administration | | | 878 | | | 2,347 | | | 415 | | | 171 | | | 1,473 | |
Distribution | | | 1,460 | | | — | | | 1,020 | | | 853 | | | — | |
Shareholder Servicing | | | 3,522 | | | — | | | 1,025 | | | 1,923 | | | — | |
Compliance Service | | | 18 | | | 45 | | | 8 | | | 3 | | | 38 | |
Transfer Agent | | | 27,844 | | | 9,921 | | | 22,381 | | | 12,587 | | | 9,660 | |
Other | | | 13,812 | | | 106,882 | | | 4,271 | | | 307 | | | 35,262 | |
| |
|
| |
|
| |
|
| |
|
| |
|
| |
Total Liabilities | | | 335,559 | | | 238,815 | | | 198,009 | | | 79,733 | | | 66,201 | |
| |
|
| |
|
| |
|
| |
|
| |
|
| |
Net Assets | | $ | 51,905,692 | | $ | 133,700,805 | | $ | 12,368,130 | | $ | 9,603,307 | | $ | 83,966,352 | |
| |
|
| |
|
| |
|
| |
|
| |
|
| |
|
Composition of Net Assets: | | | | | | | | | | | | | | | | |
Capital | | $ | 65,967,371 | | $ | 242,214,528 | | $ | 16,990,899 | | $ | 13,046,962 | | $ | 113,199,135 | |
Accumulated net investment income (loss) | | | (18,197 | ) | | 997,274 | | | 31,415 | | | (50,718 | ) | | (199,031 | ) |
Accumulated net realized gains (losses) from
investment and foreign currency transactions | | | (9,202,022 | ) | | (46,817,717 | ) | | (3,813,365 | ) | | (1,731,455 | ) | | (14,828,498 | ) |
Unrealized appreciation/depreciation from
investments and foreign currencies | | | (4,841,460 | ) | | (62,693,280 | ) | | (840,819 | ) | | (1,661,482 | ) | | (14,205,254 | ) |
| |
|
| |
|
| |
|
| |
|
| |
|
| |
Net Assets | | $ | 51,905,692 | | $ | 133,700,805 | | $ | 12,368,130 | | $ | 9,603,307 | | $ | 83,966,352 | |
| |
|
| |
|
| |
|
| |
|
| |
|
| |
|
Net Assets: | | | | | | | | | | | | | | | | |
Class A Shares | | $ | 15,078,022 | | $ | — | | $ | 3,471,297 | | $ | 8,201,081 | | $ | — | |
Class B Shares | | | 2,346,141 | | | — | | | 1,687,128 | | | 1,212,943 | | | — | |
Class C Shares | | | 68,323 | | | — | | | 10,869 | | | 189,283 | | | — | |
Class I Shares | | | 34,413,206 | | | 133,700,805 | | | 7,198,836 | | | — | | | 83,966,352 | |
| |
|
| |
|
| |
|
| |
|
| |
|
| |
| | $ | 51,905,692 | | $ | 133,700,805 | | $ | 12,368,130 | | $ | 9,603,307 | | $ | 83,966,352 | |
| |
|
| |
|
| |
|
| |
|
| |
|
| |
|
Shares Outstanding ($0.001 par value,
unlimited number of shares authorized): | | | | | | | | | | | | | | | | |
Class A Shares | | | 1,403,078 | | | — | | | 722,893 | | | 1,297,371 | | | — | |
Class B Shares | | | 234,952 | | | — | | | 388,967 | | | 226,773 | | | — | |
Class C Shares | | | 6,798 | | | — | | | 2,477 | | | 34,707 | | | — | |
Class I Shares | | | 3,177,616 | | | 14,706,350 | | | 1,456,345 | | | — | | | 10,144,918 | |
|
Net Asset Value, Offering Price and
Redemption Price per share: | | | | | | | | | | | | | | | | |
Class A Shares | | $ | 10.75 | | $ | — | | $ | 4.80 | | $ | 6.32 | | $ | — | |
Class B Shares* | | $ | 9.99 | | $ | — | | $ | 4.34 | | $ | 5.35 | | $ | — | |
Class C Shares* | | $ | 10.05 | | $ | — | | $ | 4.39 | | $ | 5.45 | | $ | — | |
Class I Shares | | $ | 10.83 | | $ | 9.09 | | $ | 4.94 | | $ | — | | $ | 8.28 | |
Maximum Sales Charge—Class A Shares | | | 5.00 | % | | — | % | | 5.00 | % | | 5.00 | % | | — | % |
| |
|
| |
|
| |
|
| |
|
| |
|
| |
Maximum Offering Price per share (Net Asset
Value/(100%-maximum sales charge))—Class A Shares | | $ | 11.32 | | $ | — | | $ | 5.05 | | $ | 6.65 | | $ | — | |
| |
|
| |
|
| |
|
| |
|
| |
|
| |
Total Investments, at cost | | | | | | | | $ | 13,196,586 | | | | | | | |
| | | | | | | |
|
| | | | | | | |
| |
|
* | Redemption Price per share varies by length of time shares are held. |
| | |
See notes to financial statements. | HSBC INVESTOR FAMILY OF FUNDS | 28 |
|
HSBC INVESTOR FAMILY OF FUNDS |
|
Statements of Assets and Liabilities—as of April 30, 2009 (Unaudited) (continued) |
| | | | | | | |
| | Overseas
Equity Fund | | Value
Fund | |
| |
Assets: | | | | | | | |
Investments in Affiliated Portfolios | | $ | 6,232,265 | | $ | 26,525,728 | |
Receivable for capital shares issued | | | 71 | | | 6,511 | |
Reclaims receivable | | | 78,824 | | | — | |
Receivable from Investment Adviser | | | 5,334 | | | 5,550 | |
Prepaid expenses and other assets | | | 13,021 | | | 9,589 | |
| |
|
| |
|
| |
Total Assets | | | 6,329,515 | | | 26,547,378 | |
| |
|
| |
|
| |
Liabilities: | | | | | | | |
Payable for capital shares redeemed | | | 75,770 | | | 225,146 | |
Accrued expenses and other liabilities: | | | | | | | |
Administration | | | 113 | | | 481 | |
Distribution | | | 599 | | | 358 | |
Shareholder Servicing | | | 1,255 | | | 2,497 | |
Compliance Service | | | 2 | | | 23 | |
Transfer Agent | | | 14,010 | | | 14,785 | |
Other | | | 183 | | | 5,740 | |
| |
|
| |
|
| |
Total Liabilities | | | 91,932 | | | 249,030 | |
| |
|
| |
|
| |
Net Assets | | $ | 6,237,583 | | $ | 26,298,348 | |
| |
|
| |
|
| |
|
Composition of Net Assets: | | | | | | | |
Capital | | $ | 10,614,013 | | $ | 41,041,719 | |
Accumulated net investment income | | | 38,165 | | | 115,541 | |
Accumulated net realized gains (losses) from investment and foreign currency transactions | | | (1,879,188 | ) | | (5,552,963 | ) |
Unrealized appreciation/depreciation from investments and foreign currencies | | | (2,535,407 | ) | | (9,305,949 | ) |
| |
|
| |
|
| |
Net Assets | | $ | 6,237,583 | | $ | 26,298,348 | |
| |
|
| |
|
| |
|
Net Assets: | | | | | | | |
Class A Shares | | $ | 5,247,658 | | $ | 11,602,372 | |
Class B Shares | | | 934,990 | | | 524,805 | |
Class C Shares | | | 54,935 | | | 56,914 | |
Class I Shares | | | — | | | 14,114,257 | |
| |
|
| |
|
| |
| | $ | 6,237,583 | | $ | 26,298,348 | |
| |
|
| |
|
| |
|
Shares Outstanding ($0.001 par value, unlimited number of shares authorized): | | | | | | | |
Class A Shares | | | 1,666,878 | | | 1,373,718 | |
Class B Shares | | | 337,938 | | | 65,099 | |
Class C Shares | | | 18,314 | | | 7,006 | |
Class I Shares | | | — | | | 1,674,250 | |
|
Net Asset Value, Offering Price and Redemption Price per share: | | | | | | | |
Class A Shares | | $ | 3.15 | | $ | 8.45 | |
Class B Shares* | | $ | 2.77 | | $ | 8.06 | |
Class C Shares* | | $ | 3.00 | | $ | 8.12 | |
Class I Shares | | $ | — | | $ | 8.43 | |
Maximum Sales Charge—Class A Shares | | | 5.00 | % | | 5.00 | % |
| |
|
| |
|
| |
Maximum Offering Price per share (Net Asset Value/(100%-maximum sales charge))—Class A Shares | | $ | 3.32 | | $ | 8.89 | |
| |
|
| |
|
| |
| |
|
* | Redemption Price per share varies by length of time shares are held. |
| | |
29 | HSBC INVESTOR FAMILY OF FUNDS | See notes to financial statements. |
|
HSBC INVESTOR FAMILY OF FUNDS |
|
Statements of Operations—For the six months ended April 30, 2009 (Unaudited) |
| | | | | | | | | | | | | |
| | Core Plus
Fixed Income
Fund
(Advisor) | | Core Plus
Fixed Income
Fund | | Intermediate
Duration
Fixed Income
Fund | | New York
Tax-Free
Bond Fund | |
| |
Investment Income: | | | | | | | | | | | | | |
Interest | | $ | — | | $ | — | | $ | — | | $ | 1,003,123 | |
Dividends | | | — | | | — | | | — | | | 2,009 | |
Investment Income from Affiliated Portfolios (a) | | | 1,471,980 | | | 269,909 | | | 300,265 | | | — | |
Expenses from Affiliated Portfolios (a) | | | (171,815 | ) | | (31,484 | ) | | (56,856 | ) | | — | |
| |
|
| |
|
| |
|
| |
|
| |
Total Investment Income (Loss) | | | 1,300,165 | | | 238,425 | | | 243,409 | | | 1,005,132 | |
| |
|
| |
|
| |
|
| |
|
| |
|
Expenses: | | | | | | | | | | | | | |
Investment Management | | | — | | | — | | | — | | | 53,865 | |
Administration | | | 5,181 | | | 947 | | | 1,273 | | | 8,780 | |
Distribution: | | | | | | | | | | | | | |
Class B Shares | | | — | | | 4,124 | | | 4,766 | | | 15,646 | |
Class C Shares | | | — | | | 325 | | | — | | | 1,780 | |
Shareholder Servicing: | | | | | | | | | | | | | |
Class A Shares | | | — | | | 9,631 | | | 2,114 | | | 29,484 | |
Class B Shares | | | — | | | 1,776 | | | 1,613 | | | 5,281 | |
Class C Shares | | | — | | | 121 | | | 248 | | | 597 | |
Accounting | | | 4,501 | | | 9,416 | | | 11,930 | | | 33,805 | |
Compliance Service | | | 126 | | | 8 | | | 8 | | | 177 | |
Custodian | | | — | | | — | | | — | | | 2,295 | |
Printing | | | 9,469 | | | 2,356 | | | 2,998 | | | 9,769 | |
Professional fees | | | 741 | | | 144 | | | 228 | | | 997 | |
Transfer Agent | | | 14,866 | | | 24,751 | | | 20,170 | | | 25,601 | |
Trustee | | | 357 | | | 51 | | | 59 | | | 594 | |
Registration fees | | | 4,108 | | | 4,755 | | | 1,960 | | | 2,082 | |
Other | | | 5,758 | | | 1,234 | | | 1,216 | | | 9,507 | |
| |
|
| |
|
| |
|
| |
|
| |
Total expenses before fee reductions | | | 45,107 | | | 59,639 | | | 48,583 | | | 200,260 | |
Fees reduced by Investment Adviser | | | (102,865 | ) | | (52,987 | ) | | (70,865 | ) | | — | |
| |
|
| |
|
| |
|
| |
|
| |
Net Expenses (Recoveries) | | | (57,758 | ) | | 6,652 | | | (22,282 | ) | | 200,260 | |
| |
|
| |
|
| |
|
| |
|
| |
|
Net Investment Income (Loss) | | | 1,357,923 | | | 231,773 | | | 265,691 | | | 804,872 | |
| |
|
| |
|
| |
|
| |
|
| |
|
Net Realized/Unrealized Gains (Losses) from Investments: (a) | | | | | | | | | | | | | |
Net realized gains (losses) from investment and foreign currency
transactions | | | (150,895 | ) | | (72,894 | ) | | 123,680 | | | (60,228 | ) |
Change in unrealized appreciation/depreciation from investments and
foreign currencies | | | 1,843,421 | | | 377,281 | | | 289,420 | | | 2,033,768 | |
| |
|
| |
|
| |
|
| |
|
| |
|
Net realized/unrealized gains (losses) from investments and foreign
currency transactions | | | 1,692,526 | | | 304,387 | | | 413,100 | | | 1,973,540 | |
| |
|
| |
|
| |
|
| |
|
| |
Change In Net Assets Resulting From Operations | | $ | 3,050,449 | | $ | 536,160 | | $ | 678,791 | | $ | 2,778,412 | |
| |
|
| |
|
| |
|
| |
|
| |
| |
|
(a) | With the exception of New York Tax-Free Bond Fund, represents amounts allocated from the respective Affiliated Portfolios. |
| |
| | |
See notes to financial statements. | HSBC INVESTOR FAMILY OF FUNDS | 30 |
| | | | | | | | | | | | | | | | |
HSBC INVESTOR FAMILY OF FUNDS | |
| |
Statements of Operations—For the six months ended April 30, 2009 (Unaudited) (continued) | |
| |
| | Growth
Fund | | International
Equity Fund | | Mid-Cap
Fund | | Opportunity
Fund | | Opportunity
Fund
(Advisor) | |
|
|
|
|
|
|
|
|
|
|
|
|
|
|
|
|
|
Investment Income: | | | | | | | | | | | | | | | | |
Dividends | | $ | — | | $ | — | | $ | 113,472 | | $ | — | | $ | — | |
Investment Income from Affiliated Portfolios (a) | | | 250,585 | | | 2,355,623 | | | — | | | 25,727 | | | 222,249 | |
Tax reclaims (a) | | | — | | | 35,170 | | | — | | | — | | | — | |
Foreign tax withholding from Affiliated Portfolios (a) | | | (190 | ) | | (363,449 | ) | | — | | | — | | | — | |
Expenses from Affiliated Portfolios (a) | | | (175,944 | ) | | (595,799 | ) | | — | | | (41,833 | ) | | (361,389 | ) |
| |
|
| |
|
| |
|
| |
|
| |
|
| |
Total Investment Income (Loss) | | | 74,451 | | | 1,431,545 | | | 113,472 | | | (16,106 | ) | | (139,140 | ) |
| |
|
| |
|
| |
|
| |
|
| |
|
| |
|
|
|
|
|
|
|
|
|
|
|
|
|
|
|
|
|
Expenses: | | | | | | | | | | | | | | | | |
Investment Management | | | — | | | — | | | 47,556 | | | — | | | — | |
Administration | | | 4,987 | | | 13,284 | | | 2,518 | | | 942 | | | 8,157 | |
Distribution: | | | | | | | | | | | | | | | | |
Class B Shares | | | 8,900 | | | — | | | 6,103 | | | 4,674 | | | — | |
Class C Shares | | | 235 | | | — | | | 36 | | | 633 | | | — | |
Shareholder Servicing: | | | | | | | | | | | | | | | | |
Class A Shares | | | 17,973 | | | — | | | 3,926 | | | 8,063 | | | — | |
Class B Shares | | | 2,999 | | | — | | | 2,076 | | | 1,561 | | | — | |
Class C Shares | | | 79 | | | — | | | 13 | | | 212 | | | — | |
Accounting | | | 9,034 | | | 4,501 | | | 30,252 | | | 9,416 | | | 4,501 | |
Compliance Service | | | 114 | | | 284 | | | 16 | | | 8 | | | 168 | |
Custodian | | | — | | | — | | | 6,233 | | | — | | | — | |
Printing | | | 12,675 | | | 16,419 | | | 3,290 | | | 2,819 | | | 14,327 | |
Professional fees | | | 598 | | | 1,747 | | | 269 | | | 133 | | | 988 | |
Transfer Agent | | | 41,954 | | | 17,693 | | | 37,645 | | | 39,613 | | | 17,528 | |
Trustee | | | 330 | | | 875 | | | 176 | | | 51 | | | 534 | |
Registration fees | | | 20,733 | | | 7,424 | | | 2,811 | | | 5,673 | | | 3,720 | |
Other | | | 6,398 | | | 16,403 | | | 3,173 | | | 1,178 | | | 9,968 | |
| |
|
| |
|
| |
|
| |
|
| |
|
| |
Total expenses before fee reductions | | | 127,009 | | | 78,630 | | | 146,093 | | | 74,976 | | | 59,891 | |
Fees reduced by Investment Adviser | | | (34,361 | ) | | — | | | (64,036 | ) | | (40,364 | ) | | — | |
| |
|
| |
|
| |
|
| |
|
| |
|
| |
Net Expenses | | | 92,648 | | | 78,630 | | | 82,057 | | | 34,612 | | | 59,891 | |
| |
|
| |
|
| |
|
| |
|
| |
|
| |
|
|
|
|
|
|
|
|
|
|
|
|
|
|
|
|
|
Net Investment Income (Loss) | | | (18,197 | ) | | 1,352,915 | | | 31,415 | | | (50,718 | ) | | (199,031 | ) |
| |
|
| |
|
| |
|
| |
|
| |
|
| |
|
|
|
|
|
|
|
|
|
|
|
|
|
|
|
|
|
Net Realized/Unrealized Gains (Losses) from Investments: (a) | | | | | | | | | | | | | | | | |
| | | | | | | | | | | | | | | | |
Net realized gains (losses) from investment and foreign
currency transactions | | | (9,355,284 | ) | | (46,132,903 | ) | | (3,643,072 | ) | | (1,634,722 | ) | | (14,020,263 | ) |
Change in unrealized appreciation/depreciation from
investments and foreign currencies | | | 9,645,226 | | | 37,301,064 | | | 3,012,285 | | | 1,124,716 | | | 9,532,392 | |
| |
|
| |
|
| |
|
| |
|
| |
|
| |
|
|
|
|
|
|
|
|
|
|
|
|
|
|
|
|
|
Net realized/unrealized gains (losses) from investments
and foreign currency transactions | | | 289,942 | | | (8,831,839 | ) | | (630,787 | ) | | (510,006 | ) | | (4,487,871 | ) |
| |
|
| |
|
| |
|
| |
|
| |
|
| |
Change In Net Assets Resulting From Operations | | $ | 271,745 | | $ | (7,478,924 | ) | $ | (599,372 | ) | $ | (560,724 | ) | $ | (4,686,902 | ) |
| |
|
| |
|
| |
|
| |
|
| |
|
| |
| |
|
(a) | With the exception of the Mid-Cap Fund, represents amounts allocated from the respective Affiliated Portfolios. |
| | |
31 | HSBC INVESTOR FAMILY OF FUNDS | See notes to financial statements. |
| | | | | | | |
HSBC INVESTOR FAMILY OF FUNDS | |
| |
Statements of Operations—For the six months ended April 30, 2009 (Unaudited) (continued) | |
| |
| | Overseas
Equity Fund | | Value
Fund | |
|
|
|
|
|
|
Investment Income: | | | | | | | |
Investment Income from Affiliated Portfolios (a) | | $ | 113,703 | | $ | 366,701 | |
Tax reclaims (a) | | | (473 | ) | | — | |
Foreign tax withholding from Affiliated Portfolios (a) | | | (17,470 | ) | | — | |
Expenses from Affiliated Portfolios (a) | | | (29,167 | ) | | (95,744 | ) |
| |
|
| |
|
| |
Total Investment Income (Loss) | | | 66,593 | | | 270,957 | |
| |
|
| |
|
| |
|
|
|
|
|
|
|
|
Expenses: | | | | | | | |
Administration | | | 651 | | | 2,827 | |
Distribution: | | | | | | | |
Class B Shares | | | 3,691 | | | 2,126 | |
Class C Shares | | | 189 | | | 213 | |
Shareholder Servicing: | | | | | | | |
Class A Shares | | | 6,556 | | | 14,980 | |
Class B Shares | | | 1,249 | | | 719 | |
Class C Shares | | | 64 | | | 71 | |
Accounting | | | 9,416 | | | 11,930 | |
Compliance Service | | | 4 | | | 20 | |
Printing | | | 1,622 | | | 6,151 | |
Professional fees | | | 54 | | | 337 | |
Transfer Agent | | | 30,666 | | | 39,903 | |
Trustee | | | 13 | | | 176 | |
Registration fees | | | 5,476 | | | 5,957 | |
Other | | | 773 | | | 3,408 | |
| |
|
| |
|
| |
Total expenses before fee reductions | | | 60,424 | | | 88,818 | |
Fees reduced by Investment Adviser | | | (31,996 | ) | | (35,689 | ) |
| |
|
| |
|
| |
Net Expenses | | | 28,428 | | | 53,129 | |
| |
|
| |
|
| |
|
|
|
|
|
|
|
|
Net Investment Income (Loss) | | | 38,165 | | | 217,828 | |
| |
|
| |
|
| |
|
|
|
|
|
|
|
|
Net Realized/Unrealized Gains (Losses) from Investments: (a) | | | | | | | |
Net realized gains (losses) from investments and foreign currency transactions | | | (1,850,461 | ) | | (1,065,732 | ) |
Change in unrealized appreciation/depreciation from investments and foreign currencies | | | 1,348,358 | | | (1,135,357 | ) |
| |
|
| |
|
| |
|
|
|
|
|
|
|
|
Net realized/unrealized gains (losses) from investments and foreign currency transactions | | | (502,103 | ) | | (2,201,089 | ) |
| |
|
| |
|
| |
Change In Net Assets Resulting From Operations | | $ | (463,938 | ) | $ | (1,983,261 | ) |
| |
|
| |
|
| |
| |
|
(a) | Represents amounts allocated from the respective Affiliated Portfolios. |
| | |
See notes to financial statements. | HSBC INVESTOR FAMILY OF FUNDS | 32 |
| | | | | | | | | | | | | |
HSBC INVESTOR FAMILY OF FUNDS | |
| |
Statements of Changes in Net Assets | |
|
| | Core Plus
Fixed Income Fund (Advisor) | | Core Plus Fixed
Income Fund | |
|
|
|
|
|
|
| | For the six
months ended
April 30, 2009
(Unaudited) | | For the
year ended
October 31, 2008 | | For the six
months ended
April 30, 2009
(Unaudited) | | For the
year ended
October 31, 2008 | |
|
|
|
|
|
|
|
|
|
|
Investment Activities: | | | | | | | | | | | | | |
Operations: | | | | | | | | | | | | | |
Net investment income (loss) | | $ | 1,357,923 | | $ | 3,469,858 | | $ | 231,773 | | $ | 702,100 | |
Net realized gains (losses) from investment
transactions | | | (150,895 | ) | | (1,184,807 | ) | | (72,894 | ) | | (265,253 | ) |
Change in unrealized appreciation/
depreciation from investments and
foreign currencies | | | 1,843,421 | | | (8,103,005 | ) | | 377,281 | | | (1,704,210 | ) |
| |
|
| |
|
| |
|
| |
|
| |
Change in net assets resulting from
operations | | | 3,050,449 | | | (5,817,954 | ) | | 536,160 | | | (1,267,363 | ) |
| |
|
| |
|
| |
|
| |
|
| |
|
|
|
|
|
|
|
|
|
|
|
|
|
|
Dividends: | | | | | | | | | | | | | |
Net investment income: | | | | | | | | | | | | | |
Class A Shares | | | — | | | — | | | (194,435 | ) | | (598,607 | ) |
Class B Shares | | | — | | | — | | | (30,538 | ) | | (113,867 | ) |
Class C Shares | | | — | | | — | | | (2,046 | ) | | (3,888 | ) |
Class I Shares | | | (1,337,512 | ) | | (3,535,491 | ) | | — | | | — | |
Net realized gains: | | | | | | | | | | | | | |
Class I Shares | | | — | | | (562,425 | ) | | — | | | — | |
| |
|
| |
|
| |
|
| |
|
| |
Change in net assets resulting from
shareholder dividends | | | (1,337,512 | ) | | (4,097,916 | ) | | (227,019 | ) | | (716,362 | ) |
| |
|
| |
|
| |
|
| |
|
| |
Change in net assets resulting from
capital transactions | | | (9,095,028 | ) | | (16,559,085 | ) | | (1,601,265 | ) | | (5,243,046 | ) |
| |
|
| |
|
| |
|
| |
|
| |
Change in net assets | | | (7,382,091 | ) | | (26,474,955 | ) | | (1,292,124 | ) | | (7,226,771 | ) |
|
|
|
|
|
|
|
|
|
|
|
|
|
|
Net Assets: | | | | | | | | | | | | | |
Beginning of period | | | 54,917,516 | | | 81,392,471 | | | 10,187,530 | | | 17,414,301 | |
| |
|
| |
|
| |
|
| |
|
| |
End of period | | $ | 47,535,425 | | $ | 54,917,516 | | $ | 8,895,406 | | $ | 10,187,530 | |
| |
|
| |
|
| |
|
| |
|
| |
Accumulated net investment income (loss) | | $ | 72,762 | | $ | 52,351 | | $ | 3,023 | | $ | (1,731 | ) |
| |
|
| |
|
| |
|
| |
|
| |
| | |
33 | HSBC INVESTOR FAMILY OF FUNDS | See notes to financial statements. |
| | | | | | | | | | | | | |
HSBC INVESTOR FAMILY OF FUNDS | |
| | | | | | | | | | | | | |
Statements of Changes in Net Assets (continued) | |
| | | | | | | | | | | | | |
| | Core Plus
Fixed Income Fund (Advisor) | | Core Plus Fixed
Income Fund | |
|
| | For the six
months ended
April 30, 2009
(Unaudited) | | For the
year ended
October 31, 2008 | | For the six
months ended
April 30, 2009
(Unaudited) | | For the
year ended
October 31, 2008 | |
|
CAPITAL TRANSACTIONS: | | | | | | | | | | | | | |
Class A Shares: | | | | | | | | | | | | | |
Proceeds from shares issued | | $ | — | | $ | — | | $ | 410,041 | | $ | 1,848,069 | |
Dividends reinvested | | | — | | | — | | | 181,337 | | | 567,781 | |
Value of shares redeemed | | | — | | | — | | | (1,674,536 | ) | | (5,999,967 | ) |
| |
|
| |
|
| |
|
| |
|
| |
Class A Shares capital transactions | | | — | | | — | | | (1,083,158 | ) | | (3,584,117 | ) |
| |
|
| |
|
| |
|
| |
|
| |
|
Class B Shares: | | | | | | | | | | | | | |
Proceeds from shares issued | | | — | | | — | | | 108,436 | | | 152,662 | |
Dividends reinvested | | | — | | | — | | | 28,061 | | | 104,382 | |
Value of shares redeemed | | | — | | | — | | | (657,210 | ) | | (1,994,529 | ) |
| |
|
| |
|
| |
|
| |
|
| |
Class B Shares capital transactions | | | — | | | — | | | (520,713 | ) | | (1,737,485 | ) |
| |
|
| |
|
| |
|
| |
|
| |
|
Class C Shares: | | | | | | | | | | | | | |
Proceeds from shares issued | | | — | | | — | | | 610 | | | 79,000 | |
Dividends reinvested | | | — | | | — | | | 2,046 | | | 3,768 | |
Value of shares redeemed | | | — | | | — | | | (50 | ) | | (4,212 | ) |
| |
|
| |
|
| |
|
| |
|
| |
Class C Shares capital transactions | | | — | | | — | | | 2,606 | | | 78,556 | |
| |
|
| |
|
| |
|
| |
|
| |
|
Class I Shares: | | | | | | | | | | | | | |
Proceeds from shares issued | | | 768,214 | | | 11,045,505 | | | — | | | — | |
Dividends reinvested | | | 1,114,275 | | | 3,221,531 | | | — | | | — | |
Value of shares redeemed | | | (10,977,517 | ) | | (30,826,121 | ) | | — | | | — | |
| |
|
| |
|
| |
|
| |
|
| |
Class I Shares capital transactions | | | (9,095,028 | ) | | (16,559,085 | ) | | — | | | — | |
| |
|
| |
|
| |
|
| |
|
| |
Change in net assets resulting from capital transactions | | $ | (9,095,028 | ) | $ | (16,559,085 | ) | $ | (1,601,265 | ) | $ | (5,243,046 | ) |
| |
|
| |
|
| |
|
| |
|
| |
|
SHARE TRANSACTIONS: | | | | | | | | | | | | | |
Class A Shares: | | | | | | | | | | | | | |
Issued | | | — | | | — | | | 44,799 | | | 183,156 | |
Reinvested | | | — | | | — | | | 19,683 | | | 56,566 | |
Redeemed | | | — | | | — | | | (183,089 | ) | | (615,873 | ) |
| |
|
| |
|
| |
|
| |
|
| |
Change in Class A Shares | | | — | | | — | | | (118,607 | ) | | (376,151 | ) |
| |
|
| |
|
| |
|
| |
|
| |
|
Class B Shares: | | | | | | | | | | | | | |
Issued | | | — | | | — | | | 11,801 | | | 15,333 | |
Reinvested | | | — | | | — | | | 3,045 | | | 10,322 | |
Redeemed | | | — | | | — | | | (71,417 | ) | | (197,907 | ) |
| |
|
| |
|
| |
|
| |
|
| |
Change in Class B Shares | | | — | | | — | | | (56,571 | ) | | (172,252 | ) |
| |
|
| |
|
| |
|
| |
|
| |
|
Class C Shares: | | | | | | | | | | | | | |
Issued | | | — | | | — | | | 67 | | | 7,588 | |
Reinvested | | | — | | | — | | | 222 | | | 378 | |
Redeemed | | | — | | | — | | | (5 | ) | | (403 | ) |
| |
|
| |
|
| |
|
| |
|
| |
Change in Class C Shares | | | — | | | — | | | 284 | | | 7,563 | |
| |
|
| |
|
| |
|
| |
|
| |
|
Class I Shares: | | | | | | | | | | | | | |
Issued | | | 85,485 | | | 1,115,935 | | | — | | | — | |
Reinvested | | | 123,674 | | | 326,863 | | | — | | | — | |
Redeemed | | | (1,218,170 | ) | | (3,155,373 | ) | | — | | | — | |
| |
|
| |
|
| |
|
| |
|
| |
Change in Class I Shares | | | (1,009,011 | ) | | (1,712,575 | ) | | — | | | — | |
| |
|
| |
|
| |
|
| |
|
| |
| | |
See notes to financial statements. | HSBC INVESTOR FAMILY OF FUNDS | 34 |
| | | | | | | | | | | | | |
HSBC INVESTOR FAMILY OF FUNDS | |
| | | | | | | | | | | | | |
Statements of Changes in Net Assets (continued) | |
| | | | | | | | | | | | | |
| | Intermediate Duration
Fixed Income Fund | | New York Tax-Free
Bond Fund | |
|
| | For the six
months ended
April 30, 2009
(Unaudited) | | For the
year ended
October 31, 2008 | | For the six
months ended
April 30, 2009
(Unaudited) | | For the
year ended
October 31, 2008 | |
|
Investment Activities: | | | | | | | | | | | | | |
Operations: | | | | | | | | | | | | | |
Net investment income (loss) | | $ | 265,691 | | $ | 608,944 | | $ | 804,872 | | $ | 2,059,228 | |
Net realized gains (losses) from investment
transactions | | | 123,680 | | | (127,295 | ) | | (60,228 | ) | | 151,884 | |
Change in unrealized appreciation/
depreciation from investments and
foreign currencies | | | 289,420 | | | (1,432,619 | ) | | 2,033,768 | | | (3,382,762 | ) |
| |
|
| |
|
| |
|
| |
|
| |
Change in net assets resulting from operations | | | 678,791 | | | (950,970 | ) | | 2,778,412 | | | (1,171,650 | ) |
| |
|
| |
|
| |
|
| |
|
| |
|
Dividends: | | | | | | | | | | | | | |
Net investment income: | | | | | | | | | | | | | |
Class A Shares | | | (31,714 | ) | | (55,096 | ) | | (441,555 | ) | | (1,111,330 | ) |
Class B Shares | | | (19,401 | ) | | (82,985 | ) | | (63,337 | ) | | (188,686 | ) |
Class C Shares | | | (2,990 | ) | | (10,215 | ) | | (7,075 | ) | | (15,852 | ) |
Class I Shares | | | (185,849 | ) | | (472,469 | ) | | (292,688 | ) | | (764,542 | ) |
Net realized gains: | | | | | | | | | | | | | |
Class A Shares | | | — | | | (3,193 | ) | | (82,654 | ) | | (41,981 | ) |
Class B Shares | | | — | | | (10,717 | ) | | (15,856 | ) | | (10,694 | ) |
Class C Shares | | | — | | | (1,145 | ) | | (1,656 | ) | | (809 | ) |
Class I Shares | | | — | | | (38,243 | ) | | (51,714 | ) | | (26,013 | ) |
| |
|
| |
|
| |
|
| |
|
| |
Change in net assets resulting from
shareholder dividends | | | (239,954 | ) | | (674,063 | ) | | (956,535 | ) | | (2,159,907 | ) |
| |
|
| |
|
| |
|
| |
|
| |
Change in net assets resulting from
capital transactions | | | (962,260 | ) | | 453,241 | | | (4,671,885 | ) | | (12,285,228 | ) |
| |
|
| |
|
| |
|
| |
|
| |
Change in net assets | | | (523,423 | ) | | (1,171,792 | ) | | (2,850,008 | ) | | (15,616,785 | ) |
|
Net Assets: | | | | | | | | | | | | | |
Beginning of period | | | 12,873,744 | | | 14,045,536 | | | 45,412,769 | | | 61,029,554 | |
| |
|
| |
|
| |
|
| |
|
| |
End of period | | $ | 12,350,321 | | $ | 12,873,744 | | $ | 42,562,761 | | $ | 45,412,769 | |
| |
|
| |
|
| |
|
| |
|
| |
Accumulated net investment income (loss) | | $ | 34,470 | | $ | 8,733 | | $ | 576 | | $ | 359 | |
| |
|
| |
|
| |
|
| |
|
| |
| | |
35 | HSBC INVESTOR FAMILY OF FUNDS | See notes to financial statements. |
| | | | | | | | | | | | | |
HSBC INVESTOR FAMILY OF FUNDS | |
| | | | | | | | | | | | | |
Statements of Changes in Net Assets (continued) | |
| | | | | | | | | | | | | |
| | Intermediate Duration
Fixed Income Fund | | New York Tax-Free
Bond Fund | |
|
| | For the six
months ended
April 30, 2009
(Unaudited) | | For the
year ended
October 31, 2008 | | For the six
months ended
April 30, 2009
(Unaudited) | | For the
year ended
October 31, 2008 | |
|
CAPITAL TRANSACTIONS: | | | | | | | | | | | | | |
Class A Shares: | | | | | | | | | | | | | |
Proceeds from shares issued | | $ | 338,504 | | $ | 1,234,199 | | $ | 1,198,312 | | $ | 4,006,530 | |
Dividends reinvested | | | 23,477 | | | 47,821 | | | 461,772 | | | 1,035,303 | |
Value of shares redeemed | | | (281,247 | ) | | (270,271 | ) | | (3,451,000 | ) | | (11,207,042 | ) |
| |
|
| |
|
| |
|
| |
|
| |
Class A Shares capital transactions | | | 80,734 | | | 1,011,749 | | | (1,790,916 | ) | | (6,165,209 | ) |
| |
|
| |
|
| |
|
| |
|
| |
|
Class B Shares: | | | | | | | | | | | | | |
Proceeds from shares issued | | | 207,743 | | | 28,472 | | | 84,834 | | | 120,432 | |
Dividends reinvested | | | 16,652 | | | 83,053 | | | 59,926 | | | 147,784 | |
Value of shares redeemed | | | (453,193 | ) | | (1,496,720 | ) | | (1,289,378 | ) | | (3,728,591 | ) |
| |
|
| |
|
| |
|
| |
|
| |
Class B Shares capital transactions | | | (228,798 | ) | | (1,385,195 | ) | | (1,144,618 | ) | | (3,460,375 | ) |
| |
|
| |
|
| |
|
| |
|
| |
|
Class C Shares: | | | | | | | | | | | | | |
Proceeds from shares issued | | | 600 | | | 2,250 | | | 415 | | | 33,615 | |
Dividends reinvested | | | 2,936 | | | 11,183 | | | 6,631 | | | 12,094 | |
Value of shares redeemed | | | (30,645 | ) | | (66,567 | ) | | (12,923 | ) | | (352,550 | ) |
| |
|
| |
|
| |
|
| |
|
| |
Class C Shares capital transactions | | | (27,109 | ) | | (53,134 | ) | | (5,877 | ) | | (306,841 | ) |
| |
|
| |
|
| |
|
| |
|
| |
|
Class I Shares: | | | | | | | | | | | | | |
Proceeds from shares issued | | | 57,209 | | | 3,331,706 | | | 225,825 | | | 5,250,741 | |
Dividends reinvested | | | 151,416 | | | 437,644 | | | 111,603 | | | 286,948 | |
Value of shares redeemed | | | (995,712 | ) | | (2,889,529 | ) | | (2,067,902 | ) | | (7,890,492 | ) |
| |
|
| |
|
| |
|
| |
|
| |
Class I Shares capital transactions | | | (787,087 | ) | | 879,821 | | | (1,730,474 | ) | | (2,352,803 | ) |
| |
|
| |
|
| |
|
| |
|
| |
| | | | | | | | | | | | | |
Change in net assets resulting from capital transactions | | $ | (962,260 | ) | $ | 453,241 | | $ | (4,671,885 | ) | $ | (12,285,228 | ) |
| |
|
| |
|
| |
|
| |
|
| |
|
SHARE TRANSACTIONS: | | | | | | | | | | | | | |
Class A Shares: | | | | | | | | | | | | | |
Issued | | | 37,457 | | | 128,765 | | | 112,059 | | | 365,610 | |
Reinvested | | | 2,598 | | | 4,994 | | | 43,580 | | | 95,116 | |
Redeemed | | | (31,086 | ) | | (29,064 | ) | | (326,599 | ) | | (1,044,410 | ) |
| |
|
| |
|
| |
|
| |
|
| |
Change in Class A Shares | | | 8,969 | | | 104,695 | | | (170,960 | ) | | (583,684 | ) |
| |
|
| |
|
| |
|
| |
|
| |
|
Class B Shares: | | | | | | | | | | | | | |
Issued | | | 22,893 | | | 2,919 | | | 7,887 | | | 10,955 | |
Reinvested | | | 1,842 | | | 8,530 | | | 5,674 | | | 13,566 | |
Redeemed | | | (49,977 | ) | | (154,813 | ) | | (120,761 | ) | | (339,919 | ) |
| |
|
| |
|
| |
|
| |
|
| |
Change in Class B Shares | | | (25,242 | ) | | (143,364 | ) | | (107,200 | ) | | (315,398 | ) |
| |
|
| |
|
| |
|
| |
|
| |
|
Class C Shares: | | | | | | | | | | | | | |
Issued | | | 67 | | | 230 | | | 38 | | | 3,026 | |
Reinvested | | | 325 | | | 1,154 | | | 624 | | | 1,091 | |
Redeemed | | | (3,449 | ) | | (6,896 | ) | | (1,204 | ) | | (31,836 | ) |
| |
|
| |
|
| |
|
| |
|
| |
Change in Class C Shares | | | (3,057 | ) | | (5,512 | ) | | (542 | ) | | (27,719 | ) |
| |
|
| |
|
| |
|
| |
|
| |
|
Class I Shares: | | | | | | | | | | | | | |
Issued | | | 6,312 | | | 345,371 | | | 21,195 | | | 476,765 | |
Reinvested | | | 16,734 | | | 45,299 | | | 10,553 | | | 26,350 | |
Redeemed | | | (110,103 | ) | | (299,875 | ) | | (197,488 | ) | | (738,030 | ) |
| |
|
| |
|
| |
|
| |
|
| |
Change in Class I Shares | | | (87,057 | ) | | 90,795 | | | (165,740 | ) | | (234,915 | ) |
| |
|
| |
|
| |
|
| |
|
| |
| | |
See notes to financial statements. | HSBC INVESTOR FAMILY OF FUNDS | 36 |
HSBC INVESTOR FAMILY OF FUNDS
Statements of Changes in Net Assets (continued)
| | | | | | | |
| | Growth Fund | |
|
|
|
|
| | For the six
months ended
April 30, 2009
(Unaudited) | | | For the
year ended
October 31, 2008 | |
|
|
|
|
|
|
|
Investment Activities: | | | | | | | |
Operations: | | | | | | | |
Net investment income (loss) | | $ | (18,197 | ) | $ | (153,221 | ) |
Net realized gains (losses) from investment transactions | | | (9,355,284 | ) | | 182,222 | |
Change in unrealized appreciation/depreciation from investments and foreign currencies | | | 9,645,226 | | | (30,016,810 | ) |
| |
|
| |
|
| |
Change in net assets resulting from operations | | | 271,745 | | | (29,987,809 | ) |
| |
|
| |
|
| |
|
|
|
|
|
|
|
|
Dividends: | | | | | | | |
Net realized gains: | | | | | | | |
Class A Shares | | | — | | | (1,383,410 | ) |
Class B Shares | | | — | | | (79,802 | ) |
Class C Shares | | | — | | | (4,866 | ) |
Class I Shares | | | — | | | (1,424,277 | ) |
| |
|
| |
|
| |
Change in net assets resulting from shareholder dividends | | | — | | | (2,892,355 | ) |
| |
|
| |
|
| |
Change in net assets resulting from capital transactions | | | (7,324,375 | ) | | 28,956,532 | |
| |
|
| |
|
| |
Change in net assets | | | (7,052,630 | ) | | (3,923,632 | ) |
|
|
|
|
|
|
|
|
Net Assets: | | | | | | | |
Beginning of period | | | 58,958,322 | | | 62,881,954 | |
| |
|
| |
|
| |
End of period | | $ | 51,905,692 | | $ | 58,958,322 | |
| |
|
| |
|
| |
Accumulated net investment income (loss) | | $ | (18,197 | ) | $ | — | |
| |
|
| |
|
| |
| | |
37 | HSBC INVESTOR FAMILY OF FUNDS | See notes to financial statements. |
HSBC INVESTOR FAMILY OF FUNDS
Statements of Changes in Net Assets (continued)
| | | | | | | |
| | Growth Fund | |
|
|
|
|
| | For the six
months ended
April 30, 2009
(Unaudited) | | For the
year ended
October 31, 2008 | |
|
|
|
|
|
|
CAPITAL TRANSACTIONS: | | | | | | | |
Class A Shares: | | | | | | | |
Proceeds from shares issued | | $ | 511,087 | | $ | 2,184,134 | |
Proceeds from shares issued in conversion | | | — | | | 2,181,685 | |
Dividends reinvested | | | — | | | 1,365,451 | |
Value of shares redeemed | | | (2,687,265 | ) | | (7,496,370 | ) |
| |
|
| |
|
| |
Class A Shares capital transactions | | | (2,176,178 | ) | | (1,765,100 | ) |
| |
|
| |
|
| |
|
|
|
|
|
|
|
|
Class B Shares: | | | | | | | |
Proceeds from shares issued | | | 39,585 | | | 94,123 | |
Proceeds from shares issued in conversion | | | — | | | 3,033,945 | |
Dividends reinvested | | | — | | | 79,295 | |
Value of shares redeemed | | | (520,327 | ) | | (621,351 | ) |
| |
|
| |
|
| |
Class B Shares capital transactions | | | (480,742 | ) | | 2,586,012 | |
| |
|
| |
|
| |
|
|
|
|
|
|
|
|
Class C Shares: | | | | | | | |
Proceeds from shares issued | | | 104 | | | 316 | |
Proceeds from shares issued in conversion | | | — | | | 27,158 | |
Dividends reinvested | | | — | | | 4,866 | |
Value of shares redeemed | | | (4,166 | ) | | (12,332 | ) |
| |
|
| |
|
| |
Class C Shares capital transactions | | | (4,062 | ) | | 20,008 | |
| |
|
| |
|
| |
|
|
|
|
|
|
|
|
Class I Shares: | | | | | | | |
Proceeds from shares issued | | | 1,926,234 | | | 5,289,940 | |
Proceeds from shares issued in conversion | | | — | | | 29,095,081 | |
Dividends reinvested | | | — | | | 1,334,114 | |
Value of shares redeemed | | | (6,589,627 | ) | | (7,603,523 | ) |
| |
|
| |
|
| |
Class I Shares capital transactions | | | (4,663,393 | ) | | 28,115,612 | |
| |
|
| |
|
| |
Change in net assets resulting from capital transactions | | $ | (7,324,375 | ) | $ | 28,956,532 | |
| |
|
| |
|
| |
|
|
|
|
|
|
|
|
SHARE TRANSACTIONS: | | | | | | | |
Class A Shares: | | | | | | | |
Issued | | | 52,181 | | | 171,527 | |
Issued in conversion | | | — | | | 154,250 | |
Reinvested | | | — | | | 82,517 | |
Redeemed | | | (277,064 | ) | | (499,620 | ) |
| |
|
| |
|
| |
Change in Class A Shares | | | (224,883 | ) | | (91,326 | ) |
| |
|
| |
|
| |
|
|
|
|
|
|
|
|
Class B Shares: | | | | | | | |
Issued | | | 4,328 | | | 6,697 | |
Issued in conversion | | | — | | | 229,821 | |
Reinvested | | | — | | | 5,109 | |
Redeemed | | | (57,698 | ) | | (49,634 | ) |
| |
|
| |
|
| |
Change in Class B Shares | | | (53,370 | ) | | 191,993 | |
| |
|
| |
|
| |
|
|
|
|
|
|
|
|
Class C Shares: | | | | | | | |
Issued | | | 10 | | | 21 | |
Issued in conversion | | | — | | | 2,045 | |
Reinvested | | | — | | | 312 | |
Redeemed | | | (464 | ) | | (900 | ) |
| |
|
| |
|
| |
Change in Class C Shares | | | (454 | ) | | 1,478 | |
| |
|
| |
|
| |
|
|
|
|
|
|
|
|
Class I Shares: | | | | | | | |
Issued | | | 201,958 | | | 372,328 | |
Issued in Conversion | | | — | | | 2,043,578 | |
Reinvested | | | — | | | 80,320 | |
Redeemed | | | (682,507 | ) | | (519,054 | ) |
| |
|
| |
|
| |
Change in Class I Shares | | | (480,549 | ) | | 1,977,172 | |
| |
|
| |
|
| |
| | |
See notes to financial statements. | HSBC INVESTOR FAMILY OF FUNDS | 38 |
HSBC INVESTOR FAMILY OF FUNDS
Statements of Changes in Net Assets (continued)
| | | | | | | | | | | | | |
| | International Equity Fund | | Mid-Cap Fund | |
|
|
|
|
|
|
| | For the six
months ended
April 30, 2009
(Unaudited) | | For the
year ended
October 31, 2008 | | For the six
months ended
April 30, 2009
(Unaudited) | | For the
year ended
October 31, 2008 | |
|
|
|
|
|
|
|
|
|
|
Investment Activities: | | | | | | | | | | | | | |
Operations: | | | | | | | | | | | | | |
Net investment income (loss) | | $ | 1,352,915 | | $ | 7,877,663 | | $ | 31,415 | | $ | (87,610 | ) |
Net realized gains (losses) from investment
transactions | | | (46,132,903 | ) | | 7,880,059 | | | (3,643,072 | ) | | 1,072,890 | |
Change in unrealized appreciation/
depreciation from investments and
foreign currencies | | | 37,301,064 | | | (201,336,999 | ) | | 3,012,285 | | | (14,339,743 | ) |
| |
|
| |
|
| |
|
| |
|
| |
Change in net assets resulting from operations | | | (7,478,924 | ) | | (185,579,277 | ) | | (599,372 | ) | | (13,354,463 | ) |
| |
|
| |
|
| |
|
| |
|
| |
|
|
|
|
|
|
|
|
|
|
|
|
|
|
Dividends: | | | | | | | | | | | | | |
Net investment income: | | | | | | | | | | | | | |
Class I Shares | | | (7,354,738 | ) | | (5,964,290 | ) | | — | | | — | |
Net realized gains: | | | | | | | | | | | | | |
Class A Shares | | | — | | | — | | | (294,264 | ) | | (598,216 | ) |
Class B Shares | | | — | | | — | | | (174,161 | ) | | (737,486 | ) |
Class C Shares | | | — | | | — | | | (1,041 | ) | | (9,380 | ) |
Class I Shares | | | (8,461,420 | ) | | (28,980,345 | ) | | (681,038 | ) | | (2,185,201 | ) |
| |
|
| |
|
| |
|
| |
|
| |
Change in net assets resulting from
shareholder dividends | | | (15,816,158 | ) | | (34,944,635 | ) | | (1,150,504 | ) | | (3,530,283 | ) |
| |
|
| |
|
| |
|
| |
|
| |
Change in net assets resulting from
capital transactions | | | (4,057,461 | ) | | (4,139,847 | ) | | (2,532,788 | ) | | 603,841 | |
| |
|
| |
|
| |
|
| |
|
| |
Change in net assets | | | (27,352,543 | ) | | (224,663,759 | ) | | (4,282,664 | ) | | (16,280,905 | ) |
|
|
|
|
|
|
|
|
|
|
|
|
|
|
Net Assets: | | | | | | | | | | | | | |
Beginning of period | | | 161,053,348 | | | 385,717,107 | | | 16,650,794 | | | 32,931,699 | |
| |
|
| |
|
| |
|
| |
|
| |
End of period | | $ | 133,700,805 | | $ | 161,053,348 | | $ | 12,368,130 | | $ | 16,650,794 | |
| |
|
| |
|
| |
|
| |
|
| |
Accumulated net investment income (loss) | | $ | 997,274 | | $ | 6,999,097 | | $ | 31,415 | | $ | — | |
| |
|
| |
|
| |
|
| |
|
| |
| | |
39 | HSBC INVESTOR FAMILY OF FUNDS | See notes to financial statements. |
HSBC INVESTOR FAMILY OF FUNDS
Statements of Changes in Net Assets (continued)
| | | | | | | | | | | | | |
| | International Equity Fund | | Mid-Cap Fund | |
|
|
|
|
|
|
| | For the six
months ended
April 30, 2009
(Unaudited) | | For the
year ended
October 31, 2008 | | For the six
months ended
April 30, 2009
(Unaudited) | | For the
year ended
October 31, 2008 | |
|
|
|
|
|
|
|
|
|
|
CAPITAL TRANSACTIONS: | | | | | | | | | | | | | |
Class A Shares: | | | | | | | | | | | | | |
Proceeds from shares issued | | $ | — | | $ | — | | $ | 233,529 | | $ | 2,247,640 | |
Dividends reinvested | | | — | | | — | | | 290,977 | | | 592,760 | |
Value of shares redeemed | | | — | | | — | | | (270,503 | ) | | (1,823,839 | ) |
| |
|
| |
|
| |
|
| |
|
| |
Class A Shares capital transactions | | | — | | | — | | | 254,003 | | | 1,016,561 | |
| |
|
| |
|
| |
|
| |
|
| |
|
|
|
|
|
|
|
|
|
|
|
|
|
|
Class B Shares: | | | | | | | | | | | | | |
Proceeds from shares issued | | | — | | | — | | | 48,591 | | | 132,611 | |
Dividends reinvested | | | — | | | — | | | 169,310 | | | 721,029 | |
Value of shares redeemed | | | — | | | — | | | (272,974 | ) | | (2,456,625 | ) |
| |
|
| |
|
| |
|
| |
|
| |
Class B Shares capital transactions | | | — | | | — | | | (55,073 | ) | | (1,602,985 | ) |
| |
|
| |
|
| |
|
| |
|
| |
|
|
|
|
|
|
|
|
|
|
|
|
|
|
Class C Shares: | | | | | | | | | | | | | |
Proceeds from shares issued | | | — | | | — | | | — | | | 9 | |
Dividends reinvested | | | — | | | — | | | 1,041 | | | 9,380 | |
Value of shares redeemed | | | — | | | — | | | (508 | ) | | (52,339 | ) |
| |
|
| |
|
| |
|
| |
|
| |
Class C Shares capital transactions | | | — | | | — | | | 533 | | | (42,950 | ) |
| |
|
| |
|
| |
|
| |
|
| |
|
|
|
|
|
|
|
|
|
|
|
|
|
|
Class I Shares: | | | | | | | | | | | | | |
Proceeds from shares issued | | | 11,855,603 | | | 40,597,462 | | | 277,531 | | | 2,731,685 | |
Dividends reinvested | | | 11,845,280 | | | 26,918,243 | | | 462,791 | | | 1,405,125 | |
Value of shares redeemed | | | (27,758,344 | ) | | (71,655,552 | ) | | (3,472,573 | ) | | (2,903,595 | ) |
| |
|
| |
|
| |
|
| |
|
| |
Class I Shares capital transactions | | | (4,057,461 | ) | | (4,139,847 | ) | | (2,732,251 | ) | | 1,233,215 | |
| |
|
| |
|
| |
|
| |
|
| |
Change in net assets resulting from
capital transactions | | $ | (4,057,461 | ) | $ | (4,139,847 | ) | $ | (2,532,788 | ) | $ | 603,841 | |
| |
|
| |
|
| |
|
| |
|
| |
|
|
|
|
|
|
|
|
|
|
|
|
|
|
SHARE TRANSACTIONS: | | | | | | | | | | | | | |
Class A Shares: | | | | | | | | | | | | | |
Issued | | | — | | | — | | | 52,018 | | | 266,103 | |
Reinvested | | | — | | | — | | | 65,535 | | | 65,426 | |
Redeemed | | | — | | | — | | | (61,442 | ) | | (210,220 | ) |
| |
|
| |
|
| |
|
| |
|
| |
Change in Class A Shares | | | — | | | — | | | 56,111 | | | 121,309 | |
| |
|
| |
|
| |
|
| |
|
| |
|
|
|
|
|
|
|
|
|
|
|
|
|
|
Class B Shares: | | | | | | | | | | | | | |
Issued | | | — | | | — | | | 12,062 | | | 17,380 | |
Reinvested | | | — | | | — | | | 42,117 | | | 86,351 | |
Redeemed | | | — | | | — | | | (66,730 | ) | | (326,374 | ) |
| |
|
| |
|
| |
|
| |
|
| |
Change in Class B Shares | | | — | | | — | | | (12,551 | ) | | (222,643 | ) |
| |
|
| |
|
| |
|
| |
|
| |
|
|
|
|
|
|
|
|
|
|
|
|
|
|
Class C Shares: | | | | | | | | | | | | | |
Reinvested | | | — | | | — | | | 256 | | | 1,113 | |
Redeemed | | | — | | | — | | | (138 | ) | | (6,502 | ) |
| |
|
| |
|
| |
|
| |
|
| |
Change in Class C Shares | | | — | | | — | | | 118 | | | (5,389 | ) |
| |
|
| |
|
| |
|
| |
|
| |
|
|
|
|
|
|
|
|
|
|
|
|
|
|
Class I Shares: | | | | | | | | | | | | | |
Issued | | | 1,406,054 | | | 2,263,402 | | | 59,333 | | | 318,390 | |
Reinvested | | | 1,323,495 | | | 1,358,821 | | | 101,267 | | | 151,578 | |
Redeemed | | | (3,026,191 | ) | | (4,112,422 | ) | | (714,081 | ) | | (334,242 | ) |
| |
|
| |
|
| |
|
| |
|
| |
Change in Class I Shares | | | (296,642 | ) | | (490,199 | ) | | (553,481 | ) | | 135,726 | |
| |
|
| |
|
| |
|
| |
|
| |
| | |
See notes to financial statements. | HSBC INVESTOR FAMILY OF FUNDS | 40 |
HSBC INVESTOR FAMILY OF FUNDS
Statements of Changes in Net Assets (continued)
| | | | | | | | | | | | | |
| | Opportunity Fund | | Opportunity Fund (Advisor) | |
|
|
|
|
|
|
| | For the six
months ended
April 30, 2009
(Unaudited) | | For the
year ended
October 31, 2008 | | For the six
months ended
April 30, 2009
(Unaudited) | | For the
year ended
October 31, 2008 | |
|
|
|
|
|
|
|
|
|
|
Investment Activities: | | | | | | | | | | | | | |
Operations: | | | | | | | | | | | | | |
Net investment income (loss) | | $ | (50,718 | ) | $ | (217,394 | ) | $ | (199,031 | ) | $ | (799,142 | ) |
Net realized gains (losses) from
investment transactions | | | (1,634,722 | ) | | 619,272 | | | (14,020,263 | ) | | 2,335,993 | |
Change in unrealized appreciation/
depreciation from investments and
foreign currencies | | | 1,124,716 | | | (7,169,941 | ) | | 9,532,392 | | | (57,458,069 | ) |
| |
|
| |
|
| |
|
| |
|
| |
Change in net assets resulting from
operations | | | (560,724 | ) | | (6,768,063 | ) | | (4,686,902 | ) | | (55,921,218 | ) |
| |
|
| |
|
| |
|
| |
|
| |
|
|
|
|
|
|
|
|
|
|
|
|
|
|
Dividends: | | | | | | | | | | | | | |
Net realized gains: | | | | | | | | | | | | | |
Class A Shares | | | (539,992 | ) | | (4,275,970 | ) | | — | | | — | |
Class B Shares | | | (107,053 | ) | | (1,656,407 | ) | | — | | | — | |
Class C Shares | | | (13,420 | ) | | (112,933 | ) | | — | | | — | |
Class I Shares | | | — | | | — | | | (2,746,629 | ) | | (45,200,235 | ) |
| |
|
| |
|
| |
|
| |
|
| |
Change in net assets resulting from
shareholder dividends | | | (660,465 | ) | | (6,045,310 | ) | | (2,746,629 | ) | | (45,200,235 | ) |
| |
|
| |
|
| |
|
| |
|
| |
Change in net assets resulting from
capital transactions | | | (542,176 | ) | | 3,861,286 | | | (6,440,690 | ) | | 22,369,148 | |
| |
|
| |
|
| |
|
| |
|
| |
Change in net assets | | | (1,763,365 | ) | | (8,952,087 | ) | | (13,874,221 | ) | | (78,752,305 | ) |
|
|
|
|
|
|
|
|
|
|
|
|
|
|
Net Assets: | | | | | | | | | | | | | |
Beginning of period | | | 11,366,672 | | | 20,318,759 | | | 97,840,573 | | | 176,592,878 | |
| |
|
| |
|
| |
|
| |
|
| |
End of period | | $ | 9,603,307 | | $ | 11,366,672 | | $ | 83,966,352 | | $ | 97,840,573 | |
| |
|
| |
|
| |
|
| |
|
| |
Accumulated net investment income (loss) | | $ | (50,718 | ) | $ | — | | $ | (199,031 | ) | $ | — | |
| |
|
| |
|
| |
|
| |
|
| |
| | |
41 | HSBC INVESTOR FAMILY OF FUNDS | See notes to financial statements. |
|
HSBC INVESTOR FAMILY OF FUNDS |
|
Statements of Changes in Net Assets (continued) |
| | | | | | | | | | | | | |
| | Opportunity Fund | | Opportunity Fund (Advisor) | |
|
|
|
|
|
|
| | For the six
months ended
April 30, 2009
(Unaudited) | | For the
year ended
October 31, 2008 | | For the six
months ended
April 30, 2009
(Unaudited) | | For the
year ended
October 31, 2008 | |
|
|
|
|
|
|
|
|
|
|
CAPITAL TRANSACTIONS: | | | | | | | | | | | | | |
Class A Shares: | | | | | | | | | | | | | |
Proceeds from shares issued | | $ | 272,772 | | $ | 4,352,351 | | $ | — | | $ | — | |
Dividends reinvested | | | 537,466 | | | 4,182,326 | | | — | | | — | |
Value of shares redeemed | | | (1,208,034 | ) | | (4,197,723 | ) | | — | | | — | |
| |
|
| |
|
| |
|
| |
|
| |
Class A Shares capital transactions | | | (397,796 | ) | | 4,336,954 | | | — | | | — | |
| |
|
| |
|
| |
|
| |
|
| |
|
|
|
|
|
|
|
|
|
|
|
|
|
|
Class B Shares: | | | | | | | | | | | | | |
Proceeds from shares issued | | | 42,046 | | | 123,807 | | | — | | | — | |
Dividends reinvested | | | 106,455 | | | 1,634,480 | | | — | | | — | |
Value of shares redeemed | | | (313,987 | ) | | (2,318,068 | ) | | — | | | — | |
| |
|
| |
|
| |
|
| |
|
| |
Class B Shares capital transactions | | | (165,486 | ) | | (559,781 | ) | | — | | | — | |
| |
|
| |
|
| |
|
| |
|
| |
|
|
|
|
|
|
|
|
|
|
|
|
|
|
Class C Shares: | | | | | | | | | | | | | |
Proceeds from shares issued | | | 17,736 | | | 54,646 | | | — | | | — | |
Dividends reinvested | | | 13,420 | | | 111,644 | | | — | | | — | |
Value of shares redeemed | | | (10,050 | ) | | (82,177 | ) | | — | | | — | |
| |
|
| |
|
| |
|
| |
|
| |
Class C Shares capital transactions | | | 21,106 | | | 84,113 | | | — | | | — | |
| |
|
| |
|
| |
|
| |
|
| |
|
|
|
|
|
|
|
|
|
|
|
|
|
|
Class I Shares: | | | | | | | | | | | | | |
Proceeds from shares issued | | | — | | | — | | | 4,790,565 | | | 18,539,696 | |
Dividends reinvested | | | — | | | — | | | 2,020,969 | | | 33,936,218 | |
Value of shares redeemed | | | — | | | — | | | (13,252,224 | ) | | (30,106,766 | ) |
| |
|
| |
|
| |
|
| |
|
| |
Class I Shares capital transactions | | | — | | | — | | | (6,440,690 | ) | | 22,369,148 | |
| |
|
| |
|
| |
|
| |
|
| |
Change in net assets resulting from
capital transactions | | $ | (542,176 | ) | $ | 3,861,286 | | $ | (6,440,690 | ) | $ | 22,369,148 | |
| |
|
| |
|
| |
|
| |
|
| |
|
|
|
|
|
|
|
|
|
|
|
|
|
|
SHARE TRANSACTIONS: | | | | | | | | | | | | | |
Class A Shares: | | | | | | | | | | | | | |
Issued | | | 45,581 | | | 413,739 | | | — | | | — | |
Reinvested | | | 95,805 | | | 393,076 | | | — | | | — | |
Redeemed | | | (197,212 | ) | | (371,280 | ) | | — | | | — | |
| |
|
| |
|
| |
|
| |
|
| |
Change in Class A Shares | | | (55,826 | ) | | 435,535 | | | — | | | — | |
| |
|
| |
|
| |
|
| |
|
| |
|
|
|
|
|
|
|
|
|
|
|
|
|
|
Class B Shares: | | | | | | | | | | | | | |
Issued | | | 8,373 | | | 12,688 | | | — | | | — | |
Reinvested | | | 22,365 | | | 177,468 | | | — | | | — | |
Redeemed | | | (62,478 | ) | | (261,383 | ) | | — | | | — | |
| |
|
| |
|
| |
|
| |
|
| |
Change in Class B Shares | | | (31,740 | ) | | (71,227 | ) | | — | | | — | |
| |
|
| |
|
| |
|
| |
|
| |
|
|
|
|
|
|
|
|
|
|
|
|
|
|
Class C Shares: | | | | | | | | | | | | | |
Issued | | | 3,424 | | | 5,891 | | | — | | | — | |
Reinvested | | | 2,767 | | | 11,915 | | | — | | | — | |
Redeemed | | | (1,959 | ) | | (9,434 | ) | | — | | | — | |
| |
|
| |
|
| |
|
| |
|
| |
Change in Class C Shares | | | 4,232 | | | 8,372 | | | — | | | — | |
| |
|
| |
|
| |
|
| |
|
| |
|
|
|
|
|
|
|
|
|
|
|
|
|
|
Class I Shares: | | | | | | | | | | | | | |
Issued | | | — | | | — | | | 632,163 | | | 1,473,803 | |
Reinvested | | | — | | | — | | | 275,712 | | | 2,551,595 | |
Redeemed | | | — | | | — | | | (1,745,925 | ) | | (2,365,826 | ) |
| |
|
| |
|
| |
|
| |
|
| |
Change in Class I Shares | | | — | | | — | | | (838,050 | ) | | 1,659,572 | |
| |
|
| |
|
| |
|
| |
|
| |
| | |
See notes to financial statements. | HSBC INVESTOR FAMILY OF FUNDS | 42 |
|
HSBC INVESTOR FAMILY OF FUNDS |
|
Statements of Changes in Net Assets (continued) |
| | | | | | | | | | | | | |
| | Overseas Equity Fund | | Value Fund | |
|
|
|
|
|
|
| | For the six
months ended
April 30, 2009
(Unaudited) | | For the
year ended
October 31, 2008 | | For the six
months ended
April 30, 2009
(Unaudited) | | For the
year ended
October 31, 2008 | |
|
|
|
|
|
|
|
|
|
|
Investment Activities: | | | | | | | | | | | | | |
Operations: | | | | | | | | | | | | | |
Net investment income (loss) | | $ | 38,165 | | $ | 216,267 | | $ | 217,828 | | $ | 508,204 | |
Net realized gains (losses) from
investment transactions | | | (1,850,461 | ) | | 3,797,400 | | | (1,065,732 | ) | | (4,675,106 | ) |
Change in unrealized appreciation/
depreciation from investments and
foreign currencies | | | 1,348,358 | | | (12,419,361 | ) | | (1,135,357 | ) | | (17,328,757 | ) |
| |
|
| |
|
| |
|
| |
|
| |
Change in net assets resulting
from operations | | | (463,938 | ) | | (8,405,694 | ) | | (1,983,261 | ) | | (21,495,659 | ) |
| |
|
| |
|
| |
|
| |
|
| |
|
|
|
|
|
|
|
|
|
|
|
|
|
|
Dividends: | | | | | | | | | | | | | |
Net investment income: | | | | | | | | | | | | | |
Class A Shares | | | (374,072 | ) | | (105,065 | ) | | (90,507 | ) | | (197,548 | ) |
Class B Shares | | | (62,669 | ) | | (4,715 | ) | | (1,573 | ) | | (1,645 | ) |
Class C Shares | | | (2,972 | ) | | (123 | ) | | (176 | ) | | (118 | ) |
Class I Shares | | | — | | | — | | | (136,923 | ) | | (297,653 | ) |
Net realized gains: | | | | | | | | | | | | | |
Class A Shares | | | (2,912,698 | ) | | (2,297,440 | ) | | — | | | (2,036,989 | ) |
Class B Shares | | | (617,230 | ) | | (617,609 | ) | | — | | | (144,385 | ) |
Class C Shares | | | (28,817 | ) | | (24,923 | ) | | — | | | (10,272 | ) |
Class I Shares | | | — | | | — | | | — | | | (2,265,906 | ) |
| |
|
| |
|
| |
|
| |
|
| |
Change in net assets resulting from
shareholder dividends | | | (3,998,458 | ) | | (3,049,875 | ) | | (229,179 | ) | | (4,954,516 | ) |
| |
|
| |
|
| |
|
| |
|
| |
Change in net assets resulting from
capital transactions | | | 2,748,157 | | | (515,372 | ) | | (4,933,109 | ) | | 2,078,757 | |
| |
|
| |
|
| |
|
| |
|
| |
Change in net assets | | | (1,714,239 | ) | | (11,970,941 | ) | | (7,145,549 | ) | | (24,371,418 | ) |
|
|
|
|
|
|
|
|
|
|
|
|
|
|
Net Assets: | | | | | | | | | | | | | |
Beginning of period | | | 7,951,822 | | | 19,922,763 | | | 33,443,897 | | | 57,815,315 | |
| |
|
| |
|
| |
|
| |
|
| |
End of period | | $ | 6,237,583 | | $ | 7,951,822 | | $ | 26,298,348 | | $ | 33,443,897 | |
| |
|
| |
|
| |
|
| |
|
| |
Accumulated net investment income (loss) | | $ | 38,165 | | $ | 439,713 | | $ | 115,541 | | $ | 126,892 | |
| |
|
| |
|
| |
|
| |
|
| |
| | |
43 | HSBC INVESTOR FAMILY OF FUNDS | See notes to financial statements. |
|
HSBC INVESTOR FAMILY OF FUNDS |
|
Statements of Changes in Net Assets (continued) |
| | | | | | | | | | | | | |
| | Overseas Equity Fund | | Value Fund | |
|
|
|
|
|
|
| | For the six
months ended
April 30, 2009
(Unaudited) | | For the
year ended
October 31, 2008 | | For the six
months ended
April 30, 2009
(Unaudited) | | For the
year ended
October 31, 2008 | |
|
|
|
|
|
|
|
|
|
|
CAPITAL TRANSACTIONS: | | | | | | | | | | | | | |
Class A Shares: | | | | | | | | | | | | | |
Proceeds from shares issued | | $ | 221,769 | | $ | 2,168,458 | | $ | 191,867 | | $ | 3,123,186 | |
Dividends reinvested | | | 3,262,709 | | | 2,383,150 | | | 89,958 | | | 2,222,634 | |
Value of shares redeemed | | | (1,215,166 | ) | | (4,837,345 | ) | | (2,609,230 | ) | | (5,905,400 | ) |
| |
|
| |
|
| |
|
| |
|
| |
Class A Shares capital transactions | | | 2,269,312 | | | (285,737 | ) | | (2,327,405 | ) | | (559,580 | ) |
| |
|
| |
|
| |
|
| |
|
| |
|
|
|
|
|
|
|
|
|
|
|
|
|
|
Class B Shares: | | | | | | | | | | | | | |
Proceeds from shares issued | | | 10,953 | | | 151,714 | | | 6,249 | | | 107,540 | |
Dividends reinvested | | | 667,369 | | | 599,255 | | | 1,569 | | | 145,230 | |
Value of shares redeemed | | | (230,798 | ) | | (986,692 | ) | | (152,965 | ) | | (583,192 | ) |
| |
|
| |
|
| |
|
| |
|
| |
Class B Shares capital transactions | | | 447,524 | | | (235,723 | ) | | (145,147 | ) | | (330,422 | ) |
| |
|
| |
|
| |
|
| |
|
| |
|
|
|
|
|
|
|
|
|
|
|
|
|
|
Class C Shares: | | | | | | | | | | | | | |
Proceeds from shares issued | | | 27 | | | 3,000 | | | 4 | | | 50 | |
Dividends reinvested | | | 31,789 | | | 25,043 | | | 176 | | | 10,390 | |
Value of shares redeemed | | | (495 | ) | | (21,955 | ) | | (5,550 | ) | | (11,882 | ) |
| |
|
| |
|
| |
|
| |
|
| |
Class C Shares capital transactions | | | 31,321 | | | 6,088 | | | (5,370 | ) | | (1,442 | ) |
| |
|
| |
|
| |
|
| |
|
| |
|
|
|
|
|
|
|
|
|
|
|
|
|
|
Class I Shares: | | | | | | | | | | | | | |
Proceeds from shares issued | | | — | | | — | | | 573,117 | | | 6,102,681 | |
Dividends reinvested | | | — | | | — | | | 123,075 | | | 2,444,669 | |
Value of shares redeemed | | | — | | | — | | | (3,151,379 | ) | | (5,577,149 | ) |
| |
|
| |
|
| |
|
| |
|
| |
Class I Shares capital transactions | | | — | | | — | | | (2,455,187 | ) | | 2,970,201 | |
| |
|
| |
|
| |
|
| |
|
| |
Change in net assets resulting from
capital transactions | | $ | 2,748,157 | | $ | (515,372 | ) | $ | (4,933,109 | ) | $ | 2,078,757 | |
| |
|
| |
|
| |
|
| |
|
| |
|
|
|
|
|
|
|
|
|
|
|
|
|
|
SHARE TRANSACTIONS: | | | | | | | | | | | | | |
Class A Shares: | | | | | | | | | | | | | |
Issued | | | 68,385 | | | 229,442 | | | 23,803 | | | 313,160 | |
Reinvested | | | 1,049,103 | | | 162,229 | | | 10,786 | | | 157,396 | |
Redeemed | | | (296,783 | ) | | (330,382 | ) | | (325,695 | ) | | (452,094 | ) |
| |
|
| |
|
| |
|
| |
|
| |
Change in Class A Shares | | | 820,705 | | | 61,289 | | | (291,106 | ) | | 18,462 | |
| |
|
| |
|
| |
|
| |
|
| |
|
|
|
|
|
|
|
|
|
|
|
|
|
|
Class B Shares: | | | | | | | | | | | | | |
Issued | | | 3,528 | | | 11,070 | | | 807 | | | 9,342 | |
Reinvested | | | 243,565 | | | 43,236 | | | 197 | | | 10,720 | |
Redeemed | | | (78,823 | ) | | (75,053 | ) | | (20,021 | ) | | (47,908 | ) |
| |
|
| |
|
| |
|
| |
|
| |
Change in Class B Shares | | | 168,270 | | | (20,747 | ) | | (19,017 | ) | | (27,846 | ) |
| |
|
| |
|
| |
|
| |
|
| |
|
|
|
|
|
|
|
|
|
|
|
|
|
|
Class C Shares: | | | | | | | | | | | | | |
Issued | | | — | | | 165 | | | — | | | 3 | |
Reinvested | | | 10,703 | | | 1,749 | | | 22 | | | 761 | |
Redeemed | | | (68 | ) | | (1,593 | ) | | (751 | ) | | (939 | ) |
| |
|
| |
|
| |
|
| |
|
| |
Change in Class C Shares | | | 10,635 | | | 321 | | | (729 | ) | | (175 | ) |
| |
|
| |
|
| |
|
| |
|
| |
|
|
|
|
|
|
|
|
|
|
|
|
|
|
Class I Shares: | | | | | | | | | | | | | |
Issued | | | — | | | — | | | 73,814 | | | 527,200 | |
Reinvested | | | — | | | — | | | 14,793 | | | 173,797 | |
Redeemed | | | — | | | — | | | (405,824 | ) | | (446,281 | ) |
| |
|
| |
|
| |
|
| |
|
| |
Change in Class I Shares | | | — | | | — | | | (317,217 | ) | | 254,716 | |
| |
|
| |
|
| |
|
| |
|
| |
| | |
See notes to financial statements. | HSBC INVESTOR FAMILY OF FUNDS | 44 |
|
HSBC INVESTOR ADVISOR FUNDS TRUST—CORE PLUS FIXED INCOME FUND (ADVISOR) |
|
|
Financial Highlights |
|
Selected data for a share outstanding throughout the periods indicated. (a) |
| | | | | | | | | | | | | | | | | | | | | | | | |
| | | | Investment Activities | | Dividends | |
| | | |
| |
|
|
| | Net Asset
Value,
Beginning
of Period | | Net
Investment
Income | | Net Realized
and Unrealized
Gains
(Losses) from
Investments | | Total from
Investment
Activities | | Net
Investment
Income | | Net
Realized
Gains from
Investment
Transactions | | Total
Dividends | |
|
|
|
|
|
|
|
|
|
|
|
|
|
|
|
|
CLASS I SHARES | | | | | | | | | | | | | | | | | | | | | | | | |
Year Ended October 31, 2004 | | | $ | 10.73 | | | 0.45 | | | 0.12 | | | 0.57 | | | (0.45 | ) | | — | | | (0.45 | ) | |
Year Ended October 31, 2005 | | | | 10.85 | | | 0.44 | | | (0.27 | ) | | 0.17 | | | (0.47 | ) | | — | | | (0.47 | ) | |
Year Ended October 31, 2006 | | | | 10.55 | | | 0.53 | | | 0.02 | | | 0.55 | | | (0.51 | ) | | (0.46 | ) | | (0.97 | ) | |
Year Ended October 31, 2007 | | | | 10.13 | | | 0.54 | | | 0.17 | | | 0.71 | | | (0.53 | ) | | — | | | (0.53 | ) | |
Year Ended October 31, 2008 | | | | 10.31 | | | 0.49 | | | (1.33 | ) | | (0.84 | ) | | (0.50 | ) | | (0.08 | ) | | (0.58 | ) | |
Six Months Ended April 30, 2009
(Unaudited) | | | | 8.89 | | | 0.24 | | | 0.29 | | | 0.53 | | | (0.23 | ) | | — | | | (0.23 | ) | |
|
|
|
|
|
|
|
|
|
|
|
|
|
|
|
|
|
|
|
|
|
|
|
|
|
| | | | | | | | | | | | | | | | | | | | | | | | | | |
| | | | | | Ratios/Supplementary Data | |
| | | | | |
|
|
| | Net Asset
Value, End
of Period | | Total
Return(b) | | Net Assets
at End of
Period
(000’s) | | Ratio of Net
Expenses to
Average Net
Assets(c) | | Ratio of Net
Investment
Income to
Average
Net Assets(c) | | Ratio of
Expenses to
Average Net
Assets(c)(d) | | Portfolio
Turnover
Rate(b)(e) | |
|
|
|
|
|
|
|
|
|
|
|
|
|
|
|
|
CLASS I SHARES | | | | | | | | | | | | | | | | | | | | | | |
Year Ended October 31, 2004 | | | $ | 10.85 | | | 5.46 | % | | | $ | 109,518 | | | 0.64 | % | | 4.20 | % | | 0.64 | % | | 34.88 | % | |
Year Ended October 31, 2005 | | | | 10.55 | | | 1.55 | %(f) | | | | 89,743 | | | 0.52 | %(f) | | 4.15 | %(f) | | 0.52 | %(f) | | 176.60 | % | |
Year Ended October 31, 2006 | | | | 10.13 | | | 5.56 | % | | | | 80,976 | | | 0.56 | % | | 5.05 | % | | 0.80 | % | | 273.91 | % | |
Year Ended October 31, 2007 | | | | 10.31 | | | 7.20 | %(g)(h) | | | | 81,392 | | | 0.35 | %(g) | | 5.24 | %(g) | | 0.72 | % | | 252.26 | % | |
Year Ended October 31, 2008 | | | | 8.89 | | | (8.60 | )%(i) | | | | 54,918 | | | 0.45 | % | | 4.96 | % | | 0.72 | % | | 119.38 | % | |
Six Months Ended April 30, 2009
(Unaudited) | | | | 9.19 | | | 6.10 | % | | | | 47,535 | | | 0.45 | % | | 5.35 | % | | 0.86 | % | | 17.88 | % | |
|
|
|
|
|
|
|
|
|
|
|
|
|
|
|
|
|
|
|
|
|
|
|
|
|
|
|
| |
(a) | The per share amounts and percentages reflect income and expenses assuming inclusion of the Fund’s proportionate share of the income and expenses of the HSBC Investor Core Plus Fixed Income Portfolio. |
| |
(b) | Not annualized for periods less than one year. Total return calculations do not include any sales or redemption charges. |
| |
(c) | Annualized for periods less than one year. |
| |
(d) | During the period certain fees were reduced. If such fee reductions had not occurred, the ratio would have been as indicated. |
| |
(e) | Portfolio turnover rate is calculated on the basis of the respective Portfolio in which the Fund invests all of its investable assets. |
| |
(f) | During the year ended October 31, 2005, HSBC reimbursed certain amounts to the respective Portfolio in which the Fund invests related to violation of certain investment policies and limitations. The corresponding impact to the net expense ratio, net income ratio, gross expense ratio and total return were 0.11% for the Class I Shares. |
| |
(g) | During the year ended October 31, 2007, HSBC reimbursed amounts to certain Funds related to past marketing arrangements. The corresponding impact to the net expense ratio, net income ratio, and the total return were 0.10% for the Class I Shares. |
| |
(h) | During the year ended October 31, 2007, the respective Portfolio in which the Fund invests received monies related to certain nonrecurring litigation settlements. The corresponding impact to total return was 1.80%. |
| |
(i) | During the year ended October 31, 2008, the respective Portfolio in which the Fund invests received monies related to certain nonrecurring litigation settlements. The corresponding impact to total return was 0.38%. |
| | |
45 | HSBC INVESTOR FAMILY OF FUNDS | See notes to financial statements. |
|
HSBC INVESTOR FUNDS—CORE PLUS FIXED INCOME FUND |
|
|
Financial Highlights |
|
Selected data for a share outstanding throughout the periods indicated. (a) |
| | | | | | | | | | | | | | | | | | | | | | | | |
| | | | Investment Activities | | Dividends | |
| | | |
| |
|
|
| | Net Asset
Value,
Beginning
of Period | | Net
Investment
Income | | Net Realized
and Unrealized
Gains
(Losses) from
Investments | | Total from
Investment
Activities | | Net
Investment
Income | | Net
Realized
Gains from
Investment
Transactions | | Total
Dividends | |
|
|
|
|
|
|
|
|
|
|
|
|
|
|
|
|
CLASS A SHARES | | | | | | | | | | | | | | | | | | | | | | | | |
Year Ended October 31, 2004 | | | $ | 10.48 | | | 0.40 | | | 0.12 | | | 0.52 | | | (0.40 | ) | | — | | | (0.40 | ) | |
Year Ended October 31, 2005 | | | | 10.60 | | | 0.39 | | | (0.27 | ) | | 0.12 | | | (0.42 | ) | | — | | | (0.42 | ) | |
Year Ended October 31, 2006 | | | | 10.30 | | | 0.49 | * | | 0.05 | | | 0.54 | | | (0.49 | ) | | (0.05 | ) | | (0.54 | ) | |
Year Ended October 31, 2007 | | | | 10.30 | | | 0.51 | * | | 0.19 | | | 0.70 | | | (0.52 | ) | | — | | | (0.52 | ) | |
Year Ended October 31, 2008 | | | | 10.48 | | | 0.48 | * | | (1.39 | ) | | (0.91 | ) | | (0.48 | ) | | — | | | (0.48 | ) | |
Six Months Ended April 30, 2009
(Unaudited) | | | | 9.09 | | | 0.23 | * | | 0.31 | | | 0.54 | | | (0.23 | ) | | — | | | (0.23 | ) | |
|
|
|
|
|
|
|
|
|
|
|
|
|
|
|
|
|
|
|
|
|
|
|
|
|
CLASS B SHARES | | | | | | | | | | | | | | | | | | | | | | | | |
Year Ended October 31, 2004 | | | $ | 10.49 | | | 0.32 | | | 0.11 | | | 0.43 | | | (0.32 | ) | | — | | | (0.32 | ) | |
Year Ended October 31, 2005 | | | | 10.60 | | | 0.32 | | | (0.27 | ) | | 0.05 | | | (0.34 | ) | | — | | | (0.34 | ) | |
Year Ended October 31, 2006 | | | | 10.31 | | | 0.41 | | | 0.06 | | | 0.47 | | | (0.42 | ) | | (0.05 | ) | | (0.47 | ) | |
Year Ended October 31, 2007 | | | | 10.31 | | | 0.44 | * | | 0.18 | | | 0.62 | | | (0.44 | ) | | — | | | (0.44 | ) | |
Year Ended October 31, 2008 | | | | 10.49 | | | 0.40 | * | | (1.38 | ) | | (0.98 | ) | | (0.41 | ) | | — | | | (0.41 | ) | |
Six Months Ended April 30, 2009
(Unaudited) | | | | 9.10 | | | 0.20 | * | | 0.31 | | | 0.51 | | | (0.20 | ) | | — | | | (0.20 | ) | |
|
|
|
|
|
|
|
|
|
|
|
|
|
|
|
|
|
|
|
|
|
|
|
|
|
CLASS C SHARES | | | | | | | | | | | | | | | | | | | | | | | | |
Year Ended October 31, 2004 | | | $ | 10.48 | | | 0.32 | | | 0.11 | | | 0.43 | | | (0.32 | ) | | — | | | (0.32 | ) | |
Year Ended October 31, 2005 | | | | 10.59 | | | 0.32 | | | (0.27 | ) | | 0.05 | | | (0.34 | ) | | — | | | (0.34 | ) | |
Year Ended October 31, 2006 | | | | 10.30 | | | 0.41 | * | | 0.06 | | | 0.47 | | | (0.42 | ) | | (0.05 | ) | | (0.47 | ) | |
Year Ended October 31, 2007 | | | | 10.30 | | | 0.44 | * | | 0.16 | | | 0.60 | | | (0.44 | ) | | — | | | (0.44 | ) | |
Year Ended October 31, 2008 | | | | 10.46 | | | 0.39 | * | | (1.37 | ) | | (0.98 | ) | | (0.41 | ) | | — | | | (0.41 | ) | |
Six Months Ended April 30, 2009
(Unaudited) | | | | 9.07 | | | 0.20 | * | | 0.31 | | | 0.51 | | | (0.20 | ) | | — | | | (0.20 | ) | |
|
|
|
|
|
|
|
|
|
|
|
|
|
|
|
|
|
|
|
|
|
|
|
|
|
| | | | | | | | | | | | | | | | | | | | | | | | | | |
| | | | | | Ratios/Supplementary Data | |
| | | | | |
|
|
| | Net Asset
Value, End
of Period | | Total
Return(b) | | Net Assets
at End of
Period
(000’s) | | Ratio of Net
Expenses to
Average Net
Assets(c) | | Ratio of Net
Investment
Income to
Average
Net Assets(c) | | Ratio of
Expenses to
Average Net
Assets(c)(d) | | Portfolio
Turnover
Rate(b)(e) | |
|
|
|
|
|
|
|
|
|
|
|
|
|
|
|
|
CLASS A SHARES | | | | | | | | | | | | | | | | | | | | | | | | | | |
Year Ended October 31, 2004 | | | $ | 10.60 | | | 5.07 | % | | | $ | 17,248 | | | 1.04 | % | | 3.78 | % | | 1.26 | % | | 34.88 | % | |
Year Ended October 31, 2005 | | | | 10.30 | | | 1.16 | %(f) | | | | 17,646 | | | 0.84 | %(f) | | 3.82 | %(f) | | 1.15 | %(f) | | 176.60 | % | |
Year Ended October 31, 2006 | | | | 10.30 | | | 5.45 | % | | | | 12,248 | | | 0.79 | % | | 4.82 | % | | 1.43 | % | | 273.91 | % | |
Year Ended October 31, 2007 | | | | 10.48 | | | 6.90 | %(g)(h) | | | | 13,592 | | | 0.67 | %(g) | | 4.93 | %(g) | | 1.41 | % | | 252.26 | % | |
Year Ended October 31, 2008 | | | | 9.09 | | | (8.99 | )%(i) | | | | 8,371 | | | 0.70 | % | | 4.72 | % | | 1.46 | % | | 119.38 | % | |
Six Months Ended April 30, 2009
(Unaudited) | | | | 9.40 | | | 5.99 | % | | | | 7,546 | | | 0.70 | % | | 5.12 | % | | 1.87 | % | | 17.88 | % | |
|
|
|
|
|
|
|
|
|
|
|
|
|
|
|
|
|
|
|
|
|
|
|
|
|
|
|
CLASS B SHARES | | | | | | | | | | | | | | | | | | | | | | | | | | |
Year Ended October 31, 2004 | | | $ | 10.60 | | | 4.19 | % | | | $ | 7,017 | | | 1.79 | % | | 3.05 | % | | 2.01 | % | | 34.88 | % | |
Year Ended October 31, 2005 | | | | 10.31 | | | 0.50 | %(f) | | | | 6,168 | | | 1.59 | %(f) | | 3.08 | %(f) | | 1.90 | %(f) | | 176.90 | % | |
Year Ended October 31, 2006 | | | | 10.31 | | | 4.67 | % | | | | 4,267 | | | 1.54 | % | | 4.06 | % | | 2.19 | % | | 273.91 | % | |
Year Ended October 31, 2007 | | | | 10.49 | | | 6.10 | %(g)(h) | | | | 3,792 | | | 1.42 | %(g) | | 4.18 | %(g) | | 2.12 | % | | 252.26 | % | |
Year Ended October 31, 2008 | | | | 9.10 | | | (9.66 | )%(i) | | | | 1,722 | | | 1.45 | % | | 3.98 | % | | 2.19 | % | | 119.38 | % | |
Six Months Ended April 30, 2009
(Unaudited) | | | | 9.41 | | | 5.59 | % | | | | 1,249 | | | 1.45 | % | | 4.37 | % | | 2.44 | % | | 17.88 | % | |
|
|
|
|
|
|
|
|
|
|
|
|
|
|
|
|
|
|
|
|
|
|
|
|
|
|
|
CLASS C SHARES | | | | | | | | | | | | | | | | | | | | | | | | | | |
Year Ended October 31, 2004 | | | $ | 10.59 | | | 4.20 | % | | | $ | 377 | | | 1.80 | % | | 3.07 | % | | 2.02 | % | | 34.88 | % | |
Year Ended October 31, 2005 | | | | 10.30 | | | 0.51 | %(f) | | | | 285 | | | 1.58 | %(f) | | 3.14 | %(f) | | 1.89 | %(f) | | 176.90 | % | |
Year Ended October 31, 2006 | | | | 10.30 | | | 4.67 | % | | | | 236 | | | 1.54 | % | | 4.07 | % | | 2.19 | % | | 273.91 | % | |
Year Ended October 31, 2007 | | | | 10.46 | | | 5.92 | %(g)(h) | | | | 30 | | | 1.43 | %(g) | | 4.24 | %(g) | | 2.19 | % | | 252.26 | % | |
Year Ended October 31, 2008 | | | | 9.07 | | | (9.69 | )%(i) | | | | 95 | | | 1.45 | % | | 3.92 | % | | 2.22 | % | | 119.38 | % | |
Six Months Ended April 30, 2009
(Unaudited) | | | | 9.38 | | | 5.61 | % | | | | 101 | | | 1.45 | % | | 4.36 | % | | 2.55 | % | | 17.88 | % | |
|
|
|
|
|
|
|
|
|
|
|
|
|
|
|
|
|
|
|
|
|
|
|
|
|
|
|
| |
* | Calculated based on average shares outstanding. |
| |
(a) | The per share amounts and percentages reflect income and expenses assuming inclusion of the Fund’s proportionate share of the income and expenses of the HSBC Investor Core Plus Fixed Income Portfolio. |
| |
(b) | Not annualized for periods less than one year. Total return calculations do not include any sales or redemption charges. |
| |
(c) | Annualized for periods less than one year. |
| |
(d) | During the period certain fees were reduced. If such fee reductions had not occurred, the ratio would have been as indicated. |
| |
(e) | Portfolio turnover rate is calculated on the basis of the respective Portfolio in which the Fund invests all of its investable assets. |
| |
(f) | During the year ended October 31, 2005, HSBC reimbursed certain amounts to the respective Portfolio in which the Fund invests related to violation of certain investment policies and limitations. The corresponding impact to the net expense ratio, net income ratio, gross expense ratio and total return were 0.11%, 0.11% and 0.12% for Class A Shares, Class B Shares and Class C Shares, respectively. |
| |
(g) | During the year ended October 31, 2007, HSBC reimbursed amounts to certain Funds related to past marketing arrangements. The corresponding impact to the net expense ratio, net income ratio, and the total returns were 0.03%, 0.03%, and 0.02% for Class A Shares, Class B Shares, and Class C Shares, respectively. |
| |
(h) | During the year ended October 31, 2007, the respective Portfolio in which the Fund invests received monies related to certain nonrecurring litigation settlements. The corresponding impact to the total return was 1.77%, 1.76% and 1.77% for Class A Shares, Class B Shares and Class C Shares, respectively. |
| |
(i) | During the year ended October 31, 2008, the respective Portfolio in which the Fund invests received monies related to certain nonrecurring litigation settlements. The corresponding impact to the total return was 0.38%, 0.38% and 0.38% for Class A Shares, Class B Shares and Class C Shares respectively. |
| | |
See notes to financial statements. | HSBC INVESTOR FAMILY OF FUNDS | 46 |
|
HSBC INVESTOR FUNDS—INTERMEDIATE DURATION FIXED INCOME FUND |
|
|
Financial Highlights |
|
Selected data for a share outstanding throughout the periods indicated. (a) |
| | | | | | | | | | | | | | | | | | | | | | | | |
| | | | Investment Activities | | Dividends | |
| | | |
| |
|
|
| | Net Asset
Value,
Beginning
of Period | | Net
Investment
Income | | Net Realized
and Unrealized
Gains
(Losses) from
Investments | | Total from
Investment
Activities | | Net
Investment
Income | | Net
Realized
Gains from
Investment
Transactions | | Total
Dividends | |
|
|
|
|
|
|
|
|
|
|
|
|
|
|
|
|
CLASS A SHARES | | | | | | | | | | | | | | | | | | | | | | | | |
Year Ended October 31, 2004 | | | $ | 10.47 | | | 0.32 | * | | 0.06 | | | 0.38 | | | (0.33 | ) | | (0.46 | ) | | (0.79 | ) | |
Year Ended October 31, 2005 | | | | 10.06 | | | 0.33 | | | (0.29 | ) | | 0.04 | | | (0.37 | ) | | (0.06 | ) | | (0.43 | ) | |
Year Ended October 31, 2006 | | | | 9.67 | | | 0.45 | | | 0.05 | | | 0.50 | | | (0.45 | ) | | — | | | (0.45 | ) | |
Year Ended October 31, 2007 | | | | 9.72 | | | 0.50 | * | | 0.33 | | | 0.83 | | | (0.50 | ) | | — | | | (0.50 | ) | |
Year Ended October 31, 2008 | | | | 10.05 | | | 0.41 | * | | (1.08 | ) | | (0.67 | ) | | (0.43 | ) | | (0.04 | ) | | (0.47 | ) | |
Six Months Ended April 30, 2009
(Unaudited) | | | | 8.91 | | | 0.19 | * | | 0.30 | | | 0.49 | | | (0.17 | ) | | — | | | (0.17 | ) | |
|
|
|
|
|
|
|
|
|
|
|
|
|
|
|
|
|
|
|
|
|
|
|
|
|
CLASS B SHARES | | | | | | | | | | | | | | | | | | | | | | | | |
Year Ended October 31, 2004 | | | $ | 10.49 | | | 0.23 | | | 0.08 | | | 0.31 | | | (0.26 | ) | | (0.46 | ) | | (0.72 | ) | |
Year Ended October 31, 2005 | | | | 10.08 | | | 0.25 | | | (0.29 | ) | | (0.04 | ) | | (0.29 | ) | | (0.06 | ) | | (0.35 | ) | |
Year Ended October 31, 2006 | | | | 9.69 | | | 0.38 | | | 0.04 | | | 0.42 | | | (0.38 | ) | | — | | | (0.38 | ) | |
Year Ended October 31, 2007 | | | | 9.73 | | | 0.43 | * | | 0.33 | | | 0.76 | | | (0.42 | ) | | — | | | (0.42 | ) | |
Year Ended October 31, 2008 | | | | 10.07 | | | 0.36 | * | | (1.10 | ) | | (0.74 | ) | | (0.36 | ) | | (0.04 | ) | | (0.40 | ) | |
Six Months Ended April 30, 2009
(Unaudited) | | | | 8.93 | | | 0.15 | * | | 0.30 | | | 0.45 | | | (0.13 | ) | | — | | | (0.13 | ) | |
|
|
|
|
|
|
|
|
|
|
|
|
|
|
|
|
|
|
|
|
|
|
|
|
|
CLASS C SHARES | | | | | | | | | | | | | | | | | | | | | | | | |
Year Ended October 31, 2004 | | | $ | 10.49 | | | 0.22 | | | 0.08 | | | 0.30 | | | (0.26 | ) | | (0.46 | ) | | (0.72 | ) | |
Year Ended October 31, 2005 | | | | 10.07 | | | 0.25 | | | (0.29 | ) | | (0.04 | ) | | (0.29 | ) | | (0.06 | ) | | (0.35 | ) | |
Year Ended October 31, 2006 | | | | 9.68 | | | 0.38 | | | 0.05 | | | 0.43 | | | (0.38 | ) | | — | | | (0.38 | ) | |
Year Ended October 31, 2007 | | | | 9.73 | | | 0.43 | * | | 0.33 | | | 0.76 | | | (0.43 | ) | | — | | | (0.43 | ) | |
Year Ended October 31, 2008 | | | | 10.06 | | | 0.36 | * | | (1.09 | ) | | (0.73 | ) | | (0.36 | ) | | (0.04 | ) | | (0.40 | ) | |
Six Months Ended April 30, 2009
(Unaudited) | | | | 8.93 | | | 0.15 | * | | 0.30 | | | 0.45 | | | (0.13 | ) | | — | | | (0.13 | ) | |
|
|
|
|
|
|
|
|
|
|
|
|
|
|
|
|
|
|
|
|
|
|
|
|
|
CLASS I SHARES | | | | | | | | | | | | | | | | | | | | | | | | |
Year Ended October 31, 2004 | | | $ | 10.48 | | | 0.33 | | | 0.09 | | | 0.42 | | | (0.36 | ) | | (0.46 | ) | | (0.82 | ) | |
Year Ended October 31, 2005 | | | | 10.08 | | | 0.35 | | | (0.30 | ) | | 0.05 | | | (0.39 | ) | | (0.06 | ) | | (0.45 | ) | |
Year Ended October 31, 2006 | | | | 9.68 | | | 0.47 | | | 0.05 | | | 0.52 | | | (0.47 | ) | | — | | | (0.47 | ) | |
Year Ended October 31, 2007 | | | | 9.73 | | | 0.53 | * | | 0.32 | | | 0.85 | | | (0.52 | ) | | — | | | (0.52 | ) | |
Year Ended October 31, 2008 | | | | 10.06 | | | 0.45 | * | | (1.08 | ) | | (0.63 | ) | | (0.46 | ) | | (0.04 | ) | | (0.50 | ) | |
Six Months Ended April 30, 2009
(Unaudited) | | | | 8.93 | | | 0.20 | * | | 0.30 | | | 0.50 | | | (0.18 | ) | | — | | | (0.18 | ) | |
|
|
|
|
|
|
|
|
|
|
|
|
|
|
|
|
|
|
|
|
|
|
|
|
|
| | | | | | | | | | | | | | | | | | | | | | | | | | |
| | | | | | Ratios/Supplementary Data | |
| | | | | |
|
|
| | Net Asset
Value, End
of Period | | Total
Return(b) | | Net Assets
at End of
Period
(000’s) | | Ratio of Net
Expenses to
Average Net
Assets(c) | | Ratio of Net
Investment
Income
(Loss) to
Average
Net Assets(c) | | Ratio of
Expenses to
Average Net
Assets(c)(d) | | Portfolio
Turnover
Rate(b)(e) | |
|
|
|
|
|
|
|
|
|
|
|
|
|
|
|
|
CLASS A SHARES | | | | | | | | | | | | | | | | | | | | | | |
Year Ended October 31, 2004 | | | $ | 10.06 | | | 3.90 | % | | | $ | 1,558 | | | 1.10 | % | | 3.01 | % | | 1.21 | % | | 50.06 | % | |
Year Ended October 31, 2005 | | | | 9.67 | | | 0.31 | %(f) | | | | 1,055 | | | 1.01 | %(f) | | 3.37 | %(f) | | 1.10 | %(f) | | 107.26 | % | |
Year Ended October 31, 2006 | | | | 9.72 | | | 5.30 | % | | | | 976 | | | 0.80 | % | | 4.61 | % | | 1.65 | % | | 236.51 | % | |
Year Ended October 31, 2007 | | | | 10.05 | | | 8.67 | %(g)(h) | | | | 803 | | | 0.53 | %(g) | | 5.02 | %(g) | | 1.67 | % | | 219.76 | % | |
Year Ended October 31, 2008 | | | | 8.91 | | | (6.90 | )%(i) | | | | 1,646 | | | 0.65 | % | | 4.33 | % | | 1.78 | % | | 124.23 | % | |
Six Months Ended April 30, 2009
(Unaudited) | | | | 9.23 | | | 5.53 | % | | | | 1,787 | | | 0.65 | % | | 4.20 | % | | 1.81 | % | | 62.22 | % | |
|
|
|
|
|
|
|
|
|
|
|
|
|
|
|
|
|
|
|
|
|
|
|
|
|
|
|
CLASS B SHARES | | | | | | | | | | | | | | | | | | | | | | | | | | |
Year Ended October 31, 2004 | | | $ | 10.08 | | | 3.11 | % | | | $ | 6,321 | | | 1.85 | % | | 2.28 | % | | 1.96 | % | | 50.06 | % | |
Year Ended October 31, 2005 | | | | 9.69 | | | (0.44 | )%(f) | | | | 4,852 | | | 1.76 | %(f) | | 2.60 | %(f) | | 1.85 | %(f) | | 107.26 | % | |
Year Ended October 31, 2006 | | | | 9.73 | | | 4.40 | % | | | | 3,738 | | | 1.56 | % | | 3.84 | % | | 2.40 | % | | 236.51 | % | |
Year Ended October 31, 2007 | | | | 10.07 | | | 7.96 | %(g)(h) | | | | 2,982 | | | 1.28 | %(g) | | 4.26 | %(g) | | 2.41 | % | | 219.76 | % | |
Year Ended October 31, 2008 | | | | 8.93 | | | (7.58 | )%(i) | | | | 1,365 | | | 1.40 | % | | 3.74 | % | | 2.51 | % | | 124.23 | % | |
Six Months Ended April 30, 2009
(Unaudited) | | | | 9.25 | | | 5.12 | % | | | | 1,181 | | | 1.40 | % | | 3.38 | % | | 2.53 | % | | 62.22 | % | |
|
|
|
|
|
|
|
|
|
|
|
|
|
|
|
|
|
|
|
|
|
|
|
|
|
|
|
CLASS C SHARES | | | | | | | | | | | | | | | | | | | | | | | | | | |
Year Ended October 31, 2004 | | | $ | 10.07 | | | 3.03 | % | | | $ | 679 | | | 1.85 | % | | 2.25 | % | | 1.96 | % | | 50.06 | % | |
Year Ended October 31, 2005 | | | | 9.68 | | | (0.44 | )%(f) | | | | 527 | | | 1.77 | %(f) | | 2.60 | %(f) | | 1.86 | %(f) | | 107.26 | % | |
Year Ended October 31, 2006 | | | | 9.73 | | | 4.51 | % | | | | 503 | | | 1.55 | % | | 3.86 | % | | 2.40 | % | | 236.51 | % | |
Year Ended October 31, 2007 | | | | 10.06 | | | 7.86 | %(g)(h) | | | | 305 | | | 1.27 | %(g) | | 4.27 | %(g) | | 2.43 | % | | 219.76 | % | |
Year Ended October 31, 2008 | | | | 8.93 | | | (7.49 | )%(i) | | | | 222 | | | 1.40 | % | | 3.69 | % | | 2.51 | % | | 124.23 | % | |
Six Months Ended April 30, 2009
(Unaudited) | | | | 9.25 | | | 5.13 | % | | | | 201 | | | 1.40 | % | | 3.43 | % | | 1.60 | % | | 62.22 | % | |
|
|
|
|
|
|
|
|
|
|
|
|
|
|
|
|
|
|
|
|
|
|
|
|
|
|
|
CLASS I SHARES | | | | | | | | | | | | | | | | | | | | | | | | | | |
Year Ended October 31, 2004 | | | $ | 10.08 | | | 4.25 | % | | | $ | 31,217 | | | 0.85 | % | | 3.28 | % | | 0.96 | % | | 50.06 | % | |
Year Ended October 31, 2005 | | | | 9.68 | | | 0.45 | %(f) | | | | 24,744 | | | 0.76 | %(f) | | 3.60 | %(f) | | 0.85 | %(f) | | 107.26 | % | |
Year Ended October 31, 2006 | | | | 9.73 | | | 5.56 | % | | | | 13,000 | | | 0.58 | % | | 4.77 | % | | 1.38 | % | | 236.51 | % | |
Year Ended October 31, 2007 | | | | 10.06 | | | 8.93 | %(g)(h) | | | | 9,955 | | | 0.28 | %(g) | | 5.25 | %(g) | | 1.42 | % | | 219.76 | % | |
Year Ended October 31, 2008 | | | | 8.93 | | | (6.56 | )%(i) | | | | 9,641 | | | 0.40 | % | | 4.66 | % | | 1.51 | % | | 124.23 | % | |
Six Months Ended April 30, 2009
(Unaudited) | | | | 9.25 | | | 5.64 | % | | | | 9,181 | | | 0.40 | % | | 4.40 | % | | 1.55 | % | | 62.22 | % | |
|
|
|
|
|
|
|
|
|
|
|
|
|
|
|
|
|
|
|
|
|
|
|
|
|
|
|
| |
* | Calculated based on average shares outstanding. |
| |
(a) | The per share amounts and percentages reflect income and expenses assuming inclusion of the Fund’s proportionate share of the income and expenses of the HSBC Investor Intermediate Duration Fixed Income Portfolio. |
| |
(b) | Not annualized for periods less than one year. Total return calculations do not include any sales or redemption charges. |
| |
(c) | Annualized for periods less than one year. |
| |
(d) | During the period certain fees were reduced. If such fee reductions had not occurred, the ratio would have been as indicated. |
| |
(e) | Portfolio turnover rate is calculated on the basis of the respective Portfolio in which the Fund invests all of its investable assets. |
| |
(f) | During the year ended October 31, 2005, HSBC reimbursed certain amounts to the respective Portfolio in which the Fund invests related to violation of certain investment policies and limitations. The corresponding impact to the net expense ratio, net income ratio, gross expense ratio and total return were 0.09%, 0.09%, 0.09% and 0.08% for Class A Shares, Class B Shares, Class C Shares and Class I Shares, respectively. |
| |
(g) | During the year ended October 31, 2007, HSBC reimbursed amounts to certain Funds related to past marketing arrangements. The corresponding impact to the net expense ratio, net income ratio, and the total returns were 0.12%, 0.12%, 0.13%, and 0.12% for Class A Shares, Class B Shares, Class C Shares and Class I Shares, respectively. |
| |
(h) | During the year ended October 31, 2007, the respective Portfolio in which the Fund invests in received monies related to certain nonrecurring litigation settlements. The corresponding impact to the total return was 3.75%, 3.74%, 3.74% and 3.75% for Class A Shares, Class B Shares, Class C Shares and Class I Shares, respectively. |
| |
(i) | During the year ended October 31, 2008, the respective Portfolio in which the Fund invests in received monies related to certain nonrecurring litigation settlements. The corresponding impact to the total return was 1.39%, 1.39%, 1.39% and 1.39% for Class A Shares, Class B Shares, Class C Shares and Class I Shares, respectively. |
| | |
47 | HSBC INVESTOR FAMILY OF FUNDS | See notes to financial statements. |
|
HSBC INVESTOR FUNDS—NEW YORK TAX-FREE BOND FUND |
|
Financial Highlights
Selected data for a share outstanding throughout the periods indicated. (a)
| | | | | | | | | | | | | | | | | | | | | | | | |
| | | | Investment Activities | | Dividends | |
| | | |
| |
|
| | Net Asset
Value,
Beginning
of Period | | Net
Investment
Income | | Net Realized
and Unrealized
Gains
(Losses) from
Investments | | Total from
Investment
Activities | | Net
Investment
Income | | Net
Realized
Gains from
Investment
Transactions | | Total
Dividends | |
|
|
|
|
|
|
|
|
|
|
|
|
|
|
|
|
CLASS A SHARES | | | | | | | | | | | | | | | | | | | | | | | | |
Year Ended October 31, 2004 | | | $ | 11.21 | | | 0.34 | | | 0.17 | | | 0.51 | | | (0.34 | ) | | (0.06 | ) | | (0.40 | ) | |
Year Ended October 31, 2005 | | | | 11.32 | | | 0.34 | | | (0.22 | ) | | 0.12 | | | (0.34 | ) | | (0.02 | ) | | (0.36 | ) | |
Year Ended October 31, 2006 | | | | 11.08 | | | 0.37 | | | 0.12 | | | 0.49 | | | (0.37 | ) | | (0.02 | ) | | (0.39 | ) | |
Year Ended October 31, 2007 | | | | 11.18 | | | 0.39 | * | | (0.14 | ) | | 0.25 | | | (0.38 | ) | | — | | | (0.38 | ) | |
Year Ended October 31, 2008 | | | | 11.05 | | | 0.39 | * | | (0.63 | ) | | (0.24 | ) | | (0.39 | ) | | (0.01 | ) | | (0.40 | ) | |
Six Months Ended April 30, 2009
(Unaudited) | | | | 10.41 | | | 0.20 | * | | 0.50 | | | 0.70 | | | (0.20 | ) | | (0.04 | ) | | (0.24 | ) | |
|
|
|
|
|
|
|
|
|
|
|
|
|
|
|
|
|
|
|
|
|
|
|
|
|
CLASS B SHARES | | | | | | | | | | | | | | | | | | | | | | | | |
Year Ended October 31, 2004 | | | $ | 11.20 | | | 0.25 | | | 0.17 | | | 0.42 | | | (0.25 | ) | | (0.06 | ) | | (0.31 | ) | |
Year Ended October 31, 2005 | | | | 11.31 | | | 0.25 | | | (0.22 | ) | | 0.03 | | | (0.25 | ) | | (0.02 | ) | | (0.27 | ) | |
Year Ended October 31, 2006 | | | | 11.07 | | | 0.28 | | | 0.12 | | | 0.40 | | | (0.28 | ) | | (0.02 | ) | | (0.30 | ) | |
Year Ended October 31, 2007 | | | | 11.17 | | | 0.30 | * | | (0.13 | ) | | 0.17 | | | (0.30 | ) | | — | | | (0.30 | ) | |
Year Ended October 31, 2008 | | | | 11.04 | | | 0.31 | * | | (0.63 | ) | | (0.32 | ) | | (0.31 | ) | | (0.01 | ) | | (0.32 | ) | |
Six Months Ended April 30, 2009
(Unaudited) | | | | 10.40 | | | 0.16 | * | | 0.50 | | | 0.66 | | | (0.16 | ) | | (0.04 | ) | | (0.20 | ) | |
|
|
|
|
|
|
|
|
|
|
|
|
|
|
|
|
|
|
|
|
|
|
|
|
|
CLASS C SHARES | | | | | | | | | | | | | | | | | | | | | | | | |
Year Ended October 31, 2004 | | | $ | 11.25 | | | 0.25 | | | 0.16 | | | 0.41 | | | (0.25 | ) | | (0.06 | ) | | (0.31 | ) | |
Year Ended October 31, 2005 | | | | 11.35 | | | 0.25 | | | (0.22 | ) | | 0.03 | | | (0.25 | ) | | (0.02 | ) | | (0.27 | ) | |
Year Ended October 31, 2006 | | | | 11.11 | | | 0.28 | | | 0.12 | | | 0.40 | | | (0.28 | ) | | (0.02 | ) | | (0.30 | ) | |
Year Ended October 31, 2007 | | | | 11.21 | | | 0.31 | * | | (0.14 | ) | | 0.17 | | | (0.30 | ) | | — | | | (0.30 | ) | |
Year Ended October 31, 2008 | | | | 11.08 | | | 0.31 | * | | (0.62 | ) | | (0.31 | ) | | (0.31 | ) | | (0.01 | ) | | (0.32 | ) | |
Six Months Ended April 30, 2009
(Unaudited) | | | | 10.45 | | | 0.16 | * | | 0.49 | | | 0.65 | | | (0.16 | ) | | (0.04 | ) | | (0.20 | ) | |
|
|
|
|
|
|
|
|
|
|
|
|
|
|
|
|
|
|
|
|
|
|
|
|
|
CLASS I SHARES | | | | | | | | | | | | | | | | | | | | | | | | |
Year Ended October 31, 2004 | | | $ | 11.21 | | | 0.37 | | | 0.17 | | | 0.54 | | | (0.37 | ) | | (0.06 | ) | | (0.43 | ) | |
Year Ended October 31, 2005 | | | | 11.32 | | | 0.37 | | | (0.22 | ) | | 0.15 | | | (0.37 | ) | | (0.02 | ) | | (0.39 | ) | |
Year Ended October 31, 2006 | | | | 11.08 | | | 0.39 | | | 0.12 | | | 0.51 | | | (0.39 | ) | | (0.02 | ) | | (0.41 | ) | |
Year Ended October 31, 2007 | | | | 11.18 | | | 0.41 | * | | (0.13 | ) | | 0.28 | | | (0.41 | ) | | — | | | (0.41 | ) | |
Year Ended October 31, 2008 | | | | 11.05 | | | 0.42 | * | | (0.63 | ) | | (0.21 | ) | | (0.42 | ) | | (0.01 | ) | | (0.43 | ) | |
Six Months Ended April 30, 2009
(Unaudited) | | | | 10.41 | | | 0.21 | * | | 0.50 | | | 0.71 | | | (0.21 | ) | | (0.04 | ) | | (0.25 | ) | |
|
|
|
|
|
|
|
|
|
|
|
|
|
|
|
|
|
|
|
|
|
|
|
|
|
| | | | | | | | | | | | | | | | | | | | | | | | | | |
| | | | | | | | | | Ratios/Supplementary Data | |
| | | | | | | | | |
|
|
| | Net Asset
Value, End
of Period | | Total
Return(b) | | Net Assets
at End of
Period
(000’s) | | Ratio of Net
Expenses to
Average Net
Assets(b) | | Ratio of Net
Investment
Income to
Average
Net Assets(b) | | Ratio of
Expenses to
Average Net
Assets(b)(c) | | Portfolio
Turnover
Rate(a)(d) | |
|
|
|
|
|
|
|
|
|
|
|
|
|
|
|
|
CLASS A SHARES | | | | | | | | | | | | | | | | | | | | | | | | | | |
Year Ended October 31, 2004 | | | $ | 11.32 | | | 4.57 | % | | | $ | 32,889 | | | 0.87 | % | | 3.01 | % | | 0.87 | % | | 26.96 | % | |
Year Ended October 31, 2005 | | | | 11.08 | | | 1.03 | %(e) | | | | 34,441 | | | 0.88 | %(e) | | 3.02 | %(e) | | 0.89 | % | | 13.87 | % | |
Year Ended October 31, 2006 | | | | 11.18 | | | 4.45 | % | | | | 32,727 | | | 0.93 | % | | 3.30 | % | | 0.93 | % | | 12.69 | % | |
Year Ended October 31, 2007 | | | | 11.05 | | | 2.34 | %(f) | | | | 32,305 | | | 0.86 | %(f) | | 3.50 | %(f) | | 0.89 | % | | 17.03 | % | |
Year Ended October 31, 2008 | | | | 10.41 | | | (2.20 | )% | | | | 24,363 | | | 0.84 | % | | 3.56 | % | | 0.84 | % | | 0.00 | % | |
Six Months Ended April 30, 2009
(Unaudited) | | | | 10.87 | | | 6.73 | % | | | | 23,566 | | | 0.93 | % | | 3.73 | % | | 0.93 | % | | 5.16 | % | |
|
|
|
|
|
|
|
|
|
|
|
|
|
|
|
|
|
|
|
|
|
|
|
|
|
|
|
CLASS B SHARES | | | | | | | | | | | | | | | | | | | | | | | | | | |
Year Ended October 31, 2004 | | | $ | 11.31 | | | 3.80 | % | | | $ | 17,457 | | | 1.62 | % | | 2.27 | % | | 1.62 | % | | 26.96 | % | |
Year Ended October 31, 2005 | | | | 11.07 | | | 0.28 | %(e) | | | | 16,258 | | | 1.63 | %(e) | | 2.27 | %(e) | | 1.64 | % | | 13.87 | % | |
Year Ended October 31, 2006 | | | | 11.17 | | | 3.67 | % | | | | 13,735 | | | 1.68 | % | | 2.56 | % | | 1.68 | % | | 12.69 | % | |
Year Ended October 31, 2007 | | | | 11.04 | | | 1.58 | %(f) | | | | 8,635 | | | 1.61 | %(f) | | 2.75 | %(f) | | 1.64 | % | | 17.03 | % | |
Year Ended October 31, 2008 | | | | 10.40 | | | (2.94 | )% | | | | 4,856 | | | 1.59 | % | | 2.80 | % | | 1.59 | % | | 0.00 | % | |
Six Months Ended April 30, 2009
(Unaudited) | | | | 10.86 | | | 6.35 | % | | | | 3,904 | | | 1.67 | % | | 2.99 | % | | 1.67 | % | | 5.16 | % | |
|
|
|
|
|
|
|
|
|
|
|
|
|
|
|
|
|
|
|
|
|
|
|
|
|
|
|
CLASS C SHARES | | | | | | | | | | | | | | | | | | | | | | | | | | |
Year Ended October 31, 2004 | | | $ | 11.35 | | | 3.69 | % | | | $ | 2,340 | | | 1.62 | % | | 2.26 | % | | 1.62 | % | | 26.96 | % | |
Year Ended October 31, 2005 | | | | 11.11 | | | 0.28 | %(e) | | | | 1,782 | | | 1.63 | %(e) | | 2.26 | %(e) | | 1.64 | % | | 13.87 | % | |
Year Ended October 31, 2006 | | | | 11.21 | | | 3.66 | % | | | | 1,246 | | | 1.68 | % | | 2.55 | % | | 1.68 | % | | 12.69 | % | |
Year Ended October 31, 2007 | | | | 11.08 | | | 1.57 | %(f) | | | | 807 | | | 1.60 | %(f) | | 2.75 | %(f) | | 1.63 | % | | 17.03 | % | |
Year Ended October 31, 2008 | | | | 10.45 | | | (2.84 | )% | | | | 471 | | | 1.59 | % | | 2.80 | % | | 1.59 | % | | 0.00 | % | |
Six Months Ended April 30, 2009
(Unaudited) | | | | 10.90 | | | 6.22 | % | | | | 486 | | | 1.68 | % | | 2.96 | % | | 1.68 | % | | 5.16 | % | |
|
|
|
|
|
|
|
|
|
|
|
|
|
|
|
|
|
|
|
|
|
|
|
|
|
|
|
CLASS I SHARES | | | | | | | | | | | | | | | | | | | | | | | | | | |
Year Ended October 31, 2004 | | | $ | 11.32 | | | 4.83 | % | | | $ | 19,908 | | | 0.62 | % | | 3.27 | % | | 0.62 | % | | 26.96 | % | |
Year Ended October 31, 2005 | | | | 11.08 | | | 1.28 | %(e) | | | | 16,981 | | | 0.63 | %(e) | | 3.27 | %(e) | | 0.64 | % | | 13.87 | % | |
Year Ended October 31, 2006 | | | | 11.18 | | | 4.71 | % | | | | 13,746 | | | 0.68 | % | | 3.55 | % | | 0.68 | % | | 12.69 | % | |
Year Ended October 31, 2007 | | | | 11.05 | | | 2.59 | %(f) | | | | 19,282 | | | 0.60 | %(f) | | 3.74 | %(f) | | 0.63 | % | | 17.03 | % | |
Year Ended October 31, 2008 | | | | 10.41 | | | (1.96 | )% | | | | 15,723 | | | 0.59 | % | | 3.80 | % | | 0.59 | % | | 0.00 | % | |
Six Months Ended April 30, 2009
(Unaudited) | | | | 10.87 | | | 6.86 | % | | | | 14,607 | | | 0.68 | % | | 3.97 | % | | 0.68 | % | | 5.16 | % | |
|
|
|
|
|
|
|
|
|
|
|
|
|
|
|
|
|
|
|
|
|
|
|
|
|
|
|
| |
* | Calculated based on average shares outstanding. |
| |
(a) | Not Annualized for periods less than one year. Total return calculations do not include any sales or redemption charges. |
| |
(b) | Annualized for periods less than one year. |
| |
(c) | During the period certain fees were reduced. If such fee reductions had not occurred, the ratio would have been as indicated. |
| |
(d) | Portfolio turnover rate is calculated on the basis of the Fund as a whole, without the distinguishing between the classes of shares issued. |
| |
(e) | During the year ended October 31, 2005, HSBC reimbursed certain amounts to the Fund related to violation of certain investment policies and limitations. The corresponding impact to the net expense ratio, net income ratio and total returns were 0.01%, 0.01%, 0.01% and 0.01% for Class A Shares, Class B Shares, Class C Shares and Class I Shares, respectively. |
| |
(f) | During the year ended October 31, 2007, HSBC reimbursed amounts to certain Funds related to past marketing arrangements. The corresponding impact to the net expense ratio, net income ratio and the total returns were 0.03%, 0.04%, 0.03% and 0.03% for Class A Shares, Class B Shares, Class C Shares and Class I Shares, respectively. |
| | |
See notes to financial statements. | HSBC INVESTOR FAMILY OF FUNDS | 48 |
|
HSBC INVESTOR FUNDS—GROWTH FUND |
|
Financial Highlights
Selected data for a share outstanding throughout the periods indicated.
| | | | | | | | | | | | | | | | | | | | | | | | |
| | | | | | | Investment Activities | | Dividends | |
| | | | | | |
| |
|
| | Net Asset
Value,
Beginning
of Period | | Net
Investment
Income
(Loss) | | Net Realized
and Unrealized
Gains
(Losses) from
Investments | | Total from
Investment
Activities | | Net
Investment
Income | | Net
Realized
Gains from
Investment
Transactions | | Total
Dividends | |
|
|
|
|
|
|
|
|
|
|
|
|
|
|
|
|
CLASS A SHARES | | | | | | | | | | | | | | | | | | | | | | | | |
Period Ended October 31, 2004 (f) | | | $ | 12.68 | | | (0.02 | ) | | (0.11 | ) | | (0.13 | ) | | — | | | — | | | — | | |
Year Ended October 31, 2005 | | | | 12.55 | | | 0.03 | | | 1.59 | | | 1.62 | | | (0.05 | ) | | — | | | (0.05 | ) | |
Year Ended October 31, 2006 | | | | 14.12 | | | (0.02 | )* | | 0.99 | | | 0.97 | | | — | | | (0.23 | ) | | (0.23 | ) | |
Year Ended October 31, 2007 | | | | 14.86 | | | 0.00 | *(i) | | 4.23 | | | 4.23 | | | (0.01 | ) | | (1.13 | ) | | (1.14 | ) | |
Year Ended October 31, 2008 | | | | 17.95 | | | (0.05 | )* | | (6.51 | ) | | (6.56 | ) | | — | | | (0.84 | ) | | (0.84 | ) | |
Six Months Ended April 30, 2009
(Unaudited) | | | | 10.55 | | | (0.01 | )* | | 0.21 | | | 0.20 | | | — | | | — | | | — | | |
|
|
|
|
|
|
|
|
|
|
|
|
|
|
|
|
|
|
|
|
|
|
|
|
|
CLASS B SHARES | | | | | | | | | | | | | | | | | | | | | | | | |
Period Ended October 31, 2004 (f) | | | $ | 12.28 | | | (0.07 | ) | | (0.10 | ) | | (0.17 | ) | | — | | | — | | | — | | |
Year Ended October 31, 2005 | | | | 12.11 | | | (0.07 | ) | | 1.53 | | | 1.46 | | | — | | | — | | | — | | |
Year Ended October 31, 2006 | | | | 13.57 | | | (0.12 | )* | | 0.95 | | | 0.83 | | | — | | | (0.23 | ) | | (0.23 | ) | |
Year Ended October 31, 2007 | | | | 14.17 | | | (0.11 | )* | | 3.99 | | | 3.88 | | | — | | | (1.13 | ) | | (1.13 | ) | |
Year Ended October 31, 2008 | | | | 16.92 | | | (0.16 | )* | | (6.07 | ) | | (6.23 | ) | | — | | | (0.84 | ) | | (0.84 | ) | |
Six Months Ended April 30, 2009
(Unaudited) | | | | 9.85 | | | (0.04 | )* | | 0.18 | | | 0.14 | | | — | | | — | | | — | | |
|
|
|
|
|
|
|
|
|
|
|
|
|
|
|
|
|
|
|
|
|
|
|
|
|
CLASS C SHARES | | | | | | | | | | | | | | | | | | | | | | | | |
Period Ended October 31, 2004 (f) | | | $ | 12.35 | | | (0.06 | ) | | (0.12 | ) | | (0.18 | ) | | — | | | — | | | — | | |
Year Ended October 31, 2005 | | | | 12.17 | | | (0.07 | ) | | 1.54 | | | 1.47 | | | — | | | — | | | — | | |
Year Ended October 31, 2006 | | | | 13.64 | | | (0.16 | )* | | 0.99 | | | 0.83 | | | — | | | (0.23 | ) | | (0.23 | ) | |
Year Ended October 31, 2007 | | | | 14.24 | | | (0.11 | )* | | 4.02 | | | 3.91 | | | — | | | (1.13 | ) | | (1.13 | ) | |
Year Ended October 31, 2008 | | | | 17.02 | | | (0.16 | )* | | (6.11 | ) | | (6.27 | ) | | — | | | (0.84 | ) | | (0.84 | ) | |
Six Months Ended April 30, 2009
(Unaudited) | | | | 9.91 | | | (0.04 | )* | | 0.18 | | | 0.14 | | | — | | | — | | | — | | |
|
|
|
|
|
|
|
|
|
|
|
|
|
|
|
|
|
|
|
|
|
|
|
|
|
CLASS I SHARES | | | | | | | | | | | | | | | | | | | | | | | | |
Period Ended October 31, 2004 (f) | | | $ | 12.67 | | | (0.01 | ) | | (0.11 | ) | | (0.12 | ) | | — | | | — | | | — | | |
Year Ended October 31, 2005 | | | | 12.55 | | | 0.06 | | | 1.59 | | | 1.65 | | | (0.08 | ) | | — | | | (0.08 | ) | |
Year Ended October 31, 2006 | | | | 14.12 | | | 0.02 | * | | 0.99 | | | 1.01 | | | — | | | (0.23 | ) | | (0.23 | ) | |
Year Ended October 31, 2007 | | | | 14.90 | | | 0.03 | * | | 4.24 | | | 4.27 | | | (0.02 | ) | | (1.13 | ) | | (1.15 | ) | |
Year Ended October 31, 2008 | | | | 18.02 | | | (0.02 | )* | | (6.54 | ) | | (6.56 | ) | | — | | | (0.84 | ) | | (0.84 | ) | |
Six Months Ended April 30, 2009
(Unaudited) | | | | 10.62 | | | 0.00 | *(i) | | 0.21 | | | 0.21 | | | — | | | — | | | — | | |
|
|
|
|
|
|
|
|
|
|
|
|
|
|
|
|
|
|
|
|
|
|
|
|
|
| | | | | | | | | | | | | | | | | | | | | | | | | | |
| | | | | | | | | | Ratios/Supplementary Data | |
| | | | | | | | | |
|
|
| | Net Asset
Value, End
of Period | | Total
Return(b) | | Net Assets
at End of
Period
(000’s) | | Ratio of Net
Expenses to
Average Net
Assets(c) | | Ratio of Net
Investment
Income to
Average
Net Assets(c) | | Ratio of
Expenses to
Average Net
Assets(c)(d) | | Portfolio
Turnover
Rate(b)(e) | |
|
|
|
|
|
|
|
|
|
|
|
|
|
|
|
|
CLASS A SHARES | | | | | | | | | | | | | | | | | | | | | | | | | | |
Period Ended October 31, 2004 (f) | | | $ | 12.55 | | | (1.03 | )% | | | $ | 17,372 | | | 1.20 | % | | (0.42 | )% | | 1.31 | % | | 53.08 | % | |
Year Ended October 31, 2005 | | | | 14.12 | | | 12.91 | %(g) | | | | 21,866 | | | 1.15 | %(g) | | 0.19 | %(g) | | 1.35 | % | | 79.54 | % | |
Year Ended October 31, 2006 | | | | 14.86 | | | 6.92 | % | | | | 21,985 | | | 1.20 | % | | (0.14 | )% | | 1.44 | % | | 75.06 | % | |
Year Ended October 31, 2007 | | | | 17.95 | | | 30.45 | %(h) | | | | 30,858 | | | 1.11 | %(h) | | (0.03 | )%(h) | | 1.22 | % | | 57.04 | % | |
Year Ended October 31, 2008 | | | | 10.55 | | | (38.23 | )%(j) | | | | 17,180 | | | 1.20 | % | | (0.36 | )% | | 1.22 | % | | 157.87 | % | |
Six Months Ended April 30, 2009
(Unaudited) | | | | 10.75 | | | 1.90 | %(k) | | | | 15,078 | | | 1.20 | % | | (0.20 | )% | | 1.34 | % | | 33.58 | % | |
|
|
|
|
|
|
|
|
|
|
|
|
|
|
|
|
|
|
|
|
|
|
|
|
|
|
|
CLASS B SHARES | | | | | | | | | | | | | | | | | | | | | | | | | | |
Period Ended October 31, 2004 (f) | | | $ | 12.11 | | | (1.38 | )% | | | $ | 1,402 | | | 1.95 | % | | (1.17 | )% | | 2.06 | % | | 53.08 | % | |
Year Ended October 31, 2005 | | | | 13.57 | | | 12.06 | %(g) | | | | 1,317 | | | 1.90 | %(g) | | (0.48 | )%(g) | | 2.09 | % | | 79.54 | % | |
Year Ended October 31, 2006 | | | | 14.17 | | | 6.16 | % | | | | 1,446 | | | 1.95 | % | | (0.88 | )% | | 2.19 | % | | 75.06 | % | |
Year Ended October 31, 2007 | | | | 16.92 | | | 29.43 | %(h) | | | | 1,630 | | | 1.86 | %(h) | | (0.78 | )%(h) | | 1.98 | % | | 57.04 | % | |
Year Ended October 31, 2008 | | | | 9.85 | | | (38.62 | )%(j) | | | | 2,839 | | | 1.95 | % | | (1.20 | )% | | 1.96 | % | | 157.87 | % | |
Six Months Ended April 30, 2009
(Unaudited) | | | | 9.99 | | | 1.42 | %(k) | | | | 2,346 | | | 1.95 | % | | (0.94 | )% | | 2.08 | % | | 33.58 | % | |
|
|
|
|
|
|
|
|
|
|
|
|
|
|
|
|
|
|
|
|
|
|
|
|
|
|
|
CLASS C SHARES | | | | | | | | | | | | | | | | | | | | | | | | | | |
Period Ended October 31, 2004 (f) | | | $ | 12.17 | | | (1.46 | )% | | | $ | 309 | | | 1.95 | % | | (1.18 | )% | | 2.06 | % | | 53.08 | % | |
Year Ended October 31, 2005 | | | | 13.64 | | | 12.08 | %(g) | | | | 344 | | | 1.90 | %(g) | | (0.51 | )%(g) | | 2.10 | % | | 79.54 | % | |
Year Ended October 31, 2006 | | | | 14.24 | | | 6.13 | % | | | | 270 | | | 1.95 | % | | (0.89 | )% | | 2.18 | % | | 75.06 | % | |
Year Ended October 31, 2007 | | | | 17.02 | | | 29.49 | %(h) | | | | 98 | | | 1.86 | %(h) | | (0.79 | )%(h) | | 1.96 | % | | 57.04 | % | |
Year Ended October 31, 2008 | | | | 9.91 | | | (38.63 | )%(j) | | | | 72 | | | 1.95 | % | | (1.13 | )% | | 1.97 | % | | 157.87 | % | |
Six Months Ended April 30, 2009
(Unaudited) | | | | 10.05 | | | 1.41 | %(k) | | | | 68 | | | 1.95 | % | | (0.96 | )% | | 2.08 | % | | 33.58 | % | |
|
|
|
|
|
|
|
|
|
|
|
|
|
|
|
|
|
|
|
|
|
|
|
|
|
|
|
CLASS I SHARES | | | | | | | | | | | | | | | | | | | | | | | | | | |
Period Ended October 31, 2004 (f) | | | $ | 12.55 | | | 0.95 | % | | | $ | 19,115 | | | 0.95 | % | | (0.17 | )% | | 1.06 | % | | 53.08 | % | |
Year Ended October 31, 2005 | | | | 14.12 | | | 13.17 | %(g) | | | | 13,107 | | | 0.90 | %(g) | | 0.56 | %(g) | | 1.07 | % | | 79.54 | % | |
Year Ended October 31, 2006 | | | | 14.90 | | | 7.21 | % | | | | 15,042 | | | 0.95 | % | | 0.12 | % | | 1.19 | % | | 75.06 | % | |
Year Ended October 31, 2007 | | | | 18.02 | | | 30.73 | %(h) | | | | 30,295 | | | 0.87 | %(h) | | 0.20 | %(h) | | 0.96 | % | | 57.04 | % | |
Year Ended October 31, 2008 | | | | 10.62 | | | (38.07 | )%(j) | | | | 38,868 | | | 0.95 | % | | (0.16 | )% | | 0.97 | % | | 157.87 | % | |
Six Months Ended April 30, 2009
(Unaudited) | | | | 10.83 | | | 1.98 | %(k) | | | | 34,413 | | | 0.95 | % | | 0.05 | % | | 1.09 | % | | 33.58 | % | |
|
|
|
|
|
|
|
|
|
|
|
|
|
|
|
|
|
|
|
|
|
|
|
|
|
|
|
| |
* | Calculated based on average shares outstanding. |
| |
(a) | The per share amounts and percentages reflect income and expenses assuming inclusion of the Fund’s proportionate share of the income and expenses of the HSBC Investor Growth Portfolio. |
| |
(b) | Not annualized for periods less than one year. Total return calculations do not include any sales or redemption charges. |
| |
(c) | Annualized for periods less than one year. |
| |
(d) | During the period certain fees were reduced. If such fee reductions had not occurred, the ratio would have been as indicated. |
| |
(e) | Portfolio turnover rate is calculated on the basis of the respective Portfolio in which the Fund invests all its investable assets. |
| |
(f) | Class A Shares, Class B Shares, Class C Shares and Class I Shares commenced operations on May 10, 2004. |
| |
(g) | During the year ended October 31, 2005, HSBC reimbursed certain amounts to the respective Portfolio in which the Fund invests related to violation of certain investment policies and limitations. The corresponding impact to the net expense ratio, net income ratio, gross expense ratio and total return were 0.05%, 0.05%, 0.05% and 0.05% for Class A Shares, Class B Shares, Class C Shares and Class I Shares, respectively. |
| |
(h) | During the year ended October 31, 2007, HSBC reimbursed amounts to certain Funds related to past marketing arrangements. The corresponding impact to the net expense ratio, net income ratio, and the total returns were 0.09%, 0.09%, 0.09%, and 0.08% for Class A Shares, Class B Shares, Class C Shares and Class I Shares, respectively. |
| |
(i) | Represents less than $0.005. |
| |
(j) | During the year ended October 31, 2008, the respective Portfolio in which the Fund invests in received monies related to certain nonrecurring litigation settlements. The corresponding impact to the total return was 0.19%, 0.19%, 0.19% and 0.19% for Class A Shares, Class B Shares, Class C Shares and Class I Shares, respectively. |
| |
(k) | During the period ended April 30, 2009, the respective Portfolio in which the Fund invests in received monies related to certain nonrecurring litigation settlements. The corresponding impact to the total return was 0.44%, 0.44% and 0.44% and 0.44% for Class A Shares, Class B Shares, Class C Shares, and Class I Shares, respectively. |
| | |
49 | HSBC INVESTOR FAMILY OF FUNDS | See notes to financial statements. |
|
HSBC INVESTOR ADVISOR FUNDS TRUST—INTERNATIONAL EQUITY FUND |
|
Financial Highlights
Selected data for a share outstanding throughout the periods indicated. (a)
| | | | | | | | | | | | | | | | | | | | | | | | |
| | | | | | | Investment Activities | | Dividends | |
| | | | | | |
| |
|
| | Net Asset
Value,
Beginning
of Period | | Net
Investment
Income
(Loss) | | Net Realized
and Unrealized
Gains
(Losses) from
Investments | | Total from
Investment
Activities | | Net
Investment
Income | | Net
Realized
Gains from
Investment
Transactions | | Total
Dividends | |
|
|
|
|
|
|
|
|
|
|
|
|
|
|
|
|
|
|
|
|
|
|
|
|
|
CLASS I SHARES | | | | | | | | | | | | | | | | | | | | | | | | |
Year Ended October 31, 2004 | | | $ | 12.76 | | | 0.18 | | | 2.32 | | | 2.50 | | | (0.39 | ) | | — | | | (0.39 | ) | |
Year Ended October 31, 2005 | | | | 14.87 | | | 0.31 | | | 2.59 | | | 2.90 | | | (0.23 | ) | | — | | | (0.23 | ) | |
Year Ended October 31, 2006 | | | | 17.54 | | | 0.38 | | | 5.14 | | | 5.52 | | | (0.36 | ) | | (0.60 | ) | | (0.96 | ) | |
Year Ended October 31, 2007 | | | | 22.10 | | | 0.50 | | | 4.69 | | | 5.19 | | | (0.55 | ) | | (1.84 | ) | | (2.39 | ) | |
Year Ended October 31, 2008 | | | | 24.90 | | | 0.53 | | | (12.41 | ) | | (11.88 | ) | | (0.39 | ) | | (1.90 | ) | | (2.29 | ) | |
Six Months Ended April 30, 2009
(Unaudited) | | | | 10.73 | | | 0.14 | | | (0.62 | ) | | (0.48 | ) | | (0.54 | ) | | (0.62 | ) | | (1.16 | ) | |
|
|
|
|
|
|
|
|
|
|
|
|
|
|
|
|
|
|
|
|
|
|
|
|
|
| | | | | | | | | | | | | | | | | | | | | | | | | | |
| | | | | | | | | | Ratios/Supplementary Data | |
| | | | | | | | | |
|
|
| | Net Asset
Value, End
of Period | | Total
Return(b) | | Net Assets
at End of
Period
(000’s) | | Ratio of Net
Expenses to
Average Net
Assets(c) | | Ratio of Net
Investment
Income to
Average
Net Assets(c) | | Ratio of
Expenses to
Average Net
Assets(c)(d) | | Portfolio
Turnover
Rate(b)(e) | |
|
|
|
|
|
|
|
|
|
|
|
|
|
|
|
|
|
|
|
|
|
|
|
|
|
CLASS I SHARES | | | | | | | | | | | | | | | | | | | | | | | | | | |
Year Ended October 31, 2004 | | | $ | 14.87 | | | 20.06 | % | | | $ | 148,317 | | | 1.05 | % | | 1.39 | % | | 1.05 | % | | 106.11 | % | |
Year Ended October 31, 2005 | | | | 17.54 | | | 19.69 | % | | | | 193,144 | | | 0.92 | % | | 2.01 | % | | 0.92 | % | | 31.32 | % | |
Year Ended October 31, 2006 | | | | 22.10 | | | 32.70 | % | | | | 283,749 | | | 0.97 | % | | 2.02 | % | | 0.97 | % | | 33.39 | % | |
Year Ended October 31, 2007 | | | | 24.90 | | | 25.41 | %(f)(g) | | | | 385,717 | | | 0.87 | %(f) | | 2.15 | %(f) | | 0.89 | % | | 26.08 | % | |
Year Ended October 31, 2008 | | | | 10.73 | | | (51.92 | )% | | | | 161,053 | | | 0.84 | % | | 2.69 | % | | 0.84 | % | | 28.98 | % | |
Six Months Ended April 30, 2009
(Unaudited) | | | | 9.09 | | | (4.39 | )%(h) | | | | 133,701 | | | 1.05 | % | | 2.10 | % | | 1.05 | % | | 29.46 | % | |
|
|
|
|
|
|
|
|
|
|
|
|
|
|
|
|
|
|
|
|
|
|
|
|
|
|
|
| |
(a) | The per share amounts and percentages reflect income and expense assuming inclusion of the Fund’s proportionate share of the income and expenses of the HSBC Investor International Portfolio. |
| |
(b) | Not annualized for periods less than one year. Total return calculations do not include any sales or redemption charges. |
| |
(c) | Annualized for periods less than one year. |
| |
(d) | During the period certain fees were reduced. If such fee reductions had not occurred, the ratio would have been as indicated. |
| |
(e) | Portfolio turnover rate is calculated on the basis of the respective Portfolio in which the Fund invests all of its investable assets. |
| |
(f) | During the year ended October 31, 2007, HSBC reimbursed amounts to certain Funds related to past marketing arrangements. The corresponding impact to the net expense ratio, net income ratio and the total return were 0.02% for the Class I Shares. |
| |
(g) | During the year ended October 31, 2007, the respective Portfolio in which the Fund invests in received monies related to certain nonrecurring litigation settlements. The corresponding impact to the total return was 0.18%. |
| |
(h) | During the period ended April 30, 2009, the respective Portfolio in which the Fund invests in received monies related to certain nonrecurring litigation settlements. The corresponding impact to the total return was 0.01%. |
| | |
See notes to financial statements. | HSBC INVESTOR FAMILY OF FUNDS | 50 |
|
HSBC INVESTOR FUNDS—MID-CAP FUND |
|
|
Financial Highlights |
Selected data for a share outstanding throughout the periods indicated.
| | | | | | | | | | | | | | | | | | | | | |
| | | | Investment Activities | | Dividends | |
| | | |
| |
|
|
| | Net Asset
Value,
Beginning
of Period | | Net
Investment
Income
(Loss) | | Net Realized
and Unrealized
Gains
(Losses) from
Investments | | Total from
Investment
Activities | | Net Realized
Gains from
Investment
Transactions | | Total
Dividends | |
|
|
|
|
|
|
|
|
|
|
|
|
|
|
CLASS A SHARES | | | | | | | | | | | | | | | | | | | |
Year Ended October 31, 2004 | | | $ | 7.95 | | | (0.04 | )* | | 0.53 | | | 0.49 | | | — | | | — | | |
Year Ended October 31, 2005 | | | | 8.44 | | | (0.06 | )* | | 1.49 | | | 1.43 | | | — | | | — | | |
Year Ended October 31, 2006 | | | | 9.87 | | | (0.00 | )> | | 1.19 | | | 1.19 | | | (2.18 | ) | | (2.18 | ) | |
Year Ended October 31, 2007 | | | | 8.88 | | | (0.04 | )* | | 2.59 | | | 2.55 | | | (0.62 | ) | | (0.62 | ) | |
Year Ended October 31, 2008 | | | | 10.81 | | | (0.03 | )* | | (4.17 | ) | | (4.20 | ) | | (1.23 | ) | | (1.23 | ) | |
Six Months Ended April 30, 2009
(Unaudited) | | | | 5.38 | | | 0.01 | * | | (0.15 | ) | | (0.14 | ) | | (0.44 | ) | | (0.44 | ) | |
|
|
|
|
|
|
|
|
|
|
|
|
|
|
|
|
|
|
|
|
|
|
CLASS B SHARES | | | | | | | | | | | | | | | | | | | | | |
Year Ended October 31, 2004 | | | $ | 7.75 | | | (0.10 | )* | | 0.51 | | | 0.41 | | | — | | | — | | |
Year Ended October 31, 2005 | | | | 8.16 | | | (0.13 | )* | | 1.45 | | | 1.32 | | | — | | | — | | |
Year Ended October 31, 2006 | | | | 9.48 | | | (0.06 | )* | | 1.13 | | | 1.07 | | | (2.18 | ) | | (2.18 | ) | |
Year Ended October 31, 2007 | | | | 8.37 | | | (0.10 | )* | | 2.42 | | | 2.32 | | | (0.62 | ) | | (0.62 | ) | |
Year Ended October 31, 2008 | | | | 10.07 | | | (0.09 | )* | | (3.83 | ) | | (3.92 | ) | | (1.23 | ) | | (1.23 | ) | |
Six Months Ended April 30, 2009
(Unaudited) | | | | 4.92 | | | (0.01 | )* | | (0.13 | ) | | (0.14 | ) | | (0.44 | ) | | (0.44 | ) | |
|
|
|
|
|
|
|
|
|
|
|
|
|
|
|
|
|
|
|
|
|
|
CLASS C SHARES | | | | | | | | | | | | | | | | | | | | | |
Year Ended October 31, 2004 | | | $ | 7.80 | | | (0.10 | )* | | 0.52 | | | 0.42 | | | — | | | — | | |
Year Ended October 31, 2005 | | | | 8.22 | | | (0.13 | )* | | 1.45 | | | 1.32 | | | — | | | — | | |
Year Ended October 31, 2006 | | | | 9.54 | | | (0.06 | )* | | 1.15 | | | 1.09 | | | (2.18 | ) | | (2.18 | ) | |
Year Ended October 31, 2007 | | | | 8.45 | | | (0.10 | )* | | 2.43 | | | 2.33 | | | (0.62 | ) | | (0.62 | ) | |
Year Ended October 31, 2008 | | | | 10.16 | | | (0.10 | )* | | (3.86 | ) | | (3.96 | ) | | (1.23 | ) | | (1.23 | ) | |
Six Months Ended April 30, 2009
(Unaudited) | | | | 4.97 | | | (0.01 | )* | | (0.13 | ) | | (0.14 | ) | | (0.44 | ) | | (0.44 | ) | |
|
|
|
|
|
|
|
|
|
|
|
|
|
|
|
|
|
|
|
|
|
|
CLASS I SHARES | | | | | | | | | | | | | | | | | | | | | |
Year Ended October 31, 2004 | | | $ | 8.01 | | | (0.02 | )* | | 0.53 | | | 0.51 | | | — | | | — | | |
Year Ended October 31, 2005 | | | | 8.52 | | | (0.02 | )* | | 1.48 | | | 1.46 | | | — | | | — | | |
Year Ended October 31, 2006 | | | | 9.98 | | | 0.03 | * | | 1.20 | | | 1.23 | | | (2.18 | ) | | (2.18 | ) | |
Year Ended October 31, 2007 | | | | 9.03 | | | (0.02 | )* | | 2.64 | | | 2.62 | | | (0.62 | ) | | (0.62 | ) | |
Year Ended October 31, 2008 | | | | 11.03 | | | (0.01 | )* | | (4.28 | ) | | (4.29 | ) | | (1.23 | ) | | (1.23 | ) | |
Six Months Ended April 30, 2009
(Unaudited) | | | | 5.51 | | | 0.02 | * | | (0.15 | ) | | (0.13 | ) | | (0.44 | ) | | (0.44 | ) | |
|
|
|
|
|
|
|
|
|
|
|
|
|
|
|
|
|
|
|
|
|
|
| | | | | | | | | | | | | | | | | | | | | | | | | | |
| | | | | | | | Ratios/Supplementary Data | |
| | | | | | | |
|
|
| | Net Asset
Value, End
of Period | | Total
Return(a) | | Net Assets
at End of
Period
(000’s) | | Ratio of Net
Expenses to
Average Net
Assets(b) | | Ratio of Net
Investment
Income
(Loss) to
Average
Net Assets(b) | | Ratio of
Expenses to
Average Net
Assets(b)(c) | | Portfolio
Turnover
Rate(a)(d) | |
|
|
|
|
|
|
|
|
|
|
|
|
|
|
|
|
CLASS A SHARES | | | | | | | | | | | | | | | | | | | | | | |
Year Ended October 31, 2004 | | | $ | 8.44 | | | 6.16 | % | | | $ | 1,878 | | | 1.09 | % | | (0.54 | )% | | 1.09 | % | | 106.72 | % | |
Year Ended October 31, 2005 | | | | 9.87 | | | 16.94 | %(e) | | | | 2,151 | | | 1.38 | %(e) | | (0.65 | )%(e) | | 1.53 | % | | 169.62 | % | |
Year Ended October 31, 2006 | | | | 8.88 | | | 13.66 | % | | | | 3,185 | | | 1.48 | % | | (0.01 | )% | | 1.85 | % | | 53.16 | % | |
Year Ended October 31, 2007 | | | | 10.81 | | | 30.51 | %(f) | | | | 5,897 | | | 1.19 | %(f) | | (0.45 | )%(f) | | 1.70 | % | | 66.16 | % | |
Year Ended October 31, 2008 | | | | 5.38 | | | (43.49 | )% | | | | 3,584 | | | 1.35 | % | | (0.36 | )% | | 1.80 | % | | 64.65 | % | |
Six Months Ended April 30, 2009
(Unaudited) | | | | 4.80 | | | (1.91 | )%(g) | | | | 3,471 | | | 1.35 | % | | 0.43 | % | | 2.36 | % | | 24.81 | % | |
|
|
|
|
|
|
|
|
|
|
|
|
|
|
|
|
|
|
|
|
|
|
|
|
|
|
|
CLASS B SHARES | | | | | | | | | | | | | | | | | | | | | | | | | | |
Year Ended October 31, 2004 | | | $ | 8.16 | | | 5.29 | % | | | $ | 7,037 | | | 1.84 | % | | (1.29 | )% | | 1.84 | % | | 106.72 | % | |
Year Ended October 31, 2005 | | | | 9.48 | | | 16.18 | %(e) | | | | 7,415 | | | 2.11 | %(e) | | (1.38 | )%(e) | | 2.27 | % | | 169.62 | % | |
Year Ended October 31, 2006 | | | | 8.37 | | | 12.78 | % | | | | 7,425 | | | 2.25 | % | | (0.72 | )% | | 2.60 | % | | 53.16 | % | |
Year Ended October 31, 2007 | | | | 10.07 | | | 29.56 | %(f) | | | | 6,285 | | | 1.92 | %(f) | | (1.15 | )%(f) | | 2.48 | % | | 66.16 | % | |
Year Ended October 31, 2008 | | | | 4.92 | | | (43.97 | )% | | | | 1,975 | | | 2.09 | % | | (1.15 | )% | | 2.51 | % | | 64.65 | % | |
Six Months Ended April 30, 2009
(Unaudited) | | | | 4.34 | | | (2.11 | )%(g) | | | | 1,687 | | | 2.10 | % | | (0.31 | )% | | 3.09 | % | | 24.81 | % | |
|
|
|
|
|
|
|
|
|
|
|
|
|
|
|
|
|
|
|
|
|
|
|
|
|
|
|
CLASS C SHARES | | | | | | | | | | | | | | | | | | | | | | | | | | |
Year Ended October 31, 2004 | | | $ | 8.22 | | | 5.38 | % | | | $ | 94 | | | 1.84 | % | | (1.29 | )% | | 1.84 | % | | 106.72 | % | |
Year Ended October 31, 2005 | | | | 9.54 | | | 16.06 | %(e) | | | | 111 | | | 2.13 | %(e) | | (1.40 | )%(e) | | 2.28 | % | | 169.62 | % | |
Year Ended October 31, 2006 | | | | 8.45 | | | 12.93 | % | | | | 95 | | | 2.25 | % | | (0.72 | )% | | 2.60 | % | | 53.16 | % | |
Year Ended October 31, 2007 | | | | 10.16 | | | 29.40 | %(f) | | | | 79 | | | 1.93 | %(f) | | (1.16 | )%(f) | | 2.46 | % | | 66.16 | % | |
Year Ended October 31, 2008 | | | | 4.97 | | | (43.97 | )% | | | | 12 | | | 2.09 | % | | (1.20 | )% | | 2.49 | % | | 64.65 | % | |
Six Months Ended April 30, 2009
(Unaudited) | | | | 4.39 | | | (2.09 | )%(g) | | | | 11 | | | 2.10 | % | | (0.32 | )% | | 3.06 | % | | 24.81 | % | |
|
|
|
|
|
|
|
|
|
|
|
|
|
|
|
|
|
|
|
|
|
|
|
|
|
|
|
CLASS I SHARES | | | | | | | | | | | | | | | | | | | | | | | | | | |
Year Ended October 31, 2004 | | | $ | 8.52 | | | 6.37 | % | | | $ | 117,354 | | | 0.84 | % | | (0.28 | )% | | 0.84 | % | | 106.72 | % | |
Year Ended October 31, 2005 | | | | 9.98 | | | 17.14 | %(e) | | | | 19,618 | | | 0.89 | %(e) | | (0.19 | )%(e) | | 1.02 | % | | 169.62 | % | |
Year Ended October 31, 2006 | | | | 9.03 | | | 13.97 | % | | | | 17,029 | | | 1.26 | % | | 0.29 | % | | 1.60 | % | | 53.16 | % | |
Year Ended October 31, 2007 | | | | 11.03 | | | 30.80 | %(f) | | | | 20,671 | | | 0.93 | %(f) | | (0.19 | )%(f) | | 1.47 | % | | 66.16 | % | |
Year Ended October 31, 2008 | | | | 5.51 | | | (43.44 | )% | | | | 11,080 | | | 1.10 | % | | (0.12 | )% | | 1.54 | % | | 64.65 | % | |
Six Months Ended April 30, 2009
(Unaudited) | | | | 4.94 | | | (1.69 | )%(g) | | | | 7,199 | | | 1.10 | % | | 0.69 | % | | 2.11 | % | | 24.81 | % | |
|
|
|
|
|
|
|
|
|
|
|
|
|
|
|
|
|
|
|
|
|
|
|
|
|
|
|
| |
* | Calculated based on average shares outstanding. |
| |
> | Less than $0.005 per share. |
| |
(a) | Not annualized for periods less than one year. Total return calculations do not include any sales or redemption charges. |
| |
(b) | Annualized for periods less than one year. |
| |
(c) | During the period certain fees were reduced. If such fee reductions had not occurred, the ratio would have been indicated. |
| |
(d) | Portfolio turnover rate is calculated on the basis of the Fund as a whole, without the distinguishing between the classes of shares issued. |
| |
(e) | During the year ended October 31, 2005, HSBC reimbursed certain amounts to the Fund related to violation of certain investment policies and limitations. The corresponding impact to the net expense ratio and net income ratio were 0.10%, 0.10%, 0.10% and 0.09% for Class A Shares, Class B Shares, Class C Shares and Class I Shares, respectively. The corresponding impact to the total return was 0.57%, 0.57%, 0.57% and 0.56% for Class A Shares, Class B Shares, Class C Shares and Class I Shares, respectively. |
| |
(f) | During the year ended October 31, 2007, HSBC reimbursed amounts to certain Funds related to past marketing arrangements. The corresponding impact to the net expense ratio, net income ratio, and the total returns were 0.16%, 0.18%, 0.17%, and 0.17% for Class A Shares, Class B Shares, Class C Shares and Class I Shares, respectively. |
| |
(g) | During the period ended April 30, 2009, the Fund received monies related to certain nonrecurring litigation settlements. The corresponding impact to the total return was 0.03%, 0.03%, 0.03% and 0.03% for Class A Shares, Class B Shares, Class C Shares and Class I Shares, respectively. |
| | |
51 | HSBC INVESTOR FAMILY OF FUNDS | See notes to financial statements. |
|
HSBC INVESTOR FUNDS—OPPORTUNITY FUND |
|
|
Financial Highlights |
Selected data for a share outstanding throughout the periods indicated. (a)
| | | | | | | | | | | | | | | | | | | | | |
| | | | Investment Activities | | Dividends | |
| | | |
| |
|
|
| | Net Asset
Value,
Beginning
of Period | | Net
Investment
Income
(Loss) | | Net Realized
and Unrealized
Gains
(Losses) from
Investments | | Total from
Investment
Activities | | Net
Realized
Gains from
Investment
Transactions | | Total
Dividends | |
|
|
|
|
|
|
|
|
|
|
|
|
|
|
CLASS A SHARES | | | | | | | | | | | | | | | | | | | |
Year Ended October 31, 2004 | | | $ | 10.36 | | | (0.13 | ) | | 0.68 | | | 0.55 | | | — | | | — | | |
Year Ended October 31, 2005 | | | | 10.91 | | | (0.14 | ) | | 1.62 | | | 1.48 | | | — | | | — | | |
Year Ended October 31, 2006 | | | | 12.39 | | | (0.14 | )* | | 2.43 | | | 2.29 | | | (0.39 | ) | | (0.39 | ) | |
Year Ended October 31, 2007 | | | | 14.29 | | | (0.16 | )* | | 4.01 | | | 3.85 | | | (1.73 | ) | | (1.73 | ) | |
Year Ended October 31, 2008 | | | | 16.41 | | | (0.12 | )* | | (4.04 | ) | | (4.16 | ) | | (5.16 | ) | | (5.16 | ) | |
Six Months Ended April 30, 2009
(Unaudited) | | | | 7.09 | | | (0.03 | )* | | (0.31 | ) | | (0.34 | ) | | (0.43 | ) | | (0.43 | ) | |
|
|
|
|
|
|
|
|
|
|
|
|
|
|
|
|
|
|
|
|
|
|
CLASS B SHARES | | | | | | | | | | | | | | | | | | | | | |
Year Ended October 31, 2004 | | | $ | 9.85 | | | (0.20 | ) | | 0.64 | | | 0.44 | | | — | | | — | | |
Year Ended October 31, 2005 | | | | 10.29 | | | (0.22 | ) | | 1.53 | | | 1.31 | | | — | | | — | | |
Year Ended October 31, 2006 | | | | 11.60 | | | (0.23 | )* | | 2.27 | | | 2.04 | | | (0.39 | ) | | (0.39 | ) | |
Year Ended October 31, 2007 | | | | 13.25 | | | (0.25 | )* | | 3.67 | | | 3.42 | | | (1.73 | ) | | (1.73 | ) | |
Year Ended October 31, 2008 | | | | 14.94 | | | (0.18 | )* | | (3.50 | ) | | (3.68 | ) | | (5.16 | ) | | (5.16 | ) | |
Six Months Ended April 30, 2009
(Unaudited) | | | | 6.10 | | | (0.04 | )* | | (0.28 | ) | | (0.32 | ) | | (0.43 | ) | | (0.43 | ) | |
|
|
|
|
|
|
|
|
|
|
|
|
|
|
|
|
|
|
|
|
|
|
CLASS C SHARES | | | | | | | | | | | | | | | | | | | | | |
Year Ended October 31, 2004 | | | $ | 9.94 | | | (0.22 | ) | | 0.67 | | | 0.45 | | | — | | | — | | |
Year Ended October 31, 2005 | | | | 10.39 | | | (0.21 | ) | | 1.53 | | | 1.32 | | | — | | | — | | |
Year Ended October 31, 2006 | | | | 11.71 | | | (0.23 | )* | | 2.29 | | | 2.06 | | | (0.39 | ) | | (0.39 | ) | |
Year Ended October 31, 2007 | | | | 13.38 | | | (0.26 | )* | | 3.72 | | | 3.46 | | | (1.73 | ) | | (1.73 | ) | |
Year Ended October 31, 2008 | | | | 15.11 | | | (0.17 | )* | | (3.57 | ) | | (3.74 | ) | | (5.16 | ) | | (5.16 | ) | |
Six Months Ended April 30, 2009
(Unaudited) | | | | 6.21 | | | (0.04 | )* | | (0.29 | ) | | (0.33 | ) | | (0.43 | ) | | (0.43 | ) | |
|
|
|
|
|
|
|
|
|
|
|
|
|
|
|
|
|
|
|
|
|
|
| | | | | | | | | | | | | | | | | | | | | | | | | | |
| | | | | | Ratios/Supplementary Data | |
| | | | | |
|
|
| | Net Asset
Value, End
of Period | | Total
Return(b) | | Net Assets
at End of
Period
(000’s) | | Ratio of Net
Expenses to
Average Net
Assets(c) | | Ratio of Net
Investment
Income to
Average
Net Assets(c) | | Ratio of
Expenses to
Average Net
Assets(c)(d) | | Portfolio
Turnover
Rate(b)(e) | |
|
|
|
|
|
|
|
|
|
|
|
|
|
|
|
|
CLASS A SHARES | | | | | | | | | | | | | | | | | | | | | | |
Year Ended October 31, 2004 | | | $ | 10.91 | | | 5.31 | % | | | $ | 20,902 | | | 1.61 | % | | (1.24 | )% | | 1.72 | % | | 81.75 | % | |
Year Ended October 31, 2005 | | | | 12.39 | | | 13.57 | %(f) | | | | 22,875 | | | 1.51 | %(f) | | (1.11 | )%(f) | | 1.69 | %(f) | | 63.95 | % | |
Year Ended October 31, 2006 | | | | 14.29 | | | 18.81 | % | | | | 24,463 | | | 1.55 | % | | (1.04 | )% | | 1.70 | % | | 60.83 | % | |
Year Ended October 31, 2007 | | | | 16.41 | | | 30.28 | %(g) | | | | 15,057 | | | 1.52 | %(g) | | (1.13 | )%(g) | | 1.77 | % | | 69.41 | % | |
Year Ended October 31, 2008 | | | | 7.09 | | | (35.84 | )% | | | | 9,600 | | | 1.55 | % | | (1.13 | )% | | 1.82 | % | | 80.42 | % | |
Six Months Ended April 30, 2009
(Unaudited) | | | | 6.32 | | | (3.99 | )% | | | | 8,201 | | | 1.55 | % | | (0.99 | )% | | 2.42 | % | | 29.04 | % | |
|
|
|
|
|
|
|
|
|
|
|
|
|
|
|
|
|
|
|
|
|
|
|
|
|
|
|
CLASS B SHARES | | | | | | | | | | | | | | | | | | | | | | | | | | |
Year Ended October 31, 2004 | | | $ | 10.29 | | | 4.47 | % | | | $ | 4,611 | | | 2.36 | % | | (2.00 | )% | | 2.47 | % | | 81.75 | % | |
Year Ended October 31, 2005 | | | | 11.60 | | | 12.73 | %(f) | | | | 4,539 | | | 2.26 | %(f) | | (1.86 | )%(f) | | 2.44 | %(f) | | 63.95 | % | |
Year Ended October 31, 2006 | | | | 13.25 | | | 17.91 | % | | | | 4,768 | | | 2.30 | % | | (1.79 | )% | | 2.45 | % | | 60.83 | % | |
Year Ended October 31, 2007 | | | | 14.94 | | | 29.30 | %(g) | | | | 4,928 | | | 2.26 | %(g) | | (1.91 | )%(g) | | 2.52 | % | | 69.41 | % | |
Year Ended October 31, 2008 | | | | 6.10 | | | (36.30 | )% | | | | 1,578 | | | 2.29 | % | | (1.88 | )% | | 2.58 | % | | 80.42 | % | |
Six Months Ended April 30, 2009
(Unaudited) | | | | 5.35 | | | (4.32 | )% | | | | 1,213 | | | 2.30 | % | | (1.73 | )% | | 3.20 | % | | 29.04 | % | |
|
|
|
|
|
|
|
|
|
|
|
|
|
|
|
|
|
|
|
|
|
|
|
|
|
|
|
CLASS C SHARES | | | | | | | | | | | | | | | | | | | | | | | | | | |
Year Ended October 31, 2004 | | | $ | 10.39 | | | 4.53 | % | | | $ | 344 | | | 2.37 | % | | (2.00 | )% | | 2.48 | % | | 81.75 | % | |
Year Ended October 31, 2005 | | | | 11.71 | | | 12.70 | %(f) | | | | 306 | | | 2.26 | %(f) | | (1.86 | )%(f) | | 2.44 | %(f) | | 63.95 | % | |
Year Ended October 31, 2006 | | | | 13.38 | | | 17.92 | % | | | | 299 | | | 2.30 | % | | (1.78 | )% | | 2.45 | % | | 60.83 | % | |
Year Ended October 31, 2007 | | | | 15.11 | | | 29.32 | %(g) | | | | 334 | | | 2.27 | %(g) | | (1.91 | )%(g) | | 2.50 | % | | 69.41 | % | |
Year Ended October 31, 2008 | | | | 6.21 | | | (36.27 | )% | | | | 189 | | | 2.30 | % | | (1.88 | )% | | 2.58 | % | | 80.42 | % | |
Six Months Ended April 30, 2009
(Unaudited) | | | | 5.45 | | | (4.41 | )% | | | | 189 | | | 2.30 | % | | (1.74 | )% | | 3.21 | % | | 29.04 | % | |
|
|
|
|
|
|
|
|
|
|
|
|
|
|
|
|
|
|
|
|
|
|
|
|
|
|
|
| |
* | Calculated based on average shares outstanding. |
| |
(a) | The per share amounts and percentages reflect income and expense assuming inclusion of the Fund’s proportionate share of the income and expenses of the HSBC Investor Opportunity Portfolio. |
| |
(b) | Not annualized for periods less than one year. Total return calculations do not include any sales or redemption charges. |
| |
(c) | Annualized for periods less than one year. |
| |
(d) | During the period certain fees were reduced. If such fee reductions had not occurred, the ratio would have been as indicated. |
| |
(e) | Portfolio turnover rate is calculated on the basis of the respective Portfolio in which the Fund invests all of its investable assets. |
| |
(f) | During the year ended October 31, 2005, HSBC reimbursed certain amounts to the respective Portfolio in which the Fund invests related to violation of certain investment policies and limitations. The corresponding impact to the net expense ratio, net income ratio, gross expense ratio and total return were 0.04%, 0.04% and 0.04% for Class A Shares, Class B Shares and Class C Shares, respectively. |
| |
(g) | During the year ended October 31, 2007, HSBC reimbursed amounts to certain Funds related to past marketing arrangements. The corresponding impact to the net expense ratio, net income ratio and the total returns were 0.03%, 0.04% and 0.03% for Class A Shares, Class B Shares and Class C Shares, respectively. |
| | |
See notes to financial statements. | HSBC INVESTOR FAMILY OF FUNDS | 52 |
|
HSBC INVESTOR ADVISOR FUNDS TRUST—OPPORTUNITY FUND (ADVISOR) |
|
|
Financial Highlights |
Selected data for a share outstanding throughout the periods indicated. (a)
| | | | | | | | | | | | | | | | | | | | | |
| | | | Investment Activities | | Dividends | |
| | | |
| |
|
|
| | Net Asset
Value,
Beginning
of Period | | Net
Investment
Income
(Loss) | | Net Realized
and Unrealized
Gains
(Losses) from
Investments | | Total from
Investment
Activities | | Net
Realized
Gains from
Investment
Transactions | | Total
Dividends | |
|
|
|
|
|
|
|
|
|
|
|
|
|
|
CLASS I SHARES | | | | | | | | | | | | | | | | | | | |
Year Ended October 31, 2004 | | | $ | 12.36 | | | (0.08 | ) | | 0.79 | | | 0.71 | | | — | | | — | | |
Year Ended October 31, 2005 | | | | 13.07 | | | (0.10 | ) | | 1.97 | | | 1.87 | | | — | | | — | | |
Year Ended October 31, 2006 | | | | 14.94 | | | (0.09 | ) | | 2.93 | | | 2.84 | | | (0.50 | ) | | (0.50 | ) | |
Year Ended October 31, 2007 | | | | 17.28 | | | (0.11 | ) | | 4.48 | | | 4.37 | | | (2.71 | ) | | (2.71 | ) | |
Year Ended October 31, 2008 | | | | 18.94 | | | (0.07 | ) | | (4.99 | ) | | (5.06 | ) | | (4.97 | ) | | (4.97 | ) | |
Six Months Ended April 30, 2009
(Unaudited) | | | | 8.91 | | | (0.02 | ) | | (0.35 | ) | | (0.37 | ) | | (0.26 | ) | | (0.26 | ) | |
|
|
|
|
|
|
|
|
|
|
|
|
|
|
|
|
|
|
|
|
|
|
| | | | | | | | | | | | | | | | | | | | | | | | | | |
| | | | | | Ratios/Supplementary Data | |
| | | | | |
| |
| | Net Asset
Value, End
of Period | | Total
Return(b) | | Net Assets
at End of
Period
(000’s) | | Ratio of Net
Expenses to
Average Net
Assets(c) | | Ratio of Net
Investment
Income to
Average
Net Assets(c) | | Ratio of
Expenses to
Average Net
Assets(c)(d) | | Portfolio
Turnover
Rate(b)(e) | |
|
|
|
|
|
|
|
|
|
|
|
|
|
|
|
|
CLASS I SHARES | | | | | | | | | | | | | | | | | | | | | | |
Year Ended October 31, 2004 | | | $ | 13.07 | | | 5.74 | % | | | $ | 279,669 | | | 0.98 | % | | (0.62 | )% | | 0.98 | % | | 81.75 | % | |
Year Ended October 31, 2005 | | | | 14.94 | | | 14.31 | %(f) | | | | 177,519 | | | 0.94 | %(f) | | (0.54 | )%(f) | | 0.94 | % | | 63.95 | % | |
Year Ended October 31, 2006 | | | | 17.28 | | | 19.40 | % | | | | 192,124 | | | 1.03 | % | | (0.51 | )% | | 1.03 | % | | 60.83 | % | |
Year Ended October 31, 2007 | | | | 18.94 | | | 29.42 | %(g) | | | | 176,593 | | | 0.96 | %(g) | | (0.60 | )% | | 1.03 | % | | 69.41 | % | |
Year Ended October 31, 2008 | | | | 8.91 | | | (35.39 | )% | | | | 97,841 | | | 0.97 | % | | (0.55 | )% | | 0.97 | % | | 80.42 | % | |
Six Months Ended April 30, 2009
(Unaudited) | | | | 8.28 | | | (3.72 | )% | | | | 83,966 | | | 1.06 | % | | (0.50 | )% | | 1.06 | % | | 29.04 | % | |
|
|
|
|
|
|
|
|
|
|
|
|
|
|
|
|
|
|
|
|
|
|
|
|
|
|
|
| |
(a) | The per share amounts and percentages reflect income and expense assuming inclusion of the Fund’s proportionate share of the income and expenses of the HSBC Investor Opportunity Portfolio. |
| |
(b) | Not annualized for periods less than one year. Total return calculations do not include any sales or redemption charges. |
| |
(c) | Annualized for periods less than one year. |
| |
(d) | During the period certain fees were reduced. If such fee reductions had not occurred, the ratio would have been as indicated. |
| |
(e) | Portfolio turnover rate is calculated on the basis of the respective Portfolio in which the Fund invests all of its investable assets. |
| |
(f) | During the year ended October 31, 2005, HSBC reimbursed certain amounts to the respective Portfolio in which the Fund invests related to violation of certain investment policies and limitations. The corresponding impact to the net expense ratio, net income ratio, gross expense ratio and total return was 0.04% for the Class I Shares. |
| |
(g) | During the year ended October 31, 2007, HSBC reimbursed amounts to certain Funds related to past marketing arrangements. The corresponding impact to the net expense ratio, net income ratio and the total return were 0.07% for the Class I Shares. |
| | |
53 | HSBC INVESTOR FAMILY OF FUNDS | See notes to financial statements. |
|
HSBC INVESTOR FUNDS—OVERSEAS EQUITY FUND |
|
|
Financial Highlights |
|
Selected data for a share outstanding throughout the periods indicated. (a) |
| | | | | | | | | | | | | | | | | | | | | | | | |
| | | | | | | Investment Activities | | Dividends | |
| | | | | | |
| |
|
|
| | Net Asset
Value,
Beginning
of Period | | Net
Investment
Income
(Loss) | | Net Realized
and Unrealized
Gains
(Losses) from
Investments | | Total from
Investment
Activities | | Net
Investment
Income | | Net Realized
Gains from
Investment
Transactions | | Total
Dividends | |
|
|
|
|
|
|
|
|
|
|
|
|
|
|
|
|
CLASS A SHARES | | | | | | | | | | | | | | | | | | | | | | | | |
Year Ended October 31, 2004 | | | $ | 11.73 | | | 0.08 | | | 2.19 | | | 2.27 | | | (0.07 | ) | | — | | | (0.07 | ) | |
Year Ended October 31, 2005 | | | | 13.93 | | | 0.18 | | | 2.33 | | | 2.51 | | | (0.06 | ) | | (0.79 | ) | | (0.85 | ) | |
Year Ended October 31, 2006 | | | | 15.59 | | | 0.22 | | | 4.45 | | | 4.67 | | | (0.25 | ) | | (1.16 | ) | | (1.41 | ) | |
Year Ended October 31, 2007 | | | | 18.85 | | | 0.22 | * | | 3.92 | | | 4.14 | | | (0.40 | ) | | (2.11 | ) | | (2.51 | ) | |
Year Ended October 31, 2008 | | | | 20.48 | | | 0.24 | * | | (9.41 | ) | | (9.17 | ) | | (0.15 | ) | | (3.31 | ) | | (3.46 | ) | |
Six Months Ended April 30, 2009
(Unaudited) | | | | 7.85 | | | 0.02 | * | | (0.44 | ) | | (0.42 | ) | | (0.49 | ) | | (3.79 | ) | | (4.28 | ) | |
|
|
|
|
|
|
|
|
|
|
|
|
|
|
|
|
|
|
|
|
|
|
|
|
|
CLASS B SHARES | | | | | | | | | | | | | | | | | | | | | | | | |
Year Ended October 31, 2004 | | | $ | 11.34 | | | 0.01 | * | | 2.08 | | | 2.09 | | | — | | | — | | | — | | |
Year Ended October 31, 2005 | | | | 13.43 | | | 0.07 | | | 2.24 | | | 2.31 | | | — | | | (0.79 | ) | | (0.79 | ) | |
Year Ended October 31, 2006 | | | | 14.95 | | | 0.09 | | | 4.26 | | | 4.35 | | | (0.14 | ) | | (1.16 | ) | | (1.30 | ) | |
Year Ended October 31, 2007 | | | | 18.00 | | | 0.10 | * | | 3.70 | | | 3.80 | | | (0.27 | ) | | (2.11 | ) | | (2.38 | ) | |
Year Ended October 31, 2008 | | | | 19.42 | | | 0.14 | * | | (8.86 | ) | | (8.72 | ) | | (0.03 | ) | | (3.31 | ) | | (3.34 | ) | |
Six Months Ended April 30, 2009
(Unaudited) | | | | 7.36 | | | 0.01 | * | | (0.43 | ) | | (0.42 | ) | | (0.38 | ) | | (3.79 | ) | | (4.17 | ) | |
|
|
|
|
|
|
|
|
|
|
|
|
|
|
|
|
|
|
|
|
|
|
|
|
|
CLASS C SHARES | | | | | | | | | | | | | | | | | | | | | | | | |
Year Ended October 31, 2004 | | | $ | 11.54 | | | (0.01 | ) | | 2.14 | | | 2.13 | | | — | | | — | | | — | | |
Year Ended October 31, 2005 | | | | 13.67 | | | 0.06 | | | 2.29 | | | 2.35 | | | — | | | (0.79 | ) | | (0.79 | ) | |
Year Ended October 31, 2006 | | | | 15.23 | | | 0.11 | | | 4.33 | | | 4.44 | | | (0.14 | ) | | (1.16 | ) | | (1.30 | ) | |
Year Ended October 31, 2007 | | | | 18.37 | | | 0.11 | * | | 3.80 | | | 3.91 | | | (0.23 | ) | | (2.11 | ) | | (2.34 | ) | |
Year Ended October 31, 2008 | | | | 19.94 | | | 0.15 | * | | (9.15 | ) | | (9.00 | ) | | (0.02 | ) | | (3.31 | ) | | (3.33 | ) | |
Six Months Ended April 30, 2009
(Unaudited) | | | | 7.61 | | | 0.01 | * | | (0.44 | ) | | (0.43 | ) | | (0.39 | ) | | (3.79 | ) | | (4.18 | ) | |
|
|
|
|
|
|
|
|
|
|
|
|
|
|
|
|
|
|
|
|
|
|
|
|
|
| | | | | | | | | | | | | | | | | | | | | | | | | | |
| | | | | | | | | | Ratios/Supplementary Data | |
| | | | | | | | | |
|
|
| | Net Asset
Value, End
of Period | | Total
Return(b) | | Net Assets
at End of
Period
(000’s) | | Ratio of Net
Expenses to
Average Net
Assets(c) | | Ratio of Net
Investment
Income to
Average
Net Assets(c) | | Ratio of
Expenses to
Average Net
Assets(c)(d) | | Portfolio
Turnover
Rate(b)(e) | |
|
|
|
|
|
|
|
|
|
|
|
|
|
|
|
|
|
|
|
|
|
|
|
CLASS A SHARES | | | | | | | | | | | | | | | | | | | | | | |
Year Ended October 31, 2004 | | | $ | 13.93 | | | 19.40 | % | | | $ | 17,721 | | | 1.78 | % | | 0.79 | % | | 1.88 | % | | 106.11 | % | |
Year Ended October 31, 2005 | | | | 15.59 | | | 18.64 | % | | | | 20,680 | | | 1.66 | % | | 1.21 | % | | 1.66 | % | | 31.32 | % | |
Year Ended October 31, 2006 | | | | 18.85 | | | 31.85 | % | | | | 22,761 | | | 1.67 | % | | 1.24 | % | | 1.67 | % | | 33.39 | % | |
Year Ended October 31, 2007 | | | | 20.48 | | | 24.19 | %(f) | | | | 16,078 | | | 1.62 | %(f) | | 1.15 | %(f) | | 1.64 | % | | 26.08 | % | |
Year Ended October 31, 2008 | | | | 7.85 | | | (52.63 | )% | | | | 6,645 | | | 1.70 | % | | 1.75 | % | | 1.81 | % | | 28.98 | % | |
Six Months Ended April 30, 2009
(Unaudited) | | | | 3.15 | | | (4.74 | )%(g) | | | | 5,248 | | | 1.70 | % | | 1.35 | % | | 2.71 | % | | 29.46 | % | |
|
|
|
|
|
|
|
|
|
|
|
|
|
|
|
|
|
|
|
|
|
|
|
|
|
|
|
CLASS B SHARES | | | | | | | | | | | | | | | | | | | | | | | | | | |
Year Ended October 31, 2004 | | | $ | 13.43 | | | 18.43 | % | | | $ | 2,061 | | | 2.53 | % | | 0.05 | % | | 2.63 | % | | 106.11 | % | |
Year Ended October 31, 2005 | | | | 14.95 | | | 17.72 | % | | | | 2,403 | | | 2.41 | % | | 0.47 | % | | 2.41 | % | | 31.32 | % | |
Year Ended October 31, 2006 | | | | 18.00 | | | 30.87 | % | | | | 3,234 | | | 2.42 | % | | 0.58 | % | | 2.42 | % | | 33.39 | % | |
Year Ended October 31, 2007 | | | | 19.42 | | | 23.26 | %(f) | | | | 3,698 | | | 2.37 | %(f) | | 0.59 | %(f) | | 2.40 | % | | 26.08 | % | |
Year Ended October 31, 2008 | | | | 7.36 | | | (52.97 | )% | | | | 1,249 | | | 2.45 | % | | 1.05 | % | | 2.56 | % | | 28.98 | % | |
Six Months Ended April 30, 2009
(Unaudited) | | | | 2.77 | | | (5.07 | )%(g) | | | | 935 | | | 2.45 | % | | 0.49 | % | | 3.45 | % | | 29.46 | % | |
|
|
|
|
|
|
|
|
|
|
|
|
|
|
|
|
|
|
|
|
|
|
|
|
|
|
|
CLASS C SHARES | | | | | | | | | | | | | | | | | | | | | | | | | | |
Year Ended October 31, 2004 | | | $ | 13.67 | | | 18.46 | % | | | $ | 137 | | | 2.54 | % | | (0.10 | )% | | 2.66 | % | | 106.11 | % | |
Year Ended October 31, 2005 | | | | 15.23 | | | 17.70 | % | | | | 164 | | | 2.41 | % | | 0.48 | % | | 2.41 | % | | 31.32 | % | |
Year Ended October 31, 2006 | | | | 18.37 | | | 30.92 | % | | | | 163 | | | 2.41 | % | | 0.58 | % | | 2.41 | % | | 33.39 | % | |
Year Ended October 31, 2007 | | | | 19.94 | | | 23.39 | %(f) | | | | 147 | | | 2.30 | %(f) | | 0.59 | %(f) | | 2.32 | % | | 26.08 | % | |
Year Ended October 31, 2008 | | | | 7.61 | | | (52.96 | )% | | | | 58 | | | 2.45 | % | | 1.12 | % | | 2.57 | % | | 28.98 | % | |
Six Months Ended April 30, 2009
(Unaudited) | | | | 3.00 | | | (5.14 | )%(g) | | | | 55 | | | 2.45 | % | | 0.67 | % | | 3.46 | % | | 29.46 | % | |
|
|
|
|
|
|
|
|
|
|
|
|
|
|
|
|
|
|
|
|
|
|
|
|
|
|
|
| |
* | Calculated based on average shares outstanding. |
| |
(a) | The per share amounts and percentages reflect income and expense assuming inclusion of the Fund’s proportionate share of the income and expenses of the HSBC Investor International Portfolio. |
| |
(b) | Not annualized for periods less than one year. Total return calculations do not include any sales or redemption charges. |
| |
(c) | Annualized for periods less than one year. |
| |
(d) | During the period certain fees were reduced. If such fee reductions had not occurred, the ratio would have been as indicated. |
| |
(e) | Portfolio turnover rate is calculated on the basis of the respective Portfolio in which the Fund invests all of its investable assets. |
| |
(f) | During the year ended October 31, 2007, HSBC reimbursed amounts to certain Funds related to past marketing arrangements. The corresponding impact to the net expense ratio, net income ratio and the total returns were 0.02%, 0.03% and 0.02% for Class A Shares, Class B Shares and Class C Shares, respectively. |
| |
(g) | During the period ended April 30, 2009, the respective Portfolio in which the Fund invests in received monies related to certain nonrecurring litigation settlements. The corresponding impact to the total return was 0.01%, 0.01% and 0.01% for Class A Shares, Class B Shares and Class C Shares, respectively. |
| | |
See notes to financial statements. | HSBC INVESTOR FAMILY OF FUNDS | 54 |
|
HSBC INVESTOR FUNDS—VALUE FUND |
|
|
Financial Highlights |
|
Selected data for a share outstanding throughout the periods indicated. (a) |
| | | | | | | | | | | | | | | | | | | | | | | | |
| | | | | | | Investment Activities | | Dividends | |
| | | | | | |
| |
| |
| | Net Asset
Value,
Beginning
of Period | | Net
Investment
Income
(Loss) | | Net Realized
and Unrealized
Gains
(Losses) from
Investments | | Total from
Investment
Activities | | Net
Investment
Income | | Net
Realized
Gains from
Investment
Transactions | | Total
Dividends | |
|
|
|
|
|
|
|
|
|
|
|
|
|
|
|
|
CLASS A SHARES | | | | | | | | | | | | | | | | | | | | | | | | |
Period Ended October 31, 2004 (f) | | | $ | 12.68 | | | 0.05 | | | 0.69 | | | 0.74 | | | (0.04 | ) | | — | | | (0.04 | ) | |
Year Ended October 31, 2005 | | | | 13.38 | | | 0.10 | | | 1.86 | | | 1.96 | | | (0.08 | ) | | (0.13 | ) | | (0.21 | ) | |
Year Ended October 31, 2006 | | | | 15.13 | | | 0.12 | * | | 2.95 | | | 3.07 | | | (0.19 | ) | | (1.29 | ) | | (1.48 | ) | |
Year Ended October 31, 2007 | | | | 16.72 | | | 0.14 | * | | 1.38 | | | 1.52 | | | (0.13 | ) | | (1.57 | ) | | (1.70 | ) | |
Year Ended October 31, 2008 | | | | 16.54 | | | 0.13 | * | | (6.30 | ) | | (6.17 | ) | | (0.13 | ) | | (1.30 | ) | | (1.43 | ) | |
Six Months Ended April 30, 2009
(Unaudited) | | | | 8.94 | | | 0.06 | * | | (0.49 | ) | | (0.43 | ) | | (0.06 | ) | | — | | | (0.06 | ) | |
|
|
|
|
|
|
|
|
|
|
|
|
|
|
|
|
|
|
|
|
|
|
|
|
|
CLASS B SHARES | | | | | | | | | | | | | | | | | | | | | | | | |
Period Ended October 31, 2004 (f) | | | $ | 12.28 | | | — | | | 0.68 | | | 0.68 | | | (0.01 | ) | | — | | | (0.01 | ) | |
Year Ended October 31, 2005 | | | | 12.95 | | | (0.02 | ) | | 1.80 | | | 1.78 | | | — | | | (0.13 | ) | | (0.13 | ) | |
Year Ended October 31, 2006 | | | | 14.60 | | | — | * | | 2.84 | | | 2.84 | | | (0.07 | ) | | (1.29 | ) | | (1.36 | ) | |
Year Ended October 31, 2007 | | | | 16.08 | | | 0.02 | * | | 1.32 | | | 1.34 | | | (0.02 | ) | | (1.57 | ) | | (1.59 | ) | |
Year Ended October 31, 2008 | | | | 15.83 | | | 0.03 | * | | (6.01 | ) | | (5.98 | ) | | (0.02 | ) | | (1.30 | ) | | (1.32 | ) | |
Six Months Ended April 30, 2009
(Unaudited) | | | | 8.53 | | | 0.03 | * | | (0.48 | ) | | (0.45 | ) | | (0.02 | ) | | — | | | (0.02 | ) | |
|
|
|
|
|
|
|
|
|
|
|
|
|
|
|
|
|
|
|
|
|
|
|
|
|
CLASS C SHARES | | | | | | | | | | | | | | | | | | | | | | | | |
Period Ended October 31, 2004 (f) | | | $ | 12.35 | | | 0.01 | | | 0.67 | | | 0.68 | | | (0.02 | ) | | — | | | (0.02 | ) | |
Year Ended October 31, 2005 | | | | 13.01 | | | (0.02 | ) | | 1.82 | | | 1.80 | | | (0.01 | ) | | (0.13 | ) | | (0.14 | ) | |
Year Ended October 31, 2006 | | | | 14.67 | | | — | * | | 2.85 | | | 2.85 | | | (0.05 | ) | | (1.29 | ) | | (1.34 | ) | |
Year Ended October 31, 2007 | | | | 16.18 | | | 0.02 | * | | 1.32 | | | 1.34 | | | (0.01 | ) | | (1.57 | ) | | (1.58 | ) | |
Year Ended October 31, 2008 | | | | 15.94 | | | 0.03 | * | | (6.05 | ) | | (6.02 | ) | | (0.02 | ) | | (1.30 | ) | | (1.32 | ) | |
Six Months Ended April 30, 2009
(Unaudited) | | | | 8.60 | | | 0.03 | * | | (0.49 | ) | | (0.46 | ) | | (0.02 | ) | | — | | | (0.02 | ) | |
|
|
|
|
|
|
|
|
|
|
|
|
|
|
|
|
|
|
|
|
|
|
|
|
|
CLASS I SHARES | | | | | | | | | | | | | | | | | | | | | | | | |
Period Ended October 31, 2004 (f) | | | $ | 12.67 | | | 0.07 | | | 0.70 | | | 0.77 | | | (0.06 | ) | | — | | | (0.06 | ) | |
Year Ended October 31, 2005 | | | | 13.38 | | | 0.13 | | | 1.86 | | | 1.99 | | | (0.11 | ) | | (0.13 | ) | | (0.24 | ) | |
Year Ended October 31, 2006 | | | | 15.13 | | | 0.15 | * | | 2.94 | | | 3.09 | | | (0.23 | ) | | (1.29 | ) | | (1.52 | ) | |
Year Ended October 31, 2007 | | | | 16.70 | | | 0.18 | * | | 1.38 | | | 1.56 | | | (0.17 | ) | | (1.57 | ) | | (1.74 | ) | |
Year Ended October 31, 2008 | | | | 16.52 | | | 0.16 | * | | (6.28 | ) | | (6.12 | ) | | (0.17 | ) | | (1.30 | ) | | (1.47 | ) | |
Six Months Ended April 30, 2009
(Unaudited) | | | | 8.93 | | | 0.07 | * | | (0.50 | ) | | (0.43 | ) | | (0.07 | ) | | — | | | (0.07 | ) | |
|
|
|
|
|
|
|
|
|
|
|
|
|
|
|
|
|
|
|
|
|
|
|
|
|
| | | | | | | | | | | | | | | | | | | | | | | | | | |
| | | | | | | | | | Ratios/Supplementary Data | |
| | | | | | | | | |
| |
| | Net Asset
Value, End
of Period | | Total
Return(b) | | Net Assets
at End of
Period
(000’s) | | Ratio of Net
Expenses to
Average Net
Assets(c) | | Ratio of Net
Investment
Income to
Average
Net Assets(c) | | Ratio of
Expenses to
Average Net
Assets(c)(d) | | Portfolio
Turnover
Rate(b)(e) | |
|
|
|
|
|
|
|
|
|
|
|
|
|
|
|
|
CLASS A SHARES | | | | | | | | | | | | | | | | | | | | | | | | | | |
Period Ended October 31, 2004 (f) | | | $ | 13.38 | | | 7.79 | % | | | $ | 20,933 | | | 1.20 | % | | 0.81 | % | | 1.25 | % | | 10.33 | % | |
Year Ended October 31, 2005 | | | | 15.13 | | | 14.69 | %(g) | | | | 23,315 | | | 1.15 | %(g) | | 0.64 | %(g) | | 1.30 | %(g) | | 16.45 | % | |
Year Ended October 31, 2006 | | | | 16.72 | | | 21.70 | % | | | | 24,688 | | | 1.20 | % | | 0.74 | % | | 1.43 | % | | 20.63 | % | |
Year Ended October 31, 2007 | | | | 16.54 | | | 9.77 | %(h) | | | | 27,225 | | | 1.11 | %(h) | | 0.84 | %(h) | | 1.25 | % | | 18.67 | % | |
Year Ended October 31, 2008 | | | | 8.94 | | | (40.46 | )%(i) | | | | 14,881 | | | 1.20 | % | | 0.99 | % | | 1.23 | % | | 24.61 | % | |
Six Months Ended April 30, 2009
(Unaudited) | | | | 8.45 | | | (4.81 | )%(j) | | | | 11,602 | | | 1.20 | % | | 1.47 | % | | 1.46 | % | | 13.02 | % | |
|
|
|
|
|
|
|
|
|
|
|
|
|
|
|
|
|
|
|
|
|
|
|
|
|
|
|
CLASS B SHARES | | | | | | | | | | | | | | | | | | | | | | | | | | |
Period Ended October 31, 2004 (f) | | | $ | 12.95 | | | 9.06 | % | | | $ | 1,938 | | | 1.95 | % | | 0.05 | % | | 2.00 | % | | 10.33 | % | |
Year Ended October 31, 2005 | | | | 14.60 | | | 13.78 | %(g) | | | | 1,767 | | | 1.90 | %(g) | | (0.10 | )%(g) | | 2.04 | %(g) | | 16.45 | % | |
Year Ended October 31, 2006 | | | | 16.08 | | | 20.78 | % | | | | 1,939 | | | 1.95 | % | | (0.01 | )% | | 2.18 | % | | 20.63 | % | |
Year Ended October 31, 2007 | | | | 15.83 | | | 8.92 | %(h) | | | | 1,772 | | | 1.87 | %(h) | | 0.10 | %(h) | | 2.00 | % | | 18.67 | % | |
Year Ended October 31, 2008 | | | | 8.53 | | | (40.89 | )%(i) | | | | 717 | | | 1.95 | % | | 0.24 | % | | 1.98 | % | | 24.61 | % | |
Six Months Ended April 30, 2009
(Unaudited) | | | | 8.06 | | | (5.27 | )%(j) | | | | 525 | | | 1.95 | % | | 0.73 | % | | 2.19 | % | | 13.02 | % | |
|
|
|
|
|
|
|
|
|
|
|
|
|
|
|
|
|
|
|
|
|
|
|
|
|
|
|
CLASS C SHARES | | | | | | | | | | | | | | | | | | | | | | | | | | |
Period Ended October 31, 2004 (f) | | | $ | 13.01 | | | 8.47 | % | | | $ | 399 | | | 1.95 | % | | 0.04 | % | | 2.00 | % | | 10.33 | % | |
Year Ended October 31, 2005 | | | | 14.67 | | | 13.86 | %(g) | | | | 388 | | | 1.90 | %(g) | | (0.12 | )%(g) | | 2.05 | %(g) | | 16.45 | % | |
Year Ended October 31, 2006 | | | | 16.18 | | | 20.72 | % | | | | 157 | | | 1.95 | % | | 0.01 | % | | 2.17 | % | | 20.63 | % | |
Year Ended October 31, 2007 | | | | 15.94 | | | 8.95 | %(h) | | | | 126 | | | 1.87 | %(h) | | 0.11 | %(h) | | 1.99 | % | | 18.67 | % | |
Year Ended October 31, 2008 | | | | 8.60 | | | (40.89 | )%(i) | | | | 66 | | | 1.95 | % | | 0.24 | % | | 1.98 | % | | 24.61 | % | |
Six Months Ended April 30, 2009
(Unaudited) | | | | 8.12 | | | (5.31 | )%(j) | | | | 57 | | | 1.95 | % | | 0.70 | % | | 2.20 | % | | 13.02 | % | |
|
|
|
|
|
|
|
|
|
|
|
|
|
|
|
|
|
|
|
|
|
|
|
|
|
|
|
CLASS I SHARES | | | | | | | | | | | | | | | | | | | | | | | | | | |
Period Ended October 31, 2004 (f) | | | $ | 13.38 | | | 6.05 | % | | | $ | 25,600 | | | 0.95 | % | | 1.05 | % | | 1.00 | % | | 10.33 | % | |
Year Ended October 31, 2005 | | | | 15.13 | | | 14.96 | %(g) | | | | 15,044 | | | 0.90 | %(g) | | 0.91 | %(g) | | 1.02 | %(g) | | 16.45 | % | |
Year Ended October 31, 2006 | | | | 16.70 | | | 21.90 | % | | | | 18,036 | | | 0.95 | % | | 0.99 | % | | 1.18 | % | | 20.63 | % | |
Year Ended October 31, 2007 | | | | 16.52 | | | 10.04 | %(h) | | | | 28,692 | | | 0.87 | %(h) | | 1.07 | %(h) | | 0.99 | % | | 18.67 | % | |
Year Ended October 31, 2008 | | | | 8.93 | | | (40.29 | )%(i) | | | | 17,779 | | | 0.95 | % | | 1.24 | % | | 0.98 | % | | 24.61 | % | |
Six Months Ended April 30, 2009
(Unaudited) | | | | 8.43 | | | (4.79 | )%(j) | | | | 14,114 | | | 0.95 | % | | 1.71 | % | | 1.21 | % | | 13.02 | % | |
|
|
|
|
|
|
|
|
|
|
|
|
|
|
|
|
|
|
|
|
|
|
|
|
|
|
|
| |
* | Calculated based on average shares outstanding. |
| |
(a) | The per share amounts and percentages reflect income and expenses assuming inclusion of the Fund’s proportionate share of the income and expenses of the HSBC Investor Value Portfolio. |
| |
(b) | Not annualized for periods less than one year. Total return calculations do not include any sales or redemption charges. |
| |
(c) | Annualized for periods less than one year. |
| |
(d) | During the period certain fees were reduced. If such fee reductions had not occurred, the ratio would have been as indicated. |
| |
(e) | Portfolio turnover rate is calculated on the basis of the respective Portfolio in which the Fund invests all its investable assets. |
| |
(f) | Class A Shares, Class B Shares, Class C Shares and Class I Shares commenced operations on May 10, 2004. |
| |
(g) | During the year ended October 31, 2005, HSBC reimbursed certain amounts to the respective Portfolio in which the Fund invests related to violation of certain investment policies and limitations. The corresponding impact to the net expense ratio, net income ratio, gross expense ratio and total return were 0.05%, 0.05%, 0.05% and 0.05% for Class A Shares, Class B Shares, Class C Shares and Class I Shares, respectively. |
| |
(h) | During the year ended October 31, 2007, HSBC reimbursed amounts to certain Funds related to past marketing arrangements. The corresponding impact to the net expense ratio, net income ratio and the total returns were 0.09%, 0.08%, 0.08% and 0.08% for Class A Shares, Class B Shares, Class C Shares and Class I Shares, respectively. |
| |
(i) | During the year ended October 31, 2008, the respective Portfolio in which the Fund invests in received monies related to certain nonrecurring litigations settlements. The corresponding impact to the total return was 0.22%, 0.22%, 0.22% and 0.22% for Class A Shares, Class B Shares, Class C Shares and Class I Shares, respectively. |
| |
(j) | During the period ended April 30, 2009, the respective Portfolio in which the Fund invests in received monies related to certain nonrecurring litigation settlements. The corresponding impact to the total return was 0.03%, 0.03%, 0.03% and 0.03% for Class A Shares, Class B Shares, Class C Shares and Class I Shares, respectively. |
| | |
55 | HSBC INVESTOR FAMILY OF FUNDS | See notes to financial statements. |
|
HSBC INVESTOR FAMILY OF FUNDS |
|
|
Notes to Financial Statements—as of April 30, 2009 (Unaudited) |
| |
1. | Organization: |
| |
| The HSBC Investor Funds (the “Trust”), a Massachusetts business trust organized on April 22, 1987, and the HSBC Advisor Funds Trust (the “Advisor Trust”), a Massachusetts business trust organized on April 5, 1996, are registered under the Investment Company Act of 1940, as amended (the “Act”), as open-end management investment companies. As of April 30, 2009, the Trust is comprised of 18 separate operational funds and the Advisor Trust is comprised of 3 separate operational funds. The accompanying financial statements are presented for the following 11 funds (individually a “Fund”, collectively the “Funds”) of the Trust and Advisor Trust (collectively the “Trusts”): |
| | | | |
Fund | | Short Name | | Trust |
| |
| |
|
HSBC Investor Core Plus Fixed Income Fund (Advisor) | | Core Plus Fixed Income Fund (Advisor) | | Advisor Trust |
HSBC Investor Core Plus Fixed Income Fund | | Core Plus Fixed Income Fund | | Trust |
HSBC Investor Intermediate Duration Fixed Income Fund | | Intermediate Duration Fixed Income Fund | | Trust |
HSBC Investor New York Tax-Free Bond Fund | | New York Tax-Free Bond Fund | | Trust |
HSBC Investor Growth Fund | | Growth Fund | | Trust |
HSBC Investor International Equity Fund | | International Equity Fund | | Advisor Trust |
HSBC Investor Mid-Cap Fund | | Mid-Cap Fund | | Trust |
HSBC Investor Opportunity Fund | | Opportunity Fund | | Trust |
HSBC Investor Opportunity Fund (Advisor) | | Opportunity Fund (Advisor) | | Advisor Trust |
HSBC Investor Overseas Equity Fund | | Overseas Fund | | Trust |
HSBC Investor Value Fund | | Value Fund | | Trust |
| |
| All the Funds, except the New York Tax-Free Bond Fund, are diversified funds. The New York Tax-Free Bond Fund is a non-diversified fund which means it may concentrate its investments in the securities of a limited number of issuers. Each Fund is a part of the HSBC Family of Funds. |
| |
| Financial statements for all other funds of the HSBC Investor Family of Funds are published separately. The Core Plus Fixed Income Fund (Advisor), Core Plus Fixed Income Fund, Intermediate Duration Fixed Income Fund, Growth Fund, International Equity Fund, Opportunity Fund, Opportunity Fund (Advisor), Overseas Equity Fund, and the Value Fund (individually a “Feeder Fund”, collectively the “Feeder Funds”) utilize the master-feeder fund structure and seek to achieve their investment objectives by investing all of their investable assets in their respective Portfolios (as defined below). |
| | | | | |
Fund | | Respective Portfolio | | Proportionate
Interest on
April 30, 2009 |
| |
| |
|
Core Plus Fixed Income Fund Fund (Advisor) | | HSBC Investor Core Plus Fixed Income Portfolio | | 68.8% | |
Core Plus Fixed Income Fund | | HSBC Investor Core Plus Fixed Income Portfolio | | 12.9% | |
Intermediate Duration
Fixed Income Fund | | HSBC Investor Intermediate Duration
Fixed Income Portfolio | | 97.8% | |
Growth Fund | | HSBC Investor Growth Portfolio | | 66.3% | |
International Equity Fund | | HSBC Investor International Equity Portfolio | | 80.2% | |
Opportunity Fund | | HSBC Investor Opportunity Portfolio | | 8.7% | |
Opportunity Fund (Advisor) | | HSBC Investor Opportunity Portfolio | | 75.7% | |
Overseas Equity Fund | | HSBC Investor International Equity Portfolio | | 3.7% | |
Value Fund | | HSBC Investor Value Portfolio | | 61.5% | |
| |
HSBC INVESTOR FAMILY OF FUNDS | 56 |
|
HSBC INVESTOR FAMILY OF FUNDS |
|
|
Notes to Financial Statements—as of April 30, 2009 (Unaudited) (continued) |
| |
| The HSBC Investor Core Plus Fixed Income Portfolio, HSBC Investor Intermediate Duration Fixed Income Portfolio, HSBC Investor Growth Portfolio, HSBC Investor International Equity Portfolio, HSBC Investor Opportunity Portfolio and the HSBC Investor Value Portfolio (individually a “Portfolio”, collectively the “Portfolios”) are diversified series of the HSBC Investor Portfolios (the “Portfolio Trust”). The Portfolios operate as master funds in master-feeder arrangements and also receive investments from fund of funds. |
| |
| The financial statements of the Portfolios, including the Schedules of Portfolio Investments, are included elsewhere in this report. The financial statements of the Portfolios should be read in conjunction with the financial statements of the Feeder Funds. |
| |
| The Funds are authorized to issue an unlimited number of shares of beneficial interest with a par value of $0.001 per share. The Intermediate Duration Fixed Income Fund, New York Tax-Free Bond Fund, Growth Fund, Mid-Cap Fund, and the Value Fund each offer four classes of shares: Class A Shares, Class B Shares, Class C Shares, and Class I Shares. The Core Plus Fixed Income Fund (Advisor), International Equity Fund, and the Opportunity Fund (Advisor) each offer one class of shares: Class I Shares. The Core Plus Fixed Income Fund, Opportunity Fund, and the Overseas Equity Fund each offer three classes of shares: Class A Shares, Class B Shares, and Class C Shares. Class A Shares of the Growth Fund, Mid-Cap Fund, Opportunity Fund, Overseas Fund, and Value Fund have a maximum sales charge of 5.00% as a percentage of the original purchase price while Class A Shares of the Core Plus Fixed Income Fund, Intermediate Duration Fixed Income Fund, and New York Tax-Free Bond Fund have a maximum sales charge of 4.75% as a percentage of the original purchase price. The Class B Shares of the Funds are offered without any front-end sales charge but will be subject to a contingent deferred sales charge (“CDSC”) ranging from a maximum of 4.00% if redeemed less than one year after purchase to 0.00% if redeemed more than four years after purchase. Class C Shares of the Funds are offered without any front-end sales charge but will be subject to a maximum CDSC of 1.00% if redeemed less than one year after purchase. No sales charges are assessed with respect to Class I Shares of the Funds. Each class of shares in the Funds has identical rights and privileges except with respect to arrangements pertaining to shareholder servicing or distribution, class-related expenses, voting rights on matters affecting a single class of shares, and the exchange privilege of each class of shares. |
| |
| Under the Trusts’ organizational documents, the Trusts’ officers and trustees are indemnified against certain liabilities arising out of the performance of their duties to the Funds. In addition, in the normal course of business, the Trusts enter into contracts with service providers, which also provide for indemnifications by the Funds. The Funds’ maximum exposure under these arrangements is unknown, as this would involve any future claims that may be made against the Funds. However, based on experience, the Trust expects that risk of loss to be remote. |
| |
2. | Significant Accounting Policies: |
| |
| The following is a summary of the significant accounting policies followed by the Funds in the preparation of their financial statements. The policies are in conformity with U.S. generally accepted accounting principles (“GAAP”). The preparation of financial statements requires management to make estimates and assumptions that affect the reported amounts of assets and liabilities and disclosure of contingent assets and liabilities at the date of the financial statements and the reported amounts of income and expenses for the period. Actual results could differ from those estimates. |
| |
| Securities Valuation: |
| |
| Effective November 1, 2008, the Trust adopted Statement of Financial Accounting Standards (“SFAS”) No. 157, “Fair Value Measurements.” There was no impact to the Funds’ net assets or results of operations upon adoption. SFAS 157 defines fair value as the price that would be received to sell an asset or paid to transfer a liability in an orderly transaction between market participants at the measurement date. |
| |
| A. New York Tax-Free Bond Fund and Mid-Cap Fund |
| |
| Bonds and other fixed income securities (other than short-term obligations but including listed issues) are valued on the basis of valuations furnished by a pricing service, the use of which has been approved by the Funds’ Board of Trustees. In making such valuations, the pricing service utilizes both dealer-supplied valuations and the use of matrix techniques which take into account appropriate factors such as the institutional-size trading in similar groups of securities, yield, quality, coupon rate, maturity, type of issue, trading characteristics other than market data and without exclusive reliance upon quoted prices or exchanges or over-the-counter prices, since such valuations are believed to reflect more accurately the fair value of such securities. |
| |
57 | HSBC INVESTOR FAMILY OF FUNDS |
|
HSBC INVESTOR FAMILY OF FUNDS |
|
|
Notes to Financial Statements—as of April 30, 2009 (Unaudited) (continued) |
| |
| The value of each equity security is based either on the last sale price on a national securities exchange, or in the absence of recorded sales, at the closing bid prices on such exchanges, or at the quoted bid price in the over-the-counter market. Securities or other assets for which market quotations are not readily available, or are deemed unreliable due to a significant event or otherwise, are valued by or at the direction of the Funds’ Board of Trustees. In addition, specific securities may need to be valued by or at the direction of the Funds’ Board of Trustees due to potentially significant events. Examples of potentially significant events that could affect the value of an individual security include corporate actions by the issuer, announcements by the issuer relating to its earnings or profits, regulatory news, natural disasters and litigation. Examples of potentially significant events that could affect multiple securities held by a Fund include governmental actions, natural disasters and armed conflicts. |
| |
| B. Feeder Funds |
| |
| The Feeder Funds record their investments in their respective Portfolios at fair value. Securities of the Portfolios are recorded at fair value as more fully discussed in the notes to those financial statements. |
| |
| Investment Transactions and Related Income: |
| |
| A. New York Tax-Free Bond Fund and Mid-Cap Fund |
| |
| Investment transactions are accounted for no later than one business day after trade date. For financial reporting purposes, changes in holdings are accounted for on trade date on the last business day of the reporting period. Investment gains and losses are calculated on the identified cost basis. Interest income is recognized on the accrual basis and includes, where applicable, the amortization or accretion of premium or discount. Dividend income is recorded on the ex-dividend date. |
| |
| B. Feeder Funds |
| |
| The Feeder Funds record daily their pro-rata share of income, expenses, changes in unrealized appreciation and depreciation and realized gains and losses derived from their respective Portfolios. In addition, the Feeder Funds accrue their own expenses daily as incurred. |
| |
| Futures Contracts: |
| |
| The New York Tax-Free Bond Fund and Mid-Cap Fund may invest in futures contracts for the purpose of hedging existing portfolio securities or securities it intends to purchase against fluctuations in fair value caused by changes in prevailing market interest rates. Upon entering into a futures contract, a Fund is required to pledge to the broker an amount of cash and/or other assets equal to a certain percentage of the contract amount (initial margin deposit). Subsequent payments, known as “variation margin,” are made each day, depending on the daily fluctuations in the fair value of the underlying security. A gain or loss equal to the daily variation margin is recognized on a daily basis. |
| |
| Should market conditions move unexpectedly, a Fund may not achieve the anticipated benefits of the futures contracts and may realize a loss. Futures contracts involve, to varying degrees, elements of market risk (generally equity price risk related to stock futures, interest rate risk related to Bond futures, and foreign currency risk related to currency futures) and exposure to loss in excess of the variation margin, The use of futures transactions involves the risk of imperfect correlation in movements in the price of futures contracts, interest rates and the underlying hedged assets. As of April 30, 2009, the Funds did not hold any investments in futures contracts. |
| |
| Options: |
| |
| The Mid-Cap Fund may write covered call options against some of the securities in their portfolios provided the securities are listed on a national securities exchange. A call option is “covered” if the Fund owns the underlying securities covered by the call. The premium received is recorded as a liability and is subsequently adjusted to the current fair value of the option written. Premiums received from writing options that expire unexercised are treated on the expiration date as realized gains from investments. The difference between the premium and the amount paid on effecting a closing purchase transaction, including brokerage commissions, is also treated as a realized gain or loss. If the call option is exercised, the premium is added to the proceeds from the sale of the underlying security in determining a realized gain or loss. For the period ended April 30, 2009, the Fund did not write any covered call options. |
| |
| Allocations: |
| |
| Expenses directly attributable to a Fund are charged to that Fund. Expenses not directly attributable to a Fund are allocated proportionately among various or all funds within the HSBC Investor Family of Funds in relation to the net |
| |
HSBC INVESTOR FAMILY OF FUNDS | 58 |
| |
| |
HSBC INVESTOR FAMILY OF FUNDS |
|
|
Notes to Financial Statements—as of April 30, 2009 (Unaudited) (continued) |
| |
| assets of each fund or on another reasonable basis. Class specific expenses are charged directly to the class incurring the expense. In addition, income, expenses (other than class specific expenses), and unrealized/realized gains and losses in investments are allocated to each class of shares based on its relative net assets on a daily basis. |
| |
| Dividends to Shareholders: |
| |
| The Core Plus Fixed Income Fund (Advisor), Core Plus Fixed Income Fund, Intermediate Duration Fixed Income Fund, and the New York Tax-Free Bond Fund declare all net investment income daily as dividends to their shareholders and distribute such dividends monthly. Dividends from net investment income, if any, are declared and distributed semi-annually in the case of the Growth Fund, Opportunity Fund, Opportunity (Advisor) and the Value Fund, and annually in the case of the International Equity Fund, Mid-Cap Fund, and Overseas Fund. |
| |
| The Funds’ net realized gains, if any, are distributed to shareholders at least annually. Additional distributions are also made to the Funds’ shareholders to the extent necessary to avoid the federal excise tax on certain undistributed income and net capital gains of regulated investment companies. |
| |
| The amount and character of net investment income and net realized gains distributions are determined in accordance with federal income tax regulations which may differ from GAAP. These “book/tax” differences are either considered temporary or permanent in nature. To the extent these differences are permanent in nature (e.g., reclassification of market discounts, certain gain/loss, paydowns, and certain distributions), such amounts are reclassified within the composition of net assets; temporary differences (e.g., wash losses and post-October loss deferrals) do not require reclassification. The Funds may utilize equalization accounting for tax purposes and designate earnings and profits, including net realized gains distributed to shareholders on redemption of shares, as a part of the dividends paid deduction for income tax purposes. To the extent distributions from net investment income and net realized gains exceed net investment income and net realized gains for tax purposes, they are reported as distributions of capital. |
| |
| Redemption Fee: |
| |
| A redemption fee of 2.00% is charged and recorded as paid-in-capital for any shares redeemed or exchanged after holding them for less than 30 days. This fee does not apply to shares purchased through reinvested dividends or capital gains or shares held in certain omnibus accounts or retirement plans that cannot implement the fee. For the fiscal year ended October 31, 2008 and period ended April 30, 2009, the following Funds collected redemption fees as follows: |
| | | | | | | | | | | |
Fund | | Fees Collected
October 31, 2008 | | Fees Collected
April 30, 2009 | |
| |
| |
| |
Core Plus Fixed Income Fund (Advisor) | | | $ | 2,944 | | | | $ | 103 | | |
Core Plus Fixed Income Fund | | | | 2,237 | | | | | — | | |
Intermediate Duration Fixed Income Fund | | | | 4 | | | | | — | | |
New York Tax-Free Bond Fund | | | | — | | | | | 133 | | |
Growth Fund | | | | 1,549 | | | | | 81 | | |
International Equity Fund | | | | 868 | | | | | 1,963 | | |
Mid-Cap Fund | | | | 20 | | | | | 10 | | |
Opportunity Fund (Advisor) | | | | 5 | | | | | 881 | | |
Opportunity Fund | | | | 749 | | | | | 167 | | |
Overseas Equity Fund | | | | 1,711 | | | | | 35 | | |
Value Fund | | | | 761 | | | | | 19 | | |
| |
| Federal Income Taxes: |
| |
| Each Fund is a separate taxable entity for federal income tax purposes. Each Fund has qualified and intends to continue to qualify each year as a “regulated investment company” under Subchapter M of the Internal Revenue Code, as amended and to distribute substantially all of their taxable net investment income and net realized gains, if any, to their shareholders. Accordingly, no provision for federal income or excise tax is required. |
| |
| In addition, Financial Accounting Standards Board Interpretation No. 48, Accounting for Uncertainty in Income Taxes (“FIN 48”) provides guidance for how uncertain tax positions should be recognized, measured, presented and disclosed in the financial statements. FIN 48 requires the affirmative evaluation of tax positions taken or expected to be taken in the course of preparing the Trust’s tax returns to determine whether it is more-likely-than-not (i.e., greater than 50-percent) that each tax position will be sustained upon examination by a taxing authority based on the technical merits of the position. A tax position that meets the more-likely-than-not recognition threshold is measured to determine the amount of |
| |
59 | HSBC INVESTOR FAMILY OF FUNDS |
| |
HSBC INVESTOR FAMILY OF FUNDS |
|
|
Notes to Financial Statements—as of April 30, 2009 (Unaudited) (continued) |
| |
| benefit to recognize in the financial statements. Differences between tax positions taken in a tax return and amounts recognized in the financial statements will generally result in an increase in a liability for taxes payable (or a reduction of a tax refund receivable), including the recognition of any related interest and penalties as an operating expense. The FIN 48 analysis included a review of tax positions taken in tax years that remain subject to examination by tax authorities in all major tax jurisdictions, including federal (i.e., the last 4 tax year ends and the interim tax period since then, as applicable). FIN 48 did not impact the Funds’ net assets or results of operations during the period. |
| |
| New Accounting Pronouncements: |
| |
| In March 2008, the Financial Accounting Standards Board (“FASB”) issued the Statement of Financial Accounting Standards No. 161, “Disclosures about Derivative Instruments and Hedging Activities” (“SFAS 161”). SFAS 161 will be effective for fiscal years and interim periods beginning after November 15, 2008. SFAS 161 requires enhanced disclosures about the Funds’ derivative and hedging activities, including how such activities are accounted for and their effect on the Funds’ financial position, performance and cash flows. Management is currently evaluating the impact the adoption of SFAS 161 will have on the Funds’ financial statements and related disclosures. |
| |
| In April 2009, the FASB issued FASB Staff Position No. 157-4, “Determining Fair Value When the Volume and Level of Activity for the Asset or Liability Have Significantly Decreased and Identifying Transactions That Are Not Orderly” (“FSP 157-4”). FSP 157-4 provides additional guidance for estimating fair value in accordance with SFAS No. 157, when the volume and level of activity for the asset or liability have significantly decreased as well as guidance on identifying circumstances that indicate a transaction is not orderly. FSP 157-4 is effective for fiscal years and interim periods ending after June 15, 2009. Management is currently evaluating the impact the adoption of FSP 157-4 will have on the Funds’ financial statement disclosures. |
| |
3. | Investment Valuation Summary |
| | |
| | The inputs used for valuing the Funds’ investments are summarized in the three broad levels listed below: |
| | | |
| | • | Level 1: quoted prices in active markets for identical assets |
| | | |
| | • | Level 2: other significant observable inputs (including quoted prices for similar securities, interest rates, prepayment speeds, credit risk, etc.) |
| | | |
| | • | Level 3: significant unobservable inputs (including the Fund’s own assumptions in determining the fair value of investments) |
| |
| The inputs or methodology used for valuing investments is not necessarily an indication of the risk associated with investing in those investments. For example, short-term debt securities of sufficient credit quality maturing in sixty days or less are generally valued at amortized cost, which approximates fair value. Generally, amortized cost approximates the current fair value of a security, but since the valuation is not obtained from a quoted price in an active market, such securities are reflected as Level 2. |
| |
| The following is a summary of the valuation as of April 30, 2009 for each Fund based upon the three levels defined above: |
| | | | | | | | | | | | | | | | | |
| | LEVEL 1 - Quoted Prices | | LEVEL 2 - Other Significant | |
| |
| |
| |
Fund Name | | Investment
Securities | | Other Financial
Instruments* | | Investment
Securities | | Other Financial
Instruments* | |
| |
| |
| |
| |
| |
Core Plus Fixed Income Fund (Advisor) | | $ | — | | | $ | — | | | $ | 47,774,522 | | | $ | — | | |
Core Plus Fixed Income Fund | | | — | | | | — | | | | 8,960,382 | | | | — | | |
Intermediate Duration Fixed Income Fund | | | — | | | | — | | | | 12,365,152 | | | | — | | |
New York Tax-Free Bond Fund | | | 180,080 | | | | — | | | | 42,033,676 | | | | — | | |
Growth Fund | | | — | | | | — | | | | 52,188,306 | | | | — | | |
International Equity Fund | | | — | | | | — | | | | 133,307,368 | | | | — | | |
Mid-Cap Fund | | | 12,355,767 | | | | — | | | | — | | | | — | | |
Opportunity Fund | | | — | | | | — | | | | 9,648,262 | | | | — | | |
Opportunity Fund (Advisor) | | | — | | | | — | | | | 83,967,965 | | | | — | | |
Overseas Equity Fund | | | — | | | | — | | | | 6,232,265 | | | | — | | |
Value Fund | | | — | | | | — | | | | 26,525,728 | | | | — | | |
| |
HSBC INVESTOR FAMILY OF FUNDS | 60 |
|
HSBC INVESTOR FAMILY OF FUNDS |
|
|
Notes to Financial Statements—as of April 30, 2009 (Unaudited) (continued) |
| | | | | | | | | | | | | | | | | | | |
| | LEVEL 3 - Significant | | Total | |
| |
| |
| |
Fund Name | | Investment
Securities | | Other Financial
Instruments* | | Investment
Securities | | Other Financial
Instruments* | |
| |
| |
| |
| |
| |
Core Plus Fixed Income Fund (Advisor) | | | $ | — | | | | $ | — | | | $ | 47,774,522 | | | $ | — | | |
Core Plus Fixed Income Fund | | | | — | | | | | — | | | | 8,960,382 | | | | — | | |
Intermediate Duration Fixed Income Fund | | | | — | | | | | — | | | | 12,365,152 | | | | — | | |
New York Tax-Free Bond Fund | | | | — | | | | | — | | | | 42,213,756 | | | | — | | |
Growth Fund | | | | — | | | | | — | | | | 52,188,306 | | | | — | | |
International Equity Fund | | | | — | | | | | — | | | | 133,307,368 | | | | — | | |
Mid-Cap Fund | | | | — | | | | | — | | | | 12,355,767 | | | | — | | |
Opportunity Fund | | | | — | | | | | — | | | | 9,648,262 | | | | — | | |
Opportunity Fund (Advisor) | | | | — | | | | | — | | | | 83,967,965 | | | | — | | |
Overseas Equity Fund | | | | — | | | | | — | | | | 6,232,265 | | | | — | | |
Value Fund | | | | | | | | | — | | | | 26,525,728 | | | | — | | |
| | |
| |
* | Other financial instruments would include any derivative instruments, such as any futures, forwards, and swap agreements. These investments are generally recorded in the financial statements at the unrealized gain or loss on the investment. |
| | |
| |
4. | Related Party Transactions: |
| |
| Investment Management: |
| |
| HSBC Global Asset Management (USA) Inc. (“HSBC” or the “Investment Adviser”), a wholly owned subsidiary of HSBC Bank USA, N.A., a national bank organized under the laws of the United States, acts as Investment Adviser to the New York Tax-Free Bond Fund and the Mid-Cap Fund. As Investment Adviser, HSBC manages the investments of the Funds and continuously reviews, supervises, and administers the Funds’ investments. Investment Sub-Advisory services are provided by Munder Capital Management (“Munder”) for the Mid-Cap Fund. |
| |
| For its services as Investment Adviser, HSBC receives, in the aggregate, a fee, accrued daily and paid monthly at an annual rate of 0.25% of the New York Tax-Free Bond Fund’s average daily net assets. |
| |
| For their services as Investment Adviser and Investment Sub-Adviser, respectively, HSBC and Munder receive, in the aggregate, a fee, accrued daily and paid monthly at an annual rate of 0.75% of the Mid-Cap Fund’s average daily net assets. |
| |
| Feeder Funds are not directly charged any investment management fees. |
| |
| Administration: |
| |
| HSBC serves the Funds as Administrator. Under the terms of the Administration Agreement, HSBC received from the Funds (as well as other funds in the HSBC Investor Funds) a fee, accrued daily and paid monthly, during the period November 1, 2008 to December 31, 2008, at an annual rate of: |
| | | |
Based on Average Daily Net Assets of | | Fee Rate | |
| |
| |
Up to $12 billion | | 0.0525% | |
In excess of $12 billion | | 0.0350% | |
| |
| Effective January 1, 2009, under the terms of the Administration Agreement, HSBC receives from the Funds (as well as other funds in the HSBC Investor Funds) a fee, accrued daily and paid monthly, at an annual rate of: |
| | | |
Based on Average Daily Net Assets of | | Fee Rate | |
| |
| |
Up to $10 billion | | 0.0550% | |
In excess of $10 billion but not exceeding $20 billion | | 0.0350% | |
In excess of $20 billion but not exceeding $50 billion | | 0.0275% | |
In excess of $50 billion | | 0.0250% | |
| |
| The fee breakpoints are determined on the basis of the aggregate average daily net assets of the HSBC Investor Family of Funds. The fee is allocated to each series of the HSBC Investor Family of Funds based upon its pro-rata share of net assets for each class. For assets invested in the underlying Portfolios by the Feeder Funds, the Portfolios pay half of the administration fee and the Feeder Funds pay half, for a combination of the total fee rate above. Certain administra- |
| |
61 | HSBC INVESTOR FAMILY OF FUNDS |
| |
HSBC INVESTOR FAMILY OF FUNDS |
|
| |
Notes to Financial Statements—as of April 30, 2009 (Unaudited) (continued) |
| |
| tion fees of the Portfolios also may be reduced by treating them as apportioned in part to other funds making investments in the Portfolios. |
| |
| The administration fees accrued for each class by fund, of which 50% of such fees are deemed to be class specific, are as follows: |
| | | | | | | | | | | | | | | | | | | | | | | | | | | | | |
| | Core Plus
Fixed
Income
(Advisor) | | Core Plus
Fixed
Income | | Intermediate
Duration
Fixed
Income
Fund | | New York
Tax-Free
Bond Fund | | Growth
Fund | | International
Equity
Fund | |
| |
| |
| |
| |
| |
| |
| |
Class A | | | $ | — | | | | $ | 794 | | | | $ | 193 | | | | $ | 4,820 | | | $ | 1,439 | | | $ | — | | |
Class B | | | | — | | | | | 144 | | | | | 129 | | | | | 867 | | | | 238 | | | | — | | |
Class C | | | | — | | | | | 9 | | | | | 20 | | | | | 97 | | | | 6 | | | | — | | |
Class I | | | | 5,181 | | | | | — | | | | | 931 | | | | | 2,996 | | | | 3,304 | | | | 13,284 | | |
| | |
|
| | | |
|
| | | |
|
| | | |
|
| | |
|
| | |
|
| | |
Total | | | $ | 5,181 | | | | $ | 947 | | | | $ | 1,273 | | | | $ | 8,780 | | | $ | 4,987 | | | $ | 13,284 | | |
| | |
|
| | | |
|
| | | |
|
| | | |
|
| | |
|
| | |
|
| | |
| | | | | | | | | | | | | | | | | | | | | | | | | | | | | |
| | Mid-Cap
Fund | | Opportunity
Fund | | Opportunity
Fund
(Advisor) | | Overseas
Equity
Fund | | | Value
Fund | | | | | | |
| |
| |
| |
| |
| | |
| | | | | | |
Class A | | | $ | 629 | | | | $ | 796 | | | | $ | — | | | | $ | 543 | | | $ | 1,241 | | | | | | |
Class B | | | | 332 | | | | | 129 | | | | | — | | | | | 103 | | | | 60 | | | | | | |
Class C | | | | 3 | | | | | 17 | | | | | — | | | | | 5 | | | | 5 | | | | | | |
Class I | | | | 1,554 | | | | | — | | | | | 8,157 | | | | | — | | | | 1,521 | | | | | | |
| | |
|
| | | |
|
| | | |
|
| | | |
|
| | |
|
| | | | | | |
Total | | | $ | 2,518 | | | | $ | 942 | | | | $ | 8,157 | | | | $ | 651 | | | $ | 2,827 | | | | | | |
| | |
|
| | | |
|
| | | |
|
| | | |
|
| | |
|
| | | | | | |
| |
| Pursuant to a Sub-Administration Agreement with HSBC, Citi Fund Services Ohio, Inc. (“Citi Ohio”), a wholly-owned subsidiary of The Citigroup, Inc., serves as the Trust’s Sub-Administrator subject to the general supervision of the Funds’ Board of Trustees and HSBC. For these services, Citi Ohio is entitled to a fee, payable by HSBC, at an annual rate equivalent to the fee rates set forth above, minus 0.02% (2 basis points) which is retained by HSBC. |
| |
| Under a Compliance Services Agreement between the Trust and Citi Ohio (the “CCO Agreement”), Citi Ohio makes an employee available to serve as the Funds’ Chief Compliance Officer (the “CCO”). Under the CCO Agreement, Citi Ohio also provides infrastructure and support in implementing the written policies and procedures comprising the Funds’ compliance program, including support services to the CCO. For the services provided under the CCO Agreement, the HSBC Investor Family of Funds paid Citi Ohio $133,049 for the period ended April 30, 2009, plus reimbursement of certain expenses. Expenses incurred by each Fund are reflected on the Statements of Operations as “Compliance Service.” Citi Ohio pays the salary and other compensation earned by any such individuals as employees of Citi Ohio. |
| |
| Distribution Plan: |
| |
| Foreside Distribution Services, L.P. (“Foreside”), a wholly-owned subsidiary of Foreside Financial Group LLC, serves the Trusts as Distributor (the “Distributor”). The Trusts have adopted a non-compensatory Distribution Plan and Agreement (the “Plan”) pursuant to Rule 12b-1 of the Act. The Plan provides for reimbursement of expenses incurred by the Distributor related to distribution and marketing, at a rate not to exceed 0.25%, 1.00%, and 1.00% of the average daily net assets of Class A Shares (currently not being charged), Class B Shares (currently charging 0.75%), and Class C Shares (currently charging 0.75%) of the Funds, respectively. Foreside, as Distributor, also received $106,503, $76,505, and $5,366 in commissions from sales of HSBC Investor Family of Funds, for Class A Shares, Class B Shares, and Class C Shares, respectively of which $40, $6, and $0 were reallowed to HSBC affiliated brokers and dealers, for Class A Shares, Class B Shares, and Class C Shares, respectively. |
| |
| Shareholder Servicing: |
| |
| The Trusts have adopted a Shareholder Services Plan which provides for payments to shareholder servicing agents (which currently consist of HSBC and its affiliates) for providing various shareholder services. For performing these services, the shareholder servicing agents receive a fee up to 0.25%, 0.25%, and 0.25% that is computed daily and paid month- |
| |
HSBC INVESTOR FAMILY OF FUNDS | 62 |
|
HSBC INVESTOR FAMILY OF FUNDS |
|
|
Notes to Financial Statements—as of April 30, 2009 (Unaudited) (continued) |
| |
| ly equal to a percentage of average daily net assets of Class A Shares, Class B Shares, and Class C Shares of the Funds, respectively. The aggregate fees paid to the Distributor pursuant to the Distribution Plan and to shareholder servicing agents pursuant to the Administrative Services Plans currently are not intended to exceed 0.25% of the average daily net assets of Class A Shares, and 1.00% of the average daily net assets of Class B Shares and Class C Shares. |
| |
| Fund Accounting, Transfer Agency and Trustee: |
| |
| Citi Ohio provides fund accounting and transfer agency services for each fund of the HSBC Investor Family of Funds. As transfer agent for the Funds, Citi Ohio receives a fee based on the number of funds and shareholder accounts, subject to certain minimums and reimbursement of certain expenses. As fund accountant, Citi Ohio receives an annual fee per fund and share class, subject to certain minimums and reimbursement of certain expenses. |
| |
| Each of the non-interested Trustees is compensated with a $60,000 annual Board retainer for service as a Trustee of the Trust and other HSBC Investor Funds, as well as a $3,000 annual retainer for each Committee of the Board of the Trust and other HSBC Investor Funds. Each non-interested Trustee also receives a $5,000 and $3,000 meeting fee for each regular in-person Board meeting and Committee meeting, respectively. Furthermore, each non-interested Trustee receives compensation for attending special meetings and/or functioning as a Committee Chairperson or Lead Trustee. In addition, the non-interested Trustees are reimbursed for certain expenses incurred in connection with their Board membership. |
| |
| Fee Reductions: |
| |
| The Investment Adviser has agreed to contractually waive 0.05% of its management fee, computed daily and paid monthly, and based on the average daily net assets of the Mid-Cap Fund. |
| |
| The Investment Adviser has also agreed to contractually limit, through March 1, 2010, the total expenses, exclusive of interest, taxes, brokerage commissions and extraordinary expenses, of certain Funds. Each affected Fund Class has its own expense limitations based on the average daily net assets for any full fiscal year as follows: |
| | | | | | |
Fund | | Class | | Current Contractual
Expense
Limitation | |
| |
| |
| |
Core Plus Fixed Income Fund (Advisor) | | I | | 0.45 | % | |
Core Plus Fixed Income Fund | | A | | 0.70 | % | |
Core Plus Fixed Income Fund | | B | | 1.45 | % | |
Core Plus Fixed Income Fund | | C | | 1.45 | % | |
Intermediate Duration Fixed Income Fund | | A | | 0.65 | % | |
Intermediate Duration Fixed Income Fund | | B | | 1.40 | % | |
Intermediate Duration Fixed Income Fund | | C | | 1.40 | % | |
Intermediate Duration Fixed Income Fund | | I | | 0.40 | % | |
Growth Fund | | A | | 1.20 | % | |
Growth Fund | | B | | 1.95 | % | |
Growth Fund | | C | | 1.95 | % | |
Growth Fund | | I | | 0.95 | % | |
Mid-Cap Fund | | A | | 1.35 | % | |
Mid-Cap Fund | | B | | 2.10 | % | |
Mid-Cap Fund | | C | | 2.10 | % | |
Mid-Cap Fund | | I | | 1.10 | % | |
Opportunity Fund | | A | | 1.65 | % | |
Opportunity Fund | | B | | 2.40 | % | |
Opportunity Fund | | C | | 2.40 | % | |
Overseas Equity Fund | | A | | 1.85 | % | |
Overseas Equity Fund | | B | | 2.60 | % | |
Overseas Equity Fund | | C | | 2.60 | % | |
Value Fund | | A | | 1.20 | % | |
Value Fund | | B | | 1.95 | % | |
Value Fund | | C | | 1.95 | % | |
Value Fund | | I | | 0.95 | % | |
| |
63 | HSBC INVESTOR FAMILY OF FUNDS |
|
HSBC INVESTOR FAMILY OF FUNDS |
|
|
Notes to Financial Statements—as of April 30, 2008 (Unaudited) (continued) |
| |
| The Administrator and Citi Ohio may voluntarily waive/reimburse fees to help support the expense limits of the Funds. In addition, the Investment Adviser may waive/reimburse additional fees at its discretion. Amounts waived/reimbursed by the Investment Adviser, Administrator and Citi Ohio are reported separately on the Statements of Operations, as applicable. All contractual and any voluntary fee waivers/reimbursements are not subject to recoupment in subsequent fiscal periods. Voluntary waivers/reimbursements may be stopped at any time. |
| |
5. | Investment Transactions: |
| |
| Purchases and sales of securities (excluding securities maturing less than one year from acquisition) for the period ended April 30, 2009 were as follows: |
| | | | | | | |
Fund | | Purchases | | Sales | |
| |
| |
| |
New York Tax-Free Bond Fund | | $ | 2,204,532 | | $ | 13,903,535 | |
Mid-Cap Fund | | | 3,221,374 | | | 6,731,626 | |
| |
| There were no long-term U.S. Government securities held during the period ended April 30, 2009. |
| |
| Contributions and withdrawals of the respective Portfolios by each Fund listed below for the period ended April 30, 2009 totaled: |
| | | | | | | |
Fund | | Contributions | | Withdrawals | |
| |
| |
| |
Core Plus Fixed Income Fund (Advisor) | | $ | 126,368 | | $ | 11,347,409 | |
Core Plus Fixed Income Fund | | | 78,735 | | | 2,309,114 | |
Intermediate Duration Fixed Income Fund | | | 268,291 | | | 1,436,561 | |
Growth Fund | | | 1,095,498 | | | 7,985,284 | |
International Equity Fund | | | 9,112,964 | | | 29,512,622 | |
Opportunity Fund | | | 62,674 | | | 1,279,746 | |
Opportunity Fund (Advisor) | | | 2,717,066 | | | 12,490,765 | |
Overseas Equity Fund | | | 281,529 | | | 1,305,240 | |
Value Fund | | | 968,456 | | | 5,310,451 | |
| |
6. | Concentration of Credit Risk: |
| |
| The New York Tax-Free Bond Fund invests primarily in debt obligations issued by the State of New York and its respective political subdivisions, agencies, and public authorities. The Fund is more susceptible to economic and political factors adversely affecting issuers of New York specific municipal securities than are municipal bond funds that are not concentrated in these issuers to the same extent. |
| |
7. | Federal Income Tax Information: |
| |
| At April 30, 2009, the cost basis for federal income tax purposes, gross unrealized appreciation, gross unrealized depreciation and net unrealized appreciation/depreciation were as follows: |
| | | | | | | | | | | |
Fund | | Tax Cost
of Securities ($) | | Tax Unrealized
Appreciation ($) | | Tax Unrealized
Depreciation ($) | | Net Unrealized
Appreciation/
(Depreciation)($)* | |
| |
| |
| |
| |
| |
New York Tax-Free Bond Fund | | 41,908,120 | | 1,127,327 | | (821,691 | ) | | 305,636 | | |
Mid-Cap Fund | | 13,196,586 | | 1,413,411 | | (2,254,230 | ) | | (840,819 | ) | |
| |
|
* | The difference between book-basis and tax-basis unrealized appreciation (depreciation) is attributable primarily to: tax deferral of losses on wash sales. |
| |
HSBC INVESTOR FAMILY OF FUNDS | 64 |
|
HSBC INVESTOR FAMILY OF FUNDS |
|
|
Notes to Financial Statements—as of April 30, 2009 (Unaudited) (continued) |
| |
| The tax character of dividends paid by the Funds as of latest tax year ended of October 31, 2008 were as follows: |
| | | | | | | | | | | | | | | | |
| | Dividends paid from | | | | | | | |
| |
| | | | | | | |
| | Ordinary
Income | | Net
Long
Term
Capital
Gains | | Total
Taxable
Dividends | | Tax
Exempt
Distributions | | Total
Dividends
Paid** | |
| |
| |
| |
| |
| |
| |
Core Plus Fixed Income (Advisor) | | $ | 3,640,676 | | $ | 562,425 | | $ | 4,203,101 | | $ | — | | $ | 4,203,101 | |
Core Plus Fixed Income Fund | | | 740,557 | | | — | | | 740,557 | | | — | | | 740,557 | |
Intermediate Duration Fixed Income Fund | | | 635,917 | | | 53,298 | | | 689,215 | | | — | | | 689,215 | |
New York Tax-Free Bond Fund | | | 27,836 | | | 56,103 | | | 83,939 | | | 2,095,822 | | | 2,179,761 | |
Growth Fund | | | — | | | 2,892,355 | | | 2,892,355 | | | — | | | 2,892,355 | |
International Equity Fund (Advisor) | | | 10,817,657 | | | 24,126,978 | | | 34,944,635 | | | — | | | 34,944,635 | |
Mid-Cap Fund | | | — | | | 3,530,283 | | | 3,530,283 | | | — | | | 3,530,283 | |
Opportunity Fund | | | 1,084,594 | | | 4,960,716 | | | 6,045,310 | | | — | | | 6,045,310 | |
Opportunity Fund (Advisor) | | | 9,223,734 | | | 35,976,501 | | | 45,200,235 | | | — | | | 45,200,235 | |
Overseas Equity Fund | | | 562,242 | | | 2,487,633 | | | 3,049,875 | | | — | | | 3,049,875 | |
Value Fund | | | 868,977 | | | 4,085,539 | | | 4,954,516 | | | — | | | 4,954,516 | |
| | |
|
|
| ** | Total dividends paid may differ from the amount reported in the Statements of Changes in Net Assets because dividends are recognized when actually paid for tax purposes. |
| | |
| As of latest tax year ended October 31, 2008, the components of accumulated earnings/(deficit) on a tax basis for the Funds were as follows: |
| | | | | | | | | | | | | | | | | | | | | | | | | | | | | | | |
| | Undistributed
Ordinary
Income | | Undistributed
Tax
Exempt
Income | | Undistributed
Long
Term
Capital
Gains | | Accumulated
Earnings | | Dividends
Payable | | Accumulated
Capital
and
Other
Losses | | Unrealized
Appreciation/
(Depreciation)† | | Total
Accumulated
Earnings/
(Deficit) | |
| |
| |
| |
| |
| |
| |
| |
| |
| |
Core Plus Fixed
Income (Advisor) | | | $ | 329,363 | | | | $ | — | | | | $ | — | | | $ | 329,363 | | $ | (277,012 | ) | $ | (1,002,028 | ) | $ | (8,450,309 | ) | $ | (9,399,986 | ) |
Core Plus Fixed
Income Fund | | | | 50,521 | | | | | — | | | | | — | | | | 50,521 | | | (52,252 | ) | | (787,733 | ) | | (1,776,131 | ) | | (2,565,595 | ) |
Intermediate
Duration Fixed
Income Fund | | | | 57,749 | | | | | — | | | | | — | | | | 57,749 | | | (49,016 | ) | | (85,092 | ) | | (1,555,362 | ) | | (1,631,721 | ) |
New York Tax-Free
Bond Fund | | | | 9,870 | | | | | 164,572 | | | | | 142,012 | | | | 316,454 | | | (164,213 | ) | | — | | | (1,728,132 | ) | | (1,575,891 | ) |
Growth Fund | | | | — | | | | | — | | | | | — | | | | — | | | — | | | (211,343 | ) | | (14,122,081 | ) | | (14,333,424 | ) |
International Equity
Fund (Advisor) | | | | 6,999,097 | | | | | — | | | | | 8,461,419 | | | | 15,460,516 | | | — | | | — | | | (100,679,157 | ) | | (85,218,641 | ) |
Mid-Cap Fund | | | | — | | | | | — | | | | | 1,150,505 | | | | 1,150,505 | | | — | | | — | | | (4,023,398 | ) | | (2,872,893 | ) |
Opportunity Fund | | | | — | | | | | — | | | | | 660,465 | | | | 660,465 | | | — | | | — | | | (2,882,931 | ) | | (2,222,466 | ) |
Opportunity Fund
(Advisor) | | | | — | | | | | — | | | | | 2,746,625 | | | | 2,746,625 | | | — | | | — | | | (24,545,877 | ) | | (21,799,252 | ) |
Overseas Equity
Fund | | | | 651,141 | | | | | — | | | | | 3,347,318 | | | | 3,998,459 | | | — | | | — | | | (3,912,493 | ) | | 85,966 | |
Value Fund | | | | 126,892 | | | | | — | | | | | — | | | | 126,892 | | | — | | | (4,701,437 | ) | | (7,956,386 | ) | | (12,530,931 | ) |
| | |
|
|
| † | The differences between book-basis and tax-basis unrealized appreciation/depreciation are attributable primarily to: tax deferral of losses on wash sales, the realization for tax purposes of unrealized gains/losses on certain derivative instruments, the difference between book and tax amortization methods for premium and market discount, the realization for tax purposes of unrealized gains/losses on investments in passive foreign investment companies, and the return of capital adjustments from real estate investment trusts. |
| | |
| As of the latest tax year ended of October 31, 2008, the following Funds have net capital loss carryforwards, which are available to offset future realized gains, if any, to the extent provided by the Treasury regulations. To the extent that these carryforwards are used to offset future capital gains, it is probable that the gains that are offset will not be distributed to shareholders. |
| |
65 | HSBC INVESTOR FAMILY OF FUNDS |
|
HSBC INVESTOR FAMILY OF FUNDS |
|
|
Notes to Financial Statements—as of April 30, 2009 (Unaudited) (continued) |
| | | | | | | |
| | Amount | | Expires | |
| |
| |
| |
Core Plus Fixed Income (Advisor) | | $ | 1,002,028 | | | 2016 | |
Core Plus Fixed Income Fund | | | 185,453 | | | 2012 | |
| | | 372,525 | | | 2014 | |
| | | 229,755 | | | 2016 | |
Intermediate Duration Fixed Income Fund | | | 85,092 | | | 2016 | |
Growth Fund | | | 211,343 | | | 2016 | |
Value Fund | | | 4,701,437 | | | 2016 | |
| |
| The tax character of current year distributions paid and the tax basis of the current components of accumulated earnings and any net capital loss carryforwards will be determined at the end of the current tax year ending October 31, 2009. |
| |
8. | Legal and Regulatory Matters: |
| |
| On September 26, 2006 BISYS Fund Services, Inc. (“BISYS”), an affiliate of BISYS Fund Services Ohio, Inc. which provided various services to the Funds, reached a settlement with the Securities and Exchange Commission (“the SEC”) regarding the SEC’s investigation related to BISYS’ past payment of certain marketing and other expenses with respect to certain of its mutual fund clients. Although BISYS has reached a settlement with the SEC, the Funds’ management is not aware that any determination has been made as to how the BISYS settlement monies will be distributed. While the Funds’ management is currently unable to determine the impact, if any, of such matters on the Funds or the Funds’ financial statements, management does not anticipate a material, adverse impact to the Funds or the Funds’ financial statements. |
| |
9. | Subsequent Event: (Unaudited) |
| |
| Fund Mergers: |
| |
| On June 1, 2009, the Board of Trustees of the Trusts approved a form of Agreement and Plan of Reorganization (“Reorganization Plan”) to be entered into between each of the four portfolios of the Trusts listed below (the “Investor Funds”) and certain registered investment companies which are sponsored and advised by Franklin Advisers, Inc. (“Franklin” and each registered investment company advised by Franklin, a “Franklin Fund”). The Reorganization Plan, which provides for the reorganization of the Investor Funds into corresponding Franklin Funds (each a “Reorganization” and collectively, the “Reorganizations”), will be submitted to a vote of shareholders of the applicable Investor Funds at a shareholder meeting to be held in August 2009 (“Shareholder Meeting”). Should the Reorganization Plan be approved by shareholders, the Reorganizations are expected to occur in August 2009 (“Reorganization Date”). Until the Reorganization Date, shareholders will be able to redeem or exchange Investor Funds shares, subject to the usual limitations described in the Investor Funds’ prospectus. However, purchase orders into the Investor Funds may be restricted in advance of the closing of the Reorganization. Shareholders of the Investor Funds may also receive a capital gains distribution prior to the closing of the Reorganizations. |
| |
| The following outlines the proposed Reorganizations: |
| | |
Target Fund | | Acquiring Fund |
| |
|
HSBC Investor Core Plus Fixed Income Fund | | Franklin Total Return Fund |
Class A | | Class A |
Class B | | Class A |
Class C | | Class C |
Class I (Advisor) | | Advisor Class |
HSBC Investor Intermediate Duration Fixed Income Fund | | Franklin Total Return Fund |
Class A | | Class A |
Class B | | Class A |
Class C | | Class C |
Class I | | Advisor Class |
HSBC Investor New York Tax-Free Bond Fund | | Franklin New York Intermediate-Term Tax-Free Income Fund |
Class A | | Class A |
Class B | | Class A |
Class C | | Class C |
Class I | | Advisor Class |
| |
HSBC INVESTOR FAMILY OF FUNDS | 66 |
|
HSBC INVESTOR FAMILY OF FUNDS |
|
|
Investment Adviser Contract Approval—April 30, 2009 (Unaudited) |
| |
| The Board of Trustees of the HSBC Investor Funds Trust, HSBC Advisor Funds Trust and HSBC Investor Portfolios (collectively, the “Trusts”), and the non-interested Trustees (“Independent Trustees”), voting separately, approved the renewal, for a year, of the Investment Advisory Agreements and, where applicable Sub-Advisory Agreements (other than the Sub-Advisory Agreement with Halbis Capital Management (USA) Inc. (“Halbis”)), with respect to the respective series of the Trusts then existing (“Funds”) at an in-person meeting held on December 8, 2008. At that meeting, as well as at the regular meeting of the Board held on March 30, 2009, the Independent Trustees also reviewed and approved short-term extensions to the Sub-Advisory Agreement between the HSBC Global Asset Management (USA) Inc. (“Adviser”) and Halbis with respect to the HSBC Investor Core Plus Fixed Income Fund, HSBC Investor High Yield Fixed Income Fund, HSBC Investor Intermediate Duration Fixed Income Fund, and the HSBC Investor New York-Tax Free Bond Fund (the “Fixed Income Funds”) (the Investment Advisory Agreements and Sub-Advisory Agreements are collectively referred to as the “Agreements”). |
| |
| In determining whether it was appropriate to approve the Agreements for the Funds, the Independent Trustees requested information from the Adviser and the various subadvisers that they believed to be reasonably necessary to reach their conclusion. In an Executive Session, the Independent Trustees carefully evaluated this information, and were advised by independent legal counsel with respect to their deliberations. Based on their review of the information requested and provided for each Fund, the Independent Trustees determined that the relevant Agreements were consistent with the best interests of the Funds and their shareholders, and enabled the Funds to receive high quality services at a cost that is appropriate and reasonable. The Independent Trustees, along with the entire Board of Trustees, made these determinations on the basis of the following considerations, among others: |
| | |
| | Nature, Extent, and Quality of Services Provided by Adviser and Sub-Advisers. The Trustees considered the nature, quality and extent of the investment advisory services provided by the Adviser (and, as applicable, the subadvisers), in light of the high quality services provided to the Funds, and each Fund’s historic performance. The Trustees considered the commitment of the Adviser to the successful operations of the Funds. The Trustees considered the historical performance of the Funds and the level of expenses of the Funds. With respect to the equity Funds, the Trustees considered the capabilities and performance of the Adviser’s Multimanager unit. The Trustees also considered the use of expense limitation agreements in order to reduce the overall operating expenses of certain Funds. The Trustees also took note of the long term relationship between the Adviser and the Funds and the efforts undertaken by the Adviser to foster the growth and development of the Funds since the inception of each of the Funds. For the Fixed Income Funds, the Independent Trustees also considered the Adviser’s and Halbis’ plans for the Fixed Income Funds. The Trustees also considered the extent to which the Adviser and investment Sub-Advisers had achieved economies of scale and the extent to which shareholders benefited from those economies of scale. |
| | |
| | Investment Performance of the Funds, Adviser and Sub-Advisers. The Trustees considered short-term and long-term investment performance of each Fund over various periods of time as compared to a peer group of comparable funds. The Trustees took note of performance information for one, three and five year periods and since inception as relevant. In addition, the Trustees compared expenses of each Fund to the expenses of its peers, noting that the expenses for each of the Funds compare favorably with industry averages for other funds of similar size. |
| | |
| | Costs of Services and Profits Realized by the Adviser. The Trustees considered the Adviser’s overall profitability and costs and an analysis of the estimated profitability to the Adviser from its relationship with the Funds. The Trustees considered that the advisory fees under the Agreements were within the range of those of similar funds, noting the high level of resource, expertise and experience that was provided to the Funds by the Adviser and Sub-Advisers. The Trustees concluded that the combined advisory fees payable to the Adviser and the Funds’ Sub-Advisers are fair and reasonable in light of the services to be provided, the anticipated costs of these services, the profitability of the Adviser’s relationship with the Funds, and the comparability of the advisory fee to similar fees paid by comparable mutual funds. |
| | |
| | Other Relevant Considerations. The Independent Trustees also considered the overall high quality of the personnel, operations, financial condition, investment management capabilities, methodologies, and performance of the Adviser and Sub-Advisers. The Trustees also noted the range of investment advisory and administrative services provided by the Adviser to the Funds and the level and quality of these services, in particular the quality of the personnel providing these services. In addition, the Trustees considered the overall favorable investment performance of the Funds. |
| | |
| Accordingly, in light of the above considerations and such other factors and information it considered relevant, the Board of Trustees by a unanimous vote of those present in person at the meetings (including a separate vote of the Independent Trustees present in person at the meetings), approved the Agreements. |
| |
67 | HSBC INVESTOR FAMILY OF FUNDS |
|
HSBC INVESTOR FAMILY OF FUNDS |
|
|
Table of Shareholders Expenses (Unaudited)—as of April 30, 2009 |
| |
| As a shareholder of the HSBC Investor Funds (“Funds”), you incur two types of costs: (1) transaction costs, including sales charges (loads) on purchases, redemption fees and exchange fees, (2) ongoing costs, including management fees; distribution and /or shareholder servicing fees; and other Fund expenses. These examples are intended to help you understand your ongoing costs (in dollars) of investing in the Funds and to compare these cost with the ongoing costs of investing in other mutual funds. |
| |
| These examples are based on an investment of $1,000 invested at the beginning of the period and held for the entire period from November 1, 2008 through April 30, 2009. |
| |
| Actual Example |
| |
| The table below provides information about actual account values and actual expenses. You may use the information below, together with the amount you invested, to estimate the expenses that you paid over the period. Simply divide your account value by $1,000 (for example, an $8,600 account value divided by $1,000 = 8.6), then multiply the result by the number in the table under the heading entitled “Expenses Paid During Period” to estimate the expenses you paid on your account during this period. |
| | | | | | | | | | | | | | | | | |
| | | | Beginning
Account Value
11/1/08 | | Ending
Account
Value
4/30/09 | | Expenses Paid
During Period*
11/1/08 - 4/30/09 | | Annualized
Expense Ratio
During Period
11/1/08 - 4/30/09 | |
| | | |
| |
| |
| |
| |
Core Plus Fixed Income Fund
(I Shares) | | Class I Shares | | $ | 1,000.00 | | $ | 1,061.00 | | | $ | 2.30 | | | 0.45 | % | |
Core Plus Fixed
Income Fund | | Class A Shares | | | 1,000.00 | | | 1,059.90 | | | | 3.58 | | | 0.70 | % | |
| | Class B Shares | | | 1,000.00 | | | 1,055.90 | | | | 7.39 | | | 1.45 | % | |
| | Class C Shares | | | 1,000.00 | | | 1,056.10 | | | | 7.39 | | | 1.45 | % | |
Intermediate Duration Fixed
Income Fund | | Class A Shares | | | 1,000.00 | | | 1,055.30 | | | | 3.31 | | | 0.65 | % | |
| | Class B Shares | | | 1,000.00 | | | 1,051.20 | | | | 7.12 | | | 1.40 | % | |
| | Class C Shares | | | 1,000.00 | | | 1,051.30 | | | | 7.12 | | | 1.40 | % | |
| | Class I Shares | | | 1,000.00 | | | 1,056.40 | | | | 2.04 | | | 0.40 | % | |
New York Tax-Free Bond Fund | | Class A Shares | | | 1,000.00 | | | 1,067.30 | | | | 4.77 | | | 0.93 | % | |
| | Class B Shares | | | 1,000.00 | | | 1,063.50 | | | | 8.54 | | | 1.67 | % | |
| | Class C Shares | | | 1,000.00 | | | 1,062.20 | | | | 8.59 | | | 1.68 | % | |
| | Class I Shares | | | 1,000.00 | | | 1,068.60 | | | | 3.49 | | | 0.68 | % | |
Growth Fund | | Class A Shares | | | 1,000.00 | | | 1,019.00 | | | | 6.01 | | | 1.20 | % | |
| | Class B Shares | | | 1,000.00 | | | 1,014.20 | | | | 9.74 | | | 1.95 | % | |
| | Class C Shares | | | 1,000.00 | | | 1,014.10 | | | | 9.74 | | | 1.95 | % | |
| | Class I Shares | | | 1,000.00 | | | 1,019.80 | | | | 4.76 | | | 0.95 | % | |
International Equity Fund | | Class I Shares | | | 1,000.00 | | | 956.10 | | | | 5.09 | | | 1.05 | % | |
Mid-Cap Fund | | Class A Shares | | | 1,000.00 | | | 980.90 | | | | 6.63 | | | 1.35 | % | |
| | Class B Shares | | | 1,000.00 | | | 978.90 | | | | 10.30 | | | 2.10 | % | |
| | Class C Shares | | | 1,000.00 | | | 979.10 | | | | 10.30 | | | 2.10 | % | |
| | Class I Shares | | | 1,000.00 | | | 983.10 | | | | 5.41 | | | 1.10 | % | |
| |
HSBC INVESTOR FAMILY OF FUNDS | 68 |
|
HSBC INVESTOR FAMILY OF FUNDS |
|
|
Table of Shareholders Expenses (Unaudited)—as of April 30, 2009 |
| | | | | | | | | | | | | | |
| | | | Beginning
Account Value
11/1/08 | | Ending
Account
Value
4/30/09 | | Expenses Paid
During Period*
11/1/08 - 4/30/09 | | Annualized
Expense Ratio
During Period
11/1/08 - 4/30/09 | |
| | | |
| |
| |
| |
| |
Opportunity Fund | | Class A Shares | | 1,000.00 | | | 960.10 | | 7.53 | | | 1.55 | % | |
| | Class B Shares | | 1,000.00 | | | 956.80 | | 11.16 | | | 2.30 | % | |
| | Class C Shares | | 1,000.00 | | | 955.90 | | 11.15 | | | 2.30 | % | |
Opportunity Fund (I Shares) | | Class I Shares | | 1,000.00 | | | 962.80 | | 5.16 | | | 1.06 | % | |
Overseas Equity Fund | | Class A Shares | | 1,000.00 | | | 952.60 | | 8.23 | | | 1.70 | % | |
| | Class B Shares | | 1,000.00 | | | 949.30 | | 11.84 | | | 2.45 | % | |
| | Class C Shares | | 1,000.00 | | | 948.60 | | 11.84 | | | 2.45 | % | |
Value Fund | | Class A Shares | | 1,000.00 | | | 951.90 | | 5.81 | | | 1.20 | % | |
| | Class B Shares | | 1,000.00 | | | 947.30 | | 9.42 | | | 1.95 | % | |
| | Class C Shares | | 1,000.00 | | | 946.90 | | 9.41 | | | 1.95 | % | |
| | Class I Shares | | 1,000.00 | | | 952.10 | | 4.60 | | | 0.95 | % | |
| |
|
* | Expenses are equal to the average account value over the period multiplied by the Fund’s annualized expense ratio, multiplied by the number of days in the most recent fiscal half-year divided by the number of days in the fiscal year (to reflect the one half year period). |
| |
69 | HSBC INVESTOR FAMILY OF FUNDS |
|
HSBC INVESTOR FAMILY OF FUNDS |
|
|
Table of Shareholders Expenses (Unaudited)—as of April 30, 2009 (continued) |
Hypothetical Example for Comparison Purposes
The table below provides information about hypothetical account values and hypothetical expenses based on each Fund’s actual expense ratio and an assumed rate of return of 5% per year before expenses, which is not the Fund’s actual return. The hypothetical account values and expenses may not be used to estimate the actual ending account balance or expenses you paid for the period. You may use this information to compare this 5% hypothetical example with the 5% hypothetical examples that appear in the shareholder reports of other funds.
Please note that the expenses shown in the table are meant to highlight your ongoing costs only and do not reflect any transactional costs, such as sales charges (loads), redemption fees, or exchange fees. Therefore, the table is useful in comparing ongoing costs only, and will not help you determine the relative total costs of owning different funds. In addition, if these transactional costs were included, your costs would have been higher.
| | | | | | | | | | | | | | | | | | | |
| | | | Beginning
Account Value
11/1/08 | | Ending
Account
Value
4/30/09 | | Expenses Paid
During Period*
11/1/08 - 4/30/09 | | Annualized
Expense Ratio
During Period
11/1/08 - 4/30/09 | |
| | | |
| |
| |
| |
| |
Core Plus Fixed Income Fund
(I Shares) | | Class I Shares | | | $ | 1,000.00 | | | $ | 1,022.56 | | | $ | 2.26 | | | 0.45 | % | |
Core Plus Fixed Income Fund | | Class A Shares | | | | 1,000.00 | | | | 1,021.32 | | | | 3.51 | | | 0.70 | % | |
| | Class B Shares | | | | 1,000.00 | | | | 1,017.60 | | | | 7.25 | | | 1.45 | % | |
| | Class C Shares | | | | 1,000.00 | | | | 1,017.60 | | | | 7.25 | | | 1.45 | % | |
Intermediate Duration Fixed
Income Fund | | Class A Shares | | | | 1,000.00 | | | | 1,021.57 | | | | 3.26 | | | 0.65 | % | |
| | Class B Shares | | | | 1,000.00 | | | | 1,017.85 | | | | 7.00 | | | 1.40 | % | |
| | Class C Shares | | | | 1,000.00 | | | | 1,017.85 | | | | 7.00 | | | 1.40 | % | |
| | Class I Shares | | | | 1,000.00 | | | | 1,022.81 | | | | 2.01 | | | 0.40 | % | |
New York Tax-Free Bond Fund | | Class A Shares | | | | 1,000.00 | | | | 1,020.18 | | | | 4.66 | | | 0.93 | % | |
| | Class B Shares | | | | 1,000.00 | | | | 1,016.51 | | | | 8.35 | | | 1.67 | % | |
| | Class C Shares | | | | 1,000.00 | | | | 1,016.46 | | | | 8.40 | | | 1.68 | % | |
| | Class I Shares | | | | 1,000.00 | | | | 1,021.42 | | | | 3.41 | | | 0.68 | % | |
Growth Fund | | Class A Shares | | | | 1,000.00 | | | | 1,018.84 | | | | 6.01 | | | 1.20 | % | |
| | Class B Shares | | | | 1,000.00 | | | | 1,015.12 | | | | 9.74 | | | 1.95 | % | |
| | Class C Shares | | | | 1,000.00 | | | | 1,015.12 | | | | 9.74 | | | 1.95 | % | |
| | Class I Shares | | | | 1,000.00 | | | | 1,020.08 | | | | 4.76 | | | 0.95 | % | |
International Equity Fund | | Class I Shares | | | | 1,000.00 | | | | 1,019.59 | | | | 5.26 | | | 1.05 | % | |
Mid-Cap Fund | | Class A Shares | | | | 1,000.00 | | | | 1,018.10 | | | | 6.76 | | | 1.35 | % | |
| | Class B Shares | | | | 1,000.00 | | | | 1,014.38 | | | | 10.49 | | | 2.10 | % | |
| | Class C Shares | | | | 1,000.00 | | | | 1,014.38 | | | | 10.49 | | | 2.10 | % | |
| | Class I Shares | | | | 1,000.00 | | | | 1,019.34 | | | | 5.51 | | | 1.10 | % | |
Opportunity Fund | | Class A Shares | | | | 1,000.00 | | | | 1,017.11 | | | | 7.75 | | | 1.55 | % | |
| | Class B Shares | | | | 1,000.00 | | | | 1,013.39 | | | | 11.48 | | | 2.30 | % | |
| | Class C Shares | | | | 1,000.00 | | | | 1,013.39 | | | | 11.48 | | | 2.30 | % | |
Opportunity Fund (I Shares) | | Class I Shares | | | | 1,000.00 | | | | 1,019.54 | | | | 5.31 | | | 1.06 | % | |
Overseas Equity Fund | | Class A Shares | | | | 1,000.00 | | | | 1,016.36 | | | | 8.50 | | | 1.70 | % | |
| | Class B Shares | | | | 1,000.00 | | | | 1,012.65 | | | | 12.23 | | | 2.45 | % | |
| | Class C Shares | | | | 1,000.00 | | | | 1,012.65 | | | | 12.23 | | | 2.45 | % | |
Value Fund | | Class A Shares | | | | 1,000.00 | | | | 1,018.84 | | | | 6.01 | | | 1.20 | % | |
| | Class B Shares | | | | 1,000.00 | | | | 1,015.12 | | | | 9.74 | | | 1.95 | % | |
| | Class C Shares | | | | 1,000.00 | | | | 1,015.12 | | | | 9.74 | | | 1.95 | % | |
| | Class I Shares | | | | 1,000.00 | | | | 1,020.08 | | | | 4.76 | | | 0.95 | % | |
| |
|
* | Expenses are equal to the average account value over the period multiplied by the Fund’s annualized expense ratio, multiplied by the number of days in the most recent fiscal half-year divided by the number of days in the fiscal year (to reflect the one half year period). |
| |
HSBC INVESTOR FAMILY OF FUNDS | 70 |
|
HSBC INVESTOR CORE PLUS FIXED INCOME PORTFOLIO |
|
|
Schedule of Portfolio Investments—as of April 30, 2009 (Unaudited) |
| | | | | | | |
Certificates of Deposit—0.2% |
|
| | | | | | | |
| | Principal
Amount($) | | Value($) | |
| |
| |
| |
Banking – 0.2% | | | | | | | |
First Tennessee Bank, 1.46%, 12/17/09 (a) | | | 100,000 | | | 99,507 | |
| | | | |
|
| |
TOTAL CERTIFICATES OF DEPOSIT
(COST $97,149) | | | | | | 99,507 | |
| | | | |
|
| |
U.S. Government and Government Agency Obligations—49.3% |
|
Federal Home Loan Mortgage Corp. – 5.3% | | | | | |
Pool #1B2655, 4.96%, 12/1/34 (a)(h) | | | 382,161 | | | 391,497 | |
Pool #1J1313, 6.34%, 6/1/36 (a) | | | 983,117 | | | 1,014,181 | |
Pool #847557, 4.41%, 7/1/34 (a)(h) | | | 541,992 | | | 549,783 | |
Pool #C00368, 8.50%, 10/1/24 | | | 23,119 | | | 25,355 | |
Pool #C00922, 8.00%, 2/1/30 | | | 138,704 | | | 152,195 | |
Pool #C54447, 7.00%, 7/1/31 | | | 25,275 | | | 27,111 | |
Pool #C60712, 6.50%, 11/1/31 | | | 439,261 | | | 470,497 | |
Pool #C80387, 6.50%, 4/1/26 | | | 21,248 | | | 22,799 | |
Pool #D62926, 6.50%, 8/1/25 | | | 18,636 | | | 19,979 | |
Pool #G01317, 7.00%, 10/1/31 | | | 103,172 | | | 110,666 | |
Pool #G02981, 6.00%, 6/1/37 | | | 884,805 | | | 924,569 | |
| | | | |
|
| |
| | | | | | 3,708,632 | |
| | | | |
|
| |
Federal National Mortgage Association – 39.3% | | | |
Pool #253438, 8.50%, 9/1/30 | | | 27,567 | | | 30,159 | |
Pool #256723, 6.50%, 5/1/37 | | | 885,426 | | | 939,346 | |
Pool #329530, 7.00%, 12/1/25 | | | 45,795 | | | 49,666 | |
Pool #329655, 7.00%, 11/1/25 | | | 7,011 | | | 7,604 | |
Pool #356905, 5.13%, 10/1/36 (a) | | | 138,656 | | | 141,245 | |
Pool #398958, 6.50%, 10/1/12 | | | 16,626 | | | 17,579 | |
Pool #535332, 8.50%, 4/1/30 | | | 32,053 | | | 35,048 | |
Pool #535440, 8.50%, 8/1/30 | | | 36,405 | | | 39,827 | |
Pool #548965, 8.50%, 7/1/30 | | | 35,223 | | | 38,534 | |
Pool #568486, 7.00%, 1/1/31 | | | 37,580 | | | 40,558 | |
Pool #573752, 8.50%, 2/1/31 | | | 26,969 | | | 29,504 | |
Pool #575328, 6.50%, 4/1/31 | | | 47,454 | | | 50,903 | |
Pool #922090, 5.91%, 3/1/37 (a) | | | 1,107,779 | | | 1,159,723 | |
TBA May, 5.50%, 5/12/39 | | | 13,655,000 | | | 14,145,733 | |
TBA June | | | | | | | |
5.50%, 6/18/16 | | | 5,750,000 | | | 5,972,812 | |
5.00%, 6/11/39 | | | 4,500,000 | | | 4,615,313 | |
| | | | |
|
| |
| | | | | | 27,313,554 | |
| | | | |
|
| |
Government National Mortgage Association – 0.3% | | | |
Pool #346406, 7.50%, 2/15/23 | | | 39,834 | | | 43,084 | |
Pool #412530, 7.50%, 12/15/25 | | | 61,981 | | | 66,930 | |
Pool #781300, 7.00%, 6/15/31 | | | 101,933 | | | 109,545 | |
| | | | |
|
| |
| | | | | | 219,559 | |
| | | | |
|
| |
U.S. Treasury Bonds – 3.3% | | | | | | | |
5.00%, 5/15/37 | | | 1,685,000 | | | 1,945,122 | |
4.50%, 5/15/38 | | | 300,000 | | | 322,828 | |
| | | | |
|
| |
| | | | | | 2,267,950 | |
| | | | |
|
| |
U.S. Treasury Notes – 1.1% | | | | | | | |
4.00%, 8/15/18 | | | 715,000 | | | 767,061 | |
| | | | |
|
| |
TOTAL U.S. GOVERNMENT AND
GOVERNMENT AGENCY
OBLIGATIONS (COST $33,967,738) | | | | | | 34,276,756 | |
| | | | |
|
| |
| | | | | | | |
Corporate Obligations—39.8% |
|
| | | | | | | |
| | Principal
Amount($) | | Value($) | |
| |
| |
| |
Agricultural Chemicals – 1.6% | | | | | | | |
Agrium, Inc., 6.75%, 1/15/19 | | | 600,000 | | | 546,066 | |
Cargill, Inc., 5.60%, 9/15/12 (b) | | | 600,000 | | | 594,287 | |
| | | | |
|
| |
| | | | | | 1,140,353 | |
| | | | |
|
| |
Banking – 0.9% | | | | | | | |
American Express Centurion Bank,
5.95%, 6/12/17 | | | 700,000 | | | 599,626 | |
| | | | |
|
| |
Building & Construction Products – 1.6% | | | | | | | |
Martin Marietta Materials, Inc.,
1.19%, 4/30/10 (a)(h) | | | 600,000 | | | 573,450 | |
Masco Corp., 1.63%, 3/12/10 (a)(h) | | | 550,000 | | | 524,300 | |
| | | | |
|
| |
| | | | | | 1,097,750 | |
| | | | |
|
| |
Cable Television – 0.9% | | | | | | | |
Time Warner Cable, Inc., 7.30%, 7/1/38 | | | 625,000 | | | 624,762 | |
| | | | |
|
| |
Computer Services – 1.1% | | | | | | | |
Electronic Data Systems, Series B,
6.00%, 8/1/13 | | | 700,000 | | | 748,689 | |
| | | | |
|
| |
Consumer Products – 1.4% | | | | | | | |
Clorox Co. (The), 5.45%, 10/15/12 | | | 900,000 | | | 942,021 | |
| | | | |
|
| |
Electric – 5.2% | | | | | | | |
Commonwealth Edison Co.,
6.45%, 1/15/38 | | | 700,000 | | | 624,840 | |
Dominion Resources, Inc., 6.40%, 6/15/18 | | | 250,000 | | | 258,266 | |
Duke Energy Corp., 5.65%, 6/15/13 | | | 450,000 | | | 462,555 | |
MidAmerican Energy Co., 5.95%, 7/15/17 | | | 1,900,000 | | | 1,965,236 | |
Puget Sound Energy, Inc., 6.97%, 6/1/67,
Callable 6/1/17 @ 100 | | | 600,000 | | | 313,500 | |
| | | | |
|
| |
| | | | | | 3,624,397 | |
| | | | |
|
| |
Finance – 9.7% | | | | | | | |
American Honda Finance Corp.,
4.63%, 4/2/13, MTN (b) | | | 250,000 | | | 223,445 | |
Bear Stearns Co., Inc., 4.50%, 10/28/10 | | | 600,000 | | | 605,533 | |
Bear Stearns Co., Inc., Series B,
6.95%, 8/10/12, MTN | | | 950,000 | | | 1,000,171 | |
Citigroup, Inc., 6.50%, 8/19/13 | | | 225,000 | | | 205,336 | |
Countrywide Home Loans, Series L,
4.00%, 3/22/11, MTN | | | 1,150,000 | | | 1,078,238 | |
Ford Motor Credit Co., LLC,
9.75%, 9/15/10 | | | 750,000 | | | 675,033 | |
General Electric Capital Corp.,
5.63%, 5/1/18 | | | 400,000 | | | 348,974 | |
Lehman Brothers Holdings, Series I,
0.00%, 5/2/18, MTN (c)(d) | | | 500,000 | | | 74,375 | |
Morgan Stanley, Series F,
6.00%, 4/28/15, MTN | | | 565,000 | | | 533,707 | |
Preferred Term Securities Ltd., 8.79%,
9/15/30, Callable 9/15/10 @ 104.395 (b) | | | 741,202 | | | 392,837 | |
Wells Fargo Financial, 5.50%, 8/1/12 | | | 850,000 | | | 846,303 | |
XTRA Finance Corp., 5.15%, 4/1/17 | | | 750,000 | | | 727,693 | |
| | | | |
|
| |
| | | | | | 6,711,645 | |
| | | | |
|
| |
Forestry/Paper – 0.3% | | | | | | | |
Georgia-Pacific Corp., 7.70%, 6/15/15 | | | 250,000 | | | 235,000 | |
| | | | |
|
| |
| | |
71 | HSBC INVESTOR PORTFOLIOS | See notes to financial statements. |
|
HSBC INVESTOR CORE PLUS FIXED INCOME PORTFOLIO |
|
|
Schedule of Portfolio Investments—as of April 30, 2009 (Unaudited) (continued) |
| | | | | | | |
Corporate Obligations, continued |
|
| | | | | | | |
| | Principal
Amount($) | | Value($) | |
| |
| |
| |
Health Services – 0.2% | | | | | | | |
Community Health Systems, Inc., 8.88%,
7/15/15, Callable 7/15/11 @ 104.44 | | | 175,000 | | | 174,125 | |
| | | | |
|
| |
Hospitals – 1.7% | | | | | | | |
Covidien International Finance SA,
5.45%, 10/15/12 | | | 550,000 | | | 570,908 | |
HCA, Inc., 5.75%, 3/15/14 | | | 750,000 | | | 592,500 | |
| | | | |
|
| |
| | | | | | 1,163,408 | |
| | | | |
|
| |
Media – 1.0% | | | | | | | |
News America Holdings, 7.90%, 12/1/95 | | | 500,000 | | | 392,997 | |
Vivendi, 5.75%, 4/4/13 (b) | | | 350,000 | | | 335,324 | |
| | | | |
|
| |
| | | | | | 728,321 | |
| | | | |
|
| |
Media - Cable – 0.2% | | | | | | | |
Cablevision Systems Corp., Series B,
8.00%, 4/15/12 | | | 175,000 | | | 174,125 | |
| | | | |
|
| |
Office Equipment & Services – 0.8% | | | | | | | |
Xerox Corp., 2.06%, 12/18/09 (a)(h) | | | 550,000 | | | 536,810 | |
| | | | |
|
| |
Oil & Gas – 0.2% | | | | | | | |
Pioneer Natural Resources Co.,
5.88%, 7/15/16 | | | 175,000 | | | 145,048 | |
| | | | |
|
| |
Pipelines – 0.8% | | | | | | | |
Dynegy Holdings, Inc., 7.75%, 6/1/19 | | | 175,000 | | | 128,625 | |
Transcontinental Gas Pipeline Corp.,
6.05%, 6/15/18 | | | 450,000 | | | 417,969 | |
| | | | |
|
| |
| | | | | | 546,594 | |
| | | | |
|
| |
Retail – 1.1% | | | | | | | |
Kohl’s Corp., 6.25%, 12/15/17 | | | 550,000 | | | 531,516 | |
Kroger Co. (The), 5.00%, 4/15/13 | | | 250,000 | | | 252,488 | |
| | | | |
|
| |
| | | | | | 784,004 | |
| | | | |
|
| |
Support - Services – 0.5% | | | | | | | |
Aramark Services, Inc., 8.50%,
2/1/15, Callable 2/1/11 @ 104.25 | | | 175,000 | | | 167,125 | |
Iron Mountain, Inc., 8.00%,
6/15/20, Callable 6/15/13 @ 104 | | | 175,000 | | | 168,875 | |
| | | | |
|
| |
| | | | | | 336,000 | |
| | | | |
|
| |
Telecom - Integrated/Services – 0.2% | | | | | | | |
Qwest Corp., 7.63%, 6/15/15 | | | 175,000 | | | 165,813 | |
| | | | |
|
| |
Telecommunications – 3.9% | | | | | | | |
AOL Time Warner, Inc. | | | | | | | |
6.88%, 5/1/12 | | | 600,000 | | | 631,026 | |
7.70%, 5/1/32 | | | 550,000 | | | 500,638 | |
GTE Corp., 6.84%, 4/15/18 | | | 750,000 | | | 753,238 | |
Time Warner Entertainment Co.,
8.38%, 3/15/23 | | | 800,000 | | | 821,215 | |
| | | | |
|
| |
| | | | | | 2,706,117 | |
| | | | |
|
| |
Transportation – 6.5% | | | | | | | |
American Airlines, Inc., Series 2001-2 | | | | | | | |
Class A1, 6.98%, 4/1/11 | | | 369,844 | | | 338,407 | |
Class A2, 7.86%, 10/1/11 | | | 1,250,000 | | | 1,037,500 | |
Burlington North Santa Fe, 7.57%, 1/2/21 | | | 261,280 | | | 267,224 | |
| | | | | | | |
Corporate Obligations, continued |
|
| | | | | | | |
| | Principal
Amount($) | | Value($) | |
| |
| |
| |
Transportation, continued | | | | | | | |
Continental Airlines, Inc., 5.98%, 4/19/22 | | | 750,000 | | | 592,500 | |
Union Pacific Corp. | | | | | | | |
5.75%, 11/15/17 | | | 1,200,000 | | | 1,155,888 | |
6.85%, 1/2/19 | | | 1,038,106 | | | 1,102,977 | |
| | | | |
|
| |
| | | | | | 4,494,496 | |
| | | | |
|
| |
TOTAL CORPORATE OBLIGATIONS
(COST $30,220,122) | | | | | | 27,679,104 | |
| | | | |
|
| |
Asset Backed Securities—16.5% |
|
Asset Backed Funding Certificates,
Series 2003-AHL1, Class A1,
3.68%, 3/25/33 | | | 738,743 | | | 386,043 | |
Cairn Mezzanine plc, Series 2007-3A,
Class B1, 2.13%, 8/13/47 (a)(b) | | | 905,000 | | | 0 | |
Capital Auto Receivables Asset Trust | | | | | | | |
Series 2006-SN1A, Class A4B,
0.56%, 3/20/10 (a)(b) | | | 376,167 | | | 373,524 | |
Series 2007-SN1, Class A3A,
5.47%, 7/15/10 (h) | | | 416,899 | | | 410,283 | |
Series 2007-SN1, Class A3B,
0.51%, 7/15/10 (a)(h) | | | 484,505 | | | 472,418 | |
Capital One Prime Auto Receivables Trust | | | | | | | |
Series 2005-1, Class A4,
0.47%, 4/15/11 (a)(h) | | | 239,168 | | | 236,534 | |
Series 2006-1, Class A3,
4.99%, 9/15/10 (b)(h) | | | 110,553 | | | 110,744 | |
Carmax Auto Owner Trust,
Series 2008-2, Class A2B,
1.35%, 9/15/11 (a)(h) | | | 1,251,645 | | | 1,245,440 | |
Countrywide Asset-Backed Certificates | | | | | | | |
Series 2006-S2, Class A5,
5.75%, 7/25/27 (a) | | | 994,380 | | | 299,209 | |
Series 2006-S4, Class A3,
5.80%, 7/25/34 | | | 1,021,754 | | | 332,382 | |
Dominos Pizza Master Issuer LLC,
Series 2007-1, Class A2,
5.26%, 4/25/37 (b) | | | 1,200,000 | | | 646,555 | |
Duane Street CLO, Series 2007-4A,
Class C, 2.23%, 11/14/21 (a)(b) | | | 850,000 | | | 68,000 | |
GE Business Loan Trust, Series 2006-2A,
Class A, 0.63%, 11/15/34 (a)(b)(h) | | | 1,340,071 | | | 855,351 | |
GMAC Mortgage Corp., Loan Trust,
Series 2006-HE3, Class A3,
5.81%, 10/25/36 | | | 900,000 | | | 269,559 | |
Hyundai Auto Receivables Trust,
Series 2008-A, Class A2,
4.16%, 5/16/11 (h) | | | 915,578 | | | 923,974 | |
National Collegiate Student Loan Trust,
Series 2006-3, Class A1,
0.47%, 9/25/19 (a)(h) | | | 408,375 | | | 391,839 | |
Preferred Term Securities XXII Ltd.,
1.66%, 9/22/36, Callable
6/22/11 @ 100 (a)(b)(h) | | | 1,062,623 | | | 329,413 | |
Residential Funding Mortgage Securities,
Series 2006-HSA1, Class A5,
5.31%, 2/25/36 | | | 474,293 | | | 139,945 | |
| | |
See notes to financial statements. | HSBC INVESTOR PORTFOLIOS | 72 |
|
HSBC INVESTOR CORE PLUS FIXED INCOME PORTFOLIO |
|
|
Schedule of Portfolio Investments—as of April 30, 2009 (Unaudited) (continued) |
| | | | | | | |
Asset Backed Securities, continued |
|
| | | | | | | |
| | Principal
Amount($) | | Value($) | |
| |
| |
| |
SLM Student Loan Trust | | | | | | | |
Series 2005-4, Class A2,
1.24%, 4/26/21 (a)(h) | | | 490,000 | | | 476,542 | |
Series 2005-9, Class A4,
1.26%, 1/25/23 (a)(h) | | | 1,360,000 | | | 1,331,783 | |
Series 2006-7, Class A2,
1.15%, 10/25/16 (a)(h) | | | 326,568 | | | 326,170 | |
Series 2006-9, Class A2,
1.16%, 4/25/17 (a)(h) | | | 208,721 | | | 207,761 | |
Series 2006-B, Class A1,
1.33%, 9/15/20 (a)(h) | | | 942,875 | | | 896,632 | |
South Carolina Student Loan Corp.,
Series 2008-1, Class A1,
1.76%, 9/2/14 (a) | | | 718,648 | | | 709,737 | |
| | | | |
|
| |
TOTAL ASSET BACKED SECURITIES
(COST $16,711,903) | | | | | | 11,439,838 | |
| | | | |
|
| |
Collateralized Mortgage Obligations—6.1% |
|
Banc of America Mortgage Securities,
Series 2005-D, Class 2A4,
4.79%, 5/25/35 (a)(h) | | | 767,738 | | | 724,925 | |
Deutsche Mortgage Securities, Inc.,
Series 2006-WF1, Class 1A1,
5.10%, 6/26/35 (a)(b) | | | 629,341 | | | 625,743 | |
Fannie Mae IO | | | | | | | |
Series 270, Class 2, 8.50%, 9/1/23 (e) | | | 34,703 | | | 5,896 | |
Series 296, Class 2, 8.00%, 4/1/24 (e) | | | 41,477 | | | 6,904 | |
Series 306, Class IO, 8.00%, 5/1/30 (e) | | | 50,438 | | | 7,368 | |
Series 2000-16, Class PS,
8.16%, 10/25/29 (a) | | | 21,735 | | | 856 | |
Series 2001-4, Class SA,
7.10%, 2/17/31 (a) | | | 158,614 | | | 14,248 | |
FHA Weyerhauser, 7.43%, 1/1/24 (g)(i) | | | 25,711 | | | 25,711 | |
Freddie Mac | | | | | | | |
Series 2988, Class AF, 0.75%, 6/15/35 (a)(h) | | | 922,891 | | | 903,503 | |
Series 3212, Class BK, 5.40%, 9/15/36 | | | 900,000 | | | 945,939 | |
Freddie Mac IO | | | | | | | |
Series 1534, Class K, 6.90%, 6/15/23 (a) | | | 110,136 | | | 12,420 | |
Series 2141, Class SD, 7.70%, 4/15/29 (a) | | | 90,678 | | | 9,944 | |
Series 2247, Class SC, 7.05%, 8/15/30 (a) | | | 46,250 | | | 4,064 | |
Government National Mortgage Association IO | | | | | | | |
Series 1999-30, Class S,
8.15%, 8/16/29 (a) | | | 40,958 | | | 4,326 | |
Series 1999-30, Class SA,
7.55%, 4/16/29 (a) | | | 55,284 | | | 4,257 | |
Residential Asset Securitization Trust,
Series 2003-A15, Class 1A2,
0.89%, 2/25/34 (a)(h) | | | 1,177,046 | | | 963,170 | |
| | | | |
|
| |
TOTAL COLLATERALIZED MORTAGE
OBLIGATIONS (COST $4,416,075) | | | | | | 4,259,274 | |
| | | | |
|
| |
Commercial Mortgage Backed Securities—9.0% |
|
Citigroup Commercial Mortgage Trust,
Series 2006-C5, Class A2,
5.38%, 10/15/49 | | | 1,100,000 | | | 997,929 | |
Commercial Mortgage Pass-Through Certificate,
Series 2006-FL12, Class A2,
0.55%, 12/15/20 (a)(b)(h) | | | 1,422,841 | | | 996,926 | |
| | | | | | | |
Commercial Mortgage Backed Securities, continued |
|
| | | | | | | |
| | Shares or
Principal
Amount($) | | Value($) | |
| |
| |
| |
CWCapital Cobalt,
Series 2006-C1, Class A2,
5.17%, 8/15/48 | | | 1,232,000 | | | 1,086,906 | |
DLJ Mortgage Acceptance Corp., IO,
Series 1997-CF1, Class S,
1.20%, 5/15/30 (a)(b)(e)(g) | | | 16,850 | | | 1 | |
Greenwich Capital Commercial Funding Corp. | | | | | | | |
Series 2006-GG7, Class A2,
6.03%, 7/10/38 (a) | | | 640,000 | | | 598,744 | |
Series 2006-GG7, Class A4,
6.11%, 7/10/38 (a) | | | 1,040,000 | | | 869,400 | |
GS Mortgage Securities Corp., IO,
Series 1997-GL, Class X2,
0.29%, 7/13/30 (a)(e)(g) | | | 35,251 | | | 373 | |
Morgan Stanley Capital I, Series 2007-IQ14,
Class A2, 5.61%, 4/15/49 | | | 1,380,000 | | | 1,199,206 | |
Washington Mutual Commercial
Mortgage Securities Trust,
Series 2006-SL1, Class A,
5.42%, 11/23/43 (a)(b) | | | 935,175 | | | 514,346 | |
| | | | |
|
| |
TOTAL COMMERCIAL MORTGAGE
BACKED SECURITIES
(COST $7,760,066) | | | | | | 6,263,831 | |
| | | | |
|
| |
Foreign Bonds—0.5% |
|
United Kingdom – 0.5% | | | | | | | |
Barclays Bank plc, 5.93%, 12/31/49 (b) | | | 850,000 | | | 339,643 | |
| | | | |
|
| |
TOTAL FOREIGN BONDS
(COST $861,568) | | | | | | 339,643 | |
| | | | |
|
| |
Municipal Bonds—2.2% |
|
Chicago Transit Authority Sales & Transfer
Tax Receipts Revenue, Series A,
6.90%, 12/1/40, AMT | | | 800,000 | | | 799,488 | |
Connecticut State, GO, Series B,
5.00%, 4/15/18 | | | 650,000 | | | 756,294 | |
| | | | |
|
| |
TOTAL MUNICIPAL BONDS
(COST $1,498,995) | | | | | | 1,555,782 | |
| | | | |
|
| |
Investment Company—11.1% |
|
Northern Institutional Diversified Assets
Portfolio, Shares Class, 0.44% (f) | | | 7,693,048 | | | 7,693,048 | |
| | | | |
|
| |
TOTAL INVESTMENT COMPANY
(COST $7,693,048) | | | | | | 7,693,048 | |
| | | | |
|
| |
TOTAL INVESTMENTS
(COST $103,226,664) — 134.7% | | | | | | 93,606,783 | |
| | | | |
|
| |
| | |
|
|
| Percentages indicated are based on net assets of $69,482,704. |
| | |
(a) | Variable rate security. The interest rates on these securities are adjusted periodically to reflect then-current short-term interest rates. The rates presented represent the rates in effect on April 30, 2009. The maturity dates presented reflect the final maturity dates. However, some of these securities may contain put or demand features that allow the fund to require the issuer to repurchase the security from the fund within various time periods, including daily, weekly, monthly, or semi-annually. |
| | |
(b) | Security exempt from registration under Rule 144a of the Securities Act of 1933. This security may be resold in transactions exempt from registration, normally to qualified institutional buyers. This security has been deemed liquid by the Investment Adviser based on procedures approved by the Board of Trustees. |
| | |
73 | HSBC INVESTOR PORTFOLIOS | See notes to financial statements. |
|
HSBC INVESTOR CORE PLUS FIXED INCOME PORTFOLIO |
|
|
Schedule of Portfolio Investments—as of April 30, 2009 (Unaudited) (continued) |
| |
(c) | Non-Income Producing; Defaulted Bond. |
| |
(d) | In connection with the Lehman Brothers Holdings, Inc. bankruptcy filing announcement on September 15, 2008, the Fund stopped accruing prospective interests amounts on that date. |
| |
(e) | Interest-Only represents securities that entitle holders to receive only interest payments on the underlying mortgages. The yield to maturity of an Interest-Only is extremely sensitive to the rate of principal payments on the underlying mortgage assets. A rapid (slow) rate of principal repayments may have an adverse (positive) effect on yield to maturity. Interest rate adjusts periodically based on the pay off of the underlying mortgage. The interest rate presented represents the rates in effect on April 30, 2009. The principal amount shown is the notional amount of the underlying mortgages. |
| |
(f) | The rates presented represent the annualized one day yield that was in effect on April 30, 2009. |
| |
(g) | Rule 144a, section 4(2) or other security which is restricted as to resale to institutional investors. The Investment Adviser, using Board approved procedures, has deemed these securities to be illiquid. Represents 0.04% of net assets. |
| |
(h) | Security held as collateral for to be announced securities. |
| |
(i) | Security was fair valued as of April 20, 2009. Represents 0.04% of net assets. |
| |
AMT | — Interest on security is subject to federal alternative minimum tax |
FHA | — Federal Housing Administration |
GO | — General Obligation |
IO | — Interest-Only security. Represents 0.10% of net assets. |
LLC | — Limited Liability Co. |
MTN | — Medium Term Note |
PLC | — Public Limited Co. |
TBA | — Security was traded on a “to be announced” basis. Represents 35.6% of net assets. |
| |
| | |
See notes to financial statements. | HSBC INVESTOR PORTFOLIOS | 74 |
|
HSBC INVESTOR INTERMEDIATE DURATION FIXED INCOME PORTFOLIO |
|
|
Schedule of Portfolio Investments—as of April 30, 2009 (Unaudited) |
|
Certificates of Deposit — 0.8% |
|
| | | | | | | |
| | Principal
Amount($) | | Value($) | |
| |
| |
| |
Banking – 0.8% | | | | | | | |
First Tennessee Bank,
1.46%, 12/17/09 (a) | | | 100,000 | | | 99,507 | |
| | | | |
|
| |
TOTAL CERTIFICATES OF DEPOSIT
(COST $97,149) | | | | | | 99,507 | |
| | | | |
|
| |
U.S. Government and Government Agency Obligations — 56.9% | |
|
|
|
|
|
|
|
|
Federal Home Loan Mortgage Corp. – 7.5% | | | | | | | |
5.13%, 11/17/17 | | | 400,000 | | | 445,810 | |
Pool #1B2655, 4.96%, 12/1/34 (a)(f) | | | 70,771 | | | 72,499 | |
Pool #1J1313, 6.34%, 6/1/36 (a) | | | 182,906 | | | 188,685 | |
Pool #847557, 4.41%, 7/1/34 (a)(f) | | | 86,236 | | | 87,476 | |
Pool #G02981, 6.00%, 6/1/37 | | | 142,711 | | | 149,124 | |
| | | | |
|
| |
| | | | | | 943,594 | |
| | | | |
|
| |
Federal National Mortgage Association – 42.4% | | | | | | | |
3.25%, 8/12/10 | | | 150,000 | | | 154,295 | |
Pool #922090, 5.91%, 3/1/37 (a) | | | 177,433 | | | 185,753 | |
TBA May, 5.50%, 5/12/39 | | | 2,535,000 | | | 2,626,103 | |
TBA June | | | | | | | |
5.50%, 6/18/16 | | | 1,675,000 | | | 1,739,906 | |
5.00%, 6/11/39 | | | 640,000 | | | 656,400 | |
| | | | |
|
| |
| | | | | | 5,362,457 | |
| | | | |
|
| |
U.S. Treasury Notes – 7.0% | | | | | | | |
3.38%, 7/31/13 | | | 185,000 | | | 197,242 | |
1.88%, 4/30/14 | | | 650,000 | | | 645,580 | |
3.88%, 5/15/18 | | | 45,000 | | | 47,956 | |
| | | | |
|
| |
| | | | | | 890,778 | |
| | | | |
|
| |
TOTAL U.S. GOVERNMENT AND
GOVERNMENT AGENCY
OBLIGATIONS (COST $7,145,123) | | | | | | 7,196,829 | |
| | | | |
|
| |
Corporate Obligations—34.3% | | | | | | | |
|
|
|
|
|
|
|
|
Agricultural Chemicals – 0.7% | | | | | | | |
Agrium, Inc., 6.75%, 1/15/19 | | | 100,000 | | | 91,011 | |
| | | | |
|
| |
Banking – 0.7% | | | | | | | |
American Express Centurion Bank,
5.95%, 6/12/17 | | | 100,000 | | | 85,661 | |
| | | | |
|
| |
Building & Construction Products – 1.5% | | | | | | | |
Martin Marietta Materials, Inc.,
1.19%, 4/30/10 (a)(f) | | | 100,000 | | | 95,575 | |
Masco Corp., 1.63%, 3/12/10 (a)(f) | | | 100,000 | | | 95,327 | |
| | | | |
|
| |
| | | | | | 190,902 | |
| | | | |
|
| |
Computer Services – 0.8% | | | | | | | |
Electronic Data Systems, Series B,
6.00%, 8/1/13 | | | 100,000 | | | 106,955 | |
| | | | |
|
| |
Electric – 3.5% | | | | | | | |
Duke Energy Corp., 5.65%, 6/15/13 | | | 75,000 | | | 77,093 | |
MidAmerican Energy Co., 5.95%, 7/15/17 | | | 300,000 | | | 310,300 | |
Puget Sound Energy, Inc., 6.97%, 6/1/67,
Callable 6/1/17 @ 100 | | | 100,000 | | | 52,250 | |
| | | | |
|
| |
| | | | | | 439,643 | |
| | | | |
|
| |
|
Corporate Obligations, continued |
|
| | | | | | | |
| | Principal
Amount($) | | Value($) | |
| |
| |
| |
Finance – 10.3% | | | | | | | |
Bear Stearns Co., Inc., 4.50%, 10/28/10 | | | 75,000 | | | 75,692 | |
Bear Stearns Co., Inc., Series B,
6.95%, 8/10/12, MTN | | | 150,000 | | | 157,922 | |
Citigroup, Inc., 6.50%, 8/19/13 | | | 25,000 | | | 22,815 | |
Countrywide Home Loans, Series L,
4.00%, 3/22/11, MTN | | | 150,000 | | | 140,640 | |
Ford Motor Credit Co., LLC,
9.75%, 9/15/10 | | | 100,000 | | | 90,004 | |
General Electric Capital Corp.,
5.63%, 5/1/18 | | | 100,000 | | | 87,244 | |
Lehman Brothers Holdings, Series I,
0.00%, 5/2/18, MTN (b)(c) | | | 75,000 | | | 11,156 | |
Morgan Stanley, 1.95%, 6/20/12 | | | 500,000 | | | 497,751 | |
Morgan Stanley, Series F,
6.00%, 4/28/15, MTN | | | 75,000 | | | 70,846 | |
XTRA Finance Corp., 5.15%, 4/1/17 | | | 150,000 | | | 145,538 | |
| | | | |
|
| |
| | | | | | 1,299,608 | |
| | | | |
|
| |
Forestry/Paper – 0.2% | | | | | | | |
Georgia-Pacific Corp., 7.70%, 6/15/15 | | | 25,000 | | | 23,500 | |
| | | | |
|
| |
Health Services – 0.2% | | | | | | | |
Community Health Systems, Inc., 8.88%,
7/15/15, Callable 7/15/11 @ 104.44 | | | 25,000 | | | 24,875 | |
| | | | |
|
| |
Hospitals – 0.6% | | | | | | | |
HCA, Inc., 5.75%, 3/15/14 | | | 100,000 | | | 79,000 | |
| | | | |
|
| |
Media – 3.4% | | | | | | | |
Time Warner Entertainment, 8.88%, 10/1/12 | | | 350,000 | | | 377,860 | |
Vivendi, 5.75%, 4/4/13 (d) | | | 50,000 | | | 47,903 | |
| | | | |
|
| |
| | | | | | 425,763 | |
| | | | |
|
| |
Media - Cable – 0.2% | | | | | | | |
Cablevision Systems Corp., Series B,
8.00%, 4/15/12 | | | 25,000 | | | 24,875 | |
| | | | |
|
| |
Medical – 0.2% | | | | | | | |
Glaxosmithkline Capital, Inc.,
4.85%, 5/15/13 | | | 25,000 | | | 25,934 | |
| | | | |
|
| |
Office Equipment & Services – 0.8% | | | | | | | |
Xerox Corp., 2.06%, 12/18/09 (a)(f) | | | 100,000 | | | 97,602 | |
| | | | |
|
| |
Oil & Gas – 0.1% | | | | | | | |
Pioneer Natural Resources Co.,
5.88%, 7/15/16 | | | 25,000 | | | 20,721 | |
| | | | |
|
| |
Pipelines – 0.9% | | | | | | | |
Dynegy Holdings, Inc., 7.75%, 6/1/19 | | | 25,000 | | | 18,375 | |
Transcontinental Gas Pipeline Corp.,
6.05%, 6/15/18 | | | 100,000 | | | 92,882 | |
| | | | |
|
| |
| | | | | | 111,257 | |
| | | | |
|
| |
Retail – 0.2% | | | | | | | |
Kroger Co. (The), 5.00%, 4/15/13 | | | 25,000 | | | 25,249 | |
| | | | |
|
| |
Support - Services – 0.4% | | | | | | | |
Aramark Services, Inc., 8.50%, 2/1/15,
Callable 2/1/11 @ 104.25 | | | 25,000 | | | 23,875 | |
| | |
75 | HSBC INVESTOR PORTFOLIOS | See notes to financial statements. |
|
HSBC INVESTOR INTERMEDIATE DURATION FIXED INCOME PORTFOLIO |
|
|
Schedule of Portfolio Investments—as of April 30, 2009 (Unaudited) (continued) |
|
Corporate Obligations, continued |
|
| | | | | | | |
| | Principal
Amount($) | | Value($) | |
| |
| |
| |
Support - Services, continued | | | | | | | |
Iron Mountain, Inc., 8.00%, 6/15/20,
Callable 6/15/13 @ 104 | | | 25,000 | | | 24,125 | |
| | | | |
|
| |
| | | | | | 48,000 | |
| | | | |
|
| |
Telecom - Integrated/Services – 0.2% | | | | | | | |
Qwest Corp., 7.63%, 6/15/15 | | | 25,000 | | | 23,688 | |
| | | | |
|
| |
Telecommunications – 2.2% | | | | | | | |
Verizon Pennsylvania, Inc., 5.65%, 11/15/11 | | | 275,000 | | | 283,965 | |
| | | | |
|
| |
Transportation – 7.2% | | | | | | | |
American Airlines, Inc., Series 2001-2 | | | | | | | |
Class A1, 6.98%, 4/1/11 | | | 54,389 | | | 49,766 | |
Class A2, 7.86%, 10/1/11 | | | 200,000 | | | 166,000 | |
Burlington Northern Santa Fe Railway Co.,
4.83%, 1/15/23 | | | 214,072 | | | 194,615 | |
Continental Airlines, Inc., 5.98%, 4/19/22 | | | 100,000 | | | 79,000 | |
Union Pacific Corp., 5.75%, 11/15/17 | | | 150,000 | | | 144,486 | |
Union Pacific Railroad, 5.08%, 1/2/29 | | | 289,577 | | | 280,212 | |
| | | | |
|
| |
| | | | | | 914,079 | |
| | | | |
|
| |
TOTAL CORPORATE OBLIGATIONS
(COST $4,604,703) | | | | | | 4,342,288 | |
| | | | |
|
| |
Asset Backed Securities — 12.7% | | | | | | | |
|
|
|
|
|
|
|
|
Asset Backed Funding Certificates,
Series 2003-AHL1, Class A1,
3.68%, 3/25/33 | | | 210,318 | | | 109,905 | |
Cairn Mezzanine plc, Series 2007-3A,
Class B1, 2.13%, 8/13/47 (a)(d) | | | 145,000 | | | 0 | |
Capital Auto Receivables Asset Trust | | | | | | | |
Series 2006-SN1A, Class A4B,
0.56%, 3/20/10 (a)(d)(f) | | | 69,661 | | | 69,171 | |
Series 2007-SN1, Class A3A,
5.47%, 7/15/10 (f) | | | 56,338 | | | 55,444 | |
Series 2007-SN1, Class A3B,
0.51%, 7/15/10 (a)(f) | | | 61,972 | | | 60,425 | |
Capital One Prime Auto Receivables Trust | | | | | | | |
Series 2005-1, Class A4,
0.47%, 4/15/11 (a)(f) | | | 34,167 | | | 33,791 | |
Series 2006-1, Class A3,
4.99%, 9/15/10 (d)(f) | | | 16,461 | | | 16,489 | |
Carmax Auto Owner Trust, Series 2008-2,
Class A2B, 1.35%, 9/15/11 (a)(f) | | | 169,866 | | | 169,024 | |
Countrywide Asset-Backed Certificates | | | | | | | |
Series 2006-S2, Class A5,
5.75%, 7/25/27 (a) | | | 130,251 | | | 39,193 | |
Series 2006-S4, Class A3,
5.80%, 7/25/34 | | | 202,423 | | | 65,849 | |
GE Business Loan Trust, Series 2006-2A,
Class A, 0.63%, 11/15/34 (a)(d)(f) | | | 229,223 | | | 146,310 | |
GMAC Mortgage Corp., Loan Trust,
Series 2006-HE3, Class A3,
5.81%, 10/25/36 | | | 170,000 | | | 50,917 | |
Hyundai Auto Receivables Trust,
Series 2008-A, Class A2, 4.16%, 5/16/11 (f) | | | 125,668 | | | 126,820 | |
National Collegiate Student Loan Trust,
Series 2006-3, Class A1,
0.47%, 9/25/19 (a)(f) | | | 56,328 | | | 54,047 | |
|
Asset Backed Securities, continued |
|
| | | | | | | |
| | Principal
Amount($) | | Value($) | |
| |
| |
| |
Preferred Term Securities XXII Ltd., 1.66%,
9/22/36, Callable 6/22/11 @ 100 (a)(d)(f) | | | 193,204 | | | 59,893 | |
Residential Funding Mortgage Securities,
Series 2006-HSA1, Class A5,
5.31%, 2/25/36 (f) | | | 62,916 | | | 18,564 | |
SLM Student Loan Trust | | | | | | | |
Series 2005-4, Class A2,
1.24%, 4/26/21 (a)(f) | | | 60,000 | | | 58,352 | |
Series 2005-9, Class A4,
1.26%, 1/25/23 (a)(f) | | | 190,000 | | | 186,058 | |
Series 2006-7, Class A2,
1.15%, 10/25/16 (a)(f) | | | 45,056 | | | 45,001 | |
Series 2006-9, Class A2,
1.16%, 4/25/17 (a)(f) | | | 26,504 | | | 26,382 | |
Series 2006-B, Class A1,
1.33%, 9/15/20 (a)(f) | | | 128,045 | | | 121,765 | |
South Carolina Student Loan Corp.,
Series 2008-1, Class A1, 1.76%, 9/2/14 (a)(f) | | | 96,404 | | | 95,209 | |
| | | | |
|
| |
TOTAL ASSET BACKED SECURITIES
(COST $2,355,131) | | | | | | 1,608,609 | |
| | | | |
|
| |
Collateralized Mortgage Obligations — 5.3% | | | | | | | |
|
|
|
|
|
|
|
|
Banc of America Mortgage Securities,
Series 2005-D, Class 2A4,
4.79%, 5/25/35 (a)(f) | | | 139,589 | | | 131,805 | |
Deutsche Mortgage Securities, Inc.,
Series 2006-WF1, Class 1A1,
5.10%, 6/26/35 (a)(d) | | | 95,769 | | | 95,222 | |
Freddie Mac | | | | | | | |
Series 2988, Class AF, 0.75%, 6/15/35 (a)(f) | | | 138,434 | | | 135,525 | |
Series 3212, Class BK, 5.40%, 9/15/36 | | | 150,000 | | | 157,656 | |
Residential Asset Securitization Trust,
Series 2003-A15, Class 1A2,
0.89%, 2/25/34 (a) | | | 190,872 | | | 156,190 | |
| | | | |
|
| |
TOTAL COLLATERALIZED MORTGAGE
OBLIGATIONS (COST $708,294) | | | | | | 676,398 | |
| | | | |
|
| |
Commercial Mortgage Backed Securities — 6.4% | | | | | |
|
|
|
|
|
|
|
|
Citigroup/Deutsche Bank Commercial
Mortgage Trust, Series 2007-CD4,
Class A2B, 5.21%, 12/11/49 | | | 200,000 | | | 174,457 | |
Commercial Mortgage Pass-Through
Certificate, Series 2006-FL12,
Class A2, 0.55%, 12/15/20 (a)(d)(f) | | | 236,062 | | | 165,399 | |
Greenwich Capital Commercial Funding Corp. | | | | | | | |
Series 2006-GG7, Class A2,
6.03%, 7/10/38 (a) | | | 90,000 | | | 84,198 | |
Series 2006-GG7, Class A4,
6.11%, 7/10/38 (a) | | | 140,000 | | | 117,035 | |
Morgan Stanley Capital I, Series 2007-IQ14,
Class A2, 5.61%, 4/15/49 | | | 220,000 | | | 191,178 | |
Washington Mutual Commercial Mortgage
Securities Trust, Series 2006-SL1, Class A,
5.42%, 11/23/43 (a)(d) | | | 140,276 | | | 77,152 | |
| | | | |
|
| |
TOTAL COMMERCIAL MORTGAGE
BACKED SECURITIES
(COST $1,026,713) | | | | | | 809,419 | |
| | | | |
|
| |
| | |
See notes to financial statements. | HSBC INVESTOR PORTFOLIOS | 76 |
|
HSBC INVESTOR INTERMEDIATE DURATION FIXED INCOME PORTFOLIO |
|
|
Schedule of Portfolio Investments—as of April 30, 2009 (Unaudited) (continued) |
| | | | | | | |
| | Shares or
Principal
Amount($) | | Value($) | |
| |
| |
| |
United Kingdom – 0.5% | | | | | | | |
Barclays Bank plc, 5.93%, 12/31/49 (d) | | | 150,000 | | | 59,937 | |
| | | | |
|
| |
TOTAL FOREIGN BONDS
(COST $151,085) | | | | | | 59,937 | |
| | | | |
|
| |
| | | | | | | |
Investment Company—27.3% | | | | | | | |
|
|
|
|
|
|
|
|
Northern Institutional Diversified Assets
Portfolio, Shares Class, 0.44% (e) | | | 3,448,598 | | | 3,448,598 | |
| | | | |
|
| |
TOTAL INVESTMENT COMPANY
(COST $3,448,598) | | | | | | 3,448,598 | |
| | | | |
|
| |
TOTAL INVESTMENTS
(COST $19,536,796) — 144.2% | | | | | | 18,241,585 | |
| | | | |
|
| |
| |
|
|
| Percentages indicated are based on net assets of $12,648,664. |
| |
(a) | Variable rate security. The interest rates on these securities are adjusted periodically to reflect then-current short-term interest rates. The rates presented represent the rates in effect on April 30, 2009. The maturity dates presented reflect the final maturity dates. However, some of these securities may contain put or demand features that allow the fund to require the issuer to repurchase the security from the fund within various time periods, including daily, weekly, monthly, or semi-annually. |
| |
(b) | In connection with the Lehman Brothers Holdings, Inc. bankruptcy filing announcement on September 15, 2008, the Fund stopped accruing prospective interests amounts on that date. |
| |
(c) | Non-Income Producing; Defaulted Bond. |
| |
(d) | Security exempt from registration under Rule 144a of the Securities Act of 1933. This security may be resold in transactions exempt from registration, normally to qualified institutional buyers. This security has been deemed liquid by the Investment Adviser based on procedures approved by the Board of Trustees. |
| |
(e) | The rates presented represent the annualized one day yield that was in effect on April 30, 2009. |
| |
(f) | Security held as collateral for to be announced securities. |
| |
LLC — | Limited Liability Co. |
MTN— | Medium Term Note |
PLC — | Public Limited Co. |
TBA — | Security was traded on a “to be announced” basis. Represents 39.7% of net assets. |
| | |
77 | HSBC INVESTOR PORTFOLIOS | See notes to financial statements. |
|
HSBC INVESTOR GROWTH PORTFOLIO |
|
|
Schedule of Portfolio Investments—as of April 30, 2009 (Unaudited) |
| | | | | | | |
| | Shares | | Value($) | |
| |
| |
| |
Aerospace & Defense – 2.3% | | | | | | | |
Lockheed Martin Corp. | | | 9,400 | | | 738,182 | |
Precision Castparts Corp. | | | 14,800 | | | 1,107,928 | |
| | | | |
|
| |
| | | | | | 1,846,110 | |
| | | | |
|
| |
Agriculture – 3.0% | | | | | | | |
Monsanto Co. | | | 28,100 | | | 2,385,409 | |
| | | | |
|
| |
Biotechnology – 3.8% | | | | | | | |
Gilead Sciences, Inc. (a) | | | 49,000 | | | 2,244,200 | |
Illumina, Inc. (a) | | | 20,600 | | | 769,410 | |
| | | | |
|
| |
| | | | | | 3,013,610 | |
| | | | |
|
| |
Business Services – 3.1% | | | | | | | |
Apollo Group, Inc., Class A (a) | | | 12,200 | | | 767,990 | |
Ecolab, Inc. | | | 20,100 | | | 774,855 | |
ITT Educational Services, Inc. (a) | | | 9,200 | | | 927,084 | |
| | | | |
|
| |
| | | | | | 2,469,929 | |
| | | | |
|
| |
Communication Equipment – 5.6% | | | | | | | |
American Tower Corp., Class A (a) | | | 25,900 | | | 822,584 | |
Cisco Systems, Inc. (a) | | | 109,000 | | | 2,105,880 | |
Juniper Networks, Inc. (a) | | | 30,000 | | | 649,500 | |
Research In Motion Ltd. (a) | | | 11,500 | | | 799,250 | |
| | | | |
|
| |
| | | | | | 4,377,214 | |
| | | | |
|
| |
Credit Card – 5.7% | | | | | | | |
MasterCard, Inc., Class A | | | 9,500 | | | 1,742,775 | |
Visa, Inc., Class A | | | 41,800 | | | 2,715,328 | |
| | | | |
|
| |
| | | | | | 4,458,103 | |
| | | | |
|
| |
Distribution & Wholesale – 1.8% | | | | | | | |
Fastenal Co. | | | 36,000 | | | 1,380,960 | |
| | | | |
|
| |
Exchanges – 1.3% | | | | | | | |
IntercontinentalExchange, Inc. (a) | | | 12,100 | | | 1,059,960 | |
| | | | |
|
| |
Hardware & Peripherals – 5.3% | | | | | | | |
Apple, Inc. (a) | | | 18,100 | | | 2,277,523 | |
Hewlett-Packard Co. | | | 51,701 | | | 1,860,202 | |
| | | | |
|
| |
| | | | | | 4,137,725 | |
| | | | |
|
| |
Industrial Conglomerates – 7.0% | | | | | | | |
Danaher Corp. | | | 39,500 | | | 2,308,380 | |
General Mills, Inc. | | | 21,700 | | | 1,099,973 | |
Lam Research Corp. (a) | | | 13,900 | | | 387,532 | |
United Technologies Corp. | | | 34,400 | | | 1,680,096 | |
| | | | |
|
| |
| | | | | | 5,475,981 | |
| | | | |
|
| |
Internet – 4.5% | | | | | | | |
Baidu, Inc. ADR (a) | | | 5,200 | | | 1,211,080 | |
Google, Inc., Class A (a) | | | 5,950 | | | 2,356,021 | |
| | | | |
|
| |
| | | | | | 3,567,101 | |
| | | | |
|
| |
Investment Management – 6.4% | | | | | | | |
BlackRock, Inc. | | | 8,250 | | | 1,208,790 | |
Goldman Sachs Group, Inc. | | | 3,300 | | | 424,050 | |
JP Morgan Chase & Co | | | 41,700 | | | 1,376,100 | |
The Charles Schwab Corp. | | | 110,600 | | | 2,043,888 | |
| | | | |
|
| |
| | | | | | 5,052,828 | |
| | | | |
|
| |
| | | | | | | |
| | Shares | | Value($) | |
| |
| |
| |
Medical Products – 5.9% | | | | | | | |
Baxter International, Inc. | | | 30,700 | | | 1,488,950 | |
Cephalon, Inc. (a) | | | 14,100 | | | 925,101 | |
Mindray Medical International Ltd. ADR | | | 37,490 | | | 855,522 | |
St. Jude Medical, Inc. (a) | | | 42,200 | | | 1,414,544 | |
| | | | |
|
| |
| | | | | | 4,684,117 | |
| | | | |
|
| |
Medical Services & Distributors – 4.4% | | | | | | | |
Medco Health Solutions, Inc. (a) | | | 79,600 | | | 3,466,580 | |
| | | | |
|
| |
Oil & Gas Drill & Equipment – 1.2% | | | | | | | |
FMC Technologies, Inc. (a) | | | 28,100 | | | 961,863 | |
| | | | |
|
| |
Oil & Gas Exploration & Production – 3.0% | | | | | | | |
Petro-Canada | | | 25,000 | | | 788,250 | |
Petroleo Brasileiro SA ADR | | | 21,500 | | | 721,755 | |
Southwestern Energy Co. (a) | | | 22,800 | | | 817,608 | |
| | | | |
|
| |
| | | | | | 2,327,613 | |
| | | | |
|
| |
Pharmaceuticals – 2.5% | | | | | | | |
Teva Pharmaceutical Industries Ltd. ADR | | | 44,500 | | | 1,953,105 | |
| | | | |
|
| |
Railroad – 2.9% | | | | | | | |
Union Pacific Corp. | | | 47,200 | | | 2,319,408 | |
| | | | |
|
| |
Retail – 5.1% | | | | | | | |
Best Buy Co., Inc. | | | 15,300 | | | 587,214 | |
Kohl’s Corp. (a) | | | 23,300 | | | 1,056,655 | |
Lowe’s Cos., Inc. | | | 36,500 | | | 784,750 | |
Wal-Mart Stores, Inc. | | | 30,800 | | | 1,552,320 | |
| | | | |
|
| |
| | | | | | 3,980,939 | |
| | | | |
|
| |
Retail Pharmacy – 2.0% | | | | | | | |
CVS Caremark Corp. | | | 48,900 | | | 1,554,042 | |
| | | | |
|
| |
Software Services – 10.4% | | | | | | | |
Adobe Systems, Inc. (a) | | | 20,900 | �� | | 571,615 | |
Autodesk, Inc. (a) | | | 20,100 | | | 400,794 | |
Cognizant Technology Solutions Corp. (a) | | | 83,600 | | | 2,072,444 | |
Dolby Laboratories, Inc., Class A (a) | | | 28,600 | | | 1,147,718 | |
McAfee, Inc. (a) | | | 17,500 | | | 656,950 | |
Microsoft Corp. | | | 86,300 | | | 1,748,438 | |
Oracle Corp. | | | 81,000 | | | 1,566,540 | |
| | | | |
|
| |
| | | | | | 8,164,499 | |
| | | | |
|
| |
Telecommunications – 7.4% | | | | | | | |
American Movil SAB de C.V. ADR, Seies L | | | 23,400 | | | 768,690 | |
Equinix, Inc. (a) | | | 17,600 | | | 1,236,048 | |
MetroPCS Communications, Inc. (a) | | | 42,900 | | | 733,161 | |
QUALCOMM, Inc. | | | 73,600 | | | 3,114,752 | |
| | | | |
|
| |
| | | | | | 5,852,651 | |
| | | | |
|
| |
Transportation – 1.6% | | | | | | | |
C.H. Robinson Worldwide, Inc. | | | 14,800 | | | 786,768 | |
Expeditors International of Washington, Inc. | | | 13,200 | | | 458,172 | |
| | | | |
|
| |
| | | | | | 1,244,940 | |
| | | | |
|
| |
Travel & Leisure – 3.3% | | | | | | | |
Carnival Corp. | | | 43,900 | | | 1,180,032 | |
Priceline.com, Inc. (a) | | | 14,800 | | | 1,436,932 | |
| | | | |
|
| |
| | | | | | 2,616,964 | |
| | | | |
|
| |
| | |
See notes to financial statements. | HSBC INVESTOR PORTFOLIOS | 78 |
|
HSBC INVESTOR GROWTH PORTFOLIO |
|
|
Schedule of Portfolio Investments—as of April 30, 2009 (Unaudited) (continued) |
| | | | | | | |
| | Shares | | Value($) | |
| |
| |
| |
TOTAL COMMON STOCKS
(COST $84,532,207) | | | | | | 78,351,651 | |
| | | | |
|
| |
| | | | | | | |
Investment Company — 0.3% | | | | | | | |
|
|
|
|
|
|
|
|
Northern Institutional Diversified Assets
Portfolio, Shares Class, 0.44% (b) | | | 203,165 | | | 203,165 | |
| | | | |
|
| |
TOTAL INVESTMENT COMPANY
(COST $203,165) | | | | | | 203,165 | |
| | | | |
|
| |
TOTAL INVESTMENTS
(COST $84,735,372) — 99.8% | | | | | | 78,554,816 | |
| | | | |
|
| |
| |
|
|
| Percentages indicated are based on net assets of $78,715,834. |
| |
(a) | Represents non-income producing security. |
| |
(b) | The rates presented represent the annualized one day yield that was in effect on April 30, 2009. |
| |
ADR — American Depositary Receipt |
| | |
79 | HSBC INVESTOR PORTFOLIOS | See notes to financial statements. |
|
HSBC INVESTOR INTERNATIONAL EQUITY PORTFOLIO |
|
|
Schedule of Portfolio Investments—as of April 30, 2009 (Unaudited) |
| | | | | | | |
Common Stocks—98.0% | | | | | | | |
|
|
|
|
|
|
|
|
| | | | | |
| | Shares | | Value($) | |
| |
| |
| |
Australia – 4.5% | | | | | | | |
Australia & New Zealand
Banking Group Ltd. | | | 199,300 | | | 2,302,188 | |
BHP Billiton Ltd. | | | 36,500 | | | 882,230 | |
Commonwealth Bank of Australia | | | 48,200 | | | 1,229,460 | |
Lend Lease Corp., Ltd. | | | 143,700 | | | 753,755 | |
National Australia Bank Ltd. | | | 113,565 | | | 1,702,081 | |
Qantas Airways Ltd. | | | 412,833 | | | 593,849 | |
| | | | |
|
| |
| | | | | | 7,463,563 | |
| | | | |
|
| |
Belgium – 0.9% | | | | | | | |
Delhaize Group SA | | | 22,100 | | | 1,496,878 | |
| | | | |
|
| |
Brazil – 0.3% | | | | | | | |
Banco Do Brasil SA | | | 60,000 | | | 514,686 | |
| | | | |
|
| |
Canada – 5.4% | | | | | | | |
BCE, Inc. | | | 58,900 | | | 1,259,463 | |
Fairfax Financial Holdings Ltd. | | | 5,200 | | | 1,375,624 | |
Industrial Alliance Insurance and
Financial Services, Inc. | | | 26,100 | | | 523,313 | |
National Bank of Canada | | | 26,600 | | | 973,252 | |
Nexen, Inc. | | | 40,490 | | | 771,109 | |
Petro-Canada | | | 60,100 | | | 1,897,205 | |
Royal Bank of Canada | | | 30,300 | | | 1,074,342 | |
Telus Corp. | | | 19,700 | | | 458,236 | |
WestJet Airlines Ltd. | | | 59,300 | | | 580,573 | |
| | | | |
|
| |
| | | | | | 8,913,117 | |
| | | | |
|
| |
China – 0.9% | | | | | | | |
China Petroleum & Chemical Corp. | | | 1,920,000 | | | 1,506,310 | |
| | | | |
|
| |
Czech Republic – 0.5% | | | | | | | |
CEZ | | | 20,900 | | | 864,120 | |
| | | | |
|
| |
Finland – 1.1% | | | | | | | |
Nokia Oyj | | | 129,400 | | | 1,871,021 | |
| | | | |
|
| |
France – 12.8% | | | | | | | |
BNP Paribas SA | | | 55,180 | | | 2,938,135 | |
Credit Agricole SA | | | 185,402 | | | 2,746,987 | |
France Telecom SA | | | 63,200 | | | 1,410,445 | |
Lagardere S.C.A. | | | 46,400 | | | 1,467,340 | |
Renault SA | | | 68,700 | | | 2,232,986 | |
Sanofi-Aventis | | | 52,700 | | | 3,051,486 | |
Societe Generale | | | 58,231 | | | 3,017,009 | |
Total SA | | | 76,100 | | | 3,860,269 | |
Vallourec SA | | | 4,500 | | | 496,422 | |
| | | | |
|
| |
| | | | | | 21,221,079 | |
| | | | |
|
| |
Germany – 13.0% | | | | | | | |
Allianz SE | | | 27,200 | | | 2,505,471 | |
BASF AG (a) | | | 64,800 | | | 2,455,117 | |
Bayer AG (a) | | | 29,100 | | | 1,445,530 | |
Deutsche Bank AG | | | 52,800 | | | 2,807,916 | |
Deutsche Lufthansa AG | | | 81,300 | | | 1,024,424 | |
Deutsche Post AG | | | 132,950 | | | 1,523,107 | |
Deutsche Telekom AG | | | 150,900 | | | 1,841,534 | |
E.ON AG | | | 91,100 | | | 3,067,117 | |
Fresenius Medical Care AG & Co. KGaA | | | 18,100 | | | 711,147 | |
Metro AG | | | 10,000 | | | 425,971 | |
| | | | | | | |
Common Stocks, continued | | | | | | | |
|
|
|
|
|
|
|
|
| | | | | |
| | Shares | | Value($) | |
| |
| |
| |
Germany, continued | | | | | | | |
Muenchener Rueckversicherungs-
Gesellschaft AG | | | 17,600 | | | 2,402,794 | |
RWE AG | | | 11,170 | | | 806,069 | |
Siemens AG | | | 10,000 | | | 668,986 | |
| | | | |
|
| |
| | | | | | 21,685,183 | |
| | | | |
|
| |
India – 0.6% | | | | | | | |
State Bank of India GDR | | | 17,600 | | | 985,600 | |
| | | | |
|
| |
Italy – 4.4% | | | | | | | |
ENI SpA | | | 139,700 | | | 3,040,090 | |
Intesa Sanpaolo SpA | | | 650,300 | | | 2,096,923 | |
Telecom Italia SpA | | | 1,036,200 | | | 1,320,061 | |
Telecom Italia RSP | | | 920,000 | | | 827,601 | |
| | | | |
|
| |
| | | | | | 7,284,675 | |
| | | | |
|
| |
Japan – 17.3% | | | | | | | |
Canon, Inc. | | | 29,800 | | | 891,582 | |
FUJITSU Ltd. | | | 424,000 | | | 1,806,085 | |
Hitachi Ltd. | | | 332,000 | | | 1,148,195 | |
Honda Motor Co., Ltd. | | | 27,600 | | | 796,369 | |
JFE Holdings, Inc. | | | 26,800 | | | 727,079 | |
KDDI Corp. | | | 279 | | | 1,250,690 | |
Kyocera Corp. | | | 24,500 | | | 1,893,408 | |
Mitsubishi Chemical Holdings Corp. | | | 303,000 | | | 1,146,237 | |
Mitsubishi Corp. | | | 129,000 | | | 1,975,558 | |
Mitsui & Co., Ltd. | | | 149,000 | | | 1,568,580 | |
Mitsui Fudosan Co. Ltd. | | | 49,000 | | | 614,239 | |
NAMCO BANDAI Holdings, Inc. | | | 123,800 | | | 1,229,211 | |
Nippon Mining Holdings, Inc. | | | 187,000 | | | 849,655 | |
Nippon Telegraph & Telephone Corp. | | | 63,000 | | | 2,351,318 | |
Nissan Motor Co., Ltd. | | | 371,400 | | | 1,921,035 | |
Sharp Corp. | | | 203,000 | | | 2,112,353 | |
Sony Corp. | | | 37,910 | | | 972,741 | |
Sumitomo Mitsui Financial Group, Inc. | | | 46,900 | | | 1,617,241 | |
The Furukawa Electric Co. Ltd. | | | 123,000 | | | 366,755 | |
The Tokyo Electric Power Co., Inc. | | | 28,000 | | | 655,984 | |
Toshiba Corp. | | | 543,000 | | | 1,850,385 | |
Toyota Motor Corp. | | | 25,500 | | | 995,690 | |
| | | | |
|
| |
| | | | | | 28,740,390 | |
| | | | |
|
| |
Netherlands – 3.9% | | | | | | | |
ArcelorMittal | | | 59,952 | | | 1,427,580 | |
ING Groep NV | | | 155,768 | | | 1,460,170 | |
Koninklijke (Royal) Philips Electronics NV | | | 62,210 | | | 1,132,408 | |
Koninklijke Ahold NV | | | 223,020 | | | 2,458,200 | |
| | | | |
|
| |
| | | | | | 6,478,358 | |
| | | | |
|
| |
New Zealand – 0.4% | | | | | | | |
Telecom Corp. of New Zealand Ltd. | | | 456,800 | | | 730,105 | |
| | | | |
|
| |
Norway – 1.5% | | | | | | | |
StatoilHydro ASA | | | 128,500 | | | 2,444,448 | |
| | | | |
|
| |
Russian Federation – 0.8% | | | | | | | |
JSC MMC Norilsk Nickel ADR | | | 67,789 | | | 564,682 | |
| | |
See notes to financial statements. | HSBC INVESTOR PORTFOLIOS | 80 |
|
HSBC INVESTOR INTERNATIONAL EQUITY PORTFOLIO |
|
|
Schedule of Portfolio Investments—as of April 30, 2009 (Unaudited) (continued) |
| | | | | | | |
Common Stocks, continued | | | | | | | |
|
|
|
|
|
|
|
|
| | | | | | | |
| | Shares | | Value($) | |
| |
| |
| |
Russian Federation, continued | | | | | | | |
LUKOIL ADR | | | 16,550 | | | 738,130 | |
| | | | |
|
| |
| | | | | | 1,302,812 | |
| | | | |
|
| |
Singapore – 0.2% | | | | | | | |
Neptune Orient Lines Ltd. | | | 427,000 | �� | | 375,144 | |
| | | | |
|
| |
South Africa – 0.8% | | | | | | | |
Sanlam Ltd. | | | 554,040 | | | 1,041,588 | |
Standard Bank Group Ltd. | | | 31,023 | | | 302,619 | |
| | | | |
|
| |
| | | | | | 1,344,207 | |
| | | | |
|
| |
South Korea – 1.1% | | | | | | | |
KB Financial Group, Inc. ADR (a) | | | 33,200 | | | 1,058,416 | |
Samsung Electronics Co., Ltd., Preferred | | | 2,900 | | | 751,073 | |
| | | | |
|
| |
| | | | | | 1,809,489 | |
| | | | |
|
| |
Spain – 1.8% | | | | | | | |
Telefonica SA (a) | | | 161,400 | | | 3,076,746 | |
| | | | |
|
| |
Sweden – 2.8% | | | | | | | |
Ericsson LM, B Shares | | | 153,000 | | | 1,351,035 | |
Nordea Bank AB | | | 114,080 | | | 859,803 | |
Svenska Cellusoa AB (SCA), B Shares | | | 189,700 | | | 1,852,055 | |
Volvo AB, B Shares | | | 86,500 | | | 572,866 | |
| | | | |
|
| |
| | | | | | 4,635,759 | |
| | | | |
|
| |
Switzerland – 3.4% | | | | | | | |
Credit Suisse Group | | | 81,100 | | | 3,170,079 | |
Novartis AG | | | 63,940 | | | 2,432,073 | |
| | | | |
|
| |
| | | | | | 5,602,152 | |
| | | | |
|
| |
Taiwan – 1.5% | | | | | | | |
AU Optronics Corp. | | | 1,101,000 | | | 1,140,734 | |
China Steel Corp. GDR | | | 40,044 | | | 618,279 | |
Compal Electronics, Inc. | | | 581,895 | | | 494,638 | |
United Microelectronics Corp. | | | 862,805 | | | 323,647 | |
| | | | |
|
| |
| | | | | | 2,577,298 | |
| | | | |
|
| |
Thailand – 0.4% | | | | | | | |
PTT Public Co., Ltd. | | | 121,400 | | | 652,448 | |
| | | | |
|
| |
United Kingdom – 17.7% | | | | | | | |
Associated British Foods plc | | | 199,300 | | | 2,116,262 | |
AstraZeneca plc | | | 43,100 | | | 1,520,209 | |
Aviva plc | | | 352,191 | | | 1,643,294 | |
Barclays plc | | | 451,300 | | | 1,878,804 | |
BP plc | | | 532,500 | | | 3,799,746 | |
Centrica plc | | | 618,000 | | | 2,074,684 | |
Drax Group plc | | | 51,100 | | | 389,950 | |
GlaxoSmithKline plc | | | 213,800 | | | 3,316,812 | |
Lloyds Banking Group plc | | | 886,507 | | | 1,468,378 | |
Royal Dutch Shell plc, A Shares | | | 200,987 | | | 4,671,581 | |
RSA Insurance Group plc | | | 505,627 | | | 981,074 | |
Thomas Cook Group plc | | | 175,500 | | | 681,958 | |
Tui Travel plc | | | 208,700 | | | 781,645 | |
Vodafone Group plc | | | 2,240,458 | | | 4,131,816 | |
| | | | |
|
| |
| | | | | | 29,456,213 | |
| | | | |
|
| |
| | | | | | | |
Common Stocks, continued | | | | | | | |
|
|
|
|
|
|
|
|
| | | | | | | |
| | Shares | | Value($) | |
| |
| |
| |
TOTAL COMMON STOCKS
(COST $238,609,787) | | | | | | 163,031,801 | |
| | | | |
|
| |
| | | | | | | |
Right—0.0% | | | | | | | |
|
|
|
|
|
|
|
|
Belgium – 0.0% | | | | | | | |
Fortis (a) | | | 121,532 | | | 0 | |
| | | | |
|
| |
TOTAL RIGHTS
(COST $0) | | | | | | 0 | |
| | | | |
|
| |
| | | | | | | |
Investment Company—0.9% | | | | | | | |
|
|
|
|
|
|
|
|
Northern Institutional Diversified Assets
Portfolio, Shares Class, 0.44% (b) | | | 1,401,968 | | | 1,401,968 | |
| | | | |
|
| |
TOTAL INVESTMENT COMPANY
(COST $1,401,968) | | | | | | 1,401,968 | |
| | | | |
|
| |
TOTAL INVESTMENTS
(COST $240,011,755) — 98.9% | | | | | | 164,433,769 | |
| | | | |
|
| |
| |
|
|
| Percentages indicated are based on net assets of $166,309,015. |
| |
(a) | Represents non-income producing security. |
| |
(b) | The rates presented represent the annualized one day yield that was in effect on April 30, 2009. |
| |
ADR — American Depositary Receipt |
GDR — Global Depositary Receipt |
PLC — Public Limited Co. |
SPA — Standby Purchase Agreement |
| | | | | |
Schedule of Portfolio Investments—April 30, 2009 | | | | |
|
|
|
|
| | | |
Industry | | Percent of Net Assets | |
| |
| |
Automotive | | | 3.6 | % | |
Banking & Financial Services | | | 23.9 | % | |
Building & Construction | | | 1.1 | % | |
Cash & Cash Equivalents | | | 0.8 | % | |
Chemicals | | | 2.2 | % | |
Drugs - Medical | | | 6.6 | % | |
Electrical | | | 4.7 | % | |
Electronic Components & Semiconductors | | | 5.0 | % | |
Food & Beverage | | | 2.2 | % | |
Import/Export | | | 0.9 | % | |
Insurance | | | 4.0 | % | |
Manufacturing | | | 7.1 | % | |
Metals & Mining | | | 2.0 | % | |
Oil & Gas | | | 15.8 | % | |
Publishing | | | 0.9 | % | |
Real Estate | | | 0.8 | % | |
Retail | | | 1.7 | % | |
Telecommunications | | | 13.2 | % | |
Transportation Services | | | 2.4 | % | |
| | |
| | |
Total Investments | | | 98.9 | % | |
| | |
| | |
| | |
81 | HSBC INVESTOR PORTFOLIOS | See notes to financial statements. |
|
HSBC INVESTOR INTERNATIONAL EQUITY PORTFOLIO |
|
|
Schedule of Portfolio Investments—as of April 30, 2009 (Unaudited) (continued) |
At April 30, 2009 the portfolio’s open forward currency contracts were as follows:
| | | | | | | | | | | |
Currency | | Delivery
Date | | Amount
(Local
Currency) | | Contract
Value
(U.S. Dollars)
($) | | Value
($) | | Unrealized
Appreciation/
(Depreciation)
($) | |
| |
| |
| |
| |
| |
| |
SHORT CONTRACTS | | | | | | | | | | | |
British Sterling Pound | | 06/15/09 | | 2,338,000 | | 3,291,436 | | 3,457,533 | | (166,097 | ) |
British Sterling Pound | | 07/15/09 | | 930,000 | | 1,386,463 | | 1,375,377 | | 11,086 | |
British Sterling Pound | | 07/15/09 | | 379,000 | | 555,466 | | 560,503 | | (5,037 | ) |
Canadian Dollar | | 06/15/09 | | 1,988,000 | | 1,571,467 | | 1,666,805 | | (95,338 | ) |
Canadian Dollar | | 06/15/09 | | 4,930,000 | | 3,860,762 | | 4,133,473 | | (272,711 | ) |
Canadian Dollar | | 06/15/09 | | 933,000 | | 733,808 | | 782,258 | | (48,450 | ) |
Canadian Dollar | | 06/15/09 | | 1,158,000 | | 934,776 | | 970,905 | | (36,129 | ) |
Canadian Dollar | | 07/15/09 | | 9,009,000 | | 7,276,766 | | 7,555,630 | | (278,864 | ) |
Swedish Krone | | 06/15/09 | | 28,436,000 | | 3,242,750 | | 3,536,838 | | (294,088 | ) |
| | | |
| |
| |
| |
| |
Total | | | | 50,101,000 | | 22,853,694 | | 24,039,322 | | (1,185,628 | ) |
| | | |
| |
| |
| |
| |
| | | | | | | | | | | |
LONG CONTRACTS | | | | | | | | | | | |
Canadian Dollar | | 06/15/09 | | 9,009,000 | | 7,275,591 | | 7,553,442 | | 277,851 | |
British Sterling Pound | | 06/15/09 | | 1,959,000 | | 2,899,320 | | 2,897,052 | | (2,268 | ) |
British Sterling Pound | | 06/15/09 | | 379,000 | | 555,489 | | 560,481 | | 4,992 | |
Swedish Krone | | 06/15/09 | | 3,116,000 | | 350,242 | | 387,565 | | 37,323 | |
Swedish Krone | | 06/15/09 | | 25,320,000 | | 2,993,085 | | 3,149,273 | | 156,188 | |
| | | |
| |
| |
| |
| |
Total | | | | 39,783,000 | | 14,073,727 | | 14,547,813 | | 474,086 | |
| | | |
| |
| |
| |
| |
| | |
See notes to financial statements. | HSBC INVESTOR PORTFOLIOS | 82 |
|
HSBC INVESTOR OPPORTUNITY PORTFOLIO |
|
|
Schedule of Portfolio Investments—as of April 30, 2009 (Unaudited) (continued) |
| | | | | | | |
Common Stocks—97.3% | | | | | | | |
|
|
|
|
|
|
|
|
|
| | Shares | | Value($) | |
| |
| |
| |
Aerospace & Defense – 1.3% | | | | | | | |
BE Aerospace, Inc. (a) | | | 138,700 | | | 1,496,573 | |
| | | | |
|
| |
Biotechnology – 5.8% | | | | | | | |
Illumina, Inc. (a) | | | 103,350 | | | 3,860,122 | |
Life Technologies Corp. (a) | | | 68,900 | | | 2,569,970 | |
| | | | |
|
| |
| | | | | | 6,430,092 | |
| | | | |
|
| |
Business Services – 3.1% | | | | | | | |
MSCI, Inc., Class A (a) | | | 61,700 | | | 1,295,083 | |
Navigant Consulting, Inc. (a) | | | 148,650 | | | 2,186,642 | |
| | | | |
|
| |
| | | | | | 3,481,725 | |
| | | | |
|
| |
Communications – 1.0% | | | | | | | |
Discovery Communications, Inc.,
Class A (a) | | | 58,800 | | | 1,116,612 | |
| | | | |
|
| |
Computer Software – 16.3% | | | | | | | |
ACI Worldwide, Inc. (a) | | | 73,200 | | | 1,264,164 | |
BMC Software, Inc. (a) | | | 98,400 | | | 3,411,528 | |
Brocade Communications Systems, Inc. (a) | | | 306,600 | | | 1,772,148 | |
Check Point Software Technologies Ltd. (a) | | | 139,250 | | | 3,226,422 | |
Citrix Systems, Inc. (a) | | | 73,200 | | | 2,088,396 | |
Nuance Communications, Inc. (a) | | | 235,450 | | | 3,143,257 | |
Salesforce.com, Inc. (a) | | | 38,050 | | | 1,628,921 | |
VeriFone Holdings, Inc. (a) | | | 200,300 | | | 1,504,253 | |
| | | | |
|
| |
| | | | | | 18,039,089 | |
| | | | |
|
| |
Consumer Products – 4.4% | | | | | | | |
Church & Dwight Co., Inc. | | | 39,800 | | | 2,165,518 | |
Crown Holdings, Inc. (a) | | | 121,300 | | | 2,674,665 | |
| | | | |
|
| |
| | | | | | 4,840,183 | |
| | | | |
|
| |
Diversified Manufacturing Operations – 5.1% | | | | | | | |
Actuant Corp., Class A | | | 113,400 | | | 1,390,284 | |
AMETEK, Inc. | | | 66,800 | | | 2,151,628 | |
Joy Global, Inc. | | | 84,050 | | | 2,143,275 | |
| | | | |
|
| |
| | | | | | 5,685,187 | |
| | | | |
|
| |
Education – 1.7% | | | | | | | |
Corinthian Colleges, Inc. (a) | | | 609 | | | 9,379 | |
DeVry, Inc. | | | 44,400 | | | 1,889,664 | |
| | | | |
|
| |
| | | | | | 1,899,043 | |
| | | | |
|
| |
Electronic Components & Semiconductors – 3.0% | | | | | | | |
Maxim Integrated Products, Inc. | | | 77,400 | | | 1,048,770 | |
National Semiconductor Corp. | | | 83,350 | | | 1,031,040 | |
Xilinx, Inc. | | | 63,550 | | | 1,298,962 | |
| | | | |
|
| |
| | | | | | 3,378,772 | |
| | | | |
|
| |
Environmental Services – 1.5% | | | | | | | |
Stericycle, Inc. (a) | | | 34,700 | | | 1,633,676 | |
| | | | |
|
| |
Financial Services – 4.5% | | | | | | | |
Annaly Capital Management, Inc. | | | 106,950 | | | 1,504,787 | |
PrivateBancorp, Inc. | | | 83,300 | | | 1,686,825 | |
Waddell & Reed Financial, Inc., Class A | | | 81,000 | | | 1,815,210 | |
| | | | |
|
| |
| | | | | | 5,006,822 | |
| | | | |
|
| |
Gaming – 1.1% | | | | | | | |
Scientific Games Corp., Class A (a) | | | 71,600 | | | 1,252,284 | |
| | | | |
|
| |
| | | | | | | |
Common Stocks, continued | | | | | | | |
|
|
|
|
|
|
|
|
| | | | | | | |
| | Shares | | Value($) | |
| |
| |
| |
Health Care – 6.5% | | | | | | | |
DaVita, Inc. (a) | | | 63,900 | | | 2,963,043 | |
IDEXX Laboratories, Inc. (a) | | | 62,500 | | | 2,456,250 | |
MEDNAX, Inc. (a) | | | 36,250 | | | 1,301,375 | |
Skilled Healthcare Group, Inc., Class A (a) | | | 54,600 | | | 476,658 | |
| | | | |
|
| |
| | | | | | 7,197,326 | |
| | | | |
|
| |
Industrial Manufacturing – 6.0% | | | | | | | |
IDEX Corp. | | | 89,000 | | | 2,247,250 | |
Mettler-Toledo International, Inc. (a) | | | 44,550 | | | 2,745,616 | |
WESCO International, Inc. (a) | | | 62,500 | | | 1,625,000 | |
| | | | |
|
| |
| | | | | | 6,617,866 | |
| | | | |
|
| |
Insurance – 1.3% | | | | | | | |
HCC Insurance Holdings, Inc. | | | 62,100 | | | 1,485,432 | |
| | | | |
|
| |
Internet Related – 1.4% | | | | | | | |
VeriSign, Inc. (a) | | | 76,100 | | | 1,566,138 | |
| | | | |
|
| |
Oil & Gas – 11.8% | | | | | | | |
Consol Energy, Inc. | | | 69,700 | | | 2,180,216 | |
Denbury Resources, Inc. (a) | | | 221,800 | | | 3,610,904 | |
EQT Corp. | | | 47,400 | | | 1,594,062 | |
Exterran Holdings, Inc. (a) | | | 104,600 | | | 2,159,990 | |
Massey Energy Co. | | | 179,450 | | | 2,855,049 | |
Range Resources Corp. | | | 17,000 | | | 679,490 | |
| | | | |
|
| |
| | | | | | 13,079,711 | |
| | | | |
|
| |
Pharmaceuticals – 10.7% | | | | | | | |
Alexion Pharmaceuticals, Inc. (a) | | | 108,650 | | | 3,631,083 | |
Elan Corp. plc ADR (a) | | | 235,500 | | | 1,391,805 | |
OSI Pharmaceuticals, Inc. (a) | | | 89,300 | | | 2,997,801 | |
Santarus, Inc. (a) | | | 211,800 | | | 372,768 | |
Shire plc ADR | | | 91,900 | | | 3,425,113 | |
| | | | |
|
| |
| | | | | | 11,818,570 | |
| | | | |
|
| |
Retail – 6.9% | | | | | | | |
American Eagle Outfitters, Inc. | | | 201,350 | | | 2,984,007 | |
O’Reilly Automotive, Inc. (a) | | | 72,500 | | | 2,816,625 | |
PetSmart, Inc. | | | 79,700 | | | 1,823,536 | |
| | | | |
|
| |
| | | | | | 7,624,168 | |
| | | | |
|
| |
Telecommunications – 3.9% | | | | | | | |
Comverse Technology, Inc. (a) | | | 196,000 | | | 1,401,400 | |
Equinix, Inc. (a) | | | 10,850 | | | 761,996 | |
Polycom, Inc. (a) | | | 114,300 | | | 2,130,552 | |
| | | | |
|
| |
| | | | | | 4,293,948 | |
| | | | |
|
| |
TOTAL COMMON STOCKS
(COST $126,142,743) | | | | | | 107,943,217 | |
| | | | |
|
| |
Investment Company—2.6% | | | | | | | |
|
|
|
|
|
|
|
|
Northern Institutional Government Select
Portfolio, Shares Class, 0.10% (b) | | | 2,842,694 | | | 2,842,694 | |
| | | | |
|
| |
TOTAL INVESTMENT COMPANY
(COST $2,842,694) | | | | | | 2,842,694 | |
| | | | |
|
| |
TOTAL INVESTMENTS
(COST $128,985,437) — 99.9% | | | | | | 110,785,911 | |
| | | | |
|
| |
| |
|
|
| Percentages indicated are based on net assets of $110,888,905. |
| |
(a) | Represents non-income producing security. |
| |
(b) | The rates presented represent the annualized one day yield that was in effect on April 30, 2009. |
| |
ADR — American Depositary Receipt |
PLC — Public Limited Co. |
| | |
83 | HSBC INVESTOR PORTFOLIOS | See notes to financial statements. |
|
HSBC INVESTOR VALUE PORTFOLIO |
|
|
Schedule of Portfolio Investments—as of April 30, 2009 (Unaudited) |
| | | | | | | |
Common Stocks—97.4% | | | | | | | |
|
|
|
|
|
|
|
|
| | | | | | | |
| | Shares | | Value($) | |
| |
| |
| |
Aerospace & Defense – 5.8% | | | | | | | |
Lockheed Martin Corp. | | | 14,900 | | | 1,170,097 | |
Raytheon Co. | | | 29,100 | | | 1,316,193 | |
| | | | |
|
| |
| | | | | | 2,486,290 | |
| | | | |
|
| |
Agricultural Chemicals – 1.1% | | | | | | | |
The Mosaic Co. | | | 11,500 | | | 465,175 | |
| | | | |
|
| |
Banking – 2.4% | | | | | | | |
Wells Fargo & Co. | | | 50,700 | | | 1,014,507 | |
| | | | |
|
| |
Business Services – 3.7% | | | | | | | |
Pitney Bowes, Inc. | | | 65,700 | | | 1,612,278 | |
| | | | |
|
| |
Computer Software – 8.6% | | | | | | | |
CA, Inc. | | | 120,200 | | | 2,073,450 | |
Microsoft Corp. | | | 81,500 | | | 1,651,190 | |
| | | | |
|
| |
| | | | | | 3,724,640 | |
| | | | |
|
| |
Conglomerates – 3.0% | | | | | | | |
Loews Corp. | | | 51,240 | | | 1,275,364 | |
| | | | |
|
| |
Consumer Products – 4.2% | | | | | | | |
Kimberly-Clark Corp. | | | 24,600 | | | 1,208,844 | |
Kraft Foods, Inc. | | | 25,069 | | | 586,615 | |
| | | | |
|
| |
| | | | | | 1,795,459 | |
| | | | |
|
| |
Diversified Manufacturing Operations – 1.5% | | | | | | | |
Ingersoll-Rand Co., Class A | | | 30,100 | | | 655,277 | |
| | | | |
|
| |
Electronic Components & Semiconductors – 2.5% | | | | | | | |
Agilent Technologies, Inc. (a) | | | 58,800 | | | 1,073,688 | |
| | | | |
|
| |
Energy – 2.8% | | | | | | | |
Halliburton Co. | | | 30,600 | | | 618,732 | |
NRG Energy, Inc. (a) | | | 33,800 | | | 607,724 | |
| | | | |
|
| |
| | | | | | 1,226,456 | |
| | | | |
|
| |
Financial Services – 3.4% | | | | | | | |
JP Morgan Chase & Co. | | | 44,250 | | | 1,460,250 | |
| | | | |
|
| |
Insurance – 8.0% | | | | | | | |
Aetna, Inc. | | | 20,800 | | | 457,808 | |
Aon Corp. | | | 30,400 | | | 1,282,880 | |
Genworth Financial, Inc., Class A | | | 93,500 | | | 220,660 | |
MetLife, Inc. | | | 35,200 | | | 1,047,200 | |
The Hartford Financial
Services Group, Inc. | | | 37,300 | | | 427,831 | |
| | | | |
|
| |
| | | | | | 3,436,379 | |
| | | | |
|
| |
Media – 6.5% | | | | | | | |
CBS Corp., Class B | | | 34,350 | | | 241,824 | |
Comcast Corp., Class A | | | 51,650 | | | 758,222 | |
Viacom, Inc., Class B (a) | | | 94,000 | | | 1,808,560 | |
| | | | |
|
| |
| | | | | | 2,808,606 | |
| | | | |
|
| |
Metals & Mining – 8.0% | | | | | | | |
AngloGold Ashanti Ltd. ADR | | | 47,327 | | | 1,457,671 | |
Barrick Gold Corp. | | | 55,800 | | | 1,623,780 | |
United States Steel Corp. | | | 13,800 | | | 366,390 | |
| | | | |
|
| |
| | | | | | 3,447,841 | |
| | | | |
|
| |
| | | | | | | |
Common Stocks, continued | | | | | | | |
|
|
|
|
|
|
|
|
| | | | | | | |
| | Shares | | Value($) | |
| |
| |
| |
Oil & Gas – 14.4% | | | | | | | |
Apache Corp. | | | 24,400 | | | 1,777,784 | |
ConocoPhillips | | | 9,571 | | | 392,411 | |
EOG Resources, Inc. | | | 9,075 | | | 576,081 | |
Hess Corp. | | | 13,600 | | | 745,144 | |
Noble Energy, Inc. | | | 35,900 | | | 2,037,325 | |
Talisman Energy, Inc. | | | 55,200 | | | 692,208 | |
| | | | |
|
| |
| | | | | | 6,220,953 | |
| | | | |
|
| |
Pharmaceuticals – 7.6% | | | | | | | |
Amgen, Inc. (a) | | | 31,100 | | | 1,507,417 | |
Merck & Co., Inc. | | | 30,600 | | | 741,744 | |
Sanofi-Aventis ADR | | | 36,200 | | | 1,039,664 | |
| | | | |
|
| |
| | | | | | 3,288,825 | |
| | | | |
|
| |
Telecommunications – 8.0% | | | | | | | |
AT&T, Inc. | | | 33,000 | | | 845,460 | |
Motorola, Inc. | | | 319,000 | | | 1,764,070 | |
Verizon Communications, Inc. | | | 27,800 | | | 843,452 | |
| | | | |
|
| |
| | | | | | 3,452,982 | |
| | | | |
|
| |
Tobacco – 3.9% | | | | | | | |
Lorillard, Inc. | | | 9,927 | | | 626,691 | |
Philip Morris International, Inc. | | | 28,700 | | | 1,038,940 | |
| | | | |
|
| |
| | | | | | 1,665,631 | |
| | | | |
|
| |
Transportation – 2.0% | | | | | | | |
Union Pacific Corp. | | | 18,000 | | | 884,520 | |
| | | | |
|
| |
TOTAL COMMON STOCKS
(COST $56,119,439) | | | | | | 41,995,121 | |
| | | | |
|
| |
| | | | | | | |
Investment Company—2.5% | | | | | | | |
|
|
|
|
|
|
|
|
Northern Institutional Government Select
Portfolio, Shares Class, 0.10% (b) | | | 1,071,696 | | | 1,071,696 | |
| | | | |
|
| |
TOTAL INVESTMENT COMPANY
(COST $1,071,696) | | | | | | 1,071,696 | |
| | | | |
|
| |
TOTAL INVESTMENTS
(COST $57,191,135) — 99.9% | | | | | | 43,066,817 | |
| | | | |
|
| |
| |
|
|
| Percentages indicated are based on net assets of $43,127,664. |
| |
(a) | Represents non-income producing security. |
| |
(b) | The rates presented represent the annualized one day yield that was in effect on April 30, 2009. |
| |
ADR — American Depositary Receipt |
| | |
See notes to financial statements. | HSBC INVESTOR PORTFOLIOS | 84 |
|
HSBC INVESTOR PORTFOLIOS |
|
Statements of Assets and Liabilities—as of April 30, 2009 (Unaudited) |
| | | | | | | | | | | | | |
| | Core Plus
Fixed Income
Portfolio | | Intermediate
Duration
Fixed Income
Portfolio | | Growth
Portfolio | | International
Equity
Portfolio | |
|
|
|
|
|
|
|
|
|
|
|
|
| |
Assets: | | | | | | | | | | | | | |
Investments in non-affiliates, at value | | $ | 93,606,783 | | $ | 18,241,585 | | $ | 78,554,816 | | $ | 164,433,769 | |
Foreign currency, at value | | | — | | | — | | | — | | | 2,521,711 | |
Unrealized appreciation on forward foreign
currency exchange contracts | | | — | | | — | | | — | | | 487,440 | |
Interest and dividends receivable | | | 632,107 | | | 91,144 | | | 30,209 | | | 662,006 | |
Receivable for investments sold | | | 10,729,803 | | | 3,095,685 | | | 1,182,861 | | | 339,018 | |
Prepaid expenses and other assets | | | 7 | | | 170 | | | 746 | | | 1,470 | |
| |
|
| |
|
| |
|
| |
|
| |
Total Assets | | | 104,968,700 | | | 21,428,584 | | | 79,768,632 | | | 168,445,414 | |
| |
|
| |
|
| |
|
| |
|
| |
|
|
|
|
|
|
|
|
|
|
|
|
| |
Liabilities: | | | | | | | | | | | | | |
Cash overdraft | | | 3,873 | | | 6,131 | | | — | | | — | |
Unrealized depreciation on forward foreign
currency contracts | | | — | | | — | | | — | | | 1,198,982 | |
Payable for investments purchased | | | 35,443,151 | | | 8,763,180 | | | 1,010,356 | | | 815,275 | |
Accrued expenses and other liabilities: | | | | | | | | | | | | | |
Investment Management | | | 30,671 | | | 4,151 | | | 36,044 | | | 94,281 | |
Administration | | | 1,241 | | | 226 | | | 1,356 | | | 2,889 | |
Compliance Service | | | 24 | | | 4 | | | 27 | | | 56 | |
Other | | | 7,036 | | | 6,228 | | | 5,015 | | | 24,916 | |
| |
|
| |
|
| |
|
| |
|
| |
Total Liabilities | | | 35,485,996 | | | 8,779,920 | | | 1,052,798 | | | 2,136,399 | |
| |
|
| |
|
| |
|
| |
|
| |
|
|
|
|
|
|
|
|
|
|
|
|
| |
Net Assets: | | | | | | | | | | | | | |
Applicable to investors’ beneficial interest | | $ | 69,482,704 | | $ | 12,648,664 | | $ | 78,715,834 | | $ | 166,309,015 | |
| |
|
| |
|
| |
|
| |
|
| |
Total Investments, at cost | | $ | 103,226,664 | | $ | 19,536,796 | | $ | 84,735,372 | | $ | 240,011,755 | |
| |
|
| |
|
| |
|
| |
|
| |
Foreign currency, at cost | | $ | — | | $ | — | | $ | — | | $ | 2,504,392 | |
| |
|
| |
|
| |
|
| |
|
| |
| | |
85 | HSBC INVESTOR PORTFOLIOS | See notes to financial statements. |
|
HSBC INVESTOR PORTFOLIOS |
|
Statements of Assets and Liabilities—as of April 30, 2009 (Unaudited) (continued) |
| | | | | | | |
| | Opportunity
Portfolio | | Value
Portfolio | |
|
|
|
|
|
|
| |
Assets: | | | | | | | |
Investments in non-affiliates, at value | | $ | 110,785,911 | | $ | 43,066,817 | |
Dividend income | | | 2,825 | | | 82,117 | |
Receivable for investments sold | | | 1,231,827 | | | — | |
Prepaid expenses and other assets | | | — | | | 889 | |
| |
|
| |
|
| |
Total Assets | | | 112,020,563 | | | 43,149,823 | |
| |
|
| |
|
| |
|
|
|
|
|
|
| |
Liabilities: | | | | | | | |
Payable for investments purchased | | | 1,047,632 | | | — | |
Accrued expenses and other liabilities: | | | | | | | |
Investment Management | | | 70,435 | | | 18,009 | |
Administration | | | 1,921 | | | 760 | |
Compliance Service | | | 38 | | | 15 | |
Other | | | 11,632 | | | 3,375 | |
| |
|
| |
|
| |
Total Liabilities | | | 1,131,658 | | | 22,159 | |
| |
|
| |
|
| |
|
|
|
|
|
|
| |
Net Assets: | | | | | | | |
Applicable to investors’ beneficial interest | | $ | 110,888,905 | | $ | 43,127,664 | |
| |
|
| |
|
| |
Total Investments, at cost | | $ | 128,985,437 | | $ | 57,191,135 | |
| |
|
| |
|
| |
| | |
See notes to financial statements. | HSBC INVESTOR PORTFOLIOS | 86 |
|
HSBC INVESTOR PORTFOLIOS |
|
Statements of Operations—For the six months ended April 30, 2009 (Unaudited) |
| | | | | | | | | | | | | |
| | Core Plus
Fixed Income
Portfolio | | Intermediate
Duration
Fixed Income
Portfolio | | Growth
Portfolio | | International
Equity
Portfolio | |
|
|
|
|
|
|
|
|
| |
Investment Income: | | | | | | | | | | | | | |
Interest | | $ | 2,118,629 | | $ | 304,397 | | $ | — | | $ | 3,441 | |
Dividends | | | 5,734 | | | 4,879 | | | 363,478 | | | 2,937,928 | |
Foreign tax withholding | | | — | | | — | | | — | | | (453,901 | ) |
| |
|
| |
|
| |
|
| |
|
| |
Total Investment Income (Loss) | | | 2,124,363 | | | 309,276 | | | 363,478 | | | 2,487,468 | |
| |
|
| |
|
| |
|
| |
|
| |
|
|
|
|
|
|
|
|
|
|
|
|
| |
Expenses: | | | | | | | | | | | | | |
Investment Management | | | 196,009 | | | 25,771 | | | 209,638 | | | 576,888 | |
Administration | | | 7,500 | | | 1,315 | | | 7,447 | | | 16,550 | |
Accounting | | | 32,290 | | | 29,135 | | | 24,861 | | | 45,159 | |
Compliance Service | | | 127 | | | 8 | | | 169 | | | 340 | |
Custodian | | | 2,266 | | | 872 | | | 4,129 | | | 81,166 | |
Printing | | | 132 | | | 553 | | | 480 | | | 1,788 | |
Professional fees | | | 618 | | | 260 | | | 1,203 | | | 2,035 | |
Trustee | | | 532 | | | 59 | | | 518 | | | 1,227 | |
Other | | | 8,389 | | | 605 | | | 8,149 | | | 19,270 | |
| |
|
| |
|
| |
|
| |
|
| |
Total Expenses | | | 247,863 | | | 58,578 | | | 256,594 | | | 744,423 | |
| |
|
| |
|
| |
|
| |
|
| |
|
|
|
|
|
|
|
|
|
|
|
|
| |
Net Investment Income (Loss) | | | 1,876,500 | | | 250,698 | | | 106,884 | | | 1,743,045 | |
| |
|
| |
|
| |
|
| |
|
| |
|
|
|
|
|
|
|
|
|
|
|
|
| |
Net Realized/Unrealized Gains (Losses)
from Investments: | | | | | | | | | | | | | |
Net realized gains (losses) from investments and
foreign currency transactions | | | 51,411 | | | 177,985 | | | (12,863,368 | ) | | (56,073,611 | ) |
Net realized gains (losses) from futures transactions | | | (380,711 | ) | | (57,805 | ) | | — | | | — | |
Change in unrealized appreciation/depreciation from
investments and foreign currencies | | | 2,779,601 | | | 305,872 | | | 13,870,510 | | | 44,805,697 | |
| |
|
| |
|
| |
|
| |
|
| |
|
|
|
|
|
|
|
|
|
|
|
|
| |
Net realized/unrealized gains (losses) from investments and foreign currency transactions | | | 2,450,301 | | | 426,052 | | | 1,007,142 | | | (11,267,914 | ) |
| |
|
| |
|
| |
|
| |
|
| |
Change In Net Assets Resulting From
Operations | | $ | 4,326,801 | | $ | 676,750 | | $ | 1,114,026 | | $ | (9,524,869 | ) |
| |
|
| |
|
| |
|
| |
|
| |
| | |
87 | HSBC INVESTOR PORTFOLIOS | See notes to financial statements. |
|
HSBC INVESTOR PORTFOLIOS |
|
Statements of Operations—For the six months ended April 30, 2009 (Unaudited) (continued) |
| | | | | | | |
| | Opportunity
Portfolio | | Value
Portfolio | |
|
|
|
|
|
|
| |
Investment Income: | | | | | | | |
Dividends | | $ | 292,719 | | $ | 567,167 | |
| |
|
| |
|
| |
Total Investment Income (Loss) | | | 292,719 | | | 567,167 | |
| |
|
| |
|
| |
|
|
|
|
|
|
| |
Expenses: | | | | | | | |
Investment Management | | | 418,743 | | | 112,278 | |
Administration | | | 10,754 | | | 4,396 | |
Accounting | | | 24,621 | | | 24,275 | |
Compliance Service | | | 184 | | | 115 | |
Custodian | | | 7,505 | | | 1,662 | |
Printing | | | 221 | | | 397 | |
Professional fees | | | 403 | | | 519 | |
Trustee | | | 820 | | | 239 | |
Other | | | 12,910 | | | 4,691 | |
| |
|
| |
|
| |
Total Expenses | | | 476,161 | | | 148,572 | |
| |
|
| |
|
| |
|
|
|
|
|
|
| |
Net Investment Income (Loss) | | | (183,442 | ) | | 418,595 | |
| |
|
| |
|
| |
|
|
|
|
|
|
| |
Net Realized/Unrealized Gains (Losses) from Investments: | | | | | | | |
Net realized losses from investment transactions | | | (18,090,240 | ) | | (1,624,297 | ) |
Change in unrealized appreciation/depreciation
from investments and foreign currencies | | | 12,416,564 | | | (1,507,018 | ) |
| |
|
| |
|
| |
|
|
|
|
|
|
| |
Net realized/unrealized gains (losses) from
investment transactions | | | (5,673,676 | ) | | (3,131,315 | ) |
| |
|
| |
|
| |
Change In Net Assets Resulting From Operations | | $ | (5,857,118 | ) | $ | (2,712,720 | ) |
| |
|
| |
|
| |
| | |
See notes to financial statements. | HSBC INVESTOR PORTFOLIOS | 88 |
HSBC INVESTOR PORTFOLIOS
Statements of Changes in Net Assets
| | | | | | | | | | | | | |
| | Core Plus
Fixed Income
Portfolio | | Intermediate Duration
Fixed Income
Portfolio | |
|
|
|
|
|
|
| | For the six
months ended
April 30, 2009
(Unaudited) | | For the
year ended
October 31, 2008 | | For the six
months ended
April 30, 2009
(Unaudited) | | For the
year ended
October 31, 2008 | |
|
|
|
|
|
|
|
|
|
|
Investment Activities: | | | | | | | | | | | | | |
Operations: | | | | | | | | | | | | | |
Net investment income (loss) | | $ | 1,876,500 | | $ | 5,103,577 | | $ | 250,698 | | $ | 602,838 | |
Net realized gains (losses) from
investment and futures transactions | | | (329,300 | ) | | (1,760,929 | ) | | 120,180 | | | (137,944 | ) |
Change in unrealized
appreciation/depreciation from
investments | | | 2,779,601 | | | (12,280,378 | ) | | 305,872 | | | (1,515,259 | ) |
| |
|
| |
|
| |
|
| |
|
| |
Change in net assets resulting from
operations | | | 4,326,801 | | | (8,937,730 | ) | | 676,750 | | | (1,050,365 | ) |
| |
|
| |
|
| |
|
| |
|
| |
Proceeds from contributions | | | 779,241 | | | 13,894,668 | | | 293,480 | | | 3,554,894 | |
Value of withdrawals | | | (17,351,215 | ) | | (43,040,969 | ) | | (1,852,552 | ) | | (4,032,112 | ) |
| |
|
| |
|
| |
|
| |
|
| |
Change in net assets resulting from
transactions in investors’
beneficial interest | | | (16,571,974 | ) | | (29,146,301 | ) | | (1,559,072 | ) | | (477,218 | ) |
| |
|
| |
|
| |
|
| |
|
| |
Change in net assets | | | (12,245,173 | ) | | (38,084,031 | ) | | (882,322 | ) | | (1,527,583 | ) |
|
|
|
|
|
|
|
|
|
|
|
|
|
|
Net Assets: | | | | | | | | | | | | | |
Beginning of period | | | 81,727,877 | | | 119,811,908 | | | 13,530,986 | | | 15,058,569 | |
| |
|
| |
|
| |
|
| |
|
| |
End of period | | $ | 69,482,704 | | $ | 81,727,877 | | $ | 12,648,664 | | $ | 13,530,986 | |
| |
|
| |
|
| |
|
| |
|
| |
| | |
89 | HSBC INVESTOR PORTFOLIOS | See notes to financial statements. |
HSBC INVESTOR PORTFOLIOS
Statements of Changes in Net Assets (continued)
| | | | | | | | | | | | | |
| | Growth
Portfolio | | International Equity
Portfolio | |
|
|
|
|
|
|
| | For the six
months ended
April 30, 2009
(Unaudited) | | For the
year ended
October 31, 2008 | | For the six
months ended
April 30, 2009
(Unaudited) | | For the
year ended
October 31, 2008 | |
|
|
|
|
|
|
|
|
|
|
Investment Activities: | | | | | | | | | | | | | |
Operations: | | | | | | | | | | | | | |
Net investment income (loss) | | $ | 106,884 | | $ | 158,253 | | $ | 1,743,045 | | $ | 9,312,232 | |
Net realized gains (losses) from
investment transactions | | | (12,863,368 | ) | | (80,608 | ) | | (56,073,611 | ) | | 10,348,234 | |
Change in unrealized
appreciation/depreciation from
investments and foreign currencies | | | 13,870,510 | | | (42,269,939 | ) | | 44,805,697 | | | (242,760,619 | ) |
| |
|
| |
|
| |
|
| |
|
| |
Change in net assets resulting from
operations | | | 1,114,026 | | | (42,192,294 | ) | | (9,524,869 | ) | | (223,100,153 | ) |
| |
|
| |
|
| |
|
| |
|
| |
Proceeds from contributions | | | 6,048,952 | | | 50,198,227 | | | 10,790,392 | | | 43,694,202 | |
Value of withdrawals | | | (10,388,656 | ) | | (15,750,298 | ) | | (34,265,418 | ) | | (76,346,748 | ) |
| |
|
| |
|
| |
|
| |
|
| |
Change in net assets resulting from
transactions in investors’
beneficial interest | | | (4,339,704 | ) | | 34,447,929 | | | (23,475,026 | ) | | (32,652,546 | ) |
| |
|
| |
|
| |
|
| |
|
| |
Change in net assets | | | (3,225,678 | ) | | (7,744,365 | ) | | (32,999,895 | ) | | (255,752,699 | ) |
|
|
|
|
|
|
|
|
|
|
|
|
|
|
Net Assets: | | | | | | | | | | | | | |
Beginning of period | | | 81,941,512 | | | 89,685,877 | | | 199,308,910 | | | 455,061,609 | |
| |
|
| |
|
| |
|
| |
|
| |
End of period | | $ | 78,715,834 | | $ | 81,941,512 | | $ | 166,309,015 | | $ | 199,308,910 | |
| |
|
| |
|
| |
|
| |
|
| |
| | |
See notes to financial statements. | HSBC INVESTOR PORTFOLIOS | 90 |
HSBC INVESTOR PORTFOLIOS
Statements of Changes in Net Assets (continued)
| | | | | | | | | | | | | |
| | Opportunity
Portfolio | | Value
Portfolio | |
|
|
|
|
|
|
| | For the six
months ended
April 30, 2009
(Unaudited) | | For the
year ended
October 31, 2008 | | For the six
months ended
April 30, 2009
(Unaudited) | | For the
year ended
October 31, 2008 | |
|
|
|
|
|
|
|
|
|
|
Investment Activities: | | | | | | | | | | | | | |
Operations: | | | | | | | | | | | | | |
Net investment income (loss) | | $ | (183,442 | ) | $ | (854,296 | ) | $ | 418,595 | | $ | 1,062,396 | |
Net realized gains (losses) from
investment transactions | | | (18,090,240 | ) | | 2,354,698 | | | (1,624,297 | ) | | (7,776,127 | ) |
Change in unrealized
appreciation/depreciation from
investments and foreign currencies | | | 12,416,564 | | | (73,360,727 | ) | | (1,507,018 | ) | | (25,258,253 | ) |
| |
|
| |
|
| |
|
| |
|
| |
Change in net assets resulting from
operations | | | (5,857,118 | ) | | (71,860,325 | ) | | (2,712,720 | ) | | (31,971,984 | ) |
| |
|
| |
|
| |
|
| |
|
| |
Proceeds from contributions | | | 4,180,538 | | | 20,402,348 | | | 3,017,348 | | | 12,224,588 | |
Value of withdrawals | | | (15,404,154 | ) | | (44,840,850 | ) | | (6,840,136 | ) | | (13,247,672 | ) |
| |
|
| |
|
| |
|
| |
|
| |
Change in net assets resulting from
transactions in investors’
beneficial interest | | | (11,223,616 | ) | | (24,438,502 | ) | | (3,822,788 | ) | | (1,023,084 | ) |
| |
|
| |
|
| |
|
| |
|
| |
Change in net assets | | | (17,080,734 | ) | | (96,298,827 | ) | | (6,535,508 | ) | | (32,995,068 | ) |
|
|
|
|
|
|
|
|
|
|
|
|
|
|
Net Assets: | | | | | | | | | | | | | |
Beginning of period | | | 127,969,639 | | | 224,268,466 | | | 49,663,172 | | | 82,658,240 | |
| |
|
| |
|
| |
|
| |
|
| |
End of period | | $ | 110,888,905 | | $ | 127,969,639 | | $ | 43,127,664 | | $ | 49,663,172 | |
| |
|
| |
|
| |
|
| |
|
| |
| | |
91 | HSBC INVESTOR PORTFOLIOS | See notes to financial statements. |
This page is intentionally left blank.
|
HSBC INVESTOR PORTFOLIOS |
|
|
Financial Highlights |
| | | | | | | | | | | | | | | | | | | |
| | | | Ratio/Supplementary Data | |
| | | |
| |
| | Total
Return(a) | | Net Assets
at End of
Period
(000’s) | | Ratio of Net
Expenses
to Average
Net Assets(b) | | Ratio of Net
Investment
Income (Loss)
to Average
Net Assets(b) | | Ratio of
Expenses
to Average
Net Assets(b)(c) | | Portfolio
Turnover
Rate(a) | |
|
|
|
|
|
|
|
|
|
|
|
|
| |
CORE PLUS FIXED INCOME PORTFOLIO | | | | | | | | | | | | | | | | | | | |
Year Ended October 31, 2004 | | 5.56 | % | | $ | 169,459 | | 0.52 | % | | 4.31 | % | | 0.52 | % | | 34.88 | % | |
Year Ended October 31, 2005 | | 1.64 | %(d) | | | 122,530 | | 0.40 | %(d) | | 4.25 | %(d) | | 0.53 | % | | 176.60 | % | |
Year Ended October 31, 2006 | | 5.55 | % | | | 111,192 | | 0.63 | % | | 4.96 | % | | 0.63 | % | | 273.91 | % | |
Year Ended October 31, 2007 | | 6.94 | % | | | 119,812 | | 0.59 | % | | 4.99 | % | | 0.59 | % | | 252.56 | % | |
Year Ended October 31, 2008 | | (8.78 | )% | | | 81,728 | | 0.59 | % | | 4.80 | % | | 0.59 | % | | 119.38 | % | |
Six Months Ended April 30, 2009 (Unaudited) | | 6.05 | % | | | 69,483 | | 0.68 | % | | 5.11 | % | | 0.68 | % | | 17.88 | % | |
|
|
|
|
|
|
|
|
|
|
|
|
|
|
|
|
|
|
| |
INTERMEDIATE DURATION FIXED INCOME PORTFOLIO | | | | | | | | | | | | | | |
Year Ended October 31, 2004 | | 4.48 | % | | $ | 63,697 | | 0.57 | % | | 3.54 | % | | 0.57 | % | | 50.06 | % | |
Year Ended October 31, 2005 | | 0.76 | %(d) | | | 32,810 | | 0.49 | %(d) | | 3.85 | %(d) | | 0.58 | % | | 107.26 | % | |
Year Ended October 31, 2006 | | 5.29 | % | | | 19,517 | | 0.78 | % | | 4.58 | % | | 0.78 | % | | 236.51 | % | |
Year Ended October 31, 2007 | | 8.38 | % | | | 15,059 | | 0.84 | % | | 4.68 | % | | 0.84 | % | | 219.76 | % | |
Year Ended October 31, 2008 | | (7.08 | )% | | | 13,531 | | 0.91 | % | | 4.15 | % | | 0.91 | % | | 124.23 | % | |
Six Months Ended April 30, 2009 (Unaudited) | | 5.37 | % | | | 12,649 | | 0.91 | % | | 3.89 | % | | 0.91 | % | | 62.22 | % | |
|
|
|
|
|
|
|
|
|
|
|
|
|
|
|
|
|
|
| |
GROWTH PORTFOLIO | | | | | | | | | | | | | | | | | | | |
Period Ended October 31, 2004 (f) | | (0.86 | )% | | $ | 49,680 | | 0.72 | % | | 0.06 | % | | 0.72 | % | | 53.08 | % | |
Year Ended October 31, 2005 | | 13.59 | %(d) | | | 49,415 | | 0.63 | %(d) | | 0.77 | %(d) | | 0.68 | % | | 79.54 | % | |
Year Ended October 31, 2006 | | 7.53 | % | | | 59,828 | | 0.69 | % | | 0.38 | % | | 0.69 | % | | 75.06 | % | |
Year Ended October 31, 2007 | | 31.11 | % | | | 89,686 | | 0.62 | % | | 0.45 | % | | 0.62 | % | | 57.04 | % | |
Year Ended October 31, 2008 | | (37.75 | )%(e) | | | 81,942 | | 0.62 | % | | 0.19 | % | | 0.62 | % | | 157.87 | % | |
Six Months Ended April 30, 2009 (Unaudited) | | 2.05 | % | | | 78,716 | | 0.70 | % | | 0.29 | % | | 0.70 | % | | 33.58 | % | |
|
|
|
|
|
|
|
|
|
|
|
|
|
|
|
|
|
|
| |
INTERNATIONAL EQUITY PORTFOLIO | | | | | | | | | | | | | | | | | | | |
Year Ended October 31, 2004 | | 20.29 | % | | $ | 220,025 | | 0.94 | % | | 1.53 | % | | 0.94 | % | | 106.11 | % | |
Year Ended October 31, 2005 | | 19.54 | % | | | 230,230 | | 0.84 | % | | 1.92 | % | | 0.84 | % | | 31.32 | % | |
Year Ended October 31, 2006 | | 32.79 | % | | | 333,755 | | 0.86 | % | | 2.03 | % | | 0.86 | % | | 33.39 | % | |
Year Ended October 31, 2007 | | 25.17 | % | | | 455,062 | | 0.79 | % | | 2.16 | % | | 0.79 | % | | 26.08 | % | |
Year Ended October 31, 2008 | | (51.95 | )% | | | 199,309 | | 0.76 | % | | 2.65 | % | | 0.76 | % | | 28.98 | % | |
Six Months Ended April 30, 2009 (Unaudited) | | (4.47 | )% | | | 166,309 | | 0.93 | % | | 2.17 | % | | 0.93 | % | | 29.46 | % | |
|
|
|
|
|
|
|
|
|
|
|
|
|
|
|
|
|
|
| |
OPPORTUNITY PORTFOLIO | | | | | | | | | | | | | | | | | | | |
Year Ended October 31, 2004 | | 5.93 | % | | $ | 359,333 | | 0.88 | % | | (0.52 | )% | | 0.88 | % | | 81.75 | % | |
Year Ended October 31, 2005 | | 14.35 | %(d) | | | 218,778 | | 0.85 | %(d) | | (0.45 | )%(d) | | 0.90 | % | | 63.95 | % | |
Year Ended October 31, 2006 | | 19.54 | % | | | 241,495 | | 0.91 | % | | (0.40 | )% | | 0.91 | % | | 60.83 | % | |
Year Ended October 31, 2007 | | 30.54 | % | | | 224,268 | | 0.91 | % | | (0.55 | )% | | 0.91 | % | | 69.41 | % | |
Year Ended October 31, 2008 | | (35.30 | )% | | | 127,970 | | 0.87 | % | | (0.46 | )% | | 0.87 | % | | 80.42 | % | |
Six Months Ended April 30, 2009 (Unaudited) | | (3.69 | )% | | | 110,889 | | 0.91 | % | | (0.35 | )% | | 0.91 | % | | 29.04 | % | |
|
|
|
|
|
|
|
|
|
|
|
|
|
|
|
|
|
|
| |
VALUE PORTFOLIO | | | | | | | | | | | | | | | | | | | |
Period Ended October 31, 2004 (f) | | 6.12 | % | | $ | 61,414 | | 0.71 | % | | 1.28 | % | | 0.71 | % | | 10.33 | % | |
Year Ended October 31, 2005 | | 15.23 | %(d) | | | 54,150 | | 0.64 | %(d) | | 1.15 | %(d) | | 0.69 | % | | 16.45 | % | |
Year Ended October 31, 2006 | | 22.21 | % | | | 67,432 | | 0.71 | % | | 1.23 | % | | 0.71 | % | | 20.63 | % | |
Year Ended October 31, 2007 | | 10.28 | % | | | 82,658 | | 0.66 | % | | 1.29 | % | | 0.66 | % | | 18.67 | % | |
Year Ended October 31, 2008 | | (39.91 | )% | | | 49,663 | | 0.64 | % | | 1.54 | % | | 0.64 | % | | 24.61 | % | |
Six Months Ended April 30, 2009 (Unaudited) | | (4.59 | )% | | | 43,128 | | 0.69 | % | | 1.96 | % | | 0.69 | % | | 13.02 | % | |
|
|
|
|
|
|
|
|
|
|
|
|
|
|
|
|
|
|
| |
| |
(a) | Not annualized for periods less than one year. |
| |
(b) | Annualized for periods less than one year. |
| |
(c) | During the period, certain fees were reduced. If such fee reductions had not occurred, the ratio would have been as indicated. |
| |
(d) | During the year ended October 31, 2005, HSBC reimbursed certain amounts to the Portfolios related to violations of certain investment policies and limitations. The corresponding impact to the net expense ratio, net income ratio and total return were 0.12%, 0.09%, 0.05%, 0.04% and 0.05% for the Core Plus Fixed Income Portfolio, Intermediate Duration Fixed Income Portfolio, Growth Portfolio, Opportunity Portfolio and Value Portfolio, respectively. |
| |
(e) | During the year ended October 31, 2008, Winslow Capital Management, Inc. reimbursed $64,658 to the Portfolio related to violations of certain investment policies and limitations. The corresponding impact to the total return was 0.08%. |
| |
(f) | Growth Portfolio commenced operations on May 7, 2004.
Value Portfolio commenced operations on May 7, 2004. |
| | |
93 | HSBC INVESTOR PORTFOLIOS | See notes to financial statements. |
|
HSBC INVESTOR PORTFOLIOS |
|
|
Notes to Financial Statements—as of April 30, 2009 (Unaudited) |
| |
1. | Organization: |
| |
| The HSBC Investor Portfolios (the “Portfolio Trust”), is an open-end management investment company organized as a New York trust under the laws of the State of New York on November 1, 1994. The Portfolio Trust contains the following master funds (individually a “Portfolio,” collectively the “Portfolios”): |
| | | | |
Portfolio | | | Short Name | |
| | |
| |
HSBC Investor Core Plus Fixed Income Portfolio | | Core Plus Fixed Income Portfolio |
HSBC Investor Intermediate Duration Fixed Income Portfolio | | Intermediate Duration Fixed Income Portfolio |
HSBC Investor Growth Portfolio | | Growth Portfolio |
HSBC Investor International Equity Portfolio | | International Equity Portfolio |
HSBC Investor Opportunity Portfolio | | Opportunity Portfolio |
HSBC Investor Value Portfolio | | Value Portfolio |
| |
| The Portfolios operate as master funds in master-feeder arrangements, in which other funds invest all of their investable assets in the Portfolios. The Portfolios also receive investments from funds of funds. The Declaration of Trust permits the Board of Trustees to issue an unlimited number of beneficial interests in the Portfolios. |
| |
| The Portfolios are diversified series of the Portfolio Trust and are part of the HSBC Investor Family of Funds. Financial statements for all other funds of the HSBC Investor Family of Funds are published separately. |
| |
| Under the Portfolio Trust’s organizational documents, the Portfolio Trust’s Officers and Trustees are indemnified against certain liabilities arising out of the performance of their duties to the Portfolios. In addition, in the normal course of business, the Portfolio Trust may enter into contracts with its service providers, which also provide for indemnifications by the Portfolios. The Portfolios’ maximum exposure under these arrangements is unknown as this would involve any future claims that may be made against the Portfolios. However, based on experience, the Portfolio Trust expects that risk of loss to be remote. |
| |
2. | Significant Accounting Policies: |
| |
| The following is a summary of the significant accounting policies followed by the Portfolios in the preparation of their financial statements. The policies are in conformity with U.S. generally accepted accounting principles (“GAAP”). The preparation of financial statements requires management to make estimates and assumptions that affect the reported amounts of assets and liabilities and disclosure of contingent assets and liabilities at the date of the financial statements and the reported amounts of income and expenses for the period. Actual results could differ from those estimates. |
| |
| Securities Valuation: |
| |
| Effective November 1, 2008, the Portfolio Trust adopted Statement of Financial Accounting Standards (“SFAS”) No. 157, “Fair Value Measurements.” There was no impact to the Portfolios’ net assets or results of operations upon adoption. SFAS 157 defines fair value as the price that would be received to sell an asset or paid to transfer a liability in an orderly transaction between market participants at the measurement date. |
| |
| Bonds and other fixed income securities (other than short-term obligations but including listed issues) are valued on the basis of valuations furnished by a pricing service, the use of which has been approved by the Portfolios’ Board of Trustees. In making such valuations, the pricing service utilizes both dealer-supplied valuations and the use of matrix techniques which take into account appropriate factors such as institutional-size trading in similar groups of securities, yield, quality, coupon rate, maturity, type of issue, trading characteristics other than market data and without exclusive reliance upon quoted prices or exchanges or over-the-counter prices, since such valuations are believed to reflect more accurately the fair value of such securities. |
| |
| The value of each equity security is based either on the last sale price on a national securities exchange, or in the absence of recorded sales, at the closing bid prices on such exchanges, or at the quoted bid price in the over-the-counter market. Securities or other assets for which market quotations are not readily available, or are deemed unreliable due to a significant event or otherwise, are valued by or at the direction of the Portfolio Trusts’ Board of Trustees. Examples of potentially significant events that could affect the value of an individual security include corporate actions by the issuer, announcements by the issuer relating to its earnings or products, regulatory news, natural disasters, and litigation. |
| |
HSBC INVESTOR PORTFOLIOS | 94 |
|
HSBC INVESTOR PORTFOLIOS |
|
|
Notes to Financial Statements—as of April 30, 2009 (Unaudited) (continued) |
| |
| Examples of potentially significant events that could affect multiple securities held by a Portfolio include governmental actions, natural disasters, and armed conflicts. In addition, if events materially affecting the value of foreign securities occur between the time when the exchange on which they are traded closes and the time when the Portfolios’ net assets are calculated, such securities may be valued using fair value pricing in accordance with procedures adopted by the Board of Trustees. Management identifies possible fluctuations in foreign securities by monitoring the rise or fall in the value of a designated benchmark index. In the event of a rise or fall greater than predetermined levels, the International Equity Portfolio may use a systematic valuation model provided by an independent third party to value its foreign securities, rather than local market closing prices. When the International Equity Portfolio uses such a valuation model, the value assigned to the International Equity Portfolio’s foreign securities may not be the quoted or published prices of the investment on their primary markets or exchanges. |
| |
| Exchange traded futures contracts are valued at the last sales price as of the close of the primary exchange. Forward foreign currency contracts are generally valued at the foreign currency exchange rate as of the close of the New York Stock Exchange. |
| |
| Investment Transactions and Related Income: |
| |
| Investment transactions are accounted for no later than one business day after trade date. For financial reporting purposes, changes in holdings are accounted for on trade date on the last business day of the reporting period. Investment gains and losses are calculated on the identified cost basis. Interest income is recognized on the accrual basis and includes, where applicable, the amortization or accretion of premium or discount. Dividend income is recorded on the ex-dividend date. |
| |
| Foreign Currency Translation: |
| |
| The accounting records of the Portfolios are maintained in U.S. dollars. Foreign currency amounts are translated into U.S. dollars at the current rate of exchange to determine the value of investments, assets and liabilities. Purchases and sales of securities, and income and expenses are translated at the prevailing rate of exchange on the respective dates of such transactions. The Portfolios do not isolate the portion of the results of operations resulting from changes in foreign exchange rates on investments from fluctuations arising from changes in market prices of securities held. Such fluctuations are included with the net realized and unrealized gain or loss from investments and foreign currencies. |
| |
| Forward Foreign Currency Exchange Contracts: |
| |
| The Portfolios may enter into forward foreign currency exchange contracts in connection with planned purchases or sales of securities or to hedge the U.S. dollar value of portfolio securities denominated in a particular currency. The Portfolios could be exposed to risks if the counterparties to the contracts are unable to meet the terms of their contracts and from unanticipated movements in the value of a foreign currency relative to the U.S. dollar. The forward foreign currency exchange contracts are adjusted by the daily exchange rate of the underlying currency and any gains or losses are recorded for financial statement purposes as unrealized gains or losses until the contract settlement date. |
| |
| Futures Contracts: |
| |
| Each Portfolio may invest in futures contracts for the purpose of hedging its existing portfolio securities or securities it intends to purchase against fluctuations in fair value caused by changes in prevailing market interest rates. Upon entering into a futures contract, the Portfolio is required to pledge to the broker an amount of cash and/or other assets equal to a certain percentage of the contract amount (initial margin deposit). Subsequent payments, known as “variation margin,” are made or received by the Portfolio each day, depending on the daily fluctuations in the fair value of the underlying security. The Portfolio recognizes a gain or loss equal to the daily variation margin. Should market conditions move unexpectedly, the Portfolio may not achieve the anticipated benefits of the futures contracts and may realize a loss. The use of futures transactions involves the risk of imperfect correlation in movements in the price of futures contracts, interest rates, and the underlying hedged assets. |
| |
| Mortgage Dollar Roll Transactions: |
| |
| The Core Plus Fixed Income Portfolio and the Intermediate Duration Fixed Income Portfolio may engage in dollar roll transactions with respect to mortgage securities issued by the Government National Mortgage Association, the Federal National Mortgage Association and the Federal Home Loan Mortgage Corporation. In a dollar roll transaction, the Portfolio sells a mortgage-backed security and simultaneously agrees to repurchase a similar security on a specified future |
| |
95 | HSBC INVESTOR PORTFOLIOS |
|
HSBC INVESTOR PORTFOLIOS |
|
|
Notes to Financial Statements—as of April 30, 2009 (Unaudited) (continued) |
| |
| date at an agreed upon price. During the roll period, the Portfolio will not be entitled to receive any interest or principal paid on the securities sold. The Portfolio is compensated for the lost interest on the securities sold by the difference between the sales price and the lower price for the future repurchase as well as by the interest earned on the reinvestment of the sales proceeds. The Portfolio may also be compensated by receipt of a commitment fee. |
| |
| Restricted and Illiquid Securities: |
| |
| A restricted security is a security which has been purchased through a private offering and cannot be resold to the general public without prior registration under the Securities Act of 1933 (the “1933 Act”) or pursuant to the resale limitations provided by Rule 144 under the 1933 Act, or another exemption from the registration requirements of the 1933 Act. Certain restricted securities may be resold in transactions exempt from registration, normally to qualified institutional buyers, and may be deemed liquid by the investment adviser based on procedures established by the Board of Trustees. Therefore, not all restricted securities are considered illiquid. At April 30, 2009 the HSBC Core Plus Fixed Income Portfolio held restricted securities that were illiquid, representing 0.04% of net assets, as follows: |
| | | | | | | | | | |
Security Name | | | Acquisition
Date | | Acquisition
Cost($) | | Principal
Amount($) | | Value($) | |
| | |
| |
| |
| |
| |
DLJ Mortgage Acceptance Corp. IO, Series 1997,
Class S, 1.20%, 5/15/30 | | 5/15/1997 | | 1,168 | | 16,850 | | 1 | |
FHA Weyerhauser, 7.43%, 1/1/24 | | 3/28/2002 | | 24,528 | | 25,711 | | 25,711 | |
GS Mortgage Securities Corp. IO, Series 1997-GL,
Class X2, 0.29, 7/13/30 | | 8/14/1997 | | 1,192 | | 35,320 | | 373 | |
| |
| Repurchase Agreements: |
| |
| The Portfolios may enter into repurchase agreements with an entity which is a member of the Federal Reserve System or which is a “primary dealer” (as designated by the Federal Reserve Bank of New York) in U.S. Government obligations. The repurchase price generally equals the price paid by a Portfolio plus interest negotiated on the basis of current short-term rates, which may be more or less than the rate on the underlying portfolio securities. The seller, under a repurchase agreement, is required to maintain the collateral held pursuant to the agreement, with a fair value equal to or greater than the repurchase price (including accrued interest). Collateral subject to repurchase agreements is held by the Portfolios’ Custodian or another qualified Custodian or in the Federal Reserve/Treasury book-entry system. In the event of counter-party default, the Portfolio has the right to use the collateral to offset losses incurred. There is a potential for loss to the Portfolio in the event the Portfolio is delayed or prevented from exercising its rights to dispose of the collateral securities, including the risk of a possible decline in the fair value of the underlying securities during the period while the Portfolio seeks to assert its rights. |
| |
| Expense Allocations: |
| |
| Expenses directly attributable to a Portfolio are charged to that Portfolio. Expenses not directly attributable to a Portfolio are allocated proportionally among various or all funds within the HSBC Investor Family of Funds in relation to net assets or on another reasonable basis. |
| |
| Federal Income Taxes: |
| |
| Each Portfolio will be treated as a partnership for U.S. Federal income tax purposes. Accordingly, each Portfolio passes through all of its net investment income and gains and losses to its feeder funds, and is therefore not subject to U.S. Federal income tax. As such, investors in the Portfolios will be taxed on their respective share of the Portfolios’ ordinary income and realized gains. It is intended that the Portfolios will be managed in such a way that an investor will be able to satisfy the requirements of the Internal Revenue Code applicable to regulated investment companies. |
| |
| In addition, Financial Accounting Standards Board Interpretation No. 48, Accounting for Uncertainty in Income Taxes (“FIN 48”) provides guidance for how uncertain tax positions should be recognized, measured, presented and disclosed in the financial statements. FIN 48 requires the affirmative evaluation of tax positions taken or expected to be taken in the course of preparing the Portfolio Trust’s tax returns to determine whether it is more-likely-than-not (i.e., greater than 50-percent) that each tax position will be sustained upon examination by a taxing authority based on the technical merits of the position. A tax position that meets the more-likely-than-not recognition threshold is measured to determine the amount of benefit to recognize in the financial statements. Differences between tax positions taken in a tax return and amounts recognized in the financial statements will generally result in an increase in a liability for taxes payable (or a |
| |
HSBC INVESTOR PORTFOLIOS | 96 |
|
HSBC INVESTOR PORTFOLIOS |
|
|
Notes to Financial Statements—as of April 30, 2009 (Unaudited) (continued) |
| | | |
| reduction of a tax refund receivable), including the recognition of any related interest and penalties as an operating expense. The FIN 48 analysis included a review of tax positions taken in tax years that remain subject to examination by tax authorities in all major tax jurisdictions, including federal (i.e., the last 4 tax year ends and the interim tax period since then, as applicable). FIN 48 did not impact the Portfolios’ net assets or results of operations during the period. |
| | | |
| New Accounting Pronouncements: |
| | | |
| In March 2008, the Financial Accounting Standards Board (“FASB”) issued the Statement of Financial Accounting Standards No. 161, “Disclosures about Derivative Instruments and Hedging Activities” (“SFAS 161”). SFAS 161 will be effective for fiscal years and interim periods beginning after November 15, 2008. SFAS 161 requires enhanced disclosures about the Portfolios’ derivative and hedging activities, including how such activities are accounted for and their effect on the Portfolios’ financial position, performance and cash flows. Management is currently evaluating the impact the adoption of SFAS 161 will have on the Portfolios’ financial statements and related disclosures. |
| | | |
| In April 2009, the FASB issued FASB Staff Position No. 157-4, “Determining Fair Value When the Volume and Level of Activity for the Asset or Liability Have Significantly Decreased and Identifying Transactions That Are Not Orderly” (“FSP 157-4”). FSP 157-4 provides additional guidance for estimating fair value in accordance with SFAS No. 157, when the volume and level of activity for the asset or liability have significantly decreased as well as guidance on identifying circumstances that indicate a transaction is not orderly. FSP 157-4 is effective for fiscal years and interim periods ending after June 15, 2009. Management is currently evaluating the impact the adoption of FSP 157-4 will have on the Portfolios’ financial statement disclosures. |
| | |
3. | Investment Valuation Summary |
| | | |
| The inputs used for valuing the Funds’ investments are summarized in the three broad levels listed below: |
| | | |
| | • | Level 1: quoted prices in active markets for identical assets |
| | | |
| | • | Level 2: other significant observable inputs (including quoted prices for similar securities, interest rates, prepayment speeds, credit risk, etc.) |
| | | |
| | • | Level 3: significant unobservable inputs (including the Fund’s own assumptions in determining the fair value of investments) |
| | | |
| The inputs or methodology used for valuing investments is not necessarily an indication of the risk associated with investing in those investments. For example, short-term debt securities of sufficient credit quality maturing in sixty days or less are generally valued at amortized cost, which approximates fair value. Generally, amortized cost approximates the current fair value of a security, but since the valuation is not obtained from a quoted price in an active market, such securities are reflected as Level 2. |
| | | |
| The following is a summary of the valuation as of April 30, 2009 for each Fund based upon the three levels defined above: |
| | | | | | | | | | | | | |
| | LEVEL 1 – Quoted Prices | | LEVEL 2 – Other Significant | |
| |
| |
| |
Fund Name | | Investment
Securities | | Other Financial
Instruments* | | Investment
Securities | | Other Financial
Instruments* | |
| |
| |
| |
| |
| |
Core Plus Fixed Income Portfolio | | | 7,693,048 | | | — | | | 85,888,024 | | | — | |
Intermediate Duration Fixed Income Portfolio | | | 3,448,598 | | | — | | | 14,792,987 | | | — | |
Growth Portfolio | | | 78,554,816 | | | — | | | — | | | — | |
International Equity Portfolio | | | 14,280,193 | | | — | | | 150,153,576 | | | (711,542 | ) |
Opportunity Portfolio | | | 110,785,911 | | | — | | | — | | | — | |
Value Portfolio | | | 43,066,817 | | | — | | | — | | | — | |
| |
97 | HSBC INVESTOR PORTFOLIOS |
|
HSBC INVESTOR PORTFOLIOS |
|
|
Notes to Financial Statements—as of April 30, 2009 (Unaudited) (continued) |
| | | | | | | | | | | | | |
| | LEVEL 3 – Significant | | Total | |
| |
| |
| |
Fund Name | | Investment
Securities | | Other Financial
Instruments* | | Investment
Securities | | Other Financial
Instruments* | |
| |
| |
| |
| |
| |
Core Plus Fixed Income Portfolio | | | 25,711 | | | — | | | 93,606,783 | | | — | |
Intermediate Duration Fixed Income Portfolio | | | — | | | — | | | 18,241,585 | | | — | |
Growth Portfolio | | | — | | | — | | | 78,554,816 | | | — | |
International Equity Portfolio | | | — | | | — | | | 164,433,769 | | | (711,542 | ) |
Opportunity Portfolio | | | — | | | — | | | 110,785,911 | | | — | |
Value Portfolio | | | — | | | — | | | 43,066,817 | | | — | |
Following is a reconciliation of assets in which significant unobservable inputs (Level 3) were used in determining fair value:
| | | | | | | | | | | | | |
Core Plus Fixed Income Portfolio | | | | | | | | Investment
Securities | | Other Financial
Instruments* | |
| | | | | | | |
| |
| |
Balance as of October 31, 2008 | | | | | | | | $ | 26,158 | | $ | — | |
Realized gain (loss) | | | | | | | | | (27 | ) | | — | |
Change in unrealized appreciation/(depreciation) | | | | | | | | | (21 | ) | | — | |
Net purchases (sales) | | | | | | | | | (399 | ) | | — | |
Transfers in (out) of Level 3 | | | | | | | | | — | | | — | |
| | | | | | | |
|
| |
|
| |
Balance as of April 30, 2009 | | | | | | | | $ | 25,711 | | $ | — | |
| | | | | | | |
|
| |
|
| |
| | | | | | | | | | | | | |
Intermediate Duration Fixed Income Portfolio | | | | | | | | Investment
Securities | | Other Financial
Instruments* | |
| | | | | | | |
| |
| |
Balance as of October 31, 2008 | | | | | | | | $ | — | | $ | — | |
Realized gain (loss) | | | | | | | | | — | | | — | |
Change in unrealized appreciation/(depreciation) | | | | | | | | | — | | | — | |
Net purchases (sales) | | | | | | | | | — | | | — | |
Transfers in (out) of Level 3 | | | | | | | | | — | | | — | |
| | | | | | | |
|
| |
|
| |
Balance as of April 30, 2009 | | | | | | | | $ | — | | $ | — | |
| | | | | | | |
|
| |
|
| |
| |
|
* | Other financial instruments would include any derivative instruments, such as any futures, forwards, and swap agreements. These investments are generally recorded in the financial statements at the unrealized gain or loss on the investment. |
| |
4. | Related Party Transactions: |
| |
| Investment Management: |
| |
| HSBC Global Asset Management (USA) Inc. (“HSBC” or the “Investment Adviser”), a wholly owned subsidiary of HSBC Bank USA, N.A., a national bank organized under the laws of the United States, acts as the Investment Adviser to the Portfolios pursuant to an investment management contract with the Portfolio Trust. As Investment Adviser, HSBC manages the investments of the Portfolios and continuously reviews, supervises, and administers the Portfolios’ investments, except that Winslow Capital Management, Inc., AllianceBernstein Investment Research and Management, Westfield Capital Management, LLC and NWQ Investment Management Co., LLC serve as Sub-Investment Advisers for the Growth Portfolio, International Equity Portfolio, Opportunity Portfolio, and the Value Portfolio, respectively, and are paid for their services directly by the respective Portfolios. |
| |
| For its services, the Investment Adviser receives a fee, accrued daily and paid monthly, at an annual rate of 0.40% of the Intermediate Duration Fixed Income Portfolio’s average daily net assets. Halbis Capital Management, a wholly owned subsidiary of Halbis Capital Management (UK) Limited an affiliate of the Investment Adviser, serves as the Sub-Investment Advisor and is paid by the Investment Adviser. |
| |
HSBC INVESTOR PORTFOLIOS | 98 |
|
HSBC INVESTOR PORTFOLIOS |
|
|
Notes to Financial Statements—as of April 30, 2009 (Unaudited) (continued) |
For its services, the Investment Adviser receives, from the Core Plus Fixed Income Portfolio, a fee, accrued daily and paid monthly, at an annual rate of:
| | | | |
Based on Average Daily Net Assets of | | Fee Rate | |
| |
| |
Up to $50 million | | | 0.575% | |
In excess of $50 million but not exceeding $95 million | | | 0.450% | |
In excess of $95 million but not exceeding $150 million | | | 0.200% | |
In excess of $150 million but not exceeding $250 million | | | 0.400% | |
In excess of $250 million | | | 0.350% | |
For their services, the Investment Adviser and Winslow Capital Management, Inc. (“Winslow”) receive in aggregate, from the Growth Portfolio, a fee, accrued daily and paid monthly, at an annual rate of:
| | | | |
Based on Sub-Advised HSBC Investor Family of Funds Average Daily Net Assets of | | Fee Rate* | |
| |
| |
Up to $250 million | | | 0.575% | |
In excess of $250 million but not exceeding $500 million | | | 0.525% | |
In excess of $500 million but not exceeding $750 million | | | 0.475% | |
In excess of $750 million but not exceeding $1 billion | | | 0.425% | |
In excess of $1 billion | | | 0.375% | |
| |
|
* | The investment advisory contract provides that the Growth Portfolio may pay the Investment Adviser an aggregate maximum fee of 0.68%. Currently, the Investment Adviser’s share of the aggregate maximum fee rate is capped at 0.175%. Accordingly, the aggregate maximum fee rate is 0.575%. |
For their services, the Investment Adviser and AllianceBernstein Investment Research and Management receive in aggregate, from the International Equity Portfolio, a fee, accrued daily and paid monthly, at an annual rate of:
| | | | |
Based on Average Daily Net Assets of | | Fee Rate | |
| |
| |
Up to $10 million | | | 1.015% | |
In excess of $10 million but not exceeding $25 million | | | 0.925% | |
In excess of $25 million but not exceeding $50 million | | | 0.79% | |
In excess of $50 million but not exceeding $100 million | | | 0.70% | |
In excess of $100 million | | | 0.61% | |
For their services, the Investment Adviser and Westfield Capital Management, LLC receive in aggregate, a fee, accrued daily and paid monthly, at an annual rate of 0.80% of the Opportunity Portfolio’s average daily net assets.
For their services, the Investment Adviser and NWQ Investment Management Co., LLC receive in aggregate, from the Value Portfolio, a fee, accrued daily and paid monthly, at an annual rate of:
| | | | |
Based on Average Daily Net Assets of | | Fee Rate | |
| |
| |
Up to $500 million | | | 0.525% | |
In excess of $500 million but not exceeding $1 billion | | | 0.475% | |
In excess of $1 billion | | | 0.425% | |
All contractual and any voluntary fee waivers/reimbursements are not subject to recoupment in subsequent fiscal periods. Voluntary waiver/reimbursements may be stopped at any time.
| |
99 | HSBC INVESTOR PORTFOLIOS |
|
HSBC INVESTOR PORTFOLIOS |
|
|
Notes to Financial Statements—as of April 30, 2009 (Unaudited) (continued) |
| |
| Administration: |
| |
| HSBC serves the Portfolios as Administrator. Under the terms of the Administration Agreement, HSBC received from the Portfolios (as well as the other funds in the HSBC Investor Funds) a fee, accrued daily and paid monthly, during the period November 1, 2008 to December 31, 2008, at an annual rate of: |
| | | | |
Based on Average Daily Net Assets of | | Fee Rate | |
| |
| |
Up to $12 billion | | | 0.0525% | |
In excess of $12 billion | | | 0.0350% | |
| |
| Effective January 1, 2009, under the terms of the Administration Agreement, HSBC receives from the Portfolios a fee, accrued daily and paid monthly, at an annual rate of: |
| | | | |
Based on Average Daily Net Assets of | | Fee Rate | |
| |
| |
Up to $10 billion | | | 0.0550% | |
In excess of $10 billion but not exceeding $20 billion | | | 0.0350% | |
In excess of $20 billion but not exceeding $50 billion | | | 0.0275% | |
In excess of $50 billion | | | 0.0250% | |
| |
| The fee rates and breakpoints are determined on the basis of the aggregate average daily net assets of the HSBC Investor Family of Funds, however, the assets of the Portfolios and HSBC Investor Funds that invest in the Portfolios are not double-counted. The total administration fee paid to HSBC is allocated to each series in the HSBC Investor Family of Funds based upon its proportionate share of the aggregate net assets of the Family of Funds. For assets invested in the Portfolios by HSBC Investor Funds, the Portfolios pay half of the administration fee and the other funds pay half of the administration fee, for a combination of the total fee rate set forth above. Certain administrative fees of the Portfolios also may be received by treating them as apportioned in part to other funds makes investments in the Portfolios a master-feeder structures. |
| |
| Pursuant to a Sub-Administration Agreement with HSBC, Citi Fund Services Ohio, Inc. (“Citi Ohio”), a wholly-owned subsidiary of The Citigroup, Inc., serves as the Portfolio Trust’s Sub-Administrator subject to the general supervision of the Portfolio Trust’s Board of Trustees and HSBC. For these services, Citi Ohio is entitled to a fee, payable by HSBC, at an annual rate equivalent to the fee rates set forth above, minus 0.02% (2 basis points) which is retained by HSBC. |
| |
| Under a Compliance Services Agreement between the Portfolio Trust as the other HSBC Investor Funds (the “Trusts”) and Citi Ohio (the “CCO Agreement”), Citi Ohio makes an employee available to serve as the Trusts’ Chief Compliance Officer (the “CCO”). Under the CCO Agreement, Citi Ohio also provides infrastructure and support in implementing the written policies and procedures comprising the Portfolios’ compliance program, including support services to the CCO. For the services provided under the CCO Agreement, the HSBC Investor Family of Funds paid Citi Ohio $133,049 for the period ended April 30, 2009, plus reimbursement of certain expenses. Expenses incurred by each Portfolio are reflected on the Statements of Operations as “Compliance Service.” Citi Ohio pays the salary and other compensation earned by any such individuals as employees of Citi Ohio. |
| |
| Fund Accounting, Custodian and Trustee: |
| |
| Citi Ohio provides fund accounting services for the Trusts. For its services to the Portfolios, Citi Ohio receives an annual fee per Portfolio, including reimbursement of certain expenses, that is accrued daily and paid monthly. |
| |
| Each of the non-interested Trustees is compensated with a $60,000 annual Board retainer for services as a Trustee of the Trusts and the other HSBC Investor Funds, as well as a $3,000 annual retainer for each Committee of the Board of the Trusts and other HSBC Investor Funds. Each non-interested Trustee also receives a $5,000 and $3,000 meeting fee for each regular in-person Board meeting and Committee meeting, respectively. Furthermore, each non-interested Trustee receives compensation for attending special meetings and/or functioning as a Committee Chairperson or Lead Trustee. In addition, the non-interested Trustees are reimbursed for certain expenses incurred in connection with their Board membership. |
| |
HSBC INVESTOR PORTFOLIOS | 100 |
|
HSBC INVESTOR PORTFOLIOS |
|
|
Notes to Financial Statements—as of April 30, 2009 (Unaudited) (continued) |
| |
5. | Investment Transactions: |
| |
| Purchases and sales of securities (excluding securities maturing less than one year from acquisition) for the period ended April 30, 2009 were as follows: |
| | | | | | | | | | | | | |
Portfolio Name | | Purchases
(excluding U.S.
Government) | | Sales
(excluding U.S.
Government) | | Purchases
of U.S.
Government | | Sales
of U.S.
Government | |
| |
| |
| |
| |
| |
Core Plus Fixed Income Portfolio | | $ | 11,803,002 | | $ | 50,830,863 | | $ | 1,076,886 | | $ | 265,202 | |
Intermediate Duration Fixed Income Portfolio | | | 6,093,970 | | | 10,230,505 | | | 752,233 | | | 1,120,765 | |
Growth Portfolio | | | 24,756,762 | | | 26,642,330 | | | — | | | — | |
International Equity Portfolio | | | 47,378,470 | | | 66,117,358 | | | — | | | — | |
Opportunity Portfolio | | | 30,428,251 | | | 40,680,839 | | | — | | | — | |
Value Portfolio | | | 9,255,213 | | | 5,537,209 | | | — | | | — | |
| |
6. | Federal Income Tax Information: |
| |
| At April 30, 2009, the cost, gross unrealized appreciation and gross unrealized depreciation on securities for federal income tax purposes, were as follows: |
| | | | | | | | | | | | | |
Fund | | Tax Cost of
Securities ($) | | Tax Unrealized
Appreciation ($) | | Tax Unrealized
Depreciation ($) | | Net Unrealized
Appreciation/
(Depreciation) ($)* | |
| |
| |
| |
| |
| |
Core Plus Fixed Income Portfolio | | | 103,264,397 | | | 832,138 | | | (10,489,752 | ) | | (9,657,614 | ) |
Intermediate Duration Portfolio | | | 19,536,927 | | | 115,226 | | | (1,410,568 | ) | | (1,295,342 | ) |
Growth Portfolio | | | 84,398,334 | | | 4,783,687 | | | (10,627,205 | ) | | (5,843,518 | ) |
International Equity Portfolio | | | 240,920,820 | | | 5,284,841 | | | (81,771,892 | ) | | (76,487,051 | ) |
Opportunity Portfolio | | | 131,926,987 | | | 7,847,417 | | | (28,988,493 | ) | | (21,141,076 | ) |
Value Portfolio | | | 57,029,091 | | | 2,994,252 | | | (16,956,526 | ) | | (13,962,274 | ) |
| |
|
* | The difference between book-basis and tax-basis unrealized appreciation (depreciation) is attributable primarily to: tax deferral of losses on wash sales. |
| |
7. | Legal and Regulatory Matters: |
| |
| On September 26, 2006 BISYS Fund Services, Inc. (“BISYS”), an affiliate of BISYS Fund Services Ohio, Inc. which provides various services to the Portfolios as described in footnote 3, reached a settlement with the Securities and Exchange Commission (“the SEC”) regarding the SEC’s investigation related to BISYS’ past payment of certain marketing and other expenses with respect to certain of its mutual fund clients. Although BISYS has reached a settlement with the SEC, the Portfolios’ management is not aware that any determination has been made as to how the BISYS settlement monies will be distributed. While the Portfolios’ management is currently unable to determine the impact, if any, of such matters on the Portfolios or the Portfolios’ financial statements, management does not anticipate a material, adverse impact to the Portfolios or the Portfolios’ financial statements. |
| |
101 | HSBC INVESTOR PORTFOLIOS |
|
HSBC INVESTOR PORTFOLIOS |
|
|
Investment Adviser Contract Approval—as of April 30, 2009 (Unaudited) |
| | |
| The Board of Trustees of the HSBC Investor Funds Trust, HSBC Advisor Funds Trust and HSBC Investor Portfolios (collectively, the “Trusts”), and the non-interested Trustees (“Independent Trustees”), voting separately, approved the renewal, for a year, of the Investment Advisory Agreements and, where applicable Sub-Advisory Agreements (other than the Sub-Advisory Agreement with Halbis Capital Management (USA) Inc. (“Halbis”)), with respect to the respective series of the Trusts then existing (“Funds”) at an in-person meeting held on December 8, 2008. At that meeting, as well as at the regular meeting of the Board held on March 30, 2009, the Independent Trustees also reviewed and approved short-term extensions to the Sub-Advisory Agreement between the HSBC Global Asset Management (USA) Inc. (“Adviser”) and Halbis with respect to the HSBC Investor Core Plus Fixed Income Fund, HSBC Investor High Yield Fixed Income Fund, HSBC Investor Intermediate Duration Fixed Income Fund, and the HSBC Investor New York-Tax Free Bond Fund (the “Fixed Income Funds”) (the Investment Advisory Agreements and Sub-Advisory Agreements are collectively referred to as the “Agreements”). |
| |
| In determining whether it was appropriate to approve the Agreements for the Funds, the Independent Trustees requested information from the Adviser and the various subadvisers that they believed to be reasonably necessary to reach their conclusion. In an Executive Session, the Independent Trustees carefully evaluated this information, and were advised by independent legal counsel with respect to their deliberations. Based on their review of the information requested and provided for each Fund, the Independent Trustees determined that the relevant Agreements were consistent with the best interests of the Funds and their shareholders, and enabled the Funds to receive high quality services at a cost that is appropriate and reasonable. The Independent Trustees, along with the entire Board of Trustees, made these determinations on the basis of the following considerations, among others: |
| | |
| | Nature, Extent, and Quality of Services Provided by Adviser and Sub-Advisers. The Trustees considered the nature, quality and extent of the investment advisory services provided by the Adviser (and, as applicable, the subadvisers), in light of the high quality services provided to the Funds, and each Fund’s historic performance. The Trustees considered the commitment of the Adviser to the successful operations of the Funds. The Trustees considered the historical performance of the Funds and the level of expenses of the Funds. With respect to the equity Funds, the Trustees considered the capabilities and performance of the Adviser’s Multimanager unit. The Trustees also considered the use of expense limitation agreements in order to reduce the overall operating expenses of certain Funds. The Trustees also took note of the long term relationship between the Adviser and the Funds and the efforts undertaken by the Adviser to foster the growth and development of the Funds since the inception of each of the Funds. For the Fixed Income Funds, the Independent Trustees also considered the Adviser’s and Halbis’ plans for the Fixed Income Funds. The Trustees also considered the extent to which the Adviser and investment Sub-Advisers had achieved economies of scale and the extent to which shareholders benefited from those economies of scale. |
| | |
| | Investment Performance of the Funds, Adviser and Sub-Advisers. The Trustees considered short-term and long-term investment performance of each Fund over various periods of time as compared to a peer group of comparable funds. The Trustees took note of performance information for one, three and five year periods and since inception as relevant. In addition, the Trustees compared expenses of each Fund to the expenses of its peers, noting that the expenses for each of the Funds compare favorably with industry averages for other funds of similar size. |
| | |
| | Costs of Services and Profits Realized by the Adviser. The Trustees considered the Adviser’s overall profitability and costs and an analysis of the estimated profitability to the Adviser from its relationship with the Funds. The Trustees considered that the advisory fees under the Agreements were within the range of those of similar funds, noting the high level of resource, expertise and experience that was provided to the Funds by the Adviser and Sub-Advisers. The Trustees concluded that the combined advisory fees payable to the Adviser and the Funds’ Sub-Advisers are fair and reasonable in light of the services to be provided, the anticipated costs of these services, the profitability of the Adviser’s relationship with the Funds, and the comparability of the advisory fee to similar fees paid by comparable mutual funds. |
| | |
| | Other Relevant Considerations. The Independent Trustees also considered the overall high quality of the personnel, operations, financial condition, investment management capabilities, methodologies, and performance of the Adviser and Sub-Advisers. The Trustees also noted the range of investment advisory and administrative services provided by the Adviser to the Funds and the level and quality of these services, in particular the quality of the personnel providing these services. In addition, the Trustees considered the overall favorable investment performance of the Funds. |
| | |
| Accordingly, in light of the above considerations and such other factors and information it considered relevant, the Board of Trustees by a unanimous vote of those present in person at the meetings (including a separate vote of the Independent Trustees present in person at the meetings), approved the Agreements. |
| |
HSBC INVESTOR PORTFOLIOS | 102 |
|
HSBC INVESTOR PORTFOLIOS |
|
|
Table of Shareholder Expenses (unaudited)—as of April 30, 2009 |
| |
| As a shareholder of the HSBC Investor Portfolios (“Portfolios”), you incur ongoing costs, including management fees and other Fund expenses. |
| |
| These examples are intended to help you understand your ongoing costs (in dollars) of investing in the Portfolios and to compare these costs with the ongoing costs of investing in other mutual funds. |
| |
| These examples are based on an investment of $1,000 invested at the beginning of the period and held for the entire period from November 1, 2008 through April 30, 2009. |
| |
| Actual Example |
| |
| The table below provides information about actual account values and actual expenses. You may use the information below, together with the amount you invested, to estimate the expenses that you paid over the period. Simply divide your account value by $1,000 (for example, an $8,600 account value divided by $1,000 = 8.6), then multiply the result by the number in the table under the heading entitled “Expenses Paid During Period” to estimate the expenses you paid on your account during this period. |
| | | | | | | | | | | | | | | | | | | |
| | Beginning
Account Value
11/1/08 | | Ending
Account Value
4/30/09 | | Expenses Paid
During Period*
11/1/08 – 4/30/09 | | Annualized
Expense Ratio
During Period
11/1/08 – 4/30/09 | |
| |
| |
| |
| |
| |
Core Plus Fixed Income Portfolio | | | $ | 1,000.00 | | | | $ | 1,060.50 | | | | $ | 3.47 | | | 0.68 | % | |
Intermediate Duration Fixed Income Portfolio | | | | 1,000.00 | | | | | 1,053.70 | | | | | 4.63 | | | 0.91 | % | |
Growth Portfolio | | | | 1,000.00 | | | | | 1,020.50 | | | | | 3.51 | | | 0.70 | % | |
International Equity Portfolio | | | | 1,000.00 | | | | | 955.30 | | | | | 4.51 | | | 0.93 | % | |
Opportunity Portfolio | | | | 1,000.00 | | | | | 963.10 | | | | | 4.43 | | | 0.91 | % | |
Value Portfolio | | | | 1,000.00 | | | | | 954.10 | | | | | 3.34 | | | 0.69 | % | |
| |
|
* | Expenses are equal to the average account value over the period multiplied by the Portfolio’s annualized expense ratio, multiplied by the number of days in the most recent fiscal half-year divided by the number of days in the fiscal year (to reflect the one half year period). |
| |
| Hypothetical Example for Comparison Purposes |
| |
| The table below provides information about hypothetical account values and hypothetical expenses based on each Portfolio’s actual expense ratio and an assumed rate of return of 5% per year before expenses, which is not the Portfolio’s actual return. The hypothetical account values and expenses may not be used to estimate the actual ending account balance or expenses you paid for the period. You may use this information to compare this 5% hypothetical example with the 5% hypothetical examples that appear in the shareholder reports of other funds. |
| |
| Please note that the expenses shown in the table are meant to highlight your ongoing costs only and do not reflect any transactional costs, such as sales charges (loads), redemption fees, or exchange fees. Therefore, the table is useful in comparing ongoing costs only, and will not help you determine the relative total costs of owning different funds. In addition, if these transactional costs were included, your costs would have been higher. |
| | | | | | | | | | | | | | | | | | | |
| | Beginning
Account Value
11/1/08 | | Ending
Account Value
4/30/09 | | Expenses Paid
During Period*
11/1/08 – 4/30/09 | | Annualized
Expense Ratio
During Period
11/1/08 – 4/30/09 | |
| |
| |
| |
| |
| |
Core Plus Fixed Income Portfolio | | | $ | 1,000.00 | | | | $ | 1,021.42 | | | | $ | 3.41 | | | 0.68 | % | |
Intermediate Duration Fixed Income Portfolio | | | | 1,000.00 | | | | | 1,020.28 | | | | | 4.56 | | | 0.91 | % | |
Growth Portfolio | | | | 1,000.00 | | | | | 1,021.32 | | | | | 3.51 | | | 0.70 | % | |
International Equity Portfolio | | | | 1,000.00 | | | | | 1,020.18 | | | | | 4.66 | | | 0.93 | % | |
Opportunity Portfolio | | | | 1,000.00 | | | | | 1,020.28 | | | | | 4.56 | | | 0.91 | % | |
Value Portfolio | | | | 1,000.00 | | | | | 1,021.37 | | | | | 3.46 | | | 0.69 | % | |
| |
|
* | Expenses are equal to the average account value over the period multiplied by the Portfolio’s annualized expense ratio, multiplied by the number of days in the most recent fiscal half-year divided by the number of days in the fiscal year (to reflect the one half year period). |
| |
103 | HSBC INVESTOR PORTFOLIOS |
Other Information:
A description of the policies and procedures that the Funds and Portfolios use to determine how to vote proxies relating to the portfolio securities is available without charge, upon request, by calling 1-800-525-5757 for HSBC Bank USA and HSBC Brokerage (USA) Inc. clients and 1-800-782-8183 for all other shareholders or on the Funds’ website at www.investorfunds.us.hsbc.com and the Securities and Exchange Commission’s (“Commission”) website at http://www.sec.gov. A copy of the Funds’ and Portfolios’ voting records for the most recent 12 month period ending June 30 are available at the Commission’s website at http://www.sec.gov.
Schedules of Portfolio Investments for fiscal quarters ending January 31 and July 31 will be available no later than 60 days after each period end, without charge, on the Funds’ website at www.investorfunds.us.hsbc.com and on the Commission’s website at http://www.sec.gov.
An investment in a Fund is not a deposit of HSBC Bank USA, National Association, and is not insured or guaranteed by the Federal Deposit Insurance Corporation or any other government agency.
| |
HSBC INVESTOR PORTFOLIOS | 104 |
This page is intentionally left blank.
|
HSBC INVESTOR FAMILY OF FUNDS: |
|
INVESTMENT ADVISER AND ADMINISTRATOR |
HSBC Global Asset Management (USA) Inc. |
452 Fifth Avenue |
New York, NY 10018 |
|
SUB-ADVISERS |
HSBC Investor Growth Portfolio |
Winslow Capital Management, Inc. |
4720 IDS Tower |
80th South Eighth Street |
Minneapolis, MN 55402 |
|
HSBC Investor International Equity Portfolio |
AllianceBernstein Investment Research and Management |
1345 Avenue of the Americas, 39th Floor |
New York, NY 10105 |
|
HSBC Investor Mid-Cap Fund |
Munder Capital Management |
Munder Capital Center |
480 Pierce Street |
Birmingham, MI 48009-6063 |
|
HSBC Investor Opportunity Portfolio |
Westfield Capital Management, LLC |
One Financial Center |
Boston, MA 02111 |
|
HSBC Investor Value Portfolio |
NWQ Investment Management Co., LLC |
2049 Century Park East, 16th Floor |
Los Angeles, CA 90067 |
|
HSBC Investor Core Plus Fixed Income Portfolio |
HSBC Investor Intermediate Duration Fixed |
Income Portfolio |
HSBC Investor New York Tax-Free Bond Fund |
Halbis Capital Management (USA) Inc. |
452 Fifth Avenue, 18th Floor |
New York, NY 10018 |
|
SHAREHOLDER SERVICING AGENTS |
For HSBC Bank USA, N.A. and |
HSBC Securities (USA) Inc. Clients |
HSBC Bank USA, N.A. |
452 Fifth Avenue |
New York, NY 10018 |
1-888-525-5757 |
|
For All Other Shareholders |
HSBC Investor Funds |
P.O. Box 182845 |
Columbus, OH 43218-2845 |
1-800-782-8183 |
|
TRANSFER AGENT AND SPONSOR |
Citi Fund Services |
3435 Stelzer Road |
Columbus, OH 43219 |
|
DISTRIBUTOR |
Foreside Distribution Services, L.P. |
690 Taylor Road, Suite 150 |
Gahanna, OH 43230-3202 |
|
CUSTODIAN |
The Northern Trust Company |
50 South LaSalle Street |
Chicago, IL 60603 |
|
INDEPENDENT REGISTERED PUBLIC |
ACCOUNTING FIRM |
KPMG LLP |
191 West Nationwide Blvd., Suite 500 |
Columbus, OH 43215 |
|
LEGAL COUNSEL |
Dechert LLP |
1775 I Street, N.W. |
Washington, D.C. 20006 |


The HSBC Investor Family of Funds are distributed by Foreside Distribution Services, L.P. This document must be preceded or accompanied by a current prospectus for the HSBC Investor Funds, which you should read carefully before you invest or send money.
| | |
— NOT FDIC INSURED | — NO BANK GUARANTEE | — MAY LOSE VALUE |

HSBC Global Asset Management (USA) Inc.
April 30th, 2009
HSBC Investor Funds
Semi-Annual Report
MONEY MARKET FUNDS
HSBC Investor California Tax-Free Money Market Fund
HSBC Investor New York Tax-Free Money Market Fund
HSBC Investor Prime Money Market Fund
HSBC Investor Tax-Free Money Market Fund
HSBC Investor U.S. Government Money Market Fund
HSBC Investor U.S. Treasury Money Market Fund
HSBC Investor Family of Funds
Semi-Annual Report - April 30, 2009
This page is intentionally left blank.
Barclays Capital U.S. Aggregate Bond Index (formerly Lehman Brothers U.S. Aggregate Index) is an unmanaged index generally representative of investment-grade fixed-rate debt issues, including government, corporate, asset-backed, and mortgage-backed securities, with maturities of at least one year.
Gross Domestic Product (“GDP”) is the measure of the market value of the goods and services produced by labor and property in the United States.
Lipper California Tax-Exempt Money Market Funds Average is an average of managed mutual funds that invest in high quality municipal obligations of California with dollar-weighted average maturities of less than 90 days.
Lipper Money Market Instrument Funds Average is an average of managed mutual funds that invest in high-quality financial instruments rated in the top two grades, with dollar-weighted average maturities of less than 90 days.
Lipper New York Tax-Exempt Money Market Funds Average is an average of managed mutual funds that invest in municipal obligations of New York with dollar-weighted average maturities of less than 90 days.
Lipper Tax-Exempt Money Market Funds Average is an average of managed mutual funds that invest in high quality municipal obligations with dollar-weighted average maturities of less than 90 days.
Lipper U.S. Government Money Market Funds Average is an average of managed mutual funds that invest principally in financial instruments issued or guaranteed by the U.S. government, its agencies, or its instrumentalities with dollar-weighted average maturities of less than 90 days.
Lipper U.S. Treasury Money Market Funds Average is an average of managed mutual funds that invest principally in U.S. Treasury obligations with dollar-weighted average maturities of less than 90 days.
Morgan Stanley Capital International Europe, Australasia and Far East (“MSCI EAFE”) Index is an unmanaged free float-adjusted market capitalization index that is designed to measure the equity market performance of developed markets, excluding the U.S. & Canada.
Standard & Poor’s 500 (“S&P 500”) Index is an unmanaged index that is widely regarded as a gauge of the U.S. equities market, this index includes 500 leading companies in leading industries of the U.S. economy. The S&P 500 focuses on the large cap segment of the market, with approximately 75% coverage of U.S. equities.
The Russell Universe - Russell is a recognized leader in consulting, multi-manager investing and institutional investment management. Russell’s consultants advise clients on more than $2 trillion in assets. Russell delivers investment programs to over 2,000 clients in 44 countries. With more than $230 billion in assets in our funds, Russell researchers meet with over 4,000 investment managers around the world to evaluate their investment process.
Russell 2000® Index is an unmanaged index which measures the performance of the 2,000 smallest companies in the Russell 3000 Index, which represents approximately 8% of the total market capitalization of the Russell 3000 Index. The companies which comprise this index have high price-to-book ratios and higher forecasted growth values.
Lipper is an independent mutual fund performance monitor whose results are based on total return and do not reflect a sales charge.
Securities indexes assume reinvestment of all distributions and interest payments and do not take in account brokerage fees or expenses. Securities in the Fund do not match those in the indexes and performance of the Fund will differ. Investors cannot invest directly in an index.
Dear Shareholder,
The difficulties in the markets that I mentioned in my last letter continued for the period covered by this semi-annual financial report. In response, governments around the world announced programs of varying types designed to provide support to key industries and generally promote economic activity.
In the face of these market conditions, investors have seen the value of their portfolios decrease, in some cases dramatically. Even money market funds, which are considered by many to be “safe havens” have not been immune from these conditions. In October 2008, a large U.S.-registered money market fund experienced significant market depreciation of some of its portfolio holdings and announced that its price per share had sunk below $1.00.
The U.S. government has responded to this situation with a number of programs. Several were designed to support the credit markets by encouraging investments in money market instruments. Another program was specifically aimed at supporting investor confidence in money market funds. The U.S. Treasury offered money market funds the opportunity to participate in a temporary guarantee program under which a participating fund would receive financial support from the Treasury if its price per share were to depreciate below $1.00. Most money market funds in the U.S. participated in this program.
The Board of Trustees of the HSBC Investor Funds has actively monitored these developments and, along with the Funds’ adviser, has taken actions designed to support the financial interests of the Funds’ shareholders. For example, most of the HSBC Investor money market funds have participated in the Treasury’s Temporary Guarantee Program. The sole exception was the HSBC Investor U.S. Treasury Money Market Fund, which invests in obligations issued by the U.S. Treasury.
The Board continues to work with the Adviser on evaluating investment options and taking actions designed to benefit the shareholders. We remain committed to managing the HSBC Investor Funds in a prudent manner for long-term performance, while taking advantage of short-term market movements.
For commentary on the Funds’ investment results, please read the portfolio managers’ analysis of current market conditions.
After 22 years of serving as the Chairman of the Funds’ Board of Trustees, I will be stepping down, effective July 1, 2009; however, I will continue as a trustee. Michael Seely, who has also been a trustee of the funds since their inception, will be taking over as chairman on that date. I would like to take this time to thank you for the opportunity to serve as Chairman and for your continuing investments with the HSBC Investor Funds.
Sincerely,
Larry M. Robbins, Chairman, HSBC Investor Funds
| |
1 | HSBC INVESTOR FAMILY OF FUNDS |
|
Commentary From the Investment Manager |
|
HSBC Global Asset Management (USA) Inc.
U.S. Economic Review
Several factors weighed on the U.S. economy during the six-month period between November 1, 2008 and April 30, 2009. Employment continued to decline, causing weakness in consumer spending. The decline in consumer spending also reflected falling prices for goods and services, particularly oil and gas. Consumer spending accounts for more than two-thirds of U.S. economic activity, so slower spending posed a significant threat to economic growth.
Housing values continued to decline in the wake of the subprime mortgage crisis. Foreclosures mounted, forcing financial firms to continue writing down the value of their assets in mortgage-related securities. The federal government responded by designating $1 trillion to help investors buy distressed loans and other assets from U.S. banks. Meanwhile, U.S. automakers struggled with a steep decline in sales and sought a federal bailout in order to avoid bankruptcy.
The Federal Reserve Board acted aggressively as it attempted to ameliorate the credit situation and stimulate the economy. The Fed in December reduced the federal funds rate, its target short-term interest rate, from 1.00% to a range between 0.00% and 0.25% in order to inject liquidity into the financial markets.
In addition, in December, the National Bureau of Economic Research announced that the United States had officially been in a recession since the previous December. The U.S. economy contracted substantially during the period under review: Gross domestic product decreased at annualized rates of 6.3% during the fourth quarter of 2008 and 5.7% in the first quarter of 2009.
Meanwhile, governments across the globe took unprecedented measures to fight the slowdown—the first synchronized global recession since World War II. The G-20, which includes 20 developed and emerging countries with some of the world’s largest economies, agreed on a $1.1 trillion program that the International Monetary Fund would use to help afflicted countries boost economic activity. Both the U.S. and U.K. governments attempted to stimulate lending via quantitative easing, in addition to maintaining target short-term interest rates near zero. Quantitative easing increases the amount of money in circulation by boosting the supply of credit and thus stimulating the flow of money around the economy.
Market Review
Investors during most of this six-month period responded to the uncertain economic environment by fleeing from the perceived risk of stocks and into the perceived safety of high-quality bonds. U.S. stock returns were volatile during this time, as grim economic news and the emerging federal response to the crisis caused traders to react aggressively in response to new data. The U.S. market recovered between early March and the end of April, as investors anticipating improving economic and market conditions sought to capitalize on low valuations. The period ended with the stock market’s best six-week performance since 1938. For the period as a whole the S&P 500 Index1 returned -8.52%, while the small-cap Russell 2000® Index1 lost 8.40%.
Foreign stocks generally posted losses, with the MSCI EAFE Index1 of developed foreign stock markets falling -2.35% during the period under review. Investors sold foreign stocks due to a general aversion to risk, and because of concerns about the repercussions from the turmoil in the credit markets. Emerging markets were mixed during the period. These shares suffered as investors sold assets they perceived to be risky, then rebounded powerfully later in the period as risk aversion decreased and commodity prices rebounded.
The fixed-income markets experienced several distinct environments during the six-month period. The worsening global recession fueled a flight to quality in November as investors sought out the most conservative and secure fixed-income investments—in particular Treasury securities. As the financial crisis began to recede, demand rose for higher-risk fixed-income securities such as corporate and government agency issues. The Barclays Capital U.S. Aggregate Bond Index1, which tracks the broad fixed-income market, returned 7.74% for the six months through April.
| |
1 | For additional information, please refer to the Glossary of Terms. |
| |
HSBC INVESTOR FAMILY OF FUNDS | 2 |
|
Portfolio Reviews |
|
|
HSBC Investor California Tax-Free Money Market Fund† |
(Class A Shares, C Shares, D Shares and Y Shares)
by Jason Moshos
Portfolio Manager |
Investment Concerns
An investment in the Fund is not insured or guaranteed by the FDIC or any other government agency. Although the Fund seeks to preserve the value of your investment at $1.00 per share, it is possible to lose money by investing in this Fund. The Fund’s income may be subject to the federal alternative minimum tax and to certain state and local taxes. Regional funds may be subject to additional risk, since companies they invest in are located in one geographical location.
The money markets were turbulent at the beginning of the six-month period under review, as credit remained extremely tight amid a worsening global recession. The Federal Reserve Board (the “Fed”) attempted to address the financial system’s credit and liquidity problems in December by lowering its target short-term interest rate from 1.00% to a range between 0.00% and 0.25%. The rate cut caused yields on money market securities to decline.
Lower interest rates, as well as several other Federal Reserve programs intended to boost credit and protect the financial markets, helped fuel a rally later in the period. The intended effect was to bring down the rates on higher-yielding money market securities. Municipal issuers across the country have benefited from the reduced cost of borrowing, but continued to experience revenue shortfalls causing widening budget gaps. The state of California has been one of the hardest hit by the current recession.
We generally maintained between 80% and 85% of the Fund’s assets in one- and seven-day reset variable rate demand notes that were returnable to issuers for the securities’ par value.
The Fund remained defensively positioned to meet our primary objective of providing a high level of safety and liquidity. This objective is pursued by performing thorough fundamental credit research and positioning the Fund’s average maturity on the short end of the yield curve. That strategy caused the Fund to offer lower yield than many of its peers, but is consistent with our primary objectives.*
| |
* | Portfolio composition is subject to change. |
| |
† | On October 7, 2008, December 4, 2008 and April 8, 2009 the Fund participated in the Treasury Money Market Guarantee Program and related extensions. The Program is for shareholders as of September 19, 2008 and generally covers the lesser of the amount that the shareholder held on September 19 or the amount they hold on the date the fund needs to utilize the guarantee. If a shareholder closes its account with the Fund or broker dealer after September 19, any future investment in the Fund will not be guaranteed. The current extended guarantee is through September 18, 2009. |
| | | | | | | | | | | | | | | | | | | | | | | | | |
Fund Performance | | | | | | | | Average Annual
Total Return (%) | | Yield (%)2 | | Expense
Ratio (%)3 | |
|
As of April 30, 2009 | | Inception
Date | | Six
Month†† | | 1
Year | | 5
Year | | Since
Inception | | 7-Day
Average | | Gross | | Net | |
|
|
|
|
|
|
|
|
|
|
|
|
|
|
|
|
|
|
Class A Shares† | | 3/2/07 | | | 0.06 | | | 0.80 | | | — | | 1.09 | | | 0.05 | | | 0.75 | | | 0.75 | |
|
|
|
|
|
|
|
|
|
|
|
|
|
|
|
|
|
|
|
|
|
|
|
|
Class C Shares**† | | 5/7/07 | | | 0.01 | | | | — | | | — | | 1.75 | | | — | | | 1.35 | | | 1.35 | |
|
|
|
|
|
|
|
|
|
|
|
|
|
|
|
|
|
|
|
|
|
|
|
|
Class D Shares | | 6/17/02 | | | 0.09 | | | 0.90 | | 1.95 | | 1.59 | | | 0.05 | | | 0.60 | | | 0.60 | |
|
|
|
|
|
|
|
|
|
|
|
|
|
|
|
|
|
|
|
|
|
|
|
|
Class Y Shares | | 7/18/02 | | | 0.18 | | | 1.12 | | 2.20 | | 1.86 | | | 0.18 | | | 0.35 | | | 0.35 | |
|
|
|
|
|
|
|
|
|
|
|
|
|
|
|
|
|
|
|
|
|
|
|
|
Lipper California Tax-Exempt Money Market Funds Average1 | | — | | | 0.20 | | | 1.06 | | 1.98 | | N/A | | | N/A | | | N/A | | | N/A | |
|
|
|
|
|
|
|
|
|
|
|
|
|
|
|
|
|
|
|
|
|
|
|
|
Past performance does not guarantee future results. The performance data quoted represents past performance and current returns may be lower or higher. Total return figures include change in share price, reinvestment of dividends and capital gains and do not reflect taxes that a shareholder would pay on fund distributions or on the redemption of fund shares. The investment return and principal value will fluctuate so that an investor’s shares, when redeemed may be worth more or less than the original cost. To obtain performance information current to the most recent month end, please call 1-800-782-8183.
The performance above reflects any fee waivers that have been in effect during the applicable periods, as well as any expense reimbursements that have periodically been made. Absent such waivers and reimbursements, returns would have been lower.
| |
** | Reflects the applicable contingent deferred sales charge, maximum of 1.00%. |
| |
† | Class A Shares were operational during a portion of the periods presented. Amounts reflect performance for the period of the time the class had operations, which was 3 days during the year ended October 31, 2007 and 332 days during the period ended April 30, 2009. Class C shares were operational during a portion of the periods presented. Amounts reflect performance for the period of the time the class had operations, which was 165 days during the year ended October 31, 2007 and 152 days during the period ended April 30, 2009. |
| |
1 | For additional information, please refer to the Glossary of Terms. |
| |
2 | The 7-day yield quotation more closely reflects the current earnings of the Fund than the total return quotation. |
| |
3 | Reflects the expense ratio as reported in the prospectus dated February 27, 2009. |
| |
†† | Aggregate total return. |
| |
3 | HSBC INVESTOR FAMILY OF FUNDS |
|
Portfolio Reviews |
|
|
HSBC Investor New York Tax-Free Money Market Fund† |
(Class A Shares, B Shares, C Shares, D Shares and Y Shares)
by Jason Moshos
Portfolio Manager |
Investment Concerns
An investment in the Fund is not insured or guaranteed by the FDIC or any other government agency. Although the Fund seeks to preserve the value of your investment at $1.00 per share, it is possible to lose money by investing in the Fund. The Fund’s income may be subject to the federal alternative minimum tax and to certain state and local taxes. Regional funds may be subject to additional risk, since companies they invest in are located in one geographical location.
The money markets were turbulent at the beginning of the six-month period under review, as credit remained extremely tight amid a worsening global recession. The Federal Reserve Board (the “Fed”) attempted to address the financial system’s credit and liquidity problems in December by lowering its target short-term interest rate from 1.00% to a range between 0.00% and 0.25%. The rate cut caused yields on money market securities to decline.
Lower interest rates, as well as several other Federal Reserve programs intended to boost credit and protect the financial markets, helped fuel a rally later in the period. The effect was to bring down the rates on higher-yielding money market securities. Municipal issuers across the country have benefited from the reduced cost of borrowing but continue to experience revenue shortfalls, causing widening budget gaps. The State of New York continues to feel the fiscal strain of the ongoing recession.
We generally maintained between 80% and 85% of the Fund’s assets in one- and seven-day reset variable rate demand notes that were returnable to issuers for the securities’ par value.*
The Fund remained defensively positioned to meet our primary objective of providing a high level of safety and liquidity. This objective is pursued by performing thorough fundamental credit research and positioning the Fund’s average maturity on the short end of the yield curve. That strategy caused the Fund to offer lower yield than many of its peers, but is consistent with our primary objectives.*
| |
* | Portfolio composition is subject to change. |
| |
† | On October 7, 2008, December 4, 2008 and April 8, 2009 the Fund participated in the Treasury Money Market Guarantee Program and related extensions. The Program is for shareholders as of September 19, 2008 and generally covers the lesser of the amount that the shareholder held on September 19 or the amount they hold on the date the fund needs to utilize the guarantee. If a shareholder closes its account with the Fund or broker dealer after September 19, any future investment in the Fund will not be guaranteed. The current extended guarantee is through September 18, 2009. |
| | | | | | | | | | | | | | | | | | | | | | | | | | | |
Fund Performance | | | | | | | | Average Annual
Total Return (%) | | | Yield (%)2 | | Expense
Ratio (%)3 | |
|
As of April 30, 2009 | | Inception
Date | | Six
Month†† | | 1
Year | | 5
Year | | 10
Year | | Since
Inception | | 7-Day
Average | | Gross | | Net | |
|
Class A Shares | | 11/17/94 | | | 0.17 | | | 1.04 | | 1.89 | | | 1.78 | | | 2.16 | | | 0.05 | | | 0.63 | | | 0.63 | |
|
|
|
|
|
|
|
|
|
|
|
|
|
|
|
|
|
|
|
|
|
|
|
|
|
|
|
Class B Shares** | | 4/29/98 | | | -3.94 | | | -3.37 | | 1.35 | | | 0.95 | | | 0.97 | | | 0.05 | | | 1.23 | | | 1.23 | |
|
|
|
|
|
|
|
|
|
|
|
|
|
|
|
|
|
|
|
|
|
|
|
|
|
|
|
Class C Shares*** | | 3/19/01 | | | — | | | — | | — | | | — | | | 0.77 | | | — | | | 1.23 | | | 1.23 | |
|
|
|
|
|
|
|
|
|
|
|
|
|
|
|
|
|
|
|
|
|
|
|
|
|
|
|
Class D Shares | | 4/1/99 | | | 0.23 | | | 1.18 | | 2.04 | | | 1.93 | | | 1.93 | | | 0.14 | | | 0.48 | | | 0.48 | |
|
|
|
|
|
|
|
|
|
|
|
|
|
|
|
|
|
|
|
|
|
|
|
|
|
|
|
Class Y Shares | | 7/1/96 | | | 0.36 | | | 1.43 | | 2.29 | | | 2.18 | | | 2.38 | | | 0.39 | | | 0.23 | | | 0.23 | |
|
|
|
|
|
|
|
|
|
|
|
|
|
|
|
|
|
|
|
|
|
|
|
|
|
|
|
Lipper New York Tax-Exempt Money Market Funds Average1 | | — | | | 0.24 | | | 1.15 | | 2.02 | | | 1.90 | | | N/A | | | N/A | | | N/A | | | N/A | |
|
|
|
|
|
|
|
|
|
|
|
|
|
|
|
|
|
|
|
|
|
|
|
|
|
|
|
Past performance does not guarantee future results. The performance data quoted represents past performance and current returns may be lower or higher. Total return figures include change in share price, reinvestment of dividends and capital gains and do not reflect taxes that a shareholder would pay on fund distributions or on the redemption of fund shares. The investment return and principal value will fluctuate so that an investor’s shares, when redeemed may be worth more or less than the original cost. To obtain performance information current to the most recent month end, please call 1-800-782-8183.
The performance above reflects any fee waivers that have been in effect during the applicable periods, as well as any expense reimbursements that have periodically been made. Absent such waivers and reimbursements, returns would have been lower.
| |
** | Reflects the applicable contingent deferred sales charge, maximum of 4.00%. |
| |
*** | Reflects the applicable contingent deferred sales charge, maximum of 1.00%. Class C Shares were operational during a portion of the periods presented. Amounts reflect performance for the period of the time the class had operations, which was 81 days, 81 days, 145 days and 227 days during the years ended October 31, 2004, 2003, 2002, and 2001, respectively. |
| |
1 | For additional information, please refer to the Glossary of Terms. |
| |
2 | The 7-day yield quotation more closely reflects the current earnings of the Fund than the total return quotation. |
| |
3 | Reflects the expense ratio as reported in the prospectus dated February 27, 2009. |
| |
†† | Aggregate total return. |
| |
HSBC INVESTOR FAMILY OF FUNDS | 4 |
| | |
Portfolio Reviews | | |
| |
| |
HSBC Investor Prime Money Market Fund†
(Class A Shares, B Shares, C Shares, D Shares, I Shares and Y Shares)
by John Chiodi
Senior Portfolio Manager |
| |
Moody’s and Standard & Poor’s
has assigned an “Aaa” and “AAAm”
rating to the HSBC Investor Prime
Money Market Fund.1 | |
|
|
| |
|
Investment Concerns
An investment in the Fund is not insured or guaranteed by the FDIC or any other government agency. Although the Fund seeks to preserve the value of your investment at $1.00 per share, it is possible to lose money by investing in the Fund.
The money markets were turbulent at the beginning of the six-month period under review, as credit remained extremely tight amid a worsening global recession. The Federal Reserve Board (the “Fed”) attempted to address the financial system’s credit and liquidity problems in December by lowering its target short-term interest rate from 1.00% to a range between 0.00% and 0.25%. The rate cut caused yields on money market securities to decline.
Lower interest rates, as well as several other Federal Reserve programs intended to boost credit and protect the financial markets, helped fuel a rally later in the period. The intended effect was to bring down the rates on higher-yielding money market securities. Treasury securities remained very volatile during the period.
We sought to protect shareholders’ principal by maintaining liquidity. We positioned the portfolio’s average maturity on the short end of the yield curve, which meant sacrificing yield in exchange for liquidity. That strategy caused the Fund to offer lower yield than many of its peers.*
We looked to shore up the Fund’s yield by purchasing longer dated securities in the government agency space. That strategy helped buoy the Fund’s yield as interest rates fell.*
| |
* | Portfolio composition is subject to change. |
| |
† | On October 7, 2008, December 4, 2008 and April 8, 2009 the Fund participated in the Treasury Money Market Guarantee Program and related extensions. The Program is for shareholders as of September 19, 2008 and generally covers the lesser of the amount that the shareholder held on September 19 or the amount they hold on the date the fund needs to utilize the guarantee. If a shareholder closes its account with the Fund or broker dealer after September 19, any future investment in the Fund will not be guaranteed. The current extended guarantee is through September 18, 2009. |
| | | | | | | | | | | | | | | | | | | | | | |
Fund Performance | | | | | | | | Average Annual
Total Return (%) | | Yield (%)3 | | Expense
Ratio (%)4 | |
|
As of April 30, 2009 | | Inception
Date | | Six
Month†† | | 1
Year | | 5
Year | | Since
Inception | | 7-Day
Average | | Gross | | Net | |
|
Class A Shares | | 11/13/98 | | | 0.31 | | | 1.28 | | 2.90 | | 2.98 | | | 0.05 | | | 0.67 | | | 0.67 | |
|
|
|
|
|
|
|
|
|
|
|
|
|
|
|
|
|
|
|
|
|
|
|
Class B Shares** | | 4/4/01 | | | -3.84 | | | -3.17 | | 2.33 | | 1.91 | | | 0.05 | | | 1.27 | | | 1.27 | |
|
|
|
|
|
|
|
|
|
|
|
|
|
|
|
|
|
|
|
|
|
|
|
Class C Shares*** | | 3/23/01 | | | -0.84 | | | -0.17 | | 2.33 | | 1.79 | | | 0.05 | | | 1.27 | | | 1.27 | |
|
|
|
|
|
|
|
|
|
|
|
|
|
|
|
|
|
|
|
|
|
|
|
Class D Shares | | 4/1/99 | | | 0.38 | | | 1.43 | | 3.05 | | 3.07 | | | 0.15 | | | 0.52 | | | 0.52 | |
|
|
|
|
|
|
|
|
|
|
|
|
|
|
|
|
|
|
|
|
|
|
|
Class I Shares | | 1/9/02 | | | 0.55 | | | 1.79 | | 3.44 | | 2.79 | | | 0.51 | | | 0.17 | | | 0.17 | |
|
|
|
|
|
|
|
|
|
|
|
|
|
|
|
|
|
|
|
|
|
|
|
Class Y Shares | | 11/12/98 | | | 0.50 | | | 1.68 | | 3.31 | | 3.39 | | | 0.40 | | | 0.27 | | | 0.27 | |
|
|
|
|
|
|
|
|
|
|
|
|
|
|
|
|
|
|
|
|
|
|
|
Lipper Money Market Instrument Funds Average2 | | — | | | 0.30 | | | 1.21 | | 2.73 | | N/A | | | N/A | | | N/A | | | N/A | |
|
|
|
|
|
|
|
|
|
|
|
|
|
|
|
|
|
|
|
|
|
|
|
Past performance does not guarantee future results. The performance data quoted represents past performance and current returns may be lower or higher. Total return figures include change in share price, reinvestment of dividends and capital gains and do not reflect taxes that a shareholder would pay on fund distributions or on the redemption of fund shares. The investment return and principal value will fluctuate so that an investor’s shares, when redeemed may be worth more or less than the original cost. To obtain performance information current to the most recent month end, please call 1-800-782-8183.
The performance above reflects any fee waivers that have been in effect during the applicable periods, as well as any expense reimbursements that have periodically been made. Absent such waivers and reimbursements, returns would have been lower. Currently, for Class I contractual fee waivers are in effect from March 1, 2009 through March 1, 2010.
| |
** | Reflects the applicable contingent deferred sales charge, maximum of 4.00%. |
| |
*** | Reflects the applicable contingent deferred sales charge, maximum of 1.00%. |
| |
1 | The “Aaa” and “AAAm” money market fund rating is historical and reflects the superior quality of the Fund’s investments, sound liquidity management, and strong operations and trading support. Periodic reviews are conducted to ensure a secure operations environment. Moody’s and Standard & Poor’s ratings represent an opinion only, not a recommendation to buy or sell. |
| |
2 | For additional information, please refer to the Glossary of Terms. |
| |
3 | The 7-day yield quotation more closely reflects the current earnings of the Fund than the total return quotation. |
| |
4 | Reflects the expense ratio as reported in the prospectus dated February 27, 2009. |
| |
† | Effective June 18, 2008, the HSBC Investor Money Market Fund was renamed the HSBC Investor Prime Money Market Fund. |
| |
†† | Aggregate total return. |
| |
5 | HSBC INVESTOR FAMILY OF FUNDS |
|
Portfolio Reviews |
|
|
HSBC Investor Tax-Free Money Market Fund† |
(Class A Shares, D Shares, I Shares and Y Shares)
by Jason Moshos
Portfolio Manager |
Investment Concerns
An investment in the Fund is not insured or guaranteed by the FDIC or any other government agency. Although the Fund seeks to preserve the value of your investment at $1.00 per share, it is possible to lose money by investing in the Fund. The Fund’s income may be subject to the federal alternative minimum tax and to certain state and local taxes.
The money markets were turbulent at the beginning of the six-month period under review, as credit remained extremely tight amid a worsening global recession. The Federal Reserve Board (the “Fed”) attempted to address the financial system’s credit and liquidity problems in December by lowering its target short-term interest rate from 1.00% to a range between 0.00% and 0.25%. The rate cut caused yields on money market securities to decline.
Lower interest rates, as well as several other Federal Reserve programs intended to boost credit and protect the financial markets, helped fuel a rally later in the period. The intended effect was to bring down the rates on higher-yielding money market securities. Municipal issuers across the country have benefited from the reduced cost of borrowing, but continue to experience revenue shortfalls causing widening budgetary gaps.
We generally maintained between 80% and 85% of the Fund’s assets in one- and seven-day reset variable rate demand notes that were returnable to issuers for the securities’ par value.*
The Fund remained defensively positioned to meet our primary objective of providing a high level of safety and liquidity. This objective is pursued by performing thorough fundamental credit research and positioning the Fund’s average maturity on the short end of the yield curve. That strategy caused the Fund to offer lower yield than many of its peers, but is consistent with our primary objectives.*
| |
* | Portfolio composition is subject to change. |
| |
† | On October 7, 2008, December 4, 2008 and April 8, 2009 the Fund participated in the Treasury Money Market Guarantee Program and related extensions. The Program is for shareholders as of September 19, 2008 and generally covers the lesser of the amount that the shareholder held on September 19 or the amount they hold on the date the fund needs to utilize the guarantee. If a shareholder closes its account with the Fund or broker dealer after September 19, any future investment in the Fund will not be guaranteed. The current extended guarantee is through September 18, 2009. |
| | | | | | | | | | | | | | | | | | | | | | |
Fund Performance | | | | | | | | Average Annual
Total Return (%) | | Yield (%)2 | | Expense
Ratio (%)3 | |
|
As of April 30, 2009 | | Inception
Date | | Six
Month†† | | 1
Year | | 3
Year | | Since
Inception | | 7-Day
Average | | Gross | | Net | |
|
Class A Shares** | | 8/27/04 | | | — | | | — | | — | | 0.69 | | | — | | | 0.80 | | | 0.80 | |
|
|
|
|
|
|
|
|
|
|
|
|
|
|
|
|
|
|
|
|
|
|
|
Class D Shares | | 8/24/04 | | | 0.29 | | | 1.25 | | 2.33 | | 2.15 | | | 0.26 | | | 0.65 | | | 0.65 | |
|
|
|
|
|
|
|
|
|
|
|
|
|
|
|
|
|
|
|
|
|
|
|
Class I Shares*** | | 6/25/04 | | | — | | | — | | — | | 0.26 | | | — | | | 0.30 | | | 0.30 | |
|
|
|
|
|
|
|
|
|
|
|
|
|
|
|
|
|
|
|
|
|
|
|
Class Y Shares | | 6/8/04 | | | 0.41 | | | 1.50 | | 2.58 | | 2.34 | | | 0.51 | | | 0.40 | | | 0.40 | |
|
|
|
|
|
|
|
|
|
|
|
|
|
|
|
|
|
|
|
|
|
|
|
Lipper Tax-Exempt Money Market Funds Average1 | | — | | | 0.22 | | | 1.14 | | 2.27 | | N/A | | | N/A | | | N/A | | | N/A | |
|
|
|
|
|
|
|
|
|
|
|
|
|
|
|
|
|
|
|
|
|
|
|
Past performance does not guarantee future results. The performance data quoted represents past performance and current returns may be lower or higher. Total return figures include change in share price, reinvestment of dividends and capital gains and do not reflect taxes that a shareholder would pay on fund distributions or on the redemption of fund shares. The investment return and principal value will fluctuate so that an investor’s shares, when redeemed may be worth more or less than the original cost. To obtain performance information current to the most recent month end, please call 1-800-782-8183.
The performance above reflects any fee waivers that have been in effect during the applicable periods, as well as any expense reimbursements that have periodically been made. Absent such waivers and reimbursements, returns would have been lower.
| |
** | Class A Shares were operational during a portion of the periods presented. Amounts reflect performance for the period of the time the class had operations, which was 78 days, 78 days and 5 days during the periods ended April 30, 2009 and October 31, 2007, 2006 and 2004, respectively. |
| |
*** | Class I Shares were operational during a portion of the periods presented. Amounts reflect performance for the period of the time the class had operations, which was 27 and 40 days during the years ended October 31, 2005 and 2004, respectively. |
| |
1 | For additional information, please refer to the Glossary of Terms. |
| |
2 | The 7-day yield quotation more closely reflects the current earnings of the Fund than the total return quotation. |
| |
3 | Reflects the expense ratio as reported in the prospectus dated February 27, 2009. |
| |
†† | Aggregate total return. |
| |
HSBC INVESTOR FAMILY OF FUNDS | 6 |
| |
Portfolio Reviews | |
|
|
| |
HSBC Investor U.S. Government Money Market Fund†
(Class A Shares, B Shares, C Shares, D Shares, I Shares and Y Shares)
by John Chiodi
Senior Portfolio Manager |
|
Moody’s and Standard & Poor’s
has assigned an “Aaa” and
“AAAm” rating to the HSBC
Investor U.S. Government
Money Market Fund.1 |
|
|
Investment Concerns
An investment in the Fund is not insured or guaranteed by the FDIC or any other government agency. Although the Fund seeks to preserve the value of your investment at $1.00 per share, it is possible to lose money by investing in the Fund.
The money markets were turbulent during the period under review as the fallout from the credit crisis fueled a global recession. The Federal Reserve Board (the “Fed”) employed several strategies to repair the financial markets, including a significant reduction of its short-term target interest rate in December from 1.0% to a range between 0.00% and 0.25%. That rate cut pushed down yields on money market securities.
As the Fed’s economic stimulus efforts took hold toward the middle of the six-month period, investors sought out higher-risk money market securities, including corporate paper. Government money market securities as a whole underperformed their corporate peers, but outperformed Treasury money market securities, which were the worst performers during the period. In search of higher yielding securities within the government money markets, we boosted the Fund’s allocation to floating-rate notes and repurchase transactions. That strategy benefited performance during the period.*
We positioned the Fund with a longer average maturity than its peer average, which enabled the Fund to lock in the higher yields available on longer-term issues. We believe that the Fund also experienced less-volatile investment inflows than its peers, many of which we believe experienced high levels of inflows and were forced to invest those assets at relatively low yields. The stable inflows helped the Fund maintain a relatively steady yield during the period.*
| |
* | Portfolio composition is subject to change. |
| |
† | On October 7, 2008, December 4, 2008 and April 8, 2009 the Fund participated in the Treasury Money Market Guarantee Program and related extensions. The Program is for shareholders as of September 19, 2008 and generally covers the lesser of the amount that the shareholder held on September 19 or the amount they hold on the date the fund needs to utilize the guarantee. If a shareholder closes its account with the Fund or broker dealer after September 19, any future investment in the Fund will not be guaranteed. The current extended guarantee is through September 18, 2009. |
| | | | | | | | | | | | | | | | | | | | | | | | | | | | |
Fund Performance | | | | | | | | Average Annual
Total Return (%) | | Yield (%)3 | | Expense
Ratio (%)4 | |
|
|
|
|
|
|
|
|
|
|
|
|
|
|
|
|
|
|
|
|
As of April 30, 2009 | | Inception
Date | | Six
Month†† | | 1
Year | | 5
Year | | 10
Year | | Since
Inception | | 7-Day
Average | | Gross | | Net | |
|
|
|
|
|
|
|
|
|
|
|
|
|
|
|
|
|
|
|
|
|
|
|
|
|
|
|
|
|
Class A Shares | | 5/3/90 | | | 0.12 | | | 0.86 | | | 2.70 | | | 2.70 | | | 3.64 | | | 0.05 | | | 0.67 | | | 0.67 | | |
|
|
|
|
|
|
|
|
|
|
|
|
|
|
|
|
|
|
|
|
|
|
|
|
|
|
|
|
|
Class B Shares** | | 9/11/98 | | | -3.94 | | | -3.51 | | | 2.52 | | | 2.40 | | | 2.51 | | | 0.05 | | | 1.27 | | | 1.27 | | |
|
|
|
|
|
|
|
|
|
|
|
|
|
|
|
|
|
|
|
|
|
|
|
|
|
|
|
|
|
Class C Shares*** | | 11/20/06 | | | -0.94 | | | -0.51 | | | — | | | — | | | 2.22 | | | 0.05 | | | 1.27 | | | 1.27 | | |
|
|
|
|
|
|
|
|
|
|
|
|
|
|
|
|
|
|
|
|
|
|
|
|
|
|
|
|
|
Class D Shares | | 4/1/99 | | | 0.17 | | | 0.98 | | | 2.85 | | | 2.85 | | | 2.86 | | | 0.05 | | | 0.52 | | | 0.52 | | |
|
|
|
|
|
|
|
|
|
|
|
|
|
|
|
|
|
|
|
|
|
|
|
|
|
|
|
|
|
Class I Shares**** | | 12/24/03 | | | 0.34 | | | 1.33 | | | — | | | — | | | 3.33 | | | 0.31 | | | 0.17 | | | 0.17 | | |
|
|
|
|
|
|
|
|
|
|
|
|
|
|
|
|
|
|
|
|
|
|
|
|
|
|
|
|
|
Class Y Shares | | 7/1/96 | | | 0.29 | | | 1.22 | | | 3.10 | | | 3.11 | | | 3.53 | | | 0.21 | | | 0.27 | | | 0.27 | | |
|
|
|
|
|
|
|
|
|
|
|
|
|
|
|
|
|
|
|
|
|
|
|
|
|
|
|
|
|
Lipper U.S. Government Money Market Funds Average2 | | — | | | 0.18 | | | 0.93 | | | 2.66 | | | 2.74 | | | N/A | | | N/A | | | N/A | | | N/A | | |
|
|
|
|
|
|
|
|
|
|
|
|
|
|
|
|
|
|
|
|
|
|
|
|
|
|
|
|
|
Past performance does not guarantee future results. The performance data quoted represents past performance and current returns may be lower or higher. Total return figures include change in share price, reinvestment of dividends and capital gains and do not reflect taxes that a shareholder would pay on fund distributions or on the redemption of fund shares. The investment return and principal value will fluctuate so that an investor’s shares, when redeemed may be worth more or less than the original cost. To obtain performance information current to the most recent month end, please call 1-800-782-8183.
The performance above reflects any fee waivers that have been in effect during the applicable periods, as well as any expense reimbursements that have periodically been made. Absent such waivers and reimbursements, returns would have been lower. Currently, for Class I contractual fee waivers are in effect from March 1, 2009 through March 1, 2010.
| |
** | Reflects the applicable contingent deferred sales charge, maximum of 4.00%. |
| |
*** | Reflects the applicable contingent deferred sales charge, maximum of 1.00%. |
| |
**** | Class I Shares were operational during a portion of the periods presented. Amounts reflect performance for the period of the time the class had operations, which was 357 days, 136 days, 89 days and 10 days during the years ended October 31, 2007, 2006, 2005 and 2004, respectively. |
| |
1 | The “Aaa” and “AAAm” money market fund rating is historical and reflects the superior quality of the Fund’s investments, sound liquidity management, and strong operations and trading support. Periodic reviews are conducted to ensure a secure operations environment. Moody’s and Standard & Poor’s ratings represent an opinion only, not a recommendation to buy or sell. |
| |
2 | For additional information, please refer to the Glossary of Terms. |
| |
3 | The 7-day yield quotation more closely reflects the current earnings of the Fund than the total return quotation. |
| |
4 | Reflects the expense ratio as reported in the prospectus dated February 27, 2009. |
| |
†† | Aggregate total return. |
| |
7 | HSBC INVESTOR FAMILY OF FUNDS |
| |
| Portfolio Reviews |
|
| |
|
|
HSBC Investor U.S. Treasury Money Market Fund
(Class A Shares, B Shares, C Shares, D Shares, I Shares and Y Shares) | Standard & Poor’s has assigned an
“AAA” rating to the HSBC Investor
U.S. Treasury Money Market Fund.1 |
|
by John Chiodi |
|
Senior Portfolio Manager | |
Investment Concerns
An investment in the Fund is not insured or guaranteed by the FDIC or any other government agency. Although the Fund seeks to preserve the value of your investment at $1.00 per share, it is possible to lose money by investing in the fund. The Fund’s income may be subject to the federal alternative minimum tax and to certain state and local taxes.
Rising subprime mortgage defaults fueled a global recession and credit and liquidity crises during the six months through April 30, 2009, making for a difficult period in the money markets. The Federal Reserve Board (the “Fed”) employed several strategies in hopes of stimulating economic growth and unfreezing the credit markets, including cutting the federal funds rate in December from 1.00% to a target range between 0.00% and 0.25%. The Fed’s actions caused yields on money market securities to fall.
Yields on Treasury money securities were particularly affected by the Fed’s rate cut. Meanwhile, investors concerned with the direction of the economy sought the relative security of the government-backed money markets. The resulting increase in demand pushed down Treasury bill yields, which briefly reached
negative territory early in the period. The Fund experienced large cash inflows during this time, which further reduced the yield it was able to generate for shareholders.*
We deployed a “barbell” approach, by focusing on securities with maturities on the short and long ends of the treasury bill yield curve. Maintaining heavy exposure to securities on the short end of the yield curve helped the Fund achieve a high level of liquidity. Also emphasizing securities at the longer end of the yield curve allowed us to lock in higher yields. As a result, the Fund’s average maturity was longer than its typical peer. That strategy benefited performance as rates fell during the period.*
| |
* | Portfolio composition is subject to change. |
| | | | | | | | | | | | | | | | | | | | | | | | | |
Fund Performance | | | | | | | | Average Annual
Total Return (%) | | Yield (%)3 | | Expense
Ratio (%)4 | |
|
|
|
|
|
|
|
|
|
|
|
|
|
|
|
|
|
|
As of April 30, 2009 | | Inception
Date | | Six
Month†† | | 1
Year | | 5
Year | | Since
Inception | | 7-Day
Average | | Gross | | Net | |
|
|
|
|
|
|
|
|
|
|
|
|
|
|
|
|
|
|
Class A Shares | | 5/24/01 | | | 0.05 | | | 0.42 | | | 2.29 | | | 1.77 | | | 0.05 | | | 0.66 | | | 0.66 | | |
|
|
|
|
|
|
|
|
|
|
|
|
|
|
|
|
|
|
|
|
|
|
|
|
|
|
Class B Shares** | | 8/13/04 | | | -3.95 | | | -3.80 | | | — | | | 1.88 | | | 0.05 | | | 1.26 | | | 1.26 | | |
|
|
|
|
|
|
|
|
|
|
|
|
|
|
|
|
|
|
|
|
|
|
|
|
|
|
Class C Shares*** | | 12/24/03 | | | -0.95 | | | — | | | — | | | 0.06 | | | 0.05 | | | 1.26 | | | 1.26 | | |
|
|
|
|
|
|
|
|
|
|
|
|
|
|
|
|
|
|
|
|
|
|
|
|
|
|
Class D Shares | | 5/14/01 | | | 0.05 | | | 0.50 | | | 2.43 | | | 1.91 | | | 0.05 | | | 0.51 | | | 0.51 | | |
|
|
|
|
|
|
|
|
|
|
|
|
|
|
|
|
|
|
|
|
|
|
|
|
|
|
Class I Shares**** | | 12/30/03 | | | 0.11 | | | 0.73 | | | 2.62 | | | 2.45 | | | 0.13 | | | 0.16 | | | 0.16 | | |
|
|
|
|
|
|
|
|
|
|
|
|
|
|
|
|
|
|
|
|
|
|
|
|
|
|
Class Y Shares | | 5/11/01 | | | 0.06 | | | 0.64 | | | 2.66 | | | 2.16 | | | 0.05 | | | 0.26 | | | 0.26 | | |
|
|
|
|
|
|
|
|
|
|
|
|
|
|
|
|
|
|
|
|
|
|
|
|
|
|
Lipper U.S. Treasury Money Market Funds Average2 | | — | | | 0.05 | | | 0.53 | | | 2.41 | | | N/A | | | N/A | | | N/A | | | N/A | | |
|
|
|
|
|
|
|
|
|
|
|
|
|
|
|
|
|
|
|
|
|
|
|
|
|
|
Past performance does not guarantee future results. The performance data quoted represents past performance and current returns may be lower or higher. Total return figures include change in share price, reinvestment of dividends and capital gains and do not reflect taxes that a shareholder would pay on fund distributions or on the redemption of fund shares. The investment return and principal value will fluctuate so that an investor’s shares, when redeemed may be worth more or less than the original cost. To obtain performance information current to the most recent month end, please call 1-800-782-8183.
The performance above reflects any fee waivers that have been in effect during the applicable periods, as well as any expense reimbursements that have periodically been made. Absent such waivers and reimbursements, returns would have been lower. Currently, for Class I contractual fee waivers are in effect from March 1, 2009 through March 1, 2010.
| |
** | Reflects the applicable contingent deferred sales charge, maximum of 4.00%. |
| |
*** | Reflects the applicable contingent deferred sales charge, maximum of 1.00%. |
| |
**** | Class I Shares were operational during a portion of the periods presented. Amounts reflect performance for the period of the time the class had operations, which was 280 and 13 days during the years ended October 31, 2005 and 2004, respectively. |
| |
1 | The “AAA” money market fund rating is historical and reflects the superior quality of the Fund’s investments, sound liquidity management, and strong operations and trading support. Periodic reviews are conducted to ensure a secure operations environment. Standard & Poor’s rating represent an opinion only, not a recommendation to buy or sell. |
| |
2 | For additional information, please refer to the Glossary of Terms. |
| |
3 | The 7-day yield quotation more closely reflects the current earnings of the Fund than the total return quotation. |
| |
4 | Reflects the expense ratio as reported in the prospectus dated February 27, 2009. |
| |
†† | Aggregate total return. |
| |
HSBC INVESTOR FAMILY OF FUNDS | 8 |
| |
Portfolio Reviews | |
|
| |
| Portfolio Composition* |
| April 30, 2009 |
| (Unaudited) |
| | | | |
HSBC Investor California Tax-Free Money Market Fund |
| |
| | | |
Investment Allocation | | Percentage of Investments at Value | |
|
|
|
|
Variable Rate Demand Notes | | 80.7 | % | |
|
|
|
|
|
Commercial Paper and Notes | | 18.2 | % | |
|
|
|
|
|
Cash and Equivalents | | 1.1 | % | |
|
|
|
|
|
Total | | 100.0 | % | |
|
|
|
|
|
| | | | |
HSBC Investor N.Y. Tax-Free Money Market Fund |
|
|
|
|
|
| | | | |
Investment Allocation | | Percentage of Investments at Value | |
|
|
|
|
|
Variable Rate Demand Notes | | 84.4 | % | |
|
|
|
|
|
Tax-Free Notes and Commercial Paper | | 14.6 | % | |
|
|
|
|
|
Cash and Equivalents | | 1.0 | % | |
|
|
|
|
|
Total | | 100.0 | % | |
|
|
|
|
|
| | | | |
HSBC Investor Prime Money Market Fund |
|
|
|
|
|
| | | | |
Investment Allocation | | Percentage of Investments at Value | |
|
|
|
|
|
Commercial Paper and Notes | | 31.3 | % | |
|
|
|
|
|
U.S. Government and Government
Agency Obligations | | 24.3 | % | |
|
|
|
|
|
Certificates of Deposit | | 19.7 | % | |
|
|
|
|
|
Time Deposits | | 9.6 | % | |
|
|
|
|
|
Variable Rate Demand Notes | | 8.4 | % | |
|
|
|
|
|
Yankee Dollars | | 3.2 | % | |
|
|
|
|
|
Corporate Obligations | | 2.7 | % | |
|
|
|
|
|
Repurchase Agreements | | 0.8 | % | |
|
|
|
|
|
Total | | 100.0 | % | |
|
|
|
|
|
| | | | |
HSBC Investor Tax-Free Money Market Fund |
|
|
|
|
|
| | | | |
Investment Allocation | | Percentage of Investments at Value | |
|
|
|
|
|
Municipal Bonds | | 43.6 | % | |
|
|
|
|
|
Variable Rate Demand Notes | | 33.4 | % | |
|
|
|
|
|
Commercial Paper and Notes | | 16.1 | % | |
|
|
|
|
|
Cash and Equivalents | | 6.9 | % | |
|
|
|
|
|
Total | | 100.0 | % | |
|
|
|
|
|
| | | | |
HSBC Investor U.S. Government Money Market Fund |
|
|
|
|
|
| | | | |
Investment Allocation | | Percentage of Investments at Value | |
|
|
|
|
|
U.S. Government and Government
Agency Obligations | | 66.7 | % | |
|
|
|
|
|
Repurchase Agreements | | 33.3 | % | |
|
|
|
|
|
Total | | 100.0 | % | |
|
|
|
|
|
| | | | |
HSBC Investor U.S. Treasury Money Market Fund |
|
|
|
|
|
| | | | |
Investment Allocation | | Percentage of Investments at Value | |
|
|
|
|
|
U.S. Treasury Bills | | 98.2 | % | |
|
|
|
|
|
U.S. Treasury Notes | | 1.8 | % | |
|
|
|
|
|
Total | | 100.0 | % | |
|
|
|
|
|
| |
* | Portfolio composition is subject to change. |
| |
9 | HSBC INVESTOR FAMILY OF FUNDS |
|
HSBC INVESTOR CALIFORNIA TAX-FREE MONEY MARKET FUND |
|
|
Schedule of Portfolio Investments—as of April 30, 2009 (Unaudited) |
| | | | | | | |
Variable Rate Demand Notes—80.7% | | | | | | | |
|
|
|
|
|
|
|
|
| | | | | | | |
| | Principal
Amount($) | | Value($) | |
| |
| |
| |
California – 80.7% | | | | | | | |
ABAG Finance Authority for
Nonprofit Corps. Multi-family
Revenue, Series A, 0.45%, 12/15/32,
(Credit Support FNMA) (a) | | | 1,975,000 | | | 1,975,000 | |
ABAG Finance Authority for
Nonprofit Corps. Multi-family
Revenue, Series A, 0.66%, 12/15/32,
AMT, (Credit Support FNMA,
Liquid Facility FNMA) (a) | | | 1,000,000 | | | 1,000,000 | |
ABAG Finance Authority for
Nonprofit Corps. Revenue, 1.20%,
8/1/34, (LOC Allied Irish Bank
plc) (a) | | | 1,150,000 | | | 1,150,000 | |
ABAG Finance Authority for
Nonprofit Corps. Revenue, 0.32%,
7/1/35, (LOC Wells Fargo Bank N.A.,
U.S. Bank N.A.) (a) | | | 1,500,000 | | | 1,500,000 | |
ABAG Finance Authority for
Nonprofit Corps. Revenue, 0.38%,
9/1/35, (LOC Bank of New York) (a) | | | 775,000 | | | 775,000 | |
Anaheim California Union High School
District Certificates of Participation,
1.75%, 9/1/29, (Credit Support FSA,
SpA First Union National Bank) (a) | | | 1,485,000 | | | 1,485,000 | |
Burbank California Redevelopment
Agency Multi-family Housing
Revenue, Series A, 0.30%, 11/1/10,
(LOC FHLB, Washington Mutual
Bank) (a) | | | 1,000,000 | | | 1,000,000 | |
California Economic Development
Financing Authority IDR, 0.66%,
5/1/23, AMT, (LOC Wells Fargo
Bank N.A.) (a) | | | 500,000 | | | 500,000 | |
California Health Facilities Financing
Authority Revenue, Series A, 0.27%,
8/1/21, (LOC U.S. Bank N.A.) (a) | | | 500,000 | | | 500,000 | |
California Infrastructure & Economic
Development Bank Revenue, 0.31%,
11/15/37, (LOC Bank of New York,
California State Teacher’s
Retirement) (a) | | | 1,500,000 | | | 1,500,000 | |
California Infrastructure & Economic
Development Bank Revenue, Series B,
0.40%, 4/1/42, (LOC Bank of
America N.A.) (a) | | | 1,500,000 | | | 1,500,000 | |
California Municipal Finance Authority
Revenue, 0.32%, 7/1/38, (LOC U.S.
Bank N.A.) (a) | | | 1,500,000 | | | 1,500,000 | |
California Municipal Finance Authority
Solid Waste Disposal Revenue,
Series A, 0.45%, 2/1/19, (LOC
JP Morgan Chase Bank) (a) | | | 1,000,000 | | | 1,000,000 | |
California Pollution Control Financing
Authority Revenue, Series C, 0.52%,
11/1/17, AMT, (LOC BNP
Paribas) (a) | | | 1,000,000 | | | 1,000,000 | |
| | | | | | | |
Variable Rate Demand Notes, continued | | | | | | | |
|
|
|
|
|
|
|
|
| | | | | | | |
| | Principal
Amount($) | | Value($) | |
| |
| |
| |
California, continued | | | | | | | |
California Pollution Control Financing
Authority Revenue, Series C, 0.33%,
11/1/26, (LOC JP Morgan Chase
Bank) (a) | | | 500,000 | | | 500,000 | |
California State Department of Water
Resources Power Supply Revenue,
Series C-1, 1.00%, 5/1/22, (LOC Dexia
Credit Local) (a) | | | 1,500,000 | | | 1,500,000 | |
California State Department of Water
Resources Supply Revenue, 0.20%,
5/1/22, (LOC Bayerische
Landesbank) (a) | | | 2,200,000 | | | 2,200,000 | |
California State Economic Development
Financing Authority IDR, 0.66%,
4/1/16, AMT, (LOC Wells Fargo
Bank N.A.) (a) | | | 500,000 | | | 500,000 | |
California State GO, 0.30%, 5/1/33,
(LOC Westlandesbank AG, JP Morgan
Chase Bank) (a) | | | 1,700,000 | | | 1,700,000 | |
California State GO, Series A-3, 0.37%,
5/1/33, (LOC Westdeutsche Landesbank
AG, JP Morgan Chase Bank) (a) | | | 1,000,000 | | | 1,000,000 | |
California State GO, Series B-1, 0.20%,
5/1/33, (LOC BNP Paribas, Bank of
New York, California State Teacher’s
Retirement) (a) | | | 2,000,000 | | | 2,000,000 | |
California State GO, Series B-3, 0.20%,
5/1/33, (LOC BNP Paribas, Bank of
New York, California State Teacher’s
Retirement) (a) | | | 510,000 | | | 510,000 | |
California Statewide Communities
Development Authority Multi-family
Revenue, Series J, 0.29%, 9/1/29,
(LOC Wells Fargo Bank N.A.) (a) | | | 500,000 | | | 500,000 | |
California Statewide Communities
Development Authority Revenue,
0.51%, 5/1/25, (LOC Bank of New
York) (a) | | | 1,065,000 | | | 1,065,000 | |
California Statewide Communities
Development Authority Revenue,
1.20%, 5/1/35, (LOC Allied Irish
Bank plc) (a) | | | 900,000 | | | 900,000 | |
California Statewide Communities
Development Authority Revenue,
Series B, 0.26%, 6/1/35, (LOC
Citibank N.A.) (a) | | | 1,000,000 | | | 1,000,000 | |
California Statewide Communities
Development Authority Revenue,
Series B, 0.22%, 8/15/36, (LOC
UBS AG) (a) | | | 1,500,000 | | | 1,500,000 | |
Contra Costa County California Housing
Authority Multi-family Revenue,
0.35%, 11/15/17, (Credit Support
FHLMC) (a) | | | 1,075,000 | | | 1,075,000 | |
Contra Costa County California
Multi-family Mortgage Revenue,
Series B, 0.35%, 11/15/22, (Credit
Support FNMA, Liquid Facility
FNMA) (a) | | | 900,000 | | | 900,000 | |
| | |
See notes to financial statements | HSBC INVESTOR FAMILY OF FUNDS | 10 |
|
HSBC INVESTOR CALIFORNIA TAX-FREE MONEY MARKET FUND |
|
|
Schedule of Portfolio Investments—as of April 30, 2009 (Unaudited) (continued) |
| | | | | | | |
Variable Rate Demand Notes, continued | | | | | | | |
|
|
|
|
|
|
|
|
| | | | | | | |
| | Principal
Amount($) | | Value($) | |
| |
| |
| |
California, continued | | | | | | | |
Easy Bay California Municipal
Utility District Water System Revenue,
Sub-series B, 1.25%, 6/1/25, (Credit
Support FSA, SpA Dexia Credit
Local) (a) | | | 500,000 | | | 500,000 | |
Hayward California Housing Authority
Multi-family Housing Revenue,
Series A, 0.35%, 6/15/25, (Credit
Support FNMA, Liquid Facility
FNMA) (a) | | | 950,000 | | | 950,000 | |
Hemet California Unified School
District Certificates of Participation,
1.10%, 10/1/36, (LOC State Street
B&T Co.) (a) | | | 1,445,000 | | | 1,445,000 | |
Irvine Public Facilities & Infrastructure
Authority Lease Revenue, 0.73%,
11/1/10, (LOC State Street B&T
Co.) (a) | | | 790,000 | | | 790,000 | |
Irvine Ranch California Water District GO,
Series A, 0.32%, 11/15/13, (LOC
Landesbank Hessen-Thuringen) (a) | | | 800,000 | | | 800,000 | |
Irvine Ranch California Water District GO,
0.32%, 1/1/21, (LOC State Street
B&T Co.) (a) | | | 1,300,000 | | | 1,300,000 | |
Los Angeles California Wastewater
System Revenue, Series A, 0.20%,
6/1/28, (LOC Bank of Nova
Scotia) (a) | | | 500,000 | | | 500,000 | |
Los Angeles County California
Multi-family Mortgage Revenue,
Series C, 0.30%, 4/1/31, (Credit
Support FHLMC, Liquid Facility
FHLMC) (a) | | | 515,000 | | | 515,000 | |
Los Angeles County Housing Authority
Multi-family Housing Revenue, 0.35%,
12/1/32, (Credit Support FHLMC) (a) | | 1,350,000 | | 1,350,000 | |
Los Angeles County Housing Authority
Multi-family Housing Revenue, 0.35%,
5/1/33, (Credit Support FHLMC) (a) | | 1,150,000 | | 1,150,000 | |
Los Angeles Unified School District
Certificates of Participation, Series A,
0.25%, 12/1/17, (LOC Bank of New
York) (a) | | | 900,000 | | | 900,000 | |
M-S-R Public Power Agency San Juan
Project Revenue, Series M, 0.40%,
7/1/22, (LOC Dexia Credit Local) (a) | | | 1,200,000 | | | 1,200,000 | |
Oakland-Alameda County California
Coliseum Authority Lease Revenue,
Series C-1, 0.35%, 2/1/25, (LOC Bank
of New York, California State Teacher’s
Retirement) (a) | | | 1,600,000 | | | 1,600,000 | |
Orange County California Apartment
Development Revenue, Series 2, 0.35%,
11/15/28, (Credit Support FNMA) (a) | | | 500,000 | | | 500,000 | |
| | | | | | | |
Variable Rate Demand Notes, continued | | | | | | | |
|
|
|
|
|
|
|
|
| | | | | | | |
| | Principal
Amount($) | | Value($) | |
| |
| |
| |
California, continued | | | | | | | |
San Bernardino County California
Certificates of Participation, 0.22%,
7/1/15, (LOC BNP Paribas) (a) | | | 1,000,000 | | | 1,000,000 | |
San Bernardino County California
Multi-family Revenue, Series A, 0.35%,
5/15/29, (Credit Support FNMA,
Liquid Facility FNMA) (a) | | | 525,000 | | | 525,000 | |
San Diego California Housing Authority
Multi-family Housing Revenue, Series F,
0.53%, 9/1/39, AMT, (Credit Support
FHLMC, Liquid Facility FHLMC) (a) | | | 500,000 | | | 500,000 | |
San Jacinto California Unified School
District Certificates of Participation,
1.75%, 10/1/28, (LOC FSA, SpA
Wachovia Bank N.A.) (a) | | | 1,100,000 | | | 1,100,000 | |
San Jose California Redevelopment
Agency Revenue, Series A, 0.20%,
7/1/26, (LOC Morgan Guaranty
Trust) (a) | | | 800,000 | | | 800,000 | |
San Jose California Redevelopment
Agency Revenue, Series B, 0.20%,
8/1/32, (LOC JP Morgan Chase
Bank) (a) | | | 800,000 | | | 800,000 | |
San Mateo County California Board of
Education Certificates of Participation,
Series A, 1.25%, 5/1/35, (LOC Allied
Irish Bank plc) (a) | | | 1,150,000 | | | 1,150,000 | |
San Rafael California Redevelopment
Agency Multi-family Revenue,
Series A, 0.57%, 9/1/31, (LOC
Citibank N.V.) (a) | | | 500,000 | | | 500,000 | |
Santa Ana Unified School District
Certificates of Participation, 0.20%,
7/1/15, (LOC BNP Paribas) (a) | | | 1,700,000 | | | 1,700,000 | |
Santa Clara California Electric Revenue,
Sub-series B, 0.83%, 7/1/27, (LOC
Dexia Credit Local) (a) | | | 1,600,000 | | | 1,600,000 | |
Stockton California Health Facilities
Revenue, Series A, 0.37%, 12/1/32,
(LOC Citibank N.V.) (a) | | | 1,465,000 | | | 1,465,000 | |
Tracy California Multi-family Housing
Revenue, Series A, 0.35%, 5/1/15,
(LOC FHLMC) (a) | | | 1,700,000 | | | 1,700,000 | |
| | | | |
|
| |
TOTAL VARIABLE RATE DEMAND
NOTES (COST $59,575,000) | | | | | | 59,575,000 | |
| | | | |
|
| |
| | | | | | | |
Commercial Paper And Notes—18.1% | | | | | | | |
|
|
|
|
|
|
|
|
California – 18.1% | | | | | | | |
California State University,
0.45%, 5/6/09 | | | 1,100,000 | | | 1,100,000 | |
Los Angeles Municipal Improvement,
0.40%, 5/21/09 | | | 1,000,000 | | | 1,000,000 | |
Orange County Local Transit, Series A,
2.00%, 5/6/09, (LOC Dexia Credit
Local) | | | 2,000,000 | | | 2,000,000 | |
| | |
11 | HSBC INVESTOR FAMILY OF FUNDS | See notes to financial statements |
|
HSBC INVESTOR CALIFORNIA TAX-FREE MONEY MARKET FUND |
|
|
Schedule of Portfolio Investments—as of April 30, 2009 (Unaudited) (continued) |
| | | | | | | |
Commercial Paper And Notes, continued | | | | | | | |
|
|
|
|
|
|
|
|
| | | | | | | |
| | Shares or
Principal
Amount($) | | Value($) | |
| |
| |
| |
California, continued | | | | | | | |
Riverside County Teeter Finance,
0.53%, 8/5/09 | | | 2,000,000 | | | 2,000,000 | |
San Diego County Regional Airport,
0.60%, 7/9/09 | | | 1,500,000 | | | 1,500,000 | |
San Francisco Airport, 0.45%, 6/4/09 | | | 1,600,000 | | | 1,600,000 | |
San Gabriel Valley Government,
0.45%, 7/9/09 | | | 1,000,000 | | | 1,000,000 | |
Turlock Irrigation District,
0.45%, 5/11/09 | | | 1,000,000 | | | 1,000,000 | |
Turlock Irrigation District,
0.40%, 5/13/09 | | | 1,000,000 | | | 1,000,000 | |
Ventura County California Public
Financing Authority Lease Revenue,
0.50%, 6/11/09 | | | 1,200,000 | | | 1,200,000 | |
| | | | |
|
| |
TOTAL COMMERCIAL PAPER AND
NOTES (COST $13,400,000) | | | | | | 13,400,000 | |
| | | | |
|
| |
| | | | | | | |
Investment Companies—1.1% | | | | | | | |
|
|
|
|
|
|
|
|
BlackRock Provident California
Institutional Shares, 0.57% (b) | | | 742,403 | | | 742,403 | |
Northern Institutional Tax Exempt
Portfolio, Shares Class, 0.45% (b) | | | 49,790 | | | 49,790 | |
| | | | |
|
| |
TOTAL INVESTMENT COMPANIES
(COST $792,193) | | | | | | 792,193 | |
| | | | |
|
| |
TOTAL INVESTMENTS
(COST $73,767,193) — 99.9% | | | | | | 73,767,193 | |
| | | | |
|
| |
| |
|
| |
| Percentages indicated are based on net assets of $73,824,993. |
| |
(a) | Variable rate security. The interest rates on these securities are adjusted periodically to reflect then-current short-term interest rates. The rates presented represent the rates in effect on April 30, 2009. The maturity dates presented reflect the final maturity dates. However, some of these securities may contain put or demand features that allow the fund to require the issuer to repurchase the security from the fund within various time periods, including daily, weekly, monthly, or semi-annually. |
| |
(b) | The rates presented represent the annualized one day yield that was in effect on April 30, 2009. |
| |
AMT | — Interest on security is subject to federal alternative minimum tax |
FHLMC | — Federal Home Loan Mortgage Corporation |
FNMA | — Federal National Mortgage Association |
FSA | — Financial Security Assurance |
GO | — General Obligation |
IDR | — Industrial Development Revenue |
LOC | — Letter of Credit |
PLC | — Public Limited Co. |
SPA | — Standby Purchase Agreement |
| | |
See notes to financial statements | HSBC INVESTOR FAMILY OF FUNDS | 12 |
|
HSBC INVESTOR NEW YORK TAX-FREE MONEY MARKET FUND |
|
|
Schedule of Portfolio Investments—as of April 30, 2009 (Unaudited) |
| | | | | | | |
Variable Rate Demand Notes—84.2% | | | | | | | |
|
|
|
|
|
|
|
|
| | | | | | | |
| | Principal
Amount($) | | Value($) | |
| |
| |
| |
New York – 84.2% | | | | | | | |
Buffalo Municipal Water Finance
Authority Water Systems Revenue,
0.36%, 7/1/35, (LOC JP Morgan
Chase Bank) (a) | | | 7,125,000 | | | 7,125,000 | |
Chautauqua County IDA Exempt
Facility Revenue, 0.45%, 4/1/42,
(LOC Bank of America N.A.) (a) | | | 8,500,000 | | | 8,500,000 | |
Dutchess County IDA Civic Facility
Revenue, Series A, 0.49%, 7/1/38,
(LOC KeyBank N.A.) (a) | | | 7,000,000 | | | 7,000,000 | |
Franklin County IDA Civic Facility
Revenue, 0.40%, 5/1/19, (LOC Fleet
National Bank) (a) | | | 2,515,000 | | | 2,515,000 | |
Long Island Power Authority Electrical
Systems Revenue, 3.00%, 12/1/29,
(Credit Support FSA, SpA Dexia
Credit Local) (a) | | | 8,930,000 | | | 8,930,000 | |
Long Island Power Authority Electrical
Systems Revenue, Series G, 4.00%,
12/1/29, (Credit Support FSA, SpA
Dexia Credit Local) (a) | | | 5,550,000 | | | 5,550,000 | |
Long Island Power Authority New York
Electrical Systems Revenue, Series J,
3.00%, 12/1/29, (Credit Support FSA,
SpA Dexia Credit Local) (a) | | | 7,000,000 | | | 7,000,000 | |
Metropolitan Transportation Authority
Revenue, Sub-series B-1, 0.25%,
11/1/34, (LOC Scotiabank) (a) | | | 10,000,000 | | | 10,000,000 | |
Metropolitan Transportation Authority
Revenue, Sub-series B-2, 0.25%,
11/1/34, (LOC BNP Paribas) (a) | | | 18,500,000 | | | 18,500,000 | |
Metropolitan Transportation Authority
Revenue, Sub-series B-3, 0.25%,
11/1/34, (LOC Lloyds TSB Bank
plc) (a) | | | 10,000,000 | | | 10,000,000 | |
Metropolitan Transportation Authority
Revenue, Sub-series D-2, 0.20%,
11/1/35, (LOC Landesbank
Hessen-Thuringen) (a) | | | 9,400,000 | | | 9,400,000 | |
Metropolitan Transportation Authority
Revenue, Sub-series G-2, 0.20%,
11/1/26, (LOC BNP Paribas) (a) | | | 2,100,000 | | | 2,100,000 | |
Monroe County IDA Civic Facility
Revenue, 0.43%, 1/15/32, (LOC
JP Morgan Chase Bank) (a) | | | 4,000,000 | | | 4,000,000 | |
Monroe County IDA Civic Facility
Revenue, 0.38%, 4/1/35, (LOC
JP Morgan Chase Bank) (a) | | | 4,050,000 | | | 4,050,000 | |
Monroe County IDA Civic Facility
Revenue, 0.43%, 6/1/36, (LOC
JP Morgan Chase Bank) (a) | | | 3,800,000 | | | 3,800,000 | |
Monroe County IDA Civic Facility
Revenue, 0.88%, 2/1/38, (LOC
JP Morgan Chase Bank) (a) | | | 1,900,000 | | | 1,900,000 | |
Monroe County IDA Civic Facility
Revenue, 0.48%, 4/1/38, (LOC
JP Morgan Chase Bank) (a) | | | 2,200,000 | | | 2,200,000 | |
| | | | | | | |
Variable Rate Demand Notes, continued | | | | | | | |
|
|
|
|
|
|
|
|
| | | | | | | |
| | Principal
Amount($) | | Value($) | |
| |
| |
| |
New York, continued | | | | | | | |
Nassau County IDA Civic Facility
Revenue, 0.65%, 6/1/19, (LOC Fleet
Bank N.A.) (a)(b) | | | 1,715,000 | | | 1,715,000 | |
Nassau County Interim Finance
Authority Revenue, 0.62%, 11/15/22,
(Credit Support FSA, SpA BNP
Paribas) (a) | | | 30,095,000 | | | 30,095,000 | |
Nassau County Interim Finance
Authority Revenue, Series A, 2.35%,
11/15/22, (Credit Support FSA, SpA
Dexia Credit Local) (a) | | | 1,380,000 | | | 1,380,000 | |
Nassau Health Care Corp. Revenue,
0.35%, 8/1/29, (LOC TD Bank
N.A.) (a) | | | 2,000,000 | | | 2,000,000 | |
Nassau Health Care Corp. Revenue,
Sub-series B-2, 0.35%, 8/1/29, (Credit
Support County Guaranteed, LOC
TD Bank N.A.) (a) | | | 5,000,000 | | | 5,000,000 | |
New York City Capital Resources Corp.
Revenue, Series B1, 0.40%, 7/1/37,
(LOC Bank of America N.A.) (a) | | | 5,920,000 | | | 5,920,000 | |
New York City GO, 0.45%, 8/1/23,
(LOC Westdeutsche Landesbank) (a) | | | 2,500,000 | | | 2,500,000 | |
New York City GO, Series C, 0.40%,
10/1/23, (LOC JP Morgan Chase
Bank) (a) | | | 1,600,000 | | | 1,600,000 | |
New York City GO, Series J, Sub-series
J2, 0.33%, 2/15/16, (LOC Westdeutsche
Landesbank) (a) | | | 4,800,000 | | | 4,800,000 | |
New York City GO, Sub-series A6,
0.50%, 11/1/26, (Credit Support FSA,
SpA Dexia Credit Local) (a) | | | 9,000,000 | | | 9,000,000 | |
New York City GO, Sub-series J-8,
0.42%, 8/1/21, (LOC Landesbank
Baden-Wurttemberg) (a) | | | 7,100,000 | | | 7,100,000 | |
New York City GO, Sub-series L-4,
0.23%, 4/1/38, (LOC U.S. Bank
N.A.) (a) | | | 19,500,000 | | | 19,500,000 | |
New York City Health & Hospital Corp.
Revenue, Series B, 0.36%, 2/15/31,
(LOC TD Bank N.A.) (a) | | | 7,400,000 | | | 7,400,000 | |
New York City Housing Development
Corp., 0.38%, 12/1/34, (LOC Citibank
N.A.) (a) | | | 6,615,000 | | | 6,615,000 | |
New York City Housing Development
Corp. Multi-family Housing Revenue,
Series A, 0.18%, 4/1/31, (Credit
Support FHLMC) (a) | | | 1,135,000 | | | 1,135,000 | |
New York City Housing Development
Corp. Multi-family Mortgage Revenue,
0.23%, 6/15/32, (Credit Support
FNMA) (a) | | | 8,965,000 | | | 8,965,000 | |
New York City Housing Development
Corp. Multi-family Mortgage Revenue,
0.38%, 12/1/36, (LOC Landesbank
Hessen) (a) | | | 17,535,000 | | | 17,535,000 | |
| | |
13 | HSBC INVESTOR FAMILY OF FUNDS | See notes to financial statements |
|
HSBC INVESTOR NEW YORK TAX-FREE MONEY MARKET FUND |
|
|
Schedule of Portfolio Investments—as of April 30, 2009 (Unaudited) (continued) |
| | | | | | | |
Variable Rate Demand Notes, continued | | | | | |
|
|
|
|
|
|
| | | | | |
| | Principal
Amount($) | | Value($) | |
| |
| |
| |
New York, continued | | | | | | | |
New York City Housing Development
Corp. Multi-family Mortgage
Revenue, 0.58%, 1/1/37, AMT,
(LOC Citibank N.A.) (a) | | | 5,000,000 | | | 5,000,000 | |
New York City Housing Development
Corp. Multi-family Mortgage Revenue,
0.51%, 6/1/42, AMT, (LOC Citibank
N.A.) (a) | | | 10,000,000 | | | 10,000,000 | |
New York City Housing Development
Corp. Multi-family Mortgage Revenue,
0.51%, 9/1/42, AMT, (LOC Citibank
N.A.) (a) | | | 11,000,000 | | | 11,000,000 | |
New York City Housing Development
Corp. Multi-family Mortgage Revenue,
0.25%, 11/1/46, (Credit Support
FHLMC, Liquid Facility FHLMC) (a) | | | 4,000,000 | | | 4,000,000 | |
New York City Housing Development
Corp. Multi-family Mortgage Revenue,
Series A, 0.58%, 1/1/36, AMT, (LOC
Citibank N.A.) (a) | | | 5,000,000 | | | 5,000,000 | |
New York City Housing Development
Corp. Multi-family Mortgage Revenue,
Series A, 0.58%, 1/1/38, AMT, (LOC
Citibank N.A.) (a) | | | 4,550,000 | | | 4,550,000 | |
New York City Housing Development
Corp. Revenue, Series A, 0.41%,
3/1/38, (LOC Freddie Mac) (a) | | | 4,900,000 | | | 4,900,000 | |
New York City IDA Civic Facility
Revenue, 0.38%, 5/1/21, (LOC
JP Morgan Chase Bank) (a) | | | 2,500,000 | | | 2,500,000 | |
New York City IDA Civic Facility
Revenue, 0.28%, 1/1/31, (LOC
JP Morgan Chase Bank) (a) | | | 1,900,000 | | | 1,900,000 | |
New York City IDA Civic Facility
Revenue, 0.44%, 6/1/32, (LOC
JP Morgan Chase Bank) (a) | | | 2,500,000 | | | 2,500,000 | |
New York City IDA Civic Facility
Revenue, 0.47%, 11/1/32, (LOC
Wachovia Bank N.A.) (a) | | | 1,500,000 | | | 1,500,000 | |
New York City IDA Civic Facility
Revenue, 0.68%, 12/1/36, (LOC
JP Morgan Chase Bank) (a) | | | 4,440,000 | | | 4,440,000 | |
New York City IDA Civic Facility
Revenue, 1.10%, 11/1/39, (LOC
Bank of America, Citibank N.A.) (a) | | | 21,000,000 | | | 21,000,000 | |
New York City IDA Civic Facility
Revenue, Series B, 0.45%, 6/1/36,
(Credit Support Radian, LOC
TD Bank N.A.) (a) | | | 4,800,000 | | | 4,800,000 | |
New York City IDA Special Facility
Revenue, Series B, 0.40%, 5/1/33,
(LOC Bank of America N.A.) (a) | | | 2,960,000 | | | 2,960,000 | |
New York City Municipal Water Finance
Authority Water & Sewer System
Revenue, Sub-series B4, 0.36%,
6/15/23, (SpA BNP Paribas) (a) | | | 2,000,000 | | | 2,000,000 | |
| | | | | | | |
Variable Rate Demand Notes, continued | | | | | | | |
|
|
|
|
|
|
|
|
| | | | | | | |
| | Principal
Amount($) | | Value($) | |
| |
| |
| |
New York, continued | | | | | | | |
New York City Transitional Finance
Authority Revenue, 0.23%, 11/1/22,
(SpA Royal Bank of Canada) (a) | | | 13,000,000 | | | 13,000,000 | |
New York City Transitional Finance
Authority Revenue, 0.25%, 11/1/28,
(SpA JP Morgan Chase Bank) (a) | | | 4,000,000 | | | 4,000,000 | |
New York City Transitional Finance
Authority Revenue, Series 3,
Sub-series 3C, 1.40%, 11/1/22,
(SpA Dexia Credit Local) (a) | | | 6,145,000 | | | 6,145,000 | |
New York City Transitional Finance
Authority Revenue, Series 3,
Sub-series 3D, 1.40%, 11/1/22,
(SpA Dexia Credit Local) (a) | | | 12,910,000 | | | 12,910,000 | |
New York City Transitional Finance
Authority Revenue, Series 3,
Sub-series 3-F, 0.40%, 11/1/22,
(SpA Royal Bank of Canada) (a) | | | 15,400,000 | | | 15,400,000 | |
New York City Transitional Finance
Authority Revenue, Series 3,
Sub-series 3G, 0.36%, 11/1/22,
(SpA Bank of New York) (a) | | | 2,085,000 | | | 2,085,000 | |
New York City Transitional Finance
Authority Revenue, Series A2, 0.28%,
11/15/27, (SpA Bank of Nova
Scotia) (a) | | | 6,100,000 | | | 6,100,000 | |
New York City Transitional Finance
Authority Revenue, Sub-series 2A,
0.50%, 11/1/22, (Liquidity Facility
Dexia Credit Local) (a) | | | 2,400,000 | | | 2,400,000 | |
New York City Trust for Cultural
Resources Revenue, 0.38%, 7/1/33,
(LOC Citibank N.A.) (a) | | | 2,000,000 | | | 2,000,000 | |
New York City Trust for Cultural
Resources Revenue, 0.45%, 12/1/35,
(LOC Citibank N.A.) (a) | | | 6,375,000 | | | 6,375,000 | |
New York City Trust for Cultural
Resources Revenue, Series A1,
0.25%, 12/1/35, (LOC Bank of
America N.A.) (a) | | | 10,600,000 | | | 10,600,000 | |
New York City Trust for Cultural
Resources Revenue, Series B-1, 0.36%,
11/1/38, (LOC U.S. Bank N.A.) (a) | | | 3,750,000 | | | 3,750,000 | |
New York Local Government Assistance
Corp., 0.17%, 4/1/25, (LOC Societe
Generale) (a) | | | 21,450,000 | | | 21,450,000 | |
New York Local Government Assistance
Corp., 0.34%, 4/1/25, (LOC Bank of
Nova Scotia) (a) | | | 19,400,000 | | | 19,400,000 | |
New York State Dormitory Authority
Revenue, 0.38%, 7/1/28, (LOC
TD Bank N.A.) (a) | | | 4,500,000 | | | 4,500,000 | |
New York State Dormitory Authority
Revenue, 0.30%, 7/1/30, (SpA
JP Morgan Chase Bank) (a) | | | 7,700,000 | | | 7,700,000 | |
New York State Dormitory Authority
Revenue, Series D, 0.44%, 7/1/34,
(LOC TD Banknorth N.A.) (a) | | | 4,875,000 | | | 4,875,000 | |
| | |
See notes to financial statements | HSBC INVESTOR FAMILY OF FUNDS | 14 |
|
HSBC INVESTOR NEW YORK TAX-FREE MONEY MARKET FUND |
|
|
Schedule of Portfolio Investments—as of April 30, 2009 (Unaudited) (continued) |
| | | | | | | |
Variable Rate Demand Notes, continued | | | | | | | |
|
|
|
|
|
|
|
|
| | | | | |
| | Principal
Amount($) | | Value($) | |
| |
| |
| |
New York, continued | | | | | | | |
New York State Dormitory Authority
Revenue, Non State Supported Debt,
0.44%, 7/1/36, (Credit Support XLCA,
LOC TD Banknorth N.A.) (a) | | | 1,975,000 | | | 1,975,000 | |
New York State Dormitory Authority
Revenue, Non State Supported Debt,
0.44%, 1/1/39, (LOC TD Banknorth
N.A.) (a) | | | 4,000,000 | | | 4,000,000 | |
New York State Dormitory Authority
Revenue, Non State Supported Debt,
Series A, 0.46%, 7/1/30, (LOC
JP Morgan Chase Bank) (a) | | | 5,000,000 | | | 5,000,000 | |
New York State Dormitory Authority
Revenue, Non State Supported Debt,
Series A, 0.18%, 11/15/36, (Credit
Support FNMA, Liquidity Facility
FNMA) (a) | | | 10,000,000 | | | 10,000,000 | |
New York State Dormitory Authority
Revenue, State Supported Debt,
Series C, 0.38%, 7/1/31, (LOC Bank
of America N.A.) (a) | | | 9,900,000 | | | 9,900,000 | |
New York State Dormitory Authority
Revenue, State Supported Debt,
Series D, 0.44%, 7/1/31, (LOC
TD Bank N.A.) (a) | | | 5,000,000 | | | 5,000,000 | |
New York State Energy Research &
Development Authority Facilities
Revenue, 0.51%, 11/1/39, AMT,
(LOC Citibank N.A.) (a) | | | 1,000,000 | | | 1,000,000 | |
New York State Energy Research &
Development Authority Facilities
Revenue, 0.58%, 11/1/39, AMT,
(LOC Citibank N.A.) (a) | | | 4,300,000 | | | 4,300,000 | |
New York State Energy Research &
Development Authority Facilities
Revenue, Series C2, 0.65%, 11/1/39,
AMT, (LOC Citibank N.A.) (a) | | | 11,100,000 | | | 11,100,000 | |
New York State Energy Research &
Development Authority Facilities
Revenue, Sub-series A-3, 0.55%,
5/1/39, (LOC Wachovia Bank
N.A.) (a) | | | 19,100,000 | | | 19,100,000 | |
New York State GO, 2.50%, 3/13/20,
(LOC Dexia Credit Local) (a) | | | 24,050,000 | | | 24,050,000 | |
New York State GO, 0.45%, 8/1/34,
(LOC Bank of America) (a) | | | 12,740,000 | | | 12,740,000 | |
New York State Housing Finance Agency
Revenue, 0.27%, 5/15/15, (LOC
Landesbank Hessen-Thuringen) (a) | | | 800,000 | | | 800,000 | |
New York State Housing Finance Agency
Revenue, 0.56%, 5/15/28, AMT, (Credit
Support FNMA, LOC FNMA) (a) | | | 13,000,000 | | | 13,000,000 | |
New York State Housing Finance Agency
Revenue, 0.41%, 5/15/31, AMT,
(Credit Support FNMA) (a) | | | 1,700,000 | | | 1,700,000 | |
| | | | | | | |
Variable Rate Demand Notes, continued | | | | | | | |
|
|
|
|
|
|
|
|
| | | | | | | |
| | Principal
Amount($) | | Value($) | |
| |
| |
| |
New York, continued | | | | | | | |
New York State Housing Finance Agency
Revenue, 0.53%, 5/15/33, AMT,
(Credit Support FNMA) (a) | | | 2,000,000 | | | 2,000,000 | |
New York State Housing Finance Agency
Revenue, 0.31%, 5/15/34, (Credit
Support FNMA) (a) | | | 10,000,000 | | | 10,000,000 | |
New York State Housing Finance Agency
Revenue, 0.31%, 11/15/37, (Credit
Support FNMA) (a) | | | 10,000,000 | | | 10,000,000 | |
New York State Housing Finance Agency
Revenue, 0.40%, 11/1/41, AMT,
(LOC Bank of New York) (a) | | | 10,000,000 | | | 10,000,000 | |
New York State Housing Finance Agency
Revenue, Series A, 0.60%, 5/15/32,
AMT, (Credit Support FNMA) (a) | | | 1,600,000 | | | 1,600,000 | |
New York State Housing Finance Agency
Revenue, Series A, 0.39%, 11/1/32,
AMT, (Credit Support FHLMC,
Liquidity Facility FHLMC) (a) | | | 2,050,000 | | | 2,050,000 | |
New York State Housing Finance Agency
Revenue, Series A, 0.31%, 5/15/34,
(Credit Support FNMA) (a) | | | 1,400,000 | | | 1,400,000 | |
New York State Housing Finance Agency
Revenue, Series A, 0.20%, 5/1/35,
(Credit Support FHLMC) (a) | | | 9,365,000 | | | 9,365,000 | |
New York State Housing Finance Agency
Revenue, Series A, 0.45%, 11/1/36,
(LOC Landesbank Hessen-
Thuringen) (a) | | | 16,255,000 | | | 16,255,000 | |
New York State Housing Finance Agency
Revenue, Series A, 0.58%, 11/1/39,
AMT, (LOC Citibank N.A.) (a) | | | 9,600,000 | | | 9,600,000 | |
New York State Housing Finance Agency
Revenue, Series A, 0.35%, 11/1/41,
(LOC Landesbank Baden-
Wurttemberg) (a) | | | 16,000,000 | | | 16,000,000 | |
New York State Housing Finance Agency
Revenue, Series A, 0.21%, 5/1/42,
(LOC Wachovia Bank N.A.) (a) | | | 10,000,000 | | | 10,000,000 | |
New York State Housing Finance Agency
Revenue, Series A, 0.38%, 5/1/42,
(LOC Wachovia Bank N.A.) (a) | | | 4,200,000 | | | 4,200,000 | |
New York State Housing Finance Agency
Revenue, Series A, 0.31%, 5/1/45,
(Credit Support FHLMC, Liquidity
Facility FHLMC) (a) | | | 9,750,000 | | | 9,750,000 | |
New York State Power Authority, Finance
& Administration GO, 1.60%, 3/1/20,
(Liquidity Facility Bank of Novia
Scotia) (a) | | | 21,000,000 | | | 21,000,000 | |
New York State Urban Development
Corp. Revenue, Series A5, 0.28%,
1/1/30, (LOC TD Banknorth
N.A.) (a) | | | 2,700,000 | | | 2,700,000 | |
Onondaga County IDA Revenue,
Series B, 0.29%, 7/1/37, (LOC
JP Morgan Chase Bank) (a) | | | 1,940,000 | | | 1,940,000 | |
| | |
15 | HSBC INVESTOR FAMILY OF FUNDS | See notes to financial statements |
|
HSBC INVESTOR NEW YORK TAX-FREE MONEY MARKET FUND |
|
|
Schedule of Portfolio Investments—as of April 30, 2009 (Unaudited) (continued) |
| | | | | | | |
Variable Rate Demand Notes, continued | | | | | | | |
|
|
|
|
|
|
|
|
| | | | | | | |
| | Principal
Amount($) | | Value($) | |
| |
| |
| |
New York, continued | | | | | | | |
Oswego County IDA Civic Facility
Revenue, 0.65%, 6/1/14, AMT,
(LOC Fleet National Bank) (a) | | | 1,195,000 | | | 1,195,000 | |
Schenectady County IDA Revenue,
Series A, 0.40%, 6/1/09, (LOC Fleet
Bank of New York) (a) | | | 900,000 | | | 900,000 | |
Suffolk County IDA, 0.65%, 8/1/18,
AMT, (LOC JP Morgan Chase
Bank) (a) | | | 2,720,000 | | | 2,720,000 | |
Suffolk County IDA Civic Facility,
0.45%, 11/1/14, (LOC Bank of
America N.A.) (a) | | | 1,805,000 | | | 1,805,000 | |
Suffolk County Water Authority,
0.19%, 12/1/09, (SpA Bank of
Nova Scotia) (a) | | | 1,200,000 | | | 1,200,000 | |
Syracuse IDA Civic Facility Revenue,
Series A-1, 0.40%, 7/1/37, (LOC
JP Morgan Chase Bank) (a) | | | 1,300,000 | | | 1,300,000 | |
Syracuse IDA Civic Facility Revenue,
Series A2, 0.40%, 12/1/37, (LOC
JP Morgan Chase Bank) (a) | | | 4,000,000 | | | 4,000,000 | |
Tompkins County IDA Civic Facility
Revenue, Series A-2, 0.44%, 7/1/37,
(SpA JP Morgan Chase Bank) (a) | | | 11,800,000 | | | 11,800,000 | |
Triborough Bridge & Tunnel Authority
Revenue, Series C, 0.55%, 1/1/32,
(LOC Bayerische Landesbank) (a) | | | 15,000,000 | | | 15,000,000 | |
Triborough Bridge & Tunnel Authority
Revenue, Sub-series CD, 1.60%,
1/1/19, (Credit Support FSA, SpA
Lloyds TSB Bank plc) (a) | | | 10,700,000 | | | 10,700,000 | |
Troy IDA Civic Facility Revenue,
Series B, 0.50%, 9/1/37, (LOC
Bank of America N.A.) (a) | | | 10,000,000 | | | 10,000,000 | |
Ulster County IDA Civic Facility
Revenue, Series A, 0.97%, 7/1/21,
AMT, (LOC TD Banknorth N.A.,
ABN Amro Bank N.V.) (a) | | | 1,105,000 | | | 1,105,000 | |
| | | | |
|
| |
TOTAL VARIABLE RATE DEMAND
NOTES (COST $798,820,000) | | | | | | 798,820,000 | |
| | | | |
|
| |
| | | | | | | |
Tax-Free Notes And Commercial Paper—14.5% | | | |
|
|
|
|
|
|
|
|
New York – 14.5% | | | | | | | |
Long Island Power Authority,
Series CP-1, 0.55%, 7/9/09 | | | 10,200,000 | | | 10,200,000 | |
New York City Municipal Water Industry
Regional Authority, 0.35%, 5/11/09 | | | 21,000,000 | | | 21,000,000 | |
New York City Municipal Water Industry
Regional Authority, 0.50%, 6/1/09 | | | 20,000,000 | | | 20,000,000 | |
New York City Municipal Water Industry
Regional Authority, 0.50%, 6/15/09 | | | 22,500,000 | | | 22,500,000 | |
New York Metropolitan Transit Authority,
0.50%, 6/8/09 | | | 15,000,000 | | | 15,000,000 | |
| | | | | | | |
Tax-Free Notes And Commercial Paper, continued | | | |
|
|
|
|
|
|
|
|
| | | | | | | |
| | Principal
Amount($) | | Value($) | |
| |
| |
| |
New York, continued | | | | | | | |
New York State, 0.55%, 5/6/09 | | | 13,000,000 | | | 13,000,000 | |
New York State Regional Authority,
0.40%, 7/21/09 | | | 20,000,000 | | | 20,000,000 | |
New York State Regional Authority,
0.40%, 7/28/09 | | | 16,000,000 | | | 16,000,000 | |
| | | | |
|
| |
TOTAL TAX-FREE NOTES AND
COMMERCIAL PAPER
(COST $137,700,000) | | | | | | 137,700,000 | |
| | | | |
|
| |
| | | | | | | |
Investment Companies—1.0% | | | | | | | |
|
|
|
|
|
|
|
|
BlackRock Liquidity New York Money
Fund, Portfolio Institutional Shares,
0.51% (c) | | | 84,788 | | | 84,788 | |
JPMorgan New York Municipal Money
Market Fund, 0.21% (c) | | | 100,000 | | | 100,000 | |
Northern Institutional Tax Exempt
Portfolio, Shares Class, 0.45% (c) | | | 9,387,984 | | | 9,387,984 | |
| | | | |
|
| |
TOTAL INVESTMENT COMPANIES
(COST $9,572,772) | | | | | | 9,572,772 | |
| | | | |
|
| |
TOTAL INVESTMENTS
(COST $946,092,772) — 99.7% | | | | | | 946,092,772 | |
| | | | |
|
| |
| |
|
| |
| Percentages indicated are based on net assets of $949,164,161. |
| |
(a) | Variable rate security. The interest rates on these securities are adjusted periodically to reflect then-current short-term interest rates. The rates presented represent the rates in effect on April 30, 2009. The maturity dates presented reflect the final maturity dates. However, some of these securities may contain put or demand features that allow the fund to require the issuer to repurchase the security from the fund within various time periods, including daily, weekly, monthly, or semi-annually. |
| |
(b) | Security exempt from registration under Rule 144a of the Securities Act of 1933. This security may be resold in transactions exempt from registration, normally to qualified institutional buyers. This security has been deemed liquid by the Investment Adviser based on procedures approved by the Board of Trustees. |
| |
(c) | The rates presented represent the annualized one day yield that was in effect on April 30, 2009. |
| | |
AMT | — | Interest on security is subject to federal alternative minimum tax |
FHLMC | — | Federal Home Loan Mortgage Corporation |
FNMA | — | Federal National Mortgage Association |
FSA | — | Financial Security Assurance |
GO | — | General Obligation |
IDA | — | Industrial Development Agency |
LOC | — | Letter of Credit |
PLC | — | Public Limited Co. |
SPA | — | Standby Purchase Agreement |
XLCA | — | XL Capital Assurance |
| | |
See notes to financial statements | HSBC INVESTOR FAMILY OF FUNDS | 16 |
|
HSBC INVESTOR PRIME MONEY MARKET FUND |
|
|
Schedule of Portfolio Investments—as of April 30, 2009 (Unaudited) |
| | | | | | | |
Corporate Obligations—2.8% | | | | | | | |
|
|
|
|
|
|
|
|
| | | | | |
| | Principal
Amount($) | | Value($) | |
| |
| |
| |
Banking – 1.8% | | | | | | | |
Bank of America Corp., Series BKNT,
1.40%, 10/3/09 (b) | | | 80,000,000 | | | 80,000,000 | |
U.S. Bank N.A., Series BKNT, 1.39%,
9/10/09 (b) | | | 75,000,000 | | | 75,000,000 | |
Wells Fargo & Co., 0.60%, 7/15/09 (b) | | | 50,000,000 | | | 50,003,350 | |
| | | | |
|
| |
| | | | | | 205,003,350 | |
| | | | |
|
| |
Finance – 1.0% | | | | | | | |
American Honda Finance, 1.28%,
5/12/09, MTN (b) | | | 50,000,000 | | | 49,999,624 | |
American Honda Finance, 1.46%,
9/18/09, MTN (a)(b) | | | 50,000,000 | | | 50,000,000 | |
JP Morgan Chase & Co., 1.31%,
6/5/09, MTN (b) | | | 17,043,000 | | | 17,050,552 | |
| | | | |
|
| |
| | | | | | 117,050,176 | |
| | | | |
|
| |
TOTAL CORPORATE OBLIGATIONS
(COST $322,053,526) | | | | | | 322,053,526 | |
| | | | |
|
| |
| | | | | | | |
Variable Rate Demand Notes—8.6% | | | | | | | |
|
|
|
|
|
|
|
|
California – 0.4% | | | | | | | |
Los Angeles Community Redevelopment
Agency Multi-family Housing
Revenue, 0.67%, 10/15/38, AMT,
(LOC Fleet National Bank) (b) | | | 40,700,000 | | | 40,700,000 | |
Northern California Power Agency
Revenue, Series A, 1.20%, 7/1/32,
(LOC Dexia Credit Local) (b) | | | 8,600,000 | | | 8,600,000 | |
| | | | |
|
| |
| | | | | | 49,300,000 | |
| | | | |
|
| |
Colorado – 1.2% | | | | | | | |
Colorado Housing & Finance Authority
Multi-family Revenue, 0.61%, 5/1/25,
AMT, (LOC U.S. Bank N.A.) (b) | | | 13,250,000 | | | 13,250,000 | |
University of Colorado Hospital
Authority Revenue, Series B, 0.48%,
11/15/31, (LOC Wachovia Bank
N.A.) (b) | | | 44,900,000 | | | 44,900,000 | |
Denver Colorado City & County
Airport Revenue, Series B, 0.58%,
11/15/25, AMT, (LOC Wachovia
Bank N.A.) (b) | | | 78,800,000 | | | 78,800,000 | |
| | | | |
|
| |
| | | | | | 136,950,000 | |
| | | | |
|
| |
District of Columbia – 0.2% | | | | | | | |
District of Columbia, GO, Series D,
2.47%, 6/1/34, (LOC Dexia Credit
Local) (b) | | | 24,600,000 | | | 24,600,000 | |
| | | | |
|
| |
Florida – 0.2% | | | | | | | |
Pinellas County Health Facility Authority
Revenue, 0.47%, 12/1/24, (LOC
Wachovia Bank N.A.) (b) | | | 16,820,000 | | | 16,820,000 | |
| | | | |
|
| |
| | | | | | | |
Variable Rate Demand Notes, continued | | | | | | | |
|
|
|
|
|
|
| | | | | |
| | Principal
Amount($) | | Value($) | |
| |
| |
| |
Idaho – 0.2% | | | | | | | |
Power County Industrial Development
Corp. Exempt Facilities Revenue,
0.62%, 4/1/14, AMT, (LOC Wachovia
Bank N.A.) (b) | | | 20,000,000 | | | 20,000,000 | |
| | | | |
|
| |
Illinois – 0.2% | | | | | | | |
Illinois Development Finance Authority
Solid Waste Disposal Revenue, 0.80%,
9/1/27, AMT, (LOC Wachovia
Bank N.A.) (b) | | | 24,900,000 | | | 24,900,000 | |
| | | | |
|
| |
Indiana – 0.3% | | | | | | | |
Indianapolis Local Public Improvement
Bond Bank Revenue, Series C-3,
2.00%, 1/1/33, AMT, (Credit Support
FSA, SpA Dexia Credit Local) (b) | | | 35,000,000 | | | 35,000,000 | |
| | | | |
|
| |
Louisiana – 0.7% | | | | | | | |
East Baton Rouge Parish Sales Tax
Revenue, Series A, 1.00%, 8/1/30,
(LOC Dexia Credit Local) (b) | | | 81,240,000 | | | 81,240,000 | |
| | | | |
|
| |
Maine – 0.2% | | | | | | | |
Old Town Solid Waste Disposal Revenue,
0.80%, 12/1/24, AMT, (LOC Bank of
America N.A.) (b) | | | 22,260,000 | | | 22,260,000 | |
| | | | |
|
| |
Maryland – 0.4% | | | | | | | |
Maryland State Economic Development
Corp. Lease Environmental
Improvement Revenue, 0.75%,
12/1/37, AMT, (LOC Wachovia
Bank N.A.) (b) | | | 47,000,000 | | | 47,000,000 | |
| | | | |
|
| |
Massachusetts – 0.2% | | | | | | | |
Massachusetts State Development
Finance Agency Solid Waste Disposal
Revenue, Series A, 0.65%, 7/1/28,
AMT, (LOC Wachovia Bank N.A.) (b) | | | 12,000,000 | | | 12,000,000 | |
Massachusetts State Housing Finance
Agency Rent Housing Mortgage
Revenue, Series A, 3.00%, 1/1/43,
AMT, (Credit Support FSA, SpA
Dexia Credit Local) (b) | | | 15,630,000 | | | 15,630,000 | |
| | | | |
|
| |
| | | | | | 27,630,000 | |
| | | | |
|
| |
Nevada – 0.6% | | | | | | | |
Clark County Airport Revenue, Series B-1,
2.43%, 7/1/22, AMT, (Credit Support
FSA, SpA Dexia Credit Local) (b) | | | 70,000,000 | | | 70,000,000 | |
| | | | |
|
| |
New Jersey – 0.2% | | | | | | | |
New Jersey Economic Development
Authority Revenue, Series V-2,
1.25%, 3/1/24, (LOC Dexia Credit
Local) (b) | | | 21,700,000 | | | 21,700,000 | |
| | | | |
|
| |
| | |
17 | HSBC INVESTOR FAMILY OF FUNDS | See notes to financial statements |
|
HSBC INVESTOR PRIME MONEY MARKET FUND |
|
|
Schedule of Portfolio Investments—as of April 30, 2009 (Unaudited) (continued) |
| | | | | | | |
Variable Rate Demand Notes, continued | | | | | | | |
|
|
|
|
|
|
|
|
| | | | | | | |
| | Principal
Amount($) | | Value($) | |
| |
| |
| |
New York – 1.2% | | | | | | | |
Syracuse IDA Civic Facility Revenue,
Series A, 0.52%, 1/1/23, (LOC Fleet
National Bank) (b) | | | 10,440,000 | | | 10,440,000 | |
Long Island Power Authority Electric
System Revenue, Series O, 2.50%,
12/1/29, (Credit Support FSA, SpA
Dexia Credit Local) (b) | | | 15,000,000 | | | 15,000,000 | |
New York City Municipal Water Finance
Authority Water & Sewer System
Revenue, Sub-series B-1, 0.35%,
6/15/24, (SpA JP Morgan Chase
Bank) (b) | | | 61,100,000 | | | 61,100,000 | |
New York City Transitional Finance
Authority Revenue, 0.23%, 8/1/31,
(SpA Citibank) (b) | | | 23,400,000 | | | 23,400,000 | |
New York City Transitional Finance
Authority Revenue, Series 1,
Sub- series 1C, 0.23%, 11/1/22,
(Liquidity Facility JP Morgan Chase
Bank) (b) | | | 10,910,000 | | | 10,910,000 | |
New York City Housing Development
Corp. Multi-family Mortgage Revenue,
Series A, 0.60%, 10/1/40, AMT,
(LOC Bank of America N.A.) (b) | | | 11,200,000 | | | 11,200,000 | |
| | | | |
|
| |
| | | | | | 132,050,000 | |
| | | | |
|
| |
Pennsylvania – 1.1% | | | | | | | |
Bethlehem Area School District, GO,
Series 2005, 3.25%, 1/1/30, (Credit
Support FSA State Aid Withholding,
SpA Dexia Credit Local) (b) | | | 34,680,000 | | | 34,680,000 | |
Delaware River Joint Toll Bridge
Commission Revenue, Series B-1,
1.30%, 7/1/32, (LOC Dexia Credit
Local) (b) | | | 20,325,000 | | | 20,325,000 | |
Cumberland County Municipal Authority
Revenue, Series D, 0.47%, 1/1/33,
(LOC Wachovia Bank N.A.) (b) | | | 9,295,000 | | | 9,295,000 | |
Shippensburg Boro Authority Revenue,
3.25%, 7/1/31, (Credit Support FSA
State Aid Withholding, SpA Dexia
Credit Local) (b) | | | 15,045,000 | | | 15,045,000 | |
Upper Dauphin Industrial Development
Authority Revenue, 0.67%, 12/1/26,
(LOC Wachovia Bank N.A.) (b) | | | 6,000,000 | | | 6,000,000 | |
West Cornwall Township Municipal
Authority Revenue, 3.25%, 10/15/21,
(Credit Support FSA State Aid
Withholding, SpA Dexia Credit
Local) (b) | | | 37,800,000 | | | 37,800,000 | |
| | | | |
|
| |
| | | | | | 123,145,000 | |
| | | | |
|
| |
| | | | | | | |
Variable Rate Demand Notes, continued | | | | | | | |
|
|
|
|
|
|
|
|
| | | | | | | |
| | Principal
Amount($) | | Value($) | |
| |
| |
| |
South Carolina – 0.2% | | | | | | | |
South Carolina Jobs-Economic
Development Authority Revenue,
0.52%, 3/1/28, (LOC Wachovia
Bank N.A.) (b) | | | 8,652,000 | | | 8,652,000 | |
South Carolina State Housing Finance &
Development Authority Multi-family
Rental Housing Improvement Revenue,
0.62%, 7/15/39, AMT, (LOC Wachovia
Bank N.A.) (b) | | | 17,250,000 | | | 17,250,000 | |
| | | | |
|
| |
| | | | | | 25,902,000 | |
| | | | |
|
| |
Texas – 1.1% | | | | | | | |
Houston Utility System Revenue,
Series B4, 0.75%, 5/15/34, (LOC
Bank of America N.A., Bank of New
York, Dexia Credit Local, State Street
B&T Co.) (b) | | | 27,855,000 | | | 27,855,000 | |
Houston Utility System Revenue,
Series B5, 0.75%, 5/15/34, (LOC
Bank of America N.A., Bank of New
York, Dexia Credit Local, State Street
B&T Co.) (b) | | | 24,000,000 | | | 24,000,000 | |
Montgomery County Housing Finance
Corp. Multi-family Housing Revenue,
0.61%, 2/1/38, AMT, (LOC Citibank
N.A.) (b) | | | 14,900,000 | | | 14,900,000 | |
Texas State Department of Housing &
Community Affairs Multi-family
Housing Revenue, 0.64%, 12/1/39,
AMT, (LOC Citibank N.A.) (b) | | | 7,200,000 | | | 7,200,000 | |
San Antonio Hotel Occupancy Tax
Revenue, 0.48%, 8/15/34, (LOC
Wachovia Bank N.A.) (b) | | | 31,000,000 | | | 31,000,000 | |
Austin Hotel Occupancy Tax Revenue,
Sub-series B, 2.75%, 11/15/29, (LOC
Dexia Credit Local) (b) | | | 25,740,000 | | | 25,740,000 | |
| | | | |
|
| |
| | | | | | 130,695,000 | |
| | | | |
|
| |
TOTAL VARIABLE RATE DEMAND
NOTES (COST $989,192,000) | | | | | | 989,192,000 | |
| | | | |
|
| |
| | | | | | | |
U.S. Government and Government Agency Obligations—25.0% | | | |
|
|
|
|
|
|
|
Federal Home Loan Bank – 17.9% | | | | | | | |
0.37%, 5/18/09 (c) | | | 200,000,000 | | | 199,966,000 | |
0.40%, 5/29/09 (c) | | | 75,000,000 | | | 74,977,250 | |
0.47%, 6/17/09 (c) | | | 70,000,000 | | | 69,957,961 | |
0.51%, 7/2/09 (c) | | | 50,000,000 | | | 49,956,944 | |
1.09%, 8/5/09 (b) | | | 157,000,000 | | | 157,039,293 | |
5.13%, 8/5/09 | | | 50,000,000 | | | 50,594,290 | |
0.58%, 8/17/09 (c) | | | 75,000,000 | | | 74,871,750 | |
0.58%, 9/4/09 | | | 50,000,000 | | | 49,898,500 | |
5.00%, 9/18/09 | | | 50,000,000 | | | 50,874,198 | |
0.41%, 10/2/09 (c) | | | 50,000,000 | | | 49,914,444 | |
0.66%, 10/5/09 (c) | | | 50,000,000 | | | 49,858,264 | |
0.42%, 10/9/09 (c) | | | 50,000,000 | | | 49,908,320 | |
| | |
See notes to financial statements | HSBC INVESTOR FAMILY OF FUNDS | 18 |
|
HSBC INVESTOR PRIME MONEY MARKET FUND |
|
|
Schedule of Portfolio Investments—as of April 30, 2009 (Unaudited) (continued) |
| | | | | | | |
U.S. Government and Government Agency Obligations, continued | | | | |
|
|
|
|
|
|
|
|
| | | | | | | |
| | Principal
Amount($) | | Value($) | |
| |
| |
| |
Federal Home Loan Bank, continued | | | | | | | |
0.43%, 10/15/09 (c) | | | 50,000,000 | | | 49,902,583 | |
1.37%, 11/18/09 (b) | | | 100,000,000 | | | 100,000,000 | |
0.58%, 12/9/09 | | | 21,425,000 | | | 21,425,000 | |
1.15%, 12/11/09 | | | 100,000,000 | | | 100,302,351 | |
0.58%, 12/14/09 | | | 50,000,000 | | | 50,000,000 | |
0.90%, 1/22/10 (b) | | | 150,000,000 | | | 150,000,000 | |
0.78%, 1/27/10 (b) | | | 150,000,000 | | | 150,000,000 | |
0.80%, 2/26/10 (b) | | | 150,000,000 | | | 150,000,000 | |
Series 1, 1.29%, 9/10/09 (b) | | | 100,000,000 | | | 99,984,521 | |
Series 1, 0.36%, 12/28/09 (b) | | | 75,000,000 | | | 74,977,200 | |
Series 2, 1.06%, 9/18/09 (b) | | | 85,000,000 | | | 85,024,533 | |
Series 3, 1.04%, 5/13/09 (b) | | | 50,000,000 | | | 50,005,265 | |
Series 665, 5.38%, 7/17/09 | | | 50,000,000 | | | 50,518,048 | |
| | | | |
|
| |
| | | | | | 2,059,956,715 | |
| | | | |
|
| |
Federal Home Loan Mortgage Corp. – 4.3% | | | | | | | |
0.49%, 7/20/09 (c) | | | 75,000,000 | | | 74,920,000 | |
0.46%, 7/30/09 (c) | | | 50,000,000 | | | 49,943,750 | |
0.58%, 8/10/09 (c) | | | 50,000,000 | | | 49,920,042 | |
0.59%, 8/17/09 (c) | | | 100,000,000 | | | 99,826,000 | |
0.40%, 9/28/09 (c) | | | 116,797,000 | | | 116,604,422 | |
0.42%, 10/5/09 (c) | | | 50,000,000 | | | 49,909,507 | |
Series RB, 0.40%, 6/9/09 (c) | | | 50,000,000 | | | 49,978,875 | |
| | | | |
|
| |
| | | | | | 491,102,596 | |
| | | | |
|
| |
Federal National Mortgage Association – 2.8% | | | | | | | |
1.79%, 5/20/09 (c) | | | 75,000,000 | | | 74,930,729 | |
0.39%, 5/27/09 (c) | | | 50,000,000 | | | 49,986,278 | |
0.54%, 7/27/09 (c) | | | 50,000,000 | | | 49,935,958 | |
0.46%, 7/29/09 (c) | | | 53,000,000 | | | 52,941,038 | |
0.39%, 9/25/09 (c) | | | 50,000,000 | | | 49,922,417 | |
1.17%, 2/12/10 (b) | | | 50,000,000 | | | 49,919,525 | |
| | | | |
|
| |
| | | | | | 327,635,945 | |
| | | | |
|
| |
TOTAL U.S. GOVERNMENT AND
GOVERNMENT AGENCY OBLIGATIONS
(COST $2,878,695,256) | | | | | | 2,878,695,256 | |
| | | | |
|
| |
| | | | | | | |
Commercial Paper And Notes—32.2% | | | | | | | |
|
|
|
|
|
|
|
|
Banking – 9.0% | | | | | | | |
Bank of Nova Scotia, 0.67%, 6/4/09 (c) | | | 60,000,000 | | | 59,962,033 | |
Banque Et Caisse Epargne, 0.31%,
5/1/09 (c) | | | 50,000,000 | | | 50,000,000 | |
Banque Et Caisse Epargne, 0.31%,
5/6/09 (c) | | | 100,000,000 | | | 99,995,695 | |
Banque Et Caisse Epargne, 0.69%,
6/8/09 (c) | | | 60,000,000 | | | 59,956,300 | |
Caisse Nat CSSE Epar Pre, 0.88%,
8/4/09 (a)(c) | | | 125,000,000 | | | 124,709,722 | |
Deutsche Bank Financial LLC, 0.36%,
5/13/09 (c) | | | 45,000,000 | | | 44,994,600 | |
Deutsche Bank Financial LLC, 0.56%,
7/28/09 (c) | | | 75,000,000 | | | 74,897,333 | |
DNB Norbank ASA, 0.91%,
6/15/09 (a)(c) | | | 60,000,000 | | | 59,932,500 | |
| | | | | | | |
Commercial Paper And Notes, continued | | | | | | | |
|
|
|
|
|
|
|
|
| | | | | | | |
| | Principal
Amount($) | | Value($) | |
| |
| |
| |
Banking, continued | | | | | | | |
DNB Norbank ASA, 0.67%,
7/7/09 (a)(c) | | | 80,700,000 | | | 80,596,923 | |
DNB Norbank ASA, 0.53%,
7/22/09 (a)(c) | | | 50,000,000 | | | 49,939,639 | |
National Australia Funding, 0.48%,
7/31/09, (LOC National Australia
Bank Ltd.) (a)(c) | | | 50,000,000 | | | 49,939,965 | |
Societe General N.A., 0.91%, 5/27/09,
(LOC Societe Generale) (c) | | | 100,000,000 | | | 99,934,278 | |
State Street Corp., 0.30%, 5/15/09 (c) | | | 100,000,000 | | | 99,988,333 | |
Westpac Banking Corp., 0.49%,
7/29/09 (a)(c) | | | 75,000,000 | | | 74,909,146 | |
| | | | |
|
| |
| | | | | | 1,029,756,467 | |
| | | | |
|
| |
Diversified – 1.9% | | | | | | | |
E.On AG, 0.40%, 5/22/09 (a)(c) | | | 75,000,000 | | | 74,982,500 | |
General Electric Co., 0.30%,
5/11/09 (c) | | | 100,000,000 | | | 99,991,667 | |
General Electric Co., 0.70%, 6/1/09 (c) | | | 50,000,000 | | | 49,969,861 | |
| | | | |
|
| |
| | | | | | 224,944,028 | |
| | | | |
|
| |
Finance – 21.3% | | | | | | | |
CBA Delaware Finance, 0.80%,
6/11/09 (c) | | | 60,000,000 | | | 59,945,333 | |
CBA Delaware Finance, 0.43%,
7/31/09 (c) | | | 60,000,000 | | | 59,934,783 | |
Chariot Funding LLC, 0.55%,
6/5/09 (a)(c) | | | 38,482,000 | | | 38,461,423 | |
Chariot Funding LLC, 0.55%,
6/15/09 (a)(c) | | | 100,000,000 | | | 99,931,250 | |
Ciesco LLC, 0.56%, 5/11/09 (a)(c) | | | 50,000,000 | | | 49,992,222 | |
Danske Corp., 0.39%, 5/7/09 (a)(c) | | | 125,000,000 | | | 124,991,875 | |
Danske Corp., 0.52%, 7/29/09 (a)(c) | | | 60,000,000 | | | 59,922,867 | |
Falcon Asset Securitization Co. LLC,
0.55%, 6/2/09 (a)(c) | | | 150,000,000 | | | 149,926,667 | |
Falcon Asset Securitization Co. LLC,
0.55%, 6/15/09 (a)(c) | | | 35,000,000 | | | 34,975,938 | |
Gemini Securitization Corp. LLC,
0.85%, 5/20/09 (a)(c) | | | 85,000,000 | | | 84,961,868 | |
Gemini Securitization Corp. LLC,
0.85%, 6/4/09 (a)(c) | | | 75,000,000 | | | 74,939,792 | |
Gemini Securitization Corp. LLC,
0.85%, 6/18/09 (a)(c) | | | 50,000,000 | | | 49,943,333 | |
General Electric Capital Corp., 0.70%,
5/27/09 (c) | | | 60,000,000 | | | 59,969,667 | |
Gotham Funding Corp., 0.35%,
5/22/09 (a)(c) | | | 100,000,000 | | | 99,979,583 | |
JP Morgan Chase & Co., 0.30%,
5/21/09 (a)(c) | | | 100,000,000 | | | 99,983,333 | |
Jupiter Securitization Co. LLC, 0.55%,
5/21/09 (a)(c) | | | 100,000,000 | | | 99,969,444 | |
Nationwide Building Society, 0.47%,
5/12/09 (a)(c) | | | 50,000,000 | | | 49,992,819 | |
Nordea N.A., Inc., 0.72%, 6/9/09 (c) | | | 60,000,000 | | | 59,953,200 | |
Old Line Funding LLC, 0.52%,
5/15/09 (a)(c) | | | 125,015,000 | | | 124,987,580 | |
Old Line Funding LLC, 0.65%,
6/1/09 (a)(c) | | | 50,000,000 | | | 49,972,014 | |
| | |
19 | HSBC INVESTOR FAMILY OF FUNDS | See notes to financial statements |
|
HSBC INVESTOR PRIME MONEY MARKET FUND |
|
|
Schedule of Portfolio Investments—as of April 30, 2009 (Unaudited) (continued) |
| | | | | | | |
Commercial Paper And Notes, continued | | | | | | | |
|
|
|
|
|
|
|
|
| | | | | | | |
| | Principal
Amount($) | | Value($) | |
| |
| |
| |
Finance, continued | | | | | | | |
Old Line Funding LLC, 0.50%,
7/1/09 (a)(c) | | | 30,039,000 | | | 30,013,550 | |
Park Avenue Receivables Corp., 0.55%,
6/3/09 (a)(c) | | | 50,000,000 | | | 49,974,792 | |
Park Avenue Receivables Corp., 0.55%,
6/4/09 (a)(c) | | | 75,000,000 | | | 74,961,042 | |
Ranger Funding Co. LLC, 0.67%,
5/19/09 (a)(c) | | | 50,000,000 | | | 49,983,250 | |
Ranger Funding Co. LLC, 0.73%,
6/1/09 (a)(c) | | | 50,000,000 | | | 49,968,569 | |
Ranger Funding Co. LLC, 0.72%,
6/8/09 (a)(c) | | | 89,884,000 | | | 89,815,688 | |
Sheffield Receivables Corp., 0.60%,
5/20/09 (a)(c) | | | 25,000,000 | | | 24,992,083 | |
Sheffield Receivables Corp., 0.65%,
5/22/09 (a)(c) | | | 110,000,000 | | | 109,958,292 | |
Sheffield Receivables Corp., 0.61%,
5/26/09 (a)(c) | | | 50,000,000 | | | 49,978,819 | |
Sheffield Receivables Corp., 0.63%,
6/3/09 (a)(c) | | | 10,000,000 | | | 9,994,271 | |
Thames Asset Global Securitization
No.1, Inc., 0.45%, 5/15/09 (a)(c) | | | 100,000,000 | | | 99,982,500 | |
Thames Asset Global Securitization
No.1, Inc., 0.43%, 5/20/09 (a)(c) | | | 20,000,000 | | | 19,995,461 | |
Toyota Motor Credit Corp., 0.24%,
5/18/09 (c) | | �� | 80,000,000 | | | 79,990,934 | |
Toyota Motor Credit Corp., 0.60%,
5/27/09 (c) | | | 100,000,000 | | | 99,956,667 | |
Yorktown Capital LLC, 0.57%,
5/18/09 (a)(c) | | | 35,000,000 | | | 34,990,579 | |
Yorktown Capital LLC, 0.67%,
6/8/09 (a)(c) | | | 45,351,000 | | | 45,318,927 | |
| | | | |
|
| |
| | | | | | 2,452,610,415 | |
| | | | |
|
| |
TOTAL COMMERCIAL PAPER AND
NOTES (COST $3,707,310,910) | | | | | | 3,707,310,910 | |
| | | | |
|
| |
| | | | | | | |
Certificates of Deposit—20.3% | | | | | | | |
|
|
|
|
|
|
|
|
Banking – 20.3% | | | | | | | |
Australia & New Zealand Banking
Group Ltd., N.Y., 0.25%, 5/11/09 | | | 75,000,000 | | | 75,000,000 | |
Bank of Montreal, 0.31%, 5/4/09 | | | 100,000,000 | | | 100,000,000 | |
Bank of Nova Scotia, 0.25%, 5/22/09 | | | 100,000,000 | | | 100,000,291 | |
Bank of Nova Scotia, 0.70%, 5/26/09 | | | 50,000,000 | | | 50,000,347 | |
Bank of Nova Scotia, 0.43%, 7/31/09 | | | 65,000,000 | | | 65,000,000 | |
Bank of Scotland plc, N.Y., 1.45%,
5/6/09 (b) | | | 125,000,000 | | | 125,000,000 | |
Bank of Tokyo-Mitsubishi UFJ, N.Y.,
0.89%, 7/31/09 | | | 62,000,000 | | | 62,001,564 | |
Banque Paribas, N.Y., 0.29%, 5/22/09 | | | 75,000,000 | | | 75,000,000 | |
Banque Paribas, N.Y., 0.85%, 5/26/09 | | | 60,000,000 | | | 60,000,000 | |
Barclays Bank plc, N.Y., 0.25%,
5/13/09 | | | 110,000,000 | | | 110,000,000 | |
Calyon N.A., Inc., 1.00%, 6/3/09 | | | 60,000,000 | | | 60,000,000 | |
Calyon N.A., Inc., 1.00%, 6/5/09 | | | 75,000,000 | | | 75,000,000 | |
| | | | | | | |
Certificates of Deposit, continued | | | | | | | |
|
|
|
|
|
|
|
|
| | | | | | | |
| | Principal
Amount($) | | Value($) | |
| |
| |
| |
Banking, continued | | | | | | | |
Canadian Imperial Bank of Commerce,
N.Y., 0.49%, 8/3/09 | | | 75,000,000 | | | 75,001,956 | |
Deutsche Bank, N.Y.,
1.46%, 7/21/09 (b) | | | 100,000,000 | | | 100,000,000 | |
Lloyds TSB Bank plc, N.Y.,
0.40%, 5/15/09 | | | 100,000,000 | | | 100,000,000 | |
National Bank of Canada, N.Y.,
0.20%, 5/21/09 | | | 75,000,000 | | | 75,000,000 | |
Norinchukin Bank, N.Y.,
0.45%, 5/4/09 | | | 100,000,000 | | | 100,000,000 | |
Rabobank Nederland NV, N.Y.,
0.40%, 5/6/09 | | | 50,000,000 | | | 50,002,496 | |
Rabobank Nederland NV, N.Y.,
0.70%, 6/2/09 | | | 100,000,000 | | | 100,000,000 | |
Rabobank Nederland NV, N.Y.,
0.40%, 8/3/09 | | | 50,000,000 | | | 50,000,000 | |
Royal Bank of Scotland plc, N.Y.,
0.50%, 5/4/09 | | | 100,000,000 | | | 100,000,000 | |
Royal Bank of Scotland plc, N.Y.,
0.40%, 5/26/09 | | | 100,000,000 | | | 100,000,000 | |
Royal Bank of Scotland plc, N.Y.,
0.86%, 6/29/09 | | | 60,000,000 | | | 60,000,000 | |
Royal Bank of Scotland plc, N.Y.,
1.08%, 7/28/09 | | | 60,000,000 | | | 60,000,000 | |
Sumitomo Mitsui Banking Corp.,
0.48%, 5/22/09 | | | 90,000,000 | | | 90,000,000 | |
Sumitomo Mitsui Banking Corp.,
1.03%, 6/1/09 | | | 75,000,000 | | | 75,000,000 | |
Sumitomo Mitsui Banking Corp.,
0.99%, 6/15/09 | | | 40,000,000 | | | 40,000,000 | |
Svenska Handelsbanken, 0.34%,
5/7/09, (LOC Citigroup) | | | 125,000,000 | | | 125,000,208 | |
Svenska Handelsbanken,
1.60%, 8/20/09 (b) | | | 75,000,000 | | | 75,000,000 | |
| | | | |
|
| |
TOTAL CERTIFICATES OF DEPOSIT
(COST $2,332,006,862) | | | | | | 2,332,006,862 | |
| | | | |
|
| |
| | | | | | | |
Repurchase Agreement—0.9% | | | | | | | |
|
|
|
|
|
|
|
|
Deutsche Bank, purchased on 4/30/09,
0.14%, due 5/1/09 with a maturity value
of $100,000,389 (Collateralized fully
by various U.S. Government and
Government Agency Obligations) | | | 100,000,000 | | | 100,000,000 | |
| | | | |
|
| |
TOTAL REPURCHASE AGREEMENTS
(COST $100,000,000) | | | | | | 100,000,000 | |
| | | | |
|
| |
| | | | | | | |
Yankee Dollars—3.3% | | | | | | | |
|
|
|
|
|
|
|
|
Australia & New Zealand Banking Group,
1.47%, 10/2/09 (b) | | | 75,000,000 | | | 75,000,000 | |
BNP Paribas, 1.46%, 8/13/09 (b) | | | 65,000,000 | | | 65,000,000 | |
Credit Agricole (London), 1.48%,
7/22/09 (b) | | | 75,000,000 | | | 75,000,000 | |
| | |
See notes to financial statements | HSBC INVESTOR FAMILY OF FUNDS | 20 |
|
HSBC INVESTOR PRIME MONEY MARKET FUND |
|
|
Schedule of Portfolio Investments—as of April 30, 2009 (Unaudited) (continued) |
| | | | | | | |
Yankee Dollars, continued | | | | | | | |
|
|
|
|
|
|
|
|
| | | | | | | |
| | Shares or
Principal
Amount($) | | Value($) | |
| |
| |
| |
National Australia Bank Ltd., 1.51%,
10/6/09 (b) | | | 60,000,000 | | | 60,000,000 | |
Royal Bank of Canada, 1.54%,
10/15/09 (b) | | | 50,000,000 | | | 50,000,000 | |
Westpac Banking Corp., 1.55%,
8/20/09 (b) | | | 50,000,000 | | | 50,000,000 | |
| | | | |
|
| |
TOTAL YANKEE DOLLARS
(COST $375,000,000) | | | | | | 375,000,000 | |
| | | | |
|
| |
| | | | | | | |
Time Deposits—9.9% | | | | | | | |
|
|
|
|
|
|
|
|
Citibank N.A. Nassau Euro Time Deposit,
0.19%, 5/1/09 | | | 201,500,000 | | | 201,500,000 | |
Natixis Time Deposit, 0.22%, 5/4/09 | | | 225,000,000 | | | 225,000,000 | |
Societe Generale Cayman Time Deposit,
0.20%, 5/1/09 | | | 460,000,000 | | | 460,000,000 | |
Wells Fargo Bank Time Deposit,
0.17%, 5/1/09 | | | 250,000,000 | | | 250,000,000 | |
| | | | |
|
| |
TOTAL TIME DEPOSITS
(COST $1,136,500,000) | | | | | | 1,136,500,000 | |
| | | | |
|
| |
TOTAL INVESTMENTS
(COST $11,840,758,554) — 103.0% | | | | | | 11,840,758,554 | |
| | | | |
|
| |
| |
|
| Percentages indicated are based on net assets of $11,496,637,949. |
| |
(a) | Security exempt from registration under Rule 144a of the Securities Act of 1933. This security may be resold in transactions exempt from registration, normally to qualified institutional buyers. This security has been deemed liquid by the Investment Adviser based on procedures approved by the Board of Trustees. |
| |
(b) | Variable rate security. The interest rates on these securities are adjusted periodically to reflect then-current short-term interest rates. The rates presented represent the rates in effect on April 30, 2009. The maturity dates presented reflect the final maturity dates. However, some of these securities may contain put or demand features that allow the fund to require the issuer to repurchase the security from the fund within various time periods, including daily, weekly, monthly, or semi-annually. |
| |
(c) | Discount note. Rate presented represents the effective yield at time of purchase. |
| |
AMT | — Interest on security is subject to federal alternative minimum tax |
FSA | — Financial Security Assurance |
GO | — General Obligation |
IDA | — Industrial Development Agency |
LLC | — Limited Liability Co. |
LOC | — Letter of Credit |
MTN | — Medium Term Note |
PLC | — Public Limited Co. |
SPA | — Standby Purchase Agreement |
| | |
21 | HSBC INVESTOR FAMILY OF FUNDS | See notes to financial statements |
|
HSBC INVESTOR TAX-FREE MONEY MARKET FUND |
|
|
Schedule of Portfolio Investments—as of April 30, 2009 (Unaudited) |
| | | | | | | |
Variable Rate Demand Notes—33.1% | | | | | | | |
|
|
|
|
|
|
|
|
| | | | | | | |
| | Principal
Amount($) | | Value($) | |
| |
| |
| |
Arizona—1.1% | | | | | | | |
Apache County Arizona Industrial
Development Authority Revenue,
Series 83A, 0.49%, 12/15/18,
(LOC ABN AMRO Bank N.V.) (a) | | | 600,000 | | | 600,000 | |
Apache County Arizona Industrial
Development Authority Revenue,
Series 83C, 0.49%, 12/15/18,
(LOC Bank of New York) (a) | | | 700,000 | | | 700,000 | |
Yuma Arizona Industrial Development
Authority Multi-family Revenue,
0.55%, 4/15/33, (Credit Support
FNMA) (a) | | | 1,050,000 | | | 1,050,000 | |
| | | | |
|
| |
| | | | | | 2,350,000 | |
| | | | |
|
| |
California – 3.7% | | | | | | | |
California State Department of Water
Resources Power Supply Revenue,
Sub-series G-7, 1.20%, 5/1/17,
(Credit Support FSA, SpA Societe
Generale) (a) | | | 1,600,000 | | | 1,600,000 | |
California State Department of Water
Resources Power Supply Revenue,
Series C-1, 1.00%, 5/1/22, (LOC
Dexia Credit Local) (a) | | | 3,500,000 | | | 3,500,000 | |
Los Angeles California Multi-family
Revenue, Series A, 0.67%, 8/1/26,
AMT, (LOC FHLMC) (a) | | | 1,000,000 | | | 1,000,000 | |
Northern California Transmission
Agency Revenue, 2.40%, 5/1/24, (LOC
FSA, SpA Dexia Credit Local) (a) | | | 2,110,000 | | | 2,110,000 | |
| | | | |
|
| |
| | | | | | 8,210,000 | |
| | | | |
|
| |
Colorado – 1.7% | | | | | | | |
Denver Colorado City & County Airport
Revenue, Series F, 0.64%, 11/15/25,
AMT, (LOC Lloyds TSB Bank
plc) (a) | | | 3,850,000 | | | 3,850,000 | |
| | | | |
|
| |
Florida – 2.6% | | | | | | | |
Broward County Florida Housing
Finance Authority Multi-family
Housing Revenue, 0.54%, 12/1/29,
(Credit Support Freddie Mac) (a) | | | 2,000,000 | | | 1,999,982 | |
Broward County Florida School Board
Certificates of Participation, 0.50%,
7/1/21, (Credit Support FSA, SpA
Bank of America N.A.) (a) | | | 2,000,000 | | | 2,000,000 | |
Orange County Florida Housing Finance
Authority Multi-family Revenue,
0.54%, 7/1/32, (Credit Support
Freddie Mac) (a) | | | 1,000,000 | | | 999,982 | |
Volusia County Florida Housing Finance
Authority Multi-family Revenue,
0.54%, 10/15/32, (Credit Support
FNMA) (a) | | | 700,000 | | | 699,998 | |
| | | | |
|
| |
| | | | | | 5,699,962 | |
| | | | |
|
| |
Georgia – 2.1% | | | | | | | |
De Kalb County Georgia Housing
Authority Multi-family Housing
Revenue, 0.67%, 12/1/25, (Credit
Support Freddie Mac) (a) | | | 2,000,000 | | | 2,000,000 | |
| | | | | | | |
Variable Rate Demand Notes, continued | | | | | | | |
|
|
|
|
|
|
|
|
| | | | | | | |
| | Principal
Amount($) | | Value($) | |
| |
| |
| |
Georgia, continued | | | | | | | |
Roswell Georgia Housing Authority
Multi-family Revenue, 0.55%,
6/15/25, (Credit Support FNMA) (a) | | | 1,400,000 | | | 1,400,000 | |
Roswell Georgia Housing Authority
Multi-family Revenue, 0.55%, 11/15/32,
(Credit Support FNMA) (a) | | | 1,300,000 | | | 1,300,000 | |
| | | | |
|
| |
| | | | | | 4,700,000 | |
| | | | |
|
| |
Illinois – 5.6% | | | | | | | |
Chicago Illinois O’Hare International
Airport Revenue, Series B, 0.73%,
1/1/18, (LOC Societe Generale) (a) | | | 1,800,000 | | | 1,800,000 | |
Chicago Illinois O’Hare International
Airport Revenue, Series C, 0.63%,
1/1/18, (LOC Societe Generale) (a) | | | 1,800,000 | | | 1,800,000 | |
Illinois Development Finance Authority
Revenue, 0.48%, 12/1/28, (LOC
Northern Trust Co.) (a) | | | 4,300,000 | | | 4,300,000 | |
Illinois Development Finance Authority
Revenue, 0.48%, 6/1/37, (LOC
Bank One N.A.) (a) | | | 2,000,000 | | | 2,000,000 | |
Illinois Finance Authority Revenue,
0.48%, 3/1/36, (LOC JP Morgan
Chase Bank) (a) | | | 1,100,000 | | | 1,100,000 | |
Illinois Finance Authority Revenue,
0.48%, 4/1/37, (LOC JP Morgan
Chase Bank) (a) | | | 600,000 | | | 600,000 | |
Illinois Finance Authority Revenue,
0.48%, 12/1/37, (LOC JP Morgan
Chase Bank) (a) | | | 900,000 | | | 900,000 | |
| | | | |
|
| |
| | | | | | 12,500,000 | |
| | | | |
|
| |
Indiana – 0.5% | | | | | | | |
Indiana Municipal Power Agency Power
Supply System Revenue, 1.40%,
1/1/18, (LOC Dexia Credit) (a) | | | 1,040,000 | | | 1,040,000 | |
| | | | |
|
| |
Maryland – 1.7% | | | | | | | |
Baltimore Maryland Industrial
Development Authority Revenue,
0.53%, 8/1/16, (LOC Bayerische
Landesbank) (a) | | | 1,725,000 | | | 1,725,000 | |
Maryland State Health & Higher
Educational Facilities Authority
Revenue, 0.60%, 7/1/38, (LOC
UBS AG) (a) | | | 2,000,000 | | | 2,000,000 | |
| | | | |
|
| |
| | | | | | 3,725,000 | |
| | | | |
|
| |
Michigan – 0.4% | | | | | | | |
Michigan State Hospital Finance
Authority Revenue, Series B, 0.50%,
11/15/40, (LOC Landesbank Hessen -
Thuringen) (a) | | | 1,000,000 | | | 1,000,000 | |
| | | | |
|
| |
Minnesota – 2.9% | | | | | | | |
Bloomington Minnesota Housing
Revenue, 0.50%, 7/1/38, (LOC
Freddie Mac) (a) | | | 2,000,000 | | | 2,000,000 | |
| | |
See notes to financial statements | HSBC INVESTOR FAMILY OF FUNDS | 22 |
|
HSBC INVESTOR TAX-FREE MONEY MARKET FUND |
|
|
Schedule of Portfolio Investments—as of April 30, 2009 (Unaudited) (continued) |
| | | | | | | |
Variable Rate Demand Notes, continued | | | | | | | |
|
|
|
|
|
|
|
|
| | | | | | | |
| | Principal
Amount($) | | Value($) | |
| |
| |
| |
Minnesota, continued | | | | | | | |
Oakdale Minnesota Multi-family
Revenue, 0.60%, 6/1/45, AMT,
(LOC Freddie Mac) (a) | | | 2,000,000 | | | 2,000,000 | |
Robbinsdale Minnesota Revenue,
Series A-1, 0.50%, 5/1/33, (LOC Wells
Fargo Bank N.A.) (a) | | | 2,400,000 | | | 2,400,000 | |
| | | | |
|
| |
| | | | | | 6,400,000 | |
| | | | |
|
| |
Missouri – 0.4% | | | | | | | |
Missouri State Health & Educational
Facilities Authority Revenue, 0.42%,
8/1/37, (LOC U.S. Bank N.A.) (a) | | | 1,000,000 | | | 1,000,000 | |
| | | | |
|
| |
Nebraska – 1.6% | | | | | | | |
Lancaster County Nebraska Hospital
Authority No. 1 Hospital Revenue,
Series B-1, 0.52%, 6/1/31, (LOC
U.S. Bank N.A.) (a) | | | 5,000 | | | 5,000 | |
Lancaster County Nebraska Hospital
Authority No. 1 Hospital Revenue,
Series B-2, 0.50%, 6/1/31, (LOC U.S.
Bank N.A.) (a) | | | 2,500,000 | | | 2,500,000 | |
Saline County Nebraska Hospital
Authority No. 1 Hospital Revenue,
Series C, 0.50%, 6/1/31, (LOC U.S.
Bank N.A.) (a) | | | 1,075,000 | | | 1,075,000 | |
| | | | |
|
| |
| | | | | | 3,580,000 | |
| | | | |
|
| |
New Mexico – 0.2% | | | | | | | |
Farmington New Mexico Hospital
Revenue, 0.50%, 6/1/28, (LOC
Bank of Nova Scotia) (a) | | | 500,000 | | | 500,000 | |
| | | | |
|
| |
Ohio – 0.9% | | | | | | | |
Lorain County Ohio Hospital Revenue,
0.55%, 11/1/21, (LOC JP Morgan
Chase Bank) (a) | | | 1,000,000 | | | 1,000,000 | |
Ohio State Water Development Authority
Pollution Control Facilities Revenue,
Series A, 0.45%, 8/1/29, (LOC
Barclays Bank plc) (a) | | | 1,000,000 | | | 1,000,000 | |
| | | | |
|
| |
| | | | | | 2,000,000 | |
| | | | |
|
| |
Pennsylvania – 1.8% | | | | | | | |
Beaver County Pennsylvania Industrial
Development Authority Pollution
Control Revenue, 0.45%, 4/1/41,
(LOC Barclays Bank plc) (a) | | | 700,000 | | | 700,000 | |
Beaver County Pennsylvania Industrial
Development Authority Pollution
Control Revenue, Series A, 0.48%,
1/1/35, (LOC Barclays Bank plc) (a) | | | 1,500,000 | | | 1,500,000 | |
Delaware Valley Pennsylvania Regional
Financing Authority Local Government
Revenue, 0.50%, 8/1/16, (LOC
Bayerische Landesbank) (a) | | | 1,700,000 | | | 1,700,000 | |
| | | | |
|
| |
| | | | | | 3,900,000 | |
| | | | |
|
| |
| | | | | | | |
Variable Rate Demand Notes, continued | | | | | | | |
|
|
|
|
|
|
|
|
| | | | | | | |
| | Principal
Amount($) | | Value($) | |
| |
| |
| |
Tennessee – 1.4% | | | | | | | |
Hamilton County Tennessee Industrial
Development Board IDR, 0.50%,
3/1/15, (LOC Bank of America
N.A.) (a)(b) | | | 1,050,000 | | | 1,050,000 | |
Jackson Tennessee Health Educational &
Housing Facility Board Multi-family
Revenue, 0.54%, 5/15/31, (Credit
Support FNMA) (a) | | | 1,375,000 | | | 1,375,000 | |
Metropolitan Government Nashville &
Davidson County IDR, 0.54%, 2/15/34,
(Credit Support FNMA) (a) | | | 800,000 | | | 800,000 | |
| | | | |
|
| |
| | | | | | 3,225,000 | |
| | | | |
|
| |
Texas – 0.6% | | | | | | | |
Tarrant County Texas Housing Finance
Corp. Revenue, 0.55%, 2/15/36,
(Credit Support FNMA) (a) | | | 1,400,000 | | | 1,400,000 | |
| | | | |
|
| |
Vermont – 1.3% | | | | | | | |
Vermont Housing Finance Agency Single
Family Revenue, Series 21A, 3.58%,
11/1/34, AMT, (Credit Support FSA,
SpA Dexia Credit Local) (a) | | | 915,000 | | | 915,000 | |
Vermont State Student Assistance Corp.
Education Loan Revenue, Series C-1,
0.75%, 12/15/40, AMT, (LOC Lloyds
Bank) (a) | | | 2,000,000 | | | 2,000,000 | |
| | | | |
|
| |
| | | | | | 2,915,000 | |
| | | | |
|
| |
Washington – 1.7% | | | | | | | |
Washington State Health Care Facilities
Authority Lease Revenue, 0.43%,
1/1/32, (LOC BNP Paribas) (a) | | | 1,000,000 | | | 1,000,000 | |
Washington State Health Care Facilities
Authority Revenue, 0.70%, 11/15/26,
(LOC Citibank N.A.) (a)(b) | | | 2,800,000 | | | 2,800,000 | |
| | | | |
|
| |
| | | | | | 3,800,000 | |
| | | | |
|
| |
Wisconsin – 0.9% | | | | | | | |
Wisconsin State Health & Educational
Facilities Authority Revenue, Series B,
0.41%, 8/15/33, (LOC U.S. Bank
N.A.) (a) | | | 1,990,000 | | | 1,990,000 | |
| | | | |
|
| |
TOTAL VARIABLE RATE DEMAND
NOTES (COST $73,784,962) | | | | | | 73,784,962 | |
| | | | |
|
| |
| | | | | | | |
Commercial Paper And Notes—16.0% | | | | | | | |
|
|
|
|
|
|
|
|
California – 3.1% | | | | | | | |
Orange County Local Transit, Series A,
1.65%, 5/6/09, (LOC Dexia Credit
Local) | | | 2,725,000 | | | 2,725,000 | |
Orange County Local Transit, Series A,
2.00%, 5/6/09, (LOC Dexia Credit
Local) | | | 1,275,000 | | | 1,275,000 | |
Orange County Local Transit, Series A,
1.50%, 6/17/09, (LOC Dexia Credit
Local) | | | 3,000,000 | | | 3,000,000 | |
| | | | |
|
| |
| | | | | | 7,000,000 | |
| | | | |
|
| |
| | |
23 | HSBC INVESTOR FAMILY OF FUNDS | See notes to financial statements |
|
HSBC INVESTOR TAX-FREE MONEY MARKET FUND |
|
|
Schedule of Portfolio Investments—as of April 30, 2009 (Unaudited) (continued) |
| | | | | | | |
Commercial Paper And Notes, continued | | | | | | | |
|
|
|
|
|
|
|
|
| | | | | | | |
| | Principal
Amount($) | | Value($) | |
| |
| |
| |
Colorado – 1.3% | | | | | | | |
Denver City & County, 0.65%, 5/5/09 | | | 3,000,000 | | | 3,000,000 | |
| | | | |
|
| |
Connecticut – 1.7% | | | | | | | |
City of New Haven Connecticut, 0.40%,
6/12/09, (LOC Landesbank Hessen) | | | 3,680,000 | | | 3,680,000 | |
| | | | |
|
| |
Florida – 0.9% | | | | | | | |
Florida Local Government Finance
Commission, 0.50%, 5/7/09, (LOC
First Union National Bank) | | | 1,075,000 | | | 1,075,000 | |
Hillsborough County Florida, 0.50%,
6/2/09, (LOC State Street B&T) | | | 824,000 | | | 824,000 | |
| | | | |
|
| |
| | | | | | 1,899,000 | |
| | | | |
|
| |
Georgia – 2.0% | | | | | | | |
Municipal Electric Authority Georgia,
0.60%, 5/19/09, (LOC Bayerische
Landesbank) | | | 4,400,000 | | | 4,400,000 | |
| | | | |
|
| |
New York – 0.4% | | | | | | | |
Metropolitan Transportation Authority
Revenue, 0.50%, 7/13/09, (LOC ABN
AMRO Bank NV) | | | 1,000,000 | | | 1,000,000 | |
| | | | |
|
| |
Pennsylvania – 1.8% | | | | | | | |
Montgomery Country Pennsylvania
Industrial Pollution Control Revenue,
0.70%, 5/4/09 | | | 2,000,000 | | | 2,000,000 | |
Montgomery Country Pennsylvania
Industrial Pollution Control Revenue,
0.70%, 5/7/09 | | | 2,000,000 | | | 2,000,000 | |
| | | | |
|
| |
| | | | | | 4,000,000 | |
| | | | |
|
| |
Texas – 4.1% | | | | | | | |
Harris County Texas, 0.60%, 6/8/09 | | | 1,690,000 | | | 1,690,000 | |
Harris County Texas, 0.60%, 6/9/09 | | | 1,500,000 | | | 1,500,000 | |
Houston Texas, 0.55%, 6/2/09 | | | 4,000,000 | | | 4,000,000 | |
North Texas Tollway, 0.45%, 7/2/09,
(LOC Bank of America) | | | 2,000,000 | | | 2,000,000 | |
| | | | |
|
| |
| | | | | | 9,190,000 | |
| | | | |
|
| |
Wyoming – 0.7% | | | | | | | |
Sweetwater County Wyoming Pollution
Control Revenue, 0.60%, 6/11/09 | | | 1,500,000 | | | 1,500,000 | |
| | | | |
|
| |
TOTAL COMMERCIAL PAPER AND
NOTES (COST $35,669,000) | | | | | | 35,669,000 | |
| | | | |
|
| |
| | | | | | | |
Municipal Bonds—43.3% | | | | | | | |
|
|
|
|
|
|
|
|
Alabama – 1.0% | | | | | | | |
Mobile Alabama Industrial Development
Board Dock & Wharf Revenue,
Series A, 0.50%, 6/1/32, (LOC
Bayerische Landesbank) (a) | | | 2,200,000 | | | 2,200,000 | |
| | | | |
|
| |
| | | | | | | |
Municipal Bonds, continued | | | | | | | |
|
|
|
|
|
|
|
|
| | | | | | | |
| | Principal
Amount($) | | Value($) | |
| |
| |
| |
Arizona – 0.9% | | | | | | | |
Salt River Pima - Maricopa Indian
Community Revenue, 0.50%, 10/1/26,
(LOC Bank of America N.A.) (a) | | | 1,900,000 | | | 1,900,000 | |
| | | | |
|
| |
California – 1.2% | | | | | | | |
Menlo Park California Community
Development Agency Tax Allocation,
0.37%, 1/1/31, (Credit Support AMBAC,
LOC State Street B&T Co.) (a) | | | 1,000,000 | | | 1,000,000 | |
Tahoe Forest California Hospital District
Revenue, 0.37%, 7/1/33, (LOC
U.S. Bank N.A.) (a) | | | 1,700,000 | | | 1,700,000 | |
| | | | |
|
| |
| | | | | | 2,700,000 | |
| | | | |
|
| |
Colorado – 1.8% | | | | | | | |
Broomfield Colorado Urban Renewal
Authority Tax Increment Revenue,
0.50%, 12/1/30, (LOC BNP
Paribas) (a) | | | 650,000 | | | 650,000 | |
Denver Colorado City & County Airport
Revenue, Series G, 0.64%, 11/15/25,
AMT, (LOC Lloyds TSB Bank) (a) | | | 900,000 | | | 900,000 | |
Thornton Colorado Multi-family Housing
Revenue, Series A, 0.53%, 4/1/10,
(Credit Support FHLMC, Liquid
Facility FHLMC) (a) | | | 2,500,000 | | | 2,500,000 | |
| | | | |
|
| |
| | | | | | 4,050,000 | |
| | | | |
|
| |
Florida – 0.5% | | | | | | | |
Florida Housing Finance Corp.
Multi-family Mortgage Revenue,
Series P, 0.61%, 8/1/35, AMT,
(LOC Citibank N.A.) (a) | | | 1,100,000 | | | 1,100,000 | |
| | | | |
|
| |
Georgia – 1.3% | | | | | | | |
Savannah Georgia Economic Development
Authority Revenue, 0.50%, 9/1/24,
(LOC Bank of America N.A.) (a) | | | 3,000,000 | | | 3,000,000 | |
| | | | |
|
| |
Illinois – 2.6% | | | | | | | |
Illinois Educational Facilities Authority
Revenue, 0.55%, 3/1/28, (Credit
Support GO of Institution, LOC Bank
of America N.A.) (a) | | | 2,865,000 | | | 2,865,000 | |
Illinois Health Facilities Authority
Revenue, 0.52%, 10/1/22, (LOC
Bank One N.A.) (a) | | | 1,000,000 | | | 1,000,000 | |
Rock Island County Illinois Metropolitan
Airport Authority Revenue, 0.75%,
12/1/18, AMT, (LOC U.S. Bank
N.A.) (a) | | | 2,000,000 | | | 2,000,000 | |
| | | | |
|
| |
| | | | | | 5,865,000 | |
| | | | |
|
| |
Indiana – 3.1% | | | | | | | |
Indiana State Finance Authority Revenue,
Series A, 0.50%, 7/1/36, (LOC
Northern Trust Co.) (a) | | | 4,085,000 | | | 4,085,000 | |
| | |
See notes to financial statements | HSBC INVESTOR FAMILY OF FUNDS | 24 |
|
HSBC INVESTOR TAX-FREE MONEY MARKET FUND |
|
|
Schedule of Portfolio Investments—as of April 30, 2009 (Unaudited) (continued) |
| | | | | | | |
Municipal Bonds, continued |
|
| | | | | | | |
| | Principal
Amount($) | | Value($) | |
| |
| |
| |
Indiana, Continued | | | | | | | |
Indianapolis Indiana Multi-family
Housing Revenue, Series A, 0.55%,
8/15/40, (Credit Support FNMA,
Liquid Facility FNMA) (a) | | | 1,720,000 | | | 1,720,000 | |
Valparaiso Indiana Economic
Development Revenue, 0.77%, 5/1/19,
AMT, (LOC U.S. Bank N.A.) (a) | | | 1,005,000 | | | 1,005,000 | |
| | | | |
|
| |
| | | | | | 6,810,000 | |
| | | | |
|
| |
Iowa – 1.0% | | | | | | | |
Iowa Higher Education Loan Authority
Revenue, 0.52%, 5/1/29, (LOC
Northern Trust Co.) (a) | | | 400,000 | | | 400,000 | |
Iowa Higher Education Loan Authority
Revenue, 0.52%, 4/1/33, (LOC
Northern Trust Co.) (a) | | | 300,000 | | | 300,000 | |
Iowa Higher Education Loan Authority
Revenue, 0.52%, 4/1/35, (LOC
Northern Trust Co.) (a) | | | 1,500,000 | | | 1,500,000 | |
| | | | |
|
| |
| | | | | | 2,200,000 | |
| | | | |
|
| |
Kansas – 1.5% | | | | | | | |
University of Kansas Hospital Authority
Health Facilities Revenue, 0.42%,
9/1/34, (Credit Support GO of
Authority, LOC U.S. Bank N.A.) (a) | | | 3,420,000 | | | 3,420,000 | |
| | | | |
|
| |
Maine – 0.6% | | | | | | | |
Gorham Maine Revenue Obligation
Securities, Series A, 0.85%, 7/1/21,
AMT, (LOC TD Banknorth N.A.) (a) | | | 1,250,000 | | | 1,250,000 | |
| | | | |
|
| |
Maryland – 0.9% | | | | | | | |
Maryland State Economic Development
Corp. Revenue, Series A, 0.63%, 4/1/24,
(LOC Wachovia Bank N.A.) (a) | | | 2,000,000 | | | 2,000,000 | |
| | | | |
|
| |
Massachusetts – 5.7% | | | | | | | |
Massachusetts State Health & Educational
Facilities Authority Revenue, Series N,
0.52%, 2/1/38, (LOC TD Banknorth
N.A.) (a) | | | 5,900,000 | | | 5,900,000 | |
Massachusetts State Health &
Educational Facilities Authority
Revenue, Series C, 0.52%, 7/1/38,
(LOC TD Banknorth N.A.) (a) | | | 4,000,000 | | | 4,000,000 | |
Massachusetts State Industrial Finance
Agency Mortgage Revenue, 1.25%,
8/1/26, (Credit Support FHA 221,
LOC Sumitomo Bank Ltd.) (a) | | | 2,860,000 | | | 2,860,000 | |
| | | | |
|
| |
| | | | | | 12,760,000 | |
| | | | |
|
| |
Minnesota – 1.2% | | | | | | | |
Center City Minnesota Health Care
Facilities Revenue, 0.52%, 11/1/35,
(LOC Bank of New York) (a) | | | 600,000 | | | 600,000 | |
St. Paul Minnesota Port Authority
Revenue, 0.52%, 4/1/36, (LOC
Bank of New York) (a) | | | 435,000 | | | 435,000 | |
| | | | | | | |
Municipal Bonds, continued |
|
| | | | | | | |
| | Principal
Amount($) | | Value($) | |
| |
| |
| |
Minnesota, Continued | | | | | | | |
St. Paul Minnesota Port Authority Tax
Increment Revenue, 0.65%, 2/1/15,
(LOC U.S. Bank N.A.) (a) | | | 1,690,000 | | | 1,690,000 | |
| | | | |
|
| |
| | | | | | 2,725,000 | |
| | | | |
|
| |
New Jersey – 0.9% | | | | | | | |
Salem County Pollution Control
Financing Authority Revenue,
Series B2, 0.46%, 11/1/33, (LOC
Bank of Nova Scotia) (a) | | | 2,000,000 | | | 2,000,000 | |
| | | | |
|
| |
New York – 0.9% | | | | | | | |
New York City Housing Development
Corp. Multi-family Revenue, Series A,
0.52%, 12/1/37, AMT, (LOC Citibank
N.A.) (a) | | | 2,000,000 | | | 2,000,000 | |
| | | | |
|
| |
North Carolina – 0.4% | | | | | | | |
New Hanover County North Carolina
Hospital Revenue, Series B, 0.40%,
10/1/38, (LOC RBC Bank U.S.A.) (a) | | | 1,000,000 | | | 1,000,000 | |
| | | | |
|
| |
Ohio – 1.6% | | | | | | | |
Hamilton County Ohio Health Care
Revenue, Series B, 0.55%, 1/1/37,
(LOC PNB Bank N.A.) (a) | | | 500,000 | | | 500,000 | |
Lorain County Ohio Hospital Revenue,
0.55%, 5/1/26, (LOC JP Morgan
Chase Bank) (a) | | | 3,000,000 | | | 3,000,000 | |
| | | | |
|
| |
| | | | | | 3,500,000 | |
| | | | |
|
| |
Pennsylvania – 4.8% | | | | | | | |
Beaver County Pennsylvania Industrial
Development Authority Pollution
Control Revenue, 0.45%, 1/1/35,
(LOC Barclays Bank plc) (a) | | | 600,000 | | | 600,000 | |
Delaware Valley Pennsylvania Regional
Financial Authority Local Government
Revenue, Series C, 0.50%, 12/1/20,
(LOC Bayerische Landesbank) (a) | | | 2,000,000 | | | 2,000,000 | |
Haverford Township Pennsylvania School
District GO, 0.50%, 3/1/30, (Credit
Support State Aid Withholding, LOC
TD Bank N.A.) (a) | | | 2,000,000 | | | 2,000,000 | |
Jackson Township Pennsylvania Industrial
Development Authority Revenue,
0.64%, 12/1/34, AMT, (LOC PNC
Bank N.A.) (a) | | | 5,000,000 | | | 5,000,000 | |
Philadelphia Pennsylvania School District
GO, Series B-5, 0.67%, 9/1/30, (Credit
Support State Aid Withholding, LOC
Wachovia Bank N.A.) (a) | | | 1,085,000 | | | 1,085,000 | |
| | | | |
|
| |
| | | | | | 10,685,000 | |
| | | | |
|
| |
Puerto Rico – 1.1% | | | | | | | |
Puerto Rico Commonwealth, Series B-2,
2.27%, 7/1/24, (Credit Support FSA,
SpA Dexia Bank) (a) | | | 2,500,000 | | | 2,500,000 | |
| | | | |
|
| |
| | |
25 | HSBC INVESTOR FAMILY OF FUNDS | See notes to financial statements |
|
HSBC INVESTOR TAX-FREE MONEY MARKET FUND |
|
|
Schedule of Portfolio Investments—as of April 30, 2009 (Unaudited) (continued) |
| | | | | | | |
Municipal Bonds, continued |
|
| | | | | | | |
| | Principal
Amount($) | | Value($) | |
| |
| |
| |
South Carolina—2.5% | | | | | | | |
North Charleston South Carolina
Certificates of Participation, 0.55%,
9/1/19, (LOC Bank of America
N.A.) (a) | | | 5,500,000 | | | 5,500,000 | |
| | | | |
|
| |
Texas – 1.8% | | | | | | | |
Tarrant County Texas Housing Finance
Corp. Revenue, 0.55%, 2/15/28,
(Credit Support FNMA) (a) | | | 3,900,000 | | | 3,900,000 | |
| | | | |
|
| |
Vermont – 1.6% | | | | | | | |
Vermont Educational & Health Buildings
Financing Agency Revenue, Series A,
0.50%, 4/1/15, (LOC TD Banknorth
N.A., SpA TD Banknorth N.A.) (a) | | | 2,580,000 | | | 2,580,000 | |
Vermont Educational & Health Buildings
Financing Agency Revenue, Series A,
0.50%, 10/1/28, (LOC Banknorth
N.A.) (a) | | | 875,000 | | | 875,000 | |
| | | | |
|
| |
| | | | | | 3,455,000 | |
| | | | |
|
| |
Washington – 2.8% | | | | | | | |
Port Seattle Washington Industrial
Development Corp. Revenue, 0.62%,
12/31/21, AMT, (LOC Citibank
N.A.) (a) | | | 2,000,000 | | | 2,000,000 | |
Seattle Washington Housing Authority
Low Income Housing Assistance
Revenue, 0.49%, 12/1/24, (LOC
Wells Fargo Bank N.A.) (a) | | | 2,245,000 | | | 2,245,000 | |
Tulalip Tribes of The Tulalip Reservation
Washington Revenue, 0.40%, 6/1/19,
(LOC Wells Fargo Bank N.A.) (a) | | | 2,000,000 | | | 2,000,000 | |
| | | | |
|
| |
| | | | | | 6,245,000 | |
| | | | |
|
| |
Wyoming – 1.6% | | | | | | | |
Sweetwater County Wyoming Pollution
Control Revenue, Series A, 0.47%,
7/1/15, (LOC Barclays Bank plc) (a) | | | 2,100,000 | | | 2,100,000 | |
Sweetwater County Wyoming Pollution
Control Revenue, 0.60%, 11/1/24,
(LOC Wells Fargo Bank N.A.) (a) | | | 1,500,000 | | | 1,500,000 | |
| | | | |
|
| |
| | | | | | 3,600,000 | |
| | | | |
|
| |
TOTAL MUNICIPAL BONDS
(COST $96,365,000) | | | | | | 96,365,000 | |
| | | | |
|
| |
| | | | | | | |
Investment Companies—6.8% |
|
| | | | | |
| | Shares | | Value($) | |
| |
| |
| |
BlackRock Liquidity Funds MuniFund
Portfolio Institutional Shares,
0.77% (c) | | | 10,094,439 | | | 10,094,439 | |
Northern Institutional Tax Exempt
Portfolio, Shares Class, 0.45% (c) | | | 4,971,443 | | | 4,971,443 | |
| | | | |
|
| |
TOTAL INVESTMENT COMPANIES
(COST $15,065,882) | | | | | | 15,065,882 | |
| | | | |
|
| |
TOTAL INVESTMENTS
(COST $220,884,844) — 99.2% | | | | | | 220,884,844 | |
| | | | |
|
| |
| | |
| |
|
| Percentages indicated are based on net assets of $222,669,977. |
| | |
(a) | Variable rate security. The interest rates on these securities are adjusted periodically to reflect then-current short-term interest rates. The rates presented represent the rates in effect on April 30, 2009. The maturity dates presented reflect the final maturity dates. However, some of these securities may contain put or demand features that allow the fund to require the issuer to repurchase the security from the fund within various time periods, including daily, weekly, monthly, or semi-annually. |
| | |
(b) | Security exempt from registration under Rule 144a of the Securities Act of 1933. This security may be resold in transactions exempt from registration, normally to qualified institutional buyers. This security has been deemed liquid by the Investment Adviser based on procedures approved by the Board of Trustees. |
| | |
(c) | The rates presented represents the annualized one day yield that was in effect on April 30, 2009. |
| |
AMBAC | — American Municipal Bond Assurance Corp. |
AMT | — Interest on security is subject to federal alternative minimum tax |
FHA | — Federal Housing Administration |
FHLMC | — Federal Home Loan Mortgage Corporation |
FNMA | — Federal National Mortgage Association |
FSA | — Financial Security Assurance |
GO | — General Obligation |
IDR | — Industrial Development Revenue |
LOC | — Letter of Credit |
PLC | — Public Limited Co. |
SPA | — Standby Purchase Agreement |
| | |
See notes to financial statements | HSBC INVESTOR FAMILY OF FUNDS | 26 |
|
HSBC INVESTOR U.S. GOVERNMENT MONEY MARKET FUND |
|
|
Schedule of Portfolio Investments—as of April 30, 2009 (Unaudited) |
| | | | | | | |
U.S. Government and Government Agency Obligations—67.1% |
|
| | | | | | | |
| | Principal
Amount($) | | Value($) | |
| |
| |
| |
Federal Farm Credit Bank – 18.0% | | | | | | | |
0.21%, 5/11/09 (a) | | | 150,000,000 | | | 149,999,607 | |
0.35%, 5/15/09 (a) | | | 300,000,000 | | | 300,000,000 | |
0.25%, 5/26/09 (b) | | | 50,000,000 | | | 49,991,319 | |
0.25%, 5/28/09 (b) | | | 75,000,000 | | | 74,985,937 | |
0.21%, 6/8/09 (a) | | | 100,000,000 | | | 99,999,004 | |
0.41%, 6/10/09 (b) | | | 10,000,000 | | | 9,995,556 | |
1.64%, 6/17/09 (b) | | | 100,000,000 | | | 99,791,111 | |
1.69%, 6/19/09 (b) | | | 25,000,000 | | | 24,943,854 | |
2.81%, 7/13/09 (b) | | | 74,000,000 | | | 73,594,850 | |
0.36%, 7/17/09 (b) | | | 50,000,000 | | | 49,962,569 | |
0.32%, 7/22/09 (a) | | | 25,000,000 | | | 24,997,740 | |
0.56%, 7/22/09 (b) | | | 150,000,000 | | | 149,812,083 | |
0.54%, 8/3/09 (b) | | | 20,000,000 | | | 19,971,800 | |
0.46%, 8/17/09 (b) | | | 50,000,000 | | | 49,932,500 | |
1.96%, 9/14/09 (b) | | | 50,000,000 | | | 49,641,111 | |
1.70%, 9/21/09 (b) | | | 30,000,000 | | | 29,803,375 | |
2.01%, 10/7/09 (b) | | | 50,000,000 | | | 49,569,375 | |
0.37%, 10/14/09 (a) | | | 68,000,000 | | | 68,000,000 | |
0.35%, 10/21/09 (a) | | | 150,000,000 | | | 149,992,949 | |
5.00%, 10/23/09 | | | 125,950,000 | | | 128,126,853 | |
0.31%, 11/16/09 (a) | | | 200,000,000 | | | 200,000,000 | |
0.72%, 11/17/09 (b) | | | 25,000,000 | | | 24,901,389 | |
0.66%, 11/20/09 (b) | | | 125,000,000 | | | 124,541,840 | |
1.11%, 12/9/09 (b) | | | 250,000,000 | | | 248,335,000 | |
0.81%, 12/15/09 (b) | | | 25,000,000 | | | 24,874,917 | |
| | | | |
|
| |
| | | | | | 2,275,764,739 | |
| | | | |
|
| |
Federal Home Loan Bank – 25.1% | | | | | | | |
2.57%, 5/5/09 | | | 90,000,000 | | | 90,002,920 | |
2.65%, 5/6/09 | | | 50,000,000 | | | 50,000,000 | |
2.48%, 5/7/09 | | | 46,095,000 | | | 46,096,384 | |
2.75%, 5/7/09 | | | 18,550,000 | | | 18,551,325 | |
1.05%, 5/13/09 (a) | | | 200,000,000 | | | 199,973,087 | |
1.07%, 5/20/09 (a) | | | 45,000,000 | | | 44,999,407 | |
0.14%, 5/22/09 (b) | | | 50,000,000 | | | 49,995,917 | |
0.10%, 5/27/09 (b) | | | 50,000,000 | | | 49,996,389 | |
1.09%, 8/5/09 (a) | | | 100,000,000 | | | 99,992,215 | |
1.09%, 8/5/09 (a) | | | 500,000,000 | | | 499,833,847 | |
1.10%, 8/7/09 (a) | | | 300,000,000 | | | 300,012,392 | |
0.44%, 9/4/09 (a) | | | 470,000,000 | | | 470,000,000 | |
2.25%, 10/2/09 | | | 25,000,000 | | | 25,168,397 | |
1.13%, 10/5/09 (a) | | | 400,000,000 | | | 400,017,300 | |
0.37%, 10/16/09 (a) | | | 300,000,000 | | | 299,972,409 | |
0.51%, 2/1/10 | | | 100,000,000 | | | 99,616,667 | |
0.40%, 4/16/10 (a) | | | 300,000,000 | | | 300,000,000 | |
Series 2, 1.00%, 2/5/10 | | | 150,000,000 | | | 149,942,466 | |
| | | | |
|
| |
| | | | | | 3,194,171,122 | |
| | | | |
|
| |
| | | | | | | |
U.S. Government and Government Agency Obligations, continued |
|
| | | | | | | |
| | Shares or
Principal
Amount($) | | Value($) | |
| |
| |
| |
Federal Home Loan Mortgage Corp. – 10.9% | | | | | | | |
0.41%, 5/27/09 (b) | | | 181,955,000 | | | 181,902,435 | |
5.00%, 6/11/09 | | | 150,000,000 | | | 150,778,961 | |
0.14%, 6/29/09 (b) | | | 100,000,000 | | | 99,977,056 | |
0.51%, 7/27/09 (b) | | | 167,000,000 | | | 166,798,208 | |
0.64%, 9/14/09 (b) | | | 177,266,000 | | | 176,844,107 | |
4.13%, 11/30/09 | | | 71,861,000 | | | 73,247,929 | |
4.00%, 12/15/09 | | | 10,579,000 | | | 10,801,690 | |
0.64%, 1/4/10 (b) | | | 100,000,000 | | | 99,566,000 | |
0.65%, 1/8/10 (a) | | | 10,000,000 | | | 10,000,000 | |
1.25%, 3/12/10 | | | 25,000,000 | | | 24,989,387 | |
7.00%, 3/15/10 | | | 19,445,000 | | | 20,527,188 | |
1.38%, 3/16/10 | | | 75,000,000 | | | 75,000,000 | |
2.88%, 4/30/10 | | | 10,000,000 | | | 10,216,900 | |
Series RB, 0.22%, 6/18/09 (b) | | | 124,000,000 | | | 123,963,627 | |
Series RB, 0.45%, 10/13/09 (b) | | | 150,000,000 | | | 149,688,333 | |
| | | | |
|
| |
| | | | | | 1,374,301,821 | |
| | | | |
|
| |
Federal National Mortgage Association – 13.1% | | | | | | | |
0.17%, 5/13/09 (b) | | | 200,000,000 | | | 199,988,667 | |
0.15%, 6/15/09 (b) | | | 250,000,000 | | | 249,953,125 | |
0.30%, 6/15/09 (b) | | | 36,800,000 | | | 36,786,331 | |
5.13%, 7/13/09 | | | 156,900,000 | | | 158,367,557 | |
0.30%, 8/24/09 (b) | | | 100,000,000 | | | 99,904,167 | |
0.30%, 8/26/09 (b) | | | 100,000,000 | | | 99,902,500 | |
0.32%, 9/1/09 (b) | | | 100,000,000 | | | 99,890,667 | |
0.65%, 9/21/09 (b) | | | 200,000,000 | | | 199,491,555 | |
0.32%, 9/25/09 (b) | | | 30,314,000 | | | 30,274,390 | |
0.51%, 12/29/09 (a) | | | 150,000,000 | | | 149,729,819 | |
0.49%, 12/30/09 (b) | | | 96,400,000 | | | 96,087,664 | |
0.50%, 2/22/10 (b) | | | 175,566,000 | | | 174,856,274 | |
2.50%, 4/9/10 | | | 57,836,000 | | | 58,864,324 | |
| | | | |
|
| |
| | | | | | 1,654,097,040 | |
| | | | |
|
| |
TOTAL U.S. GOVERNMENT AND
GOVERNMENT AGENCY OBLIGATIONS
(COST $8,498,334,722) | | | | | | 8,498,334,722 | |
| | | | |
|
| |
Repurchase Agreements—33.5% |
|
Bank of America Corp., purchased on
4/9/09, 0.24%, due 5/5/09 with a
maturity value of $250,041,667
(Collateralized fully by various U.S.
Government and Government Agency
Obligations) | | | 250,000,000 | | | 250,000,000 | |
Barclays Capital Group, purchased on
4/30/09, 0.16%, due 5/1/09 with a
maturity value of $200,000,889
(Collateralized fully by various U.S.
Government and Government Agency
Obligations) | | | 200,000,000 | | | 200,000,000 | |
BNP Paribas, purchased on 4/14/09,
0.21%, due 5/14/09 with a maturity
value of $500,087,500 (Collateralized
fully by various U.S. Government and
Government Agency Obligations) | | | 500,000,000 | | | 500,000,000 | |
| | |
27 | HSBC INVESTOR FAMILY OF FUNDS | See notes to financial statements |
|
HSBC INVESTOR U.S. GOVERNMENT MONEY MARKET FUND |
|
|
Schedule of Portfolio Investments—as of April 30, 2009 (Unaudited) (continued) |
| | | | | | | |
Repurchase Agreements, continued |
|
| | | | | | | |
| | Shares or
Principal
Amount($) | | Value($) | |
| |
| |
| |
BNP Paribas, purchased on 4/16/09,
0.18%, due 5/7/09 with a maturity
value of $350,036,750 (Collateralized
fully by various U.S. Government and
Government Agency Obligations) | | | 350,000,000 | | | 350,000,000 | |
BNP Paribas, purchased on 4/27/09,
0.17%, due 5/27/09 with a maturity
value of $250,035,417 (Collateralized
fully by various U.S. Government and
Government Agency Obligations) | | | 250,000,000 | | | 250,000,000 | |
BNP Paribas, purchased on 4/30/09,
0.16%, due 5/1/09 with a maturity
value of $500,002,222 (Collateralized
fully by various U.S. Government and
Government Agency Obligations) | | | 500,000,000 | | | 500,000,000 | |
Deutsche Bank, purchased on 4/30/09,
0.14%, due 5/1/09 with a maturity
value of $150,000,583 (Collateralized
fully by various U.S. Government and
Government Agency Obligations) | | | 150,000,000 | | | 150,000,000 | |
Deutsche Bank, purchased on 4/30/09,
0.20%, due 5/1/09 with a maturity
value of $135,400,752 (Collateralized
fully by various U.S. Government and
Government Agency Obligations) | | | 135,400,000 | | | 135,400,000 | |
Goldman Sachs, purchased on 4/30/09,
0.17%, due 5/1/09 with a maturity
value of $200,000,944 (Collateralized
fully by various U.S. Government and
Government Agency Obligations) | | | 200,000,000 | | | 200,000,000 | |
Goldman Sachs, purchased on 4/30/09,
0.18%, due 5/1/09 with a maturity
value of $300,001,500 (Collateralized
fully by various U.S. Government and
Government Agency Obligations) | | | 300,000,000 | | | 300,000,000 | |
Greenwich Capital Market, purchased
on 4/16/09, 0.20%, due 5/7/09 with
a maturity value of $250,029,167
(Collateralized fully by various U.S.
Government and Government Agency
Obligations) | | | 250,000,000 | | | 250,000,000 | |
Greenwich Capital Market, purchased
on 4/23/09, 0.18%, due 5/14/09 with
a maturity value of $250,026,250
(Collateralized fully by various U.S.
Government and Government Agency
Obligations) | | | 250,000,000 | | | 250,000,000 | |
Greenwich Capital Market, purchased
on 4/30/09, 0.17%, due 5/1/09 with
a maturity value of $250,001,181
(Collateralized fully by various U.S.
Government and Government Agency
Obligations) | | | 250,000,000 | | | 250,000,000 | |
Greenwich Capital Market, purchased
on 4/30/09, 0.18%, due 5/21/09 with
a maturity value of $250,026,250
(Collateralized fully by various U.S.
Government and Government Agency
Obligations) | | | 250,000,000 | | | 250,000,000 | |
| | | | | | | |
Repurchase Agreements, continued |
|
| | | | | | | |
| | Shares or
Principal
Amount($) | | Value($) | |
| |
| |
| |
Mizuho, purchased on 4/30/09, 0.15%,
due 5/1/09 with a maturity value of
$200,000,833 (Collateralized fully by
various U.S. Government and
Government Agency Obligations) | | | 200,000,000 | | | 200,000,000 | |
Morgan Stanley, purchased on 4/30/09,
0.14%, due 5/1/09 with a maturity
value of $200,000,778 (Collateralized
fully by various U.S. Government and
Government Agency Obligations) | | | 200,000,000 | | | 200,000,000 | |
| | | | |
|
| |
TOTAL REPURCHASE AGREEMENTS
(COST $4,235,400,000) | | | | | | 4,235,400,000 | |
| | | | |
|
| |
TOTAL INVESTMENTS
(COST $12,733,734,722) — 100.6% | | | | | | 12,733,734,722 | |
| | | | |
|
| |
| | |
| |
|
| Percentages indicated are based on net assets of $12,660,715,582. |
| | |
(a) | Variable rate security. The interest rates on these securities are adjusted periodically to reflect then-current short-term interest rates. The rates presented represent the rates in effect on April 30, 2009. The maturity dates presented reflect the final maturity dates. However, some of these securities may contain put or demand features that allow the fund to require the issuer to repurchase the security from the fund within various time periods, including daily, weekly, monthly, or semi-annually. |
| | |
(b) | Discount note. Rate presented represents the effective yield at time of purchase. |
| | |
See notes to financial statements | HSBC INVESTOR FAMILY OF FUNDS | 28 |
|
HSBC INVESTOR U.S. TREASURY MONEY MARKET FUND |
|
|
Schedule of Portfolio Investments—as of April 30, 2009 (Unaudited) |
| | | | | | | |
U.S. Treasury Obligations—100.0% |
|
| | | | | | | |
| | Principal
Amount($) | | Value($) | |
| |
| |
| |
U.S. Treasury Bills – 98.2% | | | | | | | |
0.22%, 5/7/09 (a) | | | 1,081,491,000 | | | 1,081,464,780 | |
0.35%, 5/14/09 (a) | | | 405,900,000 | | | 405,859,024 | |
0.65%, 5/15/09 (a) | | | 275,000,000 | | | 274,941,749 | |
0.32%, 5/21/09 (a) | | | 955,000,000 | | | 954,925,856 | |
0.16%, 5/28/09 (a) | | | 838,700,000 | | | 838,620,420 | |
0.44%, 6/4/09 (a) | | | 285,000,000 | | | 284,900,343 | |
0.30%, 6/11/09 (a) | | | 50,000,000 | | | 49,982,917 | |
0.29%, 7/16/09 (a) | | | 282,000,000 | | | 281,824,993 | |
0.32%, 7/23/09 (a) | | | 175,000,000 | | | 174,870,284 | |
0.34%, 7/30/09 (a) | | | 200,000,000 | | | 199,832,750 | |
0.49%, 8/20/09 (a) | | | 200,000,000 | | | 199,705,696 | |
0.50%, 8/27/09 (a) | | | 175,000,000 | | | 174,716,062 | |
0.46%, 9/3/09 (a) | | | 175,000,000 | | | 174,723,829 | |
0.45%, 9/10/09 (a) | | | 35,000,000 | | | 34,942,314 | |
0.35%, 10/1/09 (a) | | | 100,000,000 | | | 99,850,401 | |
0.38%, 10/8/09 (a) | | | 275,000,000 | | | 274,543,834 | |
0.37%, 10/15/09 (a) | | | 100,000,000 | | | 99,827,898 | |
0.48%, 10/22/09 (a) | | | 225,000,000 | | | 224,548,205 | |
0.30%, 10/29/09 (a) | | | 135,000,000 | | | 134,797,921 | |
0.42%, 11/19/09(a) | | | 25,000,000 | | | 24,941,146 | |
0.35%, 12/17/09(a) | | | 25,000,000 | | | 24,944,175 | |
| | | | |
|
| |
| | | | | | 6,014,764,597 | |
| | | | |
|
| |
U.S. Treasury Notes – 1.8% | | | | | | | |
4.88%, 5/15/09 | | | 113,000,000 | | | 113,202,649 | |
| | | | |
|
| |
Total U.S. Treasury Obligations (Cost $6,127,967,246) | | | | | | 6,127,967,246 | |
| | | | |
|
| |
TOTAL INVESTMENTS
(COST $6,127,967,246) — 100.0% | | | | | | 6,127,967,246 | |
| | | | |
|
| |
| | |
| |
| Percentages indicated are based on net assets of $6,129,569,262. |
| | |
(a) | Discount note. Rate presented represents the effective yield at time of purchase. |
| | |
29 | HSBC INVESTOR FAMILY OF FUNDS | See notes to financial statements |
This page is intentionally left blank.
|
HSBC INVESTOR FAMILY OF FUNDS |
|
Statements of Assets and Liabilities—as of April 30, 2009 (Unaudited) |
| | | | | | | | | | |
| | California
Tax-Free
Money Market
Fund | | New York
Tax-Free
Money Market
Fund | | Prime
Money Market
Fund | |
|
|
|
|
|
|
|
|
Assets: | | | | | | | | | | |
Investments, at amortized cost | | $ | 73,767,193 | | $ | 946,092,772 | | $ | 11,740,758,554 | |
Repurchase agreements, at cost | | | — | | | — | | | 100,000,000 | |
| |
|
| |
|
| |
|
| |
Total Investments | | | 73,767,193 | | | 946,092,772 | | | 11,840,758,554 | |
| |
|
| |
|
| |
|
| |
Cash | | | — | | | — | | | 42,787 | |
Interest and dividends receivable | | | 48,180 | | | 819,917 | | | 8,538,914 | |
Receivable for capital shares issued | | | 1,334 | | | 148,660 | | | 2,037,177 | |
Receivable for investments sold | | | — | | | 2,400,000 | | | — | |
Treasury Guarantee Program | | | 18,710 | | | 161,999 | | | 1,240,568 | |
Prepaid expenses and other assets | | | 18,142 | | | 27,942 | | | 200,036 | |
| |
|
| |
|
| |
|
| |
Total Assets | | | 73,853,559 | | | 949,651,290 | | | 11,852,818,036 | |
| |
|
| |
|
| |
|
| |
Liabilities: | | | | | | | | | | |
Dividends payable | | | 3,867 | | | 186,761 | | | 3,441,634 | |
Payable for investments purchased | | | — | | | — | | | 350,001,956 | |
Accrued expenses and other liabilities: | | | | | | | | | | |
Investment Management | | | 3,222 | | | 120,846 | | | 1,352,141 | |
Administration | | | 2,716 | | | 35,057 | | | 403,880 | |
Distribution | | | — | | | 66 | | | 159,064 | |
Shareholder Servicing | | | 5,766 | | | 113,805 | | | 587,048 | |
Compliance Service | | | 54 | | | 670 | | | 7,993 | |
Transfer Agent | | | 5,926 | | | 4,113 | | | 7,435 | |
Other | | | 7,015 | | | 25,811 | | | 218,936 | |
| |
|
| |
|
| |
|
| |
Total Liabilities | | | 28,566 | | | 487,129 | | | 356,180,087 | |
| |
|
| |
|
| |
|
| |
Net Assets | | $ | 73,824,993 | | $ | 949,164,161 | | $ | 11,496,637,949 | |
| |
|
| |
|
| |
|
| |
|
|
|
|
|
|
|
|
Composition of Net Assets: | | | | | | | | | | |
Capital | | $ | 73,827,918 | | $ | 949,164,161 | | $ | 11,497,056,413 | |
Accumulated net investment income (loss) | | | — | | | — | | | (539 | ) |
Accumulated net realized gains (losses) from investment and foreign currency transactions | | | (2,925 | ) | | — | | | (417,925 | ) |
| |
|
| |
|
| |
|
| |
Net Assets | | $ | 73,824,993 | | $ | 949,164,161 | | $ | 11,496,637,949 | |
| |
|
| |
|
| |
|
| |
|
|
|
|
|
|
|
|
Net Assets: | | | | | | | | | | |
Class A Shares | | $ | 260,611 | | $ | 37,017,791 | | $ | 307,347,177 | |
Class B Shares | | | — | | | 21,443 | | | 392,686 | |
Class C Shares | | | — | | | 1 | | | 246,358,097 | |
Class D Shares | | | 67,858,027 | | | 469,107,726 | | | 2,412,830,925 | |
Class I Shares | | | — | | | — | | | 7,225,360,972 | |
Class Y Shares | | | 5,706,355 | | | 443,017,200 | | | 1,304,348,092 | |
| |
|
| |
|
| |
|
| |
| | $ | 73,824,993 | | $ | 949,164,161 | | $ | 11,496,637,949 | |
| |
|
| |
|
| |
|
| |
Shares Outstanding | | | | | | | | | | |
($0.001 par value, unlimited number of shares authorized): | | | | | | | | | | |
Class A Shares | | | 260,616 | | | 37,016,414 | | | 307,457,928 | |
Class B Shares | | | — | | | 21,405 | | | 392,675 | |
Class C Shares | | | — | | | 1 | | | 246,378,332 | |
Class D Shares | | | 67,854,308 | | | 469,113,057 | | | 2,413,852,313 | |
Class I Shares | | | — | | | — | | | 7,224,762,152 | |
Class Y Shares | | | 5,714,614 | | | 443,013,364 | | | 1,304,227,665 | |
Net Asset Value, Offering Price and Redemption Price per share: | | | | | | | | | | |
Class A Shares | | $ | 1.00 | | $ | 1.00 | | $ | 1.00 | |
Class B Shares* | | $ | — | | $ | 1.00 | | $ | 1.00 | |
Class C Shares* | | $ | — | | $ | 1.00 | | $ | 1.00 | |
Class D Shares | | $ | 1.00 | | $ | 1.00 | | $ | 1.00 | |
Class I Shares | | $ | — | | $ | — | | $ | 1.00 | |
Class Y Shares | | $ | 1.00 | | $ | 1.00 | | $ | 1.00 | |
| |
|
| |
|
| |
|
| |
Total Investments, at cost | | $ | 73,767,193 | | $ | 946,092,772 | | $ | 11,840,758,554 | |
| |
|
| |
|
| |
|
| |
|
|
* Redemption price per varies by length of time shares are held. |
| | |
31 | HSBC INVESTOR FAMILY OF FUNDS | See notes to financial statements |
|
HSBC INVESTOR FAMILY OF FUNDS |
|
Statements of Assets and Liabilities—as of April 30, 2009 (Unaudited) (continued) |
| | | | | | | | | | |
| | Tax-Free
Money Market
Fund | | U.S.
Government
Money Market
Fund | | U.S. Treasury
Money Market
Fund | |
|
|
|
|
|
|
|
|
Assets: | | | | | | | | | | |
Investments, at amortized cost | | $ | 220,884,844 | | $ | 8,498,334,722 | | $ | 6,127,967,246 | |
Repurchase agreements, at cost | | | — | | | 4,235,400,000 | | | — | |
| |
|
| |
|
| |
|
| |
Total Investments | | | 220,884,844 | | | 12,733,734,722 | | | 6,127,967,246 | |
| |
|
| |
|
| |
|
| |
Cash | | | — | | | — | | | 143,684 | |
Interest and dividends receivable | | | 156,315 | | | 14,855,197 | | | 2,541,329 | |
Receivable for capital shares issued | | | 33,256 | | | 2,207,732 | | | 292,878 | |
Receivable for investments sold | | | 1,625,000 | | | — | | | — | |
Receivable from Investment Adviser | | | — | | | — | | | 36,944 | |
Treasury Guarantee Program | | | 32,054 | | | 3,224,651 | | | — | |
Prepaid expenses and other assets | | | 55,610 | | | 601,492 | | | 196,717 | |
| |
|
| |
|
| |
|
| |
Total Assets | | | 222,787,079 | | | 12,754,623,794 | | | 6,131,178,798 | |
| |
|
| |
|
| |
|
| |
Liabilities: | | | | | | | | | | |
Cash overdraft | | | — | | | 18,921,851 | | | — | |
Dividends payable | | | 74,349 | | | 2,924,506 | | | 490,558 | |
Payable for investments purchased | | | — | | | 69,081,224 | | | — | |
Accrued expenses and other liabilities: | | | | | | | | | | |
Investment Management | | | — | | | 1,488,923 | | | 709,549 | |
Administration | | | 8,239 | | | 454,133 | | | 192,993 | |
Distribution | | | 9 | | | 914 | | | — | |
Shareholder Servicing | | | 17,590 | | | 252,854 | | | — | |
Compliance Service | | | 159 | | | 8,854 | | | 4,088 | |
Transfer Agent | | | 6,923 | | | 3,994 | | | 4,800 | |
Other | | | 9,833 | | | 770,959 | | | 207,548 | |
| |
|
| |
|
| |
|
| |
Total Liabilities | | | 117,102 | | | 93,908,212 | | | 1,609,536 | |
| |
|
| |
|
| |
|
| |
Net Assets | | $ | 222,669,977 | | $ | 12,660,715,582 | | $ | 6,129,569,262 | |
| |
|
| |
|
| |
|
| |
|
|
|
|
|
|
|
|
Composition of Net Assets: | | | | | | | | | | |
Capital | | $ | 222,669,977 | | $ | 12,658,856,793 | | $ | 6,129,657,583 | |
Accumulated net investment income (loss) | | | — | | | (1 | ) | | (602 | ) |
Accumulated net realized gains (losses) from investment and foreign currency transactions | | | — | | | 1,858,790 | | | (87,719 | ) |
| |
|
| |
|
| |
|
| |
Net Assets | | $ | 222,669,977 | | $ | 12,660,715,582 | | $ | 6,129,569,262 | |
| |
|
| |
|
| |
|
| |
|
|
|
|
|
|
|
|
Net Assets: | | | | | | | | | | |
Class A Shares | | $ | 25 | | $ | 631,894,395 | | $ | 493,937,686 | |
Class B Shares | | | — | | | 92,000 | | | 168,259 | |
Class C Shares | | | — | | | 126,154 | | | 4,733,196 | |
Class D Shares | | | 80,769,306 | | | 920,097,854 | | | 1,021,220,606 | |
Class I Shares | | | — | | | 7,917,493,178 | | | 3,504,568,620 | |
Class Y Shares | | | 141,900,646 | | | 3,191,012,001 | | | 1,104,940,895 | |
| |
|
| |
|
| |
|
| |
| | $ | 222,669,977 | | $ | 12,660,715,582 | | $ | 6,129,569,262 | |
| |
|
| |
|
| |
|
| |
Shares Outstanding | | | | | | | | | | |
($0.001 par value, unlimited number of shares authorized): | | | | | | | | | | |
Class A Shares | | | 25 | | | 631,404,977 | | �� | 493,976,368 | |
Class B Shares | | | — | | | 91,998 | | | 168,264 | |
Class C Shares | | | — | | | 126,145 | | | 4,733,272 | |
Class D Shares | | | 80,767,731 | | | 919,655,165 | | | 1,021,227,288 | |
Class I Shares | | | — | | | 7,917,028,531 | | | 3,504,618,834 | |
Class Y Shares | | | 141,901,853 | | | 3,190,550,334 | | | 1,104,945,425 | |
Net Asset Value, Offering Price and Redemption Price per share: | | | | | | | | | | |
Class A Shares | | $ | 1.00 | | $ | 1.00 | | $ | 1.00 | |
Class B Shares* | | $ | — | | $ | 1.00 | | $ | 1.00 | |
Class C Shares * | | $ | — | | $ | 1.00 | | $ | 1.00 | |
Class D Shares | | $ | 1.00 | | $ | 1.00 | | $ | 1.00 | |
Class I Shares | | $ | — | | $ | 1.00 | | $ | 1.00 | |
Class Y Shares | | $ | 1.00 | | $ | 1.00 | | $ | 1.00 | |
| |
|
| |
|
| |
|
| |
Total Investments, at cost | | $ | 220,884,844 | | $ | 12,733,734,722 | | $ | 6,127,967,246 | |
| |
|
| |
|
| |
|
| |
|
|
* Redemption price per varies by length of time shares are held. |
| | |
See notes to financial statements | HSBC INVESTOR FAMILY OF FUNDS | 32 |
|
HSBC INVESTOR FAMILY OF FUNDS |
|
Statements of Operations—For the six months ended April 30, 2009 (Unaudited) |
| | | | | | | | | | |
| | California
Tax-Free
Money Market
Fund | | New York
Tax-Free
Money Market
Fund | | Prime
Money Market
Fund | |
|
|
|
|
|
|
|
|
Investment Income: | | | | | | | | | | |
Interest | | $ | 314,516 | | $ | 4,786,493 | | $ | 62,873,784 | |
Dividends | | | 13,484 | | | 117,409 | | | — | |
| |
|
| |
|
| |
|
| |
Total Investment Income (Loss) | | | 328,000 | | | 4,903,902 | | | 62,873,784 | |
| |
|
| |
|
| |
|
| |
|
|
|
|
|
|
|
|
Expenses: | | | | | | | | | | |
Investment Management | | | 44,933 | | | 498,915 | | | 5,104,123 | |
Advisory Services: | | | | | | | | | | |
Operational Support—Class A Shares | | | 141 | | | 10,110 | | | 163,124 | |
Operational Support—Class B Shares | | | — | | | 8 | | | 170 | |
Operational Support—Class C Shares | | | 4 | | | — | | | 147,210 | |
Operational Support—Class D Shares | | | 36,893 | | | 143,793 | | | 1,353,447 | |
Operational Support—Class Y Shares | | | 7,895 | | | 95,547 | | | 741,534 | |
Administration | | | 17,988 | | | 201,818 | | | 2,057,746 | |
Distribution: | | | | | | | | | | |
Class B Shares | | | — | | | 122 | | | 1,275 | |
Class C Shares | | | 19 | | | — | | | 1,104,086 | |
Shareholder Servicing: | | | | | | | | | | |
Class A Shares | | | 563 | | | 80,870 | | | 652,506 | |
Class B Shares | | | — | | | 41 | | | 425 | |
Class C Shares | | | 5 | | | — | | | 368,029 | |
Class D Shares | | | 92,236 | | | 718,917 | | | 3,383,649 | |
Accounting | | | 38,101 | | | 43,354 | | | 40,550 | |
Compliance Service | | | 349 | | | 4,016 | | | 38,604 | |
Custodian | | | 4,735 | | | 28,024 | | | 63,929 | |
Printing | | | 3,657 | | | 9,089 | | | 92,942 | |
Professional fees | | | 2,346 | | | 23,359 | | | 231,240 | |
Transfer Agent | | | 20,004 | | | 22,282 | | | 60,540 | |
Treasury Guarantee Program | | | 26,959 | | | 233,494 | | | 1,788,085 | |
Trustee | | | 1,384 | | | 13,035 | | | 124,325 | |
Registration fees | | | 14,551 | | | 20,206 | | | 138,525 | |
Other | | | 2,100 | | | 15,748 | | | 157,611 | |
| |
|
| |
|
| |
|
| |
Total expenses before fee reductions | | | 314,863 | | | 2,162,748 | | | 17,813,675 | |
Fees reduced by Investment Adviser | | | (67,399 | ) | | — | | | — | |
Fees reduced by Administrator | | | — | | | — | | | (49,780 | ) |
Fees reduced by Distributor | | | (6 | ) | | (24 | ) | | (54,830 | ) |
Fees reduced by Shareholder Servicing Agent | | | (23,282 | ) | | (3,993 | ) | | (386,572 | ) |
Fees reduced by Custody Credits | | | — | | | — | | | (12,542 | ) |
| |
|
| |
|
| |
|
| |
Net Expenses | | | 224,176 | | | 2,158,731 | | | 17,309,951 | |
| |
|
| |
|
| |
|
| |
|
|
|
|
|
|
|
|
Net Investment Income (Loss) | | | 103,824 | | | 2,745,171 | | | 45,563,833 | |
| |
|
| |
|
| |
|
| |
|
|
|
|
|
|
|
|
Net realized gains (losses) from investments transactions | | | (1 | ) | | — | | | 3,541,101 | |
| |
|
| |
|
| |
|
| |
Change In Net Assets Resulting From Operations | | $ | 103,823 | | $ | 2,745,171 | | $ | 49,104,934 | |
| |
|
| |
|
| |
|
| |
| | |
33 | HSBC INVESTOR FAMILY OF FUNDS | See notes to financial statements |
|
HSBC INVESTOR FAMILY OF FUNDS |
|
Statements of Operations—For the six months ended April 30, 2009 (Unaudited) (continued) |
| | | | | | | | | | |
| | Tax-Free
Money Market
Fund | | U.S.
Government
Money Market
Fund | | U.S. Treasury
Money Market
Fund | |
|
|
|
|
|
|
|
|
Investment Income: | | | | | | | | | | |
Interest | | $ | 1,126,743 | | $ | 56,484,741 | | $ | 12,186,321 | |
Dividends | | | 36,859 | | | — | | | — | |
| |
|
| |
|
| |
|
| |
Total Investment Income (Loss) | | | 1,163,602 | | | 56,484,741 | | | 12,186,321 | |
| |
|
| |
|
| |
|
| |
|
|
|
|
|
|
|
|
Expenses: | | | | | | | | | | |
Investment Management | | | 116,032 | | | 6,297,826 | | | 3,282,051 | |
Advisory Services: | | | | | | | | | | |
Operational Support—Class A Shares | | | — | | | 325,471 | | | 247,746 | |
Operational Support—Class B Shares | | | — | | | 41 | | | 78 | |
Operational Support—Class C Shares | | | — | | | 83 | | | 1,806 | |
Operational Support—Class D Shares | | | 45,116 | | | 560,394 | | | 580,416 | |
Operational Support—Class Y Shares | | | 70,916 | | | 2,177,420 | | | 524,057 | |
Administration | | | 46,837 | | | 2,532,351 | | | 1,326,927 | |
Distribution: | | | | | | | | | | |
Class B Shares | | | — | | | 312 | | | 585 | |
Class C Shares | | | — | | | 622 | | | 13,548 | |
Shareholder Servicing: | | | | | | | | | | |
Class A Shares | | | — | | | 1,301,899 | | | 990,995 | |
Class B Shares | | | — | | | 104 | | | 195 | |
Class C Shares | | | — | | | 207 | | | 4,516 | |
Class D Shares | | | 112,791 | | | 1,400,999 | | | 1,451,053 | |
Accounting | | | 42,012 | | | 39,441 | | | 35,319 | |
Compliance Service | | | 950 | | | 56,444 | | | 25,385 | |
Custodian | | | 7,665 | | | 185,501 | | | 120,486 | |
Printing | | | 1,811 | | | 112,488 | | | 54,310 | |
Professional fees | | | 5,477 | | | 325,044 | | | 170,795 | |
Transfer Agent | | | 22,819 | | | 67,642 | | | 40,888 | |
Treasury Guarantee Program | | | 46,200 | | | 4,647,722 | | | — | |
Trustee | | | 2,882 | | | 187,952 | | | 82,805 | |
Registration fees | | | 32,927 | | | 200,829 | | | 109,259 | |
Other | | | 3,146 | | | 249,507 | | | 94,942 | |
| |
|
| |
|
| |
|
| |
Total expenses before fee reductions | | | 557,581 | | | 20,670,299 | | | 9,158,162 | |
Fees reduced by Investment Adviser | | | (232,064 | ) | | — | | | (90,320 | ) |
Fees reduced by Administrator | | | — | | | (159,433 | ) | | (74,448 | ) |
Fees reduced by Distributor | | | — | | | (370 | ) | | (14,128 | ) |
Fees reduced by Shareholder Servicing Agent | | | — | | | (280,323 | ) | | (2,385,757 | ) |
Fees reduced by Custody Credits | | | — | | | (27,335 | ) | | (24,377 | ) |
| |
|
| |
|
| |
|
| |
Net Expenses | | | 325,517 | | | 20,202,838 | | | 6,569,132 | |
| |
|
| |
|
| |
|
| |
|
|
|
|
|
|
|
|
Net Investment Income (Loss) | | | 838,085 | | | 36,281,903 | | | 5,617,189 | |
| |
|
| |
|
| |
|
| |
|
|
|
|
|
|
|
|
Net realized gains (losses) from investments transactions | | | — | | | 1,858,790 | | | 227,836 | |
| |
|
| |
|
| |
|
| |
Change In Net Assets Resulting From Operations | | $ | 838,085 | | $ | 38,140,693 | | $ | 5,845,025 | |
| |
|
| |
|
| |
|
| |
| | |
See notes to financial statements | HSBC INVESTOR FAMILY OF FUNDS | 34 |
|
HSBC INVESTOR FAMILY OF FUNDS |
|
Statements of Changes in Net Assets |
All capital share transactions have been processed at a net asset value of $1.00 per share. |
| | | | | | | | | | | | | |
| | California Tax-Free
Money Market Fund | | New York Tax-Free
Money Market Fund | |
|
|
|
|
|
|
| | For the
six months ended
April 30, 2009
(Unaudited) | | For the
year ended
October 31, 2008 | | For the
six months ended
April 30, 2009
(Unaudited) | | For the
year ended
October 31, 2008 | |
|
|
|
|
|
|
|
|
|
|
Investment Activities: | | | | | | | | | | | | | |
Operations: | | | | | | | | | | | | | |
Net investment income (loss) | | $ | 103,824 | | $ | 3,525,705 | | $ | 2,745,171 | | $ | 22,986,049 | |
Net realized gains (losses) from investment transactions | | | (1 | ) | | (2,900 | ) | | — | | | 19,955 | |
| |
|
| |
|
| |
|
| |
|
| |
Change in net assets resulting from operations | | | 103,823 | | | 3,522,805 | | | 2,745,171 | | | 23,006,004 | |
| |
|
| |
|
| |
|
| |
|
| |
|
|
|
|
|
|
|
|
|
|
|
|
|
|
Dividends: | | | | | | | | | | | | | |
Net investment income: | | | | | | | | | | | | | |
Class A Shares | | | (215 | ) | | (518 | ) | | (75,688 | ) | | (1,479,339 | ) |
Class B Shares | | | — | | | — | | | (21 | ) | | (455 | ) |
Class C Shares | | | (4 | ) | | (6,483 | ) | | — | | | — | |
Class D Shares | | | (72,169 | ) | | (1,842,641 | ) | | (1,369,445 | ) | | (13,705,945 | ) |
Class Y Shares | | | (31,436 | ) | | (1,697,267 | ) | | (1,300,017 | ) | | (7,966,517 | ) |
Net realized gains: | | | | | | | | | | | | | |
Class A Shares | | | — | | | — | | | (383 | ) | | — | |
Class D Shares | | | — | | | — | | | (4,864 | ) | | — | |
Class Y Shares | | | — | | | — | | | (2,970 | ) | | — | |
| |
|
| |
|
| |
|
| |
|
| |
Change in net assets resulting from shareholder dividends | | | (103,824 | ) | | (3,546,909 | ) | | (2,753,388 | ) | | (23,152,256 | ) |
| |
|
| |
|
| |
|
| |
|
| |
Change in net assets resulting from capital transactions | | | (36,041,049 | ) | | (14,176,303 | ) | | (3,240,483 | ) | | (39,845,047 | ) |
| |
|
| |
|
| |
|
| |
|
| |
Change in net assets | | | (36,041,050 | ) | | (14,200,407 | ) | | (3,248,700 | ) | | (39,991,299 | ) |
| |
|
| |
|
| |
|
| |
|
| |
|
|
|
|
|
|
|
|
|
|
|
|
|
|
Net Assets: | | | | | | | | | | | | | |
Beginning of period | | | 109,866,043 | | | 124,066,450 | | | 952,412,861 | | | 992,404,160 | |
| |
|
| |
|
| |
|
| |
|
| |
End of period | | $ | 73,824,993 | | $ | 109,866,043 | | $ | 949,164,161 | | $ | 952,412,861 | |
| |
|
| |
|
| |
|
| |
|
| |
| | |
35 | HSBC INVESTOR FAMILY OF FUNDS | See notes to financial statements |
|
HSBC INVESTOR FAMILY OF FUNDS |
|
Statements of Changes in Net Assets (continued) |
All capital share transactions have been processed at a net asset value of $1.00 per share. |
| | | | | | | | | | | | | |
| | California Tax-Free
Money Market Fund | | New York Tax-Free
Money Market Fund | |
|
|
|
|
|
|
| | For the
six months ended
April 30, 2009
(Unaudited) | | For the
year ended
October 31, 2008 | | For the
six months ended
April 30, 2009
(Unaudited) | | For the
year ended
October 31, 2008 | |
|
|
|
|
|
|
|
|
|
|
CAPITAL TRANSACTIONS: | | | | | | | | | | | | | |
Class A Shares: | | | | | | | | | | | | | |
Proceeds from shares issued | | $ | 59,398 | | $ | 681,499 | | $ | 55,968,240 | | $ | 210,390,939 | |
Dividends reinvested | | | 215 | | | 518 | | | 74,742 | | | 1,443,966 | |
Value of shares redeemed | | | (241,020 | ) | | (239,994 | ) | | (64,815,259 | ) | | (286,871,286 | ) |
| |
|
| |
|
| |
|
| |
|
| |
Class A Shares capital transactions | | | (181,407 | ) | | 442,023 | | | (8,772,277 | ) | | (75,036,381 | ) |
| |
|
| |
|
| |
|
| |
|
| |
|
|
|
|
|
|
|
|
|
|
|
|
|
|
Class B Shares: | | | | | | | | | | | | | |
Dividends reinvested | | | — | | | — | | | 21 | | | 455 | |
Value of shares redeemed | | | — | | | — | | | (13,219 | ) | | (54 | ) |
| |
|
| |
|
| |
|
| |
|
| |
Class B Shares capital transactions | | | — | | | — | | | (13,198 | ) | | 401 | |
| |
|
| |
|
| |
|
| |
|
| |
|
|
|
|
|
|
|
|
|
|
|
|
|
|
Class C Shares: | | | | | | | | | | | | | |
Proceeds from shares issued | | | 27,562 | | | 784 | | | — | | | — | |
Dividends reinvested | | | 4 | | | 6,483 | | | — | | | — | |
Value of shares redeemed | | | (27,566 | ) | | (1,025,743 | ) | | — | | | — | |
| |
|
| |
|
| |
|
| |
|
| |
Class C Shares capital transactions | | | — | | | (1,018,476 | ) | | — | | | — | |
| |
|
| |
|
| |
|
| |
|
| |
|
|
|
|
|
|
|
|
|
|
|
|
|
|
Class D Shares: | | | | | | | | | | | | | |
Proceeds from shares issued | | | 97,545,703 | | | 415,175,969 | | | 540,506,529 | | | 2,052,625,049 | |
Dividends reinvested | | | 33,605 | | | 1,228,442 | | | 1,095,555 | | | 11,715,496 | |
Value of shares redeemed | | | (112,982,382 | ) | | (423,974,744 | ) | | (659,280,109 | ) | | (2,009,326,659 | ) |
| |
|
| |
|
| |
|
| |
|
| |
Class D Shares capital transactions | | | (15,403,074 | ) | | (7,570,333 | ) | | (117,678,025 | ) | | 55,013,886 | |
| |
|
| |
|
| |
|
| |
|
| |
|
|
|
|
|
|
|
|
|
|
|
|
|
|
Class Y Shares: | | | | | | | | | | | | | |
Proceeds from shares issued | | | 61,967,817 | | | 542,672,399 | | | 603,314,293 | | | 1,210,332,698 | |
Dividends reinvested | | | 4,754 | | | 1,121,256 | | | 1,034,517 | | | 5,947,200 | |
Value of shares redeemed | | | (82,429,139 | ) | | (549,823,172 | ) | | (481,125,793 | ) | | (1,236,102,851 | ) |
| |
|
| |
|
| |
|
| |
|
| |
Class Y Shares capital transactions | | | (20,456,568 | ) | | (6,029,517 | ) | | 123,223,017 | | | (19,822,953 | ) |
| |
|
| |
|
| |
|
| |
|
| |
Change in net assets resulting from capital transactions | | $ | (36,041,049 | ) | $ | (14,176,303 | ) | $ | (3,240,483 | ) | $ | (39,845,047 | ) |
| |
|
| |
|
| |
|
| |
|
| |
| | |
See notes to financial statements | HSBC INVESTOR FAMILY OF FUNDS | 36 |
|
HSBC INVESTOR FAMILY OF FUNDS |
|
Statements of Changes in Net Assets (continued) |
All capital share transactions have been processed at a net asset value of $1.00 per share. |
| | | | | | | | | | | | | |
| | Prime
Money Market Fund | | Tax-Free
Money Market Fund | |
|
|
|
|
|
|
| | For the
six months ended
April 30, 2009
(Unaudited) | | For the
year ended
October 31, 2008 | | For the
six months ended
April 30, 2009
(Unaudited) | | For the
year ended
October 31, 2008 | |
|
|
|
|
|
|
|
|
|
|
Investment Activities: | | | | | | | | | | | | | |
Operations: | | | | | | | | | | | | | |
Net investment income (loss) | | $ | 45,563,833 | | $ | 234,083,656 | | $ | 838,085 | | $ | 3,181,467 | |
Net realized gains (losses) from investment transactions | | | 3,541,101 | | | (3,685,003 | ) | | — | | | 716 | |
| |
|
| |
|
| |
|
| |
|
| |
Change in net assets resulting from operations | | | 49,104,934 | | | 230,398,653 | | | 838,085 | | | 3,182,183 | |
| |
|
| |
|
| |
|
| |
|
| |
|
|
|
|
|
|
|
|
|
|
|
|
|
|
Dividends: | | | | | | | | | | | | | |
Net investment income: | | | | | | | | | | | | | |
Class A Shares | | | (969,933 | ) | | (10,717,376 | ) | | — | | | — | |
Class B Shares | | | (449 | ) | | (4,255 | ) | | — | | | — | |
Class C Shares | | | (482,937 | ) | | (7,530,526 | ) | | — | | | — | |
Class D Shares | | | (10,086,773 | ) | | (98,458,039 | ) | | (253,074 | ) | | (1,494,796 | ) |
Class I Shares | | | (25,868,314 | ) | | (79,246,127 | ) | | — | | | — | |
Class Y Shares | | | (8,155,427 | ) | | (38,841,857 | ) | | (585,011 | ) | | (1,686,697 | ) |
Net realized gains: | | | | | | | | | | | | | |
Class D Shares | | | — | | | — | | | (278 | ) | | — | |
Class Y Shares | | | — | | | — | | | (438 | ) | | — | |
| |
|
| |
|
| |
|
| |
|
| |
Change in net assets resulting from shareholder dividends | | | (45,563,833 | ) | | (234,798,180 | ) | | (838,801 | ) | | (3,181,493 | ) |
| |
|
| |
|
| |
|
| |
|
| |
|
|
|
|
|
|
|
|
|
|
|
|
|
|
Change in net assets resulting from capital transactions | | | 2,955,848,035 | | | 1,134,798,302 | | | 9,153,672 | | | 154,396,548 | |
| |
|
| |
|
| |
|
| |
|
| |
Change in net assets | | | 2,959,389,136 | | | 1,130,398,775 | | | 9,152,956 | | | 154,397,238 | |
|
|
|
|
|
|
|
|
|
|
|
|
|
|
Net Assets: | | | | | | | | | | | | | |
Beginning of period | | | 8,537,248,813 | | | 7,406,850,038 | | | 213,517,021 | | | 59,119,783 | |
| |
|
| |
|
| |
|
| |
|
| |
End of period | | $ | 11,496,637,949 | | $ | 8,537,248,813 | | $ | 222,669,977 | | $ | 213,517,021 | |
| |
|
| |
|
| |
|
| |
|
| |
Accumulated net investment income (loss) | | $ | (539 | ) | $ | (539 | ) | $ | — | | $ | — | |
| |
|
| |
|
| |
|
| |
|
| |
| | |
37 | HSBC INVESTOR FAMILY OF FUNDS | See notes to financial statements |
|
HSBC INVESTOR FAMILY OF FUNDS |
|
Statements of Changes in Net Assets (continued) |
All capital share transactions have been processed at a net asset value of $1.00 per share. |
| | | | | | | | | | | | | |
| | Prime
Money Market Fund | | Tax-Free
Money Market Fund | |
|
|
|
|
|
|
| | For the
six months ended
April 30, 2009
(Unaudited) | | For the
year ended
October 31, 2008 | | For the
six months ended
April 30, 2009
(Unaudited) | | For the
year ended
October 31, 2008 | |
|
|
|
|
|
|
|
|
|
|
CAPITAL TRANSACTIONS: | | | | | | | | | | | | | |
Class A Shares: | | | | | | | | | | | | | |
Proceeds from shares issued | | $ | 421,625,291 | | $ | 812,447,094 | | $ | 25 | | $ | 828 | |
Dividends reinvested | | | 843,107 | | | 8,967,364 | | | — | | | — | |
Value of shares redeemed | | | (423,745,172 | ) | | (983,783,863 | ) | | — | | | (828 | ) |
| |
|
| |
|
| |
|
| |
|
| |
Class A Shares capital transactions | | | (1,276,774 | ) | | (162,369,405 | ) | | 25 | | | — | |
| |
|
| |
|
| |
|
| |
|
| |
|
|
|
|
|
|
|
|
|
|
|
|
|
|
Class B Shares: | | | | | | | | | | | | | |
Proceeds from shares issued | | | 258,850 | | | 200,130 | | | — | | | — | |
Dividends reinvested | | | 372 | | | 1,251 | | | — | | | — | |
Value of shares redeemed | | | (65,295 | ) | | (206,424 | ) | | — | | | — | |
| |
|
| |
|
| |
|
| |
|
| |
Class B Shares capital transactions | | | 193,927 | | | (5,043 | ) | | — | | | — | |
| |
|
| |
|
| |
|
| |
|
| |
|
|
|
|
|
|
|
|
|
|
|
|
|
|
Class C Shares: | | | | | | | | | | | | | |
Proceeds from shares issued | | | 386,822,966 | | | 1,414,798,792 | | | — | | | — | |
Dividends reinvested | | | 482,937 | | | 7,530,526 | | | — | | | — | |
Value of shares redeemed | | | (457,848,415 | ) | | (1,422,597,259 | ) | | — | | | — | |
| |
|
| |
|
| |
|
| |
|
| |
Class C Shares capital transactions | | | (70,542,512 | ) | | (267,941 | ) | | ��� | | | — | |
| |
|
| |
|
| |
|
| |
|
| |
|
|
|
|
|
|
|
|
|
|
|
|
|
|
Class D Shares: | | | | | | | | | | | | | |
Proceeds from shares issued | | | 4,694,173,414 | | | 14,056,339,720 | | | 139,239,288 | | | 197,036,869 | |
Dividends reinvested | | | 7,540,115 | | | 73,917,807 | | | 72,839 | | | 298,710 | |
Value of shares redeemed | | | (5,010,577,310 | ) | | (15,118,065,887 | ) | | (128,329,497 | ) | | (167,733,619 | ) |
| |
|
| |
|
| |
|
| |
|
| |
Class D Shares capital transactions | | | (308,863,781 | ) | | (987,808,360 | ) | | 10,982,630 | | | 29,601,960 | |
| |
|
| |
|
| |
|
| |
|
| |
|
|
|
|
|
|
|
|
|
|
|
|
|
|
Class I Shares: | | | | | | | | | | | | | |
Proceeds from shares issued | | | 30,645,651,906 | | | 20,082,620,039 | | | — | | | — | |
Dividends reinvested | | | 14,929,444 | | | 35,720,314 | | | — | | | — | |
Value of shares redeemed | | | (26,391,005,525 | ) | | (19,033,614,412 | ) | | — | | | — | |
| |
|
| |
|
| |
|
| |
|
| |
Class I Shares capital transactions | | | 4,269,575,825 | | | 1,084,725,941 | | | — | | | — | |
| |
|
| |
|
| |
|
| |
|
| |
|
|
|
|
|
|
|
|
|
|
|
|
|
|
Class Y Shares: | | | | | | | | | | | | | |
Proceeds from shares issued | | | 4,408,129,178 | | | 7,458,133,919 | | | 157,675,416 | | | 300,761,859 | |
Dividends reinvested | | | 6,015,267 | | | 35,421,479 | | | 296,659 | | | 807,043 | |
Value of shares redeemed | | | (5,347,383,095 | ) | | (6,293,032,288 | ) | | (159,801,058 | ) | | (176,774,314 | ) |
| |
|
| |
|
| |
|
| |
|
| |
Class Y Shares capital transactions | | | (933,238,650 | ) | | 1,200,523,110 | | | (1,828,983 | ) | | 124,794,588 | |
| |
|
| |
|
| |
|
| |
|
| |
Change in net assets resulting from capital transactions | | $ | 2,955,848,035 | | $ | 1,134,798,302 | | $ | 9,153,672 | | $ | 154,396,548 | |
| |
|
| |
|
| |
|
| |
|
| |
| | | | | | | | | | | | | |
| | |
See notes to financial statements | HSBC INVESTOR FAMILY OF FUNDS | 38 |
|
HSBC INVESTOR FAMILY OF FUNDS |
|
Statements of Changes in Net Assets (continued) |
All capital share transactions have been processed at a net asset value of $1.00 per share. |
| | | | | | | | | | | | | |
| | U.S. Government
Money Market Fund | | U.S. Treasury
Money Market Fund | |
|
|
|
|
|
|
| | For the
six months ended
April 30, 2009
(Unaudited) | | For the
year ended
October 31, 2008 | | For the
six months ended
April 30, 2009
(Unaudited) | | For the
year ended
October 31, 2008 | |
|
|
|
|
|
|
Investment Activities: | | | | | | | | | | | | | |
Operations: | | | | | | | | | | | | | |
Net investment income (loss) | | $ | 36,281,903 | | $ | 384,597,544 | | $ | 5,617,189 | | $ | 30,525,495 | |
Net realized gains (losses) from investment transactions | | | 1,858,790 | | | 852,522 | | | 227,836 | | | 56,374 | |
| |
|
| |
|
| |
|
| |
|
| |
Change in net assets resulting from operations | | | 38,140,693 | | | 385,450,066 | | | 5,845,025 | | | 30,581,869 | |
| |
|
| |
|
| |
|
| |
|
| |
|
|
|
|
|
|
|
|
|
|
|
|
|
|
Dividends: | | | | | | | | | | | | | |
Net investment income: | | | | | | | | | | | | | |
Class A Shares | | | (790,229 | ) | | (20,761,810 | ) | | (241,346 | ) | | (2,345,769 | ) |
Class B Shares | | | (41 | ) | | (208 | ) | | (70 | ) | | (368 | ) |
Class C Shares | | | (93 | ) | | (4,999 | ) | | (1,342 | ) | | (113 | ) |
Class D Shares | | | (2,129,727 | ) | | (110,537,831 | ) | | (548,539 | ) | | (8,589,362 | ) |
Class I Shares | | | (20,090,200 | ) | | (36,476,266 | ) | | (4,142,208 | ) | | (11,454,843 | ) |
Class Y Shares | | | (13,271,613 | ) | | (217,291,492 | ) | | (683,684 | ) | | (8,162,220 | ) |
Net realized gains: | | | | | | | | | | | | | |
Class A Shares | | | (43,041 | ) | | — | | | (20,098 | ) | | — | |
Class B Shares | | | (6 | ) | | — | | | (7 | ) | | — | |
Class C Shares | | | (13 | ) | | — | | | (173 | ) | | — | |
Class D Shares | | | (70,176 | ) | | — | | | (53,316 | ) | | — | |
Class I Shares | | | (429,417 | ) | | — | | | (166,785 | ) | | — | |
Class Y Shares | | | (307,699 | ) | | — | | | (41,513 | ) | | — | |
| |
|
| |
|
| |
|
| |
|
| |
Change in net assets resulting from shareholder dividends | | | (37,132,255 | ) | | (385,072,606 | ) | | (5,899,081 | ) | | (30,552,675 | ) |
| |
|
| |
|
| |
|
| |
|
| |
|
|
|
|
|
|
|
|
|
|
|
|
|
|
Change in net assets resulting from capital transactions | | | (1,139,002,505 | ) | | 4,729,251,775 | | | (525,547,293 | ) | | 6,158,909,368 | |
| |
|
| |
|
| |
|
| |
|
| |
Change in net assets | | | (1,137,994,067 | ) | | 4,729,629,235 | | | (525,601,349 | ) | | 6,158,938,562 | |
|
|
|
|
|
|
|
|
|
|
|
|
|
|
Net Assets: | | | | | | | | | | | | | |
Beginning of period | | | 13,798,709,649 | | | 9,069,080,414 | | | 6,655,170,611 | | | 496,232,049 | |
| |
|
| |
|
| |
|
| |
|
| |
End of period | | $ | 12,660,715,582 | | $ | 13,798,709,649 | | $ | 6,129,569,262 | | $ | 6,655,170,611 | |
| |
|
| |
|
| |
|
| |
|
| |
Accumulated net investment income (loss) | | $ | (1 | ) | $ | (1 | ) | $ | (602 | ) | $ | (602 | ) |
| |
|
| |
|
| |
|
| |
|
| |
| | |
39 | HSBC INVESTOR FAMILY OF FUNDS | See notes to financial statements |
|
HSBC INVESTOR FAMILY OF FUNDS |
|
Statements of Changes in Net Assets (continued) |
All capital share transactions have been processed at a net asset value of $1.00 per share. |
| | | | | | | | | | | | | |
| | U.S. Government
Money Market Fund | | U.S. Treasury
Money Market Fund | |
|
|
|
|
|
|
| | For the
six months ended
April 30, 2009
(Unaudited) | | For the
year ended
October 31, 2008 | | For the
six months ended
April 30, 2009
(Unaudited) | | For the
year ended
October 31, 2008 | |
|
|
|
|
|
|
CAPITAL TRANSACTIONS: | | | | | | | | | | | | | |
Class A Shares: | | | | | | | | | | | | | |
Proceeds from shares issued | | $ | 1,002,888,518 | | $ | 2,218,184,757 | | $ | 594,512,899 | | $ | 1,146,228,416 | |
Dividends reinvested | | | 829,060 | | | 20,748,773 | | | 259,734 | | | 2,345,451 | |
Value of shares redeemed | | | (1,075,590,612 | ) | | (2,626,012,754 | ) | | (681,288,855 | ) | | (652,469,814 | ) |
| |
|
| |
|
| |
|
| |
|
| |
Class A Shares capital transactions | | | (71,873,034 | ) | | (387,079,224 | ) | | (86,516,222 | ) | | 496,104,053 | |
| |
|
| |
|
| |
|
| |
|
| |
|
|
|
|
|
|
|
|
|
|
|
|
|
|
Class B Shares: | | | | | | | | | | | | | |
Proceeds from shares issued | | | 38,078 | | | 53,672 | | | 53,703 | | | 156,653 | |
Dividends reinvested | | | 47 | | | 208 | | | 77 | | | 366 | |
Value of shares redeemed | | | — | | | (635 | ) | | (16,908 | ) | | (66,940 | ) |
| |
|
| |
|
| |
|
| |
|
| |
Class B Shares capital transactions | | | 38,125 | | | 53,245 | | | 36,872 | | | 90,079 | |
| |
|
| |
|
| |
|
| |
|
| |
|
|
|
|
|
|
|
|
|
|
|
|
|
|
Class C Shares: | | | | | | | | | | | | | |
Proceeds from shares issued | | | 3,193,578 | | | 10,271,297 | | | 8,483,710 | | | 1,308,712 | |
Dividends reinvested | | | 106 | | | 4,310 | | | 1,515 | | | 113 | |
Value of shares redeemed | | | (3,168,151 | ) | | (10,602,789 | ) | | (4,854,804 | ) | | (205,984 | ) |
| |
|
| |
|
| |
|
| |
|
| |
Class C Shares capital transactions | | | 25,533 | | | (327,182 | ) | | 3,630,421 | | | 1,102,841 | |
| |
|
| |
|
| |
|
| |
|
| |
|
|
|
|
|
|
|
|
|
|
|
|
|
|
Class D Shares: | | | | | | | | | | | | | |
Proceeds from shares issued | | | 2,429,250,270 | | | 21,742,131,804 | | | 1,756,785,951 | | | 3,861,433,949 | |
Dividends reinvested | | | 767,312 | | | 12,459,719 | | | 356,976 | | | 5,493,923 | |
Value of shares redeemed | | | (2,948,261,528 | ) | | (21,077,754,961 | ) | | (1,673,810,196 | ) | | (3,226,179,507 | ) |
| |
|
| |
|
| |
|
| |
|
| |
Class D Shares capital transactions | | | (518,243,946 | ) | | 676,836,562 | | | 83,332,731 | | | 640,748,365 | |
| |
|
| |
|
| |
|
| |
|
| |
|
|
|
|
|
|
|
|
|
|
|
|
|
|
Class I Shares: | | | | | | | | | | | | | |
Proceeds from shares issued | | | 22,903,391,726 | | | 15,079,578,869 | | | 5,924,509,450 | | | 6,937,308,780 | |
Dividends reinvested | | | 16,475,092 | | | 31,259,496 | | | 2,955,426 | | | 10,722,081 | |
Value of shares redeemed | | | (19,911,607,845 | ) | | (11,151,199,818 | ) | | (6,194,133,737 | ) | | (3,250,211,911 | ) |
| |
|
| |
|
| |
|
| |
|
| |
Class I Shares capital transactions | | | 3,008,258,973 | | | 3,959,638,547 | | | (266,668,861 | ) | | 3,697,818,950 | |
| |
|
| |
|
| |
|
| |
|
| |
|
|
|
|
|
|
|
|
|
|
|
|
|
|
Class Y Shares: | | | | | | | | | | | | | |
Proceeds from shares issued | | | 14,911,153,804 | | | 37,523,017,690 | | | 2,495,540,836 | | | 4,734,361,422 | |
Dividends reinvested | | | 13,470,985 | | | 216,736,458 | | | 676,807 | | | 7,992,936 | |
Value of shares redeemed | | | (18,481,832,945 | ) | | (37,259,624,321 | ) | | (2,755,579,877 | ) | | (3,419,309,278 | ) |
| |
|
| |
|
| |
|
| |
|
| |
Class Y Shares capital transactions | | | (3,557,208,156 | ) | | 480,129,827 | | | (259,362,234 | ) | | 1,323,045,080 | |
| |
|
| |
|
| |
|
| |
|
| |
Change in net assets resulting from capital transactions | | $ | (1,139,002,505 | ) | $ | 4,729,251,775 | | $ | (525,547,293 | ) | $ | 6,158,909,368 | |
| |
|
| |
|
| |
|
| |
|
| |
| | |
See notes to financial statements | HSBC INVESTOR FAMILY OF FUNDS | 40 |
|
HSBC INVESTOR CALIFORNIA TAX-FREE MONEY MARKET FUND |
|
Financial Highlights
Selected data for a share outstanding throughout the periods indicated.
| | | | | | | | | | | | | | | | | | |
| | | | | Investment Activities | | Dividends | |
| | | | |
| |
|
|
| | Net Asset
Value,
Beginning
of Period | | Net
Investment
Income | | Total from
Investment
Activities | | Net
Investment
Income | | Total
Dividends | |
|
|
|
|
|
|
|
|
|
|
|
|
|
|
|
|
|
CLASS A SHARES | | | | | | | | | | | | | | | | | | |
Period Ended October 31, 2007 (d) | | | $ | 1.00 | | | 0.00 | * | | 0.00 | * | | (0.00 | )* | | (0.00 | )* | |
Year Ended October 31, 2008 (i) | | | | 1.00 | | | 0.01 | | | 0.01 | | | (0.01 | ) | | (0.01 | ) | |
Six Months Ended April 30, 2009 (Unaudited) | | | | 1.00 | | | 0.00 | * | | 0.00 | * | | (0.00 | )* | | (0.00 | )* | |
|
|
|
|
|
|
|
|
|
|
|
|
|
|
|
|
|
|
|
CLASS C SHARES | | | | | | | | | | | | | | | | | | |
Year Ended October 31, 2007 (e) | | | $ | 1.00 | | | 0.01 | | | 0.01 | | | (0.01 | ) | | (0.01 | ) | |
Year Ended October 31, 2008 (f) | | | | 1.00 | | | 0.01 | | | 0.01 | | | (0.01 | ) | | (0.01 | ) | |
Six Months Ended April 30, 2009 (j) (Unaudited) | | | | 1.00 | | | 0.00 | * | | 0.00 | * | | (0.00 | )* | | (0.00 | )* | |
|
|
|
|
|
|
|
|
|
|
|
|
|
|
|
|
|
|
|
CLASS D SHARES | | | | | | | | | | | | | | | | | | |
Year Ended October 31, 2004 | | | $ | 1.00 | | | 0.01 | | | 0.01 | | | (0.01 | ) | | (0.01 | ) | |
Year Ended October 31, 2005 | | | | 1.00 | | | 0.02 | | | 0.02 | | | (0.02 | ) | | (0.02 | ) | |
Year Ended October 31, 2006 | | | | 1.00 | | | 0.03 | | | 0.03 | | | (0.03 | ) | | (0.03 | ) | |
Year Ended October 31, 2007 | | | | 1.00 | | | 0.03 | | | 0.03 | | | (0.03 | ) | | (0.03 | ) | |
Year Ended October 31, 2008 | | | | 1.00 | | | 0.02 | | | 0.02 | | | (0.02 | ) | | (0.02 | ) | |
Six Months Ended April 30, 2009 (Unaudited) | | | | 1.00 | | | 0.00 | * | | 0.00 | * | | (0.00 | )* | | (0.00 | )* | |
|
|
|
|
|
|
|
|
|
|
|
|
|
|
|
|
|
|
|
CLASS Y SHARES | | | | | | | | | | | | | | | | | | |
Year Ended October 31, 2004 | | | $ | 1.00 | | | 0.01 | | | 0.01 | | | (0.01 | ) | | (0.01 | ) | |
Year Ended October 31, 2005 | | | | 1.00 | | | 0.02 | | | 0.02 | | | (0.02 | ) | | (0.02 | ) | |
Year Ended October 31, 2006 | | | | 1.00 | | | 0.03 | | | 0.03 | | | (0.03 | ) | | (0.03 | ) | |
Year Ended October 31, 2007 | | | | 1.00 | | | 0.03 | | | 0.03 | | | (0.03 | ) | | (0.03 | ) | |
Year Ended October 31, 2008 | | | | 1.00 | | | 0.02 | | | 0.02 | | | (0.02 | ) | | (0.02 | ) | |
Six Months Ended April 30, 2009 (Unaudited) | | | | 1.00 | | | 0.00 | * | | 0.00 | * | | (0.00 | )* | | (0.00 | )* | |
|
|
|
|
|
|
|
|
|
|
|
|
|
|
|
|
|
|
|
| | | | | | | | | | | | | | | | | | | | | | | |
| | | | | | | | Ratios/Supplementary Data | |
| | | | | | | |
|
|
| | Net Asset
Value, End
of Period | | Total
Return(a) | | Net Assets
at End of
Period
(000’s) | | Ratio of Net
Expenses to
Average Net
Assets(b) | | Ratio of Net
Investment
Income to
Average
Net Assets(b) | | Ratio of
Expenses to
Average Net
Assets(b)(c) | |
|
|
|
|
|
|
|
|
|
|
|
|
|
|
CLASS A SHARES | | | | | | | | | | | | | | | | | | | | | | | |
Period Ended October 31, 2007 (d) | | | $ | 1.00 | | | 0. 00 | % | | | $ | — | | | 0.72 | % | | 2.71 | % | | 0.87 | % | |
Year Ended October 31, 2008 (i) | | | | 1.00 | | | 1.48 | % | | | | 442 | | | 0.67 | % | | 1.49 | % | | 0.82 | % | |
Six Months Ended April 30, 2009 (Unaudited) | | | | 1.00 | | | 0.06 | % | | | | 261 | | | 0.59 | %(k) | | 0.15 | % | | 0.89 | %(k) | |
|
|
|
|
|
|
|
|
|
|
|
|
|
|
|
|
|
|
|
|
|
|
|
|
CLASS C SHARES | | | | | | | | | | | | | | | | | | | | | | | |
Year Ended October 31, 2007 (e) | | | $ | 1.00 | | | 1.08 | % | | | $ | 1,018 | | | 1.22 | % | | 2.41 | % | | 1.37 | % | |
Year Ended October 31, 2008 (f) | | | | 1.00 | | | 0.65 | % | | | | — | | | 1.21 | % | | 1.62 | % | | 1.36 | % | |
Six Months Ended April 30, 2009 (j) (Unaudited) | | | | 1.00 | | | 0.02 | % | | | | — | | | 0.90 | %(k) | | 0.08 | % | | 1.59 | %(k) | |
|
|
|
|
|
|
|
|
|
|
|
|
|
|
|
|
|
|
|
|
|
|
|
|
CLASS D SHARES | | | | | | | | | | | | | | | | | | | | | | | |
Year Ended October 31, 2004 | | | $ | 1.00 | | | 0.58 | % | | | $ | 122,260 | | | 0.52 | % | | 0.59 | % | | 0.71 | % | |
Year Ended October 31, 2005 | | | | 1.00 | | | 1.64 | %(g) | | | | 132,649 | | | 0.50 | %(g) | | 1.64 | %(g) | | 0.65 | % | |
Year Ended October 31, 2006 | | | | 1.00 | | | 2.73 | % | | | | 86,686 | | | 0.57 | % | | 2.66 | % | | 0.72 | % | |
Year Ended October 31, 2007 | | | | 1.00 | | | 3.09 | %(h) | | | | 90,843 | | | 0.50 | %(h) | | 3.08 | %(h) | | 0.66 | % | |
Year Ended October 31, 2008 | | | | 1.00 | | | 1.90 | % | | | | 83,261 | | | 0.47 | % | | 1.76 | % | | 0.62 | % | |
Six Months Ended April 30, 2009 (Unaudited) | | | | 1.00 | | | 0.09 | % | | | | 67,858 | | | 0.53 | %(k) | | 0.20 | % | | 0.74 | %(k) | |
|
|
|
|
|
|
|
|
|
|
|
|
|
|
|
|
|
|
|
|
|
|
|
|
CLASS Y SHARES | | | | | | | | | | | | | | | | | | | | | | | |
Year Ended October 31, 2004 | | | $ | 1.00 | | | 0.83 | % | | | $ | 2,013 | | | 0.27 | % | | 0.82 | % | | 0.46 | % | |
Year Ended October 31, 2005 | | | | 1.00 | | | 1.89 | %(g) | | | | 43,722 | | | 0.25 | %(g) | | 2.04 | %(g) | | 0.40 | % | |
Year Ended October 31, 2006 | | | | 1.00 | | | 2.98 | % | | | | 43,114 | | | 0.31 | % | | 2.95 | % | | 0.46 | % | |
Year Ended October 31, 2007 | | | | 1.00 | | | 3.35 | %(h) | | | | 32,205 | | | 0.24 | %(h) | | 3.32 | %(h) | | 0.40 | % | |
Year Ended October 31, 2008 | | | | 1.00 | | | 2.16 | % | | | | 26,163 | | | 0.20 | % | | 2.03 | % | | 0.35 | % | |
Six Months Ended April 30, 2009 (Unaudited) | | | | 1.00 | | | 0.18 | % | | | | 5,706 | | | 0.34 | %(k) | | 0.40 | % | | 0.49 | %(k) | |
|
|
|
|
|
|
|
|
|
|
|
|
|
|
|
|
|
|
|
|
|
|
|
|
| |
* | Less than $0.005 per share. |
| |
** | Less than $500. |
| |
(a) | Not annualized for periods less than one year. Total returns do not include redemption charges. |
| |
(b) | Annualized for periods less than one year. |
| |
(c) | During the period, certain fees were reduced. If such fee reductions had not occurred, the ratio would have been as indicated. |
| |
(d) | Class A Shares commenced operations on March 2, 2007 and was operational during a portion of the period only. Amounts reflect performance for the period of time the class had operations, which was 3 days during the period. |
| |
(e) | Class C Shares commenced operations on May 7, 2007. |
| |
(f) | Class C Shares were operational during a portion of the period only. Amounts reflect performance for the period of time the class had operations, which was 152 days during the period. |
| |
(g) | During the year ended October 31, 2005, HSBC reimbursed certain amounts to the Fund related to violation of certain investment policies and limitations. There was no rounded impact to the net expense ratio, net income ratio or total return for Class D Shares and Class Y Shares. |
| |
(h) | During the year ended October 31, 2007, HSBC reimbursed amounts to certain Funds related to past marketing arrangements. The corresponding impact to the net expense ratio, net income ratio and the total return were 0.02% and 0.01% for Class D Shares and Class Y Shares, respectively. |
| |
(i) | Class A Shares were operational during a portion of the year only. Amounts reflect performance for the period of time the class had operations, which was 332 days during the period. |
| |
(j) | Class C Shares were operational during a portion of the period only. Amounts reflect performance for the period of time the class had operations, which was 28 days during the period. |
| |
(k) | Included in the expense ratios is the Treasury Guarantee Program fees incurred by the Fund during the period. Without these fees, the gross and net expense ratios would have decreased by 0.06%. |
| | |
41 | HSBC INVESTOR FAMILY OF FUNDS | See notes to financial statements |
|
HSBC INVESTOR NEW YORK TAX-FREE MONEY MARKET FUND |
|
Financial Highlights
Selected data for a share outstanding throughout the periods indicated.
| | | | | | | | | | | | | | | | | | | | | | | | |
| | | | | Investment Activities | | Dividends | |
| | | | |
| |
|
|
| | Net Asset
Value,
Beginning
of Period | | Net
Investment
Income | | Net Realized
Gains
(Losses) from
Investments | | Total from
Investment
Activities | | Net
Investment
Income | | Net Realized
Gains from
Investments | | Total
Dividends | |
|
|
|
|
|
|
|
|
|
|
|
|
|
|
|
|
|
|
|
|
|
|
|
CLASS A SHARES | | | | | | | | | | | | | | | | | | | | | | | | |
Year Ended October 31, 2004 | | | $ | 1.00 | | | 0.00 | * | | — | | | 0.00 | * | | (0.00 | )* | | — | | | (0.00 | )** | |
Year Ended October 31, 2005 | | | | 1.00 | | | 0.01 | | | — | | | 0.01 | | | (0.01 | ) | | — | | | (0.01 | ) | |
Year Ended October 31, 2006 | | | | 1.00 | | | 0.03 | | | — | | | 0.03 | | | (0.03 | ) | | — | | | (0.03 | ) | |
Year Ended October 31, 2007 | | | | 1.00 | | | 0.03 | | | — | | | 0.03 | | | (0.03 | ) | | — | | | (0.03 | ) | |
Year Ended October 31, 2008 | | | | 1.00 | | | 0.02 | | | — | | | 0.02 | | | (0.02 | ) | | — | | | (0.02 | ) | |
Six Months Ended April 30, 2009 (Unaudited) | | | | 1.00 | | | 0.00 | * | | 0.00 | * | | 0.00 | * | | (0.00 | )* | | (0.00 | )* | | (0.00 | )* | |
|
|
|
|
|
|
|
|
|
|
|
|
|
|
|
|
|
|
|
|
|
|
|
|
|
CLASS B SHARES | | | | | | | | | | | | | | | | | | | | | | | | |
Year Ended October 31, 2004 | | | $ | 1.00 | | | 0.00 | * | | — | | | 0.00 | * | | (0.00 | )* | | — | | | (0.00 | )* | |
Year Ended October 31, 2005 | | | | 1.00 | | | 0.01 | | | — | | | 0.01 | | | (0.01 | ) | | — | | | (0.01 | ) | |
Year Ended October 31, 2006 | | | | 1.00 | | | 0.02 | | | — | | | 0.02 | | | (0.02 | ) | | — | | | (0.02 | ) | |
Year Ended October 31, 2007 | | | | 1.00 | | | 0.02 | | | — | | | 0.02 | | | (0.02 | ) | | — | | | (0.02 | ) | |
Year Ended October 31, 2008 | | | | 1.00 | | | 0.01 | | | — | | | 0.01 | | | (0.01 | ) | | — | | | (0.01 | ) | |
Six Months Ended April 30, 2009 (Unaudited) | | | | 1.00 | | | 0.00 | * | | — | | | 0.00 | * | | (0.00 | )* | | — | | | (0.00 | )* | |
|
|
|
|
|
|
|
|
|
|
|
|
|
|
|
|
|
|
|
|
|
|
|
|
|
CLASS C SHARES | | | | | | | | | | | | | | | | | | | | | | | | |
Year Ended October 31, 2004 (f) | | | $ | 1.00 | | | 0.00 | * | | — | | | 0.00 | * | | (0.00 | )* | | — | | | (0.00 | )* | |
Year Ended October 31, 2005 (g) | | | | 1.00 | | | — | | | — | | | — | | | — | | | — | | | — | | |
Year Ended October 31, 2006 (g) | | | | 1.00 | | | — | | | — | | | — | | | — | | | — | | | — | | |
Year Ended October 31, 2007 (g) | | | | 1.00 | | | — | | | — | | | — | | | — | | | — | | | — | | |
Year Ended October 31, 2008 (g) | | | | 1.00 | | | — | | | — | | | — | | | — | | | — | | | — | | |
Six Months Ended April 30, 2009 (g) (Unaudited) | | | | 1.00 | | | — | | | — | | | — | | | — | | | — | | | — | | |
|
|
|
|
|
|
|
|
|
|
|
|
|
|
|
|
|
|
|
|
|
|
|
|
|
CLASS D SHARES | | | | | | | | | | | | | | | | | | | | | | | | |
Year Ended October 31, 2004 | | | $ | 1.00 | | | 0.01 | | | — | | | 0.01 | | | (0.01 | ) | | — | | | (0.01 | ) | |
Year Ended October 31, 2005 | | | | 1.00 | | | 0.02 | | | — | | | 0.02 | | | (0.02 | ) | | — | | | (0.02 | ) | |
Year Ended October 31, 2006 | | | | 1.00 | | | 0.03 | | | — | | | 0.03 | | | (0.03 | ) | | — | | | (0.03 | ) | |
Year Ended October 31, 2007 | | | | 1.00 | | | 0.03 | | | — | | | 0.03 | | | (0.03 | ) | | — | | | (0.03 | ) | |
Year Ended October 31, 2008 | | | | 1.00 | | | 0.02 | | | — | | | 0.02 | | | (0.02 | ) | | — | | | (0.02 | ) | |
Six Months Ended April 30, 2009 (Unaudited) | | | | 1.00 | | | 0.00 | * | | 0.00 | * | | 0.00 | * | | (0.00 | )* | | (0.00 | )* | | (0.00 | )* | |
|
|
|
|
|
|
|
|
|
|
|
|
|
|
|
|
|
|
|
|
|
|
|
|
|
CLASS Y SHARES | | | | | | | | | | | | | | | | | | | | | | | | |
Year Ended October 31, 2004 | | | $ | 1.00 | | | 0.01 | | | — | | | 0.01 | | | (0.01 | ) | | — | | | (0.01 | ) | |
Year Ended October 31, 2005 | | | | 1.00 | | | 0.02 | | | — | | | 0.02 | | | (0.02 | ) | | — | | | (0.02 | ) | |
Year Ended October 31, 2006 | | | | 1.00 | | | 0.03 | | | — | | | 0.03 | | | (0.03 | ) | | — | | | (0.03 | ) | |
Year Ended October 31, 2007 | | | | 1.00 | | | 0.03 | | | — | | | 0.03 | | | (0.03 | ) | | — | | | (0.03 | ) | |
Year Ended October 31, 2008 | | | | 1.00 | | | 0.02 | | | — | | | 0.02 | | | (0.02 | ) | | — | | | (0.02 | ) | |
Six Months Ended April 30, 2009 (Unaudited) | | | | 1.00 | | | 0.00 | * | | 0.00 | * | | 0.00 | * | | (0.00 | )* | | (0.00 | )* | | (0.00 | )* | |
|
|
|
|
|
|
|
|
|
|
|
|
|
|
|
|
|
|
|
|
|
|
|
|
|
| | | | | | | | | | | | | | | | | | | | | | | |
| | | | | | | | Ratios/Supplementary Data | |
| | | | | | | |
|
|
| | Net Asset
Value, End
of Period | | Total
Return(a) | | Net Assets
at End of
Period
(000’s) | | Ratio of Net
Expenses to
Average Net
Assets(b) | | Ratio of Net
Investment
Income to
Average
Net Assets(b) | | Ratio of
Expenses to
Average Net
Assets(b)(c) | |
|
|
|
|
|
|
|
|
|
|
|
|
|
|
|
|
|
|
|
|
CLASS A SHARES | | | | | | | | | | | | | | | | | | | | | | | |
Year Ended October 31, 2004 | | | $ | 1.00 | | | 0.40 | % | | | $ | 217,659 | | | 0.70 | % | | 0.42 | % | | 0.70 | % | |
Year Ended October 31, 2005 | | | | 1.00 | | | 1.46 | %(d) | | | | 128,218 | | | 0.70 | %(d) | | 1.38 | %(d) | | 0.71 | % | |
Year Ended October 31, 2006 | | | | 1.00 | | | 2.63 | % | | | | 153,523 | | | 0.70 | % | | 2.61 | % | | 0.70 | % | |
Year Ended October 31, 2007 | | | | 1.00 | | | 3.00 | %(e) | | | | 120,841 | | | 0.65 | %(e) | | 2.98 | %(e) | | 0.67 | % | |
Year Ended October 31, 2008 | | | | 1.00 | | | 1.94 | % | | | | 45,791 | | | 0.63 | % | | 2.09 | % | | 0.63 | % | |
Six Months Ended April 30, 2009 (Unaudited) | | | | 1.00 | | | 0.17 | % | | | | 37,018 | | | 0.65 | %(h) | | 0.37 | % | | 0.67 | %(h) | |
|
|
|
|
|
|
|
|
|
|
|
|
|
|
|
|
|
|
|
|
|
|
|
|
CLASS B SHARES | | | | | | | | | | | | | | | | | | | | | | | |
Year Ended October 31, 2004 | | | $ | 1.00 | | | 0.26 | % | | | $ | 683 | | | 0.96 | % | | 0.26 | % | | 1.31 | % | |
Year Ended October 31, 2005 | | | | 1.00 | | | 0.85 | %(d) | | | | 228 | | | 1.29 | %(d) | | 0.77 | %(d) | | 1.31 | % | |
Year Ended October 31, 2006 | | | | 1.00 | | | 2.01 | % | | | | 55 | | | 1.30 | % | | 1.88 | % | | 1.30 | % | |
Year Ended October 31, 2007 | | | | 1.00 | | | 2.39 | %(e) | | | | 34 | | | 1.25 | %(e) | | 2.38 | %(e) | | 1.27 | % | |
Year Ended October 31, 2008 | | | | 1.00 | | | 1.33 | % | | | | 35 | | | 1.23 | % | | 1.30 | % | | 1.23 | % | |
Six Months Ended April 30, 2009 (Unaudited) | | | | 1.00 | | | 0.06 | % | | | | 21 | | | 0.87 | %(h) | | 0.13 | % | | 1.27 | %(h) | |
|
|
|
|
|
|
|
|
|
|
|
|
|
|
|
|
|
|
|
|
|
|
|
|
CLASS C SHARES | | | | | | | | | | | | | | | | | | | | | | | |
Year Ended October 31, 2004 (f) | | | $ | 1.00 | | | 0.06 | % | | | $ | 0 | ** | | 0.78 | % | | 0.26 | % | | 1.29 | % | |
Year Ended October 31, 2005 (g) | | | | 1.00 | | | — | | | | | 0 | ** | | — | | | — | | | — | | |
Year Ended October 31, 2006 (g) | | | | 1.00 | | | — | | | | | 0 | ** | | — | | | — | | | — | | |
Year Ended October 31, 2007 (g) | | | | 1.00 | | | — | | | | | 0 | ** | | — | | | — | | | — | | |
Year Ended October 31, 2008 (g) | | | | 1.00 | | | — | | | | | 0 | ** | | — | | | — | | | — | | |
Six Months Ended April 30, 2009 (g) (Unaudited) | | | | 1.00 | | | — | | | | | 0 | ** | | — | | | — | | | — | | |
|
|
|
|
|
|
|
|
|
|
|
|
|
|
|
|
|
|
|
|
|
|
|
|
CLASS D SHARES | | | | | | | | | | | | | | | | | | | | | | | |
Year Ended October 31, 2004 | | | $ | 1.00 | | | 0.56 | % | | | $ | 171,151 | | | 0.55 | % | | 0.54 | % | | 0.55 | % | |
Year Ended October 31, 2005 | | | | 1.00 | | | 1.61 | %(d) | | | | 189,538 | | | 0.55 | %(d) | | 1.61 | %(d) | | 0.56 | % | |
Year Ended October 31, 2006 | | | | 1.00 | | | 2.78 | % | | | | 352,630 | | | 0.55 | % | | 2.78 | % | | 0.55 | % | |
Year Ended October 31, 2007 | | | | 1.00 | | | 3.16 | %(e) | | | | 531,864 | | | 0.50 | %(e) | | 3.14 | %(e) | | 0.52 | % | |
Year Ended October 31, 2008 | | | | 1.00 | | | 2.09 | % | | | | 586,791 | | | 0.48 | % | | 1.99 | % | | 0.48 | % | |
Six Months Ended April 30, 2009 (Unaudited) | | | | 1.00 | | | 0.23 | % | | | | 469,108 | | | 0.52 | %(h) | | 0.48 | % | | 0.52 | %(h) | |
|
|
|
|
|
|
|
|
|
|
|
|
|
|
|
|
|
|
|
|
|
|
|
|
CLASS Y SHARES | | | | | | | | | | | | | | | | | | | | | | | |
Year Ended October 31, 2004 | | | $ | 1.00 | | | 0.81 | % | | | $ | 98,260 | | | 0.30 | % | | 0.79 | % | | 0.30 | % | |
Year Ended October 31, 2005 | | | | 1.00 | | | 1.86 | %(d) | | | | 280,683 | | | 0.30 | %(d) | | 1.89 | %(d) | | 0.31 | % | |
Year Ended October 31, 2006 | | | | 1.00 | | | 3.04 | % | | | | 263,187 | | | 0.30 | % | | 2.99 | % | | 0.30 | % | |
Year Ended October 31, 2007 | | | | 1.00 | | | 3.42 | %(e) | | | | 339,665 | | | 0.25 | %(e) | | 3.39 | %(e) | | 0.27 | % | |
Year Ended October 31, 2008 | | | | 1.00 | | | 2.35 | % | | | | 319,797 | | | 0.23 | % | | 2.27 | % | | 0.23 | % | |
Six Months Ended April 30, 2009 (Unaudited) | | | | 1.00 | | | 0.36 | % | | | | 443,017 | | | 0.27 | %(h) | | 0.68 | % | | 0.27 | %(h) | |
|
|
|
|
|
|
|
|
|
|
|
|
|
|
|
|
|
|
|
|
|
|
|
|
| |
* | Less than $0.005 per share. |
| |
** | Less than $500. |
| |
(a) | Not annualized for periods less than one year. Total returns do not include redemption charges. |
| |
(b) | Annualized for periods less than one year. |
| |
(c) | During the period, certain fees were reduced. If such fee reductions had not occurred, the ratio would have been as indicated. |
| |
(d) | During the year ended October 31, 2005, HSBC reimbursed certain amounts to the Fund related to violation of certain investment policies and limitations. The corresponding impact to the net expense ratio, net income ratio and total return were 0.01%, 0.01%, 0.01% and 0.01% for Class A Shares, Class B Shares, Class D Shares and Class Y Shares, respectively. |
| |
(e) | During the year ended October 31, 2007, HSBC reimbursed amounts to certain Funds related to past marketing arrangements. The corresponding impact to the net expense ratio, net income ratio and the total return were 0.02%, 0.02%, 0.02%, and 0.02% for Class A Shares, Class B Shares, Class D Shares, and Class Y Shares, respectively. |
| |
(f) | Class C Shares were operational during a portion of the year only. Amounts reflect performance for the period of time the class had operations, which was 81 days during the period. |
| |
(g) | During the year ended, Class C Shares had no operations. Net assets at the end of the period represent seed money. |
| |
(h) | Included in the expense ratios is the Treasury Guarantee Program fees incurred by the Fund during the period. Without these fees, the gross and net expense ratios would have decreased by 0.05%. |
| | |
See notes to financial statements | HSBC INVESTOR FAMILY OF FUNDS | 42 |
|
HSBC INVESTOR PRIME MONEY MARKET FUND |
|
Financial Highlights
Selected data for a share outstanding throughout the periods indicated.
| | | | | | | | | | | | | | | | | | |
| | | | | Investment Activities | | Dividends | |
| | | | |
| |
|
|
| | Net Asset
Value,
Beginning
of Period | | Net
Investment
Income | | Total from
Investment
Activities | | Net
Investment
Income | | Total
Dividends | |
|
|
|
|
|
|
|
|
|
|
|
|
|
|
|
|
|
CLASS A SHARES | | | | | | | | | | | | | | | | | | |
Year Ended October 31, 2004 | | | $ | 1.00 | | | 0.01 | | | 0.01 | | | (0.01 | ) | | (0.01 | ) | |
Year Ended October 31, 2005 | | | | 1.00 | | | 0.02 | | | 0.02 | | | (0.02 | ) | | (0.02 | ) | |
Year Ended October 31, 2006 | | | | 1.00 | | | 0.04 | | | 0.04 | | | (0.04 | ) | | (0.04 | ) | |
Year Ended October 31, 2007 | | | | 1.00 | | | 0.05 | | | 0.05 | | | (0.05 | ) | | (0.05 | ) | |
Year Ended October 31, 2008 | | | | 1.00 | | | 0.03 | | | 0.03 | | | (0.03 | ) | | (0.03 | ) | |
Six Months Ended April 30, 2009 (Unaudited) | | | | 1.00 | | | 0.00 | * | | 0.00 | * | | (0.00 | )* | | (0.00 | )* | |
|
|
|
|
|
|
|
|
|
|
|
|
|
|
|
|
|
|
|
CLASS B SHARES | | | | | | | | | | | | | | | | | | |
Year Ended October 31, 2004 | | | $ | 1.00 | | | 0.00 | * | | 0.00 | * | | (0.00 | )* | | (0.00 | )* | |
Year Ended October 31, 2005 | | | | 1.00 | | | 0.02 | | | 0.02 | | | (0.02 | ) | | (0.02 | ) | |
Year Ended October 31, 2006 | | | | 1.00 | | | 0.04 | | | 0.04 | | | (0.04 | ) | | (0.04 | ) | |
Year Ended October 31, 2007 | | | | 1.00 | | | 0.04 | | | 0.04 | | | (0.04 | ) | | (0.04 | ) | |
Year Ended October 31, 2008 | | | | 1.00 | | | 0.02 | | | 0.02 | | | (0.02 | ) | | (0.02 | ) | |
Six Months Ended April 30, 2009 (Unaudited) | | | | 1.00 | | | 0.00 | * | | 0.00 | * | | (0.00 | )* | | (0.00 | )* | |
|
|
|
|
|
|
|
|
|
|
|
|
|
|
|
|
|
|
|
CLASS C SHARES | | | | | | | | | | | | | | | | | | |
Year Ended October 31, 2004 | | | $ | 1.00 | | | 0.00 | * | | 0.00 | * | | (0.00 | )* | | (0.00 | )* | |
Year Ended October 31, 2005 | | | | 1.00 | | | 0.02 | | | 0.02 | | | (0.02 | ) | | (0.02 | ) | |
Year Ended October 31, 2006 | | | | 1.00 | | | 0.04 | | | 0.04 | | | (0.04 | ) | | (0.04 | ) | |
Year Ended October 31, 2007 | | | | 1.00 | | | 0.04 | | | 0.04 | | | (0.04 | ) | | (0.04 | ) | |
Year Ended October 31, 2008 | | | | 1.00 | | | 0.02 | | | 0.02 | | | (0.02 | ) | | (0.02 | ) | |
Six Months Ended April 30, 2009 (Unaudited) | | | | 1.00 | | | 0.00 | * | | 0.00 | * | | (0.00 | )* | | (0.00 | )* | |
|
|
|
|
|
|
|
|
|
|
|
|
|
|
|
|
|
|
|
CLASS D SHARES | | | | | | | | | | | | | | | | | | |
Year Ended October 31, 2004 | | | $ | 1.00 | | | 0.01 | | | 0.01 | | | (0.01 | ) | | (0.01 | ) | |
Year Ended October 31, 2005 | | | | 1.00 | | | 0.02 | | | 0.02 | | | (0.02 | ) | | (0.02 | ) | |
Year Ended October 31, 2006 | | | | 1.00 | | | 0.04 | | | 0.04 | | | (0.04 | ) | | (0.04 | ) | |
Year Ended October 31, 2007 | | | | 1.00 | | | 0.05 | | | 0.05 | | | (0.05 | ) | | (0.05 | ) | |
Year Ended October 31, 2008 | | | | 1.00 | | | 0.03 | | | 0.03 | | | (0.03 | ) | | (0.03 | ) | |
Six Months Ended April 30, 2009 (Unaudited) | | | | 1.00 | | | 0.00 | * | | 0.00 | * | | (0.00 | )* | | (0.00 | )* | |
|
|
|
|
|
|
|
|
|
|
|
|
|
|
|
|
|
|
|
CLASS I SHARES | | | | | | | | | | | | | | | | | | |
Year Ended October 31, 2004 | | | $ | 1.00 | | | 0.01 | | | 0.01 | | | (0.01 | ) | | (0.01 | ) | |
Year Ended October 31, 2005 | | | | 1.00 | | | 0.03 | | | 0.03 | | | (0.03 | ) | | (0.03 | ) | |
Year Ended October 31, 2006 | | | | 1.00 | | | 0.05 | | | 0.05 | | | (0.05 | ) | | (0.05 | ) | |
Year Ended October 31, 2007 | | | | 1.00 | | | 0.05 | | | 0.05 | | | (0.05 | ) | | (0.05 | ) | |
Year Ended October 31, 2008 | | | | 1.00 | | | 0.03 | | | 0.03 | | | (0.03 | ) | | (0.03 | ) | |
Six Months Ended April 30, 2009 (Unaudited) | | | | 1.00 | | | 0.00 | * | | 0.00 | * | | (0.00 | )* | | (0.00 | )* | |
|
|
|
|
|
|
|
|
|
|
|
|
|
|
|
|
|
|
|
CLASS Y SHARES | | | | | | | | | | | | | | | | | | |
Year Ended October 31, 2004 | | | $ | 1.00 | | | 0.01 | | | 0.01 | | | (0.01 | ) | | (0.01 | ) | |
Year Ended October 31, 2005 | | | | 1.00 | | | 0.03 | | | 0.03 | | | (0.03 | ) | | (0.03 | ) | |
Year Ended October 31, 2006 | | | | 1.00 | | | 0.05 | | | 0.05 | | | (0.05 | ) | | (0.05 | ) | |
Year Ended October 31, 2007 | | | | 1.00 | | | 0.05 | | | 0.05 | | | (0.05 | ) | | (0.05 | ) | |
Year Ended October 31, 2008 | | | | 1.00 | | | 0.03 | | | 0.03 | | | (0.03 | ) | | (0.03 | ) | |
Six Months Ended April 30, 2009 (Unaudited) | | | | 1.00 | | | 0.01 | | | 0.01 | | | (0.01 | ) | | (0.01 | ) | |
|
|
|
|
|
|
|
|
|
|
|
|
|
|
|
|
|
|
|
| | | | | | | | | | | | | | | | | | | | | | | |
| | | | | | | | Ratios/Supplementary Data | |
| | | | | | | |
|
|
| | Net Asset
Value, End
of Period | | Total
Return(a) | | Net Assets
at End of
Period
(000’s) | | Ratio of Net
Expenses to
Average Net
Assets(b) | | Ratio of Net
Investment
Income to
Average
Net Assets(b) | | Ratio of
Expenses to
Average Net
Assets(b)(c) | |
|
|
|
|
|
|
|
|
|
|
|
|
|
|
|
|
|
|
|
|
CLASS A SHARES | | | | | | | | | | | | | | | | | | | | | | | |
Year Ended October 31, 2004 | | | $ | 1.00 | | | 0.57 | % | | | $ | 301,384 | | | 0.72 | % | | 0.56 | % | | 0.72 | % | |
Year Ended October 31, 2005 | | | | 1.00 | | | 2.17 | % | | | | 243,772 | | | 0.73 | % | | 2.10 | % | | 0.73 | % | |
Year Ended October 31, 2006 | | | | 1.00 | | | 4.24 | % | | | | 415,514 | | | 0.72 | % | | 4.20 | % | | 0.73 | % | |
Year Ended October 31, 2007 | | | | 1.00 | | | 4.77 | %(d) | | | | 471,148 | | | 0.67 | %(d) | | 4.68 | %(d) | | 0.70 | % | |
Year Ended October 31, 2008 | | | | 1.00 | | | 2.71 | %(e) | | | | 308,499 | | | 0.67 | % | | 2.73 | % | | 0.67 | % | |
Six Months Ended April 30, 2009 (Unaudited) | | | | 1.00 | | | 0.31 | % | | | | 307,347 | | | 0.68 | %(f) | | 0.59 | % | | 0.69 | %(f) | |
|
|
|
|
|
|
|
|
|
|
|
|
|
|
|
|
|
|
|
|
|
|
|
|
CLASS B SHARES | | | | | | | | | | | | | | | | | | | | | | | |
Year Ended October 31, 2004 | | | $ | 1.00 | | | 0.23 | % | | | $ | 195 | | | 1.04 | % | | 0.23 | % | | 1.32 | % | |
Year Ended October 31, 2005 | | | | 1.00 | | | 1.56 | % | | | | 88 | | | 1.33 | % | | 1.40 | % | | 1.33 | % | |
Year Ended October 31, 2006 | | | | 1.00 | | | 3.61 | % | | | | 109 | | | 1.32 | % | | 3.60 | % | | 1.33 | % | |
Year Ended October 31, 2007 | | | | 1.00 | | | 4.14 | %(d) | | | | 204 | | | 1.27 | %(d) | | 4.07 | %(d) | | 1.30 | % | |
Year Ended October 31, 2008 | | | | 1.00 | | | 2.10 | %(e) | | | | 199 | | | 1.27 | % | | 2.08 | % | | 1.27 | % | |
Six Months Ended April 30, 2009 (Unaudited) | | | | 1.00 | | | 0.16 | % | | | | 393 | | | 0.95 | %(f) | | 0.26 | % | | 1.29 | %(f) | |
|
|
|
|
|
|
|
|
|
|
|
|
|
|
|
|
|
|
|
|
|
|
|
|
CLASS C SHARES | | | | | | | | | | | | | | | | | | | | | | | |
Year Ended October 31, 2004 | | | $ | 1.00 | | | 0.23 | % | | | $ | 170,451 | | | 1.05 | % | | 0.23 | % | | 1.32 | % | |
Year Ended October 31, 2005 | | | | 1.00 | | | 1.56 | % | | | | 195,246 | | | 1.33 | % | | 1.54 | % | | 1.33 | % | |
Year Ended October 31, 2006 | | | | 1.00 | | | 3.61 | % | | | | 268,071 | | | 1.32 | % | | 3.59 | % | | 1.33 | % | |
Year Ended October 31, 2007 | | | | 1.00 | | | 4.14 | %(d) | | | | 317,217 | | | 1.27 | %(d) | | 4.08 | %(d) | | 1.30 | % | |
Year Ended October 31, 2008 | | | | 1.00 | | | 2.10 | %(e) | | | | 316,779 | | | 1.27 | % | | 2.04 | % | | 1.27 | % | |
Six Months Ended April 30, 2009 (Unaudited) | | | | 1.00 | | | 0.16 | % | | | | 246,358 | | | 1.01 | %(f) | | 0.33 | % | | 1.29 | %(f) | |
|
|
|
|
|
|
|
|
|
|
|
|
|
|
|
|
|
|
|
|
|
|
|
|
CLASS D SHARES | | | | | | | | | | | | | | | | | | | | | | | |
Year Ended October 31, 2004 | | | $ | 1.00 | | | 0.72 | % | | | $ | 1,013,427 | | | 0.57 | % | | 0.72 | % | | 0.57 | % | |
Year Ended October 31, 2005 | | | | 1.00 | | | 2.32 | % | | | | 1,351,695 | | | 0.58 | % | | 2.36 | % | | 0.58 | % | |
Year Ended October 31, 2006 | | | | 1.00 | | | 4.39 | % | | | | 2,098,413 | | | 0.57 | % | | 4.38 | % | | 0.58 | % | |
Year Ended October 31, 2007 | | | | 1.00 | | | 4.92 | %(d) | | | | 3,710,803 | | | 0.52 | %(d) | | 4.83 | %(d) | | 0.55 | % | |
Year Ended October 31, 2008 | | | | 1.00 | | | 2.86 | %(e) | | | | 2,720,592 | | | 0.52 | % | | 2.89 | % | | 0.52 | % | |
Six Months Ended April 30, 2009 (Unaudited) | | | | 1.00 | | | 0.38 | % | | | | 2,412,831 | | | 0.54 | %(f) | | 0.74 | % | | 0.54 | %(f) | |
|
|
|
|
|
|
|
|
|
|
|
|
|
|
|
|
|
|
|
|
|
|
|
|
CLASS I SHARES | | | | | | | | | | | | | | | | | | | | | | | |
Year Ended October 31, 2004 | | | $ | 1.00 | | | 1.09 | % | | | $ | 2,777,675 | | | 0.20 | % | | 1.07 | % | | 0.22 | % | |
Year Ended October 31, 2005 | | | | 1.00 | | | 2.71 | % | | | | 1,476,725 | | | 0.20 | % | | 2.55 | % | | 0.23 | % | |
Year Ended October 31, 2006 | | | | 1.00 | | | 4.79 | % | | | | 2,111,147 | | | 0.19 | % | | 4.70 | % | | 0.22 | % | |
Year Ended October 31, 2007 | | | | 1.00 | | | 5.33 | %(d) | | | | 1,870,485 | | | 0.14 | %(d) | | 5.21 | %(d) | | 0.21 | % | |
Year Ended October 31, 2008 | | | | 1.00 | | | 3.23 | %(e) | | | | 2,954,253 | | | 0.16 | % | | 3.14 | % | | 0.17 | % | |
Six Months Ended April 30, 2009 (Unaudited) | | | | 1.00 | | | 0.55 | % | | | | 7,225,361 | | | 0.19 | %(f) | | 0.96 | % | | 0.19 | %(f) | |
|
|
|
|
|
|
|
|
|
|
|
|
|
|
|
|
|
|
|
|
|
|
|
|
CLASS Y SHARES | | | | | | | | | | | | | | | | | | | | | | | |
Year Ended October 31, 2004 | | | $ | 1.00 | | | 0.97 | % | | | $ | 512,287 | | | 0.32 | % | | 0.95 | % | | 0.32 | % | |
Year Ended October 31, 2005 | | | | 1.00 | | | 2.58 | % | | | | 420,576 | | | 0.33 | % | | 2.49 | % | | 0.33 | % | |
Year Ended October 31, 2006 | | | | 1.00 | | | 4.65 | % | | | | 530,780 | | | 0.32 | % | | 4.59 | % | | 0.33 | % | |
Year Ended October 31, 2007 | | | | 1.00 | | | 5.19 | %(d) | | | | 1,036,994 | | | 0.27 | %(d) | | 5.08 | %(d) | | 0.30 | % | |
Year Ended October 31, 2008 | | | | 1.00 | | | 3.12 | %(e) | | | | 2,236,927 | | | 0.27 | % | | 2.96 | % | | 0.27 | % | |
Six Months Ended April 30, 2009 (Unaudited) | | | | 1.00 | | | 0.50 | % | | | | 1,304,348 | | | 0.30 | %(f) | | 1.10 | % | | 0.30 | %(f) | |
|
|
|
|
|
|
|
|
|
|
|
|
|
|
|
|
|
|
|
|
|
|
|
|
| |
* | Less than $0.005 per share. |
| |
(a) | Not annualized for periods less than one year. Total returns do not include redemption charges. |
| |
(b) | Annualized for periods less than one year. |
| |
(c) | During the period, certain fees were reduced. If such fee reductions had not occurred, the ratio would have been as indicated. |
| |
(d) | During the year ended October 31, 2007, HSBC reimbursed amounts to certain Funds related to past marketing arrangements. The corresponding impact to the net expense ratio, net income ratio and the total return were 0.02%, 0.02%, 0.02%, 0.02%, 0.02% and 0.02% for Class A Shares, Class B Shares, Class C Shares, Class D Shares, Class I Shares and Class Y Shares, respectively. |
| |
(e) | During the year ended October 31, 2008, an affiliate of the Fund’s investment adviser purchased certain defaulted securities at $16,746,382, in excess of their fair value on the purchase date. The corresponding impact of this excess amount to the total returns were 0.20%, 0.20%, 0.20%, 0.20%, 0.20% and 0.20% for Class A Shares, Class B Shares, Class C Shares, Class D Shares, Class I Shares and Class Y Shares, respectively. |
| |
(f) | Included in the expense ratios is the Treasury Guarantee Program fees incurred by the Fund during the period. Without these fees, the gross and net expense ratios would have been decreased by 0.04%. |
| | |
43 | HSBC INVESTOR FAMILY OF FUNDS | See notes to financial statements |
|
HSBC INVESTOR TAX-FREE MONEY MARKET FUND |
|
Financial Highlights
Selected data for a share outstanding throughout the periods indicated.
| | | | | | | | | | | | | | | | | | | | | | | | |
| | | | Investment Activities | | Dividends | |
| | | |
| |
|
|
| |
Net Asset
Value,
Beginning
of Period
| | Net
Investment
Income | | Net Realized
Gains
(Losses) from
Investments | | Total from
Investment
Activities | | Net
Investment
Income | | Net Realized
Gains from
Investments | | Total
Dividends | |
|
|
|
|
|
|
|
|
|
|
|
|
|
|
|
|
CLASS A SHARES | | | | | | | | | | | | | | | | | | | | | | | | |
Period Ended October 31, 2004 (d) | | | $ | 1.00 | | | 0.00 | * | | — | | | 0.00 | * | | (0.00 | )* | | — | | | (0.00 | )* | |
Year Ended October 31, 2005 (e) | | | | 1.00 | | | — | | | — | | | — | | | — | | | — | | | — | | |
Year Ended October 31, 2006 (f) | | | | 1.00 | | | 0.01 | | | — | | | 0.01 | | | (0.01 | ) | | — | | | (0.01 | ) | |
Year Ended October 31, 2007 (g) | | | | 1.00 | | | 0.00 | * | | — | | | 0.00 | * | | (0.00 | )* | | — | | | (0.00 | )* | |
Year Ended October 31, 2008 (l) | | | | 1.00 | | | — | | | — | | | — | | | — | | | — | | | — | | |
Six Months Ended April 30, 2009 (h) (Unaudited) | | | | 1.00 | | | 0.00 | * | | — | | | 0.00 | * | | — | | | — | | | — | | |
|
|
|
|
|
|
|
|
|
|
|
|
|
|
|
|
|
|
|
|
|
|
|
|
|
CLASS C SHARES | | | | | | | | | | | | | | | | | | | | | | | | |
Period Ended October 31, 2007 (i) | | | $ | 1.00 | | | 0.00 | * | | — | | | 0.00 | * | | (0.00 | )* | | — | | | (0.00 | ) | |
Year Ended October 31, 2008 (l) | | | | 1.00 | | | — | | | — | | | — | | | — | | | — | | | — | | |
Six Months Ended April 30, 2009 (Unaudited) (l) | | | | 1.00 | | | — | | | — | | | — | | | — | | | — | | | — | | |
|
|
|
|
|
|
|
|
|
|
|
|
|
|
|
|
|
|
|
|
|
|
|
|
|
CLASS D SHARES | | | | | | | | | | | | | | | | | | | | | | | | |
Period Ended October 31, 2004 (j) | | | $ | 1.00 | | | 0.00 | | | — | | | 0.00 | | | (0.00 | ) | | — | | | (0.00 | ) | |
Year Ended October 31, 2005 | | | | 1.00 | | | 0.02 | | | — | | | 0.02 | | | (0.02 | ) | | — | | | (0.02 | ) | |
Year Ended October 31, 2006 | | | | 1.00 | | | 0.03 | | | — | | | 0.03 | | | (0.03 | ) | | — | | | (0.03 | ) | |
Year Ended October 31, 2007 | | | | 1.00 | | | 0.03 | | | — | | | 0.03 | | | (0.03 | ) | | — | | | (0.03 | ) | |
Year Ended October 31, 2008 | | | | 1.00 | | | 0.02 | | | — | | | 0.02 | | | (0.02 | ) | | — | | | (0.02 | ) | |
Six Months Ended April 30, 2009 (Unaudited) | | | | 1.00 | | | 0.00 | * | | 0.00 | * | | 0.00 | * | | (0.00 | )* | | (0.00 | )* | | (0.00 | )* | |
|
|
|
|
|
|
|
|
|
|
|
|
|
|
|
|
|
|
|
|
|
|
|
|
|
CLASS I SHARES | | | | | | | | | | | | | | | | | | | | | | | | |
Period Ended October 31, 2004 (d) | | | $ | 1.00 | | | 0.00 | * | | — | | | 0.00 | * | | (0.00 | )* | | — | | | (0.00 | )* | |
Year Ended October 31, 2005 (k) | | | | 1.00 | | | 0.00 | * | | — | | | 0.00 | | | (0.00 | )* | | — | | | (0.00 | )* | |
Year Ended October 31, 2006 (l) | | | | 1.00 | | | — | | | — | | | — | | | — | | | — | | | — | | |
Year Ended October 31, 2007 (l) | | | | 1.00 | | | — | | | — | | | — | | | — | | | — | | | — | | |
Year Ended October 31, 2008 (l) | | | | 1.00 | | | — | | | — | | | — | | | — | | | — | | | — | | |
Six Months Ended April 30, 2009 (k) (Unaudited) | | | | 1.00 | | | — | | | — | | | — | | | — | | | — | | | — | | |
|
|
|
|
|
|
|
|
|
|
|
|
|
|
|
|
|
|
|
|
|
|
|
|
|
CLASS Y SHARES | | | | | | | | | | | | | | | | | | | | | | | | |
Period Ended October 31, 2004(j) | | | $ | 1.00 | | | 0.00 | * | | — | | | 0.00 | * | | (0.00 | )* | | — | | | (0.00 | )* | |
Year Ended October 31, 2005 | | | | 1.00 | | | 0.02 | | | — | | | 0.02 | | | (0.02 | ) | | — | | | (0.02 | ) | |
Year Ended October 31, 2006 | | | | 1.00 | | | 0.03 | | | — | | | 0.03 | | | (0.03 | ) | | — | | | (0.03 | ) | |
Year Ended October 31, 2007 | | | | 1.00 | | | 0.03 | | | — | | | 0.03 | | | (0.03 | ) | | — | | | (0.03 | ) | |
Year Ended October 31, 2008 | | | | 1.00 | | | 0.02 | | | — | | | 0.02 | | | (0.02 | ) | | — | | | (0.02 | ) | |
Six Months Ended April 30, 2009 (Unaudited) | | | | 1.00 | | | 0.00 | * | | 0.00 | * | | 0.00 | * | | (0.00 | )* | | (0.00 | )* | | (0.00 | )* | |
|
|
|
|
|
|
|
|
|
|
|
|
|
|
|
|
|
|
|
|
|
|
|
|
|
| | | | | | | | | | | | | | | | | | | | | | | |
| | | | | | | | | | Ratios/Supplementary Data | |
| | | | | | | | | |
|
|
| | Net Asset
Value, End
of Period | | Total
Return(a) | | Net Assets
at End of
Period
(000’s) | | Ratio of Net
Expenses to
Average Net
Assets(b) | | Ratio of Net
Investment
Income to
Average
Net Assets(b) | | Ratio of
Expenses to
Average Net
Assets(b)(c) | |
|
|
|
|
|
|
|
|
|
|
|
|
|
|
CLASS A SHARES | | | | | | | | | | | | | | | | | | | |
Period Ended October 31, 2004 (d) | | | $ | 1.00 | | | 0.00 | % | | | $ | 0 | ** | | 0.44 | % | | 0.51 | % | | 2.12 | % | |
Year Ended October 31, 2005 (e) | | | | 1.00 | | | — | | | | | 0 | ** | | — | | | — | | | — | | |
Year Ended October 31, 2006 (f) | | | | 1.00 | | | 0.56 | % | | | | 1 | | | 1.06 | % | | 3.35 | % | | 1.49 | % | |
Year Ended October 31, 2007 (g) | | | | 1.00 | | | 0.18 | % | | | | — | | | 0.72 | % | | 2.96 | % | | 0.92 | % | |
Year Ended October 31, 2008 (l) | | | | 1.00 | | | — | | | | | — | | | — | | | — | | | — | | |
Six Months Ended April 30, 2009 (h) (Unaudited) | | | | 1.00 | | | 0.00 | % | | | | 0 | ** | | 0.48 | %(m) | | 0.62 | % | | 1.57 | %(m) | |
|
|
|
|
|
|
|
|
|
|
|
|
|
|
|
|
|
|
|
|
|
|
|
|
CLASS C SHARES | | | | | | | | | | | | | | | | | | | | | | | |
Period Ended October 31, 2007 (i) | | | $ | 1.00 | | | 0.09 | % | | | $ | — | | | 1.34 | % | | 2.24 | % | | 1.54 | % | |
Year Ended October 31, 2008 (l) | | | | 1.00 | | | — | | | | | — | | | — | | | — | | | — | | |
Six Months Ended April 30, 2009 (Unaudited) (l) | | | | 1.00 | | | — | | | | | — | | | — | | | — | | | — | | |
|
|
|
|
|
|
|
|
|
|
|
|
|
|
|
|
|
|
|
|
|
|
|
|
CLASS D SHARES | | | | | | | | | | | | | | | | | | | | | | | |
Period Ended October 31, 2004 (j) | | | $ | 1.00 | | | 0.23 | % | | | $ | 3,248 | | | 0.27 | % | | 1.34 | % | | 1.50 | % | |
Year Ended October 31, 2005 | | | | 1.00 | | | 1.60 | % | | | | 11,892 | | | 0.57 | % | | 1.71 | % | | 1.11 | % | |
Year Ended October 31, 2006 | | | | 1.00 | | | 2.77 | % | | | | 48,502 | | | 0.66 | % | | 2.76 | % | | 0.99 | % | |
Year Ended October 31, 2007 | | | | 1.00 | | | 3.04 | % | | | | 40,184 | | | 0.63 | % | | 3.04 | % | | 0.83 | % | |
Year Ended October 31, 2008 | | | | 1.00 | | | 2.13 | % | | | | 69,787 | | | 0.46 | % | | 2.05 | % | | 0.66 | % | |
Six Months Ended April 30, 2009 (Unaudited) | | | | 1.00 | | | 0.29 | % | | | | 80,769 | | | 0.43 | %(m) | | 0.56 | % | | 0.63 | %(m) | |
|
|
|
|
|
|
|
|
|
|
|
|
|
|
|
|
|
|
|
|
|
|
|
|
CLASS I SHARES | | | | | | | | | | | | | | | | | | | | | | | |
Period Ended October 31, 2004 (d) | | | $ | 1.00 | | | 0.12 | % | | | $ | 0 | ** | | 0.00 | % | | 1.07 | % | | 1.80 | % | |
Year Ended October 31, 2005 (k) | | | | 1.00 | | | 0.15 | % | | | | 0 | ** | | 0.33 | % | | 2.11 | % | | 0.74 | % | |
Year Ended October 31, 2006 (l) | | | | 1.00 | | | — | | | | | — | | | — | | | — | | | — | | |
Year Ended October 31, 2007 (l) | | | | 1.00 | | | — | | | | | — | | | — | | | — | | | — | | |
Year Ended October 31, 2008 (l) | | | | 1.00 | | | — | | | | | — | | | — | | | — | | | — | | |
Six Months Ended April 30, 2009 (k) (Unaudited) | | | | 1.00 | | | — | | | | | — | | | — | | | — | | | — | | |
|
|
|
|
|
|
|
|
|
|
|
|
|
|
|
|
|
|
|
|
|
|
|
|
CLASS Y SHARES | | | | | | | | | | | | | | | | | | | | | | | |
Period Ended October 31, 2004(j) | | | $ | 1.00 | | | 0.50 | % | | | $ | 15,544 | | | 0.03 | % | | 1.27 | % | | 1.48 | % | |
Year Ended October 31, 2005 | | | | 1.00 | | | 1.86 | % | | | | 26,569 | | | 0.31 | % | | 1.86 | % | | 0.87 | % | |
Year Ended October 31, 2006 | | | | 1.00 | | | 3.02 | % | | | | 12,424 | | | 0.39 | % | | 2.92 | % | | 0.77 | % | |
Year Ended October 31, 2007 | | | | 1.00 | | | 3.30 | % | | | | 18,936 | | | 0.34 | % | | 3.31 | % | | 0.54 | % | |
Year Ended October 31, 2008 | | | | 1.00 | | | 2.38 | % | | | | 143,730 | | | 0.20 | % | | 2.31 | % | | 0.40 | % | |
Six Months Ended April 30, 2009 (Unaudited) | | | | 1.00 | | | 0.41 | % | | | | 141,901 | | | 0.18 | %(m) | | 0.82 | % | | 0.38 | %(m) | |
|
|
|
|
|
|
|
|
|
|
|
|
|
|
|
|
|
|
|
|
|
|
|
|
| |
* | Less than $0.005 per share. |
| |
** | Less than $500. |
| |
(a) | Not annualized for periods less than one year. Total returns do not include redemption charges. |
| |
(b) | Annualized for periods less than one year. |
| |
(c) | During the period, certain fees were reduced. If such fee reductions had not occurred, the ratio would have been as indicated. |
| |
(d) | Class A Shares commenced operations on August 27, 2004 and was operational during a portion of the year only. Amounts reflect performance for the period of time the class had operations, which was 5 days during the period. Class I Shares commenced operations on June 25, 2004 and were operational during a portion of the year only. Amounts reflect performance for the period of time the class had operations, which was 40 days during the period. |
| |
(e) | During the period, Class A shares had no operations. Net Assets at the end of the year represent seed money. |
| |
(f) | Class A Shares were operational during a portion of the year only. Amounts reflect performance for the period of the time the class had operations, which was 78 days during the period. |
| |
(g) | Class A Shares were operational during a portion of the year only. Amounts reflect performance for the period of the time the class had operations, which was 24 days during the period. |
| |
(h) | Class A Shares were operational during a portion of the period only. Amounts reflect performance for the period of time the class had operations, which was 78 days during the period. |
| |
(i) | Class C Shares commenced operations on July 30, 2007 and was operational during a portion of the year only. Amounts reflect performance for the period of time the class had operations, which was 15 days during the period. |
| |
(j) | Class D Shares commenced operations on August 24, 2004. Class Y Shares commenced operations on June 8, 2004. |
| |
(k) | Class I Shares were operational during a portion of the year only. Amounts reflect performance for the period of the time the class had operations, which was 27 days during the period. |
| |
(l) | During the period, class had no operations. |
| |
(m) | Included in the expense ratios is the Treasury Guarantee Program fees incurred by the Fund during the period. Without these fees, the gross and net expense ratios would have been decreased by 0.04%. |
| | |
See notes to financial statements | HSBC INVESTOR FAMILY OF FUNDS | 44 |
|
HSBC INVESTOR U.S. GOVERNMENT MONEY MARKET FUND |
|
Financial Highlights
Selected data for a share outstanding throughout the periods indicated.
| | | | | | | | | | | | | | | | | | | | | | | | |
| | | | | Investment Activities | | Dividends | |
| | | | |
| |
|
| |
Net Asset
Value,
Beginning
of Period
| | Net
Investment
Income | | Net Realized
Gains
(Losses) from
Investments | | Total from
Investment
Activities | | Net
Investment
Income | | Net Realized
Gains from
Investments | | Total
Dividends | |
|
|
|
|
|
|
|
|
|
|
|
|
|
|
|
|
CLASS A SHARES | | | | | | | | | | | | | | | | | | | | | | | | |
Year Ended October 31, 2004 | | | $ | 1.00 | | | 0.01 | | | — | | | 0.01 | | | (0.01 | ) | | — | | | (0.01 | ) | |
Year Ended October 31, 2005 | | | | 1.00 | | | 0.02 | | | — | | | 0.02 | | | (0.02 | ) | | — | | | (0.02 | ) | |
Year Ended October 31, 2006 | | | | 1.00 | | | 0.04 | | | — | | | 0.04 | | | (0.04 | ) | | — | | | (0.04 | ) | |
Year Ended October 31, 2007 | | | | 1.00 | | | 0.05 | | | — | | | 0.05 | | | (0.05 | ) | | — | | | (0.05 | ) | |
Year Ended October 31, 2008 | | | | 1.00 | | | 0.02 | | | — | | | 0.02 | | | (0.02 | ) | | — | | | (0.02 | ) | |
Six Months Ended April 30, 2009 (Unaudited) | | | | 1.00 | | | 0.00 | * | | 0.00 | * | | 0.00 | * | | (0.00 | )* | | (0.00 | )* | | (0.00 | )* | |
|
|
|
|
|
|
|
|
|
|
|
|
|
|
|
|
|
|
|
|
|
|
|
|
|
CLASS B SHARES | | | | | | | | | | | | | | | | | | | | | | | | |
Year Ended October 31, 2004 | | | $ | 1.00 | | | 0.00 | * | | — | | | 0.00 | * | | (0.00 | )* | | — | | | (0.00 | )* | |
Year Ended October 31, 2005 | | | | 1.00 | | | 0.02 | | | — | | | 0.02 | | | (0.02 | ) | | — | | | (0.02 | ) | |
Year Ended October 31, 2006 | | | | 1.00 | | | 0.04 | | | — | | | 0.04 | | | (0.04 | ) | | — | | | (0.04 | ) | |
Year Ended October 31, 2007 | | | | | | | 0.05 | | | — | | | 0.05 | | | (0.05 | ) | | — | | | (0.05 | ) | |
Year Ended October 31, 2008 | | | | 1.00 | | | 0.02 | | | — | | | 0.02 | | | (0.02 | ) | | — | | | (0.02 | ) | |
Six Months Ended April 30, 2009 (Unaudited) | | | | 1.00 | | | 0.00 | * | | 0.00 | * | | 0.00 | * | | (0.00 | )* | | (0.00 | )* | | (0.00 | )* | |
|
|
|
|
|
|
|
|
|
|
|
|
|
|
|
|
|
|
|
|
|
|
|
|
|
CLASS C SHARES | | | | | | | | | | | | | | | | | | | | | | | | |
Period Ended October 31, 2007 (e) | | | $ | 1.00 | | | 0.04 | | | — | | | 0.04 | | | (0.04 | ) | | — | | | (0.04 | ) | |
Year Ended October 31, 2008 | | | | 1.00 | | | 0.02 | | | — | | | 0.02 | | | (0.02 | ) | | — | | | (0.02 | ) | |
Six Months Ended April 30, 2009 (Unaudited) | | | | 1.00 | | | 0.00 | * | | 0.00 | * | | 0.00 | * | | (0.00 | )* | | (0.00 | )* | | (0.00 | )* | |
|
|
|
|
|
|
|
|
|
|
|
|
|
|
|
|
|
|
|
|
|
|
|
|
|
CLASS D SHARES | | | | | | | | | | | | | | | | | | | | | | | | |
Year Ended October 31, 2004 | | | $ | 1.00 | | | 0.01 | | | — | | | 0.01 | | | (0.01 | ) | | — | | | (0.01 | ) | |
Year Ended October 31, 2005 | | | | 1.00 | | | 0.02 | | | — | | | 0.02 | | | (0.02 | ) | | — | | | (0.02 | ) | |
Year Ended October 31, 2006 | | | | 1.00 | | | 0.04 | | | — | | | 0.04 | | | (0.04 | ) | | — | | | (0.04 | ) | |
Year Ended October 31, 2007 | | | | 1.00 | | | 0.05 | | | — | | | 0.05 | | | (0.05 | ) | | — | | | (0.05 | ) | |
Year Ended October 31, 2008 | | | | 1.00 | | | 0.02 | | | — | | | 0.02 | | | (0.02 | ) | | — | | | (0.02 | ) | |
Six Months Ended April 30, 2009 (Unaudited) | | | | 1.00 | | | 0.00 | * | | 0.00 | * | | 0.00 | * | | (0.00 | )* | | (0.00 | )* | | (0.00 | )* | |
|
|
|
|
|
|
|
|
|
|
|
|
|
|
|
|
|
|
|
|
|
|
|
|
|
CLASS I SHARES | | | | | | | | | | | | | | | | | | | | | | | | |
Period Ended October 31, 2004 (f) | | | $ | 1.00 | | | 0.00 | * | | — | | | 0.00 | * | | (0.00 | )* | | — | | | (0.00 | ) | |
Year Ended October 31, 2005 (g) | | | | 1.00 | | | 0.01 | | | — | | | 0.01 | | | (0.01 | ) | | — | | | (0.01 | ) | |
Year Ended October 31, 2006 (h) | | | | 1.00 | | | 0.02 | | | — | | | 0.02 | | | (0.02 | ) | | — | | | (0.02 | ) | |
Year Ended October 31, 2007 (i) | | | | 1.00 | | | 0.05 | | | — | | | 0.05 | | | (0.05 | ) | | — | | | (0.05 | ) | |
Year Ended October 31, 2008 | | | | 1.00 | | | 0.03 | | | — | | | 0.03 | | | (0.03 | ) | | — | | | (0.03 | ) | |
Six Months Ended April 30, 2009 (Unaudited) | | | | 1.00 | | | 0.00 | * | | 0.00 | * | | 0.00 | * | | (0.00 | )* | | (0.00 | )* | | (0.00 | )* | |
|
|
|
|
|
|
|
|
|
|
|
|
|
|
|
|
|
|
|
|
|
|
|
|
|
CLASS Y SHARES | | | | | | | | | | | | | | | | | | | | | | | | |
Year Ended October 31, 2004 | | | $ | 0.01 | | | 0.01 | | | — | | | 0.01 | | | (0.01 | ) | | — | | | (0.01 | ) | |
Year Ended October 31, 2005 | | | | 0.02 | | | 0.02 | | | — | | | 0.02 | | | (0.02 | ) | | — | | | (0.02 | ) | |
Year Ended October 31, 2006 | | | | 0.04 | | | 0.04 | | | — | | | 0.04 | | | (0.04 | ) | | — | | | (0.04 | ) | |
Year Ended October 31, 2007 | | | | 0.05 | | | 0.05 | | | — | | | 0.05 | | | (0.05 | ) | | — | | | (0.05 | ) | |
Year Ended October 31, 2008 | | | | 0.03 | | | 0.03 | | | — | | | 0.03 | | | (0.03 | ) | | — | | | (0.03 | ) | |
Six Months Ended April 30, 2009 (Unaudited) | | | | 0.00 | * | | 0.00 | * | | 0.00 | * | | 0.00 | * | | (0.00 | )* | | (0.00 | )* | | (0.00 | )* | |
|
|
|
|
|
|
|
|
|
|
|
|
|
|
|
|
|
|
|
|
|
|
|
|
|
| | | | | | | | | | | | | | | | | | | | | | | |
| | | | | | | | | | Ratios/Supplementary Data | |
| | | | | | | | | |
|
|
| | Net Asset
Value, End
of Period | | Total
Return(a) | | Net Assets
at End of
Period
(000’s) | | Ratio of Net
Expenses to
Average Net
Assets(b) | | Ratio of Net
Investment
Income to
Average
Net Assets(b) | | Ratio of
Expenses to
Average Net
Assets(b)(c) | |
|
|
|
|
|
|
|
|
|
|
|
|
|
|
CLASS A SHARES | | | | | | | | | | | | | | | | | | | | | | | |
Year Ended October 31, 2004 | | | $ | 1.00 | | | 0.53 | % | | | $ | 640,096 | | | 0.73 | % | | 0.53 | % | | 0.73 | % | |
Year Ended October 31, 2005 | | | | 1.00 | | | 2.09 | % | | | | 725,469 | | | 0.73 | % | | 2.08 | % | | 0.74 | % | |
Year Ended October 31, 2006 | | | | 1.00 | | | 4.16 | % | | | | 1,287,045 | | | 0.72 | % | | 4.13 | % | | 0.73 | % | |
Year Ended October 31, 2007 | | | | 1.00 | | | 4.63 | %(d) | | | | 1,090,807 | | | 0.65 | %(d) | | 4.56 | %(d) | | 0.70 | % | |
Year Ended October 31, 2008 | | | | 1.00 | | | 2.20 | % | | | | 703,712 | | | 0.67 | % | | 2.29 | % | | 0.67 | % | |
Six Months Ended April 30, 2009 (Unaudited) | | | | 1.00 | | | 0.12 | % | | | | 631,894 | | | 0.67 | %(j) | | 0.24 | % | | 0.74 | %(j) | |
|
|
|
|
|
|
|
|
|
|
|
|
|
|
|
|
|
|
|
|
|
|
|
|
CLASS B SHARES | | | | | | | | | | | | | | | | | | | | | | | |
Year Ended October 31, 2004 | | | $ | 1.00 | | | 0.28 | % | | | $ | 17 | | | 0.98 | % | | 0.28 | % | | 1.34 | % | |
Year Ended October 31, 2005 | | | | 1.00 | | | 1.72 | % | | | | 1 | | | 1.32 | % | | 1.10 | % | | 1.32 | % | |
Year Ended October 31, 2006 | | | | 1.00 | | | 4.29 | % | | | | 1 | | | 1.31 | % | | 3.95 | % | | 1.32 | % | |
Year Ended October 31, 2007 | | | | 1.00 | | | 4.76 | %(d) | | | | 1 | | | 1.25 | %(d) | | 4.01 | %(d) | | 1.28 | % | |
Year Ended October 31, 2008 | | | | 1.00 | | | 1.67 | % | | | | 54 | | | 1.29 | % | | 1.24 | % | | 1.29 | % | |
Six Months Ended April 30, 2009 (Unaudited) | | | | 1.00 | | | 0.06 | % | | | | 92 | | | 0.76 | %(j) | | 0.10 | % | | 1.33 | %(j) | |
|
|
|
|
|
|
|
|
|
|
|
|
|
|
|
|
|
|
|
|
|
|
|
|
CLASS C SHARES | | | | | | | | | | | | | | | | | | | | | | | |
Period Ended October 31, 2007 (e) | | | $ | 1.00 | | | 3.79 | %(d) | | | $ | 428 | | | 1.20 | %(d) | | 3.78 | %(d) | | 1.25 | % | |
Year Ended October 31, 2008 | | | | 1.00 | | | 1.59 | % | | | | 101 | | | 1.27 | % | | 1.28 | % | | 1.27 | % | |
Six Months Ended April 30, 2009 (Unaudited) | | | | 1.00 | | | 0.06 | % | | | | 126 | | | 0.80 | %(j) | | 0.09 | % | | 1.34 | %(j) | |
|
|
|
|
|
|
|
|
|
|
|
|
|
|
|
|
|
|
|
|
|
|
|
|
CLASS D SHARES | | | | | | | | | | | | | | | | | | | | | | | |
Year Ended October 31, 2004 | | | $ | 1.00 | | | 0.68 | % | | | $ | 517,500 | | | 0.58 | % | | 0.67 | % | | 0.58 | % | |
Year Ended October 31, 2005 | | | | 1.00 | | | 2.24 | % | | | | 525,937 | | | 0.58 | % | | 2.21 | % | | 0.59 | % | |
Year Ended October 31, 2006 | | | | 1.00 | | | 4.32 | % | | | | 967,456 | | | 0.57 | % | | 4.27 | % | | 0.58 | % | |
Year Ended October 31, 2007 | | | | 1.00 | | | 4.79 | %(d) | | | | 761,155 | | | 0.50 | %(d) | | 4.66 | %(d) | | 0.54 | % | |
Year Ended October 31, 2008 | | | | 1.00 | | | 2.36 | % | | | | 1,438,199 | | | 0.52 | % | | 1.92 | % | | 0.52 | % | |
Six Months Ended April 30, 2009 (Unaudited) | | | | 1.00 | | | 0.17 | % | | | | 920,098 | | | 0.58 | %(j) | | 0.38 | % | | 0.59 | %(j) | |
|
|
|
|
|
|
|
|
|
|
|
|
|
|
|
|
|
|
|
|
|
|
|
|
CLASS I SHARES | | | | | | | | | | | | | | | | | | | | | | | |
Period Ended October 31, 2004 (f) | | | $ | 1.00 | | | 0.01 | % | | | $ | 0 | ** | | 0.20 | % | | 0.93 | % | | 0.21 | % | |
Year Ended October 31, 2005 (g) | | | | 1.00 | | | 0.73 | % | | | | 0 | ** | | 0.20 | % | | 3.08 | % | | 0.24 | % | |
Year Ended October 31, 2006 (h) | | | | 1.00 | | | 1.80 | % | | | | 23,002 | | | 0.17 | % | | 5.08 | % | | 0.23 | % | |
Year Ended October 31, 2007 (i) | | | | 1.00 | | | 4.99 | %(d) | | | | 949,095 | | | 0.15 | %(d) | | 4.73 | %(d) | | 0.17 | % | |
Year Ended October 31, 2008 | | | | 1.00 | | | 2.72 | % | | | | 4,908,887 | | | 0.17 | % | | 2.23 | % | | 0.18 | % | |
Six Months Ended April 30, 2009 (Unaudited) | | | | 1.00 | | | 0.34 | % | | | | 7,917,493 | | | 0.23 | %(j) | | 0.62 | % | | 0.23 | %(j) | |
|
|
|
|
|
|
|
|
|
|
|
|
|
|
|
|
|
|
|
|
|
|
|
|
CLASS Y SHARES | | | | | | | | | | | | | | | | | | | | | | | |
Year Ended October 31, 2004 | | | $ | 1.00 | | | 0.93 | % | | | $ | 337,343 | | | 0.32 | % | | 0.91 | % | | 0.32 | % | |
Year Ended October 31, 2005 | | | | 1.00 | | | 2.50 | % | | | | 465,996 | | | 0.34 | % | | 2.49 | % | | 0.34 | % | |
Year Ended October 31, 2006 | | | | 1.00 | | | 4.58 | % | | | | 517,089 | | | 0.32 | % | | 4.49 | % | | 0.33 | % | |
Year Ended October 31, 2007 | | | | 1.00 | | | 5.05 | %(d) | | | | 6,267,594 | | | 0.26 | %(d) | | 4.78 | %(d) | | 0.28 | % | |
Year Ended October 31, 2008 | | | | 1.00 | | | 2.61 | % | | | | 6,747,758 | | | 0.27 | % | | 2.53 | % | | 0.27 | % | |
Six Months Ended April 30, 2009 (Unaudited) | | | | 1.00 | | | 0.29 | % | | | | 3,191,012 | | | 0.34 | %(j) | | 0.61 | % | | 0.34 | %(j) | |
|
|
|
|
|
|
|
|
|
|
|
|
|
|
|
|
|
|
|
|
|
|
|
|
| |
* | Less than $0.005 per share. |
| |
** | Less than $500. |
| |
(a) | Not annualized for periods less than one year. Total returns do not include redemption charges. |
| |
(b) | Annualized for periods less than one year. |
| |
(c) | During the period, certain fees were reduced. If such fee reductions had not occurred, the ratio would have been as indicated. |
| |
(d) | During the year ended October 31, 2007, HSBC reimbursed amounts to certain Funds related to past marketing arrangements. The corresponding impact to the net expense ratio, net income ratio and the total return were 0.03%, 0.03%, 0.02%, 0.02%, 0.00% and 0.01% for Class A Shares, Class B Shares, Class C Shares, Class D Shares, Class I Shares and Class Y Shares, respectively. |
| |
(e) | Class C Shares commenced operations on November 20, 2006 and were operational during a portion of the year only. Amounts reflect performance for the period of time the class had operations, which was 346 days during the period. |
| |
(f) | Class I Shares commenced operations on December 24, 2003 and was operational during a portion of the year only. Amounts reflect performance for the period of time the class had operations, which was 10 days during the period. |
| |
(g) | Class I Shares were operational during a portion of the year only. Amounts reflect performance for the period of time the class had operations, which was 89 days during the period. |
| |
(h) | Class I Shares were operational during a portion of the year only. Amounts reflect performance for the period of time the class had operations, which was 136 days during the period. |
| |
(i) | Class I Shares were operational during a portion of the year only. Amounts reflect performance for the period of time the class had operations, which was 357 days during the period. |
| |
(j) | Included in the expense ratios is the Treasury Guarantee Program fees incurred by the Fund during the period. Without these fees, the gross and net expense ratios would have been decreased by 0.07%. |
| | |
45 | HSBC INVESTOR FAMILY OF FUNDS | See notes to financial statements |
|
HSBC INVESTOR U.S. TREASURY MONEY MARKET FUND |
|
Financial Highlights
Selected data for a share outstanding throughout the periods indicated.
| | | | | | | | | | | | | | | | | | | | | | | | |
| | | | | Investment Activities | | Dividends | |
| | | | |
| |
|
|
| |
Net Asset
Value,
Beginning
of Period
| | Net
Investment
Income | | Net Realized
Gains
(Losses) from
Investments | | Total from
Investment
Activities | | Net
Investment
Income | | Net Realized
Gains from
Investments | | Total
Dividends | |
|
|
|
|
|
|
|
|
|
|
|
|
|
|
|
|
|
|
|
|
|
|
|
CLASS A SHARES | | | | | | | | | | | | | | | | | | | | | | | | |
Year Ended October 31, 2004 | | | $ | 1.00 | | | 0.00 | * | | — | | | 0.00 | * | | (0.00 | )* | | — | | | (0.00 | )* | |
Year Ended October 31, 2005 | | | | 1.00 | | | 0.02 | | | — | | | 0.02 | | | (0.02 | ) | | — | | | (0.02 | ) | |
Year Ended October 31, 2006 | | | | 1.00 | | | 0.04 | | | — | | | 0.04 | | | (0.04 | ) | | — | | | (0.04 | ) | |
Year Ended October 31, 2007 | | | | 1.00 | | | 0.04 | | | — | | | 0.04 | | | (0.04 | ) | | — | | | (0.04 | ) | |
Year Ended October 31, 2008 | | | | 1.00 | | | 0.01 | | | — | | | 0.01 | | | (0.01 | ) | | — | | | (0.01 | ) | |
Six Months Ended April 30, 2009 (Unaudited) | | | | 1.00 | | | 0.00 | * | | 0.00 | * | | 0.00 | * | | (0.00 | )* | | (0.00 | )* | | (0.00 | )* | |
|
|
|
|
|
|
|
|
|
|
|
|
|
|
|
|
|
|
|
|
|
|
|
|
|
CLASS B SHARES | | | | | | | | | | | | | | | | | | | | | | | | |
Period Ended October 31, 2004 (e) | | | $ | 1.00 | | | 0.00 | * | | — | | | 0.00 | * | | (0.00 | )* | | — | | | (0.00 | )* | |
Year Ended October 31, 2005 | | | | 1.00 | | | 0.01 | | | — | | | 0.01 | | | (0.01 | ) | | — | | | (0.01 | ) | |
Year Ended October 31, 2006 | | | | 1.00 | | | 0.03 | | | — | | | 0.03 | | | (0.03 | ) | | — | | | (0.03 | ) | |
Year Ended October 31, 2007 | | | | | | | 0.04 | | | — | | | 0.04 | | | (0.04 | ) | | — | | | (0.04 | ) | |
Year Ended October 31, 2008 | | | | 1.00 | | | 0.01 | | | — | | | 0.01 | | | (0.01 | ) | | — | | | (0.01 | ) | |
Six Months Ended April 30, 2009 (Unaudited) | | | | 1.00 | | | 0.00 | * | | 0.00 | * | | 0.00 | * | | (0.00 | )* | | (0.00 | )* | | (0.00 | )* | |
|
|
|
|
|
|
|
|
|
|
|
|
|
|
|
|
|
|
|
|
|
|
|
|
|
CLASS C SHARES | | | | | | | | | | | | | | | | | | | | | | | | |
Year Ended October 31, 2008 (f) | | | $ | 1.00 | | | 0.00 | * | | — | | | 0.00 | * | | (0.00 | )* | | — | | | (0.00 | )* | |
Six Months Ended April 30, 2009 (Unaudited) | | | | 1.00 | | | 0.00 | * | | 0.00 | * | | 0.00 | * | | (0.00 | )* | | (0.00 | )* | | (0.00 | )* | |
|
|
|
|
|
|
|
|
|
|
|
|
|
|
|
|
|
|
|
|
|
|
|
|
|
CLASS D SHARES | | | | | | | | | | | | | | | | | | | | | | | | |
Year Ended October 31, 2004 | | | | | | | 0.01 | | | — | | | 0.01 | | | (0.01 | ) | | — | | | (0.01 | ) | |
Year Ended October 31, 2005 | | | $ | 1.00 | | | 0.02 | | | — | | | 0.02 | | | (0.02 | ) | | — | | | (0.02 | ) | |
Year Ended October 31, 2006 | | | | 1.00 | | | 0.04 | | | — | | | 0.04 | | | (0.04 | ) | | — | | | (0.04 | ) | |
Year Ended October 31, 2007 | | | | 1.00 | | | 0.04 | | | — | | | 0.04 | | | (0.04 | ) | | — | | | (0.04 | ) | |
Year Ended October 31, 2008 | | | | 1.00 | | | 0.02 | | | — | | | 0.02 | | | (0.02 | ) | | — | | | (0.02 | ) | |
Six Months Ended April 30, 2009 (Unaudited) | | | | 1.00 | | | 0.00 | * | | 0.00 | * | | 0.00 | * | | (0.00 | )* | | (0.00 | )* | | (0.00 | )* | |
|
|
|
|
|
|
|
|
|
|
|
|
|
|
|
|
|
|
|
|
|
|
|
|
|
CLASS I SHARES | | | | | | | | | | | | | | | | | | | | | | | | |
Period Ended October 31, 2004 (g) | | | $ | 1.00 | | | 0.00 | * | | — | | | 0.00 | * | | (0.00 | )* | | — | | | (0.00 | )* | |
Year Ended October 31, 2005 (h) | | | | 1.00 | | | 0.02 | | | — | | | 0.02 | | | (0.02 | ) | | — | | | (0.02 | ) | |
Year Ended October 31, 2006 | | | | 1.00 | | | 0.04 | | | — | | | 0.04 | | | (0.04 | ) | | — | | | (0.04 | ) | |
Year Ended October 31, 2007 | | | | 1.00 | | | 0.05 | | | — | | | 0.05 | | | (0.05 | ) | | — | | | (0.05 | ) | |
Year Ended October 31, 2008 | | | | 1.00 | | | 0.02 | | | — | | | 0.02 | | | (0.02 | ) | | — | | | (0.02 | ) | |
Six Months Ended April 30, 2009 (Unaudited) | | | | 1.00 | | | 0.00 | * | | 0.00 | * | | 0.00 | * | | (0.00 | )* | | (0.00 | )* | | (0.00 | )* | |
|
|
|
|
|
|
|
|
|
|
|
|
|
|
|
|
|
|
|
|
|
|
|
|
|
CLASS Y SHARES | | | | | | | | | | | | | | | | | | | | | | | | |
Year Ended October 31, 2004 | | | $ | 1.00 | | | 0.01 | | | — | | | 0.01 | | | (0.01 | ) | | — | | | (0.01 | ) | |
Year Ended October 31, 2005 | | | | 1.00 | | | 0.02 | | | — | | | 0.02 | | | (0.02 | ) | | — | | | (0.02 | ) | |
Year Ended October 31, 2006 | | | | 1.00 | | | 0.04 | | | — | | | 0.04 | | | (0.04 | ) | | — | | | (0.04 | ) | |
Year Ended October 31, 2007 | | | | 1.00 | | | 0.05 | | | — | | | 0.05 | | | (0.05 | ) | | — | | | (0.05 | ) | |
Year Ended October 31, 2008 | | | | 1.00 | | | 0.02 | | | — | | | 0.02 | | | (0.02 | ) | | — | | | (0.02 | ) | |
Six Months Ended April 30, 2009 (Unaudited) | | | | 1.00 | | | 0.00 | * | | 0.00 | * | | 0.00 | * | | (0.00 | )* | | (0.00 | )* | | (0.00 | )* | |
|
|
|
|
|
|
|
|
|
|
|
|
|
|
|
|
|
|
|
|
|
|
|
|
|
| | | | | | | | | | | | | | | | | | | | | | | |
| | | | | | | | Ratios/Supplementary Data |
| | | | | | | |
|
| | Net Asset
Value, End
of Period | | Total
Return(a) | | Net Assets
at End of
Period
(000’s) | | Ratio of Net
Expenses to
Average Net
Assets(b) | | Ratio of Net
Investment
Income to
Average
Net Assets(b) | | Ratio of
Expenses to
Average Net
Assets(b)(c) | |
|
|
|
|
|
|
|
|
|
|
|
|
|
|
CLASS A SHARES | | | | | | | | | | | | | | | | | | | | | | | |
Year Ended October 31, 2004 | | | $ | 1.00 | | | 0.39 | % | | | $ | 85,882 | | | 0.71 | % | | 0.39 | % | | 0.76 | % | |
Year Ended October 31, 2005 | | | | 1.00 | | | 1.89 | % | | | | 56,307 | | | 0.76 | % | | 1.84 | % | | 0.76 | % | |
Year Ended October 31, 2006 | | | | 1.00 | | | 3.74 | % | | | | 67,861 | | | 0.74 | % | | 3.75 | % | | 0.77 | % | |
Year Ended October 31, 2007 | | | | 1.00 | | | 4.19 | %(d) | | | | 84,355 | | | 0.68 | %(d) | | 4.09 | %(d) | | 0.74 | % | |
Year Ended October 31, 2008 | | | | 1.00 | | | 1.38 | % | | | | 580,458 | | | 0.67 | % | | 1.06 | % | | 0.67 | % | |
Six Months Ended April 30, 2009 (Unaudited) | | | | 1.00 | | | 0.05 | % | | | | 493,938 | | | 0.28 | % | | 0.10 | % | | 0.66 | % | |
|
|
|
|
|
|
|
|
|
|
|
|
|
|
|
|
|
|
|
|
|
|
|
|
CLASS B SHARES | | | | | | | | | | | | | | | | | | | | | | | |
Period Ended October 31, 2004 (e) | | | $ | 1.00 | | | 0.04 | % | | | $ | 38 | | | 1.31 | % | | 0.18 | % | | 1.35 | % | |
Year Ended October 31, 2005 | | | | 1.00 | | | 1.29 | % | | | | 39 | | | 1.36 | % | | 1.28 | % | | 1.36 | % | |
Year Ended October 31, 2006 | | | | 1.00 | | | 3.12 | % | | | | 40 | | | 1.35 | % | | 3.09 | % | | 1.38 | % | |
Year Ended October 31, 2007 | | | | 1.00 | | | 3.57 | %(d) | | | | 41 | | | 1.28 | %(d) | | 3.51 | %(d) | | 1.35 | % | |
Year Ended October 31, 2008 | | | | 1.00 | | | 0.86 | % | | | | 131 | | | 1.11 | % | | 1.01 | % | | 1.28 | % | |
Six Months Ended April 30, 2009 (Unaudited) | | | | 1.00 | | | 0.05 | % | | | | 168 | | | 0.27 | % | | 0.09 | % | | 1.26 | % | |
|
|
|
|
|
|
|
|
|
|
|
|
|
|
|
|
|
|
|
|
|
|
|
|
CLASS C SHARES | | | | | | | | | | | | | | | | | | | | | | | |
Year Ended October 31, 2008 (f) | | | $ | 1.00 | | | 0.01 | % | | | $ | 1,103 | | | 0.64 | % | | 0.20 | % | | 1.26 | % | |
Six Months Ended April 30, 2009 (Unaudited) | | | | 1.00 | | | 0.05 | % | | | | 4,733 | | | 0.25 | % | | 0.07 | % | | 1.26 | % | |
|
|
|
|
|
|
|
|
|
|
|
|
|
|
|
|
|
|
|
|
|
|
|
|
CLASS D SHARES | | | | | | | | | | | | | | | | | | | | | | | |
Year Ended October 31, 2004 | | | $ | 1.00 | | | 0.54 | % | | | $ | 208,633 | | | 0.56 | % | | 0.54 | % | | 0.60 | % | |
Year Ended October 31, 2005 | | | | 1.00 | | | 2.04 | % | | | | 293,480 | | | 0.62 | % | | 2.08 | % | | 0.62 | % | |
Year Ended October 31, 2006 | | | | 1.00 | | | 3.90 | % | | | | 302,637 | | | 0.60 | % | | 3.85 | % | | 0.62 | % | |
Year Ended October 31, 2007 | | | | 1.00 | | | 4.34 | %(d) | | | | 297,120 | | | 0.53 | %(d) | | 4.28 | %(d) | | 0.59 | % | |
Year Ended October 31, 2008 | | | | 1.00 | | | 1.53 | % | | | | 937,905 | | | 0.52 | % | | 1.33 | % | | 0.52 | % | |
Six Months Ended April 30, 2009 (Unaudited) | | | | 1.00 | | | 0.05 | % | | | | 1,021,221 | | | 0.27 | % | | 0.09 | % | | 0.51 | % | |
|
|
|
|
|
|
|
|
|
|
|
|
|
|
|
|
|
|
|
|
|
|
|
|
CLASS I SHARES | | | | | | | | | | | | | | | | | | | | | | | |
Period Ended October 31, 2004 (g) | | | $ | 1.00 | | | 0.02 | % | | | $ | 0 | | | 0.17 | % | | 0.77 | % | | 0.23 | % | |
Year Ended October 31, 2005 (h) | | | | 1.00 | | | 2.02 | % | | | | 30,518 | | | 0.20 | % | | 2.62 | % | | 0.26 | % | |
Year Ended October 31, 2006 | | | | 1.00 | | | 4.37 | % | | | | 6,521 | | | 0.19 | % | | 4.12 | % | | 0.27 | % | |
Year Ended October 31, 2007 | | | | 1.00 | | | 4.74 | %(d) | | | | 73,460 | | | 0.15 | %(d) | | 4.38 | %(d) | | 0.22 | % | |
Year Ended October 31, 2008 | | | | 1.00 | | | 1.90 | % | | | | 3,771,262 | | | 0.16 | % | | 1.26 | % | | 0.16 | % | |
Six Months Ended April 30, 2009 (Unaudited) | | | | 1.00 | | | 0.11 | % | | | | 3,504,569 | | | 0.16 | % | | 0.21 | % | | 0.16 | % | |
|
|
|
|
|
|
|
|
|
|
|
|
|
|
|
|
|
|
|
|
|
|
|
|
CLASS Y SHARES | | | | | | | | | | | | | | | | | | | | | | | |
Year Ended October 31, 2004 | | | $ | 1.00 | | | 0.79 | % | | | $ | 172,704 | | | 0.31 | % | | 0.82 | % | | 0.35 | % | |
Year Ended October 31, 2005 | | | | 1.00 | | | 2.30 | % | | | | 47,804 | | | 0.36 | % | | 2.13 | % | | 0.36 | % | |
Year Ended October 31, 2006 | | | | 1.00 | | | 4.16 | % | | | | 42,934 | | | 0.35 | % | | 4.07 | % | | 0.37 | % | |
Year Ended October 31, 2007 | | | | 1.00 | | | 4.60 | %(d) | | | | 41,256 | | | 0.27 | %(d) | | 4.34 | %(d) | | 0.32 | % | |
Year Ended October 31, 2008 | | | | 1.00 | | | 1.78 | % | | | | 1,364,310 | | | 0.27 | % | | 1.34 | % | | 0.27 | % | |
Six Months Ended April 30, 2009 (Unaudited) | | | | 1.00 | | | 0.06 | % | | | | 1,104,941 | | | 0.24 | % | | 0.13 | % | | 0.26 | % | |
|
|
|
|
|
|
|
|
|
|
|
|
|
|
|
|
|
|
|
|
|
|
|
|
| |
* | Less than $0.005 per share. |
| |
** | Less than $500. |
| |
(a) | Not annualized for periods less than one year. Total returns do not include redemption charges. |
| |
(b) | Annualized for periods less than one year. |
| |
(c) | During the period, certain fees were reduced. If such fee reductions had not occurred, the ratio would have been as indicated. |
| |
(d) | During the year ended October 31, 2007, HSBC reimbursed amounts to certain Funds related to past marketing arrangements. The corresponding impact to the net expense ratio, net income ratio and the total return were 0.01%, 0.01%, 0.01%, 0.01% and 0.01% for Class A Shares, Class B Shares, Class D Shares, Class I Shares and Class Y Shares, respectively. |
| |
(e) | Class B Shares commenced operations on August 13, 2004. |
| |
(f) | Class C Shares were operational during a portion of the year only. Amounts reflect performance for the period of time the class had operations, which was 26 days during the period. |
| |
(g) | Class I Shares commenced operations on December 30, 2003 and were operational during a portion of the year only. Amounts reflect performance for the period of time the class had operations, which was 13 days during the period. |
| |
(h) | Class I Shares were operational during a portion of the year only. Amounts reflect performance for the period of time the class had operations, which was 280 days during the period. |
| | |
See notes to financial statements | HSBC INVESTOR FAMILY OF FUNDS | 46 |
|
HSBC INVESTOR FAMILY OF FUNDS |
|
|
Notes to Financial Statements—as of April 30, 2009 (Unaudited) |
| |
1. | Organization: |
| |
| HSBC Investor Funds (the “Trust”), a Massachusetts business trust organized on April 22, 1987, is registered under the Investment Company Act of 1940, as amended (the “Act”), as an open-end management investment company. As of April 30, 2009, the Trust is comprised of 18 separate operational funds, each a series of the HSBC Investor Family of Funds. The accompanying financial statements are presented for the following 6 funds (individually a “Fund,” collectively the “Funds”): |
| | |
Fund | | Short Name |
| |
|
HSBC Investor California Tax-Free Money Market Fund | | California Tax-Free Money Market Fund |
HSBC Investor New York Tax-Free Money Market Fund | | N.Y. Tax-Free Money Market Fund |
HSBC Investor Prime Money Market Fund | | Prime Money Market Fund |
HSBC Investor Tax-Free Money Market Fund | | Tax-Free Money Market Fund |
HSBC Investor U.S. Government Money Market Fund | | U.S. Government Money Market Fund |
HSBC Investor U.S. Treasury Money Market Fund | | U.S Treasury Money Market Fund |
| |
| Each Fund except the N.Y. Tax-Free Money Market Fund is a diversified fund under the Act. The N.Y. Tax-Free Money Market Fund is a non-diversified fund, which means it may concentrate its investments in the investments of a limited number of issuers. |
| |
| Financial statements for all other funds of HSBC Investor Family of Funds are published separately. |
| |
| The Funds are authorized to issue an unlimited number of shares of beneficial interest with a par value of $0.001 per share. The Funds are authorized to issue five classes of shares: Class A Shares, Class B Shares, Class C Shares, Class D Shares, and Class Y Shares. In addition, the Prime Money Market Fund, Tax-Free Money Market Fund, U.S. Government Money Market Fund and U.S. Treasury Money Market Fund are authorized to issue Class I Shares. The Class B Shares of the Funds are offered without any front-end sales charge but will be subject to a contingent deferred sales charge (“CDSC”) ranging from a maximum of 4.00% if redeemed less than one year after purchase to 0.00% if redeemed more than four years after purchase. Class C Shares of the Funds are offered without any front-end sales charge but will be subject to a maximum CDSC of 1.00% if redeemed less than one year after purchase. No sales charges are assessed with respect to Class A, Class D, Class I or Class Y Shares of the Funds. Each class of shares in each Fund has identical rights and privileges, except with respect to arrangements pertaining to shareholder servicing and/or distribution, class-related expenses, voting rights on matters affecting a single class of shares, and exchange privileges. |
| |
| Under the Trust’s organizational documents, the Funds’ officers and trustees are indemnified against certain liabilities arising out of the performance of their duties to the Funds. In addition, in the normal course of business, the Trust may enter into contracts with its service providers, which also provide for indemnifications by the Funds. The Funds’ maximum exposure under these arrangements is unknown as this would involve future claims that may be made against the Funds. However, based on experience, the Trust expects that risk of loss to be remote. |
| |
2. | Significant Accounting Policies: |
| |
| The following is a summary of the significant accounting policies followed by the Funds in the preparation of their financial statements. The policies are in conformity with U.S. generally accepted accounting principles (“GAAP”). The preparation of financial statements requires management to make estimates and assumptions that affect the reported amounts of assets and liabilities and disclosure of contingent assets and liabilities at the date of the financial statements and the reported amounts of income and expenses for the period. Actual results could differ from those estimates. |
| |
| Securities Valuation: |
| |
| Effective November 1, 2008, the Trust adopted Statement of Financial Accounting Standards (“SFAS”) No. 157, “Fair Value Measurements.” There was no impact to the Funds’ net assets or results of operations upon adoption. SFAS 157 defines fair value as the price that would be received to sell an asset or paid to transfer a liability in an orderly transaction between market participants at the measurement date. |
| |
| Investments of the Funds are valued at amortized cost, which approximates fair value. Investments in other money market funds are priced at net asset value as reported by such companies. Under the amortized cost method, premium or discount, if any, is amortized or accreted, respectively, on a constant (straight-line) basis to the maturity of the security. |
| |
| Investment Transactions and Related Income: |
| |
| Investment transactions are accounted for no later than one business day after trade date. For financial reporting pur- |
| |
47 | HSBC INVESTOR FAMILY OF FUNDS |
|
HSBC INVESTOR FAMILY OF FUNDS |
|
|
Notes to Financial Statements—as of April 30, 2009 (Unaudited) (continued) |
| |
| poses, changes in holdings are accounted for on trade date on the last business day of the reporting period. Investment gains and losses are calculated on the identified cost basis. Interest income is recognized on the accrual basis and includes, where applicable, the amortization or accretion of premium or discount. Dividend income is recorded on the ex-dividend date. |
| |
| Restricted and Illiquid Securities: |
| |
| A restricted security is a security which has been purchased through a private offering and cannot be resold to the general public without prior registration under the Securities Act of 1933 (the “1933 Act”) or pursuant to the resale limitations provided by Rule 144 under the 1933 Act, or another exemption from the registration requirements of the 1933 Act. Certain restricted securities may be resold in transactions exempt from registration, normally to qualified institutional buyers, and may be deemed liquid by the Investment Adviser (as defined in Note 4) based on procedures established by the Board of Trustees. Therefore, not all restricted securities are considered illiquid. At April 30, 2009 the Funds did not hold any restricted securities that were illiquid. |
| |
| Repurchase Agreements: |
| |
| The Funds (except U.S. Treasury Money Market Fund) may enter into repurchase agreements with an entity which is a member of the Federal Reserve System or which is a “primary dealer” (as designated by the Federal Reserve Bank of New York) in U.S. Government obligations. The U.S. Treasury Money Market Fund may temporarily invest in repurchase agreements collateralized by U.S. Treasury Obligations. The repurchase price generally equals the price paid by a Fund plus interest negotiated on the basis of current short-term rates, which may be more or less than the rate on the underlying portfolio securities. The seller, under a repurchase agreement, is required to maintain the collateral held pursuant to the agreement, with a fair value equal to or greater than the repurchase price (including accrued interest). Collateral subject to repurchase agreements is held by the Funds’ custodian or another qualified custodian or in the Federal Reserve/Treasury book-entry system. In the event of counterparty default, the Fund has the right to use the collateral to offset losses incurred. There is potential for loss to the Fund in the event the Fund is delayed or prevented from exercising its rights to dispose of the collateral securities, including the risk of a possible decline in the fair value of the underlying securities during the period while the Fund seeks to assert its rights. |
| |
| Allocations: |
| |
| Expenses directly attributable to a Fund are charged to that Fund. Expenses not directly attributable to a Fund are allocated proportionately among various or all funds within the HSBC Investor Family of Funds in relation to the net assets of each fund or on another reasonable basis. Class specific expenses are charged directly to the class incurring the expense. In addition, income, expenses (other than class specific expenses), and unrealized/realized gains and losses in investments are allocated to each class of shares based on its relative net assets on a daily basis. |
| |
| Dividends to Shareholders: |
| |
| Dividends from net investment income are declared daily and paid monthly from each Fund. Dividends from net realized gains, if any, are declared and paid at least annually by the Funds. Additional distributions are also made to the Funds’ shareholders to the extent necessary to avoid the federal excise tax on certain undistributed income and net realized gains of regulated investment companies. |
| |
| The character of net investment income and net realized gains distributed are determined in accordance with federal income tax regulations, which may differ from GAAP. These “book/tax” differences are either considered temporary or permanent in nature. To the extent these differences are permanent in nature (e.g., reclassification of market discounts, certain gain/loss, paydowns, and distributions), such amounts are reclassified within the composition of net assets based on their federal tax-basis treatment; temporary differences (e.g., wash losses and post-October loss deferrals) do not require reclassification. To the extent distributions from net investment income and net realized gains exceed net investment income and net realized gains for tax purposes, they are reported as distributions of capital. |
| |
| Federal Income Taxes: |
| |
| Each Fund is a separate taxable entity for federal income tax purposes. Each Fund has qualified and intends to continue to qualify each year as a “regulated investment company” under Subchapter M of the Internal Revenue Code, as amended and to distribute substantially all of their taxable net investment income and net realized gains, if any, to their shareholders. Accordingly, no provision for federal income or excise tax is required. |
| |
| In addition, Financial Accounting Standards Board Interpretation No. 48, Accounting for Uncertainty in Income Taxes (“FIN 48”) provides guidance for how uncertain tax positions should be recognized, measured, presented and disclosed in |
| |
HSBC INVESTOR FAMILY OF FUNDS | 48 |
|
HSBC INVESTOR FAMILY OF FUNDS |
|
|
Notes to Financial Statements—as of April 30, 2009 (Unaudited) (continued) |
| | |
| the financial statements. FIN 48 requires the affirmative evaluation of tax positions taken or expected to be taken in the course of preparing the Trust’s tax returns to determine whether it is more-likely-than-not (i.e., greater than 50-percent) that each tax position will be sustained upon examination by a taxing authority based on the technical merits of the position. A tax position that meets the more-likely-than-not recognition threshold is measured to determine the amount of benefit to recognize in the financial statements. Differences between tax positions taken in a tax return and amounts recognized in the financial statements will generally result in an increase in a liability for taxes payable (or a reduction of a tax refund receivable), including the recognition of any related interest and penalties as an operating expense. The FIN 48 analysis included a review of tax positions taken in tax years that remain subject to examination by tax authorities in all major tax jurisdictions, including federal (i.e., the last 4 tax year ends and the interim tax period since then, as applicable). FIN 48 did not impact the Funds’ net assets or results of operations during the period. |
| |
| New Accounting Pronouncements: |
| |
| In March 2008, the Financial Accounting Standards Board (“FASB”) issued the Statement of Financial Accounting Standards No. 161, “Disclosures about Derivative Instruments and Hedging Activities” (“SFAS 161”). SFAS 161 will be effective for fiscal years and interim periods beginning after November 15, 2008. SFAS 161 requires enhanced disclosures about the Funds’ derivative and hedging activities, including how such activities are accounted for and their effect on the Funds’ financial position, performance and cash flows. Management is currently evaluating the impact the adoption of SFAS 161 will have on the Funds’ financial statements and related disclosures. |
| |
| In April 2009, the FASB issued FASB Staff Position No. 157-4, “Determining Fair Value When the Volume and Level of Activity for the Asset or Liability Have Significantly Decreased and Identifying Transactions That Are Not Orderly” (“FSP 157-4”). FSP 157-4 provides additional guidance for estimating fair value in accordance with SFAS No. 157, when the volume and level of activity for the asset or liability have significantly decreased as well as guidance on identifying circumstances that indicate a transaction is not orderly. FSP 157-4 is effective for fiscal years and interim periods ending after June 15, 2009. Management is currently evaluating the impact the adoption of FSP 157-4 will have on the Funds’ financial statement disclosures. |
| |
| |
3. | Investment Valuation Summary |
| | |
| | The inputs used for valuing the Funds’ investments are summarized in the three broad levels listed below: |
| | | | |
| | • | Level 1: | quoted prices in active markets for identical assets |
| | | | |
| | • | Level 2: | other significant observable inputs (including quoted prices for similar securities, interest rates, prepayment speeds, credit risk, etc.) |
| | | | |
| | • | Level 3: | significant unobservable inputs (including the Fund’s own assumptions in determining the fair value of investments) |
| |
| The inputs or methodology used for valuing investments is not necessarily an indication of the risk associated with investing in those investments. For example, debt securities held in the Funds are valued at amortized cost in accordance with Rule 2a-7, which approximates fair value. Generally, amortized cost approximates the current fair value of a security, but since the valuation is not obtained from a quoted price in an active market, such securities are reflected as Level 2. |
| |
| The following is a summary of the valuation as of April 30, 2009 for each Fund based upon the three levels defined above: |
| | | | | | | | | | | | | |
| | LEVEL 1 – Quoted Prices | | LEVEL 2 – Other Significant | |
| |
| |
| |
Fund Name | | Investment
Securities | | Other Financial
Instruments* | | Investment
Securities | | Other Financial
Instruments* | |
| |
| |
| |
| |
| |
California Tax-Free Money Market Fund | | $ | 792,193 | | $ | — | | $ | 72,975,000 | | $ | — | |
New York Tax-Free Money Market Fund | | | 9,572,772 | | | — | | | 936,520,000 | | | — | |
Prime Money Market Fund | | | — | | | — | | | 11,840,758,554 | | | — | |
Tax-Free Money Market Fund | | | 15,065,882 | | | — | | | 205,818,962 | | | — | |
U.S. Government Money Market Fund | | | — | | | — | | | 12,733,734,722 | | | — | |
U.S. Treasury Money Market Fund | | | — | | | — | | | 6,127,967,246 | | | — | |
| |
49 | HSBC INVESTOR FAMILY OF FUNDS |
|
HSBC INVESTOR FAMILY OF FUNDS |
|
|
Notes to Financial Statements—as of April 30, 2009 (Unaudited) (continued) |
| | | | | | | | | | | | | |
| | LEVEL 3 – Significant | | Total | |
| |
| |
| |
Fund Name | | Investment
Securities | | Other Financial
Instruments* | | Investment
Securities | | Other Financial
Instruments* | |
| |
| |
| |
| |
| |
California Tax-Free Money Market Fund | | $ | — | | $ | — | | $ | 73,767,193 | | $ | — | |
New York Tax-Free Money Market Fund | | | — | | | — | | | 946,092,772 | | | — | |
Prime Money Market Fund | | | — | | | — | | | 11,840,758,554 | | | — | |
Tax-Free Money Market Fund | | | — | | | — | | | 220,884,844 | | | — | |
U.S. Government Money Market Fund | | | — | | | — | | | 12,733,734,722 | | | — | |
U.S. Treasury Money Market Fund | | | — | | | — | | | 6,127,967,246 | | | — | |
| | | | |
| |
| |
| | * | Other financial instruments would include any derivative instruments, such as any futures, forwards, and swap agreements. These investments are generally recorded in the financial statements at the unrealized gain or loss on the investment. |
| |
4. | Related Party Transactions: |
| |
| Investment Management: |
| |
| HSBC Global Asset Management (USA) Inc. (“HSBC” or the “Investment Adviser”), a wholly owned subsidiary of HSBC Bank USA, N.A., a national bank organized under the laws of the United States, acts as Investment Adviser to the Funds. As Investment Adviser, HSBC manages the investments of the Funds and continuously reviews, supervises and administers the Funds’ investments pursuant to an Investment Advisory Agreement. For its services, HSBC receives a fee from each Fund, accrued daily and paid monthly, based on the average daily net assets of each respective Fund, at an annual rate of 0.10%. |
| |
| HSBC also provides operational support services to the Funds pursuant to an Operational Support Services Agreement. For its services, HSBC receives a fee, accrued daily and paid monthly, based on the average daily net assets of Class A Shares, Class B Shares, Class C Shares, Class D Shares and Class Y Shares, at an annual rate of: |
| | |
Fund | | Fee Rate |
| |
|
California Tax-Free Money Market Fund | | 0.10% |
N.Y. Tax-Free Money Market Fund | | 0.05% |
Prime Money Market Fund | | 0.10% |
Tax-Free Money Market Fund | | 0.10% |
U.S. Government Money Market Fund | | 0.10% |
U.S. Treasury Money Market Fund | | 0.10% |
| |
| Administration: |
| |
| HSBC serves the Funds as Administrator. Under the terms of the Administration Agreement, HSBC received from the Funds (as well as other funds of the HSBC Investor Funds) a fee, accrued daily and paid monthly, during the period November 1, 2008 though December 31, 2008, at an annual rate of: |
| | |
Based on Average Daily Net Assets of | | Fee Rate |
| |
|
Up to $12 billion | | 0.0525% |
In excess of $12 billion | | 0.0350% |
| |
| Effective January 1, 2009, under the terms of the Administration Agreement, HSBC receives from the Funds a fee, accrued daily and paid monthly, at an annual rate of: |
| | |
Based on Average Daily Net Assets of | | Fee Rate |
| |
|
Up to $10 billion | | 0.0550% |
In excess of $10 billion but not exceeding $20 billion | | 0.0350% |
In excess of $20 billion but not exceeding $50 billion | | 0.0275% |
In excess of $50 billion | | 0.0250% |
| |
| The fee breakpoints are determined on the basis of the aggregate average daily net assets of the HSBC Investor Family of Funds. The fee is allocated to each of the HSBC Investor Family of Funds based upon its pro-rata share of net assets for each class, subject to certain allocations in cases where one fund invests some or all of its assets in another fund. |
| |
HSBC INVESTOR FAMILY OF FUNDS | 50 |
|
HSBC INVESTOR FAMILY OF FUNDS |
|
|
Notes to Financial Statements—as of April 30, 2009 (Unaudited) (continued) |
| |
| The administration fees accrued for each class by fund, of which 50% of such fees are deemed to be class specific, are as follows: |
| | | | | | | | | | | | | | | | | | | |
| | | | | | | | | | | | | | | | | | | |
| | California
Tax-Free
Money
Market Fund | | New York
Tax-Free
Money
Market Fund | | Prime
Money
Market Fund | | Tax-Free
Money
Market Fund | | U.S.
Government
Money
Market Fund | | U.S.
Treasury
Money
Market Fund | |
| |
| |
| |
| |
| |
| |
| |
Class A | | $ | 56 | | $ | 8,206 | | $ | 65,825 | | $ | — | | $ | 131,004 | | $ | 100,114 | |
Class B | | | — | | | 7 | | | 70 | | | — | | | 16 | | | 31 | |
Class C | | | 1 | | | — | | | 59,480 | | | — | | | 33 | | | 726 | |
Class D | | | 14,776 | | | 116,408 | | | 546,300 | | | 18,200 | | | 226,360 | | | 234,135 | |
Class I | | | — | | | — | | | 1,085,605 | | | — | | | 1,297,611 | | | 779,995 | |
Class Y | | | 3,155 | | | 77,197 | | | 300,466 | | | 28,637 | | | 877,327 | | | 211,926 | |
| |
|
| |
|
| |
|
| |
|
| |
|
| |
|
| |
Total | | $ | 17,988 | | $ | 201,818 | | $ | 2,057,746 | | $ | 46,837 | | $ | 2,532,351 | | $ | 1,326,927 | |
| |
|
| |
|
| |
|
| |
|
| |
|
| |
|
| |
| |
| Pursuant to a Sub-Administration Agreement with HSBC, Citi Fund Services Ohio, Inc. (“Citi Ohio”), a wholly-owned subsidiary of The Citigroup, Inc., serves as the Trust’s Sub-Administrator subject to the general supervision of the Trust’s Board of Trustees and HSBC. For these services, Citi Ohio is entitled to a fee, payable by HSBC, at an annual rate equivalent to the fee rates set forth above, minus 0.02% (2 basis points) which is retained by HSBC. During the period ended April 30, 2009, HSBC reduced its administrative fees by $283,661. |
| |
| Under a Compliance Services Agreement between the Trust and Citi Ohio (the “CCO Agreement”), Citi Ohio makes an employee available to serve as the Funds’ Chief Compliance Officer (the “CCO”). Under the CCO Agreement, Citi Ohio also provides infrastructure and support in implementing the written policies and procedures comprising the Funds’ compliance program, including support services to the CCO. For the services provided under the CCO Agreement, the HSBC Investor Family of Funds paid Citi Ohio $133,049 for the period ended April 30, 2009 plus reimbursement of certain expenses. Expenses incurred by each Fund are reflected on the Statements of Operations as “Compliance Service.” Citi Ohio pays the salary and other compensation earned by any such individuals as employees of Citi Ohio. |
| |
| Distribution Plan: |
| |
| Foreside Distribution Services, L.P. (“Foreside”), a wholly-owned subsidiary of Foreside Financial Group LLC, serves the Trust as Distributor (the “Distributor”). The Trust has adopted a non-compensatory Distribution Plan and Agreement (the “Plan”) pursuant to Rule 12b-1 of the Act. The Plan provides for reimbursement of expenses incurred by the Distributor related to distribution and marketing, at a rate not to exceed 0.25%, 1.00%, 1.00% and 0.25% of the average daily net assets of Class A Shares (currently not being charged), Class B Shares (currently charging 0.75%), Class C Shares (currently charging 0.75%) and Class D Shares (currently not being charged) of the Funds, respectively. Foreside, as Distributor, also received $106,503, $76,505 and $5,366 in commissions from sales of HSBC Investor Family of Funds, for Class A Shares, Class B Shares and Class C Shares, respectively, of which $40, $6, and $0 were reallowed to affiliated brokers and dealers for Class A Shares, Class B Shares and Class C Shares, respectively. |
| |
| Shareholder Servicing: |
| |
| The Trust has adopted a Shareholder Services Plan, formerly known as administrative services plan, which provides for payments to shareholder servicing agents (which currently consist of HSBC and its affiliates) for providing various shareholder services. For performing these services, the shareholder servicing agents receive a fee that is computed daily and paid monthly up to 0.60%, 0.25%, 0.25% and 0.25% of the average daily net assets of Class A Shares (currently charging 0.40%), Class B Shares, Class C Shares and Class D Shares of the Funds, respectively. The fees paid to the Distributor pursuant to the Distribution Plan and to shareholder servicing agents pursuant to the Shareholder Services Plan may not exceed, in the aggregate, 0.60%, 1.00%, 1.00% and 0.25% annually of each Fund’s average daily net assets of Class A Shares, Class B Shares, Class C Shares and Class D Shares, respectively. |
| |
| Fund Accounting, Transfer Agent and Trustee: |
| |
| Citi Ohio provides fund accounting and transfer agency services for each fund of the HSBC Investor Family of Funds. As transfer agent for the Funds, Citi Ohio receives a fee based on the number of Funds and shareholder accounts, subject to certain minimums and reimbursement of certain expenses. As fund accountant, Citi Ohio receives an annual fee per Fund and share class, subject to certain minimums and reimbursement of certain expenses. |
| |
51 | HSBC INVESTOR FAMILY OF FUNDS |
|
HSBC INVESTOR FAMILY OF FUNDS |
|
|
Notes to Financial Statements—as of April 30, 2009 (Unaudited) (continued) |
| |
| Each of the non-interested Trustees is compensated with a $60,000 annual Board retainer for service as a Trustee of the Trust and the other HSBC Investor Funds, as well as a $3,000 annual retainer for each Committee of the Board of the Trust and other HSBC Investor Funds. Each non-interested Trustee also receives a $5,000 and $3,000 meeting fee for each regular in-person Board meeting and Committee meeting, respectively. Furthermore, each non-interested Trustee receives compensation for attending special meetings and/or functioning as a Committee Chairperson or Lead Trustee. In addition, the non-interested Trustees are reimbursed for certain expenses incurred in connection with their Board membership. |
| |
| Fee Reductions: |
| |
| The Investment Adviser has agreed to contractually limit through March 1, 2010 the annual total expenses, exclusive of interest, taxes, brokerage commissions, and extraordinary expenses, of the California Tax-Free Money Market Fund, Prime Money Market Fund, U.S. Government Money Market Fund and U.S. Treasury Money Market Fund. Each Fund Class has its own expense limitations based on the average daily net assets for any full fiscal year as follows: |
| | | | | | |
Fund | | Class | | Contractual
Expense
Limitations | |
| |
| |
| |
California Tax-Free Money Market Fund | | A | | 0.80 | % | |
California Tax-Free Money Market Fund | | B | | 1.40 | %* | |
California Tax-Free Money Market Fund | | C | | 1.40 | % | |
California Tax-Free Money Market Fund | | D | | 0.65 | % | |
California Tax-Free Money Market Fund | | Y | | 0.40 | % | |
Prime Money Market Fund | | I | | 0.20 | % | |
U.S. Government Money Market Fund | | I | | 0.20 | % | |
U.S. Treasury Money Market Fund | | I | | 0.20 | % | |
| | |
|
|
| * | The California Tax-Free Money Market Fund Class B Shares have not commenced operations as of April 30, 2009. |
| |
| The Administrator and Citi Ohio may voluntarily waive/reimburse fees to help support the expense limits of the Funds. In addition, the Administrator and Investment Adviser may waive/reimburse additional fees at their discretion. Amounts waived/reimbursed by the Investment Adviser, Administrator and Citi Ohio are reported separately on the Statements of Operations, as applicable. All contractual and any voluntary fee waivers/reimbursements are not subject to recoupment in subsequent fiscal periods. Voluntary waivers/reimbursements may be stopped at any time. |
| |
| The Funds’ have entered into an arrangement with their custodian whereby credits realized as a result of uninvested cash balances are used to reduce a portion of the Funds’ custodian expenses. Expenses reduced during the period ended April 30, 2009 are reflected on the Statements of Operations as “Fees Reduced by Custody Credits.” |
| |
5. | Concentration of Credit Risk: |
| |
| The California Tax-Free Money Market Fund and N.Y. Tax-Free Money Market Fund invest primarily in debt obligations issued by the State of California and the State of New York, respectively, and their respective political subdivisions, agencies and public authorities. The Funds are more susceptible to economic and political factors adversely affecting issuers of California and New York municipal securities than are municipal money market funds that are not concentrated in these issuers to the same extent. |
| |
6. | Federal Income Tax Information: |
| |
| At April 30, 2009, the cost basis for federal income tax purposes, gross unrealized appreciation, gross unrealized depreciation and net unrealized appreciation/depreciation were as follows: |
| | | | | | | | | | | | | |
Fund | | Tax Cost
of Securities
($) | | Tax
Unrealized
Appreciation
($) | | Tax
Unrealized
Depreciation
($) | | Net Unrealized
Appreciation/
(Depreciation)
($)* | |
| |
| |
| |
| |
| |
California Tax-Free Money Market Fund | | | 73,767,193 | | — | | | — | | | — | | |
New York Tax-Free Money Market Fund | | | 946,092,772 | | — | | | — | | | — | | |
Prime Money Market Fund | | | 11,840,758,554 | | — | | | — | | | — | | |
Tax-Free Money Market Fund | | | 220,884,844 | | — | | | — | | | — | | |
U.S. Government Money Market Fund | | | 12,733,736,972 | | — | | | (2,250 | ) | | (2,250 | ) | |
U.S. Treasury Money Market Fund | | | 6,128,304,408 | | — | | | (337,162 | ) | | (337,162 | ) | |
| |
|
* | The difference between book-basis and tax-basis unrealized appreciation (depreciation) is attributable primarily to: tax deferral of losses on wash sales. |
| |
HSBC INVESTOR FAMILY OF FUNDS | 52 |
|
HSBC INVESTOR FAMILY OF FUNDS |
|
Notes to Financial Statements—as of April 30, 2009 (Unaudited) (continued)
|
|
The tax character of dividends paid by the Funds as of latest tax year ended of October 31, 2008 were as follows: |
| | | | | | | | | | | | | | | | | | |
| | Dividends paid from | | | | | | | | | | |
| |
| | | | | | | | | | |
| | Ordinary
Income | | Net
Long Term
Gains | | Total
Taxable
Dividends | | Tax
Exempt
Distributions | | Total
Dividends
Paid** | |
| |
| |
| |
| |
| |
| |
California Tax-Free Money Market Fund | | $ | 40,728 | | | $ | — | | | $ | 40,728 | | $ | 3,640,204 | | $ | 3,680,932 | |
New York Tax-Free Money Market Fund | | | 153,488 | | | | — | | | | 153,488 | | | 22,999,078 | | | 23,152,566 | |
Prime Money Market Fund | | | 250,554,750 | | | | — | | | | 250,554,750 | | | — | | | 250,554,750 | |
Tax-Free Money Market Fund | | | 8,629 | | | | — | | | | 8,629 | | | 2,832,608 | | | 2,841,237 | |
U.S. Government Money Market Fund | | | 398,399,999 | | | | — | | | | 398,399,999 | | | — | | | 398,399,999 | |
U.S. Treasury Money Market Fund | | | 29,192,297 | | | | — | | | | 29,192,297 | | | — | | | 29,192,297 | |
| | |
|
|
| ** | Total dividends paid may differ from the amount reported in the Statements of Changes in Net Assets because dividends are recognized when actually paid for tax purposes. |
| |
| As of latest tax year ended October 31, 2008, the components of accumulated earnings/(deficit) on a tax basis for the Funds were as follows: |
| | | | | | | | | | | | | | | | | | | | | | | | | | | | | |
| | Undistributed
Ordinary
Income | | Undistributed
Tax Exempt
Income | | Undistributed
Long Term
Capital Gains | | Accumulated
Earnings | | Dividends
Payable | | Accumulated
Capital
and Other
Losses | | Unrealized
Appreciation/
(Depreciation) | | Total
Accumulated
Earnings/
(Deficit) | |
| |
| |
| |
| |
| |
| |
| |
| |
| |
California Tax-Free
Money Market Fund | | $ | — | | $ | 195,764 | | | $ | — | | | $ | 195,764 | | $ | (195,764 | ) | $ | (2,924 | ) | | $ | — | | | $ | (2,924 | ) |
New York Tax-Free
Money Market Fund | | | 8,217 | | | 2,640,870 | | | | — | | | | 2,649,087 | | | (2,640,870 | ) | | — | | | | — | | | | 8,217 | |
Prime Money
Market Fund | | | 12,941,248 | | | — | | | | — | | | | 12,941,248 | | | (12,941,787 | ) | | (3,959,026 | ) | | | — | | | | (3,959,565 | ) |
Tax-Free Money
Market Fund | | | 716 | | | 525,961 | | | | — | | | | 526,677 | | | (525,961 | ) | | — | | | | — | | | | 716 | |
U.S. Government
Money Market Fund | | | 22,249,095 | | | — | | | | — | | | | 22,249,095 | | | (21,398,744 | ) | | — | | | | — | | | | 850,351 | |
U.S. Treasury
Money Market Fund | | | 3,061,365 | | | — | | | | — | | | | 3,061,365 | | | (2,780,074 | ) | | — | | | | (315,556 | ) | | | (34,265 | ) |
| |
|
† | The difference between book-basis and tax-basis unrealized appreciation/(depreciation) is attributable to: tax-deferral of losses on wash sales. |
| |
| As of the latest tax year ended of October 31, 2008, the following Funds have net capital loss carryforwards, which are available to offset future realized gains, if any, to the extent provided by the Treasury regulations. To the extent that these carryforwards are used to offset future capital gains, it is probable that the gains that are offset will not be distributed to shareholders. |
| | | | | | | |
| | Amount | | Expires | |
| |
| |
| |
California Tax-Free Money Market Fund | | $ | 24 | | 2014 | | |
| | | 2,900 | | 2016 | | |
Prime Money Market Fund | | | 59,832 | | 2012 | | |
| | | 12,537 | | 2013 | | |
| | | 3,997 | | 2014 | | |
| | | 197,657 | | 2015 | | |
| | | 3,685,003 | | 2016 | | |
| |
| The tax character of current year distributions paid and the tax basis of the current components of accumulated earnings and any net capital loss carryforwards will be determined at the end of the current tax year ending October 31, 2009. |
| |
7. | Legal and Regulatory Matters: |
| |
| On September 26, 2006 BISYS Fund Services, Inc. (“BISYS”), an affiliate of BISYS Fund Services Ohio, Inc. which provided various services to the Funds, reached a settlement with the Securities and Exchange Commission (“the SEC”) regarding the SEC’s investigation related to BISYS’ past payment of certain marketing and other expenses with respect to certain of its mutual fund clients. Although BISYS has reached a settlement with the SEC, the Funds’ management is not aware that any determination has been made as to how the BISYS settlement monies will be distributed. While the Funds’ management is currently unable to determine the impact, if any, of such matters on the Funds or the Funds’ financial statements, management does not anticipate a material, adverse impact to the Funds or the Funds’ financial statements. |
| |
53 | HSBC INVESTOR FAMILY OF FUNDS |
| |
HSBC INVESTOR FAMILY OF FUNDS |
|
| |
Notes to Financial Statements—as of April 30, 2009 (Unaudited) (continued) |
| |
8. | Participation in the U.S. Department of Treasury’s Temporary Guarantee Program for Money Market Funds: |
| |
| On October 6, 2008, the Board of Trustees of the Funds approved the participation by each of the Money Market Funds, excluding the U.S. Treasury Money Market Fund, in the U.S. Department of the Treasury’s Temporary Guarantee Program for Money Market Funds (the “Program”). The Funds’ participation agreement was reviewed and accepted by the Treasury on October 16, 2008. The Program protects the shares of money market fund investors as of September 19, 2008. Any shares held by investors in the Funds as of the close of business on September 19, 2008 are insured against loss under the Program in the event any Fund liquidates and the per share value at the time of liquidation is less than $1 per share. Shares acquired by investors after September 19, 2008 are not eligible for protection under the Program. The Program provides a guarantee based on the number of shares held at the close of business on September 19, 2008 and any increase in the number of shares held in an account after the close of business on September 19, 2008 will not be guaranteed. If the number of shares held in an account fluctuates over the period, investors will be covered for either the number of shares held as of the close of business on September 19, 2008 or the amount held at liquidation, whichever is less. |
| |
| Participation in the Program required a payment to the U.S. Department of Treasury in the amount of $3,118,655, which represented 0.01% based on the net asset value of each Fund as of September 19, 2008. This payment covers participation in the Program until December 18, 2008 and was expensed by each Fund through that date without regard to any expense limitation in effect for the Funds. Amounts expensed during the period ended April 30, 2009 are reflected in the Statements of Operations as “Treasury Guarantee Program fees”. |
| |
| The Program was subsequently extended by the Treasury Department through April 30, 2009, and the Board of Trustees of the Funds approved the continued participation by each of the Money Market Funds, excluding the U.S. Treasury Money Market Fund, in the extended program. The terms of the extended Program are essentially the same as the Program providing protection through April 30, 2009, as well as the extended Program participation fee which represented 0.015% based on the net asset value of each Fund as of September 19, 2008. The payment amounted to $4,677,982 and was expensed from December 19, 2008 through April 30, 2009 without regard to any expense limitation in effect for the Funds. |
| |
| On March 31, 2009, the U.S. Department of the Treasury (the “Treasury”) announced that it would extend its Program until September 18, 2009. The Board of Trustees of the Funds has approved the Funds’ continued participation in the Program. The terms of the extended Program are essentially the same as the Program providing protection through September 18, 2009, as well as the extended Program participation fee which represented 0.015% based on the net asset value of each Fund as of September 19, 2008. The payment amounted to $4,677,982 and is being expensed from May 1, 2009 through September 18, 2009 without regard to any expense limitation in effect for the Funds. |
| |
HSBC INVESTOR FAMILY OF FUNDS | 54 |
| | |
HSBC INVESTOR FAMILY OF FUNDS |
|
| | |
Investment Adviser Contract Approval—April 30, 2009 (Unaudited) |
| | |
| The Board of Trustees of the HSBC Investor Funds Trust, HSBC Advisor Funds Trust and HSBC Investor Portfolios (collectively, the “Trusts”), and the non-interested Trustees (“Independent Trustees”), voting separately, approved the renewal, for a year, of the Investment Advisory Agreements and, where applicable Sub-Advisory Agreements (other than the Sub-Advisory Agreement with Halbis Capital Management (USA) Inc. (“Halbis”)), with respect to the respective series of the Trusts then existing (“Funds”) at an in-person meeting held on December 8, 2008. At that meeting, as well as at the regular meeting of the Board held on March 30, 2009, the Independent Trustees also reviewed and approved short-term extensions to the Sub-Advisory Agreement between the HSBC Global Asset Management (USA) Inc. (“Adviser”) and Halbis with respect to the HSBC Investor Core Plus Fixed Income Fund, HSBC Investor High Yield Fixed Income Fund, HSBC Investor Intermediate Duration Fixed Income Fund, and the HSBC Investor New York-Tax Free Bond Fund (the “Fixed Income Funds”) (the Investment Advisory Agreements and Sub-Advisory Agreements are collectively referred to as the “Agreements”). |
| | |
| In determining whether it was appropriate to approve the Agreements for the Funds, the Independent Trustees requested information from the Adviser and the various subadvisers that they believed to be reasonably necessary to reach their conclusion. In an Executive Session, the Independent Trustees carefully evaluated this information, and were advised by independent legal counsel with respect to their deliberations. Based on their review of the information requested and provided for each Fund, the Independent Trustees determined that the relevant Agreements were consistent with the best interests of the Funds and their shareholders, and enabled the Funds to receive high quality services at a cost that is appropriate and reasonable. The Independent Trustees, along with the entire Board of Trustees, made these determinations on the basis of the following considerations, among others: |
| | |
| | Nature, Extent, and Quality of Services Provided by Adviser and Sub-Advisers. The Trustees considered the nature, quality and extent of the investment advisory services provided by the Adviser (and, as applicable, the subad-visers), in light of the high quality services provided to the Funds, and each Fund’s historic performance. The Trustees considered the commitment of the Adviser to the successful operations of the Funds. The Trustees considered the historical performance of the Funds and the level of expenses of the Funds. With respect to the equity Funds, the Trustees considered the capabilities and performance of the Adviser’s Multimanager unit. The Trustees also considered the use of expense limitation agreements in order to reduce the overall operating expenses of certain Funds. The Trustees also took note of the long term relationship between the Adviser and the Funds and the efforts undertaken by the Adviser to foster the growth and development of the Funds since the inception of each of the Funds. For the Fixed Income Funds, the Independent Trustees also considered the Adviser’s and Halbis’ plans for the Fixed Income Funds. The Trustees also considered the extent to which the Adviser and investment Sub-Advisers had achieved economies of scale and the extent to which shareholders benefited from those economies of scale. |
| | |
| | Investment Performance of the Funds, Adviser and Sub-Advisers. The Trustees considered short-term and long-term investment performance of each Fund over various periods of time as compared to a peer group of comparable funds. The Trustees took note of performance information for one, three and five year periods and since inception as relevant. In addition, the Trustees compared expenses of each Fund to the expenses of its peers, noting that the expenses for each of the Funds compare favorably with industry averages for other funds of similar size. |
| | |
| | Costs of Services and Profits Realized by the Adviser. The Trustees considered the Adviser’s overall profitability and costs and an analysis of the estimated profitability to the Adviser from its relationship with the Funds. The Trustees considered that the advisory fees under the Agreements were within the range of those of similar funds, noting the high level of resource, expertise and experience that was provided to the Funds by the Adviser and Sub-Advisers. The Trustees concluded that the combined advisory fees payable to the Adviser and the Funds’ Sub-Advisers are fair and reasonable in light of the services to be provided, the anticipated costs of these services, the profitability of the Adviser’s relationship with the Funds, and the comparability of the advisory fee to similar fees paid by comparable mutual funds. |
| | |
| | Other Relevant Considerations. The Independent Trustees also considered the overall high quality of the personnel, operations, financial condition, investment management capabilities, methodologies, and performance of the Adviser and Sub-Advisers. The Trustees also noted the range of investment advisory and administrative services provided by the Adviser to the Funds and the level and quality of these services, in particular the quality of the personnel providing these services. In addition, the Trustees considered the overall favorable investment performance of the Funds. |
| | |
| Accordingly, in light of the above considerations and such other factors and information it considered relevant, the Board of Trustees by a unanimous vote of those present in person at the meetings (including a separate vote of the Independent Trustees present in person at the meetings), approved the Agreements. |
| | |
55 | HSBC INVESTOR FAMILY OF FUNDS |
|
HSBC INVESTOR FAMILY OF FUNDS |
|
Table of Shareholder Expenses (Unaudited)—as of April 30, 2009
|
As a shareholder of the HSBC Investor Funds (“Funds”), you incur two types of costs: (1) transaction costs, shareholder servicing fees; and exchange fees: (2) ongoing costs, including management fees; distribution; and other Fund expenses. These examples are intended to help you understand your ongoing costs (in dollars) of investing in the Funds and to compare the cost with the ongoing costs of investing in other mutual funds.
These examples are based on an investment of $1,000 invested at the beginning of the period and held for the entire period from November 1, 2008 through April 30, 2009.
Actual Example
The table below provides information about actual account values and actual expenses. You may use the information below, together with the amount you invested, to estimate the expenses that you paid over the period. Simply divide your account value by $1,000 (for example, an $8,600 account value divided by $1,000 = 8.6), then multiply the result by the number in the table under the heading entitled “Expenses Paid During Period” to estimate the expenses you paid on your account during this period.
| | | | | | | | | | | | | | | | | | | | | |
| | | | Beginning
Account Value
11/1/08 | | Ending
Account Value
4/30/09 | | Expenses Paid
During Period*
11/1/08 – 4/30/09 | | Annualized
Expense Ratio
During Period
11/1/08 – 4/30/09 | |
| | | |
| |
| |
| |
| |
California Tax-Free Money Market Fund | | Class A Shares | | | $ | 1,000.00 | | | | $ | 1,000.60 | | | | $ | 2.93 | | | 0.59 | % | |
| | Class C Shares** | | | | 1,000.00 | | | | | 1,000.20 | | | | | 0.69 | | | 0.90 | % | |
| | Class D Shares | | | | 1,000.00 | | | | | 1,000.90 | | | | | 2.63 | | | 0.53 | % | |
| | Class Y Shares | | | | 1,000.00 | | | | | 1,001.80 | | | | | 1.69 | | | 0.34 | % | |
New York Tax-Free Money Market Fund | | Class A Shares | | | | 1,000.00 | | | | | 1,001.70 | | | | | 3.23 | | | 0.65 | % | |
| | Class B Shares | | | | 1,000.00 | | | | | 1,000.60 | | | | | 4.32 | | | 0.87 | % | |
| | Class D Shares | | | | 1,000.00 | | | | | 1,002.30 | | | | | 2.58 | | | 0.52 | % | |
| | Class Y Shares | | | | 1,000.00 | | | | | 1,003.60 | | | | | 1.34 | | | 0.27 | % | |
Prime Money Market Fund | | Class A Shares | | | | 1,000.00 | | | | | 1,003.10 | | | | | 3.38 | | | 0.68 | % | |
| | Class B Shares | | | | 1,000.00 | | | | | 1,001.60 | | | | | 4.71 | | | 0.95 | % | |
| | Class C Shares | | | | 1,000.00 | | | | | 1,001.60 | | | | | 5.01 | | | 1.01 | % | |
| | Class D Shares | | | | 1,000.00 | | | | | 1,003.80 | | | | | 2.68 | | | 0.54 | % | |
| | Class I Shares | | | | 1,000.00 | | | | | 1,005.50 | | | | | 0.94 | | | 0.19 | % | |
| | Class Y Shares | | | | 1,000.00 | | | | | 1,005.00 | | | | | 1.49 | | | 0.30 | % | |
Tax-Free Money Market Fund | | Class A Shares*** | | | | 1,000.00 | | | | | 1,000.00 | | | | | 1.03 | | | 0.48 | % | |
| | Class D Shares | | | | 1,000.00 | | | | | 1,002.90 | | | | | 2.14 | | | 0.43 | % | |
| | Class Y Shares | | | | 1,000.00 | | | | | 1,004.10 | | | | | 0.89 | | | 0.18 | % | |
U.S. Government Money Market Fund | | Class A Shares | | | | 1,000.00 | | | | | 1,001.20 | | | | | 3.32 | | | 0.67 | % | |
| | Class B Shares | | | | 1,000.00 | | | | | 1,000.60 | | | | | 3.77 | | | 0.76 | % | |
| | Class C Shares | | | | 1,000.00 | | | | | 1,000.60 | | | | | 3.97 | | | 0.80 | % | |
| | Class D Shares | | | | 1,000.00 | | | | | 1,001.70 | | | | | 2.88 | | | 0.58 | % | |
| | Class I Shares | | | | 1,000.00 | | | | | 1,003.40 | | | | | 1.14 | | | 0.23 | % | |
| | Class Y Shares | | | | 1,000.00 | | | | | 1,002.90 | | | | | 1.69 | | | 0.34 | % | |
U.S. Treasury Money Market Fund | | Class A Shares | | | | 1,000.00 | | | | | 1,000.50 | | | | | 1.39 | | | 0.28 | % | |
| | Class B Shares | | | | 1,000.00 | | | | | 1,000.50 | | | | | 1.34 | | | 0.27 | % | |
| | Class C Shares | | | | 1,000.00 | | | | | 1,000.50 | | | | | 0.18 | | | 0.25 | % | |
| | Class D Shares | | | | 1,000.00 | | | | | 1,000.50 | | | | | 1.34 | | | 0.27 | % | |
| | Class I Shares | | | | 1,000.00 | | | | | 1,001.10 | | | | | 0.79 | | | 0.16 | % | |
| | Class Y Shares | | | | 1,000.00 | | | | | 1,000.60 | | | | | 1.19 | | | 0.24 | % | |
| |
|
* | Expenses are equal to the average account value over the period multiplied by the Fund’s annualized expense ratio, multiplied by the number of days in the most recent fiscal half-year divided by the number of days in the fiscal year (to reflect the one half year period). |
| |
** | Information shown reflects values using the expense ratios for the 28 days of operations during the period for California Tax-Free Money Market Fund Class C shares, and has been annualized to reflect values for the period November 1, 2008 to April 30, 2009. |
| |
*** | Information shown reflects values using the expense ratios for the 78 days of operations during the period for Tax-Free Money Market Fund Class A shares, and has been annualized to reflect values for the period November 1, 2008 to April 30, 2009. |
| |
HSBC INVESTOR FAMILY OF FUNDS | 56 |
|
HSBC INVESTOR FAMILY OF FUNDS |
|
Table of Shareholder Expenses (Unaudited)—as of April 30, 2009 (continued)
|
Hypothetical Example for Comparison Purposes
The table below provides information about hypothetical account values and hypothetical expenses based on each Fund’s actual expense ratio and an assumed rate of return of 5% per year before expenses, which is not the Fund’s actual return. The hypothetical account values and expenses may not be used to estimate the actual ending account balance or expenses you paid for the period. You may use this information to compare this 5% hypothetical example with the 5% hypothetical examples that appear in the shareholder reports of other funds.
Please note that the expenses shown in the table are meant to highlight your ongoing costs only and do not reflect any transactional costs, such as sales charges (loads), redemption fees, or exchange fees. Therefore, the table is useful in comparing ongoing costs only, and will not help you determine the relative total costs of owning different funds. In addition, if these transactional costs were included, your costs would have been higher.
| | | | | | | | | | | | | | | | | | | | | |
| | | | Beginning
Account Value
11/1/08 | | Ending
Account Value
4/30/09 | | Expenses Paid
During Period*
11/1/08 – 4/30/09 | | Annualized
Expense Ratio
During Period
11/1/08 – 4/30/09 | |
| | | |
| |
| |
| |
| |
California Tax-Free Money Market Fund | | Class A Shares | | | $ | 1,000.00 | | | | $ | 1,021.87 | | | | $ | 2.96 | | | 0.59 | % | |
| | Class C Shares** | | | | 1,000.00 | | | | | 1,003.15 | | | | | 0.69 | | | 0.90 | % | |
| | Class D Shares | | | | 1,000.00 | | | | | 1,022.17 | | | | | 2.66 | | | 0.53 | % | |
| | Class Y Shares | | | | 1,000.00 | | | | | 1,023.11 | | | | | 1.71 | | | 0.34 | % | |
New York Tax-Free Money Market Fund | | Class A Shares | | | | 1,000.00 | | | | | 1,021.57 | | | | | 3.26 | | | 0.65 | % | |
| | Class B Shares | | | | 1,000.00 | | | | | 1,020.48 | | | | | 4.36 | | | 0.87 | % | |
| | Class D Shares | | | | 1,000.00 | | | | | 1,022.22 | | | | | 2.61 | | | 0.52 | % | |
| | Class Y Shares | | | | 1,000.00 | | | | | 1,023.46 | | | | | 1.35 | | | 0.27 | % | |
Prime Money Market Fund | | Class A Shares | | | | 1,000.00 | | | | | 1,021.42 | | | | | 3.41 | | | 0.68 | % | |
| | Class B Shares | | | | 1,000.00 | | | | | 1,020.08 | | | | | 4.76 | | | 0.95 | % | |
| | Class C Shares | | | | 1,000.00 | | | | | 1,019.79 | | | | | 5.06 | | | 1.01 | % | |
| | Class D Shares | | | | 1,000.00 | | | | | 1,022.12 | | | | | 2.71 | | | 0.54 | % | |
| | Class I Shares | | | | 1,000.00 | | | | | 1,023.85 | | | | | 0.95 | | | 0.19 | % | |
| | Class Y Shares | | | | 1,000.00 | | | | | 1,023.31 | | | | | 1.51 | | | 0.30 | % | |
Tax-Free Money Market Fund | | Class A Shares** | | | | 1,000.00 | | | | | 1,009.66 | | | | | 1.03 | | | 0.48 | % | |
| | Class D Shares | | | | 1,000.00 | | | | | 1,022.66 | | | | | 2.16 | | | 0.43 | % | |
| | Class Y Shares | | | | 1,000.00 | | | | | 1,023.90 | | | | | 0.90 | | | 0.18 | % | |
U.S. Government Money Market Fund | | Class A Shares | | | | 1,000.00 | | | | | 1,021.47 | | | | | 3.36 | | | 0.67 | % | |
| | Class B Shares | | | | 1,000.00 | | | | | 1,021.03 | | | | | 3.81 | | | 0.76 | % | |
| | Class C Shares | | | | 1,000.00 | | | | | 1,020.83 | | | | | 4.01 | | | 0.80 | % | |
| | Class D Shares | | | | 1,000.00 | | | | | 1,021.92 | | | | | 2.91 | | | 0.58 | % | |
| | Class I Shares | | | | 1,000.00 | | | | | 1,023.65 | | | | | 1.15 | | | 0.23 | % | |
| | Class Y Shares | | | | 1,000.00 | | | | | 1,023.11 | | | | | 1.71 | | | 0.34 | % | |
U.S. Treasury Money Market Fund | | Class A Shares | | | | 1,000.00 | | | | | 1,023.41 | | | | | 1.40 | | | 0.28 | % | |
| | Class B Shares | | | | 1,000.00 | | | | | 1,023.46 | | | | | 1.35 | | | 0.27 | % | |
| | Class C Shares | | | | 1,000.00 | | | | | 1,023.55 | | | | | 1.25 | | | 0.25 | % | |
| | Class D Shares | | | | 1,000.00 | | | | | 1,023.46 | | | | | 1.35 | | | 0.27 | % | |
| | Class I Shares | | | | 1,000.00 | | | | | 1,024.00 | | | | | 0.80 | | | 0.16 | % | |
| | Class Y Shares | | | | 1,000.00 | | | | | 1,023.60 | | | | | 1.20 | | | 0.24 | % | |
| |
|
* | Expenses are equal to the average account value over the period multiplied by the Fund’s annualized expense ratio, multiplied by the number of days in the most recent fiscal half-year divided by the number of days in the fiscal year (to reflect the one half year period). |
| |
** | Information shown reflects values using the expense ratios for the 28 days of operations during the period for California Tax-Free Money Market Fund Class C Shares and 78 days of operations for the Tax-Free Money Market Fund Class A Shares and has been annualized to reflect values for the period November 1, 2008 to April 30, 2009. |
| |
57 | HSBC INVESTOR FAMILY OF FUNDS |
Other Information:
A description of the policies and procedures that the Funds use to determine how to vote proxies relating to the portfolio securities is available without charge, upon request, by calling 1-800-525-5757 for HSBC Bank USA and HSBC Brokerage (USA) Inc. clients and 1-800-782-8183 for all other shareholders or on the Fund’s website at www.investorfunds.us.hsbc.com and the Securities and Exchange Commission’s (“Commission”) website at http://www.sec.gov. A copy of the Fund’s voting record for the most recent 12 month period ending June 30 is available at the Commission’s website at http://www.sec.gov.
Schedules of Portfolio Investments for fiscal quarters ending January 31 and July 31 will be available no later than 60 days after each period end, without charge, on the Fund’s website at www.investorfunds.us.hsbc.com and on the Commission’s web-site at http://www.sec.gov.
An investment in a Fund is not a deposit of HSBC Bank USA, National Association, and is not insured or guaranteed by the Federal Deposit Insurance Corporation or any other government agency.
| |
HSBC INVESTOR FAMILY OF FUNDS | 58 |
| |
HSBC INVESTOR FAMILY OF FUNDS: | CUSTODIAN |
| The Northern Trust Company |
INVESTMENT ADVISER AND ADMINISTRATOR | 50 South LaSalle Street |
HSBC Global Asset Management (USA) Inc. | Chicago, IL 60603 |
452 Fifth Avenue | |
New York, NY 10018 | INDEPENDENT REGISTERED |
| PUBLIC ACCOUNTING FIRM |
SHAREHOLDER SERVICING AGENTS | KPMG LLP |
For HSBC Bank USA, N.A. and | 191 West Nationwide Blvd. |
HSBC Securities (USA) Inc. Clients: | Suite 500 |
HSBC Bank USA, N.A. | Columbus, OH 43215 |
452 Fifth Avenue | |
New York, NY 10018 | LEGAL COUNSEL |
1-888-525-5757 | Dechert LLP |
| 1775 I Street, N.W. |
For All Other Shareholders: | Washington, D.C. 20006 |
HSBC Investor Funds | |
P.O. Box 182845 | |
Columbus, OH 43218-2845 | |
1-800-782-8183 | |
| |
TRANSFER AGENT AND SPONSOR | |
Citi Fund Services | |
3435 Stelzer Road | |
Columbus, OH 43219 | |
| |
DISTRIBUTOR | |
Foreside Distribution Services, L.P. | |
690 Taylor Road, Suite 150 | |
Gahanna, Ohio 43230-3202 | |


The HSBC Investor Family of Funds are distributed by Foreside Distribution Services, L.P. This document must be preceded or accompanied by a current prospectus for the HSBC Investor Funds, which you should read carefully before you invest or send money.
| | |
— NOT FDIC INSURED | — NO BANK GUARANTEE | — MAY LOSE VALUE |

HSBC Global Asset Management (USA) Inc.
April 30th, 2009
HSBC Investor LifeLine FundsTM
Semi-Annual Report
HSBC Investor Aggressive Growth Strategy Fund
HSBC Investor Growth Strategy Fund
HSBC Investor Moderate Growth Strategy Fund
HSBC Investor Conservative Growth Strategy Fund
HSBC Investor Lifeline Funds
Semi-Annual Report - April 30, 2009
This page is intentionally left blank.
Barclays Capital U.S. Aggregate Bond Index (formerly Lehman Brothers U.S. Aggregate Index) is an unmanaged index generally representative of investment-grade fixed-rate debt issues, including government, corporate, asset-backed, and mortgage-backed securities, with maturities of at least one year.
Barclays Capital Intermediate U.S. Aggregate Index (formerly Lehman Brothers U.S. Intermediate Aggregate Index) is an unmanaged index generally representative of investment-grade issues with maturities between three- and ten-years.
Citigroup U.S. Domestic Three Month Treasury Bill Index is an unmanaged index of three-month Treasury bills.
Citigroup U.S. High Yield Market Capped Index, the “U.S. High Yield Market Capped Index” uses the U.S. High-Yield Market Index as its foundation, imposing a cap on the par amount of each issuer in order to limit the impact of large issuers while retaining the characteristics of the issuer’s distribution across different maturities. The U.S. High-Yield Market Index is an index that captures the performance of below-investments-grade debt issued by corporations domiciled in the United States or Canada.
Gross Domestic Product (GDP) is the measure of the market value of the goods and services produced by labor and property in the United States.
Morgan Stanley Capital International Europe, Australasia and Far East (“MSCI EAFE”) Index is an unmanaged free float-adjusted market capitalization index that is designed to measure the equity market performance of developed markets, excluding the U.S. & Canada. As of June 2007 the MSCI EAFE Index consisted of the following 21 developed market country indices: Australia, Austria, Belgium, Denmark, Finland, France, Germany, Greece, Hong Kong, Ireland, Italy, Japan, the Netherlands, New Zealand, Norway, Portugal, Singapore, Spain, Sweden, Switzerland, and the United Kingdom.
The Russell Universe - Russell is a recognized leader in consulting, multi-manager investing and institutional investment management. Russell’s consultants advise clients on more than $2 trillion in assets. Russell delivers investment programs to over 2,000 clients in 44 countries. With more than $230 billion in assets in our funds, Russell researchers meet with over 4,000 investment managers around the world to evaluate their investment process.
Russell 1000® Growth Index is an unmanaged index which measures the performance of the large-cap growth segment of the U.S. equity universe. It includes those Russell 1000 companies with higher price-to-book ratios and higher forecasted growth values.
Russell 1000® Value Index is an unmanaged index which measures the performance of the large-cap value segment of the U.S. equity universe. It includes those Russell 1000 companies with lower price-to-book ratios and lower expected growth values.
Russell 2000® Index is an unmanaged index which measures the performance of the small-cap segment of the U.S. equity universe. The Russell 2000 Index is a subset of the Russell 3000® Index representing approximately 10% of the total market capitalization of that index. It includes approximately 2000 of the smallest securities based on a combination of their market cap and current index membership.
Russell 2500™ Growth Index is an unmanaged index which measures the performance of the small to mid-cap growth segment of the U.S. equity universe. It includes those Russell 2500 companies with higher price-to-book ratios and higher forecasted growth values.
Standard & Poor’s (“S&P 500”) 500 Index is an unmanaged index that is widely regarded as a gauge of the U.S. equities market, this index includes 500 leading companies in leading industries of the U.S. economy. The S&P 500 focuses on the large cap segment of the market, with approximately 75% coverage of U.S. equities.
Securities indexes assume reinvestment of all distributions and interest payments and do not take in account brokerage fees or expenses. Securities in the Fund do not match those in the indexes and performance of the Fund will differ. Investors cannot invest directly in an index.
Dear Shareholder,
The difficulties in the markets that I mentioned in my last letter continued for the period covered by this semi-annual financial report. In response, governments around the world announced programs of varying types designed to provide support to key industries and generally promote economic activity.
In the face of these market conditions, investors have seen the value of their portfolios decrease, in some cases dramatically. Even money market funds, which are considered by many to be “safe havens” have not been immune from these conditions. In October 2008, a large U.S.-registered money market fund experienced significant market depreciation of some of its portfolio holdings and announced that its price per share had sunk below $1.00.
The U.S. government has responded to this situation with a number of programs. Several were designed to support the credit markets by encouraging investments in money market instruments. Another program was specifically aimed at supporting investor confidence in money market funds. The U.S. Treasury offered money market funds the opportunity to participate in a temporary guarantee program under which a participating fund would receive financial support from the Treasury if its price per share were to depreciate below $1.00. Most money market funds in the U.S. participated in this program.
The Board of Trustees of the HSBC Investor Funds has actively monitored these developments and, along with the Funds’ adviser, has taken actions designed to support the financial interests of the Funds’ shareholders. For example, most of the HSBC Investor money market funds have participated in the Treasury’s Temporary Guarantee Program. The sole exception was the HSBC Investor U.S. Treasury Money Market Fund, which invests in obligations issued by the U.S. Treasury.
The Board continues to work with the Adviser on evaluating investment options and taking actions designed to benefit the shareholders. We remain committed to managing the HSBC Investor Funds in a prudent manner for long-term performance, while taking advantage of short-term market movements.
For commentary on the Funds’ investment results, please read the portfolio managers’ analysis of current market conditions.
After 22 years of serving as the Chairman of the Funds’ Board of Trustees, I will be stepping down, effective July 1, 2009; however, I will continue as a trustee. Michael Seely, who has also been a trustee of the funds since their inception, will be taking over as chairman on that date. I would like to take this time to thank you for the opportunity to serve as Chairman and for your continuing investments with the HSBC Investor Funds.
|
Sincerely, |
|
 |
|
Larry M. Robbins, Chairman, HSBC Investor Funds |
| |
1 | HSBC INVESTOR FAMILY OF FUNDS |
|
Commentary From the Investment Manager |
|
|
HSBC Global Asset Management (USA) Inc.
U.S. Economic Review
Several factors weighed on the U.S. economy during the six-month period between November 1, 2008 and April 30, 2009. Employment continued to decline, causing weakness in consumer spending. The decline in consumer spending also reflected falling prices for goods and services, particularly oil and gas. Consumer spending accounts for more than two-thirds of U.S. economic activity, so slower spending posed a significant threat to economic growth.
Housing values continued to decline in the wake of the subprime mortgage crisis. Foreclosures mounted, forcing financial firms to continue writing down the value of their assets in mortgage-related securities. The federal government responded by designating $1 trillion to help investors buy distressed loans and other assets from U.S. banks. Meanwhile, U.S. automakers struggled with a steep decline in sales and sought a federal bailout in order to avoid bankruptcy.
The Federal Reserve Board acted aggressively as it attempted to ameliorate the credit situation and stimulate the economy. The Fed in December reduced the federal funds rate, its target short-term interest rate, from 1.00% to a range between 0.00% and 0.25% in order to inject liquidity into the financial markets.
In addition, in December, the National Bureau of Economic Research announced that the United States had officially been in a recession since the previous December. The U.S. economy contracted substantially during the period under review: Gross domestic product decreased at annualized rates of 6.3% during the fourth quarter of 2008 and 5.7% in the first quarter of 2009.
Meanwhile, governments across the globe took unprecedented measures to fight the slowdown—the first synchronized global recession since World War II. The G-20, which includes 20 developed and emerging countries with some of the world’s largest economies, agreed on a $1.1 trillion program that the International Monetary Fund would use to help afflicted countries boost economic activity. Both the U.S. and U.K. governments attempted to stimulate lending via quantitative easing, in addition to maintaining target short-term interest rates near zero. Quantitative easing increases the amount of money in circulation by boosting the supply of credit and thus stimulating the flow of money around the economy.
Market Review
Investors during most of this six-month period responded to the uncertain economic environment by fleeing from the perceived risk of stocks and into the perceived safety of high-quality bonds. U.S. stock returns were volatile during this time, as grim economic news and the emerging federal response to the crisis caused traders to react aggressively in response to new data. The U.S. market recovered between early March and the end of April, as investors anticipating improving economic and market conditions sought to capitalize on low valuations. The period ended with the stock market’s best six-week performance since 1938. For the period as a whole the S&P 500 Index1 returned -8.52%, while the small-cap Russell 2000® Index1 lost 8.40%.
Foreign stocks generally posted losses, with the MSCI EAFE Index1 of developed foreign stock markets falling -2.35% during the period under review. Investors sold foreign stocks due to a general aversion to risk, and because of concerns about the repercussions from the turmoil in the credit markets. Emerging markets were mixed during the period. These shares suffered as investors sold assets they perceived to be risky, then rebounded powerfully later in the period as risk aversion decreased and commodity prices rebounded.
The fixed-income markets experienced several distinct environments during the six-month period. The worsening global recession fueled a flight to quality in November as investors sought out the most conservative and secure fixed-income investments—in particular Treasury securities. As the financial crisis began to recede, demand rose for higher-risk fixed-income securities such as corporate and government agency issues. The Barclays Capital U.S. Aggregate Bond Index1, which tracks the broad fixed-income market, returned 7.74% for the six months through April.
| |
1 | For additional information, please refer to the Glossary of Terms. |
| |
HSBC INVESTOR FAMILY OF FUNDS | 2 |
HSBC Investor Aggressive Growth Strategy Fund
HSBC Investor Growth Strategy Fund
HSBC Investor Moderate Growth Strategy Fund
HSBC Investor Conservative Growth Strategy Fund
Investment Concerns
Common stocks, and funds investing in common stocks, generally provide greater return potential when compared with other types of investments.
Equity securities (stocks) are more volatile and carry more risk than other forms of investments, including investments in high-grade fixed income securities. The net asset value per share of these Funds will fluctuate as the value of the securities in their portfolios change.
There are risks associated with investing in foreign companies, such as erratic market conditions, economic and political instability and fluctuations in currency and exchange rates. Value-based investments are subject to the risk that the broad market may not recognize their intrinsic value.
Small capitalization funds typically carry additional risks, since smaller companies generally have a higher risk of failure and historically have experienced a greater degree of market volatility than average. There are risks associated with investing in a fund that invests in securities of foreign countries, such as erratic market conditions, economic and political instabilities and fluctuations in currency exchanges.
Bonds offer a relatively stable level of income, although bond prices will fluctuate providing the potential for principal gain or loss. Intermediate-term, higher-quality bonds generally offer less risk and a lower rate of return than longer-term bonds.
The mortgage market in the U.S. recently experienced difficulties that may adversely affect the performance and market value of certain mortgage-related investments.
An investment in money market funds is not insured or guaranteed by the FDIC or any other government agency. Although the money market funds seek to preserve the value of your investment at $1.00.
The LifeLine Funds, through a fund of funds structure, provide an asset allocation option to investors who seek to diversify their investment across a variety of asset classes by allocating investments to different underlying mutual funds (“Underlying Funds”) in accordance with the LifeLine Funds’ asset allocation model. Each LifeLine Fund provides an asset allocation option corresponding to different investment objectives and risk tolerances.
| |
3 | HSBC INVESTOR FAMILY OF FUNDS |
During the last period, each LifeLine Fund invested in a different combination of the Underlying Funds according to the various target percentage weightings selected by the Adviser, approximately as set forth in the table below.
| | | | | | | | | | | | | |
Underlying Portfolio | | HSBC Investor
Aggressive Growth
Strategy
Fund | | HSBC Investor
Growth
Strategy
Fund | | HSBC Investor
Moderate Growth
Strategy
Fund | | HSBC Investor
Conservative Growth
Strategy
Fund | |
|
|
|
|
|
|
|
|
|
|
|
|
| |
Large Cap Growth Fund | | 21% | | | 21 | % | | 19 | % | | 15 | % | |
|
|
|
|
|
|
|
|
|
|
|
|
| |
Large Cap Value Fund | | 21% | | | 21 | % | | 18 | % | | 14 | % | |
|
|
|
|
|
|
|
|
|
|
|
|
| |
Small-Cap Fund | | 34% | | | 20 | % | | 11 | % | | 4 | % | |
|
|
|
|
|
|
|
|
|
|
|
|
| |
International Equity Fund | | 23% | | | 20 | % | | 15 | % | | 10 | % | |
|
|
|
|
|
|
|
|
|
|
|
|
| |
Fixed Income | | None | | | 15 | % | | 26 | % | | 28 | % | |
|
|
|
|
|
|
|
|
|
|
|
|
| |
High Yield Fixed Income Fund | | None | | | 2 | % | | 5 | % | | 8 | % | |
|
|
|
|
|
|
|
|
|
|
|
|
| |
Money Market Fund | | 1% | | | 1 | % | | 6 | % | | 21 | % | |
|
|
|
|
|
|
|
|
|
|
|
|
| |
Total: | | 100% | | | 100 | % | | 100 | % | | 100 | % | |
| |
| |
HSBC INVESTOR FAMILY OF FUNDS | 4 |
HSBC Investor Aggressive Growth Strategy Fund
| | | | | | | | | | | | | | | | | | | | | | |
Fund Performance | | | | | | | | Average Annual
Total Return (%) | | Expense
Ratio (%)4 | |
|
|
|
|
|
|
|
|
|
|
|
|
|
|
|
|
|
|
|
|
|
|
|
As of April 30, 2009 | | Inception
Date | | Six
Month† | | 1
Year | | 3
Year | | Since
Inception | | Gross | | Net | |
|
|
|
|
|
|
|
|
|
|
|
|
|
|
|
|
|
|
|
|
|
|
|
HSBC Investor Aggressive Growth Strategy Fund Class A1 | | | 2/14/05 | | | -7.75 | | | -41.11 | | | -11.96 | | | -3.81 | | | 1.98 | | | 1.50 | |
|
|
|
|
|
|
|
|
|
|
|
|
|
|
|
|
|
|
|
|
|
|
|
HSBC Investor Aggressive Growth Strategy Fund Class B2 | | | 2/9/05 | | | -7.32 | | | -40.91 | | | -11.68 | | | -3.29 | | | 2.73 | | | 2.25 | |
|
|
|
|
|
|
|
|
|
|
|
|
|
|
|
|
|
|
|
|
|
|
|
HSBC Investor Aggressive Growth Strategy Fund Class C3 | | | 6/10/05 | | | -4.54 | | | -39.09 | | | -11.08 | | | -3.59 | | | 2.73 | | | 2.25 | |
|
|
|
|
|
|
|
|
|
|
|
|
|
|
|
|
|
|
|
|
|
|
|
Standard & Poor’s 500 Index | | | — | | | -8.52 | | | -35.29 | | | -10.76 | | | N/A | | | N/A | | | N/A | |
|
|
|
|
|
|
|
|
|
|
|
|
|
|
|
|
|
|
|
|
|
|
|
Aggressive Growth Blended Portfolio Index5 | | | — | | | -3.40 | | | -35.83 | | | -11.03 | | | N/A | | | N/A | | | N/A | |
|
|
|
|
|
|
|
|
|
|
|
|
|
|
|
|
|
|
|
|
|
|
|
Past performance does not guarantee future results. The performance data quoted represents past performance and current returns may be lower or higher. Total return figures include change in share price, reinvestment of dividends and capital gains and do not reflect the taxes that a shareholder would pay on fund distributions or on the redemption of fund shares. The investment return and principal value will fluctuate so that an investor’s shares, when redeemed may be worth more or less than the original cost. To obtain performance information current to the most recent month end, please call 1-800-782-8183.
The performance above reflects any fee waivers that have been in effect during the applicable periods, as well as any expense reimbursements that have periodically been made. Absent such waivers and reimbursements, returns would have been lower. Currently, contractual fee waivers are in effect from March 1, 2009 through March 1, 2010.
During the periods ended October 31, 2008 and April 30, 2009, the one or more Underlying Funds the Fund invests in received monies certain related to nonrecurring litigation settlements. Without the receipt of this payment, the returns for the applicable periods would be lower.
| |
† | Aggregate total return. |
| |
1 | Reflects the maximum sales charge of 5.00%. |
| |
2 | Reflects the applicable contingent deferred sales charge, maximum of 4.00%. |
| |
3 | Reflects the applicable contingent deferred sales charge, maximum of 1.00%. |
| |
4 | Reflects the expense ratio as reported in the prospectus dated February 27, 2009. |
| |
5 | The performance of the HSBC Investor Aggressive Growth Strategy Fund is compared to a Blended Portfolio Index, which is a hypothetical combination of broad-based indexes. The components of the Blended Portfolio Index and their weighting are as follows: The 90-Day T-Bill (1%); Russell 1000® Growth Index (21%); Russell 1000® Value Index (21%); Russell 2500™ Growth Index (34%) and the MSCI EAFE Index (23%), such as the 90 day T-Bill. Return and principal of stocks and bonds will vary with market conditions. Treasury bills are less volatile than longer-term fixed income securities and are guaranteed as to timely payment of principal and interest by the U.S. Government. The Russell 1000® Growth Index measures the performance of those Russell companies with higher price-to-book ratios and higher forecasted growth values. The Russell 1000® Value Index measures the performance of those Russell companies with lower price-to-book ratios and lower forecasted growth values. The Russell 2500™ Growth Index measures the performance of those Russell 2500 companies with higher price-to-book ratios and higher forecasted growth values. The MSCI EAFE Index is a market capitalization-weighted equity index comprising 21 of the 48 countries in the MSCI universe and representing the developed world outside of North America. These indices are unmanaged and do not reflect the expenses associated with a mutual fund, such as investment management and fund accounting fees. The Fund’s performance reflects the deduction of fees for these value-added services. Investors cannot invest directly in an index. For a complete definition of the above referenced indices, please refer to the Glossary of Terms. |
| |
5 | HSBC INVESTOR FAMILY OF FUNDS |
HSBC Investor Growth Strategy Fund
| | | | | | | | | | | | | | | | | | | | | | |
Fund Performance | | | | | | Average Annual
Total Return (%) | | Expense
Ratio (%)4 | |
|
|
|
|
|
|
|
|
|
|
As of April 30, 2009 | | Inception
Date | | Six
Month† | | 1
Year | | 3
Year | | Since
Inception | | Gross | | | Net | |
|
|
|
|
|
|
|
|
|
|
|
|
|
|
|
|
|
HSBC Investor Growth Strategy Fund Class A1 | | | 2/8/05 | | | -6.43 | | | -36.03 | | | -10.01 | | | -2.74 | | | 1.53 | | | 1.50 | |
|
|
|
|
|
|
|
|
|
|
|
|
|
|
|
|
|
|
|
|
|
|
|
HSBC Investor Growth Strategy Fund Class B2 | | | 2/1/05 | | | -5.77 | | | -35.82 | | | -9.71 | | | -2.02 | | | 2.28 | | | 2.25 | |
|
|
|
|
|
|
|
|
|
|
|
|
|
|
|
|
|
|
|
|
|
|
|
HSBC Investor Growth Strategy Fund Class C3 | | | 4/27/05 | | | -2.86 | | | -33.84 | | | -9.13 | | | -2.02 | | | 2.28 | | | 2.25 | |
|
|
|
|
|
|
|
|
|
|
|
|
|
|
|
|
|
|
|
|
|
|
|
Standard & Poor’s 500 Index | | | — | | | -8.52 | | | -35.29 | | | -10.76 | | | N/A | | | N/A | | | N/A | |
|
|
|
|
|
|
|
|
|
|
|
|
|
|
|
|
|
|
|
|
|
|
|
Growth Blended Portfolio Index5 | | | — | | | -1.81 | | | -30.38 | | | -8.14 | | | N/A | | | N/A | | | N/A | |
|
|
|
|
|
|
|
|
|
|
|
|
|
|
|
|
|
|
|
|
|
|
|
Past performance does not guarantee future results. The performance data quoted represents past performance and current returns may be lower or higher. Total return figures include change in share price, reinvestment of dividends and capital gains and do not reflect the taxes that a shareholder would pay on fund distributions or on the redemption of fund shares. The investment return and principal value will fluctuate so that an investor’s shares, when redeemed may be worth more or less than the original cost. To obtain performance information current to the most recent month end, please call 1-800-782-8183.
The performance above reflects any fee waivers that have been in effect during the applicable periods, as well as any expense reimbursements that have periodically been made. Absent such waivers and reimbursements, returns would have been lower. Currently, contractual fee waivers are in effect from March 1, 2009 through March 1, 2010.
During the periods ended October 31, 2007, October 31, 2008 and April 30, 2009 one or more Underlying Funds the Fund invests in received monies related to certain nonrecurring litigation settlements. Without the receipt of this payment, the returns for the applicable periods would be lower.
| |
† | Aggregate total return. |
| |
1 | Reflects the maximum sales charge of 5.00%. |
| |
2 | Reflects the applicable contingent deferred sales charge, maximum of 4.00%. |
| |
3 | Reflects the applicable contingent deferred sales charge, maximum of 1.00%. |
| |
4 | Reflects the expense ratio as reported in the prospectus dated February 27, 2009. |
| |
5 | The performance of the HSBC Investor Growth Strategy Fund is compared to a Blended Portfolio Index, which is a hypothetical combination of broad-based indexes. The components of the Blended Portfolio Index and their weighting are as follows: The 90-Day T-Bill (1%); Barclays Capital U.S. Aggregate Bond Fund Index (15%); Citigroup U.S. High Yield Market Capped Index (2%); Russell 1000® Growth Index (21%); Russell 1000® Value Index (21%); Russell 2500™ Growth Index (20%) and the MSCI EAFE Index (20%). The stated performance for the Blended Index from April 30, 2006 to February 28, 2008 reflects a 2% allocation for the Merrill Lynch U.S. High Yield Master II Index. On February 29, 2008, the Merrill Lynch U.S. High Yield Master II Index was replaced with the Citigroup U.S. High Yield Market Capped Index. Due to the liquidation of the HSBC Investor High Yield Fixed Income Fund on March 31, 2009, the LifeLine Fund changed the underlying high yield index from Citigroup U.S. High Yield Market Capped Index to Barclays Capital U.S. Corp. High Yield Bond Index, 2% Capped. Return and principal of stocks and bonds will vary with market conditions. Treasury bills such as the 90 day T-Bill are less volatile than longer-term fixed income securities and are guaranteed as to timely payment of principal and interest by the U.S. Government. The Barclays Capital U.S. Corp. High Yield Bond Index, 2% Capped is a, market value-weighted index which covers the universe of fixed rate, non-investment grade debt. The Barclays Capital U.S. Aggregate Bond Fund Index is a market value-weighted performance benchmark for investment-grade fixed-rate debt issues, including government, corporate, asset-backed, and mortgage-backed securities, with maturities of at least one-year. The Citigroup U.S. High Yield Market Capped Index uses the U.S. High-Yield Market Index as its foundation imposing a cap on the par amount of each issuer in order to limit the impact of large issuers while retaining the characteristics of the issuer’s distribution across different maturities. The U.S. High-Yield Market Index is an index that captures the performance of below-investments-grade debt issued by corporations domiciled in the United States or Canada. The Russell 1000® Growth Index measures the performance of those Russell companies with higher price-to-book ratios and higher forecasted growth values. The Russell 1000® Value Index measures the performance of those Russell companies with lower price-to-book ratios and lower forecasted growth values. The Russell 2500™ Growth Index measures the performance of those Russell 2500 companies with higher price-to-book ratios and higher forecasted growth values. The MSCI EAFE Index is a market capitalization-weighted equity index comprising 21 of the 48 countries in the MSCI universe and representing the developed world outside of North America. These indices are unmanaged and do not reflect the expenses associated with a mutual fund, such as investment management and fund accounting fees. The Fund’s performance reflects the deduction of fees for these value-added services. Investors cannot invest directly in an index. For a complete definition of the above referenced indices, please refer to the Glossary of Terms. |
| |
HSBC INVESTOR FAMILY OF FUNDS | 6 |
HSBC Investor Moderate Growth Strategy Fund
| | | | | | | | | | | | | | | | | | | | | | |
Fund Performance | | | | | | Average Annual
Total Return (%) | | Expense
Ratio (%)4 | |
|
|
|
|
|
|
|
|
|
|
As of April 30, 2009 | | Inception
Date | | Six
Month† | | 1
Year | | 3
Year | | Since
Inception | | Gross | | Net | |
|
|
|
|
|
|
|
|
|
|
|
|
|
|
|
|
HSBC Investor Moderate Growth Strategy Fund Class A1 | | | 2/3/05 | | | -4.06 | | | -30.10 | | | -7.71 | | | -2.22 | | | 1.48 | | | 1.48 | |
|
|
|
|
|
|
|
|
|
|
|
|
|
|
|
|
|
|
|
|
|
|
|
HSBC Investor Moderate Growth Strategy Fund Class B2 | | | 2/1/05 | | | -4.39 | | | -29.85 | | | -7.43 | | | -1.62 | | | 2.23 | | | 2.23 | |
|
|
|
|
|
|
|
|
|
|
|
|
|
|
|
|
|
|
|
|
|
|
|
HSBC Investor Moderate Growth Strategy Fund Class C3 | | | 6/10/05 | | | -1.55 | | | -27.72 | | | -6.87 | | | -2.31 | | | 2.23 | | | 2.23 | |
|
|
|
|
|
|
|
|
|
|
|
|
|
|
|
|
|
|
|
|
|
|
|
Standard & Poor’s 500 Index | | | — | | | -8.52 | | | -35.29 | | | -10.76 | | | N/A | | | N/A | | | N/A | |
|
|
|
|
|
|
|
|
|
|
|
|
|
|
|
|
|
|
|
|
|
|
|
Moderate Growth Blended Portfolio Index5 | | | — | | | 0.06 | | | -23.84 | | | -5.12 | | | N/A | | | N/A | | | N/A | |
|
|
|
|
|
|
|
|
|
|
|
|
|
|
|
|
|
|
|
|
|
|
|
Past performance does not guarantee future results. The performance data quoted represents past performance and current returns may be lower or higher. Total return figures include change in share price, reinvestment of dividends and capital gains and do not reflect the taxes that a shareholder would pay on fund distributions or on the redemption of fund shares. The investment return and principal value will fluctuate so that an investor’s shares, when redeemed may be worth more or less than the original cost. To obtain performance information current to the most recent month end, please call 1-800-782-8183.
The performance above reflects any fee waivers that have been in effect during the applicable periods, as well as any expense reimbursements that have periodically been made. Absent such waivers and reimbursements, returns would have been lower. Currently, contractual fee waivers are in effect from March 1, 2009 through March 1, 2010.
During the periods ended October 31, 2007, October 31, 2008 and April 30, 2009 one or more Underlying Funds the Fund invests in received monies related to certain nonrecurring litigation settlements. Without the receipt of this payment, the returns for the applicable periods would be lower.
| |
† | Aggregate total return. |
| |
1 | Reflects the maximum sales charge of 5.00%. |
| |
2 | Reflects the applicable contingent deferred sales charge, maximum of 4.00%. |
| |
3 | Reflects the applicable contingent deferred sales charge, maximum of 1.00%. |
| |
4 | Reflects the expense ratio as reported in the prospectus dated February 27, 2009. |
| |
5 | The performance of the HSBC Investor Moderate Growth Strategy Fund is compared to a Blended Portfolio Index, which is a hypothetical combination of broad-based indexes. The components of the Blended Portfolio Index and their weighting are as follows: The 90-Day T-Bill (6%); Citigroup U.S. High Yield Market Capped Index (5%); Barclays Capital U.S. Aggregate Bond Fund Index (26%); Russell 1000® Growth Index (19%); Russell 1000® Value Index (18%); Russell 2500™ Growth Index (11%) and the MSCI EAFE Index (15%). The stated performance for the Blended Index from April 30, 2006 to February 28, 2008 reflects a 5% allocation for the Merrill Lynch U.S. High Yield Master II Index. On February 29, 2008, the Merrill Lynch U.S. High Yield Master II Index was replaced with the Citigroup U.S. High Yield Market Capped Index. Due to the liquidation of the HSBC Investor High Yield Fixed Income Fund on March 31, 2009, the LifeLine Fund has changed the underlying high yield index from Citigroup U.S. High Yield Market Capped Index to Barclays Capital U.S. Corp. High Yield Bond Index, 2% Capped. Return and principal of stocks and bonds will vary with market conditions. Treasury bills such as the 90 day T-Bill are less volatile than longer-term fixed-income securities and are guaranteed as to timely payment of principal and interest by the U.S. Government. The Barclays Capital U.S. Aggregate Bond Fund Index is a market value-weighted performance benchmark for investment-grade fixed-rate debt issues, including government, corporate, asset-backed, and mortgage-backed securities, with maturities of at least one-year. The Citigroup U.S. High Yield Market Capped Index uses the U.S. High-Yield Market Index as its foundation imposing a cap on the par amount of each issuer in order to limit the impact of large issuers while retaining the characteristics of the issuer’s distribution across different maturities. The U.S. High-Yield Market Index is an index that captures the performance of below-investments-grade debt issued by corporations domiciled in the United States or Canada. The Russell 1000® Growth Index measures the performance of those Russell companies with higher price-to-book ratios and higher forecasted growth values. The Russell 1000® Value Index measures the performance of those Russell companies with lower price-to-book and lower forecasted growth values. The Russell 2500™ Growth Index measures the performance of those Russell 2500 companies with higher price-to-book ratios and higher forecasted growth values. The MSCI EAFE Index is a market capitalization-weighted equity index comprising 21 of the 48 countries in the MSCI universe and representing the developed world outside of North America. These indices are unmanaged and do not reflect the expenses associated with a mutual fund, such as investment management and fund accounting fees. The Fund’s performance reflects the deduction of fees for these value-added services. Investors cannot invest directly in an index. For a complete definition of the above referenced indices, please refer to the Glossary of Terms. |
| |
7 | HSBC INVESTOR FAMILY OF FUNDS |
HSBC Investor Conservative Growth Strategy Fund
| | | | | | | | | | | | | | | | | | | | | | |
Fund Performance | | | | | | Average Annual
Total Return (%) | | Expense
Ratio (%)4 | |
|
|
|
|
|
|
|
|
|
|
As of April 30, 2009 | | Inception
Date | | Six
Month† | | 1
Year | | 3
Year | | Since
Inception | | Gross | | Net | |
|
|
|
|
|
|
|
|
|
|
|
|
|
|
|
|
HSBC Investor Conservative Growth Strategy Fund Class A1 | | | 2/23/05 | | | -4.37 | | | -23.32 | | | -5.38 | | | -1.54 | | | 1.72 | | | 1.50 | |
|
|
|
|
|
|
|
|
|
|
|
|
|
|
|
|
|
|
|
|
|
|
|
HSBC Investor Conservative Growth Strategy Fund Class B2 | | | 2/17/05 | | | -3.63 | | | -22.96 | | | -5.01 | | | -1.13 | | | 2.47 | | | 2.25 | |
|
|
|
|
|
|
|
|
|
|
|
|
|
|
|
|
|
|
|
|
|
|
|
HSBC Investor Conservative Growth Strategy Fund Class C3 | | | 4/19/05 | | | -0.65 | | | -20.66 | | | -4.25 | | | -0.54 | | | 2.47 | | | 2.25 | |
|
|
|
|
|
|
|
|
|
|
|
|
|
|
|
|
|
|
|
|
|
|
|
Standard & Poor’s 500 Index | | | — | | | -8.52 | | | -35.29 | | | -10.76 | | | N/A | | | N/A | | | N/A | |
|
|
|
|
|
|
|
|
|
|
|
|
|
|
|
|
|
|
|
|
|
|
|
Conservative Growth Blended Portfolio Index5 | | | — | | | 1.33 | | | -16.73 | | | -2.25 | | | N/A | | | N/A | | | N/A | |
|
|
|
|
|
|
|
|
|
|
|
|
|
|
|
|
|
|
|
|
|
|
|
Past performance does not guarantee future results. The performance data quoted represents past performance and current returns may be lower or higher. Total return figures include change in share price, reinvestment of dividends and capital gains and do not reflect the taxes that a shareholder would pay on fund distributions or on the redemption of fund shares. The investment return and principal value will fluctuate so that an investor’s shares, when redeemed may be worth more or less than the original cost. To obtain performance information current to the most recent month end, please call 1-800-782-8183.
The performance above reflects any fee waivers that have been in effect during the applicable periods, as well as any expense reimbursements that have periodically been made. Absent such waivers and reimbursements, returns would have been lower. Currently, contractual fee waivers are in effect from March 1, 2009 through March 1, 2010.
During the periods October 31, 2007, October 31, 2008 and April 30, 2009 one or more Underlying Funds the Fund invests in received monies related to certain nonrecurring litigation settlements. Without the receipt of this payment, the returns for the applicable periods would be lower.
| |
† | Aggregate total return. |
| |
1 | Reflects the maximum sales charge of 5.00%. |
| |
2 | Reflects the applicable contingent deferred sales charge, maximum of 4.00%. |
| |
3 | Reflects the applicable contingent deferred sales charge, maximum of 1.00%. |
| |
4 | Reflects the expense ratio as reported in the prospectus dated February 27, 2009. |
| |
5 | The performance of the HSBC Investor Conservative Growth Strategy Fund is compared to a Blended Portfolio Index, which is a hypothetical combination of broad-based indexes. The components of the Blended Portfolio Index and their weighting are as follows: The 90-Day T-Bill (21%); Barclays Capital U.S. Corp. High Yield Bond Index, 2% Capped (8%); Barclays Capital U.S. Aggregate Bond Fund Index (25%); Barclays Capital U.S. Interm. Aggregate Index (3%); Russell 1000® Growth Index (15%); Russell 1000® Value Index (14%); Russell 2500™ Growth Index (4%) and the MSCI EAFE Index (10%). The stated performance for the Blended Index from April 30, 2006 to February 28, 2008 reflects an 8% allocation for the Merrill Lynch U.S. High Yield Master II Index. On February 29, 2008, the Merrill Lynch U.S. High Yield Master II Index was replaced with the Citigroup U.S. High Yield Market Capped Index. Due to the liquidation of the HSBC Investor High Yield Fixed Income Fund on March 31, 2009, the LifeLine Fund changed the underlying high yield index from Citigroup U.S. High Yield Market Capped Index to Barclays Capital U.S. Corp. High Yield Bond Index, 2% Capped. Return and principal of stocks and bonds will vary with market conditions. Treasury bills such as the 90 day T-Bill are less volatile than longer-term fixed-income securities and are guaranteed as to timely payment of principal and interest by the U.S. Government. The Barclays Capital U.S. Corp. High Yield Bond Index, 2% Capped is a, market value-weighted index which covers the universe of fixed rate, non-investment grade debt. The Citigroup U.S. High Yield Market Capped Index uses the U.S. High-Yield Market Index as its foundation imposing a cap on the par amount of each issuer in order to limit the impact of large issuers while retaining the characteristics of the issuer’s distribution across different maturities. The U.S. High-Yield Market Index is an index that captures the performance of below-investments-grade debt issued by corporations domiciled in the United States or Canada. The Barclays Capital U.S. Aggregate Bond Fund Index is a market value-weighted performance benchmark for investment-grade fixed-rate debt issues, including government, corporate, asset-backed, and mortgage-backed securities, with maturities of at least one-year. The Barclays Capital U.S. Intermediate Aggregate Index is generally representative of investment-grade debt issues with maturities between three- and ten-years. The Russell 1000® Growth Index measures the performance of those Russell companies with higher price-to-book ratios and higher forecasted growth values. The Russell 1000® Value Index measures the performance of those Russell companies with lower price-to-book and lower forecasted growth values. The Russell 2500™ Growth Index measures the performance of those Russell 2500™ companies with higher price-to-book ratios and higher forecasted growth values. The MSCI EAFE Index is a market capitalization-weighted equity index comprising 21 of the 48 countries in the MSCI universe and representing the developed world outside of North America. These indices are unmanaged and do not reflect the expenses associated with a mutual fund, such as investment management and fund accounting fees. The Fund’s performance reflects the deduction of fees for these value-added services. Investors cannot invest directly in an index. For a complete definition of the above referenced indices, please refer to the Glossary of Terms. |
| |
HSBC INVESTOR FAMILY OF FUNDS | 8 |
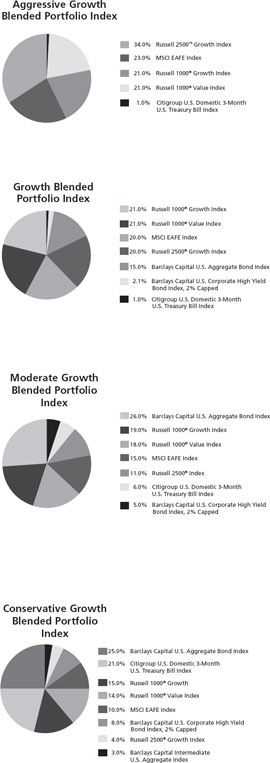
| | | | |
Standardized Performance Benchmark Indices for the
period ended April 30, 2009 | | 1
Year
(%) | |
|
|
|
|
Citigroup U.S. Domestic 3-Month U.S. Treasury Bill Index | | | 1.01 | |
Barclays Capital U.S. Corporate High Yield Bond Index, 2% Capped | | | -12.55 | |
Barclays Capital U.S. Aggregate Bond Index | | | 3.84 | |
Barclays Capital U.S. Intermediate Aggregate Index | | | 4.30 | |
MSCI EAFE Index | | | -42.42 | |
Russell 1000® Growth Index | | | -31.57 | |
Russell 1000® Value Index | | | -39.21 | |
Russell 2500™ Growth Index | | | -32.98 | |
Citigroup U.S. Domestic 3-Month U.S. Treasury Bill Index is is an unmanged index of three-month Treasury bills.
Barclays Capital U.S. Aggregate Bond Index (formerly Lehman Brothers U.S. Aggregate Index) is an unmanaged index generally representative of the investment-grade debt issues with at least one year to final maturity.
Barclays Capital U.S. Corporate High Yield Bond Index, 2% Capped is an unmanaged market value-weighted index which covers the universe of fixed rate, non-investment grade debt.
Barclays Capital U.S. Intermediate Aggregate Bond Index (formerly Lehman Brothers Intermediate U.S. Aggregate Index) is an unmanaged index market value-weighted performance benchmark for investment-grade fixed-rate debt issues, including government, corporate, asset-backed, and mortgage-backed securities, with maturities of at least one year.
Morgan Stanley Capital International Europe, Australasia and Far East Index (MSCI EAFE) is an unmanaged free float-adjusted market capitalization index that is designed to measure the equity market performance of developed markets, excluding the U.S. & Canada. As of June 2007 the MSCI EAFE Index consisted of the following 21 developed market country indices: Australia, Austria, Belgium, Denmark, Finland, France, Germany, Greece, Hong Kong, Ireland, Italy, Japan, the Netherlands, New Zealand, Norway, Portugal, Singapore, Spain, Sweden, Switzerland, and the United Kingdom.
Russell 1000® Growth Index is an unmanaged index which measures the performance of the large-cap growth segment of the U.S. equity universe. It includes those Russell 1000 companies with higher price-to-book ratios and higher forecasted growth values.
Russell 1000® Value Index is an unmanaged index which measures the performance of the large-cap value segment of the U.S. equity universe. It includes those Russell 1000 companies with lower price-to-book ratios and lower expected growth values.
Russell 2500™ Growth Index is an unmanaged index which measures the performance of the small to mid-cap growth segment of the U.S. equity universe. It includes those Russell 2500 companies with higher price-to-book ratios and higher forecasted growth values.
| |
9 | HSBC INVESTOR FAMILY OF FUNDS |
This page is intentionally left blank.
|
HSBC INVESTOR LIFELINE FUNDS |
|
Statements of Assets and Liabilities—As of April 30, 2009 (Unaudited) |
| | | | | | | | | | | | | |
| | Aggressive
Growth
Strategy Fund | | Growth
Strategy
Fund | | Moderate
Growth
Strategy Fund | | Conservative
Growth
Strategy Fund | |
|
|
|
|
|
|
|
|
|
|
Assets: | | | | | | | | | | | | | |
Investments in Affiliated Portfolios | | $ | 7,811,022 | | $ | 22,818,944 | | $ | 24,122,701 | | $ | 6,806,581 | |
Investments in Affiliated Fund, at value (a) | | | 76,439 | | | 233,314 | | | 1,596,039 | | | 1,974,567 | |
Investments in non-affiliates, at value (b) | | | — | | | 468,632 | | | 1,355,220 | | | 769,262 | |
| |
|
| |
|
| |
|
| |
|
| |
Total Investments | | | 7,887,461 | | | 23,520,890 | | | 27,073,960 | | | 9,550,410 | |
| |
|
| |
|
| |
|
| |
|
| |
Receivable for capital shares issued | | | 4,176 | | | 10,047 | | | 35,383 | | | 95 | |
Reclaims receivable | | | 3,681 | | | 12,418 | | | 9,990 | | | 490 | |
Receivable from Investment Adviser | | | 4,529 | | | 1,032 | | | 1,071 | | | 1,116 | |
Prepaid expenses and other assets | | | 6,612 | | | 4,799 | | | 10,217 | | | 2,298 | |
| |
|
| |
|
| |
|
| |
|
| |
Total Assets | | | 7,906,459 | | | 23,549,186 | | | 27,130,621 | | | 9,554,409 | |
| |
|
| |
|
| |
|
| |
|
| |
Liabilities: | | | | | | | | | | | | | |
Payable for capital shares redeemed | | | 3,384 | | | — | | | 71,889 | | | 15,844 | |
Accrued expenses and other liabilities: | | | | | | | | | | | | | |
Investment Management | | | 312 | | | 931 | | | 3,054 | | | 380 | |
Administration | | | 139 | | | 416 | | | 478 | | | 169 | |
Distribution | | | 2,020 | | | 6,237 | | | 7,875 | | | 2,861 | |
Shareholder Servicing | | | 1,561 | | | 4,654 | | | 5,356 | | | 1,901 | |
Compliance Service | | | 3 | | | 8 | | | 9 | | | 3 | |
Transfer Agent | | | 13,042 | | | 23,285 | | | 25,332 | | | 10,129 | |
Other | | | 7,403 | | | 23,923 | | | 26,349 | | | 7,604 | |
| |
|
| |
|
| |
|
| |
|
| |
Total Liabilities | | | 27,864 | | | 59,454 | | | 140,342 | | | 38,891 | |
| |
|
| |
|
| |
|
| |
|
| |
Net Assets | | $ | 7,878,595 | | $ | 23,489,732 | | $ | 26,990,279 | | $ | 9,515,518 | |
| |
|
| |
|
| |
|
| |
|
| |
|
|
|
|
|
|
|
|
|
|
|
|
|
|
Composition of Net Assets: | | | | | | | | | | | | | |
Capital | | $ | 11,759,082 | | $ | 33,404,481 | | $ | 36,359,295 | | $ | 12,006,842 | |
Accumulated net investment income (loss) | | | (3,941 | ) | | 56,605 | | | 43,259 | | | 14,487 | |
Accumulated net realized gains (losses) from investment
and foreign currency transactions | | | (2,183,492 | ) | | (5,377,319 | ) | | (5,159,539 | ) | | (1,468,365 | ) |
Unrealized appreciation/depreciation from investments
and foreign currencies | | | (1,693,054 | ) | | (4,594,035 | ) | | (4,252,736 | ) | | (1,037,446 | ) |
| |
|
| |
|
| |
|
| |
|
| |
Net Assets | | $ | 7,878,595 | | $ | 23,489,732 | | $ | 26,990,279 | | $ | 9,515,518 | |
| |
|
| |
|
| |
|
| |
|
| |
|
|
|
|
|
|
|
|
|
|
|
|
|
|
Net Assets: | | | | | | | | | | | | | |
Class A Shares | | $ | 4,456,128 | | $ | 12,971,261 | | $ | 13,771,462 | | $ | 4,729,511 | |
Class B Shares | | | 3,109,156 | | | 9,259,502 | | | 11,919,950 | | | 4,340,680 | |
Class C Shares | | | 313,311 | | | 1,258,969 | | | 1,298,867 | | | 445,327 | |
| |
|
| |
|
| |
|
| |
|
| |
| | $ | 7,878,595 | | $ | 23,489,732 | | $ | 26,990,279 | | $ | 9,515,518 | |
| |
|
| |
|
| |
|
| |
|
| |
|
|
|
|
|
|
|
|
|
|
|
|
|
|
Shares Outstanding | | | | | | | | | | | | | |
($0.001 par value, unlimited number of shares authorized): | | | | | | | | | | | | | |
Class A Shares | | | 533,636 | | | 1,511,726 | | | 1,598,228 | | | 535,316 | |
Class B Shares | | | 383,897 | | | 1,077,676 | | | 1,383,318 | | | 496,059 | |
Class C Shares | | | 38,707 | | | 145,985 | | | 154,412 | | | 49,532 | |
|
|
|
|
|
|
|
|
|
|
|
|
|
|
Net Asset Value, Offering Price and Redemption Price per share: | | | | | | | | | | | | | |
Class A Shares | | $ | 8.35 | | $ | 8.58 | | $ | 8.62 | | $ | 8.83 | |
Class B Shares* | | $ | 8.10 | | $ | 8.59 | | $ | 8.62 | | $ | 8.75 | |
Class C Shares* | | $ | 8.09 | | $ | 8.62 | | $ | 8.41 | | $ | 8.99 | |
Maximum Sales Charge — Class A Shares | | | 5.00 | % | | 5.00 | % | | 5.00 | % | | 5.00 | % |
| |
|
| |
|
| |
|
| |
|
| |
Maximum Offering Price per share (Net Asset Value/
(100%-maximum sales charge)) — Class A Shares | | $ | 8.79 | | $ | 9.03 | | $ | 9.07 | | $ | 9.29 | |
| |
|
| |
|
| |
|
| |
|
| |
Investments in Affiliated Fund, at cost (a) | | $ | 76,439 | | $ | 233,314 | | $ | 1,596,039 | | $ | 1,974,567 | |
| |
|
| |
|
| |
|
| |
|
| |
Investments in non-affiliates, at cost (b) | | $ | — | | $ | 431,683 | | $ | 1,248,925 | | $ | 708,853 | |
| |
|
| |
|
| |
|
| |
|
| |
| |
|
* | Redemption Price per share varies by length of time shares are held. |
|
(a) | The investment in the affiliated fund are holdings of the HSBC Investor Prime Money Market Fund Class I Shares (see Note 1). The shares held in the Fund are identical to value since it is at $1.00 net asset value per share. In addition, value and cost for financial reporting and federal income tax purposes are the same. |
|
(b) | The investment in the non-affiliated fund are holdings of the Goldman Sachs High Yield Fund Class I Shares (see Note 1). |
| | |
11 | HSBC INVESTOR LIFELINE FUNDS | See notes to financial statements. |
|
HSBC INVESTOR LIFELINE FUNDS |
|
Statements of Operations—For the six months ended April 30, 2009 (Unaudited) |
| | | | | | | | | | | | | |
| | Aggressive
Growth
Strategy Fund | | Growth
Strategy
Fund | | Moderate
Growth
Strategy Fund | | Conservative
Growth
Strategy Fund | |
|
|
|
|
|
|
|
|
|
|
Investment Income: | | | | | | | | | | | | | |
Investment Income from Affiliated Portfolios (a) | | $ | 65,193 | | $ | 295,474 | | $ | 413,224 | | $ | 141,568 | |
Investment Income from Affiliated Fund | | | 403 | | | 1,250 | | | 8,753 | | | 10,638 | |
Investment Income from non-affiliates | | | — | | | 3,628 | | | 10,418 | | | 5,963 | |
Tax reclaims (a) | | | 731 | | | 2,256 | | | 2,031 | | | 251 | |
Foreign tax withholding from Affiliated Portfolios (a) | | | (4,847 | ) | | (12,668 | ) | | (10,959 | ) | | (2,570 | ) |
Expenses from Affiliated Portfolios (a) | | | (29,278 | ) | | (87,168 | ) | | (94,895 | ) | | (28,420 | ) |
| |
|
| |
|
| |
|
| |
|
| |
Total Investment Income (Loss) | | | 32,202 | | | 202,772 | | | 328,572 | | | 127,430 | |
| |
|
| |
|
| |
|
| |
|
| |
|
|
|
|
|
|
|
|
|
|
|
|
|
|
Expenses: | | | | | | | | | | | | | |
Investment Management | | | 1,791 | | | 5,503 | | | 6,368 | | | 2,225 | |
Administration | | | 736 | | | 2,259 | | | 2,611 | | | 910 | |
Distribution: | | | | | | | | | | | | | |
Class B Shares | | | 10,497 | | | 32,019 | | | 42,147 | | | 15,009 | |
Class C Shares | | | 1,067 | | | 4,006 | | | 4,658 | | | 1,533 | |
Shareholder Servicing: | | | | | | | | | | | | | |
Class A Shares | | | 5,060 | | | 15,399 | | | 16,119 | | | 5,568 | |
Class B Shares | | | 3,509 | | | 10,700 | | | 14,082 | | | 5,009 | |
Class C Shares | | | 358 | | | 1,337 | | | 1,558 | | | 512 | |
Accounting | | | 10,348 | | | 10,348 | | | 10,348 | | | 10,348 | |
Compliance Service | | | 4 | | | 16 | | | 16 | | | 8 | |
Printing | | | 3,931 | | | 11,697 | | | 14,447 | | | 6,139 | |
Professional fees | | | 56 | | | 345 | | | 357 | | | 90 | |
Transfer Agent | | | 26,716 | | | 41,890 | | | 43,223 | | | 21,522 | |
Trustee | | | 17 | | | 167 | | | 175 | | | 21 | |
Registration fees | | | 3,720 | | | 3,548 | | | 4,906 | | | 2,444 | |
Other | | | 805 | | | 2,477 | | | 2,796 | | | 819 | |
| |
|
| |
|
| |
|
| |
|
| |
Total expenses before fee reductions | | | 68,615 | | | 141,711 | | | 163,811 | | | 72,157 | |
Fees reduced by Investment Adviser | | | (32,472 | ) | | (27,462 | ) | | (20,487 | ) | | (17,160 | ) |
| |
|
| |
|
| |
|
| |
|
| |
Net Expenses | | | 36,143 | | | 114,249 | | | 143,324 | | | 54,997 | |
| |
|
| |
|
| |
|
| |
|
| |
|
|
|
|
|
|
|
|
|
|
|
|
|
|
Net Investment Income (Loss) | | | (3,941 | ) | | 88,523 | | | 185,248 | | | 72,433 | |
| |
|
| |
|
| |
|
| |
|
| |
|
|
|
|
|
|
|
|
|
|
|
|
|
|
Net Realized/Unrealized Gains (Losses) from Investments: | | | | | | | | | | | | | |
Net realized gains (losses) from investments and foreign currency
transactions (a) | | | (1,221,396 | ) | | (3,139,249 | ) | | (3,101,710 | ) | | (909,408 | ) |
Net realized gains (losses) from non-affiliates investment transactions | | | — | | | (1 | ) | | — | | | — | |
Change in unrealized appreciation/depreciation from Affiliated
Portfolios investments and foreign currencies (a) | | | 961,309 | | | 2,518,310 | | | 2,621,369 | | | 828,250 | |
Change in unrealized appreciation/depreciation from non-affiliates investments | | | — | | | 36,949 | | | 106,295 | | | 60,409 | |
| |
|
| |
|
| |
|
| |
|
| |
|
|
|
|
|
|
|
|
|
|
|
|
|
|
Net realized/unrealized gains (losses) from investments
and foreign currency transactions | | | (260,087 | ) | | (583,991 | ) | | (374,046 | ) | | (20,749 | ) |
| |
|
| |
|
| |
|
| |
|
| |
Change In Net Assets Resulting From Operations | | $ | (264,028 | ) | $ | (495,468 | ) | $ | (188,798 | ) | $ | 51,684 | |
| |
|
| |
|
| |
|
| |
|
| |
| |
|
(a) | Represents amounts allocated from the respective Affiliated Portfolios. |
| | |
See notes to financial statements. | HSBC INVESTOR LIFELINE FUNDS | 12 |
HSBC INVESTOR LIFELINE FUNDS
Statements of Changes in Net Assets
| | | | | | | | | | | | | |
| | Aggressive Growth Strategy Fund | | Growth Strategy Fund | |
|
|
|
|
|
|
| | For the six
months ended
April 30, 2009
(Unaudited) | | For the
year ended
October 31, 2008 | | For the six
months ended
April 30, 2009
(Unaudited) | | For the
year ended
October 31, 2008 | |
|
|
|
|
|
|
|
|
|
|
Investment Activities: | | | | | | | | | | | | | |
Operations: | | | | | | | | | | | | | |
Net investment income (loss) | | $ | (3,941 | ) | $ | (23,552 | ) | $ | 88,523 | | $ | 225,539 | |
Net realized gains (losses) from
investment transactions | | | (1,221,396 | ) | | (1,008,442 | ) | | (3,139,250 | ) | | (2,323,453 | ) |
Change in unrealized appreciation/
depreciation from investments and foreign currencies | | | 961,309 | | | (4,611,582 | ) | | 2,555,259 | | | (12,045,449 | ) |
| |
|
| |
|
| |
|
| |
|
| |
Change in net assets resulting from
operations | | | (264,028 | ) | | (5,643,576 | ) | | (495,468 | ) | | (14,143,363 | ) |
| |
|
| |
|
| |
|
| |
|
| |
|
|
|
|
|
|
|
|
|
|
|
|
|
|
Dividends: | | | | | | | | | | | | | |
Net investment income: | | | | | | | | | | | | | |
Class A Shares | | | — | | | — | | | (139,549 | ) | | (137,880 | ) |
Class B Shares | | | — | | | — | | | (7,901 | ) | | (1,259 | ) |
Class C Shares | | | — | | | — | | | (1,544 | ) | | (816 | ) |
|
|
|
|
|
|
|
|
|
|
|
|
|
|
Net realized gains: | | | | | | | | | | | | | |
Class A Shares | | | — | | | (420,292 | ) | | — | | | (1,103,525 | ) |
Class B Shares | | | — | | | (302,904 | ) | | — | | | (702,526 | ) |
Class C Shares | | | — | | | (31,294 | ) | | — | | | (63,975 | ) |
|
|
|
|
|
|
|
|
|
|
|
|
|
|
Return of Capital: | | | | | | | | | | | | | |
Class A Shares | | | — | | | (1,758 | ) | | — | | | — | |
Class B Shares | | | — | | | (1,250 | ) | | — | | | — | |
Class C Shares | | | — | | | (126 | ) | | — | | | — | |
| |
|
| |
|
| |
|
| |
|
| |
Change in net assets resulting from
shareholder dividends | | | — | | | (757,624 | ) | | (148,994 | ) | | (2,009,981 | ) |
| |
|
| |
|
| |
|
| |
|
| |
Change in net assets resulting from capital
transactions | | | 85,385 | | | 1,942,878 | | | (226,871 | ) | | 3,984,572 | |
| |
|
| |
|
| |
|
| |
|
| |
Change in net assets | | | (178,643 | ) | | (4,458,322 | ) | | (871,333 | ) | | (12,168,772 | ) |
|
|
|
|
|
|
|
|
|
|
|
|
|
|
Net Assets: | | | | | | | | | | | | | |
Beginning of period | | | 8,057,238 | | | 12,515,560 | | | 24,361,065 | | | 36,529,837 | |
| |
|
| |
|
| |
|
| |
|
| |
End of period | | $ | 7,878,595 | | $ | 8,057,238 | | $ | 23,489,732 | | $ | 24,361,065 | |
| |
|
| |
|
| |
|
| |
|
| |
Accumulated net investment income (loss) | | $ | (3,941 | ) | $ | — | | $ | 56,605 | | $ | 117,076 | |
| |
|
| |
|
| |
|
| |
|
| |
| | |
13 | HSBC INVESTOR LIFELINE FUNDS | See notes to financial statements. |
HSBC INVESTOR LIFELINE FUNDS
Statements of Changes in Net Assets (continued)
| | | | | | | | | | | | | |
| | Aggressive Growth Strategy Fund | | Growth Strategy Fund | |
|
|
|
|
|
|
| | For the six
months ended
April 30, 2009
(Unaudited) | | For the
year ended
October 31, 2008 | | For the six
months ended
April 30, 2009
(Unaudited) | | For the
year ended
October 31, 2008 | |
|
|
|
|
|
|
|
|
|
|
CAPITAL TRANSACTIONS: | | | | | | | | | | | | | |
Class A Shares: | | | | | | | | | | | | | |
Proceeds from shares issued | | $ | 481,954 | | $ | 1,808,587 | | $ | 657,446 | | $ | 4,094,924 | |
Dividends reinvested | | | — | | | 421,632 | | | 138,893 | | | 1,235,211 | |
Value of shares redeemed | | | (456,772 | ) | | (1,135,189 | ) | | (1,291,849 | ) | | (3,486,779 | ) |
| |
|
| |
|
| |
|
| |
|
| |
Class A Shares capital transactions | | | 25,182 | | | 1,095,030 | | | (495,510 | ) | | 1,843,356 | |
| |
|
| |
|
| |
|
| |
|
| |
|
|
|
|
|
|
|
|
|
|
|
|
|
|
Class B Shares: | | | | | | | | | | | | | |
Proceeds from shares issued | | | 207,473 | | | 1,075,628 | | | 480,537 | | | 2,700,023 | |
Dividends reinvested | | | — | | | 303,827 | | | 7,888 | | | 701,613 | |
Value of shares redeemed | | | (151,794 | ) | | (597,445 | ) | | (539,800 | ) | | (1,552,870 | ) |
| |
|
| |
|
| |
|
| |
|
| |
Class B Shares capital transactions | | | 55,679 | | | 782,010 | | | (51,375 | ) | | 1,848,766 | |
| |
|
| |
|
| |
|
| |
|
| |
|
|
|
|
|
|
|
|
|
|
|
|
|
|
Class C Shares: | | | | | | | | | | | | | |
Proceeds from shares issued | | | 16,071 | | | 160,943 | | | 360,300 | | | 471,136 | |
Dividends reinvested | | | — | | | 31,420 | | | 1,543 | | | 64,791 | |
Value of shares redeemed | | | (11,547 | ) | | (126,525 | ) | | (41,829 | ) | | (243,477 | ) |
| |
|
| |
|
| |
|
| |
|
| |
Class C Shares capital transactions | | | 4,524 | | | 65,838 | | | 320,014 | | | 292,450 | |
| |
|
| |
|
| |
|
| |
|
| |
|
|
|
|
|
|
|
|
|
|
|
|
|
|
Change in net assets resulting from capital
transactions | | $ | 85,385 | | $ | 1,942,878 | | $ | (226,871 | ) | $ | 3,984,572 | |
| |
|
| |
|
| |
|
| |
|
| |
|
|
|
|
|
|
|
|
|
|
|
|
|
|
SHARE TRANSACTIONS: | | | | | | | | | | | | | |
Class A Shares: | | | | | | | | | | | | | |
Issued | | | 62,722 | | | 140,000 | | | 80,817 | | | 323,501 | |
Reinvested | | | — | | | 30,686 | | | 17,211 | | | 93,719 | |
Redeemed | | | (59,468 | ) | | (93,561 | ) | | (165,777 | ) | | (287,477 | ) |
| |
|
| |
|
| |
|
| |
|
| |
Change in Class A Shares | | | 3,254 | | | 77,125 | | | (67,749 | ) | | 129,743 | |
| |
|
| |
|
| |
|
| |
|
| |
|
|
|
|
|
|
|
|
|
|
|
|
|
|
Class B Shares: | | | | | | | | | | | | | |
Issued | | | 27,313 | | | 84,358 | | | 58,546 | | | 218,579 | |
Reinvested | | | — | | | 22,556 | | | 973 | | | 53,152 | |
Redeemed | | | (20,650 | ) | | (53,351 | ) | | (67,870 | ) | | (133,643 | ) |
| |
|
| |
|
| |
|
| |
|
| |
Change in Class B Shares | | | 6,663 | | | 53,563 | | | (8,351 | ) | | 138,088 | |
| |
|
| |
|
| |
|
| |
|
| |
|
|
|
|
|
|
|
|
|
|
|
|
|
|
Class C Shares: | | | | | | | | | | | | | |
Issued | | | 2,146 | | | 12,747 | | | 44,398 | | | 37,995 | |
Reinvested | | | — | | | 2,334 | | | 190 | | | 4,890 | |
Redeemed | | | (1,530 | ) | | (11,560 | ) | | (5,056 | ) | | (22,815 | ) |
| |
|
| |
|
| |
|
| |
|
| |
Change in Class C Shares | | | 616 | | | 3,521 | | | 39,532 | | | 20,070 | |
| |
|
| |
|
| |
|
| |
|
| |
| | |
See notes to financial statements. | HSBC INVESTOR LIFELINE FUNDS | 14 |
HSBC INVESTOR LIFELINE FUNDS
Statements of Changes in Net Assets (continued)
| | | | | | | | | | | | | |
| | Moderate Growth Strategy Fund | | Conservative Growth Strategy Fund | |
|
|
|
|
|
|
| | For the six
months ended
April 30, 2009
(Unaudited) | | For the
year ended
October 31, 2008 | | For the six
months ended
April 30, 2009
(Unaudited) | | For the
year ended
October 31, 2008 | |
|
|
|
|
|
|
|
|
|
|
Investment Activities: | | | | | | | | | | | | | |
Operations: | | | | | | | | | | | | | |
Net investment income (loss) | | $ | 185,248 | | $ | 510,248 | | $ | 72,433 | | $ | 224,175 | |
Net realized gains (losses) from investment transactions | | | (3,101,710 | ) | | (2,119,789 | ) | | (909,408 | ) | | (572,415 | ) |
Change in unrealized appreciation/depreciation from investments and foreign currencies | | | 2,727,664 | | | (11,008,540 | ) | | 888,659 | | | (2,729,503 | ) |
| |
|
| |
|
| |
|
| |
|
| |
Change in net assets resulting from operations | | | (188,798 | ) | | (12,618,081 | ) | | 51,684 | | | (3,077,743 | ) |
| |
|
| |
|
| |
|
| |
|
| |
|
|
|
|
|
|
|
|
|
|
|
|
|
|
Dividends: | | | | | | | | | | | | | |
Net investment income: | | | | | | | | | | | | | |
Class A Shares | | | (94,741 | ) | | (306,761 | ) | | (36,910 | ) | | (141,579 | ) |
Class B Shares | | | (42,598 | ) | | (139,765 | ) | | (19,154 | ) | | (79,044 | ) |
Class C Shares | | | (4,650 | ) | | (16,616 | ) | | (1,882 | ) | | (7,481 | ) |
|
|
|
|
|
|
|
|
|
|
|
|
|
|
Net realized gains: | | | | | | | | | | | | | |
Class A Shares | | | — | | | (772,146 | ) | | — | | | (146,067 | ) |
Class B Shares | | | — | | | (634,501 | ) | | — | | | (110,864 | ) |
Class C Shares | | | — | | | (74,952 | ) | | — | | | (9,305 | ) |
|
|
|
|
|
|
|
|
|
|
|
|
|
|
Return of capital: | | | | | | | | | | | | | |
Class A Shares | | | — | | | (20,619 | ) | | — | | | (262 | ) |
Class B Shares | | | — | | | (17,902 | ) | | — | | | (242 | ) |
Class C Shares | | | — | | | (2,090 | ) | | — | | | (23 | ) |
| |
|
| |
|
| |
|
| |
|
| |
Change in net assets resulting from
shareholder dividends | | | (141,989 | ) | | (1,985,352 | ) | | (57,946 | ) | | (494,867 | ) |
| |
|
| |
|
| |
|
| |
|
| |
Change in net assets resulting from
capital transactions | | | (666,408 | ) | | 4,171,062 | | | (3,282 | ) | | 1,063,369 | |
| |
|
| |
|
| |
|
| |
|
| |
Change in net assets | | | (997,195 | ) | | (10,432,371 | ) | | (9,544 | ) | | (2,509,241 | ) |
|
|
|
|
|
|
|
|
|
|
|
|
|
|
Net Assets: | | | | | | | | | | | | | |
Beginning of period | | | 27,987,474 | | | 38,419,845 | | | 9,525,062 | | | 12,034,303 | |
| |
|
| |
|
| |
|
| |
|
| |
End of period | | $ | 26,990,279 | | $ | 27,987,474 | | $ | 9,515,518 | | $ | 9,525,062 | |
| |
|
| |
|
| |
|
| |
|
| |
Accumulated net investment income (loss) | | $ | 43,259 | | $ | — | | $ | 14,487 | | $ | — | |
| |
|
| |
|
| |
|
| |
|
| |
| | |
15 | HSBC INVESTOR LIFELINE FUNDS | See notes to financial statements. |
HSBC INVESTOR LIFELINE FUNDS
Statements of Changes in Net Assets (continued)
| | | | | | | | | | | | | |
| | Moderate Growth Strategy Fund | | Conservative Growth Strategy Fund | |
|
|
|
|
|
|
| | For the six
months ended
April 30, 2009
(Unaudited) | | For the
year ended
October 31, 2008 | | For the six
months ended
April 30, 2009
(Unaudited) | | For the
year ended
October 31, 2008 | |
|
|
|
|
|
|
|
|
|
|
CAPITAL TRANSACTIONS: | | | | | | | | | | | | | |
Class A Shares: | | | | | | | | | | | | | |
Proceeds from shares issued | | $ | 766,081 | | $ | 4,477,845 | | $ | 469,617 | | $ | 1,702,567 | |
Dividends reinvested | | | 94,601 | | | 1,096,649 | | | 35,845 | | | 277,201 | |
Value of shares redeemed | | | (1,159,530 | ) | | (3,953,091 | ) | | (517,920 | ) | | (2,025,309 | ) |
| |
|
| |
|
| |
|
| |
|
| |
Class A Shares capital transactions | | | (298,848 | ) | | 1,621,403 | | | (12,458 | ) | | (45,541 | ) |
| |
|
| |
|
| |
|
| |
|
| |
|
|
|
|
|
|
|
|
|
|
|
|
|
|
Class B Shares: | | | | | | | | | | | | | |
Proceeds from shares issued | | | 729,145 | | | 3,948,083 | | | 424,827 | | | 1,595,118 | |
Dividends reinvested | | | 42,488 | | | 790,250 | | | 18,530 | | | 183,107 | |
Value of shares redeemed | | | (1,060,081 | ) | | (2,551,316 | ) | | (449,442 | ) | | (813,124 | ) |
| |
|
| |
|
| |
|
| |
|
| |
Class B Shares capital transactions | | | (288,448 | ) | | 2,187,017 | | | (6,085 | ) | | 965,101 | |
| |
|
| |
|
| |
|
| |
|
| |
|
|
|
|
|
|
|
|
|
|
|
|
|
|
Class C Shares: | | | | | | | | | | | | | |
Proceeds from shares issued | | | 118,766 | | | 778,453 | | | 26,638 | | | 203,099 | |
Dividends reinvested | | | 4,606 | | | 93,634 | | | 1,882 | | | 16,809 | |
Value of shares redeemed | | | (202,484 | ) | | (509,445 | ) | | (13,259 | ) | | (76,099 | ) |
| |
|
| |
|
| |
|
| |
|
| |
Class C Shares capital transactions | | | (79,112 | ) | | 362,642 | | | 15,261 | | | 143,809 | |
| |
|
| |
|
| |
|
| |
|
| |
|
|
|
|
|
|
|
|
|
|
|
|
|
|
Change in net assets resulting from
capital transactions | | $ | (666,408 | ) | $ | 4,171,062 | | $ | (3,282 | ) | $ | 1,063,369 | |
| |
|
| |
|
| |
|
| |
|
| |
|
|
|
|
|
|
|
|
|
|
|
|
|
|
SHARE TRANSACTIONS: | | | | | | | | | | | | | |
Class A Shares: | | | | | | | | | | | | | |
Issued | | | 93,599 | | | 382,474 | | | 55,977 | | | 157,831 | |
Reinvested | | | 11,660 | | | 91,761 | | | 4,250 | | | 25,060 | |
Redeemed | | | (143,643 | ) | | (355,687 | ) | | (61,829 | ) | | (199,713 | ) |
| |
|
| |
|
| |
|
| |
|
| |
Change in Class A Shares | | | (38,384 | ) | | 118,548 | | | (1,602 | ) | | (16,822 | ) |
| |
|
| |
|
| |
|
| |
|
| |
|
|
|
|
|
|
|
|
|
|
|
|
|
|
Class B Shares: | | | | | | | | | | | | | |
Issued | | | 89,072 | | | 340,238 | | | 50,973 | | | 148,878 | |
Reinvested | | | 5,229 | | | 65,629 | | | 2,218 | | | 16,609 | |
Redeemed | | | (131,980 | ) | | (229,160 | ) | | (53,518 | ) | | (81,932 | ) |
| |
|
| |
|
| |
|
| |
|
| |
Change in Class B Shares | | | (37,679 | ) | | 176,707 | | | (327 | ) | | 83,555 | |
| |
|
| |
|
| |
|
| |
|
| |
|
|
|
|
|
|
|
|
|
|
|
|
|
|
Class C Shares: | | | | | | | | | | | | | |
Issued | | | 14,545 | | | 68,169 | | | 3,050 | | | 18,026 | |
Reinvested | | | 581 | | | 7,964 | | | 219 | | | 1,489 | |
Redeemed | | | (26,601 | ) | | (46,372 | ) | | (1,535 | ) | | (7,369 | ) |
| |
|
| |
|
| |
|
| |
|
| |
Change in Class C Shares | | | (11,475 | ) | | 29,761 | | | 1,734 | | | 12,146 | |
| |
|
| |
|
| |
|
| |
|
| |
| | |
See notes to financial statements. | HSBC INVESTOR LIFELINE FUNDS | 16 |
|
HSBC INVESTOR AGGRESSIVE GROWTH STRATEGY FUND |
|
|
Financial Highlights |
|
Selected data for a share outstanding throughout the periods indicated. (a) |
| | | | | | | | | | | | | | | | | | | |
| | | | | Investment Activities | | Dividends | |
| | | | |
| |
|
|
| | Net Asset
Value,
Beginning
of Period | | Net
Investment
Income
(Loss) | | Net Realized
and Unrealized
Gains
(Losses) from
Investments | | Total from
Investment
Activities | | Net
Realized
Gains from
Investment
Transactions | | Total
Dividends | |
|
|
|
|
|
|
|
|
|
|
|
|
|
|
CLASS A SHARES | | | | | | | | | | | | | | | | | | | |
Period Ended October 31, 2005 (i) | | $ | 10.00 | | | (0.01 | ) | | 0.61 | | | 0.60 | | | — | | | — | |
Year Ended October 31, 2006 | | | 10.60 | | | 0.01 | | | 2.01 | | | 2.02 | | | (0.05 | ) | | (0.05 | ) |
Year Ended October 31, 2007 | | | 12.57 | | | — | *(h) | | 2.98 | | | 2.98 | | | — | | | — | |
Year Ended October 31, 2008 | | | 15.55 | | | 0.02 | * | | (6.05 | ) | | (6.03 | ) | | (0.90 | ) | | (0.90 | ) |
Six Months Ended April 30, 2009
(Unaudited) | | | 8.62 | | | 0.01 | * | | (0.28 | ) | | (0.27 | ) | | — | | | — | |
|
|
|
|
|
|
|
|
|
|
|
|
|
|
|
|
|
|
|
|
CLASS B SHARES | | | | | | | | | | | | | | | | | | | |
Period Ended October 31, 2005 (j) | | $ | 10.00 | | | (0.04 | ) | | 0.61 | | | 0.57 | | | — | | | — | |
Year Ended October 31, 2006 | | | 10.57 | | | (0.05 | ) | | 1.97 | | | 1.92 | | | (0.05 | ) | | (0.05 | ) |
Year Ended October 31, 2007 | | | 12.44 | | | (0.11 | )* | | 2.94 | | | 2.83 | | | — | | | — | |
Year Ended October 31, 2008 | | | 15.27 | | | (0.08 | )* | | (5.90 | ) | | (5.98 | ) | | (0.90 | ) | | (0.90 | ) |
Six Months Ended April 30, 2009
(Unaudited) | | | 8.39 | | | (0.02 | )* | | (0.27 | ) | | (0.29 | ) | | — | | | — | |
|
|
|
|
|
|
|
|
|
|
|
|
|
|
|
|
|
|
|
|
CLASS C SHARES | | | | | | | | | | | | | | | | | | | |
Period Ended October 31, 2005 (k) | | $ | 10.00 | | | (0.05 | ) | | 0.60 | | | 0.55 | | | — | | | — | |
Year Ended October 31, 2006 | | | 10.55 | | | (0.04 | ) | | 1.95 | | | 1.91 | | | (0.05 | ) | | (0.05 | ) |
Year Ended October 31, 2007 | | | 12.41 | | | (0.11 | )* | | 2.96 | | | 2.85 | | | — | | | — | |
Year Ended October 31, 2008 | | | 15.26 | | | (0.08 | )* | | (5.89 | ) | | (5.97 | ) | | (0.90 | ) | | (0.90 | ) |
Six Months Ended April 30, 2009
(Unaudited) | | | 8.39 | | | (0.02 | )* | | (0.28 | ) | | (0.30 | ) | | — | | | — | |
|
|
|
|
|
|
|
|
|
|
|
|
|
|
|
|
|
|
|
|
| | | | | | | | | | | | | | | | | | | | | | |
| | | | | | | | Ratios/Supplementary Data | |
| | | | | | | |
|
|
| | Net Asset
Value, End
of Period | | Total
Return(b) | | Net Assets
at End of
Period
(000’s) | | Ratio of Net
Expenses to
Average
Net Assets(c) | | Ratio of Net
Investment
Income (Loss)
to Average
Net Assets(c) | | Ratio of
Expenses to
Average Net
Assets(c)(d) | | Portfolio
Turnover
Rate(b)(e) | |
|
|
|
|
|
|
|
|
|
|
|
|
|
|
|
|
CLASS A SHARES | | | | | | | | | | | | | | | | | | | | | | |
Period Ended October 31, 2005 (i) | | $ | 10.60 | | | 6.00 | % | $ | 726 | | | 1.50 | % | | (0.20 | )% | | 11.72 | % | | 49.10 | % |
Year Ended October 31, 2006 | | | 12.57 | | | 19.15 | % | | 4,116 | | | 1.50 | % | | 0.05 | % | | 3.52 | % | | 48.46 | % |
Year Ended October 31, 2007 | | | 15.55 | | | 23.71 | % | | 7,046 | | | 1.50 | % | | (0.03 | )% | | 2.27 | % | | 45.50 | % |
Year Ended October 31, 2008 | | | 8.62 | | | (40.92 | )%(f) | | 4,572 | | | 1.50 | % | | 0.13 | % | | 1.98 | % | | 72.33 | % |
Six Months Ended April 30, 2009
(Unaudited) | | | 8.35 | | | (3.13 | )%(g) | | 4,456 | | | 1.50 | % | | 0.22 | % | | 2.41 | % | | 26.44 | % |
|
|
|
|
|
|
|
|
|
|
|
|
|
|
|
|
|
|
|
|
|
|
|
CLASS B SHARES | | | | | | | | | | | | | | | | | | | | | | |
Period Ended October 31, 2005 (j) | | $ | 10.57 | | | 5.70 | % | $ | 700 | | | 2.25 | % | | (1.01 | )% | | 11.63 | % | | 49.10 | % |
Year Ended October 31, 2006 | | | 12.44 | | | 18.25 | % | | 2,998 | | | 2.25 | % | | (0.70 | )% | | 4.33 | % | | 48.46 | % |
Year Ended October 31, 2007 | | | 15.27 | | | 22.75 | % | | 4,942 | | | 2.25 | % | | (0.77 | )% | | 3.02 | % | | 45.50 | % |
Year Ended October 31, 2008 | | | 8.39 | | | (41.36 | )%(f) | | 3,166 | | | 2.25 | % | | (0.62 | )% | | 2.73 | % | | 72.33 | % |
Six Months Ended April 30, 2009
(Unaudited) | | | 8.10 | | | (3.46 | )%(g) | | 3,109 | | | 2.25 | % | | (0.54 | )% | | 3.15 | % | | 26.44 | % |
|
|
|
|
|
|
|
|
|
|
|
|
|
|
|
|
|
|
|
|
|
|
|
CLASS C SHARES | | | | | | | | | | | | | | | | | | | | | | |
Period Ended October 31, 2005 (k) | | $ | 10.55 | | | 5.50 | % | $ | 21 | | | 2.25 | % | | (1.15 | )% | | 9.79 | % | | 49.10 | % |
Year Ended October 31, 2006 | | | 12.41 | | | 18.19 | % | | 229 | | | 2.25 | % | | (0.69 | )% | | 4.20 | % | | 48.46 | % |
Year Ended October 31, 2007 | | | 15.26 | | | 22.97 | % | | 528 | | | 2.25 | % | | (0.79 | )% | | 2.99 | % | | 45.50 | % |
Year Ended October 31, 2008 | | | 8.39 | | | (41.32 | )%(f) | | 319 | | | 2.25 | % | | (0.64 | )% | | 2.73 | % | | 72.33 | % |
Six Months Ended April 30, 2009
(Unaudited) | | | 8.09 | | | (3.58 | )%(g) | | 313 | | | 2.25 | % | | (0.54 | )% | | 3.15 | % | | 26.44 | % |
|
|
|
|
|
|
|
|
|
|
|
|
|
|
|
|
|
|
|
|
|
|
|
| |
* | Calculated based on average shares outstanding. |
| |
(a) | The per share amounts and percentages reflect income and expenses assuming inclusion of the Fund’s proportionate share of the income and expenses of the applicable HSBC Investor Portfolios. |
| |
(b) | Not annualized for periods less than one year. Total return calculations do not include any sales or redemption charges. |
| |
(c) | Annualized for periods less than one year. |
| |
(d) | During the period certain fees were reduced. If such fee reductions had not occurred, the ratio would have been as indicated. |
| |
(e) | Portfolio turnover rate is calculated by aggregating the results of multiplying the Fund’s investment percentage in the respective Portfolios by the corresponding Portfolio’s portfolio turnover rates. Portfolio turnover rate is calculated on the basis of the Fund as a whole without distinguishing between classes of shares issued. |
| |
(f) | During the year ended October 31, 2008, certain HSBC Investor Portfolios in which the Fund invests in received monies related to certain nonrecurring litigation settlements. The corresponding impact to the total return was 0.11%, 0.11% and 0.11% for Class A Shares, Class B Shares and Class C Shares, respectively. |
| |
(g) | During the period ended April 30, 2009, certain HSBC Investor Portfolios in which the Fund invests in received monies related to certain nonrecurring litigation settlements. The corresponding impact to the total return was 0.10%, 0.10% and 0.10% for Class A Shares, Class B Shares and Class C Shares, respectively. |
| |
(h) | Rounds to less than $0.01. |
| |
(i) | Class A Shares commenced operations on February 14, 2005. |
| |
(j) | Class B Shares commenced operations on February 9, 2005. |
| |
(k) | Class C Shares commenced operations on June 9, 2005. |
| | |
17 | HSBC INVESTOR LIFELINE FUNDS | See notes to financial statements. |
|
HSBC INVESTOR GROWTH STRATEGY FUND |
|
|
Financial Highlights |
Selected data for a share outstanding throughout the periods indicated. (a)
| | | | | | | | | | | | | | | | | | | | | | |
| | | | Investment Activities | | Dividends | |
| | | |
| |
|
|
| | Net Asset
Value,
Beginning
of Period | | Net
Investment
Income
(Loss) | | Net Realized
and Unrealized
Gains
(Losses) from
Investments | | Total from
Investment
Activities | | Net
Investment
Income | | Net
Realized
Gains from
Investment
Transactions | | Total
Dividends | |
|
|
|
|
|
|
|
|
|
|
|
|
|
|
|
|
CLASS A SHARES | | | | | | | | | | | | | | | | | | | | | | |
Period Ended October 31, 2005 (f) | | $ | 10.00 | | | 0.02 | | | 0.70 | | | 0.72 | | | — | | | — | | | — | |
Year Ended October 31, 2006 | | | 10.72 | | | 0.07 | | | 1.69 | | | 1.76 | | | — | | | (0.03 | ) | | (0.03 | ) |
Year Ended October 31, 2007 | | | 12.45 | | | 0.11 | * | | 2.34 | | | 2.45 | | | (0.08 | ) | | (0.09 | ) | | (0.17 | ) |
Year Ended October 31, 2008 | | | 14.73 | | | 0.12 | * | | (5.21 | ) | | (5.09 | ) | | (0.09 | ) | | (0.74 | ) | | (0.83 | ) |
Six Months Ended April 30, 2009
(Unaudited) | | | 8.81 | | | 0.05 | * | | (0.19 | ) | | (0.14 | ) | | (0.09 | ) | | — | | | (0.09 | ) |
|
|
|
|
|
|
|
|
|
|
|
|
|
|
|
|
|
|
|
|
|
|
|
CLASS B SHARES | | | | | | | | | | | | | | | | | | | | | | |
Period Ended October 31, 2005 (j) | | $ | 10.00 | | | (0.01 | ) | | 0.79 | | | 0.78 | | | — | | | — | | | — | |
Year Ended October 31, 2006 | | | 10.78 | | | 0.02 | | | 1.66 | | | 1.68 | | | — | | | (0.03 | ) | | (0.03 | ) |
Year Ended October 31, 2007 | | | 12.43 | | | 0.01 | * | | 2.34 | | | 2.35 | | | (0.02 | ) | | (0.09 | ) | | (0.11 | ) |
Year Ended October 31, 2008 | | | 14.67 | | | 0.03 | * | | (5.20 | ) | | (5.17 | ) | | — | (l) | | (0.74 | ) | | (0.74 | ) |
Six Months Ended April 30, 2009
(Unaudited) | | | 8.76 | | | 0.02 | * | | (0.18 | ) | | (0.16 | ) | | (0.01 | ) | | — | | | (0.01 | ) |
|
|
|
|
|
|
|
|
|
|
|
|
|
|
|
|
|
|
|
|
|
|
|
CLASS C SHARES | | | | | | | | | | | | | | | | | | | | | | |
Period Ended October 31, 2005 (k) | | $ | 10.00 | | | (0.02 | ) | | 0.84 | | | 0.82 | | | — | | | — | | | — | |
Year Ended October 31, 2006 | | | 10.82 | | | 0.02 | | | 1.67 | | | 1.69 | | | — | | | (0.03 | ) | | (0.03 | ) |
Year Ended October 31, 2007 | | | 12.48 | | | 0.01 | * | | 2.35 | | | 2.36 | | | (0.01 | ) | | (0.09 | ) | | (0.10 | ) |
Year Ended October 31, 2008 | | | 14.74 | | | 0.03 | * | | (5.22 | ) | | (5.19 | ) | | (0.01 | ) | | (0.74 | ) | | (0.75 | ) |
Six Months Ended April 30, 2009
(Unaudited) | | | 8.80 | | | 0.02 | * | | (0.19 | ) | | (0.17 | ) | | (0.01 | ) | | — | | | (0.01 | ) |
|
|
|
|
|
|
|
|
|
|
|
|
|
|
|
|
|
|
|
|
|
|
|
| | | | | | | | | | | | | | | | | | | | | | |
| | | | | | Ratios/Supplementary Data | |
| | | | | |
|
|
| | Net Asset
Value, End
of Period | | Total
Return(b) | | Net Assets
at End of
Period
(000’s) | | Ratio of Net
Expenses to
Average
Net Assets(c) | | Ratio of Net
Investment
Income (Loss)
to Average
Net Assets(c) | | Ratio of
Expenses to
Average Net
Assets(c)(d) | | Portfolio
Turnover
Rate(b)(e) | |
|
|
|
|
|
|
|
|
|
|
|
|
|
|
|
|
CLASS A SHARES | | | | | | | | | | | | | | | | | | | | | | |
Period Ended October 31, 2005 (f) | | $ | 10.72 | | | 7.20 | % | $ | 2,814 | | | 1.50 | % | | 0.42 | % | | 5.19 | % | | 69.23 | % |
Year Ended October 31, 2006 | | | 12.45 | | | 16.41 | % | | 12,562 | | | 1.50 | % | | 0.87 | % | | 2.19 | % | | 80.30 | % |
Year Ended October 31, 2007 | | | 14.73 | | | 19.92 | %(g) | | 21,352 | | | 1.50 | % | | 0.84 | % | | 1.65 | % | | 73.45 | % |
Year Ended October 31, 2008 | | | 8.81 | | | (36.43 | )%(h) | | 13,908 | | | 1.50 | % | | 0.98 | % | | 1.53 | % | | 78.59 | % |
Six Months Ended April 30, 2009
(Unaudited) | | | 8.58 | | | (1.54 | )%(i) | | 12,971 | | | 1.50 | % | | 1.13 | % | | 1.75 | % | | 24.25 | % |
|
|
|
|
|
|
|
|
|
|
|
|
|
|
|
|
|
|
|
|
|
|
|
CLASS B SHARES | | | | | | | | | | | | | | | | | | | | | | |
Period Ended October 31, 2005 (j) | | $ | 10.78 | | | 7.80 | % | $ | 2,670 | | | 2.25 | % | | (0.38 | )% | | 5.74 | % | | 69.23 | % |
Year Ended October 31, 2006 | | | 12.43 | | | 15.57 | % | | 8,702 | | | 2.25 | % | | 0.11 | % | | 2.94 | % | | 80.30 | % |
Year Ended October 31, 2007 | | | 14.67 | | | 18.98 | %(g) | | 13,905 | | | 2.25 | % | | 0.09 | % | | 2.40 | % | | 73.45 | % |
Year Ended October 31, 2008 | | | 8.76 | | | (36.95 | )%(h) | | 9,516 | | | 2.25 | % | | 0.24 | % | | 2.28 | % | | 78.59 | % |
Six Months Ended April 30, 2009
(Unaudited) | | | 8.59 | | | (1.85 | )%(i) | | 9,260 | | | 2.25 | % | | 0.39 | % | | 2.50 | % | | 24.25 | % |
|
|
|
|
|
|
|
|
|
|
|
|
|
|
|
|
|
|
|
|
|
|
|
CLASS C SHARES | | | | | | | | | | | | | | | | | | | | | | |
Period Ended October 31, 2005 (k) | | $ | 10.82 | | | 8.20 | % | $ | 106 | | | 2.25 | % | | (0.55 | )% | | 5.24 | % | | 69.23 | % |
Year Ended October 31, 2006 | | | 12.48 | | | 15.61 | % | | 585 | | | 2.25 | % | | 0.14 | % | | 2.90 | % | | 80.30 | % |
Year Ended October 31, 2007 | | | 14.74 | | | 19.04 | %(g) | | 1,273 | | | 2.25 | % | | 0.07 | % | | 2.39 | % | | 73.45 | % |
Year Ended October 31, 2008 | | | 8.80 | | | (36.94 | )%(h) | | 937 | | | 2.25 | % | | 0.25 | % | | 2.29 | % | | 78.59 | % |
Six Months Ended April 30, 2009
(Unaudited) | | | 8.62 | | | (1.88 | )%(i) | | 1,259 | | | 2.25 | % | | 0.39 | % | | 2.49 | % | | 24.25 | % |
|
|
|
|
|
|
|
|
|
|
|
|
|
|
|
|
|
|
|
|
|
|
|
* | |
* | Calculated based on average shares outstanding. |
| |
(a) | The per share amounts and percentages reflect income and expenses assuming inclusion of the Fund’s proportionate share of the income and expenses of the applicable HSBC Investor Portfolios. |
| |
(b) | Not annualized for periods less than one year. Total return calculations do not include any sales or redemption charges. |
| |
(c) | Annualized for periods less than one year. |
| |
(d) | During the period certain fees were reduced. If such fee reductions had not occurred, the ratio would have been as indicated. |
| |
(e) | Portfolio turnover rate is calculated by aggregating the results of multiplying the Fund’s investment percentage in the respective Portfolios by the corresponding Portfolio’s portfolio turnover rates. Portfolio turnover rate is calculated on the basis of the Fund as a whole without distinguishing between classes of shares issued. |
| |
(f) | Class A Shares commenced operations on February 8, 2005. |
| |
(g) | During the year ended October 31, 2007, certain HSBC Investor Portfolios in which the Fund invests in received monies related to certain nonrecurring litigation settlements. The corresponding impact to the total return was 0.23%, 0.24% and 0.23% for Class A Shares, Class B Shares and Class C Shares, respectively. |
| |
(h) | During year ended October 31, 2008, certain HSBC Investor Portfolios in which the Fund invests in received monies related to certain nonrecurring litigation settlements. The corresponding impact to the total return was 0.15%, 0.15% and 0.15% for Class A Shares, Class B Shares and Class C Shares, respectively. |
| |
(i) | During the period ended April 30, 2009, certain HSBC Investor Portfolios in which the Fund invests in received monies related to certain nonrecurring litigation settlements. The corresponding impact to the total return was 0.10%, 0.10% and 0.10% for Class A Shares, Class B Shares and Class C Shares, respectively. |
| |
(j) | Class B Shares commenced operations on February 1, 2005. |
| |
(k) | Class C Shares commenced operations on April 27, 2005. |
| |
(l) | Rounds to less than $0.01. |
| | |
See notes to financial statements. | HSBC INVESTOR LIFELINE FUNDS | 18 |
|
HSBC INVESTOR MODERATE GROWTH STRATEGY FUND |
|
|
Financial Highlights |
Selected data for a share outstanding throughout the periods indicated. (a)
| | | | | | | | | | | | | | | | | | | | | | | | | |
| | | | | Investment Activities | | Dividends | |
| | | | |
| |
|
|
| | Net Asset
Value,
Beginning
of Period | | Net
Investment
Income
(Loss) | | Net Realized
and Unrealized
Gains
(Losses) from
Investments | | Total from
Investment
Activities | | Net
Investment
Income | | Net
Realized
Gains from
Investment
Transactions | | Return of
Capital | | Total
Dividends | |
|
|
|
|
|
|
|
|
|
|
|
|
|
|
|
|
|
|
CLASS A SHARES | | | | | | | | | | | | | | | | | | | | | | | | | |
Period Ended October 31, 2005 (f) | | $ | 10.00 | | | 0.04 | | | 0.45 | | | 0.49 | | | — | (g) | | — | | | — | | | — | (g) |
Year Ended October 31, 2006 | | | 10.49 | | | 0.17 | | | 1.23 | | | 1.40 | | | (0.17 | ) | | (0.01 | ) | | — | | | (0.18 | ) |
Year Ended October 31, 2007 | | | 11.71 | | | 0.21 | * | | 1.65 | | | 1.86 | | | (0.20 | ) | | (0.10 | ) | | — | | | (0.30 | ) |
Year Ended October 31, 2008 | | | 13.27 | | | 0.20 | * | | (4.08 | ) | | (3.88 | ) | | (0.19 | ) | | (0.50 | ) | | (0.01 | ) | | (0.70 | ) |
Six Months Ended April 30, 2009
(Unaudited) | | | 8.69 | | | 0.07 | * | | (0.08 | ) | | (0.01 | ) | | (0.06 | ) | | — | | | — | | | (0.06 | ) |
|
|
|
|
|
|
|
|
|
|
|
|
|
|
|
|
|
|
|
|
|
|
|
|
|
|
CLASS B SHARES | | | | | | | | | | | | | | | | | | | | | | | | | |
Period Ended October 31, 2005 (k) | | $ | 10.00 | | | 0.01 | | | 0.49 | | | 0.50 | | | — | (g) | | — | | | — | | | — | (g) |
Year Ended October 31, 2006 | | | 10.50 | | | 0.09 | | | 1.22 | | | 1.31 | | | (0.08 | ) | | (0.01 | ) | | — | | | (0.09 | ) |
Year Ended October 31, 2007 | | | 11.72 | | | 0.12 | * | | 1.65 | | | 1.77 | | | (0.12 | ) | | (0.10 | ) | | — | | | (0.22 | ) |
Year Ended October 31, 2008 | | | 13.27 | | | 0.11 | * | | (4.08 | ) | | (3.97 | ) | | (0.10 | ) | | (0.50 | ) | | (0.01 | ) | | (0.61 | ) |
Six Months Ended April 30, 2009
(Unaudited) | | | 8.69 | | | 0.04 | * | | (0.08 | ) | | (0.04 | ) | | (0.03 | ) | | — | | | — | | | (0.03 | ) |
|
|
|
|
|
|
|
|
|
|
|
|
|
|
|
|
|
|
|
|
|
|
|
|
|
|
CLASS C SHARES | | | | | | | | | | | | | | | | | | | | | | | | | |
Period Ended October 31, 2005 (l) | | $ | 10.00 | | | — | (g) | | 0.28 | | | 0.28 | | | — | | | — | | | — | | | — | |
Year Ended October 31, 2006 | | | 10.28 | | | 0.09 | | | 1.19 | | | 1.28 | | | (0.08 | ) | | (0.01 | ) | | — | | | (0.09 | ) |
Year Ended October 31, 2007 | | | 11.47 | | | 0.12 | * | | 1.60 | | | 1.72 | | | (0.12 | ) | | (0.10 | ) | | — | | | (0.22 | ) |
Year Ended October 31, 2008 | | | 12.97 | | | 0.11 | * | | (3.97 | ) | | (3.86 | ) | | (0.11 | ) | | (0.50 | ) | | (0.01 | ) | | (0.62 | ) |
Six Months Ended April 30, 2009
(Unaudited) | | | 8.49 | | | 0.04 | * | | (0.09 | ) | | (0.05 | ) | | (0.03 | ) | | — | | | — | | | (0.03 | ) |
|
|
|
|
|
|
|
|
|
|
|
|
|
|
|
|
|
|
|
|
|
|
|
|
|
|
| | | | | | | | | | | | | | | | | | | | | | |
| | | | | | | | Ratios/Supplementary Data | |
| | | | | | | |
|
|
| | Net Asset
Value, End
of Period | | Total
Return(b) | | Net Assets
at End of
Period
(000’s) | | Ratio of Net
Expenses to
Average
Net Assets(c) | | Ratio of Net
Investment
Income (Loss)
to Average
Net Assets(c) | | Ratio of
Expenses to
Average Net
Assets(c)(d) | | Portfolio
Turnover
Rate(b)(e) | |
|
|
|
|
|
|
|
|
|
|
|
|
|
|
|
|
CLASS A SHARES | | | | | | | | | | | | | | | | | | | | | | |
Period Ended October 31, 2005 (f) | | $ | 10.49 | | | 4.94 | % | $ | 3,241 | | | 1.50 | % | | 0.95 | % | | 4.30 | % | | 84.55 | % |
Year Ended October 31, 2006 | | | 11.71 | | | 13.40 | % | | 11,973 | | | 1.50 | % | | 1.65 | % | | 2.12 | % | | 101.57 | % |
Year Ended October 31, 2007 | | | 13.27 | | | 16.12 | %(h) | | 20,140 | | | 1.50 | % | | 1.70 | % | | 1.60 | % | | 92.87 | % |
Year Ended October 31, 2008 | | | 8.69 | | | (30.65 | )%(i) | | 14,226 | | | 1.48 | % | | 1.75 | % | | 1.48 | % | | 79.86 | % |
Six Months Ended April 30, 2009
(Unaudited) | | | 8.62 | | | (0.08 | )%(j) | | 13,771 | | | 1.50 | % | | 1.82 | % | | 1.66 | % | | 21.19 | % |
|
|
|
|
|
|
|
|
|
|
|
|
|
|
|
|
|
|
|
|
|
|
|
CLASS B SHARES | | | | | | | | | | | | | | | | | | | | | | |
Period Ended October 31, 2005 (k) | | $ | 10.50 | | | 5.03 | % | $ | 3,604 | | | 2.25 | % | | 0.18 | % | | 5.01 | % | | 84.55 | % |
Year Ended October 31, 2006 | | | 11.72 | | | 12.45 | % | | 10,731 | | | 2.25 | % | | 0.91 | % | | 2.87 | % | | 101.57 | % |
Year Ended October 31, 2007 | | | 13.27 | | | 15.25 | %(h) | | 16,513 | | | 2.25 | % | | 0.95 | % | | 2.35 | % | | 92.87 | % |
Year Ended October 31, 2008 | | | 8.69 | | | (31.17 | )%(i) | | 12,354 | | | 2.23 | % | | 1.00 | % | | 2.23 | % | | 79.86 | % |
Six Months Ended April 30, 2009
(Unaudited) | | | 8.62 | | | (0.43 | )%(j) | | 11,920 | | | 2.25 | % | | 1.07 | % | | 2.41 | % | | 21.19 | % |
|
|
|
|
|
|
|
|
|
|
|
|
|
|
|
|
|
|
|
|
|
|
|
CLASS C SHARES | | | | | | | | | | | | | | | | | | | | | | |
Period Ended October 31, 2005 (l) | | $ | 10.28 | | | 2.80 | % | $ | 278 | | | 2.25 | % | | 0.05 | % | | 4.69 | % | | 84.55 | % |
Year Ended October 31, 2006 | | | 11.47 | | | 12.53 | % | | 763 | | | 2.25 | % | | 0.87 | % | | 2.83 | % | | 101.57 | % |
Year Ended October 31, 2007 | | | 12.97 | | | 15.20 | %(h) | | 1,766 | | | 2.25 | % | | 0.95 | % | | 2.33 | % | | 92.87 | % |
Year Ended October 31, 2008 | | | 8.49 | | | (31.09 | )%(i) | | 1,408 | | | 2.23 | % | | 1.00 | % | | 2.23 | % | | 79.86 | % |
Six Months Ended April 30, 2009
(Unaudited) | | | 8.41 | | | (0.56 | )%(j) | | 1,299 | | | 2.25 | % | | 1.07 | % | | 2.41 | % | | 21.19 | % |
|
|
|
|
|
|
|
|
|
|
|
|
|
|
|
|
|
|
|
|
|
|
|
| |
* | Calculated based on average shares outstanding. |
| |
(a) | The per share amounts and percentages reflect income and expenses assuming inclusion of the Fund’s proportionate share of the income and expenses of the applicable HSBC Investor Portfolios. |
| |
(b) | Not annualized for periods less than one year. Total return calculations do not include any sales or redemption charges. |
| |
(c) | Annualized for periods less than one year. |
| |
(d) | During the period certain fees were reduced. If such fee reductions had not occurred, the ratio would have been as indicated. |
| |
(e) | Portfolio turnover rate is calculated by aggregating the results of multiplying the Fund’s investment percentage in the respective Portfolios by the corresponding Portfolio’s portfolio turnover rates. Portfolio turnover rate is calculated on the basis of the Fund as a whole without distinguishing between classes of shares issued. |
| |
(f) | Class A Shares commenced operations on February 3, 2005. |
| |
(g) | Rounds to less than $0.01. |
| |
(h) | During the year ended October 31, 2007, certain HSBC Investor Portfolios in which the Fund invests in received monies related to certain nonrecurring litigation settlements. The corresponding impact to the total return was 0.41%, 0.41% and 0.33% for Class A Shares, Class B Shares and Class C Shares, respectively. |
| |
(i) | During the year ended October 31, 2008, certain HSBC Investor Portfolios in which the Fund invests in received monies related to certain nonrecurring litigation settlements. The corresponding impact to the total return was 0.19%, 0.19% and 0.19% for Class A Shares, Class B Shares and Class C Shares, respectively. |
| |
(j) | During the period ended April 30, 2009, certain HSBC Investor Portfolios in which the Fund invests in received monies related to certain nonrecurring litigation settlements. The corresponding impact to the total return was 0.09%, 0.09% and 0.09% for Class A Shares, Class B Shares and Class C Shares, respectively. |
| |
(k) | Class B Shares commenced operations on February 1, 2005. |
| |
(l) | Class C Shares commenced operations on June 9, 2005. |
| | |
19 | HSBC INVESTOR LIFELINE FUNDS | See notes to financial statements. |
|
HSBC INVESTOR CONSERVATIVE GROWTH STRATEGY FUND |
|
Financial Highlights
Selected data for a share outstanding throughout the periods indicated. (a)
| | | | | | | | | | | | | | | | | | | | | | |
| | | | | Investment Activities | | Dividends | |
| | | | |
| |
| |
| | Net Asset
Value,
Beginning
of Period | | Net
Investment
Income
(Loss) | | Net Realized
and Unrealized
Gains
(Losses) from
Investments | | Total from
Investment
Activities | | Net
Investment
Income | | Net
Realized
Gains from
Investment
Transactions | | Total
Dividends | |
|
|
|
|
|
|
|
|
|
|
|
|
|
|
|
|
CLASS A SHARES | | | | | | | | | | | | | | | | | | | | | | |
Period Ended October 31, 2005 (j) | | $ | 10.00 | | | 0.04 | | | 0.26 | | | 0.30 | | | (0.01 | ) | | — | | | (0.01 | ) |
Year Ended October 31, 2006 | | | 10.29 | | | 0.22 | | | 0.85 | | | 1.07 | | | (0.25 | ) | | — | | | (0.25 | ) |
Year Ended October 31, 2007 | | | 11.11 | | | 0.29 | * | | 1.03 | | | 1.32 | | | (0.27 | ) | | (0.12 | ) | | (0.39 | ) |
Year Ended October 31, 2008 | | | 12.04 | | | 0.24 | * | | (2.93 | ) | | (2.69 | ) | | (0.25 | ) | | (0.26 | ) | | (0.51 | ) |
Six Months Ended April 30, 2009
(Unaudited) | | | 8.84 | | | 0.08 | * | | (0.02 | ) | | 0.06 | | | (0.07 | ) | | — | | | (0.07 | ) |
|
|
|
|
|
|
|
|
|
|
|
|
|
|
|
|
|
|
|
|
|
|
|
CLASS B SHARES | | | | | | | | | | | | | | | | | | | | | | |
Period Ended October 31, 2005 (k) | | $ | 10.00 | | | 0.03 | | | 0.16 | | | 0.19 | | | — | (f) | | — | | | — | (f) |
Year Ended October 31, 2006 | | | 10.19 | | | 0.15 | | | 0.83 | | | 0.98 | | | (0.16 | ) | | — | | | (0.16 | ) |
Year Ended October 31, 2007 | | | 11.01 | | | 0.20 | * | | 1.05 | | | 1.25 | | | (0.20 | ) | | (0.12 | ) | | (0.32 | ) |
Year Ended October 31, 2008 | | | 11.94 | | | 0.16 | * | | (2.91 | ) | | (2.75 | ) | | (0.17 | ) | | (0.26 | ) | | (0.43 | ) |
Six Months Ended April 30, 2009
(Unaudited) | | | 8.76 | | | 0.05 | * | | (0.02 | ) | | 0.03 | | | (0.04 | ) | | — | | | (0.04 | ) |
|
|
|
|
|
|
|
|
|
|
|
|
|
|
|
|
|
|
|
|
|
|
|
CLASS C SHARES | | | | | | | | | | | | | | | | | | | | | | |
Period Ended October 31, 2005 (l) | | $ | 10.00 | | | 0.03 | | | 0.38 | | | 0.41 | | | — | | | — | | | — | |
Year Ended October 31, 2006 | | | 10.41 | | | 0.15 | | | 0.85 | | | 1.00 | | | (0.17 | ) | | — | | | (0.17 | ) |
Year Ended October 31, 2007 | | | 11.24 | | | 0.21 | * | | 1.11 | | | 1.32 | | | (0.19 | ) | | (0.12 | ) | | (0.31 | ) |
Year Ended October 31, 2008 | | | 12.25 | | | 0.16 | * | | (2.98 | ) | | (2.82 | ) | | (0.17 | ) | | (0.26 | ) | | (0.43 | ) |
Six Months Ended April 30, 2009
(Unaudited) | | | 9.00 | | | 0.05 | * | | (0.02 | ) | | 0.03 | | | (0.04 | ) | | — | | | (0.04 | ) |
|
|
|
|
|
|
|
|
|
|
|
|
|
|
|
|
|
|
|
|
|
|
|
| | | | | | | | | | | | | | | | | | | | | | |
| | | | | | | | Ratios/Supplementary Data |
| | | | | | | |
|
| | Net Asset
Value, End
of Period | | Total
Return(b) | | Net Assets
at End of
Period
(000’s) | | Ratio of Net
Expenses to
Average
Net Assets(c) | | Ratio of Net
Investment
Income (Loss)
to Average
Net Assets(c) | | Ratio of
Expenses to
Average Net
Assets(c)(d) | | Portfolio
Turnover
Rate(b)(e) | |
|
|
|
|
|
|
|
|
|
|
|
|
|
|
|
|
CLASS A SHARES | | | | | | | | | | | | | | | | | | | | | | |
Period Ended October 31, 2005 (j) | | $ | 10.29 | | | 2.96 | % | $ | 1,054 | | | 1.50 | % | | 1.28 | % | | 8.01 | % | | 72.14 | % |
Year Ended October 31, 2006 | | | 11.11 | | | 10.48 | % | | 3,069 | | | 1.50 | % | | 2.33 | % | | 3.22 | % | | 96.58 | % |
Year Ended October 31, 2007 | | | 12.04 | | | 12.13 | %(g) | | 6,669 | | | 1.50 | % | | 2.52 | % | | 2.06 | % | | 88.67 | % |
Year Ended October 31, 2008 | | | 8.84 | | | (23.17 | )%(h) | | 4,747 | | | 1.50 | % | | 2.24 | % | | 1.72 | % | | 68.74 | % |
Six Months Ended April 30, 2009
(Unaudited) | | | 8.83 | | | 0.71 | %(i) | | 4,730 | | | 1.50 | % | | 2.00 | % | | 1.89 | % | | 21.30 | % |
|
|
|
|
|
|
|
|
|
|
|
|
|
|
|
|
|
|
|
|
|
|
|
CLASS B SHARES | | | | | | | | | | | | | | | | | | | | | | |
Period Ended October 31, 2005 (k) | | $ | 10.19 | | | 1.92 | % | $ | 1,306 | | | 2.25 | % | | 0.53 | % | | 9.21 | % | | 72.14 | % |
Year Ended October 31, 2006 | | | 11.01 | | | 9.65 | % | | 2,567 | | | 2.25 | % | | 1.54 | % | | 3.98 | % | | 96.58 | % |
Year Ended October 31, 2007 | | | 11.94 | | | 11.51 | %(g) | | 4,928 | | | 2.25 | % | | 1.77 | % | | 2.82 | % | | 88.67 | % |
Year Ended October 31, 2008 | | | 8.76 | | | (23.76 | )%(h) | | 4,348 | | | 2.25 | % | | 1.48 | % | | 2.48 | % | | 68.74 | % |
Six Months Ended April 30, 2009
(Unaudited) | | | 8.75 | | | 0.36 | %(i) | | 4,341 | | | 2.25 | % | | 1.25 | % | | 2.63 | % | | 21.30 | % |
|
|
|
|
|
|
|
|
|
|
|
|
|
|
|
|
|
|
|
|
|
|
|
CLASS C SHARES | | | | | | | | | | | | | | | | | | | | | | |
Period Ended October 31, 2005 (l) | | $ | 10.41 | | | 4.10 | % | $ | 82 | | | 2.25 | % | | 0.66 | % | | 7.94 | % | | 72.14 | % |
Year Ended October 31, 2006 | | | 11.24 | | | 9.66 | % | | 320 | | | 2.25 | % | | 1.56 | % | | 3.92 | % | | 96.58 | % |
Year Ended October 31, 2007 | | | 12.25 | | | 11.97 | %(g) | | 437 | | | 2.25 | % | | 1.78 | % | | 2.85 | % | | 88.67 | % |
Year Ended October 31, 2008 | | | 9.00 | | | (23.73 | )%(h) | | 430 | | | 2.25 | % | | 1.46 | % | | 2.48 | % | | 68.74 | % |
Six Months Ended April 30, 2009
(Unaudited) | | | 8.99 | | | 0.35 | %(i) | | 445 | | | 2.25 | % | | 1.25 | % | | 2.64 | % | | 21.30 | % |
|
|
|
|
|
|
|
|
|
|
|
|
|
|
|
|
|
|
|
|
|
|
|
| |
* | Calculated based on average shares outstanding. |
| |
(a) | The per share amounts and percentages reflect income and expenses assuming inclusion of the Fund’s proportionate share of the income and expenses of the applicable HSBC Investor Portfolios. |
| |
(b) | Not annualized for periods less than one year. Total return calculations do not include any sales or redemption charges. |
| |
(c) | Annualized for periods less than one year. |
| |
(d) | During the period certain fees were reduced. If such fee reductions had not occurred, the ratio would have been as indicated. |
| |
(e) | Portfolio turnover rate is calculated by aggregating the results of multiplying the Fund’s investment percentage in the respective Portfolios by the corresponding Portfolio’s portfolio turnover rates. Portfolio turnover rate is calculated on the basis of the Fund as a whole without distinguishing between classes of shares issued. |
| |
(f) | Rounds to less than $0.01. |
| |
(g) | During the year ended October 31, 2007, certain HSBC Investor Portfolios in which the Fund invests in received monies related to certain nonrecurring litigation settlements. The corresponding impact to the total return was 0.44%, 0.47% and 0.48% for Class A Shares, Class B Shares and Class C Shares, respectively. |
| |
(h) | During the year ended October 31, 2008, certain HSBC Investor Portfolios in which the Fund invests in received monies related to certain nonrecurring litigation settlements. The corresponding impact to the total return was 0.19%, 0.19% and 0.19% for Class A Shares, Class B Shares and Class C Shares, respectively. |
| |
(i) | During the period ended April 30, 2009, certain HSBC Investor Portfolios in which the Fund invests in received monies related to certain nonrecurring litigation settlements. The corresponding impact to the total return was 0.07%, 0.07% and 0.07% for Class A Shares, Class B Shares and Class C Shares, respectively. |
| |
(j) | Class A Shares commenced operations on February 23, 2005. |
| |
(k) | Class B Shares commenced operations on February 17, 2005. |
| |
(l) | Class C Shares commenced operations on April 19, 2005. |
| | |
See notes to financial statements. | HSBC INVESTOR LIFELINE FUNDS | 20 |
|
HSBC INVESTOR LIFELINE FUNDS |
|
|
Notes to Financial Statements—As of April 30, 2009 (Unaudited) |
| |
1. | Organization: |
| |
| The HSBC Investor Funds (the “Trust”), a Massachusetts business trust organized on April 22, 1987, is registered under the Investment Company Act of 1940, as amended (the “Act”), as an open-end management investment company. As of April 30, 2009, the Trust is comprised of 18 separate operational funds, each a series of the HSBC Investor Family of Funds. The accompanying financial statements are presented for the following 4 funds (individually a “Fund”, collectively the “LifeLine Funds”): |
| | |
Fund | | Short Name |
| |
|
HSBC Investor Aggressive Growth Strategy Fund | | Aggressive Growth Fund |
HSBC Investor Growth Strategy Fund | | Growth Strategy Fund |
HSBC Investor Moderate Growth Strategy Fund | | Moderate Growth Fund |
HSBC Investor Conservative Growth Strategy Fund | | Conservative Growth Fund |
| |
| The LifeLine Funds are diversified series of the Trust and part of the HSBC Investor Family of Funds. Financial statements for all other funds of the HSBC Investor Family of Funds are published separately. |
| |
| The LifeLine Funds are fund of funds that invest in other funds in the HSBC Investor Family of Funds as well as mutual funds that are not affiliated with the HSBC Investor Family of Funds (collectively the “Underlying Funds”). The LifeLine Funds currently invest in the HSBC Investor Core Plus Fixed Income Portfolio, HSBC Investor Intermediate Duration Fixed Income Portfolio, HSBC Investor Growth Portfolio, HSBC Investor International Equity Portfolio, HSBC Investor Opportunity Portfolio and the HSBC Investor Value Portfolio (individually a “Portfolio,” collectively the “Portfolios”) which are each diversified series of the HSBC Investor Portfolios (the “Portfolio Trust”). The Portfolios operate as master funds in master-feeder arrangements, in addition to receiving investments from the LifeLine Funds. Prior to February 9, 2009, the applicable LifeLine Funds invested in the HSBC Investor High Yield Fixed Income Portfolio for any LifeLine Fund that had an allocation to High Yield Fixed Income. |
| |
| The LifeLine Funds also invest in the HSBC Investor Prime Money Market Fund (the “Prime Money Market Fund”) which is an open-end management investment company that is a diversified series of the Trust. In addition, effective February 9, 2009, the applicable LifeLine Funds began investing in the Goldman Sachs High Yield Fund, Class I, as a replacement to the HSBC Investor High Yield Fixed Income Portfolio. The Goldman Sachs High Yield Fund is also an open-end management investment company within the Goldman Sachs Trust. |
| |
| The financial statements of the Portfolios, including the Schedules of Portfolio Investments, are included elsewhere in this report. The financial statements of the Portfolios should be read in conjunction with the financial statements of the LifeLine Funds. |
| |
| The LifeLine Funds portfolio weightings and summary of Underlying Funds are as follows: |
| |
| LifeLine Funds Portfolio Weightings |
| | | | | | | | | | | | | |
Asset Class of Underlying Funds | | Aggressive
Growth
Fund | | Growth
Strategy
Fund | | Moderate
Growth
Fund | | Conservative
Growth
Fund | |
| |
| |
| |
| |
| |
Large Cap Growth | | | 21 | % | | 21 | % | | 19 | % | | 15 | % |
Large Cap Value | | | 21 | % | | 21 | % | | 18 | % | | 14 | % |
Small-cap | | | 34 | % | | 20 | % | | 11 | % | | 4 | % |
International Equity | | | 23 | % | | 20 | % | | 15 | % | | 10 | % |
Fixed Income | | | None | | | 15 | % | | 26 | % | | 28 | % |
High Yield Fixed Income | | | None | | | 2 | % | | 5 | % | | 8 | % |
Money Market | | | 1 | % | | 1 | % | | 6 | % | | 21 | % |
| |
|
| |
|
| |
|
| |
|
| |
Total | | | 100 | % | | 100 | % | | 100 | % | | 100 | % |
| |
|
| |
|
| |
|
| |
|
| |
| |
21 | HSBC INVESTOR LIFELINE FUNDS |
|
HSBC INVESTOR LIFELINE FUNDS |
|
|
Notes to Financial Statements—As of April 30, 2009 (Unaudited) (continued) |
LifeLine Funds Portfolio Investments
| | | | | | | | | | | | | |
Underlying Funds | | Aggressive
Growth
Fund | | Growth
Strategy
Fund | | Moderate
Growth
Fund | | Conservative
Growth
Fund | |
| |
| |
| |
| |
| |
Core Plus Fixed Income Portfolio | | $ | — | | $ | 3,455,630 | | $ | 6,928,570 | | $ | 2,363,599 | |
Intermediate Duration Fixed Income Portfolio | | | — | | | — | | | — | | | 283,513 | |
Growth Portfolio | | | 1,649,493 | | | 4,941,303 | | | 5,171,458 | | | 1,448,495 | |
International Equity Portfolio | | | 1,833,899 | | | 4,777,137 | | | 4,144,451 | | | 980,264 | |
Opportunity Portfolio | | | 2,690,843 | | | 4,741,644 | | | 3,016,686 | | | 389,192 | |
Value Portfolio | | | 1,636,787 | | | 4,903,230 | | | 4,861,536 | | | 1,341,518 | |
Prime Money Market Fund | | | 76,439 | | | 233,314 | | | 1,596,039 | | | 1,974,567 | |
Goldman Sachs High Yield Fund, Class I | | | — | | | 468,632 | | | 1,355,220 | | | 769,262 | |
| |
|
| |
|
| |
|
| |
|
| |
Total | | $ | 7,887,461 | | $ | 23,520,890 | | $ | 27,073,960 | | $ | 9,550,410 | |
| |
|
| |
|
| |
|
| |
|
| |
| |
| The LifeLine Funds are authorized to issue an unlimited number of shares of beneficial interest with a par value of $0.001 per share. Each Fund offers three classes of shares: Class A Shares, Class B Shares and Class C Shares. Class A Shares of the LifeLine Funds have a maximum sales charge of 5.00% as a percentage of the original purchase price. The Class B Shares of the LifeLine Funds are offered without any front-end sales charge, but will be subject to a contingent deferred sales charge (“CDSC”) ranging from a maximum of 4.00% if redeemed less than one year after purchase to 0.00% if redeemed more than four years after purchase. Class C Shares of the LifeLine Funds are offered without any front-end sales charge, but will be subject to a maximum CDSC of 1.00% if redeemed less than one year after purchase. Each class of shares in the LifeLine Funds has identical rights and privileges except with respect to arrangements pertaining to shareholder servicing or distribution, class-related expenses, voting rights on matters affecting a single class of shares, and the exchange privileges of each class of shares. |
| |
| Under the Trust’s organizational documents, the LifeLine Funds’ Officers and Trustees are indemnified against certain liabilities arising out of the performance of their duties to the LifeLine Funds. In addition, in the normal course of business, the Trust enters into contracts with its service providers, which also provide for indemnifications by the LifeLine Funds. The LifeLine Funds’ maximum exposure under these arrangements is unknown as this would involve any future claims that may be made against the LifeLine Funds. However, based on experience, the Trust expects that risk of loss to be remote. |
| |
2. | Significant Accounting Policies: |
| |
| The following is a summary of the significant accounting policies followed by the LifeLine Funds in the preparation of their financial statements. The policies are in conformity with U.S. generally accepted accounting principles (“GAAP”). The preparation of financial statements requires management to make estimates and assumptions that affect the reported amounts of assets and liabilities and disclosure of contingent assets and liabilities at the date of the financial statements and the reported amounts of income and expenses for the period. Actual results could differ from those estimates. |
| |
| Securities Valuation: |
| |
| Effective November 1, 2008, the Trust adopted Statement of Financial Accounting Standards (“SFAS”) No. 157, “Fair Value Measurements.” There was no impact to the Funds net assets or results of operations upon adoption. SFAS 157 defines fair value as the price that would be received to sell an asset or paid to transfer a liability in an orderly transaction between market participants at the measurement date. |
| |
| The LifeLine Funds record their investments in the Portfolios at fair value. The LifeLine Funds record their investments in the Prime Money Market Fund and Goldman Sachs High Yield Fund at the net asset value reported by the funds. The underlying securities of the Underlying Funds are recorded at fair value and at amortized cost, respectively, as more fully discussed in the notes to those financial statements. |
| |
HSBC INVESTOR LIFELINE FUNDS | 22 |
|
HSBC INVESTOR LIFELINE FUNDS |
|
|
Notes to Financial Statements—As of April 30, 2009 (Unaudited) (continued) |
| |
| Investment Transactions and Related Income: |
| |
| The LifeLine Funds record daily their pro-rata income, expenses and unrealized/realized gains and losses derived from their respective Portfolio. Dividend income is recorded on the ex-dividend date for the Prime Money Market Fund and Goldman Sachs High Yield Fund. Changes in holdings of the Prime Money Market Fund and Goldman Sachs High Yield Fund for each LifeLine Fund are reflected no later than the first business day following trade date. However, for financial reporting purposes, changes in holdings of the Prime Money Market Fund are reflected as of trade date. In addition, the LifeLine Funds accrue their own expenses daily as incurred. |
| |
| Allocations: |
| |
| Expenses directly attributable to a Fund are charged to that Fund. Expenses not directly attributable to a Fund are allocated proportionately among various or all funds within the HSBC Investor Family of Funds in relation to the net assets of each fund or on another reasonable basis. Class specific expenses are charged directly to the class incurring the expense. In addition, income, expenses (other than class specific expenses), and unrealized/realized gains and losses are allocated to each class based on relative net assets on a daily basis. |
| |
| Dividends to Shareholders: |
| |
| Dividends from net investment income, if any, are declared and distributed quarterly in the case of the Moderate Growth Fund and Conservative Growth Fund, and annually in the case of the Aggressive Growth Fund and Growth Strategy Fund. |
| |
| The LifeLine Funds’ net realized gains, if any, are distributed to shareholders at least annually. Additional distributions are also made to the LifeLine Funds’ shareholders to the extent necessary to avoid the federal excise tax on certain undistributed income and net capital gains of regulated investment companies. |
| |
| The amount and character of net investment income and net realized gains distributions are determined in accordance with federal income tax regulations which may differ from GAAP. These “book/tax” differences are either considered temporary or permanent in nature. To the extent these differences are permanent in nature (e.g., reclassification of market discounts, certain gain/loss, paydowns, and certain distributions), such amounts are reclassified within the composition of net assets; temporary differences (e.g., wash losses and post-october loss deferrals) do not require reclassification. The LifeLine Funds may utilize equalization accounting for tax purposes and designate earnings and profits, including net realized gains distributed to shareholders on redemption of shares, as a part of the dividends paid deduction for income tax purposes. |
| |
| Redemption Fee: |
| |
| A redemption fee of 2.00% will be charged and recorded as paid-in-capital for any shares redeemed or exchanged after holding them for less than 30 days. This fee does not apply to shares purchased through reinvested dividends or capital gains or shares held in certain omnibus accounts or retirement plans that cannot implement the fee. For the fiscal year ended October 31, 2008 and period ended April 30, 2009, the following LifeLine Funds collected redemption fees as follows: |
| | | | | | | |
Fund | | October 31, 2008
Fees Collected | | April 30, 2009
Fees Collected | |
| |
| |
| |
Aggressive Growth Fund | | $ | 119 | | $ | 38 | |
Growth Strategy Fund | | | 1,152 | | | 190 | |
Moderate Growth Fund | | | 187 | | | 246 | |
Conservative Growth Fund | | | 2,849 | | | 63 | |
| |
| Federal Income Taxes: |
| |
| Each Fund is a separate taxable entity for federal income tax purposes. Each Fund has qualified and intends to continue to qualify each year as a “regulated investment company” under Subchapter M of the Internal Revenue Code, as amended and to distribute substantially all of their taxable net investment income and net realized gains, if any, to their shareholders. Accordingly, no provision for federal income or excise tax is required. |
| |
| In addition, Financial Accounting Standards Board Interpretation No. 48, Accounting for Uncertainty in Income Taxes (“FIN 48”) provides guidance for how uncertain tax positions should be recognized, measured, presented and disclosed in the financial statements. FIN 48 requires the affirmative evaluation of tax positions taken or expected to be taken in the course of preparing the Trust’s tax returns to determine whether it is more-likely-than-not (i.e., greater than 50-percent) that each tax position will be sustained upon examination by a taxing authority based on the technical merits |
| |
23 | HSBC INVESTOR LIFELINE FUNDS |
|
HSBC INVESTOR LIFELINE FUNDS |
|
|
Notes to Financial Statements—As of April 30, 2009 (Unaudited) (continued) |
| | |
| of the position. A tax position that meets the more-likely-than-not recognition threshold is measured to determine the amount of benefit to recognize in the financial statements. Differences between tax positions taken in a tax return and amounts recognized in the financial statements will generally result in an increase in a liability for taxes payable (or a reduction of a tax refund receivable), including the recognition of any related interest and penalties as an operating expense. The FIN 48 analysis included a review of tax positions taken in tax years that remain subject to examination by tax authorities in all major tax jurisdictions, including federal (i.e., the last 4 tax year ends and the interim tax period since then, as applicable). FIN 48 did not impact the Funds’ net assets or results of operation during the period. |
| |
| New Accounting Pronouncements: |
| |
| In March 2008, the Financial Accounting Standards Board (“FASB”) issued the Statement of Financial Accounting Standards No. 161, “Disclosures about Derivative Instruments and Hedging Activities” (“SFAS 161”). SFAS 161 will be effective for fiscal years and interim periods beginning after November 15, 2008. SFAS 161requires enhanced disclosures about the Funds’ derivative and hedging activities, including how such activities are accounted for and their effect on the Funds’ financial position, performance and cash flows. Management is currently evaluating the impact the adoption of SFAS 161 will have on the Funds’ financial statements and related disclosures. |
| |
| In April 2009, the FASB issued FASB Staff Position No. 157-4, “Determining Fair Value When the Volume and Level of Activity for the Asset or Liability Have Significantly Decreased and Identifying Transactions That Are Not Orderly” (“FSP 157-4”). FSP 157-4 provides additional guidance for estimating fair value in accordance with SFAS No. 157, when the volume and level of activity for the asset or liability have significantly decreased as well as guidance on identifying circumstances that indicate a transaction is not orderly. FSP 157-4 is effective for fiscal years and interim periods ending after June 15, 2009. Management is currently evaluating the impact the adoption of FSP 157-4 will have on the Funds’ financial statement disclosures. |
| |
3. | Investment Valuation Summary |
| |
| The inputs used for valuing the Funds’ investments are summarized in the three broad levels listed below: |
| | | |
| | • | Level 1: quoted prices in active markets for identical assets |
| | | |
| | • | Level 2: other significant observable inputs (including quoted prices for similar securities, interest rates, prepayment speeds, credit risk, etc.) |
| | | |
| | • | Level 3: significant unobservable inputs (including the Fund’s own assumptions in determining the fair value of investments) |
| | |
| The inputs or methodology used for valuing investments is not necessarily an indication of the risk associated with investing in those investments. For example, short-term debt securities of sufficient credit quality maturing in sixty days or less are generally valued at amortized cost, which approximates fair value. Generally, amortized cost approximates the current fair value of a security, but since the valuation is not obtained from a quoted price in an active market, such securities are reflected as Level 2. |
| |
| The following is a summary of the valuation as of April 30, 2009 for each Fund based upon the three levels defined above: |
| | | | | | | | | | | | | |
| | LEVEL 1 - Quoted Prices | | LEVEL 2 - Other Significant | |
| |
| |
| |
Fund Name | | Investment
Securities | | Other Financial
Instruments* | | Investment
Securities | | Other Financial
Instruments* | |
| |
| |
| |
| |
| |
Aggressive Growth Strategy Fund | | $ | 76,439 | | $ | — | | $ | 7,811,022 | | $ | — | |
Growth Strategy Fund | | | 701,946 | | | — | | | 22,818,944 | | | — | |
Moderate Growth Strategy Fund | | | 2,951,259 | | | — | | | 24,122,701 | | | — | |
Conservative Growth Strategy Fund | | | 2,743,829 | | | — | | | 6,806,581 | | | — | |
| |
HSBC INVESTOR LIFELINE FUNDS | 24 |
|
HSBC INVESTOR LIFELINE FUNDS |
|
|
Notes to Financial Statements—As of April 30, 2009 (Unaudited) (continued) |
| | | | | | | | | | | | | |
| | LEVEL 3 - Significant | | Total | |
| |
| |
| |
Fund Name | | Investment
Securities | | Other Financial
Instruments* | | Investment
Securities | | Other Financial
Instruments* | |
| |
| |
| |
| |
| |
Aggressive Growth Strategy Fund | | $ | — | | $ | — | | $ | 7,887,461 | | $ | — | |
Growth Strategy Fund | | | — | | | — | | | 23,520,890 | | | — | |
Moderate Growth Strategy Fund | | | — | | | — | | | 27,073,960 | | | — | |
Conservative Growth Strategy Fund | | | — | | | — | | | 9,550,410 | | | — | |
| |
|
* | Other financial instruments would include any derivative instruments, such as any futures, forwards, and swap agreements. These investments are generally recorded in the financial statements at the unrealized gain or loss on the investment. |
| |
4. | Related Party Transactions: |
| |
| Investment Management: |
| |
| HSBC Global Asset Management (USA) Inc. (“HSBC” or the “Investment Adviser”), a wholly owned subsidiary of HSBC Bank USA, N.A., a national bank organized under the laws of the United States, acts as Investment Adviser to the LifeLine Funds. As Investment Adviser, HSBC manages the investments of the LifeLine Funds and continuously reviews, supervises and administers the LifeLine Funds’ investments. For its services as Investment Adviser, HSBC is entitled to receive a fee, computed daily and paid monthly, based on average daily net assets, at an annual rate of 0.05% for each Fund. The Investment Adviser is waiving all of the fee for each of the Funds’. All contractual and any voluntary fee waivers/reimbursements are not subject to recoupment in subsequent fiscal periods. Voluntary waivers/reimbursements may be stopped at any time. |
| |
| Administration: |
| |
| HSBC serves the LifeLine Funds as Administrator. Under the terms of the Administration Agreement, HSBC received from the Lifeline Funds (as well as the other funds in the HSBC Investor Family of Funds) a fee, accrued daily and paid monthly, during the period November 1, 2008 to December 31, 2008, at an annual rate of: |
| | | | |
Based on Average Daily Net Assets of | | Fee Rate | |
| |
| |
Up to $12 billion | | | 0.0525 | % |
In excess of $12 billion | | | 0.0350 | % |
| |
| Effective January 1, 2009, under the terms of the Administration Agreement, HSBC receives from the LifeLine Funds (as well as the other funds in the HSBC Investor Family of Funds) a fee, accrued daily and paid monthly, at an annual rate of: |
| | | | |
Based on Average Daily Net Assets of | | Fee Rate | |
| |
| |
Up to $10 billion | | | 0.0550 | % |
In excess of $10 billion but not exceeding $20 billion | | | 0.0350 | % |
In excess of $20 billion but not exceeding $50 billion | | | 0.0275 | % |
In excess of $50 billion | | | 0.0250 | % |
| |
| The fee breakpoints are determined on the basis of the aggregate average daily net assets of the HSBC Investor Family of Funds. The fee is allocated to each series of the HSBC Investor Family of Funds based upon its pro-rata share of net assets. For assets invested in Underlying Portfolios by LifeLine Funds, the Portfolios pay half of the administration fee and the LifeLine Funds pay half, for a combination of the total fee rate above. Certain administration fees of the Portfolios also may be reduced by treating them as apportioned in part to other funds making investments in the Portfolios in master-feeder structures. |
| |
25 | HSBC INVESTOR LIFELINE FUNDS |
|
HSBC INVESTOR LIFELINE FUNDS |
|
|
Notes to Financial Statements—As of April 30, 2009 (Unaudited) (continued) |
| |
| The administration fees accrued for each class by Fund, of which 50% of such fees are deemed to be class specific, are as follows: |
| | | | | | | | | | | | | |
| | Aggressive
Growth
Strategy Fund | | Growth
Strategy Fund | | Moderate
Growth
Fund | | Conservative
Growth
Fund | |
| |
| |
| |
| |
| |
Class A | | $ | 417 | | $ | 1,268 | | $ | 1,326 | | $ | 457 | |
Class B | | | 289 | | | 881 | | | 1,157 | | | 411 | |
Class C | | | 30 | | | 110 | | | 128 | | | 42 | |
| |
|
| |
|
| |
|
| |
|
| |
Total | | $ | 736 | | $ | 2,259 | | $ | 2,611 | | $ | 910 | |
| |
|
| |
|
| |
|
| |
|
| |
| |
| Pursuant to a Sub-Administration Agreement with HSBC, Citi Fund Services Ohio, Inc. (“Citi Ohio”), a wholly-owned subsidiary of The Citigroup, Inc., serves as the Trust’s and other HSBC Investor Funds (collectively, the “Trusts”) Sub-Administrator subject to the general supervision of the Trust’s Board of Trustees and HSBC. For these services, Citi Ohio is entitled to a fee, payable by HSBC, at an annual rate equivalent to the fee rates set forth above, minus 0.02% (2 basis points) which is retained by HSBC. |
| |
| Under a Compliance Services Agreement between the Trusts and Citi Ohio (the “CCO Agreement”), Citi Ohio makes an employee available to serve as the Funds’ Chief Compliance Officer (the “CCO”). Under the CCO Agreement, Citi Ohio also provides infrastructure and support in implementing the written policies and procedures comprising the Trusts’ compliance program, including support services to the CCO. For the services provided under the CCO Agreement, the HSBC Investor Family of Funds paid Citi Ohio $133,049 for the period ended April 30, 2009, plus reimbursement of certain out of pocket expenses. Expenses incurred by each Fund are reflected on the Statements of Operations as “Compliance Service.” Citi Ohio pays the salary and other compensation earned by any such individuals as employees of Citi Ohio. |
| |
| Distribution Plan: |
| |
| Foreside Distribution Services, L.P. (“Foreside”), a wholly-owned subsidiary of Foreside Financial Group LLC, serves the Trust as Distributor (the “Distributor”). The Trust has adopted a non-compensatory Distribution Plan and Agreement (the “Plan”) pursuant to Rule 12b-1 of the Act. The Plan provides for reimbursement of expenses incurred by the Distributor related to distribution and marketing, at a rate not to exceed 0.25%, 1.00%, and 1.00% of the average daily net assets of Class A Shares (currently not being charged), Class B Shares (currently charging 0.75%), and Class C Shares (currently charging 0.75%) of the LifeLine Funds, respectively. Foreside, as Distributor, also received $106,503, $76,505 and $5,366 in commissions from sales of HSBC Investor Family of Funds, for Class A Shares, Class B Shares, and Class C Shares, respectively of which $40, $6, and $0 were reallowed to affiliated brokers and dealers, for Class A Shares, Class B Shares, and Class C Shares, respectively. |
| |
| Shareholder Servicing: |
| |
| The Trust has adopted an Shareholder Services Plan, formerly known as Administrative Service Plan, which provides for payments to Shareholder Servicing Agents (which currently consist of HSBC and its affiliates) for providing various shareholder services. For performing these services, the Shareholder Servicing Agents receive a fee up to 0.25%, 0.25% and 0.25% that is computed daily and paid monthly equal to a percentage of average daily net assets of Class A Shares, Class B Shares and Class C Shares of the Lifeline Funds, respectively. The fees paid to the Distributor pursuant to the Distribution Plan and to shareholder servicing agents pursuant to the Shareholder Services Plan currently are not intended to exceed, in the aggregate, 0.25% of the average daily net assets of Class A Shares, 1.00% of the average daily net assets of Class B Shares and Class C Shares. |
| |
| Fund Accounting, Transfer Agency and Trustee: |
| |
| Citi Ohio provides fund accounting and transfer agency services for the Trusts. As Transfer Agent, Citi Ohio receives a fee based on the number of funds and shareholder accounts, subject to certain minimums and reimbursement of certain expenses. As Fund Accountant, Citi Ohio receives an annual fee per Fund and share class, subject to minimums and reimbursement of certain expenses. |
| |
| Each of the non-interested Trustees is compensated with a $60,000 annual Board retainer for services as a Trustee of the Trusts, as well as a $3,000 annual retainer for each Committee of the Board of the Trusts. Each non-interested Trustee |
| |
HSBC INVESTOR LIFELINE FUNDS | 26 |
|
HSBC INVESTOR LIFELINE FUNDS |
|
|
Notes to Financial Statements—As of April 30, 2009 (Unaudited) (continued) |
| |
| also receives a $5,000 and $3,000 meeting fee for each regular in-person Board meeting and Committee meeting, respectively. Furthermore, each non-interested Trustee receives compensation for attending special meetings and/or functioning as a Committee Chairperson or Lead Trustee. In addition, the non-interested Trustees are reimbursed for certain expenses incurred in connection with their Board membership. |
| |
| Fee Reductions: |
| |
| The Investment Adviser has agreed to contractually limit through March 1, 2010 the total expenses, exclusive of interest, taxes, brokerage commissions, and extraordinary expenses of the LifeLine Funds. Each Fund Class has its own expense limitations based on the average daily net assets for any full fiscal year as follows: Class A Shares 1.50%, Class B Shares 2.25%, Class C Shares 2.25%. |
| |
| The Administrator and Citi Ohio may voluntarily waive/reimburse fees to help support the expense limits of each Fund. In addition, the Investment Adviser may waive/reimburse additional fees at its discretion. Amounts waived/reimbursed by the Investment Adviser, Administrator, and Citi Ohio are reported separately on the Statements of Operations, as applicable. All contractual and any voluntary fee waivers/reimbursements are not subject to recoupment in subsequent fiscal periods. Voluntary waivers/reimbursements may be stopped at any time. |
| |
5. | Investment Transactions: |
| |
| Aggregate contributions and withdrawals of the Underlying Portfolios by the Funds for the period ended April 30, 2009 totaled: |
| | | | | | | | |
| | | Contributions | | Withdrawals | |
| | |
| |
| |
| Aggressive Growth Fund | | $ | 708,145 | | $ | 659,805 | |
| Growth Strategy Fund | | | 1,382,057 | | | 2,315,480 | |
| Moderate Growth Fund | | | 1,400,639 | | | 3,608,831 | |
| Conservative Growth Fund | | | 789,148 | | | 1,581,990 | |
| |
6. | Federal Tax Information: |
| |
| The tax characteristics of dividends paid by the LifeLine Funds during the latest tax year ended as of October 31, 2008 were as follows: |
| | | | | | | | | | | | | | | | | |
| | | Dividends paid from | | | | | | | | | | |
| | |
| | | | | | | | | | |
| | | Ordinary
Income | | Net Long
Term Gains | | Total
Taxable
Dividends | | Return of
Capital | | Total
Dividends
Paid* | |
| | |
| |
| |
| |
| |
| |
| Aggressive Growth Fund | | $ | 87,226 | | $ | 667,264 | | $ | 754,490 | | $ | 3,134 | | $ | 757,624 | |
| Growth Strategy Fund | | | 434,489 | | | 1,575,492 | | | 2,009,981 | | | — | | | 2,009,981 | |
| Moderate Growth Fund | | | 686,794 | | | 1,257,947 | | | 1,944,741 | | | 40,611 | | | 1,985,352 | |
| Conservative Growth Fund | | | 265,882 | | | 228,458 | | | 494,340 | | | 527 | | | 494,867 | |
| | |
|
|
| * | Total dividends paid may differ from the amount reported in the Statement of Changes in Net Assets because dividends are recognized when actually paid for tax purposes. |
| | |
| As of the latest tax year end October 31, 2008, the components of accumulated earnings/(deficit) on a tax basis for the Lifeline Funds were as follows: |
| | | | | | | | | | | | | | | | | | | | | | | |
| | | Undistributed
Ordinary
Income | | Undistributed
Tax Exempt
Income | | Accumulated
Earnings | | Dividends
Payable | | Accumulated
Capital and
Other Losses | | Unrealized
Appreciation/
(Depreciation)
** | | Total
Accumulated
Earnings/
(Deficit) | |
| | |
| |
| |
| |
| |
| |
| |
| |
| Aggressive Growth Fund | | $ | — | | $ | — | | $ | — | | $ | — | | $ | (911,837 | ) | $ | (2,704,622 | ) | $ | (3,616,459 | ) |
| Growth Strategy Fund | | | 117,076 | | | — | | | 117,076 | | | — | | | (2,102,770 | ) | | (7,284,593 | ) | | (9,270,287 | ) |
| Moderate Growth Fund | | | — | | | — | | | — | | | — | | | (1,920,789 | ) | | (7,117,440 | ) | | (9,038,229 | ) |
| Conservative Growth Fund | | | — | | | — | | | — | | | — | | | (522,075 | ) | | (1,962,987 | ) | | (2,485,062 | ) |
| | |
|
|
| ** | The differences between book-basis and tax-basis unrealized appreciation/deprecation are attributable primarily to: tax deferral of losses on wash sales, the realization for tax purposes of unrealized gains/losses on certain derivative instruments, the difference between book and tax amortization methods for premium and market discount, the realization for tax purposes of unrealized gains/losses on investments in passive foreign investment companies, and the return of capital adjustments from real estate investment trusts. |
| |
27 | HSBC INVESTOR LIFELINE FUNDS |
|
HSBC INVESTOR LIFELINE FUNDS |
|
|
Notes to Financial Statements—As of April 30, 2009 (Unaudited) (continued) |
| |
| As of the latest tax year ended of October 31, 2008, the following Funds have net capital loss carryforwards, which are available to offset future realized gains, if any, to the extent provided by the Treasury regulations. To the extent that these carryforwards are used to offset future capital gains, it is probable that the gains that are offset will not be distributed to shareholders. |
| | | | | | | | |
| | | Amount | | Expires | |
| | |
| |
| |
| Aggressive Growth Fund | | $ | 911,837 | | | 2016 | |
| Growth Strategy Fund | | | 2,102,771 | | | 2016 | |
| Moderate Growth Fund | | | 1,920,789 | | | 2016 | |
| Conservative Growth Fund | | | 522,075 | | | 2016 | |
| |
| The tax character of current year distributions paid and the tax basis of the current components of accumulated earnings and any net capital loss carry-forwards will be determined at the end of the current tax year ending October 31, 2009. |
| |
7. | Legal and Regulatory Matters: |
| |
| On September 26, 2006 BISYS Fund Services, Inc. (“BISYS”), an affiliate of BISYS Fund Services Ohio, Inc. which provides various services to the LifeLine Funds as described in footnote 3, reached a settlement with the Securities and Exchange Commission (“the SEC”) regarding the SEC’s investigation related to BISYS’ past payment of certain marketing and other expenses with respect to certain of its mutual fund clients. Although BISYS has reached a settlement with the SEC, the LifeLine Funds’ management is not aware that any determination has been made as to how the BISYS settlement monies will be distributed. While the LifeLine Funds’ management is currently unable to determine the impact, if any, of such matters on the Portfolios or the LifeLine Funds’ financial statements, management does not anticipate a material, adverse impact to the LifeLine Funds or the LifeLine Funds’ financial statements. |
| |
HSBC INVESTOR LIFELINE FUNDS | 28 |
|
HSBC INVESTOR LIFELINE FUNDS |
|
|
Investment Adviser Contract Approval—April 30, 2009 (Unaudited) |
| | |
| The Board of Trustees of the HSBC Investor Funds Trust, HSBC Advisor Funds Trust and HSBC Investor Portfolios (collectively, the “Trusts”), and the non-interested Trustees (“Independent Trustees”), voting separately, approved the renewal, for a year, of the Investment Advisory Agreements and, where applicable Sub-Advisory Agreements (other than the Sub-Advisory Agreement with Halbis Capital Management (USA) Inc. (“Halbis”)), with respect to the respective series of the Trusts then existing (“Funds”) at an in-person meeting held on December 8, 2008. At that meeting, as well as at the regular meeting of the Board held on March 30, 2009, the Independent Trustees also reviewed and approved short-term extensions to the Sub-Advisory Agreement between the HSBC Global Asset Management (USA) Inc. (“Adviser”) and Halbis with respect to the HSBC Investor Core Plus Fixed Income Fund, HSBC Investor High Yield Fixed Income Fund, HSBC Investor Intermediate Duration Fixed Income Fund, and the HSBC Investor New York-Tax Free Bond Fund (the “Fixed Income Funds”) (the Investment Advisory Agreements and Sub-Advisory Agreements are collectively referred to as the “Agreements”). |
| | |
| In determining whether it was appropriate to approve the Agreements for the Funds, the Independent Trustees requested information from the Adviser and the various subadvisers that they believed to be reasonably necessary to reach their conclusion. In an Executive Session, the Independent Trustees carefully evaluated this information, and were advised by independent legal counsel with respect to their deliberations. Based on their review of the information requested and provided for each Fund, the Independent Trustees determined that the relevant Agreements were consistent with the best interests of the Funds and their shareholders, and enabled the Funds to receive high quality services at a cost that is appropriate and reasonable. The Independent Trustees, along with the entire Board of Trustees, made these determinations on the basis of the following considerations, among others: |
| | |
| | Nature, Extent, and Quality of Services Provided by Adviser and Sub-Advisers. The Trustees considered the nature, quality and extent of the investment advisory services provided by the Adviser (and, as applicable, the subadvisers), in light of the high quality services provided to the Funds, and each Fund’s historic performance. The Trustees considered the commitment of the Adviser to the successful operations of the Funds. The Trustees considered the historical performance of the Funds and the level of expenses of the Funds. With respect to the equity Funds, the Trustees considered the capabilities and performance of the Adviser’s Multimanager unit. The Trustees also considered the use of expense limitation agreements in order to reduce the overall operating expenses of certain Funds. The Trustees also took note of the long term relationship between the Adviser and the Funds and the efforts undertaken by the Adviser to foster the growth and development of the Funds since the inception of each of the Funds. For the Fixed Income Funds, the Independent Trustees also considered the Adviser’s and Halbis’ plans for the Fixed Income Funds. The Trustees also considered the extent to which the Adviser and investment Sub-Advisers had achieved economies of scale and the extent to which shareholders benefited from those economies of scale. |
| | |
| | Investment Performance of the Funds, Adviser and Sub-Advisers. The Trustees considered short-term and long-term investment performance of each Fund over various periods of time as compared to a peer group of comparable funds. The Trustees took note of performance information for one, three and five year periods and since inception as relevant. In addition, the Trustees compared expenses of each Fund to the expenses of its peers, noting that the expenses for each of the Funds compare favorably with industry averages for other funds of similar size. |
| | |
| | Costs of Services and Profits Realized by the Adviser. The Trustees considered the Adviser’s overall profitability and costs and an analysis of the estimated profitability to the Adviser from its relationship with the Funds. The Trustees considered that the advisory fees under the Agreements were within the range of those of similar funds, noting the high level of resource, expertise and experience that was provided to the Funds by the Adviser and Sub-Advisers. The Trustees concluded that the combined advisory fees payable to the Adviser and the Funds’ Sub-Advisers are fair and reasonable in light of the services to be provided, the anticipated costs of these services, the profitability of the Adviser’s relationship with the Funds, and the comparability of the advisory fee to similar fees paid by comparable mutual funds. |
| | |
| | Other Relevant Considerations. The Independent Trustees also considered the overall high quality of the personnel, operations, financial condition, investment management capabilities, methodologies, and performance of the Adviser and Sub-Advisers. The Trustees also noted the range of investment advisory and administrative services provided by the Adviser to the Funds and the level and quality of these services, in particular the quality of the personnel providing these services. In addition, the Trustees considered the overall favorable investment performance of the Funds. |
| | |
| Accordingly, in light of the above considerations and such other factors and information it considered relevant, the Board of Trustees by a unanimous vote of those present in person at the meetings (including a separate vote of the Independent Trustees present in person at the meetings), approved the Agreements. |
| |
29 | HSBC INVESTOR LIFELINE FUNDS |
|
HSBC INVESTOR LIFELINE FUNDS |
|
|
Table of Shareholders Expenses (Unaudited)—As of April 30, 2009 |
| |
| As a shareholder of the HSBC Investor LifeLine Funds (“Funds”), you incur two types of costs: (1) transaction costs, including sales charges (loads) on purchases, redemption fees; and exchange fees; (2) ongoing costs, including management fees; distribution and/or shareholder servicing fees; and other Fund expenses. These examples are intended to help you understand your ongoing costs (in dollars) of investing in the Funds and to compare these costs with the ongoing costs of investing in other mutual funds. |
| |
| These examples are based on an investment of $1,000 invested at the beginning of the period and held for the entire period from November 1, 2008 through April 30, 2009. |
| |
| Actual Example |
| |
| The table below provides information about actual account values and actual expenses. You may use the information below, together with the amount you invested, to estimate the expenses that you paid over the period. Simply divide your account value by $1,000 (for example, an $8,600 account value divided by $1,000 = 8.6), then multiply the result by the number in the table under the heading entitled “Expenses Paid During Period” to estimate the expenses you paid on your account during this period. |
| | | | | | | | | | | | | | | | |
| | | | | Beginning
Account Value
11/1/08 | | Ending
Account Value
4/30/09 | | Expenses Paid
During Period*
11/1/08 - 4/30/09 | | Annualized
Expense Ratio
During Period
11/1/08 - 4/30/09 | |
| | | | |
| |
| |
| |
| |
| Aggressive Growth
Strategy Fund | | Class A Shares | | $ | 1,000.00 | | $ | 968.70 | | $ | 7.32 | | | 1.50 | % |
| | | Class B Shares | | | 1,000.00 | | | 965.40 | | | 10.96 | | | 2.25 | % |
| | | Class C Shares | | | 1,000.00 | | | 964.20 | | | 10.96 | | | 2.25 | % |
| Growth Strategy Fund | | Class A Shares | | | 1,000.00 | | | 984.60 | | | 7.38 | | | 1.50 | % |
| | | Class B Shares | | | 1,000.00 | | | 981.50 | | | 11.05 | | | 2.25 | % |
| | | Class C Shares | | | 1,000.00 | | | 981.20 | | | 11.05 | | | 2.25 | % |
| Moderate Growth
Strategy Fund | | Class A Shares | | | 1,000.00 | | | 999.20 | | | 7.44 | | | 1.50 | % |
| | | Class B Shares | | | 1,000.00 | | | 995.70 | | | 11.13 | | | 2.25 | % |
| | | Class C Shares | | | 1,000.00 | | | 994.40 | | | 11.13 | | | 2.25 | % |
| Conservative Growth
Strategy Fund | | Class A Shares | | | 1,000.00 | | | 1,007.10 | | | 7.46 | | | 1.50 | % |
| | | Class B Shares | | | 1,000.00 | | | 1,003.60 | | | 11.18 | | | 2.25 | % |
| | | Class C Shares | | | 1,000.00 | | | 1,003.50 | | | 11.18 | | | 2.25 | % |
| | |
|
|
| * | Expenses are equal to the average account value over the period multiplied by the Fund’s annualized expense ratio, multiplied by the number of days in the most recent fiscal half-year divided by the number of days in the fiscal year (to reflect the one half year period). |
| |
HSBC INVESTOR LIFELINE FUNDS | 30 |
|
HSBC INVESTOR LIFELINE FUNDS |
|
|
Table of Shareholders Expenses (Unaudited)—As of April 30, 2009 (continued) |
Hypothetical Example for Comparison Purposes
| |
| The table below provides information about hypothetical account values and hypothetical expenses based on the Fund’s actual expense ratio and an assumed rate of return of 5% per year before expenses, which is not the Fund’s actual return. The hypothetical account values and expenses may not be used to estimate the actual ending account balance or expenses you paid for the period. You may use this information to compare this 5% hypothetical example with the 5% hypothetical examples that appear in the shareholder reports of other funds. |
| |
| Please note that the expenses shown in the table are meant to highlight your ongoing costs only and do not reflect any transactional costs, such as sales charges (loads), redemption fees, or exchange fees. Therefore, the table is useful in comparing ongoing costs only, and will not help you determine the relative total costs of owning different funds. In addition, if these transactional costs were included, your costs would have been higher. |
| | | | | | | | | | | | | | | | |
| | | | | Beginning
Account Value
11/1/08 | | Ending
Account Value
4/30/09 | | Expenses Paid
During Period*
11/1/08 - 4/30/09 | | Annualized
Expense Ratio
During Period
11/1/08 - 4/30/09 | |
| | | | |
| |
| |
| |
| |
| Aggressive Growth
Strategy Fund | | Class A Shares | | $ | 1,000.00 | | $ | 1,017.36 | | $ | 7.50 | | | 1.50 | % |
| | | Class B Shares | | | 1,000.00 | | | 1,013.64 | | | 11.23 | | | 2.25 | % |
| | | Class C Shares | | | 1,000.00 | | | 1,013.64 | | | 11.23 | | | 2.25 | % |
| Growth Strategy Fund | | Class A Shares | | | 1,000.00 | | | 1,017.36 | | | 7.50 | | | 1.50 | % |
| | | Class B Shares | | | 1,000.00 | | | 1,013.64 | | | 11.23 | | | 2.25 | % |
| | | Class C Shares | | | 1,000.00 | | | 1,013.64 | | | 11.23 | | | 2.25 | % |
| Moderate Growth
Strategy Fund | | Class A Shares | | | 1,000.00 | | | 1,017.36 | | | 7.50 | | | 1.50 | % |
| | | Class B Shares | | | 1,000.00 | | | 1,013.64 | | | 11.23 | | | 2.25 | % |
| | | Class C Shares | | | 1,000.00 | | | 1,013.64 | | | 11.23 | | | 2.25 | % |
| Conservative Growth
Strategy Fund | | Class A Shares | | | 1,000.00 | | | 1,017.36 | | | 7.50 | | | 1.50 | % |
| | | Class B Shares | | | 1,000.00 | | | 1,013.64 | | | 11.23 | | | 2.25 | % |
| | | Class C Shares | | | 1,000.00 | | | 1,013.64 | | | 11.23 | | | 2.25 | % |
| | |
|
|
| * | Expenses are equal to the average account value over the period multiplied by the Fund’s annualized expense ratio, multiplied by the number of days in the most recent fiscal half-year divided by the number of days in the fiscal year (to reflect the one half year period). |
| |
31 | HSBC INVESTOR LIFELINE FUNDS |
HSBC Investor Core Plus Fixed Income Portfolio
by Halbis Capital Management (USA) Inc., Broad Markets Fixed Income Team
The HSBC Investor Core Plus Fixed Income Portfolio (the “Portfolio”) seeks to maximize total return, consistent with reasonable risk. The “total return’’ sought by the Portfolio consists of income earned on investments, plus capital appreciation, if any, which generally arises from decreases in interest rates or improving credit fundamentals for a particular sector or security. The Portfolio employs Halbis Capital Management (USA) Inc. as subadviser.
Investment Concerns
Bonds offer a relatively stable level of income, although bond prices will fluctuate providing the potential for principal gain or loss. Intermediate-term, higher-quality bonds generally offer less risk and a lower rate of return than longer-term bonds.
The mortgage market in the U.S. recently experienced difficulties that may adversely affect the performance and market value of certain mortgage-related investments.
Market Commentary
The fixed-income markets experienced several distinct environments during the six-month period. The worsening global recession fueled a flight to quality in November as investors sought out the most conservative and secure fixed-income investments—in particular Treasury securities, followed by a significant rally in December. The market came under heavy pressure in February, followed by a strong rally in March and April. As the financial crisis began to recede, demand rose for higher-risk fixed-income securities such as corporate and government agency issues.
The Portfolio held a relatively heavy weighting in corporate and other non-Treasury bonds. We saw opportunities among such bonds, which we believed were not properly valued in the early part of the period. That focus on corporate bonds and other non-Treasury securities initially weighed on relative performance, but boosted returns against the benchmark as investors became less risk-averse during the second half of the period. The Portfolio maintained a high credit rating throughout the period, though it did have a modest exposure to securities rated below investment grade.*
We maintained an average maturity that was neutral to that of the benchmark. We focused the portfolio largely on intermediate-term securities, which in our estimation offered the most compelling values among corporate issues.*,1
| |
* | Portfolio composition is subject to change. |
| |
1 | The current management team took over management of the Fund on February 1, 2009. |
Past performance does not guarantee future results. The performance data quoted represents past performance and current returns may be lower or higher. Total return figures include change in share price, reinvestment of dividends and capital gains and do not reflect taxes that a shareholder would pay on fund distributions or on the redemption of fund shares. The investment return and principal value will fluctuate so that an investor’s shares, when redeemed may be worth more or less than the original cost. To obtain performance information current to the most recent month end, please call 1-800-782-8183.
| |
HSBC INVESTOR PORTFOLIOS | 32 |
HSBC Investor Intermediate Duration Fixed Income Portfolio
by Halbis Capital Management (USA) Inc., Broad Markets Fixed Income Team
The HSBC Investor Intermediate Duration Fixed Income Portfolio (the “Portfolio”) seeks to maximize total return, consistent with reasonable risk. The “total return’’ sought by the Portfolio consists of income earned on investments, plus capital appreciation, if any, which generally arises from decreases in interest rates or improving credit fundamentals for a particular sector or security. Under normal market conditions, the Portfolio invest at least 80% of its net assets in fixed income securities. The Portfolio expects to maintain an average portfolio duration with respect to fixed income securities of 3 to 6 years. The Portfolio employs Halbis Capital Management (USA) Inc. as subadviser.
Investment Concerns
Bonds offer a relatively stable level of income, although bond prices will fluctuate providing the potential for principal gain or loss. Intermediate-term, higher-quality bonds generally offer less risk and a lower rate of return than longer-term bonds.
The mortgage market in the U.S. recently experienced difficulties that may adversely affect the performance and market value of certain mortgage-related investments.
Market Commentary
The fixed-income markets were turbulent to begin the period as the global economic recession continued to worsen. Seeking safety, investors in the fixed-income market favored high-quality securities such as Treasuries. A year-end rally was followed by a significant decline in credit markets in February. A more sustained rally began in March. As the period continued, the financial crisis diminished and investors began seeking higher-risk fixed-income securities such as corporate and government agency issues.
We positioned the Portfolio with a heavy exposure to corporate and other non-Treasury bonds, as such, securities offered strong yields compared to Treasuries. That strategy dragged on relative performance early in the period, but boosted Portfolio returns against the benchmarks as demand for higher-risk securities increased later in the period. Issues with high credit ratings made up the bulk of the portfolio throughout the period, though it did have a modest exposure to securities rated below investment grade.
The Portfolio’s average maturity was positioned close to that of its benchmark, and its portfolio was focused largely on intermediate-term securities. We believed such securities offered the most compelling values among corporate issues.*, 1
| |
* | Portfolio composition is subject to change. |
| |
1 | The current management team took over management of the Fund on February 1, 2009. |
Past performance does not guarantee future results. The performance data quoted represents past performance and current returns may be lower or higher. Total return figures include change in share price, reinvestment of dividends and capital gains and do not reflect taxes that a shareholder would pay on fund distributions or on the redemption of fund shares. The investment return and principal value will fluctuate so that an investor’s shares, when redeemed may be worth more or less than the original cost. To obtain performance information current to the most recent month end, please call 1-800-782-8183.
| |
33 | HSBC INVESTOR PORTFOLIOS |
HSBC Investor Growth Portfolio
by Clark J. Winslow, Chief Executive Officer/Portfolio Manager
Justin H. Kelly, CFA, Managing Director/Portfolio Manager
R. Bart Wear CFA, Managing Director/Portfolio Manager
The HSBC Investor Growth Portfolio (the “Portfolio”) seeks long-term growth of capital. Under normal market conditions, the Portfolio invests primarily in U.S. and foreign equity securities of high quality companies with market capitalization generally in excess of $2 billion, which the subadviser believes have the potential to generate superior levels of long-term profitability and growth. The Portfolio employs Winslow Capital Management Inc. as subadviser.
Investment Concerns
Equity securities (stocks) are more volatile and carry more risk than other forms of investments, including investments in high-grade fixed income securities. The net asset value per share of this Fund will fluctuate as the value of the securities in the portfolio changes.
Market Commentary
The market experienced a great deal of volatility during the period under review. Stocks fell in November on fears about the health of the financial sector. The market then rebounded on optimism the new administration would take swift action to address the country’s economic and financial problems. But stocks slumped in February after the U.S. Treasury Department announced a financial rescue plan with few details. By early March the Russell 1000® Growth Index’ had declined 18% for the year.
Then some signs of economic recovery began to appear: Consumer sentiment improved; some major banks indicated earnings would be better than expected; and the U.S. Treasury Department provided details on key parts of its financial rescue plan. Stocks rallied strongly, ending the period with the best six-week performance since 1938.
Stock selection in the technology and financials sectors helped the Portfolio outperform its benchmark. Shares of two Internet stocks led performance in the Portfolio’s technology allocation, while stocks of major credit card companies boosted the returns of the Portfolio’s financials stake. An overweight position in the financials sector also contributed to outperformance. The Portfolio’s healthcare and industrials holdings helped relative performance as well. They produced negative returns, in aggregate, but outperformed the respective sectors in the benchmark.*
An underweight position in consumer discretionary stocks held back performance relative to the index. Stock selection within this sector also weighed on relative returns. The Portfolio’s smaller-than-benchmark stake in energy stocks likewise weighed on relative performance.*
| |
* | Portfolio composition is subject to change. |
Past performance does not guarantee future results. The performance data quoted represents past performance and current returns may be lower or higher. Total return figures include change in share price, reinvestment of dividends and capital gains and do not reflect taxes that a shareholder would pay on fund distributions or on the redemption of fund shares. The investment return and principal value will fluctuate so that an investor’s shares, when redeemed may be worth more or less than the original cost. To obtain performance information current to the most recent month end, please call 1-800-782-8183.
| |
HSBC INVESTOR PORTFOLIOS | 34 |
HSBC Investor International Equity Portfolio
by Kevin F. Simms
Co-CIO International Value Equities and Director of Research – Global and International Value Equities
AllianceBernstein Investment Research and Management
The HSBC Investor International Equity Portfolio (the “Portfolio”) seeks to provide its shareholders with long-term growth of capital and future income. Under normal market conditions, the Portfolio invests at least 80% of its net assets in equity securities of companies organized and domiciled in developed nations outside the United States or for which the principal trading market is outside the United States, including Europe, Canada, Australia and the Far East. The Portfolio may invest up to 20% of its assets in equity securities of companies in emerging markets. The Portfolio employs AllianceBernstein L.P. (“AllianceBernstein”), a unit of AllianceBernstein Investment Research and Management, as subadviser.
Investment Concerns
There are risks associated with investing in foreign companies, such as erratic market conditions, economic and political instability and fluctuations in currency and exchange rates.
Equity securities (stocks) are more volatile and carry more risk than other forms of investments, including investments in high-grade fixed income securities. The net asset value per share of this Portfolio will fluctuate as the value of the securities in the portfolio changes.
Market Commentary
Investors’ fears about the length and severity of the global economic recession, as well as the extent of the trouble in the global banking system, dominated financial markets from the beginning of the period through late February. This period of sustained weakness contributed to the Portfolio’s negative performance. In the latter portion of the period under review, investors believed that both the global economy and the global financial system had stabilized, and financial markets worldwide largely recovered from their prior underperformance. International stocks generally followed this trend.
The Portfolio’s overweight position in energy shares boosted performance relative to its benchmark index, as did stock selection within the sector. Stock selection among financial firms also boosted relative performance. By the period’s end, investors began to discriminate between those financial firms that had a great deal of exposure to significant credit losses and those that did not. The Portfolio’s holdings among the latter group contributed positively to relative performance.*
The Portfolio’s overweight position in telecommunications shares hurt relative performance. As investors’ appetite for risk increased at the end of the period, defensive sectors including telecom underperformed. Stock selection in industrial commodities also dragged on relative performance, as the Portfolio’s limited exposure to metals and mining firms benefiting from renewed economic growth in China, relative to that of the benchmark, hurt returns.*
| |
* | Portfolio composition is subject to change. |
Past performance does not guarantee future results. The performance data quoted represents past performance and current returns may be lower or higher. Total return figures include change in share price, reinvestment of dividends and capital gains and do not reflect taxes that a shareholder would pay on fund distributions or on the redemption of fund shares. The investment return and principal value will fluctuate so that an investor’s shares, when redeemed may be worth more or less than the original cost. To obtain performance information current to the most recent month end, please call 1-800-782-8183.
| |
35 | HSBC INVESTOR PORTFOLIOS |
HSBC Investor Opportunity Portfolio
by William A. Muggia
President–Chief Investment Officer
Westfield Capital Management, LLC
The HSBC Investor Opportunity Portfolio (the “Portfolio”) seeks to provide its shareholders with long-term growth of capital by investing in equity securities of small cap companies. The Portfolio may also invest in bonds, notes, commercial paper, U.S. Government securities, and foreign securities. Small cap companies generally are defined as those that have market capitalizations within the range of market capitalizations represented in the Russell 2500™ Growth Index1. The Portfolio may also invest in equity securities of larger, more established companies if they are expected to show increased earnings. The Portfolio employs Westfield Capital Management Company, LLC as subadviser.
Investment Concerns
Equity securities (stocks) are more volatile and carry more risk than other forms of investments, including investments in high-grade fixed income securities. The net asset value per share of this Portfolio will fluctuate as the value of the securities in the portfolio changes.
Small-capitalization funds typically carry additional risks since smaller companies generally have a higher risk of failure, and historically, their stocks have experienced a greater degree of market volatility than stocks on average.
Market Commentary
The six-month period was punctuated by both periods of negative performance and periods of positive performance. Early in the period, the global recession significantly weighed down stock market performance. However, early signs of an economic recovery began to show toward the end of the period, fueling a broad and relatively strong rally among stocks that continued through April 30.
The Portfolio’s relative return benefited from a larger-than-benchmark position in the technology sector. Investors sought out higher-risk investments such as technology stocks as the economy improved toward the end of the period, resulting in relatively strong net gains for such stocks during the six months through April. Selection among technology stocks also helped the Portfolio’s performance relative to its benchmark.
The Portfolio also benefited in relative terms from its positioning in the energy sector. The subadviser identified a number of attractive investments in energy sub-sectors such as oil exploration and production, and those holdings helped boost relative performance.*
Stock selection within the financial sector was the largest drag on the Portfolio’s relative performance during the period. The subadviser focused much of the Portfolio’s investments among regional banks. Though shares of such firms rebounded late in the period, the Portfolio’s allocation to shares of regional banks early in the period hurt relative performance. The Portfolio’s relative performance also suffered from holding a smaller position than its benchmark in the consumer discretionary sector, which was the top-performing sector during the period. Selection of certain media stocks and shares of education services firms also negatively affected relative performance.*
| |
1 | For additional information, please refer to the Glossary of Terms. |
| |
* | Portfolio composition is subject to change. |
Past performance does not guarantee future results. The performance data quoted represents past performance and current returns may be lower or higher. Total return figures include change in share price, reinvestment of dividends and capital gains and do not reflect taxes that a shareholder would pay on fund distributions or on the redemption of fund shares. The investment return and principal value will fluctuate so that an investor’s shares, when redeemed may be worth more or less than the original cost. To obtain performance information current to the most recent month end, please call 1-800-782-8183.
| |
HSBC INVESTOR PORTFOLIOS | 36 |
HSBC Investor Value Portfolio
by Jon D. Bosse, CFA
Chief Investment Officer
NWQ Investment Management Company, LLC
The HSBC Investor Value Portfolio (the “Portfolio”) seeks long-term growth of capital and income. Under normal market conditions, the Portfolio invests primarily in U.S. and foreign companies with large and medium capitalizations that the subadviser believes possess opportunities underappreciated or misperceived by the market. The Portfolio employs NWQ Investment Management Company, LLC (“NWQ”) as subadviser.
Investment Concerns
Value-based investments are subject to the risk that the broad market may not recognize their intrinsic value.
Equity securities (stocks) are more volatile and carry more risk than other forms of investments, including investments in high-grade fixed income securities. The net asset value per share of this Portfolio will fluctuate as the value of the securities in the Portfolio changes.
Market Commentary
The largest contributors to the Portfolio’s absolute and relative return were stocks of two gold companies. The shares benefited from a rise in gold prices as well as from improved business fundamentals, particularly for one South Africa-based company. The Portfolio’s overweight technology position was a positive contributor to both absolute and relative performance, as technology stocks appreciated from their very depressed levels experienced at the beginning of the period. The sub-advisor early in the period sold shares of a large forest products company and purchased stock of a fertilizer firm; those trades also boosted returns.
An underweight position in financial services versus the Russell 1000® Value Index1 helped the Portfolio’s relative performance. Some of the Portfolio’s holdings in the sector performed quite poorly, however. In particular, the Portfolio’s worst performing stock during the period was a money center bank. Concerns about the health of the U.S. and global financial system—and how the system’s problems would affect companies—adversely affected valuations in the sector.
The Portfolio’s positions in the consumer discretionary, consumer staples and healthcare sectors hurt its performance during the period. Continued economic weakness weighed heavily on these sectors. Uncertainty about the size and scope of the government’s future role in the U.S. healthcare system had a particularly large effect on healthcare stocks during this period.*
| |
1 | For additional information, please refer to the Glossary of Terms. |
| |
* | Portfolio composition is subject to change. |
Past performance does not guarantee future results. The performance data quoted represents past performance and current returns may be lower or higher. Total return figures include change in share price, reinvestment of dividends and capital gains and do not reflect taxes that a shareholder would pay on fund distributions or on the redemption of fund shares. The investment return and principal value will fluctuate so that an investor’s shares, when redeemed may be worth more or less than the original cost. To obtain performance information current to the most recent month end, please call 1-800-782-8183.
| |
37 | HSBC INVESTOR PORTFOLIOS |
Portfolio Composition*
April 30, 2009
(Unaudited)
| | |
HSBC Investor Core Plus Fixed Income Portfolio |
|
| |
Investment Allocation | Percentage of Investments at Value |
|
U.S. Government and Government
Agency Obligations | 36.5% | |
|
|
Corporate Obligations | 29.6% | |
|
|
Asset Backed Securities | 12.2% | |
|
|
Cash and Equivalents | 8.2% | |
|
|
Commercial Mortgage Backed
Securities | 6.7% | |
|
|
Collateralized Mortgage Obligations | 4.6% | |
|
|
Municipal Bonds | 1.7% | |
|
|
Foreign Bonds | 0.4% | |
|
|
Certificates of Deposit | 0.1% | |
|
|
Total | 100.0% | |
|
|
| |
HSBC Investor Intermediate Duration
Fixed Income Portfolio |
|
| |
Investment Allocation | Percentage of Investments at Value |
|
U.S. Government and Government
Agency Obligations | 39.6% | |
|
|
Corporate Obligations | 23.8% | |
|
|
Cash and Equivalents | 18.9% | |
|
|
Asset Backed Securities | 8.8% | |
|
|
Commercial Mortgage Backed
Securities | 4.4% | |
|
|
Collateralized Mortgage Obligations | 3.7% | |
|
|
Certificates of Deposit | 0.5% | |
|
|
Foreign Bonds | 0.3% | |
|
|
Total | 100.0% | |
|
|
| | |
HSBC Investor Growth Portfolio |
|
| |
Investment Allocation | Percentage of Investments at Value |
|
Software Services | 10.4% | |
|
|
Telecommunications | 7.5% | |
|
|
Industrial Conglomerates | 7.0% | |
|
|
Investment Management | 6.4% | |
|
|
Medical Products | 6.0% | |
|
|
Credit Card | 5.6% | |
|
|
Communication Equipment | 5.6% | |
|
|
Hardware & Peripherals | 5.3% | |
|
|
Retail | 5.1% | |
|
|
Internet | 4.5% | |
|
|
Medical Services & Distributors | 4.4% | |
|
|
Biotechnology | 3.8% | |
|
|
Travel & Leisure | 3.2% | |
|
|
Business Services | 3.1% | |
|
|
Agriculture | 3.0% | |
|
|
Oil & Gas Exploration & Production | 3.0% | |
|
|
Railroad | 3.0% | |
|
|
Pharmaceuticals | 2.5% | |
|
|
Aerospace & Defense | 2.4% | |
|
|
Retail Pharmacy | 2.0% | |
|
|
Distribution & Wholesale | 1.8% | |
|
|
Transportation | 1.6% | |
|
|
Exchanges | 1.3% | |
|
|
Oil & Gas Drill & Equipment | 1.2% | |
|
|
Cash and Equivalents | 0.3% | |
|
|
Total | 100.0% | |
|
|
| |
HSBC International Equity Portfolio |
|
|
Investment Allocation | Percentage of Investments at Value |
|
Europe | 65.8% | |
|
|
Japan | 17.5% | |
|
|
Australia & Far East | 8.7% | |
|
|
Canada | 5.4% | |
|
|
Other | 1.7% | |
|
|
Cash and Equivalents | 0.9% | |
|
|
Total | 100.0% | |
|
|
| |
* | Portfolio composition is subject to change. |
| |
HSBC INVESTOR PORTFOLIOS | 38 |
Portfolio Composition*
April 30, 2009
(Unaudited)
| | |
HSBC Investor Opportunity Portfolio |
|
| |
Investment Allocation | Percentage of Investments at Value |
|
Computer Software | 16.3% | |
|
Oil & Gas | 11.8% | |
|
|
|
Pharmaceuticals | 10.7% | |
|
|
|
Retail | 6.9% | |
|
|
|
Health Care | 6.5% | |
|
|
|
Industrial Manufacturing | 6.0% | |
|
|
|
Biotechnology | 5.8% | |
|
|
|
Diversified Manufacturing Operations | 5.1% | |
|
|
|
Financial Services | 4.5% | |
|
|
|
Consumer Products | 4.4% | |
|
|
|
Telecommunications | 3.9% | |
|
|
|
Business Services | 3.1% | |
|
|
|
Electronic Components &
Semiconductors | 3.0% | |
|
|
|
Cash and Equivalents | 2.6% | |
|
|
|
Education | 1.7% | |
|
|
|
Environmental Services | 1.5% | |
|
|
|
Aerospace & Defense | 1.4% | |
|
|
|
Internet Related | 1.4% | |
|
|
|
Insurance | 1.3% | |
|
|
|
Gaming | 1.1% | |
|
|
|
Communications | 1.0% | |
|
|
|
Total | 100.0% | |
|
|
|
| | |
HSBC Investor Value Portfolio |
|
| |
Investment Allocation | Percentage of Investments at Value |
|
Oil & Gas | 14.3% | |
|
|
|
Computer Software | 8.6% | |
|
|
|
Insurance | 8.0% | |
|
|
|
Metals & Mining | 8.0% | |
|
|
|
Telecommunications | 8.0% | |
|
|
|
Pharmaceuticals | 7.6% | |
|
|
|
Media | 6.5% | |
|
|
|
Aerospace & Defense | 5.8% | |
|
|
|
Consumer Products | 4.2% | |
|
|
|
Tobacco | 3.9% | |
|
|
|
Business Services | 3.7% | |
|
|
|
Financial Services | 3.4% | |
|
|
|
Conglomerates | 3.0% | |
|
|
|
Energy | 2.8% | |
|
|
|
Cash and Equivalents | 2.6% | |
|
|
|
Electronic Components &
Semiconductors | 2.5% | |
|
|
|
Banking | 2.4% | |
|
|
|
Transportation | 2.1% | |
|
|
|
Diversified Manufacturing Operations | 1.5% | |
|
|
|
Agricultural Chemicals | 1.1% | |
|
|
|
Total | 100.0% | |
|
|
|
| |
* | Portfolio composition is subject to change. |
| |
39 | HSBC INVESTOR PORTFOLIOS |
This page is intentionally left blank.
|
HSBC INVESTOR CORE PLUS FIXED INCOME PORTFOLIO |
|
Schedule of Portfolio Investments—as of April 30, 2009 (Unaudited)
|
Certificates of Deposit—0.2% |
|
| | | | | | | |
| | Principal
Amount($) | | Value($) | |
| |
| |
| |
Banking – 0.2% | | | | | | | |
First Tennessee Bank, 1.46%, 12/17/09 (a) | | | 100,000 | | | 99,507 | |
| | | | |
|
| |
TOTAL CERTIFICATES OF DEPOSIT
(COST $97,149) | | | | | | 99,507 | |
| | | | |
|
| |
|
U.S. Government and Government Agency Obligations—49.3% |
|
| | | | | | | |
Federal Home Loan Mortgage Corp. – 5.3% | | | | | | | |
Pool #1B2655, 4.96%, 12/1/34 (a)(h) | | | 382,161 | | | 391,497 | |
Pool #1J1313, 6.34%, 6/1/36 (a) | | | 983,117 | | | 1,014,181 | |
Pool #847557, 4.41%, 7/1/34 (a)(h) | | | 541,992 | | | 549,783 | |
Pool #C00368, 8.50%, 10/1/24 | | | 23,119 | | | 25,355 | |
Pool #C00922, 8.00%, 2/1/30 | | | 138,704 | | | 152,195 | |
Pool #C54447, 7.00%, 7/1/31 | | | 25,275 | | | 27,111 | |
Pool #C60712, 6.50%, 11/1/31 | | | 439,261 | | | 470,497 | |
Pool #C80387, 6.50%, 4/1/26 | | | 21,248 | | | 22,799 | |
Pool #D62926, 6.50%, 8/1/25 | | | 18,636 | | | 19,979 | |
Pool #G01317, 7.00%, 10/1/31 | | | 103,172 | | | 110,666 | |
Pool #G02981, 6.00%, 6/1/37 | | | 884,805 | | | 924,569 | |
| | | | |
|
| |
| | | | | | 3,708,632 | |
| | | | |
|
| |
Federal National Mortgage Association – 39.3% | | | | | | | |
Pool #253438, 8.50%, 9/1/30 | | | 27,567 | | | 30,159 | |
Pool #256723, 6.50%, 5/1/37 | | | 885,426 | | | 939,346 | |
Pool #329530, 7.00%, 12/1/25 | | | 45,795 | | | 49,666 | |
Pool #329655, 7.00%, 11/1/25 | | | 7,011 | | | 7,604 | |
Pool #356905, 5.13%, 10/1/36 (a) | | | 138,656 | | | 141,245 | |
Pool #398958, 6.50%, 10/1/12 | | | 16,626 | | | 17,579 | |
Pool #535332, 8.50%, 4/1/30 | | | 32,053 | | | 35,048 | |
Pool #535440, 8.50%, 8/1/30 | | | 36,405 | | | 39,827 | |
Pool #548965, 8.50%, 7/1/30 | | | 35,223 | | | 38,534 | |
Pool #568486, 7.00%, 1/1/31 | | | 37,580 | | | 40,558 | |
Pool #573752, 8.50%, 2/1/31 | | | 26,969 | | | 29,504 | |
Pool #575328, 6.50%, 4/1/31 | | | 47,454 | | | 50,903 | |
Pool #922090, 5.91%, 3/1/37 (a) | | | 1,107,779 | | | 1,159,723 | |
TBA May, 5.50%, 5/12/39 | | | 13,655,000 | | | 14,145,733 | |
TBA June | | | | | | | |
5.50%, 6/18/16 | | | 5,750,000 | | | 5,972,812 | |
5.00%, 6/11/39 | | | 4,500,000 | | | 4,615,313 | |
| | | | |
|
| |
| | | | | | 27,313,554 | |
| | | | |
|
| |
Government National Mortgage Association – 0.3% | | | | | | | |
Pool #346406, 7.50%, 2/15/23 | | | 39,834 | | | 43,084 | |
Pool #412530, 7.50%, 12/15/25 | | | 61,981 | | | 66,930 | |
Pool #781300, 7.00%, 6/15/31 | | | 101,933 | | | 109,545 | |
| | | | |
|
| |
| | | | | | 219,559 | |
| | | | |
|
| |
U.S. Treasury Bonds – 3.3% | | | | | | | |
5.00%, 5/15/37 | | | 1,685,000 | | | 1,945,122 | |
4.50%, 5/15/38 | | | 300,000 | | | 322,828 | |
| | | | |
|
| |
| | | | | | 2,267,950 | |
| | | | |
|
| |
U.S. Treasury Notes – 1.1% | | | | | | | |
4.00%, 8/15/18 | | | 715,000 | | | 767,061 | |
| | | | |
|
| |
TOTAL U.S. GOVERNMENT AND
GOVERNMENT AGENCY
OBLIGATIONS (COST $33,967,738) | | | | | | 34,276,756 | |
| | | | |
|
| |
|
Corporate Obligations—39.8% |
|
| | | | | | | |
| | Principal
Amount($) | | Value($) | |
| |
| |
| |
Agricultural Chemicals – 1.6% | | | | | | | |
Agrium, Inc., 6.75%, 1/15/19 | | | 600,000 | | | 546,066 | |
Cargill, Inc., 5.60%, 9/15/12 (b) | | | 600,000 | | | 594,287 | |
| | | | |
|
| |
| | | | | | 1,140,353 | |
| | | | |
|
| |
Banking – 0.9% | | | | | | | |
American Express Centurion Bank,
5.95%, 6/12/17 | | | 700,000 | | | 599,626 | |
| | | | |
|
| |
Building & Construction Products – 1.6% | | | | | | | |
Martin Marietta Materials, Inc.,
1.19%, 4/30/10 (a)(h) | | | 600,000 | | | 573,450 | |
Masco Corp., 1.63%, 3/12/10 (a)(h) | | | 550,000 | | | 524,300 | |
| | | | |
|
| |
| | | | | | 1,097,750 | |
| | | | |
|
| |
Cable Television – 0.9% | | | | | | | |
Time Warner Cable, Inc., 7.30%, 7/1/38 | | | 625,000 | | | 624,762 | |
| | | | |
|
| |
Computer Services – 1.1% | | | | | | | |
Electronic Data Systems, Series B,
6.00%, 8/1/13 | | | 700,000 | | | 748,689 | |
| | | | |
|
| |
Consumer Products – 1.4% | | | | | | | |
Clorox Co. (The), 5.45%, 10/15/12 | | | 900,000 | | | 942,021 | |
| | | | |
|
| |
Electric – 5.2% | | | | | | | |
Commonwealth Edison Co.,
6.45%, 1/15/38 | | | 700,000 | | | 624,840 | |
Dominion Resources, Inc., 6.40%, 6/15/18 | | | 250,000 | | | 258,266 | |
Duke Energy Corp., 5.65%, 6/15/13 | | | 450,000 | | | 462,555 | |
MidAmerican Energy Co., 5.95%, 7/15/17 | | | 1,900,000 | | | 1,965,236 | |
Puget Sound Energy, Inc., 6.97%, 6/1/67,
Callable 6/1/17 @ 100 | | | 600,000 | | | 313,500 | |
| | | | |
|
| |
| | | | | | 3,624,397 | |
| | | | |
|
| |
Finance – 9.7% | | | | | | | |
American Honda Finance Corp.,
4.63%, 4/2/13, MTN (b) | | | 250,000 | | | 223,445 | |
Bear Stearns Co., Inc., 4.50%, 10/28/10 | | | 600,000 | | | 605,533 | |
Bear Stearns Co., Inc., Series B,
6.95%, 8/10/12, MTN | | | 950,000 | | | 1,000,171 | |
Citigroup, Inc., 6.50%, 8/19/13 | | | 225,000 | | | 205,336 | |
Countrywide Home Loans, Series L,
4.00%, 3/22/11, MTN | | | 1,150,000 | | | 1,078,238 | |
Ford Motor Credit Co., LLC,
9.75%, 9/15/10 | | | 750,000 | | | 675,033 | |
General Electric Capital Corp.,
5.63%, 5/1/18 | | | 400,000 | | | 348,974 | |
Lehman Brothers Holdings, Series I,
0.00%, 5/2/18, MTN (c)(d) | | | 500,000 | | | 74,375 | |
Morgan Stanley, Series F,
6.00%, 4/28/15, MTN | | | 565,000 | | | 533,707 | |
Preferred Term Securities Ltd., 8.79%,
9/15/30, Callable 9/15/10 @ 104.395 (b) | | | 741,202 | | | 392,837 | |
Wells Fargo Financial, 5.50%, 8/1/12 | | | 850,000 | | | 846,303 | |
XTRA Finance Corp., 5.15%, 4/1/17 | | | 750,000 | | | 727,693 | |
| | | | |
|
| |
| | | | | | 6,711,645 | |
| | | | |
|
| |
Forestry/Paper – 0.3% | | | | | | | |
Georgia-Pacific Corp., 7.70%, 6/15/15 | | | 250,000 | | | 235,000 | |
| | | | |
|
| |
| | |
41 | HSBC INVESTOR PORTFOLIOS | See notes to financial statements. |
|
HSBC INVESTOR CORE PLUS FIXED INCOME PORTFOLIO |
|
|
Schedule of Portfolio Investments—as of April 30, 2009 (Unaudited) (continued) |
| | | | | | | |
Corporate Obligations, continued | | | | | | | |
|
|
|
|
|
|
|
|
| | | | | | | |
| | Principal
Amount($) | | Value($) | |
| |
| |
| |
Health Services – 0.2% | | | | | | | |
Community Health Systems, Inc., 8.88%,
7/15/15, Callable 7/15/11 @ 104.44 | | | 175,000 | | | 174,125 | |
| | | | |
|
| |
Hospitals – 1.7% | | | | | | | |
Covidien International Finance SA,
5.45%, 10/15/12 | | | 550,000 | | | 570,908 | |
HCA, Inc., 5.75%, 3/15/14 | | | 750,000 | | | 592,500 | |
| | | | |
|
| |
| | | | | | 1,163,408 | |
| | | | |
|
| |
Media – 1.0% | | | | | | | |
News America Holdings, 7.90%, 12/1/95 | | | 500,000 | | | 392,997 | |
Vivendi, 5.75%, 4/4/13 (b) | | | 350,000 | | | 335,324 | |
| | | | |
|
| |
| | | | | | 728,321 | |
| | | | |
|
| |
Media - Cable – 0.2% | | | | | | | |
Cablevision Systems Corp., Series B,
8.00%, 4/15/12 | | | 175,000 | | | 174,125 | |
| | | | |
|
| |
Office Equipment & Services – 0.8% | | | | | | | |
Xerox Corp., 2.06%, 12/18/09 (a)(h) | | | 550,000 | | | 536,810 | |
| | | | |
|
| |
Oil & Gas – 0.2% | | | | | | | |
Pioneer Natural Resources Co.,
5.88%, 7/15/16 | | | 175,000 | | | 145,048 | |
| | | | |
|
| |
Pipelines – 0.8% | | | | | | | |
Dynegy Holdings, Inc., 7.75%, 6/1/19 | | | 175,000 | | | 128,625 | |
Transcontinental Gas Pipeline Corp.,
6.05%, 6/15/18 | | | 450,000 | | | 417,969 | |
| | | | |
|
| |
| | | | | | 546,594 | |
| | | | |
|
| |
Retail – 1.1% | | | | | | | |
Kohl’s Corp., 6.25%, 12/15/17 | | | 550,000 | | | 531,516 | |
Kroger Co. (The), 5.00%, 4/15/13 | | | 250,000 | | | 252,488 | |
| | | | |
|
| |
| | | | | | 784,004 | |
| | | | |
|
| |
Support - Services – 0.5% | | | | | | | |
Aramark Services, Inc., 8.50%,
2/1/15, Callable 2/1/11 @ 104.25 | | | 175,000 | | | 167,125 | |
Iron Mountain, Inc., 8.00%,
6/15/20, Callable 6/15/13 @ 104 | | | 175,000 | | | 168,875 | |
| | | | |
|
| |
| | | | | | 336,000 | |
| | | | |
|
| |
Telecom - Integrated/Services – 0.2% | | | | | | | |
Qwest Corp., 7.63%, 6/15/15 | | | 175,000 | | | 165,813 | |
| | | | |
|
| |
Telecommunications – 3.9% | | | | | | | |
AOL Time Warner, Inc. | | | | | | | |
6.88%, 5/1/12 | | | 600,000 | | | 631,026 | |
7.70%, 5/1/32 | | | 550,000 | | | 500,638 | |
GTE Corp., 6.84%, 4/15/18 | | | 750,000 | | | 753,238 | |
Time Warner Entertainment Co.,
8.38%, 3/15/23 | | | 800,000 | | | 821,215 | |
| | | | |
|
| |
| | | | | | 2,706,117 | |
| | | | |
|
| |
Transportation – 6.5% | | | | | | | |
American Airlines, Inc., Series 2001-2 | | | | | | | |
Class A1, 6.98%, 4/1/11 | | | 369,844 | | | 338,407 | |
Class A2, 7.86%, 10/1/11 | | | 1,250,000 | | | 1,037,500 | |
Burlington North Santa Fe, 7.57%, 1/2/21 | | | 261,280 | | | 267,224 | |
| | | | | | | |
Corporate Obligations, continued | | | | | | | |
|
|
|
|
|
|
|
|
| | | | | | | |
| | Principal
Amount($) | | Value($) | |
| |
| |
| |
Transportation, continued | | | | | | | |
Continental Airlines, Inc., 5.98%, 4/19/22 | | | 750,000 | | | 592,500 | |
Union Pacific Corp. | | | | | | | |
5.75%, 11/15/17 | | | 1,200,000 | | | 1,155,888 | |
6.85%, 1/2/19 | | | 1,038,106 | | | 1,102,977 | |
| | | | |
|
| |
| | | | | | 4,494,496 | |
| | | | |
|
| |
TOTAL CORPORATE OBLIGATIONS
(COST $30,220,122) | | | | | | 27,679,104 | |
| | | | |
|
| |
| | | | | | | |
Asset Backed Securities—16.5% | | | | | | | |
|
|
|
|
|
|
|
|
| | | | | | | |
Asset Backed Funding Certificates,
Series 2003-AHL1, Class A1,
3.68%, 3/25/33 | | | 738,743 | | | 386,043 | |
Cairn Mezzanine plc, Series 2007-3A,
Class B1, 2.13%, 8/13/47 (a)(b) | | | 905,000 | | | 0 | |
Capital Auto Receivables Asset Trust
Series 2006-SN1A, Class A4B,
0.56%, 3/20/10 (a)(b) | | | 376,167 | | | 373,524 | |
Series 2007-SN1, Class A3A,
5.47%, 7/15/10 (h) | | | 416,899 | | | 410,283 | |
Series 2007-SN1, Class A3B,
0.51%, 7/15/10 (a)(h) | | | 484,505 | | | 472,418 | |
Capital One Prime Auto Receivables Trust
Series 2005-1, Class A4,
0.47%, 4/15/11 (a)(h) | | | 239,168 | | | 236,534 | |
Series 2006-1, Class A3,
4.99%, 9/15/10 (b)(h) | | | 110,553 | | | 110,744 | |
Carmax Auto Owner Trust,
Series 2008-2, Class A2B,
1.35%, 9/15/11 (a)(h) | | | 1,251,645 | | | 1,245,440 | |
Countrywide Asset-Backed Certificates
Series 2006-S2, Class A5,
5.75%, 7/25/27 (a) | | | 994,380 | | | 299,209 | |
Series 2006-S4, Class A3,
5.80%, 7/25/34 | | | 1,021,754 | | | 332,382 | |
Dominos Pizza Master Issuer LLC,
Series 2007-1, Class A2,
5.26%, 4/25/37 (b) | | | 1,200,000 | | | 646,555 | |
Duane Street CLO, Series 2007-4A,
Class C, 2.23%, 11/14/21 (a)(b) | | | 850,000 | | | 68,000 | |
GE Business Loan Trust, Series 2006-2A,
Class A, 0.63%, 11/15/34 (a)(b)(h) | | | 1,340,071 | | | 855,351 | |
GMAC Mortgage Corp., Loan Trust,
Series 2006-HE3, Class A3,
5.81%, 10/25/36 | | | 900,000 | | | 269,559 | |
Hyundai Auto Receivables Trust,
Series 2008-A, Class A2,
4.16%, 5/16/11 (h) | | | 915,578 | | | 923,974 | |
National Collegiate Student Loan Trust,
Series 2006-3, Class A1,
0.47%, 9/25/19 (a)(h) | | | 408,375 | | | 391,839 | |
Preferred Term Securities XXII Ltd.,
1.66%, 9/22/36, Callable
6/22/11 @ 100 (a)(b)(h) | | | 1,062,623 | | | 329,413 | |
Residential Funding Mortgage Securities,
Series 2006-HSA1, Class A5,
5.31%, 2/25/36 | | | 474,293 | | | 139,945 | |
| | |
See notes to financial statements. | HSBC INVESTOR PORTFOLIOS | 42 |
|
HSBC INVESTOR CORE PLUS FIXED INCOME PORTFOLIO |
|
|
Schedule of Portfolio Investments—as of April 30, 2009 (Unaudited) (continued) |
| | | | | | | |
Asset Backed Securities, continued | | | | | | | |
|
|
| | Principal
Amount($) | | Value($) | |
| |
| |
| |
SLM Student Loan Trust | | | | | | | |
Series 2005-4, Class A2,
1.24%, 4/26/21 (a)(h) | | | 490,000 | | | 476,542 | |
Series 2005-9, Class A4,
1.26%, 1/25/23 (a)(h) | | | 1,360,000 | | | 1,331,783 | |
Series 2006-7, Class A2,
1.15%, 10/25/16 (a)(h) | | | 326,568 | | | 326,170 | |
Series 2006-9, Class A2,
1.16%, 4/25/17 (a)(h) | | | 208,721 | | | 207,761 | |
Series 2006-B, Class A1,
1.33%, 9/15/20 (a)(h) | | | 942,875 | | | 896,632 | |
South Carolina Student Loan Corp.,
Series 2008-1, Class A1,
1.76%, 9/2/14 (a) | | | 718,648 | | | 709,737 | |
| | | | |
|
| |
TOTAL ASSET BACKED SECURITIES
(COST $16,711,903) | | | | | | 11,439,838 | |
| | | | |
|
| |
Collateralized Mortgage Obligations—6.1% | | | | | | | |
|
|
|
|
|
|
|
|
Banc of America Mortgage Securities,
Series 2005-D, Class 2A4,
4.79%, 5/25/35 (a)(h) | | | 767,738 | | | 724,925 | |
Deutsche Mortgage Securities, Inc.,
Series 2006-WF1, Class 1A1,
5.10%, 6/26/35 (a)(b) | | | 629,341 | | | 625,743 | |
Fannie Mae IO | | | | | | | |
Series 270, Class 2, 8.50%, 9/1/23 (e) | | | 34,703 | | | 5,896 | |
Series 296, Class 2, 8.00%, 4/1/24 (e) | | | 41,477 | | | 6,904 | |
Series 306, Class IO, 8.00%, 5/1/30 (e) | | | 50,438 | | | 7,368 | |
Series 2000-16, Class PS,
8.16%, 10/25/29 (a) | | | 21,735 | | | 856 | |
Series 2001-4, Class SA,
7.10%, 2/17/31 (a) | | | 158,614 | | | 14,248 | |
FHA Weyerhauser, 7.43%, 1/1/24 (g)(i) | | | 25,711 | | | 25,711 | |
Freddie Mac | | | | | | | |
Series 2988, Class AF, 0.75%, 6/15/35 (a)(h) | | | 922,891 | | | 903,503 | |
Series 3212, Class BK, 5.40%, 9/15/36 | | | 900,000 | | | 945,939 | |
Freddie Mac IO | | | | | | | |
Series 1534, Class K, 6.90%, 6/15/23 (a) | | | 110,136 | | | 12,420 | |
Series 2141, Class SD, 7.70%, 4/15/29 (a) | | | 90,678 | | | 9,944 | |
Series 2247, Class SC, 7.05%, 8/15/30 (a) | | | 46,250 | | | 4,064 | |
Government National Mortgage
Association IO | | | | | | | |
Series 1999-30, Class S,
8.15%, 8/16/29 (a) | | | 40,958 | | | 4,326 | |
Series 1999-30, Class SA,
7.55%, 4/16/29 (a) | | | 55,284 | | | 4,257 | |
Residential Asset Securitization Trust,
Series 2003-A15, Class 1A2,
0.89%, 2/25/34 (a)(h) | | | 1,177,046 | | | 963,170 | |
| | | | |
|
| |
TOTAL COLLATERALIZED MORTAGE
OBLIGATIONS (COST $4,416,075) | | | | | | 4,259,274 | |
| | | | |
|
| |
Commercial Mortgage Backed Securities—9.0% | | | | | | | |
|
|
|
|
|
|
|
|
Citigroup Commercial Mortgage Trust,
Series 2006-C5, Class A2,
5.38%, 10/15/49 | | | 1,100,000 | | | 997,929 | |
Commercial Mortgage Pass-Through Certificate,
Series 2006-FL12, Class A2,
0.55%, 12/15/20 (a)(b)(h) | | | 1,422,841 | | | 996,926 | |
| | | | | | | |
Commercial Mortgage Backed Securities, continued | | | |
|
|
|
|
|
|
|
|
| | | | | | | |
| | Shares or
Principal
Amount($) | | Value($) | |
| |
| |
| |
CWCapital Cobalt,
Series 2006-C1, Class A2,
5.17%, 8/15/48 | | | 1,232,000 | | | 1,086,906 | |
DLJ Mortgage Acceptance Corp., IO,
Series 1997-CF1, Class S,
1.20%, 5/15/30 (a)(b)(e)(g) | | | 16,850 | | | 1 | |
Greenwich Capital Commercial Funding Corp.
Series 2006-GG7, Class A2,
6.03%, 7/10/38 (a) | | | 640,000 | | | 598,744 | |
Series 2006-GG7, Class A4,
6.11%, 7/10/38 (a) | | | 1,040,000 | | | 869,400 | |
GS Mortgage Securities Corp., IO,
Series 1997-GL, Class X2,
0.29%, 7/13/30 (a)(e)(g) | | | 35,251 | | | 373 | |
Morgan Stanley Capital I, Series 2007-IQ14,
Class A2, 5.61%, 4/15/49 | | | 1,380,000 | | | 1,199,206 | |
Washington Mutual Commercial
Mortgage Securities Trust,
Series 2006-SL1, Class A,
5.42%, 11/23/43 (a)(b) | | | 935,175 | | | 514,346 | |
| | | | |
|
| |
TOTAL COMMERCIAL MORTGAGE
BACKED SECURITIES
(COST $7,760,066) | | | | | | 6,263,831 | |
| | | | |
|
| |
Foreign Bonds—0.5% | | | | | | | |
|
|
|
|
|
|
|
|
United Kingdom – 0.5% | | | | | | | |
Barclays Bank plc, 5.93%, 12/31/49 (b) | | | 850,000 | | | 339,643 | |
| | | | |
|
| |
TOTAL FOREIGN BONDS
(COST $861,568) | | | | | | 339,643 | |
| | | | |
|
| |
Municipal Bonds—2.2% | | | | | | | |
|
|
|
|
|
|
|
|
Chicago Transit Authority Sales & Transfer
Tax Receipts Revenue, Series A,
6.90%, 12/1/40, AMT | | | 800,000 | | | 799,488 | |
Connecticut State, GO, Series B,
5.00%, 4/15/18 | | | 650,000 | | | 756,294 | |
| | | | |
|
| |
TOTAL MUNICIPAL BONDS
(COST $1,498,995) | | | | | | 1,555,782 | |
| | | | |
|
| |
Investment Company—11.1% | | | | | | | |
|
|
|
|
|
|
|
|
Northern Institutional Diversified Assets
Portfolio, Shares Class, 0.44% (f) | | | 7,693,048 | | | 7,693,048 | |
| | | | |
|
| |
TOTAL INVESTMENT COMPANY
(COST $7,693,048) | | | | | | 7,693,048 | |
| | | | |
|
| |
TOTAL INVESTMENTS
(COST $103,226,664) — 134.7% | | | | | | 93,606,783 | |
| | | | |
|
| |
| |
|
| Percentages indicated are based on net assets of $69,482,704. |
| |
(a) | Variable rate security. The interest rates on these securities are adjusted periodically to reflect then-current short-term interest rates. The rates presented represent the rates in effect on April 30, 2009. The maturity dates presented reflect the final maturity dates. However, some of these securities may contain put or demand features that allow the fund to require the issuer to repurchase the security from the fund within various time periods, including daily, weekly, monthly, or semi-annually. |
| |
(b) | Security exempt from registration under Rule 144a of the Securities Act of 1933. This security may be resold in transactions exempt from registration, normally to qualified institutional buyers. This security has been deemed liquid by the Investment Adviser based on procedures approved by the Board of Trustees. |
| | |
43 | HSBC INVESTOR PORTFOLIOS | See notes to financial statements. |
|
HSBC INVESTOR CORE PLUS FIXED INCOME PORTFOLIO |
|
|
Schedule of Portfolio Investments—as of April 30, 2009 (Unaudited) (continued) |
| |
(c) | Non-Income Producing; Defaulted Bond. |
| |
(d) | In connection with the Lehman Brothers Holdings, Inc. bankruptcy filing announcement on September 15, 2008, the Fund stopped accruing prospective interests amounts on that date. |
| |
(e) | Interest-Only represents securities that entitle holders to receive only interest payments on the underlying mortgages. The yield to maturity of an Interest-Only is extremely sensitive to the rate of principal payments on the underlying mortgage assets. A rapid (slow) rate of principal repayments may have an adverse (positive) effect on yield to maturity. Interest rate adjusts periodically based on the pay off of the underlying mortgage. The interest rate presented represents the rates in effect on April 30, 2009. The principal amount shown is the notional amount of the underlying mortgages. |
| |
(f) | The rates presented represent the annualized one day yield that was in effect on April 30, 2009. |
| |
(g) | Rule 144a, section 4(2) or other security which is restricted as to resale to institutional investors. The Investment Adviser, using Board approved procedures, has deemed these securities to be illiquid. Represents 0.04% of net assets. |
| |
(h) | Security held as collateral for to be announced securities. |
| |
(i) | Security was fair valued as of April 20, 2009. Represents 0.04% of net assets. |
| |
AMT | — Interest on security is subject to federal alternative minimum tax |
FHA | — Federal Housing Administration |
GO | — General Obligation |
IO | — Interest-Only security. Represents 0.10% of net assets. |
LLC | — Limited Liability Co. |
MTN | — Medium Term Note |
PLC | — Public Limited Co. |
TBA | — Security was traded on a “to be announced” basis. Represents 35.6% of net assets. |
| | |
See notes to financial statements. | HSBC INVESTOR PORTFOLIOS | 44 |
|
HSBC INVESTOR INTERMEDIATE DURATION FIXED INCOME PORTFOLIO |
|
|
Schedule of Portfolio Investments—as of April 30, 2009 (Unaudited) |
| | | | | | | |
Certificates of Deposit—0.8% | | | | | | | |
|
|
|
|
|
|
|
|
| | | | | | | |
| | Principal
Amount($) | | Value($) | |
| |
| |
| |
Banking – 0.8% | | | | | | | |
First Tennessee Bank,
1.46%, 12/17/09 (a) | | | 100,000 | | | 99,507 | |
| | | | |
|
| |
TOTAL CERTIFICATES OF DEPOSIT
(COST $97,149) | | | | | | 99,507 | |
| | | | |
|
| |
U.S. Government and Government Agency Obligations—56.9% | |
|
|
|
|
|
|
|
|
Federal Home Loan Mortgage Corp. – 7.5% | | | | | | | |
5.13%, 11/17/17 | | | 400,000 | | | 445,810 | |
Pool #1B2655, 4.96%, 12/1/34 (a)(f) | | | 70,771 | | | 72,499 | |
Pool #1J1313, 6.34%, 6/1/36 (a) | | | 182,906 | | | 188,685 | |
Pool #847557, 4.41%, 7/1/34 (a)(f) | | | 86,236 | | | 87,476 | |
Pool #G02981, 6.00%, 6/1/37 | | | 142,711 | | | 149,124 | |
| | | | |
|
| |
| | | | | | 943,594 | |
| | | | |
|
| |
Federal National Mortgage Association – 42.4% | | | | | | | |
3.25%, 8/12/10 | | | 150,000 | | | 154,295 | |
Pool #922090, 5.91%, 3/1/37 (a) | | | 177,433 | | | 185,753 | |
TBA May, 5.50%, 5/12/39 | | | 2,535,000 | | | 2,626,103 | |
TBA June | | | | | | | |
5.50%, 6/18/16 | | | 1,675,000 | | | 1,739,906 | |
5.00%, 6/11/39 | | | 640,000 | | | 656,400 | |
| | | | |
|
| |
| | | | | | 5,362,457 | |
| | | | |
|
| |
U.S. Treasury Notes – 7.0% | | | | | | | |
3.38%, 7/31/13 | | | 185,000 | | | 197,242 | |
1.88%, 4/30/14 | | | 650,000 | | | 645,580 | |
3.88%, 5/15/18 | | | 45,000 | | | 47,956 | |
| | | | |
|
| |
| | | | | | 890,778 | |
| | | | |
|
| |
TOTAL U.S. GOVERNMENT AND
GOVERNMENT AGENCY
OBLIGATIONS (COST $7,145,123) | | | | | | 7,196,829 | |
| | | | |
|
| |
Corporate Obligations—34.3% | | | | | | | |
|
|
|
|
|
|
|
|
Agricultural Chemicals – 0.7% | | | | | | | |
Agrium, Inc., 6.75%, 1/15/19 | | | 100,000 | | | 91,011 | |
| | | | |
|
| |
Banking – 0.7% | | | | | | | |
American Express Centurion Bank,
5.95%, 6/12/17 | | | 100,000 | | | 85,661 | |
| | | | |
|
| |
Building & Construction Products – 1.5% | | | | | | | |
Martin Marietta Materials, Inc.,
1.19%, 4/30/10 (a)(f) | | | 100,000 | | | 95,575 | |
Masco Corp., 1.63%, 3/12/10 (a)(f) | | | 100,000 | | | 95,327 | |
| | | | |
|
| |
| | | | | | 190,902 | |
| | | | |
|
| |
Computer Services – 0.8% | | | | | | | |
Electronic Data Systems, Series B,
6.00%, 8/1/13 | | | 100,000 | | | 106,955 | |
| | | | |
|
| |
Electric – 3.5% | | | | | | | |
Duke Energy Corp., 5.65%, 6/15/13 | | | 75,000 | | | 77,093 | |
MidAmerican Energy Co., 5.95%, 7/15/17 | | | 300,000 | | | 310,300 | |
Puget Sound Energy, Inc., 6.97%, 6/1/67,
Callable 6/1/17 @ 100 | | | 100,000 | | | 52,250 | |
| | | | |
|
| |
| | | | | | 439,643 | |
| | | | |
|
| |
| | | | | | | |
Corporate Obligations, continued | | | | | | | |
|
|
|
|
|
|
|
|
| | | | | |
| | Principal
Amount($) | | Value($) | |
| |
| |
| |
Finance – 10.3% | | | | | | | |
Bear Stearns Co., Inc., 4.50%, 10/28/10 | | | 75,000 | | | 75,692 | |
Bear Stearns Co., Inc., Series B,
6.95%, 8/10/12, MTN | | | 150,000 | | | 157,922 | |
Citigroup, Inc., 6.50%, 8/19/13 | | | 25,000 | | | 22,815 | |
Countrywide Home Loans, Series L,
4.00%, 3/22/11, MTN | | | 150,000 | | | 140,640 | |
Ford Motor Credit Co., LLC,
9.75%, 9/15/10 | | | 100,000 | | | 90,004 | |
General Electric Capital Corp.,
5.63%, 5/1/18 | | | 100,000 | | | 87,244 | |
Lehman Brothers Holdings, Series I,
0.00%, 5/2/18, MTN (b)(c) | | | 75,000 | | | 11,156 | |
Morgan Stanley, 1.95%, 6/20/12 | | | 500,000 | | | 497,751 | |
Morgan Stanley, Series F,
6.00%, 4/28/15, MTN | | | 75,000 | | | 70,846 | |
XTRA Finance Corp., 5.15%, 4/1/17 | | | 150,000 | | | 145,538 | |
| | | | |
|
| |
| | | | | | 1,299,608 | |
| | | | |
|
| |
Forestry/Paper – 0.2% | | | | | | | |
Georgia-Pacific Corp., 7.70%, 6/15/15 | | | 25,000 | | | 23,500 | |
| | | | |
|
| |
Health Services – 0.2% | | | | | | | |
Community Health Systems, Inc., 8.88%,
7/15/15, Callable 7/15/11 @ 104.44 | | | 25,000 | | | 24,875 | |
| | | | |
|
| |
Hospitals – 0.6% | | | | | | | |
HCA, Inc., 5.75%, 3/15/14 | | | 100,000 | | | 79,000 | |
| | | | |
|
| |
Media – 3.4% | | | | | | | |
Time Warner Entertainment, 8.88%, 10/1/12 | | | 350,000 | | | 377,860 | |
Vivendi, 5.75%, 4/4/13 (d) | | | 50,000 | | | 47,903 | |
| | | | |
|
| |
| | | | | | 425,763 | |
| | | | |
|
| |
Media - Cable – 0.2% | | | | | | | |
Cablevision Systems Corp., Series B,
8.00%, 4/15/12 | | | 25,000 | | | 24,875 | |
| | | | |
|
| |
Medical – 0.2% | | | | | | | |
Glaxosmithkline Capital, Inc.,
4.85%, 5/15/13 | | | 25,000 | | | 25,934 | |
| | | | |
|
| |
Office Equipment & Services – 0.8% | | | | | | | |
Xerox Corp., 2.06%, 12/18/09 (a)(f) | | | 100,000 | | | 97,602 | |
| | | | |
|
| |
Oil & Gas – 0.1% | | | | | | | |
Pioneer Natural Resources Co.,
5.88%, 7/15/16 | | | 25,000 | | | 20,721 | |
| | | | |
|
| |
Pipelines – 0.9% | | | | | | | |
Dynegy Holdings, Inc., 7.75%, 6/1/19 | | | 25,000 | | | 18,375 | |
Transcontinental Gas Pipeline Corp.,
6.05%, 6/15/18 | | | 100,000 | | | 92,882 | |
| | | | |
|
| |
| | | | | | 111,257 | |
| | | | |
|
| |
Retail – 0.2% | | | | | | | |
Kroger Co. (The), 5.00%, 4/15/13 | | | 25,000 | | | 25,249 | |
| | | | |
|
| |
Support - Services – 0.4% | | | | | | | |
Aramark Services, Inc., 8.50%, 2/1/15,
Callable 2/1/11 @ 104.25 | | | 25,000 | | | 23,875 | |
| | |
45 | HSBC INVESTOR PORTFOLIOS | See notes to financial statements. |
|
HSBC INVESTOR INTERMEDIATE DURATION FIXED INCOME PORTFOLIO |
|
|
Schedule of Portfolio Investments—as of April 30, 2009 (Unaudited) (continued) |
| | | | | | | |
Corporate Obligations, continued | | | | | | | |
|
|
|
|
|
|
|
|
| | | | | | | |
| | Principal
Amount($) | | Value($) | |
| |
| |
| |
Support - Services, continued | | | | | | | |
Iron Mountain, Inc., 8.00%, 6/15/20,
Callable 6/15/13 @ 104 | | | 25,000 | | | 24,125 | |
| | | | |
|
| |
| | | | | | 48,000 | |
| | | | |
|
| |
Telecom - Integrated/Services – 0.2% | | | | | | | |
Qwest Corp., 7.63%, 6/15/15 | | | 25,000 | | | 23,688 | |
| | | | |
|
| |
Telecommunications – 2.2% | | | | | | | |
Verizon Pennsylvania, Inc., 5.65%, 11/15/11 | | | 275,000 | | | 283,965 | |
| | | | |
|
| |
Transportation – 7.2% | | | | | | | |
American Airlines, Inc., Series 2001-2 | | | | | | | |
Class A1, 6.98%, 4/1/11 | | | 54,389 | | | 49,766 | |
Class A2, 7.86%, 10/1/11 | | | 200,000 | | | 166,000 | |
Burlington Northern Santa Fe Railway Co.,
4.83%, 1/15/23 | | | 214,072 | | | 194,615 | |
Continental Airlines, Inc., 5.98%, 4/19/22 | | | 100,000 | | | 79,000 | |
Union Pacific Corp., 5.75%, 11/15/17 | | | 150,000 | | | 144,486 | |
Union Pacific Railroad, 5.08%, 1/2/29 | | | 289,577 | | | 280,212 | |
| | | | |
|
| |
| | | | | | 914,079 | |
| | | | |
|
| |
TOTAL CORPORATE OBLIGATIONS
(COST $4,604,703) | | | | | | 4,342,288 | |
| | | | |
|
| |
Asset Backed Securities—12.7% | | | | | | | |
|
|
|
|
|
|
|
|
Asset Backed Funding Certificates,
Series 2003-AHL1, Class A1,
3.68%, 3/25/33 | | | 210,318 | | | 109,905 | |
Cairn Mezzanine plc, Series 2007-3A,
Class B1, 2.13%, 8/13/47 (a)(d) | | | 145,000 | | | 0 | |
Capital Auto Receivables Asset Trust
Series 2006-SN1A, Class A4B,
0.56%, 3/20/10 (a)(d)(f) | | | 69,661 | | | 69,171 | |
Series 2007-SN1, Class A3A,
5.47%, 7/15/10 (f) | | | 56,338 | | | 55,444 | |
Series 2007-SN1, Class A3B,
0.51%, 7/15/10 (a)(f) | | | 61,972 | | | 60,425 | |
Capital One Prime Auto Receivables Trust
Series 2005-1, Class A4,
0.47%, 4/15/11 (a)(f) | | | 34,167 | | | 33,791 | |
Series 2006-1, Class A3,
4.99%, 9/15/10 (d)(f) | | | 16,461 | | | 16,489 | |
Carmax Auto Owner Trust, Series 2008-2,
Class A2B, 1.35%, 9/15/11 (a)(f) | | | 169,866 | | | 169,024 | |
Countrywide Asset-Backed Certificates
Series 2006-S2, Class A5, | | | | | | | |
5.75%, 7/25/27 (a) | | | 130,251 | | | 39,193 | |
Series 2006-S4, Class A3,
5.80%, 7/25/34 | | | 202,423 | | | 65,849 | |
GE Business Loan Trust, Series 2006-2A,
Class A, 0.63%, 11/15/34 (a)(d)(f) | | | 229,223 | | | 146,310 | |
GMAC Mortgage Corp., Loan Trust,
Series 2006-HE3, Class A3,
5.81%, 10/25/36 | | | 170,000 | | | 50,917 | |
Hyundai Auto Receivables Trust,
Series 2008-A, Class A2, 4.16%, 5/16/11 (f) | | | 125,668 | | | 126,820 | |
National Collegiate Student Loan Trust,
Series 2006-3, Class A1,
0.47%, 9/25/19 (a)(f) | | | 56,328 | | | 54,047 | |
| | | | | | | |
Asset Backed Securities, continued | | | | | | | |
|
|
|
|
|
|
|
|
| | | | | | | |
| | Principal
Amount($) | | Value($) | |
| |
| |
| |
Preferred Term Securities XXII Ltd., 1.66%,
9/22/36, Callable 6/22/11 @ 100 (a)(d)(f) | | | 193,204 | | | 59,893 | |
Residential Funding Mortgage Securities,
Series 2006-HSA1, Class A5,
5.31%, 2/25/36 (f) | | | 62,916 | | | 18,564 | |
SLM Student Loan Trust
Series 2005-4, Class A2,
1.24%, 4/26/21 (a)(f) | | | 60,000 | | | 58,352 | |
Series 2005-9, Class A4,
1.26%, 1/25/23 (a)(f) | | | 190,000 | | | 186,058 | |
Series 2006-7, Class A2,
1.15%, 10/25/16 (a)(f) | | | 45,056 | | | 45,001 | |
Series 2006-9, Class A2,
1.16%, 4/25/17 (a)(f) | | | 26,504 | | | 26,382 | |
Series 2006-B, Class A1,
1.33%, 9/15/20 (a)(f) | | | 128,045 | | | 121,765 | |
South Carolina Student Loan Corp.,
Series 2008-1, Class A1, 1.76%, 9/2/14 (a)(f) | | | 96,404 | | | 95,209 | |
| | | | |
|
| |
TOTAL ASSET BACKED SECURITIES
(COST $2,355,131) | | | | | | 1,608,609 | |
| | | | |
|
| |
Collateralized Mortgage Obligations—5.3% | | | | | | | |
|
|
|
|
|
|
|
|
Banc of America Mortgage Securities,
Series 2005-D, Class 2A4,
4.79%, 5/25/35 (a)(f) | | | 139,589 | | | 131,805 | |
Deutsche Mortgage Securities, Inc.,
Series 2006-WF1, Class 1A1,
5.10%, 6/26/35 (a)(d) | | | 95,769 | | | 95,222 | |
Freddie Mac | | | | | | | |
Series 2988, Class AF, 0.75%, 6/15/35 (a)(f) | | | 138,434 | | | 135,525 | |
Series 3212, Class BK, 5.40%, 9/15/36 | | | 150,000 | | | 157,656 | |
Residential Asset Securitization Trust,
Series 2003-A15, Class 1A2,
0.89%, 2/25/34 (a) | | | 190,872 | | | 156,190 | |
| | | | |
|
| |
TOTAL COLLATERALIZED MORTGAGE
OBLIGATIONS (COST $708,294) | | | | | | 676,398 | |
| | | | |
|
| |
Commercial Mortgage Backed Securities—6.4% | | | | | | | |
|
|
|
|
|
|
|
|
Citigroup/Deutsche Bank Commercial
Mortgage Trust, Series 2007-CD4,
Class A2B, 5.21%, 12/11/49 | | | 200,000 | | | 174,457 | |
Commercial Mortgage Pass-Through
Certificate, Series 2006-FL12,
Class A2, 0.55%, 12/15/20 (a)(d)(f) | | | 236,062 | | | 165,399 | |
Greenwich Capital Commercial Funding Corp.
Series 2006-GG7, Class A2,
6.03%, 7/10/38 (a) | | | 90,000 | | | 84,198 | |
Series 2006-GG7, Class A4,
6.11%, 7/10/38 (a) | | | 140,000 | | | 117,035 | |
Morgan Stanley Capital I, Series 2007-IQ14,
Class A2, 5.61%, 4/15/49 | | | 220,000 | | | 191,178 | |
Washington Mutual Commercial Mortgage
Securities Trust, Series 2006-SL1, Class A,
5.42%, 11/23/43 (a)(d) | | | 140,276 | | | 77,152 | |
| | | | |
|
| |
TOTAL COMMERCIAL MORTGAGE
BACKED SECURITIES
(COST $1,026,713) | | | | | | 809,419 | |
| | | | |
|
| |
| | |
See notes to financial statements. | HSBC INVESTOR PORTFOLIOS | 46 |
|
HSBC INVESTOR INTERMEDIATE DURATION FIXED INCOME PORTFOLIO |
|
|
Schedule of Portfolio Investments—as of April 30, 2009 (Unaudited) (continued) |
| | | | | | | |
Foreign Bonds—0.5% | | | | | | | |
|
|
|
|
|
|
|
|
| | | | | | | |
| | Shares or
Principal
Amount($) | | Value($) | |
| |
| |
| |
United Kingdom – 0.5% | | | | | | | |
Barclays Bank plc, 5.93%, 12/31/49 (d) | | | 150,000 | | | 59,937 | |
| | | | |
|
| |
TOTAL FOREIGN BONDS
(COST $151,085) | | | | | | 59,937 | |
| | | | |
|
| |
Investment Company—27.3% | | | | | | | |
|
|
|
|
|
|
|
|
Northern Institutional Diversified Assets
Portfolio, Shares Class, 0.44% (e) | | | 3,448,598 | | | 3,448,598 | |
| | | | |
|
| |
TOTAL INVESTMENT COMPANY
(COST $3,448,598) | | | | | | 3,448,598 | |
| | | | |
|
| |
TOTAL INVESTMENTS
(COST $19,536,796) — 144.2% | | | | | | 18,241,585 | |
| | | | |
|
| |
| |
|
| Percentages indicated are based on net assets of $12,648,664. |
| |
(a) | Variable rate security. The interest rates on these securities are adjusted periodically to reflect then-current short-term interest rates. The rates presented represent the rates in effect on April 30, 2009. The maturity dates presented reflect the final maturity dates. However, some of these securities may contain put or demand features that allow the fund to require the issuer to repurchase the security from the fund within various time periods, including daily, weekly, monthly, or semi-annually. |
| |
(b) | In connection with the Lehman Brothers Holdings, Inc. bankruptcy filing announcement on September 15, 2008, the Fund stopped accruing prospective interests amounts on that date. |
| |
(c) | Non-Income Producing; Defaulted Bond. |
| |
(d) | Security exempt from registration under Rule 144a of the Securities Act of 1933. This security may be resold in transactions exempt from registration, normally to qualified institutional buyers. This security has been deemed liquid by the Investment Adviser based on procedures approved by the Board of Trustees. |
| |
(e) | The rates presented represent the annualized one day yield that was in effect on April 30, 2009. |
| |
(f) | Security held as collateral for to be announced securities. |
| |
LLC | — Limited Liability Co. |
MTN | — Medium Term Note |
PLC | — Public Limited Co. |
TBA | — Security was traded on a “to be announced” basis. Represents 39.7% of net assets. |
| | |
47 | HSBC INVESTOR PORTFOLIOS | See notes to financial statements. |
|
HSBC INVESTOR GROWTH PORTFOLIO |
|
|
Schedule of Portfolio Investments—as of April 30, 2009 (Unaudited) |
| | | | | | | |
Common Stocks—99.5% | | | | | | | |
|
|
|
|
|
|
|
|
| | | | | | | |
| | Shares | | Value($) | |
| |
| |
| |
Aerospace & Defense – 2.3% | | | | | | | |
Lockheed Martin Corp. | | | 9,400 | | | 738,182 | |
Precision Castparts Corp. | | | 14,800 | | | 1,107,928 | |
| | | | |
|
| |
| | | | | | 1,846,110 | |
| | | | |
|
| |
Agriculture – 3.0% | | | | | | | |
Monsanto Co. | | | 28,100 | | | 2,385,409 | |
| | | | |
|
| |
Biotechnology – 3.8% | | | | | | | |
Gilead Sciences, Inc. (a) | | | 49,000 | | | 2,244,200 | |
Illumina, Inc. (a) | | | 20,600 | | | 769,410 | |
| | | | |
|
| |
| | | | | | 3,013,610 | |
| | | | |
|
| |
Business Services – 3.1% | | | | | | | |
Apollo Group, Inc., Class A (a) | | | 12,200 | | | 767,990 | |
Ecolab, Inc. | | | 20,100 | | | 774,855 | |
ITT Educational Services, Inc. (a) | | | 9,200 | | | 927,084 | |
| | | | |
|
| |
| | | | | | 2,469,929 | |
| | | | |
|
| |
Communication Equipment – 5.6% | | | | | | | |
American Tower Corp., Class A (a) | | | 25,900 | | | 822,584 | |
Cisco Systems, Inc. (a) | | | 109,000 | | | 2,105,880 | |
Juniper Networks, Inc. (a) | | | 30,000 | | | 649,500 | |
Research In Motion Ltd. (a) | | | 11,500 | | | 799,250 | |
| | | | |
|
| |
| | | | | | 4,377,214 | |
| | | | |
|
| |
Credit Card – 5.7% | | | | | | | |
MasterCard, Inc., Class A | | | 9,500 | | | 1,742,775 | |
Visa, Inc., Class A | | | 41,800 | | | 2,715,328 | |
| | | | |
|
| |
| | | | | | 4,458,103 | |
| | | | |
|
| |
Distribution & Wholesale – 1.8% | | | | | | | |
Fastenal Co. | | | 36,000 | | | 1,380,960 | |
| | | | |
|
| |
Exchanges – 1.3% | | | | | | | |
IntercontinentalExchange, Inc. (a) | | | 12,100 | | | 1,059,960 | |
| | | | |
|
| |
| | | | | | | |
Hardware & Peripherals – 5.3% | | | | | | | |
Apple, Inc. (a) | | | 18,100 | | | 2,277,523 | |
Hewlett-Packard Co. | | | 51,701 | | | 1,860,202 | |
| | | | |
|
| |
| | | | | | 4,137,725 | |
| | | | |
|
| |
Industrial Conglomerates – 7.0% | | | | | | | |
Danaher Corp. | | | 39,500 | | | 2,308,380 | |
General Mills, Inc. | | | 21,700 | | | 1,099,973 | |
Lam Research Corp. (a) | | | 13,900 | | | 387,532 | |
United Technologies Corp. | | | 34,400 | | | 1,680,096 | |
| | | | |
|
| |
| | | | | | 5,475,981 | |
| | | | |
|
| |
Internet – 4.5% | | | | | | | |
Baidu, Inc. ADR (a) | | | 5,200 | | | 1,211,080 | |
Google, Inc., Class A (a) | | | 5,950 | | | 2,356,021 | |
| | | | |
|
| |
| | | | | | 3,567,101 | |
| | | | |
|
| |
Investment Management – 6.4% | | | | | | | |
BlackRock, Inc. | | | 8,250 | | | 1,208,790 | |
Goldman Sachs Group, Inc. | | | 3,300 | | | 424,050 | |
JP Morgan Chase & Co. | | | 41,700 | | | 1,376,100 | |
The Charles Schwab Corp. | | | 110,600 | | | 2,043,888 | |
| | | | |
|
| |
| | | | | | 5,052,828 | |
| | | | |
|
| |
| | | | | | | |
Common Stocks, continued | | | | | | | |
|
|
|
|
|
|
|
|
| | | | | | | |
| | Shares | | Value($) | |
| |
| |
| |
Medical Products – 5.9% | | | | | | | |
Baxter International, Inc. | | | 30,700 | | | 1,488,950 | |
Cephalon, Inc. (a) | | | 14,100 | | | 925,101 | |
Mindray Medical International Ltd. ADR | | | 37,490 | | | 855,522 | |
St. Jude Medical, Inc. (a) | | | 42,200 | | | 1,414,544 | |
| | | | |
|
| |
| | | | | | 4,684,117 | |
| | | | |
|
| |
Medical Services & Distributors – 4.4% | | | | | | | |
Medco Health Solutions, Inc. (a) | | | 79,600 | | | 3,466,580 | |
| | | | |
|
| |
Oil & Gas Drill & Equipment – 1.2% | | | | | | | |
FMC Technologies, Inc. (a) | | | 28,100 | | | 961,863 | |
| | | | |
|
| |
Oil & Gas Exploration & Production – 3.0% | | | | | | | |
Petro-Canada | | | 25,000 | | | 788,250 | |
Petroleo Brasileiro SA ADR | | | 21,500 | | | 721,755 | |
Southwestern Energy Co. (a) | | | 22,800 | | | 817,608 | |
| | | | |
|
| |
| | | | | | 2,327,613 | |
| | | | |
|
| |
Pharmaceuticals – 2.5% | | | | | | | |
Teva Pharmaceutical Industries Ltd. ADR | | | 44,500 | | | 1,953,105 | |
| | | | |
|
| |
Railroad – 2.9% | | | | | | | |
Union Pacific Corp. | | | 47,200 | | | 2,319,408 | |
| | | | |
|
| |
Retail – 5.1% | | | | | | | |
Best Buy Co., Inc. | | | 15,300 | | | 587,214 | |
Kohl’s Corp. (a) | | | 23,300 | | | 1,056,655 | |
Lowe’s Cos., Inc. | | | 36,500 | | | 784,750 | |
Wal-Mart Stores, Inc. | | | 30,800 | | | 1,552,320 | |
| | | | |
|
| |
| | | | | | 3,980,939 | |
| | | | |
|
| |
Retail Pharmacy – 2.0% | | | | | | | |
CVS Caremark Corp. | | | 48,900 | | | 1,554,042 | |
| | | | |
|
| |
Software Services – 10.4% | | | | | | | |
Adobe Systems, Inc. (a) | | | 20,900 | | | 571,615 | |
Autodesk, Inc. (a) | | | 20,100 | | | 400,794 | |
Cognizant Technology Solutions Corp. (a) | | | 83,600 | | | 2,072,444 | |
Dolby Laboratories, Inc., Class A (a) | | | 28,600 | | | 1,147,718 | |
McAfee, Inc. (a) | | | 17,500 | | | 656,950 | |
Microsoft Corp. | | | 86,300 | | | 1,748,438 | |
Oracle Corp. | | | 81,000 | | | 1,566,540 | |
| | | | |
|
| |
| | | | | | 8,164,499 | |
| | | | |
|
| |
Telecommunications – 7.4% | | | | | | | |
American Movil SAB de C.V. ADR, Seies L | | | 23,400 | | | 768,690 | |
Equinix, Inc. (a) | | | 17,600 | | | 1,236,048 | |
MetroPCS Communications, Inc. (a) | | | 42,900 | | | 733,161 | |
QUALCOMM, Inc. | | | 73,600 | | | 3,114,752 | |
| | | | |
|
| |
| | | | | | 5,852,651 | |
| | | | |
|
| |
Transportation – 1.6% | | | | | | | |
C.H. Robinson Worldwide, Inc. | | | 14,800 | | | 786,768 | |
Expeditors International of Washington, Inc. | | | 13,200 | | | 458,172 | |
| | | | |
|
| |
| | | | | | 1,244,940 | |
| | | | |
|
| |
Travel & Leisure – 3.3% | | | | | | | |
Carnival Corp. | | | 43,900 | | | 1,180,032 | |
Priceline.com, Inc. (a) | | | 14,800 | | | 1,436,932 | |
| | | | |
|
| |
| | | | | | 2,616,964 | |
| | | | |
|
| |
| | |
See notes to financial statements. | HSBC INVESTOR PORTFOLIOS | 48 |
|
HSBC INVESTOR GROWTH PORTFOLIO |
|
|
Schedule of Portfolio Investments—as of April 30, 2009 (Unaudited) (continued) |
| | | | | | | |
Common Stocks, continued | | | | | | | |
|
|
|
|
|
|
|
|
| | | | | | | |
| | Shares | | Value($) | |
| |
| |
| |
TOTAL COMMON STOCKS
(COST $84,532,207) | | | | | | 78,351,651 | |
| | | | |
|
| |
Investment Company—0.3% | | | | | | | |
|
|
|
|
|
|
|
|
Northern Institutional Diversified Assets
Portfolio, Shares Class, 0.44% (b) | | | 203,165 | | | 203,165 | |
| | | | |
|
| |
TOTAL INVESTMENT COMPANY
(COST $203,165) | | | | | | 203,165 | |
| | | | |
|
| |
TOTAL INVESTMENTS
(COST $84,735,372) — 99.8% | | | | | | 78,554,816 | |
| | | | |
|
| |
| |
| Percentages indicated are based on net assets of $78,715,834. |
| |
(a) | Represents non-income producing security. |
| |
(b) | The rates presented represent the annualized one day yield that was in effect on April 30, 2009. |
| |
ADR — American Depositary Receipt |
| | |
49 | HSBC INVESTOR PORTFOLIOS | See notes to financial statements. |
|
HSBC INVESTOR INTERNATIONAL EQUITY PORTFOLIO |
|
|
Schedule of Portfolio Investments—as of April 30, 2009 (Unaudited) |
| | | | | | | |
Common Stocks—98.0% | | | | | | | |
|
|
|
|
|
|
|
|
| | | | | | | |
| | Shares | | Value($) | |
| |
| |
| |
Australia – 4.5% | | | | | | | |
Australia & New Zealand
Banking Group Ltd. | | | 199,300 | | | 2,302,188 | |
BHP Billiton Ltd. | | | 36,500 | | | 882,230 | |
Commonwealth Bank of Australia | | | 48,200 | | | 1,229,460 | |
Lend Lease Corp., Ltd. | | | 143,700 | | | 753,755 | |
National Australia Bank Ltd. | | | 113,565 | | | 1,702,081 | |
Qantas Airways Ltd. | | | 412,833 | | | 593,849 | |
| | | | |
|
| |
| | | | | | 7,463,563 | |
| | | | |
|
| |
Belgium – 0.9% | | | | | | | |
Delhaize Group SA | | | 22,100 | | | 1,496,878 | |
| | | | |
|
| |
Brazil – 0.3% | | | | | | | |
Banco Do Brasil SA | | | 60,000 | | | 514,686 | |
| | | | |
|
| |
Canada – 5.4% | | | | | | | |
BCE, Inc. | | | 58,900 | | | 1,259,463 | |
Fairfax Financial Holdings Ltd. | | | 5,200 | | | 1,375,624 | |
Industrial Alliance Insurance and
Financial Services, Inc. | | | 26,100 | | | 523,313 | |
National Bank of Canada | | | 26,600 | | | 973,252 | |
Nexen, Inc. | | | 40,490 | | | 771,109 | |
Petro-Canada | | | 60,100 | | | 1,897,205 | |
Royal Bank of Canada | | | 30,300 | | | 1,074,342 | |
Telus Corp. | | | 19,700 | | | 458,236 | |
WestJet Airlines Ltd. | | | 59,300 | | | 580,573 | |
| | | | |
|
| |
| | | | | | 8,913,117 | |
| | | | |
|
| |
China – 0.9% | | | | | | | |
China Petroleum & Chemical Corp. | | | 1,920,000 | | | 1,506,310 | |
| | | | |
|
| |
Czech Republic – 0.5% | | | | | | | |
CEZ | | | 20,900 | | | 864,120 | |
| | | | |
|
| |
Finland – 1.1% | | | | | | | |
Nokia Oyj | | | 129,400 | | | 1,871,021 | |
| | | | |
|
| |
France – 12.8% | | | | | | | |
BNP Paribas SA | | | 55,180 | | | 2,938,135 | |
Credit Agricole SA | | | 185,402 | | | 2,746,987 | |
France Telecom SA | | | 63,200 | | | 1,410,445 | |
Lagardere S.C.A. | | | 46,400 | | | 1,467,340 | |
Renault SA | | | 68,700 | | | 2,232,986 | |
Sanofi-Aventis | | | 52,700 | | | 3,051,486 | |
Societe Generale | | | 58,231 | | | 3,017,009 | |
Total SA | | | 76,100 | | | 3,860,269 | |
Vallourec SA | | | 4,500 | | | 496,422 | |
| | | | |
|
| |
| | | | | | 21,221,079 | |
| | | | |
|
| |
Germany – 13.0% | | | | | | | |
Allianz SE | | | 27,200 | | | 2,505,471 | |
BASF AG (a) | | | 64,800 | | | 2,455,117 | |
Bayer AG (a) | | | 29,100 | | | 1,445,530 | |
Deutsche Bank AG | | | 52,800 | | | 2,807,916 | |
Deutsche Lufthansa AG | | | 81,300 | | | 1,024,424 | |
Deutsche Post AG | | | 132,950 | | | 1,523,107 | |
Deutsche Telekom AG | | | 150,900 | | | 1,841,534 | |
E.ON AG | | | 91,100 | | | 3,067,117 | |
Fresenius Medical Care AG & Co. KGaA | | | 18,100 | | | 711,147 | |
Metro AG | | | 10,000 | | | 425,971 | |
| | | | | | | |
Common Stocks, continued | | | | | | | |
|
|
|
|
|
|
|
|
| | | | | | | |
| | Shares | | Value($) | |
| |
| |
| |
Germany, continued | | | | | | | |
| | | | | | | |
Muenchener Rueckversicherungs-
Gesellschaft AG | | | 17,600 | | | 2,402,794 | |
RWE AG | | | 11,170 | | | 806,069 | |
Siemens AG | | | 10,000 | | | 668,986 | |
| | | | |
|
| |
| | | | | | 21,685,183 | |
| | | | |
|
| |
India – 0.6% | | | | | | | |
State Bank of India GDR | | | 17,600 | | | 985,600 | |
| | | | |
|
| |
Italy – 4.4% | | | | | | | |
ENI SpA | | | 139,700 | | | 3,040,090 | |
Intesa Sanpaolo SpA | | | 650,300 | | | 2,096,923 | |
Telecom Italia SpA | | | 1,036,200 | | | 1,320,061 | |
Telecom Italia RSP | | | 920,000 | | | 827,601 | |
| | | | |
|
| |
| | | | | | 7,284,675 | |
| | | | |
|
| |
Japan – 17.3% | | | | | | | |
Canon, Inc. | | | 29,800 | | | 891,582 | |
FUJITSU Ltd. | | | 424,000 | | | 1,806,085 | |
Hitachi Ltd. | | | 332,000 | | | 1,148,195 | |
Honda Motor Co., Ltd. | | | 27,600 | | | 796,369 | |
JFE Holdings, Inc. | | | 26,800 | | | 727,079 | |
KDDI Corp. | | | 279 | | | 1,250,690 | |
Kyocera Corp. | | | 24,500 | | | 1,893,408 | |
Mitsubishi Chemical Holdings Corp. | | | 303,000 | | | 1,146,237 | |
Mitsubishi Corp. | | | 129,000 | | | 1,975,558 | |
Mitsui & Co., Ltd. | | | 149,000 | | | 1,568,580 | |
Mitsui Fudosan Co. Ltd. | | | 49,000 | | | 614,239 | |
NAMCO BANDAI Holdings, Inc. | | | 123,800 | | | 1,229,211 | |
Nippon Mining Holdings, Inc. | | | 187,000 | | | 849,655 | |
Nippon Telegraph & Telephone Corp. | | | 63,000 | | | 2,351,318 | |
Nissan Motor Co., Ltd. | | | 371,400 | | | 1,921,035 | |
Sharp Corp. | | | 203,000 | | | 2,112,353 | |
Sony Corp. | | | 37,910 | | | 972,741 | |
Sumitomo Mitsui Financial Group, Inc. | | | 46,900 | | | 1,617,241 | |
The Furukawa Electric Co. Ltd. | | | 123,000 | | | 366,755 | |
The Tokyo Electric Power Co., Inc. | | | 28,000 | | | 655,984 | |
Toshiba Corp. | | | 543,000 | | | 1,850,385 | |
Toyota Motor Corp. | | | 25,500 | | | 995,690 | |
| | | | |
|
| |
| | | | | | 28,740,390 | |
| | | | |
|
| |
Netherlands – 3.9% | | | | | | | |
ArcelorMittal | | | 59,952 | | | 1,427,580 | |
ING Groep NV | | | 155,768 | | | 1,460,170 | |
Koninklijke (Royal) Philips Electronics NV | | | 62,210 | | | 1,132,408 | |
Koninklijke Ahold NV | | | 223,020 | | | 2,458,200 | |
| | | | |
|
| |
| | | | | | 6,478,358 | |
| | | | |
|
| |
New Zealand – 0.4% | | | | | | | |
Telecom Corp. of New Zealand Ltd. | | | 456,800 | | | 730,105 | |
| | | | |
|
| |
Norway – 1.5% | | | | | | | |
StatoilHydro ASA | | | 128,500 | | | 2,444,448 | |
| | | | |
|
| |
Russian Federation – 0.8% | | | | | | | |
JSC MMC Norilsk Nickel ADR | | | 67,789 | | | 564,682 | |
| | |
See notes to financial statements. | HSBC INVESTOR PORTFOLIOS | 50 |
|
HSBC INVESTOR INTERNATIONAL EQUITY PORTFOLIO |
|
|
Schedule of Portfolio Investments—as of April 30, 2009 (Unaudited) (continued) |
| | | | | | | |
Common Stocks, continued | | | | | | | |
|
|
|
|
|
|
|
|
| | | | | | | |
| | Shares | | Value($) | |
| |
| |
| |
Russian Federation, continued | | | | | | | |
LUKOIL ADR | | | 16,550 | | | 738,130 | |
| | | | |
|
| |
| | | | | | 1,302,812 | |
| | | | |
|
| |
Singapore – 0.2% | | | | | | | |
Neptune Orient Lines Ltd. | | | 427,000 | | | 375,144 | |
| | | | |
|
| |
South Africa – 0.8% | | | | | | | |
Sanlam Ltd. | | | 554,040 | | | 1,041,588 | |
Standard Bank Group Ltd. | | | 31,023 | | | 302,619 | |
| | | | |
|
| |
| | | | | | 1,344,207 | |
| | | | |
|
| |
South Korea – 1.1% | | | | | | | |
KB Financial Group, Inc. ADR (a) | | | 33,200 | | | 1,058,416 | |
Samsung Electronics Co., Ltd., Preferred | | | 2,900 | | | 751,073 | |
| | | | |
|
| |
| | | | | | 1,809,489 | |
| | | | |
|
| |
Spain – 1.8% | | | | | | | |
Telefonica SA (a) | | | 161,400 | | | 3,076,746 | |
| | | | |
|
| |
Sweden – 2.8% | | | | | | | |
Ericsson LM, B Shares | | | 153,000 | | | 1,351,035 | |
Nordea Bank AB | | | 114,080 | | | 859,803 | |
Svenska Cellusoa AB (SCA), B Shares | | | 189,700 | | | 1,852,055 | |
Volvo AB, B Shares | | | 86,500 | | | 572,866 | |
| | | | |
|
| |
| | | | | | 4,635,759 | |
| | | | |
|
| |
Switzerland – 3.4% | | | | | | | |
Credit Suisse Group | | | 81,100 | | | 3,170,079 | |
Novartis AG | | | 63,940 | | | 2,432,073 | |
| | | | |
|
| |
| | | | | | 5,602,152 | |
| | | | |
|
| |
Taiwan – 1.5% | | | | | | | |
AU Optronics Corp. | | | 1,101,000 | | | 1,140,734 | |
China Steel Corp. GDR | | | 40,044 | | | 618,279 | |
Compal Electronics, Inc. | | | 581,895 | | | 494,638 | |
United Microelectronics Corp. | | | 862,805 | | | 323,647 | |
| | | | |
|
| |
| | | | | | 2,577,298 | |
| | | | |
|
| |
Thailand – 0.4% | | | | | | | |
PTT Public Co., Ltd. | | | 121,400 | | | 652,448 | |
| | | | |
|
| |
United Kingdom – 17.7% | | | | | | | |
Associated British Foods plc | | | 199,300 | | | 2,116,262 | |
AstraZeneca plc | | | 43,100 | | | 1,520,209 | |
Aviva plc | | | 352,191 | | | 1,643,294 | |
Barclays plc | | | 451,300 | | | 1,878,804 | |
BP plc | | | 532,500 | | | 3,799,746 | |
Centrica plc | | | 618,000 | | | 2,074,684 | |
Drax Group plc | | | 51,100 | | | 389,950 | |
GlaxoSmithKline plc | | | 213,800 | | | 3,316,812 | |
Lloyds Banking Group plc | | | 886,507 | | | 1,468,378 | |
Royal Dutch Shell plc, A Shares | | | 200,987 | | | 4,671,581 | |
RSA Insurance Group plc | | | 505,627 | | | 981,074 | |
Thomas Cook Group plc | | | 175,500 | | | 681,958 | |
Tui Travel plc | | | 208,700 | | | 781,645 | |
Vodafone Group plc | | | 2,240,458 | | | 4,131,816 | |
| | | | |
|
| |
| | | | | | 29,456,213 | |
| | | | |
|
| |
| | | | | | | |
Common Stocks, continued | | | | | | | |
|
|
|
|
|
|
|
|
| | | | | | | |
| | Shares | | Value($) | |
| |
| |
| |
TOTAL COMMON STOCKS
(COST $238,609,787) | | | | | | 163,031,801 | |
| | | | |
|
| |
Right—0.0% | | | | | | | |
|
|
|
|
|
|
|
|
Belgium – 0.0% | | | | | | | |
Fortis (a) | | | 121,532 | | | 0 | |
| | | | |
|
| |
TOTAL RIGHTS
(COST $0) | | | | | | 0 | |
| | | | |
|
| |
| | | | | | | |
Investment Company—0.9% | | | | | | | |
|
|
|
|
|
|
|
|
Northern Institutional Diversified Assets
Portfolio, Shares Class, 0.44% (b) | | | 1,401,968 | | | 1,401,968 | |
| | | | |
|
| |
TOTAL INVESTMENT COMPANY
(COST $1,401,968) | | | | | | 1,401,968 | |
| | | | |
|
| |
TOTAL INVESTMENTS
(COST $240,011,755) — 98.9% | | | | | | 164,433,769 | |
| | | | |
|
| |
| |
| Percentages indicated are based on net assets of $166,309,015. |
| |
(a) | Represents non-income producing security. |
| |
(b) | The rates presented represent the annualized one day yield that was in effect on April 30, 2009. |
| |
ADR — American Depositary Receipt |
GDR — Global Depositary Receipt |
PLC — Public Limited Co. |
SPA — Standby Purchase Agreement |
| | | | | | |
Schedule of Portfolio Investments—April 30, 2009 | | | | |
|
|
|
|
|
|
|
| | | | | | |
Industry | | Percent of Net Assets | |
| |
| |
Automotive | | | | 3.6 | % | |
Banking & Financial Services | | | | 23.9 | % | |
Building & Construction | | | | 1.1 | % | |
Cash & Cash Equivalents | | | | 0.8 | % | |
Chemicals | | | | 2.2 | % | |
Drugs - Medical | | | | 6.6 | % | |
Electrical | | | | 4.7 | % | |
Electronic Components & Semiconductors | | | | 5.0 | % | |
Food & Beverage | | | | 2.2 | % | |
Import/Export | | | | 0.9 | % | |
Insurance | | | | 4.0 | % | |
Manufacturing | | | | 7.1 | % | |
Metals & Mining | | | | 2.0 | % | |
Oil & Gas | | | | 15.8 | % | |
Publishing | | | | 0.9 | % | |
Real Estate | | | | 0.8 | % | |
Retail | | | | 1.7 | % | |
Telecommunications | | | | 13.2 | % | |
Transportation Services | | | | 2.4 | % | |
| | |
|
| | |
Total Investments | | | | 98.9 | % | |
| | |
|
| | |
| | |
51 | HSBC INVESTOR PORTFOLIOS | See notes to financial statements. |
|
HSBC INVESTOR INTERNATIONAL EQUITY PORTFOLIO |
|
|
Schedule of Portfolio Investments—as of April 30, 2009 (Unaudited) (continued) |
At April 30, 2009 the portfolio’s open forward currency contracts were as follows:
| | | | | | | | | | | | | | | | |
Currency | | Delivery
Date | | Amount
(Local
Currency) | | Contract
Value
(U.S. Dollars)
($) | | Value
($) | | Unrealized
Appreciation/
(Depreciation)
($) | |
| |
| |
| |
| |
| |
|
|
SHORT CONTRACTS | | | | | | | | | | | | | | | | |
British Sterling Pound | | | 06/15/09 | | | 2,338,000 | | | 3,291,436 | | | 3,457,533 | | | (166,097 | ) |
British Sterling Pound | | | 07/15/09 | | | 930,000 | | | 1,386,463 | | | 1,375,377 | | | 11,086 | |
British Sterling Pound | | | 07/15/09 | | | 379,000 | | | 555,466 | | | 560,503 | | | (5,037 | ) |
Canadian Dollar | | | 06/15/09 | | | 1,988,000 | | | 1,571,467 | | | 1,666,805 | | | (95,338 | ) |
Canadian Dollar | | | 06/15/09 | | | 4,930,000 | | | 3,860,762 | | | 4,133,473 | | | (272,711 | ) |
Canadian Dollar | | | 06/15/09 | | | 933,000 | | | 733,808 | | | 782,258 | | | (48,450 | ) |
Canadian Dollar | | | 06/15/09 | | | 1,158,000 | | | 934,776 | | | 970,905 | | | (36,129 | ) |
Canadian Dollar | | | 07/15/09 | | | 9,009,000 | | | 7,276,766 | | | 7,555,630 | | | (278,864 | ) |
Swedish Krone | | | 06/15/09 | | | 28,436,000 | | | 3,242,750 | | | 3,536,838 | | | (294,088 | ) |
| | | | |
|
| |
|
| |
|
| |
|
| |
Total | | | | | | 50,101,000 | | | 22,853,694 | | | 24,039,322 | | | (1,185,628 | ) |
| | | | |
|
| |
|
| |
|
| |
|
| |
LONG CONTRACTS | | | | | | | | | | | | | | | | |
Canadian Dollar | | | 06/15/09 | | | 9,009,000 | | | 7,275,591 | | | 7,553,442 | | | 277,851 | |
British Sterling Pound | | | 06/15/09 | | | 1,959,000 | | | 2,899,320 | | | 2,897,052 | | | (2,268 | ) |
British Sterling Pound | | | 06/15/09 | | | 379,000 | | | 555,489 | | | 560,481 | | | 4,992 | |
Swedish Krone | | | 06/15/09 | | | 3,116,000 | | | 350,242 | | | 387,565 | | | 37,323 | |
Swedish Krone | | | 06/15/09 | | | 25,320,000 | | | 2,993,085 | | | 3,149,273 | | | 156,188 | |
| | | | |
|
| |
|
| |
|
| |
|
| |
Total | | | | | | 39,783,000 | | | 14,073,727 | | | 14,547,813 | | | 474,086 | |
| | | | |
|
| |
|
| |
|
| |
|
| |
| | |
See notes to financial statements. | HSBC INVESTOR PORTFOLIOS | 52 |
|
HSBC INVESTOR OPPORTUNITY PORTFOLIO |
|
|
Schedule of Portfolio Investments—as of April 30, 2009 (Unaudited) (continued) |
| | | | | | | |
Common Stocks—97.3% | | | | | | | |
|
|
|
|
|
|
|
|
| | | | | |
| | Shares | | Value($) | |
| |
| |
| |
Aerospace & Defense – 1.3% | | | | | | | |
BE Aerospace, Inc. (a) | | | 138,700 | | | 1,496,573 | |
| | | | |
|
| |
Biotechnology – 5.8% | | | | | | | |
Illumina, Inc. (a) | | | 103,350 | | | 3,860,122 | |
Life Technologies Corp. (a) | | | 68,900 | | | 2,569,970 | |
| | | | |
|
| |
| | | | | | 6,430,092 | |
| | | | |
|
| |
Business Services – 3.1% | | | | | | | |
MSCI, Inc., Class A (a) | | | 61,700 | | | 1,295,083 | |
Navigant Consulting, Inc. (a) | | | 148,650 | | | 2,186,642 | |
| | | | |
|
| |
| | | | | | 3,481,725 | |
| | | | |
|
| |
Communications – 1.0% | | | | | | | |
Discovery Communications, Inc.,
Class A (a) | | | 58,800 | | | 1,116,612 | |
| | | | |
|
| |
Computer Software – 16.3% | | | | | | | |
ACI Worldwide, Inc. (a) | | | 73,200 | | | 1,264,164 | |
BMC Software, Inc. (a) | | | 98,400 | | | 3,411,528 | |
Brocade Communications Systems, Inc. (a) | | | 306,600 | | | 1,772,148 | |
Check Point Software Technologies Ltd. (a) | | | 139,250 | | | 3,226,422 | |
Citrix Systems, Inc. (a) | | | 73,200 | | | 2,088,396 | |
Nuance Communications, Inc. (a) | | | 235,450 | | | 3,143,257 | |
Salesforce.com, Inc. (a) | | | 38,050 | | | 1,628,921 | |
VeriFone Holdings, Inc. (a) | | | 200,300 | | | 1,504,253 | |
| | | | |
|
| |
| | | | | | 18,039,089 | |
| | | | |
|
| |
Consumer Products – 4.4% | | | | | | | |
Church & Dwight Co., Inc. | | | 39,800 | | | 2,165,518 | |
Crown Holdings, Inc. (a) | | | 121,300 | | | 2,674,665 | |
| | | | |
|
| |
| | | | | | 4,840,183 | |
| | | | |
|
| |
Diversified Manufacturing Operations – 5.1% | | | | | | | |
Actuant Corp., Class A | | | 113,400 | | | 1,390,284 | |
AMETEK, Inc. | | | 66,800 | | | 2,151,628 | |
Joy Global, Inc. | | | 84,050 | | | 2,143,275 | |
| | | | |
|
| |
| | | | | | 5,685,187 | |
| | | | |
|
| |
Education – 1.7% | | | | | | | |
Corinthian Colleges, Inc. (a) | | | 609 | | | 9,379 | |
DeVry, Inc. | | | 44,400 | | | 1,889,664 | |
| | | | |
|
| |
| | | | | | 1,899,043 | |
| | | | |
|
| |
Electronic Components & Semiconductors – 3.0% | | | | | | | |
Maxim Integrated Products, Inc. | | | 77,400 | | | 1,048,770 | |
National Semiconductor Corp. | | | 83,350 | | | 1,031,040 | |
Xilinx, Inc. | | | 63,550 | | | 1,298,962 | |
| | | | |
|
| |
| | | | | | 3,378,772 | |
| | | | |
|
| |
Environmental Services – 1.5% | | | | | | | |
Stericycle, Inc. (a) | | | 34,700 | | | 1,633,676 | |
| | | | |
|
| |
Financial Services – 4.5% | | | | | | | |
Annaly Capital Management, Inc. | | | 106,950 | | | 1,504,787 | |
PrivateBancorp, Inc. | | | 83,300 | | | 1,686,825 | |
Waddell & Reed Financial, Inc., Class A | | | 81,000 | | | 1,815,210 | |
| | | | |
|
| |
| | | | | | 5,006,822 | |
| | | | |
|
| |
Gaming – 1.1% | | | | | | | |
Scientific Games Corp., Class A (a) | | | 71,600 | | | 1,252,284 | |
| | | | |
|
| |
| | | | | | | |
Common Stocks, continued |
|
| | | | | | | |
| | Shares | | Value($) | |
| |
| |
| |
Health Care – 6.5% | | | | | | | |
DaVita, Inc. (a) | | | 63,900 | | | 2,963,043 | |
IDEXX Laboratories, Inc. (a) | | | 62,500 | | | 2,456,250 | |
MEDNAX, Inc. (a) | | | 36,250 | | | 1,301,375 | |
Skilled Healthcare Group, Inc., Class A (a) | | | 54,600 | | | 476,658 | |
| | | | |
|
| |
| | | | | | 7,197,326 | |
| | | | |
|
| |
Industrial Manufacturing – 6.0% | | | | | | | |
IDEX Corp. | | | 89,000 | | | 2,247,250 | |
Mettler-Toledo International, Inc. (a) | | | 44,550 | | | 2,745,616 | |
WESCO International, Inc. (a) | | | 62,500 | | | 1,625,000 | |
| | | | |
|
| |
| | | | | | 6,617,866 | |
| | | | |
|
| |
Insurance – 1.3% | | | | | | | |
HCC Insurance Holdings, Inc. | | | 62,100 | | | 1,485,432 | |
| | | | |
|
| |
Internet Related – 1.4% | | | | | | | |
VeriSign, Inc. (a) | | | 76,100 | | | 1,566,138 | |
| | | | |
|
| |
|
Oil & Gas – 11.8% | | | | | | | |
Consol Energy, Inc. | | | 69,700 | | | 2,180,216 | |
Denbury Resources, Inc. (a) | | | 221,800 | | | 3,610,904 | |
EQT Corp. | | | 47,400 | | | 1,594,062 | |
Exterran Holdings, Inc. (a) | | | 104,600 | | | 2,159,990 | |
Massey Energy Co. | | | 179,450 | | | 2,855,049 | |
Range Resources Corp. | | | 17,000 | | | 679,490 | |
| | | | |
|
| |
| | | | | | 13,079,711 | |
| | | | |
|
| |
Pharmaceuticals – 10.7% | | | | | | | |
Alexion Pharmaceuticals, Inc. (a) | | | 108,650 | | | 3,631,083 | |
Elan Corp. plc ADR (a) | | | 235,500 | | | 1,391,805 | |
OSI Pharmaceuticals, Inc. (a) | | | 89,300 | | | 2,997,801 | |
Santarus, Inc. (a) | | | 211,800 | | | 372,768 | |
Shire plc ADR | | | 91,900 | | | 3,425,113 | |
| | | | |
|
| |
| | | | | | 11,818,570 | |
| | | | |
|
| |
Retail – 6.9% | | | | | | | |
American Eagle Outfitters, Inc. | | | 201,350 | | | 2,984,007 | |
O’Reilly Automotive, Inc. (a) | | | 72,500 | | | 2,816,625 | |
PetSmart, Inc. | | | 79,700 | | | 1,823,536 | |
| | | | |
|
| |
| | | | | | 7,624,168 | |
| | | | |
|
| |
Telecommunications – 3.9% | | | | | | | |
Comverse Technology, Inc. (a) | | | 196,000 | | | 1,401,400 | |
Equinix, Inc. (a) | | | 10,850 | | | 761,996 | |
Polycom, Inc. (a) | | | 114,300 | | | 2,130,552 | |
| | | | |
|
| |
| | | | | | 4,293,948 | |
| | | | |
|
| |
TOTAL COMMON STOCKS
(COST $126,142,743) | | | | | | 107,943,217 | |
| | | | |
|
| |
| | | | | | | |
Investment Company—2.6% | | | | | | | |
|
|
|
|
|
|
|
|
Northern Institutional Government Select
Portfolio, Shares Class, 0.10% (b) | | | 2,842,694 | | | 2,842,694 | |
| | | | |
|
| |
TOTAL INVESTMENT COMPANY
(COST $2,842,694) | | | | | | 2,842,694 | |
| | | | |
|
| |
TOTAL INVESTMENTS
(COST $128,985,437) — 99.9% | | | | | | 110,785,911 | |
| | | | |
|
| |
| |
|
| Percentages indicated are based on net assets of $110,888,905. |
| |
(a) | Represents non-income producing security. |
| |
(b) | The rates presented represent the annualized one day yield that was in effect on April 30, 2009. |
| |
ADR — American Depositary Receipt |
PLC — Public Limited Co. |
| | |
53 | HSBC INVESTOR PORTFOLIOS | See notes to financial statements. |
|
HSBC INVESTOR VALUE PORTFOLIO |
|
|
Schedule of Portfolio Investments—as of April 30, 2009 (Unaudited) |
| | | | | | | |
Common Stocks—97.4% | | | | | | | |
|
|
|
|
|
|
|
|
| | | | | | | |
| | Shares | | Value($) | |
| |
| |
| |
Aerospace & Defense – 5.8% | | | | | | | |
Lockheed Martin Corp. | | | 14,900 | | | 1,170,097 | |
Raytheon Co. | | | 29,100 | | | 1,316,193 | |
| | | | |
|
| |
| | | | | | 2,486,290 | |
| | | | |
|
| |
Agricultural Chemicals – 1.1% | | | | | | | |
The Mosaic Co. | | | 11,500 | | | 465,175 | |
| | | | |
|
| |
Banking – 2.4% | | | | | | | |
Wells Fargo & Co. | | | 50,700 | | | 1,014,507 | |
| | | | |
|
| |
Business Services – 3.7% | | | | | | | |
Pitney Bowes, Inc. | | | 65,700 | | | 1,612,278 | |
| | | | |
|
| |
Computer Software – 8.6% | | | | | | | |
CA, Inc. | | | 120,200 | | | 2,073,450 | |
Microsoft Corp. | | | 81,500 | | | 1,651,190 | |
| | | | |
|
| |
| | | | | | 3,724,640 | |
�� | | | | |
|
| |
Conglomerates – 3.0% | | | | | | | |
Loews Corp. | | | 51,240 | | | 1,275,364 | |
| | | | |
|
| |
Consumer Products – 4.2% | | | | | | | |
Kimberly-Clark Corp. | | | 24,600 | | | 1,208,844 | |
Kraft Foods, Inc. | | | 25,069 | | | 586,615 | |
| | | | |
|
| |
| | | | | | 1,795,459 | |
| | | | |
|
| |
Diversified Manufacturing Operations – 1.5% | | | | | | | |
Ingersoll-Rand Co., Class A | | | 30,100 | | | 655,277 | |
| | | | |
|
| |
Electronic Components & Semiconductors – 2.5% | | | | | | | |
Agilent Technologies, Inc. (a) | | | 58,800 | | | 1,073,688 | |
| | | | |
|
| |
Energy – 2.8% | | | | | | | |
Halliburton Co. | | | 30,600 | | | 618,732 | |
NRG Energy, Inc. (a) | | | 33,800 | | | 607,724 | |
| | | | |
|
| |
| | | | | | 1,226,456 | |
| | | | |
|
| |
Financial Services – 3.4% | | | | | | | |
JP Morgan Chase & Co. | | | 44,250 | | | 1,460,250 | |
| | | | |
|
| |
Insurance – 8.0% | | | | | | | |
Aetna, Inc. | | | 20,800 | | | 457,808 | |
Aon Corp. | | | 30,400 | | | 1,282,880 | |
Genworth Financial, Inc., Class A | | | 93,500 | | | 220,660 | |
MetLife, Inc. | | | 35,200 | | | 1,047,200 | |
The Hartford Financial
Services Group, Inc. | | | 37,300 | | | 427,831 | |
| | | | |
|
| |
| | | | | | 3,436,379 | |
| | | | |
|
| |
Media – 6.5% | | | | | | | |
CBS Corp., Class B | | | 34,350 | | | 241,824 | |
Comcast Corp., Class A | | | 51,650 | | | 758,222 | |
Viacom, Inc., Class B (a) | | | 94,000 | | | 1,808,560 | |
| | | | |
|
| |
| | | | | | 2,808,606 | |
| | | | |
|
| |
Metals & Mining – 8.0% | | | | | | | |
AngloGold Ashanti Ltd. ADR | | | 47,327 | | | 1,457,671 | |
Barrick Gold Corp. | | | 55,800 | | | 1,623,780 | |
United States Steel Corp. | | | 13,800 | | | 366,390 | |
| | | | |
|
| |
| | | | | | 3,447,841 | |
| | | | |
|
| |
| | | | | | | |
Common Stocks, continued |
|
| | | | | | | |
| | Shares | | Value($) | |
| |
| |
| |
Oil & Gas – 14.4% | | | | | | | |
Apache Corp. | | | 24,400 | | | 1,777,784 | |
ConocoPhillips | | | 9,571 | | | 392,411 | |
EOG Resources, Inc. | | | 9,075 | | | 576,081 | |
Hess Corp. | | | 13,600 | | | 745,144 | |
Noble Energy, Inc. | | | 35,900 | | | 2,037,325 | |
Talisman Energy, Inc. | | | 55,200 | | | 692,208 | |
| | | | |
|
| |
| | | | | | 6,220,953 | |
| | | | |
|
| |
Pharmaceuticals – 7.6% | | | | | | | |
Amgen, Inc. (a) | | | 31,100 | | | 1,507,417 | |
Merck & Co., Inc. | | | 30,600 | | | 741,744 | |
Sanofi-Aventis ADR | | | 36,200 | | | 1,039,664 | |
| | | | |
|
| |
| | | | | | 3,288,825 | |
| | | | |
|
| |
Telecommunications – 8.0% | | | | | | | |
AT&T, Inc. | | | 33,000 | | | 845,460 | |
Motorola, Inc. | | | 319,000 | | | 1,764,070 | |
Verizon Communications, Inc. | | | 27,800 | | | 843,452 | |
| | | | |
|
| |
| | | | | | 3,452,982 | |
| | | | |
|
| |
Tobacco – 3.9% | | | | | | | |
Lorillard, Inc. | | | 9,927 | | | 626,691 | |
Philip Morris International, Inc. | | | 28,700 | | | 1,038,940 | |
| | | | |
|
| |
| | | | | | 1,665,631 | |
| | | | |
|
| |
Transportation – 2.0% | | | | | | | |
Union Pacific Corp. | | | 18,000 | | | 884,520 | |
| | | | |
|
| |
| | | | | | | |
TOTAL COMMON STOCKS
(COST $56,119,439) | | | | | | 41,995,121 | |
| | | | |
|
| |
Investment Company—2.5% | | | | | | | |
|
Northern Institutional Government Select
Portfolio, Shares Class, 0.10% (b) | | | 1,071,696 | | | 1,071,696 | |
| | | | |
|
| |
TOTAL INVESTMENT COMPANY
(COST $1,071,696) | | | | | | 1,071,696 | |
| | | | |
|
| |
TOTAL INVESTMENTS
(COST $57,191,135) — 99.9% | | | | | | 43,066,817 | |
| | | | |
|
| |
| |
|
| Percentages indicated are based on net assets of $43,127,664. |
| |
(a) | Represents non-income producing security. |
| |
(b) | The rates presented represent the annualized one day yield that was in effect on April 30, 2009. |
| |
ADR — American Depositary Receipt |
| | |
| | |
See notes to financial statements. | HSBC INVESTOR PORTFOLIOS | 54 |
|
HSBC INVESTOR PORTFOLIOS |
|
Statements of Assets and Liabilities—as of April 30, 2009 (Unaudited) |
| | | | | | | | | | | | | |
| | Core Plus
Fixed Income
Portfolio | | Intermediate
Duration
Fixed Income
Portfolio | | Growth
Portfolio | | International
Equity
Portfolio | |
|
|
|
|
|
|
|
|
|
|
|
|
| |
Assets: | | | | | | | | | | | | | |
Investments in non-affiliates, at value | | $ | 93,606,783 | | $ | 18,241,585 | | $ | 78,554,816 | | $ | 164,433,769 | |
Foreign currency, at value | | | — | | | — | | | — | | | 2,521,711 | |
Unrealized appreciation on forward foreign currency
exchange contracts | | | — | | | — | | | — | | | 487,440 | |
Interest and dividends receivable | | | 632,107 | | | 91,144 | | | 30,209 | | | 662,006 | |
Receivable for investments sold | | | 10,729,803 | | | 3,095,685 | | | 1,182,861 | | | 339,018 | |
Prepaid expenses and other assets | | | 7 | | | 170 | | | 746 | | | 1,470 | |
| |
|
| |
|
| |
|
| |
|
| |
Total Assets | | | 104,968,700 | | | 21,428,584 | | | 79,768,632 | | | 168,445,414 | |
| |
|
| |
|
| |
|
| |
|
| |
|
|
|
|
|
|
|
|
|
|
|
|
| |
Liabilities: | | | | | | | | | | | | | |
Cash overdraft | | | 3,873 | | | 6,131 | | | — | | | — | |
Unrealized depreciation on forward foreign
currency contracts | | | — | | | — | | | — | | | 1,198,982 | |
Payable for investments purchased | | | 35,443,151 | | | 8,763,180 | | | 1,010,356 | | | 815,275 | |
Accrued expenses and other liabilities: | | | | | | | | | | | | | |
Investment Management | | | 30,671 | | | 4,151 | | | 36,044 | | | 94,281 | |
Administration | | | 1,241 | | | 226 | | | 1,356 | | | 2,889 | |
Compliance Service | | | 24 | | | 4 | | | 27 | | | 56 | |
Other | | | 7,036 | | | 6,228 | | | 5,015 | | | 24,916 | |
| |
|
| |
|
| |
|
| |
|
| |
Total Liabilities | | | 35,485,996 | | | 8,779,920 | | | 1,052,798 | | | 2,136,399 | |
| |
|
| |
|
| |
|
| |
|
| |
|
|
|
|
|
|
|
|
|
|
|
|
| |
Net Assets: | | | | | | | | | | | | | |
Applicable to investors’ beneficial interest | | $ | 69,482,704 | | $ | 12,648,664 | | $ | 78,715,834 | | $ | 166,309,015 | |
| |
|
| |
|
| |
|
| |
|
| |
Total Investments, at cost | | $ | 103,226,664 | | $ | 19,536,796 | | $ | 84,735,372 | | $ | 240,011,755 | |
| |
|
| |
|
| |
|
| |
|
| |
Foreign currency, at cost | | $ | — | | $ | — | | $ | — | | $ | 2,504,392 | |
| |
|
| |
|
| |
|
| |
|
| |
| | |
55 | HSBC INVESTOR PORTFOLIOS | See notes to financial statements. |
|
HSBC INVESTOR PORTFOLIOS |
|
Statements of Assets and Liabilities—as of April 30, 2009 (Unaudited) (continued) |
| | | | | | | |
| | Opportunity
Portfolio | | Value
Portfolio | |
|
|
|
|
|
|
| |
Assets: | | | | | | | |
Investments in non-affiliates, at value | | $ | 110,785,911 | | $ | 43,066,817 | |
Dividend income | | | 2,825 | | | 82,117 | |
Receivable for investments sold | | | 1,231,827 | | | — | |
Prepaid expenses and other assets | | | — | | | 889 | |
| |
|
| |
|
| |
Total Assets | | | 112,020,563 | | | 43,149,823 | |
| |
|
| |
|
| |
|
|
|
|
|
|
| |
Liabilities: | | | | | | | |
Payable for investments purchased | | | 1,047,632 | | | — | |
Accrued expenses and other liabilities: | | | | | | | |
Investment Management | | | 70,435 | | | 18,009 | |
Administration | | | 1,921 | | | 760 | |
Compliance Service | | | 38 | | | 15 | |
Other | | | 11,632 | | | 3,375 | |
| |
|
| |
|
| |
Total Liabilities | | | 1,131,658 | | | 22,159 | |
| |
|
| |
|
| |
|
|
|
|
|
|
| |
Net Assets: | | | | | | | |
Applicable to investors’ beneficial interest | | $ | 110,888,905 | | $ | 43,127,664 | |
| |
|
| |
|
| |
Total Investments, at cost | | $ | 128,985,437 | | $ | 57,191,135 | |
| |
|
| |
|
| |
| | |
See notes to financial statements. | HSBC INVESTOR PORTFOLIOS | 56 |
|
HSBC INVESTOR PORTFOLIOS |
|
Statements of Operations—For the six months ended April 30, 2009 (Unaudited) |
| | | | | | | | | | | | | |
| | Core Plus
Fixed Income
Portfolio | | Intermediate
Duration
Fixed Income
Portfolio | | Growth
Portfolio | | International
Equity
Portfolio | |
|
|
|
|
|
|
|
|
| |
Investment Income: | | | | | | | | | | | | | |
Interest | | $ | 2,118,629 | | $ | 304,397 | | $ | — | | $ | 3,441 | |
Dividends | | | 5,734 | | | 4,879 | | | 363,478 | | | 2,937,928 | |
Foreign tax withholding | | | — | | | — | | | — | | | (453,901 | ) |
| |
|
| |
|
| |
|
| |
|
| |
Total Investment Income (Loss) | | | 2,124,363 | | | 309,276 | | | 363,478 | | | 2,487,468 | |
| |
|
| |
|
| |
|
| |
|
| |
|
|
|
|
|
|
|
|
|
|
|
|
| |
Expenses: | | | | | | | | | | | | | |
Investment Management | | | 196,009 | | | 25,771 | | | 209,638 | | | 576,888 | |
Administration | | | 7,500 | | | 1,315 | | | 7,447 | | | 16,550 | |
Accounting | | | 32,290 | | | 29,135 | | | 24,861 | | | 45,159 | |
Compliance Service | | | 127 | | | 8 | | | 169 | | | 340 | |
Custodian | | | 2,266 | | | 872 | | | 4,129 | | | 81,166 | |
Printing | | | 132 | | | 553 | | | 480 | | | 1,788 | |
Professional fees | | | 618 | | | 260 | | | 1,203 | | | 2,035 | |
Trustee | | | 532 | | | 59 | | | 518 | | | 1,227 | |
Other | | | 8,389 | | | 605 | | | 8,149 | | | 19,270 | |
| |
|
| |
|
| |
|
| |
|
| |
Total Expenses | | | 247,863 | | | 58,578 | | | 256,594 | | | 744,423 | |
| |
|
| |
|
| |
|
| |
|
| |
|
|
|
|
|
|
|
|
|
|
|
|
| |
Net Investment Income (Loss) | | | 1,876,500 | | | 250,698 | | | 106,884 | | | 1,743,045 | |
| |
|
| |
|
| |
|
| |
|
| |
|
|
|
|
|
|
|
|
|
|
|
|
| |
Net Realized/Unrealized Gains (Losses)
from Investments: | | | | | | | | | | | | | |
Net realized gains (losses) from investments and
foreign currency transactions | | | 51,411 | | | 177,985 | | | (12,863,368 | ) | | (56,073,611 | ) |
Net realized gains (losses) from futures transactions | | | (380,711 | ) | | (57,805 | ) | | — | | | — | |
Change in unrealized appreciation/depreciation from
investments and foreign currencies | | | 2,779,601 | | | 305,872 | | | 13,870,510 | | | 44,805,697 | |
| |
|
| |
|
| |
|
| |
|
| |
|
|
|
|
|
|
|
|
|
|
|
|
| |
Net realized/unrealized gains (losses) from
investments and foreign currency transactions | | | 2,450,301 | | | 426,052 | | | 1,007,142 | | | (11,267,914 | ) |
| |
|
| |
|
| |
|
| |
|
| |
Change In Net Assets Resulting From
Operations | | $ | 4,326,801 | | $ | 676,750 | | $ | 1,114,026 | | $ | (9,524,869 | ) |
| |
|
| |
|
| |
|
| |
|
| |
| | |
57 | HSBC INVESTOR PORTFOLIOS | See notes to financial statements. |
|
HSBC INVESTOR PORTFOLIOS |
|
Statements of Operations—For the six months ended April 30, 2009 (Unaudited) (continued) |
| | | | | | | |
| | Opportunity
Portfolio | | Value
Portfolio | |
|
|
|
|
|
|
| |
Investment Income: | | | | | | | |
Dividends | | $ | 292,719 | | $ | 567,167 | |
| |
|
| |
|
| |
Total Investment Income (Loss) | | | 292,719 | | | 567,167 | |
| |
|
| |
|
| |
|
|
|
|
|
|
| |
Expenses: | | | | | | | |
Investment Management | | | 418,743 | | | 112,278 | |
Administration | | | 10,754 | | | 4,396 | |
Accounting | | | 24,621 | | | 24,275 | |
Compliance Service | | | 184 | | | 115 | |
Custodian | | | 7,505 | | | 1,662 | |
Printing | | | 221 | | | 397 | |
Professional fees | | | 403 | | | 519 | |
Trustee | | | 820 | | | 239 | |
Other | | | 12,910 | | | 4,691 | |
| |
|
| |
|
| |
Total Expenses | | | 476,161 | | | 148,572 | |
| |
|
| |
|
| |
|
|
|
|
|
|
| |
Net Investment Income (Loss) | | | (183,442 | ) | | 418,595 | |
| |
|
| |
|
| |
|
|
|
|
|
|
| |
Net Realized/Unrealized Gains (Losses)
from Investments: | | | | | | | |
Net realized losses from investment transactions | | | (18,090,240 | ) | | (1,624,297 | ) |
Change in unrealized appreciation/depreciation
from investments and foreign currencies | | | 12,416,564 | | | (1,507,018 | ) |
| |
|
| |
|
| |
|
|
|
|
|
|
| |
Net realized/unrealized gains (losses) from
investment transactions | | | (5,673,676 | ) | | (3,131,315 | ) |
| |
|
| |
|
| |
Change In Net Assets Resulting From Operations | | $ | (5,857,118 | ) | $ | (2,712,720 | ) |
| |
|
| |
|
| |
| | |
See notes to financial statements. | HSBC INVESTOR PORTFOLIOS | 58 |
|
HSBC INVESTOR PORTFOLIOS |
|
Statements of Changes in Net Assets |
| | | | | | | | | | | | | |
| | Core Plus
Fixed Income
Portfolio | | Intermediate Duration
Fixed Income
Portfolio | |
|
|
|
|
| |
| | For the six
months ended
April 30, 2009
(Unaudited) | | For the
year ended
October 31, 2008 | | For the six
months ended
April 30, 2009
(Unaudited) | | For the
year ended
October 31, 2008 | |
|
|
|
|
|
|
|
|
| |
Investment Activities: | | | | | | | | | | | | | |
Operations: | | | | | | | | | | | | | |
Net investment income (loss) | | $ | 1,876,500 | | $ | 5,103,577 | | $ | 250,698 | | $ | 602,838 | |
Net realized gains (losses) from
investment and futures transactions | | | (329,300 | ) | | (1,760,929 | ) | | 120,180 | | | (137,944 | ) |
Change in unrealized
appreciation/depreciation
from investments | | | 2,779,601 | | | (12,280,378 | ) | | 305,872 | | | (1,515,259 | ) |
| |
|
| |
|
| |
|
| |
|
| |
Change in net assets resulting
from operations | | | 4,326,801 | | | (8,937,730 | ) | | 676,750 | | | (1,050,365 | ) |
| |
|
| |
|
| |
|
| |
|
| |
Proceeds from contributions | | | 779,241 | | | 13,894,668 | | | 293,480 | | | 3,554,894 | |
Value of withdrawals | | | (17,351,215 | ) | | (43,040,969 | ) | | (1,852,552 | ) | | (4,032,112 | ) |
| |
|
| |
|
| |
|
| |
|
| |
Change in net assets resulting from
transactions in investors’
beneficial interest | | | (16,571,974 | ) | | (29,146,301 | ) | | (1,559,072 | ) | | (477,218 | ) |
| |
|
| |
|
| |
|
| |
|
| |
Change in net assets | | | (12,245,173 | ) | | (38,084,031 | ) | | (882,322 | ) | | (1,527,583 | ) |
|
|
|
|
|
|
|
|
|
|
|
|
| |
Net Assets: | | | | | | | | | | | | | |
Beginning of period | | | 81,727,877 | | | 119,811,908 | | | 13,530,986 | | | 15,058,569 | |
| |
|
| |
|
| |
|
| |
|
| |
End of period | | $ | 69,482,704 | | $ | 81,727,877 | | $ | 12,648,664 | | $ | 13,530,986 | |
| |
|
| |
|
| |
|
| |
|
| |
| | |
59 | HSBC INVESTOR PORTFOLIOS | See notes to financial statements. |
|
HSBC INVESTOR PORTFOLIOS |
|
Statements of Changes in Net Assets (continued) |
| | | | | | | | | | | | | |
| | Growth
Portfolio | | International Equity
Portfolio | |
|
|
|
|
| |
| | For the six
months ended
April 30, 2009
(Unaudited) | | For the
year ended
October 31, 2008 | | For the six
months ended
April 30, 2009
(Unaudited) | | For the
year ended
October 31, 2008 | |
|
|
|
|
|
|
|
|
|
|
|
|
| |
Investment Activities: | | | | | | | | | | | | | |
Operations: | | | | | | | | | | | | | |
Net investment income (loss) | | $ | 106,884 | | $ | 158,253 | | $ | 1,743,045 | | $ | 9,312,232 | |
Net realized gains (losses) from
investment transactions | | | (12,863,368 | ) | | (80,608 | ) | | (56,073,611 | ) | | 10,348,234 | |
Change in unrealized
appreciation/depreciation from
investments and foreign currencies | | | 13,870,510 | | | (42,269,939 | ) | | 44,805,697 | | | (242,760,619 | ) |
| |
|
| |
|
| |
|
| |
|
| |
Change in net assets resulting from
operations | | | 1,114,026 | | | (42,192,294 | ) | | (9,524,869 | ) | | (223,100,153 | ) |
| |
|
| |
|
| |
|
| |
|
| |
Proceeds from contributions | | | 6,048,952 | | | 50,198,227 | | | 10,790,392 | | | 43,694,202 | |
Value of withdrawals | | | (10,388,656 | ) | | (15,750,298 | ) | | (34,265,418 | ) | | (76,346,748 | ) |
| |
|
| |
|
| |
|
| |
|
| |
Change in net assets resulting from
transactions in investors’
beneficial interest | | | (4,339,704 | ) | | 34,447,929 | | | (23,475,026 | ) | | (32,652,546 | ) |
| |
|
| |
|
| |
|
| |
|
| |
Change in net assets | | | (3,225,678 | ) | | (7,744,365 | ) | | (32,999,895 | ) | | (255,752,699 | ) |
|
|
|
|
|
|
|
|
|
|
|
|
| |
Net Assets: | | | | | | | | | | | | | |
Beginning of period | | | 81,941,512 | | | 89,685,877 | | | 199,308,910 | | | 455,061,609 | |
| |
|
| |
|
| |
|
| |
|
| |
End of period | | $ | 78,715,834 | | $ | 81,941,512 | | $ | 166,309,015 | | $ | 199,308,910 | |
| |
|
| |
|
| |
|
| |
|
| |
| | |
See notes to financial statements. | HSBC INVESTOR PORTFOLIOS | 60 |
|
HSBC INVESTOR PORTFOLIOS |
|
Statements of Changes in Net Assets (continued) |
| | | | | | | | | | | | | |
| | Opportunity
Portfolio | | Value
Portfolio | |
|
|
|
|
| |
| | For the six
months ended
April 30, 2009
(Unaudited) | | For the
year ended
October 31, 2008 | | For the six
months ended
April 30, 2009
(Unaudited) | | For the
year ended
October 31, 2008 | |
|
|
|
|
|
|
|
|
|
|
|
|
| |
Investment Activities: | | | | | | | | | | | | | |
Operations: | | | | | | | | | | | | | |
Net investment income (loss) | | $ | (183,442 | ) | $ | (854,296 | ) | $ | 418,595 | | $ | 1,062,396 | |
Net realized gains (losses) from
investment transactions | | | (18,090,240 | ) | | 2,354,698 | | | (1,624,297 | ) | | (7,776,127 | ) |
Change in unrealized
appreciation/depreciation from
investments and foreign currencies | | | 12,416,564 | | | (73,360,727 | ) | | (1,507,018 | ) | | (25,258,253 | ) |
| |
|
| |
|
| |
|
| |
|
| |
Change in net assets resulting from
operations | | | (5,857,118 | ) | | (71,860,325 | ) | | (2,712,720 | ) | | (31,971,984 | ) |
| |
|
| |
|
| |
|
| |
|
| |
Proceeds from contributions | | | 4,180,538 | | | 20,402,348 | | | 3,017,348 | | | 12,224,588 | |
Value of withdrawals | | | (15,404,154 | ) | | (44,840,850 | ) | | (6,840,136 | ) | | (13,247,672 | ) |
| |
|
| |
|
| |
|
| |
|
| |
Change in net assets resulting from
transactions in investors’
beneficial interest | | | (11,223,616 | ) | | (24,438,502 | ) | | (3,822,788 | ) | | (1,023,084 | ) |
| |
|
| |
|
| |
|
| |
|
| |
Change in net assets | | | (17,080,734 | ) | | (96,298,827 | ) | | (6,535,508 | ) | | (32,995,068 | ) |
|
|
|
|
|
|
|
|
|
|
|
|
| |
Net Assets: | | | | | | | | | | | | | |
Beginning of period | | | 127,969,639 | | | 224,268,466 | | | 49,663,172 | | | 82,658,240 | |
| |
|
| |
|
| |
|
| |
|
| |
End of period | | $ | 110,888,905 | | $ | 127,969,639 | | $ | 43,127,664 | | $ | 49,663,172 | |
| |
|
| |
|
| |
|
| |
|
| |
| | |
61 | HSBC INVESTOR PORTFOLIOS | See notes to financial statements. |
This page is intentionally left blank.
|
HSBC INVESTOR PORTFOLIOS |
|
|
Financial Highlights |
| | | | | | | | | | | | | | | | | | | | | |
| | | | Ratio/Supplementary Data | |
| | | |
|
|
| | Total
Return(a) | | Net Assets
at End of
Period
(000’s) | | Ratio of Net
Expenses
to Average
Net Assets(b) | | Ratio of Net
Investment
Income (Loss)
to Average
Net Assets(b) | | Ratio of
Expenses
to Average
Net Assets(b)(c) | | Portfolio
Turnover
Rate(a) | |
|
|
|
|
|
|
|
|
|
|
|
|
|
|
CORE PLUS FIXED INCOME PORTFOLIO | | | | | | | | | | | | | | | | | | | | | |
Year Ended October 31, 2004 | | 5.56 | % | | | $ | 169,459 | | | 0.52 | % | | 4.31 | % | | 0.52 | % | | 34.88 | % | |
Year Ended October 31, 2005 | | 1.64 | %(d) | | | | 122,530 | | | 0.40 | %(d) | | 4.25 | %(d) | | 0.53 | % | | 176.60 | % | |
Year Ended October 31, 2006 | | 5.55 | % | | | | 111,192 | | | 0.63 | % | | 4.96 | % | | 0.63 | % | | 273.91 | % | |
Year Ended October 31, 2007 | | 6.94 | % | | | | 119,812 | | | 0.59 | % | | 4.99 | % | | 0.59 | % | | 252.56 | % | |
Year Ended October 31, 2008 | | (8.78 | )% | | | | 81,728 | | | 0.59 | % | | 4.80 | % | | 0.59 | % | | 119.38 | % | |
Six Months Ended April 30, 2009 (Unaudited) | | 6.05 | % | | | | 69,483 | | | 0.68 | % | | 5.11 | % | | 0.68 | % | | 17.88 | % | |
|
|
|
|
|
|
|
|
|
|
|
|
|
|
|
|
|
|
|
|
|
|
INTERMEDIATE DURATION FIXED INCOME PORTFOLIO | | | | | | | | | | | | | | | | | | | | | |
Year Ended October 31, 2004 | | 4.48 | % | | | $ | 63,697 | | | 0.57 | % | | 3.54 | % | | 0.57 | % | | 50.06 | % | |
Year Ended October 31, 2005 | | 0.76 | %(d) | | | | 32,810 | | | 0.49 | %(d) | | 3.85 | %(d) | | 0.58 | % | | 107.26 | % | |
Year Ended October 31, 2006 | | 5.29 | % | | | | 19,517 | | | 0.78 | % | | 4.58 | % | | 0.78 | % | | 236.51 | % | |
Year Ended October 31, 2007 | | 8.38 | % | | | | 15,059 | | | 0.84 | % | | 4.68 | % | | 0.84 | % | | 219.76 | % | |
Year Ended October 31, 2008 | | (7.08 | )% | | | | 13,531 | | | 0.91 | % | | 4.15 | % | | 0.91 | % | | 124.23 | % | |
Six Months Ended April 30, 2009 (Unaudited) | | 5.37 | % | | | | 12,649 | | | 0.91 | % | | 3.89 | % | | 0.91 | % | | 62.22 | % | |
|
|
|
|
|
|
|
|
|
|
|
|
|
|
|
|
|
|
|
|
|
|
GROWTH PORTFOLIO | | | | | | | | | | | | | | | | | | | | | |
Period Ended October 31, 2004 (f) | | (0.86 | )% | | | $ | 49,680 | | | 0.72 | % | | 0.06 | % | | 0.72 | % | | 53.08 | % | |
Year Ended October 31, 2005 | | 13.59 | %(d) | | | | 49,415 | | | 0.63 | %(d) | | 0.77 | %(d) | | 0.68 | % | | 79.54 | % | |
Year Ended October 31, 2006 | | 7.53 | % | | | | 59,828 | | | 0.69 | % | | 0.38 | % | | 0.69 | % | | 75.06 | % | |
Year Ended October 31, 2007 | | 31.11 | % | | | | 89,686 | | | 0.62 | % | | 0.45 | % | | 0.62 | % | | 57.04 | % | |
Year Ended October 31, 2008 | | (37.75 | )%(e) | | | | 81,942 | | | 0.62 | % | | 0.19 | % | | 0.62 | % | | 157.87 | % | |
Six Months Ended April 30, 2009 (Unaudited) | | 2.05 | % | | | | 78,716 | | | 0.70 | % | | 0.29 | % | | 0.70 | % | | 33.58 | % | |
|
|
|
|
|
|
|
|
|
|
|
|
|
|
|
|
|
|
|
|
|
|
INTERNATIONAL EQUITY PORTFOLIO | | | | | | | | | | | | | | | | | | | | | |
Year Ended October 31, 2004 | | 20.29 | % | | | $ | 220,025 | | | 0.94 | % | | 1.53 | % | | 0.94 | % | | 106.11 | % | |
Year Ended October 31, 2005 | | 19.54 | % | | | | 230,230 | | | 0.84 | % | | 1.92 | % | | 0.84 | % | | 31.32 | % | |
Year Ended October 31, 2006 | | 32.79 | % | | | | 333,755 | | | 0.86 | % | | 2.03 | % | | 0.86 | % | | 33.39 | % | |
Year Ended October 31, 2007 | | 25.17 | % | | | | 455,062 | | | 0.79 | % | | 2.16 | % | | 0.79 | % | | 26.08 | % | |
Year Ended October 31, 2008 | | (51.95 | )% | | | | 199,309 | | | 0.76 | % | | 2.65 | % | | 0.76 | % | | 28.98 | % | |
Six Months Ended April 30, 2009 (Unaudited) | | (4.47 | )% | | | | 166,309 | | | 0.93 | % | | 2.17 | % | | 0.93 | % | | 29.46 | % | |
|
|
|
|
|
|
|
|
|
|
|
|
|
|
|
|
|
|
|
|
|
|
OPPORTUNITY PORTFOLIO | | | | | | | | | | | | | | | | | | | | | |
Year Ended October 31, 2004 | | 5.93 | % | | | $ | 359,333 | | | 0.88 | % | | (0.52 | )% | | 0.88 | % | | 81.75 | % | |
Year Ended October 31, 2005 | | 14.35 | %(d) | | | | 218,778 | | | 0.85 | %(d) | | (0.45 | )%(d) | | 0.90 | % | | 63.95 | % | |
Year Ended October 31, 2006 | | 19.54 | % | | | | 241,495 | | | 0.91 | % | | (0.40 | )% | | 0.91 | % | | 60.83 | % | |
Year Ended October 31, 2007 | | 30.54 | % | | | | 224,268 | | | 0.91 | % | | (0.55 | )% | | 0.91 | % | | 69.41 | % | |
Year Ended October 31, 2008 | | (35.30 | )% | | | | 127,970 | | | 0.87 | % | | (0.46 | )% | | 0.87 | % | | 80.42 | % | |
Six Months Ended April 30, 2009 (Unaudited) | | (3.69 | )% | | | | 110,889 | | | 0.91 | % | | (0.35 | )% | | 0.91 | % | | 29.04 | % | |
|
|
|
|
|
|
|
|
|
|
|
|
|
|
|
|
|
|
|
|
|
|
VALUE PORTFOLIO | | | | | | | | | | | | | | | | | | | | | |
Period Ended October 31, 2004 (f) | | 6.12 | % | | | $ | 61,414 | | | 0.71 | % | | 1.28 | % | | 0.71 | % | | 10.33 | % | |
Year Ended October 31, 2005 | | 15.23 | %(d) | | | | 54,150 | | | 0.64 | %(d) | | 1.15 | %(d) | | 0.69 | % | | 16.45 | % | |
Year Ended October 31, 2006 | | 22.21 | % | | | | 67,432 | | | 0.71 | % | | 1.23 | % | | 0.71 | % | | 20.63 | % | |
Year Ended October 31, 2007 | | 10.28 | % | | | | 82,658 | | | 0.66 | % | | 1.29 | % | | 0.66 | % | | 18.67 | % | |
Year Ended October 31, 2008 | | (39.91 | )% | | | | 49,663 | | | 0.64 | % | | 1.54 | % | | 0.64 | % | | 24.61 | % | |
Six Months Ended April 30, 2009 (Unaudited) | | (4.59 | )% | | | | 43,128 | | | 0.69 | % | | 1.96 | % | | 0.69 | % | | 13.02 | % | |
|
|
|
|
|
|
|
|
|
|
|
|
|
|
|
|
|
|
|
|
|
|
| |
(a) | Not annualized for periods less than one year. |
| |
(b) | Annualized for periods less than one year. |
| |
(c) | During the period, certain fees were reduced. If such fee reductions had not occurred, the ratio would have been as indicated. |
| |
(d) | During the year ended October 31, 2005, HSBC reimbursed certain amounts to the Portfolios related to violations of certain investment policies and limitations. The corresponding impact to the net expense ratio, net income ratio and total return were 0.12%, 0.09%, 0.05%, 0.04% and 0.05% for the Core Plus Fixed Income Portfolio, Intermediate Duration Fixed Income Portfolio, Growth Portfolio, Opportunity Portfolio and Value Portfolio, respectively. |
| |
(e) | During the year ended October 31, 2008, Winslow Capital Management, Inc. reimbursed $64,658 to the Portfolio related to violations of certain investment policies and limitations. The corresponding impact to the total return was 0.08%. |
| |
(f) | Growth Portfolio commenced operations on May 7, 2004. |
| Value Portfolio commenced operations on May 7, 2004. |
| | |
63 | HSBC INVESTOR PORTFOLIOS | See notes to financial statements. |
|
HSBC INVESTOR PORTFOLIOS |
|
|
Notes to Financial Statements—as of April 30, 2009 (Unaudited) |
| |
1. | Organization: |
| |
| The HSBC Investor Portfolios (the “Portfolio Trust”), is an open-end management investment company organized as a New York trust under the laws of the State of New York on November 1, 1994. The Portfolio Trust contains the following master funds (individually a “Portfolio,” collectively the “Portfolios”): |
| |
Portfolio | Short Name |
|
|
HSBC Investor Core Plus Fixed Income Portfolio | Core Plus Fixed Income Portfolio |
HSBC Investor Intermediate Duration Fixed Income Portfolio | Intermediate Duration Fixed Income Portfolio |
HSBC Investor Growth Portfolio | Growth Portfolio |
HSBC Investor International Equity Portfolio | International Equity Portfolio |
HSBC Investor Opportunity Portfolio | Opportunity Portfolio |
HSBC Investor Value Portfolio | Value Portfolio |
| |
| The Portfolios operate as master funds in master-feeder arrangements, in which other funds invest all of their investable assets in the Portfolios. The Portfolios also receive investments from funds of funds. The Declaration of Trust permits the Board of Trustees to issue an unlimited number of beneficial interests in the Portfolios. |
| |
| The Portfolios are diversified series of the Portfolio Trust and are part of the HSBC Investor Family of Funds. Financial statements for all other funds of the HSBC Investor Family of Funds are published separately. |
| |
| Under the Portfolio Trust’s organizational documents, the Portfolio Trust’s Officers and Trustees are indemnified against certain liabilities arising out of the performance of their duties to the Portfolios. In addition, in the normal course of business, the Portfolio Trust may enter into contracts with its service providers, which also provide for indemnifications by the Portfolios. The Portfolios’ maximum exposure under these arrangements is unknown as this would involve any future claims that may be made against the Portfolios. However, based on experience, the Portfolio Trust expects that risk of loss to be remote. |
| |
2. | Significant Accounting Policies: |
| |
| The following is a summary of the significant accounting policies followed by the Portfolios in the preparation of their financial statements. The policies are in conformity with U.S. generally accepted accounting principles (“GAAP’’). The preparation of financial statements requires management to make estimates and assumptions that affect the reported amounts of assets and liabilities and disclosure of contingent assets and liabilities at the date of the financial statements and the reported amounts of income and expenses for the period. Actual results could differ from those estimates. |
| |
| Securities Valuation: |
| |
| Effective November 1, 2008, the Portfolio Trust adopted Statement of Financial Accounting Standards (“SFAS”) No. 157, “Fair Value Measurements.” There was no impact to the Portfolios’ net assets or results of operations upon adoption. SFAS 157 defines fair value as the price that would be received to sell an asset or paid to transfer a liability in an orderly transaction between market participants at the measurement date. |
| |
| Bonds and other fixed income securities (other than short-term obligations but including listed issues) are valued on the basis of valuations furnished by a pricing service, the use of which has been approved by the Portfolios’ Board of Trustees. In making such valuations, the pricing service utilizes both dealer-supplied valuations and the use of matrix techniques which take into account appropriate factors such as institutional-size trading in similar groups of securities, yield, quality, coupon rate, maturity, type of issue, trading characteristics other than market data and without exclusive reliance upon quoted prices or exchanges or over-the-counter prices, since such valuations are believed to reflect more accurately the fair value of such securities. |
| |
| The value of each equity security is based either on the last sale price on a national securities exchange, or in the absence of recorded sales, at the closing bid prices on such exchanges, or at the quoted bid price in the over-the-counter market. Securities or other assets for which market quotations are not readily available, or are deemed unreliable due to a significant event or otherwise, are valued by or at the direction of the Portfolio Trusts’ Board of Trustees. Examples of potentially significant events that could affect the value of an individual security include corporate actions by the issuer, announcements by the issuer relating to its earnings or products, regulatory news, natural disasters, and litigation. |
| |
HSBC INVESTOR PORTFOLIOS | 64 |
|
HSBC INVESTOR PORTFOLIOS |
|
|
Notes to Financial Statements—as of April 30, 2009 (Unaudited) (continued) |
| |
| Examples of potentially significant events that could affect multiple securities held by a Portfolio include governmental actions, natural disasters, and armed conflicts. In addition, if events materially affecting the value of foreign securities occur between the time when the exchange on which they are traded closes and the time when the Portfolios’ net assets are calculated, such securities may be valued using fair value pricing in accordance with procedures adopted by the Board of Trustees. Management identifies possible fluctuations in foreign securities by monitoring the rise or fall in the value of a designated benchmark index. In the event of a rise or fall greater than predetermined levels, the International Equity Portfolio may use a systematic valuation model provided by an independent third party to value its foreign securities, rather than local market closing prices. When the International Equity Portfolio uses such a valuation model, the value assigned to the International Equity Portfolio’s foreign securities may not be the quoted or published prices of the investment on their primary markets or exchanges. |
| |
| Exchange traded futures contracts are valued at the last sales price as of the close of the primary exchange. Forward foreign currency contracts are generally valued at the foreign currency exchange rate as of the close of the New York Stock Exchange. |
| |
| Investment Transactions and Related Income: |
| |
| Investment transactions are accounted for no later than one business day after trade date. For financial reporting purposes, changes in holdings are accounted for on trade date on the last business day of the reporting period. Investment gains and losses are calculated on the identified cost basis. Interest income is recognized on the accrual basis and includes, where applicable, the amortization or accretion of premium or discount. Dividend income is recorded on the ex-dividend date. |
| |
| Foreign Currency Translation: |
| |
| The accounting records of the Portfolios are maintained in U.S. dollars. Foreign currency amounts are translated into U.S. dollars at the current rate of exchange to determine the value of investments, assets and liabilities. Purchases and sales of securities, and income and expenses are translated at the prevailing rate of exchange on the respective dates of such transactions. The Portfolios do not isolate the portion of the results of operations resulting from changes in foreign exchange rates on investments from fluctuations arising from changes in market prices of securities held. Such fluctuations are included with the net realized and unrealized gain or loss from investments and foreign currencies. |
| |
| Forward Foreign Currency Exchange Contracts: |
| |
| The Portfolios may enter into forward foreign currency exchange contracts in connection with planned purchases or sales of securities or to hedge the U.S. dollar value of portfolio securities denominated in a particular currency. The Portfolios could be exposed to risks if the counterparties to the contracts are unable to meet the terms of their contracts and from unanticipated movements in the value of a foreign currency relative to the U.S. dollar. The forward foreign currency exchange contracts are adjusted by the daily exchange rate of the underlying currency and any gains or losses are recorded for financial statement purposes as unrealized gains or losses until the contract settlement date. |
| |
| Futures Contracts: |
| |
| Each Portfolio may invest in futures contracts for the purpose of hedging its existing portfolio securities or securities it intends to purchase against fluctuations in fair value caused by changes in prevailing market interest rates. Upon entering into a futures contract, the Portfolio is required to pledge to the broker an amount of cash and/or other assets equal to a certain percentage of the contract amount (initial margin deposit). Subsequent payments, known as “variation margin,” are made or received by the Portfolio each day, depending on the daily fluctuations in the fair value of the underlying security. The Portfolio recognizes a gain or loss equal to the daily variation margin. Should market conditions move unexpectedly, the Portfolio may not achieve the anticipated benefits of the futures contracts and may realize a loss. The use of futures transactions involves the risk of imperfect correlation in movements in the price of futures contracts, interest rates, and the underlying hedged assets. |
| |
| Mortgage Dollar Roll Transactions: |
| |
| The Core Plus Fixed Income Portfolio and the Intermediate Duration Fixed Income Portfolio may engage in dollar roll transactions with respect to mortgage securities issued by the Government National Mortgage Association, the Federal National Mortgage Association and the Federal Home Loan Mortgage Corporation. In a dollar roll transaction, the Portfolio sells a mortgage-backed security and simultaneously agrees to repurchase a similar security on a specified future |
| |
65 | HSBC INVESTOR PORTFOLIOS |
|
HSBC INVESTOR PORTFOLIOS |
|
|
Notes to Financial Statements—as of April 30, 2009 (Unaudited) (continued) |
| |
| date at an agreed upon price. During the roll period, the Portfolio will not be entitled to receive any interest or principal paid on the securities sold. The Portfolio is compensated for the lost interest on the securities sold by the difference between the sales price and the lower price for the future repurchase as well as by the interest earned on the reinvestment of the sales proceeds. The Portfolio may also be compensated by receipt of a commitment fee. |
| |
| Restricted and Illiquid Securities: |
| |
| A restricted security is a security which has been purchased through a private offering and cannot be resold to the general public without prior registration under the Securities Act of 1933 (the “1933 Act”) or pursuant to the resale limitations provided by Rule 144 under the 1933 Act, or another exemption from the registration requirements of the 1933 Act. Certain restricted securities may be resold in transactions exempt from registration, normally to qualified institutional buyers, and may be deemed liquid by the investment adviser based on procedures established by the Board of Trustees. Therefore, not all restricted securities are considered illiquid. At April 30, 2009 the HSBC Core Plus Fixed Income Portfolio held restricted securities that were illiquid, representing 0.04% of net assets, as follows: |
| | | | | | | | | | | | | |
Security Name | | Acquisition
Date | | Acquisition
Cost($) | | Principal
Amount($) | | Value($) | |
| |
| |
| |
| |
| |
DLJ Mortgage Acceptance Corp. IO, Series 1997,
Class S, 1.20%, 5/15/30 | | 5/15/1997 | | | 1,168 | | | 16,850 | | | 1 | |
FHA Weyerhauser, 7.43%, 1/1/24 | | 3/28/2002 | | | 24,528 | | | 25,711 | | | 25,711 | |
GS Mortgage Securities Corp. IO, Series 1997-GL,
Class X2, 0.29, 7/13/30 | | 8/14/1997 | | | 1,192 | | | 35,320 | | | 373 | |
| |
| Repurchase Agreements: |
| |
| The Portfolios may enter into repurchase agreements with an entity which is a member of the Federal Reserve System or which is a “primary dealer” (as designated by the Federal Reserve Bank of New York) in U.S. Government obligations. The repurchase price generally equals the price paid by a Portfolio plus interest negotiated on the basis of current short-term rates, which may be more or less than the rate on the underlying portfolio securities. The seller, under a repurchase agreement, is required to maintain the collateral held pursuant to the agreement, with a fair value equal to or greater than the repurchase price (including accrued interest). Collateral subject to repurchase agreements is held by the Portfolios’ Custodian or another qualified Custodian or in the Federal Reserve/Treasury book-entry system. In the event of counter-party default, the Portfolio has the right to use the collateral to offset losses incurred. There is a potential for loss to the Portfolio in the event the Portfolio is delayed or prevented from exercising its rights to dispose of the collateral securities, including the risk of a possible decline in the fair value of the underlying securities during the period while the Portfolio seeks to assert its rights. |
| |
| Expense Allocations: |
| |
| Expenses directly attributable to a Portfolio are charged to that Portfolio. Expenses not directly attributable to a Portfolio are allocated proportionally among various or all funds within the HSBC Investor Family of Funds in relation to net assets or on another reasonable basis. |
| |
| Federal Income Taxes: |
| |
| Each Portfolio will be treated as a partnership for U.S. Federal income tax purposes. Accordingly, each Portfolio passes through all of its net investment income and gains and losses to its feeder funds, and is therefore not subject to U.S. Federal income tax. As such, investors in the Portfolios will be taxed on their respective share of the Portfolios’ ordinary income and realized gains. It is intended that the Portfolios will be managed in such a way that an investor will be able to satisfy the requirements of the Internal Revenue Code applicable to regulated investment companies. |
| |
| In addition, Financial Accounting Standards Board Interpretation No. 48, Accounting for Uncertainty in Income Taxes (“FIN 48”) provides guidance for how uncertain tax positions should be recognized, measured, presented and disclosed in the financial statements. FIN 48 requires the affirmative evaluation of tax positions taken or expected to be taken in the course of preparing the Portfolio Trust’s tax returns to determine whether it is more-likely-than-not (i.e., greater than 50-percent) that each tax position will be sustained upon examination by a taxing authority based on the technical merits of the position. A tax position that meets the more-likely-than-not recognition threshold is measured to determine the amount of benefit to recognize in the financial statements. Differences between tax positions taken in a tax return and amounts recognized in the financial statements will generally result in an increase in a liability for taxes payable (or a |
| |
HSBC INVESTOR PORTFOLIOS | 66 |
|
HSBC INVESTOR PORTFOLIOS |
|
|
Notes to Financial Statements—as of April 30, 2009 (Unaudited) (continued) |
| | | |
| reduction of a tax refund receivable), including the recognition of any related interest and penalties as an operating expense. The FIN 48 analysis included a review of tax positions taken in tax years that remain subject to examination by tax authorities in all major tax jurisdictions, including federal (i.e., the last 4 tax year ends and the interim tax period since then, as applicable). FIN 48 did not impact the Portfolios’ net assets or results of operations during the period. |
| |
| New Accounting Pronouncements: |
| |
| In March 2008, the Financial Accounting Standards Board (“FASB”) issued the Statement of Financial Accounting Standards No. 161, “Disclosures about Derivative Instruments and Hedging Activities” (“SFAS 161”). SFAS 161 will be effective for fiscal years and interim periods beginning after November 15, 2008. SFAS 161 requires enhanced disclosures about the Portfolios’ derivative and hedging activities, including how such activities are accounted for and their effect on the Portfolios’ financial position, performance and cash flows. Management is currently evaluating the impact the adoption of SFAS 161 will have on the Portfolios’ financial statements and related disclosures. |
| |
| In April 2009, the FASB issued FASB Staff Position No. 157-4, “Determining Fair Value When the Volume and Level of Activity for the Asset or Liability Have Significantly Decreased and Identifying Transactions That Are Not Orderly” (“FSP 157-4”). FSP 157-4 provides additional guidance for estimating fair value in accordance with SFAS No. 157, when the volume and level of activity for the asset or liability have significantly decreased as well as guidance on identifying circumstances that indicate a transaction is not orderly. FSP 157-4 is effective for fiscal years and interim periods ending after June 15, 2009. Management is currently evaluating the impact the adoption of FSP 157-4 will have on the Portfolios’ financial statement disclosures. |
| |
3. | Investment Valuation Summary |
| |
| | The inputs used for valuing the Funds’ investments are summarized in the three broad levels listed below: |
| | |
| | • | Level 1: quoted prices in active markets for identical assets |
| | | |
| | • | Level 2: other significant observable inputs (including quoted prices for similar securities, interest rates, prepayment speeds, credit risk, etc.) |
| | | |
| | • | Level 3: significant unobservable inputs (including the Fund’s own assumptions in determining the fair value of investments) |
| | | |
| The inputs or methodology used for valuing investments is not necessarily an indication of the risk associated with investing in those investments. For example, short-term debt securities of sufficient credit quality maturing in sixty days or less are generally valued at amortized cost, which approximates fair value. Generally, amortized cost approximates the current fair value of a security, but since the valuation is not obtained from a quoted price in an active market, such securities are reflected as Level 2. |
| |
| The following is a summary of the valuation as of April 30, 2009 for each Fund based upon the three levels defined above: |
| | | | | | | | | | | | | |
| | LEVEL 1 – Quoted Prices | | LEVEL 2 – Other Significant | |
| |
| |
| |
Fund Name | | Investment |