UNITED STATES
SECURITIES AND EXCHANGE COMMISSION
Washington, D.C. 20549
FORM N-CSR
CERTIFIED SHAREHOLDER REPORT OF REGISTERED
MANAGEMENT INVESTMENT COMPANIES
Investment Company Act file number: 811-04782
HSBC FUNDS
(Exact name of registrant as specified in charter)
66 Hudson Boulevard e.
4th Floor
New York, NY 10001
(Address of principal executive offices) (Zip code)
STEFANO MICHELAGNOLI
PRESIDENT
66 Hudson Boulevard e.
4th Floor
New York, NY 10001
(Name and address of agent for service)
Registrant’s telephone number, including area code: 1-800-782-8183
Date of fiscal year end: October 31
Date of reporting period: October 31, 2024
Item 1. Reports to Shareholders.
(a) The Reports to Shareholders are attached herewith.
 | Annual Shareholder Report
October 31, 2024 |
HSBC Radiant U.S. Smaller Companies Fund (Class I)
Class I | RESCX
This annual shareholder report contains important information about HSBC Radiant U.S. Smaller Companies Fund (Class I) for the period of November 1, 2023 to October 31, 2024. You can find additional information about the Fund at www.assetmanagement.us.hsbc.com/en/institutional-investor/funds. You can also request this information by contacting us at 1-800-782-8183.
What were the Fund costs for the last year?
(based on a hypothetical $10,000 investment)
| Class Name | Cost of a $10,000 investment | Costs paid as a percentage of a $10,000 investment |
| Class I | $104 | 0.90% |
The Fund is a feeder fund that invests all of its investable assets in a master portfolio, HSBC Radiant U.S. Smaller Companies Portfolio (the “Portfolio”). Fund costs reflect the expenses of both the Fund and the Portfolio.
How did the Fund perform the last year and what affected its performance?
For the 12-month period ended October 31, 2024, the Fund returned 31.86% for its Class I shares (net of fees). That compared to a 35.61% return for the Bloomberg US 2500 Growth Total Return Index, the Fund's performance benchmark.
U.S. smaller company equities experienced a strong rally across much of the 12-month period under review due in large part to market anticipation of the Federal Reserve’s interest rate cut. The rate cut, which took place in September 2024, drove expectations of lower debt payments and improved access to capital, which generally benefited smaller companies and companies with greater leverage. Among small-cap U.S. equities, all sectors except Energy returned double-digit gains for the period, with the Financials, Utilities, and Information Technology sectors outperforming the rest. Strong corporate earnings, a stable jobs market, and a backdrop of receding inflation helped stabilize investor sentiment amid volatility driven by the lead-up to the U.S. election.
The Fund underperformed the Bloomberg US 2500 Growth Total Return Index for the period under review. By far the largest detractor from the Fund’s relative performance was its lack of exposure to two benchmark holdings: an artificial intelligence analytics firm that trades as a Bitcoin proxy and an e-commerce site for used car sales. The Fund’s below-benchmark exposure to the Materials and Industrials sectors also dragged on relative results. A below-benchmark exposure to companies that experience interest from short-sellers also detracted from relative performance, as investors generally covered their short positions in anticipation of a rally in more speculative names driven by the anticipated interest rate cuts.
The Fund’s relative performance benefited from its emphasis on companies with higher earnings yields, greater profitability, and strong price momentum. The Fund’s relative results also benefited from its above-benchmark exposure to companies with higher leverage in the lead-up to the interest rate cut, as well as its above-benchmark allocation to the Healthcare and Information Technology sectors, which outperformed.
| HSBC Radiant U.S. Smaller Companies Fund (Class I) | Class I |
Fund Performance

| Year | Class I | Bloomberg US 2500 Growth Total Return Index | Bloomberg US 3000 Total Return Index |
| 10/31/2014 | $1,000,000 | $1,000,000 | $1,000,000 |
| 11/30/2014 | $1,010,303 | $1,012,612 | $1,023,658 |
| 12/31/2014 | $1,021,764 | $1,023,761 | $1,023,388 |
| 1/31/2015 | $995,253 | $1,011,243 | $995,149 |
| 2/28/2015 | $1,079,803 | $1,080,149 | $1,052,662 |
| 3/31/2015 | $1,083,385 | $1,095,548 | $1,042,165 |
| 4/30/2015 | $1,065,472 | $1,071,083 | $1,046,822 |
| 5/31/2015 | $1,095,566 | $1,099,032 | $1,061,361 |
| 6/30/2015 | $1,076,220 | $1,095,964 | $1,043,378 |
| 7/31/2015 | $1,082,669 | $1,105,945 | $1,060,792 |
| 8/31/2015 | $1,003,851 | $1,034,741 | $997,035 |
| 9/30/2015 | $935,781 | $984,650 | $967,897 |
| 10/31/2015 | $983,072 | $1,036,504 | $1,043,932 |
| 11/30/2015 | $1,003,134 | $1,063,323 | $1,049,906 |
| 12/31/2015 | $975,907 | $1,025,520 | $1,028,779 |
| 1/31/2016 | $854,814 | $937,592 | $970,308 |
| 2/29/2016 | $834,751 | $936,755 | $969,784 |
| 3/31/2016 | $915,002 | $1,009,260 | $1,038,062 |
| 4/30/2016 | $940,797 | $1,018,240 | $1,045,070 |
| 5/31/2016 | $967,308 | $1,046,351 | $1,064,236 |
| 6/30/2016 | $932,915 | $1,049,507 | $1,066,392 |
| 7/31/2016 | $990,954 | $1,103,570 | $1,108,977 |
| 8/31/2016 | $1,004,568 | $1,109,895 | $1,111,762 |
| 9/30/2016 | $998,119 | $1,114,030 | $1,113,918 |
| 10/31/2016 | $950,828 | $1,062,263 | $1,089,436 |
| 11/30/2016 | $1,001,701 | $1,134,967 | $1,137,726 |
| 12/31/2016 | $1,004,463 | $1,148,479 | $1,159,482 |
| 1/31/2017 | $1,049,248 | $1,171,766 | $1,181,658 |
| 2/28/2017 | $1,093,233 | $1,208,022 | $1,225,305 |
| 3/31/2017 | $1,108,428 | $1,217,838 | $1,226,623 |
| 4/30/2017 | $1,129,221 | $1,236,387 | $1,239,769 |
| 5/31/2017 | $1,130,820 | $1,238,433 | $1,252,557 |
| 6/30/2017 | $1,146,015 | $1,265,043 | $1,264,041 |
| 7/31/2017 | $1,161,210 | $1,281,657 | $1,287,834 |
| 8/31/2017 | $1,175,605 | $1,283,411 | $1,289,826 |
| 9/30/2017 | $1,194,799 | $1,335,992 | $1,321,539 |
| 10/31/2017 | $1,231,587 | $1,366,387 | $1,350,273 |
| 11/30/2017 | $1,287,568 | $1,405,913 | $1,391,136 |
| 12/31/2017 | $1,307,250 | $1,407,474 | $1,405,061 |
| 1/31/2018 | $1,398,858 | $1,462,766 | $1,479,614 |
| 2/28/2018 | $1,349,390 | $1,419,799 | $1,424,901 |
| 3/31/2018 | $1,360,383 | $1,435,485 | $1,396,466 |
| 4/30/2018 | $1,371,376 | $1,433,532 | $1,401,662 |
| 5/31/2018 | $1,433,669 | $1,513,418 | $1,441,626 |
| 6/30/2018 | $1,430,005 | $1,527,639 | $1,451,464 |
| 7/31/2018 | $1,460,236 | $1,554,981 | $1,499,453 |
| 8/31/2018 | $1,511,536 | $1,646,963 | $1,550,857 |
| 9/30/2018 | $1,495,047 | $1,622,799 | $1,553,073 |
| 10/31/2018 | $1,317,327 | $1,450,849 | $1,437,583 |
| 11/30/2018 | $1,329,236 | $1,481,549 | $1,467,410 |
| 12/31/2018 | $1,197,251 | $1,322,920 | $1,330,254 |
| 1/31/2019 | $1,328,904 | $1,471,458 | $1,445,699 |
| 2/28/2019 | $1,388,541 | $1,558,370 | $1,496,833 |
| 3/31/2019 | $1,391,917 | $1,553,025 | $1,518,110 |
| 4/30/2019 | $1,457,180 | $1,606,337 | $1,578,363 |
| 5/31/2019 | $1,354,784 | $1,507,960 | $1,476,604 |
| 6/30/2019 | $1,447,053 | $1,617,991 | $1,579,771 |
| 7/31/2019 | $1,463,932 | $1,640,483 | $1,603,893 |
| 8/31/2019 | $1,420,048 | $1,589,054 | $1,571,491 |
| 9/30/2019 | $1,408,795 | $1,582,274 | $1,598,922 |
| 10/31/2019 | $1,439,177 | $1,613,288 | $1,632,822 |
| 11/30/2019 | $1,571,955 | $1,696,853 | $1,694,602 |
| 12/31/2019 | $1,607,760 | $1,722,815 | $1,743,056 |
| 1/31/2020 | $1,611,367 | $1,711,651 | $1,741,559 |
| 2/29/2020 | $1,493,521 | $1,582,787 | $1,599,206 |
| 3/31/2020 | $1,196,500 | $1,298,323 | $1,378,199 |
| 4/30/2020 | $1,405,737 | $1,496,203 | $1,562,312 |
| 5/31/2020 | $1,582,507 | $1,630,998 | $1,647,346 |
| 6/30/2020 | $1,608,962 | $1,681,071 | $1,685,753 |
| 7/31/2020 | $1,694,341 | $1,770,315 | $1,779,996 |
| 8/31/2020 | $1,762,884 | $1,842,764 | $1,908,288 |
| 9/30/2020 | $1,759,276 | $1,805,773 | $1,839,859 |
| 10/31/2020 | $1,764,086 | $1,826,225 | $1,801,408 |
| 11/30/2020 | $1,981,741 | $2,099,977 | $2,020,903 |
| 12/31/2020 | $2,144,214 | $2,261,078 | $2,111,687 |
| 1/31/2021 | $2,115,203 | $2,318,782 | $2,104,604 |
| 2/28/2021 | $2,223,336 | $2,420,484 | $2,171,565 |
| 3/31/2021 | $2,227,293 | $2,408,395 | $2,247,556 |
| 4/30/2021 | $2,352,570 | $2,500,692 | $2,363,480 |
| 5/31/2021 | $2,305,096 | $2,462,111 | $2,373,063 |
| 6/30/2021 | $2,360,482 | $2,544,439 | $2,435,816 |
| 7/31/2021 | $2,393,449 | $2,512,349 | $2,478,805 |
| 8/31/2021 | $2,456,747 | $2,573,736 | $2,550,228 |
| 9/30/2021 | $2,418,505 | $2,475,013 | $2,437,194 |
| 10/31/2021 | $2,527,957 | $2,607,191 | $2,601,932 |
| 11/30/2021 | $2,401,362 | $2,479,486 | $2,563,046 |
| 12/31/2021 | $2,491,747 | $2,535,624 | $2,660,088 |
| 1/31/2022 | $2,230,396 | $2,245,226 | $2,499,858 |
| 2/28/2022 | $2,197,727 | $2,250,048 | $2,436,640 |
| 3/31/2022 | $2,206,636 | $2,270,161 | $2,513,843 |
| 4/30/2022 | $1,974,984 | $2,032,299 | $2,285,378 |
| 5/31/2022 | $1,936,375 | $1,982,716 | $2,280,033 |
| 6/30/2022 | $1,725,512 | $1,831,179 | $2,090,544 |
| 7/31/2022 | $1,942,315 | $2,038,618 | $2,287,684 |
| 8/31/2022 | $1,874,007 | $1,974,569 | $2,202,276 |
| 9/30/2022 | $1,737,392 | $1,800,119 | $1,996,541 |
| 10/31/2022 | $1,894,797 | $1,934,575 | $2,159,153 |
| 11/30/2022 | $1,983,894 | $2,005,076 | $2,271,438 |
| 12/31/2022 | $1,859,158 | $1,898,949 | $2,138,295 |
| 1/31/2023 | $2,022,502 | $2,085,091 | $2,287,041 |
| 2/28/2023 | $2,043,292 | $2,034,067 | $2,232,882 |
| 4/30/2023 | $1,983,894 | $1,971,244 | $2,315,250 |
| 5/31/2023 | $1,980,924 | $1,959,321 | $2,326,196 |
| 6/30/2023 | $2,200,696 | $2,110,936 | $2,485,064 |
| 7/31/2023 | $2,271,974 | $2,192,813 | $2,574,485 |
| 8/31/2023 | $2,209,606 | $2,108,529 | $2,524,190 |
| 9/30/2023 | $2,102,690 | $1,977,832 | $2,404,133 |
| 10/31/2023 | $1,948,255 | $1,841,342 | $2,340,046 |
| 11/30/2023 | $2,120,509 | $2,026,167 | $2,559,856 |
| 12/31/2023 | $2,319,493 | $2,241,015 | $2,696,474 |
| 1/31/2024 | $2,304,643 | $2,194,799 | $2,725,357 |
| 2/29/2024 | $2,420,469 | $2,350,458 | $2,873,100 |
| 3/31/2024 | $2,497,687 | $2,434,864 | $2,965,546 |
| 4/30/2024 | $2,322,462 | $2,253,562 | $2,834,559 |
| 5/31/2024 | $2,450,168 | $2,349,154 | $2,968,945 |
| 6/30/2024 | $2,417,499 | $2,331,022 | $3,061,271 |
| 7/31/2024 | $2,571,934 | $2,468,629 | $3,116,718 |
| 8/31/2024 | $2,592,723 | $2,471,341 | $3,183,230 |
| 9/30/2024 | $2,622,422 | $2,514,292 | $3,248,753 |
| 10/31/2024 | $2,568,964 | $2,497,121 | $3,223,523 |
Average Annual Total Returns (%)
As of October 31, 2024
| R | 1 Year | 5 Years | 10 Years |
| Class I | 31.86% | 12.29% | 9.89% |
| Bloomberg US 2500 Growth Total Return Index | 35.61% | 9.13% | 9.58% |
| Bloomberg US 3000 Total Return Index | 37.75% | 14.57% | 12.42% |
The Fund's past performance is not a good predictor of the Fund's future performance. The performance data quoted above represents past performance (including prior to the date on which the Fund changed its name, principal investment strategies and sub-adviser) and current returns may be lower or higher. Total return figures include change in share price, reinvestment of dividends and capital gains and do not reflect the taxes that a shareholder would pay on Fund distributions or on the redemption of Fund shares. The performance data quoted above also reflects any fee waivers and/or expense reimbursements that have been in effect during the applicable periods. Investment return and principal value will fluctuate so that an investor’s shares, when redeemed may be worth more or less than the original cost. In accordance with changing regulatory requirements, the Fund is now required to compare its performance to a regulatory benchmark, which in this case is the Bloomberg US 3000 Total Return Index. Updated performance information is available at no cost at www.assetmanagement.us.hsbc.com/en/institutional-investor/funds.
Key Fund Statistics
| As of October 31, 2024 | Precentage |
| Total Net Assets | $24,876,126 |
| # of Portfolio Holdings | 85 |
| Portfolio Turnover Rate | 84% |
| Advisory and Sub-Advisory Fees Paid | $150,046 |
The total number of portfolio holdings, portfolio turnover rate and total advisory fees paid reflects statistics for the Portfolio, in which the Fund invests.
What did the Fund invest in?
As of October 31, 2024
The tables below show the investment makeup of the Fund, representing the percentage of total investments of the Portfolio, in which the Fund invests. These allocations may not be representative of the Fund’s future investments.
| Portfolio Composition (%) | |
| Information Technology | 25.6% |
| Health Care | 20.8% |
| Industrials | 16.7% |
| Consumer Discretionary | 13.5% |
| Financials | 11.5% |
| Real Estate | 5.3% |
| Materials | 3.2% |
| Consumer Staples | 2.1% |
| Communication Services | 1.3% |
| HSBC Radiant U.S. Smaller Companies Fund (Class I) | Class I |
| Top Ten Corporate Issuers (%) | |
| Sprouts Farmers Market, Inc. | 2.2% |
| Guidewire Software, Inc. | 2.1% |
| DocuSign, Inc. | 2.0% |
| Gen Digital, Inc. | 1.9% |
| Nutanix, Inc. A | 1.8% |
| Frontdoor, Inc. | 1.8% |
| Semtech Corp. | 1.8% |
| East West Bancorp, Inc. | 1.7% |
| Burlington Stores, Inc. | 1.7% |
| Jones Lang LaSalle, Inc. | 1.7% |
Additional Information
If you wish to view additional information about the Fund, including but not limited to the Fund's prospectus, proxy voting information, financial statements or holdings, please visit www.assetmanagement.us.hsbc.com/en/institutional-investor/funds.
Householding
In order to reduce the amount of mail you receive and to help reduce expenses, we generally send a single copy of any shareholder report and prospectus to each household. If you do not want the mailing of these documents to be combined with those for other members of your household, or you wish to receive a copy of this document at a new address, please contact 1-800-782-8183.

| HSBC Radiant U.S. Smaller Companies Fund (Class I) | Class I |
| Annual Shareholder Report
October 31, 2024 |
HSBC Radiant U.S. Smaller Companies Fund
Class A | HSOAX
This annual shareholder report contains important information about HSBC Radiant U.S. Smaller Companies Fund for the period of November 1, 2023 to October 31, 2024. You can find additional information about the Fund at www.assetmanagement.us.hsbc.com/en/individual-investor/funds. You can also request this information by contacting us at 1-800-782-8183.
What were the Fund costs for the last year?
(based on a hypothetical $10,000 investment)
| Class Name | Cost of a $10,000 investment | Costs paid as a percentage of a $10,000 investment |
| Class A | $156 | 1.35% |
The Fund is a feeder fund that invests all of its investable assets in a master portfolio, HSBC Radiant U.S. Smaller Companies Portfolio (the “Portfolio”). Fund costs reflect the expenses of both the Fund and the Portfolio.
How did the Fund perform the last year and what affected its performance?
For the 12-month period ended October 31, 2024, the Fund returned 31.66% for its Class A shares (net of fees). That compared to a 35.61% return for the Bloomberg US 2500 Growth Total Return Index, the Fund's performance benchmark.
U.S. smaller company equities experienced a strong rally across much of the 12-month period under review due in large part to market anticipation of the Federal Reserve’s interest rate cut. The rate cut, which took place in September 2024, drove expectations of lower debt payments and improved access to capital, which generally benefited smaller companies and companies with greater leverage. Among small-cap U.S. equities, all sectors except Energy returned double-digit gains for the period, with the Financials, Utilities, and Information Technology sectors outperforming the rest. Strong corporate earnings, a stable jobs market, and a backdrop of receding inflation helped stabilize investor sentiment amid volatility driven by the lead-up to the U.S. election.
The Fund underperformed the Bloomberg US 2500 Growth Total Return Index for the period under review. By far the largest detractor from the Fund’s relative performance was its lack of exposure to two benchmark holdings: an artificial intelligence analytics firm that trades as a Bitcoin proxy and an e-commerce site for used car sales. The Fund’s below-benchmark exposure to the Materials and Industrials sectors also dragged on relative results. A below-benchmark exposure to companies that experience interest from short-sellers also detracted from relative performance, as investors generally covered their short positions in anticipation of a rally in more speculative names driven by the anticipated interest rate cuts.
The Fund’s relative performance benefited from its emphasis on companies with higher earnings yields, greater profitability, and strong price momentum. The Fund’s relative results also benefited from its above-benchmark exposure to companies with higher leverage in the lead-up to the interest rate cut, as well as its above-benchmark allocation to the Healthcare and Information Technology sectors, which outperformed.
| HSBC Radiant U.S. Smaller Companies Fund | Class A |
Fund Performance
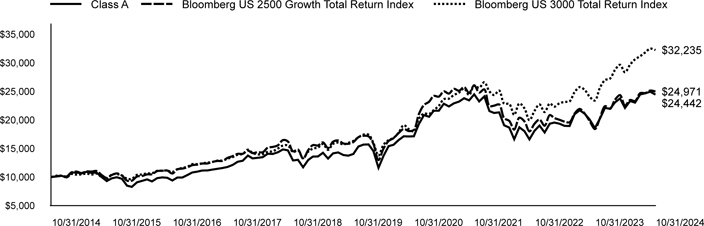
| Year | Class A | Bloomberg US 2500 Growth Total Return Index | Bloomberg US 3000 Total Return Index |
| 10/31/2014 | $10,000 | $10,000 | $10,000 |
| 11/30/2014 | $10,101 | $10,126 | $10,237 |
| 12/31/2014 | $10,214 | $10,238 | $10,234 |
| 1/31/2015 | $9,940 | $10,112 | $9,951 |
| 2/28/2015 | $10,781 | $10,801 | $10,527 |
| 3/31/2015 | $10,810 | $10,955 | $10,422 |
| 4/30/2015 | $10,621 | $10,711 | $10,468 |
| 5/31/2015 | $10,923 | $10,990 | $10,614 |
| 6/30/2015 | $10,725 | $10,960 | $10,434 |
| 7/31/2015 | $10,781 | $11,059 | $10,608 |
| 8/31/2015 | $9,987 | $10,347 | $9,970 |
| 9/30/2015 | $9,306 | $9,846 | $9,679 |
| 10/31/2015 | $9,779 | $10,365 | $10,439 |
| 11/30/2015 | $9,968 | $10,633 | $10,499 |
| 12/31/2015 | $9,694 | $10,255 | $10,288 |
| 1/31/2016 | $8,493 | $9,376 | $9,703 |
| 2/29/2016 | $8,285 | $9,368 | $9,698 |
| 3/31/2016 | $9,079 | $10,093 | $10,381 |
| 4/30/2016 | $9,325 | $10,182 | $10,451 |
| 5/31/2016 | $9,590 | $10,464 | $10,642 |
| 6/30/2016 | $9,240 | $10,495 | $10,664 |
| 7/31/2016 | $9,807 | $11,036 | $11,090 |
| 8/31/2016 | $9,940 | $11,099 | $11,118 |
| 9/30/2016 | $9,874 | $11,140 | $11,139 |
| 10/31/2016 | $9,401 | $10,623 | $10,894 |
| 11/30/2016 | $9,911 | $11,350 | $11,377 |
| 12/31/2016 | $9,926 | $11,485 | $11,595 |
| 1/31/2017 | $10,368 | $11,718 | $11,817 |
| 2/28/2017 | $10,800 | $12,080 | $12,253 |
| 3/31/2017 | $10,951 | $12,178 | $12,266 |
| 4/30/2017 | $11,145 | $12,364 | $12,398 |
| 5/31/2017 | $11,156 | $12,384 | $12,526 |
| 6/30/2017 | $11,307 | $12,650 | $12,640 |
| 7/31/2017 | $11,447 | $12,817 | $12,878 |
| 8/31/2017 | $11,587 | $12,834 | $12,898 |
| 9/30/2017 | $11,771 | $13,360 | $13,215 |
| 10/31/2017 | $12,127 | $13,664 | $13,503 |
| 11/30/2017 | $12,677 | $14,059 | $13,911 |
| 12/31/2017 | $12,862 | $14,075 | $14,051 |
| 1/31/2018 | $13,767 | $14,628 | $14,796 |
| 2/28/2018 | $13,272 | $14,198 | $14,249 |
| 3/31/2018 | $13,369 | $14,355 | $13,965 |
| 4/30/2018 | $13,477 | $14,335 | $14,017 |
| 5/31/2018 | $14,080 | $15,134 | $14,416 |
| 6/30/2018 | $14,044 | $15,276 | $14,515 |
| 7/31/2018 | $14,334 | $15,550 | $14,995 |
| 8/31/2018 | $14,841 | $16,470 | $15,509 |
| 9/30/2018 | $14,672 | $16,228 | $15,531 |
| 10/31/2018 | $12,910 | $14,508 | $14,376 |
| 11/30/2018 | $13,019 | $14,815 | $14,674 |
| 12/31/2018 | $11,717 | $13,229 | $13,303 |
| 1/31/2019 | $12,999 | $14,715 | $14,457 |
| 2/28/2019 | $13,581 | $15,584 | $14,968 |
| 3/31/2019 | $13,610 | $15,530 | $15,181 |
| 4/30/2019 | $14,252 | $16,063 | $15,784 |
| 5/31/2019 | $13,238 | $15,080 | $14,766 |
| 6/30/2019 | $14,147 | $16,180 | $15,798 |
| 7/31/2019 | $14,311 | $16,405 | $16,039 |
| 8/31/2019 | $13,864 | $15,891 | $15,715 |
| 9/30/2019 | $13,745 | $15,823 | $15,989 |
| 10/31/2019 | $14,043 | $16,133 | $16,328 |
| 11/30/2019 | $15,340 | $16,969 | $16,946 |
| 12/31/2019 | $15,683 | $17,228 | $17,431 |
| 1/31/2020 | $15,715 | $17,117 | $17,416 |
| 2/29/2020 | $14,563 | $15,828 | $15,992 |
| 3/31/2020 | $11,618 | $12,983 | $13,782 |
| 4/30/2020 | $13,683 | $14,962 | $15,623 |
| 5/31/2020 | $15,411 | $16,310 | $16,473 |
| 6/30/2020 | $15,651 | $16,811 | $16,858 |
| 7/31/2020 | $16,483 | $17,703 | $17,800 |
| 8/31/2020 | $17,139 | $18,428 | $19,083 |
| 9/30/2020 | $17,107 | $18,058 | $18,399 |
| 10/31/2020 | $17,139 | $18,262 | $18,014 |
| 11/30/2020 | $19,268 | $21,000 | $20,209 |
| 12/31/2020 | $20,845 | $22,611 | $21,117 |
| 1/31/2021 | $20,558 | $23,188 | $21,046 |
| 2/28/2021 | $21,605 | $24,205 | $21,716 |
| 3/31/2021 | $21,622 | $24,084 | $22,476 |
| 4/30/2021 | $22,838 | $25,007 | $23,635 |
| 5/31/2021 | $22,365 | $24,621 | $23,731 |
| 6/30/2021 | $22,906 | $25,444 | $24,358 |
| 7/31/2021 | $23,210 | $25,123 | $24,788 |
| 8/31/2021 | $23,801 | $25,737 | $25,502 |
| 9/30/2021 | $23,430 | $24,750 | $24,372 |
| 10/31/2021 | $24,477 | $26,072 | $26,019 |
| 11/30/2021 | $23,244 | $24,795 | $25,630 |
| 12/31/2021 | $24,115 | $25,356 | $26,601 |
| 1/31/2022 | $21,553 | $22,452 | $24,999 |
| 2/28/2022 | $21,226 | $22,500 | $24,366 |
| 3/31/2022 | $21,327 | $22,702 | $25,138 |
| 4/30/2022 | $19,066 | $20,323 | $22,854 |
| 5/31/2022 | $18,664 | $19,827 | $22,800 |
| 6/30/2022 | $16,629 | $18,312 | $20,905 |
| 7/31/2022 | $18,714 | $20,386 | $22,877 |
| 8/31/2022 | $18,036 | $19,746 | $22,023 |
| 9/30/2022 | $16,604 | $18,001 | $19,965 |
| 10/31/2022 | $18,112 | $19,346 | $21,592 |
| 11/30/2022 | $19,016 | $20,051 | $22,714 |
| 12/31/2022 | $17,810 | $18,989 | $21,383 |
| 1/31/2023 | $19,342 | $20,851 | $22,870 |
| 2/28/2023 | $19,543 | $20,341 | $22,329 |
| 3/31/2023 | $19,342 | $20,024 | $22,926 |
| 4/30/2023 | $18,966 | $19,712 | $23,153 |
| 5/31/2023 | $18,941 | $19,593 | $23,262 |
| 6/30/2023 | $21,000 | $21,109 | $24,851 |
| 7/31/2023 | $21,704 | $21,928 | $25,745 |
| 8/31/2023 | $21,076 | $21,085 | $25,242 |
| 9/30/2023 | $20,046 | $19,778 | $24,041 |
| 10/31/2023 | $18,564 | $18,413 | $23,400 |
| 11/30/2023 | $20,197 | $20,262 | $25,599 |
| 12/31/2023 | $22,106 | $22,410 | $26,965 |
| 1/31/2024 | $21,955 | $21,948 | $27,254 |
| 2/29/2024 | $23,060 | $23,505 | $28,731 |
| 3/31/2024 | $23,764 | $24,349 | $29,655 |
| 4/30/2024 | $22,106 | $22,536 | $28,346 |
| 5/31/2024 | $23,311 | $23,492 | $29,689 |
| 6/30/2024 | $23,035 | $23,310 | $30,613 |
| 7/31/2024 | $24,467 | $24,686 | $31,167 |
| 8/31/2024 | $24,668 | $24,713 | $31,832 |
| 9/30/2024 | $24,944 | $25,143 | $32,488 |
| 10/31/2024 | $24,442 | $24,971 | $32,235 |
Average Annual Total Returns (%)
As of October 31, 2024
| R | 1 Year | 5 Years | 10 Years |
| Class A | 31.66% | 11.72% | 9.35% |
| Bloomberg US 2500 Growth Total Return Index | 35.61% | 9.13% | 9.58% |
| Bloomberg US 3000 Total Return Index | 37.75% | 14.57% | 12.42% |
The Fund's past performance is not a good predictor of the Fund's future performance. The performance data quoted above represents past performance (including prior to the date on which the Fund changed its name, principal investment strategies and sub-adviser) and current returns may be lower or higher. Total return figures include change in share price, reinvestment of dividends and capital gains and do not reflect the taxes that a shareholder would pay on Fund distributions or on the redemption of Fund shares. The performance data quoted above also reflects any fee waivers and/or expense reimbursements that have been in effect during the applicable periods. Investment return and principal value will fluctuate so that an investor’s shares, when redeemed may be worth more or less than the original cost. In accordance with changing regulatory requirements, the Fund is now required to compare its performance to a regulatory benchmark, which in this case is the Bloomberg US 3000 Total Return Index. Updated performance information is available at no cost at www.assetmanagement.us.hsbc.com/en/individual-investor/funds.
Key Fund Statistics
| As of October 31, 2024 | Precentage |
| Total Net Assets | $8,346,528 |
| # of Portfolio Holdings | 85 |
| Portfolio Turnover Rate | 84% |
| Advisory and Sub-Advisory Fees Paid | $150,046 |
The total number of portfolio holdings, portfolio turnover rate and total advisory fees paid reflects statistics for the Portfolio, in which the Fund invests.
What did the Fund invest in?
As of October 31, 2024
The tables below show the investment makeup of the Fund, representing the percentage of total investments of the Portfolio, in which the Fund invests. These allocations may not be representative of the Fund’s future investments.
| Portfolio Composition (%) | |
| Information Technology | 25.6% |
| Health Care | 20.8% |
| Industrials | 16.7% |
| Consumer Discretionary | 13.5% |
| Financials | 11.5% |
| Real Estate | 5.3% |
| Materials | 3.2% |
| Consumer Staples | 2.1% |
| Communication Services | 1.3% |
| HSBC Radiant U.S. Smaller Companies Fund | Class A |
| Top Ten Corporate Issuers (%) | |
| Sprouts Farmers Market, Inc. | 2.2% |
| Guidewire Software, Inc. | 2.1% |
| DocuSign, Inc. | 2.0% |
| Gen Digital, Inc. | 1.9% |
| Nutanix, Inc. A | 1.8% |
| Frontdoor, Inc. | 1.8% |
| Semtech Corp. | 1.8% |
| East West Bancorp, Inc. | 1.7% |
| Burlington Stores, Inc. | 1.7% |
| Jones Lang LaSalle, Inc. | 1.7% |
Additional Information
If you wish to view additional information about the Fund, including but not limited to the Fund's prospectus, proxy voting information, financial statements or holdings, please visit www.assetmanagement.us.hsbc.com/en/individual-investor/funds.
Householding
In order to reduce the amount of mail you receive and to help reduce expenses, we generally send a single copy of any shareholder report and prospectus to each household. If you do not want the mailing of these documents to be combined with those for other members of your household, or you wish to receive a copy of this document at a new address, please contact 1-800-782-8183.

| HSBC Radiant U.S. Smaller Companies Fund | Class A |
| Annual Shareholder Report
October 31, 2024 |
HSBC U.S. Government Money Market Fund
Class A | HGDXX
This annual shareholder report contains important information about HSBC U.S. Government Money Market Fund for the period of November 1, 2023 to October 31, 2024. You can find additional information about the Fund at www.assetmanagement.us.hsbc.com/en/individual-investor/funds. You can also request this information by contacting us at 1-800-782-8183.
What were the Fund costs for the last year?
(based on a hypothetical $10,000 investment)
| Class Name | Cost of a $10,000 investment | Costs paid as a percentage of a $10,000 investment |
| Class A | $49 | 0.48% |
How did the Fund perform the last year and what affected its performance?
Yields on U.S. government money market securities fell during the 12-month period ending October 31, 2024. Interest rates remained relatively high during the period until the Federal Reserve (Fed) cut the federal funds rate by 50 basis points in September 2024.
At the start of the period, forecasters had expected cooling inflation to prompt the Fed to reduce the federal funds rate by more than 100 basis points in early 2024. Those expectations shifted as stubbornly high inflation made rate cuts less likely in the near term and left rates persistently higher.
In this environment, money market securities became more attractive than initially expected, pushing yields higher.
As the inflation rate established a consistent downward trajectory in the second half of the period, expectations for rate cuts rose again. These expectations, along with the rate cuts enacted by the Fed, depressed yields late in the period.
Throughout most of the period, the Fund maintained a long weighted average maturity (WAM) in response to a persistent higher-rate environment and market volatility that reduced confidence in forecasts. The Fund maintained a long weighted average life throughout the period.
As yields in reverse repurchase agreements (RRPs) became volatile, the Fund opportunistically increased its position in floating-rate notes to take advantage of higher yields when possible.
| HSBC U.S. Government Money Market Fund | Class A |
Key Fund Statistics
| As of October 31, 2024 | Precentage |
| Total Net Assets | $36,979,115,571 |
| # of Portfolio Holdings | 161 |
| Net Advisory Fees Paid | $30,090,412 |
What did the Fund invest in?
As of October 31, 2024
The table below shows the investment makeup of the Fund, representing the percentage of total investments of the Fund. These allocations may not be representative of the Fund’s future investments.
| Investment Allocation (%) | |
| Repurchase Agreements | 34.5% |
| U.S. Treasury Obligations | 33.6% |
| U.S. Government and Government Agency Obligations | 26.8% |
| Investment Companies | 5.1% |
Householding
In order to reduce the amount of mail you receive and to help reduce expenses, we generally send a single copy of any shareholder report and prospectus to each household. If you do not want the mailing of these documents to be combined with those for other members of your household, or you wish to receive a copy of this document at a new address, please contact 1-800-782-8183.
Additional Information
If you wish to view additional information about the Fund, including but not limited to the Fund's prospectus, proxy voting information, financial statements or holdings, please visit www.assetmanagement.us.hsbc.com/en/individual-investor/funds.

| HSBC U.S. Government Money Market Fund | Class A |
| Annual Shareholder Report
October 31, 2024 |
HSBC U.S. Government Money Market Fund
Class I | HGIXX
This annual shareholder report contains important information about HSBC U.S. Government Money Market Fund for the period of November 1, 2023 to October 31, 2024. You can find additional information about the Fund at www.assetmanagement.us.hsbc.com/en/institutional-investor/funds. You can also request this information by contacting us at 1-800-782-8183.
What were the Fund costs for the last year?
(based on a hypothetical $10,000 investment)
| Class Name | Cost of a $10,000 investment | Costs paid as a percentage of a $10,000 investment |
| Class I | $13 | 0.13% |
How did the Fund perform the last year and what affected its performance?
Yields on U.S. government money market securities fell during the 12-month period ending October 31, 2024. Interest rates remained relatively high during the period until the Federal Reserve (Fed) cut the federal funds rate by 50 basis points in September 2024.
At the start of the period, forecasters had expected cooling inflation to prompt the Fed to reduce the federal funds rate by more than 100 basis points in early 2024. Those expectations shifted as stubbornly high inflation made rate cuts less likely in the near term and left rates persistently higher.
In this environment, money market securities became more attractive than initially expected, pushing yields higher.
As the inflation rate established a consistent downward trajectory in the second half of the period, expectations for rate cuts rose again. These expectations, along with the rate cuts enacted by the Fed, depressed yields late in the period.
Throughout most of the period, the Fund maintained a long weighted average maturity (WAM) in response to a persistent higher-rate environment and market volatility that reduced confidence in forecasts. The Fund maintained a long weighted average life throughout the period.
As yields in reverse repurchase agreements (RRPs) became volatile, the Fund opportunistically increased its position in floating-rate notes to take advantage of higher yields when possible.
| HSBC U.S. Government Money Market Fund | Class I |
Key Fund Statistics
| As of October 31, 2024 | Precentage |
| Total Net Assets | $36,979,115,571 |
| # of Portfolio Holdings | 161 |
| Net Advisory Fees Paid | $30,090,412 |
What did the Fund invest in?
As of October 31, 2024
The table below shows the investment makeup of the Fund, representing the percentage of total investments of the Fund. These allocations may not be representative of the Fund’s future investments.
| Investment Allocation (%) | |
| Repurchase Agreements | 34.5% |
| U.S. Treasury Obligations | 33.6% |
| U.S. Government and Government Agency Obligations | 26.8% |
| Investment Companies | 5.1% |
Householding
In order to reduce the amount of mail you receive and to help reduce expenses, we generally send a single copy of any shareholder report and prospectus to each household. If you do not want the mailing of these documents to be combined with those for other members of your household, or you wish to receive a copy of this document at a new address, please contact 1-800-782-8183.
Additional Information
If you wish to view additional information about the Fund, including but not limited to the Fund's prospectus, proxy voting information, financial statements or holdings, please visit www.assetmanagement.us.hsbc.com/en/institutional-investor/funds.

| HSBC U.S. Government Money Market Fund | Class I |
| Annual Shareholder Report
October 31, 2024 |
HSBC U.S. Government Money Market Fund
Class P | HGPXX
This annual shareholder report contains important information about HSBC U.S. Government Money Market Fund for the period of November 1, 2023 to October 31, 2024. You can find additional information about the Fund at www.assetmanagement.us.hsbc.com/en/institutional-investor/funds. You can also request this information by contacting us at 1-800-782-8183.
What were the Fund costs for the last year?
(based on a hypothetical $10,000 investment)
| Class Name | Cost of a $10,000 investment | Costs paid as a percentage of a $10,000 investment |
| Class P | $18 | 0.18% |
How did the Fund perform the last year and what affected its performance?
Yields on U.S. government money market securities fell during the 12-month period ending October 31, 2024. Interest rates remained relatively high during the period until the Federal Reserve (Fed) cut the federal funds rate by 50 basis points in September 2024.
At the start of the period, forecasters had expected cooling inflation to prompt the Fed to reduce the federal funds rate by more than 100 basis points in early 2024. Those expectations shifted as stubbornly high inflation made rate cuts less likely in the near term and left rates persistently higher.
In this environment, money market securities became more attractive than initially expected, pushing yields higher.
As the inflation rate established a consistent downward trajectory in the second half of the period, expectations for rate cuts rose again. These expectations, along with the rate cuts enacted by the Fed, depressed yields late in the period.
Throughout most of the period, the Fund maintained a long weighted average maturity (WAM) in response to a persistent higher-rate environment and market volatility that reduced confidence in forecasts. The Fund maintained a long weighted average life throughout the period.
As yields in reverse repurchase agreements (RRPs) became volatile, the Fund opportunistically increased its position in floating-rate notes to take advantage of higher yields when possible.
| HSBC U.S. Government Money Market Fund | Class P |
Key Fund Statistics
| As of October 31, 2024 | Precentage |
| Total Net Assets | $36,979,115,571 |
| # of Portfolio Holdings | 161 |
| Net Advisory Fees Paid | $30,090,412 |
What did the Fund invest in?
As of October 31, 2024
The table below shows the investment makeup of the Fund, representing the percentage of total investments of the Fund. These allocations may not be representative of the Fund’s future investments.
| Investment Allocation (%) | |
| Repurchase Agreements | 34.5% |
| U.S. Treasury Obligations | 33.6% |
| U.S. Government and Government Agency Obligations | 26.8% |
| Investment Companies | 5.1% |
Householding
In order to reduce the amount of mail you receive and to help reduce expenses, we generally send a single copy of any shareholder report and prospectus to each household. If you do not want the mailing of these documents to be combined with those for other members of your household, or you wish to receive a copy of this document at a new address, please contact 1-800-782-8183.
Additional Information
If you wish to view additional information about the Fund, including but not limited to the Fund's prospectus, proxy voting information, financial statements or holdings, please visit www.assetmanagement.us.hsbc.com/en/institutional-investor/funds.

| HSBC U.S. Government Money Market Fund | Class P |
| Annual Shareholder Report
October 31, 2024 |
HSBC U.S. Government Money Market Fund
Class Y | RGYXX
This annual shareholder report contains important information about HSBC U.S. Government Money Market Fund for the period of November 1, 2023 to October 31, 2024. You can find additional information about the Fund at www.assetmanagement.us.hsbc.com/en/institutional-investor/funds. You can also request this information by contacting us at 1-800-782-8183.
What were the Fund costs for the last year?
(based on a hypothetical $10,000 investment)
| Class Name | Cost of a $10,000 investment | Costs paid as a percentage of a $10,000 investment |
| Class Y | $24 | 0.23% |
How did the Fund perform the last year and what affected its performance?
Yields on U.S. government money market securities fell during the 12-month period ending October 31, 2024. Interest rates remained relatively high during the period until the Federal Reserve (Fed) cut the federal funds rate by 50 basis points in September 2024.
At the start of the period, forecasters had expected cooling inflation to prompt the Fed to reduce the federal funds rate by more than 100 basis points in early 2024. Those expectations shifted as stubbornly high inflation made rate cuts less likely in the near term and left rates persistently higher.
In this environment, money market securities became more attractive than initially expected, pushing yields higher.
As the inflation rate established a consistent downward trajectory in the second half of the period, expectations for rate cuts rose again. These expectations, along with the rate cuts enacted by the Fed, depressed yields late in the period.
Throughout most of the period, the Fund maintained a long weighted average maturity (WAM) in response to a persistent higher-rate environment and market volatility that reduced confidence in forecasts. The Fund maintained a long weighted average life throughout the period.
As yields in reverse repurchase agreements (RRPs) became volatile, the Fund opportunistically increased its position in floating-rate notes to take advantage of higher yields when possible.
| HSBC U.S. Government Money Market Fund | Class Y |
Key Fund Statistics
| As of October 31, 2024 | Precentage |
| Total Net Assets | $36,979,115,571 |
| # of Portfolio Holdings | 161 |
| Net Advisory Fees Paid | $30,090,412 |
What did the Fund invest in?
As of October 31, 2024
The table below shows the investment makeup of the Fund, representing the percentage of total investments of the Fund. These allocations may not be representative of the Fund’s future investments.
| Investment Allocation (%) | |
| Repurchase Agreements | 34.5% |
| U.S. Treasury Obligations | 33.6% |
| U.S. Government and Government Agency Obligations | 26.8% |
| Investment Companies | 5.1% |
Householding
In order to reduce the amount of mail you receive and to help reduce expenses, we generally send a single copy of any shareholder report and prospectus to each household. If you do not want the mailing of these documents to be combined with those for other members of your household, or you wish to receive a copy of this document at a new address, please contact 1-800-782-8183.
Additional Information
If you wish to view additional information about the Fund, including but not limited to the Fund's prospectus, proxy voting information, financial statements or holdings, please visit www.assetmanagement.us.hsbc.com/en/institutional-investor/funds.

| HSBC U.S. Government Money Market Fund | Class Y |
| Annual Shareholder Report
October 31, 2024 |
HSBC U.S. Government Money Market Fund
Intermediary | HGGXX
This annual shareholder report contains important information about HSBC U.S. Government Money Market Fund for the period of November 1, 2023 to October 31, 2024. You can find additional information about the Fund at www.assetmanagement.us.hsbc.com/en/institutional-investor/funds. You can also request this information by contacting us at 1-800-782-8183.
What were the Fund costs for the last year?
(based on a hypothetical $10,000 investment)
| Class Name | Cost of a $10,000 investment | Costs paid as a percentage
of a $10,000 investment |
| Intermediary | $16 | 0.16% |
How did the Fund perform the last year and what affected its performance?
Yields on U.S. government money market securities fell during the 12-month period ending October 31, 2024. Interest rates remained relatively high during the period until the Federal Reserve (Fed) cut the federal funds rate by 50 basis points in September 2024.
At the start of the period, forecasters had expected cooling inflation to prompt the Fed to reduce the federal funds rate by more than 100 basis points in early 2024. Those expectations shifted as stubbornly high inflation made rate cuts less likely in the near term and left rates persistently higher.
In this environment, money market securities became more attractive than initially expected, pushing yields higher.
As the inflation rate established a consistent downward trajectory in the second half of the period, expectations for rate cuts rose again. These expectations, along with the rate cuts enacted by the Fed, depressed yields late in the period.
Throughout most of the period, the Fund maintained a long weighted average maturity (WAM) in response to a persistent higher-rate environment and market volatility that reduced confidence in forecasts. The Fund maintained a long weighted average life throughout the period.
As yields in reverse repurchase agreements (RRPs) became volatile, the Fund opportunistically increased its position in floating-rate notes to take advantage of higher yields when possible.
| HSBC U.S. Government Money Market Fund | Intermediary |
Key Fund Statistics
| As of October 31, 2024 | Precentage |
| Total Net Assets | $36,979,115,571 |
| # of Portfolio Holdings | 161 |
| Net Advisory Fees Paid | $30,090,412 |
What did the Fund invest in?
As of October 31, 2024
The table below shows the investment makeup of the Fund, representing the percentage of total investments of the Fund. These allocations may not be representative of the Fund’s future investments.
| Investment Allocation (%) | |
| Repurchase Agreements | 34.5% |
| U.S. Treasury Obligations | 33.6% |
| U.S. Government and Government Agency Obligations | 26.8% |
| Investment Companies | 5.1% |
Householding
In order to reduce the amount of mail you receive and to help reduce expenses, we generally send a single copy of any shareholder report and prospectus to each household. If you do not want the mailing of these documents to be combined with those for other members of your household, or you wish to receive a copy of this document at a new address, please contact 1-800-782-8183.
Additional Information
If you wish to view additional information about the Fund, including but not limited to the Fund's prospectus, proxy voting information, financial statements or holdings, please visit www.assetmanagement.us.hsbc.com/en/institutional-investor/funds.

| HSBC U.S. Government Money Market Fund | Intermediary |
| Annual Shareholder Report
October 31, 2024 |
HSBC U.S. Government Money Market Fund
Intermediary Service | HGFXX
This annual shareholder report contains important information about HSBC U.S. Government Money Market Fund for the period of November 1, 2023 to October 31, 2024. You can find additional information about the Fund at www.assetmanagement.us.hsbc.com/en/institutional-investor/funds. You can also request this information by contacting us at 1-800-782-8183.
What were the Fund costs for the last year?
(based on a hypothetical $10,000 investment)
| Class Name | Cost of a $10,000 investment | Costs paid as a percentage of a $10,000 investment |
| Intermediary Service | $18 | 0.18% |
How did the Fund perform the last year and what affected its performance?
Yields on U.S. government money market securities fell during the 12-month period ending October 31, 2024. Interest rates remained relatively high during the period until the Federal Reserve (Fed) cut the federal funds rate by 50 basis points in September 2024.
At the start of the period, forecasters had expected cooling inflation to prompt the Fed to reduce the federal funds rate by more than 100 basis points in early 2024. Those expectations shifted as stubbornly high inflation made rate cuts less likely in the near term and left rates persistently higher.
In this environment, money market securities became more attractive than initially expected, pushing yields higher.
As the inflation rate established a consistent downward trajectory in the second half of the period, expectations for rate cuts rose again. These expectations, along with the rate cuts enacted by the Fed, depressed yields late in the period.
Throughout most of the period, the Fund maintained a long weighted average maturity (WAM) in response to a persistent higher-rate environment and market volatility that reduced confidence in forecasts. The Fund maintained a long weighted average life throughout the period.
As yields in reverse repurchase agreements (RRPs) became volatile, the Fund opportunistically increased its position in floating-rate notes to take advantage of higher yields when possible.
| HSBC U.S. Government Money Market Fund | Intermediary Service |
Key Fund Statistics
| As of October 31, 2024 | Precentage |
| Total Net Assets | $36,979,115,571 |
| # of Portfolio Holdings | 161 |
| Net Advisory Fees Paid | $30,090,412 |
What did the Fund invest in?
As of October 31, 2024
The table below shows the investment makeup of the Fund, representing the percentage of total investments of the Fund. These allocations may not be representative of the Fund’s future investments.
| Investment Allocation (%) | |
| Repurchase Agreements | 34.5% |
| U.S. Treasury Obligations | 33.6% |
| U.S. Government and Government Agency Obligations | 26.8% |
| Investment Companies | 5.1% |
Householding
In order to reduce the amount of mail you receive and to help reduce expenses, we generally send a single copy of any shareholder report and prospectus to each household. If you do not want the mailing of these documents to be combined with those for other members of your household, or you wish to receive a copy of this document at a new address, please contact 1-800-782-8183.
Additional Information
If you wish to view additional information about the Fund, including but not limited to the Fund's prospectus, proxy voting information, financial statements or holdings, please visit www.assetmanagement.us.hsbc.com/en/institutional-investor/funds.

| HSBC U.S. Government Money Market Fund | Intermediary Service |
| Annual Shareholder Report
October 31, 2024 |
HSBC U.S. Treasury Money Market Fund
Class A | HTDXX
This annual shareholder report contains important information about HSBC U.S. Treasury Money Market Fund for the period of November 1, 2023 to October 31, 2024. You can find additional information about the Fund at www.assetmanagement.us.hsbc.com/en/individual-investor/funds. You can also request this information by contacting us at 1-800-782-8183.
What were the Fund costs for the last year?
(based on a hypothetical $10,000 investment)
| Class Name | Cost of a $10,000 investment | Costs paid as a percentage of a $10,000 investment |
| Class A | $51 | 0.50% |
How did the Fund perform the last year and what affected its performance?
Yields on U.S. Treasury money market securities fell during the 12-month period ending October 31, 2024. The Federal Reserve (Fed)cut the federal funds rate by 50 basis points in September 2024. The rate remained relatively high during the period.
At the start of the period, forecasters had expected cooling inflation to prompt the Fed to reduce the federal funds rate by more than 100 basis points in early 2024. Those expectations shifted as stubbornly high inflation made rate cuts less likely in the near term and left rates persistently higher.
In this environment, money market securities became more attractive than initially expected, pushing yields higher.
As the inflation rate established a consistent downward trajectory in the second half of the period, expectations for rate cuts rose again.These expectations, along with the rate cuts enacted by the Fed, depressed yields late in the period.
The Fund maintained a very long weighted average maturity (WAM) throughout the period in response to the persistent higher-rate environment, as well as volatility that reduced confidence in forecasts.
| HSBC U.S. Treasury Money Market Fund | Class A |
Key Fund Statistics
| As of October 31, 2024 | Precentage |
| Total Net Assets | $4,898,221,476 |
| # of Portfolio Holdings | 95 |
| Net Advisory Fees Paid | $2,230,814 |
What did the Fund invest in?
As of October 31, 2024
The table below shows the investment makeup of the Fund, representing the percentage of total investments of the Fund. These allocations may not be representative of the Fund’s future investments.
| Investment Allocation (%) | |
| U.S. Treasury Obligations | 100.0% |
Householding
In order to reduce the amount of mail you receive and to help reduce expenses, we generally send a single copy of any shareholder report and prospectus to each household. If you do not want the mailing of these documents to be combined with those for other members of your household, or you wish to receive a copy of this document at a new address, please contact 1-800-782-8183.
Additional Information
If you wish to view additional information about the Fund, including but not limited to the Fund's prospectus, proxy voting information, financial statements or holdings, please visit www.assetmanagement.us.hsbc.com/en/individual-investor/funds.

| HSBC U.S. Treasury Money Market Fund | Class A |
| Annual Shareholder Report
October 31, 2024 |
HSBC U.S. Treasury Money Market Fund
Class I | HBIXX
This annual shareholder report contains important information about HSBC U.S. Treasury Money Market Fund for the period of November 1, 2023 to October 31, 2024. You can find additional information about the Fund at www.assetmanagement.us.hsbc.com/en/institutional-investor/funds. You can also request this information by contacting us at 1-800-782-8183.
What were the Fund costs for the last year?
(based on a hypothetical $10,000 investment)
| Class Name | Cost of a $10,000 investment | Costs paid as a percentage of a $10,000 investment |
| Class I | $14 | 0.14% |
How did the Fund perform the last year and what affected its performance?
Yields on U.S. Treasury money market securities fell during the 12-month period ending October 31, 2024. The Federal Reserve (Fed)cut the federal funds rate by 50 basis points in September 2024. The rate remained relatively high during the period.
At the start of the period, forecasters had expected cooling inflation to prompt the Fed to reduce the federal funds rate by more than 100 basis points in early 2024. Those expectations shifted as stubbornly high inflation made rate cuts less likely in the near term and left rates persistently higher.
In this environment, money market securities became more attractive than initially expected, pushing yields higher.
As the inflation rate established a consistent downward trajectory in the second half of the period, expectations for rate cuts rose again.These expectations, along with the rate cuts enacted by the Fed, depressed yields late in the period.
The Fund maintained a very long weighted average maturity (WAM) throughout the period in response to the persistent higher-rate environment, as well as volatility that reduced confidence in forecasts.
| HSBC U.S. Treasury Money Market Fund | Class I |
Key Fund Statistics
| As of October 31, 2024 | Precentage |
| Total Net Assets | $4,898,221,476 |
| # of Portfolio Holdings | 95 |
| Net Advisory Fees Paid | $2,230,814 |
What did the Fund invest in?
As of October 31, 2024
The table below shows the investment makeup of the Fund, representing the percentage of total investments of the Fund. These allocations may not be representative of the Fund’s future investments.
| Investment Allocation (%) | |
| U.S. Treasury Obligations | 100.0% |
Householding
In order to reduce the amount of mail you receive and to help reduce expenses, we generally send a single copy of any shareholder report and prospectus to each household. If you do not want the mailing of these documents to be combined with those for other members of your household, or you wish to receive a copy of this document at a new address, please contact 1-800-782-8183.
Additional Information
If you wish to view additional information about the Fund, including but not limited to the Fund's prospectus, proxy voting information, financial statements or holdings, please visit www.assetmanagement.us.hsbc.com/en/institutional-investor/funds.

| HSBC U.S. Treasury Money Market Fund | Class I |
| Annual Shareholder Report
October 31, 2024 |
HSBC U.S. Treasury Money Market Fund
Class P | HTPXX
This annual shareholder report contains important information about HSBC U.S. Treasury Money Market Fund for the period of November 1, 2023 to October 31, 2024. You can find additional information about the Fund at www.assetmanagement.us.hsbc.com/en/institutional-investor/funds. You can also request this information by contacting us at 1-800-782-8183.
What were the Fund costs for the last year?
(based on a hypothetical $10,000 investment)
| Class Name | Cost of a $10,000 investment | Costs paid as a percentage of a $10,000 investment |
| Class P | $18 | 0.18% |
How did the Fund perform the last year and what affected its performance?
Yields on U.S. Treasury money market securities fell during the 12-month period ending October 31, 2024. The Federal Reserve (Fed)cut the federal funds rate by 50 basis points in September 2024. The rate remained relatively high during the period.
At the start of the period, forecasters had expected cooling inflation to prompt the Fed to reduce the federal funds rate by more than 100 basis points in early 2024. Those expectations shifted as stubbornly high inflation made rate cuts less likely in the near term and left rates persistently higher.
In this environment, money market securities became more attractive than initially expected, pushing yields higher.
As the inflation rate established a consistent downward trajectory in the second half of the period, expectations for rate cuts rose again.These expectations, along with the rate cuts enacted by the Fed, depressed yields late in the period.
The Fund maintained a very long weighted average maturity (WAM) throughout the period in response to the persistent higher-rate environment, as well as volatility that reduced confidence in forecasts.
| HSBC U.S. Treasury Money Market Fund | Class P |
Key Fund Statistics
| As of October 31, 2024 | Precentage |
| Total Net Assets | $4,898,221,476 |
| # of Portfolio Holdings | 95 |
| Net Advisory Fees Paid | $2,230,814 |
What did the Fund invest in?
As of October 31, 2024
The table below shows the investment makeup of the Fund, representing the percentage of total investments of the Fund. These allocations may not be representative of the Fund’s future investments.
| Investment Allocation (%) | |
| U.S. Treasury Obligations | 100.0% |
Householding
In order to reduce the amount of mail you receive and to help reduce expenses, we generally send a single copy of any shareholder report and prospectus to each household. If you do not want the mailing of these documents to be combined with those for other members of your household, or you wish to receive a copy of this document at a new address, please contact 1-800-782-8183.
Additional Information
If you wish to view additional information about the Fund, including but not limited to the Fund's prospectus, proxy voting information, financial statements or holdings, please visit www.assetmanagement.us.hsbc.com/en/institutional-investor/funds.

| HSBC U.S. Treasury Money Market Fund | Class P |
| Annual Shareholder Report
October 31, 2024 |
HSBC U.S. Treasury Money Market Fund
Class Y | HTYXX
This annual shareholder report contains important information about HSBC U.S. Treasury Money Market Fund for the period of November 1, 2023 to October 31, 2024. You can find additional information about the Fund at www.assetmanagement.us.hsbc.com/en/institutional-investor/funds. You can also request this information by contacting us at 1-800-782-8183.
What were the Fund costs for the last year?
(based on a hypothetical $10,000 investment)
| Class Name | Cost of a $10,000 investment | Costs paid as a percentage of a $10,000 investment |
| Class Y | $26 | 0.25% |
How did the Fund perform the last year and what affected its performance?
Yields on U.S. Treasury money market securities fell during the 12-month period ending October 31, 2024. The Federal Reserve (Fed)cut the federal funds rate by 50 basis points in September 2024. The rate remained relatively high during the period.
At the start of the period, forecasters had expected cooling inflation to prompt the Fed to reduce the federal funds rate by more than 100 basis points in early 2024. Those expectations shifted as stubbornly high inflation made rate cuts less likely in the near term and left rates persistently higher.
In this environment, money market securities became more attractive than initially expected, pushing yields higher.
As the inflation rate established a consistent downward trajectory in the second half of the period, expectations for rate cuts rose again.These expectations, along with the rate cuts enacted by the Fed, depressed yields late in the period.
The Fund maintained a very long weighted average maturity (WAM) throughout the period in response to the persistent higher-rate environment, as well as volatility that reduced confidence in forecasts.
| HSBC U.S. Treasury Money Market Fund | Class Y |
Key Fund Statistics
| As of October 31, 2024 | Precentage |
| Total Net Assets | $4,898,221,476 |
| # of Portfolio Holdings | 95 |
| Net Advisory Fees Paid | $2,230,814 |
What did the Fund invest in?
As of October 31, 2024
The table below shows the investment makeup of the Fund, representing the percentage of total investments of the Fund. These allocations may not be representative of the Fund’s future investments.
| Investment Allocation (%) | |
| U.S. Treasury Obligations | 100.0% |
Householding
In order to reduce the amount of mail you receive and to help reduce expenses, we generally send a single copy of any shareholder report and prospectus to each household. If you do not want the mailing of these documents to be combined with those for other members of your household, or you wish to receive a copy of this document at a new address, please contact 1-800-782-8183.
Additional Information
If you wish to view additional information about the Fund, including but not limited to the Fund's prospectus, proxy voting information, financial statements or holdings, please visit www.assetmanagement.us.hsbc.com/en/institutional-investor/funds.

| HSBC U.S. Treasury Money Market Fund | Class Y |
| Annual Shareholder Report
October 31, 2024 |
HSBC U.S. Treasury Money Market Fund
Intermediary | HTGXX
This annual shareholder report contains important information about HSBC U.S. Treasury Money Market Fund for the period of November 1, 2023 to October 31, 2024. You can find additional information about the Fund at www.assetmanagement.us.hsbc.com/en/institutional-investor/funds. You can also request this information by contacting us at 1-800-782-8183.
What were the Fund costs for the last year?
(based on a hypothetical $10,000 investment)
| Class Name | Cost of a $10,000 investment | Costs paid as a percentage of a $10,000 investment |
| Intermediary | $16 | 0.16% |
How did the Fund perform the last year and what affected its performance?
Yields on U.S. Treasury money market securities fell during the 12-month period ending October 31, 2024. The Federal Reserve (Fed)cut the federal funds rate by 50 basis points in September 2024. The rate remained relatively high during the period.
At the start of the period, forecasters had expected cooling inflation to prompt the Fed to reduce the federal funds rate by more than 100 basis points in early 2024. Those expectations shifted as stubbornly high inflation made rate cuts less likely in the near term and left rates persistently higher.
In this environment, money market securities became more attractive than initially expected, pushing yields higher.
As the inflation rate established a consistent downward trajectory in the second half of the period, expectations for rate cuts rose again.These expectations, along with the rate cuts enacted by the Fed, depressed yields late in the period.
The Fund maintained a very long weighted average maturity (WAM) throughout the period in response to the persistent higher-rate environment, as well as volatility that reduced confidence in forecasts.
| HSBC U.S. Treasury Money Market Fund | Intermediary |
Key Fund Statistics
| As of October 31, 2024 | Precentage |
| Total Net Assets | $4,898,221,476 |
| # of Portfolio Holdings | 95 |
| Net Advisory Fees Paid | $2,230,814 |
What did the Fund invest in?
As of October 31, 2024
The table below shows the investment makeup of the Fund, representing the percentage of total investments of the Fund. These allocations may not be representative of the Fund’s future investments.
| Investment Allocation (%) | |
| U.S. Treasury Obligations | 100.0% |
Householding
In order to reduce the amount of mail you receive and to help reduce expenses, we generally send a single copy of any shareholder report and prospectus to each household. If you do not want the mailing of these documents to be combined with those for other members of your household, or you wish to receive a copy of this document at a new address, please contact 1-800-782-8183.
Additional Information
If you wish to view additional information about the Fund, including but not limited to the Fund's prospectus, proxy voting information, financial statements or holdings, please visit www.assetmanagement.us.hsbc.com/en/institutional-investor/funds.

| HSBC U.S. Treasury Money Market Fund | Intermediary |
| Annual Shareholder Report
October 31, 2024 |
HSBC U.S. Treasury Money Market Fund
Intermediary Service | HTFXX
This annual shareholder report contains important information about HSBC U.S. Treasury Money Market Fund for the period of November 1, 2023 to October 31, 2024. You can find additional information about the Fund at www.assetmanagement.us.hsbc.com/en/institutional-investor/funds. You can also request this information by contacting us at 1-800-782-8183.
What were the Fund costs for the last year?
(based on a hypothetical $10,000 investment)
| Class Name | Cost of a $10,000 investment | Costs paid as a percentage of a $10,000 investment |
| Intermediary Service | $18 | 0.18% |
How did the Fund perform the last year and what affected its performance?
Yields on U.S. Treasury money market securities fell during the 12-month period ending October 31, 2024. The Federal Reserve (Fed)cut the federal funds rate by 50 basis points in September 2024. The rate remained relatively high during the period.
At the start of the period, forecasters had expected cooling inflation to prompt the Fed to reduce the federal funds rate by more than 100 basis points in early 2024. Those expectations shifted as stubbornly high inflation made rate cuts less likely in the near term and left rates persistently higher.
In this environment, money market securities became more attractive than initially expected, pushing yields higher.
As the inflation rate established a consistent downward trajectory in the second half of the period, expectations for rate cuts rose again.These expectations, along with the rate cuts enacted by the Fed, depressed yields late in the period.
The Fund maintained a very long weighted average maturity (WAM) throughout the period in response to the persistent higher-rate environment, as well as volatility that reduced confidence in forecasts.
| HSBC U.S. Treasury Money Market Fund | Intermediary Service |
Key Fund Statistics
| As of October 31, 2024 | Precentage |
| Total Net Assets | $4,898,221,476 |
| # of Portfolio Holdings | 95 |
| Net Advisory Fees Paid | $2,230,814 |
What did the Fund invest in?
As of October 31, 2024
The table below shows the investment makeup of the Fund, representing the percentage of total investments of the Fund. These allocations may not be representative of the Fund’s future investments.
| Investment Allocation (%) | |
| U.S. Treasury Obligations | 100.0% |
Householding
In order to reduce the amount of mail you receive and to help reduce expenses, we generally send a single copy of any shareholder report and prospectus to each household. If you do not want the mailing of these documents to be combined with those for other members of your household, or you wish to receive a copy of this document at a new address, please contact 1-800-782-8183.
Additional Information
If you wish to view additional information about the Fund, including but not limited to the Fund's prospectus, proxy voting information, financial statements or holdings, please visit www.assetmanagement.us.hsbc.com/en/institutional-investor/funds.

| HSBC U.S. Treasury Money Market Fund | Intermediary Service |
(b) Not applicable.
Item 2. Code of Ethics.
(a)
HSBC Funds (the “Registrant”) has adopted a Code of Ethics that applies to the Registrant’s principal executive officer and principal financial officer.
(b)
No disclosures are required by this Item 2(b).
(c)
There have been no amendments to the Registrant’s Code of Ethics during the reporting period for this Form N-CSR.
(d)
There have been no waivers granted by the Registrant to individuals covered by the Registrant’s Code of Ethics during the reporting period for this Form N-CSR.
(e)
Not applicable.
(f)
A copy of the Registrant’s Code of Ethics is attached as Exhibit 19(a)(1) to this Form N-CSR.
Item 3. Audit Committee Financial Expert.
(a)(1)
The Board of Trustees of the Registrant has determined that the Registrant has at least one member serving on the Registrant’s Audit Committee that possesses the attributes identified in Instruction 2(b) of Item 3 to Form N-CSR to qualify as an “audit committee financial expert.”
(a)(2)
The name of the audit committee financial experts are Marcia Beck, Susan Gause and Hugh Hurley III. Each is deemed to be “independent” as that term is defined in Item 3(a)(2) of Form N-CSR.
(a)(3)
Not applicable.
Item 4. Principal Accountant Fees and Services.
(a)
Audit Fees. The aggregate fees billed for professional services rendered by the independent registered public accounting firm for the audit of the Registrant’s annual financial statements or services normally provided in connection with statutory and regulatory filings or engagements for the last two fiscal years ended October 31, 2023 and 2024 were $270,000 and $211,500, respectively.
(b)
Audit-Related Fees. For the fiscal years ended October 31, 2023 and 2024, the independent registered public accounting firm did not bill the Registrant any fees for audit-related services which are not reported under paragraph (a) of this Item 4.
During the last two fiscal years ended October 31, 2023 and 2024, no fees for assurance and related services that relate directly to the operations and financial reporting of the Registrant were billed by the independent registered public accounting firm to the Registrant’s investment adviser (the “Adviser”) or any other entity controlling, controlled by, or under common control with the Adviser that provides ongoing services to the Registrant.
(c)
Tax Fees. The aggregate fees billed for professional services rendered by the independent registered public accounting firm to the Registrant for tax compliance, tax advice, tax planning and tax return preparation for the last two fiscal years ended October 31, 2023 and 2024 were $52,700 and $57,850, respectively. The fees for 2023 and 2024 relate primarily to the preparation of federal and state income and excise tax returns and the review of excise tax distributions.
During the last two fiscal years ended October 31, 2023 and 2024, no fees for tax compliance, tax advice or tax planning services that relate directly to the operations and financial reporting of the Registrant were billed by the independent registered public accounting firm to the Adviser or any other entity controlling, controlled by, or under common control with the Adviser that provides ongoing services to the Registrant.
(d)
All Other Fees. The aggregate fees billed for products and services provided by the independent registered public accounting firm to the Registrant, other than the services reported in paragraphs (a) – (c) of this Item 4, for the last two fiscal years ended October 31, 2023 and 2024 were $0 and $0, respectively.
During the last two fiscal years ended October 31, 2023 and 2024, no fees for other services that relate directly to the operations and financial reporting of the Registrant were billed by the independent registered public accounting firm to the Adviser or any other entity controlling, controlled by, or under common control with the Adviser that provides ongoing services to the Registrant.
(e)(1)
Pre-Approval Policies and Procedures. The Registrant’s Audit Committee is required to pre-approve all audit and permitted non-audit services performed by the Registrant’s independent registered public accounting firm in accordance with the Registrant’s Audit Committee Charter and the Investment Company Act of 1940, as amended.
(2)
There were no pre-approval requirements waived for the services provided to the Registrant described in paragraphs (b)-(d) of Item 4 by the Audit Committee pursuant to paragraph (c)(7)(i)(C) of Rule 2-01 of Regulation S-X (the “De Minimis Rule”). There were no fees billed for services provided to the Adviser described in paragraphs (b)-(d) of Item 4 that were required to be pre-approved by the Audit Committee as described in paragraph (e)(1) of Item 4.
(f)
No disclosures are required by this Item 4(f).
(g)
Non-Audit Fees. For the last two fiscal years ended October 31, 2023 and 2024, the aggregate non-audit fees billed by the independent registered public accounting firm for services rendered to the Registrant and the Adviser and any entity controlling, controlled by, or under common control with the Adviser that provided ongoing services to the Registrant were approximately $2,263,977 and $12,813,592, respectively. Fees for 2023 and 2024 represent independent registered public accounting firm’s services provided to the Registrant and to HSBC Bank and affiliates related to general corporate, state and local tax assistance, accounting matters and various advisory projects.
(h)
The Registrant’s Audit Committee considered the non-audit services rendered to the Registrant’s Adviser and any entity controlling, controlled by, or under common control with the Adviser, and believes the services are compatible with the principal accountant’s independence.
(i)
Not applicable.
(j)
Not applicable.
Item 5. Audit Committees of Listed Registrants.
| (a) | Not applicable. |
| | |
| (b) | Not applicable. |
Item 6. Investments.
(a) Schedules of Investments are included as part of the reports to shareholders filed under Item 7(a) of this Form N-CSR.
(b) Not applicable to the Registrant.
Item 7. Financial Statements and Financial Highlights for Open-End Management Investment Companies
(a) The Registrant’s Financial Statements are attached herewith.
HSBC Funds
Financial Statements and Additional Information
October 31, 2024

| MONEY MARKET FUNDS | | Class A | | Class I | | Intermediary
Class | | Intermediary
Service Class | | Class P | | Class Y |
| HSBC U.S. Government Money Market Fund | | HGDXX | | HGIXX | | HGGXX | | HGFXX | | HGPXX | | RGYXX |
| HSBC U.S. Treasury Money Market Fund | | HTDXX | | HBIXX | | HTGXX | | HTFXX | | HTPXX | | HTYXX |
HSBC Family of Funds
October 31, 2024
| HSBC U.S. GOVERNMENT MONEY MARKET FUND |
Schedule of Portfolio Investments—as of October 31, 2024
U.S. Government and Government Agency
Obligations — 27.3% |
| | | Principal
Amount ($) | | | Value ($) | |
| Federal Farm Credit Banks—14.5% | |
| 4.89% (SOFR + 8 bps), 11/08/2024 (a) | | | 4,000,000 | | | | 3,999,910 | |
| 4.92% (SOFR + 11 bps), 11/22/2024 (a) | | | 50,000,000 | | | | 50,000,000 | |
| 4.93% (FCPR DLY - 307 bps), 09/23/2025 (a) | | | 150,000,000 | | | | 150,000,000 | |
| 4.93% (SOFR + 12 bps), 07/10/2026 (a) | | | 50,000,000 | | | | 50,000,000 | |
| 4.94% (SOFR + 13 bps), 10/21/2025 (a) | | | 100,000,000 | | | | 99,995,059 | |
| 4.95% (FCPR DLY - 305 bps), 04/01/2025 (a) | | | 10,000,000 | | | | 9,999,778 | |
| 4.95% (SOFR + 14 bps), 08/19/2026 (a) | | | 60,000,000 | | | | 60,000,000 | |
| 4.95% (SOFR + 14 bps), 09/09/2026 (a) | | | 10,000,000 | | | | 10,000,000 | |
| 4.95% (SOFR + 14 bps), 11/04/2026 (a) | | | 15,000,000 | | | | 15,000,000 | |
| 4.96% (FCPR DLY - 304 bps), 06/18/2025 (a) | | | 59,567,000 | | | | 59,560,365 | |
| 4.96% (FCPR DLY - 305 bps), 07/15/2026 (a) | | | 175,000,000 | | | | 175,000,000 | |
| 4.96% (FEDL01 + 13 bps), 05/02/2025 (a) | | | 35,000,000 | | | | 35,000,000 | |
| 4.96% (SOFR + 15 bps), 12/29/2025 (a) | | | 50,000,000 | | | | 50,000,000 | |
| 4.97% (FCPR DLY - 303 bps), 07/22/2025 (a) | | | 100,000,000 | | | | 100,000,000 | |
| 4.97% (FCPR DLY - 303 bps), 09/25/2025 (a) | | | 400,000,000 | | | | 399,990,173 | |
| 4.97% (FCPR DLY - 303 bps), 07/13/2026 (a) | | | 150,000,000 | | | | 150,000,000 | |
| 4.97% (FCPR DLY - 304 bps), 03/24/2026 (a) | | | 100,000,000 | | | | 100,000,000 | |
| 4.97% (SOFR + 16 bps), 08/28/2025 (a) | | | 22,000,000 | | | | 22,000,000 | |
| 4.98% (FCPR DLY - 302 bps), 08/25/2025 (a) | | | 325,000,000 | | | | 324,972,302 | |
| 4.98% (FCPR DLY - 302 bps), 09/08/2025 (a) | | | 265,174,000 | | | | 265,144,114 | |
| 4.98% (FCPR DLY - 302 bps), 06/17/2026 (a) | | | 280,000,000 | | | | 280,000,000 | |
| 4.98% (FCPR DLY - 302 bps), 06/22/2026 (a) | | | 200,000,000 | | | | 199,984,244 | |
| 4.98% (FCPR DLY - 303 bps), 03/10/2025 (a) | | | 300,000,000 | | | | 299,996,942 | |
| 4.98% (FCPR DLY - 303 bps), 08/14/2025 (a) | | | 200,000,000 | | | | 199,997,109 | |
| 4.98% (FCPR DLY - 303 bps), 10/23/2025 (a) | | | 100,000,000 | | | | 99,979,535 | |
| 4.99% (FCPR DLY - 301 bps), 08/07/2025 (a) | | | 149,173,000 | | | | 149,171,663 | |
| 4.99% (FCPR DLY - 301 bps), 10/06/2025 (a) | | | 225,000,000 | | | | 225,000,000 | |
| 4.99% (FCPR DLY - 301 bps), 01/16/2026 (a) | | | 200,000,000 | | | | 200,000,000 | |
| 5.00% (FCPR DLY - 300 bps), 04/21/2025 (a) | | | 241,332,000 | | | | 241,340,899 | |
U.S. Government and Government Agency
Obligations (continued) |
| | | Principal
Amount ($) | | | Value ($) | |
| 5.00% (FCPR DLY - 300 bps), 07/28/2025 (a) | | | 218,393,000 | | | | 218,403,669 | |
| 5.00% (FCPR DLY - 300 bps), 11/17/2025 (a) | | | 70,000,000 | | | | 70,000,000 | |
| 5.00% (FCPR DLY - 300 bps), 07/07/2026 (a) | | | 350,000,000 | | | | 350,000,000 | |
| 5.00% (FCPR DLY - 301 bps), 02/10/2025 (a) | | | 184,700,000 | | | | 184,736,094 | |
| 5.00% (SOFR + 19 bps), 11/25/2024 (a) | | | 27,476,000 | | | | 27,476,160 | |
| 5.01% (FCPR DLY - 299 bps), 10/02/2026 (a) | | | 175,000,000 | | | | 175,000,000 | |
| 5.01% (FCPR DLY - 300 bps), 03/20/2025 (a) | | | 125,000,000 | | | | 125,000,000 | |
| 5.01% (SOFR + 20 bps), 12/05/2024 (a) | | | 5,000,000 | | | | 5,000,124 | |
| 5.01% (SOFR + 20 bps), 06/02/2025 (a) | | | 9,439,000 | | | | 9,442,615 | |
| 5.02% (FCPR DLY - 298 bps), 01/09/2025 (a) | | | 109,495,000 | | | | 109,524,637 | |
| 5.02% (FEDL01 + 19 bps), 06/20/2025 (a) | | | 75,000,000 | | | | 75,000,000 | |
| 5.07%, 11/29/2024 (b) | | | 23,000,000 | | | | 22,914,133 | |
| | | | | | | | 5,398,629,525 | |
| Federal Home Loan Banks—12.6% | |
| 1.00% (SOFR + 4 bps), 08/07/2025 (a) | | | 50,000,000 | | | | 50,000,000 | |
| 4.81%, 12/05/2024 | | | 250,000,000 | | | | 250,000,000 | |
| 4.81%, 01/06/2025 | | | 350,000,000 | | | | 350,000,000 | |
| 4.82% (SOFR + 1 bps), 11/29/2024 (a) | | | 300,000,000 | | | | 300,000,000 | |
| 4.82% (SOFR + 1 bps), 12/05/2024 (a) | | | 250,000,000 | | | | 250,000,000 | |
| 4.82% (SOFR + 1 bps), 12/11/2024 (a) | | | 250,000,000 | | | | 250,000,000 | |
| 4.82% (SOFR + 1 bps), 12/16/2024 (a) | | | 150,000,000 | | | | 150,000,000 | |
| 4.82% (SOFR + 1 bps), 12/23/2024 (a) | | | 250,000,000 | | | | 250,000,000 | |
| 4.82% (SOFR + 1 bps), 02/04/2025 (a) | | | 100,000,000 | | | | 100,000,000 | |
| 4.83% (SOFR + 2 bps), 12/30/2024 (a) | | | 100,000,000 | | | | 100,000,000 | |
| 4.83% (SOFR + 2 bps), 01/06/2025 (a) | | | 100,000,000 | | | | 100,000,000 | |
| 4.83% (SOFR + 2 bps), 03/17/2025 (a) | | | 200,000,000 | | | | 200,000,000 | |
| 4.84%, 01/24/2025 (b) | | | 109,400,000 | | | | 108,235,984 | |
| 4.84% (SOFR + 3 bps), 04/04/2025 (a) | | | 100,000,000 | | | | 100,000,000 | |
| 4.85%, 01/27/2025 (b) | | | 200,000,000 | | | | 197,796,000 | |
| 4.88%, 03/14/2025 (b) | | | 200,000,000 | | | | 196,542,000 | |
| 4.91% (SOFR + 10 bps), 12/10/2024 (a) | | | 55,000,000 | | | | 54,995,160 | |
| 4.92%, 01/27/2025 (b) | | | 125,000,000 | | | | 123,601,354 | |
| 4.92% (SOFR + 11 bps), 11/08/2024 (a) | | | 95,000,000 | | | | 94,999,925 | |
| 4.92% (SOFR + 11 bps), 12/02/2024 (a) | | | 100,000,000 | | | | 100,000,000 | |
| 2 | HSBC FAMILY OF FUNDS | See notes to financial statements. |
| HSBC U.S. GOVERNMENT MONEY MARKET FUND |
Schedule of Portfolio Investments—as of October 31, 2024 (continued)
U.S. Government and Government Agency
Obligations (continued) | |
| | | | Principal
Amount ($) | | | | Value ($) | |
| 4.95%, 02/03/2025 (b) | | | 100,000,000 | | | | 98,785,833 | |
| 4.96% (SOFR + 15 bps), 06/06/2025 (a) | | | 6,835,000 | | | | 6,835,914 | |
| 4.96% (SOFR + 15 bps), 12/08/2025 (a) | | | 200,000,000 | | | | 199,998,515 | |
| 4.96% (SOFR + 15 bps), 12/26/2025 (a) | | | 200,000,000 | | | | 200,000,000 | |
| 4.99%, 11/15/2024 (b) | | | 100,000,000 | | | | 99,816,639 | |
| 4.99%, 11/15/2024 (b) | | | 100,000,000 | | | | 99,816,639 | |
| 5.01% (SOFR + 20 bps), 10/29/2025 (a) | | | 60,000,000 | | | | 60,031,325 | |
| 5.07%, 02/10/2025 (b) | | | 200,000,000 | | | | 197,329,111 | |
| 5.11%, 02/07/2025 (b) | | | 150,000,000 | | | | 148,040,000 | |
| 5.12%, 02/07/2025 (b) | | | 50,000,000 | | | | 49,345,306 | |
| 5.12%, 02/14/2025 (b) | | | 75,000,000 | | | | 73,948,906 | |
| 5.35%, 01/02/2025 (b) | | | 47,000,000 | | | | 46,585,564 | |
| | | | | | | | 4,606,704,175 | |
| Federal National Mortgage Association—0.2% | |
| Federal National Mortgage Association 4.93% (SOFR + 12 bps), 07/29/2026 (a) | | | 73,000,000 | | | | 73,000,000 | |
| TOTAL U.S. GOVERNMENT AND GOVERNMENT AGENCY OBLIGATIONS (Cost $10,078,333,700) | | | | | | | 10,078,333,700 | |
| | | | | | | | | |
| U.S. Treasury Obligations — 34.2% |
| U.S. Treasury Bills—33.5% | | | | | | | | |
| 3.99%, 10/02/2025 (b) | | | 50,000,000 | | | | 48,239,854 | |
| 4.32%, 10/30/2025 (b) | | | 100,000,000 | | | | 95,880,958 | |
| 4.36%, 04/03/2025 (b) | | | 200,000,000 | | | | 196,418,950 | |
| 4.39%, 09/04/2025 (b) | | | 50,000,000 | | | | 48,230,486 | |
| 4.43%, 04/17/2025 (b) | | | 200,000,000 | | | | 196,038,389 | |
| 4.45%, 04/10/2025 (b) | | | 150,000,000 | | | | 147,136,667 | |
| 4.45%, 04/10/2025 (b) | | | 150,000,000 | | | | 147,136,000 | |
| 4.45%, 04/17/2025 (b) | | | 300,000,000 | | | | 294,022,792 | |
| 4.47%, 04/24/2025 (b) | | | 200,000,000 | | | | 195,833,183 | |
| 4.48%, 05/01/2025 (b) | | | 200,000,000 | | | | 195,658,011 | |
| 4.48%, 05/01/2025 (b) | | | 250,000,000 | | | | 244,569,372 | |
| 4.55%, 02/18/2025 (b) | | | 170,000,000 | | | | 167,724,928 | |
| 4.56%, 02/11/2025 (b) | | | 170,000,000 | | | | 167,866,217 | |
| 4.57%, 02/25/2025 (b) | | | 200,000,000 | | | | 197,135,444 | |
| 4.57%, 03/20/2025 (b) | | | 300,000,000 | | | | 294,892,908 | |
| 4.65%, 12/31/2024 (b) | | | 500,000,000 | | | | 496,457,222 | |
| 4.66%, 12/03/2024 (b) | | | 100,000,000 | | | | 99,643,778 | |
| 4.69%, 12/24/2024 (b) | | | 500,000,000 | | | | 496,621,250 | |
| 4.70%, 03/13/2025 (b) | | | 100,000,000 | | | | 98,339,000 | |
| 4.72%, 12/12/2024 (b) | | | 390,000,000 | | | | 387,944,397 | |
| 4.73%, 12/17/2024 (b) | | | 250,000,000 | | | | 248,520,972 | |
| 4.74%, 12/10/2024 (b) | | | 300,000,000 | | | | 298,492,812 | |
| 4.78%, 11/19/2024 (b) | | | 250,000,000 | | | | 249,412,500 | |
| 4.81%, 11/21/2024 (b) | | | 400,000,000 | | | | 398,951,111 | |
| 4.82%, 03/06/2025 (b) | | | 100,000,000 | | | | 98,387,152 | |
| 4.86%, 02/27/2025 (b) | | | 400,000,000 | | | | 393,860,722 | |
| 4.88%, 12/19/2024 (b) | | | 300,000,000 | | | | 298,099,800 | |
| 4.88%, 01/14/2025 (b) | | | 150,000,000 | | | | 148,538,192 | |
| 4.91%, 12/24/2024 (b) | | | 130,000,000 | | | | 129,085,161 | |
| 4.92%, 07/10/2025 (b) | | | 110,000,000 | | | | 106,447,513 | |
| 4.94%, 01/07/2025 (b) | | | 200,000,000 | | | | 198,215,194 | |
| 4.95%, 02/20/2025 (b) | | | 150,000,000 | | | | 147,795,355 | |
| U.S. Treasury Obligations (continued) |
| | | Principal
Amount ($) | | | Value ($) | |
| 4.96%, 02/20/2025 (b) | | | 150,000,000 | | | | 147,790,175 | |
| 4.97%, 02/06/2025 (b) | | | 200,000,000 | | | | 197,421,417 | |
| 4.97%, 02/06/2025 (b) | | | 200,000,000 | | | | 197,420,878 | |
| 4.97%, 02/13/2025 (b) | | | 200,000,000 | | | | 197,234,178 | |
| 4.98%, 02/13/2025 (b) | | | 200,000,000 | | | | 197,230,133 | |
| 5.00%, 02/13/2025 (b) | | | 100,000,000 | | | | 98,610,156 | |
| 5.02%, 12/24/2024 (b) | | | 100,000,000 | | | | 99,282,439 | |
| 5.02%, 12/31/2024 (b) | | | 200,000,000 | | | | 198,377,000 | |
| 5.03%, 12/12/2024 (b) | | | 110,000,000 | | | | 109,386,765 | |
| 5.05%, 11/29/2024 (b) | | | 150,000,000 | | | | 149,445,833 | |
| 5.09%, 07/10/2025 (b) | | | 200,000,000 | | | | 193,341,527 | |
| 5.12%, 01/30/2025 (b) | | | 400,000,000 | | | | 395,075,000 | |
| 5.12%, 01/30/2025 (b) | | | 200,000,000 | | | | 197,536,000 | |
| 5.13%, 12/17/2024 (b) | | | 200,000,000 | | | | 198,727,844 | |
| 5.14%, 12/10/2024 (b) | | | 200,000,000 | | | | 198,919,267 | |
| 5.14%, 12/10/2024 (b) | | | 200,000,000 | | | | 198,918,833 | |
| 5.18%, 11/29/2024 (b) | | | 150,000,000 | | | | 149,432,942 | |
| 5.18%, 01/16/2025 (b) | | | 310,000,000 | | | | 306,739,231 | |
| 5.19%, 01/02/2025 (b) | | | 300,000,000 | | | | 297,416,667 | |
| 5.19%, 01/16/2025 (b) | | | 210,000,000 | | | | 207,788,875 | |
| 5.19%, 01/23/2025 (b) | | | 125,000,000 | | | | 123,563,062 | |
| 5.19%, 01/23/2025 (b) | | | 125,000,000 | | | | 123,562,630 | |
| 5.20%, 11/21/2024 (b) | | | 40,000,000 | | | | 39,887,489 | |
| 5.20%, 11/29/2024 (b) | | | 100,000,000 | | | | 99,620,289 | |
| 5.20%, 01/23/2025 (b) | | | 125,000,000 | | | | 123,560,325 | |
| 5.24%, 06/12/2025 (b) | | | 20,000,000 | | | | 19,391,024 | |
| 5.30%, 11/19/2024 (b) | | | 400,000,000 | | | | 398,973,000 | |
| 5.32%, 01/02/2025 (b) | | | 200,000,000 | | | | 198,239,028 | |
| 5.36%, 11/12/2024 (b) | | | 400,000,000 | | | | 399,365,361 | |
| | | | | | | | 12,393,853,658 | |
| U.S. Treasury Notes—0.7% | |
| 1.75%, 12/31/2024 | | | 100,000,000 | | | | 99,511,800 | |
| 4.13%, 01/31/2025 | | | 160,000,000 | | | | 159,764,249 | |
| | | | | | | | 259,276,049 | |
TOTAL U.S. TREASURY OBLIGATIONS
(Cost $12,653,129,707) | | | | | | | 12,653,129,707 | |
| | | | | | | | | |
| Repurchase Agreements — 35.1% |
| BNP Paribas SA, 4.850%, 11/1/24, (Purchased on 10/31/24, proceeds at maturity $250,033,681, Collateralized by various U.S. Treasury Obligations, (0.00% - 4.13%), (1/9/25 - 8/15/52), fair value of $255,000,014) | | | 250,000,000 | | | | 250,000,000 | |
| BNP Paribas SA, 4.860%, 11/1/24, (Purchased on 10/31/24, proceeds at maturity $25,003,375, Collateralized by various U.S. Government Agency Obligations, (0.00% - 8.00%), (12/31/24 - 6/20/64), fair value of $25,500,000) | | | 25,000,000 | | | | 25,000,000 | |
| See notes to financial statements. | HSBC FAMILY OF FUNDS | 3 |
| HSBC U.S. GOVERNMENT MONEY MARKET FUND |
Schedule of Portfolio Investments—as of October 31, 2024 (continued)
| Repurchase Agreements (continued) |
| | | Principal
Amount ($) | | | Value ($) | |
| Canadian Imperial Bank of Commerce, 4.850%, 11/1/24, (Purchased on 10/31/24, proceeds at maturity $400,053,889, Collateralized by various U.S. Government Agency Obligations, (0.00% - 7.00%), (7/15/25 - 10/1/54), fair value of $408,000,002) | | | 400,000,000 | | | | 400,000,000 | |
| Citigroup Global Markets, 4.860%, 11/1/24, (Purchased on 10/31/24, proceeds at maturity $500,067,500, Collateralized by various U.S. Treasury Obligations, (0.00%), (2/15/25 - 5/15/54), fair value of $510,000,027) | | | 500,000,000 | | | | 500,000,000 | |
| Credit Agricole, 4.840%, 11/1/24, (Purchased on 10/31/24, proceeds at maturity $750,100,833, Collateralized by various U.S. Government Agency Obligations, (2.00% - 6.00%), (2/1/51 - 5/1/54), fair value of $765,000,001) | | | 750,000,000 | | | | 750,000,000 | |
| Credit Agricole, 4.850%, 11/1/24, (Purchased on 10/31/24, proceeds at maturity $700,094,305, Collateralized by various U.S. Government Agency Obligations, (2.23% - 7.00%), (12/1/25 - 10/1/54), fair value of $714,000,000) | | | 700,000,000 | | | | 700,000,000 | |
| Fixed Income Clearing Corporation (Bank of New York), 4.840%, 11/1/24, (Purchased on 10/31/24, proceeds at maturity $2,000,268,889, Collateralized by various U.S. Treasury Obligations, (0.00% - 3.63%), (10/30/25 - 3/31/28), fair value of $2,040,000,054) | | | 2,000,000,000 | | | | 2,000,000,000 | |
| Repurchase Agreements (continued) |
| | | Principal
Amount ($) | | | Value ($) | |
| Fixed Income Clearing Corporation (Northern Trust Corp.), 4.840%, 11/1/24, (Purchased on 10/31/24, proceeds at maturity $500,067,222, Collateralized by various U.S. Treasury Obligations, (1.88% - 2.88%), (2/15/32 - 5/15/32), fair value of $510,000,000) | | | 500,000,000 | | | | 500,000,000 | |
| Fixed Income Clearing Corporation (State Street Bank & Trust Co.), 4.850%, 11/1/24, (Purchased on 10/31/24, proceeds at maturity $3,605,485,674, Collateralized by various U.S. Treasury Obligations, (0.75% - 4.88%), (5/15/26 - 6/30/26), fair value of $3,677,100,210) | | | 3,605,000,000 | | | | 3,605,000,000 | |
| Mizuho Securities USA, Inc., 4.850%, 11/1/24, (Purchased on 10/31/24, proceeds at maturity $350,047,153, Collateralized by various U.S. Government Agency Obligations, (2.00% - 8.00%), (12/1/24 - 10/1/54), fair value of $357,000,000) | | | 350,000,000 | | | | 350,000,000 | |
| Societe’ Generale NY, 4.890%, 11/4/24, (Purchased on 10/02/24, proceeds at maturity $502,241,250, Collateralized by U.S. Treasury Obligation, (4.00%), (7/31/29), fair value of $510,000,059) | | | 500,000,000 | | | | 500,000,000 | |
| Societe’ Generale NY, 4.860%, 11/1/24, (Purchased on 10/31/24, proceeds at maturity $1,400,189,000, Collateralized by various U.S. Government Agency Obligations, (2.00% - 6.50%), (10/1/50 - 3/1/54), fair value of $1,428,000,000) | | | 1,400,000,000 | | | | 1,400,000,000 | |
| 4 | HSBC FAMILY OF FUNDS | See notes to financial statements. |
| HSBC U.S. GOVERNMENT MONEY MARKET FUND |
Schedule of Portfolio Investments—as of October 31, 2024 (continued)
| Repurchase Agreements (continued) |
| | | Principal
Amount ($) | | | Value ($) | |
| Standard Chartered Bank, 4.840%, 11/1/24, (Purchased on 10/31/24, proceeds at maturity $500,067,222, Collateralized by various U.S. Government Agency Obligations, (2.00% - 7.00%), (9/1/46 - 9/1/54), fair value of $510,000,000) | | | 500,000,000 | | | | 500,000,000 | |
| Toronto Dominion Bank NY, 4.860%, 11/1/24, (Purchased on 10/31/24, proceeds at maturity $500,067,500, Collateralized by various U.S. Government Agency Obligations, (2.00% - 6.00%), (10/1/44 - 8/1/54), fair value of $510,000,000) | | | 500,000,000 | | | | 500,000,000 | |
| Wells Fargo Securities LLC, 4.850%, 11/1/24, (Purchased on 10/25/24, proceeds at maturity $500,471,528, Collateralized by various U.S. Government Agency Obligations, (1.50% - 8.00%), (7/1/27 - 11/1/54), fair value of $510,000,000) | | | 500,000,000 | | | | 500,000,000 | |
| Wells Fargo Securities LLC, 4.860%, 11/1/24, (Purchased on 10/31/24, proceeds at maturity $500,067,500, Collateralized by various U.S. Government Agency Obligations, (2.00% - 6.00%), (8/1/50 - 11/1/54), fair value of $510,000,000) | | | 500,000,000 | | | | 500,000,000 | |
| TOTAL REPURCHASE AGREEMENTS (Cost $12,980,000,000) | | | | | | | 12,980,000,000 | |
| | | | | | | | | |
| Investment Companies — 5.2% |
| | | | Shares | | | | Value ($) | |
| BlackRock Liquidity FedFund Portfolio, Institutional Shares, 4.75% (c) | | | 9,702,094 | | | | 9,702,094 | |
| Dreyfus Government Cash Management, Institutional shares, 4.75% (c) | | | 7,138,049 | | | | 7,138,049 | |
| Investment Companies (continued) |
| | | Shares | | | Value ($) | |
| Federated Government Obligation Fund, Premier Shares, 4.77% (c) | | | 400,041,162 | | | | 400,041,162 | |
| State Street Institutional U.S. Government Money Market Fund, Premier Class, 4.82% (c) | | | 1,517,915,296 | | | | 1,517,915,296 | |
| TOTAL INVESTMENT COMPANIES (Cost $1,934,796,601) | | | | | | | 1,934,796,601 | |
| TOTAL INVESTMENTS IN SECURITIES (Cost $37,646,260,008) — 101.8% | | | | | | | 37,646,260,008 | |
| Other Assets (Liabilities) — (1.8)% | | | | | | | (667,144,437 | ) |
| NET ASSETS — 100.0% | | | | | | $ | 36,979,115,571 | |
| (a) | Floating or variable rate security linked to the referenced benchmark. The rate presented represents the rate in effect on October 31, 2024. These securities are deemed to have a maturity remaining until the next adjustment of the interest rate or the longer of the demand period or time to the next readjustment. |
| (b) | Discount note. Rate presented represents the effective yield at time of purchase. |
| (c) | The rate represents the annualized 7-day yield that was in effect on October 31, 2024. |
bps – Basis Points
FCPR DLY – Federal Reserve Bank Prime Rate Loan US
FEDL01 – Effective Federal Funds Rate
SOFR – Secured Overnight Financing Rate
| See notes to financial statements. | HSBC FAMILY OF FUNDS | 5 |
| HSBC U.S. TREASURY MONEY MARKET FUND |
Schedule of Portfolio Investments—as of October 31, 2024
| U.S. Treasury Obligations — 103.0% |
| | | Principal Amount ($) | | | Value ($) | |
| U.S. Treasury Bills — 93.6% | | | | | | | | |
| 4.32%, 10/30/2025 (a) | | | 20,000,000 | | | | 19,176,192 | |
| 4.39%, 09/04/2025 (a) | | | 1,000,000 | | | | 964,610 | |
| 4.47%, 04/24/2025 (a) | | | 40,000,000 | | | | 39,166,637 | |
| 4.48%, 05/01/2025 (a) | | | 40,000,000 | | | | 39,131,099 | |
| 4.48%, 05/01/2025 (a) | | | 120,000,000 | | | | 117,389,678 | |
| 4.51%, 03/20/2025 (a) | | | 20,000,000 | | | | 19,664,238 | |
| 4.51%, 04/24/2025 (a) | | | 200,000 | | | | 195,791 | |
| 4.54%, 02/04/2025 (a) | | | 40,000,000 | | | | 39,534,764 | |
| 4.55%, 02/18/2025 (a) | | | 40,000,000 | | | | 39,464,689 | |
| 4.56%, 01/28/2025 (a) | | | 40,000,000 | | | | 39,566,844 | |
| 4.56%, 02/11/2025 (a) | | | 40,000,000 | | | | 39,497,933 | |
| 4.56%, 03/04/2025 (a) | | | 40,000,000 | | | | 39,414,256 | |
| 4.57%, 02/25/2025 (a) | | | 40,000,000 | | | | 39,427,089 | |
| 4.57%, 03/20/2025 (a) | | | 40,000,000 | | | | 39,319,054 | |
| 4.65%, 12/26/2024 (a) | | | 40,000,000 | | | | 39,723,136 | |
| 4.65%, 12/31/2024 (a) | | | 100,000,000 | | | | 99,291,444 | |
| 4.67%, 01/21/2025 (a) | | | 40,000,000 | | | | 39,591,850 | |
| 4.69%, 11/12/2024 (a) | | | 52,300,000 | | | | 52,226,487 | |
| 4.69%, 11/12/2024 (a) | | | 200,000,000 | | | | 199,718,828 | |
| 4.69%, 12/24/2024 (a) | | | 10,000,000 | | | | 9,929,628 | |
| 4.69%, 12/24/2024 (a) | | | 75,000,000 | | | | 74,493,188 | |
| 4.69%, 12/24/2024 (a) | | | 100,000,000 | | | | 99,324,176 | |
| 4.70%, 11/12/2024 (a) | | | 113,000,000 | | | | 112,840,861 | |
| 4.70%, 03/13/2025 (a) | | | 10,000,000 | | | | 9,833,900 | |
| 4.72%, 12/12/2024 (a) | | | 200,000,000 | | | | 198,945,389 | |
| 4.73%, 11/26/2024 (a) | | | 75,000,000 | | | | 74,757,812 | |
| 4.73%, 12/17/2024 (a) | | | 200,000,000 | | | | 198,816,778 | |
| 4.74%, 11/14/2024 (a) | | | 50,000,000 | | | | 49,915,870 | |
| 4.74%, 12/05/2024 (a) | | | 150,000,000 | | | | 149,341,250 | |
| 4.74%, 12/10/2024 (a) | | | 200,000,000 | | | | 198,994,667 | |
| 4.75%, 11/14/2024 (a) | | | 50,000,000 | | | | 49,915,681 | |
| 4.75%, 11/26/2024 (a) | | | 25,000,000 | | | | 24,919,271 | |
| 4.75%, 12/03/2024 (a) | | | 250,000,000 | | | | 248,965,556 | |
| 4.78%, 11/05/2024 (a) | | | 73,850,000 | | | | 73,811,390 | |
| 4.78%, 11/19/2024 (a) | | | 50,000,000 | | | | 49,882,750 | |
| 4.79%, 11/07/2024 (a) | | | 75,000,000 | | | | 74,941,125 | |
| 4.80%, 01/21/2025 (a) | | | 40,000,000 | | | | 39,580,600 | |
| 4.81%, 11/21/2024 (a) | | | 200,000,000 | | | | 199,475,556 | |
| 4.82%, 03/06/2025 (a) | | | 10,000,000 | | | | 9,838,715 | |
| 4.84%, 11/14/2024 (a) | | | 100,000,000 | | | | 99,828,653 | |
| 4.84%, 11/14/2024 (a) | | | 100,000,000 | | | | 99,828,562 | |
| 4.86%, 12/26/2024 (a) | | | 1,500,000 | | | | 1,489,510 | |
| 4.86%, 02/27/2025 (a) | | | 40,000,000 | | | | 39,386,072 | |
| 4.88%, 12/19/2024 (a) | | | 40,000,000 | | | | 39,746,640 | |
| 4.88%, 12/26/2024 (a) | | | 25,000,000 | | | | 24,824,688 | |
| 4.88%, 01/14/2025 (a) | | | 40,000,000 | | | | 39,610,267 | |
| 4.91%, 12/24/2024 (a) | | | 40,000,000 | | | | 39,712,976 | |
| 4.94%, 01/07/2025 (a) | | | 20,000,000 | | | | 19,821,519 | |
| 4.95%, 02/20/2025 (a) | | | 20,000,000 | | | | 19,706,047 | |
| 4.96%, 02/20/2025 (a) | | | 20,000,000 | | | | 19,705,357 | |
| 5.02%, 12/24/2024 (a) | | | 25,000,000 | | | | 24,818,953 | |
| 5.02%, 12/31/2024 (a) | | | 18,000,000 | | | | 17,854,545 | |
| 5.02%, 12/31/2024 (a) | | | 40,000,000 | | | | 39,675,400 | |
| 5.02%, 01/23/2025 (a) | | | 10,000,000 | | | | 9,890,970 | |
| 5.03%, 12/12/2024 (a) | | | 20,000,000 | | | | 19,888,503 | |
| 5.05%, 11/29/2024 (a) | | | 150,000,000 | | | | 149,453,417 | |
| 5.09%, 07/10/2025 (a) | | | 15,000,000 | | | | 14,500,615 | |
| 5.12%, 01/30/2025 (a) | | | 40,000,000 | | | | 39,507,500 | |
| 5.12%, 01/30/2025 (a) | | | 20,000,000 | | | | 19,753,600 | |
| 5.13%, 12/17/2024 (a) | | | 50,000,000 | | | | 49,681,961 | |
| 5.14%, 12/10/2024 (a) | | | 20,000,000 | | | | 19,891,927 | |
| 5.14%, 12/10/2024 (a) | | | 20,000,000 | | | | 19,891,883 | |
| U.S. Treasury Obligations (continued) |
| | | Principal Amount ($) | | | Value ($) | |
| 5.18%, 11/29/2024 (a) | | | 5,000,000 | | | | 4,981,014 | |
| 5.18%, 01/16/2025 (a) | | | 20,000,000 | | | | 19,789,628 | |
| 5.19%, 11/21/2024 (a) | | | 40,000,000 | | | | 39,887,667 | |
| 5.19%, 01/16/2025 (a) | | | 20,000,000 | | | | 19,789,417 | |
| 5.19%, 01/23/2025 (a) | | | 10,000,000 | | | | 9,895,674 | |
| 5.19%, 01/23/2025 (a) | | | 20,000,000 | | | | 19,789,249 | |
| 5.20%, 11/29/2024 (a) | | | 20,000,000 | | | | 19,919,624 | |
| 5.20%, 01/23/2025 (a) | | | 40,000,000 | | | | 39,539,304 | |
| 5.22%, 05/15/2025 (a) | | | 20,000,000 | | | | 19,469,600 | |
| 5.24%, 04/17/2025 (a) | | | 20,000,000 | | | | 19,543,997 | |
| 5.24%, 06/12/2025 (a) | | | 10,000,000 | | | | 9,695,512 | |
| 5.25%, 12/03/2024 (a) | | | 60,000,000 | | | | 59,728,533 | |
| 5.25%, 03/20/2025 (a) | | | 15,000,000 | | | | 14,714,471 | |
| 5.25%, 03/20/2025 (a) | | | 15,000,000 | | | | 14,714,413 | |
| 5.29%, 01/09/2025 (a) | | | 50,000,000 | | | | 49,513,167 | |
| 5.30%, 11/19/2024 (a) | | | 200,000,000 | | | | 199,531,000 | |
| 5.30%, 11/19/2024 (a) | | | 50,000,000 | | | | 49,871,625 | |
| 5.32%, 01/02/2025 (a) | | | 50,000,000 | | | | 49,559,757 | |
| 5.35%, 12/05/2024 (a) | | | 40,000,000 | | | | 39,805,728 | |
| 5.35%, 12/26/2024 (a) | | | 50,000,000 | | | | 49,607,361 | |
| 5.36%, 12/19/2024 (a) | | | 40,000,000 | | | | 39,725,333 | |
| 5.37%, 12/12/2024 (a) | | | 40,000,000 | | | | 39,764,819 | |
| | | | | | | | 4,588,295,240 | |
| U.S. Treasury Notes — 9.4% |
| 1.75%, 03/15/2025 | | | 20,000,000 | | | | 19,766,806 | |
| 2.13%, 11/30/2024 | | | 10,000,000 | | | | 9,977,987 | |
| 3.88%, 03/31/2025 | | | 10,000,000 | | | | 9,957,733 | |
| 4.13%, 01/31/2025 | | | 20,000,000 | | | | 19,970,531 | |
| 4.63%, 02/28/2025 | | | 10,000,000 | | | | 9,996,107 | |
| 4.69% (USBMMY3M + 15 bps), 04/30/2026 (b) | | | 25,000,000 | | | | 24,997,663 | |
| 4.71% (USBMMY3M + 17 bps), 04/30/2025 (b) | | | 25,000,000 | | | | 24,999,636 | |
| 4.71% (USBMMY3M + 17 bps), 10/31/2025 (b) | | | 100,000,000 | | | | 99,921,737 | |
| 4.74% (USBMMY3M + 20 bps), 01/31/2025 (b) | | | 85,000,000 | | | | 85,000,341 | |
| 4.75% (USBMMY3M + 21 bps), 10/31/2026 (b) | | | 75,000,000 | | | | 74,999,999 | |
| 4.79% (USBMMY3M + 25 bps), 01/31/2026 (b) | | | 75,000,000 | | | | 75,047,355 | |
| | | | | | | | 454,635,895 | |
| TOTAL U.S. TREASURY OBLIGATIONS (Cost $5,042,931,135) | | | | | | | 5,042,931,135 | |
| TOTAL INVESTMENTS IN SECURITIES (Cost $5,042,931,135) — 103.0% | | | | | | | 5,042,931,135 | |
| Other Assets (Liabilities) — (3.0)% | | | | | | | (144,709,659 | ) |
| NET ASSETS — 100.0% | | | | | | $ | 4,898,221,476 | |
| (a) | Discount note. Rate presented represents the effective yield at time of purchase. |
| (b) | Floating or variable rate security linked to the referenced benchmark. The rate presented represents the rate in effect on October 31, 2024. These securities are deemed to have a maturity remaining until the next adjustment of the interest rate or the longer of the demand period or time to the next readjustment. |
bps – Basis Points
USBMMY3M – 3 Month Treasury Bill Rate
| 6 | HSBC FAMILY OF FUNDS | See notes to financial statements. |
HSBC FAMILY OF FUNDS
Statements of Assets and Liabilities—as of October 31, 2024
| | | HSBC U.S.
Government
Money
Market Fund | | HSBC U.S.
Treasury
Money
Market Fund |
| Assets: | | | | | | | | |
| Investments in securities, at value | | $ | 24,666,260,008 | | | $ | 5,042,931,135 | |
| Repurchase agreements, at value | | | 12,980,000,000 | | | | — | |
| Cash | | | 640,993 | | | | 93,195 | |
| Receivable for fund shares sold | | | 531 | | | | — | |
| Interest receivable | | | 65,651,016 | | | | 507,522 | |
| Prepaid expenses and other assets | | | 313,756 | | | | 75,770 | |
| Total Assets | | | 37,712,866,304 | | | | 5,043,607,622 | |
| Liabilities: | | | | | | | | |
| Distributions payable | | | 59,517,548 | | | | 5,923,105 | |
| Payable for investments purchased | | | 669,406,486 | | | | 138,705,700 | |
| Payable for Fund shares purchased | | | 164 | | | | — | |
| Accrued expenses and other liabilities: | | | | | | | | |
| Investment Management | | | 3,428,691 | | | | 469,041 | |
| Administrative Services | | | 591,125 | | | | 84,734 | |
| Sub-Administration | | | 28,728 | | | | 9,502 | |
| Shareholder Servicing | | | 409,307 | | | | 34,115 | |
| Accounting | | | 107,069 | | | | 23,665 | |
| Compliance Services | | | 5,727 | | | | 5,727 | |
| Custodian | | | 19,148 | | | | 2,825 | |
| Printing | | | 55,903 | | | | 2,715 | |
| Professional | | | 88,920 | | | | 83,769 | |
| Sub-Transfer Agent | | | 77,875 | | | | 26,196 | |
| Trustee | | | 6,924 | | | | 6,924 | |
| Other | | | 7,118 | | | | 8,128 | |
| Total Liabilities | | | 733,750,733 | | | | 145,386,146 | |
| Commitments and contingent liabilities (Note 4) | | | — | | | | — | |
| Net Assets | | $ | 36,979,115,571 | | | $ | 4,898,221,476 | |
| Composition of Net Assets: | | | | | | | | |
| Paid in Capital | | $ | 36,983,581,248 | | | $ | 4,898,264,163 | |
| Total distributable earnings/(loss) | | | (4,465,677 | ) | | | (42,687 | ) |
| Net Assets | | $ | 36,979,115,571 | | | $ | 4,898,221,476 | |
| | | | | | | | | |
| Net Assets: | | | | | | | | |
| Class A Shares | | $ | 1,876,057,989 | | | $ | 85,757,633 | |
| Class I Shares | | | 28,522,912,415 | | | | 2,752,423,148 | |
| Intermediary Class Shares | | | 2,453,798,655 | | | | 554,093,120 | |
| Intermediary Service Class Shares | | | 2,293,243,270 | | | | 876,082,851 | |
| Class P Shares | | | 134,104,353 | | | | 272,412,723 | |
| Class Y Shares | | | 1,698,998,889 | | | | 357,452,001 | |
| | | $ | 36,979,115,571 | | | $ | 4,898,221,476 | |
| Shares Outstanding: | | | | | | | | |
| ($0.001 par value, unlimited number of shares authorized): | | | | | | | | |
| Class A Shares | | | 1,875,960,688 | | | | 85,796,365 | |
| Class I Shares | | | 28,527,027,090 | | | | 2,752,462,605 | |
| Intermediary Class Shares | | | 2,454,035,677 | | | | 554,079,303 | |
| Intermediary Service Class Shares | | | 2,293,269,268 | | | | 876,095,362 | |
| Class P Shares | | | 134,094,743 | | | | 272,411,826 | |
| Class Y Shares | | | 1,699,210,129 | | | | 357,423,669 | |
| Net Asset Value, Offering Price and Redemption Price per share: | | | | | | | | |
| Class A Shares | | $ | 1.00 | | | $ | 1.00 | |
| Class I Shares | | $ | 1.00 | | | $ | 1.00 | |
| Intermediary Class Shares | | $ | 1.00 | | | $ | 1.00 | |
| Intermediary Service Class Shares | | $ | 1.00 | | | $ | 1.00 | |
| Class P Shares | | $ | 1.00 | | | $ | 1.00 | |
| Class Y Shares | | $ | 1.00 | | | $ | 1.00 | |
| Investments in securities, at cost | | $ | 24,666,260,008 | | | $ | 5,042,931,135 | |
| Repurchase agreements, at cost | | $ | 12,980,000,000 | | | $ | — | |
Amounts designated as “—” are $0.00 or have been rounded to $0.00.
| See notes to financial statements. | HSBC FAMILY OF FUNDS | 7 |
HSBC FAMILY OF FUNDS
Statements of Operations—For the year ended October 31, 2024
| | | HSBC U.S.
Government
Money
Market Fund | | HSBC U.S.
Treasury
Money
Market Fund |
| Investment Income: | | | | | | |
| Interest | | $ | 1,846,428,737 | | | $ | 269,438,662 | |
| Dividends | | | 73,060,346 | | | | — | |
Total Investment Income | | | 1,919,489,083 | | | | 269,438,662 | |
| | | | | | | | |
| Expenses: | | | | | | | | |
| Investment Management Fees | | | 35,964,273 | | | | 5,052,548 | |
| Operational Support: | | | | | | | | |
| Class A Shares | | | 1,725,883 | | | | 77,100 | |
| Intermediary Class Shares | | | 2,488,768 | | | | 630,877 | |
| Intermediary Service Class Shares | | | 1,796,293 | | | | 761,283 | |
| Class P Shares | | | 175,980 | | | | 184,909 | |
| Class Y Shares | | | 1,510,609 | | | | 379,025 | |
| Administrative Services: | | | | | | | | |
| Class A Shares | | | 345,114 | | | | 15,428 | |
| Class I Shares | | | 5,653,466 | | | | 603,876 | |
| Intermediary Class Shares | | | 497,739 | | | | 126,175 | |
| Intermediary Service Class Shares | | | 359,220 | | | | 152,255 | |
| Class P Shares | | | 35,190 | | | | 36,979 | |
| Class Y Shares | | | 302,126 | | | | 75,797 | |
| Shareholder Servicing: | | | | | | | | |
| Class A Shares | | | 4,314,708 | | | | 192,752 | |
| Intermediary Class Shares | | | 1,244,384 | | | | 315,438 | |
| Intermediary Service Class Shares | | | 1,796,293 | | | | 761,283 | |
| Class P Shares | | | 87,990 | | | | 92,454 | |
| Accounting | | | 461,593 | | | | 100,733 | |
| Sub-Administration | | | 122,048 | | | | 40,051 | |
| Compliance Services | | | 57,313 | | | | 57,313 | |
| Custodian | | | 80,953 | | | | 12,485 | |
| Printing | | | 225,557 | | | | 14,505 | |
| Professional | | | 445,540 | | | | 424,591 | |
| Sub-Transfer Agent | | | 913,240 | | | | 313,143 | |
| Trustee | | | 309,231 | | | | 309,231 | |
| Registration fees | | | 207,454 | | | | 123,964 | |
| Other | | | 779,173 | | | | 252,464 | |
| Total expenses before fee and expense reductions | | | 61,900,138 | | | | 11,106,659 | |
| Fees voluntarily reduced/reimbursed by Investment Adviser and/or Administrator | | | (868,091 | ) | | | (278,432 | ) |
| Fees contractually reduced/reimbursed by Investment Adviser and/or Administrator | | | (5,005,770 | ) | | | (2,543,302 | ) |
| Net Expenses | | | 56,026,277 | | | | 8,284,925 | |
| | | | | | | | | |
| Net Investment Income/(Loss) | | $ | 1,863,462,806 | | | $ | 261,153,737 | |
| | | | | | | | | |
| Realized/Unrealized Gains/(Losses) from Investments: | | | | | | | | |
| Net realized gains/(losses) from investments in securities | | | 2,602,623 | | | | 38,708 | |
| | | | | | | | | |
| Net realized/unrealized gains/(losses) on investments | | | 2,602,623 | | | | 38,708 | |
| Change in Net Assets Resulting from Operations | | $ | 1,866,065,429 | | | $ | 261,192,445 | |
Amounts designated as “—” are $0.00 or have been rounded to $0.00.
| 8 | HSBC FAMILY OF FUNDS | See notes to financial statements. |
HSBC FAMILY OF FUNDS
Statements of Changes in Net Assets
| | | HSBC U.S. Government Money Market Fund | | HSBC U.S. Treasury Money
Market Fund |
| | | | Year Ended
October 31, 2024 | | | | Year Ended
October 31, 2023 | | | | Year Ended
October 31, 2024 | | | | Year Ended
October 31, 2023 | |
| Investment Activities: | | | | | | | | | | | | | | | | |
| Operations: | | | | | | | | | | | | | | | | |
| Net investment income/(loss) | | $ | 1,863,462,806 | | | $ | 1,636,047,847 | | | $ | 261,153,737 | | | $ | 212,148,505 | |
| Net realized gains/(losses) from investments | | | 2,602,623 | | | | (6,256,527 | ) | | | 38,708 | | | | 29,710 | |
| Change in net assets resulting from operations | | | 1,866,065,429 | | | | 1,629,791,320 | | | | 261,192,445 | | | | 212,178,215 | |
| Distributions to shareholders: | | | | | | | | | | | | | | | | |
Class A Shares(1) | | | — | | | | (52,670 | ) | | | — | | | | — | |
Class A Shares (formerly, Class D Shares)(2) | | | (83,623,092 | ) | | | (62,512,099 | ) | | | (3,711,872 | ) | | | (3,341,868 | ) |
| Class I Shares | | | (1,472,641,573 | ) | | | (1,352,492,184 | ) | | | (156,582,024 | ) | | | (137,455,864 | ) |
| Intermediary Class Shares | | | (128,869,995 | ) | | | (100,060,659 | ) | | | (32,666,066 | ) | | | (38,247,656 | ) |
| Intermediary Service Class Shares | | | (92,291,330 | ) | | | (56,753,437 | ) | | | (39,084,678 | ) | | | (19,098,645 | ) |
Class P Shares(3) | | | (9,076,197 | ) | | | (112,652 | ) | | | (9,440,025 | ) | | | (29,082 | ) |
| Class Y Shares | | | (76,960,619 | ) | | | (64,064,109 | ) | | | (19,227,698 | ) | | | (14,416,652 | ) |
| Change in net assets resulting from distributions to shareholders: | | | (1,863,462,806 | ) | | | (1,636,047,810 | ) | | | (260,712,363 | ) | | | (212,589,767 | ) |
| Change in net assets resulting from capital transactions | | | (1,890,362,980 | ) | | | (18,622,461,894 | ) | | | (388,963,608 | ) | | | (55,861,511 | ) |
| Change in net assets | | | (1,887,760,357 | ) | | | (18,628,718,384 | ) | | | (388,483,526 | ) | | | (56,273,063 | ) |
| Net Assets: | | | | | | | | | | | | | | | | |
| Beginning of period | | | 38,866,875,928 | | | | 57,495,594,312 | | | | 5,286,705,002 | | | | 5,342,978,065 | |
| End of period | | $ | 36,979,115,571 | | | $ | 38,866,875,928 | | | $ | 4,898,221,476 | | | $ | 5,286,705,002 | |
| CAPITAL TRANSACTIONS*: | | | | | | | | | | | | | | | | |
Class A Shares(1): | | | | | | | | | | | | | | | | |
| Proceeds from shares issued | | $ | — | | | $ | 115,774 | | | $ | — | | | $ | — | |
| Dividends reinvested | | | — | | | | 48,166 | | | | — | | | | — | |
| Value of shares converted to Class D | | | — | | | | (1,182,359 | ) | | | — | | | | — | |
| Value of shares redeemed | | | — | | | | (314,419 | ) | | | — | | | | — | |
| Class A Shares capital transactions | | | — | | | | (1,332,838 | ) | | | — | | | | — | |
Class A Shares (formerly, Class D Shares)(2): | | | | | | | | | | | | | | | | |
| Proceeds from shares issued | | $ | 3,812,601,241 | | | $ | 4,105,620,940 | | | $ | 301,402,190 | | | $ | 431,039,861 | |
| Dividends reinvested | | | 71,327,851 | | | | 50,973,224 | | | | 1,728,953 | | | | 1,836,316 | |
| Value of shares converted from Class A | | | — | | | | 1,182,359 | | | | — | | | | — | |
| Value of shares redeemed | | | (3,473,520,232 | ) | | | (3,926,132,928 | ) | | | (281,307,645 | ) | | | (462,620,149 | ) |
| Class A Shares (formerly, Class D Shares) capital transactions | | | 410,408,860 | | | | 231,643,595 | | | | 21,823,498 | | | | (29,743,972 | ) |
| Class I Shares: | | | | | | | | | | | | | | | | |
| Proceeds from shares issued | | $ | 364,519,806,940 | | | $ | 304,431,517,364 | | | $ | 15,257,247,949 | | | $ | 20,528,417,805 | |
| Dividends reinvested | | | 843,454,792 | | | | 786,390,845 | | | | 111,391,185 | | | | 99,054,268 | |
| Value of shares redeemed | | | (368,124,287,730 | ) | | | (323,385,737,925 | ) | | | (15,937,802,632 | ) | | | (20,299,871,518 | ) |
| Class I Shares capital transactions | | | (2,761,025,998 | ) | | | (18,167,829,716 | ) | | | (569,163,498 | ) | | | 327,600,555 | |
| Intermediary Class Shares: | | | | | | | | | | | | | | | | |
| Proceeds from shares issued | | $ | 40,929,434,910 | | | $ | 25,779,690,861 | | | $ | 3,291,462,384 | | | $ | 6,142,813,553 | |
| Dividends reinvested | | | 46,790,239 | | | | 21,882,156 | | | | 4,385,143 | | | | 2,949,907 | |
| Value of shares redeemed | | | (41,861,130,694 | ) | | | (26,468,835,081 | ) | | | (3,714,713,806 | ) | | | (6,295,124,707 | ) |
| Intermediary Class Shares capital transactions | | | (884,905,545 | ) | | | (667,262,064 | ) | | | (418,866,279 | ) | | | (149,361,247 | ) |
| Intermediary Service Class Shares: | | | | | | | | | | | | | | | | |
| Proceeds from shares issued | | $ | 18,011,540,421 | | | $ | 10,116,604,389 | | | $ | 2,155,841,241 | | | $ | 1,632,066,793 | |
| Dividends reinvested | | | 45,590,781 | | | | 23,278,132 | | | | 24,704,582 | | | | 15,592,665 | |
| Value of shares redeemed | | | (17,232,874,618 | ) | | | (9,727,328,042 | ) | | | (1,910,011,858 | ) | | | (1,836,105,565 | ) |
| Intermediary Service Class Shares capital transactions | | | 824,256,584 | | | | 412,554,479 | | | | 270,533,965 | | | | (188,446,107 | ) |
Class P Shares(3): | | | | | | | | | | | | | | | | |
| Proceeds from shares issued | | $ | 2,436,371,364 | | | $ | 47,883,526 | | | $ | 517,358,031 | | | $ | 14,600,001 | |
| Dividends reinvested | | | 8,349,692 | | | | 99,554 | | | | 9,371,503 | | | | 28,349 | |
| Value of shares redeemed | | $ | (2,344,893,932 | ) | | $ | (13,715,461 | ) | | $ | (254,546,058 | ) | | $ | (14,400,000 | ) |
| Class P Shares capital transactions | | | 99,827,124 | | | | 34,267,619 | | | | 272,183,476 | | | | 228,350 | |
| Class Y Shares: | | | | | | | | | | | | | | | | |
| Proceeds from shares issued | | $ | 29,395,475,902 | | | $ | 20,524,165,007 | | | $ | 3,574,909,023 | | | $ | 1,478,199,523 | |
| Dividends reinvested | | | 74,882,089 | | | | 62,480,889 | | | | 18,440,494 | | | | 14,313,476 | |
| Value of shares redeemed | | | (29,049,281,996 | ) | | | (21,051,148,865 | ) | | | (3,558,824,287 | ) | | | (1,508,652,089 | ) |
| Class Y Shares capital transactions | | | 421,075,995 | | | | (464,502,969 | ) | | | 34,525,230 | | | | (16,139,090 | ) |
| Change in net assets resulting from capital transactions | | $ | (1,890,362,980 | ) | | $ | (18,622,461,894 | ) | | $ | (388,963,608 | ) | | $ | (55,861,511 | ) |
| * | Share transactions are at net asset value of $1.00 per share. |
| (1) | Class A Shares are no longer offered by the Fund effective October 29, 2023. Subsequently, the Class D Shares were redesignated as Class A Shares. |
| (2) | Includes the conversion of Class A Shares to Class D Shares during November 1, 2022 to October 31, 2023 and the redesignation of Class D Shares as Class A Shares at the close of business on October 29, 2023. |
| (3) | Commencement of operations May 11, 2023. |
Amounts designated as “—” are $0.00 or have been rounded to $0.00.
| See notes to financial statements. | HSBC FAMILY OF FUNDS | 9 |
| HSBC U.S. GOVERNMENT MONEY MARKET FUND |
Financial Highlights
Selected data for a share outstanding throughout the periods indicated.
| | | | | Investment Activities | | Distributions | | | | | | Ratios/Supplementary Data |
| | | Net Asset Value, Beginning of Period | | Net Investment Income/
(Loss) | | Net Realized and Unrealized Gains/ (Losses) from Investments | | Total from Investment Activities | | Net Investment Income | | Net Realized Gains from Investment Transactions | | Total Distributions | | Net Asset Value, End of Period | | Total Return | | Net Assets at Value, End of Period (000’s) | | Ratio of Net Expense to Average Net Assets | | Ratio of Net Investment Income to Average Net Assets | | Ratio of Expenses to Average Net Assets (Excluding Fee Reductions) |
| Class A Shares | | | | | | | | | | | | | | | | | | | | | | | | | | |
| Year Ended October 31, 2024 | | $1.00 | | $0.05(c) | | $— | | $0.05 | | $(0.05) | | $— | | $(0.05) | | $1.00 | | 4.96% | | $1,876,058 | | 0.48% | | 4.85% | | 0.48% |
Year Ended October 31, 2023(1) | | 1.00 | | 0.04(c) | | — | | 0.04 | | (0.04) | | — | | (0.04) | | 1.00 | | 4.42% | | 1,465,532 | | 0.48% | | 4.37% | | 0.48% |
| Year Ended October 31, 2022 | | 1.00 | | 0.01(c) | | — | | 0.01 | | (0.01) | | — | | (0.01) | | 1.00 | | 0.76% | | 1,234,039 | | 0.30% | | 0.68% | | 0.49% |
| Year Ended October 31, 2021 | | 1.00 | | — | | — | | — | | — | | — | | — | | 1.00 | | 0.01% | | 1,680,757 | | 0.08% | | 0.01% | | 0.49% |
| Year Ended October 31, 2020 | | 1.00 | | — | | — | | — | | — | | — | | — | | 1.00 | | 0.44% | | 2,484,374 | | 0.32% | | 0.39% | | 0.50% |
| Class I Shares | | | | | | | | | | | | | | | | | | | | | | | | | | |
| Year Ended October 31, 2024 | | 1.00 | | 0.05(c) | | — | | 0.05 | | (0.05) | | — | | (0.05) | | 1.00 | | 5.33% | | 28,522,912 | | 0.13% | | 5.21% | | 0.13% |
| Year Ended October 31, 2023 | | 1.00 | | 0.05(c) | | — | | 0.05 | | (0.05) | | — | | (0.05) | | 1.00 | | 4.79% | | 31,281,874 | | 0.13% | | 4.61% | | 0.13% |
| Year Ended October 31, 2022 | | 1.00 | | 0.01(c) | | — | | 0.01 | | (0.01) | | — | | (0.01) | | 1.00 | | 0.98% | | 49,455,073 | | 0.10% | | 1.20% | | 0.14% |
| Year Ended October 31, 2021 | | 1.00 | | — | | — | | — | | — | | — | | — | | 1.00 | | 0.03% | | 29,897,234 | | 0.06% | | 0.03% | | 0.14% |
| Year Ended October 31, 2020 | | 1.00 | | 0.01 | | — | | 0.01 | | (0.01) | | — | | (0.01) | | 1.00 | | 0.65% | | 27,383,086 | | 0.12% | | 0.44% | | 0.15% |
| Intermediary Class Shares | | | | | | | | | | | | | | | | | | | | | | | | | | |
| Year Ended October 31, 2024 | | 1.00 | | 0.05(c) | | — | | 0.05 | | (0.05) | | — | | (0.05) | | 1.00 | | 5.30% | | 2,453,799 | | 0.16% | | 5.18% | | 0.28% |
| Year Ended October 31, 2023 | | 1.00 | | 0.05(c) | | — | | 0.05 | | (0.05) | | — | | (0.05) | | 1.00 | | 4.76% | | 3,338,524 | | 0.16% | | 4.56% | | 0.28% |
| Year Ended October 31, 2022 | | 1.00 | | 0.01(c) | | — | | 0.01 | | (0.01) | | — | | (0.01) | | 1.00 | | 0.95% | | 4,006,166 | | 0.13% | | 1.50% | | 0.29% |
| Year Ended October 31, 2021 | | 1.00 | | — | | — | | — | | — | | — | | — | | 1.00 | | 0.02% | | 1,237,168 | | 0.07% | | 0.01% | | 0.29% |
| Year Ended October 31, 2020 | | 1.00 | | 0.01 | | — | | 0.01 | | (0.01) | | — | | (0.01) | | 1.00 | | 0.62% | | 441,888 | | 0.16% | | 0.63% | | 0.30% |
| Intermediary Service Class Shares | | | | | | | | | | | | | | | | | | | | | | | | | | |
| Year Ended October 31, 2024 | | 1.00 | | 0.05(c) | | — | | 0.05 | | (0.05) | | — | | (0.05) | | 1.00 | | 5.28% | | 2,293,243 | | 0.18% | | 5.14% | | 0.33% |
| Year Ended October 31, 2023 | | 1.00 | | 0.05(c) | | — | | 0.05 | | (0.05) | | — | | (0.05) | | 1.00 | | 4.74% | | 1,468,865 | | 0.18% | | 4.73% | | 0.33% |
| Year Ended October 31, 2022 | | 1.00 | | 0.01(c) | | — | | 0.01 | | (0.01) | | — | | (0.01) | | 1.00 | | 0.94% | | 1,056,440 | | 0.14% | | 0.93% | | 0.34% |
| Year Ended October 31, 2021 | | 1.00 | | — | | — | | — | | — | | — | | — | | 1.00 | | 0.02% | | 1,026,492 | | 0.07% | | 0.01% | | 0.34% |
| Year Ended October 31, 2020 | | 1.00 | | 0.01 | | — | | 0.01 | | (0.01) | | — | | (0.01) | | 1.00 | | 0.60% | | 329,786 | | 0.17% | | 0.39% | | 0.35% |
| Class P Shares | | | | | | | | | | | | | | | | | | | | | | | | | | |
| Year Ended October 31, 2024 | | 1.00 | | 0.05(c) | | — | | 0.05 | | (0.05) | | — | | (0.05) | | 1.00 | | 5.27% | | 134,104 | | 0.18% | | 5.16% | | 0.28% |
Period Ended October 31, 2023(2) | | 1.00 | | 0.02(c) | | — | | 0.02 | | (0.02) | | — | | (0.02) | | 1.00 | | 2.45%(a) | | 34,268 | | 0.18%(b) | | 5.22%(b) | | 0.28%(b) |
| 10 | HSBC FAMILY OF FUNDS | See notes to financial statements. |
| HSBC U.S. GOVERNMENT MONEY MARKET FUND |
Financial Highlights (continued)
Selected data for a share outstanding throughout the periods indicated.
| | | | | Investment Activities | | Distributions | | | | | | Ratios/Supplementary Data |
| | | Net Asset Value, Beginning of Period | | Net Investment Income/
(Loss) | | Net Realized and Unrealized Gains/ (Losses) from Investments | | Total from Investment Activities | | Net Investment Income | | Net Realized Gains from Investment Transactions | | Total Distributions | | Net Asset Value, End of Period | | Total Return | | Net Assets at Value, End of Period (000’s) | | Ratio of Net Expense to Average Net Assets | | Ratio of Net Investment Income to Average Net Assets | | Ratio of Expenses to Average Net Assets (Excluding Fee Reductions) |
| Class Y Shares | | | | | | | | | | | | | | | | | | | | | | | | | | |
| Year Ended October 31, 2024 | | $1.00 | | $0.05(c) | | $— | | $0.05 | | $(0.05) | | $— | | $(0.05) | | $1.00 | | 5.22% | | $1,698,999 | | 0.23% | | 5.09% | | 0.23% |
| Year Ended October 31, 2023 | | 1.00 | | 0.05(c) | | — | | 0.05 | | (0.05) | | — | | (0.05) | | 1.00 | | 4.68% | | 1,277,813 | | 0.23% | | 4.49% | | 0.23% |
| Year Ended October 31, 2022 | | 1.00 | | 0.01(c) | | — | | 0.01 | | (0.01) | | — | | (0.01) | | 1.00 | | 0.90% | | 1,742,544 | | 0.17% | | 0.91% | | 0.24% |
| Year Ended October 31, 2021 | | 1.00 | | — | | — | | — | | — | | — | | — | | 1.00 | | 0.01% | | 1,386,114 | | 0.08% | | 0.01% | | 0.24% |
| Year Ended October 31, 2020 | | 1.00 | | 0.01 | | — | | 0.01 | | (0.01) | | — | | (0.01) | | 1.00 | | 0.56% | | 1,274,781 | | 0.21% | | 0.63% | | 0.25% |
| (1) | Includes the conversion of Class A Shares to Class D Shares and the redesignation of Class D Shares as Class A Shares at the close of business on October 29, 2023. |
| (2) | Commencement of operations May 11, 2023. |
| (a) | Not annualized for periods less than one year. Total return calculations do not include any sales or redemption charges. |
| (b) | Annualized for periods less than one year. |
| (c) | Calculated based on average shares outstanding. |
Amounts designated as “—” are $0.00 or have been rounded to $0.00.
| See notes to financial statements. | HSBC FAMILY OF FUNDS | 11 |
| HSBC U.S. TREASURY MONEY MARKET FUND |
Financial Highlights
Selected data for a share outstanding throughout the periods indicated.
| | | | | Investment Activities | | Distributions | | | | | | Ratios/Supplementary Data |
| | | Net Asset Value, Beginning of Period | | Net Investment Income/
(Loss) | | Net Realized and Unrealized Gains/
(Losses)
from Investments | | Total from Investment Activities | | Net Investment Income | | Net Realized Gains from Investment Transactions | | Total Distributions | | Net Asset Value, End of Period | | Total Return | | Net Assets at Value, End of Period (000’s) | | Ratio of Net Expense to Average Net Assets | | Ratio of Net Investment Income to Average Net Assets | | Ratio of Expenses to Average Net Assets (Excluding Fee Reductions) |
| Class A Shares | | | | | | | | | | | | | | | | | | | | | | | | | | |
| Year Ended October 31, 2024 | | $1.00 | | $0.05(c) | | $— | | $0.05 | | $(0.05) | | $— | | $(0.05) | | $1.00 | | 4.93% | | $85,758 | | 0.50% | | 4.82% | | 0.50% |
Year Ended October 31, 2023(1) | | 1.00 | | 0.04(c) | | — | | 0.04 | | (0.04) | | — | | (0.04) | | 1.00 | | 4.38% | | 63,928 | | 0.51% | | 4.18% | | 0.51% |
| Year Ended October 31, 2022 | | 1.00 | | 0.01(c) | | — | | 0.01 | | (0.01) | | — | | (0.01) | | 1.00 | | 0.73% | | 93,677 | | 0.31% | | 0.63% | | 0.53% |
| Year Ended October 31, 2021 | | 1.00 | | — | | — | | — | | — | | — | | — | | 1.00 | | 0.02% | | 120,467 | | 0.06% | | 0.02% | | 0.51% |
| Year Ended October 31, 2020 | | 1.00 | | — | | — | | — | | — | | — | | — | | 1.00 | | 0.44% | | 146,852 | | 0.35% | | 0.42% | | 0.52% |
| Class I Shares | | | | | | | | | | | | | | | | | | | | | | | | | | |
| Year Ended October 31, 2024 | | 1.00 | | 0.05(c) | | — | | 0.05 | | (0.05) | | — | | (0.05) | | 1.00 | | 5.31% | | 2,752,423 | | 0.14% | | 5.20% | | 0.15% |
| Year Ended October 31, 2023 | | 1.00 | | 0.05(c) | | — | | 0.05 | | (0.05) | | — | | (0.05) | | 1.00 | | 4.76% | | 3,321,282 | | 0.14% | | 4.64% | | 0.16% |
| Year Ended October 31, 2022 | | 1.00 | | 0.01(c) | | — | | 0.01 | | (0.01) | | — | | (0.01) | | 1.00 | | 0.94% | | 2,993,947 | | 0.12% | | 1.13% | | 0.18% |
| Year Ended October 31, 2021 | | 1.00 | | — | | — | | — | | — | | — | | — | | 1.00 | | 0.01% | | 1,318,598 | | 0.06% | | 0.02% | | 0.16% |
| Year Ended October 31, 2020 | | 1.00 | | 0.01 | | — | | 0.01 | | (0.01) | | — | | (0.01) | | 1.00 | | 0.64% | | 2,278,404 | | 0.14% | | 0.37% | | 0.16% |
| Intermediary Class Shares | | | | | | | | | | | | | | | | | | | | | | | | | | |
| Year Ended October 31, 2024 | | 1.00 | | 0.05(c) | | — | | 0.05 | | (0.05) | | — | | (0.05) | | 1.00 | | 5.29% | | 554,093 | | 0.16% | | 5.19% | | 0.30% |
| Year Ended October 31, 2023 | | 1.00 | | 0.05(c) | | — | | 0.05 | | (0.05) | | — | | (0.05) | | 1.00 | | 4.74% | | 972,875 | | 0.16% | | 4.58% | | 0.31% |
| Year Ended October 31, 2022 | | 1.00 | | 0.01(c) | | — | | 0.01 | | (0.01) | | — | | (0.01) | | 1.00 | | 0.93% | | 1,122,315 | | 0.14% | | 1.36% | | 0.33% |
| Year Ended October 31, 2021 | | 1.00 | | — | | — | | — | | — | | — | | — | | 1.00 | | 0.01% | | 350,940 | | 0.06% | | 0.01% | | 0.31% |
| Year Ended October 31, 2020 | | 1.00 | | 0.01 | | — | | 0.01 | | (0.01) | | — | | (0.01) | | 1.00 | | 0.63% | | 265,607 | | 0.16% | | 0.48% | | 0.32% |
| Intermediary Service Class Shares | | | | | | | | | | | | | | | | | | | | | | | | | | |
| Year Ended October 31, 2024 | | 1.00 | | 0.05(c) | | — | | 0.05 | | (0.05) | | — | | (0.05) | | 1.00 | | 5.27% | | 876,083 | | 0.18% | | 5.14% | | 0.35% |
| Year Ended October 31, 2023 | | 1.00 | | 0.05(c) | | — | | 0.05 | | (0.05) | | — | | (0.05) | | 1.00 | | 4.72% | | 605,495 | | 0.18% | | 4.43% | | 0.36% |
| Year Ended October 31, 2022 | | 1.00 | | 0.01(c) | | — | | 0.01 | | (0.01) | | — | | (0.01) | | 1.00 | | 0.92% | | 793,981 | | 0.15% | | 0.98% | | 0.38% |
| Year Ended October 31, 2021 | | 1.00 | | — | | — | | — | | — | | — | | — | | 1.00 | | 0.01% | | 794,437 | | 0.06% | | 0.00% | | 0.36% |
| Year Ended October 31, 2020 | | 1.00 | | 0.01 | | — | | 0.01 | | (0.01) | | — | | (0.01) | | 1.00 | | 0.61% | | 176,037 | | 0.17% | | 0.47% | | 0.37% |
| Class P Shares | | | | | | | | | | | | | | | | | | | | | | | | | | |
| Year Ended October 31, 2024 | | 1.00 | | 0.05(c) | | — | | 0.05 | | (0.05) | | — | | (0.05) | | 1.00 | | 5.26% | | 272,413 | | 0.18% | | 5.11% | | 0.30% |
Period Ended October 31, 2023(2) | | 1.00 | | 0.02(c) | | — | | 0.02 | | (0.02) | | — | | (0.02) | | 1.00 | | 2.45%(a) | | 228 | | 0.18%(b) | | 5.20%(b) | | 0.31%(b) |
| 12 | HSBC FAMILY OF FUNDS | See notes to financial statements. |
| HSBC U.S. TREASURY MONEY MARKET FUND |
Financial Highlights (continued)
Selected data for a share outstanding throughout the periods indicated.
| | | | | Investment Activities | | Distributions | | | | | | Ratios/Supplementary Data |
| | | Net Asset Value, Beginning of Period | | Net Investment Income/
(Loss) | | Net Realized and Unrealized Gains/
(Losses)
from Investments | | Total from Investment Activities | | Net Investment Income | | Net Realized Gains from Investment Transactions | | Total Distributions | | Net Asset Value, End of Period | | Total Return | | Net Assets at Value, End of Period (000’s) | | Ratio of Net Expense to Average Net Assets | | Ratio of Net Investment Income to Average Net Assets | | Ratio of Expenses to Average Net Assets (Excluding Fee Reductions) |
| Class Y Shares | | | | | | | | | | | | | | | | | | | | | | | | | | |
| Year Ended October 31, 2024 | | $1.00 | | $0.05(c) | | $— | | $0.05 | | $(0.05) | | $— | | $(0.05) | | $1.00 | | 5.19% | | $357,452 | | 0.25% | | 5.08% | | 0.25% |
| Year Ended October 31, 2023 | | 1.00 | | 0.05(c) | | — | | 0.05 | | (0.05) | | — | | (0.05) | | 1.00 | | 4.64% | | 322,897 | | 0.26% | | 4.49% | | 0.26% |
| Year Ended October 31, 2022 | | 1.00 | | 0.01(c) | | — | | 0.01 | | (0.01) | | — | | (0.01) | | 1.00 | | 0.87% | | 339,059 | | 0.19% | | 0.75% | | 0.28% |
| Year Ended October 31, 2021 | | 1.00 | | — | | — | | — | | — | | — | | — | | 1.00 | | 0.01% | | 440,144 | | 0.06% | | 0.02% | | 0.26% |
| Year Ended October 31, 2020 | | 1.00 | | 0.01 | | — | | 0.01 | | (0.01) | | — | | (0.01) | | 1.00 | | 0.56% | | 536,101 | | 0.22% | | 0.63% | | 0.27% |
| (1) | Includes the conversion of Class A Shares to Class D Shares and the redesignation of Class D Shares as Class A Shares at the close of business on October 29, 2023. |
| (2) | Commencement of operations May 11, 2023. |
| (a) | Not annualized for periods less than one year. Total return calculations do not include any sales or redemption charges. |
| (b) | Annualized for periods less than one year. |
| (c) | Calculated based on average shares outstanding. |
Amounts designated as “—” are $0.00 or have been rounded to $0.00.
| See notes to financial statements. | HSBC FAMILY OF FUNDS | 13 |
Notes to Financial Statements—October 31, 2024
The HSBC Funds (the “Trust”), a Delaware statutory trust organized on March 2, 2016, is registered under the Investment Company Act of 1940, as amended (the “Act”), as an open-end management investment company. As of October 31, 2024, the Trust is comprised of 5 separate operational funds, each a series of the HSBC Family of Funds. The accompanying financial statements are presented for the following two diversified funds (individually a “Fund”, collectively the “Funds”) of the Trust.
| Fund | Short Name |
| HSBC U.S. Government Money Market Fund | U.S. Government Money Market Fund |
| HSBC U.S. Treasury Money Market Fund | U.S. Treasury Money Market Fund |
Financial statements for all other funds of the Trust are published separately.
Both of the Funds are government money market funds (as defined in Rule 2a-7) and seek to maintain a stable net asset value (“NAV”) of $1.00 per share, although it is possible to lose money by investing in the Funds. The Funds are authorized to issue an unlimited number of shares of beneficial interest with a par value of $0.001 per share. Each of the Funds has six classes of shares: Class A Shares, Class I Shares, Intermediary Class Shares, Intermediary Service Class Shares, Class P Shares and Class Y Shares. Class E Shares of the Funds were terminated by the Board of Trustees of the Funds during the reporting period. None of the share classes charge a sales load. Each class of shares in each Fund has identical rights and privileges, except with respect to arrangements pertaining to shareholder servicing and/or distribution, class-related expenses, voting rights on matters affecting a single class of shares, and exchange privileges.
Under the Trust’s organizational documents, the Trust’s Officers and Trustees are indemnified against certain liabilities arising out of the performance of their duties to the Funds. In addition, in the normal course of business, the Trust may enter into contracts with its service providers, which also provide for indemnifications by the Funds. The Funds’ maximum exposure under these arrangements is unknown as this would involve future claims that may be made against the Funds. However, based on experience, the Trust believes the risk of loss to be remote.
The Funds are investment companies and follow accounting and reporting guidance under Financial Accounting Standards Board Accounting Standards Codification Topic 946, “Financial Services-Investment Companies.”
| 2. | Significant Accounting Policies: |
The following is a summary of the significant accounting policies followed by the Funds in the preparation of their financial statements. The policies are in conformity with generally accepted accounting principles in the United States of America (“GAAP”). The preparation of financial statements requires management to make certain estimates and assumptions that affect the reported amounts of assets and liabilities and disclosure of contingent assets and liabilities at the date of the financial statements and the reported amounts of increases and decreases in net assets from operations during the reporting period. Actual results could differ from those estimates.
Securities Valuation:
Investments of the Funds, other than investments in other money market funds, are valued using the amortized cost method pursuant to Rule 2a-7 under the Act, provided that certain conditions are met. Generally, amortized cost approximates fair value. Investments in other money market funds are priced at NAV as reported by such investment companies. Repurchase agreements are valued at original cost. Fair value is defined as the price that would be received to sell an asset or paid to transfer a liability in an orderly transaction between market participants at the measurement date. The valuation techniques used to determine fair value are further described in Note 3 below.
Notes to Financial Statements—October 31, 2024 (continued)
Investment Transactions and Related Income:
Investment transactions are accounted for no later than one business day after trade date. However, for financial reporting purposes, investment transactions are accounted for on trade date on the last business day of the reporting period. Investment gains and losses are calculated on the identified cost basis. Interest income is determined on the basis of coupon interest accrued using the effective interest method which adjusts for amortization of premiums and accretion of discounts. Dividend income is recorded on the ex-dividend date.
Repurchase Agreements:
The U.S. Government Money Market Fund may enter into repurchase agreements with an entity which is a member of the Federal Reserve System or which is a “primary dealer” (as designated by the Federal Reserve Bank of New York) in U.S. government obligations. The U.S. Government Money Market Fund may also enter into a repurchase agreement with the Federal Reserve Bank of New York, the Fixed Income Clearing Corporation, or certain counterparties approved by the Investment Adviser (as defined in Note 4 - Related Party Transactions and Other Agreements and Plans). The U.S. Treasury Money Market Fund may temporarily invest in repurchase agreements collateralized by U.S. Treasury Obligations under adverse market conditions. The repurchase price generally equals the price paid by a Fund plus interest negotiated on the basis of current short-term rates, which may be more or less than the rate on the underlying portfolio securities. The seller, under a repurchase agreement, is required to maintain the collateral held pursuant to the agreement, with a fair value equal to or greater than the repurchase price (including accrued interest). Securities subject to repurchase agreements are held by the Funds’ custodian or another qualified custodian or in the Federal Reserve/ Treasury book-entry system. Master Repurchase Agreements (“MRA”) permit the Fund, under certain circumstances, including an event of default (such as bankruptcy or insolvency), to offset receivables under the MRA with collateral posted by the counterparty and create one net payment due to or from the Fund. However, bankruptcy or insolvency laws of a particular jurisdiction may impose restrictions on or prohibitions against such a right of offset in the event of the MRA counterparty’s bankruptcy or insolvency. Pursuant to terms of the MRA, the Fund receives securities as collateral with a market value in excess of the repurchase price to be received by the Fund upon the maturity of the transaction. Upon bankruptcy or insolvency of the MRA counterparty, the Fund would recognize a liability with respect to such excess collateral to reflect the Fund’s obligation under bankruptcy law to return the excess to the counterparty. There is potential for loss to a Fund in the event the Fund is delayed or prevented from exercising its rights to dispose of the collateral securities, including the risk of a possible decline in the fair value of the underlying securities during the period while the Fund seeks to assert its rights.
Cash:
Cash is held in deposit accounts at the Funds’ custodian bank, State Street Bank and Trust Company (“Custodian”), and may represent a significant portion of a Fund’s net assets, which may exceed the amount insured by the Federal Deposit Insurance Corporation (“FDIC”). To the extent that such balances exceed FDIC insurance limits, the Funds are subject to the creditworthiness of the Custodian.
Allocations:
Expenses directly attributable to a Fund are charged to that Fund. Expenses not directly attributable to a Fund are allocated among the applicable series within the Trust equally to each series, in relation to its net assets, or another appropriate basis. Class specific expenses are charged directly to the class incurring the expense. In addition, income, expenses (other than class specific expenses), and unrealized and realized gains and losses are allocated to each class based on relative net assets on a daily basis.
Notes to Financial Statements—October 31, 2024 (continued)
Distributions to Shareholders:
Dividends distributed to shareholders of the Funds from net investment income, if any, are declared daily and distributed monthly from each Fund. Distributions from net realized gains, if any, are declared and paid at least annually by the Funds. Additional distributions are also made to the Funds’ shareholders to the extent necessary to avoid the federal excise tax on certain undistributed income and net realized gains of regulated investment companies.
Federal Income Taxes:
Each Fund is a separate taxable entity for federal income tax purposes. Each Fund has qualified and intends to continue to qualify each year as a “regulated investment company” under Subchapter M of the Internal Revenue Code, as amended, and to distribute substantially all of its taxable net investment income and net realized gains, if any, to its shareholders. Accordingly, no provision for federal income or excise tax is required for the Funds, although shareholders may be taxed on distributions they receive.
Management of the Funds has reviewed tax positions taken in tax years that remain subject to examination by all major tax jurisdictions, including federal (i.e., the last four tax year ends and the interim tax period since then, as applicable). Management believes that there is no tax liability resulting from unrecognized tax benefits related to uncertain tax positions taken. Management’s conclusions may be subject to future review based on changes in, or interpretation of, accounting standards or tax laws and regulations.
| 3. | Investment Valuation Summary |
The valuation techniques employed by the Funds, as described below, maximize the use of observable inputs and minimize the use of unobservable inputs in determining fair value. The Funds’ investments are classified within the fair value hierarchy based on the lowest level of input that is significant to the fair value measurement. The inputs used for valuing the Funds’ investments are summarized in the three broad levels listed below:
| ● | Level 1—quoted prices (unadjusted) in active markets for identical assets |
| ● | Level 2—other significant observable inputs (including quoted prices for similar securities, interest rates, prepayments speeds, credit risk, etc.) |
| ● | Level 3—significant unobservable inputs (including the Investment Adviser’s own assumptions in determining the fair value of investments) |
Changes in valuation techniques may result in transfers in or out of an assigned level within the fair value hierarchy. The inputs or methodology used for valuing investments are not necessarily an indication of the risk associated with investing in those investments.
Investments of the Funds, other than investments in other money market funds, are valued using the amortized cost method pursuant to Rule 2a-7 under the Act, and are typically categorized as Level 2 in the fair value hierarchy. The amortized cost method involves valuing an instrument at its cost initially and thereafter assuming a constant amortization to maturity of any discounts or premium, regardless of the impact of fluctuating interest rates on the market value of the instrument. The amortized cost method may result in periods during which value, as determined by amortized cost, is higher or lower than the price a Fund holding the instrument would receive if it sold the instrument. The fair value of securities in the Funds can be expected to vary with changes in prevailing interest rates.
Investments in other money market funds are priced at NAV as reported by such money market funds and are typically categorized as Level 1 in the fair value hierarchy.
Notes to Financial Statements — October 31, 2024 (continued)
The following is a summary of the valuation inputs used as of October 31, 2024 in valuing the Funds’ investments based upon the three levels defined above. The breakdown of investment categorization is disclosed in the Schedule of Portfolio Investments for each Fund.
| | | Level 1 ($) | | | Level 2 ($) | | | Level 3 ($) | | | Total ($) | |
| U.S. Government Money Market Fund | | | | | | | | | | | | | | | | |
| Investment Securities: | | | | | | | | | | | | | | | | |
| U.S. Government and Government Agency Obligations | | | — | | | | 10,078,333,700 | | | | — | | | | 10,078,333,700 | |
| U.S. Treasury Obligations | | | — | | | | 12,653,129,707 | | | | — | | | | 12,653,129,707 | |
| Repurchase Agreements | | | — | | | | 12,980,000,000 | | | | — | | | | 12,980,000,000 | |
| Investment Companies | | | 1,934,796,601 | | | | — | | | | — | | | | 1,934,796,601 | |
| Total Investment Securities | | | 1,934,796,601 | | | | 35,711,463,407 | | | | — | | | | 37,646,260,008 | |
| U.S. Treasury Money Market Fund | | | | | | | | | | | | | | | | |
| Investment Securities: | | | | | | | | | | | | | | | | |
| U.S. Treasury Obligations | | | — | | | | 5,042,931,135 | | | | — | | | | 5,042,931,135 | |
| Total Investment Securities | | | — | | | | 5,042,931,135 | | | | — | | | | 5,042,931,135 | |
| 4. | Related Party Transactions and Other Agreements and Plans: |
Investment Management:
HSBC Global Asset Management (USA) Inc. (“HSBC” or the “Investment Adviser”), a wholly owned subsidiary of HSBC USA, Inc., a registered bank holding company under the laws of the United States, acts as Investment Adviser to the Funds. As Investment Adviser, HSBC manages the investments of the Funds and continuously reviews, supervises and administers the Funds’ investments pursuant to an Investment Advisory Contract. For its services in this capacity, HSBC receives a fee from each Fund, accrued daily and paid monthly, based on the average daily net assets of each respective Fund, at an annual rate of 0.10%.
HSBC also provides operational support services to the Funds pursuant to an Operational Support Services Agreement in connection with the operation of certain classes of shares of the Funds. For its services in this capacity, HSBC is entitled to receive a fee, accrued daily and paid monthly, based on the average daily net assets of Class A Shares, Intermediary Class Shares, Intermediary Service Class Shares, Class P Shares and Class Y Shares, at an annual rate of 0.10%.
HSBC has entered into agreements with certain financial intermediaries (the “Servicers”) to provide recordkeeping, reporting and processing services to the Funds. The Servicers are paid by the Investment Adviser, and not by the Funds, for these services. Since these fees are paid for by the Investment Adviser, they do not represent an additional charge to the Funds or their shareholders and are not reflected in the Funds’ expenses.
Administration, Fund Accounting and Other Services:
HSBC also serves the Funds as Administrator. Under the terms of the Amended and Restated Administration Services Agreement, HSBC receives from the Funds (as well as other series of the Trust combined) a fee, accrued daily and paid monthly, at an annual rate of two basis points (0.02%) of average daily net assets. The fee rate is determined on the basis of the aggregate average daily net assets of the Trust. The total administration fee paid to HSBC is allocated to each series based upon its proportionate share of the aggregate net assets of the Trust subject to certain allocations in cases where one series invests some or all of its assets in another series of the Trust.
Notes to Financial Statements—October 31, 2024 (continued)
State Street Bank and Trust Company (“State Street”) serves as Sub-Administrator to the Funds and provides fund accounting, custody, fund administration, regulatory administration and certain other services to the Funds pursuant to a Master Services Agreement with the Trust. For its services, State Street is entitled to a fee, payable by the Funds, based on a Fund’s net assets, subject to per Fund fees, miscellaneous fees and reimbursements of certain expenses.
Under the Amended and Restated Fund PFO/Treasurer, CCO, Secretary and AMLO Agreement between Foreside Fund Officer Services, LLC (“Foreside”) and the Trust, Foreside makes individuals available to serve as the Trust’s Chief Compliance Officer, Anti-Money Laundering Officer, Treasurer and Secretary and other individuals available to support such officers. For the services provided under that agreement, the Trust paid Foreside $364,966 for the fiscal year ended October 31, 2024, including reimbursement of certain out-of-pocket expenses. Compliance services fees incurred by each Fund are reflected on the Statements of Operations as “Compliance Services” and the other services fees are included in “Other” on the Statements of Operations. Foreside pays the salary and other compensation earned by individuals performing these services.
Distribution Arrangements:
Foreside Distribution Services, L.P. (“Foreside” or the “Distributor”) serves the Trust as Distributor. The Trust has adopted a non-compensatory Distribution Plan and Agreement (the “Distribution Plan”) pursuant to Rule 12b-1 of the Act. The Distribution Plan provides for reimbursement of expenses incurred by the Distributor related to distribution and marketing, at a rate not to exceed 0.25% of the average daily net assets of Class A Shares (currently not being charged) of the Funds.
Shareholder Servicing:
The Trust has adopted a Shareholder Services Plan, which provides for payments to shareholder servicing agents (which includes HSBC and its affiliates) for providing various shareholder services. For performing these services, the shareholder servicing agents are entitled to receive a fee that is computed based on average daily net assets and paid monthly up to the following:
| Share Class | | Fee Rate (%) | |
| Class A Shares | | 0.25 | |
| Intermediary Class Shares | | 0.05 | |
| Intermediary Service Class Shares | | 0.10 | |
| Class P Shares | | 0.05 | |
The aggregate fees paid to the Distributor pursuant to the Distribution Plan and to shareholder servicing agents pursuant to the Shareholder Services Plan may not exceed, in the aggregate, the following:
| Share Class | | Fee Rate (%) | |
| Class A Shares | | 0.25 | |
| Intermediary Class Shares | | 0.05 | |
| Intermediary Service Class Shares | | 0.10 | |
| Class P Shares | | 0.05 | |
The Trust has entered into shareholder services contracts with affiliated and unaffiliated financial intermediaries who provide shareholder services and other related services to their clients or customers who invest in the Funds under which the Funds will pay all or a portion of the fees incurred by such financial intermediaries for performing such services.
Notes to Financial Statements—October 31, 2024 (continued)
Transfer Agency:
State Street serves as the transfer agent for each Fund, and has delegated its responsibilities to SS&C Global Investor and Distribution Solutions, Inc. (“SS&C”). As sub-transfer agent, SS&C receives a fee based on the number of funds and shareholder accounts, subject to certain minimums, and reimbursement of certain expenses.
Independent Trustees:
The Trust pays an annual retainer to each Independent Trustee, plus additional annual retainers to each Committee Chair and the Chairman of the Board of Trustees (the “Board”). The Independent Trustees also receive a fee for each regular, special, and informational meeting of the Board attended. The aggregate amount of the fees and expenses of the Independent Trustees are allocated amongst all the funds in the Trust and are presented in the Statements of Operations.
Fee Reductions:
The Investment Adviser has agreed to contractually limit through February 28, 2025 the total annual expenses of certain classes of the Funds, exclusive of interest, taxes, brokerage commissions, extraordinary expenses and estimated indirect expenses attributable to each Fund’s investments in other investment companies, as applicable.
The applicable classes of each Fund have their own expense limitations based on the average daily net assets for any full fiscal year as follows:
| | Class | | Contractual Expense
Limitations (%) | |
| U.S. Government Money Market Fund | | I | | 0.14 | |
| U.S. Government Money Market Fund | | Intermediary Class | | | |
| | Shares | | 0.18 | |
| U.S. Government Money Market Fund | | Intermediary Service | | | |
| | Class Shares | | 0.20 | |
| U.S. Government Money Market Fund | | P | | 0.18 | |
| U.S. Treasury Money Market Fund | | I | | 0.14 | |
| U.S. Treasury Money Market Fund | | Intermediary Class | | | |
| | Shares | | 0.18 | |
| U.S. Treasury Money Market Fund | | Intermediary Service | | | |
| | Class Shares | | 0.20 | |
| U.S. Treasury Money Market Fund | | P | | 0.18 | |
Any amounts contractually waived or reimbursed by the Investment Adviser will be subject to repayment by the respective Fund to the Investment Adviser within three years calculated monthly from when the waiver or reimbursement is recorded to the extent that the repayment will not cause the Fund’s operating expenses to exceed the contractual expense limit that was in effect at the time of such waiver or reimbursement. As of October 31, 2024, there was no contingent liability.
Notes to Financial Statements—October 31, 2024 (continued)
As of October 31, 2024, the repayments that may potentially be made by the Funds are as follows:
| | | Amount Eligible Through |
| | | October 31,
2027 ($) | | October 31,
2026 ($) | | October 31,
2025 ($) | | Total ($) |
| U.S. Government Money Market Fund | | 5,005,770 | | 3,853,788 | | 6,058,540 | | 14,918,098 |
| U.S. Treasury Money Market Fund | | 2,543,302 | | 2,259,407 | | 2,553,570 | | 7,356,279 |
In addition to the contractual expense limitation agreement with the Funds, HSBC, in its role as Investment Adviser and Administrator, may waive/reimburse additional fees at its discretion. Any voluntary fee waivers/reimbursements are not subject to repayment in subsequent fiscal periods. Voluntary waivers/reimbursements may be eliminated or changed at any time. Amounts waived/reimbursed by the Investment Adviser and/or Administrator are reported on the Statements of Operations, as applicable.
During the fiscal year ended October 31, 2024, the following amounts of expenses were voluntarily and/or contractually waived:
| | | Class I
($) | | Intermediary
Class ($) | | Intermediary
Service
Class ($) | | Class P ($) | | Total ($) |
| U.S. Government Money Market Fund | | — | | 2,987,346 | | 2,710,480 | | 176,035 | | 5,873,861 |
| U.S. Treasury Money Market Fund | | 379,484 | | 897,166 | | 1,316,311 | | 228,773 | | 2,821,734 |
Affiliated Securities Transactions:
The Funds are permitted to effect purchase and sale transactions with affiliated funds under procedures adopted by the Board. The procedures have been designed to seek to ensure that any such security transaction complies with certain conditions of Rule 17a-7 of the Act. Further, as defined under the procedures, each transaction is effected at the current market price. Pursuant to these procedures, for the fiscal year ended October 31, 2024, the Funds did not engage in Rule 17a-7 transactions.
The risks are presented in an order intended to facilitate readability, and their order does not imply that the realization of one risk is likely to occur more frequently than another risk, nor does it imply that the realization of one risk is likely to have a greater adverse impact than another risk.
Interest Rate Risk: Fluctuations in interest rates may affect the yield, volatility, liquidity and value of investments in income-producing or debt instruments. Generally, if interest rates rise, the value of such investments will fall. In addition, rising interest rates could lead to heightened investment volatility and decreased liquidity. During periods of falling interest rates, borrowers may pay off their debt sooner than expected, forcing the reinvestment of principal proceeds at lower interest rates, resulting in less interest income. Conversely, during periods of rising interest rates, borrowers may pay off their debt later than expected, thereby preventing reinvestment of principal proceeds at higher interest rates, increasing a Fund’s sensitivity to changes in interest rates and resulting in less income to the Fund than potentially available. The Funds may face a heightened level of interest rate risk due to certain changes in monetary policy, such as certain interest rate changes by the Federal Reserve. A low interest rate environment poses additional risks to the Funds. Low yields on a Fund’s portfolio holdings may have an adverse impact on the Fund’s ability to provide a positive yield to shareholders, pay expenses out of current income, or, at times, maintain a stable $1.00 share price and/or achieve its investment objective. Interest rate changes can be sudden and unpredictable, and a Fund may lose money if these changes are not anticipated by the Investment Adviser. A wide variety of factors can cause interest rates or yields to rise or fall (e.g., central bank monetary policies, inflationary or deflationary pressures, changing inflation or real growth rates, general market and economic conditions, etc.). The risks associated with changing interest rates may have unpredictable effects on the markets and a Fund’s investments. Recently, the interest rates in the United States rose from historically low levels and the U.S. Federal Reserve and other countries’ central banks increased interest rates in response to global inflation. It is unclear whether interest rates will remain at current levels.
Notes to Financial Statements—October 31, 2024 (continued)
Market Risk: The value of a Fund’s investments may decline due to changing economic, political, social, regulatory or market conditions. Issuer, political, economic, regulatory, social or market developments can affect a single issuer, issuers within an industry or economic sector, or the market as a whole. In the short term, a Fund’s investments can fluctuate dramatically in response to these developments. Different parts of the market and different types of securities can react differently to these developments. Moreover, the conditions in one country or geographic region could adversely affect a Fund’s investments in a different country or geographic region due to increasingly interconnected global economies and financial markets. In addition, market risk includes the risk that geopolitical and other events will disrupt the economy on a regional, national or global level. Events such as war, acts of terrorism, regional conflicts, market manipulation, government defaults, government shutdowns, natural/environmental disasters, inflation, rapid interest rate changes, supply chain disruptions, international sanctions, global recessions, social unrest, the spread of infectious illness or other public health threats could also significantly impact a Fund and its investments, including in ways that cannot be foreseen. A Fund could be negatively impacted if the values of its investments were harmed by such events. Any market disruptions could also prevent a Fund from executing investment decisions in a timely manner.
U.S. Government Securities Risk: There are different types of U.S. Government Securities with different levels of credit risk. Some U.S. Government Securities are issued or guaranteed by the U.S. Treasury and are supported by the full faith and credit of the United States. Other types of U.S. Government Securities are supported by the full faith and credit of the United States (but not issued by the U.S. Treasury). These securities have the lowest credit risk, although they are not risk free. Still other types of U.S. Government Securities are: (1) supported by the ability of the issuer to borrow from the U.S. Treasury; (2) supported only by the credit of the issuing agency, instrumentality or government-sponsored corporation; (3) supported by pools of assets (e.g., mortgage-backed securities); or (4) supported by the United States in some other way. Certain U.S. Government Securities are riskier than others. The relative level of risk depends on the nature of the particular security and government support. A U.S. government-sponsored entity, although chartered or sponsored by an Act of Congress, may issue securities that are neither insured nor guaranteed by the U.S. Treasury and are riskier than those that are. Regarding certain federal agency securities or government sponsored entity securities (such as debt securities or mortgage-backed securities issued by Federal National Mortgage Association (“Fannie Mae”), Federal Home Loan Mortgage Corporation (“Freddie Mac”), Federal Farm Credit Banks, Federal Home Loan Banks, and other government sponsored agencies), investors should be aware that although the issuer may be chartered or sponsored by an Act of Congress, the issuer is not funded by congressional appropriations, and its securities are neither guaranteed nor insured by the U.S. Treasury. Fannie Mae and Freddie Mac have been operating under conservatorship, with the Federal Housing Finance Agency acting as their conservator, since September 2008. This risk does not apply to the HSBC U.S. Treasury Money Market Fund, which normally invests only in obligations of the U.S. Treasury and does not invest in obligations issued or guaranteed by agencies or instrumentalities of the U.S. government.
| 6. | Federal Income Tax Information: |
As of the tax fiscal year ended October 31, 2024, the cost basis of investments for federal income tax purposes, gross unrealized appreciation, gross unrealized depreciation and net unrealized appreciation/(depreciation) were as follows:
| | | Tax Cost ($) | | Tax Unrealized
Appreciation ($) | | Tax Unrealized
(Depreciation) ($) | | Net Unrealized
Appreciation/
(Depreciation) ($) |
| U.S. Government Money Market Fund | | 37,646,260,008 | | — | | — | | — |
| U.S. Treasury Money Market Fund | | 5,042,931,135 | | — | | — | | — |
Notes to Financial Statements—October 31, 2024 (continued)
The tax character of distributions paid by the Funds for the tax year ended October 31, 2024, was as follows:
| | | Distributions paid from |
| | | Ordinary Income ($) | | Total Taxable
Distributions ($) | | Total Distributions
Paid ($) |
| U.S. Government Money Market Fund | | 1,863,462,806 | | 1,863,462,806 | | 1,863,462,806 |
| U.S. Treasury Money Market Fund | | 260,712,363 | | 260,712,363 | | 260,712,363 |
The tax character of distributions paid by the Funds for the tax year ended October 31, 2023, was as follows:
| | | Distributions paid from |
| | | Ordinary Income ($) | | Total Taxable
Distributions ($) | | Total Distributions
Paid ($) |
| U.S. Government Money Market Fund | | 1,636,047,810 | | 1,636,047,810 | | 1,636,047,810 |
| U.S. Treasury Money Market Fund | | 212,589,767 | | 212,589,767 | | 212,589,767 |
As of the tax year ended October 31, 2024, the components of accumulated earnings/(deficit) on a tax basis for the Funds were as follows:
| | | | Undistributed
Ordinary
Income ($) | | Distributions
Payable ($) | | Accumulated
Capital and
Other Losses
($) | | Unrealized
Appreciation/
(Depreciation)
($) | | Total
Accumulated
Earnings/
(Deficit) ($) |
| U.S. Government Money Market Fund | | | 59,520,962 | | (59,517,548) | | (4,469,091) | | — | | (4,465,677) |
| U.S. Treasury Money Market Fund | | | 5,920,490 | | (5,923,105) | | (40,072) | | — | | (42,687) |
As of the tax year ended October 31, 2024, the Funds had net capital loss carryforwards (“CLCFs”) not subject to expiration as summarized in the table below. The Board does not intend to authorize a distribution of any realized gain for the Funds until any applicable CLCF has been offset.
| | | Short Term
Amount ($) | | Long Term
Amount ($) | | Total ($) |
| U.S. Government Money Market Fund | | 4,469,091 | | — | | 4,469,091 |
| U.S. Treasury Money Market Fund | | 39,280 | | 792 | | 40,072 |
The amount and character of net investment income and net realized gains distributed are determined in accordance with federal income tax regulations, which may differ from GAAP. These “book/tax” differences are either considered temporary or permanent in nature. To the extent these differences are permanent in nature (e.g., reclassification of market discounts, certain gain/loss and certain distributions), such amounts are reclassified within the composition of net assets based on their federal tax-basis treatment; temporary differences (e.g., wash sale losses and post-October loss deferrals) do not require reclassification. To the extent distributions to shareholders from net investment income and net realized gains exceed net investment income and net realized gains for tax purposes, they are reported as distributions of capital.
Notes to Financial Statements—October 31, 2024 (continued)
During the year ended October 31, 2024, the Funds utilized capital loss carry forwards for U.S. federal income tax purposes as follows:
| | | Capital Loss
Carry Forward
Utilized ($) |
| U.S. Government Money Market Fund | | 2,602,623 |
| U.S. Treasury Money Market Fund | | 38,708 |
| 7. | Significant Shareholders: |
Shareholders, including other funds, individuals, and accounts, as well as each Fund’s Investment Adviser and/or investment personnel, may from time to time own (beneficially or of record) a significant percentage of the Fund’s shares and can be considered to “control” the Fund when that ownership exceeds 25% of the Fund’s assets (and which may differ from control as determined in accordance with GAAP).
The following list includes the Funds which had individual shareholder accounts with ownership of voting securities greater than 10% of the total outstanding voting securities but less than 25% and/or accounts with ownership of voting securities greater than 25% of the total outstanding voting securities. Significant transactions by these shareholder accounts may negatively impact the Funds’ performance.
| | Number of
shareholders with
ownership of
voting securities
of the Fund
greater than 10%
and less than
25% of the total
Fund’s outstanding
voting securities | | Percentage
owned in
aggregate by
10% - 25%
shareholders (%) | | Number of
shareholders with
ownership of
voting securities
of the Fund
greater than 25%
of the total Fund’s
outstanding
voting securities | | Percentage owned
in aggregate by
greater than 25%
shareholders (%) |
| U.S. Government Money Market Fund | 2 | | 27 | | — | | — |
| U.S. Treasury Money Market Fund | 1 | | 10 | | 1 | | 28 |
As of October 31, 2024, the Investment Adviser and/or its affiliates owned less than 1% of each Fund’s outstanding voting securities.
| 8. | Recent Accounting Pronouncements: |
In November 2023, the FASB issued ASU 2023-07, “Segment Reporting (Topic 280): Improvements to Reportable Segment Disclosures (“ASU 2023-07”),” which enhances disclosure requirements about significant segment expenses. ASU 2023-07 is effective for the fiscal years beginning after December 15, 2023, and interim periods beginning with the first quarter ended March 31, 2025. Early adoption is permitted and retrospective adoption is required for all prior periods presented. The Funds are currently assessing the impact of this guidance, however, the Funds do not expect a material impact on their financial statements.
Subsequent events occurring after the date of this report have been evaluated for potential impact, for purposes of recognition or disclosure in the financial statements, through the date the report was issued and no adjustments or additional disclosures were required to the financial statements.
Report of Independent Registered Public Accounting Firm
To the Board of Trustees of HSBC Funds and Shareholders of HSBC U.S. Government Money Market Fund and HSBC U.S. Treasury Money Market Fund
Opinions on the Financial Statements
We have audited the accompanying statements of assets and liabilities, including the schedules of portfolio investments, of HSBC U.S. Government Money Market Fund and HSBC U.S. Treasury Money Market Fund (two of the funds constituting HSBC Funds, hereafter collectively referred to as the “Funds”) as of October 31, 2024, the related statements of operations for the year ended October 31, 2024, the statements of changes in net assets for each of the two years in the period ended October 31, 2024, including the related notes, and the financial highlights for each of the periods indicated therein (collectively referred to as the “financial statements”). In our opinion, the financial statements present fairly, in all material respects, the financial position of each of the Funds as of October 31, 2024, the results of each of their operations for the year then ended, the changes in each of their net assets for each of the two years in the period ended October 31, 2024 and each of the financial highlights for each of the periods indicated therein in conformity with accounting principles generally accepted in the United States of America.
Basis for Opinions
These financial statements are the responsibility of the Funds’ management. Our responsibility is to express an opinion on the Funds’ financial statements based on our audits. We are a public accounting firm registered with the Public Company Accounting Oversight Board (United States) (PCAOB) and are required to be independent with respect to the Funds in accordance with the U.S. federal securities laws and the applicable rules and regulations of the Securities and Exchange Commission and the PCAOB.
We conducted our audits of these financial statements in accordance with the standards of the PCAOB. Those standards require that we plan and perform the audit to obtain reasonable assurance about whether the financial statements are free of material misstatement, whether due to error or fraud.
Our audits included performing procedures to assess the risks of material misstatement of the financial statements, whether due to error or fraud, and performing procedures that respond to those risks. Such procedures included examining, on a test basis, evidence regarding the amounts and disclosures in the financial statements. Our audits also included evaluating the accounting principles used and significant estimates made by management, as well as evaluating the overall presentation of the financial statements. Our procedures included confirmation of securities owned as of October 31, 2024 by correspondence with the custodian, transfer agents and brokers; when replies were not received from brokers, we performed other auditing procedures. We believe that our audits provide a reasonable basis for our opinions.
/s/PricewaterhouseCoopers LLP
New York, New York
December 26, 2024
We have served as the auditor of one or more investment companies in the HSBC Funds since 2015.
HSBC FAMILY OF FUNDS:
INVESTMENT ADVISER AND ADMINISTRATOR
HSBC Global Asset Management (USA) Inc.
452 Fifth Avenue
New York, NY 10018
SHAREHOLDER SERVICING AGENTS
For HSBC Bank USA, N.A. and
HSBC Securities (USA) Inc. Clients
HSBC Bank USA, N.A.
452 Fifth Avenue
New York, NY 10018
1-888-525-5757
For All Other Shareholders
HSBC Funds
PO. Box 219691
Kansas City, MO 64121-9691
1-800-782-8183
SUB-TRANSFER AGENT
SS&C Global Investor and
Distribution Solutions, Inc.
2000 Crown Colony Drive
Quincy, MA 02169
DISTRIBUTOR
Foreside Distribution Services, L.P
Three Canal Plaza, Suite 100
Portland, ME 04101

Investment products:
| ARE NOT A BANK DEPOSIT OR OBLIGATION OF THE BANK OR ANY OF ITS AFFILIATES | ARE NOT FDIC INSURED | ARE NOT INSURED BY ANY FEDERAL GOVERNMENT AGENCY |
| ARE NOT GUARANTEED BY THE BANK OR ANY OF ITS AFFILIATES | MAY LOSE VALUE |
CUSTODIAN AND TRANSFER AGENT
State Street Bank and Trust Company
1 Congress Street
Boston, MA 02114
INDEPENDENT REGISTERED PUBLIC ACCOUNTING FIRM
PricewaterhouseCoopers LLP
300 Madison Avenue
New York, NY 10017
LEGAL COUNSEL
Dechert LLP
1900 K Street, N.W
Washington, D.C. 20006
Investment products are offered by HSBC Securities (USA) Inc. (HSI), member NYSE/FINRA/SIPC. HSI is an affiliate of HSBC Bank USA, N.A. Investment products: Are not a deposit or other obligation of the bank or any of its affiliates; Not FDIC insured or insured by any federal government agency of the United States; Not guaranteed by the bank or any of its affiliates; and are subject to investment risk, including possible loss of principal invested.
Investors should consider the investment objectives, risks, charges, and expenses of the investment company carefully before investing. The prospectus contains this and other important information about the investment company. For clients of HSBC Securities (USA) Inc., please call 1-888-525-5757 for more information. For other investors and prospective investors, please call the Funds directly at 1-800-782-8183 or visit our website at https://www.assetmanagement.us.hsbc.com/en/individual-investor/fund-centre. Investors should read the prospectus carefully before investing or sending money.
Table of Contents
HSBC Funds
Financial Statements and Additional Information
October 31, 2024

| EQUITY FUND | Class A | | Class I |
| HSBC Radiant U.S. Smaller Companies Fund | HSOAX | | RESCX |
HSBC FAMILY OF FUNDS
Statements of Assets and Liabilities—as of October 31, 2024
| | | | HSBC Radiant
U.S. Smaller
Companies Fund | | | HSBC Radiant
U.S. Smaller
Companies
Fund (Class I) |
| Assets: | | | | | | | | |
| Investments in Affiliated Portfolio | | $ | 8,352,159 | | | $ | 24,835,881 | |
| Receivable from Investment Adviser | | | 24,740 | | | | 51,526 | |
| Receivable for fund shares sold | | | — | | | | 10,775 | |
| Prepaid expenses and other assets | | | 7,813 | | | | 17,597 | |
| Total Assets | | | 8,384,712 | | | | 24,915,779 | |
| | | | | | | | | |
| Liabilities: | | | | | | | | |
| Payable for Fund shares purchased | | | — | | | | 8,883 | |
| Accrued expenses and other liabilities: | | | | | | | | |
| Administrative Services | | | 72 | | | | 207 | |
| Shareholder Servicing | | | 2,338 | | | | — | |
| Accounting | | | 3,000 | | | | 3,000 | |
| Compliance Services | | | 500 | | | | 500 | |
| Printing | | | 2,992 | | | | 4,658 | |
| Professional | | | 16,500 | | | | 16,500 | |
| Sub-Transfer Agent | | | 11,679 | | | | 4,331 | |
| Other | | | 1,103 | | | | 1,574 | |
| Total Liabilities | | | 38,184 | | | | 39,653 | |
| Commitments and contingent liabilities (Note 4) | | | — | | | | — | |
| Net Assets | | $ | 8,346,528 | | | $ | 24,876,126 | |
| | | | | | | | | |
| Composition of Net Assets: | | | | | | | | |
| Paid in Capital | | $ | 7,206,512 | | | $ | 23,759,814 | |
| Total distributable earnings/(loss) | | | 1,140,016 | | | | 1,116,312 | |
| Net Assets | | $ | 8,346,528 | | | $ | 24,876,126 | |
| | | | | | | | | |
| Net Assets: | | | | | | | | |
| Class A Shares | | $ | 8,346,528 | | | $ | — | |
| Class I Shares | | | — | | | | 24,876,126 | |
| Total | | $ | 8,346,528 | | | $ | 24,876,126 | |
| | | | | | | | | |
| Shares Outstanding: | | | | | | | | |
| ($0.001 par value, unlimited number of shares authorized): | | | | | | | | |
| Class A Shares | | | 857,695 | | | | — | |
| Class I Shares | | | — | | | | 2,874,447 | |
| | | | | | | | | |
| Net Asset Value, Offering Price (Class A and Class I) and Redemption Price per share: | | | | | | | | |
| Class A Shares | | $ | 9.73 | | | $ | — | |
| Class I Shares | | $ | — | | | $ | 8.65 | |
| | | | | | | | | |
Amounts designated as “—“ are $0.00 or have been rounded to $0.00.
| 2 | HSBC FAMILY OF FUNDS | See notes to financial statements. |
HSBC FAMILY OF FUNDS
Statements of Operations - For the year ended October 31, 2024
| | | | HSBC
Radiant
U.S. Smaller
Companies
Fund | | | | HSBC
Radiant
U.S. Smaller
Companies
Fund (Class I) | |
| Investment Income: | | | | | | | | |
| Investment income from Affiliated Portfolio | | $ | 63,961 | | | $ | 130,789 | |
| Expenses from Affiliated Portfolio(1) | | | (337,792) | | | | (688,535) | |
| Net Investment Income/(Loss) from Affiliated Portfolio | | | (273,831) | | | | (557,746) | |
| Other Income | | | 2,591 | | | | — | |
| Total Investment Income/(Loss) | | | (271,240) | | | | (557,746) | |
| | | | | | | | | |
Expenses: | | | | | | | | |
| Administrative Services | | | 807 | | | | 1,697 | |
| Shareholder Servicing: | | | | | | | | |
| Class A Shares | | | 20,165 | | | | — | |
| Accounting | | | 12,000 | | | | 12,000 | |
| Compliance Services | | | 6,562 | | | | 6,562 | |
| Printing | | | 17,538 | | | | 27,254 | |
| Professional | | | 38,315 | | | | 38,315 | |
| Sub-Transfer Agent | | | 140,701 | | | | 52,422 | |
| Registration fees | | | 28,144 | | | | 24,614 | |
| Other | | | 2,124 | | | | 5,145 | |
| Total expenses before fee and expense reductions | | | 266,356 | | | | 168,009 | |
| Fees voluntarily reduced/reimbursed by Investment Adviser and/or Administrator | | | (8,066) | | | | — | |
| Fees contractually reduced/reimbursed by Investment Adviser and/or Administrator | | | (487,191) | | | | (703,828) | |
| Net Expenses(1) | | | (228,901) | | | | (535,819) | |
| | | | | | | | | |
Net Investment Income/(Loss) | | $ | (42,339) | | | $ | (21,927) | |
| | | | | | | | | |
Realized/Unrealized Gains/(Losses) on Investments Allocated from Affiliated Portfolio: | | | | | | | | |
| Net realized gains/(losses) from Affiliated Portfolio | | | 385,100 | | | | 756,288 | |
| Change in unrealized appreciation/(depreciation) on investments from Affiliated Portfolio | | | 1,788,963 | | | | 3,560,193 | |
| | | | | | | | | |
Net realized/unrealized gains/(losses) on investments from Affiliated Portfolio | | | 2,174,063 | | | | 4,316,481 | |
| Change in Net Assets Resulting from Operations | | $ | 2,131,724 | | | $ | 4,294,554 | |
| | | | | | | | | |
(1) Total Net Fund expenses includes Expenses Allocated from Affiliated Portfolio and Net Expenses of the Fund.
Amounts designated as “—“ are $0.00 or have been rounded to $0.00.
| See notes to financial statements. | HSBC FAMILY OF FUNDS | 3 |
HSBC FAMILY OF FUNDS
Statements of Changes in Net Assets
| | | | HSBC Radiant U.S. Smaller
Companies Fund | | | | HSBC Radiant U.S. Smaller
Companies Fund (Class I) | |
| | | | Year Ended
October 31, 2024 | | | | Year Ended
October 31, 2023 | | | | Year Ended
October 31, 2024 | | | | Year Ended
October 31, 2023 | |
| Investment Activities: | | | | | | | | | | | | | | | | |
| Operations: | | | | | | | | | | | | | | | | |
| Net investment income/(loss) | | $ | (42,339) | | | $ | (36,751) | | | $ | (21,927) | | | $ | (4,687) | |
| Net realized gains/(losses) from investments | | | 385,100 | | | | 759,926 | | | | 756,288 | | | | 1,373,296 | |
| Change in unrealized appreciation/(depreciation) on investments | | | 1,788,963 | | | | (485,947) | | | | 3,560,193 | | | | (818,279) | |
| Change in net assets resulting from operations | | | 2,131,724 | | | | 237,228 | | | | 4,294,554 | | | | 550,330 | |
| Change in net assets resulting from capital transactions(1) | | | (623,082) | | | | (1,617,732) | | | | 7,819,443 | | | | (4,782,072) | |
| Change in net assets | | | 1,508,642 | | | | (1,380,504) | | | | 12,113,997 | | | | (4,231,742) | |
| | | | | | | | | | | | | | | | | |
Net Assets: | | | | | | | | | | | | | | | | |
| Beginning of period | | | 6,837,886 | | | | 8,218,390 | | | | 12,762,129 | | | | 16,993,871 | |
| End of period | | $ | 8,346,528 | | | $ | 6,837,886 | | | $ | 24,876,126 | | | $ | 12,762,129 | |
| | | | | | | | | | | | | | | | | |
CAPITAL TRANSACTIONS: | | | | | | | | | | | | | | | | |
| Class A Shares: | | | | | | | | | | | | | | | | |
| Proceeds from shares issued | | $ | 209,205 | | | $ | 117,904 | | | $ | — | | | $ | — | |
| Value of shares converted from Class C | | | — | | | | 18,933 | | | | — | | | | — | |
| Value of shares redeemed | | | (832,287) | | | | (1,737,431) | | | | — | | | | — | |
| Class A Shares capital transactions | | | (623,082) | | | | (1,600,594) | | | | — | | | | — | |
| Class C Shares: | | | | | | | | | | | | | | | | |
| Proceeds from shares issued | | $ | — | | | $ | 13,100 | | | $ | — | | | $ | — | |
| Value of shares converted to Class A | | | — | | | | (18,933) | | | | — | | | | — | |
| Value of shares redeemed | | | — | | | | (11,305) | | | | — | | | | — | |
| Class C Shares capital transactions | | | — | | | | (17,138) | | | | — | | | | — | |
| Class I Shares: | | | | | | | | | | | | | | | | |
| Proceeds from shares issued | | $ | — | | | $ | — | | | $ | 10,306,691 | | | $ | 523,276 | |
| Value of shares redeemed | | | — | | | | — | | | | (2,487,248) | | | | (5,305,348) | |
| Class I Shares capital transactions | | | — | | | | — | | | | 7,819,443 | | | | (4,782,072) | |
| Change in net assets resulting from capital transactions(1) | | $ | (623,082) | | | $ | (1,617,732) | | | $ | 7,819,443 | | | $ | (4,782,072) | |
| | | | | | | | | | | | | | | | | |
SHARE TRANSACTIONS: | | | | | | | | | | | | | | | | |
| Class A Shares: | | | | | | | | | | | | | | | | |
| Issued | | | 23,192 | | | | 14,905 | | | | — | | | | — | |
| Converted from Class C Shares | | | — | | | | 2,599 | | | | — | | | | — | |
| Redeemed | | | (90,769) | | | | (226,078) | | | | — | | | | — | |
| Change in Class A Shares | | | (67,577) | | | | (208,574) | | | | — | | | | — | |
| Class C Shares: | | | | | | | | | | | | | | | | |
| Issued | | | — | | | | 8,973 | | | | — | | | | — | |
| Converted to Class A Shares | | | — | | | | (15,341) | | | | — | | | | — | |
| Redeemed | | | — | | | | (8,973) | | | | — | | | | — | |
| Change in Class C Shares | | | — | | | | (15,341) | | | | — | | | | — | |
| Class I Shares: | | | | | | | | | | | | | | | | |
| Issued | | | — | | | | — | | | | 1,249,655 | | | | 76,163 | |
| Redeemed | | | — | | | | — | | | | (321,621) | | | | (785,593) | |
| Change in Class I Shares | | | — | | | | — | | | | 928,034 | | | | (709,430) | |
| | | | | | | | | | | | | | | | | |
(1) Includes the conversion of Class C Shares to Class A Shares during November 1, 2022 to October 31, 2023.
Amounts designated as “—“ are $0.00 or have been rounded to $0.00.
| 4 | HSBC FAMILY OF FUNDS | See notes to financial statements. |
| HSBC RADIANT U.S. SMALLER COMPANIES FUND |
Financial Highlights
Selected data for a share outstanding throughout the periods indicated.*
| | | | | Investment Activities | | Distributions | | | | | | Ratios/Supplementary Data |
| | | Net Asset
Value,
Beginning
of Period | | Net
Investment
Income/
(Loss)
(a) | | Net
Realized
and
Unrealized
Gains/
(Losses)
from
Investments | | Total from
Investment
Activities | | Net
Investment
Income | | Net Realized
Gains from
Investment
Transactions | | Total
Distributions | | Net Asset
Value, End
of Period | | Total Return
(b) | | Net
Assets at
Value,
End of
Period
(000’s) | | Ratio
of Net
Expense to
Average
Net Assets | | Ratio of
Net
Investment
Income to
Average
Net Assets | | Ratio of
Expenses
to Average
Net Assets
(Excluding
Fee
Reductions) | | Portfolio
Turnover
(c) |
| Class A Shares | | | | | | | | | | | | | | | | | | | | | | | | | | | | |
| Year Ended October 31, 2024 | $ | 7.39 | $ | (0.05) | $ | 2.39 | $ | 2.34 | $ | — | $ | — | $ | — | $ | 9.73 | | 31.66% | $ | 8,347 | | 1.35% | | (0.52)% | | 7.49% | | 84% |
| Year Ended October 31, 2023 | | 7.23 | | (0.04) | | 0.20 | | 0.16 | | — | | — | | — | | 7.39 | | 2.21% | | 6,838 | | 1.35% | | (0.47)% | | 8.84% | | 103% |
| Year Ended October 31, 2022 | | 14.49 | | (0.05)(d) | | (2.80) | | (2.85) | | — | | (4.41) | | (4.41) | | 7.23(e) | | (25.80)% | | 8,200 | | 1.49%(f) | | (0.65)%(d) | | 6.47% | | 120% |
| Year Ended October 31, 2021 | | 10.71 | | (0.11) | | 4.57 | | 4.46 | | — | | (0.68) | | (0.68) | | 14.49 | | 42.81% | | 12,518 | | 1.55% | | (0.83)% | | 7.00% | | 78% |
| Year Ended October 31, 2020 | | 9.42 | | (0.09) | | 2.10 | | 2.01 | | — | | (0.72) | | (0.72) | | 10.71 | | 22.05% | | 9,224 | | 1.55% | | (0.91)% | | 7.29% | | 94% |
| * | The per share amounts and percentages reflect income and expenses assuming inclusion of the Fund’s proportionate share of income and expenses of the HSBC Radiant U.S. Smaller Companies Portfolio (the “Portfolio”). |
| (a) | Calculated based on average shares outstanding. |
| (b) | Total return calculations do not include any sales or redemption charges. |
| (c) | Portfolio turnover rate is calculated on the basis of the Portfolio, in which the Fund invests all of its investable assets. Portfolio turnover is calculated on the basis of the Portfolio as a whole without distinguishing between the classes of shares issued. |
| (d) | Reflects special dividends paid out during the year by several of the Portfolio’s holdings. Had the Portfolio, in which the Fund invests all of its investable assets, not received the special dividends, the net investment income/(loss) per share would have been $(0.08) and the net investment income/(loss) ratio would have been (0.97)%. |
| (e) | The net asset value per share (“NAV”) for financial reporting purposes differs from the NAV reported due to adjustments made in accordance with accounting principles generally accepted in the United States of America. |
| (f) | The net expense ratio shown for the period reflects the expense limitation agreement in effect as of June 28, 2022 and the higher limit in effect prior to that date. |
Amounts designated as “—” are $0.00 or have been rounded to $0.00.
| See notes to financial statements. | HSBC FAMILY OF FUNDS | 5 |
| HSBC RADIANT U.S. SMALLER COMPANIES FUND (CLASS I) |
Financial Highlights
Selected data for a share outstanding throughout the periods indicated.*
| | | | | Investment Activities | | Distributions | | | | | | Ratios/Supplementary Data |
| | | Net Asset
Value,
Beginning
of Period | | Net
Investment
Income/
(Loss)
(a) | | Net
Realized
and
Unrealized
Gains/
(Losses)
from
Investments | | Total from
Investment
Activities | | Net
Investment
Income | | Net Realized
Gains from
Investment
Transactions | | Total
Distributions | | Net Asset
Value, End
of Period | | Total Return
(b) | | Net
Assets at
Value,
End of
Period
(000’s) | | Ratio
of Net
Expense to
Average
Net Assets | | Ratio of
Net
Investment
Income to
Average
Net Assets | | Ratio of
Expenses
to Average
Net Assets
(Excluding
Fee
Reductions) | | Portfolio
Turnover
(c) |
| Class I Shares | | | | | | | | | | | | | | | | | | | | | | | | | | | | |
| Year Ended October 31, 2024 | $ | 6.56 | $ | (0.01) | $ | 2.10 | $ | 2.09 | $ | — | $ | — | $ | — | $ | 8.65 | | 31.86% | $ | 24,876 | | 0.90% | | (0.13)% | | 5.05% | | 84% |
| Year Ended October 31, 2023 | | 6.40 | | (0.00) | | 0.16 | | 0.16 | | — | | — | | — | | 6.56 | | 2.50% | | 12,762 | | 0.90% | | (0.03)% | | 6.11% | | 103% |
| Year Ended October 31, 2022 | | 19.16 | | (0.02)(d) | | (2.84) | | (2.86) | | — | | (9.90) | | (9.90) | | 6.40(e) | | (24.77)% | | 16,993 | | 1.07%(f) | | (0.19)%(d) | | 3.02% | | 120% |
| Year Ended October 31, 2021 | | 14.67 | | (0.07) | | 6.13 | | 6.06 | | — | | (1.57) | | (1.57) | | 19.16(e) | | 43.23% | | 88,809 | | 1.10% | | (0.39)% | | 1.88% | | 78% |
| Year Ended October 31, 2020 | | 12.79 | | (0.06) | | 2.85 | | 2.79 | | — | | (0.91) | | (0.91) | | 14.67 | | 22.58% | | 121,959 | | 1.10% | | (0.46)% | | 1.63% | | 94% |
| * | The per share amounts and percentages reflect income and expenses assuming inclusion of the Fund’s proportionate share of income and expenses of the HSBC Radiant U.S. Smaller Companies Portfolio (the “Portfolio”). |
| (a) | Calculated based on average shares outstanding. |
| (b) | Total return calculations do not include any sales or redemption charges. |
| (c) | Portfolio turnover rate is calculated on the basis of the Portfolio, in which the Fund invests all of its investable assets. Portfolio turnover is calculated on the basis of the Portfolio as a whole without distinguishing between the classes of shares issued. |
| (d) | Reflects special dividends paid out during the year by several of the Portfolio’s holdings. Had the Portfolio, in which the Fund invests all of its investable assets, not received the special dividends, the net investment income/(loss) per share would have been $(0.05) and the net investment income/(loss) ratio would have been (0.59)%. |
| (e) | The net asset value per share (“NAV”) for financial reporting purposes differs from the NAV reported due to adjustments made in accordance with accounting principles generally accepted in the United States of America. |
| (f) | The net expense ratio shown for the period reflects the expense limitation agreement in effect as of June 28, 2022 and the higher limit in effect prior to that date. |
Amounts designated as “—” are $0.00 or have been rounded to $0.00.
| 6 | HSBC FAMILY OF FUNDS | See notes to financial statements. |
Notes to Financial Statements—October 31, 2024
The HSBC Funds (the “Trust”), a Delaware statutory trust organized on March 2, 2016, is registered under the Investment Company Act of 1940, as amended (the “Act”), as an open-end management investment company. As of October 31, 2024, the Trust is comprised of 5 separate operational funds, each a series of the HSBC Family of Funds. The accompanying financial statements are presented for the following two diversified funds (individually a “Fund”, collectively the “Funds”) of the Trust:
| | Fund | | Short Name |
| | HSBC Radiant U.S. Smaller Companies Fund | | Radiant U.S. Smaller Companies Fund |
| | HSBC Radiant U.S. Smaller Companies Fund (Class I) | | Radiant U.S. Smaller Companies Fund (Class I) |
Financial statements for all other funds of the Trust are published separately.
Each Fund is a feeder fund in a master-feeder fund structure and seeks to achieve its investment objective by investing all of its investable assets in the HSBC Radiant U.S. Smaller Companies Portfolio (the “Portfolio”), which is a diversified series of the Trust with the same investment objective as the Funds. The Portfolio operates as the master fund in a master-feeder arrangement in which the feeder funds invest all of their investable assets in the Portfolio. The investment objective of the Portfolio is long-term growth of capital. The Funds’ proportionate ownership of the Portfolio as of the date of this report was as follows:
| Fund | | Proportionate
Ownership
Interest on
October 31, 2024
(%) |
| | Radiant U.S. Smaller Companies Fund | | 25.2 |
| | Radiant U.S. Smaller Companies Fund (Class I) | | 74.8 |
The financial statements of the Portfolio, including the Schedule of Portfolio Investments, are included elsewhere in this report. The financial statements of the Portfolio should be read in conjunction with the financial statements of the Funds.
The Funds are authorized to issue an unlimited number of shares of beneficial interest with a par value of $0.001 per share. The Radiant U.S. Smaller Companies Fund offers one class of shares: Class A Shares. The Radiant U.S. Smaller Companies Fund (Class I) also offers one class of shares: Class I Shares. No sales charges are assessed with respect to Class A Shares and Class I Shares of the Radiant U.S. Smaller Companies Fund and Radiant U.S. Smaller Companies Fund (Class I), respectively. Each class of shares in the Funds has identical rights and privileges except with respect to arrangements pertaining to shareholder servicing and/or distribution, class-related expenses, voting rights on matters affecting a single class of shares, and exchange privileges of each class of shares.
Under the Trust’s organizational documents, the Trust’s Officers and Trustees are indemnified against certain liabilities arising out of the performance of their duties to the Funds. In addition, in the normal course of business, the Trust may enter into contracts with its service providers, which also provide for indemnifications by the Funds. The Funds’ maximum exposure under these arrangements is unknown as this would involve future claims that may be made against the Funds. However, based on experience, the Trust believes the risk of loss to be remote.
The Funds are investment companies and follow accounting and reporting guidance under Financial Accounting Standards Board Accounting Standards Codification Topic 946, “Financial Services-Investment Companies.”
Notes to Financial Statements—October 31, 2024 (continued)
| 2. | Significant Accounting Policies: |
The following is a summary of the significant accounting policies followed by the Funds in the preparation of their financial statements. The policies are in conformity with generally accepted accounting principles in the United States of America (“GAAP”). The preparation of financial statements requires management to make certain estimates and assumptions that affect the reported amounts of assets and liabilities and disclosure of contingent assets and liabilities at the date of the financial statements and the reported amounts of increases and decreases in net assets from operations during the reporting period. Actual results could differ from those estimates.
Securities Valuation:
The Funds record their investments in the Portfolio at fair value, which represents their proportionate ownership of the value of the Portfolio’s net assets. The notes to the Portfolio’s financial statements included elsewhere in this report provide information about the Portfolio’s valuation policy and its period-end security valuations.
Investment Transactions and Related Income:
The Funds record investments in the Portfolio on a trade date basis. The Funds record daily their proportionate share of income, expenses, changes in unrealized appreciation and depreciation and realized gains and losses derived from the Portfolio. In addition, the Funds accrue their own expenses daily as incurred.
Foreign Currency Translation:
The accounting records of the Funds are maintained in U.S. dollars. Foreign currency amounts, if any, are translated into U.S. dollars at the current rate of exchange to determine the value of investments, assets and liabilities at the close of each business day. Purchases and sales of securities, and income and expenses, are, as applicable, translated at the prevailing rate of exchange on the respective dates of such transactions. The Funds do not isolate the portion of the results of operations resulting from changes in foreign exchange rates on investments from fluctuations arising from changes in market prices of securities held. If applicable, any such fluctuations are included with the net realized and unrealized gain or loss from investments in securities and foreign currency translations.
Allocations:
Expenses directly attributable to a Fund are charged to that Fund. Expenses not directly attributable to a Fund are allocated among the applicable series within the Trust equally to each series, in relation to its net assets, or another appropriate basis. Because the Funds operate in a master-feeder structure, in which the Funds invest all of their investable assets in the Portfolio, certain expenses are allocated solely to the Portfolio rather than the Funds. Class specific expenses are charged directly to the class incurring the expense. In addition, income, expenses (other than class specific expenses), and unrealized and realized gains and losses are allocated to each class based on relative net assets on a daily basis.
Distributions to Shareholders:
Dividends distributed to shareholders of the Funds from net investment income, if any, are declared and distributed semiannually.
Distributions from net realized gains, if any, are declared and paid at least annually by the Funds. Additional distributions are also made to the Funds’ shareholders to the extent necessary to avoid the federal excise tax on certain undistributed income and net realized gains of regulated investment companies.
Notes to Financial Statements—October 31, 2024 (continued)
Federal Income Taxes:
Each Fund is a separate taxable entity for federal income tax purposes. Each Fund has qualified and intends to continue to qualify each year as a “regulated investment company” under Subchapter M of the Internal Revenue Code, as amended, and to distribute substantially all of its taxable net investment income and net realized gains, if any, to its shareholders. Accordingly, no provision for federal income or excise tax is required for the Funds, although shareholders may be taxed on distributions they receive.
Management of the Funds has reviewed tax positions taken in tax years that remain subject to examination by all major tax jurisdictions, including federal (i.e., the last four tax year ends and the interim tax period since then, as applicable). Management believes that there is no tax liability resulting from unrecognized tax benefits related to uncertain tax positions taken. Management’s conclusions may be subject to future review based on changes in, or interpretation of, accounting standards or tax laws and regulations.
| 3. | Investment Valuation Summary: |
The valuation techniques employed by the Funds, as described below, maximize the use of observable inputs and minimize the use of unobservable inputs in determining fair value. The Funds’ investments are classified within the fair value hierarchy based on the lowest level of input that is significant to the fair value measurement. The inputs used for valuing the Funds’ investments are summarized in the three broad levels listed below:
| • | Level 1—quoted prices (unadjusted) in active markets for identical assets |
| • | Level 2—other significant observable inputs (including quoted prices for similar securities, interest rates, prepayments speeds, credit risk, etc.) |
| • | Level 3—significant unobservable inputs (including the Investment Adviser’s own assumptions in determining the fair value of investments) |
Changes in valuation techniques may result in transfers in or out of an assigned level within the fair value hierarchy. The inputs or methodology used for valuing investments are not necessarily an indication of the risk associated with investing in those investments.
The Funds record their investment in the Portfolio at fair value, which represents their proportionate ownership of the value of the Portfolio’s net assets. This investment is typically categorized as Level 2 in the fair value hierarchy. The underlying security of the Portfolio is recorded at fair value, as discussed more fully in the Notes to Financial Statements of the Portfolio included in the attached financial statements.
As of October 31, 2024, the investment held by the Funds was categorized as Level 2 in the fair value hierarchy.
| 4. | Related Party Transactions and Other Agreements and Plans: |
Investment Management:
HSBC Global Asset Management (USA) Inc. (“HSBC” or the “Investment Adviser”), a wholly-owned subsidiary of HSBC USA, Inc., a registered bank holding company under the laws of the United States, acts as Investment Adviser to the Portfolio pursuant to an Investment Advisory Contract. As Investment Adviser, HSBC manages the investments of the Portfolio and continuously reviews, supervises, and administers the Portfolio’s investments. The Investment Adviser has retained Radiant Global Investors LLC (“Radiant” or the “Subadviser”) to provide day-to-day management of the Portfolio. The Funds are not directly charged any investment management fees, but rather share proportionately in the investment management fees charged to the Portfolio.
Notes to Financial Statements—October 31, 2024 (continued)
Administration, Fund Accounting and Other Services:
HSBC also serves the Funds as Administrator. Under the terms of the Amended and Restated Administration Services Agreement, HSBC receives from the Funds (as well as other series of the Trust combined) a fee, accrued daily and paid monthly, at an annual rate of two basis points (0.02%) of average daily net assets. The fee rate is determined on the basis of the aggregate average daily net assets of the Trust. The total administration fee paid to HSBC is allocated to each series based upon its proportionate share of the aggregate net assets of the Trust subject to certain allocations in cases where one series invests some or all of its assets in another series of the Trust (for example, the Funds). For assets invested in the Portfolio by the Funds, the Portfolio pays half of the administration fee and the Funds pay the remaining half, for a combination of the total fee rate set forth above.
State Street Bank and Trust Company (“State Street”) serves as Sub-Administrator to the Funds and provides fund accounting, custody, fund administration, regulatory administration and certain other services to the Funds pursuant to a Master Services Agreement with the Trust. For its services, State Street is entitled to a fee, payable by the Funds, based on a Fund’s net assets, subject to per Fund fees, miscellaneous fees and reimbursements of certain expenses.
Under the Amended and Restated Fund PFO/Treasurer, CCO, Secretary and AMLO Agreement between Foreside Fund Officer Services, LLC (“Foreside”) and the Trust, Foreside makes individuals available to serve as the Trust’s Chief Compliance Officer, Anti-Money Laundering Officer, Treasurer and Secretary and other individuals available to support such officers. For the services provided under that agreement, the Trust paid Foreside $364,966 for the fiscal year ended October 31, 2024, including reimbursement of certain out-of-pocket expenses. Compliance services fees incurred by each Fund are reflected on the Statements of Operations as “Compliance Services” and the other services fees are included in “Professional” on the Statements of Operations. Foreside pays the salary and other compensation earned by individuals performing these services.
Distribution Arrangements:
Foreside Distribution Services, L.P. (“Foreside” or the “Distributor”) serves the Trust as Distributor. The Trust, on behalf of the Radiant U.S. Smaller Companies Fund, has adopted a non-compensatory Distribution Plan and Agreement (the “Distribution Plan”) pursuant to Rule 12b-1 of the Act. The Distribution Plan provides for reimbursement of expenses incurred by the Distributor related to distribution and marketing, at a rate not to exceed 0.25% of the average daily net assets of Class A Shares (currently not being charged). For the fiscal year ended October 31, 2024, Foreside did not receive any commissions from sales of the Trust.
Shareholder Servicing:
The Trust has adopted a Shareholder Services Plan, which provides for payments to shareholder servicing agents for providing various shareholder services. For performing these services, the shareholder servicing agents receive a fee that is computed daily and paid monthly up to 0.25% of the average daily net assets of Class A Shares of the Radiant U.S. Smaller Companies Fund. The fees paid to the Distributor pursuant to the Distribution Plan and to shareholder servicing agents pursuant to the Shareholder Services Plan may not exceed in the aggregate 0.50% annually of the average daily net assets of Class A Shares.
The Trust has entered into shareholder services contracts with affiliated and unaffiliated financial intermediaries who provide shareholder services and other related services to their clients or customers who invest in the Funds under which the Funds will pay all or a portion of such fees incurred by such financial intermediaries for performing such services.
Notes to Financial Statements—October 31, 2024 (continued)
Transfer Agency:
State Street serves as the transfer agent for each Fund, and has delegated its responsibilities to SS&C Global Investor and Distribution Solutions, Inc. (“SS&C”). As sub-transfer agent, SS&C receives a fee based on the number of funds and shareholder accounts, subject to certain minimums, and reimbursement of certain expenses.
Independent Trustees:
The Trust pays an annual retainer to each Independent Trustee, plus additional annual retainers to each Committee Chair and the Chairman of the Board of Trustees (the “Board”). The Independent Trustees also receive a fee for each regular, special, and informational meeting of the Board attended. The aggregate amount of the fees and expenses of the Independent Trustees are allocated among all the series in the Trust (except that these fees and expenses are allocated to the Portfolio rather than the Funds).
Other:
The Funds pay fees to certain intermediaries or financial institutions for recordkeeping, sub-accounting services and other administrative services as included in “Other” on the Statements of Operations.
The Funds may use related party broker-dealers. For the fiscal year ended October 31, 2024, there were no brokerage commissions paid to broker-dealers affiliated with the Investment Adviser.
The Investment Adviser and its affiliates may have lending, banking, brokerage, underwriting, or other business relationships with the issuers of the securities in which the Portfolio invests.
Fee Reductions:
The Investment Adviser has agreed to contractually limit through February 28, 2025 the total annual expenses of the Funds, including the allocated expenses from the Portfolio, exclusive of interest, taxes, brokerage commissions, extraordinary expenses, and estimated indirect expenses attributable to the Funds’ investments in other investment companies. Each Fund class has its own expense limitations based on the average daily net assets for any full fiscal year as follows:
| | | | Class | | Contractual
Expense
Limitations (%) |
| | Radiant U.S. Smaller Companies Fund | | Class A Shares | | 1.45 |
| | Radiant U.S. Smaller Companies Fund (Class I) | | Class I Shares | | 0.90 |
Notes to Financial Statements—October 31, 2024 (continued)
Any amounts contractually waived or reimbursed by the Investment Adviser will be subject to repayment by the respective Fund to the Investment Adviser within three years calculated monthly from when the waiver or reimbursement is recorded to the extent that the repayment will not cause the Fund’s operating expenses to exceed the contractual expense limit that was in effect at the time of such waiver or reimbursement. During the fiscal year ended October 31, 2024, the Investment Adviser did not recapture any of its prior contractual waivers or reimbursements. As of October 31, 2024, there was no contingent liability.
As of October 31, 2024, the repayments that may potentially be made by the Funds are as follows:
| | | | Amount Eligible Through |
| | | | October 31,
2027 ($) | | October 31,
2026 ($) | | October 31,
2025 ($) | | Total
($) |
| | Radiant U.S. Smaller Companies Fund | | 487,191 | | 573,897 | | 486,510 | | 1,547,598 |
| | Radiant U.S. Smaller Companies Fund (Class I) | | 703,828 | | 782,084 | | 1,033,366 | | 2,519,278 |
In addition to the contractual expense limitation agreement with the Funds, HSBC, in its role as Investment Adviser and Administrator, may waive/reimburse additional fees at its discretion. Any voluntary fee waivers/reimbursements are not subject to repayment in subsequent fiscal periods. Voluntary waivers/reimbursements may be eliminated or changed at any time. Amounts waived/reimbursed by the Investment Adviser and/or Administrator are reported on the Statements of Operations, as applicable.
During the fiscal year ended October 31, 2024, the following amounts of expenses were voluntarily and/or contractually waived:
| | | | Class A
($) | | Class I
($) |
| | Radiant U.S. Smaller Companies Fund | | 495,257 | | — |
| | Radiant U.S. Smaller Companies Fund (Class I) | | — | | 703,828 |
| 5. | Affiliated Investment Transactions: |
A summary of each Fund’s investment in the Portfolio for the fiscal year ended October 31, 2024 is as follows:
| | | | Value
10/31/2023
($) | | Contributions
($) | | Withdrawals
($) | | Net
Realized
Gains/
(Losses)
($) | | Change in
Unrealized
Appreciation/
Depreciation
($) | | Net
Income/
(Loss)
($) | | Value
10/31/2024
($) |
| | Radiant U.S. Smaller Companies Fund | | | | | | | | | | | | | | |
| | HSBC Radiant U.S. Smaller Companies Portfolio | | 6,837,927 | | 727,952 | | (1,113,952) | | 385,100 | | 1,788,963 | | (273,831) | | 8,352,159 |
| | Radiant U.S. Smaller Companies Fund (Class I) | | | | | | | | | | | | | | |
| | HSBC Radiant U.S. Smaller Companies Portfolio | | 12,749,551 | | 10,995,801 | | (2,668,206) | | 756,288 | | 3,560,193 | | (557,746) | | 24,835,881 |
Notes to Financial Statements—October 31, 2024 (continued)
The risks are presented in an order intended to facilitate readability, and their order does not imply that the realization of one risk is likely to occur more frequently than another risk, nor does it imply that the realization of one risk is likely to have a greater adverse impact than another risk.
Equity Securities Risk: The prices of equity securities fluctuate from time to time based on changes in a company’s financial condition or overall market and economic conditions, and government policies, including tax incentives and subsidies. As a result, the value of equity securities may fluctuate drastically from day to day.
Market Risk: The value of the Portfolio’s investments may decline due to changing economic, political, social, regulatory or market conditions. Market risk may affect a single issuer, industry or sector of the economy or it may affect the economy as a whole. Moreover, the conditions in one country or geographic region could adversely affect the Portfolio’s investments in a different country or geographic region. Events such as war, acts of terrorism, social unrest, natural disasters, rapid changes in interest rates, the spread of infectious illness or other public health threats could also significantly impact the Portfolio and its investments.
Model and Data Risk: Radiant employs proprietary quantitative models in selecting investments for the Portfolio. Investments selected using these models may perform differently than expected as a result of the factors used in the models, the weight placed on each factor, changes in a factor’s historical trends, and technical issues in the construction, implementation, and maintenance of the models (including, for example, problems with data sourced by Radiant or supplied by third parties, software issues, or other types of errors). There are limitations inherent in every quantitative model and there is no guarantee that quantitative models will perform as expected or result in effective investment decisions for the Portfolio, especially during rapidly changing market conditions. Additionally, commonality of holdings across quantitative asset managers may amplify losses.
ESG Investing Risk: The incorporation of environmental, social and governance (“ESG”) criteria, including ESG and Impact scores and the identification of controversial business lines and other screens, into the investment process will cause the Portfolio to forgo investment opportunities available to other mutual funds that do not use these criteria, or to increase or decrease its exposure to certain sectors or certain types of companies. For example, the Portfolio will generally not seek to invest in companies that operate in, or derive a specific amount of revenue from, controversial business lines (e.g., tobacco, nuclear armaments and other controversial weapons, and thermal coal extraction), or companies with severe controversies (e.g., severe violators of human rights and liberties). As a result, the Portfolio could underperform or outperform other mutual funds that do not consider ESG criteria in their investment processes. In evaluating a company, Radiant is dependent upon third-party data that it believes to be reliable, but it does not guarantee the accuracy of such third-party data. ESG data from third-party data providers may be incomplete, inaccurate, or unavailable and may vary significantly from one third-party data provider to another, which could adversely affect the analysis of ESG criteria relevant to a particular company. Investing on the basis of ESG criteria is qualitative and subjective by nature and there can be no assurance that the process utilized by Radiant or any third-party research or data providers or any judgment exercised by Radiant will reflect the views of any particular investor. Radiant’s ESG criteria and ESG-related investment processes may be changed periodically without shareholder approval or notice.
Notes to Financial Statements—October 31, 2024 (continued)
| 7. | Federal Income Tax Information: |
As of the tax fiscal year ended October 31, 2024, the cost basis of investments for federal income tax purposes, gross unrealized appreciation, gross unrealized depreciation and net unrealized appreciation/(depreciation) were as follows:
| | | | Tax Cost ($) | | Tax Unrealized
Appreciation ($) | | Tax Unrealized
Depreciation ($) | | Net Unrealized
Appreciation/
(Depreciation) ($)* |
| | Radiant U.S. Smaller Companies Fund | | 6,655,685 | | 1,696,474 | | — | | 1,696,474 |
| | Radiant U.S. Smaller Companies Fund (Class I) | | 21,143,330 | | 3,692,551 | | — | | 3,692,551 |
| * | The differences between book-basis and tax-basis unrealized appreciation/(depreciation) are attributable primarily to tax deferral of losses on wash sales. |
The tax character of distributions paid by the Funds for the tax year ended October 31, 2024, was as follows:
| | | | Distributions paid from |
| | | | Ordinary Income ($) | | Total Taxable
Distributions ($) | | Total Distributions
Paid ($) |
| | Radiant U.S. Smaller Companies Fund | | — | | — | | — |
| | Radiant U.S. Smaller Companies Fund (Class I) | | — | | — | | — |
The tax character of distributions paid by the Funds for the tax year ended October 31, 2023, was as follows:
| | | | Distributions paid from |
| | | | Ordinary Income ($) | | Total Taxable
Distributions ($) | | Total Distributions
Paid ($) |
| | Radiant U.S. Smaller Companies Fund | | — | | — | | — |
| | Radiant U.S. Smaller Companies Fund (Class I) | | — | | — | | — |
| | | | | | | | |
As of the tax year ended October 31, 2024, the components of accumulated earnings/(deficit) on a tax basis for the Funds were as follows:
| | | | Accumulated
Capital and Other
Losses ($) | | Unrealized Appreciation/
(Depreciation)
($)(1) | | Total Accumulated
Earnings/
(Deficit) ($) |
| | Radiant U.S. Smaller Companies Fund | | (556,458) | | 1,696,474 | | 1,140,016 |
| | Radiant U.S. Smaller Companies Fund (Class I) | | (2,576,239) | | 3,692,551 | | 1,116,312 |
| (1) | The differences between book-basis and tax-basis unrealized appreciation/(depreciation) are attributable primarily to tax deferral of losses on wash sales. |
As of the tax year ended October 31, 2024, the Funds had net capital loss carryforwards (“CLCFs”) not subject to expiration as summarized in the table below. The Board does not intend to authorize a distribution of any realized gain for the Funds until any applicable CLCF has been offset or expires.
| | | | Short Term
Amount ($) | | Long Term
Amount ($) | | Total ($) |
| | Radiant U.S. Smaller Companies Fund | | 501,619 | | — | | 501,619 |
| | Radiant U.S. Smaller Companies Fund (Class I) | | 2,520,010 | | — | | 2,520,010 |
Notes to Financial Statements—October 31, 2024 (continued)
The amount and character of net investment income and net realized gains distributed are determined in accordance with federal income tax regulations, which may differ from GAAP. These “book/tax” differences are either considered temporary or permanent in nature. To the extent these differences are permanent in nature (e.g., certain gain/loss and certain distributions), such amounts are reclassified within the composition of net assets based on their federal tax-basis treatment; temporary differences (e.g., wash sale losses) do not require reclassification. To the extent distributions to shareholders from net investment income and net realized gains exceed net investment income and net realized gains for tax purposes, they are reported as distributions of capital.
During the year ended October 31, 2024, the Funds utilized capital loss carry forwards for U.S. federal income tax purposes as follows:
| | | Capital Loss
Carry Forward
Utilized ($) |
| Radiant U.S. Smaller Companies Fund | | 394,896 |
| Radiant U.S. Smaller Companies Fund (Class I) | | 766,761 |
| 8. | Significant Shareholders: |
Shareholders, including other funds, individuals, and accounts, as well as each Fund’s investment manager(s) and/or investment personnel, may from time to time own (beneficially or of record) a significant percentage of the Fund’s shares and can be considered to “control” the Fund when that ownership exceeds 25% of the Fund’s assets (and which may differ from control as determined in accordance with GAAP).
The following list includes the Funds which had individual shareholder accounts with ownership of voting securities greater than 10% of the total outstanding voting securities but less than 25% and/or accounts with ownership of voting securities greater than 25% of the total outstanding voting securities. Significant transactions by these shareholder accounts may negatively impact the Funds’ performance.
| | | Number of
shareholders with
ownership of voting
securities of the Fund
greater than 10% and
less than 25% of the
total Fund’s
outstanding voting
securities | | Percentage
owned
in aggregate
by 10% – 25%
shareholders (%) | | Number of
shareholders with
ownership of
voting securities
of the Fund
greater than 25%
of the total Fund’s
outstanding
voting securities | | Percentage owned
in aggregate by
greater than 25%
shareholders (%) |
| | Radiant U.S. Smaller Companies Fund | — | | — | | 1 | | 59 |
| | Radiant U.S. Smaller Companies Fund (Class I) | — | | — | | 2 | | 69 |
| 9. | Recent Accounting Pronouncements: |
In November 2023, the FASB issued ASU 2023-07, “Segment Reporting (Topic 280): Improvements to Reportable Segment Disclosures (“ASU 2023-07”),” which enhances disclosure requirements about significant segment expenses. ASU 2023-07 is effective for the fiscal years beginning after December 15, 2023, and interim periods beginning with the first quarter ended March 31, 2025. Early adoption is permitted and retrospective adoption is required for all prior periods presented. The Funds are currently assessing the impact of this guidance, however, the Funds do not expect a material impact on their financial statements.
Subsequent events occurring after the date of this report have been evaluated for potential impact, for purposes of recognition or disclosure in the financial statements, through the date the report was issued and no adjustments or additional disclosures were required to the financial statements.
Report of Independent Registered Public Accounting Firm
To the Board of Trustees of HSBC Funds and Shareholders of HSBC Radiant U.S. Smaller Companies Fund and HSBC Radiant U.S. Smaller Companies Fund (Class I)
Opinions on the Financial Statements
We have audited the accompanying statements of assets and liabilities of HSBC Radiant U.S. Smaller Companies Fund and HSBC Radiant U.S. Smaller Companies Fund (Class I) (two of the funds constituting HSBC Funds, hereafter collectively referred to as the “Funds”) as of October 31, 2024, the related statements of operations for the year ended October 31, 2024, the statements of changes in net assets for each of the two years in the period ended October 31, 2024, including the related notes, and the financial highlights for each of the five years in the period ended October 31, 2024 (collectively referred to as the “financial statements”). In our opinion, the financial statements present fairly, in all material respects, the financial position of each of the Funds as of October 31, 2024, the results of each of their operations for the year then ended, the changes in each of their net assets for each of the two years in the period ended October 31, 2024 and each of the financial highlights for each of the five years in the period ended October 31, 2024 in conformity with accounting principles generally accepted in the United States of America.
Basis for Opinions
These financial statements are the responsibility of the Funds’ management. Our responsibility is to express an opinion on the Funds’ financial statements based on our audits. We are a public accounting firm registered with the Public Company Accounting Oversight Board (United States) (PCAOB) and are required to be independent with respect to the Funds in accordance with the U.S. federal securities laws and the applicable rules and regulations of the Securities and Exchange Commission and the PCAOB.
We conducted our audits of these financial statements in accordance with the standards of the PCAOB. Those standards require that we plan and perform the audit to obtain reasonable assurance about whether the financial statements are free of material misstatement, whether due to error or fraud.
Our audits included performing procedures to assess the risks of material misstatement of the financial statements, whether due to error or fraud, and performing procedures that respond to those risks. Such procedures included examining, on a test basis, evidence regarding the amounts and disclosures in the financial statements. Our audits also included evaluating the accounting principles used and significant estimates made by management, as well as evaluating the overall presentation of the financial statements. Our procedures included confirmation of securities owned as of October 31, 2024 by correspondence with the sub-administrator of the Funds. We believe that our audits provide a reasonable basis for our opinions.
/s/PricewaterhouseCoopers
LLP New York, New York
December 26, 2024
We have served as the auditor of one or more investment companies in the HSBC Funds since 2015.
| HSBC RADIANT U.S. SMALLER COMPANIES PORTFOLIO |
Schedule of Portfolio Investments—as of October 31, 2024
| Common Stocks — 98.3% |
| |
| | Shares | | Value ($) |
| Biotechnology — 10.3% | | | |
| Alkermes PLC (a) | 13,530 | | 347,721 |
| Dynavax Technologies Corp. (a) | 16,340 | | 193,629 |
| Exelixis, Inc. (a) | 12,000 | | 398,400 |
| Halozyme Therapeutics, Inc. (a) | 8,120 | | 410,628 |
| MiMedx Group, Inc. (a) | 49,450 | | 338,733 |
| Myriad Genetics, Inc. (a) | 10,380 | | 227,945 |
| Natera, Inc. (a) | 2,460 | | 297,562 |
| Neurocrine Biosciences, Inc. (a) | 2,540 | | 305,486 |
| United Therapeutics Corp. (a) | 890 | | 332,833 |
| Veracyte, Inc. (a) | 7,920 | | 267,221 |
| Vericel Corp. (a) | 6,960 | | 306,518 |
| | | | 3,426,676 |
| Broadline Retail — 1.2% | | | |
| Nordstrom, Inc. | 18,210 | | 411,728 |
| Building Products — 4.2% | | | |
| Apogee Enterprises, Inc. | 5,830 | | 436,317 |
| Fortune Brands Innovations, Inc. | 1,490 | | 124,162 |
| Griffon Corp. | 5,870 | | 369,105 |
| Owens Corning | 2,600 | | 459,654 |
| | | | 1,389,238 |
| Capital Markets — 1.2% | | | |
Donnelley Financial Solutions, Inc. (a) | 7,020 | | 409,547 |
| Commercial Banks — 5.0% | | | |
| East West Bancorp, Inc. | 5,750 | | 560,567 |
| First Horizon Corp. | 27,420 | | 475,189 |
| Pathward Financial, Inc. | 4,390 | | 310,636 |
| Synovus Financial Corp. | 6,010 | | 299,719 |
| | | | 1,646,111 |
| Construction & Engineering — 0.9% | | | |
| Valmont Industries, Inc. | 950 | | 296,096 |
| Consumer Staples Distribution & Retail — 2.1% | |
| Sprouts Farmers Market, Inc. (a) | 5,470 | | 702,512 |
| Containers & Packaging — 1.3% | | | |
| Graphic Packaging Holding Co. | 15,230 | | 430,400 |
| Diversified Consumer Services — 1.8% | | | |
| Frontdoor, Inc. (a) | 11,760 | | 584,354 |
| Diversified REITs — 1.3% | | | |
| American Assets Trust, Inc. REIT | 16,260 | | 438,207 |
| Electrical Equipment — 4.7% | | | |
| Acuity Brands, Inc. | 800 | | 240,552 |
| Generac Holdings, Inc. (a) | 2,670 | | 442,019 |
| NEXTracker, Inc. Class A (a) | 10,190 | | 405,766 |
| Vertiv Holdings Co. Class A | 4,460 | | 487,433 |
| | | | 1,575,770 |
| Electronic Equipment, Instruments & Components — 7.6% | |
| Belden, Inc. | 4,330 | | 493,057 |
| ePlus, Inc. (a) | 3,440 | | 305,988 |
| Fabrinet (a) | 1,560 | | 375,913 |
| Flex Ltd. (a) | 8,910 | | 308,910 |
| Jabil, Inc. | 3,900 | | 480,051 |
| Novanta, Inc. (a) | 1,680 | | 286,003 |
| Vontier Corp. | 7,790 | | 288,853 |
| | | | 2,538,775 |
| Common Stocks, continued | | | |
| | | | |
| | Shares | | Value ($) |
| Entertainment — 1.1% |
| Cinemark Holdings, Inc. (a) | 11,840 | | 352,240 |
| Financial Services — 2.5% |
| Jackson Financial, Inc. Class A | 3,890 | | 388,806 |
| Voya Financial, Inc. | 5,580 | | 448,074 |
| | | | 836,880 |
| Health Care Equipment & Supplies — 6.5% |
| Artivion, Inc. (a) | 9,470 | | 249,345 |
| Glaukos Corp. (a) | 3,640 | | 481,390 |
| Haemonetics Corp. (a) | 3,280 | | 233,405 |
| Lantheus Holdings, Inc. (a) | 4,200 | | 461,328 |
| RxSight, Inc. (a) | 4,090 | | 207,199 |
| Tandem Diabetes Care, Inc. (a) | 5,130 | | 160,928 |
| Teleflex, Inc. | 1,110 | | 223,177 |
| TransMedics Group, Inc. (a) | 1,690 | | 138,529 |
| | | | 2,155,301 |
| Health Care Providers & Services — 3.7% |
| Encompass Health Corp. | 3,150 | | 313,299 |
| Ensign Group, Inc. | 2,930 | | 454,121 |
| Option Care Health, Inc. (a) | 9,260 | | 213,350 |
| Select Medical Holdings Corp. | 7,590 | | 243,487 |
| | | | 1,224,257 |
| Household Durables — 2.8% |
| Installed Building Products, Inc. | 2,080 | | 451,152 |
| Tempur Sealy International, Inc. | 9,730 | | 466,164 |
| | | | 917,316 |
| Insurance — 2.5% |
| Axis Capital Holdings Ltd. | 5,590 | | 437,473 |
| Palomar Holdings, Inc. (a) | 4,410 | | 395,886 |
| | | | 833,359 |
| Leisure Equipment & Products — 1.2% |
| Hasbro, Inc. | 5,820 | | 381,967 |
| Machinery — 5.7% |
| Donaldson Co., Inc. | 5,180 | | 378,969 |
| Douglas Dynamics, Inc. | 11,870 | | 268,856 |
| Mueller Water Products, Inc. Class A. | 19,470 | | 420,357 |
| Tennant Co. | 4,150 | | 363,374 |
| Trinity Industries, Inc. | 12,940 | | 443,583 |
| | | | 1,875,139 |
| Media — 1.2% |
| Magnite, Inc. (a) | 30,820 | | 384,634 |
| Metals & Mining — 0.8% |
| Constellium SE Class A (a) | 24,920 | | 276,612 |
| Paper & Forest Products — 1.1% | | | |
| Sylvamo Corp. | 4,420 | | 375,788 |
| Professional Services — 1.0% | | | |
| Verra Mobility Corp. (a) | 12,330 | | 320,210 |
| Real Estate Management & Development — 1.6% | | |
| Jones Lang LaSalle, Inc. (a) | 2,000 | | 541,920 |
| Semiconductors & Semiconductor Equipment — 3.6% |
| Penguin Solutions, Inc. (a) | 20,780 | | 312,739 |
| Qorvo, Inc. (a) | 4,450 | | 317,107 |
| Semtech Corp. (a) | 13,120 | | 579,773 |
| | | | 1,209,619 |
| See notes to financial statements. | HSBC FAMILY OF FUNDS | 17 |
| HSBC RADIANT U.S. SMALLER COMPANIES PORTFOLIO |
Schedule of Portfolio Investments—as of October 31, 2024 (continued)
| Common Stocks, continued | | | |
| | | | |
| | Shares | | Value ($) |
| Software — 12.9% | | | |
| CommVault Systems, Inc. (a) | 2,420 | | 377,980 |
| DocuSign, Inc. (a) | 9,470 | | 657,029 |
| Gen Digital, Inc. | 21,640 | | 629,940 |
| Guidewire Software, Inc. (a) | 3,600 | | 670,536 |
| Manhattan Associates, Inc. (a) | 2,050 | | 539,888 |
| Nutanix, Inc. Class A (a) | 9,480 | | 588,708 |
| Smartsheet, Inc. Class A (a) | 8,350 | | 471,107 |
| Varonis Systems, Inc. (a) | 6,590 | | 331,938 |
| | | | 4,267,126 |
| Specialized REITs — 2.3% | | | |
| EPR Properties REIT | 5,470 | | 248,174 |
| Iron Mountain, Inc. REIT | 4,160 | | 514,717 |
| | | | 762,891 |
| Specialty Retail — 4.7% | | | |
| Abercrombie & Fitch Co. Class A (a) | 3,070 | | 404,595 |
| Burlington Stores, Inc. (a) | 2,220 | | 550,050 |
| Dick's Sporting Goods, Inc. | 1,960 | | 383,670 |
| Gap, Inc. | 10,490 | | 217,877 |
| | | | 1,556,192 |
| Textiles, Apparel & Luxury Goods — 1.5% | | | |
| Kontoor Brands, Inc. | 5,970 | | 511,211 |
| | | | |
TOTAL COMMON STOCKS
(Cost $27,053,493) | | | 32,632,076 |
| TOTAL INVESTMENTS IN SECURITIES | | | |
| (Cost $27,053,493) — 98.3% | | | 32,632,076 |
| Other Assets (Liabilities) — 1.7% | | | 555,964 |
| NET ASSETS — 100.0% | | | $33,188,040 |
(a) Represents non-income producing security.
| 18 | HSBC FAMILY OF FUNDS | See notes to financial statements. |
HSBC FAMILY OF FUNDS
Statement of Assets and Liabilities—as of October 31, 2024
| | | HSBC
Radiant
U.S. Smaller
Companies
Portfolio | |
| Assets: | | | | |
| Investments in securities, at value | | $ | 32,632,076 | |
| Cash | | | 673,176 | |
| Dividends receivable | | | 4,696 | |
| Prepaid expenses and other assets | | | 910 | |
| Total Assets | | | 33,310,858 | |
| | | | | |
| Liabilities: | | | | |
| Accrued expenses and other liabilities: | | | | |
| Investment Management | | | 6,951 | |
| Sub-Advisory | | | 9,732 | |
| Administrative Services | | | 278 | |
| Sub-Administration | | | 1,110 | |
| Accounting | | | 1,051 | |
| Compliance Services | | | 5,727 | |
| Custodian | | | 105 | |
| Professional | | | 83,822 | |
| Trustee | | | 6,924 | |
| Other | | | 7,118 | |
| Total Liabilities | | | 122,818 | |
| | | | | |
| Net Assets Applicable to investors’ beneficial interest | | $ | 33,188,040 | |
| Investments in securities, at cost | | $ | 27,053,493 | |
| See notes to financial statements. | HSBC FAMILY OF FUNDS | 19 |
HSBC FAMILY OF FUNDS
Statement of Operations - For the year ended October 31, 2024
| | HSBC
Radiant
U.S. Smaller
Companies
Portfolio | |
| Investment Income: | | | | |
| Dividends | | $ | 194,750 | |
| Total Investment Income | | | 194,750 | |
| | | | | |
| Expenses: | | | | |
| Investment Management Fees | | | 62,519 | |
| Sub-Advisory Fees | | | 87,527 | |
| Administration | | | 2,501 | |
| Accounting | | | 4,124 | |
| Sub-Administration | | | 4,336 | |
| Compliance Services | | | 57,313 | |
| Custodian | | | 551 | |
| Professional | | | 468,424 | |
| Trustee | | | 322,313 | |
| Other | | | 16,719 | |
| Total Expenses | | | 1,026,327 | |
| | | | | |
| Net Investment Income/(Loss) | | $ | (831,577) | |
| | | | | |
| Net Realized/Unrealized Gains/(Losses) from Investments in Securities: | | | | |
| Net realized gains/(losses) from investment securities | | | 1,141,388 | |
| Change in unrealized appreciation/(depreciation) on investment securities | | | 5,349,156 | |
| | | | | |
| Net realized/unrealized gains/(losses) on investments | | | 6,490,544 | |
| Change in Net Assets Resulting from Operations | | $ | 5,658,967 | |
| 20 | HSBC FAMILY OF FUNDS | See notes to financial statements. |
HSBC FAMILY OF FUNDS
Statements of Changes in Net Assets
| | HSBC Radiant U.S. Smaller
Companies Portfolio |
| | | Year Ended
October 31, 2024 | | | Year Ended
October 31, 2023 | |
| Investment Activities: | | | | | | | | |
| Operations: | | | | | | | | |
| Net investment income/(loss) | | $ | (831,577) | | | $ | (801,606) | |
| Net realized gains/(losses) from investments | | | 1,141,388 | | | | 2,133,222 | |
| Change in unrealized appreciation/(depreciation) on investments | | | 5,349,156 | | | | (1,304,226) | |
| Change in net assets resulting from operations | | | 5,658,967 | | | | 27,390 | |
| Proceeds from contributions | | | 11,723,753 | | | | 2,163,983 | |
| Value of withdrawals | | | (3,782,158) | | | | (7,802,667) | |
| Change in net assets resulting from transactions in investors’ beneficial interest | | | 7,941,595 | | | | (5,638,684) | |
| Change in net assets | | | 13,600,562 | | | | (5,611,294) | |
| | | | | | | | | |
| | | | | | | | | |
| Net Assets: | | | | | | | | |
| Beginning of period | | | 19,587,478 | | | | 25,198,772 | |
| End of period | | $ | 33,188,040 | | | $ | 19,587,478 | |
| See notes to financial statements. | HSBC FAMILY OF FUNDS | 21 |
| HSBC RADIANT U.S. SMALLER COMPANIES PORTFOLIO |
Financial Highlights
Selected data for a share outstanding throughout the periods indicated.
| | Ratios/Supplemental Data | |
| | Total
Return | | Net Assets at
End of Period
(000’s) | | Ratio of Net
Expenses to
Average Net
Assets | | Ratio of Net
Investment
Income/(Loss) to
Average Net Assets | | Portfolio
Turnover | |
| HSBC Radiant U.S. Smaller Companies Portfolio | | | | | | | | | | |
| Year Ended October 31, 2024 | 27.86% | | $33,188 | | 4.10% | | (3.33)% | | 84% | |
| Year Ended October 31, 2023 | (0.69)% | | 19,587 | | 4.39% | | (3.52)% | | 103% | |
| Year Ended October 31, 2022 | (27.12)% | | 25,198 | | 2.60% | | (1.72)% | (a) | 120% | |
| Year Ended October 31, 2021 | 43.07% | | 101,359 | | 1.25% | | (0.53)% | | 78% | |
| Year Ended October 31, 2020 | 22.50% | | 131,286 | | 1.13% | | (0.49)% | | 94% | |
| (a) | Reflects special dividends paid out during the year by several of the Portfolio’s holdings. Had the Portfolio not received the special dividends, the net investment income/(loss) ratio would have been (2.11)%. |
| 22 | HSBC FAMILY OF FUNDS | See notes to financial statements. |
Notes to Financial Statements—October 31, 2024
The HSBC Funds (the “Trust”), a Delaware statutory trust organized on March 2, 2016, is registered under the Investment Company Act of 1940, as amended (the “Act”), as an open-end management investment company. As of October 31, 2024, the Trust is comprised of 5 separate operational funds, each a series of the HSBC Family of Funds. The accompanying financial statements are presented for the HSBC Radiant U.S. Smaller Companies Portfolio (the “Portfolio”).
For simplicity purposes, this document may use the term “Fund” to include the Portfolio. This two-tier fund structure is commonly referred to as a “master-feeder” structure because one fund (the Fund or “feeder fund”) is investing all its assets in a second fund (the Portfolio or “master fund”).
The Portfolio operates as a master fund in a master-feeder arrangement, in which the two feeder funds invest all of their investable assets in the Portfolio. The Agreement and Declaration of Trust permits the Board of Trustees (the “Board”) to issue an unlimited number of beneficial interests in the Portfolio.
The Portfolio is a diversified series of the Trust. Financial statements for all other funds of the Trust are published separately. The investment objective of the Portfolio is long-term growth of capital.
The following represents each feeder fund’s proportionate ownership interest in the Portfolio:
| Fund | Proportionate
Ownership
Interest on
October 31, 2024
(%) |
| | Radiant U.S. Smaller Companies Fund | 25.2 |
| | Radiant U.S. Smaller Companies Fund (Class I) | 74.8 |
Under the Trust’s organizational documents, the Trust’s Officers and Trustees are indemnified against certain liabilities arising out of the performance of their duties to the Portfolio. In addition, in the normal course of business, the Trust may enter into contracts with its service providers, which also provide for indemnifications by the Portfolio. The Portfolio’s maximum exposure under these arrangements is unknown as this would involve future claims that may be made against the Portfolio. However, based on experience, the Trust believes the risk of loss to be remote.
The Portfolio is an investment company and follows accounting and reporting guidance under Financial Accounting Standards Board Accounting Standards Codification Topic 946, “Financial Services-Investment Companies.”
| 2. | Significant Accounting Policies: |
The following is a summary of the significant accounting policies followed by the Portfolio in the preparation of its financial statements. The policies are in conformity with generally accepted accounting principles in the United States of America. The preparation of financial statements requires management to make certain estimates and assumptions that affect the reported amounts of assets and liabilities and disclosure of contingent assets and liabilities at the date of the financial statements and the reported amounts of increases and decreases in net assets from operations during the reporting period. Actual results could differ from those estimates.
Securities Valuation:
The Portfolio records its investments at fair value. Fair value is defined as the price that would be received to sell an asset or paid to transfer a liability in an orderly transaction between market participants at the measurement date. The valuation techniques used to determine fair value are further described in Note 3 below.
Investment Transactions and Related Income:
Investment transactions are accounted for no later than one business day after trade date. However, for financial reporting purposes, investment transactions are accounted for on trade date on the last business day of the reporting period. Investment gains and losses are calculated on the identified cost basis.
Notes to Financial Statements—October 31, 2024 (continued)
Dividend income is recorded on the ex-dividend date. Non-cash dividend income received in the form of securities in-lieu of cash, if any, is recorded at the fair value of the securities received. The Portfolio records distributions received in excess of income earned from underlying investments as a reduction of cost of investments and/or realized gain, to the extent such information is publicly available. Such amounts are based on estimates if actual amounts are not available and actual amounts of income, realized gain and return of capital may differ from the estimated amounts. The Portfolio adjusts the estimated amounts of the components of distributions (and consequently their net investment income) as necessary, once the issuers provide information about the actual composition of the distributions.
Foreign Currency Translation:
The accounting records of the Portfolio are maintained in U.S. dollars. Foreign currency amounts, if any, are translated into U.S. dollars at the current rate of exchange to determine the value of investments, assets and liabilities at the close of each business day. Purchases and sales of securities, and income and expenses, as applicable, are translated at the prevailing rate of exchange on the respective dates of such transactions. The Portfolio does not isolate the portion of the results of operations resulting from changes in foreign exchange rates on investments from fluctuations arising from changes in market prices of securities held. If applicable, any such fluctuations are included with the net realized and unrealized gain or loss from investments in securities and foreign currency translations.
Restricted Securities:
The Portfolio may invest in restricted securities. A restricted security is a security which has been purchased through a private offering and cannot be resold to the general public without prior registration under the Securities Act of 1933, as amended (the “1933 Act”) or pursuant to the resale limitations provided by Rule 144 under the 1933 Act, or another exemption from the registration requirements of the 1933 Act. Certain restricted securities may be resold in transactions exempt from registration, normally to qualified institutional buyers, and may be classified as liquid by the Investment Adviser (as defined in Note 4 - Related Party Transactions and Other Agreements and Plans) under the Trust’s liquidity risk management program, as approved by the Board. Therefore, not all restricted securities are considered illiquid. Disposal of restricted securities may involve time consuming negotiations and expense. Prompt sale at the current valuation may be difficult and could adversely affect the net assets of the Portfolio. As of October 31, 2024, there were no restricted securities held by the Portfolio.
Allocations:
Expenses directly attributable to the Portfolio are charged to the Portfolio. Expenses not directly attributable to the Portfolio are allocated among the applicable series within the Trust equally to each series, in relation to its net assets, or another appropriate basis. Because the Portfolio operates in a master-feeder structure, in which the feeder funds invest all of their investable assets in the Portfolio, certain expenses are allocated solely to the Portfolio rather than the feeder funds. The Portfolio makes an allocation of its investment income, expenses and realized gains and losses from securities transactions to its investors in proportion to their investment in the Portfolio on the date of such accrual or gain/loss.
Federal Income Taxes:
The Portfolio is treated as a partnership for U.S. federal income tax purposes. Accordingly, the Portfolio passes through all of its net investment income and gains and losses to its feeder funds, and is therefore not subject to U.S. federal income tax. As such, the feeder funds are allocated for tax purposes their respective share of the Portfolio’s ordinary income and realized gains or losses. It is intended that the Portfolio will continue to be managed in such a way that its feeder funds will be able to satisfy the requirements of the Internal Revenue Code, as amended, applicable to regulated investment companies.
Management of the Portfolio has reviewed tax positions taken in tax years that remain subject to examination by all major tax jurisdictions, including federal (i.e., the last four tax year ends and the interim tax period since then, as applicable). Management believes that there is no tax liability resulting from unrecognized tax benefits related to uncertain tax positions taken. Management’s conclusions may be subject to future review based on changes in, or interpretation of, accounting standards or tax laws and regulations.
Notes to Financial Statements—October 31, 2024 (continued)
| 3. | Investment Valuation Summary: |
The valuation techniques employed by the Portfolio, as described below, maximize the use of observable inputs and minimize the use of unobservable inputs in determining fair value. The Portfolio’s investments are classified within the fair value hierarchy based on the lowest level of input that is significant to the fair value measurement. The inputs used for valuing the Portfolio’s investments are summarized in the three broad levels listed below:
| • | Level 1—quoted prices (unadjusted) in active markets for identical assets |
| • | Level 2—other significant observable inputs (including quoted prices for similar securities, interest rates, prepayments speeds, credit risk, etc.) |
| • | Level 3—significant unobservable inputs (including the Investment Adviser’s (as defined in Note 4 - Related Party Transactions and Other Agreements and Plans) own assumptions in determining the fair value of investments) |
Changes in valuation techniques may result in transfers in or out of an assigned level within the fair value hierarchy. The inputs or methodology used for valuing investments are not necessarily an indication of the risk associated with investing in those investments.
Exchange traded domestic equity securities are valued at the last sale price on a national securities exchange (except the Nasdaq Stock Market), or in the absence of recorded sales, at the readily available closing bid price on such exchanges. Securities traded on the Nasdaq Stock Market are valued at the Nasdaq Official Closing Price on the date of valuation. Domestic equity securities that are not traded on an exchange are valued at the quoted bid price in the over-the-counter market. These securities are typically categorized as Level 1 in the fair value hierarchy.
Shares of exchange traded and closed-end registered investment companies are valued in the same manner as other equity securities and are typically categorized as Level 1 in the fair value hierarchy. Investments in other mutual funds are valued at their net asset values (“NAVs”), as reported by such mutual funds and are typically categorized as Level 1 in the fair value hierarchy.
Securities or other assets for which market quotations are not readily available, or are deemed unreliable due to a significant event or otherwise, are fair valued pursuant to procedures approved by the Board (“Procedures”).
With respect to the Portfolio’s investments that do not have readily available or reliable market quotations, the Board has designated the Investment Adviser as the valuation designee to perform fair valuations pursuant to Rule 2a-5 under the Act. These instruments are classified as Level 2 or Level 3 in the fair value hierarchy.
Examples of potentially significant events that could affect the value of an individual security and thus require fair value pricing under the Procedures include corporate actions by the issuer, announcements by the issuer relating to its earnings or products, regulatory news, natural disasters, and litigation. Examples of potentially significant events that could affect multiple securities held by the Portfolio include governmental actions, natural disasters, and armed conflicts. Fair value pricing may require subjective determinations about the value of a security. While the Procedures are intended to result in a calculation of the Portfolio’s NAV that fairly reflects security values as of the time of pricing, neither the Trust nor the Investment Adviser can ensure that fair values determined under the Procedures would accurately reflect the price that the Portfolio could obtain for a security if it were to dispose of that security as of the time of pricing. The prices used by the Portfolio may differ from the value that would be realized if the securities were sold and the differences could be material to the financial statements.
As of October 31, 2024, all investments were categorized as Level 1 in the fair value hierarchy. The breakdown of investment categorization is disclosed in the Schedule of Portfolio Investments.
Notes to Financial Statements—October 31, 2024 (continued)
| 4. | Related Party Transactions and Other Agreements and Plans: |
Investment Management:
HSBC Global Asset Management (USA) Inc. (“HSBC” or the “Investment Adviser”), a wholly owned subsidiary of HSBC USA, Inc., a registered bank holding company under the laws of the United States, acts as Investment Adviser to the Portfolio. As Investment Adviser, HSBC manages the investments of the Portfolio and continuously reviews, supervises, and administers the Portfolio’s investments pursuant to an Investment Advisory Contract. The Investment Adviser has retained Radiant Global Investors LLC (“Radiant” or the “Subadviser”) to provide day-to-day management of the Portfolio. Radiant is paid for its services directly by the Portfolio.
For their services, the Investment Adviser and Radiant receive in aggregate, a fee, accrued daily and paid monthly and quarterly respectively, at an annual rate of 0.60% of the Portfolio’s average daily net assets. The Investment Adviser’s contractual fee is 0.25% and Radiant’s contractual fee is 0.35%.
Administration, Fund Accounting and Other Services:
HSBC also serves the Portfolio as Administrator. Under the terms of the Amended and Restated Administration Services Agreement, HSBC receives from the Portfolio (as well as other series of the Trust combined) a fee, accrued daily and paid monthly, at an annual rate of two basis points (0.02%) of average daily net assets. The fee rate is determined on the basis of the aggregate average daily net assets of the Trust. The total administration fee paid to HSBC is allocated to each series based upon its proportionate share of the aggregate net assets of the Trust subject to certain allocations in cases where one series invests some or all of its assets in another series of the Trust (for example, the feeder funds). For assets invested in the Portfolio by the Funds, the Portfolio pays half of the administration fee and the Funds pay the remaining half, for a combination of the total fee rate set forth above.
State Street Bank and Trust Company (“State Street”) serves as Sub-Administrator to the Portfolio and provides fund accounting, custody, fund administration, regulatory administration and certain other services to the Portfolio pursuant to a Master Services Agreement with the Trust. For its services, State Street is entitled to a fee, payable by the Portfolio, based on the Portfolio’s net assets, subject to per Portfolio fees, miscellaneous fees and reimbursements of certain expenses.
Under the Amended and Restated Fund PFO/Treasurer, CCO, Secretary and AMLO Agreement between Foreside Fund Officer Services, LLC (“Foreside”) and the Trust, Foreside makes individuals available to serve as the Trust’s Chief Compliance Officer, Anti-Money Laundering Officer, Treasurer and Secretary and other individuals available to support such officers. For the services provided under that agreement, the Trust paid Foreside $364,966 for the fiscal year ended October 31, 2024, plus reimbursement of certain out-of-pocket expenses. Compliance services fees incurred by each Fund are reflected on the Statement of Operations as “Compliance Services” and the other services fees are included in “Professional” on the Statement of Operations. Foreside pays the salary and other compensation earned by individuals performing these services.
Independent Trustees:
The Trust pays an annual retainer to each Independent Trustee, plus additional annual retainers to each Committee Chair and the Chairman of the Board. The Independent Trustees also receive a fee for each regular, special, and informational meeting of the Board attended. The aggregate amount of the fees and expenses of the Independent Trustees are allocated amongst all the funds in the Trust and are presented in the Statement of Operations.
Notes to Financial Statements—October 31, 2024 (continued)
Other:
The Portfolio may purchase securities from an underwriting syndicate in which the principal underwriter or members of the syndicate are affiliated with the Investment Adviser. For the fiscal year ended October 31, 2024, the Portfolio did not purchase any such securities.
The Portfolio may use related party broker-dealers. For the fiscal year ended October 31, 2024, there were no brokerage commissions paid to broker-dealers affiliated with the Investment Adviser.
The Investment Adviser and its affiliates may have lending, banking, brokerage, underwriting, or other business relationships with the issuers of the securities in which the Portfolio invests.
Investment Transactions:
Cost of purchases and proceeds from sales of securities (excluding securities maturing less than one year from acquisition) for the fiscal year ended October 31, 2024 were as follows:
| | | Purchases ($) | | Sales ($) |
| | Radiant U.S. Smaller Companies Portfolio | 27,772,043 | | 20,896,683 |
The risks are presented in an order intended to facilitate readability, and their order does not imply that the realization of one risk is likely to occur more frequently than another risk, nor does it imply that the realization of one risk is likely to have a greater adverse impact than another risk.
Equity Securities Risk: The prices of equity securities fluctuate from time to time based on changes in a company’s financial condition or overall market and economic conditions, and government policies, including tax incentives and subsidies. As a result, the value of equity securities may fluctuate drastically from day to day.
Market Risk: The value of the Portfolio’s investments may decline due to changing economic, political, social, regulatory or market conditions. Market risk may affect a single issuer, industry or sector of the economy or it may affect the economy as a whole. Moreover, the conditions in one country or geographic region could adversely affect the Portfolio’s investments in a different country or geographic region. Events such as war, acts of terrorism, social unrest, natural disasters, rapid changes in interest rates, the spread of infectious illness or other public health threats could also significantly impact the Portfolio and its investments.
Model and Data Risk: Radiant employs proprietary quantitative models in selecting investments for the Portfolio. Investments selected using these models may perform differently than expected as a result of the factors used in the models, the weight placed on each factor, changes in a factor’s historical trends, and technical issues in the construction, implementation, and maintenance of the models (including, for example, problems with data sourced by Radiant or supplied by third parties, software issues, or other types of errors). There are limitations inherent in every quantitative model and there is no guarantee that quantitative models will perform as expected or result in effective investment decisions for the Portfolio, especially during rapidly changing market conditions. Additionally, commonality of holdings across quantitative asset managers may amplify losses.
ESG Investing Risk: The incorporation of environmental, social and governance (“ESG”) criteria, including ESG and Impact scores and the identification of controversial business lines and other screens, into the investment process will cause the Portfolio to forgo investment opportunities available to other mutual funds that do not use these criteria, or to increase or decrease its exposure to certain sectors or certain types of companies. For example, the Portfolio will generally not seek to invest in companies that operate in, or derive a specific amount of revenue from, controversial business lines (e.g., tobacco, nuclear armaments and other controversial weapons, and thermal coal extraction), or companies with severe controversies (e.g., severe violators of human rights and liberties). As a result, the Portfolio could underperform or outperform other mutual funds that do not consider ESG criteria in their investment processes. In evaluating a company, Radiant is dependent upon third-party data that it believes to be reliable, but it does not guarantee the accuracy of
Notes to Financial Statements—October 31, 2024 (continued)
such third-party data. ESG data from third-party data providers may be incomplete, inaccurate, or unavailable and may vary significantly from one third-party data provider to another, which could adversely affect the analysis of ESG criteria relevant to a particular company. Investing on the basis of ESG criteria is qualitative and subjective by nature and there can be no assurance that the process utilized by Radiant or any third-party research or data providers or any judgment exercised by Radiant will reflect the views of any particular investor. Radiant’s ESG criteria and ESG-related investment processes may be changed periodically without shareholder approval or notice.
| 6. | Federal Income Tax Information: |
As of the tax fiscal year ended October 31, 2024, the cost basis of investments for federal income tax purposes, gross unrealized appreciation, gross unrealized depreciation and net unrealized appreciation/(depreciation) were as follows:
| | | Tax Cost
($) | | Tax
Unrealized
Appreciation
($) | | Tax
Unrealized
Depreciation
($) | | Net Unrealized
Appreciation/
(Depreciation)
($)* |
| | Radiant U.S. Smaller Companies Portfolio | | 27,094,675 | | 6,583,128 | | (1,045,727) | | 5,537,401 |
| * | The differences between book-basis and tax-basis unrealized appreciation/(depreciation) are attributable primarily to tax deferral of losses on wash sales. |
| 7. | Recent Accounting Pronouncements: |
In November 2023, the FASB issued ASU 2023-07, “Segment Reporting (Topic 280): Improvements to Reportable Segment Disclosures (“ASU 2023-07”),” which enhances disclosure requirements about significant segment expenses. ASU 2023-07 is effective for the fiscal years beginning after December 15, 2023, and interim periods beginning with the first quarter ended March 31, 2025. Early adoption is permitted and retrospective adoption is required for all prior periods presented. The Portfolio is currently assessing the impact of this guidance, however, the Portfolio does not expect a material impact on its financial statements.
Subsequent events occurring after the date of this report have been evaluated for potential impact, for purposes of recognition or disclosure in the financial statements, through the date the report was issued and no adjustments or additional disclosures were required to the financial statements.
Report of Independent Registered Public Accounting Firm
To the Board of Trustees of HSBC Funds and Shareholders of HSBC Radiant U.S. Smaller Companies Portfolio
Opinion on the Financial Statements
We have audited the accompanying statement of assets and liabilities, including the schedule of portfolio investments, of HSBC Radiant U.S. Smaller Companies Portfolio (one of the funds constituting HSBC Funds, hereafter collectively referred to as the “Fund”) as of October 31, 2024, the related statement of operations for the year ended October 31, 2024, the statements of changes in net assets for each of the two years in the period ended October 31, 2024, including the related notes, and the financial highlights for each of the five years in the period ended October 31, 2024 (collectively referred to as the “financial statements”). In our opinion, the financial statements present fairly, in all material respects, the financial position of the Fund as of October 31, 2024, the results of its operations for the year then ended, the changes in its net assets for each of the two years in the period ended October 31, 2024 and the financial highlights for each of the five years in the period ended October 31, 2024 in conformity with accounting principles generally accepted in the United States of America.
Basis for Opinion
These financial statements are the responsibility of the Fund’s management. Our responsibility is to express an opinion on the Fund’s financial statements based on our audits. We are a public accounting firm registered with the Public Company Accounting Oversight Board (United States) (PCAOB) and are required to be independent with respect to the Fund in accordance with the U.S. federal securities laws and the applicable rules and regulations of the Securities and Exchange Commission and the PCAOB.
We conducted our audits of these financial statements in accordance with the standards of the PCAOB. Those standards require that we plan and perform the audit to obtain reasonable assurance about whether the financial statements are free of material misstatement, whether due to error or fraud.
Our audits included performing procedures to assess the risks of material misstatement of the financial statements, whether due to error or fraud, and performing procedures that respond to those risks. Such procedures included examining, on a test basis, evidence regarding the amounts and disclosures in the financial statements. Our audits also included evaluating the accounting principles used and significant estimates made by management, as well as evaluating the overall presentation of the financial statements. Our procedures included confirmation of securities owned as of October 31, 2024 by correspondence with the custodian. We believe that our audits provide a reasonable basis for our opinion.
/s/PricewaterhouseCoopers LLP
New York, New York
December 26, 2024
We have served as the auditor of one or more investment companies in the HSBC Funds since 2015.
HSBC FAMILY OF FUNDS:
INVESTMENT ADVISER AND ADMINISTRATOR
HSBC Global Asset Management (USA) Inc.
4th Floor, 66 Hudson Boulevard E
New York, NY 10001
SUB-ADVISER
HSBC Radiant U.S. Smaller Companies Portfolio
Radiant Global Investors LLC
21 Orinda Way, Suite C-546
Orinda, CA 94563

Investment products:
| ARE NOT A BANK DEPOSIT OR OBLIGATION OF THE BANK OR ANY OF ITS AFFILIATES | ARE NOT FDIC INSURED | ARE NOT INSURED BY ANY FEDERAL GOVERNMENT AGENCY |
| ARE NOT GUARANTEED BY THE BANK OR ANY OF ITS AFFILIATES | MAY LOSE VALUE |
SHAREHOLDER SERVICING AGENTS
For HSBC Bank USA, N.A. and
HSBC Securities (USA) Inc. Clients
HSBC Bank USA, N.A.
4th Floor, 66 Hudson Boulevard E
New York, NY 10001
1-888-525-5757
For All Other Shareholders
HSBC Funds
P.O. Box 219691
Kansas City, MO 64121-9691
1-800-782-8183
SUB-TRANSFER AGENT
SS&C Global Investor and Distribution Solutions, Inc.
2000 Crown Colony Drive
Quincy, MA 02169
DISTRIBUTOR
Foreside Distribution Services, L.P.
Three Canal Plaza, Suite 100
Portland, ME 04101
CUSTODIAN AND TRANSFER AGENT
State Street Bank and Trust Company
1 Congress Street
Boston, MA 02114
INDEPENDENT REGISTERED PUBLIC ACCOUNTING FIRM
PricewaterhouseCoopers LLP
300 Madison Avenue
New York, NY 10017
LEGAL COUNSEL
Dechert LLP
1900 K Street, N.W.
Washington, D.C. 20006
Investment products are offered by HSBC Securities (USA) Inc. (HSI), member NYSE/FINRA/SIPC. HSI is an affiliate of HSBC Bank USA, N.A. Investment products: Are not a deposit or other obligation of the bank or any of its affiliates; Not FDIC insured or insured by any federal government agency of the United States; Not guaranteed by the bank or any of its affiliates; and are subject to investment risk, including possible loss of principal invested.
Investors should consider the investment objectives, risks, charges, and expenses of the investment company carefully before investing. The prospectus contains this and other important information about the investment company. For clients of HSBC Securities (USA) Inc., please call 1-888-525-5757 for more information. For other investors and prospective investors, please call the Funds directly at 1-800-782-8183 or visit our website at https://www.assetmanagement.us.hsbc.com/en/individual-investor/fund-centre. Investors should read the prospectus carefully before investing or sending money.
(b) The Registrant’s Financial Highlights are included as part of the Financial Statements filed under Item 7(a) of this Form.
Item 8. Changes in and Disagreements with Accountants for Open-End Management Investment Companies
Not applicable.
Item 9. Proxy Disclosures for Open-End Management Investment Companies
Not applicable.
Item 10. Remuneration Paid to Directors, Officers, and Others of Open-End Management Investment Companies
Renumeration Paid to Directors, Officers, and Others of Open-End Investment Companies is included as part of the Financial Statements filed under Item 7(a) of this Form.
Item 11. Statement Regarding Basis for Approval of Investment Advisory Contract
Not applicable.
Item 12. Disclosure of Proxy Voting Policies and Procedures for Closed-End Management Investment Companies
Not applicable.
Item 13. Portfolio Managers of Closed-End Management Investment Companies
Not applicable.
Item 14. Purchases of Equity Securities by Closed-End Management Investment Company and Affiliated Purchasers
Not applicable.
Item 15. Submission of Matters to a Vote of Security Holders
Not applicable.
Item 16. Controls and Procedures
(a)
The Registrant’s principal executive and principal financial officers have concluded that the Registrant’s disclosure controls and procedures (as defined in Rule 30a-3(c) under the 1940 Act) are effective, as of a date within 90 days of the filing date of this Form N-CSR based on their evaluation of these controls and procedures required by Rule 30a-3(b) under the 1940 Act and Rules 13a-15(b) or 15d-15(b) under the Securities Exchange Act of 1934.
(b)
There were no changes in the Registrant’s internal control over financial reporting (as defined in Rule 30a-3(d) under the 1940 Act) that occurred during the period covered by this report that have materially affected, or is reasonably likely to materially affect, the Registrant’s internal control over financial reporting.
Item 17. Disclosure of Securities Lending Activities for Closed-End Management Investment Companies
| (a) | Not applicable. |
| | |
| (b) | Not applicable. |
Item 18. Recovery of Erroneously Awarded Compensation
Not applicable to the Registrant.
Item 19. Exhibits
(b)
The certifications required by Rule 30a-2(b) of the 1940 Act and Section 906 of the Sarbanes-Oxley Act of 2002 are attached hereto.
(101) Inline Interactive Data File - the instance document does not appear in the Interactive Data File because its XBRL tags are embedded within the inline XBRL document.
SIGNATURES
Pursuant to the requirements of the Securities Exchange Act of 1934, as amended, and the Investment Company Act of 1940, as amended, the registrant has duly caused this report to be signed on its behalf by the undersigned, thereunto duly authorized.
HSBC Funds
| By: | /s/ Stefano R. Michelagnoli | |
| | Stefano R. Michelagnoli | |
| | President (Principal Executive Officer) | |
| | | |
| Date: | January 8, 2025 | |
Pursuant to the requirements of the Securities Exchange Act of 1934, as amended, and the Investment Company Act of 1940, as amended, this report has been signed below by the following persons on behalf of the registrant and in the capacities and on the dates indicated.
| By: | /s/ Stefano R. Michelagnoli | |
| | Stefano R. Michelagnoli | |
| | President (Principal Executive Officer) | |
| | | |
| Date: | January 8, 2025 |
| | |
| By: | /s/ Maria Clem Sell | |
| | Maria Clem Sell | |
| | Treasurer (Principal Financial Officer) | |
| | | |
| Date: | January 8, 2025 |