UNITED STATES
SECURITIES AND EXCHANGE COMMISSION
Washington, D.C. 20549
FORM N-CSR
CERTIFIED SHAREHOLDER REPORT OF REGISTERED
MANAGEMENT INVESTMENT COMPANIES
Investment Company Act file number: 811-04782
HSBC FUNDS
(Exact name of registrant as specified in charter)
452 FIFTH AVENUE
NEW YORK, NY 10018
(Address of principal executive offices) (Zip code)
STEFANO MICHELAGNOLI
PRESIDENT
452 FIFTH AVENUE
NEW YORK, NY 10018
(Name and address of agent for service)
Registrant’s telephone number, including area code: 1-800-782-8183
Date of fiscal year end: October 31
Date of reporting period: October 31, 2023
Explanatory Note: On January 5, 2024, HSBC Funds (the “Registrant”) timely filed its Form N-CSR for the fiscal year ending October 31, 2023, which included the Annual Shareholder Report dated October 31, 2023 for the HSBC Radiant U.S. Smaller Companies Fund (the “Fund”) and HSBC U.S. Smaller Companies Portfolio (the “Portfolio”), into which the Fund invests all of its assets.
However, the series and class identifier for the Portfolio (S000055061 and C000173143, respectively) was inadvertently excluded from the submission. The series and class identifiers for the Fund and the other series of the Registrant were appropriately included with the submission. The Registrant is re-filing its Form N-CSR for the fiscal year ending October 31, 2023 solely for the purpose of including the series and class identifier for the Portfolio. There are no changes being made to the Form N-CSR or the Annual Shareholder Report that was previously filed on behalf of the Registrant on January 5, 2024.
Item 1. Reports to Shareholders.
| (a) | The following is a copy of the report transmitted to stockholders pursuant to Rule 30e-1 under the Investment Company Act of 1940, as amended (the “1940 Act”): |
HSBC Funds
Annual Report
October 31, 2023

| EQUITY FUND | | Class A | | Class I | |
| HSBC Radiant U.S. Smaller Companies Fund (formerly, HSBC RadiantESG U.S. Smaller Companies Fund) | | HSOAX | | RESCX | |
HSBC Family of Funds
Annual Report - October 31, 2023
Basis points (BPS) refers to a common unit of measure for interest rates and other percentages in finance. One basis point is equal to 1/100th of 1%, or 0.01%, or 0.0001, and is used to denote the percentage change in a financial instrument.
Gross Domestic Product (“GDP”) is the value of goods and services produced in a given country in a given year.
Russell 2500TM Growth Index is an index that measures the performance of the small- to mid-cap growth segment of the U.S. equity universe. It includes those Russell 2500TM companies with higher price-to-book ratios and higher forecasted growth values.
Securities indices are unmanaged and assume reinvestment of all distributions and interest payments and do not take in account brokerage fees or expenses. Securities in the Fund do not match those in the indices and performance of the Fund will differ. Investors cannot invest directly in an index.
| Portfolio Reviews (Unaudited) |
HSBC Radiant U.S. Smaller Companies Fund
(Class A Shares and Class I Shares)
Investment decisions for the HSBC Radiant U.S. Smaller Companies Portfolio (the “Portfolio”) are made by the investment team at the Portfolio’s subadviser, Radiant Global Investors LLC (the “Subadviser”), which is led by Kathryn McDonald, co-founder and Head of Investments and Sustainability, and Harry Prabandham, Chief Investment Officer. Mr. Prabandham and Kevin Lin, CFA, Senior Portfolio Manager, are responsible for day-to-day management of the Portfolio. Ms. McDonald and Messrs. Prabandham and Lin have been portfolio managers of the Portfolio since June 2022.
The HSBC Radiant U.S. Smaller Companies Fund (the “Fund”) seeks long-term growth of capital by investing, under normal circumstances, at least 80% of its net assets, plus borrowings for investment purposes, in U.S. equity securities of small and mid-cap companies that meet the Subadviser’s fundamental and environmental, social, and governance (“ESG”) criteria (measured at the time of purchase). The Fund employs a two-tier structure, commonly referred to as a “master-feeder” structure, in which the Fund invests all of its investable assets in the Portfolio.
Investment Concerns
There is no assurance that the Fund will achieve its investment objective or will work under all market conditions. The value of investments may go down as well as up and you may not get back the amount originally invested. The Fund may be subject to certain additional risks, which should be considered carefully along with its investment objective and fees. Equity investments fluctuate in value based on changes to an individual company’s financial condition and overall market conditions. The Fund is also subject to market risk, which is the risk that the value of the Fund’s portfolio investments may decline due to changing market conditions. Market conditions may be negatively impacted by events such as war, acts of terrorism, social unrest, natural disasters, the spread of infectious illness, or other public health threats. Investing in smaller companies is more risky and volatile than investing in large companies. Growth investment style may fall out of favor in the marketplace and result in significant declines in the value of the Fund’s securities. Securities of companies considered growth investments may have rapid price swings in the event of earnings disappointments or during periods of market, political, regulatory, and economic uncertainty. Using ESG criteria will cause the Fund to forgo investment opportunities in certain companies and sectors that are available to other mutual funds that do not use these criteria, which could affect the Fund’s performance. The use of proprietary quantitative models in selecting investments could be adversely impacted by unforeseeable software or hardware malfunctions and other technological risks, and the data used in the models may cause the models to perform differently than expected.
For a complete description of these and other risks associated with investment in a mutual fund, please refer to the Fund’s prospectus.
Market Commentary
For the 12-month period ended October 31, 2023, the Fund returned 2.21% for its Class A shares (no load). That compared to a -4.80% return for the Russell 2500TM Growth Index, the Fund’s primary benchmark.
Portfolio Performance
U.S. equities ended the 12-month period in positive territory amid a general pivot toward a risk-on appetite among investors. The Federal Reserve raised interest rates multiple times throughout the period, which contributed to an increase in market volatility as equity investors sought to anticipate the effect of higher rates on the economy. The ongoing war in Ukraine and the emerging violence in the Middle East also contributed to bouts of volatility during the year, as did the banking crisis in March that was brought on by the failures of Silicon Valley Bank and Signature Bank, and the subsequent contagion to First Republic Bank. Large-cap stocks significantly outperformed their smaller cap peers for the period. On a sector basis, Information Technology, Communication and Consumer Discretionary companies outperformed while companies in the Utilities, Real Estate, and Healthcare sector underperformed.
The Fund outperformed its primary benchmark for the period under review. Stock selection, particularly within the Information Technology sector, was the main driver of the Fund’s outperformance, most notably holdings of a company that provides semiconductor equipment to chip manufacturers and a contract manufacturer for hardware companies. Both companies benefited from increased investment and growth in the semiconductor industry along with investor interest in artificial intelligence (AI). The Fund’s strategy of targeting companies with higher profitability and better earnings, stronger price momentum and lower price/earnings profiles also added to relative results. The Fund’s above-benchmark exposure to the Information Technology and Real Estate sectors also added to relative performance, as did its underweight exposure to the Industrials and Materials sectors.
The Fund’s above-benchmark exposure to companies with higher leverage dragged on relative results as those names generally underperformed as interest rates increased. The Fund’s overweight exposure to the Healthcare sector also negatively impacted relative results as that sector was one of the worst performing sectors for the period among U.S. smaller cap growth companies.
Past performance does not guarantee future results. The performance data quoted represents past performance and current returns may be lower or higher. Total return figures include change in share price, reinvestment of dividends and capital gains and do not reflect taxes that a shareholder would pay on Fund distributions or on the redemption of Fund shares. Investment return and principal value will fluctuate so that an investor’s shares, when redeemed may be worth more or less than the original cost. To obtain performance information current to the most recent month end, please call 1-800-782-8183.
| Portfolio Reviews (Unaudited) |
HSBC Radiant U.S. Smaller Companies Fund
| Value of an Investment |
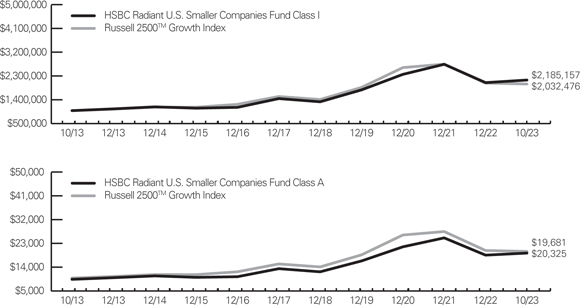 |
The charts above represent a historical 10-year performance comparison of a hypothetical investment in the indicated share class versus a similar investment in the Fund’s benchmark and represents the reinvestment of dividends and capital gains in the Fund.
| Fund Performance | | | Average Annual
Total Returns (%)3 | | Expense
Ratio (%)4 | |
| As of October 31, 2023 | | Inception
Date | | 1 Year | | 5 Year | | 10 Year | | Gross | | Net | |
| HSBC Radiant U.S. Smaller Companies Fund Class A1 | | 9/23/96 | | –2.64 | | 6.44 | | 7.00 | | 8.07 | | 1.45 | |
| HSBC Radiant U.S. Smaller Companies Fund Class I† | | 9/3/96 | | 2.50 | | 8.14 | | 8.13 | | 6.79 | | 0.90 | |
| Russell 2500 GrowthTM Index2 | | — | | –4.80 | | 5.22 | | 7.35 | | N/A | | N/A | |
Past performance does not guarantee future results. The performance data quoted represents past performance (including prior to the date on which the Fund changed its name, principal investment strategies and sub-adviser) and current returns may be lower or higher. Total return figures include change in share price, reinvestment of dividends and capital gains and do not reflect the taxes that a shareholder would pay on Fund distributions or on the redemption of Fund shares. Investment return and principal value will fluctuate so that an investor’s shares, when redeemed may be worth more or less than the original cost. To obtain performance information current to the most recent month end, please call 1-800-782-8183.
The performance above reflects any fee waivers that have been in effect during the applicable periods, as well as any expense reimbursements that have periodically been made. Absent such waivers and reimbursements, returns would have been lower. Currently, contractual fee waivers and/or expense reimbursements are in effect for the Fund through March 1, 2024.
Certain returns shown include monies received by the HSBC Radiant U.S. Smaller Companies Portfolio (the “Portfolio”), in which the Fund invests, in respect of one-time class action settlements and monies received by the Fund from a one-time reimbursement from HSBC Global Asset Management (USA) Inc. (the “Adviser”) related to past marketing arrangements. As a result, the Fund’s total returns for those periods were higher than they would have been had the Portfolio and the Fund not received the payments.
| † | The Class I Shares are issued by a separate series of the HSBC Funds. |
| 1 | Reflects the maximum sales charge of 5.00% through October 29, 2023. Effective October 29, 2023, the sales charge was eliminated. |
| 2 | For additional information, please refer to the Glossary of Terms. |
| 3 | Reflects actual NAV at the end of the period. |
| 4 | Reflects the expense ratio as reported in the prospectus dated February 28, 2023, as supplemented to date. The Adviser has entered into a contractual expense limitation agreement with the Fund under which it will limit total expenses of the Fund (excluding interest, taxes, brokerage commissions, extraordinary expenses and estimated indirect expenses attributable to the Fund’s investments in investment companies other than the Portfolio) to an annual rate of 1.45% and 0.90% for Class A Shares and Class I Shares, respectively. The expense limitations shall be in effect until March 1, 2024. Additional information pertaining to the October 31, 2023 expense ratios can be found in the financial highlights. |
The Fund’s performance is measured against the Russell 2500TM Growth Index, an unmanaged index that measures the performance of the small- to mid-cap growth segment of the U.S. equity universe. It includes those Russell 2500 companies with higher price-to-book ratios and higher forecasted growth values. The performance for the index does not reflect the deduction of expenses associated with a mutual fund, such as investment management and fund accounting fees. The Fund’s performance reflects the deduction of fees for these value-added services. Investors cannot invest directly in an index.
HSBC FAMILY OF FUNDS
Statements of Assets and Liabilities—as of October 31, 2023
| | | HSBC Radiant
U.S. Smaller
Companies Fund | | | HSBC Radiant
U.S. Smaller
Companies Fund
(Class I) | |
| Assets: | | | | | | | | |
| Investments in Affiliated Portfolio | | $ | 6,837,927 | | | $ | 12,749,551 | |
| Receivable from Investment Adviser | | | 45,639 | | | | 47,583 | |
| Prepaid expenses and other assets | | | 10,745 | | | | 14,757 | |
| Total Assets | | | 6,894,311 | | | | 12,811,891 | |
| | | | | | | | | |
| Liabilities: | | | | | | | | |
| Accrued expenses and other liabilities: | | | | | | | | |
| Administrative Services | | | 61 | | | | 113 | |
| Distribution fees | | | 18 | | | | — | |
| Shareholder Servicing | | | 1,287 | | | | — | |
| Accounting | | | 4,600 | | | | 4,000 | |
| Compliance Services | | | 484 | | | | 484 | |
| Printing | | | 1,635 | | | | 2,516 | |
| Professional | | | 30,035 | | | | 30,035 | |
| Sub-Transfer Agent | | | 18,141 | | | | 12,326 | |
| Other | | | 164 | | | | 288 | |
| Total Liabilities | | | 56,425 | | | | 49,762 | |
| Commitments and contingent liabilities (Note 4) | | | — | | | | — | |
| Net Assets | | $ | 6,837,886 | | | $ | 12,762,129 | |
| | | | | | | | | |
| Composition of Net Assets: | | | | | | | | |
| Paid in Capital | | $ | 7,865,972 | | | $ | 15,934,858 | |
| Total distributable earnings/(loss) | | | (1,028,086 | ) | | | (3,172,729 | ) |
| Net Assets | | $ | 6,837,886 | | | $ | 12,762,129 | |
| | | | | | | | | |
| Net Assets: | | | | | | | | |
| Class A Shares | | $ | 6,837,886 | | | $ | — | |
| Class I Shares | | | — | | | | 12,762,129 | |
| Total | | $ | 6,837,886 | | | $ | 12,762,129 | |
| | | | | | | | | |
| Shares Outstanding: | | | | | | | | |
| ($0.001 par value, unlimited number of shares authorized): | | | | | | | | |
| Class A Shares | | | 925,272 | | | | — | |
| Class I Shares | | | — | | | | 1,946,413 | |
| | | | | | | | | |
| Net Asset Value, Offering Price (Class A and Class I) and Redemption Price per share: | | | | | | | | |
| Class A Shares | | $ | 7.39 | | | $ | — | |
| Class I Shares | | $ | — | | | $ | 6.56 | |
Amounts designated as “—“ are $0.00 or have been rounded to $0.00.
| See notes to financial statements. | HSBC FAMILY OF FUNDS 5 |
HSBC FAMILY OF FUNDS
Statements of Operations - For the year ended October 31, 2023
| | | HSBC
Radiant
U.S. Smaller
Companies
Fund | | | HSBC
Radiant
U.S. Smaller
Companies
Fund (Class I) | |
| Net Investment Income/(Loss) Allocated from Affiliated Portfolio: | | | | | | | | |
| Investment income from Affiliated Portfolio | | $ | 68,510 | | | $ | 130,455 | |
| Expenses from Affiliated Portfolio(1) | | | (341,655 | ) | | | (658,916 | ) |
| Net Investment Income/(Loss) from Affiliated Portfolio | | | (273,145 | ) | | | (528,461 | ) |
| | | | | | | | | |
| Expenses: | | | | | | | | |
| Administrative Services: | | | | | | | | |
| Class A Shares | | | 776 | | | | — | |
| Class C Shares(2) | | | 3 | | | | — | |
| Class I Shares | | | — | | | | 1,502 | |
| Distribution: | | | | | | | | |
| Class C Shares(2) | | | 175 | | | | — | |
| Shareholder Servicing: | | | | | | | | |
| Class A Shares | | | 19,387 | | | | — | |
| Class C Shares(2) | | | 58 | | | | — | |
| Accounting | | | 8,106 | | | | 7,120 | |
| Compliance Services | | | 6,193 | | | | 6,193 | |
| Printing | | | 12,840 | | | | 20,577 | |
| Professional | | | 55,428 | | | | 55,432 | |
| Sub-Transfer Agent | | | 205,664 | | | | 133,428 | |
| Registration fees | | | 26,972 | | | | 23,500 | |
| Other | | | 11,397 | | | | 10,558 | |
| Total expenses before fee and expense reductions | | | 346,999 | | | | 258,310 | |
| Fees voluntarily reduced/reimbursed by Investment Adviser and/or Administrator | | | (7,784 | ) | | | — | |
| Fees contractually reduced/reimbursed by Investment Adviser | | | (575,609 | ) | | | (782,084 | ) |
| Net Expenses(1) | | | (236,394 | ) | | | (523,774 | ) |
| | | | | | | | | |
| Net Investment Income/(Loss) | | $ | (36,751 | ) | | $ | (4,687 | ) |
| | | | | | | | | |
| Realized/Unrealized Gains/(Losses) on Investments Allocated from Affiliated Portfolio: | | | | | | | | |
| Net realized gains/(losses) from Affiliated Portfolio | | | 759,926 | | | | 1,373,296 | |
| Change in unrealized appreciation/(depreciation) on investments from Affiliated Portfolio | | | (485,947 | ) | | | (818,279 | ) |
| | | | | | | | | |
| Net realized/unrealized gains/(losses) on investments from Affiliated Portfolio | | | 273,979 | | | | 555,017 | |
| Change in Net Assets Resulting from Operations | | $ | 237,228 | | | $ | 550,330 | |
| (1) | Total Net Fund expenses includes Expenses Allocated from Affiliated Portfolio and Net Expenses of the Fund. |
| (2) | Class C Shares are no longer offered by the Fund. Effective October 29, 2023, the then-existing Class C Shares converted to Class A Shares. |
Amounts designated as “—“ are $0.00 or have been rounded to $0.00.
| 6 HSBC FAMILY OF FUNDS | See notes to financial statements. |
HSBC FAMILY OF FUNDS
Statements of Changes in Net Assets
| | | HSBC Radiant U.S. Smaller
Companies Fund | | | HSBC Radiant U.S. Smaller
Companies Fund (Class I) | |
| | | Year Ended
October 31, 2023 | | | Year Ended
October 31, 2022 | | | Year Ended
October 31, 2023 | | | Year Ended
October 31, 2022 | |
| Investment Activities: | | | | | | | | | | | | | | | | |
| Operations: | | | | | | | | | | | | | | | | |
| Net investment loss | | $ | (36,751 | ) | | $ | (65,170 | ) | | $ | (4,687 | ) | | $ | (99,271 | ) |
| Net realized gains/(losses) from investments | | | 759,926 | | | | (1,486,716 | ) | | | 1,373,296 | | | | (4,652,078 | ) |
| Change in unrealized appreciation/(depreciation) on investments | | | (485,947 | ) | | | (1,648,501 | ) | | | (818,279 | ) | | | (18,029,576 | ) |
| Change in net assets resulting from operations | | | 237,228 | | | | (3,200,387 | ) | | | 550,330 | | | | (22,780,925 | ) |
| | | | | | | | | | | | | | | | | |
| Distributions to shareholders: | | | | | | | | | | | | | | | | |
| Class A Shares | | | — | | | | (3,766,491 | ) | | | — | | | | — | |
| Class C Shares | | | — | | | | (27,849 | ) | | | — | | | | — | |
| Class I Shares | | | — | | | | — | | | | — | | | | (45,436,904 | ) |
| Change in net assets resulting from distributions to shareholders: | | | — | | | | (3,794,340 | ) | | | — | | | | (45,436,904 | ) |
| Change in net assets resulting from capital transactions(1) | | | (1,617,732 | ) | | | 2,654,398 | | | | (4,782,072 | ) | | | (3,597,262 | ) |
| Change in net assets | | | (1,380,504 | ) | | | (4,340,329 | ) | | | (4,231,742 | ) | | | (71,815,091 | ) |
| | | | | | | | | | | | | | | | | |
| Net Assets: | | | | | | | | | | | | | | | | |
| Beginning of period | | | 8,218,390 | | | | 12,558,719 | | | | 16,993,871 | | | | 88,808,962 | |
| End of period | | $ | 6,837,886 | | | $ | 8,218,390 | | | $ | 12,762,129 | | | $ | 16,993,871 | |
| | | | | | | | | | | | | | | | | |
| CAPITAL TRANSACTIONS: | | | | | | | | | | | | | | | | |
| Class A Shares: | | | | | | | | | | | | | | | | |
| Proceeds from shares issued | | $ | 117,904 | | | $ | 1,230,933 | | | $ | — | | | $ | — | |
| Dividends reinvested | | | — | | | | 3,689,980 | | | | — | | | | — | |
| Value of shares converted from Class C | | | 18,933 | | | | — | | | | — | | | | — | |
| Value of shares redeemed | | | (1,737,431 | ) | | | (2,282,301 | ) | | | — | | | | — | |
| Class A Shares capital transactions | | | (1,600,594 | ) | | | 2,638,612 | | | | — | | | | — | |
| Class C Shares: | | | | | | | | | | | | | | | | |
| Proceeds from shares issued | | $ | 13,100 | | | $ | — | | | $ | — | | | $ | — | |
| Dividends reinvested | | | — | | | | 27,849 | | | | — | | | | — | |
| Value of shares converted to Class A | | | (18,933 | ) | | | — | | | | — | | | | — | |
| Value of shares redeemed | | | (11,305 | ) | | | (12,063 | ) | | | — | | | | — | |
| Class C Shares capital transactions | | | (17,138 | ) | | | 15,786 | | | | — | | | | — | |
| Class I Shares: | | | | | | | | | | | | | | | | |
| Proceeds from shares issued | | $ | — | | | $ | — | | | $ | 523,276 | | | $ | 13,910,403 | |
| Dividends reinvested | | | — | | | | — | | | | — | | | | 44,902,419 | |
| Value of shares redeemed | | | — | | | | — | | | | (5,305,348 | ) | | | (62,410,084 | ) |
| Class I Shares capital transactions | | | — | | | | — | | | | (4,782,072 | ) | | | (3,597,262 | ) |
| Change in net assets resulting from capital transactions(1) | | $ | (1,617,732 | ) | | $ | 2,654,398 | | | $ | (4,782,072 | ) | | $ | (3,597,262 | ) |
| | | | | | | | | | | | | | | | | |
| SHARE TRANSACTIONS: | | | | | | | | | | | | | | | | |
| Class A Shares: | | | | | | | | | | | | | | | | |
| Issued | | | 14,905 | | | | 153,638 | | | | — | | | | — | |
| Reinvested | | | — | | | | 407,733 | | | | — | | | | — | |
| Converted from Class C Shares | | | 2,599 | | | | — | | | | — | | | | — | |
| Redeemed | | | (226,078 | ) | | | (291,396 | ) | | | — | | | | — | |
| Change in Class A Shares | | | (208,574 | ) | | | 269,975 | | | | — | | | | — | |
| Class C Shares: | | | | | | | | | | | | | | | | |
| Issued | | | 8,973 | | | | — | | | | — | | | | — | |
| Reinvested | | | — | | | | 17,967 | | | | — | | | | — | |
| Converted to Class A Shares | | | (15,341 | ) | | | — | | | | — | | | | — | |
| Redeemed | | | (8,973 | ) | | | (8,944 | ) | | | — | | | | — | |
| Change in Class C Shares | | | (15,341 | ) | | | 9,023 | | | | — | | | | — | |
| Class I Shares: | | | | | | | | | | | | | | | | |
| Issued | | | — | | | | — | | | | 76,163 | | | | 2,222,072 | |
| Reinvested | | | — | | | | — | | | | — | | | | 5,676,665 | |
| Redeemed | | | — | | | | — | | | | (785,593 | ) | | | (9,876,855 | ) |
| Change in Class I Shares | | | — | | | | — | | | | (709,430 | ) | | | (1,978,118 | ) |
| (1) | Includes the conversion of Class C Shares to Class A Shares at the close of business on October 29, 2023. |
Amounts designated as “—“ are $0.00 or have been rounded to $0.00.
| See notes to financial statements. | HSBC FAMILY OF FUNDS 7 |
| HSBC RADIANT U.S. SMALLER COMPANIES FUND |
Financial Highlights
Selected data for a share outstanding throughout the periods indicated.*
| | | | | Investment Activities | | Distributions | | | | | Ratios/Supplementary Data |
| | | Net Asset
Value,
Beginning
of Period | | Net
Investment
Loss
(a) | | Net
Realized
and
Unrealized
Gains/
(Losses)
from
Investments | | Total from
Investment
Activities | | Net
Investment
Income | | Net Realized
Gains from
Investment
Transactions | | Total
Distributions | | Net Asset
Value, End
of Period | | Total Return
(b) | | Net
Assets at
Value,
End of
Period
(000’s) | | Ratio
of Net
Expense
to Average
Net Assets | | Ratio of
Net
Investment
Income to
Average
Net Assets | | Ratio of
Expenses
to Average
Net Assets
(Excluding
Fee
Reductions) | | Portfolio
Turnover
(c) |
| Class A Shares | | | | | | | | | | | | | | | | | | | | | | | | | | | | |
| Year Ended October 31, 2023 | | $7.23 | | $(0.04) | | $0.20 | | $0.16 | | $— | | $— | | $— | | $7.39 | | 2.21% | | $6,838 | | 1.35% | | (0.47)% | | 8.84% | | 103% |
| Year Ended October 31, 2022 | | 14.49 | | (0.05)(d) | | (2.80) | | (2.85) | | — | | (4.41) | | (4.41) | | 7.23(e) | | (25.80)% | | 8,200 | | 1.49%(f) | | (0.65)%(d) | | 6.47% | | 120% |
| Year Ended October 31, 2021 | | 10.71 | | (0.11) | | 4.57 | | 4.46 | | — | | (0.68) | | (0.68) | | 14.49 | | 42.81% | | 12,518 | | 1.55% | | (0.83)% | | 7.00% | | 78% |
| Year Ended October 31, 2020 | | 9.42 | | (0.09) | | 2.10 | | 2.01 | | — | | (0.72) | | (0.72) | | 10.71 | | 22.05% | | 9,224 | | 1.55% | | (0.91)% | | 7.29% | | 94% |
| Year Ended October 31, 2019 | | 10.70 | | (0.07) | | 0.59 | | 0.52 | | — | | (1.80) | | (1.80) | | 9.42 | | 8.77% | | 8,449 | | 1.55% | | (0.79)% | | 5.77% | | 81% |
| * | The per share amounts and percentages reflect income and expenses assuming inclusion of the Fund’s proportionate share of the income and expenses of the HSBC Radiant U.S. Smaller Companies Portfolio (the “Portfolio”). |
| (a) | Calculated based on average shares outstanding. |
| (b) | Total return calculations do not include any sales or redemption charges. |
| (c) | Portfolio turnover rate is calculated on the basis of the Portfolio, in which the Fund invests all of its investable assets. Portfolio turnover is calculated on the basis of the Portfolio as a whole without distinguishing between the classes of shares issued. |
| (d) | Reflects special dividends paid out during the year by several of the Portfolio’s holdings. Had the Portfolio, in which the Fund invests all of its investable assets, not received the special dividends, the net investment income/(loss) per share would have been $(0.08) and the net investment income/(loss) ratio would have been (0.97)%. |
| (e) | The net asset value per share (“NAV”) for financial reporting purposes differs from the NAV reported due to adjustments made in accordance with accounting principles generally accepted in the United States of America. |
| (f) | The net expense ratio shown for the period reflects the expense limitation agreement in effect as of June 28, 2022 and the higher limit in effect prior to that date. |
Amounts designated as “—” are $0.00 or have been rounded to $0.00.
| 8 HSBC FAMILY OF FUNDS | See notes to financial statements. |
| HSBC RADIANT U.S. SMALLER COMPANIES FUND (CLASS I) |
Financial Highlights
Selected data for a share outstanding throughout the periods indicated.*
| | | | | Investment Activities | | Distributions | | | | | | Ratios/Supplementary Data |
| | | Net Asset
Value,
Beginning
of Period | | Net
Investment
Loss
(a) | | Net
Realized
and Unrealized
Gains/
(Losses)
from
Investments | | Total from
Investment
Activities | | Net
Investment
Income | | Net Realized
Gains from
Investment
Transactions | | Total
Distributions | | Net Asset
Value, End
of Period | | Total Return
(b) | | Net
Assets at Value,
End of
Period
(000's) | | Ratio
of Net
Expense
to Average
Net Assets | | Ratio of
Net
Investment
Income to
Average
Net Assets | | Ratio of
Expenses
to Average
Net Assets
(Excluding
Fee
Reductions) | | Portfolio
Turnover
(c) |
| Class I Shares | | | | | | | | | | | | | | | | | | | | | | | | | | | | |
| Year Ended October 31, 2023 | | $6.40 | | $(0.00) | | $0.16 | | $0.16 | | $— | | $— | | $— | | $6.56 | | 2.50% | | $12,762 | | 0.90% | | (0.03)% | | 6.11% | | 103% |
| Year Ended October 31, 2022 | | 19.16 | | (0.02)(d) | | (2.84) | | (2.86) | | — | | (9.90) | | (9.90) | | 6.40(e) | | (24.77)% | | 16,993 | | 1.07%(f) | | (0.19)%(d) | | 3.02% | | 120% |
| Year Ended October 31, 2021 | | 14.67 | | (0.07) | | 6.13 | | 6.06 | | — | | (1.57) | | (1.57) | | 19.16(e) | | 43.23% | | 88,809 | | 1.10% | | (0.39)% | | 1.88% | | 78% |
| Year Ended October 31, 2020 | | 12.79 | | (0.06) | | 2.85 | | 2.79 | | — | | (0.91) | | (0.91) | | 14.67 | | 22.58% | | 121,959 | | 1.10% | | (0.46)% | | 1.63% | | 94% |
| Year Ended October 31, 2019 | | 14.38 | | (0.04) | | 0.81 | | 0.77 | | — | | (2.36) | | (2.36) | | 12.79 | | 9.25% | | 115,924 | | 1.10% | | (0.34)% | | 1.44% | | 81% |
| * | The per share amounts and percentages reflect income and expenses assuming inclusion of the Fund’s proportionate share of the income and expenses of the HSBC Radiant U.S. Smaller Companies Portfolio (the “Portfolio”). |
| (a) | Calculated based on average shares outstanding. |
| (b) | Total return calculations do not include any sales or redemption charges. |
| (c) | Portfolio turnover rate is calculated on the basis of the Portfolio, in which the Fund invests all of its investable assets. Portfolio turnover is calculated on the basis of the Portfolio as a whole without distinguishing between the classes of shares issued. |
| (d) | Reflects special dividends paid out during the year by several of the Portfolio’s holdings. Had the Portfolio, in which the Fund invests all of its investable assets, not received the special dividends, the net investment income/(loss) per share would have been $(0.05) and the net investment income/(loss) ratio would have been (0.59)%. |
| (e) | The net asset value per share (“NAV”) for financial reporting purposes differs from the NAV reported due to adjustments made in accordance with accounting principles generally accepted in the United States of America. |
| (f) | The net expense ratio shown for the period reflects the expense limitation agreement in effect as of June 28, 2022 and the higher limit in effect prior to that date. |
Amounts designated as “—” are $0.00 or have been rounded to $0.00.
| See notes to financial statements. | HSBC FAMILY OF FUNDS 9 |
Notes to Financial Statements—October 31, 2023
The HSBC Funds (the “Trust”), a Delaware statutory trust organized on March 2, 2016, is registered under the Investment Company Act of 1940, as amended (the “Act”), as an open-end management investment company. As of October 31, 2023, the Trust is comprised of 5 separate operational funds, each a series of the HSBC Family of Funds. The accompanying financial statements are presented for the following two diversified funds (individually a “Fund”, collectively the “Funds”) of the Trust. The Funds changed their names on October 27, 2023.
| Fund | Short Name |
HSBC Radiant U.S. Smaller Companies Fund
(formerly, HSBC RadiantESG U.S. Smaller Companies Fund) | Radiant U.S. Smaller Companies Fund |
| HSBC Radiant U.S. Smaller Companies Fund (Class I) (formerly, HSBC RadiantESG U.S. Smaller Companies Fund (Class I)) | Radiant U.S. Smaller Companies Fund (Class I) |
Financial statements for all other series of the Trust are published separately.
Each Fund is a feeder fund in a master-feeder fund structure and seeks to achieve its investment objective by investing all of its investable assets in the HSBC Radiant U.S. Smaller Companies Portfolio (formerly, HSBC RadiantESG U.S. Smaller Companies Portfolio) (the “Portfolio”), which is a diversified series of the Trust with the same investment objective as the Funds. The Portfolio operates as the master fund in a master-feeder arrangement in which the feeder funds invest all or part of their investable assets in the Portfolio. The Funds’ proportionate ownership of the Portfolio as of the date of this report was as follows:
| Fund | Proportionate
Ownership
Interest on
October 31, 2023
(%) |
| Radiant U.S. Smaller Companies Fund | 34.9 |
| Radiant U.S. Smaller Companies Fund (Class I) | 65.1 |
The financial statements of the Portfolio, including the Schedule of Portfolio Investments, are included elsewhere in this report. The financial statements of the Portfolio should be read in conjunction with the financial statements of the Funds.
The Funds are authorized to issue an unlimited number of shares of beneficial interest with a par value of $0.001 per share. The Radiant U.S. Smaller Companies Fund offers one class of shares: Class A Shares. The Radiant U.S. Smaller Companies Fund (Class I) also offers one class of shares: Class I Shares. Effective October 29, 2023, Class A Shares of Radiant U.S. Smaller Companies Fund are offered with no sales charge. Prior to October 29, 2023, Class A Shares had a maximum sales charge of 5.00% as a percentage of the offering price. The Fund previously offered Class C Shares, which the Fund no longer offers. After the close of business on October 29, 2023, Class C Shares of HSBC Radiant U.S. Smaller Companies Fund converted into Class A Shares (without a contingent deferred sales charge or other charge). No sales charges are assessed with respect to Class I Shares of the Radiant U.S. Smaller Companies Fund (Class I). Each class of shares in the Funds has identical rights and privileges except with respect to arrangements pertaining to shareholder servicing and/or distribution, class-related expenses, voting rights on matters affecting a single class of shares, and exchange privileges of each class of shares.
Under the Trust’s organizational documents, the Trust’s officers and Trustees are indemnified against certain liabilities arising out of the performance of their duties to the Funds. In addition, in the normal course of business, the Trust enters into contracts with its service providers, which also provide for indemnifications by the Funds. The Funds’ maximum exposure under these arrangements is unknown, as this would involve future claims that may be made against the Funds. However, based on experience, the Trust believes the risk of loss to be remote.
Notes to Financial Statements—October 31, 2023 (continued)
The Funds are investment companies and follow accounting and reporting guidance under Financial Accounting Standards Board Accounting Standards Codification Topic 946, “Financial Services-Investment Companies.”
| 2. | Significant Accounting Policies: |
The following is a summary of the significant accounting policies followed by the Funds in the preparation of their financial statements. The policies are in conformity with generally accepted accounting principles in the United States of America (“GAAP”). The preparation of financial statements requires management to make certain estimates and assumptions that affect the reported amounts of assets and liabilities and disclosure of contingent assets and liabilities at the date of the financial statements and the reported amounts of increases and decreases in net assets from operations during the reporting period. Actual results could differ from those estimates.
Securities Valuation:
The Funds record their investments in the Portfolio at fair value, which represents their proportionate ownership of the value of the Portfolio’s net assets. The notes to the Portfolio’s financial statements included elsewhere in this report provide information about the Portfolio’s valuation policy and its period-end security valuations.
Investment Transactions and Related Income:
The Funds record investments in the Portfolio on a trade date basis. The Funds record daily their proportionate share of income, expenses, changes in unrealized appreciation and depreciation and realized gains and losses derived from the Portfolio. In addition, the Funds accrue their own expenses daily as incurred.
Foreign Currency Translation:
The accounting records of the Funds are maintained in U.S. dollars. Foreign currency amounts, if any, are translated into U.S. dollars at the current rate of exchange to determine the value of investments, assets and liabilities at the close of each business day. Purchases and sales of securities, and income and expenses, are, as applicable, translated at the prevailing rate of exchange on the respective dates of such transactions. The Funds do not isolate the portion of the results of operations resulting from changes in foreign exchange rates on investments from fluctuations arising from changes in market prices of securities held. If applicable, any such fluctuations are included with the net realized and unrealized gain or loss from investments in securities and foreign currency translations.
Allocations:
Expenses directly attributable to a Fund are charged to that Fund. Expenses not directly attributable to a Fund are allocated among the applicable series within the Trust equally to each series, in relation to its net assets, or another appropriate basis. Because the Funds operate in a master-feeder structure, in which the Funds invest all of their investable assets in the Portfolio, certain expenses are allocated solely to the Portfolio rather than the Funds. Class specific expenses are charged directly to the class incurring the expense. In addition, income, expenses (other than class specific expenses), and unrealized and realized gains and losses are allocated to each class based on relative net assets on a daily basis.
Distributions to Shareholders:
Dividends distributed to shareholders of the Funds from net investment income, if any, are declared and distributed semiannually.
Distributions from net realized gains, if any, are declared and paid at least annually by the Funds. Additional distributions are also made to the Funds’ shareholders to the extent necessary to avoid the federal excise tax on certain undistributed income and net realized gains of regulated investment companies.
Notes to Financial Statements—October 31, 2023 (continued)
Federal Income Taxes:
Each Fund is a separate taxable entity for federal income tax purposes. Each Fund has qualified and intends to continue to qualify each year as a “regulated investment company” under Subchapter M of the Internal Revenue Code, as amended, and to distribute substantially all of its taxable net investment income and net realized gains, if any, to its shareholders. Accordingly, no provision for federal income or excise tax is required for the Funds, although shareholders may be taxed on distributions they receive.
Management of the Funds has reviewed tax positions taken in tax years that remain subject to examination by all major tax jurisdictions, including federal (i.e., the last four tax year ends and the interim tax period since then, as applicable). Management believes that there is no tax liability resulting from unrecognized tax benefits related to uncertain tax positions taken. Management’s conclusions may be subject to future review based on changes in, or interpretation of, accounting standards or tax laws and regulations.
| 3. | Investment Valuation Summary |
The valuation techniques employed by the Funds, as described below, maximize the use of observable inputs and minimize the use of unobservable inputs in determining fair value. The Funds’ investments are classified within the fair value hierarchy based on the lowest level of input that is significant to the fair value measurement. The inputs used for valuing the Funds’ investments are summarized in the three broad levels listed below:
| ● | Level 1—quoted prices (unadjusted) in active markets for identical assets |
| ● | Level 2—other significant observable inputs (including quoted prices for similar securities, interest rates, prepayments speeds, credit risk, etc.) |
| ● | Level 3—significant unobservable inputs (including the Investment Adviser’s own assumptions in determining the fair value of investments) |
Changes in valuation techniques may result in transfers in or out of an assigned level within the fair value hierarchy. The inputs or methodology used for valuing investments are not necessarily an indication of the risk associated with investing in those investments.
The Funds record their investments in the Portfolio at fair value, which represents their proportionate ownership of the value of the Portfolio’s net assets. These investments are typically categorized as Level 2 in the fair value hierarchy. The underlying securities of the Portfolio are recorded at fair value, as discussed more fully in the Notes to Financial Statements of the Portfolio included in the attached financial statements.
As of October 31, 2023, all investments by the Funds were categorized as Level 2 in the fair value hierarchy.
| 4. | Related Party Transactions and Other Agreements and Plans: |
Investment Management:
HSBC Global Asset Management (USA) Inc. (“HSBC” or the “Investment Adviser”), a wholly-owned subsidiary of HSBC USA, Inc., a registered bank holding company under the laws of the United States, acts as Investment Adviser to the Portfolio pursuant to an Investment Advisory Contract. As Investment Adviser, HSBC manages the investments of the Portfolio and continuously reviews, supervises, and administers the Portfolio’s investments. The Adviser has retained Radiant Global Investors LLC (“Radiant” or the “Subadviser”) to provide day-to-day management of the Portfolio. The Funds are not directly charged any investment management fees, but rather share proportionately in the investment management fees charged to the Portfolio.
Notes to Financial Statements—October 31, 2023 (continued)
Administration, Fund Accounting and Other Services:
HSBC also serves the Funds as Administrator. Effective November 7, 2022, under the terms of the Amended and Restated Administration Services Agreement, HSBC receives from the Funds (as well as other series of the Trust combined) a fee, accrued daily and paid monthly, at an annual rate of two basis points (0.02%) of average daily net assets. The fee rate is determined on the basis of the aggregate average daily net assets of the Trust. The total administration fee paid to HSBC is allocated to each series based upon its proportionate share of the aggregate net assets of the Trust subject to certain allocations in cases where one series invests some or all of its assets in another series of the Trust (for example, the Funds). For assets invested in the Portfolio by the Funds, the Portfolio pays half of the administration fee and the Funds pay the remaining half, for a combination of the total fee rate set forth above.
Prior to November 7, 2022, HSBC received, as Administrator to the Funds, a fee, accrued daily and paid monthly, at an annual rate based on the aggregate average daily net assets of the Trust, based on the breakpoints set forth below. A portion of such fees was paid by HSBC to the Funds’ former Sub-Administrator, Citi Fund Services Ohio, Inc. (“Citi”).
| Based on Average Daily Net Assets of the Trust | | Fee Rate (%) |
| Up to $10 billion | | 0.0400 |
| In excess of $10 billion but not exceeding $20 billion | | 0.0350 |
| In excess of $20 billion but not exceeding $50 billion | | 0.0265 |
| In excess of $50 billion | | 0.0245 |
Effective as of November 7, 2022, State Street Bank and Trust Company (“State Street”) serves as Sub-Administrator to the Funds and provides fund accounting, custody, fund administration, regulatory administration and certain other services to the Funds pursuant to a Master Services Agreement with the Trust. For its services, State Street is entitled to a fee, payable by the Funds, based on a Fund’s net assets, subject to per Fund fees, miscellaneous fees and reimbursements of certain expenses.
Effective as of November 7, 2022, under a Fund PFO/Treasurer, CCO, Secretary and AMLO Agreement between Foreside Fund Officer Services, LLC (“Foreside”) and the Trust, Foreside makes individuals available to serve as the Trust’s Chief Compliance Officer, Anti-Money Laundering Officer, Treasurer and Secretary. For the services provided under that agreement, the Trust paid Foreside $200,146 for the year ended October 31, 2023, plus reimbursement of certain out-of-pocket expenses. Compliance services fees incurred by each Fund are reflected on the Statements of Operations as “Compliance Services” and the other services fees are included in “Other” on the Statements of Operations. Foreside pays the salary and other compensation earned by individuals performing these services. Prior to November 7, 2022, Citi provided these officer services.
Distribution Arrangements:
Foreside Distribution Services, L.P. (“Foreside” or the “Distributor”) serves the Trust as Distributor. The Trust, on behalf of the Radiant U.S. Smaller Companies Fund, has adopted a non-compensatory Distribution Plan and Agreement (the “Distribution Plan”) pursuant to Rule 12b-1 of the Act. The Distribution Plan provides for reimbursement of expenses incurred by the Distributor related to distribution and marketing, at a rate not to exceed 0.25% and 1.00% of the average daily net assets of Class A Shares (currently not being charged) and Class C Shares (charged 0.75% until October 29, 2023 when Class C Shares converted to Class A Shares and ceased operations) of the Fund, respectively. For the year ended October 31, 2023, Foreside received $175 in commissions from sales of the Trust.
Notes to Financial Statements—October 31, 2023 (continued)
Shareholder Servicing:
The Trust has adopted a Shareholder Services Plan, which provides for payments to shareholder servicing agents for providing various shareholder services. For performing these services, the shareholder servicing agents receive a fee that is computed daily and paid monthly up to 0.25% of the average daily net assets of Class A Shares of the Radiant U.S. Smaller Companies Fund. The fees paid to the Distributor pursuant to the Distribution Plan and to shareholder servicing agents pursuant to the Shareholder Services Plan may not exceed in the aggregate 0.50% annually of the average daily net assets of Class A Shares and for Class C shares was 1.00% of the average daily net assets.
The Trust has entered into shareholder services contracts with affiliated and unaffiliated financial intermediaries who provide shareholder services and other related services to their clients or customers who invest in the Funds under which the Funds will pay all or a portion of such fees earned to financial intermediaries for performing such services.
Transfer Agency:
Effective as of November 7, 2022, State Street replaced SS&C Global Investor and Distribution Solutions, Inc. (formerly, DST Asset Manager Solutions, Inc.) (“SS&C”) as the transfer agent for each Fund, although State Street has delegated its responsibilities to SS&C and SS&C continues to provide transfer agency services to the Funds. As sub-transfer agent, SS&C receives a fee based on the number of funds and shareholder accounts, subject to certain minimums, and reimbursement of certain expenses.
Independent Trustees:
The Trust pays an annual retainer to each Independent Trustee, plus additional annual retainers to each Committee Chair and the Chairman of the Board of Trustees (the “Board”). The Independent Trustees also receive a fee for each regular, special, and informational meeting of the Board attended. The aggregate amount of the fees and expenses of the Independent Trustees are allocated among all the series in the Trust (except that these fees and expenses are allocated to the Portfolio rather than the Funds).
Other:
The Funds pay fees to certain intermediaries or financial institutions for record keeping, sub-accounting services, transfer agency and other administrative services as reflected on the Statements of Operations as “Administrative Services.”
The Funds may use related party broker-dealers. For the year ended October 31, 2023, there were no brokerage commissions paid to broker-dealers affiliated with the Investment Adviser.
The Investment Adviser and its affiliates may have lending, banking, brokerage, underwriting, or other business relationships with the issuers of the securities in which the Portfolio invests.
Fee Reductions:
The Investment Adviser has agreed to contractually limit through March 1, 2024 the total annual expenses of the Funds, including the allocated expenses from the Portfolio, exclusive of interest, taxes, brokerage commissions, extraordinary expenses, and estimated indirect expenses attributable to the Funds’ investments in investment companies. Each Fund Class has its own expense limitations based on the average daily net assets for any full fiscal year as follows:
| | | Class | | Contractual
Expense
Limitations (%) |
| Radiant U.S. Smaller Companies Fund | | Class A Shares | | 1.45 |
| Radiant U.S. Smaller Companies Fund | | Class C Shares | | 2.20* |
| Radiant U.S. Smaller Companies Fund (Class I) | | Class I Shares | | 0.90 |
| * | Ceased to exist effective October 29, 2023. |
Notes to Financial Statements—October 31, 2023 (continued)
Any amounts contractually waived or reimbursed by the Investment Adviser will be subject to repayment by the respective Fund to the Investment Adviser within three years calculated monthly from when the waiver or reimbursement is recorded to the extent that the repayment will not cause the Fund’s operating expenses to exceed the contractual expense limit that was in effect at the time of such waiver or reimbursement. During the year ended October 31, 2023, the Investment Adviser did not recapture any of its prior contractual waivers or reimbursements. As of October 31, 2023, there was no contingent liability.
As of October 31, 2023, the repayments that may potentially be made by the Funds are as follows:
| | | Amount Eligible Through | |
| | | October 31,
2026 ($) | | | October 31,
2025 ($) | | | October 31,
2024 ($) | | | Total
($) | |
Radiant U.S. Smaller
Companies Fund | | 575,609 | | | 487,707 | | | 623,917 | | | 1,687,233 | |
Radiant U.S. Smaller
Companies Fund (Class I) | | 782,084 | | | 1,033,366 | | | 821,503 | | | 2,636,953 | |
In addition to the contractual expense limitation agreement with the Funds, HSBC, in its role as Investment Adviser and Administrator, may waive/reimburse additional fees at its discretion. Any voluntary fee waivers/reimbursements are not subject to repayment in subsequent fiscal periods. Voluntary waivers/reimbursements may be eliminated or changed at any time. Amounts waived/reimbursed by the Investment Adviser and/or Administrator are reported on the Statements of Operations, as applicable.
During the year ended October 31, 2023, the following amounts of expenses were voluntarily and/or contractually waived:
| | | Class A
($) | | | Class C
($) | | | Class I
($) | | | Total
($) | |
| Radiant U.S. Smaller Companies Fund | | 581,657 | | | 1,736 | | | — | | | 583,393 | |
| Radiant U.S. Smaller Companies Fund (Class I) | | — | | | — | | | 782,084 | | | 782,084 | |
| 5. | Affiliated Investment Transactions: |
A summary of each Fund’s investment in the Portfolio for the year ended October 31, 2023 is as follows:
| | | Value
10/31/2022
($) | | | Contributions
($) | | | Withdrawals
($) | | | Net
Realized
Gains/
(Losses)
($) | | | Change in
Unrealized
Appreciation/
Depreciation
($) | | | Net
Income/
(Loss)
($) | | | Value
10/31/2023
($) | |
Radiant U.S. Smaller
Companies Fund | | | | | | | | | | | | | | | | | | | | | | | | | | | | |
HSBC Radiant
U.S. Smaller Companies Portfolio | | | 8,175,190 | | | | 762,492 | | | | (2,100,589 | ) | | | 759,926 | | | | (485,947 | ) | | | (273,145 | ) | | | 6,837,927 | |
| Total | | | 8,175,190 | | | | 762,492 | | | | (2,100,589 | ) | | | 759,926 | | | | (485,947 | ) | | | (273,145 | ) | | | 6,837,927 | |
Radiant U.S. Smaller
Companies Fund
(Class I) | | | | | | | | | | | | | | | | | | | | | | | | | | | | |
HSBC Radiant U.S.
Smaller Companies Portfolio | | | 17,023,582 | | | | 1,401,491 | | | | (5,702,078 | ) | | | 1,373,296 | | | | (818,279 | ) | | | (528,461 | ) | | | 12,749,551 | |
| Total | | | 17,023,582 | | | | 1,401,491 | | | | (5,702,078 | ) | | | 1,373,296 | | | | (818,279 | ) | | | (528,461 | ) | | | 12,749,551 | |
Notes to Financial Statements—October 31, 2023 (continued)
The risks are presented in an order intended to facilitate readability, and their order does not imply that the realization of one risk is likely to occur more frequently than another risk, nor does it imply that the realization of one risk is likely to have a greater adverse impact than another risk.
Equity Securities Risk: The prices of equity securities fluctuate from time to time based on changes in a company’s financial condition or overall market and economic conditions. As a result, the value of equity securities may fluctuate drastically from day to day.
Market Risk: The value of the Portfolio’s investments may decline due to changing economic, political, social, regulatory or market conditions. Market risk may affect a single issuer, industry or sector of the economy or it may affect the economy as a whole. Moreover, the conditions in one country or geographic region could adversely affect the Portfolio’s investments in a different country or geographic region. Events such as war, acts of terrorism, social unrest, natural disasters, rapid changes in interest rates, the spread of infectious illness or other public health threats could also significantly impact the Portfolio and its investments.
Model and Data Risk: Radiant employs proprietary quantitative models in selecting investments for the Portfolio. Investments selected using these models may perform differently than expected as a result of the factors used in the models, the weight placed on each factor, changes in a factor’s historical trends, and technical issues in the construction, implementation, and maintenance of the models (including, for example, problems with data sourced by Radiant or supplied by third parties, software issues, or other types of errors). There are limitations inherent in every quantitative model and there is no guarantee that quantitative models will perform as expected or result in effective investment decisions for the Portfolio. Additionally, commonality of holdings across quantitative asset managers may amplify losses.
ESG Investing Risk: The incorporation of environmental, social and governance (“ESG”) criteria, including ESG and Impact scores and the identification of controversial business lines and other screens, into the investment process will cause the Portfolio to forgo investment opportunities available to other mutual funds that do not use these criteria, or to increase or decrease its exposure to certain sectors or certain types of companies. For example, the Portfolio will generally not seek to invest in companies that operate in, or derive a specific amount of revenue from, controversial business lines (e.g., tobacco, nuclear armaments and other controversial weapons, and thermal coal extraction), or companies with severe controversies (e.g., severe violators of human rights and liberties). As a result, the Portfolio could underperform or outperform other mutual funds that do not consider ESG criteria in their investment processes. In evaluating a company, Radiant is dependent upon third-party data that it believes to be reliable, but it does not guarantee the accuracy of such third-party data. ESG data from third-party data providers may be incomplete, inaccurate, or unavailable and may vary significantly from one third-party data provider to another, which could adversely affect the analysis of ESG criteria relevant to a particular company. Investing on the basis of ESG criteria is qualitative and subjective by nature and there can be no assurance that the process utilized by Radiant or any third-party research or data providers or any judgment exercised by Radiant will reflect the views of any particular investor. Radiant’s ESG criteria and ESG-related investment processes may be changed periodically without shareholder approval or notice.
Notes to Financial Statements—October 31, 2023 (continued)
| 7. | Federal Income Tax Information: |
As of the tax year ended October 31, 2023, the cost basis of investments for federal income tax purposes, gross unrealized appreciation, gross unrealized depreciation and net unrealized appreciation/(depreciation) were as follows:
| | | Tax Cost ($) | | | Tax Unrealized
Appreciation ($) | | | Tax Unrealized
Depreciation ($) | | | Net Unrealized
Appreciation/
(Depreciation) ($)* | |
| Radiant U.S. Smaller Companies Fund | | 6,937,686 | | | — | | | (99,759) | | | (99,759) | |
| Radiant U.S. Smaller Companies Fund (Class I) | | 12,631,916 | | | 117,635 | | | — | | | 117,635 | |
| * | The differences between book-basis and tax-basis unrealized appreciation/(depreciation) are attributable primarily to tax deferral of losses on wash sales. |
The tax character of distributions paid by the Funds for the tax year ended October 31, 2023, was as follows:
| | | | Distributions paid from | |
| | | | Ordinary Income ($) | | | | Total Taxable
Distributions ($) | | | | Total Distributions
Paid ($)(1) | |
| Radiant U.S. Smaller Companies Fund | | | — | | | | — | | | | — | |
| Radiant U.S. Smaller Companies Fund (Class I) | | | — | | | | — | | | | — | |
| (1) | Total distributions paid may differ from that disclosed in the Statements of Changes in Net Assets because distributions are recognized when actually paid for tax purposes. |
The tax character of distributions paid by the Funds for the tax year ended October 31, 2022, was as follows:
| | | Distributions paid from | |
| | | Ordinary Income ($) | | | Net Long-Term
Capital Gains ($) | | | Total Taxable
Distributions ($) | | | Total Distributions
Paid ($)(1) | |
| Radiant U.S. Smaller Companies Fund | | | 1,311,809 | | | | 2,482,531 | | | | 3,794,340 | | | | 3,794,340 | |
| Radiant U.S. Smaller Companies Fund (Class I) | | | 16,743,166 | | | | 28,693,738 | | | | 45,436,904 | | | | 45,436,904 | |
| (1) | Total distributions paid may differ from that disclosed in the Statements of Changes in Net Assets because distributions are recognized when actually paid for tax purposes. |
As of the tax year ended October 31, 2023, the components of accumulated earnings/(deficit) on a tax basis for the Funds were as follows:
| | | Accumulated
Capital and Other
Losses ($) | | | Unrealized Appreciation/
(Depreciation)
($)(1) | | | Total Accumulated
Earnings/
(Deficit) ($) | |
| Radiant U.S. Smaller Companies Fund | | (928,327) | | | (99,759) | | | (1,028,086) | |
| Radiant U.S. Smaller Companies Fund (Class I) | | (3,290,364) | | | 117,635 | | | (3,172,729) | |
| (1) | The differences between book-basis and tax-basis unrealized appreciation/depreciation are attributable primarily to tax deferral of losses on wash sales. |
Notes to Financial Statements—October 31, 2023 (continued)
As of the tax year ended October 31, 2023, the Funds had net capital loss carryforwards (“CLCFs”) not subject to expiration as summarized in the table below. The Board does not intend to authorize a distribution of any realized gain for the Funds until any applicable CLCF has been offset or expires.
| | | Short Term
Amount ($) | | | Long Term
Amount ($) | | | Total ($) | |
| Radiant U.S. Smaller Companies Fund | | 896,515 | | | — | | | 896,515 | |
| Radiant U.S. Smaller Companies Fund (Class I) | | 3,286,771 | | | — | | | 3,286,771 | |
The amount and character of net investment income and net realized gains distributed are determined in accordance with federal income tax regulations, which may differ from GAAP. These “book/tax” differences are either considered temporary or permanent in nature. To the extent these differences are permanent in nature (e.g., certain gain/loss and certain distributions), such amounts are reclassified within the composition of net assets based on their federal tax-basis treatment; temporary differences (e.g., wash sale losses) do not require reclassification. To the extent distributions to shareholders from net investment income and net realized gains exceed net investment income and net realized gains for tax purposes, they are reported as distributions of capital.
On the Statements of Assets and Labilities, as a result of permanent book-to-tax differences, reclassification adjustments were made as follows:
| | | Accumulated Net
Investment Income/
(Distributions in Excess
of Net Investment
Income)
($)* | | | Accumulated
Net Realized
Gains/(Losses)
($)* | | | Paid in Capital
($) | |
| Radiant U.S. Smaller Companies Fund | | 64,910 | | | (103,899) | | | 38,989 | |
| Radiant U.S. Smaller Companies Fund (Class I) | | 100,365 | | | 103,899 | | | (204,264) | |
| * | These components of capital are presented together as “Total distributable earnings/(loss)” on the Statements of Assets and Liabilities. |
| 8. | Significant Shareholders: |
Shareholders, including other funds, individuals, and accounts, as well as each Fund’s investment manager(s) and/or investment personnel, may from time to time own (beneficially or of record) a significant percentage of the Fund’s shares and can be considered to “control” the Fund when that ownership exceeds 25% of the Fund’s assets (and which may differ from control as determined in accordance with GAAP).
The following list includes the Funds which had individual shareholder accounts with ownership of voting securities greater than 10% of the total outstanding voting securities but less than 25% and/or accounts with ownership of voting securities greater than 25% of the total outstanding voting securities. Significant transactions by these shareholder accounts may negatively impact the Funds’ performance.
| | | Number of
shareholders with
ownership of voting
securities of the Fund
greater than 10% and
less than 25% of the
total Fund’s
outstanding voting
securities | | | Percentage
owned
in aggregate
by 10% – 25%
shareholders (%) | | | Number of
shareholders with
ownership of
voting securities
of the Fund
greater than 25%
of the total Fund’s
outstanding
voting securities | | | Percentage owned
in aggregate by
greater than 25%
shareholders (%) | |
| Radiant U.S. Smaller Companies Fund | | — | | | — | | | 1 | | | 63 | |
| Radiant U.S. Smaller Companies Fund (Class I) | | 3 | | | 39 | | | 1 | | | 47 | |
Subsequent events occurring after the date of this report have been evaluated for potential impact, for purposes of recognition or disclosure in the financial statements, through the date the report was issued and no adjustments or additional disclosures were required to the financial statements.
Report of Independent Registered Public Accounting Firm
To the Board of Trustees of HSBC Funds and Shareholders of HSBC Radiant U.S. Smaller Companies Fund and HSBC Radiant U.S. Smaller Companies Fund (Class I)
Opinions on the Financial Statements
We have audited the accompanying statements of assets and liabilities of HSBC Radiant U.S. Smaller Companies Fund and HSBC Radiant U.S. Smaller Companies Fund (Class I) (two of the funds constituting HSBC Funds, hereafter collectively referred to as the “Funds”) as of October 31, 2023, the related statements of operations for the year ended October 31, 2023, the statements of changes in net assets for each of the two years in the period ended October 31, 2023, including the related notes, and the financial highlights for each of the five years in the period ended October 31, 2023 (collectively referred to as the “financial statements”). In our opinion, the financial statements present fairly, in all material respects, the financial position of each of the Funds as of October 31, 2023, the results of each of their operations for the year then ended, the changes in each of their net assets for each of the two years in the period ended October 31, 2023 and each of the financial highlights for each of the five years in the period ended October 31, 2023 in conformity with accounting principles generally accepted in the United States of America.
Basis for Opinions
These financial statements are the responsibility of the Funds’ management. Our responsibility is to express an opinion on the Funds’ financial statements based on our audits. We are a public accounting firm registered with the Public Company Accounting Oversight Board (United States) (PCAOB) and are required to be independent with respect to the Funds in accordance with the U.S. federal securities laws and the applicable rules and regulations of the Securities and Exchange Commission and the PCAOB.
We conducted our audits of these financial statements in accordance with the standards of the PCAOB. Those standards require that we plan and perform the audit to obtain reasonable assurance about whether the financial statements are free of material misstatement, whether due to error or fraud.
Our audits included performing procedures to assess the risks of material misstatement of the financial statements, whether due to error or fraud, and performing procedures that respond to those risks. Such procedures included examining, on a test basis, evidence regarding the amounts and disclosures in the financial statements. Our audits also included evaluating the accounting principles used and significant estimates made by management, as well as evaluating the overall presentation of the financial statements. Our procedures included confirmation of securities owned as of October 31, 2023 by correspondence with the sub-administrator of the Funds. We believe that our audits provide a reasonable basis for our opinions.
/s/PricewaterhouseCoopers LLP
New York, New York
December 26, 2023
We have served as the auditor of one or more investment companies in the HSBC Funds since 2015.
Table of Shareholder Expenses—as of October 31, 2023 (Unaudited)
As a shareholder of the Funds, you incur two types of costs: (1) transaction costs, including exchange fees (if any); and (2) ongoing costs, including management fees, distribution fees and other Fund expenses. These examples are intended to help you understand your ongoing costs (in dollars) of investing in the Funds and to compare these costs with the ongoing costs of investing in other mutual funds.
Actual Expenses
The actual examples are based on an investment of $1,000 invested at the beginning of a six-month period beginning May 1, 2023 and held through the period ended October 31, 2023.
The columns below under the heading entitled “Actual” provide information about actual account values and actual expenses. You may use this information, together with the amount you invested, to estimate the expenses that you paid over the period. Simply divide your account value by $1,000 (for example, an $8,600 account value divided by $1,000 = 8.6), then multiply the result by the number in the table under the heading entitled “Actual Expenses Paid During the Period” to estimate the expenses you paid on your account during this period.
Hypothetical Example for Comparison Purposes
The hypothetical expense examples are based on an investment of $1,000 invested at the beginning of a six-month period and held throughout the period ended October 31, 2023.
The columns below under the heading entitled “Hypothetical” provide information about hypothetical account values and hypothetical expenses based on each Fund’s actual expense ratio and an assumed rate of return of 5% per year before expenses, which is not each Fund’s actual return. The hypothetical account values and expenses may not be used to estimate the actual ending account balance or expenses you paid for the period. You may use this information to compare this 5% hypothetical example with the 5% hypothetical examples that appear in the shareholder reports of other funds.
Please note that the expenses shown in the table are meant to highlight your ongoing costs only and do not reflect any transactional costs, such as sales charges (loads), redemption fees, or exchange fees. Therefore, the columns under the heading entitled “Hypothetical” are useful in comparing ongoing costs only, and will not help you determine the relative total costs of owning different funds. In addition, if these transactional costs were included, your costs would have been higher.
| | | | | | | | | Actual | | | Hypothetical
(5% return before expenses) | |
| | | Annualized
Expense
Ratio During
Period | | | Beginning
Account
Value
5/1/23 | | | Ending
Account
Value
10/31/23 | | | Expenses
Paid During
Period(1) | | | Ending
Account
Value
10/31/23 | | | Expenses
Paid During
Period(1) | |
| Radiant U.S. Smaller Companies Fund – Class A Shares | | | 1.35% | | | | $1,000.00 | | | | $978.80 | | | | $6.73 | | | | $1,018.40 | | | | $6.87 | |
| Radiant U.S. Smaller Companies Fund (Class I) – Class I Shares | | | 0.90% | | | | 1,000.00 | | | | 982.00 | | | | 4.50 | | | | 1,020.70 | | | | 4.58 | |
| (1) | Expenses are equal to the average account value over the period multiplied by the Fund’s annualized expense ratio, multiplied by 184/365 (the number of days in the most recent fiscal half-year divided by the number of days in the fiscal year.) |
Portfolio Composition*
October 31, 2023 (Unaudited)
| HSBC Radiant U.S. Smaller Companies Portfolio |
| Investment Allocation | Percentage of Investments
at Value (%) |
| Software | 15.6 | |
| Health Care Equipment & Supplies | 12.3 | |
| Biotechnology | 8.3 | |
| Health Care Providers & Services | 6.8 | |
| Electronic Equipment, Instruments & Components | 5.3 | |
| Professional Services | 5.1 | |
| Diversified Consumer Services | 4.6 | |
| Building Products | 4.5 | |
| Household Durables | 3.8 | |
| Construction & Engineering | 3.2 | |
| Specialized REITs | 3.0 | |
| Capital Markets | 2.3 | |
| Technology Hardware, Storage & Peripherals | 2.2 | |
| Trading Companies & Distributors | 2.2 | |
| Textiles, Apparel & Luxury Goods | 2.1 | |
| Commercial Banks | 2.1 | |
| Electrical Equipment | 1.8 | |
| Communications Equipment | 1.6 | |
| Semiconductors & Semiconductor Equipment | 1.6 | |
| Financial Services | 1.4 | |
| Diversified Telecommunication Services | 1.4 | |
| Consumer Staples Distribution & Retail | 1.4 | |
| Insurance | 1.3 | |
| Health Care REITs | 1.3 | |
| Specialty Retail | 1.2 | |
| Metals & Mining | 1.1 | |
| Office REITs | 0.9 | |
| Health Care Technology | 0.8 | |
| Interactive Media & Services | 0.8 | |
| Total | 100.0 | |
* Portfolio composition is subject to change.
| HSBC RADIANT U.S. SMALLER COMPANIES PORTFOLIO |
Schedule of Portfolio Investments—as of October 31, 2023
| Common Stocks — 98.6% | | | | | | | | |
| | | | | | | | | |
| | | | Shares | | | | Value ($) | |
| Biotechnology — 8.2% | |
| Alkermes PLC (a) | | | 13,530 | | | | 327,291 | |
| Dynavax Technologies Corp. (a) | | | 16,340 | | | | 232,191 | |
| Exact Sciences Corp. (a) | | | 4,560 | | | | 280,850 | |
| Halozyme Therapeutics, Inc. (a) | | | 10,710 | | | | 362,748 | |
| Ironwood Pharmaceuticals, Inc. Class A(a) | | | 14,380 | | | | 128,989 | |
| MiMedx Group, Inc. (a) | | | 28,520 | | | | 187,091 | |
| Neurocrine Biosciences, Inc. (a) | | | 750 | | | | 83,205 | |
| | | | | | | | 1,602,365 | |
| Building Products — 4.5% | |
| Apogee Enterprises, Inc. | | | 2,900 | | | | 124,468 | |
| Griffon Corp. | | | 5,870 | | | | 234,448 | |
| JELD-WEN Holding, Inc. (a) | | | 3,500 | | | | 39,655 | |
| Owens Corning | | | 2,570 | | | | 291,361 | |
| Quanex Building Products Corp. | | | 7,030 | | | | 188,755 | |
| | | | | | | | 878,687 | |
| Capital Markets — 2.3% | |
| Donnelley Financial Solutions, Inc. (a) | | | 4,670 | | | | 254,188 | |
| Victory Capital Holdings, Inc. Class A | | | 6,710 | | | | 197,677 | |
| | | | | | | | 451,865 | |
| Commercial Banks — 2.1% | |
| Ameris Bancorp | | | 5,810 | | | | 216,713 | |
| SouthState Corp. | | | 2,980 | | | | 196,978 | |
| | | | | | | | 413,691 | |
| Communications Equipment — 1.6% | |
| Extreme Networks, Inc. (a) | | | 15,120 | | | | 311,774 | |
| Construction & Engineering — 3.1% | | | | | | | | |
| Sterling Infrastructure, Inc. (a) | | | 3,830 | | | | 279,015 | |
| WillScot Mobile Mini Holdings Corp. (a) | | | 8,460 | | | | 333,409 | |
| | | | | | | | 612,424 | |
| Consumer Staples Distribution & Retail — 1.3% | |
| Sprouts Farmers Market, Inc. (a) | | | 6,240 | | | | 262,205 | |
| Diversified Consumer Services — 4.6% | |
| Coursera, Inc. (a) | | | 16,360 | | | | 283,682 | |
| Frontdoor, Inc. (a) | | | 7,970 | | | | 230,572 | |
| H&R Block, Inc. | | | 9,250 | | | | 379,713 | |
| | | | | | | | 893,967 | |
| Diversified Telecommunication Services — 1.4% | |
| Iridium Communications, Inc. | | | 7,360 | | | | 272,688 | |
| Electrical Equipment — 1.8% | | | | | | | | |
| Atkore, Inc. (a) | | | 2,780 | | | | 345,498 | |
| Electronic Equipment, Instruments & Components — 5.3% | |
| Advanced Energy Industries, Inc. | | | 3,880 | | | | 338,569 | |
| Jabil, Inc. | | | 3,790 | | | | 465,412 | |
| Vontier Corp. | | | 7,790 | | | | 230,272 | |
| | | | | | | | 1,034,253 | |
| Financial Services — 1.4% | |
| WEX, Inc. (a) | | | 1,640 | | | | 273,027 | |
| Health Care Equipment & Supplies — 12.1% | |
| Alphatec Holdings, Inc. (a) | | | 18,750 | | | | 172,125 | |
| Artivion, Inc. (a) | | | 14,460 | | | | 184,220 | |
| AtriCure, Inc. (a) | | | 5,130 | | | | 177,703 | |
| CONMED Corp. | | | 3,000 | | | | 292,380 | |
| Glaukos Corp. (a) | | | 3,640 | | | | 248,248 | |
| Common Stocks, continued | | | | |
| | | | | |
| | | | Shares | | | | Value ($) | |
| Haemonetics Corp. (a) | | | 3,280 | | | | 279,554 | |
| Inari Medical, Inc. (a) | | | 4,290 | | | | 260,446 | |
| Inspire Medical Systems, Inc. (a) | | | 960 | | | | 141,274 | |
| Lantheus Holdings, Inc. (a) | | | 4,200 | | | | 271,320 | |
| Penumbra, Inc. (a) | | | 740 | | | | 141,451 | |
| Tactile Systems Technology, Inc. (a) | | | 8,680 | | | | 94,786 | |
| TransMedics Group, Inc. (a) | | | 2,970 | | | | 111,316 | |
| | | | | | | | 2,374,823 | |
| Health Care Providers & Services — 6.7% | |
| AMN Healthcare Services, Inc. (a) | | | 2,510 | | | | 190,409 | |
| Ensign Group, Inc. | | | 4,580 | | | | 442,428 | |
| Option Care Health, Inc. (a) | | | 9,260 | | | | 256,780 | |
| Progyny, Inc. (a) | | | 3,580 | | | | 110,479 | |
| RadNet, Inc. (a) | | | 7,500 | | | | 202,200 | |
| Select Medical Holdings Corp. | | | 4,850 | | | | 110,240 | |
| | | | | | | | 1,312,536 | |
| Health Care REITs — 1.3% | |
| Omega Healthcare Investors, Inc.REIT | | | 7,430 | | | | 245,933 | |
| Health Care Technology — 0.8% | |
| Health Catalyst, Inc. (a) | | | 19,860 | | | | 148,751 | |
| Household Durables — 3.8% | |
| Cavco Industries, Inc. (a) | | | 100 | | | | 24,951 | |
| Installed Building Products, Inc. | | | 3,250 | | | | 362,927 | |
| Tempur Sealy International, Inc. | | | 8,760 | | | | 349,787 | |
| | | | | | | | 737,665 | |
| Insurance — 1.3% | |
| Everest Group Ltd. | | | 640 | | | | 253,197 | |
| Interactive Media & Services — 0.7% | |
| Cars.com, Inc. (a) | | | 9,680 | | | | 147,426 | |
| Metals & Mining — 1.0% | |
| Constellium SE Class A(a) | | | 13,080 | | | | 206,664 | |
| Office REITs — 0.9% | | | | | | | | |
| Boston Properties, Inc.REIT | | | 3,390 | | | | 181,602 | |
| Professional Services — 5.0% | |
| Paylocity Holding Corp. (a) | | | 2,210 | | | | 396,474 | |
| TriNet Group, Inc. (a) | | | 2,650 | | | | 272,288 | |
| Verra Mobility Corp. Class A(a) | | | 15,870 | | | | 313,750 | |
| | | | | | | | 982,512 | |
| Semiconductors & Semiconductor Equipment — 1.6% | |
| Rambus, Inc. (a) | | | 5,700 | | | | 309,681 | |
| Software — 15.3% | |
| Elastic NV (a) | | | 4,020 | | | | 301,661 | |
| Gen Digital, Inc. | | | 20,200 | | | | 336,532 | |
| Manhattan Associates, Inc. (a) | | | 2,350 | | | | 458,203 | |
| Nutanix, Inc. Class A(a) | | | 11,890 | | | | 430,299 | |
| PROS Holdings, Inc. (a) | | | 7,730 | | | | 240,790 | |
| Smartsheet, Inc. Class A(a) | | | 6,410 | | | | 253,451 | |
| Tenable Holdings, Inc. (a) | | | 6,330 | | | | 266,556 | |
| Teradata Corp. (a) | | | 4,990 | | | | 213,173 | |
| Workiva, Inc. Class A(a) | | | 4,040 | | | | 351,844 | |
| Zuora, Inc. Class A(a) | | | 20,620 | | | | 152,794 | |
| | | | | | | | 3,005,303 | |
| Specialized REITs — 2.9% | |
| EPR Properties REIT | | | 5,470 | | | | 233,569 | |
| Iron Mountain, Inc. REIT | | | 5,730 | | | | 338,471 | |
| | | | | | | | 572,040 | |
| 22 HSBC FAMILY OF FUNDS | See notes to financial statements. |
| HSBC RADIANT U.S. SMALLER COMPANIES PORTFOLIO |
Schedule of Portfolio Investments—as of October 31, 2023 (continued)
| Common Stocks, continued | | | | | | | | |
| | | | | | | | | |
| | | | Shares | | | | Value ($) | |
| Specialty Retail — 1.2% | |
| Abercrombie & Fitch Co. Class A(a) | | | 3,870 | | | | 235,373 | |
| Technology Hardware, Storage & Peripherals — 2.2% | |
| Pure Storage, Inc. Class A(a) | | | 12,540 | | | | 423,978 | |
| Textiles, Apparel & Luxury Goods — 2.1% | |
| Kontoor Brands, Inc. | | | 8,930 | | | | 414,799 | |
| Trading Companies & Distributors — 2.1% | |
| Boise Cascade Co. | | | 2,150 | | | | 201,563 | |
| SiteOne Landscape Supply, Inc. (a) | | | 1,570 | | | | 216,299 | |
| | | | | | | | 417,862 | |
TOTAL COMMON STOCKS
(Cost $19,093,162) | | | | | | | 19,322,589 | |
TOTAL INVESTMENTS IN
SECURITIES | | | | | | | | |
| (Cost $19,093,162) — 98.6% | | | | | | | 19,322,589 | |
| Other Assets (Liabilities) — 1.4% | | | | | | | 264,889 | |
| NET ASSETS — 100.0% | | | | | | $ | 19,587,478 | |
(a) Represents non-income producing security.
| See notes to financial statements. | HSBC FAMILY OF FUNDS 23 |
HSBC FAMILY OF FUNDS
Statement of Assets and Liabilities—as of October 31, 2023
| | | HSBC
Radiant
U.S. Smaller
Companies
Portfolio |
| Assets: | | |
| Investments in securities, at value | | $ | 19,322,589 | |
| Cash | | | 376,331 | |
| Dividends receivable | | | 8,663 | |
| Prepaid expenses and other assets | | | 6,908 | |
| Total Assets | | | 19,714,491 | |
| | | | | |
| Liabilities: | | | | |
| Accrued expenses and other liabilities: | | | | |
| Investment Management | | | 4,351 | |
| Sub-Advisory | | | 6,091 | |
| Administrative Services | | | 8 | |
| Sub-Administration | | | 1,392 | |
| Accounting | | | 1,316 | |
| Compliance Services | | | 5,815 | |
| Custodian | | | 264 | |
| Printing | | | 1,450 | |
| Professional | | | 95,359 | |
| Trustee | | | 6,072 | |
| Other | | | 4,895 | |
| Total Liabilities | | | 127,013 | |
| | | | | |
| Net Assets Applicable to investors' beneficial interest | | $ | 19,587,478 | |
| Investments in securities, at cost | | $ | 19,093,162 | |
| 24 HSBC FAMILY OF FUNDS | See notes to financial statements. |
HSBC FAMILY OF FUNDS
Statement of Operations - For the year ended October 31, 2023
| | | HSBC
Radiant
U.S. Smaller
Companies
Portfolio |
| Investment Income: | | |
| Dividends | | $ | 199,072 | |
| Foreign tax withholding | | | (107 | ) |
| Total Investment Income | | | 198,965 | |
| | | | | |
| Expenses: | | | | |
| Investment Management Fees | | | 56,998 | |
| Sub-Advisory Fees | | | 79,798 | |
| Administrative Services | | | 2,280 | |
| Accounting | | | 4,822 | |
| Sub-Administration | | | 1,281 | |
| Compliance Services | | | 39,608 | |
| Custodian | | | 4,112 | |
| Professional | | | 490,889 | |
| Trustee | | | 283,755 | |
| Other | | | 37,028 | |
| Total Expenses | | | 1,000,571 | |
| | | | | |
| Net Investment Income/(Loss) | | $ | (801,606 | ) |
| | | | | |
| Net Realized/Unrealized Gains/(Losses) from Investments in Securities: | | | | |
| Net realized gains/(losses) from investment securities | | | 2,133,222 | |
| Change in unrealized appreciation/(depreciation) on investment securities | | | (1,304,226 | ) |
| | | | | |
| Net realized/unrealized gains/(losses) on investments | | | 828,996 | |
| Change in Net Assets Resulting from Operations | | $ | 27,390 | |
| See notes to financial statements. | HSBC FAMILY OF FUNDS 25 |
HSBC FAMILY OF FUNDS
Statement of Changes in Net Assets
| | HSBC Radiant U.S. Smaller
Companies Portfolio |
| | | | Year Ended
October 31, 2023 | | | | Year Ended
October 31, 2022 | |
| Investment Activities: | | | | | | | | |
| Operations: | | | | | | | | |
| Net investment income/(loss) | | $ | (801,606 | ) | | $ | (1,089,013 | ) |
| Net realized gains/(losses) from investments | | | 2,133,222 | | | | (6,138,794 | ) |
| Change in unrealized appreciation/(depreciation) on investments | | | (1,304,226 | ) | | | (19,678,077 | ) |
| Change in net assets resulting from operations | | | 27,390 | | | | (26,905,884 | ) |
| Proceeds from contributions | | | 2,163,983 | | | | 64,074,231 | |
| Value of withdrawals | | | (7,802,667 | ) | | | (113,329,023 | ) |
| Change in net assets resulting from transactions in investors' beneficial interest | | | (5,638,684 | ) | | | (49,254,792 | ) |
| Change in net assets | | | (5,611,294 | ) | | | (76,160,676 | ) |
| | | | | | | | | |
| Net Assets: | | | | | | | | |
| Beginning of period | | | 25,198,772 | | | | 101,359,448 | |
| End of period | | $ | 19,587,478 | | | $ | 25,198,772 | |
| 26 HSBC FAMILY OF FUNDS | See notes to financial statements. |
| HSBC RADIANT U.S. SMALLER COMPANIES PORTFOLIO |
Financial Highlights
Selected data for a share outstanding throughout the periods indicated.*
| | Ratios/Supplemental Data |
| | | | Total
Return | | | | Net Assets at
End of Period
(000’s) | | | | Ratio of Net
Expenses to
Average Net
Assets | | | | Ratio of Net
Investment Income
to Average Net
Assets | | | | Portfolio
Turnover | |
| HSBC Radiant U.S. Smaller Companies Portfolio | | | | | | | | | | | | | | | |
| Year Ended October 31, 2023 | | | (0.69 | )% | | | $19,587 | | | | 4.39 | % | | | (3.52 | )% | | | 103 | % |
| Year Ended October 31, 2022 | | | (27.12 | )% | | | 25,198 | | | | 2.60 | % | | | (1.72 | )%(a) | | | 120 | % |
| Year Ended October 31, 2021 | | | 43.07 | % | | | 101,359 | | | | 1.25 | % | | | (0.53 | )% | | | 78 | % |
| Year Ended October 31, 2020 | | | 22.50 | % | | | 131,286 | | | | 1.13 | % | | | (0.49 | )% | | | 94 | % |
| Year Ended October 31, 2019 | | | 9.31 | % | | | 124,533 | | | | 1.07 | % | | | (0.31 | )% | | | 81 | % |
| (a) | Reflects special dividends paid out during the year by several of the Portfolio’s holdings. Had the Portfolio not received the special dividends, the net investment income/(loss) ratio would have been (2.11)%. |
| See notes to financial statements. | HSBC FAMILY OF FUNDS 27 |
Notes to Financial Statements—October 31, 2023
The HSBC Funds (the “Trust”), a Delaware statutory trust organized on March 2, 2016, is registered under the Investment Company Act of 1940, as amended (the “Act”), as an open-end management investment company. As of October 31, 2023, the Trust is comprised of 5 separate operational funds, each a series of the HSBC Family of Funds. The accompanying financial statements are presented for the HSBC Radiant U.S. Smaller Companies Portfolio (the “Portfolio”) (formerly, HSBC RadiantESG U.S. Smaller Companies Portfolio).
For simplicity purposes, this document may use the term “Fund” to include the Portfolio. This two-tier fund structure is commonly referred to as a “master-feeder” structure because one fund (the Fund or “feeder fund”) is investing all its assets in a second fund (the Portfolio or “master fund”).
The Portfolio operates as a master fund in a master-feeder arrangement, in which the two feeder funds invest all or part of their investable assets in the Portfolio. The Agreement and Declaration of Trust permits the Board of Trustees (the “Board”) to issue an unlimited number of beneficial interests in the Portfolio.
The Portfolio is a diversified series of the Trust. Financial statements for all other series of the Trust are published separately.
The following represents each feeder fund’s proportionate ownership interest in the Portfolio:
| | Fund | Proportionate
Ownership
Interest on
October 31, 2023
(%) |
| | Radiant U.S. Smaller Companies Fund | 34.9 |
| | Radiant U.S. Smaller Companies Fund (Class I) | 65.1 |
Under the Trust’s organizational documents, the Trust’s officers and Trustees are indemnified against certain liabilities arising out of the performance of their duties to the Portfolio. In addition, in the normal course of business, the Trust may enter into contracts with its service providers, which also provide for indemnifications by the Portfolio. The Portfolio’s maximum exposure under these arrangements is unknown as this would involve future claims that may be made against the Portfolio. However, based on experience, the Trust believes the risk of loss to be remote.
The Portfolio is an investment company and follows accounting and reporting guidance under Financial Accounting Standards Board Accounting Standards Codification Topic 946, “Financial Services-Investment Companies.”
| 2. | Significant Accounting Policies: |
The following is a summary of the significant accounting policies followed by the Portfolio in the preparation of its financial statements. The policies are in conformity with generally accepted accounting principles in the United States of America. The preparation of financial statements requires management to make certain estimates and assumptions that affect the reported amounts of assets and liabilities and disclosure of contingent assets and liabilities at the date of the financial statements and the reported amounts of increases and decreases in net assets from operations during the reporting period. Actual results could differ from those estimates.
Securities Valuation:
The Portfolio records its investments at fair value. Fair value is defined as the price that would be received to sell an asset or paid to transfer a liability in an orderly transaction between market participants at the measurement date. The valuation techniques used to determine fair value are further described in Note 3 below.
Investment Transactions and Related Income:
Investment transactions are accounted for no later than one business day after trade date. However, for financial reporting purposes, investment transactions are accounted for on trade date on the last business day of the reporting period. Investment gains and losses are calculated on the identified cost basis. Interest income is determined on the basis of coupon interest accrued using the effective interest method which adjusts for amortization of premiums and accretion of discounts.
Notes to Financial Statements—October 31, 2023 (continued)
Dividend income is recorded on the ex-dividend date. Pay-in-kind interest income and non-cash dividend income received in the form of securities in-lieu of cash, if any, are recorded at the fair value of the securities received. To the extent such information is publicly available, the Portfolio records distributions received in excess of income earned from underlying investments as a reduction of cost of investments and/or realized gain. Such amounts are based on estimates if actual amounts are not available and actual amounts of income, realized gain and return of capital may differ from the estimated amounts. The Portfolio adjusts the estimated amounts of the components of distributions (and consequently their net investment income) as necessary, once the issuers provide information about the actual composition of the distributions. The Portfolio makes an allocation of its investment income, expenses and realized gains and losses from securities transactions to its investors in proportion to their investment in the Portfolio on the date of such accrual or gain/loss.
Foreign Currency Translation:
The accounting records of the Portfolio are maintained in U.S. dollars. Foreign currency amounts, if any, are translated into U.S. dollars at the current rate of exchange to determine the value of investments, assets and liabilities at the close of each business day. Purchases and sales of securities, and income and expenses, as applicable, are translated at the prevailing rate of exchange on the respective dates of such transactions. The Portfolio does not isolate the portion of the results of operations resulting from changes in foreign exchange rates on investments from fluctuations arising from changes in market prices of securities held. If applicable, any such fluctuations are included with the net realized and unrealized gain or loss from investments in securities.
Restricted Securities:
The Portfolio may invest in restricted securities. A restricted security is a security which has been purchased through a private offering and cannot be resold to the general public without prior registration under the Securities Act of 1933, as amended (the “1933 Act”) or pursuant to the resale limitations provided by Rule 144 under the 1933 Act, or another exemption from the registration requirements of the 1933 Act. Certain restricted securities may be resold in transactions exempt from registration, normally to qualified institutional buyers, and may be classified as liquid by the Investment Adviser (as defined in Note 4 - Related Party Transactions and Other Agreements and Plans) under the Trust’s liquidity risk management program, as approved by the Board. Therefore, not all restricted securities are considered illiquid. Disposal of restricted securities may involve time consuming negotiations and expense. Prompt sale at the current valuation may be difficult and could adversely affect the net assets of the Portfolio. As of October 31, 2023, there were no restricted securities held by the Portfolio.
Expenses directly attributable to the Portfolio are charged to the Portfolio. Expenses not directly attributable to the Portfolio are allocated among the applicable series within the Trust equally to each series, in relation to its net assets, or another appropriate basis. Because the Portfolio operates in a master-feeder structure, in which the feeder funds invest all of their investable assets in the Portfolio, certain expenses are allocated solely to the Portfolio rather than the feeder funds.
Federal Income Taxes:
The Portfolio is treated as a partnership for U.S. federal income tax purposes. Accordingly, the Portfolio passes through all of its net investment income and gains and losses to its feeder funds, and is therefore not subject to U.S. federal income tax. As such, the feeder funds are allocated for tax purposes their respective share of the Portfolio’s ordinary income and realized gains or losses. It is intended that the Portfolio will continue to be managed in such a way that its feeder funds will be able to satisfy the requirements of the Internal Revenue Code, as amended, applicable to regulated investment companies.
Management of the Portfolio has reviewed tax positions taken in tax years that remain subject to examination by all major tax jurisdictions, including federal (i.e., the last four tax year ends and the interim tax period since then, as applicable). Management believes that there is no tax liability resulting from unrecognized tax benefits related to uncertain tax positions taken. Management’s conclusions may be subject to future review based on changes in, or interpretation of, accounting standards or tax laws and regulations.
Notes to Financial Statements—October 31, 2023 (continued)
| 3. | Investment Valuation Summary: |
The valuation techniques employed by the Portfolio, as described below, maximize the use of observable inputs and minimize the use of unobservable inputs in determining fair value. The Portfolio’s investments are classified within the fair value hierarchy based on the lowest level of input that is significant to the fair value measurement. The inputs used for valuing the Portfolio’s investments are summarized in the three broad levels listed below:
| | • | Level 1—quoted prices (unadjusted) in active markets for identical assets |
| | • | Level 2—other significant observable inputs (including quoted prices for similar securities, interest rates, prepayments speeds, credit risk, etc.) |
| | • | Level 3—significant unobservable inputs (including the Investment Adviser’s own assumptions in determining the fair value of investments) |
Changes in valuation techniques may result in transfers in or out of an assigned level within the fair value hierarchy. The inputs or methodology used for valuing investments are not necessarily an indication of the risk associated with investing in those investments.
Exchange traded domestic equity securities are valued at the last sale price on a national securities exchange (except the Nasdaq Stock Market), or in the absence of recorded sales, at the readily available closing bid price on such exchanges. Securities traded on the Nasdaq Stock Market are valued at the Nasdaq Official Closing Price on the date of valuation. Domestic equity securities that are not traded on an exchange are valued at the quoted bid price in the over-the-counter market. These securities are typically categorized as Level 1 in the fair value hierarchy.
Shares of exchange traded and closed-end registered investment companies are valued in the same manner as other equity securities and are typically categorized as Level 1 in the fair value hierarchy. Investments in other mutual funds are valued at their net asset values (“NAVs”), as reported by such mutual funds and are typically categorized as Level 1 in the fair value hierarchy.
Securities or other assets for which market quotations are not readily available, or are deemed unreliable due to a significant event or otherwise, are fair valued pursuant to procedures approved by the Board (“Procedures”).
With respect to the Portfolio’s investments that do not have readily available or reliable market quotations, the Board has designated the Investment Adviser as the valuation designee to perform fair valuations pursuant to Rule 2a-5 under the Act. These instruments are classified as Level 2 or Level 3 in the fair value hierarchy.
Examples of potentially significant events that could affect the value of an individual security and thus require fair value pricing under the Procedures include corporate actions by the issuer, announcements by the issuer relating to its earnings or products, regulatory news, natural disasters, and litigation. Examples of potentially significant events that could affect multiple securities held by the Portfolio include governmental actions, natural disasters, and armed conflicts. Fair value pricing may require subjective determinations about the value of a security. While the Procedures are intended to result in a calculation of the Portfolio’s NAV that fairly reflects security values as of the time of pricing, neither the Trust nor the Investment Adviser can ensure that fair values determined under the Procedures would accurately reflect the price that the Portfolio could obtain for a security if it were to dispose of that security as of the time of pricing. The prices used by the Portfolio may differ from the value that would be realized if the securities were sold and the differences could be material to the financial statements.
As of October 31, 2023, all investments were categorized as Level 1 in the fair value hierarchy. The breakdown of investment categorization is disclosed in the Schedule of Portfolio Investments.
Notes to Financial Statements—October 31, 2023 (continued)
| 4. | Related Party Transactions and Other Agreements and Plans: |
Investment Management:
HSBC Global Asset Management (USA) Inc. (“HSBC” or the “Investment Adviser”), a wholly owned subsidiary of HSBC USA, Inc., a registered bank holding company under the laws of the United States, acts as Investment Adviser to the Portfolio. As Investment Adviser, HSBC manages the investments of the Portfolio and continuously reviews, supervises, and administers the Portfolio’s investments pursuant to an Investment Advisory Contract. The Adviser has retained Radiant Global Investors LLC (“Radiant” or the “Subadviser”) to provide day-to-day management of the Portfolio. Radiant is paid for its services directly by the Portfolio.
For their services, the Investment Adviser and Radiant receive in aggregate, a fee, accrued daily and paid monthly, at an annual rate of 0.60% of the Portfolio’s average daily net assets. The Investment Adviser’s contractual fee is 0.25% and Radiant’s contractual fee is 0.35%.
Administration, Fund Accounting and Other Services:
HSBC also serves the Portfolio as Administrator. Effective November 7, 2022, under the terms of the Amended and Restated Administration Services Agreement, HSBC receives from the Portfolio (as well as other series of the Trust combined) a fee, accrued daily and paid monthly, at an annual rate of two basis points (0.02%) of average daily net assets. The fee rate is determined on the basis of the aggregate average daily net assets of the Trust. The total administration fee paid to HSBC is allocated to each series based upon its proportionate share of the aggregate net assets of the Trust subject to certain allocations in cases where one series invests some or all of its assets in another series of the Trust (for example, the feeder funds). For assets invested in the Portfolio by the Funds, the Portfolio pays half of the administration fee and the Funds pay the remaining half, for a combination of the total fee rate set forth above.
Prior to November 7, 2022, HSBC received, as Administrator to the Portfolio (as well as other series of the Trust), a fee, accrued daily and paid monthly, at an annual rate based on the aggregate average daily net assets of the Trust, based on the breakpoints set forth below. A portion of such fees was paid by HSBC to the Portfolio’s former Sub-Administrator, Citi Fund Services Ohio, Inc. (“Citi”).
| | Based on Average Daily Net Assets of the Trust | Fee Rate (%) |
| | Up to $10 billion | 0.0400 |
| | In excess of $10 billion but not exceeding $20 billion | 0.0350 |
| | In excess of $20 billion but not exceeding $50 billion | 0.0265 |
| | In excess of $50 billion | 0.0245 |
Effective as of November 7, 2022, State Street Bank and Trust Company (“State Street”) serves as Sub-Administrator to the Portfolio and provides fund accounting, custody, fund administration, regulatory administration and certain other services to the Portfolio pursuant to a Master Services Agreement with the Trust. For its services, State Street is entitled to a fee, payable by the Portfolio, based on the Portfolio’s net assets, subject to per Portfolio fees, miscellaneous fees and reimbursements of certain expenses.
Effective as of November 7, 2022, under a Fund PFO/Treasurer, CCO, Secretary and AMLO Agreement between Foreside Fund Officer Services, LLC (“Foreside”) and the Trust, Foreside makes individuals available to serve as the Trust’s Chief Compliance Officer, Anti-Money Laundering Officer, Treasurer and Secretary. For the services provided under that agreement, the Trust paid Foreside $200,146 for the year ended October 31, 2023, plus reimbursement of certain out-of-pocket expenses. Compliance services fees incurred by each Fund are reflected on the Statement of Operations as “Compliance Services” and the other services fees are included in “Other” on the Statement of Operations. Foreside pays the salary and other compensation earned by individuals performing these services. Prior to November 7, 2022, Citi provided these officer services.
Notes to Financial Statements—October 31, 2023 (continued)
Independent Trustees:
The Trust pays an annual retainer to each Independent Trustee, plus additional annual retainers to each Committee Chair and the Chairman of the Board. The Independent Trustees also receive a fee for each regular, special, and informational meeting of the Board attended. The aggregate amount of the fees and expenses of the Independent Trustees are allocated amongst all the funds in the Trust and are presented in the Statement of Operations.
The Portfolio may purchase securities from an underwriting syndicate in which the principal underwriter or members of the syndicate are affiliated with the Investment Adviser. For the year ended October 31, 2023, the Portfolio did not purchase any such securities.
The Portfolio may use related party broker-dealers. For the year ended October 31, 2023, there were no brokerage commissions paid to broker-dealers affiliated with the Investment Adviser.
The Investment Adviser and its affiliates may have lending, banking, brokerage, underwriting, or other business relationships with the issuers of the securities in which the Portfolio invests.
Investment Transactions:
Cost of purchases and proceeds from sales of securities (excluding securities maturing less than one year from acquisition) for the year ended October 31, 2023 were as follows:
| | | | Purchases ($) | | Sales ($) |
| | Radiant U.S. Smaller Companies Portfolio | | 23,149,057 | | 29,639,862 |
The risks are presented in an order intended to facilitate readability, and their order does not imply that the realization of one risk is likely to occur more frequently than another risk, nor does it imply that the realization of one risk is likely to have a greater adverse impact than another risk.
Equity Securities Risk: The prices of equity securities fluctuate from time to time based on changes in a company’s financial condition or overall market and economic conditions. As a result, the value of equity securities may fluctuate drastically from day to day.
Market Risk: The value of the Portfolio’s investments may decline due to changing economic, political, social, regulatory or market conditions. Market risk may affect a single issuer, industry or sector of the economy or it may affect the economy as a whole. Moreover, the conditions in one country or geographic region could adversely affect the Portfolio’s investments in a different country or geographic region. Events such as war, acts of terrorism, social unrest, natural disasters, rapid changes in interest rates, the spread of infectious illness or other public health threats could also significantly impact the Portfolio and its investments.
Model and Data Risk: Radiant employs proprietary quantitative models in selecting investments for the Portfolio. Investments selected using these models may perform differently than expected as a result of the factors used in the models, the weight placed on each factor, changes in a factor’s historical trends, and technical issues in the construction, implementation, and maintenance of the models (including, for example, problems with data sourced by Radiant or supplied by third parties, software issues, or other types of errors). There are limitations inherent in every quantitative model and there is no guarantee that quantitative models will perform as expected or result in effective investment decisions for the Portfolio. Additionally, commonality of holdings across quantitative asset managers may amplify losses.
Notes to Financial Statements—October 31, 2023 (continued)
ESG Investing Risk: The incorporation of environmental, social and governance (“ESG”) criteria, including ESG and Impact scores and the identification of controversial business lines and other screens, into the investment process will cause the Portfolio to forgo investment opportunities available to other mutual funds that do not use these criteria, or to increase or decrease its exposure to certain sectors or certain types of companies. For example, the Portfolio will generally not seek to invest in companies that operate in, or derive a specific amount of revenue from, controversial business lines (e.g., tobacco, nuclear armaments and other controversial weapons, and thermal coal extraction), or companies with severe controversies (e.g., severe violators of human rights and liberties). As a result, the Portfolio could underperform or outperform other mutual funds that do not consider ESG criteria in their investment processes. In evaluating a company, Radiant is dependent upon third-party data that it believes to be reliable, but it does not guarantee the accuracy of such third-party data. ESG data from third-party data providers may be incomplete, inaccurate, or unavailable and may vary significantly from one third-party data provider to another, which could adversely affect the analysis of ESG criteria relevant to a particular company. Investing on the basis of ESG criteria is qualitative and subjective by nature and there can be no assurance that the process utilized by Radiant or any third-party research or data providers or any judgment exercised by Radiant will reflect the views of any particular investor. Radiant ESG criteria and ESG-related investment processes may be changed periodically without shareholder approval or notice.
| 7. | Federal Income Tax Information: |
As of the tax year ended October 31, 2023, the cost basis of investments for federal income tax purposes, gross unrealized appreciation, gross unrealized depreciation and net unrealized appreciation/(depreciation) were as follows:
| | | | Tax Cost
($) | | Tax
Unrealized
Appreciation
($) | | Tax
Unrealized
Depreciation
($) | | Net Unrealized
Appreciation/
(Depreciation)
($)* |
| | Radiant U.S. Smaller Companies Portfolio | | 19,154,910 | | 1,800,440 | | (1,632,761) | | 167,679 |
| * | The difference between book-basis and tax-basis unrealized appreciation/(depreciation) is attributable primarily to tax deferral of losses on wash sales. |
Subsequent events occurring after the date of this report have been evaluated for potential impact, for purposes of recognition or disclosure in the financial statements, through the date the report was issued and no adjustments or additional disclosures were required to the financial statements.
Report of Independent Registered Public Accounting Firm
To the Board of Trustees of HSBC Funds and Shareholders of HSBC Radiant U.S. Smaller Companies Portfolio
Opinion on the Financial Statements
We have audited the accompanying statement of assets and liabilities, including the schedule of portfolio investments, of HSBC Radiant U.S. Smaller Companies Portfolio (one of the funds constituting HSBC Funds, hereafter collectively referred to as the “Fund”) as of October 31, 2023, the related statement of operations for the year ended October 31, 2023, the statements of changes in net assets for each of the two years in the period ended October 31, 2023, including the related notes, and the financial highlights for each of the five years in the period ended October 31, 2023 (collectively referred to as the “financial statements”). In our opinion, the financial statements present fairly, in all material respects, the financial position of the Fund as of October 31, 2023, the results of its operations for the year then ended, the changes in its net assets for each of the two years in the period ended October 31, 2023 and the financial highlights for each of the five years in the period ended October 31, 2023 in conformity with accounting principles generally accepted in the United States of America.
Basis for Opinion
These financial statements are the responsibility of the Fund’s management. Our responsibility is to express an opinion on the Fund’s financial statements based on our audits. We are a public accounting firm registered with the Public Company Accounting Oversight Board (United States) (PCAOB) and are required to be independent with respect to the Fund in accordance with the U.S. federal securities laws and the applicable rules and regulations of the Securities and Exchange Commission and the PCAOB.
We conducted our audits of these financial statements in accordance with the standards of the PCAOB. Those standards require that we plan and perform the audit to obtain reasonable assurance about whether the financial statements are free of material misstatement, whether due to error or fraud.
Our audits included performing procedures to assess the risks of material misstatement of the financial statements, whether due to error or fraud, and performing procedures that respond to those risks. Such procedures included examining, on a test basis, evidence regarding the amounts and disclosures in the financial statements. Our audits also included evaluating the accounting principles used and significant estimates made by management, as well as evaluating the overall presentation of the financial statements. Our procedures included confirmation of securities owned as of October 31, 2023 by correspondence with the custodian. We believe that our audits provide a reasonable basis for our opinion.
/s/PricewaterhouseCoopers LLP
New York, New York
December 26, 2023
We have served as the auditor of one or more investment companies in the HSBC Funds since 2015.
Table of Shareholder Expenses—as of October 31, 2023 (Unaudited)
As a shareholder of the Portfolio, you incur ongoing costs, including management fees and other expenses. These examples are intended to help you understand your ongoing costs (in dollars) of investing in the Portfolio and to compare these costs with the ongoing costs of investing in other mutual funds.
Actual Expenses
The actual examples are based on an investment of $1,000 invested at the beginning of a six-month period beginning May 1, 2023 and held through the period ended October 31, 2023.
The columns below under the heading entitled “Actual” provide information about actual account values and actual expenses. You may use this information, together with the amount you invested, to estimate the expenses that you paid over the period. Simply divide your account value by $1,000 (for example, an $8,600 account value divided by $1,000 = 8.6), then multiply the result by the number in the table under the heading entitled “Actual Expenses Paid During the Period” to estimate the expenses you paid on your account during this period.
Hypothetical Example for Comparison Purposes
The hypothetical expense examples are based on an investment of $1,000 invested at the beginning of a six-month period and held throughout the period ended October 31, 2023.
The columns below under the heading entitled “Hypothetical” provide information about hypothetical account values and hypothetical expenses based on the Portfolio’s actual expense ratio and an assumed rate of return of 5% per year before expenses, which is not the Portfolio’s actual return. The hypothetical account values and expenses may not be used to estimate the actual ending account balance or expenses you paid for the period. You may use this information to compare this 5% hypothetical example with the 5% hypothetical examples that appear in the shareholder reports of other funds.
Please note that the expenses shown in the table are meant to highlight your ongoing costs only and do not reflect any transactional costs, such as sales charges (loads), redemption fees, or exchange fees. Therefore, the columns under the heading entitled “Hypothetical” are useful in comparing ongoing costs only, and will not help you determine the relative total costs of owning different funds. In addition, if these transactional costs were included, your costs would have been higher.
| | | | | | | Actual | | Hypothetical
(5% return before expenses) |
| | | Annualized
Expense
Ratio During Period | | Beginning
Account
Value
5/1/23 | | Ending
Account
Value
10/31/23 | | Expenses
Paid During
Period(1) | | Ending
Account
Value
10/31/23 | | Expenses
Paid During
Period(1) |
Radiant U.S. Smaller
Companies Portfolio | | 4.48% | | $1,000.00 | | $964.20 | | $22.18 | | $1,002.60 | | $22.61 |
| (1) | Expenses are equal to the average account value over the period multiplied by the Fund’s annualized expense ratio, multiplied by 184/365 (the number of days in the most recent fiscal half-year divided by the number of days in the fiscal year.) |
Board of Trustees and Officers (Unaudited)
MANAGEMENT OF THE TRUST
The following table contains information regarding the HSBC Family of Funds’ Board of Trustees (“Trustees”). The HSBC Family of Funds’ Statement of Additional Information includes additional information about the Trustees and is available, without charge, upon request by calling (888) 525-5757.
Name,
Address(1) and Age | Position(s)
Held
With Trust | Length of
Time Served | Principal Occupation(s)
During Past 5 Years | Portfolios in
Fund Complex
Overseen by
Trustee(2) | Other
Directorships Held
By Trustee During
the Past 5 Years(3) |
| Independent Trustees | | | | | |
MARCIA L. BECK
Age: 68 | Trustee and Chair | Indefinite;
2008 to present | Private Investor (1999 – present) | 5 | None |
SUSAN C. GAUSE
Age: 71 | Trustee | Indefinite;
2013 to present | Private Investor (2003 – present) | 5 | Brighthouse Funds Trust II (fka Metropolitan Series Fund) (2012 – present); Brighthouse Funds Trust I (fka Met Investors Series Trust) (2008 – present) |
SUSAN S. HUANG
Age: 69 | Trustee | Indefinite;
2008 to present | Private Investor (2000 – present) | 5 | None |
HUGH T. HURLEY III
Age: 59 | Trustee | Indefinite;
2020 to present | Private Investor (2017 – present) | 5 | Oakmark Funds
(2018 – present) |
| Interested Trustee | | | | | |
PAUL D. DAWE(4)
Age: 53 | Trustee | Indefinite;
2023 to present | Chief Executive Officer and Chief Operating Officer, HSBC Global Asset Management (USA) Inc. (2020 – present); Chief Operating Officer, HSBC Global Asset Management (USA) Inc. (2011 – 2020) | 5 | None |
| (1) | Each Independent Trustee may be contacted by writing to the Trustee, c/o SS&C Global Investor and Distribution Solutions, Inc., P.O. Box 219691, Kansas City, MO 64121-9691, Attn: Stefano Michelagnoli. Mr. Dawe may be contacted by writing to the Adviser, 452 Fifth Avenue, New York, New York 10018. |
| (2) | The “Fund Complex” is comprised of the 5 portfolios of HSBC Funds. |
| (3) | This column includes only directorships of companies required to report to the SEC under the Securities Exchange Act of 1934 (i.e., “public companies”) or other investment companies registered under the 1940 Act. |
| (4) | Mr. Dawe is considered an interested Trustee (i.e., not independent) because of his affiliation with the Adviser and its affiliates. |
Board of Trustees and Officers (Unaudited) (continued)
Name,
Address and Age | Position(s)
Held With Trust | Term of Office and
Length of Time Served | Principal Occupation(s)
During Past 5 Years |
| Officers | | | |
STEFANO R. MICHELAGNOLI
452 Fifth Avenue
New York, NY 10018
Age: 53 | President | One year;
2020 to present | Global Head of Client Operations, HSBC Global Asset Management (USA) Inc. (June 2020 – present); Regional Head of Product (Americas), HSBC Global Asset Management (USA) Inc. (2015 – June 2020) |
JAMES D. LEVY
452 Fifth Avenue
New York, NY 10018
Age: 60 | Vice President | One year;
2014 to present | Vice President, Product Management, HSBC Global Asset Management (USA) Inc. (2014 – present) |
MARIA CLEM SELL(1)
3 Canal Plaza, Suite 100
Portland, ME 04101
Age: 45 | Treasurer | One year;
2022 to present | Senior Principal Consultant and Fund Treasurer, ACA Global (f/k/a Foreside Financial Group, LLC) (2021 – present); Director, Franklin Templeton Investments (2014 – 2021) |
PATRICK J. KENISTON(1)
3 Canal Plaza, Suite 100
Portland, ME 04101
Age: 59 | Chief Compliance Officer and Secretary | One year;
2022 to present | Senior Principal Consultant, ACA Global (f/k/a Foreside Fund Officer Services, LLC) (2008 – present) |
JAMES M. CURTIS
452 Fifth Avenue
New York, NY 10018
Age: 55 | Chief Legal Officer | One year;
2018 to present | Associate General Counsel, HSBC Technology & Services (USA) Inc. (2018 – present); Associate General Counsel, HSBC Securities (USA) Inc. (2005 – 2017) |
| (1) | Mr. Keniston and Ms. Sell are also officers of certain other investment companies. |
Other Information (Unaudited)
Information regarding how the Funds voted proxies relating to portfolio securities during the most recent 12-month period ended June 30th is available (i) without charge, upon request, by calling 1-800-525-5757 for HSBC Bank USA and HSBC Brokerage (USA) Inc. clients and 1-800-782-8183 for all other shareholders; (ii) on the Funds’ website at https://www.assetmanagement.us.hsbc.com/en/individual-investor/fund-centre; and (iii) on the Security and Exchange Commission’s (“SEC”) website at http://www.sec.gov.
The Funds file their portfolio holdings information for each month in a fiscal quarter within 60 days after the end of the relevant fiscal quarter with the SEC on Form N-PORT. Portfolio holdings information for the third month of each fiscal quarter is available on the SEC’s website at http://www.sec.gov. The Funds’ Schedules of Investments will be available no later than 60 days after each period end, without charge, on the Funds’ website at https://www.assetmanagement.us.hsbc.com/en/individual-investor/fund-centre.
An investment in a Fund is not a deposit of HSBC Bank USA, National Association, and is not insured or guaranteed by the Federal Deposit Insurance Corporation or any other government agency.
This page is intentionally left blank.
This page is intentionally left blank.
HSBC FAMILY OF FUNDS:
INVESTMENT ADVISER AND ADMINISTRATOR
HSBC Global Asset Management (USA) Inc.
452 Fifth Avenue
New York, NY 10018
SUB-ADVISER
HSBC Radiant U.S. Smaller Companies Portfolio
Radiant Global Investors LLC
21 Orinda Way, Suite C-546
Orinda, CA 94563

Investment products:
| ARE NOT A BANK DEPOSIT OR OBLIGATION OF THE BANK OR ANY OF ITS AFFILIATES | ARE NOT FDIC INSURED | ARE NOT INSURED BY ANY FEDERAL GOVERNMENT AGENCY |
| ARE NOT GUARANTEED BY THE BANK OR ANY OF ITS AFFILIATES | MAY LOSE VALUE |
SHAREHOLDER SERVICING AGENTS
For HSBC Bank USA, N.A. and
HSBC Securities (USA) Inc. Clients
HSBC Bank USA, N.A.
452 Fifth Avenue
New York, NY 10018
1-888-525-5757
For All Other Shareholders
HSBC Funds
P.O. Box 219691
Kansas City,
MO 64121-9691
1-800-782-8183
SUB-TRANSFER AGENT
SS&C Global Investor and Distribution Solutions, Inc.
2000 Crown Colony Drive
Quincy, MA 02169
DISTRIBUTOR
Foreside Distribution Services, L.P.
Three Canal Plaza, Suite 100
Portland, ME 04101
CUSTODIAN AND TRANSFER AGENT
State Street Bank and Trust Company
1 Congress Street
Boston, MA 02114
INDEPENDENT REGISTERED PUBLIC ACCOUNTING FIRM
PricewaterhouseCoopers LLP
300 Madison Avenue
New York, NY 10017
LEGAL COUNSEL
Dechert LLP
1900 K Street, N.W.
Washington, D.C. 20006
Investment products are offered by HSBC Securities (USA) Inc. (HSI), member NYSE/FINRA/SIPC. HSI is an affiliate of HSBC Bank USA, N.A. Investment products: Are not a deposit or other obligation of the bank or any of its affiliates; Not FDIC insured or insured by any federal government agency of the United States; Not guaranteed by the bank or any of its affiliates; and are subject to investment risk, including possible loss of principal invested.
Investors should consider the investment objectives, risks, charges, and expenses of the investment company carefully before investing. The prospectus contains this and other important information about the investment company. For clients of HSBC Securities (USA) Inc., please call 1-888-525-5757 for more information. For other investors and prospective investors, please call the Funds directly at 1-800-782-8183 or visit our website at https://www.assetmanagement.us.hsbc.com/en/ individual-investor/fund-centre. Investors should read the prospectus carefully before investing or sending money.
Item 2. Code of Ethics.
(a) HSBC Funds (the “Registrant”) has adopted a Code of Ethics that applies to the Registrant’s principal executive officer and principal financial officer.
(b) No disclosures are required by this Item 2(b).
(c) There have been no amendments to the Registrant’s Code of Ethics during the reporting period for this Form N-CSR.
(d) There have been no waivers granted by the Registrant to individuals covered by the Registrant’s Code of Ethics during the reporting period for this Form N-CSR.
(e) Not applicable.
(f) A copy of the Registrant’s Code of Ethics is attached as Exhibit 13(a)(1) to this Form N-CSR.
Item 3. Audit Committee Financial Expert.
(a)(1)
The Board of Trustees of the Registrant has determined that the Registrant has at least one member serving on the Registrant’s Audit Committee that possesses the attributes identified in Instruction 2(b) of Item 3 to Form N-CSR to qualify as an “audit committee financial expert.”
(a)(2)
The name of the audit committee financial experts are Marcia Beck, Susan Gause and Hugh Hurley III. Each is deemed to be “independent” as that term is defined in Item 3(a)(2) of Form N-CSR.
Item 4. Principal Accountant Fees and Services.
(a)
Audit Fees. The aggregate fees billed for professional services rendered by the independent registered public accounting firm for the audit of the Registrant’s annual financial statements or services normally provided in connection with statutory and regulatory filings or engagements for the last two fiscal years ended October 31, 2022 and 2023 were $175,000 and $270,000, respectively.
(b)
Audit-Related Fees. During the fiscal year ended October 31, 2022, the Registrant was billed $36,000 for audit-related services provided by the independent registered public accounting firm in connection with the transition of certain of the Funds’ service provider arrangements. These fees are not reported under paragraph (a) of this Item 4. During the fiscal year ended October 31, 2023, the Registrant was not billed for any audit-related services provided by the independent registered public accounting firm.
During the last two fiscal years ended October 31, 2022 and 2023, no fees for assurance and related services that relate directly to the operations and financial reporting of the Registrant were billed by the independent registered public accounting firm to the Registrant’s investment adviser (the “Adviser”) or any other entity controlling, controlled by, or under common control with the Adviser that provides ongoing services to the Registrant.
(c)
Tax Fees. The aggregate fees billed for professional services rendered by the independent registered public accounting firm to the Registrant for tax compliance, tax advice, tax planning and tax return
preparation for the last two fiscal years ended October 31, 2022 and 2023 were $57,870 and $56,870, respectively. The fees for 2022 and 2023 relate primarily to the preparation of federal and state income and excise tax returns and the review of excise tax distributions.
During the last two fiscal years ended October 31, 2022 and 2023, no fees for tax compliance, tax advice or tax planning services that relate directly to the operations and financial reporting of the Registrant were billed by the independent registered public accounting firm to the Adviser or any other entity controlling, controlled by, or under common control with the Adviser that provides ongoing services to the Registrant.
(d)
All Other Fees. The aggregate fees billed for products and services provided by the independent registered public accounting firm to the Registrant, other than the services reported in paragraphs (a) – (c) of this Item 4, for the last two fiscal years ended October 31, 2022 and 2023 were $0 and $0, respectively.
During last two fiscal years ended October 31, 2022 and 2023, no fees for other services that relate directly to the operations and financial reporting of the Registrant were billed by the independent registered public accounting firm to the Adviser or any other entity controlling, controlled by, or under common control with the Adviser that provides ongoing services to the Registrant.
(e)(1)
Pre-Approval Policies and Procedures. The Registrant’s Audit Committee is required to pre-approve all audit and permitted non-audit services performed by the Registrant’s independent registered public accounting firm in accordance with the Registrant’s Audit Committee Charter and the Investment Company Act of 1940, as amended.
(2)
There were no pre-approval requirements waived for the services provided to the Registrant described in paragraphs (b)-(d) of Item 4 by the Audit Committee pursuant to paragraph (c)(7)(i)(C) of Rule 2-01 of Regulation S-X (the “De Minimis Rule”). There were no fees billed for services provided to the Adviser described in paragraphs (b)-(d) of Item 4 that were required to be pre-approved by the Audit Committee as described in paragraph (e)(1) of Item 4.
| (f) | No disclosures are required by this Item 4(f). |
(g)
Non-Audit Fees. For the last two fiscal years ended October 31, 2022 and 2023, the aggregate non-audit fees billed by the independent registered public accounting firm for services rendered to the Registrant and the Adviser and any entity controlling, controlled by, or under common control with the Adviser that provided ongoing services to the Registrant were approximately $1,890,000 and $2,263,977, respectively. Fees for 2022 and 2023 represent independent registered public accounting firm’s services provided to the Registrant and to HSBC Bank and affiliates related to general corporate, state and local tax assistance, accounting matters and various advisory projects.
(h)
The Registrant’s Audit Committee considered the non-audit services rendered to the Registrant’s Adviser and any entity controlling, controlled by, or under common control with the Adviser, and believes the services are compatible with the principal accountant’s independence.
Item 5. Audit Committee of Listed Registrants.
Item 6. Investments.
(a)
Schedule of Investments is included as a part of the report to shareholders filed under Item 1 of this Form N-CSR.
(b)
Not applicable.
Item 7. Disclosure of Proxy Voting Policies and Procedures for Closed-End Management Investment Companies.
Not applicable.
Item 8. Portfolio Managers of Closed-End Management Investment Companies.
Not applicable.
Item 9. Purchases of Equity Securities by Closed-End Management Investment Company and Affiliated Purchasers.
Not applicable.
Item 10. Submission of Matters to a Vote of Security Holders.
Not applicable.
Item 11. Controls and Procedures.
(a)
The Registrant’s principal executive and principal financial officers have concluded that the Registrant’s disclosure controls and procedures (as defined in Rule 30a-3(c) under the 1940 Act) are effective, as of a date within 90 days of the filing date of this Form N-CSR based on their evaluation of these controls and procedures required by Rule 30a-3(b) under the 1940 Act and Rules 13a-15(b) or 15d-15(b) under the Securities Exchange Act of 1934.
(b)
There were no changes in the Registrant’s internal control over financial reporting (as defined in Rule 30a-3(d) under the 1940 Act) that occurred during the period covered by this report that have materially affected, or is reasonably likely to materially affect, the Registrant’s internal control over financial reporting.
Item 12. Disclosure of Securities Lending Activities for Closed-End Management Investment Companies.
Not applicable.
Item 13. Exhibits.
| (a)(3) | Not applicable for open-end investment companies. |
| | |
| (a)(4) | Not applicable. |
(b)
The certifications required by Rule 30a-2(b) of the 1940 Act and Section 906 of the Sarbanes-Oxley Act of 2002 are attached hereto.
SIGNATURES
Pursuant to the requirements of the Securities Exchange Act of 1934 and the Investment Company Act of 1940, the registrant has duly caused this report to be signed on its behalf by the undersigned, thereunto duly authorized.
HSBC Funds
| | |
| | |
| By: | /s/ Stefano R. Michelagnoli |
| | Stefano R. Michelagnoli |
| | President (Principal Executive Officer) |
| | |
| Date: | February 23, 2024 |
Pursuant to the requirements of the Securities Exchange Act of 1934 and the Investment Company Act of 1940, this report has been signed below by the following persons on behalf of the registrant and in the capacities and on the dates indicated.
| | | |
| | | |
| | | |
| By: | /s/ Stefano R. Michelagnoli | |
| | Stefano R. Michelagnoli | |
| | President (Principal Executive Officer) | |
| | | |
| Date: | February 23, 2024 | |
| | | |
| | | |
| | | |
| By: | /s/ Maria Clem Sell | |
| | Maria Clem Sell | |
| | Treasurer (Principal Financial Officer) | |
| | | |
| Date: | February 23, 2024 | |