HSBC Funds
Annual Report
October 31, 2021
| MONEY MARKET | | | | | | Intermediary | Intermediary | |
| FUNDS | Class A | Class C | Class D | Class E | Class I | Class | Service Class | Class Y |
HSBC U.S. Government
Money Market Fund | FTRXX | HUMXX | HGDXX | HGEXX | HGIXX | HGGXX | HGFXX | RGYXX |
HSBC U.S. Treasury
Money Market Fund | HWAXX | HUCXX | HTDXX | HTEXX | HBIXX | HTGXX | HTFXX | HTYXX |

| Table of Contents |
| HSBC Family of Funds |
| Annual Report - October 31, 2021 |
| Glossary of Terms | | 2 |
| Commentary From the Investment Manager | | 3 |
| Portfolio Reviews | | 4 |
| Portfolio Composition | | 6 |
| | | |
| Schedules of Portfolio Investments | | |
| HSBC U.S. Government Money Market Fund | | 7 |
| HSBC U.S. Treasury Money Market Fund | | 11 |
| Statements of Assets and Liabilities | | 12 |
| Statements of Operations | | 13 |
| Statements of Changes in Net Assets | | 14 |
| Financial Highlights | | 15 |
| Notes to Financial Statements | | 18 |
| Report of Independent Registered Public Accounting Firm | | 29 |
| Other Federal Income Tax Information | | 31 |
| Table of Shareholder Expenses | | 32 |
| Board of Trustees and Officers | | 34 |
| Other Information | | 36 |
Basis points (BPS) refers to a common unit of measure for interest rates and other percentages in finance. One basis point is equal to 1/100th of 1%, or 0.01%, or 0.0001, and is used to denote the percentage change in a financial instrument.
Bloomberg Global Aggregate Index is an index that is the measure of the global investment-grade debt from 24 local currency markets, which include treasury, government-related, corporate, and securitized fixed-rate bonds from both developed and emerging markets issuers.
Bloomberg U.S. Aggregate Bond Index is a broad-based benchmark that measures the investment-grade, U.S. dollar-denominated, fixed-rate taxable bond market. This includes Treasuries, government-related and corporate securities, mortgage-backed securities, asset-backed securities and collateralized mortgage-backed securities.
Bloomberg U.S. Corporate High Yield Bond Index measures the USD-denominated, high-yield, fixed-rate corporate bond market. Securities are classified as high yield if the middle rating of Moody’s, Fitch and S&P is Ba1/BB+/ BB+ or below. Bonds from issuers with an emerging markets (EM) country of risk, based on Barclays EM country definition, are excluded.
Duration is a measure of the sensitivity of the price of a bond or other debt instrument to a change in interest rates. The longer a security’s duration, the more sensitive it will be to changes in interest rates. A bond’s duration is easily confused with its term or time to maturity because they are both measured in years. However, a bond’s term is a linear measure of the years until repayment of principal is due; it does not change with the interest rate environment. Duration, on the other hand is non-linear and accelerates as time to maturity lessens.
ICE BofA U.S. High Yield Constrained Index is an index that contains all of the securities in the ICE BofA U.S. High Yield Index, but caps issuer exposure at 2%. The ICE BofA U.S. High Yield Index tracks the performance of U.S. dollar-denominated below investment-grade corporate debt publicly issued in the U.S. domestic market.
Gross Domestic Product (“GDP”) is the value of goods and services produced in a given country in a given year.
London Interbank Offered Rate (“LIBOR”) is an interest rate at which banks can borrow funds, in marketable size, from other banks in the London interbank market. The LIBOR is fixed on a daily basis by the British Bankers’ Association. The LIBOR is derived from a filtered average of the world’s most creditworthy banks’ interbank deposit rates for larger loans with maturities between overnight and one full year.
MSCI Europe Australasia and Far East (“MSCI EAFE”) Index is an equity index which captures the large- and mid-cap representation across 21 developed markets countries, excluding the U.S. and Canada.
MSCI Emerging Markets Index is a float-adjusted market capitalization index that is designed to measure equity market performance in global emerging markets.
Russell 1000® Index measures the performance of the large-cap segment of the U.S. equity universe. It is a subset of the Russell 3000® Index and includes approximately 1000 of the largest securities based on a combination of their market cap and current index membership. The Russell 1000 represents approximately 92% of the U.S. market.
Russell 2000® Index measures the performance of the small-cap segment of the U.S. equity universe. The Russell 2000® Index is a subset of the Russell 3000® Index representing approximately 8% of the total market capitalization of that index. It includes approximately 2000 of the smallest securities based on a combination of their market cap and current index membership.
Secured Overnight Financing Rate (SOFR) is a broad measure of the cost of borrowing cash overnight collateralized by Treasury securities. The SOFR includes all trades in the Broad General Collateral Rate plus bilateral Treasury repurchase agreement (repo) transactions cleared through the Delivery-versus-Payment (DVP) service offered by the Fixed Income Clearing Corporation (FICC), which is filtered to remove a portion of transactions considered specials.
Securities indices are unmanaged and assume reinvestment of all distributions and interest payments and do not take in account brokerage fees or expenses. Securities in the Funds do not match those in the indices and performance of the Funds will differ. Investors cannot invest directly in an index.
| Commentary From the Investment Manager (Unaudited) |
| HSBC Global Asset Management (USA) Inc. |
Global Economic Review
During the 12-month period that began on November 1, 2020, the global economy continued to recover from challenges of the COVID-19 pandemic. Early in the period, the global economy entered the restoration phase of the economic cycle. This phase was marked by more moderate growth relative to the economic growth experienced earlier in 2020. In June 2021, the global economy transitioned into its expansion phase, led by strong growth in the U.S. and China. In this phase, economic growth exceeded pre-pandemic levels, although the economic recovery remained uneven across major economies, with many developed market and emerging market economies lagging throughout most of the period.
Positive developments around vaccines—including successful rollouts across many developed nations—and fiscal stimulus efforts in the U.S. helped drive global equities higher early in the period. In the U.S., positive consumer spending data, capital goods shipments and home sales early in the period outweighed weakness around job growth and personal income. Additional fiscal stimulus in the first quarter of 2021 and the promise of an infrastructure spending package supported consumer spending and the U.S. housing market well into the summer. As the period progressed, however, short-term inflation concerns and shortages in labor and goods had a cooling effect on consumer spending and the U.S. economy.
U.S. GDP reflected this 12-month narrative. The economy posted strong annualized growth across the first three quarters of the period: 4.3% in the fourth quarter of 2020, 6.4% in the first quarter of 2021, and 6.7% in the second quarter. However, economic growth cooled to a relatively modest 2.0% in the third quarter of 2021 as consumer spending declined. However, the U.S. unemployment rate also reflected the largely positive economic story for the period, declining steadily across the 12 months from 6.7% in November 2020 to 4.6% in October 2021.
In Europe, national lockdowns triggered by a resurgence of the virus weighed on economic growth at the start of the period under review. Growth remained structurally weak throughout the opening months of 2021 as the region continued to deal with virus-related lockdowns. For its part, the U.K. entered a phase of strong, catch-up growth in the summer, ahead of the rest of Europe, due in large part to the country’s successful vaccination rollout. However, while the eurozone showed signs of a strong rebound in economic activity by the end of the period, U.K. economic growth was already cooling due to supply-side disruptions to labor and goods.
Japan lagged other developed nations in its vaccination rollout, which hampered economic growth early in the period. Constraints on the Bank of Japan’s policy options added to these economic headwinds. By late summer, however, the country had succeeded in accelerating its vaccine program—a key step to unlocking its domestic spending and its manufacturing sector’s ability to benefit from a growth in global spending.
Many emerging markets countries continued to face economic headwinds throughout much of the period under review as they struggled to contain the virus. Economic growth was uneven, however, as China in particular, and industrialized Asia in general, generally outperformed through the first half of the period. China’s economy benefited from strong growth in its services sector and expectations for more stable trade relations with the U.S. Meanwhile, tightening virus restrictions in Russia, low oil prices, and weak tourism in the Middle East and North Africa weighed on other emerging markets.
In the second half of the period, China’s economic growth slowed due to a mix of new virus outbreaks and fiscal policy tightening. A rotation among many developed economies from spending on goods to spending on services weighed on Chinese exports, further cooling the nation’s economic growth. India’s economic rebound was derailed in April when a second wave of infections led to additional lockdowns and a health care crisis in the nation. However, a boost in its vaccination program in the summer helped control the case numbers and has put the economy back on track for an economic rebound.
Amid relatively strong global economic growth, inflation concerns grew stronger, particularly in the U.S. The dovish tone of the Federal Reserve helped keep short-term interest rates low, even as long-term interest rates rose higher, leading to a steeper yield curve. The U.S. consumer price index (a measure of inflation) rose from 1.2% in November 2020 to 2.6% in March 2021, before jumping to 4.2% in April and staying above 5% through September. The jump in inflation triggered a slight shift in the tone of the Fed by the end of the period, raising expectations that the Fed may begin raising interest rates more quickly than projected.
Market review
Global equity markets posted strong gains for the 12-month period despite concerns over resurging COVID-19 cases. In the U.S., small- and mid-cap stocks generally outperformed their large-cap counterparts during the first half of the period, but that performance gap narrowed during the latter half of the period as supply chain and labor shortages had an outsized effect on smaller companies. The Russell 2000 Index of small-cap stocks returned 50.8% for the 12 months under review, compared to a 43.5% return for the Russell 1000 Index of large-cap stocks. Value stocks strongly outperformed growth-oriented companies early in the period, but lost momentum and closed out the period only modestly ahead of growth stocks.
International equities posted strong absolute returns, but generally trailed U.S. stocks for the period. The MSCI EAFE Index of developed-market international stocks rose 34.21% (net return), while the MSCI Emerging Markets Index returning 16.97% (net return).
Global fixed income markets struggled due to inflation concerns in the U.S. and the high level of new debt issued by European governments. Spreads on corporate bonds tightened across most developed markets throughout the first half of the period and remained tight through the end of the period. In this environment, high yield indexes outperformed investment-grade securities. The Bloomberg U.S. Aggregate Bond Index, which tracks investment-grade bonds in the U.S. market, returned -0.48% for the period under review. By comparison, the Bloomberg U.S. Corporate High Yield Bond Index, which tracks high-yield bonds in the U.S. market, returned 10.53%. The Bloomberg Global Aggregate Bond Index (USD hedged), which tracks the broader global investment-grade fixed income market, slightly underperformed the comparable U.S. market, with a -0.83% return for the 12-month period.
| 1 | For additional information, please refer to the Glossary of Terms. |
| Portfolio Reviews (Unaudited) |
| HSBC U.S. Government Money Market Fund |
| (Class A Shares, Class C Shares, Class D Shares, Class E Shares, Class I Shares, |
| Intermediary Class, Intermediary Service Class and Class Y Shares) |
| by John Chiodi |
| Senior Portfolio Manager |
Moody’s and Standard & Poor’s
have assigned an “Aaa-mf” and
“AAAm” rating to the
HSBC U.S. Treasury
Money Market Fund.1 |
Investment Concerns
You could lose money by investing in the Fund. Although the Fund seeks to preserve the value of your investment at $1.00 per share, it cannot guarantee it will do so. An investment in the Fund is not a deposit of HSBC Bank USA, N.A. and is not insured or guaranteed by the Federal Deposit Insurance Corporation or any other government agency. The Fund’s sponsor has no legal obligation to provide financial support to the Fund, and you should not expect that the sponsor will provide financial support to the Fund at any time.
For a complete description of these and other risks associated with investment in a mutual fund, please refer to the Fund’s prospectus.
Portfolio Performance
Yields on U.S. government money market securities remained low throughout the 12-month period ended October 31, 2021. On June 16, 2021, the Federal Reserve directed its Open Market Desk to conduct overnight reverse repurchase agreement operations at an offering rate of five basis points. This strategy is typically used by central banks to tighten liquidity. The move made reverse repurchase agreements the primary source of yield during a period in which rates otherwise largely remained near zero for short-duration bond issuances.
In the final weeks of the period, rising inflation and anticipation of future Fed rate hikes produced a slight rise in the low end of the yield curve.
The Fund took advantage of this yield by building its position in reverse repurchase agreements. In addition, the Fund made tactical purchases to take advantage of any additional yield available during the period. This activity created a barbell-shaped distribution of maturities within the Fund, as these purchases gravitated toward a combination of overnight reverse repurchase agreements and longer-term floating-rate notes. This movement decreased the Fund’s weighted average maturity during the period. †
| † | Portfolio composition is subject to change. |
| ‡ | For additional information, please refer to the Glossary of Terms. |
| Fund Performance | | Average Annual
Total Return (%) | | Yield (%)2 | Expense
Ratio (%)3 |
| As of October 31, 2021 | Inception
Date | 1 Year | 5 Year | 10 Year | Since
Inception | 7-Day
Average | Gross | Net |
| Class A | 5/3/90 | 0.01 | 0.67 | 0.34 | 2.29 | 0.01 | 0.65 | 0.65 |
| Class C4 | 11/20/06 | — | — | — | 1.39 | — | 1.25 | 1.25 |
| Class D | 4/1/99 | 0.01 | 0.77 | 0.39 | 1.45 | 0.01 | 0.50 | 0.50 |
| Class E5 | 7/12/16 | — | — | — | 0.34 | — | 0.25 | 0.25 |
| Class I6 | 12/24/03 | 0.03 | 1.03 | 0.54 | 1.04 | 0.03 | 0.15 | 0.14 |
| Intermediary Class | 7/12/16 | 0.02 | 0.99 | — | 0.96 | 0.02 | 0.30 | 0.18 |
| Intermediary Service Class | 7/12/16 | 0.02 | 0.98 | — | 0.94 | 0.02 | 0.35 | 0.20 |
| Class Y | 7/1/96 | 0.01 | 0.94 | 0.49 | 1.97 | 0.01 | 0.25 | 0.25 |
Past performance does not guarantee future results. The performance data quoted represents past performance and current returns may be lower or higher. Total return figures include change in share price, reinvestment of dividends and capital gains and do not reflect taxes that a shareholder would pay on Fund distributions or on the redemption of Fund shares. Investment return and principal value will fluctuate so that an investor’s shares, when redeemed may be worth more or less than the original cost. To obtain performance information current to the most recent month end, please call 1-800-782-8183.
The performance above reflects any fee waivers that have been in effect during the applicable periods, as well as any expense reimbursements that have periodically been made. Absent such waivers and reimbursements, returns would have been lower. Currently, contractual fee waivers and/or expense reimbursements are in effect for the Fund through March 1, 2022 for the Class E Shares, Class I Shares, Intermediary Class Shares and Intermediary Service Class Shares and HSBC Global Asset Management (USA) Inc., the Adviser, working in conjunction with the Fund’s other service providers, has voluntarily agreed to waive or limit net operating expenses in excess of the Fund’s daily yield. The Adviser may terminate these temporary waivers and expense limitation efforts at any time and shareholders should not expect these temporary waiver and expense limitation efforts to continue indefinitely.
| 1 | The “Aaa-mf ” and “AAAm” money market fund rating is historical and reflects Moody’s and Standard & Poor’s opinion as to the quality of the Fund’s investments, liquidity management, and operations and trading support. Periodic reviews are conducted to ensure a secure operations environment. Moody’s and Standard & Poor’s ratings represent an opinion only, not a recommendation to buy or sell. Obligations rated A-1+, A-1 or P-1 are rated in the highest short-term rating category by Standard & Poor’s (A-1+ or A-1) or Moody’s Investor Service (P-1). The obligor’s capacity to meet its financial commitments on these obligations is regarded to be “extremely strong” (A-1+), “strong” (A-1) or “superior” (P-1). |
| 2 | The seven-day yield quotation more closely reflects the current earnings of the money market fund than the total return quotation. The seven-day yield reflects voluntary fee waivers/expense reimbursements. Without the voluntary fee waivers/expense reimbursements, the yields would have been -0.57%, -0.42%, -0.07%, -0.22%, -0.27% and -0.16% for Class A Shares, Class D Shares, Class I Shares, Intermediary Class, Intermediary Service Class, and Class Y Shares, respectively. |
| 3 | Reflects the expense ratio as reported in the prospectus dated February 28, 2021. The Adviser has entered into a contractual expense limitation agreement with the Fund under which it will limit total expenses of the Fund (excluding interest, taxes, brokerage commissions, extraordinary expenses and estimated indirect expenses attributable to the Fund’s investments in investment companies) to an annual rate of 0.25%, 0.14%, 0.18%, and 0.20% for Class E Shares, Class I Shares, Intermediary Class Shares, and Intermediary Service Class Shares, respectively. The expense limitation shall be in effect until March 1, 2022. Additional information pertaining to the October 31, 2021 expense ratios can be found in the financial highlights. |
| 4 | Reflects the applicable contingent deferred sales charge, maximum of 1.00%, for returns presented. Class C Shares were operational during a portion of the periods presented. Amounts reflect performance for the period of time the Class had operations, which was 346, 362 and 351 days during the years ended October 31, 2006, 2009 and 2010, respectively. The Class was not operational during the entire fiscal years ended October 31, 2007, 2008, and 2011 through 2021. No returns are presented for the one-year, five-year and 10-year periods with non-continuous operations. |
| 5 | Class E Shares were operational during a portion of the periods presented. Amounts reflect performance for the period of time the Class had operations, which was 112 and 283 days during the years ended October 31, 2016 and 2017, respectively. The Class was not operational during the entire fiscal years ended October 31, 2018 through 2021. No return is presented for the one-year period with non-continuous operations. |
| 6 | Class I Shares were operational during a portion of the periods presented. Amounts reflect performance for the period of time the Class had operations, which was 10, 89,136 and 357 days during the years ended October 31, 2004, 2005, 2006 and 2007, respectively. The Class was operational during the entire fiscal years ended October 31, 2008 through 2021. |
| Portfolio Reviews (Unaudited) |
| HSBC U.S. Treasury Money Market Fund |
| (Class A Shares, Class C Shares, Class D Shares, Class E Shares, Class I Shares, Intermediary Class, |
| Intermediary Service Class and Class Y Shares) |
| by John Chiodi |
| Senior Portfolio Manager |
Moody’s and Standard & Poor’s
have assigned an “Aaa-mf” and
“AAAm” rating to the
HSBC U.S. Treasury
Money Market Fund.1 |
Investment Concerns
You could lose money by investing in the Fund. Although the Fund seeks to preserve the value of your investment at $1.00 per share, it cannot guarantee it will do so. An investment in the Fund is not a deposit of HSBC Bank USA, N.A. and is not insured or guaranteed by the Federal Deposit Insurance Corporation or any other government agency. The Fund’s sponsor has no legal obligation to provide financial support to the Fund, and you should not expect that the sponsor will provide financial support to the Fund at any time.
For a complete description of these and other risks associated with investment in a mutual fund, please refer to the Fund’s prospectus.
Portfolio Performance
Yields on U.S. government money market securities remained low throughout the 12-month period ended October 31, 2021. On June 16, 2021, the Federal Reserve directed its Open Market Desk to conduct overnight reverse repurchase agreement operations at an offering rate of five basis points. This strategy is typically used by central banks to tighten liquidity. The move made reverse repurchase agreements the primary source of yield during a period in which rates otherwise largely remained near zero for short-duration bond issuances.
In the final weeks of the period, rising inflation and anticipation of future Fed rate hikes produced a slight rise in the low end of the yield curve.
Throughout the period, the Fund sought to extend its weighted average maturity to capture what yield remained available in a low-rate environment. Because the Fund is not allowed to trade repurchase agreements, it was unable to take advantage of the positive yields in that part of the market. Rising rates in short-duration Treasury bills occurred too late in the period to have a material impact on the Fund’s results. As a result, the Fund operated near its maximum duration throughout the period.†
| † | Portfolio composition is subject to change. |
| ‡ | For additional information, please refer to the Glossary of Terms. |
| Fund Performance | | Average Annual
Total Returns (%) | | Yield (%)2 | Expense
Ratio (%)3 |
| As of October 31, 2021 | Inception
Date | 1 Year | 5 Year | 10 Year | Since
Inception | 7-Day
Average | Gross | Net |
| Class A4 | 5/24/01 | — | — | — | 1.08 | — | 0.66 | 0.66 |
| Class C5 | 12/24/03 | — | — | — | 0.04 | — | 1.26 | 1.26 |
| Class D | 5/14/01 | 0.02 | 0.74 | 0.37 | 0.92 | 0.01 | 0.51 | 0.51 |
| Class E6 | 7/12/16 | — | — | — | 0.37 | — | 0.26 | 0.25 |
| Class I7 | 12/30/03 | 0.01 | 1.00 | 0.51 | 1.02 | 0.01 | 0.16 | 0.14 |
| Intermediary Class | 7/12/16 | 0.01 | 0.94 | — | 0.91 | 0.01 | 0.31 | 0.18 |
| Intermediary Service Class | 7/12/16 | 0.01 | 0.96 | — | 0.92 | 0.01 | 0.36 | 0.20 |
| Class Y | 5/11/01 | 0.01 | 0.91 | 0.46 | 1.06 | 0.01 | 0.26 | 0.26 |
Past performance does not guarantee future results. The performance data quoted represents past performance and current returns may be lower or higher. Total return figures include change in share price, reinvestment of dividends and capital gains and do not reflect taxes that a shareholder would pay on Fund distributions or on the redemption of Fund shares. Investment return and principal value will fluctuate so that an investor’s shares, when redeemed may be worth more or less than the original cost. To obtain performance information current to the most recent month end, please call 1-800-782-8183.
The performance above reflects any fee waivers that have been in effect during the applicable periods, as well as any expense reimbursements that have periodically been made. Absent such waivers and reimbursements, returns would have been lower. Currently, contractual fee waivers and/or expense reimbursements are in effect for the Fund through March 1, 2022 for the Class E Shares, Class I Shares, Intermediary Class Shares and Intermediary Service Class Shares and HSBC Global Asset Management (USA) Inc., the Adviser, working in conjunction with the Fund’s other service providers, has voluntarily agreed to waive or limit net operating expenses in excess of the Fund’s daily yield. The Adviser may terminate these temporary waivers and expense limitation efforts at any time and shareholders should not expect these temporary waiver and expense limitation efforts to continue indefinitely.
| 1 | The “Aaa-mf and “AAAm” money market fund rating is historical and reflects Moody’s and Standard & Poor’s opinion as to the quality of the Fund’s investments, liquidity management, and operations and trading support. Periodic reviews are conducted to ensure a secure operations environment. Moody’s and Standard & Poor’s ratings represent an opinion only, not a recommendation to buy or sell. Obligations rated A-1+, A-1 or P-1 are rated in the highest short-term rating category by Standard & Poor’s (A-1+ or A-1) or Moody’s Investor Service (P-1). The obligor’s capacity to meet its financial commitments on these obligations is regarded to be “extremely strong” (A-1+), “strong” (A-1) or “superior” (P-1). |
| 2 | The seven-day yield quotation more closely reflects the current earnings of the money market fund than the total return quotation. Without the voluntary fee waivers/expense reimbursements, the yields would have been -0.45%, -0.10%, -0.25%, -0.30%, and -0.20% for the Class D Shares, Class I Shares, Intermediary Class, Intermediary Service Class, and Class Y Shares, respectively. |
| 3 | Reflects the expense ratio as reported in the prospectus dated February 28, 2021. The Adviser has entered into a contractual expense limitation agreement with the Fund under which it will limit total expenses of the Fund (excluding interest, taxes, brokerage commissions, extraordinary expenses and estimated indirect expenses attributable to the Fund’s investments in investment companies) to an annual rate of 0.25%, 0.14%, 0.18%, and 0.20% for Class E Shares, Class I Shares, Intermediary Class Shares, and Intermediary Service Class Shares, respectively. The expense limitation shall be in effect until March 1, 2022. Additional information pertaining to the October 31, 2021 expense ratios can be found in the financial highlights. |
| 4 | Class A Shares were operational during a portion of the periods presented. Amounts reflect performance for the period of time the Class had operations, which was 201 days during the year ended October 31, 2014 and the entire fiscal years ended October 31, 2001 through 2013. The Class was not operational during the entire fiscal years ended October 31, 2015 through 2021. No returns are presented for the one-year, five-year and 10-year periods with non-continuous operations. |
| 5 | Reflects the applicable contingent deferred sales charge, maximum of 1.00%, for returns presented. Class C Shares were operational during a portion of the periods presented. Amounts reflect performance for the period of time the Class had operations, which was 26 and 351 days during the years ended October 31, 2008 and 2010, respectively. The Class was operational during the entire fiscal years ended October 31, 2005, 2006, 2007 and 2009. The Class was not operational during the entire fiscal years ended October 31, 2011 through 2021. No returns are presented for the one-year, five-year and 10-year periods with non-continuous operations. |
| 6 | Class E Shares were operational during a portion of the periods presented. Amounts reflect performance for the period of time the Class had operations, which was 112 and 283 days during the fiscal years ended October 31, 2016 and 2017, respectively. The Class was not operational during the entire fiscal years ended October 31, 2018 through 2021. No return is presented for the one-year period with non-continuous operations. |
| 7 | Class I Shares were operational during a portion of the periods presented. Amounts reflect performance for the period of time the Class had operations, which was 13 and 280 days during the fiscal years ended October 31, 2004 and 2005, respectively. The Class was operational during the entire fiscal years ended October 31, 2006 through 2021. |
| Portfolio Reviews |
Portfolio Composition*
October 31, 2021 (Unaudited) |
| HSBC U.S. Government Money Market Fund |
| | Percentage of Investments |
| Investment Allocation | | at Value (%) |
| Repurchase Agreements | | | 47.0 | |
| U.S. Treasury Obligations | | | 29.1 | |
| U.S. Government and Government | | | | |
| Agency Obligations | | | 20.9 | |
| Investment Companies | | | 3.0 | |
| Total | | | 100.0 | |
| | | | | |
| HSBC U.S. Treasury Money Market Fund |
| | Percentage of Investments |
| Investment Allocation | | at Value (%) |
| U.S. Treasury Obligations | | | 100.0 | |
| Total | | | 100.0 | |
____________________
| * | Portfolio composition is subject to change. |
| HSBC U.S. GOVERNMENT MONEY MARKET FUND |
| Schedule of Portfolio Investments—as of October 31, 2021 |
U.S. Government and Government Agency Obligations
— 21.3% |
| | Principal
Amount ($) | | Value ($) |
| Federal Farm Credit Bank — 12.1% |
| 0.04%, 11/5/2021(a) | | 5,000,000 | | 4,999,972 |
| 0.04% (US0001M - 5 bps), | | | | |
| 11/22/2021(b) | | 100,000,000 | | 99,999,883 |
| 0.05%, 12/7/2021(a) | | 8,000,000 | | 7,999,600 |
| 0.05%, 1/6/2022(a) | | 4,000,000 | | 3,999,633 |
| 0.05%, 1/10/2022(a) | | 6,000,000 | | 5,999,417 |
| 0.05%, 1/18/2022(a) | | 4,000,000 | | 3,999,567 |
| 0.05%, 1/21/2022(a) | | 5,000,000 | | 4,999,438 |
| 0.05%, 1/24/2022(a) | | 5,000,000 | | 4,999,417 |
| 0.05%, 3/23/2022(a) | | 50,000,000 | | 49,990,139 |
| 0.05%, 3/28/2022(a) | | 10,000,000 | | 9,997,958 |
| 0.05%, 4/4/2022(a) | | 10,000,000 | | 9,997,861 |
| 0.05%, 4/6/2022(a) | | 10,000,000 | | 9,997,833 |
| 0.05%, 4/11/2022(a) | | 30,000,000 | | 29,993,292 |
| 0.06% (SOFR + 1 bps), | | | | |
| 11/22/2022(b) | | 50,000,000 | | 49,998,659 |
| 0.06% (FCPR DLY - 319 bps), | | | | |
| 5/25/2022(b) | | 20,000,000 | | 19,999,141 |
| 0.06% (SOFR + 1 bps), | | | | |
| 1/30/2023(b) | | 50,000,000 | | 50,000,000 |
| 0.06% (US0001M - 3 bps), | | | | |
| 12/23/2021(b) | | 150,000,000 | | 149,998,375 |
| 0.07% (SOFR + 2 bps), | | | | |
| 3/20/2023(b) | | 50,000,000 | | 49,998,557 |
| 0.07% (US0001M - 2 bps), | | | | |
| 11/16/2021(b) | | 36,750,000 | | 36,749,962 |
| 0.07% (FCPR DLY - 318 bps), | | | | |
| 8/16/2022(b) | | 225,000,000 | | 224,982,027 |
| 0.07% (FCPR DLY - 318 bps), | | | | |
| 10/4/2022(b) | | 50,000,000 | | 49,996,912 |
| 0.07% (SOFR + 2 bps), | | | | |
| 10/27/2022(b) | | 150,000,000 | | 149,992,508 |
| 0.07% (FEDL01 - 1 bps), | | | | |
| 4/10/2023(b) | | 355,000,000 | | 354,982,778 |
| 0.07% (SOFR + 3 bps), | | | | |
| 9/8/2023(b) | | 64,000,000 | | 64,000,000 |
| 0.07% (SOFR + 3 bps), | | | | |
| 9/27/2023(b) | | 73,000,000 | | 73,000,000 |
| 0.07% (SOFR + 3 bps), | | | | |
| 10/27/2023(b) | | 94,000,000 | | 94,000,000 |
| 0.08% (US0001M - 2 bps), | | | | |
| 12/15/2021(b) | | 225,000,000 | | 224,998,902 |
| 0.08% (SOFR + 3 bps), | | | | |
| 4/6/2023(b) | | 44,000,000 | | 43,996,817 |
| 0.08% (SOFR + 3 bps), | | | | |
| 10/20/2023(b) | | 35,000,000 | | 35,000,000 |
| 0.09% (FCPR DLY - 317 bps), | | | | |
| 4/21/2023(b) | | 150,000,000 | | 149,991,076 |
| 0.09% (SOFR + 4 bps), | | | | |
| 5/12/2023(b) | | 151,000,000 | | 151,000,000 |
| 0.09% (SOFR + 4 bps), | | | | |
| 5/19/2023(b) | | 38,000,000 | | 38,000,000 |
| 0.09% (SOFR + 4 bps), | | | | |
| 3/10/2023(b) | | 14,000,000 | | 14,004,333 |
| 0.09% (USBMMY3M + 4 | | | | |
| bps), 5/3/2023(b) | | 175,000,000 | | 175,000,000 |
| 0.10% (SOFR + 5 bps), | | | | |
| 8/25/2022(b) | | 75,000,000 | | 74,993,801 |
| 0.10% (SOFR + 5 bps), | | | | |
| 1/11/2022(b) | | 25,000,000 | | 25,002,202 |
| 0.11% (FCPR DLY - 315 bps), | | | | |
| 3/15/2023(b) | | 175,000,000 | | 174,987,864 |
U.S. Government and Government Agency Obligations,
continued |
| | Principal
Amount ($) | | Value ($) |
| 0.11% (US0001M + 2 bps), | | | | |
| 11/26/2021(b) | | 25,000,000 | | 25,001,021 |
| 0.13% (SOFR + 8 bps), | | | | |
| 3/10/2022(b) | | 15,000,000 | | 15,000,000 |
| 0.14% (SOFR + 9 bps), | | | | |
| 7/25/2022(b) | | 73,000,000 | | 72,997,302 |
| 0.14% (FEDL01 + 6 bps), | | | | |
| 1/19/2023(b) | | 50,000,000 | | 49,996,925 |
| 0.16% (FCPR DLY - 310 bps), | | | | |
| 4/20/2022(b) | | 60,000,000 | | 59,998,581 |
| 0.18% (US0001M + 9 bps), | | | | |
| 11/18/2021(b) | | 129,565,000 | | 129,566,755 |
| 0.18% (FEDL01 + 10 bps), | | | | |
| 2/3/2022(b) | | 150,000,000 | | 149,998,437 |
| 0.18% (FCPR DLY - 307 bps), | | | | |
| 7/25/2022(b) | | 150,000,000 | | 149,996,676 |
| 0.19% (US0001M + 11 bps), | | | | |
| 11/2/2021(b) | | 100,000,000 | | 100,000,000 |
| 0.19% (US0001M + 10 bps), | | | | |
| 12/23/2021(b) | | 59,000,000 | | 59,011,853 |
| 0.20% (FCPR - 306 bps), | | | | |
| 2/3/2022(b) | | 50,000,000 | | 49,991,613 |
| 0.20% (SOFR + 15 bps), | | | | |
| 7/28/2022(b) | | 75,000,000 | | 75,000,000 |
| 0.20% (US0001M + 11 bps), | | | | |
| 12/10/2021(b) | | 50,000,000 | | 50,000,000 |
| 0.20% (FCPR - 305 bps), | | | | |
| 3/9/2022(b) | | 95,000,000 | | 94,993,948 |
| 0.21% (US0001M + 13 bps), | | | | |
| 11/5/2021(b) | | 5,000,000 | | 5,000,082 |
| 0.21% (FCPR DLY - 304 bps), | | | | |
| 5/3/2022(b) | | 250,000,000 | | 249,996,184 |
| 0.25% (SOFR + 20 bps), | | | | |
| 4/22/2022(b) | | 8,500,000 | | 8,495,145 |
| 0.28% (FEDL01 + 20 bps), | | | | |
| 2/17/2022(b) | | 45,000,000 | | 45,005,376 |
| 0.28% (FCPR DLY - 297 bps), | | | | |
| 6/8/2022(b) | | 35,000,000 | | 34,998,891 |
| 0.29% (FCPR DLY - 296 bps), | | | | |
| 7/15/2022(b) | | 47,007,000 | | 47,007,000 |
| 0.37% (SOFR + 32 bps), | | | | |
| 1/12/2022(b) | | 25,000,000 | | 25,000,000 |
| 0.40% (SOFR + 35 bps), | | | | |
| 4/7/2022(b) | | 25,000,000 | | 25,000,000 |
| 0.43% (SOFR + 38 bps), | | | | |
| 5/8/2023(b) | | 8,500,000 | | 8,545,054 |
| 0.45% (FCPR DLY - 280 bps), | | | | |
| 11/23/2021(b) | | 19,500,000 | | 19,501,752 |
| | | | | 4,271,750,519 |
| Federal Home Loan Bank — 6.1% | | |
| 0.04%, 1/7/2022 | | 250,000,000 | | 249,994,902 |
| 0.05%, 4/22/2022 | | 125,000,000 | | 124,996,760 |
| 0.05%, 1/14/2022 | | 340,000,000 | | 339,995,908 |
| 0.05%, 3/30/2022(a) | | 98,000,000 | | 97,979,720 |
| 0.05%, 4/6/2022(a) | | 398,000,000 | | 397,906,868 |
| 0.05%, 4/8/2022(a) | | 46,000,000 | | 45,988,896 |
| 0.05%, 4/29/2022 | | 125,000,000 | | 124,997,985 |
| 0.06% (SOFR + 1 bps), | | | | |
| 1/25/2022(b) | | 250,000,000 | | 250,000,000 |
| 0.06% (SOFR + 1 bps), | | | | |
| 10/24/2022(b) | | 50,000,000 | | 50,000,000 |
| See notes to financial statements. | HSBC FAMILY OF FUNDS | 7 |
| HSBC U.S. GOVERNMENT MONEY MARKET FUND |
| Schedule of Portfolio Investments—as of October 31, 2021 (continued) |
| | | | |
| U.S. Government and Government Agency Obligations, |
| continued | | | | |
| | Principal | | |
| | Amount ($) | | Value ($) |
| 0.07% (SOFR + 2 bps), | | | | |
| 2/8/2023(b) | | 50,000,000 | | 50,000,000 |
| 0.09% (SOFR + 4 bps), | | | | |
| 5/19/2023(b) | | 25,000,000 | | 25,000,000 |
| 0.09% (US0001M–), | | | | |
| 1/27/2022(b) | | 250,000,000 | | 250,021,234 |
| 0.11% (SOFR + 6 bps), | | | | |
| 5/13/2022(b) | | 50,000,000 | | 50,000,000 |
| 0.11% (SOFR + 6 bps), | | | | |
| 11/18/2022(b) | | 50,000,000 | | 50,000,000 |
| 0.11% (SOFR + 7 bps), | | | | |
| 11/10/2022(b) | | 50,000,000 | | 50,000,000 |
| | | | 2,156,882,273 |
| Federal Home Loan Mortgage Corporation — 1.4% | | | | |
| 0.14% (SOFR + 9 bps), | | | | |
| 8/3/2022(b) | | 75,000,000 | | 75,000,000 |
| 0.15% (SOFR + 10 bps), | | | | |
| 8/19/2022(b) | | 107,900,000 | | 107,903,297 |
| 0.15% (SOFR + 10 bps), | | | | |
| 9/9/2022(b) | | 70,000,000 | | 70,000,000 |
| 0.17% (SOFR + 12 bps), | | | | |
| 4/29/2022(b) | | 69,750,000 | | 69,750,000 |
| 0.19% (SOFR + 14 bps), | | | | |
| 12/10/2021(b) | | 5,000,000 | | 4,998,866 |
| 0.20% (SOFR + 15 bps), | | | | |
| 3/4/2022(b) | | 15,000,000 | | 14,987,733 |
| 0.31% (SOFR + 26 bps), | | | | |
| 5/5/2022(b) | | 150,000,000 | | 150,000,000 |
| | | | 492,639,896 |
| Federal National Mortgage Association — 1.7% | | | | |
| 0.15% (SOFR + 10 bps), | | | | |
| 12/3/2021(b) | | 5,600,000 | | 5,600,373 |
| 0.16% (SOFR + 11 bps), | | | | |
| 3/4/2022(b) | | 77,100,000 | | 77,039,530 |
| 0.23% (SOFR + 18 bps), | | | | |
| 6/3/2022(b) | | 99,500,000 | | 99,556,205 |
| 0.35% (SOFR + 30 bps), | | | | |
| 1/7/2022(b) | | 50,000,000 | | 50,000,000 |
| 0.35% (SOFR + 30 bps), | | | | |
| 1/27/2022(b) | | 200,000,000 | | 200,000,000 |
| 0.37% (SOFR + 32 bps), | | | | |
| 4/27/2022(b) | | 50,000,000 | | 50,000,000 |
| 0.37% (SOFR + 32 bps), | | | | |
| 4/28/2022(b) | | 50,000,000 | | 50,000,000 |
| 0.40% (SOFR + 35 bps), | | | | |
| 4/7/2022(b) | | 50,000,000 | | 50,000,000 |
| 0.41% (SOFR + 36 bps), | | | | |
| 1/20/2022(b) | | 10,000,000 | | 10,002,433 |
| | | | 592,198,541 |
| TOTAL U.S. GOVERNMENT | | | | |
| AND GOVERNMENT | | | | |
| AGENCY OBLIGATIONS | | | | |
| (Cost $7,513,471,229) | | | | 7,513,471,229 |
| | | | | |
| U.S.Treasury Obligations — 29.7% | | | | |
| U.S. Treasury Bills — 26.3% | | | | |
| 0.03%, 1/6/2022(a) | | 750,000,000 | | 749,927,125 |
| 0.05%, 11/12/2021(a) | | 575,000,000 | | 574,991,005 |
| 0.05%, 11/18/2021(a) | | 375,000,000 | | 374,990,556 |
| 0.05%, 11/26/2021(a) | | 350,000,000 | | 349,987,187 |
| 0.05%, 12/16/2021(a) | | 150,000,000 | | 149,992,875 |
| 0.05%, 12/23/2021(a) | | 250,000,000 | | 249,980,861 |
| 0.05%, 1/4/2022(a) | | 920,000,000 | | 919,911,111 |
| 0.05%, 1/20/2022(a) | | 500,000,000 | | 499,938,889 |
| 0.05%, 1/27/2022(a) | | 180,000,000 | | 179,976,945 |
| 0.05%, 2/3/2022(a) | | 290,000,000 | | 289,959,241 |
| 0.05%, 2/8/2022(a) | | 250,000,000 | | 249,962,188 |
| 0.05%, 2/10/2022(a) | | 500,000,000 | | 499,926,003 |
| 0.05%, 2/22/2022(a) | | 250,000,000 | | 249,958,410 |
| 0.05%, 3/3/2022(a) | | 300,000,000 | | 299,946,625 |
| 0.05%, 3/31/2022(a) | | 250,000,000 | | 249,947,917 |
| 0.05%, 4/14/2022(a) | | 250,000,000 | | 249,937,361 |
| 0.06%, 3/1/2022(a) | | 100,000,000 | | 99,980,993 |
| 0.06%, 4/7/2022(a) | | 400,000,000 | | 399,906,781 |
| 0.06%, 4/21/2022(a) | | 150,000,000 | | 149,959,031 |
| 0.06%, 4/28/2022(a) | | 180,000,000 | | 179,948,380 |
| 0.07%, 12/2/2021(a) | | 1,000,000,000 | | 999,935,890 |
| 0.07%, 12/30/2021(a) | | 500,000,000 | | 499,938,132 |
| 0.07%, 6/16/2022(a) | | 200,000,000 | | 199,911,092 |
| 0.08%, 8/11/2022(a) | | 300,000,000 | | 299,814,871 |
| 0.09%, 12/28/2021(a) | | 285,000,000 | | 284,958,467 |
| | | | 9,253,687,936 |
| U.S. Treasury Notes — 3.4% | | | | |
| 0.09% (USBMMY3M + 3 | | | | |
| bps), 4/30/2023(b) | | 250,000,000 | | 250,006,053 |
| 0.13%, 6/30/2022 | | 180,000,000 | | 180,069,552 |
| 0.21% (USBMMY3M + 15 | | | | |
| bps), 1/31/2022(b) | | 50,000,000 | | 50,019,838 |
| 1.75%, 11/30/2021 | | 150,000,000 | | 150,193,861 |
| 1.75%, 6/15/2022 | | 50,000,000 | | 50,521,981 |
| 1.88%, 1/31/2022 | | 200,000,000 | | 200,901,308 |
| 1.88%, 5/31/2022 | | 200,000,000 | | 202,102,022 |
| 2.63%, 12/15/2021 | | 125,000,000 | | 125,377,119 |
| | | | 1,209,191,734 |
| TOTAL U.S.TREASURY | | | | |
| OBLIGATIONS (Cost | | | | |
| $10,462,879,670) | | | | 10,462,879,670 |
| | | | | |
| Investment Companies — 3.1% | | | | |
| | Shares | | |
| BlackRock Liquidity Funds | | | | |
| FedFund Portfolio, | | | | |
| Institutional Shares, | | | | |
| 0.03%(c) | | 259,879,435 | | 259,879,435 |
| Dreyfus Government | | | | |
| Cash Management, | | | | |
| Institutional Shares, | | | | |
| 0.03%(c) | | 294,799,144 | | 294,799,144 |
| Federated Hermes | | | | |
| Government Obligations | | | | |
| Fund, Institutional | | | | |
| Shares, 0.03%(c) | | 541,719,177 | | 541,719,176 |
| TOTAL INVESTMENT | | | | |
| COMPANIES | | | | |
| (Cost $1,096,397,755) | | | | 1,096,397,755 |
| 8 | HSBC FAMILY OF FUNDS | See notes to financial statements. |
| HSBC U.S. GOVERNMENT MONEY MARKET FUND |
| Schedule of Portfolio Investments—as of October 31, 2021 (continued) |
| Repurchase Agreements — 48.1% | | |
| | Principal | | |
| | Amount ($) | | Value ($) |
| Australia & New Zealand | | | | |
| Bank, 0.050%, | | | | |
| 11/1/21, (Purchased on | | | | |
| 10/29/21, proceeds at | | | | |
| maturity $150,000,212, | | | | |
| Collateralized by U.S. | | | | |
| Treasury Security, | | | | |
| (2.63%), (11/1/21), fair | | | | |
| value of $150,000,212) | | 149,999,587 | | 149,999,587 |
| BNP Paribas SA, 0.050%, | | | | |
| 11/1/21, (Purchased on | | | | |
| 10/29/21, proceeds at | | | | |
| maturity $310,001,292, | | | | |
| Collateralized by | | | | |
| various U.S. Treasury | | | | |
| Obligations, (0.00% | | | | |
| - 8.00%), (11/12/21 - | | | | |
| 2/15/51), fair value of | | | | |
| $316,200,000) | | 310,000,000 | | 310,000,000 |
| Canadian Imperial Bank, | | | | |
| 0.050%, 11/1/21, | | | | |
| (Purchased on | | | | |
| 10/29/21, proceeds at | | | | |
| maturity $25,000,104, | | | | |
| Collateralized by various | | | | |
| U.S. Government Agency | | | | |
| Obligations, (0.00% | | | | |
| - 3.13%), (2/28/22 - | | | | |
| 8/15/51), fair value of | | | | |
| $25,500,034) | | 25,000,000 | | 25,000,000 |
| Canadian Imperial Bank, | | | | |
| 0.050%, 11/1/21, | | | | |
| (Purchased on | | | | |
| 10/29/21, proceeds at | | | | |
| maturity $100,000,416, | | | | |
| Collateralized by various | | | | |
| U.S. Government | | | | |
| Agency Obligations, | | | | |
| (1.25% - 5.50%), (10/1/27 | | | | |
| - 9/1/51), fair value of | | | | |
| $102,000,002) | | 100,000,000 | | 100,000,000 |
| Citigroup Global Markets, | | | | |
| 0.060%, 11/1/21, | | | | |
| (Purchased on 10/29/21, | | | | |
| proceeds at maturity | | | | |
| $500,002,500, | | | | |
| Collateralized by various | | | | |
| U.S. Government Agency | | | | |
| Obligations, (0.13% | | | | |
| - 3.72%), (10/31/21 - | | | | |
| 10/1/33), fair value of | | | | |
| $510,000,049) | | 500,000,000 | | 500,000,000 |
| Deutsche Bank Securities, | | | | |
| Inc., 0.050%, 11/1/21, | | | | |
| (Purchased on | | | | |
| 10/29/21, proceeds at | | | | |
| maturity $400,001,667, | | | | |
| Collateralized by various | | | | |
| U.S. Government | | | | |
| Agency Obligations, | | | | |
| (2.00% - 4.50%), (6/1/44 | | | | |
| - 9/1/51), fair value of | | | | |
| $408,000,000) | | 400,000,000 | | 400,000,000 |
| Federal Reserve Bank NY, | | | | |
| 0.050%, 11/1/21, | | | | |
| (Purchased on 10/29/21, | | | | |
| proceeds at maturity | | | | |
| $11,000,045,833, | | | | |
| Collateralized by | | | | |
| various U.S. Treasury | | | | |
| Obligations, (0.13% | | | | |
| - 2.88%), (2/28/23 - | | | | |
| 8/15/50), fair value of | | | | |
| $11,000,045,880) | | 11,000,000,000 | | 11,000,000,000 |
| Fixed Income Clearing | | | | |
| Corporation (Bank of New | | | | |
| York), 0.050%, 11/1/21, | | | | |
| (Purchased on 10/29/21, | | | | |
| proceeds at maturity | | | | |
| $500,002,083, | | | | |
| Collateralized by | | | | |
| various U.S. Treasury | | | | |
| Obligations, (0.13% | | | | |
| - 0.88%), (1/15/22 - | | | | |
| 6/30/26), fair value of | | | | |
| $510,000,019) | | 500,000,000 | | 500,000,000 |
| Goldman Sachs & Co., | | | | |
| 0.050%, 11/1/21, | | | | |
| (Purchased on | | | | |
| 10/29/21, proceeds at | | | | |
| maturity $400,001,667, | | | | |
| Collateralized by | | | | |
| various U.S. Treasury | | | | |
| Obligations, (2.10% | | | | |
| - 6.00%), (1/15/26 - | | | | |
| 9/15/56), fair value of | | | | |
| $408,000,000) | | 400,000,000 | | 400,000,000 |
| Mizuho Securities USA, | | | | |
| Inc., 0.050%, 11/1/21, | | | | |
| (Purchased on | | | | |
| 10/29/21, proceeds at | | | | |
| maturity $100,000,417, | | | | |
| Collateralized by | | | | |
| various U.S. Treasury | | | | |
| Obligations, (0.00% | | | | |
| - 3.00%), (12/31/21 - | | | | |
| 2/15/29), fair value of | | | | |
| $102,000,090) | | 100,000,000 | | 100,000,000 |
| Royal Bank of Canada, | | | | |
| 0.050%, 11/1/21, | | | | |
| (Purchased on | | | | |
| 10/29/21, proceeds at | | | | |
| maturity $100,000,417, | | | | |
| Collateralized by various | | | | |
| U.S. Government Agency | | | | |
| Obligations, (0.00% | | | | |
| - 6.50%), (12/15/21 - | | | | |
| 5/20/51), fair value of | | | | |
| $102,000,000) | | 100,000,000 | | 100,000,000 |
| See notes to financial statements. | HSBC FAMILY OF FUNDS | 9 |
| HSBC U.S. GOVERNMENT MONEY MARKET FUND |
| Schedule of Portfolio Investments—as of October 31, 2021 (continued) |
| | | | |
| Repurchase Agreements, continued | | |
| | Principal | | |
| | Amount ($) | | Value ($) |
| Societe' Generale NY, | | | | |
| 0.055%, 11/12/21, | | | | |
| (Purchased on 10/29/21, | | | | |
| proceeds at maturity | | | | |
| $500,002,084, | | | | |
| Collateralized by | | | | |
| various U.S. Treasury | | | | |
| Obligations, (0.00% | | | | |
| - 6.88%), (10/31/21 - | | | | |
| 9/1/51), fair value of | | | | |
| $510,000,000) | | 500,000,000 | | 500,000,000 |
| Societe' Generale NY, | | | | |
| 0.050%, 11/1/21, | | | | |
| (Purchased on 10/29/21, | | | | |
| proceeds at maturity | | | | |
| $1,100,004,583, | | | | |
| Collateralized by | | | | |
| various U.S. Treasury | | | | |
| Obligations, (0.00% | | | | |
| - 8.00%), (10/31/21 - | | | | |
| 8/15/50), fair value of | | | | |
| $1,122,000,047) | | 1,100,000,000 | | 1,100,000,000 |
| Standard Chartered Bank, | | | | |
| 0.055%, 11/1/21, | | | | |
| (Purchased on | | | | |
| 10/29/21, proceeds at | | | | |
| maturity $250,001,146, | | | | |
| Collateralized by various | | | | |
| U.S. Government Agency | | | | |
| Obligations, (2.00% | | | | |
| - 4.50%), (12/31/25 - | | | | |
| 9/20/51), fair value of | | | | |
| $255,000,090) | | 250,000,000 | | 250,000,000 |
| Standard Chartered Bank, | | | | |
| 0.050%, 11/1/21, | | | | |
| (Purchased on 10/29/21, | | | | |
| proceeds at maturity | | | | |
| $1,000,004,167, | | | | |
| Collateralized by various | | | | |
| U.S. Government Agency | | | | |
| Obligations, (0.00% | | | | |
| - 6.25%), (1/31/22 - | | | | |
| 7/1/51), fair value of | | | | |
| $1,020,000,001) | | 1,000,000,000 | | 1,000,000,000 |
| Toronto Dominion Bank | | | | |
| NY, 0.050%, 11/1/21, | | | | |
| (Purchased on 10/29/21, | | | | |
| proceeds at maturity | | | | |
| $500,002,083, | | | | |
| Collateralized by | | | | |
| various U.S. Treasury | | | | |
| Obligations, (0.00% | | | | |
| - 5.50%), (11/1/21 - | | | | |
| 8/15/28), fair value of | | | | |
| $510,000,064) | | 500,000,000 | | 500,000,000 |
| TOTAL REPURCHASE | | | | |
| AGREEMENTS | | | | |
| (Cost $16,934,999,587) | | | | 16,934,999,587 |
| TOTAL INVESTMENTS IN | | | | |
| SECURITIES | | | | |
| (Cost $36,007,748,241) | | | | |
| — 102.2% | | | | 36,007,748,241 |
| Other Assets (Liabilities) - | | | | |
| (2.2)% | | | | (778,216,274) |
| NET ASSETS - 100% | | | $ | 35,229,531,967 |
____________________
| (a) | | Discount note. Rate presented represents the effective yield at time of purchase. |
(b) | | Floating or variable rate security linked to the referenced benchmark. The rate presented represents the rate in effect on October 31, 2021. These securities are deemed to have a maturity remaining until the next adjustment of the interest rate or the longer of the demand period or time to the next readjustment. |
| (c) | | The rate represents the annualized 7-day yield that was in effect on October 31, 2021. |
bps - Basis Points
FCPR DLY - Federal Reserve Bank Prime Rate Loan US
FEDL01 - Effective Federal Funds Rate
SOFR - Secured Overnight Financing Rate
USBMMY3M - 3 Month Treasury Bill Rate
US0001M - 1 Month US Dollar LIBOR
| 10 | HSBC FAMILY OF FUNDS | See notes to financial statements. |
| HSBC U.S. TREASURY MONEY MARKET FUND |
| Schedule of Portfolio Investments—as of October 31, 2021 |
| | | | | |
| U.S.Treasury Obligations — 103.8% | | | |
| | Principal | | | |
| | Amount ($) | | Value ($) |
| U.S. Treasury Bills — 84.3% | | | | | |
| 0.02%, 11/2/2021(a) | | 46,000,000 | | | 45,999,939 |
| 0.03%, 11/16/2021(a) | | 275,000,000 | | | 274,995,834 |
| 0.03%, 1/6/2022(a) | | 50,000,000 | | | 49,997,021 |
| 0.03%, 1/25/2022(a) | | 50,000,000 | | | 49,995,868 |
| 0.04%, 11/9/2021(a) | | 64,700,000 | | | 64,699,298 |
| 0.04%, 11/30/2021(a) | | 150,000,000 | | | 149,994,563 |
| 0.05%, 11/12/2021(a) | | 350,000,000 | | | 349,994,576 |
| 0.05%, 11/18/2021(a) | | 100,000,000 | | | 99,997,403 |
| 0.05%, 11/23/2021(a) | | 225,000,000 | | | 224,993,126 |
| 0.05%, 11/26/2021(a) | | 50,000,000 | | | 49,998,160 |
| 0.05%, 12/16/2021(a) | | 50,000,000 | | | 49,996,844 |
| 0.05%, 1/4/2022(a) | | 200,000,000 | | | 199,981,556 |
| 0.05%, 1/13/2022(a) | | 150,000,000 | | | 149,984,793 |
| 0.05%, 1/20/2022(a) | | 100,000,000 | | | 99,987,778 |
| 0.05%, 1/27/2022(a) | | 75,000,000 | | | 74,990,575 |
| 0.05%, 2/1/2022(a) | | 100,000,000 | | | 99,987,094 |
| 0.05%, 2/3/2022(a) | | 50,000,000 | | | 49,992,950 |
| 0.05%, 2/8/2022(a) | | 25,000,000 | | | 24,996,219 |
| 0.05%, 2/15/2022(a) | | 50,000,000 | | | 49,992,639 |
| 0.05%, 3/3/2022(a) | | 50,000,000 | | | 49,991,105 |
| 0.05%, 3/17/2022(a) | | 75,000,000 | | | 74,985,834 |
| 0.06%, 11/1/2021(a) | | 12,700,000 | | | 12,700,000 |
| 0.06%, 4/7/2022(a) | | 100,000,000 | | | 99,975,796 |
| 0.06%, 4/21/2022(a) | | 50,000,000 | | | 49,985,750 |
| 0.06%, 4/28/2022(a) | | 50,000,000 | | | 49,985,537 |
| 0.09%, 12/28/2021(a) | | 50,000,000 | | | 49,992,611 |
| | | | | 2,548,192,869 |
| U.S. Treasury Notes — 19.5% | | | | | |
| 0.08% (USBMMY3M + 3 | | | | | |
| bps), 7/31/2023(b) | | 35,000,000 | | | 35,002,388 |
| 0.09% (USBMMY3M + 3 | | | | | |
| bps), 4/30/2023(b) | | 35,000,000 | | | 35,002,124 |
| 0.10% (USBMMY3M + 5 | | | | | |
| bps), 1/31/2023(b) | | 50,000,000 | | | 50,002,530 |
| 0.11% (USBMMY3M + 6 | | | | | |
| bps), 7/31/2022(b) | | 140,000,000 | | | 139,998,750 |
| 0.11% (USBMMY3M + 6 | | | | | |
| bps), 10/31/2022(b) | | 130,000,000 | | | 129,999,393 |
| 0.13%, 6/30/2022 | | 15,000,000 | | | 15,005,803 |
| 0.17% (USBMMY3M + 11 | | | | | |
| bps), 4/30/2022(b) | | 50,000,000 | | | 50,004,028 |
| 0.21% (USBMMY3M + 15 | | | | | |
| bps), 1/31/2022(b) | | 60,500,000 | | | 60,510,854 |
| 1.88%, 1/31/2022 | | 75,000,000 | | | 75,334,726 |
| | | | | 590,860,596 |
| TOTAL U.S.TREASURY | | | | | |
| OBLIGATIONS (Cost | | | | | |
| $3,139,053,465) | | | | | 3,139,053,465 |
| TOTAL INVESTMENTS IN | | | | | |
| SECURITIES | | | | | |
| (Cost $3,139,053,465) | | | | | |
| — 103.8% | | | | | 3,139,053,465 |
| Other Assets (Liabilities) - | | | | | |
| (3.8)% | | | | | (114,467,186) |
| NET ASSETS - 100% | | | | $ | 3,024,586,279 |
____________________
| (a) | | Discount note. Rate presented represents the effective yield at time of purchase. |
| (b) | | Floating or variable rate security linked to the referenced benchmark. The rate presented represents the rate in effect on October 31, 2021. These securities are deemed to have a maturity remaining until the next adjustment of the interest rate or the longer of the demand period or time to the next readjustment. |
bps - Basis Points
USBMMY3M - 3 Month Treasury Bill Rate
| See notes to financial statements. | HSBC FAMILY OF FUNDS | 11 |
HSBC FAMILY OF FUNDS
Statements of Assets and Liabilities—as of October 31, 2021
| | HSBC U.S. | |
| | Government | HSBC U.S. |
| | Money Market | Treasury Money |
| | Fund | Market Fund |
| Assets: | | | | | | | | | | | |
| Investments in securities, at value | | | $ | 19,072,748,654 | | | | $ | 3,139,053,465 | | |
| Repurchase agreements, at value | | | | 16,934,999,587 | | | | | — | | |
| Cash | | | | 2,284,770 | | | | | 125,755 | | |
| Interest receivable | | | | 6,474,657 | | | | | 521,788 | | |
| Receivable for investments sold | | | | — | | | | | 10,000,000 | | |
| Receivable from Investment Adviser | | | | — | | | | | 15,096 | | |
| Prepaid expenses and other assets | | | | 337,637 | | | | | 73,766 | | |
| Total Assets | | | | 36,016,845,305 | | | | | 3,149,789,870 | | |
| Liabilities: | | | | | | | | | | | |
| Distributions payable | | | | 294,322 | | | | | 3,983 | | |
| Payable for investments purchased | | | | 784,896,793 | | | | | 124,984,611 | | |
| Accrued expenses and other liabilities: | | | | | | | | | | | |
| Investment Management | | | | 205,533 | | | | | — | | |
| Administration | | | | 860,593 | | | | | 66,733 | | |
| Compliance Services | | | | 5,235 | | | | | 5,235 | | |
| Shareholder Servicing | | | | 31,808 | | | | | 149 | | |
| Accounting | | | | 6,249 | | | | | 4,866 | | |
| Custodian fees | | | | 147,697 | | | | | 15,513 | | |
| Transfer Agent | | | | 50,260 | | | | | 18,685 | | |
| Trustee | | | | 1,998 | | | | | 2,000 | | |
| Other | | | | 812,850 | | | | | 101,816 | | |
| Total Liabilities | | | | 787,313,338 | | | | | 125,203,591 | | |
| Net Assets | | | $ | 35,229,531,967 | | | | $ | 3,024,586,279 | | |
| Composition of Net Assets: | | | | | | | | | | | |
| Paid in capital | | | | 35,229,911,279 | | | | | 3,024,601,745 | | |
| Total distributable earnings/loss | | | | (379,312 | ) | | | | (15,466 | ) | |
| Net Assets | | | $ | 35,229,531,967 | | | | $ | 3,024,586,279 | | |
| | | | | | | | | | | | |
| Net Assets: | | | | | | | | | | | |
| Class A Shares | | | $ | 1,766,357 | | | | $ | — | | |
| Class D Shares | | | | 1,680,757,294 | | | | | 120,466,876 | | |
| Class I Shares | | | | 29,897,234,273 | | | | | 1,318,598,358 | | |
| Intermediary Class Shares | | | | 1,237,167,992 | | | | | 350,939,873 | | |
| Intermediary Service Class Shares | | | | 1,026,492,296 | | | | | 794,436,779 | | |
| Class Y Shares | | | | 1,386,113,755 | | | | | 440,144,393 | | |
| | | $ | 35,229,531,967 | | | | $ | 3,024,586,279 | | |
| Shares Outstanding: | | | | | | | | | | | |
| ($0.001 par value, unlimited number of shares authorized): | | | | | | | | | | | |
| Class A Shares | | | | 1,766,341 | | | | | — | | |
| Class D Shares | | | | 1,680,602,659 | | | | | 120,499,666 | | |
| Class I Shares | | | | 29,897,665,201 | | | | | 1,318,610,249 | | |
| Intermediary Class Shares | | | | 1,237,190,994 | | | | | 350,940,331 | | |
| Intermediary Service Class Shares | | | | 1,026,495,072 | | | | | 794,443,526 | | |
| Class Y Shares | | | | 1,386,207,359 | | | | | 440,112,940 | | |
| Net Asset Value, Offering Price and Redemption Price per share: | | | | | | | | | | | |
| Class A Shares | | | $ | 1.00 | | | | $ | — | | |
| Class D Shares | | | $ | 1.00 | | | | $ | 1.00 | | |
| Class I Shares | | | $ | 1.00 | | | | $ | 1.00 | | |
| Intermediary Class Shares | | | $ | 1.00 | | | | $ | 1.00 | | |
| Intermediary Service Class Shares | | | $ | 1.00 | | | | $ | 1.00 | | |
| Class Y Shares | | | $ | 1.00 | | | | $ | 1.00 | | |
| Investments in securities, at cost | | | $ | 19,072,748,654 | | | | $ | 3,139,053,465 | | |
| Repurchase agreements, at cost | | | $ | 16,934,999,587 | | | | $ | — | | |
____________________
Amounts designated as "—" are $0.00 or have been rounded to $0.00.
| 12 | HSBC FAMILY OF FUNDS | See notes to financial statements. |
HSBC FAMILY OF FUNDS
Statements of Operations - For the year ended October 31, 2021
| | HSBC U.S. | HSBC U.S. |
| | Government | Treasury |
| | Money | Money |
| | Market Fund | Market Fund |
| Investment Income: | | | | | | | | | | | |
| Interest | | | $ | 30,918,469 | | | | $ | 2,748,879 | | |
| Dividends | | | | 473,526 | | | | | — | | |
| Total Investment Income | | | | 31,391,995 | | | | | 2,748,879 | | |
| | | | | | | | | | | | |
| Expenses: | | | | | | | | | | | |
| Investment Management | | | | 34,565,724 | | | | | 3,637,213 | | |
| Operational Support: | | | | | | | | | | | |
| Class A Shares | | | | 1,653 | | | | | — | | |
| Class D Shares | | | | 2,033,510 | | | | | 126,174 | | |
| Intermediary Class Shares | | | | 1,386,426 | | | | | 350,725 | | |
| Intermediary Service Class Shares | | | | 768,069 | | | | | 539,017 | | |
| Class Y Shares | | | | 1,314,900 | | | | | 453,174 | | |
| Administration: | | | | | | | | | | | |
| Class A Shares | | | | 534 | | | | | — | | |
| Class D Shares | | | | 656,903 | | | | | 40,804 | | |
| Class I Shares | | | | 9,393,354 | | | | | 699,610 | | |
| Intermediary Class Shares | | | | 447,570 | | | | | 113,344 | | |
| Intermediary Service Class Shares | | | | 248,591 | | | | | 174,401 | | |
| Class Y Shares | | | | 424,955 | | | | | 146,534 | | |
| Shareholder Servicing: | | | | | | | | | | | |
| Class A Shares | | | | 6,612 | | | | | — | | |
| Class D Shares | | | | 5,083,819 | | | | | 315,438 | | |
| Intermediary Class Shares | | | | 693,090 | | | | | 175,368 | | |
| Intermediary Service Class Shares | | | | 768,182 | | | | | 538,973 | | |
| Accounting | | | | 77,222 | | | | | 58,337 | | |
| Compliance Services | | | | 58,302 | | | | | 58,302 | | |
| Custodian | | | | 822,313 | | | | | 95,462 | | |
| Printing | | | | 263,253 | | | | | 6,380 | | |
| Professional | | | | 214,173 | | | | | 208,363 | | |
| Transfer Agent | | | | 648,567 | | | | | 245,837 | | |
| Trustee | | | | 135,732 | | | | | 135,723 | | |
| Registration fees | | | | 258,063 | | | | | 102,208 | | |
| Other | | | | 853,673 | | | | | 174,814 | | |
| Total expenses before fee and expense reductions | | | | 61,125,190 | | | | | 8,396,201 | | |
| Fees voluntarily reduced/reimbursed by Investment Adviser | | | | (25,279,418 | ) | | | | (2,923,599 | ) | |
| Fees contractually reduced/reimbursed by Investment Adviser | | | | (3,148,725 | ) | | | | (1,813,309 | ) | |
| Fees voluntarily reduced by Administrator | | | | (3,433,590 | ) | | | | (359,940 | ) | |
| Fees voluntarily reduced by Shareholder Servicing Agent | | | | (6,189,529 | ) | | | | (1,029,377 | ) | |
| Custody earnings credit | | | | (44,929 | ) | | | | (2,068 | ) | |
| Net Expenses | | | | 23,028,999 | | | | | 2,267,908 | | |
| | | | | | | | | | | | |
| Net Investment Income/(Loss) | | | | 8,362,996 | | | | | 480,971 | | |
| | | | | | | | | | | | |
| Realized/Unrealized Gains/(Losses) from Investments: | | | | | | | | | | | |
| Net realized gains/(losses) from investments in securities | | | | 32,855 | | | | | 1,808 | | |
| | | | | | | | | | | | |
| Net realized/unrealized gains/(losses) on investments | | | | 32,855 | | | | | 1,808 | | |
| Change in Net Assets Resulting from Operations | | | $ | 8,395,851 | | | | $ | 482,779 | | |
____________________
Amounts designated as "—" are $0.00 or have been rounded to $0.00.
| See notes to financial statements. | HSBC FAMILY OF FUNDS | 13 |
HSBC FAMILY OF FUNDS
Statements of Changes in Net Assets
| | HSBC U.S. Government Money | HSBC U.S. Treasury Money Market |
| | Market Fund | Fund |
| | Year Ended | Year Ended | Year Ended | Year Ended |
| | October 31, 2021 | October 31, 2020 | October 31, 2021 | October 31, 2020 |
| Investment Activities: | | | | | | | | | | | | | | | | | | | | | |
| Operations: | | | | | | | | | | | | | | | | | | | | | |
| Net investment income | | | $ | 8,362,996 | | | | $ | 128,543,126 | | | | $ | 480,971 | | | | $ | 14,152,611 | | |
| Net realized gains/(losses) from investments | | | | 32,855 | | | | | 84,343 | | | | | 1,808 | | | | | 42,340 | | |
| Change in net assets resulting from operations | | | | 8,395,851 | | | | | 128,627,469 | | | | | 482,779 | | | | | 14,194,951 | | |
| Distributions to shareholders: | | | | | | | | | | | | | | | | | | | | | |
| Class A Shares | | | | (161 | ) | | | | (9,340 | ) | | | | — | | | | | — | | |
| Class D Shares | | | | (202,869 | ) | | | | (8,937,485 | ) | | | | (20,001 | ) | | | | (732,027 | ) | |
| Class I Shares | | | | (8,048,385 | ) | | | | (102,733,757 | ) | | | | (344,629 | ) | | | | (6,767,856 | ) | |
| Intermediary Class Shares | | | | (328,257 | ) | | | | (4,489,803 | ) | | | | (47,762 | ) | | | | (1,817,968 | ) | |
| Intermediary Service Class Shares | | | | (166,641 | ) | | | | (1,032,348 | ) | | | | (58,317 | ) | | | | (611,854 | ) | |
| Class Y Shares | | | | (100,143 | ) | | | | (11,353,930 | ) | | | | (61,466 | ) | | | | (4,259,173 | ) | |
| Change in net assets resulting from distributions to | | | | | | | | | | | | | | | | | | | | | |
| shareholders: | | | | (8,846,456 | ) | | | | (128,556,663 | ) | | | | (532,175 | ) | | | | (14,188,878 | ) | |
| Change in net assets resulting from capital transactions | | | | 3,314,391,671 | | | | | 13,424,116,399 | | | | | (378,364,761 | ) | | | | 1,376,593,739 | | |
| Change in net assets | | | | 3,313,941,066 | | | | | 13,424,187,205 | | | | | (378,414,157 | ) | | | | 1,376,599,812 | | |
| Net Assets: | | | | | | | | | | | | | | | | | | | | | |
| Beginning of period | | | | 31,915,590,901 | | | | | 18,491,403,696 | | | | | 3,403,000,436 | | | | | 2,026,400,624 | | |
| End of period | | | $ | 35,229,531,967 | | | | $ | 31,915,590,901 | | | | $ | 3,024,586,279 | | | | $ | 3,403,000,436 | | |
| CAPITAL TRANSACTIONS*: | | | | | | | | | | | | | | | | | | | | | |
| Class A Shares | | | | | | | | | | | | | | | | | | | | | |
| Proceeds from shares issued | | | $ | 757,445 | | | | $ | 1,330,138 | | | | $ | — | | | | $ | — | | |
| Dividends reinvested | | | | 161 | | | | | 8,864 | | | | | — | | | | | — | | |
| Value of shares redeemed | | | | (666,093 | ) | | | | (2,587,299 | ) | | | | — | | | | | — | | |
| Class A Shares capital transactions | | | | 91,513 | | | | | (1,248,297 | ) | | | | — | | | | | — | | |
| Class D Shares | | | | | | | | | | | | | | | | | | | | | |
| Proceeds from shares issued | | | | 5,145,054,934 | | | | | 5,313,772,326 | | | | | 803,965,836 | | | | | 678,932,724 | | |
| Dividends reinvested | | | | 168,447 | | | | | 6,750,797 | | | | | 15,388 | | | | | 627,361 | | |
| Value of shares redeemed | | | | (5,948,814,211 | ) | | | | (4,746,252,393 | ) | | | | (830,364,608 | ) | | | | (676,212,593 | ) | |
| Class D Shares capital transactions | | | | (803,590,830 | ) | | | | 574,270,730 | | | | | (26,383,384 | ) | | | | 3,347,492 | | |
| Class I Shares | | | | | | | | | | | | | | | | | | | | | |
| Proceeds from shares issued | | | | 245,346,401,955 | | | | | 278,371,602,337 | | | | | 10,836,056,744 | | | | | 11,551,666,641 | | |
| Dividends reinvested | | | | 4,196,879 | | | | | 54,988,045 | | | | | 257,339 | | | | | 3,589,766 | | |
| Value of shares redeemed | | | | (242,836,070,440 | ) | | | | (265,032,343,473 | ) | | | | (11,796,089,903 | ) | | | | (10,156,259,731 | ) | |
| Class I Shares capital transactions | | | | 2,514,528,394 | | | | | 13,394,246,909 | | | | | (959,775,820 | ) | | | | 1,398,996,676 | | |
| Intermediary Class Shares | | | | | | | | | | | | | | | | | | | | | |
| Proceeds from shares issued | | | | 8,909,982,412 | | | | | 9,191,560,775 | | | | | 975,831,213 | | | | | 1,815,669,451 | | |
| Dividends reinvested | | | | 29,654 | | | | | 2,928,724 | | | | | 3,772 | | | | | 29,433 | | |
| Value of shares redeemed | | | | (8,114,713,220 | ) | | | | (9,256,927,437 | ) | | | | (890,498,206 | ) | | | | (1,715,933,227 | ) | |
| Intermediary Class Shares capital transactions | | | | 795,298,846 | | | | | (62,437,938 | ) | | | | 85,336,779 | | | | | 99,765,657 | | |
| Intermediary Service Class Shares | | | | | | | | | | | | | | | | | | | | | |
| Proceeds from shares issued | | | | 5,177,885,534 | | | | | 2,746,721,783 | | | | | 1,415,669,614 | | | | | 340,050,975 | | |
| Dividends reinvested | | | | 56,668 | | | | | 559,285 | | | | | 54,455 | | | | | 472,478 | | |
| Value of shares redeemed | | | | (4,481,229,062 | ) | | | | (2,563,944,015 | ) | | | | (797,315,999 | ) | | | | (250,560,336 | ) | |
| Intermediary Service Class Shares capital transactions | | | | 696,713,140 | | | | | 183,337,053 | | | | | 618,408,070 | | | | | 89,963,117 | | |
| Class Y Shares | | | | | | | | | | | | | | | | | | | | | |
| Proceeds from shares issued | | | | 14,446,966,452 | | | | | 11,898,432,250 | | | | | 1,439,160,011 | | | | | 1,675,077,085 | | |
| Dividends reinvested | | | | 95,299 | | | | | 10,964,255 | | | | | 61,430 | | | | | 4,254,099 | | |
| Value of shares redeemed | | | | (14,335,711,143 | ) | | | | (12,573,448,563 | ) | | | | (1,535,171,847 | ) | | | | (1,894,810,387 | ) | |
| Class Y Shares capital transactions | | | | 111,350,608 | | | | | (664,052,058 | ) | | | | (95,950,406 | ) | | | | (215,479,203 | ) | |
| Change in net assets resulting from capital transactions | | | $ | 3,314,391,671 | | | | $ | 13,424,116,399 | | | | $ | (378,364,761 | ) | | | $ | 1,376,593,739 | | |
____________________
Amounts designated as "—" are $0.00 or have been rounded to $0.00.
| * | Share transactions are at net asset value of $1.00 per share. |
| 14 | HSBC FAMILY OF FUNDS | See notes to financial statements. |
| HSBC U.S. GOVERNMENT MONEY MARKET FUND |
| Financial Highlights |
Selected data for a share outstanding throughout the periods indicated.
| | | | | | | Investment Activities | | Distributions | | | | | | | | | | Ratios/Supplementary Data |
| | Net Asset
Value,
Beginning
of Period | | Net
Investment
Income | | Net
Realized
and
Unrealized
Gains
(Losses)
from
Investments | | Total from
Investment
Activities | | Net
Investment
Income | | Net Realized
Gains from
Investment
Transactions | | Total
Distributions | | Net Asset
Value, End
of Period | | Total
Return
(a) | | Net Assets at
End of Period
(000's) | | Ratio of Net
Expense to
Average Net
Assets
(b) | | Ratio of Net
Investment
Income to
Average Net
Assets
(b) | | Ratio of
Expenses
to Average
Net Assets
(Excluding
Fee
Reductions)
(b) |
| Class A Shares | | | | | | | | | | | | | | | | | | | | | | | | | | | | | | | | | | | | | | | | | | | | | | | | | | | | |
| Year Ended October 31, 2021 | | | $1.00 | | | | $— | | | | $— | | | | $— | | | | $— | | | | $— | | | | $— | | | | $1.00 | | | | 0.01% | | | | $1,766 | | | | 0.08% | | | | 0.01% | | | | 0.64% | |
| Year Ended October 31, 2020 | | | 1.00 | | | | — | | | | — | | | | — | | | | — | | | | — | | | | — | | | | 1.00 | | | | 0.38% | | | | 1,675 | | | | 0.42% | | | | 0.46% | | | | 0.65% | |
| Year Ended October 31, 2019 | | | 1.00 | | | | 0.02 | | | | — | | | | 0.02 | | | | (0.02) | | | | — | | | | (0.02) | | | | 1.00 | | | | 1.71% | | | | 2,923 | | | | 0.63% | | | | 1.70% | | | | 0.63% | |
| Year Ended October 31, 2018 | | | 1.00 | | | | 0.01 | | | | — | | | | 0.01 | | | | (0.01) | | | | — | | | | (0.01) | | | | 1.00 | | | | 1.05% | | | | 2,728 | | | | 0.63% | | | | 1.08% | | | | 0.65% | |
| Year Ended October 31, 2017 | | | 1.00 | | | | — | | | | — | | | | — | | | | — | | | | — | | | | — | | | | 1.00 | | | | 0.22% | | | | 1,998 | | | | 0.59% | | | | 0.23% | | | | 0.68% | |
| Class D Shares | | | | | | | | | | | | | | | | | | | | | | | | | | | | | | | | | | | | | | | | | | | | | | | | | | | | |
| Year Ended October 31, 2021 | | | $1.00 | | | | $— | | | | $— | | | | $— | | | | $— | | | | $— | | | | $— | | | | $1.00 | | | | 0.01% | | | | $1,680,757 | | | | 0.08% | | | | 0.01% | | | | 0.49% | |
| Year Ended October 31, 2020 | | | 1.00 | | | | — | | | | — | | | | — | | | | — | | | | — | | | | — | | | | 1.00 | | | | 0.44% | | | | 2,484,374 | | | | 0.32% | | | | 0.39% | | | | 0.50% | |
| Year Ended October 31, 2019 | | | 1.00 | | | | 0.02 | | | | — | | | | 0.02 | | | | (0.02) | | | | — | | | | (0.02) | | | | 1.00 | | | | 1.87% | | | | 1,910,115 | | | | 0.48% | | | | 1.84% | | | | 0.51% | |
| Year Ended October 31, 2018 | | | 1.00 | | | | 0.01 | | | | — | | | | 0.01 | | | | (0.01) | | | | — | | | | (0.01) | | | | 1.00 | | | | 1.20% | | | | 1,648,226 | | | | 0.48% | | | | 1.19% | | | | 0.51% | |
| Year Ended October 31, 2017 | | | 1.00 | | | | — | | | | — | | | | — | | | | — | | | | — | | | | — | | | | 1.00 | | | | 0.34% | | | | 1,645,222 | | | | 0.47% | | | | 0.32% | | | | 0.54% | |
| Class E Shares | | | | | | | | | | | | | | | | | | | | | | | | | | | | | | | | | | | | | | | | | | | | | | | | | | | | |
| October 31, 2016 through August 10, | | | | | | | | | | | | | | | | | | | | | | | | | | | | | | | | | | | | | | | | | | | | | | | | | | | | |
| 2017(c) | | | $1.00 | | | | — | | | | — | | | | — | | | | — | | | | — | | | | — | | | | $1.00 | | | | 0.26% | | | | — | | | | 0.23% | | | | 0.33% | | | | 0.29% | |
| Class I Shares | | | | | | | | | | | | | | | | | | | | | | | | | | | | | | | | | | | | | | | | | | | | | | | | | | | | |
| Year Ended October 31, 2021 | | | $1.00 | | | | $— | | | | $— | | | | $— | | | | $— | | | | $— | | | | $— | | | | $1.00 | | | | 0.03% | | | | $29,897,234 | | | | 0.06% | | | | 0.03% | | | | 0.14% | |
| Year Ended October 31, 2020 | | | 1.00 | | | | 0.01 | | | | — | | | | 0.01 | | | | (0.01) | | | | — | | | | (0.01) | | | | 1.00 | | | | 0.65% | | | | 27,383,086 | | | | 0.12% | | | | 0.44% | | | | 0.15% | |
| Year Ended October 31, 2019 | | | 1.00 | | | | 0.02 | | | | — | | | | 0.02 | | | | (0.02) | | | | — | | | | (0.02) | | | | 1.00 | | | | 2.23% | | | | 13,988,739 | | | | 0.12% | | | | 2.19% | | | | 0.16% | |
| Year Ended October 31, 2018 | | | 1.00 | | | | 0.02 | | | | — | | | | 0.02 | | | | (0.02) | | | | — | | | | (0.02) | | | | 1.00 | | | | 1.57% | | | | 6,400,700 | | | | 0.12% | | | | 1.52% | | | | 0.16% | |
| Year Ended October 31, 2017 | | | 1.00 | | | | 0.01 | | | | — | | | | 0.01 | | | | (0.01) | | | | — | | | | (0.01) | | | | 1.00 | | | | 0.69% | | | | 7,853,457 | | | | 0.12% | | | | 0.71% | | | | 0.18% | |
| Intermediary Class Shares | | | | | | | | | | | | | | | | | | | | | | | | | | | | | | | | | | | | | | | | | | | | | | | | | | | | |
| Year Ended October 31, 2021 | | | $1.00 | | | | $— | | | | $— | | | | $— | | | | $— | | | | $— | | | | $— | | | | $1.00 | | | | 0.02% | | | | $1,237,168 | | | | 0.07% | | | | 0.01% | | | | 0.29% | |
| Year Ended October 31, 2020 | | | 1.00 | | | | 0.01 | | | | — | | | | 0.01 | | | | (0.01) | | | | — | | | | (0.01) | | | | 1.00 | | | | 0.62% | | | | 441,888 | | | | 0.16% | | | | 0.63% | | | | 0.30% | |
| Year Ended October 31, 2019 | | | 1.00 | | | | 0.02 | | | | — | | | | 0.02 | | | | (0.02) | | | | — | | | | (0.02) | | | | 1.00 | | | | 2.20% | | | | 504,329 | | | | 0.15% | | | | 2.09% | | | | 0.30% | |
| Year Ended October 31, 2018 | | | 1.00 | | | | 0.02 | | | | — | | | | 0.02 | | | | (0.02) | | | | — | | | | (0.02) | | | | 1.00 | | | | 1.52% | | | | 164,082 | | | | 0.16% | | | | 1.57% | | | | 0.31% | |
| Year Ended October 31, 2017 | | | 1.00 | | | | 0.01 | | | | — | | | | 0.01 | | | | (0.01) | | | | — | | | | (0.01) | | | | 1.00 | | | | 0.63% | | | | 19,694 | | | | 0.18% | | | | 0.65% | | | | 0.33% | |
| Intermediary Service Class Shares | | | | | | | | | | | | | | | | | | | | | | | | | | | | | | | | | | | | | | | | | | | | | | | | | | | | |
| Year Ended October 31, 2021 | | | $1.00 | | | | $— | | | | $— | | | | $— | | | | $— | | | | $— | | | | $— | | | | $1.00 | | | | 0.02% | | | | $1,026,492 | | | | 0.07% | | | | 0.01% | | | | 0.34% | |
| Year Ended October 31, 2020 | | | 1.00 | | | | 0.01 | | | | — | | | | 0.01 | | | | (0.01) | | | | — | | | | (0.01) | | | | 1.00 | | | | 0.60% | | | | 329,786 | | | | 0.17% | | | | 0.39% | | | | 0.35% | |
| Year Ended October 31, 2019 | | | 1.00 | | | | 0.02 | | | | — | | | | 0.02 | | | | (0.02) | | | | — | | | | (0.02) | | | | 1.00 | | | | 2.17% | | | | 146,441 | | | | 0.18% | | | | 2.15% | | | | 0.36% | |
| Year Ended October 31, 2018 | | | 1.00 | | | | 0.01 | | | | — | | | | 0.01 | | | | (0.01) | | | | — | | | | (0.01) | | | | 1.00 | | | | 1.50% | | | | 184,921 | | | | 0.18% | | | | 1.70% | | | | 0.36% | |
| Year Ended October 31, 2017 | | | 1.00 | | | | 0.01 | | | | — | | | | 0.01 | | | | (0.01) | | | | — | | | | (0.01) | | | | 1.00 | | | | 0.61% | | | | 57,042 | | | | 0.20% | | | | 0.63% | | | | 0.39% | |
| Class Y Shares | | | | | | | | | | | | | | | | | | | | | | | | | | | | | | | | | | | | | | | | | | | | | | | | | | | | |
| Year Ended October 31, 2021 | | | $1.00 | | | | $— | | | | $— | | | | $— | | | | $— | | | | $— | | | | $— | | | | $1.00 | | | | 0.01% | | | | $1,386,114 | | | | 0.08% | | | | 0.01% | | | | 0.24% | |
| Year Ended October 31, 2020 | | | 1.00 | | | | 0.01 | | | | — | | | | 0.01 | | | | (0.01) | | | | — | | | | (0.01) | | | | 1.00 | | | | 0.56% | | | | 1,274,781 | | | | 0.21% | | | | 0.63% | | | | 0.25% | |
| Year Ended October 31, 2019 | | | 1.00 | | | | 0.02 | | | | — | | | | 0.02 | | | | (0.02) | | | | — | | | | (0.02) | | | | 1.00 | | | | 2.12% | | | | 1,938,856 | | | | 0.23% | | | | 2.10% | | | | 0.26% | |
| Year Ended October 31, 2018 | | | 1.00 | | | | 0.01 | | | | — | | | | 0.01 | | | | (0.01) | | | | — | | | | (0.01) | | | | 1.00 | | | | 1.45% | | | | 1,757,925 | | | | 0.23% | | | | 1.43% | | | | 0.26% | |
| Year Ended October 31, 2017 | | | 1.00 | | | | 0.01 | | | | — | | | | 0.01 | | | | (0.01) | | | | — | | | | (0.01) | | | | 1.00 | | | | 0.58% | | | | 2,402,354 | | | | 0.23% | | | | 0.53% | | | | 0.29% | |
| (a) | Not annualized for periods less than one year. Total return calculations do not include any sales or redemption charges. |
| (b) | Annualized for periods less than one year. |
| (c) | Closed operations on August 10, 2017. |
Amounts designated as “—“ are $0.00 or have been rounded to $0.00. |
| See notes to financial statements. | HSBC FAMILY OF FUNDS | 15 |
HSBC U.S. TREASURY MONEY MARKET FUND |
Financial Highlights
Selected data for a share outstanding throughout the periods indicated.
| | | | | Investment Activities | | Distributions | | | | | | | | | | Ratios/Supplementary Data |
| Net Asset
Value,
Beginning
of Period | | Net
Investment
Income | | Net
Realized
and
Unrealized
Gains
(Losses)
from
Investments | | Total from
Investment
Activities | | Net
Investment
Income | | Net Realized
Gains from
Investment
Transactions | | Total
Distributions | | Net Asset
Value, End
of Period | | Total
Return
(a) | | Net Assets at
End of Period
(000's) | | Ratio of Net
Expense to
Average Net
Assets
(b) | | Ratio of Net
Investment
Income to
Average Net
Assets
(b) | | Ratio of
Expenses
to Average
Net Assets
(Excluding
Fee
Reductions)
(b) |
| Class D Shares | | | | | | | | | | | | | | | | | | | | | | | | | | | | | | | | | | | | | | | | | | | | | | | | | | | |
| Year Ended October 31, 2021 | | $1.00 | | | | $— | | | | $— | | | | $— | | | | $— | | | | $— | | | | $— | | | | $1.00 | | | | 0.02% | | | | $120,467 | | | | 0.06% | | | | 0.02% | | | | 0.51% | |
| Year Ended October 31, 2020 | | 1.00 | | | | — | | | | — | | | | — | | | | — | | | | — | | | | — | | | | 1.00 | | | | 0.44% | | | | 146,852 | | | | 0.35% | | | | 0.42% | | | | 0.52% | |
| Year Ended October 31, 2019 | | 1.00 | | | | 0.02 | | | | — | | | | 0.02 | | | | (0.02) | | | | — | | | | (0.02) | | | | 1.00 | | | | 1.79% | | | | 143,506 | | | | 0.50% | | | | 1.79% | | | | 0.53% | |
| Year Ended October 31, 2018 | | 1.00 | | | | 0.01 | | | | — | | | | 0.01 | | | | (0.01) | | | | — | | | | (0.01) | | | | 1.00 | | | | 1.17% | | | | 308,136 | | | | 0.50% | | | | 1.12% | | | | 0.53% | |
| Year Ended October 31, 2017 | | 1.00 | | | | — | | | | — | | | | — | | | | — | | | | — | | | | — | | | | 1.00 | | | | 0.29% | | | | 257,062 | | | | 0.49% | | | | 0.28% | | | | 0.55% | |
| Class E Shares | | | | | | | | | | | | | | | | | | | | | | | | | | | | | | | | | | | | | | | | | | | | | | | | | | | |
| October 31, 2016 through August 10, | | | | | | | | | | | | | | | | | | | | | | | | | | | | | | | | | | | | | | | | | | | | | | | | | | | |
| 2017(c) | | $1.00 | | | | — | | | | — | | | | — | | | | — | | | | — | | | | — | | | | $1.00 | | | | 0.29% | | | | — | | | | 0.25% | | | | 0.37% | | | | 0.29% | |
| Class I Shares | | | | | | | | | | | | | | | | | | | | | | | | | | | | | | | | | | | | | | | | | | | | | | | | | | | |
| Year Ended October 31, 2021 | | $1.00 | | | | $— | | | | $— | | | | $— | | | | $— | | | | $— | | | | $— | | | | $1.00 | | | | 0.01% | | | | $1,318,598 | | | | 0.06% | | | | 0.02% | | | | 0.16% | |
| Year Ended October 31, 2020 | | 1.00 | | | | 0.01 | | | | — | | | | 0.01 | | | | (0.01) | | | | — | | | | (0.01) | | | | 1.00 | | | | 0.64% | | | | 2,278,404 | | | | 0.14% | | | | 0.37% | | | | 0.16% | |
| Year Ended October 31, 2019 | | 1.00 | | | | 0.02 | | | | — | | | | 0.02 | | | | (0.02) | | | | — | | | | (0.02) | | | | 1.00 | | | | 2.16% | | | | 879,396 | | | | 0.14% | | | | 2.13% | | | | 0.18% | |
| Year Ended October 31, 2018 | | 1.00 | | | | 0.02 | | | | — | | | | 0.02 | | | | (0.02) | | | | — | | | | (0.02) | | | | 1.00 | | | | 1.54% | | | | 707,804 | | | | 0.14% | | | | 1.53% | | | | 0.18% | |
| Year Ended October 31, 2017 | | 1.00 | | | | 0.01 | | | | — | | | | 0.01 | | | | (0.01) | | | | — | | | | (0.01) | | | | 1.00 | | | | 0.64% | | | | 861,944 | | | | 0.14% | | | | 0.65% | | | | 0.19% | |
| Intermediary Class Shares | | | | | | | | | | | | | | | | | | | | | | | | | | | | | | | | | | | | | | | | | | | | | | | | | | | |
| Year Ended October 31, 2021 | | $1.00 | | | | $— | | | | $— | | | | $— | | | | $— | | | | $— | | | | $— | | | | $1.00 | | | | 0.01% | | | | $350,940 | | | | 0.06% | | | | 0.01% | | | | 0.31% | |
| Year Ended October 31, 2020 | | 1.00 | | | | 0.01 | | | | — | | | | 0.01 | | | | (0.01) | | | | — | | | | (0.01) | | | | 1.00 | | | | 0.63% | | | | 265,607 | | | | 0.16% | | | | 0.48% | | | | 0.32% | |
| Year Ended October 31, 2019 | | 1.00 | | | | 0.02 | | | | — | | | | 0.02 | | | | (0.02) | | | | — | | | | (0.02) | | | | 1.00 | | | | 2.14% | | | | 165,842 | | | | 0.16% | | | | 2.10% | | | | 0.33% | |
| Year Ended October 31, 2018 | | 1.00 | | | | 0.01 | | | | — | | | | 0.01 | | | | (0.01) | | | | — | | | | (0.01) | | | | 1.00 | | | | 1.49% | | | | 169,827 | | | | 0.16% | | | | 1.54% | | | | 0.33% | |
| Year Ended October 31, 2017 | | 1.00 | | | | — | | | | — | | | | — | | | | — | | | | — | | | | — | | | | 1.00 | | | | 0.44% | | | | 1 | | | | 0.18% | | | | 0.44% | | | | 0.34% | |
| Intermediary Service Class Shares | | | | | | | | | | | | | | | | | | | | | | | | | | | | | | | | | | | | | | | | | | | | | | | | | | | |
| Year Ended October 31, 2021 | | $1.00 | | | | $— | | | | $— | | | | $— | | | | $— | | | | $— | | | | $— | | | | $1.00 | | | | 0.01% | | | | $794,437 | | | | 0.06% | | | | 0.00% | | | | 0.36% | |
| Year Ended October 31, 2020 | | 1.00 | | | | 0.01 | | | | — | | | | 0.01 | | | | (0.01) | | | | — | | | | (0.01) | | | | 1.00 | | | | 0.61% | | | | 176,037 | | | | 0.17% | | | | 0.47% | | | | 0.37% | |
| Year Ended October 31, 2019 | | 1.00 | | | | 0.02 | | | | — | | | | 0.02 | | | | (0.02) | | | | — | | | | (0.02) | | | | 1.00 | | | | 2.12% | | | | 86,073 | | | | 0.18% | | | | 2.10% | | | | 0.38% | |
| Year Ended October 31, 2018 | | 1.00 | | | | 0.01 | | | | — | | | | 0.01 | | | | (0.01) | | | | — | | | | (0.01) | | | | 1.00 | | | | 1.49% | | | | 51,220 | | | | 0.18% | | | | 1.54% | | | | 0.38% | |
| Year Ended October 31, 2017 | | 1.00 | | | | 0.01 | | | | — | | | | 0.01 | | | | (0.01) | | | | — | | | | (0.01) | | | | 1.00 | | | | 0.58% | | | | 22,016 | | | | 0.20% | | | | 0.58% | | | | 0.40% | |
| Class Y Shares | | | | | | | | | | | | | | | | | | | | | | | | | | | | | | | | | | | | | | | | | | | | | | | | | | | |
| Year Ended October 31, 2021 | | $1.00 | | | | $— | | | | $— | | | | $— | | | | $— | | | | $— | | | | $— | | | | $1.00 | | | | 0.01% | | | | $440,144 | | | | 0.06% | | | | 0.02% | | | | 0.26% | |
| Year Ended October 31, 2020 | | 1.00 | | | | 0.01 | | | | — | | | | 0.01 | | | | (0.01) | | | | — | | | | (0.01) | | | | 1.00 | | | | 0.56% | | | | 536,101 | | | | 0.22% | | | | 0.63% | | | | 0.27% | |
| Year Ended October 31, 2019 | | 1.00 | | | | 0.02 | | | | — | | | | 0.02 | | | | (0.02) | | | | — | | | | (0.02) | | | | 1.00 | | | | 2.05% | | | | 751,584 | | | | 0.25% | | | | 2.03% | | | | 0.28% | |
| Year Ended October 31, 2018 | | 1.00 | | | | 0.01 | | | | — | | | | 0.01 | | | | (0.01) | | | | — | | | | (0.01) | | | | 1.00 | | | | 1.43% | | | | 697,972 | | | | 0.25% | | | | 1.37% | | | | 0.28% | |
| Year Ended October 31, 2017 | | 1.00 | | | | 0.01 | | | | — | | | | 0.01 | | | | (0.01) | | | | — | | | | (0.01) | | | | 1.00 | | | | 0.53% | | | | 1,101,219 | | | | 0.25% | | | | 0.56% | | | | 0.29% | |
| (a) | Not annualized for periods less than one year. Total return calculations do not include any sales or redemption charges. |
| (b) | Annualized for periods less than one year. |
| (c) | Closed operations on August 10, 2017. |
Amounts designated as “—“ are $0.00 or have been rounded to $0.00. |
| 16 | HSBC FAMILY OF FUNDS | See notes to financial statements. |
| HSBC FAMILY OF FUNDS |
| Notes to Financial Statements—October 31, 2021 |
1. Organization:
The HSBC Funds (the “Trust”), a Delaware statutory trust organized on March 2, 2016, is registered under the Investment Company Act of 1940, as amended (the “Act”), as an open-end management investment company. As of October 31, 2021, the Trust is composed of 5 separate operational funds, each a series of the HSBC Family of Funds. The accompanying financial statements are presented for the following two diversified funds (individually a “Fund”, collectively the “Funds”) of the Trust:
| Fund | | Short Name |
| HSBC U.S. Government Money Market Fund | | U.S. Government Money Market Fund |
| HSBC U.S. Treasury Money Market Fund | | U.S. Treasury Money Market Fund |
Financial statements for all other funds of the Trust are published separately.
Both of the Funds are government money market funds (as defined in Rule 2a-7) and seek to maintain a stable net asset value (“NAV”) of $1.00 per share, although it is possible to lose money by investing in the Funds. The Funds are authorized to issue an unlimited number of shares of beneficial interest with a par value of $0.001 per share. Each of the Funds has eight classes of shares: Class A Shares, Class C Shares, Class D Shares, Class E Shares, Class I Shares, Intermediary Class Shares, Intermediary Service Class Shares and Class Y Shares. Class C Shares of the Funds are offered without any front-end sales charge but will be subject to a maximum CDSC of 1.00% if redeemed less than one year after purchase. Class C Shares are not offered for sale, but are offered as an exchange option for Class C shareholders of the Trust’s other funds. No sales charges are assessed with respect to Class A, Class D, Class E, Class I, Intermediary Class, Intermediary Service Class or Class Y Shares of the Funds. Each class of shares in each Fund has identical rights and privileges, except with respect to arrangements pertaining to shareholder servicing and/or distribution, class- related expenses, voting rights on matters affecting a single class of shares, and exchange privileges.
Under the Trust’s organizational documents, the Trust’s officers and Trustees are indemnified against certain liabilities arising out of the performance of their duties to the Funds. In addition, in the normal course of business, the Trust may enter into contracts with its service providers, which also provide for indemnifications by the Funds. The Funds’ maximum exposure under these arrangements is unknown as this would involve future claims that may be made against the Funds. However, based on experience, the Trust believes the risk of loss to be remote.
The Funds are investment companies and follow accounting and reporting guidance under Financial Accounting Standards Board (“FASB”) Accounting Standards Codification Topic 946, “Financial Services-Investment Companies.”
2. Significant Accounting Policies:
The following is a summary of the significant accounting policies followed by the Funds in the preparation of their financial statements. The policies are in conformity with generally accepted accounting principles in the United States of America (“GAAP”). The preparation of financial statements requires management to make certain estimates and assumptions that affect the reported amounts of assets and liabilities and disclosure of contingent assets and liabilities at the date of the financial statements and the reported amounts of increases and decreases in net assets from operations during the reporting period. Actual results could differ from those estimates.
Securities Valuation:
Investments of the Funds, other than investments in other money market funds, are valued using the amortized cost method pursuant to Rule 2a-7 under the Act, provided that certain conditions are met. Generally, amortized cost approximates fair value. Investments in other money market funds are priced at NAV as reported by such investment companies. Repurchase agreements are valued at original cost. Fair value is defined as the price that would be received to sell an asset or paid to transfer a liability in an orderly transaction between
| HSBC FAMILY OF FUNDS |
| Notes to Financial Statements—October 31, 2021 (continued) |
market participants at the measurement date. The valuation techniques used to determine fair value are further described in Note 3 below.
Investment Transactions and Related Income:
Investment transactions are accounted for no later than one business day after trade date. However, for financial reporting purposes, investment transactions are accounted for on trade date on the last business day of the reporting period. Investment gains and losses are calculated on the identified cost basis. Interest income is determined on the basis of coupon interest accrued using the effective interest method which adjusts for amortization of premiums and accretion of discounts. Dividend income is recorded on the ex-dividend date.
Repurchase Agreements:
The U.S. Government Money Market Fund may enter into repurchase agreements with an entity which is a member of the Federal Reserve System or which is a “primary dealer” (as designated by the Federal Reserve Bank of New York) in U.S. government obligations. The U.S. Government Money Market Fund may also enter into a repurchase agreement with the Federal Reserve Bank of New York, the Fixed Income Clearing Corporation, or certain counterparties approved by the Investment Adviser (as defined in Note 4). The U.S. Treasury Money Market Fund may temporarily invest in repurchase agreements collateralized by U.S. Treasury Obligations under adverse market conditions. The repurchase price generally equals the price paid by a Fund plus interest negotiated on the basis of current short-term rates, which may be more or less than the rate on the underlying portfolio securities. The seller, under a repurchase agreement, is required to maintain the collateral held pursuant to the agreement, with a fair value equal to or greater than the repurchase price (including accrued interest). Securities subject to repurchase agreements are held by the Funds’ custodian or another qualified custodian or in the Federal Reserve/ Treasury book-entry system. Master Repurchase Agreements (“MRA”) permit the Fund, under certain circumstances, including an event of default (such as bankruptcy or insolvency), to offset receivables under the MRA with collateral posted by the counterparty and create one net payment due to or from the Fund. However, bankruptcy or insolvency laws of a particular jurisdiction may impose restrictions on or prohibitions against such a right of offset in the event of the MRA counterparty’s bankruptcy or insolvency. Pursuant to terms of the MRA, the Fund receives securities as collateral with a market value in excess of the repurchase price to be received by the Fund upon the maturity of the transaction. Upon bankruptcy or insolvency of the MRA counterparty, the Fund would recognize a liability with respect to such excess collateral to reflect the Fund’s obligation under bankruptcy law to return the excess to the counterparty. There is potential for loss to a Fund in the event the Fund is delayed or prevented from exercising its rights to dispose of the collateral securities, including the risk of a possible decline in the fair value of the underlying securities during the period while the Fund seeks to assert its rights.
Cash:
Cash is held in deposit accounts at the Funds’ custodian bank, The Northern Trust Company (“Custodian”), and is a significant portion of the net assets, which may exceed the amount insured by the Federal Deposit Insurance Corporation (“FDIC”). To the extent that such balances exceed FDIC insurance limits, the Funds are subject to the creditworthiness of the Custodian.
Allocations:
Expenses directly attributable to a Fund are charged to that Fund. Expenses not directly attributable to a Fund are allocated among the applicable series within the Trust equally to each fund, in relation to its net assets, or another appropriate basis. Class specific expenses are charged directly to the class incurring the expense. In addition, income, expenses (other than class specific expenses), and unrealized and realized gains and losses are allocated to each class based on relative net assets on a daily basis.
Distributions to Shareholders:
Dividends distributed to shareholders of the Funds from net investment income, if any, are declared daily and distributed monthly from each Fund. Distributions from net realized gains, if any, are declared and paid at least annually by the Funds. Additional distributions are also made to the Funds’ shareholders to the extent
| HSBC FAMILY OF FUNDS |
| Notes to Financial Statements—October 31, 2021 (continued) |
necessary to avoid the federal excise tax on certain undistributed income and net realized gains of regulated investment companies.
Federal Income Taxes:
Each Fund is a separate taxable entity for federal income tax purposes. Each Fund has qualified and intends to continue to qualify each year as a “regulated investment company” under Subchapter M of the Internal Revenue Code, as amended, and to distribute substantially all of its taxable net investment income and net realized gains, if any, to its shareholders. Accordingly, no provision for federal income or excise tax is required for the Funds, although shareholders may be taxed on distributions they receive.
Management of the Funds has reviewed tax positions taken in tax years that remain subject to examination by all major tax jurisdictions, including federal (i.e., the last four tax year ends and the interim tax period since then, as applicable). Management believes that there is no tax liability resulting from unrecognized tax benefits related to uncertain tax positions taken. Management’s conclusions may be subject to future review based on changes in, or interpretation of, accounting standards or tax laws and regulations.
3. Investment Valuation Summary
The valuation techniques employed by the Funds, as described below, maximize the use of observable inputs and minimize the use of unobservable inputs in determining fair value. The Funds’ investments are classified within the fair value hierarchy based on the lowest level of input that is significant to the fair value measurement. The inputs used for valuing the Funds’ investments are summarized in the three broad levels listed below:
| ● | Level 1—quoted prices in active markets for identical assets |
| | |
| ● | Level 2—other significant observable inputs (including quoted prices for similar securities, interest rates, prepayments speeds, credit risk, etc.) |
| | |
| ● | Level 3—significant unobservable inputs (including the Fund’s own assumptions in determining the fair value of investments) |
Changes in valuation techniques may result in transfers in or out of an assigned level within the fair value hierarchy. The inputs or methodology used for valuing investments are not necessarily an indication of the risk associated with investing in those investments.
Investments of the Funds, other than investments in other money market funds, are valued using the amortized cost method pursuant to Rule 2a-7 under the Act, and are typically categorized as Level 2 in the fair value hierarchy. The amortized cost method involves valuing an instrument at its cost initially and thereafter assuming a constant amortization to maturity of any discounts or premium, regardless of the impact of fluctuating interest rates on the market value of the instrument. The amortized cost method may result in periods during which value, as determined by amortized cost, is higher or lower than the price a Fund holding the instrument would receive if it sold the instrument. The fair value of securities in the Funds can be expected to vary with changes in prevailing interest rates.
Investments in other money market funds are priced at NAV as reported by such money market funds and are typically categorized as Level 1 in the fair value hierarchy.
| HSBC FAMILY OF FUNDS |
| Notes to Financial Statements—October 31, 2021 (continued) |
The following is a summary of the valuation inputs used as of October 31, 2021 in valuing the Funds’ investments based upon the three levels defined above. The breakdown of investment categorization is disclosed in the Schedule of Portfolio Investments for each Fund.
| | Level 1 ($) | | Level 2 ($) | | Level 3 ($) | | Total ($) |
| U.S. Government Money Market Fund | | | | | | | | |
| Investment Securities: | | | | | | | | |
U.S. Government and Government
Agency Obligations | | — | | 7,513,471,229 | | — | | 7,513,471,229 |
| U.S. Treasury Obligations | | — | | 10,462,879,670 | | — | | 10,462,879,670 |
| Investment Companies | | 1,096,397,755 | | — | | — | | 1,096,397,755 |
| Repurchase Agreements | | — | | 16,934,999,587 | | — | | 16,934,999,587 |
| Total Investment Securities | | 1,096,397,755 | | 34,911,350,486 | | — | | 36,007,748,241 |
| |
| U.S. Treasury Money Market Fund | | | | | | | | |
| Investment Securities: | | | | | | | | |
| U.S. Treasury Obligations | | — | | 3,139,053,465 | | — | | 3,139,053,465 |
| Total Investment Securities | | — | | 3,139,053,465 | | — | | 3,139,053,465 |
4. Related Party Transactions and Other Agreements and Plans:
Investment Management:
HSBC Global Asset Management (USA) Inc. (“HSBC” or the “Investment Adviser”), a wholly owned subsidiary of HSBC USA, Inc., a registered bank holding company under the laws of the United States, acts as Investment Adviser to the Funds. As Investment Adviser, HSBC manages the investments of the Funds and continuously reviews, supervises and administers the Funds’ investments pursuant to an Investment Advisory Contract. For its services in this capacity, HSBC receives a fee from each Fund, accrued daily and paid monthly, based on the average daily net assets of each respective Fund, at an annual rate of 0.10%.
HSBC also provides operational support services to the Funds pursuant to an Operational Support Services Agreement in connection with the operation of certain classes of shares of the Funds. For its services in this capacity, HSBC is entitled to receive a fee, accrued daily and paid monthly, based on the average daily net assets of Class A Shares, Class C Shares, Class D Shares, Intermediary Class Shares, Intermediary Service Class Shares and Class Y Shares, at an annual rate of 0.10%.
HSBC has entered into agreements with certain financial intermediaries (the “Servicers”) to provide recordkeeping, reporting and processing services to the Funds. The Servicers are paid by the Investment Adviser, and not by the Funds, for these services. Since these fees are paid for by the Investment Adviser, they do not represent an additional charge to the Funds or their shareholders and are not reflected in the Funds’ expenses.
Administration, Fund Accounting and Other Services:
HSBC also serves the Funds as Administrator. Under the terms of the Administration Services Agreement, HSBC receives from the Funds (as well as other funds in the Trust combined) a fee, accrued daily and paid monthly, at an annual rate of:
| Based on Average Daily Net Assets of | | Fee Rate (%) |
| Up to $10 billion | | 0.0400 |
| In excess of $10 billion but not exceeding $20 billion | | 0.0350 |
| In excess of $20 billion but not exceeding $50 billion | | 0.0265 |
| In excess of $50 billion | | 0.0245 |
The fee rates and breakpoints are determined on the basis of the aggregate average daily net assets of the Trust. For the year ended October 31, 2021, the effective annualized rate was 0.033%, prior to any fee waivers or expense reimbursements, based on the average daily net assets of the Trust. The total administration fee
| HSBC FAMILY OF FUNDS |
| Notes to Financial Statements—October 31, 2021 (continued) |
paid to HSBC is allocated to each series based upon its proportionate share of the aggregate net assets of the Trust subject to certain allocations in cases where one fund invests some or all of its assets in another fund.
Pursuant to a Sub-Administration Services Agreement with HSBC, Citi Fund Services Ohio, Inc. (“Citi”), a wholly-owned subsidiary of Citigroup, Inc., serves as the Trust’s Sub-Administrator. For these services, Citi is entitled to a fee, payable by HSBC, at an annual rate equivalent to the fee rates set forth below:
| Based on Average Daily Net Assets of | | Fee Rate (%) |
| Up to $10 billion | | 0.0200 |
| In excess of $10 billion but not exceeding $20 billion | | 0.0150 |
| In excess of $20 billion but not exceeding $50 billion | | 0.0065 |
| In excess of $50 billion | | 0.0045 |
Under a Services Agreement between the Trust and Citi (the “Services Agreement”), Citi makes an individual available to serve as the Trust’s Chief Compliance Officer (the “CCO”). Citi also provides infrastructure and support in implementing the written policies and procedures comprising the Trust’s compliance program, including support services to the CCO. For the services provided under the Services Agreement, the Trust paid Citi $313,915 for the year ended October 31, 2021, plus reimbursement of certain out-of-pocket expenses. Expenses incurred by each Fund are reflected on the Statements of Operations as “Compliance Services.” Citi pays the salary and other compensation earned by individuals performing these services, as employees of Citi.
In addition, Citi provides fund accounting services for each Fund under the Services Agreement. As fund accountant, Citi receives an annual fee per Fund and share class, subject to certain minimums and reimbursements of certain expenses. Citi receives additional fees paid by the Trust for regulatory administration services and money market fund reporting services.
Distribution Arrangements:
Foreside Distribution Services, L.P. (“Foreside” or the “Distributor”) serves the Trust as Distributor. The Trust has adopted a non-compensatory Distribution Plan and Agreement (the “Distribution Plan”) pursuant to Rule 12b-1 of the Act. The Distribution Plan provides for reimbursement of expenses incurred by the Distributor related to distribution and marketing, at a rate not to exceed 0.25%, 1.00% and 0.25% of the average daily net assets of Class A Shares (currently not being charged), Class C Shares (currently charging 0.75%) and Class D Shares (currently not being charged) of the Funds, respectively. For the year ended October 31, 2021, Foreside received $267 in commissions from sales of the Trust.
Expenses reduced during the year ended October 31, 2021 are reflected on the Statements of Operations as “Fees voluntarily reduced by Distributor”, as applicable.
Shareholder Servicing:
The Trust has adopted a Shareholder Services Plan, which provides for payments to shareholder servicing agents (which includes HSBC and its affiliates) for providing various shareholder services. As disclosed in the Statements of Operations, for the current fiscal period certain amounts of the Shareholder Servicing Fees have been waived by those shareholder servicing agents, including HSBC and its affiliates. Expenses reduced during the year ended October 31, 2021 are reflected on the Statements of Operations as “Fees voluntarily reduced
| HSBC FAMILY OF FUNDS |
| Notes to Financial Statements—October 31, 2021 (continued) |
by Shareholder Servicing Agent.” For performing these services, the shareholder servicing agents are entitled to receive a fee that is computed daily and paid monthly up to the following:
| Share Class | | Fee Rate (%) |
| Class A Shares | | | 0.60% | * |
| Class C Shares | | | 0.25% | |
| Class D Shares | | | 0.25% | |
| Class E Shares | | | 0.10% | |
| Intermediary Class Shares | | | 0.05% | |
| Intermediary Service Class Shares | | | 0.10% | |
____________________
*Currently charging 0.40%
The aggregate fees paid to the Distributor pursuant to the Distribution Plan and to shareholder servicing agents pursuant to the Shareholder Services Plan may not exceed, in the aggregate, the following:
| Share Class | | Fee Rate (%) |
| Class A Shares | | | 0.60% | |
| Class C Shares | | | 1.00% | |
| Class D Shares | | | 0.25% | |
| Class E Shares | | | 0.10% | |
| Intermediary Class Shares | | | 0.05% | |
| Intermediary Service Class Shares | | | 0.10% | |
The Trust has entered into shareholder services contracts with affiliated and unaffiliated financial intermediaries who provide shareholder services and other related services to their clients or customers who invest in the Funds under which the Funds will pay all or a portion of such fees earned to financial intermediaries for performing such services.
Transfer Agency:
DST Asset Manager Solutions, Inc. (“DST”) provides transfer agency services for each Fund. As transfer agent, DST receives a fee based on the number of funds and shareholder accounts, subject to certain minimums, and reimbursement of certain expenses.
Independent Trustees:
The Trust pays an annual retainer to each Independent Trustee, plus additional annual retainers to each Committee Chair and the Chairman of the Board of Trustees (the “Board”). The Independent Trustees also receive a fee for each regular, special in-person, and telephonic meeting of the Board attended. The aggregate amount of the fees and expenses of the Independent Trustees are allocated amongst all the funds in the Trust and are presented in the Statements of Operations.
Fee Reductions:
The Investment Adviser has agreed to contractually limit through March 1, 2022 the total annual expenses of certain classes of the Funds, exclusive of interest, taxes, brokerage commissions, extraordinary expenses and estimated indirect expenses attributable to each Fund’s investments in investment companies, as applicable.
| HSBC FAMILY OF FUNDS |
| Notes to Financial Statements—October 31, 2021 (continued) |
The applicable classes of each Fund have their own expense limitations based on the average daily net assets for any full fiscal year as follows:
| | | | Contractual |
| | | | Expense |
| | Class | | Limitations (%) |
| U.S. Government Money Market Fund | | E | | 0.25 |
| U.S. Government Money Market Fund | | I | | 0.14 |
| | Intermediary Class | | |
| U.S. Government Money Market Fund | | Shares | | 0.18 |
| | Intermediary Service | | |
| U.S. Government Money Market Fund | | Class Shares | | 0.20 |
| U.S. Treasury Money Market Fund | | E | | 0.25 |
| U.S. Treasury Money Market Fund | | I | | 0.14 |
| | Intermediary Class | | |
| U.S. Treasury Money Market Fund | | Shares | | 0.18 |
| | Intermediary Service | | |
| U.S. Treasury Money Market Fund | | Class Shares | | 0.20 |
Any amounts contractually waived or reimbursed by the Investment Adviser will be subject to repayment by the respective Fund to the Investment Adviser within three years calculated monthly from when the waiver or reimbursement is recorded to the extent that the repayment will not cause the Fund’s operating expenses to exceed the contractual expense limit that was in effect at the time of such waiver or reimbursement. As of October 31, 2021, the repayments that may potentially be made by the Funds are as follows:
| | Amount Eligible Through |
| | 2024 ($) | | 2023 ($) | �� | 2022 ($) | | Total ($) |
| U.S. Government Money Market Fund | | 3,148,724 | | 1,881,829 | | 1,734,355 | | 6,764,908 |
| U.S. Treasury Money Market Fund | | 1,813,309 | | 649,884 | | 482,618 | | 2,945,811 |
In addition to the contractual expense limitation agreement with the Funds, in an effort to avoid a negative yield for the Funds, the Investment Adviser, working in conjunction with the Funds’ other service providers, has voluntarily undertaken through a combination of waivers and reductions in fees and expenses, including shareholder servicing fees, to temporarily limit net operating expenses in excess of each Fund’s daily yield. The Investment Adviser may terminate these temporary waiver and expense limitation efforts at any time and shareholders should not expect these temporary waiver and expense limitation efforts to continue indefinitely.
In addition, Citi may voluntarily waive/reimburse fees to help support the expense limits of the Funds. In addition, HSBC, in its role as Investment Adviser and Administrator, may waive/reimburse additional fees at its discretion. Any voluntary fee waivers/reimbursements are not subject to recoupment in subsequent fiscal periods. Voluntary waivers/reimbursements may be eliminated or changed at any time. Amounts waived/ reimbursed by the Investment Adviser, Administrator and Citi as Sub-Administrator are reported separately on the Statements of Operations, as applicable.
During the year ended October 31, 2021, the following amounts of expenses were voluntarily and contractually waived:
| | | | | | | | | | | | | | Intermediary | | Intermediary | | |
| | Class A ($) | | Class C ($) | | Class D ($) | | Class E ($) | | Class I ($) | | Class Y ($) | | Class ($) | | Service ($) | | Total ($) |
| U.S. Government Money | | | | | | | | | | | | | | | | | | |
| Market Fund | | 9,254 | | — | | 8,329,008 | | — | | 22,468,425 | | 2,066,832 | | 3,089,700 | | 2,088,043 | | 38,051,262 |
| U.S. Treasury Money | | | | | | | | | | | | | | | | | | |
| Market Fund | | — | | — | | 570,193 | | — | | 2,151,277 | | 903,095 | | 877,379 | | 1,624,281 | | 6,126,225 |
| HSBC FAMILY OF FUNDS |
| Notes to Financial Statements—October 31, 2021 (continued) |
The Funds have entered into an arrangement with their Custodian whereby credits realized as a result of uninvested cash balances are used to reduce the Custodian’s expenses. Expenses reduced during the year ended October 31, 2021 are reflected on the Statements of Operations as “Custody earnings credits,” as applicable.
Overdraft Facility:
The Funds have entered into an arrangement with the Custodian whereby an uncommitted, secured overdraft facility is made available to meet unanticipated end-of-day liquidity needs of the Funds which cannot be fulfilled by trading activities. The interest rate on overdraft amounts is calculated at an annual rate of 0.50% plus the Federal Funds Rate. The overdraft facility is limited to $750,000,000 and $50,000,000 for the U.S. Government Money Market Fund and the U.S. Treasury Money Market Fund, respectively. As of October 31, 2021, the Funds did not have any overdrafts outstanding. Fees incurred during the year ended October 31, 2021 by the Funds on overdrafts are reflected on the Statements of Operations within the “Custodian” expenses, and were as follows:
| | Total ($) |
| U.S. Government Money Market Fund | | 4,523 |
| U.S. Treasury Money Market Fund | | 3,368 |
Affiliated Securities Transactions:
The Funds are permitted to effect purchase and sale transactions with affiliated funds under procedures adopted by the Board. The procedures have been designed to seek to ensure that any such security transaction complies with certain conditions of Rule 17a-7 of the Act. Further, as defined under the procedures, each transaction is effected at the current market price. Pursuant to these procedures, for the year ended October 31, 2021, the Funds did not engage in 17a-7 transactions.
5. Investment Risks:
The risks are presented in an order intended to facilitate readability, and their order does not imply that the realization of one risk is likely to occur more frequently than another risk, nor does it imply that the realization of one risk is likely to have a greater adverse impact than another risk.
Interest Rate Risk: Fluctuations in interest rates may affect the yield, volatility, liquidity and value of investments in income producing or debt instruments. Generally, if interest rates rise, the value of such investments will fall. A low or negative interest rate environment poses additional risks to a Fund, because low or negative yields on the Fund’s portfolio holdings may have an adverse impact on the Fund’s ability to provide a positive yield to shareholders, pay expenses out of current income, or, at times, maintain a stable $1.00 share price and/or achieve its investment objective. The risks associated with changing interest rates may have unpredictable effects on the markets and a Fund’s investments. Interest rates in the United States are currently at historically low levels, but may increase in the future. Certain countries have already experienced negative interest rates on certain fixed-income instruments. Very low or negative interest rates may magnify interest rate risk.
Market Risk: The value of a Fund’s investments may decline due to changing economic, political, social, regulatory or market conditions. Market risk may affect a single issuer, industry or section of the economy or it may affect the economy as a whole. Events such as war, acts of terrorism, social unrest, natural disasters, the spread of infectious illness or other public health threats could also significantly impact a Fund and its investments.
U.S. Government Securities Risk: There are different types of U.S. Government Securities with different levels of credit risk. U.S. Government Securities issued or guaranteed by the U.S. Treasury and/or supported by the full faith and credit of the United States have the lowest credit risk. A U.S. government-sponsored entity,
| HSBC FAMILY OF FUNDS |
| Notes to Financial Statements—October 31, 2021 (continued) |
although chartered or sponsored by an Act of Congress, may issue securities that are neither insured nor guaranteed by the U.S. Treasury and are riskier than those that are.
6. Federal Income Tax Information:
As of the tax year ended October 31, 2021, the cost basis of investments for federal income tax purposes, gross unrealized appreciation, gross unrealized depreciation and net unrealized appreciation/depreciation were as follows:
| | | | | | | | Net Unrealized |
| | | | | | | | Appreciation/ |
| | | | Tax Unrealized | | Tax Unrealized | | (Depreciation) |
| | Tax Cost ($) | | Appreciation ($) | | Depreciation ($) | | ($)* |
| U.S. Government Money Market Fund | | 36,008,102,862 | | — | | (354,621) | | (354,621) |
| U.S. Treasury Money Market Fund | | 3,139,054,834 | | — | | (1,369) | | (1,369) |
____________________
| * | The difference between book-basis and tax-basis unrealized appreciation/(depreciation) is attributable primarily to tax deferral of losses on wash sales. |
The tax character of distributions paid by the Funds for the tax year ended October 31, 2021, was as follows:
| | | | | Distributions paid from | | |
| | | | | | | | Total |
| | Ordinary Income | | Net Long-Term | | Total Taxable | | Distributions |
| | ($) | | Capital Gains ($) | | Distributions ($) | | Paid ($)(1) |
| U.S. Government Money Market Fund | | 8,870,719 | | 38,174 | | 8,908,893 | | 8,908,893 |
| U.S. Treasury Money Market Fund | | 532,807 | | — | | 532,807 | | 532,807 |
____________________
| (1) | Total distributions paid may differ from that disclosed in the Statements of Changes in Net Assets because distributions are recognized when actually paid for tax purposes. |
The tax character of distributions paid by the Funds for the tax year ended October 31, 2020, was as follows:
| | | Distributions paid from |
| | | | | | Total |
| | Ordinary Income | | Total Taxable | | Distributions |
| | ($) | | Distributions ($) | | Paid ($)(1) |
| U.S. Government Money Market Fund | | 138,077,495 | | 138,077,495 | | 138,077,495 |
| U.S. Treasury Money Market Fund | | 15,072,170 | | 15,072,170 | | 15,072,170 |
____________________
| (1) | Total distributions paid may differ from that disclosed in the Statements of Changes in Net Assets because distributions are recognized when actually paid for tax purposes. |
As of the tax year ended October 31, 2021, the components of accumulated earnings/(deficit) on a tax basis for the Funds were as follows:
| | | | | | | | | Accumulated | | Unrealized | | Total |
| | Undistributed | | | | | | | Capital and | | Appreciation/ | | Accumulated |
| | Ordinary | | Accumulated | | Distributions | | Other Losses | | (Depreciation) | | Earnings/ |
| | Income ($) | | Earnings ($) | | Payable ($) | | ($) | | ($)(1) | | (Deficit) ($) |
| U.S. Government | | | | | | | | | | | | | | | |
| Money Market | | | | | | | | | | | | | | | |
| Fund | | 298,290 | | 298,290 | | (294,322 | ) | | (28,659 | ) | | (354,621) | | (379,312 | ) |
| U.S. Treasury | | | | | | | | | | | | | | | |
| Money Market | | | | | | | | | | | | | | | |
| Fund | | 707 | | 707 | | (3,983 | ) | | (10,821 | ) | | (1,369 | ) | (15,466 | ) |
____________________
| (1) | The differences between book-basis and tax-basis unrealized appreciation/depreciation are attributable primarily to: tax deferral of losses on wash sales. |
| HSBC FAMILY OF FUNDS |
| Notes to Financial Statements—October 31, 2021 (continued) |
As of the tax year ended October 31, 2021, the Funds had net capital loss carryforwards (“CLCFs”) not subject to expiration as summarized in the table below. The Board does not intend to authorize a distribution of any realized gain for the Funds until any applicable CLCF has been offset or expires.
| | Short Term | | Long Term | | | |
| | Amount ($) | | Amount ($) | | Total ($) |
| U.S. Government Money Market Fund | | (28,659 | ) | | — | | (28,659 | ) |
| U.S. Treasury Money Market Fund | | (10,821 | ) | | — | | (10,821 | ) |
The amount and character of net investment income and net realized gains distributed are determined in accordance with federal income tax regulations, which may differ from GAAP. These “book/tax” differences are either considered temporary or permanent in nature. To the extent these differences are permanent in nature (e.g., reclassification of market discounts, certain gain/loss, and certain distributions), such amounts are reclassified within the composition of net assets based on their federal tax-basis treatment; temporary differences (e.g., wash losses and post-October loss deferrals) do not require reclassification. To the extent distributions to shareholders from net investment income and net realized gains exceed net investment income and net realized gains for tax purposes, they are reported as distributions of capital.
7. Significant Shareholders:
Shareholders, including other funds, individuals, and accounts, as well as each Fund’s investment manager(s) and/or investment personnel, may from time to time own (beneficially or of record) a significant percentage of the Fund’s Shares and can be considered to “control” the Fund when that ownership exceeds 25% of the Fund’s assets (and which may differ from control as determined in accordance with GAAP).
The following list includes the Funds which had individual shareholder accounts with ownership of voting securities greater than 10% of the total outstanding voting securities but less than 25% and/or accounts with ownership of voting securities greater than 25% of the total outstanding voting securities. Significant transactions by these shareholder accounts may negatively impact the Funds’ performance.
| Number of | | | | | | | | | | | | |
| shareholders with | | | | | | Number of | | | | |
| ownership of | | | | | | shareholders with | | | | |
| voting securities | | | | | | ownership of | | | | |
| of the Portfolio | | | | | | voting securities | | | | |
| greater than | | | | | | of the Portfolio | | | | |
| 10% and less | | | | | | greater than | | | | |
| than 25% of the | | Percentage owned | | 25% of the | | Percentage owned |
| total Portfolio’s | | in aggregate | | total Portfolio’s | | in aggregate by |
| outstanding | | by 10% - 25% | | outstanding | | greater than 25% |
| voting securities | | shareholders (%) | | voting securities | | shareholders (%) |
| U.S. Government Money Market Fund | | 2 | | | | 34 | | | | — | | | | — | |
| U.S. Treasury Money Market Fund | | 1 | | | | 12 | | | | 1 | | | | 40* | |
____________________
| * | Owned by the Investment Adviser or an affiliate. |
8. Recent Accounting Pronouncements
In March 2020, the Financial Accounting Standards Board ("FASB") issued Accounting Standards Update ("ASU") No. 2020-04 ("ASU 2020-04"), "Reference Rate Reform (Topic 848) -Facilitation of the Effects of Reference Rate Reform on Financial Reporting," and in January 2021, the FASB issued ASU No. 2021-01 ("ASU 2021-01"), "Reference Rate Reform (Topic 848)-Scope”, which provides optional, temporary relief with respect to the financial reporting of contracts subject to certain types of modifications due to the planned discontinuation of the London Interbank Offered Rate ("LIBOR") and other interbank offered rates as of the end of 2021. The temporary relief provided by ASU 2020-04 and ASU 2021-01 is effective for certain reference rate-related contract modifications that occur during the period from March 12, 2020 through December 31, 2022. Management is evaluating the impact of ASU 2020-04 and ASU 2021-01 on the Funds' investments and other contracts that will undergo reference rate-related modifications as a result of the reference rate reform.
| HSBC FAMILY OF FUNDS |
| Notes to Financial Statements—October 31, 2021 (continued) |
9. Subsequent Events
Management has evaluated subsequent events through the date these financial statements were issued. Based on the evaluation, no adjustments or additional disclosures were required to the financial statements as of October 31, 2021.
Report of Independent Registered Public Accounting Firm
To the Board of Trustees of HSBC Funds and Shareholders of HSBC U.S. Government Money Market Fund and HSBC U.S. Treasury Money Market Fund
Opinions on the Financial Statements
We have audited the accompanying statements of assets and liabilities, including the schedules of portfolio investments, of HSBC U.S. Government Money Market Fund and HSBC U.S. Treasury Money Market Fund (two of the funds constituting HSBC Funds, hereafter collectively referred to as the "Funds") as of October 31, 2021, the related statements of operations for the year ended October 31, 2021, the statements of changes in net assets for each of the two years in the period ended October 31, 2021, including the related notes, and the financial highlights for each of the periods indicated therein (collectively referred to as the “financial statements”). In our opinion, the financial statements present fairly, in all material respects, the financial position of each of the Funds as of October 31, 2021, the results of each of their operations for the year then ended, the changes in each of their net assets for each of the two years in the period ended October 31, 2021 and each of the financial highlights for each of the periods indicated therein in conformity with accounting principles generally accepted in the United States of America.
Basis for Opinions
These financial statements are the responsibility of the Funds’ management. Our responsibility is to express an opinion on the Funds’ financial statements based on our audits. We are a public accounting firm registered with the Public Company Accounting Oversight Board (United States) (PCAOB) and are required to be independent with respect to the Funds in accordance with the U.S. federal securities laws and the applicable rules and regulations of the Securities and Exchange Commission and the PCAOB.
We conducted our audits of these financial statements in accordance with the standards of the PCAOB. Those standards require that we plan and perform the audit to obtain reasonable assurance about whether the financial statements are free of material misstatement, whether due to error or fraud.
Report of Independent Registered Public Accounting Firm (continued)
Our audits included performing procedures to assess the risks of material misstatement of the financial statements, whether due to error or fraud, and performing procedures that respond to those risks. Such procedures included examining, on a test basis, evidence regarding the amounts and disclosures in the financial statements. Our audits also included evaluating the accounting principles used and significant estimates made by management, as well as evaluating the overall presentation of the financial statements. Our procedures included confirmation of securities owned as of October 31, 2021 by correspondence with the custodian, transfer agents and brokers; when replies were not received from brokers, we performed other auditing procedures. We believe that our audits provide a reasonable basis for our opinions.
/s/ PricewaterhouseCoopers LLP
New York, New York
December 21, 2021
We have served as the auditor of one or more investment companies in the HSBC Funds since 2015.
| HSBC FAMILY OF FUNDS |
| Other Federal Income Tax Information—as of October 31, 2021 (Unaudited) |
During the year ended October 31, 2021, the following Funds declared capital gain distributions:
| | Short Term | | Long Term |
| | Capital Gain | | Capital Gain |
| | Distributions ($) | | Distributions ($) |
| U.S. Government Money Market Fund | | | 444,995 | | | | 38,174 | |
| U.S. Treasury Money Market Fund | | | 41,816 | | | | — | |
During the year ended October 31, 2021, the following Funds designated the maximum amount allowable as interest-related dividends for certain non-U.S. resident investors:
| | Qualified |
| | Interest Income |
| | % |
| U.S. Government Money Market Fund | | 100.00% |
| U.S. Treasury Money Market Fund | | 100.00% |
| HSBC FAMILY OF FUNDS |
| Table of Shareholder Expenses—as of October 31, 2021 (Unaudited) |
As a shareholder of the Funds, you incur two types of costs: (1) transaction costs, including sales charges (loads) on purchases, redemption fees and exchange fees; and (2) ongoing costs, including management fees, distribution fees and other Fund expenses. These examples are intended to help you understand your ongoing costs (in dollars) of investing in the Funds and to compare these costs with the ongoing costs of investing in other mutual funds.
Actual Expenses
The actual examples are based on an investment of $1,000 invested at the beginning of a six-month period beginning May 1, 2021 and held through the period ended October 31, 2021.
The columns below under the heading entitled “Actual” provide information about actual account values and actual expenses. You may use this information, together with the amount you invested, to estimate the expenses that you paid over the period. Simply divide your account value by $1,000 (for example, an $8,600 account value divided by $1,000 = 8.6), then multiply the result by the number in the table under the heading entitled “Actual Expenses Paid During the Period” to estimate the expenses you paid on your account during this period.
Hypothetical Example for Comparison Purposes
The hypothetical expense examples are based on an investment of $1,000 invested at the beginning of a six-month period and held throughout the period ended October 31, 2021.
The columns below under the heading entitled “Hypothetical” provide information about hypothetical account values and hypothetical expenses based on each Fund’s actual expense ratio and an assumed rate of return of 5% per year before expenses, which is not each Fund’s actual return. The hypothetical account values and expenses may not be used to estimate the actual ending account balance or expenses you paid for the period. You may use this information to compare this 5% hypothetical example with the 5% hypothetical examples that appear in the shareholder reports of other funds.
Please note that the expenses shown in the table are meant to highlight your ongoing costs only and do not reflect any transactional costs, such as sales charges (loads), redemption fees, or exchange fees. Therefore, the columns under the heading entitled “Hypothetical” are useful in comparing ongoing costs only, and will not help you determine the relative total costs of owning different funds. In addition, if these transactional costs were included, your costs would have been higher.
| HSBC FAMILY OF FUNDS |
| Table of Shareholder Expenses—as of October 31, 2021 (Unaudited) |
| | | | | | | | | | | | | | | | Hypothetical |
| | | | | | | | | | | Actual | | (5% return before expenses) |
| | Annualized | | Beginning | | Ending | | | | | | Ending | | |
| | Expense | | Account | | Account | | Expenses | | Account | | Expenses |
| | Ratio During | | Value | | Value | | Paid During | | Value | | Paid During |
| | Period | | 5/1/21 | | 10/31/21 | | Period(1) | | 10/31/21 | | Period(1) |
| U.S. Government Money Market | | | | | | | | | | | | | | | | | | | | |
| Fund - Class A | | | 0.06% | | | | $1,000.00 | | | $1,000.00 | | | $0.30 | | | $1,024.90 | | | $0.31 | |
| U.S. Government Money Market | | | | | | | | | | | | | | | | | | | | |
| Fund - Class D | | | 0.06% | | | | 1,000.00 | | | 1,000.00 | | | 0.30 | | | 1,024.90 | | | 0.31 | |
| U.S. Government Money Market | | | | | | | | | | | | | | | | | | | | |
| Fund - Class I | | | 0.05% | | | | 1,000.00 | | | 1,000.10 | | | 0.25 | | | 1,024.95 | | | 0.26 | |
| U.S. Government Money Market | | | | | | | | | | | | | | | | | | | | |
| Fund - Intermediary Class | | | 0.05% | | | | 1,000.00 | | | 1,000.10 | | | 0.25 | | | 1,024.95 | | | 0.26 | |
| U.S. Government Money Market | | | | | | | | | | | | | | | | | | | | |
| Fund - Intermediary Service Class | | | 0.05% | | | | 1,000.00 | | | 1,000.10 | | | 0.25 | | | 1,024.95 | | | 0.26 | |
| U.S. Government Money Market | | | | | | | | | | | | | | | | | | | | |
| Fund - Class Y | | | 0.07% | | | | 1,000.00 | | | 1,000.00 | | | 0.35 | | | 1,024.85 | | | 0.36 | |
| U.S. Treasury Money Market Fund - | | | | | | | | | | | | | | | | | | | | |
| Class D | | | 0.05% | | | | 1,000.00 | | | 1,000.00 | | | 0.25 | | | 1,024.95 | | | 0.26 | |
| U.S. Treasury Money Market Fund - | | | | | | | | | | | | | | | | | | | | |
| Class I | | | 0.05% | | | | 1,000.00 | | | 1,000.00 | | | 0.25 | | | 1,024.95 | | | 0.26 | |
| U.S. Treasury Money Market Fund - | | | | | | | | | | | | | | | | | | | | |
| Intermediary Class | | | 0.05% | | | | 1,000.00 | | | 1,000.00 | | | 0.25 | | | 1,024.95 | | | 0.26 | |
| U.S. Treasury Money Market Fund - | | | | | | | | | | | | | | | | | | | | |
| Intermediary Service Class | | | 0.05% | | | | 1,000.00 | | | 1,000.00 | | | 0.25 | | | 1,024.95 | | | 0.26 | |
| U.S. Treasury Money Market Fund - | | | | | | | | | | | | | | | | | | | | |
| Class Y | | | 0.05% | | | | 1,000.00 | | | 1,000.00 | | | 0.25 | | | 1,024.95 | | | 0.26 | |
____________________
| (1) | Expenses are equal to the average account value over the period multiplied by the Fund’s annualized expense ratio, multiplied by 184/365 (the number of days in the most recent fiscal half-year divided by the number of days in the fiscal year.) |
| HSBC FAMILY OF FUNDS |
| Board of Trustees and Officers (Unaudited) |
MANAGEMENT OF THE TRUST
The following table contains information regarding the HSBC Family of Funds’ Board of Trustees (“Trustees”). The HSBC Family of Funds’ Statement of Additional Information includes additional information about the Trustees and is available, without charge, upon request by calling (888) 525-5757.
| | | | | | | | Portfolios in | | Other |
| | Position(s) | | Term of Office | | | | Fund Complex | | Directorships |
| Name | | Held | | and Length of | | Principal Occupations | | Overseen | | Held by Trustee |
| Address, Age | | with Funds | | Time Served | | During Past 5 Years | | By Trustee* | | During Past 5 Years** |
| NON-INTERESTED | | | | | | | | | | |
| TRUSTEES | | | | | | | | | | |
| |
| MARCIA L. BECK | | Chairman | | Indefinite; | | Private Investor (1999 – present) | | 5 | | None |
| P.O. Box 182845 | | and Trustee | | 2008 to | | | | | | |
| Columbus, OH | | | | present | | | | | | |
| 43218-3035 | | | | | | | | | | |
| Age: 66 | | | | | | | | | | |
| |
| SUSAN C. GAUSE | | Trustee | | Indefinite; | | Private Investor (2003 – present) | | 5 | | Metropolitan Series Fund |
| P.O. Box 182845 | | | | 2013 to | | | | | | (2012 – present); |
| Columbus, OH | | | | present | | | | | | and Met Investors Series |
| 43218-3035 | | | | | | | | | | Trust (2008 – present) |
| Age: 69 | | | | | | | | | | |
| |
| SUSAN S. HUANG | | Trustee | | Indefinite; | | Private Investor (2000 – present) | | 5 | | None |
| P.O. Box 182845 | | | | 2008 to | | | | | | |
| Columbus, OH 43218-3035 | | | | present | | | | | | |
| Age: 67 | | | | | | | | | | |
| |
| HUGH T. HURLEY, III | | Trustee | | Indefinite; | | Private Investor (2017 – present); Manag- | | 5 | | Oakmark Funds |
| P.O. Box 182845 | | | | 2020 to | | ing Director and Global Head of Product | | | | (2018 – present) |
| Columbus, OH | | | | present | | Strategy Active Equity, BlackRock, Inc. | | | | |
| 43218-3035 | | | | | | from 2006 to 2017. | | | | |
| Age: 57 | | | | | | | | | | |
____________________
| * | Includes all series of the HSBC Funds. |
| ** | This column includes only directorships of companies required to report to the SEC under the Securities Exchange Act of 1934 (i.e., “public companies”) or other investment companies registered under the 1940 Act. |
| HSBC FAMILY OF FUNDS |
| Board of Trustees and Officers (Unaudited) (continued) |
| | Position(s) | | Term of Office and | | Principal Occupation(s) |
| Name, Address, Age | | Held | | Length of Time Served | | During Past 5 Years |
| Officers | | | | | | |
| |
| STEFANO R. MICHELAGNOLI | | President | | One year; | | Global Head of Client Operations, HSBC Global Asset Management |
| 452 Fifth Avenue | | | | 2020 to present | | (USA) Inc. (June 2020 - present); Regional Head of Product (Ameri- |
| New York, | | | | | | cas), HSBC Global Asset Management (USA) Inc.(2015-June 2020) |
| NY 10018 | | | | | | |
| Age: 51 | | | | | | |
| |
| JAMES D. LEVY | | Vice President | | One year; | | Vice President, Product Management, HSBC Global Asset Manage- |
| 452 Fifth Avenue | | | | 2014 to present | | ment (USA) Inc. (2014 – present) |
| New York, | | | | | | |
| NY 10018 | | | | | | |
| Age: 58 | | | | | | |
| |
| DENISE LEWIS* | | Treasurer | | One year; | | Sr. Vice President, Financial Administration, Citi Fund Services |
| 4400 Easton Commons, | | | | 2021 to present | | (2020 - present); Director, BNY Mellon Asset Servicing, BNY Mellon |
| Suite 200 Columbus, | | | | | | (2015-2020) |
| OH 43219-3035 | | | | | | |
| Age: 58 | | | | | | |
| |
| JENNIFER ENGLISH* | | Secretary | | One year; | | Sr. Vice President, Regulatory Administration, Citi Fund Services |
| One Post Office Square, Suite 3710, | | | | 2021 to present | | (2016 - present) |
| Boston, MA 02109 | | | | | | |
| Age: 49 | | | | | | |
| |
| CHARLES BOOTH* | | Chief Compliance | | One year; | | Director and Compliance Officer, CCO Services, Citi Fund Services |
| 4400 Easton Commons, | | Officer | | 2015 to present | | (1988 - present) |
| Suite 200 | | | | | | |
| Columbus, OH 43219-3035 | | | | | | |
| Age: 61 | | | | | | |
| |
| JAMES M. CURTIS | | Chief Legal Officer | | One year; | | Associate General Counsel, HSBC Securities (USA) Inc. (2005- 2017); |
| 452 Fifth Avenue | | | | 2018 to present | | Associate General Counsel, HSBC Technology & Services (USA) Inc. |
| New York, | | | | | | (2018-present) |
| NY 10018 | | | | | | |
| Age: 53 | | | | | | |
____________________
| * | Ms. Lewis, Ms. English and Mr. Booth also are officers of other investment companies of which Citi (or an affiliate) is the administrator or sub-administrator. |
| HSBC FAMILY OF FUNDS |
| Other Information (Unaudited) |
Information regarding how the Funds voted proxies relating to portfolio securities during the most recent 12-month period ended June 30th is available (i) without charge, upon request, by calling 1-800-525-5757 for HSBC Bank USA and HSBC Brokerage (USA) Inc. clients and 1-800-782-8183 for all other shareholders; (ii) on the Funds’ website at www.investorfunds.us.hsbc.com; and (iii) on the Security and Exchange Commission’s (“SEC”) website at http://www.sec.gov.
The Funds disclose on the Investment Adviser’s website within five business days after the end of each month a complete schedule of portfolio holdings and certain other information, including the dollar-weighted average portfolio maturity and dollar-weighted average portfolio life. In addition, each Fund will file with the SEC on Form N-MFP, within five business days after the end of each month, more detailed portfolio holdings information. The Funds’ Form N-MFP filings will be available on the SEC’s website, and the Investment Adviser’s website will contain a link to such filings.
An investment in a Fund is not a deposit of HSBC Bank USA, National Association, and is not insured or guaranteed by the Federal Deposit Insurance Corporation or any other government agency.
| HSBC FAMILY OF FUNDS: INVESTMENT ADVISER AND ADMINISTRATOR HSBC Global Asset Management (USA) Inc.
452 Fifth Avenue
New York, NY 10018 SHAREHOLDER SERVICING AGENTS For HSBC Bank USA, N.A. and
HSBC Securities (USA) Inc. Clients HSBC Bank USA, N.A.
452 Fifth Avenue
New York, NY 10018
1-888-525-5757 For All Other Shareholders HSBC Funds
P.O. Box 8106
Boston, MA 02266-8106
1-800-782-8183 TRANSFER AGENT DST Asset Manager Solutions, Inc.
2000 Crown Colony Drive
Quincy, MA 02169 DISTRIBUTOR Foreside Distribution Services, L.P.
Three Canal Plaza, Suite 100
Portland, ME 04101 | CUSTODIAN The Northern Trust Company
50 South LaSalle Street
Chicago, IL 60603 INDEPENDENT REGISTERED PUBLIC ACCOUNTING FIRM PricewaterhouseCoopers LLP
300 Madison Avenue
New York, NY 10017 LEGAL COUNSEL Dechert LLP
1900 K Street, N.W.
Washington, D.C. 20006 |

| Investment products: | |
ARE NOT A
BANK DEPOSIT
OR OBLIGATION
OF THE BANK
OR ANY OF ITS
AFFILIATES | ARE NOT
FDIC
INSURED | ARE NOT
INSURED BY
ANY FEDERAL
GOVERNMENT
AGENCY |
ARE NOT GUARANTEED BY
THE BANK OR ANY OF ITS
AFFILIATES | MAY LOSE
VALUE |
Investment products are offered by HSBC Securities (USA) Inc. (HSI), member NYSE/FINRA/SIPC. HSI is an affiliate of HSBC Bank USA, N.A. Investment products: Are not a deposit or other obligation of the bank or any of its affiliates; Not FDIC insured or insured by any federal government agency of the United States; Not guaranteed by the bank or any of its affiliates; and are subject to investment risk, including possible loss of principal invested.
Investors should consider the investment objectives, risks, charges, and expenses of the investment company carefully before investing. The prospectus contains this and other important information about the investment company. For clients of HSBC Securities (USA) Inc., please call 1-888-525-5757 for more information. For other investors and prospective investors, please call the Funds directly at 1-800-782-8183 or visit our website at www.investorfunds.us.hsbc.com. Investors should read the prospectus carefully before investing or sending money.
HSBC Funds
Annual Report
October 31, 2021
| EQUITY FUNDS | Class A | | Class C | | Class I |
| HSBC Opportunity Fund | HSOAX | | HOPCX | | RESCX |

HSBC Family of Funds
Annual Report - October 31, 2021
| Glossary of Terms | 2 |
| Commentary From the Investment Manager | 3 |
| Portfolio Reviews | 4 |
| Statements of Assets and Liabilities | 6 |
| Statements of Operations | 7 |
| Statements of Changes in Net Assets | 8 |
| Financial Highlights | 9 |
| Notes to Financial Statements | 11 |
| Report of Independent Registered Public Accounting Firm | 19 |
| Other Federal Income Tax Information | 21 |
| Table of Shareholder Expenses | 22 |
| Portfolio Composition | 23 |
| | |
| Schedule of Portfolio Investments | |
| HSBC Opportunity Portfolio | 24 |
| Statement of Assets and Liabilities | 26 |
| Statement of Operations | 27 |
| Statement of Changes in Net Assets | 28 |
| Financial Highlights | 29 |
| Notes to Financial Statements | 30 |
| Report of Independent Registered Public Accounting Firm | 35 |
| Table of Shareholder Expenses | 37 |
| Board of Trustees and Officers | 38 |
| Other Information | 40 |
Bloomberg Global Aggregate Index is an index that is the measure of the global investment-grade debt from 24 local currency markets, which include treasury, government-related, corporate, and securitized fixed-rate bonds from both developed and emerging markets issuers.
Bloomberg U.S. Aggregate Bond Index is a broad-based benchmark that measures the investment-grade, U.S. dollar-denominated, fixed-rate taxable bond market. This includes Treasuries, government-related and corporate securities, mortgage-backed securities, asset-backed securities and collateralized mortgage-backed securities.
Bloomberg U.S. Corporate High Yield Bond Index measures the USD-denominated, high-yield, fixed-rate corporate bond market. Securities are classified as high yield if the middle rating of Moody’s, Fitch and S&P is Ba1/BB+/ BB+ or below. Bonds from issuers with an emerging markets (EM) country of risk, based on Barclays EM country definition, are excluded.
Gross Domestic Product (“GDP”) is the value of goods and services produced in a given country in a given year.
MSCI Europe Australasia and Far East (“MSCI EAFE”) Index is an equity index which captures the large- and mid-cap representation across 21 developed markets countries, excluding the U.S. and Canada.
MSCI Emerging Markets Index is a float-adjusted market capitalization index that is designed to measure equity market performance in global emerging markets.
Russell 1000® Index measures the performance of the large-cap segment of the U.S. equity universe. It is a subset of the Russell 3000® Index and includes approximately 1000 of the largest securities based on a combination of their market cap and current index membership. The Russell 1000 represents approximately 92% of the U.S. market.
Russell 2000® Index measures the performance of the small-cap segment of the U.S. equity universe. The Russell 2000® Index is a subset of the Russell 3000® Index representing approximately 8% of the total market capitalization of that index. It includes approximately 2000 of the smallest securities based on a combination of their market cap and current index membership.
Russell 2500TM Growth Index is an index that measures the performance of the small- to mid-cap growth segment of the U.S. equity universe. It includes those Russell 2500 companies with higher price-to-book ratios and higher forecasted growth values.
Securities indices are unmanaged and assume reinvestment of all distributions and interest payments and do not take in account brokerage fees or expenses. Securities in the Funds do not match those in the indices and performance of the Funds will differ. Investors cannot invest directly in an index.
| Commentary From the Investment Manager (Unaudited) |
HSBC Global Asset Management (USA) Inc.
Global Economic Review
During the 12-month period that began on November 1, 2020, the global economy continued to recover from challenges of the COVID-19 pandemic. Early in the period, the global economy entered the restoration phase of the economic cycle. This phase was marked by more moderate growth relative to the economic growth experienced earlier in 2020. In June 2021, the global economy transitioned into its expansion phase, led by strong growth in the U.S. and China. In this phase, economic growth exceeded pre-pandemic levels, although the economic recovery remained uneven across major economies, with many developed market and emerging market economies lagging throughout most of the period.
Positive developments around vaccines—including successful rollouts across many developed nations—and fiscal stimulus efforts in the U.S. helped drive global equities higher early in the period. In the U.S., positive consumer spending data, capital goods shipments and home sales early in the period outweighed weakness around job growth and personal income. Additional fiscal stimulus in the first quarter of 2021 and the promise of an infrastructure spending package supported consumer spending and the U.S. housing market well into the summer. As the period progressed, however, short-term inflation concerns and shortages in labor and goods had a cooling effect on consumer spending and the U.S. economy.
U.S. GDP reflected this 12-month narrative. The economy posted strong annualized growth across the first three quarters of the period: 4.3% in the fourth quarter of 2020, 6.4% in the first quarter of 2021, and 6.7% in the second quarter. However, economic growth cooled to a relatively modest 2.0% in the third quarter of 2021 as consumer spending declined. However, the U.S. unemployment rate also reflected the largely positive economic story for the period, declining steadily across the 12 months from 6.7% in November 2020 to 4.6% in October 2021.
In Europe, national lockdowns triggered by a resurgence of the virus weighed on economic growth at the start of the period under review. Growth remained structurally weak throughout the opening months of 2021 as the region continued to deal with virus-related lockdowns. For its part, the U.K. entered a phase of strong, catch-up growth in the summer, ahead of the rest of Europe, due in large part to the country’s successful vaccination rollout. However, while the eurozone showed signs of a strong rebound in economic activity by the end of the period, U.K. economic growth was already cooling due to supply-side disruptions to labor and goods.
Japan lagged other developed nations in its vaccination rollout, which hampered economic growth early in the period. Constraints on the Bank of Japan’s policy options added to these economic headwinds. By late summer, however, the country had succeeded in accelerating its vaccine program—a key step to unlocking its domestic spending and its manufacturing sector’s ability to benefit from a growth in global spending.
Many emerging markets countries continued to face economic headwinds throughout much of the period under review as they struggled to contain the virus. Economic growth was uneven, however, as China in particular, and industrialized Asia in general, generally outperformed through the first half of the period. China’s economy benefited from strong growth in its services sector and expectations for more stable trade relations with the U.S. Meanwhile, tightening virus restrictions in Russia, low oil prices, and weak tourism in the Middle East and North Africa weighed on other emerging markets.
In the second half of the period, China’s economic growth slowed due to a mix of new virus outbreaks and fiscal policy tightening. A rotation among many developed economies from spending on goods to spending on services weighed on Chinese exports, further cooling the nation’s economic growth. India’s economic rebound was derailed in April when a second wave of infections led to additional lockdowns and a health care crisis in the nation. However, a boost in its vaccination program in the summer helped control the case numbers and has put the economy back on track for an economic rebound.
Amid relatively strong global economic growth, inflation concerns grew stronger, particularly in the U.S. The dovish tone of the Federal Reserve helped keep short-term interest rates low, even as long-term interest rates rose higher, leading to a steeper yield curve. The U.S. consumer price index (a measure of inflation) rose from 1.2% in November 2020 to 2.6% in March 2021, before jumping to 4.2% in April and staying above 5% through September. The jump in inflation triggered a slight shift in the tone of the Fed by the end of the period, raising expectations that the Fed may begin raising interest rates more quickly than projected.
Market review
Global equity markets posted strong gains for the 12-month period despite concerns over resurging COVID-19 cases. In the U.S., small- and mid-cap stocks generally outperformed their large-cap counterparts during the first half of the period, but that performance gap narrowed during the latter half of the period as supply chain and labor shortages had an outsized effect on smaller companies. The Russell 2000 Index of small-cap stocks returned 50.8% for the 12 months under review, compared to a 43.5% return for the Russell 1000 Index of large-cap stocks. Value stocks strongly outperformed growth-oriented companies early in the period, but lost momentum and closed out the period only modestly ahead of growth stocks.
International equities posted strong absolute returns, but generally trailed U.S. stocks for the period. The MSCI EAFE Index of developed-market international stocks rose 34.21% (net return), while the MSCI Emerging Markets Index returned 16.97% (net return).
Global fixed income markets struggled due to inflation concerns in the U.S. and the high level of new debt issued by European governments. Spreads on corporate bonds tightened across most developed markets throughout the first half of the period and remained tight through the end of the period. In this environment, high yield indexes outperformed investment-grade securities. The Bloomberg U.S. Aggregate Bond Index, which tracks investment-grade bonds in the U.S. market, returned -0.48% for the period under review. By comparison, the Bloomberg U.S. Corporate High Yield Bond Index, which tracks high-yield bonds in the U.S. market, returned 10.53%. The Bloomberg Global Aggregate Bond Index (USD hedged), which tracks the broader global investment-grade fixed income market, slightly underperformed the comparable U.S. market, with a -0.83% return for the 12-month period.
| 1 | For additional information, please refer to the Glossary of Terms. |
| | |
| Portfolio Reviews (Unaudited) |
HSBC Opportunity Fund
(Class A Shares, Class C Shares and Class I Shares)
by William A. Muggia, Committee Lead/Portfolio Manager
Richard D. Lee, CFA, Portfolio Manager
Ethan J. Myers, CFA, Portfolio Manager
John M. Montgomery, Portfolio Manager
Westfield Capital Management Company, L.P.
The HSBC Opportunity Fund (the “Fund”) seeks long-term growth of capital by investing, under normal circumstances, primarily in equity securities of small- and mid-cap companies. Small- and mid-cap companies generally are defined as those that have market capitalizations within the range of market capitalizations represented in the Russell 2500TM Growth Index1. The Fund may also invest in equity securities of larger, more established companies and may invest up to 20% of its assets in securities of foreign companies. The Fund employs a two-tier structure, commonly referred to as a “master-feeder” structure, in which the Fund invests all of its investable assets in the HSBC Opportunity Portfolio (the “Portfolio”). The Portfolio employs Westfield Capital Management Company, L.P. as its subadviser.
Investment Concerns
There is no assurance that a portfolio will achieve its investment objective or will work under all market conditions. The value of investments may go down as well as up and you may not get back the amount originally invested. Portfolios may be subject to certain additional risks, which should be considered carefully along with their investment objectives and fees. Equity investments fluctuate in value based on changes to an individual company’s financial condition and overall market conditions. The Fund is also subject to market risk, which is the risk that the value of the Fund’s portfolio investments may decline due to changing market conditions. Market conditions may be negatively impacted by events such as war, acts of terrorism, social unrest, natural disasters, the spread of infectious illness, or other public health threats. Investments in foreign markets entail special risks such as currency, political, economic, and market risks. Fluctuations in exchange rates between the U.S. dollar and foreign currencies, or between various foreign currencies, may negatively affect the Fund’s performance. Investing in smaller companies is more risky and volatile than investing in large companies. Growth investment style may fall out of favor in the marketplace and result in significant declines in the value of the Portfolio’s securities. Securities of companies considered growth investments may have rapid price swings in the event of earnings disappointments or during periods of market, political, regulatory, and economic uncertainty.
For a complete description of these and other risks associated with investment in a mutual fund, please refer to the Fund’s prospectus.
Market Commentary
For the 12-month period ended October 31, 2021, the Fund returned 42.81% for its Class A shares (no load). That compared to a 37.12% return for the Russell 2500 Growth Index, the Fund’s primary benchmark.
Portfolio Performance
U.S. equities posted strong returns during the 12-month period under review. Equities began the period buoyed by the $900 billion federal stimulus approved in December of 2020. After a volatile start to 2021, markets quickly recovered, and the second quarter of 2021 marked the fifth consecutive quarterly gain for U.S. equities. Stocks benefitted from the acceleration of the COVID-19 vaccine rollout and a new round of federal stimulus. Over the second half of the period under review, investor concern mounted over rising inflation, the delta variant and persistent supply chain disruptions. Large-cap stocks slightly outperformed small-cap stocks in this environment. Still, small-cap stocks outperformed their larger counterparts over the entire 12-month period, thanks to their especially strong performance in the final quarter of 2020. The Financials and Consumer Discretionary sectors were among the best performers on an absolute basis, while the Communication Services and Materials sectors weighed on absolute returns.
The Fund outperformed its primary benchmark for the period under review. Stock selection within the Consumer Discretionary sector was a top driver of the Fund’s relative performance. In particular, the Fund benefitted from its investment in an ecommerce retailer that performed well during the period, managing its business efficiently despite top-line headwinds related to the pandemic’s impact on consumer shopping behaviors. Stock selection within the Financials sector also boosted relative returns. Most notably, the Fund’s investments in a full-service commercial bank benefitted from the launch of a crypto-asset payment network as cryptocurrency assets drew increased investor attention.
Stock selection in the Information Technology sector weighed on the Fund’s relative returns for the period. The Fund’s holdings of a software company servicing the mortgage industry was the largest relative detractor. With the company facing hurdles in a rising interest rate environment, the Fund sold its position during the third quarter. A market leader in optical equipment for telecom operators also detracted from relative returns as the company’s share price suffered due to slowing 5G deployment in China.†
| † | Portfolio composition is subject to change. |
| 1 | For additional information, please refer to the Glossary of Terms. |
Past performance does not guarantee future results. The performance data quoted represents past performance and current returns may be lower or higher. Total return figures include change in share price, reinvestment of dividends and capital gains and do not reflect taxes that a shareholder would pay on Fund distributions or on the redemption of Fund shares. Investment return and principal value will fluctuate so that an investor’s shares, when redeemed may be worth more or less than the original cost. To obtain performance information current to the most recent month end, please call 1-800-782-8183.
| Portfolio Reviews (Unaudited) |
HSBC Opportunity Fund
| Value of an Investment |
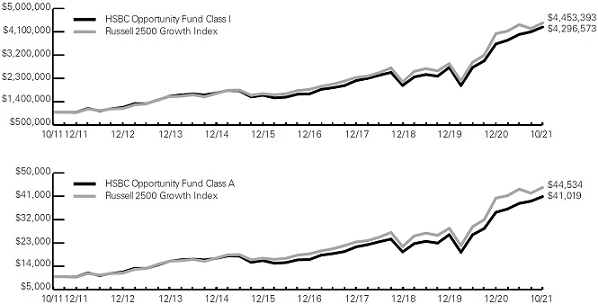 |
The charts above represent a historical 10-year performance comparison of a hypothetical investment in the indicated share class versus a similar investment in the Fund’s benchmark and represents the reinvestment of dividends and capital gains in the Fund.
| Fund Performance | | Average Annual
Total Returns (%) | | Expense
Ratio (%)4 | |
| As of October 31, 2021 | | Inception
Date | | 1 Year | | 5 Year | | 10 Year | | Gross | | Net | |
| HSBC Opportunity Fund Class A1 | | 9/23/96 | | 35.71 | | 19.86 | | 14.57 | | 7.29 | | 1.65 | |
| HSBC Opportunity Fund Class C2 | | 11/4/98 | | 40.77 | | 20.23 | | 14.73 | | 8.04 | | 2.40 | |
| HSBC Opportunity Fund Class I† | | 9/3/96 | | 43.30 | | 21.60 | | 15.69 | | 1.63 | | 1.10 | |
| Russell 2500 GrowthTM Index3 | | — | | 37.12 | | 20.68 | | 16.11 | | N/A | | N/A | |
Past performance does not guarantee future results.The performance data quoted represents past performance and current returns may be lower or higher. Total return figures include change in share price, reinvestment of dividends and capital gains and do not reflect the taxes that a shareholder would pay on Fund distributions or on the redemption of Fund shares. Investment return and principal value will fluctuate so that an investor’s shares, when redeemed may be worth more or less than the original cost.To obtain performance information current to the most recent month end, please call 1-800-782-8183.
The performance above reflects any fee waivers that have been in effect during the applicable periods, as well as any expense reimbursements that have periodically been made. Absent such waivers and reimbursements, returns would have been lower. Currently, contractual fee waivers and/or expense reimbursements are in effect for the Fund through March 1, 2022.
Certain returns shown include monies received by the Portfolio, in which the Fund invests, in respect of one-time class action settlements and monies received by the Fund from a one-time reimbursement from HSBC Global Asset Management (USA) Inc. (the “Adviser”) related to past marketing arrangements. As a result, the Fund’s total returns for those periods were higher than they would have been had the Portfolio and the Fund not received the payments.
| † | The Class I Shares are issued by a separate series of the HSBC Funds. |
| 1 | Reflects the maximum sales charge of 5.00%. |
| 2 | Reflects the applicable contingent deferred sales charge, maximum of 1.00%. |
| 3 | For additional information, please refer to the Glossary of Terms. |
| 4 | Reflects the expense ratio as reported in the prospectus dated February 28, 2021, as supplemented to date. HSBC Global Asset Management (USA) Inc., the Adviser, has entered into a contractual expense limitation agreement with the Fund under which it will limit total expenses of the Fund (excluding interest, taxes, brokerage commissions, extraordinary expenses and estimated indirect expenses attributable to the Fund’s investments in investment companies other than the Portfolio) to an annual rate of 1.65%, 2.40% and 1.10% for Class A Shares, Class C and Class I Shares, respectively. The expense limitations shall be in effect until March 1, 2022. Additional information pertaining to the October 31, 2021 expense ratios can be found in the financial highlights. |
The Fund’s performance is measured against the Russell 2500TM Growth Index, an unmanaged index that measures the performance of the small- to mid-cap growth segment of the U.S. equity universe. It includes those Russell 2500 companies with higher price-to-book ratios and higher forecasted growth values. The performance for the index does not reflect the deduction of expenses associated with a mutual fund, such as investment management and fund accounting fees. The Fund’s performance reflects the deduction of fees for these value-added services. Investors cannot invest directly in an index.
HSBC FAMILY OF FUNDS
Statements of Assets and Liabilities—as of October 31, 2021
| | | | HSBC Opportunity
Fund | | | HSBC Opportunity
Fund (Class I) | |
| Assets: | | | | | | | |
| Investments in Affiliated Portfolio | | | | 12,564,869 | | | | 88,794,579 | |
| Receivable for capital shares issued | | | | — | | | | 7,960 | |
| Receivable from Investment Adviser | | | | 68,104 | | | | 77,205 | |
| Prepaid expenses and other assets | | | | 4,183 | | | | 12,877 | |
| Total Assets | | | | 12,637,156 | | | | 88,892,621 | |
| | | | | | | | | | |
| | | | | | | | | | |
| Liabilities: | | | | | | | | | |
| Accrued expenses and other payables: | | | | | | | | | |
| Administration | | | | 170 | | | | 1,193 | |
| Distribution fees | | | | 26 | | | | — | |
| Shareholder Servicing | | | | 2,609 | | | | — | |
| Accounting | | | | 2,002 | | | | 1,581 | |
| Compliance Services | | | | 5,235 | | | | 5,235 | |
| Printing | | | | 2,364 | | | | 7,392 | |
| Professional | | | | 42,775 | | | | 42,778 | |
| Transfer Agent | | | | 15,321 | | | | 16,809 | |
| Trustee | | | | 1,997 | | | | 1,997 | |
| Other | | | | 5,938 | | | | 6,674 | |
| Total Liabilities | | | | 78,437 | | | | 83,659 | |
| Net Assets | | | $ | 12,558,719 | | | $ | 88,808,962 | |
| | | | | | | | | | |
| | | | | | | | | | |
| Composition of Net Assets: | | | | | | | | | |
| Paid in capital | | | $ | 6,795,516 | | | $ | 24,518,461 | |
| Total distributable earnings/(loss) | | | | 5,763,203 | | | | 64,290,501 | |
| Net Assets | | | $ | 12,558,719 | | | $ | 88,808,962 | |
| | | | | | | | | | |
| | | | | | | | | | |
| Net Assets: | | | | | | | | | |
| Class A Shares | | | $ | 12,518,120 | | | $ | — | |
| Class C Shares | | | | 40,599 | | | | — | |
| Class I Shares | | | | — | | | | 88,808,962 | |
| Total | | | $ | 12,558,719 | | | $ | 88,808,962 | |
| | | | | | | | | | |
| | | | | | | | | | |
| Shares Outstanding: | | | | | | | | | |
| ($0.001 par value, unlimited number of shares authorized): | | | | | | | | | |
| Class A Shares | | | | 863,871 | | | | — | |
| Class C Shares | | | | 6,318 | | | | — | |
| Class I Shares | | | | — | | | | 4,633,961 | |
| | | | | | | | | | |
| | | | | | | | | | |
| Net Asset Value, Offering Price (Class C and Class I) and Redemption Price per share: | | | | | | | | | |
| Class A Shares | | | $ | 14.49 | | | $ | — | |
| Class C Shares(a) | | | $ | 6.43 | | | $ | — | |
| Class I Shares | | | $ | — | | | $ | 19.16 | |
| Maximum Sales Charge: | | | | | | | | | |
| Class A Shares | | | | 5.00 | % | | | — | % |
| Maximum Offering Price per share (Net Asset Value / (100%-maximum sales charge)) | | | | | | | | | |
| Class A Shares | | | $ | 15.25 | | | $ | — | |
| Investments in Affiliated Portfolio, at Cost | | | $ | 10,559,194 | | | $ | 70,017,225 | |
Amounts designated as “—” are $0.00 or have been rounded to $0.00.
| (a) | Redemption price per share varies by length of time shares are held. |
| 6 | HSBC FAMILY OF FUNDS | See notes to financial statements. |
HSBC FAMILY OF FUNDS
Statements of Operations - For the year ended October 31, 2021
| | | | HSBC
Opportunity
Fund | | | HSBC
Opportunity
Fund (Class I) | |
| Net Investment Income Allocated from Affiliated Portfolio: | | | | | | | | | |
| Investment income from Affiliated Portfolio | | | | 83,460 | | | | 742,363 | |
| Expenses from Affiliated Portfolio | | | | (146,339 | ) | | | (1,304,664 | ) |
| Net Investment Income from Affiliated Portfolio | | | | (62,879 | ) | | | (562,301 | ) |
| | | | | | | | | | |
| | | | | | | | | | |
| Expenses: | | | | | | | | | |
| Administration: | | | | | | | | | |
| Class A Shares | | | | 1,877 | | | | — | |
| Class C Shares | | | | 6 | | | | — | |
| Class I Shares | | | | — | | | | 17,001 | |
| Distribution: | | | | | | | | | |
| Class C Shares | | | | 293 | | | | — | |
| Shareholder Servicing: | | | | | | | | | |
| Class A Shares | | | | 28,088 | | | | — | |
| Class C Shares | | | | 97 | | | | — | |
| Accounting | | | | 19,006 | | | | 13,996 | |
| Compliance Services | | | | 58,302 | | | | 58,301 | |
| Printing | | | | 17,373 | | | | 29,345 | |
| Professional | | | | 160,905 | | | | 160,904 | |
| Transfer Agent | | | | 191,554 | | | | 210,169 | |
| Trustee | | | | 135,722 | | | | 135,722 | |
| Registration fees | | | | 27,024 | | | | 23,109 | |
| Other | | | | 30,119 | | | | 26,048 | |
| Total expenses before fee and expense reductions | | | | 670,366 | | | | 674,595 | |
| Fees voluntarily reduced/reimbursed by Investment Adviser | | | | (11,667 | ) | | | — | |
| Fees contractually reduced/reimbursed by Investment Adviser | | | | (623,917 | ) | | | (821,503 | ) |
| Net Expenses | | | | 34,782 | | | | (146,908 | ) |
| | | | | | | | | | |
| | | | | | | | | | |
| Net Investment Income/(Loss) | | | | (97,661 | ) | | | (415,393 | ) |
| | | | | | | | | | |
| | | | | | | | | | |
| Realized/Unrealized Gains/(Losses) on Investments Allocated from Affiliated Portfolio: | | | | | | | | | |
| Net realized gains/(losses) from Affiliated Portfolio | | | | 3,921,511 | | | | 46,102,447 | |
| Change in unrealized appreciation/depreciation on investments from Affiliated Portfolio | | | | 81,612 | | | | (6,145,310 | ) |
| | | | | | | | | | |
| | | | | | | | | | |
| Net realized/unrealized gains/(losses) on investments from Affiliated Portfolio | | | | 4,003,123 | | | | 39,957,137 | |
| Change in Net Assets Resulting from Operations | | | $ | 3,905,462 | | | $ | 39,541,744 | |
Amounts designated as “—” are $0.00 or have been rounded to $0.00.
| See notes to financial statements. | HSBC FAMILY OF FUNDS | 7 |
HSBC FAMILY OF FUNDS
Statements of Changes in Net Assets
| | | | HSBC Opportunity Fund | | | HSBC Opportunity Fund (Class I) | |
| | | | | For the year ended
October 31, 2021 | | | | For the year ended
October 31, 2020 | | | | For the year ended
October 31, 2021 | | | | For the year ended
October 31, 2020 | |
| Investment Activities: | | | | | | | | | | | | | | | | | |
| Operations: | | | | | | | | | | | | | | | | | |
| Net investment income/(loss) | | | $ | (97,661 | ) | | $ | (80,100 | ) | | $ | (415,393 | ) | | $ | (532,577 | ) |
| Net realized gains/(losses) from investments | | | | 3,921,511 | | | | 784,472 | | | | 46,102,447 | | | | 11,485,875 | |
| Change in unrealized appreciation/depreciation on investments | | | | 81,612 | | | | 1,041,011 | | | | (6,145,310 | ) | | | 12,657,198 | |
| Change in net assets resulting from operations | | | | 3,905,462 | | | | 1,745,383 | | | | 39,541,744 | | | | 23,610,496 | |
| | | | | | | | | | | | | | | | | | |
| Distributions to shareholders: | | | | | | | | | | | | | | | | | |
| Class A Shares | | | | (591,303 | ) | | | (638,850 | ) | | | — | | | | — | |
| Class C Shares | | | | (4,962 | ) | | | (10,418 | ) | | | — | | | | — | |
| Class I Shares | | | | — | | | | — | | | | (10,024,994 | ) | | | (8,206,443 | ) |
| Change in net assets resulting from distributions to shareholders | | | | (596,265 | ) | | | (649,268 | ) | | | (10,024,994 | ) | | | (8,206,443 | ) |
| Change in net assets resulting from capital transactions | | | | (12,016 | ) | | | (361,257 | ) | | | (62,666,721 | ) | | | (9,369,425 | ) |
| Change in net assets | | | | 3,297,181 | | | | 734,858 | | | | (33,149,971 | ) | | | 6,034,628 | |
| | | | | | | | | | | | | | | | | | |
| Net Assets: | | | | | | | | | | | | | | | | | |
| Beginning of period | | | | 9,261,538 | | | | 8,526,680 | | | | 121,958,933 | | | | 115,924,305 | |
| End of period | | | $ | 12,558,719 | | | $ | 9,261,538 | | | $ | 88,808,962 | | | $ | 121,958,933 | |
Amounts designated as “—” are $0.00 or have been rounded to $0.00. |
| CAPITAL TRANSACTIONS: | | | | | | | | | | | | | | | | | |
| Class A Shares: | | | | | | | | | | | | | | | | | |
| Proceeds from shares issued | | | $ | 269,188 | | | $ | 310,750 | | | $ | — | | | $ | — | |
| Dividends reinvested | | | | 566,123 | | | | 617,808 | | | | — | | | | — | |
| Value of shares redeemed | | | | (841,668 | ) | | | (1,245,353 | ) | | | — | | | | — | |
| Class A Shares capital transactions | | | | (6,357 | ) | | | (316,795 | ) | | | — | | | | — | |
| Class C Shares: | | | | | | | | | | | | | | | | | |
| Dividends reinvested | | | | 4,962 | | | | 10,418 | | | | — | | | | — | |
| Value of shares redeemed | | | | (10,621 | ) | | | (54,880 | ) | | | — | | | | — | |
| Class C Shares capital transactions | | | | (5,659 | ) | | | (44,462 | ) | | | — | | | | — | |
| Class I Shares: | | | | | | | | | | | | | | | | | |
| Proceeds from shares issued | | | | — | | | | — | | | | 3,553,293 | | | | 9,559,317 | |
| Dividends reinvested | | | | — | | | | — | | | | 9,848,822 | | | | 8,087,006 | |
| Value of shares redeemed | | | | — | | | | — | | | | (76,068,836 | ) | | | (27,015,748 | ) |
| Class I Shares capital transactions | | | | — | | | | — | | | | (62,666,721 | ) | | | (9,369,425 | ) |
| | | | | | | | | | | | | | | | | | |
| Change in net assets resulting from capital transactions | | | $ | (12,016 | ) | | $ | (361,257 | ) | | $ | (62,666,721 | ) | | $ | (9,369,425 | ) |
| | | | | | | | | | | | | | | | | | |
| SHARE TRANSACTIONS: | | | | | | | | | | | | | | | | | |
| Class A Shares: | | | | | | | | | | | | | | | | | |
| Issued | | | | 20,601 | | | | 31,391 | | | | — | | | | — | |
| Reinvested | | | | 46,026 | | | | 63,365 | | | | — | | | | — | |
| Redeemed | | | | (63,754 | ) | | | (130,418 | ) | | | — | | | | — | |
| Change in Class A Shares | | | | 2,873 | | | | (35,662 | ) | | | — | | | | — | |
| Class C Shares: | | | | | | | | | | | | | | | | | |
| Reinvested | | | | 904 | | | | 2,231 | | | | — | | | | — | |
| Redeemed | | | | (1,857 | ) | | | (10,878 | ) | | | — | | | | — | |
| Change in Class C Shares | | | | (953 | ) | | | (8,647 | ) | | | — | | | | — | |
| Class I Shares: | | | | | | | | | | | | | | | | | |
| Issued | | | | — | | | | — | | | | 206,182 | | | | 727,797 | |
| Reinvested | | | | — | | | | — | | | | 607,577 | | | | 608,046 | |
| Redeemed | | | | — | | | | — | | | | (4,494,614 | ) | | | (2,083,351 | ) |
| Change in Class I Shares | | | | — | | | | — | | | | (3,680,855 | ) | | | (747,508 | ) |
Amounts designated as “—” are $0.00 or have been rounded to $0.00.
| 8 | HSBC FAMILY OF FUNDS | See notes to financial statements. |
Financial Highlights
Selected data for a share outstanding throughout the periods indicated.*
| | | | | | | Investment Activities | | Distributions | | | | | | | | | | Ratios/Supplementary Data |
| | | Net Asset
Value,
Beginning
of Period | | Net
Investment
Income/
(Loss)(a) | | Net Realized
and
Unrealized
Gains
(Losses)
from
Investments | | Total from
Investment
Activities | | Net
Investment
Income | | Net Realized
Gains from
Investment
Transactions | | Total
Distributions | | Net Asset
Value, End
of Period | | Total
Return
(b) | | Net Assets
at End
of Period
(000’s) | | Ratio of Net
Expense to
Average Net
Assets | | Ratio of Net
Investment
Income to
Average Net
Assets | | Ratio of
Expenses
to Average
Net Assets
(Excluding
Fee
Reductions) | | Portfolio
Turnover | (c) |
| Class A Shares | | | | | | | | | | | | | | | | | | | | | | | | | | | | | | | | | | | | | | | | | | | | | | | | | | | | | | | | |
| Year Ended October 31, 2021 | | | $10.71 | | | | $(0.11) | | | | $4.57 | | | | $4.46 | | | | $— | | | | $(0.68) | | | | $(0.68) | | | | $14.49 | | | | 42.81% | | | | $12,518 | | | | 1.55% | | | | (0.83)% | | | | 7.00% | | | | 78% | |
| Year Ended October 31, 2020 | | | 9.42 | | | | (0.09) | | | | 2.10 | | | | 2.01 | | | | — | | | | (0.72) | | | | (0.72) | | | | 10.71 | | | | 22.05% | | | | 9,224 | | | | 1.55% | | | | (0.91)% | | | | 7.29% | | | | 94% | |
| Year Ended October 31, 2019 | | | 10.70 | | | | (0.07) | | | | 0.59 | | | | 0.52 | | | | — | | | | (1.80) | | | | (1.80) | | | | 9.42 | | | | 8.77% | | | | 8,449 | | | | 1.55% | | | | (0.79)% | | | | 5.77% | | | | 81% | |
| Year Ended October 31, 2018 | | | 11.24 | | | | (0.10) | | | | 0.82 | | | | 0.72 | | | | — | | | | (1.26) | | | | (1.26) | | | | 10.70 | | | | 6.46% | | | | 9,352 | | | | 1.55% | | | | (0.84)% | | | | 5.37% | | | | 77% | |
| Year Ended October 31, 2017 | | | 9.94 | | | | (0.08) | | | | 2.68 | | | | 2.60 | | | | — | | | | (1.30) | | | | (1.30) | | | | 11.24 | | | | 29.00% | | | | 9,422 | | | | 1.55% | | | | (0.79)% | | | | 2.98% | | | | 80% | |
| Class C Shares | | | | | | | | | | | | | | | | | | | | | | | | | | | | | | | | | | | | | | | | | | | | | | | | | | | | | | | | |
| Year Ended October 31, 2021 | | | $5.10 | | | | $(0.09) | | | | $2.10 | | | | $2.01 | | | | $— | | | | $(0.68) | | | | $(0.68) | | | | $6.43 | | | | 41.77% | | | | $41 | | | | 2.30% | | | | (1.60)% | | | | 7.74% | | | | 78% | |
| Year Ended October 31, 2020 | | | 4.85 | | | | (0.08) | | | | 1.05 | | | | 0.97 | | | | — | | | | (0.72) | | | | (0.72) | | | | 5.10 | | | | 21.29% | | | | 37 | | | | 2.30% | | | | (1.65)% | | | | 8.13% | | | | 94% | |
| Year Ended October 31, 2019 | | | 6.53 | | | | (0.08) | | | | 0.20 | | | | 0.12 | | | | — | | | | (1.80) | | | | (1.80) | | | | 4.85 | | | | 8.07% | | | | 77 | | | | 2.30% | | | | (1.54)% | | | | 6.60% | | | | 81% | |
| Year Ended October 31, 2018 | | | 7.38 | | | | (0.11) | | | | 0.52 | | | | 0.41 | | | | — | | | | (1.26) | | | | (1.26) | | | | 6.53 | | | | 5.52% | | | | 116 | | | | 2.30% | | | | (1.60)% | | | | 6.08% | | | | 77% | |
| Year Ended October 31, 2017 | | | 6.99 | | | | (0.11) | | | | 1.80 | | | | 1.69 | | | | — | | | | (1.30) | | | | (1.30) | | | | 7.38 | | | | 28.11% | | | | 454 | | | | 2.30% | | | | (1.54)% | | | | 3.71% | | | | 80% | |
| * | The per share amounts and percentages reflect income and expenses assuming inclusion of the Fund’s proportionate share of the income and expenses of the HSBC Opportunity Portfolio. |
| (a) | Calculated based on average shares outstanding. |
| (b) | Total return calculations do not include any sales or redemption charges. |
| (c) | Portfolio turnover rate is calculated on the basis of the respective Portfolio in which the Fund invests all of its investable assets. Portfolio turnover is calculated on the basis of the Fund as a whole without distinguishing between the classes of shares issued. |
Amounts designated as “—” are $0.00 or have been rounded to $0.00.
| See notes to financial statements. | HSBC FAMILY OF FUNDS | 9 |
| HSBC OPPORTUNITY FUND (CLASS I) |
Financial Highlights
Selected data for a share outstanding throughout the periods indicated.*
| | | | | | | Investment Activities | | Distributions | | | | | | | | | | Ratios/Supplementary Data |
| | | Net Asset
Value,
Beginning
of Period | | Net
Investment
Income/
(Loss)(a) | | Net Realized
and
Unrealized
Gains
(Losses)
from
Investments | | Total from
Investment
Activities | | Net
Investment
Income | | Net Realized
Gains from
Investment
Transactions | | Total
Distributions | | Net Asset
Value, End
of Period | | Total
Return
(b) | | Net Assets
at End
of Period
(000’s) | | Ratio of Net
Expense to
Average Net
Assets | | Ratio of Net
Investment
Income to
Average Net
Assets | | Ratio of
Expenses
to Average
Net Assets
(Excluding
Fee
Reductions) | | Portfolio
Turnover | (c) |
| Class I Shares | | | | | | | | | | | | | | | | | | | | | | | | | | | | | | | | | | | | | | | | | | | | | | | | | | | | | | | | |
| Year Ended October 31, 2021 | | | $14.67 | | | | $(0.07) | | | | $6.13 | | | | $6.06 | | | | $— | | | | $(1.57) | | | | $(1.57) | | | | $19.16 | (d) | | | 43.23% | | | | $88,809 | | | | 1.10% | | | | (0.39)% | | | | 1.88% | | | | 78% | |
| Year Ended October 31, 2020 | | | 12.79 | | | | (0.06) | | | | 2.85 | | | | 2.79 | | | | — | | | | (0.91) | | | | (0.91) | | | | 14.67 | | | | 22.58% | | | | 121,959 | | | | 1.10% | | | | (0.46)% | | | | 1.63% | | | | 94% | |
| Year Ended October 31, 2019 | | | 14.38 | | | | (0.04) | | | | 0.81 | | | | 0.77 | | | | — | | | | (2.36) | | | | (2.36) | | | | 12.79 | | | | 9.25% | | | | 115,924 | | | | 1.10% | | | | (0.34)% | | | | 1.44% | | | | 81% | |
| Year Ended October 31, 2018 | | | 15.40 | | | | (0.06) | | | | 1.12 | | | | 1.06 | | | | — | | | | (2.08) | | | | (2.08) | | | | 14.38 | | | | 6.96% | | | | 136,640 | | | | 1.10% | | | | (0.40)% | | | | 1.39% | | | | 77% | |
| Year Ended October 31, 2017 | | | 13.27 | | | | (0.05) | | | | 3.65 | | | | 3.60 | | | | — | | | | (1.47) | | | | (1.47) | | | | 15.40 | | | | 29.53% | | | | 127,861 | | | | 1.10% | | | | (0.34)% | | | | 1.12% | | | | 80% | |
| * | The per share amounts and percentages reflect income and expenses assuming inclusion of the Fund’s proportionate share of the income and expenses of the HSBC Opportunity Portfolio. |
| (a) | Calculated based on average shares outstanding. |
| (b) | Total return calculations do not include any sales or redemption charges. |
| (c) | Portfolio turnover rate is calculated on the basis of the respective Portfolio in which the Fund invests all of its investable assets. Portfolio turnover is calculated on the basis of the Fund as a whole without distinguishing between the classes of shares issued. |
| (d) | The net asset value per share (“NAV”) for financial reporting purposes differs from the NAV reported due to adjustments made in accordance with accounting principles generally accepted in the United States of America. |
Amounts designated as “—” are $0.00 or have been rounded to $0.00.
| 10 | HSBC FAMILY OF FUNDS | See notes to financial statements. |
Notes to Financial Statements—October 31, 2021
1. Organization:
The HSBC Funds (the “Trust”), a Delaware statutory trust organized on March 2, 2016, is registered under the Investment Company Act of 1940, as amended (the “Act”), as an open-end management investment company. As of October 31, 2021, the Trust is composed of 5 separate operational funds, each a series of the HSBC Family of Funds. The accompanying financial statements are presented for the following two diversified funds (individually a “Fund”, collectively the “Funds”) of the Trust:
| Fund | Short Name |
| HSBC Opportunity Fund | Opportunity Fund |
| HSBC Opportunity Fund (Class I) | Opportunity Fund (Class I) |
Financial statements for all other funds of the Trust are published separately.
Each Fund is a feeder fund in a master-feeder fund structure and seeks to achieve its investment objectives by investing all of its investable assets in the HSBC Opportunity Portfolio (the “Portfolio”), which is a diversified series of the Trust with the same investment objective as the Funds. The Portfolio operates as the master fund in a master-feeder arrangement in which the feeder funds invest all or part of their investable assets in the Portfolio. The Funds’ proportionate ownership of the Portfolio was as follows:
| Fund | | Proportionate
Ownership
Interest on
October 31, 2021
(%) |
| Opportunity Fund | | 12.4 | |
| Opportunity Fund (Class I) | | 87.6 | |
The financial statements of the Portfolio, including the Schedule of Portfolio Investments, are included elsewhere in this report. The financial statements of the Portfolio should be read in conjunction with the financial statements of the Funds.
The Funds are authorized to issue an unlimited number of shares of beneficial interest with a par value of $0.001 per share. The Opportunity Fund offers two classes of shares: Class A Shares and Class C Shares. The Opportunity Fund (Class I) offers one class of shares: Class I Shares. Class A Shares of the Opportunity Fund have a maximum sales charge of 5.00% as a percentage of the offering price. Class C Shares of the Opportunity Fund are offered without any front-end sales charge but will be subject to a maximum CDSC of 1.00% if redeemed less than one year after purchase. No sales charges are assessed with respect to Class I Shares of the Opportunity Fund (Class I). Each class of shares in the Funds has identical rights and privileges except with respect to arrangements pertaining to shareholder servicing and/or distribution, class-related expenses, voting rights on matters affecting a single class of shares, and exchange privileges of each class of shares.
Under the Trust’s organizational documents, the Trust’s officers and Trustees are indemnified against certain liabilities arising out of the performance of their duties to the Funds. In addition, in the normal course of business, the Trust enters into contracts with its service providers, which also provide for indemnifications by the Funds. The Funds’ maximum exposure under these arrangements is unknown, as this would involve future claims that may be made against the Funds. However, based on experience, the Trust believes the risk of loss to be remote.
The Funds are investment companies and follow accounting and reporting guidance under Financial Accounting Standards Board Accounting Standards Codification Topic 946, “Financial Services-Investment Companies.”
Notes to Financial Statements—October 31, 2021 (continued)
2. Significant Accounting Policies:
The following is a summary of the significant accounting policies followed by the Funds in the preparation of their financial statements. The policies are in conformity with generally accepted accounting principles in the United States of America (“GAAP”). The preparation of financial statements requires management to make certain estimates and assumptions that affect the reported amounts of assets and liabilities and disclosure of contingent assets and liabilities at the date of the financial statements and the reported amounts of increases and decreases in net assets from operations during the reporting period. Actual results could differ from those estimates.
Securities Valuation:
The Funds record their investments in the Portfolio at fair value. The notes to the Portfolio’s financial statements included elsewhere in this report provide information about the Portfolio’s valuation policy and its period-end security valuations.
Investment Transactions and Related Income:
The Funds record investments in the Portfolio on a trade date basis. The Funds record daily their proportionate share of income, expenses, changes in unrealized appreciation and depreciation and realized gains and losses derived from the Portfolio. In addition, the Funds accrue their own expenses daily as incurred.
Foreign Currency Translation:
The accounting records of the Funds are maintained in U.S. dollars. Foreign currency amounts are translated into U.S. dollars at the current rate of exchange to determine the value of investments, assets and liabilities at the close of each business day. Purchases and sales of securities, and income and expenses are translated at the prevailing rate of exchange on the respective dates of such transactions. The Funds do not isolate the portion of the results of operations resulting from changes in foreign exchange rates on investments from fluctuations arising from changes in market prices of securities held. Such fluctuations are included with the net realized and unrealized gain or loss from investments in securities and foreign currency translations.
Allocations:
Expenses directly attributable to a Fund are charged to that Fund. Expenses not directly attributable to a Fund are allocated among the applicable series within the Trust equally to each fund, in relation to its net assets, or another appropriate basis. Class specific expenses are charged directly to the class incurring the expense. In addition, income, expenses (other than class specific expenses), and unrealized and realized gains and losses are allocated to each class based on relative net assets on a daily basis.
Distributions to Shareholders:
Dividends distributed to shareholders of the Funds from net investment income, if any, are declared and distributed semiannually for the Funds.
Distributions from net realized gains, if any, are declared and paid at least annually by the Funds. Additional distributions are also made to the Funds’ shareholders to the extent necessary to avoid the federal excise tax on certain undistributed income and net realized gains of regulated investment companies.
Federal Income Taxes:
Each Fund is a separate taxable entity for federal income tax purposes. Each Fund has qualified and intends to continue to qualify each year as a “regulated investment company” under Subchapter M of the Internal Revenue Code, as amended, and to distribute substantially all of its taxable net investment income and net realized gains, if any, to its shareholders. Accordingly, no provision for federal income or excise tax is required for the Funds, although shareholders may be taxed on distributions they receive.
Management of the Funds has reviewed tax positions taken in tax years that remain subject to examination by all major tax jurisdictions, including federal (i.e., the last four tax year ends and the interim tax period since then, as applicable). Management believes that there is no tax liability resulting from unrecognized tax benefits related to uncertain tax positions taken. Management’s conclusions may be subject to future review based on changes in, or interpretation of, accounting standards or tax laws and regulations.
Notes to Financial Statements—October 31, 2021 (continued)
3. Investment Valuation Summary
The valuation techniques employed by the Funds, as described below, maximize the use of observable inputs and minimize the use of unobservable inputs in determining fair value. The Funds’ investments are classified within the fair value hierarchy based on the lowest level of input that is significant to the fair value measurement. The inputs used for valuing the Funds’ investments are summarized in the three broad levels listed below:
| | ● | Level 1—quoted prices in active markets for identical assets |
| | ● | Level 2—other significant observable inputs (including quoted prices for similar securities, interest rates, prepayments speeds, credit risk, etc.) |
| | ● | Level 3—significant unobservable inputs (including the Fund’s own assumptions in determining the fair value of investments) |
Changes in valuation techniques may result in transfers in or out of an assigned level within the fair value hierarchy. The inputs or methodology used for valuing investments are not necessarily an indication of the risk associated with investing in those investments.
The Funds record their investments in the Portfolio at fair value, which represents their proportionate ownership of the value of the Portfolios’ net assets. These investments are typically categorized as Level 2 in the fair value hierarchy. The underlying securities of the Portfolio are recorded at fair value, as discussed more fully in the Notes to Financial Statements of the Portfolio included elsewhere in this report.
As of October 31, 2021, all investments were categorized as Level 2 in the fair value hierarchy.
4. Related Party Transactions and Other Agreements and Plans:
Investment Management:
HSBC Global Asset Management (USA) Inc. (“HSBC” or the “Investment Adviser”), a wholly-owned subsidiary of HSBC USA, Inc., a registered bank holding company under the laws of the United States, acts as Investment Adviser to the Portfolio pursuant to an Investment Advisory Contract. As Investment Adviser, HSBC manages the investments of the Portfolio and continuously reviews, supervises, and administers the Portfolios’ investments. The Funds are not directly charged any investment management fees.
Administration, Fund Accounting and Other Services:
HSBC also serves the Funds as Administrator. Under the terms of the Administration Services Agreement, HSBC receives from the Funds (as well as other funds in the Trust combined) a fee, accrued daily and paid monthly, at an annual rate of:
| Based on Average Daily Net Assets of | | Fee Rate (%) |
| Up to $10 billion | | 0.0400 | |
| In excess of $10 billion but not exceeding $20 billion | | 0.0350 | |
| In excess of $20 billion but not exceeding $50 billion | | 0.0265 | |
| In excess of $50 billion | | 0.0245 | |
The fee rates and breakpoints are determined on the basis of the aggregate average daily net assets of the Trust. For the year ended October 31, 2021, the effective annualized rate was 0.033%, prior to any fee waivers or expense reimbursements, based on the average daily net assets of the Trust. The total administration fee paid to HSBC is allocated to each series based upon its proportionate share of the aggregate net assets of the Trust subject to certain allocations in cases where one fund invests some or all of its assets in another fund. For assets invested in the Portfolio by the Funds, the Portfolio pays half of the administration fee and the Funds pay half, for a combination of the total fee rate set forth above.
Notes to Financial Statements—October 31, 2021 (continued)
Pursuant to a Sub-Administration Services Agreement with HSBC, Citi Fund Services Ohio, Inc. (“Citi”), a wholly-owned subsidiary of Citigroup, Inc., serves as the Trust’s Sub-Administrator. For these services, Citi is entitled to a fee, payable by HSBC, at an annual rate equivalent to the fee rates set forth below:
| Based on Average Daily Net Assets of | | Fee Rate (%) |
| Up to $10 billion | | 0.0200 | |
| In excess of $10 billion but not exceeding $20 billion | | 0.0150 | |
| In excess of $20 billion but not exceeding $50 billion | | 0.0065 | |
| In excess of $50 billion | | 0.0045 | |
Under a Services Agreement between the Trust and Citi (the “Services Agreement”), Citi makes an individual available to serve as the Trust’s Chief Compliance Officer (the “CCO”). Citi also provides infrastructure and support in implementing the written policies and procedures comprising the Trust’s compliance program, including support services to the CCO. For the services provided under the Services Agreement, the Trust paid Citi $313,915 for the year ended October 31, 2021, plus reimbursement of certain out-of-pocket expenses. Expenses incurred by each Fund are reflected on the Statements of Operations as “Compliance Services.” Citi pays the salary and other compensation earned by individuals performing these services, as employees of Citi.
In addition, Citi provides fund accounting services for each Fund under the Services Agreement. As fund accountant, Citi receives an annual fee per Fund and share class, subject to certain minimums and reimbursements of certain expenses. Citi receives additional fees paid by the Trust for regulatory administration services.
Distribution Arrangements:
Foreside Distribution Services, L.P. (“Foreside” or the “Distributor”) serves the Trust as Distributor. The Trust, on behalf of the Funds has adopted a non-compensatory Distribution Plan and Agreement (the “Distribution Plan”) pursuant to Rule 12b-1 of the Act. The Distribution Plan provides for reimbursement of expenses incurred by the Distributor related to distribution and marketing, at a rate not to exceed 0.25% and 1.00% of the average daily net assets of Class A Shares (currently not being charged) and Class C Shares (currently charging 0.75%) of the applicable funds, respectively. For the year ended October 31, 2021, Foreside received $267 in commissions from sales of the Trust.
Shareholder Servicing:
The Trust has adopted a Shareholder Services Plan, which provides for payments to shareholder servicing agents for providing various shareholder services. For performing these services, the shareholder servicing agents receive a fee that is computed daily and paid monthly up to 0.25% of the average daily net assets of Class A Shares and Class C Shares of the applicable funds. The fees paid to the Distributor pursuant to the Distribution Plan and to shareholder servicing agents pursuant to the Shareholder Services Plan may not exceed in the aggregate 0.50% annually of the average daily net assets of Class A Shares, and 1.00% of the average daily net assets of Class C Shares.
The Trust has entered into shareholder services contracts with affiliated and unaffiliated financial intermediaries who provide shareholder services and other related services to their clients or customers who invest in the Funds under which the Funds will pay all or a portion of such fees earned to financial intermediaries for performing such services.
Transfer Agency:
DST Asset Manager Solutions, Inc. (“DST”) provides transfer agency services for each Fund. As transfer agent, DST receives a fee based on the number of funds and shareholder accounts, subject to certain minimums, and reimbursement of certain expenses.
Notes to Financial Statements—October 31, 2021 (continued)
Independent Trustees:
The Trust pays an annual retainer to each Independent Trustee, plus additional annual retainers to each Committee Chair and the Chairman of the Board of Trustees (the “Board”). The Independent Trustees also receive a fee for each regular, special in-person, and telephonic meeting of the Board attended. The aggregate amount of the fees and expenses of the Independent Trustees are allocated amongst all the funds in the Trust and are presented in the Statements of Operations.
Other:
The Funds pay fees to certain intermediaries or financial institutions for record keeping, sub-accounting services, transfer agency and other administrative services as reflected on the Statements of Operations as “Administrative Services.” The Funds may use related party broker-dealers. For the year ended October 31, 2021, there were no brokerage commissions paid to broker-dealers affiliated with the Adviser.
The Adviser and its affiliates may have lending, banking, brokerage, underwriting, or other business relationships with the issuers of the securities in which the Funds invest.
Fee Reductions:
The Investment Adviser has agreed to contractually limit through March 1, 2022 the total annual expenses of the Funds, including the allocated expenses from the Portfolio, exclusive of interest, taxes, brokerage commissions, extraordinary expenses, and estimated indirect expenses attributable to the Funds’ investments in investment companies. Each Fund Class has its own expense limitations based on the average daily net assets for any full fiscal year as follows:
| | | Class | | Contractual
Expense
Limitations (%) |
| Opportunity Fund | | A | | 1.65 | |
| Opportunity Fund | | C | | 2.40 | |
| Opportunity Fund (Class I) | | I | | 1.10 | |
Any amounts contractually waived or reimbursed by the Investment Adviser will be subject to repayment by the respective Fund to the Investment Adviser within three years calculated monthly from when the waiver or reimbursement is recorded to the extent that the repayment will not cause the Fund’s operating expenses to exceed the contractual expense limit that was in effect at the time of such waiver or reimbursement. During the year ended October 31, 2021, the Investment Adviser did not recapture any of its prior contractual waivers or reimbursements.
As of October 31, 2021, the repayments that may potentially be made by the Funds are as follows:
| | | Amount Eligible Through |
| | | 2024 ($) | | 2023 ($) | | 2022 ($) | | Total ($) |
| Opportunity Fund | | 623,917 | | 491,640 | | 378,659 | | 1,494,216 |
| Opportunity Fund (Class I) | | 821,503 | | 605,184 | | 432,989 | | 1,859,676 |
Citi may voluntarily waive/reimburse fees to help support the expense limits of the Funds. In addition, HSBC, in its role as Investment Adviser and Administrator, may waive/reimburse additional fees at its discretion. Any voluntary fee waivers/reimbursements are not subject to recoupment in subsequent fiscal periods. Voluntary waivers/reimbursements may be eliminated or changed at any time. Amounts waived/ reimbursed by the Investment Adviser, Administrator and Citi as Sub-Administrator are reported separately on the Statements of Operations, as applicable.
Notes to Financial Statements—October 31, 2021 (continued)
5. Affiliated Investment Transactions:
A summary of each Fund’s investment in the Portfolio for the year ended October 31, 2021 is as follows:
| | | Value
10/31/2020
($) | | Contributions
($) | | Withdrawals
($) | | Net
Realized
Gains/
(Losses)
($) | | Change in
Unrealized
Appreciation
/Depreciation
($) | | Value
10/31/2021
($) | | Net
Income/
(Loss)
($) | |
| Opportunity Fund | | | | | | | | | | | | | | | |
| Opportunity Portfolio | | 9,278,208 | | 940,247 | | (1,593,830 | ) | 3,921,511 | | 81,612 | | 12,564,869 | | (62,879 | ) |
| Total | | 9,278,208 | | 940,247 | | (1,593,830 | ) | 3,921,511 | | 81,612 | | 12,564,869 | | (62,879 | ) |
| | | | | | | | | | | | | | | | |
| Opportunity Fund (Class I) | | | | | | | | | | | | | |
| Opportunity Portfolio | | 122,007,469 | | 3,714,380 | | (76,322,106 | ) | 46,102,447 | | (6,145,310) | | 88,794,579 | | (562,301 | ) |
| Total | | 122,007,469 | | 3,714,380 | | (76,322,106 | ) | 46,102,447 | | (6,145,310 | ) | 88,794,579 | | (562,301 | ) |
6. Investment Risks:
The risks are presented in an order intended to facilitate readability, and their order does not imply that the realization of one risk is likely to occur more frequently than another risk, nor does it imply that the realization of one risk is likely to have a greater adverse impact than another risk.
Currency Risk: Fluctuations in exchange rates between the U.S. dollar and foreign currencies, or between various foreign currencies, may negatively affect a Fund’s performance. A Fund may seek to reduce currency risk by hedging part or all of its exposure to various foreign currencies; however, even if such hedging techniques are employed, there is no assurance that they will be successful.
Equity Securities Risk: The prices of equity securities fluctuate from time to time based on changes in a company’s financial condition or overall market and economic conditions. As a result, the value of equity securities may fluctuate drastically from day to day.
Foreign Securities Risk: Investments in foreign securities are generally considered riskier than investments in U.S. securities. Foreign securities, including those of emerging and frontier market issuers, are subject to additional risks, including international trade, political and regulatory risks.
Market Risk: The value of a Fund’s investments may decline due to changing economic, political, social, regulatory or market conditions. Market risk may affect a single issuer, industry or sector of the economy or it may affect the economy as a whole. Moreover, the conditions in one country or geographic region could adversely affect the Fund’s investments in a different country or geographic region. Events such as war, acts of terrorism, social unrest, natural disasters, the spread of infectious illness or other public health threats could also significantly impact a Fund and its investments.
7. Federal Income Tax Information:
As of the tax year ended October 31, 2021, the cost basis of investments for federal income tax purposes, gross unrealized appreciation, gross unrealized depreciation and net unrealized appreciation/depreciation were as follows:
| | | Tax Cost ($) | | Tax Unrealized
Appreciation ($) | | Tax Unrealized
Depreciation ($) | | Net Unrealized
Appreciation/
(Depreciation)
($)* |
| Opportunity Fund | | 10,596,006 | | 2,006,721 | | | (37,858) | | | 1,968,863 | |
| Opportunity Fund (Class I) | | 69,940,976 | | 18,867,338 | | | (13,735) | | | 18,853,603 | |
| * | The difference between book-basis and tax-basis unrealized appreciation/(depreciation) is attributable primarily to tax deferral of losses on wash sales. |
Notes to Financial Statements—October 31, 2021 (continued)
The tax character of distributions paid by the Funds for the tax year ended October 31, 2021, was as follows:
| | | Distributions paid from |
| | | Ordinary Income
($) | | Net Long-Term
Capital Gains ($) | | Total Taxable
Distributions ($) | | Total
Distributions
Paid ($)(1) |
| Opportunity Fund | | 106,753 | | | 489,512 | | | 596,265 | | | 596,265 | |
| Opportunity Fund (Class I) | | 2,927,949 | | | 7,097,045 | | | 10,024,994 | | | 10,024,994 | |
| (1) | Total distributions paid may differ from that disclosed in the Statements of Changes in Net Assets because distributions are recognized when actually paid for tax purposes. |
The tax character of distributions paid by the Funds for the tax year ended October 31, 2020, was as follows:
| | | Distributions paid from |
| | | Net Long-Term
Capital Gains ($) | | Total Taxable
Distributions ($) | | Total
Distributions
Paid ($)(1) |
| Opportunity Fund | | 649,268 | | | 649,268 | | | 649,268 | |
| Opportunity Fund (Class I) | | 8,206,443 | | | 8,206,443 | | | 8,206,443 | |
| (1) | Total distributions paid may differ from that disclosed in the Statements of Changes in Net Assets because distributions are recognized when actually paid for tax purposes. |
As of the tax year ended October 31, 2021, the components of accumulated earnings/(deficit) on a tax basis for the Funds were as follows:
| | | Undistributed
Ordinary
Income ($) | | Undistributed
Long-Term
Capital Gains
($) | | Accumulated
Earnings ($) | | Unrealized
Appreciation/
(Depreciation)
($)(1) | | Total
Accumulated
Earnings/
(Deficit) ($) |
| Opportunity Fund | | 1,311,809 | | | 2,482,531 | | | 3,794,340 | | | 1,968,863 | | | 5,763,203 | |
| Opportunity Fund (Class I) | | 16,743,163 | | | 28,693,735 | | | 45,436,898 | | | 18,853,603 | | | 64,290,501 | |
| (1) | The differences between book-basis and tax-basis unrealized appreciation/depreciation are attributable primarily to: tax deferral of losses on wash sales. |
The amount and character of net investment income and net realized gains distributed are determined in accordance with federal income tax regulations, which may differ from GAAP. These “book/tax” differences are either considered temporary or permanent in nature. To the extent these differences are permanent in nature (e.g., certain gain/loss and certain distributions), such amounts are reclassified within the composition of net assets based on their federal tax-basis treatment; temporary differences (e.g., wash losses and the realization for tax purposes of unrealized gains/losses on investments in passive foreign investment companies) do not require reclassification. The Funds may utilize equalization accounting for tax purposes and designate earnings and profits, including net realized gains distributed to shareholders on redemption of shares, as part of the dividends paid deduction for income tax purposes. To the extent distributions to shareholders from net investment income and net realized gains exceed net investment income and net realized gains for tax purposes, they are reported as distributions of capital.
Notes to Financial Statements—October 31, 2021 (continued)
On the Statements of Assets and Liabilities, as a result of permanent book-to-tax differences, reclassification adjustments were made as follows:
| | | Accumulated
Net Investment
Income/
(Distributions
in Excess of
Net Investment
Income) ($)* | | Accumulated
Net Realized
Gains/(Losses)
($)* | | Paid in Capital
($) |
| Opportunity Fund | | 97,661 | | | (97,661) | | | — | |
| Opportunity Fund (Class I) | | 415,393 | | | (415,393) | | | — | |
| * | These components of capital are presented together as “Total distributable earnings/(loss)” on the Statements of Assets and Liabilities. |
8. Significant Shareholders:
Shareholders, including other funds, individuals, and accounts, as well as each Fund’s investment manager(s) and/or investment personnel, may from time to time own (beneficially or of record) a significant percentage of the Fund’s Shares and can be considered to “control” the Fund when that ownership exceeds 25% of the Fund’s assets (and which may differ from control as determined in accordance with GAAP).
The following list includes the Funds which had individual shareholder accounts with ownership of voting securities greater than 10% of the total outstanding voting securities but less than 25% and/or accounts with ownership of voting securities greater than 25% of the total outstanding voting securities. Significant transactions by these shareholder accounts may negatively impact the Funds’ performance.
| | | Number of
shareholders with
ownership of
voting securities
of the Portfolio
greater than
10% and less
than 25% of the
total Portfolio’s
outstanding
voting securities | | Percentage owned
in aggregate
by 10% - 25%
shareholders (%) | | Number of
shareholders with
ownership of
voting securities
of the Portfolio
greater than
25% of the
total Portfolio’s
outstanding
voting securities | | Percentage owned
in aggregate by
greater than 25%
shareholders (%) |
| Opportunity Fund | | — | | | — | | | 1 | | | 64 | |
| Opportunity Fund (Class I) | | 3 | | | 43 | | | 1 | | | 45 | |
9. Subsequent Events:
Management has evaluated subsequent events through the date these financial statements were issued. Based on the evaluation, no adjustments or additional disclosures were required to the financial statements as of October 31, 2021.
Report of Independent Registered Public Accounting Firm
To the Board of Trustees of HSBC Funds and Shareholders of HSBC Opportunity Fund and HSBC Opportunity Fund (Class I)
Opinions on the Financial Statements
We have audited the accompanying statements of assets and liabilities of HSBC Opportunity Fund and HSBC Opportunity Fund (Class I) (two of the funds constituting HSBC Funds, hereafter collectively referred to as the “Funds”) as of October 31, 2021, the related statements of operations for the year ended October 31, 2021, the statements of changes in net assets for each of the two years in the period ended October 31, 2021, including the related notes, and the financial highlights for each of the five years in the period ended October 31, 2021 (collectively referred to as the “financial statements”). In our opinion, the financial statements present fairly, in all material respects, the financial position of each of the Funds as of October 31, 2021, the results of each of their operations for the year then ended, the changes in each of their net assets for each of the two years in the period ended October 31, 2021 and each of the financial highlights for each of the five years in the period ended October 31, 2021 in conformity with accounting principles generally accepted in the United States of America.
Basis for Opinions
These financial statements are the responsibility of the Funds’ management. Our responsibility is to express an opinion on the Funds’ financial statements based on our audits. We are a public accounting firm registered with the Public Company Accounting Oversight Board (United States) (PCAOB) and are required to be independent with respect to the Funds in accordance with the U.S. federal securities laws and the applicable rules and regulations of the Securities and Exchange Commission and the PCAOB.
We conducted our audits of these financial statements in accordance with the standards of the PCAOB. Those standards require that we plan and perform the audit to obtain reasonable assurance about whether the financial statements are free of material misstatement, whether due to error or fraud.
Report of Independent Registered Public Accounting Firm (continued)
Our audits included performing procedures to assess the risks of material misstatement of the financial statements, whether due to error or fraud, and performing procedures that respond to those risks. Such procedures included examining, on a test basis, evidence regarding the amounts and disclosures in the financial statements. Our audits also included evaluating the accounting principles used and significant estimates made by management, as well as evaluating the overall presentation of the financial statements. Our procedures included confirmation of securities owned as of October 31, 2021 by correspondence with the transfer agent. We believe that our audits provide a reasonable basis for our opinions.
/s/ PricewaterhouseCoopers LLP
New York, New York
December 21, 2021
We have served as the auditor of one or more investment companies in the HSBC Funds since 2015.
Other Federal Income Tax Information—as of October 31, 2021 (Unaudited)
During the year ended October 31, 2021, the following Funds declared capital gain distributions:
| | | Short Term
Capital Gain
Distributions ($) | | Long Term
Capital Gain
Distributions ($) |
| Opportunity Fund | | 106,753 | | | 489,512 | |
| Opportunity Fund (Class I) | | 2,927,949 | | | 7,097,045 | |
Table of Shareholder Expenses—as of October 31, 2021 (Unaudited)
As a shareholder of the Funds, you incur two types of costs: (1) transaction costs, including sales charges (loads) on purchases, redemption fees and exchange fees; and (2) ongoing costs, including management fees, distribution fees and other Fund expenses. These examples are intended to help you understand your ongoing costs (in dollars) of investing in the Funds and to compare these costs with the ongoing costs of investing in other mutual funds.
Actual Expenses
The actual examples are based on an investment of $1,000 invested at the beginning of a six-month period beginning May 1, 2021 and held through the period ended October 31, 2021.
The columns below under the heading entitled “Actual” provide information about actual account values and actual expenses. You may use this information, together with the amount you invested, to estimate the expenses that you paid over the period. Simply divide your account value by $1,000 (for example, an $8,600 account value divided by $1,000 = 8.6), then multiply the result by the number in the table under the heading entitled “Actual Expenses Paid During the Period” to estimate the expenses you paid on your account during this period.
Hypothetical Example for Comparison Purposes
The hypothetical expense examples are based on an investment of $1,000 invested at the beginning of a six-month period and held throughout the period ended October 31, 2021.
The columns below under the heading entitled “Hypothetical” provide information about hypothetical account values and hypothetical expenses based on each Fund’s actual expense ratio and an assumed rate of return of 5% per year before expenses, which is not each Fund’s actual return. The hypothetical account values and expenses may not be used to estimate the actual ending account balance or expenses you paid for the period. You may use this information to compare this 5% hypothetical example with the 5% hypothetical examples that appear in the shareholder reports of other funds.
Please note that the expenses shown in the table are meant to highlight your ongoing costs only and do not reflect any transactional costs, such as sales charges (loads), redemption fees, or exchange fees. Therefore, the columns under the heading entitled “Hypothetical” are useful in comparing ongoing costs only, and will not help you determine the relative total costs of owning different funds. In addition, if these transactional costs were included, your costs would have been higher.
| | | | | | | Actual | | Hypothetical
(5% return before expenses) |
| | | Annualized
Expense
Ratio During
Period | | Beginning
Account
Value
5/1/21 | | Ending
Account
Value
10/31/21 | | Expenses
Paid During
Period(1) | | Ending
Account
Value
10/31/21 | | Expenses
Paid During
Period(1) |
| Opportunity Fund - Class A | | 1.55% | | | $1,000.00 | | $1,071.70 | | $8.09 | | | $1,017.39 | | $7.88 | |
| Opportunity Fund - Class C | | 2.30% | | | 1,000.00 | | 1,068.10 | | 11.99 | | | 1,013.61 | | 11.67 | |
| Opportunity Fund - Class I | | 1.10% | | | 1,000.00 | | 1,074.60 | | 5.75 | | | 1,019.66 | | 5.60 | |
| (1) | Expenses are equal to the average account value over the period multiplied by the Fund’s annualized expense ratio, multiplied by 184/365 (the number of days in the most recent fiscal half-year divided by the number of days in the fiscal year.) |
Portfolio Composition*
October 31, 2021 (Unaudited)
| HSBC Opportunity Portfolio | | | |
| Investment Allocation | | Percentage of Investments
at Value (%) |
| Biotechnology | | 13.7 | |
| Software | | 11.2 | |
| Life Sciences Tools & Services | | 7.2 | |
| Specialty Retail | | 4.5 | |
| Semiconductors & Semiconductor Equipment | | 4.2 | |
| Communications Equipment | | 3.8 | |
| Capital Markets | | 3.7 | |
| Electrical Equipment | | 3.7 | |
| Building Products | | 3.7 | |
| IT Services | | 3.6 | |
| Equity Real Estate Investment Trusts | | 3.2 | |
| Road & Rail | | 3.0 | |
| Machinery | | 2.9 | |
| Health Care Equipment & Supplies | | 2.5 | |
| Pharmaceuticals | | 2.3 | |
| Insurance | | 2.2 | |
| Chemicals | | 2.1 | |
| Professional Services | | 1.9 | |
| Construction Materials | | 1.8 | |
| Textiles, Apparel & Luxury Goods | | 1.7 | |
| Banks | | 1.7 | |
| Household Durables | | 1.7 | |
| Hotels, Restaurants & Leisure | | 1.5 | |
| Oil, Gas & Consumable Fuels | | 1.5 | |
| Diversified Telecommunication Services | | 1.4 | |
| Leisure Products | | 1.4 | |
| Commercial Services & Supplies | | 1.4 | |
| Electronic Equipment, Instruments & Components | | 1.3 | |
| Health Care Providers & Services | | 1.3 | |
| Entertainment | | 1.2 | |
| Aerospace & Defense | | 1.2 | |
| Internet & Direct Marketing Retail | | 1.0 | |
| Investment Companies | | 0.5 | |
| Total | | 100.0 | |
| * | Portfolio composition is subject to change. |
| HSBC OPPORTUNITY PORTFOLIO |
Schedule of Portfolio Investments—as of October 31, 2021
| Common Stocks — 99.6% | | | | |
| | | Shares | | Value ($) |
| Aerospace & Defense — 1.2% | | | | |
| Hexcel Corp.(a) | | 20,760 | | 1,177,922 |
| Banks — 1.7% | | | | |
| Signature Bank | | 5,790 | | 1,724,378 |
| Biotechnology — 13.8% | | | | |
| Acceleron Pharma, Inc.(a) | | 11,520 | | 2,006,554 |
| Ascendis Pharma AS, ADR(a) | | 14,917 | | 2,261,566 |
| Blueprint Medicines Corp.(a) | | 19,523 | | 2,196,142 |
| Ironwood Pharmaceuticals, Inc.(a) | | 117,920 | | 1,505,838 |
| Mirati Therapeutics, Inc.(a) | | 5,450 | | 1,030,159 |
| Neurocrine Biosciences, Inc.(a) | | 20,260 | | 2,135,607 |
| Novavax, Inc.(a) | | 4,670 | | 695,036 |
| Rocket Pharmaceuticals, Inc.(a) | | 23,570 | | 700,265 |
| TG Therapeutics, Inc.(a) | | 45,150 | | 1,409,583 |
| | | | | 13,940,750 |
| Building Products — 3.7% | | | | |
| Advanced Drainage Systems, Inc. | | 17,211 | | 1,941,401 |
| Trex Co., Inc.(a) | | 16,870 | | 1,794,968 |
| | | | | 3,736,369 |
| Capital Markets — 3.7% | | | | |
| Ares Management Corp., Class A | | 18,510 | | 1,568,537 |
| LPL Financial Holdings, Inc. | | 13,500 | | 2,214,270 |
| | | | | 3,782,807 |
| Chemicals — 2.1% | | | | |
| Axalta Coating Systems Ltd.(a) | | 31,910 | | 995,273 |
| FMC Corp. | | 12,250 | | 1,114,872 |
| | | | | 2,110,145 |
| Commercial Services & Supplies — 1.4% | | | | |
| IAA, Inc.(a) | | 23,310 | | 1,390,442 |
| Communications Equipment — 3.8% | | | | |
| F5 Networks, Inc.(a) | | 9,320 | | 1,967,918 |
| Lumentum Holdings, Inc.(a) | | 22,500 | | 1,858,050 |
| | | | | 3,825,968 |
| Construction Materials — 1.8% | | | | |
| Vulcan Materials Co.(a) | | 9,740 | | 1,851,769 |
| Diversified Telecommunication Services — 1.4% | | | | |
| Cogent Communications Holdings, Inc. | | 18,680 | | 1,430,701 |
| Electrical Equipment — 3.7% | | | | |
| Atkore, Inc.(a) | | 25,288 | | 2,390,475 |
| Sensata Technologies Holding PLC(a) | | 24,710 | | 1,361,521 |
| | | | | 3,751,996 |
| Electronic Equipment, Instruments & Components — 1.3% | | | | |
| Teledyne Technologies, Inc.(a) | | 2,980 | | 1,338,676 |
| Entertainment — 1.2% | | | | |
| Zynga, Inc., Class A(a) | | 160,180 | | 1,182,128 |
| Equity Real Estate Investment Trusts — 3.2% | | | | |
| Douglas Emmett, Inc. | | 75,090 | | 2,453,941 |
| Independence Realty Trust, Inc. | | 32,890 | | 777,191 |
| | | | | 3,231,132 |
| Health Care Equipment & Supplies — 2.5% | | | | |
| Haemonetics Corp.(a) | | 14,360 | | 986,675 |
| Insulet Corp.(a) | | 5,083 | | 1,575,832 |
| | | | | 2,562,507 |
| Health Care Providers & Services — 1.3% | | | | |
| Oak Street Health, Inc.(a) | | 27,440 | | 1,295,991 |
| Hotels, Restaurants & Leisure — 1.5% | | | | |
| Vail Resorts, Inc. | | 4,420 | | 1,523,618 |
| Household Durables — 1.7% | | | | |
| TopBuild Corp.(a) | | 6,600 | | 1,696,002 |
| Insurance — 2.2% | | | | |
| American Financial Group, Inc.(a) | | 16,450 | | 2,237,858 |
| Internet & Direct Marketing Retail — 1.0% | | | | |
| Revolve Group, Inc.(a) | | 13,023 | | 977,246 |
| IT Services — 3.6% | | | | |
| Gartner, Inc.(a) | | 5,830 | | 1,935,035 |
| Paya Holdings, Inc.(a) | | 94,190 | | 858,071 |
| WEX, Inc.(a) | | 5,735 | | 858,530 |
| | | | | 3,651,636 |
| Leisure Products — 1.4% | | | | |
| BRP, Inc. | | 16,020 | | 1,412,163 |
| Life Sciences Tools & Services — 7.2% | | | | |
| Avantor, Inc.(a) | | 34,170 | | 1,379,784 |
| BIO-RAD Laboratories, Inc., Class A(a) | | 3,010 | | 2,391,987 |
| ICON PLC(a) | | 9,910 | | 2,841,891 |
| Pacific Biosciences of California, Inc.(a) | | 24,700 | | 654,056 |
| | | | | 7,267,718 |
| Machinery — 2.9% | | | | |
| IDEX Corp. | | 6,900 | | 1,535,733 |
| Lincoln Electric Holdings, Inc.(a) | | 9,870 | | 1,405,488 |
| | | | | 2,941,221 |
| Oil, Gas & Consumable Fuels — 1.5% | | | | |
| Diamondback Energy, Inc. | | 13,880 | | 1,487,797 |
| Pharmaceuticals — 2.3% | | | | |
| Catalent, Inc.(a) | | 17,050 | | 2,350,513 |
| Professional Services — 1.9% | | | | |
| TransUnion | | 16,950 | | 1,954,166 |
| Road & Rail — 3.0% | | | | |
| Lyft, Inc., Class A(a) | | 28,310 | | 1,298,580 |
| Saia, Inc.(a) | | 5,730 | | 1,791,427 |
| | | | | 3,090,007 |
| Semiconductors & Semiconductor Equipment — 4.2% | | | | |
| Cirrus Logic, Inc.(a) | | 17,650 | | 1,426,296 |
| MKS Instruments, Inc. | | 10,260 | | 1,539,513 |
| Silicon Motion Technology Corp., ADR | | 17,890 | | 1,277,525 |
| | | | | 4,243,334 |
| Software — 11.2% | | | | |
| Avalara, Inc.(a) | | 10,050 | | 1,805,382 |
| HubSpot, Inc.(a) | | 3,848 | | 3,117,765 |
| Nice, Ltd., ADR(a) | | 6,320 | | 1,788,686 |
| Paylocity Holding Corp.(a) | | 8,530 | | 2,602,844 |
| Pegasystems, Inc. | | 12,440 | | 1,476,877 |
| Zendesk, Inc.(a) | | 5,900 | | 600,620 |
| | | | | 11,392,174 |
| Specialty Retail — 4.5% | | | | |
| Five Below, Inc.(a) | | 10,540 | | 2,079,542 |
| National Vision Holdings, Inc.(a) | | 40,090 | | 2,471,148 |
| | | | | 4,550,690 |
| 24 | HSBC FAMILY OF FUNDS | See notes to financial statements. |
| HSBC OPPORTUNITY PORTFOLIO |
Schedule of Portfolio Investments—as of October 31, 2021 (continued)
| Common Stocks, continued | | | | |
| | | Shares | | Value ($) |
| Textiles, Apparel & Luxury Goods — 1.7% | | | | |
| Tapestry, Inc.(a) | | 45,370 | | 1,768,523 |
TOTAL COMMON STOCKS
(COST $80,095,314) | | | | 100,878,347 |
| | | | | |
| Investment Company — 0.5% | | | | |
| | | | | |
| Northern Institutional Government Select Portfolio, Institutional Shares, 0.03%(b) | | 554,234 | | 554,234 |
TOTAL INVESTMENT COMPANY
(Cost $554,234) | | | | 554,234 |
TOTAL INVESTMENTS IN SECURITIES
(Cost $80,649,548) — 100.1% | | | | 101,432,581 |
| Other Assets (Liabilities) - (0.1)% | | | | (73,133) |
| NET ASSETS - 100% | | | | $101,359,448 |
| (a) | Represents non-income producing security. |
| (b) | The rate represents the annualized 7-day yield that was in effect on October 31, 2021. |
ADR - American Depositary Receipt
| See notes to financial statements. | HSBC FAMILY OF FUNDS | 25 |
HSBC FAMILY OF FUNDS
Statement of Assets and Liabilities—as of October 31, 2021
| | HSBC
Opportunity
Portfolio |
| Assets: | | | |
| Investment in securities, at value | | $ | 101,432,581 | |
| Dividends receivable | | | 12,185 | |
| Receivable for investments sold | | | 476,566 | |
| Prepaid expenses | | | 12,651 | |
| Total Assets | | | 101,933,983 | |
| | | | | |
| Liabilities: | | | | |
| Payable for investments purchased | | | 439,667 | |
| Accrued expenses and other liabilities: | | | | |
| Investment Management | | | 21,084 | |
| Sub-Advisory | | | 46,380 | |
| Administration | | | 1,365 | |
| Accounting | | | 5,781 | |
| Compliance Services | | | 5,235 | |
| Custodian | | | 3,582 | |
| Printing | | | 646 | |
| Professional | | | 48,791 | |
| Trustee | | | 2,004 | |
| Total Liabilities | | $ | 574,535 | |
| | | | | |
| Net Assets Applicable to investors’ beneficial interest | | $ | 101,359,448 | |
| Investments in securities, at cost | | $ | 80,649,548 | |
| 26 | HSBC FAMILY OF FUNDS | See notes to financial statements. |
HSBC FAMILY OF FUNDS
Statement of Operations - For the year ended October 31, 2021
| | HSBC
Opportunity
Portfolio |
| Investment Income: | | | |
| Dividends | | $ | 828,039 | |
| Foreign tax withholding | | | (2,216 | ) |
| Total Investment Income | | | 825,823 | |
| | | | | |
| Expenses: | | | | |
| Investment Management Fees | | | 292,561 | |
| Sub-Advisory Fees | | | 643,636 | |
| Administration | | | 18,894 | |
| Accounting | | | 55,372 | |
| Compliance Services | | | 58,302 | |
| Custodian | | | 40,574 | |
| Printing | | | 2,043 | |
| Professional | | | 173,424 | |
| Trustee | | | 135,726 | |
| Other | | | 30,471 | |
| Total Expenses | | | 1,451,003 | |
| | | | | |
| Net Investment Income/(Loss) | | $ | (625,180 | ) |
| | | | | |
| Net Realized/Unrealized Gains/(Losses) from Investments in Securities: | | | | |
| Net realized gains/(losses) from investment securities | | | 50,023,958 | |
| Change in unrealized appreciation/depreciation on investment securities | | | (6,063,698 | ) |
| | | | | |
| Net realized/unrealized gains/(losses) on investments | | | 43,960,260 | |
| Change in Net Assets Resulting from Operations | | $ | 43,335,080 | |
| See notes to financial statements. | HSBC FAMILY OF FUNDS | 27 |
HSBC FAMILY OF FUNDS
Statement of Changes in Net Assets
| | HSBC Opportunity Portfolio | |
| | | For the year ended
October 31, 2021 | | | | For the year ended
October 31, 2020 | | |
| Investment Activities: | | | | | | | | |
| Operations: | | | | | | | | |
| Net investment income/(loss) | | $ | (625,180 | ) | | | $ | (606,915 | ) | |
| Net realized gains/(losses) from investments | | | 50,023,958 | | | | | 12,275,071 | | |
| Change in unrealized appreciation/depreciation on investments | | | (6,063,698 | ) | | | | 13,693,484 | | |
| Change in net assets resulting from operations | | | 43,335,080 | | | | | 25,361,640 | | |
| Proceeds from contributions | | | 4,654,627 | | | | | 6,752,448 | | |
| Value of withdrawals | | | (77,915,936 | ) | | | | (25,360,981 | ) | |
| Change in net assets resulting from transactions in investors’ beneficial interest | | | (73,261,309 | ) | | | | (18,608,533 | ) | |
| Change in net assets | | | (29,926,229 | ) | | | | 6,753,107 | | |
| | | | | | | | | | | |
| Net Assets: | | | | | | | | | | |
| Beginning of period | | | 131,285,677 | | | | | 124,532,570 | | |
| End of period | | $ | 101,359,448 | | | | $ | 131,285,677 | | |
| 28 | HSBC FAMILY OF FUNDS | See notes to financial statements. |
| HSBC OPPORTUNITY PORTFOLIO |
Financial Highlights
| | | | | Ratios/Supplementary Data | |
| | | Total
Return | | Net Assets at
End of Period
(000’s) | | Ratio of Net
Expense to
Average Net
Assets | | Ratio of Net
Investment
Income to
Average Net
Assets | | Portfolio
Turnover | |
| HSBC OPPORTUNITY PORTFOLIO | | | | | | | | | | | |
| Year Ended October 31, 2021 | | 43.07% | | $101,359 | | 1.25% | | (0.53)% | | 78% | |
| Year Ended October 31, 2020 | | 22.50% | | 131,286 | | 1.13% | | (0.49)% | | 94% | |
| Year Ended October 31, 2019 | | 9.31% | | 124,533 | | 1.07% | | (0.31)% | | 81% | |
| Year Ended October 31, 2018 | | 6.99% | | 146,185 | | 1.04% | | (0.34)% | | 77% | |
| Year Ended October 31, 2017 | | 29.79% | | 137,857 | | 0.91% | | (0.15)% | | 80% | |
| See notes to financial statements. | HSBC FAMILY OF FUNDS | 29 |
Notes to Financial Statements—October 31, 2021
1. Organization:
The HSBC Funds (the “Trust”), a Delaware statutory trust organized on March 2, 2016, is registered under the Investment Company Act of 1940, as amended (the “Act”), as an open-end management investment company. As of October 31, 2021, the Trust is composed of 5 separate operational funds, each a series of the HSBC Family of Funds. The accompanying financial statements are presented for the HSBC Opportunity Portfolio (the “Portfolio”).
The Portfolio operates as a master fund in a master-feeder arrangement, in which the two feeder funds invest all or part of their investable assets in the Portfolio. The Agreement and Declaration of Trust permits the Board of Trustees (the “Board”) to issue an unlimited number of beneficial interests in the Portfolio.
The Portfolio is a diversified series of the Trust. Financial statements for all other funds of the Trust are published separately.
The following represents each feeder fund’s proportionate ownership interest in the Portfolio:
| Feeder Fund | Proportionate
Ownership
Interest on
October 31, 2021
(%) |
| Opportunity Fund | | 12.4 | |
| Opportunity Fund (Class I) | | 87.6 | |
Under the Trust’s organizational documents, the Trust’s officers and Trustees are indemnified against certain liabilities arising out of the performance of their duties to the Portfolio. In addition, in the normal course of business, the Trust may enter into contracts with its service providers, which also provide for indemnifications by the Portfolio. The Portfolio’s maximum exposure under these arrangements is unknown as this would involve future claims that may be made against the Portfolio. However, based on experience, the Trust believes the risk of loss to be remote.
The Portfolio is an investment company and follows accounting and reporting guidance under Financial Accounting Standards Board Accounting Standards Codification Topic 946, “Financial Services-Investment Companies.”
2. Significant Accounting Policies:
The following is a summary of the significant accounting policies followed by the Portfolio in the preparation of its financial statements. The policies are in conformity with generally accepted accounting principles in the United States of America. The preparation of financial statements requires management to make certain estimates and assumptions that affect the reported amounts of assets and liabilities and disclosure of contingent assets and liabilities at the date of the financial statements and the reported amounts of increases and decreases in net assets from operations during the reporting period. Actual results could differ from those estimates.
Securities Valuation:
The Portfolio records its investments at fair value. Fair value is defined as the price that would be received to sell an asset or paid to transfer a liability in an orderly transaction between market participants at the measurement date. The valuation techniques used to determine fair value are further described in Note 3 below.
Investment Transactions and Related Income:
Investment transactions are accounted for no later than one business day after trade date. However, for financial reporting purposes, investment transactions are accounted for on trade date on the last business day of the reporting period. Investment gains and losses are calculated on the identified cost basis. Interest income
Notes to Financial Statements—October 31, 2021 (continued)
is determined on the basis of coupon interest accrued using the effective interest method which adjusts for amortization of premiums and accretion of discounts. Dividend income is recorded on the ex-dividend date. Pay-in-kind interest income and non-cash dividend income received in the form of securities in-lieu of cash, if any, are recorded at the fair value of the securities received. The Portfolio makes an allocation of its investment income, expenses and realized gains and losses from securities transactions to its investors in proportion to their investment in the Portfolio on the date of such accrual or gain/loss.
Foreign Currency Translation:
The accounting records of the Portfolio are maintained in U.S. dollars. Foreign currency amounts are translated into U.S. dollars at the current rate of exchange to determine the value of investments, assets and liabilities at the close of each business day. Purchases and sales of securities, and income and expenses are translated at the prevailing rate of exchange on the respective dates of such transactions. The Portfolio does not isolate the portion of the results of operations resulting from changes in foreign exchange rates on investments from fluctuations arising from changes in market prices of securities held. Such fluctuations are included with the net realized and unrealized gain or loss from investments in securities and foreign currency translations.
Restricted Securities:
The Portfolio may invest in restricted securities. A restricted security is a security which has been purchased through a private offering and cannot be resold to the general public without prior registration under the Securities Act of 1933 (the “1933 Act”) or pursuant to the resale limitations provided by Rule 144 under the 1933 Act, or another exemption from the registration requirements of the 1933 Act. Certain restricted securities may be resold in transactions exempt from registration, normally to qualified institutional buyers, and may be classified as liquid by the Investment Adviser (as defined in Note 4) under the Portfolio’s liquidity risk management program, as approved by the Board. Therefore, not all restricted securities are considered illiquid. Disposal of restricted securities may involve time consuming negotiations and expense. Prompt sale at the current valuation may be difficult and could adversely affect the net assets of the Portfolio. As of October 31, 2021, there were no restricted securities held by the Portfolio.
Allocations:
Expenses directly attributable to the Portfolio are charged to the Portfolio. Expenses not directly attributable to the Portfolio are allocated among the applicable series within the Trust equally to each fund, in relation to its net assets, or another appropriate basis.
Federal Income Taxes:
The Portfolio is treated as a partnership for U.S. federal income tax purposes. Accordingly, the Portfolio passes through all of its net investment income and gains and losses to its feeder funds, and is therefore not subject to U.S. federal income tax. As such, feeder funds are allocated for tax purposes their respective share of the Portfolio’s ordinary income and realized gains or losses. It is intended that the Portfolio will continue to be managed in such a way that its feeder funds will be able to satisfy the requirements of the Internal Revenue Code, as amended, applicable to regulated investment companies.
Management of the Portfolio has reviewed tax positions taken in tax years that remain subject to examination by all major tax jurisdictions, including federal (i.e., the last four tax year ends and the interim tax period since then, as applicable). Management believes that there is no tax liability resulting from unrecognized tax benefits related to uncertain tax positions taken. Management’s conclusions may be subject to future review based on changes in, or interpretation of, accounting standards or tax laws and regulations.
3. Investment Valuation Summary
The valuation techniques employed by the Portfolio, as described below, maximize the use of observable inputs and minimize the use of unobservable inputs in determining fair value. The Portfolio’s investments are classified within the fair value hierarchy based on the lowest level of input that is significant to the fair value measurement. The inputs used for valuing the Portfolio’s investments are summarized in the three broad levels listed below:
Notes to Financial Statements—October 31, 2021 (continued)
| | ● | Level 1—quoted prices in active markets for identical assets |
| | | |
| | ● | Level 2—other significant observable inputs (including quoted prices for similar securities, interest rates, prepayments speeds, credit risk, etc.) |
| | | |
| | ● | Level 3—significant unobservable inputs (including the Fund’s own assumptions in determining the fair value of investments) |
Changes in valuation techniques may result in transfers in or out of an assigned level within the fair value hierarchy. The inputs or methodology used for valuing investments are not necessarily an indication of the risk associated with investing in those investments.
Exchange traded domestic equity securities are valued at the last sale price on a national securities exchange (except the Nasdaq Stock Market), or in the absence of recorded sales, at the readily available closing bid price on such exchanges. Securities traded on the Nasdaq Stock Market are valued at the Nasdaq Official Closing Price on the date of valuation. Domestic equity securities that are not traded on an exchange are valued at the quoted bid price in the over-the-counter market. These securities are typically categorized as Level 1 in the fair value hierarchy.
Shares of exchange traded and closed-end registered investment companies are valued in the same manner as other equity securities and are typically categorized as Level 1 in the fair value hierarchy. Investments in other mutual funds are valued at their net asset values (“NAVs”), as reported by such mutual funds and are typically categorized as Level 1 in the fair value hierarchy.
Securities or other assets for which market quotations or an independent pricing service evaluation are not readily available, or are deemed unreliable due to a significant event or otherwise, are valued pursuant to procedures adopted by the Board (“Procedures”). Depending on the source and relative significance of valuation inputs, these instruments may be classified as Level 2 or Level 3 in the fair value hierarchy. Examples of potentially significant events that could affect the value of an individual security and thus require pricing under the Procedures include corporate actions by the issuer, announcements by the issuer relating to its earnings or products, regulatory news, natural disasters, and litigation. Examples of potentially significant events that could affect multiple securities held by the Portfolio include governmental actions, natural disasters, and armed conflicts. Fair value pricing may require subjective determinations about the value of a security. While the Trust’s policy is intended to result in a calculation of the Portfolio’s NAV that fairly reflects security values as of the time of pricing, the Trust cannot ensure that fair values determined would accurately reflect the price that the Portfolio could obtain for a security if it were to dispose of that security as of the time of pricing. The prices used by the Portfolio may differ from the value that would be realized if the securities were sold and the differences could be material to the financial statements.
As of October 31, 2021, all investments were categorized as Level 1 in the fair value hierarchy. The breakdown of investment categorization is disclosed in the Schedule of Portfolio Investments.
4. Related Party Transactions and Other Agreements and Plans:
Investment Management:
HSBC Global Asset Management (USA) Inc. (“HSBC” or the “Investment Adviser”), a wholly owned subsidiary of HSBC USA, Inc., a registered bank holding company under the laws of the United States, acts as Investment Adviser to the Portfolio. As Investment Adviser, HSBC manages the investments of the Portfolio and continuously reviews, supervises, and administers the Portfolio’s investments pursuant to an Investment Advisory Contract. Westfield Capital Management Company, L.P. (“Westfield”) serves as subadviser for the Portfolio and is paid for its services directly by the Portfolio.
For their services, the Investment Adviser and Westfield receive in aggregate, a fee, accrued daily and paid monthly, at an annual rate of 0.80% of the Portfolio’s average daily net assets. Currently, the Investment Adviser’s contractual fee is 0.25% and Westfield’s contractual fee is 0.55%.
Notes to Financial Statements—October 31, 2021 (continued)
Administration, Fund Accounting and Other Services:
HSBC also serves as the Portfolio’s Administrator. Under the terms of the Administration Services Agreement, HSBC receives from the Portfolio (as well as other funds in the Trust combined) a fee, accrued daily and paid monthly, at an annual rate of:
| Based on Average Daily Net Assets of | Fee Rate (%) |
| Up to $10 billion | 0.0400 |
| In excess of $10 billion but not exceeding $20 billion | 0.0350 |
| In excess of $20 billion but not exceeding $50 billion | 0.0265 |
| In excess of $50 billion | 0.0245 |
The fee rates and breakpoints are determined on the basis of the aggregate average daily net assets of the Trust, however, the assets of the funds of the HSBC Funds that invest in the Portfolio are not double-counted. For the year ended October 31, 2021, the effective annualized rate was 0.033%, prior to any fee waivers or expense reimbursements, based on the average daily net assets of the Trust. The total administration fee paid to HSBC is allocated to each series based upon its proportionate share of the aggregate net assets of the Trust. For assets invested in the Portfolio by the HSBC Funds, the Portfolio pays half of the administration fee and the feeder funds pay half of the administration fee, for a combination of the total fee rate set forth above.
Pursuant to a Sub-Administration Services Agreement with HSBC, Citi Fund Services Ohio, Inc. (“Citi”), a wholly-owned subsidiary of Citigroup, Inc., serves as the Trust’s Sub-Administrator. For these services, Citi is entitled to a fee, payable by HSBC, at an annual rate equivalent to the fee rates set forth below:
| Based on Average Daily Net Assets of | Fee Rate (%) |
| Up to $10 billion | 0.0200 |
| In excess of $10 billion but not exceeding $20 billion | 0.0150 |
| In excess of $20 billion but not exceeding $50 billion | 0.0065 |
| In excess of $50 billion | 0.0045 |
Under a Services Agreement between the Trust and Citi (the “Services Agreement”), Citi makes an individual available to serve as the Trust’s Chief Compliance Officer (the “CCO”). Citi also provides infrastructure and support in implementing the written policies and procedures comprising the Trust’s compliance program, including support services to the CCO. For the services provided under the Services Agreement, the Trust paid Citi $313,915 for the year ended October 31, 2021, plus reimbursement of certain out-of-pocket expenses. Expenses incurred by the Portfolio are reflected on the Statement of Operations as “Compliance Services.” Citi pays the salary and other compensation earned by individuals performing these services, as employees of Citi.
In addition, Citi provides fund accounting services for the Portfolio under the Services Agreement. For its services to the Portfolio, Citi receives an annual fee per portfolio, subject to certain minimums and reimbursement of certain expenses. Citi receives additional fees paid by the Trust for regulatory administration services.
Independent Trustees:
The Trust pays an annual retainer to each Independent Trustee, plus additional annual retainers to each Committee Chair and the Chairman of the Board. The Independent Trustees also receive a fee for each regular, special in-person, and telephonic meeting of the Board attended. The aggregate amount of the fees and expenses of the Independent Trustees are allocated amongst all the funds in the Trust and are presented in the Statement of Operations.
Other:
The Portfolio may purchase securities from an underwriting syndicate in which the principal underwriter or members of the syndicate are affiliated with the Adviser. For the year ended October 31, 2021, the Portfolio did not purchase any such securities.
Notes to Financial Statements—October 31, 2021 (continued)
The Adviser and its affiliates may have lending, banking, brokerage, underwriting, or other business relationships with the issuers of the securities in which the Portfolio invest.
5. Investment Transactions:
Cost of purchases and proceeds from sales of securities (excluding securities maturing less than one year from acquisition) for the year ended October 31, 2021 were as follows:
| | | Purchases ($) | | Sales ($) |
| Opportunity Portfolio | | 89,867,829 | | 163,503,711 |
6. Investment Risks:
The risks are presented in an order intended to facilitate readability, and their order does not imply that the realization of one risk is likely to occur more frequently than another risk, nor does it imply that the realization of one risk is likely to have a greater adverse impact than another risk.
Currency Risk: Fluctuations in exchange rates between the U.S. dollar and foreign currencies, or between various foreign currencies, may negatively affect the Portfolio’s performance. The Portfolio may seek to reduce currency risk by hedging part or all of its exposure to various foreign currencies; however, even if such hedging techniques are employed, there is no assurance that they will be successful.
Equity Securities Risk: The prices of equity securities fluctuate from time to time based on changes in a company’s financial condition or overall market and economic conditions. As a result, the value of equity securities may fluctuate drastically from day to day.
Foreign Securities Risk: Investments in foreign securities are generally considered riskier than investments in U.S. securities. Foreign securities, including those of emerging and frontier market issuers, are subject to additional risks, including international trade, political and regulatory risks.
Market Risk:The value of the Portfolio’s investments may decline due to changing economic, political, social, regulatory or market conditions. Market risk may affect a single issuer, industry or section of the economy or it may affect the economy as a whole. Moreover, the conditions in one country or geographic region could adversely affect the Portfolio’s investments in a different country or geographic region. Events such as war, acts of terrorism, social unrest, natural disasters, the spread of infectious illness or other public health threats could also significantly impact the Portfolio and its investments.
7. Federal Income Tax Information:
As of the tax year ended October 31, 2021, the cost basis of investments for federal income tax purposes, gross unrealized appreciation, gross unrealized depreciation and net unrealized appreciation/depreciation were as follows:
| | | Tax Cost ($) | | Tax Unrealized
Appreciation ($) | | Tax Unrealized
Depreciation ($) | | Net Unrealized
Appreciation/
(Depreciation)
($)* |
| Opportunity Portfolio | | 80,889,008 | | 24,007,197 | | (3,533,624) | | 20,543,573 |
| * | The difference between book-basis and tax-basis unrealized appreciation/(depreciation) is attributable primarily to tax deferral of losses on wash sales. |
8. Subsequent Events:
Management has evaluated subsequent events through the date these financial statements were issued. Based on the evaluation, no adjustments or additional disclosures were required to the financial statements as of October 31, 2021.
Report of Independent Registered Public Accounting Firm
To the Board of Trustees of HSBC Funds and Shareholders of HSBC Opportunity Portfolio
Opinion on the Financial Statements
We have audited the accompanying statement of assets and liabilities, including the schedule of portfolio investments, of HSBC Opportunity Portfolio (one of the funds constituting HSBC Funds, hereafter referred to as the “Fund”) as of October 31, 2021, the related statement of operations for the year ended October 31, 2021, the statement of changes in net assets for each of the two years in the period ended October 31, 2021, including the related notes, and the financial highlights for each of the five years in the period ended October 31, 2021 (collectively referred to as the “financial statements”). In our opinion, the financial statements present fairly, in all material respects, the financial position of the Fund as of October 31, 2021, the results of its operations for the year then ended, the changes in its net assets for each of the two years in the period ended October 31, 2021 and the financial highlights for each of the five years in the period ended October 31, 2021 in conformity with accounting principles generally accepted in the United States of America.
Basis for Opinion
These financial statements are the responsibility of the Fund’s management. Our responsibility is to express an opinion on the Fund’s financial statements based on our audits. We are a public accounting firm registered with the Public Company Accounting Oversight Board (United States) (PCAOB) and are required to be independent with respect to the Funds in accordance with the U.S. federal securities laws and the applicable rules and regulations of the Securities and Exchange Commission and the PCAOB.
We conducted our audits of these financial statements in accordance with the standards of the PCAOB. Those standards require that we plan and perform the audit to obtain reasonable assurance about whether the financial statements are free of material misstatement, whether due to error or fraud.
Report of Independent Registered Public Accounting Firm (continued)
Our audits included performing procedures to assess the risks of material misstatement of the financial statements, whether due to error or fraud, and performing procedures that respond to those risks. Such procedures included examining, on a test basis, evidence regarding the amounts and disclosures in the financial statements. Our audits also included evaluating the accounting principles used and significant estimates made by management, as well as evaluating the overall presentation of the financial statements. Our procedures included confirmation of securities owned as of October 31, 2021 by correspondence with the custodian and brokers; when replies were not received from brokers, we performed other auditing procedures. We believe that our audits provide a reasonable basis for our opinion.
/s/ PricewaterhouseCoopers LLP
New York, New York
December 21, 2021
We have served as the auditor of one or more investment companies in the HSBC Funds since 2015.
Table of Shareholder Expenses—as of October 31, 2021 (Unaudited)
As a shareholder of the Portfolio, you incur ongoing costs, including management fees and other expenses. These examples are intended to help you understand your ongoing costs (in dollars) of investing in the Portfolio and to compare these costs with the ongoing costs of investing in other mutual funds.
Actual Expenses
The actual examples are based on an investment of $1,000 invested at the beginning of a six-month period beginning May 1, 2021 and held through the period ended October 31, 2021.
The columns below under the heading entitled “Actual” provide information about actual account values and actual expenses. You may use this information, together with the amount you invested, to estimate the expenses that you paid over the period. Simply divide your account value by $1,000 (for example, an $8,600 account value divided by $1,000 = 8.6), then multiply the result by the number in the table under the heading entitled “Actual Expenses Paid During the Period” to estimate the expenses you paid on your account during this period.
Hypothetical Example for Comparison Purposes
The hypothetical expense examples are based on an investment of $1,000 invested at the beginning of a six-month period and held throughout the period ended October 31, 2021.
The columns below under the heading entitled “Hypothetical” provide information about hypothetical account values and hypothetical expenses based on the Portfolio’s actual expense ratio and an assumed rate of return of 5% per year before expenses, which is not the Portfolio’s actual return. The hypothetical account values and expenses may not be used to estimate the actual ending account balance or expenses you paid for the period. You may use this information to compare this 5% hypothetical example with the 5% hypothetical examples that appear in the shareholder reports of other funds.
Please note that the expenses shown in the table are meant to highlight your ongoing costs only and do not reflect any transactional costs, such as sales charges (loads), redemption fees, or exchange fees. Therefore, the columns under the heading entitled “Hypothetical” are useful in comparing ongoing costs only, and will not help you determine the relative total costs of owning different funds. In addition, if these transactional costs were included, your costs would have been higher.
| | | | | | | Actual | | Hypothetical
(5% return before expenses) |
| | | Annualized
Expense
Ratio During
Period | | Beginning
Account
Value
5/1/21 | | Ending
Account
Value
10/31/21 | | Expenses
Paid During
Period(1) | | Ending
Account
Value
10/31/21 | | Expenses
Paid During
Period(1) |
| Opportunity Portfolio | | 1.30% | | $1,000.00 | | $1,078.10 | | $6.81 | | $1,018.65 | | $6.61 |
| (1) | Expenses are equal to the average account value over the period multiplied by the Fund’s annualized expense ratio, multiplied by 181/365 (the number of days in the most recent fiscal half-year divided by the number of days in the fiscal year.) |
Board of Trustees and Officers (Unaudited)
MANAGEMENT OF THE TRUST
The following table contains information regarding the HSBC Family of Funds’ Board of Trustees (“Trustees”). The HSBC Family of Funds’ Statement of Additional Information includes additional information about the Trustees and is available, without charge, upon request by calling (888) 525-5757.
Name
Address, Age | | Position(s)
Held
with Funds | | Term of Office
and Length of
Time Served | | Principal Occupations
During Past 5 Years | | Portfolios in
Fund Complex
Overseen
By Trustee* | | Other
Directorships
Held by Trustee
During Past 5 Years** |
| | | | | | | | | | | |
NON-INTERESTED
TRUSTEES | | | | | | | | | | |
| | | | | | | | | | | |
MARCIA L. BECK
P.O. Box 182845
Columbus, OH
43218-3035
Age: 66 | | Chairman
and Trustee | | Indefinite;
2008 to present | | Private Investor (1999 – present) | | 5 | | None |
| | | | | | | | | | | |
| | | | | | | | | | | |
SUSAN C. GAUSE
P.O. Box 182845
Columbus, OH
43218-3035
Age: 69 | | Trustee | | Indefinite;
2013 to present | | Private Investor (2003 – present) | | 5 | | Metropolitan Series Fund
(2012 – present);
and Met Investors Series
Trust (2008 – present) |
| | | | | | | | | | | |
| | | | | | | | | | | |
SUSAN S. HUANG
P.O. Box 182845
Columbus, OH 43218-3035
Age: 67 | | Trustee | | Indefinite;
2008 to present | | Private Investor (2000 – present) | | 5 | | None |
| | | | | | | | | | | |
| | | | | | | | | | | |
HUGH T. HURLEY, III
P.O. Box 182845
Columbus, OH
43218-3035
Age: 57 | | Trustee | | Indefinite;
2020 to present | | Private Investor (2017 – present); Managing Director and Global Head of Product Strategy Active Equity, BlackRock, Inc. from 2006 to 2017. | | 5 | | Oakmark Funds
(2018 – present) |
| | | | | | | | | | | |
| * | Includes all series of the HSBC Funds. |
| ** | This column includes only directorships of companies required to report to the SEC under the Securities Exchange Act of 1934 (i.e., “public companies”) or other investment companies registered under the 1940 Act. |
Board of Trustees and Officers (Unaudited) (continued)
| Name, Address, Age | | Position(s)
Held | | Term of Office and
Length of Time Served | | Principal Occupation(s)
During Past 5 Years |
| | | | | | | |
| Officers | | | | | | |
| | | | | | | |
STEFANO R. MICHELAGNOLI
452 Fifth Avenue
New York,
NY 10018
Age: 51 | | President | | One year;
2020 to present | | Global Head of Client Operations, HSBC Global Asset Management (USA) Inc. (June 2020 - present); Regional Head of Product (Americas), HSBC Global Asset Management (USA) Inc.(2015-June 2020) |
| | | | | | | |
| | | | | | | |
JAMES D. LEVY
452 Fifth Avenue
New York,
NY 10018
Age: 58 | | Vice President | | One year;
2014 to present | | Vice President, Product Management, HSBC Global Asset Management (USA) Inc. (2014 – present) |
| | | | | | | |
| | | | | | | |
DENISE LEWIS*
4400 Easton Commons,
Suite 200 Columbus,
OH 43219-3035
Age: 58 | | Treasurer | | One year;
2021 to present | | Sr. Vice President, Financial Administration, Citi Fund Services (2020 - present); Director, BNY Mellon Asset Servicing, BNY Mellon (2015-2020) |
| | | | | | | |
| | | | | | | |
JENNIFER ENGLISH*
One Post Office Square, Suite 3710,
Boston, MA 02109
Age: 49 | | Secretary | | One year;
2021 to present | | Sr. Vice President, Regulatory Administration, Citi Fund Services (2016 - present) |
| | | | | | | |
| | | | | | | |
CHARLES BOOTH*
4400 Easton Commons,
Suite 200
Columbus, OH 43219-3035
Age: 61 | | Chief Compliance Officer | | One year;
2015 to present | | Director and Compliance Officer, CCO Services, Citi Fund Services (1988 - present) |
| | | | | | | |
| | | | | | | |
JAMES M. CURTIS
452 Fifth Avenue
New York,
NY 10018
Age: 53 | | Chief Legal Officer | | One year;
2018 to present | | Associate General Counsel, HSBC Securities (USA) Inc. (2005- 2017); Associate General Counsel, HSBC Technology & Services (USA) Inc. (2018-present) |
| | | | | | | |
| * | Ms. Lewis, Ms. English and Mr. Booth also are officers of other investment companies of which Citi (or an affiliate) is the administrator or sub-administrator. |
Other Information (Unaudited)
Information regarding how the Funds voted proxies relating to portfolio securities during the most recent 12-month period ended June 30th is available (i) without charge, upon request, by calling 1-800-525-5757 for HSBC Bank USA and HSBC Brokerage (USA) Inc. clients and 1-800-782-8183 for all other shareholders; (ii) on the Funds’ website at www.investorfunds.us.hsbc.com; and (iii) on the Security and Exchange Commission’s (“SEC”) website at http://www.sec.gov.
The Funds file their portfolio holdings information for each month in a fiscal quarter within 60 days after the end of the relevant fiscal quarter with the SEC on Form N-PORT. Portfolio holdings information for the third month of each fiscal quarter is available on the SEC’s website at http://www.sec.gov. The Funds’ Schedules of Investments will be available no later than 60 days after each period end, without charge, on the Funds’ website at www.investorfunds.us.hsbc.com.
An investment in a Fund is not a deposit of HSBC Bank USA, National Association, and is not insured or guaranteed by the Federal Deposit Insurance Corporation or any other government agency.
HSBC FAMILY OF FUNDS: INVESTMENT ADVISER AND ADMINISTRATOR HSBC Global Asset Management (USA) Inc.
452 Fifth Avenue
New York, NY 10018 SUB-ADVISER HSBC Opportunity Portfolio
Westfield Capital Management Company, L.P.
One Financial Center
Boston, MA 02111 |

Investment products:
| ARE NOT A BANK DEPOSIT OR OBLIGATION OF THE BANK OR ANY OF ITS AFFILIATES | ARE NOT FDIC INSURED | ARE NOT INSURED BY ANY FEDERAL GOVERNMENT AGENCY |
| ARE NOT GUARANTEED BY THE BANK OR ANY OF ITS AFFILIATES | MAY LOSE VALUE |
SHAREHOLDER SERVICING AGENTS For HSBC Bank USA, N.A. and
HSBC Securities (USA) Inc. Clients HSBC Bank USA, N.A.
452 Fifth Avenue
New York, NY 10018 1-888-525-5757 For All Other Shareholders HSBC Funds P.O. Box 8106
Boston, MA 02266-8106
1-800-782-8183 TRANSFER AGENT DST Asset Manager Solutions, Inc.
2000 Crown Colony Drive
Quincy, MA 02169 DISTRIBUTOR Foreside Distribution Services, L.P.
Three Canal Plaza, Suite 100
Portland, ME 04101
CUSTODIAN The Northern Trust Company
50 South LaSalle Street
Chicago, IL 60603 INDEPENDENT REGISTERED PUBLIC ACCOUNTING FIRM PricewaterhouseCoopers LLP
300 Madison Avenue
New York, NY 10017 LEGAL COUNSEL Dechert LLP
1900 K Street, N.W.
Washington, D.C. 20006 |
| |
Investment products are offered by HSBC Securities (USA) Inc. (HSI), member NYSE/FINRA/SIPC. HSI is an affiliate of HSBC Bank USA, N.A. Investment products: Are not a deposit or other obligation of the bank or any of its affiliates; Not FDIC insured or insured by any federal government agency of the United States; Not guaranteed by the bank or any of its affiliates; and are subject to investment risk, including possible loss of principal invested.
Investors should consider the investment objectives, risks, charges, and expenses of the investment company carefully before investing.The prospectus contains this and other important information about the investment company. For clients of HSBC Securities (USA) Inc., please call 1-888-525-5757 for more information. For other investors and prospective investors, please call the Funds directly at 1-800-782-8183 or visit our website at www.investorfunds.us.hsbc.com. Investors should read the prospectus carefully before investing or sending money.
(a) The registrant has adopted a code of ethics that applies to the registrant’s principal executive officer, principal financial officer, principal accounting officer or controller, or persons performing similar functions. This code of ethics is included as an Exhibit.
(b) During the period covered by the report, with respect to the registrant's code of ethics that applies to its principal executive officer, principal financial officer, principal accounting officer or controller, or persons performing similar functions; there have been no amendments to, nor any waivers granted from, a provision that relates to any element of the code of ethics definition enumerated in paragraph (b) of this Item 2.
3(a)(1) The registrant’s board of directors has determined that the registrant has at least one audit committee financial expert serving on its audit committee.
3(a)(2) The audit committee financial expert is Marcia Beck, who is “independent” for purposes of this Item 3 of Form N-CSR.
(e)(1) The audit committee is required to pre-approve all audit and permitted non-audit services performed by the registrant’s independent auditors in accordance with the audit committee charter and the Investment Company Act of 1940.
Fees for 2020 and 2021 represent PricewaterhouseCoopers LLP services provided to the Funds and to HSBC Bank and affiliates related to general corporate, state and local tax assistance, accounting matters and various advisory projects.
(h) The audit committee considered the nonaudit services rendered to the registrant’s investment adviser and any entity controlling, controlled by, or under common control with the investment adviser, and believes the services are compatible with the principal accountant’s independence.
Not applicable.
(a) Included as a part of the report to shareholders filed under Item 1.
(b) Not applicable.
Not applicable.
Not applicable.
Not applicable.
Not applicable.
(a)The registrant’s principal executive officer and principal financial officer have concluded, based on their evaluation of the registrant's disclosure controls and procedures as conducted within 90 days of the filing date of this report, that these disclosure controls and procedures are adequately designed and are operating effectively to ensure that information required to be disclosed by the registrant on Form N-CSR is recorded, processed, summarized and reported within the time periods specified in the Securities and Exchange Commission's rules and forms.
(b)There were no changes in the registrant’s internal control over financial reporting (as defined in Rule 30a-3(d) under the Act (17 CFR 270.30a-3(d)) that occurred during the period covered by this report that have materially affected or are reasonably likely to materially affect, the registrant’s internal control over financial reporting.
Not applicable.
(a)(3) Not applicable.
Pursuant to the requirements of the Securities Exchange Act of 1934 and the Investment Company Act of 1940, the registrant has duly caused this report to be signed on its behalf by the undersigned, thereunto duly authorized.
Pursuant to the requirements of the Securities Exchange Act of 1934 and the Investment Company Act of 1940, this report has been signed below by the following persons on behalf of the registrant and in the capacities and on the dates indicated.