UNITED STATES
SECURITIES AND EXCHANGE COMMISSION
Washington, D.C. 20549
FORM N-CSR
CERTIFIED SHAREHOLDER REPORT OF REGISTERED
MANAGEMENT INVESTMENT COMPANIES
Investment Company Act file number: 811-04782
HSBC FUNDS
(Exact name of registrant as specified in charter)
452 FIFTH AVENUE
NEW YORK, NY 10018
(Address of principal executive offices) (Zip code)
CITI FUND SERVICES
4400 EASTON COMMONS, SUITE 200
COLUMBUS, OH 43219
(Name and address of agent for service)
Registrant’s telephone number, including area code: 1-800-782-8183
Date of fiscal year end: October 31 Date of reporting period: October 31, 2018 |
Item 1. Reports to Stockholders.
HSBC Global Asset Management (USA) Inc.
HSBC Funds
Annual Report
October 31, 2018
| | | | | | Intermediary | Intermediary | |
| MONEY MARKET FUNDS | Class A | Class C | Class D | Class E | Class I | Class | Service Class | Class Y |
| HSBC U.S. Government Money Market Fund | FTRXX | HUMXX | HGDXX | HGEXX | HGIXX | HGGXX | HGFXX | RGYXX |
| HSBC U.S. Treasury Money Market Fund | HWAXX | HUCXX | HTDXX | HTEXX | HBIXX | HTGXX | HTFXX | HTYXX |
| Table of Contents |
HSBC Family of Funds |
Annual Report - October 31, 2018 |
| Glossary of Terms | | 2 |
| Commentary From the Investment Manager | | 3 |
| Portfolio Reviews | | 4 |
| Portfolio Composition | | 6 |
| | | |
| Schedules of Portfolio Investments | | |
| HSBC U.S. Government Money Market Fund | | 7 |
| HSBC U.S. Treasury Money Market Fund | | 10 |
| Statements of Assets and Liabilities | | 11 |
| Statements of Operations | | 12 |
| Statements of Changes in Net Assets | | 13 |
| Financial Highlights | | 15 |
| Notes to Financial Statements | | 19 |
| Report of Independent Registered Public Accounting Firm | | 29 |
| Other Federal Income Tax Information | | 31 |
| Table of Shareholder Expenses | | 32 |
| Results of Special Meeting of Shareholders of HSBC U.S. Government Money Market Fund | | 34 |
| Board of Trustees and Officers | | 35 |
| Other Information | | 37 |
Bloomberg Barclays Global Aggregate Bond Index is a measure of global investment-grade debt from 24 local currency markets, which include treasury, government-related, corporate, and securitized fixed-rate bonds from both developed and emerging markets issuers.
Gross Domestic Product (“GDP”) is the value of goods and services produced in a given country in a given year.
J.P. Morgan Emerging Markets Bond Index Global tracks returns for USD-denominated debt instruments issued by emerging market sovereign and quasi-sovereign entities, Brady bonds, loans, Eurobonds, and local market instruments.
Lipper U.S. Government Money Market Funds Average is an equally weighted average of mutual funds that invest principally in financial instruments issued or guaranteed by the U.S. government, its agencies, or its instrumentalities, with dollar-weighted average maturities of less than 90 days. These funds intend to keep a constant net asset value.
Lipper U.S. Treasury Money Market Funds Average is an equally weighted average of mutual funds that invest principally in U.S. Treasury obligations with dollar-weighted average maturities of less than 90 days. These funds intend to keep a constant net asset value.
London Interbank Offered Rate (LIBOR) is a daily reference rate based on the interest rates at which banks borrow unsecured funds from other banks in the London wholesale money market.
MSCI Europe Australasia and Far East (“MSCI EAFE”) Index is an equity index which captures the large- and mid-cap representation across the following developed markets countries: Australia, Austria, Belgium, Denmark, Finland, France, Germany, Hong Kong, Ireland, Israel, Italy, Japan, the Netherlands, New Zealand, Norway, Portugal, Singapore, Spain, Sweden, Switzerland and the UK.
MSCI Frontier Markets Index is a free float-adjusted market capitalization index that is designed to measure equity market performance of frontier markets. The index consists of 29 frontier markets country indices.
Standard & Poor’s 500 (“S&P 500”) Index is an index that is widely regarded as a gauge of the U.S. equities market. This index includes 500 leading companies in leading industries of the U.S. economy. The S&P 500 Index focuses on the large-cap segment of the market, with approximately 80% coverage of U.S. equities.
Lipper is an independent mutual fund performance monitor whose results are based on total return and do not reflect a sales charge.
Securities indices are unmanaged and assume reinvestment of all distributions and interest payments and do not take in account brokerage fees or expenses. Securities in the Funds do not match those in the indices and performance of the Funds will differ. Investors cannot invest directly in an index.
| Commentary From the Investment Manager (Unaudited) |
| HSBC Global Asset Management (USA) Inc. |
Global Economic Review
The global economy transitioned away from a period of synchronized growth during the 12-month period from November 1, 2017, through October 31, 2018, and entered a period characterized by divergence and diversity. While both developed and emerging markets economies were lifted up by broad economic expansion throughout 2017, growth was much less consistent in 2018 amid concerns surrounding inflation, trade policy, monetary policy and country-specific issues. Some economies and sectors were affected much more negatively than others and experienced higher levels of volatility in their financial markets. This divergence and volatility weighed on investor sentiment, leading to a shift away from risk assets that resulted in losses for international equities and more modest returns for U.S. equities. Despite this mixed picture, fundamentals of the global economy appeared relatively strong throughout the period, and corporate profits remained robust.
During the first several months of the period economic data generally showed low inflation, healthy corporate fundamentals and strong activity in manufacturing and global trade. In the U.S., regulatory rollbacks, positive earnings growth and the passage of business-friendly tax reform stirred optimism among investors, eventually driving stocks to record highs in a January rally.
The less-consistent macroeconomic environment that came to define the period emerged in February, as stocks took a sharp dive and became more volatile. First, U.S. economic data showed prices rising faster than expected, signaling a period of low inflation was ending, second, the outcome of tumultuous trade diplomacy between the U.S. and several key trading partners became increasingly unpredictable and concerning. Third, economic data began to show slowing growth in some regions, particularly Europe and Japan. Fourth, signs of slowing growth and rising inflation helped strengthen the U.S. dollar against other currencies, producing headwinds for emerging markets.
The impact of rising interest rates rippled through the global economy during the period and contributed to a weaker appetite for risk assets such as equities. The U.S. Federal Reserve (the Fed) increased its federal funds rate four times during the 12-month period, lifting it by a total of 100 basis points (1.00%). The Fed signaled that it would continue its campaign of gradually raising interest rates as long as the U.S. economy continues to show broad strength. The theme of divergence also played out globally in terms of monetary policy. Unlike the Fed, central banks in some other developed economies pursued looser monetary policy.
Economic data continued to indicate that the U.S economy was on sound footing. Gross domestic product1 (GDP) growth peaked during the period under review at a rate of 4.2% during the second quarter of 2018 after growing 2.3% during the fourth quarter of 2017 and 2.2% during the first quarter of 2018. GDP grew at a rate of 3.5% during the third quarter of 2018, according to preliminary estimates. The tax reform legislation passed by Congress late in 2017 provided a tailwind for businesses, boosting corporate profits and helping to offset pressures caused by rising wages and a tight labor market. Data showed that industrial production picked up and activity in the services sector increased. A new trade deal between the U.S., Mexico and Canada removed some of the uncertainty surrounding President Trump’s trade policy.
The unemployment rate was 3.7%—its lowest level since 1969—at the close of the period under review. The continuing strength of the labor market helped boost consumer confidence and consumer spending. The housing market presented a more mixed picture than other aspects of the economy, as declining home sales and housing permits suggested emerging weaknesses.
China’s economy continued to be weakened by an industrial slowdown and its increasing reliance on consumption as a driver of economic growth. Amid this difficult long-term transition, China faced during the period the additional challenge of steeply rising trade barriers with the U.S. As part of a broader tightening of trade policy, President Donald Trump ratcheted up pressure on China by threatening tariffs on virtually all Chinese exports to the U.S. The escalating rhetoric and faltering diplomacy between China and U.S. sent ripple effects through global markets. The yuan devalued significantly during the period, making Chinese goods more competitive on global markets. But in a notable change the Chinese government suggested it would prevent its currency from devaluing further.
China’s troubles spilled over into other emerging markets, especially those in Asia and in other regions heavily dependent on demand from Chinese industries. Other factors stalling the momentum of emerging market growth were rising U.S. interest rates and higher oil prices.
Argentina had a very volatile year as its currency depreciated more than 50% during 2018. The decline forced the country to reach out to the International Monetary Fund for financial support and triggered a recession in the country.
Eurozone economies experienced the most severe slowdown among developed economies during the period. Increasing trade tensions between Europe and the U.S. further weighed on the outlook of the region. Unsuccessful negotiations over the United Kingdom’s exit from the Eurozone (commonly referred to as Brexit) continued to sow uncertainty and led to a steep decline in the value of the British pound. Brexit has resulted in volatility in European and global markets and could have significant negative impacts on financial markets in the United Kingdom and throughout Europe. The extent of the impact of Brexit in the United Kingdom and in global markets as well as any associated adverse consequences remain unclear. Economic growth in Japan also slowed significantly amid lower private consumption and weak export demand. Data suggested that both wages and inflation in Japan may be ticking upwards, however, and the labor market improved.
Prices of many key commodities such as soybeans and silver slumped during much of the period under review, partly as a result of rising trade tensions between the U.S. and its key economic partners. Crude oil prices hit four-year highs late in the period, driven up in part by expectations that U.S. sanctions on Iran would curb the nation’s oil exports. However, oil prices began to fall sharply during the final weeks of the period.
Market review
Global equity markets delivered mixed results during the period. Stocks performed very well during the first three months. But, by February of 2018, concerns of an impending economic slowdown began to weigh on investors and fueled an uptick in volatility. Still, equities in many economies and sectors zig-zagged upward until October, when much of the period’s earlier gains were lost during a sharp sell-off.
U.S. stocks ended the period with modest gains, even after entering into correction territory in October. The S&P 500 Index1 of large-capitalization U.S. stocks returned 7.35%. Equities in other developed economies showed losses during the 12 months under review, while emerging markets equities suffered even greater losses amid concerns about U.S. trade protectionism and a strengthening U.S. dollar. The MSCI Frontier Markets Index1 returned -11.84% during the period, compared to a -6.39% return for the MSCI EAFE Index1 of developed market international stocks.
Global fixed income markets lost ground amid rising interest rates. Investors saw the onset of full employment and rising inflation in Germany and the U.S., nations that have a major impact on bond markets, as an indication that further increases in interest rates were on the horizon. Yields on U.S. government debt rose during the period. The U.S. Treasury curve flattened and global high-yield and investment-grade credit spreads widened. Emerging market debt performed especially poorly during the period, amid shrinking demand and growing supply. The Bloomberg Barclays Global Aggregate Bond Index1, which tracks investment grade debt in 24 local currency markets, returned -2.05% during the period, while the JP Morgan Emerging Markets Bond Index Global1 returned -5.27%.
1 For additional information, please refer to the Glossary of Terms.
| Portfolio Reviews (Unaudited) |
| |
HSBC U.S. Government Money Market Fund
(Class A Shares, Class C Shares, Class D Shares, Class E Shares, Class I Shares,
Intermediary Class, Intermediary Service Class and Class Y Shares) by John Chiodi
Senior Portfolio Manager | Moody’s and Standard & Poor’s
have assigned an “Aaa-mf” and
“AAAm” rating to the
HSBC U.S. Government
Money Market Fund.1 |
Investment Concerns
You could lose money by investing in the Fund. Although the Fund seeks to preserve the value of your investment at $1.00 per share, it cannot guarantee it will do so. An investment in the Fund is not a deposit of HSBC Bank USA, N.A. and is not insured or guaranteed by the Federal Deposit Insurance Corporation or any other government agency. The Fund’s sponsor has no legal obligation to provide financial support to the Fund, and you should not expect that the sponsor will provide financial support to the Fund at any time.
For a complete description of these and other risks associated with investment in a mutual fund, please refer to the Fund’s prospectus.
Portfolio Performance
Yields on U.S. government money market securities rose during the year ended October 31, 2018. The Federal Reserve (the Fed) raised short-term interest rates four times during the period—once in December 2017, then again in March, June and September of 2018.
In this rising rate environment, the Fund was positioned with a shorter-than-usual weighted average maturity. This supported the Fund’s absolute performance. The Fund also benefited from its exposure to floating rate notes in the first half of the period, as well as its exposure to repurchase agreements (repos) during the summer.†
The reporting period was marked by an abrupt shift in money market supply. The typical year-end shortage in money market securities was compounded by the government’s debate over extending the debt ceiling. Reduced new debt issuance further lowered money market supplies. However, supply rebounded strongly in early 2018 after the debt ceiling debate was resolved and lawmakers passed tax reform measures. The Fed’s decision to wind down its quantitative easing efforts also contributed to increased supply, as it stopped buying Treasuries and sold off Treasury holdings.
The Treasury supply glut drove short-term yields higher than expected, causing credit yields to rise as well as pushing spreads on floating rate notes wider through the end of the first quarter of 2018. Markets absorbed the added supply during the second quarter, as both spreads and London Interbank Offered Rate (LIBOR)7 levels narrowed dramatically. During the second quarter and part of the third, overnight repo offered higher yields than agency-issued LIBOR floating rate notes as spreads continued to narrow. By late summer, floating notes offered more attractive yields, markets experienced a more balanced increase in the supply of Treasuries, and spreads returned to more normal levels. Yields ended the period higher than where they started.
| † Portfolio composition is subject to change. |
| | | | | | | | Average Annual | | | | | | Expense |
| Fund Performance | | | | | | | | Total Return (%) | | | | Yield (%)2 | | Ratio (%)3 |
| | Inception | | 1 | | 5 | | 10 | | Since | | 7-Day | | | | |
| As of October 31, 2018 | | Date | | Year | | Year | | Year | | Inception | | Average | | Gross | | Net |
| Class A | | | 5/3/90 | | | 1.05 | | 0.27 | | 0.15 | | 2.46 | | 1.57 | | 0.66 | | 0.66 |
| Class C4 | | | 11/20/06 | | | — | | — | | — | | 1.39 | | — | | 1.26 | | 1.26 |
| Class D | | | 4/1/99 | | | 1.20 | | 0.32 | | 0.18 | | 1.55 | | 1.72 | | 0.51 | | 0.51 |
| Class E5 | | | 7/12/16 | | | — | | — | | — | | 0.34 | | — | | 0.26 | | 0.25 |
| Class I6 | | | 12/24/03 | | | 1.57 | | 0.50 | | 0.31 | | 1.02 | | 2.08 | | 0.16 | | 0.16 |
| Intermediary Class | | | 7/12/16 | | | 1.52 | | — | | — | | 0.98 | | 2.04 | | 0.31 | | 0.18 |
| Intermediary Service Class | | | 7/12/16 | | | 1.50 | | — | | — | | 0.96 | | 2.02 | | 0.36 | | 0.20 |
| Class Y | | | 7/1/96 | | | 1.45 | | 0.44 | | 0.26 | | 2.12 | | 1.97 | | 0.26 | | 0.26 |
Lipper U.S. Government
Money Market Funds Average7 | | | — | | | 1.02 | | 0.25 | | 0.16 | | 2.518 | | N/A | | N/A | | N/A |
Past performance does not guarantee future results. The performance data quoted represents past performance and current returns may be lower or higher. Total return figures include change in share price, reinvestment of dividends and capital gains and do not reflect taxes that a shareholder would pay on Fund distributions or on the redemption of Fund shares. Investment return and principal value will fluctuate so that an investor’s shares, when redeemed may be worth more or less than the original cost. To obtain performance information current to the most recent month end, please call 1-800-782-8183.
The performance above reflects any fee waivers that have been in effect during the applicable periods, as well as any expense reimbursements that have periodically been made. Absent such waivers and reimbursements, returns would have been lower. Currently, contractual fee waivers and/or expense reimbursements are in effect for the Fund through March 1, 2019 for the Class E Shares, Intermediary Class Shares and Intermediary Service Class Shares.
| 1 | The “Aaa-mf ” and “AAAm” money market fund rating is historical and reflects Moody’s and Standard & Poor’s opinion as to the quality of the Fund’s investments, liquidity management, and operations and trading support. Periodic reviews are conducted to ensure a secure operations environment. Moody’s and Standard & Poor’s ratings represent an opinion only, not a recommendation to buy or sell. Obligations rated A-1+, A-1 or P-1 are rated in the highest short-term rating category by Standard & Poor’s (A-1+ or A-1) or Moody’s Investor Service (P-1). The obligor’s capacity to meet its financial commitments on these obligations is regarded to be “extremely strong” (A-1+), “strong” (A-1) or “superior” (P-1). |
| 2 | The seven-day yield quotation more closely reflects the current earnings of the money market fund than the total return quotation. The seven-day yield reflects voluntary fee waivers/expense reimbursements. Without the voluntary fee waivers/expense reimbursements, the yields would have been 1.57%, 1.72%, 2.06%, 1.91%, 1.86% and 1.96% for Class A Shares, Class D Shares, Class I Shares, Intermediary Class, Intermediary Service Class and Class Y Shares, respectively. |
| 3 | Reflects the expense ratio as reported in the prospectus dated February 28, 2018. HSBC Global Asset Management (USA) Inc., the Adviser, has entered into a contractual expense limitation agreement with the Fund under which it will limit total expenses of the Fund (excluding interest, taxes, brokerage commissions, extraordinary expenses and estimated indirect expenses attributable to the Fund’s investments in investment companies) to an annual rate of 0.25%, 0.18% and 0.20% for Class E Shares, Intermediary Class Shares and Intermediary Service Class Shares, respectively. The expense limitation shall be in effect until March 1, 2019. Additional information pertaining to the October 31, 2018 expense ratios can be found in the financial highlights. |
| 4 | Reflects the applicable contingent deferred sales charge, maximum of 1.00%, for returns presented. Class C Shares were operational during a portion of the periods presented. Amounts reflect performance for the period of time the Class had operations, which was 346, 362 and 351 days during the years ended October 31, 2006, 2009 and 2010, respectively. The Class was not operational during the entire fiscal years ended October 31, 2007, 2008, 2011, 2012, 2013, 2014, 2015, 2016, 2017 and 2018. No returns are presented for the one-year, five-year and 10-year periods with non-continuous operations. |
| 5 | Class E Shares were operational during a portion of the periods presented. Amounts reflect performance for the period of time the Class had operations, which was 112 and 283 days during the years ended October 31, 2016 and 2017, respectively. The Class was not operational during the entire fiscal year ended October 31, 2018. No return is presented for the one-year period with non-continuous operations. |
| 6 | Class I Shares were operational during a portion of the periods presented. Amounts reflect performance for the period of time the Class had operations, which was 10, 89, 136 and 357 days during the years ended October 31, 2004, 2005, 2006 and 2007, respectively. The Class was operational during the entire fiscal years ended October 31, 2008 through 2018. |
| 7 | For additional information, please refer to the Glossary of Terms. |
| 8 | Return for the period April 30, 1990 to October 31, 2018. |
| Portfolio Reviews (Unaudited) |
| |
HSBC U.S. Treasury Money Market Fund
(Class A Shares, Class C Shares, Class D Shares, Class E Shares, Class I Shares,
Intermediary Class, Intermediary Service Class and Class Y Shares) by John Chiodi
Senior Portfolio Manager | Moody’s and Standard & Poor’s
have assigned an “Aaa-mf” and
“AAAm” rating to the
HSBC U.S. Treasury
Money Market Fund.1 |
Investment Concerns
You could lose money by investing in the Fund. Although the Fund seeks to preserve the value of your investment at $1.00 per share, it cannot guarantee it will do so. An investment in the Fund is not a deposit of HSBC Bank USA, N.A. and is not insured or guaranteed by the Federal Deposit Insurance Corporation or any other government agency. The Fund’s sponsor has no legal obligation to provide financial support to the Fund, and you should not expect that the sponsor will provide financial support to the Fund at any time.
For a complete description of these and other risks associated with investment in a mutual fund, please refer to the Fund’s prospectus.
Portfolio Performance
The Federal Reserve (the Fed) raised the federal funds rate, a short-term interest rate that influences Treasury bill yields, four times during the period—once in December 2017, then again in March, June and September of 2018. As a result, Treasury bill yields increased during the 12-month reporting period ended October 31, 2018.
In this rising rate environment, the Fund was positioned with a shorter-than-usual weighted average maturity. That positioning supported the Fund’s absolute performance. The Fund also benefited from its exposure to floating rate notes in the first half of the period, which performed well in the start of 2018 as interest rates rose.†
The reporting period was marked by an abrupt shift in money market supply. The typical year-end shortage in money market securities was compounded by the government’s debate over extending the debt ceiling. Reduced new debt issuance further lowered money market supplies. However, supply rebounded strongly in early 2018 after the debt ceiling debate was resolved and lawmakers passed tax reform measures. The Fed’s decision to wind down its quantitative easing efforts also contributed to increased supply, as it stopped buying Treasuries and sold off Treasury holdings.
The Treasury supply glut drove short-term yields higher than expected, causing credit yields to rise as well as pushing spreads on floating rate notes wider through the end of the first quarter of 2018. Markets absorbed the added supply during the second quarter, as both spreads and London Interbank Offered Rate (LIBOR)8 levels narrowed dramatically. During the second quarter and part of the third, Treasury floaters underperformed shorter, fixed-rate Treasury bills. By late summer, floating rate securities offered more attractive yields, the markets experienced a more balanced increase to Treasury supply, and spreads returned to more normal levels.
| † Portfolio composition is subject to change. |
| | | | | | | | Average Annual | | | | | | Expense |
| Fund Performance | | | | | | | | Total Return (%) | | | | Yield (%)2 | | Ratio (%)3 |
| | Inception | | 1 | | 5 | | 10 | | Since | | 7-Day | | | | |
| As of October 31, 2018 | | Date | | Year | | Year | | Year | | Inception | | Average | | Gross | | Net |
| Class A4 | | | 5/24/01 | | | — | | — | | — | | 1.08 | | — | | 0.68 | | 0.68 |
| Class C5 | | | 12/24/03 | | | — | | — | | — | | 0.04 | | — | | 1.28 | | 1.28 |
| Class D | | | 5/14/01 | | | 1.17 | | 0.29 | | 0.15 | | 0.95 | | 1.73 | | 0.53 | | 0.53 |
| Class E6 | | | 7/12/16 | | | — | | — | | — | | 0.37 | | — | | 0.28 | | 0.25 |
| Class I7 | | | 12/30/03 | | | 1.54 | | 0.46 | | 0.25 | | 1.11 | | 2.09 | | 0.18 | | 0.18 |
| Intermediary Class | | | 7/12/16 | | | 1.49 | | — | | — | | 0.89 | | 2.07 | | 0.33 | | 0.18 |
| Intermediary Service Class | | | 7/12/16 | | | 1.49 | | — | | — | | 0.94 | | 2.05 | | 0.38 | | 0.20 |
| Class Y | | | 5/11/01 | | | 1.43 | | 0.40 | | 0.21 | | 1.09 | | 1.98 | | 0.28 | | 0.28 |
Lipper U.S. Treasury
Money Market Funds Average8 | | | — | | | 1.07 | | 0.27 | | 0.14 | | 1.009 | | N/A | | N/A | | N/A |
Past performance does not guarantee future results. The performance data quoted represents past performance and current returns may be lower or higher. Total return figures include change in share price, reinvestment of dividends and capital gains and do not reflect taxes that a shareholder would pay on Fund distributions or on the redemption of Fund shares. Investment return and principal value will fluctuate so that an investor’s shares, when redeemed may be worth more or less than the original cost. To obtain performance information current to the most recent month end, please call 1-800-782-8183.
The performance above reflects any fee waivers that have been in effect during the applicable periods, as well as any expense reimbursements that have periodically been made. Absent such waivers and reimbursements, returns would have been lower. Currently, contractual fee waivers and/or expense reimbursements are in effect for the Fund through March 1, 2019 for the Class E Shares, Intermediary Class Shares and Intermediary Service Class Shares.
| 1 | The “Aaa-mf ” and “AAAm” money market fund rating is historical and reflects Moody’s and Standard & Poor’s opinion as to the quality of the Fund’s investments, liquidity management, and operations and trading support. Periodic reviews are conducted to ensure a secure operations environment. Moody’s and Standard & Poor’s ratings represent an opinion only, not a recommendation to buy or sell. Obligations rated A-1+, A-1 or P-1 are rated in the highest short-term rating category by Standard & Poor’s (A-1+ or A-1) or Moody’s Investor Service (P-1). The obligor’s capacity to meet its financial commitments on these obligations is regarded to be “extremely strong” (A-1+), “strong” (A-1) or “superior” (P-1). |
| 2 | The seven-day yield quotation more closely reflects the current earnings of the money market fund than the total return quotation. Without the voluntary fee waivers/expense reimbursements, the yields would have been 1.73%, 2.13%, 1.98%, 1.93% and 2.03% for Class D Shares, Class I Shares, Intermediary Class, Intermediary Service Class and Class Y Shares, respectively. |
| 3 | Reflects the expense ratio as reported in the prospectus dated February 28, 2018. HSBC Global Asset Management (USA) Inc., the Adviser, has entered into a contractual expense limitation agreement with the Fund under which it will limit total expenses of the Fund (excluding interest, taxes, brokerage commissions, extraordinary expenses and estimated indirect expenses attributable to the Fund’s investments in investment companies) to an annual rate of 0.25%, 0.18% and 0.20% for Class E Shares, Intermediary Class Shares and Intermediary Service Class Shares, respectively. The expense limitation shall be in effect until March 1, 2019. Additional information pertaining to the October 31, 2018 expense ratios can be found in the financial highlights. |
| 4 | Class A Shares were operational during a portion of the periods presented. Amounts reflect performance for the period of time the Class had operations, which was 201 days during the year ended October 31, 2014 and the entire fiscal years ended October 31, 2001 through 2013. The Class was not operational during the entire fiscal years ended October 31, 2015 through 2018. No returns are presented for the one-year, five-year and 10-year periods with non-continuous operations. |
| 5 | Reflects the applicable contingent deferred sales charge, maximum of 1.00%, for returns presented. Class C Shares were operational during a portion of the periods presented. Amounts reflect performance for the period of time the Class had operations, which was 26 and 351 days during the years ended October 31, 2008 and 2010, respectively. The Class was operational during the entire fiscal years ended October 31, 2005, 2006, 2007 and 2009. The Class was not operational during the entire fiscal year ended October 31, 2011 through 2018. No returns are presented for the one-year, five-year and 10-year periods with non-continuous operations. |
| 6 | Class E Shares were operational during a portion of the periods presented. Amounts reflect performance for the period of time the Class had operations, which was 112 and 283 days during the fiscal years ended October 31, 2016 and 2017, respectively. The Class was not operational during the entire fiscal year ended October 31, 2018. No return is presented for the one-year period with non-continuous operations. |
| 7 | Class I Shares were operational during a portion of the periods presented. Amounts reflect performance for the period of time the Class had operations, which was 13 and 280 days during the fiscal years ended October 31, 2004 and 2005, respectively. The Class was operational during the entire fiscal years ended October 31, 2006 through 2018. |
| 8 | For additional information, please refer to the Glossary of Terms. |
| 9 | Return for the period April 30, 2001 to October 31, 2018. |
| Portfolio Reviews |
Portfolio Composition*
October 31, 2018 (Unaudited) |
| HSBC U.S. Government Money Market Fund |
| Investment Allocation | | Percentage of Investments at Value (%) |
| U.S. Government and | | | | |
| Government Agency | | | | |
| Obligations | | | 54.8 | |
| Repurchase Agreements | | | 37.5 | |
| U.S. Treasury Obligations | | | 4.5 | |
| Investment Companies | | | 3.2 | |
| Total | | | 100.0 | |
| | | | | |
| HSBC U.S. Treasury Money Market Fund | |
| Investment Allocation | | Percentage of Investments at Value (%) |
| U.S. Treasury Obligations | | | 100.0 | |
| Total | | | 100.0 | |
____________________
| * | Portfolio composition is subject to change. |
| HSBC U.S. GOVERNMENT MONEY MARKET FUND |
| Schedule of Portfolio Investments—as of October 31, 2018 |
| U.S. Government and Government Agency |
| Obligations – 55.4% |
| | | | | |
| | Principal | | |
| | Amount ($) | | Value ($) |
| Federal Farm Credit Bank – 5.2% | | | | |
| 1.02%, 11/02/2018 | | 21,660,000 | | 21,659,663 |
| 1.75%, 12/10/2018 (a) | | 60,000,000 | | 59,883,650 |
| 2.17% (FCPR DLY - 308 bps), | | | | |
| 03/11/2019 (b) | | 150,000,000 | | 149,997,336 |
| 2.18% (US0001M - 8 bps), | | | | |
| 06/01/2020 (b) | | 73,000,000 | | 72,988,286 |
| 2.21% (FEDL01 + 1 bps), | | | | |
| 04/24/2019 (b) | | 75,000,000 | | 74,996,411 |
| 2.23% (FEDL01 + 3 bps), | | | | |
| 04/25/2019 (b) | | 100,000,000 | | 100,000,000 |
| 2.25% (FEDL01 + 5 bps), | | | | |
| 11/01/2018 (b) | | 50,000,000 | | 50,000,000 |
| | | | 529,525,346 |
| Federal Home Loan Bank – 49.7% | | | | |
| 1.09%, 11/02/2018 (a) | | 128,000,000 | | 127,992,284 |
| 2.02% (US0003M - 33 bps), | | | | |
| 12/21/2018 (b) | | 100,000,000 | | 100,000,000 |
| 2.03%, 11/14/2018 (a) | | 152,000,000 | | 151,880,342 |
| 2.04%, 11/15/2018 (a) | | 300,000,000 | | 299,744,889 |
| 2.07%, 01/02/2019 (a) | | 48,884,000 | | 48,707,624 |
| 2.09%, 12/27/2018 (a) | | 150,000,000 | | 149,505,333 |
| 2.10%, 12/20/2018 (a) | | 150,000,000 | | 149,563,083 |
| 2.10%, 12/28/2018 (a) | | 200,000,000 | | 199,325,500 |
| 2.11%, 11/28/2018 (a) | | 182,988,000 | | 182,688,815 |
| 2.13%, 12/03/2018 (a) | | 50,000,000 | | 49,902,667 |
| 2.13% (US0001M - 13 bps), | | | | |
| 03/01/2019 (b) | | 200,000,000 | | 200,000,000 |
| 2.15% (US0001M - 13 bps), | | | | |
| 11/09/2018 (b) | | 100,000,000 | | 100,000,000 |
| 2.15% (US0001M - 13 bps), | | | | |
| 03/15/2019 (b) | | 100,000,000 | | 100,000,000 |
| 2.16% (US0001M - 13 bps), | | | | |
| 06/07/2019 (b) | | 200,000,000 | | 199,997,098 |
| 2.16%, 12/19/2018 (a) | | 100,000,000 | | 99,706,933 |
| 2.16% (US0001M - 12 bps), | | | | |
| 09/20/2019 (b) | | 100,000,000 | | 100,000,000 |
| 2.16% (US0001M - 13 bps), | | | | |
| 06/24/2019 (b) | | 100,000,000 | | 100,000,000 |
| 2.17% (US0001M - 12 bps), | | | | |
| 11/21/2018 (b) | | 150,000,000 | | 150,001,731 |
| 2.17% (US0001M - 12 bps), | | | | |
| 02/25/2019 (b) | | 100,000,000 | | 100,000,000 |
| 2.17% (US0001M - 12 bps), | | | | |
| 04/12/2019 (b) | | 150,000,000 | | 150,000,000 |
| 2.18% (US0001M - 11 bps), | | | | |
| 07/19/2019 (b) | | 100,000,000 | | 100,000,000 |
| 2.18% (US0001M - 12 bps), | | | | |
| 04/26/2019 (b) | | 100,000,000 | | 100,000,000 |
| 2.18% (US0001M - 12 bps), | | | | |
| 04/26/2019 (b) | | 100,000,000 | | 100,000,000 |
| 2.19% (US0001M - 10 bps), | | | | |
| 10/23/2019 (b) | | 75,000,000 | | 75,000,000 |
| 2.19% (US0001M - 9 bps), | | | | |
| 04/05/2019 (b) | | 75,000,000 | | 75,000,000 |
| 2.19%, 12/26/2018 (a) | | 200,000,000 | | 199,319,528 |
| 2.19% (US0001M - 9 bps), | | | | |
| 02/07/2020 (b) | | 50,000,000 | | 50,000,000 |
| 2.19% (US0001M - 10 bps), | | | | |
| 04/18/2019 (b) | | 150,000,000 | | 150,000,000 |
| 2.19% (US0001M - 9 bps), | | | | |
| 11/21/2019 (b) | | 65,000,000 | | 65,000,000 |
| 2.20% (US0001M - 8 bps), | | | | |
| 07/09/2019 (b) | | 100,000,000 | | 100,000,000 |
| 2.20% (US0001M - 8 bps), | | | | |
| 12/21/2018 (b) | | 100,000,000 | | 100,000,000 |
| 2.21% (US0001M - 7 bps), | | | | |
| 02/25/2019 (b) | | 100,000,000 | | 100,000,000 |
| 2.21% (US0001M - 7 bps), | | | | |
| 02/07/2020 (b) | | 125,000,000 | | 125,000,000 |
| 2.22% (US0001M - 7 bps), | | | | |
| 07/25/2019 (b) | | 100,000,000 | | 100,000,000 |
| 2.22% (US0001M - 6 bps), | | | | |
| 02/20/2020 (b) | | 150,000,000 | | 150,000,000 |
| 2.22% (US0001M - 7 bps), | | | | |
| 04/24/2019 (b) | | 100,000,000 | | 100,000,000 |
| 2.24% (US0001M - 6 bps), | | | | |
| 11/01/2019 (b) | | 100,000,000 | | 100,000,000 |
| 2.24% (US0001M - 5 bps), | | | | |
| 01/17/2020 (b) | | 100,000,000 | | 100,000,000 |
| 2.26% (US0001M - 3 bps), | | | | |
| 04/20/2020 (b) | | 100,000,000 | | 100,000,000 |
| 2.36%, 03/11/2019 (a) | | 50,000,000 | | 49,573,889 |
| 2.38%, 03/21/2019 (a) | | 100,000,000 | | 99,078,333 |
| 2.48%, 10/22/2019 | | 150,000,000 | | 150,000,000 |
| | | | 5,046,988,049 |
| Federal National Mortgage Association – 0.5% | | | | |
| 2.22% (SOFR + 4 bps), | | | | |
| 04/30/2019 (b) | | 50,000,000 | | 50,000,000 |
| TOTAL U.S. GOVERNMENT | | | | |
| AND GOVERNMENT | | | | |
| AGENCY OBLIGATIONS | | | | |
| (Cost $5,626,513,395) | | | | 5,626,513,395 |
| |
| U.S. Treasury Obligations – 4.5% |
| | | | | |
| U.S. Treasury Bills – 4.2% | | | | |
| 1.98%, 11/29/2018 (a) | | 100,000,000 | | 99,840,556 |
| 2.06%, 01/10/2019 (a) | | 75,000,000 | | 74,696,521 |
| 2.07%, 11/23/2018 (a) | | 150,000,000 | | 149,809,058 |
| 2.32%, 06/20/2019 (a) | | 100,000,000 | | 98,529,621 |
| | | | 422,875,756 |
| U.S. Treasury Notes – 0.3% | | | | |
| 2.37% (USBMMY3M + 6 bps), | | | | |
| 07/31/2019 (b) | | 35,000,000 | | 35,024,226 |
| TOTAL U.S. TREASURY | | | | |
| OBLIGATIONS | | | | |
| (Cost $457,899,982) | | | | 457,899,982 |
| See notes to financial statements. | HSBC FAMILY OF FUNDS 7 |
| HSBC U.S. GOVERNMENT MONEY MARKET FUND |
| Schedule of Portfolio Investments—as of October 31, 2018 (continued) |
| Investment Companies – 3.2% |
| |
| | Shares | | Value ($) |
| BlackRock Liquidity Funds | | | | |
| FedFund Portfolio, | | | | |
| Institutional Shares, 2.07% (c) | | 124,482,074 | | 124,482,074 |
| Dreyfus Government | | | | |
| Cash Management, | | | | |
| Institutional Shares, 2.05% (c) | | 199,566,257 | | 199,566,257 |
| Federated Government | | | | |
| Obligations Fund, | | | | |
| Institutional Shares, 2.03% (c) | | 1,640,008 | | 1,640,008 |
| TOTAL INVESTMENT | | | | |
| COMPANIES | | | | |
| (Cost $325,688,339) | | | | 325,688,339 |
| |
| Repurchase Agreements – 37.9% |
| |
| | | Principal | | |
| | Amount ($) | | |
| BNP Paribas, 2.20%, | | | | |
| 11/1/18, Purchased on | | | | |
| 10/31/18, with maturity | | | | |
| value of $1,125,068,750, | | | | |
| collateralized by U.S. Treasury | | | | |
| Obligations, 0.00%-8.13%, | | | | |
| 11/30/18-2/15/48, fair value | | | | |
| $1,147,500,053 | | 1,125,000,000 | | 1,125,000,000 |
| BNP Paribas, 2.21%, 11/1/18, | | | | |
| Purchased on 10/31/18, | | | | |
| with maturity value of | | | | |
| $100,006,139, collateralized | | | | |
| by various U.S. Government | | | | |
| and Government Agency | | | | |
| Obligations, 0.00%-7.00%, | | | | |
| 11/8/18-10/1/48, fair value | | | | |
| $102,000,098 | | 100,000,000 | | 100,000,000 |
| Citigroup Global Markets, | | | | |
| 2.22%, 11/1/18, Purchased on | | | | |
| 10/31/18, with maturity value | | | | |
| of $100,006,167, collateralized | | | | |
| by various U.S. Government | | | | |
| and Government Agency | | | | |
| Obligations, 0.00%-4.00%, | | | | |
| 4/15/19- 6/1/48, fair value | | | | |
| $102,000,000 | | 100,000,000 | | 100,000,000 |
| Credit Agricole Cib NY, | | | | |
| 2.21%, 11/1/18, Purchased | | | | |
| on 10/31/18, with maturity | | | | |
| value of $350,021,486, | | | | |
| collateralized by U.S. Treasury | | | | |
| Obligations, 2.13%-2.25%, | | | | |
| 3/31/24-11/15/24, fair value | | | | |
| $357,000,066 | | 350,000,000 | | 350,000,000 |
| Credit Agricole Cib NY, 2.19%, | | | | |
| 11/1/18, Purchased on | | | | |
| 10/31/18, with maturity value | | | | |
| of $325,019,771, collateralized | | | | |
| by U.S. Treasury Obligations, | | | | |
| 2.75%, 5/31/23, fair value | | | | |
| $331,500,070 | | 325,000,000 | | 325,000,000 |
| Deutsche Bank Securities, Inc., | | | | |
| 2.21%, 11/1/18, Purchased | | | | |
| on 10/31/18, with maturity | | | | |
| value of $450,027,625, | | | | |
| collateralized by various U.S. | | | | |
| Government and Government | | | | |
| Agency Obligations, 0.00%- | | | | |
| 8.75%, 11/8/18-11/1/48, fair | | | | |
| value $459,000,063 | | 450,000,000 | | 450,000,000 |
| Merrill Lynch Pierce Fenner & | | | | |
| Smith, Inc., 2.19%, 11/1/18, | | | | |
| Purchased on 10/31/18, | | | | |
| with maturity value of | | | | |
| $100,006,083, collateralized | | | | |
| by U.S. Treasury Obligations, | | | | |
| 0.00-1.38%, 5/15/22-8/31/23, | | | | |
| fair value $102,000,000 | | 100,000,000 | | 100,000,000 |
| Natwest Markets PLC, | | | | |
| 2.19%, 11/1/18, Purchased | | | | |
| on 10/31/18, with maturity | | | | |
| value of $400,024,333, | | | | |
| collateralized by U.S. Treasury | | | | |
| Obligations, 0.75%-2.75%, | | | | |
| 8/15/19-1/15/25, fair value | | | | |
| $408,000,007 | | 400,000,000 | | 400,000,000 |
| Societe’ Generale, 2.21%, | | | | |
| 11/1/18, Purchased on | | | | |
| 10/31/18, with maturity | | | | |
| value of $650,039,903, | | | | |
| collateralized by various U.S. | | | | |
| Government and Government | | | | |
| Agency Obligations, 0.00%- | | | | |
| 7.00%, 11/25/18-7/20/68, fair | | | | |
| value $663,000,000 | | 650,000,000 | | 650,000,000 |
| Societe’ Generale, 2.23%, | | | | |
| 11/9/18, Purchased on | | | | |
| 10/9/18, with maturity value of | | | | |
| $150,288,042, collateralized | | | | |
| by various U.S. Government | | | | |
| and Government Agency | | | | |
| Obligations, 0.00%-7.00%, | | | | |
| 11/23/18-2/15/48, fair value | | | | |
| $153,000,000 | | 150,000,000 | | 150,000,000 |
| 8 HSBC FAMILY OF FUNDS | See notes to financial statements. |
| HSBC U.S. GOVERNMENT MONEY MARKET FUND |
| Schedule of Portfolio Investments—as of October 31, 2018 (continued) |
| Repurchase Agreements, continued |
| |
| | Principal | | | | |
| | Amount ($) | | Value ($) |
| Toronto Dominion Bank NY, | | | | | | |
| 2.19%, 11/1/18, Purchased | | | | | | |
| on 10/31/18, with maturity | | | | | | |
| value of $100,006,083, | | | | | | |
| collateralized by U.S. Treasury | | | | | | |
| Obligations, 2.25-2.75%, | | | | | | |
| 8/15/21-12/31/23, fair value | | | | | | |
| $102,000,071 | | 100,000,000 | | | 100,000,000 | |
| TOTAL REPURCHASE | | | | | | |
| AGREEMENTS | | | | | | |
| (Cost $3,850,000,000) | | | | | 3,850,000,000 | |
| TOTAL INVESTMENTS | | | | | | |
| IN SECURITIES (Cost | | | | | | |
| $10,260,101,716) – 101.0% | | | | | 10,260,101,716 | |
| Other Assets | | | | | | |
| (Liabilities) – (1.0)% | | | | | (101,518,611 | ) |
| NET ASSETS – 100% | | | | $ | 10,158,583,105 | |
____________________
| (a) | Discount note. Rate presented represents the effective yield at time of purchase. |
| (b) | Floating or variable rate security linked to the referenced benchmark. The rate presented represents the rate in effect on October 31, 2018. These securities are deemed to have a maturity remaining until the next adjustment of the interest rate or the longer of the demand period or time to the next readjustment. |
| (c) | The rate represents the annualized one day yield that was in effect on October 31, 2018. |
| bps - Basis Points |
| FCPR DLY - Federal Reserve Bank Prime Rate Loan US |
| FEDL01 - Effective Federal Funds Rate |
| SOFR - Secured Overnight Financing Rate |
| USBMMY3M - 3 Month Treasury Bill Rate |
| US0001M - 1 Month US Dollar LIBOR |
| US0003M - 3 Month US Dollar LIBOR |
| See notes to financial statements. | HSBC FAMILY OF FUNDS 9 |
| HSBC U.S. TREASURY MONEY MARKET FUND |
| Schedule of Portfolio Investments—as of October 31, 2018 |
| U.S. Treasury Obligations – 102.6% |
| |
| | Principal | | | | |
| | Amount ($) | | Value ($) |
| U.S. Treasury Bills – 83.5% | | | | | | |
| 1.84%, 11/08/2018 (a) | | 100,000,000 | | | 99,959,167 | |
| 1.86%, 11/01/2018 (a) | | 315,650,000 | | | 315,649,999 | |
| 2.07%, 11/23/2018 (a) | | 300,000,000 | | | 299,603,356 | |
| 2.08%, 12/13/2018 (a) | | 40,000,000 | | | 39,900,927 | |
| 2.09%, 12/20/2018 (a) | | 100,000,000 | | | 99,710,764 | |
| 2.14%, 12/11/2018 (a) | | 90,000,000 | | | 89,781,000 | |
| 2.15%, 12/18/2018 (a) | | 75,000,000 | | | 74,785,562 | |
| 2.15%, 01/03/2019 (a) | | 150,000,000 | | | 149,428,713 | |
| 2.17%, 12/26/2018 (a) | | 50,000,000 | | | 49,831,486 | |
| 2.18%, 12/27/2018 (a) | | 200,000,000 | | | 199,324,170 | |
| 2.25%, 01/17/2019 (a) | | 75,000,000 | | | 74,636,255 | |
| 2.29%, 01/24/2019 (a) | | 75,000,000 | | | 74,597,501 | |
| 2.32%, 06/20/2019 (a) | | 50,000,000 | | | 49,264,811 | |
| | | | | 1,616,473,711 | |
| U.S. Treasury Notes – 19.1% | | | | | | |
| 2.36% (USBMMY3M + 4 bps), 07/31/2020 (b) | | 50,000,000 | | | 50,000,000 | |
| 2.36% (USBMMY3M + 5 bps), 10/31/2019 (b) | | 24,000,000 | | | 24,012,699 | |
| 2.37% (USBMMY3M + 6 bps), 07/31/2019 (b) | | 145,000,000 | | | 145,057,925 | |
| 2.38% (USBMMY3M + 7 bps), 04/30/2019 (b) | | 50,000,000 | | | 50,032,390 | |
| 2.45% (USBMMY3M + 14 bps), 01/31/2019 (b) | | 100,000,000 | | | 100,045,686 | |
| | | | | 369,148,700 | |
| TOTAL U.S. TREASURY OBLIGATIONS (Cost $1,985,622,411) | | | | | 1,985,622,411 | |
| TOTAL INVESTMENTS IN SECURITIES (Cost $1,985,622,411) – 102.6% | | | | | 1,985,622,411 | |
| Other Assets (Liabilities) – (2.6)% | | | | | (50,664,014 | ) |
| NET ASSETS – 100% | | | | $ | 1,934,958,397 | |
____________________
| (a) | Discount note. Rate presented represents the effective yield at time of purchase. |
| (b) | Floating or variable rate security linked to the referenced benchmark. The rate presented represents the rate in effect on October 31, 2018. These securities are deemed to have a maturity remaining until the next adjustment of the interest rate or the longer of the demand period or time to the next readjustment. |
| bps - Basis Points |
| USBMMY3M - 3 Month Treasury Bill Rate |
| 10 HSBC FAMILY OF FUNDS | See notes to financial statements. |
HSBC FAMILY OF FUNDS
Statements of Assets and Liabilities—as of October 31, 2018
| | HSBC U.S. | | HSBC |
| | Government | | U.S. Treasury |
| | Money Market | | Money Market |
| | Fund | | Fund |
| Assets: | | | | | | | | | | | | |
| Investments in securities, at value | | | $ | 6,410,101,716 | | | | | $ | 1,985,622,411 | | |
| Repurchase agreements, at value | | | | 3,850,000,000 | | | | | | — | | |
| Cash | | | | 1,164,181 | | | | | | 360,565 | | |
| Interest receivable | | | | 5,128,903 | | | | | | 17,680 | | |
| Prepaid expenses and other assets | | | | 253,482 | | | | | | 67,092 | | |
| Total Assets | | | | 10,266,648,282 | | | | | | 1,986,067,748 | | |
| | | | | | | | | | | | | |
| Liabilities: | | | | | | | | | | | | |
| Distributions payable | | | | 5,956,754 | | | | | | 815,432 | | |
| Payable for investments purchased | | | | 100,000,000 | | | | | | 49,831,486 | | |
| Accrued expenses and other liabilities: | | | | | | | | | | | | |
| Investment Management | | | | 823,708 | | | | | | 205,290 | | |
| Administration | | | | 300,412 | | | | | | 55,901 | | |
| Shareholder Servicing | | | | 350,535 | | | | | | 37,374 | | |
| Accounting | | | | 6,262 | | | | | | 5,145 | | |
| Custodian fees | | | | 93,007 | | | | | | 9,907 | | |
| Transfer Agent | | | | 36,978 | | | | | | 16,828 | | |
| Trustee | | | | 4,500 | | | | | | 4,501 | | |
| Other | | | | 493,021 | | | | | | 127,487 | | |
| Total Liabilities | | | | 108,065,177 | | | | | | 51,109,351 | | |
| Net Assets | | | $ | 10,158,583,105 | | | | | $ | 1,934,958,397 | | |
| | | | | | | | | | | | | |
| Composition of Net Assets: | | | | | | | | | | | | |
| Paid in capital | | | | 10,158,663,342 | | | | | | 1,934,989,736 | | |
| Total distributable earnings/loss | | | | (80,237 | ) | | | | | (31,339 | ) | |
| Net Assets | | | $ | 10,158,583,105 | | | | | $ | 1,934,958,397 | | |
| | | | | | | | | | | | | |
| Net Assets: | | | | | | | | | | | | |
| Class A Shares | | | $ | 2,728,242 | | | | | $ | — | | |
| Class D Shares | | | | 1,648,226,336 | | | | | | 308,136,005 | | |
| Class I Shares | | | | 6,400,700,366 | | | | | | 707,804,478 | | |
| Intermediary Class Shares | | | | 164,081,920 | | | | | | 169,826,622 | | |
| Intermediary Service Class Shares | | | | 184,921,172 | | | | | | 51,219,682 | | |
| Class Y Shares | | | | 1,757,925,069 | | | | | | 697,971,610 | | |
| | | $ | 10,158,583,105 | | | | | $ | 1,934,958,397 | | |
| | | | | | | | | | | | | |
| Shares Outstanding: | | | | | | | | | | | | |
| ($0.001 par value, unlimited number of shares authorized): | | | | | | | | | | | | |
| Class A Shares | | | | 2,728,230 | | | | | | — | | |
| Class D Shares | | | | 1,648,043,123 | | | | | | 308,173,113 | | |
| Class I Shares | | | | 6,400,913,766 | | | | | | 707,815,069 | | |
| Intermediary Class Shares | | | | 164,083,427 | | | | | | 169,828,630 | | |
| Intermediary Service Class Shares | | | | 184,925,473 | | | | | | 51,221,358 | | |
| Class Y Shares | | | | 1,757,985,670 | | | | | | 697,956,533 | | |
| | | | | | | | | | | | | |
| Net Asset Value, Offering Price and Redemption Price per share: | | | | | | | | | | | | |
| Class A Shares | | | $ | 1.00 | | | | | $ | — | | |
| Class D Shares | | | $ | 1.00 | | | | | $ | 1.00 | | |
| Class I Shares | | | $ | 1.00 | | | | | $ | 1.00 | | |
| Intermediary Class Shares | | | $ | 1.00 | | | | | $ | 1.00 | | |
| Intermediary Service Class Shares | | | $ | 1.00 | | | | | $ | 1.00 | | |
| Class Y Shares | | | $ | 1.00 | | | | | $ | 1.00 | | |
| Investments in securities, at cost | | | $ | 6,410,101,716 | | | | | $ | 1,985,622,411 | | |
| Repurchase agreements, at cost | | | $ | 3,850,000,000 | | | | | $ | — | | |
____________________
Amounts designated as “—” are $0.00 or have been rounded to $0.00.
| See notes to financial statements. | HSBC FAMILY OF FUNDS 11 |
HSBC FAMILY OF FUNDS
Statements of Operations—For the year ended October 31, 2018
| | HSBC U.S. | | HSBC U.S. |
| | Government | | Treasury |
| | Money Market | | Money Market |
| | Fund | | Fund |
| Investment Income: | | | | | | | | | | | | |
| Interest | | | $ | 169,097,292 | | | | | $ | 32,065,229 | | |
| Dividends | | | | 3,815,914 | | | | | | — | | |
| Total Investment Income | | | | 172,913,206 | | | | | | 32,065,229 | | |
| | | | | | | | | | | | | |
| Expenses: | | | | | | | | | | | | |
| Investment Management | | | | 10,471,003 | | | | | | 1,955,197 | | |
| Operational Support: | | | | | | | | | | | | |
| Class A Shares | | | | 2,268 | | | | | | — | | |
| Class D Shares | | | | 1,647,319 | | | | | | 220,616 | | |
| Intermediary Class Shares | | | | 175,694 | | | | | | 117,468 | | |
| Intermediary Service Class Shares | | | | 91,318 | | | | | | 42,876 | | |
| Class Y Shares | | | | 1,749,119 | | | | | | 970,555 | | |
| Administration: | | | | | | | | | | | | |
| Class A Shares | | | | 882 | | | | | | — | | |
| Class D Shares | | | | 640,303 | | | | | | 85,703 | | |
| Class I Shares | | | | 2,643,755 | | | | | | 234,644 | | |
| Intermediary Class Shares | | | | 68,289 | | | | | | 45,625 | | |
| Intermediary Service Class Shares | | | | 35,625 | | | | | | 16,673 | | |
| Class Y Shares | | | | 679,751 | | | | | | 376,820 | | |
| Shareholder Servicing: | | | | | | | | | | | | |
| Class A Shares | | | | 8,858 | | | | | | — | | |
| Class D Shares | | | | 4,113,387 | | | | | | 551,409 | | |
| Intermediary Class Shares | | | | 87,850 | | | | | | 58,736 | | |
| Intermediary Service Class Shares | | | | 91,317 | | | | | | 42,875 | | |
| Accounting | | | | 68,444 | | | | | | 56,921 | | |
| Compliance Services | | | | 28,431 | | | | | | 28,431 | | |
| Custodian | | | | 639,986 | | | | | | 77,485 | | |
| Printing | | | | 307,838 | | | | | | 19,969 | | |
| Professional | | | | 248,848 | | | | | | 177,372 | | |
| Transfer Agent | | | | 273,312 | | | | | | 123,140 | | |
| Trustee | | | | 69,783 | | | | | | 67,794 | | |
| Registration fees | | | | 143,397 | | | | | | 84,494 | | |
| Other | | | | 836,822 | | | | | | 203,799 | | |
| Total expenses before fee and expense reductions | | | | 25,123,599 | | | | | | 5,558,602 | | |
| Fees voluntarily reduced/reimbursed by Investment Adviser | | | | (3,216,505 | ) | | | | | (581,742 | ) | |
| Fees contractually reduced/reimbursed by Investment Adviser | | | | (195,009 | ) | | | | | (147,166 | ) | |
| Fees voluntarily reduced by Administrator | | | | (680,535 | ) | | | | | (60,369 | ) | |
| Fees voluntarily reduced by Shareholder Servicing Agent | | | | (179,167 | ) | | | | | (101,611 | ) | |
| Custody earnings credits | | | | (295,142 | ) | | | | | (27,453 | ) | |
| Net Expenses | | | | 20,557,241 | | | | | | 4,640,261 | | |
| | | | | | | | | | | | | |
| Net Investment Income | | | | 152,355,965 | | | | | | 27,424,968 | | |
| | | | | | | | | | | | | |
| Realized/Unrealized Gains/(Losses) from Investments: | | | | | | | | | | | | |
| Net realized gains/(losses) from investments in securities | | | | (101,139 | ) | | | | | (28,378 | ) | |
| Net realized/unrealized gains/(losses) on investments | | | | (101,139 | ) | | | | | (28,378 | ) | |
| Change in Net Assets Resulting from Operations | | | $ | 152,254,826 | | | | | $ | 27,396,590 | | |
____________________
Amounts designated as “—” are $0.00 or have been rounded to $0.00.
| 12 HSBC FAMILY OF FUNDS | See notes to financial statements. |
HSBC FAMILY OF FUNDS
Statements of Changes in Net Assets
| | HSBC U.S. Government | | HSBC U.S. Treasury |
| | Money Market Fund | | Money Market Fund |
| | Year Ended | Year Ended | | Year Ended | Year Ended |
| | October 31, 2018 | October 31, 2017 | | October 31, 2018 | October 31, 2017 |
| Investment Activities: | | | | | | | | | | | | | | | | | | | | | | |
| Operations: | | | | | | | | | | | | | | | | | | | | | | |
| Net investment income | | | $ | 152,355,965 | | | | $ | 65,724,470 | | | | | $ | 27,424,968 | | | | $ | 10,022,175 | | |
| Net realized gains/(losses) from investments | | | | (101,139 | ) | | | | 16,147 | | | | | | (28,378 | ) | | | | (6,519 | ) | |
| Change in net assets resulting from operations | | | | 152,254,826 | | | | | 65,740,617 | | | | | | 27,396,590 | | | | | 10,015,656 | | |
| | | | | | | | | | | | | | | | | | | | | | | |
| Distributions to shareholders: | | | | | | | | | | | | | | | | | | | | | | |
| Class A Shares | | | | (24,470 | ) | | | | (4,047 | ) | | | | | — | | | | | — | | |
| Class B Shares* | | | | — | | | | | (4 | ) | | | | | — | | | | | — | | |
| Class D Shares | | | | (19,666,401 | ) | | | | (5,652,657 | ) | | | | | (2,460,655 | ) | | | | (773,186 | ) | |
| Class E Shares** | | | | — | | | | | (5 | ) | | | | | — | | | | | (3 | ) | |
| Class I Shares | | | | (103,412,452 | ) | | | | (46,522,336 | ) | | | | | (9,224,480 | ) | | | | (4,082,835 | ) | |
| Intermediary Class Shares | | | | (2,755,565 | ) | | | | (334,211 | ) | | | | | (1,806,276 | ) | | | | (5 | ) | |
| Intermediary Service Class Shares | | | | (1,548,121 | ) | | | | (149,884 | ) | | | | | (662,873 | ) | | | | (108,905 | ) | |
| Class Y Shares | | | | (24,958,653 | ) | | | | (13,153,578 | ) | | | | | (13,271,641 | ) | | | | (5,065,978 | ) | |
| Change in net assets resulting from | | | | | | | | | | | | | | | | | | | | | | |
| distributions to shareholders | | | | (152,365,662 | ) | | | | (65,816,722 | ) | | | | | (27,425,925 | ) | | | | (10,030,912 | ) | |
| | | | | | | | | | | | | | | | | | | | | | | |
| Change in net assets resulting from | | | | | | | | | | | | | | | | | | | | | | |
| capital transactions | | | | (1,821,073,641 | ) | | | | 1,435,225,862 | | | | | | (307,254,231 | ) | | | | 965,841,130 | | |
| Change in net assets | | | | (1,821,184,477 | ) | | | | 1,435,149,757 | | | | | | (307,283,566 | ) | | | | 965,825,874 | | |
| | | | | | | | | | | | | | | | | | | | | | | |
| Net Assets: | | | | | | | | | | | | | | | | | | | | | | |
| Beginning of period | | | | 11,979,767,582 | | | | | 10,544,617,825 | | | | | | 2,242,241,963 | | | | | 1,276,416,089 | | |
| End of period | | | $ | 10,158,583,105 | | | | $ | 11,979,767,582 | | | | | $ | 1,934,958,397 | | | | $ | 2,242,241,963 | | |
____________________
| Amounts designated as “—” are $0.00 or have been rounded to $0.00. |
| * | Class B Shares were liquidated on June 15, 2017 and are no longer offered. |
| ** | Class E Shares are still offered, but no shares are outstanding. |
| See notes to financial statements. | HSBC FAMILY OF FUNDS 13 |
HSBC FAMILY OF FUNDS
Statements of Changes in Net Assets (continued)
| | HSBC U.S. Government | | HSBC U.S. Treasury |
| | Money Market Fund | | Money Market Fund |
| | Year Ended | Year Ended | | Year Ended | Year Ended |
| | October 31, 2018 | October 31, 2017 | | October 31, 2018 | October 31, 2017 |
| CAPITAL TRANSACTIONS*: | | | | | | | | | | | | | | | | | | |
| Class A Shares | | | | | | | | | | | | | | | | | | |
| Proceeds from shares issued | | | $ | 1,420,071 | | | $ | 1,250,433 | | | | $ | — | | | $ | — | |
| Dividends reinvested | | | | 24,437 | | | | 4,023 | | | | | — | | | | — | |
| Value of shares redeemed | | | | (714,565 | ) | | | (976,253 | ) | | | | — | | | | — | |
| Class A Shares capital transactions | | | | 729,943 | | | | 278,203 | | | | | — | | | | — | |
| | | | | | | | | | | | | | | | | | | |
| Class B Shares** | | | | | | | | | | | | | | | | | | |
| Proceeds from shares issued | | | | — | | | | 833 | | | | | — | | | | — | |
| Dividends reinvested | | | | — | | | | 4 | | | | | — | | | | — | |
| Value of shares redeemed | | | | — | | | | (49,611 | ) | | | | — | | | | — | |
| Class B Shares capital transactions | | | | — | | | | (48,774 | ) | | | | — | | | | — | |
| | | | | | | | | | | | | | | | | | | |
| Class D Shares | | | | | | | | | | | | | | | | | | |
| Proceeds from shares issued | | | | 3,738,220,266 | | | | 3,439,557,773 | | | | | 1,080,459,039 | | | | 1,725,188,294 | |
| Dividends reinvested | | | | 13,844,262 | | | | 3,741,527 | | | | | 1,712,324 | | | | 452,304 | |
| Value of shares redeemed | | | | (3,749,041,777 | ) | | | (3,747,291,178 | ) | | | | (1,031,094,573 | ) | | | (1,682,583,070 | ) |
| Class D Shares capital transactions | | | | 3,022,751 | | | | (303,991,878 | ) | | | | 51,076,790 | | | | 43,057,528 | |
| | | | | | | | | | | | | | | | | | | |
| Class E Shares*** | | | | | | | | | | | | | | | | | | |
| Dividends reinvested | | | | — | | | | 5 | | | | | — | | | | 3 | |
| Value of shares redeemed | | | | — | | | | (2,007 | ) | | | | — | | | | (1,004 | ) |
| Class E Shares capital transactions | | | | — | | | | (2,002 | ) | | | | — | | | | (1,001 | ) |
| | | | | | | | | | | | | | | | | | | |
| Class I Shares | | | | | | | | | | | | | | | | | | |
| Proceeds from shares issued | | | | 108,881,275,893 | | | | 129,309,701,797 | | | | | 7,277,473,790 | | | | 8,144,761,629 | |
| Dividends reinvested | | | | 45,087,744 | | | | 17,104,301 | | | | | 4,029,375 | | | | 1,676,610 | |
| Value of shares redeemed | | | | (110,379,050,672 | ) | | | (126,160,507,607 | ) | | | | (7,435,633,995 | ) | | | (7,630,922,394 | ) |
| Class I Shares capital transactions | | | | (1,452,687,035 | ) | | | 3,166,298,491 | | | | | (154,130,830 | ) | | | 515,515,845 | |
| | | | | | | | | | | | | | | | | | | |
| Intermediary Class Shares | | | | | | | | | | | | | | | | | | |
| Proceeds from shares issued | | | | 1,294,482,655 | | | | 406,593,674 | | | | | 312,385,011 | | | | 11 | |
| Dividends reinvested | | | | 274,502 | | | | 61,962 | | | | | 15 | | | | 4 | |
| Value of shares redeemed | | | | (1,150,368,774 | ) | | | (397,082,021 | ) | | | | (142,557,401 | ) | | | (11 | ) |
| Intermediary Class Shares capital transactions | | | | 144,388,383 | | | | 9,573,615 | | | | | 169,827,625 | | | | 4 | |
| | | | | | | | | | | | | | | | | | | |
| Intermediary Service Class Shares | | | | | | | | | | | | | | | | | | |
| Proceeds from shares issued | | | | 1,719,925,638 | | | | 1,407,115,250 | | | | | 65,384,844 | | | | 29,200,010 | |
| Dividends reinvested | | | | 522,793 | | | | 139,084 | | | | | 326,427 | | | | 108,710 | |
| Value of shares redeemed | | | | (1,592,568,189 | ) | | | (1,355,215,341 | ) | | | | (36,505,552 | ) | | | (25,401,015 | ) |
| Intermediary Service Class Shares | | | | | | | | | | | | | | | | | | |
| capital transactions | | | | 127,880,242 | | | | 52,038,993 | | | | | 29,205,719 | | | | 3,907,705 | |
| | | | | | | | | | | | | | | | | | | |
| Class Y Shares | | | | | | | | | | | | | | | | | | |
| Proceeds from shares issued | | | | 9,462,774,658 | | | | 13,932,449,680 | | | | | 1,764,679,669 | | | | 2,041,622,527 | |
| Dividends reinvested | | | | 23,299,512 | | | | 12,442,356 | | | | | 12,937,171 | | | | 4,982,199 | |
| Value of shares redeemed | | | | (10,130,482,095 | ) | | | (15,433,812,822 | ) | | | | (2,180,850,375 | ) | | | (1,643,243,677 | ) |
| Class Y Shares capital transactions | | | | (644,407,925 | ) | | | (1,488,920,786 | ) | | | | (403,233,535 | ) | | | 403,361,049 | |
| Change in net assets resulting from | | | | | | | | | | | | | | | | | | |
| capital transactions | | | $ | (1,821,073,641 | ) | | $ | 1,435,225,862 | | | | $ | (307,254,231 | ) | | $ | 965,841,130 | |
____________________
Amounts designated as “—” are $0.00 or have been rounded to $0.00. |
| * | Share transactions are at net asset value of $1.00 per share. |
| ** | Class B Shares were liquidated on June 15, 2017 and are no longer offered. |
| *** | Class E Shares are still offered, but no shares are outstanding. |
| 14 | HSBC FAMILY OF FUNDS | See notes to financial statements. |
| HSBC U.S. GOVERNMENT MONEY MARKET FUND |
| Financial Highlights |
Selected data for a share outstanding throughout the periods indicated.
| | | | | | Investment Activities | | Distributions | | | | | | | | | | Ratios/Supplementary Data |
| | | | | | | | | | Net | | | | | | | | | | | | | | | | | | | | | | | | | | | | | | | | | | Ratio of |
| | | | | | | | | | Realized and | | | | | | | | | | | | | | Net | | | | | | | | | | | | | | Ratio of Net | | Expenses |
| | Net Asset | | | | | | Unrealized | | | | | | | | Net Realized | | | | Asset | | | | | | Net Assets | | Ratio of Net | | Investment | | to Average |
| | Value, | | Net | | Gains | | Total from | | Net | | Gains from | | | | Value, | | | | | | at End of | | Expenses to | | Income to | | Net Assets |
| | Beginning | | Investment | | (Losses) from | | Investment | | Investment | | Investment | | Total | | End of | | Total | | Period | | Average Net | | Average Net | | (Excluding Fee |
| | of Period | | Income | | Investments | | Activities | | Income | | Transactions | | Distributions | | Period | | Return(a) | | (000’s) | | Assets(b) | | Assets(b) | | Reductions)(b) |
| CLASS A SHARES | | | | | | | | | | | | | | | | | | | | | | | | | | | | | | | | | | | | | | | | | | | | | | | | | | | | | | | | | | | | | | | |
| Year Ended October 31, 2018 | | | $ | 1.00 | | | | $ | 0.01 | | | | $ | — | | | | $ | 0.01 | | | $ | (0.01 | ) | | | $ | — | | | $ | (0.01 | ) | | | $ | 1.00 | | | | 1.05 | % | | | | $ | 2,728 | | | | 0.63 | % | | | | 1.08 | % | | | | 0.65 | % | |
| Year Ended October 31, 2017 | | | | 1.00 | | | | | — | | | | | — | | | | | — | | | | — | | | | | — | | | | — | | | | | 1.00 | | | | 0.22 | % | | | | | 1,998 | | | | 0.59 | % | | | | 0.23 | % | | | | 0.68 | % | |
| Year Ended October 31, 2016 | | | | 1.00 | | | | | — | | | | | — | | | | | — | | | | — | | | | | — | | | | — | | | | | 1.00 | | | | 0.02 | % | | | | | 1,720 | | | | 0.34 | % | | | | 0.02 | % | | | | 0.69 | % | |
| Year Ended October 31, 2015 | | | | 1.00 | | | | | — | | | | | — | | | | | — | | | | — | | | | | — | | | | — | | | | | 1.00 | | | | 0.03 | % | | | | | 929 | | | | 0.08 | % | | | | 0.03 | % | | | | 0.69 | % | |
| Year Ended October 31, 2014 | | | | 1.00 | | | | | — | | | | | — | | | | | — | | | | — | | | | | — | | | | — | | | | | 1.00 | | | | 0.02 | % | | | | | 154 | | | | 0.07 | % | | | | 0.02 | % | | | | 0.69 | % | |
| CLASS D SHARES | | | | | | | | | | | | | | | | | | | | | | | | | | | | | | | | | | | | | | | | | | | | | | | | | | | | | | | | | | | | | | | |
| Year Ended October 31, 2018 | | | $ | 1.00 | | | | $ | 0.01 | | | | | — | | | | $ | 0.01 | | | $ | (0.01 | ) | | | | — | | | $ | (0.01 | ) | | | $ | 1.00 | | | | 1.20 | % | | | | $ | 1,648,226 | | | | 0.48 | % | | | | 1.19 | % | | | | 0.51 | % | |
| Year Ended October 31, 2017 | | | | 1.00 | | | | | — | | | | | — | | | | | — | | | | — | | | | | — | | | | — | | | | | 1.00 | | | | 0.34 | % | | | | | 1,645,222 | | | | 0.47 | % | | | | 0.32 | % | | | | 0.54 | % | |
| Year Ended October 31, 2016 | | | | 1.00 | | | | | — | | | | | — | | | | | — | | | | — | | | | | — | | | | — | | | | | 1.00 | | | | 0.02 | % | | | | | 1,949,225 | | | | 0.34 | % | | | | 0.02 | % | | | | 0.54 | % | |
| Year Ended October 31, 2015 | | | | 1.00 | | | | | — | | | | | — | | | | | — | | | | — | | | | | — | | | | — | | | | | 1.00 | | | | 0.03 | % | | | | | 888,084 | | | | 0.07 | % | | | | 0.03 | % | | | | 0.53 | % | |
| Year Ended October 31, 2014 | | | | 1.00 | | | | | — | | | | | — | | | | | — | | | | — | | | | | — | | | | — | | | | | 1.00 | | | | 0.02 | % | | | | | 727,290 | | | | 0.06 | % | | | | 0.02 | % | | | | 0.54 | % | |
| CLASS E SHARES | | | | | | | | | | | | | | | | | | | | | | | | | | | | | | | | | | | | | | | | | | | | | | | | | | | | | | | | | | | | | | | |
| October 31, 2016 through | | | | | | | | | | | | | | | | | | | | | | | | | | | | | | | | | | | | | | | | | | | | | | | | | | | | | | | | | | | | | | | |
| August 10, 2017(c) | | | $ | 1.00 | | | | | — | | | | | — | | | | | — | | | | — | | | | | — | | | | — | | | | $ | 1.00 | | | | 0.26 | % | | | | $ | — | | | | 0.23 | % | | | | 0.33 | % | | | | 0.29 | % | |
| July 12, 2016(d) through | | | | | | | | | | | | | | | | | | | | | | | | | | | | | | | | | | | | | | | | | | | | | | | | | | | | | | | | | | | | | | | |
| October 31, 2016 | | | | 1.00 | | | | | — | | | | | — | | | | | — | | | | — | | | | | — | | | | — | | | | | 1.00 | | | | 0.11 | % | | | | | 2 | | | | 0.06 | % | | | | 0.32 | % | | | | 0.31 | % | |
| CLASS I SHARES | | | | | | | | | | | | | | | | | | | | | | | | | | | | | | | | | | | | | | | | | | | | | | | | | | | | | | | | | | | | | | | |
| Year Ended October 31, 2018 | | | $ | 1.00 | | | | $ | 0.02 | | | | | — | | | | $ | 0.02 | | | $ | (0.02 | ) | | | | — | | | $ | (0.02 | ) | | | $ | 1.00 | | | | 1.57 | % | | | | $ | 6,400,700 | | | | 0.12 | % | | | | 1.52 | % | | | | 0.16 | % | |
| Year Ended October 31, 2017 | | | | 1.00 | | | | | 0.01 | | | | | — | | | | | 0.01 | | | | (0.01 | ) | | | | — | | | | (0.01 | ) | | | | 1.00 | | | | 0.69 | % | | | | | 7,853,457 | | | | 0.12 | % | | | | 0.71 | % | | | | 0.18 | % | |
| Year Ended October 31, 2016 | | | | 1.00 | | | | | — | | | | | — | | | | | — | | | | — | | | | | — | | | | — | | | | | 1.00 | | | | 0.21 | % | | | | | 4,687,197 | | | | 0.14 | % | | | | 0.23 | % | | | | 0.19 | % | |
| Year Ended October 31, 2015 | | | | 1.00 | | | | | — | | | | | — | | | | | — | | | | — | | | | | — | | | | — | | | | | 1.00 | | | | 0.03 | % | | | | | 1,589,264 | | | | 0.07 | % | | | | 0.03 | % | | | | 0.18 | % | |
| Year Ended October 31, 2014 | | | | 1.00 | | | | | — | | | | | — | | | | | — | | | | — | | | | | — | | | | — | | | | | 1.00 | | | | 0.02 | % | | | | | 1,411,088 | | | | 0.06 | % | | | | 0.02 | % | | | | 0.19 | % | |
| INTERMEDIARY CLASS SHARES | | | | | | | | | | | | | | | | | | | | | | | | | | | | | | | | | | | | | | | | | | | | | | | | | | | | | | | | | | | | | | | |
| Year Ended October 31, 2018 | | | $ | 1.00 | | | | $ | 0.02 | | | | | — | | | | $ | 0.02 | | | $ | (0.02 | ) | | | | — | | | $ | (0.02 | ) | | | $ | 1.00 | | | | 1.52 | % | | | | $ | 164,082 | | | | 0.16 | % | | | | 1.57 | % | | | | 0.31 | % | |
| Year Ended October 31, 2017 | | | | 1.00 | | | | | 0.01 | | | | | — | | | | | 0.01 | | | | (0.01 | ) | | | | — | | | | (0.01 | ) | | | | 1.00 | | | | 0.63 | % | | | | | 19,694 | | | | 0.18 | % | | | | 0.65 | % | | | | 0.33 | % | |
| July 12, 2016(d) through | | | | | | | | | | | | | | | | | | | | | | | | | | | | | | | | | | | | | | | | | | | | | | | | | | | | | | | | | | | | | | | |
| October 31, 2016 | | | | 1.00 | | | | | — | | | | | — | | | | | — | | | | — | | | | | — | | | | — | | | | | 1.00 | | | | 0.11 | % | | | | | 10,121 | | | | 0.18 | % | | | | 0.26 | % | | | | 0.37 | % | |
| See notes to financial statements. | HSBC FAMILY OF FUNDS 15 |
| HSBC U.S. GOVERNMENT MONEY MARKET FUND |
| Financial Highlights (continued) |
| | | | | | Investment Activities | | Distributions | | | | | | | | | | Ratios/Supplementary Data |
| | | | | | | | | | Net | | | | | | | | | | | | | | | | | | | | | | | | | | | | | | | | | | Ratio of |
| | | | | | | | | | Realized and | | | | | | | | | | | | | | Net | | | | | | | | | | | | | | Ratio of Net | | Expenses |
| | Net Asset | | | | | | Unrealized | | | | | | | | Net Realized | | | | Asset | | | | | | Net Assets | | Ratio of Net | | Investment | | to Average |
| | Value, | | Net | | Gains | | Total from | | Net | | Gains from | | | | Value, | | | | | | at End of | | Expenses to | | Income to | | Net Assets |
| | Beginning | | Investment | | (Losses) from | | Investment | | Investment | | Investment | | Total | | End of | | Total | | Period | | Average Net | | Average Net | | (Excluding Fee |
| | of Period | | Income | | Investments | | Activities | | Income | | Transactions | | Distributions | | Period | | Return(a) | | (000’s) | | Assets(b) | | Assets(b) | | Reductions)(b) |
| INTERMEDIARY SERVICE | | | | | | | | | | | | | | | | | | | | | | | | | | | | | | | | | | | | | | | | | | | | | | | | | | | | | | | | | | | | | | | |
| CLASS SHARES | | | | | | | | | | | | | | | | | | | | | | | | | | | | | | | | | | | | | | | | | | | | | | | | | | | | | | | | | | | | | | | |
| Year Ended October 31, 2018 | | | $ | 1.00 | | | | $ | 0.01 | | | | $ | — | | | | $ | 0.01 | | | $ | (0.01 | ) | | | $ | — | | | $ | (0.01 | ) | | | $ | 1.00 | | | | 1.50 | % | | | | $ | 184,921 | | | | 0.18 | % | | | | 1.70 | % | | | | 0.36 | % | |
| Year Ended October 31, 2017 | | | | 1.00 | | | | | 0.01 | | | | | — | | | | | 0.01 | | | | (0.01 | ) | | | | — | | | | (0.01 | ) | | | | 1.00 | | | | 0.61 | % | | | | | 57,042 | | | | 0.20 | % | | | | 0.63 | % | | | | 0.39 | % | |
| July 12, 2016(d) through | | | | | | | | | | | | | | | | | | | | | | | | | | | | | | | | | | | | | | | | | | | | | | | | | | | | | | | | | | | | | | | |
| October 31, 2016 | | | | 1.00 | | | | | — | | | | | — | | | | | — | | | | — | | | | | — | | | | — | | | | | 1.00 | | | | 0.10 | % | | | | | 5,003 | | | | 0.18 | % | | | | 0.22 | % | | | | 0.42 | % | |
| CLASS Y SHARES | | | | | | | | | | | | | | | | | | | | | | | | | | | | | | | | | | | | | | | | | | | | | | | | | | | | | | | | | | | | | | | |
| Year Ended October 31, 2018 | | | $ | 1.00 | | | | $ | 0.01 | | | | | — | | | | $ | 0.01 | | | $ | (0.01 | ) | | | | — | | | $ | (0.01 | ) | | | $ | 1.00 | | | | 1.45 | % | | | | $ | 1,757,925 | | | | 0.23 | % | | | | 1.43 | % | | | | 0.26 | % | |
| Year Ended October 31, 2017 | | | | 1.00 | | | | | 0.01 | | | | | — | | | | | 0.01 | | | | (0.01 | ) | | | | — | | | | (0.01 | ) | | | | 1.00 | | | | 0.58 | % | | | | | 2,402,354 | | | | 0.23 | % | | | | 0.53 | % | | | | 0.29 | % | |
| Year Ended October 31, 2016 | | | | 1.00 | | | | | — | | | | | — | | | | | — | | | | — | | | | | — | | | | — | | | | | 1.00 | | | | 0.12 | % | | | | | 3,891,299 | | | | 0.23 | % | | | | 0.11 | % | | | | 0.28 | % | |
| Year Ended October 31, 2015 | | | | 1.00 | | | | | — | | | | | — | | | | | — | | | | — | | | | | — | | | | — | | | | | 1.00 | | | | 0.03 | % | | | | | 3,779,595 | | | | 0.07 | % | | | | 0.03 | % | | | | 0.28 | % | |
| Year Ended October 31, 2014 | | | | 1.00 | | | | | — | | | | | — | | | | | — | | | | — | | | | | — | | | | — | | | | | 1.00 | | | | 0.02 | % | | | | | 3,458,399 | | | | 0.06 | % | | | | 0.02 | % | | | | 0.29 | % | |
| (a) | Not annualized for periods less than one year. Total return calculations do not include any sales or redemption charges. |
| (b) | Annualized for periods less than one year. |
| (c) | Closed operations on August 10, 2017. |
| (d) | Commencement of operations on July 12, 2016. |
Amounts designated as “—“ are $0.00 or have been rounded to $0.00. |
| 16 | HSBC FAMILY OF FUNDS | See notes to financial statements. |
| HSBC U.S. TREASURY MONEY MARKET FUND |
| Financial Highlights |
Selected data for a share outstanding throughout the periods indicated.
| | | | | | Investment Activities | | Distributions | | | | | | | | | | Ratios/Supplementary Data |
| | | | | | | | | | Net | | | | | | | | | | | | | | | | | | | | | | | | | | | | | | | | | | Ratio of |
| | | | | | | | | | Realized and | | | | | | | | | | | | | | Net | | | | | | | | | | | | | | Ratio of Net | | Expenses |
| | Net Asset | | | | | | Unrealized | | | | | | | | Net Realized | | | | Asset | | | | | | Net Assets | | Ratio of Net | | Investment | | to Average |
| | Value, | | Net | | Gains | | Total from | | Net | | Gains from | | | | Value, | | | | | | at End of | | Expenses to | | Income to | | Net Assets |
| | Beginning | | Investment | | (Losses) from | | Investment | | Investment | | Investment | | Total | | End of | | Total | | Period | | Average Net | | Average Net | | (Excluding Fee |
| | of Period | | Income | | Investments | | Activities | | Income | | Transactions | | Distributions | | Period | | Return(a) | | (000’s) | | Assets(b) | | Assets(b) | | Reductions)(b) |
| CLASS A SHARES | | | | | | | | | | | | | | | | | | | | | | | | | | | | | | | | | | | | | | | | | | | | | | | | | | | | | | | | | | | | | | | |
| Year Ended October 31, 2014(c) | | | $ | 1.00 | | | | $ | — | | | | $ | — | | | | $ | — | | | $ | — | | | | $ | — | | | $ | — | | | | $ | 1.00 | | | | — | % | | | | $ | — | | | | — | % | | | | — | % | | | | — | % | |
| CLASS D SHARES | | | | | | | | | | | | | | | | | | | | | | | | | | | | | | | | | | | | | | | | | | | | | | | | | | | | | | | | | | | | | | | |
| Year Ended October 31, 2018 | | | $ | 1.00 | | | | $ | 0.01 | | | | | — | | | | $ | 0.01 | | | $ | (0.01 | ) | | | | — | | | $ | (0.01 | ) | | | $ | 1.00 | | | | 1.17 | % | | | | $ | 308,136 | | | | 0.50 | % | | | | 1.12 | % | | | | 0.53 | % | |
| Year Ended October 31, 2017 | | | | 1.00 | | | | | — | | | | | — | | | | | — | | | | — | | | | | — | | | | — | | | | | 1.00 | | | | 0.29 | % | | | | | 257,062 | | | | 0.49 | % | | | | 0.28 | % | | | | 0.55 | % | |
| Year Ended October 31, 2016 | | | | 1.00 | | | | | — | | | | | — | | | | | — | | | | — | | | | | — | | | | — | | | | | 1.00 | | | | — | % | | | | | 214,041 | | | | 0.28 | % | | | | — | % | | | | 0.55 | % | |
| Year Ended October 31, 2015 | | | | 1.00 | | | | | — | | | | | — | | | | | — | | | | — | | | | | — | | | | — | | | | | 1.00 | | | | — | % | | | | | 280,032 | | | | 0.06 | % | | | | — | % | | | | 0.54 | % | |
| Year Ended October 31, 2014 | | | | 1.00 | | | | | — | | | | | — | | | | | — | | | | — | | | | | — | | | | — | | | | | 1.00 | | | | 0.01 | % | | | | | 638,939 | | | | 0.06 | % | | | | — | % | | | | 0.54 | % | |
| CLASS E SHARES | | | | | | | | | | | | | | | | | | | | | | | | | | | | | | | | | | | | | | | | | | | | | | | | | | | | | | | | | | | | | | | |
| October 31, 2016 through | | | | | | | | | | | | | | | | | | | | | | | | | | | | | | | | | | | | | | | | | | | | | | | | | | | | | | | | | | | | | | | |
| August 10, 2017(d) | | | $ | 1.00 | | | | | — | | | | | — | | | | | — | | | | — | | | | | — | | | | — | | | | $ | 1.00 | | | | 0.29 | % | | | | $ | — | | | | 0.25 | % | | | | 0.37 | % | | | | 0.29 | % | |
| July 12, 2016(e) through | | | | | | | | | | | | | | | | | | | | | | | | | | | | | | | | | | | | | | | | | | | | | | | | | | | | | | | | | | | | | | | |
| October 31, 2016 | | | | 1.00 | | | | | — | | | | | — | | | | | — | | | | — | | | | | — | | | | — | | | | | 1.00 | | | | 0.11 | % | | | | | 1 | | | | — | % | | | | 0.37 | % | | | | 0.33 | % | |
| CLASS I SHARES | | | | | | | | | | | | | | | | | | | | | | | | | | | | | | | | | | | | | | | | | | | | | | | | | | | | | | | | | | | | | | | |
| Year Ended October 31, 2018 | | | $ | 1.00 | | | | $ | 0.02 | | | | | — | | | | $ | 0.02 | | | $ | (0.02 | ) | | | | — | | | $ | (0.02 | ) | | | $ | 1.00 | | | | 1.54 | % | | | | $ | 707,804 | | | | 0.14 | % | | | | 1.53 | % | | | | 0.18 | % | |
| Year Ended October 31, 2017 | | | | 1.00 | | | | | 0.01 | | | | | — | | | | | 0.01 | | | | (0.01 | ) | | | | — | | | | (0.01 | ) | | | | 1.00 | | | | 0.64 | % | | | | | 861,944 | | | | 0.14 | % | | | | 0.65 | % | | | | 0.19 | % | |
| Year Ended October 31, 2016 | | | | 1.00 | | | | | — | | | | | — | | | | | — | | | | — | | | | | — | | | | — | | | | | 1.00 | | | | 0.13 | % | | | | | 346,399 | | | | 0.16 | % | | | | 0.13 | % | | | | 0.20 | % | |
| Year Ended October 31, 2015 | | | | 1.00 | | | | | — | | | | | — | | | | | — | | | | — | | | | | — | | | | — | | | | | 1.00 | | | | — | % | | | | | 384,363 | | | | 0.05 | % | | | | — | % | | | | 0.19 | % | |
| Year Ended October 31, 2014 | | | | 1.00 | | | | | — | | | | | — | | | | | — | | | | — | | | | | — | | | | — | | | | | 1.00 | | | | 0.01 | % | | | | | 263,714 | | | | 0.06 | % | | | | 0.01 | % | | | | 0.19 | % | |
| INTERMEDIARY CLASS SHARES | | | | | | | | | | | | | | | | | | | | | | | | | | | | | | | | | | | | | | | | | | | | | | | | | | | | | | | | | | | | | | | |
| Year Ended October 31, 2018 | | | $ | 1.00 | | | | $ | 0.01 | | | | | — | | | | $ | 0.01 | | | $ | (0.01 | ) | | | | — | | | $ | (0.01 | ) | | | $ | 1.00 | | | | 1.49 | % | | | | $ | 169,827 | | | | 0.16 | % | | | | 1.54 | % | | | | 0.33 | % | |
| Year Ended October 31, 2017 | | | | 1.00 | | | | | — | | | | | — | | | | | — | | | | — | | | | | — | | | | — | | | | | 1.00 | | | | 0.44 | % | | | | | 1 | | | | 0.18 | % | | | | 0.44 | % | | | | 0.34 | % | |
| July 12, 2016(e) through | | | | | | | | | | | | | | | | | | | | | | | | | | | | | | | | | | | | | | | | | | | | | | | | | | | | | | | | | | | | | | | |
| October 31, 2016 | | | | 1.00 | | | | | — | | | | | — | | | | | — | | | | — | | | | | — | | | | — | | | | | 1.00 | | | | 0.11 | % | | | | | 1 | | | | — | % | | | | 0.37 | % | | | | 0.38 | % | |
| INTERMEDIARY SERVICE | | | | | | | | | | | | | | | | | | | | | | | | | | | | | | | | | | | | | | | | | | | | | | | | | | | | | | | | | | | | | | | |
| CLASS SHARES | | | | | | | | | | | | | | | | | | | | | | | | | | | | | | | | | | | | | | | | | | | | | | | | | | | | | | | | | | | | | | | |
| Year Ended October 31, 2018 | | | $ | 1.00 | | | | $ | 0.01 | | | | | — | | | | $ | 0.01 | | | $ | (0.01 | ) | | | | — | | | $ | (0.01 | ) | | | $ | 1.00 | | | | 1.49 | % | | | | $ | 51,220 | | | | 0.18 | % | | | | 1.54 | % | | | | 0.38 | % | |
| Year Ended October 31, 2017 | | | | 1.00 | | | | | 0.01 | | | | | — | | | | | 0.01 | | | | (0.01 | ) | | | | — | | | | (0.01 | ) | | | | 1.00 | | | | 0.58 | % | | | | | 22,016 | | | | 0.20 | % | | | | 0.58 | % | | | | 0.40 | % | |
| July 12, 2016(e) through | | | | | | | | | | | | | | | | | | | | | | | | | | | | | | | | | | | | | | | | | | | | | | | | | | | | | | | | | | | | | | | |
| October 31, 2016 | | | | 1.00 | | | | | — | | | | | — | | | | | — | | | | — | | | | | — | | | | — | | | | | 1.00 | | | | 0.10 | % | | | | | 18,108 | | | | 0.20 | % | | | | 0.14 | % | | | | 0.48 | % | |
| See notes to financial statements. | HSBC FAMILY OF FUNDS 17 |
| HSBC U.S. TREASURY MONEY MARKET FUND |
| Financial Highlights (continued) |
| | | | | | Investment Activities | | Distributions | | | | | | | | | | Ratios/Supplementary Data |
| | | | | | | | | | Net | | | | | | | | | | | | | | | | | | | | | | | | | | | | | | | | | | Ratio of |
| | | | | | | | | | Realized and | | | | | | | | | | | | | | Net | | | | | | | | | | | | | | Ratio of Net | | Expenses |
| | Net Asset | | | | | | Unrealized | | | | | | | | Net Realized | | | | Asset | | | | | | Net Assets | | Ratio of Net | | Investment | | to Average |
| | Value, | | Net | | Gains | | Total from | | Net | | Gains from | | | | Value, | | | | | | at End of | | Expenses to | | Income to | | Net Assets |
| | Beginning | | Investment | | (Losses) from | | Investment | | Investment | | Investment | | Total | | End of | | Total | | Period | | Average Net | | Average Net | | (Excluding Fee |
| | of Period | | Income | | Investments | | Activities | | Income | | Transactions | | Distributions | | Period | | Return(a) | | (000’s) | | Assets(b) | | Assets(b) | | Reductions)(b) |
| CLASS Y SHARES | | | | | | | | | | | | | | | | | | | | | | | | | | | | | | | | | | | | | | | | | | | | | | | | | | | | | | | | | | | | | | | |
| Year Ended October 31, 2018 | | | $ | 1.00 | | | | $ | 0.01 | | | | $ | — | | | | $ | 0.01 | | | $ | (0.01 | ) | | | $ | — | | | $ | (0.01 | ) | | | $ | 1.00 | | | | 1.43 | % | | | | $ | 697,972 | | | | 0.25 | % | | | | 1.37 | % | | | | 0.28 | % | |
| Year Ended October 31, 2017 | | | | 1.00 | | | | | 0.01 | | | | | — | | | | | 0.01 | | | | (0.01 | ) | | | | — | | | | (0.01 | ) | | | | 1.00 | | | | 0.53 | % | | | | | 1,101,219 | | | | 0.25 | % | | | | 0.56 | % | | | | 0.29 | % | |
| Year Ended October 31, 2016 | | | | 1.00 | | | | | — | | | | | — | | | | | — | | | | — | | | | | — | | | | — | | | | | 1.00 | | | | 0.04 | % | | | | | 697,866 | | | | 0.25 | % | | | | 0.04 | % | | | | 0.30 | % | |
| Year Ended October 31, 2015 | | | | 1.00 | | | | | — | | | | | — | | | | | — | | | | — | | | | | — | | | | — | | | | | 1.00 | | | | — | % | | | | | 763,473 | | | | 0.06 | % | | | | — | % | | | | 0.29 | % | |
| Year Ended October 31, 2014 | | | | 1.00 | | | | | — | | | | | — | | | | | — | | | | — | | | | | — | | | | — | | | | | 1.00 | | | | 0.01 | % | | | | | 956,312 | | | | 0.06 | % | | | | 0.01 | % | | | | 0.29 | % | |
| (a) | Not annualized for periods less than one year. Total return calculations do not include any sales or redemption charges. |
| (b) | Annualized for periods less than one year. |
| (c) | Class A Shares were operational during a portion of the year only. Amounts reflect performance for a period of time the class had operations, which was 201 days during the period. The net asset value reflected represents the last day the class had operations. |
| (d) | Closed operations on August 10, 2017. |
| (e) | Commencement of operations on July 12, 2016. |
Amounts designated as “—“ are $0.00 or have been rounded to $0.00. |
| 18 | HSBC FAMILY OF FUNDS | See notes to financial statements. |
| HSBC FAMILY OF FUNDS |
| Notes to Financial Statements—as of October 31, 2018 |
1. Organization:
The HSBC Funds (the “Trust”), a Delaware statutory trust organized on March 2, 2016, is registered under the Investment Company Act of 1940, as amended (the “Act”), as an open-end management investment company. As of October 31, 2018, the Trust is composed of 10 separate operational funds, each a series of the HSBC Family of Funds. The accompanying financial statements are presented for the following two funds (individually a “Fund”, collectively the “Funds”) of the Trust:
| Fund | | Short Name |
| HSBC U.S. Government Money Market Fund | | U.S. Government Money Market Fund |
| | | |
| HSBC U.S. Treasury Money Market Fund | | U.S. Treasury Money Market Fund |
Both of the Funds are diversified funds. Financial statements for all other funds of the Trust are published separately.
Both of the Funds are government money market funds (as defined in Rule 2a-7) and seek to maintain a stable net asset value (“NAV”) of $1.00 per share, although it is possible to lose money by investing in the Funds. The Funds are authorized to issue an unlimited number of shares of beneficial interest with a par value of $0.001 per share. Each of the Funds has eight classes of shares: Class A Shares, Class C Shares, Class D Shares, Class E Shares, Class I Shares, Intermediary Class Shares, Intermediary Service Class Shares and Class Y Shares. Class C Shares of the Funds are offered without any front-end sales charge but will be subject to a maximum CDSC of 1.00% if redeemed less than one year after purchase. Class C Shares are not offered for sale, but are offered as an exchange option for Class C shareholders of the Trust’s other funds. No sales charges are assessed with respect to Class A, Class D, Class E, Class I, Intermediary Class, Intermediary Service Class or Class Y Shares of the Funds. Each class of shares in each Fund has identical rights and privileges, except with respect to arrangements pertaining to shareholder servicing and/or distribution, class-related expenses, voting rights on matters affecting a single class of shares, and exchange privileges.
Under the Trust’s organizational documents, the Trust’s officers and Trustees are indemnified against certain liabilities arising out of the performance of their duties to the Funds. In addition, in the normal course of business, the Trust may enter into contracts with its service providers, which also provide for indemnifications by the Funds. The Funds’ maximum exposure under these arrangements is unknown as this would involve future claims that may be made against the Funds. However, based on experience, the Trust believes the risk of loss to be remote.
The Funds are investment companies and follow accounting and reporting guidance under Financial Accounting Standards Board (“FASB”) Accounting Standards Codification (“ASC”) Topic 946, “Financial Services-Investment Companies.”
2. Significant Accounting Policies:
The following is a summary of the significant accounting policies followed by the Funds in the preparation of their financial statements. The policies are in conformity with generally accepted accounting principles in the United States of America (“GAAP”). The preparation of financial statements requires management to make certain estimates and assumptions that affect the reported amounts of assets and liabilities and disclosure of contingent assets and liabilities at the date of the financial statements and the reported amounts of increases and decreases in net assets from operations during the reporting period. Actual results could differ from those estimates.
| HSBC FAMILY OF FUNDS |
| Notes to Financial Statements—as of October 31, 2018 (continued) |
Securities Valuation:
Investments of the Funds, other than investments in other money market funds, are valued using the amortized cost method pursuant to Rule 2a-7 under the Act, provided that certain conditions are met. Generally, amortized cost approximates fair value. Investments in other money market funds are priced at NAV as reported by such investment companies. Fair value is defined as the price that would be received to sell an asset or paid to transfer a liability in an orderly transaction between market participants at the measurement date. The valuation techniques used to determine fair value are further described in Note 3 below.
Investment Transactions and Related Income:
Investment transactions are accounted for no later than one business day after trade date. However, for financial reporting purposes, investment transactions are accounted for on trade date. Investment gains and losses are calculated on the identified cost basis. Interest income is determined on the basis of coupon interest accrued using the effective interest method which adjusts for amortization of premiums and accretion of discounts. Dividend income is recorded on the ex-dividend date.
Restricted Securities:
The Funds may invest in restricted securities. A restricted security is a security which has been purchased through a private offering and cannot be resold to the general public without prior registration under the Securities Act of 1933 (the “1933 Act”) or pursuant to the resale limitations provided by Rule 144 under the 1933 Act, or another exemption from the registration requirements of the 1933 Act. Certain restricted securities may be resold in transactions exempt from registration, normally to qualified institutional buyers, and may be deemed liquid by the Investment Adviser (as defined in Note 4) based on procedures established by the Board of Trustees (the “Board”). Therefore, not all restricted securities are considered illiquid. To the extent that a Fund purchases securities that are restricted as to resale or for which current market quotations are not available, such securities will be valued based upon all relevant factors as outlined in Securities and Exchange Commission (“SEC”) Financial Reporting Release No. 1. Disposal of restricted securities may involve time consuming negotiations and expense. Prompt sale at the current valuation may be difficult and could adversely affect the net assets of the Funds. At October 31, 2018, there were no restricted securities held by the Funds.
Repurchase Agreements:
The U.S. Government Money Market Fund may enter into repurchase agreements with an entity which is a member of the Federal Reserve System or which is a “primary dealer” (as designated by the Federal Reserve Bank of New York) in U.S. government obligations. The U.S. Government Money Market Fund may also enter into a repurchase agreement with the Federal Reserve Bank of New York. The U.S. Treasury Money Market Fund may temporarily invest in repurchase agreements collateralized by U.S. Treasury Obligations under adverse market conditions. The repurchase price generally equals the price paid by a Fund plus interest negotiated on the basis of current short-term rates, which may be more or less than the rate on the underlying portfolio securities. The seller, under a repurchase agreement, is required to maintain the collateral held pursuant to the agreement, with a fair value equal to or greater than the repurchase price (including accrued interest). Securities subject to repurchase agreements are held by the Funds’ custodian or another qualified custodian or in the Federal Reserve/Treasury book-entry system. Master Repurchase Agreements (“MRA”) permit the Fund, under certain circumstances, including an event of default (such as bankruptcy or insolvency), to offset receivables under the MRA with collateral posted by the counterparty and create one net payment due to or from the Fund. However, bankruptcy or insolvency laws of a particular jurisdiction may impose restrictions on or prohibitions against such a right of offset in the event of the MRA counterparty’s bankruptcy or insolvency. Pursuant to terms of the MRA, the Fund receives securities as collateral with a market value in excess of the repurchase price to be received by the Fund upon the maturity of the transaction. Upon bankruptcy or insolvency of the MRA counterparty, the Fund would recognize a liability with respect to such excess collateral to reflect the Fund’s obligation under bankruptcy law to return the excess to the counterparty. There is potential for loss to a Fund in the event the Fund is delayed or prevented from exercising its rights to dispose of the collateral securities, including the risk of a possible decline in the fair value of the underlying securities during the period while the Fund seeks to assert its rights.
| HSBC FAMILY OF FUNDS |
| Notes to Financial Statements—as of October 31, 2018 (continued) |
Cash:
Cash is held in deposit accounts at the Funds’ custodian bank, The Northern Trust Company (“Custodian”), and is a significant portion of the net assets, which may exceed the amount insured by the Federal Deposit Insurance Corporation (“FDIC”). To the extent that such balances exceed FDIC insurance limits, the Funds are subject to the creditworthiness of the Custodian.
Allocations:
Expenses directly attributable to a Fund are charged to that Fund. Expenses not directly attributable to a Fund are allocated among the applicable series within the Trust equally to each fund, in relation to their net assets, or another appropriate basis. Class specific expenses are charged directly to the class incurring the expense. In addition, income, expenses (other than class specific expenses), and unrealized and realized gains and losses are allocated to each class based on relative net assets on a daily basis.
Distributions to Shareholders:
Dividends distributed to shareholders of the Funds from net investment income, if any, are declared daily and distributed monthly from each Fund. Distributions from net realized gains, if any, are declared and paid at least annually by the Funds. Additional distributions are also made to the Funds’ shareholders to the extent necessary to avoid the federal excise tax on certain undistributed income and net realized gains of regulated investment companies.
Federal Income Taxes:
Each Fund is a separate taxable entity for federal income tax purposes. Each Fund has qualified and intends to continue to qualify each year as a “regulated investment company’’ under Subchapter M of the Internal Revenue Code, as amended, and to distribute substantially all of its taxable net investment income and net realized gains, if any, to its shareholders. Accordingly, no provision for federal income or excise tax is required for the Funds, although shareholders may be taxed on distributions they receive.
Management of the Funds has reviewed tax positions taken in tax years that remain subject to examination by all major tax jurisdictions, including federal (i.e., the last four tax year ends and the interim tax period since then, as applicable). Management believes that there is no tax liability resulting from unrecognized tax benefits related to uncertain tax positions taken. Management’s conclusions may be subject to future review based on changes in, or interpretation of, accounting standards or tax laws and regulations.
3. Investment Valuation Summary
The valuation techniques employed by the Funds, as described below, maximize the use of observable inputs and minimize the use of unobservable inputs in determining fair value. The Funds’ investments are classified within the fair value hierarchy based on the lowest level of input that is significant to the fair value measurement. The inputs used for valuing the Funds’ investments are summarized in the three broad levels listed below:
| ● | Level 1—quoted prices in active markets for identical assets |
| ● | Level 2—other significant observable inputs (including quoted prices for similar securities, interest rates, prepayments speeds, credit risk, etc.) |
| ● | Level 3—significant unobservable inputs (including the Fund’s own assumptions in determining the fair value of investments) |
Changes in valuation techniques may result in transfers in or out of an assigned level within the fair value hierarchy. The inputs or methodology used for valuing investments are not necessarily an indication of the risk associated with investing in those investments.
| HSBC FAMILY OF FUNDS |
| Notes to Financial Statements—as of October 31, 2018 (continued) |
Investments of the Funds, other than investments in other money market funds, are valued using the amortized cost method pursuant to Rule 2a-7 under the Act, and are typically categorized as Level 2 in the fair value hierarchy. The amortized cost method involves valuing an instrument at its cost initially and thereafter assuming a constant amortization to maturity of any discounts or premium, regardless of the impact of fluctuating interest rates on the market value of the instrument. The amortized cost method may result in periods during which value, as determined by amortized cost, is higher or lower than the price a Fund holding the instrument would receive if it sold the instrument. The fair value of securities in the Funds can be expected to vary with changes in prevailing interest rates.
Investments in other money market funds are priced at NAV as reported by such money market funds and are typically categorized as Level 1 in the fair value hierarchy.
The following is a summary of the valuation inputs used as of October 31, 2018 in valuing the Funds’ investments based upon the three levels defined above. The breakdown of investment categorization is disclosed in the Schedule of Portfolio Investments for each Fund.
| U.S. Government Money Market Fund |
| Investment Securities: | | LEVEL 1 ($) | | LEVEL 2 ($) | | LEVEL 3 ($) | | Total ($) |
| U.S. Government and Government | | | | | | | | |
| Agency Obligations | | — | | 5,626,513,395 | | — | | 5,626,513,395 |
| U.S. Treasury Obligations | | — | | 457,899,982 | | — | | 457,899,982 |
| Investment Companies | | 325,688,339 | | — | | — | | 325,688,339 |
| Repurchase Agreements | | — | | 3,850,000,000 | | — | | 3,850,000,000 |
| Total Investment Securities | | 325,688,339 | | 9,934,413,377 | | — | | 10,260,101,716 |
| | | | | | | | | |
| U.S. Treasury Money Market Fund | | | | | | | | |
| Investment Securities: | | LEVEL 1 ($) | | LEVEL 2 ($) | | LEVEL 3 ($) | | Total ($) |
| U.S. Treasury Obligations | | — | | 1,985,622,411 | | — | | 1,985,622,411 |
| Total Investment Securities | | — | | 1,985,622,411 | | — | | 1,985,622,411 |
4. Related Party Transactions and Other Agreements and Plans:
Investment Management:
HSBC Global Asset Management (USA), Inc. (“HSBC” or the “Investment Adviser”), a wholly owned subsidiary of HSBC Bank USA, N.A., a national bank organized under the laws of the United States, acts as Investment Adviser to the Funds. As Investment Adviser, HSBC manages the investments of the Funds and continuously reviews, supervises and administers the Funds’ investments pursuant to an Investment Advisory Contract. For its services in this capacity, HSBC receives a fee from each Fund, accrued daily and paid monthly, based on the average daily net assets of each respective Fund, at an annual rate of 0.10%.
HSBC also provides operational support services to the Funds pursuant to an Operational Support Services Agreement in connection with the operation of certain classes of shares of the Funds. For its services in this capacity, HSBC is entitled to receive a fee, accrued daily and paid monthly, based on the average daily net assets of Class A Shares, Class C Shares, Class D Shares, Intermediary Class Shares, Intermediary Service Class Shares and Class Y Shares, at an annual rate of 0.10%.
HSBC has entered into agreements with certain financial intermediaries (the “Servicers”) to provide recordkeeping, reporting and processing services to the Funds. The Servicers are paid by the Investment Adviser, and not by the Funds, for these services. Since these fees are paid for by the Investment Adviser, they do not represent an additional charge to the Funds or their shareholders and are not reflected in the Funds’ expenses.
| HSBC FAMILY OF FUNDS |
| Notes to Financial Statements—as of October 31, 2018 (continued) |
Administration, Fund Accounting and Other Services:
HSBC also serves the Funds as Administrator. Under the terms of the Administration Services Agreement, HSBC receives from the Funds (as well as other funds in the Trust combined) a fee, accrued daily and paid monthly, at an annual rate of:
| Based on Average Daily Net Assets of | | Fee Rate(%) |
| Up to $10 billion | | 0.0400 |
| In excess of $10 billion but not exceeding $20 billion | | 0.0350 |
| In excess of $20 billion but not exceeding $50 billion | | 0.0265 |
| In excess of $50 billion | | 0.0245 |
The fee rates and breakpoints are determined on the basis of the aggregate average daily net assets of the Trust. For the year ended October 31, 2018, the effective annualized rate was 0.038%, prior to any fee waivers or expense reimbursements, based on the average daily net assets of the Trust. The total administration fee paid to HSBC is allocated to each series based upon its proportionate share of the aggregate net assets of the Trust, subject to certain allocations in cases where one fund invests some or all of its assets in another fund.
Pursuant to a Sub-Administration Services Agreement with HSBC, Citi Fund Services Ohio, Inc. (“Citi”), a wholly-owned subsidiary of Citigroup, Inc., serves as the Trust’s Sub-Administrator. For these services, Citi is entitled to a fee, payable by HSBC, at an annual rate equivalent to the fee rates set forth below:
| Based on Average Daily Net Assets of | | Fee Rate(%) |
| Up to $10 billion | | 0.0200 |
| In excess of $10 billion but not exceeding $20 billion | | 0.0150 |
| In excess of $20 billion but not exceeding $50 billion | | 0.0065 |
| In excess of $50 billion | | 0.0045 |
Under a Services Agreement between the Trust and Citi (the “Services Agreement”), Citi makes an individual available to serve as the Trust’s Chief Compliance Officer (the “CCO”). Citi also provides infrastructure and support in implementing the written policies and procedures comprising the Trust’s compliance program, including support services to the CCO. For the services provided under the Services Agreement, the Trust paid Citi $313,915 for the year ended October 31, 2018, plus reimbursement of certain out-of-pocket expenses. Expenses incurred by each Fund are reflected on the Statements of Operations as “Compliance Services.” Citi pays the salary and other compensation earned by individuals performing these services, as employees of Citi.
In addition, Citi provides fund accounting services for each Fund under the Services Agreement. As fund accountant, Citi receives an annual fee per Fund and share class, subject to certain minimums and reimbursements of certain expenses. Citi receives additional fees paid by the Trust for regulatory administration services and money market fund reporting services.
Distribution Arrangements:
Foreside Distribution Services, L.P. (“Foreside”) serves the Trust as Distributor (the “Distributor”). The Trust has adopted a non-compensatory Distribution Plan and Agreement (the “Distribution Plan”) pursuant to Rule 12b-1 of the Act. The Distribution Plan provides for reimbursement of expenses incurred by the Distributor related to distribution and marketing, at a rate not to exceed 0.25%, 1.00% and 0.25% of the average daily net assets of Class A Shares (currently not being charged), Class C Shares (currently charging 0.75%) and Class D Shares (currently not being charged) of the Funds, respectively. For the year ended October 31, 2018, Foreside, as Distributor, also received $1,976 in commissions from sales of the Trust.
Expenses reduced during the year ended October 31, 2018 are reflected on the Statements of Operations as “Fees voluntarily reduced by Distributor.’’
| HSBC FAMILY OF FUNDS |
| Notes to Financial Statements—as of October 31, 2018 (continued) |
Shareholder Servicing:
The Trust has adopted a Shareholder Services Plan, which provides for payments to shareholder servicing agents (which includes HSBC and its affiliates) for providing various shareholder services. As disclosed in the Statements of Operations, for the current fiscal period certain amounts of the Shareholder Servicing Fees have been waived by those shareholder servicing agents, including HSBC and its affiliates. Expenses reduced during the year ended October 31, 2018 are reflected on the Statements of Operations as “Fees voluntarily reduced by Shareholder Servicing Agent.” For performing these services, the shareholder servicing agents are entitled to receive a fee that is computed daily and paid monthly up to the following:
| Share Class | | Fee Rate(%) |
| Class A Shares | | | 0.60 | %* | |
| Class C Shares | | | 0.25 | % | |
| Class D Shares | | | 0.25 | % | |
| Class E Shares | | | 0.10 | % | |
| Intermediary Class Shares | | | 0.05 | % | |
| Intermediary Service Class Shares | | | 0.10 | % | |
____________________
| * | Currently charging 0.40% |
The aggregate fees paid to the Distributor pursuant to the Distribution Plan and to shareholder servicing agents pursuant to the Shareholder Services Plan may not exceed, in the aggregate, the following:
| Share Class | | Fee Rate(%) |
| Class A Shares | | 0.60% |
| Class C Shares | | 1.00% |
| Class D Shares | | 0.25% |
| Class E Shares | | 0.10% |
| Intermediary Class Shares | | 0.05% |
| Intermediary Service Class Shares | | 0.10% |
The Trust has entered into shareholder services contracts with affiliated and unaffiliated financial intermediaries who provide shareholder services and other related services to their clients or customers who invest in the Funds under which the Funds will pay all or a portion of such fees earned to financial intermediaries for performing such services.
Transfer Agency:
On April 16, 2018, DST Asset Manager Solutions, Inc. (“DST”) (formerly, Boston Financial Data Services, Inc.) announced that SS&C Technologies completed its acquisition of DST Systems, Inc., the parent of DST. DST provides transfer agency services for each Fund. As transfer agent, DST receives a fee based on the number of funds and shareholder accounts, subject to certain minimums, and reimbursement of certain expenses.
Independent Trustees:
The Trust pays an annual retainer to each Independent Trustee, plus additional annual retainers to each Committee Chair and the Chairman of the Board. The Independent Trustees also receive a fee for each regular, special in-person, and telephonic meeting of the Board attended. The aggregate amount of the fees and expenses of the Independent Trustees are allocated amongst all the funds in the Trust and are presented in the Statements of Operations.
| HSBC FAMILY OF FUNDS |
| Notes to Financial Statements—as of October 31, 2018 (continued) |
Fee Reductions:
The Investment Adviser has agreed to contractually limit through March 1, 2019 the total annual expenses of certain classes of the Funds, exclusive of interest, taxes, brokerage commissions, extraordinary expenses and estimated indirect expenses attributable to each Fund’s investments in investment companies, as applicable. The applicable classes of each Fund have their own expense limitations based on the average daily net assets for any full fiscal year as follows:
| | | | Contractual |
| | | | Expense |
| Fund | | Class | | Limitations(%) |
| U.S. Government Money Market Fund | | E | | | 0.25 | |
| U.S. Government Money Market Fund | | I | | | 0.20 | |
| U.S. Government Money Market Fund | | Intermediary Shares | | | 0.18 | * |
| U.S. Government Money Market Fund | | Intermediary
Service Shares | | | 0.20 | * |
| U.S. Treasury Money Market Fund | | E | | | 0.25 | |
| U.S. Treasury Money Market Fund | | I | | | 0.20 | |
| U.S. Treasury Money Market Fund | | Intermediary Shares | | | 0.18 | * |
| U.S. Treasury Money Market Fund | | Intermediary
Service Shares | | | 0.20 | * |
____________________
| * | Effective December 14, 2017. Prior to December 14, 2017 there was no contractual waiver in place for this class. |
Any amounts contractually waived or reimbursed by the Investment Adviser will be subject to repayment by the respective Fund to the Investment Adviser within three years calculated monthly from when the waiver or reimbursement is recorded to the extent that the repayment will not cause the Fund’s operating expenses to exceed the contractual expense limit that was in effect at the time of such waiver or reimbursement. As of October 31, 2018, the repayments that may potentially be made by the Funds are as follows:
| | Amount |
| | Eligible Through |
| Fund | | 2021($) |
| U.S. Government Money Market Fund | | 195,009 |
| U.S. Treasury Money Market Fund | | 147,166 |
The Administrator and Citi may voluntarily waive/reimburse fees to help support the expense limits of the Funds. In addition, HSBC, in its role as Investment Adviser and Administrator, may waive/reimburse additional fees at its discretion. Any voluntary fee waivers/reimbursements are not subject to recoupment in subsequent fiscal periods. Voluntary waivers/reimbursements may be eliminated or changed at any time. Amounts waived/reimbursed by the Investment Adviser Administrator and Citi as Sub-Administrator are reported separately on the Statements of Operations, as applicable.
During the year ended October 31, 2018, the following amounts of expenses were voluntarily and contractually waived:
| | | | | | | | | | | | | | | | Intermediary | | |
| | Class A | | Class C | | Class D | | Class E | | Class I | | Class Y | | Intermediary | | Service | | |
| Fund | | ($) | | ($) | | ($) | | ($) | | ($) | | ($) | | Class ($) | | Class ($) | | Total ($) |
| U.S. Government Money | | | | | | | | | | | | | | | | | | |
| Market Fund | | 492 | | — | | 507,537 | | — | | 2,790,808 | | 541,528 | | 265,587 | | 165,264 | | 4,271,216 |
| U.S. Treasury Money | | | | | | | | | | | | | | | | | | |
| Market Fund | | — | | — | | 66,646 | | — | | 242,631 | | 297,737 | | 198,635 | | 85,239 | | 890,888 |
| HSBC FAMILY OF FUNDS |
| Notes to Financial Statements—as of October 31, 2018 (continued) |
The Funds have entered into an arrangement with their Custodian, whereby credits realized as a result of uninvested cash balances are used to reduce the Custodian’s expenses. Expenses reduced during the year ended October 31, 2018 are reflected on the Statements of Operations as “Custody earnings credits,” as applicable.
Overdraft Facility:
The Funds have entered into an arrangement with the Custodian whereby an uncommitted, secured overdraft facility is made available to meet unanticipated end-of-day liquidity needs of the Funds which cannot be fulfilled by trading activities. The interest rate on overdraft amounts is calculated at an annual rate of 0.50% plus the Federal Funds Rate. The overdraft facility is limited to $750,000,000 and $50,000,000 for the U.S. Government Money Market Fund and the U.S. Treasury Money Market Fund, respectively. As of October 31, 2018, the Funds did not have any overdrafts outstanding. Fees incurred during the year ended October 31, 2018 by the Funds on overdrafts are reflected on the Statements of Operations within the “Custodian” expenses, and were as follows:
| U.S. Government Money Market Fund | | $ | 189,377 |
| U.S. Treasury Money Market Fund | | $ | 2,066 |
5. Federal Income Tax Information:
At October 31, 2018, the cost basis of investments for federal income tax purposes, gross unrealized appreciation, gross unrealized depreciation and net unrealized appreciation/depreciation were as follows:
| | | | | | | | Net Unrealized |
| | | | Tax Unrealized | | Tax Unrealized | | Appreciation/ |
| | Tax Cost ($) | | Appreciation ($) | | Depreciation ($) | | (Depreciation) ($) |
| U.S. Government Money Market Fund | | 10,260,101,716 | | — | | — | | — |
| U.S. Treasury Money Market Fund | | 1,985,622,411 | | — | | — | | — |
The tax character of distributions paid by the Funds for the tax year ended October 31, 2018, was as follows:
| | Distributions paid from |
| | | | Net | | Total | | |
| | | | Long Term | | Taxable | | Total |
| | Ordinary | | Capital | | Distributions | | Distributions |
| | Income ($) | | Gains ($) | | ($) | | Paid ($)(1) |
| U.S. Government Money Market Fund | | 150,216,854 | | 12,281 | | 150,229,135 | | 150,229,135 |
| U.S. Treasury Money Market Fund | | 26,994,417 | | — | | 26,994,417 | | 26,994,417 |
____________________
| (1) | Total distributions paid may differ from the amount reported in the Statements of Changes in Net Assets because distributions are recognized when actually paid for tax purposes. |
The tax character of distributions paid by the Funds for the tax year ended October 31, 2017, was as follows:
| | Distributions paid from |
| | | | Total | | |
| | | | Taxable | | Total |
| | Ordinary | | Distributions | | Distributions |
| | Income ($) | | ($) | | Paid ($)(1) |
| U.S. Government Money Market Fund | | 62,438,599 | | 62,438,599 | | 62,438,599 |
| U.S. Treasury Money Market Fund | | 9,690,876 | | 9,690,876 | | 9,690,876 |
____________________
| (1) | Total distributions paid may differ from the amount reported in the Statements of Changes in Net Assets because distributions are recognized when actually paid for tax purposes. |
| HSBC FAMILY OF FUNDS |
| Notes to Financial Statements—as of October 31, 2018 (continued) |
As of the tax year ended October 31, 2018, the components of accumulated earnings/(deficit) on a tax basis for the Funds were as follows:
| | | | | | | | | | | | | | | Accumulated | | | | | | | |
| | | | | | | | | | | | | | | Capital and | | Unrealized | | Total |
| | Undistributed | | | | | | | | | | | Other | | Appreciation/ | | Accumulated |
| | Ordinary | | Accumulated | | Distributions | | Losses | | (Depreciation) | | Earnings/ |
| | Income ($) | | Earnings ($) | | Payable ($) | | ($) | | ($) | | (Deficit) ($) |
| U.S. Government Money | | | | | | | | | | | | | | | | | | | | | | | | | |
| Market Fund | | | 5,977,656 | | | | 5,977,656 | | | | (5,956,754 | ) | | | | (101,139 | ) | | | — | | | (80,237 | ) | |
| U.S. Treasury Money | | | | | | | | | | | | | | | | | | | | | | | | | |
| Market Fund | | | 818,990 | | | | 818,990 | | | | (815,432 | ) | | | | (34,897 | ) | | | — | | | (31,339 | ) | |
As of the tax year ended October 31, 2018, the Funds have net capital loss carryforwards (“CLCFs”) not subject to expiration as summarized in the table below. The Board does not intend to authorize a distribution of any realized gain for the Funds until any applicable CLCF has been offset or expires.
| | Short Term |
| | Amount ($) |
| U.S. Government Money Market Fund | | 101,139 |
| U.S. Treasury Money Market Fund | | 34,897 |
Under current law, capital losses and specified ordinary losses realized after October 31 and non-specified ordinary losses incurred after December 31 (ordinary losses collectively known as “late year ordinary loss”) may be deferred and treated as occurring on the first business day of the following fiscal year. As of the tax year ended October 31, 2018, the Funds had no deferred losses.
The amount and character of net investment income and net realized gains distributed are determined in accordance with federal income tax regulations, which may differ from GAAP. These “book/tax” differences are either considered temporary or permanent in nature. To the extent these differences are permanent in nature (e.g., reclassification of market discounts, certain gain/loss, and certain distributions), such amounts are reclassified within the composition of net assets based on their federal tax-basis treatment; temporary differences (e.g., wash losses and post-October loss deferrals) do not require reclassification. To the extent distributions to shareholders from net investment income and net realized gains exceed net investment income and net realized gains for tax purposes, they are reported as distributions of capital.
6. Significant Shareholders:
Shareholders, including other funds, individuals, and accounts, as well as each Fund’s investment manager(s) and/or investment personnel, may from time to time own (beneficially or of record) a significant percentage of the Fund’s Shares and can be considered to “control” the Fund when that ownership exceeds 25% of the Fund’s assets (and which may differ from control as determined in accordance with GAAP).
The following list includes the Funds which had individual shareholder accounts with ownership of voting securities greater than 10% of the total outstanding voting securities but less than 25% and/or accounts with ownership of voting securities greater than 25% of the total outstanding voting securities. Significant transactions by these shareholder accounts may negatively impact the Funds’ performance.
| | Number of shareholders | | | | Number of | | |
| | with ownership of | | | | shareholders with | | |
| | voting securities of the | | | | ownership of voting | | |
| | Portfolio greater than | | | | securities of the | | % owned in |
| | 10% and less than 25% | | % owned in | | Portfolio greater | | aggregate |
| | of the total Portfolio’s | | aggregate | | than 25% of the total | | by greater |
| | outstanding voting | | by 10% - 25% | | Portfolio’s outstanding | | than 25% |
| Fund | | securities | | shareholders | | voting securities | | shareholders |
| U.S. Government Money Market Fund | | 2 | | 37%(a) | | — | | — |
| U.S. Treasury Money Market Fund | | — | | — | | 1 | | 70%(b) |
____________________
| (a) | 23% owned by the Investment Adviser or an affiliate |
| (b) | 70% owned by the Investment Adviser or an affiliate |
| HSBC FAMILY OF FUNDS |
| Notes to Financial Statements—as of October 31, 2018 (continued) |
7. Recent Accounting Pronouncements:
In August 2018, the FASB issued ASU No. 2018-13, “Fair Value Measurements” (“ASU 2018-13”). This update makes certain removals from, changes to and additions to existing disclosure requirements for fair value measurements. ASU 2018-13 does not change fair value measurements already required or permitted by existing standards. ASU 2018-13 is effective for financial statements issued for fiscal years beginning after December 15, 2019, and interim periods within those fiscal years. As permitted, the Funds have early adopted ASU 2018-13 with the financial statements prepared as of October 31, 2018.
In August 2018, the SEC adopted amendments to certain financial statement disclosure requirements to conform them to GAAP for investment companies. These amendments made certain removals from, changes to and additions to existing disclosure requirements under Regulation S-X. The Funds’ adoption of these amendments, effective with the financial statements prepared as of October 31, 2018 had no effect on the Funds’ net assets or results of operations. As a result of adopting these amendments, the distributions to shareholders in the October 31, 2017 Statements of Changes in Net Assets presented herein have been reclassified to conform to the current year presentation, which includes all distributions to each class of shareholders, other than tax basis return of capital distributions, in one line item per share class. Prior to adoption of this amendment, the distributions to shareholders in the October 31, 2017 Statements of Changes in Net Assets appeared as follows:
| | U.S. Government | | U.S. Treasury |
| | Money Market Fund | | Money Market Fund |
| | For the year ended | | For the year ended |
| | October 31, 2017 ($) | | October 31, 2017 ($) |
| Distributions: | | | | | | | | | | |
| Net investment income: | | | | | | | | | | |
| Class A Shares | | | (4,031 | ) | | | | — | | |
| Class B Shares | | | (4 | ) | | | | — | | |
| Class D Shares | | | (5,633,122 | ) | | | | (771,011 | ) | |
| Class E Shares | | | (5 | ) | | | | (3 | ) | |
| Class I Shares | | | (46,468,106 | ) | | | | (4,077,583 | ) | |
| Intermediary Class Shares | | | (334,084 | ) | | | | (5 | ) | |
| Intermediary Service Class Shares | | | (149,565 | ) | | | | (108,766 | ) | |
| Class Y Shares | | | (13,117,235 | ) | | | | (5,060,292 | ) | |
| | | | | | | | | | | |
| Net realized gains: | | | | | | | | | | |
| Class A Shares | | | (16 | ) | | | | — | | |
| Class D Shares | | | (19,535 | ) | | | | (2,175 | ) | |
| Class I Shares | | | (54,230 | ) | | | | (5,252 | ) | |
| Intermediary Class Shares | | | (127 | ) | | | | — | | |
| Intermediary Service Class Shares | | | (319 | ) | | | | (139 | ) | |
| Class Y Shares | | | (36,343 | ) | | | | (5,686 | ) | |
| Total | | | (65,816,722 | ) | | | | (10,030,912 | ) | |
8. Subsequent Events:
Management has evaluated subsequent events through the date these financial statements were issued. Based on the evaluation, no adjustments or additional disclosures were required to the financial statements as of October 31, 2018.
Report of Independent Registered Public Accounting Firm
To the Board of Trustees of HSBC Funds and Shareholders of HSBC U.S. Government Money Market Fund and HSBC U.S. Treasury Money Market Fund
Opinions on the Financial Statements
We have audited the accompanying statements of assets and liabilities, including the schedules of portfolio investments, of HSBC U.S. Government Money Market Fund and HSBC U.S. Treasury Money Market Fund (two of the funds constituting HSBC Funds, hereafter collectively referred to as the “Funds”) as of October 31, 2018, the related statements of operations for the year ended October 31, 2018, the statements of changes in net assets for each of the two years in the period ended October 31, 2018, including the related notes, and the financial highlights for each of the periods presented ended on or after October 31, 2015 (collectively referred to as the “financial statements”). In our opinion, the financial statements present fairly, in all material respects, the financial position of each of the Funds as of October 31, 2018, the results of each of their operations for the year then ended, the changes in each of their net assets for each of the two years in the period ended October 31, 2018 and each of the financial highlights for each of the periods presented ended on or after October 31, 2015 in conformity with accounting principles generally accepted in the United States of America.
The financial statements and financial highlights as of and for the year ended October 31, 2014 (not presented herein, other than the financial highlights) were audited by other auditors whose report dated December 23, 2014 expressed an unqualified opinion on those financial statements and financial highlights.
Basis for Opinions
These financial statements are the responsibility of the Funds’ management. Our responsibility is to express an opinion on the Funds’ financial statements based on our audits. We are a public accounting firm registered with the Public Company Accounting Oversight Board (United States) (“PCAOB”) and are required to be independent with respect to the Funds in accordance with the U.S. federal securities laws and the applicable rules and regulations of the Securities and Exchange Commission and the PCAOB.
We conducted our audits of these financial statements in accordance with the standards of the PCAOB. Those standards require that we plan and perform the audit to obtain reasonable assurance about whether the financial statements are free of material misstatement, whether due to error or fraud.
Report of Independent Registered Public Accounting Firm (continued)
Our audits included performing procedures to assess the risks of material misstatement of the financial statements, whether due to error or fraud, and performing procedures that respond to those risks. Such procedures included examining, on a test basis, evidence regarding the amounts and disclosures in the financial statements. Our audits also included evaluating the accounting principles used and significant estimates made by management, as well as evaluating the overall presentation of the financial statements. Our procedures included confirmation of securities owned as of October 31, 2018 by correspondence with the custodian, transfer agents and brokers; when replies were not received from brokers, we performed other auditing procedures. We believe that our audits provide a reasonable basis for our opinions.
PricewaterhouseCoopers LLP
New York, New York
December 20, 2018
We have served as the auditor of one or more investment companies in the HSBC Funds since 2015.
| HSBC FAMILY OF FUNDS |
| Other Federal Income Tax Information—as of October 31, 2018 (Unaudited) |
During the year ended October 31, 2018, the following Fund declared capital gain distributions:
| | Long Term |
| | Capital Gain |
| | Distributions ($) |
| U.S. Government Money Market Fund | | 12,281 |
During the year ended October 31, 2018, the following Funds designated the maximum amount allowable as interest-related dividends for certain non-U.S. resident investors:
| | Qualified Interest |
| | Income % |
| U.S. Government Money Market Fund | | 100.00% |
| U.S. Treasury Money Market Fund | | 100.00% |
| HSBC FAMILY OF FUNDS |
| Table of Shareholder Expenses—as of October 31, 2018 (Unaudited) |
As a shareholder of the Funds, you incur two types of costs: (1) transaction costs, including sales charges (loads) on purchases, redemption fees and exchange fees; and (2) ongoing costs, including management fees, distribution fees and other Fund expenses. These examples are intended to help you understand your ongoing costs (in dollars) of investing in the Funds and to compare the cost with the ongoing costs of investing in other mutual funds.
The Example is based on an investment of $1,000 invested at the beginning of the period and held for the entire period from May 1, 2018 through October 31, 2018.
Actual Expenses
The table below provides information about actual account values and actual expenses. You may use the information below, together with the amount you invested, to estimate the expenses that you paid over the period. Simply divide your account value by $1,000 (for example, an $8,600 account value divided by $1,000 = 8.6), then multiply the result by the number in the table under the heading entitled “Expenses Paid During Period” to estimate the expenses you paid on your account during this period.
| | | | | | | | | | | | | | | | Annualized |
| | | | Beginning | | Ending | | Expenses Paid | | Expense Ratio |
| | | | Account Value | | Account Value | | During Period* | | During Period |
| | | | 5/1/2018 | | 10/31/2018 | | 5/1/18 - 10/31/18 | | 5/1/18 - 10/31/18 |
| U.S. Government Money | | | | | | | | | | | | | | | | | | | | | | |
| Market Fund | | Class A Shares | | | $ | 1,000.00 | | | | $ | 1,006.60 | | | | $ | 3.19 | | | | 0.63 | % | |
| | Class D Shares | | | | 1,000.00 | | | | | 1,007.40 | | | | | 2.43 | | | | 0.48 | % | |
| | Class I Shares | | | | 1,000.00 | | | | | 1,009.20 | | | | | 0.61 | | | | 0.12 | % | |
| | Intermediary | | | | | | | | | | | | | | | | | | | | |
| | Class Shares | | | | 1,000.00 | | | | | 1,009.00 | | | | | 0.81 | | | | 0.16 | % | |
| | Intermediary | | | | | | | | | | | | | | | | | | | | |
| | Service | | | | | | | | | | | | | | | | | | | | |
| | Class Shares | | | | 1,000.00 | | | | | 1,008.90 | | | | | 0.91 | | | | 0.18 | % | |
| | Class Y Shares | | | | 1,000.00 | | | | | 1,008.60 | | | | | 1.16 | | | | 0.23 | % | |
| | |
| U.S. Treasury Money | | | | | | | | | | | | | | | | | | | | | | |
| Market Fund | | Class D Shares | | | | 1,000.00 | | | | | 1,007.30 | | | | | 2.53 | | | | 0.50 | % | |
| | Class I Shares | | | | 1,000.00 | | | | | 1,009.10 | | | | | 0.71 | | | | 0.14 | % | |
| | Intermediary | | | | | | | | | | | | | | | | | | | | |
| | Class Shares | | | | 1,000.00 | | | | | 1,009.00 | | | | | 0.81 | | | | 0.16 | % | |
| | Intermediary | | | | | | | | | | | | | | | | | | | | |
| | Service | | | | | | | | | | | | | | | | | | | | |
| | Class Shares | | | | 1,000.00 | | | | | 1,008.90 | | | | | 0.91 | | | | 0.18 | % | |
| | Class Y Shares | | | | 1,000.00 | | | | | 1,008.50 | | | | | 1.27 | | | | 0.25 | % | |
____________________
| * | Expenses are equal to the average account value over the period, multiplied by the Fund’s annualized expense ratio, multiplied by 184/365 (to reflect the one half year period). |
| HSBC FAMILY OF FUNDS |
| Table of Shareholder Expenses—as of October 31, 2018 (Unaudited) (continued) |
Hypothetical Example for Comparison Purposes
The table below provides information about hypothetical account values and hypothetical expenses based on each Fund’s actual expense ratio and an assumed rate of return of 5% per year before expenses, which is not the Fund’s actual return. The hypothetical account values and expenses may not be used to estimate the actual ending account balance or expenses you paid for the period. You may use this information to compare this 5% hypothetical example with the 5% hypothetical examples that appear in the shareholder reports of other funds.
Please note that the expenses shown in the table are meant to highlight your ongoing costs only and do not reflect any transactional costs, such as sales charges (loads), redemption fees, or exchange fees. Therefore, the table is useful in comparing ongoing costs only, and will not help you determine the relative total costs of owning different funds. In addition, if these transactional costs were included, your costs would have been higher.
| | | | | | | | | | | | | | | | | | | Annualized |
| | | | Beginning | | Ending | | Expenses Paid | | Expense Ratio |
| | | | Account Value | | Account Value | | During Period* | | During Period |
| | | | 5/1/2018 | | 10/31/2018 | | 5/1/18 - 10/31/18 | | 5/1/18 - 10/31/18 |
| U.S. Government Money | | | | | | | | | | | | | | | | | | | | | | |
| Market Fund | | Class A Shares | | | $ | 1,000.00 | | | | $ | 1,022.03 | | | | $ | 3.21 | | | | 0.63 | % | |
| | Class D Shares | | | | 1,000.00 | | | | | 1,022.79 | | | | | 2.45 | | | | 0.48 | % | |
| | Class I Shares | | | | 1,000.00 | | | | | 1,024.60 | | | | | 0.61 | | | | 0.12 | % | |
| | Intermediary | | | | | | | | | | | | | | | | | | | | |
| | Class Shares | | | | 1,000.00 | | | | | 1,024.40 | | | | | 0.82 | | | | 0.16 | % | |
| | Intermediary | | | | | | | | | | | | | | | | | | | | |
| | Service | | | | | | | | | | | | | | | | | | | | |
| | Class Shares | | | | 1,000.00 | | | | | 1,024.30 | | | | | 0.92 | | | | 0.18 | % | |
| | Class Y Shares | | | | 1,000.00 | | | | | 1,024.05 | | | | | 1.17 | | | | 0.23 | % | |
| | |
| U.S. Treasury Money | | | | | | | | | | | | | | | | | | | | | | |
| Market Fund | | Class D Shares | | | | 1,000.00 | | | | | 1,022.68 | | | | | 2.55 | | | | 0.50 | % | |
| | Class I Shares | | | | 1,000.00 | | | | | 1,024.50 | | | | | 0.71 | | | | 0.14 | % | |
| | Intermediary | | | | | | | | | | | | | | | | | | | | |
| | Class Shares | | | | 1,000.00 | | | | | 1,024.40 | | | | | 0.82 | | | | 0.16 | % | |
| | Intermediary | | | | | | | | | | | | | | | | | | | | |
| | Service | | | | | | | | | | | | | | | | | | | | |
| | Class Shares | | | | 1,000.00 | | | | | 1,024.30 | | | | | 0.92 | | | | 0.18 | % | |
| | Class Y Shares | | | | 1,000.00 | | | | | 1,023.95 | | | | | 1.28 | | | | 0.25 | % | |
____________________
| * | Expenses are equal to the average account value over the period, multiplied by the Fund’s annualized expense ratio, multiplied by 184/365 (to reflect the one half year period). |
| HSBC FAMILY OF FUNDS |
| Results of Special Meeting of Shareholders of HSBC U.S. Government Money Market Fund (Unaudited) |
Special Meeting of Shareholders
A Special Meeting of Shareholders of the HSBC U.S. Government Money Market Fund (the “Fund”) was held on March 9, 2018. The purpose of the Special Meeting was for shareholders to consider a proposal to eliminate one of the Fund’s fundamental investment policies that restricts the Fund’s ability to invest in other investment companies. The results were as follows:
| Outstanding Shares | | Total Voted | | Total For | | Total Against | | Total Abstain | | Result |
| 11,950,033,418 | | 6,292,983,122 | | 5,732,808,737 | | 396,780,918 | | 163,393,466 | | Approved 3/9/18 |
| HSBC FAMILY OF FUNDS |
| Board of Trustees and Officers (Unaudited) |
MANAGEMENT OF THE TRUST
The following table contains information regarding the HSBC Family of Funds’ Board of Trustees (“Trustees”). The HSBC Family of Funds’ Statement of Additional Information includes additional information about the Trustees and is available, without charge, upon request by calling (888) 525-5757.
| | | | | | | | Portfolios in | | Other |
| | Position(s) | | Term of Office | | | | Fund Complex | | Directorships |
| | Held | | and Length of | | Principal Occupation(s) During Past | | Overseen | | Held by Trustee |
| Name, Address, Age | | with Funds | | Time Served | | 5 Years | | By Trustee* | | During Past 5 Years |
| NON-INTERESTED TRUSTEES |
| |
MARCIA L. BECK
P.O. Box 182845
Columbus, OH
43218-3035
Age: 63 | | Trustee | | Indefinite;
2008 to present | | Private Investor (1999 – present) | | 10 | | None |
| |
SUSAN C. GAUSE
P.O. Box 182845
Columbus, OH
43218-3035
Age: 66 | | Trustee | | Indefinite;
2013 to present | | Private Investor (2003 – present) | | 10 | | Metropolitan Series Fund
(2012 – present); and
Met Investors Series
Trust (2008 – present) |
| |
SUSAN S. HUANG
P.O. Box 182845
Columbus, OH
43218-3035
Age: 64 | | Trustee | | Indefinite;
2008 to present | | Private Investor (2000 – present) | | 10 | | None |
| |
THOMAS F. ROBARDS
P.O. Box 182845
Columbus, OH
43218-3035
Age: 72 | | Trustee and
Chairman | | Indefinite;
2005 to present | | Private Investor (2003 – present) | | 10 | | Ellington Residential
Mortgage REIT (NYSE
listed real estate
investment trust)
(2013 – present);
Ellington Financial LLC
(NYSE listed financial
services company)
(2007 – present); and
Overseas Shipholding
Group (OSG) (NYSE
listed company)
(2005 – 2014) |
| |
| INTERESTED TRUSTEE |
| |
DEBORAH HAZELL
452 Fifth Avenue
New York
NY 10018
Age: 55 | | Trustee | | Indefinite;
2011 to present | | Director and Chief Executive Officer, HSBC Global Asset Management (USA) Inc. (2011 - present) | | 10 | | None |
____________________
| * | Includes all series of the HSBC Funds. |
| HSBC FAMILY OF FUNDS |
| Board of Trustees and Officers (Unaudited) (continued) |
| | | | Term of Office and | | |
| Name, Address, Age | | Position(s) Held Funds | | Length of Time Served | | Principal Occupation(s) During Past 5 Years |
| OFFICERS |
| |
RICHARD A. FABIETTI
452 Fifth Avenue
New York, NY 10018
Age: 60 | | President | | One year;
2004 to present | | Senior Vice President, HSBC Global Asset Management (USA) Inc.
(1998 - present) |
| |
JAMES D. LEVY
452 Fifth Avenue
New York, NY 10018
Age: 55 | | Vice President | | One year;
2014 to present | | Vice President, Product Management, HSBC Global Asset
Management (USA) Inc. (2014 – present); Vice President, Mutual
Funds Product Development, GE Asset Management Inc.
(2007 – 2014) |
| |
ALLAN SHAER*
Prudential Center
800 Boylston Street,
24th Floor
Boston, MA 02199
Age: 53 | | Treasurer | | One year;
2017 to present | | Senior Vice President, Citi Investor Services (2016 - present);
Vice President, Mutual Fund Administration, JP Morgan Chase
(2011 - 2016) |
| |
IOANNIS TZOUGANATOS*
Prudential Center
800 Boylston Street,
24th Floor
Boston, MA 02199
Age: 42 | | Secretary | | One Year;
2015 to present | | Vice President, Regulatory Administration, Citi Fund Services
(2008 - present) |
| |
CHARLES BOOTH*
4400 Easton Commons,
Suite 200
Columbus, OH 43219-3035
Age: 58 | | Chief Compliance Officer | | One year;
2015 to present | | Director and Compliance Officer, CCO Services, Citi Fund Services
(1988 - present) |
____________________
| * | Mr. Shaer, Mr. Tzouganatos, and Mr. Booth also are officers of other investment companies of which Citi (or an affiliate) is the administrator or sub-administrator. |
| HSBC FAMILY OF FUNDS |
| Other Information (Unaudited) |
Information regarding how the Funds voted proxies relating to portfolio securities during the most recent 12-month period ended June 30th is available (i) without charge, upon request, by calling 1-800-525-5757 for HSBC Bank USA and HSBC Brokerage (USA) Inc. clients and 1-800-782-8183 for all other shareholders; (ii) on the Funds’ website at www.investorfunds.us.hsbc.com; and (iii) on the Security and Exchange Commission’s (“Commission”) website at http://www.sec.gov.
The Funds file their complete schedules of portfolio holdings with the Commission for the first and third quarters of each fiscal year on Form N-Q. The Funds’ Forms N-Q are available on the Commission’s website at http://www.sec.gov. The Funds’ Forms N-Q may be reviewed and copied at the Commission’s Public Reference Room in Washington, D.C. and information on the operation of the Public Reference Room may be obtained by calling 1-800-SEC-0330. The Funds’ Schedules of Investments will be available no later than 60 days after each period end, without charge, on the Funds’ website at www.investorfunds.us.hsbc.com.
An investment in a Fund is not a deposit of HSBC Bank USA, National Association, and is not insured or guaranteed by the Federal Deposit Insurance Corporation or any other government agency.
HSBC FAMILY OF FUNDS: INVESTMENT ADVISER AND ADMINISTRATOR HSBC Global Asset Management (USA) Inc.
452 Fifth Avenue
New York, NY 10018 SHAREHOLDER SERVICING AGENTS For HSBC Bank USA, N.A. and
HSBC Securities (USA) Inc. Clients:
HSBC Bank USA, N.A.
452 Fifth Avenue
New York, NY 10018
1-888-525-5757 For All Other Shareholders: HSBC Funds
P.O. Box 8106
Boston, MA 02266-8106
1-800-782-8183 TRANSFER AGENT DST Asset Manager Solutions, Inc.
2000 Crown Colony Drive
Quincy, MA 02169 DISTRIBUTOR Foreside Distribution Services, L.P.
Three Canal Plaza, Suite 100
Portland, ME 04101 | | CUSTODIAN The Northern Trust Company
50 South LaSalle Street
Chicago, IL 60603 INDEPENDENT REGISTERED PUBLIC ACCOUNTING FIRM PricewaterhouseCoopers LLP
300 Madison Avenue
New York, NY 10017 LEGAL COUNSEL Dechert LLP
1900 K Street, N.W.
Washington, D.C. 20006 |

Investment products:
ARE NOT A
BANK DEPOSIT
OR OBLIGATION
OF THE BANK
OR ANY OF ITS
AFFILIATES | ARE NOT
FDIC
INSURED | ARE NOT
INSURED BY
ANY FEDERAL
GOVERNMENT
AGENCY |
ARE NOT GUARANTEED BY
THE BANK OR ANY OF ITS
AFFILIATES | MAY LOSE
VALUE |
Investment products are offered by HSBC Securities (USA) Inc. (HSI), member NYSE/FINRA/SIPC. HSI is an affiliate of HSBC Bank USA, N.A. Investment products: Are not a deposit or other obligation of the bank or any of its affiliates; Not FDIC insured or insured by any federal government agency of the United States; Not guaranteed by the bank or any of its affiliates; and are subject to investment risk, including possible loss of principal invested.
Investors should consider the investment objectives, risks, charges, and expenses of the investment company carefully before investing. The prospectus contains this and other important information about the investment company. For clients of HSBC Securities (USA) Inc., please call 1-888-525-5757 for more information. For other investors and prospective investors, please call the Funds directly at 1-800-782-8183 or visit our website at www.investorfunds.us.hsbc.com. Investors should read the prospectus carefully before investing or sending money.
HSBC Global Asset Management (USA) Inc.
HSBC Funds
Annual Report
October 31, 2018
| EQUITY FUNDS | | Class A | | Class B | | Class C | | Class I |
| HSBC Opportunity Fund | | HSOAX | | HOPBX | | HOPCX | | RESCX |

| Table of Contents |
HSBC Family of Funds |
Annual Report - October 31, 2018 |
| Glossary of Terms | | 2 |
| Commentary From the Investment Manager | | 3 |
| Portfolio Reviews | | 4 |
| Statements of Assets and Liabilities | | 6 |
| Statements of Operations | | 7 |
| Statements of Changes in Net Assets | | 8 |
| Financial Highlights | | 10 |
| Notes to Financial Statements | | 12 |
| Report of Independent Registered Public Accounting Firm | | 21 |
| Other Federal Income Tax Information | | 23 |
| Table of Shareholder Expenses | | 24 |
| | | |
| HSBC Portfolios | | |
| | | |
| Portfolio Composition | | 25 |
| Schedule of Portfolio Investments | | |
| HSBC Opportunity Portfolio | | 26 |
| Statement of Assets and Liabilities | | 28 |
| Statement of Operations | | 29 |
| Statement of Changes in Net Assets | | 30 |
| Financial Highlights | | 31 |
| Notes to Financial Statements | | 32 |
| Report of Independent Registered Public Accounting Firm | | 38 |
| Table of Shareholder Expenses | | 40 |
| Board of Trustees and Officers | | 41 |
| Other Information | | 43 |
Bloomberg Barclays Global Aggregate Bond Index is a measure of global investment-grade debt from 24 local currency markets, which include treasury, government-related, corporate, and securitized fixed-rate bonds from both developed and emerging markets issuers.
Gross Domestic Product (“GDP”) is the value of goods and services produced in a given country in a given year.
J.P. Morgan Emerging Markets Bond Index Global tracks returns for USD-denominated debt instruments issued by emerging market sovereign and quasi-sovereign entities, Brady bonds, loans, Eurobonds, and local market instruments.
Lipper Mid-Cap Growth Funds Average is an equally weighted average of mutual funds that, by portfolio practice, invest at least 75% of their equity assets in companies with market capitalizations (on a three-year weighted basis) below Lipper’s large-cap floor. Mid-cap growth funds typically have an above-average price-to-earnings ratio, price-to-book ratio, and three-year sales-per-share growth value, compared to the S&P MidCap 400 Index.
MSCI Europe Australasia and Far East (“MSCI EAFE”) Index is an equity index which captures the large- and mid-cap representation across developed markets countries: Australia, Austria, Belgium, Denmark, Finland, France, Germany, Hong Kong, Ireland, Israel, Italy, Japan, the Netherlands, New Zealand, Norway, Portugal, Singapore, Spain, Sweden, Switzerland and the UK.
MSCI Frontier Markets Index is a free float-adjusted market capitalization index that is designed to measure equity market performance of frontier markets. The index consists of 29 frontier markets country indices.
Russell 2500TM Growth Index is an index that measures the performance of the small- to mid-cap growth segment of the U.S. equity universe. It includes those Russell 2500 companies with higher price-to-book ratios and higher forecasted growth values.
Standard & Poor’s 500 (“S&P 500”) Index is an index that is widely regarded as a gauge of the U.S. equities market. This index includes 500 leading companies in leading industries of the U.S. economy. The S&P 500 Index focuses on the large-cap segment of the market, with approximately 80% coverage of U.S. equities.
Lipper is an independent mutual fund performance monitor whose results are based on total return and do not reflect a sales charge.
Securities indices are unmanaged and assume reinvestment of all distributions and interest payments and do not take in account brokerage fees or expenses. Securities in the Funds do not match those in the indices and performance of the Funds will differ. Investors cannot invest directly in an index.
| Commentary From the Investment Manager (Unaudited) |
| HSBC Global Asset Management (USA) Inc. |
Global Economic Review
The global economy transitioned away from a period of synchronized growth during the 12-month period from November 1, 2017, through October 31, 2018, and entered a period characterized by divergence and diversity. While both developed and emerging markets economies were lifted up by broad economic expansion throughout 2017, growth was much less consistent in 2018 amid concerns surrounding inflation, trade policy, monetary policy and country-specific issues. Some economies and sectors were affected much more negatively than others and experienced higher levels of volatility in their financial markets. This divergence and volatility weighed on investor sentiment, leading to a shift away from risk assets that resulted in losses for international equities and more modest returns for U.S. equities. Despite this mixed picture, fundamentals of the global economy appeared relatively strong throughout the period, and corporate profits remained robust.
During the first several months of the period economic data generally showed low inflation, healthy corporate fundamentals and strong activity in manufacturing and global trade. In the U.S., regulatory rollbacks, positive earnings growth and the passage of business-friendly tax reform stirred optimism among investors, eventually driving stocks to record highs in a January rally.
The less-consistent macroeconomic environment that came to define the period emerged in February, as stocks took a sharp dive and became more volatile. First, U.S. economic data showed prices rising faster than expected, signaling a period of low inflation was ending, second, the outcome of tumultuous trade diplomacy between the U.S. and several key trading partners became increasingly unpredictable and concerning. Third, economic data began to show slowing growth in some regions, particularly Europe and Japan. Fourth, signs of slowing growth and rising inflation helped strengthen the U.S. dollar against other currencies, producing headwinds for emerging markets.
The impact of rising interest rates rippled through the global economy during the period and contributed to a weaker appetite for risk assets such as equities. The U.S. Federal Reserve (the Fed) increased its federal funds rate four times during the 12-month period, lifting it by a total of 100 basis points (1.00%). The Fed signaled that it would continue its campaign of gradually raising interest rates as long as the U.S. economy continues to show broad strength. The theme of divergence also played out globally in terms of monetary policy. Unlike the Fed, central banks in some other developed economies pursued looser monetary policy.
Economic data continued to indicate that the U.S economy was on sound footing. Gross domestic product1 (GDP) growth peaked during the period under review at a rate of 4.2% during the second quarter of 2018 after growing 2.3% during the fourth quarter of 2017 and 2.2% during the first quarter of 2018. GDP grew at a rate of 3.5% during the third quarter of 2018, according to preliminary estimates. The tax reform legislation passed by Congress late in 2017 provided a tailwind for businesses, boosting corporate profits and helping to offset pressures caused by rising wages and a tight labor market. Data showed that industrial production picked up and activity in the services sector increased. A new trade deal between the U.S., Mexico and Canada removed some of the uncertainty surrounding President Trump’s trade policy.
The unemployment rate was 3.7%—its lowest level since 1969—at the close of the period under review. The continuing strength of the labor market helped boost consumer confidence and consumer spending. The housing market presented a more mixed picture than other aspects of the economy, as declining home sales and housing permits suggested emerging weaknesses.
China’s economy continued to be weakened by an industrial slowdown and its increasing reliance on consumption as a driver of economic growth. Amid this difficult long-term transition, China faced during the period the additional challenge of steeply rising trade barriers with the U.S. As part of a broader tightening of trade policy, President Donald Trump ratcheted up pressure on China by threatening tariffs on virtually all Chinese exports to the U.S. The escalating rhetoric and faltering diplomacy between China and U.S. sent ripple effects through global markets. The yuan devalued significantly during the period, making Chinese goods more competitive on global markets. But in a notable change the Chinese government suggested it would prevent its currency from devaluing further.
China’s troubles spilled over into other emerging markets, especially those in Asia and in other regions heavily dependent on demand from Chinese industries. Other factors stalling the momentum of emerging market growth were rising U.S. interest rates and higher oil prices.
Argentina had a very volatile year as its currency depreciated more than 50% during 2018. The decline forced the country to reach out to the International Monetary Fund for financial support and triggered a recession in the country.
Eurozone economies experienced the most severe slowdown among developed economies during the period. Increasing trade tensions between Europe and the U.S. further weighed on the outlook of the region. Unsuccessful negotiations over the United Kingdom’s exit from the Eurozone (commonly referred to as Brexit) continued to sow uncertainty and led to a steep decline in the value of the British pound. Brexit has resulted in volatility in European and global markets and could have significant negative impacts on financial markets in the United Kingdom and throughout Europe. The extent of the impact of Brexit in the United Kingdom and in global markets as well as any associated adverse consequences remain unclear. Economic growth in Japan also slowed significantly amid lower private consumption and weak export demand. Data suggested that both wages and inflation in Japan may be ticking upwards, however, and the labor market improved.
Prices of many key commodities such as soybeans and silver slumped during much of the period under review, partly as a result of rising trade tensions between the U.S. and its key economic partners. Crude oil prices hit four-year highs late in the period, driven up in part by expectations that U.S. sanctions on Iran would curb the nation’s oil exports. However, oil prices began to fall sharply during the final weeks of the period.
Market review
Global equity markets delivered mixed results during the period. Stocks performed very well during the first three months. But, by February of 2018, concerns of an impending economic slowdown began to weigh on investors and fueled an uptick in volatility. Still, equities in many economies and sectors zig-zagged upward until October, when much of the period’s earlier gains were lost during a sharp sell-off.
U.S. stocks ended the period with modest gains, even after entering into correction territory in October. The S&P 500 Index1 of large-capitalization U.S. stocks returned 7.35%. Equities in other developed economies showed losses during the 12 months under review, while emerging markets equities suffered even greater losses amid concerns about U.S. trade protectionism and a strengthening U.S. dollar. The MSCI Frontier Markets Index1 returned -11.84% during the period, compared to a -6.39% return for the MSCI EAFE Index1 of developed market international stocks.
Global fixed income markets lost ground amid rising interest rates. Investors saw the onset of full employment and rising inflation in Germany and the U.S., nations that have a major impact on bond markets, as an indication that further increases in interest rates were on the horizon. Yields on U.S. government debt rose during the period. The U.S. Treasury curve flattened and global high-yield and investment- grade credit spreads widened. Emerging market debt performed especially poorly during the period, amid shrinking demand and growing supply. The Bloomberg Barclays Global Aggregate Bond Index1, which tracks investment grade debt in 24 local currency markets, returned -2.05% during the period, while the JP Morgan Emerging Markets Bond Index Global1 returned -5.27%.
1 For additional information, please refer to the Glossary of Terms.
| Portfolio Reviews (Unaudited) |
| HSBC Opportunity Fund |
| (Class A Shares, Class B Shares, Class C Shares and Class I Shares) |
by William A. Muggia, Committee Lead/Portfolio Manager
Richard D. Lee, CFA, Portfolio Manager
Ethan J. Myers, CFA, Portfolio Manager
John M. Montgomery, Portfolio Manager
Westfield Capital Management Company, L.P.
The HSBC Opportunity Fund (the “Fund”) seeks long-term growth of capital by investing, under normal market conditions, primarily in equity securities of small- and mid-cap companies. Small- and mid-cap companies generally are defined as those that have market capitalizations within the range of market capitalizations represented in the Russell 2500TM Growth Index1. The Fund may also invest in equity securities of larger, more established companies and may invest up to 20% of its assets in securities of foreign companies. The Fund employs a two-tier structure, commonly referred to as a “master-feeder” structure, in which the Fund invests all of its investable assets in the HSBC Opportunity Portfolio (the “Portfolio”). The Portfolio employs Westfield Capital Management Company, L.P. as its subadviser.
Investment Concerns
There is no assurance that a portfolio will achieve its investment objective or will work under all market conditions. The value of investments may go down as well as up and you may not get back the amount originally invested. Portfolios may be subject to certain additional risks, which should be considered carefully along with their investment objectives and fees. Equity investments fluctuate in value based on changes to an individual company’s financial condition and overall market conditions. Investments in foreign markets entail special risks such as currency, political, economic, and market risks. Fluctuations in exchange rates between the U.S. dollar and foreign currencies, or between various foreign currencies, may negatively affect the Fund’s performance. Investing in smaller companies is more risky and volatile than investing in large companies. Growth investment style may fall out of favor in the marketplace and result in significant declines in the value of the Portfolio’s securities. Securities of companies considered growth investments may have rapid price swings in the event of earnings disappointments or during periods of market, political, regulatory, and economic uncertainty.
For a complete description of these and other risks associated with investment in a mutual fund, please refer to the Fund’s prospectus.
Market Commentary
For the year ended October 31, 2018, the Class I Shares of the HSBC Opportunity Fund produced a 6.96% total return, and the Class A Shares of the Fund produced a 6.46% total return (without sales charge). The Russell 2500™ Growth Index1, the Fund’s primary performance benchmark, and the Lipper Mid-Cap Growth Funds Average1 returned 5.52% and 6.34%, respectively.
Portfolio Performance
U.S. equity markets posted strong returns throughout much of the 12-month period under review, shrugging off investor concerns about trade wars between the U.S. and China. Much of those early gains were erased in October 2018, however, as worries of an impending economic slowdown weighed on investor risk appetite. From a sector standpoint, health care, consumer staples and energy stocks delivered the bulk of the Fund’s positive absolute returns, while materials, communication services and consumer discretionary detracted.†
Class I Shares outperformed the Fund’s primary benchmark. Stock selection in the industrials sector drove much of the outperformance. Exposure to aerospace and defense names contributed positively to relative results, most notably shares in a provider of electronic and communication products for wireless and satellite systems, which rose after the company delivered better-than-expected quarterly earnings and sales in August. Investments in the health care sector also benefited the Fund on a relative basis. Shares in a clinical-stage biopharmaceutical developer rose at the end of 2017 after the company posted strong clinical data for its immuno-oncology compound and then again in early 2018 after the company announced a collaboration agreement. The Fund locked in gains from the initial investment by selling the position in October 2018 as the stock began to show signs of weakness. The Fund’s holdings in the energy sector also boosted relative results, driven primarily by the acquisition of one of the Fund’s refining holdings.†
Stock selection in the consumer discretionary sector weighed on relative results. Investments in a manufacturer of electrical, powertrain and safety vehicle components negatively affected relative performance as tariffs on steel and aluminum drove up costs within the automotive industry. The Fund’s holdings of a retailer of hard surface flooring also dragged on relative results after the company posted disappointing quarterly results in August. Investments in the materials sector also negatively impacted relative performance, most notably shares of a construction materials provider, which fell after the company lowered its 2018 guidance.†
† Portfolio composition is subject to change. |
1 For additional information, please refer to the Glossary of Terms. |
Past performance does not guarantee future results. The performance data quoted represents past performance and current returns may be lower or higher. Total return figures include change in share price, reinvestment of dividends and capital gains and do not reflect taxes that a shareholder would pay on Fund distributions or on the redemption of Fund shares. Investment return and principal value will fluctuate so that an investor’s shares, when redeemed may be worth more or less than the original cost. To obtain performance information current to the most recent month end, please call 1-800-782-8183.
| Portfolio Reviews (Unaudited) |
| |
HSBC Opportunity Fund |
The charts above represent a historical 10-year performance comparison of a hypothetical investment in the indicated share class versus a similar investment in the Fund’s benchmark and represents the reinvestment of dividends and capital gains in the Fund.
| | | | | | Average Annual | | Expense |
| Fund Performance | | | | | | Total Return (%) | | Ratio (%)5 |
| | Inception | | | | | | | | | | |
| As of October 31, 2018 | | Date | | 1 Year | | 5 Year | | 10 Year | | Gross | | Net |
| HSBC Opportunity Fund Class A1 | | | 9/23/96 | | | 1.15 | | 6.48 | | 12.92 | | 5.87 | | 1.65 |
| HSBC Opportunity Fund Class B2 | | | 1/6/98 | | | 1.99 | | 6.75 | | 12.98 | | 6.62 | | 2.40 |
| HSBC Opportunity Fund Class C3 | | | 11/4/98 | | | 4.63 | | 6.75 | | 13.08 | | 6.62 | | 2.40 |
| HSBC Opportunity Fund Class I† | | | 9/3/96 | | | 6.96 | | 8.12 | | 14.08 | | 1.31 | | 1.10 |
| Russell 2500TM Growth Index4 | | | — | | | 5.52 | | 9.53 | | 15.06 | | N/A | | N/A |
| Lipper Mid-Cap Growth Funds Average4 | | | — | | | 6.34 | | 9.00 | | 13.41 | | N/A | | N/A |
Past performance does not guarantee future results. The performance data quoted represents past performance and current returns may be lower or higher. Total return figures include change in share price, reinvestment of dividends and capital gains and do not reflect the taxes that a shareholder would pay on Fund distributions or on the redemption of Fund shares. Investment return and principal value will fluctuate so that an investor’s shares, when redeemed may be worth more or less than the original cost. To obtain performance information current to the most recent month end, please call 1-800-782-8183.
The performance above reflects any fee waivers that have been in effect during the applicable periods, as well as any expense reimbursements that have periodically been made. Absent such waivers and reimbursements, returns would have been lower. Currently, contractual fee waivers and/or expense reimbursements are in effect for the Fund through March 1, 2019.
Certain returns shown include monies received by the Portfolio, in which the Fund invests, in respect of one-time class action settlements and monies received by the Fund from a one-time reimbursement from HSBC Global Asset Management (USA) Inc. (the “Adviser”) related to past marketing arrangements. As a result, the Fund’s total returns for those periods were higher than they would have been had the Portfolio and the Fund not received the payments.
| † | | The Class I Shares are issued by a separate series of the HSBC Funds. |
| 1 | | Reflects the maximum sales charge of 5.00%. |
| 2 | | Reflects the applicable contingent deferred sales charge, maximum of 4.00%. |
| 3 | | Reflects the applicable contingent deferred sales charge, maximum of 1.00%. |
| 4 | | For additional information, please refer to the Glossary of Terms. |
| 5 | | Reflects the expense ratio as reported in the prospectus dated February 28, 2018. HSBC Global Asset Management (USA) Inc., the Adviser, has entered into a contractual expense limitation agreement with the Fund under which it will limit total expenses of the Fund (excluding interest, taxes, brokerage commissions, extraordinary expenses and estimated indirect expenses attributable to the Fund’s investments in investment companies other than the Portfolio) to an annual rate of 1.65%, 2.40%, 2.40% and 1.10% for Class A Shares, Class B Shares, Class C and Class I Shares, respectively. The expense limitation shall be in effect until March 1, 2019. Additional information pertaining to the October 31, 2018 expense ratios can be found in the financial highlights. |
The Fund’s performance is measured against the Russell 2500TM Growth Index, an unmanaged index that measures the performance of the small- to mid-cap growth segment of the U.S. equity universe. It includes those Russell 2500 companies with higher price-to-book ratios and higher forecasted growth values. The performance for the index does not reflect the deduction of expenses associated with a mutual fund, such as investment management and fund accounting fees. The Fund’s performance reflects the deduction of fees for these value-added services. Investors cannot invest directly in an index.
HSBC FAMILY OF FUNDS
Statements of Assets and Liabilities—as of October 31, 2018
| | HSBC
Opportunity
Fund | | HSBC
Opportunity
Fund
(Class I) |
| Assets: | | | | | | | | | | | | |
| Investments in Affiliated Portfolio | | | $ | 9,507,807 | | | | | $ | 136,677,586 | | |
| Receivable for capital shares issued | | | | 143 | | | | | | 44,619 | | |
| Receivable from Investment Adviser | | | | 28,701 | | | | | | 38,469 | | |
| Prepaid expenses and other assets | | | | 7,078 | | | | | | 16,632 | | |
| Total Assets | | | | 9,543,729 | | | | | | 136,777,306 | | |
| | | | | | | | | | | | | |
| Liabilities: | | | | | | | | | | | | |
| Payable for capital shares redeemed | | | | — | | | | | | 61,781 | | |
| Accrued expenses and other payables: | | | | | | | | | | | | |
| Administration | | | | 162 | | | | | | 2,349 | | |
| Distribution fees | | | | 91 | | | | | | — | | |
| Shareholder Servicing | | | | 1,926 | | | | | | — | | |
| Accounting | | | | 2,417 | | | | | | 1,584 | | |
| Printing | | | | 4,312 | | | | | | 14,167 | | |
| Professional | | | | 32,388 | | | | | | 31,617 | | |
| Transfer Agent | | | | 13,072 | | | | | | 19,282 | | |
| Trustee | | | | 4,500 | | | | | | 4,500 | | |
| Other | | | | 496 | | | | | | 2,257 | | |
| Total Liabilities | | | | 59,364 | | | | | | 137,537 | | |
| Net Assets | | | $ | 9,484,365 | | | | | $ | 136,639,769 | | |
| | | | | | | | | | | | | |
| Composition of Net Assets: | | | | | | | | | | | | |
| Paid in capital | | | $ | 7,304,815 | | | | | $ | 107,129,852 | | |
| Total distributable earnings/(loss) | | | | 2,179,550 | | | | | | 29,509,917 | | |
| Net Assets | | | $ | 9,484,365 | | | | | $ | 136,639,769 | | |
| | | | | | | | | | | | | |
| Net Assets: | | | | | | | | | | | | |
| Class A Shares | | | $ | 9,351,711 | | | | | $ | — | | |
| Class B Shares | | | | 17,023 | | | | | | — | | |
| Class C Shares | | | | 115,631 | | | | | | — | | |
| Class I Shares | | | | — | | | | | | 136,639,769 | | |
| Total | | | $ | 9,484,365 | | | | | $ | 136,639,769 | | |
| | | | | | | | | | | | | |
| Shares Outstanding: | | | | | | | | | | | | |
| ($0.001 par value, unlimited number of shares authorized): | | | | | | | | | | | | |
| Class A Shares | | | | 874,039 | | | | | | — | | |
| Class B Shares | | | | 2,762 | | | | | | — | | |
| Class C Shares | | | | 17,695 | | | | | | — | | |
| Class I Shares | | | | — | | | | | | 9,501,052 | | |
| | | | | | | | | | | | | |
| Net Asset Value, Offering Price and Redemption Price per share: | | | | | | | | | | | | |
| Class A Shares | | | $ | 10.70 | | | | | $ | — | | |
| Class B Shares(a) | | | $ | 6.16 | | | | | $ | — | | |
| Class C Shares(a) | | | $ | 6.53 | | | | | $ | — | | |
| Class I Shares | | | $ | — | | | | | $ | 14.38 | | |
| Maximum Sales Charge: | | | | | | | | | | | | |
| Class A Shares | | | | 5.00 | % | | | | | — | % | |
| Maximum Offering Price per share (Net Asset Value / (100%-maximum sales charge)) | | | | | | | | | | | | |
| Class A Shares | | | $ | 11.26 | | | | | $ | — | | |
| Investments in Affiliated Portfolio, at Cost | | | $ | 8,846,210 | | | | | $ | 128,304,890 | | |
____________________
| Amounts designated as “—” are $0.00 or have been rounded to $0.00. |
| (a) | | Redemption price per share varies by length of time shares are held. |
| 6 HSBC FAMILY OF FUNDS | See notes to financial statements. |
HSBC FAMILY OF FUNDS
Statements of Operations—For the year ended October 31, 2018
| | | | | | | HSBC |
| | HSBC | | Opportunity |
| | Opportunity | | Fund |
| | Fund | | (Class I) |
| Investment Income: | | | | | | | | | | |
| Investment Income from Affiliated Portfolio | | | $ | 74,269 | | | | $ | 1,013,881 | |
| Expenses from Affiliated Portfolio | | | | (109,991 | ) | | | | (1,505,733 | ) |
| Total Investment Income/(Loss) | | | | (35,722 | ) | | | | (491,852 | ) |
| | | | | | | | | | | |
| Expenses: | | | | | | | | | | |
| Administration: | | | | | | | | | | |
| Class A Shares | | | | 1,992 | | | | | — | |
| Class B Shares | | | | 7 | | | | | — | |
| Class C Shares | | | | 45 | | | | | — | |
| Class I Shares | | | | — | | | | | 28,071 | |
| Distribution: | | | | | | | | | | |
| Class B Shares | | | | 255 | | | | | — | |
| Class C Shares | | | | 1,721 | | | | | — | |
| Shareholder Servicing: | | | | | | | | | | |
| Class A Shares | | | | 23,771 | | | | | — | |
| Class B Shares | | | | 85 | | | | | — | |
| Class C Shares | | | | 476 | | | | | — | |
| Accounting | | | | 21,086 | | | | | 11,081 | |
| Administrative Services | | | | 6,401 | | | | | 2,201 | |
| Compliance Services | | | | 28,431 | | | | | 28,431 | |
| Printing | | | | 7,795 | | | | | 24,578 | |
| Professional | | | | 135,843 | | | | | 135,033 | |
| Transfer Agent | | | | 109,421 | | | | | 143,524 | |
| Trustee | | | | 72,368 | | | | | 72,445 | |
| Registration fees | | | | 23,325 | | | | | 22,293 | |
| Other | | | | 23,126 | | | | | 29,513 | |
| Total expenses before fee and expense reductions | | | | 456,148 | | | | | 497,170 | |
| Fees voluntarily reduced/reimbursed by Investment Adviser | | | | (10,513 | ) | | | | — | |
| Fees contractually reduced/reimbursed by Investment Adviser | | | | (390,697 | ) | | | | (414,357 | ) |
| Net Expenses | | | | 54,938 | | | | | 82,813 | |
| | | | | | | | | | | |
| Net Investment Income/(Loss) | | | | (90,660 | ) | | | | (574,665 | ) |
| | | | | | | | | | | |
| Realized/Unrealized Gains/(Losses) from Investments: | | | | | | | | | | |
| Net realized gains/(losses) from investments from Affiliated Portfolio | | | | 1,711,715 | | | | | 22,339,913 | |
| Change in unrealized appreciation/depreciation on investments from Affiliated Portfolio | | | | (934,014 | ) | | | | (12,911,260 | ) |
| | | | | | | | | | | |
| Net realized/unrealized gains/(losses) on investments from Affiliated Portfolio | | | | 777,701 | | | | | 9,428,653 | |
| Change in Net Assets Resulting from Operations | | | $ | 687,041 | | | | $ | 8,853,988 | |
Amounts designated as “—” are $0.00 or have been rounded to $0.00.
| See notes to financial statements. | HSBC FAMILY OF FUNDS 7 |
HSBC FAMILY OF FUNDS
Statements of Changes in Net Assets
| | HSBC Opportunity Fund | | HSBC Opportunity Fund (Class I) |
| | For the | For the | | For the | For the |
| | year ended | year ended | | year ended | year ended |
| | October 31, 2018 | October 31, 2017 | | October 31, 2018 | October 31, 2017 |
| Investment Activities: | | | | | | | | | | | | | | | | | | |
| Operations: | | | | | | | | | | | | | | | | | | |
| Net investment income/(loss) | | | $ | (90,660 | ) | | $ | (82,641 | ) | | | $ | (574,665 | ) | | $ | (454,613 | ) |
| Net realized gains/(losses) from investments | | | | 1,711,715 | | | | 1,383,534 | | | | | 22,339,913 | | | | 19,709,152 | |
| Change in unrealized appreciation/depreciation | | | | | | | | | | | | | | | | | | |
| on investments | | | | (934,014 | ) | | | 1,222,544 | | | | | (12,911,260 | ) | | | 15,692,968 | |
| Change in net assets resulting from operations | | | | 687,041 | | | | 2,523,437 | | | | | 8,853,988 | | | | 34,947,507 | |
| | | | | | | | | | | | | | | | | | | |
| Distributions to shareholders: | | | | | | | | | | | | | | | | | | |
| Class A Shares | | | | (1,047,996 | ) | | | (1,128,826 | ) | | | | — | | | | — | |
| Class B Shares | | | | (7,279 | ) | | | (12,613 | ) | | | | — | | | | — | |
| Class C Shares | | | | (71,416 | ) | | | (79,223 | ) | | | | — | | | | — | |
| Class I Shares | | | | — | | | | — | | | | | (17,639,612 | ) | | | (14,495,106 | ) |
| Change in net assets resulting from distributions | | | | | | | | | | | | | | | | | | |
| to shareholders | | | | (1,126,691 | ) | | | (1,220,662 | ) | | | | (17,639,612 | ) | | | (14,495,106 | ) |
| Change in net assets resulting from | | | | | | | | | | | | | | | | | | |
| capital transactions | | | | 4,054 | | | | (1,208,010 | ) | | | | 17,564,892 | | | | (33,653,038 | ) |
| Change in net assets | | | | (435,596 | ) | | | 94,765 | | | | | 8,779,268 | | | | (13,200,637 | ) |
| | | | | | | | | | | | | | | | | | | |
| Net Assets: | | | | | | | | | | | | | | | | | | |
| Beginning of period | | | | 9,919,961 | | | | 9,825,196 | | | | | 127,860,501 | | | | 141,061,138 | |
| End of period | | | $ | 9,484,365 | | | $ | 9,919,961 | | | | $ | 136,639,769 | | | $ | 127,860,501 | |
Amounts designated as “—” are $0.00 or have been rounded to $0.00.
| 8 HSBC FAMILY OF FUNDS | See notes to financial statements. |
HSBC FAMILY OF FUNDS
Statements of Changes in Net Assets (continued)
| | HSBC Opportunity Fund | | HSBC Opportunity Fund (Class I) |
| | For the | For the | | For the | For the |
| | year ended | year ended | | year ended | year ended |
| | October 31, 2018 | October 31, 2017 | | October 31, 2018 | October 31, 2017 |
| CAPITAL TRANSACTIONS: | | | | | | | | | | | | | | | | | | |
| Class A Shares: | | | | | | | | | | | | | | | | | | |
| Proceeds from shares issued | | | $ | 582,737 | | | $ | 490,391 | | | | $ | — | | | $ | — | |
| Dividends reinvested | | | | 1,020,798 | | | | 1,096,861 | | | | | — | | | | — | |
| Value of shares redeemed | | | | (1,265,078 | ) | | | (2,703,036 | ) | | | | — | | | | — | |
| Class A Shares capital transactions | | | | 338,457 | | | | (1,115,784 | ) | | | | — | | | | — | |
| | | | | | | | | | | | | | | | | | | |
| Class B Shares: | | | | | | | | | | | | | | | | | | |
| Proceeds from shares issued | | | | — | | | | 7,643 | | | | | — | | | | — | |
| Dividends reinvested | | | | 7,279 | | | | 12,613 | | | | | — | | | | — | |
| Value of shares redeemed | | | | (31,516 | ) | | | (53,986 | ) | | | | — | | | | — | |
| Class B Shares capital transactions | | | | (24,237 | ) | | | (33,730 | ) | | | | — | | | | — | |
| | | | | | | | | | | | | | | | | | | |
| Class C Shares: | | | | | | | | | | | | | | | | | | |
| Proceeds from shares issued | | | | 6,582 | | | | 9,094 | | | | | — | | | | — | |
| Dividends reinvested | | | | 71,416 | | | | 79,223 | | | | | — | | | | — | |
| Value of shares redeemed | | | | (388,164 | ) | | | (146,813 | ) | | | | — | | | | — | |
| Class C Shares capital transactions | | | | (310,166 | ) | | | (58,496 | ) | | | | — | | | | — | |
| | | | | | | | | | | | | | | | | | | |
| Class I Shares: | | | | | | | | | | | | | | | | | | |
| Proceeds from shares issued | | | | — | | | | — | | | | | 18,679,912 | | | | 9,067,442 | |
| Dividends reinvested | | | | — | | | | — | | | | | 17,448,749 | | | | 14,367,761 | |
| Value of shares redeemed | | | | — | | | | — | | | | | (18,563,769 | ) | | | (57,088,241 | ) |
| Class I Shares capital transactions | | | | — | | | | — | | | | | 17,564,892 | | | | (33,653,038 | ) |
| Change in net assets resulting from capital transactions | | | $ | 4,054 | | | $ | (1,208,010 | ) | | | $ | 17,564,892 | | | $ | (33,653,038 | ) |
| | | | | | | | | | | | | | | | | | | |
| SHARE TRANSACTIONS: | | | | | | | | | | | | | | | | | | |
| Class A Shares: | | | | | | | | | | | | | | | | | | |
| Issued | | | | 50,934 | | | | 47,663 | | | | | — | | | | — | |
| Reinvested | | | | 95,491 | | | | 118,452 | | | | | — | | | | — | |
| Redeemed | | | | (110,424 | ) | | | (260,788 | ) | | | | — | | | | — | |
| Change in Class A Shares | | | | 36,001 | | | | (94,673 | ) | | | | — | | | | — | |
| | | | | | | | | | | | | | | | | | | |
| Class B Shares: | | | | | | | | | | | | | | | | | | |
| Issued | | | | — | | | | 1,202 | | | | | — | | | | — | |
| Reinvested | | | | 1,174 | | | | 2,167 | | | | | — | | | | — | |
| Redeemed | | | | (4,677 | ) | | | (8,201 | ) | | | | — | | | | — | |
| Change in Class B Shares | | | | (3,503 | ) | | | (4,832 | ) | | | | — | | | | — | |
| | | | | | | | | | | | | | | | | | | |
| Class C Shares: | | | | | | | | | | | | | | | | | | |
| Issued | | | | 998 | | | | 1,383 | | | | | — | | | | — | |
| Reinvested | | | | 10,870 | | | | 12,966 | | | | | — | | | | — | |
| Redeemed | | | | (55,691 | ) | | | (20,791 | ) | | | | — | | | | — | |
| Change in Class C Shares | | | | (43,823 | ) | | | (6,442 | ) | | | | — | | | | — | |
| | | | | | | | | | | | | | | | | | | |
| Class I Shares: | | | | | | | | | | | | | | | | | | |
| Issued | | | | — | | | | — | | | | | 1,176,332 | | | | 656,336 | |
| Reinvested | | | | — | | | | — | | | | | 1,219,340 | | | | 1,137,590 | |
| Redeemed | | | | — | | | | — | | | | | (1,195,712 | ) | | | (4,121,773 | ) |
| Change in Class I Shares | | | | — | | | | — | | | | | 1,199,960 | | | | (2,327,847 | ) |
Amounts designated as “—” are $0.00 or have been rounded to $0.00.
| See notes to financial statements. | HSBC FAMILY OF FUNDS 9 |
| HSBC OPPORTUNITY FUND |
| Financial Highlights |
Selected data for a share outstanding throughout the periods indicated.*
| | | | Investment Activities | | Distributions | | | | | | Ratios/Supplementary Data |
| | Net Asset
Value,
Beginning
of Period | | Net
Investment
Income/
(Loss)(a) | | Net Realized
and Unrealized
Gains/
(Losses) from
Investments | | Total from
Investment
Activities | | Net
Investment
Income | | Net Realized
Gains from
Investment
Transactions | | Total
Distributions | | Net
Asset
Value,
End of
Period | | Total
Return(b) | | Net
Assets at
End
of Period
(000’s) | | Ratio
of Net
Expenses
to Average
Net Assets | | Ratio
of Net
Investment
Income/
(Loss) to
Average
Net Assets | | Ratio of
Expenses
to Average
Net Assets
(Excluding Fee
Reductions) | | Portfolio
Turnover(c) |
| Class A Shares | | | | | | | | | | | | | | | | | | | | | | | | | | | | | | | | | | | | | | | | | | | | | | | | | | | | | | | | | | | | | | | |
| Year Ended October 31, 2018 | | | $ | 11.24 | | | | $ | (0.10 | ) | | | | $ | 0.82 | | | | | $ | 0.72 | | | | | $ | — | | | | $ | (1.26 | ) | | | | $ | (1.26 | ) | | | | $ | 10.70 | | | | 6.46 | % | | | | $ | 9,352 | | | 1.55% | | (0.84)% | | 5.37% | | 77% |
| Year Ended October 31, 2017 | | | | 9.94 | | | | | (0.08 | ) | | | | | 2.68 | | | | | | 2.60 | | | | | | — | | | | | (1.30 | ) | | | | | (1.30 | ) | | | | | 11.24 | | | | 29.00 | % | | | | | 9,422 | | | 1.55% | | (0.79)% | | 2.98% | | 80% |
| Year Ended October 31, 2016 | | | | 10.34 | | | | | (0.07 | ) | | | | | (0.33 | ) | | | | | (0.40 | ) | | | | | — | | | | | — | | | | | | — | | | | | | 9.94 | | | | (3.87 | )% | | | | | 9,276 | | | 1.55% | | (0.66)% | | 2.11% | | 96% |
| Year Ended October 31, 2015 | | | | 12.83 | | | | | (0.10 | ) | | | | | (0.07 | ) | | | | | (0.17 | ) | | | | | — | | | | | (2.32 | ) | | | | | (2.32 | ) | | | | | 10.34 | | | | (2.21 | )% | | | | | 16,593 | | | 1.55% | | (0.86)% | | 1.84% | | 63% |
| Year Ended October 31, 2014 | | | | 12.78 | | | | | (0.13 | ) | | | | | 1.53 | | | | | | 1.40 | | | | | | — | | | | | (1.35 | ) | | | | | (1.35 | ) | | | | | 12.83 | | | | 11.57 | % | | | | | 16,110 | | | 1.55% | | (1.04)% | | 1.86% | | 66% |
| Class B Shares | | | | | | | | | | | | | | | | | | | | | | | | | | | | | | | | | | | | | | | | | | | | | | | | | | | | | | | | | | | | | | | |
| Year Ended October 31, 2018 | | | | 7.03 | | | | | (0.11 | ) | | | | | 0.50 | | | | | | 0.39 | | | | | | — | | | | | (1.26 | ) | | | | | (1.26 | ) | | | | | 6.16 | | | | 5.50 | % | | | | | 17 | | | 2.30% | | (1.57)% | | 6.14% | | 77% |
| Year Ended October 31, 2017 | | | | 6.72 | | | | | (0.10 | ) | | | | | 1.71 | | | | | | 1.61 | | | | | | — | | | | | (1.30 | ) | | | | | (1.30 | ) | | | | | 7.03 | | | | 28.05 | % | | | | | 44 | | | 2.30% | | (1.52)% | | 3.73% | | 80% |
| Year Ended October 31, 2016 | | | | 7.04 | | | | | (0.09 | ) | | | | | (0.23 | ) | | | | | (0.32 | ) | | | | | — | | | | | — | | | | | | — | | | | | | 6.72 | | | | (4.55 | )% | | | | | 75 | | | 2.30% | | (1.41)% | | 2.86% | | 96% |
| Year Ended October 31, 2015 | | | | 9.51 | | | | | (0.13 | ) | | | | | (0.02 | ) | | | | | (0.15 | ) | | | | | — | | | | | (2.32 | ) | | | | | (2.32 | ) | | | | | 7.04 | | | | (2.90 | )% | | | | | 178 | | | 2.30% | | (1.61)% | | 2.60% | | 63% |
| Year Ended October 31, 2014 | | | | 9.87 | | | | | (0.16 | ) | | | | | 1.15 | | | | | | 0.99 | | | | | | — | | | | | (1.35 | ) | | | | | (1.35 | ) | | | | | 9.51 | | | | 10.74 | % | | | | | 334 | | | 2.30% | | (1.74)% | | 2.60% | | 66% |
| Class C Shares | | | | | | | | | | | | | | | | | | | | | | | | | | | | | | | | | | | | | | | | | | | | | | | | | | | | | | | | | | | | | | | |
| Year Ended October 31, 2018 | | | | 7.38 | | | | | (0.11 | ) | | | | | 0.52 | | | | | | 0.41 | | | | | | — | | | | | (1.26 | ) | | | | | (1.26 | ) | | | | | 6.53 | | | | 5.52 | % | | | | | 116 | | | 2.30% | | (1.60)% | | 6.08% | | 77% |
| Year Ended October 31, 2017 | | | | 6.99 | | | | | (0.11 | ) | | | | | 1.80 | | | | | | 1.69 | | | | | | — | | | | | (1.30 | ) | | | | | (1.30 | ) | | | | | 7.38 | | | | 28.11 | % | | | | | 454 | | | 2.30% | | (1.54)% | | 3.71% | | 80% |
| Year Ended October 31, 2016 | | | | 7.32 | | | | | (0.10 | ) | | | | | (0.23 | ) | | | | | (0.33 | ) | | | | | — | | | | | — | | | | | | — | | | | | | 6.99 | | | | (4.51 | )% | | | | | 475 | | | 2.30% | | (1.41)% | | 2.88% | | 96% |
| Year Ended October 31, 2015 | | | | 9.80 | | | | | (0.13 | ) | | | | | (0.03 | ) | | | | | (0.16 | ) | | | | | — | | | | | (2.32 | ) | | | | | (2.32 | ) | | | | | 7.32 | | | | (2.93 | )% | | | | | 825 | | | 2.30% | | (1.61)% | | 2.62% | | 63% |
| Year Ended October 31, 2014 | | | | 10.14 | | | | | (0.17 | ) | | | | | 1.18 | | | | | | 1.01 | | | | | | — | | | | | (1.35 | ) | | | | | (1.35 | ) | | | | | 9.80 | | | | 10.64 | % | | | | | 822 | | | 2.30% | | (1.77)% | | 2.61% | | 66% |
| * | The per share amounts and percentages reflect income and expenses assuming inclusion of the Fund’s proportionate share of the income and expenses of the HSBC Opportunity Portfolio. Amounts designated as “—“ are $0.00 or have been rounded to $0.00. |
| (a) | Calculated based on average shares outstanding. |
| (b) | Total return calculations do not include any sales or redemption charges. |
| (c) | Portfolio turnover rate is calculated on the basis of the Portfolio in which the Fund invests all of its investable assets. Portfolio turnover is calculated on the basis of the Fund as a whole without distinguishing between the classes of shares issued. |
| 10 HSBC FAMILY OF FUNDS | See notes to financial statements. |
| HSBC OPPORTUNITY FUND (CLASS I) |
| Financial Highlights |
Selected data for a share outstanding throughout the periods indicated.*
| | | | Investment Activities | | Distributions | | | | | | | | | | | | Ratios/Supplementary Data |
| | Net Asset
Value,
Beginning
of Period | | Net
Investment
Income/
(Loss)(a) | | Net Realized
and Unrealized
Gains/
(Losses) from
Investments | | Total from
Investment
Activities | | Net
Investment
Income | | Net Realized
Gains from
Investment
Transactions | | Total
Distributions | | Net
Asset
Value,
End of
Period | | Total
Return(b) | | Net
Assets at
End
of Period
(000’s) | | Ratio
of Net
Expenses
to Average
Net Assets | | Ratio
of Net
Investment
Income/
(Loss) to
Average
Net Assets | | Ratio of
Expenses
to Average
Net Assets
(Excluding Fee
Reductions) | | Portfolio
Turnover(c) |
| Class I Shares | | | | | | | | | | | | | | | | | | | | | | | | | | | | | | | | | | | | | | | | | | | | | | | | | | | | | | | | | | | | | | | | |
| Year Ended October 31, 2018 | | | $ | 15.40 | | | | $ | (0.06 | ) | | | | $ | 1.12 | | | | | $ | 1.06 | | | | | $ | — | | | | | $ | (2.08 | ) | | | | $ | (2.08 | ) | | | | $ | 14.38 | | | | 6.96 | % | | | | $ | 136,640 | | | 1.10% | | (0.40)% | | 1.39% | | 77% |
| Year Ended October 31, 2017 | | | | 13.27 | | | | | (0.05 | ) | | | | | 3.65 | | | | | | 3.60 | | | | | | — | | | | | | (1.47 | ) | | | | | (1.47 | ) | | | | | 15.40 | | | | 29.53 | % | | | | | 127,861 | | | 1.10% | | (0.34)% | | 1.12% | | 80% |
| Year Ended October 31, 2016 | | | | 13.72 | | | | | (0.02 | ) | | | | | (0.43 | ) | | | | | (0.45 | ) | | | | | — | | | | | | — | | | | | | — | | | | | | 13.27 | | | | (3.28 | )% | | | | | 141,061 | | | 1.03% | | (0.15)% | | 1.03% | | 96% |
| Year Ended October 31, 2015 | | | | 17.47 | | | | | (0.05 | ) | | | | | (0.08 | ) | | | | | (0.13 | ) | | | | | — | | | | | | (3.62 | ) | | | | | (3.62 | ) | | | | | 13.72 | | | | (1.69 | )% | | | | | 219,846 | | | 0.99% | | (0.30)% | | 0.99% | | 63% |
| Year Ended October 31, 2014 | | | | 17.27 | | | | | (0.08 | ) | | | | | 2.07 | | | | | | 1.99 | | | | | | (0.04 | ) | | | | | (1.75 | ) | | | | | (1.79 | ) | | | | | 17.47 | | | | 12.16 | % | | | | | 205,237 | | | 1.00% | | (0.49)% | | 1.00% | | 66% |
| * | The per share amounts and percentages reflect income and expenses assuming inclusion of the Fund’s proportionate share of the income and expenses of the HSBC Opportunity Portfolio. Amounts designated as “—“ are $0.00 or have been rounded to $0.00. |
| (a) | Calculated based on average shares outstanding. |
| (b) | Total return calculations do not include any sales or redemption charges. |
| (c) | Portfolio turnover rate is calculated on the basis of the Portfolio in which the Fund invests all of its investable assets. Portfolio turnover is calculated on the basis of the Fund as a whole without distinguishing between the classes of shares issued. |
| See notes to financial statements. | HSBC FAMILY OF FUNDS 11 |
| HSBC FAMILY OF FUNDS |
| Notes to Financial Statements—as of October 31, 2018 |
1. Organization:
The HSBC Funds (the “Trust”), a Delaware statutory trust organized on March 2, 2016, is registered under the Investment Company Act of 1940, as amended (the “Act”), as an open-end management investment company. As of October 31, 2018, the Trust is composed of 10 separate operational funds, each a series of the HSBC Family of Funds. The accompanying financial statements are presented for the following two funds (individually a “Fund”, collectively the “Funds”) of the Trust:
| Fund | | Short Name |
| HSBC Opportunity Fund | | Opportunity Fund |
| HSBC Opportunity Fund (Class I) | | Opportunity Fund (Class I) |
The Funds are diversified funds. Financial statements for all other funds of the Trust are published separately.
Each Fund is a feeder fund in a master-feeder fund structure and seeks to achieve its investment objectives by investing all of its investable assets in the HSBC Opportunity Portfolio (the “Portfolio”), which is a diversified series of the Trust. The Portfolio operates as the master fund in a master-feeder arrangement in which the feeder funds invest all or part of their investable assets in the Portfolio. The Funds’ proportionate ownership of the Portfolio as of October 31, 2018 was as follows:
| | Proportionate |
| | Ownership |
| | Interest on |
| Fund | | October 31, 2018 (%) |
| Opportunity Fund | | | 6.5 | |
| Opportunity Fund (Class I) | | | 93.5 | |
The financial statements of the Portfolio, including the Schedule of Portfolio Investments, are included elsewhere in this report. The financial statements of the Portfolio should be read in conjunction with the financial statements of the Funds.
The Funds are authorized to issue an unlimited number of shares of beneficial interest with a par value of $0.001 per share. The Opportunity Fund offers three classes of shares: Class A Shares, Class B Shares, and Class C Shares. The Opportunity Fund (Class I) offers one class of shares: Class I Shares. Class A Shares of the Opportunity Fund have a maximum sales charge of 5.00% as a percentage of the offering price. Class B Shares of the Opportunity Fund are offered without any front-end sales charge but will be subject to a contingent deferred sales charge (“CDSC”) ranging from a maximum of 4.00% if redeemed less than one year after purchase to 0.00% if redeemed more than four years after purchase. Class C Shares of the Opportunity Fund are offered without any front-end sales charge but will be subject to a maximum CDSC of 1.00% if redeemed less than one year after purchase. No sales charges are assessed with respect to Class I Shares of the Opportunity Fund (Class I). Each class of shares in the Funds has identical rights and privileges except with respect to arrangements pertaining to shareholder servicing and/or distribution, class-related expenses, voting rights on matters affecting a single class of shares, and exchange privileges of each class of shares. Class B Shares of the Opportunity Fund may no longer be purchased or acquired by any new or existing Class B shareholder, except through dividend and/or capital gains reinvestment.
Under the Trust’s organizational documents, the Trust’s officers and Trustees are indemnified against certain liabilities arising out of the performance of their duties to the Funds. In addition, in the normal course of business, the Trust enters into contracts with its service providers, which also provide for indemnifications by the Funds. The Funds’ maximum exposure under these arrangements is unknown, as this would involve future claims that may be made against the Funds. However, based on experience, the Trust believes the risk of loss to be remote.
The Funds are investment companies and follow accounting and reporting guidance under Financial Accounting Standards Board (“FASB”) Accounting Standards Codification (“ASC”) Topic 946, “Financial Services-Investment Companies.”
| HSBC FAMILY OF FUNDS |
| Notes to Financial Statements—as of October 31, 2018 (continued) |
2. Significant Accounting Policies:
The following is a summary of the significant accounting policies followed by the Funds in the preparation of their financial statements. The policies are in conformity with generally accepted accounting principles in the United States of America (“GAAP”). The preparation of financial statements requires management to make certain estimates and assumptions that affect the reported amounts of assets and liabilities and disclosure of contingent assets and liabilities at the date of the financial statements and the reported amounts of increases and decreases in net assets from operations during the reporting period. Actual results could differ from those estimates.
Securities Valuation:
The Funds record their investments at fair value. Fair value is defined as the price that would be received to sell an asset or paid to transfer a liability in an orderly transaction between market participants at the measurement date. The valuation techniques used to determine fair value are further described in Note 3 below.
Investment Transactions and Related Income:
The Funds record investments to the Portfolio on a trade date basis. The Funds record daily their proportionate share of income, expenses, changes in unrealized appreciation and depreciation and realized gains and losses derived from the Portfolio. In addition, the Funds accrue their own expenses daily as incurred.
Allocations:
Expenses directly attributable to a Fund are charged to that Fund. Expenses not directly attributable to a Fund are allocated among the applicable series within the Trust equally to each fund, in relation to their net assets, or another appropriate basis. Class specific expenses are charged directly to the class incurring the expense. In addition, income, expenses (other than class specific expenses), and unrealized and realized gains and losses are allocated to each class based on relative net assets on a daily basis.
Distributions to Shareholders:
Dividends distributed to shareholders of the Funds from net investment income, if any, are declared and distributed semiannually.
The Funds’ net realized gains, if any, are declared and paid at least annually. Additional distributions are also made to the Funds’ shareholders to the extent necessary to avoid the federal excise tax on certain undistributed income and net realized gains of regulated investment companies.
Federal Income Taxes:
Each Fund is a separate taxable entity for federal income tax purposes. Each Fund has qualified and intends to continue to qualify each year as a “regulated investment company” under Subchapter M of the Internal Revenue Code, as amended, and to distribute substantially all of its taxable net investment income and net realized gains, if any, to its shareholders. Accordingly, no provision for federal income or excise tax is required for the Funds, although shareholders may be taxed on distributions they receive.
Management of the Funds has reviewed tax positions taken in tax years that remain subject to examination by all major tax jurisdictions, including federal (i.e., the last four tax year ends and the interim tax period since then, as applicable). Management believes that there is no tax liability resulting from unrecognized tax benefits related to uncertain tax positions taken. Management’s conclusions may be subject to future review based on changes in, or interpretation of, accounting standards or tax laws and regulations.
| HSBC FAMILY OF FUNDS |
| Notes to Financial Statements—as of October 31, 2018 (continued) |
3. Investment Valuation Summary
The valuation techniques employed by the Funds, as described below, maximize the use of observable inputs and minimize the use of unobservable inputs in determining fair value. The Funds’ investments are classified within the fair value hierarchy based on the lowest level of input that is significant to the fair value measurement. The inputs used for valuing the Funds’ investments are summarized in the three broad levels listed below:
| ● | Level 1—quoted prices in active markets for identical assets |
| ● | Level 2—other significant observable inputs (including quoted prices for similar securities, interest rates, prepayments speeds, credit risk, etc.) |
| ● | Level 3—significant unobservable inputs (including the Fund’s own assumptions in determining the fair value of investments) |
Changes in valuation techniques may result in transfers in or out of an assigned level within the fair value hierarchy. The inputs or methodology used for valuing investments are not necessarily an indication of the risk associated with investing in those investments.
The Funds record their investments in the Portfolio at fair value, which represents their proportionate ownership of the value of the Portfolios’ net assets. These investments are typically categorized as Level 2 in the fair value hierarchy. The underlying securities of the Portfolio are recorded at fair value, as discussed more fully in the Notes to Financial Statements of the Portfolio included elsewhere in this report.
As of October 31, 2018, all investments were categorized as Level 2 in the fair value hierarchy.
4. Related Party Transactions and Other Agreements and Plans:
Investment Management:
HSBC Global Asset Management (USA), Inc. (“HSBC” or the “Investment Adviser”), a wholly-owned subsidiary of HSBC Bank USA, N.A., a national bank organized under the laws of the United States, acts as Investment Adviser to the Portfolio pursuant to an Investment Advisory Contract. As Investment Adviser, HSBC manages the investments of the Portfolio and continuously reviews, supervises, and administers the Portfolios’ investments. The Funds are not directly charged any investment management fees.
Administration, Fund Accounting and Other Services:
HSBC also serves the Funds as Administrator. Under the terms of the Administration Services Agreement, HSBC receives from the Funds (as well as other funds in the Trust combined) a fee, accrued daily and paid monthly, at an annual rate of:
| Based on Average Daily Net Assets of | | Fee Rate (%) |
| Up to $10 billion | | 0.0400 |
| In excess of $10 billion but not exceeding $20 billion | | 0.0350 |
| In excess of $20 billion but not exceeding $50 billion | | 0.0265 |
| In excess of $50 billion | | 0.0245 |
The fee rates and breakpoints are determined on the basis of the aggregate average daily net assets of the Trust. For the year ended October 31, 2018, the effective annualized rate was 0.038%, prior to any fee waivers or expense reimbursements, based on the average daily net assets of the Trust. The total administration fee paid to HSBC is allocated to each series based upon its proportionate share of the aggregate net assets of the Trust. For assets invested in the Portfolio by the Funds, the Portfolio pays half of the administration fee and the Funds pay half, for a combination of the total fee rate set forth above.
| HSBC FAMILY OF FUNDS |
| Notes to Financial Statements—as of October 31, 2018 (continued) |
Pursuant to a Sub-Administration Services Agreement with HSBC, Citi Fund Services Ohio, Inc. (“Citi”), a wholly-owned subsidiary of Citigroup, Inc., serves as the Trust’s Sub-Administrator. For these services, Citi is entitled to a fee, payable by HSBC, at an annual rate equivalent to the fee rates set forth below:
| Based on Average Daily Net Assets of | Fee Rate (%) |
| Up to $10 billion | 0.0200 |
| In excess of $10 billion but not exceeding $20 billion | 0.0150 |
| In excess of $20 billion but not exceeding $50 billion | 0.0065 |
| In excess of $50 billion | 0.0045 |
Under a Services Agreement between the Trust and Citi (the “Services Agreement”), Citi makes an individual available to serve as the Trust’s Chief Compliance Officer (the “CCO”). Citi also provides infrastructure and support in implementing the written policies and procedures comprising the Trust’s compliance program, including support services to the CCO. For the services provided under the Services Agreement, the Trust paid Citi $313,915 for the year ended October 31, 2018, plus reimbursement of certain out-of-pocket expenses. Expenses incurred by each Fund are reflected on the Statements of Operations as “Compliance Services.” Citi pays the salary and other compensation earned by individuals performing these services, as employees of Citi.
In addition, Citi provides fund accounting services for each Fund under the Services Agreement. As fund accountant, Citi receives an annual fee per Fund and share class, subject to certain minimums and reimbursement of certain expenses. Citi receives additional fees paid by the Trust for regulatory administration services.
Distribution Arrangements:
Foreside Distribution Services, L.P. (“Foreside”) serves the Trust as Distributor (the “Distributor”). The Trust has adopted a non-compensatory Distribution Plan and Agreement (the “Distribution Plan”) pursuant to Rule 12b-1 of the Act. The Distribution Plan provides for reimbursement of expenses incurred by the Distributor related to distribution and marketing, at a rate not to exceed 0.25%, 1.00%, and 1.00% of the average daily net assets of Class A Shares (currently not being charged), Class B Shares (currently charging 0.75%), Class C Shares (currently charging 0.75%) of the Opportunity Fund, respectively. For the year ended October 31, 2018, Foreside, as Distributor, also received $1,976 in commissions from sales of the Trust.
Shareholder Servicing:
The Trust has adopted a Shareholder Services Plan, which provides for payments to shareholder servicing agents for providing various shareholder services. For performing these services, the shareholder servicing agents receive a fee that is computed daily and paid monthly up to 0.25% of the average daily net assets of Class A Shares, Class B Shares, and Class C Shares of the Opportunity Fund. The fees paid to the Distributor pursuant to the Distribution Plan and to shareholder servicing agents pursuant to the Shareholder Services Plan may not exceed in the aggregate 0.50% annually of the average daily net assets of Class A Shares, and 1.00% of the average daily net assets of Class B Shares and Class C Shares.
The Trust has entered into shareholder services contracts with affiliated and unaffiliated financial intermediaries who provide shareholder services and other related services to their clients or customers who invest in the Funds under which the Funds will pay all or a portion of such fees earned to financial intermediaries for performing such services.
Transfer Agency:
On April 16, 2018, DST Asset Manager Solutions, Inc. (“DST”) (formerly, Boston Financial Data Services, Inc.) announced that SS&C Technologies completed its acquisition of DST Systems, Inc., the parent of DST. DST provides transfer agency services for each Fund. As transfer agent, DST receives a fee based on the number of funds and shareholder accounts, subject to certain minimums, and reimbursement of certain expenses.
| HSBC FAMILY OF FUNDS |
| Notes to Financial Statements—as of October 31, 2018 (continued) |
Independent Trustees:
The Trust pays an annual retainer to each Independent Trustee, plus additional annual retainers to each Committee Chair and the Chairman of the Trust’s Board of Trustees (the “Board”). The Independent Trustees also receive a fee for each regular, special in-person, and telephonic meeting of the Board attended. The aggregate amount of the fees and expenses of the Independent Trustees are allocated amongst all the funds in the Trust and are presented in the Statements of Operations.
Other:
The Funds pay fees to certain intermediaries or financial institutions for record keeping, sub-accounting services, transfer agency and other administrative services as reflected on the Statements of Operations as “Administrative Services.”
Fee Reductions:
The Investment Adviser has agreed to contractually limit through March 1, 2019 the total annual expenses of the Funds, exclusive of interest, taxes, brokerage commissions, extraordinary expenses, and estimated indirect expenses attributable to the Fund’s investments in investment companies. Each Fund Class has its own expense limitations based on the average daily net assets for any full fiscal year as follows:
| | | | Contractual Expense |
| Fund | | Class | | Limitations (%) |
| Opportunity Fund | | A | | 1.65 |
| Opportunity Fund | | B | | 2.40 |
| Opportunity Fund | | C | | 2.40 |
| Opportunity Fund (Class I) | | I | | 1.10 |
Any amounts contractually waived or reimbursed by the Investment Adviser will be subject to repayment by the respective Fund to the Investment Adviser within three years calculated monthly from when the waiver or reimbursement is recorded to the extent that the repayment will not cause the Fund’s operating expenses to exceed the contractual expense limit that was in effect at the time of such waiver or reimbursement. During the year ended October 31, 2018, the Investment Adviser did not recapture any of its prior contractual waivers or reimbursements. As of October 31, 2018, the repayments that may potentially be made by the Funds are as follows:
| | Amount Eligible Through |
| Fund | | 2021 ($) | | 2020 ($) | | 2019 ($) | | Total ($) |
| Opportunity Fund | | 390,697 | | 131,244 | | 62,736 | | 584,677 |
| Opportunity Fund (Class I) | | 414,357 | | 28,269 | | — | | 442,626 |
The Administrator and Citi may voluntarily waive/reimburse fees to help support the expense limits of the Funds. In addition, HSBC, in its role as Investment Adviser and Administrator, may waive/reimburse additional fees at its discretion. Any voluntary fee waivers/reimbursements are not subject to recoupment in subsequent fiscal periods. Voluntary waivers/reimbursements may be eliminated or changed at any time. Amounts waived/reimbursed by the Investment Adviser, Administrator and Citi as Sub-Administrator are reported separately on the Statements of Operations, as applicable.
| HSBC FAMILY OF FUNDS |
| Notes to Financial Statements—as of October 31, 2018 (continued) |
5. Affiliated Investment Transactions:
A summary of each Fund’s investment in the affiliated Portfolio for the year ended October 31, 2018 is as follows:
| | | | | | | | | Net | | Change in | | | | | |
| | | | | | | | | Realized | | Unrealized | | | | Net |
| | Value | | | | | | | Gains/ | | Appreciation/ | | Value | | Income/ |
| | 10/31/2017 | | Contributions | | Withdrawals | | (Losses) | | Depreciation | | 10/31/2018 | | (Loss) |
| | ($) | | ($) | | ($) | | ($) | | ($) | | ($) | | ($) |
| Opportunity Fund | | | | | | | | | | | | | | | | | |
| Opportunity Portfolio | | 9,931,067 | | 451,089 | | (1,616,328 | ) | | 1,711,715 | | (934,014 | ) | | 9,507,807 | | (35,722 | ) |
| Total | | 9,931,067 | | 451,089 | | (1,616,328 | ) | | 1,711,715 | | (934,014 | ) | | 9,507,807 | | (35,722 | ) |
| |
| Opportunity Fund (Class I) | | | | | | | | | | | | | | | | | |
| Opportunity Portfolio | | 127,926,102 | | 19,391,958 | | (19,577,275 | ) | | 22,339,913 | | (12,911,260 | ) | | 136,677,586 | | (491,852 | ) |
| Total | | 127,926,102 | | 19,391,958 | | (19,577,275 | ) | | 22,339,913 | | (12,911,260 | ) | | 136,677,586 | | (491,852 | ) |
6. Federal Income Tax Information:
At October 31, 2018, the cost basis of investments for federal income tax purposes, gross unrealized appreciation, gross unrealized depreciation and net unrealized appreciation/depreciation were as follows:
| | | | | | | | | | Net Unrealized |
| | | | Tax Unrealized | | Tax Unrealized | | Appreciation/ |
| | Tax Cost ($) | | Appreciation ($) | | Depreciation ($) | | (Depreciation) ($)* |
| Opportunity Fund | | 8,908,204 | | | 599,603 | | | — | | | 599,603 | |
| Opportunity Fund (Class I) | | 128,361,594 | | | 8,315,992 | | | — | | | 8,315,992 | |
____________________
| * | The difference between book-basis unrealized appreciation (depreciation) is attributable primarily to tax deferral of losses on wash sales. |
The tax character of distributions paid by the Funds for the tax year ended October 31, 2018, was as follows:
| | Distributions paid from |
| | | | | | | | | | | | Total |
| | Ordinary | | Net Long Term | | Total Taxable | | Distributions |
| | Income ($) | | Capital Gains ($) | | Distributions ($) | | Paid ($)(1) |
| Opportunity Fund | | 468,858 | | | 657,833 | | | | 1,126,691 | | | | 1,126,691 | |
| Opportunity Fund (Class I) | | 8,359,597 | | | 9,280,015 | | | | 17,639,612 | | | | 17,639,612 | |
____________________
| (1) | Total distributions paid may differ from the amount reported in the Statements of Changes in Net Assets because distributions are recognized when actually paid for tax purposes. |
The tax character of distributions paid by the Funds for the tax year ended October 31, 2017, was as follows:
| | Distributions paid from |
| | | | | | | | | | Total |
| | Net Long Term | | Total Taxable | | Distributions |
| | Capital Gains ($) | | Distributions ($) | | Paid ($)(1) |
| Opportunity Fund | | | 1,220,662 | | | | 1,220,662 | | | | 1,220,662 | |
| Opportunity Fund (Class I) | | | 14,495,106 | | | | 14,495,106 | | | | 14,495,106 | |
____________________
| (1) | Total distributions paid may differ from the amount reported in the Statements of Changes in Net Assets because distributions are recognized when actually paid for tax purposes. |
| HSBC FAMILY OF FUNDS |
| Notes to Financial Statements—as of October 31, 2018 (continued) |
As of the tax year ended October 31, 2018, the components of accumulated earnings/(deficit) on a tax basis for the Funds were as follows:
| | | | | | Undistributed | | | | Unrealized | | Total |
| | Undistributed | | Long Term | | | | Appreciation/ | | Accumulated |
| | Ordinary | | Capital | | Accumulated | | (Depreciation) | | Earnings/ |
| | Income ($) | | Gains ($) | | Earnings ($) | | ($)(1) | | (Deficit) ($) |
| Opportunity Fund | | | 214,513 | | | 1,365,435 | | 1,579,948 | | | 599,603 | | | 2,179,551 |
| Opportunity Fund (Class I) | | | 3,258,490 | | | 17,935,433 | | 21,193,923 | | | 8,315,992 | | | 29,509,915 |
____________________
| (1) | The differences between book-basis and tax-basis unrealized appreciation/depreciation are attributable primarily to: tax deferral of losses on wash sales, and the return of capital adjustments from real estate investment trusts. |
Under current law, capital losses and specified ordinary losses realized after October 31 and non-specified ordinary losses incurred after December 31 (ordinary losses collectively known as “late year ordinary loss”) may be deferred and treated as occurring on the first business day of the following fiscal year. As of the tax year ended October 31, 2018, the Funds had no deferred losses.
The amount and character of net investment income and net realized gains distributed are determined in accordance with federal income tax regulations which may differ from GAAP. These “book/tax” differences are either considered temporary or permanent in nature. To the extent these differences are permanent in nature (e.g., reclassification of market discounts, certain gain/loss, and certain distributions), such amounts are reclassified within the composition of net assets based on their federal tax-basis treatment; temporary differences (e.g., wash losses and post-October loss deferrals) do not require reclassification. The Funds may utilize equalization accounting for tax purposes and designate earnings and profits, including net realized gains distributed to shareholders on redemption of shares, as a part of the dividends paid deduction for income tax purposes. To the extent distributions to shareholders from net investment income and net realized gains exceed net investment income and net realized gains for tax purposes, they are reported as distributions of capital.
On the Statements of Assets and Liabilities, as a result of permanent book-to-tax differences, reclassification adjustments were made as follows:
| | Accumulated Net | | | | | | | | |
| | Investment Income/ | | | | | | | | |
| | (Distributions | | | | | | | | |
| | in Excess of Net | | Accumulated | | | |
| | Investment Income) | | Net Realized | | Paid-In |
| | ($)* | | Gains/(Losses) ($)* | | Capital ($) |
| Opportunity Fund | | | 90,660 | | | | (89,736 | ) | | | (924 | ) |
| Opportunity Fund (Class I) | | | 574,665 | | | | (562,441 | ) | | | (12,224 | ) |
____________________
| * | These components of capital are presented together as “Total distributable earnings/(loss)” on the Statements of Assets and Liabilities. |
The reclassification for the Funds primarily relate to net investment loss.
7. Significant Shareholders:
Shareholders, including other funds, individuals, and accounts, as well as each Fund’s investment manager(s) and/or investment personnel, may from time to time own (beneficially or of record) a significant percentage of the Fund’s Shares and can be considered to “control” the Fund when that ownership exceeds 25% of the Fund’s assets (and which may differ from control as determined in accordance with GAAP).
| HSBC FAMILY OF FUNDS |
| Notes to Financial Statements—as of October 31, 2018 (continued) |
The following list includes the Funds which had individual shareholder accounts with ownership of voting securities greater than 10% of the total outstanding voting securities but less than 25% and/or accounts with ownership of voting securities greater than 25% of the total outstanding voting securities. Significant transactions by these shareholder accounts may negatively impact the Funds’ performance.
| | Number of shareholders | | | | | | | | | | | |
| | with ownership of | | | | | | Number of shareholders | | | | | |
| | voting securities of the | | | | | | with ownership of | | | | | |
| | Portfolio greater than | | | | | | voting securities of the | | % owned in |
| | 10% and less than 25% | | % owned in | | Portfolio greater than 25% | | aggregate |
| | of the total Portfolio’s | | aggregate | | of the total Portfolio’s | | by greater |
| | outstanding voting | | by 10% - 25% | | outstanding voting | | than 25% |
| Fund | | securities | | shareholders | | securities | | shareholders |
| Opportunity Fund | | | — | | | | — | | | 1 | | | 71 | % | |
| Opportunity Fund (Class I) | | | 3 | | | | 49% | | | 1 | | | 27 | % | |
8. Investment Risks:
Currency Risk: Fluctuations in exchange rates between the U.S. dollar and foreign currencies, or between various foreign currencies, may negatively affect the Funds’ performance. The Funds may seek to reduce currency risk by hedging part or all of its exposure to various foreign currencies; however, even if such hedging techniques are employed, there is no assurance that they will be successful.
Equity Securities Risk: The prices of equity securities fluctuate from time to time based on changes in a company’s financial condition or overall market and economic conditions. As a result, the value of equity securities may fluctuate drastically from day to day.
Foreign Securities Risk: Investments in foreign securities are generally considered riskier than investments in U.S. securities. Foreign securities, including those of emerging and frontier market issuers, are subject to additional risks, including international trade, political and regulatory risks.
Market Risk: The value of the Funds’ investments may decline due to changing economic, political, social, regulatory or market conditions. Market risk may affect a single issuer, industry or sector of the economy or it may affect the economy as a whole. Moreover, the conditions in one country or geographic region could adversely affect the Funds’ investments in a different country or geographic region.
9. Recent Accounting Pronouncements:
In August 2018, the FASB issued ASU No. 2018-13, “Fair Value Measurements” (“ASU 2018-13”). This update makes certain removals from, changes to and additions to existing disclosure requirements for fair value measurements. ASU 2018-13 does not change fair value measurements already required or permitted by existing standards. ASU 2018-13 is effective for financial statements issued for fiscal years beginning after December 15, 2019, and interim periods within those fiscal years. As permitted, the Funds have early adopted ASU 2018-13 with the financial statements prepared as of October 31, 2018.
In August 2018, the Securities and Exchange Commission (“SEC”) adopted amendments to certain financial statement disclosure requirements to conform them to GAAP for investment companies. These amendments made certain removals from, changes to and additions to existing disclosure requirements under Regulation S-X. The Funds’ adoption of these amendments, effective with the financial statements prepared as of October 31, 2018 had no effect on the Funds’ net assets or results of operations. As a result of adopting these amendments, the distributions to shareholders in the October 31, 2017 Statements of Changes in Net Assets presented herein have been reclassified to conform to the current year presentation, which includes all
| HSBC FAMILY OF FUNDS |
| Notes to Financial Statements—as of October 31, 2018 (continued) |
distributions to each class of shareholders, other than tax basis return of capital distributions, in one line item per share class. Prior to adoption of this amendment, the distributions to shareholders in the October 31, 2017 Statements of Changes in Net Assets appeared as follows:
| | Opportunity Fund | | Opportunity Fund (Class I) |
| | For the year ended | | For the year ended |
| | October 31, 2017 ($) | | October 31, 2017 ($) |
| Distributions: | | | | | | | | | | |
| Net Realized Gains: | | | | | | | | | | |
| Class A Shares | | | (1,128,826 | ) | | | | — | | |
| Class B Shares | | | (12,613 | ) | | | | — | | |
| Class C Shares | | | (79,223 | ) | | | | — | | |
| Class I Shares | | | — | | | | | (14,495,106 | ) | |
| Total | | | (1,220,662 | ) | | | | (14,495,106 | ) | |
10. Subsequent Events:
Management has evaluated subsequent events through the date these financial statements were issued. Based on the evaluation, no adjustments or additional disclosures were required to the financial statements as of October 31, 2018.
Report of Independent Registered Public Accounting Firm
To the Board of Trustees of HSBC Funds and Shareholders of HSBC Opportunity Fund and HSBC Opportunity Fund (Class I)
Opinions on the Financial Statements
We have audited the accompanying statements of assets and liabilities of HSBC Opportunity Fund and HSBC Opportunity Fund (Class I) (two of the funds constituting HSBC Funds, hereafter collectively referred to as the “Funds”) as of October 31, 2018, the related statements of operations for the year ended October 31, 2018, the statements of changes in net assets for each of the two years in the period ended October 31, 2018, including the related notes, and the financial highlights for each of the four years in the period ended October 31, 2018 (collectively referred to as the “financial statements”). In our opinion, the financial statements present fairly, in all material respects, the financial position of each of the Funds as of October 31, 2018, the results of each of their operations for the year then ended, the changes in each of their net assets for each of the two years in the period ended October 31, 2018 and each of the financial highlights for each of the four years in the period ended October 31, 2018 in conformity with accounting principles generally accepted in the United States of America.
The financial statements and financial highlights as of and for the year ended October 31, 2014 (not presented herein, other than the financial highlights) were audited by other auditors whose report dated December 23, 2014 expressed an unqualified opinion on those financial statements and financial highlights.
Basis for Opinions
These financial statements are the responsibility of the Funds’ management. Our responsibility is to express an opinion on the Funds’ financial statements based on our audits. We are a public accounting firm registered with the Public Company Accounting Oversight Board (United States) (“PCAOB”) and are required to be independent with respect to the Funds in accordance with the U.S. federal securities laws and the applicable rules and regulations of the Securities and Exchange Commission and the PCAOB.
We conducted our audits of these financial statements in accordance with the standards of the PCAOB. Those standards require that we plan and perform the audit to obtain reasonable assurance about whether the financial statements are free of material misstatement, whether due to error or fraud.
Report of Independent Registered Public Accounting Firm (continued)
Our audits included performing procedures to assess the risks of material misstatement of the financial statements, whether due to error or fraud, and performing procedures that respond to those risks. Such procedures included examining, on a test basis, evidence regarding the amounts and disclosures in the financial statements. Our audits also included evaluating the accounting principles used and significant estimates made by management, as well as evaluating the overall presentation of the financial statements. Our procedures included confirmation of securities owned as of October 31, 2018 by correspondence with the fund accounting agent for the HSBC Opportunity Portfolio, the master fund in which the Funds invest. We believe that our audits provide a reasonable basis for our opinions.
PricewaterhouseCoopers LLP
New York, New York
December 20, 2018
We have served as the auditor of one or more investment companies in the HSBC Funds since 2015.
| HSBC FAMILY OF FUNDS |
| Other Federal Income Tax Information—as of October 31, 2018 (Unaudited) |
During the year ended October 31, 2018, the following Funds declared capital gain distributions:
| | Short Term | | Long Term |
| | Capital Gain | | Capital Gain |
| | Distributions ($) | | Distributions ($) |
| Opportunity Fund | | 468,858 | | 657,833 |
| Opportunity Fund (Class I) | | 8,359,597 | | 9,280,015 |
For the year ended October 31, 2018, the following percentages of the total ordinary income dividends paid by the Fund qualify for the corporate dividends received deduction available to corporate shareholders:
| Dividends |
| Received |
| Deduction (%) |
| Opportunity Fund (Class I) | 11.27% |
For the year ended October 31, 2018, dividends paid by the Funds may be subject to a maximum tax rate of 15%, as provided for by the Jobs and Growth Tax Relief Reconciliation Act of 2003. The Fund intends to designate the maximum amount allowable as taxed at a maximum rate of 15%. Complete information will be reported in conjunction with your 2018 Form 1099-DIV:
| Qualified |
| Dividend |
| Income % |
| Opportunity Fund (Class I) | 11.81% |
| HSBC FAMILY OF FUNDS |
| Table of Shareholder Expenses—as of October 31, 2018 (Unaudited) |
As a shareholder of the Funds, you incur two types of costs: (1) transaction costs, including sales charges (loads) on purchases, redemption fees and exchange fees; and (2) ongoing costs, including management fees, distribution fees and /or shareholder servicing fees and other Fund expenses (including expenses allocated from the Portfolios). These examples are intended to help you understand your ongoing costs (in dollars) of investing in the Funds and to compare these cost with the ongoing costs of investing in other mutual funds.
These examples are based on an investment of $1,000 invested at the beginning of the period and held for the entire period from May 1, 2018 through October 31, 2018.
Actual Example
The table below provides information about actual account values and actual expenses. You may use the information below, together with the amount you invested, to estimate the expenses that you paid over the period. Simply divide your account value by $1,000 (for example, an $8,600 account value divided by $1,000 = 8.6), then multiply the result by the number in the table under the heading entitled “Expenses Paid During Period” to estimate the expenses you paid on your account during this period.
| | | | | | | | | | | | | | | | | | | Annualized |
| | | | Beginning | | Ending | | Expenses Paid | | Expense Ratio |
| | | | Account Value | | Account Value | | During Period* | | During Period |
| | | | 5/1/18 | | 10/31/18 | | 5/1/18 - 10/31/18 | | 5/1/18 - 10/31/18 |
| Opportunity Fund | | Class A Shares | | | $ | 1,000.00 | | | | $ | 957.90 | | | | $ | 7.65 | | | | 1.55 | % | |
| | Class B Shares | | | | 1,000.00 | | | | | 953.60 | | | | | 11.33 | | | | 2.30 | % | |
| | Class C Shares | | | | 1,000.00 | | | | | 953.30 | | | | | 11.32 | | | | 2.30 | % | |
| Opportunity Fund (Class I) | | Class I Shares | | | | 1,000.00 | | | | | 960.60 | | | | | 5.44 | | | | 1.10 | % | |
____________________
| * | Expenses are equal to the average account value over the period, multiplied by the Fund’s annualized expense ratio, multiplied by 184/365 (to reflect the one half year period). |
Hypothetical Example for Comparison Purposes
The table below provides information about hypothetical account values and hypothetical expenses based on each Fund’s actual expense ratio and an assumed rate of return of 5% per year before expenses, which is not the Fund’s actual return. The hypothetical account values and expenses may not be used to estimate the actual ending account balance or expenses you paid for the period. You may use this information to compare this 5% hypothetical example with the 5% hypothetical examples that appear in the shareholder reports of other funds.
Please note that the expenses shown in the table are meant to highlight your ongoing costs only and do not reflect any transactional costs, such as sales charges (loads), redemption fees, or exchange fees. Therefore, the table is useful in comparing ongoing costs only, and will not help you determine the relative total costs of owning different funds. In addition, if these transactional costs were included, your costs would have been higher.
| | | | | | | | | | | | | | | | | | | Annualized |
| | | | Beginning | | Ending | | Expenses Paid | | Expense Ratio |
| | | | Account Value | | Account Value | | During Period* | | During Period |
| | | | 5/1/18 | | 10/31/18 | | 5/1/18 - 10/31/18 | | 5/1/18 - 10/31/18 |
| Opportunity Fund | | Class A Shares | | | $ | 1,000.00 | | | | $ | 1,017.39 | | | | $ | 7.88 | | | | 1.55 | % | |
| | Class B Shares | | | | 1,000.00 | | | | | 1,013.61 | | | | | 11.67 | | | | 2.30 | % | |
| | Class C Shares | | | | 1,000.00 | | | | | 1,013.61 | | | | | 11.67 | | | | 2.30 | % | |
| Opportunity Fund (Class I) | | Class I Shares | | | | 1,000.00 | | | | | 1,019.66 | | | | | 5.60 | | | | 1.10 | % | |
____________________
| * | Expenses are equal to the average account value over the period, multiplied by the Fund’s annualized expense ratio, multiplied by 184/365 (to reflect the one half year period). |
| Portfolio Reviews |
| Portfolio Composition* |
| October 31, 2018 (Unaudited) |
| HSBC Opportunity Portfolio |
| Percentage of |
| Investment Allocation | Investments at Value (%) |
| IT Services | | 10.8 | |
| Software | | 8.6 | |
| Biotechnology | | 5.8 | |
| Hotels, Restaurants & Leisure | | 4.9 | |
| Capital Markets | | 4.8 | |
| Oil, Gas & Consumable Fuels | | 4.3 | |
| Semiconductors & Semiconductor Equipment | | 4.3 | |
| Pharmaceuticals | | 3.7 | |
| Aerospace & Defense | | 3.5 | |
| Life Sciences Tools & Services | | 3.5 | |
| Machinery | | 3.5 | |
| Road & Rail | | 3.4 | |
| Equity Real Estate Investment Trusts | | 3.2 | |
| Chemicals | | 3.0 | |
| Professional Services | | 2.9 | |
| Health Care Equipment & Supplies | | 2.8 | |
| Specialty Retail | | 2.6 | |
| Diversified Consumer Services | | 2.6 | |
| Insurance | | 2.6 | |
| Entertainment | | 2.6 | |
| Building Products | | 2.2 | |
| Thrifts & Mortgage Finance | | 2.0 | |
| Health Care Providers & Services | | 1.9 | |
| Containers & Packaging | | 1.8 | |
| Investment Companies | | 1.7 | |
| Electronic Equipment, Instruments & | | | |
| Components | | 1.7 | |
| Media | | 1.4 | |
| Construction & Engineering | | 1.1 | |
| Banks | | 1.0 | |
| Communications Equipment | | 0.9 | |
| Construction Materials | | 0.8 | |
| Technology Hardware, Storage & Peripherals | | 0.1 | |
| Total | | 100.0 | |
____________________
* Portfolio composition is subject to change. |
| HSBC OPPORTUNITY PORTFOLIO |
| Schedule of Portfolio Investments—as of October 31, 2018 |
| Common Stocks — 97.8% |
| | | | | |
| | Shares | | Value ($) |
| Aerospace & Defense — 3.5% | | | | |
| Teledyne Technologies, Inc. (a) | | 12,545 | | 2,775,958 |
| TransDigm Group, Inc. (a) | | 7,176 | | 2,369,874 |
| | | | 5,145,832 |
| Banks — 1.0% | | | | |
| East West BanCorp, Inc. | | 28,170 | | 1,477,235 |
| Biotechnology — 5.6% | | | | |
| Acceleron Pharma, Inc. (a) | | 45,060 | | 2,287,695 |
| Agios Pharmaceuticals, Inc. (a) | | 23,800 | | 1,500,828 |
| Alnylam Pharmaceuticals, Inc. (a) | | 18,960 | | 1,524,953 |
| Blueprint Medicines Corp. (a) | | 21,880 | | 1,329,648 |
| Sarepta Therapeutics, Inc. (a) | | 11,950 | | 1,598,432 |
| | | | 8,241,556 |
| Building Products — 2.2% | | | | |
| Lennox International, Inc. | | 15,275 | | 3,221,345 |
| Capital Markets — 4.8% | | | | |
| BGC Partners, Inc. | | 212,180 | | 2,246,986 |
| LPL Financial Holdings, Inc. | | 36,600 | | 2,254,560 |
| Raymond James Financial, Inc. | | 32,910 | | 2,523,867 |
| | | | 7,025,413 |
| Chemicals — 2.9% | | | | |
| Orion Engineered Carbons SA | | 80,010 | | 2,065,058 |
| W.R. Grace & Co. | | 34,535 | | 2,237,523 |
| | | | 4,302,581 |
| Communications Equipment — 0.9% | | | | |
| CommScope Holding Co., Inc. (a) | | 55,000 | | 1,323,300 |
| Construction & Engineering — 1.1% | | | | |
| MasTec, Inc. (a) | | 37,520 | | 1,632,495 |
| Construction Materials — 0.8% | | | | |
| Summit Materials, Inc., Class A (a) | | 88,501 | | 1,194,764 |
| Containers & Packaging — 1.8% | | | | |
| Avery Dennison Corp. | | 29,180 | | 2,647,210 |
| Diversified Consumer Services — 2.6% | | | | |
| Frontdoor, Inc. (a) | | 49,765 | | 1,694,498 |
| Servicemaster Global | | | | |
| Holdings, Inc. (a) | | 48,260 | | 2,069,389 |
| | | | 3,763,887 |
| Electronic Equipment, Instruments & Components — 1.7% |
| FLIR Systems, Inc. | | 53,560 | | 2,480,364 |
| Entertainment — 2.6% | | | | |
| Lions Gate Entertainment, Class B | | 80,710 | | 1,435,831 |
| Madison Square Garden Co., | | | | |
| Class A (a) | | 8,343 | | 2,307,841 |
| | | | 3,743,672 |
| Equity Real Estate Investment Trusts — 3.1% | | |
| QTS Realty Trust, Inc. | | 55,000 | | 2,107,600 |
| Sun Communities, Inc. | | 24,810 | | 2,492,661 |
| | | | 4,600,261 |
| Health Care Equipment & Supplies — 2.8% | | |
| Haemonetics Corp. (a) | | 13,960 | | 1,458,401 |
| STERIS plc | | 24,375 | | 2,664,431 |
| | | | 4,122,832 |
| Health Care Providers & Services — 1.9% | | |
| Quest Diagnostics, Inc. | | 29,860 | | 2,810,125 |
| Hotels, Restaurants & Leisure — 4.9% | | | | |
| Jack in the Box, Inc. | | 33,230 | | 2,622,844 |
| Penn National Gaming, Inc. (a) | | 60,890 | | 1,478,409 |
| Vail Resorts, Inc. | | 12,290 | | 3,088,722 |
| | | | | 7,189,975 |
| Insurance — 2.6% | | | | |
| Arthur J. Gallagher & Co. | | 50,610 | | 3,745,646 |
| IT Services — 10.8% | | | | |
| Black Knight, Inc. (a) | | 68,550 | | 3,343,183 |
| Gartner, Inc. (a) | | 14,990 | | 2,211,325 |
| Godaddy, Inc., Class A (a) | | 40,330 | | 2,950,946 |
| Total System Services, Inc. | | 45,340 | | 4,132,740 |
| Twilio, Inc. (a) | | 10,290 | | 774,014 |
| WEX INC (a) | | 12,610 | | 2,218,856 |
| | | | 15,631,064 |
| Life Sciences Tools & Services — 3.5% | | | | |
| BIO-RAD Laboratories, Inc., | | | | |
| Class A (a) | | 9,000 | | 2,455,650 |
| Mettler-Toledo International, Inc. (a) | | 4,884 | | 2,670,669 |
| | | | 5,126,319 |
| Machinery — 3.5% | | | | |
| Crane Co. | | 31,750 | | 2,763,520 |
| Flowserve Corp. | | 51,230 | | 2,351,457 |
| | | | 5,114,977 |
| Media — 1.4% | | | | |
| Nexstar Media Group, Inc., Class A | | 26,980 | | 2,020,532 |
| Oil, Gas & Consumable Fuels — 4.3% | | | | |
| Diamondback Energy, Inc. | | 23,770 | | 2,670,796 |
| PBF Energy, Inc. | | 42,510 | | 1,779,044 |
| WPX Energy, Inc. (a) | | 116,290 | | 1,865,292 |
| | | | 6,315,132 |
| Pharmaceuticals — 3.8% | | | | |
| Catalent, Inc. (a) | | 23,850 | | 962,109 |
| Jazz Pharmaceuticals plc (a) | | 18,949 | | 3,009,480 |
| The Medicines Co. (a) | | 63,460 | | 1,476,080 |
| | | | 5,447,669 |
| Professional Services — 2.9% | | | | |
| CoStar Group, Inc. (a) | | 5,585 | | 2,018,531 |
| Transunion | | 33,260 | | 2,186,845 |
| | | | 4,205,376 |
| Road & Rail — 3.4% | | | | |
| J. B. Hunt Transportation | | | | |
| Services, Inc. | | 32,085 | | 3,548,922 |
| Old Dominion Freight Line, Inc. | | 10,340 | | 1,348,543 |
| | | | 4,897,465 |
| 26 | HSBC FAMILY OF FUNDS | See notes to financial statements. |
| HSBC OPPORTUNITY PORTFOLIO |
| Schedule of Portfolio Investments—as of October 31, 2018 (continued) |
| Common Stocks, continued |
| |
| Shares | | Value ($) |
| Semiconductors & Semiconductor Equipment — 4.2% |
| Marvell Technology Group, Ltd. | 126,810 | | | 2,080,952 |
| MKS Instruments, Inc. | 21,330 | | | 1,571,808 |
| On Semiconductor Corp. (a) | 149,850 | | | 2,547,450 |
| | | | 6,200,210 |
| Software — 8.5% | | | | |
| Envestnet, Inc. (a) | 27,950 | | | 1,453,959 |
| Fortinet, Inc. (a) | 32,620 | | | 2,680,712 |
| Guidewire Software, Inc. (a) | 31,110 | | | 2,767,857 |
| New Relic, Inc. (a) | 8,020 | | | 715,785 |
| RealPage, Inc. (a) | 54,080 | | | 2,866,239 |
| Splunk, Inc. (a) | 18,555 | | | 1,852,531 |
| | | | 12,337,083 |
| Specialty Retail — 2.6% | | | | |
| Burlington Stores, Inc. (a) | 18,640 | | | 3,196,573 |
| Floor & Decor Holdings, Inc., | | | | |
| Class A (a) | 25,210 | | | 644,872 |
| | | | 3,841,445 |
| Technology Hardware, Storage & Peripherals — 0.1% |
| NCR Corp. (a) | 7,290 | | | 195,737 |
| Thrifts & Mortgage Finance — 2.0% | | | | |
| Essent Group, Ltd. (a) | 74,680 | | | 2,943,886 |
| TOTAL COMMON STOCKS | | | | |
| (COST $133,906,371) | | | | 142,945,388 |
| |
| Investment Company — 1.7% | | | | |
| | | | | |
| Northern Institutional Government | | | | |
| Select Portfolio, Institutional Shares, | | | | |
| 1.92% (b) | 2,505,718 | | | 2,505,718 |
| TOTAL INVESTMENT COMPANY | | | | |
| (Cost $2,505,718) | | | | 2,505,718 |
| TOTAL INVESTMENTS | | | | |
| IN SECURITIES | | | | |
| (Cost $136,412,089) — 99.5% | | | | 145,451,106 |
| Other Assets (Liabilities) — 0.5% | | | | 734,287 |
| NET ASSETS — 100% | | | $ | 146,185,393 |
____________________
| (a) | Represents non-income producing security. |
| (b) | The rate represents the annualized one day yield that was in effect on October 31, 2018. |
| See notes to financial statements. | HSBC FAMILY OF FUNDS | 27 |
HSBC FAMILY OF FUNDS
Statement of Assets and Liabilities—as of October 31, 2018
| | HSBC |
| | Opportunity |
| | Portfolio |
| Assets: | | | | | |
| Investment in securities, at value | | | $ | 145,451,106 | |
| Dividends receivable | | | | 14,239 | |
| Receivable for investments sold | | | | 1,082,220 | |
| Prepaid expenses and other assets | | | | 2,180 | |
| Total Assets | | | | 146,549,745 | |
| | | | | | |
| Liabilities: | | | | | |
| Payable for investments purchased | | | | 202,165 | |
| Accrued expenses and other liabilities: | | | | | |
| Investment Management | | | | 32,595 | |
| Sub-Advisory | | | | 71,707 | |
| Administration | | | | 2,513 | |
| Accounting | | | | 5,913 | |
| Custodian | | | | 4,968 | |
| Printing | | | | 2,105 | |
| Professional | | | | 35,890 | |
| Trustee | | | | 4,500 | |
| Other | | | | 1,996 | |
| Total Liabilities | | | $ | 364,352 | |
| | | | | | |
| Net Assets Applicable to investors’ beneficial interest | | | $ | 146,185,393 | |
| Investments in securities, at cost | | | $ | 136,412,089 | |
| 28 | HSBC FAMILY OF FUNDS | See notes to financial statements. |
HSBC FAMILY OF FUNDS
Statement of Operations—For the year ended October 31, 2018
| | HSBC |
| | Opportunity |
| | Portfolio |
| Investment Income: | | | | | |
| Dividends | | | $ | 1,100,379 | |
| Foreign tax withholding | | | | (12,230 | ) |
| Total Investment Income | | | | 1,088,149 | |
| | | | | | |
| Expenses: | | | | | |
| Investment Management Fees | | | | 387,585 | |
| Sub-Advisory Fees | | | | 852,690 | |
| Administration | | | | 30,127 | |
| Accounting | | | | 48,239 | |
| Compliance Services | | | | 28,431 | |
| Custodian | | | | 25,375 | |
| Printing | | | | 3,115 | |
| Professional | | | | 145,234 | |
| Trustee | | | | 72,225 | |
| Other | | | | 22,703 | |
| Total Expenses | | | | 1,615,724 | |
| | | | | | |
| Net Investment Income/(Loss) | | | $ | (527,575 | ) |
| | | | | | |
| Net Realized/Unrealized Gains/(Losses) from Investments: | | | | | |
| Net realized gains/(losses) from investment securities | | | | 24,051,438 | |
| Change in unrealized appreciation/depreciation on investment securities | | | | (13,845,082 | ) |
| | | | | | |
| Net realized/unrealized gains/(losses) on investments | | | | 10,206,356 | |
| Change in Net Assets Resulting from Operations | | | $ | 9,678,781 | |
| See notes to financial statements. | HSBC FAMILY OF FUNDS | 29 |
HSBC FAMILY OF FUNDS
Statements of Changes in Net Assets
| | HSBC Opportunity Portfolio |
| | For the | For the |
| | year ended | year ended |
| | October 31, 2018 | October 31, 2017 |
| Investment Activities: | | | | | | | | | | | |
| Operations: | | | | | | | | | | | |
| Net investment income/(loss) | | | $ | (527,575 | ) | | | $ | (209,643 | ) | |
| Net realized gains/(losses) from investments | | | | 24,051,438 | | | | | 21,092,686 | | |
| Change in unrealized appreciation/depreciation on investments | | | | (13,845,082 | ) | | | | 16,915,512 | | |
| Change in net assets resulting from operations | | | | 9,678,781 | | | | | 37,798,555 | | |
| Proceeds from contributions | | | | 19,843,046 | | | | | 4,637,280 | | |
| Value of withdrawals | | | | (21,193,603 | ) | | | | (55,806,665 | ) | |
| Change in net assets resulting from transactions in investors’ beneficial interest | | | | (1,350,557 | ) | | | | (51,169,385 | ) | |
| Change in net assets | | | | 8,328,224 | | | | | (13,370,830 | ) | |
| | | | | | | | | | | | |
| Net Assets: | | | | | | | | | | | |
| Beginning of period | | | | 137,857,169 | | | | | 151,227,999 | | |
| End of period | | | $ | 146,185,393 | | | | $ | 137,857,169 | | |
| 30 HSBC FAMILY OF FUNDS | See notes to financial statements. |
| HSBC OPPORTUNITY PORTFOLIO |
| Financial Highlights |
| | | | | Ratios/Supplementary Data |
| | | | | | | | | | | | | | | Ratio of Net | | | | | |
| | | | | | | | | | | | | | | Investment | | | | | |
| | | | | | | | | | Ratio of Net | | Income/ | | | | | |
| | | | | Net Assets at | | Expenses to | | (Loss) to | | | | | |
| | Total | | End of Period | | Average Net | | Average Net | | Portfolio |
| | Return | | (000’s) | | Assets | | Assets | | Turnover |
| HSBC OPPORTUNITY PORTFOLIO | | | | | | | | | | | | | | | | | | | | | | | |
| Year Ended October 31, 2018 | | 6.99 | % | | | $ | 146,185 | | | | 1.04 | % | | | | (0.34 | )% | | | | 77 | % | |
| Year Ended October 31, 2017 | | 29.79 | % | | | | 137,857 | | | | 0.91 | % | | | | (0.15 | )% | | | | 80 | % | |
| Year Ended October 31, 2016 | | (3.14 | )% | | | | 151,228 | | | | 0.89 | % | | | | (0.01 | )% | | | | 96 | % | |
| Year Ended October 31, 2015 | | (1.57 | )% | | | | 237,595 | | | | 0.88 | % | | | | (0.19 | )% | | | | 63 | % | |
| Year Ended October 31, 2014 | | 12.26 | % | | | | 222,581 | | | | 0.88 | % | | | | (0.37 | )% | | | | 66 | % | |
| See notes to financial statements. | HSBC FAMILY OF FUNDS 31 |
| HSBC FAMILY OF FUNDS |
| Notes to Financial Statements—as of October 31, 2018 |
1. Organization:
The HSBC Funds (the “Trust”), a Delaware statutory trust organized on March 2, 2016, is registered under the Investment Company Act of 1940, as amended (the “Act”), as an open-end management investment company. As of October 31, 2018, the Trust is composed of 10 separate operational funds, each a series of the HSBC Family of Funds. The accompanying financial statements are presented for the HSBC Opportunity Portfolio (the “Portfolio”).
The Portfolio operates as a master fund in a master-feeder arrangement, in which the two feeder funds invest all or part of their investable assets in the Portfolio. The Agreement and Declaration of Trust permits the Board of Trustees (the “Board”) to issue an unlimited number of beneficial interests in the Portfolio.
The Portfolio is a diversified series of the Trust. Financial statements for all other funds of the Trust are published separately.
The following represents each feeder fund’s proportionate ownership interest in the Portfolio:
| | Proportionate |
| | Ownership |
| | Interest on |
| Feeder Fund | | October 31, 2018 (%) |
| Opportunity Fund | | | 6.5 | |
| Opportunity Fund (Class I) | | | 93.5 | |
Under the Trust’s organizational documents, the Trust’s officers and Trustees are indemnified against certain liabilities arising out of the performance of their duties to the Portfolio. In addition, in the normal course of business, the Trust may enter into contracts with its service providers, which also provide for indemnifications by the Portfolio. The Portfolio’s maximum exposure under these arrangements is unknown as this would involve future claims that may be made against the Portfolio. However, based on experience, the Trust believes the risk of loss to be remote.
The Portfolio is an investment company and follows accounting and reporting guidance under Financial Accounting Standards Board (“FASB”) Accounting Standards Codification (“ASC”) Topic 946, “Financial Services-Investment Companies.”
2. Significant Accounting Policies:
The following is a summary of the significant accounting policies followed by the Portfolio in the preparation of its financial statements. The policies are in conformity with generally accepted accounting principles in the United States of America (“GAAP”). The preparation of financial statements requires management to make certain estimates and assumptions that affect the reported amounts of assets and liabilities and disclosure of contingent assets and liabilities at the date of the financial statements and the reported amounts of increases and decreases in net assets from operations during the reporting period. Actual results could differ from those estimates.
Securities Valuation:
The Portfolio records its investments at fair value. Fair value is defined as the price that would be received to sell an asset or paid to transfer a liability in an orderly transaction between market participants at the measurement date. The valuation techniques used to determine fair value are further described in Note 3 below.
| HSBC FAMILY OF FUNDS |
| Notes to Financial Statements—as of October 31, 2018 (continued) |
Investment Transactions and Related Income:
Investment transactions are accounted for no later than one business day after trade date. However, for financial reporting purposes, investment transactions are accounted for on trade date. Investment gains and losses are calculated on the identified cost basis. Interest income is determined on the basis of coupon interest accrued using the effective interest method which adjusts for amortization of premiums and accretion of discounts. Dividend income is recorded on the ex-dividend date.
The Portfolio makes an allocation of its investment income, expenses and realized gains and losses from securities transactions to its investors in proportion to their investment in the Portfolio on the date of such accrual or gain/loss.
Restricted Securities and Illiquid Securities:
The Portfolio may invest in restricted securities. A restricted security is a security which has been purchased through a private offering and cannot be resold to the general public without prior registration under the Securities Act of 1933 (the “1933 Act”) or pursuant to the resale limitations provided by Rule 144 under the 1933 Act, or another exemption from the registration requirements of the 1933 Act. Certain restricted securities may be resold in transactions exempt from registration, normally to qualified institutional buyers, and may be deemed liquid by the Investment Adviser (as defined in Note 4) based on procedures established by the Board. Therefore, not all restricted securities are considered illiquid. To the extent that the Portfolio purchases securities that are restricted as to resale or for which current market quotations are not available, such securities will be valued based upon all relevant factors as outlined in SEC Financial Reporting Release No. 1. Disposal of restricted securities may involve time consuming negotiations and expense. Prompt sale at the current valuation may be difficult and could adversely affect the net assets of the Portfolio.
Allocations:
Expenses directly attributable to the Portfolio are charged to the Portfolio. Expenses not directly attributable to the Portfolio are allocated among the applicable series within the Trust equally to each fund, in relation to their net assets, or another appropriate basis.
Federal Income Taxes:
The Portfolio is treated as a partnership for U.S. federal income tax purposes. Accordingly, the Portfolio passes through all of its net investment income and gains and losses to its feeder funds, and is therefore not subject to U.S. federal income tax. As such, feeder funds are allocated for tax purposes their respective share of the Portfolio’s ordinary income and realized gains or losses. It is intended that the Portfolio will continue to be managed in such a way that its feeder funds will be able to satisfy the requirements of the Internal Revenue Code, as amended, applicable to regulated investment companies.
Management of the Portfolio has reviewed tax positions taken in tax years that remain subject to examination by all major tax jurisdictions, including federal (i.e., the last four tax year ends and the interim tax period since then, as applicable). Management believes that there is no tax liability resulting from unrecognized tax benefits related to uncertain tax positions taken. Management’s conclusions may be subject to future review based on changes in, or interpretation of, accounting standards or tax laws and regulations.
| HSBC FAMILY OF FUNDS |
| Notes to Financial Statements—as of October 31, 2018 (continued) |
3. Investment Valuation Summary
The valuation techniques employed by the Portfolio, as described below, maximize the use of observable inputs and minimize the use of unobservable inputs in determining fair value. The Portfolio’s investments are classified within the fair value hierarchy based on the lowest level of input that is significant to the fair value measurement. The inputs used for valuing the Portfolio’s investments are summarized in the three broad levels listed below:
| ● | Level 1—quoted prices in active markets for identical assets |
| | |
| ● | Level 2—other significant observable inputs (including quoted prices for similar securities, interest rates, prepayments speeds, credit risk, etc.) |
| | |
| ● | Level 3—significant unobservable inputs (including the Fund’s own assumptions in determining the fair value of investments) |
Changes in valuation techniques may result in transfers in or out of an assigned level within the fair value hierarchy. The inputs or methodology used for valuing investments are not necessarily an indication of the risk associated with investing in those investments.
Exchange traded domestic equity securities are valued at the last sale price on a national securities exchange (except the NASDAQ Stock Market), or in the absence of recorded sales, at the readily available closing bid price on such exchanges. Securities traded on the NASDAQ Stock Market are valued at the NASDAQ Official Closing Price on the date of valuation. Domestic equity securities that are not traded on an exchange are valued at the quoted bid price in the over-the-counter market. These securities are typically categorized as Level 1 in the fair value hierarchy.
Shares of exchange traded and closed-end registered investment companies are valued in the same manner as other equity securities and are typically categorized as Level 1 in the fair value hierarchy. Investments in other mutual funds are valued at their net asset values (“NAVs”), as reported by such mutual funds and are typically categorized as Level 1 in the fair value hierarchy.
Securities or other assets for which market quotations or an independent pricing service evaluation are not readily available, or are deemed unreliable due to a significant event or otherwise, are valued pursuant to procedures adopted by the Board (“Procedures”). Depending on the source and relative significance of valuation inputs, these instruments may be classified as Level 2 or Level 3 in the fair value hierarchy. Examples of potentially significant events that could affect the value of an individual security and thus require pricing under the Procedures include corporate actions by the issuer, announcements by the issuer relating to its earnings or products, regulatory news, natural disasters, and litigation. Examples of potentially significant events that could affect multiple securities held by the Portfolio include governmental actions, natural disasters, and armed conflicts. Fair value pricing may require subjective determinations about the value of a security. While the Trust’s policy is intended to result in a calculation of the Portfolio’s NAV that fairly reflects security values as of the time of pricing, the Trust cannot ensure that fair values determined would accurately reflect the price that the Portfolio could obtain for a security if it were to dispose of that security as of the time of pricing. The prices used by the Portfolio may differ from the value that would be realized if the securities were sold and the differences could be material to the financial statements.
As of October 31, 2018, all investments were categorized as Level 1 in the fair value hierarchy. The breakdown of investment categorization is disclosed in the Schedule of Portfolio Investments.
| HSBC FAMILY OF FUNDS |
| Notes to Financial Statements—as of October 31, 2018 (continued) |
4. Related Party Transactions and Other Agreements and Plans:
Investment Management:
HSBC Global Asset Management (USA), Inc. (“HSBC” or the “Investment Adviser”), a wholly owned subsidiary of HSBC Bank USA, N.A., a national bank organized under the laws of the United States, acts as Investment Adviser to the Portfolio. As Investment Adviser, HSBC manages the investments of the Portfolio and continuously reviews, supervises, and administers the Portfolio’s investments pursuant to an Investment Advisory Contract. Westfield Capital Management Company, L.P. (“Westfield”) serves as subadviser for the Portfolio and is paid for its services directly by the Portfolio.
For their services, the Investment Adviser and Westfield receive in aggregate, a fee, accrued daily and paid monthly, at an annual rate of 0.80% of the Portfolio’s average daily net assets. Currently, the Investment Adviser’s contractual fee is 0.25% and Westfield’s contractual fee is 0.55%.
Administration, Fund Accounting and Other Services:
HSBC also serves the Portfolio as Administrator. Under the terms of the Administration Services Agreement, HSBC receives from the Portfolio (as well as other funds in the Trust combined) a fee, accrued daily and paid monthly, at an annual rate of:
| Based on Average Daily Net Assets of | | Fee Rate (%) |
| Up to $10 billion | | 0.0400 |
| In excess of $10 billion but not exceeding $20 billion | | 0.0350 |
| In excess of $20 billion but not exceeding $50 billion | | 0.0265 |
| In excess of $50 billion | | 0.0245 |
The fee rates and breakpoints are determined on the basis of the aggregate average daily net assets of the Trust, however, the assets of the funds of the HSBC Funds that invest in the Portfolio are not double-counted. For the year ended October 31, 2018, the effective annualized rate was 0.038%, prior to any fee waivers or expense reimbursements, based on the average daily net assets of the Trust. The total administration fee paid to HSBC is allocated to each series based upon its proportionate share of the aggregate net assets of the Trust. For assets invested in the Portfolio by the HSBC Funds, the Portfolio pays half of the administration fee and the feeder funds pay half of the administration fee, for a combination of the total fee rate set forth above.
Pursuant to a Sub-Administration Services Agreement with HSBC, Citi Fund Services Ohio, Inc. (“Citi”), a wholly-owned subsidiary of Citigroup, Inc., serves as the Trust’s Sub-Administrator. For these services, Citi is entitled to a fee, payable by HSBC, at an annual rate equivalent to the fee rates set forth below:
| Based on Average Daily Net Assets of | | Fee Rate (%) |
| Up to $10 billion | | 0.0200 |
| In excess of $10 billion but not exceeding $20 billion | | 0.0150 |
| In excess of $20 billion but not exceeding $50 billion | | 0.0065 |
| In excess of $50 billion | | 0.0045 |
Under a Services Agreement between the Trust and Citi (the “Services Agreement”), Citi makes an individual available to serve as the Trust’s Chief Compliance Officer (the “CCO”). Citi also provides infrastructure and support in implementing the written policies and procedures comprising the Trust’s compliance program, including support services to the CCO. For the services provided under the Services Agreement, the Trust paid Citi $313,915 for the year ended October 31, 2018, plus reimbursement of certain out-of-pocket expenses. Expenses incurred by the Portfolio are reflected on the Statements of Operations as “Compliance Services.” Citi pays the salary and other compensation earned by individuals performing these services, as employees of Citi.
In addition, Citi provides fund accounting services for the Portfolio under the Services Agreement. For its services to the Portfolio, Citi receives an annual fee per portfolio, subject to certain minimums and reimbursement of certain expenses. Citi receives additional fees paid by the Trust for regulatory administration services.
| HSBC FAMILY OF FUNDS |
| Notes to Financial Statements—as of October 31, 2018 (continued) |
Independent Trustees:
The Trust pays an annual retainer to each Independent Trustee, plus additional annual retainers to each Committee Chair and the Chairman of the Board. The Independent Trustees also receive a fee for each regular, special in-person, and telephonic meeting of the Board attended. The aggregate amount of the fees and expenses of the Independent Trustees are allocated amongst all the funds in the Trust and are presented in the Statements of Operations.
Other:
The Portfolio may purchase securities from an underwriting syndicate in which the principal underwriter or members of the syndicate are affiliated with the Adviser. For the year ended October 31, 2018, the Portfolio did not purchase any such securities.
The Adviser and its affiliates may have lending, banking, brokerage, underwriting, or other business relationships with the issuers of the securities in which the Portfolio invest.
5. Investment Transactions:
Cost of purchases and proceeds from sales of securities (excluding securities maturing less than one year from acquisition) for the year ended October 31, 2018 were as follows:
| | Purchases ($) | | Sales ($) |
| Opportunity Portfolio | | 116,001,916 | | 121,590,304 |
6. Federal Income Tax Information:
At October 31, 2018, the cost basis of investments for federal income tax purposes, gross unrealized appreciation, gross unrealized depreciation and net unrealized appreciation/depreciation were as follows:
| | | | | | | | Net Unrealized |
| | | | Tax Unrealized | | Tax Unrealized | | Appreciation/ |
| | Tax Cost ($) | | Appreciation ($) | | Depreciation ($) | | (Depreciation) ($)* |
| Opportunity Portfolio | | 136,809,683 | | 18,600,863 | | (9,959,440) | | 8,641,423 |
____________________
| * | The difference between book-basis unrealized appreciation (depreciation) is attributable primarily to tax deferral of losses on wash sales. |
7. Investment Risks:
Currency Risk: Fluctuations in exchange rates between the U.S. dollar and foreign currencies, or between various foreign currencies, may negatively affect the Portfolio’s performance. The Portfolio may seek to reduce currency risk by hedging part or all of its exposure to various foreign currencies; however, even if such hedging techniques are employed, there is no assurance that they will be successful.
Equity Securities Risk: The prices of equity securities fluctuate from time to time based on changes in a company’s financial condition or overall market and economic conditions. As a result, the value of equity securities may fluctuate drastically from day to day.
Foreign Securities Risk: Investments in foreign securities are generally considered riskier than investments in U.S. securities. Foreign securities, including those of emerging and frontier market issuers, are subject to additional risks, including international trade, political and regulatory risks.
Market Risk: The value of the Portfolio’s investments may decline due to changing economic, political, social, regulatory or market conditions. Market risk may affect a single issuer, industry or sector of the economy or it may affect the economy as a whole. Moreover, the conditions in one country or geographic region could adversely affect the Portfolio’s investments in a different country or geographic region.
| HSBC FAMILY OF FUNDS |
| Notes to Financial Statements—as of October 31, 2018 (continued) |
8. Recent Accounting Pronouncements:
In August 2018, the FASB issued ASU No. 2018-13, “Fair Value Measurements” (“ASU 2018-13”). This update makes certain removals from, changes to and additions to existing disclosure requirements for fair value measurements. ASU 2018-13 does not change fair value measurements already required or permitted by existing standards. ASU 2018-13 is effective for financial statements issued for fiscal years beginning after December 15, 2019, and interim periods within those fiscal years. As permitted, the Portfolio has early adopted ASU 2018-13 with the financial statements prepared as of October 31, 2018.
In August 2018, the SEC adopted amendments to certain financial statement disclosure requirements to conform them to GAAP for investment companies. These amendments made certain removals from, changes to and additions to existing disclosure requirements under Regulation S-X. The Portfolio’s adoption of these amendments, effective with the financial statements prepared as of October 31, 2018 had no effect on the Portfolio’s net assets or results of operations.
9. Subsequent Events:
Management has evaluated subsequent events through the date these financial statements were issued. Based on the evaluation, no adjustments or additional disclosures were required to the financial statements as of October 31, 2018.
Report of Independent Registered Public Accounting Firm
To the Board of Trustees of HSBC Funds and Shareholders of
HSBC Opportunity Portfolio
Opinion on the Financial Statements
We have audited the accompanying statement of assets and liabilities, including the schedule of portfolio investments, of HSBC Opportunity Portfolio (one of the funds constituting HSBC Funds, hereafter referred to as the “Fund”) as of October 31, 2018, the related statement of operations for the year ended October 31, 2018, the statement of changes in net assets for each of the two years in the period ended October 31, 2018, including the related notes, and the financial highlights for each of the four years in the period ended October 31, 2018 (collectively referred to as the “financial statements”). In our opinion, the financial statements present fairly, in all material respects, the financial position of the Fund as of October 31, 2018, the results of its operations for the year then ended, the changes in its net assets for each of the two years in the period ended October 31, 2018 and the financial highlights for each of the four years in the period ended October 31, 2018 in conformity with accounting principles generally accepted in the United States of America.
The financial statements and financial highlights as of and for the year ended October 31, 2014 (not presented herein, other than the financial highlights) were audited by other auditors whose report dated December 23, 2014 expressed an unqualified opinion on those financial statements and financial highlights.
Basis for Opinion
These financial statements are the responsibility of the Fund’s management. Our responsibility is to express an opinion on the Fund’s financial statements based on our audits. We are a public accounting firm registered with the Public Company Accounting Oversight Board (United States) (“PCAOB”) and are required to be independent with respect to the Fund in accordance with the U.S. federal securities laws and the applicable rules and regulations of the Securities and Exchange Commission and the PCAOB.
We conducted our audits of these financial statements in accordance with the standards of the PCAOB. Those standards require that we plan and perform the audit to obtain reasonable assurance about whether the financial statements are free of material misstatement, whether due to error or fraud.
Report of Independent Registered Public Accounting Firm (continued)
Our audits included performing procedures to assess the risks of material misstatement of the financial statements, whether due to error or fraud, and performing procedures that respond to those risks. Such procedures included examining, on a test basis, evidence regarding the amounts and disclosures in the financial statements. Our audits also included evaluating the accounting principles used and significant estimates made by management, as well as evaluating the overall presentation of the financial statements. Our procedures included confirmation of securities owned as of October 31, 2018 by correspondence with the custodian and brokers; when replies were not received from brokers, we performed other auditing procedures. We believe that our audits provide a reasonable basis for our opinion.
PricewaterhouseCoopers LLP
New York, New York
December 20, 2018
We have served as the auditor of one or more investment companies in the HSBC Funds since 2015.
| HSBC FAMILY OF FUNDS |
| Table of Shareholder Expenses—as of October 31, 2018 (Unaudited) |
As a shareholder of the Portfolio, you incur ongoing costs, including management fees and other Fund expenses.
These examples are intended to help you understand your ongoing costs (in dollars) of investing in the Portfolio and to compare these costs with the ongoing costs of investing in other mutual funds.
These examples are based on an investment of $1,000 invested at the beginning of the period and held for the entire period from May 1, 2018 through October 31, 2018.
Actual Example
The table below provides information about actual account values and actual expenses. You may use the information below, together with the amount you invested, to estimate the expenses that you paid over the period. Simply divide your account value by $1,000 (for example, an $8,600 account value divided by $1,000 = 8.6), then multiply the result by the number in the table under the heading entitled “Expenses Paid During Period” to estimate the expenses you paid on your account during this period.
| | | | | | | | Annualized |
| | Beginning | | Ending | | Expenses Paid | | Expense Ratio |
| | Account Value | | Account Value | | During Period* | | During Period |
| | 5/1/18 | | 10/31/18 | | 5/1/18 - 10/31/18 | | 5/1/18 - 10/31/18 |
| Opportunity Portfolio | | $1,000.00 | | $960.70 | | $5.24 | | 1.06% |
____________________
| * | Expenses are equal to the average account value over the period, multiplied by the Portfolio’s annualized expense ratio, multiplied by 184/365 (to reflect the one half year period). |
Hypothetical Example for Comparison Purposes
The table below provides information about hypothetical account values and hypothetical expenses based on the Portfolio’s actual expense ratio and an assumed rate of return of 5% per year before expenses, which is not the Portfolio’s actual return. The hypothetical account values and expenses may not be used to estimate the actual ending account balance or expenses you paid for the period. You may use this information to compare this 5% hypothetical example with the 5% hypothetical examples that appear in the shareholder reports of other funds.
Please note that the expenses shown in the table are meant to highlight your ongoing costs only and do not reflect any transactional costs, such as sales charges (loads), redemption fees, or exchange fees. Therefore, the table is useful in comparing ongoing costs only, and will not help you determine the relative total costs of owning different funds. In addition, if these transactional costs were included, your costs would have been higher.
| | | | | | | | Annualized |
| | Beginning | | Ending | | Expenses Paid | | Expense Ratio |
| | Account Value | | Account Value | | During Period* | | During Period |
| | 5/1/18 | | 10/31/18 | | 5/1/18 - 10/31/18 | | 5/1/18 - 10/31/18 |
| Opportunity Portfolio | | $1,000.00 | | $1,019.86 | | $5.40 | | 1.06% |
____________________
| * | Expenses are equal to the average account value over the period, multiplied by the Portfolio’s annualized expense ratio, multiplied by 184/365 (to reflect the one half year period). |
| HSBC FAMILY OF FUNDS |
| Board of Trustees and Officers (Unaudited) |
MANAGEMENT OF THE TRUST
The following table contains information regarding the HSBC Family of Funds’ Board of Trustees (“Trustees”). The HSBC Family of Funds’ Statement of Additional Information includes additional information about the Trustees and is available, without charge, upon request by calling (888) 525-5757.
| | | | | | | | Portfolios in | | Other |
| | Position(s) | | Term of Office | | | | Fund Complex | | Directorships |
| Name, | | Held with | | and Length of | | Principal Occupation(s) | | Overseen By | | Held by Trustee |
| Address, Age | | Funds | | Time Served | | During Past 5 Years | | Trustee* | | During Past 5 Years |
NON-INTERESTED
TRUSTEES | | | | | | | | | | |
| | | | | | | | | | | |
MARCIA L. BECK
P.O. Box 182845
Columbus, OH
43218-3035
Age: 63 | | Trustee | | Indefinite;
2008 to
present | | Private Investor (1999 – present) | | 10 | | None |
| | | | | | | | | | |
SUSAN C. GAUSE
P.O. Box 182845
Columbus, OH
43218-3035
Age: 66 | | Trustee | | Indefinite;
2013 to
present | | Private Investor (2003 - present) | | 10 | | Metropolitan Series Fund
(2012 – present); and
Met Investors Series
Trust (2008 – present) |
| | | | | | | | | | |
SUSAN S. HUANG
P.O. Box 182845
Columbus, OH
43218-3035
Age: 64 | | Trustee | | Indefinite;
2008 to
present | | Private Investor (2000 - present) | | 10 | | None |
| | | | | | | | | | |
THOMAS F. ROBARDS
P.O. Box 182845
Columbus, OH
43218-3035
Age: 72 | | Trustee and
Chairman | | Indefinite;
2005 to
present | | Private Investor (2003 - present) | | 10 | | Ellington Residential
Mortgage REIT (NYSE
listed real estate
investment trust)
(2013 – present);
Ellington Financial LLC
(NYSE listed financial
services company)
(2007 – present); and
Overseas Shipholding
Group (OSG)
(NYSE listed company)
(2005 – 2014) |
| | | | | | | | | | |
INTERESTED TRUSTEE | | | | | | | | | | |
| | | | | | | | | | |
DEBORAH HAZELL
452 Fifth Avenue
New York
NY 10018
Age: 55 | | Trustee | | Indefinite;
2011 to
present | | Director and Chief Executive Officer, HSBC Global Asset Management (USA) Inc. (2011 - present) | | 10 | | None |
____________________
| * | Includes all series of the HSBC Funds. |
| HSBC FAMILY OF FUNDS |
| Board of Trustees and Officers (Unaudited) (continued) |
| | Position(s) Held | | Term of Office and | | Principal Occupation(s) |
| Name, Address, Age | | Funds | | Length of Time Served | | During Past 5 Years |
| OFFICERS | | | | | | |
| | | | | | |
RICHARD A. FABIETTI
452 Fifth Avenue
New York,
NY 10018
Age: 60 | | President | | One year;
2004 to present | | Senior Vice President, HSBC Global Asset Management (USA) Inc. (1998 - present) |
| | | | | | |
JAMES D. LEVY
452 Fifth Avenue
New York, NY 10018
Age: 55 | | Vice President | | One year;
2014 to present | | Vice President, Product Management, HSBC Global Asset Management (USA) Inc. (2014 – present); Vice President, Mutual Funds Product Development, GE Asset Management Inc. (2007 – 2014) |
| | | | | | |
ALLAN SHAER*
Prudential Center
800 Boylston Street,
24th Floor
Boston, MA 02199
Age: 53 | | Treasurer | | One year;
2017 to present | | Senior Vice President, Citi Investor Services (2016 - present); Vice President, Mutual Fund Administration, JP Morgan Chase (2011 - 2016) |
| | | | | | |
IOANNIS TZOUGANATOS*
Prudential Center
800 Boylston Street, 24th Floor
Boston, MA 02199
Age: 42 | | Secretary | | One Year;
2015 to present | | Vice President, Regulatory Administration, Citi Fund Services (2008 - present) |
| | | | | | |
CHARLES BOOTH*
4400 Easton Commons,
Suite 200
Columbus, OH 43219-3035
Age: 58 | | Chief Compliance
Officer | | One year;
2015 to present | | Director and Compliance Officer, CCO Services, Citi Fund Services (1988 - present) |
____________________
| * | Mr. Shaer, Mr. Tzouganatos, and Mr. Booth also are officers of other investment companies of which Citi (or an affiliate) is the administrator or sub-administrator. |
| HSBC FAMILY OF FUNDS |
| Other Information (Unaudited) |
Information regarding how the Funds voted proxies relating to portfolio securities during the most recent 12-month period ended June 30th is available (i) without charge, upon request, by calling 1-800-525-5757 for HSBC Bank USA and HSBC Brokerage (USA) Inc. clients and 1-800-782-8183 for all other shareholders; (ii) on the Funds’ website at www.investorfunds.us.hsbc.com; and (iii) on the Security and Exchange Commission’s (“Commission”) website at http://www.sec.gov.
The Funds file their complete schedules of portfolio holdings with the Commission for the first and third quarters of each fiscal year on Form N-Q. The Funds’ Forms N-Q are available on the Commission’s website at http://www.sec.gov. The Funds’ Forms N-Q may be reviewed and copied at the Commission’s Public Reference Room in Washington, D.C. and information on the operation of the Public Reference Room may be obtained by calling 1-800-SEC-0330. The Funds’ Schedules of Investments will be available no later than 60 days after each period end, without charge, on the Funds’ website at www.investorfunds.us.hsbc.com.
An investment in a Fund is not a deposit of HSBC Bank USA, National Association, and is not insured or guaranteed by the Federal Deposit Insurance Corporation or any other government agency.
HSBC FAMILY OF FUNDS: INVESTMENT ADVISER AND ADMINISTRATOR HSBC Global Asset Management (USA) Inc.
452 Fifth Avenue
New York, NY 10018 SUB-ADVISER HSBC Opportunity Portfolio
Westfield Capital Management Company, L.P.
One Financial Center
Boston, MA 02111 | SHAREHOLDER SERVICING AGENTS For HSBC Bank USA, N.A. and
HSBC Securities (USA) Inc. Clients HSBC Bank USA, N.A.
452 Fifth Avenue
New York, NY 10018
1-888-525-5757 For All Other Shareholders HSBC Funds
P.O. Box 8106
Boston, MA 02266-8106
1-800-782-8183 TRANSFER AGENT DST Asset Manager Solutions, Inc.
2000 Crown Colony Drive
Quincy, MA 02169 DISTRIBUTOR Foreside Distribution Services, L.P.
Three Canal Plaza, Suite 100
Portland, ME 04101 CUSTODIAN The Northern Trust Company
50 South LaSalle Street
Chicago, IL 60603 INDEPENDENT REGISTERED PUBLIC ACCOUNTING FIRM PricewaterhouseCoopers LLP
300 Madison Avenue
New York, NY 10017 LEGAL COUNSEL Dechert LLP
1900 K Street, N.W.
Washington, D.C. 20006 |

| Investment products: |
ARE NOT A
BANK DEPOSIT
OR OBLIGATION
OF THE BANK
OR ANY OF ITS
AFFILIATES | ARE NOT
FDIC
INSURED | ARE NOT
INSURED BY
ANY FEDERAL
GOVERNMENT
AGENCY |
ARE NOT GUARANTEED BY
THE BANK OR ANY OF ITS
AFFILIATES | MAY LOSE
VALUE |
Investment products are offered by HSBC Securities (USA) Inc. (HSI), member NYSE/FINRA/SIPC. HSI is an affiliate of HSBC Bank USA, N.A. Investment products: Are not a deposit or other obligation of the bank or any of its affiliates; Not FDIC insured or insured by any federal government agency of the United States; Not guaranteed by the bank or any of its affiliates; and are subject to investment risk, including possible loss of principal invested.
Investors should consider the investment objectives, risks, charges, and expenses of the investment company carefully before investing. The prospectus contains this and other important information about the investment company. For clients of HSBC Securities (USA) Inc., please call 1-888-525-5757 for more information. For other investors and prospective investors, please call the Funds directly at 1-800-782-8183 or visit our website at www.investorfunds.us.hsbc.com. Investors should read the prospectus carefully before investing or sending money.
HSBC Global Asset Management (USA) Inc.
HSBC Funds
Annual Report
October 31, 2018
| GLOBAL FUNDS | | Class A | | Class I |
| HSBC Emerging Markets Debt Fund | | HCGAX | | HCGIX |
| HSBC Frontier Markets Fund | | HSFAX | | HSFIX |
| HSBC Asia ex-Japan Smaller Companies Equity Fund | | HAJAX | | HAJIX |
| HSBC Global High Yield Bond Fund | | HBYAX | | HBYIX |
| HSBC Global High Income Bond Fund | | HBIAX | | HBIIX |
| Table of Contents |
| HSBC Family of Funds | |
| Annual Report - October 31, 2018 | |
| Glossary of Terms | | 2 |
| Commentary From the Investment Manager | | 3 |
| Portfolio Reviews | | 4 |
| Portfolio Composition | | 14 |
| | | |
| Schedules of Portfolio Investments | | |
| HSBC Emerging Markets Debt Fund | | 16 |
| HSBC Frontier Markets Fund | | 25 |
| HSBC Asia ex-Japan Smaller Companies Equity Fund | | 27 |
| HSBC Global High Yield Bond Fund | | 30 |
| HSBC Global High Income Bond Fund | | 40 |
| Statements of Assets and Liabilities | | 53 |
| Statements of Operations | | 57 |
| Statements of Changes in Net Assets | | 59 |
| Financial Highlights | | 65 |
| Notes to Financial Statements | | 70 |
| Report of Independent Registered Public Accounting Firm | | 96 |
| Other Federal Income Tax Information | | 98 |
| Table of Shareholder Expenses | | 99 |
| Board of Trustees and Officers | | 101 |
| Other Information | | 103 |
Beta is a measure of the volatility, or systematic risk, of a security or a portfolio in comparison to the market as a whole, beta is used in the capital asset pricing model, which calculates the expected return of an asset based on its beta and expected market returns.
Bloomberg Barclays Global Aggregate Bond Index is a measure of global investment-grade debt from 24 local currency markets, which include treasury, government-related, corporate, and securitized fixed-rate bonds from both developed and emerging markets issuers.
Emerging Markets Debt Composite Index is a blended index comprised of J.P. Morgan Emerging Markets Bond Index Global (50%) and J.P. Morgan Government Bond Index–Emerging Markets Global Diversified (50%).
Gross Domestic Product (“GDP”) is the value of goods and services produced in a given country in a given year.
ICE BofA Merrill Lynch BB-B Global High Yield Constrained Index tracks the performance of the United States Dollar, Canadian Dollar, British Pound, and Euro denominated below investment-grade corporate debt publicly issued in the major domestic or Eurobond markets.
J.P. Morgan Emerging Markets Bond Index Global tracks returns for USD-denominated debt instruments issued by emerging market sovereign and quasi-sovereign entities, Brady bonds, loans, Eurobonds, and local market instruments.
J.P. Morgan Government Bond Index-Emerging Markets Global Diversified is a comprehensive global emerging markets fixed income index that consists of regularly traded, liquid fixed-rate, domestic currency government bonds to which international investors can gain exposure.
MSCI All Country Asia ex Japan Small Cap Index is a free float-adjusted market capitalization-weighted small call index of the stock markets of two developed markets countries: Hong Kong and Singapore, and nine emerging markets countries: China, India, Indonesia, Korea, Malaysia, Pakistan, the Philippines, Taiwan and Thailand.
MSCI Europe Australasia and Far East (“MSCI EAFE”) Index captures the large- and mid-cap representation across the following developed markets countries: Australia, Austria, Belgium, Denmark, Finland, France, Germany, Hong Kong, Ireland, Israel, Italy, Japan, the Netherlands, New Zealand, Norway, Portugal, Singapore, Spain, Sweden, Switzerland and the UK.
MSCI Frontier Markets Index is a free float-adjusted market capitalization index that is designed to measure equity market performance of frontier markets. The index consists of 29 frontier markets country indices.
MSCI Select Frontier and Emerging Markets Capped Index is a version of the MSCI Frontier Index (capped), which also includes raises the initial cap of the 6 crossover countries to 30% and includes Qatar and United Arab Emirates.
Standard & Poor’s 500 (“S&P 500”) Index is widely regarded as a gauge of the U.S. equities market. This index includes 500 leading companies in leading industries of the U.S. economy. The S&P 500 Index focuses on the large-cap segment of the market, with approximately 80% coverage of U.S. equities.
Securities indices are unmanaged and assume reinvestment of all distributions and interest payments and do not take in account brokerage fees or expenses. Securities in the Funds do not match those in the indices and performance of the Funds will differ. Investors cannot invest directly in an index.
| Commentary From the Investment Manager (Unaudited) |
| HSBC Global Asset Management (USA) Inc. |
Global Economic Review
The global economy transitioned away from a period of synchronized growth during the 12-month period from November 1, 2017, through October 31, 2018, and entered a period characterized by divergence and diversity. While both developed and emerging markets economies were lifted up by broad economic expansion throughout 2017, growth was much less consistent in 2018 amid concerns surrounding inflation, trade policy, monetary policy and country-specific issues. Some economies and sectors were affected much more negatively than others and experienced higher levels of volatility in their financial markets. This divergence and volatility weighed on investor sentiment, leading to a shift away from risk assets that resulted in losses for international equities and more modest returns for U.S. equities. Despite this mixed picture, fundamentals of the global economy appeared relatively strong throughout the period, and corporate profits remained robust.
During the first several months of the period economic data generally showed low inflation, healthy corporate fundamentals and strong activity in manufacturing and global trade. In the U.S., regulatory rollbacks, positive earnings growth and the passage of business-friendly tax reform stirred optimism among investors, eventually driving stocks to record highs in a January rally.
The less-consistent macroeconomic environment that came to define the period emerged in February, as stocks took a sharp dive and became more volatile. First, U.S. economic data showed prices rising faster than expected, signaling a period of low inflation was ending, second, the outcome of tumultuous trade diplomacy between the U.S. and several key trading partners became increasingly unpredictable and concerning. Third, economic data began to show slowing growth in some regions, particularly Europe and Japan. Fourth, signs of slowing growth and rising inflation helped strengthen the U.S. dollar against other currencies, producing headwinds for emerging markets.
The impact of rising interest rates rippled through the global economy during the period and contributed to a weaker appetite for risk assets such as equities. The U.S. Federal Reserve (the Fed) increased its federal funds rate four times during the 12-month period, lifting it by a total of 100 basis points (1.00%). The Fed signaled that it would continue its campaign of gradually raising interest rates as long as the U.S. economy continues to show broad strength. The theme of divergence also played out globally in terms of monetary policy. Unlike the Fed, central banks in some other developed economies pursued looser monetary policy.
Economic data continued to indicate that the U.S economy was on sound footing. Gross domestic product1 (GDP) growth peaked during the period under review at a rate of 4.2% during the second quarter of 2018 after growing 2.3% during the fourth quarter of 2017 and 2.2% during the first quarter of 2018. GDP grew at a rate of 3.5% during the third quarter of 2018, according to preliminary estimates. The tax reform legislation passed by Congress late in 2017 provided a tailwind for businesses, boosting corporate profits and helping to offset pressures caused by rising wages and a tight labor market. Data showed that industrial production picked up and activity in the services sector increased. A new trade deal between the U.S., Mexico and Canada removed some of the uncertainty surrounding President Trump’s trade policy.
The unemployment rate was 3.7%—its lowest level since 1969—at the close of the period under review. The continuing strength of the labor market helped boost consumer confidence and consumer spending. The housing market presented a more mixed picture than other aspects of the economy, as declining home sales and housing permits suggested emerging weaknesses.
China’s economy continued to be weakened by an industrial slowdown and its increasing reliance on consumption as a driver of economic growth. Amid this difficult long-term transition, China faced during the period the additional challenge of steeply rising trade barriers with the U.S. As part of a broader tightening of trade policy, President Donald Trump ratcheted up pressure on China by threatening tariffs on virtually all Chinese exports to the U.S. The escalating rhetoric and faltering diplomacy between China and U.S. sent ripple effects through global markets. The yuan devalued significantly during the period, making Chinese goods more competitive on global markets. But in a notable change the Chinese government suggested it would prevent its currency from devaluing further.
China’s troubles spilled over into other emerging markets, especially those in Asia and in other regions heavily dependent on demand from Chinese industries. Other factors stalling the momentum of emerging market growth were rising U.S. interest rates and higher oil prices.
Argentina had a very volatile year as its currency depreciated more than 50% during 2018. The decline forced the country to reach out to the International Monetary Fund for financial support and triggered a recession in the country.
Eurozone economies experienced the most severe slowdown among developed economies during the period. Increasing trade tensions between Europe and the U.S. further weighed on the outlook of the region. Unsuccessful negotiations over the United Kingdom’s exit from the Eurozone (commonly referred to as Brexit) continued to sow uncertainty and led to a steep decline in the value of the British pound. Brexit has resulted in volatility in European and global markets and could have significant negative impacts on financial markets in the United Kingdom and throughout Europe. The extent of the impact of Brexit in the United Kingdom and in global markets as well as any associated adverse consequences remain unclear. Economic growth in Japan also slowed significantly amid lower private consumption and weak export demand. Data suggested that both wages and inflation in Japan may be ticking upwards, however, and the labor market improved.
Prices of many key commodities such as soybeans and silver slumped during much of the period under review, partly as a result of rising trade tensions between the U.S. and its key economic partners. Crude oil prices hit four-year highs late in the period, driven up in part by expectations that U.S. sanctions on Iran would curb the nation’s oil exports. However, oil prices began to fall sharply during the final weeks of the period.
Market review
Global equity markets delivered mixed results during the period. Stocks performed very well during the first three months. But, by February of 2018, concerns of an impending economic slowdown began to weigh on investors and fueled an uptick in volatility. Still, equities in many economies and sectors zig-zagged upward until October, when much of the period’s earlier gains were lost during a sharp sell-off.
U.S. stocks ended the period with modest gains, even after entering into correction territory in October. The S&P 500 Index1 of large-capitalization U.S. stocks returned 7.35%. Equities in other developed economies showed losses during the 12 months under review, while emerging markets equities suffered even greater losses amid concerns about U.S. trade protectionism and a strengthening U.S. dollar. The MSCI Frontier Markets Index1 returned -11.84% during the period, compared to a -6.39% return for the MSCI EAFE Index1 of developed market international stocks.
Global fixed income markets lost ground amid rising interest rates. Investors saw the onset of full employment and rising inflation in Germany and the U.S., nations that have a major impact on bond markets, as an indication that further increases in interest rates were on the horizon. Yields on U.S. government debt rose during the period. The U.S. Treasury curve flattened and global high-yield and investment- grade credit spreads widened. Emerging market debt performed especially poorly during the period, amid shrinking demand and growing supply. The Bloomberg Barclays Global Aggregate Bond Index1, which tracks investment grade debt in 24 local currency markets, returned -2.05% during the period, while the JP Morgan Emerging Markets Bond Index Global1 returned -5.27%.
1 For additional information, please refer to the Glossary of Terms.
| Portfolio Reviews (Unaudited) |
| HSBC Emerging Markets Debt Fund |
| (Class A Shares and Class I Shares) |
by Nishant Upadhyay, Senior Vice President, Head of Emerging Markets Debt Portfolio Management
Zeke Diwan, Senior Vice President/Senior Portfolio Manager
Billy Lang, Vice President/Portfolio Manager
The HSBC Emerging Markets Debt Fund (the “Fund”) seeks to maximize total return (comprised of capital appreciation and income). Under normal market conditions, the Fund invests at least 80% of its net assets, plus borrowings for investment purposes, in fixed income instruments of issuers that economically are tied to emerging markets. The Fund will invest in instruments issued by foreign governments, government agencies and corporations. The Fund generally invests in both U.S. dollar denominated instruments as well as emerging market local currency denominated instruments.
Investment Concerns
There is no assurance that a portfolio will achieve its investment objective or will work under all market conditions. The value of investments may go down as well as up and you may not get back the amount originally invested. Portfolios may be subject to certain additional risks, which should be considered carefully along with their investment objectives and fees. Investments in foreign markets entail special risks such as currency, political, economic, and market risks. The risks of investing in emerging markets countries are greater than the risks generally associated with foreign investments. Fixed income securities are subject to credit and interest rate risk. Credit risk refers to the ability of an issuer to make timely payments of interest and principal. Interest rate risk refers to fluctuations in the value of a fixed income security resulting from changes in the general level of interest rates. In a declining interest rate environment, the portfolio may generate less income. In a rising interest rate environment, bond prices may fall. Investments in high-yield securities are often considered speculative investments and have significantly higher credit risk than investment-grade securities. The prices of high-yield securities, which may be less liquid than higher-rated securities, may be more vulnerable to adverse market, economic or political conditions. Non-diversified funds focus investments in a small number of issuers, industries, foreign currencies or particular countries or regions, which increase the risks associated with a single economic, political, or regulatory occurrence. Derivatives may be riskier than other types of investments and could result in losses that significantly exceed the Fund’s original investment.
For a complete description of these and other risks associated with investment in a mutual fund, please refer to the Fund’s prospectus.
Market Commentary
For the year ended October 31, 2018, the Fund returned -7.51% (without sales charge) for the Class A Shares and -7.14% for the Class I Shares. That compared to a -5.85% total return for the Fund’s benchmark, the Emerging Markets Debt Composite Index1, and a -5.27% and -6.58%total return for the J.P. Morgan Emerging Markets Bond Index Global1 and the J.P. Morgan Government Bond Index-Emerging Markets Global Diversified1, respectively, for the same period.
Portfolio Performance
Emerging markets (EM) debt struggled during most of the 12-month period. Rising U.S. Treasury yields, sluggish ex-U.S. developed market growth and global trade tensions fueled higher market volatility. In particular, markets in twin deficit EM countries that have a fiscal deficit and current account deficit, such as Turkey and Argentina, suffered from a strengthening U.S. dollar and weakening investor demand. Argentina also experienced a sharp decline in its currency during 2018, which forced the country to raise interest rates multiple times and ultimately required it to reach out to the International Monetary Fund for financial support. The sharp decline in the value of its currency triggered a recession in the country. EM debt also faced a challenging technical environment. Increased bond supply and mutual fund outflows depressed prices and helped create wider spreads on EM debt assets as investors demanded higher yields.
The Fund underperformed its blended benchmark for the period. Overweight allocations to Argentina and Turkey detracted significantly as they experienced significant sell-offs due to rising inflation, rising oil prices and a strengthening U.S. dollar. Within EM hard currency holdings, underweight allocations to high-quality, low-beta1 investment-grade countries, such as China, Malaysia, Hungary and Poland, also weighed on relative performance.†
Within EM local debt, the Fund’s net long EM currency position hurt returns in part because of the strengthening U.S. dollar. The overweight allocation to the Russian ruble hurt returns as geopolitical tensions weighed on investor sentiment. Among EM local debt assets, the largest contribution came from a tactical overweight exposure to Mexican local rates. An overweight allocation to the Chilean peso also boosted relative results.†
The Fund benefited from security selection in its high-yield hard currency exposure. Security selection in Egypt, Nigeria, Angola and Sri Lanka added to relative results, as new bond issues in these countries were very well subscribed.†
The Fund benefited from the use of derivatives such as futures, forward foreign exchange contracts and, in particular, the portfolio’s credit default swap overlay, which generated outperformance as spread levels rose through most of 2018.†
† Portfolio composition is subject to change.
1 For additional information, please refer to the Glossary of Terms.
Past performance does not guarantee future results. The performance data quoted represents past performance and current returns may be lower or higher. Total return figures include change in share price, reinvestment of dividends and capital gains and do not reflect taxes that a shareholder would pay on Fund distributions or on the redemption of Fund shares. Investment return and principal value will fluctuate so that an investor’s shares, when redeemed may be worth more or less than the original cost. To obtain performance information current to the most recent month end, please call 1-800-782-8183.
| Portfolio Reviews (Unaudited) |
| HSBC Emerging Markets Debt Fund | |
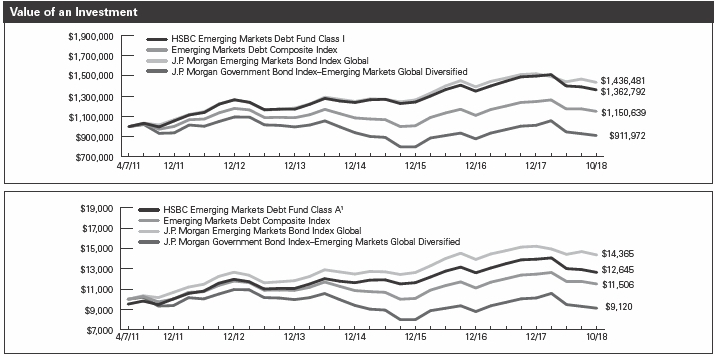
The charts above represent a historical since inception performance comparison of a hypothetical investment in the indicated share class versus a similar investment in the Fund’s benchmark and represents the reinvestment of dividends and capital gains in the Fund.
| | | | | | Average Annual | | Expense |
| Fund Performance | | | | | | Total Return (%) | | Ratio (%)2 |
| | Inception | | 1 | | 5 | | Since | | | | |
| As of October 31, 2018* | | Date | | Year | | Year | | Inception | | Gross | | Net |
| HSBC Emerging Markets Debt Fund Class A1 | | 4/7/11 | | -11.94 | | 1.17 | | 3.15 | | 2.04 | | 0.85 |
| HSBC Emerging Markets Debt Fund Class I | | 4/7/11 | | -7.14 | | 2.52 | | 4.18 | | 1.69 | | 0.50 |
| Emerging Markets Debt Composite Index3 | | — | | -5.85 | | 0.53 | | 1.87 | | N/A | | N/A |
| J.P. Morgan Emerging Markets Bond Index Global3 | | — | | -5.27 | | 3.61 | | 4.90 | | N/A | | N/A |
| J.P. Morgan Government Bond Index–Emerging | | | | | | | | | | | | |
| Markets Global Diversified3 | | — | | -6.58 | | -2.59 | | -1.21 | | N/A | | N/A |
Past performance does not guarantee future results. The performance data quoted represents past performance and current returns may be lower or higher. Total return figures include change in share price, reinvestment of dividends and capital gains and do not reflect the taxes that a shareholder would pay on Fund distributions or on the redemption of Fund shares. Investment return and principal value will fluctuate so that an investor’s shares, when redeemed may be worth more or less than the original cost. To obtain performance information current to the most recent month end, please call 1-800-782-8183.
The performance above reflects any fee waivers that have been in effect during the applicable periods, as well as any expense reimbursements that have periodically been made. Absent such waivers and reimbursements, returns would have been lower. Currently, contractual fee waivers and/or expense reimbursements are in effect for the Fund through March 1, 2019.
| * | Prior to April 7, 2017, the Fund’s investments were primarily comprised of U.S. dollar denominated instruments issued by foreign governments and corporations. Accordingly, performance information prior to that date reflects the Fund’s former investment strategies, and future performance will vary. |
| 1 | Reflects the maximum sales charge of 4.75%. |
| 2 | Reflects the expense ratio as reported in the prospectus dated February 28, 2018. HSBC Global Asset Management (USA) Inc., the Adviser, has entered into a contractual expense limitation agreement with the Fund under which it will limit total expenses of the Fund (excluding interest, taxes, brokerage commissions, extraordinary expenses and estimated indirect expenses attributable to the Fund’s investments in investment companies) to an annual rate of 0.85% and 0.50% for Class A Shares and Class I Shares, respectively. The expense limitation shall be in effect until March 1, 2019. Additional information pertaining to the October 31, 2018 expense ratios can be found in the financial highlights. |
| 3 | For additional information, please refer to the Glossary of Terms. |
The performance of the Fund is measured against the Emerging Markets Debt Composite Index, which is a blend of J.P. Morgan Emerging Markets Bond Index Global (50%) and J.P. Morgan Government Bond Index–Emerging Markets Global Diversified (50%). The J.P. Morgan Emerging Markets Bond Index Global tracks returns for USD-denominated debt instruments issued by emerging market sovereign and quasi-sovereign entities, Brady bonds, loans, Eurobonds, and local market instruments. The J.P. Morgan Government Bond Index-Emerging Markets Global Diversified is a comprehensive global emerging markets fixed income index that consists of regularly traded, liquid fixed-rate, domestic currency government bonds to which international investors can gain exposure. The performance of the indexes does not reflect the deduction of expenses associated with a mutual fund, such as investment management and fund accounting fees. The Fund’s performance reflects the deduction of fees for these value-added services. Investors cannot invest directly in an index.
HSBC FAMILY OF FUNDS 5
| Portfolio Reviews (Unaudited) |
| HSBC Frontier Markets Fund |
| (Class A Shares and Class I Shares) |
by Ramzi Sidani, Lead/Senior Portfolio Manager
The HSBC Frontier Markets Fund (the “Fund”) seeks long-term capital appreciation. Under normal market conditions, the Fund invests at least 80% of its net assets, plus any borrowings for investment purposes, in issuers located in “frontier market countries.” The term “frontier market countries” encompasses those countries that are at an earlier stage of economic, political, or financial development, even by emerging markets standards.
Investment Concerns
There is no assurance that a portfolio will achieve its investment objective or will work under all market conditions. The value of investments may go down as well as up and you may not get back the amount originally invested. Portfolios may be subject to certain additional risks, which should be considered carefully along with their investment objectives and fees. Equity investments fluctuate in value based on changes to an individual company’s financial condition and overall market conditions. Investments in foreign markets entail special risks such as currency, political, economic, and market risks. The risks of investing in emerging markets countries are greater than the risks generally associated with foreign investments. Investing in smaller companies is more risky and volatile than investing in larger companies. Frontier markets countries generally have smaller economies and even less developed capital markets or legal and political systems than traditional emerging market countries. As a result, the risks of investing in emerging market countries are magnified in frontier market countries. The Fund will invest more than 25% of its total assets in securities issued by companies in the financial services group of industries. Accordingly, the Fund will be more susceptible to developments that affect such industries than other funds that do not concentrate their investments. Exposure to commodities markets, including investments in companies in commodity-related industries, may subject the Fund to greater volatility than investments in traditional securities. Overall market movements and factors specific to a particular industry or commodity may affect the value of commodity-related investments. Derivatives may be riskier than other types of investments and could result in losses that significantly exceed the Funds’ original investment.
For a complete description of these and other risks associated with investment in a mutual fund, please refer to the Fund’s prospectus.
Market Commentary
For the year ended October 31, 2018, the Fund returned -19.02% (without sales charge) for the Class A Shares and -18.72% for the Class I Shares. That compared to a -4.44% and -11.84% total return for the Fund’s benchmarks, the MSCI Select Frontier and Emerging Markets Capped Index1 and the MSCI Frontier Markets Index1, respectively, for the same period.
Portfolio Performance
Frontier markets (FM) pulled back relative to the previous 12-month period. Argentina was responsible for most of the Fund’s negative absolute returns during the period. The country, which was one of the best-performing markets in 2017, declined more than 50% from the start of 2018 through the end of the period, driven by a weakening in the peso. This forced the Argentinian Central Bank to raise interest rates multiple times unexpectedly and required the government to ask the International Monetary Fund for financial support. Currencies of many other FM and emerging markets declined versus the U.S. dollar during the period. This had a negative absolute impact on Fund performance as measured in U.S. dollars. Strength in the U.S. dollar also spurred expectations of additional foreign currency weakness across FM and subsequent negative impacts on earnings.†
In this environment, the Fund underperformed its reference indices for the period. The Fund suffered from its overweight exposure to Argentina relative to the MSCI Select Frontier and Emerging Markets Capped Index1. An underweight exposure to Qatar also weighed on relative results. It was one of the best-performing markets in 2018 as the largest component in Qatar index rallied after raising its foreign ownership limit, which resulted in significant flows that pushed share prices higher.†
The Fund’s underweight allocation to Croatia and overweight exposures to Kazakhstan and Kuwait helped offset some of those losses. Kuwait delivered strong performance in 2018 following a positive announcement from the MSCI that the market could be upgraded to emerging market status by 2019.†
Stock selection also weighed on relative returns, particularly the Fund’s holdings of two Argentinian banks that underperformed during the period. Although the Fund’s overall stock selection detracted, a few key positive contributors helped offset some of those effects. In particular, a Kuwait-based education service company and an off-benchmark leisure and tourism company based in Cambodia added to relative results.†
| † | Portfolio composition is subject to change. |
| 1 | For additional information, please refer to the Glossary of Terms. |
Past performance does not guarantee future results. The performance data quoted represents past performance and current returns may be lower or higher. Total return figures include change in share price, reinvestment of dividends and capital gains and do not reflect taxes that a shareholder would pay on Fund distributions or on the redemption of Fund shares. Investment return and principal value will fluctuate so that an investor’s shares, when redeemed may be worth more or less than the original cost. To obtain performance information current to the most recent month end, please call 1-800-782-8183.
6 HSBC FAMILY OF FUNDS
| Portfolio Reviews (Unaudited) |
| HSBC Frontier Markets Fund | |
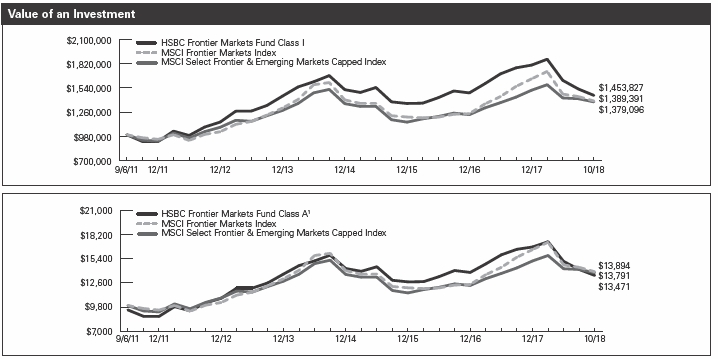
The charts above represent a historical since inception performance comparison of a hypothetical investment in the indicated share class versus a similar investment in the Fund’s benchmark and represents the reinvestment of dividends and capital gains in the Fund.
| | | | | | Average Annual | | Expense |
| Fund Performance | | | | | | Total Return (%) | | Ratio (%)2 |
| | Inception | | | | | | Since | | | | |
| As of October 31, 2018 | | Date | | 1 Year | | 5 Year | | Inception | | Gross | | Net |
| HSBC Frontier Markets Fund Class A1 | | 9/6/11 | | -23.06 | | -0.12 | | 4.26 | | 3.89 | | 1.85 |
| HSBC Frontier Markets Fund Class I | | 9/6/11 | | -18.72 | | 1.26 | | 5.37 | | 3.54 | | 1.50 |
| MSCI Frontier Markets Index3 | | — | | -11.84 | | 2.02 | | 4.71 | | N/A | | N/A |
| MSCI Select Frontier and Emerging Markets Capped Index3 | | — | | -4.44 | | 1.86 | | 4.60 | | N/A | | N/A |
Past performance does not guarantee future results. The performance data quoted represents past performance and current returns may be lower or higher. Total return figures include change in share price, reinvestment of dividends and capital gains and do not reflect the taxes that a shareholder would pay on Fund distributions or on the redemption of Fund shares. Investment return and principal value will fluctuate so that an investor’s shares, when redeemed may be worth more or less than the original cost. To obtain performance information current to the most recent month end, please call 1-800-782-8183.
The performance above reflects any fee waivers that have been in effect during the applicable periods, as well as any expense reimbursements that have periodically been made. Absent such waivers and reimbursements, returns would have been lower. Currently, contractual fee waivers and/or expense reimbursements are in effect for the Fund through March 1, 2020.
| 1 | Reflects the maximum sales charge of 5.00%. |
| 2 | Reflects the expense ratio as reported in the prospectus dated February 28, 2018, as supplemented to date. HSBC Global Asset Management (USA) Inc., the Adviser, has entered into a contractual expense limitation agreement with the Fund under which it will limit total expenses of the Fund (excluding interest, taxes, brokerage commissions, extraordinary expenses and estimated indirect expenses attributable to the Fund’s investments in investment companies) to an annual rate of 1.85% and 1.50% for Class A Shares and Class I Shares, respectively. The expense limitation shall be in effect until March 1, 2020. Additional information pertaining to the October 31, 2018 expense ratios can be found in the financial highlights. |
| 3 | For additional information, please refer to the Glossary of Terms. |
The performance of the Fund is measured against the MSCI Frontier Markets Index and the MSCI Select Frontier and Emerging Markets Capped Index. The MSCI Frontier Markets Index is a free float-adjusted market capitalization index that captures large- and mid-cap representation across 29 Frontier Markets. The MSCI Select Frontier and Emerging Markets Index is a version of the MSCI Frontier Emerging Markets Index (capped) that raises the initial cap of the 6 “cross-over” countries to 30% and includes Qatar and UAE. The indexes are unmanaged and their performance does not reflect the deduction of expenses associated with a mutual fund, such as investment management and fund accounting fees. The Fund’s performance reflects the deduction of fees for these value-added services. Investors cannot invest directly in an index.
HSBC FAMILY OF FUNDS 7
| Portfolio Reviews (Unaudited) |
| HSBC Asia ex-Japan Smaller Companies Equity Fund |
| (Class A Shares and Class I Shares) |
by Elina Fung, Investment Director of Equities/Lead Portfolio Manager
Alex Kwan, Associate Director of Asia Pacific Equities/Co-Portfolio Manager
The HSBC Asia ex-Japan Smaller Companies Equity Fund (the “Fund”) seeks long-term capital appreciation. Under normal market conditions, the Fund invests at least 80% of its net assets, plus any borrowings for investment purposes, in equity of, and equity-related instruments related to, smaller companies that are economically tied to Asia (excluding Japan).
Investment Concerns
There is no assurance that a portfolio will achieve its investment objective or will work under all market conditions. The value of investments may go down as well as up and you may not get back the amount originally invested. Portfolios may be subject to certain additional risks, which should be considered carefully along with their investment objectives and fees. Equity investments fluctuate in value based on changes to an individual company’s financial condition and overall market conditions. The Fund’s performance is expected to be closely tied to the social, political, economic, and regulatory developments within Asia and to be more volatile than the performance of a more geographically diversified mutual fund. Moreover, the economies of countries in Asia, including China, differ from the U.S. economy in several ways, including the rate of growth, reliance on a small number of industries or natural resources, rates of inflation, capital reinvestment, and balance of payments position. As export-driven economies, the economies of these countries are affected by developments in the economies of their principal trading partners, including the U.S. Furthermore, flooding, monsoons, and other natural disasters also can significantly affect the value of investments. Investments in foreign markets entail special risks such as currency, political, economic, and market risks. The risks of investing in emerging-market countries are greater than the risks generally associated with foreign investments. Fluctuations in exchange rates between the U.S. dollar and foreign currencies, or between various foreign currencies, may negatively affect the Fund’s performance. Investing in smaller companies is more risky and volatile than investing in large companies. Because the Fund invests in a single region, its shares do not represent a complete investment program and are subject to greater risk of loss as a result of adverse economic business or other developments affecting that region. As a geographically concentrated fund, the value of the shares may fluctuate more than shares invested in a broader range of industries and companies because of concentration in a specific region. Derivatives may be riskier than other types of investments and could result in losses that significantly exceed the Fund’s original investment.
For a complete description of these and other risks associated with investment in a mutual fund, please refer to the Fund’s prospectus.
Market Commentary
For the year ended October 31, 2018, the Fund returned -23.23% (without sales charge) for the Class A Shares, -22.89% for the Class I Shares. That compared to a -17.99% total return for the Fund’s benchmark, the MSCI All Country Asia ex Japan Small Cap Index1, for the same period.
Portfolio Performance
Asian equity markets posted poor returns for the period under review. The decline began in earnest in February due to concerns over higher inflation and interest rate hikes by the U.S. Federal Reserve. Market sentiment in India was particularly weak after the introduction of a long-term capital gains tax on equities and a fraud case involving the Punjab National Bank. Markets slumped further in March following the announcement of billions of dollars of U.S. tariffs on imported goods from China and continued falling through the second and third quarters amid escalating trade tensions between the two nations. In China, poor consumer spending and manufacturing data, a weak renminbi and decreased infrastructure spending weighed on investor sentiment, as well as a strong U.S. dollar and high oil prices. Emerging markets suffered as investors sold off risk assets. Rising inflation, non-bank financial institution credit issues and a widening deficit caused Indian small caps to fall the most.
The Fund’s relative underperformance mainly stemmed from July to October, driven largely by indiscriminate selling related to the significant net outflows from the region during the period. Stock selection in the consumer discretionary and technology sectors detracted from relative performance the most. The overweight allocations to Hong Kong and China dragged on performance as well. The two areas represent the most liquid markets in Asia outside of Japan but saw a disproportionate sell-off exacerbated by the U.S.-China trade tensions.†
Stock selection in the technology, real estate and telecommunication services sectors made positive contributions to relative performance. An electronic component manufacturer in Taiwan and a Chinese real estate developer were among the top performers after both companies reported strong quarterly results.†
| † | Portfolio composition is subject to change. |
| 1 | For additional information, please refer to the Glossary of Terms. |
Past performance does not guarantee future results. The performance data quoted represents past performance and current returns may be lower or higher. Total return figures include change in share price, reinvestment of dividends and capital gains and do not reflect taxes that a shareholder would pay on Fund distributions or on the redemption of Fund shares. Investment return and principal value will fluctuate so that an investor’s shares, when redeemed may be worth more or less than the original cost. To obtain performance information current to the most recent month end, please call 1-800-782-8183.
8 HSBC FAMILY OF FUNDS
| Portfolio Reviews (Unaudited) |
| HSBC Asia ex-Japan Smaller Companies Equity Fund | |

The charts above represent a historical since inception performance comparison of a hypothetical investment in the indicated share class versus a similar investment in the Fund’s benchmark and represents the reinvestment of dividends and capital gains in the Fund.
| | | | Average Annual | | Expense |
| Fund Performance | | | | Total Return (%) | | Ratio (%)2 |
| | Inception | | 1 | | Since | | | | |
| As of October 31, 2018 | | Date | | Year | | Inception | | Gross | | Net |
| HSBC Asia ex-Japan Smaller Companies Equity Class A1 | | 11/11/14 | | -27.05 | | 0.70 | | 5.18 | | 1.32 |
| HSBC Asia ex-Japan Smaller Companies Equity Class I | | 11/11/14 | | -22.89 | | 2.40 | | 4.83 | | 0.97 |
| MSCI All Country Asia ex Japan Small Cap Index3 | | — | | -17.99 | | -0.87 | | N/A | | N/A |
Past performance does not guarantee future results. The performance data quoted represents past performance and current returns may be lower or higher. Total return figures include change in share price, reinvestment of dividends and capital gains and do not reflect the taxes that a shareholder would pay on Fund distributions or on the redemption of Fund shares. Investment return and principal value will fluctuate so that an investor’s shares, when redeemed may be worth more or less than the original cost. To obtain performance information current to the most recent month end, please call 1-800-782-8183.
The performance above reflects any fee waivers that have been in effect during the applicable periods, as well as any expense reimbursements that have periodically been made. Absent such waivers and reimbursements, returns would have been lower. Currently, contractual fee waivers and/or expense reimbursements are in effect for the Fund through March 1, 2019.
| 1 | Reflects the maximum sales charge of 5.00%. |
| 2 | Reflects the expense ratio as reported in the prospectus dated February 28, 2018. HSBC Global Asset Management (USA) Inc., the Adviser, has entered into a contractual expense limitation agreement with the Fund under which it will limit total expenses of the Fund (excluding interest, taxes, brokerage commissions, extraordinary expenses and estimated indirect expenses attributable to the Fund’s investments in investment companies) to an annual rate of 1.25% and 0.90% for Class A Shares and Class I Shares, respectively. The expense limitation shall be in effect until March 1, 2019. The expense ratios reflected include acquired fund fees and expenses. Additional information pertaining to the October 31, 2018 expense ratios can be found in the financial highlights. |
| 3 | For additional information, please refer to the Glossary of Terms. |
The MSCI All Country Asia ex Japan Small Cap Index is a free float-adjusted market capitalization-weighted small-cap index of the stock markets of two developed markets, Hong Kong and Singapore, and nine emerging markets: China, India, Indonesia, Malaysia, Pakistan, Philippines, Korea, Taiwan and Thailand. The index is unmanaged and its performance does not reflect the deduction of expenses associated with a mutual fund, such as investment management and fund accounting fees. The Fund’s performance reflects the deduction of fees for these value-added services. Investors cannot invest directly in an index.
HSBC FAMILY OF FUNDS 9
| Portfolio Reviews (Unaudited) |
| HSBC Global High Yield Bond Fund |
| (Class A Shares and Class I Shares) |
by Mary Bowers, Senior Portfolio Manager
Rick Liu, CFA/Portfolio Manager
Nishant Upadhyay, Senior Vice President/Portfolio Manager
The HSBC Global High Yield Bond Fund (the “Fund”) seeks to maximize total return (comprised of capital appreciation and income). Under normal market conditions, the Fund invests at least 80% of its net assets, plus any borrowings for investment purposes, in a globally diversified portfolio of high-yield securities.
Investment Concerns
There is no assurance that a portfolio will achieve its investment objective or will work under all market conditions. The value of investments may go down as well as up and you may not get back the amount originally invested. Portfolios may be subject to certain additional risks, which should be considered carefully along with their investment objectives and fees. Investments in foreign markets entail special risks such as currency, political, economic, and market risks. The risks of investing in emerging markets countries are greater than the risks generally associated with foreign investments. Fixed income securities are subject to credit and interest rate risk. Credit risk refers to the ability of an issuer to make timely payments of interest and principal. Interest rate risk refers to fluctuations in the value of a fixed income security resulting from changes in the general level of interest rates. In a declining interest rate environment, the portfolio may generate less income. In a rising interest rate environment, bond prices may fall. Investments in high-yield securities are often considered speculative investments and have significantly higher credit risk than investment-grade securities. The prices of high-yield securities, which may be less liquid than higher rated securities, may be more vulnerable to adverse market, economic or political conditions. Convertible securities entail risks associated with equity securities (whose value can fluctuate based on changes in a company’s financial condition or overall market conditions); investments in convertible securities are subject to the risks associated with fixed-income securities. Derivatives may be riskier than other types of investments and could result in losses that significantly exceed the Fund’s original investment.
For a complete description of these and other risks associated with investment in a mutual fund, please refer to the Fund’s prospectus.
Market Commentary
For the year ended October 31, 2018, the Fund returned -0.84% (without sales charge) for the Class A Shares and -0.41% for the Class I Shares. That compared to a 0.04% total return for the Fund’s benchmark, the ICE BofA Merrill Lynch BB-B Global High Yield Constrained Index1, for the same period.
Portfolio Performance
Risk assets rallied in late 2017 and January 2018 amid continued economic growth and tax reform measures passed by U.S. lawmakers. However, markets were jolted in February by concerns over inflation and the U.S. administration’s protectionist trade policies. Volatility persisted through the spring and summer as investors reconciled solid global growth and strong corporate earnings with geopolitical risks, trade tensions and country-specific issues in Europe and emerging markets (EM). The third quarter of 2018 started with a risk-asset rally, largely in response to strong U.S. economic data. A strong end-of-quarter performance in September was followed by a risk asset sell-off in October, as markets were shaken by rate and equity volatility and investors remained nervous about continuing trade issues and signs of slowing global growth.
The U.S. Treasury curve flattened over the period, with U.S. 2-year Treasury yields rising 127 basis points (1.27%) to 2.87%. U.S. 10-year Treasury yields rose 76 basis points (0.76%) to finish at 3.14% as investor concerns over inflationary pressures grew. Meanwhile, Euro 10-year Treasury yields finished largely unchanged, increasing by 3 basis points (0.03%) to 0.39% over the period. Global high- yield credit spreads widened by 76 basis points (0.76%) to 414 basis points (4.14%), while global investment-grade credit spreads widened a more modest 28 basis points (0.28%), and ended at 127 (1.27%).
The Fund’s sector allocation had a neutral impact on relative performance. U.S. and EM sector allocations detracted from performance, but these losses were offset by the Fund’s position in European retail, media and utilities. Issue selection was a drag on relative performance, especially the Fund’s position in both the U.S. and European high-yield segments.†
The Fund’s regional allocations boosted relative performance. In particular, an underweight position in EM debt helped the Fund’s relative performance as EM strongly underperformed other segments over the period. The Fund’s shorter duration positioning versus the benchmark contributed to relative performance as treasury yields rose over the period, driving down prices.†
The Fund maintained some derivative exposure during the period, including futures contracts, currency forwards used to hedge non-USD exposure and a small position in credit default swaps (CDS). The futures contracts, currency forwards and the CDS exposure did not materially impact performance.†
† Portfolio composition is subject to change.
1 For additional information, please refer to the Glossary of Terms.
Past performance does not guarantee future results. The performance data quoted represents past performance and current returns may be lower or higher. Total return figures include change in share price, reinvestment of dividends and capital gains and do not reflect taxes that a shareholder would pay on Fund distributions or on the redemption of Fund shares. Investment return and principal value will fluctuate so that an investor’s shares, when redeemed may be worth more or less than the original cost. To obtain performance information current to the most recent month end, please call 1-800-782-8183.
| Portfolio Reviews (Unaudited) |
| HSBC Global High Yield Bond Fund | |
The charts above represent a historical since inception performance comparison of a hypothetical investment in the indicated share class versus a similar investment in the Fund’s benchmark and represents the reinvestment of dividends and capital gains in the Fund.
| | | | Average Annual | | Expense |
| Fund Performance | | | | Total Return (%) | | Ratio (%)2 |
| | Inception | | 1 | | Since | | | | |
| As of October 31, 2018 | | Date | | Year | | Inception | | Gross | | Net |
| HSBC Global High Yield Bond Class A1 | | 7/14/15 | | -5.54 | | 1.94 | | 2.66 | | 1.18 |
| HSBC Global High Yield Bond Class I | | 7/14/15 | | -0.41 | | 3.82 | | 2.31 | | 0.83 |
| ICE BofA Merrill Lynch BB-B Global High Yield Constrained Index3 | | — | | 0.04 | | 5.05 | | N/A | | N/A |
Past performance does not guarantee future results. The performance data quoted represents past performance and current returns may be lower or higher. Total return figures include change in share price, reinvestment of dividends and capital gains and do not reflect the taxes that a shareholder would pay on Fund distributions or on the redemption of Fund shares. Investment return and principal value will fluctuate so that an investor’s shares, when redeemed may be worth more or less than the original cost. To obtain performance information current to the most recent month end, please call 1-800-782-8183.
The performance above reflects any fee waivers that have been in effect during the applicable periods, as well as any expense reimbursements that have periodically been made. Absent such waivers and reimbursements, returns would have been lower. Currently, contractual fee waivers and/or expense reimbursements are in effect for the Fund through March 1, 2019.
| 1 | | Reflects the maximum sales charge of 4.75%. |
| 2 | | Reflects the expense ratio as reported in the prospectus dated February 28, 2018. HSBC Global Asset Management (USA) Inc., the Adviser, has entered into a contractual expense limitation agreement with the Fund under which it will limit total expenses of the Fund (excluding interest, taxes, brokerage commissions, extraordinary expenses and estimated indirect expenses attributable to the Fund’s investments in investment companies) to an annual rate of 1.15% and 0.80% for Class A Shares and Class I Shares, respectively. The expense limitation shall be in effect until March 1, 2019. The expense ratios reflected include acquired fund fees and expenses. Additional information pertaining to the October 31, 2018 expense ratios can be found in the financial highlights. |
| 3 | | For additional information, please refer to the Glossary of Terms. |
The performance of the Fund is measured against the ICE BofA Merrill Lynch BB-B Global High Yield Constrained Index, which tracks the performance of United States Dollar, Canadian Dollar, British Pound and Euro denominated below investment-grade corporate debt publicly issued in the major domestic or Eurobond markets. The index is unmanaged and its performance does not reflect the deduction of expenses associated with a mutual fund, such as investment management and fund accounting fees. The Fund’s performance reflects the deduction of fees for these value-added services. Investors cannot invest directly in an index.
| Portfolio Reviews (Unaudited) |
| HSBC Global High Income Bond Fund |
| (Class A Shares and Class I Shares) |
by Jerry Samet, Senior Portfolio Manager
Rick Liu, CFA/Portfolio Manager
Nishant Upadhyay, Senior Vice President/Portfolio Manager
The HSBC Global High Income Bond Fund (the “Fund”) seeks to provide a high level of current income. Under normal market conditions, the Fund invests at least 80% of its net assets, plus any borrowings for investment purposes, in a globally diversified portfolio of higher yielding securities.
Investment Concerns
There is no assurance that a portfolio will achieve its investment objective or will work under all market conditions. The value of investments may go down as well as up and you may not get back the amount originally invested. Portfolios may be subject to certain additional risks, which should be considered carefully along with their investment objectives and fees. Investments in foreign markets entail special risks such as currency, political, economic, and market risks. The risks of investing in emerging markets countries are greater than the risks generally associated with foreign investments. Fixed income securities are subject to credit and interest rate risk. Credit risk refers to the ability of an issuer to make timely payments of interest and principal. Interest rate risk refers to fluctuations in the value of a fixed income security resulting from changes in the general level of interest rates. In a declining interest rate environment, the portfolio may generate less income. In a rising interest rate environment, bond prices may fall. Investments in high-yield securities are often considered speculative investments and have significantly higher credit risk than investment-grade securities. The prices of high-yield securities, which may be less liquid than higher rated securities, may be more vulnerable to adverse market, economic or political conditions. Convertible securities entail risks associated with equity securities (value can fluctuate based on changes in a company’s financial condition or overall market conditions); investments in convertible securities are subject to the risks associated with fixed income securities. Derivatives may be riskier than other types of investments and could result in losses that significantly exceed the Fund’s original investment.
For a complete description of these and other risks associated with investment in a mutual fund, please refer to the Fund’s prospectus.
Market Commentary
For the year ended October 31, 2018, the Fund returned -2.39% (without sales charge) for the Class A Shares and -2.12% for the Class I Shares. That compared to a -1.63% total return for the Fund’s benchmark, the Bloomberg Barclays High Income Bond Composite Index1, for the same period
Portfolio Performance
Risk assets rallied in late 2017 and January 2018 amid continued economic growth and tax reform measures passed by U.S. lawmakers. However, markets were jolted in February by concerns over inflation and the U.S. administration’s protectionist trade policies. Volatility persisted through the spring and summer as investors reconciled solid global growth and strong corporate earnings with geopolitical risks, trade tensions and country-specific issues in Europe and emerging markets (EM). The third quarter of 2018 started with a risk-asset rally, largely in response to strong U.S. economic data. A strong end-of-quarter performance in September was followed by a risk asset sell-off in October, as markets were shaken by rate and equity volatility and investors remained nervous about continuing trade issues and signs of slowing global growth.
The U.S. Treasury curve flattened over the period, with U.S. 2-year Treasury yields rising 127 basis points (1.27%) to 2.87%. U.S. 10-year Treasury yields rose 76 basis points (0.76%) to finish at 3.14% as investor concerns over inflationary pressures grew. Meanwhile, Euro 10-year Treasury yields finished largely unchanged, increasing by 3 basis points (0.03%) to 0.39% over the period. Global high- yield credit spreads widened by 76 basis points (0.76%) to 414 basis points (4.14%), while global investment-grade credit spreads widened a more modest 28 basis points (0.28%), and ended at 127 (1.27%).
The Fund’s sector allocation had a neutral impact on performance relative to the benchmark. Positive positioning in EM sector allocations was countered by negative positioning in U.S. BBB-rated assets. Relative performance benefited from issuer selection, specifically in U.S. BB-rated assets and EM assets.†
The Fund’s regional allocations detracted from relative performance. Underweight positions in Europe and overweight positions in U.S. BBB-rated issues detracted from the Fund’s relative performance as European assets were the best performers and U.S. BBB-rated issues underperformed during the period.†
The Fund’s shorter duration positioning versus the benchmark contributed to relative performance as Treasury yields rose over the period, driving down prices.†
The Fund maintained some derivative exposure during the period, including futures contracts, currency forwards used to hedge non-USD exposure and a small position in credit default swaps (CDS). The futures contracts, currency forwards and the CDS exposure did not materially impact performance.†
† Portfolio composition is subject to change.
1 For additional information, please refer to the Glossary of Terms.
Past performance does not guarantee future results. The performance data quoted represents past performance and current returns may be lower or higher. Total return figures include change in share price, reinvestment of dividends and capital gains and do not reflect taxes that a shareholder would pay on Fund distributions or on the redemption of Fund shares. Investment return and principal value will fluctuate so that an investor’s shares, when redeemed may be worth more or less than the original cost. To obtain performance information current to the most recent month end, please call 1-800-782-8183.
| Portfolio Reviews (Unaudited) |
| HSBC Global High Income Bond Fund | |
The charts above represent a historical since inception performance comparison of a hypothetical investment in the indicated share class versus a similar investment in the Fund’s benchmark and represents the reinvestment of dividends and capital gains in the Fund.
| | | | Average Annual | | Expense |
| Fund Performance | | | | Total Return (%) | | Ratio (%)2 |
| | Inception | | 1 | | Since | | | | |
| As of October 31, 2018 | | Date | | Year | | Inception | | Gross | | Net |
| HSBC Global High Income Bond Fund Class A1 | | 7/14/15 | | -7.02 | | 1.12 | | 2.79 | | 1.16 |
| HSBC Global High Income Bond Fund Class I | | 7/14/15 | | -2.12 | | 2.97 | | 2.44 | | 0.81 |
| Bloomberg Barclays High Income Bond Composite Index3 | | — | | -1.63 | | 4.13 | | N/A | | N/A |
Past performance does not guarantee future results. The performance data quoted represents past performance and current returns may be lower or higher. Total return figures include change in share price, reinvestment of dividends and capital gains and do not reflect the taxes that a shareholder would pay on Fund distributions or on the redemption of Fund shares. Investment return and principal value will fluctuate so that an investor’s shares, when redeemed may be worth more or less than the original cost. To obtain performance information current to the most recent month end, please call 1-800-782-8183.
The performance above reflects any fee waivers that have been in effect during the applicable periods, as well as any expense reimbursements that have periodically been made. Absent such waivers and reimbursements, returns would have been lower. Currently, contractual fee waivers and/or expense reimbursements are in effect for the Fund through March 1, 2019.
| 1 | | Reflects the maximum sales charge of 4.75%. |
| 2 | | Reflects the expense ratio as reported in the prospectus dated February 28, 2018. HSBC Global Asset Management (USA) Inc., the Adviser, has entered into a contractual expense limitation agreement with the Fund under which it will limit total expenses of the Fund (excluding interest, taxes, brokerage commissions, extraordinary expenses and estimated indirect expenses attributable to the Fund’s investments in investment companies) to an annual rate of 1.15% and 0.80% for Class A Shares and Class I Shares, respectively. The expense limitation shall be in effect until March 1, 2019. The expense ratios reflected include acquired fund fees and expenses. Additional information pertaining to the October 31, 2018 expense ratios can be found in the financial highlights. |
| 3 | | For additional information, please refer to the Glossary of Terms. |
The performance of the Fund is measured against the Bloomberg Barclays High Income Bond Composite Index, which is a customized index that is close to equally weighted across US, Euro and EM markets. The Index is comprised of the following indices: Bloomberg Barclays USD Unhedged Emerging Markets Aggregate Index (35%), Bloomberg Barclays U.S. High Yield Ba Index (15%), Bloomberg Barclays U.S. Credit Baa Index (20%), Bloomberg Barclays EuroAgg Corporate Baa USD Hedged Index (15%), and Bloomberg Barclays Pan Euro HY (Euro) BB Rating Only USD Hedged Index (15%). The index is unmanaged and its performance does not reflect the deduction of expenses associated with a mutual fund, such as investment management and fund accounting fees. The Fund’s performance reflects the deduction of fees for these value-added services. Investors cannot invest directly in an index.
| Portfolio Reviews |
| Portfolio Composition* |
| October 31, 2018 (Unaudited) |
| HSBC Emerging Markets Debt Fund |
| Country | | Percentage of Investments at Value (%)† |
| Mexico | | | 12.0 | |
| Indonesia | | | 10.0 | |
| Turkey | | | 8.6 | |
| Brazil | | | 8.1 | |
| Russian Federation | | | 7.7 | |
| South Africa | | | 6.0 | |
| Colombia | | | 5.5 | |
| Argentina | | | 3.1 | |
| Malaysia | | | 3.0 | |
| Poland | | | 3.0 | |
| Chile | | | 2.5 | |
| Thailand | | | 2.5 | |
| Hungary | | | 2.5 | |
| Egypt | | | 2.0 | |
| Peru | | | 2.0 | |
| Dominican Republic | | | 1.8 | |
| Sri Lanka | | | 1.5 | |
| Oman | | | 1.5 | |
| Romania | | | 1.3 | |
| Ukraine | | | 1.2 | |
| Philippines | | | 1.0 | |
| Ecuador | | | 1.0 | |
| Zambia | | | 0.9 | |
| Czech Republic | | | 0.9 | |
| Nigeria | | | 0.8 | |
| China | | | 0.8 | |
| Senegal | | | 0.8 | |
| El Salvador | | | 0.7 | |
| Jamaica | | | 0.7 | |
| Costa Rica | | | 0.7 | |
| Panama | | | 0.5 | |
| Iraq | | | 0.5 | |
| Guatemala | | | 0.5 | |
| Ghana | | | 0.5 | |
| Ireland | | | 0.4 | |
| Angola | | | 0.4 | |
| Kazakhstan | | | 0.4 | |
| Mongolia | | | 0.4 | |
| Morocco | | | 0.4 | |
| Kenya | | | 0.4 | |
| India | | | 0.4 | |
| Singapore | | | 0.4 | |
| Venezuela | | | 0.3 | |
| Cote D’Ivoire | | | 0.2 | |
| Uruguay | | | 0.2 | |
| Lebanon | | | 0.0 | |
| | | 100.0 | |
| | | | | |
| HSBC Frontier Markets Fund |
| Country | | Percentage of Investments at Value (%)† |
| Egypt | | | 15.7 | |
| Kuwait | | | 13.4 | |
| United Arab Emirates | | | 13.1 | |
| Philippines | | | 7.6 | |
| Argentina | | | 7.1 | |
| Vietnam | | | 6.2 | |
| Romania | | | 6.1 | |
| Kazakhstan | | | 4.8 | |
| Georgia | | | 4.7 | |
| Colombia | | | 3.8 | |
| Nigeria | | | 3.3 | |
| Cambodia | | | 3.0 | |
| Kenya | | | 2.9 | |
| Morocco | | | 2.9 | |
| Peru | | | 2.5 | |
| Mauritius | | | 1.8 | |
| Bangladesh | | | 1.0 | |
| Croatia | | | 0.1 | |
| | | 100.0 | |
| | |
| HSBC Asia ex-Japan Smaller Companies Equity Fund |
| Country | | Percentage of Investments at Value (%)† |
| China | | | 16.9 | |
| Hong Kong | | | 16.5 | |
| Taiwan, | | | | |
| Province of China | | | 16.4 | |
| India | | | 15.1 | |
| Korea, Republic Of | | | 14.8 | |
| Thailand | | | 5.2 | |
| Indonesia | | | 4.9 | |
| Malaysia | | | 4.7 | |
| Singapore | | | 2.8 | |
| Japan | | | 1.5 | |
| Macau | | | 1.2 | |
| | | 100.0 | |
| Portfolio Reviews |
| Portfolio Composition* (continued) |
| October 31, 2018 (Unaudited) |
| HSBC Global High Yield Bond Fund | |
| Country | | Percentage of Investments at Value (%)† |
| United States | | | 60.0 | |
| France | | | 5.9 | |
| Luxembourg | | | 4.6 | |
| Brazil | | | 3.5 | |
| Canada | | | 3.2 | |
| Germany | | | 2.8 | |
| United Kingdom | | | 2.7 | |
| Netherlands | | | 2.2 | |
| Ireland | | | 1.7 | |
| Turkey | | | 1.7 | |
| Russian Federation | | | 1.5 | |
| Argentina | | | 1.3 | |
| Spain | | | 1.1 | |
| Bermuda | | | 0.8 | |
| Indonesia | | | 0.8 | |
| Switzerland | | | 0.8 | |
| Belgium | | | 0.7 | |
| United Arab Emirates | | | 0.7 | |
| Bahamas | | | 0.6 | |
| Sweden | | | 0.4 | |
| Colombia | | | 0.4 | |
| Italy | | | 0.4 | |
| South Africa | | | 0.4 | |
| Sri Lanka | | | 0.4 | |
| Peru | | | 0.3 | |
| Mexico | | | 0.3 | |
| Denmark | | | 0.2 | |
| Nigeria | | | 0.2 | |
| Israel | | | 0.1 | |
| El Salvador | | | 0.1 | |
| Venezuela | | | 0.1 | |
| Lebanon | | | 0.1 | |
| Guatemala | | | 0.0 | |
| Chile | | | 0.0 | |
| | | 100.0 | |
| | | | | |
| HSBC Global High Income Bond Fund | |
| Country | | Percentage of Investments at Value (%)† |
| United States | | | 38.9 | |
| France | | | 7.2 | |
| Germany | | | 6.1 | |
| United Kingdom | | | 4.7 | |
| China | | | 4.0 | |
| Italy | | | 3.5 | |
| Indonesia | | | 2.4 | |
| Mexico | | | 2.3 | |
| Brazil | | | 2.3 | |
| Netherlands | | | 1.9 | |
| Canada | | | 1.9 | |
| Argentina | | | 1.8 | |
| Ireland | | | 1.8 | |
| Switzerland | | | 1.7 | |
| Qatar | | | 1.6 | |
| India | | | 1.5 | |
| Turkey | | | 1.5 | |
| Colombia | | | 1.2 | |
| Spain | | | 1.1 | |
| Russian Federation | | | 0.8 | |
| Peru | | | 0.8 | |
| Ghana | | | 0.8 | |
| Morocco | | | 0.8 | |
| Saudi Arabia | | | 0.8 | |
| Macau | | | 0.7 | |
| Egypt | | | 0.7 | |
| Hong Kong | | | 0.7 | |
| Oman | | | 0.7 | |
| Costa Rica | | | 0.7 | |
| United Arab Emirates | | | 0.5 | |
| Malaysia | | | 0.4 | |
| Belgium | | | 0.4 | |
| Bermuda | | | 0.4 | |
| Croatia | | | 0.4 | |
| Sri Lanka | | | 0.4 | |
| South Africa | | | 0.4 | |
| Ukraine | | | 0.3 | |
| Luxembourg | | | 0.3 | |
| Romania | | | 0.3 | |
| Bahamas | | | 0.2 | |
| Israel | | | 0.2 | |
| Uruguay | | | 0.1 | |
| Chile | | | 0.1 | |
| Panama | | | 0.1 | |
| Nigeria | | | 0.1 | |
| Philippines | | | 0.1 | |
| Australia | | | 0.1 | |
| Venezuela | | | 0.1 | |
| Hungary | | | 0.1 | |
| Guatemala | | | 0.1 | |
| El Salvador | | | 0.0 | |
| | | 100.0 | |
____________________
| * | Portfolio composition is subject to change. |
| † | Excludes any instruments used for cash management. |
| HSBC EMERGING MARKETS DEBT FUND |
| Schedule of Portfolio Investments—as of October 31, 2018 |
| Foreign Bonds – 45.0% | | | | |
| | | | | |
| | Principal | | |
| | Amount † | | Value ($) |
| Brazil – 5.6% | | | | |
| Nota do Tesouro Nacional, | | | | |
| Series NTNF, 10.00%, 1/1/21 | | 5,950,000 | | 1,707,926 |
| Nota do Tesouro Nacional, | | | | |
| Series NTNB, 6.00%, 8/15/22 | | 680,000 | | 612,773 |
| Nota do Tesouro Nacional, | | | | |
| Series NTNF, 10.00%, 1/1/27 | | 200,000 | | 55,512 |
| Nota Do Tesouro Nacional, | | | | |
| 10.00%, 1/1/23 | | 1,400,000 | | 398,132 |
| | | | 2,774,343 |
Chile – 1.2% | | | | |
| Bonos de la Tesoreria de | | | | |
| la Republica en pesos, | | | | |
| 4.50%, 3/1/21 | | 150,000,000 | | 219,978 |
| Bonos de la Tesoreria de | | | | |
| la Republica en pesos, | | | | |
| 4.50%, 3/1/26 | | 70,000,000 | | 101,479 |
| Republic of Chile, | | | | |
| 5.50%, 8/5/20 | | 182,000,000 | | 269,144 |
| | | | 590,601 |
| Colombia – 3.4% | | | | |
| Titulos de Tesoreria Bond, | | | | |
| Series B, 5.00%, 11/21/18 | | 1,199,700,000 | | 373,245 |
| Titulos de Tesoreria Bond, | | | | |
| Series B, 7.00%, 9/11/19 | | 1,307,000,000 | | 414,232 |
| Titulos de Tesoreria Bond, | | | | |
| Series B, 10.00%, 7/24/24 | | 1,833,400,000 | | 663,865 |
| Titulos de Tesoreria Bond, | | | | |
| Series B, 6.00%, 4/28/28 | | 860,000,000 | | 246,103 |
| | | | 1,697,445 |
| Czech Republic – 0.8% | | | | |
| Republic of Czech, | | | | |
| Series 52, 4.70%, 9/12/22 | | 5,000,000 | | 242,383 |
| Republic of Czech, | | | | |
| Series 58, 5.70%, 5/25/24 | | 3,100,000 | | 163,901 |
| | | | 406,284 |
| Hungary – 2.3% | | | | |
| Hungary Government Bond, | | | | |
| 2.50%, 10/27/21 | | 75,000,000 | | 267,843 |
| Hungary Government Bond, | | | | |
| Series 22/B, 1.75%, 10/26/22 | | 110,000,000 | | 376,938 |
| Hungary Government Bond, | | | | |
| 6.00%, 11/24/23 | | 44,000,000 | | 179,065 |
| Hungary Government Bond, | | | | |
| Series 25/B, 5.50%, 6/24/25 | | 73,000,000 | | 290,575 |
| | | | 1,114,421 |
| Indonesia – 4.8% | | | | |
| Indonesia Government, | | | | |
| Series FR53, 8.25%, 7/15/21 | | 1,161,000,000 | | 76,677 |
| Indonesia Government, | | | | |
| Series FR70, 8.38%, 3/15/24 | | 10,272,000,000 | | 669,032 |
| Indonesia Government, | | | | |
| Series FR40, 11.00%, 9/15/25 | | 2,000,000,000 | | 147,393 |
| Indonesia Government, | | | | |
| Series FR56, 8.38%, 9/15/26 | | 18,323,000,000 | | 1,187,675 |
| Indonesia Government, | | | | |
| 7.00%, 5/15/27 | | 1,710,000,000 | | 101,363 |
| Indonesia Government, | | | | |
| 6.13%, 5/15/28 | | 1,626,000,000 | | 89,858 |
| Indonesia Government, | | | | |
| 8.75%, 5/15/31 | | 1,300,000,000 | | 85,046 |
| | | | 2,357,044 |
| Malaysia – 2.8% | | | | |
| Malaysian Government, | | | | |
| Series 315, 3.66%, 10/15/20 | | 950,000 | | 227,706 |
| Malaysian Government, | | | | |
| Series 416, 3.62%, 11/30/21 | | 2,000,000 | | 477,289 |
| Malaysian Government, | | | | |
| Series 114, 4.18%, 7/15/24 | | 500,000 | | 120,627 |
| Malaysian Government, Series 115, | | | | |
| 3.96%, 9/15/25 | | 1,000,000 | | 237,138 |
| Malaysian Government, Series 316, | | | | |
| 3.90%, 11/30/26 | | 200,000 | | 47,078 |
| Malaysian Government, | | | | |
| 3.90%, 11/16/27 | | 1,100,000 | | 256,870 |
| | | | 1,366,708 |
| Mexico – 5.8% | | | | |
| Mexican Bonos Desarrollo, | | | | |
| 8.00%, 6/11/20 | | 9,530,000 | | 464,830 |
| Mexican Bonos Desarrollo, | | | | |
| Series M, 6.50%, 6/10/21 | | 3,760,000 | | 175,966 |
| Mexican Bonos Desarrollo, | | | | |
| 6.50%, 6/9/22 | | 3,700,000 | | 170,083 |
| Mexican Bonos Desarrollo, | | | | |
| Series M20, 10.00%, 12/5/24 | | 7,000,000 | | 365,182 |
| Mexican Bonos Desarrollo, | | | | |
| Series M, 5.75%, 3/5/26 | | 1,320,000 | | 54,358 |
| Mexican Bonos Desarrollo, | | | | |
| Series M20, 7.50%, 6/3/27 | | 24,600,000 | | 1,114,472 |
| Mexican Bonos Desarrollo, | | | | |
| Series M30, 10.00%, 11/20/36 | | 9,600,000 | | 515,877 |
| | | | 2,860,768 |
| Peru – 1.2% | | | | |
| Republic of Peru, Registered, | | | | |
| 8.20%, 8/12/26 | | 550,000 | | 189,914 |
| Republic of Peru, Registered, | | | | |
| 6.35%, 8/12/28 | | 1,300,000 | | 400,585 |
| | | | 590,499 |
| Philippines – 0.4% | | | | |
| Republic of Philippines, | | | | |
| 3.90%, 11/26/22 | | 10,000,000 | | 173,672 |
| Poland – 2.7% | | | | |
| Poland Government Bond, | | | | |
| Series 0719, 3.25%, 7/25/19 | | 808,000 | | 213,690 |
| Poland Government Bond, | | | | |
| Series 1020, 5.25%, 10/25/20 | | 250,000 | | 69,830 |
| Poland Government Bond, | | | | |
| Series 1021, 5.75%, 10/25/21 | | 475,000 | | 137,729 |
| 16 HSBC FAMILY OF FUNDS | See notes to financial statements. |
| HSBC EMERGING MARKETS DEBT FUND |
| Schedule of Portfolio Investments—as of October 31, 2018 (continued) |
| Foreign Bonds, continued |
| |
| | Principal | | |
| | Amount † | | Value ($) |
| Poland – continued | | | | |
| Poland Government Bond, | | | | |
| Series 0725, 3.25%, 7/25/25 | | 3,450,000 | | 919,035 |
| Poland Government Bond, | | | | |
| Series 0726, 2.50%, 7/25/26 | | 40,000 | | 10,043 |
| | | | 1,350,327 |
| Romania – 1.0% | | | | |
| Romania Government Bond, | | | | |
| 3.40%, 3/8/22 | | 1,600,000 | | 371,780 |
| Romania Government Bond, | | | | |
| Series 10Y, 4.75%, 2/24/25 | | 210,000 | | 50,500 |
| Romania Government Bond, | | | | |
| Series 15Y, 5.80%, 7/26/27 | | 300,000 | | 76,890 |
| | | | 499,170 |
| Russian Federation – 4.5% | | | | |
| Russia Government Bond, | | | | |
| 6.80%, 12/11/19 | | 5,535,000 | | 83,377 |
| Russia Government Bond, | | | | |
| Series 6209, 7.60%, 7/20/22 | | 33,000,000 | | 493,651 |
| Russia Government Bond, | | | | |
| Series 6215, 7.00%, 8/16/23 | | 38,100,000 | | 551,750 |
| Russia Government Bond, | | | | |
| Series 6207, 8.15%, 2/3/27 | | 37,000,000 | | 551,982 |
| Russia Government Bond, | | | | |
| Series 6212, 7.05%, 1/19/28 | | 37,000,000 | | 513,107 |
| | | | 2,193,867 |
| South Africa – 4.0% | | | | |
| Republic of South Africa, | | | | |
| Series R204, 8.00%, 12/21/18 | | 2,600,000 | | 176,613 |
| Republic of South Africa, | | | | |
| Series 2023, 7.75%, 2/28/23 | | 5,240,000 | | 343,803 |
| Republic of South Africa, | | | | |
| Series R186, 10.50%, 12/21/26 | | 3,100,000 | | 222,879 |
| Republic of South Africa, | | | | |
| Series R209, 6.25%, 3/31/36 | | 14,927,000 | | 696,789 |
| Republic of South Africa, | | | | |
| Series 2040, 9.00%, 1/31/40 | | 9,000,000 | | 542,322 |
| | | | 1,982,406 |
| Thailand – 2.3% | | | | |
| Thailand Government Bond, | | | | |
| 1.88%, 6/17/22 | | 2,300,000 | | 68,369 |
| Thailand Government Bond, | | | | |
| 3.85%, 12/12/25 | | 20,686,000 | | 672,418 |
| Thailand Government Bond, | | | | |
| 2.13%, 12/17/26 | | 720,000 | | 20,720 |
| Thailand Government Bond, | | | | |
| 4.88%, 6/22/29 | | 10,500,000 | | 371,031 |
| | | | 1,132,538 |
| Turkey – 2.2% | | | | |
| Turkey Government Bond, | | | | |
| 10.70%, 2/17/21 | | 1,690,000 | | 242,917 |
| Turkey Government Bond, | | | | |
| 9.50%, 1/12/22 | | 1,490,000 | | 196,945 |
| Turkey Government Bond, | | | | |
| 8.80%, 9/27/23 | | 2,400,000 | | 296,365 |
| Turkey Government Bond, | | | | |
| 8.00%, 3/12/25 | | 3,020,000 | | 340,993 |
| | | | 1,077,220 |
| TOTAL FOREIGN BONDS | | | | |
| (COST $25,561,372) | | | | 22,167,313 |
| |
| Yankee Dollars – 47.4% |
| |
| | Principal | | |
| | Amount ($) | | |
| Angola – 0.4% | | | | |
| Republic of Angola, | | | | |
| 8.25%, 5/9/28 (a) | | 200,000 | | 199,798 |
| Argentina – 2.9% | | | | |
| Provincia de Buenos Aires/ | | | | |
| Argentina, Registered, | | | | |
| 9.13%, 3/16/24 | | 150,000 | | 133,877 |
| Republic of Argentina, | | | | |
| 4.63%, 1/11/23 | | 65,000 | | 55,088 |
| Republic of Argentina, | | | | |
| 6.88%, 1/26/27 | | 287,000 | | 240,076 |
| Republic of Argentina, | | | | |
| 5.88%, 1/11/28 | | 930,000 | | 720,749 |
| Republic of Argentina, | | | | |
| 7.63%, 4/22/46 | | 150,000 | | 118,050 |
| Republic of Argentina, | | | | |
| 6.88%, 1/11/48 | | 38,000 | | 28,025 |
| Republic of Argentina, | | | | |
| 7.13%, 6/28/17 | | 90,000 | | 67,050 |
| YPF SA, 7.00%, 12/15/47, Callable | | | | |
| 6/15/47 @ 100 (a)(b) | | 92,000 | | 69,754 |
| | | | 1,432,669 |
| Brazil – 1.8% | | | | |
| Centrais Eletricas Brasileiras SA, | | | | |
| Registered, 5.75%, 10/27/21 | | 200,000 | | 200,800 |
| Federal Republic of Brazil, | | | | |
| 7.13%, 1/20/37 | | 206,000 | | 226,600 |
| Petrobras Global Finance BV, | | | | |
| 8.38%, 5/23/21 | | 10,000 | | 10,909 |
| Petrobras Global Finance BV, | | | | |
| 7.38%, 1/17/27 | | 45,000 | | 46,703 |
| Petrobras Global Finance BV, | | | | |
| 6.85%, 6/5/15 | | 50,000 | | 44,375 |
| Rede D'or Finance Sarl, 4.95%, | | | | |
| 1/17/28, Callable 10/17/27 | | | | |
| @ 100 (a)(b) | | 200,000 | | 176,852 |
| Suzano Austria GMBH, 6.00%, | | | | |
| 1/15/29, Callable 10/15/28 | | | | |
| @ 100 (a)(b) | | 200,000 | | 203,750 |
| | | | 909,989 |
| See notes to financial statements. | HSBC FAMILY OF FUNDS 17 |
| HSBC EMERGING MARKETS DEBT FUND |
| Schedule of Portfolio Investments—as of October 31, 2018 (continued) |
| Yankee Dollars, continued |
| |
| | Principal | | |
| | Amount ($) | | Value ($) |
| Chile – 1.1% | | | | |
| Banco Santander Chile, 2.50%, | | | | |
| 12/15/20, Callable 11/15/20 | | | | |
| @ 100 (a)(b) | | 150,000 | | 145,956 |
| Empresa Nacional del Petroleo, | | | | |
| 4.50%, 9/14/47, Callable 3/14/47 | | | | |
| @ 100 (a)(b) | | 200,000 | | 169,700 |
| Enel Chile SA, 4.88%, 6/12/28 | | 110,000 | | 109,010 |
| Republic of Chile, | | | | |
| 3.63%, 10/30/42 | | 150,000 | | 134,259 |
| | | | 558,925 |
| China – 0.8% | | | | |
| Sinopec Capital (2013), Ltd., | | | | |
| 3.13%, 4/24/23 (a) | | 200,000 | | 191,364 |
| State Grid Overseas Investment | | | | |
| 2016, Ltd., 3.50%, 5/4/27 (a) | | 200,000 | | 187,483 |
| | | | 378,847 |
| Colombia – 1.6% | | | | |
| Banco de Bogota SA, | | | | |
| 4.38%, 8/3/27 (a) | | 200,000 | | 186,252 |
| Bancolombia SA, 5.13%, 9/11/22 | | 216,000 | | 217,080 |
| Colombia Government International | | | | |
| Bond, 3.88%, 4/25/27, Callable | | | | |
| 1/25/27 @ 100 (b) | | 276,000 | | 263,028 |
| Republic of Colombia, | | | | |
| 7.38%, 9/18/37 | | 100,000 | | 120,750 |
| | | | 787,110 |
| Costa Rica – 0.6% | | | | |
| Costa Rica Government, | | | | |
| Registered, 4.38%, 4/30/25 | | 200,000 | | 165,436 |
| Costa Rica Government, | | | | |
| Registered, 5.63%, 4/30/43 | | 200,000 | | 145,606 |
| | | | 311,042 |
| Cote D'Ivoire – 0.2% | | | | |
| Ivory Coast Government Bond, | | | | |
| Registered, 5.75%, 12/31/32, | | | | |
| Callable 12/31/18 @ 100 (b)(c) | | 115,625 | | 104,671 |
| Dominican Republic – 1.6% | | | | |
| Dominican Republic, | | | | |
| 5.95%, 1/25/27 (a) | | 100,000 | | 99,500 |
| Dominican Republic, | | | | |
| 6.50%, 2/15/48 (a) | | 150,000 | | 141,975 |
| Dominican Republic, | | | | |
| Registered, 7.50%, 5/6/21 | | 300,000 | | 310,500 |
| Dominican Republic, | | | | |
| Registered, 5.95%, 1/25/27 | | 250,000 | | 248,750 |
| | | | | 800,725 |
| Ecuador – 0.9% | | | | |
| Republic of Ecuador, | | | | |
| Registered, 7.95%, 6/20/24 | | 300,000 | | 268,350 |
| Republic of Ecuador, | | | | |
| Registered, 7.88%, 1/23/28 (a) | | 200,000 | | 167,140 |
| | | | 435,490 |
| Egypt – 1.9% | | | | |
| Arab Republic of Egypt, | | | | |
| Registered, 5.88%, 6/11/25 | | 200,000 | | 186,364 |
| Arab Republic of Egypt, | | | | |
| Registered, 6.59%, 2/21/28 (a) | | 200,000 | | 183,174 |
| Arab Republic of Egypt, | | | | |
| Registered, 6.59%, 2/21/28 | | 400,000 | | 366,348 |
| Arab Republic of Egypt, | | | | |
| Registered, 7.90%, 2/21/48 (a) | | 200,000 | | 178,866 |
| | | | 914,752 |
| El Salvador – 0.7% | | | | |
| Republic of El Salvador, | | | | |
| Registered, 7.75%, 1/24/23 | | 60,000 | | 60,413 |
| Republic of El Salvador, | | | | |
| Registered, 5.88%, 1/30/25 | | 161,000 | | 144,095 |
| Republic of El Salvador, | | | | |
| Registered, 6.38%, 1/18/27 | | 150,000 | | 134,063 |
| | | | 338,571 |
| Ghana – 0.4% | | | | |
| Republic of Ghana, | | | | |
| Registered, 7.88%, 8/7/23 | | 200,000 | | 203,766 |
| Guatemala – 0.4% | | | | |
| Comcel Trust, Registered, | | | | |
| 6.88%, 2/6/24, Callable 2/6/19 | | | | |
| @ 103.44 (b) | | 200,000 | | 204,575 |
| India – 0.4% | | | | |
| Export-Import Bank of India, | | | | |
| Registered, 3.38%, 8/5/26 | | 200,000 | | 180,977 |
| Indonesia – 4.4% | | | | |
| Indonesia Government Bond, | | | | |
| Registered, 5.13%, 1/15/45 | | 200,000 | | 187,870 |
| Pertamina Persero PT, | | | | |
| 5.63%, 5/20/43 | | 200,000 | | 180,361 |
| Perusahaan Listrik Negara PT, | | | | |
| 4.13%, 5/15/27 (a) | | 450,000 | | 405,014 |
| Perusahaan Listrik Negara PT, | | | | |
| 5.45%, 5/21/28 (a) | | 200,000 | | 197,910 |
| Republic of Indonesia, | | | | |
| 4.10%, 4/24/28 | | 345,000 | | 324,061 |
| Republic of Indonesia, | | | | |
| Registered, 5.38%, 10/17/23 | | 270,000 | | 278,953 |
| Republic of Indonesia, | | | | |
| Registered, 8.50%, 10/12/35 | | 100,000 | | 131,066 |
| Republic of Indonesia, | | | | |
| Registered, 6.63%, 2/17/37 | | 100,000 | | 112,083 |
| Republic of Indonesia, | | | | |
| Registered, 7.75%, 1/17/38 | | 100,000 | | 124,617 |
| Republic of Indonesia, | | | | |
| Registered, 6.75%, 1/15/44 | | 200,000 | | 230,057 |
| | | | 2,171,992 |
| 18 HSBC FAMILY OF FUNDS | See notes to financial statements. |
| HSBC EMERGING MARKETS DEBT FUND |
| Schedule of Portfolio Investments—as of October 31, 2018 (continued) |
| Yankee Dollars, continued |
| |
| | Principal | | |
| | Amount ($) | | Value ($) |
| Iraq – 0.5% | | | | |
| Republic of Iraq, Registered, | | | | |
| 5.80%, 1/15/28, Callable | | | | |
| 12/24/18 @ 100 (b) | | 250,000 | | 228,997 |
| Ireland – 0.4% | | | | |
| C&W Senior Financing Dac, 7.50%, | | | | |
| 10/15/26, Callable 10/15/21 @ | | | | |
| 103.75 (a)(b) | | 200,000 | | 200,500 |
| Jamaica – 0.7% | | | | |
| Government of Jamaica, | | | | |
| 6.75%, 4/28/28 | | 200,000 | | 217,000 |
| Jamaica Government Bond, | | | | |
| 8.00%, 3/15/39 | | 100,000 | | 115,796 |
| | | | 332,796 |
| Kazakhstan – 0.4% | | | | |
| Kazmunaygas National Co., | | | | |
| 5.75%, 4/19/47 (a) | | 200,000 | | 190,880 |
| Kenya – 0.4% | | | | |
| Republic of Kenya, | | | | |
| 7.25%, 2/28/28 (a) | | 200,000 | | 188,620 |
| Lebanon – 0.0% | | | | |
| Republic of Lebanon, Series G, | | | | |
| 6.38%, 3/9/20 | | 22,000 | | 21,162 |
| Mexico – 5.3% | | | | |
| Banco Mercantil del Norte SA, | | | | |
| 5.75% (H15T5Y + 445 bps), | | | | |
| 10/4/31, Callable 10/4/26 | | | | |
| @ 100 (b)(d) | | 200,000 | | 183,002 |
| Comision Federal de Electricidad, | | | | |
| Registered, 4.75%, 2/23/27 | | 200,000 | | 188,902 |
| Nemak Sab de CV, 4.75%, 1/23/25, | | | | |
| Callable 1/23/21 @ 103.56 (a)(b) . | | 200,000 | | 192,580 |
| Petroleos Mexicanos, | | | | |
| 6.38%, 2/4/21 | | 221,000 | | 226,123 |
| Petroleos Mexicanos, | | | | |
| 3.50%, 1/30/23 | | 100,000 | | 92,100 |
| Petroleos Mexicanos, | | | | |
| 4.50%, 1/23/26 | | 191,000 | | 169,547 |
| Petroleos Mexicanos, | | | | |
| 6.50%, 3/13/27 | | 399,000 | | 386,631 |
| Petroleos Mexicanos, 5.35%, | | | | |
| 2/12/28 (a) | | 172,000 | | 153,235 |
| Petroleos Mexicanos, 6.50%, | | | | |
| 1/23/29 (a) | | 60,000 | | 57,330 |
| Petroleos Mexicanos, | | | | |
| 6.63%, 6/15/35 | | 220,000 | | 201,300 |
| Petroleos Mexicanos, | | | | |
| 5.50%, 6/27/44 | | 100,000 | | 77,340 |
| Petroleos Mexicanos, | | | | |
| 6.75%, 9/21/47 | | 66,000 | | 56,852 |
| Petroleos Mexicanos, 6.35%, | | | | |
| 2/12/48 (a) | | 36,000 | | 29,840 |
| Petroleos Mexicanos, Registered, | | | | |
| 5.35%, 2/12/28 | | 150,000 | | 133,635 |
| United Mexican States, | | | | |
| 6.05%, 1/11/40 | | 80,000 | | 83,360 |
| United Mexican States, Series M, | | | | |
| 4.75%, 3/8/44, MTN | | 230,000 | | 203,897 |
| United Mexican States, | | | | |
| 4.60%, 1/23/46 | | 200,000 | | 172,702 |
| | | | 2,608,376 |
| Mongolia – 0.4% | | | | |
| Mongolia Government International | | | | |
| Bond, 5.13%, 12/5/22 | | 200,000 | | 189,201 |
| Morocco – 0.4% | | | | |
| Office Cherifien DES Pho, | | | | |
| 4.50%, 10/22/25 | | 200,000 | | 189,000 |
| Nigeria – 0.8% | | | | |
| Republic of Nigeria, | | | | |
| 6.38%, 7/12/23 | | 200,000 | | 199,224 |
| Republic of Nigeria, | | | | |
| 7.70%, 2/23/38 (a) | | 200,000 | | 180,002 |
| | | | 379,226 |
| Oman – 1.4% | | | | |
| Oman Government International | | | | |
| Bond, 4.13%, 1/17/23 (a) | | 290,000 | | 277,716 |
| Oman Government International | | | | |
| Bond, 5.63%, 1/17/28 (a) | | 200,000 | | 190,500 |
| Oztel Holdings SPC, Ltd., | | | | |
| 5.63%, 10/24/23 (a) | | 200,000 | | 199,700 |
| | | | 667,916 |
| Panama – 0.5% | | | | |
| Republic of Panama, | | | | |
| 6.70%, 1/26/36 | | 41,000 | | 49,098 |
| Republic of Panama, 4.50%, | | | | |
| 4/16/50, Callable 10/16/49 @ | | | | |
| 100 (b) | | 200,000 | | 184,300 |
| | | | 233,398 |
| Peru – 0.7% | | | | |
| BBVA Banco Continental, | | | | |
| Registered, 5.00%, 8/26/22 | | 10,000 | | 10,203 |
| Peru LNG Srl, | | | | |
| 5.38%, 3/22/30 (a) | | 200,000 | | 197,799 |
| Republic of Peru, | | | | |
| 6.55%, 3/14/37 | | 75,000 | | 91,313 |
| Southern Copper Corp., | | | | |
| 5.25%, 11/8/42 | | 25,000 | | 24,351 |
| | | | 323,666 |
| See notes to financial statements. | HSBC FAMILY OF FUNDS 19 |
| HSBC EMERGING MARKETS DEBT FUND |
| Schedule of Portfolio Investments—as of October 31, 2018 (continued) |
| Yankee Dollars, continued | | | | |
| |
| | Principal | | |
| | Amount ($) | | Value ($) |
| Philippines – 0.6% | | | | |
| Republic of Philippines, | | | | |
| 7.75%, 1/14/31 | | 120,000 | | 157,285 |
| Republic of Philippines, | | | | |
| 6.38%, 10/23/34 | | 100,000 | | 121,517 |
| | | | 278,802 |
| Romania – 0.2% | | | | |
| Romania Government Bond, | | | | |
| 6.13%, 1/22/44 (a) | | 50,000 | | 53,838 |
| Romania Government Bond, | | | | |
| Registered, 4.88%, 1/22/24 | | 40,000 | | 40,752 |
| | | | 94,590 |
| Russian Federation – 2.7% | | | | |
| Gazprom OAO, Registered, | | | | |
| 6.51%, 3/7/22 | | 100,000 | | 104,655 |
| Gazprom OAO, Registered, | | | | |
| 7.29%, 8/16/37 | | 230,000 | | 253,430 |
| Lukoil International Finance BV, | | | | |
| Registered, 4.75%, 11/2/26 | | 200,000 | | 196,000 |
| MMC Norilsk Nickel OJSC Via | | | | |
| MMC Finance DAC, | | | | |
| Registered, 4.10%, 4/11/23 | | 200,000 | | 189,000 |
| Phosagro OAO Via Phosagro | | | | |
| Bond Funding DAC, | | | | |
| 3.95%, 4/24/23 (a) | | 200,000 | | 187,680 |
| Russian Federation, | | | | |
| Registered, 4.25%, 6/23/27 | | 200,000 | | 189,337 |
| Sberbank of Russia Via | | | | |
| SB Capital SA, Registered, | | | | |
| 5.13%, 10/29/22 | | 200,000 | | 196,616 |
| | | | 1,316,718 |
| Senegal – 0.8% | | | | |
| Republic of Senegal, | | | | |
| 8.75%, 5/13/21 | | 200,000 | | 213,104 |
| Republic of Senegal, | | | | |
| 6.75%, 3/13/48 (a) | | 200,000 | | 164,340 |
| | | | 377,444 |
| Singapore – 0.3% | | | | |
| Puma International Financing SA, | | | | |
| 5.00%, 1/24/26, Callable 1/24/21 | | | | |
| @ 102.5 (a)(b) | | 200,000 | | 165,078 |
| South Africa – 1.5% | | | | |
| Republic of South Africa, | | | | |
| 4.67%, 1/17/24 | | 200,000 | | 191,096 |
| Republic of South Africa, | | | | |
| 4.88%, 4/14/26 | | 600,000 | | 555,000 |
| | | | 746,096 |
| Sri Lanka – 1.4% | | | | |
| Republic of Sri Lanka, | | | | |
| 6.75%, 4/18/28 (a) | | 200,000 | | 176,002 |
| Republic of Sri Lanka, | | | | |
| Registered, 6.00%, 1/14/19 | | 200,000 | | 197,983 |
| Republic of Sri Lanka, | | | | |
| Registered, 6.25%, 10/4/20 | | 130,000 | | 125,446 |
| Republic of Sri Lanka, | | | | |
| Registered, 5.88%, 7/25/22 | | 200,000 | | 184,481 |
| | | | 683,912 |
| Turkey – 5.6% | | | | |
| Export Credit Bank of Turkey, | | | | |
| 6.13%, 5/3/24 (a) | | 200,000 | | 179,000 |
| Republic of Turkey, | | | | |
| 7.00%, 6/5/20 | | 200,000 | | 201,293 |
| Republic of Turkey, | | | | |
| 5.63%, 3/30/21 | | 300,000 | | 292,483 |
| Republic of Turkey, | | | | |
| 6.25%, 9/26/22 | | 375,000 | | 363,272 |
| Republic of Turkey, | | | | |
| 5.75%, 3/22/24 | | 802,000 | | 747,056 |
| Republic of Turkey, | | | | |
| 4.88%, 10/9/26 | | 330,000 | | 278,937 |
| Republic of Turkey, | | | | |
| 5.13%, 2/17/28 | | 200,000 | | 168,750 |
| Republic of Turkey, | | | | |
| 8.00%, 2/14/34 | | 96,000 | | 95,358 |
| Republic of Turkey, | | | | |
| 6.00%, 1/14/41 | | 200,000 | | 159,107 |
| Republic of Turkey, | | | | |
| 6.63%, 2/17/45 | | 200,000 | | 168,856 |
| Republic of Turkey, | | | | |
| 5.75%, 5/11/47 | | 200,000 | | 151,500 |
| | | | 2,805,612 |
| Ukraine – 1.1% | | | | |
| MHP Lux SA, | | | | |
| 6.95%, 4/3/26 (a) | | 200,000 | | 184,832 |
| Ukraine Government, | | | | |
| 7.75%, 9/1/27 | | 140,000 | | 125,191 |
| Ukraine Government, | | | | |
| 7.38%, 9/25/32 (a) | | 290,000 | | 241,703 |
| | | | 551,726 |
| Uruguay – 0.1% | | | | |
| Republic of Uruguay, | | | | |
| 4.98%, 4/20/55 | | 25,000 | | 23,188 |
| Republic of Uruguay, PIK, | | | | |
| 7.88%, 1/15/33 | | 20,000 | | 25,999 |
| Republica Oriental del Uruguay, | | | | |
| 4.50%, 8/14/24 | | 10,000 | | 10,090 |
| Republica Oriental del Uruguay, | | | | |
| 5.10%, 6/18/50 | | 10,000 | | 9,475 |
| | | | 68,752 |
| 20 HSBC FAMILY OF FUNDS | See notes to financial statements. |
| HSBC EMERGING MARKETS DEBT FUND |
| Schedule of Portfolio Investments—as of October 31, 2018 (continued) |
| Yankee Dollars, continued | | | | | |
| | | | | | |
| | Principal | | | |
| | Amount ($) | | Value ($) |
| Venezuela – 0.2% | | | | | |
| Bolivarian Republic of Venezuela, | | | | | |
| 9.25%, 5/7/28 (e) | | 176,000 | | | 44,000 |
| Petroleos de Venezuela SA, | | | | | |
| Registered, 3.54%, 10/27/20 | | 45,000 | | | 41,962 |
| Petroleos de Venezuela SA, | | | | | |
| Registered, 6.00%, 5/16/24 (e) | | 155,771 | | | 26,715 |
| Petroleos de Venezuela SA, | | | | | |
| Registered, 6.00%, 11/15/26 (e) | | 32,000 | | | 5,520 |
| | | | | 118,197 |
| Zambia – 0.9% | | | | | |
| Republic of Zambia, Registered, | | | | | |
| 5.38%, 9/20/22 | | 330,000 | | | 222,165 |
| SASOL Financing USA LLC, | | | | | |
| 5.88%, 3/27/24, Callable 2/27/24 | | | | | |
| @ 100 (b) | | 200,000 | | | 201,500 |
| | | | | 423,665 |
| TOTAL YANKEE DOLLARS | | | | | |
| (COST $25,394,311) | | | | | 23,318,229 |
| | | | | | |
| Investment Companies – 1.2% | | | | | |
| | | | | | |
| | Shares | | | |
| Northern Institutional Government | | | | | |
| Assets Portfolio, Institutional | | | | | |
| Shares, 1.87%(f) | | 587,485 | | | 587,485 |
| TOTAL INVESTMENT COMPANIES | | | | | |
| (COST $587,485) | | | | | 587,485 |
| TOTAL INVESTMENTS | | | | | |
| IN SECURITIES | | | | | |
| (COST $ 51,543,168) – 93.6% | | | | | 46,073,027 |
| Other Assets (Liabilities) - 6.4% | | | | | 3,175,971 |
| NET ASSETS - 100% | | | | $ | 49,248,998 |
____________________
| † | The principal amount is disclosed in local currency and the value is disclosed in U.S. Dollars. |
| (a) | Rule 144A security or other security which is restricted as to resale to institutional investors. This security has been deemed liquid by the Investment Adviser based on procedures approved by the Board of Trustees. |
| (b) | Represents next call date. Additional subsequent call dates and amounts may apply to this security. |
| (c) | Step Bond. Coupon rate is set for an initial period and then increased to a higher coupon rate at a specified date. The rate shown is the rate in effect at October 31, 2018. |
| (d) | Floating or variable rate security linked to the referenced benchmark. The rate presented represents the rate in effect on October 31, 2018. |
| (e) | Defaulted security. |
| (f) | The rate represents the annualized one day yield that was in effect on October 31, 2018. |
| bps — Basis Points |
| H15T5Y — 5 Year Treasury Constant Maturity Rate |
| LLC — Limited Liability Company |
| MTN — Medium Term Note |
| PIK — Payment-in-Kind |
The Fund invested, as a percentage of net assets at value, in the following industries, as of October 31, 2018:
| | Percentage of |
| Industry | | Net Assets at Value (%) |
| Sovereign Bond | | | 76.4 | |
| Oil, Gas & Consumable Fuels | | | 6.4 | |
| Electric Utilities | | | 2.2 | |
| Banks | | | 1.9 | |
| Diversified Financial Services | | | 1.2 | |
| Investment Companies | | | 1.2 | |
| Chemicals | | | 1.2 | |
| Wireless Telecommunication Services | | | 0.7 | |
| Machinery | | | 0.4 | |
| Auto Components | | | 0.4 | |
| Capital Markets | | | 0.4 | |
| Construction & Engineering | | | 0.4 | |
| Metals & Mining | | | 0.4 | |
| Paper & Forest Products | | | 0.4 | |
| Total | | | 93.6 | |
| See notes to financial statements. | HSBC FAMILY OF FUNDS 21 |
| HSBC EMERGING MARKETS DEBT FUND |
| Schedule of Portfolio Investments—as of October 31, 2018 (continued) |
Futures Contracts Purchased
| | | | | | | | Value and |
| | | | | | | | Unrealized |
| | | | | | Notional | | Appreciation/ |
| | Number of | | Expiration | | Amount | | (Depreciation) |
| Description | | Contracts | | Date | | ($) | | ($) |
| 5-Year US Treasury Note Futures | | 20 | | 12/31/18 | | 2,247,657 | | | (22,031 | ) | |
| | | | | | 2,247,657 | | | (22,031 | ) | |
Futures Contracts Sold
| | | | | | | | Value and |
| | | | | | | | Unrealized |
| | | | | | Notional | | Appreciation/ |
| | Number of | | Expiration | | Amount | | (Depreciation) |
| Description | | Contracts | | Date | | ($) | | ($) |
| 10-Year US Treasury Note Futures | | 16 | | 12/19/18 | | 1,895,000 | | | | 30,102 | | |
| | | | | | 1,895,000 | | | | 30,102 | | |
| | | | | | | | | | |
| | Total unrealized appreciation | | | $ | 30,102 | | |
| | Total unrealized depreciation | | | | (22,031 | ) | |
| | Total net unrealized appreciation/(depreciation) | | | $ | 8,071 | | |
Credit Default Swap Agreements - Buy Protection(a)
| | | | | | Implied | | | | | | | | | | | Upfront | | |
| | | | | | Credit | | | | | | | | | | | Premiums | | Unrealized |
| | | | | | Spread at | | | | | | Notional | | | | | Paid/ | | Appreciation/ |
| | Pay Fixed | | Payment | | October 31, | | | | Expiration | | Amount | | Value | | (Received) | | (Depreciation) |
| Underlying Instrument | | Rate (%) | | Frequency | | 2018 (%)(b) | | Counterparty | | Date | | ($)(c) | | ($) | | ($) | | ($) |
| Republic of Colombia | | 1.00 | | Quarterly | | 0.81 | | Barclays Bank PLC | | 12/20/21 | | 110,000 | | (749 | ) | | | 3,534 | | | | (4,283 | ) | |
| Republic of Panama | | 1.00 | | Quarterly | | 0.24 | | JP Morgan Chase | | 12/20/20 | | 250,000 | | (4,291 | ) | | | 7,223 | | | | (11,514 | ) | |
| Republic of Turkey | | 1.00 | | Quarterly | | 3.51 | | Barclays Bank PLC | | 12/20/21 | | 180,000 | | 12,820 | | | | 13,194 | | | | (374 | ) | |
| United Mexican States | | 1.00 | | Quarterly | | 0.98 | | Credit Suisse | | 12/20/21 | | 210,000 | | (363 | ) | | | 5,656 | | | | (6,019 | ) | |
| | | | | | | | | | | | | | 7,417 | | | | 29,607 | | | | (22,190 | ) | |
Credit Default Swap Agreements - Sell Protection(a)
| | | | | | Implied | | | | | | | | | | | | Upfront | | | | | | |
| | | | | | Credit | | | | | | | | | | | | Premiums | | Unrealized |
| | Receive | | | | Spread at | | | | | | Notional | | | | | Paid/ | | Appreciation/ |
| | Fixed | | Payment | | October 31, | | | | Expiration | | Amount ($) | | Value | | (Received) | | (Depreciation) |
| Underlying Instrument | | Rate (%) | | Frequency | | 2018 (%)(b) | | Counterparty | | Date | | (c) | | ($) | | ($) | | ($) |
| CDX Emerging Markets | | | | | | | | | | | | | | | | | | | | | | | | | | | |
| Index, Series 25* | | 1.00 | | Quarterly | | 1.27 | | Credit Suisse | | 6/20/21 | | 1,510,500 | ** | | (8,684 | ) | | | (93,198 | ) | | | | | 84,514 | | |
| CDX Emerging Markets | | | | | | | | | | | | | | | | | | | | | | | | | | | |
| Index, Series 26* | | 1.00 | | Quarterly | | 1.56 | | Barclays Bank PLC | | 12/20/21 | | 485,000 | ** | | (7,396 | ) | | | (37,267 | ) | | | | | 29,871 | | |
| Republic of Colombia | | 1.00 | | Quarterly | | 0.73 | | Barclays Bank PLC | | 6/20/21 | | 100,000 | | | 776 | | | | (4,440 | ) | | | | | 5,216 | | |
| Republic of Indonesia | | 1.00 | | Quarterly | | 0.92 | | Barclays Bank PLC | | 6/20/21 | | 100,000 | | | 320 | | | | (2,534 | ) | | | | | 2,854 | | |
| Republic of Panama | | 1.00 | | Quarterly | | 0.24 | | Barclays Bank PLC | | 12/20/20 | | 125,000 | | | 2,146 | | | | (4,644 | ) | | | | | 6,790 | | |
| Republic of Peru | | 1.00 | | Quarterly | | 0.32 | | Credit Suisse | | 9/20/20 | | 125,000 | | | 1,751 | | | | (2,370 | ) | | | | | 4,121 | | |
| Republic of Peru | | 1.00 | | Quarterly | | 0.40 | | Bank of America | | 6/20/21 | | 40,000 | | | 655 | | | | (906 | ) | | | | | 1,561 | | |
| | | | | | | | | | | | | | | (10,432 | ) | | | (145,359 | ) | | | | | 134,927 | | |
| | | | | | | | | | | | | | | | | | |
| | | | | | | | | | Total swap agreements at value (assets) | | | | | $ | 18,468 | | |
| | | | | | | | | | Total swap agreements at value (liabilities) | | | | | | (21,483 | ) | |
| | | | | | | | | | Net swap agreements at value | | | | | $ | (3,015 | ) | |
| 22 HSBC FAMILY OF FUNDS | See notes to financial statements. |
| HSBC EMERGING MARKETS DEBT FUND |
| Schedule of Portfolio Investments—as of October 31, 2018 (continued) |
Centrally Cleared Credit Default Swap Agreements - Sell Protection(a)
| | | | | | Implied | | | | | | | | | Upfront | | | | | |
| | | | | | Credit | | | | | | | | | Premiums | | Unrealized |
| | Receive | | | | Spread at | | | | Notional | | | | | Paid/ | | Appreciation/ |
| | Fixed | | Payment | | October 31, | | Expiration | | Amount | | Value | | (Received) | | (Depreciation) |
| Underlying Instrument | | Rate (%) | | Frequency | | 2018 (%)(b) | | Date | | ($)(c) | | ($) | | ($) | | ($) |
| Republic of Argentina | | 5.00 | | Daily | | 6.06 | | 12/20/22 | | 760,000 | | (24,808 | ) | | | 80,192 | | | | (105,000 | ) | |
| | | | | | | | | | | | (24,808 | ) | | | 80,192 | | | | (105,000 | ) | |
| (a) | When a credit event occurs as defined under the terms of the swap agreement, the Fund as a seller of credit protection will either (i) pay to the buyer of protection an amount equal to the par value of the defaulted reference entity and take delivery of the reference entity or (ii) pay a net amount equal to the par value of the defaulted reference entity less its recovery value. Alternatively, the Fund as a buyer of credit protection will either (i) receive from the seller of protection an amount equal to the par value of the defaulted reference entity and deliver the reference entity to the seller or (ii) receive a net amount equal to the par value of the defaulted reference entity less its recovery value. |
| (b) | Implied credit spread, represented in absolute terms, utilized in determining the fair value of the credit default swap agreements as of period end serve as an indicator of the current status of the payment/performance risk and represents the likelihood or risk of default for the credit derivative. The implied credit spread of a referenced entity reflects the cost of buying/selling protection and may include upfront or daily payments required to be made to enter into the agreement. Generally, wider credit spreads represent a perceived deterioration of the referenced entity’s credit soundness and a greater likelihood or risk of default or other credit event occurring as defined under the terms of the swap agreement. |
| (c) | The notional amount represents the maximum potential amount of future payments that the Fund may receive as a buyer of credit protection if a credit event occurs, as defined under the terms of the swap agreement. Alternatively, the notional amount represents the maximum potential amount of payment the Fund could be required to make as a seller of credit protection if a credit event occurs, as defined under the terms of the swap agreement. |
| * | As of October 31, 2018, the CDX Emerging Market Index, Series 25 and Series 26 included securities which had defaulted and |
| represented 5% and 3%, respectively, of the Index. |
| ** | Reflects the notional amount after the default of securities. |
Forward Currency Exchange Contracts - Short Contracts
| | | | | | | | | | | | | | Net Unrealized |
| | | | | | | | | | | | | | Appreciation/ |
| Description and amount of | | Description and amount of | | | | Settlement | | (Depreciation) |
| currency to be purchased | | currency to be sold | | Counterparty | | Date | | ($) |
| U.S. Dollar | | 525,835 | | European Euro | | 452,221 | | UBS AG | | | 11/15/18 | | | | 13,129 | | |
| U.S. Dollar | | 1,527,791 | | Hungarian Forint | | 421,511,482 | | Bank of America | | | 11/16/18 | | | | 54,902 | | |
| U.S. Dollar | | 764,553 | | Mexican Peso | | 14,459,000 | | JP Morgan Chase | | | 12/19/18 | | | | 58,471 | | |
| U.S. Dollar | | 524,000 | | Polish Zloty | | 1,924,518 | | UBS AG | | | 11/16/18 | | | | 22,048 | | |
| U.S. Dollar | | 243,883 | | Romanian Leu | | 994,067 | | Credit Suisse | | | 11/6/18 | | | | 2,309 | | |
| U.S. Dollar | | 6,976 | | South African Rand | | 100,755 | | Bank of America | | | 11/6/18 | | | | 149 | | |
| U.S. Dollar | | 354,580 | | South African Rand | | 4,802,148 | | Goldman Sachs | | | 11/6/18 | | | | 29,228 | | |
| U.S. Dollar | | 365,000 | | South African Rand | | 5,497,154 | | JP Morgan Chase | | | 11/6/18 | | | | (7,439 | ) | |
| U.S. Dollar | | 104,000 | | South African Rand | | 1,441,314 | | Standard Chartered Bank | | | 11/6/18 | | | | 6,349 | | |
| U.S. Dollar | | 510,000 | | Thai Baht | | 16,432,200 | | Standard Chartered Bank | | | 1/18/19 | | | | 12,701 | | |
| U.S. Dollar | | 250,000 | | Thai Baht | | 8,320,000 | | Standard Chartered Bank | | | 1/18/19 | | | | (1,793 | ) | |
| U.S. Dollar | | 124,000 | | Turkish Lira | | 732,806 | | Goldman Sachs | | | 1/25/19 | | | | (632 | ) | |
| | | | | | | | | | | | | | | 189,422 | | |
| See notes to financial statements. | HSBC FAMILY OF FUNDS 23 |
| HSBC EMERGING MARKETS DEBT FUND |
| Schedule of Portfolio Investments—as of October 31, 2018 (continued) |
Forward Currency Exchange Contracts - Long Contracts
| | | | | | | | | | | | | | Net Unrealized |
| | | | | | | | | | | | | | Appreciation/ |
| Description and amount of | | Description and amount of | | | | Settlement | | (Depreciation) |
| currency to be purchased | | currency to be sold | | Counterparty | | Date | | ($) |
| Romanian Leu | | 994,067 | | U.S. Dollar | | 249,678 | | Goldman Sachs | | | 11/6/18 | | | | | (8,104 | ) | |
| Romanian Leu | | 994,067 | | U.S. Dollar | | 243,227 | | Credit Suisse | | | 2/6/19 | | | | | (1,913 | ) | |
| Czech Koruna | | 17,139,692 | | U.S. Dollar | | 791,306 | | Bank of America | | | 1/18/19 | | | | | (35,942 | ) | |
| European Euro | | 450,000 | | U.S. Dollar | | 525,099 | | Goldman Sachs | | | 11/15/18 | | | | | (14,912 | ) | |
| Hungarian Forint | | 70,570,963 | | U.S. Dollar | | 260,000 | | Goldman Sachs | | | 11/16/18 | | | | | (13,404 | ) | |
| Hungarian Forint | | 139,975,840 | | U.S. Dollar | | 500,000 | | JP Morgan Chase | | | 11/16/18 | | | | | (10,882 | ) | |
| Polish Zloty | | 916,500 | | U.S. Dollar | | 250,000 | | Bank of America | | | 11/16/18 | | | | | (10,959 | ) | |
| Polish Zloty | | 5,384,938 | | U.S. Dollar | | 1,465,152 | | Goldman Sachs | | | 11/16/18 | | | | | (60,654 | ) | |
| Polish Zloty | | 2,042,196 | | U.S. Dollar | | 560,000 | | JP Morgan Chase | | | 11/16/18 | | | | | (27,355 | ) | |
| South African Rand | | 11,841,371 | | U.S. Dollar | | 810,000 | | Goldman Sachs | | | 11/6/18 | | | | | (7,731 | ) | |
| Thai Baht | | 47,881,174 | | U.S. Dollar | | 1,468,860 | | Standard Chartered Bank | | | 1/18/19 | | | | | (19,800 | ) | |
| Turkish Lira | | 3,505,422 | | U.S. Dollar | | 577,642 | | Credit Suisse | | | 1/25/19 | | | | | 18,543 | | |
| | | | | | | | | | | | | | | | (193,113 | ) | |
| | | | | | | | | | | | | | | | | |
| | | | | | Total unrealized appreciation | | | | $ | 217,829 | | |
| | | | | | Total unrealized depreciation | | | | | (221,520 | ) | |
| | | | | | Total net unrealized appreciation/(depreciation) | | | | $ | (3,691 | ) | |
| 24 HSBC FAMILY OF FUNDS | See notes to financial statements. |
| HSBC FRONTIER MARKETS FUND |
| Schedule of Portfolio Investments—as of October 31, 2018 |
| Common Stocks – 91.6% |
| | | | | |
| | Shares | | Value ($) |
| Argentina – 6.8% | | | | |
| Banco Macro SA, ADR | | 8,913 | | 398,323 |
| BBVA Banco Frances SA, ADR | | 15,417 | | 169,124 |
| Central Puerto SA, ADR | | 23,195 | | 222,208 |
| YPF Sociedad Anonima, ADR (a) | | 11,192 | | 167,880 |
| | | | 957,535 |
| Bangladesh – 0.9% | | | | |
| Square Pharmaceuticals, Ltd. | | 41,308 | | 131,630 |
| Cambodia – 2.8% | | | | |
| NagaCorp, Ltd. | | 440,000 | | 403,420 |
| Colombia – 3.6% | | | | |
| Banco Davivienda SA | | 46,210 | | 445,553 |
| CEMEX Latam Holdings SA (a) | | 40,721 | | 63,327 |
| | | | 508,880 |
| Croatia – 0.1% | | | | |
| Ledo dd (a)(b)(c) | | 311 | | 9,193 |
| Egypt – 15.0% | | | | |
Cairo Investment & Real Estate
Development Co. SAE (a) | | 206,575 | | 77,177 |
| Centamin PLC | | 304,548 | | 386,685 |
| Cleopatra Hospital (a) | | 541,891 | | 111,833 |
Commercial International Bank,
Registered, GDR | | 67,867 | | 294,882 |
| Credit Agricole Egypt | | 87,554 | | 196,364 |
| Juhayna Food Industries | | 802,931 | | 431,121 |
MM Group for Industry &
International Trade SAE (a) | | 439,700 | | 212,848 |
| Talaat Moustafa Group | | 819,683 | | 424,798 |
| | | | 2,135,708 |
| Georgia – 4.5% | | | | |
| Bank of Georgia Group PLC | | 4,089 | | 81,585 |
| Georgia Capital PLC (a) | | 9,889 | | 147,867 |
| TBC Bank Group PLC | | 18,600 | | 401,727 |
| | | | 631,179 |
| Kazakhstan – 4.6% | | | | |
Halyk Savings Bank of Kazakhstan
JSC, Registered, GDR | | 39,356 | | 448,658 |
| KAZ Minerals PLC | | 31,494 | | 207,914 |
| | | | 656,572 |
| Kenya – 2.8% | | | | |
| Safaricom, Ltd. | | 1,736,000 | | 394,140 |
| Kuwait – 12.7% | | | | |
| Agility Public Warehousing Co. KSC | | 165,885 | | 453,370 |
| Human Soft Holding Co. KSC | | 64,995 | | 652,986 |
| National Bank of Kuwait SAK | | 261,150 | | 707,401 |
| | | | 1,813,757 |
| Mauritius – 1.7% | | | | |
| MCB Group, Ltd. | | 30,000 | | 239,403 |
| Morocco – 2.8% | | | | |
| Attijariwafa Bank | | 9,007 | | 392,383 |
| Nigeria – 3.2% | | | | |
| Dangote Cement PLC | | 266,177 | | 153,465 |
| Guaranty Trust Bank PLC | | 2,886,010 | | 298,179 |
| | | | 451,644 |
| Peru – 2.4% | | | | |
| Credicorp, Ltd. | | 1,475 | | 332,922 |
| Philippines – 7.3% | | | | |
| International Container Termin | | 333,800 | | 564,937 |
| Puregold Price Club, Inc. | | 374,030 | | 284,301 |
| Vista Land & Lifescapes, Inc. | | 1,880,300 | | 185,900 |
| | | | 1,035,138 |
| Romania – 5.9% | | | | |
| BRD-Groupe Societe Generale | | 97,405 | | 308,331 |
| SIF 5 Oltenia Craiova | | 341,165 | | 171,062 |
| Societatea Nationala de Gaze | | 26,172 | | 216,455 |
| Sphera Franchise Group SA (a) | | 24,392 | | 133,511 |
| | | | 829,359 |
| United Arab Emirates – 10.3% | | | | |
Abu Dhabi National Oil Co. For
Distribution PJSC | | 260,325 | | 157,099 |
| Aramex PJSC | | 36,569 | | 39,317 |
| DP World, Ltd. | | 19,868 | | 357,425 |
| Emaar Development PJSC | | 102,657 | | 138,744 |
| Emaar Properties PJSC | | 175,711 | | 243,823 |
| Emirates NBD PJSC | | 77,405 | | 195,578 |
| Gulf Marine Services PLC (a) | | 126,535 | | 66,787 |
| NMC Health PLC | | 6,013 | | 271,082 |
| | | | 1,469,855 |
| Vietnam – 4.2% | | | | |
| Masan Group Corp. (a) | | 32,800 | | 117,057 |
Vietnam Technological &
Commercial Joint Stock Bank (a) | | 261,850 | | 303,536 |
| Vincom Retail JSC (a) | | 134,580 | | 172,583 |
| | | | 593,176 |
TOTAL COMMON STOCKS
(COST $15,386,333) | | | | 12,985,894 |
| See notes to financial statements. | HSBC FAMILY OF FUNDS 25 |
| HSBC FRONTIER MARKETS FUND |
| Schedule of Portfolio Investments—as of October 31, 2018 (continued) |
| Participatory Notes – 4.0% |
| | | | | |
| | Shares | | Value ($) |
| United Arab Emirates – 2.2% | | | | | |
| Aramex PJSC, 3/14/19, (Merrill Lynch | | | | | |
| International & Co.) (a) | | 288,032 | | | 309,771 |
| Vietnam – 1.8% | | | | | |
| Vietnam Dairy Products JSC, 2/12/19, | | | | | |
| (JPMorgan Chase) (a) | | 50,590 | | | 251,617 |
| TOTAL PARTICIPATORY NOTES | | | | | |
| (COST $650,285) | | | | | 561,388 |
| | | | | | |
| Investment Companies – 3.6% |
| | | | | | |
| Northern Institutional Government | | | | | |
| Assets Portfolio, Institutional | | | | | |
| Shares, 1.87% (d) | | 507,891 | | | 507,891 |
| TOTAL INVESTMENT COMPANIES | | | | | |
| (COST $507,891) | | | | | 507,891 |
| TOTAL INVESTMENTS | | | | | |
| IN SECURITIES | | | | | |
| (COST $16,544,509) – 99.2% | | | | | 14,055,173 |
| Other Assets (Liabilities) – 0.8% | | | | | 113,769 |
| NET ASSETS – 100% | | | | $ | 14,168,942 |
____________________
| (a) | Represents non-income producing security. |
| (b) | Security was valued using significant unobservable inputs as of October 31, 2018. |
| (c) | Security was valued in good faith pursuant to procedures approved by the Board of Trustees as of October 31, 2018. The total of all such securities represents 0.1% of net assets of the Fund. |
| (d) | The rate represents the annualized one day yield that was in effect on October 31, 2018. |
ADR — American Depositary Receipt
GDR — Global Depository Receipt |
The Fund invested, as a percentage of net assets at value, in the following industries, as of October 31, 2018:
| | Percentage of |
| Industry | | Net Assets at Value (%) |
| Banks | | | 36.7 | |
Real Estate Management
& Development | | | 8.8 | |
| Transportation Infrastructure | | | 6.5 | |
| Air Freight & Logistics | | | 5.7 | |
| Diversified Consumer Services | | | 4.6 | |
| Metals & Mining | | | 4.2 | |
| Food Products | | | 3.9 | |
| Hotels, Restaurants & Leisure | | | 3.8 | |
| Investment Companies | | | 3.6 | |
| Wireless Telecommunication Services | | | 2.8 | |
| Oil, Gas & Consumable Fuels | | | 2.7 | |
| Health Care Providers & Services | | | 2.7 | |
| Capital Markets | | | 2.3 | |
| Food & Staples Retailing | | | 2.0 | |
| Equity Real Estate Investment Trusts | | | 1.8 | |
Independent Power and Renewable
Electricity Producers | | | 1.6 | |
| Distributors | | | 1.5 | |
| Construction Materials | | | 1.5 | |
| Specialty Retail | | | 1.1 | |
| Pharmaceuticals | | | 0.9 | |
| Energy Equipment & Services | | | 0.5 | |
| Total | | | 99.2 | |
| 26 HSBC FAMILY OF FUNDS | See notes to financial statements. |
| HSBC ASIA EX-JAPAN SMALLER COMPANIES EQUITY FUND |
| Schedule of Portfolio Investments—as of October 31, 2018 |
| Common Stocks – 97.2% | | | | |
| | | | | |
| | Shares | | Value ($) |
| China – 16.3% | | | | |
| A-Living Services Co., Ltd., | | | | |
| Class H (a) | | 426,000 | | 518,895 |
| Avichina Industry & Technology, | | | | |
| Class H | | 1,763,000 | | 1,177,347 |
| BBI Life Sciences Corp, Class H | | 1,209,000 | | 389,856 |
| China Bluechemical, Ltd., Class H | | 1,156,000 | | 396,294 |
| China Modern Dairy | | | | |
| Holdings, Ltd., Class H (a) | | 3,564,000 | | 446,447 |
| China National Buildings | | | | |
| Material Co., Ltd., Class H | | 556,000 | | 399,762 |
| China Resources Cement | | | | |
| Holdings, Ltd., Class H | | 1,062,000 | | 942,757 |
| China Singyes Solar Technologies | | | | |
| Holdings, Ltd., Class H (b)(c) | | 1,451,000 | | 338,158 |
| China Xinhua Education | | | | |
| Group, Ltd., Class H (a) | | 3,220,000 | | 854,111 |
| China XLX Fertiliser, Ltd., Class H | | 1,635,000 | | 594,240 |
| China Yongda Automobiles Services | | | | |
| Holdings, Ltd., Class H | | 371,500 | | 199,344 |
| CNOOC, Ltd., Class H | | 293,000 | | 498,995 |
| COSCO SHIPPING Energy | | | | |
| Transportation Co., Ltd., Class H | | 1,126,000 | | 616,951 |
| Goodbaby International | | | | |
| Holdings Limited, Class H | | 672,000 | | 208,541 |
| Honghua Group, Ltd., Class H (a) | | 2,266,000 | | 147,232 |
| Li Ning Co., Ltd., Class H (a) | | 451,000 | | 424,271 |
| Picc Property & Casuality Co., Ltd., | | | | |
| Class H | | 476,000 | | 462,712 |
| Shimao Property Holdings, Ltd., | | | | |
| Class H | | 212,500 | | 418,737 |
| Sinotrans Shipping, Ltd., Class H | | 5,638,500 | | 1,885,600 |
| Sitc International Holdings Co., Ltd., | | | | |
| Class H | | 437,000 | | 321,088 |
| Ten Pao Group Holdings, Ltd., | | | | |
| Class H | | 484,000 | | 30,935 |
| Texhong Textile Group, Ltd., | | | | |
| Class H | | 415,500 | | 501,867 |
| Times China Holdings, Ltd., | | | | |
| Class H | | 368,964 | | 323,322 |
| Yichang Hec Changjiang Pha, | | | | |
| Class H | | 72,200 | | 247,466 |
| Zijin Mining Group Co., Ltd., Class H | | 1,222,000 | | 457,126 |
| | | | 12,802,054 |
| Hong Kong – 16.0% | | | | |
| AIA Group, Ltd. | | 116,200 | | 883,978 |
| CGN New Energy Holdings Co., Ltd. | | 3,908,000 | | 514,411 |
| China Education Group | | | | |
| Holdings, Ltd. (a) | | 810,000 | | 973,935 |
| China Traditional Chinese Medicine | | | | |
| Holdings Co., Ltd. | | 632,000 | | 403,537 |
| Crystal International Group, Ltd. | | 71,500 | | 39,143 |
| Dream International, Ltd. | | 690,000 | | 379,431 |
| EVA Precision Industrial | | | | |
| Holdings, Ltd. | | 7,018,000 | | 557,091 |
| Far East Consortium | | | | |
| International, Ltd. | | 1,399,000 | | 653,220 |
| HKBN, Ltd. | | 594,500 | | 892,550 |
| Jacobson Pharma Corp., Ltd. | | 6,932,000 | | 1,430,194 |
| K Wah International Holdings, Ltd. | | 983,000 | | 445,361 |
| Kingboard Chemical Holdings, Ltd. | | 103,500 | | 278,037 |
| Kingmaker Footwear Holdings, Ltd. | | 892,000 | | 192,003 |
| Kwg Property Holding, Ltd. | | 360,500 | | 276,669 |
| Lee & Man Chemical Co., Ltd. | | 216,000 | | 131,427 |
| Link REIT | | 162,000 | | 1,439,774 |
| L’Occitane International SA | | 93,250 | | 174,654 |
| Regina Miracle International | | | | |
| Holdings, Ltd. | | 403,000 | | 202,851 |
| Shangri-La Asia, Ltd. | | 730,000 | | 997,221 |
| Tongda Group Holdings, Ltd. | | 1,370,000 | | 177,211 |
| Valuetronics Holdings, Ltd. | | 1,839,420 | | 839,271 |
| Vinda International Holdings, Ltd. | | 222,000 | | 317,146 |
| Xinyi Glass Holdings, Ltd. | | 288,000 | | 285,966 |
| | | | 12,485,081 |
| India – 14.7% | | | | |
| Action Construction Equipment, Ltd. | | 513,923 | | 669,878 |
| Ahluwalia Contracts India, Ltd. | | 21,753 | | 87,880 |
| Ashok Leyland Limited | | 264,200 | | 409,742 |
| Cesc, Ltd. | | 14,353 | | 134,873 |
| Cyient, Ltd. | | 48,626 | | 409,002 |
| Finolex Industries, Ltd. | | 1,642 | | 12,146 |
| Geojit Financial Services, Ltd. | | 34,252 | | 18,054 |
| Godawari Power and Ispat, Ltd. (a) | | 158,145 | | 819,349 |
| Gujarat Alkalies & Chemicals, Ltd. | | 9,308 | | 67,738 |
| Himadri Speciality Chemical, Ltd. | | 480,906 | | 815,790 |
| Indian Bank | | 54,564 | | 186,500 |
| Indraprastha Gas, Ltd. | | 307,607 | | 1,112,545 |
| JK Tyre & Industries, Ltd. | | 551,700 | | 776,302 |
| JM Financial, Ltd. | | 117,958 | | 120,816 |
| Khadim India, Ltd. | | 17,161 | | 136,819 |
| Lupin, Ltd. | | 78,143 | | 936,613 |
| Magma Fincorp, Ltd. | | 263,276 | | 380,255 |
| Muthoot Finance, Ltd. | | 69,798 | | 386,310 |
| Navin Fluorine International, Ltd. | | 32,576 | | 286,587 |
| PTC India, Ltd. | | 73,040 | | 75,800 |
| RP- SG Business Process | | | | |
| Services, Ltd. (a)(c) | | 2,871 | | 18,815 |
| RP- SG Retail, Ltd. (a)(c) | | 8,612 | | 18,815 |
| Sandhar Technologies, Ltd. (a) | | 195,203 | | 836,050 |
| Simplex Infrastructures, Ltd. | | 157,600 | | 492,804 |
| Sintex Plastics Technology, Ltd. (a) | | 730,071 | | 257,055 |
| Sobha, Ltd. | | 130,228 | | 786,991 |
| Star Cement, Ltd. | | 158,781 | | 217,517 |
| Suven Life Sciences, Ltd. | | 139,460 | | 457,272 |
| Welspun India, Ltd. | | 688,498 | | 548,963 |
| | | | 11,477,281 |
| Indonesia – 4.7% | | | | |
| Indo Tambangraya Megah PT | | 552,900 | | 906,082 |
| PT ACE Hardware Indonesia Tbk | | 4,030,700 | | 363,617 |
| PT Adhi Karya Persero Tbk | | 1,414,100 | | 104,819 |
| PT Bank Tabungan Negara Tbk | | 1,077,200 | | 150,399 |
| PT Pakuwon Jati Tbk | | 9,743,300 | | 306,646 |
| See notes to financial statements. | HSBC FAMILY OF FUNDS 27 |
| HSBC ASIA EX-JAPAN SMALLER COMPANIES EQUITY FUND |
| Schedule of Portfolio Investments—as of October 31, 2018 (continued) |
| Common Stocks, continued |
| | | | | |
| | Shares | | Value ($) |
| PT Tunas Baru Lampung Tbk | | 2,383,400 | | | 139,530 |
| PT XL Axiata Tbk (a) | | 7,824,000 | | | 1,352,274 |
| Vale Indonesia TBK PT (a) | | 1,897,700 | | | 366,309 |
| | | | | 3,689,676 |
| Japan – 1.5% | | | | | |
| Universal Entertainment Corp. (a) | | 37,400 | | | 1,133,951 |
| Korea, Republic Of – 14.4% | | | | | |
| Asia Cement Co., Ltd. | | 5,492 | | | 538,099 |
| BGF Retail Co., Ltd. | | 1,022 | | | 151,213 |
| BNK Financial Group, Inc. | | 70,691 | | | 472,225 |
| CJ CheilJedang Corp. | | 968 | | | 276,158 |
| Cuckoo Homesys Co., Ltd. (a) | | 5,496 | | | 755,531 |
| Dentium Co., Ltd. | | 14,225 | | | 903,935 |
| DGB Financial Group, Inc. | | 87,162 | | | 721,032 |
| Fila Korea, Ltd. | | 15,086 | | | 558,776 |
| Hankook Tire Co., Ltd. | | 21,072 | | | 766,503 |
| HDC Hyundai Development Co- | | | | | |
| Engineering & Construction (a) | | 11,335 | | | 439,409 |
| Hyundai Mipo Dockyard Co. (a) | | 7,726 | | | 640,886 |
| JW Life Science Corp. | | 33,673 | | | 653,289 |
| KIWOOM Securities Co., Ltd. | | 14,543 | | | 971,455 |
| Korea Zinc Co. | | 419 | | | 139,763 |
| Kyung Dong Navien Co., Ltd. | | 13,542 | | | 439,793 |
| Lotte Fine Chemical Co., Ltd. | | 30,402 | | | 1,093,400 |
| PS Tec Co., Ltd. | | 11,871 | | | 46,285 |
| Samsung Biologics Co., Ltd. (a) | | 2,429 | | | 831,506 |
| ToolGen, Inc. (a) | | 3,234 | | | 231,892 |
| Vieworks Co., Ltd. | | 2,890 | | | 81,937 |
| Youngone Corp. | | 16,148 | | | 508,095 |
| | | | | 11,221,182 |
| Macau – 1.2% | | | | | |
| MGM China Holdings, Ltd. | | 485,600 | | | 689,231 |
| Wynn Macau, Ltd. | | 112,400 | | | 234,156 |
| | | | | 923,387 |
| Malaysia – 4.5% | | | | | |
| ATA IMS Berhad (a) | | 1,449,200 | | | 574,942 |
| Bermaz Auto Berhad | | 806,900 | | | 366,510 |
| Genting Berhad | | 42,800 | | | 75,138 |
| Genting Malaysia Berhad | | 1,453,000 | | | 1,561,175 |
| Kerjaya Prospek Group Berhad | | 512,920 | | | 143,560 |
| Pentamaster International, Ltd. (a) | | 4,156,000 | | | 499,513 |
| Scientex Berhad | | 147,900 | | | 303,690 |
| | | | | 3,524,528 |
| Singapore – 2.8% | | | | | |
| Aslan Pharmaceuticals, | | | | | |
| Ltd., ADR (a) | | 164,661 | | | 866,116 |
| Aslan Pharmaceuticals, Ltd. (a) | | 145,000 | | | 155,942 |
| Ezion Holdings, Ltd. (a) | | 9,652,000 | | | 391,029 |
| HRnetGroup, Ltd. | | 1,272,700 | | | 744,762 |
| | | | | 2,157,849 |
| Taiwan, Province of China – 16.0% | | | | | |
| Accton Technology Corp. | | 199,000 | | | 550,852 |
| Asia Cement Corp. | | 904,000 | | | 958,551 |
| Cleanaway Co., Ltd. | | 244,000 | | | 1,346,679 |
| E Ink Holdings, Inc. | | 216,000 | | | 171,052 |
| Gigabyte Technology Co., Ltd. | | 389,000 | | | 511,486 |
| Globalwafers Co., Ltd. | | 65,000 | | | 517,469 |
| Gourmet Master Co., Ltd. | | 103,691 | | | 628,943 |
| Mega Financial Holdings Co., Ltd. | | 1,035,000 | | | 876,488 |
| MiTac Holdings Corp. | | 8,005 | | | 6,510 |
| PharmaEngine, Inc. | | 210,196 | | | 711,676 |
| Primax Electronics, Ltd. | | 619,000 | | | 836,656 |
| Radiant Opto-Electronics Corp. | | 537,000 | | | 1,411,342 |
| Sinbon Electronics Co., Ltd. | | 449,989 | | | 1,243,587 |
| Sunonwealth Electric Machine | | | | | |
| Industry Co., Ltd. | | 590,000 | | | 641,459 |
| Topco Scientific Co., Ltd. | | 47,153 | | | 97,803 |
| WT Microelectronics Co., Ltd. | | 1,072,729 | | | 1,383,805 |
| Yageo Corp. | | 53,703 | | | 550,713 |
| | | | | 12,445,071 |
| Thailand – 5.1% | | | | | |
| B Grimm Power PCL | | 862,300 | | | 730,417 |
| Bangkok Dusit Med Service | | 1,205,900 | | | 894,434 |
| Erawan Group PCL (The) | | 5,416,400 | | | 1,195,846 |
| Sri Trang Agro-Industry PCL | | 979,000 | | | 530,558 |
| TPI Polene Power PCL | | 3,344,500 | | | 605,974 |
| | | | | 3,957,229 |
| TOTAL COMMON STOCKS | | | | | |
| (COST $94,221,113) | | | | | 75,817,289 |
| | | | | | |
| Warrant – 0.0% |
| |
| Singapore – 0.0% | | | | | |
| Ezion Holdings, Ltd., 4/6/23 | | 432,120 | | | — |
| TOTAL WARRANT (COST $–) | | | | | — |
| | | | | | |
| Investment Companies – 2.1% |
| |
| Northern Institutional Government | | | | | |
| Assets Portfolio, Institutional | | | | | |
| Shares, 1.87% (d) | | 1,612,674 | | | 1,612,674 |
| TOTAL INVESTMENT COMPANIES | | | | | |
| (COST $1,612,674) | | | | | 1,612,674 |
| TOTAL INVESTMENTS | | | | | |
| IN SECURITIES | | | | | |
| (COST $95,833,787) – 99.3% | | | | | 77,429,963 |
| Other Assets (Liabilities) – 0.7% | | | | | 564,075 |
| NET ASSETS – 100% | | | | $ | 77,994,038 |
____________________
| (a) | Represents non-income producing security. |
| (b) | Security was valued using significant unobservable inputs as of October 31, 2018. |
| (c) | Security was valued in good faith pursuant to procedures approved by the Board of Trustees as of October 31, 2018. The total of all such securities represents 0.5% of net assets of the Fund. |
| (d) | The rate represents the annualized one day yield that was in effect on October 31, 2018. |
ADR — American Depositary Receipt
REIT — Real Estate Investment Trust |
| 28 HSBC FAMILY OF FUNDS | See notes to financial statements. |
| HSBC ASIA EX-JAPAN SMALLER COMPANIES EQUITY FUND |
| Schedule of Portfolio Investments—as of October 31, 2018 (continued) |
The Fund invested, as a percentage of net assets at value, in the following industries, as of October 31, 2018:
| | Percentage of |
| Industry | | Net Assets at Value (%) |
| Hotels, Restaurants & Leisure | | | 7.0 | |
Electronic Equipment, Instruments
& Components | | | 6.1 | |
| Pharmaceuticals | | | 5.4 | |
| Chemicals | | | 4.8 | |
| Auto Components | | | 4.1 | |
Real Estate Management
& Development | | | 4.1 | |
| Construction Materials | | | 3.9 | |
| Textiles, Apparel & Luxury Goods | | | 3.8 | |
| Machinery | | | 3.7 | |
| Marine | | | 3.6 | |
Semiconductors &
Semiconductor Equipment | | | 3.2 | |
| Banks | | | 3.1 | |
| Biotechnology | | | 3.0 | |
| Specialty Retail | | | 2.6 | |
Independent Power and Renewable
Electricity Producers | | | 2.5 | |
| Commercial Services & Supplies | | | 2.4 | |
| Metals & Mining | | | 2.3 | |
| Diversified Consumer Services | | | 2.3 | |
| Leisure Products | | | 2.2 | |
| Investment Companies | | | 2.1 | |
| Construction & Engineering | | | 2.1 | |
| Oil, Gas & Consumable Fuels | | | 1.8 | |
| Equity Real Estate Investment Trusts | | | 1.8 | |
| Insurance | | | 1.7 | |
Technology Hardware, Storage
& Peripherals | | | 1.7 | |
| Wireless Telecommunication Services | | | 1.7 | |
| Aerospace & Defense | | | 1.5 | |
| Gas Utilities | | | 1.4 | |
| Capital Markets | | | 1.4 | |
| Health Care Equipment & Supplies | | | 1.3 | |
| Food Products | | | 1.1 | |
| Health Care Providers & Services | | | 1.1 | |
| Life Sciences Tools & Services | | | 1.1 | |
Diversified
Telecommunication Services | | | 1.1 | |
| Consumer Finance | | | 1.0 | |
| Professional Services | | | 1.0 | |
| Building Products | | | 0.9 | |
| Containers & Packaging | | | 0.7 | |
| Energy Equipment & Services | | | 0.7 | |
| Communications Equipment | | | 0.7 | |
| Software | | | 0.5 | |
| Household Products | | | 0.4 | |
| Electric Utilities | | | 0.2 | |
| Food & Staples Retailing | | | 0.2 | |
| IT Services | | | — | |
| Electrical Equipment | | | — | |
| Total | | | 99.3 | |
| See notes to financial statements. | HSBC FAMILY OF FUNDS 29 |
| HSBC GLOBAL HIGH YIELD BOND FUND |
| Schedule of Portfolio Investments—as of October 31, 2018 |
| Foreign Bonds – 12.8% | | | | |
| |
| Principal | | |
| Amount † | | Value ($) |
| Belgium – 0.6% | | | | |
| Solvay Finance, 5.12% | | | | |
| (EUSA5 + 489 bps), Callable | | | | |
| 6/2/21 @ 100 (a)(b)(c) | | 150,000 | | 184,213 |
| Denmark – 0.2% | | | | |
| DONG Energy A/S, 6.25% | | | | |
| (EUSA5 + 475 bps), 6/26/13, | | | | |
| Callable 6/26/23 @ 100 (a)(c) | EUR | 50,000 | | 64,898 |
| France – 4.5% | | | | |
| Accor SA, 4.13% (EUSA5 + 365 bps), | | | | |
| Callable 6/30/20 @ 100 (a)(b)(c) | | 100,000 | | 117,672 |
| Arkema SA, 4.75% (EUSA5 + 435 | | | | |
| bps), Callable 10/29/20 | | | | |
| @ 100 (a)(b)(c) | | 100,000 | | 119,286 |
| AXA SA, Series E, 3.94% | | | | |
| (EUSA10 + 390 bps), Callable | | | | |
| 11/7/24 @ 100 (a)(b)(c) | | 100,000 | | 117,770 |
| Credit Agricole SA, 6.50% | | | | |
| (EUSA5 + 512 bps), Callable | | | | |
| 6/23/21 @ 100 (a)(b)(c) | | 200,000 | | 244,032 |
| Crown European Holdings, | | | | |
| Registered, 4.00%, 7/15/22, Callable | | | | |
| 4/15/22 @ 100 (a) | | 100,000 | | 124,564 |
| Electricite de France SA, Series E, | | | | |
| 5.38% (EUSA12 + 379 bps), Callable | | | | |
| 1/29/25 @ 100 (a)(b)(c) | | 100,000 | | 120,507 |
| Europcar Groupe SA, 5.75%, 6/15/22, | | | | |
| Callable 11/22/18 @ 102.88 (a) | | 100,000 | | 115,765 |
| GDF SUEZ, 4.75% (EUSA8 + 342 bps), | | | | |
| Callable 7/10/21 @ 100 (a)(b)(c) | | 100,000 | | 122,676 |
| Orange SA, 5.00% (EUSA5 + 399 | | | | |
| bps), Callable 10/1/26 @ | | | | |
| 100 (a)(b)(c) | | 200,000 | | 245,724 |
| | | | | 1,327,996 |
| Germany – 1.9% | | | | |
| Allianz SE, 3.38% (EUAMDB10 + 320 | | | | |
| bps), Callable 9/18/24 @ | | | | |
| 100 (a)(b)(c) | | 100,000 | | 118,619 |
| IHO Verwaltungs GmbH, 3.25%, | | | | |
| 9/15/23, Callable 9/15/19 @ | | | | |
| 101.63 (a) | | 100,000 | | 113,382 |
| Talanx AG, Series E, 8.37% (EUR003M | | | | |
| + 706 bps), 6/15/42, Callable 6/15/22 | | | | |
| @ 100 (a)(c) | | 100,000 | | 138,490 |
| Unitymedia GmbH, Registered, | | | | |
| 6.25%, 1/15/29, Callable 1/15/21 | | | | |
| @ 103.13 (a) | | 112,500 | | 143,274 |
| Volkswagen AG, 5.13% (EUSA10 + | | | | |
| 335 bps), Callable 9/4/23 | | | | |
| @ 100 (a)(b)(c) | | 50,000 | | 61,220 |
| | | | | 574,985 |
| Ireland – 0.4% | | | | |
| Ardagh Packaging Holdings, Ltd., | | | | |
| 4.13%, 5/15/23, Callable 5/15/19 | | | | |
| @ 102.06 (a)(d) | | 100,000 | | 116,683 |
| Italy – 0.3% | | | | |
| Wind Tre SpA, 3.13%, 1/20/25, | | | | |
| Callable 11/3/20 @ 101.56 (a)(d) | | 100,000 | | 103,048 |
| Luxembourg – 1.0% | | | | |
| Ineos Group Holdings SA, Registered, | | | | |
| 5.38%, 8/1/24, Callable 8/1/19 | | | | |
| @ 102.69 (a) | | 100,000 | | 115,908 |
| Kleopatra Holdings 1 SCA, 8.50%, | | | | |
| 6/30/23, Callable 7/15/19 | | | | |
| @ 102 (a)(d) | | 100,000 | | 72,697 |
| Telenet Finance VI Luxembourg SCA, | | | | |
| Registered, 4.88%, 7/15/27, | | | | |
| Callable 7/15/21 @ 102.44 (a) | | 90,000 | | 109,843 |
| | | | | 298,448 |
| Netherlands – 2.0% | | | | |
| ABN AMRO Bank NV, 5.75% (EUSA5 | | | | |
| + 545 bps), Callable 9/22/20 | | | | |
| @ 100 (a)(b)(c) | | 200,000 | | 237,238 |
| LGE Holdco VI BV, Registered, | | | | |
| 7.13%, 5/15/24, Callable 5/15/19 | | | | |
| @ 103.56 (a) | | 100,000 | | 120,425 |
| NN Group NV, 4.62% (EUR003M + | | | | |
| 395 bps), 4/8/44, Callable 4/8/24 | | | | |
| @ 100 (a)(c) | | 100,000 | | 121,697 |
| Vonovia Finance BV, 4.00% (EUSA5 + | | | | |
| 339 bps), Callable 12/17/21 | | | | |
| @ 100 (a)(b)(c) | | 100,000 | | 119,168 |
| | | | | 598,528 |
| Spain – 0.4% | | | | |
| Gas Natural Fenosa Finance BV, | | | | |
| 4.13% (EUSA8 + 335 bps), Callable | | | | |
| 11/18/22 @ 100 (a)(b)(c) | | 100,000 | | 118,194 |
| Sweden – 0.4% | | | | |
| Volvo Treasury AB, 4.20% (EUSA5 + | | | | |
| 380 bps), 6/10/75, Callable 6/10/20 | | | | |
| @ 100 (a)(c) | EUR | 100,000 | | 117,817 |
| United Kingdom – 1.1% | | | | |
| Aviva PLC, Series E, 3.38% (EUR003M | | | | |
| + 355 bps), 12/4/45, Callable 12/4/25 | | | | |
| @ 100 (a)(c) | EUR | 100,000 | | 112,866 |
| CNH Industrial Finance Europe SA, | | | | |
| Series E, 1.75%, 9/12/25, Callable | | | | |
| 6/12/25 @ 100 (a) | EUR | 100,000 | | 111,511 |
| Virgin Media Finance PLC, Registered, | | | | |
| 4.50%, 1/15/25, Callable 1/15/20 | | | | |
| @ 102.25 (a) | EUR | 100,000 | | 114,475 |
| | | | | 338,852 |
| TOTAL FOREIGN BONDS | | | | |
| (COST $3,906,859) | | | | 3,843,662 |
| 30 | HSBC FAMILY OF FUNDS | See notes to financial statements. |
| HSBC GLOBAL HIGH YIELD BOND FUND |
| Schedule of Portfolio Investments—as of October 31, 2018 (continued) |
| Yankee Dollars – 23.4% | | | | |
| | | | | |
| | Principal | | |
| | Amount ($) | | Value ($) |
| Argentina – 1.1% | | | | |
| IRSA Propiedades Comerciales SA, | | | | |
| Registered, 8.75%, 3/23/23, Callable | | | | |
| 3/23/20 @ 104.38 (a) | | 23,000 | | 22,971 |
| Petrobras Argentina SA, Registered, | | | | |
| 7.38%, 7/21/23, Callable 7/21/20 | | | | |
| @ 103.69 (a) | | 28,000 | | 25,864 |
| Provincia de Buenos Aires, | | | | |
| 6.50%, 2/15/23 | | 52,000 | | 44,460 |
| Provincia de Buenos Aires, | | | | |
| Registered, 6.50%, 2/15/23 (d) | | 50,000 | | 42,750 |
| Republic of Argentina, | | | | |
| 5.63%, 1/26/22 | | 60,000 | | 53,999 |
| Republic of Argentina, | | | | |
| 4.63%, 1/11/23 | | 20,000 | | 16,950 |
| Republic of Argentina, | | | | |
| 6.88%, 1/26/27 | | 53,000 | | 44,335 |
| Republic of Argentina, | | | | |
| 6.88%, 1/11/48 | | 4,000 | | 2,950 |
| Republic of Argentina, | | | | |
| 7.13%, 6/28/17 | | 14,000 | | 10,430 |
| YPF Sociedad Anonima, | | | | |
| Registered, 8.50%, 3/23/21 | | 77,000 | | 77,732 |
| | | | | 342,441 |
| Bahamas – 0.5% | | | | |
| Silversea Cruise Finance, | | | | |
| 7.25%, 2/1/25, Callable 2/1/20 | | | | |
| @ 105.44 (a)(d) | | 151,000 | | 162,704 |
| Bermuda – 0.7% | | | | |
| Viking Cruises, Ltd., 5.88%, 9/15/27, | | | | |
| Callable 9/15/22 @ 102.94 (a)(d) | | 219,000 | | 208,598 |
| VOC Escro, Ltd., 5.00%, 2/15/28, | | | | |
| Callable 2/15/23 @ 102.5 (a)(d) | | 11,000 | | 10,340 |
| | | | | 218,938 |
| Brazil – 3.3% | | | | |
| Banco Bradesco SA, | | | | |
| 5.90%, 1/16/21 | | 100,000 | | 102,420 |
| Banco Do Brasil (Cayman), Registered, | | | | |
| 6.00%, 1/22/20 | | 100,000 | | 102,375 |
| Centrais Eletricas Brasileiras SA, | | | | |
| Registered, 6.88%, 7/30/19 | | 100,000 | | 101,800 |
| Federal Republic of Brazil, | | | | |
| 8.88%, 4/15/24 | | 24,000 | | 28,770 |
| Federal Republic of Brazil, | | | | |
| 8.25%, 1/20/34 | | 40,000 | | 47,900 |
| Itau Unibanco Holding SA/KY, | | | | |
| Registered, 5.75%, 1/22/21 | | 100,000 | | 102,251 |
| Petrobras Global Finance BV, | | | | |
| 8.38%, 5/23/21 | | 6,000 | | 6,545 |
| Petrobras Global Finance BV, | | | | |
| 6.13%, 1/17/22 | | 28,000 | | 29,015 |
| Petrobras Global Finance BV, | | | | |
| 4.38%, 5/20/23 | | 25,000 | | 24,063 |
| Petrobras Global Finance BV, | | | | |
| 6.25%, 3/17/24 | | 62,000 | | 62,713 |
| Petrobras Global Finance BV, | | | | |
| 8.75%, 5/23/26 | | 37,000 | | 41,397 |
| Petrobras Global Finance BV, | | | | |
| 7.38%, 1/17/27 | | 245,000 | | 254,273 |
| Petrobras Global Finance BV, | | | | |
| 7.25%, 3/17/44 | | 46,000 | | 44,390 |
| Vale SA, 4.38%, 1/11/22 | | 13,000 | | 13,073 |
| | | | | 960,985 |
| Canada – 3.0% | | | | |
| GFL Environmental, Inc., 5.38%, | | | | |
| 3/1/23, Callable 3/1/20 | | | | |
| @ 102.69 (a)(d) | | 37,000 | | 33,948 |
| Hudbay Minerals, Inc., 7.25%, 1/15/23, | | | | |
| Callable 7/15/19 @ 103.63 (a)(d) | | 2,000 | | 1,990 |
| Hudbay Minerals, Inc., 7.63%, 1/15/25, | | | | |
| Callable 1/15/20 @ 105.72 (a)(d) | | 158,000 | | 158,395 |
| Iamgold Corp., 7.00%, 4/15/25, | | | | |
| Callable 4/15/20 @ 105.25 (a)(d) | | 89,000 | | 88,221 |
| Mattamy Group Corp., 6.88%, | | | | |
| 12/15/23, Callable 12/15/19 | | | | |
| @ 103.44 (a)(d) | | 64,000 | | 62,320 |
| Mattamy Group Corp., 6.50%, 10/1/25, | | | | |
| Callable 10/1/20 @ 104.88 (a)(d) | | 50,000 | | 47,000 |
| Mountain Province Diamonds, Inc., | | | | |
| 8.00%, 12/15/22, Callable 12/15/19 | | | | |
| @ 104 (a)(d) | | 110,000 | | 111,650 |
| New Gold, Inc., 6.25%, 11/15/22, | | | | |
| Callable 11/20/18 @ 103.13 (a)(d) | | 140,000 | | 121,800 |
| New Gold, Inc., 6.38%, 5/15/25, | | | | |
| Callable 5/15/20 @ 104.78 (a)(d) | | 68,000 | | 54,485 |
| Northwest Acquisitions ULC, 7.13%, | | | | |
| 11/1/22, Callable 11/1/19 | | | | |
| @ 103.56 (a)(d) | | 18,000 | | 18,123 |
| Nova Chemicals Corp., 5.25%, 8/1/23, | | | | |
| Callable 12/10/18 @ 102.63 (a)(d) | | 40,000 | | 38,600 |
| Nova Chemicals Corp., 4.88%, 6/1/24, | | | | |
| Callable 3/3/24 @ 100 (a)(d) | | 100,000 | | 91,875 |
| Nova Chemicals Corp., 5.00%, 5/1/25, | | | | |
| Callable 1/31/25 @ 100 (a)(d) | | 34,000 | | 30,940 |
| Nova Chemicals Corp., 5.25%, 6/1/27, | | | | |
| Callable 3/3/27 @ 100 (a)(d) | | 13,000 | | 11,733 |
| | | | | 871,080 |
| Chile – 0.0% | | | | |
| Codelco, Inc., 5.63%, 9/21/35 (d) | | 7,000 | | 7,420 |
| Colombia – 0.3% | | | | |
| Bancolombia SA, 6.13%, 7/26/20 | | 21,000 | | 21,735 |
| Bancolombia SA, 5.13%, 9/11/22 | | 35,000 | | 35,175 |
| Republic of Colombia, | | | | |
| 8.13%, 5/21/24 | | 40,000 | | 47,080 |
| | | | | 103,990 |
| El Salvador – 0.1% | | | | |
| Republic of El Salvador, | | | | |
| Registered, 7.75%, 1/24/23 | | 35,000 | | 35,241 |
| See notes to financial statements. | HSBC FAMILY OF FUNDS | 31 |
| HSBC GLOBAL HIGH YIELD BOND FUND |
| Schedule of Portfolio Investments—as of October 31, 2018 (continued) |
| Yankee Dollars, continued | | | | |
| | | | | |
| | Principal | | |
| | Amount ($) | | Value ($) |
| France – 1.0% | | | | |
| Electricite de France SA, Registered, | | | | |
| 5.25% (USSW10 + 371 bps), Callable | | | | |
| 1/29/23 @ 100 (a)(b)(c) | | 100,000 | | 96,875 |
| Numericable-SFR SA, 7.38%, 5/1/26, | | | | |
| Callable 5/1/21 @ 103.69 (a)(d) | | 200,000 | | 192,000 |
| | | | | 288,875 |
| Germany – 0.6% | | | | |
| IHO Verwaltungs (Schaeffler) GmbH, | | | | |
| 4.50%, 9/15/23, Callable 9/15/19 | | | | |
| @ 102.25 (a)(d) | | 200,000 | | 186,250 |
| Guatemala – 0.0% | | | | |
| Central American Bottling Corp., | | | | |
| 5.75%, 1/31/27, Callable 1/31/22 | | | | |
| @ 102.88 (a)(d) | | 10,000 | | 9,855 |
| Indonesia – 0.7% | | | | |
| Majapahit Holding BV, | | | | |
| Registered, 7.75%, 1/20/20 | | 200,000 | | 208,944 |
| Ireland – 1.2% | | | | |
| Avolon Holdings Funding, Ltd., | | | | |
| 5.13%, 10/1/23, Callable 9/1/23 | | | | |
| @ 100 (a)(d) | | 85,000 | | 83,406 |
| Park Aerospace Holdings, | | | | |
| 5.25%, 8/15/22 (d) | | 93,000 | | 92,303 |
| Park Aerospace Holdings, | | | | |
| 5.50%, 2/15/24 (d) | | 181,000 | | 179,235 |
| | | | | 354,944 |
| Israel – 0.1% | | | | |
| Teva Pharmaceuticals NE, | | | | |
| 3.15%, 10/1/26 | | 50,000 | | 40,735 |
| Lebanon – 0.0% | | | | |
| Lebanon Government International | | | | |
| Bond, Series G, 7.05%, 11/2/35 | | 18,000 | | 13,958 |
| Luxembourg – 3.3% | | | | |
| Altice Luxembourg SA, 7.75%, | | | | |
| 5/15/22, Callable 12/10/18 | | | | |
| @ 103.88 (a)(d) | | 200,000 | | 185,000 |
| Camelot Finance SA, 7.88%, 10/15/24, | | | | |
| Callable 10/15/19 @ 103.94 (a)(d) | | 80,000 | | 79,200 |
| Dana Financing Luxembourg Sarl, | | | | |
| 5.75%, 4/15/25, Callable 4/15/20 | | | | |
| @ 104.31 (a)(d) | | 84,000 | | 80,430 |
| Dana Financing Luxembourg Sarl, | | | | |
| 6.50%, 6/1/26, Callable 6/1/21 | | | | |
| @ 103.25 (a)(d) | | 33,000 | | 32,464 |
| FAGE International SA, | | | | |
| 5.63%, 8/15/26, Callable 8/15/21 | | | | |
| @ 102.81 (a)(d) | | 200,000 | | 183,000 |
| Intelsat Jackson Holdings SA, | | | | |
| 8.50%, 10/15/24, Callable 10/15/20 | | | | |
| @ 106.38 (a)(d) | | 157,000 | | 154,252 |
| Telenet Finance Luxembourg Notes | | | | |
| Sarl, 5.50%, 3/1/28, Callable 12/1/22 | | | | |
| @ 102.75 (a)(d) | | 200,000 | | 185,499 |
| Trinseo Materials Operating SCA/ | | | | |
| Trinseo Materials Finance, Inc., | | | | |
| 5.38%, 9/1/25, Callable 9/1/20 | | | | |
| @ 102.69 (a)(d) | | 66,000 | | 61,215 |
| | | | | 961,060 |
| Mexico – 0.3% | | | | |
| Petroleos Mexicanos, | | | | |
| 6.38%, 2/4/21 | | 10,000 | | 10,232 |
| Petroleos Mexicanos, | | | | |
| 6.50%, 3/13/27 | | 26,000 | | 25,193 |
| Petroleos Mexicanos, | | | | |
| 5.35%, 2/12/28 (d) | | 23,000 | | 20,491 |
| Petroleos Mexicanos, | | | | |
| 6.50%, 1/23/29 (d) | | 11,000 | | 10,511 |
| Petroleos Mexicanos, | | | | |
| 6.75%, 9/21/47 | | 10,000 | | 8,614 |
| Petroleos Mexicanos, | | | | |
| 6.35%, 2/12/48 (d) | | 10,000 | | 8,289 |
| | | | | 83,330 |
| Nigeria – 0.1% | | | | |
| Nigeria Government International Bond, | | | | |
| 5.63%, 6/27/22 | | 45,000 | | 44,352 |
| Peru – 0.3% | | | | |
| Banco de Credito del Peru, | | | | |
| Registered, 5.38%, 9/16/20 | | 40,000 | | 41,208 |
| BBVA Banco Continental, | | | | |
| Registered, 5.00%, 8/26/22 | | 14,000 | | 14,284 |
| Southern Copper Corp., | | | | |
| 6.75%, 4/16/40 | | 27,000 | | 30,721 |
| Southern Copper Corp., | | | | |
| 5.88%, 4/23/45 | | 5,000 | | 5,212 |
| | | | | 91,425 |
| Russian Federation – 1.4% | | | | |
| Gazprom OAO Via Gaz Capital SA, | | | | |
| Registered, 4.95%, 7/19/22 | | 200,000 | | 200,414 |
| LUKOIL International Finance BV, | | | | |
| Registered, 6.66%, 6/7/22 | | 100,000 | | 106,199 |
| VTB Bank OJSC Via VTB Capital SA, | | | | |
| 6.55%, 10/13/20 | | 100,000 | | 102,950 |
| | | | | 409,563 |
| South Africa – 0.3% | | | | |
| Republic of South Africa, | | | | |
| 5.50%, 3/9/20 | | 100,000 | | 101,000 |
| Spain – 0.6% | | | | |
| Banco BIL Vizcaya Arg, 6.12% (USSW5 | | | | |
| + 387 bps), Callable 11/16/27 | | | | |
| @ 100 (a)(b)(c) | | 200,000 | | 172,250 |
| 32 | HSBC FAMILY OF FUNDS | See notes to financial statements. |
| HSBC GLOBAL HIGH YIELD BOND FUND |
| Schedule of Portfolio Investments—as of October 31, 2018 (continued) |
| Yankee Dollars, continued | | | | |
| | | | | |
| | Principal | | |
| | Amount ($) | | Value ($) |
| Sri Lanka – 0.3% | | | | |
| Republic of Sri Lanka, | | | | |
| Registered, 6.25%, 10/4/20 | | 100,000 | | 96,497 |
| Switzerland – 0.7% | | | | |
| UBS Group AG, 7.00% (USSW5 | | | | |
| + 487 bps), Callable 2/19/25 | | | | |
| @ 100 (a)(b)(c) | | 200,000 | | 208,250 |
| Turkey – 1.5% | | | | |
| Republic of Turkey, 7.00%, 3/11/19 | | 200,000 | | 200,822 |
| Republic of Turkey, 7.00%, 6/5/20 | | 173,000 | | 174,118 |
| Republic of Turkey, 7.38%, 2/5/25 | | 62,000 | | 61,452 |
| Republic of Turkey, 6.88%, 3/17/36 | | 32,000 | | 28,450 |
| | | | 464,842 |
| United Arab Emirates – 0.6% | | | | |
| Shelf Drilling Holdings, Ltd., | | | | |
| 8.25%, 2/15/25, Callable 2/15/21 | | | | |
| @ 106.19 (a)(d) | | 178,000 | | 178,445 |
| United Kingdom – 1.3% | | | | |
| Royal Bank of Scotland Group PLC, | | | | |
| 8.63% (USSW5 + 760 bps), Callable | | | | |
| 8/15/21 @ 100 (a)(b)(c) | | 200,000 | | 210,250 |
| Virgin Media Finance PLC, | | | | |
| 6.00%, 10/15/24, Callable 10/15/19 | | | | |
| @ 103 (a)(d) | | 200,000 | | 195,250 |
| | | | | 405,500 |
| Venezuela – 0.1% | | | | |
| Bolivarian Republic of Venezuela, | | | | |
| 9.25%, 5/7/28(e) | | 4,000 | | 1,000 |
| Petroleos de Venezuela SA, | | | | |
| Registered, 9.00%, 11/17/21 (e) | | 35,000 | | 7,347 |
| Petroleos de Venezuela SA, | | | | |
| Registered, 12.75%, 2/17/22(e) | | 9,000 | | 1,913 |
| Petroleos de Venezuela SA, | | | | |
| Registered, 6.00%, 5/16/24 (e) | | 70,000 | | 12,004 |
| Petroleos de Venezuela SA, | | | | |
| Registered, 6.00%, 11/15/26 (e) | | 63,000 | | 10,868 |
| | | | | 33,132 |
| TOTAL YANKEE DOLLARS | | | | |
| (COST $7,369,009) | | | | 7,056,006 |
| |
| Corporate Bonds – 50.3% | | | | |
| |
| United States – 50.3% | | | | |
| Acadia Healthcare Co., Inc., | | | | |
| 5.63%, 2/15/23, Callable 12/10/18 | | | | |
| @ 104.22 (a) | | 65,000 | | 65,081 |
| Acadia Healthcare Co., Inc., | | | | |
| 6.50%, 3/1/24, Callable 3/1/19 | | | | |
| @ 104.88 (a) | | 150,000 | | 152,475 |
| Ally Financial, Inc., 4.13%, 3/30/20 | | 135,000 | | 134,831 |
| Ally Financial, Inc., 5.75%, 11/20/25, | | | | |
| Callable 10/21/25 @ 100.00 (a) | | 3,000 | | 3,075 |
| Ally Financial, Inc., 7.50%, 9/15/20 | | 87,000 | | 92,220 |
| Ally Financial, Inc., 8.00%, 3/15/20 | | 87,000 | | 91,241 |
| American Axle & Manufacturing, Inc., | | | | |
| 6.25%, 4/1/25, Callable 4/1/20 | | | | |
| @ 104.69 (a) | | 93,000 | | 87,769 |
| American Axle & Manufacturing, Inc., | | | | |
| 6.25%, 3/15/26, Callable 3/15/21 | | | | |
| @ 103.13 (a) | | 58,000 | | 54,810 |
| American Axle & Manufacturing, Inc., | | | | |
| 6.50%, 4/1/27, Callable 4/1/22 | | | | |
| @ 103.25 (a) | | 101,000 | | 96,076 |
| American Express Co., 5.20% | | | | |
| (US0003M + 343 bps), Callable | | | | |
| 11/15/19 @ 100.00 (a)(b)(c) | | 65,000 | | 65,000 |
| Andeavor Logistics LP, 6.88% | | | | |
| (US0003M + 465 bps), Callable | | | | |
| 2/15/23 @ 100.00 (a)(b)(c) | | 61,000 | | 59,170 |
| Ascent Resources Utica Holdings LLC/ | | | | |
| ARU Finance Corp., 7.00%, 11/1/26, | | | | |
| Callable 11/1/21 @ 103.50 (a)(d) | | 42,000 | | 40,740 |
| Ball Corp., 4.38%, 12/15/23 | EUR | 100,000 | | 126,235 |
| Bank of America Corp., 6.50% | | | | |
| (US0003M + 417 bps), Callable | | | | |
| 10/23/24 @ 100.00 (a)(b)(c) | | 75,000 | | 79,534 |
| Blue Cube Spinco, Inc., | | | | |
| 9.75%, 10/15/23, Callable | | | | |
| 10/15/20 @ 102.44 (a) | | 88,000 | | 97,900 |
| Blue Cube Spinco, Inc., | | | | |
| 10.00%, 10/15/25, Callable | | | | |
| 10/15/20 @ 105.00 (a) | | 28,000 | | 31,710 |
| Blue Racer Mid LLC, 6.63%, 7/15/26, | | | | |
| Callable 7/15/21 @ 104.97 (a)(d) | | 40,000 | | 40,600 |
| Blue Racer Midstream LLC, | | | | |
| 6.13%, 11/15/22, Callable 12/10/18 | | | | |
| @ 103.06 (a)(d) | | 173,000 | | 176,459 |
| Blueline Rental Finance Corp./Blueline | | | | |
| Rental LLC, 9.25%, 3/15/24 (d) | | 175,000 | | 182,657 |
| Boyd Gaming Corp., 6.88%, 5/15/23, | | | | |
| Callable 11/26/18 @ 105.16 (a) | | 115,000 | | 119,456 |
| Boyne USA, Inc., 7.25%, 5/1/25, | | | | |
| Callable 5/1/21 @ 103.63 (a)(d) | | 60,000 | | 62,550 |
| Buckeye Partners LP, 6.38% | | | | |
| (US0003M + 402 bps), 1/22/78, | | | | |
| Callable 1/22/23 @ 100.00 (a)(c) | | 33,000 | | 30,211 |
| Cablevision Systems Corp., | | | | |
| 5.88%, 9/15/22 | | 174,000 | | 174,870 |
| Calpine Corp., 5.75%, 1/15/25, Callable | | | | |
| 10/15/19 @ 102.88 (a) | | 180,000 | | 160,839 |
| Calpine Corp., 6.00%, 1/15/22, Callable | | | | |
| 12/10/18 @ 101.50 (a)(d) | | 75,000 | | 75,375 |
| Capital One Financial Corp., 5.55% | | | | |
| (US0003M + 380 bps), Callable | | | | |
| 6/1/20 @ 100.00 (a)(b)(c) | | 120,000 | | 121,200 |
| Carmike Cinemas, Inc., 6.00%, | | | | |
| 6/15/23, Callable 12/10/18 | | | | |
| @ 104.50 (a)(d) | | 110,000 | | 111,100 |
| Carrizo Oil & Gas, Inc., 7.50%, 9/15/20, | | | | |
| Callable 11/19/18 @ 100.00 (a) | | 16,000 | | 16,027 |
| CCO Holdings LLC, 5.00%, 2/1/28, | | | | |
| Callable 8/1/22 @ 102.50 (a)(d) | | 134,000 | | 125,123 |
| See notes to financial statements. | HSBC FAMILY OF FUNDS | 33 |
| HSBC GLOBAL HIGH YIELD BOND FUND |
| Schedule of Portfolio Investments—as of October 31, 2018 (continued) |
| Corporate Bonds, continued | | | | |
| |
| | Principal | | |
| | Amount ($) | | Value ($) |
| United States – continued | | | | |
| CCO Holdings LLC, 5.13%, 5/1/23, | | | | |
| Callable 12/10/18 @ 103.84(a)(d) | | 164,000 | | 163,180 |
| CCO Holdings LLC, 5.75%, 1/15/24, | | | | |
| Callable 12/10/18 @ 102.88(a) | | 100,000 | | 101,000 |
| Cemex Finance LLC, Registered, | | | | |
| 6.00%, 4/1/24, Callable 4/1/19 | | | | |
| @ 103.00 (a) | | 200,000 | | 199,549 |
| Centene Corp., 4.75%, 5/15/22, | | | | |
| Callable 5/15/19 @ 102.38 (a) | | 14,000 | | 14,018 |
| Centene Corp., 6.13%, 2/15/24, | | | | |
| Callable 2/15/19 @ 104.59 (a) | | 73,000 | | 76,285 |
| Centene Escrow I Corp., 5.38%, | | | | |
| 6/1/26, Callable 6/1/21 | | | | |
| @ 104.03 (a)(d) | | 85,000 | | 86,275 |
| CenturyLink, Inc., 6.75%, 12/1/23 | | 96,000 | | 97,920 |
| Cheniere Energy Partners, 5.25%, | | | | |
| 10/1/25, Callable 10/1/20 | | | | |
| @ 102.63 (a) | | 38,000 | | 37,288 |
| Citigroup, Inc., 5.87% (US0003M + | | | | |
| 406 bps), Callable 3/27/20 | | | | |
| @ 100.00 (a)(b)(c) | | 70,000 | | 70,963 |
| Clearwater Paper Corp., 5.38%, | | | | |
| 2/1/25 (d) | | 202,000 | | 185,335 |
| Cleveland-Cliffs, Inc., 5.75%, 3/1/25, | | | | |
| Callable 3/1/20 @ 104.31 (a) | | 149,000 | | 140,805 |
| CSC Holdings LLC, 5.25%, 6/1/24 | | 200,000 | | 192,749 |
| DCP Midstream LLC, 8.13%, | | | | |
| 8/16/30 | | 77,000 | | 89,705 |
| DCP Midstream Partners, 7.37% | | | | |
| (US0003M + 515 bps), Callable | | | | |
| 12/15/22 @ 100.00 (a)(b)(c) | | 221,000 | | 211,745 |
| Dell, Inc., 7.10%, 4/15/28 | | 109,000 | | 115,132 |
| Delta Merger Sub, Inc., 6.00%, | | | | |
| 9/15/26, Callable 9/15/21 | | | | |
| @ 104.50 (a)(d) | | 52,000 | | 51,025 |
| Diamond 1 Finance/Diamond 2, | | | | |
| 5.88%, 6/15/21, Callable 11/26/18 | | | | |
| @ 102.94 (a)(d) | | 19,000 | | 19,262 |
| Diamond 1 Finance/Diamond 2, 7.13%, | | | | |
| 6/15/24, Callable 6/15/19 | | | | |
| @ 105.34 (a)(d) | | 74,000 | | 78,315 |
| DISH DBS Corp., 5.88%, 7/15/22 | | 195,000 | | 184,274 |
| Eagle Holding Co. II LLC, 7.63%, | | | | |
| 5/15/22, Callable 12/10/18 | | | | |
| @ 102.00 (a)(d) | | 193,000 | | 193,965 |
| Eldorado Resorts, Inc., 7.00%, 8/1/23, | | | | |
| Callable 12/10/18 @ 105.25 (a) | | 135,000 | | 141,750 |
| Energy Transfer Partners LP, 6.25% | | | | |
| (US0003M + 418 bps), Callable | | | | |
| 2/15/23 @ 100.00 (a)(b)(c) | | 83,000 | | 77,605 |
| EnLink Midstream Partners LP, 6.00% | | | | |
| (US0003M + 411 bps), Callable | | | | |
| 12/15/22 @ 100.00 (a)(b)(c) | | 197,000 | | 171,611 |
| Enterprise Merger Sub In, 8.75%, | | | | |
| 10/15/26, Callable 10/15/21 | | | | |
| @ 104.38 (a)(d) | | 177,000 | | 171,690 |
| Equinix, Inc., 2.88%, 10/1/25, Callable | | | | |
| 10/1/20 @ 101.44 (a) | | 100,000 | | 110,943 |
| Exela Intermediate LLC Exela Finance, | | | | |
| Inc., 10.00%, 7/15/23, Callable | | | | |
| 7/15/20 @ 105.00 (a)(d) | | 71,000 | | 73,819 |
| First Data Corp., 7.00%, 12/1/23, | | | | |
| Callable 12/1/18 @ 103.50 (a)(d) | | 200,000 | | 207,400 |
| Flex Acquisition Co., Inc., 7.88%, | | | | |
| 7/15/26, Callable 7/15/21 | | | | |
| @ 103.94 (a)(d) | | 77,000 | | 74,328 |
| Freeport-McMoRan, Inc., 3.88%, | | | | |
| 3/15/23, Callable 12/15/22 | | | | |
| @ 100.00 (a) | | 44,000 | | 40,700 |
| Freeport-McMoRan, Inc., 6.88%, | | | | |
| 2/15/23, Callable 2/15/20 | | | | |
| @ 103.44 (a) | | 18,000 | | 18,833 |
| Genesis Energy LP, 5.63%, 6/15/24, | | | | |
| Callable 6/15/19 @ 102.81 (a) | | 40,000 | | 36,200 |
| Genesis Energy LP, 6.00%, 5/15/23, | | | | |
| Callable 12/10/18 @ 104.50 (a) | | 100,000 | | 94,250 |
| Genesis Energy LP, 6.75%, 8/1/22, | | | | |
| Callable 12/10/18 @ 103.38 (a) | | 76,000 | | 76,380 |
| Golden Nugget, Inc., 6.75%, 10/15/24, | | | | |
| Callable 10/15/19 @ 103.38 (a)(d) | | 99,000 | | 98,753 |
| Golden Nugget, Inc., 8.75%, 10/1/25, | | | | |
| Callable 10/1/20 @ 104.38 (a)(d) | | 256,000 | | 263,039 |
| Goldman Sachs Group, Inc., 5.00% | | | | |
| (US0003M + 287 bps), Callable | | | | |
| 11/10/22 @ 100.00 (a)(b)(c) | | 85,000 | | 78,396 |
| Gulfport Energy Corp., 6.38%, 5/15/25, | | | | |
| Callable 5/15/20 @ 104.78 (a) | | 77,000 | | 73,150 |
| Gulfport Enregy Corp., 6.00%, | | | | |
| 10/15/24, Callable 10/15/19 | | | | |
| @ 104.50 (a) | | 196,000 | | 183,749 |
| Halcon Resources Corp., 6.75%, | | | | |
| 2/15/25, Callable 2/15/20 | | | | |
| @ 105.06 (a) | | 92,000 | | 83,720 |
| HCA Healthcare, Inc., 5.88%, 2/15/26, | | | | |
| Callable 8/15/25 @ 100.00 (a) | | 200,000 | | 204,499 |
| HCA Holdings, Inc., 6.50%, 2/15/20 | | 70,000 | | 72,275 |
| HCA, Inc., 5.38%, 9/1/26, Callable | | | | |
| 3/1/26 @ 100.00 (a) | | 15,000 | | 14,888 |
| HCA, Inc., 7.50%, 2/15/22 | | 64,000 | | 69,440 |
| Herc Rentals, Inc., 7.50%, 6/1/22, | | | | |
| Callable 6/1/19 @ 103.75 (a)(d) | | 61,000 | | 63,440 |
| Infor, Inc., 5.75%, 8/15/20, Callable | | | | |
| 11/26/18 @ 101.44 (a)(d) | | 5,000 | | 5,056 |
| Infor, Inc., 6.50%, 5/15/22, Callable | | | | |
| 11/26/18 @ 103.25 (a) | | 125,000 | | 124,688 |
| Inventiv Group Holdings, Inc., 7.50%, | | | | |
| 10/1/24, Callable 10/1/19 | | | | |
| @ 103.75 (a)(d) | | 79,000 | | 83,148 |
| Jacobs Entertainment, Inc., 7.88%, | | | | |
| 2/1/24, Callable 2/1/20 | | | | |
| @ 105.91 (a)(d) | | 138,000 | | 145,417 |
| Jaguar Holding Co. II, 6.38%, 8/1/23, | | | | |
| Callable 12/10/18 @ 104.78 (a)(d) | | 69,000 | | 68,979 |
| 34 | HSBC FAMILY OF FUNDS | See notes to financial statements. |
| HSBC GLOBAL HIGH YIELD BOND FUND |
| Schedule of Portfolio Investments—as of October 31, 2018 (continued) |
| Corporate Bonds, continued |
| |
| | | | Principal | | |
| | | | Amount ($) | | Value ($) |
| United States – continued | | | | | |
| JPMorgan Chase & Co., 6.00% | | | | | |
| | (US0003M + 330 bps), Callable | | | | | |
| 8/1/23 @ 100.00 (a)(b)(c) | | | 85,000 | | 85,424 |
| Level 3 Communications, 5.75%, | | | | | |
| 12/1/22, Callable 12/10/18 | | | | | |
| @ 101.44 (a) | | | 96,000 | | 95,740 |
| Level 3 Financing, Inc., 5.13%, 5/1/23, | | | | | |
| Callable 12/10/18 @ 102.56 (a) | | | 90,000 | | 89,325 |
| Level 3 Financing, Inc., 5.38%, 5/1/25, | | | | | |
| Callable 5/1/20 @ 102.69 (a) | | | 39,000 | | 38,074 |
| Level 3 Financing, Inc., 5.38%, | | | | | |
| 1/15/24, Callable 1/15/19 | | | | | |
| @ 102.69 (a) | | | 24,000 | | 23,760 |
| LifePoint Health, Inc., 5.38%, 5/1/24, | | | | | |
| Callable 5/1/19 @ 104.03 (a) | | | 119,000 | | 124,807 |
| M/I Homes, Inc., 5.63%, 8/1/25, | | | | | |
| Callable 8/1/20 @ 104.22 (a) | | | 34,000 | | 31,280 |
| Matador Resources Co., 5.88%, | | | | | |
| 9/15/26, Callable 9/15/21 | | | | | |
| @ 104.41 (a)(d) | | | 51,000 | | 49,853 |
| Match Group, Inc., 6.38%, 6/1/24, | | | | | |
| Callable 6/1/19 @ 104.78 (a) | | | 91,000 | | 94,640 |
| MGM Growth/MGM Finance, | | | | | |
| 5.63%, 5/1/24, Callable 2/1/24 | | | | | |
| @ 100.00 (a) | | | 38,000 | | 38,048 |
| MGM Resorts International, | | | | | |
| 5.75%, 6/15/25, Callable 3/15/25 | | | | | |
| @ 100.00 (a) | | | 100,000 | | 97,500 |
| MPH Acquisition Holdings LLC, | | | | | |
| 7.13%, 6/1/24, Callable 6/1/19 | | | | | |
| @ 105.34 (a)(d) | | | 66,000 | | 67,044 |
| MPT Operating Partnership LP, | | | | | |
| 5.00%, 10/15/27, Callable 10/15/22 | | | | | |
| @ 102.50 (a) | | | 115,000 | | 108,066 |
| MPT Operating Partnership LP, | | | | | |
| 5.25%, 8/1/26, Callable 8/1/21 | | | | | |
| @ 102.63 (a) | | | 20,000 | | 19,300 |
| Navient Corp., 7.25%, 9/25/23 | | | 49,000 | | 50,979 |
| Navient Corp., 7.25%, 1/25/22, MTN | | | 150,000 | | 156,000 |
| Navistar International Corp., 6.63%, | | | | | |
| 11/1/25, Callable 11/1/20 | | | | | |
| @ 103.31 (a)(d) | | | 85,000 | | 86,700 |
| Nine Energy Service, Inc., 8.75%, | | | | | |
| 11/1/23, Callable 11/1/20 | | | | | |
| @ 104.38 (a)(d) | | | 25,000 | | 25,375 |
| Outfront Media Capital LLC, 5.25%, | | | | | |
| 2/15/22, Callable 12/10/18 | | | | | |
| @ 102.63 (a) | | | 130,000 | | 130,935 |
| Owens-Brockway Packaging, Inc., | | | | | |
| 6.38%, 8/15/25 (d) | | | 100,000 | | 100,500 |
| Party City Holdings, Inc., 6.63%, | | | | | |
| 8/1/26, Callable 8/1/21 | | | | | |
| @ 103.31 (a)(d) | | | 86,000 | | 83,635 |
| PBF Holding Co. LLC, 7.00%, 11/15/23, | | | | | |
| Callable 12/10/18 @ 105.25 (a) | | | 133,000 | | 137,323 |
| PBF Holding Co. LLC, 7.25%, 6/15/25, | | | | | |
| | Callable 6/15/20 @ 105.44 (a) | | | 90,000 | | 92,700 |
| PBF Logistics LP, 6.88%, 5/15/23, | | | | | |
| Callable 12/10/18 @ 105.16 (a) | | | 130,000 | | 132,275 |
| Pilgrim’s Pride Corp., 5.75%, 3/15/25, | | | | | |
| Callable 3/15/20 @ 102.88 (a)(d) | | | 121,000 | | 112,833 |
| Pilgrim’s Pride Corp., 5.88%, 9/30/27, | | | | | |
| Callable 9/30/22 @ 102.94 (a)(d) | | | 96,000 | | 87,120 |
| Pisces Midco, Inc., 8.00%, 4/15/26, | | | | | |
| Callable 4/15/21 @ 104.00 (a)(d) | | | 135,000 | | 131,119 |
| Plains All American Pipeline LP, 6.12% | | | | | |
| (US0003M + 411 bps), Callable | | | | | |
| 11/15/22 @ 100.00 (a)(b)(c) | | | 73,000 | | 68,620 |
| Plastipak Holdings, Inc., 6.25%, | | | | | |
| 10/15/25, Callable 10/15/20 | | | | | |
| @ 103.13 (a)(d) | | | 127,000 | | 116,205 |
| Polaris Intermediate Corp., 8.50%, | | | | | |
| 12/1/22, Callable 6/1/19 | | | | | |
| @ 104.00 (a)(d) | | | 118,000 | | 120,950 |
| Prestige Brands, Inc., 6.38%, 3/1/24, | | | | | |
| Callable 3/1/19 @ 104.78 (a)(d) | | | 250,000 | | 246,875 |
| Quintiles IMS, Inc., Registered, 3.50%, | | | | | |
| 10/15/24, Callable 10/15/19 | | | | | |
| @ 101.75 (a) | EUR | | 100,000 | | 116,247 |
| Rayonier Am Prod, Inc., 5.50%, 6/1/24, | | | | | |
| Callable 6/1/19 @ 102.75 (a)(d) | | | 86,000 | | 80,410 |
| Refinitiv US Holdings, Inc., 4.50%, | | | | | |
| 5/15/26, Callable 11/15/21 | | | | | |
| @ 102.25 (a)(d) | EUR | | 200,000 | | 226,480 |
| Refinitiv US Holdings, Inc., 6.25%, | | | | | |
| | 5/15/26, Callable 11/15/21 | | | | | |
| @ 103.13 (a)(d) | | | 41,000 | | 40,795 |
| Refinitiv US Holdings, Inc., 8.25%, | | | | | |
| 11/15/26, Callable 11/15/21 | | | | | |
| @ 104.13 (a)(d) | | | 87,000 | | 84,390 |
| Rose Rock Midstream LP, 5.63%, | | | | | |
| 11/15/23, Callable 5/15/19 | | | | | |
| @ 102.81 (a) | | | 61,000 | | 57,645 |
| Sanchez Energy Corp., 6.13%, 1/15/23, | | | | | |
| Callable 12/10/18 @ 103.06 (a) | | | 411,000 | | 153,098 |
| Sanchez Energy Corp., 7.25%, 2/15/23, | | | | | |
| Callable 2/15/20 @ 103.63 (a)(d) | | | 70,000 | | 63,875 |
| Sealed Air Corp., Registered, 4.50%, | | | | | |
| 9/15/23, Callable 6/15/23 | | | | | |
| @ 100.00 (a) | EUR | | 100,000 | | 125,359 |
| Select Medical Holdings Corp., 6.38%, | | | | | |
| 6/1/21, Callable 12/10/18 | | | | | |
| @ 101.59 (a) | | | 134,000 | | 135,173 |
| SemGroup Corp., 6.38%, 3/15/25, | | | | | |
| Callable 3/15/20 @ 103.19 (a) | | | 139,000 | | 134,483 |
| SemGroup Corp., 7.25%, 3/15/26, | | | | | |
| Callable 3/15/21 @ 103.63 (a) | | | 28,000 | | 27,335 |
| Seminole Hard Rock Entertainment, | | | | | |
| Inc., 5.88%, 5/15/21, Callable | | | | | |
| 12/10/18 @ 101.47 (a)(d) | | | 125,000 | | 124,688 |
| Sirius XM Radio, Inc., 6.00%, 7/15/24, | | | | | |
| Callable 7/15/19 @ 103.00 (a)(d) | | | 75,000 | | 76,673 |
| Southwestern Energy Co., 4.10%, | | | | | |
| 3/15/22, Callable 12/15/21 | | | | | |
| @ 100.00 (a) | | | 35,000 | | 34,475 |
| Springleaf Finance Corp., 6.88%, | | | | | |
| 3/15/25 | | | 88,000 | | 84,260 |
| Sprint Capital Corp., 6.88%, 11/15/28 | | | 30,000 | | 29,475 |
| See notes to financial statements. | HSBC FAMILY OF FUNDS 35 |
| HSBC GLOBAL HIGH YIELD BOND FUND |
| Schedule of Portfolio Investments—as of October 31, 2018 (continued) |
| Corporate Bonds, continued |
| |
| | | Principal | | | |
| | | | Amount ($) | | Value ($) |
| United States – continued | | | | | |
| Sprint Communications, Inc., 6.00%, | | | | | |
| 11/15/22 | | 125,000 | | | 126,172 |
| Sprint Corp., 7.63%, 3/1/26, Callable | | | | | |
| 11/1/25 @ 100.00 (a) | | 43,000 | | | 44,532 |
| Sprint Corp., 7.88%, 9/15/23 | | 328,000 | | | 350,140 |
| Surgery Center Holdings, Inc., 8.88%, | | | | | |
| 4/15/21, Callable 12/10/18 | | | | | |
| @ 106.66 (a)(d) | | 95,000 | | | 97,613 |
| Targa Resources Partners, 5.00%, | | | | | |
| 1/15/28, Callable 1/15/23 | | | | | |
| @ 102.50 (a) | | 64,000 | | | 60,640 |
| Targa Resources Partners LP, 6.75%, | | | | | |
| 3/15/24, Callable 9/15/19 | | | | | |
| @ 103.38 (a) | | 31,000 | | | 32,473 |
| Taylor Morrison Communities, Inc., | | | | | |
| 5.88%, 4/15/23, Callable 1/15/23 | | | | | |
| @ 100.00 (a)(d) | | 110,000 | | | 108,625 |
| Tempo Acquisition Ll/Fi, 6.75%, | | | | | |
| 6/1/25, Callable 6/1/20 | | | | | |
| @ 103.38 (a)(d) | | 167,000 | | | 159,017 |
| Tenet Healthcare Corp., 6.00%, | | | | | |
| 10/1/20 | | 115,000 | | | 117,766 |
| Tenet Healthcare Corp., 8.13%, 4/1/22 | | 245,000 | | | 255,105 |
| Tennessee Merger Sub, Inc., 6.38%, | | | | | |
| 2/1/25, Callable 2/1/20 | | | | | |
| @ 103.19 (a)(d) | | 48,000 | | | 41,280 |
| The Chemours Co., 5.38%, 5/15/27, | | | | | |
| Callable 2/15/27 @ 100.00 (a) | | 65,000 | | | 60,450 |
| The Chemours Co., 6.63%, 5/15/23, | | | | | |
| Callable 12/10/18 @ 104.97 (a) | | 39,000 | | | 39,878 |
| T-Mobile US, Inc., 6.00%, 4/15/24, | | | | | |
| Callable 4/15/19 @ 104.50 (a) | | 5,000 | | | 5,125 |
| T-Mobile US, Inc., 6.50%, 1/15/24, | | | | | |
| Callable 1/15/19 @ 103.25 (a) | | 150,000 | | | 155,250 |
| Tribune Media Co., 5.88%, 7/15/22, | | | | | |
| Callable 11/20/18 @ 102.94 (a) | | 110,000 | | | 111,375 |
| Tronox, Inc., 6.50%, 4/15/26, Callable | | | | | |
| 4/15/21 @ 103.25 (a)(d) | | 105,000 | | | 96,075 |
| United Rentals North America, Inc., | | | | | |
| 4.63%, 7/15/23, Callable 12/10/18 | | | | | |
| @ 103.47 (a) | | 85,000 | | | 84,256 |
| United Rentals North America, Inc., | | | | | |
| 6.50%, 12/15/26, Callable 12/15/21 | | | | | |
| @ 103.25 (a) | | 105,000 | | | 106,181 |
| Wand Merger Corp., 8.13%, 7/15/23, | | | | | |
| Callable 7/15/20 @ 104.06 (a)(d) | | 126,000 | | | 128,205 |
| Warrior Met Coal, Inc., 8.00%, 11/1/24, | | | | | |
| Callable 11/1/20 @ 104.00 (a)(d) | | 203,000 | | | 208,582 |
| Waste Pro USA, Inc., 5.50%, 2/15/26, | | | | | |
| Callable 2/15/21 @ 104.13 (a)(d) | | 113,000 | | | 107,068 |
| William Lyon Homes, Inc., 6.00%, | | | | | |
| 9/1/23, Callable 9/1/20 | | | | | |
| @ 103.00 (a) | | 12,000 | | | 10,950 |
| Wyndham Worldwide Corp., | | | | | |
| 6.35%, 10/1/25, Callable 7/1/25 | | | | | |
| @ 100.00 (a) | | 98,000 | | | 97,510 |
| Zayo Group LLC/Zayo Capital LLC, | | | | | |
| 5.75%, 1/15/27, Callable 1/15/22 | | | | | |
| @ 102.88 (a)(d) | | 23,000 | | | 22,545 |
| Zayo Group LLC/Zayo Capital LLC, | | | | | |
| 6.00%, 4/1/23, Callable 12/10/18 | | | | | |
| @ 104.50 (a) | | 125,000 | | | 127,499 |
| Zayo Group LLC/Zayo Capital LLC, | | | | | |
| 6.38%, 5/15/25, Callable 5/15/20 | | | | | |
| @ 103.19(a) | | 75,000 | | | 76,688 |
| | | | | | 15,180,136 |
| TOTAL CORPORATE BONDS | | | | | |
| (COST $15,645,994) | | | | | 15,180,136 |
| |
| Exchange Traded Fund — 4.2% |
| |
| | | Shares | | | |
| iShares JPMorgan USD Emerging | | | | | |
| Markets Bond ETF | | 11,969 | | | 1,252,676 |
| TOTAL EXCHANGE TRADED FUND | | | | | |
| (COST $1,336,572) | | | | | 1,252,676 |
| |
| Investment Companies – 7.4% |
| |
| Northern Institutional Government | | | | | |
| Assets Portfolio, Institutional | | | | | |
| Shares, 1.87%(f) | | 2,162,760 | | | 2,162,760 |
| Northern Institutional Government | | | | | |
| Select Portfolio, Institutional | | | | | |
| Shares, 1.92%(f) | | 52,444 | | | 52,444 |
| TOTAL INVESTMENT COMPANIES | | | | | |
| (COST $2,215,204) | | | | | 2,215,204 |
| TOTAL INVESTMENTS IN | | | | | |
| SECURITIES | | | | | |
| (COST $30,473,638) – 98.1% | | | | | 29,547,684 |
| Other Assets (Liabilities) – 1.9% | | | | | 568,434 |
| NET ASSETS – 100% | | | | $ | 30,116,118 |
____________________
| † | The principal amount is disclosed in local currency and the value is disclosed in U.S. Dollars. |
| (a) | Represents next call date. Additional subsequent call dates and amounts may apply to this security. |
| (b) | Securities are perpetual and, thus, do not have a predetermined maturity date. |
| (c) | Floating or variable rate security linked to the referenced benchmark. The rate presented represents the rate in effect on October 31, 2018. |
| (d) | Rule 144A security or other security which is restricted as to resale to institutional investors. This security has been deemed liquid by the Investment Adviser based on procedures approved by the Board of Trustees. |
| (e) | Defaulted security. |
| (f) | The rate represents the annualized one day yield that was in effect on October 31, 2018. |
| 36 HSBC FAMILY OF FUNDS | See notes to financial statements. |
| HSBC GLOBAL HIGH YIELD BOND FUND |
| Schedule of Portfolio Investments—as of October 31, 2018 (continued) |
| bps - Basis Points |
| ETF - Exchange-Traded Fund |
| EUAMDB10 - EU LIBOR 10 Year |
| EUR - Euro |
| EUR003M - 3 Month EUR LIBOR |
| EUSA5 - Euro 5 Year Swap Rate |
| EUSA8 - Euro 8 Year Swap Rate |
| EUSA10 - Euro 10 Year Swap Rate |
| EUSA12 - Euro 12 Year Swap Rate |
| LLC - Limited Liability Company |
| MTN - Medium Term Note |
| SpA - Standby Purchase Agreement |
| ULC - Unlimited Liability Co. |
| US0003M - 3 Month US Dollar LIBOR |
| USSW5 - USD 5 Year Swap Rate |
| USSW10 - USD 10 Year Swap Rate |
The Fund invested, as a percentage of net assets at value, in the following industries, as of October 31, 2018:
| Percentage of Net Assets |
| Industry | at Value (%) |
| Oil, Gas & Consumable Fuels | | 10.9 | |
| Diversified Financial Services | | 9.1 | |
| Investment Companies | | 7.4 | |
| Health Care Providers & Services | | 6.1 | |
| Banks | | 5.4 | |
| Hotels, Restaurants & Leisure | | 5.2 | |
| Exchange Traded Fund | | 4.2 | |
| Media | | 4.2 | |
| Diversified Telecommunication | | | |
| Services | | 3.5 | |
| Sovereign Bond | | 3.5 | |
| Metals & Mining | | 3.4 | |
| Chemicals | | 3.0 | |
| Electric Utilities | | 2.7 | |
| Consumer Finance | | 2.6 | |
| Containers & Packaging | | 2.5 | |
| Wireless Telecommunication Services | | 2.4 | |
| Insurance | | 2.1 | |
| IT Services | | 2.1 | |
| Auto Components | | 1.8 | |
| Trading Companies & Distributors | | 1.5 | |
| Equity Real Estate Investment Trusts | | 1.4 | |
| Food Products | | 1.3 | |
| Pharmaceuticals | | 1.0 | |
| Commercial Services & Supplies | | 1.0 | |
| Capital Markets | | 1.0 | |
| Household Durables | | 0.9 | |
| Independent Power and Renewable | | | |
| Electricity Producers | | 0.8 | |
| Technology Hardware, Storage & | | | |
| Peripherals | | 0.8 | |
| Life Sciences Tools & Services | | 0.7 | |
| Machinery | | 0.7 | |
| Energy Equipment & Services | | 0.7 | |
| Paper & Forest Products | | 0.6 | |
| Multi-Utilities | | 0.4 | |
| Thrifts & Mortgage Finance | | 0.4 | |
| Entertainment | | 0.4 | |
| Software | | 0.4 | |
| Building Products | | 0.4 | |
| Road & Rail | | 0.4 | |
| Specialty Retail | | 0.3 | |
| Aerospace & Defense | | 0.3 | |
| Interactive Media & Services | | 0.3 | |
| Automobiles | | 0.2 | |
| Real Estate Management & | | | |
| Development | | 0.1 | |
| Beverages | | — | |
| Total | | 98.1 | |
| See notes to financial statements. | HSBC FAMILY OF FUNDS 37 |
| HSBC GLOBAL HIGH YIELD BOND FUND |
| Schedule of Portfolio Investments—as of October 31, 2018 (continued) |
Futures Contracts Purchased
| | | | | | | | Value and Unrealized |
| | | | | | Notional | | Appreciation/ |
| | Number of | | Expiration | | Amount | | (Depreciation) |
| Description | | Contracts | | Date | | ($) | | ($) |
| 10-Year US Treasury Note Futures | | 3 | | 12/19/18 | | 355,313 | | | | (5,726 | ) | |
| | | | | | 355,313 | | | | (5,726 | ) | |
| | |
| | Total unrealized appreciation | | | $ | — | | |
| | Total unrealized depreciation | | | | (5,726 | ) | |
| | Total net unrealized appreciation/ | | | | | | |
| | (depreciation) | | | $ | (5,726 | ) | |
Credit Default Swap Agreements - Sell Protection(a)
| | | | | | Implied | | | | | | | | | | | | | | | | | | | | |
| | | | | | Credit | | | | | | | | | | | Upfront | | | | | | |
| | | | | | Spread at | | | | | | | | | | | Premiums | | Unrealized |
| | Receive | | | | October 31, | | | | | | Notional | | | | | Paid/ | | Appreciation/ |
| | Fixed | | Payment | | 2018 | | | | Expiration | | Amount | | Value | | (Received) | | (Depreciation) |
| Underlying Instrument | | Rate (%) | | Frequency | | (%)(b) | | Counterparty | | Date | | ($)(c) | | ($) | | ($) | | ($) |
| CDX Emerging Markets | | | | | | | | | | | | | | | | | | | | | | | | | | |
| Index, Series 25* | | 1.00 | | Quarterly | | 1.27 | | Bank of America | | 6/20/21 | | 316,350** | | (1,819 | ) | | | (22,247 | ) | | | | | 20,428 | | |
| | | | | | | | | | | | | | (1,819 | ) | | | (22,247 | ) | | | | | 20,428 | | |
| | |
| | | | | | | | | | Total swap agreements at value (assets) | | | | | $ | — | | |
| | | | | | | | | | Total swap agreements at value (liabilities) | | | | | | (1,819 | ) | |
| | | | | | | | | | Net swap agreements at value | | | | | $ | (1,819 | ) | |
Centrally Cleared Credit Default Swap Agreements - Sell Protection(a)
| | | | | | | Implied | | | | | | | | | | | | | | | | |
| | | | | | Credit | | | | | | | | | | Upfront | | | | |
| | | | | | Spread at | | | | | | | | | | Premiums | | Unrealized |
| | Receive | | | | October 31, | | | | Notional | | | | | | Paid/ | | Appreciation/ |
| | Fixed | | Payment | | 2018 | | Expiration | | Amount | | Value | | (Received) | | (Depreciation) |
| Underlying Instrument | | Rate (%) | | Frequency | | (%)(b) | | Date | | ($)(c) | | ($) | | ($) | | ($) |
| CDX N.A. High Yield Index, Series 31 | | 5.00 | | Daily | | 3.73 | | 12/20/23 | | 200,000 | | | 10,680 | | | | 9,620 | | | | 1,060 | |
| | | | | | | | | | | | | 10,680 | | | | 9,620 | | | | 1,060 | |
| (a) | When a credit event occurs as defined under the terms of the swap agreement, the Fund as a seller of credit protection will either (i) pay to the buyer of protection an amount equal to the par value of the defaulted reference entity and take delivery of the reference entity or (ii) pay a net amount equal to the par value of the defaulted reference entity less its recovery value. Alternatively, the Fund as a buyer of credit protection will either (i) receive from the seller of protection an amount equal to the par value of the defaulted reference entity and deliver the reference entity to the seller or (ii) receive a net amount equal to the par value of the defaulted reference entity less its recovery value. |
| (b) | Implied credit spread, represented in absolute terms, utilized in determining the fair value of the credit default swap agreements as of period end serve as an indicator of the current status of the payment/performance risk and represents the likelihood or risk of default for the credit derivative. The implied credit spread of a referenced entity reflects the cost of buying/selling protection and may include upfront or daily payments required to be made to enter into the agreement. Generally, wider credit spreads represent a perceived deterioration of the referenced entity’s credit soundness and a greater likelihood or risk of default or other credit event occurring as defined under the terms of the swap agreement. |
| (c) | The notional amount represents the maximum potential amount of future payments that the Fund may receive as a buyer of credit protection if a credit event occurs, as defined under the terms of the swap agreement. Alternatively, the notional amount represents the maximum potential amount of payment the Fund could be required to make as a seller of credit protection if a credit event occurs, as defined under the terms of the swap agreement. |
| * | As of October 31, 2018, the CDX Emerging Markets Index, Series 25 included securities which had defaulted and represented 5% of the Index. |
| ** | Reflects the notional amount after the default of securities. |
| 38 HSBC FAMILY OF FUNDS | See notes to financial statements. |
| HSBC GLOBAL HIGH YIELD BOND FUND |
| Schedule of Portfolio Investments—as of October 31, 2018 (continued) |
Forward Currency Exchange Contracts - Short Contracts
| | | | | | | | | | | | Net Unrealized |
| | | | | | | | | | | | Appreciation/ |
| Description and amount of | | Description and amount | | | | Settlement | | (Depreciation) |
| currency to be purchased | | of currency to be sold | | Counterparty | | Date | | ($) |
| U.S. Dollar | | 175,000 | | European Euro | | 150,965 | | Bank of America | | 11/2/18 | | | | 4,047 | | |
| U.S. Dollar | | 4,590,865 | | European Euro | | 3,957,000 | | UBS AG | | 11/2/18 | | | | 109,958 | | |
| U.S. Dollar | | 4,658,299 | | European Euro | | 4,108,000 | | UBS AG | | 12/4/18 | | | | (6,800 | ) | |
| | | | | | | | | | | | | | 107,205 | | |
| | |
| | | | | | Total unrealized appreciation | | | | | $ | 114,005 | | |
| | | | | | Total unrealized depreciation | | | | | | (6,800 | ) | |
| | | | | | Total net unrealized appreciation/(depreciation) | | | $ | 107,205 | | |
| See notes to financial statements. | HSBC FAMILY OF FUNDS 39 |
| HSBC GLOBAL HIGH INCOME BOND FUND |
| Schedule of Portfolio Investments—as of October 31, 2018 |
| Foreign Bonds – 21.0% | | | | |
| | | | | |
| | Principal | | |
| | Amount † | | Value ($) |
| Belgium – 0.4% | | | | |
| AG Insurance SA-NV, 3.50%, 6/30/47, | | | | |
| Callable 6/30/27 @ 100 (a) | | 100,000 | | 111,972 |
| France – 6.9% | | | | |
| AXA SA, Series E, 3.94% (EUSA10 + | | | | |
| 390 bps), Callable 11/7/24 | | | | |
| @ 100 (a)(b)(c) | | 100,000 | | 117,770 |
| Banque Federative du Credit Mutuel | | | | |
| SA, Series E, 3.00%, 5/21/24 | | 100,000 | | 120,390 |
| BNP Paribas Cardif SA, 4.03% | | | | |
| (EUR003M + 393 bps), Callable | | | | |
| 11/25/25 @ 100 (a)(b)(c) | | 200,000 | | 233,817 |
| BPCE SA, 2.75% (EUSA5 + 183 bps), | | | | |
| 7/8/26, Callable 7/8/21 @ 100 (a)(c) | | 200,000 | | 236,360 |
| Credit Agricole SA, 6.50% (EUSA5 | | | | |
| + 512 bps), Callable 6/23/21 | | | | |
| @ 100 (a)(b)(c) | | 150,000 | | 183,024 |
| Crown European Holdings, Registered, | | | | |
| 4.00%, 7/15/22, Callable 4/15/22 | | | | |
| @ 100 (a) | | 100,000 | | 124,564 |
| Electricite de France SA, Series E, | | | | |
| 5.38% (EUSA12 + 379 bps), Callable | | | | |
| 1/29/25 @ 100 (a)(b)(c) | | 100,000 | | 120,507 |
| GDF SUEZ, Series N10, 3.88% | | | | |
| (EUSA10 + 290 bps), Callable 6/2/24 | | | | |
| @ 100 (a)(b)(c) | | 100,000 | | 118,464 |
| GDF SUEZ, 4.75% (EUSA8 + 342 bps), | | | | |
| Callable 7/10/21 @ 100 (a)(b)(c) | | 100,000 | | 122,676 |
| Novalis SAS, Registered, 3.00%, | | | | |
| 4/30/22, Callable 12/12/18 | | | | |
| @ 101.5 (a) | | 100,000 | | 114,939 |
| Orange SA, 4.25% (EUSA5 + 308 bps), | | | | |
| Callable 2/7/20 @ 100 (a)(b)(c) | | 100,000 | | 117,573 |
| Societe Generale, 2.50% (EUSA5 + | | | | |
| 183 bps), 9/16/26, Callable 9/16/21 | | | | |
| @ 100 (a)(c) | | 100,000 | | 116,950 |
| Total SA, 2.25% (EUSA5 + 186 bps), | | | | |
| Callable 2/26/21 @ 100 (a)(b)(c) | | 125,000 | | 144,593 |
| | | | 1,871,627 |
| Germany – 5.7% | | | | |
| Bayer AG, Series E, 3.00% (EUSA5 | | | | |
| + 218 bps), 7/1/75, Callable 7/1/20 | | | | |
| @ 100 (a)(c) | | 150,000 | | 172,106 |
| Bertelsmann SE & Co. KGaA, 3.00% | | | | |
| (EUSA5 + 264 bps), 4/23/75, | | | | |
| Callable 4/23/23 @ 100 (a)(c) | | 100,000 | | 113,029 |
| BMW Finance NV, Series E, | | | | |
| 1.00%, 2/15/22 | | 150,000 | | 173,824 |
| Commerzbank AG, Series E, | | | | |
| 4.00%, 3/30/27 | | 100,000 | | 119,311 |
| HeidelbergCement AG, | | | | |
| 8.50%, 10/31/19 | | 150,000 | | 184,125 |
| Talanx AG, Series E, 8.37% | | | | |
| (EUR003M + 706 bps), 6/15/42, | | | | |
| Callable 6/15/22 @ 100 (a)(c) | | 200,000 | | 276,979 |
| Unitymedia GmbH, Registered, | | | | |
| 6.25%, 1/15/29, Callable 1/15/21 | | | | |
| @ 103.13 (a) | | 135,000 | | 171,929 |
| Volkswagen AG, 5.13% (EUSA10 | | | | |
| + 335 bps), Callable 9/4/23 | | | | |
| @ 100 (a)(b)(c) | | 175,000 | | 214,271 |
| ZF Friedrichshafen AG, | | | | |
| 2.75%, 4/27/23 | | 100,000 | | 118,300 |
| | | | 1,543,874 |
| Ireland – 0.4% | | | | |
| Bank of Ireland, Series E, 4.25% | | | | |
| (EUSA5 + 355 bps), 6/11/24, Callable | | | | |
| 6/11/19 @ 100 (a)(c) | | 100,000 | | 115,369 |
| Italy – 3.4% | | | | |
| Enel SpA, 5.00% (EUSA5 + 365 bps), | | | | |
| 1/15/75, Callable 1/15/20 | | | | |
| @ 100 (a)(c) | | 100,000 | | 117,757 |
| Eni SpA, Series E, 0.75%, 5/17/22 | | 150,000 | | 171,515 |
| EXOR SpA, 2.50%, 10/8/24 | | 100,000 | | 117,949 |
| Intesa Sanpaolo SpA, Series E, | | | | |
| 6.63%, 9/13/23 | | 150,000 | | 189,202 |
| Snam SpA, 1.25%, 1/25/25 | | 200,000 | | 218,419 |
| Wind Tre SpA, 3.13%, 1/20/25, | | | | |
| Callable 11/3/20 @ 101.56 (a)(d) | | 100,000 | | 103,048 |
| | | | 917,890 |
| Netherlands – 1.8% | | | | |
| Aegon NV, Series E, 4.00% (EUR003M | | | | |
| + 335 bps), 4/25/44, Callable 4/25/24 | | | | |
| @ 100 (a)(c) | | 100,000 | | 117,486 |
| Cooperatieve Rabobank UA, Series E, | | | | |
| 4.13%, 9/14/22 | | 100,000 | | 127,213 |
| Fresenius SE & Co. KGaA, Registered, | | | | |
| 3.00%, 2/1/21 | | 100,000 | | 120,289 |
| Wolters Kluwer NV, 2.50%, 5/13/24, | | | | |
| Callable 2/13/24 @ 100 (a) | | 100,000 | | 123,081 |
| | | | 488,069 |
| Spain – 0.4% | | | | |
| Santander Issuances, Series E, | | | | |
| 2.50%, 3/18/25 | | 100,000 | | 113,048 |
| Switzerland – 1.2% | | | | |
| Credit Suisse Group AG, 1.25% (EUSA1 | | | | |
| + 75 bps), 7/17/25, Callable 7/17/24 | | | | |
| @ 100 (a)(c) | | 100,000 | | 111,538 |
| UBS Group Funding Switzerland AG, | | | | |
| 1.50%, 11/30/24, Callable 11/30/23 | | | | |
| @ 100 (a) | | 200,000 | | 229,173 |
| | | | 340,711 |
| 40 HSBC FAMILY OF FUNDS | See notes to financial statements. |
| HSBC GLOBAL HIGH INCOME BOND FUND |
| Schedule of Portfolio Investments—as of October 31, 2018 (continued) |
| Foreign Bonds, continued | | | | |
| | | | | |
| | Principal | | |
| | Amount † | | Value ($) |
| United Kingdom – 0.8% | | | | |
| CNH Industrial Finance Europe SA, | | | | |
| Series E, 1.75%, 9/12/25, Callable | | | | |
| 6/12/25 @ 100 (a) | | EUR 100,000 | | 111,511 |
| FCE Bank PLC, Series E, | | | | |
| 1.11%, 5/13/20 | | EUR 100,000 | | 114,132 |
| | | | 225,643 |
| TOTAL FOREIGN BONDS | | | | |
| (COST $ 5,705,357) | | | | 5,728,203 |
| | | | | |
| Yankee Dollars – 37.7% | | | | |
| | | | | |
| | Principal | | |
| | Amount ($) | | |
| Argentina – 1.8% | | | | |
| Provincia de Buenos Aires, | | | | |
| 6.50%, 2/15/23 | | 34,000 | | 29,070 |
| Provincia de Buenos Aires, | | | | |
| Registered, 6.50%, 2/15/23 | | 174,000 | | 148,770 |
| Republic of Argentina, | | | | |
| 5.63%, 1/26/22 | | 110,000 | | 99,000 |
| Republic of Argentina, | | | | |
| 6.88%, 1/26/27 | | 12,000 | | 10,038 |
| Republic of Argentina, | | | | |
| 5.88%, 1/11/28 | | 28,000 | | 21,700 |
| Republic of Argentina, | | | | |
| 6.88%, 1/11/48 | | 146,000 | | 107,675 |
| Republic of Argentina, | | | | |
| 7.13%, 6/28/17 | | 24,000 | | 17,880 |
| YPF SA, 7.00%, 12/15/47, | | | | |
| Callable 6/15/47 @ 100 (a)(d) | | 30,000 | | 22,746 |
| YPF Sociedad Anonima, | | | | |
| Registered, 8.50%, 3/23/21 | | 22,000 | | 22,209 |
| | | | 479,088 |
| Australia – 0.1% | | | | |
| Westpac Banking Corp., 5.00% | | | | |
| (USISDA05 + 289 bps), Callable | | | | |
| 9/21/27 @ 100 (a)(b)(c) | | 35,000 | | 30,618 |
| Bahamas – 0.2% | | | | |
| Silversea Cruise Finance, 7.25%, | | | | |
| 2/1/25, Callable 2/1/20 | | | | |
| @ 105.44 (a)(d) | | 48,000 | | 51,720 |
| Bermuda – 0.4% | | | | |
| Aircastle, Ltd., 5.50%, 2/15/22 | | 100,000 | | 103,533 |
| VOC Escro, Ltd., 5.00%, 2/15/28, | | | | |
| Callable 2/15/23 @ 102.5 (a)(d) | | 3,000 | | 2,820 |
| | | | 106,353 |
| Brazil – 2.2% | | | | |
| Banco Do Brasil (Cayman), Registered, | | | | |
| 6.00%, 1/22/20 | | 100,000 | | 102,375 |
| Centrais Eletricas Brasileiras SA, | | | | |
| Registered, 6.88%, 7/30/19 | | 100,000 | | 101,800 |
| Federal Republic of Brazil, | | | | |
| 8.25%, 1/20/34 | | 35,000 | | 41,913 |
| Federal Republic of Brazil, | | | | |
| 5.63%, 1/7/41 | | 100,000 | | 92,050 |
| Petrobras Global Finance BV, | | | | |
| 6.13%, 1/17/22 | | 18,000 | | 18,653 |
| Petrobras Global Finance BV, | | | | |
| 6.00%, 1/27/28 | | 62,000 | | 58,838 |
| Petrobras Global Finance BV, | | | | |
| 5.75%, 2/1/29 | | 115,000 | | 106,374 |
| Vale Overseas, Ltd., | | | | |
| 6.88%, 11/21/36 | | 52,000 | | 57,735 |
| Yamana Gold, Inc., 4.63%, 12/15/27, | | | | |
| Callable 9/15/27 @ 100 (a) | | 20,000 | | 18,519 |
| | | | 598,257 |
| Canada – 1.8% | | | | |
| Bank of Montreal, 3.80% (USSW5 + | | | | |
| 143 bps), 12/15/32, Callable 12/15/27 | | | | |
| @ 100 (a)(c) | | 25,000 | | 22,914 |
| Bank of Nova Scotia, 4.65% (US0003M | | | | |
| + 265 bps), Callable 10/12/22 | | | | |
| @ 100 (a)(b)(c) | | 20,000 | | 18,424 |
| Cascades, Inc., 5.50%, 7/15/22, | | | | |
| Callable 12/10/18 @ 102.75 (a)(d) | | 4,000 | | 3,970 |
| CCL Industries, Inc., 3.25%, 10/1/26, | | | | |
| Callable 7/1/26 @ 100 (a)(d) | | 30,000 | | 27,243 |
| Enbridge, Inc., 5.50% (US0003M + 342 | | | | |
| bps), 7/15/77, Callable 7/15/27 | | | | |
| @ 100 (a)(c) | | 55,000 | | 48,891 |
| Enbridge, Inc., 6.25% (US0003M + 364 | | | | |
| bps), 3/1/78, Callable 3/1/28 | | | | |
| @ 100 (a)(c) | | 15,000 | | 14,043 |
| GFL Environmental, Inc., 5.38%, | | | | |
| 3/1/23, Callable 3/1/20 | | | | |
| @ 102.69 (a)(d) | | 8,000 | | 7,340 |
| Hudbay Minerals, Inc., 7.25%, 1/15/23, | | | | |
| Callable 7/15/19 @ 103.63 (a)(d) | | 1,000 | | 995 |
| Hudbay Minerals, Inc., 7.63%, 1/15/25, | | | | |
| Callable 1/15/20 @ 105.72 (a)(d) | | 46,000 | | 46,114 |
| Iamgold Corp., 7.00%, 4/15/25, Callable | | | | |
| 4/15/20 @ 105.25 (a)(d) | | 24,000 | | 23,790 |
| Kinross Gold Corp., 4.50%, 7/15/27, | | | | |
| Callable 4/15/27 @ 100 (a) | | 50,000 | | 44,750 |
| Mattamy Group Corp., 6.88%, | | | | |
| 12/15/23, Callable 12/15/19 | | | | |
| @ 103.44 (a)(d) | | 18,000 | | 17,528 |
| Mattamy Group Corp., 6.50%, 10/1/25, | | | | |
| Callable 10/1/20 @ 104.88 (a)(d) | | 6,000 | | 5,640 |
| Mountain Province Diamonds, Inc., | | | | |
| 8.00%, 12/15/22, Callable 12/15/19 | | | | |
| @ 104 (a)(d) | | 28,000 | | 28,420 |
| New Gold, Inc., 6.25%, 11/15/22, | | | | |
| Callable 11/20/18 @ 103.13 (a)(d) | | 35,000 | | 30,450 |
| New Gold, Inc., 6.38%, 5/15/25, | | | | |
| Callable 5/15/20 @ 104.78 (a)(d) | | 18,000 | | 14,423 |
| Northwest Acquisitions ULC, 7.13%, | | | | |
| 11/1/22, Callable 11/1/19 | | | | |
| @ 103.56 (a)(d) | | 12,000 | | 12,082 |
| See notes to financial statements. | HSBC FAMILY OF FUNDS 41 |
| HSBC GLOBAL HIGH INCOME BOND FUND |
| Schedule of Portfolio Investments—as of October 31, 2018 (continued) |
| Yankee Dollars, continued | | | | |
| | | | |
| | Principal | | |
| | Amount ($) | | Value ($) |
| Canada – continued | | | | |
| Nova Chemicals Corp., 5.25%, 8/1/23, | | | | |
| Callable 12/10/18 @ 102.63 (a)(d) | | 22,000 | | 21,230 |
| Nova Chemicals Corp., 4.88%, 6/1/24, | | | | |
| Callable 3/3/24 @ 100 (a)(d) | | 10,000 | | 9,188 |
| Nova Chemicals Corp., 5.00%, 5/1/25, | | | | |
| Callable 1/31/25 @ 100 (a)(d) | | 17,000 | | 15,470 |
| Nova Chemicals Corp., 5.25%, 6/1/27, | | | | |
| Callable 3/3/27 @ 100 (a)(d) | | 65,000 | | 58,662 |
| Transcanada Trust, 5.30% (US0003M + | | | | |
| 321 bps), 3/15/77, Callable 3/15/27 | | | | |
| @ 100 (a)(c) | | 10,000 | | 9,150 |
| | | | 480,717 |
| Chile – 0.1% | | | | |
| Codelco, Inc., 5.63%, 9/21/35 (d) | | 35,000 | | 37,100 |
| China – 3.8% | | | | |
| China Overseas Finance KY II, | | | | |
| 5.50%, 11/10/20 | | 200,000 | | 205,820 |
| CNOOC Finance (2003), Ltd., | | | | |
| 5.50%, 5/21/33 | | 50,000 | | 54,238 |
| CNOOC Finance (2013), Ltd., | | | | |
| 3.00%, 5/9/23 | | 200,000 | | 190,943 |
| ICBCIL Finance Co., Ltd., | | | | |
| 2.60%, 11/13/18 (d) | | 200,000 | | 199,958 |
| Sinopec Group Overseas Development | | | | |
| (2012), Ltd. Registered, | | | | |
| 3.90%, 5/17/22 | | 200,000 | | 199,678 |
| State Grid Overseas Investment (2016), | | | | |
| Ltd., 2.25%, 5/4/20 | | 200,000 | | 195,976 |
| | | | 1,046,613 |
| Colombia – 1.1% | | | | |
| Bancolombia SA, 6.13%, 7/26/20 | | 20,000 | | 20,700 |
| Bancolombia SA, 5.13%, 9/11/22 | | 20,000 | | 20,100 |
| Republic of Colombia, 8.13%, | | | | |
| 5/21/24 | | 229,000 | | 269,533 |
| | | | 310,333 |
| Costa Rica – 0.6% | | | | |
| Costa Rica Government, | | | | |
| Registered, 4.25%, 1/26/23 | | 200,000 | | 174,500 |
| Croatia – 0.4% | | | | |
| Republic of Croatia, | | | | |
| Registered, 6.75%, 11/5/19 | | 100,000 | | 103,045 |
| Egypt – 0.7% | | | | |
| Egypt Government International Bond, | | | | |
| Registered, 7.50%, 1/31/27 | | 200,000 | | 195,564 |
| El Salvador – 0.0% | | | | |
| Republic of El Salvador, | | | | |
| Registered, 7.65%, 6/15/35 | | 10,000 | | 9,163 |
| Germany – 0.2% | | | | |
| Deutsche Bank AG/New York NY, | | | | |
| 2.70%, 7/13/20 | | 55,000 | | 53,740 |
| Ghana – 0.7% | | | | |
| Republic of Ghana, Registered, | | | | |
| 7.88%, 8/7/23 | | 200,000 | | 203,766 |
| Guatemala – 0.1% | | | | |
| Central American Bottling Corp., | | | | |
| 5.75%, 1/31/27, Callable 1/31/22 | | | | |
| @ 102.88 (a)(d) | | 19,000 | | 18,725 |
| Hong Kong – 0.7% | | | | |
| CK Hutchison Capital Securities 17, Ltd., | | | | |
| 4.00% (H15T5Y + 207 bps), Callable | | | | |
| 5/12/22 @ 100 (a)(b)(c)(d) | | 200,000 | | 191,095 |
| Hungary – 0.1% | | | | |
| Republic of Hungary, | | | | |
| 6.25%, 1/29/20 | | 20,000 | | 20,650 |
| India – 1.5% | | | | |
| Export-Import BK India, | | | | |
| Series E, 2.75%, 8/12/20 | | 200,000 | | 196,047 |
| State Bank India, Registered, | | | | |
| 3.62%, 4/17/19 | | 200,000 | | 200,005 |
| | | | 396,052 |
| Indonesia – 2.3% | | | | |
| Republic of Indonesia, | | | | |
| 5.88%, 3/13/20 | | 100,000 | | 103,093 |
| Republic of Indonesia, | | | | |
| Registered, 3.75%, 4/25/22 | | 200,000 | | 196,207 |
| Republic of Indonesia, | | | | |
| Registered, 3.38%, 4/15/23 | | 200,000 | | 191,175 |
| Republic of Indonesia, | | | | |
| Registered, 7.75%, 1/17/38 | | 100,000 | | 124,617 |
| | | | 615,092 |
| Ireland – 1.3% | | | | |
| AerCap Ireland Capital, Ltd., 3.95%, | | | | |
| 2/1/22, Callable 1/1/22 | | | | |
| @ 100 (a) | | 150,000 | | 148,496 |
| Aercap Ireland Capital/Global, 3.50%, | | | | |
| 1/15/25, Callable 11/15/24 | | | | |
| @ 100 (a) | | 150,000 | | 139,851 |
| Avolon Holdings Funding, Ltd., 5.13%, | | | | |
| 10/1/23, Callable 9/1/23 | | | | |
| @ 100 (a)(d) | | 20,000 | | 19,625 |
| Park Aerospace Holdings, 5.25%, | | | | |
| 8/15/22 (d) | | 44,000 | | 43,670 |
| Park Aerospace Holdings, 4.50%, | | | | |
| 3/15/23, Callable 2/15/23 | | | | |
| @ 100 (a)(d) | | 11,000 | | 10,465 |
| | | | 362,107 |
| 42 HSBC FAMILY OF FUNDS | See notes to financial statements. |
| HSBC GLOBAL HIGH INCOME BOND FUND |
| Schedule of Portfolio Investments—as of October 31, 2018 (continued) |
| Yankee Dollars, continued | | | | |
| | | | | |
| | Principal | | |
| | Amount ($) | | Value ($) |
| Israel – 0.2% | | | | |
| Teva Pharmaceuticals NE, | | | | |
| 2.20%, 7/21/21 | | 20,000 | | 18,674 |
| Teva Pharmaceuticals NE, | | | | |
| 3.15%, 10/1/26 | | 34,000 | | 27,699 |
| | | | 46,373 |
| Luxembourg – 0.3% | | | | |
| Actavis Funding SCS, 4.75%, 3/15/45, | | | | |
| Callable 9/15/44 @ 100 (a) | | 34,000 | | 31,852 |
| Dana Financing Luxembourg Sarl, | | | | |
| 5.75%, 4/15/25, Callable 4/15/20 | | | | |
| @ 104.31 (a)(d) | | 40,000 | | 38,299 |
| Trinseo Materials Operating SCA/ | | | | |
| Trinseo Materials Finance, Inc., | | | | |
| 5.38%, 9/1/25, Callable 9/1/20 | | | | |
| @ 102.69 (a)(d) | | 17,000 | | 15,768 |
| | | | 85,919 |
| Macau – 0.7% | | | | |
| Sands China, Ltd., 5.13%, 8/8/25, | | | | |
| Callable 6/8/25 @ 100 (a)(d) | | 200,000 | | 196,114 |
| Malaysia – 0.4% | | | | |
| Petronas Capital Ltd., Registered, | | | | |
| 7.88%, 5/22/22 | | 100,000 | | 113,068 |
| Mexico – 2.2% | | | | |
| BBVA Bancomer SA Institucion de | | | | |
| Banca, Registered, | | | | |
| 6.50%, 3/10/21 | | 150,000 | | 154,500 |
| Petroleos Mexicanos, | | | | |
| 4.88%, 1/24/22 | | 150,000 | | 148,445 |
| Petroleos Mexicanos, | | | | |
| 6.50%, 3/13/27 | | 27,000 | | 26,163 |
| Petroleos Mexicanos, | | | | |
| 5.35%, 2/12/28 (d) | | 46,000 | | 40,981 |
| Petroleos Mexicanos, | | | | |
| 6.50%, 1/23/29 (d) | | 18,000 | | 17,199 |
| Petroleos Mexicanos, | | | | |
| 5.50%, 6/27/44 | | 30,000 | | 23,202 |
| Petroleos Mexicanos, | | | | |
| 6.75%, 9/21/47 | | 20,000 | | 17,228 |
| Petroleos Mexicanos, | | | | |
| 6.35%, 2/12/48 (d) | | 10,000 | | 8,289 |
| United Mexican States, | | | | |
| 4.00%, 10/2/23 | | 166,000 | | 164,174 |
| | | | 600,181 |
| Morocco – 0.7% | | | | |
| Morocco Government International | | | | |
| Bond, 4.25%, 12/11/22 | | 200,000 | | 198,928 |
| Netherlands – 0.1% | | | | |
| LyondellBasell Industries NV, | | | | |
| 4.63%, 2/26/55, Callable 8/26/54 | | | | |
| @ 100 (a) | | 25,000 | | 21,012 |
| Nigeria – 0.1% | | | | |
| Nigeria Government International Bond, | | | | |
| 5.63%, 6/27/22 | | 35,000 | | 34,496 |
| Oman – 0.7% | | | | |
| Oman Government International, | | | | |
| Registered, 5.38%, 3/8/27 | | 200,000 | | 188,300 |
| Panama – 0.1% | | | | |
| Republic of Panama, | | | | |
| 6.70%, 1/26/36 | | 30,000 | | 35,925 |
| Peru – 0.8% | | | | |
| Republic of Peru, 7.35%, 7/21/25 | | 100,000 | | 120,500 |
| Southern Copper Corp., | | | | |
| 6.75%, 4/16/40 | | 80,000 | | 91,025 |
| | | | 211,525 |
| Philippines – 0.1% | | | | |
| Republic of Philippines, | | | | |
| 9.50%, 2/2/30 | | 22,000 | | 31,667 |
| Qatar – 1.6% | | | | |
| Qatar Government Bond, Registered, | | | | |
| 3.88%, 4/23/23 (d) | | 200,000 | | 200,440 |
| Qatar Government Bond, Registered, | | | | |
| 9.75%, 6/15/30 | | 25,000 | | 36,989 |
| Qatar Government International Bond, | | | | |
| Registered, 3.25%, 6/2/26 | | 200,000 | | 189,832 |
| | | | 427,261 |
| Romania – 0.3% | | | | |
| Romania Government Bond, | | | | |
| 6.13%, 1/22/44 | | 30,000 | | 32,303 |
| Romania Government Bond, | | | | |
| Registered, 6.75%, 2/7/22 | | 40,000 | | 43,103 |
| | | | 75,406 |
| Russian Federation – 0.8% | | | | |
| Gazprom OAO, Registered, | | | | |
| 7.29%, 8/16/37 | | 100,000 | | 110,187 |
| LUKOIL International Finance BV, | | | | |
| Registered, 6.66%, 6/7/22 | | 100,000 | | 106,199 |
| | | | 216,386 |
| Saudi Arabia – 0.7% | | | | |
| Saudi International Bond, | | | | |
| 4.50%, 4/17/30 (d) | | 200,000 | | 197,000 |
| South Africa – 0.4% | | | | |
| Republic of South Africa, | | | | |
| 4.67%, 1/17/24 | | 100,000 | | 95,548 |
| Spain – 0.7% | | | | |
| Banco Santander SA, | | | | |
| 3.80%, 2/23/28 | | 200,000 | | 177,725 |
| Sri Lanka – 0.4% | | | | |
| Republic of Sri Lanka, Registered, | | | | |
| 6.25%, 10/4/20 | | 100,000 | | 96,497 |
| See notes to financial statements. | HSBC FAMILY OF FUNDS 43 |
| HSBC GLOBAL HIGH INCOME BOND FUND |
| Schedule of Portfolio Investments—as of October 31, 2018 (continued) |
| Yankee Dollars, continued | | | | |
| | | | | |
| | Principal | | |
| | Amount ($) | | Value ($) |
| Switzerland – 0.4% | | | | |
| Glencore Finance Canada, Ltd., | | | | |
| 6.00%, 11/15/41 (d) | | 100,000 | | 100,409 |
| Turkey – 1.4% | | | | |
| Republic of Turkey, 7.00%, 3/11/19 | | 100,000 | | 100,411 |
| Republic of Turkey, 6.88%, 3/17/36 | | 158,000 | | 140,470 |
| Republic of Turkey, 4.88%, 4/16/43 | | 200,000 | | 141,836 |
| | | | 382,717 |
| Ukraine – 0.3% | | | | |
| Ukraine Government, 7.75%, 9/1/26 | | 100,000 | | 90,382 |
| United Arab Emirates – 0.4% | | | | |
| Abu Dhabi National Energy Co. PJSC, | | | | |
| 6.50%, 10/27/36 | | 100,000 | | 118,696 |
| United Kingdom – 3.6% | | | | |
| Anglo American Capital PLC, | | | | |
| 4.50%, 3/15/28 (d) | | 200,000 | | 188,616 |
| Barclays, 4.38%, 1/12/26 | | 200,000 | | 191,671 |
| CNH Industrial NV, 3.85%, 11/15/27, | | | | |
| Callable 8/15/27 @ 100 (a) | | 30,000 | | 27,722 |
| Lloyds Banking Group PLC, | | | | |
| 4.65%, 3/24/26 | | 200,000 | | 193,583 |
| Nationwide Building Society, 4.36% | | | | |
| (US0003M + 139 bps), 8/1/24, | | | | |
| Callable 8/1/23 @ 100 (a)(c)(d) | | 200,000 | | 198,361 |
| Santander UK Group Holdings PLC, | | | | |
| 4.75%, 9/15/25 (d) | | 200,000 | | 192,056 |
| | | | 992,009 |
| Uruguay – 0.1% | | | | |
| Republic of Uruguay, | | | | |
| 4.98%, 4/20/55 | | 4,000 | | 3,710 |
| Republica Orient Uruguay, | | | | |
| 4.38%, 10/27/27 | | 36,000 | | 35,550 |
| | | | 39,260 |
| Venezuela – 0.1% | | | | |
| Petroleos de Venezuela SA, | | | | |
| Registered, 6.00%, 11/15/26 (e) | | 77,000 | | 13,283 |
| Republic of Venezuela, | | | | |
| 7.75%, 10/13/19 (e) | | 25,000 | | 6,163 |
| Republic of Venezuela, | | | | |
| 11.95%, 8/5/31 (e) | | 30,000 | | 7,649 |
| | | | 27,095 |
| TOTAL YANKEE DOLLARS | | | | |
| (COST $10,698,696) | | | | 10,284,197 |
| | | | | |
| Corporate Bonds – 35.7% | | | | |
| | | | | |
| United States – 35.7% | | | | |
| Abbvie, Inc., 4.88%, 11/14/48, | | | | |
| Callable 5/14/48 @ 100.00 (a) | | 55,000 | | 50,534 |
| AbbVie, Inc., 4.45%, 5/14/46, | | | | |
| Callable 11/14/45 @ 100.00 (a) | | 30,000 | | 26,245 |
| AbbVie, Inc., 4.70%, 5/14/45, | | | | |
| Callable 11/14/44 @ 100.00 (a) | | 25,000 | | 22,602 |
| AK Steel Corp., 7.50%, 7/15/23, | | | | |
| Callable 7/15/19 @ 103.75 (a) | | 16,000 | | 16,300 |
| Alcoa, Inc., 5.90%, 2/1/27 | | 20,000 | | 19,750 |
| Alexandria Real Estate Equities, Inc., | | | | |
| 4.00%, 1/15/24, Callable 12/15/23 | | | | |
| @ 100.00 (a) | | 55,000 | | 54,911 |
| Ally Financial, Inc., 3.25%, 11/5/18 | | 85,000 | | 84,989 |
| Ally Financial, Inc., 4.13%, 3/30/20 | | 50,000 | | 49,938 |
| Ally Financial, Inc., 5.75%, 11/20/25, | | | | |
| Callable 10/21/25 @ 100.00 (a) | | 63,000 | | 64,575 |
| American Axle & Manufacturing, Inc., | | | | |
| 6.25%, 4/1/25, Callable 4/1/20 | | | | |
| @ 104.69 (a) | | 14,000 | | 13,213 |
| American Axle & Manufacturing, Inc., | | | | |
| 6.25%, 3/15/26, Callable 3/15/21 | | | | |
| @ 103.13 (a) | | 25,000 | | 23,625 |
| American Axle & Manufacturing, Inc., | | | | |
| 6.50%, 4/1/27, Callable 4/1/22 | | | | |
| @ 103.25 (a) | | 14,000 | | 13,318 |
| American Express Co., 5.20% | | | | |
| (US0003M + 343 bps), Callable | | | | |
| 11/15/19 @ 100.00 (a)(b)(c) | | 48,000 | | 48,000 |
| American Tower Corp., 4.40%, 2/15/26, | | | | |
| Callable 11/15/25 @ 100.00 (a) | | 35,000 | | 34,683 |
| Amgen, Inc., 2.66% (US0003M + 32 | | | | |
| bps), 5/10/19 (c) | | 25,000 | | 25,026 |
| Amgen, Inc., 4.40%, 5/1/45, | | | | |
| Callable 11/1/44 @ 100.00 (a) | | 100,000 | | 90,739 |
| Andeavor Logistics LP/Tesoro Logistics | | | | |
| Finance Corp., 4.25%, 12/1/27, | | | | |
| Callable 9/1/27 @ 100.00 (a) | | 10,000 | | 9,519 |
| Antero Resources Corp., 5.00%, 3/1/25, | | | | |
| Callable 3/1/20 @ 103.75 (a) | | 65,000 | | 63,131 |
| AT&T, Inc., 3.51% (US0003M + 118 | | | | |
| bps), 6/12/24 (c) | | 40,000 | | 40,111 |
| AT&T, Inc., 4.80%, 6/15/44, | | | | |
| Callable 12/15/43 @ 100.00 (a) | | 25,000 | | 21,878 |
| AT&T, Inc., 5.25%, 3/1/37, | | | | |
| Callable 9/1/36 @ 100.00 (a) | | 105,000 | | 100,437 |
| AT&T, Inc., 5.65%, 2/15/47, | | | | |
| Callable 8/15/46 @ 100.00 (a) | | 75,000 | | 72,843 |
| Bank of America Corp., 2.82% | | | | |
| (US0003M + 93 bps), 7/21/23, | | | | |
| Callable 7/21/22 @ 100.00 (a)(c) | | 90,000 | | 86,641 |
| Bank of America Corp., 3.05% | | | | |
| (US0003M + 65 bps), 10/1/21, | | | | |
| Callable 10/1/20 @ 100.00 (a)(c) | | 65,000 | | 65,227 |
| Bank of America Corp., 4.18%, | | | | |
| 11/25/27, Callable 11/25/26 | | | | |
| @ 100.00 (a) | | 35,000 | | 33,613 |
| Bank of America Corp., 4.24% | | | | |
| (US0003M + 181 bps), 4/24/38, | | | | |
| Callable 4/24/37 @ 100.00 (a)(c) | | 30,000 | | 28,287 |
| Bank of America Corp., | | | | |
| 4.45%, 3/3/26 | | 40,000 | | 39,585 |
| Bank of America Corp., 6.50% | | | | |
| (US0003M + 417 bps), Callable | | | | |
| 10/23/24 @ 100.00 (a)(b)(c) | | 35,000 | | 37,116 |
| Bayer US Finance II LLC, 4.88%, | | | | |
| 6/25/48, Callable 12/25/47 | | | | |
| @ 100.00 (a)(d) | | 200,000 | | 186,481 |
| 44 HSBC FAMILY OF FUNDS | See notes to financial statements. |
| HSBC GLOBAL HIGH INCOME BOND FUND |
| Schedule of Portfolio Investments—as of October 31, 2018 (continued) |
| Corporate Bonds, continued |
| |
| | Principal | | |
| | Amount ($) | | Value ($) |
| Biogen, Inc., 5.20%, 9/15/45, | | | | |
| Callable 3/15/45 @ 100.00 (a) | | 40,000 | | 40,069 |
| Blue Cube Spinco, Inc., 9.75%, | | | | |
| 10/15/23, Callable 10/15/20 | | | | |
| @ 102.44 (a) | | 12,000 | | 13,350 |
| Blue Cube Spinco, Inc., 10.00%, | | | | |
| 10/15/25, Callable 10/15/20 | | | | |
| @ 105.00 (a) | | 25,000 | | 28,313 |
| Blue Racer Midstream LLC, 6.13%, | | | | |
| 11/15/22, Callable 12/10/18 | | | | |
| @ 103.06 (a)(d) | | 14,000 | | 14,280 |
| Boardwalk Pipelines LP, 5.95%, | | | | |
| 6/1/26, Callable 3/1/26 | | | | |
| @ 100.00 (a) | | 89,000 | | 93,005 |
| Brandywine Operating Partnership LP, | | | | |
| 3.95%, 11/15/27, Callable 8/15/27 | | | | |
| @ 100.00 (a) | | 35,000 | | 32,836 |
| Buckeye Partners LP, 4.13%, 12/1/27, | | | | |
| Callable 9/1/27 @ 100.00 (a) | | 15,000 | | 13,652 |
| Buckeye Partners LP, 6.38% | | | | |
| (US0003M + 402 bps), 1/22/78, | | | | |
| Callable 1/22/23 @ 100.00 (a)(c) | | 55,000 | | 50,351 |
| Building Materials Corp., 6.00%, | | | | |
| 10/15/25, Callable 10/15/20 | | | | |
| @ 103.00 (a)(d) | | 100,000 | | 98,375 |
| Capital One Financial Corp., 3.10% | | | | |
| (US0003M + 76 bps), 5/12/20, | | | | |
| Callable 4/12/20 @ 100.00 (a)(c) | | 25,000 | | 25,121 |
| Capital One Financial Corp., 3.30%, | | | | |
| 10/30/24, Callable 9/30/24 | | | | |
| @ 100.00 (a) | | 40,000 | | 37,796 |
| Capital One Financial Corp., 3.75%, | | | | |
| 7/28/26, Callable 6/28/26 | | | | |
| @ 100.00 (a) | | 65,000 | | 59,794 |
| Capital One Financial Corp., 4.20%, | | | | |
| 10/29/25, Callable 9/29/25 | | | | |
| @ 100.00 (a) | | 35,000 | | 33,795 |
| Capital One Financial Corp., 4.25%, | | | | |
| 4/30/25, Callable 3/31/25 | | | | |
| @ 100.00 (a) | | 40,000 | | 39,528 |
| Capital One Financial Corp., 5.55% | | | | |
| (US0003M + 380 bps), Callable | | | | |
| 6/1/20 @ 100.00 (a)(b)(c) | | 50,000 | | 50,500 |
| Care Capital Properties, Inc., 5.13%, | | | | |
| 8/15/26, Callable 5/15/26 | | | | |
| @ 100.00 (a) | | 45,000 | | 43,092 |
| Carrizo Oil & Gas, Inc., 7.50%, 9/15/20, | | | | |
| Callable 11/19/18 @ 100.00 (a) | | 4,000 | | 4,007 |
| CCO Holdings LLC, 5.00%, 2/1/28, | | | | |
| Callable 8/1/22 @ 102.50 (a)(d) | | 53,000 | | 49,489 |
| CCO Holdings LLC, 5.75%, 2/15/26, | | | | |
| Callable 2/15/21 @ 102.88 (a)(d) | | 65,000 | | 64,350 |
| CCO Holdings LLC, 5.88%, 4/1/24, | | | | |
| Callable 4/1/19 @ 104.41 (a)(d) | | 55,000 | | 55,481 |
| Celgene Corp., 5.00%, 8/15/45, | | | | |
| Callable 2/15/45 @ 100.00 (a) | | 45,000 | | 42,075 |
| Centene Corp., 6.13%, 2/15/24, | | | | |
| Callable 2/15/19 @ 104.59 (a) | | 29,000 | | 30,305 |
| Centene Escrow I Corp., 5.38%, | | | | |
| 6/1/26, Callable 6/1/21 | | | | |
| @ 104.03 (a)(d) | | 35,000 | | 35,525 |
| Central Garden & Pet Co., 6.13%, | | | | |
| 11/15/23, Callable 12/10/18 | | | | |
| @ 104.59 (a) | | 31,000 | | 31,543 |
| CenturyLink, Inc., 7.50%, 4/1/24, | | | | |
| Callable 1/1/24 @ 100.00 (a) | | 50,000 | | 52,500 |
| Charter Communications Operating | | | | |
| LLC/Capital, 4.50%, 2/1/24, Callable | | | | |
| 1/1/24 @ 100.00 (a) | | 25,000 | | 25,030 |
| Charter Communications Operating | | | | |
| LLC/Capital, 5.75%, 4/1/48, Callable | | | | |
| 10/1/47 @ 100.00 (a) | | 35,000 | | 33,043 |
| Cheniere Corp. Christi Holding LLC, | | | | |
| 5.88%, 3/31/25, Callable | | | | |
| 10/2/24 @ 100.00 (a) | | 5,000 | | 5,138 |
| Cheniere Energy Partners, 5.25%, | | | | |
| 10/1/25, Callable 10/1/20 | | | | |
| @ 102.63 (a) | | 30,000 | | 29,438 |
| Citigroup, Inc., 3.41% (US0003M + 110 | | | | |
| bps), 5/17/24, Callable | | | | |
| 5/17/23 @ 100.00 (a)(c) | | 45,000 | | 45,269 |
| Citigroup, Inc., 3.52% (US0003M + 115 | | | | |
| bps), 10/27/28, Callable 10/27/27 | | | | |
| @ 100.00 (a)(c) | | 110,000 | | 101,941 |
| Citigroup, Inc., 3.67% (US0003M + 139 | | | | |
| bps), 7/24/28, Callable 7/24/27 | | | | |
| @ 100.00 (a)(c) | | 50,000 | | 46,881 |
| Citigroup, Inc., 3.88% (US0003M + 117 | | | | |
| bps), 1/24/39, Callable 1/24/38 | | | | |
| @ 100.00 (a)(c) | | 25,000 | | 22,183 |
| Citigroup, Inc., 4.07% (US0003M + 119 | | | | |
| bps), 4/23/29, Callable 4/23/28 | | | | |
| @ 100.00 (a)(c) | | 25,000 | | 24,114 |
| Citigroup, Inc., 4.13%, 7/25/28 | | 70,000 | | 66,454 |
| Citigroup, Inc., 4.60%, 3/9/26 | | 40,000 | | 39,696 |
| Citigroup, Inc., 4.65%, 7/23/48, | | | | |
| Callable 6/23/48 @ 100.00 (a) | | 35,000 | | 33,821 |
| Citigroup, Inc., 5.80% (US0003M + | | | | |
| 409 bps), Callable 11/15/19 | | | | |
| @ 100.00 (a)(b)(c) | | 50,000 | | 50,813 |
| Clearwater Paper Corp., | | | | |
| 5.38%, 2/1/25 (d) | | 59,000 | | 54,133 |
| Cleveland-Cliffs, Inc., 5.75%, 3/1/25, | | | | |
| Callable 3/1/20 @ 104.31 (a) | | 60,000 | | 56,700 |
| Commercial Metals Co., 5.75%, | | | | |
| 4/15/26, Callable 4/15/21 | | | | |
| @ 102.88 (a)(d) | | 37,000 | | 35,520 |
| Commscope, Inc., 5.00%, 6/15/21, | | | | |
| Callable 11/20/18 @ 101.25 (a)(d) | | 14,000 | | 13,955 |
| Constellation Brands, Inc., 5.25%, | | | | |
| 11/15/48, Callable 5/15/48 | | | | |
| @ 100.00 (a) | | 20,000 | | 20,018 |
| Continental Resources, 4.90%, 6/1/44, | | | | |
| Callable 12/1/43 @ 100.00 (a) | | 110,000 | | 102,402 |
| Corning, Inc., 4.38%, 11/15/57, Callable | | | | |
| 5/15/57 @ 100.00 (a) | | 20,000 | | 16,253 |
| See notes to financial statements. | HSBC FAMILY OF FUNDS 45 |
| HSBC GLOBAL HIGH INCOME BOND FUND |
| Schedule of Portfolio Investments—as of October 31, 2018 (continued) |
| Corporate Bonds, continued |
| |
| | Principal | | |
| | Amount ($) | | Value ($) |
| United States – continued | | | | | |
| Crown Castle International Corp., | | | | | |
| 3.80%, 2/15/28, Callable 11/15/27 | | | | | |
| @ 100.00 (a) | | | 30,000 | | 27,936 |
| CSC Holdings LLC, 5.25%, 6/1/24 | | | 55,000 | | 53,006 |
| CSX Corp., 4.30%, 3/1/48, Callable | | | | | |
| 9/1/47 @ 100.00 (a) | | | 40,000 | | 36,887 |
| CVS Health Corp., 4.78%, 3/25/38, | | | | | |
| Callable 9/25/37 @ 100.00 (a) | | | 15,000 | | 14,369 |
| CyrusOne LP/CyrusOne Finance Corp., | | | | | |
| 5.00%, 3/15/24, Callable 3/15/20 | | | | | |
| @ 102.50 (a) | | | 20,000 | | 20,000 |
| CyrusOne LP/CyrusOne Finance Corp., | | | | | |
| 5.38%, 3/15/27, Callable 3/15/22 | | | | | |
| @ 102.69 (a) | | | 20,000 | | 19,850 |
| DCP Midstream LLC, | | | | | |
| 8.13%, 8/16/30 | | | 55,000 | | 64,075 |
| DCP Midstream Partners, 7.37% | | | | | |
| (US0003M + 515 bps), Callable | | | | | |
| 12/15/22 @ 100.00 (a)(b)(c) | | | 40,000 | | 38,325 |
| Dell, Inc., 7.10%, 4/15/28 | | | 28,000 | | 29,575 |
| Diamond 1 Finance/Diamond 2, 5.88%, | | | | | |
| 6/15/21, Callable 11/26/18 | | | | | |
| @ 102.94 (a)(d) | | | 6,000 | | 6,083 |
| Diamond 1 Finance/Diamond 2, | | | | | |
| 7.13%, 6/15/24, Callable 6/15/19 | | | | | |
| @ 105.34 (a)(d) | | | 33,000 | | 34,924 |
| Diamondback Energy, Inc., | | | | | |
| 4.75%, 11/1/24, Callable 11/1/19 | | | | | |
| @ 103.56 (a) | | | 12,000 | | 11,670 |
| Diamondback Energy, Inc., | | | | | |
| 5.38%, 5/31/25, Callable 5/31/20 | | | | | |
| @ 104.03 (a) | | | 27,000 | | 26,865 |
| Discover Financial Services, | | | | | |
| 3.95%, 11/6/24, Callable 8/6/24 | | | | | |
| @ 100.00 (a) | | | 100,000 | | 97,741 |
| Discovery Communications, | | | | | |
| 3.05% (US0003M + 71 bps), | | | | | |
| 9/20/19 (c) | | | 20,000 | | 20,071 |
| Discovery Communications, Inc., | | | | | |
| 1.90%, 3/19/27, Callable 12/19/26 | | | | | |
| @ 100.00 (a) | | EUR | 100,000 | | 110,822 |
| Dominion Resources, Inc., 2.96%, | | | | | |
| 7/1/19 (c)(f) | | | 30,000 | | 29,873 |
| Enable Midstream Partners LP, | | | | | |
| 4.95%, 5/15/28, Callable 2/15/28 | | | | | |
| @ 100.00 (a) | | | 20,000 | | 19,568 |
| Energy Transfer Partners LP, | | | | | |
| 3.60%, 2/1/23, Callable 11/1/22 | | | | | |
| @ 100.00 (a) | | | 100,000 | | 97,379 |
| Energy Transfer Partners LP, | | | | | |
| 5.30%, 4/15/47, Callable 10/15/46 | | | | | |
| @ 100.00 (a) | | | 25,000 | | 22,396 |
| Energy Transfer Partners LP, | | | | | |
| 6.00%, 6/15/48, Callable 12/15/47 | | | | | |
| @ 100.00 (a) | | | 25,000 | | 24,631 |
| Energy Transfer Partners LP, 6.25% | | | | | |
| (US0003M + 418 bps), Callable | | | | | |
| 2/15/23 @ 100.00 (a)(b)(c) | | | 50,000 | | 46,750 |
| EnLink Midstream Partners LP, 5.45%, | | | | | |
| 6/1/47, Callable 12/1/46 @ 100.00 (a) | | | 80,000 | | 67,394 |
| EnLink Midstream Partners LP, 6.00% | | | | | |
| (US0003M + 411 bps), Callable | | | | | |
| 12/15/22 @ 100.00 (a)(b)(c) | | | 51,000 | | 44,428 |
| Enterprise Products Operating LLC, | | | | | |
| 5.25% (US0003M + 303 bps), | | | | | |
| 8/16/77, Callable 8/16/27 | | | | | |
| @ 100.00 (a)(c) | | | 35,000 | | 31,346 |
| Enterprise Products Operating LLC, | | | | | |
| 5.38% (US0003M + 257 bps), | | | | | |
| 2/15/78, Callable 2/15/28 | | | | | |
| @ 100.00 (a)(c) | | | 30,000 | | 26,744 |
| EPR Properties, 4.50%, 6/1/27, | | | | | |
| Callable 3/1/27 @ 100.00 (a) | | | 35,000 | | 33,144 |
| EPR Properties, 4.75%, 12/15/26, | | | | | |
| Callable 9/15/26 @ 100.00 (a) | | | 100,000 | | 96,521 |
| EPR Properties, 4.95%, 4/15/28, | | | | | |
| Callable 1/15/28 @ 100.00 (a) | | | 35,000 | | 33,826 |
| Equinix, Inc., 2.88%, 10/1/25, | | | | | |
| Callable 10/1/20 @ 101.44 (a) | | | 100,000 | | 110,942 |
| Equinix, Inc., 5.88%, 1/15/26, | | | | | |
| Callable 1/15/21 @ 102.94 (a) | | | 50,000 | | 50,750 |
| Equities Corp., 2.50%, 10/1/20, | | | | | |
| Callable 9/1/20 @ 100.00 (a) | | | 20,000 | | 19,502 |
| ESH Hospitality, Inc., 5.25%, 5/1/25, | | | | | |
| Callable 5/1/20 @ 102.63 (a)(d) | | | 55,000 | | 52,044 |
| Fidelity National Information Services, | | | | | |
| Inc., 4.75%, 5/15/48, Callable | | | | | |
| 11/15/47 @ 100.00 (a) | | | 50,000 | | 47,356 |
| Fifth Third Bancorp, 4.90% (US0003M | | | | | |
| + 313 bps), Callable 9/30/19 | | | | | |
| @ 100.00 (a)(b)(c) | | | 50,000 | | 49,313 |
| First Data Corp., 5.00%, 1/15/24, | | | | | |
| Callable 1/15/19 @ 102.50 (a)(d) | | | 52,000 | | 51,480 |
| First Horizon National Corp., 3.50%, | | | | | |
| 12/15/20, Callable 11/15/20 | | | | | |
| @ 100.00 (a) | | | 50,000 | | 49,967 |
| Fiserv, Inc., 3.80%, 10/1/23, | | | | | |
| Callable 9/1/23 @ 100.00 (a) | | | 20,000 | | 19,989 |
| Fortune Brands Home & Security, Inc., | | | | | |
| 4.00%, 9/21/23, Callable 8/21/23 | | | | | |
| @ 100.00 (a) | | | 35,000 | | 34,980 |
| Freeport-McMoRan, Inc., 3.88%, | | | | | |
| 3/15/23, Callable 12/15/22 | | | | | |
| @ 100.00 (a) | | | 12,000 | | 11,100 |
| Freeport-McMoRan, Inc., 6.88%, | | | | | |
| 2/15/23, Callable 2/15/20 | | | | | |
| @ 103.44 (a) | | | 5,000 | | 5,231 |
| Fresenius Medical Care AG & Co. | | | | | |
| KGaA, 5.88%, 1/31/22 (d) | | | 50,000 | | 52,554 |
| General Motors Financial Co., Inc., | | | | | |
| 3.10%, 1/15/19 | | | 40,000 | | 40,010 |
| General Motors Financial Co., Inc., | | | | | |
| 4.35%, 1/17/27, Callable 10/17/26 | | | | | |
| @ 100.00 (a) | | | 120,000 | | 111,737 |
| Genesis Energy LP, 5.63%, 6/15/24, | | | | | |
| Callable 6/15/19 @ 102.81 (a) | | | 30,000 | | 27,150 |
| 46 HSBC FAMILY OF FUNDS | See notes to financial statements. |
| HSBC GLOBAL HIGH INCOME BOND FUND |
| Schedule of Portfolio Investments—as of October 31, 2018 (continued) |
| Corporate Bonds, continued |
| |
| | Principal | | |
| | Amount ($) | | Value ($) |
| United States – continued | | | | |
| Genesis Energy LP, 6.75%, 8/1/22, | | | | |
| Callable 12/10/18 @ 103.38 (a) | | 23,000 | | 23,115 |
| GLP Capital LP/GLP Financing II, Inc., | | | | |
| 5.25%, 6/1/25, Callable 3/1/25 | | | | |
| @ 100.00 (a) | | 60,000 | | 60,301 |
| Goldman Sachs Group, Inc., 3.69% | | | | |
| (US0003M + 151 bps), 6/5/28, | | | | |
| Callable 6/5/27 @ 100.00 (a)(c) | | 55,000 | | 51,628 |
| Goldman Sachs Group, Inc., 4.22% | | | | |
| (US0003M + 130 bps), 5/1/29, | | | | |
| Callable 5/1/28 @ 100.00 (a)(c) | | 40,000 | | 38,797 |
| Goldman Sachs Group, Inc., 5.00% | | | | |
| (US0003M + 287 bps), Callable | | | | |
| 11/10/22 @ 100.00 (a)(b)(c) | | 20,000 | | 18,446 |
| Goodyear Tire & Rubber Co., | | | | |
| 4.88%, 3/15/27, Callable 12/15/26 | | | | |
| @ 100.00 (a) | | 45,000 | | 40,162 |
| Goodyear Tire & Rubber Co., | | | | |
| 5.00%, 5/31/26, Callable 5/31/21 | | | | |
| @ 102.50 (a) | | 30,000 | | 27,225 |
| Greif, Inc., 7.75%, 8/1/19 | | 30,000 | | 30,675 |
| Gulfport Energy Corp., 6.38%, | | | | |
| 5/15/25, Callable 5/15/20 | | | | |
| @ 104.78 (a) | | 36,000 | | 34,200 |
| Gulfport Enregy Corp., 6.00%, | | | | |
| 10/15/24, Callable 10/15/19 | | | | |
| @ 104.50 (a) | | 25,000 | | 23,438 |
| Halliburton Co., 4.85%, 11/15/35, | | | | |
| Callable 5/15/35 @ 100.00 (a) | | 35,000 | | 35,084 |
| HCA Healthcare, Inc., 5.88%, 2/15/26, | | | | |
| Callable 8/15/25 @ 100.00 (a) | | 50,000 | | 51,125 |
| HCA, Inc., 4.50%, 2/15/27, | | | | |
| Callable 8/15/26 @ 100.00 (a) | | 50,000 | | 48,625 |
| HCA, Inc., 5.25%, 4/15/25, | | | | |
| Callable 3/15/25 @ – (a) | | 50,000 | | 51,063 |
| HCA, Inc., 5.38%, 9/1/26, | | | | |
| Callable 3/1/26 @ 100.00 (a) | | 44,000 | | 43,670 |
| HCA, Inc., 5.50%, 6/15/47, | | | | |
| Callable 12/15/46 @ 100.00 (a) | | 35,000 | | 34,440 |
| Health Care Realty Trust, 3.63%, | | | | |
| 1/15/28, Callable 10/15/27 | | | | |
| @ 100.00 (a) | | 10,000 | | 9,182 |
| HealthSouth Corp., 5.75%, 11/1/24, | | | | |
| Callable 12/10/18 @ 101.92 (a) | | 34,000 | | 33,915 |
| Herc Rentals, Inc., 7.50%, 6/1/22, | | | | |
| Callable 6/1/19 @ 103.75 (a)(d) | | 34,000 | | 35,360 |
| Host Hotels & Resorts LP, | | | | |
| 4.50%, 2/1/26, Callable 11/1/25 | | | | |
| @ 100.00 (a) | | 50,000 | | 49,214 |
| Hyundai Capital America, | | | | |
| 2.75%, 9/27/26 (d) | | 28,000 | | 24,270 |
| IHS Markit, Ltd., 4.75%, 8/1/28, | | | | |
| Callable 5/1/28 @ 100.00 (a) | | 45,000 | | 43,944 |
| Infor, Inc., 5.75%, 8/15/20, Callable | | | | |
| 11/26/18 @ 101.44 (a)(d) | | 2,000 | | 2,023 |
| Jabil, Inc., 3.95%, 1/12/28, Callable | | | | |
| 10/12/27 @ 100.00 (a) | | 20,000 | | 18,316 |
| JPMorgan Chase & Co., 6.10% | | | | |
| (US0003M + 333 bps), Callable | | | | |
| 10/1/24 @ 100.00 (a)(b)(c) | | 40,000 | | 40,662 |
| Kennametal, Inc., 4.63%, 6/15/28, | | | | |
| Callable 3/15/28 @ 100.00 (a) | | 35,000 | | 34,112 |
| KeyCorp, 4.15%, 10/29/25, MTN | | 25,000 | | 25,074 |
| Kinder Morgan, Inc., 3.05%, 12/1/19, | | | | |
| Callable 11/1/19 @ 100.00 (a) | | 150,000 | | 149,452 |
| Kinder Morgan, Inc., 5.05%, 2/15/46, | | | | |
| Callable 8/15/45 @ 100.00 (a) | | 100,000 | | 94,479 |
| Kinder Morgan, Inc., 5.20%, 3/1/48, | | | | |
| Callable 9/1/47 @ 100.00 (a) | | 10,000 | | 9,656 |
| Lennar Corp., 4.75%, 5/30/25, | | | | |
| Callable 2/28/25 @ 100.00 (a) | | 45,000 | | 42,863 |
| Lennar Corp., 4.88%, 12/15/23, | | | | |
| Callable 9/15/23 @ 100.00 (a) | | 20,000 | | 19,525 |
| Level 3 Financing, Inc., 5.13%, 5/1/23, | | | | |
| Callable 12/10/18 @ 102.56 (a) | | 25,000 | | 24,813 |
| Level 3 Financing, Inc., 5.38%, 1/15/24, | | | | |
| Callable 1/15/19 @ 102.69 (a) | | 11,000 | | 10,890 |
| LifePoint Health, Inc., 5.88%, 12/1/23, | | | | |
| Callable 12/10/18 @ 104.41 (a) | | 40,000 | | 41,900 |
| Live Nation Entertainment, Inc., | | | | |
| 4.88%, 11/1/24, Callable 11/1/19 | | | | |
| @ 103.66 (a)(d) | | 30,000 | | 28,725 |
| Masco Corp., 3.50%, 4/1/21, Callable | | | | |
| 3/1/21 @ 100.00 (a) | | 40,000 | | 39,792 |
| Massachusetts Mutual Life Insurance | | | | |
| Co., 4.90%, 4/1/77 (d) | | 35,000 | | 33,399 |
| Match Group, Inc., 6.38%, 6/1/24, | | | | |
| Callable 6/1/19 @ 104.78 (a) | | 25,000 | | 26,000 |
| MGM Growth/MGM Finance, | | | | |
| 4.50%, 9/1/26, Callable 6/1/26 | | | | |
| @ 100.00 (a) | | 25,000 | | 22,625 |
| MGM Growth/MGM Finance, | | | | |
| 5.63%, 5/1/24, Callable 2/1/24 | | | | |
| @ 100.00 (a) | | 37,000 | | 37,046 |
| MGM Resorts International, | | | | |
| 5.75%, 6/15/25, Callable 3/15/25 | | | | |
| @ 100.00 (a) | | 30,000 | | 29,250 |
| MPLX LP, 5.20%, 3/1/47, Callable | | | | |
| 9/1/46 @ 100.00 (a) | | 25,000 | | 23,637 |
| MPT Operating Partnership LP, | | | | |
| 5.00%, 10/15/27, Callable 10/15/22 | | | | |
| @ 102.50 (a) | | 88,000 | | 82,694 |
| MPT Operating Partnership LP, | | | | |
| 5.25%, 8/1/26, Callable 8/1/21 | | | | |
| @ 102.63 (a) | | 20,000 | | 19,300 |
| MSCI, Inc., 5.75%, 8/15/25, | | | | |
| Callable 8/15/20 @ 102.88 (a)(d) | | 20,000 | | 20,550 |
| Mutlti-Color Corp., 4.88%, 11/1/25, | | | | |
| Callable 11/1/20 @ 102.44 (a)(d) | | 58,000 | | 53,070 |
| Navient Corp., 8.00%, | | | | |
| 3/25/20, MTN | | 75,000 | | 78,281 |
| Nine Energy Service, Inc., | | | | |
| 8.75%, 11/1/23, Callable | | | | |
| 11/1/20 @ 104.38 (a)(d) | | 10,000 | | 10,150 |
| See notes to financial statements. | HSBC FAMILY OF FUNDS 47 |
| HSBC GLOBAL HIGH INCOME BOND FUND |
| Schedule of Portfolio Investments—as of October 31, 2018 (continued) |
| Corporate Bonds, continued |
| |
| | Principal | | |
| | Amount ($) | | Value ($) |
| United States – continued | | | | | |
| Norfolk Southern Corp., 5.10%, 8/1/18, | | | | | |
| Callable 2/1/18 @ 100.00 (a) | | | 10,000 | | 9,399 |
| Omega Healthcare Investors, Inc., | | | | | |
| 4.38%, 8/1/23, Callable 6/1/23 | | | | | |
| @ 100.00 (a) | | | 25,000 | | 24,725 |
| Outfront Media Capital LLC, 5.25%, | | | | | |
| 2/15/22, Callable 12/10/18 | | | | | |
| @ 102.63 (a) | | | 25,000 | | 25,180 |
| Owens-Brockway Packaging, Inc., | | | | | |
| 5.00%, 1/15/22 (d) | | | 50,000 | | 49,375 |
| Owens-Brockway Packaging, Inc., | | | | | |
| 6.38%, 8/15/25 (d) | | | 30,000 | | 30,150 |
| PBF Holding Co. LLC, 7.00%,11/15/23, | | | | | |
| Callable 12/10/18 @ 105.25 (a) | | | 25,000 | | 25,813 |
| PBF Holding Co. LLC, 7.25%, 6/15/25, | | | | | |
| Callable 6/15/20 @ 105.44 (a) | | | 38,000 | | 39,140 |
| Pilgrim’s Pride Corp., 5.75%, 3/15/25, | | | | | |
| Callable 3/15/20 @ 102.88 (a)(d) | | | 43,000 | | 40,097 |
| Pilgrim’s Pride Corp., 5.88%, 9/30/27, | | | | | |
| Callable 9/30/22 @ 102.94 (a)(d) | | | 23,000 | | 20,873 |
| Plains All American Pipeline LP, 6.12% | | | | | |
| (US0003M + 411 bps), Callable | | | | | |
| 11/15/22 @ 100.00 (a)(b)(c) | | | 13,000 | | 12,220 |
| Plastipak Holdings, Inc., 6.25%, | | | | | |
| 10/15/25, Callable 10/15/20 | | | | | |
| @ 103.13 (a)(d) | | | 34,000 | | 31,110 |
| PPL Capital Funding, Inc., 4.00%, | | | | | |
| 9/15/47, Callable 3/15/47 | | | | | |
| @ 100.00 (a) | | | 50,000 | | 43,396 |
| Prudential Financial, Inc., 5.70% | | | | | |
| (US0003M + 267 bps), 9/15/48, | | | | | |
| Callable 9/15/28 @ 100.00 (a)(c) | | | 30,000 | | 29,040 |
| PulteGroup, Inc., 4.25%, 3/1/21, | | | | | |
| Callable 2/1/21 @ 100.00 (a) | | | 70,000 | | 69,831 |
| PulteGroup, Inc., 5.50%, 3/1/26, | | | | | |
| Callable 12/1/25 @ 100.00 (a) | | | 16,000 | | 15,660 |
| Rayonier Am Prod, Inc., 5.50%, 6/1/24, | | | | | |
| Callable 6/1/19 @ 102.75 (a)(d) | | | 23,000 | | 21,505 |
| Refinitiv US Holdings, Inc., 6.25%, | | | | | |
| 5/15/26, Callable 11/15/21 | | | | | |
| @ 103.13 (a)(d) | | | 11,000 | | 10,945 |
| Reynolds American, Inc., | | | | | |
| 5.85%, 8/15/45, Callable 2/15/45 | | | | | |
| @ 100.00 (a) | | | 100,000 | | 102,518 |
| Rose Rock Midstream LP, 5.63%, | | | | | |
| 11/15/23, Callable 5/15/19 | | | | | |
| @ 102.81 (a) | | | 50,000 | | 47,250 |
| Sabine Pass Liquefaction LLC, | | | | | |
| 5.63%, 3/1/25, Callable 12/1/24 | | | | | |
| @ 100.00 (a) | | | 35,000 | | 36,542 |
| Sabre Global, Inc., 5.25%, 11/15/23, | | | | | |
| Callable 12/10/18 @ 103.94 (a)(d) | | | 32,000 | | 31,596 |
| SBA Communications Corp., | | | | | |
| 4.88%, 9/1/24, Callable 9/1/19 | | | | | |
| @ 103.66 (a) | | | 20,000 | | 19,300 |
| Senior Housing Properties Trust, | | | | | |
| 4.75%, 2/15/28, Callable 8/15/27 | | | | | |
| @ 100.00 (a) | | | 80,000 | | 76,401 |
| Service Corp. International, 4.63%, | | | | | |
| 12/15/27, Callable 12/15/22 | | | | | |
| @ 102.31 (a) | | | 65,000 | | 60,938 |
| Sirius XM Radio, Inc., 6.00%, 7/15/24, | | | | | |
| Callable 7/15/19 @ 103.00 (a)(d) | | | 75,000 | | 76,673 |
| Six Flags Entertainment Corp., | | | | | |
| 4.88%, 7/31/24, Callable 7/31/19 | | | | | |
| @ 103.66 (a)(d) | | | 42,000 | | 39,690 |
| Smithfield Foods, Inc., 2.65%, 10/3/21, | | | | | |
| Callable 9/3/21 @ 100.00 (a)(d) | | | 25,000 | | 23,792 |
| Southern Co. Gas Capital Corp., 4.40%, | | | | | |
| 5/30/47, Callable 11/30/46 | | | | | |
| @ 100.00 (a) | | | 35,000 | | 32,091 |
| Southern Natural Gas Co. LLC, 4.80%, | | | | | |
| 3/15/47, Callable 9/15/46 | | | | | |
| @ 100.00 (a)(d) | | | 25,000 | | 23,728 |
| Spectra Energy Partners, 4.50%, | | | | | |
| 3/15/45, Callable 9/15/44 | | | | | |
| @ 100.00 (a) | | | 15,000 | | 13,632 |
| Sprint Corp., 7.88%, 9/15/23 | | | 90,000 | | 96,075 |
| Sunoco Logistics Partners Operations | | | | | |
| LP, 5.40%, 10/1/47, Callable 4/1/47 | | | | | |
| @ 100.00 (a) | | | 40,000 | | 36,425 |
| SunTrust Bank/Atlanta GA, 3.69% | | | | | |
| (US0003M + 74 bps), 8/2/24, | | | | | |
| Callable 8/2/23 @ 100.00 (a)(c) | | | 75,000 | | 74,188 |
| Synchrony Financial, 3.70%, 8/4/26, | | | | | |
| Callable 5/4/26 @ 100.00 (a) | | | 30,000 | | 26,624 |
| Synchrony Financial, 4.50%, 7/23/25, | | | | | |
| Callable 4/23/25 @ 100.00 (a) | | | 100,000 | | 94,790 |
| Synovus Financial Corp., 3.13%, | | | | | |
| 11/1/22, Callable 10/1/22 | | | | | |
| @ 100.00 (a) | | | 20,000 | | 19,025 |
| Targa Resources Partners, 5.00%, | | | | | |
| 1/15/28, Callable 1/15/23 | | | | | |
| @ 102.50 (a) | | | 15,000 | | 14,213 |
| Targa Resources Partners, 5.25%, | | | | | |
| 5/1/23, Callable 12/10/18 | | | | | |
| @ 101.75 (a) | | | 30,000 | | 29,925 |
| Taylor Morrison Communities, Inc., | | | | | |
| 5.88%, 4/15/23, Callable 1/15/23 | | | | | |
| @ 100.00 (a)(d) | | | 50,000 | | 49,375 |
| Tenet Healthcare Corp., | | | | | |
| 4.50%, 4/1/21 | | | 25,000 | | 24,875 |
| Tenet Healthcare Corp., 4.63%, | | | | | |
| 7/15/24, Callable 7/15/20 | | | | | |
| @ 102.31 (a) | | | 15,000 | | 14,458 |
| Tenet Healthcare Corp., | | | | | |
| 6.00%, 10/1/20 | | | 50,000 | | 51,203 |
| Tenneco, Inc., 5.00%, 7/15/26, | | | | | |
| Callable 7/15/21 @ 102.50 (a) | | | 3,000 | | 2,490 |
| The Chemours Co., 5.38%, 5/15/27, | | | | | |
| Callable 2/15/27 @ 100.00 (a) | | | 25,000 | | 23,250 |
| The Chemours Co., 6.63%, 5/15/23, | | | | | |
| Callable 12/10/18 @ 104.97 (a) | | | 13,000 | | 13,293 |
| The Goldman Sachs Group, Inc., | | | | | |
| 4.75%, 10/12/21 | | EUR | 100,000 | | 126,642 |
| 48 HSBC FAMILY OF FUNDS | See notes to financial statements. |
| HSBC GLOBAL HIGH INCOME BOND FUND |
| Schedule of Portfolio Investments—as of October 31, 2018 (continued) |
| Corporate Bonds, continued |
| |
| | Principal | | |
| | Amount ($) | | Value ($) |
| United States – continued | | | | | |
| Time Warner Cable, Inc., 4.50%, | | | | | |
| 9/15/42, Callable 3/15/42 | | | | | |
| @ 100.00 (a) | | 100,000 | | | 80,884 |
| T-Mobile US, Inc., 6.50%, 1/15/24, | | | | | |
| Callable 1/15/19 @ 103.25 (a) | | 74,000 | | | 76,590 |
| Toll Bros Finance Corp., 4.88%, | | | | | |
| 11/15/25, Callable 8/15/25 | | | | | |
| @ 100.00 (a) | | 20,000 | | | 18,900 |
| Tribune Media Co., 5.88%, 7/15/22, | | | | | |
| Callable 11/20/18 @ 102.94 (a) | | 50,000 | | | 50,625 |
| Tronox, Inc., 6.50%, 4/15/26, Callable | | | | | |
| 4/15/21 @ 103.25 (a)(d) | | 50,000 | | | 45,749 |
| Union Pacific Corp., 4.80%, 9/10/58, | | | | | |
| Callable 3/10/58 @ 100.00 (a) | | 25,000 | | | 24,414 |
| United Rentals North America, Inc, | | | | | |
| 4.63%, 7/15/23, Callable 12/10/18 | | | | | |
| @ 103.47 (a) | | 15,000 | | | 14,869 |
| United Rentals North America, Inc, | | | | | |
| 6.50%, 12/15/26, Callable 12/15/21 | | | | | |
| @ 103.25 (a) | | 27,000 | | | 27,304 |
| Universal Health Services, Inc., | | | | | |
| 4.75%, 8/1/22, Callable 12/10/18 | | | | | |
| @ 102.38 (a)(d) | | 30,000 | | | 30,000 |
| Valeant Pharmaceuticals, 7.00%, | | | | | |
| 3/15/24, Callable 3/15/20 | | | | | |
| @ 103.50 (a)(d) | | 30,000 | | | 31,416 |
| Verizon Communications, Inc., | | | | | |
| 4.27%, 1/15/36 | | 150,000 | | | 137,818 |
| Vulcan Materials Co., 2.97% (US0003M | | | | | |
| + 65 bps), 3/1/21 (c) | | 75,000 | | | 75,111 |
| Warrior Met Coal, Inc., 8.00%, 11/1/24, | | | | | |
| Callable 11/1/20 @ 104.00 (a)(d) | | 9,000 | | | 9,248 |
| Waste Pro USA, Inc., 5.50%, 2/15/26, | | | | | |
| Callable 2/15/21 @ 104.13 (a)(d) | | 26,000 | | | 24,635 |
| WellCare Health Plans, Inc., | | | | | |
| 5.38%, 8/15/26, Callable 8/15/21 | | | | | |
| @ 104.03 (a)(d) | | 50,000 | | | 49,875 |
| Wells Fargo & Co., 6.10% (US0003M + | | | | | |
| 377 bps), Callable 12/15/18 | | | | | |
| @ 100.00 (a)(b)(c) | | 50,000 | | | 50,375 |
| Welltower, Inc., 4.95%, 9/1/48, | | | | | |
| Callable 3/1/48 @ 100.00 (a) | | 35,000 | | | 33,500 |
| Western Digital Corp., 4.75%, 2/15/26, | | | | | |
| Callable 11/15/25 @ 100.00 (a) | | 20,000 | | | 18,475 |
| Westlake Chemical Corp., 4.38%, | | | | | |
| 11/15/47, Callable 5/15/47 | | | | | |
| @ 100.00 (a) | | 35,000 | | | 29,632 |
| Westlake Chemical Corp., 5.00%, | | | | | |
| 8/15/46, Callable 2/15/46 | | | | | |
| @ 100.00 (a) | | 35,000 | | | 32,799 |
| William Lyon Homes, Inc., 6.00%, | | | | | |
| 9/1/23, Callable 9/1/20 | | | | | |
| @ 103.00 (a) | | 13,000 | | | 11,863 |
| Zayo Group LLC/Zayo Capital LLC, | | | | | |
| 5.75%, 1/15/27, Callable 1/15/22 | | | | | |
| @ 102.88 (a)(d) | | 52,000 | | | 50,970 |
| | | | | 9,736,231 |
| TOTAL CORPORATE BONDS | | | | | |
| (COST $ 9,973,367) | | | | | 9,736,231 |
| | | | | | |
| U.S. Treasury Obligations – 1.6% |
| |
| U.S. Treasury Bills – 0.6% | | | | | |
| 2.18%, 12/27/18 (g) | | 155,000 | | | 154,468 |
| U.S. Treasury Bonds – 0.0% | | | | | |
| 3.13%, 5/15/48 | | 13,000 | | | 12,360 |
| U.S. Treasury Notes – 1.0% | | | | | |
| 2.13%, 12/31/22 | | 25,000 | | | 24,170 |
| 2.36% (USBMMY3M + 5 bps), | | | | | |
| 10/31/19 (c) | | 160,000 | | | 160,126 |
| 2.50%, 6/30/20 | | 40,000 | | | 39,772 |
| 2.75%, 5/31/23 | | 17,000 | | | 16,842 |
| 3.13%, 10/31/25 | | 18,000 | | | 17,920 |
| | | | | 258,830 |
| TOTAL U.S. TREASURY | | | | | |
| OBLIGATIONS | | | | | |
| (COST $426,586) | | | | | 425,658 |
| |
| Investment Companies – 2.2% |
| | | | | | |
| | Shares | | | |
| Northern Institutional Government | | | | | |
| Assets Portfolio, Institutional Shares, | | | | | |
| 1.87% (h) | | 581,931 | | | 581,931 |
| Northern Institutional Government | | | | | |
| Select Portfolio, Institutional Shares, | | | | | |
| 1.92% (h) | | 5,812 | | | 5,812 |
| TOTAL INVESTMENT COMPANIES | | | | | |
| (COST $ 587,743) | | | | | 587,743 |
| TOTAL INVESTMENTS IN | | | | | |
| SECURITIES | | | | | |
| (COST $27,391,749) – 98.2% | | | | | 26,762,032 |
| Other Assets (Liabilities) – 1.8% | | | | | 496,268 |
| NET ASSETS – 100% | | | | $ | 27,258,300 |
____________________
| † | The principal amount is disclosed in local currency and the value is disclosed in U.S. Dollars. |
| (a) | Represents next call date. Additional subsequent call dates and amounts may apply to this security. |
| (b) | Securities are perpetual and, thus, do not have a predetermined maturity date. |
| (c) | Floating or variable rate security linked to the referenced benchmark. The rate presented represents the rate in effect on October 31, 2018. |
| (d) | (Rule 144A security or other security which is restricted as to resale to institutional investors. This security has been deemed liquid by the Investment Adviser based on procedures approved by the Board of Trustees. |
| (e) | Defaulted security. |
| (f) | Step Bond. Coupon rate is set for an initial period and then increased to a higher coupon rate at a specified date. The rate shown is the rate in effect at October 31, 2018. |
| (g) | Rate presented represents the effective yield at time of purchase. |
| (h) | The rate represents the annualized one day yield that was in effect on October 31, 2018. |
| See notes to financial statements. | HSBC FAMILY OF FUNDS 49 |
| HSBC GLOBAL HIGH INCOME BOND FUND |
| Schedule of Portfolio Investments—as of October 31, 2018 (continued) |
bps — Basis Points
EUR — Euro
EUR003M — 3 Month EUR LIBOR
EUSA1 — Euro 1 Year Swap Rate
EUSA5 — Euro 5 Year Swap Rate
EUSA8 — Euro 8 Year Swap Rate
EUSA10 — Euro 10 Year Swap Rate
EUSA12 — Euro 12 Year Swap Rate
H15T5Y — 5 Year Treasury Constant Maturity Rate
LLC — Limited Liability Company
MTN — Medium Term Note
SpA — Standby Purchase Agreement
ULC — Unlimited Liability Co.
USISDA05 — 5 Year ICE Swap Rate
USBMMY3M — 3 Month Treasury Bill Rate
US0003M — 3 Month US Dollar LIBOR
USSW5 — USD 5 Year Swap Rate
The Fund invested, as a percentage of net assets at value, in the following industries, as of October 31, 2018:
| Percentage of |
| Industry | Net Assets at Value (%) |
| Sovereign Bond | | 16.7 | |
| Banks | | 14.3 | |
| Oil, Gas & Consumable Fuels | | 11.9 | |
| Diversified Financial Services | | 4.5 | |
| Consumer Finance | | 3.8 | |
| Equity Real Estate Investment Trusts | | 3.8 | |
| Media | | 3.3 | |
| Health Care Providers & Services | | 2.8 | |
| Diversified Telecommunication Services | | 2.6 | |
| Insurance | | 2.5 | |
| Capital Markets | | 2.5 | |
| Metals & Mining | | 2.5 | |
| Investment Companies | | 2.2 | |
| Pharmaceuticals | | 1.7 | |
| Trading Companies & Distributors | | 1.7 | |
| U.S. Treasury Obligation | | 1.6 | |
| Electric Utilities | | 1.5 | |
| Multi-Utilities | | 1.4 | |
| Chemicals | | 1.2 | |
| Biotechnology | | 1.1 | |
| Hotels, Restaurants & Leisure | | 1.1 | |
| Containers & Packaging | | 1.1 | |
| Household Durables | | 1.1 | |
| Construction Materials | | 1.0 | |
| Thrifts & Mortgage Finance | | 0.8 | |
| Automobiles | | 0.8 | |
| Construction & Engineering | | 0.7 | |
| Commercial Services & Supplies | | 0.7 | |
| Professional Services | | 0.7 | |
| Auto Components | | 0.7 | |
| Wireless Telecommunication Services | | 0.7 | |
| Industrial Conglomerates | | 0.7 | |
| Building Products | | 0.6 | |
| Machinery | | 0.6 | |
| IT Services | | 0.5 | |
| Tobacco | | 0.4 | |
| Food Products | | 0.3 | |
| Technology Hardware, Storage | | | |
| & Peripherals | | 0.3 | |
| Diversified Consumer Services | | 0.2 | |
| Electronic Equipment, Instruments | | | |
| & Components | | 0.2 | |
| Paper & Forest Products | | 0.2 | |
| Aerospace & Defense | | 0.2 | |
| Road & Rail | | 0.2 | |
| Beverages | | 0.2 | |
| Energy Equipment & Services | | 0.1 | |
| Interactive Media & Services | | 0.1 | |
| Entertainment | | 0.1 | |
| Communications Equipment | | 0.1 | |
| Household Products | | 0.1 | |
| Software | | 0.1 | |
| Total | | 98.2 | |
| 50 | HSBC FAMILY OF FUNDS | See notes to financial statements. |
| HSBC GLOBAL HIGH INCOME BOND FUND |
| Schedule of Portfolio Investments—as of October 31, 2018 (continued) |
Futures Contracts Purchased
| | | | | | | | Value and |
| | | | | | | | Unrealized |
| | | | | | Notional | | Appreciation/ |
| | Number of | | Expiration | | Amount | | (Depreciation) |
| Description | | Contracts | | Date | | ($) | | ($) |
| 5-Year US Treasury Note Futures | | 4 | | 12/31/18 | | 449,531 | | | (3,320 | ) | |
| 10-Year US Treasury Note Futures | | 1 | | 12/19/18 | | 118,438 | | | (1,908 | ) | |
| | | | | | 567,969 | | | (5,228 | ) | |
Futures Contracts Sold
| | | | | | | | Value and |
| | | | | | | | Unrealized |
| | | | | | Notional | | Appreciation/ |
| | Number of | | Expiration | | Amount | | (Depreciation) |
| Description | | Contracts | | Date | | ($) | | ($) |
| 10-Year US Treasury Note Futures | | 3 | | 12/19/18 | | 355,313 | | | | 6,316 | | |
| | | | | | 355,313 | | | | 6,316 | | |
| | | | | | | | | | | | | |
| | Total unrealized appreciation | | | $ | 6,316 | | |
| | Total unrealized depreciation | | | | (5,228 | ) | |
| | Total net unrealized appreciation/(depreciation) | | | $ | 1,088 | | |
Credit Default Swap Agreements - Sell Protection(a)
| | | | | | Implied | | | | | | | | | | | | | | | | | | | | | |
| | | | | | Credit | | | | | | | | | | | | Upfront | | | | | | |
| | | | | | Spread at | | | | | | | | | | | | Premiums | | Unrealized |
| | Receive | | | | October 31, | | | | | | Notional | | | | | | Paid/ | | Appreciation/ |
| | Fixed | | Payment | | 2018 | | | | Expiration | | Amount | | Value | | (Received) | | (Depreciation) |
| Underlying Instrument | | Rate (%) | | Frequency | | (%)(b) | | Counterparty | | Date | | ($)(c) | | ($) | | ($) | | ($) |
| CDX Emerging Markets | | | | | | | | | | | | | | | | | | | | | | | | | | | |
| Index, Series 25* | | 1.00 | | Quarterly | | 1.27 | | Bank of America | | 6/20/21 | | 627,000** | | | (3,606 | ) | | | (41,319 | ) | | | | | 37,713 | | |
| | | | | | | | | | | | | | | (3,606 | ) | | | (41,319 | ) | | | | | 37,713 | | |
| | | | | | | | | | | | | | | | | |
| | | | | | | | | | Total swap agreements at value (assets) | | | $ | — | | |
| | | | | | | | | | Total swap agreements at value (liabilities) | | | | (3,606 | ) | |
| | | | | | | | | | Net swap agreements at value | | | $ | (3,606 | ) | |
| See notes to financial statements. | HSBC FAMILY OF FUNDS | 51 |
| HSBC GLOBAL HIGH INCOME BOND FUND |
| Schedule of Portfolio Investments—as of October 31, 2018 (continued) |
Centrally Cleared Credit Default Swap Agreements - Sell Protection(a)
| | | | | | | Implied | | | | | | | | | | | | |
| | | | | | Credit | | | | | | | | Upfront | | | | |
| | | | | | Spread at | | | | | | | | Premiums | | Unrealized |
| | Receive | | | | October 31, | | | | Notional | | | | Paid/ | | Appreciation/ |
| | Fixed | | Payment | | 2018 | | Expiration | | Amount | | Value | | (Received) | | (Depreciation) |
| Underlying Instrument | | Rate (%) | | Frequency | | (%)(b) | | Date | | ($)(c) | | ($) | | ($) | | ($) |
| CDX N.A. High Yield Index, | | | | | | | | | | | | | | | | | | | | |
| Series 31 | | 5.00 | | Daily | | 3.73 | | 12/20/23 | | 75,000 | | 4,005 | | | 3,637 | | | | 368 | |
| | | | | | | | | | | | 4,005 | | | 3,637 | | | | 368 | |
| (a) | When a credit event occurs as defined under the terms of the swap agreement, the Fund as a seller of credit protection will either (i) pay to the buyer of protection an amount equal to the par value of the defaulted reference entity and take delivery of the reference entity or (ii) pay a net amount equal to the par value of the defaulted reference entity less its recovery value. Alternatively, the Fund as a buyer of credit protection will either (i) receive from the seller of protection an amount equal to the par value of the defaulted reference entity and deliver the reference entity to the seller or (ii) receive a net amount equal to the par value of the defaulted reference entity less its recovery value. |
| (b) | Implied credit spread, represented in absolute terms, utilized in determining the fair value of the credit default swap agreements as of period end serve as an indicator of the current status of the payment/performance risk and represents the likelihood or risk of default for the credit derivative. The implied credit spread of a referenced entity reflects the cost of buying/selling protection and may include upfront or daily payments required to be made to enter into the agreement. Generally, wider credit spreads represent a perceived deterioration of the referenced entity’s credit soundness and a greater likelihood or risk of default or other credit event occurring as defined under the terms of the swap agreement. |
| (c) | The notional amount represents the maximum potential amount of future payments that the Fund may receive as a buyer of credit protection if a credit event occurs, as defined under the terms of the swap agreement. Alternatively, the notional amount represents the maximum potential amount of payment the Fund could be required to make as a seller of credit protection if a credit event occurs, as defined under the terms of the swap agreement. |
| ** | As of October 31, 2018, the CDX Emerging Markets Index, Series 25 included securities which had defaulted and represented 5% of the Index. |
| ** | Reflects the notional amount after the default of securities. |
Forward Currency Exchange Contracts - Short Contracts
| | | | | | | | | | | | Net Unrealized |
| | | | | | | | | | | | Appreciation/ |
| Description and amount of | | | | Description and amount of | | | | Settlement | | (Depreciation) |
| currency to be purchased | | | | currency to be sold | | Counterparty | | Date | | ($) |
| U.S. Dollar | | 6,207,400 | | European Euro | | 5,350,400 | | UBS AG | | 11/2/18 | | | | 148,606 | | |
| U.S. Dollar | | 6,066,675 | | European Euro | | 5,350,000 | | UBS AG | | 12/4/18 | | | | (8,855 | ) | |
| | | | | | | | | | | | | | 139,751 | | |
| | | | | | | | | | | | | |
| | | | | | Total unrealized appreciation | | | $ | 148,606 | | |
| | | | | | Total unrealized depreciation | | | | (8,855 | ) | |
| | | | | | Total net unrealized appreciation/(depreciation) | | | $ | 139,751 | | |
| 52 | HSBC FAMILY OF FUNDS | See notes to financial statements. |
HSBC FAMILY OF FUNDS
Statements of Assets and Liabilities – as of October 31, 2018
| | | | | | HSBC |
| | HSBC | | HSBC | | Asia ex-Japan |
| | Emerging | | Frontier | | Smaller |
| | Markets | | Markets | | Companies |
| | Debt Fund | | Fund | | Equity Fund |
| Assets: | | | | | | | | | | | | | | | |
| Investment in securities, at value | | | $ | 46,073,027 | | | | $ | 14,055,173 | | | | $ | 77,429,963 | |
| Foreign currency, at value | | | | 1,163,584 | | | | | 74,165 | | | | | 930,800 | |
| Cash held as collateral at brokers for futures contracts | | | | 8,677 | | | | | — | | | | | — | |
| Cash held as collateral at brokers for centrally cleared swaps | | | | 727,338 | | | | | — | | | | | — | |
| Unrealized appreciation on forward foreign currency exchange contracts | | | | 217,829 | | | | | — | | | | | — | |
| Swap agreements, at value | | | | 18,468 | | | | | — | | | | | — | |
| Interest and dividends receivable | | | | 644,476 | | | | | 12,274 | | | | | 94,741 | |
| Receivable for capital shares issued | | | | 2 | | | | | 131,400 | | | | | — | |
| Receivable for investments sold | | | | 646,544 | | | | | 66,586 | | | | | 722,195 | |
| Reclaims receivable | | | | 40,290 | | | | | 30,746 | | | | | — | |
| Receivable for foreign capital gains tax | | | | — | | | | | — | | | | | 1,401 | |
| Receivable from Investment Adviser | | | | 57,303 | | | | | 60,885 | | | | | 34,755 | |
| Variation margin on futures contracts | | | | 5,500 | | | | | — | | | | | — | |
| Variation margin on centrally cleared swap agreements | | | | 938 | | | | | — | | | | | — | |
| Prepaid expenses and other assets | | | | 11,003 | | | | | 15,472 | | | | | 13,291 | |
| Total Assets | | | | 49,614,979 | | | | | 14,446,701 | | | | | 79,227,146 | |
| Liabilities: | | | | | | | | | | | | | | | |
| Unrealized depreciation on forward foreign currency exchange contracts | | | | 221,520 | | | | | — | | | | | — | |
| Swap agreements, at value | | | | 21,483 | | | | | — | | | | | — | |
| Payable for investments purchased | | | | — | | | | | — | | | | | 1,076,317 | |
| Payable for capital shares redeemed | | | | — | | | | | 128,850 | | | | | — | |
| Accrued foreign capital gains tax | | | | — | | | | | 570 | | | | | — | |
| Variation margin on futures contracts | | | | 4,375 | | | | | — | | | | | — | |
| Accrued expenses and other payables: | | | | | | | | | | | | | | | |
| Administration | | | | 1,662 | | | | | 467 | | | | | 2,694 | |
| Shareholder Servicing | | | | 116 | | | | | 925 | | | | | 58 | |
| Accounting | | | | 10,308 | | | | | 6,602 | | | | | 8,092 | |
| Custodian | | | | 12,869 | | | | | 30,391 | | | | | 68,310 | |
| Printing | | | | 4,460 | | | | | 6,842 | | | | | 10,812 | |
| Professional | | | | 45,349 | | | | | 37,667 | | | | | 49,167 | |
| Transfer Agent | | | | 35,720 | | | | | 43,698 | | | | | 2,448 | |
| Trustee | | | | 4,500 | | | | | 4,501 | | | | | 4,500 | |
| Other | | | | 3,619 | | | | | 17,246 | | | | | 10,710 | |
| Total Liabilities | | | | 365,981 | | | | | 277,759 | | | | | 1,233,108 | |
| Net Assets | | | $ | 49,248,998 | | | | $ | 14,168,942 | | | | $ | 77,994,038 | |
__________________
| Amounts designated as “—” are $ 0.00 or have been rounded to $ 0.00. |
| See notes to financial statements. | HSBC FAMILY OF FUNDS | 53 |
HSBC FAMILY OF FUNDS
Statements of Assets and Liabilities – as of October 31, 2018 (continued)
| | | | | | HSBC |
| | HSBC | | HSBC | | Asia ex-Japan |
| | Emerging | | Frontier | | Smaller |
| | Markets | | Markets | | Companies |
| | Debt Fund | | Fund | | Equity Fund |
| Composition of Net Assets: | | | | | | | | | | | | | | | |
| Paid in capital | | | $ | 57,311,938 | | | | $ | 42,235,902 | | | | $ | 103,288,139 | |
| Total distributable earnings/(loss) | | | | (8,062,940 | ) | | | | (28,066,960 | ) | | | | (25,294,101 | ) |
| Net Assets | | | $ | 49,248,998 | | | | $ | 14,168,942 | | | | $ | 77,994,038 | |
| | | | | | | | | | | | | | | | |
| Net Assets: | | | | | | | | | | | | | | | |
| Class A Shares | | | $ | 1,557,724 | | | | $ | 4,342,378 | | | | $ | 217,784 | |
| Class I Shares | | | | 47,691,274 | | | | | 9,826,564 | | | | | 77,776,254 | |
| �� Total | | | $ | 49,248,998 | | | | $ | 14,168,942 | | | | $ | 77,994,038 | |
| Shares Outstanding: | | | | | | | | | | | | | | | |
| ($ 0.001 par value, unlimited number of shares authorized): | | | | | | | | | | | | | | | |
| Class A Shares | | | | 169,590 | | | | | 382,171 | | | | | 23,514 | |
| Class I Shares | | | | 5,202,798 | | | | | 859,025 | | | | | 8,376,608 | |
| Net Asset Value, Offering Price and Redemption Price per share: | | | | | | | | | | | | | | | |
| Class A Shares | | | $ | 9.19 | | | | $ | 11.36 | | | | $ | 9.26 | |
| Class I Shares | | | $ | 9.17 | | | | $ | 11.44 | | | | $ | 9.28 | |
| Maximum Sales Charge: | | | | | | | | | | | | | | | |
| Class A Shares | | | | 4.75 | % | | | | 5.00 | % | | | | 5.00 | % |
| Maximum Offering Price per share | | | | | | | | | | | | | | | |
| (Net Asset Value / (100%-maximum sales charge)) | | | | | | | | | | | | | | | |
| Class A Shares | | | $ | 9.65 | | | | $ | 11.96 | | | | $ | 9.75 | |
| Investments in securities, at cost | | | $ | 51,543,168 | | | | $ | 16,544,509 | | | | $ | 95,833,787 | |
| Foreign currency, at cost | | | $ | 1,244,366 | | | | $ | 74,120 | | | | $ | 932,623 | |
| 54 | HSBC FAMILY OF FUNDS | See notes to financial statements. |
HSBC FAMILY OF FUNDS
Statements of Assets and Liabilities – as of October 31, 2018 (continued)
| | HSBC | | HSBC |
| | Global | | Global |
| | High Yield | | High Income |
| | Bond Fund | | Bond Fund |
| Assets: | | | | | | | | | | |
| Investment in securities, at value | | | $ | 29,547,684 | | | | $ | 26,762,032 | |
| Foreign currency, at value | | | | 146,434 | | | | | 49,200 | |
| Cash held as collateral at brokers for futures contracts | | | | 2,119 | | | | | 4,448 | |
| Cash held as collateral at brokers for centrally cleared swaps | | | | 10,371 | | | | | 3,889 | |
| Unrealized appreciation on forward foreign currency exchange contracts | | | | 114,005 | | | | | 148,606 | |
| Interest and dividends receivable | | | | 417,974 | | | | | 343,173 | |
| Receivable for investments sold | | | | 8,215 | | | | | 33,207 | |
| Receivable from Investment Adviser | | | | 19,844 | | | | | 24,637 | |
| Variation margin on futures contracts | | | | — | | | | | 1,031 | |
| Variation margin on centrally cleared swap agreements | | | | 578 | | | | | 217 | |
| Prepaid expenses and other assets | | | | 9,373 | | | | | 9,310 | |
| Total Assets | | | | 30,276,597 | | | | | 27,379,750 | |
| Liabilities: | | | | | | | | | | |
| Distributions payable | | | | 18,327 | | | | | 13,453 | |
| Unrealized depreciation on forward foreign currency exchange contracts | | | | 6,800 | | | | | 8,855 | |
| Swap agreements, at value | | | | 1,819 | | | | | 3,606 | |
| Payable for investments purchased | | | | 65,163 | | | | | 22,979 | |
| Variation margin on futures contracts | | | | 1,031 | | | | | 1,219 | |
| Accrued expenses and other payables: | | | | | | | | | | |
| Administration | | | | 995 | | | | | 898 | |
| Shareholder Servicing | | | | 496 | | | | | 28 | |
| Accounting | | | | 9,886 | | | | | 11,706 | |
| Custodian | | | | 920 | | | | | 3,800 | |
| Printing | | | | 3,214 | | | | | 2,958 | |
| Professional | | | | 45,282 | | | | | 45,282 | |
| Transfer Agent | | | | 1,173 | | | | | 1,011 | |
| Trustee | | | | 4,500 | | | | | 4,500 | |
| Other | | | | 873 | | | | | 1,155 | |
| Total Liabilities | | | | 160,479 | | | | | 121,450 | |
| Net Assets | | | $ | 30,116,118 | | | | $ | 27,258,300 | |
____________________
Amounts designated as “—” are $0.00 or have been rounded to $0.00.
| See notes to financial statements. | HSBC FAMILY OF FUNDS | 55 |
HSBC FAMILY OF FUNDS
Statements of Assets and Liabilities – as of October 31, 2018 (continued)
| | | HSBC | | HSBC |
| | Global | | Global |
| | High Yield | | High Income |
| | Bond Fund | | Bond Fund |
| Composition of Net Assets: | | | | | | | | | | | | |
| Paid in capital | | | $ | 30,892,113 | | | | | $ | 27,443,288 | | |
| Total distributable earnings/(loss) | | | | (775,995 | ) | | | | | (184,988 | ) | |
| Net Assets | | | $ | 30,116,118 | | | | | $ | 27,258,300 | | |
| | | | | | | | | | | | | |
| Net Assets: | | | | | | | | | | | | |
| Class A Shares | | | $ | 2,401,682 | | | | | $ | 118,144 | | |
| Class I Shares | | | | 27,714,436 | | | | | | 27,140,156 | | |
| Total | | | $ | 30,116,118 | | | | | $ | 27,258,300 | | |
| Shares Outstanding: | | | | | | | | | | | | |
| ($ 0.001 par value, unlimited number of shares authorized): | | | | | | | | | | | | |
| Class A Shares | | | | 247,864 | | | | | | 11,964 | | |
| Class I Shares | | | | 2,851,210 | | | | | | 2,735,423 | | |
| Net Asset Value, Offering Price and Redemption Price per share: | | | | | | | | | | | | |
| Class A Shares | | | $ | 9.69 | | | | | $ | 9.88 | | |
| Class I Shares | | | $ | 9.72 | | | | | $ | 9.92 | | |
| Maximum Sales Charge: | | | | | | | | | | | | |
| Class A Shares | | | | 4.75% | | | | | | 4.75% | | |
| Maximum Offering Price per share | | | | | | | | | | | | |
| (Net Asset Value / (100%-maximum sales charge)) | | | | | | | | | | | | |
| Class A Shares | | | $ | 10.17 | | | | | $ | 10.37 | | |
| Investments in securities, at cost | | | $ | 30,473,638 | | | | | $ | 27,391,749 | | |
| Foreign currency, at cost | | | $ | 148,177 | | | | | $ | 50,009 | | |
| 56 | HSBC FAMILY OF FUNDS | See notes to financial statements. |
HSBC FAMILY OF FUNDS
Statements of Operations – For the year ended October 31, 2018
| | | | | | | | | | | | | | HSBC |
| | HSBC | | HSBC | | Asia ex-Japan |
| | Emerging | | Frontier | | Smaller |
| | Markets Debt | | Markets | | Companies Equity |
| | Fund | | Fund | | Fund |
| Investment Income: | | | | | | | | | | | | | | | | | | |
| Interest | | | $ | 2,881,888 | | | | | $ | 1,109 | | | | | $ | 1,715 | | |
| Dividends | | | | 25,514 | | | | | | 877,475 | | | | | | 1,780,074 | | |
| Foreign tax withholding | | | | (73,068 | ) | | | | | (38,318 | ) | | | | | (165,213 | ) | |
| Total Investment Income | | | | 2,834,334 | | | | | | 840,266 | | | | | | 1,616,576 | | |
| Expenses: | | | | | | | | | | | | | | | | | | |
| Investment Management | | | | 267,521 | | | | | | 343,951 | | | | | | 552,089 | | |
| Operational Support: | | | | | | | | | | | | | | | | | | |
| Class A Shares | | | | 1,636 | | | | | | 7,193 | | | | | | 862 | | |
| Administration: | | | | | | | | | | | | | | | | | | |
| Class A Shares | | | | 636 | | | | | | 2,799 | | | | | | 331 | | |
| Class I Shares | | | | 20,157 | | | | | | 7,880 | | | | | | 21,208 | | |
| Shareholder Servicing: | | | | | | | | | | | | | | | | | | |
| Class A Shares | | | | 1,393 | | | | | | 17,950 | | | | | | 1,852 | | |
| Accounting | | | | 92,136 | | | | | | 54,565 | | | | | | 68,399 | | |
| Compliance Services | | | | 28,431 | | | | | | 28,431 | | | | | | 28,431 | | |
| Custodian | | | | 82,952 | | | | | | 201,866 | | | | | | 260,519 | | |
| Printing | | | | 20,883 | | | | | | 17,757 | | | | | | 13,478 | | |
| Professional | | | | 227,470 | | | | | | 176,302 | | | | | | 177,885 | | |
| Transfer Agent | | | | 188,577 | | | | | | 349,696 | | | | | | 16,977 | | |
| Trustee | | | | 72,444 | | | | | | 72,445 | | | | | | 72,431 | | |
| Registration fees | | | | 31,520 | | | | | | 29,938 | | | | | | 29,538 | | |
| Other | | | | 40,719 | | | | | | 60,748 | | | | | | 70,938 | | |
| Total expenses before fee and expense reductions | | | | 1,076,475 | | | | | | 1,371,521 | | | | | | 1,314,938 | | |
| Fees voluntarily reduced/reimbursed by Investment Adviser | | | | — | | | | | | (6,169 | ) | | | | | — | | |
| Fees contractually reduced/reimbursed by Investment Adviser | | | | (803,300 | ) | | | | | (878,299 | ) | | | | | (813,509 | ) | |
| Net Expenses | | | | 273,175 | | | | | | 487,053 | | | | | | 501,429 | | |
| | | | | | | | | | | | | | | | | | | |
| Net Investment Income | | | | 2,561,159 | | | | | | 353,213 | | | | | | 1,115,147 | | |
| | | | | | | | | | | | | | | | | | | |
| Realized/Unrealized Gains/(Losses) from Investments: | | | | | | | | | | | | | | | | | | |
| Net realized gains/(losses) from investments in securities and | | | | | | | | | | | | | | | | | | |
| foreign currency translations (a) | | | | (959,863 | ) | | | | | 5,130,673 | | | | | | (7,892,051 | ) | |
| Net realized gains/(losses) from futures contracts | | | | 20,980 | | | | | | — | | | | | | — | | |
| Net realized gains/(losses) from forward foreign currency exchange contracts | | | | (292,337 | ) | | | | | — | | | | | | — | | |
| Net realized gains/(losses) from swap agreements | | | | (20,311 | ) | | | | | — | | | | | | — | | |
| Change in unrealized appreciation/depreciation on investments | | | | | | | | | | | | | | | | | | |
| in securities and foreign currency translations (b) | | | | (5,142,518 | ) | | | | | (8,540,176 | ) | | | | | (20,635,942 | ) | |
| Change in unrealized appreciation/depreciation on futures contracts | | | | (19,509 | ) | | | | | — | | | | | | — | | |
| Change in unrealized appreciation/depreciation on forward foreign | | | | | | | | | | | | | | | | | | |
| currency contracts | | | | 41,671 | | | | | | — | | | | | | — | | |
| Change in unrealized appreciation/depreciation on swap agreements | | | | (67,718 | ) | | | | | — | | | | | | — | | |
| Net realized/unrealized gains/(losses) on investments | | | | (6,439,605 | ) | | | | | (3,409,503 | ) | | | | | (28,527,993 | ) | |
| Change in Net Assets Resulting from Operations | | | $ | (3,878,446 | ) | | | | $ | (3,056,290 | ) | | | | $ | (27,412,846 | ) | |
____________________
Amounts designated as “—” are $0.00 or have been rounded to $0.00.
| (a) | For Frontier Markets Fund and Asia ex-Japan Smaller Companies Equity Fund, net of foreign capital gains taxes of $49,629 and $49,749, respectively. |
| (b) | For Emerging Markets Debt Fund, Frontier Markets Fund and Asia ex-Japan Smaller Companies Equity Fund, net of change in foreign capital gains taxes of $(6,959), $(36,564) and $(35,931), respectively. |
| See notes to financial statements. | HSBC FAMILY OF FUNDS | 57 |
HSBC FAMILY OF FUNDS
Statements of Operations – For the year ended October 31, 2018 (continued)
| | HSBC | | HSBC |
| | Global High | | Global High |
| | Yield Bond | | Income Bond |
| | Fund | | Fund |
| Investment Income: | | | | | | | | | | | | |
| Interest | | | $ | 1,561,961 | | | | | $ | 1,128,813 | | |
| Dividends | | | | 65,908 | | | | | | 19,090 | | |
| Foreign tax withholding | | | | (671 | ) | | | | | (6,021 | ) | |
| Total Investment Income | | | | 1,627,198 | | | | | | 1,141,882 | | |
| Expenses: | | | | | | | | | | | | |
| Investment Management | | | | 196,142 | | | | | | 180,112 | | |
| Operational Support: | | | | | | | | | | | | |
| Class A Shares | | | | 2,296 | | | | | | 225 | | |
| Administration: | | | | | | | | | | | | |
| Class A Shares | | | | 893 | | | | | | 88 | | |
| Class I Shares | | | | 10,837 | | | | | | 10,683 | | |
| Shareholder Servicing: | | | | | | | | | | | | |
| Class A Shares | | | | 5,479 | | | | | | 304 | | |
| Accounting | | | | 93,827 | | | | | | 112,340 | | |
| Compliance Services | | | | 28,431 | | | | | | 28,431 | | |
| Custodian | | | | 9,851 | | | | | | 17,455 | | |
| Printing | | | | 7,213 | | | | | | 6,212 | | |
| Professional | | | | 182,318 | | | | | | 182,304 | | |
| Transfer Agent | | | | 9,871 | | | | | | 8,970 | | |
| Trustee | | | | 72,430 | | | | | | 72,428 | | |
| Registration fees | | | | 28,774 | | | | | | 28,455 | | |
| Other | | | | 29,995 | | | | | | 28,744 | | |
| Total expenses before fee and expense reductions | | | | 678,357 | | | | | | 676,751 | | |
| Fees contractually reduced/reimbursed by Investment Adviser | | | | (428,942 | ) | | | | | (454,308 | ) | |
| Net Expenses | | | | 249,415 | | | | | | 222,443 | | |
| | | | | | | | | | | | | |
| Net Investment Income | | | | 1,377,783 | | | | | | 919,439 | | |
| | | | | | | | | | | | | |
| Realized/Unrealized Gains/(Losses) from Investments: | | | | | | | | | | | | |
| Net realized gains/(losses) from investments in securities and foreign | | | | | | | | | | | | |
| currency translations | | | | 214,624 | | | | | | 78,251 | | |
| Net realized gains/(losses) from futures contracts | | | | 8,605 | | | | | | (13,390 | ) | |
| Net realized gains/(losses) from forward foreign currency exchange contracts | | | | 275,362 | | | | | | 355,614 | | |
| Net realized gains/(losses) from swap agreements | | | | 86,828 | | | | | | (14,914 | ) | |
| Change in unrealized appreciation/depreciation on investments in | | | | | | | | | | | | |
| securities and foreign currency translations | | | | (2,080,264 | ) | | | | | (1,981,467 | ) | |
| Change in unrealized appreciation/depreciation on futures contracts | | | | (5,726 | ) | | | | | 1,060 | | |
| Change in unrealized appreciation/depreciation on forward foreign currency contracts | | | | 40,680 | | | | | | 45,987 | | |
| Change in unrealized appreciation/depreciation on swap agreements | | | | (61,722 | ) | | | | | 11,433 | | |
| Net realized/unrealized gains/(losses) on investments | | | | (1,521,613 | ) | | | | | (1,517,426 | ) | |
| Change in Net Assets Resulting from Operations | | | $ | (143,830 | ) | | | | $ | (597,987 | ) | |
| 58 | HSBC FAMILY OF FUNDS | See notes to financial statements. |
HSBC FAMILY OF FUNDS
Statements of Changes in Net Assets
| | HSBC Emerging | | HSBC Frontier |
| | Markets Debt Fund | | Markets Fund |
| | For the | | For the | | For the | | For the |
| | year ended | | year ended | | year ended | | year ended |
| | October 31, | | October 31, | | October 31, | | October 31, |
| | 2018 | | 2017 | | 2018 | | 2017 |
| Investment Activities: | | | | | | | | | | | | | | | | | | | | | | | | |
| Operations: | | | | | | | | | | | | | | | | | | | | | | | | |
| Net investment income/(loss) | | | $ | 2,561,159 | | | | | $ | 1,670,735 | | | | | $ | 353,213 | | | | | $ | 627,159 | | |
| Net realized gains/(losses) from investments | | | | (1,251,531 | ) | | | | | 274,792 | | | | | | 5,130,673 | | | | | | (1,141,141 | ) | |
| Change in unrealized appreciation/depreciation on investments | | | | (5,188,074 | ) | | | | | 424,092 | | | | | | (8,540,176 | ) | | | | | 8,390,721 | | |
| Change in net assets resulting from operations | | | | (3,878,446 | ) | | | | | 2,369,619 | | | | | | (3,056,290 | ) | | | | | 7,876,739 | | |
| | | | | | | | | | | | | | | | | | | | | | | | | |
| Distributions to shareholders: | | | | | | | | | | | | | | | | | | | | | | | | |
| Class A Shares | | | | (60,410 | ) | | | | | (51,279 | ) | | | | | (54,857 | ) | | | | | (130,080 | ) | |
| Class I Shares | | | | (2,000,196 | ) | | | | | (1,700,117 | ) | | | | | (335,337 | ) | | | | | (853,448 | ) | |
| Tax return of capital: | | | | | | | | | | | | | | | | | | | | | | | | |
| Class A Shares | | | | (5,236 | ) | | | | | — | | | | | | — | | | | | | — | | |
| Class I Shares | | | | (173,381 | ) | | | | | — | | | | | | — | | | | | | — | | |
| Change in net assets resulting from distributions to shareholders | | | | (2,239,223 | ) | | | | | (1,751,396 | ) | | | | | (390,194 | ) | | | | | (983,528 | ) | |
| Change in net assets resulting from capital transactions | | | | 358,362 | | | | | | 43,518,129 | | | | | | (28,944,038 | ) | | | | | (9,609,674 | ) | |
| Change in net assets | | | | (5,759,307 | ) | | | | | 44,136,352 | | | | | | (32,390,522 | ) | | | | | (2,716,463 | ) | |
| | | | | | | | | | | | | | | | | | | | | | | | | |
| Net Assets: | | | | | | | | | | | | | | | | | | | | | | | | |
| Beginning of period | | | | 55,008,305 | | | | | | 10,871,953 | | | | | | 46,559,464 | | | | | | 49,275,927 | | |
| End of period | | | $ | 49,248,998 | | | | | $ | 55,008,305 | | | | | $ | 14,168,942 | | | | | $ | 46,559,464 | | |
| See notes to financial statements. | HSBC FAMILY OF FUNDS | 59 |
HSBC FAMILY OF FUNDS
Statements of Changes in Net Assets (continued)
| | HSBC Emerging | | HSBC Frontier |
| | Markets Debt Fund | | Markets Fund |
| | For the | | For the | | For the | | For the |
| | year ended | | year ended | | year ended | | year ended |
| | October 31, | | October 31, | | October 31, | | October 31, |
| | 2018 | | 2017 | | 2018 | | 2017 |
| CAPITAL TRANSACTIONS: | | | | | | | | | | | | | | | | | | | | | | | | |
| Class A Shares: | | | | | | | | | | | | | | | | | | | | | | | | |
| Proceeds from shares issued | | | $ | 116,534 | | | | | $ | 127,899 | | | | | $ | 1,874,481 | | | | | $ | 1,967,929 | | |
| Proceeds from merger (Note 9) | | | | — | | | | | | 1,104,162 | | | | | | — | | | | | | — | | |
| Dividends reinvested | | | | 59,490 | | | | | | 47,154 | | | | | | 44,239 | | | | | | 110,103 | | |
| Value of shares redeemed | | | | (65,475 | ) | | | | | (113,606 | ) | | | | | (4,902,875 | ) | | | | | (1,725,833 | ) | |
| Class A Shares capital transactions | | | | 110,549 | | | | | | 1,165,609 | | | | | | (2,984,155 | ) | | | | | 352,199 | | |
| | | | | | | | | | | | | | | | | | | | | | | | | |
| Class I Shares: | | | | | | | | | | | | | | | | | | | | | | | | |
| Proceeds from shares issued | | | | 1,384,379 | | | | | | 1,262,718 | | | | | | 6,391,802 | | | | | | 8,242,571 | | |
| Proceeds from merger (Note 9) | | | | — | | | | | | 49,003,085 | | | | | | — | | | | | | — | | |
| Dividends reinvested | | | | 1,859,539 | | | | | | 1,487,387 | | | | | | 154,122 | | | | | | 248,085 | | |
| Value of shares redeemed | | | | (2,996,105 | ) | | | | | (9,400,670 | ) | | | | | (32,505,807 | ) | | | | | (18,452,529 | ) | |
| Class I Shares capital transactions | | | | 247,813 | | | | | | 42,352,520 | | | | | | (25,959,883 | ) | | | | | (9,961,873 | ) | |
| Change in net assets resulting from capital transactions | | | $ | 358,362 | | | | | $ | 43,518,129 | | | | | $ | (28,944,038 | ) | | | | $ | (9,609,674 | ) | |
| | | | | | | | | | | | | | | | | | | | | | | | | |
| SHARE TRANSACTIONS: | | | | | | | | | | | | | | | | | | | | | | | | |
| Class A Shares: | | | | | | | | | | | | | | | | | | | | | | | | |
| Issued | | | | 11,588 | | | | | | 12,171 | | | | | | 146,955 | | | | | | 148,167 | | |
| Proceeds from merger (Note 9) | | | | — | | | | | | 108,147 | | | | | | — | | | | | | — | | |
| Reinvested | | | | 5,855 | | | | | | 4,544 | | | | | | 3,167 | | | | | | 9,549 | | |
| Redeemed | | | | (6,491 | ) | | | | | (11,224 | ) | | | | | (383,470 | ) | | | | | (134,146 | ) | |
| Change in Class A Shares | | | | 10,952 | | | | | | 113,638 | | | | | | (233,348 | ) | | | | | 23,570 | | |
| | | | | | | | | | | | | | | | | | | | | | | | | |
| Class I Shares: | | | | | | | | | | | | | | | | | | | | | | | | |
| Issued | | | | 137,691 | | | | | | 126,794 | | | | | | 450,786 | | | | | | 619,935 | | |
| Proceeds from merger (Note 9) | | | | — | | | | | | 4,823,546 | | | | | | — | | | | | | — | | |
| Reinvested | | | | 183,529 | | | | | | 143,748 | | | | | | 10,993 | | | | | | 21,461 | | |
| Redeemed | | | | (303,105 | ) | | | | | (926,213 | ) | | | | | (2,274,757 | ) | | | | | (1,480,772 | ) | |
| Change in Class I Shares | | | | 18,115 | | | | | | 4,167,875 | | | | | | (1,812,978 | ) | | | | | (839,376 | ) | |
____________________
| Amounts designated as “—” are $0.00 or have been rounded to $0.00. |
| 60 HSBC FAMILY OF FUNDS | See notes to financial statements. |
HSBC FAMILY OF FUNDS
Statements of Changes in Net Assets (continued)
| | HSBC Asia ex-Japan Smaller | | HSBC Global |
| | Companies Equity Fund | | High Yield Bond Fund |
| | For the | | For the | | For the | | For the |
| | year ended | | year ended | | year ended | | year ended |
| | October 31, | | October 31, | | October 31, | | October 31, |
| | 2018 | | 2017 | | 2018 | | 2017 |
| Investment Activities: | | | | | | | | | | | | | | | | | | | | | | | | |
| Operations: | | | | | | | | | | | | | | | | | | | | | | | | |
| Net investment income/(loss) | | | $ | 1,115,147 | | | | | $ | 146,157 | | | | | $ | 1,377,783 | | | | | $ | 1,291,648 | | |
| Net realized gains/(losses) from investments | | | | (7,892,051 | ) | | | | | 1,739,607 | | | | | | 585,419 | | | | | | (15,382 | ) | |
| Change in unrealized appreciation/depreciation on investments | | | | (20,635,942 | ) | | | | | 1,210,035 | | | | | | (2,107,032 | ) | | | | | 914,110 | | |
| Change in net assets resulting from operations | | | | (27,412,846 | ) | | | | | 3,095,799 | | | | | | (143,830 | ) | | | | | 2,190,376 | | |
| | | | | | | | | | | | | | | | | | | | | | | | | |
| Distributions to shareholders: | | | | | | | | | | | | | | | | | | | | | | | | |
| Class A Shares | | | | (112,055 | ) | | | | | (1,937 | ) | | | | | (107,796 | ) | | | | | (74,068 | ) | |
| Class I Shares | | | | (1,771,541 | ) | | | | | (161,034 | ) | | | | | (1,389,290 | ) | | | | | (1,287,782 | ) | |
| Class S Shares * | | | | — | | | | | | (1,732 | ) | | | | | — | | | | | | — | | |
| Change in net assets resulting from distributions to shareholders | | | | (1,883,596 | ) | | | | | (164,703 | ) | | | | | (1,497,086 | ) | | | | | (1,361,850 | ) | |
| Change in net assets resulting from capital transactions | | | | 92,207,799 | | | | | | 743,930 | | | | | | 1,667,615 | | | | | | 2,535,293 | | |
| Change in net assets | | | | 62,911,357 | | | | | | 3,675,026 | | | | | | 26,699 | | | | | | 3,363,819 | | |
| | | | | | | | | | | | | | | | | | | | | | | | | |
| Net Assets: | | | | | | | | | | | | | | | | | | | | | | | | |
| Beginning of period | | | | 15,082,681 | | | | | | 11,407,655 | | | | | | 30,089,419 | | | | | | 26,725,600 | | |
| End of period | | | $ | 77,994,038 | | | | | $ | 15,082,681 | | | | | $ | 30,116,118 | | | | | $ | 30,089,419 | | |
____________________
Amounts designated as “—” are $0.00 or have been rounded to $0.00.
|
| * Class S Shares were liquidated on February 23, 2017 for Asia ex-Japan Smaller Companies Equity Fund and are no longer offered. |
| See notes to financial statements. | HSBC FAMILY OF FUNDS 61 |
HSBC FAMILY OF FUNDS
Statements of Changes in Net Assets (continued)
| | HSBC Asia ex-Japan Smaller | | HSBC Global |
| | | Companies Equity Fund | | High Yield Bond Fund |
| | For the | | For the | | For the | | For the |
| | year ended | | year ended | | year ended | | year ended |
| | October 31, | | October 31, | | October 31, | | October 31, |
| | 2018 | | 2017 | | 2018 | | 2017 |
| CAPITAL TRANSACTIONS: | | | | | | | | | | | | | | | | | | | | | | | | |
| Class A Shares: | | | | | | | | | | | | | | | | | | | | | | | | |
| Proceeds from shares issued | | | $ | 684,422 | | | | | $ | 615,785 | | | | | $ | 503,745 | | | | | $ | 1,424,531 | | |
| Dividends reinvested | | | | 111,779 | | | | | | 1,744 | | | | | | 105,282 | | | | | | 72,813 | | |
| Value of shares redeemed | | | | (1,276,414 | ) | | | | | (21,911 | ) | | | | | (129,960 | ) | | | | | (59,691 | ) | |
| Class A Shares capital transactions | | | | (480,213 | ) | | | | | 595,618 | | | | | | 479,067 | | | | | | 1,437,653 | | |
| | | | | | | | | | | | | | | | | | | | | | | | | |
| Class I Shares: | | | | | | | | | | | | | | | | | | | | | | | | |
| Proceeds from shares issued | | | | 111,041,520 | | | | | | 128,538 | | | | | | — | | | | | | — | | |
| Dividends reinvested | | | | 1,739,594 | | | | | | 136,787 | | | | | | 1,188,548 | | | | | | 1,097,640 | | |
| Value of shares redeemed | | | | (20,093,102 | ) | | | | | — | | | | | | — | | | | | | — | | |
| Class I Shares capital transactions | | | | 92,688,012 | | | | | | 265,325 | | | | | | 1,188,548 | | | | | | 1,097,640 | | |
| | | | | | | | | | | | | | | | | | | | | | | | | |
| Class S Shares: * | | | | | | | | | | | | | | | | | | | | | | | | |
| Dividends reinvested | | | | — | | | | | | 1,472 | | | | | | — | | | | | | — | | |
| Value of shares redeemed | | | | — | | | | | | (118,485 | ) | | | | | — | | | | | | — | | |
| Class S Shares capital transactions | | | | — | | | | | | (117,013 | ) | | | | | — | | | | | | — | | |
| Change in net assets resulting from capital transactions | | | $ | 92,207,799 | | | | | $ | 743,930 | | | | | $ | 1,667,615 | | | | | $ | 2,535,293 | | |
| | | | | | | | | | | | | | | | | | | | | | | | | |
| SHARE TRANSACTIONS: | | | | | | | | | | | | | | | | | | | | | | | | |
| Class A Shares: | | | | | | | | | | | | | | | | | | | | | | | | |
| Issued | | | | 54,479 | | | | | | 50,504 | | | | | | 50,036 | | | | | | 142,914 | | |
| Reinvested | | | | 9,253 | | | | | | 170 | | | | | | 10,601 | | | | | | 7,265 | | |
| Redeemed | | | | (105,405 | ) | | | | | (1,838 | ) | | | | | (12,981 | ) | | | | | (5,928 | ) | |
| Change in Class A Shares | | | | (41,673 | ) | | | | | 48,836 | | | | | | 47,656 | | | | | | 144,251 | | |
| | | | | | | | | | | | | | | | | | | | | | | | | |
| Class I Shares: | | | | | | | | | | | | | | | | | | | | | | | | |
| Issued | | | | 9,033,251 | | | | | | 11,282 | | | | | | — | | | | | | — | | |
| Reinvested | | | | 144,006 | | | | | | 13,384 | | | | | | 119,271 | | | | | | 109,281 | | |
| Redeemed | | | | (1,831,557 | ) | | | | | — | | | | | | — | | | | | | — | | |
| Change in Class I Shares | | | | 7,345,700 | | | | | | 24,666 | | | | | | 119,271 | | | | | | 109,281 | | |
| | | | | | | | | | | | | | | | | | | | | | | | | |
| Class S Shares: * | | | | | | | | | | | | | | | | | | | | | | | | |
| Reinvested | | | | — | | | | | | 144 | | | | | | — | | | | | | — | | |
| Redeemed | | | | — | | | | | | (10,352 | ) | | | | | — | | | | | | — | | |
| Change in Class S Shares | | | | — | | | | | | (10,208 | ) | | | | | — | | | | | | — | | |
____________________
Amounts designated as “—” are $0.00 or have been rounded to $0.00.
|
| * Class S Shares were liquidated on February 23, 2017 for Asia ex-Japan Smaller Companies Equity Fund and are no longer offered. |
| 62 HSBC FAMILY OF FUNDS | See notes to financial statements. |
HSBC FAMILY OF FUNDS
Statements of Changes in Net Assets (continued)
| | HSBC Global High |
| | Income Bond Fund |
| | For the | | For the |
| | year ended | | year ended |
| | October 31, | | October 31, |
| | 2018 | | 2017 |
| Investment Activities: | | | | | | | | | | | | |
| Operations: | | | | | | | | | | | | |
| Net investment income/(loss) | | | $ | 919,439 | | | | | $ | 871,520 | | |
| Net realized gains/(losses) from investments | | | | 405,561 | | | | | | (120,648 | ) | |
| Change in unrealized appreciation/depreciation on investments | | | | (1,922,987 | ) | | | | | 748,983 | | |
| Change in net assets resulting from operations | | | | (597,987 | ) | | | | | 1,499,855 | | |
| | | | | | | | | | | | | |
| Distributions to shareholders: | | | | | | | | | | | | |
| Class A Shares | | | | (6,841 | ) | | | | | (7,186 | ) | |
| Class I Shares | | | | (943,491 | ) | | | | | (863,926 | ) | |
| Change in net assets resulting from distributions to shareholders | | | | (950,332 | ) | | | | | (871,112 | ) | |
| Change in net assets resulting from capital transactions | | | | 638,556 | | | | | | 927,563 | | |
| Change in net assets | | | | (909,763 | ) | | | | | 1,556,306 | | |
| | | | | | | | | | | | | |
| Net Assets: | | | | | | | | | | | | |
| Beginning of period | | | | 28,168,063 | | | | | | 26,611,757 | | |
| End of period | | | $ | 27,258,300 | | | | | $ | 28,168,063 | | |
| See notes to financial statements. | HSBC FAMILY OF FUNDS 63 |
HSBC FAMILY OF FUNDS
Statements of Changes in Net Assets (continued)
| | HSBC Global High |
| | Income Bond Fund |
| | For the | | For the |
| | year ended | | year ended |
| | October 31, | | October 31, |
| | 2018 | | 2017 |
| CAPITAL TRANSACTIONS: | | | | | | | | | | | | |
| Class A Shares: | | | | | | | | | | | | |
| Proceeds from shares issued | | | $ | 1,210 | | | | | $ | 169,516 | | |
| Dividends reinvested | | | | 6,334 | | | | | | 6,687 | | |
| Value of shares redeemed | | | | (167,569 | ) | | | | | — | | |
| Class A Shares capital transactions | | | | (160,025 | ) | | | | | 176,203 | | |
| | | | | | | | | | | | | |
| Class I Shares: | | | | | | | | | | | | |
| Proceeds from shares issued | | | | — | | | | | | 40,029 | | |
| Dividends reinvested | | | | 806,095 | | | | | | 737,268 | | |
| Value of shares redeemed | | | | (7,514 | ) | | | | | (25,937 | ) | |
| Class I Shares capital transactions | | | | 798,581 | | | | | | 751,360 | | |
| Change in net assets resulting from capital transactions | | | $ | 638,556 | | | | | $ | 927,563 | | |
| | | | | | | | | | | | | |
| SHARE TRANSACTIONS: | | | | | | | | | | | | |
| Class A Shares: | | | | | | | | | | | | |
| Issued | | | | 119 | | | | | | 16,850 | | |
| Reinvested | | | | 622 | | | | | | 661 | | |
| Redeemed | | | | (16,730 | ) | | | | | — | | |
| Change in Class A Shares | | | | (15,989 | ) | | | | | 17,511 | | |
| | | | | | | | | | | | | |
| Class I Shares: | | | | | | | | | | | | |
| Issued | | | | — | | | | | | 3,881 | | |
| Reinvested | | | | 79,251 | | | | | | 72,746 | | |
| Redeemed | | | | (717 | ) | | | | | (2,558 | ) | |
| Change in Class I Shares | | | | 78,534 | | | | | | 74,069 | | |
____________________
| Amounts designated as “—” are $0.00 or have been rounded to $0.00. |
| 64 HSBC FAMILY OF FUNDS | See notes to financial statements. |
| HSBC EMERGING MARKETS DEBT FUND |
| Financial Highlights |
Selected data for a share outstanding throughout the periods indicated.
| | | | Investment Activities | | Distributions | | | | | | Ratios/Supplementary Data |
| | Net Asset
Value,
Beginning
of Period | | Net
Investment
Income/
(Loss) | | Net Realized
and
Unrealized
Gains/
(Losses) from
Investments | | Total from
Investment
Activities | | Net
Investment
Income | | Net Realized
Gains from
Investment
Transactions | | Return
of
Capital | | Total
Distributions | | Net Asset
Value, End
of Period | | Total
Return(a) | | Net
Assets
at End of
Period
(000’s) | | Ratio of Net
Expenses to
Average Net
Assets | | Ratio of Net
Investment
Income/
(Loss) to
Average Net
Assets | | Ratio of
Expenses
to Average
Net Assets
(Excluding Fee
Reductions) | | Portfolio
Turnover
(b) |
| CLASS A SHARES | | | | | | | | | | | | | | | | | | | | | | | | | | | | | | |
| Year Ended October 31, 2018 | | $ | 10.34 | | | $ | 0.44 | (c) | | $ | (1.18 | ) | | $ | (0.74 | ) | | $ | (0.38 | ) | | $ | — | | | $ | (0.03 | ) | | $ | (0.41 | ) | | $ | 9.19 | | | (7.51 | )% | | $ | 1,558 | | | 0.85 | % | | 4.45 | % | | 2.20 | % | | 53 | % |
| Year Ended October 31, 2017 | | | 10.29 | | | | 0.45 | (c) | | | 0.08 | | | | 0.53 | | | | (0.48 | ) | | | — | | | | — | | | | (0.48 | ) | | | 10.34 | | | 5.29 | % | | | 1,640 | | | 0.85 | % | | 4.33 | % | | 1.83 | % | | 50 | % |
| Year Ended October 31, 2016 | | | 9.89 | | | | 0.35 | (c) | | | 0.54 | | | | 0.89 | | | | (0.49 | ) | | | — | | | | — | | | | (0.49 | ) | | | 10.29 | | | 9.36 | % | | | 463 | | | 1.07 | % | | 3.55 | % | | 3.13 | % | | 91 | % |
| Year Ended October 31, 2015 | | | 10.37 | | | | 0.37 | (c) | | | (0.42 | ) | | | (0.05 | ) | | | (0.43 | ) | | | — | | | | — | | | | (0.43 | ) | | | 9.89 | | | (0.52 | )% | | | 742 | | | 1.20 | % | | 3.64 | % | | 1.84 | % | | 90 | % |
| Year Ended October 31, 2014 | | | 10.42 | | | | 0.37 | | | | 0.13 | | | | 0.50 | | | | (0.39 | ) | | | (0.16 | ) | | | — | | | | (0.55 | ) | | | 10.37 | | | 5.07 | % | | | 1,195 | | | 1.20 | % | | 3.59 | % | | 1.51 | % | | 51 | % |
| CLASS I SHARES | | | | | | | | | | | | | | | | | | | | | | | | | | | | | | | | | | | | | | | | | | | | | | | | | | | | | | | |
| Year Ended October 31, 2018 | | | 10.29 | | | | 0.48 | (c) | | | (1.18 | ) | | | (0.70 | ) | | | (0.39 | ) | | | — | | | | (0.03 | ) | | | (0.42 | ) | | | 9.17 | | | (7.14 | )% | | | 47,691 | | | 0.50 | % | | 4.80 | % | | 2.01 | % | | 53 | % |
| Year Ended October 31, 2017 | | | 10.24 | | | | 0.49 | (c) | | | 0.06 | | | | 0.55 | | | | (0.50 | ) | | | — | | | | — | | | | (0.50 | ) | | | 10.29 | | | 5.57 | % | | | 53,368 | | | 0.50 | % | | 4.68 | % | | 1.54 | % | | 50 | % |
| Year Ended October 31, 2016 | | | 9.91 | | | | 0.39 | (c) | | | 0.54 | | | | 0.93 | | | | (0.60 | ) | | | — | | | | — | | | | (0.60 | ) | | | 10.24 | | | 9.70 | % | | | 10,409 | | | 0.70 | % | | 3.90 | % | | 2.83 | % | | 91 | % |
| Year Ended October 31, 2015 | | | 10.39 | | | | 0.40 | (c) | | | (0.41 | ) | | | (0.01 | ) | | | (0.47 | ) | | | — | | | | — | | | | (0.47 | ) | | | 9.91 | | | (0.11 | )% | | | 11,267 | | | 0.85 | % | | 3.97 | % | | 1.29 | % | | 90 | % |
| Year Ended October 31, 2014 | | | 10.44 | | | | 0.41 | | | | 0.13 | | | | 0.54 | | | | (0.43 | ) | | | (0.16 | ) | | | — | | | | (0.59 | ) | | | 10.39 | | | 5.43 | % | | | 40,839 | | | 0.85 | % | | 3.99 | % | | 1.16 | % | | 51 | % |
| (a) | Total return calculations do not include any sales or redemption charges. |
| (b) | Portfolio turnover is calculated on the basis of the Fund as a whole without distinguishing between the classes of shares issued. |
| (c) | Calculated based on average shares outstanding. |
| Amounts designated as “—“ are $ 0.00 or have been rounded to $ 0.00. |
| See notes to financial statements. | HSBC FAMILY OF FUNDS 65 |
| HSBC FRONTIER MARKETS FUND |
| Financial Highlights |
Selected data for a share outstanding throughout the periods indicated.
| | | | Investment Activities | | Distributions | | | | | | Ratios/Supplementary Data |
| | | Net Asset
Value,
Beginning
of Period | | Net
Investment
Income/
(Loss)(a) | | Net Realized
and
Unrealized
Gains/
(Losses) from
Investments | | Total from
Investment
Activities | | Net
Investment
Income | | Net Realized
Gains from
Investment
Transactions | | Total
Distributions | | Net Asset
Value, End
of Period | | Total
Return(b) | | Net
Assets
at End of
Period
(000’s) | | Ratio of Net
Expenses to
Average Net
Assets | | Ratio of Net
Investment
Income/
(Loss) to
Average Net
Assets | | Ratio of
Expenses
to Average
Net Assets
(Excluding Fee
Reductions) | | Portfolio
Turnover
(c) |
| CLASS A SHARES | | | | | | | | | | | | | | | | | | | | | | | | | | | | | | | | | | | | | | | | | | | | | | | | | | | |
| Year Ended October 31, 2018 | | $ | 14.10 | | | $ | 0.17 | | | $ | (2.82 | ) | | $ | (2.65 | ) | | $ | (0.09 | ) | | $ | — | | | $ | (0.09 | ) | | $ | 11.36 | (d) | | (18.89 | )% | | $ | 4,342 | | | 2.00 | % | | 1.26 | % | | 5.54 | % | | 62 | % |
| Year Ended October 31, 2017 | | | 11.94 | | | | 0.16 | | | | 2.23 | | | | 2.39 | | | | (0.23 | ) | | | — | | | | (0.23 | ) | | | 14.10 | (d) | | 20.41 | % | | | 8,676 | | | 2.20 | % | | 1.20 | % | | 3.28 | % | | 44 | % |
| Year Ended October 31, 2016 | | | 12.11 | | | | 0.13 | | | | 0.14 | | | | 0.27 | | | | (0.44 | ) | | | — | | | | (0.44 | ) | | | 11.94 | | | 2.59 | % | | | 7,069 | | | 2.18 | % | | 1.17 | % | | 2.55 | % | | 8 | % |
| Year Ended October 31, 2015 | | | 14.95 | | | | 0.12 | | | | (1.81 | ) | | | (1.69 | ) | | | (0.09 | ) | | | (1.06 | ) | | | (1.15 | ) | | | 12.11 | | | (11.67 | )% | | | 21,756 | | | 2.20 | % | | 0.96 | % | | 2.20 | % | | 66 | % |
| Year Ended October 31, 2014 | | | 13.06 | | | | 0.20 | | | | 2.14 | | | | 2.34 | | | | (0.05 | ) | | | (0.40 | ) | | | (0.45 | ) | | | 14.95 | | | 18.38 | % | | | 44,837 | | | 2.20 | % | | 1.38 | % | | 2.24 | % | | 64 | % |
| CLASS I SHARES | | | | | | | | | | | | | | | | | | | | | | | | | | | | | | | | | | | | | | | | | | | | | | | | | | | |
| Year Ended October 31, 2018 | | | 14.18 | | | | 0.19 | | | | (2.79 | ) | | | (2.60 | ) | | | (0.14 | ) | | | — | | | | (0.14 | ) | | | 11.44 | (d) | | (18.52 | )% | | | 9,827 | | | 1.70 | % | | 1.30 | % | | 4.81 | % | | 62 | % |
| Year Ended October 31, 2017 | | | 12.02 | | | | 0.19 | | | | 2.25 | | | | 2.44 | | | | (0.28 | ) | | | — | | | | (0.28 | ) | | | 14.18 | (d) | | 20.78 | % | | | 37,883 | | | 1.85 | % | | 1.49 | % | | 2.90 | % | | 44 | % |
| Year Ended October 31, 2016 | | | 12.19 | | | | 0.22 | | | | 0.09 | | | | 0.31 | | | | (0.48 | ) | | | — | | | | (0.48 | ) | | | 12.02 | | | 2.99 | % | | | 42,207 | | | 1.82 | % | | 1.93 | % | | 2.20 | % | | 8 | % |
| Year Ended October 31, 2015 | | | 15.08 | | | | 0.19 | | | | (1.85 | ) | | | (1.66 | ) | | | (0.17 | ) | | | (1.06 | ) | | | (1.23 | ) | | | 12.19 | | | (11.42 | )% | | | 120,010 | | | 1.85 | % | | 1.44 | % | | 1.86 | % | | 66 | % |
| Year Ended October 31, 2014 | | | 13.15 | | | | 0.23 | | | | 2.17 | | | | 2.40 | | | | (0.07 | ) | | | (0.40 | ) | | | (0.47 | ) | | | 15.08 | | | 18.77 | % | | | 173,616 | | | 1.85 | % | | 1.57 | % | | 1.90 | % | | 64 | % |
| (a) | Calculated based on average shares outstanding. |
| (b) | Total return calculations do not include any sales or redemption charges. |
| (c) | Portfolio turnover is calculated on the basis of the Fund as a whole without distinguishing between the classes of shares issued. |
| (d) | The net asset value per share (“NAV”) for financial reporting purposes differs from the NAV reported due to adjustments made in accordance with accounting principles generally accepted in the United States of America. |
| Amounts designated as “–“ are $ 0.00 or have been rounded to $ 0.00. |
| 66 HSBC FAMILY OF FUNDS | See notes to financial statements. |
| HSBC ASIA EX-JAPAN SMALLER COMPANIES EQUITY FUND |
| Financial Highlights |
Selected data for a share outstanding throughout the periods indicated.
| | | | Investment Activities | | Distributions | | | | | | Ratios/Supplementary Data |
| | | Net Asset
Value,
Beginning
of Period | | Net
Investment
Income/
(Loss)(a) | | Net Realized
and
Unrealized
Gains/
(Losses) from
Investments | | Total from
Investment
Activities | | Net
Investment
Income | | Net Realized
Gains from
Investment
Transactions | | Total
Distributions | | Net Asset
Value, End
of Period | | Total
Return(b) | | Net
Assets
at End of
Period
(000’s) | | Ratio of Net
Expenses to
Average Net
Assets(c) | | Ratio of Net
Investment
Income/
(Loss) to
Average Net
Assets(c) | | Ratio of
Expenses
to Average
Net Assets
(Excluding Fee
Reductions)(c) | | Portfolio
Turnover
(b)(d) |
| CLASS A SHARES | | | | | | | | | | | | | | | | | | | | | | | | | | | | | | | | | | | | | | | | | | | | | | | | | | | |
| Year Ended October 31, 2018 | | $ | 13.75 | | | $ | 0.04 | | | $ | (2.84 | ) | | $ | (2.80 | ) | | $ | (0.18 | ) | | $ | (1.51 | ) | | $ | (1.69 | ) | | $ | 9.26 | | | (23.23 | )% | | $ | 218 | | | 1.25 | % | | 0.35 | % | | 4.18 | % | | 138 | % |
| Year Ended October 31, 2017 | | | 11.04 | | | | 0.18 | | | | 2.66 | | | | 2.84 | | | | (0.13 | ) | | | — | | | | (0.13 | ) | | | 13.75 | | | 26.09 | % | | | 896 | | | 1.75 | % | | 1.45 | % | | 3.94 | % | | 97 | % |
| Year Ended October 31, 2016 | | | 9.59 | | | | 0.10 | | | | 1.46 | | | | 1.56 | | | | (0.11 | ) | | | — | | | | (0.11 | ) | | | 11.04 | | | 16.29 | % | | | 181 | | | 1.72 | % | | 0.98 | % | | 3.88 | % | | 93 | % |
| Period Ended October 31, 2015(e) | | | 10.00 | | | | 0.10 | | | | (0.49 | ) | | | (0.39 | ) | | | (0.02 | ) | | | — | | | | (0.02 | ) | | | 9.59 | | | (3.82 | )% | | | 156 | | | 1.75 | % | | 1.03 | % | | 3.64 | % | | 146 | % |
| CLASS I SHARES | | | | | | | | | | | | | | | | | | | | | | | | | | | | | | | | | | | | | | | | | | | | | | | | | | | |
| Year Ended October 31, 2018 | | | 13.76 | | | | 0.23 | | | | (2.99 | ) | | | (2.76 | ) | | | (0.21 | ) | | | (1.51 | ) | | | (1.72 | ) | | | 9.28 | (f) | | (22.98 | )% | | | 77,776 | | | 0.90 | % | | 2.04 | % | | 2.35 | % | | 138 | % |
| Year Ended October 31, 2017 | | | 11.05 | | | | 0.14 | | | | 2.73 | | | | 2.87 | | | | (0.16 | ) | | | — | | | | (0.16 | ) | | | 13.76 | | | 26.47 | % | | | 14,186 | | | 1.40 | % | | 1.14 | % | | 3.66 | % | | 97 | % |
| Year Ended October 31, 2016 | | | 9.62 | | | | 0.15 | | | | 1.45 | | | | 1.60 | | | | (0.17 | ) | | | — | | | | (0.17 | ) | | | 11.05 | | | 16.75 | % | | | 11,114 | | | 1.36 | % | | 1.55 | % | | 3.57 | % | | 93 | % |
| Period Ended October 31, 2015(e) | | | 10.00 | | | | 0.13 | | | | (0.49 | ) | | | (0.36 | ) | | | (0.02 | ) | | | — | | | | (0.02 | ) | | | 9.62 | | | (3.49 | )% | | | 9,461 | | | 1.40 | % | | 1.33 | % | | 3.38 | % | | 146 | % |
| (a) | Calculated based on average shares outstanding. |
| (b) | Not annualized for periods less than one year. Total return calculations do not include any sales or redemption charges. |
| (c) | Annualized for periods less than one year. |
| (d) | Portfolio turnover is calculated on the basis of the Fund as a whole without distinguishing between the classes of shares issued. |
| (e) | Commencement of operations on November 11, 2014. |
| (f) | The net asset value per share (“NAV”) for financial reporting purposes differs from the NAV reported due to adjustments made in accordance with accounting principles generally accepted in the United States of America. |
| Amounts designated as “—“ are $ 0.00 or have been rounded to $ 0.00. |
| See notes to financial statements. | HSBC FAMILY OF FUNDS 67 |
| HSBC GLOBAL HIGH YIELD BOND FUND |
| Financial Highlights |
Selected data for a share outstanding throughout the periods indicated.
| | | | Investment Activities | | Distributions | | | | | | Ratios/Supplementary Data |
| | | Net Asset
Value,
Beginning
of Period | | Net
Investment
Income/
(Loss)(a) | | Net Realized
and
Unrealized
Gains/
(Losses) from
Investments | | Total from
Investment
Activities | | Net
Investment
Income | | Net Realized
Gains from
Investment
Transactions | | Total
Distributions | | Net Asset
Value, End
of Period | | Total
Return(b) | | Net
Assets
at End of
Period
(000’s) | | Ratio of Net
Expenses to
Average Net
Assets(c) | | Ratio of Net
Investment
Income/
(Loss) to
Average Net
Assets(c) | | Ratio of
Expenses
to Average
Net Assets
(Excluding Fee
Reductions)(c) | | Portfolio
Turnover
(b)(d) |
| CLASS A SHARES | | | | | | | | | | | | | | | | | | | | | | | | | | | | | | | | | | | | | | | | | | | | | | | | | | | |
| Year Ended October 31, 2018 | | $ | 10.24 | | | $ | 0.42 | | | $ | (0.50 | ) | | $ | (0.08 | ) | | $ | (0.47 | ) | | $ | — | | | $ | (0.47 | ) | | $ | 9.69 | | | (0.84 | )% | | $ | 2,402 | | | 1.15 | % | | 4.24 | % | | 2.57 | % | | 50 | % |
| Year Ended October 31, 2017 | | | 9.97 | | | | 0.42 | | | | 0.30 | | | | 0.72 | | | | (0.45 | ) | | | — | | | | (0.45 | ) | | | 10.24 | | | 7.45 | % | | | 2,049 | | | 1.15 | % | | 4.15 | % | | 1.81 | % | | 42 | % |
| Year Ended October 31, 2016 | | | 9.67 | | | | 0.41 | | | | 0.28 | | | | 0.69 | | | | (0.39 | ) | | | — | | | | (0.39 | ) | | | 9.97 | | | 7.37 | % | | | 558 | | | 1.15 | % | | 4.27 | % | | 1.72 | % | | 50 | % |
| Period Ended October 31, 2015(e) | | | 10.00 | | | | 0.12 | | | | (0.34 | ) | | | (0.22 | ) | | | (0.11 | ) | | | — | | | | (0.11 | ) | | | 9.67 | | | (2.23 | )% | | | 140 | | | 1.15 | % | | 4.13 | % | | 1.93 | % | | 31 | % |
| CLASS I SHARES | | | | | | | | | | | | | | | | | | | | | | | | | | | | | | | | | | | | | | | | | | | | | | | | | | | |
| Year Ended October 31, 2018 | | | 10.26 | | | | 0.46 | | | | (0.50 | ) | | | (0.04 | ) | | | (0.50 | ) | | | — | | | | (0.50 | ) | | | 9.72 | | | (0.41 | )% | | | 27,714 | | | 0.80 | % | | 4.59 | % | | 2.22 | % | | 50 | % |
| Year Ended October 31, 2017 | | | 9.98 | | | | 0.45 | | | | 0.31 | | | | 0.76 | | | | (0.48 | ) | | | — | | | | (0.48 | ) | | | 10.26 | | | 7.84 | % | | | 28,040 | | | 0.80 | % | | 4.50 | % | | 1.48 | % | | 42 | % |
| Year Ended October 31, 2016 | | | 9.68 | | | | 0.45 | | | | 0.26 | | | | 0.71 | | | | (0.41 | ) | | | — | | | | (0.41 | ) | | | 9.98 | (f) | | 7.68 | % | | | 26,168 | | | 0.80 | % | | 4.64 | % | | 1.59 | % | | 50 | % |
| Period Ended October 31, 2015(e) | | | 10.00 | | | | 0.13 | | | | (0.34 | ) | | | (0.21 | ) | | | (0.11 | ) | | | — | | | | (0.11 | ) | | | 9.68 | | | (2.15 | )% | | | 24,378 | | | 0.80 | % | | 4.45 | % | | 1.64 | % | | 31 | % |
| (a) | Calculated based on average shares outstanding. |
| (b) | Not annualized for periods less than one year. Total return calculations do not include any sales or redemption charges. |
| (c) | Annualized for periods less than one year. |
| (d) | Portfolio turnover is calculated on the basis of the Fund as a whole without distinguishing between the classes of shares issued. |
| (e) | Commencement of operations on July 14, 2015. |
| (f) | The net asset value per share (“NAV”) for financial reporting purposes differs from the NAV reported due to adjustments made in accordance with accounting principles generally accepted in the United States of America. |
| Amounts designated as “—“ are $ 0.00 or have been rounded to $ 0.00. |
| 68 HSBC FAMILY OF FUNDS | See notes to financial statements. |
| HSBC GLOBAL HIGH INCOME BOND FUND |
| Financial Highlights |
Selected data for a share outstanding throughout the periods indicated.
| | | | Investment Activities | | Distributions | | | | | | Ratios/Supplementary Data |
| | | Net Asset
Value,
Beginning
of Period | | Net
Investment
Income/
(Loss)(a) | | Net Realized
and
Unrealized
Gains/
(Losses) from
Investments | | Total from
Investment
Activities | | Net
Investment
Income | | Net Realized
Gains from
Investment
Transactions | | Total
Distributions | | Net Asset
Value, End
of Period | | Total
Return(b) | | Net
Assets
at End of
Period
(000’s) | | Ratio of Net
Expenses to
Average Net
Assets(c) | | Ratio of Net
Investment
Income/
(Loss) to
Average Net
Assets(c) | | Ratio of
Expenses
to Average
Net Assets
(Excluding Fee
Reductions)(c) | | Portfolio
Turnover
(b)(d) |
| CLASS A SHARES | | | | | | | | | | | | | | | | | | | | | | | | | | | | | | | | | | | | | | | | | | | | | | | | | | | |
| Year Ended October 31, 2018 | | $ | 10.45 | | | $ | 0.30 | | | $ | (0.55 | ) | | $ | (0.25 | ) | | $ | (0.32 | ) | | $ | — | | | $ | (0.32 | ) | | $ | 9.88 | | | (2.39 | )% | | $ | 118 | | | 1.15 | % | | 2.94 | % | | 2.61 | % | | 51 | % |
| Year Ended October 31, 2017 | | | 10.24 | | | | 0.29 | | | | 0.23 | | | | 0.52 | | | | (0.31 | ) | | | — | | | | (0.31 | ) | | | 10.45 | | | 5.24 | % | | | 292 | | | 1.15 | % | | 2.86 | % | | 1.81 | % | | 44 | % |
| Year Ended October 31, 2016 | | | 9.83 | | | | 0.30 | | | | 0.38 | | | | 0.68 | | | | (0.27 | ) | | | — | | | | (0.27 | ) | | | 10.24 | | | 7.04 | % | | | 107 | | | 1.15 | % | | 2.99 | % | | 1.71 | % | | 47 | % |
| Period Ended October 31, 2015(e) | | | 10.00 | | | | 0.09 | | | | (0.18 | ) | | | (0.09 | ) | | | (0.08 | ) | | | — | | | | (0.08 | ) | | | 9.83 | | | (0.93 | )% | | | 99 | | | 1.15 | % | | 2.89 | % | | 1.89 | % | | 24 | % |
| CLASS I SHARES | | | | | | | | | | | | | | | | | | | | | | | | | | | | | | | | | | | | | | | | | | | | | | | | | | | |
| Year Ended October 31, 2018 | | | 10.49 | | | | 0.34 | | | | (0.56 | ) | | | (0.22 | ) | | | (0.35 | ) | | | — | | | | (0.35 | ) | | | 9.92 | | | (2.12 | )% | | | 27,140 | | | 0.80 | % | | 3.32 | % | | 2.44 | % | | 51 | % |
| Year Ended October 31, 2017 | | | 10.26 | | | | 0.33 | | | | 0.23 | | | | 0.56 | | | | (0.33 | ) | | | — | | | | (0.33 | ) | | | 10.49 | | | 5.62 | % | | | 27,876 | | | 0.80 | % | | 3.21 | % | | 1.58 | % | | 44 | % |
| Year Ended October 31, 2016 | | | 9.83 | | | | 0.33 | | | | 0.39 | | | | 0.72 | | | | (0.29 | ) | | | — | | | | (0.29 | ) | | | 10.26 | | | 7.43 | % | | | 26,505 | | | 0.80 | % | | 3.34 | % | | 1.61 | % | | 47 | % |
| Period Ended October 31, 2015(e) | | | 10.00 | | | | 0.10 | | | | (0.18 | ) | | | (0.08 | ) | | | (0.09 | ) | | | — | | | | (0.09 | ) | | | 9.83 | | | (0.84 | )% | | | 24,696 | | | 0.80 | % | | 3.24 | % | | 1.61 | % | | 24 | % |
| (a) | Calculated based on average shares outstanding. |
| (b) | Not annualized for periods less than one year. Total return calculations do not include any sales or redemption charges. |
| (c) | Annualized for periods less than one year. |
| (d) | Portfolio turnover is calculated on the basis of the Fund as a whole without distinguishing between the classes of shares issued. |
| (e) | Commencement of operations on July 14, 2015. |
| Amounts designated as ““—““ are $ 0.00 or have been rounded to $ 0.00. |
| See notes to financial statements. | HSBC FAMILY OF FUNDS 69 |
| HSBC FAMILY OF FUNDS |
| Notes to Financial Statements—as of October 31, 2018 |
1. Organization:
The HSBC Funds (the “Trust”), a Delaware statutory trust organized on March 2, 2016, is registered under the Investment Company Act of 1940, as amended (the “Act”), as an open-end management investment company. As of October 31, 2018, the Trust is composed of 10 separate operational funds, each a series of the HSBC Family of Funds. The accompanying financial statements are presented for the following five funds (individually a “Fund”, collectively the “Funds” or the “Global Funds”):
| Fund | | Short Name |
| HSBC Emerging Markets Debt Fund | | Emerging Markets Debt Fund |
| HSBC Frontier Markets Fund | | Frontier Markets Fund |
| HSBC Asia ex-Japan Smaller Companies Equity Fund | | Asia ex-Japan Fund |
| HSBC Global High Yield Bond Fund | | Global High Yield Bond Fund |
| HSBC Global High Income Bond Fund | | Global High Income Bond Fund |
Financial statements for all other funds of the Trust are published separately. The Emerging Markets Debt Fund is a non-diversified fund. All of the other Funds are diversified funds. The Funds are authorized to issue an unlimited number of shares of beneficial interest with a par value of $0.001 per share. The share classes offered by each Fund and the maximum sales charge for Class A Shares are summarized in the following table.
| | Share | | Class A Shares |
| Fund | | Classes Offered | | Maximum Sales Charge |
| Emerging Markets Debt Fund | | A, I | | 4.75% |
| Frontier Markets Fund | | A, I | | 5.00% |
| Asia ex-Japan Fund | | A, I | | 5.00% |
| Global High Yield Bond Fund | | A, I | | 4.75% |
| Global High Income Bond Fund | | A, I | | 4.75% |
Each class of shares in each Fund has identical rights and privileges, except with respect to arrangements pertaining to shareholder servicing and/or distribution, class-related expenses, voting rights on matters affecting a single class of shares, and exchange privileges of each class of shares.
Under the Trust’s organizational documents, the Trust’s officers and Trustees are indemnified against certain liabilities arising out of the performance of their duties to the Funds. In addition, in the normal course of business, the Trust enters into contracts with its service providers, which also provide for indemnifications by the Funds. The Funds’ maximum exposure under these arrangements is unknown as this would involve future claims that may be made against the Funds. However, based on experience, the Trust believes the risk of loss to be remote.
The Funds are investment companies and follow accounting and reporting guidance under Financial Accounting Standards Board (“FASB”) Accounting Standards Codification (“ASC”) Topic 946, “Financial Services-Investment Companies.”
2. Significant Accounting Policies:
The following is a summary of the significant accounting policies followed by the Funds in the preparation of their financial statements. The policies are in conformity with generally accepted accounting principles in the United States of America (“GAAP”). The preparation of financial statements requires management to make certain estimates and assumptions that affect the reported amounts of assets and liabilities and disclosure of contingent assets and liabilities at the date of the financial statements and the reported amounts of increases and decreases in net assets from operations during the reporting period. Actual results could differ from those estimates.
| HSBC FAMILY OF FUNDS |
| Notes to Financial Statements—as of October 31, 2018 (continued) |
Securities Valuation:
The Funds record their investments at fair value. Fair value is defined as the price that would be received to sell an asset or paid to transfer a liability in an orderly transaction between market participants at the measurement date. The valuation techniques used to determine fair value are further described in Note 3 below.
Investment Transactions and Related Income:
Investment transactions are accounted for no later than one business day after trade date. However, for financial reporting purposes, investment transactions are accounted for on trade date. Investment gains and losses are calculated on the identified cost basis. Interest income is determined on the basis of coupon interest accrued using the effective interest method which adjusts for amortization of premiums and accretion of discounts. Dividend income is recorded on the ex-dividend date except in the case of certain foreign securities, in which case dividends are recorded as soon as such information becomes available. For derivative contracts, realized gains and losses are recorded upon settlement of the contract.
Foreign Currency Translation:
The accounting records of the Funds are maintained in U.S. dollars. Foreign currency amounts are translated into U.S. dollars at the current rate of exchange to determine the value of investments, assets and liabilities at the close of each business day. Purchases and sales of securities, and income and expenses are translated at the prevailing rate of exchange on the respective dates of such transactions. The Funds do not isolate the portion of the results of operations resulting from changes in foreign exchange rates on investments from fluctuations arising from changes in market prices of securities held. Such fluctuations are included with the net realized and unrealized gain or loss from investments in securities and foreign currency translations.
Foreign Taxes:
Income received by the Funds from sources within foreign countries may be subject to withholding and other income or similar taxes imposed by such countries. The Funds may be subject to foreign taxes on gains in investments or currency repatriation. The Funds accrue foreign capital gains taxes, as applicable, based on their current interpretation of tax rules in the foreign markets in which they invest. Such tax accrual is based in part on actual and estimated realized gains. Estimated realized gains are subject to change and such change could be material. However, management’s conclusions may be subject to future review and change based on changes in, or the interpretation of, the accounting standards or tax laws and regulations.
Restricted Securities and Illiquid Securities:
The Funds may invest in restricted securities. A restricted security is a security which has been purchased through a private offering and cannot be resold to the general public without prior registration under the Securities Act of 1933 (the “1933 Act”) or pursuant to the resale limitations provided by Rule 144 under the 1933 Act, or another exemption from the registration requirements of the 1933 Act. Certain restricted securities may be resold in transactions exempt from registration, normally to qualified institutional buyers, and may be deemed liquid by the Investment Adviser (as defined in Note 4) based on procedures established by the Board of Trustees (the “Board”). Therefore, not all restricted securities are considered illiquid. To the extent that a Fund purchases securities that are restricted as to resale or for which current market quotations are not available, such securities will be valued based upon all relevant factors as outlined in Securities and Exchange Commission (“SEC”) Financial Reporting Release No. 1. Disposal of restricted securities may involve time consuming negotiations and expense. Prompt sale at the current valuation may be difficult and could adversely affect the net assets of the Funds.
Participation Notes and Participatory Notes:
The Funds may invest in participation notes or participatory notes (“P-notes”). P-notes are participation interest notes that are issued by banks or broker-dealers and are designed to offer a return linked to a particular underlying equity, debt, currency or market. If the P-note were held to maturity, the issuer would pay to, or receive from, the purchaser the difference between the nominal value of the underlying instruments at the time of purchase and that instrument’s value at maturity. The holder of a P-note that is linked to a particular underlying security or instrument may be entitled to receive any dividends paid in connection with that
| HSBC FAMILY OF FUNDS |
| Notes to Financial Statements—as of October 31, 2018 (continued) |
underlying security or instrument, but typically does not receive voting rights as it would if it directly owned the underlying security or instrument. P-notes involve transaction costs. Investments in P-notes involve the same risks associated with a direct investment in the underlying securities, instruments or markets that they seek to replicate. In addition, there can be no assurance that there will be a trading market for a P-note or that the trading price of a P-note will equal the underlying value of the security, instrument or market that it seeks to replicate. Due to liquidity and transfer restrictions, the secondary markets on which a P-note is traded may be less liquid than the market for other securities, or may be completely illiquid, which may also affect the ability of a Fund to accurately value a P-note. P-notes typically constitute general unsecured contractual obligations of the banks or broker-dealers that issue them, which subjects a Fund that holds them to counterparty risk (and this risk may be amplified if the Fund purchases P-notes from only a small number of issuers).
Derivative Instruments:
All open derivative positions at period end are reflected on each Fund’s Schedule of Portfolio Investments. The following is a description of the derivative instruments utilized by the Funds, including the primary underlying risk exposure related to each instrument type.
Forward Foreign Currency Exchange Contracts:
Each Fund may enter into forward foreign currency exchange contracts. The Funds may enter into forward foreign currency exchange contracts in connection with planned purchases or sales of securities, to hedge the U.S. dollar value of securities denominated in a particular currency or to enhance return. The forward foreign currency exchange contracts are adjusted by the daily exchange rate of the underlying currency and any gains or losses are recorded for financial statement purposes as unrealized gains or losses until the contract settlement date.
The Funds could be exposed to risks if the counterparties to the contracts are unable to meet the terms of their contracts and from unanticipated movements in the value of a foreign currency relative to the U.S. dollar.
The Funds remain subject to credit risk with respect to the amount they expect to receive from counterparties. However, the Funds have sought to mitigate these risks by generally requiring the posting of collateral to a Fund at prearranged exposure levels to cover a Fund’s exposure to the counterparty. Generally, the amount of collateral due from or to a counterparty must exceed a minimum transfer amount threshold before a transfer is required to be made. Forward foreign currency exchange contracts may involve credit or market risk in excess of the amounts reflected on the Statements of Assets and Liabilities.
During the year ended October 31, 2018, the Emerging Markets Debt Fund, Global High Yield Bond Fund and Global High Income Bond Fund entered into forward foreign currency exchange contracts to gain exposure to certain markets and for hedging purposes. The notional amount of forward foreign currency exchange contracts outstanding as of October 31, 2018 and the monthly average notional amount for these contracts during the year ended October 31, 2018 were as follows:
| | Outstanding | | Monthly Average |
| | Notional Amount ($) | | Notional Amount ($) |
| | Long | | Short | | Long | | Short |
| Forward Foreign Currency Exchange Contracts: | | | | | | | | | | | |
| Emerging Markets Debt Fund | | 7,700,964 | | (5,300,618 | ) | | 8,577,483 | | | (5,970,454 | ) |
| Global High Yield Bond Fund | | — | | (9,424,164 | ) | | 921,422 | (a) | | (7,184,038 | ) |
| Global High Income Bond Fund | | — | | (12,274,075 | ) | | 1,085,559 | (b) | | (9,913,986 | ) |
____________________
| (a) | For the period December 1, 2017 to January 31, 2018. |
| (b) | For the period December 1, 2017 to February 28, 2018. |
| HSBC FAMILY OF FUNDS |
| Notes to Financial Statements—as of October 31, 2018 (continued) |
Option Contracts:
The Funds may purchase or write put and call options on securities, indices, foreign currencies and derivative instruments. When purchasing options, the Funds pay a premium which is recorded as the cost basis in the investment and which is subsequently marked to market to reflect the current value of the option. Premiums paid for purchasing options that expire are treated as realized losses. When an option is exercised or closed, premiums paid for purchasing options are offset against proceeds to determine the realized gain or loss on the transaction. When writing options, the Funds receive a premium which is recorded as a liability and which is subsequently marked to market to reflect the current value of the option written. Premiums received from writing options that expire are treated as realized gains. Premiums received from writing options that are either exercised or closed are offset against the proceeds received or the amount paid on the transaction to determine realized gains or losses.
The Funds may purchase or write put and call options on foreign currencies for the purpose of protecting against declines in the dollar value of foreign portfolio securities and against increases in the U.S. dollar cost of foreign securities to be acquired. The Funds could be exposed to risks if the counterparties to the contracts are unable to meet the terms of their contracts and from unanticipated movements in the value of a foreign currency relative to the U.S. dollar.
The Funds may enter into interest rate swaption agreements for hedging purposes. A swaption is an option to enter into a pre-defined swap agreement by some specified date in the future. The writer of the swaption becomes the counterparty to the swap if the buyer exercises their option. The interest rate swaption agreement will specify whether the buyer of the swaption will be a fixed rate receiver or a fixed rate buyer. The Funds could be exposed to risks if the counterparties to the contracts are unable to meet the terms of their contracts and from unanticipated movements in interest rates.
The Funds remain subject to credit risk with respect to the amount they expect to receive from counterparties. However, the Funds have sought to mitigate these risks by generally requiring the posting of collateral to a Fund at prearranged exposure levels to cover a Fund’s exposure to the counterparty. Generally, the amount of collateral due from or to a counterparty must exceed a minimum transfer amount threshold before a transfer is required to be made. Option contracts may involve credit or market risk in excess of the amounts reflected on the Statements of Assets and Liabilities. During the year ended October 31, 2018, the Funds did not hold any option contracts.
Futures Contracts:
The Funds may enter into futures contracts for the purpose of hedging existing portfolio securities or securities they intend to purchase against fluctuations in fair value caused by changes in prevailing market interest conditions. Upon entering into futures contracts, the Funds are required to pledge to the broker an amount of cash and/or other assets equal to a certain percentage of the contract amount (initial margin deposit). Subsequent payments, known as “variation margin”, are made or received each day, depending on the daily fluctuations in the fair value of the underlying security. The Funds recognize an unrealized gain or loss equal to the daily variation margin. Should market conditions move unexpectedly, the Funds may not achieve the anticipated benefits of the futures contracts and may realize a loss. Futures contracts involve, to varying degrees, elements of market risk (generally equity price risk related to stock futures, interest rate risk related to bond futures, and foreign currency risk related to currency futures) and exposure to loss in excess of the amounts reflected on the Statements of Assets and Liabilities as variation margin. The primary risks associated with the use of futures contracts are the imperfect correlation between the change in market value of the securities held by the Funds and the prices of futures contracts, the possibility of an illiquid market, and the inability of the counterparty to meet the terms of the contract. During the year ended October 31, 2018, the Emerging Markets Debt Fund, Global High Yield Bond Fund and Global High Income Bond Fund invested
| HSBC FAMILY OF FUNDS |
| Notes to Financial Statements—as of October 31, 2018 (continued) |
in futures contracts to gain exposure to certain markets and for hedging purposes. The gross notional amount of futures contracts outstanding as of October 31, 2018, and the monthly average notional amount for these contracts for the year ended October 31, 2018 were as follows:
| | Outstanding | | Monthly Average |
| | Notional Amount ($) | | Notional Amount ($) |
| | Long | | Short | | Long | | Short |
| Futures Contracts: | | | | | | | | | | | |
| Emerging Markets Debt Fund | | 2,247,657 | | (1,895,000 | ) | | 2,519,701 | | | (1,931,500 | ) |
| Global High Yield Bond Fund | | 355,313 | | — | | | 357,484 | (a) | | (121,238 | )(b) |
| Global High Income Bond Fund | | 567,969 | | (355,313 | ) | | 883,656 | (c) | | (502,891 | )(c) |
____________________
| (a) | For the period August 1, 2018 to October 31, 2018. |
| (b) | For the period November 1, 2017 to July 31, 2018. |
| (c) | For the period December 1, 2017 to October 31, 2018. |
Swap Agreements:
The Funds may enter into swap contracts in accordance with their investment objectives and policies. A swap is an agreement to exchange the return generated by one instrument for the return generated by another instrument. Swap agreements are privately negotiated in the over-the-counter (“OTC”) market and may be entered into as a bilateral contract (“OTC swaps”) or cleared through a third party, known as a clearing organization (“centrally cleared swaps”). The payment streams are calculated by reference to a specified index and agreed upon notional amount. The term specified index includes currencies, fixed interest rates, prices and total return on interest rate indices, fixed income indices, stock indices and commodity indices.
The Funds will usually enter into swaps on a net basis, which means that the two return streams are netted out in a cash settlement on the payment date or dates specified in the instrument with a Fund receiving or paying only the net amount of the two returns. Upfront receipts and payments are recorded as a liability or asset, respectively. These upfront receipts and payments are amortized or accreted to gains or losses over the life of the swap agreement. Swaps are marked to market daily based upon valuations as determined from the underlying contract or in accordance with the requirements of the clearing organization. Changes in market value, if any, are reflected as a component of net change in “unrealized appreciation or depreciation on swap agreements”. Daily changes in valuation of centrally cleared swaps, if any, are recorded as “variation margin on swap agreements”. Net periodic payments received or paid by the Funds are recorded as “realized gains or losses on swap agreements”. A Fund’s obligations under a swap agreement will be accrued daily (offset against any amounts owing to the Fund) and any accrued but unpaid net amounts owed to a swap counterparty are generally collateralized by the maintenance of a segregated account consisting of cash, U.S. government securities, or other liquid securities or by pledging such securities as collateral.
Interest rate swaps involve the exchange of commitments to pay and receive interest based on a notional amount and are subject to interest rate risk exposure. Interest rate swaps do not involve the delivery of securities, other underlying assets or principal. Accordingly, the risk of loss with respect to interest rate swaps is limited to the net amount of interest payments that a Fund is contractually obligated to make. If the other party to an interest rate swap defaults, a Fund’s risk of loss consists of the net amount of interest payments that the Fund is contractually entitled to receive.
Credit default swap agreements involve one party making a stream of payments (referred to as the buyer of protection) to another party (the seller of protection) in exchange for the right to receive a specified return in the event of a default or other credit event for the referenced entity, obligation or index and are subject to credit risk exposure. The maximum potential amount of future payments that a Fund as a seller of protection could be required to make under a credit default swap agreement would be an amount equal to the notional amount of the agreement. Notional amounts of each individual credit default swap agreement outstanding for which a Fund is the seller of protection are disclosed in the Schedules of Portfolio Investments. These potential
| HSBC FAMILY OF FUNDS |
| Notes to Financial Statements—as of October 31, 2018 (continued) |
amounts would be partially offset by any recovery values of the respective referenced obligations, upfront payments received upon entering into the agreement, or net amounts received from the settlement of buy protection credit default swap agreements entered into by a Fund for the same referenced entity or entities.
The Funds remain subject to credit risk with respect to the amount they expect to receive from counterparties. However, the Funds have sought to mitigate these risks by generally requiring the posting of collateral to a Fund at prearranged exposure levels to cover a Fund’s exposure to the counterparty. Generally, the amount of collateral due from or to a counterparty must exceed a minimum transfer amount threshold before a transfer is required to be made. The counterparty risk for centrally cleared swap agreements is generally lower than for OTC swap agreements because generally a clearing organization becomes substituted for each counterparty to a centrally cleared swap agreement and, in effect, guarantees the parties’ performance under the contract as each party to a trade looks only to a clearing house for performance of financial obligations. However, there can be no assurance that the clearing house, or its members will satisfy its obligations to a Fund. Swap agreements may involve credit or market risk in excess of the amounts reflected on the Statements of Assets and Liabilities.
The use of swaps is a highly specialized activity that involves investment techniques and risks different from those associated with ordinary portfolio securities transactions. If the Investment Adviser is incorrect in its forecasts of market values, interest rates and currency exchange rates, the investment performance of a Fund would be less favorable than it would have been if this investment technique were not used.
During the year ended October 31, 2018, the Emerging Markets Debt Fund, Global High Yield Bond Fund and Global High Income Bond Fund entered into credit default swap agreements primarily to manage and/or gain exposure to credit risk. The notional amount of swap agreements outstanding as of October 31, 2018 and the monthly average notional amount for these agreements during the year ended October 31, 2018 were as follows:
| | Outstanding | | Monthly Average |
| | Notional Amount ($) | | Notional Amount ($) |
| | Buy | | Sell | | Buy | | Sell |
| | Protection | | Protection | | Protection | | Protection |
| Credit Default Swap Agreements: | | | | | | | | | | | |
| Emerging Markets Debt Fund | | 750,000 | | (3,245,500 | ) | | 750,000 | | | (3,063,375 | ) |
| Global High Yield Bond Fund | | — | | (516,350 | ) | | 200,000 | (a) | | (926,484 | ) |
| Global High Income Bond Fund | | — | | (702,000 | ) | | — | | | (652,667 | ) |
____________________
| (a) | For the period January 1, 2018 to March 31, 2018. |
| HSBC FAMILY OF FUNDS |
| Notes to Financial Statements—as of October 31, 2018 (continued) |
Summary of Derivative Instruments:
The following is a summary of the fair values of derivative instruments on the Statements of Assets and Liabilities, categorized by risk exposure, as of October 31, 2018:
| | Assets | | Liabilities |
| Fund | | Unrealized
Appreciation
on Forward
Foreign
Currency
Exchange
Contracts ($) | | Variation
Margin
on Futures
Contracts ($)* | | Swap
Agreements
at Value ($)* | | Unrealized
Depreciation
on Forward
Foreign
Currency
Exchange
Contracts ($) | | Variation
Margin
on Futures
Contracts ($)* | | Swap
Agreements
at Value ($)* |
| Foreign Exchange Rate Risk Exposure: | | | | | | | | | | | | |
| Emerging Markets | | | | | | | | | | | | |
| Debt Fund | | 217,829 | | — | | — | | 221,520 | | — | | — |
| Global High Yield | | | | | | | | | | | | |
| Bond Fund | | 114,005 | | — | | — | | 6,800 | | — | | — |
| Global High Income | | | | | | | | | | | | |
| Bond Fund | | 148,606 | | — | | — | | 8,855 | | — | | — |
| |
| Credit Contracts Risk Exposure: | | | | | | | | | | | | |
| Emerging Markets | | | | | | | | | | | | |
| Debt Fund | | — | | — | | 18,468 | | — | | — | | 46,291 |
| Global High Yield | | | | | | | | | | | | |
| Bond Fund | | — | | — | | 10,680 | | — | | — | | 1,819 |
| Global High Income | | | | | | | | | | | | |
| Bond Fund | | — | | — | | 4,005 | | — | | — | | 3,606 |
| |
| Interest Rate Risk Exposure: | | | | | | | | | | | | |
| Emerging Markets | | | | | | | | | | | | |
| Debt Fund | | — | | 30,102 | | — | | — | | 22,031 | | — |
| Global High Yield | | | | | | | | | | | | |
| Bond Fund | | — | | — | | — | | — | | 5,726 | | — |
| Global High Income | | | | | | | | | | | | |
| Bond Fund | | — | | 6,316 | | — | | — | | 5,228 | | — |
____________________
| * | Total fair value is presented by Primary Risk Exposure. For forward currency contracts, such amounts represent the appreciation (for asset derivatives) or depreciation (for liability derivatives). For futures contracts, the amounts represent their cumulative appreciation/depreciation, which includes movements of variation margin. The Statements of Assets and Liabilities only reflect the current day variation margin. Centrally cleared swaps are reported at value, which includes movements of variation margin. |
| HSBC FAMILY OF FUNDS |
| Notes to Financial Statements—as of October 31, 2018 (continued) |
The following is a summary of the effect of derivative instruments on the Statements of Operations, categorized by risk exposure, for the year ended October 31, 2018:
| | Realized Gain (Loss) on Derivatives |
| | Recognized as a Result from Operations |
| | Net Realized | | | | | | | |
| | Gains (Losses) | | Net Realized | | Net Realized |
| | from Forward | | Gains (Losses) | | Gains (Losses) |
| | Foreign Currency | | from Futures | | from Swap |
| Fund | | Exchange Contracts ($) | | Contracts ($) | | Agreements ($) |
| Foreign Exchange Rate Risk Exposure: | | | | | | | | | | | | |
| Emerging Markets Debt Fund | | | (292,337 | ) | | | — | | | | — | |
| Global High Yield Bond Fund | | | 275,362 | | | | — | | | | — | |
| Global High Income Bond Fund | | | 355,614 | | | | — | | | | — | |
| |
| Credit Contracts Risk Exposure: | | | | | | | | | | | | |
| Emerging Markets Debt Fund | | | — | | | | — | | | | (20,311 | ) |
| Global High Yield Bond Fund | | | — | | | | — | | | | 86,828 | |
| Global High Income Bond Fund | | | — | | | | — | | | | (14,914 | ) |
| |
| Interest Rate Risk Exposure: | | | | | | | | | | | | |
| Emerging Markets Debt Fund | | | — | | | | 20,980 | | | | — | |
| Global High Yield Bond Fund | | | — | | | | 8,605 | | | | — | |
| Global High Income Bond Fund | | | — | | | | (13,390 | ) | | | — | |
| |
| | Net Change in Unrealized Appreciation/Depreciation |
| | on Derivatives Recognized as a Result from Operations |
| | Change in Unrealized | | Change in | | Change in |
| | Appreciation/ | | Unrealized | | Unrealized |
| | Depreciation | | Appreciation/ | | Appreciation/ |
| | on Forward | | Depreciation | | Depreciation |
| | Foreign Currency | | on Futures | | on Swap |
| Fund | | Exchange Contracts ($) | | Contracts ($) | | Agreements ($) |
| Foreign Exchange Rate Risk Exposure: | | | | | | | | | | | | |
| Emerging Markets Debt Fund | | | 41,671 | | | | — | | | | — | |
| Global High Yield Bond Fund | | | 40,680 | | | | — | | | | — | |
| Global High Income Bond Fund | | | 45,987 | | | | — | | | | — | |
| |
| Credit Contracts Risk Exposure: | | | | | | | | | | | | |
| Emerging Markets Debt Fund | | | — | | | | — | | | | (67,718 | ) |
| Global High Yield Bond Fund | | | — | | | | — | | | | (61,722 | ) |
| Global High Income Bond Fund | | | — | | | | — | | | | 11,433 | |
| |
| Interest Rate Risk Exposure: | | | | | | | | | | | | |
| Emerging Markets Debt Fund | | | — | | | | (19,509 | ) | | | — | |
| Global High Yield Bond Fund | | | — | | | | (5,726 | ) | | | — | |
| Global High Income Bond Fund | | | — | | | | 1,060 | | | | — | |
| HSBC FAMILY OF FUNDS |
| Notes to Financial Statements—as of October 31, 2018 (continued) |
The Funds are generally subject to master netting arrangements that allow for amounts owed between each Fund and the counterparty to be netted. The party that has the larger payable pays the excess of the larger amount over the smaller amount to the other party. The master netting arrangements do not apply to amounts owed to/from different counterparties. For financial reporting purposes, the Funds do not offset derivative assets and derivative liabilities that are subject to legally enforceable master netting arrangements in the Statements of Assets and Liabilities. The tables below present the gross and net amounts of the assets and liabilities with any offsets to reflect the Funds’ ability to reflect the master netting arrangements at October 31, 2018 in the Statements of Assets and Liabilities
As of October 31, 2018, each Fund’s derivative assets and liabilities by type are as follows:
| | Emerging Markets | | Global High Yield | | Global High Income |
| | Debt Fund | | Bond Fund | | Bond Fund |
| | Assets | | Liabilities | | Assets | | Liabilities | | Assets | | Liabilities |
| Derivative Financial Instruments: | | | | | | | | | | | | | | | | | | | | | | | | |
| Futures contracts | | $ | 5,500 | | | $ | 4,375 | | | $ | — | | | $ | 1,031 | | | $ | 1,031 | | | $ | 1,219 | |
| Forward currency contracts | | | 217,829 | | | | 221,520 | | | | 114,005 | | | | 6,800 | | | | 148,606 | | | | 8,855 | |
| Swap agreements | | | 19,406 | | | | 21,483 | | | | 578 | | | | 1,819 | | | | 217 | | | | 3,606 | |
| Total derivative assets and liabilities in the Statement of | | | | | | | | | | | | | | | | | | | | | | | | |
| Assets and Liabilities | | | 242,735 | | | | 247,378 | | | | 114,583 | | | | 9,650 | | | | 149,854 | | | | 13,680 | |
| Derivative asset and liabilities not subject to a master netting | | | | | | | | | | | | | | | | | | | | | | | | |
| agreement or similar agreement (“MNA”) | | | (6,438 | ) | | | (4,375 | ) | | | (578 | ) | | | (1,031 | ) | | | (1,248 | ) | | | (1,219 | ) |
| Total assets and liabilities subject to a MNA | | $ | 236,297 | | | $ | 243,003 | | | $ | 114,005 | | | $ | 8,619 | | | $ | 148,606 | | | $ | 12,461 | |
The following table represents each Fund’s derivative assets by counterparty net of amounts available for offset under a master netting arrangement and net of the related collateral received by each Fund as of October 31, 2018:
| | Derivative Assets | | Derivatives | | Non-cash | | | | | | | | | | |
| | Subject to a MNA | | Available | | Collateral | | Cash Collateral | | Net Amount of |
| Counterparty | | by Counterparty | | for Offset | | Received (a) | | Received (a) | | Derivative Assets |
| Emerging Markets Debt Fund: | | | | | | | | | | | | | | | | | | | | | | | | | | |
| Bank of America | | | $ | 55,706 | | | | $ | (46,901 | ) | | | | $ | — | | | | $ | — | | | | $ | 8,805 | |
| Barclays Bank PLC | | | | 16,062 | | | | | (8,145 | ) | | | | | — | | | | | — | | | | | 7,917 | |
| Credit Suisse | | | | 22,603 | | | | | (10,960 | ) | | | | | — | | | | | — | | | | | 11,643 | |
| Goldman Sachs | | | | 29,228 | | | | | (29,228 | ) | | | | | — | | | | | — | | | | | — | |
| JPMorgan Chase | | | | 58,471 | | | | | (49,967 | ) | | | | | — | | | | | — | | | | | 8,504 | |
| Standard Chartered Bank | | | | 19,050 | | | | | (19,050 | ) | | | | | — | | | | | — | | | | | — | |
| UBS AG | | | | 35,177 | | | | | — | | | | | | — | | | | | — | | | | | 35,177 | |
| Total | | | $ | 236,297 | | | | $ | (164,251 | ) | | | | $ | — | | | | $ | — | | | | $ | 72,046 | |
| HSBC FAMILY OF FUNDS |
| Notes to Financial Statements—as of October 31, 2018 (continued) |
| | Derivative Assets | | Derivatives | | Non-cash | | | | | | | |
| | Subject to a MNA | | Available | | Collateral | | Cash Collateral | | Net Amount of |
| Counterparty | | by Counterparty | | for Offset | | Received (a) | | Received (a) | | Derivative Assets |
| Global High Yield Bond Fund: | | | | | | | | | | | | | | | | | | | | | | | | | | |
| Bank of America | | | $ | 4,047 | | | | $ | (1,819 | ) | | | | $ | — | | | | $ | — | | | | $ | 2,228 | |
| UBS AG | | | | 109,958 | | | | | (6,800 | ) | | | | | — | | | | | — | | | | | 103,158 | |
| Total | | | $ | 114,005 | | | | $ | (8,619 | ) | | | | $ | — | | | | $ | — | | | | $ | 105,386 | |
| Global High Income Bond Fund: | | | | | | | | | | | | | | | | | | | | | | | | | | |
| UBS AG | | | $ | 148,606 | | | | $ | (8,855 | ) | | | | $ | — | | | | $ | — | | | | $ | 139,751 | |
| Total | | | $ | 148,606 | | | | $ | (8,855 | ) | | | | $ | — | | | | $ | — | | | | $ | 139,751 | |
____________________
| (a) | The actual collateral received may be in excess of the amounts shown in the table. The table only reflects collateral amounts up to the amount of the financial instrument disclosed on the Statements of Assets and Liabilities. |
The following table represents each Fund’s derivative liabilities by counterparty net of amounts available for offset under a master netting arrangement and net of the related collateral pledged by each Fund as of October 31, 2018:
| | Derivative | | | | | | | | | | | | | | | | | | | | | |
| | Liabilities | | Derivatives | | Non-cash | | | | | | | | | | |
| | Subject to a MNA | | Available | | Collateral | | Cash Collateral | | Net Amount of |
| Counterparty | | by Counterparty | | for Offset | | Pledged (a) | | Pledged (a) | | Derivative Liabilities |
| Emerging Markets Debt Fund: | | | | | | | | | | | | | | | | | | | | | | | | | | |
| Bank of America | | | $ | 46,901 | | | | $ | (46,901 | ) | | | | $ | — | | | | $ | — | | | | $ | — | |
| Barclays Bank PLC | | | | 8,145 | | | | | (8,145 | ) | | | | | — | | | | | — | | | | | — | |
| Credit Suisse | | | | 10,960 | | | | | (10,960 | ) | | | | | — | | | | | — | | | | | — | |
| Goldman Sachs | | | | 105,437 | | | | | (29,228 | ) | | | | | — | | | | | — | | | | | 76,209 | |
| JPMorgan Chase | | | | 49,967 | | | | | (49,967 | ) | | | | | — | | | | | — | | | | | — | |
| Standard Chartered Bank | | | | 21,593 | | | | | (19,050 | ) | | | | | — | | | | | — | | | | | 2,543 | |
| Total | | | $ | 243,003 | | | | $ | (164,251 | ) | | | | $ | — | | | | $ | — | | | | $ | 78,752 | |
| Global High Yield Bond Fund: | | | | | | | | | | | | | | | | | | | | | | | | | | |
| Bank of America | | | $ | 1,819 | | | | $ | (1,819 | ) | | | | $ | — | | | | $ | — | | | | $ | — | |
| UBS AG | | | | 6,800 | | | | | (6,800 | ) | | | | | — | | | | | — | | | | | — | |
| Total | | | $ | 8,619 | | | | $ | (8,619 | ) | | | | $ | — | | | | $ | — | | | | $ | — | |
| Global High Income Bond Fund: | | | | | | | | | | | | | | | | | | | | | | | | | | |
| Bank of America | | | $ | 3,606 | | | | $ | — | | | | | $ | — | | | | $ | — | | | | $ | 3,606 | |
| UBS AG | | | | 8,855 | | | | | (8,855 | ) | | | | | | | | | | | | | | | — | |
| Total | | | $ | 12,461 | | | | $ | (8,855 | ) | | | | $ | — | | | | $ | — | | | | $ | 3,606 | |
____________________
| (a) | The actual collateral received may be in excess of the amounts shown in the table. The table only reflects collateral amounts up to the amount of the financial instrument disclosed on the Statements of Assets and Liabilities. |
| HSBC FAMILY OF FUNDS |
| Notes to Financial Statements—as of October 31, 2018 (continued) |
Pursuant to each Fund’s ISDA Master Agreement for trading over-the-counter derivatives (“ISDA”), each Fund must notify counterparties if its net asset value (“NAV”) declines below a predetermined level over specified periods. In the event a Fund’s NAV declines below one of the predetermined levels, the decline may trigger an Additional Termination Event under the ISDA (“NAV Decline Trigger Event”) whereby each counterparty would have the right to declare an Early Termination Date, terminate the ISDA, and close-out all outstanding derivatives positions according to the close-out procedures of the ISDA. Pursuant to the terms of the ISDA, following a NAV Decline Trigger Event, counterparties may agree to waive their right to declare an Early Termination Date and thereby waive their right to terminate the ISDA and close-out any outstanding derivatives positions.
In addition to the provisions relating to Additional Termination Events, under the terms of the Credit Support Annex to the ISDA, parties to an ISDA are required to post collateral to the other party if any of their derivatives positions are in a position of net liability. If either party fails to post required collateral and such failure is not remedied following subsequent notice, the failure to post collateral may be an Additional Termination Event and the other party may declare an Early Termination Event, terminate the ISDA, and close out any outstanding derivatives position. As of October 31, 2018, for derivatives positions where the Funds were in a position of net liability, the balance of any collateral posted is included in the Statements of Assets and Liabilities.
Allocations:
Expenses directly attributable to a Fund are charged to that Fund. Expenses not directly attributable to a Fund are allocated among the applicable series within the Trust equally to each fund, in relation to their net assets, or another appropriate basis. Class specific expenses are charged directly to the class incurring the expense. In addition, income, expenses (other than class specific expenses), and unrealized and realized gains and losses are allocated to each class based on relative net assets on a daily basis.
Distributions to Shareholders:
Dividends distributed to shareholders of the Funds from net investment income, if any, are declared and distributed monthly, except for the Frontier Markets Fund and Asia ex-Japan Fund, which distribute dividends to shareholders annually. Distributions from net realized gains, if any, are declared and paid at least annually by the Funds. Additional distributions are also made to the Funds’ shareholders to the extent necessary to avoid the federal excise tax on certain undistributed income and net realized gains of regulated investment companies.
Federal Income Taxes:
Each Fund is a separate taxable entity for federal income tax purposes. Each Fund has qualified and intends to continue to qualify each year as a “regulated investment company’’ under Subchapter M of the Internal Revenue Code, as amended, and to distribute substantially all of its taxable net investment income and net realized gains, if any, to its shareholders. Accordingly, no provision for federal income or excise tax is required for the Funds, although shareholders may be taxed on distributions they receive.
Management of the Funds has reviewed tax positions taken in tax years that remain subject to examination by all major tax jurisdictions, including federal (i.e., the last four tax year ends and the interim tax period since then, as applicable). Management believes that there is no tax liability resulting from unrecognized tax benefits related to uncertain tax positions taken. Management’s conclusions may be subject to future review based on changes in, or interpretation of, accounting standards or tax laws and regulations.
| HSBC FAMILY OF FUNDS |
| Notes to Financial Statements—as of October 31, 2018 (continued) |
3. Investment Valuation Summary
The valuation techniques employed by the Funds, as described below, maximize the use of observable inputs and minimize the use of unobservable inputs in determining fair value. The Funds’ investments are classified within the fair value hierarchy based on the lowest level of input that is significant to the fair value measurement. The inputs used for valuing the Funds’ investments are summarized in the three broad levels listed below:
| ● | Level 1—quoted prices in active markets for identical assets |
| ● | Level 2—other significant observable inputs (including quoted prices for similar securities, interest rates, prepayments speeds, credit risk, etc.) |
| ● | Level 3—significant unobservable inputs (including the Fund’s own assumptions in determining the fair value of investments) |
Bonds and other fixed income securities (other than short-term obligations) are valued at the evaluated bid price, as of the time NAV is determined, supplied by an approved independent pricing service, based upon market transactions for normal, institutional-size trading units of similar securities, as well as yield, quality, coupon rate, maturity, callability or prepayment option, type and size of issue, trading characteristics and other market data (“matrix valuations”), without exclusive reliance on quoted prices on an exchange or over-the-counter prices. Because quoted prices on exchanges or over-the-counter prices are believed to reflect more accurately the fair value of such securities, matrix valuations are typically categorized as Level 2 in the fair value hierarchy.
Exchange traded, domestic equity securities are valued at the last sale price on a national securities exchange (except the NASDAQ Stock Market), or in the absence of recorded sales, at the readily available closing bid price on such exchanges. Securities traded on the NASDAQ Stock Market are valued at the NASDAQ Official Closing Price on the date of valuation. Domestic equity securities that are not traded on an exchange are valued at the quoted bid price in the over-the-counter market. These securities are typically categorized as Level 1 in the fair value hierarchy.
Exchange traded, foreign equity securities are valued in the appropriate currency on the last quoted sale price, or in the absence of recorded sales, at the readily available closing bid price on such exchange. If no sale is available because the country is on holiday the previous day’s last quoted sales price would be utilized. Foreign equity securities that are not exchange-traded are valued in the appropriate currency at the average of the quoted bid and asked prices in the over-the-counter market. These securities are typically categorized as Level 1 in the fair value hierarchy. Foreign equity securities that are not exchange traded are valued in the appropriate currency at the average of the quoted bid and asked prices in the over-the-counter market and are typically categorized as Level 2 in the fair value hierarchy.
Rights and warrants are valued at the last sales price on a national securities exchange. If these instruments are not scheduled to trade for a certain period they are generally valued intrinsically based on the terms of the issuance and the price of the underlying security. The time value of the warrants may also be considered by the Investment Adviser, as defined below. These instruments are typically categorized as Level 1 in the fair value hierarchy unless intrinsic value is used then would be categorized as Level 2 in the fair value hierarchy.
P-notes are valued by taking the last sales price of the underlying security on its primary exchange. In the absence of a recorded sale on the underlying security the readily available closing bid price on such exchange will be used. If no sale is available because the country is on holiday the previous day’s last quoted sales price would be utilized. All local prices will be converted to U.S. dollars using the foreign currency exchange rate as of the close of regular trading on the New York Stock Exchange. These instruments are typically categorized as Level 2 in the fair value hierarchy.
| HSBC FAMILY OF FUNDS |
| Notes to Financial Statements—as of October 31, 2018 (continued) |
Investments in other mutual funds are valued at their NAVs, as reported by such mutual funds and are typically categorized as Level 1 in the fair value hierarchy.
Exchange traded futures contracts are valued at their settlement price on the exchange on which they are traded and are typically categorized as Level 1 in the fair value hierarchy. Exchange traded option contracts are valued at the closing price or last sale price on the primary instrument for that option as recorded by an approved pricing service and are typically categorized as Level 1 in the fair value hierarchy.
Forward foreign currency exchange contracts are valued at the current day’s interpolated foreign exchange rate, as calculated using the current day’s spot rate, and the prevailing forward rates and converted to U.S. dollars at the exchange rate of such currencies against the U.S. dollar, as of the close of regular trading on the New York Stock Exchange, as provided by an approved pricing service, and are typically categorized as Level 2 in the fair value hierarchy. Non-exchange traded derivatives, such as swaps and certain options, are generally valued by using a valuation provided by an approved independent pricing service and are typically categorized as Level 2 in the fair value hierarchy.
Securities or other assets for which market quotations or an independent pricing service evaluation are not readily available, or are deemed unreliable due to a significant event or otherwise, are valued pursuant to procedures adopted by the Board (“Procedures”). Depending on the source and relative significance of valuation inputs, these instruments may be classified as Level 2 or Level 3 in the fair value hierarchy. Examples of potentially significant events that could affect the value of an individual security and thus require pricing under the Procedures include corporate actions by the issuer, announcements by the issuer relating to its earnings or products, regulatory news, natural disasters, and litigation. Examples of potentially significant events that could affect multiple securities held by a Fund include governmental actions, natural disasters, and armed conflicts. Fair value pricing may require subjective determinations about the value of a security. While the Trust’s policy is intended to result in a calculation of a Fund’s NAV that fairly reflects security values as of the time of pricing, the Trust cannot ensure that fair values determined would accurately reflect the price that a Fund could obtain for a security if it were to dispose of that security as of the time of pricing. The prices used by a Fund may differ from the value that would be realized if the securities were sold and the differences could be material to the financial statements.
In addition, if events materially affecting the value of foreign securities occur between the time when the exchange on which they are traded closes and the time when the Funds’ NAV is calculated, such securities may be valued using fair value pricing in accordance with procedures adopted by the Board. Management identifies possible fluctuations in foreign securities by monitoring the rise or fall in the value of a designated benchmark index. In the event of a rise or fall greater than predetermined levels, the Funds may use a systematic valuation model provided by an independent third party to value its foreign securities, rather than local market closing prices. When a Fund uses such a valuation model, the value assigned to the Fund’s foreign securities may not be the quoted or published prices of the investment on their primary markets or exchanges and are typically categorized as Level 2 in the fair value hierarchy. The number of days on which fair value prices will be used will depend on market activity and it is possible that fair value prices will be used by the Funds to a significant extent.
Changes in valuation techniques may result in transfers in or out of an assigned level within the fair value hierarchy. The inputs or methodology used for valuing investments are not necessarily an indication of the risk associated with investing in those investments.
| HSBC FAMILY OF FUNDS |
| Notes to Financial Statements—as of October 31, 2018 (continued) |
The following is a summary of the valuation inputs used as of October 31, 2018 in valuing the Funds’ investments based upon the three levels defined above. The breakdown of country descriptions is disclosed in the Schedule of Portfolio Investments for each Fund:
| | LEVEL 1 ($) | | LEVEL 2 ($) | | LEVEL 3 ($) | | Total ($) |
| Emerging Markets Debt Fund | | | | | | | | | | |
| Investment Securities: | | | | | | | | | | |
| Foreign Bonds | | — | | 22,167,313 | | | — | | 22,167,313 | |
| Yankee Dollars | | — | | 23,318,229 | | | — | | 23,318,229 | |
| Investment Company | | 587,485 | | — | | | — | | 587,485 | |
| Total Investment Securities | | 587,485 | | 45,485,542 | | | — | | 46,073,027 | |
| Other Financial Instruments: (a) | | | | | | | | | | |
| Futures Contracts | | 8,071 | | — | | | — | | 8,071 | |
| Credit Default Swaps | | — | | (3,015 | ) | | — | | (3,015 | ) |
| Centrally Cleared Credit Default Swaps | | — | | (24,808 | ) | | — | | (24,808 | ) |
| Forward Currency Contracts | | — | | (3,691 | ) | | — | | (3,691 | ) |
| Total Investments | | 595,556 | | 45,454,028 | | | — | | 46,049,584 | |
| |
| Frontier Markets Fund | | | | | | | | | | |
| Investment Securities: | | | | | | | | | | |
| Common Stocks | | | | | | | | | | |
| Banks | | 3,079,150 | | 2,134,799 | | | — | | 5,213,949 | |
| Capital Markets | | 147,867 | | 171,062 | | | — | | 318,929 | |
| Construction Materials | | 216,792 | | — | | | — | | 216,792 | |
| Energy Equipment & Services | | 66,787 | | — | | | — | | 66,787 | |
| Food Products | | — | | 548,178 | | | 9,193 | | 557,371 | |
| Health Care Providers & Services | | 111,833 | | 271,082 | | | — | | 382,915 | |
| Independent Power & Renewable | | | | | | | | | | |
| Electricity Producers | | 222,208 | | — | | | — | | 222,208 | |
| Oil, Gas & Consumable Fuels | | 167,880 | | 216,455 | | | — | | 384,335 | |
| Real Estate Management | | | | | | | | | | |
| & Development | | 77,177 | | 1,165,848 | | | — | | 1,243,025 | |
| Transportation Infrastructure | | 922,362 | | — | | | — | | 922,362 | |
| Other Common Stocks | | — | | 3,457,221 | | | — | | 3,457,221 | |
| Participatory Notes | | — | | 561,388 | | | — | | 561,388 | |
| Investment Company | | 507,891 | | — | | | — | | 507,891 | |
| Total Investment Securities | | 5,519,947 | | 8,526,033 | | | 9,193 | | 14,055,173 | |
| HSBC FAMILY OF FUNDS |
| Notes to Financial Statements—as of October 31, 2018 (continued) |
| | | LEVEL 1 ($) | | | LEVEL 2 ($) | | | LEVEL 3 ($) | | Total ($) |
| Asia ex-Japan Fund | | | | | | | | | | | |
| Investment Securities: | | | | | | | | | | | |
| Common Stocks | | | | | | | | | | | |
| Biotechnology | | 1,098,008 | | | 1,257,474 | | | — | | 2,355,482 | |
| Construction & Engineering | | — | | | 1,268,472 | | | 338,158 | | 1,606,630 | |
| Specialty Retail | | 366,510 | | | 1,629,965 | | | — | | 1,996,475 | |
| Other Common Stocks | | — | | | 69,858,702 | | | — | | 69,858,702 | |
| Warrant | | — | | | — | | | — | | — | |
| Investment Company | | 1,612,674 | | | — | | | — | | 1,612,674 | |
| Total Investment Securities | | 3,077,192 | | | 74,014,613 | | | 338,158 | | 77,429,963 | |
| |
| Global High Yield Bond Fund | | | | | | | | | | | |
| Investment Securities: | | | | | | | | | | | |
| Foreign Bonds | | — | | | 3,843,662 | | | — | | 3,843,662 | |
| Yankee Dollars | | — | | | 7,056,006 | | | — | | 7,056,006 | |
| Corporate Bonds | | — | | | 15,180,136 | | | — | | 15,180,136 | |
| Exchange Traded Fund | | 1,252,676 | | | — | | | — | | 1,252,676 | |
| Investment Companies | | 2,215,204 | | | — | | | — | | 2,215,204 | |
| Total Investment Securities | | 3,467,880 | | | 26,079,804 | | | — | | 29,547,684 | |
| Other Financial Instruments: (a) | | | | | | | | | | | |
| Futures Contracts | | (5,726 | ) | | — | | | — | | (5,726 | ) |
| Credit Default Swaps | | — | | | (1,819 | ) | | — | | (1,819 | ) |
| Centrally Cleared Credit Default Swaps | | — | | | 10,680 | | | — | | 10,680 | |
| Forward Currency Contracts | | — | | | 107,205 | | | — | | 107,205 | |
| Total Investments | | 3,462,154 | | | 26,195,870 | | | — | | 29,658,024 | |
| |
| Global High Income Bond Fund | | | | | | | | | | | |
| Investment Securities: | | | | | | | | | | | |
| Foreign Bonds | | — | | | 5,728,203 | | | — | | 5,728,203 | |
| Yankee Dollars | | — | | | 10,284,197 | | | — | | 10,284,197 | |
| Corporate Bonds | | — | | | 9,736,231 | | | — | | 9,736,231 | |
| U.S. Treasury Obligations | | — | | | 425,658 | | | — | | 425,658 | |
| Investment Companies | | 587,743 | | | — | | | — | | 587,743 | |
| Total Investment Securities | | 587,743 | | | 26,174,289 | | | — | | 26,762,032 | |
| Other Financial Instruments: (a) | | | | | | | | | | | |
| Futures Contracts | | 1,088 | | | — | | | — | | 1,088 | |
| Credit Default Swaps | | — | | | (3,606 | ) | | — | | (3,606 | ) |
| Centrally Cleared Credit Default Swaps | | — | | | 4,005 | | | — | | 4,005 | |
| Forward Currency Contracts | | — | | | 139,751 | | | — | | 139,751 | |
| Total Investments | | 588,831 | | | 26,314,439 | | | — | | 26,903,270 | |
____________________
| (a) | Other financial instruments would include derivative instruments, such as futures and forward foreign currency contracts, which are valued at the unrealized appreciation/(depreciation) on the instrument and swap agreements, which are valued at fair value. |
| HSBC FAMILY OF FUNDS |
| Notes to Financial Statements—as of October 31, 2018 (continued) |
The Level 3 investments in the Frontier Markets Fund represent a security which had halted trading at year end, for which management applied a 50% discount to the last traded price to reflect the lack of marketability, negative company guidance and changes in the price of a security issued by an affiliate of the issuer. The Level 3 investments in the Asia ex-Japan Fund represent a security which had halted trading at year end, for which management applied a 15% discount to the last traded price to reflect the lack of marketability, negative company guidance and changes in the price of bonds issued by the company. Significant changes in any of the unobservable inputs may significantly impact the fair value measurement. The impact is based on the relationship between each unobservable input and the fair value measurement. Significant increases (decreases) in the discount applied to the last traded price would decrease (increase) the fair value measurement. There were transfers from Level 3 to Level 2 in the Asia ex-Japan Fund as of October 31, 2018 related to a security which had previously halted trading and had resumed market trading as disclosed in the table below.
| | Transfers from |
| | Level 3 to |
| | Level 2 ($) |
| Asia ex-Japan Fund | | |
| Common Stocks | | 391,029 |
4. Related Party Transactions and Other Agreements and Plans:
Investment Management:
HSBC Global Asset Management (USA), Inc. (“HSBC’’ or the “Investment Adviser’’), a wholly owned subsidiary of HSBC Bank USA, N.A., a national bank organized under the laws of the United States, acts as Investment Adviser to the Funds. As Investment Adviser, HSBC manages the investments of the Funds and continuously reviews, supervises and administers the Funds’ investments pursuant to an Investment Advisory Contract. For its services in this capacity, HSBC receives a fee from each Fund, accrued daily and paid monthly, based on the average daily net assets of each respective Fund, at annual rate of:
| Fund | | Fee Rate(%) |
| Emerging Markets Debt Fund | | 0.50 |
| Frontier Markets Fund | | 1.25 |
| Asia ex-Japan Fund | | 1.00 |
| Global High Yield Bond Fund | | 0.65 |
| Global High Income Bond Fund | | 0.65 |
HSBC Global Asset Management (UK) Limited (“AMEU”) acts as sub-adviser to the Frontier Markets Fund. AMEU receives a fee, accrued daily and paid monthly, based on average daily net assets of the Frontier Markets Fund at an annual rate of 0.625% from the fees paid to the Investment Adviser.
HSBC Global Asset Management (Hong Kong) Limited (“AMHK”) acts as sub-adviser to the Asia ex-Japan Fund. AMHK receives a fee, accrued daily and paid monthly, based on average daily net assets of the Asia ex-Japan Fund at an annual rate of 0.50% from the fees paid to the Investment Adviser.
HSBC also provides support services to the Funds pursuant to a Support Services Agreement in connection with the operation of certain classes of shares of the Funds. For its services in this capacity, HSBC is entitled to a fee, accrued daily and paid monthly, based on the average daily net assets of Class A Shares of each of the Funds, at an annual rate of 0.10%. HSBC is not entitled to a support services fee for Class I Shares.
Administration, Fund Accounting and Other Services:
HSBC also serves the Funds as Administrator. Under the terms of the Administration Services Agreement, HSBC receives from the Funds (as well as other funds in the Trust combined) a fee, accrued daily and paid monthly, at an annual rate of:
| Based on Average Daily Net Assets of | | Fee Rate (%) |
| Up to $10 billion | | 0.0400 |
| In excess of $10 billion but not exceeding $20 billion | | 0.0350 |
| In excess of $20 billion but not exceeding $ 50 billion | | 0.0265 |
| In excess of $ 50 billion | | 0.0245 |
| HSBC FAMILY OF FUNDS |
| Notes to Financial Statements—as of October 31, 2018 (continued) |
The fee rates and breakpoints are determined on the basis of the aggregate average daily net assets of the Trust. For the year ended October 31, 2018, the effective annualized rate was 0.038%, prior to any fee waivers or expense reimbursements, based on the average daily net assets of the Trust. The total administration fee paid to HSBC is allocated to each series based upon its proportionate share of the aggregate net assets of the Trust, subject to certain allocations in cases where one fund invests some or all of its assets in another fund.
Pursuant to a Sub-Administration Services Agreement with HSBC, Citi Fund Services Ohio, Inc. (“Citi”), a wholly-owned subsidiary of Citigroup, Inc., serves as the Trust’s Sub-Administrator. For these services, Citi is entitled to a fee, payable by HSBC, at an annual rate equivalent to the fee rates set forth below:
| Based on Average Daily Net Assets of | | Fee Rate (%) |
| Up to $10 billion | | 0.0200 |
| In excess of $10 billion but not exceeding $20 billion | | 0.0150 |
| In excess of $20 billion but not exceeding $ 50 billion | | 0.0065 |
| In excess of $ 50 billion | | 0.0045 |
Under a Services Agreement between the Trust and Citi (the “Services Agreement”), Citi makes an individual available to serve as the Trust’s Chief Compliance Officer (the “CCO”). Citi also provides infrastructure and support in implementing the written policies and procedures comprising the Trust’s compliance program, including support services to the CCO. For the services provided under the Services Agreement, the Trust paid Citi $313,915 for the year ended October 31, 2018, plus reimbursement of certain out-of-pocket expenses. Expenses incurred by each Fund are reflected on the Statements of Operations as “Compliance Services.” Citi pays the salary and other compensation earned by individuals performing these services, as employees of Citi.
In addition, Citi provides fund accounting services for each Fund under the Services Agreement. As fund accountant, Citi receives an annual fee per Fund and share class, subject to certain minimums and reimbursements of certain expenses. Citi receives additional fees paid by the Trust for regulatory administration services.
Distribution Arrangements:
Foreside Distribution Services, L.P. (“Foreside”) serves the Trust as Distributor (the “Distributor”). The Trust, on behalf of the Emerging Markets Debt and Frontier Markets Funds, has adopted a non-compensatory Distribution Plan and Agreement (the “Distribution Plan”) pursuant to Rule 12b-1 of the Act. The Distribution Plan provides for reimbursement of expenses incurred by the Distributor related to distribution and marketing, at a rate not to exceed 0.25% of the average daily net assets of Class A Shares (currently not being charged). For the year ended October 31, 2018, Foreside, as Distributor, also received $1,976 in commissions from sales of the Trust.
Shareholder Servicing:
The Trust has adopted a Shareholder Services Plan, which provides for payments to shareholder servicing agents for providing various shareholder services. For performing these services, the shareholder servicing agents receive a fee that is computed daily and paid monthly up to 0.25% of the average daily net assets of Class A Shares of the Funds. The fees paid to the Distributor pursuant to the Distribution Plan and to shareholder servicing agents pursuant to the Shareholder Services Plan may not exceed, in the aggregate, 0.50% annually of each Fund’s average daily net assets of Class A Shares.
The Trust has entered into shareholder services contracts with affiliated and unaffiliated financial intermediaries who provide shareholder services and other related services to their clients or customers who invest in the Funds under which the Funds will pay all or a portion of such fees earned to financial intermediaries for performing such services.
| HSBC FAMILY OF FUNDS |
| Notes to Financial Statements—as of October 31, 2018 (continued) |
Transfer Agency:
On April 16, 2018, DST Asset Manager Solutions, Inc. (“DST”) (formerly, Boston Financial Data Services, Inc.) announced that SS&C Technologies completed its acquisition of DST Systems, Inc., the parent of DST. DST provides transfer agency services for each Fund. As transfer agent, DST receives a fee based on the number of funds and shareholder accounts, subject to certain minimums, and reimbursement of certain expenses.
Independent Trustees:
The Trust pays an annual retainer to each Independent Trustee, plus additional annual retainers to each Committee Chair and the Chairman of the Board. The Independent Trustees also receive a fee for each regular, special in-person, and telephonic meeting of the Board attended. The aggregate amount of the fees and expenses of the Independent Trustees are allocated amongst all the funds in the Trust and are presented in the Statements of Operations.
Fee Reductions:
The Investment Adviser has agreed to contractually limit through March 1, 2019, (March 1, 2020 with respect to the Frontier Markets Fund), the total annual expenses of the Funds, exclusive of interest, taxes, brokerage commissions, extraordinary expenses, and estimated indirect expenses attributable to the Funds’ investments in investment companies. The applicable classes of each Fund have their own expense limitations based on the average daily net assets for any full fiscal year as follows:
| | | | Contractual |
| Fund | | Class | | Expense Limitations (%) |
| Emerging Markets Debt Fund | | A | | | 0.85 | | |
| Emerging Markets Debt Fund | | I | | | 0.50 | | |
| Frontier Markets Fund | | A | | | 1.85 | * | |
| Frontier Markets Fund | | I | | | 1.50 | * | |
| Asia ex-Japan Fund | | A | | | 1.25 | | |
| Asia ex-Japan Fund | | I | | | 0.90 | | |
| Global High Yield Bond Fund | | A | | | 1.15 | | |
| Global High Yield Bond Fund | | I | | | 0.80 | | |
| Global High Income Bond Fund | | A | | | 1.15 | | |
| Global High Income Bond Fund | | I | | | 0.80 | | |
____________________
| * | Effective April 12, 2018. Prior to April 12, 2018, the contractual expense limitations for Class A and Class I Shares were 2.20% and 1.85%, respectively. |
Any amounts contractually waived or reimbursed by the Investment Adviser will be subject to repayment by the respective Fund to the Investment Adviser within three years calculated monthly from when the waiver or reimbursement is recorded to the extent that the repayment will not cause the Fund’s operating expenses to exceed the contractual expense limit that was in effect at the time of such waiver or reimbursement. During the year ended October 31, 2018, the Investment Adviser did not recapture any of its prior contractual waivers or reimbursements. As of October 31, 2018, the repayments that may potentially be made by the Funds are as follows:
| | Amount Eligible Through |
| | 2021 ($) | | 2020 ($) | | 2019 ($) | | Total ($) |
| Emerging Markets Debt Fund | | | 803,300 | | | | 364,333 | | | | 224,310 | | | | 1,391,943 | |
| Frontier Markets Fund | | | 878,299 | | | | 449,360 | | | | 246,274 | | | | 1,573,933 | |
| Asia ex-Japan Fund | | | 813,509 | | | | 282,747 | | | | 223,130 | | | | 1,319,386 | |
| Global High Yield Bond Fund | | | 428,942 | | | | 192,107 | | | | 195,535 | | | | 816,584 | |
| Global High Income Bond Fund | | | 454,308 | | | | 207,463 | | | | 205,446 | | | | 867,217 | |
| HSBC FAMILY OF FUNDS |
| Notes to Financial Statements—as of October 31, 2018 (continued) |
The Administrator and Citi may voluntarily waive/reimburse fees to help support the expense limits of the Funds. In addition, HSBC, in its role as Investment Adviser and Administrator, may waive/reimburse additional fees at its discretion. Any voluntary fee waivers/reimbursements are not subject to recoupment in subsequent fiscal periods. Voluntary waivers/reimbursements may be eliminated or changed at any time. Amounts waived/ reimbursed by the Investment Adviser, Administrator and Citi as Sub-Administrator are reported separately on the Statements of Operations, as applicable.
Other:
The Funds may purchase securities from an underwriting syndicate in which the principal underwriter or members of the syndicate are affiliated with the Adviser. For the year ended October 31, 2018, the Funds purchased the following amounts of such securities:
| | Purchases ($) |
| Emerging Markets Debt Fund | | | 2,635,000 | |
| Global High Yield Bond Fund | | | 1,188,000 | |
| Global High Income Bond Fund | | | 1,505,000 | |
The Funds may use related party broker-dealers. For the year ended October 31, 2018, there were no brokerage commissions paid to broker-dealers affiliated with the Adviser.
The Adviser and its affiliates may have lending, banking, brokerage, underwriting, or other business relationships with the issuers of the securities in which the Funds invest.
5. Investment Transactions:
Cost of purchases and proceeds from sales of securities (excluding securities maturing less than one year from acquisition) for the year ended October 31, 2018 were as follows:
| | Purchases ($) | | Sales ($) |
| Emerging Markets Debt Fund | | 25,873,064 | | 26,296,027 |
| Frontier Markets Fund | | 16,874,031 | | 44,531,205 |
| Asia ex-Japan Fund | | 159,945,728 | | 70,625,930 |
| Global High Yield Bond Fund | | 15,318,454 | | 13,604,122 |
| Global High Income Bond Fund | | 11,890,741 | | 10,479,144 |
For the year ended October 31, 2018, purchases and sales of long-term U.S. government securities were as follows:
| | Purchases ($) | | Sales ($) |
| Emerging Markets Debt Fund | | | — | | | 178,463 |
| Global High Income Bond Fund | | | 2,951,938 | | | 2,979,198 |
6. Investment Risks:
Asia Risk: The Asia ex-Japan Fund’s performance is expected to be closely tied to the social, political, economic and regulatory developments within Asia and to be more volatile than the performance of a more geographically diversified mutual fund. Moreover, the economies of certain countries in Asia, including China, differ from the U.S. economy in several ways, including the rate of growth, composition of industries or reliance on natural resources, rates of inflation, capital reinvestment and balance of payments position. As export-driven economies, the economies of these countries are affected by developments in the economies and trade policies of their principal trading partners, including the U.S. Furthermore, flooding, monsoons and other natural disasters also can significantly affect the value of investments
Concentration of Market Risk: To the extent a Fund focuses its investments in a specific region or country, the Fund will be more susceptible to the market, political, and economic risks and developments of that region or country.
| HSBC FAMILY OF FUNDS |
| Notes to Financial Statements—as of October 31, 2018 (continued) |
Derivatives Risk: The term “derivatives” covers a broad range of investments, including swaps, futures, options and currency forwards. In general, a derivative refers to any financial instrument whose value is derived, at least in part, from the price of another security or a specified index, asset or rate. The use of derivatives presents risks different from, and possibly greater than, the risks associated with investing directly in traditional securities. The use of derivatives can lead to losses because of adverse movements in the price or value of the underlying asset, index or rate, which may be magnified by certain features of the derivatives. These risks are heightened when derivatives are used to enhance a Fund’s return or as a substitute for a position or security, rather than solely to hedge (or offset) the risk of a position or security held by a Fund. The success of Fund’s derivatives strategies will also be affected by its ability to assess and predict the impact of market or economic developments on the underlying asset, index or rate and the derivative itself, without the benefit of observing the performance of the derivative under all possible market conditions. Derivatives involve the risk of mispricing or improper valuation and the risk that changes in the value of the derivative may not correlate perfectly with the underlying asset, index or rate. Certain derivative positions may be difficult to close out when a Fund’s portfolio manager may believe it would be appropriate to do so. Also, suitable derivative transactions may not be available in all circumstances and there can be no assurance that a Fund will engage in these transactions to reduce exposure to other risks when that would be beneficial.
Emerging Markets Risk: The prices of securities in emerging markets can fluctuate more significantly than the prices of companies in more developed countries. Securities of emerging market issuers generally have more risk than securities issued by issuers in more developed markets. The less developed the country, the greater effect the risks may have in an investment, and as a result, an investment may exhibit a higher degree of volatility than either the general domestic securities market or the securities markets of developed foreign countries.
Foreign Securities Risk: Investments in foreign securities are generally considered riskier than investments in U.S. securities. Foreign securities, including those of emerging and frontier market issuers, are subject to additional risks, including international trade, political and regulatory risks.
Frontier Market Countries Risk: Frontier market countries generally have smaller economies and even less developed capital markets or legal and political systems than traditional emerging market countries. As a result, the risks of investing in emerging market countries are magnified in frontier market countries. The magnification of risks are the result of: the potential for extreme price volatility and illiquidity in frontier markets; government ownership or control of parts of private sector and of certain companies; trade barriers, exchange controls, managed adjustments in relative currency values and other protectionist measures imposed or negotiated by the countries with which frontier market countries trade and the relatively new and unsettled securities laws in many frontier market countries.
High-Yield Securities Risk: Investments in high-yield securities (commonly referred to as “junk bonds”) are considered speculative investments and have significantly higher credit risk than investment-grade securities and tend to be less liquid than higher rated securities. The prices of high-yield securities, which may be more volatile than higher rated securities of similar maturity, may be more vulnerable to adverse market, economic, social or political conditions.
Interest Rate Risk: Fluctuations in interest rates may affect the yield, liquidity and value of investments in income producing or debt instruments. Generally, if interest rates rise, the value of such investments will fall. The risks associated with rising interest rates are heightened given recent increases in short-term interest rates and the possibility of further rate increases with unpredictable effects on the markets and a Fund’s investments.
Non-Diversification Risk: The Emerging Markets Debt Fund is non-diversified, meaning that it is permitted to invest a larger percentage of its assets in fewer issuers than diversified mutual funds. Thus, the Emerging Markets Debt Fund may be more susceptible to adverse developments affecting any single issuer held in its portfolio, and may be more susceptible to greater losses because of these developments.
| HSBC FAMILY OF FUNDS |
| Notes to Financial Statements—as of October 31, 2018 (continued) |
Swap Risk: The use of swap agreements, which are agreements to exchange the return generated by one instrument for the return generated by another instrument (or index), and similar instruments involves risks that are different from those associated with ordinary portfolio securities transactions. For example, a Fund bears the risk of loss of the amount expected to be received under a swap agreement in the event of the default or bankruptcy of a swap agreement counterparty. Swap agreements may also subject a Fund to the risk that the counterparty to the transaction may not meet its obligations, causing the Fund’s value to decrease. Swap agreements may also be considered illiquid.
7. Federal Income Tax Information:
At October 31, 2018, the cost basis of investments for federal income tax purposes, gross unrealized appreciation, gross unrealized depreciation and net unrealized appreciation/depreciation were as follows:
| | | | | | | | | | | | | | | Net Unrealized |
| | | | | | Tax Unrealized | | Tax Unrealized | | Appreciation/ |
| | Tax Cost ($) | | Appreciation ($) | | Depreciation ($) | | (Depreciation) ($) |
| Emerging Markets Debt Fund | | | 51,743,696 | | | | 415,231 | | | | (6,130,324 | ) | | | | (5,715,093 | ) | |
| Frontier Markets Fund | | | 17,236,593 | | | | 609,517 | | | | (3,790,937 | ) | | | | (3,181,420 | ) | |
| Asia ex-Japan Fund | | | 96,369,510 | | | | 1,269,431 | | | | (20,208,978 | ) | | | | (18,939,547 | ) | |
| Global High Yield Bond Fund | | | 30,461,011 | | | | 304,605 | | | | (1,209,071 | ) | | | | (904,466 | ) | |
| Global High Income Bond Fund | | | 27,354,067 | | | | 341,278 | | | | (932,914 | ) | | | | (591,636 | ) | |
The tax cost of investments generally includes the cost of securities and any upfront premiums paid or received on derivatives, as applicable. The tax unrealized appreciation/depreciation includes securities and derivatives that are not considered realized for tax purposes, as applicable.
The difference between book-basis and tax-basis unrealized appreciation (depreciation) is attributable primarily to tax deferral of losses on wash sales and the realization for tax purposes of unrealized gains/losses on investments in passive foreign investment companies and derivatives.
The tax character of distributions paid by the Funds for the tax year ended October 31, 2018, was as follows:
| | Distributions paid from |
| | | | | | | | | | | | | | | | | | Total |
| | Ordinary | | Net Long Term | | Total Taxable | | Return of | | Distributions |
| | Income ($) | | Capital Gains ($) | | Distributions ($) | | Capital ($) | | Paid ($)(1) |
| Emerging Markets Debt Fund | | | 2,102,122 | | | | — | | | | 2,102,122 | | | | 178,617 | | | | 2,280,739 | |
| Frontier Markets Fund | | | 390,194 | | | | — | | | | 390,194 | | | | — | | | | 390,194 | |
| Asia ex-Japan Fund | | | 1,312,827 | | | | 570,769 | | | | 1,883,596 | | | | — | | | | 1,883,596 | |
| Global High Yield Bond Fund | | | 1,490,708 | | | | — | | | | 1,490,708 | | | | — | | | | 1,490,708 | |
| Global High Income Bond Fund | | | 940,577 | | | | — | | | | 940,577 | | | | — | | | | 940,577 | |
____________________
| (1) | Total distributions paid may differ from the amount reported in the Statements of Changes in Net Assets because distributions are recognized when actually paid for tax purposes. |
| HSBC FAMILY OF FUNDS |
| Notes to Financial Statements—as of October 31, 2018 (continued) |
The tax character of distributions paid by the Funds for the tax year ended October 31, 2017, was as follows:
| | Distributions paid from |
| | | | | | | | | | Total |
| | Ordinary | | Total Taxable | | Distributions |
| | Income ($) | | Distributions ($) | | Paid ($)(1) |
| Emerging Markets Debt Fund | | | 1,710,264 | | | | 1,710,264 | | | | 1,710,264 | |
| Frontier Markets Fund | | | 983,528 | | | | 983,528 | | | | 983,528 | |
| Asia ex-Japan Fund | | | 164,703 | | | | 164,703 | | | | 164,703 | |
| Global High Yield Bond Fund | | | 1,365,979 | | | | 1,365,979 | | | | 1,365,979 | |
| Global High Income Bond Fund | | | 879,390 | | | | 879,390 | | | | 879,390 | |
____________________
| (1) | Total distributions paid may differ from the amount reported in the Statements of Changes in Net Assets because distributions are recognized when actually paid for tax purposes. |
As of the tax year ended October 31, 2018, the components of accumulated earnings/(deficit) on a tax basis for the Funds were as follows:
| | | | | | Undistributed | | | | | | | | | | | Accumulated | | | | | | | Total |
| | Undistributed | | Long Term | | | | | | | | | | | Capital and | | Unrealized | | Accumulated |
| | Ordinary | | Capital | | Accumulated | | Distributions | | Other | | Appreciation/ | | Earnings/ |
| | Income ($) | | Gains ($) | | Earnings ($) | | Payable ($)* | | Losses ($) | | (Depreciation) ($) | | (Deficit) ($) |
| Emerging Markets Debt Fund | | | — | | | — | | | — | | | | — | | | | | (2,215,383 | )(a) | | | | (5,847,557 | ) | | | | (8,062,940 | ) | |
| Frontier Markets Fund | | | 216,528 | | | — | | | 216,528 | | | | — | | | | | (25,101,356 | ) | | | | (3,182,132 | ) | | | | (28,066,960 | ) | |
| Asia ex-Japan Fund | | | 914,698 | | | — | | | 914,698 | | | | — | | | | | (7,268,820 | ) | | | | (18,939,980 | ) | | | | (25,294,102 | ) | |
| Global High Yield Bond Fund | | | 409,561 | | | — | | | 409,561 | | | | (18,327 | ) | | | | (253,335 | ) | | | | (913,893 | ) | | | | (775,994 | ) | |
| Global High Income Bond Fund | | | 482,753 | | | — | | | 482,753 | | | | (13,453 | ) | | | | (46,013 | ) | | | | (608,276 | ) | | | | (184,989 | ) | |
____________________
| * | Distributions payable may differ from the amounts reported in the Statements of Assets and Liabilities because distributions payable on a tax basis include those dividends that will be reinvested. |
| (a) | Includes $ 30,693 of straddle losses which were deferred. |
As of the tax year ended October 31, 2018, the Funds have net capital loss carryforwards (CLCFs”) not subject to expiration as summarized in the table below. The Board does not intend to authorize a distribution of any realized gain for the Funds until any applicable CLCF has been offset or expires.
| | Short Term | | Long Term | | |
| | Amount ($) | | Amount ($) | | Total ($) |
| Emerging Markets Debt Fund | | 848,751 | | 1,335,939 | | 2,184,690 |
| Frontier Markets Fund | | 7,988,786 | | 17,112,570 | | 25,101,356 |
| Asia ex-Japan Fund | | 7,268,820 | | — | | 7,268,820 |
| Global High Yield Bond Fund | | 253,335 | | — | | 253,335 |
| Global High Income Bond Fund | | 46,013 | | — | | 46,013 |
During the year ended October 31, 2018, the Funds utilized CLCFs as follows:
| | | | | | Total ($) |
| Frontier Markets Fund | | | | | | 5,272,633 |
| Global High Yield Bond Fund | | | | | | 212,034 |
| HSBC FAMILY OF FUNDS |
| Notes to Financial Statements—as of October 31, 2018 (continued) |
Under current law, capital losses and specified ordinary losses realized after October 31 and non-specified ordinary losses incurred after December 31 (ordinary losses collectively known as “late year ordinary loss”) may be deferred and treated as occurring on the first business day of the following fiscal year. As of the tax year ended October 31, 2018, the Funds had no deferred losses.
The amount and character of net investment income and net realized gains distributed are determined in accordance with federal income tax regulations, which may differ from GAAP. These “book/tax” differences are either considered temporary or permanent in nature. To the extent these differences are permanent in nature (e.g., certain gain/loss, differing treatment on certain swap agreements, and certain distributions), such amounts are reclassified within the composition of net assets based on their federal tax-basis treatment; temporary differences (e.g., wash losses and the realization for tax purposes of unrealized gains/losses on investments in passive foreign investment companies) do not require reclassification. The Funds may utilize equalization accounting for tax purposes and designate earnings and profits, including net realized gains distributed to shareholders on redemption of shares, as part of the dividends paid deduction for income tax purposes. To the extent distributions to shareholders from net investment income and net realized gains exceed net investment income and net realized gains for tax purposes, they are reported as distributions of capital.
On the Statements of Assets and Liabilities, as a result of permanent book-to-tax differences, reclassification adjustments were made as follows:
| | Accumulated Net Investment | | | | | |
| | Income/(Distributions | | Accumulated Net |
| | in Excess of Net | | Realized |
| | Investment Income) ($)* | | Gains/(Losses) ($)* |
| Emerging Markets Debt Fund | | | (808,362 | ) | | | | 808,362 | | |
| Frontier Markets Fund | | | (125,123 | ) | | | | 125,123 | | |
| Asia ex-Japan Fund | | | (114,043 | ) | | | | 114,043 | | |
| Global High Yield Bond Fund | | | 367,660 | | | | | (367,660 | ) | |
| Global High Income Bond Fund | | | 432,986 | | | | | (432,986 | ) | |
____________________
| * | These components of capital are presented together as “Total distributable earnings/(loss)” on the Statements of Assets and Liabilities. |
| |
The reclassifications for the Funds relate primarily to foreign currency gains or losses, investments in passive foreign investment companies, taxable over distributions, and the differing treatment of investments in swap agreements.
8. Significant Shareholders:
Shareholders, including other funds, individuals, and accounts, as well as each Fund’s investment manager(s) and/or investment personnel, may from time to time own (beneficially or of record) a significant percentage of the Fund’s Shares and can be considered to “control” the Fund when that ownership exceeds 25% of the Fund’s assets (and which may differ from control as determined in accordance with GAAP).
| HSBC FAMILY OF FUNDS |
| Notes to Financial Statements—as of October 31, 2018 (continued) |
The following list includes the Funds which had individual shareholder accounts with ownership of voting securities greater than 10% of the total outstanding voting securities but less than 25% and/or accounts with ownership of voting securities greater than 25% of the total outstanding voting securities. Significant transactions by these shareholder accounts may negatively impact the Funds’ performance.
| | Number of | | | | | | | | | | | | |
| | shareholders with | | | | | | | Number of | | | | | |
| | ownership of voting | | | | | | | shareholders with | | | | | |
| | securities of the | | | | | | | ownership of voting | | | | | |
| | Portfolio greater | | | | | | | securities of the | | | | | |
| | than 10% and less | | % owned in | | Portfolio greater | | % owned in |
| | than 25% of the total | | aggregate by | | than 25% of the total | | aggregate by |
| | Portfolio’s outstanding | | 10%-25% | | Portfolio’s outstanding | | greater than 25% |
| Fund | | voting securities | | shareholders | | voting securities | | shareholders |
| Emerging Markets Debt Fund | | | — | | | | — | | | | 1 | | | 97 | %* | |
| Frontier Markets Fund | | | 3 | | | | 43 | % | | | 1 | | | 32 | % | |
| Asia ex-Japan Fund | | | 1 | | | | 14 | %* | | | 1 | | | 86 | % | |
| Global High Yield Bond Fund | | | — | | | | — | | | | 1 | | | 92 | %* | |
| Global High Income | | | | | | | | | | | | | | | | |
| Bond Fund | | | — | | | | — | | | | 1 | | | 100 | %* | |
____________________
| * | Owned by the Investment Adviser or an affiliate. |
9. Business Combinations:
In March 2017, the Board approved HSBC’s proposal to merge HSBC Emerging Markets Local Debt Fund (the “Target Fund”) into HSBC Emerging Markets Debt Fund (the “Acquiring Fund”). The Agreement and Plan of Reorganization was approved by the Board on March 9, 2017. The purpose of the transaction was to respond to the potential impact on investment flows from the Funds as a result of a now vacated rule adopted by the U.S. Department of Labor that would have imposed new requirements on certain financial intermediaries and retirement plan participants and to offer investors a portfolio with a more balanced mix of U.S. dollar-denominated and local currency-denominated emerging markets debt investments. The transaction was effective after the close of business on April 7, 2017. The Acquiring Fund acquired all of the assets and assumed all of the liabilities of the Target Fund as shown in the table below. The transaction was structured to qualify as a tax-free reorganization under the Code. Pursuant to the Agreement and Plan of Reorganization, shareholders of the Target Fund received a number of shares of the corresponding class in the Acquiring Fund, with a value equal to their holdings in the Target Fund as of the close of business on April 7, 2017. The investment portfolio of the Target Fund, with a fair value of approximately $26,391,155 and identified cost of approximately $27,290,437 as of the date of the reorganization, was the principal asset acquired by the Acquiring Fund. For financial statement purposes, assets received and shares issued by the Acquiring Fund were recorded at fair value; however, the cost basis of the investments received from the Target Fund was carried forward to align ongoing reporting of the Acquiring Fund’s realized and unrealized gains and losses with amounts distributable to shareholders for tax purposes.
| HSBC FAMILY OF FUNDS |
| Notes to Financial Statements—as of October 31, 2018 (continued) |
The following is a summary of Shares Outstanding, Net Assets, NAV and Net Unrealized Appreciation (Depreciation) immediately before and after the reorganization:
| | | | | | | | | | | | | | | | | Net |
| | | | | | | | | | | Net Asset | | Unrealized |
| | Shares | | | | | | | Value | | Appreciation |
| | Outstanding | | Net Assets | | Per Share | | (Depreciation)* |
| Target Fund | | | | | | | | | | | | | | | | | | | | |
| Emerging Markets Local Debt Fund | | | | | | | | | | | | | | | | | | | | |
| Class A | | | 155,275 | | | | $ | 1,104,162 | | | | $ | 7.11 | | | | $ | (892,113 | ) | |
| Class I | | | 6,876,517 | | | | | 49,003,085 | | | | | 7.13 | | | | | | | |
| Acquiring Fund | | | | | | | | | | | | | | | | | | | | |
| Emerging Markets Debt Fund | | | | | | | | | | | | | | | | | | | | |
| Class A | | | 39,339 | | | | $ | 401,675 | | | | $ | 10.21 | | | | $ | 164,414 | | |
| Class I | | | 944,593 | | | | | 9,597,020 | | | | | 10.16 | | | | | | | |
| Post Reorganization | | | | | | | | | | | | | | | | | | | | |
| Emerging Markets Debt Fund | | | | | | | | | | | | | | | | | | | | |
| Class A | | | 147,486 | | | | $ | 1,505,837 | | | | $ | 10.21 | | | | $ | (727,699 | ) | |
| Class I | | | 5,768,139 | | | | | 58,600,105 | | | | | 10.16 | | | | | | | |
____________________
| * | Includes translation of balances held in foreign currencies to U.S. dollars. |
10. Recent Accounting Pronouncements:
In March 2017, the FASB issued Accounting Standards Update (“ASU”) No. 2017-08 “Premium Amortization on Purchased Callable Debt Securities” (“ASU 2017-08”), which shortens the premium amortization period for purchased non-contingently callable debt securities. ASU 2017-08 specifies that the premium amortization period ends at the earliest call date, for purchased non-contingently callable debt securities. ASU 2017-08 is effective for fiscal years, and interim periods within those fiscal years, beginning after December 15, 2018. Management does not believe that adoption of ASU 2017-08 will materially impact the Funds’ financial statements.
In August 2018, the FASB issued ASU No. 2018-13, “Fair Value Measurements” (“ASU 2018-13”). This update makes certain removals from, changes to and additions to existing disclosure requirements for fair value measurements. ASU 2018-13 does not change fair value measurements already required or permitted by existing standards. ASU 2018-13 is effective for financial statements issued for fiscal years beginning after December 15, 2019, and interim periods within those fiscal years. As permitted, the Funds have early adopted ASU 2018-13 with the financial statements prepared as of October 31, 2018.
In August 2018, the SEC adopted amendments to certain financial statement disclosure requirements to conform them to GAAP for investment companies. These amendments made certain removals from, changes to and additions to existing disclosure requirements under Regulation S-X. The Funds’ adoption of these amendments, effective with the financial statements prepared as of October 31, 2018 had no effect on the Funds’ net assets or results of operations. As a result of adopting these amendments, the distributions
| HSBC FAMILY OF FUNDS |
| Notes to Financial Statements—as of October 31, 2018 (continued) |
to shareholders in the October 31, 2017 Statements of Changes in Net Assets presented herein have been reclassified to conform to the current year presentation, which includes all distributions to each class of shareholders, other than tax basis return of capital distributions, in one line item per share class. Prior to adoption of this amendment, the distributions to shareholders in the October 31, 2017 Statements of Changes in Net Assets appeared as follows:
| | Emerging Markets | | Frontier | | Asia ex- | | Global High | | Global High |
| | Debt Fund | | Markets Fund | | Japan Fund | | Yield Bond Fund | | Income Bond Fund |
| | For the year | | For the year | | For the year | | For the year | | For the year |
| | ended | | ended | | ended | | ended | | ended |
| | October 31, | | October 31, | | October 31, | | October 31, | | October 31, |
| | 2017 ($) | | 2017 ($) | | 2017 ($) | | 2017 ($) | | 2017 ($) |
| Distributions: | | | | | | | | | | | | | | | | | | | | | | | | | |
| Net investment income: | | | | | | | | | | | | | | | | | | | | | | | | | |
| Class A Shares | | | (51,279 | ) | | | | (130,080 | ) | | | | (1,937 | ) | | | | (74,068 | ) | | | | (7,186 | ) | |
| Class I Shares | | | (1,700,117 | ) | | | | (853,448 | ) | | | | (161,034 | ) | | | | (1,287,782 | ) | | | | (863,926 | ) | |
| Class S Shares | | | — | | | | | — | | | | | (1,732 | ) | | | | — | | | | | — | | |
| Total | | | (1,751,396 | ) | | | | (983,528 | ) | | | | (164,703 | ) | | | | (1,361,850 | ) | | | | (871,112 | ) | |
11. Subsequent Events:
Management has evaluated subsequent events through the date these financial statements were issued. Based on the evaluation, no adjustments or additional disclosures were required to the financial statements as of October 31, 2018.
Report of Independent Registered Public Accounting Firm
To the Board of Trustees of HSBC Funds and Shareholders of HSBC Emerging Markets Debt Fund, HSBC Frontier Markets Fund, HSBC Asia ex-Japan Smaller Companies Equity Fund, HSBC Global High Yield Bond Fund and HSBC Global High Income Bond Fund
Opinions on the Financial Statements
We have audited the accompanying statements of assets and liabilities, including the schedules of portfolio investments, of HSBC Emerging Markets Debt Fund, HSBC Frontier Markets Fund, HSBC Asia ex-Japan Smaller Companies Equity Fund, HSBC Global High Yield Bond Fund and HSBC Global High Income Bond Fund (five of the funds constituting HSBC Funds, hereafter collectively referred to as the “Funds”) as of October 31, 2018, the related statements of operations for the year ended October 31, 2018, the statements of changes in net assets for each of the two years in the period ended October 31, 2018, including the related notes, and the financial highlights for each of the periods presented ended on or after October 31, 2015 (collectively referred to as the “financial statements”). In our opinion, the financial statements present fairly, in all material respects, the financial position of each of the Funds as of October 31, 2018, the results of each of their operations for the year then ended, the changes in each of their net assets for each of the two years in the period ended October 31, 2018 and each of the financial highlights for each of the periods presented ended on or after October 31, 2015 in conformity with accounting principles generally accepted in the United States of America.
The financial statements and financial highlights of HSBC Emerging Markets Debt Fund and HSBC Frontier Markets Fund as of and for the year ended October 31, 2014 (not presented herein, other than the financial highlights) were audited by other auditors whose report dated December 23, 2014 expressed an unqualified opinion on those financial statements and financial highlights.
Basis for Opinions
These financial statements are the responsibility of the Funds’ management. Our responsibility is to express an opinion on the Funds’ financial statements based on our audits. We are a public accounting firm registered with the Public Company Accounting Oversight Board (United States) (“PCAOB”) and are required to be independent with respect to the Funds in accordance with the U.S. federal securities laws and the applicable rules and regulations of the Securities and Exchange Commission and the PCAOB.
We conducted our audits of these financial statements in accordance with the standards of the PCAOB. Those standards require that we plan and perform the audit to obtain reasonable assurance about whether the financial statements are free of material misstatement, whether due to error or fraud.
Report of Independent Registered Public Accounting Firm (continued)
Our audits included performing procedures to assess the risks of material misstatement of the financial statements, whether due to error or fraud, and performing procedures that respond to those risks. Such procedures included examining, on a test basis, evidence regarding the amounts and disclosures in the financial statements. Our audits also included evaluating the accounting principles used and significant estimates made by management, as well as evaluating the overall presentation of the financial statements. Our procedures included confirmation of securities owned as of October 31, 2018 by correspondence with the custodian and brokers; when replies were not received from brokers, we performed other auditing procedures. We believe that our audits provide a reasonable basis for our opinions.
PricewaterhouseCoopers LLP
New York, New York
December 20, 2018
We have served as the auditor of one or more investment companies in the HSBC Funds since 2015.
| HSBC FAMILY OF FUNDS |
| Other Federal Income Tax Information—as of October 31, 2018 (Unaudited) |
During the year ended October 31, 2018, the following Fund declared capital gain distributions:
| | Short Term | | Long Term |
| | Capital Gain | | Capital Gain |
| | Distributions ($) | | Distributions ($) |
| Asia ex-Japan Fund | | 1,088,385 | | 570,769 |
During the year ended October 31, 2018, the following Funds designated the maximum amount allowable as interest-related dividends for certain non-U.S. resident investors:
| | Qualified Interest |
| | Income % |
| Emerging Markets Debt Fund | | | 1.04 | % | |
| Global High Yield Bond Fund | | | 73.90 | % | |
| Global High Income Bond Fund | | | 58.60 | % | |
For the year ended October 31, 2018, dividends paid by the Funds may be subject to a maximum tax rate of 15%, as provided for by the Jobs and Growth Tax Relief Reconciliation Act of 2003. The Funds intend to designate the maximum amount allowable as taxed at a maximum rate of 15%. Complete information will be reported in conjunction with your 2018 Form 1099-DIV:
| | Qualified Dividend |
| | Income % |
| Frontier Markets Fund | | | 100.00 | % | |
| Asia ex-Japan Fund | | | 7.29 | % | |
The following Funds intend to elect to pass through to shareholders the income tax credit for taxes paid to foreign countries. Foreign source income and foreign tax expense per outstanding share on October 31, 2018 are as follows:
| | Foreign | | Foreign Tax |
| | Source Income | | Expense Per |
| | Per Share ($) | | Share ($) |
| Frontier Markets Fund | | 0.75 | | 0.07 |
| Asia ex-Japan Fund | | 0.21 | | 0.03 |
The pass-through of this foreign tax credit will only affect those persons who are shareholders on the dividend record date in December 2018. These shareholders will receive more detailed information along with their 2018 Form 1099-DIV.
| HSBC FAMILY OF FUNDS |
| Table of Shareholder Expenses—as of October 31, 2018 (Unaudited) |
As a shareholder of the Funds, you incur two types of costs: (1) transaction costs, including sales charges (loads) on purchases, redemption fees and exchange fees; and (2) ongoing costs, including management fees, distribution fees and other Fund expenses. These examples are intended to help you understand your ongoing costs (in dollars) of investing in the Funds and to compare the cost with the ongoing costs of investing in other mutual funds.
The Example is based on an investment of $1,000 invested at the beginning of the period and held for the entire period from May 1, 2018 through October 31, 2018.
Actual Expenses
The table below provides information about actual account values and actual expenses. You may use the information below, together with the amount you invested, to estimate the expenses that you paid over the period. Simply divide your account value by $1,000 (for example, an $8,600 account value divided by $1,000 = 8.6), then multiply the result by the number in the table under the heading entitled “Expenses Paid During Period” to estimate the expenses you paid on your account during this period.
| | | | | | | | | | | | | | | | Annualized |
| | | | Beginning | | Ending | | Expenses Paid | | Expense Ratio |
| | | | Account Value | | Account Value | | During Period* | | During Period |
| | | | 5/1/18 | | 10/31/18 | | 5/1/18 - 10/31/18 | | 5/1/18 - 10/31/18 |
| Emerging Markets Debt Fund | | Class A | | | $ | 1,000.00 | | | | $ | 920.90 | | | | $ | 4.12 | | | | 0.85 | % | |
| | Class I | | | | 1,000.00 | | | | | 922.00 | | | | | 2.42 | | | | 0.50 | % | |
| | |
| Frontier Markets Fund | | Class A | | | | 1,000.00 | | | | | 782.80 | | | | | 8.31 | | | | 1.85 | % | |
| | Class I | | | | 1,000.00 | | | | | 784.30 | | | | | 6.75 | | | | 1.50 | % | |
| | |
| Asia ex-Japan Fund | | Class A | | | | 1,000.00 | | | | | 748.00 | | | | | 5.51 | | | | 1.25 | % | |
| | Class I | | | | 1,000.00 | | | | | 749.80 | | | | | 3.97 | | | | 0.90 | % | |
| | |
| HSBC Global High Yield Bond Fund | | Class A | | | | 1,000.00 | | | | | 999.00 | | | | | 5.79 | | | | 1.15 | % | |
| | Class I | | | | 1,000.00 | | | | | 1,000.80 | | | | | 4.03 | | | | 0.80 | % | |
| | |
| HSBC Global High Income Bond Fund | | Class A | | | | 1,000.00 | | | | | 993.30 | | | | | 5.78 | | | | 1.15 | % | |
| | Class I | | | | 1,000.00 | | | | | 994.90 | | | | | 4.02 | | | | 0.80 | % | |
____________________
| * | Expenses are equal to the average account value over the period, multiplied by the Fund’s annualized expense ratio, multiplied by 184/365 (to reflect the one half year period). |
| HSBC FAMILY OF FUNDS |
| Table of Shareholder Expenses—as of October 31, 2018 (Unaudited) (continued) |
Hypothetical Example for Comparison Purposes
The table below provides information about hypothetical account values and hypothetical expenses based on each Fund’s actual expense ratio and an assumed rate of return of 5% per year before expenses, which is not the Fund’s actual return. The hypothetical account values and expenses may not be used to estimate the actual ending account balance or expenses you paid for the period. You may use this information to compare this 5% hypothetical example with the 5% hypothetical examples that appear in the shareholder reports of other funds.
Please note that the expenses shown in the table are meant to highlight your ongoing costs only and do not reflect any transactional costs, such as sales charges (loads), redemption fees, or exchange fees. Therefore, the table is useful in comparing ongoing costs only, and will not help you determine the relative total costs of owning different funds. In addition, if these transactional costs were included, your costs would have been higher.
| | | | | | | | | | | | | | | | | | | Annualized |
| | | | Beginning | | Ending | | Expenses Paid | | Expense Ratio |
| | | | Account Value | | Account Value | | During Period* | | During Period |
| | | | 5/1/18 | | 10/31/18 | | 5/1/18 - 10/31/18 | | 5/1/18 - 10/31/18 |
| Emerging Markets Debt Fund | | Class A | | | $ | 1,000.00 | | | | $ | 1,020.92 | | | | $ | 4.33 | | | | 0.85 | % | |
| | Class I | | | | 1,000.00 | | | | | 1,022.68 | | | | | 2.55 | | | | 0.50 | % | |
| | | | | | | | | | | | | | | | | | | | | | | |
| Frontier Markets Fund | | Class A | | | | 1,000.00 | | | | | 1,015.88 | | | | | 9.40 | | | | 1.85 | % | |
| | Class I | | | | 1,000.00 | | | | | 1,017.64 | | | | | 7.63 | | | | 1.50 | % | |
| | | | | | | | | | | | | | | | | | | | | | | |
| Asia ex-Japan Fund | | Class A | | | | 1,000.00 | | | | | 1,018.90 | | | | | 6.36 | | | | 1.25 | % | |
| | Class I | | | | 1,000.00 | | | | | 1,020.67 | | | | | 4.58 | | | | 0.90 | % | |
| | | | | | | | | | | | | | | | | | | | | | | |
| HSBC Global High Yield Bond Fund | | Class A | | | | 1,000.00 | | | | | 1,019.41 | | | | | 5.85 | | | | 1.15 | % | |
| | Class I | | | | 1,000.00 | | | | | 1,021.17 | | | | | 4.08 | | | | 0.80 | % | |
| | | | | | | | | | | | | | | | | | | | | | | |
| HSBC Global High Income Bond Fund | | Class A | | | | 1,000.00 | | | | | 1,019.41 | | | | | 5.85 | | | | 1.15 | % | |
| | Class I | | | | 1,000.00 | | | | | 1,021.17 | | | | | 4.08 | | | | 0.80 | % | |
____________________
| * | Expenses are equal to the average account value over the period, multiplied by the Fund’s annualized expense ratio, multiplied by 184/365 (to reflect the one half year period). |
| HSBC FAMILY OF FUNDS |
| Board of Trustees and Officers (Unaudited) |
MANAGEMENT OF THE TRUST
The following table contains information regarding the HSBC Family of Funds’ Board of Trustees (“Trustees”). The HSBC Family of Funds’ Statement of Additional Information includes additional information about the Trustees and is available, without charge, upon request by calling (888) 525-5757.
| | | | | | | | Portfolios in | | |
| | Position(s) | | Term of Office | | | | Fund Complex | | Other Directorships |
| | Held with | | and Length of | | Principal Occupation(s) | | Overseen By | | Held by Trustee |
| Name, Address, Age | | Funds | | Time Served | | During Past 5 Years | | Trustee* | | During Past 5 Years |
| NON-INTERESTED | | | | | | | | | | |
| TRUSTEES | | | | | | | | | | |
| | | | | | | | | | | |
| MARCIA L. BECK | | Trustee | | Indefinite; | | Private Investor (1999 – present) | | 10 | | None |
| P.O. Box 182845 | | | | 2008 to | | | | | | |
| Columbus, OH | | | | present | | | | | | |
| 43218-3035 | | | | | | | | | | |
| Age: 63 | | | | | | | | | | |
| | | | | | | | | | | |
| SUSAN C. GAUSE | | Trustee | | Indefinite; | | Private Investor (2003 - present) | | 10 | | Metropolitan Series Fund |
| P.O. Box 182845 | | | | 2013 to | | | | | | (2012 – present); and |
| Columbus, OH | | | | present | | | | | | Met Investors Series |
| 43218-3035 | | | | | | | | | | Trust (2008 – present) |
| Age: 66 | | | | | | | | | | |
| | | | | | | | | | | |
| SUSAN S. HUANG | | Trustee | | Indefinite; | | Private Investor (2000 - present) | | 10 | | None |
| P.O. Box 182845 | | | | 2008 to | | | | | | |
| Columbus, OH | | | | present | | | | | | |
| 43218-3035 | | | | | | | | | | |
| Age: 64 | | | | | | | | | | |
| | | | | | | | | | | |
| THOMAS F. ROBARDS | | Trustee and | | Indefinite; | | Private Investor (2003 - present) | | 10 | | Ellington Residential |
| P.O. Box 182845 | | Chairman | | 2005 to | | | | | | Mortgage REIT (NYSE |
| Columbus, OH | | | | present | | | | | | listed real estate |
| 43218-3035 | | | | | | | | | | investment trust) |
| Age: 72 | | | | | | | | | | (2013 – present); |
| | | | | | | | | | Ellington Financial LLC |
| | | | | | | | | | (NYSE listed financial |
| | | | | | | | | | services company) |
| | | | | | | | | | (2007 – present); and |
| | | | | | | | | | Overseas Shipholding |
| | | | | | | | | | Group (OSG) |
| | | | | | | | | | (NYSE listed company) |
| | | | | | | | | | (2005 – 2014) |
| | | | | | | | | | | |
| INTERESTED TRUSTEE | | | | | | | | | | |
| | | | | | | | | | | |
| DEBORAH HAZELL | | Trustee | | Indefinite; | | Director and Chief Executive Officer, | | 10 | | None |
| 452 Fifth Avenue | | | | 2011 to present | | HSBC Global Asset Management (USA) | | | | |
| New York | | | | | | Inc. (2011 - present) | | | | |
| NY 10018 | | | | | | | | | | |
| Age: 55 | | | | | | | | | | |
____________________
| * | Includes all series of the HSBC Funds. |
| HSBC FAMILY OF FUNDS |
| Board of Trustees and Officers (Unaudited) (continued) |
| | Position(s) Held | | Term of Office and | | Principal Occupation(s) |
| Name, Address, Age | | Funds | | Length of Time Served | | During Past 5 Years |
| OFFICERS | | | | | | |
| | | | | | | |
RICHARD A. FABIETTI
452 Fifth Avenue
New York, NY 10018
Age: 60 | | President | | One year;
2004 to present | | Senior Vice President, HSBC Global Asset Management (USA) Inc. (1998 - present) |
| | | | | | | |
JAMES D. LEVY
452 Fifth Avenue
New York,
NY 10018
Age: 55 | | Vice President | | One year;
2014 to present | | Vice President, Product Management, HSBC Global Asset Management (USA) Inc. (2014 – present); Vice President, Mutual Funds Product Development, GE Asset Management Inc. (2007 – 2014) |
| | | | | | | |
ALLAN SHAER*
Prudential Center
800 Boylston Street, 24th Floor
Boston, MA 02199
Age: 53 | | Treasurer | | One year;
2017 to present | | Senior Vice President, Citi Investor Services (2016 - present); Vice President, Mutual Fund Administration, JP Morgan Chase (2011 - 2016) |
| | | | | | | |
IOANNIS TZOUGANATOS*
Prudential Center
800 Boylston Street, 24th Floor
Boston, MA 02199
Age: 42 | | Secretary | | One Year;
2015 to present | | Vice President, Regulatory Administration, Citi Fund Services (2008 - present) |
| | | | | | | |
CHARLES BOOTH*
4400 Easton Commons,
Suite 200
Columbus, OH 43219-3035
Age: 58 | | Chief Compliance
Officer | | One year;
2015 to present | | Director and Compliance Officer, CCO Services, Citi Fund Services (1988 - present) |
____________________
| * | Mr. Shaer, Mr. Tzouganatos, and Mr. Booth also are officers of other investment companies of which Citi (or an affiliate) is the administrator or sub-administrator. |
| HSBC FAMILY OF FUNDS |
| Other Information (Unaudited) |
Information regarding how the Funds voted proxies relating to portfolio securities during the most recent 12-month period ended June 30th is available (i) without charge, upon request, by calling 1-800-525-5757 for HSBC Bank USA and HSBC Brokerage (USA) Inc. clients and 1-800-782-8183 for all other shareholders; (ii) on the Funds’ website at www.investorfunds.us.hsbc.com; and (iii) on the Security and Exchange Commission’s (“Commission”) website at http://www.sec.gov.
The Funds file their complete schedules of portfolio holdings with the Commission for the first and third quarters of each fiscal year on Form N-Q. The Funds’ Forms N-Q are available on the Commission’s website at http://www.sec.gov. The Funds’ Forms N-Q may be reviewed and copied at the Commission’s Public Reference Room in Washington, D.C. and information on the operation of the Public Reference Room may be obtained by calling 1-800-SEC-0330. The Funds’ Schedules of Investments will be available no later than 60 days after each period end, without charge, on the Funds’ website at www.investorfunds.us.hsbc.com.
An investment in a Fund is not a deposit of HSBC Bank USA, National Association, and is not insured or guaranteed by the Federal Deposit Insurance Corporation or any other government agency.
HSBC FAMILY OF FUNDS:
INVESTMENT ADVISER AND ADMINISTRATOR
HSBC Global Asset Management (USA) Inc.
452 Fifth Avenue
New York, NY 10018
SUB-ADVISERS
HSBC Frontier Markets Fund
HSBC Global High Income Bond Fund
HSBC Global Asset Management (UK) Limited
78 St. James Street
London, United Kingdom, SW1A 1EJ
HSBC Asia ex-Japan Smaller Companies Equity Fund
HSBC Global Asset Management (Hong Kong) Limited
Level 22, HSBC Main Building
1 Queen’s Road Central, Hong Kong
SHAREHOLDER SERVICING AGENTS
For HSBC Bank USA, N.A. and
HSBC Securities (USA) Inc. Clients:
HSBC Bank USA, N.A.
452 Fifth Avenue
New York, NY 10018
1-888-525-5757
For All Other Shareholders:
HSBC Funds
P.O. Box 8106
Boston, MA 02266-8106
1-800-782-8183
TRANSFER AGENT
DST Asset Manager Solutions, Inc.
2000 Crown Colony Drive
Quincy, MA 02169
DISTRIBUTOR
Foreside Distribution Services, L.P.
Three Canal Plaza, Suite 100
Portland, ME 04101
CUSTODIAN
The Northern Trust Company
50 South LaSalle Street
Chicago, IL 60603
INDEPENDENT REGISTERED PUBLIC ACCOUNTING FIRM
PricewaterhouseCoopers LLP
300 Madison Avenue
New York, NY 10017
LEGAL COUNSEL
Dechert LLP
1900 K Street, N.W.
Washington, D.C. 20006

| Investment products: |
ARE NOT A
BANK DEPOSIT
OR OBLIGATION
OF THE BANK
OR ANY OF ITS
AFFILIATES | ARE NOT
FDIC
INSURED | ARE NOT
INSURED BY
ANY FEDERAL
GOVERNMENT
AGENCY |
ARE NOT GUARANTEED BY
THE BANK OR ANY OF ITS
AFFILIATES | MAY LOSE
VALUE |
Investment products are offered by HSBC Securities (USA) Inc. (HSI), member NYSE/FINRA/SIPC. HSI is an affiliate of HSBC Bank USA, N.A. Investment products: Are not a deposit or other obligation of the bank or any of its affiliates; Not FDIC insured or insured by any federal government agency of the United States; Not guaranteed by the bank or any of its affiliates; and are subject to investment risk, including possible loss of principal invested.
Investors should consider the investment objectives, risks, charges, and expenses of the investment company carefully before investing. The prospectus contains this and other important information about the investment company. For clients of HSBC Securities (USA) Inc., please call 1-888-525-5757 for more information. For other investors and prospective investors, please call the Funds directly at 1-800-782-8183 or visit our website at www.emfunds.us.hsbc.com. Investors should read the prospectus carefully before investing or sending money.
Item 2. Code of Ethics.
(a) The registrant has adopted a code of ethics that applies to the registrant’s principal executive officer, principal financial officer, principal accounting officer or controller, or persons performing similar functions. This code of ethics is included as an Exhibit.
(b) During the period covered by the report, with respect to the registrant's code of ethics that applies to its principal executive officer, principal financial officer, principal accounting officer or controller, or persons performing similar functions; there have been no amendments to, nor any waivers granted from, a provision that relates to any element of the code of ethics definition enumerated in paragraph (b) of this Item 2.
Item 3. Audit Committee Financial Expert.
3(a)(1) The registrant’s board of directors has determined that the registrant has at least one audit committee financial expert serving on its audit committee.
3(a)(2) The audit committee financial experts are Tom Robards and Marcia Beck, who are “independent” for purposes of this Item 3 of Form N-CSR.
Item 4. Principal Accountant Fees and Services.
| (a) Audit Fees, |
| | 2018 | | $283,225 |
| 2017 | | $392,975 |
| (b) Audit-Related Fees, |
| | 2018 | | $0 |
| 2017 | | $0 |
| | |
| (c) Tax Fees, |
| 2018 | | $115,700 |
| 2017 | | $229,250 |
| |
| Fees for both 2017 and 2018 relate primarily to the preparation of federal and state income and excise tax returns and the review of excise tax distributions. |
| | |
| (d) All Other Fees, |
| 2018 | | $0 |
| 2017 | | $0 |
(e)(1) The audit committee is required to pre-approve all audit and permitted non-audit services performed by the registrant’s independent auditors in accordance with the audit committee charter and the Investment Company Act of 1940.
| (e)(2) |
| | 2018 | | 0% |
| 2017 | | 0% |
| | |
| (f) Not applicable. |
| |
| (g) Non-Audit Fees, |
| 2018 | | $2,279,700 |
| 2017 | | $2,618,250 |
Fees for 2017 and 2018 represent PricewaterhouseCoopers LLP services provided to the Funds and to HSBC Bank and affiliates related to general corporate, state and local tax assistance, accounting matters and various advisory projects.
(h) The audit committee considered the nonaudit services rendered to the registrant’s investment adviser and any entity controlling, controlled by, or under common control with the investment adviser, and believes the services are compatible with the principal accountant’s independence.
Item 5. Audit Committee of Listed Registrants.
Not applicable.
Item 6. Investments.
(a) Included as a part of the report to shareholders filed under Item 1.
(b) Not applicable.
Item 7. Disclosure of Proxy Voting Policies and Procedures for Closed-End Management Investment Companies.
Not applicable.
Item 8. Portfolio Managers of Closed-End Management Investment Companies.
Not applicable.
Item 9. Purchases of Equity Securities by Closed-End Management Investment Company and Affiliated Purchasers.
Not applicable.
Item 10. Submission of Matters to a Vote of Security Holders.
Not applicable.
Item 11. Controls and Procedures.
(a)The registrant’s principal executive officer and principal financial officer have concluded, based on their evaluation of the registrant's disclosure controls and procedures as conducted within 90 days of the filing date of this report, that these disclosure controls and procedures are adequately designed and are operating effectively to ensure that information required to be disclosed by the registrant on Form N-CSR is recorded, processed, summarized and reported within the time periods specified in the Securities and Exchange Commission's rules and forms.
(b)There were no changes in the registrant’s internal control over financial reporting (as defined in Rule 30a-3(d) under the Act (17 CFR 270.30a-3(d)) that occurred during the period covered by this report that have materially affected or are reasonably likely to materially affect, the registrant’s internal control over financial reporting.
Item 12. Disclosure of Securities Lending Activities for Closed-End Management Investment Companies.
Not applicable.
Item 13. Exhibits.
(a)(1) The code of ethics that is the subject of the disclosure required by Item 2 is attached hereto.
(a)(2) Certifications pursuant to Rule 30a-2(a) are attached hereto.
(a)(3) Not applicable.
(b) Certifications pursuant to Rule 30a-2(b) are furnished herewith.
SIGNATURES
Pursuant to the requirements of the Securities Exchange Act of 1934 and the Investment Company Act of 1940, the registrant has duly caused this report to be signed on its behalf by the undersigned, thereunto duly authorized.
| By (Signature and Title) | /s/ Richard A. Fabietti |
| Richard A. Fabietti |
| President |
Pursuant to the requirements of the Securities Exchange Act of 1934 and the Investment Company Act of 1940, this report has been signed below by the following persons on behalf of the registrant and in the capacities and on the dates indicated.
| By (Signature and Title) | /s/ Richard A. Fabietti |
| Richard A. Fabietti |
| President |
| By (Signature and Title) | /s/ Allan Shaer |
| Allan Shaer |
| Treasurer |