HSBC Global Asset Management (USA) Inc.
HSBC Funds
Annual Report
October 31, 2017
| | | | | | | | | | | | Intermediary | | Intermediary | | |
| MONEY MARKET FUNDS | | Class A | | Class C | | Class D | | Class E | | Class I | | Class | | Service Class | | Class Y |
| HSBC U.S. Government Money Market Fund | | FTRXX | | HUMXX | | HGDXX | | HGEXX | | HGIXX | | HGGXX | | HGFXX | | RGYXX |
| HSBC U.S. Treasury Money Market Fund | | HWAXX | | HUCXX | | HTDXX | | HTEXX | | HBIXX | | HTGXX | | HTFXX | | HTYXX |

| Table of Contents |
| HSBC Family of Funds |
| Annual Report - October 31, 2017 |
| Glossary of Terms | | 2 |
| Commentary From the Investment Manager | | 3 |
| Portfolio Reviews | | 4 |
| Portfolio Composition | | 6 |
| | | |
| Schedules of Portfolio Investments | | |
| HSBC U.S. Government Money Market Fund | | 7 |
| HSBC U.S. Treasury Money Market Fund | | 9 |
| Statements of Assets and Liabilities | | 10 |
| Statements of Operations | | 12 |
| Statements of Changes in Net Assets | | 13 |
| Financial Highlights | | 15 |
| Notes to Financial Statements | | 19 |
| Report of Independent Registered Public Accounting Firm | | 29 |
| Other Federal Income Tax Information | | 30 |
| Table of Shareholder Expenses | | 31 |
| Board of Trustees and Officers | | 33 |
| Other Information | | 35 |
Bloomberg Barclays Global Aggregate Bond Index is an index that is a measure of global investment-grade debt from 24 local currency markets, which include treasury, government-related, corporate, and securitized fixed-rate bonds from both developed and emerging markets issuers.
Gross Domestic Product (“GDP”) is the value of goods and services produced in a given country in a given year.
J.P. Morgan Emerging Markets Bond Index Global tracks returns for USD-denominated debt instruments issued by emerging market sovereign and quasi-sovereign entities, Brady bonds, loans, Eurobonds, and local market instruments.
ISM Manufacturing Index is based on surveys of more than 300 manufacturing firms by the Institute of Supply Management. The ISM Manufacturing Index monitors employment, production, inventories, new orders, and supplier deliveries. A composite diffusion index monitors conditions in national manufacturing and is based on the data from these surveys.
Lipper U.S. Government Money Market Funds Average is an equally weighted average of mutual funds that invest principally in financial instruments issued or guaranteed by the U.S. government, its agencies, or its instrumentalities, with dollar-weighted average maturities of less than 90 days. These funds intend to keep a constant net asset value.
Lipper U.S. Treasury Money Market Funds Average is an equally weighted average of mutual funds that invest principally in U.S. Treasury obligations with dollar-weighted average maturities of less than 90 days. These funds intend to keep a constant net asset value.
London Interbank Offered Rate (LIBOR) is a daily reference rate based on the interest rates at which banks borrow unsecured funds from other banks in the London wholesale money market.
MSCI Europe Australasia and Far East (“MSCI EAFE”) Index is an equity index which captures the large- and mid-cap representation across the following developed markets countries: Australia, Austria, Belgium, Denmark, Finland, France, Germany, Hong Kong, Ireland, Israel, Italy, Japan, the Netherlands, New Zealand, Norway, Portugal, Singapore, Spain, Sweden, Switzerland and the UK.
MSCI Emerging Markets (“MSCI EM”) Index is an index that captures the large- and mid-cap representation across 24 emerging markets countries: Brazil, Chile, China, Colombia, Czech Republic, Egypt, Greece, Hungary, India, Indonesia, Korea, Malaysia, Mexico, Pakistan, Peru, Philippines, Poland, Qatar, Russia, South Africa, Taiwan, Thailand, Turkey and United Arab Emirates.
Standard & Poor’s 500 (“S&P 500”) Index is an index that is widely regarded as a gauge of the U.S. equities market. This index includes 500 leading companies in leading industries of the U.S. economy. The S&P 500 Index focuses on the large-cap segment of the market, with approximately 80% coverage of U.S. equities.
Lipper is an independent mutual fund performance monitor whose results are based on total return and do not reflect a sales charge.
Securities indices are unmanaged and assume reinvestment of all distributions and interest payments and do not take in account brokerage fees or expenses. Securities in the Funds do not match those in the indices and performance of the Funds will differ. Investors cannot invest directly in an index.
| Commentary From the Investment Manager |
| HSBC Global Asset Management (USA) Inc. |
Global Economic Review
The global economy experienced broad growth over the 12-month period from November 1, 2016, through October 31, 2017. Although there was much geopolitical turmoil and uncertainty, investor sentiment was buoyed by healthy corporate profits, supportive monetary policy, tightening labor markets and other positive economic data. Major economies experienced improvements to credit and labor conditions and major central banks continued to normalize monetary policy at a gradual pace. A synchronized economic expansion in both developed and emerging economies helped lift major market indices around the world to near record highs by the end of the period.
Early in the period, global markets were shocked by the surprise results of the November U.S. presidential elections. Positive economic data had already been pushing markets along a positive trajectory in the final months of the previous period, but the election outcome triggered an intense rally as investors grew increasingly optimistic that the new administration would follow through on campaign promises perceived as accommodative for business. The prospect of tax reform, reduced regulations and streamlined fossil fuel energy production continued to drive significant market gains throughout the period.
A rising tide of nationalist populism throughout the U.S. and Europe raised concerns among global investors. The prospect of a new era of protectionist trade policies and political unpredictability remained top-of-mind for investors throughout the period. These concerns eased somewhat after the electoral victories of centrist candidates, including the May election victory of Emmanuel Macron in the French presidential elections and the September reelection of Chancellor Angela Merkel in Germany. Even so, the changing political dynamics remained as President Trump moved forward with policies that rattled global trade and mobility, including withdrawing the U.S. from the Trans-Pacific Partnership, renegotiating the terms of the North American Free Trade Agreement and restricting immigration.
Geopolitical developments were also a source of investor uncertainty during the period and a drag on certain economies and sectors. Among the most notable events were tensions over North Korea’s continued efforts to develop its nuclear weapons capabilities, political turmoil in Turkey in April and an attempt by Catalans to declare independence from Spain in October.
The U.S. Federal Reserve (the Fed) increased its federal funds rate three times during the 12-month period, increasing its target range from 0.50% to 1.25%. The Fed also initiated its plan to scale back its monetary stimulus efforts adopted during the financial crisis in 2008.
Growth in the U.S. gross domestic product (GDP1) slowed modestly in the first two quarters of the period but then picked up significantly near the end. Preliminary estimates suggest that faster growth continued through the third quarter of 2017. Economic data in the U.S. was generally strong during the period, showing robust corporate earnings, a healthy labor market and an increase in consumer discretionary spending. The domestic unemployment rate dropped to a 16-year low and the Institute of Supply Management Manufacturing Index1 climbed to a 13-year high.
Contributors to economic growth in many economies, including in the U.S., were increases in manufacturing activity and exports. This was partly driven by an uptick in demand for imports from China.
China’s economy continued to grow at a relatively slow pace in comparison to previous years. The meeting of China’s National Congress indicated that the government was shifting from an emphasis on short-term growth objectives to a goal of sustainable economic development facilitated by political and economic reforms.
Eurozone economies also experienced solid growth as they continued to benefit from improving credit conditions and easing fiscal austerity by many of its component governments. The European Central Bank announced it would extend its quantitative easing program and implied that rates would remain low in the near term.
The Bank of Japan continued its extremely loose monetary policy and fiscal stimulus efforts with mixed results. GDP growth maintained its momentum, but declining exports and slow wage growth were among the signs indicating the Japanese economy continued to improve at a relatively sluggish pace.
Energy and metal prices climbed significantly during the period, while agricultural commodities generally slumped. Crude oil prices hit a two-year high late in the period, driven by declining global inventories and slower growth of U.S. production.
Global inflation increased very slightly during the period. The U.S. dollar weakened during the first several months of 2017 and ended the period lower than it had started. The weakening of the dollar provided a boost to U.S. exports and offered relief to countries such as Mexico, Turkey, and Indonesia that hold high levels of U.S. dollar-denominated debt.
Market Review
Global equity markets delivered strong returns during the period while showing exceptionally low volatility. Stocks rallied immediately after the election of President Trump and continued to rise somewhat steadily throughout 2017 with positive economic data adding to the momentum. Geopolitical tension and a lack of momentum in U.S. domestic policy initiatives eventually weighed on investor sentiment, but improving economic fundamentals in the Eurozone helped offset those growing concerns. The Fed’s commitment to gradually scaling back its monetary stimulus, along with new proposals for tax reform legislation, also supported gains for stocks.
Emerging markets equities began the period with a selloff triggered by concerns over U.S. trade protectionism and a strengthening U.S. dollar. The tide turned in 2017, however, as the U.S. dollar weakened and fears about the impact of changing trade policy subsided. Moreover, demand for emerging markets equities was supported through the period by relatively cheap valuations compared to developed market stocks.
The MSCI Emerging Markets Index1 (MSCI EM) hit a three-year high in September. However, emerging markets equities pulled back somewhat late in the period due to concerns that the proposed tax reform in the U.S. would repatriate dollars and draw capital out of developing countries. The MSCI EM Index returned 26.91% during the fiscal year compared to a 24.01% gain for the MSCI EAFE Index1 of international stocks in developed markets, for the same period.
U.S. equities posted strong gains similar to those of other developed economies during the period. The S&P 500 Index1 of large-cap stocks returned 23.63%.
Global fixed income markets posted modest gains during the period as investors favored equities in an environment of global economic expansion, perceived risk of inflation and gradual monetary policy normalization. Yields and credit spreads across bond sectors remained low relative to history. The Bloomberg Barclay’s Global Aggregate Bond Index1, which tracks investment-grade debt in 24 local currency markets, returned 1.18% during the period while the J.P. Morgan Emerging Market Bond Index Global1 returned 5.89%. Yields on U.S. government debt rose during the period.
1 For additional information, please refer to the Glossary of Terms.
| Portfolio Reviews (Unaudited) |
| |
HSBC U.S. Government Money Market Fund
(Class A Shares, Class C Shares, Class D Shares, Class E Shares, Class I Shares,
Intermediary Class, Intermediary Service Class and Class Y Shares) by John Chiodi
Senior Portfolio Manager | Moody’s and Standard & Poor’s
have assigned an “Aaa-mf” and
“AAAm” rating to the
HSBC U.S. Government
Money Market Fund.1 |
Investment Concerns
You could lose money by investing in the Fund. Although the Fund seeks to preserve the value of your investment at $1.00 per share, it cannot guarantee it will do so. An investment in the Fund is not a deposit of HSBC Bank USA, N.A. and is not insured or guaranteed by the Federal Deposit Insurance Corporation or any other government agency. The Fund’s sponsor has no legal obligation to provide financial support to the Fund, and you should not expect that the sponsor will provide financial support to the Fund at any time.
For a complete description of these and other risks associated with investment in a mutual fund, please refer to the Fund’s prospectus.
Portfolio Performance
Yields on U.S. government money market securities rose during the 12 months ended October 31, 2017, as the Federal Reserve Board (the Fed) raised interest rates three times during the period.
As expected, the Fed raised its target range of its federal funds rate, a short-term interest rate that significantly influences Treasury bill yields, in December 2016 to a range of 0.50% to 0.75%. This was followed by an increase in March 2017 to a range of 0.75% to 1.0%, and another increase in June 2017 to a range of 1.0% to 1.25%. The March rate increase, while not surprising, was not as anticipated as the December and June increases.
Treasury yields had largely priced in the rate increases in December and June, but did not fully price in the increase in March until a week or two before the Fed’s March meeting. The Fund benefited from being positioned with an average weighted maturity shorter than that of its peers due to the Fund’s expectation that the Fed would raise rates again in March.†
During the period, investors shifted more than $1 trillion in assets from prime-fund assets to government-fund assets. This shift was spurred by the compliance date of the SEC’s amendments to Rule 2a-7 in October 2016, which drove institutional investors to seek relative security with U.S. government money market funds. In anticipation of this massive asset migration and the subsequent elevation of London Interbank Offered Rate (LIBOR)7 levels, the Fund bought floating rate notes pegged to LIBOR, which rose during the period thus providing higher yields to the Fund.†
† Portfolio composition is subject to change.
| | | | | | Average Annual | | | | | | | | | | Expense |
| Fund Performance | | | | | | Total Return (%) | | | | | | Yield (%)2 | | Ratio (%)3 |
| | Inception | | 1 | | 5 | | 10 | | Since | | 7-Day | | | | | | | | |
| As of October 31, 2017 | | Date | | Year | | Year | | Year | | Inception | | Average | | Gross | | Net |
| Class A | | | 5/3/90 | | | 0.22 | | 0.06 | | 0.27 | | | 2.51 | | | | 0.45 | | | | 0.66 | | | | 0.66 | |
| Class C4 | | | 11/20/06 | | | — | | — | | — | | | — | | | | — | | | | 1.26 | | | | 1.26 | |
| Class D | | | 4/1/99 | | | 0.34 | | 0.08 | | 0.30 | | | 1.57 | | | | 0.60 | | | | 0.51 | | | | 0.51 | |
| Class E5 | | | 7/12/16 | | | — | | — | | — | | | — | | | | — | | | | 0.26 | | | | 0.25 | |
| Class I6 | | | 12/24/03 | | | 0.69 | | 0.19 | | 0.42 | | | 0.98 | | | | 0.96 | | | | 0.16 | | | | 0.16 | |
| Intermediary Class | | | 7/12/16 | | | 0.63 | | — | | — | | | 0.56 | | | | 0.90 | | | | 0.31 | | | | 0.31 | |
| Intermediary Service Class | | | 7/12/16 | | | 0.61 | | — | | — | | | 0.54 | | | | 0.88 | | | | 0.36 | | | | 0.36 | |
| Class Y | | | 7/1/96 | | | 0.58 | | 0.15 | | 0.37 | | | 2.15 | | | | 0.85 | | | | 0.26 | | | | 0.26 | |
| Lipper U.S. Government | | | | | | | | | | | | | | | | | | | | | | | | | | |
| Money Market Funds Average7 | | | — | | | 0.24 | | 0.06 | | 0.31 | | | 2.57 | 8 | | | N/A | | | | N/A | | | | N/A | |
Past performance does not guarantee future results. The performance data quoted represents past performance and current returns may be lower or higher. Total return figures include change in share price, reinvestment of dividends and capital gains and do not reflect taxes that a shareholder would pay on Fund distributions or on the redemption of Fund shares. Investment return and principal value will fluctuate so that an investor’s shares, when redeemed may be worth more or less than the original cost. To obtain performance information current to the most recent month end, please call 1-800-782-8183.
The performance above reflects any fee waivers that have been in effect during the applicable periods, as well as any expense reimbursements that have periodically been made. Absent such waivers and reimbursements, returns would have been lower.
Certain returns shown include monies received by the Fund in respect of a one-time payment in respect of a class action settlement and a one-time reimbursement from HSBC Global Asset Management (USA) Inc. related to past marketing arrangements. As a result, the Fund’s total returns for those periods were higher than they would have been had the Fund not received the payments.
| 1 | The “Aaa-mf ” and “AAAm” money market fund rating is historical and reflects Moody’s and Standard & Poor’s opinion as to the quality of the Fund’s investments, liquidity management, and operations and trading support. Periodic reviews are conducted to ensure a secure operations environment. Moody’s and Standard & Poor’s ratings represent an opinion only, not a recommendation to buy or sell. Obligations rated A-1+, A-1 or P-1 are rated in the highest short-term rating category by Standard & Poor’s (A-1+ or A-1) or Moody’s Investor Service (P-1). The obligor’s capacity to meet its financial commitments on these obligations is regarded to be “extremely strong” (A-1+), “strong” (A-1) or “superior” (P-1). |
| 2 | The seven-day yield quotation more closely reflects the current earnings of the money market fund than the total return quotation. The seven-day yield reflects voluntary fee waivers/expense reimbursements. Without the voluntary fee waivers/expense reimbursements, the yields would have been 0.44%, 0.59%, 0.94%, 0.79%,0.74%, and 0.84% for Class A Shares, Class D Shares, Class I Shares, Intermediary Class, Intermediary Service Class and Class Y Shares, respectively. |
| 3 | Reflects the expense ratio as reported in the prospectus dated February 28, 2017, as supplemented November 16, 2017. Additional information pertaining to the October 31, 2017 expense ratios can be found in the financial highlights. |
| 4 | Reflects the applicable contingent deferred sales charge, maximum of 1.00%, for returns presented. Class C Shares were operational during a portion of the periods presented. Amounts reflect performance for the period of time the Class had operations, which was 346, 362 and 351 days during the years ended October 31, 2006, 2009 and 2010, respectively. The Class was not operational during the entire fiscal years ended October 31, 2007, 2008, 2011, 2012, 2013, 2014, 2015, 2016 and 2017. No returns are presented for the one-year, five-year and 10-year periods with non-continuous operations. |
| 5 | Class E Shares were operational during a portion of the periods presented. Amounts reflect performance for the period of time the Class had operations, which was 112 and 283 days during the years ended October 31, 2016 and 2017, respectively. No returns are presented for the one-year period with non-continuous operations. |
| 6 | Class I Shares were operational during a portion of the periods presented. Amounts reflect performance for the period of time the Class had operations, which was 10, 89, 136 and 357 days during the years ended October 31, 2004, 2005, 2006 and 2007, respectively. The Class was operational during the entire years ended October 31, 2008 through 2017. |
| 7 | For additional information, please refer to the Glossary of Terms. |
| 8 | Return for the period April 30, 1990 to October 31, 2017. |
| Portfolio Reviews (Unaudited) |
| |
HSBC U.S. Treasury Money Market Fund
(Class A Shares, Class C Shares, Class D Shares, Class E Shares, Class I Shares,
Intermediary Class, Intermediary Service Class and Class Y Shares) by John Chiodi
Senior Portfolio Manager | Moody’s and Standard & Poor’s
have assigned an “Aaa-mf” and
“AAAm” rating to the
HSBC U.S. Treasury
Money Market Fund.1 |
Investment Concerns
You could lose money by investing in the Fund. Although the Fund seeks to preserve the value of your investment at $1.00 per share, it cannot guarantee it will do so. An investment in the Fund is not a deposit of HSBC Bank USA, N.A. and is not insured or guaranteed by the Federal Deposit Insurance Corporation or any other government agency. The Fund’s sponsor has no legal obligation to provide financial support to the Fund, and you should not expect that the sponsor will provide financial support to the Fund at any time.
For a complete description of these and other risks associated with investment in a mutual fund, please refer to the Fund’s prospectus.
Portfolio Performance
The Federal Reserve Board (the Fed) raised the target range of its federal funds rate, a short-term interest rate that significantly influences Treasury bill yields, in December 2016, March 2017, and June 2017. As a result, Treasury bill yields increased during the 12-month period ended October 31, 2017.
Toward the end of 2016, demand for Treasuries from institutional investors rose as the government restricted supply. This annual tension typically depresses yields on Treasury bills. However, the Fed’s December rate increase caused yields to spike, which benefited the Fund through its shorter–than-usual weighted average maturity.†
Much of the period was marked by concerns over an extension of the debt ceiling. In the ongoing absence of a debt ceiling resolution, the U.S. Treasury reduced bill issuance and yields suffered as demand exceeded supply. However, yields on some Treasury bills spiked in early September amid slumping demand for bonds and ongoing worries about the U.S. Treasury’s ability to meet its financial obligations. An agreement in September between the Trump Administration and Congressional leaders to suspend the borrowing limit until December pushed yields down.
The Fund benefited from its exposure to floating rate bonds, which performed well immediately after the Fed raised the target range in mid-March.†
† Portfolio composition is subject to change.
| | | | | | | | Average Annual | | | | | | Expense |
| Fund Performance | | | | | | | | Total Return (%) | | | | Yield (%)2 | | Ratio (%)3 |
| | Inception | | 1 | | 5 | | 10 | | Since | | 7-Day | | | | |
| As of October 31, 2017 | | Date | | Year | | Year | | Year | | Inception | | Average | | Gross | | Net |
| Class A4 | | | 5/24/01 | | | — | | — | | — | | — | | — | | 0.68 | | 0.68 |
| Class C5 | | | 12/24/03 | | | — | | — | | — | | — | | — | | 1.28 | | 1.28 |
| Class D | | | 5/14/01 | | | 0.29 | | 0.06 | | 0.19 | | 0.94 | | 0.58 | | 0.53 | | 0.53 |
| Class E6 | | | 7/12/16 | | | — | | — | | — | | — | | — | | 0.28 | | 0.25 |
| Class I7 | | | 12/30/03 | | | 0.64 | | 0.15 | | 0.28 | | 1.09 | | 0.94 | | 0.18 | | 0.18 |
| Intermediary Class | | | 7/12/16 | | | 0.44 | | — | | — | | 0.42 | | 0.73 | | 0.33 | | 0.33 |
| Intermediary Service Class | | | 7/12/16 | | | 0.58 | | — | | — | | 0.52 | | 0.88 | | 0.38 | | 0.38 |
| Class Y | | | 5/11/01 | | | 0.53 | | 0.11 | | 0.24 | | 1.07 | | 0.83 | | 0.28 | | 0.28 |
Lipper U.S. Treasury
Money Market Funds Average8 | | | — | | | 0.26 | | 0.06 | | 0.20 | | 1.009 | | N/A | | N/A | | N/A |
Past performance does not guarantee future results. The performance data quoted represents past performance and current returns may be lower or higher. Total return figures include change in share price, reinvestment of dividends and capital gains and do not reflect taxes that a shareholder would pay on Fund distributions or on the redemption of Fund shares. Investment return and principal value will fluctuate so that an investor’s shares, when redeemed may be worth more or less than the original cost. To obtain performance information current to the most recent month end, please call 1-800-782-8183.
The performance above reflects any fee waivers that have been in effect during the applicable periods, as well as any expense reimbursements that have periodically been made. Absent such waivers and reimbursements, returns would have been lower.
Certain returns shown include monies received by the Fund in respect of a one-time payment in respect of a class action settlement and a one-time reimbursement from HSBC Global Asset Management (USA) Inc. related to past marketing arrangements. As a result, the Fund’s total returns for those periods were higher than they would have been had the Fund not received the payments.
| 1 | The “Aaa-mf ” and “AAAm” money market fund rating is historical and reflects Moody’s and Standard & Poor’s opinion as to the quality of the Fund’s investments, liquidity management, and operations and trading support. Periodic reviews are conducted to ensure a secure operations environment. Moody’s and Standard & Poor’s ratings represent an opinion only, not a recommendation to buy or sell. Obligations rated A-1+, A-1 or P-1 are rated in the highest short-term rating category by Standard & Poor’s (A-1+ or A-1) or Moody’s Investor Service (P-1). The obligor’s capacity to meet its financial commitments on these obligations is regarded to be “extremely strong” (A-1+), “strong” (A-1) or “superior” (P-1). |
| 2 | The seven-day yield quotation more closely reflects the current earnings of the money market fund than the total return quotation. Without the voluntary fee waivers/ expense reimbursements, the yields would have been 0.57%, 0.92%, 0.72, 0.72% and 0.82% for Class D Shares, Class I Shares, Intermediary Class, Intermediary Service Class and Class Y Shares, respectively. |
| 3 | Reflects the expense ratio as reported in the prospectus dated February 28, 2017, as supplemented November 16, 2017. Additional information pertaining to the October 31, 2017 expense ratios can be found in the financial highlights. |
| 4 | Class A Shares were operational during a portion of the periods presented. Amounts reflect performance for the period of time the Class had operations, which was 201 days during the year ended October 31, 2014. The Class was operational during the entire years ended October 31, 2001 through 2013. The Class was not operational during the entire years ended October 31, 2015 through 2017. No returns are presented for the one-year, five-year and 10-year periods with non-continuous operations. |
| 5 | Reflects the applicable contingent deferred sales charge, maximum of 1.00%, for returns presented. Class C Shares were operational during a portion of the periods presented. Amounts reflect performance for the period of time the Class had operations, which was 26 and 351 days during the years ended October 31, 2008 and 2010, respectively. The Class was operational during the entire years ended October 31, 2005, 2006, 2007 and 2009. The Class was not operational during the entire years ended October 31, 2011 through 2017. No returns are presented for the one-year, five-year and 10-year periods with non-continuous operations. |
| 6 | Class E Shares were operational during a portion of the periods presented. Amounts reflect performance for the period of time the Class had operations, which was 112 and 283 days during the years ended October 31, 2016 and 2017, respectively. No returns are presented for the one-year period with non-continuous operations. |
| 7 | Class I Shares were operational during a portion of the periods presented. Amounts reflect performance for the period of time the Class had operations, which was 13 and 280 days during the years ended October 31, 2004 and 2005, respectively. The Class was operational during the entire years ended October 31, 2006 through 2017. |
| 8 | For additional information, please refer to the Glossary of Terms. |
| 9 | Return for the period April 30, 2001 to October 31, 2017. |
| Portfolio Reviews |
Portfolio Composition*
October 31, 2017 (Unaudited) |
| HSBC U.S. Government Money Market Fund |
| Investment Allocation | | Percentage of Investments at Value (%) |
U.S. Government and
Government Agency
Obligations | | | 50.2 | |
| Repurchase Agreements | | | 48.5 | |
| U.S. Treasury Obligation | | | 1.3 | |
| Total | | | 100.0 | |
| | |
| HSBC U.S. Treasury Money Market Fund |
| Investment Allocation | | Percentage of Investments at Value (%) |
| U.S. Treasury Obligations | | | 100.0 | |
| Total | | | 100.0 | |
____________________
| * | Portfolio composition is subject to change. |
| HSBC U.S. GOVERNMENT MONEY MARKET FUND |
| Schedule of Portfolio Investments—as of October 31, 2017 |
| U.S. Government and Government Agency |
| Obligations – 47.9% | | | | |
| | Principal | | Amortized |
| | Amount ($) | | Cost ($) |
| Federal Farm Credit Bank – 6.3% | | | | |
| 1.17% (FCPR DLY - 308 bps), | | | | |
| 3/11/19(a) | | 150,000,000 | | 149,989,856 |
| 1.17% (FEDL01 + 1 bps), | | | | |
| 4/24/19(a) | | 75,000,000 | | 74,988,881 |
| 1.19% (FEDL01 + 3 bps), | | | | |
| 4/25/19(a) | | 100,000,000 | | 100,000,000 |
| 1.21% (FEDL01 + 5 bps), | | | | |
| 11/1/18(a) | | 50,000,000 | | 49,997,483 |
| 1.22% (US0001M - 2 bps), | | | | |
| 4/20/18(a) | | 50,000,000 | | 49,998,757 |
| 1.22% (US0001M - 2 bps), | | | | |
| 4/16/18(a) | | 84,000,000 | | 83,998,054 |
| 1.25% (US0001M + 2 bps), | | | | |
| 10/3/18(a) | | 175,000,000 | | 175,000,000 |
| 1.35% (FCPR DLY - 290 bps), | | | | |
| 12/22/17(a) | | 66,000,000 | | 65,999,067 |
| | | | 749,972,098 |
| Federal Home Loan Bank – 41.6% | | |
| 0.97%, 11/16/17(b) | | 50,000,000 | | 49,978,438 |
| 0.97%, 11/22/17(b) | | 92,790,000 | | 92,734,790 |
| 0.98%, 11/15/17(b) | | 279,000,000 | | 278,886,114 |
| 0.99%, 11/24/17(b) | | 75,000,000 | | 74,950,454 |
| 0.99%, 11/29/17(b) | | 40,000,000 | | 39,968,111 |
| 1.00%, 12/14/17(b) | | 200,000,000 | | 199,755,139 |
| 1.03% (US0001M - 21 bps), | | | | |
| 11/1/17(a) | | 175,000,000 | | 175,000,000 |
| 1.05%, 12/28/17(b) | | 100,000,000 | | 99,830,583 |
| 1.06% (US0003M - 30 bps), | | | | |
| 1/19/18(a) | | 150,000,000 | | 150,000,000 |
| 1.06% (US0001M - 18 bps), | | | | |
| 2/9/18(a) | | 75,000,000 | | 74,999,304 |
| 1.06% (US0001M - 18 bps), | | | | |
| 2/13/18(a) | | 100,000,000 | | 100,000,000 |
| 1.07% (US0001M - 17 bps), | | | | |
| 1/19/18(a) | | 100,000,000 | | 100,000,000 |
| 1.07% (US0001M - 16 bps), | | | | |
| 4/25/18(a) | | 100,000,000 | | 100,000,000 |
| 1.07% (US0001M - 17 bps), | | | | |
| 4/27/18(a) | | 85,000,000 | | 85,000,000 |
| 1.07% (US0001M - 16 bps), | | | | |
| 5/11/18(a) | | 130,000,000 | | 130,000,000 |
| 1.08% (US0001M - 16 bps), | | | | |
| 2/8/18(a) | | 250,000,000 | | 250,000,000 |
| 1.08%, 1/9/18(b) | | 100,000,000 | | 99,790,125 |
| 1.08%, 1/12/18(b) | | 200,000,000 | | 199,564,000 |
| 1.08% (US0001M - 16 bps), | | | | |
| 2/1/18(a) | | 150,000,000 | | 150,000,000 |
| 1.08% (US0001M - 16 bps), | | | | |
| 2/28/18(a) | | 220,000,000 | | 220,000,000 |
| 1.08% (US0001M - 16 bps), | | | | |
| 1/25/18(a) | | 100,000,000 | | 100,000,000 |
| 1.09%, (US0001M - 15 bps), | | | | |
| 10/24/18(a) | | 150,000,000 | | 150,000,000 |
| 1.09%, (US0001M - 15 bps), | | | | |
| 10/23/18(a) | | 100,000,000 | | 100,000,000 |
| 1.09%, 1/19/18(b) | | 100,000,000 | | 99,758,611 |
| 1.10%, (US0001M - 13.5 bps), | | | | |
| 5/9/18(a) | | 100,000,000 | | 100,000,000 |
| 1.11%, 2/21/18(b) | | 33,825,000 | | 33,707,139 |
| 1.11%, 2/23/18(b) | | 76,000,000 | | 75,730,453 |
| 1.11% (US0001M - 12 bps), | | | | |
| 8/1/18(a) | | 100,000,000 | | 100,000,000 |
| 1.12% (US0003M - 19 bps), | | | | |
| 11/8/17(a) | | 175,000,000 | | 175,001,478 |
| 1.12% (US0001M - 12 bps), | | | | |
| 10/10/18(a) | | 140,000,000 | | 140,000,000 |
| 1.13%, (US0001M - 11.5 bps), | | | | |
| 4/26/19(a) | | 100,000,000 | | 100,000,000 |
| 1.13%, (US0001M - 11.5 bps), | | | | |
| 4/26/19(a) | | 100,000,000 | | 100,000,000 |
| 1.13%, 1/26/18(b) | | 150,000,000 | | 149,592,575 |
| 1.14% (US0001M - 9.5 bps), | | | | |
| 4/18/19(a) | | 150,000,000 | | 150,000,000 |
| 1.16% (US0001M - 8 bps), | | | | |
| 12/21/18(a) | | 100,000,000 | | 100,000,000 |
| 1.16% (US0001M - 8 bps), | | | | |
| 3/21/18(a) | | 100,000,000 | | 100,000,000 |
| 1.17% (US0001M - 7 bps), | | | | |
| 2/25/19(a) | | 100,000,000 | | 100,000,000 |
| 1.17% (US0001M - 7 bps), | | | | |
| 11/22/17(a) | | 75,000,000 | | 75,004,378 |
| 1.22% (US0003M - 9 bps), | | | | |
| 11/2/17(a) | | 50,000,000 | | 49,999,942 |
| 1.24%, 4/5/18(b) | | 200,000,000 | | 198,927,917 |
| 1.27% (US0001M + 4 bps), | | | | |
| 5/25/18(a) | | 75,000,000 | | 75,000,000 |
| 1.31% (US0003M - 4 bps), | | | | |
| 1/8/18(a) | | 50,000,000 | | 50,000,000 |
| | | | 4,993,179,551 |
| TOTAL U.S. GOVERNMENT | | | | |
| AND GOVERNMENT | | | | |
| AGENCY OBLIGATIONS | | | | |
| (Cost $5,743,151,649) | | | | 5,743,151,649 |
| |
| U.S. Treasury Obligation – 1.3% |
| | | |
| U.S. Treasury Note — 1.3% | | | | |
| 0.75%, 12/31/17 | | 150,000,000 | | 149,901,951 |
| |
| TOTAL U.S. Treasury | | | | |
| Obligation | | | | |
| (Cost $149,901,951) | | | | 149,901,951 |
| |
| Repurchase Agreements – 46.3% |
| | | |
| BNP Paribas, 1.04%, | | | | |
| 11/1/17, Purchased on | | | | |
| 10/31/17, with maturity | | | | |
| value of $1,170,033,800, | | | | |
| collateralized by U.S. Treasury | | | | |
| Obligations, 0.00%-8.75%, | | | | |
| 1/31/19-2/15/46, fair value | | | | |
| $1,193,400,000 | . | 1,170,000,000 | | 1,170,000,000 |
| BNP Paribas, 1.05%, 11/1/17, | | | | |
| Purchased on 10/31/17, | | | | |
| with maturity value of | | | | |
| $100,002,917, collateralized | | | | |
| by various U.S. Government | | | | |
| and Government Agency | | | | |
| Obligations, 0.00%-7.25%, | | | | |
| 5/30/18-2/20/47, fair value | | | | |
| $102,000,000 | | 100,000,000 | | 100,000,000 |
| See notes to financial statements. | HSBC FAMILY OF FUNDS 7 |
| HSBC U.S. GOVERNMENT MONEY MARKET FUND |
| Schedule of Portfolio Investments—as of October 31, 2017 (continued) |
| Repurchase Agreements, continued |
| | Principal | | Amortized |
| | Amount ($) | | Cost ($) |
| Citigroup Global Markets, | | | | |
| 1.07%, 11/1/17, Purchased | | | | |
| on 10/31/17, with maturity | | | | |
| value of $100,002,972, | | | | |
| collateralized by various U.S. | | | | |
| Government and Government | | | | |
| Agency Obligations, 1.35%- | | | | |
| 3.13%, 2/3/21-5/15/21, fair | | | | |
| value $102,000,066 | | 100,000,000 | | 100,000,000 |
| Credit Agricole Cib NY, | | | | |
| 1.05%, 11/1/17, Purchased | | | | |
| on 10/31/17, with maturity | | | | |
| value of $1,000,029,167, | | | | |
| collateralized by U.S. | | | | |
| Treasury Obligations, 1.38%- | | | | |
| 2.38%, 9/30/23-5/15/27, fair | | | | |
| value $1,020,000,055 | | 1,000,000,000 | | 1,000,000,000 |
| Deutsche Bank Securities, Inc., | | | | |
| 1.06%, 11/1/17, Purchased | | | | |
| on 10/31/17, with maturity | | | | |
| value of $75,002,208, | | | | |
| collateralized by U.S. Treasury | | | | |
| Obligations, 1.25%, 8/31/19, | | | | |
| fair value $76,500,033 | | 75,000,000 | | 75,000,000 |
| Federal Reserve Bank NY, | | | | |
| 1.00%, 11/1/17, Purchased | | | | |
| on 10/31/17, with maturity | | | | |
| value of $1,200,033,333, | | | | |
| collateralized by U.S. | | | | |
| Treasury Obligations, 1.38%- | | | | |
| 8.50%, 2/15/20-2/15/43, fair | | | | |
| value $1,200,033,437 | | 1,200,000,000 | | 1,200,000,000 |
| Goldman Sachs & Co., | | | | |
| 1.03%, 11/1/17, Purchased | | | | |
| on 10/25/17, with maturity | | | | |
| value of $150,030,042, | | | | |
| collateralized by various U.S. | | | | |
| Government and Government | | | | |
| Agency Obligations, 2.92%- | | | | |
| 9.50%, 7/1/18-8/1/47, fair | | | | |
| value $153,000,000 | | 150,000,000 | | 150,000,000 |
| Goldman Sachs & Co., | | | | |
| 1.03%, 11/1/17, Purchased | | | | |
| on 10/31/17, with maturity | | | | |
| value of $100,002,861, | | | | |
| collateralized by various U.S. | | | | |
| Government and Government | | | | |
| Agency Obligations, 2.09%- | | | | |
| 8.50%, 8/1/18-11/1/47, fair | | | | |
| value $102,000,000 | | 100,000,000 | | 100,000,000 |
| Merrill Lynch Pierce Fenner & | | | | |
| Smith, Inc., 1.05%, 11/1/17, | | | | |
| Purchased on 10/31/17, with | | | | |
| maturity value of $100,002,917 | | | | |
| collateralized by U.S. | | | | |
| Treasury Obligations, 0.00%- | | | | |
| 2.25%, 2/22/18-2/15/27, fair | | | | |
| value $102,000,064 | | 100,000,000 | | 100,000,000 |
| Royal Bank of Canada, 1.02%, | | | | |
| 11/1/17, Purchased on | | | | |
| 10/31/17, with maturity | | | | |
| value of $250,007,083, | | | | |
| collateralized by U.S. Treasury | | | | |
| Obligations, 0.00%-3.50%, | | | | |
| 11/15/17-8/15/47, fair | | | | |
| value $255,000,027 | | 250,000,000 | | 250,000,000 |
| RBS Securities, Inc., 1.03%, | | | | |
| 11/1/17, Purchased on | | | | |
| 10/31/17, with maturity value | | | | |
| of $500,014,306, collateralized | | | | |
| by U.S. Treasury Obligations, | | | | |
| 0.00%-4.5%, 11/2/17-5/15/42, | | | | |
| fair value $510,002,062 | | 500,000,000 | | 500,000,000 |
| Societe' Generale, 1.10%, | | | | |
| 11/1/17, Purchased on | | | | |
| 10/31/17, with maturity | | | | |
| value of $400,012,222, | | | | |
| collateralized by various U.S. | | | | |
| Government and Government | | | | |
| Agency Obligations, 0.00%- | | | | |
| 7.00%, 3/1/18-8/20/67, fair | | | | |
| value $408,000,100 | | 400,000,000 | | 400,000,000 |
| Toronto Dominion Bank NY, | | | | |
| 1.04%, 11/1/17, Purchased | | | | |
| on 10/31/17, with maturity | | | | |
| value of $400,011,556, | | | | |
| collateralized by U.S. Treasury | | | | |
| Obligations, 0.88%-2.75%, | | | | |
| 10/15/18-2/15/27, fair | | | | |
| value $408,000,064 | | 400,000,000 | | 400,000,000 |
| TOTAL REPURCHASE | | | | |
| AGREEMENTS | | | | |
| (Cost $5,545,000,000) | | | | 5,545,000,000 |
| TOTAL INVESTMENTS | | | | |
| IN SECURITIES (Cost | | | | |
| $11,438,053,600) – 95.5% | | | | 11,438,053,600 |
| Other Assets | | | | |
| (Liabilities) – 4.5%. | | | | 541,713,982 |
| NET ASSETS – 100% | | | | $11,979,767,582 |
____________________
| (a) | Floating or variable rate security. The rate presented represents the rate in effect on October 31, 2017. These securities are deemed to have a maturity remaining until the next adjustment of the interest rate or the longer of the demand period or time to the next readjustment. |
| (b) | Discount note. Rate presented represents the effective yield at time of purchase. |
bps – Basis Points
FCPR DLY – Federal Reserve Bank Prime Loan Rate US
FEDL01 – Effective Federal Funds Rate
US0001M – 1 Month US Dollar LIBOR
US0003M – 3 Month US Dollar LIBOR
| 8 HSBC FAMILY OF FUNDS | See notes to financial statements. |
| HSBC U.S. GOVERNMENT MONEY MARKET FUND |
| Schedule of Portfolio Investments—as of October 31, 2017 |
| U.S. Treasury Obligations – 107.8% |
| | Principal | | Amortized |
| | Amount ($) | | Cost ($) |
| U.S. Treasury Bills – 83.2% | | | | | |
| 0.48%, 11/2/17(a) | | 292,000,000 | | 291,992,151 | |
| 0.87%, 11/9/17(a) | | 200,000,000 | | 199,956,373 | |
| 0.90%, 11/16/17(a) | | 295,000,000 | | 294,881,397 | |
| 0.96%, 11/30/17(a) | | 150,000,000 | | 149,879,505 | |
| 0.97%, 12/8/17(a) | | 50,000,000 | | 49,948,875 | |
| 0.98%, 12/14/17(a) | | 171,000,000 | | 170,795,637 | |
| 0.98%, 12/21/17(a) | | 177,000,000 | | 176,754,717 | |
| 1.00%, 11/24/17(a) | | 30,000,000 | | 29,980,048 | |
| 1.01%, 1/4/18(a) | | 50,000,000 | | 49,909,156 | |
| 1.05%, 1/18/18(a) | | 75,000,000 | | 74,827,046 | |
| 1.06%, 1/11/18(a) | | 50,000,000 | | 49,893,895 | |
| 1.08%, 1/25/18(a) | | 100,000,000 | | 99,742,167 | |
| 1.11%, 2/1/18(a) | | 50,000,000 | | 49,857,181 | |
| 1.21%, 4/5/18(a) | | 40,000,000 | | 39,790,750 | |
| 1.23%, 4/12/18(a) | | 90,000,000 | | 89,503,425 | |
| 1.24%, 4/26/18(a) | | 50,000,000 | | 49,696,767 | |
| | | | 1,867,409,090 | |
| U.S. Treasury Notes – 24.6% | | | | | |
| 1.17% (USBMMY3M + 6 bps), 7/31/19(b) | | 70,000,000 | | 70,008,335 | |
| 1.25% (USBMMY3M + 14 bps), 1/31/19(b) | | 25,000,000 | | 25,049,941 | |
| 1.28% (USBMMY3M + 17 bps), 10/31/18(b) | | 25,000,000 | | 25,046,995 | |
| 1.28% (USBMMY3M + 17 bps), 7/31/18(b) | | 100,000,000 | | 100,144,367 | |
| 1.30% (USBMMY3M + 19 bps), 4/30/18(b) | | 185,000,000 | | 185,152,730 | |
| 1.38% (USBMMY3M + 27 bps), 1/31/18(b) | | 145,000,000 | | 145,097,217 | |
| | | | 550,499,585 | |
| TOTAL U.S. TREASURY OBLIGATIONS (Cost $2,417,908,675) | | | | 2,417,908,675 | |
| TOTAL INVESTMENTS IN SECURITIES (Cost $2,417,908,675) – 107.8% | | | | 2,417,908,675 | |
| Other Assets (Liabilities) – (7.8)% | | | | (175,666,712 | ) |
| NET ASSETS – 100% | | | | $2,242,241,963 | |
____________________
| (a) | Discount note. Rate presented represents the effective yield at time of purchase. |
| (b) | Floating or variable rate security. The rate presented represents the rate in effect on October 31, 2017. These securities are deemed to have a maturity remaining until the next adjustment of the interest rate or the longer of the demand period or time to the next readjustment. |
bps - Basis Points
USBMMY3M - 3 Month Treasury Bill Rate
| See notes to financial statements. | HSBC FAMILY OF FUNDS 9 |
HSBC FAMILY OF FUNDS
Statements of Assets and Liabilities—as of October 31, 2017
| | HSBC U. S. | | HSBC |
| | Government | | U.S. Treasury |
| | Money Market | | Money Market |
| | Fund | | Fund |
| Assets: | | | | | | | | | | | |
| Investments in securities, at amortized cost | | | $ | 5,893,053,600 | | | | $ | 2,417,908,675 | | |
| Repurchase agreements, at amortized cost | | | | 5,545,000,000 | | | | | — | | |
| Cash | | | | 544,286,085 | | | | | — | | |
| Interest receivable | | | | 3,406,312 | | | | | 19,816 | | |
| Prepaid expenses and other assets | | | | 253,704 | | | | | 59,741 | | |
| Total Assets | | | | 11,985,999,701 | | | | | 2,417,988,232 | | |
| | | | | | | | | | | | |
| Liabilities: | | | | | | | | | | | |
| Distributions payable | | | | 3,820,227 | | | | | 383,924 | | |
| Payable to custodian | | | | — | | | | | 53,283 | | |
| Payable for investments purchased | | | | — | | | | | 174,746,964 | | |
| Accrued expenses and other liabilities: | | | | | | | | | | | |
| Investment Management | | | | 984,280 | | | | | 251,421 | | |
| Administration | | | | 342,509 | | | | | 68,387 | | |
| Shareholder Servicing | | | | 358,970 | | | | | 55,348 | | |
| Accounting | | | | 8,309 | | | | | 7,453 | | |
| Custodian fees | | | | 42,017 | | | | | 19,136 | | |
| Transfer Agent | | | | 7,829 | | | | | 6,504 | | |
| Trustee | | | | 27,194 | | | | | 9,170 | | |
| Other | | | | 640,784 | | | | | 144,679 | | |
| Total Liabilities | | | | 6,232,119 | | | | | 175,746,269 | | |
| Net Assets | | | $ | 11,979,767,582 | | | | $ | 2,242,241,963 | | |
| | | | | | | | | | | |
| Composition of Net Assets: | | | | | | | | | | | |
| Capital | | | | 11,979,736,983 | | | | | 2,242,243,967 | | |
| Accumulated net investment income/(distributions in excess of net investment income) | | | | 18,318 | | | | | 4,515 | | |
| Accumulated net realized gains/(losses) from investments | | | | 12,281 | | | | | (6,519 | ) | |
| Net Assets | | | $ | 11,979,767,582 | | | | $ | 2,242,241,963 | | |
| | | | | | | | | | | | |
| Net Assets: | | | | | | | | | | | |
| Class A Shares | | | $ | 1,998,307 | | | | $ | — | | |
| Class D Shares | | | | 1,645,221,739 | | | | | 257,062,336 | | |
| Class I Shares | | | | 7,853,457,183 | | | | | 861,943,662 | | |
| Intermediary Class Shares | | | | 19,694,488 | | | | | 1,005 | | |
| Intermediary Service Class Shares | | | | 57,042,223 | | | | | 22,015,515 | | |
| Class Y Shares | | | | 2,402,353,642 | | | | | 1,101,219,445 | | |
| | | | $ | 11,979,767,582 | | | | $ | 2,242,241,963 | | |
| Shares Outstanding: | | | | | | | | | | | |
| ($0.001 par value, unlimited number of shares authorized): | | | | | | | | | | | |
| Class A Shares | | | | 1,998,287 | | | | | — | | |
| Class D Shares | | | | 1,645,020,372 | | | | | 257,096,323 | | |
| Class I Shares | | | | 7,853,600,801 | | | | | 861,945,899 | | |
| Intermediary Class Shares | | | | 19,695,044 | | | | | 1,005 | | |
| Intermediary Service Class Shares | | | | 57,045,231 | | | | | 22,015,639 | | |
| Class Y Shares | | | | 2,402,393,595 | | | | | 1,101,190,068 | | |
| 10 HSBC FAMILY OF FUNDS | See notes to financial statements. |
HSBC FAMILY OF FUNDS
Statements of Assets and Liabilities—as of October 31, 2017 (continued)
| | HSBC U. S. | | HSBC |
| | Government | | U.S. Treasury |
| | Money Market | | Money Market |
| | | Fund | | Fund |
| Net Asset Value, Offering Price and Redemption Price per share: | | | | | | | | | | |
| Class A Shares | | | $ | 1.00 | | | | $ | — | |
| Class D Shares | | | $ | 1.00 | | | | $ | 1.00 | |
| Class I Shares | | | $ | 1.00 | | | | $ | 1.00 | |
| Intermediary Class Shares | | | $ | 1.00 | | | | $ | 1.00 | |
| Intermediary Service Class Shares | | | $ | 1.00 | | | | $ | 1.00 | |
| Class Y Shares | | | $ | 1.00 | | | | $ | 1.00 | |
| See notes to financial statements. | HSBC FAMILY OF FUNDS 11 |
HSBC FAMILY OF FUNDS
Statements of Operations—For the year ended October 31, 2017
| | U.S. | | |
| | Government | | U.S. Treasury |
| | Money Market | | Money Market |
| | Fund | | Fund |
| Investment Income: | | | | | | | | | | |
| Interest | | | $ | 87,690,056 | | | | $ | 14,505,599 | |
| Total Investment Income | | | | 87,690,056 | | | | | 14,505,599 | |
| | | | | | | | | | | |
| Expenses: | | | | | | | | | | |
| Investment Management | | | | 10,854,052 | | | | | 1,825,974 | |
| Operational Support: | | | | | | | | | | |
| Class A Shares | | | | 1,770 | | | | | — | |
| Class B Shares* | | | | 28 | | | | | — | |
| Class D Shares | | | | 1,762,793 | | | | | 262,074 | |
| Intermediary Class Shares | | | | 51,130 | | | | | — | |
| Intermediary Service Class Shares | | | | 23,861 | | | | | 18,853 | |
| Class Y Shares | | | | 2,457,756 | | | | | 908,708 | |
| Administration: | | | | | | | | | | |
| Class A Shares | | | | 689 | | | | | — | |
| Class B Shares* | | | | 11 | | | | | — | |
| Class D Shares | | | | 686,193 | | | | | 102,031 | |
| Class I Shares | | | | 2,549,048 | | | | | 247,448 | |
| Intermediary Class Shares | | | | 19,800 | | | | | — | |
| Intermediary Service Class Shares | | | | 9,275 | | | | | 7,331 | |
| Class Y Shares | | | | 957,522 | | | | | 353,219 | |
| Distribution: | | | | | | | | | | |
| Class B Shares* | | | | 214 | | | | | — | |
| Shareholder Servicing: | | | | | | | | | | |
| Class A Shares | | | | 7,007 | | | | | — | |
| Class B Shares* | | | | 71 | | | | | — | |
| Class D Shares | | | | 4,407,021 | | | | | 655,191 | |
| Class E Shares | | | | 3 | | | | | — | |
| Intermediary Class Shares | | | | 25,566 | | | | | — | |
| Intermediary Service Class Shares | | | | 23,860 | | | | | 18,853 | |
| Accounting | | | | 85,721 | | | | | 74,384 | |
| Compliance Services | | | | 259,293 | | | | | 42,618 | |
| Custodian | | | | 874,275 | | | | | 92,251 | |
| Printing | | | | 477,370 | | | | | 51,112 | |
| Professional | | | | 1,221,594 | | | | | 246,324 | |
| Transfer Agent | | | | 222,926 | | | | | 88,904 | |
| Trustee | | | | 654,726 | | | | | 105,387 | |
| Registration fees | | | | 180,484 | | | | | 107,233 | |
| Other | | | | 1,000,160 | | | | | 202,285 | |
| Total expenses before fee and expense reductions | | | | 28,814,219 | | | | | 5,410,180 | |
| Fees voluntarily reduced/reimbursed by Investment Adviser | | | | (5,273,888 | ) | | | | (788,342 | ) |
| Fees voluntarily reduced by Administrator | | | | (655,678 | ) | | | | (63,634 | ) |
| Fees voluntarily reduced by Distributor | | | | (172 | ) | | | | — | |
| Fees voluntarily reduced by Shareholder Servicing Agent | | | | (227,064 | ) | | | | (47,987 | ) |
| Fees voluntarily reduced by Sub-Administrator | | | | (5,659 | ) | | | | (4,243 | ) |
| Custody earnings credits | | | | (686,172 | ) | | | | (22,550 | ) |
| Net Expenses | | | | 21,965,586 | | | | | 4,483,424 | |
| | | | | | | | | | |
| Net Investment Income | | | | 65,724,470 | | | | | 10,022,175 | |
| | | | | | | | | | | |
| | | | | | | | | | | |
| Realized/Unrealized Gains/(Losses) from Investments: | | | | | | | | | | |
| Net realized gains/(losses) from investment securities | | | | 16,147 | | | | | (6,519 | ) |
| Net realized/unrealized gains (losses) on investments | | | | 16,147 | | | | | (6,519 | ) |
| Change in Net Assets Resulting from Operations | | | $ | 65,740,617 | | | | $ | 10,015,656 | |
____________________
| Amounts designated as “—“ are $0.00 or have been rounded to $0.00. |
| * | Class B Shares were liquidated on June 15, 2017 and are no longer offered. |
| 12 HSBC FAMILY OF FUNDS | See notes to financial statements. |
HSBC FAMILY OF FUNDS
Statements of Changes in Net Assets
| | HSBC U.S. Government | | HSBC U.S. Treasury |
| | Money Market Fund | | Money Market Fund |
| | Year Ended | Year Ended | | Year Ended | Year Ended |
| | October 31, 2017 | October 31, 2016 | | October 31, 2017 | October 31, 2016 |
| Investment Activities: | | | | | | | | | | | | | | | | | | |
| Operations: | | | | | | | | | | | | | | | | | | |
| Net investment income | | | $ | 65,724,470 | | | $ | 7,180,525 | | | | $ | 10,022,175 | | | $ | 829,895 | |
| Net realized gains/(losses) from investments | | | | 16,147 | | | | 106,704 | | | | | (6,519 | ) | | | 15,357 | |
| Change in net assets resulting from operations | | | | 65,740,617 | | | | 7,287,229 | | | | | 10,015,656 | | | | 845,252 | |
| | | | | | | | | | | | | | | | | | | |
| Distributions: | | | | | | | | | | | | | | | | | | |
| Net investment income: | | | | | | | | | | | | | | | | | | |
| Class A Shares | | | | (4,031 | ) | | | (167 | ) | | | | — | | | | — | |
| Class B Shares* | | | | (4 | ) | | | (7 | ) | | | | — | | | | — | |
| Class D Shares | | | | (5,633,122 | ) | | | (157,507 | ) | | | | (771,011 | ) | | | (16 | ) |
| Class E Shares | | | | (5 | ) | | | (1 | ) | | | | (3 | ) | | | (1 | ) |
| Class I Shares | | | | (46,468,106 | ) | | | (3,240,578 | ) | | | | (4,077,583 | ) | | | (517,995 | ) |
| Intermediary Class Shares | | | | (334,084 | ) | | | (429 | ) | | | | (5 | ) | | | (1 | ) |
| Intermediary Service Class Shares | | | | (149,565 | ) | | | (1,568 | ) | | | | (108,766 | ) | | | (1,541 | ) |
| Class Y Shares | | | | (13,117,235 | ) | | | (3,780,275 | ) | | | | (5,060,292 | ) | | | (310,662 | ) |
| Net realized gains: | | | | | | | | | | | | | | | | | | |
| Class A Shares | | | | (16 | ) | | | — | | | | | — | | | | — | |
| Class D Shares | | | | (19,535 | ) | | | (1,011 | ) | | | | (2,175 | ) | | | (2,318 | ) |
| Class I Shares | | | | (54,230 | ) | | | (1,073 | ) | | | | (5,252 | ) | | | (3,554 | ) |
| Intermediary Class Shares | | | | (127 | ) | | | — | | | | | — | | | | — | |
| Intermediary Service Class Shares | | | | (319 | ) | | | — | | | | | (139 | ) | | | — | |
| Class Y Shares | | | | (36,343 | ) | | | (4,002 | ) | | | | (5,686 | ) | | | (8,118 | ) |
| Change in net assets from distributions: | | | | (65,816,722 | ) | | | (7,186,618 | ) | | | | (10,030,912 | ) | | | (844,206 | ) |
| | | | | | | | | | | | | | | | | | | |
| Change in net assets resulting from | | | | | | | | | | | | | | | | | | |
| capital transactions | | | | 1,435,225,862 | | | | 4,286,595,666 | | | | | 965,841,130 | | | | (151,452,006 | ) |
| Change in net assets | | | | 1,435,149,757 | | | | 4,286,696,277 | | | | | 965,825,874 | | | | (151,450,960 | ) |
| | | | | | | | | | | | | | | | | | | |
| Net Assets: | | | | | | | | | | | | | | | | | | |
| Beginning of period | | | | 10,544,617,825 | | | | 6,257,921,548 | | | | | 1,276,416,089 | | | | 1,427,867,049 | |
| End of period | | | $ | 11,979,767,582 | | | $ | 10,544,617,825 | | | | $ | 2,242,241,963 | | | $ | 1,276,416,089 | |
| Accumulated net investment income/(distributions | | | | | | | | | | | | | | | | | | |
| in excess of net investment income) | | | $ | 18,318 | | | $ | — | | | | $ | 4,515 | | | $ | — | |
____________________
| * | Class B Shares were liquidated on June 15, 2017 and are no longer offered. |
| See notes to financial statements. | HSBC FAMILY OF FUNDS 13 |
HSBC FAMILY OF FUNDS
Statements of Changes in Net Assets (continued)
| | HSBC U.S. Government | | HSBC U.S. Treasury |
| | Money Market Fund | | Money Market Fund |
| | Year Ended | Year Ended | | Year Ended | Year Ended |
| | October 31, 2017 | October 31, 2016 | | October 31, 2017 | October 31, 2016 |
| CAPITAL TRANSACTIONS*: | | | | | | | | | | | | | | | | | | |
| Class A Shares | | | | | | | | | | | | | | | | | | |
| Proceeds from shares issued | | | $ | 1,250,433 | | | $ | 1,205,234 | | | | $ | — | | | $ | — | |
| Proceeds from merger (Note 7) | | | | — | | | | 340,856 | | | | | — | | | | — | |
| Dividends reinvested | | | | 4,023 | | | | 167 | | | | | — | | | | — | |
| Value of shares redeemed | | | | (976,253 | ) | | | (755,634 | ) | | | | — | | | | — | |
| Class A Shares capital transactions | | | | 278,203 | | | | 790,623 | | | | | — | | | | — | |
| | | | | | | | | | | | | | | | | | | |
| Class B Shares** | | | | | | | | | | | | | | | | | | |
| Proceeds from shares issued | | | | 833 | | | | — | | | | | — | | | | — | |
| Dividends reinvested | | | | 4 | | | | 7 | | | | | — | | | | — | |
| Value of shares redeemed | | | | (49,611 | ) | | | — | | | | | — | | | | — | |
| Class B Shares capital transactions | | | | (48,774 | ) | | | 7 | | | | | — | | | | — | |
| | | | | | | | | | | | | | | | | | | |
| Class D Shares | | | | | | | | | | | | | | | | | | |
| Proceeds from shares issued | | | | 3,439,557,773 | | | | 3,682,762,518 | | | | | 1,725,188,294 | | | | 900,175,290 | |
| Proceeds from merger (Note 7) | | | | — | | | | 1,668,424 | | | | | — | | | | — | |
| Dividends reinvested | | | | 3,741,527 | | | | 46,636 | | | | | 452,304 | | | | 1,271 | |
| Value of shares redeemed | | | | (3,747,291,178 | ) | | | (2,623,349,427 | ) | | | | (1,682,583,070 | ) | | | (966,167,073 | ) |
| Class D Shares capital transactions | | | | (303,991,878 | ) | | | 1,061,128,151 | | | | | 43,057,528 | | | | (65,990,512 | ) |
| | | | | | | | | | | | | | | | | | |
| Class E Shares | | | | | | | | | | | | | | | | | | |
| Proceeds from shares issued | | | | — | | | | 1,000 | | | | | — | | | | 1,000 | |
| Proceeds from merger (Note 7) | | | | — | | | | 1,001 | | | | | — | | | | — | |
| Dividends reinvested | | | | 5 | | | | 1 | | | | | 3 | | | | 1 | |
| Value of shares redeemed | | | | (2,007 | ) | | | — | | | | | (1,004 | ) | | | — | |
| Class E Shares capital transactions | | | | (2,002 | ) | | | 2,002 | | | | | (1,001 | ) | | | 1,001 | |
| | | | | | | | | | | | | | | | | | | |
| | | | | | | | | | | | | | | | | | |
| Class I Shares | | | | | | | | | | | | | | | | | | |
| Proceeds from shares issued | | | | 129,309,701,797 | | | | 16,374,346,788 | | | | | 8,144,761,629 | | | | 3,707,312,527 | |
| Proceeds from merger (Note 7) | | | | — | | | | 516,688,873 | | | | | — | | | | — | |
| Dividends reinvested | | | | 17,104,301 | | | | 1,765,424 | | | | | 1,676,610 | | | | 135,888 | |
| Value of shares redeemed | | | | (126,160,507,607 | ) | | | (13,794,885,625 | ) | | | | (7,630,922,394 | ) | | | (3,745,412,945 | ) |
| Class I Shares capital transactions | | | | 3,166,298,491 | | | | 3,097,915,460 | | | | | 515,515,845 | | | | (37,964,530 | ) |
| | | | | | | | | | | | | | | | | | | |
| Intermediary Class Shares | | | | | | | | | | | | | | | | | | |
| Proceeds from shares issued | | | | 406,593,674 | | | | 10,119,999 | | | | | 11 | | | | 1,000 | |
| Proceeds from merger (Note 7) | | | | — | | | | 1,001 | | | | | — | | | | — | |
| Dividends reinvested | | | | 61,962 | | | | 429 | | | | | 4 | | | | 1 | |
| Value of shares redeemed | | | | (397,082,021 | ) | | | — | | | | | (11 | ) | | | — | |
| Intermediary Class Shares capital transactions | | | | 9,573,615 | | | | 10,121,429 | | | | | 4 | | | | 1,001 | |
| | | | | | | | | | | | | | | | | | | |
| Intermediary Service Class Shares | | | | | | | | | | | | | | | | | | |
| Proceeds from shares issued | | | | 1,407,115,250 | | | | 5,001,000 | | | | | 29,200,010 | | | | 18,706,393 | |
| Proceeds from merger (Note 7) | | | | — | | | | 1,001 | | | | | — | | | | — | |
| Dividends reinvested | | | | 139,084 | | | | 1,567 | | | | | 108,710 | | | | 1,541 | |
| Value of shares redeemed | | | | (1,355,215,341 | ) | | | — | | | | | (25,401,015 | ) | | | (600,000 | ) |
| Intermediary Service Class Shares | | | | | | | | | | | | | | | | | | |
| capital transactions | | | | 52,038,993 | | | | 5,003,568 | | | | | 3,907,705 | | | | 18,107,934 | |
| | | | | | | | | | | | | | | | | | | |
| Class Y Shares | | | | | | | | | | | | | | | | | | |
| Proceeds from shares issued | | | | 13,932,449,680 | | | | 25,082,584,192 | | | | | 2,041,622,527 | | | | 1,130,575,987 | |
| Proceeds from merger (Note 7) | | | | — | | | | 3,036,134 | | | | | — | | | | — | |
| Dividends reinvested | | | | 12,442,356 | | | | 3,515,422 | | | | | 4,982,199 | | | | 317,857 | |
| Value of shares redeemed | | | | (15,433,812,822 | ) | | | (24,977,501,322 | ) | | | | (1,643,243,677 | ) | | | (1,196,500,744 | ) |
| Class Y Shares capital transactions | | | | (1,488,920,786 | ) | | | 111,634,426 | | | | | 403,361,049 | | | | (65,606,900 | ) |
| Change in net assets resulting from | | | | | | | | | | | | | | | | | | |
| capital transactions | | | $ | 1,435,225,862 | | | $ | 4,286,595,666 | | | | $ | 965,841,130 | | | $ | (151,452,006 | ) |
____________________
| * | Share transactions are at net asset value of $1.00 per share. |
| ** | Class B Shares were liquidated on June 15, 2017 and are no longer offered. |
| 14 HSBC FAMILY OF FUNDS | See notes to financial statements. |
| HSBC U. S. GOVERNMENT MONEY MARKET FUND |
| Financial Highlights |
Selected data for a share outstanding throughout the periods indicated.
| | | | Investment Activities | | Distributions | | | | | | | | | | | Ratios/Supplementary Data |
| | | | | | | | | Net | | | | | | | | | | | | | | | | | | | | | | | | | | | | |
| | | | | | | | | Realized and | | | | | | | | | | | | | | | | | | | | | | | | | | | | Ratio of |
| | | | | | | | | Unrealized | | | | | | Net | | | | | | | Net | | | | | | Net | | | | Ratio of Net | | Expenses |
| | Net Asset | | | | | | | Gains/ | | | | | | Realized | | | | | | | Asset | | | | | | Assets | | Ratio of Net | | Investment | | to Average |
| | Value, | | Net | | (Losses) | | Total from | | Net | | Gains from | | | | | | | Value, | | | | | | at End | | Expenses to | | Income to | | Net Assets |
| | Beginning | | Investment | | from | | Investment | | Investment | | Investment | | Total | | End of | | Total | | of Period | | Average Net | | Average Net | | (Excluding Fee |
| | of Period | | Income | | Investments | | Activities | | Income | | Transactions | | Distributions | | Period | | Return(a) | | (000's) | | Assets(b) | | Assets(b) | | Reductions)(b) |
| CLASS A SHARES | | | | | | | | | | | | | | | | | | | | | | | | | | | | | | | | | | | | | | | | | | | | | | | | | | | | | | | | | | | | |
| Year Ended October 31, 2017 | | | $ | 1.00 | | | | $ | — | | | | $ | — | | | $ | — | | | | $ | — | | | | $ | — | | | | $ | — | | | | $ | 1.00 | | | | 0.22% | | | | $ | 1,998 | | | | 0.59% | | | | 0.23% | | | | 0.68% | |
| Year Ended October 31, 2016 | | | | 1.00 | | | | | — | | | | | — | | | | — | | | | | — | | | | | — | | | | | — | | | | | 1.00 | | | | 0.02% | | | | | 1,720 | | | | 0.34% | | | | 0.02% | | | | 0.69% | |
| Year Ended October 31, 2015 | | | | 1.00 | | | | | — | | | | | — | | | | — | | | | | — | | | | | — | | | | | — | | | | | 1.00 | | | | 0.03% | | | | | 929 | | | | 0.08% | | | | 0.03% | | | | 0.69% | |
| Year Ended October 31, 2014 | | | | 1.00 | | | | | — | | | | | — | | | | — | | | | | — | | | | | — | | | | | — | | | | | 1.00 | | | | 0.02% | | | | | 154 | | | | 0.07% | | | | 0.02% | | | | 0.69% | |
| Year Ended October 31, 2013 | | | | 1.00 | | | | | — | | | | | — | | | | — | | | | | — | | | | | — | | | | | — | | | | | 1.00 | | | | 0.01% | | | | | 428 | | | | 0.17% | | | | 0.01% | | | | 0.68% | |
| CLASS D SHARES | | | | | | | | | | | | | | | | | | | | | | | | | | | | | | | | | | | | | | | | | | | | | | | | | | | | | | | | | | | | |
| Year Ended October 31, 2017 | | | $ | 1.00 | | | | | — | | | | | — | | | | — | | | | | — | | | | | — | | | | | — | | | | $ | 1.00 | | | | 0.34% | | | | $ | 1,645,222 | | | | 0.47% | | | | 0.32% | | | | 0.54% | |
| Year Ended October 31, 2016 | | | | 1.00 | | | | | — | | | | | — | | | | — | | | | | — | | | | | — | | | | | — | | | | | 1.00 | | | | 0.02% | | | | | 1,949,225 | | | | 0.34% | | | | 0.02% | | | | 0.54% | |
| Year Ended October 31, 2015 | | | | 1.00 | | | | | — | | | | | — | | | | — | | | | | — | | | | | — | | | | | — | | | | | 1.00 | | | | 0.03% | | | | | 888,084 | | | | 0.07% | | | | 0.03% | | | | 0.53% | |
| Year Ended October 31, 2014 | | | | 1.00 | | | | | — | | | | | — | | | | — | | | | | — | | | | | — | | | | | — | | | | | 1.00 | | | | 0.02% | | | | | 727,290 | | | | 0.06% | | | | 0.02% | | | | 0.54% | |
| Year Ended October 31, 2013 | | | | 1.00 | | | | | — | | | | | — | | | | — | | | | | — | | | | | — | | | | | — | | | | | 1.00 | | | | 0.01% | | | | | 670,893 | | | | 0.13% | | | | 0.01% | | | | 0.53% | |
| CLASS E SHARES | | | | | | | | | | | | | | | | | | | | | | | | | | | | | | | | | | | | | | | | | | | | | | | | | | | | | | | | | | | | |
| October 31, 2016 through | | | | | | | | | | | | | | | | | | | | | | | | | | | | | | | | | | | | | | | | | | | | | | | | | | | | | | | | | | | | |
| August 10, 2017(c) | | | $ | 1.00 | | | | | — | | | | | — | | | | — | | | | | — | | | | | — | | | | | — | | | | $ | 1.00 | | | | 0.26% | | | | $ | — | | | | 0.23% | | | | 0.33% | | | | 0.29% | |
| July 12, 2016(d) through | | | | | | | | | | | | | | | | | | | | | | | | | | | | | | | | | | | | | | | | | | | | | | | | | | | | | | | | | | | | |
| October 31, 2016 | | | | 1.00 | | | | | — | | | | | — | | | | — | | | | | — | | | | | — | | | | | — | | | | | 1.00 | | | | 0.11% | | | | | 2 | | | | 0.06% | | | | 0.32% | | | | 0.31% | |
| CLASS I SHARES | | | | | | | | | | | | | | | | | | | | | | | | | | | | | | | | | | | | | | | | | | | | | | | | | | | | | | | | | | | | |
| Year Ended October 31, 2017 | | | $ | 1.00 | | | | | 0.01 | | | | | — | | | | 0.01 | | | | | (0.01 | ) | | | | — | | | | | (0.01 | ) | | | $ | 1.00 | | | | 0.69% | | | | $ | 7,853,457 | | | | 0.12% | | | | 0.71% | | | | 0.18% | |
| Year Ended October 31, 2016 | | | | 1.00 | | | | | — | | | | | — | | | | — | | | | | — | | | | | — | | | | | — | | | | | 1.00 | | | | 0.21% | | | | | 4,687,197 | | | | 0.14% | | | | 0.23% | | | | 0.19% | |
| Year Ended October 31, 2015 | | | | 1.00 | | | | | — | | | | | — | | | | — | | | | | — | | | | | — | | | | | — | | | | | 1.00 | | | | 0.03% | | | | | 1,589,264 | | | | 0.07% | | | | 0.03% | | | | 0.18% | |
| Year Ended October 31, 2014 | | | | 1.00 | | | | | — | | | | | — | | | | — | | | | | — | | | | | — | | | | | — | | | | | 1.00 | | | | 0.02% | | | | | 1,411,088 | | | | 0.06% | | | | 0.02% | | | | 0.19% | |
| Year Ended October 31, 2013 | | | | 1.00 | | | | | — | | | | | — | | | | — | | | | | — | | | | | — | | | | | — | | | | | 1.00 | | | | 0.01% | | | | | 1,156,894 | | | | 0.13% | | | | 0.02% | | | | 0.18% | |
| INTERMEDIARY CLASS SHARES | | | | | | | | | | | | | | | | | | | | | | | | | | | | | | | | | | | | | | | | | | | | | | | | | | | | | | | | | | | | |
| Year Ended October 31, 2017 | | | $ | 1.00 | | | | | 0.01 | | | | | — | | | | 0.01 | | | | | (0.01 | ) | | | | — | | | | | (0.01 | ) | | | $ | 1.00 | | | | 0.63% | | | | $ | 19,694 | | | | 0.18% | | | | 0.65% | | | | 0.33% | |
| July 12, 2016(d) through | | | | | | | | | | | | | | | | | | | | | | | | | | | | | | | | | | | | | | | | | | | | | | | | | | | | | | | | | | | | |
| October 31, 2016 | | | | 1.00 | | | | | — | | | | | — | | | | — | | | | | — | | | | | — | | | | | — | | | | | 1.00 | | | | 0.11% | | | | | 10,121 | | | | 0.18% | | | | 0.26% | | | | 0.37% | |
| INTERMEDIARY SERVICE | | | | | | | | | | | | | | | | | | | | | | | | | | | | | | | | | | | | | | | | | | | | | | | | | | | | | | | | | | | | |
| CLASS SHARES | | | | | | | | | | | | | | | | | | | | | | | | | | | | | | | | | | | | | | | | | | | | | | | | | | | | | | | | | | | | |
| Year Ended October 31, 2017 | | | $ | 1.00 | | | | | 0.01 | | | | | — | | | | 0.01 | | | | | (0.01 | ) | | | | — | | | | | (0.01 | ) | | | $ | 1.00 | | | | 0.61% | | | | $ | 57,042 | | | | 0.20% | | | | 0.63% | | | | 0.39% | |
| July 12, 2016(d) through | | | | | | | | | | | | | | | | | | | | | | | | | | | | | | | | | | | | | | | | | | | | | | | | | | | | | | | | | | | | |
| October 31, 2016 | | | | 1.00 | | | | | — | | | | | — | | | | — | | | | | — | | | | | — | | | | | — | | | | | 1.00 | | | | 0.10% | | | | | 5,003 | | | | 0.18% | | | | 0.22% | | | | 0.42% | |
| See notes to financial statements. | HSBC FAMILY OF FUNDS 15 |
| HSBC U. S. GOVERNMENT MONEY MARKET FUND |
| Financial Highlights (continued) |
| | | | Investment Activities | | Distributions | | | | | | | | | | | Ratios/Supplementary Data |
| | | | | | | | | Net | | | | | | | | | | | | | | | | | | | | | | | | | | | | |
| | | | | | | | | Realized and | | | | | | | | | | | | | | | | | | | | | | | | | | | | Ratio of |
| | | | | | | | | Unrealized | | | | | | Net | | | | | | | Net | | | | | | Net | | | | Ratio of Net | | Expenses |
| | Net Asset | | | | | | | Gains/ | | | | | | Realized | | | | | | | Asset | | | | | | Assets | | Ratio of Net | | Investment | | to Average |
| | Value, | | Net | | (Losses) | | Total from | | Net | | Gains from | | | | | | | Value, | | | | | | at End | | Expenses to | | Income to | | Net Assets |
| | Beginning | | Investment | | from | | Investment | | Investment | | Investment | | Total | | End of | | Total | | of Period | | Average Net | | Average Net | | (Excluding Fee |
| | of Period | | Income | | Investments | | Activities | | Income | | Transactions | | Distributions | | Period | | Return(a) | | (000's) | | Assets(b) | | Assets(b) | | Reductions)(b) |
| CLASS Y SHARES | | | | | | | | | | | | | | | | | | | | | | | | | | | | | | | | | | | | | | | | | | | | | | | | | | | | | | | | | | | | |
| Year Ended October 31, 2017 | | | $ | 1.00 | | | | $ | 0.01 | | | | $ | — | | | $ | 0.01 | | | | $ | (0.01 | ) | | | $ | — | | | | $ | (0.01) | | | | $ | 1.00 | | | | 0.58% | | | | $ | 2,402,354 | | | | 0.23% | | | | 0.53% | | | | 0.29% | |
| Year Ended October 31, 2016 | | | | 1.00 | | | | | — | | | | | — | | | | — | | | | | — | | | | | — | | | | | — | | | | | 1.00 | | | | 0.12% | | | | | 3,891,299 | | | | 0.23% | | | | 0.11% | | | | 0.28% | |
| Year Ended October 31, 2015 | | | | 1.00 | | | | | — | | | | | — | | | | — | | | | | — | | | | | — | | | | | — | | | | | 1.00 | | | | 0.03% | | | | | 3,779,595 | | | | 0.07% | | | | 0.03% | | | | 0.28% | |
| Year Ended October 31, 2014 | | | | 1.00 | | | | | — | | | | | — | | | | — | | | | | — | | | | | — | | | | | — | | | | | 1.00 | | | | 0.02% | | | | | 3,458,399 | | | | 0.06% | | | | 0.02% | | | | 0.29% | |
| Year Ended October 31, 2013 | | | | 1.00 | | | | | — | | | | | — | | | | — | | | | | — | | | | | — | | | | | — | | | | | 1.00 | | | | 0.01% | | | | | 2,404,867 | | | | 0.13% | | | | 0.01% | | | | 0.28% | |
| (a) | Not annualized for periods less than one year. Total return calculations do not include any sales or redemption charges. |
| (b) | Annualized for periods less than one year. |
| (c) | Closed operations on August 10, 2017. |
| (d) | Commencement of operations on July 12, 2016. |
| Amounts designated as “—“ are $0.00 or have been rounded to $0.00. |
| 16 HSBC FAMILY OF FUNDS | See notes to financial statements. |
| HSBC U. S. TREASURY MONEY MARKET FUND |
| Financial Highlights |
Selected data for a share outstanding throughout the periods indicated.
| | | | | | | Investment Activities | | Distributions | | | | | | | | | | | Ratios/Supplementary Data |
| | | | | | | | | | | | Net | | | | | | | | | | | | | | | | | | | | | | | | | | | | | | | | | | | | | | | | | | | | | | |
| | | | | | | | | | | | Realized and | | | | | | | | | | | | | | | | | | | | | | | | | | | | | | | | | | | | | | | | | | | | Ratio of |
| | | | | | | | | | | | Unrealized | | | | | | | | | | | | Net | | | | | | | Net | | | | | | Net | | | | | | Ratio of Net | | Expenses |
| | Net Asset | | | | | | | Gains/ | | | | | | | | | | | | Realized | | | | | | | Asset | | | | | | Assets | | Ratio of Net | | Investment | | to Average |
| | Value, | | Net | | (Losses) | | Total from | | Net | | Gains from | | | | | | | Value, | | | | | | at End | | Expenses to | | Income to | | Net Assets |
| | Beginning | | Investment | | from | | Investment | | Investment | | Investment | | Total | | End of | | Total | | of Period | | Average Net | | Average Net | | (Excluding Fee |
| | of Period | | Income | | Investments | | Activities | | Income | | Transactions | | Distributions | | Period | | Return(a) | | (000’s) | | Assets(b) | | Assets(b) | | Reductions)(b) |
| CLASS A SHARES | | | | | | | | | | | | | | | | | | | | | | | | | | | | | | | | | | | | | | | | | | | | | | | | | | | | | | | | | | | | | |
| Year Ended October 31, 2014(c) | | | $ | 1.00 | | | | $ | — | | | | $ | — | | | | $ | — | | | | $ | — | | | | $ | — | | | | $ | — | | | | $ | 1.00 | | | | —% | | | | $ | — | | | | —% | | | | —% | | | | —% | |
| Year Ended October 31, 2013 | | | | 1.00 | | | | | — | | | | | — | | | | | — | | | | | — | | | | | — | | | | | — | | | | | 1.00 | | | | —% | | | | | 5 | | | | 0.10% | | | | —% | | | | 0.69% | |
| CLASS D SHARES | | | | | | | | | | | | | | | | | | | | | | | | | | | | | | | | | | | | | | | | | | | | | | | | | | | | | | | | | | | | | |
| Year Ended October 31, 2017 | | | | 1.00 | | | | | — | | | | | — | | | | | — | | | | | — | | | | | — | | | | | — | | | | $ | 1.00 | | | | 0.29% | | | | $ | 257,062 | | | | 0.49% | | | | 0.28% | | | | 0.55% | |
| Year Ended October 31, 2016 | | | | 1.00 | | | | | — | | | | | — | | | | | — | | | | | — | | | | | — | | | | | — | | | | | 1.00 | | | | —% | | | | | 214,041 | | | | 0.28% | | | | —% | | | | 0.55% | |
| Year Ended October 31, 2015 | | | | 1.00 | | | | | — | | | | | — | | | | | — | | | | | — | | | | | — | | | | | — | | | | | 1.00 | | | | —% | | | | | 280,032 | | | | 0.06% | | | | —% | | | | 0.54% | |
| Year Ended October 31, 2014 | | | | 1.00 | | | | | — | | | | | — | | | | | — | | | | | — | | | | | — | | | | | — | | | | | 1.00 | | | | 0.01% | | | | | 638,939 | | | | 0.06% | | | | —% | | | | 0.54% | |
| Year Ended October 31, 2013 | | | | 1.00 | | | | | — | | | | | — | | | | | — | | | | | — | | | | | — | | | | | — | | | | | 1.00 | | | | —% | | | | | 517,845 | | | | 0.09% | | | | —% | | | | 0.53% | |
| CLASS E SHARES | | | | | | | | | | | | | | | | | | | | | | | | | | | | | | | | | | | | | | | | | | | | | | | | | | | | | | | | | | | | | |
| October 31, 2016 through | | | | | | | | | | | | | | | | | | | | | | | | | | | | | | | | | | | | | | | | | | | | | | | | | | | | | | | | | | | | | |
| August 10, 2017(d) | | | | 1.00 | | | | | — | | | | | — | | | | | — | | | | | — | | | | | — | | | | | — | | | | $ | 1.00 | | | | 0.29% | | | | $ | — | | | | 0.25% | | | | 0.37% | | | | 0.29% | |
| July 12, 2016(e) through | | | | | | | | | | | | | | | | | | | | | | | | | | | | | | | | | | | | | | | | | | | | | | | | | | | | | | | | | | | | | |
| October 31, 2016 | | | | 1.00 | | | | | — | | | | | — | | | | | — | | | | | — | | | | | — | | | | | — | | | | | 1.00 | | | | 0.11% | | | | | 1 | | | | —% | | | | 0.37% | | | | 0.33% | |
| CLASS I SHARES | | | | | | | | | | | | | | | | | | | | | | | | | | | | | | | | | | | | | | | | | | | | | | | | | | | | | | | | | | | | | |
| Year Ended October 31, 2017 | | | | 1.00 | | | | | 0.01 | | | | | — | | | | | 0.01 | | | | | (0.01 | ) | | | | — | | | | | (0.01 | ) | | | $ | 1.00 | | | | 0.64% | | | | $ | 861,944 | | | | 0.14% | | | | 0.65% | | | | 0.19% | |
| Year Ended October 31, 2016 | | | | 1.00 | | | | | — | | | | | — | | | | | — | | | | | — | | | | | — | | | | | — | | | | | 1.00 | | | | 0.13% | | | | | 346,399 | | | | 0.16% | | | | 0.13% | | | | 0.20% | |
| Year Ended October 31, 2015 | | | | 1.00 | | | | | — | | | | | — | | | | | — | | | | | — | | | | | — | | | | | — | | | | | 1.00 | | | | —% | | | | | 384,363 | | | | 0.05% | | | | —% | | | | 0.19% | |
| Year Ended October 31, 2014 | | | | 1.00 | | | | | — | | | | | — | | | | | — | | | | | — | | | | | — | | | | | — | | | | | 1.00 | | | | 0.01% | | | | | 263,714 | | | | 0.06% | | | | 0.01% | | | | 0.19% | |
| Year Ended October 31, 2013 | | | | 1.00 | | | | | — | | | | | — | | | | | — | | | | | — | | | | | — | | | | | — | | | | | 1.00 | | | | —% | | | | | 1,086,181 | | | | 0.09% | | | | —% | | | | 0.18% | |
| INTERMEDIARY CLASS SHARES | | | | | | | | | | | | | | | | | | | | | | | | | | | | | | | | | | | | | | | | | | | | | | | | | | | | | | | | | | | | | |
| Year Ended October 31, 2017 | | | | 1.00 | | | | | — | | | | | — | | | | | — | | | | | — | | | | | — | | | | | — | | | | $ | 1.00 | | | | 0.44% | | | | $ | 1 | | | | 0.18% | | | | 0.44% | | | | 0.34% | |
| July 12, 2016(e) through | | | | | | | | | | | | | | | | | | | | | | | | | | | | | | | | | | | | | | | | | | | | | | | | | | | | | | | | | | | | | |
| October 31, 2016 | | | | 1.00 | | | | | — | | | | | — | | | | | — | | | | | — | | | | | — | | | | | — | | | | | 1.00 | | | | 0.11% | | | | | 1 | | | | —% | | | | 0.37% | | | | 0.38% | |
| INTERMEDIARY SERVICE | | | | | | | | | | | | | | | | | | | | | | | | | | | | | | | | | | | | | | | | | | | | | | | | | | | | | | | | | | | | | |
| CLASS SHARES | | | | | | | | | | | | | | | | | | | | | | | | | | | | | | | | | | | | | | | | | | | | | | | | | | | | | | | | | | | | | |
| Year Ended October 31, 2017 | | | | 1.00 | | | | | 0.01 | | | | | — | | | | | 0.01 | | | | | (0.01 | ) | | | | — | | | | | (0.01 | ) | | | $ | 1.00 | | | | 0.58% | | | | $ | 22,016 | | | | 0.20% | | | | 0.58% | | | | 0.40% | |
| July 12, 2016(e) through | | | | | | | | | | | | | | | | | | | | | | | | | | | | | | | | | | | | | | | | | | | | | | | | | | | | | | | | | | | | | |
| October 31, 2016 | | | | 1.00 | | | | | — | | | | | — | | | | | — | | | | | — | | | | | — | | | | | — | | | | | 1.00 | | | | 0.10% | | | | | 18,108 | | | | 0.20% | | | | 0.14% | | | | 0.48% | |
| See notes to financial statements. | HSBC FAMILY OF FUNDS 17 |
| HSBC U.S. TREASURY MONEY MARKET FUND |
| Financial Highlights (continued) |
| | | | Investment Activities | | Distributions | | | | | | Ratios/Supplementary Data |
| | Net Asset
Value,
Beginning
of Period | | Net
Investment
Income | | Net
Realized and
Unrealized
Gains/
(Losses)
from
Investments | | Total from
Investment
Activities | | Net
Investment
Income | | Net
Realized
Gains from
Investment
Transactions | | Total
Distributions | | Net
Asset
Value,
End of
Period | | Total
Return(a) | | Net
Assets
at End
of Period
(000's) | | Ratio of Net
Expenses to
Average Net
Assets(b) | | Ratio of Net
Investment
Income to
Average Net
Assets(b) | | Ratio of
Expenses
to Average
Net Assets
(Excluding Fee
Reductions)(b) |
| CLASS Y SHARES | | | | | | | | | | | | | | | | | | | | | | | | | | | | | | | | | | | | | | | | | | | | | | | | | | | | | | |
| Year Ended October 31, 2017 | | | $ | 1.00 | | | | $ | 0.01 | | | | $ | — | | | | $ | 0.01 | | | | $ | (0.01 | ) | | | — | | | $ | (0.01 | ) | | | | $ | 1.00 | | | | 0.53% | | | $ | 1,101,219 | | 0.25% | | | 0.56% | | | 0.29% |
| Year Ended October 31, 2016 | | | | 1.00 | | | | | — | | | | | — | | | | | — | | | | | — | | | | — | | | | — | | | | | | 1.00 | | | | 0.04% | | | | 697,866 | | 0.25% | | | 0.04% | | | 0.30% |
| Year Ended October 31, 2015 | | | | 1.00 | | | | | — | | | | | — | | | | | — | | | | | — | | | | — | | | | — | | | | | | 1.00 | | | | —% | | | | 763,473 | | 0.06% | | | —% | | | 0.29% |
| Year Ended October 31, 2014 | | | | 1.00 | | | | | — | | | | | — | | | | | — | | | | | — | | | | — | | | | — | | | | | | 1.00 | | | | 0.01% | | | | 956,312 | | 0.06% | | | 0.01% | | | 0.29% |
| Year Ended October 31, 2013 | | | | 1.00 | | | | | — | | | | | — | | | | | — | | | | | — | | | | — | | | | — | | | | | | 1.00 | | | | —% | | | | 968,290 | | 0.09% | | | —% | | | 0.28% |
| (a) | Not annualized for periods less than one year. Total return calculations do not include any sales or redemption charges. |
| (b) | Annualized for periods less than one year. |
| (c) | Class A Shares were operational during a portion of the year only. Amounts reflect performance for a period of time the class had operations, which was 201 days during the period. The net asset value reflected represents the last day the class had operations. |
| (d) | Closed operations on August 10, 2017. |
| (e) | Commencement of operations on July 12, 2016. |
Amounts designated as “—“ are $0.00 or have been rounded to $0.00. |
| 18 HSBC FAMILY OF FUNDS | See notes to financial statements. |
| HSBC FAMILY OF FUNDS |
Notes to Financial Statements—as of October 31, 2017 |
1. Organization:
The HSBC Funds (the “Trust”), a Delaware statutory trust organized on March 2, 2016, is registered under the Investment Company Act of 1940, as amended (the “Act”), as an open-end management investment company. Effective June 24, 2016, the Funds (as defined below), which were previously series of HSBC Funds, a Massachusetts business trust, reorganized with and into corresponding series of the Trust (each, a “Reorganization”). Upon completion of each Reorganization, the respective share classes of each Fund assumed the performance, financial and other historical information of those of the corresponding predecessor series. As of October 31, 2017, the Trust is composed of 13 separate operational funds, each a series of the HSBC Family of Funds. The accompanying financial statements are presented for the following two funds (individually a “Fund”, collectively the “Funds”) of the Trust:
| | Fund | | Short Name |
| HSBC U.S. Government Money Market Fund | | U.S. Government Money Market Fund |
| HSBC U.S. Treasury Money Market Fund | | U.S. Treasury Money Market Fund |
Both of the Funds are diversified funds. Financial statements for all other funds of the Trust are published separately.
Both of the Funds are government money market funds (as defined in Rule 2a-7) and seek to maintain a stable net asset value of $1.00 per share, although it is possible to lose money by investing in the Funds. The Funds are authorized to issue an unlimited number of shares of beneficial interest with a par value of $ 0.001 per share. Each of the Funds has eight classes of shares: Class A Shares, Class C Shares, Class D Shares, Class E Shares, Class I Shares, Intermediary Class Shares, Intermediary Service Class Shares and Class Y Shares. Class C Shares of the Funds are offered without any front-end sales charge but will be subject to a maximum CDSC of 1.00% if redeemed less than one year after purchase. No sales charges are assessed with respect to Class A, Class D, Class E, Class I, Intermediary Class, Intermediary Service Class or Class Y Shares of the Funds. Each class of shares in each Fund has identical rights and privileges, except with respect to arrangements pertaining to shareholder servicing and/or distribution, class-related expenses, voting rights on matters affecting a single class of shares, and exchange privileges. Class B Shares of the U.S. Government Money Market Fund were operational during the year but were liquidated and are no longer offered as of October 31, 2017.
Under the Trust’s organizational documents, the Trust’s officers and Trustees are indemnified against certain liabilities arising out of the performance of their duties to the Funds. In addition, in the normal course of business, the Trust enters into contracts with its service providers, which also provide for indemnifications by the Funds. The Funds’ maximum exposure under these arrangements is unknown as this would involve future claims that may be made against the Funds. However, based on experience, the Trust believes the risk of loss to be remote.
The Funds are investment companies and follow accounting and reporting guidance under Financial Accounting Standards Board (“FASB”) Accounting Standards Codification (“ASC”) Topic 946, “Financial Services-Investment Companies.”
2. Significant Accounting Policies:
The following is a summary of the significant accounting policies followed by the Funds in the preparation of their financial statements. The policies are in conformity with generally accepted accounting principles in the United States of America (“GAAP”). The preparation of financial statements requires management to make certain estimates and assumptions that affect the reported amounts of assets and liabilities and disclosure of contingent assets and liabilities at the date of the financial statements and the reported amounts of increases and decreases in net assets from operations during the reporting period. Actual results could differ from those estimates.
| HSBC FAMILY OF FUNDS |
Notes to Financial Statements—as of October 31, 2017 (continued) |
Securities Valuation:
Investments of the Funds are valued using the amortized cost method pursuant to Rule 2a-7 under the Act, which approximates fair value. Fair value is defined as the price that would be received to sell an asset or paid to transfer a liability in an orderly transaction between market participants at the measurement date. The valuation techniques used to determine fair value are further described in Note 3 below.
Investment Transactions and Related Income:
Investment transactions are accounted for no later than one business day after trade date. However, for financial reporting purposes, investment transactions are accounted for on trade date. Investment gains and losses are calculated on the identified cost basis. Interest income is recognized on the accrual basis and includes, where applicable, the amortization or accretion of premium or discount based on effective yield. Dividend income is recorded on the ex-dividend date.
Restricted Securities:
The Funds may invest in restricted securities. A restricted security is a security which has been purchased through a private offering and cannot be resold to the general public without prior registration under the Securities Act of 1933 (the “1933 Act”) or pursuant to the resale limitations provided by Rule 144 under the 1933 Act, or another exemption from the registration requirements of the 1933 Act. Certain restricted securities may be resold in transactions exempt from registration, normally to qualified institutional buyers, and may be deemed liquid by the Investment Adviser (as defined in Note 4) based on procedures established by the Board of Trustees (the “Board”). Therefore, not all restricted securities are considered illiquid. To the extent that a Fund purchases securities that are restricted as to resale or for which current market quotations are not available, such securities will be valued based upon all relevant factors as outlined in SEC Financial Reporting Release No. 1. Disposal of restricted securities may involve time consuming negotiations and expense. Prompt sale at the current valuation may be difficult and could adversely affect the net assets of the Funds. At October 31, 2017, there were no restricted securities held by the Funds.
Repurchase Agreements:
The U.S. Government Money Market Fund may enter into repurchase agreements with an entity which is a member of the Federal Reserve System or which is a “primary dealer” (as designated by the Federal Reserve Bank of New York) in U.S. government obligations. The U.S. Treasury Money Market Fund may temporarily invest in repurchase agreements collateralized by U.S. Treasury Obligations. The repurchase price generally equals the price paid by a Fund plus interest negotiated on the basis of current short-term rates, which may be more or less than the rate on the underlying portfolio securities. The seller, under a repurchase agreement, is required to maintain the collateral held pursuant to the agreement, with a fair value equal to or greater than the repurchase price (including accrued interest). Securities subject to repurchase agreements are held by the Funds’ custodian or another qualified custodian or in the Federal Reserve/Treasury book-entry system. Master Repurchase Agreements (“MRA”) permit the Fund, under certain circumstances, including an event of default (such as bankruptcy or insolvency), to offset receivables under the MRA with collateral posted by the counterparty and create one net payment due to or from the Fund. However, bankruptcy or insolvency laws of a particular jurisdiction may impose restrictions on or prohibitions against such a right of offset in the event of the MRA counterparty’s bankruptcy or insolvency. Pursuant to terms of the MRA, the Fund receives securities as collateral with a market value in excess of the repurchase price to be received by the Fund upon the maturity of the transaction. Upon bankruptcy or insolvency of the MRA counterparty, the Fund would recognize a liability with respect to such excess collateral to reflect the Fund’s obligation under bankruptcy law to return the excess to the counterparty. There is potential for loss to a Fund in the event the Fund is delayed or prevented from exercising its rights to dispose of the collateral securities, including the risk of a possible decline in the fair value of the underlying securities during the period while the Fund seeks to assert its rights.
| HSBC FAMILY OF FUNDS |
Notes to Financial Statements—as of October 31, 2017 (continued) |
Cash:
Cash is held in deposit accounts at the Funds’ custodian bank, The Northern Trust Company, and is a significant portion of the net assets, which may exceed the amount insured by the Federal Deposit Insurance Corporation (“FDIC”). To the extent that such balances exceed FDIC insurance limits, the Funds are subject to the creditworthiness of the custodian bank.
Allocations:
Expenses directly attributable to a Fund are charged to that Fund. Expenses not directly attributable to a Fund are allocated among the applicable series within the Trust in relation to the net assets of each fund, equally to each fund, or another appropriate basis. Class specific expenses are charged directly to the class incurring the expense. In addition, income, expenses (other than class specific expenses), and unrealized and realized gains and losses are allocated to each class based on relative net assets on a daily basis.
Distributions to Shareholders:
Dividends to shareholders from net investment income, if any, are declared daily and distributed monthly from each Fund. Distributions from net realized gains, if any, are declared and paid at least annually by the Funds. Additional distributions are also made to the Funds’ shareholders to the extent necessary to avoid the federal excise tax on certain undistributed income and net realized gains of regulated investment companies.
Federal Income Taxes:
Each Fund is a separate taxable entity for federal income tax purposes. Each Fund has qualified and intends to continue to qualify each year as a “regulated investment company’’ under Subchapter M of the Internal Revenue Code, as amended, and to distribute substantially all of its taxable net investment income and net realized gains, if any, to its shareholders. Accordingly, no provision for federal income or excise tax is required for the Funds, although shareholders may be taxed on distributions they receive.
Management of the Funds has reviewed tax positions taken in tax years that remain subject to examination by all major tax jurisdictions, including federal (i.e., the last four tax year ends and the interim tax period since then, as applicable). Management believes that there is no tax liability resulting from unrecognized tax benefits related to uncertain tax positions taken. Management’s conclusions may be subject to future review based on changes in, or interpretation of, accounting standards or tax laws and regulations.
Recent Accounting Pronouncements:
In October 2016, the Securities and Exchange Commission (SEC) released its Final Rules on Investment Company Reporting Modernization (the “Rules”). The Rules introduce two new regulatory reporting forms for investment companies - Form N-PORT and Form N-CEN – and also contain amendments to Regulation S-X which require standardized, enhanced disclosures about derivatives in investment company financial statements, as well as other amendments. Money market funds, including the Funds, will not be required to report on Form N-PORT. The amendments to Regulation S-X became effective for filings made with the SEC after August 1, 2017. The Funds’ adoption of these amendments, effective with the financial statements prepared as of October 31, 2017, required additional disclosures reflected herein, but had no effect on the Funds’ net assets or results of operations.
| HSBC FAMILY OF FUNDS |
Notes to Financial Statements—as of October 31, 2017 (continued) |
3. Investment Valuation Summary
The valuation techniques employed by the Funds, as described below, maximize the use of observable inputs and minimize the use of unobservable inputs in determining fair value. The Funds’ investments are classified within the fair value hierarchy based on the lowest level of input that is significant to the fair value measurement. The inputs used for valuing the Funds’ investments are summarized in the three broad levels listed below:
| ● | Level 1—quoted prices in active markets for identical assets
|
| ● | Level 2—other significant observable inputs (including quoted prices for similar securities, interest rates, prepayments speeds, credit risk, etc.)
|
| ● | Level 3—significant unobservable inputs (including the Fund’s own assumptions in determining the fair value of investments) |
Changes in valuation techniques may result in transfers in or out of an assigned level within the fair value hierarchy. The Trust’s policy is to disclose transfers between fair value hierarchy levels based on valuations at the end of the reporting period. There were no transfers during the year ended October 31, 2017. The inputs or methodology used for valuing investments are not necessarily an indication of the risk associated with investing in those investments.
Investments of the Funds are valued using the amortized cost method pursuant to Rule 2a-7 under the Act, which approximates fair value, and are typically categorized as Level 2 in the fair value hierarchy. The amortized cost method involves valuing an instrument at its cost initially and thereafter assuming a constant amortization to maturity of any discounts or premium, regardless of the impact of fluctuating interest rates on the market value of the instrument. The amortized cost method may result in periods during which value, as determined by amortized cost, is higher or lower than the price a Fund holding the instrument would receive if it sold the instrument. The fair value of securities in the Funds can be expected to vary with changes in prevailing interest rates.
Repurchase agreements are valued at original cost and are typically categorized as Level 2 in the fair value hierarchy.
For the period ended October 31, 2017, there were no Level 3 investments for which significant unobservable inputs were used to determine fair value. As of October 31, 2017, all investments were categorized as Level 2 in the fair value hierarchy. The breakdown of investment categorization is disclosed in the Schedule of Portfolio Investments for each Fund.
4. Related Party Transactions and Other Agreements and Plans:
Investment Management:
HSBC Global Asset Management (USA) Inc. (“HSBC” or the “Investment Adviser”), a wholly owned subsidiary of HSBC Bank USA, N.A., a national bank organized under the laws of the United States, acts as Investment Adviser to the Funds. As Investment Adviser, HSBC manages the investments of the Funds and continuously reviews, supervises and administers the Funds’ investments pursuant to an Investment Advisory Contract. For its services in this capacity, HSBC receives a fee from each Fund, accrued daily and paid monthly, based on the average daily net assets of each respective Fund, at an annual rate of 0.10%.
HSBC also provides operational support services to the Funds pursuant to an Operational Support Services Agreement. For its services in this capacity, HSBC is entitled to receive a fee, accrued daily and paid monthly, based on the average daily net assets of Class A Shares, Class C Shares, Class D Shares, Intermediary Class Shares, Intermediary Service Class Shares and Class Y Shares, at an annual rate of 0.10%.
The Bank of New York Mellon (the “Servicer”) provides recordkeeping, reporting and processing services to the Class I Shares of the Funds. The Servicer is paid by the Investment Adviser and not by the Funds, for these services.
| HSBC FAMILY OF FUNDS |
Notes to Financial Statements—as of October 31, 2017 (continued) |
Administration:
HSBC also serves the Funds as Administrator. Under the terms of the Administration Services Agreement, HSBC receives from the Funds (as well as other funds in the Trust combined) a fee, accrued daily and paid monthly, at an annual rate of:
| | Based on Average Daily Net Assets of | | Fee Rate(%) |
| Up to $10 billion | | 0.0400 |
| In excess of $10 billion but not exceeding $20 billion | | 0.0350 |
| In excess of $20 billion but not exceeding $50 billion | | 0.0265 |
| In excess of $50 billion | | 0.0245 |
The fee rates and breakpoints are determined on the basis of the aggregate average daily net assets of the Trust. For the year ended October 31, 2017, the effective annualized rate was 0.039%, prior to any fee waivers or expense reimbursements, based on the average daily net assets of the Trust. The total administration fee paid to HSBC is allocated to each series based upon its proportionate share of the aggregate net assets of the Trust, subject to certain allocations in cases where one fund invests some or all of its assets in another fund.
Pursuant to a Sub-Administration Services Agreement with HSBC, Citi Fund Services Ohio, Inc. (“Citi”), a wholly-owned subsidiary of Citigroup, Inc., serves as the Trust’s Sub-Administrator. For these services, Citi is entitled to a fee, payable by HSBC, at an annual rate equivalent to the fee rates set forth above subject to certain reductions associated with services provided to new funds, minus 0.02% which is retained by HSBC.
Under a Compliance Services Agreement between the Trust and Citi (the “CCO Agreement”), Citi makes an employee available to serve as the Trust’s Chief Compliance Officer (the “CCO”). Under the CCO Agreement, Citi also provides infrastructure and support in implementing the written policies and procedures comprising the Trust’s compliance program, including support services to the CCO. For the services provided under the CCO Agreement, the Trust paid Citi $312,739 for the year ended October 31, 2017, plus reimbursement of certain out-of-pocket expenses. Expenses incurred by each Fund are reflected on the Statements of Operations as “Compliance Services.” Citi pays the salary and other compensation earned by individuals performing these services, as employees of Citi.
Distribution Arrangements:
On May 31, 2017, Foreside Distribution Services, L.P. (“Foreside”) announced that Lovell Minnick Partners, LLC completed its acquisition of a majority interest in Foreside Financial Group, LLC, an indirect parent of Foreside. Foreside serves the Trust as Distributor (the “Distributor”). The Trust has adopted a non-compensatory Distribution Plan and Agreement (the “Distribution Plan”) pursuant to Rule 12b-1 of the Act. The Distribution Plan provides for reimbursement of expenses incurred by the Distributor related to distribution and marketing, at a rate not to exceed 0.25%, 1.00% and 0.25% of the average daily net assets of Class A Shares (currently not being charged), Class C Shares (currently charging 0.75%) and Class D Shares (currently not being charged) of the Funds, respectively. For the year ended October 31, 2017, Foreside, as Distributor, also received $4,154 in commissions from sales of the Trust, of which $3 were reallocated to HSBC-affiliated brokers and dealers.
Expenses reduced during the year ended October 31, 2017 are reflected on the Statements of Operations as “Fees voluntarily reduced by Distributor.’’
| HSBC FAMILY OF FUNDS |
Notes to Financial Statements—as of October 31, 2017 (continued) |
Shareholder Servicing:
The Trust has adopted a Shareholder Services Plan, which provides for payments to shareholder servicing agents (which includes HSBC and its affiliates) for providing various shareholder services. As disclosed in the Statements of Operations, for the current fiscal period certain amounts of the Shareholder Servicing Fees have been waived by those shareholder servicing agents, including HSBC and its affiliates. Expenses reduced during the year ended October 31, 2017 are reflected on the Statements of Operations as “Fees voluntarily reduced by Shareholder Servicing Agent.” For performing these services, the shareholder servicing agents receive a fee that is computed daily and paid monthly up to the following:
| | Share Class | | Fee Rate(%) |
| Class A Shares | | | 0.60 | %* |
| Class C Shares | | | 0.25 | % |
| Class D Shares | | | 0.25 | % |
| Class E Shares | | | 0.10 | % |
| Intermediary Class Shares | | | 0.05 | % |
| Intermediary Service Class Shares | | | 0.10 | % |
____________________
* Currently charging 0.40%
The aggregate fees paid to the Distributor pursuant to the Distribution Plan and to shareholder servicing agents pursuant to the Shareholder Services Plan may not exceed, in the aggregate, the following:
| | Share Class | | Fee Rate(%) |
| Class A Shares | | 0.60% |
| Class C Shares | | 1.00% |
| Class D Shares | | 0.25% |
| Class E Shares | | 0.10% |
| Intermediary Class Shares | | 0.05% |
| Intermediary Service Class Shares | | 0.10% |
The Trust has entered into shareholder services contracts with affiliated and unaffiliated financial intermediaries who provide shareholder services and other related services to their clients or customers who invest in the Funds under which the Funds will pay all or a portion of such fees earned to financial intermediaries for performing such services.
Fund Accounting and Transfer Agency:
Citi provides fund accounting services for each Fund. As fund accountant, Citi receives an annual fee per Fund and share class, subject to certain minimums and reimbursements of certain expenses. Citi receives additional fees paid by the Trust for regulatory administration services and money market fund reporting services. Boston Financial Data Services, Inc. (“BFDS”) provides transfer agency services for each Fund. As transfer agent, BFDS receives a fee based on the number of funds and shareholder accounts, subject to certain minimums, and reimbursement of certain expenses.
Independent Trustees:
The Trust pays an annual retainer to each Independent Trustee, plus additional annual retainers to each Committee Chair and the Chairman of the Board. The Independent Trustees also receive a fee for each regular, special in-person, and telephonic meeting of the Board attended. The aggregate amount of the fees and expenses of the Independent Trustees are allocated amongst all the funds in the Trust and are presented in the Statements of Operations.
| HSBC FAMILY OF FUNDS |
| Notes to Financial Statements—as of October 31, 2017 (continued) |
Fee Reductions:
The Investment Adviser has agreed to contractually limit through March 1, 2018 the total annual expenses, exclusive of interest, taxes, brokerage commissions and extraordinary expenses, of certain classes of the Funds. Each Fund Class has its own expense limitations based on the average daily net assets for any full fiscal year as follows:
| | | | Contractual |
| | | | Expense |
| Fund | | | Class | | Limitations(%) |
| U.S. Government Money Market Fund | | E | | 0.25 |
| U.S. Government Money Market Fund | | I | | 0.20 |
| U.S. Treasury Money Market Fund | | E | | 0.25 |
| U.S. Treasury Money Market Fund | | I | | 0.20 |
Any amounts contractually waived or reimbursed by the Investment Adviser will be subject to repayment by the respective Fund to the Investment Adviser within three years calculated monthly from when the waiver or reimbursement is recorded to the extent that the repayment will not cause the Fund’s operating expenses to exceed the contractual expense limit that was in effect at the time of such waiver or reimbursement. Effective December 14, 2017, the Investment Adviser has agreed to contractually limit through March 1, 2019, the total annual expenses of each Fund, exclusive of interest, taxes, brokerage commissions, extraordinary expenses and estimated indirect expenses attributable to each Fund’s investments in investment companies, to an annual rate of 0.18% and 0.20% for Intermediary Shares and Intermediary Service Shares, respectively. At October 31, 2017, there were no remaining contractual reimbursements that are subject to repayment by the Funds in subsequent years.
The Administrator and Citi may voluntarily waive/reimburse fees to help support the expense limits of the Funds. In addition, HSBC, in its role as Investment Adviser and Administrator, may waive/reimburse additional fees at its discretion. Any voluntary fee waivers/reimbursements are not subject to recoupment in subsequent fiscal periods. Voluntary waivers/reimbursements may be stopped at any time. Amounts waived/reimbursed by the Investment Adviser Administrator and Citi as Sub-Administrator are reported separately on the Statements of Operations, as applicable.
During the year ended October 31, 2017, the following amounts of expenses were waived:
| | | | | | | | | | | | | | | | | | Intermediary |
| | Class A | | Class B | | Class C | | Class D | | Class E | | Class I | | Class Y | | Intermediary | | Service |
| Fund | | | ($) | | ($) | | ($) | | ($) | | ($) | | ($) | | ($) | | Class ($) | | Class ($) |
| U.S. Government Money Market Fund | | 1,449 | | 185 | | — | | 1,036,313 | | 2 | | 3,797,795 | | 1,207,632 | | 75,418 | | 43,667 |
| U.S. Treasury Money Market Fund | | — | | — | | — | | 146,117 | | — | | 337,032 | | 384,505 | | — | | 36,552 |
The Funds have entered into an arrangement with their custodian whereby credits realized as a result of uninvested cash balances are used to reduce the Funds’ custodian expenses. Expenses reduced during the year ended October 31, 2017 are reflected on the Statements of Operations as “Custody earnings credits,” as applicable.
Overdraft Facility:
The Funds have entered into an arrangement with their custodian bank (The Northern Trust Company) whereby an uncommitted, secured overdraft facility is made available to meet unanticipated end-of-day liquidity needs of the Funds which cannot be fulfilled by trading activities. The interest rate on overdraft amounts is calculated at an annual rate of 0.50% plus the Federal Funds Rate. The overdraft facility is limited to $750,000,000 and $50,000,000 for the U.S. Government Money Market Fund and the U.S. Treasury Money Market Fund, respectively.
| HSBC FAMILY OF FUNDS |
| Notes to Financial Statements—as of October 31, 2017 (continued) |
5. Federal Income Tax Information:
At October 31, 2017, the cost basis of investments for federal income tax purposes, gross unrealized appreciation, gross unrealized depreciation and net unrealized appreciation/depreciation were as follows:
| | | | | | | | Net Unrealized |
| | | | Tax Unrealized | | Tax Unrealized | | Appreciation/ |
| | Tax Cost ($) | | Appreciation ($) | | Depreciation ($) | | (Depreciation) ($) |
| U.S. Government Money Market Fund | | 11,438,053,600 | | — | | — | | — |
| U.S. Treasury Money Market Fund | | 2,417,908,675 | | — | | — | | — |
The tax character of distributions paid by the Funds for the tax year ended October 31, 2017, was as follows:
| | Distributions paid from |
| | | | Net | | Total | | | | |
| | | | Long Term | | Taxable | | | | Total |
| | Ordinary | | Capital | | Distributions | | Return of | | Distributions |
| | Income ($) | | Gains ($) | | ($) | | Capital ($) | | Paid ($)(1) |
| U.S. Government Money Market Fund | | 62,438,599 | | — | | 62,438,599 | | — | | 62,438,599 |
| U.S. Treasury Money Market Fund | | 9,690,876 | | — | | 9,690,876 | | — | | 9,690,876 |
____________________
| (1) | Total distributions paid may differ from the amount reported in the Statement of Changes in Net Assets because distributions are recognized when actually paid for tax purposes. |
The tax character of distributions paid by the Funds for the tax year ended October 31, 2016, was as follows:
| | Distributions paid from |
| | | | Net Long | | Total | | | | |
| | | | Term | | Taxable | | | | Total |
| | Ordinary | | Capital | | Distributions | | Return of | | Distributions |
| | Income ($) | | Gains ($) | | | ($) | | | Capital ($) | | Paid $ (1) |
| U.S. Government Money Market Fund | | 6,777,535 | | | 5,589 | | | | 6,783,124 | | | — | | 6,783,124 |
| U.S Treasury Money Market Fund | | 800,318 | | | — | | | | 800,318 | | | — | | 800,318 |
____________________
| (1) | Total distributions paid may differ from the amount reported in the Statement of Changes in Net Assets because distributions are recognized when actually paid for tax purposes. |
As of the tax year ended October 31, 2017, the components of accumulated earnings/(deficit) on a tax basis for the Funds were as follows:
| | | | | | Undistributed | | | | | | | | | | | Accumulated | | | | Total |
| | Undistributed | | Long Term | | | | | | | | | | | Capital and | | Unrealized | | Accumulated |
| | Ordinary | | Capital | | Accumulated | | Distributions | | Other | | Appreciation/ | | Earnings/ |
| | Income ($) | | Gains ($) | | Earnings ($) | | Payable ($) | | Losses ($) | | (Depreciation) ($) | | (Deficit) ($) |
| U.S. Government Money | | | | | | | | | | | | | | | | | | | | | | | | | | | | | |
| Market Fund | | | 3,838,545 | | | | 12,281 | | | | 3,850,826 | | | | (3,820,227 | ) | | | | — | | | | — | | | 30,599 | | |
| U.S. Treasury Money | | | | | | | | | | | | | | | | | | | | | | | | | | | | | |
| Market Fund | | | 388,439 | | | | — | | | | 388,439 | | | | (383,924 | ) | | | | (6,519 | ) | | | — | | | (2,004 | ) | |
As of the tax year ended October 31, 2017, the U.S. Treasury Money Market Fund has net capital loss carryforwards (“CLCFs”) not subject to expiration as summarized in the table below. The Board does not intend to authorize a distribution of any realized gain for the Fund until any applicable CLCF has been offset or expires.
| | Short Term | | Long Term | | |
| | Amount ($) | | Amount ($) | | Total ($) |
| U.S. Treasury Money Market Fund | | 6,519 | | — | | 6,519 |
| HSBC FAMILY OF FUNDS |
| Notes to Financial Statements—as of October 31, 2017 (continued) |
Under current law, capital losses and specified ordinary losses realized after October 31 and non-specified ordinary losses incurred after December 31 (ordinary losses collectively known as “late year ordinary loss”) may be deferred and treated as occurring on the first business day of the following fiscal year. As of the tax year ended October 31, 2017, the Funds had no deferred losses.
The amount and character of net investment income and net realized gains distributed are determined in accordance with federal income tax regulations, which may differ from GAAP. These “book/tax” differences are either considered temporary or permanent in nature. To the extent these differences are permanent in nature (e.g., reclassification of market discounts, certain gain/loss, and certain distributions), such amounts are reclassified within the composition of net assets based on their federal tax-basis treatment; temporary differences (e.g., wash losses and post-October loss deferrals) do not require reclassification. To the extent distributions to shareholders from net investment income and net realized gains exceed net investment income and net realized gains for tax purposes, they are reported as distributions of capital.
6. Significant Shareholders:
Shareholders, including other funds, individuals, and accounts, as well as the Fund’s investment manager(s) and/or investment personnel, may from time to time own (beneficially or of record) a significant percentage of the Fund’s Shares and can be considered to “control” the Fund when that ownership exceeds 25% of the Fund’s assets (and which may differ from control as determined in accordance with GAAP).
The following list includes the Funds which had individual shareholder accounts with ownership of voting securities greater than 10% of the total outstanding voting securities but less than 25% and/or accounts with ownership of voting securities greater than 25% of the total outstanding voting securities. Significant transactions by these shareholder accounts may negatively impact the Funds’ performance.
| | Number of shareholders | | | | Number of | | |
| | with ownership of | | | | shareholders with | | |
| | voting securities of the | | | | ownership of voting | | |
| | Portfolio greater than | | | | securities of the | | % owned in |
| | 10% and less than 25% | | % owned in | | Portfolio greater | | aggregate |
| | of the total Portfolio’s | | aggregate | | than 25% of the total | | by greater |
| | outstanding voting | | by 10% - 25% | | Portfolio’s outstanding | | than 25% |
| Fund | | securities | | shareholders | | voting securities | | shareholders |
| U.S. Government Money Market Fund | | — | | — | | 2 | | 50%(a) |
| U.S. Treasury Money Market Fund | | — | | — | | 1 | | 81%(b) |
____________________
| (a) | 25% owned by the Investment Adviser or an affiliate |
| (b) | 81% owned by the Investment Adviser or an affiliate |
| HSBC FAMILY OF FUNDS |
| Notes to Financial Statements—as of October 31, 2017 (continued) |
7. Business Combinations:
On October 7, 2016, the U.S. Government Money Market Fund acquired all of the assets and assumed all of the liabilities of the HSBC Prime Money Market Fund (“Prime Money Market Fund”), an open-end investment company, pursuant to a plan of reorganization approved by the Board on September 7, 2016. The purpose of the transaction was to combine two funds with substantially similar investment policies and strategies. The acquisition was accomplished by a tax-free exchange of 521,737,290 shares of the U.S. Government Money Market Fund, valued at $521,737,290, for all of the assets and the assumption of the liabilities (net assets of $521,737,290) of the Prime Money Market Fund on October 7, 2016. The investment portfolio of the Prime Money Market Fund, with an amortized cost of $430,000,000, which approximates the fair value at October 7, 2016, was the principal asset acquired by the U.S. Government Money Market Fund. For financial reporting purposes, assets received and shares issued by the U.S. Government Money Market Fund were recorded at amortized cost which approximates fair value; and the amortized cost basis of the investments received from the Prime Money Market Fund was carried forward to align ongoing reporting of the U.S. Government Money Market Fund. Immediately prior to the merger, the net assets of the U.S. Government Money Market Fund were $8,728,801,871.
8. Subsequent Events:
Management has evaluated subsequent events through the date these financial statements were issued. Based on the evaluation, no adjustments or additional disclosures were required to the financial statements as of October 31, 2017.
Report of Independent Registered Public Accounting Firm
To the Board of Trustees of HSBC Funds and Shareholders of HSBC U.S. Government Money Market Fund and HSBC U.S. Treasury Money Market Fund
In our opinion, the accompanying statements of assets and liabilities, including the schedules of portfolio investments, and the related statements of operations and of changes in net assets and the financial highlights present fairly, in all material respects, the financial position of HSBC U.S. Government Money Market Fund and HSBC U.S. Treasury Money Market Fund (two of the portfolios constituting HSBC Funds, hereafter referred to as the “Fund”) as of October 31, 2017, the results of each of their operations for the year then ended, the changes in each of their net assets for each of the two years in the period then ended and the financial highlights for each of the three years in the period then ended, in conformity with accounting principles generally accepted in the United States of America. These financial statements and financial highlights (hereafter referred to as “financial statements”) are the responsibility of the Fund’s management. Our responsibility is to express an opinion on these financial statements based on our audits. We conducted our audits of these financial statements in accordance with the standards of the Public Company Accounting Oversight Board (United States). Those standards require that we plan and perform the audit to obtain reasonable assurance about whether the financial statements are free of material misstatement. An audit includes examining, on a test basis, evidence supporting the amounts and disclosures in the financial statements, assessing the accounting principles used and significant estimates made by management, and evaluating the overall financial statement presentation. We believe that our audits, which included confirmation of securities as of October 31, 2017 by correspondence with the custodian and brokers, provide a reasonable basis for our opinion. The financial statements as of and for the year ended October 31, 2014 and the financial highlights for each of the periods ended on or prior to October 31, 2014 (not presented herein, other than the financial highlights) were audited by other auditors whose report dated December 23, 2014 expressed an unqualified opinion on those financial statements and financial highlights.
PricewaterhouseCoopers LLP
New York, New York
December 21, 2017
| HSBC FAMILY OF FUNDS |
| Other Federal Income Tax Information—as of October 31, 2017 (Unaudited) |
During the year ended October 31, 2017, the following Funds declared capital gain distributions:
| | Short Term | | Long Term |
| | Capital Gain | | Capital Gain |
| | Distributions ($) | | Distributions ($) |
| U.S. Government Money Market Fund | | | 110,570 | | | — |
| U.S. Treasury Money Market Fund | | | 13,252 | | | — |
During the year ended October 31, 2017, the following Funds designated the maximum amount allowable as interest-related dividends for certain non-U.S. resident investors:
| Qualified Interest Income (%) | | |
| U.S. Government Money Market Fund | | 100.00 |
| U.S. Treasury Money Market Fund | | 100.00 |
| HSBC FAMILY OF FUNDS |
| Table of Shareholder Expenses—as of October 31, 2017 (Unaudited) |
As a shareholder of the Funds, you incur two types of costs: (1) transaction costs, including sales charges (loads) on purchases, redemption fees and exchange fees; and (2) ongoing costs, including management fees, distribution fees and other Fund expenses. These examples are intended to help you understand your ongoing costs (in dollars) of investing in the Funds and to compare the cost with the ongoing costs of investing in other mutual funds.
These examples are based on an investment of $1,000 invested at the beginning of the period and held for the entire period from May 1, 2017 through October 31, 2017.
Actual Example
The table below provides information about actual account values and actual expenses. You may use the information below, together with the amount you invested, to estimate the expenses that you paid over the period. Simply divide your account value by $1,000 (for example, an $8,600 account value divided by $1,000 = 8.6), then multiply the result by the number in the table under the heading entitled “Expenses Paid During Period” to estimate the expenses you paid on your account during this period.
| | | | | | | | | | | | | | | | | | | | Annualized |
| | | | | Beginning | | Ending | | Expenses Paid | | Expense Ratio |
| | | | | Account Value | | Account Value | | During Period* | | During Period |
| | | | | 5/1/17 | | 10/31/17 | | 5/1/17 - 10/31/17 | | 5/1/17 - 10/31/17 |
| U.S. Government Money | | | | | | | | | | | | | | | | | | | | | | | |
| Market Fund | | Class A Shares | | | | $ | 1,000.00 | | | | $ | 1,001.90 | | | | $ | 3.18 | | | | 0.63 | % | |
| | Class D Shares | | | | | 1,000.00 | | | | | 1,002.70 | | | | | 2.42 | | | | 0.48 | % | |
| | Class E Shares | ** | | | | 1,000.00 | | | | | 1,001.30 | | | | | 0.64 | | | | 0.23 | % | |
| | Class I Shares | | | | | 1,000.00 | | | | | 1,004.50 | | | | | 0.61 | | | | 0.12 | % | |
| | Intermediary | | | | | | | | | | | | | | | | | | | | | |
| | Class Shares | | | | | 1,000.00 | | | | | 1,004.20 | | | | | 0.91 | | | | 0.18 | % | |
| | Intermediary | | | | | | | | | | | | | | | | | | | | | |
| | Service Class | | | | | | | | | | | | | | | | | | | | | |
| | Shares | | | | | 1,000.00 | | | | | 1,004.10 | | | | | 1.01 | | | | 0.20 | % | |
| | Class Y Shares | | | | | 1,000.00 | | | | | 1,003.90 | | | | | 1.16 | | | | 0.23 | % | |
| | |
| U.S. Treasury Money | | | | | | | | | | | | | | | | | | | | | | | |
| Market Fund | | Class D Shares | | | | | 1,000.00 | | | | | 1,002.40 | | | | | 2.52 | | | | 0.50 | % | |
| | Class E Shares | ** | | | | 1,000.00 | | | | | 1,001.00 | | | | | 0.70 | | | | 0.25 | % | |
| | Class I Shares | | | | | 1,000.00 | | | | | 1,004.20 | | | | | 0.71 | | | | 0.14 | % | |
| | Intermediary | | | | | | | | | | | | | | | | | | | | | |
| | Class Shares | | | | | 1,000.00 | | | | | 1,002.60 | | | | | 0.91 | | | | 0.18 | % | |
| | Intermediary | | | | | | | | | | | | | | | | | | | | | |
| | Service Class | | | | | | | | | | | | | | | | | | | | | |
| | Shares | | | | | 1,000.00 | | | | | 1,003.90 | | | | | 1.01 | | | | 0.20 | % | |
| | Class Y Shares | | | | | 1,000.00 | | | | | 1,003.60 | | | | | 1.26 | | | | 0.25 | % | |
____________________
| * | Expenses are equal to the average account value over the period, multiplied by the Fund’s annualized expense ratio, multiplied by 184/365 (to reflect the one half year period). |
| ** | Expenses are equal to the average account value over the period, multiplied by the Fund’s annualized expense ratio, multiplied by 102/365 (to reflect the stub period May 1, 2017 to August 10, 2017). |
| HSBC FAMILY OF FUNDS |
| Table of Shareholder Expenses—as of October 31, 2017 (Unaudited) (continued) |
Hypothetical Example for Comparison Purposes
The table below provides information about hypothetical account values and hypothetical expenses based on each Fund’s actual expense ratio and an assumed rate of return of 5% per year before expenses, which is not the Fund’s actual return. The hypothetical account values and expenses may not be used to estimate the actual ending account balance or expenses you paid for the period. You may use this information to compare this 5% hypothetical example with the 5% hypothetical examples that appear in the shareholder reports of other funds.
Please note that the expenses shown in the table are meant to highlight your ongoing costs only and do not reflect any transactional costs, such as sales charges (loads), redemption fees, or exchange fees. Therefore, the table is useful in comparing ongoing costs only, and will not help you determine the relative total costs of owning different funds. In addition, if these transactional costs were included, your costs would have been higher.
| | | | | | | | | | | | | | Annualized |
| | | | Beginning | | Ending | | Expenses Paid | | Expense Ratio |
| | | | Account Value | | Account Value | | During Period* | | During Period |
| | | | 5/1/17 | | 10/31/17 | | 5/1/17 - 10/31/17 | | 5/1/17 - 10/31/17 |
| U.S. Government Money | | | | | | | | | | | | | | | | | | |
| Market Fund | | Class A Shares | | | $1,000.00 | | | | $1,022.03 | | | | $3.21 | | | | 0.63% | |
| | Class D Shares | | | 1,000.00 | | | | 1,022.79 | | | | 2.45 | | | | 0.48% | |
| | Class E Shares | | | 1,000.00 | | | | 1,024.60 | | | | 1.17 | | | | 0.23% | |
| | Class I Shares | | | 1,000.00 | | | | 1,024.60 | | | | 0.61 | | | | 0.12% | |
| | Intermediary | | | | | | | | | | | | | | | | |
| | Class Shares | | | 1,000.00 | | | | 1,024.30 | | | | 0.92 | | | | 0.18% | |
| | Intermediary | | | | | | | | | | | | | | | | |
| | Service Class | | | | | | | | | | | | | | | | |
| | Shares | | | 1,000.00 | | | | 1,024.20 | | | | 1.02 | | | | 0.20% | |
| | Class Y Shares | | | 1,000.00 | | | | 1,024.05 | | | | 1.17 | | | | 0.23% | |
| | |
| U.S. Treasury Money | | | | | | | | | | | | | | | | | | |
| Market Fund | | Class D Shares | | | 1,000.00 | | | | 1,022.68 | | | | 2.55 | | | | 0.50% | |
| | Class E Shares | | | 1,000.00 | | | | 1,023.95 | | | | 1.28 | | | | 0.25% | |
| | Class I Shares | | | 1,000.00 | | | | 1,024.50 | | | | 0.71 | | | | 0.14% | |
| | Intermediary | | | | | | | | | | | | | | | | |
| | Class Shares | | | 1,000.00 | | | | 1,024.30 | | | | 0.92 | | | | 0.18% | |
| | Intermediary | | | | | | | | | | | | | | | | |
| | Service Class | | | | | | | | | | | | | | | | |
| | Shares | | | 1,000.00 | | | | 1,024.20 | | | | 1.02 | | | | 0.20% | |
| | Class Y Shares | | | 1,000.00 | | | | 1,023.95 | | | | 1.28 | | | | 0.25% | |
____________________
| * | Expenses are equal to the average account value over the period, multiplied by the Fund’s annualized expense ratio, multiplied by 184/365 (to reflect the one half year period). |
| HSBC FAMILY OF FUNDS |
Board of Trustees and Officers (Unaudited) |
MANAGEMENT OF THE TRUST
The following table contains information regarding the HSBC Family of Funds’ Board of Trustees (“Trustees”). The HSBC Family of Funds’ Statement of Additional Information includes additional information about the Trustees and is available, without charge, upon request by calling (888) 525-5757.
Name,
Address, Age | | Position(s)
Held with
Funds | | Term of Office
and Length of
Time Served | | Principal Occupation(s)
During Past 5 Years | | Portfolios in
Fund Complex
Overseen By
Trustee* | | Other
Directorships
Held by Trustee
During Past 5 Years |
NON-INTERESTED
TRUSTEES | | | | | | | | | | |
| | | | | | | | | | | |
MARCIA L. BECK
P.O. Box 182845
Columbus, OH
43218-3035
Age: 62 | | Trustee | | Indefinite;
2008 to
present | | Private Investor (1999 – present) | | 13 | | None |
| | | | | | | | | | | |
SUSAN C. GAUSE
P.O. Box 182845
Columbus, OH
43218-3035
Age: 65 | | Trustee | | Indefinite;
2013 to
present | | Private Investor (2003 - present) | | 13 | | Metropolitan Series Fund
(2012 – present); and
Met Investors Series
Trust (2008 – present) |
| | | | | | | | | | | |
SUSAN S. HUANG
P.O. Box 182845
Columbus, OH
43218-3035
Age: 63 | | Trustee | | Indefinite;
2008 to
present | | Private Investor (2000 - present) | | 13 | | None |
| | | | | | | | | | | |
THOMAS F. ROBARDS
P.O. Box 182845
Columbus, OH
43218-3035
Age: 71 | | Chairman and
Trustee | | Indefinite;
2005 to
present | | Private Investor (2003 - present) | | 13 | | Ellington Residential
Mortgage REIT (NYSE
listed real estate
investment trust)
(2013 – present);
Ellington Financial LLC
(NYSE listed financial
services company)
(2007 – present); and
Overseas Shipholding
Group (OSG)
(NYSE listed company)
(2005 – 2014) |
| | | | | | | | | | | |
| INTERESTED TRUSTEE | | | | | | | | | | |
| | | | | | | | | | | |
DEBORAH HAZELL
452 Fifth Avenue
New York
NY 10018
Age: 54 | | Trustee | | Indefinite;
2011 to
present | | Director and Chief Executive Officer, HSBC Global Asset Management (USA) Inc. (2011 - present); President and Chief Executive Officer, Fisher Francis Trees & Watts (“FFTW”) (investment adviser) (2008 - 2011) | | 13 | | None |
____________________
* Includes all series of the HSBC Funds.
| HSBC FAMILY OF FUNDS |
Board of Trustees and Officers (Unaudited) (continued) |
| Name, Address, Age | | Position(s) Held
Funds | | Term of Office and
Length of Time Served | | Principal Occupation(s)
During Past 5 Years |
| OFFICERS | | | | | | |
| | | | | | | |
RICHARD A. FABIETTI
452 Fifth Avenue
New York, NY 10018
Age: 59 | | President | | One year;
2004 to present | | Senior Vice President, HSBC Global Asset Management (USA) Inc. (1998 - present) |
| | | | | | | |
JAMES D. LEVY
452 Fifth Avenue
New York, NY 10018
Age: 54 | | Vice President | | One year;
2014 to present | | Vice President, Product Management, HSBC Global Asset Management (USA) Inc. (2014 – present); Vice President, Mutual Funds Product Development, GE Asset Management Inc. (2007 – 2014) |
| | | | | | | |
ALLAN SHAER*
Prudential Center
800 Boylston Street, 24th Floor
Boston, MA 02199
Age: 52 | | Treasurer | | One year;
2017 to present | | Senior Vice President, Citi Investor Services (2016 - present); Vice President, Mutual Fund Administration, JP Morgan Chase (2011 - 2016) |
| | | | | | | |
IOANNIS TZOUGANATOS*
Prudential Center
800 Boylston Street, 24th Floor
Boston, MA 02199
Age: 41 | | Secretary | | One Year;
2015 to present | | Vice President, Regulatory Administration, Citi Fund Services (2008 - present) |
| | | | | | | |
CHARLES BOOTH*
4400 Easton Commons,
Suite 200
Columbus, OH 43219-3035
Age: 57 | | Chief Compliance
Officer | | One year;
2015 to present | | Director and Compliance Officer, CCO Services, Citi Fund Services (1988 - present) |
____________________| * | Mr. Shaer, Mr. Tzouganatos, and Mr. Booth also are officers of other investment companies of which Citi (or an affiliate) is the administrator or sub-administrator. |
| HSBC FAMILY OF FUNDS |
Other Information (Unaudited) |
Other Information (Unaudited):
Information regarding how the Funds voted proxies relating to portfolio securities during the most recent 12-month period ended June 30th is available (i) without charge, upon request, by calling 1-800-525-5757 for HSBC Bank USA and HSBC Brokerage (USA) Inc. clients and 1-800-782-8183 for all other shareholders; (ii) on the Funds’ website at www.investorfunds.us.hsbc.com; and (iii) on the Security and Exchange Commission’s (“Commission”) website at http://www.sec.gov.
The Funds file their complete schedules of portfolio holdings with the Commission for the first and third quarters of each fiscal year on Form N-Q. The Funds’ Forms N-Q are available on the Commission’s website at http://www.sec.gov. The Funds’ Forms N-Q may be reviewed and copied at the Commission’s Public Reference Room in Washington, D.C. and information on the operation of the Public Reference Room may be obtained by calling 1-800-SEC-0330. The Funds’ Schedules of Investments will be available no later than 60 days after each period end, without charge, on the Funds’ website at www.investorfunds.us.hsbc.com.
An investment in a Fund is not a deposit of HSBC Bank USA, National Association, and is not insured or guaranteed by the Federal Deposit Insurance Corporation or any other government agency.
| HSBC FAMILY OF FUNDS: |
| |
| INVESTMENT ADVISER AND ADMINISTRATOR |
| |
| HSBC Global Asset Management (USA) Inc. |
| 452 Fifth Avenue |
| New York, NY 10018 |
| |
| SHAREHOLDER SERVICING AGENTS |
| |
| For HSBC Bank USA, N.A. and |
| HSBC Securities (USA) Inc. Clients: |
| HSBC Bank USA, N.A. |
| 452 Fifth Avenue |
| New York, NY 10018 |
| 1-888-525-5757 |
| |
| For All Other Shareholders: |
| |
| HSBC Funds |
| P.O. Box 8106 |
| Boston, MA 02266-8106 |
| 1-800-782-8183 |
| |
| TRANSFER AGENT |
| |
| Boston Financial Data Services, Inc. |
| 2000 Crown Colony Drive |
| Quincy, MA 02169 |
| |
| DISTRIBUTOR |
| |
| Foreside Distribution Services, L.P. |
| Three Canal Plaza, Suite 100 |
| Portland, ME 04101 |

| Investment products: |
ARE NOT A
BANK DEPOSIT
OR OBLIGATION
OF THE BANK
OR ANY OF ITS
AFFILIATES | ARE NOT
FDIC
INSURED | ARE NOT
INSURED BY
ANY FEDERAL
GOVERNMENT
AGENCY |
ARE NOT GUARANTEED BY
THE BANK OR ANY OF ITS
AFFILIATES | MAY LOSE
VALUE |
| CUSTODIAN |
| |
| The Northern Trust Company |
| 50 South LaSalle Street |
| Chicago, IL 60603 |
| |
| INDEPENDENT REGISTERED PUBLIC ACCOUNTING FIRM |
| |
| PricewaterhouseCoopers LLP |
| 300 Madison Avenue |
| New York, NY 10017 |
| |
| LEGAL COUNSEL |
| |
| Dechert LLP |
| 1900 K Street, N.W. |
| Washington, D.C. 20006 |
Investment products are offered by HSBC Securities (USA) Inc. (HSI), member NYSE/FINRA/SIPC. HSI is an affiliate of HSBC Bank USA, N.A. Investment products: Are not a deposit or other obligation of the bank or any of its affiliates; Not FDIC insured or insured by any federal government agency of the United States; Not guaranteed by the bank or any of its affiliates; and are subject to investment risk, including possible loss of principal invested.
Investors should consider the investment objectives, risks, charges, and expenses of the investment company carefully before investing. The prospectus contains this and other important information about the investment company. For clients of HSBC Securities (USA) Inc., please call 1-888-525-5757 for more information. For other investors and prospective investors, please call the Funds directly at 1-800-782-8183 or visit our website at www.investorfunds.us.hsbc.com. Investors should read the prospectus carefully before investing or sending money.
HSBC Global Asset Management (USA) Inc.
HSBC Funds
Annual Report
October 31, 2017
| EQUITY FUNDS | | Class A | | Class B | | Class C | | Class I |
| HSBC Opportunity Fund | | HSOAX | | HOPBX | | HOPCX | | RESCX |

| Table of Contents |
| HSBC Family of Funds |
| Annual Report - October 31, 2017 |
| Glossary of Terms | 2 |
| Commentary From the Investment Manager | 3 |
| Portfolio Reviews | 4 |
| Statements of Assets and Liabilities | 6 |
| Statements of Operations | 7 |
| Statements of Changes in Net Assets | 8 |
| Financial Highlights | 10 |
| Notes to Financial Statements | 12 |
| Report of Independent Registered Public Accounting Firm | 19 |
| Other Federal Income Tax Information | 20 |
| Table of Shareholder Expenses | 21 |
| | |
| HSBC Portfolio | |
| | |
| Portfolio Composition | 23 |
| Schedules of Portfolio Investments | |
| HSBC Opportunity Portfolio | 24 |
| Statement of Assets and Liabilities | 26 |
| Statement of Operations | 27 |
| Statements of Changes in Net Assets | 28 |
| Financial Highlights | 29 |
| Notes to Financial Statements | 30 |
| Report of Independent Registered Public Accounting Firm | 35 |
| Table of Shareholder Expenses | 36 |
| Board of Trustees and Officers | 37 |
| Other Information | 39 |
Bloomberg Barclays Global Aggregate Bond Index is an index that is a measure of global investment-grade debt from 24 local currency markets, which include treasury, government-related, corporate, and securitized fixed-rate bonds from both developed and emerging markets issuers.
Gross Domestic Product (“GDP”) is the value of goods and services produced in a given country in a given year.
ISM Manufacturing Index is based on surveys of more than 300 manufacturing firms by the Institute of Supply Management. The ISM Manufacturing Index monitors employment, production, inventories, new orders, and supplier deliveries. A composite diffusion index monitors conditions in national manufacturing and is based on the data from these surveys.
J.P. Morgan Emerging Markets Bond Index Global tracks returns for USD-denominated debt instruments issued by emerging market sovereign and quasi-sovereign entities, Brady bonds, loans, Eurobonds, and local market instruments.
Lipper Mid-Cap Growth Funds Average is an equally weighted average of mutual funds that, by portfolio practice, invest at least 75% of their equity assets in companies with market capitalizations (on a three-year weighted basis) below Lipper’s large-cap floor. Mid-cap growth funds typically have an above-average price-to-earnings ratio, price-to-book ratio, and three-year sales-per-share growth value, compared to the S&P MidCap 400 Index.
MSCI Emerging Markets (“MSCI EM”) Index is an index that captures the large- and mid-cap representation across 24 emerging markets countries: Brazil, Chile, China, Colombia, Czech Republic, Egypt, Greece, Hungary, India, Indonesia, Korea, Malaysia, Mexico, Pakistan, Peru, Philippines, Poland, Qatar, Russia, South Africa, Taiwan, Thailand, Turkey and United Arab Emirates.
MSCI Europe Australasia and Far East (“MSCI EAFE”) Index is an equity index which captures the large- and mid-cap representation across developed markets countries: Australia, Austria, Belgium, Denmark, Finland, France, Germany, Hong Kong, Ireland, Israel, Italy, Japan, the Netherlands, New Zealand, Norway, Portugal, Singapore, Spain, Sweden, Switzerland and the UK.
Russell 2500TM Growth Index is an index that measures the performance of the small- to mid-cap growth segment of the U.S. equity universe. It includes those Russell 2500 companies with higher price-to-book ratios and higher forecasted growth values.
Standard & Poor’s Mid Cap 400 Index is an unmanaged index that is the most widely used index for mid-sized companies. The S&P MidCap 400 covers 7% of the U.S. equities market, and is part of a series of S&P U.S. indices that can be used as building blocks for portfolio composition.
Standard & Poor’s 500 (“S&P 500”) Index is an index that is widely regarded as a gauge of the U.S. equities market. This index includes 500 leading companies in leading industries of the U.S. economy. The S&P 500 Index focuses on the large-cap segment of the market, with approximately 80% coverage of U.S. equities.
Lipper is an independent mutual fund performance monitor whose results are based on total return and do not reflect a sales charge.
Securities indices are unmanaged and assume reinvestment of all distributions and interest payments and do not take in account brokerage fees or expenses. Securities in the Funds do not match those in the indices and performance of the Funds will differ. Investors cannot invest directly in an index.
| Commentary From the Investment Manager |
| HSBC Global Asset Management (USA) Inc. |
Global Economic Review
The global economy experienced broad growth over the 12-month period from November 1, 2016, through October 31, 2017. Although there was much geopolitical turmoil and uncertainty, investor sentiment was buoyed by healthy corporate profits, supportive monetary policy, tightening labor markets and other positive economic data. Major economies experienced improvements to credit and labor conditions and major central banks continued to normalize monetary policy at a gradual pace. A synchronized economic expansion in both developed and emerging economies helped lift major market indices around the world to near record highs by the end of the period.
Early in the period, global markets were shocked by the surprise results of the November U.S. presidential elections. Positive economic data had already been pushing markets along a positive trajectory in the final months of the previous period, but the election outcome triggered an intense rally as investors grew increasingly optimistic that the new administration would follow through on campaign promises perceived as accommodative for business. The prospect of tax reform, reduced regulations and streamlined fossil fuel energy production continued to drive significant market gains throughout the period.
A rising tide of nationalist populism throughout the U.S. and Europe raised concerns among global investors. The prospect of a new era of protectionist trade policies and political unpredictability remained top-of-mind for investors throughout the period. These concerns eased somewhat after the electoral victories of centrist candidates, including the May election victory of Emmanuel Macron in the French presidential elections and the September reelection of Chancellor Angela Merkel in Germany. Even so, the changing political dynamics remained as President Trump moved forward with policies that rattled global trade and mobility, including withdrawing the U.S. from the Trans-Pacific Partnership, renegotiating the terms of the North American Free Trade Agreement and restricting immigration.
Geopolitical developments were also a source of investor uncertainty during the period and a drag on certain economies and sectors. Among the most notable events were tensions over North Korea’s continued efforts to develop its nuclear weapons capabilities, political turmoil in Turkey in April and an attempt by Catalans to declare independence from Spain in October.
The U.S. Federal Reserve (the Fed) increased its federal funds rate three times during the 12-month period, increasing its target range from 0.50% to 1.25%. The Fed also initiated its plan to scale back its monetary stimulus efforts adopted during the financial crisis in 2008.
Growth in the U.S. gross domestic product (GDP1) slowed modestly in the first two quarters of the period but then picked up significantly near the end. Preliminary estimates suggest that faster growth continued through the third quarter of 2017. Economic data in the U.S. was generally strong during the period, showing robust corporate earnings, a healthy labor market and an increase in consumer discretionary spending. The domestic unemployment rate dropped to a 16-year low and the Institute of Supply Management Manufacturing Index1 climbed to a 13-year high.
Contributors to economic growth in many economies, including in the U.S., were increases in manufacturing activity and exports. This was partly driven by an uptick in demand for imports from China.
China’s economy continued to grow at a relatively slow pace in comparison to previous years. The meeting of China’s National Congress indicated that the government was shifting from an emphasis on short-term growth objectives to a goal of sustainable economic development facilitated by political and economic reforms.
Eurozone economies also experienced solid growth as they continued to benefit from improving credit conditions and easing fiscal austerity by many of its component governments. The European Central Bank announced it would extend its quantitative easing program and implied that rates would remain low in the near term.
The Bank of Japan continued its extremely loose monetary policy and fiscal stimulus efforts with mixed results. GDP growth maintained its momentum, but declining exports and slow wage growth were among the signs indicating the Japanese economy continued to improve at a relatively sluggish pace.
Energy and metal prices climbed significantly during the period, while agricultural commodities generally slumped. Crude oil prices hit a two-year high late in the period, driven by declining global inventories and slower growth of U.S. production.
Global inflation increased very slightly during the period. The U.S. dollar weakened during the first several months of 2017 and ended the period lower than it had started. The weakening of the dollar provided a boost to U.S. exports and offered relief to countries such as Mexico, Turkey, and Indonesia that hold high levels of U.S. dollar-denominated debt.
Market Review
Global equity markets delivered strong returns during the period while showing exceptionally low volatility. Stocks rallied immediately after the election of President Trump and continued to rise somewhat steadily throughout 2017 with positive economic data adding to the momentum. Geopolitical tension and a lack of momentum in U.S. domestic policy initiatives eventually weighed on investor sentiment, but improving economic fundamentals in the Eurozone helped offset those growing concerns. The Fed’s commitment to gradually scaling back its monetary stimulus, along with new proposals for tax reform legislation, also supported gains for stocks.
Emerging markets equities began the period with a selloff triggered by concerns over U.S. trade protectionism and a strengthening U.S. dollar. The tide turned in 2017, however, as the U.S. dollar weakened and fears about the impact of changing trade policy subsided. Moreover, demand for emerging markets equities was supported through the period by relatively cheap valuations compared to developed market stocks.
The MSCI Emerging Markets Index1 (MSCI EM) hit a three-year high in September. However, emerging markets equities pulled back somewhat late in the period due to concerns that the proposed tax reform in the U.S. would repatriate dollars and draw capital out of developing countries. The MSCI EM Index returned 26.91% during the fiscal year compared to a 24.01% gain for the MSCI EAFE Index1 of international stocks in developed markets, for the same period.
U.S. equities posted strong gains similar to those of other developed economies during the period. The S&P 500 Index1 of large-cap stocks returned 23.63%.
Global fixed income markets posted modest gains during the period as investors favored equities in an environment of global economic expansion, perceived risk of inflation and gradual monetary policy normalization. Yields and credit spreads across bond sectors remained low relative to history. The Bloomberg Barclay’s Global Aggregate Bond Index1, which tracks investment-grade debt in 24 local currency markets, returned 1.18% during the period while the J.P. Morgan Emerging Market Bond Index Global1 returned 5.89%. Yields on U.S. government debt rose during the period.
1 For additional information, please refer to the Glossary of Terms.
| Portfolio Reviews (Unaudited) |
| |
HSBC Opportunity Fund
(Class A Shares, Class B Shares, Class C Shares and Class I Shares) by William A. Muggia, Committee Lead/Portfolio Manager
Ethan J. Myers, CFA, Portfolio Manager
John M. Montgomery, Portfolio Manager
Hamlen Thompson, Portfolio Manager
Bruce N. Jacobs, CFA, Portfolio Manager
Westfield Capital Management Company, L.P. |
The HSBC Opportunity Fund (the “Fund”) seeks long-term growth of capital by investing, under normal market conditions, primarily in equity securities of small- and mid-cap companies. Small- and mid-cap companies generally are defined as those that have market capitalizations within the range of market capitalizations represented in the Russell 2500TM Growth Index1. The Fund may also invest in equity securities of larger, more established companies and may invest up to 20% of its assets in securities of foreign companies. The Fund employs a two-tier structure, commonly referred to as a “master-feeder” structure, in which the Fund invests all of its investable assets in the HSBC Opportunity Portfolio (the “Portfolio”). The Portfolio employs Westfield Capital Management Company, L.P. as its subadviser.
Investment Concerns
There is no assurance that a portfolio will achieve its investment objective or will work under all market conditions. The value of investments may go down as well as up and you may not get back the amount originally invested. Portfolios may be subject to certain additional risks, which should be considered carefully along with their investment objectives and fees. Equity investments fluctuate in value based on changes to an individual company’s financial condition and overall market conditions. Investments in foreign markets entail special risks such as currency, political, economic, and market risks. Investing in smaller companies is more risky and volatile than investing in large companies. Growth investment style may fall out of favor in the marketplace and result in significant declines in the value of the Portfolio’s securities. Securities of companies considered growth investments may have rapid price swings in the event of earnings disappointments or during periods of market, political, regulatory, and economic uncertainty.
For a complete description of these and other risks associated with investment in a mutual fund, please refer to the Fund’s prospectus.
Market Commentary
For the year ended October 31, 2017, the Class I Shares of the HSBC Opportunity Fund produced a 29.53%* total return, and the Class A Shares of the Fund produced a 29.00%* total return (without sales charge). The Russell 2500™ Growth Index1, the Fund’s primary performance benchmark, and the Lipper Mid-Cap Growth Funds Average1 returned 30.07% and 26.29%, respectively, for the same period.
Portfolio Performance
Domestic equity markets posted broad gains during the period ended October 31, 2017. The rally began shortly after the U.S. presidential election in November 2016 and carried over into 2017 with positive economic data adding to the momentum. By the end of the summer of 2017, the domestic unemployment rate had dropped to a 16-year low and the Institute of Supply Management Manufacturing Index1 climbed to a level last seen in 2004, signaling economic strength. Declining unemployment and GDP1 growth in the Eurozone and improvements in emerging economies helped overshadow investor concerns over geopolitical tensions and a lack of momentum in U.S. policy initiatives. The Federal Reserve’s commitment to unwinding some of the monetary stimulus, along with the White House’s tax reform proposals, also supported gains among risk assets.
In this environment, the Fund benefited from positive performance across all economic sectors, with the largest contributions stemming from the information technology, health care, and industrials, which account for more than 50% of the Fund’s assets.†
However, the Fund underperformed its primary benchmark. The health care and industrials sectors were the largest detractors from the Fund’s relative results, particularly stock selection in the health care equipment and health care facilities sub-industries. Shares of a manufacturer of glucose monitoring systems declined sharply in late September after an industry competitor released details about its own device, inciting investor fears of increased competition. The negative impact of holding residual cash also dragged on relative results.†
The consumer discretionary sector was the greatest contributor to relative returns mostly due to stock selection. The Fund’s investments in movies and entertainment, leisure facilities and education services were among the top relative outperformers. Moreover, despite economic indicators that implied renewed discretionary spending by consumers, the consumer discretionary sector as a whole underperformed during the period. As a result, the Fund’s underweight allocation to the sector also contributed to returns. Stock selection within the real estate sector was another significant contributor, along with a strategic underweight allocation to the consumer staples segment, which was the market’s second-worst performing sector during the period.†
| * | The recent appreciation in the stock market has helped to produce short-term returns that are not typical and may not continue in the future. Because of ongoing market volatility, fund performance may be subject to substantial short-term changes. |
| † | Portfolio composition is subject to change. |
| 1 | For additional information, please refer to the Glossary of Terms. |
Past performance does not guarantee future results. The performance data quoted represents past performance and current returns may be lower or higher. Total return figures include change in share price, reinvestment of dividends and capital gains and do not reflect taxes that a shareholder would pay on Fund distributions or on the redemption of Fund shares. Investment return and principal value will fluctuate so that an investor’s shares, when redeemed may be worth more or less than the original cost. To obtain performance information current to the most recent month end, please call 1-800-782-8183.
| Portfolio Reviews (Unaudited) |
| |
HSBC Opportunity Fund |
The charts above represent a historical 10-year performance comparison of a hypothetical investment in the indicated share class versus a similar investment in the Fund’s benchmark and represents the reinvestment of dividends and capital gains in the Fund.
| | | | | | Average Annual | | Expense |
| Fund Performance | | | | | Total Return (%) | | Ratio (%)5 |
| | | Inception | | | | | | | | | | | | |
| As of October 31, 2017 | | | Date | | | 1 Year | | 5 Year | | 10 Year | | Gross | | Net |
| HSBC Opportunity Fund Class A1 | | | | 9/23/96 | | | | 22.59 | * | | 11.50 | | 7.34 | | 5.87 | | 1.65 |
| HSBC Opportunity Fund Class B2 | | | | 1/6/98 | | | | 24.05 | * | | 11.83 | | 7.41 | | 6.62 | | 2.40 |
| HSBC Opportunity Fund Class C3 | | | | 11/4/98 | | | | 27.11 | * | | 11.84 | | 7.49 | | 6.62 | | 2.40 |
| HSBC Opportunity Fund Class I† | | | | 9/3/96 | | | | 29.53 | * | | 13.22 | | 8.47 | | 1.31 | | 1.10 |
| Russell 2500TM Growth Index4 | | | | — | | | | 30.07 | | | 15.50 | | 8.56 | | N/A | | N/A |
| Lipper Mid-Cap Growth Funds Average4 | | | | — | | | | 26.29 | | | 13.83 | | 6.81 | | N/A | | N/A |
Past performance does not guarantee future results. The performance data quoted represents past performance and current returns may be lower or higher. Total return figures include change in share price, reinvestment of dividends and capital gains and do not reflect the taxes that a shareholder would pay on Fund distributions or on the redemption of Fund shares. Investment return and principal value will fluctuate so that an investor’s shares, when redeemed may be worth more or less than the original cost. To obtain performance information current to the most recent month end, please call 1-800-782-8183.
The performance above reflects any fee waivers that have been in effect during the applicable periods, as well as any expense reimbursements that have periodically been made. Absent such waivers and reimbursements, returns would have been lower. Currently, contractual fee waivers are in effect for the Fund through March 1, 2018 for Class A Shares, Class B Shares, Class C Shares and Class I Shares.
Certain returns shown include monies received by the Portfolio, in which the Fund invests, in respect of one-time class action settlements and monies received by the Fund from a one-time reimbursement from HSBC Global Asset Management (USA) Inc. (the “Adviser”) related to past marketing arrangements. As a result, the Fund’s total returns for those periods were higher than they would have been had the Portfolio and the Fund not received the payments.
| * | The recent appreciation in the stock market has helped to produce short-term returns that are not typical and may not continue in the future. Because of ongoing market volatility, fund performance may be subject to substantial short-term changes. |
| † | The Class I Shares are issued by a separate series of the HSBC Funds. |
| 1 | Reflects the maximum sales charge of 5.00%. |
| 2 | Reflects the applicable contingent deferred sales charge, maximum of 4.00%. |
| 3 | Reflects the applicable contingent deferred sales charge, maximum of 1.00%. |
| 4 | For additional information, please refer to the Glossary of Terms. |
| 5 | Reflects the expense ratio as reported in the prospectus dated February 28, 2017, as supplemented November 16, 2017. The Adviser has entered into a contractual expense limitation agreement with the Fund under which it will limit total expenses of the Fund (excluding interest, taxes, brokerage commissions, extraordinary expenses and estimated indirect expenses attributable to the Fund’s investments in investment companies other than the Portfolio) to an annual rate of 1.65%, 2.40%, 2.40% and 1.10% for Class A Shares, Class B Shares, Class C and Class I Shares, respectively. The expense limitation shall be in effect until March 1, 2018. Additional information pertaining to the October 31, 2017 expense ratios can be found in the financial highlights. |
The Fund’s performance is measured against the Russell 2500TM Growth Index, an unmanaged index that measures the performance of the small- to mid-cap growth segment of the U.S. equity universe. It includes those Russell 2500 companies with higher price-to-book ratios and higher forecasted growth values. The performance for the index does not reflect the deduction of expenses associated with a mutual fund, such as investment management and fund accounting fees. The Fund’s performance reflects the deduction of fees for these value-added services. Investors cannot invest directly in an index.
HSBC FAMILY OF FUNDS
Statements of Assets and Liabilities — as of October 31, 2017
| | | | | | | Opportunity |
| | Opportunity | | Fund |
| | Fund | | (Class I) |
| Assets: | | | | | | | | | | | |
| Investments in Affiliated Portfolio | | | $ | 9,931,067 | | | | | $ | 127,926,102 | |
| Receivable for capital shares issued | | | | 300 | | | | | 1,340 | |
| Receivable from Investment Adviser | | | | 13,539 | | | | | | — | |
| Prepaid expenses | | | | 5,835 | | | | | 13,412 | |
| Total Assets | | | | 9,950,741 | | | | | 127,940,854 | |
| | | | | | | | | | | |
| Liabilities: | | | | | | | | | | | |
| Payable for capital shares redeemed | | | | 3,244 | | | | | 32,891 | |
| Accrued expenses and other payables: | | | | | | | | | | | |
| Investment Management | | | | — | | | | | 4,338 | |
| Administration | | | | 162 | | | | | 2,128 | |
| Distribution fees | | | | 314 | | | | | | — | |
| Shareholder Servicing | | | | 1,970 | | | | | | — | |
| Accounting | | | | 1,581 | | | | | 752 | |
| Professional | | | | 8,518 | | | | | 10,281 | |
| Printing | | | | 1,344 | | | | | 14,965 | |
| Transfer Agent | | | | 13,341 | | | | | 14,094 | |
| Trustee | | | | 55 | | | | | 120 | |
| Other | | | | 251 | | | | | 784 | |
| Total Liabilities | | | | 30,780 | | | | | 80,353 | |
| Net Assets | | | $ | 9,919,961 | | | | | $ | 127,860,501 | |
| | | | | | | | | | | | |
| Composition of Net Assets: | | | | | | | | | | | |
| Capital | | | $ | 7,301,685 | | | | | $ | 89,577,184 | |
| Accumulated net investment income/(loss) | | | | — | | | | | | — | |
| Accumulated net realized gains/(losses) from investments | | | | 1,023,608 | | | | | 17,011,585 | |
| Net unrealized appreciation/(depreciation) on investments | | | | 1,594,668 | | | | | | 21,271,732 | |
| Net Assets | | | $ | 9,919,961 | | | | | $ | 127,860,501 | |
| | | | | | | | | | | | |
| Net Assets: | | | | | | | | | | | |
| Class A Shares | | | $ | 9,422,219 | | | | | $ | — | |
| Class B Shares | | | | 44,024 | | | | | | — | |
| Class C Shares | | | | 453,718 | | | | | | — | |
| Class I Shares | | | | — | | | | | | 127,860,501 | |
| Total | | | $ | 9,919,961 | | | | | $ | 127,860,501 | |
| | | | | | | | | | | | |
| Shares Outstanding: | | | | | | | | | | | |
| ($0.001 par value, unlimited number of shares authorized): | | | | | | | | | | | |
| Class A Shares | | | | 838,038 | | | | | | — | |
| Class B Shares | | | | 6,265 | | | | | | — | |
| Class C Shares | | | | 61,518 | | | | | | — | |
| Class I Shares | | | | — | | | | | 8,301,092 | |
| | | | | | | | | | | |
| Net Asset Value, Offering Price and Redemption Price per share: | | | | | | | | | | | |
| Class A Shares | | | $ | 11.24 | | | | | $ | — | |
| Class B Shares(a) | | | $ | 7.03 | | | | | $ | — | |
| Class C Shares(a) | | | $ | 7.38 | | | | | $ | — | |
| Class I Shares | | | $ | — | | | | | $ | 15.40 | |
| Maximum Sales Charge: | | | | | | | | | | | |
| Class A Shares | | | | 5.00 | % | | | | | —% | |
| Maximum Offering Price per share (Net Asset Value / (100%-maximum sales charge)) | | | | | | | | | | | |
| Class A Shares | | | $ | 11.83 | | | | | $ | — | |
| Investments in Affiliated Portfolio, at cost | | | $ | 8,336,399 | | | | | $ | 106,654,370 | |
____________________
| (a) | Redemption price per share varies by length of time shares are held. |
| 6 HSBC FAMILY OF FUNDS | See notes to financial statements. |
HSBC FAMILY OF FUNDS
Statements of Operations — For the year ended October 31, 2017
| | | | | | | Opportunity |
| Opportunity | | Fund |
| Fund | | (Class I) |
| Investment Income: | | | | | | | | | | | |
| Investment Income from Affiliated Portfolio | | $ | 75,498 | | | | | $ | 1,012,852 | | |
| Expenses from Affiliated Portfolio | | | (90,141 | ) | | | | | (1,207,852 | ) | |
| Total Investment Income/(Loss) | | | (14,643 | ) | | | | | (195,000 | ) | |
| | | | | | | | | | | | |
| Expenses: | | | | | | | | | | | |
| Administration: | | | | | | | | | | | |
| Class A Shares | | | 1,832 | | | | | | — | | |
| Class B Shares | | | 12 | | | | | | — | | |
| Class C Shares | | | 91 | | | | | | — | | |
| Class I Shares | | | — | | | | | | 25,958 | | |
| Distribution: | | | | | | | | | | | |
| Class B Shares | | | 457 | | | | | | — | | |
| Class C Shares | | | 3,486 | | | | | | — | | |
| Shareholder Servicing: | | | | | | | | | | | |
| Class A Shares | | | 21,832 | | | | | | — | | |
| Class B Shares | | | 155 | | | | | | — | | |
| Class C Shares | | | 998 | | | | | | — | | |
| Accounting | | | 18,946 | | | | | | 8,978 | | |
| Administrative Services | | | 6,908 | | | | | | 11,575 | | |
| Compliance Services | | | 125 | | | | | | 1,712 | | |
| Printing | | | 6,680 | | | | | | 39,056 | | |
| Professional | | | 11,288 | | | | | | 35,300 | | |
| Transfer Agent | | | 109,942 | | | | | | 117,350 | | |
| Trustee | | | 1,670 | | | | | | 4,100 | | |
| Registration fees | | | 23,542 | | | | | | 32,533 | | |
| Other | | | 2,522 | | | | | | 13,522 | | |
| Total expenses before fee and expense reductions | | | 210,486 | | | | | | 290,084 | | |
| Fees voluntarily reduced/reimbursed by Investment Adviser | | | (9,948 | ) | | | | | — | | |
| Fees contractually reduced/reimbursed by Investment Adviser | | | (131,244 | ) | | | | | (28,269 | ) | |
| Fees voluntarily reduced by Sub-Administrator | | | (1,296 | ) | | | | | (2,202 | ) | |
| Net Expenses | | | 67,998 | | | | | | 259,613 | | |
| | | | | | | | | | | |
| Net Investment Income/(Loss) | | | (82,641 | ) | | | | | (454,613 | ) | |
| | | | | | | | | | | |
| Realized/Unrealized Gains/(Losses) from Investments: | | | | | | | | | | | |
| Net realized gains/(losses) from investments from Affiliated Portfolio | | | 1,383,534 | | | | | | 19,709,152 | | |
| Change in unrealized appreciation/depreciation on investments from Affiliated Portfolio | | | 1,222,544 | | | | | | 15,692,968 | | |
| | | | | | | | | | | |
| Net realized/unrealized gains/(losses) on investments from Affiliated Portfolio | | | 2,606,078 | | | | | | 35,402,120 | | |
| Change in Net Assets Resulting from Operations | | $ | 2,523,437 | | | | | $ | 34,947,507 | | |
| See notes to financial statements. | HSBC FAMILY OF FUNDS 7 |
HSBC FAMILY OF FUNDS
Statements of Changes in Net Assets
| | Opportunity Fund | | Opportunity Fund (Class I) |
| | For the | For the | | For the | For the |
| | year ended | year ended | | year ended | year ended |
| | October 31, 2017 | October 31, 2016 | | October 31, 2017 | October 31, 2016 |
| Investment Activities: | | | | | | | | | | | | | | | | | | | | | | |
| Operations: | | | | | | | | | | | | | | | | | | | | | | |
| Net investment income/(loss) | | | $ | (82,641 | ) | | | $ | (96,199 | ) | | | | $ | (454,613 | ) | | | $ | (305,239 | ) | |
| Net realized gains/(losses) from investments | | | | 1,383,534 | | | | | 1,215,936 | | | | | | 19,709,152 | | | | | 13,908,190 | | |
| Change in unrealized appreciation/depreciation | | | | | | | | | | | | | | | | | | | | | | |
| on investments | | | | 1,222,544 | | | | | (1,855,077 | ) | | | | | 15,692,968 | | | | | (20,296,364 | ) | |
| Change in net assets resulting from operations | | | | 2,523,437 | | | | | (735,340 | ) | | | | | 34,947,507 | | | | | (6,693,413 | ) | |
| | | | | | | | | | | | | | | | | | | | | | | |
| Distributions: | | | | | | | | | | | | | | | | | | | | | | |
| Net realized gains: | | | | | | | | | | | | | | | | | | | | | | |
| Class A Shares | | | | (1,128,826 | ) | | | | — | | | | | | — | | | | | — | | |
| Class B Shares | | | | (12,613 | ) | | | | — | | | | | | — | | | | | — | | |
| Class C Shares | | | | (79,223 | ) | | | | — | | | | | | — | | | | | — | | |
| Class I Shares | | | | — | | | | | — | | | | | | (14,495,106 | ) | | | | — | | |
| Change in net assets resulting from distributions | | | | (1,220,662 | ) | | | | — | | | | | | (14,495,106 | ) | | | | — | | |
| Change in net assets resulting from | | | | | | | | | | | | | | | | | | | | | | |
| capital transactions | | | | (1,208,010 | ) | | | | (7,035,888 | ) | | | | | (33,653,038 | ) | | | | (72,091,064 | ) | |
| Change in net assets | | | | 94,765 | | | | | (7,771,228 | ) | | | | | (13,200,637 | ) | | | | (78,784,477 | ) | |
| | | | | | | | | | | | | | | | | | | | | | | |
| Net Assets: | | | | | | | | | | | | | | | | | | | | | | |
| Beginning of period | | | | 9,825,196 | | | | | 17,596,424 | | | | | | 141,061,138 | | | | | 219,845,615 | | |
| End of period | | | $ | 9,919,961 | | | | $ | 9,825,196 | | | | | $ | 127,860,501 | | | | $ | 141,061,138 | | |
| Accumulated net investment income (loss) | | | $ | — | | | | $ | (79,658 | ) | | | | $ | — | | | | $ | (332,204 | ) | |
| 8 HSBC FAMILY OF FUNDS | See notes to financial statements. |
HSBC FAMILY OF FUNDS
Statements of Changes in Net Assets (continued)
| | Opportunity Fund | | Opportunity Fund (Class I) |
| | For the | For the | | For the | For the |
| | year ended | year ended | | year ended | year ended |
| | October 31, 2017 | October 31, 2016 | | October 31, 2017 | October 31, 2016 |
| CAPITAL TRANSACTIONS: | | | | | | | | | | | | | | | | | | | | | | |
| Class A Shares: | | | | | | | | | | | | | | | | | | | | | | |
| Proceeds from shares issued | | | $ | 490,391 | | | | $ | 2,138,113 | | | | | $ | — | | | | $ | — | | |
| Dividends reinvested | | | | 1,096,861 | | | | | — | | | | | | — | | | | | — | | |
| Value of shares redeemed | | | | (2,703,036 | ) | | | | (8,758,224 | ) | | | | | — | | | | | — | | |
| Class A Shares capital transactions | | | | (1,115,784 | ) | | | | (6,620,111 | ) | | | | | — | | | | | — | | |
| | | | | | | | | | | | | | | | | | | | | | | |
| Class B Shares: | | | | | | | | | | | | | | | | | | | | | | |
| Proceeds from shares issued | | | | 7,643 | | | | | — | | | | | | — | | | | | — | | |
| �� Dividends reinvested | | | | 12,613 | | | | | — | | | | | | — | | | | | — | | |
| Value of shares redeemed | | | | (53,986 | ) | | | | (95,023 | ) | | | | | — | | | | | — | | |
| Class B Shares capital transactions | | | | (33,730 | ) | | | | (95,023 | ) | | | | | — | | | | | — | | |
| | | | | | | | | | | | | | | | | | | | | | | |
| Class C Shares: | | | | | | | | | | | | | | | | | | | | | | |
| Proceeds from shares issued | | | | 9,094 | | | | | 200 | | | | | | — | | | | | — | | |
| Dividends reinvested | | | | 79,223 | | | | | — | | | | | | — | | | | | — | | |
| Value of shares redeemed | | | | (146,813 | ) | | | | (320,954 | ) | | | | | — | | | | | — | | |
| Class C Shares capital transactions | | | | (58,496 | ) | | | | (320,754 | ) | | | | | — | | | | | — | | |
| | | | | | | | | | | | | | | | | | | | | | | |
| Class I Shares: | | | | | | | | | | | | | | | | | | | | | | |
| Proceeds from shares issued | | | | — | | | | | — | | | | | | 9,067,442 | | | | | 46,455,601 | | |
| Dividends reinvested | | | | — | | | | | — | | | | | | 14,367,761 | | | | | — | | |
| Value of shares redeemed | | | | — | | | | | — | | | | | | (57,088,241 | ) | | | | (118,546,665 | ) | |
| Class I Shares capital transactions | | | | — | | | | | — | | | | | | (33,653,038 | ) | | | | (72,091,064 | ) | |
| Change in net assets resulting from capital transactions | | | $ | (1,208,010 | ) | | | $ | (7,035,888 | ) | | | | $ | (33,653,038 | ) | | | $ | (72,091,064 | ) | |
| | | | | | | | | | | | | | | | | | | | | | | |
| SHARE TRANSACTIONS: | | | | | | | | | | | | | | | | | | | | | | |
| Class A Shares: | | | | | | | | | | | | | | | | | | | | | | |
| Issued | | | | 47,663 | | | | | 226,608 | | | | | | — | | | | | — | | |
| Reinvested | | | | 118,452 | | | | | — | | | | | | — | | | | | — | | |
| Redeemed | | | | (260,788 | ) | | | | (899,384 | ) | | | | | — | | | | | — | | |
| Change in Class A Shares | | | | (94,673 | ) | | | | (672,776 | ) | | | | | — | | | | | — | | |
| | | | | | | | | | | | | | | | | | | | | | | |
| Class B Shares: | | | | | | | | | | | | | | | | | | | | | | |
| Issued | | | | 1,202 | | | | | — | | | | | | — | | | | | — | | |
| Reinvested | | | | 2,167 | | | | | — | | | | | | — | | | | | — | | |
| Redeemed | | | | (8,201 | ) | | | | (14,246 | ) | | | | | — | | | | | — | | |
| Change in Class B Shares | | | | (4,832 | ) | | | | (14,246 | ) | | | | | — | | | | | — | | |
| | | | | | | | | | | | | | | | | | | | | | | |
| Class C Shares: | | | | | | | | | | | | | | | | | | | | | | |
| Issued | | | | 1,383 | | | | | 29 | | | | | | — | | | | | — | | |
| Reinvested | | | | 12,966 | | | | | — | | | | | | — | | | | | — | | |
| Redeemed | | | | (20,791 | ) | | | | (44,801 | ) | | | | | — | | | | | — | | |
| Change in Class C Shares | | | | (6,442 | ) | | | | (44,772 | ) | | | | | — | | | | | — | | |
| | | | | | | | | | | | | | | | | | | | | | | |
| Class I Shares: | | | | | | | | | | | | | | | | | | | | | | |
| Issued | | | | — | | | | | — | | | | | | 656,336 | | | | | 3,513,118 | | |
| Reinvested | | | | — | | | | | — | | | | | | 1,137,590 | | | | | — | | |
| Redeemed | | | | — | | | | | — | | | | | | (4,121,773 | ) | | | | (8,909,863 | ) | |
| Change in Class I Shares | | | | — | | | | | — | | | | | | (2,327,847 | ) | | | | (5,396,745 | ) | |
| See notes to financial statements. | HSBC FAMILY OF FUNDS 9 |
| HSBC OPPORTUNITY FUND |
| Financial Highlights |
Selected data for a share outstanding throughout the periods indicated.*
| | Investment Activities | | Distributions | | | | | Ratios/Supplementary Data |
| | Net Asset
Value,
Beginning
of Period | | Net
Investment
Income
(Loss)(a) | | Net Realized
and Unrealized
Gains/
(Losses) from
Investments | | Total from
Investment
Activities | | Net
Investment
Income | | Net Realized
Gains from
Investment
Transactions | | Total
Distributions | | Net
Asset
Value,
End of
Period | | Total
Return(b) | | Net
Assets at
End
of Period
(000’s) | | Ratio
of Net
Expenses
to Average
Net Assets | | Ratio
of Net
Investment
Income/
(Loss) to
Average
Net Assets | | Ratio of
Expenses
to Average
Net Assets
(Excluding Fee
Reductions) | | Portfolio
Turnover
(c) |
| Class A Shares | | | | | | | | | | | | | | | | | | | | | | | | | | | | |
| Year Ended October 31, 2017 | | | $ | 9.94 | | | | $ | (0.08 | ) | | | | $ | 2.68 | | | | | $ | 2.60 | | | | | $ | — | | | $ | (1.30 | ) | | | | $ | (1.30 | ) | | | | $ | 11.24 | | 29.00 | % | | | $ | 9,422 | | | 1.55% | | (0.79)% | | 2.98% | | 80% |
| Year Ended October 31, 2016 | | | | 10.34 | | | | | (0.07 | ) | | | | | (0.33 | ) | | | | | (0.40 | ) | | | | | — | | | | — | | | | | | — | | | | | | 9.94 | | (3.87 | )% | | | | 9,276 | | | 1.55% | | (0.66)% | | 2.11% | | 96% |
| Year Ended October 31, 2015 | | | | 12.83 | | | | | (0.10 | ) | | | | | (0.07 | ) | | | | | (0.17 | ) | | | | | — | | | | (2.32 | ) | | | | | (2.32 | ) | | | | | 10.34 | | (2.21 | )% | | | | 16,593 | | | 1.55% | | (0.86)% | | 1.84% | | 63% |
| Year Ended October 31, 2014 | | | | 12.78 | | | | | (0.13 | ) | | | | | 1.53 | | | | | | 1.40 | | | | | | — | | | | (1.35 | ) | | | | | (1.35 | ) | | | | | 12.83 | | 11.57 | % | | | | 16,110 | | | 1.55% | | (1.04)% | | 1.86% | | 66% |
| Year Ended October 31, 2013 | | | | 10.13 | | | | | (0.06 | ) | | | | | 3.34 | | | | | | 3.28 | | | | | | — | | | | (0.63 | ) | | | | | (0.63 | ) | | | | | 12.78 | | 34.02 | %(d) | | | | 14,259 | | | 1.55% | | (0.49)% | | 2.01% | | 70% |
| Class B Shares | | | | | | | | | | | | | | | | | | | | | | | | | | | | | | | | | | | | | | | | | | | | | | | | | | | | | | | | | | | |
| Year Ended October 31, 2017 | | | | 6.72 | | | | | (0.10 | ) | | | | | 1.71 | | | | | | 1.61 | | | | | | — | | | | (1.30 | ) | | | | | (1.30 | ) | | | | | 7.03 | | 28.05 | % | | | | 44 | | | 2.30% | | (1.52)% | | 3.73% | | 80% |
| Year Ended October 31, 2016 | | | | 7.04 | | | | | (0.09 | ) | | | | | (0.23 | ) | | | | | (0.32 | ) | | | | | — | | | | — | | | | | | — | | | | | | 6.72 | | (4.55 | )% | | | | 75 | | | 2.30% | | (1.41)% | | 2.86% | | 96% |
| Year Ended October 31, 2015 | | | | 9.51 | | | | | (0.13 | ) | | | | | (0.02 | ) | | | | | (0.15 | ) | | | | | — | | | | (2.32 | ) | | | | | (2.32 | ) | | | | | 7.04 | | (2.90 | )% | | | | 178 | | | 2.30% | | (1.61)% | | 2.60% | | 63% |
| Year Ended October 31, 2014 | | | | 9.87 | | | | | (0.16 | ) | | | | | 1.15 | | | | | | 0.99 | | | | | | — | | | | (1.35 | ) | | | | | (1.35 | ) | | | | | 9.51 | | 10.74 | % | | | | 334 | | | 2.30% | | (1.74)% | | 2.60% | | 66% |
| Year Ended October 31, 2013 | | | | 8.01 | | | | | (0.11 | ) | | | | | 2.60 | | | | | | 2.49 | | | | | | — | | | | (0.63 | ) | | | | | (0.63 | ) | | | | | 9.87 | | 33.10 | %(d) | | | | 480 | | | 2.30% | | (1.24)% | | 2.77% | | 70% |
| Class C Shares | | | | | | | | | | | | | | | | | | | | | | | | | | | | | | | | | | | | | | | | | | | | | | | | | | | | | | | | | | | |
| Year Ended October 31, 2017 | | | | 6.99 | | | | | (0.11 | ) | | | | | 1.80 | | | | | | 1.69 | | | | | | — | | | | (1.30 | ) | | | | | (1.30 | ) | | | | | 7.38 | | 28.11 | % | | | | 454 | | | 2.30% | | (1.54)% | | 3.71% | | 80% |
| Year Ended October 31, 2016 | | | | 7.32 | | | | | (0.10 | ) | | | | | (0.23 | ) | | | | | (0.33 | ) | | | | | — | | | | — | | | | | | — | | | | | | 6.99 | | (4.51 | )% | | | | 475 | | | 2.30% | | (1.41)% | | 2.88% | | 96% |
| Year Ended October 31, 2015 | | | | 9.80 | | | | | (0.13 | ) | | | | | (0.03 | ) | | | | | (0.16 | ) | | | | | — | | | | (2.32 | ) | | | | | (2.32 | ) | | | | | 7.32 | | (2.93 | )% | | | | 825 | | | 2.30% | | (1.61)% | | 2.62% | | 63% |
| Year Ended October 31, 2014 | | | | 10.14 | | | | | (0.17 | ) | | | | | 1.18 | | | | | | 1.01 | | | | | | — | | | | (1.35 | ) | | | | | (1.35 | ) | | | | | 9.80 | | 10.64 | % | | | | 822 | | | 2.30% | | (1.77)% | | 2.61% | | 66% |
| Year Ended October 31, 2013 | | | | 8.21 | | | | | (0.11 | ) | | | | | 2.67 | | | | | | 2.56 | | | | | | — | | | | (0.63 | ) | | | | | (0.63 | ) | | | | | 10.14 | | 33.15 | %(d) | | | | 711 | | | 2.30% | | (1.21)% | | 2.76% | | 70% |
| * | The per share amounts and percentages reflect income and expenses assuming inclusion of the Fund’s proportionate share of the income and expenses of the HSBC Opportunity Portfolio. Amounts designated as “-“ are $0.00 or have been rounded to $0.00. |
| (a) | Calculated based on average shares outstanding. |
| (b) | Total return calculations do not include any sales or redemption charges. |
| (c) | Portfolio turnover rate is calculated on the basis of the respective Portfolio in which the Fund invests all of its investable assets. Portfolio turnover is calculated on the basis of the Fund as a whole without distinguishing between the classes of shares issued. |
| (d) | The Portfolio, in which the Fund invests, received monies related to certain nonrecurring litigation settlements. The corresponding impact to the total return was 0.13% for the year ended October 31, 2013. |
| 10 HSBC FAMILY OF FUNDS | See notes to financial statements. |
| HSBC OPPORTUNITY FUND (CLASS I) |
| Financial Highlights |
Selected data for a share outstanding throughout the periods indicated.*
| | | | | | | Investment Activities | | Distributions | | | | | | | | Ratios/Supplementary Data |
| | | Net Asset
Value,
Beginning
of Period | |
Net
Investment
Income
(Loss)(a) | | Net Realized
and Unrealized
Gains/
(Losses) from
Investments | | Total from
Investment
Activities | | Net
Investment
Income | | Net Realized
Gains from
Investment
Transactions | | Total
Distributions | | Net
Asset
Value,
End of
Period | | Total
Return(b) | | Net
Assets at
End
of Period
(000’s) | | Ratio
of Net
Expenses
to Average
Net Assets | | Ratio
of Net
Investment
Income/
(Loss) to
Average
Net Assets | | Ratio of
Expenses
to Average
Net Assets
(Excluding Fee
Reductions) | | Portfolio
Turnover
(c) |
| Class I Shares | | | | | | | | | | | | | | | | | | | | | | | | | | | | | | | | | | | | | | | | | | | | | | | | | | | | | | | | | | | | | | | | | | | | | | | | |
| Year Ended October 31, 2017 | | | $ | 13.27 | | | | $ | (0.05 | ) | | | | $ | 3.65 | | | | | $ | 3.60 | | | | | $ | — | | | | | $ | (1.47 | ) | | | | $ | (1.47 | ) | | | $ | 15.40 | | 29.53 | % | | | $ | 127,861 | | | | 1.10 | % | | | | (0.34 | )% | | | | 1.12 | % | | | | 80 | % | |
| Year Ended October 31, 2016 | | | | 13.72 | | | | | (0.02 | ) | | | | | (0.43 | ) | | | | | (0.45 | ) | | | | | — | | | | | | — | | | | | | — | | | | | 13.27 | | (3.28 | )% | | | | 141,061 | | | | 1.03 | % | | | | (0.15 | )% | | | | 1.03 | % | | | | 96 | % | |
| Year Ended October 31, 2015 | | | | 17.47 | | | | | (0.05 | ) | | | | | (0.08 | ) | | | | | (0.13 | ) | | | | | — | | | | | | (3.62 | ) | | | | | (3.62 | ) | | | | 13.72 | | (1.69 | )% | | | | 219,846 | | | | 0.99 | % | | | | (0.30 | )% | | | | 0.99 | % | | | | 63 | % | |
| Year Ended October 31, 2014 | | | | 17.27 | | | | | (0.08 | ) | | | | | 2.07 | | | | | | 1.99 | | | | | | (0.04 | ) | | | | | (1.75 | ) | | | | | (1.79 | ) | | | | 17.47 | | 12.16 | % | | | | 205,237 | | | | 1.00 | % | | | | (0.49 | )% | | | | 1.00 | % | | | | 66 | % | |
| Year Ended October 31, 2013 | | | | 13.40 | | | | | 0.01 | | | | | | 4.47 | | | | | | 4.48 | | | | | | — | | | | | | (0.61 | ) | | | | | (0.61 | ) | | | | 17.27 | | 34.70 | %(d) | | | | 208,321 | | | | 0.99 | % | | | | 0.07 | % | | | | 0.99 | % | | | | 70 | % | |
| * | The per share amounts and percentages reflect income and expenses assuming inclusion of the Fund’s proportionate share of the income and expenses of the HSBC Opportunity Portfolio. Amounts designated as “-” are $0.00 or have been rounded to $0.00. |
| (a) | Calculated based on average shares outstanding. |
| (b) | Total return calculations do not include any sales or redemption charges. |
| (c) | Portfolio turnover rate is calculated on the basis of the respective Portfolio in which the Fund invests all of its investable assets. Portfolio turnover is calculated on the basis of the Fund as a whole without distinguishing between the classes of shares issued. |
| (d) | The Portfolio, in which the Fund invests, received monies related to certain nonrecurring litigation settlements. The corresponding impact to the total return was 0.13% for the year ended October 31, 2013. |
| See notes to financial statements. | HSBC FAMILY OF FUNDS 11 |
| HSBC FAMILY OF FUNDS |
| Notes to Financial Statements—as of October 31, 2017 |
1. Organization:
The HSBC Funds (the “Trust”), a Delaware statutory trust organized on March 2, 2016, is registered under the Investment Company Act of 1940, as amended (the “Act”), as an open-end management investment company. Effective June 24, 2016, the Funds (as defined below), which were series of HSBC Funds, a Massachusetts business trust, reorganized with and into corresponding series of the Trust (each, a “Reorganization”). Upon completion of each Reorganization, the respective share classes of each Fund assumed the performance, financial and other historical information of those of the corresponding predecessor series. As of October 31, 2017, the Trust is composed of 13 separate operational funds, each a series of the HSBC Family of Funds. The accompanying financial statements are presented for the following two funds (individually a “Fund”, collectively the “Funds”) of the Trust:
| Fund | | Short Name |
| HSBC Opportunity Fund | | Opportunity Fund |
| HSBC Opportunity Fund (Class I) | | Opportunity Fund (Class I) |
The Funds are diversified funds. Financial statements for all other funds of the Trust are published separately.
Each Fund utilizes a master-feeder fund structure and seeks to achieve its investment objectives by investing all of its investable assets in the HSBC Opportunity Portfolio (the “Portfolio”), which is a diversified series of the Trust. The Portfolio operates as a master fund in a master-feeder arrangement in which other feeder funds invest all or part of their investable assets in the Portfolio. The Funds’ proportionate ownership of the Portfolio as of October 31, 2017 was as follows:
| | Proportionate |
| | Ownership |
| | Interest on |
| Fund | | October 31, 2017 (%) |
| Opportunity Fund | | | 7.2 | |
| Opportunity Fund (Class I) | | | 92.8 | |
The financial statements of the Portfolio, including the Schedules of Portfolio Investments, are included elsewhere in this report. The financial statements of the Portfolio should be read in conjunction with the financial statements of the Funds.
The Funds are authorized to issue an unlimited number of shares of beneficial interest with a par value of $ 0.001 per share. The Opportunity Fund offers three classes of shares: Class A Shares, Class B Shares, and Class C Shares. The Opportunity Fund (Class I) offers one class of shares: Class I Shares. Class A Shares of the Opportunity Fund have a maximum sales charge of 5.00% as a percentage of the offering price. Class B Shares of the Opportunity Fund are offered without any front-end sales charge but will be subject to a contingent deferred sales charge (“CDSC”) ranging from a maximum of 4.00% if redeemed less than one year after purchase to 0.00% if redeemed more than four years after purchase. Class C Shares of the Opportunity Fund are offered without any front-end sales charge but will be subject to a maximum CDSC of 1.00% if redeemed less than one year after purchase. No sales charges are assessed with respect to Class I Shares of the Opportunity Fund (Class I). Each class of shares in the Funds has identical rights and privileges, except with respect to arrangements pertaining to shareholder servicing and/or distribution, class-related expenses, voting rights on matters affecting a single class of shares, and exchange privilege of each class of shares. Class B Shares of the Opportunity Fund may no longer be purchased or acquired by any new or existing Class B shareholder, except through dividend and/or capital gains reinvestment.
Under the Trust’s organizational documents, the Trust’s officers and Trustees are indemnified against certain liabilities arising out of the performance of their duties to the Funds. In addition, in the normal course of business, the Trust enters into contracts with its service providers, which also provide for indemnifications by the Funds. The Funds’ maximum exposure under these arrangements is unknown, as this would involve future claims that may be made against the Funds. However, based on experience, the Trust believes the risk of loss to be remote.
| HSBC FAMILY OF FUNDS |
| Notes to Financial Statements—as of October 31, 2017 |
The Funds are investment companies and follow accounting and reporting guidance under Financial Accounting Standards Board (“FASB”) Accounting Standards Codification (“ASC”) Topic 946, “Financial Services-Investment Companies.”
2. Significant Accounting Policies:
The following is a summary of the significant accounting policies followed by the Funds in the preparation of their financial statements. The policies are in conformity with generally accepted accounting principles in the United States of America (“GAAP”). The preparation of financial statements requires management to make certain estimates and assumptions that affect the reported amounts of assets and liabilities and disclosure of contingent assets and liabilities at the date of the financial statements and the reported amounts of increases and decreases in net assets from operations during the reporting period. Actual results could differ from those estimates.
Securities Valuation:
The Funds record their investments at fair value. Fair value is defined as the price that would be received to sell an asset or paid to transfer a liability in an orderly transaction between market participants at the measurement date. The valuation techniques used to determine fair value are further described in Note 3 below.
Investment Transactions and Related Income:
The Funds record investments to the Portfolio on a trade date basis. The Funds record daily their proportionate share of income, expenses, changes in unrealized appreciation and depreciation and realized gains and losses derived from the Portfolio. In addition, the Funds accrue their own expenses daily as incurred.
Allocations:
Expenses directly attributable to a Fund are charged to that Fund. Expenses not directly attributable to a Fund are allocated among the applicable series within the Trust in relation to the net assets of each fund, equally to each fund, or another appropriate basis. Class specific expenses are charged directly to the class incurring the expense. In addition, income, expenses (other than class specific expenses), and unrealized and realized gains and losses are allocated to each class based on relative net assets on a daily basis.
Distributions to Shareholders:
Dividends to shareholders of the Funds from net investment income, if any, are declared and distributed semiannually.
The Funds’ net realized gains, if any, are declared and distributed at least annually. Additional distributions are also made to the Funds’ shareholders to the extent necessary to avoid the federal excise tax on certain undistributed income and net realized gains of regulated investment companies.
Federal Income Taxes:
Each Fund is a separate taxable entity for federal income tax purposes. Each Fund has qualified and intends to continue to qualify each year as a “regulated investment company’’ under Subchapter M of the Internal Revenue Code, as amended, and to distribute substantially all of its taxable net investment income and net realized gains, if any, to its shareholders. Accordingly, no provision for federal income or excise tax is required for the Funds, although shareholders may be taxed on distributions they receive.
Management of the Funds has reviewed tax positions taken in tax years that remain subject to examination by all major tax jurisdictions, including federal (i.e., the last four tax year ends and the interim tax period since then, as applicable). Management believes that there is no tax liability resulting from unrecognized tax benefits related to uncertain tax positions taken. Management’s conclusions may be subject to future review based on changes in, or interpretation of, accounting standards or tax laws and regulations.
| HSBC FAMILY OF FUNDS |
| Notes to Financial Statements—as of October 31, 2017 |
Recent Accounting Pronouncements:
In October 2016, the Securities and Exchange Commission (SEC) released its Final Rules on Investment Company Reporting Modernization (the “Rules”). The Rules introduce two new regulatory reporting forms for investment companies - Form N-PORT and Form N-CEN - and also contain amendments to Regulation S-X which require standardized, enhanced disclosures about derivatives in investment company financial statements, as well as other amendments. The amendments to Regulation S-X became effective for filings made with the SEC after August 1, 2017. The Funds’ adoption of these amendments, effective with the financial statements prepared as of October 31, 2017, required additional disclosures reflected herein, but had no effect on the Funds’ net assets or results of operations.
3. Investment Valuation Summary
The valuation techniques employed by the Funds, as described below, maximize the use of observable inputs and minimize the use of unobservable inputs in determining fair value. The Funds’ investments are classified within the fair value hierarchy based on the lowest level of input that is significant to the fair value measurement. The inputs used for valuing the Funds’ investments are summarized in the three broad levels listed below:
| ● | Level 1—quoted prices in active markets for identical assets
|
| ● | Level 2—other significant observable inputs (including quoted prices for similar securities, interest rates, prepayments speeds, credit risk, etc.)
|
| ● | Level 3—significant unobservable inputs (including the Fund’s own assumptions in determining the fair value of investments) |
Changes in valuation techniques may result in transfers in or out of an assigned level within the fair value hierarchy. The Trust’s policy is to disclose transfers between fair value hierarchy levels based on valuations at the end of the reporting period. The inputs or methodology used for valuing investments are not necessarily an indication of the risk associated with investing in those investments. There were no transfers during the year ended October 31, 2017.
The Funds record their investments in the Portfolio at fair value, which represents their proportionate ownership of the value of the Portfolios’ net assets. These investments are typically categorized as Level 2 in the fair value hierarchy. The underlying securities of the Portfolio are recorded at fair value, as discussed more fully in the Notes to Financial Statements of the Portfolio included elsewhere in this report.
As of October 31, 2017, all investments were categorized as Level 2 in the fair value hierarchy.
4. Related Party Transactions and Other Agreements and Plans:
Investment Management:
HSBC Global Asset Management (USA) Inc. (“HSBC” or the “Investment Adviser”), a wholly-owned subsidiary of HSBC Bank USA, N.A., a national bank organized under the laws of the United States, acts as Investment Adviser to the Portfolio pursuant to an investment management contract. As Investment Adviser, HSBC manages the investments of the Portfolio and continuously reviews, supervises, and administers the Portfolios’ investments. The Funds are not directly charged any investment management fees.
Administration:
HSBC also serves the Funds as Administrator. Under the terms of the Administration Services Agreement, HSBC receives from the Funds (as well as other funds in the Trust combined) a fee, accrued daily and paid monthly, at an annual rate of:
| Based on Average Daily Net Assets of | | Fee Rate (%) |
| Up to $10 billion | | 0.0400 |
| In excess of $10 billion but not exceeding $20 billion | | 0.0350 |
| In excess of $20 billion but not exceeding $ 50 billion | | 0.0265 |
| In excess of $ 50 billion | | 0.0245 |
| HSBC FAMILY OF FUNDS |
| Notes to Financial Statements—as of October 31, 2017 |
The fee rates and breakpoints are determined on the basis of the aggregate average daily net assets of the Trust. For the year ended October 31, 2017, the effective annualized rate was 0.039%, prior to any fee waivers or expense reimbursements, based on the average daily net assets of the Trust. The total administration fee paid to HSBC is allocated to each series based upon its proportionate share of the aggregate net assets of the Trust. For assets invested in the Portfolio by the Funds, the Portfolio pays half of the administration fee and the Funds pay half, for a combination of the total fee rate set forth above.
Pursuant to a Sub-Administration Services Agreement with HSBC, Citi Fund Services Ohio, Inc. (“Citi”), a wholly-owned subsidiary of Citigroup, Inc., serves as the Trust’s Sub-Administrator. For these services, Citi is entitled to a fee, payable by HSBC, at an annual rate equivalent to the fee rates set forth above subject to certain reductions associated with services provided to new funds, minus 0.02% which is retained by HSBC.
Under a Compliance Services Agreement between the Trust and Citi (the “CCO Agreement”), Citi makes an employee available to serve as the Trust’s Chief Compliance Officer (the “CCO”). Under the CCO Agreement, Citi also provides infrastructure and support in implementing the written policies and procedures comprising the Trust’s compliance program, including support services to the CCO. For the services provided under the CCO Agreement, the Trust paid Citi $312,739 for the year ended October 31, 2017, plus reimbursement of certain out-of-pocket expenses. Expenses incurred by each Fund are reflected on the Statements of Operations as “Compliance Services.” Citi pays the salary and other compensation earned by individuals performing these services, as employees of Citi.
Distribution Arrangements:
On May 31, 2017, Foreside Distribution Services, L.P. (“Foreside”) announced that Lovell Minnick Partners, LLC completed its acquisition of a majority interest in Foreside Financial Group LLC, an indirect parent of Foreside. Foreside serves the Trust as Distributor (the “Distributor”). The Trust, has adopted a non-compensatory Distribution Plan and Agreement (the “Distribution Plan”) pursuant to Rule 12b-1 of the Act. The Distribution Plan provides for reimbursement of expenses incurred by the Distributor related to distribution and marketing, at a rate not to exceed 0.25%, 1.00%, and 1.00% of the average daily net assets of Class A Shares (currently not being charged), Class B Shares (currently charging 0.75%), Class C Shares (currently charging 0.75%) of the Opportunity Fund, respectively. For the year ended October 31, 2017, Foreside, as Distributor, also received $4,154 in commissions from sales of the Trust, of which $3 were reallocated to HSBC-affiliated brokers and dealers.
Shareholder Servicing:
The Trust has adopted a Shareholder Services Plan, which provides for payments to shareholder servicing agents for providing various shareholder services. For performing these services, the shareholder servicing agents receive a fee that is computed daily and paid monthly up to 0.25% of the average daily net assets of Class A Shares, Class B Shares, and Class C Shares of the Opportunity Fund. The fees paid to the Distributor pursuant to the Distribution Plan and to shareholder servicing agents pursuant to the Shareholder Services Plan may not exceed in the aggregate 0.50% annually of the average daily net assets of Class A Shares, and 1.00% of the average daily net assets of Class B Shares and Class C Shares.
The Trust has entered into shareholder services contracts with affiliated and unaffiliated financial intermediaries who provide shareholder services and other related services to their clients or customers who invest in the Funds under which the Funds will pay all or a portion of such fees earned to financial intermediaries for performing such services.
Fund Accounting and Transfer Agency:
Citi provides fund accounting services for each Fund. As fund accountant, Citi receives an annual fee per Fund and share class, subject to certain minimums, reductions associated with services provided to new funds and reimbursement of certain expenses. Citi receives additional fees paid by the Trust for regulatory administration services. Boston Financial Data Services, Inc. (“BFDS”) provides transfer agency services for each Fund. As transfer agent, BFDS receives a fee based on the number of funds and shareholder accounts, subject to certain minimums, and reimbursement of certain expenses.
| HSBC FAMILY OF FUNDS |
| Notes to Financial Statements—as of October 31, 2017 |
Independent Trustees:
The Trust pays an annual retainer to each Independent Trustee, plus additional annual retainers to each Committee Chair and the Chairman of the Trust’s Board of Trustees (the “Board”). The Independent Trustees also receive a fee for each regular, special in-person, and telephonic meeting of the Board attended. The aggregate amount of the fees and expenses of the Independent Trustees are allocated amongst all the funds in the Trust and are presented in the Statements of Operations.
Other:
The Funds pay fees to certain intermediaries or financial institutions for record keeping, sub-accounting services, transfer agency and other administrative services as reflected on the Statements of Operations as “Administrative Services.”
Fee Reductions:
The Investment Adviser has agreed to contractually limit through March 1, 2018 the total annual expenses, exclusive of interest, taxes, brokerage commissions, extraordinary expenses, and estimated indirect expenses attributable to the Fund’s investments in investment companies, of the Funds. Each Fund Class has its own expense limitations based on the average daily net assets for any full fiscal year as follows:
| | | | Contractual Expense |
| Fund | | Class | | Limitations (%) |
| Opportunity Fund | | A | | 1.65 |
| Opportunity Fund | | B | | 2.40 |
| Opportunity Fund | | C | | 2.40 |
| Opportunity Fund (Class I) | | I | | 1.10 |
Any amounts contractually waived or reimbursed by the Investment Adviser will be subject to repayment by the respective Fund to the Investment Adviser within three years calculated monthly from when the waiver or reimbursement is recorded to the extent that the repayment will not cause the Fund’s operating expenses to exceed the contractual expense limit that was in effect at the time of such waiver or reimbursement. During the year ended October 31, 2017, the Investment Adviser did not recapture any of its prior contractual waivers or reimbursements. As of October 31, 2017, the repayments that may potentially be made by the Funds are as follows:
| Fund | | 2020 ($) | | 2019 ($) | | 2018 ($) | | Total ($) |
| Opportunity Fund | | 131,244 | | 62,736 | | 34,993 | | 228,973 |
| Opportunity Fund (Class I) | | 28,269 | | — | | — | | 28,269 |
The Administrator and Citi may voluntarily waive/reimburse fees to help support the expense limits of the Funds. In addition, HSBC, in its role as Investment Adviser and Administrator, may waive/reimburse additional fees at its discretion. Any voluntary fee waivers/reimbursements are not subject to recoupment in subsequent fiscal periods. Voluntary waivers/reimbursements may be stopped at any time. Amounts waived/reimbursed by the Investment Adviser, Administrator and Citi as Sub-Administrator are reported separately on the Statements of Operations, as applicable.
| HSBC FAMILY OF FUNDS |
| Notes to Financial Statements—as of October 31, 2017 |
5. Affiliated Investment Transactions:
A summary of each Fund’s investment in the affiliated Portfolio for the year ended October 31, 2017 is as follows:
| | | | | | | | | | | | Net | | Change in | | | | | | | |
| | | | | | | | | | | | Realized | | Unrealized | | | | | Net |
| | Value | | | | | | | | | Gains/ | | Appreciation/ | | Value | | Income/ |
| | 10/31/2016 | | Contributions | | Withdrawals | | (Losses) | | Depreciation | | 10/31/2017 | | (Loss) |
| Opportunity Fund | | | | | | | | | | | | | | | | | | | | | | | |
| Opportunity Portfolio | | $ | 9,827,032 | | $ | 303,502 | | $ | (2,790,902 | ) | | $ | 1,383,534 | | $ | 1,222,544 | | $ | 9,931,067 | | $ | (14,643 | ) |
| Total | | $ | 9,827,032 | | $ | 303,502 | | $ | (2,790,902 | ) | | $ | 1,383,534 | | $ | 1,222,544 | | $ | 9,931,067 | | $ | (14,643 | ) |
| | | | | | | | | | | | | | | | | | | | | |
| Opportunity Fund (Class I) | | | | | | | | | | | | | | | | | | | | |
| Opportunity Portfolio | | $ | 141,400,967 | | $ | 4,333,778 | | $ | (53,015,763 | ) | | $ | 19,709,152 | | $ | 15,692,968 | | $ | 127,926,102 | | $ | (195,000 | ) |
| Total | | $ | 141,400,967 | | $ | 4,333,778 | | $ | (53,015,763 | ) | | $ | 19,709,152 | | $ | 15,692,968 | | $ | 127,926,102 | | $ | (195,000 | ) |
6. Federal Income Tax Information:
At October 31, 2017, the cost basis of investments for federal income tax purposes, gross unrealized appreciation, gross unrealized depreciation and net unrealized appreciation/depreciation were as follows:
| | | | | | | | | | Net Unrealized |
| | | | Tax Unrealized | | Tax Unrealized | | Appreciation/ |
| | Tax Cost ($) | | Appreciation ($) | | Depreciation ($) | | (Depreciation) ($)* |
| Opportunity Fund | | 8,439,482 | | | 1,491,585 | | | — | | | 1,491,585 | |
| Opportunity Fund (Class I) | | 107,282,394 | | | 20,643,708 | | | — | | | 20,643,708 | |
____________________
| * | The difference between book-basis unrealized appreciation (depreciation) is attributable primarily to tax deferral of losses on wash sales. |
The tax character of distributions paid by the Funds for the tax year ended October 31, 2017, was as follows:
| | Distributions paid from |
| | | | | | | | | | | | | | Total |
| | Ordinary | | Net Long Term | | Total Taxable | | Return of | | Distributions |
| | Income ($) | | Capital Gains ($) | | Distributions ($) | | Capital ($) | | Paid ($)(1) |
| Opportunity Fund | | — | | | 1,220,662 | | | | 1,220,662 | | | — | | 1,220,662 |
| Opportunity Fund (Class I) | | — | | | 14,495,106 | | | | 14,495,106 | | | — | | 14,495,106 |
____________________
| (1) | Total distributions paid may differ from the amount reported in the Statement of Changes in Net Assets because distributions are recognized when actually paid for tax purposes. |
There were no distributions paid by the Funds during the tax year ended October 31, 2016.
As of the tax year ended October 31, 2017, the components of accumulated earnings/(deficit) on a tax basis for the Funds were as follows:
| | | | | | Undistributed | | | | | | Accumulated | | Unrealized | | Total |
| | Undistributed | | Long Term | | | | | | Capital | | Appreciation/ | | Accumulated |
| | Ordinary | | Capital | | Accumulated | | Distributions | | and Other | | (Depreciation) | | Earnings/ |
| | Income ($) | | Gains ($) | | Earnings ($) | | Payable ($) | | Losses ($) | | ($)(1) | | (Deficit) ($) |
| Opportunity Fund | | | 468,858 | | | | 657,832 | | | 1,126,690 | | — | | — | | 1,491,585 | | 2,618,275 |
| Opportunity Fund (Class I) | | | 8,359,595 | | | | 9,280,011 | | | 17,639,606 | | — | | — | | 20,643,708 | | 38,283,314 |
____________________
| (1) | The differences between book-basis and tax-basis unrealized appreciation/depreciation are attributable primarily to: tax deferral of losses on wash sales, and the return of capital adjustments from real estate investment trusts. |
Under current law, capital losses and specified ordinary losses realized after October 31 and non-specified ordinary losses incurred after December 31 (ordinary losses collectively known as “late year ordinary loss”) may be deferred and treated as occurring on the first business day of the following fiscal year. As of the tax year ended October 31, 2017, the Funds had no deferred losses.
| HSBC FAMILY OF FUNDS |
| Notes to Financial Statements—as of October 31, 2017 |
The amount and character of net investment income and net realized gains distributed are determined in accordance with federal income tax regulations which may differ from GAAP. These “book/tax” differences are either considered temporary or permanent in nature. To the extent these differences are permanent in nature (e.g., reclassification of market discounts, certain gain/loss, and certain distributions), such amounts are reclassified within the composition of net assets based on their federal tax-basis treatment; temporary differences (e.g., wash losses and post-October loss deferrals) do not require reclassification. The Funds may utilize equalization accounting for tax purposes and designate earnings and profits, including net realized gains distributed to shareholders on redemption of shares, as part of the dividends paid deduction for income tax purposes. To the extent distributions to shareholders from net investment income and net realized gains exceed net investment income and net realized gains for tax purposes, they are reported as distributions of capital.
On the Statements of Assets and Liabilities, as a result of permanent book-to-tax differences, reclassification adjustments were made as follows:
| | Accumulated Net Investment | | Accumulated | | |
| | Income/(Distributions in Excess | | Net Realized | | Paid-In |
| | of Net Investment Income) ($) | | Gains/(Losses) ($) | | Capital ($) |
| Opportunity Fund | | 162,299 | | (162,300) | | 1 |
| Opportunity Fund (Class I) | | 786,817 | | (787,104) | | 287 |
The reclassification for the Funds primarily relate to net investment loss.
7. Significant Shareholders:
Shareholders, including other funds, individuals, and accounts, as well as the Fund’s investment manager(s) and/or investment personnel, may from time to time own (beneficially or of record) a significant percentage of the Fund’s Shares and can be considered to “control” the Fund when that ownership exceeds 25% of the Fund’s assets (and which may differ from control as determined in accordance with GAAP).
The following list includes the Funds which had individual shareholder accounts with ownership of voting securities greater than 10% of the total outstanding voting securities but less than 25% and/or accounts with ownership of voting securities greater than 25% of the total outstanding voting securities. Significant transactions by these shareholder accounts may negatively impact the Funds’ performance.
| | Number of shareholders | | | | | | | | | |
| | with ownership of | | | | | | | Number of shareholders | | |
| | voting securities of the | | | | | | | with ownership of | | |
| | Portfolio greater than | | | | | | | voting securities of the | | % owned in |
| | 10% and less than 25% | | % owned in | | Portfolio greater than 25% | | aggregate |
| | of the total Portfolio’s | | aggregate | | of the total Portfolio’s | | by greater |
| | outstanding voting | | by 10% - 25% | | outstanding voting | | than 25% |
| Fund | | securities | | shareholders | | securities | | shareholders |
| Opportunity Fund | | — | | | — | | | 1 | | 70% |
| Opportunity Fund (Class I) | | 3 | | | 53 | % | | | 1 | | 26% |
8. Investment Risks:
Currency Risk: Fluctuations in exchange rates between the U.S. dollar and foreign currencies, or between various foreign currencies, may negatively affect the Funds’ performance. The Funds may seek to reduce currency risk by hedging part or all of its exposure to various foreign currencies; however, even if such hedging techniques are employed, there is no assurance that they will be successful.
Equity Securities Risk: The prices of equity securities fluctuate from time to time based on changes in a company’s financial condition or overall market and economic conditions. As a result, the value of equity securities may fluctuate drastically from day to day.
Foreign Securities Risk: Investments in foreign securities are generally considered riskier than investments in U.S. securities. Foreign securities, including those of emerging and frontier market issuers, are subject to additional risks, including international trade, political and regulatory risks.
9. Subsequent Events:
Management has evaluated subsequent events through the date these financial statements were issued. Based on the evaluation, no adjustments or additional disclosures were required to the financial statements as of October 31, 2017.
Report of Independent Registered Public Accounting Firm
To the Board of Trustees of HSBC Funds and Shareholders of HSBC Opportunity Fund and HSBC Opportunity Fund (Class I)
In our opinion, the accompanying statements of assets and liabilities and the related statements of operations and of changes in net assets and the financial highlights present fairly, in all material respects, the financial position of the HSBC Opportunity Fund and the HSBC Opportunity Fund (Class I) (two of the portfolios constituting HSBC Funds, hereafter referred to as the “Fund”) as of October 31, 2017, the results of each of their operations for the year then ended, the changes in each of their net assets for each of the two years in the period then ended and the financial highlights for each of the three years in the period then ended, in conformity with accounting principles generally accepted in the United States of America. These financial statements and financial highlights (hereafter referred to as “financial statements”) are the responsibility of the Fund’s management. Our responsibility is to express an opinion on these financial statements based on our audits. We conducted our audits of these financial statements in accordance with the standards of the Public Company Accounting Oversight Board (United States). Those standards require that we plan and perform the audit to obtain reasonable assurance about whether the financial statements are free of material misstatement. An audit includes examining, on a test basis, evidence supporting the amounts and disclosures in the financial statements, assessing the accounting principles used and significant estimates made by management, and evaluating the overall financial statement presentation. We believe that our audits, which included confirmation of securities as of October 31, 2017 by correspondence with the custodian and transfer agent, provide a reasonable basis for our opinion. The financial statements as of and for the year ended October 31, 2014 and the financial highlights for each of the periods ended on or prior to October 31, 2014 (not presented herein, other than the financial highlights) were audited by other auditors whose report dated December 23, 2014 expressed an unqualified opinion on those financial statements and financial highlights.
PricewaterhouseCoopers LLP
New York, New York
December 21, 2017
| HSBC FAMILY OF FUNDS |
| Other Federal Income Tax Information—as of October 31, 2017 (Unaudited) |
During the year ended October 31, 2017, the following Funds declared capital gain distributions:
| | Short Term | | Long Term |
| | Capital Gain | | Capital Gain |
| | Distributions ($) | | Distributions ($) |
| Opportunity Fund | | — | | | 1,220,662 | |
| Opportunity Fund (Class I) | | — | | | 14,495,106 | |
| HSBC FAMILY OF FUNDS |
| Table of Shareholder Expenses—as of October 31, 2017 (Unaudited) |
As a shareholder of the Funds, you incur two types of costs: (1) transaction costs, including sales charges (loads) on purchases, redemption fees and exchange fees; and (2) ongoing costs, including management fees, distribution fees and/or shareholder servicing fees and other Fund expenses (including expenses allocated from the Portfolios). These examples are intended to help you understand your ongoing costs (in dollars) of investing in the Funds and to compare these cost with the ongoing costs of investing in other mutual funds.
These examples are based on an investment of $1,000 invested at the beginning of the period and held for the entire period from May 1, 2017 through October 31, 2017.
Actual Example
The table below provides information about actual account values and actual expenses. You may use the information below, together with the amount you invested, to estimate the expenses that you paid over the period. Simply divide your account value by $1,000 (for example, an $8,600 account value divided by $1,000 = 8.6), then multiply the result by the number in the table under the heading entitled “Expenses Paid During Period” to estimate the expenses you paid on your account during this period.
| | | | | | | | | | | | | | | | | | | Annualized |
| | | | Beginning | | Ending | | Expenses Paid | | Expense Ratio |
| | | | Account Value | | Account Value | | During Period* | | During Period |
| | | | 5/1/17 | | 10/31/17 | | 5/1/17 - 10/31/17 | | 5/1/17 - 10/31/17 |
| Opportunity Fund | | Class A Shares | | | $ | 1,000.00 | | | | $ | 1,088.10 | | | | $ | 8.16 | | | | 1.55 | % | |
| | Class B Shares | | | | 1,000.00 | | | | | 1,084.90 | | | | | 12.09 | | | | 2.30 | % | |
| | Class C Shares | | | | 1,000.00 | | | | | 1,085.30 | | | | | 12.09 | | | | 2.30 | % | |
| Opportunity Fund (Class I) | | Class I Shares | | | | 1,000.00 | | | | | 1,090.70 | | | | | 5.80 | | | | 1.10 | % | |
____________________
| * | Expenses are equal to the average account value over the period, multiplied by the Fund’s annualized expense ratio, multiplied by 184/365 (to reflect the one half year period). |
| HSBC FAMILY OF FUNDS |
| Table of Shareholder Expenses—as of October 31, 2017 (Unaudited) |
Hypothetical Example for Comparison Purposes
The table below provides information about hypothetical account values and hypothetical expenses based on each Fund's actual expense ratio and an assumed rate of return of 5% per year before expenses, which is not the Fund's actual return. The hypothetical account values and expenses may not be used to estimate the actual ending account balance or expenses you paid for the period. You may use this information to compare this 5% hypothetical example with the 5% hypothetical examples that appear in the shareholder reports of other funds.
Please note that the expenses shown in the table are meant to highlight your ongoing costs only and do not reflect any transactional costs, such as sales charges (loads), redemption fees, or exchange fees. Therefore, the table is useful in comparing ongoing costs only, and will not help you determine the relative total costs of owning different funds. In addition, if these transactional costs were included, your costs would have been higher.
| | | | | | | | | | | | | | | | | | | Annualized |
| | | | Beginning | | Ending | | Expenses Paid | | Expense Ratio |
| | | | Account Value | | Account Value | | During Period* | | During Period |
| | | | 5/1/17 | | 10/31/17 | | 5/1/17 - 10/31/17 | | 5/1/17 - 10/31/17 |
| Opportunity Fund | | Class A Shares | | | $ | 1,000.00 | | | | $ | 1,017.39 | | | | $ | 7.88 | | | | 1.55 | % | |
| | Class B Shares | | | | 1,000.00 | | | | | 1,013.61 | | | | | 11.67 | | | | 2.30 | % | |
| | Class C Shares | | | | 1,000.00 | | | | | 1,013.61 | | | | | 11.67 | | | | 2.30 | % | |
| Opportunity Fund (Class I) | | Class I Shares | | | | 1,000.00 | | | | | 1,019.66 | | | | | 5.60 | | | | 1.10 | % | |
____________________
| * | Expenses are equal to the average account value over the period, multiplied by the Fund’s annualized expense ratio, multiplied by 184/365 (to reflect the one half year period). |
| Portfolio Reviews |
| Portfolio Composition* |
| October 31, 2017 (Unaudited) |
| HSBC Opportunity Portfolio | | | |
| Percentage of |
| Investment Allocation | Investments at Value (%) |
| Software | | 7.1 | |
| Building Products | | 5.8 | |
| IT Services | | 5.8 | |
| Hotels, Restaurants & Leisure | | 5.3 | |
| Pharmaceuticals | | 5.2 | |
| Semiconductors & Semiconductor Equipment | | 4.5 | |
| Machinery | | 3.8 | |
| Chemicals | | 3.8 | |
| Health Care Equipment & Supplies | | 3.6 | |
| Road & Rail | | 3.5 | |
| Biotechnology | | 3.5 | |
| Equity Real Estate Investment Trusts | | 3.4 | |
| Internet Software & Services | | 3.3 | |
| Life Sciences Tools & Services | | 3.1 | |
| Oil, Gas & Consumable Fuels | | 2.8 | |
| Professional Services | | 2.8 | |
| Electronic Equipment, | | | |
| Instruments & Components | | 2.7 | |
| Capital Markets | | 2.6 | |
| Health Care Providers & Services | | 2.5 | |
| Aerospace & Defense | | 2.4 | |
| Thrifts & Mortgage Finance | | 2.2 | |
| Containers & Packaging | | 2.2 | |
| Media | | 2.0 | |
| Construction Materials | | 2.0 | |
| Insurance | | 1.8 | |
| Investment Companies | | 1.8 | |
| Auto Components | | 1.8 | |
| Food Products | | 1.6 | |
| Household Durables | | 1.4 | |
| Technology Hardware, Storage & Peripherals | | 1.3 | |
| Diversified Telecommunication Services | | 1.1 | |
| Diversified Consumer Services | | 1.1 | |
| Banks | | 1.0 | |
| Construction & Engineering | | 0.7 | |
| Communications Equipment | | 0.5 | |
| Total | | 100.0 | |
____________________
| * | Portfolio composition is subject to change. |
| HSBC OPPORTUNITY PORTFOLIO |
| Schedule of Portfolio Investments — as of October 31, 2017 |
| Common Stocks — 98.0% | | | | |
| | Shares | | Value ($) |
| Aerospace & Defense — 2.4% | | | | |
| KLX, Inc. (a) | | 30,040 | | 1,647,994 |
| TransDigm Group, Inc. | | 6,013 | | 1,668,608 |
| | | | 3,316,602 |
| Auto Components — 1.8% | | | | |
| Dana, Inc. | | 79,410 | | 2,421,211 |
| Banks — 1.0% | | | | |
| East West BanCorp, Inc. | | 23,440 | | 1,402,650 |
| Biotechnology — 3.5% | | | | |
| Acceleron Pharma, Inc. (a) | | 42,580 | | 1,660,620 |
| Avexis, Inc. (a) | | 10,500 | | 1,097,355 |
| Bioverativ, Inc. (a) | | 24,140 | | 1,363,910 |
| Neurocrine Biosciences, Inc. (a) | | 11,320 | | 703,085 |
| | | | 4,824,970 |
| Building Products — 5.8% | | | | |
| A.O. Smith Corp. | | 36,710 | | 2,173,232 |
| Builders FirstSource, Inc. (a) | | 157,480 | | 2,837,790 |
| Lennox International, Inc. | | 15,510 | | 2,964,426 |
| | | | 7,975,448 |
| Capital Markets — 2.6% | | | | |
| MSCI, Inc. | | 14,450 | | 1,695,852 |
| Raymond James Financial, Inc. | | 22,680 | | 1,922,810 |
| | | | 3,618,662 |
| Chemicals — 3.8% | | | | |
| Axalta Coating Systems Ltd. (a) | | 88,000 | | 2,926,000 |
| W.R. Grace & Co. | | 30,060 | | 2,299,289 |
| | | | 5,225,289 |
| Communications Equipment — 0.5% | | | | |
| Lumentum Holdings, Inc. (a) | | 11,190 | | 706,649 |
| Construction & Engineering — 0.7% | | | | |
| MasTec, Inc. (a) | | 22,390 | | 975,085 |
| Construction Materials — 2.0% | | | | |
| Summit Materials, Inc., Class A (a) | | 88,627 | | 2,782,888 |
| Containers & Packaging — 2.2% | | | | |
| Avery Dennison Corp. | | 28,290 | | 3,003,549 |
| Diversified Consumer Services — 1.1% | | | | |
| Sotheby’s Holdings, Inc., Class A (a) | | 29,310 | | 1,518,844 |
| Diversified Telecommunication Services — 1.1% | | | | |
| Zayo Group Holdings, Inc. (a) | | 42,620 | | 1,536,877 |
| Electronic Equipment, Instruments & Components — 2.7% | | | | |
| Coherent, Inc. (a) | | 5,430 | | 1,426,515 |
| FLIR Systems, Inc. | | 47,580 | | 2,227,696 |
| | | | 3,654,211 |
| Equity Real Estate Investment Trusts — 3.4% | | | | |
| CyrusOne, Inc. | | 35,130 | | 2,156,631 |
| Sun Communities, Inc. | | 27,880 | | 2,516,449 |
| | | | 4,673,080 |
| Food Products — 1.6% | | | | |
| Pinnacle Foods, Inc. | | 41,270 | | 2,245,913 |
| Health Care Equipment & Supplies — 3.5% | | | | |
| STERIS plc | | 30,240 | | 2,822,299 |
| Wright Medical Group NV (a) | | 81,498 | | 2,136,063 |
| | | | 4,958,362 |
| Health Care Providers & Services — 2.5% | | | | |
| Envision Healthcare Corp. (a) | | 39,070 | | 1,664,382 |
| Quest Diagnostics, Inc. | | 18,360 | | 1,721,801 |
| | | | 3,386,183 |
| Hotels, Restaurants & Leisure — 5.3% | | | | |
| Boyd Gaming Corp. | | 66,060 | | 1,930,934 |
| Dunkin’ Brands Group, Inc. | | 23,620 | | 1,395,233 |
| Six Flags Entertainment Corp. | | 23,570 | | 1,479,960 |
| Vail Resorts, Inc. | | 11,070 | | 2,535,252 |
| | | | 7,341,379 |
| Household Durables — 1.4% | | | | |
| Topbuild Corp. (a) | | 28,410 | | 1,874,776 |
| Insurance — 1.8% | | | | |
| Arthur J. Gallagher & Co. | | 39,465 | | 2,499,318 |
| Internet Software & Services — 3.3% | | | | |
| CoStar Group, Inc. (a) | | 10,349 | | 3,060,717 |
| New Relic, Inc. (a) | | 27,760 | | 1,424,921 |
| | | | 4,485,638 |
| IT Services — 5.8% | | | | |
| Black Knight, Inc. (a) | | 45,590 | | 2,067,507 |
| Gartner, Inc. (a) | | 20,390 | | 2,555,071 |
| Total System Services, Inc. | | 46,040 | | 3,317,181 |
| | | | 7,939,759 |
| Life Sciences Tools & Services — 3.1% | | | | |
| BIO-RAD Laboratories, Inc. (a) | | 9,135 | | 2,007,782 |
| Mettler-Toledo International, Inc. (a) | | 3,353 | | 2,288,858 |
| | | | 4,296,640 |
| Machinery — 3.8% | | | | |
| Crane Co. | | 27,560 | | 2,290,787 |
| Flowserve Corp. | | 38,260 | | 1,686,118 |
| Middleby Corp. (a) | | 10,805 | | 1,252,300 |
| | | | 5,229,205 |
| Media — 2.1% | | | | |
| Lions Gate Entertainment, Class B (a) | | 62,580 | | 1,730,963 |
| Nexstar Media Group, Inc., Class A | | 16,650 | | 1,062,270 |
| | | | 2,793,233 |
| Oil, Gas & Consumable Fuels — 2.8% | | | | |
| Andeavor | | 16,930 | | 1,798,643 |
| Diamondback Energy, Inc. (a) | | 19,700 | | 2,111,052 |
| | | | 3,909,695 |
| Pharmaceuticals — 5.2% | | | | |
| Jazz Pharmaceuticals plc (a) | | 18,908 | | 2,676,049 |
| Nektar Therapeutics (a) | | 95,250 | | 2,294,573 |
| Pacira Pharmaceuticals, Inc. (a) | | 35,110 | | 1,125,276 |
| The Medicines Co. (a) | | 36,060 | | 1,036,364 |
| | | | 7,132,262 |
| 24 | HSBC FAMILY OF FUNDS | See notes to financial statements. |
| HSBC OPPORTUNITY PORTFOLIO |
| Schedule of Portfolio Investments — as of October 31, 2017 (continued) |
| Common Stocks, continued | | | | | |
| | Shares | | Value ($) |
| Professional Services — 2.8% | | | | | |
| IHS Markit Ltd. (a) | | 45,728 | | | 1,948,470 |
| Transunion (a) | | 36,670 | | | 1,924,808 |
| | | | | 3,873,278 |
| Road & Rail — 3.5% | | | | | |
| J.B. Hunt Transportation Services, Inc. | | 24,525 | | | 2,609,215 |
| Old Dominion Freight Line, Inc. | | 18,480 | | | 2,238,482 |
| | | | | 4,847,697 |
| Semiconductors & Semiconductor Equipment — 4.5% | | | | | |
| Advanced Micro Devices, Inc. (a) | | 30,160 | | | 331,308 |
| Cabot Microelectronics Corp. | | 1,370 | | | 132,438 |
| Inphi Corp. (a) | | 33,170 | | | 1,359,307 |
| Microsemi Corp. (a) | | 40,580 | | | 2,165,755 |
| On Semiconductor Corp. (a) | | 103,710 | | | 2,211,096 |
| | | | | 6,199,904 |
| Software — 6.9% | | | | | |
| CyberArk Software Ltd. (a) | | 35,940 | | | 1,522,778 |
| Fortinet, Inc. (a) | | 52,140 | | | 2,054,837 |
| PTC, Inc. (a) | | 33,620 | | | 2,234,049 |
| RealPage, Inc. (a) | | 54,910 | | | 2,377,603 |
| Splunk, Inc. (a) | | 22,510 | | | 1,514,923 |
| | | | | 9,704,190 |
| Technology Hardware, Storage & Peripherals — 1.3% | | | | | |
| NCR Corp. (a) | | 55,320 | | | 1,775,219 |
| Thrifts & Mortgage Finance — 2.2% | | | | | |
| Essent Group Ltd. (a) | | 71,800 | | | 3,060,116 |
| TOTAL COMMON STOCKS | | | | | |
| (COST $112,311,469) | | | | | 135,188,782 |
| |
| Investment Company — 1.8% | | | | | |
| Northern Institutional Government | | | | | |
| Select Portfolio, Institutional | | | | | |
| Shares, 0.88% (b) | | 2,438,842 | | | 2,438,842 |
| TOTAL INVESTMENT COMPANY | | | | | |
| (Cost $2,438,842) | | | | | 2,438,842 |
| TOTAL INVESTMENTS | | | | | |
| IN SECURITIES | | | | | |
| (Cost $114,750,311) — 99.8% | | | | | 137,627,624 |
| Other Assets (Liabilities) — 0.2% | | | | | 229,545 |
| NET ASSETS — 100% | | | | $ | 137,857,169 |
____________________
| (a) | Represents non-income producing security. |
| (b) | The rate represents the annualized one-day yield that was in effect on October 31, 2017. |
| See notes to financial statements. | HSBC FAMILY OF FUNDS | 25 |
HSBC FAMILY OF FUNDS
Statement of Assets and Liabilities—as of October 31, 2017
| | HSBC | |
| | Opportunity | |
| | Portfolio | |
| Assets: | | | | |
| Investments in securities, at value | | $ | 137,627,624 | |
| Dividends receivable | | | 12,229 | |
| Receivable for investments sold | | | 530,051 | |
| Prepaid expenses | | | 439 | |
| Total Assets | | | 138,170,343 | |
| | | | | |
| Liabilities: | | | | |
| Accrued expenses and other liabilities: | | | | |
| Investment Management | | | 29,596 | |
| Sub-Advisory | | | 254,470 | |
| Administration | | | 2,291 | |
| Accounting | | | 3,495 | |
| Custodian | | | 6,448 | |
| Printing | | | 1,634 | |
| Professional | | | 13,803 | |
| Trustee | | | 351 | |
| Other | | | 1,086 | |
| Total Liabilities | | $ | 313,174 | |
| | | | | |
| Net Assets Applicable to investors’ beneficial interest | | $ | 137,857,169 | |
| Investments in securities, at cost | | $ | 114,750,311 | |
| 26 | HSBC FAMILY OF FUNDS | See notes to financial statements. |
HSBC FAMILY OF FUNDS
Statement of Operations—For the year ended October 31, 2017
| | Opportunity | |
| | Portfolio | |
| Investment Income: | | | |
| Dividends | | $ | 1,088,350 | | |
| Total Investment Income | | | 1,088,350 | | |
| | | | | | |
| Expenses: | | | | | |
| Investment Management Fees | | | 358,465 | | |
| Sub-Advisory Fees | | | 788,625 | | |
| Administration | | | 27,902 | | |
| Accounting | | | 41,936 | | |
| Compliance Services | | | 1,837 | | |
| Custodian | | | 26,762 | | |
| Printing | | | 4,250 | | |
| Professional | | | 39,127 | | |
| Trustee | | | 3,302 | | |
| Other | | | 5,787 | | |
| Total Expenses | | | 1,297,993 | | |
| | | | | | |
| Net Investment Income/(Loss) | | $ | (209,643 | ) | |
| | | | | | |
| Net Realized/Unrealized Gains/(Losses) from Investments: | | | | | |
| Net realized gains/(losses) from investments | | | 21,092,686 | | |
| Change in unrealized appreciation/depreciation on investments | | | 16,915,512 | | |
| | | | | | |
| Net realized/unrealized gains (losses) on investments | | | 38,008,198 | | |
| Change in Net Assets Resulting from Operations | | $ | 37,798,555 | | |
| See notes to financial statements. | HSBC FAMILY OF FUNDS | 27 |
HSBC FAMILY OF FUNDS
Statements of Changes in Net Assets
| Opportunity Portfolio |
| For the | For the |
| year ended | year ended |
| October 31, 2017 | October 31, 2016 |
| Investment Activities: | | | | | | | | | | |
| Operations: | | | | | | | | | | |
| Net investment income/(loss) | | $ | (209,643 | ) | | | $ | (23,250 | ) | |
| Net realized gains/(losses) from investments | | | 21,092,686 | | | | | 15,124,128 | | |
| Change in unrealized appreciation/depreciation on investments | | | 16,915,512 | | | | | (22,151,444 | ) | |
| Change in net assets resulting from operations | | | 37,798,555 | | | | | (7,050,566 | ) | |
| Proceeds from contributions | | | 4,637,280 | | | | | 36,125,614 | | |
| Value of withdrawals | | | (55,806,665 | ) | | | | (115,441,791 | ) | |
| Change in net assets resulting from transactions in investors’ beneficial interest | | | (51,169,385 | ) | | | | (79,316,177 | ) | |
| Change in net assets | | | (13,370,830 | ) | | | | (86,366,743 | ) | |
| | | | | | | | | | | |
| Net Assets: | | | | | | | | | | |
| Beginning of period | | | 151,227,999 | | | | | 237,594,742 | | |
| End of period | | $ | 137,857,169 | | | | $ | 151,227,999 | | |
| 28 | HSBC FAMILY OF FUNDS | See notes to financial statements. |
HSBC FAMILY OF FUNDS |
| Financial Highlights |
| | | | | Ratios/Supplementary Data |
| | | | | | | | | | | | Ratio of Net | | Ratio of | | |
| | | | | | | | | | | | Investment | | Expenses | | |
| | | | | | | | | | Ratio of Net | | Income | | to Average | | |
| | | | | Net Assets at | | Expenses to | | (Loss) to | | Net Assets | | |
| | Total | | End of Period | | Average Net | | Average Net | | (Excluding Fee | | Portfolio |
| | Return | | (000’s) | | Assets | | Assets | | Reductions) | | Turnover |
| OPPORTUNITY PORTFOLIO | | | | | | | | | | | | | | | | | | | |
| Year Ended October 31, 2017 | | 29.79 | % | | | $ | 137,857 | | | 0.91% | | | (0.15 | )% | | | 0.91% | | 80% |
| Year Ended October 31, 2016 | | (3.14 | )% | | | | 151,228 | | | 0.89% | | | (0.01 | )% | | | 0.89% | | 96% |
| Year Ended October 31, 2015 | | (1.57 | )% | | | | 237,595 | | | 0.88% | | | (0.19 | )% | | | 0.88% | | 63% |
| Year Ended October 31, 2014 | | 12.26 | % | | | | 222,581 | | | 0.88% | | | (0.37 | )% | | | 0.88% | | 66% |
| Year Ended October 31, 2013 | | 34.84 | % | | | | 227,069 | | | 0.89% | | | 0.17 | % | | | 0.89% | | 70% |
See notes to financial statements. | HSBC FAMILY OF FUNDS 29 |
| HSBC FAMILY OF FUNDS |
Notes to Financial Statements—as of October 31, 2017 |
1. Organization:
The HSBC Funds (the “Trust”), a Delaware statutory trust organized on March 2, 2016, is registered under the Investment Company Act of 1940, as amended (the “Act”), as an open-end management investment company. Effective June 24, 2016, the Portfolio (as defined below), which was a series of HSBC Portfolios, a trust organized under the laws of the State of New York, reorganized with and into a corresponding series of the Trust (the “Reorganization”). The series of the Trust into which the Portfolio reorganized had no assets, liabilities, or operations prior to the Reorganization. Upon completion of the Reorganization, the Portfolio assumed the performance, financial and other historical information of its corresponding predecessor series. As of October 31, 2017, the Trust is composed of 13 separate operational funds, each a series of the HSBC Family of Funds. The accompanying financial statements are presented for the HSBC Opportunity Portfolio (the “Portfolio”).
The Portfolio operates as a master fund in master-feeder arrangements, in which - the Funds invest all or part of their investable assets in the Portfolio. The Agreement and Declaration of Trust permits the Board of Trustees (the “Board”) to issue an unlimited number of beneficial interests in the Portfolio.
The Portfolio is a diversified series of the Trust. Financial statements for all other funds of the Trust are published separately.
The following represents each feeder fund’s proportionate ownership interest in the Portfolio:
| Fund | Proportionate
Ownership
Interest on
October 31, 2017 (%) |
| Opportunity Fund | | 7.2 | |
| Opportunity Fund (Class I) | | 92.8 | |
Under the Trust’s organizational documents, the Trust’s officers and Trustees are indemnified against certain liabilities arising out of the performance of their duties to the Portfolio. In addition, in the normal course of business, the Trust enters into contracts with its service providers, which also provide for indemnifications by the Portfolio. The Portfolio’s maximum exposure under these arrangements is unknown as this would involve future claims that may be made against the Portfolio. However, based on experience, the Trust believes the risk of loss to be remote.
The Portfolio is an investment company and follows accounting and reporting guidance under Financial Accounting Standards Board (“FASB”) Accounting Standards Codification (“ASC”) Topic 946, “Financial Services-Investment Companies.”
2. Significant Accounting Policies:
The following is a summary of the significant accounting policies followed by the Portfolio in the preparation of its financial statements. The policies are in conformity with generally accepted accounting principles (“GAAP”) in the United States of America. The preparation of financial statements requires management to make certain estimates and assumptions that affect the reported amounts of assets and liabilities and disclosure of contingent assets and liabilities at the date of the financial statements and the reported amounts of increases and decreases in net assets from operations during the reporting period. Actual results could differ from those estimates.
Securities Valuation:
The Portfolio records its investments at fair value. Fair value is defined as the price that would be received to sell an asset or paid to transfer a liability in an orderly transaction between market participants at the measurement date. The valuation techniques used to determine fair value are further described in Note 3 below.
| HSBC FAMILY OF FUNDS |
Notes to Financial Statements—as of October 31, 2017 (continued) |
Investment Transactions and Related Income:
Investment transactions are accounted for no later than one business day after trade date. However, for financial reporting purposes, investment transactions are accounted for on trade date. Investment gains and losses are calculated on the identified cost basis. Interest income is recognized on the accrual basis and includes, where applicable, the amortization or accretion of premium or discount based on effective yield. Dividend income is recorded on the ex-dividend date.
The Portfolio makes an allocation of its investment income, expenses and realized gains and losses from securities transactions to its investors in proportion to their investment in the Portfolio on the date of such accrual or gain/loss.
Restricted Securities and Illiquid Securities:
The Portfolio may invest in restricted securities. A restricted security is a security which has been purchased through a private offering and cannot be resold to the general public without prior registration under the Securities Act of 1933 (the “1933 Act”) or pursuant to the resale limitations provided by Rule 144 under the 1933 Act, or another exemption from the registration requirements of the 1933 Act. Certain restricted securities may be resold in transactions exempt from registration, normally to qualified institutional buyers, and may be deemed liquid by the Investment Adviser (as defined in Note 4) based on procedures established by the Board. Therefore, not all restricted securities are considered illiquid. To the extent that the Portfolio purchases securities that are restricted as to resale or for which current market quotations are not available, such securities will be valued based upon all relevant factors as outlined in Securities and Exchange Commission (SEC) Financial Reporting Release No. 1. Disposal of restricted securities may involve time consuming negotiations and expense. Prompt sale at the current valuation may be difficult and could adversely affect the net assets of the Portfolio.
Allocations:
Expenses directly attributable to the Portfolio are charged to the Portfolio. Expenses not directly attributable to the Portfolio are allocated among the Portfolio and applicable series within the Trust in relation to the net assets of each fund, equally to each fund, or another appropriate basis.
Federal Income Taxes:
The Portfolio is treated as a partnership for U.S. federal income tax purposes. Accordingly, the Portfolio passes through all of its net investment income and gains and losses to its feeder funds, and is therefore not subject to U.S. federal income tax. As such, investors in the Portfolio are allocated for tax purposes their respective share of the Portfolio’s ordinary income and realized gains or losses. It is intended that the Portfolio will be managed in such a way that an investor will be able to satisfy the requirements of the Internal Revenue Code, as amended, applicable to regulated investment companies.
Management of the Portfolio has reviewed tax positions taken in tax years that remain subject to examination by all major tax jurisdictions, including federal (i.e., the last four tax year ends and the interim tax period since then, as applicable). Management believes that there is no tax liability resulting from unrecognized tax benefits related to uncertain tax positions taken. Management’s conclusions may be subject to future review based on changes in, or interpretation of, accounting standards or tax laws and regulations.
Recent Accounting Pronouncements:
In October 2016, the SEC released its Final Rules on Investment Company Reporting Modernization (the “Rules”). The Rules introduce two new regulatory reporting forms for investment companies - Form N-PORT and Form N-CEN – and also contain amendments to Regulation S-X which require standardized, enhanced disclosures about derivatives in investment company financial statements, as well as other amendments. The amendments to Regulation S-X became effective for filings made with the SEC after August 1, 2017. The Portfolio’s adoption of these amendments, effective with the financial statements prepared as of October 31, 2017, required additional disclosures reflected herein, but had no effect on the Portfolio’s net assets or results of operations.
| HSBC FAMILY OF FUNDS |
Notes to Financial Statements—as of October 31, 2017 (continued) |
3. Investment Valuation Summary
The valuation techniques employed by the Portfolio, as described below, maximize the use of observable inputs and minimize the use of unobservable inputs in determining fair value. The Portfolio’s investments are classified within the fair value hierarchy based on the lowest level of input that is significant to the fair value measurement. The inputs used for valuing the Portfolio’s investments are summarized in the three broad levels listed below:
| ● | Level 1—quoted prices in active markets for identical assets
|
| ● | Level 2—other significant observable inputs (including quoted prices for similar securities, interest rates, prepayments speeds, credit risk, etc.)
|
| ● | Level 3—significant unobservable inputs (including the Fund’s own assumptions in determining the fair value of investments) |
Changes in valuation techniques may result in transfers in or out of an assigned level within the fair value hierarchy. The Trust’s policy is to disclose transfers between fair value hierarchy levels based on valuations at the end of the reporting period. The inputs or methodology used for valuing investments are not necessarily an indication of the risk associated with investing in those investments. There were no transfers during the year ended October 31, 2017.
Exchange traded domestic equity securities are valued at the last sale price on a national securities exchange (except the NASDAQ Stock Market), or in the absence of recorded sales, at the readily available closing bid price on such exchanges. Securities traded on the NASDAQ Stock Market are valued at the NASDAQ Official Closing Price on the date of valuation. Domestic equity securities that are not traded on an exchange are valued at the quoted bid price in the over-the-counter market. These securities are typically categorized as Level 1 in the fair value hierarchy.
Shares of exchange traded and closed-end registered investment companies are valued in the same manner as other equity securities and are typically categorized as Level 1 in the fair value hierarchy. Mutual funds are valued at their net asset values (“NAVs”), as reported by such companies and are typically categorized as Level 1 in the fair value hierarchy.
Securities or other assets for which market quotations are not readily available, or are deemed unreliable due to a significant event or otherwise, are valued pursuant to procedures adopted by the Board (“Procedures”). Depending on the source and relative significance of valuation inputs, these instruments may be classified as Level 2 or Level 3 in the fair value hierarchy. Examples of potentially significant events that could affect the value of an individual security and thus require pricing under the Procedures include corporate actions by the issuer, announcements by the issuer relating to its earnings or products, regulatory news, natural disasters, and litigation. Examples of potentially significant events that could affect multiple securities held by the Portfolio include governmental actions, natural disasters, and armed conflicts. Fair value pricing may require subjective determinations about the value of a security. While the Trust’s policy is intended to result in a calculation of the Portfolio’s NAV that fairly reflects security values as of the time of pricing, the Trust cannot ensure that fair values determined would accurately reflect the price that the Portfolio could obtain for a security if it were to dispose of that security as of the time of pricing. The prices used by the Portfolio may differ from the value that would be realized if the securities were sold and the differences could be material to the financial statements.
As of October 31, 2017, all investments were categorized as Level 1 in the fair value hierarchy. The breakdown of investment categorization is disclosed in the Schedule of Portfolio Investments.
4. Related Party Transactions and Other Agreements and Plans:
Investment Management:
HSBC Global Asset Management (USA) Inc. (“HSBC” or the “Investment Adviser”), a wholly owned subsidiary of HSBC Bank USA, N.A., a national bank organized under the laws of the United States, acts as Investment Adviser to the Portfolio. As Investment Adviser, HSBC manages the investments of the Portfolio and continuously reviews, supervises, and administers the Portfolio’s investments pursuant to an Investment Advisory Contract. Westfield Capital Management Company, L.P. (“Westfield”) serves as subadviser for the Portfolio and is paid for its services directly by the Portfolio.
| HSBC FAMILY OF FUNDS |
Notes to Financial Statements—as of October 31, 2017 (continued) |
For their services, the Investment Adviser and Westfield receive in aggregate, a fee, accrued daily and paid monthly, at an annual rate of 0.80% of the Portfolio’s average daily net assets. Currently, the Investment Adviser’s contractual fee is 0.25% and Westfield’s contractual fee is 0.55%.
Administration:
HSBC also serves the Portfolio as Administrator. Under the terms of the Administration Services Agreement, HSBC receives from the Portfolio (as well as other funds in the Trust combined) a fee, accrued daily and paid monthly, at an annual rate of:
| Based on Average Daily Net Assets of | | Fee Rate (%) |
| Up to $10 billion | | 0.0400 |
| In excess of $10 billion but not exceeding $20 billion | | 0.0350 |
| In excess of $20 billion but not exceeding $50 billion | | 0.0265 |
| In excess of $50 billion | | 0.0245 |
The fee rates and breakpoints are determined on the basis of the aggregate average daily net assets of the Trust, however, the assets of the funds of the HSBC Funds that invest in the Portfolio are not double-counted. For the year ended October 31, 2017, the effective annualized rate was 0.039%, prior to any fee waivers or expense reimbursements, based on the average daily net assets of the Trust. The total administration fee paid to HSBC is allocated to each series based upon its proportionate share of the aggregate net assets of the Trust. For assets invested in the Portfolio by the HSBC Funds, the Portfolio pays half of the administration fee and the feeder funds pay half of the administration fee, for a combination of the total fee rate set forth above.
Pursuant to a Sub-Administration Services Agreement with HSBC, Citi Fund Services Ohio, Inc. (“Citi”), a wholly-owned subsidiary of Citigroup, Inc., serves as the Trust’s Sub-Administrator. For these services, Citi is entitled to a fee, payable by HSBC, at an annual rate equivalent to the fee rates set forth above subject to certain reductions associated with services provided to new funds, minus 0.02% which is retained by HSBC.
Under a Compliance Services Agreement between the Trust and Citi (the “CCO Agreement”), Citi makes an employee available to serve as the Trust’s Chief Compliance Officer (the “CCO”). Under the CCO Agreement, Citi also provides infrastructure and support in implementing the written policies and procedures comprising the Trust’s compliance program, including support services to the CCO. For the services provided under the CCO Agreement, the Trust paid Citi $312,739 for the year ended October 31, 2017, plus reimbursement of certain out-of-pocket expenses. Expenses incurred by the Portfolio are reflected on the Statements of Operations as “Compliance Services.” Citi pays the salary and other compensation earned by individuals performing these services, as employees of Citi.
Fund Accounting:
Citi provides fund accounting services for the Portfolio. For its services to the Portfolio, Citi receives an annual fee per portfolio, including reimbursement of certain expenses that, is accrued daily and paid monthly. Citi receives additional fees paid by the Trust for regulatory administration services.
Independent Trustees:
The Trust pays an annual retainer to each Independent Trustee, plus additional annual retainers to each Committee Chair and the Chairman of the Board. The Independent Trustees also receive a fee for each regular, special in-person, and telephonic meeting of the Board of Trustees attended. The aggregate amount of the fees and expenses of the Independent Trustees are allocated amongst all the funds in the Trust and are presented in the Statements of Operations.
| HSBC FAMILY OF FUNDS |
Notes to Financial Statements—as of October 31, 2017 (continued) |
Other:
The Portfolio may purchase securities from an underwriting syndicate in which the principal underwriter or members of the syndicate are affiliated with the Adviser. For the year ended October 31, 2017, the Portfolio did not purchase any such securities.
The Adviser and its affiliates may have lending, banking, brokerage, underwriting, or other business relationships with the issuers of the securities in which the Portfolio invest.
5. Investment Transactions:
Cost of purchases and proceeds from sales of securities (excluding securities maturing less than one year from acquisition) for the year ended October 31, 2017 were as follows:
| | Purchases ($) | | Sales ($) |
| Opportunity Portfolio | | 111,468,087 | | 157,319,552 |
6. Federal Income Tax Information:
At October 31, 2017, the cost basis of investments for federal income tax purposes, gross unrealized appreciation, gross unrealized depreciation and net unrealized appreciation/depreciation were as follows:
| | | | Tax Unrealized | | Tax Unrealized | | Net Unrealized
Appreciation/ |
| | Tax Cost ($) | | Appreciation ($) | | Depreciation ($) | | (Depreciation) ($)* |
| Opportunity Portfolio | | 115,760,313 | | 26,117,316 | | (4,250,005) | | 21,867,311 |
____________________
| * | The difference between book-basis unrealized appreciation (depreciation) is attributable primarily to tax deferral of losses on wash sales. |
7. Investment Risks:
Equity Securities Risk: The prices of equity securities fluctuate from time to time based on changes in a company’s financial condition or overall market and economic conditions. As a result, the value of equity securities may fluctuate drastically from day to day.
Foreign Securities Risk: Investments in foreign securities are generally considered riskier than investments in U.S. securities. Foreign securities, including those of emerging and frontier market issuers, are subject to additional risks, including international trade, political and regulatory risks.
High-Yield Securities Risk: Investments in high-yield securities (commonly referred to as “junk bonds”) are considered speculative investments and have significantly higher credit risk than investment-grade securities and tend to be less liquid than higher rated securities. The prices of high-yield securities, which may be more volatile than higher rated securities of similar maturity, may be more vulnerable to adverse market, economic, social or political conditions.
Interest Rate Risk: Fluctuations in interest rates may affect the yield, liquidity and value of investments in income producing or debt instruments. Generally, if interest rates rise, the value of such investments will fall. The risks associated with rising interest rates are heightened given that interest rates are near historic lows, but are expected to increase in the future, with unpredictable effects on the markets and the Portfolio’s investments.
8. Subsequent Events:
Management has evaluated subsequent events through the date these financial statements were issued. Based on the evaluation, no adjustments or additional disclosures were required to the financial statements as of October 31, 2017
Report of Independent Registered Public Accounting Firm
To the Board of Trustees of HSBC Funds and Shareholders of
HSBC Opportunity Portfolio
In our opinion, the accompanying statement of assets and liabilities, including the schedule of portfolio investments, and the related statements of operations and of changes in net assets and the financial highlights present fairly, in all material respects, the financial position of the HSBC Opportunity Portfolio (one of the portfolios constituting HSBC Funds, hereafter referred to as the “Fund”) as of October 31, 2017, the results of its operations for the year then ended, the changes in its net assets for each of the two years in the period then ended and the financial highlights for each of the three years in the period then ended, in conformity with accounting principles generally accepted in the United States of America. These financial statements and financial highlights (hereafter referred to as “financial statements”) are the responsibility of the Fund’s management. Our responsibility is to express an opinion on these financial statements based on our audits. We conducted our audits of these financial statements in accordance with the standards of the Public Company Accounting Oversight Board (United States). Those standards require that we plan and perform the audit to obtain reasonable assurance about whether the financial statements are free of material misstatement. An audit includes examining, on a test basis, evidence supporting the amounts and disclosures in the financial statements, assessing the accounting principles used and significant estimates made by management, and evaluating the overall financial statement presentation. We believe that our audits, which included confirmation of securities as of October 31, 2017 by correspondence with the custodian and brokers, provide a reasonable basis for our opinion. The financial statements as of and for the year ended October 31, 2014 and the financial highlights for each of the periods ended on or prior to October 31, 2014 (not presented herein, other than the financial highlights) were audited by other auditors whose report dated December 23, 2014 expressed an unqualified opinion on those financial statements and financial highlights.
PricewaterhouseCoopers LLP
New York, New York
December 21, 2017
| HSBC FAMILY OF FUNDS |
| Table of Shareholder Expenses—as of October 31, 2017 (Unaudited) |
As a shareholder of the Portfolio, you incur ongoing costs, including management fees and other Fund expenses.
These examples are intended to help you understand your ongoing costs (in dollars) of investing in the Portfolio and to compare these costs with the ongoing costs of investing in other mutual funds.
These examples are based on an investment of $1,000 invested at the beginning of the period and held for the entire period from May 1, 2017 through October 31, 2017.
Actual Example
The table below provides information about actual account values and actual expenses. You may use the information below, together with the amount you invested, to estimate the expenses that you paid over the period. Simply divide your account value by $1,000 (for example, an $8,600 account value divided by $1,000 = 8.6), then multiply the result by the number in the table under the heading entitled “Expenses Paid During Period” to estimate the expenses you paid on your account during this period.
| | | | | | | | Annualized |
| | Beginning | | Ending | | Expenses Paid | | Expense Ratio |
| | Account Value | | Account Value | | During Period* | | During Period |
| | 5/1/17 | | 10/31/17 | | 5/1/17 - 10/31/17 | | 5/1/17 - 10/31/17 |
| Opportunity Portfolio | | $1,000.00 | | $1,096.10 | | $4.75 | | 0.90% |
____________________
| * | Expenses are equal to the average account value over the period, multiplied by the Portfolio’s annualized expense ratio, multiplied by 184/365 (to reflect the one half year period). |
Hypothetical Example for Comparison Purposes
The table below provides information about hypothetical account values and hypothetical expenses based on each Portfolio’s actual expense ratio and an assumed rate of return of 5% per year before expenses, which is not the Portfolio’s actual return. The hypothetical account values and expenses may not be used to estimate the actual ending account balance or expenses you paid for the period. You may use this information to compare this 5% hypothetical example with the 5% hypothetical examples that appear in the shareholder reports of other funds.
Please note that the expenses shown in the table are meant to highlight your ongoing costs only and do not reflect any transactional costs, such as sales charges (loads), redemption fees, or exchange fees. Therefore, the table is useful in comparing ongoing costs only, and will not help you determine the relative total costs of owning different funds. In addition, if these transactional costs were included, your costs would have been higher.
| | | | | | | | Annualized |
| | Beginning | | Ending | | Expenses Paid | | Expense Ratio |
| | Account Value | | Account Value | | During Period* | | During Period |
| | 5/1/17 | | 10/31/17 | | 5/1/17 - 10/31/17 | | 5/1/17 - 10/31/17 |
| Opportunity Portfolio | | $1,000.00 | | $1,020.67 | | $4.58 | | 0.90% |
____________________
| * | Expenses are equal to the average account value over the period, multiplied by the Portfolio’s annualized expense ratio, multiplied by 184/365 (to reflect the one half year period). |
| HSBC FAMILY OF FUNDS |
| Board of Trustees and Officers (Unaudited) |
MANAGEMENT OF THE TRUST
The following table contains information regarding the HSBC Family of Funds’ Board of Trustees (“Trustees”). The HSBC Family of Funds’ Statement of Additional Information includes additional information about the Trustees and is available, without charge, upon request by calling (888) 525-5757.
Name,
Address, Age | | Position(s)
Held with
Funds | | Term of Office
and Length of
Time Served | | Principal Occupation(s)
During Past 5 Years | | Portfolios in
Fund Complex
Overseen By
Trustee* | | Other
Directorships
Held by Trustee
During Past 5 Years |
NON-INTERESTED
TRUSTEES | | | | | | | | | | |
| | | | | | | | | | | |
MARCIA L. BECK
P.O. Box 182845
Columbus, OH
43218-3035
Age: 62 | | Trustee | | Indefinite;
2008 to
present | | Private Investor (1999 – present) | | 13 | | None |
| | | | | | | | | | | |
SUSAN C. GAUSE
P.O. Box 182845
Columbus, OH
43218-3035
Age: 65 | | Trustee | | Indefinite;
2013 to
present | | Private Investor (2003 - present) | | 13 | | Metropolitan Series Fund
(2012 – present); and Met
Investors Series
Trust (2008 – present) |
| | | | | | | | | | |
SUSAN S. HUANG
P.O. Box 182845
Columbus, OH
43218-3035
Age: 63 | | Trustee | | Indefinite;
2008 to
present | | Private Investor (2000 - present) | | 13 | | None |
| | | | | | | | | | | |
THOMAS F. ROBARDS
P.O. Box 182845
Columbus, OH
43218-3035
Age: 71 | | Chairman and
Trustee | | Indefinite;
2005 to
present | | Private Investor (2003 - present) | | 13 | | Ellington Residential
Mortgage REIT (NYSE
listed real estate
investment trust)
(2013 – present);
Ellington Financial LLC
(NYSE listed financial
services company)
(2007 – present); and
Overseas Shipholding
Group (OSG)
(NYSE listed company)
(2005 – 2014) |
| | | | | | | | | | | |
| INTERESTED TRUSTEE | | | | | | | | | | |
| | | | | | | | | | | |
DEBORAH HAZELL
452 Fifth Avenue
New York
NY 10018
Age: 54 | | Trustee | | Indefinite;
2011 to
present | | Director and Chief Executive Officer, HSBC Global Asset Management (USA) Inc. (2011 - present); President and Chief Executive Officer, Fisher Francis Trees & Watts (“FFTW”) (investment adviser) (2008 - 2011) | | 13 | | None |
____________________
| * | Includes all series of the HSBC Funds. |
| HSBC FAMILY OF FUNDS |
| Board of Trustees and Officers (Unaudited) (continued) |
| Name, Address, Age | | Position(s) Held
Funds | | Term of Office and
Length of Time Served | | Principal Occupation(s)
During Past 5 Years |
| OFFICERS | | | | | | |
| | | | | | | |
RICHARD A. FABIETTI
452 Fifth Avenue
New York, NY 10018
Age: 59 | | President | | One year;
2004 to present | | Senior Vice President, HSBC Global Asset Management (USA) Inc. (1998 - present) |
| | | | | | | |
JAMES D. LEVY
452 Fifth Avenue
New York, NY 10018
Age: 54 | | Vice President | | One year;
2014 to present | | Vice President, Product Management, HSBC Global Asset Management (USA) Inc. (2014 – present); Vice President, Mutual Funds Product Development, GE Asset Management Inc. (2007 – 2014) |
| | | | | | | |
ALLAN SHAER*
Prudential Center
800 Boylston Street, 24th Floor
Boston, MA 02199
Age: 52
| | Treasurer | | One year;
2017 to present | | Senior Vice President, Citi Investor Services (2016 - present); Vice President, Mutual Fund Administration, JP Morgan Chase (2011 - 2016) |
| | | | | | | |
IOANNIS TZOUGANATOS*
Prudential Center
800 Boylston Street, 24th Floor
Boston, MA 02199
Age: 41 | | Secretary | | One Year;
2015 to present | | Vice President, Regulatory Administration, Citi Fund Services (2008 - present) |
| | | | | | | |
CHARLES BOOTH*
4400 Easton Commons,
Suite 200
Columbus, OH 43219-3035
Age: 57 | | Chief Compliance
Officer | | One year;
2015 to present | | Director and Compliance Officer, CCO Services, Citi Fund Services (1988 - present) |
____________________
| * | Mr. Shaer, Mr. Tzouganatos, and Mr. Booth also are officers of other investment companies of which Citi (or an affiliate) is the administrator or sub-administrator. |
| HSBC FAMILY OF FUNDS |
| Other Information (Unaudited) |
Other Information (Unaudited):
Information regarding how the Funds voted proxies relating to portfolio securities during the most recent 12-month period ended June 30th is available (i) without charge, upon request, by calling 1-800-525-5757 for HSBC Bank USA and HSBC Brokerage (USA) Inc. clients and 1-800-782-8183 for all other shareholders; (ii) on the Funds’ website at www.investorfunds.us.hsbc.com; and (iii) on the Security and Exchange Commission’s (“Commission”) website at http://www.sec.gov.
The Funds file their complete schedules of portfolio holdings with the Commission for the first and third quarters of each fiscal year on Form N-Q. The Funds’ Forms N-Q are available on the Commission’s website at http://www.sec.gov. The Funds’ Forms N-Q may be reviewed and copied at the Commission’s Public Reference Room in Washington, D.C. and information on the operation of the Public Reference Room may be obtained by calling 1-800-SEC-0330. The Funds’ Schedules of Investments will be available no later than 60 days after each period end, without charge, on the Funds’ website at www.investorfunds.us.hsbc.com.
An investment in a Fund is not a deposit of HSBC Bank USA, National Association, and is not insured or guaranteed by the Federal Deposit Insurance Corporation or any other government agency.
HSBC FAMILY OF FUNDS: INVESTMENT ADVISER AND ADMINISTRATOR HSBC Global Asset Management (USA) Inc.
452 Fifth Avenue
New York, NY 10018 SUB-ADVISERS HSBC Opportunity Portfolio
Westfield Capital Management Company, L.P.
One Financial Center
Boston, MA 02111 | SHAREHOLDER SERVICING AGENTS For HSBC Bank USA, N.A. and
HSBC Securities (USA) Inc. Clients HSBC Bank USA, N.A.
452 Fifth Avenue
New York, NY 10018
1-888-525-5757 For All Other Shareholders HSBC Funds
P.O. Box 8106
Boston, MA 02266-8106
1-800-782-8183 TRANSFER AGENT Boston Financial Data Services, Inc.
2000 Crown Colony Drive
Quincy, MA 02169 DISTRIBUTOR Foreside Distribution Services, L.P.
Three Canal Plaza, Suite 100
Portland, ME 04101 CUSTODIAN The Northern Trust Company
50 South LaSalle Street
Chicago, IL 60603 INDEPENDENT REGISTERED PUBLIC ACCOUNTING FIRM PricewaterhouseCoopers LLP
300 Madison Avenue
New York, NY 10017 LEGAL COUNSEL Dechert LLP
1900 K Street, N.W.
Washington, D.C. 20006 |

| Investment products: |
ARE NOT A
BANK DEPOSIT
OR OBLIGATION
OF THE BANK
OR ANY OF ITS
AFFILIATES | ARE NOT
FDIC
INSURED | ARE NOT
INSURED BY
ANY FEDERAL
GOVERNMENT
AGENCY |
ARE NOT GUARANTEED BY
THE BANK OR ANY OF ITS
AFFILIATES | MAY LOSE
VALUE |
Investment products are offered by HSBC Securities (USA) Inc. (HSI), member NYSE/FINRA/SIPC. HSI is an affiliate of HSBC Bank USA, N.A. Investment products: Are not a deposit or other obligation of the bank or any of its affiliates; Not FDIC insured or insured by any federal government agency of the United States; Not guaranteed by the bank or any of its affiliates; and are subject to investment risk, including possible loss of principal invested.
Investors should consider the investment objectives, risks, charges, and expenses of the investment company carefully before investing. The prospectus contains this and other important information about the investment company. For clients of HSBC Securities (USA) Inc., please call 1-888-525-5757 for more information. For other investors and prospective investors, please call the Funds directly at 1-800-782-8183 or visit our website at www.investorfunds.us.hsbc.com. Investors should read the prospectus carefully before investing or sending money.
HSBC Global Asset Management (USA) Inc.
HSBC Funds
Annual Report
October 31, 2017
| GLOBAL FUNDS | Class A | | Class I |
| HSBC Emerging Markets Debt Fund | HCGAX | | HCGIX |
| HSBC Frontier Markets Fund | HSFAX | | HSFIX |
| HSBC Total Return Fund | HTRAX | | HTRIX |
| HSBC Asia ex-Japan Smaller Companies Equity Fund | HAJAX | | HAJIX |
| HSBC Global High Yield Bond Fund | HBYAX | | HBYIX |
| HSBC Global High Income Bond Fund | HBIAX | | HBIIX |
| HSBC Global Equity Volatility Focused Fund | HGEAX | | HGEIX |
| HSBC Euro High Yield Bond Fund (USD Hedged) | HEYAX | | HEYIX |

| Table of Contents |
| HSBC Family of Funds |
| Annual Report - October 31, 2017 |
| Glossary of Terms | 2 |
| Commentary From the Investment Manager | 3 |
| Portfolio Reviews | 4 |
| Portfolio Composition | 20 |
| | |
| Schedules of Portfolio Investments | |
| HSBC Emerging Markets Debt Fund | 23 |
| HSBC Frontier Markets Fund | 31 |
| HSBC Total Return Fund | 33 |
| HSBC Asia ex-Japan Smaller Companies Equity Fund | 40 |
| HSBC Global High Yield Bond Fund | 43 |
| HSBC Global High Income Bond Fund | 54 |
| HSBC Global Equity Volatility Focused Fund | 65 |
| HSBC Euro High Yield Bond Fund (USD Hedged) | 67 |
| Statements of Assets and Liabilities | 72 |
| Statements of Operations | 76 |
| Statements of Changes in Net Assets | 78 |
| Financial Highlights | 86 |
| Notes to Financial Statements | 94 |
| Report of Independent Registered Public Accounting Firm | 122 |
| Other Federal Income Tax Information | 123 |
| Table of Shareholder Expenses | 124 |
| Board of Trustees and Officers | 126 |
| Other Information | 128 |
Beta measures a fund’s risk in relation to the market. A beta of 0.8 means the fund’s total return is likely to move up or down 80% of the market change; 1.25 means total return is likely to move up or down 25% more than the market.
Bloomberg Barclays High Income Bond Composite Index is a customized index that is close to equally weighted across US, Euro and Emerging Markets. Components 35% Bloomberg Barclays USD Unhedged Emerging Markets Aggregate Index, 15% Bloomberg Barclays U.S. High Yield Ba Index, 20% Bloomberg Barclays U.S. Credit Baa Index, 15% Bloomberg Barclays EuroAgg Corporate Baa USD Hedged Index, and 15% Bloomberg Barclays Pan Euro HY (Euro) BB Rating Only USD Hedged Index.
Bloomberg Barclays Global Aggregate Bond Index is an index that is a measure of global investment-grade debt from 24 local currency markets, which include treasury, government-related, corporate, and securitized fixed-rate bonds from both developed and emerging markets issuers.
Emerging Markets Debt Composite Index is a blended index comprised of 50% J.P. Morgan Emerging Markets Bond Index Global and 50% J.P. Morgan Government Bond Index-Emerging Markets Global Diversified.
Gross Domestic Product (“GDP”) is the value of goods and services produced in a given country in a given year.
ICE BofA Merrill Lynch 3-Month LIBOR Constant Maturity Index tracks the performance of a synthetic asset paying LIBOR to a stated maturity. The index is based on the assumed purchase at par of a synthetic instrument having exactly its stated maturity and with a coupon equal to that days fixing rate. That issue is assumed to be sold the following business day (priced at a yield equal to the current day fixing rate) and rolled into a new instrument.
ICE BofA Merrill Lynch BB-B Euro High Yield Constrained (USD Hedged) Index contains all securities in the BofA Merrill Lynch U.S. High Yield Index rated BB+ through B- by S&P (or equivalent as rated by Moody’s or Fitch), but caps issuer exposure at 3%.
ICE BofA Merrill Lynch BB-B Global High Yield Constrained Index tracks the performance of the United States Dollar, Canadian Dollar, British Pound, and Euro denominated below investment-grade corporate debt publicly issued in the major domestic or Eurobond markets.
ISM Manufacturing Index is based on surveys of more than 300 manufacturing firms by the Institute of Supply Management. The ISM Manufacturing Index monitors employment, production, inventories, new orders, and supplier deliveries. A composite diffusion index monitors conditions in national manufacturing and is based on the data from these surveys.
J.P. Morgan Emerging Markets Bond Index Global tracks returns for USD-denominated debt instruments issued by emerging market sovereign and quasi-sovereign entities, Brady bonds, loans, Eurobonds, and local market instruments.
J.P. Morgan Government Bond Index-Emerging Markets Global Diversified is a comprehensive global emerging markets fixed income index that consists of regularly traded, liquid fixed-rate, domestic currency government bonds to which international investors can gain exposure.
MSCI All Country Asia ex Japan Small Cap Index is a free float-adjusted market capitalization-weighted small call index of the stock markets of two developed markets countries: Hong Kong and Singapore, and nine emerging markets countries: China, India, Indonesia, Korea, Malaysia, Pakistan, Philippines, Taiwan and Thailand.
MSCI All Country World Daily Total Return Index (Net USD) (“MSCI ACWI (Net USD)”) is an equity index which captures the large- and mid-cap representation across 23 developed markets countries – Australia, Austria, Belgium, Canada, Denmark, Finland, France, Germany, Hong Kong, Ireland, Israel, Italy, Japan, Netherlands, New Zealand, Norway, Portugal, Singapore, Spain, Sweden, Switzerland, the UK and the US – and 23 emerging markets countries – Brazil, Chile, China, Colombia, Czech Republic, Egypt, Greece, Hungary, India, Indonesia, Korea, Malaysia, Mexico, Peru, Philippines, Poland, Russia, Qatar, South Africa, Taiwan, Thailand, Turkey and United Arab Emirates.
MSCI Emerging Markets (“MSCI EM”) Index captures the large- and mid-cap representation across 24 emerging markets countries: Brazil, Chile, China, Colombia, Czech Republic, Egypt, Greece, Hungary, India, Indonesia, Korea, Malaysia, Mexico, Pakistan, Peru, Philippines, Poland, Qatar, Russia, South Africa, Taiwan, Thailand, Turkey and United Arab Emirates.
MSCI Europe Australasia and Far East (“MSCI EAFE”) Index captures the large- and mid-cap representation across the following developed markets countries: Australia, Austria, Belgium, Denmark, Finland, France, Germany, Hong Kong, Ireland, Israel, Italy, Japan, the Netherlands, New Zealand, Norway, Portugal, Singapore, Spain, Sweden, Switzerland and the UK.
MSCI Frontier Markets Index is a free float-adjusted market capitalization index that is designed to measure equity market performance of frontier markets. The index consists of 29 frontier markets country indices.
MSCI Select Frontier & Emerging Markets Capped Index is a version of the MSCI Frontier Index (capped), which also includes raises the initial cap of the 6 crossover countries to 30% and includes Qatar and United Arab Emirates.
Standard & Poor’s 500 (“S&P 500”) Index is widely regarded as a gauge of the U.S. equities market. This index includes 500 leading companies in leading industries of the U.S. economy. The S&P 500 Index focuses on the large-cap segment of the market, with approximately 80% coverage of U.S. equities.
Securities indices are unmanaged and assume reinvestment of all distributions and interest payments and do not take in account brokerage fees or expenses. Securities in the Funds do not match those in the indices and performance of the Funds will differ. Investors cannot invest directly in an index.
| Commentary From the Investment Manager |
| HSBC Global Asset Management (USA) Inc. |
Global Economic Review
The global economy experienced broad growth over the 12-month period from November 1, 2016, through October 31, 2017. Although there was much geopolitical turmoil and uncertainty, investor sentiment was buoyed by healthy corporate profits, supportive monetary policy, tightening labor markets and other positive economic data. Major economies experienced improvements to credit and labor conditions and major central banks continued to normalize monetary policy at a gradual pace. A synchronized economic expansion in both developed and emerging economies helped lift major market indices around the world to near record highs by the end of the period.
Early in the period, global markets were shocked by the surprise results of the November U.S. presidential elections. Positive economic data had already been pushing markets along a positive trajectory in the final months of the previous period, but the election outcome triggered an intense rally as investors grew increasingly optimistic that the new administration would follow through on campaign promises perceived as accommodative for business. The prospect of tax reform, reduced regulations and streamlined fossil fuel energy production continued to drive significant market gains throughout the period.
A rising tide of nationalist populism throughout the U.S. and Europe raised concerns among global investors. The prospect of a new era of protectionist trade policies and political unpredictability remained top-of-mind for investors throughout the period. These concerns eased somewhat after the electoral victories of centrist candidates, including the May election victory of Emmanuel Macron in the French presidential elections and the September reelection of Chancellor Angela Merkel in Germany. Even so, the changing political dynamics remained as President Trump moved forward with policies that rattled global trade and mobility, including withdrawing the U.S. from the Trans-Pacific Partnership, renegotiating the terms of the North American Free Trade Agreement and restricting immigration.
Geopolitical developments were also a source of investor uncertainty during the period and a drag on certain economies and sectors. Among the most notable events were tensions over North Korea’s continued efforts to develop its nuclear weapons capabilities, political turmoil in Turkey in April and an attempt by Catalans to declare independence from Spain in October.
The U.S. Federal Reserve (the Fed) increased its federal funds rate three times during the 12-month period, increasing its target range from 0.50% to 1.25%. The Fed also initiated its plan to scale back its monetary stimulus efforts adopted during the financial crisis in 2008.
Growth in the U.S. gross domestic product (GDP1) slowed modestly in the first two quarters of the period but then picked up significantly near the end. Preliminary estimates suggest that faster growth continued through the third quarter of 2017. Economic data in the U.S. was generally strong during the period, showing robust corporate earnings, a healthy labor market and an increase in consumer discretionary spending. The domestic unemployment rate dropped to a 16-year low and the Institute of Supply Management Manufacturing Index1 climbed to a 13-year high.
Contributors to economic growth in many economies, including in the U.S., were increases in manufacturing activity and exports. This was partly driven by an uptick in demand for imports from China.
China’s economy continued to grow at a relatively slow pace in comparison to previous years. The meeting of China’s National Congress indicated that the government was shifting from an emphasis on short-term growth objectives to a goal of sustainable economic development facilitated by political and economic reforms.
Eurozone economies also experienced solid growth as they continued to benefit from improving credit conditions and easing fiscal austerity by many of its component governments. The European Central Bank announced it would extend its quantitative easing program and implied that rates would remain low in the near term.
The Bank of Japan continued its extremely loose monetary policy and fiscal stimulus efforts with mixed results. GDP growth maintained its momentum, but declining exports and slow wage growth were among the signs indicating the Japanese economy continued to improve at a relatively sluggish pace.
Energy and metal prices climbed significantly during the period, while agricultural commodities generally slumped. Crude oil prices hit a two-year high late in the period, driven by declining global inventories and slower growth of U.S. production.
Global inflation increased very slightly during the period. The U.S. dollar weakened during the first several months of 2017 and ended the period lower than it had started. The weakening of the dollar provided a boost to U.S. exports and offered relief to countries such as Mexico, Turkey, and Indonesia that hold high levels of U.S. dollar-denominated debt.
Market Review
Global equity markets delivered strong returns during the period while showing exceptionally low volatility. Stocks rallied immediately after the election of President Trump and continued to rise somewhat steadily throughout 2017 with positive economic data adding to the momentum. Geopolitical tension and a lack of momentum in U.S. domestic policy initiatives eventually weighed on investor sentiment, but improving economic fundamentals in the Eurozone helped offset those growing concerns. The Fed’s commitment to gradually scaling back its monetary stimulus, along with new proposals for tax reform legislation, also supported gains for stocks.
Emerging markets equities began the period with a selloff triggered by concerns over U.S. trade protectionism and a strengthening U.S. dollar. The tide turned in 2017, however, as the U.S. dollar weakened and fears about the impact of changing trade policy subsided. Moreover, demand for emerging markets equities was supported through the period by relatively cheap valuations compared to developed market stocks.
The MSCI Emerging Markets Index1 (MSCI EM) hit a three-year high in September. However, emerging markets equities pulled back somewhat late in the period due to concerns that the proposed tax reform in the U.S. would repatriate dollars and draw capital out of developing countries. The MSCI EM Index returned 26.91% during the fiscal year compared to a 24.01% gain for the MSCI EAFE Index1 of international stocks in developed markets, for the same period.
U.S. equities posted strong gains similar to those of other developed economies during the period. The S&P 500 Index1 of large-cap stocks returned 23.63%.
Global fixed income markets posted modest gains during the period as investors favored equities in an environment of global economic expansion, perceived risk of inflation and gradual monetary policy normalization. Yields and credit spreads across bond sectors remained low relative to history. The Bloomberg Barclays Global Aggregate Bond Index1, which tracks investment-grade debt in 24 local currency markets, returned 1.18% during the period while the J.P. Morgan Emerging Market Bond Index Global1 returned 5.89%. Yields on U.S. government debt rose during the period.
1 For additional information, please refer to the Glossary of Terms.
| Portfolio Reviews (Unaudited) |
HSBC Emerging Markets Debt Fund
(Class A Shares and Class I Shares) |
by Nishant Upadhyay, Senior Vice President, Head of Emerging Markets Debt Portfolio Management
Zeke Diwan, Senior Vice President/Senior Portfolio Manager
Billy Lang, Vice President/Portfolio Manager
The HSBC Emerging Markets Debt Fund (the “Fund”) seeks to maximize total return (comprised of capital appreciation and income). Under normal market conditions, the Fund invests at least 80% of its net assets, plus borrowings for investment purposes, in fixed income instruments of issuers that economically are tied to emerging markets. The Fund will invest in instruments issued by foreign governments, government agencies and corporations. The Fund generally invests in both U.S. dollar denominated instruments as well as emerging market local currency denominated instruments.
Investment Concerns
There is no assurance that a portfolio will achieve its investment objective or will work under all market conditions. The value of investments may go down as well as up and you may not get back the amount originally invested. Portfolios may be subject to certain additional risks, which should be considered carefully along with their investment objectives and fees. Investments in foreign markets entail special risks such as currency, political, economic, and market risks. The risks of investing in emerging markets countries are greater than the risks generally associated with foreign investments. Fixed income securities are subject to credit and interest rate risk. Credit risk refers to the ability of an issuer to make timely payments of interest and principal. Interest rate risk refers to fluctuations in the value of a fixed income security resulting from changes in the general level of interest rates. In a declining interest rate environment, the portfolio may generate less income. In a rising interest rate environment, bond prices may fall. Investments in high-yield securities are often considered speculative investments and have significantly higher credit risk than investment-grade securities. The prices of high-yield securities, which may be less liquid than higher-rated securities, may be more vulnerable to adverse market, economic or political conditions. Non-diversified funds focus investments in a small number of issuers, industries, foreign currencies or particular countries or regions, which increase the risks associated with a single economic, political, or regulatory occurrence. Derivatives may be riskier than other types of investments and could result in losses that significantly exceed the Fund’s original investment.
For a complete description of these and other risks associated with investment in a mutual fund, please refer to the Fund’s prospectus.
Market Commentary
For the year ended October 31, 2017, the Fund returned 5.29% (without sales charge) for the Class A Shares and 5.57% for the Class I Shares. That compared to a 5.45% total return for the Fund’s benchmark, the Emerging Markets Debt Composite Index1 (a blend of (50%) J.P. Morgan Emerging Markets Bond Index Global and (50%) J.P. Morgan Government Bond Index-Emerging Markets Global Diversified), the J.P. Morgan Emerging Markets Bond Index Global1 had a total return of 5.89%, and the J.P. Morgan Government Bond Index-Emerging Markets Global Diversified1 had a return of 5.18%, respectively, for the same period.
Portfolio Performance
Emerging markets debt (EMD) generated positive returns during the 12-month period ended October 31, 2017, driven by attractive yields in the asset class and relatively low volatility. Investors also reacted positively to improving fundamentals in many emerging markets (EM) countries.
The Fund held a defensive approach to duration and spread duration during the 12-month period given the risk of increases in U.S. Treasury yields, which would have an adverse effect on EMD assets, and tighter valuations across the asset class. While this cautious positioning limited gains for most of the period, it was beneficial during the market sell-off in November.†
On April 7, 2017, the Fund merged with the HSBC Emerging Markets Local Debt Fund and revised its benchmark to a 50%-50% composite of the J.P, Morgan Emerging Markets Bond Index Global – a hard currency benchmark – and the J.P. Morgan Government Bond Index-Emerging Markets Global Diversified – a local currency benchmark. Prior to this date, the Fund’s investments were primarily comprised of U.S. dollar denominated instruments issued by foreign governments and corporations.
From a country perspective, the Fund’s above-benchmark exposure to higher beta1 countries added to relative results before and after the acquisition of the HSBC Emerging Markets Local Debt Fund. Specifically, investments in Brazil benefited from a political shift toward a reform agenda. The Fund’s underweight exposure to expensive, lower beta1 countries, including China and the Philippines, also helped performance.†
Following the acquisition, the Fund’s overweight positioning to Turkish hard currency, local rates and currency was a significant driver of returns with the improving political and fiscal landscape in Turkey. Investments in Mexico also contributed to relative performance.†
The Fund’s focus on shorter-dated hard currency bonds in Hungary and Indonesia detracted from relative performance. An underweight to Ukraine also detracted from performance as the country benefited from International Monetary Fund support throughout the period.†
The Fund benefited from the use of derivatives during the period, including forward currency exchange contracts, interest rate swaps, and credit default swaps. However, a short position in CDX, an index of credit default swaps used to hedge the risk of spread levels increasing, detracted during the period.†
† Portfolio composition is subject to change.
1 For additional information, please refer to the Glossary of Terms.
Past performance does not guarantee future results. The performance data quoted represents past performance and current returns may be lower or higher. Total return figures include change in share price, reinvestment of dividends and capital gains and do not reflect taxes that a shareholder would pay on Fund distributions or on the redemption of Fund shares. Investment return and principal value will fluctuate so that an investor’s shares, when redeemed may be worth more or less than the original cost. To obtain performance information current to the most recent month end, please call 1-800-782-8183.
| Portfolio Reviews (Unaudited) |
| HSBC Emerging Markets Debt Fund |
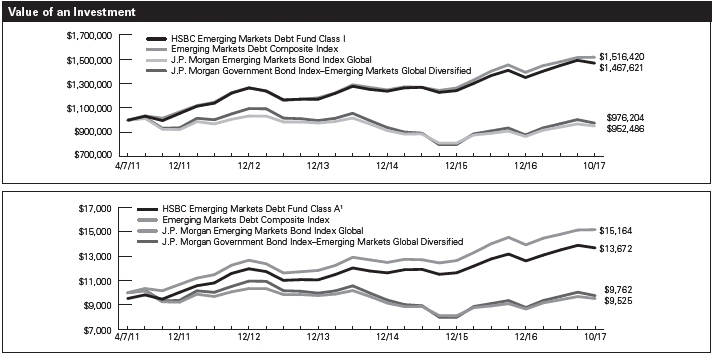
The charts above represent a historical since inception performance comparison of a hypothetical investment in the indicated share class versus a similar investment in the Fund’s benchmark and represents the reinvestment of dividends and capital gains in the Fund.
| | | | | Average Annual | | Expense |
| Fund Performance | | | | Total Return (%) | | Ratio (%)2 |
| | Inception | | 1 | | 5 | | Since | | | | |
| As of October 31, 2017* | | Date | | Year | | Year | | Inception | | Gross | | Net |
| HSBC Emerging Markets Debt Fund Class A1 | | 4/7/11 | | 0.31 | | 2.18 | | 4.88 | | 2.05 | | 0.86 |
| HSBC Emerging Markets Debt Fund Class I | | 4/7/11 | | 5.57 | | 3.52 | | 6.02 | | 1.70 | | 0.51 |
| Emerging Markets Debt Composite Index3 | | — | | 5.45 | | -1.17 | | -0.74 | | N/A | | N/A |
| J.P. Morgan Emerging Markets Bond Index Global3 | | — | | 5.89 | | 4.19 | | 6.54 | | N/A | | N/A |
| J.P. Morgan Government Bond Index–Emerging | | | | | | | | | | | | |
| Markets Global Diversified3 | | — | | 5.18 | | -1.58 | | -0.37 | | N/A | | N/A |
Past performance does not guarantee future results. The performance data quoted represents past performance and current returns may be lower or higher. Total return figures include change in share price, reinvestment of dividends and capital gains and do not reflect the taxes that a shareholder would pay on Fund distributions or on the redemption of Fund shares. Investment return and principal value will fluctuate so that an investor’s shares, when redeemed may be worth more or less than the original cost. To obtain performance information current to the most recent month end, please call 1-800-782-8183.
The performance above reflects any fee waivers that have been in effect during the applicable periods, as well as any expense reimbursements that have periodically been made. Absent such waivers and reimbursements, returns would have been lower. Currently, contractual fee waivers are in effect for the Fund through March 1, 2018.
| * | | Prior to April 7, 2017, the Fund’s investments were primarily comprised of U.S. dollar denominated instruments issued by foreign governments and corporations. Accordingly, performance information prior to that date reflects the Fund’s former investment strategies, and future performance will vary. |
| 1 | | Reflects the maximum sales charge of 4.75%. |
| 2 | | Reflects the expense ratio as reported in the prospectus dated February 28, 2017, as supplemented November 16, 2017. HSBC Global Asset Management (USA) Inc. has entered into a contractual expense limitation agreement with the Fund under which it will limit total expenses of the Fund (excluding interest, taxes, brokerage commissions, extraordinary expenses and estimated indirect expenses attributable to the Fund’s investments in investment companies) to an annual rate of 0.85% and 0.50% for Class A Shares and Class I Shares, respectively. The expense limitation shall be in effect until March 1, 2018. The expense ratios reflected include Acquired Fund fees and expenses. Additional information pertaining to the October 31, 2017 expense ratios can be found in the financial highlights. |
| 3 | | For additional information, please refer to the Glossary of Terms. |
The performance of the Fund is measured against the Emerging Markets Debt Composite Index, which is a blended index comprised of 50% J.P. Morgan Emerging Markets Bond Index Global and 50% J.P. Morgan Government Bond Index-Emerging Markets Global Diversified. The J.P. Morgan Emerging Markets Bond Index Global tracks returns for USD-denominated debt instruments issued by emerging market sovereign and quasi-sovereign entities, Brady bonds, loans, Eurobonds, and local market instruments. The J.P. Morgan Government Bond Index-Emerging Markets Global Diversified is a comprehensive global emerging markets fixed income index that consists of regularly traded, liquid fixed-rate, domestic currency government bonds to which international investors can gain exposure. The performance of the indexes does not reflect the deduction of expenses associated with a mutual fund, such as investment management and fund accounting fees. The Fund’s performance reflects the deduction of fees for these value-added services. Investors cannot invest directly in an index.
| Portfolio Reviews (Unaudited) |
HSBC Frontier Markets Fund
(Class A Shares and Class I Shares) |
by Ramzi Sidani, Lead/Senior Portfolio Manager
The HSBC Frontier Markets Fund (the “Fund”) seeks long-term capital appreciation. Under normal market conditions, the Fund invests at least 80% of its net assets, plus any borrowings for investment purposes, in issuers located in “frontier market countries.” The term “frontier market countries” encompasses those countries that are at an earlier stage of economic, political, or financial development, even by emerging markets standards.
Effective March 30, 2017, the Fund resumed accepting orders for purchase from new investors.
Investment Concerns
There is no assurance that a portfolio will achieve its investment objective or will work under all market conditions. The value of investments may go down as well as up and you may not get back the amount originally invested. Portfolios may be subject to certain additional risks, which should be considered carefully along with their investment objectives and fees. Equity investments fluctuate in value based on changes to an individual company’s financial condition and overall market conditions. Investments in foreign markets entail special risks such as currency, political, economic, and market risks. The risks of investing in emerging markets countries are greater than the risks generally associated with foreign investments. Frontier markets countries generally have smaller economies and even less developed capital markets or legal and political systems than traditional emerging market countries. As a result, the risks of investing in emerging market countries are magnified in frontier market countries. The Fund will invest more than 25% of its total assets in securities issued by companies in the financial services group of industries. Accordingly, the Fund will be more susceptible to developments that affect such industries than other funds that do not concentrate their investments. Exposure to commodities markets, including investments in companies in commodity-related industries, may subject the Fund to greater volatility than investments in traditional securities. Overall market movements and factors specific to a particular industry or commodity may affect the value of commodity-related investments. Derivatives may be riskier than other types of investments and could result in losses that significantly exceed the Funds’ original investment.
For a complete description of these and other risks associated with investment in a mutual fund, please refer to the Fund’s prospectus.
Market Commentary
For the year ended October 31, 2017, the Fund returned 20.50%* (without sales charge) for the Class A Shares and 20.87%* for the Class I Shares. That compared to a 27.99% and 16.26% total return for the Fund’s benchmarks, the MSCI Frontier Markets Index1 and the MSCI Select Frontier & Emerging Markets Capped Index1 (reference index), respectively, for the same period.
Portfolio Performance
Frontier markets performed well over the period supported by stronger global economic growth and recovery in oil prices.
The Fund underperformed the industry standard benchmark. However, it outperformed its reference index over the period, driven by good stock selection and positive country allocation.†
The difference in performance between the two reference benchmarks is due to structural differences in the composition of the indices. The industry standard MSCI Frontier Markets Index1 has large exposures to Argentina, Kuwait and Nigeria, which, when combined, account for nearly half of the Index. Our reference index is constructed to remove that bias. As a result, our reference index, and consequently the Fund, has less exposure to those three markets and did not benefit as much from their strong rally during the period. Argentina gained 45.18% following a positive election outcome and reform momentum; Kuwait returned +33.80% on better oil prices; and Nigeria returned +32.72% on improving foreign exchange liquidity in the market.†
Stock selection was a key contributor to the Fund’s performance relative to its reference benchmark. A healthcare provider reported strong results for the first half of 2017; a logistics company reported strong 2016 results and announced a higher dividend for 2016; and an education services company rallied following a successful secondary placement. The Fund’s underweight allocation to Qatar also supported relative performance as the market suffered due to geopolitical concerns.†
Offsetting some of those gains was the Fund’s exposure to an ice cream company that declined as a result of concerns over financial irregularities at its parent company and a real estate company in the Philippines that suffered due to concerns over a slowdown in demand for office space from outsourcing companies. The Fund’s underweight allocation to Vietnam also had a negative impact as the country’s equity market gained on strong gross domestic product1 growth, supported by export growth.†
| * | | The recent appreciation in the stock market has helped to produce short-term returns that are not typical and may not continue in the future. Because of ongoing market volatility, fund performance may be subject to substantial short-term changes. |
| † | | Portfolio composition is subject to change. |
| 1 | | For additional information, please refer to the Glossary of Terms. |
Past performance does not guarantee future results. The performance data quoted represents past performance and current returns may be lower or higher. Total return figures include change in share price, reinvestment of dividends and capital gains and do not reflect taxes that a shareholder would pay on Fund distributions or on the redemption of Fund shares. Investment return and principal value will fluctuate so that an investor’s shares, when redeemed may be worth more or less than the original cost. To obtain performance information current to the most recent month end, please call 1-800-782-8183.
| Portfolio Reviews (Unaudited) |
| HSBC Frontier Markets Fund |
The charts above represent a historical since inception performance comparison of a hypothetical investment in the indicated share class versus a similar investment in the Fund’s benchmark and represents the reinvestment of dividends and capital gains in the Fund.
| | | | Average Annual | | Expense |
| Fund Performance | | | | Total Return (%) | | Ratio (%)2 |
| | Inception | | | | | | Since | | | | |
| As of October 31, 2017 | | Date | | 1 Year | | 5 Year | | Inception | | Gross | | Net |
| HSBC Frontier Markets Fund Class A1 | | 9/6/11 | | 14.46 | | 8.74 | | 8.63 | | 3.89 | | 2.20 |
| HSBC Frontier Markets Fund Class I | | 9/6/11 | | 20.87 | * | 10.23 | | 9.92 | | 3.54 | | 1.85 |
| MSCI Frontier Markets Index3 | | — | | 27.99 | | 9.57 | | 7.68 | | N/A | | N/A |
| MSCI Select Frontier & Emerging Markets Capped Index3 | | — | | 16.26 | | 6.40 | | 5.71 | | N/A | | N/A |
Past performance does not guarantee future results. The performance data quoted represents past performance and current returns may be lower or higher. Total return figures include change in share price, reinvestment of dividends and capital gains and do not reflect the taxes that a shareholder would pay on Fund distributions or on the redemption of Fund shares. Investment return and principal value will fluctuate so that an investor’s shares, when redeemed may be worth more or less than the original cost. To obtain performance information current to the most recent month end, please call 1-800-782-8183.
The performance above reflects any fee waivers that have been in effect during the applicable periods, as well as any expense reimbursements that have periodically been made. Absent such waivers and reimbursements, returns would have been lower. Currently, contractual fee waivers are in effect for the Fund through March 1, 2018.
| * | | The recent appreciation in the stock market has helped to produce short-term returns that are not typical and may not continue in the future. Because of ongoing market volatility, fund performance may be subject to substantial short-term changes. |
| 1 | | Reflects the maximum sales charge of 5.00%. |
| 2 | | Reflects the expense ratio as reported in the prospectus dated February 28, 2017, as supplemented November 16, 2017. HSBC Global Asset Management (USA) Inc. has entered into a contractual expense limitation agreement with the Fund under which it will limit total expenses of the Fund (excluding interest, taxes, brokerage commissions, extraordinary expenses and estimated indirect expenses attributable to the Fund’s investments in investment companies) to an annual rate of 2.20% and 1.85% for Class A Shares and Class I Shares, respectively. The expense limitation shall be in effect until March 1, 2018. The expense ratios reflected include Acquired Fund fees and expenses. Additional information pertaining to the October 31, 2017 expense ratios can be found in the financial highlights. |
| 3 | | For additional information, please refer to the Glossary of Terms. |
The performance of the Fund is measured against the MSCI Frontier Markets Index and the MSCI Select Frontier & Emerging Markets Capped Index. The MSCI Frontier Markets Index is a free float-adjusted market capitalization index that captures large- and mid-cap representation across 29 Frontier Markets. The MSCI Select Frontier & Emerging Markets Index is a version of the MSCI Frontier Emerging Markets Index (capped) that raises the initial cap of the 6 “cross-over” countries to 30% and includes Qatar and UAE. The MSCI Frontier Emerging Markets Index (capped) is a capped version of the MSCI Frontier Emerging Markets Index, and there is an initial cap of 25% for the combined weight of the 5 “cross-over” countries. There is an initial cap of 10% for any other country. The indexes are unmanaged and their performance does not reflect the deduction of expenses associated with a mutual fund, such as investment management and fund accounting fees. The Fund’s performance reflects the deduction of fees for these value-added services. Investors cannot invest directly in an index.
| Portfolio Reviews (Unaudited) |
HSBC Total Return Fund
(Class A Shares and Class I Shares) |
by Nishant Upadhyay, Senior Vice President/Head of Emerging Markets Debt
Vinayak Potti, Vice President/Portfolio Manager
The HSBC Total Return Fund (the “Fund”) seeks maximum total return (comprised of capital appreciation and income). Under normal market conditions, the Fund invests its assets (excluding U.S. cash and U.S. cash equivalents) primarily in instruments of issuers that are economically tied to emerging market countries, including in derivative instruments such as futures (including interest rate futures), forwards (including non-deliverable forwards), swaps (including interest rate, total return and credit default swaps), options (including interest rate options) and swaptions.
Investment Concerns
There is no assurance that a portfolio will achieve its investment objective or will work under all market conditions. The value of investments may go down as well as up and you may not get back the amount originally invested. Portfolios may be subject to certain additional risks, which should be considered carefully along with their investment objectives and fees. Investments in foreign markets entail special risks such as currency, political, economic, and market risks. The risks of investing in emerging markets countries are greater than the risks generally associated with foreign investments. Fixed income securities are subject to credit and interest rate risk. Credit risk refers to the ability of an issuer to make timely payments of interest and principal. Interest-rate risk refers to fluctuations in the value of a fixed-income security resulting from changes in the general level of interest rates. In a declining interest-rate environment, the portfolio may generate less income. In a rising interest-rate environment, bond prices may fall. Investments in high-yield securities (commonly referred to as “junk bonds”) are often considered speculative investments and have significantly higher credit risk than investment-grade securities. The prices of high-yield securities, which may be less liquid than higher-rated securities, may be more vulnerable to adverse market, economic or political conditions. Convertible securities entail risks associated with equity securities (value can fluctuate based on changes in a company’s financial condition or overall market conditions); investments in convertible securities are subject to the risks associated with fixed-income securities. Exchange-Traded Funds (ETFs) are subject to the risks of the underlying securities (including market risks that could result in loss of principal) the ETF is designed to track, although lack of liquidity in an ETF could result in it being more volatile than the underlying portfolio of securities. ETFs also have management fees that increase their costs versus owning the underlying securities directly. Non-diversified funds focus investments in a small number of issuers, industries, foreign currencies or particular countries or regions, which increase the risks associated with a single economic, political, or regulatory occurrence. Derivatives may be riskier than other types of investments and could result in losses that significantly exceed the Fund’s original investment.
For a complete description of these and other risks associated with investment in a mutual fund, please refer to the Fund’s prospectus.
Market Commentary
For the year ended October 31, 2017, the Fund returned 1.05% (without sales charge) for the Class A Shares and 1.45% for the Class I Shares. That compared to a 1.06% total return for the Fund’s benchmark, the ICE BofA Merrill Lynch 3-Month LIBOR Constant Maturity Index1, for the same period.
Portfolio Performance
Emerging markets debt generated positive returns during the 12-month period ended October 31, 2017, driven by strong demand from global investors for yield and the relatively low volatility of the asset class. Investors were also attracted by improving fundamentals in many emerging markets countries. Early in the period, the surprise November election of Donald Trump triggered a sell-off in emerging markets debt, as U.S. Treasury yields spiked in anticipation of future infrastructure spending and tax reform. However, the administration’s failure to pass key policies helped emerging markets debt recover later in the period, with the U.S. dollar weakening and U.S. Treasury yields slowly declining from mid-December 2016 through early October 2017. Over this period, the Fund produced steady returns despite episodic volatility.
The Fund performed in line with its benchmark during the 12-month period ended October 31, 2017. Long exposure to Brazil local rates and currency added to relative performance, as progress on pension reform, falling inflation and subsequent monetary easing drove a rally in Brazilian assets. The Fund’s long exposure to Mexico and Turkey hard currency debt, along with their respective local rates and currencies, also helped buoy relative results. Long exposure to the Colombian peso contributed to performance as the currency benefited from stable oil prices and progress on Colombia’s fiscal reform.†
Short positions to Asian currencies weighed on relative performance with recovering demand in China for imported goods helping boost export economies in Southeast Asia. Short positions to euro-linked currencies also dragged on results, as improvements in manufacturing and industrial production added momentum to the European recovery.†
The Fund benefited from the use of derivatives during the period, using forward currency exchange contracts to achieve local currency exposures and interest rate swaps to gain local rate exposure. Credit default swaps were also used to take long positions in select hard currency sovereigns or to hedge select sovereign risks with a short position. However, a short position in CDX, an index of credit default swaps used to hedge the risk of spread levels increasing, dragged on returns as spread levels compressed over the period.†
| † | | Portfolio composition is subject to change. |
| 1 | | For additional information, please refer to the Glossary of Terms. |
Past performance does not guarantee future results. The performance data quoted represents past performance and current returns may be lower or higher. Total return figures include change in share price, reinvestment of dividends and capital gains and do not reflect taxes that a shareholder would pay on Fund distributions or on the redemption of Fund shares. Investment return and principal value will fluctuate so that an investor’s shares, when redeemed may be worth more or less than the original cost. To obtain performance information current to the most recent month end, please call 1-800-782-8183.
| Portfolio Reviews (Unaudited) |
| HSBC Total Return Fund |
The charts above represent a historical since inception performance comparison of a hypothetical investment in the indicated share class versus a similar investment in the Fund’s benchmark and represents the reinvestment of dividends and capital gains in the Fund.
| | | | Average Annual | | Expense |
| Fund Performance | | | | Total Return (%) | | Ratio (%)2 |
| | Inception | | | | | | Since | | | | |
| As of October 31, 2017 | | Date | | 1 Year | | 5 Year | | Inception | | Gross | | Net |
| HSBC Total Return Fund Class A1 | | 3/30/12 | | -3.79 | | 0.63 | | 1.20 | | 5.73 | | 1.63 |
| HSBC Total Return Fund Class I | | 3/30/12 | | 1.45 | | 1.98 | | 2.45 | | 5.38 | | 1.28 |
| ICE BofA Merrill Lynch 3-Month LIBOR Constant Maturity Index3 | | — | | 1.06 | | 0.48 | | 0.48 | | N/A | | N/A |
Past performance does not guarantee future results. The performance data quoted represents past performance and current returns may be lower or higher. Total return figures include change in share price, reinvestment of dividends and capital gains and do not reflect the taxes that a shareholder would pay on Fund distributions or on the redemption of Fund shares. Investment return and principal value will fluctuate so that an investor’s shares, when redeemed may be worth more or less than the original cost. To obtain performance information current to the most recent month end, please call 1-800-782-8183.
The performance above reflects any fee waivers that have been in effect during the applicable periods, as well as any expense reimbursements that have periodically been made. Absent such waivers and reimbursements, returns would have been lower. Currently, contractual fee waivers are in effect for the Fund through March 1, 2018.
| 1 | | Reflects the maximum sales charge of 4.75%. |
| 2 | | Reflects the expense ratio as reported in the prospectus dated February 28, 2017, as supplemented November 16, 2017. HSBC Global Asset Management (USA) Inc. has entered into a contractual expense limitation agreement with the Fund under which it will limit total expenses of the Fund (excluding interest, taxes, brokerage commissions, extraordinary expenses and estimated indirect expenses attributable to the Fund’s investments in investment companies) to an annual rate of 1.60% and 1.25% for Class A Shares and Class I Shares, respectively. The expense limitation shall be in effect until March 1, 2018. The expense ratios reflected include Acquired Fund fees and expenses. Additional information pertaining to the October 31, 2017 expense ratios can be found in the financial highlights. |
| 3 | | For additional information, please refer to the Glossary of Terms. |
The performance of the Fund is measured against the ICE BofA Merrill Lynch 3-Month LIBOR Constant Maturity Index that tracks the performance of a synthetic asset paying LIBOR to a stated maturity. The index is based on the assumed purchase at par of a synthetic instrument having exactly its stated maturity and with a coupon equal to that days fixing rate. That issue is assumed to be sold the following business day (priced at a yield equal to the current day fixing rate), and rolled into a new instrument. The index is unmanaged and the performance of the index does not reflect the deduction of expenses associated with a mutual fund, such as investment management and fund accounting fees. The Fund’s performance reflects the deduction of fees for these value-added services. Investors cannot invest directly in an index.
| Portfolio Reviews (Unaudited) |
| HSBC Asia ex-Japan Smaller Companies Equity Fund |
| (Class A Shares and Class I Shares) |
by Elina Fung, Investment Director of Equities/Lead Portfolio Manager
Alex Kwan, Associate Director of Asia Pacific Equities/Co-Portfolio Manager
The HSBC Asia ex-Japan Smaller Companies Equity Fund (the “Fund”) seeks long-term capital appreciation. Under normal market conditions, the Fund invests at least 80% of its net assets, plus any borrowings for investment purposes, in equity of, and equity-related instruments related to, smaller companies that are economically tied to Asia (excluding Japan).
Investment Concerns
There is no assurance that a portfolio will achieve its investment objective or will work under all market conditions. The value of investments may go down as well as up and you may not get back the amount originally invested. Portfolios may be subject to certain additional risks, which should be considered carefully along with their investment objectives and fees. Equity investments fluctuate in value based on changes to an individual company’s financial condition and overall market conditions. The Fund’s performance is expected to be closely tied to the social, political, economic, and regulatory developments within Asia and to be more volatile than the performance of a more geographically diversified mutual fund. Moreover, the economies of countries in Asia, including China, differ from the U.S. economy in several ways, including the rate of growth, reliance on a small number of industries or natural resources, rates of inflation, capital reinvestment, and balance of payments position. As export-driven economies, the economies of these countries are affected by developments in the economies of their principal trading partners, including the U.S. Furthermore, flooding, monsoons, and other natural disasters also can significantly affect the value of investments. Investments in foreign markets entail special risks such as currency, political, economic, and market risks. The risks of investing in emerging-market countries are greater than the risks generally associated with foreign investments. Fluctuations in exchange rates between the U.S. dollar and foreign currencies, or between various foreign currencies, may negatively affect the Fund’s performance. Investing in smaller companies is more risky and volatile than investing in large companies. Because the Fund invests in a single region, its shares do not represent a complete investment program and are subject to greater risk of loss as a result of adverse economic business or other developments affecting that region. As a geographically concentrated fund, the value of the shares may fluctuate more than shares invested in a broader range of industries and companies because of concentration in a specific region. Derivatives may be riskier than other types of investments and could result in losses that significantly exceed the Fund’s original investment.
For a complete description of these and other risks associated with investment in a mutual fund, please refer to the Fund’s prospectus.
Market Commentary
For the year ended October 31, 2017, the Fund returned 26.09%* (without sales charge) for the Class A Shares, 26.47%* for the Class I Shares. That compared to a 21.51% total return for the Fund’s benchmark, the MSCI All Country Asia ex Japan Small Cap Index1, for the same period.
Portfolio Performance
Asian equity markets posted strong gains for the 12-month period ended October 31, 2017, although there was some volatility early on. While many Asian markets gained immediately after the surprise results from the U.S. presidential elections in November 2016, most markets ended 2016 lower overall. India’s stocks ended 2016 drastically lower after the country announced its demonetization efforts, namely removing 500- and 1,000-rupee notes from circulation.
The Asian region recovered in early 2017. Investor sentiment improved on strong economic data from China, including positive consumption, production and investment numbers. Chinese and Korean markets also gained on solid corporate earnings and improving earnings outlooks. India was the best performer in the first quarter of 2017, partially due to its recovery from the shock of demonetization and the success of the incumbent Bharatiya Janata Party government in the northern state of Uttar Pradesh. A credible Union budget and progress on the passage of goods and services tax legislation also supported performance. The performance of most southeastern Asian markets trailed that of northern Asian, except in Thailand, where performance benefited from strong consumption data.
Commodity prices strengthened during the period with talk of fiscal expansion in the U.S. and synchronized global growth. The technology sector outperformed due to strong growth from Chinese internet companies and Taiwanese and Korean technology hardware companies. Banks and insurance stocks also performed well, benefiting from a steepening yield curve.
The Fund’s relative outperformance was driven by positive stock selection in a several markets, particularly China, Hong Kong, and Taiwan. Stock selection in the consumer discretionary, materials, technology, and industrials sectors also contributed to performance. In the consumer discretionary sector, investments in high-end auto dealerships in China added to relative results due to strong demand for new models. Exposure to Chinese private school operators also helped relative performance, while investments in a technology hardware supply chain also performed well.†
Stock selection in the energy sector hurt relative performance. Overweight exposures to Hong Kong, the Philippines, and Indonesia, whose performance lagged the broader region, also dragged on performance.†
| * | | The recent appreciation in the stock market has helped to produce short-term returns that are not typical and may not continue in the future. Because of ongoing market volatility, fund performance may be subject to substantial short-term changes. |
| † | | Portfolio composition is subject to change. |
| 1 | | For additional information, please refer to the Glossary of Terms. |
Past performance does not guarantee future results. The performance data quoted represents past performance and current returns may be lower or higher. Total return figures include change in share price, reinvestment of dividends and capital gains and do not reflect taxes that a shareholder would pay on Fund distributions or on the redemption of Fund shares. Investment return and principal value will fluctuate so that an investor’s shares, when redeemed may be worth more or less than the original cost. To obtain performance information current to the most recent month end, please call 1-800-782-8183.
| Portfolio Reviews (Unaudited) |
| HSBC Asia ex-Japan Smaller Companies Equity Fund |
The charts above represent a historical since inception performance comparison of a hypothetical investment in the indicated share class versus a similar investment in the Fund’s benchmark and represents the reinvestment of dividends and capital gains in the Fund.
| | | | Average Annual | | Expense |
| Fund Performance | | | | Total Return (%) | | Ratio (%)2 |
| | Inception | | 1 | | | Since | | | | |
| As of October 31, 2017 | | Date | | Year | | | Inception | | Gross | | Net |
| HSBC Asia ex-Japan Smaller Companies Equity Class A1 | | 11/11/14 | | 19.80 | | | | 10.34 | | | 5.13 | | 1.27 |
| HSBC Asia ex-Japan Smaller Companies Equity Class I | | 11/11/14 | | 26.47 | * | | | 12.67 | | | 4.78 | | 0.92 |
| MSCI All Country Asia ex Japan Small Cap Index3 | | — | | 21.51 | | | | 5.66 | | | N/A | | N/A |
Past performance does not guarantee future results. The performance data quoted represents past performance and current returns may be lower or higher. Total return figures include change in share price, reinvestment of dividends and capital gains and do not reflect the taxes that a shareholder would pay on Fund distributions or on the redemption of Fund shares. Investment return and principal value will fluctuate so that an investor’s shares, when redeemed may be worth more or less than the original cost. To obtain performance information current to the most recent month end, please call 1-800-782-8183.
The performance above reflects any fee waivers that have been in effect during the applicable periods, as well as any expense reimbursements that have periodically been made. Absent such waivers and reimbursements, returns would have been lower. Currently, contractual fee waivers are in effect for the Fund through March 1, 2019.
| * | | The recent appreciation in the stock market has helped to produce short-term returns that are not typical and may not continue in the future. Because of ongoing market volatility, fund performance may be subject to substantial short-term changes. |
| 1 | | Reflects the maximum sales charge of 5.00%. |
| 2 | | Reflects the expense ratio as reported in the prospectus dated February 28, 2017, as supplemented November 16, 2017. HSBC Global Asset Management (USA) Inc. (the “Adviser”) has entered into a contractual expense limitation agreement with the Fund under which it will limit total expenses of the Fund (excluding interest, taxes, brokerage commissions, extraordinary expenses and estimated indirect expenses attributable to the Fund’s investments in investment companies) to an annual rate of 1.75% and 1.40% for Class A Shares and Class I Shares, respectively. Effective November 1, 2017, the Advisor agreed to limit total expense of the Fund (excluding interest, taxes, brokerage commissions, extraordinary expenses and estimated indirect expenses attributable to the Funds investments in investment companies) to an annual rate of 1.25% and 0.90% limitation shall be in effect until March 1, 2019. The expense ratios reflected include Acquired Fund fees and expenses. Additional information pertaining to the October 31, 2017 expense ratios can be found in the financial highlights. |
| 3 | | For additional information, please refer to the Glossary of Terms. |
The MSCI All Country Asia ex Japan Small Cap Index is a free float-adjusted market capitalization-weighted small-cap index of the stock markets of two developed markets, Hong Kong and Singapore, and nine emerging markets: China, India, Indonesia, Malaysia, Pakistan, Philippines, Korea, Taiwan and Thailand. The index is unmanaged and its performance does not reflect the deduction of expenses associated with a mutual fund, such as investment management and fund accounting fees. The Fund’s performance reflects the deduction of fees for these value-added services. Investors cannot invest directly in an index.
| Portfolio Reviews (Unaudited) |
| HSBC Global High Yield Bond Fund |
| (Class A Shares and Class I Shares) |
by Mary Bowers, Senior Portfolio Manager
Rick Liu, CFA/Portfolio Manager
Nishant Upadhyay, Senior Vice President/Portfolio Manager
The HSBC Global High Yield Bond Fund (the “Fund”) seeks to maximize total return (comprised of capital appreciation and income). Under normal market conditions, the Fund invests at least 80% of its net assets, plus any borrowings for investment purposes, in a globally diversified portfolio of high-yield securities.
Investment Concerns
There is no assurance that a portfolio will achieve its investment objective or will work under all market conditions. The value of investments may go down as well as up and you may not get back the amount originally invested. Portfolios may be subject to certain additional risks, which should be considered carefully along with their investment objectives and fees. Investments in foreign markets entail special risks such as currency, political, economic, and market risks. The risks of investing in emerging markets countries are greater than the risks generally associated with foreign investments. Fixed income securities are subject to credit and interest rate risk. Credit risk refers to the ability of an issuer to make timely payments of interest and principal. Interest rate risk refers to fluctuations in the value of a fixed income security resulting from changes in the general level of interest rates. In a declining interest rate environment, the portfolio may generate less income. In a rising interest rate environment, bond prices may fall. Investments in high-yield securities are often considered speculative investments and have significantly higher credit risk than investment-grade securities. The prices of high-yield securities, which may be less liquid than higher rated securities, may be more vulnerable to adverse market, economic or political conditions. Convertible securities entail risks associated with equity securities (whose value can fluctuate based on changes in a company’s financial condition or overall market conditions); investments in convertible securities are subject to the risks associated with fixed-income securities. Exchange Traded Funds (ETFs) are subject to the risks of the underlying securities (including market risks that could result in loss of principal) the ETF is designed to track, although lack of liquidity in an ETF could result in it being more volatile than the underlying portfolio of securities. ETFs also have management fees that increase their costs versus owning the underlying securities directly. Derivatives may be riskier than other types of investments and could result in losses that significantly exceed the Fund’s original investment.
For a complete description of these and other risks associated with investment in a mutual fund, please refer to the Fund’s prospectus.
Market Commentary
For the year ended October 31, 2017, the Fund returned 7.45% (without sales charge) for the Class A Shares and 7.74% for the Class I Shares. That compared to a 8.72% total return for the Fund’s benchmark, the ICE BofA Merrill Lynch BB-B Global High Yield Constrained Index1, for the same period.
Portfolio Performance
The macroeconomic backdrop was supportive for credit markets over the last 12 months. Synchronized growth in both developed and emerging markets, benign inflation pressure and a low-volatility environment helped credit spreads tighten to near post-crisis lows. The stable solid growth in the U.S. allowed the Federal Reserve to continue its path to normalization while signaling it would take a gradual and measured approach based on available economic data.
Europe saw improved economic activity. Fixed income markets were supported by the continuation of the European Central Bank’s corporate bond buying program supporting fixed income markets further. U.S. 10-year Treasury yields rose over the period, from 1.83% to 2.38%. Yields moved sharply higher in November 2016 following the U.S. election as the market anticipated reflationary policies from the new administration. Meanwhile, yields on Euro 10-year government bonds increased modestly from 0.16% to 0.36% over the same period. The yield spread between corporate bonds and Treasuries narrowed as corporate bonds rallied during the period. Global high-yield credit spreads tightened by 1.40% to 3.48% while global investment-grade credit spreads tightened by a more modest 0.30%, ending the period at 0.97%.
The Fund’s overall sector allocation detracted from relative performance. The Fund’s U.S. allocation benefited from its underweight position in retail but was hurt by an underweight position in financials. In Europe, the Fund benefited from its overweight to financials and suffered from its underweight position to energy, the relative performance benefited from issuer selection, especially in the U.S. and European high-yield segments.†
The Fund’s regional allocations detracted from relative performance. Underweight positions in European high yield and emerging markets debt detracted from the Fund’s relative performance. The Fund was also hurt by its overweight position in U.S. high-yield securities, which underperformed European high yield and emerging markets debt.†
The Fund’s underweight position to duration versus the benchmark contributed to relative performance as Treasury yields rose over the period and drove down prices.†
The Fund maintained some derivative exposure during the period, including currency forwards used to hedge non-USD exposure and a small position in credit default swaps (CDS). The currency forwards and CDS exposure did not materially affect performance.†
| † | | Portfolio composition is subject to change. |
| 1 | | For additional information, please refer to the Glossary of Terms. |
Past performance does not guarantee future results. The performance data quoted represents past performance and current returns may be lower or higher. Total return figures include change in share price, reinvestment of dividends and capital gains and do not reflect taxes that a shareholder would pay on Fund distributions or on the redemption of Fund shares. Investment return and principal value will fluctuate so that an investor’s shares, when redeemed may be worth more or less than the original cost. To obtain performance information current to the most recent month end, please call 1-800-782-8183.
| Portfolio Reviews (Unaudited) |
| HSBC Global High Yield Bond Fund |
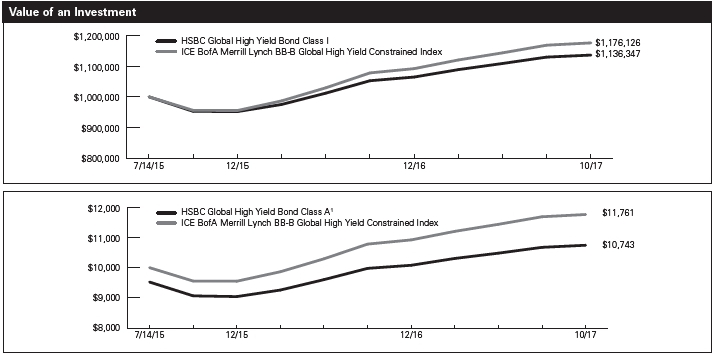
The charts above represent a historical since inception performance comparison of a hypothetical investment in the indicated share class versus a similar investment in the Fund’s benchmark and represents the reinvestment of dividends and capital gains in the Fund.
| | | | Average Annual | | Expense |
| Fund Performance | | | | Total Return (%) | | Ratio (%)2 |
| | Inception | | 1 | | Since | | | | |
| As of October 31, 2017 | | Date | | Year | | Inception | | Gross | | Net |
| HSBC Global High Yield Bond Class A1 | | 7/14/15 | | 2.32 | | 3.17 | | 2.66 | | 1.18 |
| HSBC Global High Yield Bond Class I | | 7/14/15 | | 7.74 | | 5.72 | | 2.31 | | 0.83 |
| ICE BofA Merrill Lynch BB-B Global High Yield Constrained Index3 | | — | | 8.72 | | 7.31 | | N/A | | N/A |
Past performance does not guarantee future results. The performance data quoted represents past performance and current returns may be lower or higher. Total return figures include change in share price, reinvestment of dividends and capital gains and do not reflect the taxes that a shareholder would pay on Fund distributions or on the redemption of Fund shares. Investment return and principal value will fluctuate so that an investor’s shares, when redeemed may be worth more or less than the original cost. To obtain performance information current to the most recent month end, please call 1-800-782-8183.
The performance above reflects any fee waivers that have been in effect during the applicable periods, as well as any expense reimbursements that have periodically been made. Absent such waivers and reimbursements, returns would have been lower. Currently, contractual fee waivers are in effect for the Fund through March 1, 2018.
| 1 | Reflects the maximum sales charge of 4.75%. |
| 2 | Reflects the expense ratio as reported in the prospectus dated February 28, 2017, as supplemented November 16, 2017. HSBC Global Asset Management (USA) Inc. has entered into a contractual expense limitation agreement with the Fund under which it will limit total expenses of the Fund (excluding interest, taxes, brokerage commissions, extraordinary expenses and estimated indirect expenses attributable to the Fund’s investments in investment companies) to an annual rate of 1.15% and 0.80% for Class A Shares and Class I Shares, respectively. The expense limitation shall be in effect until March 1, 2018. The expense ratios reflected include Acquired Fund fees and expenses. Additional information pertaining to the October 31, 2017 expense ratios can be found in the financial highlights. |
| 3 | For additional information, please refer to the Glossary of Terms. |
The performance of the Fund is measured against the ICE BofA Merrill Lynch BB-B Global High Yield Constrained Index, which tracks the performance of USD, CAD, GBP and EUR denominated below investment-grade corporate debt publicly issued in the major domestic or Eurobond markets. The index is unmanaged and its performance does not reflect the deduction of expenses associated with a mutual fund, such as investment management and fund accounting fees. The Fund’s performance reflects the deduction of fees for these value-added services. Investors cannot invest directly in an index.
| Portfolio Reviews (Unaudited) |
| HSBC Global High Income Bond Fund |
| (Class A Shares and Class I Shares) |
by Jerry Samet, Senior Portfolio Manager
Rick Liu, CFA/Portfolio Manager
Nishant Upadhyay, Senior Vice President/Portfolio Manager
The HSBC Global High Income Bond Fund (the “Fund”) seeks to provide a high level of current income. Under normal market conditions, the Fund invests at least 80% of its net assets, plus any borrowings for investment purposes, in a globally diversified portfolio of higher yielding securities.
Investment Concerns
There is no assurance that a portfolio will achieve its investment objective or will work under all market conditions. The value of investments may go down as well as up and you may not get back the amount originally invested. Portfolios may be subject to certain additional risks, which should be considered carefully along with their investment objectives and fees. Investments in foreign markets entail special risks such as currency, political, economic, and market risks. The risks of investing in emerging markets countries are greater than the risks generally associated with foreign investments. Fixed income securities are subject to credit and interest rate risk. Credit risk refers to the ability of an issuer to make timely payments of interest and principal. Interest rate risk refers to fluctuations in the value of a fixed income security resulting from changes in the general level of interest rates. In a declining interest rate environment, the portfolio may generate less income. In a rising interest rate environment, bond prices may fall. Investments in high-yield securities are often considered speculative investments and have significantly higher credit risk than investment-grade securities. The prices of high-yield securities, which may be less liquid than higher rated securities, may be more vulnerable to adverse market, economic or political conditions. Convertible securities entail risks associated with equity securities (value can fluctuate based on changes in a company’s financial condition or overall market conditions); investments in convertible securities are subject to the risks associated with fixed income securities. Exchange Traded Funds (ETFs) are subject to the risks of the underlying securities (including market risks that could result in loss of principal) the ETF is designed to track, although lack of liquidity in an ETF could result in it being more volatile than the underlying portfolio of securities. ETFs also have management fees that increase their costs versus owning the underlying securities directly. Derivatives may be riskier than other types of investments and could result in losses that significantly exceed the Fund’s original investment.
For a complete description of these and other risks associated with investment in a mutual fund, please refer to the Fund’s prospectus.
Market Commentary
For the year ended October 31, 2017, the Fund returned 5.24% (without sales charge) for the Class A Shares and 5.62% for the Class I Shares. That compared to a 6.28% total return for the Fund’s benchmark, the Bloomberg Barclays High Income Bond Composite Index1, for the same period
Portfolio Performance
The macroeconomic backdrop was supportive for credit markets over the last 12 months. Synchronized growth in both developed and emerging markets, benign inflation pressure and a low-volatility environment helped credit spreads tighten to near post-crisis lows. The stable, solid growth in the U.S. allowed the Federal Reserve to continue its path to normalization while signaling it would take a gradual and measured approach based on available economic data.
Europe saw improved economic activity. Fixed income markets were supported by the continuation of the European Central Bank’s corporate bond buying program. U.S. 10-year Treasury yields rose over the period, from 1.83% to 2.38%. Yields moved sharply higher in November 2016 following the U.S. election as the market anticipated reflationary policies from the new administration. Meanwhile, yields on Euro 10-year government bonds increased modestly from 0.16% to 0.36% over the same period. The yield spread between corporate bonds and Treasuries narrowed as corporate bonds rallied during the period. Global high-yield credit spreads tightened by 1.40% to 3.48% while global investment-grade credit spreads tightened by a more modest 0.30%, ending the period at 0.97%.
The Fund’s sector allocation detracted from relative performance. In the Fund’s U.S. allocation, an underweight position in financials and an overweight position in health care dragged on performance. In the Fund’s European allocation, an overweight position to financials benefited relative performance. Relative performance also benefited from issuer selection, specifically among both U.S. BBB-rated and BB-rated assets.†
The Fund’s regional allocations detracted from relative performance. Underweight positions in Europe and overweight positions in U.S. BBB-rated issues detracted from the Fund’s relative performance as European assets were the best performers and U.S. BBB-rated issues were the worst performers during the period.†
The Fund’s relative underweight position to duration versus the benchmark contributed to relative performance as Treasury yields rose over the period and drove down prices.†
The Fund maintained some derivative exposure during the period, including futures contracts, currency forwards used to hedge non-USD exposure and a small position in credit default swaps (CDS). The exposure to these derivatives did not materially impact performance.
† Portfolio composition is subject to change.
1 For additional information, please refer to the Glossary of Terms.
Past performance does not guarantee future results. The performance data quoted represents past performance and current returns may be lower or higher. Total return figures include change in share price, reinvestment of dividends and capital gains and do not reflect taxes that a shareholder would pay on Fund distributions or on the redemption of Fund shares. Investment return and principal value will fluctuate so that an investor’s shares, when redeemed may be worth more or less than the original cost. To obtain performance information current to the most recent month end, please call 1-800-782-8183.
| Portfolio Reviews (Unaudited) |
| HSBC Global High Income Bond Fund |
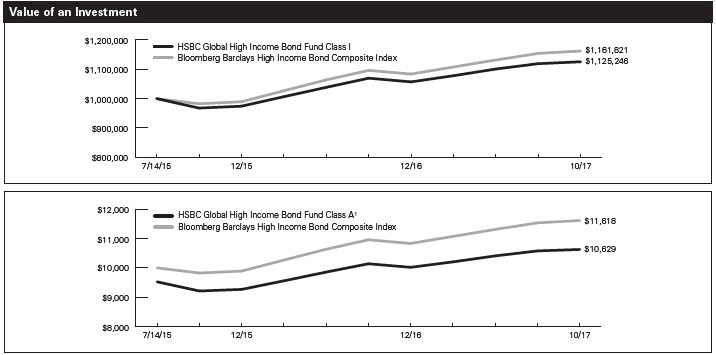
The charts above represent a historical since inception performance comparison of a hypothetical investment in the indicated share class versus a similar investment in the Fund’s benchmark and represents the reinvestment of dividends and capital gains in the Fund.
| | | | Average Annual | | Expense |
| Fund Performance | | | | Total Return (%) | | Ratio (%)2 |
| | Inception | | 1 | | Since | | | | |
| As of October 31, 2017 | | Date | | Year | | Inception | | Gross | | Net |
| HSBC Global High Income Bond Fund Class A1 | | 7/14/15 | | 0.25 | | 2.69 | | 2.80 | | 1.17 |
| HSBC Global High Income Bond Fund Class I | | 7/14/15 | | 5.62 | | 5.27 | | 2.45 | | 0.82 |
| Bloomberg Barclays High Income Bond Composite Index3 | | — | | 6.28 | | 6.74 | | N/A | | N/A |
Past performance does not guarantee future results. The performance data quoted represents past performance and current returns may be lower or higher. Total return figures include change in share price, reinvestment of dividends and capital gains and do not reflect the taxes that a shareholder would pay on Fund distributions or on the redemption of Fund shares. Investment return and principal value will fluctuate so that an investor’s shares, when redeemed may be worth more or less than the original cost. To obtain performance information current to the most recent month end, please call 1-800-782-8183.
The performance above reflects any fee waivers that have been in effect during the applicable periods, as well as any expense reimbursements that have periodically been made. Absent such waivers and reimbursements, returns would have been lower. Currently, contractual fee waivers are in effect for the Fund through March 1, 2018.
| 1 | Reflects the maximum sales charge of 4.75%. |
| 2 | Reflects the expense ratio as reported in the prospectus dated February 28, 2017, as supplemented November 16, 2017. HSBC Global Asset Management (USA) Inc. has entered into a contractual expense limitation agreement with the Fund under which it will limit total expenses of the Fund (excluding interest, taxes, brokerage commissions, extraordinary expenses and estimated indirect expenses attributable to the Fund’s investments in investment companies) to an annual rate of 1.15% and 0.80% for Class A Shares and Class I Shares, respectively. The expense limitation shall be in effect until March 1, 2018. The expense ratios reflected include Acquired Fund fees and expenses. Additional information pertaining to the October 31, 2017 expense ratios can be found in the financial highlights. |
| 3 | For additional information, please refer to the Glossary of Terms. |
The performance of the Fund is measured against the Bloomberg Barclays High Income Bond Composite Index, which is a customized index that is close to equally weighted across US, Euro and EM markets. Components include 35% Bloomberg Barclays USD Unhedged Emerging Markets Aggregate Index, 15% Bloomberg Barclays U.S. High Yield Ba Index, 20% Bloomberg Barclays U.S. Credit Baa Index, 15% Bloomberg Barclays EuroAgg Corporate Baa USD Hedged Index, and 15% Bloomberg Barclays Pan Euro HY (Euro) BB Rating Only USD Hedged Index. The index is unmanaged and its performance does not reflect the deduction of expenses associated with a mutual fund, such as investment management and fund accounting fees. The Fund’s performance reflects the deduction of fees for these value-added services. Investors cannot invest directly in an index.
| Portfolio Reviews (Unaudited) |
| HSBC Global Equity Volatility Focused Fund |
| (Class A Shares and Class I Shares) |
by Angus Parker, Portfolio Manager
HSBC Global Equity Volatility Focused Fund (the “Fund”) seeks to provide long-term total return. Under normal market conditions, at least 80% of the Fund’s nets assets, plus any borrowings for investment purposes, are invested in a globally diversified portfolio of equity securities and equity-related instruments that is expected to generate lower volatility relative to the global equity market (as measured by the Fund’s benchmark index).
Investment Concerns
There is no assurance that a portfolio will achieve its investment objective or will work under all market conditions. The value of investments may go down as well as up and you may not get back the amount originally invested. Portfolios may be subject to certain additional risks, which should be considered carefully along with their investment objectives and fees. Equity investments fluctuate in value based on changes to an individual company’s financial condition and overall market conditions. Investments in foreign markets entail special risks such as currency, political, economic, and market risks. The risks of investing in emerging markets countries are greater than the risks generally associated with foreign investments. Fluctuations in exchange rates between the U.S. dollar and foreign currencies, or between various foreign currencies, may negatively affect the Fund’s performance. Investing in smaller companies is more risky and volatile than investing in large companies. The Fund will not invest more than 25% of its total assets in the securities of one or more issuers conducting their principal business activities in the same industry, except that to the extent that an industry represents 20% or more of the Fund’s benchmark index at the time of investment. The Fund may invest up to 35% of its assets in that industry. Concentrating Fund investments in a limited number of issuers conducting business in the same industry would subject the Fund to a greater risk of loss because of adverse economic, political, regulatory or market conditions affecting that industry than if its investments were not so concentrated. The Fund’s techniques for limiting portfolio volatility may or may not be successful, may cause the Fund’s portfolio to underperform its benchmark or may cause the Fund to lose money. Derivatives may be riskier than other types of investments and could result in losses that significantly exceed the Fund’s original investment.
For a complete description of these and other risks associated with investment in a mutual fund, please refer to the Fund’s prospectus.
Market Commentary
For the year ended October 31, 2017, the Fund returned 17.32% (without sales charge) for the Class A Shares and 17.76% for the Class I Shares. That compared to a 23.20% total return for the Fund’s benchmark, the MSCI ACWI (Net USD)1, for the same period.
Portfolio Performance
Global equities improved over the 12-month period ended October 31, 2017 as volatility remained below average historical levels at 6.03% for the MSCI ACWI. The global economic recovery accelerated during the period, driving global equity markets to positive returns. Support from accommodative monetary policy and easing fiscal policy in Japan and Europe outweighed market headwinds, such as weaker-than-expected Chinese growth and U.S. interest rate increases. Political events also contributed to the rally, with President Trump’s victory early in the period buoying expectations of greater U.S. fiscal stimulus. Corporate earnings increased sharply during the period, which played a large role in driving global equity markets higher.
The Fund performed as designed, averaging 88% of the benchmark’s volatility for the 12 months under review. However, this weighed on relative results given the strongly rising market. An overweight allocation to the consumer staples and telecommunications sectors also weighed on relative results as those sectors lagged against the benchmark. The Fund’s underweight exposure to China and overweight exposure to the U.K. also detracted from performance.†
Stock selection weighed on relative performance as well, most notably in the consumer discretionary and telecommunications services sectors. Shares of a sports retailer declined amid weak sales and growth concerns. The Fund’s investment in a U.S. auto parts dealer also underperformed due to rising gas prices and concerns over increasing competition. Lastly, shares of an Australian telecommunications provider declined when the government blocked it from bidding for additional network space.†
The Fund’s stock selection process led to underweight exposure to the real estate and utilities sectors. This benefited returns as the sectors underperformed the benchmark. An underweight exposure to Canada and an overweight allocation to Japan also contributed to relative results.†
Stock selection within the financial sector, including a Singaporean bank that outperformed after benefiting from higher fees and strong sales of investment products, supported relative results. The Fund also benefited from exposure to a software company that reported better-than-expected sales driven by a price increase and increased demand for software security products following a major ransomware attack.†
† Portfolio composition is subject to change.
1 For additional information, please refer to the Glossary of Terms.
Past performance does not guarantee future results. The performance data quoted represents past performance and current returns may be lower or higher. Total return figures include change in share price, reinvestment of dividends and capital gains and do not reflect taxes that a shareholder would pay on Fund distributions or on the redemption of Fund shares. Investment return and principal value will fluctuate so that an investor’s shares, when redeemed may be worth more or less than the original cost. To obtain performance information current to the most recent month end, please call 1-800-782-8183.
| Portfolio Reviews (Unaudited) |
| HSBC Global Equity Volatility Focused Fund |
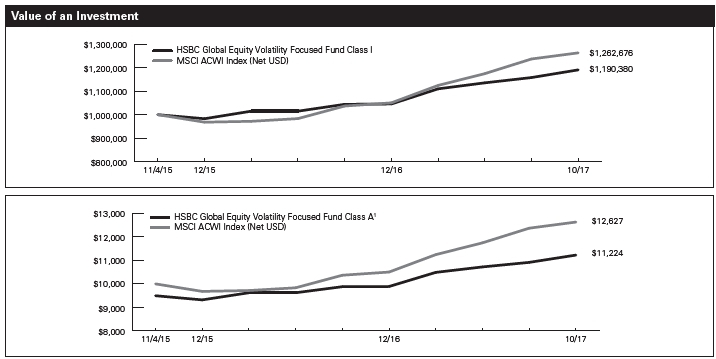
The charts above represent a historical since inception performance comparison of a hypothetical investment in the indicated share class versus a similar investment in the Fund’s benchmark and represents the reinvestment of dividends and capital gains in the Fund.
| | | | Average Annual | | Expense |
| Fund Performance | | | | Total Return (%) | | Ratio (%)2 |
| | Inception | | 1 | | Since | | | | |
| As of October 31, 2017 | | Date | | Year | | Inception | | Gross | | Net |
| HSBC Global Equity Volatility Focused Fund Class A1 | | 11/4/15 | | 11.44 | | | 5.98 | | | 4.68 | | 1.30 |
| HSBC Global Equity Volatility Focused Fund Class I | | 11/4/15 | | 17.76 | | | 9.16 | | | 4.33 | | 0.95 |
| MSCI ACWI (Net USD)3 | | — | | 23.20 | | | 11.81 | | | N/A | | N/A |
Past performance does not guarantee future results. The performance data quoted represents past performance and current returns may be lower or higher. Total return figures include change in share price, reinvestment of dividends and capital gains and do not reflect the taxes that a shareholder would pay on Fund distributions or on the redemption of Fund shares. Investment return and principal value will fluctuate so that an investor’s shares, when redeemed may be worth more or less than the original cost. To obtain performance information current to the most recent month end, please call 1-800-782-8183.
The performance above reflects any fee waivers that have been in effect during the applicable periods, as well as any expense reimbursements that have periodically been made. Absent such waivers and reimbursements, returns would have been lower. Currently, contractual fee waivers are in effect for the Fund through March 1, 2018.
| 1 | Reflects the maximum sales charge of 5.00%. |
| 2 | Reflects the expense ratio as reported in the prospectus dated February 28, 2017, as supplemented November 16, 2017. HSBC Global Asset Management (USA) Inc. has entered into a contractual expense limitation agreement with the Fund under which it will limit total expenses of the Fund (excluding interest, taxes, brokerage commissions, extraordinary expenses and estimated indirect expenses attributable to the Fund’s investments in investment companies) to an annual rate of 1.30% and 0.95% for Class A Shares and Class I Shares, respectively. The expense limitation shall be in effect until March 1, 2018. The expense ratios reflected include Acquired Fund fees and expenses. Additional information pertaining to the October 31, 2017 expense ratios can be found in the financial highlights. |
| 3 | For additional information, please refer to the Glossary of Terms. |
The performance of the Fund is measured against the MSCI All Country World Daily Total Return Index (Net USD) (“MSCI ACWI (Net USD)”), which is a free float-adjusted market capitalization weighted index that is designed to measure the equity market performance of developed and emerging markets. It consists of 46 country indexes comprising 23 developed and 23 emerging market country indexes. The index is unmanaged and its performance does not reflect the deduction of expenses associated with a mutual fund, such as investment management and fund accounting fees. The Fund’s performance reflects the deduction of fees for these value-added services. Investors cannot invest directly in an index.
| Portfolio Reviews (Unaudited) |
| HSBC Euro High Yield Bond Fund (USD Hedged) |
| (Class A Shares and Class I Shares) |
by Philippe Igigabel, Portfolio Manager
Sophie Sentilhes, Portfolio Manager
HSBC Euro High Yield Bond Fund (USD Hedged) (the “Fund”) seeks to maximize total return (comprised of capital appreciation and income). Under normal market conditions, the Fund invests at least 80% of its net assets, plus any borrowings for investment purposes, in Euro-denominated high-yield securities.
Investment Concerns
There is no assurance that a portfolio will achieve its investment objective or will work under all market conditions. The value of investments may go down as well as up and you may not get back the amount originally invested. Portfolios may be subject to certain additional risks, which should be considered carefully along with their investment objectives and fees. Investments in foreign markets entail special risks such as currency, political, economic, and market risks. The risks of investing in emerging markets countries are greater than the risks generally associated with foreign investments. Fixed income securities are subject to credit and interest rate risk. Credit risk refers to the ability of an issuer to make timely payments of interest and principal. Interest-rate risk refers to fluctuations in the value of a fixed income security resulting from changes in the general level of interest rates. In a declining interest rate environment, the portfolio may generate less income. In a rising interest rate environment, bond prices may fall. Euro-denominated securities have significant exposure to the Euro and events affecting the Euro. The Economic and Monetary Union (“EMU”) of the European Union (“EU”) is comprised of EU members that have adopted the Euro. Recent market events affecting several of the EMU member countries have adversely affected the sovereign debt issued by those countries, and ultimately may lead to a decline in the value of the Euro. Investments in high-yield securities are often considered speculative investments and have significantly higher credit risk than investment-grade securities. The prices of high-yield securities, which may be less liquid than higher rated securities, may be more vulnerable to adverse market, economic or political conditions. Convertible securities entail risks associated with equities (which fluctuate in value based on changes to an individual company’s financial condition and overall market conditions); investments in convertibles are subject to the risks associated with fixed income securities. Exchange Traded Funds (ETFs) are subject to the risks of the underlying securities (including market risks that could result in loss of principal) the ETF is designed to track, although lack of liquidity in an ETF could result in it being more volatile than the underlying portfolio of securities. ETFs also have management fees that increase their costs versus owning the underlying securities directly. Derivatives may be riskier than other types of investments and could result in losses that significantly exceed the Fund’s original investment.
For a complete description of these and other risks associated with investment in a mutual fund, please refer to the Fund’s prospectus.
Market Commentary
For the year ended October 31, 2017, the Fund returned 8.05% (without sales charge) for the Class A Shares and 8.39% for the Class I Shares. That compared to a 9.93% total return for the Fund’s benchmark, the ICE BofA Merrill Lynch BB-B Euro High Yield Constrained (USD Hedged) Index1, for the same period.
Portfolio Performance
European high-yield securities posted strong gains amid robust investor demand. Most issuers in this space have maintained prudent financial policies and are well positioned to benefit from the ongoing economic recovery in Europe. Meanwhile, historically low yields in the European fixed income markets have driven investors to seek out higher yielding assets, supporting demand for European high-yield securities. The European high-yield market performed well during the period. Certain segments that lagged in the previous 12-month period ended October 31, 2017, such as subordinated financial bonds, posted particularly strong returns in the current period.
With rising commodity and energy prices, the Fund’s relative results suffered from a lack of exposure to the commodity and energy sectors, which were among the benchmark’s strongest performing sectors. Security selection also weighed on relative returns, most notably in the Fund’s lack of exposure to a few of the benchmark’s top performers, including a French nuclear engineering company and a French insurer. The nuclear engineering company rallied after finalizing a bailout by the French government in the early months of 2017.†
The Fund’s relative performance benefited from its overweight allocation to both financial and non-financial subordinated bonds. These bonds rebounded sharply after weak performance in the previous 12-month period. The Fund also benefited from its lack of exposure to bonds issued by a Croatian retailer. The issuer experienced liquidity problems during the period, which ended up weighing on the benchmark’s returns.†
The Fund maintained some derivative exposure with currency forwards to hedge non-U.S. dollar exposure. As designed, these derivatives substantially offset the weak currency performance of the non-U.S. dollar assets in an environment where the dollar gained ground against many foreign currencies.†
† Portfolio composition is subject to change.
1 For additional information, please refer to the Glossary of Terms.
Past performance does not guarantee future results. The performance data quoted represents past performance and current returns may be lower or higher. Total return figures include change in share price, reinvestment of dividends and capital gains and do not reflect taxes that a shareholder would pay on Fund distributions or on the redemption of Fund shares. Investment return and principal value will fluctuate so that an investor’s shares, when redeemed may be worth more or less than the original cost. To obtain performance information current to the most recent month end, please call 1-800-782-8183.
| Portfolio Reviews (Unaudited) |
| HSBC Euro High Yield Bond Fund (USD Hedged) |
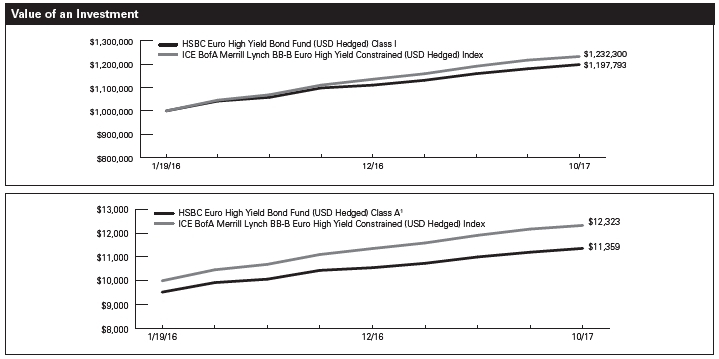
The charts above represent a historical since inception performance comparison of a hypothetical investment in the indicated share class versus a similar investment in the Fund’s benchmark and represents the reinvestment of dividends and capital gains in the Fund.
| | | | Average Annual | | Expense |
| Fund Performance | | | | Total Return (%) | | Ratio (%)2 |
| | Inception | | 1 | | Since | | | | |
| As of October 31, 2017 | | Date | | Year | | Inception | | Gross | | Net |
| HSBC Euro High Yield Bond Fund (USD Hedged) Class A1 | | 1/19/16 | | 2.96 | | | 7.41 | | | 2.56 | | 1.05 |
| HSBC Euro High Yield Bond Fund (USD Hedged) Class I | | 1/19/16 | | 8.39 | | | 10.65 | | | 2.21 | | 0.80 |
| ICE BofA Merrill Lynch BB-B Euro High Yield Constrained | | | | | | | | | | | | |
| (USD Hedged) Index3 | | — | | 9.93 | | | 12.43 | | | N/A | | N/A |
Past performance does not guarantee future results. The performance data quoted represents past performance and current returns may be lower or higher. Total return figures include change in share price, reinvestment of dividends and capital gains and do not reflect the taxes that a shareholder would pay on Fund distributions or on the redemption of Fund shares. Investment return and principal value will fluctuate so that an investor’s shares, when redeemed may be worth more or less than the original cost. To obtain performance information current to the most recent month end, please call 1-800-782-8183.
The performance above reflects any fee waivers that have been in effect during the applicable periods, as well as any expense reimbursements that have periodically been made. Absent such waivers and reimbursements, returns would have been lower. Currently, contractual fee waivers are in effect for the Fund through March 1, 2018.
| 1 | Reflects the maximum sales charge of 4.75%. |
| 2 | Reflects the expense ratio as reported in the prospectus dated February 28, 2017, as supplemented November 16, 2017. HSBC Global Asset Management (USA) Inc. has entered into a contractual expense limitation agreement with the Fund under which it will limit total expenses of the Fund (excluding interest, taxes, brokerage commissions, extraordinary expenses and estimated indirect expenses attributable to the Fund’s investments in investment companies) to an annual rate of 1.05% and 0.80% for Class A Shares and Class I Shares, respectively. The expense limitation shall be in effect until March 1, 2018. The expense ratios reflected include Acquired Fund fees and expenses. Additional information pertaining to the October 31, 2017 expense ratios can be found in the financial highlights. |
| 3 | For additional information, please refer to the Glossary of Terms. |
The performance of the Fund is measured against the ICE BofA Merrill Lynch BB-B Euro High Yield Constrained (USD Hedged) Index, which contains all securities in the ICE BofA Merrill Lynch U.S. High Yield Index rated BB+ through B- by Standard & Poor’s (or equivalent as rated by Moody’s or Fitch), but caps issuer exposure at 3%. The index is unmanaged and its performance does not reflect the deduction of expenses associated with a mutual fund, such as investment management and fund accounting fees. The Fund’s performance reflects the deduction of fees for these value-added services. Investors cannot invest directly in an index.
| Portfolio Reviews |
| Portfolio Composition* |
| October 31, 2017 (Unaudited) |
| HSBC Emerging Markets Debt Fund | |
| | |
| Country | Percentage of Investments at Value(%)† |
| Indonesia | | 11.8 | |
| Mexico | | 10.9 | |
| Turkey | | 9.0 | |
| Brazil | | 7.0 | |
| Poland | | 6.1 | |
| Russian Federation | | 5.7 | |
| South Africa | | 5.5 | |
| Colombia | | 5.3 | |
| Argentina | | 4.5 | |
| Hungary | | 2.8 | |
| Romania | | 2.5 | |
| Thailand | | 2.2 | |
| Chile | | 2.1 | |
| Malaysia | | 2.0 | |
| Peru | | 1.9 | |
| Philippines | | 1.8 | |
| Kazakhstan | | 1.6 | |
| Dominican Republic | | 1.6 | |
| Venezuela | | 1.6 | |
| China | | 1.2 | |
| India | | 1.2 | |
| Sri Lanka | | 1.1 | |
| Ukraine | | 1.0 | |
| Ecuador | | 1.0 | |
| Czech Republic | | 0.9 | |
| Egypt | | 0.8 | |
| Costa Rica | | 0.7 | |
| El Salvador | | 0.7 | |
| Jamaica | | 0.7 | |
| Zambia | | 0.6 | |
| Panama | | 0.5 | |
| Iraq | | 0.4 | |
| Senegal | | 0.4 | |
| Ghana | | 0.4 | |
| Nigeria | | 0.4 | |
| Morocco | | 0.4 | |
| Gabon | | 0.4 | |
| United States | | 0.4 | |
| Croatia | | 0.3 | |
| Cote D’Ivoire | | 0.2 | |
| Lithuania | | 0.2 | |
| Uruguay | | 0.1 | |
| Lebanon | | 0.1 | |
| | 100.0 | |
| HSBC Frontier Markets Fund | |
| | |
| Country | Percentage of Investments at Value(%)† |
| United Arab Emirates | | 14.3 | |
| Kuwait | | 13.2 | |
| Argentina | | 10.9 | |
| Philippines | | 10.2 | |
| Bangladesh | | 5.3 | |
| Romania | | 5.1 | |
| Georgia | | 4.9 | |
| Egypt | | 4.7 | |
| Morocco | | 3.3 | |
| Peru | | 3.2 | |
| Colombia | | 3.1 | |
| Cambodia | | 2.8 | |
| Nigeria | | 2.6 | |
| Vietnam | | 2.5 | |
| Kenya | | 2.5 | |
| Kazakhstan | | 2.2 | |
| Pakistan | | 2.1 | |
| Australia | | 1.6 | |
| Oman | | 1.5 | |
| Qatar | | 1.4 | |
| Mauritius | | 1.2 | |
| Croatia | | 0.9 | |
| Saudi Arabia | | 0.4 | |
| Sri Lanka | | 0.1 | |
| | 100.0 | |
| | |
| HSBC Total Return Fund | |
| | |
| Country | Percentage of Investments at Value(%)† |
| Mexico | | 20.1 | |
| Brazil | | 17.8 | |
| South Africa | | 12.7 | |
| Russian Federation | | 9.8 | |
| Argentina | | 9.0 | |
| Turkey | | 8.7 | |
| Indonesia | | 6.9 | |
| Colombia | | 3.8 | |
| Republic of Serbia | | 3.7 | |
| China | | 1.8 | |
| Dominican Republic | | 1.5 | |
| Malaysia | | 1.4 | |
| Croatia | | 1.0 | |
| Korea, Republic Of | | 0.9 | |
| United States | | 0.9 | |
| | 100.0 | |
____________________
| * | Portfolio composition is subject to change. |
| † | Excludes any instruments used for cash management. |
| Portfolio Reviews |
| Portfolio Composition* (continued) |
| October 31, 2017 (Unaudited) |
| HSBC Asia ex-Japan Smaller Companies Equity Fund |
| | |
| Country | Percentage of Investments at Value(%)† |
| Hong Kong | | 26.7 | |
| Taiwan, | | | |
| Province Of China | | 20.1 | |
| China | | 15.4 | |
| India | | 14.0 | |
| Korea, Republic Of | | 11.6 | |
| Singapore | | 3.9 | |
| Indonesia | | 3.0 | |
| Malaysia | | 2.4 | |
| Thailand | | 2.2 | |
| Philippines | | 0.7 | |
| | 100.0 | |
| | |
| HSBC Global High Yield Bond Fund | |
| | |
| Country | Percentage of Investments at Value(%)† |
| United States | | 56.2 | |
| France | | 6.4 | |
| Germany | | 5.2 | |
| Brazil | | 4.0 | |
| Luxembourg | | 3.6 | |
| Netherlands | | 3.2 | |
| Canada | | 3.2 | |
| United Kingdom | | 2.6 | |
| Turkey | | 1.7 | |
| Russian Federation | | 1.6 | |
| Argentina | | 1.4 | |
| Italy | | 1.3 | |
| Ireland | | 1.2 | |
| Spain | | 1.0 | |
| Switzerland | | 0.9 | |
| Indonesia | | 0.8 | |
| Kazakhstan | | 0.8 | |
| Denmark | | 0.7 | |
| Zambia | | 0.6 | |
| Bahamas | | 0.6 | |
| Sweden | | 0.5 | |
| Sri Lanka | | 0.4 | |
| South Africa | | 0.4 | |
| Peru | | 0.4 | |
| Colombia | | 0.3 | |
| Venezuela | | 0.3 | |
| Mexico | | 0.2 | |
| Nigeria | | 0.2 | |
| El Salvador | | 0.1 | |
| Australia | | 0.1 | |
| Lebanon | | 0.1 | |
| Bermuda | | 0.0 | |
| Guatemala | | 0.0 | |
| Chile | | 0.0 | |
| | 100.0 | |
| HSBC Global High Income Bond Fund | |
| | |
| Country | Percentage of Investments at Value(%)† |
| United States | | 41.1 | |
| France | | 6.8 | |
| Germany | | 6.7 | |
| Netherlands | | 4.2 | |
| Italy | | 3.8 | |
| United Kingdom | | 3.7 | |
| Mexico | | 3.6 | |
| China | | 3.1 | |
| Brazil | | 2.5 | |
| Canada | | 1.9 | |
| Argentina | | 1.9 | |
| Spain | | 1.8 | |
| Indonesia | | 1.7 | |
| India | | 1.5 | |
| Hong Kong | | 1.4 | |
| Turkey | | 1.3 | |
| Colombia | | 1.0 | |
| Peru | | 0.9 | |
| Switzerland | | 0.9 | |
| Russian Federation | | 0.9 | |
| Dominican Republic | | 0.8 | |
| Saudi Arabia | | 0.7 | |
| Ireland | | 0.5 | |
| Hungary | | 0.5 | |
| Belgium | | 0.5 | |
| Malaysia | | 0.5 | |
| Kazakhstan | | 0.4 | |
| Croatia | | 0.4 | |
| Bermuda | | 0.4 | |
| Sri Lanka | | 0.4 | |
| Australia | | 0.4 | |
| South Africa | | 0.4 | |
| Cote D’Ivoire | | 0.4 | |
| Venezuela | | 0.3 | |
| Romania | | 0.3 | |
| Poland | | 0.3 | |
| Uruguay | | 0.3 | |
| Israel | | 0.2 | |
| Luxembourg | | 0.2 | |
| Lebanon | | 0.2 | |
| Chile | | 0.2 | |
| Bahamas | | 0.2 | |
| Panama | | 0.2 | |
| Qatar | | 0.1 | |
| Nigeria | | 0.1 | |
| Philippines | | 0.1 | |
| Zambia | | 0.1 | |
| Guatemala | | 0.1 | |
| Republic of Serbia | | 0.1 | |
| El Salvador | | 0.0 | |
| | 100.0 | |
____________________
| * | Portfolio composition is subject to change. |
| † | Excludes any instruments used for cash management. |
| Portfolio Reviews |
| Portfolio Composition* (continued) |
| October 31, 2017 (Unaudited) |
| HSBC Global Equity Volatility Focused Fund |
| | |
| Country | Percentage of Investments at Value(%)† |
| United States | | 42.0 | |
| United Kingdom | | 13.1 | |
| Japan | | 13.0 | |
| China | | 5.2 | |
| France | | 4.8 | |
| Germany | | 4.7 | |
| Switzerland | | 3.6 | |
| Italy | | 2.7 | |
| Netherlands | | 2.4 | |
| Hong Kong | | 1.6 | |
| Indonesia | | 1.6 | |
| Ireland | | 1.1 | |
| Singapore | | 1.1 | |
| Thailand | | 1.1 | |
| Denmark | | 0.8 | |
| Australia | | 0.7 | |
| Canada | | 0.5 | |
| | 100.0 | |
| | |
| HSBC Euro High Yield Bond Fund (USD Hedged) |
| | |
| Country | Percentage of Investments at Value(%)† |
| France | | 29.0 | |
| Germany | | 18.3 | |
| Netherlands | | 11.4 | |
| United Kingdom | | 7.3 | |
| United States | | 5.2 | |
| Switzerland | | 4.8 | |
| Spain | | 4.2 | |
| Denmark | | 3.9 | |
| Belgium | | 3.8 | |
| Sweden | | 2.5 | |
| Austria | | 2.1 | |
| Finland | | 2.0 | |
| Mexico | | 1.5 | |
| Luxembourg | | 1.4 | |
| Australia | | 1.1 | |
| Italy | | 0.5 | |
| Ireland | | 0.5 | |
| South Africa | | 0.5 | |
| | 100.0 | |
____________________
| * | Portfolio composition is subject to change. |
| † | Excludes any instruments used for cash management. |
| HSBC EMERGING MARKETS DEBT FUND |
| Schedule of Portfolio Investments—as of October 31, 2017 |
| Foreign Bonds – 45.7% | | | | |
| | | | | |
| | Principal | | |
| | Amount † | | Value ($) |
| Argentina – 0.7% | | | | |
| Republic of Argentina, | | | | |
| 0.74%, 9/19/18 | | 7,000,000 | | 398,584 |
| Brazil – 4.8% | | | | |
| Nota do Tesouro Nacional, | | | | |
| Series NTNF, 10.00%, 1/1/21 | | 5,950,000 | | 1,928,196 |
| Nota do Tesouro Nacional, | | | | |
| Series NTNB, 6.00%, 8/15/22 | | 680,000 | | 672,779 |
| Nota do Tesouro Nacional, | | | | |
| Series NTNF, 10.00%, 1/1/27 | | 200,000 | | 63,721 |
| | | | | 2,664,696 |
| Chile – 0.6% | | | | |
| Bonos de la Tesoreria de la Republica | | | | |
| en pesos, 4.50%, 3/1/21 | | 150,000,000 | | 243,793 |
| Bonos de la Tesoreria de la Republica | | | | |
| en pesos, 4.50%, 3/1/26 | | 70,000,000 | | 111,480 |
| | | | | 355,273 |
| Colombia – 3.3% | | | | |
| Titulos de Tesoreria Bond, | | | | |
| 11.25%, 10/24/18 | | 1,350,000,000 | | 471,333 |
| Titulos de Tesoreria Bond, Series B, | | | | |
| 11.00%, 7/24/20 | | 900,000,000 | | 335,573 |
| Titulos de Tesoreria Bond, Series B, | | | | |
| 10.00%, 7/24/24 | | 1,833,400,000 | | 721,386 |
| Titulos de Tesoreria Bond, Series B, | | | | |
| 6.00%, 4/28/28 | | 860,000,000 | | 267,550 |
| | | | | 1,795,842 |
| Czech Republic – 0.8% | | | | |
| Republic of Czech, Series 52, | | | | |
| 4.70%, 9/12/22 | | 5,000,000 | | 269,498 |
| Republic of Czech, Series 58, | | | | |
| 5.70%, 5/25/24 | | 3,100,000 | | 182,934 |
| | | | | 452,432 |
| Hungary – 0.4% | | | | |
| Hungary Government Bond, | | | | |
| 7.50%, 11/12/20 | | 54,000,000 | | 243,870 |
| Indonesia – 6.7% | | | | |
| Indonesia Government, Series FR69, | | | | |
| 7.88%, 4/15/19 | | 7,000,000,000 | | 530,780 |
| Indonesia Government, Series FR70, | | | | |
| 8.38%, 3/15/24 | | 10,272,000,000 | | 820,500 |
| Indonesia Government, Series FR40, | | | | |
| 11.00%, 9/15/25 | | 2,000,000,000 | | 185,585 |
| Indonesia Government, Series FR56, | | | | |
| 8.38%, 9/15/26 | | 24,773,000,000 | | 2,005,042 |
| Indonesia Government, | | | | |
| 8.75%, 5/15/31 | | 1,300,000,000 | | 107,614 |
| | | | | 3,649,521 |
| Malaysia – 1.9% | | | | |
| Malaysian Government, Series 515, | | | | |
| 3.76%, 3/15/19 | | 735,000 | | 174,921 |
| Malaysian Government, Series 315, | | | | |
| 3.66%, 10/15/20 | | 950,000 | | 225,540 |
| Malaysian Government, Series 416, | | | | |
| 3.62%, 11/30/21 | | 2,000,000 | | 471,766 |
| Malaysian Government, Series 114, | | | | |
| 4.18%, 7/15/24 | | 500,000 | | 119,487 |
| Malaysian Government, Series 316, | | | | |
| 3.90%, 11/30/26 | | 200,000 | | 46,550 |
| | | | | 1,038,264 |
| Mexico – 5.1% | | | | |
| Mexican Bonos Desarrollo, Series M, | | | | |
| 6.50%, 6/10/21 | | 3,760,000 | | 192,672 |
| Mexican Bonos Desarrollo, Series M, | | | | |
| 5.75%, 3/5/26 | | 22,320,000 | | 1,057,363 |
| Mexican Bonos Desarrollo, | | | | |
| Series M20, 7.50%, 6/3/27 | | 10,100,000 | | 534,442 |
| Mexican Bonos Desarrollo, | | | | |
| Series M30, 10.00%, 11/20/36 | | 14,000,000 | | 915,019 |
| Mexican Bonos Desarrollo, | | | | |
| Series M30, 8.50%, 11/18/38 | | 1,700,000 | | 97,882 |
| | | | | 2,797,378 |
| Peru – 1.2% | | | | |
| Republic of Peru, Registered, | | | | |
| 8.20%, 8/12/26 | | 550,000 | | 207,424 |
| Republic of Peru, Registered, | | | | |
| 6.35%, 8/12/28 | | 1,300,000 | | 429,676 |
| | | | | 637,100 |
| Philippines – 0.3% | | | | |
| Republic of Philippines, | | | | |
| 3.90%, 11/26/22 | | 10,000,000 | | 192,434 |
| Poland – 5.8% | | | | |
| Poland Government Bond, | | | | |
| Series 0719, 3.25%, 7/25/19 | | 808,000 | | 228,637 |
| Poland Government Bond, | | | | |
| Series 1020, 5.25%, 10/25/20 | | 250,000 | | 74,974 |
| Poland Government Bond, | | | | |
| Series 0421, 2.00%, 4/25/21 | | 4,135,000 | | 1,125,289 |
| Poland Government Bond, | | | | |
| Series 1021, 5.75%, 10/25/21 | | 475,000 | | 146,758 |
| Poland Government Bond, | | | | |
| Series 0922, 5.75%, 9/23/22 | | 2,000,000 | | 626,230 |
| Poland Government Bond, | | | | |
| Series 0725, 3.25%, 7/25/25 | | 3,450,000 | | 947,693 |
| Poland Government Bond, | | | | |
| Series 0726, 2.50%, 7/25/26 | | 40,000 | | 10,272 |
| | | | | 3,159,853 |
| Romania – 1.2% | | | | |
| Romania Government Bond, | | | | |
| Series 5Y, 3.25%, 3/22/21 | | 1,500,000 | | 383,934 |
| Romania Government Bond, | | | | |
| Series 10Y, 5.95%, 6/11/21 | | 420,000 | | 116,917 |
| Romania Government Bond, | | | | |
| Series 10Y, 4.75%, 2/24/25 | | 210,000 | | 55,410 |
| See notes to financial statements. | HSBC FAMILY OF FUNDS 23 |
| HSBC EMERGING MARKETS DEBT FUND |
| Schedule of Portfolio Investments—as of October 31, 2017 (continued) |
| Foreign Bonds, continued | | | | |
| | | | | |
| | | Principal | | |
| | Amount † | | Value ($) |
| Romania – continued | | | | |
| Romania Government Bond, | | | | |
| Series 15Y, 5.80%, 7/26/27 | | 300,000 | | 84,536 |
| | | | | 640,797 |
| Russian Federation – 3.2% | | | | |
| Russia Government Bond, | | | | |
| Series 5081, 6.20%, 1/31/18 | | 59,200,000 | | 1,008,951 |
| Russia Government Bond, | | | | |
| Series 6208, 7.50%, 2/27/19 | | 20,400,000 | | 349,657 |
| Russia Government Bond, | | | | |
| Series 6215, 7.00%, 8/16/23 | | 14,700,000 | | 247,793 |
| Russia Government Bond, | | | | |
| Series 6207, 8.15%, 2/3/27 | | 8,000,000 | | 142,992 |
| | | | | 1,749,393 |
| South Africa – 3.8% | | | | |
| Republic of South Africa, | | | | |
| Series R204, 8.00%, 12/21/18 | | 2,600,000 | | 185,082 |
| Republic of South Africa, | | | | |
| Series 2023, 7.75%, 2/28/23 | | 5,240,000 | | 360,629 |
| Republic of South Africa, | | | | |
| Series R186, 10.50%, 12/21/26 | | 3,100,000 | | 237,611 |
| Republic of South Africa, | | | | |
| Series R209, 6.25%, 3/31/36 | | 14,927,000 | | 728,759 |
| Republic of South Africa, | | | | |
| Series 2040, 9.00%, 1/31/40 | | 9,000,000 | | 572,789 |
| | | | | 2,084,870 |
| Thailand – 2.1% | | | | |
| Thailand Government Bond, | | | | |
| 1.88%, 6/17/22 | | 2,300,000 | | 69,330 |
| Thailand Government Bond, | | | | |
| 3.85%, 12/12/25 | | 20,686,000 | | 694,618 |
| Thailand Government Bond, | | | | |
| 2.13%, 12/17/26 | | 720,000 | | 21,272 |
| Thailand Government Bond, | | | | |
| 4.88%, 6/22/29 | | 10,500,000 | | 390,650 |
| | | | | 1,175,870 |
| Turkey – 3.8% | | | | |
| Turkey Government Bond, | | | | |
| 8.80%, 11/14/18 | | 2,555,000 | | 650,154 |
| Turkey Government Bond, | | | | |
| 10.70%, 2/17/21 | | 1,090,000 | | 276,074 |
| Turkey Government Bond, | | | | |
| 9.50%, 1/12/22 | | 1,490,000 | | 361,862 |
| Turkey Government Bond, | | | | |
| 8.80%, 9/27/23 | | 2,400,000 | | 555,652 |
| Turkey Government Bond, | | | | |
| 8.00%, 3/12/25 | | 1,240,000 | | 270,738 |
| | | | | 2,114,480 |
| TOTAL FOREIGN BONDS | | | | |
| (COST $25,946,849) | | | | 25,150,657 |
| | | | | |
| Yankee Dollars – 49.7% |
| | | | | |
| Argentina – 3.6% | | | | |
| City of Buenos Aires Argentina, | | | | |
| Registered, 8.95%, 2/19/21 | | 200,000 | | 222,760 |
| Provincia de Buenos Aires/Argentina, | | | | |
| Registered, 9.13%, 3/16/24 | | 150,000 | | 174,750 |
| Republic of Argentina, | | | | |
| 6.88%, 4/22/21 | | 150,000 | | 163,500 |
| Republic of Argentina, | | | | |
| 5.63%, 1/26/22 | | 855,000 | | 897,750 |
| Republic of Argentina, | | | | |
| 6.88%, 1/26/27 | | 396,000 | | 431,838 |
| Republic of Argentina, | | | | |
| 7.13%, 6/28/17 (a) | | 90,000 | | 92,340 |
| | | | | 1,982,938 |
| Brazil – 1.9% | | | | |
| Caixa Economica Federal, | | | | |
| Registered, 4.50%, 10/3/18 (a) | | 150,000 | | 152,507 |
| Centrais Eletricas Brasileiras SA, | | | | |
| Registered, 5.75%, 10/27/21 | | 200,000 | | 211,872 |
| Federal Republic of Brazil, | | | | |
| 7.13%, 1/20/37 | | 206,000 | | 245,757 |
| Federal Republic of Brazil, | | | | |
| 5.63%, 1/7/41 | | 220,000 | | 222,970 |
| Petrobras Brasileiro SA, | | | | |
| 6.85%, 6/5/15 | | 50,000 | | 47,850 |
| Petrobras Global Finance, | | | | |
| 3.00%, 1/15/19 | | 70,000 | | 69,950 |
| Petrobras Global Finance BV, | | | | |
| 8.38%, 5/23/21 | | 36,000 | | 41,513 |
| Petrobras Global Finance BV, | | | | |
| 6.25%, 3/17/24 | | 57,000 | | 61,124 |
| Vale Overseas Ltd., | | | | |
| 6.88%, 11/21/36 | | 7,000 | | 8,386 |
| Vale SA, 5.63%, 9/11/42 | | 3,000 | | 3,169 |
| | | | | 1,065,098 |
| Chile – 1.3% | | | | |
| CorpBanca SA, 3.13%, 1/15/18 | | 200,000 | | 200,351 |
| Empresa Nacional del Petroleo, | | | | |
| 4.50%, 9/14/47, Callable 3/14/47 | | | | |
| @ 100 (a),(b) | | 200,000 | | 190,100 |
| Republic of Chile, | | | | |
| 3.63%, 10/30/42 | | 150,000 | | 148,500 |
| Saci Falabella, 3.75%, 10/30/27, | | | | |
| Callable 7/30/27 @ 100 (a),(b) | | 200,000 | | 195,000 |
| | | | | 733,951 |
| China – 1.1% | | | | |
| CNOOC Finance (2014) ULC, | | | | |
| 4.25%, 4/30/24 | | 200,000 | | 213,204 |
| Sinopec Capital (2013) Ltd., | | | | |
| 3.13%, 4/24/23 (a) | | 200,000 | | 201,813 |
| State Grid Overseas Investment | | | | |
| 2016 Ltd., 3.50%, 5/4/27 (a) | | 200,000 | | 204,116 |
| | | | | 619,133 |
| 24 HSBC FAMILY OF FUNDS | | See notes to financial statements. |
| HSBC EMERGING MARKETS DEBT FUND |
| Schedule of Portfolio Investments—as of October 31, 2017 (continued) |
| Yankee Dollars, continued | | | | |
| | | | | |
| | Principal | | |
| | Amount ($) | | Value ($) |
| Colombia – 1.8% | | | | |
| Banco de Bogota SA, | | | | |
| 4.38%, 8/3/27 (a) | | 200,000 | | 201,200 |
| Bancolombia SA, 5.13%, 9/11/22 | | 216,000 | | 227,146 |
| Colombia Government International | | | | |
| Bond, 3.88%, 4/25/27, Callable | | | | |
| 1/25/27 @ 100 (b) | | 200,000 | | 201,300 |
| Republic of Colombia, | | | | |
| 4.50%, 1/28/26, Callable | | | | |
| 10/28/25 @ 100 (b) | | 200,000 | | 213,100 |
| Republic of Colombia, | | | | |
| 7.38%, 9/18/37 | | 100,000 | | 132,000 |
| | | | | 974,746 |
| Costa Rica – 0.7% | | | | |
| Costa Rica Government, Registered, | | | | |
| 4.25%, 1/26/23 | | 200,000 | | 197,750 |
| Costa Rica Government, Registered, | | | | |
| 4.38%, 4/30/25 | | 200,000 | | 196,000 |
| | | | | 393,750 |
| Cote D’Ivoire – 0.2% | | | | |
| Ivory Coast Government Bond, | | | | |
| Registered, 5.75%, 12/31/32, | | | | |
| Callable 12/31/17 @ 100 (b)(c) | | 120,625 | | 118,927 |
| Croatia – 0.3% | | | | |
| Republic of Croatia, Registered, | | | | |
| 6.75%, 11/5/19 | | 150,000 | | 161,790 |
| Dominican Republic – 1.5% | | | | |
| Dominican Republic, | | | | |
| 6.88%, 1/29/26 (a) | | 100,000 | | 114,283 |
| Dominican Republic, | | | | |
| 5.95%, 1/25/27 (a) | | 100,000 | | 107,650 |
| Dominican Republic, Registered, | | | | |
| 7.50%, 5/6/21 | | 300,000 | | 331,875 |
| Dominican Republic, Registered, | | | | |
| 5.95%, 1/25/27 | | 250,000 | | 269,125 |
| | | | | 822,933 |
| Ecuador – 0.9% | | | | |
| Republic of Ecuador, Registered, | | | | |
| 7.95%, 6/20/24 | | 500,000 | | 505,000 |
| Egypt – 0.8% | | | | |
| Arab Republic of Egypt, Registered, | | | | |
| 6.13%, 1/31/22 | | 200,000 | | 208,545 |
| Arab Republic of Egypt, Registered, | | | | |
| 5.88%, 6/11/25 | | 200,000 | | 204,112 |
| | | | | 412,657 |
| El Salvador – 0.7% | | | | |
| Republic of El Salvador, Registered, | | | | |
| 7.75%, 1/24/23 | | 60,000 | | 64,650 |
| Republic of El Salvador, Registered, | | | | |
| 5.88%, 1/30/25 | | 170,000 | | 167,875 |
| Republic of El Salvador, Registered, | | | | |
| 6.38%, 1/18/27 | | 130,000 | | 129,350 |
| | | | | 361,875 |
| Gabon – 0.4% | | | | |
| Republic of Gabon, Registered, | | | | |
| 6.38%, 12/12/24 | | 200,000 | | 196,032 |
| Ghana – 0.4% | | | | |
| Republic of Ghana, Registered, | | | | |
| 7.88%, 8/7/23 | | 200,000 | | 216,260 |
| Hungary – 2.3% | | | | |
| Republic of Hungary, 6.25%, 1/29/20 | | 600,000 | | 650,233 |
| Republic of Hungary, 6.38%, 3/29/21 | | 100,000 | | 111,875 |
| Republic of Hungary, 5.38%, 2/21/23 | | 210,000 | | 235,200 |
| Republic of Hungary, | | | | |
| 7.63%, 3/29/41 | | 158,000 | | 243,636 |
| | | | | 1,240,944 |
| India – 1.1% | | | | |
| Export-Import Bank of India, | | | | |
| Registered, 3.38%, 8/5/26 | | 200,000 | | 198,212 |
| ICICI Bank Ltd., Registered, | | | | |
| 5.75%, 11/16/20 | | 200,000 | | 217,216 |
| State Bank India, Registered, | | | | |
| 3.62%, 4/17/19 | | 200,000 | | 203,248 |
| | | | | 618,676 |
| Indonesia – 4.8% | | | | |
| Indonesia Government Bond, | | | | |
| Registered, 5.13%, 1/15/45 | | 200,000 | | 221,934 |
| Pertamina Persero PT, Registered, | | | | |
| 5.25%, 5/23/21 | | 780,000 | | 841,704 |
| Perusahaan Listrik Negara PT, | | | | |
| 4.13%, 5/15/27 (a) | | 450,000 | | 450,780 |
| Republic of Indonesia, | | | | |
| 5.88%, 3/13/20 | | 100,000 | | 108,359 |
| Republic of Indonesia, | | | | |
| 6.75%, 1/15/44 | | 200,000 | | 268,506 |
| Republic of Indonesia, Registered, | | | | |
| 5.38%, 10/17/23 | | 270,000 | | 303,930 |
| Republic of Indonesia, Registered, | | | | |
| 8.50%, 10/12/35 | | 100,000 | | 149,622 |
| Republic of Indonesia, Registered, | | | | |
| 6.63%, 2/17/37 | | 100,000 | | 128,496 |
| Republic of Indonesia, Registered, | | | | |
| 7.75%, 1/17/38 | | 100,000 | | 142,836 |
| | | | | 2,616,167 |
| Iraq – 0.4% | | | | |
| Republic of Iraq, Registered, | | | | |
| 5.80%, 1/15/28, Callable 12/21/17 | | | | |
| @ 100 (b) | | 250,000 | | 235,299 |
| Jamaica – 0.6% | | | | |
| Government of Jamaica, | | | | |
| 6.75%, 4/28/28 | | 200,000 | | 231,718 |
| Jamaica Government Bond, | | | | |
| 8.00%, 3/15/39 | | 100,000 | | 124,750 |
| | | | | 356,468 |
| See notes to financial statements. | | HSBC FAMILY OF FUNDS 25 |
| HSBC EMERGING MARKETS DEBT FUND |
| Schedule of Portfolio Investments—as of October 31, 2017 (continued) |
| Yankee Dollars, continued | | | | |
| | | | | |
| | Principal | | |
| | Amount ($) | | Value ($) |
| Kazakhstan – 1.6% | | | | |
| Kazmunaygas National Co., | | | | |
| 9.13%, 7/2/18 | | 200,000 | | 208,722 |
| Kazmunaygas National Co., | | | | |
| 5.75%, 4/19/47 (a) | | 200,000 | | 201,000 |
| Republic of Kazakhstan, Registered, | | | | |
| 5.13%, 7/21/25 | | 400,000 | | 444,592 |
| | | | 854,314 |
| Lebanon – 0.1% | | | | |
| Republic of Lebanon, Series G, | | | | |
| 5.45%, 11/28/19 | | 20,000 | | 20,023 |
| Republic of Lebanon, Series G, | | | | |
| 6.38%, 3/9/20 | | 22,000 | | 22,343 |
| | | | 42,366 |
| Lithuania – 0.2% | | | | |
| Republic of Lithuania, Registered, | | | | |
| 7.38%, 2/11/20 | | 100,000 | | 111,758 |
| Mexico – 5.3% | | | | |
| Comision Federal de Electricidad, | | | | |
| Registered, 4.75%, 2/23/27 | | 200,000 | | 209,500 |
| Petroleos Mexicanos, | | | | |
| 6.38%, 2/4/21 | | 221,000 | | 240,315 |
| Petroleos Mexicanos, | | | | |
| 3.50%, 1/30/23 | | 100,000 | | 97,670 |
| Petroleos Mexicanos, | | | | |
| 4.50%, 1/23/26 | | 191,000 | | 188,307 |
| Petroleos Mexicanos, | | | | |
| 6.50%, 3/13/27 (a) | | 76,000 | | 82,946 |
| Petroleos Mexicanos, | | | | |
| 6.50%, 3/13/27 (a) | | 30,000 | | 32,742 |
| Petroleos Mexicanos, | | | | |
| 6.63%, 6/15/35 | | 220,000 | | 232,320 |
| Petroleos Mexicanos, | | | | |
| 5.50%, 6/27/44 | | 100,000 | | 90,340 |
| Petroleos Mexicanos, 6.75%, 9/21/47 | | | | |
| (a) | | 46,000 | | 47,412 |
| Petroleos Mexicanos, Registered, | | | | |
| 6.50%, 3/13/27 | | 243,000 | | 265,211 |
| United Mexican States, Series G, | | | | |
| 3.50%, 1/21/21 | | 250,000 | | 260,750 |
| United Mexican States, | | | | |
| 3.63%, 3/15/22 | | 300,000 | | 312,450 |
| United Mexican States, | | | | |
| 4.13%, 1/21/26 | | 200,000 | | 208,400 |
| United Mexican States, | | | | |
| 6.05%, 1/11/40 | | 80,000 | | 93,680 |
| United Mexican States, Series M, | | | | |
| 4.75%, 3/8/44 | | 230,000 | | 229,855 |
| United Mexican States, | | | | |
| 4.60%, 1/23/46 | | 400,000 | | 390,295 |
| | | | 2,982,193 |
| Morocco – 0.4% | | | | |
| OCP SA, 4.50%, 10/22/25 | | 200,000 | | 199,834 |
| Nigeria – 0.4% | | | | |
| Republic of Nigeria, | | | | |
| 6.38%, 7/12/23 | | 200,000 | | 209,874 |
| Panama – 0.5% | | | | |
| Republic of Panama, 4.00%, 9/22/24, | | | | |
| Callable 6/22/24 @ 100 (b) | | 200,000 | | 213,200 |
| Republic of Panama, | | | | |
| 9.38%, 4/1/29 | | 8,000 | | 12,020 |
| Republic of Panama, | | | | |
| 6.70%, 1/26/36 | | 41,000 | | 54,120 |
| | | | 279,340 |
| Peru – 0.7% | | | | |
| BBVA Banco Continental, Registered, | | | | |
| 5.00%, 8/26/22 | | 10,000 | | 10,888 |
| Republic of Peru, 7.35%, 7/21/25 | | 100,000 | | 130,799 |
| Republic of Peru, 4.13%, 8/25/27 | | 85,000 | | 93,160 |
| Republic of Peru, 6.55%, 3/14/37 | | 91,000 | | 122,395 |
| Southern Copper Corp., | | | | |
| 5.25%, 11/8/42 | | 25,000 | | 27,124 |
| | | | 384,366 |
| Philippines – 1.4% | | | | |
| Republic of Philippines, | | | | |
| 4.20%, 1/21/24 | | 200,000 | | 218,946 |
| Republic of Philippines, | | | | |
| 5.50%, 3/30/26 | | 200,000 | | 237,803 |
| Republic of Philippines, | | | | |
| 7.75%, 1/14/31 | | 120,000 | | 172,623 |
| Republic of Philippines, | | | | |
| 6.38%, 10/23/34 | | 100,000 | | 133,952 |
| | | | | 763,324 |
| Poland – 0.1% | | | | |
| Republic of Poland, | | | | |
| 3.00%, 3/17/23 | | 35,000 | | 35,743 |
| Romania – 1.2% | | | | |
| Romania Government Bond, | | | | |
| 6.13%, 1/22/44 (a) | | 50,000 | | 63,420 |
| Romania Government Bond, | | | | |
| 6.13%, 1/22/44 | | 48,000 | | 60,883 |
| Romania Government Bond, | | | | |
| Registered, 6.75%, 2/7/22 | | 434,000 | | 500,612 |
| Romania Government Bond, | | | | |
| Registered, 4.88%, 1/22/24 | | 40,000 | | 43,951 |
| | | | | 668,866 |
| Russian Federation – 2.3% | | | | |
| Gazprom OAO, Registered, | | | | |
| 6.51%, 3/7/22 | | 100,000 | | 110,745 |
| Gazprom OAO, Registered, | | | | |
| 7.29%, 8/16/37 | | 230,000 | | 278,949 |
| Lukoil International Finance BV, | | | | |
| Registered, 4.75%, 11/2/26 | | 200,000 | | 210,037 |
| 26 HSBC FAMILY OF FUNDS | | See notes to financial statements. |
| HSBC EMERGING MARKETS DEBT FUND |
| Schedule of Portfolio Investments—as of October 31, 2017 (continued) |
| Yankee Dollars, continued |
| | | | | | |
| | Principal | | | |
| | Amount ($) | | Value ($) |
| Russian Federation – continued | | | | | |
| Russian Federation, Registered, | | | | | |
| 4.88%, 9/16/23 | | 400,000 | | | 435,086 |
| Sberbank of Russia Via SB | | | | | |
| Capital SA, Registered, | | | | | |
| 5.13%, 10/29/22 | | 200,000 | | | 208,800 |
| | | | | 1,243,617 |
| Senegal – 0.4% | | | | | |
| Republic of Senegal, | | | | | |
| 8.75%, 5/13/21 | | 200,000 | | | 231,428 |
| South Africa – 1.5% | | | | | |
| Republic of South Africa, | | | | | |
| 4.67%, 1/17/24 | | 200,000 | | | 202,638 |
| Republic of South Africa, | | | | | |
| 4.88%, 4/14/26 | | 600,000 | | | 596,391 |
| | | | | 799,029 |
| Sri Lanka – 1.0% | | | | | |
| Republic of Sri Lanka, | | | | | |
| 5.88%, 7/25/22 | | 200,000 | | | 213,499 |
| Republic of Sri Lanka, Registered, | | | | | |
| 6.00%, 1/14/19 | | 200,000 | | | 206,246 |
| Republic of Sri Lanka, Registered, | | | | | |
| 6.25%, 10/4/20 | | 130,000 | | | 138,795 |
| | | | | 558,540 |
| Turkey – 4.8% | | | | | |
| Akbank TAS, Registered, | | | | | |
| 4.00%, 1/24/20 | | 200,000 | | | 199,292 |
| Export Credit Bank of Turkey, | | | | | |
| Registered, 5.38%, 10/24/23 | | 300,000 | | | 302,064 |
| Republic of Turkey, 5.63%, 3/30/21 | | 300,000 | | | 316,221 |
| Republic of Turkey, 6.25%, 9/26/22 | | 375,000 | | | 406,986 |
| Republic of Turkey, 4.88%, 10/9/26 | | 530,000 | | | 517,562 |
| Republic of Turkey, 8.00%, 2/14/34 | | 96,000 | | | 117,205 |
| Republic of Turkey, 6.00%, 1/14/41 | | 200,000 | | | 199,949 |
| Republic of Turkey, 6.63%, 2/17/45 | | 200,000 | | | 213,605 |
| Republic of Turkey, 5.75%, 5/11/47 | | 200,000 | | | 190,600 |
| Turkiye Is Bankasi, Registered, | | | | | |
| 5.38%, 10/6/21 | | 200,000 | | | 200,186 |
| | | | | 2,663,670 |
| Ukraine – 1.0% | | | | | |
| Ukraine Government, | | | | | |
| 7.75%, 9/1/27 | | 240,000 | | | 247,219 |
| Ukraine Government, | | | | | |
| 7.38%, 9/25/32 (a) | | 290,000 | | | 285,903 |
| | | | | 533,122 |
| Uruguay – 0.1% | | | | | |
| Republic of Uruguay, PIK, | | | | | |
| 7.88%, 1/15/33 | | 20,000 | | | 28,350 |
| Republica Oriental del Uruguay, | | | | | |
| 4.50%, 8/14/24 | | 10,000 | | | 10,965 |
| Republica Oriental del Uruguay, | | | | | |
| 5.10%, 6/18/50 | | 10,000 | | | 10,725 |
| | | | | 50,040 |
| Venezuela – 1.3% | | | | | |
| Bolivarian Republic of Venezuela, | | | | | |
| 9.25%, 5/7/28 | | 176,000 | | | 58,080 |
| Petroleos de Venezuela SA, | | | | | |
| 9.00%, 11/17/21 | | 100,000 | | | 43,875 |
| Petroleos de Venezuela SA, | | | | | |
| 5.50%, 4/12/37 | | 963,800 | | | 277,093 |
| Petroleos de Venezuela SA, | | | | | |
| Registered, 8.50%, 10/27/20 | | 300,000 | | | 249,450 |
| Petroleos de Venezuela SA, | | | | | |
| Registered, 6.00%, 5/16/24 | | 155,771 | | | 44,005 |
| Petroleos de Venezuela SA, | | | | | |
| Registered, 6.00%, 11/15/26 | | 32,000 | | | 8,880 |
| Republic of Venezuela, | | | | | |
| 7.75%, 10/13/19 | | 35,000 | | | 16,450 |
| Republic of Venezuela, Registered, | | | | | |
| 6.00%, 12/9/20 | | 100,000 | | | 39,250 |
| | | | | 737,083 |
| Zambia – 0.6% | | | | | |
| Republic of Zambia, Registered, | | | | | |
| 5.38%, 9/20/22 | | 330,000 | | | 315,216 |
| TOTAL YANKEE DOLLARS | | | | | |
| (COST $26,890,131) | | | | | 27,296,367 |
| | | | | | |
| U.S. Treasury Obligations – 0.3% | | | | | |
| | | | | | |
| U.S. Treasury Bond – 0.1% | | | | | |
| 2.88%, 11/15/46 | | 50,000 | | | 49,961 |
| U.S. Treasury Note – 0.2% | | | | | |
| 2.00%, 11/15/26 | | 141,000 | | | 136,930 |
| TOTAL U.S. TREASURY | | | | | |
| OBLIGATIONS | | | | | |
| (COST $184,878) | | | | | 186,891 |
| | | | | | |
| Investment Companies — 1.0% | | | | | |
| | | | | | |
| | Shares | | | |
| Northern Institutional Government | | | | | |
| Assets Portfolio, Institutional | | | | | |
| Shares, 0.82% (d) | | 565,344 | | | 565,344 |
| TOTAL INVESTMENT COMPANIES | | | | | |
| (COST $565,344) | | | | | 565,344 |
| TOTAL INVESTMENTS | | | | | |
| IN SECURITIES | | | | | |
| (COST $53,587,202) – 96.7% | | | | | 53,199,259 |
| Other Assets | | | | | |
| (Liabilities) – 3.3% | | | | | 1,809,046 |
| NET ASSETS – 100% | | | | $ | 55,008,305 |
| See notes to financial statements. | HSBC FAMILY OF FUNDS 27 |
| HSBC EMERGING MARKETS DEBT FUND |
| Schedule of Portfolio Investments—as of October 31, 2017 (continued) |
____________________
| † | The principal amount is disclosed in local currency and the value is disclosed in U.S. Dollars. |
| (a) | Rule 144A security or other security which is restricted as to resale to institutional investors. This security has been deemed liquid by the Investment Adviser based on procedures approved by the Board of Trustees. |
| (b) | Represents next call date. Additional subsequent call dates and amounts may apply to this security. |
| (c) | Step Bond. Coupon rate is set for an initial period and then increased to a higher coupon rate at a specified date. The rate shown is the rate in effect at October 31, 2017. |
| (d) | The rate represents the annualized one-day yield that was in effect on October 31, 2017. |
MTN — Medium Term Note
PIK — Payment-in-Kind
ULC — Unlimited Liability Co. |
The Fund invested, as a percentage of net assets at value, in the following industries, as of October 31, 2017:
| | Percentage of Net Assets |
| Industry | | at Value (%) |
| Sovereign Bonds | | | 80.9 | |
| Oil, Gas & Consumable Fuels | | | 8.3 | |
| Banks | | | 4.2 | |
| Electric Utilities | | | 1.1 | |
| Investment Companies | | | 1.0 | |
| Chemicals | | | 0.4 | |
| Multiline Retail | | | 0.4 | |
| U.S. Treasury Obligation | | | 0.3 | |
| Metals & Mining | | | 0.1 | |
| Total | | | 96.7 | |
Futures Contracts Purchased
| | | | | | | | | | | | Unrealized |
| | Number of | | Expiration | | Notional | | | | | Appreciation/ |
| Description | | Contracts | | Date | | Amount | | Value | | (Depreciation) |
| 5-Year US Treasury Note Futures | | 25 | | 12/29/17 | | $ | 2,930,757 | | $ | 2,929,689 | | | ($ | 1,068 | ) | |
| | | | | | $ | 2,930,757 | | $ | 2,929,689 | | | ($ | 1,068 | ) | |
Futures Contracts Sold
| | | | | | | | | | | | Unrealized |
| | | Number of | | Expiration | | Notional | | | | | Appreciation/ |
| Description | | Contracts | | Date | | Amount | | Value | | (Depreciation) |
| 10-Year US Treasury Note Futures | | 14 | | 12/19/17 | | $ | 1,777,773 | | $ | 1,749,125 | | | $ | 28,648 | | |
| | | | | | $ | 1,777,773 | | $ | 1,749,125 | | | $ | 28,648 | | |
| | |
| | Total unrealized appreciation | | | $ | 28,648 | | |
| | Total unrealized depreciation | | | | (1,068 | ) | |
| | Total net unrealized appreciation/(depreciation) | | | $ | 27,580 | | |
| 28 HSBC FAMILY OF FUNDS | See notes to financial statements. |
| HSBC EMERGING MARKETS DEBT FUND |
| Schedule of Portfolio Investments—as of October 31, 2017 (continued) |
Credit Default Swap Agreements - Buy Protection(a)
At October 31, 2017, the Fund’s open credit default swap agreements were as follows:
| | | | | | | | | | | | | | | | | | Upfront | | | | | |
| | | | | | Implied Credit | | | | | | | | | | | | Premiums | | Unrealized |
| | Pay | | | | Spread at | | | | | | Notional | | | | | | Paid/ | | Appreciation/ |
| Underlying | | Fixed | | Payment | | October 31, 2017 | | | | Expiration | | Amount | | | | | | (Received) | | (Depreciation) |
| Instrument | | Rate (%) | | Frequency | | (%)(b) | | Counterparty | | Date | | ($)(c) | | Value ($) | | ($) | | ($) |
| Republic of | | | | | | | | Barclays | | | | | | | | | | | | | | | | | |
| Colombia | | 1.00 | | Quarterly | | 0.83 | | Bank PLC | | 12/20/21 | | 110,000 | | | (893 | ) | | | 3,534 | | | | (4,427 | ) | |
| Republic of | | | | | | | | JP Morgan | | | | | | | | | | | | | | | | | |
| Panama | | 1.00 | | Quarterly | | 0.35 | | Chase | | 12/20/20 | | 250,000 | | | (4,929 | ) | | | 7,223 | | | | (12,152 | ) | |
| Republic of | | | | | | | | Barclays | | | | | | | | | | | | | | | | | |
| Turkey | | 1.00 | | Quarterly | | 1.50 | | Bank PLC | | 12/20/21 | | 180,000 | | | 3,286 | | | | 13,194 | | | | (9,908 | ) | |
| United Mexican | | | | | | | | Credit | | | | | | | | | | | | | | | | | |
| States | | 1.00 | | Quarterly | | 0.81 | | Suisse | | 12/20/21 | | 210,000 | | | (1,803 | ) | | | 5,656 | | | | (7,459 | ) | |
| | | | | | | | | | | | | | | (4,339 | ) | | | 29,607 | | | | (33,946 | ) | |
Credit Default Swap Agreements - Sell Protection(a)
At October 31, 2017, the Fund’s open credit default swap agreements were as follows:
| | | | | | | | | | | | | | | | | Upfront | | | | |
| | | | | | Implied Credit | | | | | | | | | | | Premiums | | Unrealized |
| | Receive | | | | Spread at | | | | | | Notional | | | | | Paid/ | | Appreciation/ |
| Underlying | | Fixed | | Payment | | October 31, 2017 | | | | Expiration | | Amount | | | | | (Received) | | (Depreciation) |
| Instrument | | Rate (%) | | Frequency | | (%)(b) | | Counterparty | | Date | | ($)(c) | | Value ($) | | ($) | | ($) |
| CDX Emerging | | | | | | | | | | | | | | | | | | | | | | |
| Markets Index, | | | | | | | | Credit | | | | | | | | | | | | | | |
| Series 25 | | 1.00 | | Quarterly | | 1.83 | | Suisse | | 6/20/21 | | 1,590,000 | | (40,582 | ) | | (98,103 | ) | | | 57,521 | |
| CDX Emerging | | | | | | | | | | | | | | | | | | | | | | |
| Markets Index, | | | | | | | | Barclays | | | | | | | | | | | | | | |
| Series 26 | | 1.00 | | Quarterly | | 1.55 | | Bank PLC | | 12/20/21 | | 500,000 | | (9,773 | ) | | (38,420 | ) | | | 28,647 | |
| Republic of | | | | | | | | Barclays | | | | | | | | | | | | | | |
| Colombia | | 1.00 | | Quarterly | | 0.73 | | Bank PLC | | 6/20/21 | | 100,000 | | 1,070 | | | (4,440 | ) | | | 5,510 | |
| Republic of | | | | | | | | Barclays | | | | | | | | | | | | | | |
| Indonesia | | 1.00 | | Quarterly | | 0.65 | | Bank PLC | | 6/20/21 | | 100,000 | | 1,351 | | | (2,534 | ) | | | 3,885 | |
| Republic of | | | | | | | | Barclays | | | | | | | | | | | | | | |
| Panama | | 1.00 | | Quarterly | | 0.35 | | Bank PLC | | 12/20/20 | | 125,000 | | 2,465 | | | (4,644 | ) | | | 7,109 | |
| Republic of | | | | | | | | Credit | | | | | | | | | | | | | | |
| Peru | | 1.00 | | Quarterly | | 0.29 | | Suisse | | 9/20/20 | | 125,000 | | 2,583 | | | (2,370 | ) | | | 4,953 | |
| Republic of | | | | | | | | Bank of | | | | | | | | | | | | | | |
| Peru | | 1.00 | | Quarterly | | 0.41 | | America | | 6/20/21 | | 40,000 | | 870 | | | (906 | ) | | | 1,776 | |
| | | | | | | | | | | | | | (42,016 | ) | | (151,417 | ) | | | 109,401 | |
(a) | When a credit event occurs as defined under the terms of the swap agreement, the Fund as a seller of credit protection will either (i) pay to the buyer of protection an amount equal to the par value of the defaulted reference entity and take delivery of the reference entity or (ii) pay a net amount equal to the par value of the defaulted reference entity less its recovery value. Alternatively, the Fund as a buyer of credit protection will either (i) receive from the seller of protection an amount equal to the par value of the defaulted reference entity and deliver the reference entity to the seller or (ii) receive a net amount equal to the par value of the defaulted reference entity less its recovery value. |
| (b) | Implied credit spread, represented in absolute terms, utilized in determining the fair value of the credit default swap agreements as of period end serve as an indicator of the current status of the payment/performance risk and represents the likelihood or risk of default for the credit derivative. The implied credit spread of a referenced entity reflects the cost of buying/selling protection and may include upfront or daily payments required to be made to enter into the agreement. Generally, wider credit spreads represent a perceived deterioration of the referenced entity’s credit soundness and a greater likelihood or risk of default or other credit event occurring as defined under the terms of the swap agreement. |
| (c) | The notional amount represents the maximum potential amount of future payments that the Fund may receive as a buyer of credit protection if a credit event occurs, as defined under the terms of the swap agreement. Alternatively, the notional amount represents the maximum potential amount of payment the Fund could be required to make as a seller of credit protection if a credit event occurs, as defined under the terms of the swap agreement. |
| See notes to financial statements. | HSBC FAMILY OF FUNDS 29 |
| HSBC EMERGING MARKETS DEBT FUND |
| Schedule of Portfolio Investments—as of October 31, 2017 (continued) |
At October 31, 2017, the Fund’s open forward foreign currency exchange contracts were as follows:
Short Contracts
| | | | | | | | | | | | | | Net Unrealized |
| | | | | | | | | | | | | | Appreciation/ |
| Description and amount of | | Description and amount of | | | | Settlement | | (Depreciation) |
| currency to be purchased | | currency to be sold | | Counterparty | | Date | | ($) |
| U.S. Dollar | | 50,645 | | Hungarian Forint | | 13,078,192 | | Bank of America | | | 2/5/18 | | | | 1,419 | | |
| U.S. Dollar | | 544,875 | | Israeli Shekel | | 1,897,587 | | JP Morgan Chase | | | 1/29/18 | | | | 3,970 | | |
| U.S. Dollar | | 543,007 | | Mexican Peso | | 9,769,895 | | Standard Chartered Bank | | | 12/20/17 | | | | 37,794 | | |
| U.S. Dollar | | 772,121 | | Polish Zloty | | 2,835,448 | | Goldman Sachs | | | 2/5/18 | | | | (7,769 | ) | |
| U.S. Dollar | | 362,501 | | Polish Zloty | | 1,293,675 | | UBS AG | | | 2/5/18 | | | | 6,676 | | |
| U.S. Dollar | | 785,986 | | South African Rand | | 10,543,827 | | Standard Chartered Bank | | | 1/29/18 | | | | 51,357 | | |
| U.S. Dollar | | 241,000 | | Turkish Lira | | 866,605 | | Goldman Sachs | | | 1/26/18 | | | | 18,322 | | |
| | | | | | | | | | | | | | | 111,769 | | |
Long Contracts
| | | | | | | | | | | | | | Net Unrealized |
| | | | | | | | | | | | | | Appreciation/ |
| Description and amount | | Description and amount | | | | Settlement | | (Depreciation) |
| of currency to be purchased | | of currency to be sold | | Counterparty | | Date | | ($) |
| Romanian Leu | | 582,664 | | U.S. Dollar | | 152,365 | | Goldman Sachs | | | 1/29/18 | | | | | (4,812 | ) | |
| Romanian Leu | | 43,000 | | U.S. Dollar | | 11,069 | | Standard Chartered Bank | | | 1/29/18 | | | | | (180 | ) | |
| Czech Koruna | | 3,869,235 | | U.S. Dollar | | 178,166 | | Goldman Sachs | | | 12/14/17 | | | | | (1,885 | ) | |
| Czech Koruna | | 8,353,608 | | U.S. Dollar | | 380,000 | | JP Morgan Chase | | | 12/14/17 | | | | | 588 | | |
| Czech Koruna | | 235,000 | | U.S. Dollar | | 10,770 | | Morgan Stanley | | | 12/14/17 | | | | | (63 | ) | |
| Hungarian Forint | | 68,116,183 | | U.S. Dollar | | 265,000 | | Standard Chartered Bank | | | 2/5/18 | | | | | (8,608 | ) | |
| Mexican Peso | | 790,000 | | U.S. Dollar | | 43,798 | | Bank of America | | | 12/20/17 | | | | | (2,946 | ) | |
| Mexican Peso | | 2,895,000 | | U.S. Dollar | | 160,824 | | Goldman Sachs | | | 12/20/17 | | | | | (11,120 | ) | |
| Mexican Peso | | 8,358,613 | | U.S. Dollar | | 440,000 | | Standard Chartered Bank | | | 12/20/17 | | | | | (7,766 | ) | |
| Polish Zloty | | 116,000 | | U.S. Dollar | | 31,858 | | JP Morgan Chase | | | 2/5/18 | | | | | 48 | | |
| South African Rand | | 4,752,889 | | U.S. Dollar | | 330,000 | | Goldman Sachs | | | 1/29/18 | | | | | 1,152 | | |
| South African Rand | | 9,683,866 | | U.S. Dollar | | 718,149 | | JP Morgan Chase | | | 1/29/18 | | | | | (43,437 | ) | |
| South African Rand | | 200,000 | | U.S. Dollar | | 14,863 | | Morgan Stanley | | | 1/29/18 | | | | | (928 | ) | |
| Thai Baht | | 30,515,894 | | U.S. Dollar | | 918,047 | | Standard Chartered Bank | | | 3/15/18 | | | | | 1,591 | | |
| Turkish Lira | | 2,031,286 | | U.S. Dollar | | 557,858 | | Bank of America | | | 1/26/18 | | | | | (35,910 | ) | |
| Turkish Lira | | 1,788,705 | | U.S. Dollar | | 501,403 | | Goldman Sachs | | | 1/26/18 | | | | | (41,787 | ) | |
| Turkish Lira | | 163,000 | | U.S. Dollar | | 42,952 | | UBS AG | | | 1/26/18 | | | | | (1,068 | ) | |
| | | | | | | | | | | | | | | | (157,131 | ) | |
| | |
| | | | | | Total unrealized appreciation | | $ | 122,917 | | |
| | | | | | Total unrealized depreciation | | | (168,279 | ) | |
| | | | | | Total net unrealized appreciation/(depreciation) | | $ | (45,362 | ) | |
| 30 HSBC FAMILY OF FUNDS | See notes to financial statements. |
| HSBC FRONTIER MARKETS FUND |
| Schedule of Portfolio Investments—as of October 31, 2017 |
| Common Stocks – 85.7% | | | |
| | | | |
| Shares | | Value ($) |
| Argentina – 10.3% | | | |
| Banco Macro SA, ADR | 16,617 | | 2,092,412 |
| BBVA Banco Frances SA, ADR | 48,557 | | 1,070,196 |
| Grupo Financiero Galicia SA, ADR | 24,617 | | 1,351,473 |
| YPF Sociedad Anonima, ADR | 12,400 | | 304,544 |
| | | 4,818,625 |
| Australia – 1.5% | | | |
| Donaco International, Ltd. | 1,963,694 | | 706,230 |
| Bangladesh – 5.0% | | | |
| Brac Bank, Ltd. | 785,456 | | 955,003 |
| GrameenPhone, Ltd. | 168,205 | | 891,035 |
| Square Pharmaceuticals, Ltd. | 133,808 | | 480,958 |
| | | 2,326,996 |
| Cambodia – 2.7% | | | |
| NagaCorp, Ltd. | 1,542,000 | | 1,245,302 |
| Colombia – 2.9% | | | |
| Banco Davivienda SA | 138,402 | | 1,364,320 |
| Croatia – 0.8% | | | |
| Hrvatski Telekom dd | 11,232 | | 301,005 |
| Ledo dd(a)(b) | 311 | | 75,907 |
| | | 376,912 |
| Egypt – 4.5% | | | |
| Centamin PLC | 780,616 | | 1,443,953 |
| Commercial International Bank, | | | |
| Registered, GDR | 137,670 | | 628,464 |
| | | 2,072,417 |
| Georgia – 4.6% | | | |
| Bank of Georgia Holdings PLC | 22,215 | | 1,050,173 |
| TBC Bank Group PLC | 48,433 | | 1,101,057 |
| | | 2,151,230 |
| Kazakhstan – 2.1% | | | |
| Halyk Savings Bank of Kazakhstan | | | |
| JSC, Registered, GDR (a) | 99,948 | | 974,493 |
| Kenya – 2.4% | | | |
| Safaricom, Ltd. | 4,466,300 | | 1,099,331 |
| Kuwait – 8.6% | | | |
| Agility Public Warehousing Co. KSC | 607,183 | | 1,560,179 |
| Mobile Telecommunications Co. | 496,168 | | 765,610 |
| National Bank of Kuwait SAK | 662,892 | | 1,683,570 |
| | | 4,009,359 |
| Mauritius – 1.2% | | | |
| Mcb Group, Ltd. | 68,400 | | 549,518 |
| Morocco – 3.2% | | | |
| Attijariwafa Bank | 29,475 | | 1,468,209 |
| Nigeria – 2.5% | | | |
| Dangote Cement PLC | 477,248 | | 297,781 |
| Guaranty Trust Bank PLC | 2,052,923 | | 240,175 |
| Nestle Foods Nigeria PLC | 30,876 | | 107,679 |
| Zenith Bank PLC | 7,048,663 | | 500,475 |
| | | 1,146,110 |
| Oman – 1.2% | | | |
| Bank Muscat SAOG | 531,970 | | 545,114 |
| Pakistan – 2.0% | | | |
| D.G. Khan Cement Co., Ltd. | 373,875 | | 484,110 |
| United Bank, Ltd. | 262,800 | | 446,917 |
| | | 931,027 |
| Peru – 3.0% | | | |
| Credicorp, Ltd. | 6,700 | | 1,403,248 |
| Philippines – 9.7% | | | |
| International Container Termin | 820,980 | | 1,684,592 |
| Puregold Price Club, Inc. | 1,268,300 | | 1,253,309 |
| Robinsons Land Corp. | 1,382,000 | | 674,799 |
| Vista Land & Lifescapes, Inc. | 7,745,300 | | 913,949 |
| | | 4,526,649 |
| Qatar – 1.3% | | | |
| Qatar Electricity & Water Co. | 11,907 | | 598,539 |
| Romania – 4.9% | | | |
| BRD-Groupe Societe Generale | 218,916 | | 689,342 |
| SIF 5 Oltenia Craiova | 1,566,593 | | 785,160 |
| Societatea Nationala de Gaze | 99,752 | | 794,108 |
| | | 2,268,610 |
| Sri Lanka – 0.1% | | | |
| Sampath Bank PLC | 27,265 | | 60,319 |
| United Arab Emirates – 11.2% | | | |
| DP World, Ltd. | 71,691 | | 1,702,660 |
| Emaar Properties PJSC | 676,044 | | 1,526,295 |
| Emirates NBD PJSC | 311,666 | | 708,737 |
| Gulf Marine Services PLC | 282,280 | | 201,476 |
| NMC Health PLC | 29,718 | | 1,141,255 |
| | | 5,280,423 |
| TOTAL COMMON STOCKS | | | |
| (COST $34,568,571) | | | 39,922,981 |
| | | | |
| Convertible Corporate Bond – 0.2% | | | |
| | | | |
| Principal | | |
| Amount ($) | | |
| Oman – 0.2% | | | |
| Bank Muscat SAOG, | | | |
| 0.35%, 3/19/18 | 383,981 | | 103,860 |
| TOTAL CONVERTIBLE CORPORATE | | | |
| BOND (COST $—) | | | 103,860 |
| See notes to financial statements. | HSBC FAMILY OF FUNDS 31 |
| HSBC FRONTIER MARKETS FUND |
| Schedule of Portfolio Investments—as of October 31, 2017 (continued) |
| Participatory Notes – 5.1% | | | | | |
| | | | | | |
| | Shares | | Value ($) |
| Saudi Arabia – 0.4% | | | | | |
| Al Tayyar Travel Group Holding Co., | | | | | |
| 5/24/18, (Merrill Lynch | | | | | |
| International & Co.) | | 22,299 | | | 195,399 |
| United Arab Emirates – 2.3% | | | | | |
| Aramex PJSC, 3/14/19, (Merrill Lynch | | | | | |
| International & Co.) (a) | | 756,771 | | | 1,055,221 |
| Vietnam – 2.4% | | | | | |
| Vietnam Dairy Products JSC, 2/22/18, | | | | | |
| (JPMorgan Chase) | | 168,201 | | | 1,118,279 |
| TOTAL PARTICIPATORY NOTES | | | | | |
| (COST $2,068,426) | | | | | 2,368,899 |
| | | | | | |
| Private Placements – 3.9% | | | | | |
| | | | | | |
| Kuwait – 3.9% | | | | | |
| Human Soft Holding Co. KSC | | 138,566 | | | 1,809,617 |
| TOTAL PRIVATE PLACEMENTS | | | | | |
| (COST $1,481,458) | | | | | 1,809,617 |
| | | | | | |
| Investment Companies – 1.7% | | | | | |
| | | | | | |
| Northern Institutional | | | | | |
| Government Assets Portfolio, | | | | | |
| Institutional Shares, 0.82% (c) | | 769,400 | | | 769,400 |
| TOTAL INVESTMENT COMPANIES | | | | | |
| (COST $769,400) | | | | | 769,400 |
| TOTAL INVESTMENTS | | | | | |
| IN SECURITIES | | | | | |
| (COST $38,887,855) – 96.6% | | | | | 44,974,757 |
| Other Assets (Liabilities) – 3.4% | | | | | 1,584,707 |
| NET ASSETS — 100% | | | | $ | 46,559,464 |
____________________
| (a) | Represents non-income producing security. |
| (b) | Security was valued using significant unobservable inputs as of October 31, 2017. |
| (c) | The rate represents the annualized one day yield that was in effect on October 31, 2017 |
ADR — American Depositary Receipt
GDR — Global Depository Receipt |
The Fund invested, as a percentage of net assets at value, in the following industries, as of October 31, 2017:
| | Percentage of Net Assets |
| Industry | | at Value (%) |
| Banks | | | 40.8 | |
| Transportation Infrastructure | | | 7.3 | |
| Real Estate Management | | | | |
| & Development | | | 6.7 | |
| Wireless Telecommunication Services | | | 5.9 | |
| Air Freight & Logistics | | | 5.6 | |
| Hotels, Restaurants & Leisure | | | 4.6 | |
| Private Placements | | | 3.9 | |
| Metals & Mining | | | 3.1 | |
| Food Products | | | 2.8 | |
| Food & Staples Retailing | | | 2.7 | |
| Health Care Providers & Services | | | 2.4 | |
| Oil, Gas & Consumable Fuels | | | 2.4 | |
| Investment Companies | | | 1.7 | |
| Construction Materials | | | 1.7 | |
| Capital Markets | | | 1.7 | |
| Multi-Utilities | | | 1.3 | |
| Pharmaceuticals | | | 1.0 | |
| Diversified Telecommunication Services | | | 0.6 | |
| Energy Equipment & Services | | | 0.4 | |
| Total | | | 96.6 | |
| 32 HSBC FAMILY OF FUNDS | See notes to financial statements. |
| HSBC TOTAL RETURN FUND |
| Schedule of Portfolio Investments—as of October 31, 2017 |
| Foreign Bonds – 18.5% | | | |
| | | | |
| Principal | | |
| Amount † | | Value ($) |
| Brazil – 5.4% | | | |
| Letra Tesouro Nacional, | | | |
| 6.59%, 4/1/18 | 2,500,000 | | 743,649 |
| Indonesia – 0.4% | | | |
| Indonesia Government, Series FR56, | | | |
| 8.38%, 9/15/26 | 700,000,000 | | 56,656 |
| Mexico – 8.5% | | | |
| Mexican Bonos Desarrollo, Series M, | | | |
| 6.50%, 6/10/21 | 12,500,000 | | 640,532 |
| Mexican Bonos Desarrollo, | | | |
| 6.50%, 6/9/22 | 3,500,000 | | 178,601 |
| Mexican Bonos Desarrollo, Series M, | | | |
| 5.75%, 3/5/26 | 6,050,000 | | 286,606 |
| Mexican Bonos Desarrollo, Series M30, | | | |
| 10.00%, 11/20/36 | 711,800 | | 46,522 |
| | | 1,152,261 |
| Turkey – 4.2% | | | |
| Turkey Government Bond, | | | |
| 9.50%, 1/12/22 | 2,400,000 | | 582,865 |
| TOTAL FOREIGN BONDS | | | |
| (COST $2,649,732) | | | 2,535,431 |
| | | | |
| Yankee Dollars – 62.6% | | | |
| | | | |
| Principal | | |
| Amount ($) | | |
| Argentina – 7.4% | | | |
| Republic of Argentina, | | | |
| 6.25%, 4/22/19 | 967,000 | | 1,013,416 |
| Brazil – 9.1% | | | |
| Banco Nac de Desen Econo, | | | |
| Registered, 6.37%, 6/16/18 | 200,000 | | 204,108 |
| Caixa Economica Federal, Registered, | | | |
| 4.50%, 10/3/18 | 380,000 | | 386,349 |
| Centrais Eletricas Brasileiras SA, | | | |
| Registered, 6.88%, 7/30/19 | 280,000 | | 297,164 |
| Petrobras Global Finance BV, | | | |
| 8.75%, 5/23/26 | 100,000 | | 121,125 |
| Petrobras International Finance Co., | | | |
| 7.88%, 3/15/19 | 229,000 | | 244,229 |
| | | 1,252,975 |
| China – 1.5% | | | |
| Export-Import Bank of China, | | | |
| Registered, 2.50%, 7/31/19 | 200,000 | | 200,945 |
| Colombia – 3.1% | | | |
| Republic of Colombia, | | | |
| 4.38%, 7/12/21 | 400,000 | | 424,000 |
| Croatia – 0.8% | | | |
| Republic of Croatia, Registered, | | | |
| 6.75%, 11/5/19 | 100,000 | | 107,860 |
| Dominican Republic – 1.2% | | | |
| Dominican Republic, Registered, | | | |
| 7.50%, 5/6/21 | 150,000 | | 165,938 |
| Indonesia – 5.2% | | | |
| Majapahit Holding BV, Registered, | | | |
| 7.75%, 1/20/20 | 100,000 | | 110,380 |
| Republic of Indonesia, | | | |
| 5.88%, 3/13/20 | 560,000 | | 606,812 |
| | | 717,192 |
| Korea, Republic Of – 0.8% | | | |
| Export-Import Bank of Korea, | | | |
| 5.13%, 6/29/20 | 100,000 | | 106,399 |
| Malaysia – 1.1% | | | |
| Petronas Capital Ltd., | | | |
| 5.25%, 8/12/19 | 150,000 | | 157,796 |
| Mexico – 8.1% | | | |
| Petroleos Mexicanos, | | | |
| 3.50%, 7/18/18 | 700,000 | | 706,607 |
| Petroleos Mexicanos, | | | |
| 3.13%, 1/23/19 | 163,000 | | 164,223 |
| Petroleos Mexicanos, | | | |
| 8.00%, 5/3/19 | 180,000 | | 194,960 |
| Petroleos Mexicanos, | | | |
| 6.00%, 3/5/20 | 38,000 | | 40,527 |
| | | 1,106,317 |
| Republic of Serbia – 3.0% | | | |
| Republic of Serbia, Registered, | | | |
| 5.88%, 12/3/18 | 400,000 | | 413,706 |
| Russian Federation – 8.0% | | | |
| Gazprom OAO Via Gaz Capital SA, | | | |
| Registered, 8.15%, 4/11/18 | 370,000 | | 379,387 |
| Gazprom OAO, Registered, | | | |
| 9.25%, 4/23/19 | 100,000 | | 108,924 |
| Russian Federation, Registered, | | | |
| 11.00%, 7/24/18 | 577,000 | | 614,065 |
| | | 1,102,376 |
| South Africa – 10.5% | | | |
| Republic of South Africa, | | | |
| 6.88%, 5/27/19 | 1,037,000 | | 1,102,739 |
| Republic of South Africa, | | | |
| 5.50%, 3/9/20 | 310,000 | | 327,825 |
| | | 1,430,564 |
| Turkey – 2.8% | | | |
| Republic of Turkey, | | | |
| 4.88%, 10/9/26 | 400,000 | | 390,613 |
| TOTAL YANKEE DOLLARS | | | |
| (COST $8,551,343) | | | 8,590,097 |
| | | | |
| U.S. Treasury Obligation — 0.8% | | | |
| | | | |
| U.S. Treasury Note – 0.8% | | | |
| 2.25%, 8/15/27 | 105,000 | | 103,835 |
| TOTAL U.S. TREASURY OBLIGATION | | | |
| (COST $103,915) | | | 103,835 |
| See notes to financial statements. | HSBC FAMILY OF FUNDS 33 |
| HSBC TOTAL RETURN FUND |
| Schedule of Portfolio Investments—as of October 31, 2017 (continued) |
| Investment Companies — 14.1% |
| |
| | Shares | | Value ($) |
| Northern Institutional Government | | | | | |
| Assets Portfolio, Institutional Shares, | | | | | |
| 0.82% (a) | | 1,937,525 | | | 1,937,525 |
| TOTAL INVESTMENT COMPANIES | | | | | |
| (COST $1,937,525) | | | | | 1,937,525 |
| TOTAL INVESTMENTS | | | | | |
| IN SECURITIES | | | | | |
| (COST $13,242,513) – 96.0% | | | | | 13,166,888 |
| Other Assets (Liabilities) – 4.0% | | | | | 554,954 |
| NET ASSETS – 100% | | | | $ | 13,721,842 |
____________________
† | The principal amount is disclosed in local currency and the value is disclosed in U.S. Dollars. |
| (a) | The rate represents the annualized one-day yield that was in effect on October 31, 2017. |
The Fund invested, as a percentage of net assets at value, in the following industries, as of October 31, 2017:
| | Percentage of Net Assets |
| Industry | | at Value (%) |
| Sovereign Bonds | | | 56.1 | |
| Oil, Gas & Consumable Fuels | | | 15.4 | |
| Investment Companies | | | 14.1 | |
| Banks | | | 3.6 | |
| Electric Utilities | | | 3.0 | |
| Diversified Financial Services | | | 3.0 | |
| U.S. Treasury Obligation | | | 0.8 | |
| Total | | | 96.0 | |
Futures Contracts Purchased
| | | | | | | | | | | Unrealized |
| | Number of | | Expiration | | Notional | | | | Appreciation/ |
| Description | | Contracts | | Date | | Amount | | Value | | (Depreciation) |
| 5-Year US Treasury Note Futures | | 22 | | 12/29/17 | | $2,587,138 | | $2,578,125 | | | $ | (9,013 | ) | |
| | | | | | $2,587,138 | | $2,578,125 | | | $ | (9,013 | ) | |
| | | | | | | | | | | | | | | |
| | | Total unrealized appreciation | | | | $ | — | | |
| | Total unrealized depreciation | | | | | (9,013 | ) | |
| | Total net unrealized appreciation/(depreciation) | | | | $ | (9,013 | ) | |
| 34 HSBC FAMILY OF FUNDS | See notes to financial statements. |
| HSBC TOTAL RETURN FUND |
| Schedule of Portfolio Investments—as of October 31, 2017 (continued) |
Interest Rate Swap Agreements
| | | | | | | | | | | | | | | | | | | Upfront | | |
| Description and | | Description and | | | | | | | | | | | | | | | | | Premiums | | Unrealized |
| terms of payments | | terms of payments | | | | | | | | | | | | | | Paid/ | | Appreciation/ |
| to be received from | | to be paid to | | Expiration | | | | | | Value | | Received | | (Depreciation) |
| another party | | another party | | Date | | Counterparty | | Notional Amount | | ($) | | ($) | | ($) |
| 6-Month | | Fixed 0.89% | | | | | | | | | | | | | | | | | | | | | | | | |
| HUF-BUBOR | | Semi-Annually | | | 9/29/22 | | | JP Morgan Chase | | | 167,000,000 HUF | | | | (2,113 | ) | | | | — | | | | (2,113 | ) | |
| 1-Month | | Fixed 6.30% | | | | | | | | | | | | | | | | | | | | | | | | |
| MXN-TIIEBanxico | | Monthly | | | 12/29/25 | | | Barclays Bank PLC | | | 38,000,000 MXN | | | | 133,658 | | | | | — | | | | 133,658 | | |
| Fixed 6.15% | | 1-Month | | | | | | Standard | | | | | | | | | | | | | | | | | | |
| Monthly | | MXN-TIIEBanxico | | | 4/14/26 | | | Chartered Bank | | | 23,000,000 MXN | | | | (95,683 | ) | | | | — | | | | (95,683 | ) | |
| | | | | | | | | | | | | | | 35,862 | | | | | — | | | | 35,862 | | |
Centrally Cleared Interest Rate Swap Agreements
| | | | | | | | | | | | | | | Upfront | | |
| Description and | | Description and | | | | | | | | | | | | | Premiums | | Unrealized |
| terms of payments | | terms of payments | | | | | | | | | | Paid/ | | Appreciation/ |
| to be received from | | to be paid to | | Payment | | Expiration | | | | Value | | (Received) | | (Depreciation) |
| another party | | another party | | Frequency | | Date | | Notional Amount | | ($) | | ($) | | ($) |
| | Semi-Annually | | | | | | | | | | | | | | | | | | | | |
| Fixed 2.40% Annually | | PLN-WIBR | | Daily | | 9/29/22 | | 2,400,000 PLN | | | (4,704 | ) | | | | 26 | | | | (4,730 | ) | |
| | | | | | | | | | | (4,704 | ) | | | | 26 | | | | (4,730 | ) | |
HUF — Hungarian Forint
MXN — Mexican Peso
PLN — Polish Zloty
| See notes to financial statements. | HSBC FAMILY OF FUNDS 35 |
| HSBC TOTAL RETURN FUND |
| Schedule of Portfolio Investments—as of October 31, 2017 (continued) |
Credit Default Swap Agreements - Buy Protection(a)
At October 31, 2017, the Fund’s open credit default swap agreements were as follows:
| | | | | | | | | | | | | | | | | | | Upfront | | | | | |
| | | | | | Implied Credit | | | | | | | | | | | | | Premiums | | Unrealized |
| | Pay | | | | Spread at | | | | | | Notional | | | | | | | Paid/ | | Appreciation/ |
| Underlying | | Fixed | | Payment | | October 31, 2017 | | | | Expiration | | Amount | | | | | | | (Received) | | (Depreciation) |
| Instrument | | Rate (%) | | Frequency | | (%)(b) | | Counterparty | | Date | | ($)(c) | | Value ($) | | ($) | | ($) |
| CDX Emerging | | | | | | | | | | | | | | | | | | | | | | | | | | |
| Markets Index, | | | | | | | | Credit | | | | | | | | | | | | | | | | | | |
| Series 26 | | 1.00 | | Quarterly | | 1.55 | | Suisse | | 12/20/21 | | 1,210,000 | | | 23,649 | | | | | 61,710 | | | | (38,061 | ) | |
| CDX Emerging | | | | | | | | | | | | | | | | | | | | | | | | | | |
| Markets Index, | | | | | | | | Bank of | | | | | | | | | | | | | | | | | | |
| Series 27 | | 1.00 | | Quarterly | | 1.62 | | America | | 6/20/22 | | 495,000 | | | 12,655 | | | | | 21,348 | | | | (8,693 | ) | |
| Federative | | | | | | | | | | | | | | | | | | | | | | | | | | |
| Republic of | | | | | | | | Barclays | | | | | | | | | | | | | | | | | | |
| Brazil | | 1.00 | | Quarterly | | 1.70 | | Bank PLC | | 12/20/22 | | 866,000 | | | 27,945 | | | | | 44,399 | | | | (16,454 | ) | |
| Republic of | | | | | | | | Barclays | | | | | | | | | | | | | | | | | | |
| Columbia | | 1.00 | | Quarterly | | 0.83 | | Bank PLC | | 12/20/21 | | 417,000 | | | (3,384 | ) | | | | 10,313 | | | | (13,697 | ) | |
| Republic of | | | | | | | | Goldman | | | | | | | | | | | | | | | | | | |
| Columbia | | 1.00 | | Quarterly | | 0.83 | | Sachs | | 12/20/21 | | 210,000 | | | (1,704 | ) | | | | 5,051 | | | | (6,755 | ) | |
| Republic of | | | | | | | | Barclays | | | | | | | | | | | | | | | | | | |
| Korea | | 1.00 | | Quarterly | | 0.53 | | Bank PLC | | 12/20/18 | | 705,000 | | | (4,996 | ) | | | | (12,502 | ) | | | 7,506 | | |
| United Mexican | | | | | | | | JP Morgan | | | | | | | | | | | | | | | | | | |
| States | | 1.00 | | Quarterly | | 0.95 | | Chase | | 6/20/22 | | 685,000 | | | (2,128 | ) | | | | 6,194 | | | | (8,322 | ) | |
| United Mexican | | | | | | | | Bank of | | | | | | | | | | | | | | | | | | |
| States | | 1.00 | | Quarterly | | 0.95 | | America | | 6/20/22 | | 8,000 | | | (25 | ) | | | | 53 | | | | (78 | ) | |
| | | | | | | | | | | | | | | 52,012 | | | | | 136,566 | | | | (84,554 | ) | |
| 36 HSBC FAMILY OF FUNDS | See notes to financial statements. |
| HSBC TOTAL RETURN FUND |
| Schedule of Portfolio Investments—as of October 31, 2017 (continued) |
Credit Default Swap Agreements - Sell Protection(a)
At October 31, 2017, the Fund’s open credit default swap agreements were as follows:
| | | | | | | | | | | | | | | | | | | Upfront | | | | |
| | | | | | Implied Credit | | | | | | | | | | | | | Premiums | | Unrealized |
| | Receive | | | | Spread at | | | | | | Notional | | | | | | | Paid/ | | Appreciation/ |
| Underlying | | Fixed | | Payment | | October 31, 2017 | | | | Expiration | | Amount | | | | | | | (Received) | | (Depreciation) |
| Instrument | | Rate (%) | | Frequency | | (%)(b) | | Counterparty | | Date | | ($)(c) | | Value ($) | | ($) | | ($) |
| CDX Emerging | | | | | | | | | | | | | | | | | | | | | | | | | | |
| Markets Index, | | | | | | | | Barclays | | | | | | | | | | | | | | | | | | |
| Series 27 | | 1.00 | | Quarterly | | 1.62 | | Bank PLC | | 6/20/22 | | 54,000 | | | (1,381 | ) | | | | (2,084 | ) | | | | 703 | |
| CDX Emerging | | | | | | | | | | | | | | | | | | | | | | | | | | |
| Markets Index, | | | | | | | | Bank of | | | | | | | | | | | | | | | | | | |
| Series 27 | | 1.00 | | Quarterly | | 1.62 | | America | | 6/20/22 | | 107,000 | | | (2,735 | ) | | | | (4,141 | ) | | | | 1,406 | |
| Federative | | | | | | | | | | | | | | | | | | | | | | | | | | |
| Republic of | | | | | | | | Credit | | | | | | | | | | | | | | | | | | |
| Brazil | | 1.00 | | Quarterly | | 0.40 | | Suisse | | 6/20/18 | | 2,255,000 | | | 10,697 | | | | | (48,374 | ) | | | | 59,071 | |
| People’s | | | | | | | | | | | | | | | | | | | | | | | | | | |
| Republic of | | | | | | | | Credit | | | | | | | | | | | | | | | | | | |
| China | | 1.00 | | Quarterly | | 0.09 | | Suisse | | 6/20/18 | | 1,000,000 | | | 6,817 | | | | | 6,272 | | | | | 545 | |
| Republic of | | | | | | | | Barclays | | | | | | | | | | | | | | | | | | |
| Turkey | | 1.00 | | Quarterly | | 0.75 | | Bank PLC | | 6/20/19 | | 2,000,000 | | | 11,044 | | | | | (137,956 | ) | | | | 149,000 | |
| | | | | | | | | | | | | | | 24,442 | | | | | (186,283 | ) | | | | 210,725 | |
| (a) | When a credit event occurs as defined under the terms of the swap agreement, the Fund as a seller of credit protection will either (i) pay to the buyer of protection an amount equal to the par value of the defaulted reference entity and take delivery of the reference entity or (ii) pay a net amount equal to the par value of the defaulted reference entity less its recovery value. Alternatively, the Fund as a buyer of credit protection will either (i) receive from the seller of protection an amount equal to the par value of the defaulted reference entity and deliver the reference entity to the seller or (ii) receive a net amount equal to the par value of the defaulted reference entity less its recovery value. |
| (b) | Implied credit spread, represented in absolute terms, utilized in determining the fair value of the credit default swap agreements as of period end serve as an indicator of the current status of the payment/performance risk and represents the likelihood or risk of default for the credit derivative. The implied credit spread of a referenced entity reflects the cost of buying/selling protection and may include upfront or daily payments required to be made to enter into the agreement. Generally, wider credit spreads represent a perceived deterioration of the referenced entity’s credit soundness and a greater likelihood or risk of default or other credit event occurring as defined under the terms of the swap agreement. |
| (c) | The notional amount represents the maximum potential amount of future payments that the Fund may receive as a buyer of credit protection if a credit event occurs, as defined under the terms of the swap agreement. Alternatively, the notional amount represents the maximum potential amount of payment the Fund could be required to make as a seller of credit protection if a credit event occurs, as defined under the terms of the swap agreement. |
| See notes to financial statements. | HSBC FAMILY OF FUNDS 37 |
| HSBC TOTAL RETURN FUND |
| Schedule of Portfolio Investments—as of October 31, 2017 (continued) |
At October 31, 2017, the Fund’s open forward foreign currency exchange contracts were as follows:
Short Contracts
| | | | | | | | | | | | Net Unrealized |
| | | | | | | | | | | | Appreciation/ |
| Description and amount of | | Description and amount of | | | | Settlement | | (Depreciation) |
| currency to be purchased | | currency to be sold | | Counterparty | | Date | | ($) |
| U.S. Dollar | | 14,567 | | Brazilian Real | | 49,158 | | Goldman Sachs | | 11/3/17 | | | (457 | ) | |
| U.S. Dollar | | 15,314 | | Brazilian Real | | 49,158 | | Bank of America | | 3/2/18 | | | 509 | | |
| U.S. Dollar | | 60,000 | | Brazilian Real | | 193,380 | | Morgan Stanley | | 3/2/18 | | | 1,760 | | |
| U.S. Dollar | | 453,876 | | Brazilian Real | | 1,443,604 | | Bank of America | | 4/3/18 | | | 20,673 | | |
| U.S. Dollar | | 303,827 | | Brazilian Real | | 962,525 | | JP Morgan Chase | | 4/3/18 | | | 14,988 | | |
| U.S. Dollar | | 119,000 | | Chilean Peso | | 75,695,900 | | JP Morgan Chase | | 1/12/18 | | | 73 | | |
| U.S. Dollar | | 318,000 | | Chilean Peso | | 201,589,740 | | Standard Chartered Bank | | 1/12/18 | | | 1,279 | | |
| U.S. Dollar | | 129,000 | | Colombian Peso | | 393,450,000 | | Barclays Bank PLC | | 11/29/17 | | | (22 | ) | |
| U.S. Dollar | | 50,000 | | Colombian Peso | | 146,900,000 | | Goldman Sachs | | 11/29/17 | | | 1,828 | | |
| U.S. Dollar | | 266,000 | | Colombian Peso | | 778,449,000 | | JP Morgan Chase | | 11/29/17 | | | 10,727 | | |
| U.S. Dollar | | 107,000 | | Colombian Peso | | 327,901,500 | | Standard Chartered Bank | | 11/29/17 | | | (527 | ) | |
| U.S. Dollar | | 771,236 | | Colombian Peso | | 2,318,691,943 | | UBS AG | | 11/29/17 | | | 10,879 | | |
| U.S. Dollar | | 113,000 | | Colombian Peso | | 346,036,510 | | UBS AG | | 11/29/17 | | | (474 | ) | |
| U.S. Dollar | | 499,537 | | Hungarian Forint | | 128,995,335 | | Bank of America | | 2/5/18 | | | 13,994 | | |
| U.S. Dollar | | 274,000 | | Hungarian Forint | | 71,452,514 | | Standard Chartered Bank | | 2/5/18 | | | 5,050 | | |
| U.S. Dollar | | 150,000 | | Indonesian Rupiah | | 2,069,370,000 | | Barclays Bank PLC | | 4/17/18 | | | 4 | | |
| U.S. Dollar | | 460,385 | | Korean Won | | 528,834,744 | | Bank of America | | 11/10/17 | | | (11,767 | ) | |
| U.S. Dollar | | 300,000 | | Korean Won | | 337,971,900 | | Standard Chartered Bank | | 11/10/17 | | | (1,747 | ) | |
| U.S. Dollar | | 114,000 | | Korean Won | | 128,426,700 | | Barclays Bank PLC | | 3/9/18 | | | (851 | ) | |
| U.S. Dollar | | 60,000 | | Korean Won | | 67,800,000 | | Credit Suisse | | 3/9/18 | | | (633 | ) | |
| U.S. Dollar | | 505,186 | | Korean Won | | 571,403,328 | | Standard Chartered Bank | | 3/9/18 | | | (5,815 | ) | |
| U.S. Dollar | | 2,669,842 | | Mexican Peso | | 48,036,347 | | Standard Chartered Bank | | 12/20/17 | | | 185,825 | | |
| U.S. Dollar | | 557,513 | | Polish Zloty | | 1,989,623 | | UBS AG | | 2/5/18 | | | 10,267 | | |
| U.S. Dollar | | 1,056,572 | | South African Rand | | 14,101,122 | | Standard Chartered Bank | | 1/29/18 | | | 74,094 | | |
| U.S. Dollar | | 147,000 | | South African Rand | | 2,028,835 | | UBS AG | | 1/29/18 | | | 5,643 | | |
| U.S. Dollar | | 694,035 | | Taiwanese Dollar | | 21,000,098 | | Standard Chartered Bank | | 11/10/17 | | | (2,633 | ) | |
| U.S. Dollar | | 13,000 | | Taiwanese Dollar | | 393,733 | | Standard Chartered Bank | | 3/9/18 | | | (151 | ) | |
| U.S. Dollar | | 50,000 | | Thai Baht | | 1,667,250 | | Standard Chartered Bank | | 3/15/18 | | | (245 | ) | |
| U.S. Dollar | | 364,000 | | Thai Baht | | 12,064,575 | | Standard Chartered Bank | | 3/15/18 | | | 418 | | |
| U.S. Dollar | | 298,109 | | Turkish Lira | | 1,120,687 | | Barclays Bank PLC | | 1/26/18 | | | 10,143 | | |
| U.S. Dollar | | 187,114 | | Turkish Lira | | 724,000 | | Goldman Sachs | | 1/26/18 | | | 1,079 | | |
| U.S. Dollar | | 78,000 | | Turkish Lira | | 280,192 | | JP Morgan Chase | | 1/26/18 | | | 6,003 | | |
| U.S. Dollar | | 430,583 | | Turkish Lira | | 1,596,179 | | Standard Chartered Bank | | 1/26/18 | | | 20,438 | | |
| | | | | | | | | | | | | 370,352 | | |
| 38 HSBC FAMILY OF FUNDS | See notes to financial statements. |
| HSBC TOTAL RETURN FUND |
| Schedule of Portfolio Investments—as of October 31, 2017 (continued) |
Long Contracts
| | | | | | | | | | | | Net Unrealized |
| | | | | | | | | | | | Appreciation/ |
| Description and amount of | | Description and amount | | | | Settlement | | (Depreciation) |
| currency to be purchased | | of currency to be sold | | Counterparty | | Date | | ($) |
| Colombian Peso | | 844,099,200 | | U.S. Dollar | | 280,000 | | Barclays Bank PLC | | 11/29/17 | | | | (3,199 | ) | |
| Colombian Peso | | 1,070,000,000 | | U.S. Dollar | | 349,017 | | Goldman Sachs | | 11/29/17 | | | | 1,863 | | |
| Colombian Peso | | 1,367,184,153 | | U.S. Dollar | | 446,282 | | Standard Chartered Bank | | 11/29/17 | | | | 2,052 | | |
| Colombian Peso | | 1,030,145,600 | | U.S. Dollar | | 340,000 | | UBS AG | | 11/29/17 | | | | (2,189 | ) | |
| Colombian Peso | | 2,073,048,223 | | U.S. Dollar | | 681,924 | | UBS AG | | 2/27/18 | | | | (7,306 | ) | |
| Brazilian Real | | 49,158 | | U.S. Dollar | | 15,542 | | Bank of America | | 11/3/17 | | | | (519 | ) | |
| Brazilian Real | | 96,660 | | U.S. Dollar | | 30,000 | | Bank of America | | 3/2/18 | | | | (889 | ) | |
| Indonesian Rupiah | | 2,225,600,000 | | U.S. Dollar | | 160,000 | | Barclays Bank PLC | | 4/17/18 | | | | 1,320 | | |
| Indonesian Rupiah | | 6,010,536,430 | | U.S. Dollar | | 444,336 | | JP Morgan Chase | | 4/17/18 | | | | (8,667 | ) | |
| Indonesian Rupiah | | 4,500,430,000 | | U.S. Dollar | | 326,000 | | JP Morgan Chase | | 4/17/18 | | | | 209 | | |
| Korean Won | | 866,806,644 | | U.S. Dollar | | 762,498 | | Standard Chartered Bank | | 11/10/17 | | | | 11,402 | | |
| Malaysian Ringgit | | 292,643 | | U.S. Dollar | | 69,166 | | UBS AG | | 3/27/18 | | | | (321 | ) | |
| Mexican Peso | | 2,038,618 | | U.S. Dollar | | 107,000 | | Bank of America | | 12/20/17 | | | | (1,581 | ) | |
| Mexican Peso | | 8,000,000 | | U.S. Dollar | | 412,999 | | Barclays Bank PLC | | 12/20/17 | | | | 690 | | |
| Mexican Peso | | 7,900,000 | | U.S. Dollar | | 425,355 | | Goldman Sachs | | 12/20/17 | | | | (16,836 | ) | |
| Mexican Peso | | 3,392,431 | | U.S. Dollar | | 178,000 | | Standard Chartered Bank | | 12/20/17 | | | | (2,574 | ) | |
| Mexican Peso | | 2,039,153 | | U.S. Dollar | | 107,000 | | UBS AG | | 12/20/17 | | | | (1,553 | ) | |
| Polish Zloty | | 536,868 | | U.S. Dollar | | 150,000 | | Morgan Stanley | | 2/5/18 | | | | (2,335 | ) | |
| South African Rand | | 1,146,489 | | U.S. Dollar | | 85,000 | | Barclays Bank PLC | | 1/29/18 | | | | (5,120 | ) | |
| South African Rand | | 1,485,537 | | U.S. Dollar | | 106,000 | | Credit Suisse | | 1/29/18 | | | | (2,497 | ) | |
| South African Rand | | 944,300 | | U.S. Dollar | | 70,000 | | JP Morgan Chase | | 1/29/18 | | | | (4,207 | ) | |
| South African Rand | | 1,498,089 | | U.S. Dollar | | 111,000 | | Standard Chartered Bank | | 1/29/18 | | | | (6,622 | ) | |
| South African Rand | | 4,633,504 | | U.S. Dollar | | 331,000 | | UBS AG | | 1/29/18 | | | | (8,166 | ) | |
| Taiwanese Dollar | | 21,000,098 | | U.S. Dollar | | 695,739 | | Standard Chartered Bank | | 11/10/17 | | | | 928 | | |
| Turkish Lira | | 4,258,054 | | U.S. Dollar | | 1,193,602 | | Goldman Sachs | | 1/26/18 | | | | (99,476 | ) | |
| Turkish Lira | | 1,738,868 | | U.S. Dollar | | 470,000 | | JP Morgan Chase | | 1/26/18 | | | | (23,190 | ) | |
| | | | | | | | | | | | | | (178,783 | ) | |
| | | | | | | | | | | | | | | | |
| | | | | Total unrealized appreciation | | | | | $ | 414,138 | | |
| | | | | Total unrealized depreciation | | | | | | (222,569 | ) | |
| | | | | Total net unrealized appreciation/(depreciation) | | | | | $ | 191,569 | | |
| See notes to financial statements. | HSBC FAMILY OF FUNDS 39 |
| HSBC ASIA EX-JAPAN SMALLER COMPANIES EQUITY FUND |
| Schedule of Portfolio Investments—as of October 31, 2017 |
| Common Stocks – 96.2% |
| | Shares | | Value ($) |
| China – 14.8% | | | | |
| Aluminum Corp. of China Ltd. (a) | | 138,000 | | 111,093 |
China Machinery Engineering Corp.,
Class H | | 185,000 | | 113,357 |
| China Modern Dairy Holdings Ltd. (a) | | 663,000 | | 135,983 |
| China Molybdenum Co. Ltd. | | 84,000 | | 54,593 |
| China New Higher Education Group Ltd. | | 212,000 | | 127,727 |
| China Resources Cement Holdings Ltd. | . | 354,000 | | 239,146 |
China State Construction International
Holdings Ltd. | | 149,000 | | 209,338 |
China Yongda Automobiles Services
Holdings Ltd. | | 172,500 | | 212,501 |
| Daphne International Holdings Ltd. (a) | | 676,000 | | 45,927 |
| Lonking Holdings Ltd. | | 217,000 | | 97,359 |
| Precision Tsugami China Corp. Ltd. (a) | | 66,000 | | 68,530 |
| Ten Pao Group Holdings Ltd. | | 460,000 | | 117,934 |
| Times Property Holdings Ltd. | | 221,964 | | 229,049 |
Wisdom Education International
Holdings Co. Ltd. | | 272,000 | | 159,344 |
| Xingda International Holdings Ltd. | | 430,000 | | 164,261 |
| Zhongsheng Group Holdings Ltd. | | 74,500 | | 152,992 |
| | | | 2,239,134 |
| Hong Kong – 25.6% | | | | |
China Overseas Grand
Oceans Group Ltd. | | 63,000 | | 36,907 |
| China Overseas Property Holdings Ltd. | | 325,000 | | 78,323 |
| Dream International Ltd. | | 706,000 | | 286,889 |
| Emperor Watch & Jewellery Ltd. | | 3,640,000 | | 179,644 |
| EVA Precision Industrial Holdings Ltd. | | 326,000 | | 45,133 |
| Far East Consortium International Ltd. | | 428,000 | | 233,724 |
Haitong International
Securities Group Ltd. | | 169,000 | | 95,754 |
Hutchison Telecommunications
Hong Kong Ltd. | | 350,000 | | 125,625 |
| Johnson Electric Holdings Ltd. | | 30,500 | | 122,962 |
| Kingboard Chemical Holdings Ltd. | | 33,000 | | 195,648 |
| Kingboard Laminates Holdings Ltd. | | 62,000 | | 104,115 |
| Kingmaker Footwear Holdings Ltd. | | 892,000 | | 285,860 |
| Kwg Property Holding Ltd. | | 115,000 | | 114,101 |
| Lee & Man Chemical Co. Ltd. | | 240,000 | | 133,829 |
| Lifestyle China Group Ltd. (a) | | 523,500 | | 174,478 |
| Lifestyle International Holdings Ltd. | | 47,500 | | 65,152 |
| Pacific Textiles Holdings Ltd. | | 70,000 | | 73,670 |
| Pou Sheng International Holdings Ltd. | | 849,000 | | 155,630 |
Regina Miracle International
Holdings Ltd. | | 204,000 | | 195,867 |
| Singamas Container Holdings LT | | 344,000 | | 71,437 |
| TCC International Holdings Ltd. | | 452,000 | | 209,747 |
| Television Broadcasts Ltd. | | 41,900 | | 158,448 |
| Texhong Textile Group Ltd. | | 156,000 | | 215,172 |
| Tsui Wah Holdings Ltd. | | 648,000 | | 98,018 |
| Valuetronics Holdings Ltd | | 357,720 | | 271,675 |
| Vinda International Holdings, Ltd. | | 3,000 | | 6,061 |
| Xinyi Glass Holdings Ltd. | | 152,000 | | 147,109 |
| | | | 3,880,978 |
| India – 13.5% | | | | |
| Ahluwalia Contracts India Ltd. (a) | | 20,364 | | 99,926 |
| Allcargo Logistics Ltd. | | 27,902 | | 74,790 |
| Cesc, Ltd. | | 7,850 | | 123,474 |
| Escorts Ltd. | | 12,332 | | 144,741 |
| Glenmark Pharmaceuticals Ltd. | | 9,853 | | 93,974 |
| Graphite India Ltd. | | 7,790 | | 59,768 |
| Gujarat Alkalies & Chemicals Ltd. | | 12,750 | | 153,987 |
| Himadri Speciality Chemical Ltd. | | 27,849 | | 74,584 |
| Indian Bank. | | 14,433 | | 70,154 |
| Indraprastha Gas Ltd. | | 1,318 | | 32,259 |
| JM Financial Ltd. | | 39,720 | | 100,918 |
| Kwality Ltd. | | 17,807 | | 27,674 |
| Magma Fincorp, Ltd. | | 30,744 | | 83,405 |
| Navin Fluorine International Ltd. | | 9,629 | | 110,355 |
| NIIT Ltd. (a) | | 79,862 | | 129,414 |
| Petronet Lng, Ltd. | | 16,812 | | 67,453 |
| Power Mech Projects Ltd. | | 3,282 | | 28,596 |
| PTC India Ltd. | | 73,040 | | 138,828 |
| Repco Home Finance Ltd. | | 11,399 | | 108,956 |
| Sintex Plastics Technology Ltd. (a) | | 9,941 | | 14,267 |
| Sobha Ltd. | | 11,443 | | 89,924 |
| Suzlon Energy Ltd. (a) | | 569,561 | | 149,062 |
| Tata Sponge Iron Ltd. | | 4,258 | | 61,926 |
| | | | 2,038,435 |
| Indonesia – 2.9% | | | | |
| PT Adhi Karya Persero Tbk | | 518,400 | | 83,724 |
| PT Aneka Gas Industri Tbk (a) | | 1,337,300 | | 57,693 |
| PT Bank Tabungan Negara Tbk | | 445,100 | | 90,596 |
| PT Bumi Serpong Damai | | 798,000 | | 101,221 |
| PT Tunas Baru Lampung Tbk | | 950,900 | | 97,825 |
| | | | 431,059 |
| Korea, Republic Of – 11.2% | | | | |
| BNK Financial Group, Inc. | | 16,376 | | 145,311 |
| Doosan Bobcat, Inc. | | 3,524 | | 114,038 |
| Hankook Tire Co. Ltd. | | 2,680 | | 129,191 |
| Hugel, Inc. (a) | | 398 | | 152,421 |
| Hyundai Mipo Dockyard Co. (a) | | 1,641 | | 158,943 |
| KIWOOM Securities Co. Ltd. | | 1,239 | | 79,304 |
| Kolon Industries, Inc. | | 1,394 | | 94,203 |
| Osstem Implant Co. Ltd. (a) | | 2,260 | | 145,058 |
| PS Tec Co. Ltd. | | 11,871 | | 57,331 |
| SK Innovation Co. Ltd. | | 500 | | 91,502 |
| SK Materials Co. Ltd. | | 764 | | 127,879 |
| TES Co. Ltd. | | 5,580 | | 172,102 |
| Vieworks Co. Ltd. | | 2,890 | | 98,294 |
| Youngone Corp. | | 3,880 | | 119,150 |
| | | | 1,684,727 |
| Malaysia – 2.3% | | | | |
| Ekovest Berhad | | 346,500 | | 95,238 |
| Kerjaya Prospek Group Berhad | | 159,100 | | 147,370 |
| Scientex Berhad | | 52,100 | | 109,568 |
| | | | 352,176 |
| 40 HSBC FAMILY OF FUNDS | See notes to financial statements. |
HSBC ASIA EX-JAPAN SMALLER COMPANIES EQUITY FUND |
Schedule of Portfolio Investments—as of October 31, 2017 (continued) |
| Common Stocks, continued |
| | | | | | |
| | Shares | | Value ($) |
| Philippines – 0.7% | | | | | |
| Melco Resorts and Entertainment | | | | | |
| Philippines Corp. (a) | | 758,900 | | | 99,991 |
| Singapore – 3.8% | | | | | |
| APAC Realty, Ltd. (a) | | 265,700 | | | 178,394 |
| Ezion Holdings Ltd. (a)(b) | | 720,200 | | | 51,526 |
| HRnetGroup Ltd. (a) | | 227,600 | | | 143,628 |
| Wing Tai Holdings Ltd. | | 113,300 | | | 199,530 |
| | | | | 573,078 |
| Taiwan, Province Of China – 19.3% | | | | | |
| Accton Technology Corp. | | 43,000 | | | 138,590 |
| Airtac International Group | | 9,446 | | | 153,007 |
| China Airlines, Ltd. (a) | | 182,000 | | | 74,229 |
| China General Plastics Corp. | | 132,410 | | | 124,033 |
| Cleanaway Co. Ltd. | | 31,000 | | | 178,344 |
| Epistar Corp. (a) | | 77,000 | | | 124,597 |
| Gourmet Master Co. Ltd. | | 12,300 | | | 141,117 |
| King Yuan Electronics Co. Ltd. | | 151,000 | | | 159,972 |
| Macronix International Co. Ltd. (a) | | 144,830 | | | 264,130 |
| Mega Financial Holdings Co. Ltd. | | 174,000 | | | 136,740 |
| MiTac Holdings Corp. | | 107,463 | | | 133,625 |
| Nien Made Enterprise Co. Ltd. | | 12,000 | | | 124,942 |
| PharmaEngine, Inc. | | 25,196 | | | 141,612 |
| Primax Electronics Ltd. | | 61,000 | | | 158,174 |
| Sinbon Electronics Co. Ltd. | | 59,989 | | | 171,665 |
| Sunonwealth Electric Machine | | | | | |
| Industry Co. Ltd. | | 78,000 | | | 173,804 |
| Topco Scientific Co. Ltd. | | 65,153 | | | 164,190 |
| WT Microelectronics Co. Ltd. | | 108,000 | | | 170,820 |
| Yageo Corp. | | 21,469 | | | 170,496 |
| | | | | 2,904,087 |
| Thailand – 2.1% | | | | | |
| Malee Group PCL | | 47,500 | | | 62,218 |
| Sino Thai Engineering & | | | | | |
| Construction PCL | | 169,300 | | | 126,427 |
| TPI Polene Power PCL | | 535,000 | | | 128,877 |
| | | | | 317,522 |
| TOTAL COMMON STOCKS | | | | | |
| (COST $12,363,069) | | | | | 14,521,187 |
| | | | | | |
| Exchange-Traded Fund – 1.9% | | | | | |
| | | | | | |
| iShares MSCI India Small-Cap ETF | | 5,781 | | | 285,466 |
| TOTAL EXCHANGE-TRADED FUND | | | | | |
| (COST $177,427) | | | | | 285,466 |
| | | | | | |
| Investment Companies – 1.3% | | | | | |
| | | | | | |
| Northern Institutional Government | | | | | |
| Assets Portfolio, Institutional Shares, | | | | | |
| 0.82% (c) | | 190,561 | | | 190,561 |
| TOTAL INVESTMENT COMPANIES | | | | | |
| (COST $190,561) | | | | | 190,561 |
| TOTAL INVESTMENTS | | | | | |
| IN SECURITIES | | | | | |
| (COST $12,731,057) – 99.4%. | | | | | 14,997,214 |
| Other Assets (Liabilities) – 0.6% | | | | | 85,467 |
| NET ASSETS – 100% | | | | $ | 15,082,681 |
____________________
| (a) | Represents non-income producing security. |
| (b) | Security was valued using significant unobservable inputs as of October 31, 2017. |
| (c) | The rate represents the annualized one-day yield that was in effect on October 31, 2017. |
ETF — Exchange-Traded Fund |
| See notes to financial statements. | HSBC FAMILY OF FUNDS 41 |
HSBC ASIA EX-JAPAN SMALLER COMPANIES EQUITY FUND |
Schedule of Portfolio Investments—as of October 31, 2017 (continued) |
The Fund invested, as a percentage of net assets at value, in the following industries, as of October 31, 2017:
| | Percentage of Net Assets |
| Industry | | at Value (%) |
Real Estate Management
& Development | | | 8.5 | |
Electronic Equipment, Instruments
& Components | | | 7.2 | |
| Machinery | | | 6.8 | |
| Chemicals | | | 6.6 | |
| Textiles, Apparel & Luxury Goods | | | 6.2 | |
| Construction & Engineering | | | 6.0 | |
Semiconductors & Semiconductor
Equipment | | | 5.9 | |
| Specialty Retail | | | 4.6 | |
| Electrical Equipment | | | 3.4 | |
| Construction Materials | | | 3.0 | |
| Banks | | | 2.9 | |
| Auto Components | | | 2.9 | |
| Hotels, Restaurants & Leisure | | | 2.2 | |
| Food Products | | | 2.1 | |
| Biotechnology | | | 1.9 | |
| Leisure Products | | | 1.9 | |
Technology Hardware, Storage
& Peripherals | | | 1.9 | |
| Diversified Consumer Services | | | 1.9 | |
| Exchange-Traded Fund | | | 1.9 | |
Independent Power & Renewable
Electricity Producers | | | 1.8 | |
| Capital Markets | | | 1.8 | |
| Health Care Equipment & Supplies | | | 1.6 | |
| Multiline Retail | | | 1.6 | |
| Metals & Mining | | | 1.5 | |
| Consumer Finance | | | 1.3 | |
| Investment Companies | | | 1.3 | |
| Commercial Services & Supplies | | | 1.2 | |
| Media | | | 1.1 | |
| Oil, Gas & Consumable Fuels | | | 1.1 | |
| Professional Services | | | 1.0 | |
| Communications Equipment | | | 0.9 | |
| IT Services | | | 0.9 | |
Diversified Telecommunication
Services | | | 0.8 | |
| Electric Utilities | | | 0.8 | |
| Household Durables | | | 0.8 | |
| Pharmaceuticals | | | 0.6 | |
| Airlines | | | 0.5 | |
| Air Freight & Logistics | | | 0.5 | |
| Energy Equipment & Services | | | 0.3 | |
| Gas Utilities | | | 0.2 | |
| Household Products | | | 0.0 | |
| Total | | | 99.4 | |
| 42 HSBC FAMILY OF FUNDS | See notes to financial statements. |
HSBC GLOBAL HIGH YIELD BOND FUND |
Schedule of Portfolio Investments—as of October 31, 2017 |
| Foreign Bonds – 14.1% | | | | |
| | | | | |
| | Principal | | |
| | Amount † | | Value ($) |
| Denmark – 0.6% | | | | |
| DONG Energy A/S, 6.25% | | | | |
| (EUSA5 + 475 bps), 12/31/3013, | | | | |
| Callable 6/26/23 @ 100 (a)(b) | | EUR 50,000 | | 70,674 |
| TDC A/S, 3.50% | | | | |
| (EUSA5 + 311 bps), 2/26/3015, | | | | |
| Callable 2/26/21 @ 100 (a)(b) | | EUR 100,000 | | 121,828 |
| | | | 192,502 |
| France – 4.8% | | | | |
| Accor SA, 4.13% (EUSA5 + 365 bps), | | | | |
| Callable 6/30/20 @ 100 (a)(b),(c) | | 100,000 | | 124,621 |
| Arkema SA, 4.75% (EUSA5 + 435 bps), | | | | |
| Callable 10/29/20 @ 100 (a)(b),(c) | | 100,000 | | 127,768 |
| AXA SA, Series E, 3.94% | | | | |
| (EUSA10 + 390 bps), Callable 11/7/24 | | | | |
| @ 100 (a)(b),(c) | | 100,000 | | 131,993 |
| Credit Agricole SA, 6.50% | | | | |
| (EUSA5 + 512 bps), Callable | | | | |
| 6/23/21 @ 100 (a)(b),(c) | | 100,000 | | 134,559 |
| Credit Agricole SA, 7.87% | | | | |
| (EUR003M + 642 bps), Callable | | | | |
| 10/26/19 @ 100 (a)(b),(c) | | 100,000 | | 133,253 |
| Crown European Holdings, | | | | |
| Registered, 4.00%, 7/15/22, | | | | |
| Callable 4/15/22 @ 100 (a) | | 100,000 | | 130,831 |
| Electricite de France SA, Series E, | | | | |
| 5.38% (EUSA12 + 379 bps), | | | | |
| Callable 1/29/25 @ 100 (a)(b),(c) | | 100,000 | | 134,816 |
| Europcar Groupe SA, 5.75%, 6/15/22, | | | | |
| Callable 6/15/18 @ 102.88 (a) | | 100,000 | | 122,934 |
| GDF SUEZ, 4.75% | | | | |
| (EUSA8 + 342 bps), Callable | | | | |
| 7/10/21 @ 100 (a)(b),(c) | | 100,000 | | 132,741 |
| Orange SA, 4.25% | | | | |
| (EUSA5 + 308 bps), Callable | | | | |
| 2/7/20 @ 100 (a)(b),(c) | | 100,000 | | 125,496 |
| Orange SA, 5.00% (EUSA5 + 399 bps), | | | | |
| Callable 10/1/26 @ 100 (a)(b),(c) | | 100,000 | | 137,493 |
| | | | 1,436,505 |
| Germany – 3.3% | | | | |
| Allianz SE, 4.75% | | | | |
| (EUR003M + 360 bps), | | | | |
| Callable 10/24/23 @ 100 (a)(b),(c) | | 100,000 | | 137,849 |
| Commerzbank AG, Series E, | | | | |
| 7.75%, 3/16/21 | | 100,000 | | 142,916 |
| FMC Finance VIII SA, | | | | |
| Registered, 6.50%, 9/15/18 | | 25,000 | | 30,732 |
| HeidelbergCement Finance | | | | |
| Luxembourg SA, 7.50%, 4/3/20 | | 25,000 | | 34,463 |
| SIG Combibloc Holdings GmbH, | | | | |
| Registered, 7.75%, 2/15/23, | | | | |
| Callable 2/15/18 @ 103.88 (a) | | 100,000 | | 122,876 |
| Talanx AG, Series E, 8.37% | | | | |
| (EUR003M + 706 bps), 6/15/42, | | | | |
| Callable 6/15/22 @ 100 (a)(b) | | 100,000 | | 154,472 |
| Unitymedia GmbH, Registered, | | | | |
| 6.25%, 1/15/29, Callable | | | | |
| 1/15/21 @ 103.13 (a) | | 125,000 | | 165,788 |
| Volkswagen AG, 5.13% | | | | |
| (EUSA10 + 335 bps), Callable | | | | |
| 9/4/23 @ 100 (a)(b),(c) | | 50,000 | | 67,987 |
| Vonovia Finance BV, 4.62% | | | | |
| (EUSA5 + 370 bps), 4/8/74, | | | | |
| Callable 4/8/19 @ 100 (a)(b) | | 100,000 | | 123,167 |
| | | | 980,250 |
| Ireland – 0.4% | | | | |
| Ardagh Packaging Holdings Ltd., | | | | |
| 4.13%, 5/15/23, Callable | | | | |
| 5/15/19 @ 102.06 (a)(d) | | 100,000 | | 123,897 |
| Italy – 0.4% | | | | |
| Wind Tre SpA, 3.13%, 1/20/25, Callable | | | | |
| 11/3/20 @ 101.56 (a)(d) | | 100,000 | | 116,824 |
| Luxembourg – 0.8% | | | | |
| Ineos Group Holdings SA, | | | | |
| Registered, 5.38%, 8/1/24, | | | | |
| Callable 8/1/19 @ 102.69 (a) | | 100,000 | | 126,225 |
| Picard Bondco SA, Registered, | | | | |
| 7.75%, 2/1/20, Callable | | | | |
| 12/6/17 @ 103.88 (a) | | 100,000 | | 121,129 |
| | | | 247,354 |
| Netherlands – 1.3% | | | | |
| Koninklijke KPN NV, 6.12% | | | | |
| (EUSA5 + 520 bps), Callable | | | | |
| 9/14/18 @ 100 (a)(b),(c) | | 100,000 | | 122,002 |
| LGE Holdco VI BV, Registered, | | | | |
| 7.13%, 5/15/24, Callable | | | | |
| 5/15/19 @ 103.56 (a) | | 100,000 | | 131,087 |
| NN Group NV, 4.62% | | | | |
| (EUR003M + 395 bps), 4/8/44, | | | | |
| Callable 4/8/24 @ 100 (a)(b) | | 100,000 | | 134,941 |
| | | | 388,030 |
| Spain – 0.9% | | | | |
| Gas Natural Fenosa Finance BV, 4.12% | | | | |
| (EUSA8 + 335 bps), Callable 11/18/22 | | | | |
| @ 100 (a)(b),(c) | | 100,000 | | 126,661 |
| Telefonica SA, 7.62% | | | | |
| (EUSA8 + 559 bps), Callable | | | | |
| 9/18/21 @ 100 (a)(b),(c) | | 100,000 | | 142,091 |
| | | | 268,752 |
| Sweden – 0.4% | | | | |
| Volvo Treasury AB, 4.20% | | | | |
| (EUSA5 + 380 bps), 6/10/75, Callable | | | | |
| 6/10/20 @ 100 (a)(b) | | EUR 100,000 | | 125,788 |
| See notes to financial statements. | HSBC FAMILY OF FUNDS 43 |
HSBC GLOBAL HIGH YIELD BOND FUND |
Schedule of Portfolio Investments—as of October 31, 2017 (continued) |
| Foreign Bonds, continued | | | | |
| | | | | |
| | Principal | | |
| | Amount ($) | | Value ($) |
| United Kingdom – 1.2% | | | | |
| Aviva PLC, Series E, 3.37% | | | | |
| (EUR003M + 355 bps), 12/4/45, | | | | |
| Callable 12/4/25 @ 100 (a)(b) | | EUR 100,000 | | 126,733 |
| CNH Industrial Finance Europe SA, | | | | |
| Series E, 6.25%, 3/9/18 | | 100,000 | | 119,032 |
| Virgin Media Finance PLC, | | | | |
| Registered, 4.50%, 1/15/25, | | | | |
| Callable 1/15/20 @ 102.25 (a) | | EUR 100,000 | | 123,109 |
| | | | 368,874 |
| TOTAL FOREIGN BONDS | | | | |
| (COST $3,804,540) | | | | 4,248,776 |
| | | | | |
| Yankee Dollars – 24.8% | | | | |
| | | | | |
| Argentina – 1.2% | | | | |
| IRSA Propiedades Comerciales SA, | | | | |
| Registered, 8.75%, 3/23/23, | | | | |
| Callable 3/23/20 @ 104.38 (a) | | 23,000 | | 25,974 |
| Petrobras Argentina SA, | | | | |
| Registered, 7.38%, 7/21/23, | | | | |
| Callable 7/21/20 @ 103.69 (a) | | 28,000 | | 30,618 |
| Provincia de Buenos Aires, | | | | |
| 6.50%, 2/15/23 (d) | | 52,000 | | 55,099 |
| Republic of Argentina, | | | | |
| 5.63%, 1/26/22 | | 60,000 | | 63,000 |
| Republic of Argentina, | | | | |
| 6.88%, 1/26/27 | | 53,000 | | 57,797 |
| Republic of Argentina, | | | | |
| 7.13%, 6/28/17 (d) | | 14,000 | | 14,364 |
| YPF SA, Registered, | | | | |
| 8.88%, 12/19/18 | | 32,000 | | 33,936 |
| YPF Sociedad Anonima, | | | | |
| Registered, 8.50%, 3/23/21 | | 77,000 | | 87,189 |
| | | | 367,977 |
| Australia – 0.1% | | | | |
| FMG Resources August 2006 | | | | |
| Pty Ltd., 4.75%, 5/15/22, | | | | |
| Callable 2/15/22 @ 100 (a)(d) | | 30,000 | | 30,638 |
| Bahamas – 0.5% | | | | |
| Silversea Cruise Finance, | | | | |
| 7.25%, 2/1/25, Callable | | | | |
| 2/1/20 @ 105.44 (a)(d) | | 140,000 | | 150,150 |
| Bermuda – 0.0% | | | | |
| Viking Cruises, Ltd., 6.25%, 5/15/25, | | | | |
| Callable 5/15/20 @ 103.13 (a)(d) | | 11,000 | | 11,385 |
| Brazil – 3.5% | | | | |
| Banco Do Brasil (Cayman), | | | | |
| Registered, 6.00%, 1/22/20 | | 100,000 | | 106,500 |
| Centrais Eletricas Brasileiras SA, | | | | |
| Registered, 6.88%, 7/30/19 | | 100,000 | | 106,130 |
| Federal Republic of Brazil, | | | | |
| 8.88%, 4/15/24 | | 24,000 | | 30,840 |
| Itau Unibanco Holding SA/KY, | | | | |
| Registered, 5.75%, 1/22/21 | | 100,000 | | 105,750 |
| Petrobras Brasileiro SA, | | | | |
| 5.75%, 1/20/20 | | 110,000 | | 115,449 |
| Petrobras Global Finance, | | | | |
| 6.13%, 1/17/22 | | 107,000 | | 115,667 |
| Petrobras Global Finance BV, | | | | |
| 8.38%, 5/23/21 | | 20,000 | | 23,063 |
| Petrobras Global Finance BV, | | | | |
| 4.38%, 5/20/23 | | 25,000 | | 24,850 |
| Petrobras Global Finance BV, | | | | |
| 6.25%, 3/17/24 | | 62,000 | | 66,486 |
| Petrobras Global Finance BV, | | | | |
| 8.75%, 5/23/26 | | 37,000 | | 44,816 |
| Petrobras Global Finance BV, | | | | |
| 7.38%, 1/17/27 | | 100,000 | | 111,000 |
| Petrobras Global Finance BV, | | | | |
| 6.75%, 1/27/41 | | 20,000 | | 20,150 |
| Petrobras International Finance Co., | | | | |
| 5.38%, 1/27/21 | | 133,000 | | 139,815 |
| Vale SA, 4.38%, 1/11/22 | | 40,000 | | 41,712 |
| Vale SA, 5.63%, 9/11/42 | | 24,000 | | 25,350 |
| | | | 1,077,578 |
| Canada – 2.9% | | | | |
| Hudbay Minerals, Inc., 7.25%, 1/15/23, | | | | |
| Callable 7/15/19 @ 103.63 (a)(d) | | 2,000 | | 2,155 |
| Hudbay Minerals, Inc., 7.63%, 1/15/25, | | | | |
| Callable 1/15/20 @ 105.72 (a)(d) | | 184,000 | | 202,859 |
| Iamgold Corp., 7.00%, 4/15/25, | | | | |
| Callable 4/15/20 @ 105.25 (a)(d) | | 30,000 | | 31,500 |
| Lundin Mining Corp., 7.50%, 11/1/20, | | | | |
| Callable 11/20/17 @ 103.75 (a)(d) | | 100,000 | | 104,010 |
| Mattamy Group Corp., | | | | |
| 6.88%, 12/15/23, Callable | | | | |
| 12/15/19 @ 103.44 (a)(d) | | 64,000 | | 67,200 |
| Mattamy Group Corp., | | | | |
| 6.50%, 10/1/25, Callable | | | | |
| 10/1/20 @ 104.88 (a)(d) | | 50,000 | | 52,125 |
| New Gold, Inc., 6.38%, 5/15/25, | | | | |
| Callable 5/15/20 @ 104.78 (a)(d) | | 67,000 | | 71,188 |
| Northwest Acquisitions ULC, | | | | |
| 7.13%, 11/1/22, Callable | | | | |
| 11/1/19 @ 103.56 (a)(d) | | 126,000 | | 131,040 |
| Nova Chemicals Corp., 5.25%, 8/1/23, | | | | |
| Callable 8/1/18 @ 102.63 (a)(d) | | 40,000 | | 41,250 |
| Nova Chemicals Corp., 4.88%, 6/1/24, | | | | |
| Callable 3/3/24 @ 100 (a)(d) | | 100,000 | | 101,874 |
| Nova Chemicals Corp., 5.00%, 5/1/25, | | | | |
| Callable 1/31/25 @ 100 (a)(d) | | 34,000 | | 34,425 |
| Nova Chemicals Corp., 5.25%, 6/1/27, | | | | |
| Callable 3/3/27 @ 100 (a)(d) | | 13,000 | | 13,228 |
| Valeant Pharmaceuticals International, | | | | |
| Inc., 5.50%, 11/1/25, Callable | | | | |
| 11/1/20 @ 102.75 (a)(d) | | 6,000 | | 6,128 |
| | | | 858,982 |
| 44 HSBC FAMILY OF FUNDS | See notes to financial statements. |
HSBC GLOBAL HIGH YIELD BOND FUND |
Schedule of Portfolio Investments—as of October 31, 2017 (continued) |
| Yankee Dollars, continued | | | | |
| | | | |
| | Principal | | |
| | Amount ($) | | Value ($) |
| Chile – 0.0% | | | | |
| Codelco, Inc., 5.63%, 9/21/35 (d) | | 7,000 | | 8,259 |
| Colombia – 0.3% | | | | |
| Bancolombia SA, 5.13%, 9/11/22 | | 35,000 | | 36,806 |
| Republic of Colombia, | | | | |
| 8.13%, 5/21/24 | | 40,000 | | 50,700 |
| | | | 87,506 |
| El Salvador – 0.1% | | | | |
| Republic of El Salvador, | | | | |
| Registered, 7.75%, 1/24/23 | | 35,000 | | 37,713 |
| France – 1.1% | | | | |
| Electricite de France SA, Registered, | | | | |
| 5.25% (USSW10 + 371 bps), | | | | |
| Callable 1/29/23 @ 100 (a)(b),(c) | | 100,000 | | 104,125 |
| Numericable-SFR SA, 7.38%, 5/1/26, | | | | |
| Callable 5/1/21 @ 103.69 (a)(d) | | 200,000 | | 215,000 |
| | | | 319,125 |
| Germany – 1.4% | | | | |
| IHO Verwaltungs (Schaeffler) GmbH, | | | | |
| 4.50%, 9/15/23, Callable | | | | |
| 9/15/19 @ 102.25 (a)(d) | | 200,000 | | 206,250 |
| Unitymedia Kabelbw GmbH, | | | | |
| 6.13%, 1/15/25, Callable | | | | |
| 1/15/20 @ 103.06 (a)(d) | | 200,000 | | 213,080 |
| | | | 419,330 |
| Guatemala – 0.0% | | | | |
| Central American Bottling Corp., | | | | |
| 5.75%, 1/31/27, Callable | | | | |
| 1/31/22 @ 102.88 (a)(d) | | 10,000 | | 10,558 |
| Indonesia – 0.7% | | | | |
| Majapahit Holding BV, Registered, | | | | |
| 7.75%, 1/20/20 | | 200,000 | | 220,760 |
| Ireland – 0.7% | | | | |
| Park Aerospace Holdings, | | | | |
| 5.25%, 8/15/22 (d) | | 93,000 | | 96,720 |
| Park Aerospace Holdings, | | | | |
| 5.50%, 2/15/24 (d) | | 110,000 | | 114,125 |
| | | | 210,845 |
| Italy – 0.8% | | | | |
| Enel SpA, 8.75% | | | | |
| (USSW5 + 588 bps), 9/24/73, | | | | |
| Callable 9/24/23 @ 100 (a)(b)(d) | | 200,000 | | 247,000 |
| Kazakhstan – 0.7% | | | | |
| Kazmunaygas National Co. JSC, | | | | |
| Registered, 4.75%, 4/19/27 | | 200,000 | | 204,300 |
| Lebanon – 0.1% | | | | |
| Lebanon Government International | | | | |
| Bond, Series G, 7.05%, 11/2/35 | | 18,000 | | 17,013 |
| Luxembourg – 2.1% | | | | |
| Altice Financing SA, 6.63%, 2/15/23, | | | | |
| Callable 2/15/18 @ 104.97 (a)(d) | | 200,000 | | 210,820 |
| Altice Luxembourg SA, | | | | |
| 7.75%, 5/15/22, Callable | | | | |
| 12/7/17 @ 105.81 (a)(d) | | 200,000 | | 211,749 |
| Camelot Finance SA, 7.88%, 10/15/24, | | | | |
| Callable 10/15/19 @ 103.94 (a)(d) | | 80,000 | | 86,000 |
| Dana Financing Luxembourg Sarl, | | | | |
| 5.75%, 4/15/25, Callable | | | | |
| 4/15/20 @ 104.31 (a)(d) | | 31,000 | | 32,860 |
| Dana Financing Luxembourg Sarl, | | | | |
| 6.50%, 6/1/26, Callable | | | | |
| 6/1/21 @ 103.25 (a)(d) | | 33,000 | | 35,888 |
| Trinseo Materials Operating SCA / | | | | |
| Trinseo Materials Finance, Inc., | | | | |
| 5.38%, 9/1/25, Callable | | | | |
| 9/1/20 @ 102.69 (a)(d) | | 46,000 | | 48,415 |
| | | | 625,732 |
| Mexico – 0.2% | | | | |
| Petroleos Mexicanos, | | | | |
| 6.38%, 2/4/21 | | 10,000 | | 10,874 |
| Petroleos Mexicanos, | | | | |
| 5.38%, 3/13/22 (d) | | 23,000 | | 24,401 |
| Petroleos Mexicanos, | | | | |
| 6.50%, 3/13/27 (d) | | 10,000 | | 10,914 |
| Petroleos Mexicanos, | | | | |
| Registered, 6.50%, 3/13/27 | | 16,000 | | 17,462 |
| | | | 63,651 |
| Netherlands – 1.6% | | | | |
| Constellium NV, 7.88%, 4/1/21 (d) | | 250,000 | | 265,700 |
| Lincoln Finance Ltd., 7.38%, 4/15/21, | | | | |
| Callable 4/15/18 @ 103.69 (a)(d) | | 200,000 | | 211,500 |
| | | | 477,200 |
| Nigeria – 0.2% | | | | |
| Nigeria Government International | | | | |
| Bond, 5.63%, 6/27/22 | | 45,000 | | 46,069 |
| Peru – 0.2% | | | | |
| Banco de Credito del Peru, | | | | |
| Registered, 5.38%, 9/16/20 | | 40,000 | | 43,350 |
| BBVA Banco Continental, | | | | |
| Registered, 5.00%, 8/26/22 | | 14,000 | | 15,243 |
| | | | 58,593 |
| Russian Federation – 1.4% | | | | |
| Gazprom OAO Via Gaz Capital SA, | | | | |
| Registered, 4.95%, 7/19/22 | | 200,000 | | 209,307 |
| LUKOIL International Finance BV, | | | | |
| Registered, 6.66%, 6/7/22 | | 100,000 | | 112,733 |
| VTB Bank OJSC Via VTB Capital SA, | | | | |
| 6.55%, 10/13/20 | | 100,000 | | 109,065 |
| | | | 431,105 |
| See notes to financial statements. | HSBC FAMILY OF FUNDS 45 |
HSBC GLOBAL HIGH YIELD BOND FUND |
Schedule of Portfolio Investments—as of October 31, 2017 (continued) |
| Yankee Dollars, continued | | | | |
| | | | | |
| | Principal | | |
| | Amount ($) | | Value ($) |
| South Africa – 0.4% | | | | |
| Republic of South Africa, | | | | |
| 5.50%, 3/9/20 | | 100,000 | | 105,750 |
| Sri Lanka – 0.4% | | | | |
| Republic of Sri Lanka, | | | | |
| Registered, 6.25%, 10/4/20 | | 100,000 | | 106,765 |
| Switzerland – 0.8% | | | | |
| UBS Group AG, 7.00% | | | | |
| (USSW5 + 487 bps), Callable 2/19/25 | | | | |
| @ 100 (a)(b),(c) | | 200,000 | | 229,146 |
| Turkey – 1.5% | | | | |
| Republic of Turkey, 7.00%, 3/11/19 | | 200,000 | | 210,600 |
| Republic of Turkey, 7.00%, 6/5/20 | | 133,000 | | 144,042 |
| Republic of Turkey, 7.38%, 2/5/25 | | 62,000 | | 71,075 |
| Republic of Turkey, 6.88%, 3/17/36 | | 32,000 | | 35,242 |
| | | | 460,959 |
| United Kingdom – 1.1% | | | | |
| Noble Holding International Ltd., | | | | |
| 7.75%, 1/15/24, Callable | | | | |
| 10/15/23 @ 100 (a) | | 149,000 | | 133,355 |
| Virgin Media Finance PLC, | | | | |
| 6.00%, 10/15/24, Callable | | | | |
| 10/15/19 @ 103 (a)(d) | | 200,000 | | 209,500 |
| | | | 342,855 |
| Venezuela – 0.3% | | | | |
| Bolivarian Republic of Venezuela, | | | | |
| 9.25%, 5/7/28 | | 4,000 | | 1,320 |
| Petroleos de Venezuela SA, | | | | |
| 9.00%, 11/17/21 | | 35,000 | | 15,356 |
| Petroleos de Venezuela SA, | | | | |
| Registered, 12.75%, 2/17/22 | | 9,000 | | 4,073 |
| Petroleos de Venezuela SA, | | | | |
| Registered, 6.00%, 5/16/24 | | 70,000 | | 19,775 |
| Petroleos de Venezuela SA, | | | | |
| Registered, 6.00%, 11/15/26 | | 158,000 | | 43,845 |
| | | | 84,369 |
| Zambia – 0.5% | | | | |
| First Quantum Minerals Ltd., | | | | |
| 7.00%, 2/15/21, Callable | | | | |
| 2/15/18 @ 103.5 (a)(d) | | 150,000 | | 155,625 |
| TOTAL YANKEE DOLLARS | | | | |
| (COST $7,214,129) | | | | 7,466,938 |
| | | | | |
| Corporate Bonds – 51.3% | | | | |
| | | | | |
| Luxembourg – 0.4% | | | | |
| Kleopatra Holdings 1 SCA, | | | | |
| 8.50%, 6/30/23, Callable 7/15/19 @ | | | | |
| 102.00 (a)(d) | | 100,000 | | 117,290 |
| Peru – 0.1% | | | | |
| Southern Copper Corp., | | | | |
| 5.88%, 4/23/45. | | 5,000 | | 5,841 |
| Southern Copper Corp., | | | | |
| 6.75%, 4/16/40 | | 27,000 | | 33,781 |
| | | | 39,622 |
| United States – 50.8% | | | | |
| Acadia Healthcare Co., Inc., | | | | |
| 6.50%, 3/1/24, Callable | | | | |
| 3/1/19 @ 104.88 (a) | | 150,000 | | 158,062 |
| Alcoa, Inc., 5.90%, 2/1/27 | | 30,000 | | 33,467 |
| Ally Financial, Inc., 4.13%, 3/30/20 | | 135,000 | | 139,388 |
| Ally Financial, Inc., 5.75%, 11/20/25, | | | | |
| Callable 10/20/25 @ 100.00 (a) | | 134,000 | | 148,069 |
| Ally Financial, Inc., 7.50%, 9/15/20 | | 87,000 | | 97,984 |
| Ally Financial, Inc., 8.00%, 3/15/20 | | 87,000 | | 97,766 |
| AMC Entertainment, Inc., | | | | |
| 5.75%, 6/15/25, Callable | | | | |
| 6/15/20 @ 102.88 (a) | | 130,000 | | 126,425 |
| American Axle & Manufacturing, Inc., | | | | |
| 6.25%, 4/1/25, Callable | | | | |
| 4/1/20 @ 104.69 (a)(d) | | 93,000 | | 95,325 |
| American Axle & Manufacturing, Inc., | | | | |
| 6.50%, 4/1/27, Callable | | | | |
| 4/1/22 @ 103.25 (a)(d) | | 51,000 | | 52,084 |
| American Express Co., 5.20% | | | | |
| (US0003M + 343 bps), Callable | | | | |
| 11/15/19 @ 100.00 (a)(b),(c) | | 65,000 | | 67,275 |
| Ashton Woods USA LLC / Ashton | | | | |
| Woods Finance Co., 6.75%, 8/1/25, | | | | |
| Callable 8/1/20 @ 105.06 (a)(d) | | 49,000 | | 48,510 |
| Avantor, Inc., 6.00%, 10/1/24, | | | | |
| Callable 10/1/20 @ 104.50 (a)(d) | | 21,000 | | 21,420 |
| Bank of America Corp., 6.50% | | | | |
| (US0003M + 417 bps), Callable | | | | |
| 10/23/24 @ 100.00 (a)(b),(c) | | 75,000 | | 85,781 |
| Bank of America Corp., 8.12% | | | | |
| (US0003M + 364 bps), Callable | | | | |
| 5/15/18 @ 100.00 (a)(b),(c) | | 100,000 | | 103,160 |
| Blue Cube Spinco, Inc., | | | | |
| 9.75%, 10/15/23, Callable | | | | |
| 10/15/20 @ 102.44 (a) | | 88,000 | | 105,380 |
| Blue Cube Spinco, Inc., | | | | |
| 10.00%, 10/15/25, Callable | | | | |
| 10/15/20 @ 105.00 (a) | | 28,000 | | 34,090 |
| Blue Racer Midstream LLC, | | | | |
| 6.13%, 11/15/22, Callable | | | | |
| 12/7/17 @ 104.59 (a)(d) | | 213,000 | | 222,052 |
| 46 HSBC FAMILY OF FUNDS | See notes to financial statements. |
HSBC GLOBAL HIGH YIELD BOND FUND |
Schedule of Portfolio Investments—as of October 31, 2017 (continued) |
| Corporate Bonds, continued | | | | |
| | | | | |
| | Principal | | |
| | Amount ($) | | Value ($) |
| United States – continued | | | | |
| Blueline Rental Finance Corp / Blueline | | | | |
| Rental LLC, 9.25%, 3/15/24, Callable | | | | |
| 3/15/20 @ 104.63 (a)(d) | | 81,000 | | 88,087 |
| Boise Cascade Co., 5.63%, 9/1/24, | | | | |
| Callable 9/1/19 @ 104.22 (a)(d) | | 45,000 | | 46,800 |
| Boyd Gaming Corp., 6.88%, 5/15/23, | | | | |
| Callable 5/15/18 @ 105.16 (a) | | 115,000 | | 123,481 |
| Cablevision Systems Corp., | | | | |
| 5.88%, 9/15/22 | | 100,000 | | 102,875 |
| Calpine Corp., 5.38%, 1/15/23, | | | | |
| Callable 10/15/18 @ 102.69 (a) | | 26,000 | | 25,285 |
| Calpine Corp., 5.75%, 1/15/25, | | | | |
| Callable 10/15/19 @ 102.88 (a) | | 69,000 | | 65,507 |
| Capital One Financial Corp., 5.55% | | | | |
| (US0003M + 380 bps), Callable | | | | |
| 6/1/20 @ 100.00 (a)(b),(c) | | 120,000 | | 125,850 |
| Carmike Cinemas, Inc., | | | | |
| 6.00%, 6/15/23, Callable | | | | |
| 6/15/18 @ 104.50 (a)(d) | | 110,000 | | 116,600 |
| Carrizo Oil & Gas, Inc., | | | | |
| 6.25%, 4/15/23, Callable | | | | |
| 4/15/18 @ 104.69 (a) | | 75,000 | | 76,313 |
| Carrizo Oil & Gas, Inc., 7.50%, 9/15/20, | | | | |
| Callable 12/7/17 @ 101.88 (a) | | 80,000 | | 81,600 |
| CCO Holdings LLC, 5.00%, 2/1/28, | | | | |
| Callable 8/1/22 @ 102.50 (a)(d) | | 134,000 | | 132,995 |
| CCO Holdings LLC, 5.13%, 5/1/23, | | | | |
| Callable 5/1/18 @ 103.84 (a)(d) | | 164,000 | | 170,970 |
| Cemex Finance LLC, Registered, | | | | |
| 6.00%, 4/1/24, Callable | | | | |
| 4/1/19 @ 103.00 (a) | | 200,000 | | 211,500 |
| Centene Corp., 4.75%, 5/15/22, | | | | |
| Callable 5/15/19 @ 102.38 (a) | | 14,000 | | 14,665 |
| Centene Corp., 4.75%, 1/15/25, | | | | |
| Callable 1/15/20 @ 103.56 (a) | | 26,000 | | 26,845 |
| Centene Corp., 5.63%, 2/15/21, | | | | |
| Callable 2/15/18 @ 102.81 (a) | | 27,000 | | 28,013 |
| Centene Corp., 6.13%, 2/15/24, | | | | |
| Callable 2/15/19 @ 104.59 (a) | | 73,000 | | 78,475 |
| Central Garden & Pet Co., | | | | |
| 6.13%, 11/15/23, Callable | | | | |
| 11/15/18 @ 104.59 (a) | | 20,000 | | 21,325 |
| CenturyLink, Inc., 5.63%, 4/1/25, | | | | |
| Callable 1/1/25 @ 100.00 (a) | | 95,000 | | 92,625 |
| Change Healthcare Holdings LLC / | | | | |
| Change Healthcare Finance, Inc., | | | | |
| 5.75%, 3/1/25, Callable | | | | |
| 3/1/20 @ 102.88 (a)(d) | | 23,000 | | 23,518 |
| Cheniere Energy Partners, | | | | |
| 5.25%, 10/1/25, Callable | | | | |
| 10/1/20 @ 102.63 (a)(d) | | 125,000 | | 128,750 |
| Citigroup, Inc., 5.80% | | | | |
| (US0003M + 409 bps), | | | | |
| Callable 11/15/19 @ 100.00 (a)(b),(c) | | 85,000 | | 88,931 |
| Citigroup, Inc., 5.87% (US0003M + | | | | |
| 406 bps), Callable 3/27/20 @ | | | | |
| 100.00 (a)(b),(c) | | 70,000 | | 73,283 |
| Clear Channel Worldwide, | | | | |
| 6.50%, 11/15/22, Callable | | | | |
| 12/7/17 @ 103.25 (a) | | 159,000 | | 164,168 |
| Clearwater Paper Corp., | | | | |
| 5.38%, 2/1/25 (d) | | 202,000 | | 203,010 |
| Cliffs Natural Resources, Inc., | | | | |
| 5.75%, 3/1/25, Callable | | | | |
| 3/1/20 @ 104.31 (a)(d) | | 149,000 | | 144,902 |
| Continental Resources, Inc., | | | | |
| 4.50%, 4/15/23, Callable | | | | |
| 1/15/23 @ 100.00 (a) | | 30,000 | | 30,375 |
| DCP Midstream LLC, 4.75%, | | | | |
| 9/30/21, Callable | | | | |
| 6/30/21 @ 100.00 (a)(d) | | 110,000 | | 113,300 |
| DCP Midstream LLC, | | | | |
| 8.13%, 8/16/30 | | 120,000 | | 141,600 |
| Dell, Inc., 7.10%, 4/15/28 | | 109,000 | | 122,080 |
| Diamond 1 Finance/Diamond 2, 5.88%, | | | | |
| 6/15/21, Callable | | | | |
| 6/15/18 @ 102.94 (a)(d) | | 19,000 | | 19,898 |
| Diamond 1 Finance/Diamond | | | | |
| 2, 6.02%, 6/15/26, Callable | | | | |
| 3/15/26 @ 100.00 (a)(d) | | 50,000 | | 55,815 |
| Diamond 1 Finance/Diamond | | | | |
| 2, 7.13%, 6/15/24, Callable | | | | |
| 6/15/19 @ 105.34 (a)(d) | | 25,000 | | 27,593 |
| Diamondback Energy, Inc., | | | | |
| 5.38%, 5/31/25, Callable | | | | |
| 5/31/20 @ 104.03 (a) | | 39,000 | | 40,511 |
| DISH DBS Corp., 5.88%, 7/15/22 | | 195,000 | | 196,218 |
| Eagle Holding Co. II LLC, | | | | |
| 7.63%, 5/15/22, Callable | | | | |
| 5/15/18 @ 102.00 (a)(d) | | 105,000 | | 108,413 |
| Eldorado Resorts, Inc., 6.00%, 4/1/25, | | | | |
| Callable 4/1/20 @ 104.50 (a) | | 76,000 | | 80,180 |
| Eldorado Resorts, Inc., 7.00%, 8/1/23, | | | | |
| Callable 8/1/18 @ 105.25 (a) | | 135,000 | | 145,800 |
| Energy Transfer Equity LP, | | | | |
| 7.50%, 10/15/20 | | 100,000 | | 112,500 |
| EnLink Midstream Partners LP, | | | | |
| 6.00%, Callable | | | | |
| 12/15/22 @ 100.00 (a)(b),(c) | | 163,000 | | 164,408 |
| EP Energy LLC/ Everest Acquisition | | | | |
| Finance, Inc., 9.38%, 5/1/20, | | | | |
| Callable 12/7/17 @ 102.34 (a) | | 55,000 | | 46,183 |
| Exela Intermediate LLC / Exela | | | | |
| Finance, Inc., 10.00%, 7/15/23, | | | | |
| Callable 7/15/20 @ 105.00 (a)(d) | | 95,000 | | 90,963 |
| First Data Corp., 7.00%, 12/1/23, | | | | |
| Callable 12/1/18 @ 103.50 (a)(d) | | 200,000 | | 214,004 |
| Freeport-McMoRan, Inc., | | | | |
| 3.88%, 3/15/23, Callable | | | | |
| 12/15/22 @ 100.00 (a) | | 44,000 | | 43,395 |
| Freeport-McMoRan, Inc., | | | | |
| 6.50%, 11/15/20, Callable | | | | |
| 12/7/17 @ 101.88 (a) | | 17,000 | | 17,319 |
| See notes to financial statements. | HSBC FAMILY OF FUNDS 47 |
| HSBC GLOBAL HIGH YIELD BOND FUND |
| Schedule of Portfolio Investments—as of October 31, 2017 (continued) |
| Corporate Bonds, continued | | | | | | |
| | | | | | | |
| | Principal | | |
| | Amount ($) | | Value ($) |
| United States – continued | | | | | | |
| Freeport-McMoRan, Inc., | | | | | | |
| 6.88%, 2/15/23, Callable | | | | | | |
| 2/15/20 @ 103.44 (a) | | | | 18,000 | | 19,690 |
| Frontier Communications, | | | | | | |
| 6.25%, 9/15/21, Callable | | | | | | |
| 6/15/21 @ 100.00 (a) | | | | 59,000 | | 48,675 |
| Genesis Energy LP, 5.63%, 6/15/24, | | | | | | |
| Callable 6/15/19 @ 102.81 (a) | | | | 40,000 | | 39,600 |
| Genesis Energy LP, 5.75%, 2/15/21, | | | | | | |
| Callable 12/7/17 @ 102.88 (a) | | | | 115,000 | | 116,771 |
| Genesis Energy LP, 6.75%, 8/1/22, | | | | | | |
| Callable 8/1/18 @ 103.38 (a) | | | | 76,000 | | 78,470 |
| Golden Nugget, Inc., 6.75%, 10/15/24, | | | | | | |
| Callable 10/15/19 @ 103.38 (a)(d) | | | | 209,000 | | 212,658 |
| Golden Nugget, Inc., 8.75%, 10/1/25, | | | | | | |
| Callable 10/1/20 @ 104.38 (a)(d) | | | | 146,000 | | 150,015 |
| Goldman Sachs Group, Inc., | | | | | | |
| 5.00%, Callable | | | | | | |
| 11/10/22 @ 100.00 (a),(b),(c) | | | | 85,000 | | 84,830 |
| Goldman Sachs Group, Inc., | | | | | | |
| 5.38% (US0003M + 392 bps), | | | | | | |
| Callable 5/10/20 @ 100.00 (a)(b),(c) | | | | 120,000 | | 124,365 |
| Gulfport Energy Corp., | | | | | | |
| 6.38%, 5/15/25, Callable | | | | | | |
| 5/15/20 @ 104.78 (a) | | | | 77,000 | | 78,155 |
| Gulfport Enregy Corp., | | | | | | |
| 6.00%, 10/15/24, Callable | | | | | | |
| 10/15/19 @ 104.50 (a) | | | | 196,000 | | 195,999 |
| Halcon Resources Corp., | | | | | | |
| 6.75%, 2/15/25, Callable | | | | | | |
| 2/15/20 @ 105.06 (a)(d) | | | | 45,000 | | 46,125 |
| HCA Holdings, Inc., 6.50%, 2/15/20 | | | | 70,000 | | 75,425 |
| Herc Rentals, Inc., 7.50%, 6/1/22, | | | | | | |
| Callable 6/1/19 @ 103.75 (a)(d) | | | | 69,000 | | 74,693 |
| Herc Rentals, Inc., 7.75%, 6/1/24, | | | | | | |
| Callable 6/1/19 @ 105.81 (a)(d) | | | | 48,000 | | 52,680 |
| Holly Energy Partners LP, | | | | | | |
| 6.00%, 8/1/24, Callable | | | | | | |
| 8/1/19 @ 104.50 (a)(d) | | | | 18,000 | | 18,855 |
| Infor, Inc., 5.75%, 8/15/20, | | | | | | |
| Callable 11/22/17 @ 102.88 (a)(d) | | | | 5,000 | | 5,146 |
| Infor, Inc., 6.50%, 5/15/22, | | | | | | |
| Callable 5/15/18 @ 103.25 (a) | | | | 125,000 | | 130,600 |
| Inventiv Group Holdings, Inc., | | | | | | |
| 7.50%, 10/1/24, Callable | | | | | | |
| 10/1/19 @ 103.75 (a)(d) | | | | 79,000 | | 87,098 |
| j2 Cloud Services LLC / j2 Global | | | | | | |
| Co-Obligor, Inc., 6.00%, 7/15/25, | | | | | | |
| Callable 7/15/20 @ 104.50 (a)(d) | | | | 21,000 | | 22,103 |
| Jacobs Entertainment, Inc., | | | | | | |
| 7.88%, 2/1/24, Callable | | | | | | |
| 2/1/20 @ 105.91 (a)(d) | | | | 138,000 | | 149,040 |
| JPMorgan Chase & Co., 5.30% | | | | | | |
| (US0003M + 380 bps), Callable | | | | | | |
| 5/1/20 @ 100.00 (a)(b),(c) | | | | 60,000 | | 63,084 |
| JPMorgan Chase & Co., 6.00% | | | | | | |
| (US0003M + 330 bps), Callable | | | | | | |
| 8/1/23 @ 100.00 (a)(b),(c) | | | | 85,000 | | 93,713 |
| Kaiser Aluminum Corp., | | | | | | |
| 5.88%, 5/15/24, Callable | | | | | | |
| 5/15/19 @ 104.41 (a) | | | | 42,000 | | 45,203 |
| Kindred Healthcare, Inc., | | | | | | |
| 6.38%, 4/15/22, Callable | | | | | | |
| 12/7/17 @ 104.78 (a) | | | | 153,000 | | 141,602 |
| Level 3 Financing, Inc., | | | | | | |
| 5.13%, 5/1/23, Callable | | | | | | |
| 5/1/18 @ 102.56 (a) | | | | 90,000 | | 92,138 |
| Level 3 Financing, Inc., | | | | | | |
| 5.38%, 5/1/25, Callable | | | | | | |
| 5/1/20 @ 102.69 (a) | | | | 39,000 | | 40,755 |
| Level 3 Financing, Inc., | | | | | | |
| 5.38%, 1/15/24, Callable | | | | | | |
| 1/15/19 @ 102.69 (a) | | | | 24,000 | | 24,930 |
| M/I Homes, Inc., 5.63%, 8/1/25, | | | | | | |
| Callable 8/1/20 @ 104.22 (a) | | | | 34,000 | | 34,595 |
| Match Group, Inc., 6.38%, 6/1/24, | | | | | | |
| Callable 6/1/19 @ 104.78 (a) | | | | 91,000 | | 98,848 |
| MGM Growth / MGM Finance, | | | | | | |
| 5.63%, 5/1/24, Callable | | | | | | |
| 2/1/24 @ 100.00 (a) | | | | 38,000 | | 41,040 |
| MGM Resorts International, | | | | | | |
| 4.63%, 9/1/26, Callable | | | | | | |
| 6/1/26 @ 100.00 (a) | | | | 90,000 | | 90,000 |
| MGM Resorts International, | | | | | | |
| 7.75%, 3/15/22 | | | | 40,000 | | 46,462 |
| Molina Healthcare, Inc., | | | | | | |
| 5.38%, 11/15/22, Callable | | | | | | |
| 8/15/22 @ 100.00 (a) | | | | 60,000 | | 62,430 |
| MPH Acquisition Holdings LLC, | | | | | | |
| 7.13%, 6/1/24, Callable | | | | | | |
| 6/1/19 @ 105.34 (a)(d) | | | | 66,000 | | 71,033 |
| Mpt Oper Partnersp/FINL, | | | | | | |
| 5.00%, 10/15/27, Callable | | | | | | |
| 10/15/22 @ 102.50 (a) | | | | 115,000 | | 118,162 |
| MPT Operating Partnership LP, | | | | | | |
| 5.25%, 8/1/26, Callable | | | | | | |
| 8/1/21 @ 102.63 (a) | | | | 20,000 | | 20,824 |
| Navient Corp., 7.25%, 1/25/22, MTN | | | | 50,000 | | 54,250 |
| Navient Corp., 8.00%, 3/25/20, MTN | | | | 67,000 | | 73,868 |
| Newell Brands, Inc., 3.75%, 10/1/21 | | EUR | | 100,000 | | 130,803 |
| NRG Energy, Inc., 7.25%, 5/15/26, | | | | | | |
| Callable 5/15/21 @ 103.63 (a) | | | | 65,000 | | 70,444 |
| Nustar Logistics LP, 5.63%, 4/28/27, | | | | | | |
| Callable 1/28/27 @ 100.00 (a) | | | | 50,000 | | 52,750 |
| Outfront Media Capital LLC, | | | | | | |
| 5.25%, 2/15/22, Callable | | | | | | |
| 12/7/17 @ 103.94 (a) | | | | 130,000 | | 134,225 |
| Owens-Brockway Packaging, Inc., | | | | | | |
| 6.38%, 8/15/25 (d) | | | | 27,000 | | 30,510 |
| PBF Holding Co. LLC, 7.00%, | | | | | | |
| 11/15/23, Callable | | | | | | |
| 11/15/18 @ 105.25 (a) | | | | 133,000 | | 138,320 |
| PBF Holding Co. LLC, 7.25%, | | | | | | |
| 6/15/25, Callable 6/15/20 @ | | | | | | |
| 105.44 (a)(d) | | | | 90,000 | | 93,038 |
| 48 HSBC FAMILY OF FUNDS | | See notes to financial statements. |
| HSBC GLOBAL HIGH YIELD BOND FUND |
| Schedule of Portfolio Investments—as of October 31, 2017 (continued) |
| Corporate Bonds, continued | | | | | | |
| | | | | | | |
| | Principal | | |
| | Amount ($) | | Value ($) |
| United States – continued | | | | | | |
| PBF Logistics LP, 6.88%, 5/15/23, | | | | | | |
| Callable 5/15/18 @ 105.16 (a) | | | | 130,000 | | 134,550 |
| Pilgrim’s Pride Corp., 5.75%, 3/15/25, | | | | | | |
| Callable 3/15/20 @ 102.88 (a)(d) | | | | 11,000 | | 11,646 |
| Pilgrim’s Pride Corp., 5.88%, 9/30/27, | | | | | | |
| Callable 9/30/22 @ 102.94 (a)(d) | | | | 96,000 | | 99,840 |
| Plains All American Pipeline LP, | | | | | | |
| 6.12% (US0003M ), Callable | | | | | | |
| 11/15/22 @ 100.00 (a)(b),(c) | | | | 91,000 | | 92,756 |
| Plastipak Holdings, Inc., | | | | | | |
| 6.25%, 10/15/25, Callable | | | | | | |
| 10/15/20 @ 103.13 (a)(d) | | | | 127,000 | | 129,381 |
| Platform Specialty Products Corp., | | | | | | |
| 10.38%, 5/1/21, Callable | | | | | | |
| 5/1/18 @ 105.19 (a)(d) | | | | 35,000 | | 37,975 |
| Rayonier Am Prod, Inc., | | | | | | |
| 5.50%, 6/1/24, Callable | | | | | | |
| 6/1/19 @ 102.75 (a)(d) | | | | 177,000 | | 171,690 |
| Rite Aid Corp., 6.13%, 4/1/23, | | | | | | |
| Callable 4/1/18 @ 104.59 (a)(d) | | | | 47,000 | | 43,828 |
| Rose Rock Midstream LP, | | | | | | |
| 5.63%, 7/15/22, Callable | | | | | | |
| 11/22/17 @ 104.22 (a) | | | | 140,000 | | 137,900 |
| Rose Rock Midstream LP, | | | | | | |
| 5.63%, 11/15/23, Callable | | | | | | |
| 5/15/19 @ 102.81 (a) | | | | 161,000 | | 157,378 |
| RSI Home Products, Inc., | | | | | | |
| 6.50%, 3/15/23, Callable | | | | | | |
| 3/15/18 @ 104.88 (a)(d) | | | | 176,000 | | 184,360 |
| Sanchez Energy Corp., | | | | | | |
| 6.13%, 1/15/23, Callable | | | | | | |
| 7/15/18 @ 103.06 (a) | | | | 257,000 | | 214,594 |
| Sealed Air Corp., 4.50%, 9/15/23, | | | | | | |
| Callable 6/15/23 @ 100.00 (a) | | EUR | | 100,000 | | 133,358 |
| Select Medical Holdings Corp., | | | | | | |
| 6.38%, 6/1/21, Callable | | | | | | |
| 12/7/17 @ 103.19 (a) | | | | 203,000 | | 208,835 |
| Semgroup Corp., 7.25%, 3/15/26, | | | | | | |
| Callable 3/15/21 @ 103.63 (a)(d) | | | | 28,000 | | 28,700 |
| Seminole Hard Rock Entertainment, | | | | | | |
| Inc., 5.88%, 5/15/21, Callable 12/7/17 | | | | | | |
| @ 102.94 (a)(d) | | | | 187,000 | | 189,805 |
| Shea Homes LP/FNDG CP, | | | | | | |
| 5.88%, 4/1/23, Callable | | | | | | |
| 4/1/18 @ 104.41 (a)(d) | | | | 56,000 | | 58,100 |
| Sirius XM Radio, Inc., 5.00%, 8/1/27, | | | | | | |
| Callable 8/1/22 @ 102.50 (a)(d) | | | | 75,000 | | 75,656 |
| Sirius XM Radio, Inc., 6.00%, 7/15/24, | | | | | | |
| Callable 7/15/19 @ 103.00 (a)(d) | | | | 175,000 | | 186,812 |
| Sprint Capital Corp., 6.88%, 11/15/28 | | | | 77,000 | | 82,149 |
| Sprint Communications, Inc., | | | | | | |
| 6.00%, 11/15/22 | | | | 125,000 | | 131,250 |
| Sprint Corp., 7.88%, 9/15/23 | | | | 380,000 | | 424,650 |
| Surgery Center Holdings, Inc., | | | | | | |
| 6.75%, 7/1/25, Callable | | | | | | |
| 7/1/20 @ 103.38 (a)(d) | | | | 51,000 | | 46,538 |
| Surgery Center Holdings, Inc., | | | | | | |
| 8.88%, 4/15/21, Callable | | | | | | |
| 4/15/18 @ 106.66 (a)(d) | | | | 95,000 | | 97,138 |
| Tallgrass Energy Partners/Finance, | | | | | | |
| 5.50%, 9/15/24, Callable | | | | | | |
| 9/15/19 @ 104.13 (a)(d) | | | | 93,000 | | 96,139 |
| Targa Resources Partners LP, 5.13%, | | | | | | |
| 2/1/25, Callable 2/1/20 @ 103.84 (a) | | | | 188,000 | | 193,639 |
| Targa Resources Partners LP, | | | | | | |
| 6.75%, 3/15/24, Callable | | | | | | |
| 9/15/19 @ 103.38 (a) | | | | 77,000 | | 82,968 |
| Taylor Morrison Communities, Inc., | | | | | | |
| 5.88%, 4/15/23, Callable | | | | | | |
| 1/15/23 @ 100.00 (a)(d) | | | | 110,000 | | 117,768 |
| Tempo Acquisition Ll/Fi, | | | | | | |
| 6.75%, 6/1/25, Callable | | | | | | |
| 6/1/20 @ 103.38 (a)(d) | | | | 132,000 | | 133,650 |
| Tenet Healthcare Corp., | | | | | | |
| 5.13%, 5/1/25, Callable | | | | | | |
| 5/1/20 @ 102.56 (a)(d) | | | | 16,000 | | 15,580 |
| Tenet Healthcare Corp., | | | | | | |
| 6.00%, 10/1/20 | | | | 100,000 | | 105,000 |
| Tenet Healthcare Corp., | | | | | | |
| 8.13%, 4/1/22 | | | | 245,000 | | 245,305 |
| Tennessee Merger Sub, Inc., | | | | | | |
| 6.38%, 2/1/25, Callable | | | | | | |
| 2/1/20 @ 103.19 (a)(d) | | | | 106,000 | | 97,520 |
| The Chemours Co., 5.38%, 5/15/27, | | | | | | |
| Callable 2/15/27 @ 100.00 (a) | | | | 95,000 | | 101,413 |
| The Chemours Co., 6.63%, 5/15/23, | | | | | | |
| Callable 5/15/18 @ 104.97 (a) | | | | 75,000 | | 79,500 |
| T-Mobile US, Inc., 6.00%, 4/15/24, | | | | | | |
| Callable 4/15/19 @ 104.50 (a) | | | | 5,000 | | 5,350 |
| T-Mobile US, Inc., 6.50%, 1/15/24, | | | | | | |
| Callable 1/15/19 @ 103.25 (a) | | | | 150,000 | | 160,125 |
| Tribune Media Co., 5.88%, 7/15/22, | | | | | | |
| Callable 7/15/18 @ 102.94 (a) | | | | 110,000 | | 114,125 |
| Tronox Ltd., 7.50%, 3/15/22, | | | | | | |
| Callable 3/15/18 @ 103.75 (a)(d) | | | | 120,000 | | 125,850 |
| TTM Technologies, Inc., | | | | | | |
| 5.63%, 10/1/25, Callable | | | | | | |
| 10/1/20 @ 102.81 (a)(d) | | | | 90,000 | | 91,800 |
| United Rentals North America, Inc., | | | | | | |
| 4.63%, 10/15/25, Callable | | | | | | |
| 10/15/20 @ 102.31 (a) | | | | 3,000 | | 3,071 |
| United Rentals North America, Inc., | | | | | | |
| 5.50%, 5/15/27, Callable | | | | | | |
| 5/15/22 @ 102.75 (a) | | | | 54,000 | | 57,780 |
| Valeant Pharmaceuticals International, | | | | | | |
| 6.38%, 10/15/20, Callable | | | | | | |
| 12/7/17 @ 101.59 (a)(d) | | | | 164,000 | | 162,975 |
| Warrior Met Coal, Inc., | | | | | | |
| 8.00%, 11/1/24, Callable | | | | | | |
| 11/1/20 @ 104.00 (a)(d) | | | | 104,000 | | 106,553 |
| WellCare Health Plans, Inc., 5.25%, | | | | | | |
| 4/1/25, Callable 4/1/20 @ 103.94 (a) | | | | 98,000 | | 103,145 |
| See notes to financial statements. | | HSBC FAMILY OF FUNDS 49 |
| HSBC GLOBAL HIGH YIELD BOND FUND |
| Schedule of Portfolio Investments—as of October 31, 2017 (continued) |
| Corporate Bonds, continued | | | | | |
| | | | | | |
| | Principal | | | |
| | Amount ($) | | Value ($) |
| United States – continued | | | | | |
| West Corp., 8.50%, 10/15/25, Callable | | | | | |
| 10/15/20 @ 104.25 (a)(d) | | 61,000 | | | 59,666 |
| West Street Merger Sub, Inc., 6.38%, | | | | | |
| 9/1/25, Callable 9/1/20 @ 103.19 (a)(d) | | 94,000 | | | 95,292 |
| WPX Energy, Inc., 6.00%, 1/15/22, | | | | | |
| Callable 10/15/21 @ 100.00 (a) | | 43,000 | | | 44,774 |
| WPX Energy, Inc., 7.50%, 8/1/20, | | | | | |
| Callable 7/1/20 @ 100.00 (a) | | 100,000 | | | 108,500 |
| Zayo Group LLC / Zayo Capital LLC, | | | | | |
| 5.75%, 1/15/27, Callable 1/15/22 @ | | | | | |
| 102.88 (a)(d) | | 23,000 | | | 24,236 |
| Zayo Group LLC/ Zayo Capital LLC, | | | | | |
| 6.00%, 4/1/23, Callable 4/1/18 @ | | | | | |
| 104.50 (a) | | 125,000 | | | 131,406 |
| | | | | | 15,279,205 |
| TOTAL CORPORATE BONDS | | | | | |
| (COST $14,990,647) | | | | | 15,436,117 |
| |
| Exchange Traded Fund – 1.1% | | | | | |
| | | | | | |
| | | Shares | | | |
| iShares JPMorgan USD Emerging | | | | | |
| Markets Bond ETF | | 2,783 | | | 323,524 |
| TOTAL EXCHANGE TRADED FUND | | | | | |
| (COST $316,453) | | | | | 323,524 |
| |
| Investment Companies – 7.5% | | | | | |
| | | | | | |
| Northern Institutional Government | | | | | |
| Assets Portfolio, Institutional | | | | | |
| Shares, 0.82% (e) | | 2,158,505 | | | 2,158,505 |
| Northern Institutional U.S. Government | | | | | |
| Select Portfolio, Institutional | | | | | |
| Shares, 0.88% (e) | | 84,814 | | | 84,814 |
| TOTAL INVESTMENT COMPANIES | | | | | |
| (COST $2,243,319) | | | | | 2,243,319 |
| TOTAL INVESTMENTS | | | | | |
| IN SECURITIES | | | | | |
| (COST $28,569,088) – 98.8% | | | | | 29,718,674 |
| Other Assets (Liabilities) – 1.2% | | | | | 370,745 |
| NET ASSETS – 100% | | | | $ | 30,089,419 |
____________________
| † | | The principal amount is disclosed in local currency and the value is disclosed in U.S. Dollars. |
| (a) | | Represents next call date. Additional subsequent call dates and amounts may apply to this security. |
| (b) | | Variable rate security. The rate presented represents the rate in effect on October 31, 2017. These securities are deemed to have a maturity remaining until the next adjustment of the interest rate or the longer of the demand period or time to the next readjustment. |
| (c) | | Securities are perpetual and, thus, do not have a predetermined maturity date. |
| (d) | | Rule 144A security or other security which is restricted as to resale to institutional investors. This security has been deemed liquid by the Investment Adviser based on procedures approved by the Board of Trustees. |
| (e) | | The rate represents the annualized one-day yield that was in effect on October 31, 2017. |
bps — Basis Points
ETF — Exchange-Traded Fund
EUR — Euro
EUR003M — 3 Month EUR LIBOR
EUSA5 — Euro 5 Year Swap Rate
EUSA8 — Euro 8 Year Swap Rate
EUSA10 — Euro 10 Year Swap Rate
EUSA12 — Euro 12 Year Swap Rate
LLC — Limited Liability Company
MTN — Medium Term Note
ULC — Unlimited Liability Co.
US0003M — 3 Month US Dollar LIBOR
USSW5 — USD 5 Year Swap Rate
USSW10 — USD 10 Year Swap Rate
| 50 HSBC FAMILY OF FUNDS | | See notes to financial statements. |
| HSBC GLOBAL HIGH YIELD BOND FUND |
| Schedule of Portfolio Investments—as of October 31, 2017 (continued) |
The Fund invested, as a percentage of net assets at value, in the following industries, as of October 31, 2017:
| Percentage of Net Assets |
| Industry | at Value (%) |
| Oil, Gas & Consumable Fuels | | 15.9 | |
| Media | | 8.2 | |
| Investment Companies | | 7.5 | |
| Diversified Telecommunication Services | | 5.9 | |
| Health Care Providers & Services | | 5.4 | |
| Metals & Mining | | 5.0 | |
| Hotels, Restaurants & Leisure | | 5.0 | |
| Banks | | 4.4 | |
| Chemicals | | 3.8 | |
| Sovereign Bonds | | 3.6 | |
| Insurance | | 3.0 | |
| Electric Utilities | | 2.9 | |
| Wireless Telecommunication Services | | 2.7 | |
| Consumer Finance | | 2.7 | |
| Household Durables | | 2.3 | |
| Containers & Packaging | | 2.2 | |
| Trading Companies & Distributors | | 1.6 | |
| Capital Markets | | 1.5 | |
| Auto Components | | 1.4 | |
| Exchange Traded Fund | | 1.1 | |
| Paper & Forest Products | | 0.9 | |
| Construction Materials | | 0.8 | |
| Machinery | | 0.8 | |
Technology Hardware,
Storage & Peripherals | | 0.8 | |
| Pharmaceuticals | | 0.8 | |
| Life Sciences Tools & Services | | 0.7 | |
| Diversified Financial Services | | 0.7 | |
| IT Services | | 0.7 | |
| Automobiles | | 0.6 | |
| Food & Staples Retailing | | 0.5 | |
| Equity Real Estate Investment Trusts | | 0.5 | |
Independent Power & Renewable
Electricity Producers | | 0.5 | |
| Real Estate Management | | | |
| & Development | | 0.5 | |
| Road & Rail | | 0.4 | |
| Professional Services | | 0.4 | |
| Software | | 0.4 | |
| Gas Utilities | | 0.4 | |
| Internet Software & Services | | 0.4 | |
| Multi-Utilities | | 0.4 | |
| Energy Equipment & Services | | 0.4 | |
Electronic Equipment,
Instruments & Components | | 0.3 | |
| Food Products | | 0.3 | |
| Commercial Services & Supplies | | 0.2 | |
| Household Products | | 0.1 | |
| Aerospace & Defense | | 0.1 | |
| Health Care Technology | | 0.1 | |
| Beverages | | 0.0 | |
| Total | | 98.8 | |
| See notes to financial statements. | | HSBC FAMILY OF FUNDS 51 |
| HSBC GLOBAL HIGH YIELD BOND FUND |
| Schedule of Portfolio Investments—as of October 31, 2017 (continued) |
Credit Default Swap Agreements - Sell Protection(a)
At October 31, 2017, the Fund’s open credit default swap agreements were as follows:
| Underlying Instrument | | | Receive
Fixed
Rate (%) | | Payment
Frequency | | Implied
Credit
Spread at
October 31,
2017 (%)(b) | | Counterparty | | Expiration
Date | | Notional
Amount
($)(c) | | Value
($) | | | Upfront
Premiums
Paid/
(Received)
($) | |
Unrealized
Appreciation/
(Depreciation)
($) |
| CDX Emerging Markets | | | | | | | | | | | | | | | | | | | | | | | |
| Index, Series 25 | | 1.00 | | Quarterly | | 1.83 | | Bank of America | | 6/20/21 | | 333,000 | | (8,499 | ) | | | (23,417 | ) | | | 14,918 | |
| | | | | | | | | | | | | | (8,499 | ) | | | (23,417 | ) | | | 14,918 | |
Centrally Cleared Credit Default Swap Agreements - Sell Protection(a)
At October 31, 2017, the Fund’s open centrally cleared credit default swap agreements were as follows:
| Underlying Instrument | | | Receive
Fixed
Rate (%) | | Payment
Frequency | | Implied
Credit
Spread at
October 31,
2017 (%)(b) | | Expiration
Date | | Notional
Amount
($)(c) | | Value
($) | | | Upfront
Premiums
Paid/
(Received)
($) | |
Unrealized
Appreciation/
(Depreciation)
($) |
CDX N.A. High Yield Index,
Series 25* | | 5.00 | | Daily | | 2.44 | | 12/20/20 | | 776,239 | ** | | 57,439 | | | | (9,315 | ) | | | 66,754 | |
CDX N.A. High Yield Index,
Series 29 | | 5.00 | | Daily | | 3.11 | | 12/20/22 | | 200,000 | | | 16,760 | | | | 15,222 | | | | 1,538 | |
| | | | | | | | | | | | | 74,199 | | | | 5,907 | | | | 68,292 | |
| (a) | | When a credit event occurs as defined under the terms of the swap agreement, the Fund as a seller of credit protection will either (i) pay to the buyer of protection an amount equal to the par value of the defaulted reference entity and take delivery of the reference entity or (ii) pay a net amount equal to the par value of the defaulted reference entity less its recovery value. Alternatively, the Fund as a buyer of credit protection will either (i) receive from the seller of protection an amount equal to the par value of the defaulted reference entity and deliver the reference entity to the seller or (ii) receive a net amount equal to the par value of the defaulted reference entity less its recovery value. |
| (b) | | Implied credit spread, represented in absolute terms, utilized in determining the fair value of the credit default swap agreements as of period end serve as an indicator of the current status of the payment/performance risk and represents the likelihood or risk of default for the credit derivative. The implied credit spread of a referenced entity reflects the cost of buying/selling protection and may include upfront or daily payments required to be made to enter into the agreement. Generally, wider credit spreads represent a perceived deterioration of the referenced entity’s credit soundness and a greater likelihood or risk of default or other credit event occurring as defined under the terms of the swap agreement. |
| (c) | | The notional amount represents the maximum potential amount of future payments that the Fund may receive as a buyer of credit protection if a credit event occurs, as defined under the terms of the swap agreement. Alternatively, the notional amount represents the maximum potential amount of payment the Fund could be required to make as a seller of credit protection if a credit event occurs, as defined under the terms of the swap agreement. |
| * | | As of October 31, 2017, The CDX N.A. High Yield Index, Series 25 included securities which had defaulted and represented 3% of the Index. |
| ** | | Reflects the notional amount after the default of securities. |
| 52 HSBC FAMILY OF FUNDS | | See notes to financial statements. |
| HSBC GLOBAL HIGH YIELD BOND FUND |
| Schedule of Portfolio Investments—as of October 31, 2017 (continued) |
At October 31, 2017, the Fund’s open forward foreign currency exchange contracts were as follows:
Short Contracts
Description and amount of
currency to be purchased | | Description and amount of
currency to be sold | | Counterparty | | Settlement
Date | | Net
Unrealized
Appreciation/
(Depreciation)
($) |
| U.S. Dollar | | 4,614,955 | | European Euro | | 3,900,000 | | | Morgan Stanley | | | 11/2/17 | | | | 72,624 | | |
| U.S. Dollar | | 116,572 | | European Euro | | 100,000 | | | Bank of America | | | 12/4/17 | | | | (120 | ) | |
| U.S. Dollar | | 4,428,322 | | European Euro | | 3,800,000 | | | UBS AG | | | 12/4/17 | | | | (5,979 | ) | |
| | | | | | | | | | | | | | | | 66,525 | | |
| | |
| | | | | Total unrealized appreciation | | | | | $ | 72,624 | | |
| | | | | Total unrealized depreciation | | | | | | (6,099 | ) | |
| | | | | Total net unrealized appreciation/(depreciation) | | | | | $ | 66,525 | | |
| See notes to financial statements. | | HSBC FAMILY OF FUNDS 53 |
| HSBC GLOBAL HIGH INCOME BOND FUND |
| Schedule of Portfolio Investments—as of October 31, 2017 |
| Foreign Bonds – 22.7% | | | | | | |
| | | | | | |
| | Principal | | |
| | Amount † | | Value ($) |
| Belgium – 0.5% | | | | | | |
| AG Insurance SA-NV, 3.50%, 6/30/47, | | | | | | |
| Callable 6/30/27 @ 100 (a),(c) | | | | 100,000 | | 127,098 |
|
| France – 6.4% | | | | | | |
| AXA SA, Series E, 3.94% | | | | | | |
| (EUSA10 + 390 bps), Callable | | | | | | |
| 11/7/24 @ 100 (a),(b)(c) | | | | 100,000 | | 131,993 |
| Banque Federative du Credit Mutuel | | | | | | |
| SA, Series E, 3.00%, 5/21/24 | | | | 100,000 | | 129,091 |
| BNP Paribas, Series E, 2.87% | | | | | | |
| (EUSA5 + 165 bps), 3/20/26, | | | | | | |
| Callable 3/20/21 @ 100 (a)(c) | | | | 150,000 | | 187,151 |
| BPCE SA, 2.75% (EUSA5 + 183 bps), | | | | | | |
| 7/8/26, Callable 7/8/21 @ 100 (a)(c) | | | | 200,000 | | 248,894 |
| Credit Agricole SA, 6.50% | | | | | | |
| (EUSA5 + 512 bps), Callable 6/23/21 | | | | | | |
| @ 100 (a),(b)(c) | | | | 150,000 | | 201,839 |
| Crown European Holdings, | | | | | | |
| Registered, 4.00%, 7/15/22, | | | | | | |
| Callable 4/15/22 @ 100 (a) | | | | 100,000 | | 130,831 |
| Electricite de France SA, Series E, | | | | | | |
| 5.38% (EUSA12 + 379 bps), | | | | | | |
| Callable 1/29/25 @ 100 (a),(b)(c) | | | | 100,000 | | 134,816 |
| GDF SUEZ, Series N10, 3.88% | | | | | | |
| (EUSA10 + 290 bps), | | | | | | |
| Callable 6/2/24 @ 100 (a),(b)(c) | | | | 100,000 | | 131,608 |
| GDF SUEZ, 4.75% | | | | | | |
| (EUSA8 + 342 bps), Callable | | | | | | |
| 7/10/21 @ 100 (a),(b)(c) | | | | 100,000 | | 132,740 |
| Novalis SAS, Registered, | | | | | | |
| 3.00%, 4/30/22, Callable | | | | | | |
| 4/30/18 @ 101.5 (a) | | | | 100,000 | | 119,469 |
| Orange SA, 4.25% (EUSA5 + 308 bps), | | | | | | |
| Callable 2/7/20 @ 100 (a),(b)(c) | | | | 100,000 | | 125,496 |
| Societe Generale, 2.50% | | | | | | |
| (EUSA5 + 183 bps), 9/16/26, | | | | | | |
| Callable 9/16/21 @ 100 (a)(c) | | | | 100,000 | | 123,867 |
| | | | | | 1,797,795 |
| Germany – 6.0% | | | | | | |
| Bayer AG, Series E, 3.00% | | | | | | |
| (EUSA5 + 218 bps), 7/1/75, | | | | | | |
| Callable 7/1/20 @ 100 (a)(c) | | | | 150,000 | | 183,877 |
| Bertelsmann SE & Co. KGaA, 3.00% | | | | | | |
| (EUSA5 + 264 bps), 4/23/75, | | | | | | |
| Callable 4/23/23 @ 100 (a)(c) | | | | 100,000 | | 123,296 |
| BMW Finance NV, | | | | | | |
| Series E, 1.00%, 2/15/22 | | | | 150,000 | | 181,977 |
| Commerzbank AG, | | | | | | |
| Series E, 7.75%, 3/16/21 | | | | 100,000 | | 142,916 |
| HeidelbergCement AG, | | | | | | |
| 8.50%, 10/31/19 | | | | 150,000 | | 204,715 |
| Talanx AG, Series E, 8.37% | | | | | | |
| (EUR003M + 706 bps), 6/15/42, | | | | | | |
| Callable 6/15/22 @ 100 (a)(c) | | | | 200,000 | | 308,944 |
| Unitymedia GmbH, | | | | | | |
| Registered, 6.25%, 1/15/29, | | | | | | |
| Callable 1/15/21 @ 103.13 (a) | | | | 150,000 | | 198,945 |
| Volkswagen AG, 5.13% | | | | | | |
| (EUSA10 + 335 bps), Callable | | | | | | |
| 9/4/23 @ 100 (a),(b)(c) | | | | 175,000 | | 237,956 |
| ZF North America Capital, Inc., | | | | | | |
| 2.25%, 4/26/19 | | EUR | | 100,000 | | 120,162 |
| | | | | | 1,702,788 |
| Hong Kong – 0.6% | | | | | | |
| CK Hutchison Holdings, 3.75% | | | | | | |
| (EUSA5 + 294 bps), Callable | | | | | | |
| 5/10/18 @ 100 (a),(b)(c) | | EUR | | 150,000 | | 177,567 |
| Ireland – 0.4% | | | | | | |
| Bank of Ireland, Series E, 4.25% | | | | | | |
| (EUSA5 + 355 bps), 6/11/24, | | | | | | |
| Callable 6/11/19 @ 100 (a)(c) | | | | 100,000 | | 122,876 |
| Italy – 3.6% | | | | | | |
| Enel SpA, 5.00% | | | | | | |
| (EUSA5 + 365 bps), 1/15/75, | | | | | | |
| Callable 1/15/20 @ 100 (a)(c) | | | | 100,000 | | 126,952 |
| Eni SpA, Series E, 0.75%, 5/17/22 | | | | 150,000 | | 179,114 |
| EXOR SpA, 2.50%, 10/8/24 | | | | 100,000 | | 127,059 |
| Intesa Sanpaolo SPA, Series E, | | | | | | |
| 6.63%, 9/13/23 | | | | 150,000 | | 220,924 |
| Snam SpA, 1.25%, 1/25/25 | | | | 200,000 | | 240,165 |
| Wind Tre SpA, 3.13%, 1/20/25, | | | | | | |
| Callable 11/3/20 @ 101.56 (a)(d) | | | | 100,000 | | 116,824 |
| | | | | | 1,011,038 |
| Netherlands – 2.8% | | | | | | |
| Aegon NV, Series E, 4.00% | | | | | | |
| (EUR003M + 335 bps), 4/25/44, | | | | | | |
| Callable 4/25/24 @ 100 (a)(c) | | | | 100,000 | | 130,729 |
| Alliander NV, 3.25% | | | | | | |
| (EUSA5 + 230 bps), Callable | | | | | | |
| 11/27/18 @ 100 (a),(b)(c) | | | | 100,000 | | 120,136 |
| Fresenius SE & Co. KGaA, | | | | | | |
| Registered, 3.00%, 2/1/21 | | | | 100,000 | | 126,976 |
| Rabobank Nederland, | | | | | | |
| Registered, 6.88%, 3/19/20 | | | | 200,000 | | 269,919 |
| Wolters Kluwer NV, 2.50%, 5/13/24, | | | | | | |
| Callable 2/13/24 @ 100 (a) | | | | 100,000 | | 129,353 |
| | | | | | 777,113 |
| Spain – 0.9% | | | | | | |
| Santander Issuances, Series E, | | | | | | |
| 2.50%, 3/18/25 | | | | 100,000 | | 122,957 |
| Telefonica SA, 7.62% | | | | | | |
| (EUSA8 + 559 bps), Callable | | | | | | |
| 9/18/21 @ 100 (a),(b)(c) | | | | 100,000 | | 142,092 |
| | | | | | 265,049 |
| Switzerland – 0.4% | | | | | | |
| Credit Suisse Group Funding Ltd., | | | | | | |
| Series E, 1.25%, 4/14/22 | | | | 100,000 | | 120,397 |
| 54 HSBC FAMILY OF FUNDS | | See notes to financial statements. |
| HSBC GLOBAL HIGH INCOME BOND FUND |
| Schedule of Portfolio Investments—as of October 31, 2017 (continued) |
| Foreign Bonds, continued | | | | |
| | | | | |
| | Principal | | |
| | Amount ($) | | Value ($) |
| United Kingdom – 1.1% | | | | |
| CNH Industrial Finance Europe SA, | | | | |
| Series E, 6.25%, 3/9/18 | | 150,000 | | 178,549 |
| FCE Bank PLC, Series E, | | | | |
| 1.11%, 5/13/20 | | EUR 100,000 | | 119,755 |
| | | | | 298,304 |
| TOTAL FOREIGN BONDS | | | | |
| (COST $5,749,958) | | | | 6,400,025 |
| |
| Yankee Dollars – 32.1% | | | | |
| |
| Argentina – 1.7% | | | | |
| Provincia de Buenos Aires, | | | | |
| 6.50%, 2/15/23 (d) | | 34,000 | | 36,026 |
| Provincia de Buenos Aires, Registered, | | | | |
| 6.50%, 2/15/23 | | 34,000 | | 36,026 |
| Republic of Argentina, | | | | |
| 5.63%, 1/26/22 | | 250,000 | | 262,500 |
| Republic of Argentina, | | | | |
| 6.88%, 1/26/27 | | 97,000 | | 105,779 |
| Republic of Argentina, | | | | |
| 7.13%, 6/28/17 (d) | | 24,000 | | 24,624 |
| YPF Sociedad Anonima, Registered, | | | | |
| 8.50%, 3/23/21 | | 22,000 | | 24,911 |
| | | | | 489,866 |
| Australia – 0.4% | | | | |
| FMG Resources August 2006 Pty Ltd., | | | | |
| 4.75%, 5/15/22, | | | | |
| Callable 2/15/22 @ 100 (a)(d) | | 10,000 | | 10,213 |
| Macquarie Bank Ltd., 2.54% | | | | |
| (US0003M + 118 bps), | | | | |
| 1/15/19 (c)(d) | | 60,000 | | 60,636 |
| Westpac Banking Corp., 5.00%, | | | | |
| Callable 9/21/27 @ 100 (a),(b),(c), | | 35,000 | | 35,165 |
| | | | | 106,014 |
| Bahamas – 0.1% | | | | |
| Silversea Cruise Finance, | | | | |
| 7.25%, 2/1/25, | | | | |
| Callable 2/1/20 @ 105.44 (a)(d) | | 38,000 | | 40,755 |
| Bermuda – 0.4% | | | | |
| Aircastle Ltd., 5.50%, 2/15/22 | | 100,000 | | 107,500 |
| Brazil – 2.4% | | | | |
| Banco Do Brasil (Cayman), Registered, | | | | |
| 6.00%, 1/22/20 | | 100,000 | | 106,500 |
| Centrais Eletricas Brasileiras SA, | | | | |
| Registered, 6.88%, 7/30/19 | | 100,000 | | 106,130 |
| Federal Republic of Brazil, | | | | |
| 5.63%, 1/7/41 | | 100,000 | | 101,350 |
| Petrobras Brasileiro SA, | | | | |
| 5.75%, 1/20/20 | | 195,000 | | 204,660 |
| Petrobras Global Finance, | | | | |
| 6.13%, 1/17/22 | | 53,000 | | 57,293 |
| Petrobras Global Finance BV, | | | | |
| 6.75%, 1/27/41 | | 28,000 | | 28,210 |
| Vale Overseas Ltd., 6.88%, 11/21/36 | | 52,000 | | 62,296 |
| | | | | 666,439 |
| Canada – 1.8% | | | | |
| Bank of Nova Scotia, 4.65% | | | | |
| (US0003M), Callable 10/12/22 @ | | | | |
| 100 (a),(b)(c) | | 20,000 | | 20,100 |
| Cascades, Inc., 5.50%, 7/15/22, | | | | |
| Callable 12/7/17 @ 104.13 (a)(d) | | 15,000 | | 15,450 |
| CCL Industries, Inc., 3.25%, 10/1/26, | | | | |
| Callable 7/1/26 @ 100 (a)(d) | | 30,000 | | 28,701 |
| Enbridge, Inc., 5.50% (US0003M + | | | | |
| 342 bps), 7/15/77, Callable | | | | |
| 7/15/27 @ 100 (a)(c) | | 55,000 | | 56,650 |
| Hudbay Minerals, Inc., 7.25%, 1/15/23, | | | | |
| Callable 7/15/19 @ 103.63 (a)(d) | | 1,000 | | 1,078 |
| Hudbay Minerals, Inc., 7.63%, 1/15/25, | | | | |
| Callable 1/15/20 @ 105.72 (a)(d) | | 53,000 | | 58,432 |
| Iamgold Corp., 7.00%, 4/15/25, | | | | |
| Callable 4/15/20 @ 105.25 (a)(d) | | 10,000 | | 10,500 |
| Kinross Gold Corp., 4.50%, 7/15/27, | | | | |
| Callable 4/15/27 @ 100 (a)(d) | | 40,000 | | 40,500 |
| Lundin Mining Corp., 7.50%, 11/1/20, | | | | |
| Callable 11/20/17 @ 103.75 (a)(d) | | 25,000 | | 26,003 |
| Mattamy Group Corp., 6.88%, | | | | |
| 12/15/23, Callable 12/15/19 @ | | | | |
| 103.44 (a)(d) | | 18,000 | | 18,900 |
| Mattamy Group Corp., | | | | |
| 6.50%, 10/1/25, Callable | | | | |
| 10/1/20 @ 104.88 (a)(d) | | 6,000 | | 6,255 |
| New Gold, Inc., 6.38%, 5/15/25, | | | | |
| Callable 5/15/20 @ 104.78 (a)(d) | | 18,000 | | 19,125 |
| Northwest Acquisitions ULC, | | | | |
| 7.13%, 11/1/22, Callable | | | | |
| 11/1/19 @ 103.56 (a)(d) | | 58,000 | | 60,319 |
| Nova Chemicals Corp., 5.25%, 8/1/23, | | | | |
| Callable 8/1/18 @ 102.63 (a)(d) | | 22,000 | | 22,687 |
| Nova Chemicals Corp., 4.88%, 6/1/24, | | | | |
| Callable 3/3/24 @ 100 (a)(d) | | 10,000 | | 10,188 |
| Nova Chemicals Corp., 5.00%, 5/1/25, | | | | |
| Callable 1/31/25 @ 100 (a)(d) | | 17,000 | | 17,213 |
| Nova Chemicals Corp., 5.25%, 6/1/27, | | | | |
| Callable 3/3/27 @ 100 (a)(d) | | 65,000 | | 66,137 |
| Transcanada Trust, 5.30% | | | | |
| (US0003M + 321 bps), 3/15/77, | | | | |
| Callable 3/15/27 @ 100 (a)(c) | | 15,000 | | 15,603 |
| Valeant Pharmaceuticals International, | | | | |
| Inc., 5.50%, 11/1/25, Callable | | | | |
| 11/1/20 @ 102.75 (a)(d) | | 2,000 | | 2,043 |
| | | | | 495,884 |
| Chile – 0.1% | | | | |
| Codelco, Inc., 5.63%, 9/21/35 (d) | | 35,000 | | 41,294 |
| China – 3.0% | | | | |
| China Overseas Finance KY II, | | | | |
| 5.50%, 11/10/20 | | 200,000 | | 216,443 |
| CNOOC Finance (2013) Ltd., | | | | |
| 3.00%, 5/9/23 | | 200,000 | | 200,952 |
| ICBCIL Finance Co. Ltd., | | | | |
| 2.60%, 11/13/18 (d) | | 200,000 | | 200,508 |
| Sinopec Group Overseas Development | | | | |
| (2012) Ltd., Registered, | | | | |
| 3.90%, 5/17/22 | | 200,000 | | 209,514 |
| | | | 827,417 |
| See notes to financial statements. | HSBC FAMILY OF FUNDS 55 |
| HSBC GLOBAL HIGH INCOME BOND FUND |
| Schedule of Portfolio Investments—as of October 31, 2017 (continued) |
| Yankee Dollars, continued | | | | |
| | | | | |
| | Principal | | |
| | | Amount ($) | | Value ($) |
| Colombia – 0.9% | | | | |
| Bancolombia SA, 5.13%, 9/11/22 | | 20,000 | | 21,032 |
| Republic of Colombia, 4.38%, 7/12/21 | | 200,000 | | 212,000 |
| Republic of Colombia, 8.13%, 5/21/24 | | 25,000 | | 31,688 |
| | | | | 264,720 |
| Cote D’Ivoire – 0.3% | | | | |
| Ivory Coast Government Bond, | | | | |
| Registered, 5.75%, 12/31/32, | | | | |
| Callable 12/31/17 @ 100 (a)(e) | | 96,500 | | 95,141 |
| Croatia – 0.4% | | | | |
| Republic of Croatia, Registered, | | | | |
| 6.75%, 11/5/19 | | 100,000 | | 107,860 |
| Dominican Republic – 0.8% | | | | |
| Dominican Republic, Registered, | | | | |
| 7.50%, 5/6/21 | | 200,000 | | 221,250 |
| El Salvador – 0.0% | | | | |
| Republic of El Salvador, Registered, | | | | |
| 7.65%, 6/15/35 | | 10,000 | | 10,425 |
| Germany – 0.2% | | | | |
| Deutsche Bank AG/New York NY, | | | | |
| 2.70%, 7/13/20 | | 55,000 | | 55,182 |
| Guatemala – 0.1% | | | | |
| Central American Bottling Corp., | | | | |
| 5.75%, 1/31/27, Callable 1/31/22 @ | | | | |
| 102.88 (a)(d) | | 19,000 | | 20,061 |
| Hong Kong – 0.7% | | | | |
| CK Hutchison Capital Securities 17 | | | | |
| Ltd., 4.00% (H15T5Y + 207 bps), | | | | |
| Callable 5/12/22 @ 100 (a),(b)(c)(d) | | 200,000 | | 203,516 |
| Hungary – 0.5% | | | | |
| Republic of Hungary, 6.25%, 1/29/20 | | 20,000 | | 21,674 |
| Republic of Hungary, 6.38%, 3/29/21 | | 100,000 | | 111,875 |
| | | | | 133,549 |
| India – 1.4% | | | | |
| Export-Import BK India, Series E, | | | | |
| 2.75%, 8/12/20 | | 200,000 | | 201,079 |
| State Bank India, | | | | |
| Registered, 3.62%, 4/17/19 | | 200,000 | | 203,249 |
| | | | | 404,328 |
| Indonesia – 1.6% | | | | |
| Republic of Indonesia, | | | | |
| 5.88%, 3/13/20 | | 100,000 | | 108,359 |
| Republic of Indonesia, Registered, | | | | |
| 3.38%, 4/15/23 | | 200,000 | | 203,189 |
| Republic of Indonesia, Registered, | | | | |
| 7.75%, 1/17/38 | | 100,000 | | 142,836 |
| | | | | 454,384 |
| Ireland – 0.1% | | | | |
| Park Aerospace Holdings, 5.25%, | | | | |
| 8/15/22 (d) | | 4,000 | | 4,160 |
| Park Aerospace Holdings, | | | | |
| 4.50%, 3/15/23, Callable | | | | |
| 2/15/23 @ 100 (a)(d) | | 11,000 | | 11,014 |
| | | | 15,174 |
| Israel – 0.2% | | | | |
| Teva Pharmaceuticals NE, | | | | |
| 2.20%, 7/21/21 | | 20,000 | | 18,809 |
| Teva Pharmaceuticals NE, | | | | |
| 2.80%, 7/21/23 | | 10,000 | | 9,199 |
| Teva Pharmaceuticals NE, | | | | |
| 3.15%, 10/1/26 | | 34,000 | | 30,128 |
| | | | | 58,136 |
| Kazakstan – 0.4% | | | | |
| Kazmunaygas National Co., | | | | |
| 7.00%, 5/5/20 | | 100,000 | | 109,067 |
| Lebanon – 0.1% | | | | |
| Lebanon Government International | | | | |
| Bond, Series G, 7.05%, 11/2/35 | | 33,000 | | 31,190 |
| Republic of Lebanon, Series G, 5.45%, | | | | |
| 11/28/19 | | 11,000 | | 11,013 |
| | | | | 42,203 |
| Luxembourg – 0.2% | | | | |
| Actavis Funding SCS, 4.75%, 3/15/45, | | | | |
| Callable 9/15/44 @ 100 (a) | | 34,000 | | 35,896 |
| Dana Financing Luxembourg Sarl, | | | | |
| 5.75%, 4/15/25, Callable 4/15/20 @ | | | | |
| 104.31 (a)(d) | | 8,000 | | 8,480 |
| Trinseo Materials Operating SCA / | | | | |
| Trinseo Materials Finance, Inc., | | | | |
| 5.38%, 9/1/25, Callable 9/1/20 @ | | | | |
| 102.69 (a)(d) | | 12,000 | | 12,630 |
| | | | 57,006 |
| Malaysia – 0.4% | | | | |
| Petronas Capital, Ltd., | | | | |
| Registered, 7.88%, 5/22/22 | | 100,000 | | 122,268 |
| Mexico – 3.5% | | | | |
| BBVA Bancomer SA Institucion de | | | | |
| Banca, Registered, 6.50%, 3/10/21 | | 150,000 | | 164,250 |
| Cemex SAB de CV, 6.13%, 5/5/25, | | | | |
| Callable 5/5/20 @ 103.06 (a) | | 200,000 | | 213,300 |
| Petroleos Mexicanos, | | | | |
| 6.38%, 2/4/21 | | 80,000 | | 86,992 |
| Petroleos Mexicanos, | | | | |
| 4.88%, 1/24/22 | | 150,000 | | 155,986 |
| Petroleos Mexicanos, | | | | |
| 5.38%, 3/13/22 (d) | | 10,000 | | 10,609 |
| Petroleos Mexicanos, | | | | |
| 6.50%, 3/13/27 (d) | | 10,000 | | 10,914 |
| Petroleos Mexicanos, | | | | |
| 6.50%, 3/13/27 (d) | | 17,000 | | 18,554 |
| Petroleos Mexicanos, | | | | |
| 6.75%, 9/21/47 (d) | | 10,000 | | 10,307 |
| United Mexican States, | | | | |
| 4.00%, 10/2/23 | | 246,000 | | 257,685 |
| United Mexican States, | | | | |
| Series M, 4.75%, 3/8/44 | | 30,000 | | 29,981 |
| | | | 958,578 |
| 56 HSBC FAMILY OF FUNDS | See notes to financial statements. |
| HSBC GLOBAL HIGH INCOME BOND FUND |
| Schedule of Portfolio Investments—as of October 31, 2017 (continued) |
| Yankee Dollars, continued | | | | | |
| | | | | | |
| | | Principal | | |
| | | Amount ($) | | Value ($) |
| Netherlands – 1.1% | | | | | |
| AerCap Ireland Capital Ltd., 3.95%, | | | | | |
| 2/1/22, Callable 1/1/22 @ 100 (a) | | | 150,000 | | 156,389 |
| LyondellBasell Industries NV, 4.63%, | | | | | |
| 2/26/55, Callable 8/26/54 @ 100 (a) | | | 100,000 | | 102,307 |
| Mylan NV, 3.00%, 12/15/18 | | | 35,000 | | 35,323 |
| Sensata Technologies BV, | | | | | |
| 5.63%, 11/1/24 (d) | | | 25,000 | | 27,750 |
| | | | | | 321,769 |
| Nigeria – 0.1% | | | | | |
| Nigeria Government International | | | | | |
| Bond, 5.63%, 6/27/22 | | | 35,000 | | 35,831 |
| Panama – 0.1% | | | | | |
| Republic of Panama, 6.70%, 1/26/36 | | | 30,000 | | 39,600 |
| Peru – 0.5% | | | | | |
| Republic of Peru, 7.35%, 7/21/25 | | | 100,000 | | 130,800 |
| Philippines – 0.1% | | | | | |
| Republic of Philippines, | | | | | |
| 9.50%, 2/2/30 | | | 22,000 | | 34,886 |
| Poland – 0.3% | | | | | |
| Republic of Poland, 5.13%, 4/21/21 | | | 70,000 | | 76,424 |
| Qatar – 0.1% | | | | | |
| Qatar Government Bond, Registered, | | | | | |
| 9.75%, 6/15/30 | | | 25,000 | | 39,000 |
| Republic of Serbia – 0.1% | | | | | |
| Republic of Serbia, 6.75%, 11/1/24, | | | | | |
| Callable 5/1/18 @ 100 (a) | | | 17,031 | | 17,329 |
| Romania – 0.3% | | | | | |
| Romania Government Bond, | | | | | |
| Registered, 6.75%, 2/7/22 | | | 40,000 | | 46,139 |
| Romania Government Bond, | | | | | |
| Registered, 6.13%, 1/22/44 | | | 30,000 | | 38,052 |
| | | | | | 84,191 |
| Russian Federation – 0.8% | | | | | |
| Gazprom OAO, Registered, | | | | | |
| 7.29%, 8/16/37 | | | 100,000 | | 121,282 |
| LUKOIL International Finance BV, | | | | | |
| Registered, 6.66%, 6/7/22 | | | 100,000 | | 112,733 |
| | | | | 234,015 |
| Saudi Arabia – 0.7% | | | | | |
| Saudi International Bond, | | | | | |
| 2.38%, 10/26/21 (d) | | | 200,000 | | 196,608 |
| South Africa – 0.4% | | | | | |
| Republic of South Africa, | | | | | |
| 4.67%, 1/17/24 | | | 100,000 | | 101,319 |
| Spain – 0.7% | | | | | |
| Banco Santander SA, | | | | | |
| 3.80%, 2/23/28 | | | 200,000 | | 199,694 |
| Sri Lanka – 0.4% | | | | | |
| Republic of Sri Lanka, Registered, | | | | | |
| 6.25%, 10/4/20 | | | 100,000 | | 106,765 |
| Switzerland – 0.4% | | | | | |
| Glencore Finance Canada Ltd., | | | | | |
| 6.00%, 11/15/41 (d) | | | 100,000 | | 116,660 |
| Turkey – 1.2% | | | | | |
| Republic of Turkey, 7.00%, 3/11/19 | | | 100,000 | | 105,300 |
| Republic of Turkey, 6.88%, 3/17/36 | | | 213,000 | | 234,581 |
| | | | | | 339,881 |
| United Kingdom – 2.4% | | | | | |
| Barclays, 4.38%, 1/12/26 | | | 200,000 | | 209,562 |
| IHS Markit Ltd., 5.00%, 11/1/22, | | | | | |
| Callable 8/1/22 @ 100 (a)(d) | | | 35,000 | | 37,625 |
| Lloyds Banking Group PLC, | | | | | |
| 4.65%, 3/24/26 | | | 200,000 | | 212,306 |
| Santander UK Group Holdings PLC, | | | | | |
| 4.75%, 9/15/25 (d) | | | 200,000 | | 209,398 |
| | | | | 668,891 |
| Uruguay – 0.3% | | | | | |
| Republica Orient Uruguay, | | | | | |
| 4.38%, 10/27/27 | | | 66,000 | | 71,346 |
| Venezuela – 0.3% | | | | | |
| Petroleos de Venezuela SA, | | | | | |
| Registered, 12.75%, 2/17/22 | | | 30,000 | | 13,575 |
| Petroleos de Venezuela SA, | | | | | |
| Registered, 6.00%, 11/15/26 | | | 182,000 | | 50,505 |
| Republic of Venezuela, | | | | | |
| 7.75%, 10/13/19 | | | 25,000 | | 11,750 |
| Republic of Venezuela, 11.95%, 8/5/31 | | | 30,000 | | 12,075 |
| | | | | | 87,905 |
| Zambia – 0.1% | | | | | |
| First Quantum Minerals Ltd., | | | | | |
| 7.00%, 2/15/21, Callable | | | | | |
| 2/15/18 @ 103.5 (a)(d) | | | 25,000 | | 25,938 |
| TOTAL YANKEE DOLLARS | | | | | |
| (COST $8,758,060) | | | | | 9,036,869 |
| |
| Corporate Bonds – 37.6% | | | | | |
| |
| Peru – 0.4% | | | | | |
| Southern Copper Corp., | | | | | |
| 6.75%, 4/16/40 | | | 80,000 | | 100,092 |
| United States – 37.2% | | | | | |
| AbbVie, Inc., 4.45%, 5/14/46, | | | | | |
| Callable 11/14/45 @ 100.00 (a) | | | 30,000 | | 31,535 |
| AbbVie, Inc., 4.70%, 5/14/45, | | | | | |
| Callable 11/14/44 @ 100.00 (a) | | | 25,000 | | 27,103 |
| Alcoa, Inc., 5.90%, 2/1/27 | | | 20,000 | | 22,311 |
| Ally Financial, Inc., 3.25%, 11/5/18 | | | 85,000 | | 85,642 |
| Ally Financial, Inc., 4.13%, 3/30/20 | | | 175,000 | | 180,687 |
| Ally Financial, Inc., 5.75%, 11/20/25, | | | | | |
| Callable 10/20/25 @ 100.00 (a) | | | 13,000 | | 14,365 |
| AMC Entertainment, Inc., | | | | | |
| 5.75%, 6/15/25, Callable | | | | | |
| 6/15/20 @ 102.88 (a) | | | 25,000 | | 24,313 |
| See notes to financial statements. | HSBC FAMILY OF FUNDS 57 |
| HSBC GLOBAL HIGH INCOME BOND FUND |
| Schedule of Portfolio Investments—as of October 31, 2017 (continued) |
| Corporate Bonds, continued | | | | |
| | | | | |
| | Principal | | |
| | Amount ($) | | Value ($) |
| United States – continued | | | | |
| American Axle & Manufacturing, Inc., | | | | |
| 6.25%, 4/1/25, Callable | | | | |
| 4/1/20 @ 104.69 (a)(d) | | 14,000 | | 14,350 |
| American Axle & Manufacturing, Inc., | | | | |
| 6.50%, 4/1/27, Callable | | | | |
| 4/1/22 @ 103.25 (a)(d) | | 14,000 | | 14,298 |
| American Express Co., 5.20% | | | | |
| (US0003M + 343 bps), Callable | | | | |
| 11/15/19 @ 100.00 (a),(b)(c) | | 48,000 | | 49,680 |
| American Express Credit Corp., 2.09% | | | | |
| (US0003M + 78 bps), 11/5/18, | | | | |
| Callable 10/15/18 @ 100.00 (a)(c) | | 50,000 | | 50,325 |
| American Tower Corp., 4.40%, | | | | |
| 2/15/26, Callable | | | | |
| 11/15/25 @ 100.00 (a) | | 35,000 | | 37,090 |
| Amgen, Inc., 1.63% (US0003M + 32 | | | | |
| bps), 5/10/19 (c) | | 25,000 | | 25,084 |
| Amgen, Inc., 4.40%, 5/1/45, | | | | |
| Callable 11/1/44 @ 100.00 (a) | | 100,000 | | 105,268 |
| AMN Healthcare, Inc., 5.13%, 10/1/24, | | | | |
| Callable 10/1/19 @ 103.84 (a)(d) | | 40,000 | | 41,300 |
| Anheuser-Busch InBev Finance, | | | | |
| 4.70%, 2/1/36, Callable | | | | |
| 8/1/35 @ 100.00 (a) | | 35,000 | | 38,484 |
| Antero Resources Corp., 5.00%, 3/1/25, | | | | |
| Callable 3/1/20 @ 103.75 (a) | | 65,000 | | 65,975 |
| AT&T, Inc., 4.80%, 6/15/44, | | | | |
| Callable 12/15/43 @ 100.00 (a) | | 25,000 | | 23,964 |
| AT&T, Inc., 4.90%, 8/14/37, | | | | |
| Callable 2/14/37 @ 100.00 (a) | | 30,000 | | 29,985 |
| AT&T, Inc., 5.25%, 3/1/37, | | | | |
| Callable 9/1/36 @ 100.00 (a) | | 35,000 | | 36,614 |
| AT&T, Inc., 5.65%, 2/15/47, | | | | |
| Callable 8/15/46 @ 100.00 (a) | | 75,000 | | 80,267 |
| Avantor, Inc., 6.00%, 10/1/24, | | | | |
| Callable 10/1/20 @ 104.50 (a)(d) | | 6,000 | | 6,120 |
| Bank of America Corp., 1.97% | | | | |
| (US0003M + 65 bps), 10/1/21, | | | | |
| Callable 10/1/20 @ 100.00 (a)(c) | | 65,000 | | 65,159 |
| Bank of America Corp., 2.82% | | | | |
| (US0003M + 93 bps), 7/21/23, | | | | |
| Callable 7/21/22 @ 100.00 (a)(c) | | 90,000 | | 89,890 |
| Bank of America Corp., 3.82% | | | | |
| (US0003M + 158 bps), | | | | |
| 1/20/28, MTN, Callable | | | | |
| 1/20/27 @ 100.00 (a)(c) | | 75,000 | | 77,218 |
| Bank of America Corp., 4.18%, | | | | |
| 11/25/27, Callable | | | | |
| 11/25/26 @ 100.00 (a) | | 85,000 | | 88,628 |
| Bank of America Corp., 4.24% | | | | |
| (US0003M + 181 bps), 4/24/38, | | | | |
| Callable 4/24/37 @ 100.00 (a)(c) | | 30,000 | | 31,806 |
| Bank of America Corp., 4.45%, 3/3/26 | | 40,000 | | 42,546 |
| Bank of America Corp., 8.12% | | | | |
| (US0003M + 364 bps), Callable | | | | |
| 5/15/18 @ 100.00 (a),(b)(c) | | 75,000 | | 77,370 |
| Biogen, Inc., 5.20%, 9/15/45, | | | | |
| Callable 3/15/45 @ 100.00 (a) | | 40,000 | | 45,939 |
| Blue Cube Spinco, Inc., 9.75%, | | | | |
| 10/15/23, Callable | | | | |
| 10/15/20 @ 102.44 (a) | | 12,000 | | 14,370 |
| Blue Cube Spinco, Inc., 10.00%, | | | | |
| 10/15/25, Callable | | | | |
| 10/15/20 @ 105.00 (a) | | 25,000 | | 30,438 |
| Blue Racer Midstream LLC, | | | | |
| 6.13%, 11/15/22, Callable | | | | |
| 12/7/17 @ 104.59 (a)(d) | | 14,000 | | 14,595 |
| BMW US Capital LLC, 1.73% | | | | |
| (US0003M + 38 bps), 4/6/20 (c)(d) | | 25,000 | | 25,121 |
| Boise Cascade Co., 5.63%, 9/1/24, | | | | |
| Callable 9/1/19 @ 104.22 (a)(d) | | 13,000 | | 13,520 |
| Building Materials Corp., | | | | |
| 6.00%, 10/15/25, Callable | | | | |
| 10/15/20 @ 103.00 (a)(d) | | 45,000 | | 48,656 |
| Capital One Financial Corp., 2.07% | | | | |
| (US0003M + 76 bps), 5/12/20, | | | | |
| Callable 4/12/20 @ 100.00 (a)(c) | | 25,000 | | 25,204 |
| Capital One Financial Corp., 3.05%, | | | | |
| 3/9/22, Callable 2/9/22 @ 100.00 (a) | | 35,000 | | 35,492 |
| Capital One Financial Corp., | | | | |
| 3.30%, 10/30/24, Callable | | | | |
| 9/30/24 @ 100.00 (a) | | 40,000 | | 40,006 |
| Capital One Financial Corp., | | | | |
| 3.75%, 7/28/26, Callable | | | | |
| 6/28/26 @ 100.00 (a) | | 65,000 | | 64,633 |
| Capital One Financial Corp., 3.75%, | | | | |
| 3/9/27, Callable 2/9/27 @ 100.00 (a) | | 10,000 | | 10,105 |
| Capital One Financial Corp., | | | | |
| 4.20%, 10/29/25, Callable | | | | |
| 9/29/25 @ 100.00 (a) | | 35,000 | | 36,085 |
| Capital One Financial Corp., 5.55% | | | | |
| (US0003M + 380 bps), Callable | | | | |
| 6/1/20 @ 100.00 (a),(b)(c) | | 50,000 | | 52,438 |
| Care Capital Properties, Inc., | | | | |
| 5.13%, 8/15/26, Callable | | | | |
| 5/15/26 @ 100.00 (a) | | 45,000 | | 46,041 |
| Carrizo Oil & Gas, Inc., 7.50%, 9/15/20, | | | | |
| Callable 12/7/17 @ 101.88 (a) | | 20,000 | | 20,400 |
| CCO Holdings LLC, 5.00%, 2/1/28, | | | | |
| Callable 8/1/22 @ 102.50 (a)(d) | | 53,000 | | 52,603 |
| CCO Holdings LLC, 5.75%, 2/15/26, | | | | |
| Callable 2/15/21 @ 102.88 (a)(d) | | 35,000 | | 36,587 |
| CCO Holdings LLC, 5.88%, 4/1/24, | | | | |
| Callable 4/1/19 @ 104.41 (a)(d) | | 55,000 | | 58,575 |
| CDW LLC/CDW Finance, 5.00%, | | | | |
| 9/1/25, Callable 3/1/20 @ 103.75 (a) | | 12,000 | | 12,555 |
| Celgene Corp., 5.00%, 8/15/45, | | | | |
| Callable 2/15/45 @ 100.00 (a) | | 45,000 | | 49,486 |
| Centene Corp., 4.75%, 1/15/25, | | | | |
| Callable 1/15/20 @ 103.56 (a) | | 7,000 | | 7,228 |
| Centene Corp., 5.63%, 2/15/21, | | | | |
| Callable 2/15/18 @ 102.81 (a) | | 8,000 | | 8,300 |
| Centene Corp., 6.13%, 2/15/24, | | | | |
| Callable 2/15/19 @ 104.59 (a) | | 29,000 | | 31,175 |
| Central Garden & Pet Co., | | | | |
| 6.13%, 11/15/23, Callable | | | | |
| 11/15/18 @ 104.59 (a) | | 31,000 | | 33,054 |
| CenturyLink, Inc., 7.50%, 4/1/24, | | | | |
| Callable 1/1/24 @ 100.00 (a) | | 50,000 | | 53,125 |
| CF Industries, Inc., 4.50%, 12/1/26 (d) | | 30,000 | | 31,581 |
| 58 HSBC FAMILY OF FUNDS | See notes to financial statements. |
| HSBC GLOBAL HIGH INCOME BOND FUND |
| Schedule of Portfolio Investments—as of October 31, 2017 (continued) |
| Corporate Bonds, continued | | | | |
| | | | | |
| | Principal | | |
| | Amount ($) | | Value ($) |
| United States – continued | | | | |
| Change Healthcare Holdings LLC / | | | | |
| Change Healthcare Finance, Inc., | | | | |
| 5.75%, 3/1/25, Callable | | | | |
| 3/1/20 @ 102.88 (a)(d) | | 6,000 | | 6,135 |
| Cheniere Corp. Christi Holding LLC, | | | | |
| 5.88%, 3/31/25, Callable | | | | |
| 10/2/24 @ 100.00 (a) | | 5,000 | | 5,413 |
| Cheniere Energy Partners, | | | | |
| 5.25%, 10/1/25, Callable | | | | |
| 10/1/20 @ 102.63 (a)(d) | | 30,000 | | 30,900 |
| Citigroup, Inc., 2.26% | | | | |
| (US0003M + 88 bps), 7/30/18 (c) | | 100,000 | | 100,510 |
| Citigroup, Inc., 2.41% | | | | |
| (US0003M + 110 bps), 5/17/24, | | | | |
| Callable 5/17/23 @ 100.00 (a)(c) | | 45,000 | | 45,428 |
| Citigroup, Inc., 2.75%, 4/25/22, | | | | |
| Callable 3/25/22 @ 100.00 (a) | | 100,000 | | 100,298 |
| Citigroup, Inc., 3.52% (US0003M), | | | | |
| 10/27/28, Callable | | | | |
| 10/27/27 @ 100.00 (a)(c) | | 110,000 | | 109,801 |
| Citigroup, Inc., 3.67% (US0003M + | | | | |
| 139 bps), 7/24/28, Callable | | | | |
| 7/24/27 @ 100.00 (a)(c) | | 50,000 | | 50,608 |
| Citigroup, Inc., 4.13%, 7/25/28 | | 60,000 | | 61,813 |
| Citigroup, Inc., 4.60%, 3/9/26 | | 40,000 | | 42,631 |
| Citigroup, Inc., 5.80% | | | | |
| (US0003M + 409 bps), Callable | | | | |
| 11/15/19 @ 100.00 (a),(b)(c) | | 50,000 | | 52,313 |
| Clearwater Paper Corp., | | | | |
| 5.38%, 2/1/25 (d) | | 59,000 | | 59,295 |
| Cliffs Natural Resources, Inc., | | | | |
| 5.75%, 3/1/25, Callable | | | | |
| 3/1/20 @ 104.31 (a)(d) | | 40,000 | | 38,900 |
| Columbia Pipeline Group, 4.50%, | | | | |
| 6/1/25, Callable 3/1/25 @ 100.00 (a) | | 100,000 | | 107,612 |
| Concho Resources, Inc., 4.88%, 10/1/47, | | | | |
| Callable 4/1/47 @ 100.00 (a) | | 10,000 | | 10,631 |
| Continental Resources, 4.90%, 6/1/44, | | | | |
| Callable 12/1/43 @ 100.00 (a) | | 100,000 | | 93,125 |
| Continental Resources, | | | | |
| 5.00%, 9/15/22, Callable | | | | |
| 12/7/17 @ 102.50 (a) | | 20,000 | | 20,225 |
| Crown Castle International Corp., | | | | |
| 3.65%, 9/1/27, Callable | | | | |
| 6/1/27 @ 100.00 (a) | | 15,000 | | 14,968 |
| Cyrusone LP/Cyrusone Finance, | | | | |
| 5.00%, 3/15/24, Callable | | | | |
| 3/15/20 @ 102.50 (a)(d) | | 20,000 | | 20,975 |
| Cyrusone LP/Cyrusone Finance, | | | | |
| 5.38%, 3/15/27, Callable | | | | |
| 3/15/22 @ 102.69 (a)(d) | | 20,000 | | 21,375 |
| DaVita Healthcare Partners, Inc., | | | | |
| 5.00%, 5/1/25, Callable | | | | |
| 5/1/20 @ 102.50 (a) | | 20,000 | | 19,700 |
| DCP Midstream LLC, 8.13%, 8/16/30 | | 55,000 | | 64,900 |
| Dell, Inc., 7.10%, 4/15/28 | | 28,000 | | 31,360 |
| Devon Energy Corp., 5.00%, 6/15/45, | | | | |
| Callable 12/15/44 @ 100.00 (a) | | 98,000 | | 103,602 |
| Diamond 1 Finance/Diamond 2, | | | | |
| 5.88%, 6/15/21, Callable | | | | |
| 6/15/18 @ 102.94 (a)(d) | | 6,000 | | 6,284 |
| Diamond 1 Finance/Diamond 2, | | | | |
| 6.02%, 6/15/26, Callable | | | | |
| 3/15/26 @ 100.00 (a)(d) | | 25,000 | | 27,907 |
| Diamond 1 Finance/Diamond 2, | | | | |
| 7.13%, 6/15/24, Callable | | | | |
| 6/15/19 @ 105.34 (a)(d) | | 8,000 | | 8,830 |
| Diamondback Energy, Inc., 4.75%, | | | | |
| 11/1/24, Callable 11/1/19 @ 103.56 (a) | | 12,000 | | 12,210 |
| Diamondback Energy, Inc., | | | | |
| 5.38%, 5/31/25, Callable | | | | |
| 5/31/20 @ 104.03 (a) | | 27,000 | | 28,046 |
| Discover Financial Services, | | | | |
| 3.95%, 11/6/24, Callable | | | | |
| 8/6/24 @ 100.00 (a) | | 100,000 | | 103,064 |
| Discovery Communications, 2.04% | | | | |
| (US0003M + 71 bps), 9/20/19 (c) | | 20,000 | | 20,126 |
| Discovery Communications, Inc., | | | | |
| 1.90%, 3/19/27, Callable | | | | |
| 12/19/26 @ 100.00 (a) | | EUR 100,000 | | 116,543 |
| DISH DBS Corp., 5.88%, 7/15/22 | | 75,000 | | 75,469 |
| Dominion Resources, Inc., | | | | |
| 2.96%, 7/1/19 (e) | | 30,000 | | 30,399 |
| Eagle Materials, Inc., 4.50%, 8/1/26, | | | | |
| Callable 8/1/21 @ 102.25 (a) | | 68,000 | | 70,889 |
| eBay, Inc., 2.50%, 3/9/18 | | 40,000 | | 40,122 |
| Energy Transfer Equity LP, | | | | |
| 5.88%, 1/15/24, Callable | | | | |
| 10/15/23 @ 100.00 (a) | | 25,000 | | 27,125 |
| Energy Transfer Partners LP, | | | | |
| 3.60%, 2/1/23, Callable | | | | |
| 11/1/22 @ 100.00 (a) | | 100,000 | | 101,920 |
| Energy Transfer Partners LP, | | | | |
| 5.30%, 4/15/47, Callable | | | | |
| 10/15/46 @ 100.00 (a) | | 25,000 | | 24,750 |
| EnLink Midstream Partners LP, | | | | |
| 4.85%, 7/15/26, Callable | | | | |
| 4/15/26 @ 100.00 (a) | | 25,000 | | 26,332 |
| EnLink Midstream Partners LP, | | | | |
| 5.45%, 6/1/47, Callable | | | | |
| 12/1/46 @ 100.00 (a) | | 80,000 | | 82,972 |
| EnLink Midstream Partners LP, | | | | |
| 6.00%, Callable | | | | |
| 12/15/22 @ 100.00 (a),(b)(c) | | 51,000 | | 51,441 |
| Enterprise Products Operating LLC, | | | | |
| 5.25% (US0003M + 303 bps), | | | | |
| 8/16/77, Callable | | | | |
| 8/16/27 @ 100.00 (a)(c) | | 35,000 | | 35,963 |
| Enterprise Products Operating LLC, | | | | |
| 7.03% (US0003M + 268 bps), | | | | |
| 1/15/68, Callable | | | | |
| 1/15/18 @ 100.00 (a)(c) | | 100,000 | | 100,000 |
| EPR Properties, 4.50%, 6/1/27, | | | | |
| Callable 3/1/27 @ 100.00 (a) | | 35,000 | | 35,588 |
| EPR Properties, 4.75%, 12/15/26, | | | | |
| Callable 9/15/26 @ 100.00 (a) | | 90,000 | | 93,788 |
| EQT Midstream Partners LP, 4.13%, | | | | |
| 12/1/26, Callable 9/1/26 @ 100.00 (a) | | 25,000 | | 25,075 |
| Equinix, Inc., 5.88%, 1/15/26, | | | | |
| Callable 1/15/21 @ 102.94 (a) | | 50,000 | | 54,188 |
| Equities Corp., 2.50%, 10/1/20, | | | | |
| Callable 9/1/20 @ 100.00 (a) | | 20,000 | | 19,987 |
| See notes to financial statements. | HSBC FAMILY OF FUNDS 59 |
| HSBC GLOBAL HIGH INCOME BOND FUND |
| Schedule of Portfolio Investments—as of October 31, 2017 (continued) |
| Corporate Bonds, continued | | | | |
| | | | | |
| | Principal | | |
| | Amount ($) | | Value ($) |
| United States – continued | | | | |
| ESH Hospitality, Inc., 5.25%, 5/1/25, | | | | |
| Callable 5/1/20 @ 102.63 (a)(d) | | 30,000 | | 31,012 |
| Exelon Generation Co. LLC, | | | | |
| 3.40%, 3/15/22, Callable | | | | |
| 2/15/22 @ 100.00 (a) | | 35,000 | | 36,027 |
| Fifth Third Bancorp, 4.90% | | | | |
| (US0003M + 313 bps), Callable | | | | |
| 9/30/19 @ 100.00 (a),(b)(c) | | 50,000 | | 50,750 |
| First Data Corp., 5.00%, 1/15/24, | | | | |
| Callable 1/15/19 @ 102.50 (a)(d) | | 17,000 | | 17,659 |
| First Horizon National Corp., | | | | |
| 3.50%, 12/15/20, Callable | | | | |
| 11/15/20 @ 100.00 (a) | | 50,000 | | 51,412 |
| Ford Motor Co., 4.35%, 12/8/26, | | | | |
| Callable 9/8/26 @ 100.00 (a) | | 70,000 | | 72,939 |
| Ford Motor Credit Co. LLC, | | | | |
| 2.24%, 6/15/18 | | 200,000 | | 200,501 |
| Freeport-McMoRan, Inc., | | | | |
| 2.30%, 11/14/17 | | 100,000 | | 99,999 |
| Freeport-McMoRan, Inc., | | | | |
| 3.88%, 3/15/23, Callable | | | | |
| 12/15/22 @ 100.00 (a) | | 12,000 | | 11,835 |
| Freeport-McMoRan, Inc., | | | | |
| 6.50%, 11/15/20, Callable | | | | |
| 12/7/17 @ 101.88 (a) | | 30,000 | | 30,563 |
| Freeport-McMoRan, Inc., | | | | |
| 6.88%, 2/15/23, Callable | | | | |
| 2/15/20 @ 103.44 (a) | | 5,000 | | 5,469 |
| Fresenius Medical Care AG & Co. | | | | |
| KGaA, 5.88%, 1/31/22 (d) | | 50,000 | | 55,829 |
| General Motors Financial Co., Inc., | | | | |
| 3.10%, 1/15/19 | | 40,000 | | 40,494 |
| Genesis Energy LP, 5.75%, | | | | |
| 2/15/21, Callable | | | | |
| 12/7/17 @ 102.88 (a) | | 25,000 | | 25,385 |
| Genesis Energy LP, 6.75%, | | | | |
| 8/1/22, Callable 8/1/18 @ 103.38 (a) | | 23,000 | | 23,748 |
| Goldman Sachs Group, Inc., 2.90% | | | | |
| (US0003M + 99 bps), 7/24/23, | | | | |
| Callable 7/24/22 @ 100.00 (a)(c) | | 25,000 | | 24,886 |
| Goldman Sachs Group, Inc., 3.69% | | | | |
| (US0003M + 151 bps), 6/5/28, | | | | |
| Callable 6/5/27 @ 100.00 (a)(c) | | 55,000 | | 55,495 |
| Goldman Sachs Group, Inc., 5.00%, | | | | |
| Callable 11/10/22 @ 100.00 (a),(b)(c) | | 20,000 | | 19,960 |
| Goldman Sachs Group, Inc., 5.38% | | | | |
| (US0003M + 392 bps), Callable | | | | |
| 5/10/20 @ 100.00 (a),(b)(c) | | 30,000 | | 31,091 |
| Goodyear Tire & Rubber Co., | | | | |
| 4.88%, 3/15/27, Callable | | | | |
| 12/15/26 @ 100.00 (a) | | 45,000 | | 45,787 |
| Goodyear Tire & Rubber Co., | | | | |
| 5.00%, 5/31/26, Callable | | | | |
| 5/31/21 @ 102.50 (a) | | 30,000 | | 30,750 |
| Greif, Inc., 7.75%, 8/1/19 | | 30,000 | | 32,400 |
| Gulfport Energy Corp., 6.38%, | | | | |
| 5/15/25, Callable | | | | |
| 5/15/20 @ 104.78 (a) | | 36,000 | | 36,540 |
| Halliburton Co., 4.85%, 11/15/35, | | | | |
| Callable 5/15/35 @ 100.00 (a) | | 35,000 | | 38,642 |
| HCA Healthcare, Inc., 5.88%, 2/15/26, | | | | |
| Callable 8/15/25 @ 100.00 (a) | | 50,000 | | 52,562 |
| HCA, Inc., 4.50%, 2/15/27, | | | | |
| Callable 8/15/26 @ 100.00 (a) | | 50,000 | | 50,500 |
| HCA, Inc., 5.25%, 4/15/25 | | 50,000 | | 53,249 |
| HCA, Inc., 5.50%, 6/15/47, | | | | |
| Callable 12/15/46 @ 100.00 (a) | | 35,000 | | 35,613 |
| HealthSouth Corp., 5.75%, 11/1/24, | | | | |
| Callable 12/7/17 @ 102.88 (a) | | 34,000 | | 34,808 |
| Herc Rentals, Inc., 7.50%, 6/1/22, | | | | |
| Callable 6/1/19 @ 103.75 (a)(d) | | 40,000 | | 43,299 |
| Herc Rentals, Inc., 7.75%, 6/1/24, | | | | |
| Callable 6/1/19 @ 105.81 (a)(d) | | 3,000 | | 3,293 |
| Hess Corp., 4.30%, 4/1/27, | | | | |
| Callable 1/1/27 @ 100.00 (a) | | 100,000 | | 100,711 |
| Holly Energy Partners LP, | | | | |
| 6.00%, 8/1/24, Callable | | | | |
| 8/1/19 @ 104.50 (a)(d) | | 55,000 | | 57,613 |
| Host Hotels & Resorts LP, | | | | |
| 4.50%, 2/1/26, Callable | | | | |
| 11/1/25 @ 100.00 (a) | | 50,000 | | 52,696 |
| Hyundai Capital America, | | | | |
| 2.75%, 9/27/26 (d) | | 28,000 | | 25,816 |
| Infor, Inc., 5.75%, 8/15/20, Callable | | | | |
| 11/22/17 @ 102.88 (a)(d) | | 2,000 | | 2,059 |
| j2 Cloud Services LLC / j2 Global | | | | |
| Co-Obligor, Inc., 6.00%, 7/15/25, | | | | |
| Callable 7/15/20 @ 104.50 (a)(d) | | 6,000 | | 6,315 |
| JPMorgan Chase & Co., 3.54% | | | | |
| (US0003M + 138 bps), 5/1/28, | | | | |
| Callable 5/1/27 @ 100.00 (a)(c) | | 100,000 | | 101,153 |
| Kaiser Aluminum Corp., | | | | |
| 5.88%, 5/15/24, Callable | | | | |
| 5/15/19 @ 104.41 (a) | | 22,000 | | 23,678 |
| Kinder Morgan, Inc., 3.05%, 12/1/19, | | | | |
| Callable 11/1/19 @ 100.00 (a) | | 150,000 | | 152,685 |
| Kinder Morgan, Inc., 5.05%, 2/15/46, | | | | |
| Callable 8/15/45 @ 100.00 (a) | | 100,000 | | 103,109 |
| Kindred Healthcare, Inc., | | | | |
| 6.38%, 4/15/22, Callable | | | | |
| 12/7/17 @ 104.78 (a) | | 34,000 | | 31,467 |
| Kraft Heinz Foods Co., 1.88% | | | | |
| (US0003M + 57 bps), 2/10/21 (c) | | 60,000 | | 60,096 |
| Kraft Heinz Foods Co., 4.38%, 6/1/46, | | | | |
| Callable 12/1/45 @ 100.00 (a) | | 20,000 | | 19,515 |
| Lennar Corp., 4.75%, 5/30/25, | | | | |
| Callable 2/28/25 @ 100.00 (a) | | 45,000 | | 47,138 |
| Lennar Corp., 4.88%, 12/15/23, | | | | |
| Callable 9/15/23 @ 100.00 (a) | | 20,000 | | 21,150 |
| Level 3 Financing, Inc., 5.13%, | | | | |
| 5/1/23, Callable 5/1/18 @ 102.56 (a) | | 25,000 | | 25,594 |
| Level 3 Financing, Inc., 5.38%, 1/15/24, | | | | |
| Callable 1/15/19 @ 102.69 (a) | | 11,000 | | 11,426 |
| Live Nation Entertainment, Inc., | | | | |
| 4.88%, 11/1/24, Callable | | | | |
| 11/1/19 @ 103.66 (a)(d) | | 30,000 | | 31,040 |
| Masco Corp., 3.50%, 4/1/21, | | | | |
| Callable 3/1/21 @ 100.00 (a) | | 40,000 | | 40,964 |
| Massachusetts Mutual Life Insurance | | | | |
| Co., 4.90%, 4/1/77 (d) | | 35,000 | | 38,613 |
| 60 HSBC FAMILY OF FUNDS | See notes to financial statements. |
| HSBC GLOBAL HIGH INCOME BOND FUND |
| Schedule of Portfolio Investments—as of October 31, 2017 (continued) |
| Corporate Bonds, continued | | | | |
| | | | | |
| | Principal | | |
| | Amount ($) | | Value ($) |
| United States – continued | | | | |
| Match Group, Inc., 6.38%, 6/1/24, | | | | |
| Callable 6/1/19 @ 104.78 (a) | | 27,000 | | 29,329 |
| MGM Growth / MGM Finance, 5.63%, | | | | |
| 5/1/24, Callable 2/1/24 @ 100.00 (a) | | 12,000 | | 12,960 |
| MGM Growth/MGM Finance, 4.50%, | | | | |
| 9/1/26, Callable 6/1/26 @ 100.00 (a) | | 25,000 | | 25,094 |
| MGM Resorts International, 4.63%, | | | | |
| 9/1/26, Callable 6/1/26 @ 100.00 (a) | | 25,000 | | 25,000 |
| Molina Healthcare, Inc., | | | | |
| 5.38%, 11/15/22, Callable | | | | |
| 8/15/22 @ 100.00 (a) | | 42,000 | | 43,701 |
| Morgan Stanley, 2.11% | | | | |
| (US0003M + 80 bps), 2/14/20, | | | | |
| Callable 2/14/19 @ 100.00 (a)(c) | | 10,000 | | 10,050 |
| Morgan Stanley, 2.45%, 2/1/19, MTN | | 35,000 | | 35,187 |
| Morgan Stanley, 3.59% | | | | |
| (US0003M + 134 bps), 7/22/28, | | | | |
| Callable 7/22/27 @ 100.00 (a)(c) | | 10,000 | | 10,077 |
| MPLX LP, 4.88%, 12/1/24, | | | | |
| Callable 9/1/24 @ 100.00 (a) | | 50,000 | | 54,375 |
| MPLX LP, 5.20%, 3/1/47, | | | | |
| Callable 9/1/46 @ 100.00 (a) | | 25,000 | | 26,747 |
| Mpt Oper Partnersp/FINL, | | | | |
| 5.00%, 10/15/27, Callable | | | | |
| 10/15/22 @ 102.50 (a) | | 88,000 | | 90,420 |
| MPT Operating Partnership LP, 5.25%, | | | | |
| 8/1/26, Callable 8/1/21 @ 102.63 (a) | | 5,000 | | 5,206 |
| MSCI, Inc., 5.75%, 8/15/25, | | | | |
| Callable 8/15/20 @ 102.88 (a)(d) | | 20,000 | | 21,600 |
| National CineMedia LLC, | | | | |
| 6.00%, 4/15/22, Callable | | | | |
| 12/7/17 @ 103.00 (a) | | 30,000 | | 30,600 |
| Navient Corp., 8.00%, 3/25/20, MTN | | 75,000 | | 82,688 |
| Newell Brands, Inc., 5.38%, 4/1/36, | | | | |
| Callable 10/1/35 @ 100.00 (a) | | 35,000 | | 40,741 |
| NextEra Energy Capital Holdings, Inc., | | | | |
| 4.80%, 12/1/77, Callable | | | | |
| 12/1/27 @ 100.00 (a)(c) | | 20,000 | | 20,000 |
| NRG Energy, Inc., 7.25%, 5/15/26, | | | | |
| Callable 5/15/21 @ 103.63 (a) | | 14,000 | | 15,173 |
| Nustar Logistics LP, 5.63%, 4/28/27, | | | | |
| Callable 1/28/27 @ 100.00 (a) | | 15,000 | | 15,825 |
| Omega Healthcare Investors, Inc., | | | | |
| 4.38%, 8/1/23, Callable | | | | |
| 6/1/23 @ 100.00 (a) | | 25,000 | | 25,632 |
| Outfront Media Capital LLC, 5.25%, | | | | |
| 2/15/22, Callable 12/7/17 | | | | |
| @ 103.94 (a) | | 25,000 | | 25,813 |
| Owens Corning, Inc., 4.20%, | | | | |
| 12/15/22, Callable 9/15/22 | | | | |
| @ 100.00 (a) | | 100,000 | | 105,894 |
| Owens-Brockway Packaging, Inc., | | | | |
| 5.00%, 1/15/22 (d) | | 50,000 | | 52,875 |
| Owens-Brockway Packaging, Inc., | | | | |
| 6.38%, 8/15/25 (d) | | 5,000 | | 5,650 |
| Parsley Energy LLC, 5.25%, 8/15/25, | | | | |
| Callable 8/15/20 @ 103.94 (a)(d) | | 5,000 | | 5,050 |
| Parsley Energy LLC, 5.38%, 1/15/25, | | | | |
| Callable 1/15/20 @ 104.03 (a)(d) | | 5,000 | | 5,075 |
| PBF Holding Co. LLC, | | | | |
| 7.00%, 11/15/23, Callable | | | | |
| 11/15/18 @ 105.25 (a) | | 25,000 | | 26,000 |
| PBF Holding Co. LLC, 7.25%, 6/15/25, | | | | |
| Callable 6/15/20 @ 105.44 (a)(d) | | 38,000 | | 39,283 |
| Philip Morris International, Inc., 1.74% | | | | |
| (US0003M + 42 bps), 2/21/20 (c) | | 15,000 | | 15,093 |
| Pilgrim’s Pride Corp., 5.75%, 3/15/25, | | | | |
| Callable 3/15/20 @ 102.88 (a)(d) | | 3,000 | | 3,176 |
| Pilgrim’s Pride Corp., 5.88%, 9/30/27, | | | | |
| Callable 9/30/22 @ 102.94 (a)(d) | | 23,000 | | 23,920 |
| Plains All American Pipeline LP, | | | | |
| 6.12% (US0003M), Callable 11/15/22 | | | | |
| @ 100.00 (a),(b)(c) | | 13,000 | | 13,251 |
| Plastipak Holdings, Inc., | | | | |
| 6.25%, 10/15/25, Callable | | | | |
| 10/15/20 @ 103.13 (a)(d) | | 34,000 | | 34,638 |
| PPL Capital Funding, Inc., 4.00%, 9/15/47, | | | | |
| Callable 3/15/47 @ 100.00 (a) | | 50,000 | | 50,625 |
| PulteGroup, Inc., 4.25%, 3/1/21, | | | | |
| Callable 2/1/21 @ 100.00 (a) | | 70,000 | | 72,887 |
| PulteGroup, Inc., 5.50%, 3/1/26, | | | | |
| Callable 12/1/25 @ 100.00 (a) | | 16,000 | | 17,540 |
| Quintiles Transnational Corp., | | | | |
| 4.88%, 5/15/23, Callable | | | | |
| 5/15/18 @ 103.66 (a)(d) | | 50,000 | | 52,000 |
| Rayonier Am Prod, Inc., | | | | |
| 5.50%, 6/1/24, Callable | | | | |
| 6/1/19 @ 102.75 (a)(d) | | 47,000 | | 45,590 |
| Regions Financial Corp., | | | | |
| 2.75%, 8/14/22, Callable | | | | |
| 7/14/22 @ 100.00 (a) | | 35,000 | | 35,055 |
| Reynolds American, Inc., | | | | |
| 5.85%, 8/15/45, Callable | | | | |
| 2/15/45 @ 100.00 (a) | | 100,000 | | 122,824 |
| Rose Rock Midstream LP, | | | | |
| 5.63%, 11/15/23, Callable | | | | |
| 5/15/19 @ 102.81 (a) | | 50,000 | | 48,875 |
| RSI Home Products, Inc., | | | | |
| 6.50%, 3/15/23, Callable | | | | |
| 3/15/18 @ 104.88 (a)(d) | | 10,000 | | 10,475 |
| Sabine Pass Liquefaction LLC, | | | | |
| 5.63%, 3/1/25, Callable | | | | |
| 12/1/24 @ 100.00 (a) | | 35,000 | | 38,882 |
| Sabine Pass Liquefaction LLC, | | | | |
| 5.88%, 6/30/26, Callable | | | | |
| 12/31/25 @ 100.00 (a) | | 5,000 | | 5,656 |
| Sabre Global, Inc., 5.25%, 11/15/23, | | | | |
| Callable 11/15/18 @ 103.94 (a)(d) | | 32,000 | | 33,520 |
| SBA Communications Corp., 4.88%, | | | | |
| 9/1/24, Callable 9/1/19 @ 103.66 (a) | | 20,000 | | 20,550 |
| Schlumberger Holdings Corp., | | | | |
| 1.90%, 12/21/17 (d) | | 20,000 | | 20,006 |
| Sirius XM Radio, Inc., 6.00%, 7/15/24, | | | | |
| Callable 7/15/19 @ 103.00 (a)(d) | | 75,000 | | 80,062 |
| Six Flags Entertainment Corp., | | | | |
| 4.88%, 7/31/24, Callable | | | | |
| 7/31/19 @ 103.66 (a)(d) | | 30,000 | | 30,863 |
| See notes to financial statements. | HSBC FAMILY OF FUNDS 61 |
| HSBC GLOBAL HIGH INCOME BOND FUND |
| Schedule of Portfolio Investments—as of October 31, 2017 (continued) |
| Corporate Bonds, continued | | | | |
| | | | |
| | Principal | | |
| | Amount ($) | | Value ($) |
| United States – continued | | | | |
| Smithfield Foods, Inc., | | | | |
| 2.65%, 10/3/21, Callable | | | | |
| 9/3/21 @ 100.00 (a)(d) | | 25,000 | | 24,796 |
| Southern Co. Gas Capital Corp., | | | | |
| 4.40%, 5/30/47, Callable | | | | |
| 11/30/46 @ 100.00 (a) | | 35,000 | | 36,732 |
| Southern Natural Gas Co. LLC, | | | | |
| 4.80%, 3/15/47, Callable | | | | |
| 9/15/46 @ 100.00 (a)(d) | | 25,000 | | 27,151 |
| Spectra Energy Partners, | | | | |
| 4.50%, 3/15/45, Callable | | | | |
| 9/15/44 @ 100.00 (a) | | 15,000 | | 15,427 |
| Sprint Corp., 7.88%, 9/15/23 | | 115,000 | | 128,513 |
| Steel Dynamics, Inc., | | | | |
| 5.25%, 4/15/23, Callable | | | | |
| 4/15/18 @ 102.63 (a) | | 20,000 | | 20,650 |
| Sunoco Logistics Partners Operations, | | | | |
| LP, 5.40%, 10/1/47, Callable | | | | |
| 4/1/47 @ 100.00 (a) | | 40,000 | | 40,527 |
| Synchrony Financial, 3.70%, 8/4/26, | | | | |
| Callable 5/4/26 @ 100.00 (a) | | 30,000 | | 29,743 |
| Synchrony Financial, 4.50%, 7/23/25, | | | | |
| Callable 4/24/25 @ 100.00 (a) | | 100,000 | | 104,864 |
| Synovus Financial Corp., | | | | |
| 3.13%, 11/1/22, Callable | | | | |
| 10/1/22 @ 100.00 (a) | | 20,000 | | 19,992 |
| Tallgrass Energy Partners/Finance, | | | | |
| 5.50%, 9/15/24, Callable | | | | |
| 9/15/19 @ 104.13 (a)(d) | | 40,000 | | 41,350 |
| Targa Resources Partners, | | | | |
| 5.25%, 5/1/23, Callable | | | | |
| 12/7/17 @ 102.63 (a) | | 30,000 | | 30,863 |
| Targa Resources Partners LP, | | | | |
| 5.00%, 1/15/28, Callable | | | | |
| 1/15/23 @ 102.50 (a)(d) | | 15,000 | | 15,094 |
| Targa Resources Partners | | | | |
| LP, 5.13%, 2/1/25, Callable | | | | |
| 2/1/20 @ 103.84 (a) | | 24,000 | | 24,720 |
| Taylor Morrison Communities, Inc., | | | | |
| 5.88%, 4/15/23, Callable | | | | |
| 1/15/23 @ 100.00 (a)(d) | | 50,000 | | 53,531 |
| Tenet Healthcare Corp., | | | | |
| 4.50%, 4/1/21 | | 25,000 | | 25,250 |
| Tenet Healthcare Corp., 5.13%, 5/1/25, | | | | |
| Callable 5/1/20 @ 102.56 (a)(d) | | 15,000 | | 14,606 |
| Tenet Healthcare Corp., | | | | |
| 6.00%, 10/1/20 | | 50,000 | | 52,500 |
| Tenneco, Inc., 5.00%, 7/15/26, | | | | |
| Callable 7/15/21 @ 102.50 (a) | | 3,000 | | 3,083 |
| Tesoro Corp., 4.75%, 12/15/23, | | | | |
| Callable 10/15/23 @ 100.00 (a)(d) | | 40,000 | | 43,254 |
| The Chemours Co., 5.38%, 5/15/27, | | | | |
| Callable 2/15/27 @ 100.00 (a) | | 10,000 | | 10,675 |
| The Chemours Co., 6.63%, 5/15/23, | | | | |
| Callable 5/15/18 @ 104.97 (a) | | 25,000 | | 26,500 |
| The Goldman Sachs Group, Inc., | | | | |
| 4.75%, 10/12/21 | | EUR 100,000 | | 135,193 |
| The Williams Cos., Inc., 4.55%, | | | | |
| 6/24/24, Callable | | | | |
| 3/24/24 @ 100.00(a) | | 100,000 | | 104,499 |
| Time Warner Cable, Inc., 4.50%, | | | | |
| 9/15/42, Callable | | | | |
| 3/15/42 @ 100.00 (a) | | 100,000 | | 92,025 |
| T-Mobile US, Inc., 6.50%, 1/15/24, | | | | |
| Callable 1/15/19 @ 103.25 (a) | | 74,000 | | 78,995 |
| Toll Bros Finance Corp., 4.88%, | | | | |
| 11/15/25, Callable | | | | |
| 8/15/25 @ 100.00 (a) | | 20,000 | | 20,975 |
| Tribune Media Co., 5.88%, 7/15/22, | | | | |
| Callable 7/15/18 @ 102.94 (a) | | 50,000 | | 51,875 |
| TTM Technologies, Inc., 5.63%, | | | | |
| 10/1/25, Callable | | | | |
| 10/1/20 @ 102.81 (a)(d) | | 23,000 | | 23,460 |
| United Rentals North America, Inc., | | | | |
| 4.63%, 10/15/25, Callable | | | | |
| 10/15/20 @ 102.31 (a) | | 2,000 | | 2,048 |
| United Rentals North America, Inc., | | | | |
| 5.50%, 5/15/27, Callable | | | | |
| 5/15/22 @ 102.75 (a) | | 14,000 | | 14,980 |
| Universal Health Services, Inc., | | | | |
| 4.75%, 8/1/22, Callable | | | | |
| 12/7/17 @ 103.56 (a)(d) | | 30,000 | | 30,975 |
| Universal Health Services, Inc., | | | | |
| 5.00%, 6/1/26, Callable | | | | |
| 6/1/21 @ 102.50 (a)(d) | | 10,000 | | 10,613 |
| Verizon Communications, Inc., | | | | |
| 4.27%, 1/15/36 | | 150,000 | | 147,521 |
| Virginia Elec & Power Co., 3.80%, 9/15/47, | | | | |
| Callable 3/15/47 @ 100.00 (a) | | 25,000 | | 25,250 |
| WellCare Health Plans, Inc., 5.25%, | | | | |
| 4/1/25, Callable 4/1/20 @ 103.94 (a) | | 26,000 | | 27,365 |
| Wells Fargo & Co., 7.98% | | | | |
| (US0003M + 377 bps), Callable | | | | |
| 3/15/18 @ 100.00 (a),(b)(c) | | 50,000 | | 51,028 |
| Westlake Chemical Corp., | | | | |
| 3.60%, 8/15/26, Callable | | | | |
| 5/15/26 @ 100.00 (a) | | 35,000 | | 35,311 |
| Westlake Chemical Corp., | | | | |
| 5.00%, 8/15/46, Callable | | | | |
| 2/15/46 @ 100.00 (a) | | 35,000 | | 38,767 |
| WPX Energy, Inc., 8.25%, 8/1/23, | | | | |
| Callable 6/1/23 @ 100.00 (a) | | 50,000 | | 56,313 |
| Zayo Group LLC / Zayo Capital LLC, | | | | |
| 5.75%, 1/15/27, Callable | | | | |
| 1/15/22 @ 102.88 (a)(d) | | 2,000 | | 2,108 |
| | | | | 10,502,215 |
| TOTAL CORPORATE BONDS | | | | |
| (COST $10,180,574) | | | | 10,602,307 |
| | | | | |
| U.S. Treasury Obligations – 1.1% | | | | |
| | | | | |
| U.S. Treasury Bond – 0.1% | | | | |
| 3.00%, 5/15/47 | | 25,000 | | 25,604 |
| U.S. Treasury Note – 1.0% | | | | |
| 1.50%, 8/15/26 | | 43,000 | | 40,129 |
| 2.13%, 2/29/24 | | 171,000 | | 170,460 |
| 2.25%, 8/15/27 | | 84,000 | | 83,068 |
| | | | | 293,657 |
| TOTAL U.S. TREASURY | | | | |
| OBLIGATIONS (COST $319,836) | | | | 319,261 |
| 62 HSBC FAMILY OF FUNDS | | See notes to financial statements. |
| HSBC GLOBAL HIGH INCOME BOND FUND |
| Schedule of Portfolio Investments—as of October 31, 2017 (continued) |
| Exchange Traded Fund – 0.6% | | | | | |
| | | | | |
| | Shares | | Value ($) |
| SPDR Barclays High Yield Bond ETF | | 4,255 | | | 158,456 |
| TOTAL EXCHANGE TRADED FUND | | | | | |
| (COST $162,954) | | | | | 158,456 |
| | | | | | |
| Investment Companies – 5.0% | | | | | |
| | | | | | |
| Northern Institutional Government | | | | | |
| Assets Portfolio, Institutional | | | | | |
| Shares, 0.82% (f) | | 1,375,841 | | | 1,375,841 |
| Northern Institutional U.S. | | | | | |
| Government Select Portfolio, | | | | | |
| Institutional Shares, 0.88% (f) | | 26,532 | | | 26,532 |
| TOTAL INVESTMENT COMPANIES | | | | | |
| (COST $1,402,373) | | | | | 1,402,373 |
| TOTAL INVESTMENTS | | | | | |
| IN SECURITIES | | | | | |
| (COST $26,573,755) – 99.1% | | | | | 27,919,291 |
| Other Assets (Liabilities) – 0.9% | | | | | 248,772 |
| NET ASSETS – 100% | | | | $ | 28,168,063 |
____________________
| † | | The principal amount is disclosed in local currency and the value is disclosed in U.S. Dollars. |
| (a) | | Represents next call date. Additional subsequent call dates and amounts may apply to this security. |
| (b) | | Securities are perpetual and, thus, do not have a predetermined maturity date. |
| (c) | | Variable rate security. The rate presented represents the rate in effect on October 31, 2017. These securities are deemed to have a maturity remaining until the next adjustment of the interest rate or the longer of the demand period or time to the next readjustment. |
| (d) | | Rule 144A security or other security which is restricted as to resale to institutional investors. This security has been deemed liquid by the Investment Adviser based on procedures approved by the Board of Trustees. |
| (e) | | Step Bond. Coupon rate is set for an initial period and then increased to a higher coupon rate at a specified date. The rate shown is the rate in effect at October 31, 2017. |
| (f) | | The rate represents the annualized one-day yield that was in effect on October 31, 2017. |
bps — Basis Points
ETF — Exchange-Traded Fund
EUR — Euro
EUR003M — 3 Month EUR LIBOR
EUSA5 — Euro 5 Year Swap Rate
EUSA8 — Euro 8 Year Swap Rate
EUSA10 — Euro 10 Year Swap Rate
EUSA12 — Euro 12 Year Swap Rate
H15T5Y — 5 Year Treasury Constant Maturity Rate
LLC — Limited Liability Company
MTN — Medium Term Note
SPA — Standby Purchase Agreement
SPDR — Standard & Poor’s Depositary Receipt
ULC — Unlimited Liability Co.
US0003M — 3 Month US Dollar LIBOR
The Fund invested, as a percentage of net assets at value, in the following industries, as of October 31, 2017:
| Percentage of Net Assets |
| Industry | at Value (%) |
| Banks | | 16.5 | |
| Oil, Gas & Consumable Fuels | | 15.2 | |
| Sovereign Bonds | | 12.3 | |
| Investment Companies | | 5.0 | |
| Consumer Finance | | 4.8 | |
| Media | | 3.6 | |
| Metals & Mining | | 2.7 | |
| Diversified Telecommunication | | | |
| Services | | 2.7 | |
| Health Care Providers & Services | | 2.7 | |
| Insurance | | 2.6 | |
| Electric Utilities | | 2.0 | |
| Equity Real Estate Investment Trusts | | 1.9 | |
| Capital Markets | | 1.8 | |
| Construction Materials | | 1.8 | |
| Automobiles | | 1.8 | |
| Diversified Financial Services | | 1.6 | |
| Chemicals | | 1.6 | |
| Multi-Utilities | | 1.5 | |
| Trading Companies & Distributors | | 1.3 | |
| Industrial Conglomerates | | 1.3 | |
| Household Durables | | 1.2 | |
| U.S. Treasury Obligation | | 1.1 | |
| Biotechnology | | 1.1 | |
| Containers & Packaging | | 1.1 | |
| Pharmaceuticals | | 1.1 | |
| Auto Components | | 0.9 | |
| Real Estate Management | | | |
| & Development | | 0.8 | |
| Wireless Telecommunication Services | | 0.8 | |
| Building Products | | 0.7 | |
| Professional Services | | 0.6 | |
| Exchange Traded Fund | | 0.6 | |
| Machinery | | 0.6 | |
| Hotels, Restaurants & Leisure | | 0.5 | |
| Food Products | | 0.5 | |
| Tobacco | | 0.5 | |
| Commercial Services & Supplies | | 0.4 | |
| Paper & Forest Products | | 0.2 | |
| Life Sciences Tools & Services | | 0.2 | |
| IT Services | | 0.2 | |
| Beverages | | 0.2 | |
| Energy Equipment & Services | | 0.2 | |
| Internet Software & Services | | 0.2 | |
| Technology Hardware, Storage | | | |
| & Peripherals | | 0.2 | |
| Aerospace & Defense | | 0.1 | |
| Independent Power & Renewable | | | |
| Electricity Producers | | 0.1 | |
| Electrical Equipment | | 0.1 | |
| Electronic Equipment, Instruments | | | |
| & Components | | 0.1 | |
| Household Products | | 0.1 | |
| Software | | 0.0 | |
| Health Care Technology | | 0.0 | |
| Total | | 99.1 | |
| See notes to financial statements. | | HSBC FAMILY OF FUNDS 63 |
| HSBC GLOBAL HIGH INCOME BOND FUND |
| Schedule of Portfolio Investments—as of October 31, 2017 (continued) |
Futures Contracts Purchased
| | | | | | | | | | | | | Unrealized |
| | | Number of | | Expiration | | Notional | | | | | Appreciation/ |
| Description | | | Contracts | | Date | | Amount | | Value | | (Depreciation) |
| 5-Year US Treasury Note Futures | | 2 | | 12/29/17 | | $ | 234,347 | | $ | 234,375 | | | $ | 28 | |
| | | | | | | $ | 234,347 | | $ | 234,375 | | | $ | 28 | |
| | | | | | | | | | | | | | | | | |
| | | Total unrealized appreciation | | | $ | 28 | |
| | | Total unrealized depreciation | | | | — | |
| | | Total net unrealized appreciation/(depreciation) | | | $ | 28 | |
Credit Default Swap Agreements - Sell Protection(a)
At October 31, 2017, the Fund’s open credit default swap agreements were as follows:
| | | | | | Implied | | | | | | | | | | | | | | | | | |
| | | | | | Credit | | | | | | | | | | | Upfront | | | | |
| | | | | | Spread at | | | | | | | | | | | Premiums | | Unrealized |
| | Receive | | | | October 31, | | | | | | Notional | | | | | Paid/ | | Appreciation/ |
| | Fixed | | Payment | | 2017 | | | | Expiration | | Amount | | Value | | (Received) | | (Depreciation) |
| Underlying Instrument | | Rate (%) | | Frequency | | (%)(b) | | Counterparty | | Date | | ($)(c) | | ($) | | ($) | | ($) |
| CDX Emerging Markets | | | | | | | | Bank of | | | | | | | | | | | | | | | |
| Index, Series 25 | | 1.00 | | Quarterly | | 1.83 | | America | | 6/20/21 | | 660,000 | | (16,845 | ) | | | (43,494 | ) | | | 26,649 | |
| | | | | | | | | | | | | | (16,845 | ) | | | (43,494 | ) | | | 26,649 | |
| (a) | | When a credit event occurs as defined under the terms of the swap agreement, the Fund as a seller of credit protection will either (i) pay to the buyer of protection an amount equal to the par value of the defaulted reference entity and take delivery of the reference entity or (ii) pay a net amount equal to the par value of the defaulted reference entity less its recovery value. Alternatively, the Fund as a buyer of credit protection will either (i) receive from the seller of protection an amount equal to the par value of the defaulted reference entity and deliver the reference entity to the seller or (ii) receive a net amount equal to the par value of the defaulted reference entity less its recovery value. |
| (b) | | Implied credit spread, represented in absolute terms, utilized in determining the fair value of the credit default swap agreements as of period end serve as an indicator of the current status of the payment/performance risk and represents the likelihood or risk of default for the credit derivative. The implied credit spread of a referenced entity reflects the cost of buying/selling protection and may include upfront or daily payments required to be made to enter into the agreement. Generally, wider credit spreads represent a perceived deterioration of the referenced entity’s credit soundness and a greater likelihood or risk of default or other credit event occurring as defined under the terms of the swap agreement. |
| (c) | | The notional amount represents the maximum potential amount of future payments that the Fund may receive as a buyer of credit protection if a credit event occurs, as defined under the terms of the swap agreement. Alternatively, the notional amount represents the maximum potential amount of payment the Fund could be required to make as a seller of credit protection if a credit event occurs, as defined under the terms of the swap agreement. |
At October 31, 2017, the Fund’s open forward foreign currency exchange contracts were as follows:
Short Contracts
| | | | | | | | | | | | Net Unrealized |
| | | | | | | | | | | | Appreciation/ |
| Description and amount of | | Description and amount of | | | | Settlement | | (Depreciation) |
| currency to be purchased | | currency to be sold | | Counterparty | | Date | | ($) |
| U.S. Dollar | | 6,508,270 | | European Euro | | 5,500,000 | | Morgan Stanley | | 11/2/17 | | | | 102,419 | | |
| U.S. Dollar | | 6,409,414 | | European Euro | | 5,500,000 | | UBS AG | | 12/4/17 | | | | (8,655 | ) | |
| | | | | | | | | | | | | | | 93,764 | | |
| | | | | | | | | | | | | | | | | |
| | | | | | Total unrealized appreciation | | | $ | 102,419 | | |
| | | | | | Total unrealized depreciation | | | | (8,655 | ) | |
| | | | | | Total net unrealized appreciation/(depreciation) | | | $ | 93,764 | | |
| 64 HSBC FAMILY OF FUNDS | | See notes to financial statements. |
| HSBC GLOBAL EQUITY VOLATILITY FOCUSED FUND |
| Schedule of Portfolio Investments—as of October 31, 2017 |
| Common Stocks – 96.7% | | | | |
| | | | | |
| | Shares | | Value ($) |
| Australia – 0.7% | | | | |
| Telstra Corp. Ltd. | | 29,482 | | 79,861 |
| Canada – 0.5% | | | | |
| Barrick Gold Corp. | | 3,953 | | 57,124 |
| China – 5.1% | | | | |
| China Mobile Ltd. | | 21,000 | | 210,916 |
China Overseas Land &
Investment Ltd. | | 16,000 | | 51,891 |
| Guangdong Investment Ltd. | | 98,000 | | 141,956 |
Industrial & Commercial Bank of
China Ltd., Class H | | 251,000 | | 199,165 |
| | | | 603,928 |
| Denmark – 0.8% | | | | |
| NOVO-Nordisk | | 1,867 | | 92,894 |
| France – 4.6% | | | | |
| BNP Paribas | | 2,222 | | 173,497 |
| Capital Gemini SA | | 1,546 | | 187,895 |
| Sodexo | | 1,478 | | 188,066 |
| | | | 549,458 |
| Germany – 4.5% | | | | |
| Brenntag AG | | 2,146 | | 121,511 |
Muenchener Rueckversicherungs-
Gesellschaft AG, Registered Shares | | 999 | | 223,457 |
| SAP SE | | 1,678 | | 190,863 |
| | | | 535,831 |
| Hong Kong – 1.6% | | | | |
| BOC Hong Kong (Holdings) Ltd. | | 39,000 | | 185,726 |
| Indonesia – 1.5% | | | | |
| PT Bank Mandiri (Persero) Tbk | | 345,600 | | 179,681 |
| Ireland – 1.1% | | | | |
| Accenture PLC, Class A | | 926 | | 131,825 |
| Italy – 2.6% | | | | |
| Eni S.P.A. | | 12,224 | | 199,892 |
| Unicredit SpA (a) | | 5,956 | | 113,974 |
| | | | 313,866 |
| Japan – 12.6% | | | | |
| KAO Corp. | | 3,800 | | 228,488 |
| Mitsubishi UFJ Financial Group, Inc. | | 36,200 | | 242,787 |
| NTT DoCoMo, Inc. | | 4,900 | | 118,136 |
| Oracle Corp. Japan | | 1,500 | | 126,001 |
| OTSUKA Corp. | | 2,400 | | 162,547 |
| Secom Co. Ltd. | | 2,000 | | 150,884 |
| Sekisui Chemical | | 6,000 | | 120,116 |
| Tokyo Electron Ltd. | | 800 | | 139,010 |
| Trend Micro, Inc. | | 4,000 | | 212,860 |
| | | | 1,500,829 |
| Netherlands – 2.3% | | | | |
| AKZO Nobel NV | | 1,074 | | 97,244 |
| Wolters Kluwer NV | | 3,572 | | 175,066 |
| | | | 272,310 |
| Singapore – 1.0% | | | | |
| DBS Group Holdings Ltd. | | 7,400 | | 123,695 |
| Switzerland – 3.5% | | | | |
| Nestle SA, Registered Shares | | 2,608 | | 219,382 |
| Roche Holding AG | | 508 | | 117,399 |
| Wolseley PLC | | 1,168 | | 81,659 |
| | | | 418,440 |
| Thailand – 1.0% | | | | |
| Siam Cement Public Co. Ltd. - NVDR | | 8,300 | | 122,463 |
| United Kingdom – 12.7% | | | | |
| BAE Systems PLC | | 30,604 | | 241,192 |
| BP PLC | | 31,938 | | 216,378 |
| British American Tobacco, ADR | | 1,820 | | 117,208 |
| Centrica PLC | | 40,015 | | 90,225 |
| Compass Group PLC | | 12,711 | | 279,008 |
| Diageo PLC | | 4,934 | | 168,514 |
| GlaxoSmithKline PLC | | 8,774 | | 158,162 |
| Prudential PLC | | 9,751 | | 239,803 |
| | | | 1,510,490 |
| United States – 40.6% | | | | |
| 3M Co. | | 1,091 | | 251,137 |
| Altria Group, Inc. | | 3,096 | | 198,825 |
| Apple, Inc. | | 1,552 | | 262,350 |
| Bank of America Corp. | | 8,893 | | 243,580 |
| Cisco Systems, Inc. | | 6,713 | | 229,249 |
| Citigroup, Inc. | | 3,243 | | 238,361 |
| Dr Pepper Snapple Group, Inc. | | 2,200 | | 188,452 |
| Everest Re Group Ltd. | | 894 | | 212,280 |
Expeditors International of
Washington, Inc. | | 1,943 | | 113,432 |
| HCA Holdings, Inc. (a) | | 1,342 | | 101,522 |
| Humana, Inc. | | 515 | | 131,505 |
| Intel Corp. | | 1,521 | | 69,190 |
| Johnson & Johnson | | 1,859 | | 259,163 |
| JPMorgan Chase & Co. | | 1,566 | | 157,555 |
| Leggett & Platt, Inc. | | 3,352 | | 158,416 |
| MASCO Corp. | | 5,289 | | 210,608 |
| Microsoft Corp. | | 2,497 | | 207,700 |
| Phillips 66 | | 1,930 | | 175,784 |
| PPG Industries, Inc. | | 1,078 | | 125,307 |
Quintiles Transnational
Holdings, Inc.(a) | | 2,431 | | 262,791 |
| Rockwell Collins, Inc. | | 1,595 | | 216,282 |
| The Home Depot, Inc. | | 1,553 | | 257,456 |
| The Walt Disney Co. | | 1,948 | | 190,534 |
| United Technologies Corp. | | 1,861 | | 222,874 |
| UnitedHealth Group, Inc. | | 671 | | 141,059 |
| | | | 4,825,412 |
| TOTAL COMMON STOCKS | | | | |
| (COST $10,159,425) | | | | 11,503,833 |
| See notes to financial statements. | | HSBC FAMILY OF FUNDS 65 |
| HSBC GLOBAL EQUITY VOLATILITY FOCUSED FUND |
| Schedule of Portfolio Investments—as of October 31, 2017 (continued) |
| Investment Companies – 3.2% | | | | | |
| | | | | |
| | Shares | | Value($) |
| Northern Institutional Government | | | | | |
| Assets Portfolio, Institutional | | | | | |
| Shares, 0.82% (b) | | 381,899 | | | 381,899 |
| TOTAL INVESTMENT COMPANIES | | | | | |
| (COST $381,899) | | | | | 381,899 |
| TOTAL INVESTMENTS | | | | | |
| IN SECURITIES | | | | | |
| (COST $10,541,324) – 99.9% | | | | | 11,885,732 |
| Other Assets (Liabilities) – 0.1% | | | | | 6,461 |
| NET ASSETS – 100% | | | | $ | 11,892,193 |
____________________
| (a) | | Represents non-income producing security. |
| (b) | | The rate represents the annualized one-day yield that was in effect on October 31, 2017. |
ADR — American Depositary Receipt
NVDR — Non-Voting Depository Receipt |
The Fund invested, as a percentage of net assets at value, in the following industries, as of October 31, 2017:
| Percentage of Net Assets |
| Industry | at Value (%) |
| Banks | | 15.5 | |
| Software | | 6.1 | |
| Insurance | | 5.7 | |
| Aerospace & Defense | | 5.7 | |
| Pharmaceuticals | | 5.3 | |
| Oil, Gas & Consumable Fuels | | 5.0 | |
| IT Services | | 4.1 | |
| Hotels, Restaurants & Leisure | | 3.9 | |
| Investment Companies | | 3.2 | |
| Health Care Providers & Services | | 3.1 | |
| Beverages | | 3.0 | |
| Wireless Telecommunication Services | | 2.8 | |
| Tobacco | | 2.7 | |
| Household Durables | | 2.3 | |
| Life Sciences Tools & Services | | 2.2 | |
Technology Hardware, Storage
& Peripherals | | 2.2 | |
| Specialty Retail | | 2.2 | |
| Industrial Conglomerates | | 2.1 | |
| Personal Products | | 1.9 | |
| Communications Equipment | | 1.9 | |
| Chemicals | | 1.9 | |
| Building Products | | 1.8 | |
| Food Products | | 1.8 | |
Semiconductors &
Semiconductor Equipment | | 1.8 | |
| Trading Companies & Distributors | | 1.7 | |
| Media | | 1.6 | |
| Professional Services | | 1.5 | |
| Commercial Services & Supplies | | 1.3 | |
| Water Utilities | | 1.2 | |
| Air Freight & Logistics | | 1.0 | |
| Construction Materials | | 1.0 | |
| Multi-Utilities | | 0.8 | |
Diversified Telecommunication
Services | | 0.7 | |
| Metals & Mining | | 0.5 | |
Real Estate Management &
Development | | 0.4 | |
| Total | | 99.9 | |
| 66 HSBC FAMILY OF FUNDS | | See notes to financial statements. |
| HSBC EURO HIGH YIELD BOND FUND (USD HEDGED) |
| Schedule of Portfolio Investments—as of October 31, 2017 |
| Foreign Bonds – 85.3% | | | | | |
| | | | | | |
| Principal | | |
| Amount † | | Value ($) |
| Australia – 1.0% | | | | | |
| BHP Billiton Ltd., 5.63% | | | | | |
| (EUSA5 + 480 bps), 10/22/79, | | | | | |
| Callable 10/22/24 @ 100 (a)(b) | | | 200,000 | | 289,147 |
| Austria – 1.2% | | | | | |
| Telekom Austria AG, 5.63% | | | | | |
| (EUSA5 + 486 bps), Callable | | | | | |
| 2/1/18 @ 100 (a)(b),(c) | | | 300,000 | | 353,743 |
| Belgium – 3.5% | | | | | |
| KBC Groep NV, 5.63% | | | | | |
| (EUSA5 + 476 bps), Callable | | | | | |
| 3/19/19 @ 100 (a)(b),(c) | | | 300,000 | | 368,191 |
| Solvay Finance SA, 5.42% | | | | | |
| (EUSA5 + 370 bps), Callable | | | | | |
| 11/12/23 @ 100 (a)(b),(c) | | | 300,000 | | 413,280 |
| Solvay Finance SA, 4.20% | | | | | |
| (EUSA5 + 300 bps), Callable | | | | | |
| 5/12/19 @ 100 (a)(b),(c) | | | 200,000 | | 245,143 |
| | | | | | 1,026,614 |
| Denmark – 3.5% | | | | | |
| Danske Bank A/S, 5.75% | | | | | |
| (EUSA6 + 464 bps), Callable 4/6/20 | | | | | |
| @ 100 (a)(b),(c) | EUR | | 200,000 | | 254,662 |
| DONG Energy A/S, Series E, 4.87% | | | | | |
| (EUSA5 + 380 bps), 7/8/99, Callable | | | | | |
| 7/8/18 @ 100 (a)(b) | | | 200,000 | | 239,928 |
| DONG Energy A/S, 6.25% | | | | | |
| (EUSA5 + 475 bps), 12/31/13, | | | | | |
| Callable 6/26/23 @ 100 (a)(b) | EUR | | 300,000 | | 424,044 |
| TDC A/S, 3.50% (EUSA5 + 311 bps), | | | | | |
| 2/26/15, Callable 2/26/21 | | | | | |
| @ 100 (a)(b) | EUR | | 100,000 | | 121,828 |
| | | | | | 1,040,462 |
| Finland – 1.8% | | | | | |
| Metsa Board OYJ, 2.75%, 9/29/27, | | | | | |
| Callable 6/29/27 @ 100 (a) | | | 100,000 | | 118,508 |
| Nokia OYJ, Series E, 2.00%, 3/15/24, | | | | | |
| Callable 12/15/23 @ 100 (a) | | | 150,000 | | 178,561 |
| Stora Enso OYJ, Series E, | | | | | |
| 2.13%, 6/16/23, Callable 3/16/23 | | | | | |
| @ 100 (a) | | | 100,000 | | 122,584 |
| Stora Enso OYJ, Series E, | | | | | |
| 2.50%, 6/7/27, Callable 3/7/27 | | | | | |
| @ 100 (a) | | | 100,000 | | 118,450 |
| | | | | | 538,103 |
| France – 26.4% | | | | | |
| Accor SA, 4.13% (EUSA5 + 365 bps), | | | | | |
| Callable 6/30/20 @ 100 (a)(b),(c) | | | 300,000 | | 373,862 |
| Arkema SA, 4.75% | | | | | |
| (EUSA5 + 435 bps), Callable | | | | | |
| 10/29/20 @ 100 (a)(b),(c) | | | 300,000 | | 383,303 |
| AXA SA, Series E, 3.94% | | | | | |
| (EUSA10 + 390 bps), Callable | | | | | |
| 11/7/24 @ 100 (a)(b),(c) | | | 400,000 | | 527,971 |
| BNP Paribas Cardif SA, 4.03% | | | | | |
| (EUR003M + 393 bps), Callable | | | | | |
| 11/25/25 @ 100 (a)(b),(c) | | | 200,000 | | 259,403 |
| BPCE SA, 12.50% | | | | | |
| (EUR003M + 1313 bps), Callable | | | | | |
| 9/30/19 @ 100 (a)(b),(c) | | | 200,000 | | 285,698 |
| Credit Agricole Assurances SA, | | | | | |
| 4.50% (EUSA5 + 435 bps), Callable | | | | | |
| 10/14/25 @ 100 (a)(b),(c) | | | 300,000 | | 400,679 |
| Credit Agricole SA, 6.50% | | | | | |
| (EUSA5 + 512 bps), Callable | | | | | |
| 6/23/21 @ 100 (a)(b),(c) | | | 200,000 | | 269,118 |
| Credit Agricole SA, 7.87% | | | | | |
| (EUR003M + 642 bps), Callable | | | | | |
| 10/26/19 @ 100 (a)(b),(c) | | | 200,000 | | 266,507 |
| Crown European Holdings, Registered, | | | | | |
| 4.00%, 7/15/22, Callable 4/15/22 | | | | | |
| @ 100 (a) | | | 300,000 | | 392,492 |
| Europcar Groupe SA, 5.75%, 6/15/22, | | | | | |
| Callable 6/15/18 @ 102.88 (a) | | | 200,000 | | 245,868 |
| Faurecia, 3.13%, 6/15/22, Callable | | | | | |
| 6/15/18 @ 101.56 (a) | | | 600,000 | | 720,889 |
| GDF SUEZ, Series N10, 3.88% | | | | | |
| (EUSA10 + 290 bps), Callable 6/2/24 | | | | | |
| @ 100 (a)(b),(c) | | | 300,000 | | 394,823 |
| Lion Polaris II SAS, Registered, 4.25% | | | | | |
| (EUR003M + 425 bps), 8/1/19, | | | | | |
| Callable 11/16/17 @ 100 (a)(b) | | | 93,917 | | 109,932 |
| Mobilux Finance SAS Registered, | | | | | |
| 5.50%, 11/15/24, Callable 11/15/19 | | | | | |
| @ 102.75 (a) | | | 100,000 | | 125,497 |
| Novalis SAS, Registered, | | | | | |
| 3.00%, 4/30/22, Callable 4/30/18 | | | | | |
| @ 101.5 (a) | | | 250,000 | | 298,673 |
| Orange SA, 5.25% | | | | | |
| (EUSA5 + 367 bps), Callable | | | | | |
| 2/7/24 @ 100 (a)(b),(c) | | | 750,000 | | 1,030,191 |
| Rexel SA, 3.50%, 6/15/23, Callable | | | | | |
| 6/15/19 @ 101.75 (a) | | | 250,000 | | 306,316 |
| Scor SE, 3.63% (EUSA10 + 390 bps), | | | | | |
| 5/27/48, Callable 5/27/28 | | | | | |
| @ 100 (a)(b) | | | 200,000 | | 261,580 |
| Societe Generale, 9.37% | | | | | |
| (EUR003M + 890 bps), Callable | | | | | |
| 9/4/19 @ 100 (a)(b),(c) | | | 100,000 | | 134,886 |
| Suez Environnement Co., 2.50% | | | | | |
| (EUSA5 + 217 bps), Callable | | | | | |
| 3/30/22 @ 100 (a)(b),(c) | | | 100,000 | | 122,585 |
| Total SA, Series E, 3.37% | | | | | |
| (EUSA5 + 335 bps), Callable | | | | | |
| 10/6/26 @ 100 (a)(b),(c) | | | 100,000 | | 128,059 |
| Total SA, Series E, 2.62% | | | | | |
| (EUSA5 + 215 bps), Callable | | | | | |
| 2/26/25 @ 100 (a)(b),(c) | | | 300,000 | | 368,689 |
| Total SA, 3.88% (EUSA5 + 378 bps), | | | | | |
| Callable 5/18/22 @ 100 (a)(b),(c) | | | 150,000 | | 196,127 |
| Veolia Environnement SA, 4.45% | | | | | |
| (EUSA5 + 360 bps), Callable | | | | | |
| 4/16/18 @ 100 (a)(b),(c) | | | 200,000 | | 237,366 |
| | | | | | 7,840,514 |
| Germany – 16.6% | | | | | |
| Allianz SE, 4.75% (EUR003M | | | | | |
| + 360 bps), Callable 10/24/23 | | | | | |
| @ 100 (a)(b),(c) | | | 200,000 | | 275,697 |
| See notes to financial statements. | | HSBC FAMILY OF FUNDS 67 |
| HSBC EURO HIGH YIELD BOND FUND (USD HEDGED) |
| Schedule of Portfolio Investments—as of October 31, 2017 (continued) |
| Foreign Bonds, continued | | | | |
| | | | |
| | Principal | | |
| | Amount † | | Value ($) |
| Germany – continued | | | | |
| Bayer AG, 3.75% (EUSA5 + 255 bps), | | | | |
| 7/1/74, Callable 7/1/24 | | | | |
| @ 100 (a)(b) | | 250,000 | | 321,051 |
| Bertelsmann SE & Co. KGaA, 3.00% | | | | |
| (EUSA5 + 264 bps), 4/23/75, | | | | |
| Callable 4/23/23 @ 100 (a)(b) | | 100,000 | | 123,296 |
| Commerzbank AG, Series E, | | | | |
| 7.75%, 3/16/21 | | 200,000 | | 285,832 |
| Commerzbank AG, Series E, | | | | |
| 4.00%, 3/23/26 | | 150,000 | | 201,031 |
| Deutsche Bank AG, Series E, | | | | |
| 5.00%, 6/24/20 | | 100,000 | | 129,455 |
| FMC Finance VIII SA, Registered, | | | | |
| 6.50%, 9/15/18 | | 100,000 | | 122,929 |
| Hannover Finance SA, 5.75% | | | | |
| (EUR003M + 424 bps), 9/14/40, | | | | |
| Callable 9/14/20 @ 100 (a)(b) | | 100,000 | | 134,228 |
| Heidelbergcement AG, 2.25%, 6/3/24, | | | | |
| Callable 3/3/24 @ 100 (a) | | 100,000 | | 127,009 |
| HeidelbergCement Finance | | | | |
| Luxembourg SA, 7.50%, 4/3/20 | | 300,000 | | 413,561 |
| Merck KGaA, 2.62% | | | | |
| (EUSA5 + 218 bps), 12/12/74, | | | | |
| Callable 6/12/21 @ 100 (a)(b) | | 200,000 | | 246,916 |
| PHOENIX Pharmahandel GmbH & Co., | | | | |
| 3.63%, 7/30/21 | | 200,000 | | 258,470 |
| Schaeffler AG, Registered, | | | | |
| 3.50%, 5/15/22, Callable 12/6/17 | | | | |
| @ 101.75 (a) | | 300,000 | | 356,398 |
| Talanx AG, Series E, 8.37% | | | | |
| (EUR003M + 706 bps), 6/15/42, | | | | |
| Callable 6/15/22 @ 100 (a)(b) | | 300,000 | | 463,415 |
| Thyssenkrupp AG, 1.38%, 3/3/22, | | | | |
| Callable 12/3/21 @ 100 (a) | | 100,000 | | 119,257 |
| TUI AG, 2.13%, 10/26/21, Callable | | | | |
| 7/26/21 @ 100 (a) | | 100,000 | | 123,167 |
| Unitymedia Hessen GmbH & Co. | | | | |
| Registered, 4.63%, 2/15/26, Callable | | | | |
| 2/15/21 @ 102.31 (a) | | 500,000 | | 637,732 |
| Volkswagen AG, 2.50% | | | | |
| (EUSA7 + 220 bps), Callable | | | | |
| 3/20/22 @ 100 (a)(b),(c) | | 300,000 | | 359,019 |
| Vonovia Finance BV, 4.62% | | | | |
| (EUSA5 + 370 bps), 4/8/74, Callable | | | | |
| 4/8/19 @ 100 (a)(b) | | 200,000 | | 246,334 |
| | | | 4,944,797 |
| Ireland – 0.4% | | | | |
| Smurfit Kappa Funding PLC, | | | | |
| Registered, 3.25%, 6/1/21, Callable | | | | |
| 3/10/21 @ 100 (a) | | 100,000 | | 126,533 |
| Italy – 0.4% | | | | |
| LKQ Italia Bondco SpA, Registered, | | | | |
| 3.88%, 4/1/24, Callable 1/1/24 | | | | |
| @ 100 (a) | | 100,000 | | 128,755 |
| Luxembourg – 1.3% | | | | |
| Hanesbrands Finance Luxembourg, | | | | |
| Registered, 3.50%, 6/15/24, Callable | | | | |
| 3/15/24 @ 100 (a) | | 100,000 | | 125,776 |
| Telenet Finance VI Luxembourg SCA, | | | | |
| Registered, 4.88%, 7/15/27, Callable | | | | |
| 7/15/21 @ 102.44 (a) | | 200,000 | | 257,458 |
| | | | 383,234 |
| Mexico – 1.4% | | | | |
| America Movil SAB de CV, Series B, | | | | |
| 6.37% (EUSA5 + 455 bps), 9/6/73, | | | | |
| Callable 9/6/23 @ 100 (a)(b) | | EUR 200,000 | | 286,738 |
| Cemex SAB de CV, Registered, | | | | |
| 4.38%, 3/5/23, Callable 3/5/19 | | | | |
| @ 102.19 (a) | | EUR 100,000 | | 123,674 |
| | | | | 410,412 |
| Netherlands – 10.4% | | | | |
| ABN AMRO Bank NV, | | | | |
| 7.13%, 7/6/22 | | 200,000 | | 301,217 |
| ABN AMRO Bank NV, 5.75% (EUSA5 | | | | |
| +545 bps), Callable 9/22/20 | | | | |
| @ 100 (a) (b),(c) | | 200,000 | | 257,845 |
| Axalta Coating, Registered, | | | | |
| 3.75%, 1/15/25, Callable 1/15/20 | | | | |
| @ 102.81 (a) | | 100,000 | | 124,998 |
| Cooperatieve Rabobank UA, 5.50% | | | | |
| (EUSA5 + 525 bps), Callable 6/29/20 | | | | |
| @ 100 (a)(b),(c) | | 200,000 | | 255,652 |
| Fresenius SE & Co., Registered, | | | | |
| 4.00%, 2/1/24 | | 250,000 | | 343,994 |
| Goodyear Tire & Rubber Co., | | | | |
| Registered, 3.75%, 12/15/23, | | | | |
| Callable 12/15/18 @ 101.88 (a) | | 250,000 | | 305,278 |
| ING Groep NV, Series E, 3.00% | | | | |
| (EUSA5 + 285 bps), 4/11/28, Callable | | | | |
| 4/11/23 @ 100 (a)(b) | | 100,000 | | 128,122 |
| InterXion Holding NV, Registered, | | | | |
| 6.00%, 7/15/20, Callable 11/16/17 | | | | |
| @ 103 (a) | | 100,000 | | 120,395 |
| Koninklijke KPN NV, | | | | |
| 6.12% (EUSA5 + 520 bps), Callable | | | | |
| 9/14/18 @ 100 (a)(b),(c) | | 300,000 | | 366,006 |
| Lincoln Finance Holdings Pte Ltd., | | | | |
| Registered, 6.88%, 4/15/21, Callable | | | | |
| 4/15/18 @ 103.44 (a) | | 100,000 | | 122,927 |
| NN Group NV, 4.62% (EUR003M | | | | |
| + 395 bps), 4/8/44, Callable | | | | |
| 4/8/24 @ 100 (a)(b) | | 200,000 | | 269,882 |
| OI European Group BV, | | | | |
| 3.13%, 11/15/24, Callable 8/15/24 | | | | |
| @ 100 (a) | | 200,000 | | 243,436 |
| Telefonica Europe BV, 3.75% | | | | |
| (EUSA5 + 386 bps), Callable | | | | |
| 3/15/22 @ 100 (a)(b),(c) | | 100,000 | | 124,394 |
| UPCB Finance IV Ltd., 4.00%, 1/15/27, | | | | |
| Callable 1/15/21 @ 102 (a) | | 100,000 | | 124,029 |
| | | | 3,088,175 |
| South Africa – 0.4% | | | | |
| Sappi Ltd., Registered, 4.00%, 4/1/23, | | | | |
| Callable 4/1/19 @ 102 (a) | | 100,000 | | 123,021 |
| 68 HSBC FAMILY OF FUNDS | | See notes to financial statements. |
| HSBC EURO HIGH YIELD BOND FUND (USD HEDGED) |
| Schedule of Portfolio Investments—as of October 31, 2017 (continued) |
| Foreign Bonds, continued | | | | | | |
| | | | | | | |
| | Principal | | |
| | Amount † | | Value ($) |
| Spain – 3.8% | | | | | | |
| Banco Santander SA, 6.25% | | | | | | |
| (EUSA5 + 541 bps), Callable | | | | | | |
| 3/12/19 @ 100 (a)(b),(c) | | | | 100,000 | | 122,003 |
| Caixabank SA, 5.00% | | | | | | |
| (EUSA5 + 395 bps), 11/14/23, | | | | | | |
| Callable 11/14/18 @ 100 (a)(b) | | | | 100,000 | | 121,468 |
| Gas Natural Fenosa Finance BV, | | | | | | |
| 4.12% (EUSA8 + 335 bps), Callable | | | | | | |
| 11/18/22 @ 100 (a)(b),(c) | | | | 200,000 | | 253,322 |
| Grupo Antolin Dutch BV, | | | | | | |
| 5.13%, 6/30/22, Callable 6/30/18 | | | | | | |
| @ 102.56 (a) | | | | 100,000 | | 122,899 |
| Iberdrola SA, 5.75% | | | | | | |
| (EUSA5 + 481 bps), Callable | | | | | | |
| 2/27/18 @ 100 (a)(b),(c) | | | | 200,000 | | 237,021 |
| Telefonica SA, 7.62% | | | | | | |
| (EUSA8 + 559 bps), Callable | | | | | | |
| 9/18/21 @ 100 (a)(b),(c) | | | | 200,000 | | 284,182 |
| | | | | | 1,140,895 |
| Sweden – 2.3% | | | | | | |
| Hoist Kredit AB, 3.13%, 12/9/19 | | EUR | | 100,000 | | 122,451 |
| Intrum Justitia AB, 2.75%, 7/15/22, | | | | | | |
| Callable 7/15/19 @ 101.38 (a) | | | | 150,000 | | 178,987 |
| Intrum Justitia AB, 3.13%, 7/15/24, | | | | | | |
| Callable 7/15/20 @ 101.56 (a) | | | | 100,000 | | 119,508 |
| Volvo Treasury AB, 4.20% | | | | | | |
| (EUSA5 + 380 bps), 6/10/75, | | | | | | |
| Callable 6/10/20 @ 100 (a)(b) | | EUR | | 200,000 | | 251,575 |
| | | | | | 672,521 |
| Switzerland – 4.3% | | | | | | |
| Aquarius & Investment PLC, Series E, | | | | | | |
| 4.25% (EUR003M + 345 bps), | | | | | | |
| 10/2/43, Callable 10/2/23 | | | | | | |
| @ 100 (a)(b) | | | | 100,000 | | 137,087 |
| Credit Suisse AG, 5.75% | | | | | | |
| (EUSA5 + 400 bps), 9/18/25, | | | | | | |
| Callable 9/18/20 @ 100 (a)(b) | | | | 200,000 | | 264,387 |
| Swiss Reinsurance Co., 2.60% | | | | | | |
| (EUR006M + 305 bps), Callable | | | | | | |
| 9/1/25 @ 100 (a)(b),(c) | | | | 400,000 | | 483,390 |
| UBS AG, 4.75% (EUSA5 + 340 bps), | | | | | | |
| 2/12/26, Callable 2/12/21 | | | | | | |
| @ 100 (a)(b) | | | | 100,000 | | 129,864 |
| UBS Group AG, 5.75% | | | | | | |
| (EUSA5 + 529 bps), Callable | | | | | | |
| 2/19/22 @ 100 (a)(b),(c) | | | | 200,000 | | 270,937 |
| | | | | | 1,285,665 |
| United Kingdom – 6.6% | | | | | | |
| Aviva PLC, Series E, 3.37% | | | | | | |
| (EUR003M + 355 bps), 12/4/45, | | | | | | |
| Callable 12/4/25 @ 100 (a)(b) | | EUR | | 300,000 | | 380,199 |
| Barclays Bank PLC, 14.00% | | | | | | |
| (BP0003M + 1340 bps), Callable | | | | | | |
| 6/15/19 @ 100 (a)(b),(c) | | | | 150,000 | | 234,230 |
| CNH Industrial Finance Europe SA, | | | | | | |
| Series E, 6.25%, 3/9/18 | | | | 67,000 | | 79,752 |
| Heathrow Finance PLC, | | | | | | |
| 5.38%, 9/2/19 | | | | 300,000 | | 427,394 |
| National Grid PLC, 4.25% | | | | | | |
| (EUSA7 + 288 bps), 6/18/76, | | | | | | |
| Callable 6/18/20 @ 100 (a)(b) | | EUR | | 350,000 | | 444,232 |
| SSE PLC, 3.88%, Callable 9/10/20 | | | | | | |
| @ 100 (a)(b),(c) | | | | 200,000 | | 275,149 |
| Worldpay Finance PLC, Registered, | | | | | | |
| 3.75%, 11/15/22, Callable 8/15/22 | | | | | | |
| @ 100 (a) | | EUR | | 100,000 | | 129,905 |
| | | | | | | 1,970,861 |
| TOTAL FOREIGN BONDS | | | | | | |
| (COST $21,647,877) | | | | | | 25,363,452 |
| |
| Yankee Dollar — 0.7% | | | | | | |
| | | | | | | |
| | Principal | | |
| | Amount ($) | | |
| Austria – 0.7% | | | | | | |
| Erste Group Bank AG, 5.50% | | | | | | |
| (USSW5 377 bps), 5/26/25, | | | | | | |
| Callable 5/26/20 @ 100 (a)(b) | | | | 200,000 | | 211,250 |
| TOTAL YANKEE DOLLAR | | | | | | |
| (COST $198,598) | | | | | | 211,250 |
| | | | | | | |
| Corporate Bonds – 4.8% | | | | | | |
| | | | | | | |
| United States – 4.8% | | | | | | |
| Ball Corp., 4.38%, 12/15/23 | | EUR | | 100,000 | | 133,620 |
| MPT Operating Partnership LP, | | | | | | |
| 4.00%, 8/19/22, Callable 5/19/22 | | | | | | |
| @ 100.00 (a) | | EUR | | 100,000 | | 129,365 |
| Newell Brands, Inc., 3.75%, 10/1/21 | | EUR | | 300,000 | | 392,409 |
| PVH Corp., 3.63%, 7/15/24, Callable | | | | | | |
| 4/15/24 @ 100.00 (a) | | EUR | | 100,000 | | 128,745 |
| Quintiles IMS, Inc., Registered, | | | | | | |
| 3.50%, 10/15/24, Callable 10/15/19 | | | | | | |
| @ 101.75 (a) | | EUR | | 100,000 | | 122,458 |
| Sealed Air Corp., 4.50%, 9/15/23, | | | | | | |
| Callable 6/15/23 @ 100.00 (a) | | EUR | | 100,000 | | 133,358 |
| Spectrum Brand, Inc. Registered, | | | | | | |
| 4.00%, 10/1/26, Callable 10/1/21 | | | | | | |
| @ 102.00 (a) | | EUR | | 100,000 | | 123,441 |
| ZF Friedrichshafen AG, | | | | | | |
| 2.75%, 4/27/23 | | EUR | | 200,000 | | 251,866 |
| | | | | | 1,415,262 |
| TOTAL CORPORATE BONDS | | | | | | |
| (COST $1,216,400) | | | | | | 1,415,262 |
| See notes to financial statements. | HSBC FAMILY OF FUNDS 69 |
| HSBC EURO HIGH YIELD BOND FUND (USD HEDGED) |
| Schedule of Portfolio Investments—as of October 31, 2017 (continued) |
| Investment Companies — 2.7% | | | | | |
| | | | | | |
| | Shares | | Value ($) |
| Northern Institutional Government | | | | | |
| Assets Portfolio, Institutional | | | | | |
| Shares, 0.82% (d) | | 797,886 | | | 797,886 |
| TOTAL INVESTMENT COMPANIES | | | | | |
| (COST $797,886) | | | | | 797,886 |
| TOTAL INVESTMENTS | | | | | |
| IN SECURITIES | | | | | |
| (COST $23,860,761) – 93.5% | | | | | 27,787,850 |
| Other Assets (Liabilities) – 6.5% | | | | | 1,947,202 |
| NET ASSETS – 100% | | | | $ | 29,735,052 |
____________________
| † | | The principal amount is disclosed in local currency and the value is disclosed in U.S. Dollars. |
| (a) | | Represents next call date. Additional subsequent call dates and amounts may apply to this security. |
| (b) | | Variable rate security. The rate presented represents the rate in effect on October 31, 2017. These securities are deemed to have a maturity remaining until the next adjustment of the interest rate or the longer of the demand period or time to the next readjustment. |
| (c) | | Securities are perpetual and, thus, do not have a predetermined maturity date. |
| (d) | | The rate represents the annualized one-day yield that was in effect on October 31, 2017. |
| bps — Basis Points |
| BP0003M — 3 Month GPB LIBOR |
| EUR — Euro |
| EUR003M — 3 Month EUR LIBOR |
| EUSA5 — Euro 5 Year Swap Rate |
| EUSA6 — Euro 6 Year Swap Rate |
| EUSA7 — Euro 7 Year Swap Rate |
| EUSA8 — Euro 8 Year Swap Rate |
| EUSA10 — Euro 10 Year Swap Rate |
| MTN — Medium Term Note |
| USSW5 — USD 5 Year Swap Rate |
The Fund invested, as a percentage of net assets at value, in the following industries, as of October 31, 2017:
| | Percentage of Net Assets |
| Industry | | at Value (%) |
| Banks | | | 14.8 | |
| Insurance | | | 10.3 | |
| Diversified Telecommunication | | | | |
| Services | | | 8.1 | |
| Auto Components | | | 5.9 | |
| Multi-Utilities | | | 4.0 | |
| Electric Utilities | | | 4.0 | |
| Chemicals | | | 3.9 | |
| Containers & Packaging | | | 3.5 | |
| Media | | | 3.4 | |
| Investment Companies | | | 2.7 | |
| Capital Markets | | | 2.7 | |
| Health Care Providers & Services | | | 2.4 | |
| Oil, Gas & Consumable Fuels | | | 2.3 | |
| Construction Materials | | | 2.2 | |
| Automobiles | | | 2.1 | |
| Commercial Services & Supplies | | | 2.0 | |
| Pharmaceuticals | | | 1.9 | |
| Hotels, Restaurants & Leisure | | | 1.7 | |
| Paper & Forest Products | | | 1.6 | |
| Metals & Mining | | | 1.4 | |
| Transportation Infrastructure | | | 1.4 | |
| Household Durables | | | 1.3 | |
| Trading Companies & Distributors | | | 1.0 | |
| Wireless Telecommunication Services | | | 1.0 | |
| Gas Utilities | | | 0.9 | |
| Textiles, Apparel & Luxury Goods | | | 0.9 | |
| Road & Rail | | | 0.8 | |
| Real Estate Management & | | | | |
| Development | | | 0.8 | |
| IT Services | | | 0.8 | |
| Communications Equipment | | | 0.6 | |
| Life Sciences Tools & Services | | | 0.4 | |
| Distributors | | | 0.4 | |
| Equity Real Estate Investment Trusts | | | 0.4 | |
| Diversified Financial Services | | | 0.4 | |
| Household Products | | | 0.4 | |
| Specialty Retail | | | 0.4 | |
| Food & Staples Retailing | | | 0.4 | |
| Machinery | | | 0.3 | |
| Total | | | 93.5 | |
| 70 HSBC FAMILY OF FUNDS | See notes to financial statements. |
| HSBC EURO HIGH YIELD BOND FUND (USD HEDGED) |
| Schedule of Portfolio Investments—as of October 31, 2017 (continued) |
At October 31, 2017, the Fund’s open forward foreign currency exchange contracts were as follows:
Short Contracts
| | | | | | | | | | | | Net |
| | | | | | | | | | | | Unrealized |
| | | | | | | | | | | | Appreciation/ |
| Description and amount of | | Description and amount of | | | | Settlement | | (Depreciation) |
| currency to be purchased | | currency to be sold | | Counterparty | | Date | | ($) |
| U.S. Dollar | | 984,646 | | British Pound | | 745,000 | | Societe Generale | | 11/13/17 | | | (5,008 | ) | |
| U.S. Dollar | | 116,510 | | European Euro | | 100,000 | | Credit Agricole | | 11/13/17 | | | (44 | ) | |
| U.S. Dollar | | 118,266 | | European Euro | | 100,000 | | Credit Agricole | | 11/13/17 | | | 1,713 | | |
| U.S. Dollar | | 28,381,751 | | European Euro | | 23,545,000 | | RBC Dominion Securities | | 11/13/17 | | | 939,337 | | |
| | | | | | | | | | | | | | 935,998 | | |
Long Contracts
| | | | | | | | | | | | Net |
| | | | | | | | | | | | Unrealized |
| | | | | | | | | | | | Appreciation/ |
| Description and amount of | | Description and amount of | | | | Settlement | | (Depreciation) |
| currency to be purchased | | currency to be sold | | Counterparty | | Date | | ($) |
| European Euro | | 200,000 | | U.S. Dollar | | 237,292 | | RBC Dominion Securities | | 11/13/17 | | | | (4,186 | ) | |
| | | | | | | | | | | | | | | (4,186 | ) | |
| | |
| | | | | Total unrealized appreciation | | | | $ | 941,050 | | |
| | | | | Total unrealized depreciation | | | | | (9,238 | ) | |
| | | | | Total net unrealized appreciation/(depreciation) | | | | $ | 931,812 | | |
| See notes to financial statements. | HSBC FAMILY OF FUNDS 71 |
HSBC FAMILY OF FUNDS
Statements of Assets and Liabilities—as of October 31, 2017
| | | | | | | | | | | | | | | | | | | | Asia ex-Japan |
| | Emerging | | Frontier | | Total | | Smaller |
| | Markets | | Markets | | Return | | Companies |
| | Debt Fund | | Fund | | Fund | | Equity Fund |
| Assets: | | | | | | | | | | | | | | | | | | | | | | | | |
| Investments in securities, at value | | | $ | 53,199,259 | | | | | $ | 44,974,757 | | | | | $ | 13,166,888 | | | | | $ | 14,997,214 | | |
| Foreign currency, at value | | | | 859,976 | | | | | | 1,694,497 | | | | | | 76,513 | | | | | | 308,482 | | |
| Cash held as collateral at broker for futures contracts | | | | 3,936 | | | | | | — | | | | | | 12,203 | | | | | | — | | |
| Cash held as collateral at broker for centrally cleared swaps | | | | — | | | | | | — | | | | | | 11,371 | | | | | | — | | |
| Cash held as collateral at custodian for OTC derivatives | | | | — | | | | | | — | | | | | | 230,000 | | | | | | — | | |
| Unrealized appreciation on forward foreign currency exchange contracts | | | | 122,917 | | | | | | — | | | | | | 414,138 | | | | | | — | | |
| Swap agreements, at value | | | | 11,625 | | | | | | — | | | | | | 226,465 | | | | | | — | | |
| Interest and dividends receivable | | | | 689,811 | | | | | | 57,688 | | | | | | 165,589 | | | | | | 6,839 | | |
| Receivable for capital shares issued | | | | 31 | | | | | | 99,510 | | | | | | 49,476 | | | | | | — | | |
| Receivable for investments sold | | | | 560,960 | | | | | | — | | | | | | — | | | | | | 101,800 | | |
| Reclaims receivable | | | | 25,971 | | | | | | 30,878 | | | | | | 96,327 | | | | | | — | | |
| Receivable from Investment Adviser | | | | — | | | | | | — | | | | | | 14,739 | | | | | | 16,999 | | |
| Variation margin on futures contracts | | | | 1,094 | | | | | | — | | | | | | — | | | | | | — | | |
| Prepaid expenses | | | | 10,848 | | | | | | 14,662 | | | | | | 6,802 | | | | | | 10,639 | | |
| Total Assets | | | | 55,486,428 | | | | | | 46,871,992 | | | | | | 14,470,511 | | | | | | 15,441,973 | | |
| Liabilities: | | | | | | | | | | | | | | | | | | | | | | | | |
| Distributions payable | | | | 41,516 | | | | | | — | | | | | | 7,904 | | | | | | — | | |
| Unrealized depreciation on forward foreign currency exchange contracts | | | | 168,279 | | | | | | — | | | | | | 222,569 | | | | | | — | | |
| Swap agreements, at value | | | | 57,980 | | | | | | — | | | | | | 114,149 | | | | | | — | | |
| Payable for investments purchased | | | | — | | | | | | 6,106 | | | | | | — | | | | | | 247,914 | | |
| Cash received as collateral for derivatives | | | | 120,000 | | | | | | — | | | | | | 290,000 | | | | | | — | | |
| Payable for capital shares redeemed | | | | 640 | | | | | | 123,128 | | | | | | 49,494 | | | | | | — | | |
| Accrued foreign capital gains tax | | | | 6,959 | | | | | | 37,134 | | | | | | — | | | | | | 34,530 | | |
| Variation margin on futures contracts | | | | 1,758 | | | | | | — | | | | | | 1,547 | | | | | | — | | |
| Variation margin on centrally cleared swap agreements | | | | — | | | | | | — | | | | | | 611 | | | | | | — | | |
| Accrued expenses and other payables: | | | | | | | | | | | | | | | | | | | | | | | | |
| Investment Management | | | | 10,305 | | | | | | 1,174 | | | | | | — | | | | | | — | | |
| Administration | | | | 1,831 | | | | | | 1,533 | | | | | | 480 | | | | | | 492 | | |
| Shareholder Servicing | | | | 239 | | | | | | 1,846 | | | | | | 472 | | | | | | 132 | | |
| Accounting | | | | 5,157 | | | | | | 4,180 | | | | | | 3,905 | | | | | | 5,177 | | |
| Custodian | | | | 28,983 | | | | | | 66,802 | | | | | | 18,611 | | | | | | 43,044 | | |
| Professional | | | | 19,744 | | | | | | 16,853 | | | | | | 18,045 | | | | | | 22,250 | | |
| Printing | | | | 9,308 | | | | | | 7,934 | | | | | | 2,650 | | | | | | 2,494 | | |
| Transfer Agent | | | | 2,743 | | | | | | 44,998 | | | | | | 14,594 | | | | | | 757 | | |
| Trustee | | | | 104 | | | | | | 78 | | | | | | 41 | | | | | | 16 | | |
| Other | | | | 2,577 | | | | | | 762 | | | | | | 3,597 | | | | | | 2,486 | | |
| Total Liabilities | | | | 478,123 | | | | | | 312,528 | | | | | | 748,669 | | | | | | 359,292 | | |
| Net Assets | | | $ | 55,008,305 | | | | | $ | 46,559,464 | | | | | $ | 13,721,842 | | | | | $ | 15,082,681 | | |
| 72 HSBC FAMILY OF FUNDS | See notes to financial statements. |
HSBC FAMILY OF FUNDS
Statements of Assets and Liabilities—as of October 31, 2017 (continued)
| | | | | | | | | | | | | | | | | | | | Asia ex-Japan |
| | Emerging | | Frontier | | Total | | Smaller |
| | Markets | | Markets | | Return | | Companies |
| | Debt Fund | | Fund | | Fund | | Equity Fund |
| Composition of Net Assets: | | | | | | | | | | | | | | | | | | | | | | | | |
| Capital | | | $ | 57,132,193 | | | | | $ | 71,179,940 | | | | | $ | 24,844,129 | | | | | $ | 11,080,340 | | |
| Accumulated net investment income/(loss) | | | | 15,985 | | | | | | 377,600 | | | | | | (491,320 | ) | | | | | 123,890 | | |
| Accumulated net realized gains/(losses) from investments | | | | (1,779,473 | ) | | | | | (31,048,204 | ) | | | | | (10,880,410 | ) | | | | | 1,646,766 | | |
| Net unrealized appreciation/(depreciation) on investments | | | | (360,400 | ) | | | | | 6,050,128 | | | | | | 249,443 | | | | | | 2,231,685 | | |
| Net Assets | | | $ | 55,008,305 | | | | | $ | 46,559,464 | | | | | $ | 13,721,842 | | | | | $ | 15,082,681 | | |
| | | | | | | | | | | | | | | | | | | | | | | | | |
| Net Assets: | | | | | | | | | | | | | | | | | | | | | | | | |
| Class A Shares | | | $ | 1,639,829 | | | | | $ | 8,676,055 | | | | | $ | 1,292,159 | | | | | $ | 896,378 | | |
| Class I Shares | | | | 53,368,476 | | | | | | 37,883,409 | | | | | | 12,429,683 | | | | | | 14,186,303 | | |
| Total | | | $ | 55,008,305 | | | | | $ | 46,559,464 | | | | | $ | 13,721,842 | | | | | $ | 15,082,681 | | |
| Shares Outstanding: | | | | | | | | | | | | | | | | | | | | | | | | |
| ($0.001 par value, unlimited number of shares authorized): | | | | | | | | | | | | | | | | | | | | | | | | |
| Class A Shares | | | | 158,638 | | | | | | 615,519 | | | | | | 129,490 | | | | | | 65,187 | | |
| Class I Shares | | | | 5,184,683 | | | | | | 2,672,003 | | | | | | 1,235,982 | | | | | | 1,030,908 | | |
| Net Asset Value, Offering Price and Redemption Price per share: | | | | | | | | | | | | | | | | | | | | | | | | |
| Class A Shares | | | $ | 10.34 | | | | | $ | 14.10 | | | | | $ | 9.98 | | | | | $ | 13.75 | | |
| Class I Shares | | | $ | 10.29 | | | | | $ | 14.18 | | | | | $ | 10.06 | | | | | $ | 13.76 | | |
| Maximum Sales Charge: | | | | | | | | | | | | | | | | | | | | | | | | |
| Class A Shares | | | | 4.75% | | | | | | 5.00% | | | | | | 4.75% | | | | | | 5.00% | | |
| Maximum Offering Price per share | | | | | | | | | | | | | | | | | | | | | | | | |
| (Net Asset Value / (100%-maximum sales charge)) | | | | | | | | | | | | | | | | | | | | | | | | |
| Class A Shares | | | $ | 10.86 | | | | | $ | 14.84 | | | | | $ | 10.48 | | | | | $ | 14.47 | | |
| Investments in securities, at cost | | | $ | 53,587,202 | | | | | $ | 38,887,855 | | | | | $ | 13,242,513 | | | | | $ | 12,731,057 | | |
| Foreign Currency, at cost | | | $ | 874,570 | | | | | $ | 1,693,500 | | | | | $ | 76,161 | | | | | $ | 308,403 | | |
| See notes to financial statements. | HSBC FAMILY OF FUNDS 73 |
HSBC FAMILY OF FUNDS
Statements of Assets and Liabilities—as of October 31, 2017 (continued)
| | | | | | | | | | | | | Global | | Euro |
| Global | | Global | | Equity | | High Yield |
| High Yield | | High Income | | Volatility | | Bond Fund |
| Bond Fund | | Bond Fund | | Focused Fund | | (USD Hedged) |
| Assets: | | | | | | | | | | | | | | | | | | | | | | | |
| Investments in securities, at value | | $ | 29,718,674 | | | | | $ | 27,919,291 | | | | | $ | 11,885,732 | | | | | $ | 27,787,850 | | |
| Foreign currency, at value | | | 138,495 | | | | | | 31,857 | | | | | | — | | | | | | 1,246,313 | | |
| Cash held as collateral at broker for futures contracts | | | — | | | | | | 1,109 | | | | | | — | | | | | | — | | |
| Cash held as collateral at broker for centrally cleared swaps | | | 38,695 | | | | | | — | | | | | | — | | | | | | — | | |
| Unrealized appreciation on forward foreign currency | | | | | | | | | | | | | | | | | | | | | | | |
| exchange contracts | | | 72,624 | | | | | | 102,419 | | | | | | — | | | | | | 941,050 | | |
| Interest and dividends receivable | | | 408,907 | | | | | | 349,331 | | | | | | 16,366 | | | | | | 410,950 | | |
| Receivable for investments sold | | | 80,595 | | | | | | 46,030 | | | | | | — | | | | | | — | | |
| Reclaims receivable | | | — | | | | | | — | | | | | | 14,671 | | | | | | — | | |
| Variation margin on centrally cleared swap agreements | | | 1,007 | | | | | | — | | | | | | — | | | | | | — | | |
| Prepaid expenses | | | 7,907 | | | | | | 7,906 | | | | | | 3,145 | | | | | | 3,157 | | |
| Total Assets | | | 30,466,904 | | | | | | 28,457,943 | | | | | | 11,919,914 | | | | | | 30,389,320 | | |
| Liabilities: | | | | | | | | | | | | | | | | | | | | | | | |
| Distributions payable | | | 11,949 | | | | | | 3,698 | | | | | | — | | | | | | — | | |
| Unrealized depreciation on forward foreign currency | | | | | | | | | | | | | | | | | | | | | | | |
| exchange contracts | | | 6,099 | | | | | | 8,655 | | | | | | — | | | | | | 9,238 | | |
| Swap agreements, at value | | | 8,499 | | | | | | 16,845 | | | | | | — | | | | | | — | | |
| Payable for investments purchased | | | 306,600 | | | | | | 214,710 | | | | | | — | | | | | | — | | |
| Cash received as collateral for derivatives | | | — | | | | | | — | | | | | | — | | | | | | 600,000 | | |
| Payable for capital shares redeemed | | | — | | | | | | 7 | | | | | | — | | | | | | — | | |
| Variation margin on futures contracts | | | — | | | | | | 141 | | | | | | — | | | | | | — | | |
| Accrued expenses and other payables: | | | | | | | | | | | | | | | | | | | | | | | |
| Investment Management | | | 9,773 | | | | | | 11,435 | | | | | | 1,267 | | | | | | 12,033 | | |
| Administration | | | 987 | | | | | | 924 | | | | | | 386 | | | | | | 970 | | |
| Shareholder Servicing | | | 405 | | | | | | 45 | | | | | | — | | | | | | — | | |
| Accounting | | | 7,321 | | | | | | 8,635 | | | | | | 4,053 | | | | | | 5,970 | | |
| Custodian | | | 2,487 | | | | | | 1,811 | | | | | | 2,259 | | | | | | 3,453 | | |
| Professional | | | 16,854 | | | | | | 16,813 | | | | | | 16,061 | | | | | | 16,643 | | |
| Printing | | | 5,529 | | | | | | 5,085 | | | | | | 2,112 | | | | | | 5,443 | | |
| Transfer Agent | | | 461 | | | | | | 417 | | | | | | 246 | | | | | | 173 | | |
| Trustee | | | 54 | | | | | | 51 | | | | | | 22 | | | | | | 57 | | |
| Other | | | 467 | | | | | | 608 | | | | | | 1,315 | | | | | | 288 | | |
| Total Liabilities | | | 377,485 | | | | | | 289,880 | | | | | | 27,721 | | | | | | 654,268 | | |
| Net Assets | | $ | 30,089,419 | | | | | $ | 28,168,063 | | | | | $ | 11,892,193 | | | | | $ | 29,735,052 | | |
| 74 HSBC FAMILY OF FUNDS | See notes to financial statements. |
HSBC FAMILY OF FUNDS
Statements of Assets and Liabilities—as of October 31, 2017 (continued)
| | | | | | | | | | | | | Global | | Euro |
| Global | | Global | | Equity | | High Yield |
| High Yield | | High Income | | Volatility | | Bond Fund |
| Bond Fund | | Bond Fund | | Focused Fund | | (USD Hedged) |
| Composition of Net Assets: | | | | | | | | | | | | | | | | | | | | | | | |
| Capital | | $ | 29,224,498 | | | | | $ | 26,804,732 | | | | | $ | 10,188,454 | | | | | $ | 25,818,140 | | |
| Accumulated net investment income/(loss) | | | 25,056 | | | | | | (92,112 | ) | | | | | 172,449 | | | | | | (931,812 | ) | |
| Accumulated net realized gains/(losses) from investments | | | (465,369 | ) | | | | | (19,676 | ) | | | | | 186,855 | | | | | | — | | |
| Net unrealized appreciation/(depreciation) on investments | | | 1,305,234 | | | | | | 1,475,119 | | | | | | 1,344,435 | | | | | | 4,848,724 | | |
| Net Assets | | $ | 30,089,419 | | | | | $ | 28,168,063 | | | | | $ | 11,892,193 | | | | | $ | 29,735,052 | | |
| | | | | | | | | | | | | | | | | | | | | | | | |
| Net Assets: | | | | | | | | | | | | | | | | | | | | | | | |
| Class A Shares | | $ | 2,049,134 | | | | | $ | 292,116 | | | | | $ | 117,892 | | | | | $ | 118,427 | | |
| Class I Shares | | | 28,040,285 | | | | | | 27,875,947 | | | | | | 11,774,301 | | | | | | 29,616,625 | | |
| Total | | $ | 30,089,419 | | | | | $ | 28,168,063 | | | | | $ | 11,892,193 | | | | | $ | 29,735,052 | | |
| Shares Outstanding: | | | | | | | | | | | | | | | | | | | | | | | |
| ($0.001 par value, unlimited number of shares authorized): | | | | | | | | | | | | | | | | | | | | | | | |
| Class A Shares | | | 200,208 | | | | | | 27,953 | | | | | | 10,164 | | | | | | 10,415 | | |
| Class I Shares | | | 2,731,939 | | | | | | 2,656,889 | | | | | | 1,009,236 | | | | | | 2,595,051 | | |
| Net Asset Value, Offering Price and Redemption Price per share: | | | | | | | | | | | | | | | | | | | | | | | |
| Class A Shares | | $ | 10.24 | | | | | $ | 10.45 | | | | | $ | 11.60 | | | | | $ | 11.37 | | |
| Class I Shares | | $ | 10.26 | | | | | $ | 10.49 | | | | | $ | 11.67 | | | | | $ | 11.41 | | |
| Maximum Sales Charge: | | | | | | | | | | | | | | | | | | | | | | | |
| Class A Shares | | | 4.75% | | | | | | 4.75% | | | | | | 5.00% | | | | | | 4.75 | % | |
| Maximum Offering Price per share | | | | | | | | | | | | | | | | | | | | | | | |
| (Net Asset Value / (100%-maximum sales charge)) | | | | | | | | | | | | | | | | | | | | | | | |
| Class A Shares | | $ | 10.75 | | | | | $ | 10.97 | | | | | $ | 12.21 | | | | | $ | 11.94 | | |
| Investments in securities, at cost | | $ | 28,569,088 | | | | | $ | 26,573,755 | | | | | $ | 10,541,324 | | | | | $ | 23,860,761 | | |
| Foreign Currency, at cost | | $ | 139,567 | | | | | $ | 32,101 | | | | | $ | — | | | | | $ | 1,141,306 | | |
| See notes to financial statements. | HSBC FAMILY OF FUNDS 75 |
HSBC FAMILY OF FUNDS
Statements of Operations—For the year ended October 31, 2017
| | Emerging
Markets
Debt Fund | | Frontier
Markets
Fund | | Total
Return
Fund | | Asia ex-Japan
Smaller
Companies
Equity Fund |
| Investment Income: | | | | | | | | | | | | | | | | | | | | | | | | |
| Interest | | | $ | 1,890,507 | | | | | $ | 180,888 | | | | | $ | 946,995 | | | | | $ | — | | |
| Dividends | | | | 5,276 | | | | | | 1,353,786 | | | | | | 20,358 | | | | | | 355,729 | | |
| Foreign tax withholding | | | | (42,378 | ) | | | | | (73,440 | ) | | | | | (4,215 | ) | | | | | (29,158 | ) | |
| Total Investment Income | | | | 1,853,405 | | | | | | 1,461,234 | | | | | | 963,138 | | | | | | 326,571 | | |
| Expenses: | | | | | | | | | | | | | | | | | | | | | | | | |
| Investment Management | | | | 178,145 | | | | | | 545,579 | | | | | | 224,691 | | | | | | 127,515 | | |
| Operational Support: | | | | | | | | | | | | | | | | | | | | | | | | |
| Class A Shares | | | | 1,128 | | | | | | 8,404 | | | | | | 2,485 | | | | | | 477 | | |
| Class I Shares | | | | 1,203 | | | | | | 4,854 | | | | | | 6,348 | | | | | | 1,298 | | |
| Administration: | | | | | | | | | | | | | | | | | | | | | | | | |
| Class A Shares | | | | 418 | | | | | | 2,943 | | | | | | 795 | | | | | | 177 | | |
| Class I Shares | | | | 13,402 | | | | | | 14,042 | | | | | | 9,521 | | | | | | 4,768 | | |
| Class S Shares* | | | | — | | | | | | — | | | | | | — | | | | | | 14 | | |
| Shareholder Servicing: | | | | | | | | | | | | | | | | | | | | | | | | |
| Class A Shares | | | | 1,305 | | | | | | 18,911 | | | | | | 5,109 | | | | | | 811 | | |
| Accounting | | | | 71,397 | | | | | | 58,099 | | | | | | 54,219 | | | | | | 70,556 | | |
| Administrative Services | | | | 25,504 | | | | | | 2,566 | | | | | | 611 | | | | | | — | | |
| Compliance Services | | | | 754 | | | | | | 1,099 | | | | | | 694 | | | | | | 489 | | |
| Custodian | | | | 72,285 | | | | | | 198,057 | | | | | | 74,255 | | | | | | 126,206 | | |
| Printing | | | | 14,557 | | | | | | 16,332 | | | | | | 8,419 | | | | | | 5,375 | | |
| Professional | | | | 103,260 | | | | | | 70,098 | | | | | | 105,572 | | | | | | 74,219 | | |
| Transfer Agent | | | | 22,990 | | | | | | 305,505 | | | | | | 122,276 | | | | | | 9,298 | | |
| Trustee | | | | 1,782 | | | | | | 2,640 | | | | | | 2,163 | | | | | | 727 | | |
| Registration fees | | | | 35,994 | | | | | | 30,757 | | | | | | 37,708 | | | | | | 36,058 | | |
| Other | | | | 9,502 | | | | | | 15,158 | | | | | | 23,922 | | | | | | 10,359 | | |
| Total expenses before fee and expense reductions | | | | 553,626 | | | | | | 1,295,044 | | | | | | 678,788 | | | | | | 468,347 | | |
| Fees voluntarily reduced/reimbursed by Investment Adviser | | | | (1,257 | ) | | | | | (5,695 | ) | | | | | (6,806 | ) | | | | | (1,317 | ) | |
| Fees contractually reduced/reimbursed by Investment Adviser | | | | (364,333 | ) | | | | | (449,360 | ) | | | | | (331,852 | ) | | | | | (282,747 | ) | |
| Fees voluntarily reduced by Sub-Administrator | | | | (5,366 | ) | | | | | (5,914 | ) | | | | | (6,634 | ) | | | | | (3,869 | ) | |
| Net Expenses | | | | 182,670 | | | | | | 834,075 | | | | | | 333,496 | | | | | | 180,414 | | |
| | | | | | | | | | | | | | | | | | | | | | | | | |
| Net Investment Income | | | | 1,670,735 | | | | | | 627,159 | | | | | | 629,642 | | | | | | 146,157 | | |
| | | | | | | | | | | | | | | | | | | | | | | | | |
| Realized/Unrealized Gains/(Losses) from Investments: | | | | | | | | | | | | | | | | | | | | | | | | |
| Net realized gains/(losses) from investments in securities and foreign | | | | | | | | | | | | | | | | | | | | | | | | |
| currency translations (a) | | | | 133,415 | | | | | | (1,141,141 | ) | | | | | (444,507 | ) | | | | | 1,739,607 | | |
| Net realized gains/(losses) from options transactions | | | | — | | | | | | — | | | | | | 16,578 | | | | | | — | | |
| Net realized gains/(losses) from futures contracts | | | | (4,999 | ) | | | | | — | | | | | | (38,591 | ) | | | | | — | | |
| Net realized gains/(losses) from forward foreign currency | | | | | | | | | | | | | | | | | | | | | | | | |
| exchange contracts | | | | 182,527 | | | | | | — | | | | | | 713,708 | | | | | | — | | |
| Net realized gains/(losses) from swap agreements | | | | (36,151 | ) | | | | | — | | | | | | (566,862 | ) | | | | | — | | |
| Change in unrealized appreciation/depreciation on investments in | | | | | | | | | | | | | | | | | | | | | | | | |
| securities, and foreign currency translations (b) | | | | 357,482 | | | | | | 8,390,721 | | | | | | (718,193 | ) | | | | | 1,210,035 | | |
| Change in unrealized appreciation/depreciation on futures contracts | | | | 27,580 | | | | | | — | | | | | | 2,825 | | | | | | — | | |
| Change in unrealized appreciation/depreciation on forward foreign | | | | | | | | | | | | | | | | | | | | | | | | |
| currency contracts | | | | (56,219 | ) | | | | | — | | | | | | (532,555 | ) | | | | | — | | |
| Change in unrealized appreciation/depreciation on swap agreements | | | | 95,249 | | | | | | — | | | | | | 395,946 | | | | | | — | | |
| Net realized/unrealized gains/(losses) on investments | | | | 698,884 | | | | | | 7,249,580 | | | | | | (1,171,651 | ) | | | | | 2,949,642 | | |
| Change in Net Assets Resulting from Operations | | | $ | 2,369,619 | | | | | $ | 7,876,739 | | | | | $ | (542,009 | ) | | | | $ | 3,095,799 | | |
____________________
| * | Class S Shares were liquidated on April 27, 2017 and February 23, 2017 for Total Return Fund and Asia ex-Japan smaller Companies fund, respectively, and are no longer offered. |
| (a) | For Frontier Markets Fund and Asia ex-Japan Smaller Companies Equity Fund, net of foreign capital gains taxes of $122,986 and $11,269, respectively. |
| (b) | For Emerging Markets Debt Fund, Frontier Markets Fund and Asia ex-Japan Smaller Companies Equity Fund, net of change in foreign capital gains taxes of $6,959, $(18,397) and $34,530, respectively. |
| 76 HSBC FAMILY OF FUNDS | See notes to financial statements. |
HSBC FAMILY OF FUNDS
Statements of Operations—For the year ended October 31, 2017 (continued)
| | Global
High Yield
Bond Fund | | Global
High Income
Bond Fund | | Global
Equity
Volatility
Focused Fund | | Euro
High Yield
Bond Fund
(USD Hedged) |
| Investment Income: | | | | | | | | | | | | | | | | | | | | | | | | |
| Interest | | | $ | 1,504,534 | | | | | $ | 1,077,706 | | | | | $ | — | | | | | $ | 1,101,318 | | |
| Dividends | | | | 23,746 | | | | | | 15,820 | | | | | | 321,653 | | | | | | 1,175 | | |
| Foreign tax withholding | | | | — | | | | | | (3,573 | ) | | | | | (21,984 | ) | | | | | (492 | ) | |
| Total Investment Income | | | | 1,528,280 | | | | | | 1,089,953 | | | | | | 299,669 | | | | | | 1,102,001 | | |
| Expenses: | | | | | | | | | | | | | | | | | | | | | | | | |
| Investment Management | | | | 187,212 | | | | | | 176,665 | | | | | | 82,871 | | | | | | 184,518 | | |
| Operational Support: | | | | | | | | | | | | | | | | | | | | | | | | |
| Class A Shares | | | | 1,722 | | | | | | 247 | | | | | | 110 | | | | | | 113 | | |
| Administration: | | | | | | | | | | | | | | | | | | | | | | | | |
| Class A Shares | | | | 671 | | | | | | 97 | | | | | | 43 | | | | | | 44 | | |
| Class I Shares | | | | 10,534 | | | | | | 10,477 | | | | | | 4,255 | | | | | | 11,000 | | |
| Shareholder Servicing: | | | | | | | | | | | | | | | | | | | | | | | | |
| Class A Shares | | | | 4,087 | | | | | | 354 | | | | | | — | | | | | | — | | |
| Accounting | | | | 83,164 | | | | | | 96,307 | | | | | | 53,428 | | | | | | 68,874 | | |
| Compliance Services | | | | 700 | | | | | | 667 | | | | | | 273 | | | | | | 644 | | |
| Custodian | | | | 12,169 | | | | | | 9,257 | | | | | | 8,265 | | | | | | 13,661 | | |
| Printing | | | | 9,557 | | | | | | 11,857 | | | | | | 3,856 | | | | | | 9,575 | | |
| Professional | | | | 70,643 | | | | | | 72,833 | | | | | | 55,910 | | | | | | 58,630 | | |
| Transfer Agent | | | | 7,166 | | | | | | 7,271 | | | | | | 5,230 | | | | | | 5,239 | | |
| Trustee | | | | 1,715 | | | | | | 1,630 | | | | | | 655 | | | | | | 1,703 | | |
| Registration fees | | | | 34,616 | | | | | | 34,252 | | | | | | 28,116 | | | | | | 28,851 | | |
| Other | | | | 8,315 | | | | | | 7,514 | | | | | | 11,194 | | | | | | 5,863 | | |
| Total expenses before fee and expense reductions | | | | 432,271 | | | | | | 429,428 | | | | | | 254,206 | | | | | | 388,715 | | |
| Fees contractually reduced/reimbursed by Investment Adviser | | | | (192,107 | ) | | | | | (207,463 | ) | | | | | (146,307 | ) | | | | | (158,304 | ) | |
| Fees voluntarily reduced by Sub-Administrator | | | | (3,532 | ) | | | | | (3,532 | ) | | | | | (2,453 | ) | | | | | (2,880 | ) | |
| Net Expenses | | | | 236,632 | | | | | | 218,433 | | | | | | 105,446 | | | | | | 227,531 | | |
| | | | | | | | | | | | | | | | | | | | | | | | | |
| Net Investment Income | | | | 1,291,648 | | | | | | 871,520 | | | | | | 194,223 | | | | | | 874,470 | | |
| | | | | | | | | | | | | | | | | | | | | | | | | |
| Realized/Unrealized Gains/(Losses) from Investments: | | | | | | | | | | | | | | | | | | | | | | | | |
| Net realized gains/(losses) from investments in securities and foreign | | | | | | | | | | | | | | | | | | | | | | | | |
| currency translations | | | | 121,360 | | | | | | 272,834 | | | | | | 526,519 | | | | | | 715,230 | | |
| Net realized gains/(losses) from forward foreign currency | | | | | | | | | | | | | | | | | | | | | | | | |
| exchange contracts | | | | (240,538 | ) | | | | | (400,174 | ) | | | | | — | | | | | | (2,182,690 | ) | |
| Net realized gains/(losses) from swap agreements | | | | 103,796 | | | | | | 6,692 | | | | | | — | | | | | | — | | |
| Change in unrealized appreciation/depreciation on investments in | | | | | | | | | | | | | | | | | | | | | | | | |
| securities, and foreign currency translations | | | | 910,375 | | | | | | 731,296 | | | | | | 1,064,616 | | | | | | 2,523,871 | | |
| Change in unrealized appreciation/depreciation on futures contracts | | | | — | | | | | | 28 | | | | | | — | | | | | | — | | |
| Change in unrealized appreciation/depreciation on forward foreign | | | | | | | | | | | | | | | | | | | | | | | | |
| currency contracts | | | | (12,701 | ) | | | | | (6,293 | ) | | | | | — | | | | | | 365,253 | | |
| Change in unrealized appreciation/depreciation on swap agreements | | | | 16,436 | | | | | | 23,952 | | | | | | — | | | | | | — | | |
| Net realized/unrealized gains/(losses) on investments | | | | 898,728 | | | | | | 628,335 | | | | | | 1,591,135 | | | | | | 1,421,664 | | |
| Change in Net Assets Resulting from Operations | | | $ | 2,190,376 | | | | | $ | 1,499,855 | | | | | $ | 1,785,358 | | | | | $ | 2,296,134 | | |
| See notes to financial statements. | HSBC FAMILY OF FUNDS 77 |
HSBC FAMILY OF FUNDS
Statements of Changes in Net Assets
| | Emerging Markets Debt Fund | | Frontier Markets Fund |
| | For the year | | For the year | | For the year | | For the year |
| | ended | | ended | | ended | | ended |
| | October 31, | | October 31, | | October 31, | | October 31, |
| | 2017 | | 2016 | | 2017 | | 2016 |
| Investment Activities: | | | | | | | | | | | | | | | | | | | | | | | | |
| Operations | | | | | | | | | | | | | | | | | | | | | | | | |
| Net investment income/(loss) | | | $ | 1,670,735 | | | | | $ | 416,910 | | | | | $ | 627,159 | | | | | $ | 1,264,074 | | |
| Net realized gains/(losses) from investments | | | | 274,792 | | | | | | (14,735 | ) | | | | | (1,141,141 | ) | | | | | (22,772,343 | ) | |
| Change in unrealized appreciation/depreciation | | | | | | | | | | | | | | | | | | | | | | | | |
| on investments | | | | 424,092 | | | | | | 484,114 | | | | | | 8,390,721 | | | | | | 17,195,522 | | |
| Change in net assets resulting from operations | | | | 2,369,619 | | | | | | 886,289 | | | | | | 7,876,739 | | | | | | (4,312,747 | ) | |
| | | | | | | | | | | | | | | | | | | | | | | | | |
| Distributions: | | | | | | | | | | | | | | | | | | | | | | | | |
| Net investment income: | | | | | | | | | | | | | | | | | | | | | | | | |
| Class A Shares | | | | (51,279 | ) | | | | | (28,346 | ) | | | | | (130,080 | ) | | | | | (743,705 | ) | |
| Class I Shares | | | | (1,700,117 | ) | | | | | (618,124 | ) | | | | | (853,448 | ) | | | | | (3,425,846 | ) | |
| Change in net assets resulting from distributions | | | | (1,751,396 | ) | | | | | (646,470 | ) | | | | | (983,528 | ) | | | | | (4,169,551 | ) | |
| Change in net assets resulting from capital transactions | | | | 43,518,129 | | | | | | (1,376,368 | ) | | | | | (9,609,674 | ) | | | | | (84,008,071 | ) | |
| Change in net assets | | | | 44,136,352 | | | | | | (1,136,549 | ) | | | | | (2,716,463 | ) | | | | | (92,490,369 | ) | |
| | | | | | | | | | | | | | | | | | | | | | | | | |
| Net Assets: | | | | | | | | | | | | | | | | | | | | | | | | |
| Beginning of period | | | | 10,871,953 | | | | | | 12,008,502 | | | | | | 49,275,927 | | | | | | 141,766,296 | | |
| End of period | | | $ | 55,008,305 | | | | | $ | 10,871,953 | | | | | $ | 46,559,464 | | | | | $ | 49,275,927 | | |
| Accumulated net investment income (loss) | | | $ | 15,985 | | | | | $ | 44,786 | | | | | $ | 377,600 | | | | | $ | 964,749 | | |
| 78 HSBC FAMILY OF FUNDS | See notes to financial statements. |
HSBC FAMILY OF FUNDS
Statements of Changes in Net Assets (continued)
| | Emerging Markets Debt Fund | | Frontier Markets Fund |
| | For the year | | For the year | | For the year | | For the year |
| | ended | | ended | | ended | | ended |
| | October 31, | | October 31, | | October 31, | | October 31, |
| | 2017 | | 2016 | | 2017 | | 2016 |
| CAPITAL TRANSACTIONS: | | | | | | | | | | | | | | | | | | | | | | | | |
| Class A Shares: | | | | | | | | | | | | | | | | | | | | | | | | |
| Proceeds from shares issued | | | $ | 127,899 | | | | | $ | 271,090 | | | | | $ | 1,967,929 | | | | | $ | 1,484,893 | | |
| Proceeds from merger (Note 9) | | | | 1,104,162 | | | | | | — | | | | | | — | | | | | | — | | |
| Dividends reinvested | | | | 47,154 | | | | | | 28,256 | | | | | | 110,103 | | | | | | 699,224 | | |
| Value of shares redeemed | | | | (113,606 | ) | | | | | (601,768 | ) | | | | | (1,725,833 | ) | | | | | (14,452,409 | ) | |
| Class A Shares capital transactions | | | | 1,165,609 | | | | | | (302,422 | ) | | | | | 352,199 | | | | | | (12,268,292 | ) | |
| | | | | | | | | | | | | | | | | | | | | | | | | |
| Class I Shares: | | | | | | | | | | | | | | | | | | | | | | | | |
| Proceeds from shares issued | | | | 1,262,718 | | | | | | 4,217,767 | | | | | | 8,242,571 | | | | | | 4,171,934 | | |
| Proceeds from merger (Note 9) | | | | 49,003,085 | | | | | | — | | | | | | — | | | | | | — | | |
| Dividends reinvested | | | | 1,487,387 | | | | | | 591,577 | | | | | | 248,085 | | | | | | 420,590 | | |
| Value of shares redeemed | | | | (9,400,670 | ) | | | | | (5,883,290 | ) | | | | | (18,452,529 | ) | | | | | (76,332,303 | ) | |
| Class I Shares capital transactions | | | | 42,352,520 | | | | | | (1,073,946 | ) | | | | | (9,961,873 | ) | | | | | (71,739,779 | ) | |
| Change in net assets resulting from capital transactions | | | $ | 43,518,129 | | | | | $ | (1,376,368 | ) | | | | $ | (9,609,674 | ) | | | | $ | (84,008,071 | ) | |
| | | | | | | | | | | | | | | | | | | | | | | | | |
| SHARE TRANSACTIONS: | | | | | | | | | | | | | | | | | | | | | | | | |
| Class A Shares: | | | | | | | | | | | | | | | | | | | | | | | | |
| Issued | | | | 12,171 | | | | | | 26,866 | | | | | | 148,167 | | | | | | 126,624 | | |
| Proceeds from merger (Note 9) | | | | 108,147 | | | | | | — | | | | | | — | | | | | | — | | |
| Reinvested | | | | 4,544 | | | | | | 2,846 | | | | | | 9,549 | | | | | | 64,326 | | |
| Redeemed | | | | (11,224 | ) | | | | | (59,729 | ) | | | | | (134,146 | ) | | | | | (1,396,242 | ) | |
| Change in Class A Shares | | | | 113,638 | | | | | | (30,017 | ) | | | | | 23,570 | | | | | | (1,205,292 | ) | |
| | | | | | | | | | | | | | | | | | | | | | | | | |
| Class I Shares: | | | | | | | | | | | | | | | | | | | | | | | | |
| Issued | | | | 126,794 | | | | | | 414,365 | | | | | | 619,935 | | | | | | 366,943 | | |
| Proceeds from merger (Note 9) | | | | 4,823,546 | | | | | | — | | | | | | — | | | | | | — | | |
| Reinvested | | | | 143,748 | | | | | | 59,821 | | | | | | 21,461 | | | | | | 38,551 | | |
| Redeemed | | | | (926,213 | ) | | | | | (594,321 | ) | | | | | (1,480,772 | ) | | | | | (6,739,260 | ) | |
| Change in Class I Shares | | | | 4,167,875 | | | | | | (120,135 | ) | | | | | (839,376 | ) | | | | | (6,333,766 | ) | |
| See notes to financial statements. | HSBC FAMILY OF FUNDS 79 |
HSBC FAMILY OF FUNDS
Statements of Changes in Net Assets (continued)
| | Total Return Fund | | Asia ex-Japan Smaller
Companies Equity Fund |
| | For the year | | For the year | | For the year | | For the year |
| | ended | | ended | | ended | | ended |
| | October 31, | | October 31, | | October 31, | | October 31, |
| | 2017 | | 2016 | | 2017 | | 2016 |
| Investment Activities: | | | | | | | | | | | | | | | | | | | | | | | | |
| Operations: | | | | | | | | | | | | | | | | | | | | | | | | |
| Net investment income/(loss) | | | $ | 629,642 | | | | | $ | 6,809,169 | | | | | $ | 146,157 | | | | | $ | 158,063 | | |
| Net realized gains/(losses) from investments | | | | (319,674 | ) | | | | | (30,370,907 | ) | | | | | 1,739,607 | | | | | | 32,179 | | |
| Change in unrealized appreciation/depreciation | | | | | | | | | | | | | | | | | | | | | | | | |
| on investments | | | | (851,977 | ) | | | | | 30,616,780 | | | | | | 1,210,035 | | | | | | 1,419,930 | | |
| Change in net assets resulting from operations | | | | (542,009 | ) | | | | | 7,055,042 | | | | | | 3,095,799 | | | | | | 1,610,172 | | |
| | | | | | | | | | | | | | | | | | | | | | | | | |
| Distributions: | | | | | | | | | | | | | | | | | | | | | | | | |
| Net investment income: | | | | | | | | | | | | | | | | | | | | | | | | |
| Class A Shares | | | | (11,896 | ) | | | | | (419,124 | ) | | | | | (1,937 | ) | | | | | (4,956 | ) | |
| Class I Shares | | | | (127,620 | ) | | | | | (27,626,404 | ) | | | | | (161,034 | ) | | | | | (164,415 | ) | |
| Class S Shares* | | | | — | | | | | | (1,555,057 | ) | | | | | (1,732 | ) | | | | | (1,774 | ) | |
| Net realized gains: | | | | | | | | | | | | | | | | | | | | | | | | |
| Class A Shares | | | | — | | | | | | (12,753 | ) | | | | | — | | | | | | — | | |
| Class I Shares | | | | — | | | | | | (837,740 | ) | | | | | — | | | | | | — | | |
| Class S Shares* | | | | — | | | | | | (44,984 | ) | | | | | — | | | | | | — | | |
| Change in net assets resulting from distributions | | | | (139,516 | ) | | | | | (30,496,062 | ) | | | | | (164,703 | ) | | | | | (171,145 | ) | |
| Change in net assets resulting from capital transactions | | | | (57,765,966 | ) | | | | | (1,119,075,724 | ) | | | | | 743,930 | | | | | | 255,188 | | |
| Change in net assets | | | | (58,447,491 | ) | | | | | (1,142,516,744 | ) | | | | | 3,675,026 | | | | | | 1,694,215 | | |
| | | | | | | | | | | | | | | | | | | | | | | | | |
| Net Assets: | | | | | | | | | | | | | | | | | | | | | | | | |
| Beginning of period | | | | 72,169,333 | | | | | | 1,214,686,077 | | | | | | 11,407,655 | | | | | | 9,713,440 | | |
| End of period | | | $ | 13,721,842 | | | | | $ | 72,169,333 | | | | | $ | 15,082,681 | | | | | $ | 11,407,655 | | |
| Accumulated net investment income (loss) | | | $ | (491,320 | ) | | | | $ | (861,297 | ) | | | | $ | 123,890 | | | | | $ | 134,404 | | |
____________________
| * | Class S Shares were liquidated on April 27, 2017 and February 23, 2017 for Total Return Fund and Asia ex-Japan smaller Companies fund, respectively, and are no longer offered. |
| 80 HSBC FAMILY OF FUNDS | See notes to financial statements. |
HSBC FAMILY OF FUNDS
Statements of Changes in Net Assets (continued)
| | Total Return Fund | | Asia ex-Japan Smaller
Companies Equity Fund |
| | For the year | | For the year | | For the year | | For the year |
| | ended | | ended | | ended | | ended |
| | October 31, | | October 31, | | October 31, | | October 31, |
| | 2017 | | 2016 | | 2017 | | 2016 |
| CAPITAL TRANSACTIONS: | | | | | | | | | | | | | | | | | | | | | | | | |
| Class A Shares: | | | | | | | | | | | | | | | | | | | | | | | | |
| Proceeds from shares issued | | | $ | 1,094,795 | | | | | $ | 3,448,491 | | | | | $ | 615,785 | | | | | $ | 316,607 | | |
| Dividends reinvested | | | | 8,820 | | | | | | 423,157 | | | | | | 1,744 | | | | | | 4,001 | | |
| Value of shares redeemed | | | | (7,458,943 | ) | | | | | (3,478,104 | ) | | | | | (21,911 | ) | | | | | (291,452 | ) | |
| Class A Shares capital transactions | | | | (6,355,328 | ) | | | | | 393,544 | | | | | | 595,618 | | | | | | 29,156 | | |
| | | | | | | | | | | | | | | | | | | | | | | | | |
| Class I Shares: | | | | | | | | | | | | | | | | | | | | | | | | |
| Proceeds from shares issued | | | | 3,158,792 | | | | | | 41,522,923 | | | | | | 128,538 | | | | | | 59,843 | | |
| Dividends reinvested | | | | 98,996 | | | | | | 4,215,497 | | | | | | 136,787 | | | | | | 164,415 | | |
| Value of shares redeemed | | | | (54,665,259 | ) | | | | | (1,140,336,346 | ) | | | | | — | | | | | | — | | |
| Class I Shares capital transactions | | | | (51,407,471 | ) | | | | | (1,094,597,926 | ) | | | | | 265,325 | | | | | | 224,258 | | |
| | | | | | | | | | | | | | | | | | | | | | | | | |
| Class S Shares:* | | | | | | | | | | | | | | | | | | | | | | | | |
| Dividends reinvested | | | | — | | | | | | 1,600,041 | | | | | | 1,472 | | | | | | 1,774 | | |
| Value of shares redeemed | | | | (3,167 | ) | | | | | (26,471,383 | ) | | | | | (118,485 | ) | | | | | — | | |
| Class S Shares capital transactions | | | | (3,167 | ) | | | | | (24,871,342 | ) | | | | | (117,013 | ) | | | | | 1,774 | | |
| Change in net assets resulting from capital transactions | | | $ | (57,765,966 | ) | | | | $ | (1,119,075,724 | ) | | | | $ | 743,930 | | | | | $ | 255,188 | | |
| | | | | | | | | | | | | | | | | | | | | | | | | |
| SHARE TRANSACTIONS: | | | | | | | | | | | | | | | | | | | | | | | | |
| Class A Shares: | | | | | | | | | | | | | | | | | | | | | | | | |
| Issued | | | | 108,831 | | | | | | 352,107 | | | | | | 50,504 | | | | | | 33,533 | | |
| Reinvested | | | | 878 | | | | | | 44,869 | | | | | | 170 | | | | | | 418 | | |
| Redeemed | | | | (763,471 | ) | | | | | (355,399 | ) | | | | | (1,838 | ) | | | | | (33,879 | ) | |
| Change in Class A Shares | | | | (653,762 | ) | | | | | 41,577 | | | | | | 48,836 | | | | | | 72 | | |
| | | | | | | | | | | | | | | | | | | | | | | | | |
| Class I Shares: | | | | | | | | | | | | | | | | | | | | | | | | |
| Issued | | | | 317,456 | | | | | | 4,321,448 | | | | | | 11,282 | | | | | | 5,990 | | |
| Reinvested | | | | 9,782 | | | | | | 444,859 | | | | | | 13,384 | | | | | | 17,216 | | |
| Redeemed | | | | (5,522,845 | ) | | | | | (113,869,906 | ) | | | | | — | | | | | | — | | |
| Change in Class I Shares | | | | (5,195,607 | ) | | | | | (109,103,599 | ) | | | | | 24,666 | | | | | | 23,206 | | |
| | | | | | | | | | | | | | | | | | | | | | | | | |
| Class S Shares:* | | | | | | | | | | | | | | | | | | | | | | | | |
| Reinvested | | | | — | | | | | | 169,427 | | | | | | 144 | | | | | | 185 | | |
| Redeemed | | | | (315 | ) | | | | | (2,719,904 | ) | | | | | (10,352 | ) | | | | | — | | |
| Change in Class S Shares | | | | (315 | ) | | | | | (2,550,477 | ) | | | | | (10,208 | ) | | | | | 185 | | |
____________________
| * | Class S Shares were liquidated on April 27, 2017 and February 23, 2017 for Total Return Fund and Asia ex-Japan smaller Companies fund, respectively, and are no longer offered. |
| See notes to financial statements. | HSBC FAMILY OF FUNDS 81 |
HSBC FAMILY OF FUNDS
Statements of Changes in Net Assets (continued)
| | Global High Yield
Bond Fund | | Global High Income
Bond Fund |
| | For the year | | For the year | | For the year | | For the year |
| | ended | | ended | | ended | | ended |
| | October 31, | | October 31, | | October 31, | | October 31, |
| | 2017 | | 2016 | | 2017 | | 2016 |
| Investment Activities: | | | | | | | | | | | | | | | | | | | | | | | | |
| Operations: | | | | | | | | | | | | | | | | | | | | | | | | |
| Net investment income/(loss) | | | $ | 1,291,648 | | | | | $ | 1,155,494 | | | | | $ | 871,520 | | | | | $ | 849,872 | | |
| Net realized gains/(losses) from investments | | | | (15,382 | ) | | | | | (367,434 | ) | | | | | (120,648 | ) | | | | | (51,313 | ) | |
| Change in unrealized appreciation/depreciation on investments | | | | 914,110 | | | | | | 1,073,275 | | | | | | 748,983 | | | | | | 1,045,319 | | |
| Change in net assets resulting from operations | | | | 2,190,376 | | | | | | 1,861,335 | | | | | | 1,499,855 | | | | | | 1,843,878 | | |
| | | | | | | | | | | | | | | | | | | | | | | | | |
| Distributions: | | | | | | | | | | | | | | | | | | | | | | | | |
| Net investment income: | | | | | | | | | | | | | | | | | | | | | | | | |
| Class A Shares | | | | (74,068 | ) | | | | | (7,575 | ) | | | | | (7,186 | ) | | | | | (2,769 | ) | |
| Class I Shares | | | | (1,287,782 | ) | | | | | (1,051,239 | ) | | | | | (863,926 | ) | | | | | (732,511 | ) | |
| Change in net assets resulting from distributions | | | | (1,361,850 | ) | | | | | (1,058,814 | ) | | | | | (871,112 | ) | | | | | (735,280 | ) | |
| Change in net assets resulting from capital transactions | | | | 2,535,293 | | | | | | 1,405,039 | | | | | | 927,563 | | | | | | 708,469 | | |
| Change in net assets | | | | 3,363,819 | | | | | | 2,207,560 | | | | | | 1,556,306 | | | | | | 1,817,067 | | |
| | | | | | | | | | | | | | | | | | | | | | | | | |
| Net Assets: | | | | | | | | | | | | | | | | | | | | | | | | |
| Beginning of period | | | | 26,725,600 | | | | | | 24,518,040 | | | | | | 26,611,757 | | | | | | 24,794,690 | | |
| End of period | | | $ | 30,089,419 | | | | | $ | 26,725,600 | | | | | $ | 28,168,063 | | | | | $ | 26,611,757 | | |
| Accumulated net investment income (loss) | | | $ | 25,056 | | | | | $ | 182,535 | | | | | $ | (92,112 | ) | | | | $ | 169,021 | | |
| 82 HSBC FAMILY OF FUNDS | See notes to financial statements. |
HSBC FAMILY OF FUNDS
Statements of Changes in Net Assets (continued)
| | Global High Yield
Bond Fund | | Global High Income
Bond Fund |
| | For the year
ended
October 31,
2017 | | For the year
ended
October 31,
2016 | | For the year
ended
October 31,
2017 | | For the year
ended
October 31,
2016 |
| CAPITAL TRANSACTIONS: | | | | | | | | | | | | | | | | | | | | | | | | |
| Class A Shares: | | | | | | | | | | | | | | | | | | | | | | | | |
| Proceeds from shares issued | | | $ | 1,424,531 | | | | | $ | 408,191 | | | | | $ | 169,516 | | | | | $ | 1,047 | | |
| Dividends reinvested | | | | 72,813 | | | | | | 7,334 | | | | | | 6,687 | | | | | | 2,598 | | |
| Value of shares redeemed | | | | (59,691 | ) | | | | | — | | | | | | — | | | | | | — | | |
| Class A Shares capital transactions | | | | 1,437,653 | | | | | | 415,525 | | | | | | 176,203 | | | | | | 3,645 | | |
| | | | | | | | | | | | | | | | | | | | | | | | | |
| Class I Shares: | | | | | | | | | | | | | | | | | | | | | | | | |
| Proceeds from shares issued | | | | — | | | | | | — | | | | | | 40,029 | | | | | | 14,801 | | |
| Dividends reinvested | | | | 1,097,640 | | | | | | 989,514 | | | | | | 737,268 | | | | | | 690,079 | | |
| Value of shares redeemed | | | | — | | | | | | — | | | | | | (25,937 | ) | | | | | (56 | ) | |
| Class I Shares capital transactions | | | | 1,097,640 | | | | | | 989,514 | | | | | | 751,360 | | | | | | 704,824 | | |
| Change in net assets resulting from capital transactions | | | $ | 2,535,293 | | | | | $ | 1,405,039 | | | | | $ | 927,563 | | | | | $ | 708,469 | | |
| | | | | | | | | | | | | | | | | | | | | | | | | |
| SHARE TRANSACTIONS: | | | | | | | | | | | | | | | | | | | | | | | | |
| Class A Shares: | | | | | | | | | | | | | | | | | | | | | | | | |
| Issued | | | | 142,914 | | | | | | 40,712 | | | | | | 16,850 | | | | | | 101 | | |
| Reinvested | | | | 7,265 | | | | | | 756 | | | | | | 661 | | | | | | 262 | | |
| Redeemed | | | | (5,928 | ) | | | | | — | | | | | | — | | | | | | — | | |
| Change in Class A Shares | | | | 144,251 | | | | | | 41,468 | | | | | | 17,511 | | | | | | 363 | | |
| | | | | | | | | | | | | | | | | | | | | | | | | |
| Class I Shares: | | | | | | | | | | | | | | | | | | | | | | | | |
| Issued | | | | — | | | | | | — | | | | | | 3,881 | | | | | | 1,460 | | |
| Reinvested | | | | 109,281 | | | | | | 102,982 | | | | | | 72,746 | | | | | | 69,540 | | |
| Redeemed | | | | — | | | | | | — | | | | | | (2,558 | ) | | | | | (5 | ) | |
| Change in Class I Shares | | | | 109,281 | | | | | | 102,982 | | | | | | 74,069 | | | | | | 70,995 | | |
| See notes to financial statements. | | HSBC FAMILY OF FUNDS 83 |
HSBC FAMILY OF FUNDS
Statements of Changes in Net Assets (continued)
| | Global Equity Volatility
Focused Fund | | Euro High Yield Bond
Fund (USD Hedged) |
| | For the year
ended
October 31,
2017 | | For the period
Nov. 4, 2015(a)
through
Oct. 31, 2016 | | For the year
ended
October 31,
2017 | | For the period
Jan. 19, 2016(a)
through
Oct. 31, 2016 |
| Investment Activities: | | | | | | | | | | | | | | | | | | | | | | | | |
| Operations: | | | | | | | | | | | | | | | | | | | | | | | | |
| Net investment income/(loss) | | | $ | 194,223 | | | | | $ | 172,612 | | | | | $ | 874,470 | | | | | $ | 717,663 | | |
| Net realized gains/(losses) from investments | | | | 526,519 | | | | | | (339,267 | ) | | | | | (1,467,460 | ) | | | | | (36,943 | ) | |
| Change in unrealized appreciation/depreciation on investments | | | | 1,064,616 | | | | | | 279,819 | | | | | | 2,889,124 | | | | | | 1,959,600 | | |
| Change in net assets resulting from operations | | | | 1,785,358 | | | | | | 113,164 | | | | | | 2,296,134 | | | | | | 2,640,320 | | |
| | | | | | | | | | | | | | | | | | | | | | | | | |
| Distributions: | | | | | | | | | | | | | | | | | | | | | | | | |
| Net investment income: | | | | | | | | | | | | | | | | | | | | | | | | |
| Class A Shares | | | | (1,680 | ) | | | | | (238 | ) | | | | | (2,707 | ) | | | | | (1,174 | ) | |
| Class I Shares | | | | (174,001 | ) | | | | | (28,041 | ) | | | | | (687,587 | ) | | | | | (299,738 | ) | |
| Net realized gains: | | | | | | | | | | | | | | | | | | | | | | | | |
| Class A Shares | | | | — | | | | | | — | | | | | | (711 | ) | | | | | — | | |
| Class I Shares | | | | — | | | | | | — | | | | | | (177,087 | ) | | | | | — | | |
| Tax return of capital: | | | | | | | | | | | | | | | | | | | | | | | | |
| Class A Shares | | | | — | | | | | | — | | | | | | (696 | ) | | | | | — | | |
| Class I Shares | | | | — | | | | | | — | | | | | | (176,629 | ) | | | | | — | | |
| Change in net assets resulting from distributions | | | | (175,681 | ) | | | | | (28,279 | ) | | | | | (1,045,417 | ) | | | | | (300,912 | ) | |
| Change in net assets resulting from capital transactions | | | | 169,352 | | | | | | 10,028,279 | | | | | | 888,932 | | | | | | 25,255,995 | | |
| Change in net assets | | | | 1,779,029 | | | | | | 10,113,164 | | | | | | 2,139,649 | | | | | | 27,595,403 | | |
| | | | | | | | | | | | | | | | | | | | | | | | | |
| Net Assets: | | | | | | | | | | | | | | | | | | | | | | | | |
| Beginning of period | | | | 10,113,164 | | | | | | — | | | | | | 27,595,403 | | | | | | — | | |
| End of period | | | $ | 11,892,193 | | | | | $ | 10,113,164 | | | | | $ | 29,735,052 | | | | | $ | 27,595,403 | | |
| Accumulated net investment income (loss) | | | $ | 172,449 | | | | | $ | 152,883 | | | | | $ | (931,812 | ) | | | | $ | 213,210 | | |
____________________
| (a) | | Commencement of operations. |
| 84 HSBC FAMILY OF FUNDS | | See notes to financial statements. |
HSBC FAMILY OF FUNDS
Statements of Changes in Net Assets (continued)
| | Global Equity Volatility
Focused Fund | | Euro High Yield Bond
Fund (USD Hedged) |
| | | For the year
ended
October 31,
2017 | | For the period
Nov. 4, 2015(a)
through
Oct. 31, 2016 | | For the year
ended
October 31,
2017 | | For the period
Jan. 19, 2016(a)
through
Oct. 31, 2016 |
| CAPITAL TRANSACTIONS: | | | | | | | | | | | | | | | | | | | | | | | | |
| Class A Shares: | | | | | | | | | | | | | | | | | | | | | | | | |
| Proceeds from shares issued | | | $ | — | | | | | $ | 100,000 | | | | | $ | — | | | | | $ | 100,000 | | |
| Dividends reinvested | | | | 1,429 | | | | | | 238 | | | | | | 3,498 | | | | | | 999 | | |
| Class A Shares capital transactions | | | | 1,429 | | | | | | 100,238 | | | | | | 3,498 | | | | | | 100,999 | | |
| | | | | | | | | | | | | | | | | | | | | | | | | |
| Class I Shares: | | | | | | | | | | | | | | | | | | | | | | | | |
| Proceeds from shares issued | | | | 19,999 | | | | | | 9,900,000 | | | | | | — | | | | | | 24,900,000 | | |
| Dividends reinvested | | | | 147,924 | | | | | | 28,041 | | | | | | 885,434 | | | | | | 254,996 | | |
| Class I Shares capital transactions | | | | 167,923 | | | | | | 9,928,041 | | | | | | 885,434 | | | | | | 25,154,996 | | |
| Change in net assets resulting from capital transactions | | | $ | 169,352 | | | | | $ | 10,028,279 | | | | | $ | 888,932 | | | | | $ | 25,255,995 | | |
| | | | | | | | | | | | | | | | | | | | | | | | | |
| SHARE TRANSACTIONS: | | | | | | | | | | | | | | | | | | | | | | | | |
| Class A Shares: | | | | | | | | | | | | | | | | | | | | | | | | |
| Issued | | | | — | | | | | | 10,000 | | | | | | — | | | | | | 10,000 | | |
| Reinvested | | | | 140 | | | | | | 24 | | | | | | 323 | | | | | | 92 | | |
| Change in Class A Shares | | | | 140 | | | | | | 10,024 | | | | | | 323 | | | | | | 10,092 | | |
| | | | | | | | | | | | | | | | | | | | | | | | | |
| Class I Shares: | | | | | | | | | | | | | | | | | | | | | | | | |
| Issued | | | | 1,949 | | | | | | 990,000 | | | | | | — | | | | | | 2,490,000 | | |
| Reinvested | | | | 14,446 | | | | | | 2,841 | | | | | | 81,635 | | | | | | 23,416 | | |
| Change in Class I Shares | | | | 16,395 | | | | | | 992,841 | | | | | | 81,635 | | | | | | 2,513,416 | | |
____________________
| (a) | | Commencement of operations. |
| See notes to financial statements. | | HSBC FAMILY OF FUNDS 85 |
| HSBC EMERGING MARKETS DEBT FUND |
| Financial Highlights |
Selected data for a share outstanding throughout the periods indicated.
| | | | | | | Investment Activities | | Distributions | | | | | | | | | | | Ratios/Supplementary Data |
| | | Net Asset
Value,
Beginning
of Period | | Net
Investment
Income
(Loss) | | Net Realized
and
Unrealized
Gains/
(Losses) from
Investments | | Total from
Investment
Activities | | Net
Investment
Income | | Net Realized
Gains from
Investment
Transactions | | Total
Distributions | | Net Asset
Value, End
of Period | | Total
Return(a) | | Net
Assets
at End of
Period
(000’s) | | Ratio of Net
Expenses to
Average Net
Assets | | Ratio of Net
Investment
Income/
(Loss) to
Average Net
Assets | | Ratio of
Expenses
to Average
Net Assets
(Excluding Fee
Reductions) | | Portfolio
Turnover
(b) |
| CLASS A SHARES | | | | | | | | | | | | | | | | | | | | | | | | | | | | | | | | | | | | | | | | | | | | | | | | | | | | | | | |
| Year Ended October 31, 2017 | | | $ | 10.29 | | | | $ | 0.45 | (c) | | | | $0.08 | | | | | $0.53 | | | | | $(0.48 | ) | | | $— | | | | | $(0.48 | ) | | | $ | 10.34 | | | | 5.29 | % | | | $1,640 | | | 0.85% | | 4.33% | | 1.83% | | 50% |
| Year Ended October 31, 2016 | | | | 9.89 | | | | | 0.35 | (c) | | | | 0.54 | | | | | 0.89 | | | | | (0.49 | ) | | | — | | | | | (0.49 | ) | | | | 10.29 | | | | 9.36 | % | | | 463 | | | 1.07% | | 3.55% | | 3.13% | | 91% |
| Year Ended October 31, 2015 | | | | 10.37 | | | | | 0.37 | (c) | | | | (0.42 | ) | | | | (0.05 | ) | | | | (0.43 | ) | | | — | | | | | (0.43 | ) | | | | 9.89 | | | | (0.52 | )% | | | 742 | | | 1.20% | | 3.64% | | 1.84% | | 90% |
| Year Ended October 31, 2014 | | | | 10.42 | | | | | 0.37 | | | | | 0.13 | | | | | 0.50 | | | | | (0.39 | ) | | | (0.16 | ) | | | | (0.55 | ) | | | | 10.37 | | | | 5.07 | % | | | 1,195 | | | 1.20% | | 3.59% | | 1.51% | | 51% |
| Year Ended October 31, 2013 | | | | 11.42 | | | | | 0.43 | | | | | (0.74 | ) | | | | (0.31 | ) | | | | (0.47 | ) | | | (0.22 | ) | | | | (0.69 | ) | | | | 10.42 | | | | (2.84 | )% | | | 1,042 | | | 1.20% | | 3.92% | | 1.48% | | 53% |
| CLASS I SHARES | | | | | | | | | | | | | | | | | | | | | | | | | | | | | | | | | | | | | | | | | | | | | | | | | | | | | | | |
| Year Ended October 31, 2017 | | | | 10.24 | | | | | 0.49 | (c) | | | | 0.06 | | | | | 0.55 | | | | | (0.50 | ) | | | — | | | | | (0.50 | ) | | | | 10.29 | | | | 5.57 | % | | | 53,368 | | | 0.50% | | 4.68% | | 1.54% | | 50% |
| Year Ended October 31, 2016 | | | | 9.91 | | | | | 0.39 | (c) | | | | 0.54 | | | | | 0.93 | | | | | (0.60 | ) | | | — | | | | | (0.60 | ) | | | | 10.24 | | | | 9.70 | % | | | 10,409 | | | 0.70% | | 3.90% | | 2.83% | | 91% |
| Year Ended October 31, 2015 | | | | 10.39 | | | | | 0.40 | (c) | | | | (0.41 | ) | | | | (0.01 | ) | | | | (0.47 | ) | | | — | | | | | (0.47 | ) | | | | 9.91 | | | | (0.11 | )% | | | 11,267 | | | 0.85% | | 3.97% | | 1.29% | | 90% |
| Year Ended October 31, 2014 | | | | 10.44 | | | | | 0.41 | | | | | 0.13 | | | | | 0.54 | | | | | (0.43 | ) | | | (0.16 | ) | | | | (0.59 | ) | | | | 10.39 | | | | 5.43 | % | | | 40,839 | | | 0.85% | | 3.99% | | 1.16% | | 51% |
| Year Ended October 31, 2013 | | | | 11.44 | | | | | 0.45 | | | | | (0.72 | ) | | | | (0.27 | ) | | | | (0.51 | ) | | | (0.22 | ) | | | | (0.73 | ) | | | | 10.44 | | | | (2.52 | )% | | | 41,027 | | | 0.85% | | 4.19% | | 1.13% | | 53% |
| (a) | Total return calculations do not include any sales or redemption charges. |
| (b) | Portfolio turnover is calculated on the basis of the Fund as a whole without distinguishing between the classes of shares issued. |
| (c) | Calculated based on average shares outstanding. |
Amounts designated as “—” are $0.00 or have been rounded to $0.00. |
| 86 HSBC FAMILY OF FUNDS | See notes to financial statements. |
| HSBC FRONTIER MARKETS FUND |
| Financial Highlights |
Selected data for a share outstanding throughout the periods indicated.
| | | | | | Investment Activities | | Distributions | | | | | | | | | | Ratios/Supplementary Data |
| | | Net Asset
Value,
Beginning
of Period | | Net
Investment
Income
(Loss)(a) | | Net Realized
and
Unrealized
Gains/
(Losses) from
Investments | | Total from
Investment
Activities | | Net
Investment
Income | | Net Realized
Gains from
Investment
Transactions | | Total
Distributions | | Net Asset
Value, End
of Period | | Total
Return(b) | | Net
Assets
at End of
Period
(000’s) | | Ratio of Net
Expenses to
Average Net
Assets | | Ratio of Net
Investment
Income/
(Loss) to
Average Net
Assets | | Ratio of
Expenses
to Average
Net Assets
(Excluding Fee
Reductions) | | Portfolio
Turnover
(c) |
| CLASS A SHARES | | | | | | | | | | | | | | | | | | | | | | | | | | | | | | | | | | | | | | | | | | | | | | | | | | | | | | | | |
| Year Ended October 31, 2017 | | $ | 11.94 | | | $ | 0.16 | | | | $2.23 | | | | $2.39 | | | $ | (0.23 | ) | | | $— | | | | $(0.23 | ) | | $ | 14.10 | (d) | | | 20.41 | % | | | $8,676 | | | | 2.20 | % | | | 1.20 | % | | | 3.28 | % | | | 44 | % |
| Year Ended October 31, 2016 | | | 12.11 | | | | 0.13 | | | | 0.14 | | | | 0.27 | | | | (0.44 | ) | | | — | | | | (0.44 | ) | | | 11.94 | | | | 2.59 | % | | | 7,069 | | | | 2.18 | % | | | 1.17 | % | | | 2.55 | % | | | 8 | % |
| Year Ended October 31, 2015 | | | 14.95 | | | | 0.12 | | | | (1.81 | ) | | | (1.69 | ) | | | (0.09 | ) | | | (1.06 | ) | | | (1.15 | ) | | | 12.11 | | | | (11.67 | )% | | | 21,756 | | | | 2.20 | % | | | 0.96 | % | | | 2.20 | % | | | 66 | % |
| Year Ended October 31, 2014 | | | 13.06 | | | | 0.20 | | | | 2.14 | | | | 2.34 | | | | (0.05 | ) | | | (0.40 | ) | | | (0.45 | ) | | | 14.95 | | | | 18.38 | % | | | 44,837 | | | | 2.20 | % | | | 1.38 | % | | | 2.24 | % | | | 64 | % |
| Year Ended October 31, 2013 | | | 10.93 | | | | 0.08 | | | | 2.45 | | | | 2.53 | | | | (0.40 | ) | | | — | | | | (0.40 | ) | | | 13.06 | | | | 23.85 | % | | | 18,342 | | | | 2.20 | % | | | 0.60 | % | | | 2.69 | % | | | 44 | % |
| CLASS I SHARES | | | | | | | | | | | | | | | | | | | | | | | | | | | | | | | | | | | | | | | | | | | | | | | | | | | | | | | | |
| Year Ended October 31, 2017 | | | 12.02 | | | | 0.19 | | | | 2.25 | | | | 2.44 | | | | (0.28 | ) | | | — | | | | (0.28 | ) | | | 14.18 | (d) | | | 20.78 | % | | | 37,883 | | | | 1.85 | % | | | 1.49 | % | | | 2.90 | % | | | 44 | % |
| Year Ended October 31, 2016 | | | 12.19 | | | | 0.22 | | | | 0.09 | | | | 0.31 | | | | (0.48 | ) | | | — | | | | (0.48 | ) | | | 12.02 | | | | 2.99 | % | | | 42,207 | | | | 1.82 | % | | | 1.93 | % | | | 2.20 | % | | | 8 | % |
| Year Ended October 31, 2015 | | | 15.08 | | | | 0.19 | | | | (1.85 | ) | | | (1.66 | ) | | | (0.17 | ) | | | (1.06 | ) | | | (1.23 | ) | | | 12.19 | | | | (11.42 | )% | | | 120,010 | | | | 1.85 | % | | | 1.44 | % | | | 1.86 | % | | | 66 | % |
| Year Ended October 31, 2014 | | | 13.15 | | | | 0.23 | | | | 2.17 | | | | 2.40 | | | | (0.07 | ) | | | (0.40 | ) | | | (0.47 | ) | | | 15.08 | | | | 18.77 | % | | | 173,616 | | | | 1.85 | % | | | 1.57 | % | | | 1.90 | % | | | 64 | % |
| Year Ended October 31, 2013 | | | 10.97 | | | | 0.15 | | | | 2.43 | | | | 2.58 | | | | (0.40 | ) | | | — | | | | (0.40 | ) | | | 13.15 | | | | 24.25 | % | | | 70,273 | | | | 1.85 | % | | | 1.20 | % | | | 2.38 | % | | | 44 | % |
| (a) | Calculated based on average shares outstanding. |
| (b) | Total return calculations do not include any sales or redemption charges. |
| (c) | Portfolio turnover is calculated on the basis of the Fund as a whole without distinguishing between the classes of shares issued. |
| (d) | The net asset value per share (“NAV”) for financial reporting purposes differs from the NAV reported due to adjustments made in accordance with accounting principles generally accepted in the United States of America. |
Amounts designated as “—” are $0.00 or have been rounded to $0.00. |
| See notes to financial statements. | HSBC FAMILY OF FUNDS 87 |
| HSBC TOTAL RETURN FUND |
| Financial Highlights |
Selected data for a share outstanding throughout the periods indicated.
| | | | | | Investment Activities | | Distributions | | | | | | | | | | Ratios/Supplementary Data |
| | | Net Asset
Value,
Beginning
of Period | | Net
Investment
Income
(Loss)(a) | | Net Realized
and
Unrealized
Gains/
(Losses) from
Investments | | Total from
Investment
Activities | | Net
Investment
Income | | Net Realized
Gains from
Investment
Transactions | | Total
Distributions | | Net Asset
Value, End
of Period | | Total
Return(b) | | Net
Assets
at End of
Period
(000’s) | | Ratio of Net
Expenses to
Average Net
Assets | | Ratio of Net
Investment
Income/
(Loss) to
Average Net
Assets | | Ratio of
Expenses
to Average
Net Assets
(Excluding Fee
Reductions) | | Portfolio
Turnover
(c) |
| CLASS A SHARES | | | | | | | | | | | | | | | | | | | | | | | | | | | | | | | | | | | | | | | | | | | | | | | | | | | | | | | | |
| Year Ended October 31, 2017 | | | $9.95 | | | | $0.26 | | | | $(0.16 | ) | | | $0.10 | | | $ | (0.07 | ) | | | $— | | | | $(0.07 | ) | | | $9.98 | | | | 1.05 | % | | | $1,292 | | | | 1.59 | % | | | 2.64 | % | | | 3.19 | % | | | 116 | % |
| Year Ended October 31, 2016 | | | 10.20 | | | | 0.21 | | | | 0.14 | | | | 0.35 | | | | (0.58 | ) | | | (0.02 | ) | | | (0.60 | ) | | | 9.95 | | | | 3.74 | % | | | 7,790 | | | | 1.56 | % | | | 2.12 | % | | | 1.99 | % | | | 47 | % |
| Year Ended October 31, 2015 | | | 10.36 | | | | 0.05 | | | | (0.06 | ) | | | (0.01 | ) | | | (0.15 | ) | | | — | | | | (0.15 | ) | | | 10.20 | | | | (0.07 | )% | | | 7,562 | | | | 1.52 | % | | | 0.52 | % | | | 1.52 | % | | | 26 | % |
| Year Ended October 31, 2014 | | | 10.13 | | | | 0.04 | | | | 0.41 | | | | 0.45 | | | | (0.18 | ) | | | (0.04 | ) | | | (0.22 | ) | | | 10.36 | | | | 4.50 | % | | | 406 | | | | 1.52 | % | | | 0.44 | % | | | 1.52 | % | | | 77 | % |
| Year Ended October 31, 2013 | | | 10.32 | | | | 0.10 | | | | (0.21 | ) | | | (0.11 | ) | | | (0.05 | ) | | | (0.03 | ) | | | (0.08 | ) | | | 10.13 | | | | (1.06 | )% | | | 268 | | | | 1.47 | % | | | 0.94 | % | | | 1.47 | % | | | 64 | % |
| CLASS I SHARES | | | | | | | | | | | | | | | | | | | | | | | | | | | | | | | | | | | | | | | | | | | | | | | | | | | | | | | | |
| Year Ended October 31, 2017 | | | 10.01 | | | | 0.25 | | | | (0.10 | ) | | | 0.15 | | | | (0.10 | ) | | | — | | | | (0.10 | ) | | | 10.06 | | | | 1.45 | % | | | 12,430 | | | | 1.24 | % | | | 2.48 | % | | | 2.53 | % | | | 116 | % |
| Year Ended October 31, 2016 | | | 10.22 | | | | 0.23 | | | | 0.16 | | | | 0.39 | | | | (0.58 | ) | | | (0.02 | ) | | | (0.60 | ) | | | 10.01 | | | | 4.16 | % | | | 64,376 | | | | 1.24 | % | | | 2.40 | % | | | 1.37 | % | | | 47 | % |
| Year Ended October 31, 2015 | | | 10.38 | | | | 0.06 | | | | (0.04 | ) | | | 0.02 | | | | (0.18 | ) | | | — | | | | (0.18 | ) | | | 10.22 | | | | 0.21 | % | | | 1,181,045 | | | | 1.13 | % | | | 0.56 | % | | | 1.13 | % | | | 26 | % |
| Year Ended October 31, 2014 | | | 10.15 | | | | 0.08 | | | | 0.40 | | | | 0.48 | | | | (0.21 | ) | | | (0.04 | ) | | | (0.25 | ) | | | 10.38 | | | | 4.85 | % | | | 1,025,926 | | | | 1.17 | % | | | 0.77 | % | | | 1.17 | % | | | 77 | % |
| Year Ended October 31, 2013 | | | 10.33 | | | | 0.13 | | | | (0.20 | ) | | | (0.07 | ) | | | (0.08 | ) | | | (0.03 | ) | | | (0.11 | ) | | | 10.15 | | | | (0.66 | )% | | | 642,545 | | | | 1.18 | % | | | 1.33 | % | | | 1.18 | % | | | 64 | % |
| (a) | Calculated based on average shares outstanding. |
| (b) | Total return calculations do not include any sales or redemption charges. |
| (c) | Portfolio turnover is calculated on the basis of the Fund as a whole without distinguishing between the classes of shares issued. |
Amounts designated as “—” are $0.00 or have been rounded to $0.00. |
| 88 HSBC FAMILY OF FUNDS | See notes to financial statements. |
| HSBC ASIA EX-JAPAN SMALLER COMPANIES EQUITY FUND |
| Financial Highlights |
Selected data for a share outstanding throughout the periods indicated.
| | | | | | Investment Activities | | Distributions | | | | | | | | | | Ratios/Supplementary Data |
| | | Net Asset
Value,
Beginning
of Period | | Net
Investment
Income
(Loss)(a) | | Net Realized
and
Unrealized
Gains/
(Losses) from
Investments | | Total from
Investment
Activities | | Net
Investment
Income | | Net Realized
Gains from
Investment
Transactions | | Total
Distributions | | Net Asset
Value, End
of Period | | Total
Return(b) | | Net
Assets
at End of
Period
(000’s) | | Ratio of Net
Expenses to
Average Net
Assets(c) | | Ratio of Net
Investment
Income/
(Loss) to
Average Net
Assets(c) | | Ratio of
Expenses
to Average
Net Assets
(Excluding Fee
Reductions)(c) | | Portfolio
Turnover
(b)(d) |
| CLASS A SHARES | | | | | | | | | | | | | | | | | | | | | | | | | | | | | | | | | | | | | | | | | | | | | | | | | | | | | | | | |
| Year Ended October 31, 2017 | | | $11.04 | | | $ | 0.18 | | | | $2.66 | | | | $2.84 | | | | $(0.13 | ) | | | $— | | | | $(0.13 | ) | | | $13.75 | | | | 26.09 | % | | | $896 | | | | 1.75 | % | | | 1.45 | % | | | 3.94 | % | | | 97 | % |
| Year Ended October 31, 2016 | | | 9.59 | | | | 0.10 | | | | 1.46 | | | | 1.56 | | | | (0.11 | ) | | | — | | | | (0.11 | ) | | | 11.04 | | | | 16.29 | % | | | 181 | | | | 1.72 | % | | | 0.98 | % | | | 3.88 | % | | | 93 | % |
| Period Ended October 31, 2015(e) | | | 10.00 | | | | 0.10 | | | | (0.49 | ) | | | (0.39 | ) | | | (0.02 | ) | | | — | | | | (0.02 | ) | | | 9.59 | | | | (3.82 | )% | | | 156 | | | | 1.75 | % | | | 1.03 | % | | | 3.64 | % | | | 146 | % |
| CLASS I SHARES | | | | | | | | | | | | | | | | | | | | | | | | | | | | | | | | | | | | | | | | | | | | | | | | | | | | | | | | |
| Year Ended October 31, 2017 | | | 11.05 | | | | 0.14 | | | | 2.73 | | | | 2.87 | | | | (0.16 | ) | | | — | | | | (0.16 | ) | | | 13.76 | | | | 26.47 | % | | | 14,186 | | | | 1.40 | % | | | 1.14 | % | | | 3.66 | % | | | 97 | % |
| Year Ended October 31, 2016 | | | 9.62 | | | | 0.15 | | | | 1.45 | | | | 1.60 | | | | (0.17 | ) | | | — | | | | (0.17 | ) | | | 11.05 | | | | 16.75 | % | | | 11,114 | | | | 1.36 | % | | | 1.55 | % | | | 3.57 | % | | | 93 | % |
| Period Ended October 31, 2015(e) | | | 10.00 | | | | 0.13 | | | | (0.49 | ) | | | (0.36 | ) | | | (0.02 | ) | | | — | | | | (0.02 | ) | | | 9.62 | | | | (3.49 | )% | | | 9,461 | | | | 1.40 | % | | | 1.33 | % | | | 3.38 | % | | | 146 | % |
| (a) | Calculated based on average shares outstanding. |
| (b) | Not annualized for periods less than one year. Total return calculations do not include any sales or redemption charges. |
| (c) | Annualized for periods less than one year. |
| (d) | Portfolio turnover is calculated on the basis of the Fund as a whole without distinguishing between the classes of shares issued. |
| (e) | Commencement of operations on November 11, 2014. |
| Amounts designated as “—” are $0.00 or have been rounded to $0.00. |
| See notes to financial statements. | HSBC FAMILY OF FUNDS 89 |
| HSBC GLOBAL HIGH YIELD BOND FUND |
| Financial Highlights |
Selected data for a share outstanding throughout the periods indicated.
| | | | | | Investment Activities | | Distributions | | | | | | | | | | Ratios/Supplementary Data |
| | | Net Asset
Value,
Beginning
of Period | | Net
Investment
Income
(Loss)(a) | | Net Realized
and
Unrealized
Gains/
(Losses) from
Investments | | Total from
Investment
Activities | | Net
Investment
Income | | Net Realized
Gains from
Investment
Transactions | | Total
Distributions | | Net Asset
Value, End
of Period | | Total
Return(b) | | Net
Assets
at End of
Period
(000’s) | | Ratio of Net
Expenses to
Average Net
Assets(c) | | Ratio of Net
Investment
Income/
(Loss) to
Average Net
Assets(c) | | Ratio of
Expenses
to Average
Net Assets
(Excluding Fee
Reductions)(c) | | Portfolio
Turnover
(b)(d) |
| CLASS A SHARES | | | | | | | | | | | | | | | | | | | | | | | | | | | | | | | | | | | | | | | | | | | | | | | | | | | | | | | | |
| Year Ended October 31, 2017 | | | $9.97 | | | | $0.42 | | | | $0.30 | | | | $0.72 | | | $ | (0.45 | ) | | | $— | | | | $(0.45 | ) | | | $10.24 | | | | 7.45 | % | | | $2,049 | | | | 1.15 | % | | | 4.15 | % | | | 1.81 | % | | | 42 | % |
| Year Ended October 31, 2016 | | | 9.67 | | | | 0.41 | | | | 0.28 | | | | 0.69 | | | | (0.39 | ) | | | — | | | | (0.39 | ) | | | 9.97 | | | | 7.37 | % | | | 558 | | | | 1.15 | % | | | 4.27 | % | | | 1.72 | % | | | 50 | % |
| Period Ended October 31, 2015(e) | | | 10.00 | | | | 0.12 | | | | (0.34 | ) | | | (0.22 | ) | | | (0.11 | ) | | | — | | | | (0.11 | ) | | | 9.67 | | | | (2.23 | )% | | | 140 | | | | 1.15 | % | | | 4.13 | % | | | 1.93 | % | | | 31 | % |
| CLASS I SHARES | | | | | | | | | | | | | | | | | | | | | | | | | | | | | | | | | | | | | | | | | | | | | | | | | | | | | | | | |
| Year Ended October 31, 2017 | | | 9.98 | | | | 0.45 | | | | 0.31 | | | | 0.76 | | | | (0.48 | ) | | | — | | | | (0.48 | ) | | | 10.26 | | | | 7.84 | % | | | 28,040 | | | | 0.80 | % | | | 4.50 | % | | | 1.48 | % | | | 42 | % |
| Year Ended October 31, 2016 | | | 9.68 | | | | 0.45 | | | | 0.26 | | | | 0.71 | | | | (0.41 | ) | | | — | | | | (0.41 | ) | | | 9.98 | (f) | | | 7.68 | % | | | 26,168 | | | | 0.80 | % | | | 4.64 | % | | | 1.59 | % | | | 50 | % |
| Period Ended October 31, 2015(e) | | | 10.00 | | | | 0.13 | | | | (0.34 | ) | | | (0.21 | ) | | | (0.11 | ) | | | — | | | | (0.11 | ) | | | 9.68 | | | | (2.15 | )% | | | 24,378 | | | | 0.80 | % | | | 4.45 | % | | | 1.64 | % | | | 31 | % |
| (a) | Calculated based on average shares outstanding. |
| (b) | Not annualized for periods less than one year. Total return calculations do not include any sales or redemption charges. |
| (c) | Annualized for periods less than one year. |
| (d) | Portfolio turnover is calculated on the basis of the Fund as a whole without distinguishing between the classes of shares issued. |
| (e) | Commencement of operations on July 14, 2015. |
| (f) | The net asset value per share (“NAV”) for financial reporting purposes differs from the NAV reported due to adjustments made in accordance with accounting principles generally accepted in the United States of America. |
| Amounts designated as “—” are $0.00 or have been rounded to $0.00. |
| 90 HSBC FAMILY OF FUNDS | See notes to financial statements. |
| HSBC GLOBAL HIGH INCOME BOND FUND |
| Financial Highlights |
Selected data for a share outstanding throughout the periods indicated.
| | | | Investment Activities | | Distributions | | | | | | Ratios/Supplementary Data |
| | Net Asset
Value,
Beginning
of Period | | Net
Investment
Income
(Loss)(a) | | Net Realized
and
Unrealized
Gains/
(Losses) from
Investments | | Total from
Investment
Activities | | Net
Investment
Income | | Net Realized
Gains from
Investment
Transactions | | Total
Distributions | | Net Asset
Value, End
of Period | | Total
Return(b) | | Net
Assets
at End of
Period
(000’s) | | Ratio of Net
Expenses to
Average Net
Assets(c) | | Ratio of Net
Investment
Income/
(Loss) to
Average Net
Assets(c) | | Ratio of
Expenses
to Average
Net Assets
(Excluding Fee
Reductions)(c) | | Portfolio
Turnover
(b)(d) |
| CLASS A SHARES | | | | | | | | | | | | | | | | | | | | | | | | | | | | | | | | | | | | | | | | | | | | | | | | | | | | | | | | | | | | | | |
| Year Ended October 31, 2017 | | | | $10.24 | | | | | $0.29 | | | | | $0.23 | | | | | | $0.52 | | | | | | $(0.31 | ) | | | | $ | — | | | | | $(0.31 | ) | | | | | $10.45 | | | | 5.24 | % | | | | | $292 | | | 1.15% | | 2.86% | | 1.81% | | 44% |
| Year Ended October 31, 2016 | | | | 9.83 | | | | | 0.30 | | | | | 0.38 | | | | | | 0.68 | | | | | | (0.27 | ) | | | | | — | | | | | (0.27 | ) | | | | | 10.24 | | | | 7.04 | % | | | | | 107 | | | 1.15% | | 2.99% | | 1.71% | | 47% |
| Period Ended October 31, 2015(e) | | | | 10.00 | | | | | 0.09 | | | | | (0.18 | ) | | | | | (0.09 | ) | | | | | (0.08 | ) | | | | | — | | | | | (0.08 | ) | | | | | 9.83 | | | | (0.93 | )% | | | | | 99 | | | 1.15% | | 2.89% | | 1.89% | | 24% |
| CLASS I SHARES | | | | | | | | | | | | | | | | | | | | | | | | | | | | | | | | | | | | | | | | | | | | | | | | | | | | | | | | | | | | | | |
| Year Ended October 31, 2017 | | | | 10.26 | | | | | 0.33 | | | | | 0.23 | | | | | | 0.56 | | | | | | (0.33 | ) | | | | | — | | | | | (0.33 | ) | | | | | 10.49 | | | | 5.62 | % | | | | | 27,876 | | | 0.80% | | 3.21% | | 1.58% | | 44% |
| Year Ended October 31, 2016 | | | | 9.83 | | | | | 0.33 | | | | | 0.39 | | | | | | 0.72 | | | | | | (0.29 | ) | | | | | — | | | | | (0.29 | ) | | | | | 10.26 | | | | 7.43 | % | | | | | 26,505 | | | 0.80% | | 3.34% | | 1.61% | | 47% |
| Period Ended October 31, 2015(e) | | | | 10.00 | | | | | 0.10 | | | | | (0.18 | ) | | | | | (0.08 | ) | | | | | (0.09 | ) | | | | | — | | | | | (0.09 | ) | | | | | 9.83 | | | | (0.84 | )% | | | | | 24,696 | | | 0.80% | | 3.24% | | 1.61% | | 24% |
| (a) | Calculated based on average shares outstanding. |
| (b) | Not annualized for periods less than one year. Total return calculations do not include any sales or redemption charges. |
| (c) | Annualized for periods less than one year. |
| (d) | Portfolio turnover is calculated on the basis of the Fund as a whole without distinguishing between the classes of shares issued. |
| (e) | Commencement of operations on July 14, 2015. |
Amounts designated as “—” are $0.00 or have been rounded to $0.00.
| See notes to financial statements. | HSBC FAMILY OF FUNDS 91 |
| HSBC GLOBAL EQUITY VOLATILITY FOCUSED FUND |
| Financial Highlights |
Selected data for a share outstanding throughout the periods indicated.
| | | | Investment Activities | | Distributions | | | | | | Ratios/Supplementary Data |
| | Net Asset
Value,
Beginning
of Period | | Net
Investment
Income
(Loss)(a) | | Net Realized
and
Unrealized
Gains/
(Losses) from
Investments | | Total from
Investment
Activities | | Net
Investment
Income | | Net Realized
Gains from
Investment
Transactions | | Total
Distributions | | Net Asset
Value, End
of Period | | Total
Return(b) | | Net
Assets
at End of
Period
(000’s) | | Ratio of Net
Expenses to
Average Net
Assets(c) | | Ratio of Net
Investment
Income/
(Loss) to
Average Net
Assets(c) | | Ratio of
Expenses
to Average
Net Assets
(Excluding Fee
Reductions)(c) | | Portfolio
Turnover
(b)(d) |
| CLASS A SHARES | | | | | | | | | | | | | | | | | | | | | | | | | | | | | | | | | | | | | | | | | | | | | | | | | | | | | | | | | | | | | |
| Year Ended October 31, 2017 | | | | $10.05 | | | | | $0.15 | | | | | $1.57 | | | | | $ | 1.72 | | | | | $(0.17 | ) | | | | $ | — | | | | | $(0.17 | ) | | | | | $11.60 | | | | 17.32 | % | | | | | $118 | | | 1.30% | | 1.41% | | 2.40% | | 62% |
| Period Ended October 31, 2016(e) | | | | 10.00 | | | | | 0.14 | | | | | (0.07 | ) | | | | | 0.07 | | | | | (0.02 | ) | | | | | — | | | | | (0.02 | ) | | | | | 10.05 | | | | 0.74 | % | | | | | 101 | | | 1.30% | | 1.40% | | 2.55% | | 41% |
| CLASS I SHARES | | | | | | | | | | | | | | | | | | | | | | | | | | | | | | | | | | | | | | | | | | | | | | | | | | | | | | | | | | | | | |
| Year Ended October 31, 2017 | | | | 10.08 | | | | | 0.19 | | | | | 1.58 | | | | | | 1.77 | | | | | (0.18 | ) | | | | | — | | | | | (0.18 | ) | | | | | 11.67 | | | | 17.76 | % | | | | | 11,774 | | | 0.95% | | 1.76% | | 2.30% | | 62% |
| Period Ended October 31, 2016(e) | | | | 10.00 | | | | | 0.17 | | | | | (0.06 | ) | | | | | 0.11 | | | | | (0.03 | ) | | | | | — | | | | | (0.03 | ) | | | | | 10.08 | | | | 1.09 | % | | | | | 10,012 | | | 0.95% | | 1.75% | | 2.43% | | 41% |
| (a) | Calculated based on average shares outstanding. |
| (b) | Not annualized for periods less than one year. Total return calculations do not include any sales or redemption charges. |
| (c) | Annualized for periods less than one year. |
| (d) | Portfolio turnover is calculated on the basis of the Fund as a whole without distinguishing between the classes of shares issued. |
| (e) | Commencement of operations on November 4, 2015. |
Amounts designated as “—” are $0.00 or have been rounded to $0.00.
| 92 HSBC FAMILY OF FUNDS | See notes to financial statements. |
| HSBC EURO HIGH YIELD BOND FUND (USD HEDGED) |
| Financial Highlights |
Selected data for a share outstanding throughout the periods indicated.
| | | | | | | Investment Activities | | Distributions | | | | | | | | | | | | Ratios/Supplementary Data |
| | Net Asset
Value,
Beginning
of Period | | Net
Investment
Income
(Loss)(a) | | Net Realized
and
Unrealized
Gains/
(Losses) from
Investments | | Total from
Investment
Activities | | Net
Investment
Income | | Net Realized
Gains from
Investment
Transactions | | Return of
Capital | | Total
Distributions | | Net Asset
Value, End
of Period | | Total
Return(b) | | Net
Assets
at End of
Period
(000’s) | | Ratio of Net
Expenses to
Average Net
Assets(c) | | Ratio of Net
Investment
Income/
(Loss) to
Average Net
Assets(c) | | Ratio of
Expenses
to Average
Net Assets
(Excluding Fee
Reductions)(c) | | Portfolio
Turnover
(b)(d) |
| CLASS A SHARES | | | | | | | | | | | | | | | | | | | | | | | | | | | | | | | | | | | | | | | | | | | | | | | | | | | | | | | | | | | | | | | | | | | |
| Year Ended | | | | | | | | | | | | | | | | | | | | | | | | | | | | | | | | | | | | | | | | | | | | | | | | | | | | | | | | | | | | | | | | | | | |
| October 31, 2017 | | | $ | 10.92 | | | | $ | 0.31 | | | | $ | 0.54 | | | | $ | 0.85 | | | | $ | (0.26 | ) | | | | | $(0.07 | ) | | | | | $(0.07 | ) | | | | | $(0.40 | ) | | | | | $11.37 | | | | 8.05 | % | | | | | $118 | | | 1.05% | | 2.83% | | 1.47% | | 11% |
| Period Ended | | | | | | | | | | | | | | | | | | | | | | | | | | | | | | | | | | | | | | | | | | | | | | | | | | | | | | | | | | | | | | | | | | | |
| October 31, 2016(e) | | | | 10.00 | | | | | 0.27 | | | | | 0.77 | | | | | 1.04 | | | | | (0.12 | ) | | | | | — | | | | | | — | | | | | | (0.12 | ) | | | | | 10.92 | | | | 10.38 | % | | | | | 110 | | | 1.05% | | 3.20% | | 1.64% | | 20% |
| CLASS I SHARES | | | | | | | | | | | | | | | | | | | | | | | | | | | | | | | | | | | | | | | | | | | | | | | | | | | | | | | | | | | | | | | | | | | |
| Year Ended | | | | | | | | | | | | | | | | | | | | | | | | | | | | | | | | | | | | | | | | | | | | | | | | | | | | | | | | | | | | | | | | | | | |
| October 31, 2017 | | | | 10.94 | | | | | 0.34 | | | | | 0.54 | | | | | 0.88 | | | | | (0.27 | ) | | | | | (0.07 | ) | | | | | (0.07 | ) | | | | | (0.41 | ) | | | | | 11.41 | | | | 8.29 | % | | | | | 29,617 | | | 0.80% | | 3.08% | | 1.37% | | 11% |
| Period Ended | | | | | | | | | | | | | | | | | | | | | | | | | | | | | | | | | | | | | | | | | | | | | | | | | | | | | | | | | | | | | | | | | | | |
| October 31, 2016(e) | | | | 10.00 | | | | | 0.29 | | | | | 0.76 | | | | | 1.05 | | | | | (0.12 | ) | | | | | — | | | | | | — | | | | | | (0.12 | ) | | | | | 10.94 | | | | 10.51 | % | | | | | 27,485 | | | 0.80% | | 3.45% | | 1.51% | | 20% |
| (a) | Calculated based on average shares outstanding. |
| (b) | Not annualized for periods less than one year. Total return calculations do not include any sales or redemption charges. |
| (c) | Annualized for periods less than one year. |
| (d) | Portfolio turnover is calculated on the basis of the Fund as a whole without distinguishing between the classes of shares issued. |
| (e) | Commencement of operations on January 19, 2016. |
Amounts designated as “—” are $0.00 or have been rounded to $0.00.
| See notes to financial statements. | HSBC FAMILY OF FUNDS 93 |
| HSBC FAMILY OF FUNDS |
| Notes to Financial Statements—as of October 31, 2017 |
1. Organization:
The HSBC Funds (the “Trust”), a Delaware statutory trust organized on March 2, 2016, is registered under the Investment Company Act of 1940, as amended (the “Act”), as an open-end management investment company. Effective June 24, 2016, the Funds (as defined below), which were previously series of HSBC Funds, a Massachusetts business trust, reorganized with and into corresponding series of the Trust (each, a “Reorganization”). Upon completion of each Reorganization, the respective share classes of each Fund assumed the performance, financial and other historical information of those of the corresponding predecessor series. As of October 31, 2017, the Trust is composed of 13 separate operational funds, each a series of the HSBC Family of Funds. The accompanying financial statements are presented for the following eight funds (individually a “Fund”, collectively the “Funds” or the “Global Funds”):
| Fund | | Short Name | |
| HSBC Emerging Markets Debt Fund | Emerging Markets Debt Fund |
| HSBC Frontier Markets Fund | Frontier Markets Fund |
| HSBC Total Return Fund | Total Return Fund |
| HSBC Asia ex-Japan Smaller Companies Equity Fund | Asia ex-Japan Fund |
| HSBC Global High Yield Bond Fund | Global High Yield Bond Fund |
| HSBC Global High Income Bond Fund | Global High Income Bond Fund |
| HSBC Global Equity Volatility Focused Fund | Global Equity Volatility Focused Fund |
| HSBC Euro High Yield Bond Fund (USD Hedged) | Euro High Yield Bond Fund |
Financial statements for all other funds of the Trust are published separately. The Emerging Markets Debt Fund and Total Return Fund are non-diversified funds. The Frontier Markets Fund, Asia ex-Japan Fund, Global High Yield Bond Fund, Global High Income Bond Fund, Global Equity Volatility Focused Fund and Euro High Yield Bond Fund are diversified funds. The Funds are authorized to issue an unlimited number of shares of beneficial interest with a par value of $ 0.001 per share. The share classes offered by each Fund and the maximum sales charge for Class A Shares are summarized in the following table.
| | | | Class A Shares |
| | Share | | Maximum |
| Fund | | Classes Offered | | Sales Charge |
| Emerging Markets Debt Fund | | A, I | | 4.75% |
| Frontier Markets Fund | | A, I | | 5.00% |
| Total Return Fund | | A, I | | 4.75% |
| Asia ex-Japan Fund | | A, I | | 5.00% |
| Global High Yield Bond Fund | | A, I | | 4.75% |
| Global High Income Bond Fund | | A, I | | 4.75% |
| Global Equity Volatility Focused Fund | | A, I | | 5.00% |
| Euro High Yield Bond Fund | | A, I | | 4.75% |
Class S shares of the Emerging Markets Debt Fund, Total Return Fund and Asia ex-Japan Fund were operational during the period but were liquidated and are no longer offered as of October 31, 2017.
Each class of shares in each Fund has identical rights and privileges, except with respect to arrangements pertaining to shareholder servicing and/or distribution, class-related expenses, voting rights on matters affecting a single class of shares, and exchange privileges of each class of shares. Effective March 30, 2017, the Frontier Markets Fund resumed accepting orders from new investors. Prior to March 30, 2017, the Frontier Markets Fund was closed to new shareholders, subject to certain exceptions.
| HSBC FAMILY OF FUNDS |
| Notes to Financial Statements—as of October 31, 2017 (continued) |
Under the Trust’s organizational documents, the Trust’s officers and Trustees are indemnified against certain liabilities arising out of the performance of their duties to the Funds. In addition, in the normal course of business, the Trust enters into contracts with its service providers, which also provide for indemnifications by the Funds. The Funds’ maximum exposure under these arrangements is unknown as this would involve future claims that may be made against the Funds. However, based on experience, the Trust believes the risk of loss to be remote.
The Funds are investment companies and follow accounting and reporting guidance under Financial Accounting Standards Board (“FASB”) Accounting Standards Codification (“ASC”) Topic 946, “Financial Services-Investment Companies”.
2. Significant Accounting Policies:
The following is a summary of the significant accounting policies followed by the Funds in the preparation of their financial statements. The policies are in conformity with generally accepted accounting principles in the United States of America (“GAAP”). The preparation of financial statements requires management to make certain estimates and assumptions that affect the reported amounts of assets and liabilities and disclosure of contingent assets and liabilities at the date of the financial statements and the reported amounts of increases and decreases in net assets from operations during the reporting period. Actual results could differ from those estimates.
Securities Valuation:
The Funds record their investments at fair value. Fair value is defined as the price that would be received to sell an asset or paid to transfer a liability in an orderly transaction between market participants at the measurement date. The valuation techniques used to determine fair value are further described in Note 3 below.
Investment Transactions and Related Income:
Investment transactions are accounted for no later than one business day after trade date. However, for financial reporting purposes, investment transactions are accounted for on trade date. Investment gains and losses are calculated on the identified cost basis. Interest income is recognized on the accrual basis and includes, where applicable, the amortization or accretion of premium or discount based on effective yield. Dividend income is recorded on the ex-dividend date except in the case of certain foreign securities, in which case dividends are recorded as soon as such information becomes available. For derivative contracts, realized gains and losses are recorded upon settlement of the contract.
Foreign Currency Translation:
The accounting records of the Funds are maintained in U.S. dollars. Foreign currency amounts are translated into U.S. dollars at the current rate of exchange to determine the value of investments, assets and liabilities at the close of each business day. Purchases and sales of securities, and income and expenses are translated at the prevailing rate of exchange on the respective dates of such transactions. The Funds do not isolate the portion of the results of operations resulting from changes in foreign exchange rates on investments from fluctuations arising from changes in market prices of securities held. Such fluctuations are included with the net realized and unrealized gain or loss from investments and foreign currency translations.
Foreign Taxes:
Income received by the Funds from sources within foreign countries may be subject to withholding and other income or similar taxes imposed by such countries. The Funds may be subject to foreign taxes on gains in investments or currency repatriation. The Funds accrue foreign capital gains taxes, as applicable, based on their current interpretation of tax rules in the foreign markets in which they invest. Such tax accrual is based in part on actual and estimated realized gains. Estimated realized gains are subject to change and such change could be material. However, management’s conclusions may be subject to future review and change based on changes in, or the interpretation of, the accounting standards or tax laws and regulations.
| HSBC FAMILY OF FUNDS |
| Notes to Financial Statements—as of October 31, 2017 (continued) |
Restricted Securities and Illiquid Securities:
The Funds may invest in restricted securities. A restricted security is a security which has been purchased through a private offering and cannot be resold to the general public without prior registration under the Securities Act of 1933 (the “1933 Act”) or pursuant to the resale limitations provided by Rule 144 under the 1933 Act, or another exemption from the registration requirements of the 1933 Act. Certain restricted securities may be resold in transactions exempt from registration, normally to qualified institutional buyers, and may be deemed liquid by the Investment Adviser (as defined in Note 4) based on procedures established by the Board of Trustees (the “Board”). Therefore, not all restricted securities are considered illiquid. To the extent that a Fund purchases securities that are restricted as to resale or for which current market quotations are not available, such securities will be valued based upon all relevant factors as outlined in Securities and Exchange Commission (SEC) Financial Reporting Release No. 1. Disposal of restricted securities may involve time consuming negotiations and expense. Prompt sale at the current valuation may be difficult and could adversely affect the net assets of the Funds.
Participation Notes and Participatory Notes:
The Funds may invest in participation notes or participatory notes (“P-notes”). P-notes are participation interest notes that are issued by banks or broker-dealers and are designed to offer a return linked to a particular underlying equity, debt, currency or market. If the P-note were held to maturity, the issuer would pay to, or receive from, the purchaser the difference between the nominal value of the underlying instruments at the time of purchase and that instrument’s value at maturity. The holder of a P-note that is linked to a particular underlying security or instrument may be entitled to receive any dividends paid in connection with that underlying security or instrument, but typically does not receive voting rights as it would if it directly owned the underlying security or instrument. P-notes involve transaction costs. Investments in P-notes involve the same risks associated with a direct investment in the underlying securities, instruments or markets that they seek to replicate. In addition, there can be no assurance that there will be a trading market for a P-note or that the trading price of a P-note will equal the underlying value of the security, instrument or market that it seeks to replicate. Due to liquidity and transfer restrictions, the secondary markets on which a P-note is traded may be less liquid than the market for other securities, or may be completely illiquid, which may also affect the ability of a Fund to accurately value a P-note. P-notes typically constitute general unsecured contractual obligations of the banks or broker-dealers that issue them, which subjects a Fund that holds them to counterparty risk (and this risk may be amplified if the Fund purchases P-notes from only a small number of issuers).
Derivative Instruments:
All open derivative positions at period end are reflected on the Funds’ Schedule of Portfolio Investments. The following is a description of the derivative instruments utilized by the Funds, including the primary underlying risk exposure related to each instrument type.
Forward Foreign Currency Exchange Contracts:
Each Fund may enter into forward foreign currency exchange contracts. The Funds may enter into forward foreign currency exchange contracts in connection with planned purchases or sales of securities, to hedge the U.S. dollar value of securities denominated in a particular currency or to enhance return. The forward foreign currency exchange contracts are adjusted by the daily exchange rate of the underlying currency and any gains or losses are recorded for financial statement purposes as unrealized gains or losses until the contract settlement date.
The Funds could be exposed to risks if the counterparties to the contracts are unable to meet the terms of their contracts and from unanticipated movements in the value of a foreign currency relative to the U.S. dollar.
| HSBC FAMILY OF FUNDS |
| Notes to Financial Statements—as of October 31, 2017 (continued) |
The Funds remain subject to credit risk with respect to the amount they expect to receive from counterparties. However, the Funds have sought to mitigate these risks by generally requiring the posting of collateral to a Fund at prearranged exposure levels to cover a Fund’s exposure to the counterparty. Generally, the amount of collateral due from or to a counterparty must exceed a minimum transfer amount threshold before a transfer is required to be made. Forward foreign currency exchange contracts may involve credit or market risk in excess of the amounts reflected on the Statements of Assets and Liabilities.
During the year ended October 31, 2017, the following Funds entered into forward foreign currency exchange contracts to gain exposure to certain markets and for hedging purposes. The notional amount of forward foreign currency exchange contracts outstanding as of October 31, 2017 and the monthly average notional amount for these contracts during the year ended October 31, 2017 were as follows:
| Outstanding | | Monthly Average |
| Notional Amount ($) | | Notional Amount ($) |
| Long | | Short | | Long | | Short |
| Forward Foreign Currency Exchange Contracts: | | | | | | | | | | |
| Emerging Markets Debt Fund | | 4,757,122 | | (3,300,135 | ) | | 4,150,370 | | (3,770,816 | ) |
| Total Return Fund | | 8,347,460 | | (11,629,693 | ) | | 29,431,760 | | (31,385,659 | ) |
| Global High Yield Bond Fund | | — | | (9,159,849 | ) | | 174,151 | | (6,354,336 | ) |
| Global High Income Bond Fund | | — | | (12,917,684 | ) | | 129,673 | | (8,806,816 | ) |
| Euro High Yield Bond Fund | | 237,292 | | (29,601,173 | ) | | 371,220 | | (27,821,713 | ) |
Option Contracts:
The Funds may purchase or write put and call options on securities, indices, foreign currencies and derivative instruments. When purchasing options, the Funds pay a premium which is recorded as the cost basis in the investment and which is subsequently marked to market to reflect the current value of the option. Premiums paid for purchasing options that expire are treated as realized losses. When an option is exercised or closed, premiums paid for purchasing options are offset against proceeds to determine the realized gain or loss on the transaction. When writing options, the Funds receive a premium which is recorded as a liability and which is subsequently marked to market to reflect the current value of the option written. Premiums received from writing options that expire are treated as realized gains. Premiums received from writing options that are either exercised or closed are offset against the proceeds received or the amount paid on the transaction to determine realized gains or losses.
The Funds may purchase or write put and call options on foreign currencies for the purpose of protecting against declines in the dollar value of foreign portfolio securities and against increases in the U.S. dollar cost of foreign securities to be acquired. The Funds could be exposed to risks if the counterparties to the contracts are unable to meet the terms of their contracts and from unanticipated movements in the value of a foreign currency relative to the U.S. dollar.
The Funds may enter into interest rate swaption agreements for hedging purposes. A swaption is an option to enter into a pre-defined swap agreement by some specified date in the future. The writer of the swaption becomes the counterparty to the swap if the buyer exercises their option. The interest rate swaption agreement will specify whether the buyer of the swaption will be a fixed rate receiver or a fixed rate buyer. The Funds could be exposed to risks if the counterparties to the contracts are unable to meet the terms of their contracts and from unanticipated movements in interest rates.
The Funds remain subject to credit risk with respect to the amount they expect to receive from counterparties. However, the Funds have sought to mitigate these risks by generally requiring the posting of collateral to a Fund at prearranged exposure levels to cover a Fund’s exposure to the counterparty. Generally, the amount of collateral due from or to a counterparty must exceed a minimum transfer amount threshold before a transfer is required to be made. Option contracts may involve credit or market risk in excess of the amounts reflected on the Statements of Assets and Liabilities. During the year ended October 31, 2017, the Total Return Fund invested in option contracts to gain exposure to certain markets and for hedging purposes.
| HSBC FAMILY OF FUNDS |
| Notes to Financial Statements—as of October 31, 2017 (continued) |
The gross notional amount of option contracts outstanding as of October 31, 2017, and the monthly average notional amount for these contracts for the year ended October 31, 2017 were as follows:
| Outstanding | | Monthly Average |
| Notional Amount ($) | | Notional Amount ($) |
| Option Contracts: | | | |
| Total Return Fund | $ — | | $6,558(a) |
____________________
| (a) | For the period November 1, 2016 to November 30, 2016, March 1, 2017 to May 31, 2017 and September 1, 2017 to September 30, 2017. |
Futures Contracts:
The Funds may invest in futures contracts for the purpose of hedging existing portfolio securities or securities they intend to purchase against fluctuations in fair value caused by changes in prevailing market interest conditions. Upon entering into futures contracts, the Funds are required to pledge to the broker an amount of cash and/or other assets equal to a certain percentage of the contract amount (initial margin deposit). Subsequent payments, known as “variation margin”, are made or received each day, depending on the daily fluctuations in the fair value of the underlying security. The Funds recognize an unrealized gain or loss equal to the daily variation margin. Should market conditions move unexpectedly, the Funds may not achieve the anticipated benefits of the futures contracts and may realize a loss. Futures contracts involve, to varying degrees, elements of market risk (generally equity price risk related to stock futures, interest rate risk related to bond futures, and foreign currency risk related to currency futures) and exposure to loss in excess of the amounts reflected on the Statements of Assets and Liabilities as variation margin. The primary risks associated with the use of futures contracts are the imperfect correlation between the change in market value of the securities held by the Funds and the prices of futures contracts, the possibility of an illiquid market, and the inability of the counterparty to meet the terms of the contract. During the year ended October 31, 2017, the Emerging Markets Debt Fund, Total Return Fund and Global High Income Bond Fund invested in futures contracts to gain exposure to certain markets and for hedging purposes. The gross notional amount of futures contracts outstanding as of October 31, 2017, and the monthly average notional amount for these contracts for the year ended October 31, 2017 were as follows:
| | Outstanding | | Monthly Average |
| | Notional Amount ($) | | Notional Amount ($) |
| Futures Contracts: | | Long | | Short | | Long | | Short |
| Emerging Markets Debt Fund | | 2,930,756 | | (1,777,773 | ) | | 2,930,756(a) | | (1,777,773) | (b) |
| Total Return Fund | | 2,587,138 | | — | | | 1,452,611(c) | | (635,584) | (d) |
| Global High Income Bond Fund | | 234,347 | | — | | | 234,347(a) | | — | |
____________________
| (a) | For the period October 1, 2017 to October 31, 2017. |
| (b) | For the period September 1, 2017 to October 31, 2017. |
| (c) | For the period July 1, 2017 to October 31, 2017. |
| (d) | For the period December 1, 2016 to February 28, 2017 and April 1, 2017 to August 31, 2017. |
Swap Agreements:
The Funds may enter into swap contracts in accordance with their investment objectives and policies. A swap is an agreement to exchange the return generated by one instrument for the return generated by another instrument. Swap agreements are privately negotiated in the over-the-counter (“OTC”) market and may be entered into as a bilateral contract (“OTC swaps”) or cleared through a third party, known as a clearing organization (“centrally cleared swaps”). The payment streams are calculated by reference to a specified index and agreed upon notional amount. The term specified index includes currencies, fixed interest rates, prices and total return on interest rate indices, fixed income indices, stock indices and commodity indices.
| HSBC FAMILY OF FUNDS |
| Notes to Financial Statements—as of October 31, 2017 (continued) |
The Funds will usually enter into swaps on a net basis, which means that the two return streams are netted out in a cash settlement on the payment date or dates specified in the instrument with a Fund receiving or paying only the net amount of the two returns. Upfront receipts and payments are recorded as a liability or asset, respectively. These upfront receipts and payments are amortized or accreted to gains or losses over the life of the swap agreement. Swaps are marked to market daily based upon valuations as determined from the underlying contract or in accordance with the requirements of the clearing organization. Changes in market value, if any, are reflected as a component of net change in “unrealized appreciation or depreciation on swap agreements”. Daily changes in valuation of centrally cleared swaps, if any, are recorded as “variation margin on swap agreements”. Net periodic payments received or paid by the Funds are recorded as “realized gains or losses on swap agreements”. A Fund’s obligations under a swap agreement will be accrued daily (offset against any amounts owing to the Fund) and any accrued but unpaid net amounts owed to a swap counterparty are generally collateralized by the maintenance of a segregated account consisting of cash, U.S. government securities, or other liquid securities or by pledging such securities as collateral.
Interest rate swaps involve the exchange of commitments to pay and receive interest based on a notional amount and are subject to interest rate risk exposure. Interest rate swaps do not involve the delivery of securities, other underlying assets or principal. Accordingly, the risk of loss with respect to interest rate swaps is limited to the net amount of interest payments that a Fund is contractually obligated to make. If the other party to an interest rate swap defaults, a Fund’s risk of loss consists of the net amount of interest payments that the Fund is contractually entitled to receive.
Credit default swap agreements involve one party making a stream of payments (referred to as the buyer of protection) to another party (the seller of protection) in exchange for the right to receive a specified return in the event of a default or other credit event for the referenced entity, obligation or index and are subject to credit risk exposure. The maximum potential amount of future payments that a Fund as a seller of protection could be required to make under a credit default swap agreement would be an amount equal to the notional amount of the agreement. Notional amounts of each individual credit default swap agreement outstanding for which a Fund is the seller of protection are disclosed in the Schedules of Portfolio Investments. These potential amounts would be partially offset by any recovery values of the respective referenced obligations, upfront payments received upon entering into the agreement, or net amounts received from the settlement of buy protection credit default swap agreements entered into by a Fund for the same referenced entity or entities.
The Funds remain subject to credit risk with respect to the amount they expect to receive from counterparties. However, the Funds have sought to mitigate these risks by generally requiring the posting of collateral to a Fund at prearranged exposure levels to cover a Fund’s exposure to the counterparty. Generally, the amount of collateral due from or to a counterparty must exceed a minimum transfer amount threshold before a transfer is required to be made. The counterparty risk for centrally cleared swap agreements is generally lower than for OTC swap agreements because generally a clearing organization becomes substituted for each counterparty to a centrally cleared swap agreement and, in effect, guarantees the parties’ performance under the contract as each party to a trade looks only to a clearing house for performance of financial obligations. However, there can be no assurance that the clearing house, or its members will satisfy its obligations to a Fund. Swap agreements may involve credit or market risk in excess of the amounts reflected on the Statements of Assets and Liabilities.
The use of swaps is a highly specialized activity that involves investment techniques and risks different from those associated with ordinary portfolio securities transactions. If the Investment Adviser is incorrect in its forecasts of market values, interest rates and currency exchange rates, the investment performance of a Fund would be less favorable than it would have been if this investment technique were not used.
| HSBC FAMILY OF FUNDS |
| Notes to Financial Statements—as of October 31, 2017 (continued) |
During the year ended October 31, 2017, the Total Return Fund entered into interest rate swap agreements to manage its exposure to interest rates and as a substitute for investing directly in securities. The Emerging Markets Debt Fund, Total Return Fund, Global High Yield Bond Fund and Global High Income Bond Fund entered into credit default swap agreements primarily to manage and/or gain exposure to credit risk. The notional amount of swap agreements outstanding as of October 31, 2017 and the monthly average notional amount for these agreements during the year ended October 31, 2017 were as follows:
| | Outstanding | | Monthly Average |
| | Notional Amount ($) | | Notional Amount ($) |
| Interest Rate Swap Agreements: | | | | |
| Total Return Fund | | 4,466,937 | | 9,662,530 |
| | Outstanding | | Monthly Average |
| | Notional Amount ($) | | Notional Amount ($) |
| | Buy | | Sell | | Buy | | Sell |
| | Protection | | Protection | | Protection | | Protection |
| Credit Default Swap Agreements: | | | | | | | | | | |
| Emerging Markets Debt Fund | | 750,000 | | (2,580,000 | ) | | 1,089,167 | | (2,641,583 | ) |
| Total Return Fund | | 4,596,000 | | (5,416,000 | ) | | 12,696,583 | | (8,048,333 | ) |
| Global High Yield Bond Fund | | — | | (1,309,239 | ) | | — | | (1,318,073 | ) |
| Global High Income Bond Fund | | — | | (660,000 | ) | | — | | (660,000 | ) |
Summary of Derivative Instruments:
The following is a summary of the fair values of derivative instruments on the Statements of Assets and Liabilities, categorized by risk exposure, as of October 31, 2017:
| | Assets | | Liabilities |
| | Unrealized | | | | | | | | | | | | Unrealized | | | | | | | | | | |
| | Appreciation | | | | | | | | | | | | Depreciation | | | | | | | | | | |
| | on Forward | | | | | | | | | | | | on Forward | | | | | | | | | | |
| | Foreign | | Variation | | Investments | | | | | | Foreign | | Variation | | Written | | | | |
| | Currency | | Margin | | at value for | | Swap | | Currency | | Margin | | Options | | Swap |
| | Exchange | | on Futures | | Written | | Agreements | | Exchange | | on Futures | | at Fair | | Agreements |
| Fund | | Contracts ($) | | Contracts ($)* | | options ($)* | | at Value ($)* | | Contracts ($) | | Contracts ($)* | | Value ($)* | | at Value ($)* |
| Foreign Exchange Rate Risk Exposure: | | | | | | | | | | | | | | | | | | | | | | | | | | | | |
| Emerging Markets Debt Fund | | | 122,917 | | | | — | | | — | | | — | | | | 168,279 | | | | — | | | — | | | — | |
| Total Return Fund | | | 414,138 | | | | — | | | — | | | — | | | | 222,569 | | | | — | | | — | | | — | |
| Global High Yield Bond Fund | | | 72,624 | | | | — | | | — | | | — | | | | 6,099 | | | | — | | | — | | | — | |
| Global High Income Bond Fund | | | 102,419 | | | | — | | | — | | | — | | | | 8,655 | | | | — | | | — | | | — | |
| Euro High Yield Bond Fund | | | 941,050 | | | | — | | | — | | | — | | | | 9,238 | | | | — | | | — | | | — | |
| | |
| Credit Contracts Risk Exposure: | | | | | | | | | | | | | | | | | | | | | | | | | | | | |
| Emerging Markets Debt Fund | | | — | | | | — | | | — | | | 11,625 | | | | — | | | | — | | | — | | | 57,980 | |
| Total Return Fund | | | — | | | | — | | | — | | | 92,807 | | | | — | | | | — | | | — | | | 16,353 | |
| Global High Yield Bond Fund | | | — | | | | — | | | — | | | 74,199 | | | | — | | | | — | | | — | | | 8,499 | |
| Global High Income Bond Fund | | | — | | | | — | | | — | | | — | | | | — | | | | — | | | — | | | 16,845 | |
| | |
| Interest Rate Risk Exposure: | | | | | | | | | | | | | | | | | | | | | | | | | | | | |
| Emerging Markets Debt Fund | | | — | | | | 28,648 | | | — | | | — | | | | — | | | | 1,068 | | | — | | | — | |
| Total Return Fund | | | — | | | | — | | | — | | | 133,658 | | | | — | | | | 9,013 | | | — | | | 102,500 | |
| Global High Income Bond Fund | | | — | | | | 28 | | | — | | | — | | | | — | | | | — | | | — | | | — | |
____________________
| * | Total fair value is presented by Primary Risk Exposure. For forward currency contracts, such amounts represent the appreciation (for asset derivatives) or depreciation (for liability derivatives). For futures contracts, the amounts represent their cumulative appreciation/depreciation, which includes movements of variation margin. Centrally cleared swaps are reported at value, which includes movements of variation margin. |
| HSBC FAMILY OF FUNDS |
| Notes to Financial Statements—as of October 31, 2017 (continued) |
The following is a summary of the effect of derivative instruments on the Statements of Operations, categorized by risk exposure, for the year ended October 31, 2017:
| | Realized Gain (Loss) on Derivatives |
| | Recognized as a Result from Operations |
| | Net Realized Gains | | | | | | | | | | | | | | |
| | (Losses) from | | Net Realized | | | Net Realized | | Net Realized |
| | Forward Foreign | | Gains (Losses) | | | Gains (Losses) | | Gains (Losses) |
| | Currency Exchange | | from Futures | | | from Option | | from Swap |
| Fund | | Contracts ($) | | Contracts ($) | | | Contracts ($) | | Agreements ($) |
| Foreign Exchange Rate Risk Exposure: | | | | | | | | | | | | | | | | | | | |
| Emerging Markets Debt Fund | | | 182,527 | | | | | — | | | | | — | | | | — | | |
| Total Return Fund | | | 713,708 | | | | | — | | | | | — | | | | — | | |
| Global High Yield Bond Fund | | | (240,538 | ) | | | | — | | | | | — | | | | — | | |
| Global High Income Bond Fund | | | (400,174 | ) | | | | — | | | | | — | | | | — | | |
| Euro High Yield Bond Fund | | | (2,182,690 | ) | | | | — | | | | | — | | | | — | | |
| | |
| Credit Contracts Risk Exposure: | | | | | | | | | | | | | | | | | | | |
| Emerging Markets Debt Fund | | | — | | | | | — | | | | | — | | | | (36,151 | ) | |
| Total Return Fund | | | — | | | | | — | | | | | — | | | | (441,824 | ) | |
| Global High Yield Bond Fund | | | — | | | | | — | | | | | — | | | | 103,796 | | |
| Global High Income Bond Fund | | | — | | | | | — | | | | | — | | | | 6,692 | | |
| | |
| Interest Rate Risk Exposure: | | | | | | | | | | | | | | | | | | | |
| Emerging Markets Debt Fund | | | — | | | | | (4,999 | ) | | | | — | | | | — | | |
| Total Return Fund | | | — | | | | | (38,591 | ) | | | | 16,578 | | | | (125,038 | ) | |
| | Net Change in Unrealized Appreciation/Depreciation on |
| | Derivatives Recognized as a Result from Operations |
| | Change in Unrealized | | Change in | | Change in |
| | Appreciation/ | | Unrealized | | Unrealized |
| | Depreciation on | | Appreciation/ | | Appreciation/ |
| | Forward Foreign | | Depreciation | | Depreciation |
| | Currency Exchange | | on Futures | | on Swap |
| Fund | | Contracts ($) | | Contracts ($) | | Agreements ($) |
| Foreign Exchange Rate Risk Exposure: | | | | | | | | | | | | | |
| Emerging Markets Debt Fund | | | (56,219 | ) | | | | — | | | | — | |
| Total Return Fund | | | (532,555 | ) | | | | — | | | | — | |
| Global High Yield Bond Fund | | | (12,701 | ) | | | | — | | | | — | |
| Global High Income Bond Fund | | | (6,293 | ) | | | | — | | | | — | |
| Euro High Yield Bond Fund | | | 365,253 | | | | | — | | | | — | |
| | |
| Credit Contracts Risk Exposure: | | | | | | | | | | | | | |
| Emerging Markets Debt Fund | | | — | | | | | — | | | | 95,249 | |
| Total Return Fund | | | — | | | | | — | | | | 164,107 | |
| Global High Yield Bond Fund | | | — | | | | | — | | | | 16,436 | |
| Global High Income Bond Fund | | | — | | | | | — | | | | 23,952 | |
| | |
| Interest Rate Risk Exposure: | | | | | | | | | | | | | |
| Emerging Markets Debt Fund | | | — | | | | | 27,580 | | | | — | |
| Total Return Fund | | | — | | | | | 2,825 | | | | 231,839 | |
| Global High Income Bond Fund | | | — | | | | | 28 | | | | — | |
| HSBC FAMILY OF FUNDS |
| Notes to Financial Statements—as of October 31, 2017 (continued) |
The Funds are generally subject to master netting arrangements that allow for amounts owed between each Fund and the counterparty to be netted. The party that has the larger payable pays the excess of the larger amount over the smaller amount to the other party. The master netting arrangements do not apply to amounts owed to/from different counterparties. For financial reporting purposes, the Funds do not offset derivative assets and derivative liabilities that are subject to legally enforceable master netting arrangements in the Statements of Assets and Liabilities. The tables below present the gross and net amounts of the assets and liabilities with any offsets to reflect the Funds’ ability to reflect the master netting arrangements at October 31, 2017 in the Statements of Assets and Liabilities.
As of October 31, 2017, each Fund’s derivative assets and liabilities by type are as follows:
| | Emerging Markets | | | | | | | | | Global High Yield | | Global High Income | | Euro High Yield |
| | Debt Fund | | Total Return Fund | | Bond Fund | | Bond Fund | | Bond Fund |
| | Assets | | Liabilities | | Assets | | Liabilities | | Assets | | Liabilities | | Assets | | Liabilities | | Assets | | Liabilities |
| Derivative Financial | | | | | | | | | | | | | | | | | | | | | | | | | | | | | | | | | | |
| Instruments: | | | | | | | | | | | | | | | | | | | | | | | | | | | | | | | | | | |
| Futures contracts | | $ | 1,094 | | | $ | 1,758 | | | $ | — | | $ | 1,547 | | | $ | — | | $ | — | | $ | — | | $ | 141 | | | $ | — | | $ | — |
| Forward currency | | | | | | | | | | | | | | | | | | | | | | | | | | | | | | | | | | |
| contracts | | | 122,917 | | | | 168,279 | | | | 414,138 | | | 222,569 | | | $ | 72,624 | | $ | 6,099 | | $ | 102,419 | | $ | 8,655 | | | $ | 941,050 | | $ | 9,238 |
| Swap agreements | | | 11,625 | | | | 57,980 | | | | 226,465 | | | 114,760 | | | | — | | | 8,499 | | | — | | | 16,845 | | | | — | | | — |
| Total derivative assets | | | | | | | | | | | | | | | | | | | | | | | | | | | | | | | | | | |
| and liabilities in the | | | | | | | | | | | | | | | | | | | | | | | | | | | | | | | | | | |
| Statements of Assets | | | | | | | | | | | | | | | | | | | | | | | | | | | | | | | | | | |
| and Liabilities | | | 135,636 | | | | 228,017 | | | | 640,603 | | | 338,876 | | | | 72,624 | | | 14,598 | | | 102,419 | | | 25,641 | | | | 941,050 | | | 9,238 |
| Derivative asset and | | | | | | | | | | | | | | | | | | | | | | | | | | | | | | | | | | |
| liabilities not subject | | | | | | | | | | | | | | | | | | | | | | | | | | | | | | | | | | |
| to a master netting | | | | | | | | | | | | | | | | | | | | | | | | | | | | | | | | | | |
| agreement or similar | | | | | | | | | | | | | | | | | | | | | | | | | | | | | | | | | | |
| agreement (“MNA”) | | | (1,094 | ) | | | (1,758 | ) | | | — | | | (2,158 | ) | | | — | | | — | | | — | | | (141 | ) | | | — | | | — |
| Total assets and liabilities | | | | | | | | | | | | | | | | | | | | | | | | | | | | | | | | | | |
| subject to a MNA | | $ | 134,542 | | | $ | 226,259 | | | $ | 640,603 | | $ | 336,718 | | | $ | 72,624 | | $ | 14,598 | | $ | 102,419 | | $ | 25,500 | | | $ | 941,050 | | $ | 9,238 |
| HSBC FAMILY OF FUNDS |
| Notes to Financial Statements—as of October 31, 2017 (continued) |
The following table represents each Fund’s derivative assets by counterparty net of amounts available for offset under a master netting arrangement and net of the related collateral received by each Fund as of October 31, 2017:
| Counterparty | | Derivative Assets
Subject to a MNA
by Counterparty | | Derivatives
Available
for Offset | | Non-cash
Collateral
Received(a) | | Cash Collateral
Received(a) | | Net Amount of
Derivative Assets |
| Emerging Markets Debt Fund: | | | | | | | | | | | | | | | | | | | | | | | | | | | |
| Bank of America | | | $ | 2,289 | | | | $ | (2,289 | ) | | | | $ | — | | | | $ | — | | | | | $ | — | |
| Barclays Bank PLC | | | | 8,172 | | | | | (8,172 | ) | | | | | — | | | | | — | | | | | | — | |
| Credit Suisse | | | | 2,583 | | | | | (2,583 | ) | | | | | — | | | | | — | | | | | | — | |
| Goldman Sachs | | | | 19,474 | | | | | (19,474 | ) | | | | | — | | | | | — | | | | | | — | |
| JPMorgan Chase | | | | 4,606 | | | | | (4,606 | ) | | | | | — | | | | | — | | | | | | — | |
| Standard Chartered Bank | | | | 90,742 | | | | | (16,554 | ) | | | | | — | | | | | (74,188 | ) | | | | | — | |
| UBS AG | | | | 6,676 | | | | | (1,068 | ) | | | | | — | | | | | — | | | | | | 5,608 | |
| Total | | | $ | 134,542 | | | | $ | (54,746 | ) | | | | $ | — | | | | $ | (74,188 | ) | | | | $ | 5,608 | |
| Total Return Fund: | | | | | | | | | | | | | | | | | | | | | | | | | | | |
| Bank of America | | | $ | 47,831 | | | | $ | (17,516 | ) | | | | $ | — | | | | $ | — | | | | | $ | 30,315 | |
| Barclays Bank PLC | | | | 184,804 | | | | | (18,953 | ) | | | | | — | | | | | (165,851 | ) | | | | | — | |
| Credit Suisse | | | | 41,163 | | | | | (3,130 | ) | | | | | — | | | | | — | | | | | | 38,033 | |
| Goldman Sachs | | | | 4,770 | | | | | (4,770 | ) | | | | | — | | | | | — | | | | | | — | |
| JPMorgan Chase | | | | 32,000 | | | | | (32,000 | ) | | | | | — | | | | | — | | | | | | — | |
| Morgan Stanley | | | | 1,760 | | | | | (1,760 | ) | | | | | — | | | | | — | | | | | | — | |
| Standard Chartered Bank | | | | 301,486 | | | | | (115,997 | ) | | | | | — | | | | | (110,000 | ) | | | | | 75,489 | |
| UBS AG | | | | 26,789 | | | | | (20,009 | ) | | | | | — | | | | | — | | | | | | 6,780 | |
| Total | | | $ | 640,603 | | | | $ | (214,135 | ) | | | | $ | — | | | | $ | (275,851 | ) | | | | $ | 150,617 | |
| Global High Yield Bond Fund: | | | | | | | | | | | | | | | | | | | | | | | | | | | |
| Morgan Stanley | | | $ | 72,624 | | | | $ | — | | | | | $ | — | | | | $ | — | | | | | $ | 72,624 | |
| Total | | | $ | 72,624 | | | | $ | — | | | | | $ | — | | | | $ | — | | | | | $ | 72,624 | |
| Global High Income Bond Fund: | | | | | | | | | | | | | | | | | | | | | | | | | | | |
| Morgan Stanley | | | $ | 102,419 | | | | $ | — | | | | | $ | — | | | | $ | — | | | | | $ | 102,419 | |
| Total | | | $ | 102,419 | | | | $ | — | | | | | $ | — | | | | $ | — | | | | | $ | 102,419 | |
| Euro High Yield Bond Fund: | | | | | | | | | | | | | | | | | | | | | | | | | | | |
| Credit Agricole | | | $ | 1,713 | | | | $ | (44 | ) | | | | $ | — | | | | $ | — | | | | | $ | 1,669 | |
| RBC Dominion Securities | | | | 939,337 | | | | | (4,186 | ) | | | | | — | | | | | (600,000 | ) | | | | | 335,151 | |
| Total | | | $ | 941,050 | | | | $ | (4,230 | ) | | | | $ | — | | | | $ | (600,000 | ) | | | | $ | 336,820 | |
____________________
| (a) | The actual collateral received may be in excess of the amounts shown in the table. The table only reflects collateral amounts up to the amount of the financial instrument disclosed on the Statements of Assets and Liabilities. |
| HSBC FAMILY OF FUNDS |
| Notes to Financial Statements—as of October 31, 2017 (continued) |
The following table represents each Fund’s derivative liabilities by counterparty net of amounts available for offset under a master netting arrangement and net of the related collateral pledged by each Fund as of October 31, 2017:
| | Derivative Liabilities | | Derivatives | | Non-cash | | | | | | | | | | | |
| | Subject to a MNA | | Available | | Collateral | | Cash Collateral | | Net Amount of |
| Counterparty | | by Counterparty | | for Offset | | Pledged(a) | | Pledged(a) | | Derivative Liabilities |
| Emerging Markets Debt Fund: | | | | | | | | | | | | | | | | | | | | | | | | | | | |
| Bank of America | | | $ | 38,856 | | | | $ | (2,289 | ) | | | | $ | — | | | | $ | — | | | | | $ | 36,567 | |
| Barclays Bank PLC | | | | 10,666 | | | | | (8,172 | ) | | | | | — | | | | | — | | | | | | 2,494 | |
| Credit Suisse | | | | 42,385 | | | | | (2,583 | ) | | | | | — | | | | | — | | | | | | 39,802 | |
| Goldman Sachs | | | | 67,373 | | | | | (19,474 | ) | | | | | — | | | | | — | | | | | | 47,899 | |
| JPMorgan Chase | | | | 48,366 | | | | | (4,606 | ) | | | | | — | | | | | — | | | | | | 43,760 | |
| Morgan Stanley | | | | 991 | | | | | — | | | | | | — | | | | | — | | | | | | 991 | |
| Standard Chartered Bank | | | | 16,554 | | | | | (16,554 | ) | | | | | — | | | | | — | | | | | | — | |
| UBS AG | | | | 1,068 | | | | | (1,068 | ) | | | | | — | | | | | — | | | | | | — | |
| Total | | | $ | 226,259 | | | | $ | (54,746 | ) | | | | $ | — | | | | $ | — | | | | | $ | 171,513 | |
| Total Return Fund: | | | | | | | | | | | | | | | | | | | | | | | | | | | |
| Bank of America | | | $ | 17,516 | | | | $ | (17,516 | ) | | | | $ | — | | | | $ | — | | | | | $ | — | |
| Barclays Bank PLC | | | | 18,953 | | | | | (18,953 | ) | | | | | — | | | | | — | | | | | | — | |
| Credit Suisse | | | | 3,130 | | | | | (3,130 | ) | | | | | — | | | | | — | | | | | | — | |
| Goldman Sachs | | | | 118,473 | | | | | (4,770 | ) | | | | | — | | | | | (113,703 | ) | | | | | — | |
| JPMorgan Chase | | | | 40,305 | | | | | (32,000 | ) | | | | | — | | | | | — | | | | | | 8,305 | |
| Morgan Stanley | | | | 2,335 | | | | | (1,760 | ) | | | | | — | | | | | (575 | ) | | | | | — | |
| Standard Chartered Bank | | | | 115,997 | | | | | (115,997 | ) | | | | | — | | | | | — | | | | | | — | |
| UBS AG | | | | 20,009 | | | | | (20,009 | ) | | | | | — | | | | | — | | | | | | — | |
| Total | | | $ | 336,718 | | | | $ | (214,135 | ) | | | | $ | — | | | | $ | (114,278 | ) | | | | $ | 8,305 | |
| Global High Yield Bond Fund: | | | | | | | | | | | | | | | | | | | | | | | | | | | |
| Bank of America | | | $ | 8,619 | | | | $ | — | | | | | $ | — | | | | $ | — | | | | | $ | 8,619 | |
| UBS AG | | | | 5,979 | | | | | — | | | | | | — | | | | | — | | | | | | 5,979 | |
| Total | | | $ | 14,598 | | | | $ | — | | | | | $ | — | | | | $ | — | | | | | $ | 14,598 | |
| Global High Income Bond Fund: | | | | | | | | | | | | | | | | | | | | | | | | | | | |
| Bank of America | | | $ | 16,845 | | | | $ | — | | | | | $ | — | | | | $ | — | | | | | $ | 16,845 | |
| UBS AG | | | | 8,655 | | | | | — | | | | | | — | | | | | — | | | | | | 8,655 | |
| Total | | | $ | 25,500 | | | | $ | — | | | | | $ | — | | | | $ | — | | | | | $ | 25,500 | |
| Euro High Yield Bond Fund: | | | | | | | | | | | | | | | | | | | | | | | | | | | |
| Credit Agricole | | | $ | 44 | | | | $ | (44 | ) | | | | $ | — | | | | $ | — | | | | | $ | — | |
| RBC Dominion Securities | | | | 4,186 | | | | | (4,186 | ) | | | | | — | | | | | — | | | | | | — | |
| Societe Generale | | | | 5,008 | | | | | — | | | | | | — | | | | | — | | | | | | 5,008 | |
| Total | | | $ | 9,238 | | | | $ | (4,230 | ) | | | | $ | — | | | | $ | — | | | | | $ | 5,008 | |
____________________
| (a) | The actual collateral pledged may be in excess of the amounts shown in the table. The table only reflects collateral amounts up to the amount of the financial instrument disclosed on the Statements of Assets and Liabilities. |
| HSBC FAMILY OF FUNDS |
| Notes to Financial Statements—as of October 31, 2017 (continued) |
Pursuant to each Fund’s ISDA Master Agreement for trading over-the-counter derivatives (“ISDA”), each Fund must notify counterparties if its net asset value (“NAV”) declines below a predetermined level over specified periods. In the event a Fund’s NAV declines below one of the predetermined levels, the decline may trigger an Additional Termination Event under the ISDA (“NAV Decline Trigger Event”) whereby each counterparty would have the right to declare an Early Termination Date, terminate the ISDA, and close-out all outstanding derivatives positions according to the close-out procedures of the ISDA. Pursuant to the terms of the ISDA, following a NAV Decline Trigger Event, counterparties may agree to waive their right to declare an Early Termination Date and thereby waive their right to terminate the ISDA and close-out any outstanding derivatives positions.
In addition to the provisions relating to Additional Termination Events, under the terms of the Credit Support Annex to the ISDA, parties to an ISDA are required to post collateral to the other party if any of their derivatives positions are in a position of net liability. If either party fails to post required collateral and such failure is not remedied following subsequent notice, the failure to post collateral may be an Additional Termination Event and the other party may declare an Early Termination Event, terminate the ISDA, and close out any outstanding derivatives position. As of October 31, 2017, for derivatives positions where the Funds were in a position of net liability, the balance of any collateral posted is included in the Statements of Assets and Liabilities.
Allocations:
Expenses directly attributable to a Fund are charged to that Fund. Expenses not directly attributable to a Fund are allocated among the applicable series within the Trust in relation to the net assets of each fund, equally to each fund, or another appropriate basis. Class specific expenses are charged directly to the class incurring the expense. In addition, income, expenses (other than class specific expenses), and unrealized and realized gains and losses are allocated to each class based on relative net assets on a daily basis.
Distributions to Shareholders:
Dividends to shareholders of the Funds from net investment income, if any, are declared and distributed monthly in the case of the Funds except for the Frontier Markets Fund, Asia ex-Japan Fund and Global Equity Volatility Focused Fund, which distribute annually. Distributions from net realized gains, if any, are declared and paid at least annually by the Funds. Additional distributions are also made to the Funds’ shareholders to the extent necessary to avoid the federal excise tax on certain undistributed income and net realized gains of regulated investment companies.
Federal Income Taxes:
Each Fund is a separate taxable entity for federal income tax purposes. Each Fund has qualified and intends to continue to qualify each year as a “regulated investment company’’ under Subchapter M of the Internal Revenue Code (the “Code”), as amended, and to distribute substantially all of its taxable net investment income and net realized gains, if any, to its shareholders. Accordingly, no provision for federal income or excise tax is required for the Funds, although shareholders may be taxed on distributions they receive.
Management of the Funds has reviewed tax positions taken in tax years that remain subject to examination by all major tax jurisdictions, including federal (i.e., the last four tax year ends and the interim tax period since then, as applicable). Management believes that there is no tax liability resulting from unrecognized tax benefits related to uncertain tax positions taken. Management’s conclusions may be subject to future review based on changes in, or interpretation of, accounting standards or tax laws and regulations.
Recent Accounting Pronouncements:
In October 2016, the SEC released its Final Rules on Investment Company Reporting Modernization (the “Rules”). The Rules introduce two new regulatory reporting forms for investment companies - Form N-PORT and Form N-CEN – and also contain amendments to Regulation S-X which require standardized, enhanced disclosures about derivatives in investment company financial statements, as well as other amendments. The amendments to Regulation S-X became effective for filings made with the SEC after August 1, 2017. The Funds’ adoption of these amendments, effective with the financial statements prepared as of October 31, 2017, required additional disclosures reflected herein, but had no effect on the Funds’ net assets or results of operations.
| HSBC FAMILY OF FUNDS |
| Notes to Financial Statements—as of October 31, 2017 (continued) |
In March 2017, the Financial Accounting Standards Board (“FASB”) issued Accounting Standards Update No. 2017-08 “Premium Amortization on Purchased Callable Debt Securities” (“ASU 2017-08”), which shortens the premium amortization period for purchased non-contingently callable debt securities. ASU 2017-08 specifies that the premium amortization period ends at the earliest call date, for purchased non-contingently callable debt securities. ASU 2017-08 is effective for fiscal years, and interim periods within those fiscal years, beginning after December 15, 2018. Management is currently evaluating the implications of ASU 2017-08 and its impact on the financial statements and related disclosures has not yet been determined.
3. Investment Valuation Summary
The valuation techniques employed by the Funds, as described below, maximize the use of observable inputs and minimize the use of unobservable inputs in determining fair value. The Funds’ investments are classified within the fair value hierarchy based on the lowest level of input that is significant to the fair value measurement. The inputs used for valuing the Funds’ investments are summarized in the three broad levels listed below:
| ● | Level 1—quoted prices in active markets for identical assets
|
| ● | Level 2—other significant observable inputs (including quoted prices for similar securities, interest rates, prepayments speeds, credit risk, etc.)
|
| ● | Level 3—significant unobservable inputs (including the Fund’s own assumptions in determining the fair value of investments) |
Bonds and other fixed income securities (other than short-term obligations) are valued at the evaluated bid price, as of the time NAV is determined, supplied by an approved independent pricing service, based upon market transactions for normal, institutional-size trading units of similar securities, as well as yield, quality, coupon rate, maturity, callability or prepayment option, type and size of issue, trading characteristics and other market data, without exclusive reliance on quoted prices on an exchange or over-the-counter prices. Because quoted prices on exchanges or over-the-counter prices are believed to reflect more accurately the fair value of such securities, matrix valuations are typically categorized as Level 2 in the fair value hierarchy.
Exchange traded, domestic equity securities are valued at the last sale price on a national securities exchange (except the NASDAQ Stock Market), or in the absence of recorded sales, at the readily available closing bid price on such exchanges. Securities traded on the NASDAQ Stock Market are valued at the NASDAQ Official Closing Price on the date of valuation. Domestic equity securities that are not traded on an exchange are valued at the quoted bid price in the over-the-counter market. These securities are typically categorized as Level 1 in the fair value hierarchy.
Exchange traded, foreign equity securities are valued in the appropriate currency on the last quoted sale price, or in the absence of recorded sales, at the readily available closing bid price on such exchange. If no sale is available because the country is on holiday the previous day’s last quoted sales price would be utilized. Foreign equity securities that are not exchange-traded are valued in the appropriate currency at the average of the quoted bid and asked prices in the over-the-counter market. These securities are typically categorized as Level 1 in the fair value hierarchy. Foreign equity securities that are not exchange traded are valued in the appropriate currency at the average of the quoted bid and asked prices in the over-the-counter market and are typically categorized as Level 2 in the fair value hierarchy.
Rights and warrants are valued at the last sales price on a national securities exchange. If these instruments are not scheduled to trade for a certain period they are generally valued intrinsically based on the terms of the issuance and the price of the underlying security. The time value of the warrants may also be considered by the Investment Adviser, as defined below. These instruments are typically categorized as Level 1 in the fair value hierarchy unless intrinsic value is used then would be categorized as Level 2 in the fair value hierarchy.
P-notes are valued by taking the last sales price of the underlying security on its primary exchange. In the absence of a recorded sale on the underlying security the readily available closing bid price on such exchange will be used. If no sale is available because the country is on holiday the previous day’s last quoted sales price would be utilized. All local prices will be converted to U.S. dollars using the foreign currency exchange rate as of the close of regular trading on the New York Stock Exchange. These instruments are typically categorized as Level 2 in the fair value hierarchy.
| HSBC FAMILY OF FUNDS |
| Notes to Financial Statements—as of October 31, 2017 (continued) |
Mutual funds are valued at their NAVs, as reported by such companies and are typically categorized as Level 1 in the fair value hierarchy.
Exchange traded futures contracts are valued at their settlement price on the exchange on which they are traded and are typically categorized as Level 1 in the fair value hierarchy. Exchange traded option contracts are valued at the closing price or last sale price on the primary instrument for that option as recorded by an approved pricing service and are typically categorized as Level 1 in the fair value hierarchy.
Forward foreign currency exchange contracts are valued at the current day’s interpolated foreign exchange rate, as calculated using the current day’s spot rate, and the prevailing forward rates and converted to U.S. dollars at the exchange rate of such currencies against the U.S. dollar, as of the close of regular trading on the New York Stock Exchange, as provided by an approved pricing service, and are typically categorized as Level 2 in the fair value hierarchy. Non-exchange traded derivatives, such as swaps and certain options, are generally valued by using a valuation provided by an approved independent pricing service and are typically categorized as Level 2 in the fair value hierarchy.
Securities or other assets for which market quotations are not readily available, or are deemed unreliable due to a significant event or otherwise, are valued pursuant to procedures adopted by the Board (“Procedures”). Depending on the source and relative significance of valuation inputs, these instruments may be classified as Level 2 or Level 3 in the fair value hierarchy. Examples of potentially significant events that could affect the value of an individual security and thus require pricing under the Procedures include corporate actions by the issuer, announcements by the issuer relating to its earnings or products, regulatory news, natural disasters, and litigation. Examples of potentially significant events that could affect multiple securities held by a Fund include governmental actions, natural disasters, and armed conflicts. Fair value pricing may require subjective determinations about the value of a security. While the Trust’s policy is intended to result in a calculation of a Fund’s NAV that fairly reflects security values as of the time of pricing, the Trust cannot ensure that fair values determined would accurately reflect the price that a Fund could obtain for a security if it were to dispose of that security as of the time of pricing. The prices used by a Fund may differ from the value that would be realized if the securities were sold and the differences could be material to the financial statements.
In addition, if events materially affecting the value of foreign securities occur between the time when the exchange on which they are traded closes and the time when the Funds’ NAV is calculated, such securities may be valued using fair value pricing in accordance with procedures adopted by the Board. Management identifies possible fluctuations in foreign securities by monitoring the rise or fall in the value of a designated benchmark index. In the event of a rise or fall greater than predetermined levels, the Funds may use a systematic valuation model provided by an independent third party to value its foreign securities, rather than local market closing prices. When a Fund uses such a valuation model, the value assigned to the Fund’s foreign securities may not be the quoted or published prices of the investment on their primary markets or exchanges and are typically categorized as Level 2 in the fair value hierarchy. The valuation of these securities may represent a transfer between Levels 1 and 2. The number of days on which fair value prices will be used will depend on market activity and it is possible that fair value prices will be used by the Funds to a significant extent.
Changes in valuation techniques may result in transfers in or out of an assigned level within the fair value hierarchy. The Trust’s policy is to disclose transfers between fair value hierarchy levels based on valuations at the end of the reporting period. The inputs or methodology used for valuing investments are not necessarily an indication of the risk associated with investing in those investments.
| HSBC FAMILY OF FUNDS |
| Notes to Financial Statements—as of October 31, 2017 (continued) |
The following is a summary of the valuation inputs used as of October 31, 2017 in valuing the Funds’ investments based upon the three levels defined above. The breakdown of country descriptions is disclosed in the Schedule of Portfolio Investments for each Fund:
| | LEVEL 1 ($) | | LEVEL 2 ($) | | LEVEL 3 ($) | | Total ($) |
| Emerging Markets Debt Fund | | | | | | | | | | | |
| Investment Securities: | | | | | | | | | | | |
| Foreign Bonds | | — | | | 25,150,657 | | | — | | 25,150,657 | |
| Yankee Dollars | | — | | | 27,296,367 | | | — | | 27,296,367 | |
| Investment Company | | 565,344 | | | — | | | — | | 565,344 | |
| U.S. Treasury Obligations | | — | | | 186,891 | | | — | | 186,891 | |
| Total Investment Securities | | 565,344 | | | 52,633,915 | | | — | | 53,199,259 | |
| Other Financial Instruments: (a) | | | | | | | | | | | |
| Futures Contracts | | 27,580 | | | — | | | — | | 27,580 | |
| Credit Default Swaps | | — | | | (46,355 | ) | | — | | (46,355 | ) |
| Forward Currency Contracts | | — | | | (45,362 | ) | | — | | (45,362 | ) |
| Total Investments | | 592,924 | | | 52,542,198 | | | — | | 53,135,122 | |
| | | | | | | | | | | | |
| Frontier Markets Fund | | | | | | | | | | | |
| Investment Securities: | | | | | | | | | | | |
| Common Stocks | | | | | | | | | | | |
| Food Products | | 1,225,958 | | | — | | | 75,907 | | 1,301,865 | |
| Other Common Stocks | | 38,621,116 | | | — | | | — | | 38,621,116 | |
| Convertible Corporate Bond | | — | | | 103,860 | | | — | | 103,860 | |
| Participatory Notes | | — | | | 2,368,899 | | | — | | 2,368,899 | |
| Investment Company | | 769,400 | | | — | | | — | | 769,400 | |
| Private Placements | | 1,809,617 | | | — | | | — | | 1,809,617 | |
| Total Investment Securities | | 42,426,091 | | | 2,472,759 | | | 75,907 | | 44,974,757 | |
| | | | | | | | | | | | |
| Total Return Fund | | | | | | | | | | | |
| Investment Securities: | | | | | | | | | | | |
| Foreign Bonds | | — | | | 2,535,431 | | | — | | 2,535,431 | |
| Yankee Dollars | | — | | | 8,590,097 | | | — | | 8,590,097 | |
| Investment Company | | 1,937,525 | | | — | | | — | | 1,937,525 | |
| U.S. Treasury Obligation | | — | | | 103,835 | | | — | | 103,835 | |
| Total Investment Securities | | 1,937,525 | | | 11,229,363 | | | — | | 13,166,888 | |
| Other Financial Instruments:(a) | | | | | | | | | | | |
| Futures Contracts | | (9,013 | ) | | — | | | — | | (9,013 | ) |
| Interest Rate Swaps | | — | | | 35,862 | | | — | | 35,862 | |
| Centrally Cleared Interest Rate Swaps | | — | | | (4,704 | ) | | — | | (4,704 | ) |
| Credit Default Swaps | | — | | | 76,454 | | | — | | 76,454 | |
| Forward Currency Contracts | | — | | | 191,569 | | | — | | 191,569 | |
| Total Investments | | 1,928,512 | | | 11,528,544 | | | — | | 13,457,056 | |
| HSBC FAMILY OF FUNDS |
| Notes to Financial Statements—as of October 31, 2017 (continued) |
| | LEVEL 1 ($) | | LEVEL 2 ($) | | LEVEL 3 ($) | | Total ($) |
| Asia ex-Japan Fund | | | | | | | | | | |
| Investment Securities: | | | | | | | | | | |
| Common Stocks | | | | | | | | | | |
| Construction & Engineering | | 682,311 | | 221,665 | | | — | | 903,976 | |
| Construction Materials | | 239,146 | | 209,747 | | | — | | 448,893 | |
| Energy Equipment & Services | | — | | — | | | 51,526 | | 51,526 | |
| Food Products | | 261,482 | | 62,218 | | | — | | 323,700 | |
| Independent Power and Renewable | | | | | | | | | | |
| Electricity Producers | | 138,828 | | 128,877 | | | — | | 267,705 | |
| Other Common Stocks | | 12,525,387 | | — | | | — | | 12,525,387 | |
| Exchange-Traded Fund | | 285,466 | | — | | | — | | 285,466 | |
| Investment Company | | 190,561 | | — | | | — | | 190,561 | |
| Total Investment Securities | | 14,323,181 | | 622,507 | | | 51,526 | | 14,997,214 | |
| | | | | | | | | | | |
| Global High Yield Bond Fund | | | | | | | | | | |
| Investment Securities: | | | | | | | | | | |
| Foreign Bonds | | — | | 4,248,776 | | | — | | 4,248,776 | |
| Yankee Dollars | | — | | 7,466,938 | | | — | | 7,466,938 | |
| Corporate Bonds | | — | | 15,436,117 | | | — | | 15,436,117 | |
| Exchange Traded Fund | | 323,524 | | — | | | — | | 323,524 | |
| Investment Companies | | 2,243,319 | | — | | | — | | 2,243,319 | |
| Total Investment Securities | | 2,566,843 | | 27,151,831 | | | — | | 29,718,674 | |
| Other Financial Instruments:(a) | | | | | | | | | | |
| Credit Default Swaps | | — | | (8,499 | ) | | — | | (8,499 | ) |
| Centrally Cleared Credit | | | | | | | | | | |
| Default Swaps | | — | | 74,199 | | | — | | 74,199 | |
| Forward Currency Contracts | | — | | 66,525 | | | — | | 66,525 | |
| Total Investments | | 2,566,843 | | 27,284,056 | | | — | | 29,850,899 | |
| | | | | | | | | | | |
| Global High Income Bond Fund | | | | | | | | | | |
| Investment Securities: | | | | | | | | | | |
| Foreign Bonds | | — | | 6,400,025 | | | — | | 6,400,025 | |
| Yankee Dollars | | — | | 9,036,869 | | | — | | 9,036,869 | |
| Corporate Bonds | | — | | 10,602,307 | | | — | | 10,602,307 | |
| Exchange Traded Fund | | 158,456 | | — | | | — | | 158,456 | |
| Investment Companies | | 1,402,373 | | — | | | — | | 1,402,373 | |
| U.S. Treasury Obligations | | — | | 319,261 | | | — | | 319,261 | |
| Total Investment Securities | | 1,560,829 | | 26,358,462 | | | — | | 27,919,291 | |
| Other Financial Instruments:(a) | | | | | | | | | | |
| Futures Contracts | | 28 | | — | | | — | | 28 | |
| Credit Default Swaps | | — | | (16,845 | ) | | — | | (16,845 | ) |
| Forward Currency Contracts | | — | | 93,764 | | | — | | 93,764 | |
| Total Investments | | 1,560,857 | | 26,435,381 | | | — | | 27,996,238 | |
| HSBC FAMILY OF FUNDS |
| Notes to Financial Statements—as of October 31, 2017 (continued) |
| | LEVEL 1 ($) | | LEVEL 2 ($) | | LEVEL 3 ($) | | Total ($) |
| Global Equity Volatility Focused Fund | | | | | | | | |
| Investment Securities: | | | | | | | | |
| Common Stocks | | 11,503,833 | | — | | — | | 11,503,833 |
| Investment Company | | 381,899 | | — | | — | | 381,899 |
| Total Investment Securities | | 11,885,732 | | — | | — | | 11,885,732 |
| | | | | | | | | |
| Euro High Yield Bond Fund (USD Hedged) | | | | | | | | |
| Investment Securities: | | | | | | | | |
| Foreign Bonds | | — | | 25,363,452 | | — | | 25,363,452 |
| Yankee Dollar | | — | | 211,250 | | — | | 211,250 |
| Corporate Bonds | | — | | 1,415,262 | | — | | 1,415,262 |
| Investment Company | | 797,886 | | — | | — | | 797,886 |
| Total Investment Securities | | 797,886 | | 26,989,964 | | — | | 27,787,850 |
| Other Financial Instruments: (a) | | | | | | | | |
| Forward Currency Contracts | | — | | 931,812 | | — | | 931,812 |
| Total Investments | | 797,886 | | 27,921,776 | | — | | 28,719,662 |
____________________
| (a) | Other financial instruments would include any derivative instruments, such as futures and forward foreign currency contracts, which are valued at the unrealized appreciation/(depreciation) on the instrument and swap agreements, which are valued at fair value. |
There were transfers from Level 1 to Level 2 and Level 3 as of October 31, 2017 as disclosed in the table below. The Asia ex-Japan Fund transfers from Level 1 to Level 2 relate to a halt in market trading activity and the use of other significant observable inputs at year-end, and the transfers from Level 1 to Level 3 relate to a security which had halted trading at year end, for which management applied a 50% discount to the last traded price to reflect the lack of marketability and negative company guidance. The Frontier Markets Fund transfers from Level 1 to Level 3 relate to a security which had halted trading at year end, for which management applied a 55% discount to the last traded price to reflect the lack of marketability, negative company guidance and changes in the price of a security issued by an affiliate of the issuer. Significant changes in any of the unobservable inputs may significantly impact the fair value measurement. The impact is based on the relationship between each unobservable input and the fair value measurement. Significant increases (decreases) in the discount applied to the last traded price would decrease (increase) the fair value measurement.
| Transfers from | | Transfers from |
| Level 1 to | | Level 1 to |
| Level 2 ($) | | Level 3 ($) |
| Frontier Markets Fund | | | |
| Common Stocks | — | | 75,907 |
| Asia ex-Japan Fund | | | |
| Common Stocks | 336,174 | | 51,526 |
| HSBC FAMILY OF FUNDS |
| Notes to Financial Statements—as of October 31, 2017 (continued) |
4. Related Party Transactions and Other Agreements and Plans:
Investment Management:
HSBC Global Asset Management (USA) Inc. (“HSBC’’ or the “Investment Adviser’’), a wholly owned subsidiary of HSBC Bank USA, N.A., a national bank organized under the laws of the United States, acts as Investment Adviser to the Funds. As Investment Adviser, HSBC manages the investments of the Funds and continuously reviews, supervises and administers the Funds’ investments pursuant to an Investment Advisory Contract. For its services in this capacity, HSBC receives a fee from each Fund, accrued daily and paid monthly, based on the average daily net assets of each respective Fund, at annual rate of:
| Fund | Fee Rate(%) |
| Emerging Markets Debt Fund | 0.50 |
| Frontier Markets Fund | 1.25 |
| Total Return Fund | 0.85 |
| Asia ex-Japan Fund | 1.00 |
| Global High Yield Bond Fund | 0.65 |
| Global High Income Bond Fund | 0.65 |
| Global Equity Volatility Focused Fund | 0.75 |
| Euro High Yield Bond Fund | 0.65 |
HSBC Global Asset Management (UK) Limited (“AMEU”) acts as sub-adviser to the Frontier Markets Fund and the Global Equity Volatility Focused Fund. AMEU receives a fee, accrued daily and paid monthly, based on average daily net assets of the Frontier Market Fund and the Global Equity Volatility Focused Fund at an annual rate of 0.625% and 0.375%, respectively, from the fees paid to the Investment Adviser.
HSBC Global Asset Management (Hong Kong) Limited (“AMHK”) acts as sub-adviser to the Asia ex-Japan Fund. AMHK receives a fee, accrued daily and paid monthly, based on average daily net assets of the Asia ex-Japan Fund at an annual rate of 0.50% from the fees paid to the Investment Adviser.
HSBC Global Asset Management (France) (“AMFR”) acts as sub-adviser to the Euro High Yield Bond Fund. AMFR receives a fee, accrued daily and paid monthly, based on average daily net assets of the Fund at an annual rate of 0.325% from the fees paid to the Investment Adviser.
HSBC also provides support services to the Funds pursuant to a Support Services Agreement. Effective December 15, 2016, for its services in this capacity, HSBC is entitled to a fee, accrued daily and paid monthly, based on the average daily net assets of Class A Shares of each of the Funds, at an annual rate of 0.10%. HSBC is not entitled to a support services fee based on the average daily net assets for Class I Shares.
Prior to December 15, 2016, for its services in this capacity, HSBC was entitled to a fee, accrued daily and paid monthly, based on the average daily net assets of Class A Shares and Class I Shares, at an annual rate of:
| Class A | | Class I |
| Fee Rate(%) | | Fee Rate(%) |
| Emerging Markets Debt Fund | 0.20 | | | 0.10 | |
| Frontier Markets Fund | 0.20 | | | 0.10 | |
| Total Return Fund | 0.20 | | | 0.10 | |
| Asia ex-Japan Fund | 0.20 | | | 0.10 | |
| Global High Yield Bond Fund | 0.10 | | | — | |
| Global High Income Bond Fund | 0.10 | | | — | |
| Global Equity Volatility Focused Fund | 0.10 | | | — | |
| Euro High Yield Bond Fund | 0.10 | | | — | |
| HSBC FAMILY OF FUNDS |
| Notes to Financial Statements—as of October 31, 2017 (continued) |
Through December 14, 2016, HSBC agreed to waive its Support Services Fees for the Class I Shares of the Emerging Markets Debt Fund, Frontier Markets Fund, Total Return Fund and Asia ex-Japan Fund. HSBC also voluntarily agreed to waive 0.10% of its Support Services Fee for the Class A Shares of those Funds.
Administration:
HSBC also serves the Funds as Administrator. Under the terms of the Administration Services Agreement, HSBC receives from the Funds (as well as other funds in the Trust combined) a fee, accrued daily and paid monthly, at an annual rate of:
| Based on Average Daily Net Assets of | Fee Rate(%) |
| Up to $10 billion | 0.0400 |
| In excess of $10 billion but not exceeding $20 billion | 0.0350 |
| In excess of $20 billion but not exceeding $50 billion | 0.0265 |
| In excess of $50 billion | 0.0245 |
The fee rates and breakpoints are determined on the basis of the aggregate average daily net assets of the Trust. For the year ended October 31, 2017, the effective annualized rate was 0.039%, prior to any fee waivers or expense reimbursements, based on the average daily net assets of the Trust. The total administration fee paid to HSBC is allocated to each series based upon its proportionate share of the aggregate net assets of the Trust, subject to certain allocations in cases where one fund invests some or all of its assets in another fund.
Pursuant to a Sub-Administration Services Agreement with HSBC, Citi Fund Services Ohio, Inc. (“Citi”), a wholly-owned subsidiary of Citigroup, Inc., serves as the Trust’s Sub-Administrator. For these services, Citi is entitled to a fee, payable by HSBC, at an annual rate equivalent to the fee rates set forth above subject to certain reductions associated with services provided to new funds, minus 0.02% which is retained by HSBC.
Under a Compliance Services Agreement between the Trust and Citi (the “CCO Agreement”), Citi makes an employee available to serve as the Trust’s Chief Compliance Officer (the “CCO”). Under the CCO Agreement, Citi also provides infrastructure and support in implementing the written policies and procedures comprising the Trust’s compliance program, including support services to the CCO. For the services provided under the CCO Agreement, the Trust paid Citi $312,739 for the year ended October 31, 2017, plus reimbursement of certain out-of-pocket expenses. Expenses incurred by each Fund are reflected on the Statements of Operations as “Compliance Services.” Citi pays the salary and other compensation earned by individuals performing these services, as employees of Citi.
Distribution Arrangements:
On May 31, 2017, Foreside Distribution Services, L.P. (“Foreside”) announced that Lovell Minnick Partners, LLC completed its acquisition of a majority interest in Foreside Financial Group, LLC, an indirect parent of Foreside. Foreside, serves the Trust as Distributor (the “Distributor”). The Trust, on behalf of the Emerging Markets Debt, Total Return and Frontier Markets Funds, has adopted a non-compensatory Distribution Plan and Agreement (the “Distribution Plan”) pursuant to Rule 12b-1 of the Act. The Distribution Plan provides for reimbursement of expenses incurred by the Distributor related to distribution and marketing, at a rate not to exceed 0.25% of the average daily net assets of Class A Shares (currently not being charged). For the year ended October 31, 2017, Foreside, as Distributor, also received $4,154 in commissions from sales of the Trust, of which $3 were reallocated to HSBC-affiliated brokers and dealers.
Shareholder Servicing:
The Trust has adopted a Shareholder Services Plan, which provides for payments to shareholder servicing agents for providing various shareholder services. For performing these services, the shareholder servicing agents receive a fee that is computed daily and paid monthly up to 0.25% of the average daily net assets of Class A Shares of the Funds. The fees paid to the Distributor pursuant to the Distribution Plan and to shareholder servicing agents pursuant to the Shareholder Services Plan may not exceed, in the aggregate, 0.50% annually of each Fund’s average daily net assets of Class A Shares.
| HSBC FAMILY OF FUNDS |
| Notes to Financial Statements—as of October 31, 2017 (continued) |
The Trust has entered into shareholder services contracts with affiliated and unaffiliated financial intermediaries who provide shareholder services and other related services to their clients or customers who invest in the Funds under which the Funds will pay all or a portion of such fees earned to financial intermediaries for performing such services.
Fund Accounting and Transfer Agency:
Citi provides fund accounting services for each Fund. As fund accountant, Citi receives an annual fee per Fund and share class, subject to certain minimums and reimbursements of certain expenses. Citi receives additional fees paid by the Trust for regulatory administration services. Boston Financial Data Services, Inc. (“BFDS”) provides transfer agency services for each Fund. As transfer agent, BFDS receives a fee based on the number of funds and shareholder accounts, subject to certain minimums, and reimbursement of certain expenses.
Independent Trustees:
The Trust pays an annual retainer to each Independent Trustee, plus additional annual retainers to each Committee Chair and the Chairman of the Board. The Independent Trustees also receive a fee for each regular, special in-person, and telephonic meeting of the Board attended. The aggregate amount of the fees and expenses of the Independent Trustees are allocated amongst all the funds in the Trust and are presented in the Statements of Operations.
Fee Reductions:
The Investment Adviser has agreed to contractually limit through March 1, 2018, the total annual expenses, exclusive of interest, taxes, brokerage commissions, extraordinary expenses, and estimated indirect expenses attributable to the Funds’ investments in investment companies, of the Funds. Each Fund Class has its own expense limitations based on the average daily net assets for any full fiscal year as follows:
| | | | Contractual |
| Fund | | Class | | Expense Limitations(%) |
| Emerging Markets Debt Fund | | A | | 0.85 |
| Emerging Markets Debt Fund | | I | | 0.50 |
| Frontier Markets Fund | | A | | 2.20 |
| Frontier Markets Fund | | I | | 1.85 |
| Total Return Fund | | A | | 1.60 |
| Total Return Fund | | I | | 1.25 |
| Asia ex-Japan Fund | | A | | 1.75 |
| Asia ex-Japan Fund | | I | | 1.40 |
| Global High Yield Bond Fund | | A | | 1.15 |
| Global High Yield Bond Fund | | I | | 0.80 |
| Global High Income Bond Fund | | A | | 1.15 |
| Global High Income Bond Fund | | I | | 0.80 |
| Global Equity Volatility Focused Fund | | A | | 1.30 |
| Global Equity Volatility Focused Fund | | I | | 0.95 |
| Euro High Yield Bond Fund | | A | | 1.05 |
| Euro High Yield Bond Fund | | I | | 0.80 |
Effective November 1, 2017, the Investment Adviser has agreed to contractually limit through March 1, 2019, the total annual expenses, exclusive of interest, taxes, brokerage commissions, extraordinary expenses and estimated indirect expenses attributable to the Asia ex-Japan Fund’s investments in investment companies, of the Asia ex-Japan Fund to 1.25% and 0.90% for Class A Shares and Class I Shares, respectively.
| HSBC FAMILY OF FUNDS |
| Notes to Financial Statements—as of October 31, 2017 (continued) |
Any amounts contractually waived or reimbursed by the Investment Adviser will be subject to repayment by the respective Fund to the Investment Adviser within three years calculated monthly from when the waiver or reimbursement is recorded to the extent that the repayment will not cause the Fund’s operating expenses to exceed the contractual expense limit that was in effect at the time of such waiver or reimbursement. During the year ended October 31, 2017, the Investment Adviser did not recapture any of its prior contractual waivers or reimbursements. As of October 31, 2017, the repayments that may potentially be made by the Funds are as follows:
| 2020($) | | 2019($) | | 2018($) | | Total($) |
| Emerging Markets Debt Fund | 364,333 | | 224,310 | | | 144,542 | | | 733,185 |
| Frontier Markets Fund | 449,360 | | 246,274 | | | 24,057 | | | 719,691 |
| Total Return Fund | 331,852 | | 342,401 | | | — | | | 674,253 |
| Asia ex-Japan Fund | 282,747 | | 223,130 | | | 195,564 | | | 701,441 |
| Global High Yield Bond Fund | 192,107 | | 195,535 | | | 61,706 | | | 449,348 |
| Global High Income Bond Fund | 207,463 | | 205,446 | | | 59,476 | | | 472,385 |
| Global Equity Volatility Focused Fund | 146,307 | | 146,695 | | | — | | | 293,002 |
| Euro High Yield Bond Fund | 158,304 | | 148,899 | | | — | | | 307,203 |
The Administrator and Citi may voluntarily waive/reimburse fees to help support the expense limits of the Funds. In addition, HSBC, in its role as Investment Adviser and Administrator, may waive/reimburse additional fees at its discretion. Any voluntary fee waivers/reimbursements are not subject to recoupment in subsequent fiscal periods. Voluntary waivers/reimbursements may be stopped at any time. Amounts waived/reimbursed by the Investment Adviser, Administrator and Citi as Sub-Administrator are reported separately on the Statements of Operations, as applicable.
Other:
The Funds may purchase securities from an underwriting syndicate in which the principal underwriter or members of the syndicate are affiliated with the Adviser. For the year ended October 31, 2017, the Funds purchased the following amounts of such securities:
| Purchases($) |
| Emerging Markets Debt Fund | | 2,281,000 | |
| Total Return Fund | | 1,025,000 | |
| Global High Yield Bond Fund | | 961,000 | |
| Global High Income Bond Fund | | 1,982,000 | |
The Funds may use related party broker-dealers. For the year-ended October 31, 2017, there were no brokerage commissions paid to broker-dealers affiliated with the Adviser.
The Adviser and its affiliates may have lending, banking, brokerage, underwriting, or other business relationships with the issuers of the securities in which the Funds invest.
| HSBC FAMILY OF FUNDS |
| Notes to Financial Statements—as of October 31, 2017 (continued) |
5. Investment Transactions:
Cost of purchases and proceeds from sales of securities (excluding securities maturing less than one year from acquisition) for the year ended October 31, 2017 were as follows:
| | Purchases($) | | Sales($) |
| Emerging Markets Debt Fund | | 34,850,941 | | 15,424,309 |
| Frontier Markets Fund | | 18,926,080 | | 31,764,767 |
| Total Return Fund | | 20,701,355 | | 46,234,934 |
| Asia ex-Japan Fund | | 12,583,983 | | 12,016,967 |
| Global High Yield Bond Fund | | 14,735,377 | | 10,913,908 |
| Global High Income Bond Fund | | 9,661,220 | | 8,438,598 |
| Global Equity Volatility Focused Fund | | 6,636,195 | | 6,668,585 |
| Euro High Yield Bond Fund | | 2,951,996 | | 3,468,877 |
For the year ended October 31, 2017, purchases and sales of long-term U.S. government securities were as follows:
| | Purchases($) | | Sales($) |
| Emerging Markets Debt Fund | | 316,677 | | 710,700 |
| Total Return Fund | | 1,940,869 | | 5,371,622 |
| Global High Income Bond Fund | | 2,846,859 | | 2,714,068 |
6. Investment Risks:
Concentration of Market Risk: To the extent a fund focuses its investments in a specific region or country, the fund will be more susceptible to the market, political, and economic risks and developments of that region or country.
Derivatives Risk: The term “derivatives” covers a broad range of investments, including swaps, futures, options and currency forwards. In general, a derivative refers to any financial instrument whose value is derived, at least in part, from the price of another security or a specified index, asset or rate. The use of derivatives presents risks different from, and possibly greater than, the risks associated with investing directly in traditional securities. The use of derivatives can lead to losses because of adverse movements in the price or value of the underlying asset, index or rate, which may be magnified by certain features of the derivatives. These risks are heightened when derivatives are used to enhance a Fund’s return or as a substitute for a position or security, rather than solely to hedge (or offset) the risk of a position or security held by a Fund. The success of Fund’s derivatives strategies will also be affected by its ability to assess and predict the impact of market or economic developments on the underlying asset, index or rate and the derivative itself, without the benefit of observing the performance of the derivative under all possible market conditions. Derivatives involve the risk of mispricing or improper valuation and the risk that changes in the value of the derivative may not correlate perfectly with the underlying asset, index or rate. Certain derivative positions may be difficult to close out when a Fund’s portfolio manager may believe it would be appropriate to do so. Also, suitable derivative transactions may not be available in all circumstances and there can be no assurance that a Fund will engage in these transactions to reduce exposure to other risks when that would be beneficial.
Emerging Markets Risk: The prices of securities in emerging markets can fluctuate more significantly than the prices of companies in more developed countries. Securities of emerging market issuers generally have more risk than securities issued by issuers in more developed markets. The less developed the country, the greater effect the risks may have in an investment, and as a result, an investment may exhibit a higher degree of volatility than either the general domestic securities market or the securities markets of developed foreign countries.
HSBC FAMILY OF FUNDS |
Notes to Financial Statements—as of October 31, 2017 (continued) |
Foreign Securities Risk: Investments in foreign securities are generally considered riskier than investments in U.S. securities. Foreign securities, including those of emerging and frontier market issuers, are subject to additional risks, including international trade, political and regulatory risks.
Frontier Market Countries Risk: Frontier market countries generally have smaller economies and even less developed capital markets or legal and political systems than traditional emerging market countries. As a result, the risks of investing in emerging market countries are magnified in frontier market countries. The magnification of risks are the result of: the potential for extreme price volatility and illiquidity in frontier markets; government ownership or control of parts of private sector and of certain companies; trade barriers, exchange controls, managed adjustments in relative currency values and other protectionist measures imposed or negotiated by the countries with which frontier market countries trade and the relatively new and unsettled securities laws in many frontier market countries.
High-Yield Securities Risk: Investments in high-yield securities (commonly referred to as “junk bonds”) are considered speculative investments and have significantly higher credit risk than investment-grade securities and tend to be less liquid than higher rated securities. The prices of high-yield securities, which may be more volatile than higher rated securities of similar maturity, may be more vulnerable to adverse market, economic, social or political conditions.
Interest Rate Risk: Fluctuations in interest rates may affect the yield, liquidity and value of investments in income producing or debt instruments. Generally, if interest rates rise, the value of such investments will fall. The risks associated with rising interest rates are heightened given that interest rates are near historic lows, but are expected to increase in the future, with unpredictable effects on the markets and a Fund’s investments.
Non-Diversification Risk: The Emerging Markets Debt and Total Return Funds are non-diversified, meaning that they are permitted to invest a larger percentage of their assets in fewer issuers than diversified mutual funds. Thus, the Emerging Markets Debt and Total Return Funds may be more susceptible to adverse developments affecting any single issuer held in its portfolio, and may be more susceptible to greater losses because of these developments.
Swap Risk: The use of swap agreements, which are agreements to exchange the return generated by one instrument for the return generated by another instrument (or index), and similar instruments involves risks that are different from those associated with ordinary portfolio securities transactions. For example, a Fund bears the risk of loss of the amount expected to be received under a swap agreement in the event of the default or bankruptcy of a swap agreement counterparty. Swap agreements may also subject a Fund to the risk that the counterparty to the transaction may not meet its obligations, causing the Fund’s value to decrease. Swap agreements may also be considered illiquid.
7. Federal Income Tax Information:
At October 31, 2017, the cost basis of investments for federal income tax purposes, gross unrealized appreciation, gross unrealized depreciation and net unrealized appreciation/depreciation were as follows:
| | | | | | | | | | | | Net Unrealized |
| | | | Tax Unrealized | | Tax Unrealized | | Appreciation/ |
| | | Tax Cost ($) | | Appreciation ($) | | Depreciation ($) | | (Depreciation) ($)* |
| Emerging Markets Debt Fund | | 53,650,482 | | | 1,462,009 | | | | (1,962,987 | ) | | | (500,978 | ) |
| Frontier Markets Fund | | 39,574,663 | | | 8,028,569 | | | | (2,628,475 | ) | | | 5,400,094 | |
| Total Return Fund | | 13,215,191 | | | 432,821 | | | | (382,652 | ) | | | 50,169 | |
| Asia ex-Japan Fund | | 12,830,068 | | | 2,792,037 | | | | (624,891 | ) | | | 2,167,146 | |
| Global High Yield Bond Fund | | 28,551,578 | | | 1,370,648 | | | | (137,852 | ) | | | 1,232,796 | |
| Global High Income Bond Fund | | 26,541,900 | | | 1,460,493 | | | | (99,947 | ) | | | 1,360,546 | |
| Global Equity Volatility Focused Fund | | 10,541,324 | | | 1,570,546 | | | | (226,138 | ) | | | 1,344,408 | |
| Euro High Yield Bond Fund | | 23,860,761 | | | 3,977,558 | | | | (50,469 | ) | | | 3,927,089 | |
____________________
| * | The difference between book-basis unrealized appreciation (depreciation) is attributable primarily to tax deferral of losses on wash sales and the realization for tax purposes of unrealized gains/losses on investments in passive foreign investment companies and derivatives. |
| HSBC FAMILY OF FUNDS |
| Notes to Financial Statements—as of October 31, 2017 (continued) |
The tax character of distributions paid by the Funds for the tax year ended October 31, 2017, was as follows:
| | Distributions paid from |
| | | | | | | | | | | | | | | | | | Total |
| | Ordinary | | Net Long Term | | Total Taxable | | Return of | | Distributions |
| | Income ($) | | Capital Gains ($) | | Distributions ($) | | Capital ($) | | Paid ($)(1) |
| Emerging Markets Debt Fund | | | 1,710,264 | | | | — | | | | 1,710,264 | | | | — | | | | 1,710,264 | |
| Frontier Markets Fund | | | 983,528 | | | | — | | | | 983,528 | | | | — | | | | 983,528 | |
| Total Return Fund | | | 131,612 | | | | — | | | | 131,612 | | | | — | | | | 131,612 | |
| Asia ex-Japan Fund | | | 164,703 | | | | — | | | | 164,703 | | | | — | | | | 164,703 | |
| Global High Yield Bond Fund | | | 1,365,979 | | | | — | | | | 1,365,979 | | | | — | | | | 1,365,979 | |
| Global High Income Bond Fund | | | 879,390 | | | | — | | | | 879,390 | | | | — | | | | 879,390 | |
| Global Equity Volatility Focused Fund | | | 175,681 | | | | — | | | | 175,681 | | | | — | | | | 175,681 | |
| Euro High Yield Bond Fund | | | 838,169 | | | | 44,991 | | | | 883,160 | | | | 177,325 | | | | 1,060,485 | |
____________________
| (1) | Total distributions paid may differ from the amount reported in the Statement of Changes in Net Assets because distributions are recognized when actually paid for tax purposes. |
The tax character of distributions paid by the Funds for the tax year ended October 31, 2016, was as follows:
| | Distributions paid from |
| | | | | | | | | | | | Total |
| | Ordinary | | Net Long Term | | Total Taxable | | Return of | | Distributions |
| | Income ($) | | Capital Gains ($) | | Distributions ($) | | Capital ($) | | Paid ($) |
| Emerging Markets Debt Fund | | 649,534 | | — | | | 649,534 | | | — | | | 649,534 | |
| Frontier Markets Fund | | 4,169,551 | | — | | | 4,169,551 | | | — | | | 4,169,551 | |
| Total Return Fund | | 31,025,925 | | — | | | 31,025,925 | | | — | | | 31,025,925 | |
| Asia ex-Japan Fund | | 171,145 | | — | | | 171,145 | | | — | | | 171,145 | |
| Global High Yield Bond Fund | | 1,042,737 | | — | | | 1,042,737 | | | — | | | 1,042,737 | |
| Global High Income Bond Fund | | 723,304 | | — | | | 723,304 | | | — | | | 723,304 | |
| Global Equity Volatility Focused Fund | | 28,279 | | — | | | 28,279 | | | — | | | 28,279 | |
| Euro High Yield Bond Fund | | 285,844 | | — | | | 285,844 | | | — | | | 285,844 | |
____________________
| (1) | Total distributions paid may differ from the amount reported in the Statement of Changes in Net Assets because distributions are recognized when actually paid for tax purposes. |
As of the tax year ended October 31, 2017, the components of accumulated earnings/(deficit) on a tax basis for the Funds were as follows:
| | | | | | Undistributed | | | | | | | | | | Accumulated | | | | | | Total |
| | Undistributed | | Long Term | | | | | | | | | | Capital and | | Unrealized | | Accumulated |
| | Ordinary | | Capital | | Accumulated | | Distributions | | Other | | Appreciation/ | | Earnings/ |
| | Income ($) | | Gains ($) | | Earnings ($) | | Payable ($)* | | Losses ($) | | (Depreciation) ($) | | (Deficit) ($) |
| Emerging Markets Debt Fund | | | 258,372 | | | | — | | | | 258,372 | | | | (41,516 | ) | | | (1,723,666 | ) | | | (562,536 | ) | | | (2,069,346 | ) |
| Frontier Markets Fund | | | 390,193 | | | | — | | | | 390,193 | | | | — | | | | (30,373,989 | ) | | | 5,363,320 | | | | (24,620,476 | ) |
| Total Return Fund | | | — | | | | — | | | | — | | | | (7,904 | ) | | | (11,031,489 | ) | | | (82,894 | ) | | | (11,122,287 | ) |
| Asia ex-Japan Fund | | | 1,298,898 | | | | 570,770 | | | | 1,869,668 | | | | — | | | | — | | | | 2,132,673 | | | | 4,002,341 | |
| Global High Yield Bond Fund | | | 113,007 | | | | — | | | | 113,007 | | | | (11,949 | ) | | | (465,369 | ) | | | 1,229,232 | | | | 864,921 | |
| Global High Income Bond Fund | | | 16,989 | | | | — | | | | 16,989 | | | | (3,698 | ) | | | (19,648 | ) | | | 1,369,688 | | | | 1,363,331 | |
| Global Equity Volatility Focused Fund | | | 172,449 | | | | 186,854 | | | | 359,303 | | | | — | | | | — | | | | 1,344,436 | | | | 1,703,739 | |
| Euro High Yield Bond Fund | | | — | | | | — | | | | — | | | | — | | | | — | | | | 3,916,912 | | | | 3,916,912 | |
____________________
| * | Distributions payable may differ from the amounts reported in the Statements of Assets and Liabilities because distributions payable on a tax basis include those dividends that will be reinvested. |
HSBC FAMILY OF FUNDS |
Notes to Financial Statements—as of October 31, 2017 (continued) |
As of the tax year ended October 31, 2017, the Funds have net capital loss carryforwards (“CLCFs”) not subject to expiration as summarized in the table below. The Board does not intend to authorize a distribution of any realized gain for the Funds until any applicable CLCF has been offset or expires.
| Short Term | | Long Term | | | |
| Amount ($) | | Amount ($) | | Total ($) |
| Emerging Markets Debt Fund | 693,486 | * | | 1,030,180 | * | | 1,723,666 | * |
| Frontier Markets Fund | 8,548,844 | | | 21,825,145 | | | 30,373,989 | |
| Total Return Fund | 7,093,093 | | | 3,780,622 | | | 10,873,715 | |
| Global High Yield Bond Fund | 445,907 | | | 19,462 | | | 465,369 | |
| Global High Income Bond Fund | 19,648 | | | — | | | 19,648 | |
____________________
| * | CLCF for Emerging Markets Debt Fund are subject to limitation under Internal Revenue Code Sections 381-384. |
During the year ended October 31, 2017, the Funds utilized CLCFs as follows:
| | Total ($) |
| Emerging Markets Debt Fund | | 76,413 |
| Frontier Markets Fund | | 133,840 |
| Asia ex-Japan Fund | | 62,641 |
| Global High Yield Bond Fund | | 71,894 |
| Global High Income Bond Fund | | 140,921 |
| Global Equity Volatility Focused Fund | | 338,640 |
Under current law, capital losses and specified ordinary losses realized after October 31 and non-specified ordinary losses incurred after December 31 (ordinary losses collectively known as “late year ordinary loss”) may be deferred and treated as occurring on the first business day of the following fiscal year. As of the tax year ended October 31, 2017, the following Fund had deferred losses:
| Late Year |
| | Ordinary Losses ($) |
| Total Return Fund | 157,774 |
The amount and character of net investment income and net realized gains distributed are determined in accordance with federal income tax regulations, which may differ from GAAP. These “book/tax” differences are either considered temporary or permanent in nature. To the extent these differences are permanent in nature (e.g., certain gain/loss, differing treatment on certain swap agreements, and certain distributions), such amounts are reclassified within the composition of net assets based on their federal tax-basis treatment; temporary differences (e.g., wash losses and the realization for tax purposes of unrealized gains/losses on investments in passive foreign investment companies) do not require reclassification. The Funds may utilize equalization accounting for tax purposes and designate earnings and profits, including net realized gains distributed to shareholders on redemption of shares, as part of the dividends paid deduction for income tax purposes. To the extent distributions to shareholders from net investment income and net realized gains exceed net investment income and net realized gains for tax purposes, they are reported as distributions of capital.
HSBC FAMILY OF FUNDS |
Notes to Financial Statements—as of October 31, 2017 (continued) |
On the Statements of Assets and Liabilities, as a result of permanent book-to-tax differences, reclassification adjustments were made as follows:
| Accumulated Net | | | | | | | | |
| Investment | | | | | | | | |
| Income/(Distributions | | Accumulated | | | | |
| in Excess of Net | | Net Realized | | Paid-In |
| Investment Income) ($) | | Gains/(Losses) ($) | | Capital ($) |
| Emerging Markets Debt Fund | | 51,860 | | | | (1,772,941 | ) | | | 1,721,081 | |
| Frontier Markets Fund | | (230,780 | ) | | | 230,781 | | | | (1 | ) |
| Total Return Fund | | (120,149 | ) | | | 120,151 | | | | (2 | ) |
| Asia ex-Japan Fund | | 8,032 | | | | (8,032 | ) | | | — | |
| Global High Yield Bond Fund | | (87,277 | ) | | | 87,275 | | | | 2 | |
| Global High Income Bond Fund | | (261,541 | ) | | | 261,541 | | | | — | |
| Global Equity Volatility Focused Fund | | 1,024 | | | | (1,024 | ) | | | — | |
| Euro High Yield Bond Fund | | (1,329,198 | ) | | | 1,467,472 | | | | (138,274 | ) |
The reclassifications for the Funds relate primarily to foreign currency gains or losses, investments in passive foreign investment companies, taxable over distributions, merger adjustments, and the differing treatment of investments in swap agreements.
8. Significant Shareholders:
Shareholders, including other funds, individuals, and accounts, as well as the Fund’s investment manager(s) and/or investment personnel, may from time to time own (beneficially or of record) a significant percentage of the Fund’s Shares and can be considered to “control” the Fund when that ownership exceeds 25% of the Fund’s assets (and which may differ from control as determined in accordance with GAAP).
The following list includes the Funds which had individual shareholder accounts with ownership of voting securities greater than 10% of the total outstanding voting securities but less than 25% and/or accounts with ownership of voting securities greater than 25% of the total outstanding voting securities. Significant transactions by these shareholder accounts may negatively impact the Funds’ performance.
| | Number of | | | | | | | | | |
| | shareholders with | | | | Number of | | | | | |
| | ownership of voting | | | | shareholders with | | | | | |
| | securities of the | | | | ownership of voting | | | | | |
| | Portfolio greater | | | | securities of the | | % owned in |
| | than 10% and less | | % owned in | | Portfolio greater | | aggregate |
| | than 25% of the total | | aggregate by | | than 25% of the total | | by greater |
| | Portfolio’s outstanding | | 10%-25% | | Portfolio’s outstanding | | than 25% |
| Fund | | voting securities | | shareholders | | voting securities | | shareholders |
| Emerging Markets Debt Fund | | — | | — | | 1 | | | 94 | %* | |
| Frontier Markets Fund | | 3 | | 35% | | 1 | | | 39 | % | |
| Total Return Fund | | 1 | | 15% | | 1 | | | 49 | % | |
| Asia ex-Japan Fund | | — | | — | | 1 | | | 94 | %* | |
| Global High Yield Bond Fund | | — | | — | | 1 | | | 94 | %* | |
| Global High Income Bond Fund | | — | | — | | 1 | | | 99 | %* | |
| Global Equity Volatility | | | | | | | | | | | |
| Focused Fund | | — | | — | | 1 | | | 100 | %* | |
| Euro High Yield Bond Fund | | — | | — | | 1 | | | 100 | %* | |
____________________
| * | Owned by the Investment Adviser or an affiliate |
HSBC FAMILY OF FUNDS |
Notes to Financial Statements—as of October 31, 2017 (continued) |
9. Business Combinations:
In March 2017, the Board approved HSBC’s proposal to merge HSBC Emerging Markets Local Debt Fund (the “Target Fund”) into HSBC Emerging Markets Debt Fund (the “Acquiring Fund”). The Agreement and Plan of Reorganization was approved by the Board on March 9, 2017. The purpose of the transaction was to respond to the potential impact on investment flows from the Funds as a result of the U.S. Department of Labor’s recently adopted rule that imposes new requirements on certain financial intermediaries and retirement plan participants and to offer investors a portfolio with a more balanced mix of U.S. dollar-denominated and local currency-denominated emerging markets debt investments. The transaction was effective after the close of business on April 7, 2017. The Acquiring Fund acquired all of the assets and assumed all of the liabilities of the Target Fund as shown in the table below. The transaction was structured to qualify as a tax-free reorganization under the Code. Pursuant to the Agreement and Plan of Reorganization, shareholders of the Target Fund received a number of shares of the corresponding class in the Acquiring Fund, with a value equal to their holdings in the Target Fund as of the close of business on April 7, 2017. The investment portfolio of the Target Fund, with a fair value of approximately $26,391,155 and identified cost of approximately $27,290,437 as of the date of the reorganization, was the principal asset acquired by the Acquiring Fund. For financial statement purposes, assets received and shares issued by the Acquiring Fund were recorded at fair value; however, the cost basis of the investments received from the Target Fund was carried forward to align ongoing reporting of the Acquiring Fund’s realized and unrealized gains and losses with amounts distributable to shareholders for tax purposes.
The following is a summary of Shares Outstanding, Net Assets, NAV and Net Unrealized Appreciation (Depreciation) immediately before and after the reorganization:
| | | | | | | Net Asset | | Net Unrealized |
| | Shares | | | | | Value | | Appreciation |
| | Outstanding | | Net Assets | | Per Share | | (Depreciation)* |
| Target Fund | | | | | | | | | | | | | | | |
| Emerging Markets Local Debt Fund | | | | | | | | | | | | | | | |
| Class A | | 155,275 | | $ | 1,104,162 | | | $ | 7.11 | | | | $ | (892,113 | ) |
| Class I | | 6,876,517 | | | 49,003,085 | | | | 7.13 | | | | | | |
| Acquiring Fund | | | | | | | | | | | | | | | |
| Emerging Markets Debt Fund | | | | | | | | | | | | | | | |
| Class A | | 39,339 | | $ | 401,675 | | | $ | 10.21 | | | | $ | 164,414 | |
| Class I | | 944,593 | | | 9,597,020 | | | | 10.16 | | | | | | |
| Post Reorganization | | | | | | | | | | | | | | | |
| Emerging Markets Debt Fund | | | | | | | | | | | | | | | |
| Class A | | 147,486 | | $ | 1,505,837 | | | $ | 10.21 | | | | $ | (727,699 | ) |
| Class I | | 5,768,139 | | | 58,600,105 | | | | 10.16 | | | | | | |
____________________
| * | Includes translation of balances held in foreign currencies to U.S. dollars. |
Expenses related to reorganization were incurred by the Investment Adviser. Expenses incurred by the Funds in the ordinary course during the reorganization continue to be treated as a Fund expense in accordance with the Funds’ advisory contracts.
Assuming the reorganization had been completed on November 1, 2016, the beginning of the annual reporting period, the pro forma results of operations of the Acquiring Fund, post reorganization for the year ended October 31, 2017, are as follows:
| Net investment income (loss) | $ | 2,199,888 |
| Net realized/unrealized gains (losses) | | 332,238 |
| Change in net assets resulting from operations | $ | 2,532,126 |
HSBC FAMILY OF FUNDS |
Notes to Financial Statements—as of October 31, 2017 (continued) |
Because the combined investment portfolios have been managed as a single integrated portfolio since the reorganization was completed, it is not practicable to separate the amounts of revenue and earnings of the Target Fund that have been included in the Statements of Operations of the Acquiring Fund, post reorganization since April 7, 2017.
10. Subsequent Events:
On December 14, 2017, the Board approved a plan of liquidation to close the Global Equity Volatility Focused Fund. The liquidation of the Global Equity Volatility Focused Fund is expected to be effective on or about January 19, 2018.
Management has evaluated subsequent events through the date these financial statements were issued. Based on the evaluation, no adjustments or additional disclosures were required to the financial statements as of October 31, 2017.
Report of Independent Registered Public Accounting Firm
To the Board of Trustees of HSBC Funds and Shareholders of HSBC Emerging Markets Debt Fund, HSBC Frontier Markets Fund, HSBC Total Return Fund, HSBC Asia ex-Japan Smaller Companies Equity Fund, HSBC Global High Yield Bond Fund, HSBC Global High Income Bond Fund, HSBC Global Equity Volatility Focused Fund and HSBC Euro High Yield Bond Fund (USD Hedged)
In our opinion, the accompanying statements of assets and liabilities, including the schedules of portfolio investments, and the related statements of operations and of changes in net assets and the financial highlights present fairly, in all material respects, the financial position of HSBC Emerging Markets Debt Fund, HSBC Frontier Markets Fund, HSBC Total Return Fund, HSBC Asia ex-Japan Smaller Companies Equity Fund, HSBC Global High Yield Bond Fund, HSBC Global High Income Bond Fund, HSBC Global Equity Volatility Focused Fund and HSBC Euro High Yield Bond Fund (USD Hedged) (eight of the portfolios constituting HSBC Funds, hereafter referred to as the “Fund”) as of October 31, 2017, the results of each of their operations for the year then ended, and the changes in each of their net assets and the financial highlights for each of the periods presented ended on or after October 31, 2015, in conformity with accounting principles generally accepted in the United States of America. These financial statements and financial highlights (hereafter referred to as “financial statements”) are the responsibility of the Fund’s management. Our responsibility is to express an opinion on these financial statements based on our audits. We conducted our audits of these financial statements in accordance with the standards of the Public Company Accounting Oversight Board (United States). Those standards require that we plan and perform the audit to obtain reasonable assurance about whether the financial statements are free of material misstatement. An audit includes examining, on a test basis, evidence supporting the amounts and disclosures in the financial statements, assessing the accounting principles used and significant estimates made by management, and evaluating the overall financial statement presentation. We believe that our audits, which included confirmation of securities as of October 31, 2017 by correspondence with the custodian and brokers, provide a reasonable basis for our opinion. The financial statements of HSBC Emerging Markets Debt Fund, HSBC Frontier Markets Fund and HSBC Total Return Fund as of and for the year ended October 31, 2014 and the financial highlights for each of the periods ended on or prior to October 31, 2014 (not presented herein, other than the financial highlights) were audited by other auditors whose report dated December 23, 2014 expressed an unqualified opinion on those financial statements and financial highlights.
As discussed in Note 10 to the financial statements, the Board of Directors of HSBC Funds on December 14, 2017 approved a plan of liquidation for HSBC Global Equity Volatility Focused Fund.
PricewaterhouseCoopers LLP
New York, New York
December 21, 2017
| HSBC FAMILY OF FUNDS |
| Other Federal Income Tax Information—as of October 31, 2017 (Unaudited) |
During the year ended October 31, 2017, the following Funds declared capital gain distributions:
| | Short Term | | Long Term |
| | Capital Gain | | Capital Gain |
| | Distributions ($) | | Distributions ($) |
| Euro High Yield Bond Fund | | 187,345 | | 44,991 |
During the year ended October 31, 2017, the following Funds designated the maximum amount allowable as interest-related dividends for certain non-U.S. resident investors:
| | Qualified Interest |
| | Income (%) |
| Emerging Markets Debt Fund | | | 1.69 | |
| Total Return Fund | | | 100.00 | |
| Global High Yield Bond Fund | | | 96.21 | |
| Global High Income Bond Fund | | | 91.96 | |
| Euro High Yield Bond Fund | | | 2.96 | |
For the year ended October 31, 2017, the following percentages of the total ordinary income dividends paid by the World Selection Funds qualify for the corporate dividends received deduction available to corporate shareholders:
| | Dividends Received |
| | Deduction (%) |
| Global Equity Volatility Focused Fund | | 51.74 |
For the year ended October 31, 2017, dividends paid by the Funds may be subject to a maximum tax rate of 15%, as provided for by the Jobs and Growth Tax Relief Reconciliation Act of 2003. The Funds intend to designate the maximum amount allowable as taxed at a maximum rate of 15%. Complete information will be reported in conjunction with your 2017 Form 1099-DIV:
| | Qualified Dividend |
| | Income (%) |
| Frontier Markets Fund | | | 81.72 | |
| Asia ex-Japan Fund | | | 16.72 | |
| Global Equity Volatility Focused Fund | | | 100.00 | |
The following Funds intend to elect to pass through to shareholders the income tax credit for taxes paid to foreign countries. Foreign source income and foreign tax expense per outstanding share on October 31, 2017 are as follows:
| | Foreign | | Foreign Tax |
| | Source Income | | Expense Per |
| | Per Share ($) | | Share ($) |
| Frontier Markets Fund | | | 0.45 | | | | 0.06 | |
| Asia ex-Japan Fund | | | 0.33 | | | | 0.04 | |
| Global Equity Volatility Focused Fund | | | 0.18 | | | | 0.02 | |
| Euro High Yield Bond Fund | | | 0.42 | | | | — | |
The pass-through of this foreign tax credit will only affect those persons who are shareholders on the dividend record date in December 2016. These shareholders will receive more detailed information along with their 2017 Form 1099-DIV.
| HSBC FAMILY OF FUNDS |
| Table of Shareholder Expenses—as of October 31, 2017 (Unaudited) |
As a shareholder of the Funds, you incur two types of costs: (1) transaction costs, including sales charges (loads) on purchases, redemption fees and exchange fees; and (2) ongoing costs, including management fees, distribution fees and other Fund expenses. These examples are intended to help you understand your ongoing costs (in dollars) of investing in the Funds and to compare the cost with the ongoing costs of investing in other mutual funds.
These examples are based on an investment of $1,000 invested at the beginning of the period and held for the entire period from May 1, 2017 through October 31, 2017.
Actual Example
The table below provides information about actual account values and actual expenses. You may use the information below, together with the amount you invested, to estimate the expenses that you paid over the period. Simply divide your account value by $1,000 (for example, an $8,600 account value divided by $1,000 = 8.6), then multiply the result by the number in the table under the heading entitled "Expenses Paid During Period" to estimate the expenses you paid on your account during this period.
| | | | Beginning | | | | | | Annualized |
| | | | Account | | Ending | | Expenses Paid | | Expense Ratio |
| | | | Value | | Account Value | | During Period* | | During Period |
| | | | 5/1/17 | | 10/31/17 | | 5/1/17 - 10/31/17 | | 5/1/17 - 10/31/17 |
| Emerging Markets Debt Fund | | Class A | | | $ | 1,000.00 | | | | $ | 1,025.00 | | | | $ | 4.34 | | | | 0.85% | |
| | Class I | | | | 1,000.00 | | | | | 1,026.10 | | | | | 2.55 | | | | 0.50% | |
| | |
| Frontier Markets Fund | | Class A | | | | 1,000.00 | | | | | 1,093.00 | | | | | 11.61 | | | | 2.20% | |
| | Class I | | | | 1,000.00 | | | | | 1,094.90 | | | | | 9.77 | | | | 1.85% | |
| | |
| Total Return Fund | | Class A | | | | 1,000.00 | | | | | 1,001.40 | | | | | 8.07 | | | | 1.60% | |
| | Class I | | | | 1,000.00 | | | | | 1,003.40 | | | | | 6.31 | | | | 1.25% | |
| | |
| Asia ex-Japan Fund | | Class A | | | | 1,000.00 | | | | | 1,148.70 | | | | | 9.48 | | | | 1.75% | |
| | Class I | | | | 1,000.00 | | | | | 1,150.50 | | | | | 7.59 | | | | 1.40% | |
| | |
| HSBC Global High Yield Bond Fund | | Class A | | | | 1,000.00 | | | | | 1,030.20 | | | | | 5.88 | | | | 1.15% | |
| | Class I | | | | 1,000.00 | | | | | 1,031.40 | | | | | 4.10 | | | | 0.80% | |
| | |
| HSBC Global High Income Bond Fund | | Class A | | | | 1,000.00 | | | | | 1,030.50 | | | | | 5.89 | | | | 1.15% | |
| | Class I | | | | 1,000.00 | | | | | 1,031.90 | | | | | 4.10 | | | | 0.80% | |
| | |
| HSBC Global Equity Volatility Focused Fund | | Class A | | | | 1,000.00 | | | | | 1,064.20 | | | | | 6.76 | | | | 1.30% | |
| | Class I | | | | 1,000.00 | | | | | 1,065.80 | | | | | 4.95 | | | | 0.95% | |
| | |
| HSBC Euro High Yield Bond Fund | | Class A | | | | 1,000.00 | | | | | 1,045.90 | | | | | 5.41 | | | | 1.05% | |
| | Class I | | | | 1,000.00 | | | | | 1,046.80 | | | | | 4.13 | | | | 0.80% | |
____________________
| * | Expenses are equal to the average account value over the period, multiplied by the Fund’s annualized expense ratio, multiplied by 184/365 (to reflect the one half year period). |
| HSBC FAMILY OF FUNDS |
| Table of Shareholder Expenses—as of October 31, 2017 (Unaudited) (continued) |
Hypothetical Example for Comparison Purposes
The table below provides information about hypothetical account values and hypothetical expenses based on each Fund’s actual expense ratio and an assumed rate of return of 5% per year before expenses, which is not the Fund’s actual return. The hypothetical account values and expenses may not be used to estimate the actual ending account balance or expenses you paid for the period. You may use this information to compare this 5% hypothetical example with the 5% hypothetical examples that appear in the shareholder reports of other funds.
Please note that the expenses shown in the table are meant to highlight your ongoing costs only and do not reflect any transactional costs, such as sales charges (loads), redemption fees, or exchange fees. Therefore, the table is useful in comparing ongoing costs only, and will not help you determine the relative total costs of owning different funds. In addition, if these transactional costs were included, your costs would have been higher.
| | | | Beginning | | | | | | Annualized |
| | | | Account | | Ending | | Expenses Paid | | Expense Ratio |
| | | | Value | | Account Value | | During Period* | | During Period |
| | | | 5/1/17 | | 10/31/17 | | 5/1/17 - 10/31/17 | | 5/1/17 - 10/31/17 |
| Emerging Markets Debt Fund | | Class A | | | $ | 1,000.00 | | | | $ | 1,020.92 | | | $ | 4.33 | | | | 0.85% | |
| | Class I | | | | 1,000.00 | | | | | 1,022.68 | | | | 2.55 | | | | 0.50% | |
| |
| Frontier Markets Fund | | Class A | | | | 1,000.00 | | | | | 1,014.12 | | | | 11.17 | | | | 2.20% | |
| | Class I | | | | 1,000.00 | | | | | 1,015.88 | | | | 9.40 | | | | 1.85% | |
| |
| Total Return Fund | | Class A | | | | 1,000.00 | | | | | 1,017.14 | | | | 8.13 | | | | 1.60% | |
| | Class I | | | | 1,000.00 | | | | | 1,018.90 | | | | 6.36 | | | | 1.25% | |
| |
| Asia ex-Japan | | Class A | | | | 1,000.00 | | | | | 1,016.38 | | | | 8.89 | | | | 1.75% | |
| | Class I | | | | 1,000.00 | | | | | 1,018.15 | | | | 7.12 | | | | 1.40% | |
| |
| HSBC Global High Yield Bond Fund | | Class A | | | | 1,000.00 | | | | | 1,019.41 | | | | 5.85 | | | | 1.15% | |
| | Class I | | | | 1,000.00 | | | | | 1,021.17 | | | | 4.08 | | | | 0.80% | |
| |
| HSBC Global High Income Bond Fund | | Class A | | | | 1,000.00 | | | | | 1,019.41 | | | | 5.85 | | | | 1.15% | |
| | Class I | | | | 1,000.00 | | | | | 1,021.17 | | | | 4.08 | | | | 0.80% | |
| |
| HSBC Global Equity Volatility Focused Fund | | Class A | | | | 1,000.00 | | | | | 1,018.65 | | | | 6.61 | | | | 1.30% | |
| | Class I | | | | 1,000.00 | | | | | 1,020.42 | | | | 4.84 | | | | 0.95% | |
| |
| HSBC Euro High Yield Bond Fund | | Class A | | | | 1,000.00 | | | | | 1,019.91 | | | | 5.35 | | | | 1.05% | |
| | Class I | | | | 1,000.00 | | | | | 1,021.17 | | | | 4.08 | | | | 0.80% | |
____________________
| * | Expenses are equal to the average account value over the period, multiplied by the Fund’s annualized expense ratio, multiplied by 184/365 (to reflect the one half year period). |
| HSBC FAMILY OF FUNDS |
| Board of Trustees and Officers (Unaudited) |
MANAGEMENT OF THE TRUST
The following table contains information regarding the HSBC Family of Funds’ Board of Trustees (“Trustees”). The HSBC Family of Funds’ Statement of Additional Information includes additional information about the Trustees and is available, without charge, upon request by calling (888) 525-5757.
| | | | | | | | Portfolios in | | |
| | Position(s) | | Term of Office | | | | Fund Complex | | Other Directorships |
| Name, | | Held with | | and Length of | | Principal Occupation(s) | | Overseen By | | Held by Trustee |
| Address, Age | | Funds | | Time Served | | During Past 5 Years | | Trustee* | | During Past 5 Years |
| NON-INTERESTED | | | | | | | | | | |
| TRUSTEES | | | | | | | | | | |
| |
| MARCIA L. BECK | | Trustee | | Indefinite; | | Private Investor (1999 – present) | | 13 | | None |
| P.O. Box 182845 | | | | 2008 to present | | | | | | |
| Columbus, OH | | | | | | | | | | |
| 43218-3035 | | | | | | | | | | |
| Age: 62 | | | | | | | | | | |
| |
| SUSAN C. GAUSE | | Trustee | | Indefinite; | | Private Investor (2003 – present) | | 13 | | Metropolitan Series Fund |
| P.O. Box 182845 | | | | 2013 to present | | | | | | (2012 – present); and |
| Columbus, OH | | | | | | | | | | Met Investors Series |
| 43218-3035 | | | | | | | | | | Trust (2008 – present) |
| Age: 65 | | | | | | | | | | |
| |
| SUSAN S. HUANG | | Trustee | | Indefinite; | | Private Investor (2000 – present) | | 13 | | None |
| P.O. Box 182845 | | | | 2008 to present | | | | | | |
| Columbus, OH | | | | | | | | | | |
| 43218-3035 | | | | | | | | | | |
| Age: 63 | | | | | | | | | | |
| |
| THOMAS F. ROBARDS | | Chairman and | | Indefinite; | | Private Investor (2003 – present) | | 13 | | Ellington Residential |
| P.O. Box 182845 | | Trustee | | 2005 to present | | | | | | Mortgage REIT (NYSE |
| Columbus, OH | | | | | | | | | | listed real estate |
| 43218-3035 | | | | | | | | | | investment trust) (2013 |
| Age: 71 | | | | | | | | | | – present); Ellington |
| | | | | | | | | | Financial LLC (NYSE |
| | | | | | | | | | listed financial services |
| | | | | | | | | | company) (2007 – |
| | | | | | | | | | present); and Overseas |
| | | | | | | | | | Shipholding Group (OSG) |
| | | | | | | | | | (NYSE listed company) |
| | | | | | | | | | (2005 – 2014) |
| |
| INTERESTED TRUSTEE | | | | | | | | | | |
| |
| DEBORAH HAZELL | | Trustee | | Indefinite; | | Director and Chief Executive Officer, | | 13 | | None |
| 452 Fifth Avenue New York | | | | 2011 to present | | HSBC Global Asset Management (USA) | | | | |
| NY 10018 | | | | | | Inc. (2011 - present); President and | | | | |
| Age: 54 | | | | | | Chief Executive Officer, Fisher Francis | | | | |
| | | | | | Trees & Watts (“FFTW”) (investment | | | | |
| | | | | | adviser) (2008 - 2011) | | | | |
____________________
| * | Includes all series of the HSBC Funds. |
| HSBC FAMILY OF FUNDS |
| Board of Trustees and Officers (Unaudited) (continued) |
| | Position(s) Held | | Term of Office and | | Principal Occupation(s) |
| Name, Address, Age | | Funds | | Length of Time Served | | During Past 5 Years |
| OFFICERS | | | | | | |
| |
RICHARD A. FABIETTI
452 Fifth Avenue New York,
NY 10018
Age: 59 | | President | | One year;
2004 to present | | Senior Vice President, HSBC Global Asset Management (USA) Inc. (1998 - present) |
| |
JAMES D. LEVY
452 Fifth Avenue New York,
NY 10018
Age: 54 | | Vice President | | One year;
2014 to present | | Vice President, Product Management, HSBC Global Asset Management (USA) Inc. (2014 – present); Vice President, Mutual Funds Product Development, GE Asset Management Inc. (2007 – 2014) |
| |
ALLAN SHAER*
Prudential Center
800 Boylston Street, 24th Floor
Boston, MA 02199
Age: 52 | | Treasurer | | One year;
2017 to present | | Senior Vice President, Citi Investor Services (2016 - present); Vice President, Mutual Fund Administration, JP Morgan Chase (2011 - 2016) |
| |
IOANNIS TZOUGANATOS*
Prudential Center
800 Boylston Street, 24th Floor
Boston, MA 02199
Age: 41 | | Secretary | | One Year;
2015 to present | | Vice President, Regulatory Administration, Citi Fund Services (2008 - present) |
| |
CHARLES BOOTH*
4400 Easton Commons,
Suite 200
Columbus, OH 43219-3035
Age: 57 | | Chief Compliance
Officer | | One year;
2015 to present | | Director and Compliance Officer, CCO Services, Citi Fund Services (1988 - present) |
____________________
| * | Mr. Shaer, Mr. Tzouganatos, and Mr. Booth also are officers of other investment companies of which Citi (or an affiliate) is the administrator or sub-administrator. |
Other Information (Unaudited):
Information regarding how the Funds voted proxies relating to portfolio securities during the most recent 12-month period ended June 30th is available (i) without charge, upon request, by calling 1-800-525-5757 for HSBC Bank USA and HSBC Brokerage (USA) Inc. clients and 1-800-782-8183 for all other shareholders; (ii) on the Funds’ website at www.investorfunds.us.hsbc.com; and (iii) on the Security and Exchange Commission’s (“Commission”) website at http://www.sec.gov.
The Funds file their complete schedules of portfolio holdings with the Commission for the first and third quarters of each fiscal year on Form N-Q. The Funds’ Forms N-Q are available on the Commission’s website at http://www.sec.gov. The Funds’ Forms N-Q may be reviewed and copied at the Commission’s Public Reference Room in Washington, D.C. and information on the operation of the Public Reference Room may be obtained by calling 1-800-SEC-0330. The Funds’ Schedules of Investments will be available no later than 60 days after each period end, without charge, on the Funds’ website at www.investorfunds.us.hsbc.com.
An investment in a Fund is not a deposit of HSBC Bank USA, National Association, and is not insured or guaranteed by the Federal Deposit Insurance Corporation or any other government agency.
HSBC FAMILY OF FUNDS:
INVESTMENT ADVISER AND ADMINISTRATOR
HSBC Global Asset Management (USA) Inc.
452 Fifth Avenue
New York, NY 10018
SUB-ADVISERS
HSBC Frontier Markets Fund
HSBC Global High Income Bond Fund
HSBC Global Equity Volatility Focused Fund
HSBC Global Asset Management (UK) Limited
78 St. James Street
London, United Kingdom, SW1A 1EJ
HSBC Asia ex-Japan Smaller Companies Equity Fund
HSBC Global Asset Management (Hong Kong) Limited
Level 22, HSBC Main Building
1 Queen’s Road Central, Hong Kong
HSBC Global High Yield Bond Fund
HSBC Euro High Yield Bond Fund (USD Hedged)
HSBC Global High Income Bond Fund
HSBC Global Asset Management (France)
4 place de la Pyramide
Immcuble Ile-de-France
92800 Put eaux
La Défence 9, France
SHAREHOLDER SERVICING AGENTS
For HSBC Bank USA, N.A. and
HSBC Securities (USA) Inc. Clients:
HSBC Bank USA, N.A.
452 Fifth Avenue
New York, NY 10018
1-888-525-5757
For All Other Shareholders:
HSBC Funds
P.O. Box 8106
Boston, MA 02266-8106
1-800-782-8183
TRANSFER AGENT
Boston Financial Data Services, Inc.
2000 Crown Colony Drive
Quincy, MA 02169
DISTRIBUTOR
Foreside Distribution Services, L.P.
Three Canal Plaza, Suite 100
Portland, ME 04101
CUSTODIAN
The Northern Trust Company
50 South LaSalle Street
Chicago, IL 60603
INDEPENDENT REGISTERED PUBLIC ACCOUNTING FIRM
PricewaterhouseCoopers LLP
300 Madison Avenue
New York, NY 10017
LEGAL COUNSEL
Dechert LLP
1900 K Street, N.W.
Washington, D.C. 20006

| Investment products: |
ARE NOT A
BANK DEPOSIT
OR OBLIGATION
OF THE BANK
OR ANY OF ITS
AFFILIATES | ARE NOT
FDIC
INSURED | ARE NOT
INSURED BY
ANY FEDERAL
GOVERNMENT
AGENCY |
ARE NOT GUARANTEED BY
THE BANK OR ANY OF ITS
AFFILIATES | MAY LOSE
VALUE |
Investment products are offered by HSBC Securities (USA) Inc. (HSI), member NYSE/FINRA/SIPC. HSI is an affiliate of HSBC Bank USA, N.A. Investment products: Are not a deposit or other obligation of the bank or any of its affiliates; Not FDIC insured or insured by any federal government agency of the United States; Not guaranteed by the bank or any of its affiliates; and are subject to investment risk, including possible loss of principal invested.
Investors should consider the investment objectives, risks, charges, and expenses of the investment company carefully before investing. The prospectus contains this and other important information about the investment company. For clients of HSBC Securities (USA) Inc., please call 1-888-525-5757 for more information. For other investors and prospective investors, please call the Funds directly at 1-800-782-8183 or visit our website at www.emfunds.us.hsbc.com. Investors should read the prospectus carefully before investing or sending money.
(a) The registrant has adopted a code of ethics that applies to the registrant’s principal executive officer, principal financial officer, principal accounting officer or controller, or persons performing similar functions. This code of ethics is included as an Exhibit.
(b) During the period covered by the report, with respect to the registrant's code of ethics that applies to its principal executive officer, principal financial officer, principal accounting officer or controller, or persons performing similar functions; there have been no amendments to, nor any waivers granted from, a provision that relates to any element of the code of ethics definition enumerated in paragraph (b) of this Item 2.
3(a)(1) The registrant’s board of directors has determined that the registrant has at least one audit committee financial expert serving on its audit committee.
3(a)(2) The audit committee financial experts are Tom Robards and Marcia Beck, who are “independent” for purposes of this Item 3 of Form N-CSR.
(e)(1) The audit committee is required to pre-approve all audit and permitted non-audit services performed by the registrant’s independent auditors in accordance with the audit committee charter and the Investment Company Act of 1940.
(h) The audit committee considered the nonaudit services rendered to the registrant’s investment adviser and any entity controlling, controlled by, or under common control with the investment adviser, and believes the services are compatible with the principal accountant’s independence.
Not applicable.
Not applicable.
(a) The registrant’s principal executive officer and principal financial officer have concluded, based on their evaluation of the registrant's disclosure controls and procedures as conducted within 90 days of the filing date of this report, that these disclosure controls and procedures are adequately designed and are operating effectively to ensure that information required to be disclosed by the registrant on Form N-CSR is recorded, processed, summarized and reported within the time periods specified in the Securities and Exchange Commission's rules and forms.
(b) There were no changes in the registrant’s internal control over financial reporting (as defined in Rule 30a-3(d) under the Act (17 CFR 270.30a-3(d)) that occurred during the period covered by this report that have materially affected or are reasonably likely to materially affect, the registrant’s internal control over financial reporting.
Not applicable.
(a)(1) The code of ethics that is the subject of the disclosure required by Item 2 is attached hereto.
(a)(2) Certifications pursuant to Rule 30a-2(a) are attached hereto.
(a)(3) Not applicable.
(b) Certifications pursuant to Rule 30a-2(b) are furnished herewith.
Pursuant to the requirements of the Securities Exchange Act of 1934 and the Investment Company Act of 1940, the registrant has duly caused this report to be signed on its behalf by the undersigned, thereunto duly authorized.
Pursuant to the requirements of the Securities Exchange Act of 1934 and the Investment Company Act of 1940, this report has been signed below by the following persons on behalf of the registrant and in the capacities and on the dates indicated.