UNITED STATES
SECURITIES AND EXCHANGE COMMISSION
Washington, D.C. 20549
FORM N-CSR
CERTIFIED SHAREHOLDER REPORT OF REGISTERED
MANAGEMENT INVESTMENT COMPANIES
Investment Company Act file number: 811-04782
HSBC FUNDS
(Exact name of registrant as specified in charter)
452 FIFTH AVENUE
NEW YORK, NY 10018
(Address of principal executive offices) (Zip code)
CITI FUND SERVICES
3435 STELZER ROAD
COLUMBUS, OH 43219
(Name and address of agent for service)
Registrant’s telephone number, including area code: 1-800-782-8183
Date of fiscal year end: October 31 Date of reporting period: October 31, 2015 |
Item 1. Reports to Stockholders.
HSBC Global Asset Management (USA) Inc.
HSBC Funds
Annual Report
October 31, 2015
| MONEY MARKET FUNDS | Class A | | Class B | | Class C | | Class D | | Class E | | Class I | | Class Y |
| HSBC Prime Money Market Fund | REAXX | | HSMXX | | HMMXX | | HIMXX | | HMEXX | | HSIXX | | RMYXX |
| HSBC U.S. Government Money Market Fund | FTRXX | | HUBXX | | HUMXX | | HGDXX | | HGEXX | | HGIXX | | RGYXX |
| HSBC U.S. Treasury Money Market Fund | HWAXX | | HTBXX | | HUCXX | | HTDXX | | HTEXX | | HBIXX | | HTYXX |

| Table of Contents |
HSBC Family of Funds
Annual Report - October 31, 2015 |
| Glossary of Terms | |
| Commentary From the Investment Manager | 3 |
| Portfolio Reviews | 4 |
| Portfolio Composition | 7 |
| | |
| Schedules of Portfolio Investments | |
| HSBC Prime Money Market Fund | 8 |
| HSBC U.S. Government Money Market Fund | 12 |
| HSBC U.S. Treasury Money Market Fund | 14 |
| Statements of Assets and Liabilities | 15 |
| Statements of Operations | 16 |
| Statements of Changes in Net Assets | 17 |
| Financial Highlights | 21 |
| Notes to Financial Statements | 27 |
| Report of Independent Registered Public Accounting Firm | 36 |
| Other Federal Income Tax Information | 37 |
| Table of Shareholder Expenses | 38 |
| Board of Trustees and Officers | 40 |
| Other Information | 42 |
Barclays Emerging Markets USD Aggregate Index is a flagship hard currency Emergency Markets debt benchmark that includes fixed and floating-rate US dollar-denominated debt issued from sovereign, quasi-sovereign, and corporate EM issuers. Country eligibility and classification as Emerging Markets is rules-based and reviewed annually using World Bank income group and International Monetary Fund country classification.
Barclays Euro Aggregate Bond Index is an index tracks fixed-rate, investment-grade Euro-denominated securities. Inclusion is based on the currency of the issue, and not the domicile of the issuer. The principal sectors in the index are Treasury, Corporate, Government-Related and Securitised. Securities in the index are part of the Pan-European Aggregate and the Global Aggregate Indices.
Barclays U.S. Aggregate Bond Index is index generally representative of investment-grade, USD-denominated, fixed-rate debt issues, taxable bond market, including Treasuries, government-related and corporate securities, asset-backed, mortgage-backed and commercial mortgage-backed securities, with maturities of at least one year.
Barclays U.S. Corporate High-Yield Bond Index is an index that measures the non-investment grade, USD-denominated, fixed-rate, taxable corporate bond market. Securities are classified as high-yield if the middle rating of Moody’s, Fitch, and S&P is Ba1/BB+/BB+ or below. The index excludes emerging markets debt.
Lipper Money Market Funds Average is an equally weighted average of mutual funds that invest in high-quality financial instruments rated in the top two grades with dollar-weighted average maturities of less than 90 days. These funds intend to keep a constant net asset value.
Lipper U.S. Government Money Market Funds Average is an equally weighted average of mutual funds that invest principally in financial instruments issued or guaranteed by the U.S. government, its agencies, or its instrumentalities, with dollar-weighted average maturities of less than 90 days. These funds intend to keep a constant net asset value.
Lipper U.S. Treasury Money Market Funds Average is an equally weighted average of mutual funds that invest principally in U.S. Treasury obligations with dollar-weighted average maturities of less than 90 days. These funds intend to keep a constant net asset value.
MSCI Europe Australasia and Far East (“MSCI EAFE”) Index is an equity index which captures the large- and mid-cap representation across Developed Markets countries: Australia, Austria, Belgium, Denmark, Finland, France, Germany, Hong Kong, Ireland, Israel, Italy, Japan, the Netherlands, New Zealand, Norway, Portugal, Singapore, Spain, Sweden, Switzerland and the UK (excluding the U.S. and Canada).
MSCI Emerging Markets (“MSCI EM”) Index is an index that captures the large- and mid-cap representation across 23 Emerging Markets (EM) countries: Brazil, Chile, China, Colombia, Czech Republic, Egypt, Greece, Hungary, India, Indonesia, Korea, Malaysia, Mexico, Peru, Philippines, Poland, Qatar, Russia, South Africa, Taiwan, Thailand, Turkey and United Arab Emirates.
MSCI Golden Dragon Index is an index that captures the equity market performance of large- and mid-cap China securities (H shares, B shares, Red-Chips and P-Chips) and non-domestic China securities listed in Hong Kong and Taiwan.
MSCI World Index is a free float adjusted market capitalization weighted index that is designed to measure the equity market performance of developed markets. The MSCI World Index consists of the following 23 developed market country indexes: Australia, Austria, Belgium, Canada, Denmark, Finland, France, Germany, Hong Kong, Ireland, Israel, Italy, Japan, Netherlands, New Zealand, Norway, Portugal, Singapore, Spain, Sweden, Switzerland, the United Kingdom, and the United States.
Standard & Poor’s 500 (“S&P 500”) Index is an index that is widely regarded as a gauge of the U.S. equities market. This index includes 500 leading companies in leading industries of the U.S. economy. The S&P 500 Index focuses on the large-cap segment of the market, with approximately 80% coverage of U.S. equities.
Lipper is an independent mutual fund performance monitor whose results are based on total return and do not reflect a sales charge.
Securities indices are unmanaged and assume reinvestment of all distributions and interest payments and do not take in account brokerage fees or expenses. Securities in the Funds do not match those in the indices and performance of the Funds will differ. Investors cannot invest directly in an index.
2 HSBC FAMILY OF FUNDS
| Commentary From the Investment Manager |
| HSBC Global Asset Management (USA) Inc. |
Global Economic Review
The global economy faced significant headwinds during the 12-month period from November 1, 2014, to October 31, 2015. Slowing economic growth in China and other emerging economies led equities lower. Developed economies fared better, however: The U.S. economy showed signs of continued recovery and the eurozone economy regained its footing after several years of slow growth.
Commodity prices generally remained low during the period, continuing a period of consolidation that began in 2011. Oil prices declined sharply early in the period, however. These declines added to existing pressures on oil-exporting emerging economies and oil-dependent sectors. Energy companies saw diminished earnings and oil and mining production declined.
Central bank policy in many economies was a source of investor uncertainty. China took steps to devalue its currency in August, triggering a dive in its stock market. However, several important monetary programs in other economies benefited equities. Quantitative easing programs in Europe and Japan both improved liquidity and helped buoy equity markets.
Throughout much of the period, investors anticipated action by the U.S. Federal Reserve (the Fed) to raise the federal funds rate—a key factor in lending rates—above the target range of between 0.00% and 0.25%. However, the Fed decided multiple times during the period to keep rates at near-zero levels, due in part to concerns about turbulence in foreign markets and the relatively slow economic recovery in the U.S. The Fed’s delays added to investor uncertainty.
The U.S. economy grew at a slower rate than in recent years. Early in 2015, harsh winter weather on the East Coast dealt a blow to consumer consumption and a West Coast dockworkers’ strike slowed international trade. Growth picked up later in the period but some key areas of the economy showed signs of weakness. In particular, industrial production, manufacturing, and business confidence declined during the period. Meanwhile, low oil and gas prices hurt the energy sector but also contributed to a sharp uptick in auto sales.
Other areas of the U.S. economy showed signs of improvement throughout the period. The labor market continued to improve, consumer confidence hit multi-year highs, and the housing market remained robust.
Global inflation remained low during the period. A strong U.S. dollar, which rose rapidly early in the period and remained strong through October 2015, encouraged U.S. imports and discouraged exports. The strong dollar took a toll on commodity-dependent economies and posed challenges for emerging market issuers of dollar-denominated debt.
China’s ongoing transition to slower economic growth had a profound impact on economies throughout the world, exacerbated by a sharp downturn in Chinese equities and currency depreciation.
Economic growth picked up in the eurozone during the period, supported by the European Central Bank’s accommodative monetary policy and improving credit conditions. However, the debt crisis in Greece continued to undermine European economic recovery early in the period.
Japanese stocks rallied throughout much of the period as the nation’s economic growth improved in large part due to Prime Minister Shinzo Abe’s economic plan, known as “Abenomics.” The program involved higher taxes, structural reforms, and quantitative easing. Japanese equities gave up much of their gains in August 2015, however, in-step with many other global equity markets. Additionally, in that month a sharp decline in Chinese equities fueled fears that a slowing economy in China could jeopardize the global economic recovery.
Geopolitical turmoil weighed on the global economy during the period, and particularly affected countries such as Russia. Conflict in the Ukraine led to stronger economic sanctions against Russia, dealing a further blow to an economy already hard hit by low oil prices. Inflation soared in Russia while exports plummeted.
Market Review
Global equities made modest but inconsistent gains during the first half of the period, but lost ground in most cases during the late summer and fall. Volatility spiked in August as a Chinese stock sell-off spread to emerging markets and triggered volatility throughout the world. The MSCI EM Index1 finished the period with a 14.22% loss. The MSCI Golden Dragon Index1 of large- and mid-cap securities in China, Hong Kong and Taiwan also fell, posting a -2.99% return. Developed markets fared better despite the increased volatility, with the MSCI World Index1 returning 2.33% on relatively strong gains late in the period.
U.S. equities performed modestly well for the period; the S&P 500 Index1 of large-company stocks returned 5.20%. Robust merger and acquisition activity, as well as strong corporate earnings growth, helped fuel those gains. Performance was uneven across sectors, however. The energy sector saw the largest losses during the period due to declining oil prices, and health care stocks performed poorly.
Fixed income markets in developed economies made modest gains. U.S. interest rates decreased in late 2014 and early 2015, boosting the performance of U.S. Treasuries and many other categories of bonds. Rates rose slightly over the next several months in anticipation of higher interest rates, only to decline as the Fed chose to postpone a rate increase. The Barclays U.S. Aggregate Bond Index1, which tracks the broad investment-grade fixed-income market, returned 1.96% for the 12-month period through October 31. Meanwhile the Barclays U.S. Corporate High-Yield Bond Index1 declined 1.94% for the same period.
Fixed-income markets in Europe rallied throughout the period, fueled by the European Central Bank’s bond-buying program and assurances from its president that it would expand stimulus efforts and further lower interest rates if necessary. The Barclays Euro Aggregate Bond Index1 returned 3.35%.
Emerging markets debt experienced volatility during the period caused by a strengthening U.S. dollar and an ongoing decline in commodity prices. Monetary easing measures from some central banks served to lower government bond yields in developed and emerging markets countries, however, which helped boost returns. The Barclays Emerging Markets USD Aggregate Index1 returned 0.02% during the 12-month period.
1 For additional information, please refer to the Glossary of Terms.
HSBC FAMILY OF FUNDS 3
| Portfolio Reviews (Unaudited) |
| |
HSBC Prime Money Market Fund
(Class A Shares, Class C Shares, Class D Shares, Class I Shares and Class Y Shares) by John Chiodi
Senior Portfolio Manager | Moody’s and Standard & Poor’s
have assigned an “Aaa-mf” and
“AAAm” rating to the HSBC Prime
Money Market Fund.1 |
Investment Concerns
An investment in the Fund is not insured or guaranteed by the FDIC or any other government agency. Although the Fund seeks to preserve the value of your investment at $1.00 per share, it is possible to lose money by investing in the Fund.
For a complete description of these and other risks associated with investment in a mutual fund, please refer to the Fund’s prospectus.
Portfolio Performance
Yields on money market securities remained near their historic low levels during the 12-month period ended October 31, 2015, as the Federal Reserve Board (the Fed) continued to delay raising short-term interest rates.
The economy’s momentum in the beginning of the period led many investors to believe that the Fed would raise rates in the first half of 2015. However, lackluster economic reports, falling oil prices, and low inflation in the first half of the period prompted the Fed to keep interest rates near historic lows. The same factors continued through the second half of the period, and combined with the growing global economic concerns surrounding slowing growth and a tepid export market in China. Wary of the economy’s ability to withstand a rate change, the Fed in September again held off boosting rates.
Early in the period, we avoided fixed-rate instruments with maturities beyond mid-July. This was based on the premise that the Fed would potentially raise rates around that time and that securities with longer maturities could suffer losses. We then began adding positions in money market instruments that matured in August and September, which offered relatively attractive yields, because we believed that rates would likely remain the same for the near-term.
We also shortened the Fund’s weighted average maturity by shifting out of longer fixed rate maturities and into longer-term floating-rate securities, thereby limiting the amount of interest rate risk in the Fund.†
Finally, the decreasing supply of short-term securities over the period affected the Fund’s yields. New regulations incentivized banks and money market issuers to issue more long-term securities and fewer short-term ones over the year, with the dwindling supply pushing down yields for the latter.†
† Portfolio composition is subject to change.
| | | Average Annual | | | | Expense |
| Fund Performance | | | Total Return (%) | | Yield (%)2 | | Ratio (%)3 |
| Inception | | 1 | | 5 | | 10 | | Since | | 7-Day | | | | |
| As of October 31, 2015 | Date | | Year | | Year | | Year | | Inception | | Average | | Gross | | Net |
| Class A | 11/13/98 | | 0.04 | | 0.02 | | 1.20 | | | 1.84 | | | 0.05 | | 0.69 | | 0.69 |
| Class C4 | 3/23/01 | | — | | — | | — | | | 1.08 | | | — | | 1.29 | | 1.29 |
| Class D | 4/1/99 | | 0.04 | | 0.02 | | 1.25 | | | 1.86 | | | 0.05 | | 0.54 | | 0.54 |
| Class I | 1/9/02 | | 0.10 | | 0.09 | | 1.44 | | | 1.52 | | | 0.16 | | 0.19 | | 0.19 |
| Class Y | 11/12/98 | | 0.04 | | 0.02 | | 1.35 | | | 2.09 | | | 0.05 | | 0.29 | | 0.29 |
| Lipper Money Market | | | | | | | | | | | | | | | | | |
| Funds Average5 | — | | 0.01 | | 0.01 | | 1.17 | | | 1.80 | 6 | | N/A | | N/A | | N/A |
Past performance does not guarantee future results. The performance data quoted represents past performance and current returns may be lower or higher. Total return figures include change in share price, reinvestment of dividends and capital gains and do not reflect taxes that a shareholder would pay on Fund distributions or on the redemption of Fund shares. Investment return and principal value will fluctuate so that an investor’s shares, when redeemed may be worth more or less than the original cost. To obtain performance information current to the most recent month end, please call 1-800-782-8183.
The performance above reflects any fee waivers that have been in effect during the applicable periods, as well as any expense reimbursements that have periodically been made. Absent such waivers and reimbursements, returns would have been lower.
Certain returns shown include monies received by the Fund in respect of a one-time payment in respect of a class action settlement and a one-time reimbursement from HSBC Global Asset Management (USA) Inc. related to past marketing arrangements. As a result, the Fund’s total returns for those periods were higher than they would have been had the Fund not received the payments.
| 1 | The “Aaa-mf” and “AAAm” money market fund rating is historical and reflects Moody’s and Standard & Poor’s opinion as to the quality of the Fund’s investments, liquidity management, and operations and trading support. Periodic reviews are conducted to ensure a secure operations environment. Moody’s and Standard & Poor’s ratings represent an opinion only, not a recommendation to buy or sell. Obligations rated A-1+, A-1 or P-1 are rated in the highest short-term rating category by Standard & Poor’s (A-1+ or A-1) or Moody’s Investor Service (P-1). The obligor’s capacity to meet its financial commitments on these obligations is regarded to be “extremely strong” (A-1+), “strong” (A-1) or “superior” (P-1). |
| 2 | The seven-day yield quotation more closely reflects the current earnings of the money market fund than the total return quotation. The seven-day yield reflects voluntary fee waivers/expense reimbursements. Without the voluntary fee waivers/expense reimbursements, the yields would have been -0.40%, -0.25%, 0.10% and 0.00% for Class A Shares, Class D Shares, Class I Shares and Class Y Shares, respectively. |
| 3 | Reflects the expense ratio as reported in the prospectus dated February 27, 2015. Additional information pertaining to the October 31, 2015 expense ratios can be found in the financial highlights. |
| 4 | Reflects the applicable contingent deferred sales charge, maximum of 1.00%, for returns presented. Class C Shares were operational during a portion of the periods presented. Amounts reflect performance for the period of time the Class had operations, which was 201, 213 and 102 days for the fiscal years ended October 31, 2001, October 31, 2014 and October 31, 2015, respectively. No returns are presented for the one-year, five-year and 10-year periods with non-continuous operations. The Class was operational during the entire fiscal years from October 31, 2002 through 2013. |
| 5 | For additional information, please refer to the Glossary of Terms. |
| 6 | Return for the period October 31, 1998 to October 31, 2015. |
4 HSBC FAMILY OF FUNDS
| Portfolio Reviews (Unaudited) |
| |
HSBC U.S. Government Money Market Fund
(Class A Shares, Class B Shares, Class C Shares, Class D Shares, Class I Shares and Class Y Shares) by John Chiodi
Senior Portfolio Manager | Moody’s and Standard & Poor’s
have assigned an “Aaa-mf” and
“AAAm” rating to the
HSBC U.S. Government
Money Market Fund.1 |
Investment Concerns
An investment in the Fund is not insured or guaranteed by the FDIC or any other government agency. Although the Fund seeks to preserve the value of your investment at $1.00 per share, it is possible to lose money by investing in the Fund.
For a complete description of these and other risks associated with investment in a mutual fund, please refer to the Fund’s prospectus.
Portfolio Performance
Yields on U.S. government money market securities remained low during the 12 months through October 31, 2015.
The Federal Reserve Board (the Fed) had seemed poised to raise short-term interest rates before the end of the first quarter of 2015. However, falling oil prices, lower than expected inflation and mixed economic factors caused the Fed to hold rates near historic lows through the first quarter. Investors continued to believe the Fed would raise rates by the third quarter of 2015, but the same domestic economic issues, combined with global volatility including slowing economic growth in China, left the Fed wary. Interest rates remained unchanged through the end of the reporting period.
During the first half of the period, the Fund deployed a barbell strategy, investing in a mix of very short-term securities for liquidity purposes and longer-term issues that offered relatively high yields. Though we favored repurchase agreements (“repos”) with maturities of one week or less at the outset of the year, new regulations challenged our ability to maintain those positions over the period’s duration, as repo counterparties were pressured to reduce repo balances.†
As the year progressed, the Fund moved away from the barbell approach and sought out longer-term floating rate securities, which provided additional protection in the face of rising interest rates. In addition, we avoided any holdings that were set to mature around the time the U.S. government was scheduled to hit its debt limit. The U.S. Senate in October approved a budget, which included an extension of the debt limit, at the end of the reporting period, likely avoiding potential financial fallout.†
† Portfolio composition is subject to change.
| | | | Average Annual | | | | Expense |
| Fund Performance | | | | Total Return (%) | | Yield (%)2 | | Ratio (%)3 |
| | Inception | | 1 | | 5 | | 10 | | Since | | 7-Day | | | | |
| As of October 31, 2015 | | Date | | Year | | Year | | Year | | Inception | | Average | | Gross | | Net |
| Class A | | 5/3/90 | | 0.03 | | 0.02 | | 1.11 | | | 2.70 | | | 0.03 | | 0.69 | | 0.69 |
| Class B4 | | 9/11/98 | | -3.97 | | 0.02 | | 1.08 | | | 1.56 | | | 0.03 | | 1.29 | | 1.29 |
| Class C5 | | 11/20/06 | | — | | — | | — | | | 1.39 | | | — | | 1.29 | | 1.29 |
| Class D | | 4/1/99 | | 0.03 | | 0.02 | | 1.16 | | | 1.74 | | | 0.03 | | 0.54 | | 0.54 |
| Class I6 | | 12/24/03 | | 0.03 | | 0.02 | | — | | | 1.10 | | | 0.03 | | 0.19 | | 0.19 |
| Class Y | | 7/1/96 | | 0.03 | | 0.02 | | 1.25 | | | 2.34 | | | 0.03 | | 0.29 | | 0.29 |
| Lipper U.S. Government | | | | | | | | | | | | | | | | | | |
| Money Market Funds Average7 | | — | | 0.01 | | 0.01 | | 1.11 | | | 2.73 | 8 | | N/A | | N/A | | N/A |
Past performance does not guarantee future results. The performance data quoted represents past performance and current returns may be lower or higher. Total return figures include change in share price, reinvestment of dividends and capital gains and do not reflect taxes that a shareholder would pay on Fund distributions or on the redemption of Fund shares. Investment return and principal value will fluctuate so that an investor’s shares, when redeemed may be worth more or less than the original cost. To obtain performance information current to the most recent month end, please call 1-800-782-8183.
The performance above reflects any fee waivers that have been in effect during the applicable periods, as well as any expense reimbursements that have periodically been made. Absent such waivers and reimbursements, returns would have been lower.
Certain returns shown include monies received by the Fund in respect of a one-time payment in respect of a class action settlement and a one-time reimbursement from HSBC Global Asset Management (USA) Inc. related to past marketing arrangements. As a result, the Fund’s total returns for those periods were higher than they would have been had the Fund not received the payments.
| 1 | The “Aaa-mf ” and “AAAm” money market fund rating is historical and reflects Moody’s and Standard & Poor’s opinion as to the quality of the Fund’s investments, liquidity management, and operations and trading support. Periodic reviews are conducted to ensure a secure operations environment. Moody’s and Standard & Poor’s ratings represent an opinion only, not a recommendation to buy or sell. Obligations rated A-1+, A-1 or P-1 are rated in the highest short-term rating category by Standard & Poor’s (A-1+ or A-1) or Moody’s Investor Service (P-1). The obligor’s capacity to meet its financial commitments on these obligations is regarded to be “extremely strong” (A-1+), “strong” (A-1) or “superior” (P-1). |
| 2 | The seven-day yield quotation more closely reflects the current earnings of the money market fund than the total return quotation. The seven-day yield reflects voluntary fee waivers/expense reimbursements. Without the voluntary fee waivers/expense reimbursements, the yields would have been -0.56%, -1.16%, -0.41%, -0.06% and -0.16% for Class A Shares, Class B Shares, Class D Shares, Class I Shares and Class Y Shares, respectively. |
| 3 | Reflects the expense ratio as reported in the prospectus dated February 27, 2015. Additional information pertaining to the October 31, 2015 expense ratios can be found in the financial highlights. |
| 4 | Reflects the applicable contingent deferred sales charge, maximum of 4.00%, for returns presented. |
| 5 | Reflects the applicable contingent deferred sales charge, maximum of 1.00%, for returns presented. Class C Shares were operational during a portion of the periods presented. Amounts reflect performance for the period of time the Class had operations, which was 346, 362 and 351 days during the years ended October 31, 2006, 2009 and 2010, respectively. The Class was not operational during the entire fiscal years ended October 31, 2007, 2008, 2011, 2012, 2013, 2014 and 2015. No returns are presented for the one-year, five-year and 10-year periods with non-continuous operations. |
| 6 | Class I Shares were operational during a portion of the periods presented. Amounts reflect performance for the period of time the Class had operations, which was 10, 89, 136 and 357 days during the years ended October 31, 2004, 2005, 2006 and 2007, respectively. No returns are presented for the 10-year period with non-continuous operations. The Class was operational during the entire years ended October 31, 2008 through 2015. |
| 7 | For additional information, please refer to the Glossary of Terms. |
| 8 | Return for the period April 30, 1990 to October 31, 2015. |
HSBC FAMILY OF FUNDS 5
| Portfolio Reviews (Unaudited) |
| |
HSBC U.S. Treasury Money Market Fund
(Class A Shares, Class C Shares, Class D Shares, Class I Shares and Class Y Shares) by John Chiodi
Senior Portfolio Manager | Moody’s and Standard & Poor’s
have assigned an “Aaa-mf” and
“AAAm” rating to the
HSBC U.S. Treasury
Money Market Fund.1 |
Investment Concerns
An investment in the Fund is not insured or guaranteed by the FDIC or any other government agency. Although the Fund seeks to preserve the value of your investment at $1.00 per share, it is possible to lose money by investing in the Fund. The Fund’s income may be subject to the federal alternative minimum tax and to certain state and local taxes.
For a complete description of these and other risks associated with investment in a mutual fund, please refer to the Fund’s prospectus.
Portfolio Performance
The Federal Reserve Board (the Fed) maintained the target federal funds rate (a short-term interest rate that significantly influences Treasury bill yields) at between 0.00% and 0.25% during the 12-month period ended October 31, 2015. In that environment, yields on Treasury bills remained at historically low levels.
Supply and demand factors affected Treasury bill yields over the reporting period. For instance, the Fed’s typical surplus of short-term cash management bills, which are introduced into the market around tax time in April, was substantially reduced due to the Treasury’s abnormally high cash balances over this period. This led to a sharp reduction in overall issuance, which consequently put pressure on the supply and kept yields low. Additionally, continued investor speculation about when the Fed would raise interest rates also affected yields.
Early in the year, encouraging economic reports prompted many investors to anticipate that the Fed would hike rates before the end of the first quarter of 2015. However, global volatility, lower than expected inflation and mixed economic factors caused the Fed to hold rates near historic lows through the first quarter.
That decision prompted a surge in demand for Treasury bills late in the period, as investors sought safer assets. That demand pushed Treasury bill yields into negative territory.
We maintained a barbell strategy throughout the period, investing in both short-term bills as well as bonds with longer maturities. This strategy provides the Fund with liquidity while still capturing yields from longer-term bonds. In addition, we invested in two-year floating-rate Treasury notes. These helped offset some of the negative yields in the shorter-term issues and boosted the Fund’s overall performance.†
† Portfolio composition is subject to change.
| | | Average Annual | | | | Expense |
| Fund Performance | | | Total Return (%) | | Yield (%)2 | | Ratio (%)3 |
| Inception | | 1 | | 5 | | 10 | | Since | | 7-Day | | | | |
| As of October 31, 2015 | Date | | Year | | Year | | Year | | Inception | | Average | | Gross | | Net |
| Class A4 | 5/24/01 | | — | | — | | — | | | 1.08 | | | — | | 0.69 | | 0.69 |
| Class C5 | 12/24/03 | | — | | — | | — | | | 0.04 | | | — | | 1.29 | | 1.29 |
| Class D | 5/14/01 | | 0.00 | | 0.00 | | 0.97 | | | 1.05 | | | 0.00 | | 0.54 | | 0.54 |
| Class I6 | 12/30/03 | | 0.00 | | 0.00 | | 1.10 | | | 1.21 | | | 0.00 | | 0.19 | | 0.19 |
| Class Y | 5/11/01 | | 0.00 | | 0.00 | | 1.05 | | | 1.18 | | | 0.00 | | 0.29 | | 0.29 |
| Lipper U.S. Treasury | | | | | | | | | | | | | | | | | |
| Money Market Funds Average7 | — | | 0.00 | | 0.01 | | 0.99 | | | 1.09 | 8 | | N/A | | N/A | | N/A |
Past performance does not guarantee future results. The performance data quoted represents past performance and current returns may be lower or higher. Total return figures include change in share price, reinvestment of dividends and capital gains and do not reflect taxes that a shareholder would pay on Fund distributions or on the redemption of Fund shares. Investment return and principal value will fluctuate so that an investor’s shares, when redeemed may be worth more or less than the original cost. To obtain performance information current to the most recent month end, please call 1-800-782-8183.
The performance above reflects any fee waivers that have been in effect during the applicable periods, as well as any expense reimbursements that have periodically been made. Absent such waivers and reimbursements, returns would have been lower.
Certain returns shown include monies received by the Fund in respect of a one-time payment in respect of a class action settlement and a one-time reimbursement from HSBC Global Asset Management (USA) Inc. related to past marketing arrangements. As a result, the Fund’s total returns for those periods were higher than they would have been had the Fund not received the payments.
| 1 | The “Aaa-mf ” and “AAAm” money market fund rating is historical and reflects Moody’s and Standard & Poor’s opinion as to the quality of the Fund’s investments, liquidity management, and operations and trading support. Periodic reviews are conducted to ensure a secure operations environment. Moody’s and Standard & Poor’s ratings represent an opinion only, not a recommendation to buy or sell. Obligations rated A-1+, A-1 or P-1 are rated in the highest short-term rating category by Standard & Poor’s (A-1+ or A-1) or Moody’s Investor Service (P-1). The obligor’s capacity to meet its financial commitments on these obligations is regarded to be “extremely strong” (A-1+), “strong” (A-1) or “superior” (P-1). |
| 2 | The seven-day yield quotation more closely reflects the current earnings of the money market fund than the total return quotation. The seven-day yield reflects voluntary fee waivers/expense reimbursements. Without the voluntary fee waivers/expense reimbursements, the yields would have been -0.45%, -0.10% and -0.20% for Class D Shares, Class I Shares and Class Y Shares, respectively. |
| 3 | Reflects the expense ratio as reported in the prospectus dated February 27, 2015. Additional information pertaining to the October 31, 2015 expense ratios can be found in the financial highlights. |
| 4 | Class A Shares were operational during a portion of the periods presented. Amounts reflect performance for the period of time the Class had operations, which was 201 days during the year ended October 31, 2014. The Class was operational during the entire years ended October 31, 2001 through 2013. The Class was not operational during the entire fiscal year ended October 31, 2015. No returns are presented for the one-year, five-year and 10-year periods with non-continuous operations. |
| 5 | Reflects the applicable contingent deferred sales charge, maximum of 1.00%, for returns presented. Class C Shares were operational during a portion of the periods presented. Amounts reflect performance for the period of time the Class had operations, which was 26 and 351 days during the years ended October 31, 2008 and 2010, respectively. The Class was operational during the entire years ended October 31, 2005, 2006, 2007 and 2009. The Class was not operational during the entire years ended October 31, 2011 through 2015. No returns are presented for the one-year, five-year and 10-year periods with non-continuous operations. |
| 6 | Class I Shares were operational during a portion of the periods presented. Amounts reflect performance for the period of time the Class had operations, which was 13 and 280 days during the years ended October 31, 2004 and 2005, respectively. The Class was operational during the entire years ended October 31, 2006 through 2015. |
| 7 | For additional information, please refer to the Glossary of Terms. |
| 8 | Return for the period April 30, 2001 to October 31, 2015. |
6 HSBC FAMILY OF FUNDS
| Portfolio Reviews |
| Portfolio Composition* |
| October 31, 2015 (Unaudited) |
| HSBC Prime Money Market Fund | |
| Investment Allocation | Percentage of Investments at Value (%) |
| Certificates of Deposit | | 46.4 | |
| Commercial Paper and | | | |
| Notes | | 39.3 | |
| Time Deposits | | 12.2 | |
| Yankee Dollars | | 1.1 | |
| Corporate Obligations | | 1.0 | |
| Total | | 100.0 | |
| | |
| HSBC U.S. Government Money Market Fund | |
| Investment Allocation | Percentage of Investments at Value (%) |
| U.S. Government and | | | |
| Government Agency | | | |
| Obligations | | 71.5 | |
| Repurchase Agreements | | 24.8 | |
| U.S. Treasury Obligations | | 3.7 | |
| Total | | 100.0 | |
| | |
| HSBC U.S. Treasury Money Market Fund | |
| Investment Allocation | Percentage of Investments at Value (%) |
| U.S. Treasury Obligations | | 100.0 | |
| Total | | 100.0 | |
____________________
* Portfolio composition is subject to change.
HSBC FAMILY OF FUNDS 7
| HSBC PRIME MONEY MARKET FUND |
| Schedule of Portfolio Investments—as of October 31, 2015 |
| Certificates of Deposit – 46.7% |
| | | | |
| Principal | | Amortized |
| Amount ($) | | Cost ($) |
| Banking – 46.7% | | | |
| Agricultural Bank of China, N.Y., | | | |
| 0.25%, 11/2/15 | 85,000,000 | | 85,000,000 |
| Agricultural Bank of China, N.Y., | | | |
| 0.19%, 11/2/15 | 40,000,000 | | 40,000,000 |
| Bank of America N.A., | | | |
| 0.37%, 2/10/16 (a) | 61,000,000 | | 61,000,000 |
| Bank of Montreal Chicago, | | | |
| 0.28%, 11/19/15 (a) | 60,000,000 | | 60,000,000 |
| Bank of Montreal Chicago, | | | |
| 0.37%, 3/21/16 (a) | 28,000,000 | | 28,000,000 |
| Bank of Montreal Chicago, | | | |
| 0.34%, 4/25/16 (a) | 25,000,000 | | 25,000,000 |
| Bank of Montreal Chicago, | | | |
| 0.46%, 6/21/16 (a) | 36,000,000 | | 36,000,000 |
| Bank of Montreal Chicago, | | | |
| 0.43%, 7/28/16 (a) | 32,000,000 | | 32,000,000 |
| Bank of Nova Scotia Houston, | | | |
| 0.38%, 3/10/16 (a) | 50,000,000 | | 50,000,000 |
| Bank of Nova Scotia Houston, | | | |
| 0.42%, 8/5/16 (a) | 20,000,000 | | 20,000,000 |
| Bank of Nova Scotia Houston, | | | |
| 0.49%, 8/10/16 (a) | 40,000,000 | | 40,003,799 |
| Bank of Tokyo-Mitsubishi UFJ, N.Y., | | | |
| 0.13%, 11/5/15 | 100,000,000 | | 100,000,000 |
| Bank of Tokyo-Mitsubishi UFJ, N.Y., | | | |
| 0.40%, 11/20/15 (a) | 35,000,000 | | 35,000,000 |
| Bank of Tokyo-Mitsubishi UFJ, N.Y., | | | |
| 0.37%, 1/7/16 | 35,000,000 | | 35,000,000 |
| Bank of Tokyo-Mitsubishi UFJ, N.Y., | | | |
| 0.52%, 2/2/16 (a) | 29,000,000 | | 29,000,000 |
| Bank of Tokyo-Mitsubishi UFJ, N.Y., | | | |
| 0.66%, 3/24/16 (a) | 18,500,000 | | 18,506,726 |
| Chase Bank USA N.A., | | | |
| 0.33%, 1/26/16 (a) | 30,000,000 | | 30,000,000 |
| Credit Industriel et Commercial, | | | |
| 0.38%, 11/5/15 | 25,000,000 | | 25,000,221 |
| Credit Industriel et Commercial, | | | |
| 0.12%, 11/6/15 | 200,000,000 | | 200,000,000 |
| Credit Industriel et Commercial, | | | |
| 0.49%, 3/17/16 | 75,000,000 | | 75,000,000 |
| Credit Industriel et Commercial, | | | |
| 0.52%, 6/1/16 (a) | 40,000,000 | | 40,000,000 |
| DZ Bank, N.Y., 0.20%, 11/18/15 | 5,000,000 | | 5,000,118 |
| DZ Bank, N.Y., 0.48%, 4/11/16 | 65,000,000 | | 64,999,976 |
| Industrial & Commercial Bank of | | | |
| China Ltd., N.Y., 0.25%, 11/2/15 | 60,000,000 | | 60,000,000 |
| Industrial & Commercial Bank of | | | |
| China Ltd., N.Y., 0.21%, 11/2/15 | 50,000,000 | | 50,000,000 |
| Industrial & Commercial Bank of | | | |
| China Ltd., N.Y., 0.20%, 11/5/15 | 70,000,000 | | 70,000,000 |
| Kookmin Bank, N.Y., | | | |
| 0.33%, 1/19/16 | 35,000,000 | | 35,000,000 |
| Korea Development Bank, N.Y., | | | |
| 0.14%, 11/5/15 | 50,000,000 | | 50,000,000 |
| Korea Development Bank, N.Y., | | | |
| 0.32%, 12/1/15 | 40,000,000 | | 40,002,323 |
| Korea Development Bank, N.Y., | | | |
| 0.51%, 4/19/16 | 30,000,000 | | 30,000,000 |
| Korea Development Bank, N.Y., | | | |
| 0.51%, 4/19/16 | 30,000,000 | | 30,000,000 |
| Lloyds TSB Bank PLC, N.Y., | | | |
| 0.35%, 11/2/15 | 50,000,000 | | 50,000,236 |
| Mizuho Bank Ltd., N.Y., | | | |
| 0.30%, 11/10/15 | 53,000,000 | | 53,000,000 |
| Mizuho Bank Ltd., N.Y., | | | |
| 0.32%, 11/17/15 | 34,000,000 | | 33,999,995 |
| Mizuho Bank Ltd., N.Y., | | | |
| 0.29%, 1/12/16 | 40,000,000 | | 40,000,000 |
| National Australia Bank, N.Y., | | | |
| 0.24%, 2/1/16 | 50,000,000 | | 50,000,000 |
| National Bank of Canada, N.Y., | | | |
| 0.39%, 2/5/16 (a) | 7,000,000 | | 7,000,000 |
| Nordea Bank Finland, N.Y., | | | |
| 0.34%, 6/21/16 (a) | 50,000,000 | | 50,000,000 |
| Norinchukin Bank, N.Y., | | | |
| 0.32%, 11/18/15 | 25,000,000 | | 25,000,000 |
| Norinchukin Bank, N.Y., | | | |
| 0.30%, 1/4/16 | 100,000,000 | | 100,000,000 |
| Oversea-Chinese Bank Co., N.Y., | | | |
| 0.32%, 11/13/15 | 10,000,000 | | 10,000,000 |
| Oversea-Chinese Bank Co., N.Y., | | | |
| 0.21%, 12/1/15 | 50,000,000 | | 50,000,000 |
| Oversea-Chinese Bank Co., N.Y., | | | |
| 0.38%, 12/23/15 | 50,000,000 | | 50,000,000 |
| Rabobank Nederland, N.Y., | | | |
| 0.34%, 2/3/16 (a) | 70,000,000 | | 70,000,000 |
| Rabobank Nederland, N.Y., | | | |
| 0.41%, 8/9/16 (a) | 15,000,000 | | 15,000,000 |
| Royal Bank of Canada, N.Y., | | | |
| 0.28%, 12/1/15 (a) | 52,000,000 | | 52,000,000 |
| Royal Bank of Canada, N.Y., | | | |
| 0.37%, 3/18/16 (a) | 50,000,000 | | 50,000,000 |
| Royal Bank of Canada, N.Y., | | | |
| 0.45%, 5/27/16 (a) | 25,000,000 | | 25,001,151 |
| Royal Bank of Canada, N.Y., | | | |
| 0.48%, 6/3/16 (a) | 15,500,000 | | 15,500,000 |
| Royal Bank of Canada, N.Y., | | | |
| 0.41%, 6/8/16 (a) | 20,000,000 | | 20,000,000 |
| Royal Bank of Canada, N.Y., | | | |
| 0.42%, 8/8/16 (a) | 10,000,000 | | 10,000,000 |
| Shinhan Bank, N.Y., | | | |
| 0.30%, 1/4/16 | 50,000,000 | | 50,000,000 |
| Societe’ Generale, N.Y., | | | |
| 0.32%, 12/1/15 | 75,000,000 | | 75,000,000 |
| Societe’ Generale, N.Y., | | | |
| 0.47%, 12/21/15 | 5,000,000 | | 5,000,000 |
| Societe’ Generale, N.Y., | | | |
| 0.46%, 1/11/16 | 18,000,000 | | 18,000,000 |
| State Street Bank & Trust, | | | |
| 0.35%, 12/14/15 | 35,000,000 | | 35,007,102 |
| State Street Bank & Trust, | | | |
| 0.37%, 3/9/16 (a) | 55,000,000 | | 55,000,000 |
| 8 HSBC FAMILY OF FUNDS | See notes to financial statements. |
| HSBC PRIME MONEY MARKET FUND |
| Schedule of Portfolio Investments—as of October 31, 2015 (continued) |
| Certificates of Deposit, continued |
| |
| Principal | | Amortized |
| Amount ($) | | Cost ($) |
| Banking, continued | | | |
| Sumitomo Mitsui Bank, N.Y., | | | |
| 0.33%, 11/24/15 | 40,000,000 | | 40,000,000 |
| Sumitomo Mitsui Bank, N.Y., | | | |
| 0.42%, 2/25/16 (a) | 60,000,000 | | 60,000,000 |
| Sumitomo Mitsui Trust, N.Y., | | | |
| 0.17%, 11/2/15 | 80,000,000 | | 80,000,000 |
| Svenska Handelsbanken, N.Y., | | | |
| 0.30%, 12/9/15 (a) | 30,000,000 | | 30,000,000 |
| Svenska Handelsbanken, N.Y., | | | |
| 0.31%, 1/4/16 | 26,000,000 | | 26,000,227 |
| Svenska Handelsbanken, N.Y., | | | |
| 0.47%, 3/18/16 | 50,000,000 | | 50,000,907 |
| Toronto Dominion Bank, N.Y., | | | |
| 0.29%, 11/18/15 (a) | 40,000,000 | | 40,000,000 |
| Toronto Dominion Bank, N.Y., | | | |
| 0.37%, 12/7/15 | 8,000,000 | | 8,000,155 |
| Toronto Dominion Bank, N.Y., | | | |
| 0.36%, 2/25/16 (a) | 65,000,000 | | 65,000,000 |
| Toronto Dominion Bank, N.Y., | | | |
| 0.34%, 6/8/16 (a) | 45,000,000 | | 45,000,000 |
| Wells Fargo Bank N.A., | | | |
| 0.30%, 11/12/15 | 50,000,000 | | 50,001,980 |
| Wells Fargo Bank N.A., | | | |
| 0.32%, 3/18/16 (a) | 13,000,000 | | 13,000,000 |
| | | 3,021,024,916 |
| TOTAL CERTIFICATES | | | |
| OF DEPOSIT | | | |
| (COST $3,021,024,916) | | | 3,021,024,916 |
| |
| Commercial Paper and Notes — 39.4% |
| |
| Banking – 34.5% | | | |
| Agricultural Bank of China, N.Y., | | | |
| 0.23%, 11/3/15 (b)(c) | 44,000,000 | | 43,999,438 |
| ANZ New Zealand International Ltd., | | | |
| 0.41%, 12/29/15 (b)(c) | 10,000,000 | | 9,993,395 |
| ANZ New Zealand International Ltd., | | | |
| 0.41%, 1/14/16 (b)(c) | 14,845,000 | | 14,832,489 |
| Australia & New Zealand Banking | | | |
| Group Ltd., 0.30%, | | | |
| 11/25/15 (a)(b) | 30,000,000 | | 30,000,231 |
| Australia & New Zealand | | | |
| Banking Group Ltd., | | | |
| 0.36%, 12/17/15 (b)(c) | 10,000,000 | | 9,995,400 |
| Australia & New Zealand | | | |
| Banking Group Ltd., | | | |
| 0.30%, 12/18/15 (a)(b) | 30,000,000 | | 30,000,000 |
| Australia & New Zealand | | | |
| Banking Group Ltd., | | | |
| 0.45%, 4/26/16 (b)(c) | 50,000,000 | | 49,889,375 |
| Australia & New Zealand | | | |
| Banking Group Ltd., | | | |
| 0.46%, 6/17/16 (a)(b) | 25,000,000 | | 25,000,000 |
| Australia & New Zealand | | | |
| Banking Group Ltd., | | | |
| 0.40%, 7/6/16 (a)(b) | 25,000,000 | | 25,000,269 |
| Bank of China Hong Kong Ltd., | | | |
| 0.50%, 12/22/15 (b)(c) | 30,000,000 | | 29,978,750 |
| Bank of Tokyo-Mitsubishi UFJ, N.Y., | | | |
| 0.50%, 4/11/16 (c) | 20,000,000 | | 19,955,000 |
| Banque et Caisse Epargne, | | | |
| 0.47%, 3/16/16 (c) | 15,000,000 | | 14,973,650 |
| Banque et Caisse Epargne, | | | |
| 0.46%, 4/1/16 (c) | 10,000,000 | | 9,980,578 |
| BNP Paribas Canada, | | | |
| 0.50%, 4/1/16 (c) | 42,000,000 | | 41,911,333 |
| BNP Paribas Fortis SA/NV, | | | |
| 0.17%, 11/2/15 (c) | 48,000,000 | | 47,999,773 |
| BNP Paribas Fortis SA/NV, | | | |
| 0.23%, 12/1/15 (c) | 40,000,000 | | 39,992,333 |
| BNP Paribas Fortis SA/NV, | | | |
| 0.36%, 12/14/15 (c) | 72,000,000 | | 71,969,040 |
| BNP Paribas Fortis SA/NV, | | | |
| 0.40%, 12/21/15 (c) | 25,000,000 | | 24,986,111 |
| China Construction Bank Corp., N.Y., | | | |
| 0.18%, 11/2/15 (b)(c) | 50,000,000 | | 49,999,750 |
| China Construction Bank Corp., N.Y., | | | |
| 0.19%, 11/5/15 (b)(c) | 150,000,000 | | 149,996,833 |
| Commonwealth Bank of Australia, | | | |
| 0.36%, 2/22/16 (a)(b) | 35,000,000 | | 35,000,000 |
| Commonwealth Bank of Australia, | | | |
| 0.30%, 3/29/16 (a)(b) | 50,000,000 | | 50,000,000 |
| Commonwealth Bank of Australia, | | | |
| 0.34%, 5/26/16 (a)(b) | 35,000,000 | | 34,998,069 |
| Credit Agricole CIB, N.Y., | | | |
| 0.32%, 11/3/15 (c) | 12,450,000 | | 12,449,779 |
| DBS Bank Ltd., | | | |
| 0.30%, 11/23/15 (b)(c) | 15,000,000 | | 14,997,250 |
| DBS Bank Ltd., | | | |
| 0.30%, 11/25/15 (b)(c) | 20,000,000 | | 19,996,000 |
| DBS Bank Ltd., | | | |
| 0.38%, 12/21/15 (b)(c) | 50,000,000 | | 49,973,611 |
| DBS Bank Ltd., | | | |
| 0.30%, 1/4/16 (b)(c) | 20,000,000 | | 19,989,333 |
| DNB NOR Bank ASA, | | | |
| 0.45%, 4/19/16 (b)(c) | 65,000,000 | | 64,861,875 |
| Erste Abwicklungsanstalt, | | | |
| 0.32%, 11/20/15 (b)(c) | 37,250,000 | | 37,243,709 |
| Erste Abwicklungsanstalt, | | | |
| 0.30%, 11/25/15 (b)(c) | 9,400,000 | | 9,398,120 |
| Erste Abwicklungsanstalt, | | | |
| 0.32%, 11/27/15 (b)(c) | 20,000,000 | | 19,995,378 |
| Erste Abwicklungsanstalt, | | | |
| 0.31%, 1/4/16 (b)(c) | 30,000,000 | | 29,983,467 |
| Erste Abwicklungsanstalt, | | | |
| 0.35%, 3/4/16 (a)(b) | 50,000,000 | | 50,000,000 |
| Erste Abwicklungsanstalt, | | | |
| 0.36%, 4/13/16 (a)(b) | 52,000,000 | | 51,998,294 |
| JPMorgan Chase & Co., | | | |
| 0.42%, 12/29/15 (c) | 23,000,000 | | 22,984,437 |
| JPMorgan Chase & Co., | | | |
| 0.50%, 3/18/16 (b)(c) | 19,000,000 | | 18,963,583 |
| See notes to financial statements. | HSBC FAMILY OF FUNDS 9 |
| HSBC PRIME MONEY MARKET FUND |
| Schedule of Portfolio Investments—as of October 31, 2015 (continued) |
| Commercial Paper and Notes, continued |
| |
| Principal | | Amortized |
| Amount ($) | | Cost ($) |
| Banking, continued | | | |
| Kookmin Bank, N.Y., | | | |
| 0.33%, 11/5/15 (b)(c) | 25,000,000 | | 24,999,083 |
| Lloyds TSB Bank PLC, N.Y., | | | |
| 0.30%, 1/4/16 (c) | 75,000,000 | | 74,960,000 |
| Mitsubishi UFJ Trust & Banking, N.Y., | | | |
| 0.29%, 1/4/16 (c) | 90,000,000 | | 89,953,600 |
| National Australia Bank, N.Y., | | | |
| 0.37%, 4/11/16 (a)(b) | 60,000,000 | | 60,000,000 |
| National Bank of Canada, N.Y., | | | |
| 0.48%, 3/18/16 (b)(c) | 50,000,000 | | 49,908,000 |
| Nordea Bank AB, | | | |
| 0.30%, 11/12/15 (b)(c) | 38,000,000 | | 37,996,575 |
| Nordea Bank AB, | | | |
| 0.38%, 12/14/15 (b)(c) | 42,000,000 | | 41,981,187 |
| Nordea Bank AB, | | | |
| 0.41%, 1/8/16 (b)(c) | 25,000,000 | | 24,980,875 |
| Nordea Bank AB, | | | |
| 0.39%, 4/1/16 (b)(c) | 50,000,000 | | 49,918,723 |
| Nrw.Bank, 0.16%, 11/2/15 (b)(c) | 70,000,000 | | 69,999,689 |
| Oversea-Chinese Banking Corp. Ltd., | | | |
| 0.31%, 2/16/16 (c) | 15,315,000 | | 15,300,889 |
| Province of Quebec, | | | |
| 0.06%, 11/2/15 (b)(c) | 26,000,000 | | 25,999,957 |
| Societe’ Generale N.A., | | | |
| 0.46%, 12/18/15 (b)(c) | 25,000,000 | | 24,984,986 |
| Sumitomo Mitsui Bank, N.Y., | | | |
| 0.23%, 12/17/15 (b)(c) | 30,000,000 | | 29,991,184 |
| Sumitomo Mitsui Bank, N.Y., | | | |
| 0.22%, 1/4/16 (b)(c) | 35,000,000 | | 34,986,311 |
| Sumitomo Trust & Bank, N.Y., | | | |
| 0.34%, 11/27/15 (b)(c) | 20,000,000 | | 19,995,161 |
| Svenska Handelsbank, Inc., | | | |
| 0.34%, 12/14/15 (b)(c) | 25,000,000 | | 24,989,847 |
| Swedbank, 0.32%, 11/16/15 (c) | 15,000,000 | | 14,998,000 |
| Swedbank, 0.32%, 11/17/15 (c) | 25,000,000 | | 24,996,445 |
| Total Capital Canada Ltd., | | | |
| 0.20%, 1/4/16 (b)(c) | 40,000,000 | | 39,985,778 |
| United Overseas Bank, | | | |
| 0.38%, 12/11/15 (c) | 50,000,000 | | 49,978,889 |
| United Overseas Bank, | | | |
| 0.30%, 1/4/16 (b)(c) | 25,000,000 | | 24,986,667 |
| Westpac Banking Corp., N.Y., | | | |
| 0.41%, 7/19/16 (a)(b) | 35,000,000 | | 35,000,000 |
| Westpac Securities NZ Ltd., | | | |
| 0.36%, 2/8/16 (a)(b) | 60,000,000 | | 60,000,000 |
| | | 2,234,178,499 |
| Diversified — 0.5% | | | |
| Caisse des Depots et Consignations, | | | |
| 0.15%, 11/23/15 (b)(c) | 15,000,000 | | 14,998,625 |
| Caisse des Depots et Consignations, | | | |
| 0.30%, 11/24/15 (b)(c) | 20,000,000 | | 19,996,167 |
| | | 34,994,792 |
| Finance — 4.4% | | | |
| ASB Finance Ltd. London, | | | |
| 0.40%, 5/20/16 (a)(b) | 14,000,000 | | 14,000,095 |
| BNZ International Funding, | | | |
| 0.34%, 1/20/16 (a)(b) | 15,000,000 | | 15,000,000 |
| Caisse Centrale Desjardins, | | | |
| 0.17%, 11/2/15 (b)(c) | 54,500,000 | | 54,499,742 |
| Caisse Centrale Desjardins, | | | |
| 0.18%, 11/12/15 (b)(c) | 40,000,000 | | 39,997,800 |
| Collateralized CP Co. LLC, | | | |
| 0.42%, 12/15/15 (c) | 15,000,000 | | 14,992,300 |
| Collateralized CP Co. LLC, | | | |
| 0.48%, 2/4/16 (c) | 18,500,000 | | 18,476,567 |
| Collateralized CP II Co. LLC, | | | |
| 0.50%, 3/28/16 (b)(c) | 25,000,000 | | 24,948,611 |
| Collateralized CP II Co. LLC, | | | |
| 0.50%, 4/27/16 (b)(c) | 24,000,000 | | 23,940,667 |
| Jupiter Securitization Co. LLC, | | | |
| 0.40%, 12/21/15 (b)(c) | 22,000,000 | | 21,987,778 |
| Toyota Motor Credit Corp., | | | |
| 0.34%, 12/11/15 (c) | 25,000,000 | | 24,990,556 |
| Toyota Motor Credit Corp., | | | |
| 0.34%, 12/14/15 (c) | 25,000,000 | | 24,989,847 |
| Toyota Motor Credit Corp., | | | |
| 0.34%, 12/15/15 (c) | 10,000,000 | | 9,995,845 |
| | | 287,819,808 |
| TOTAL COMMERCIAL | | | |
| PAPER AND NOTES | | | |
| (COST $2,556,993,099) | | | 2,556,993,099 |
| |
| Corporate Obligations – 1.0% |
| | | | |
| Banking – 1.0% | | | |
| JPMorgan Chase Bank N.A., | | | |
| 0.47%, 7/18/16 , | | | |
| Callable 4/18/16 @ 100 (a) | 25,000,000 | | 24,999,768 |
| Wells Fargo Bank N.A., | | | |
| 0.45%, 6/9/16, MTN (a) | 40,000,000 | | 40,000,000 |
| | | 64,999,768 |
| TOTAL CORPORATE | | | |
| OBLIGATIONS | | | |
| (COST $64,999,768) | | | 64,999,768 |
| |
| Yankee Dollars – 1.2% |
| | | | |
| Banking – 1.2% | | | |
| Canadian Imperial Bank, | | | |
| 2.75%, 1/27/16 (b) | 40,100,000 | | 40,318,545 |
| Westpac Banking Corp., | | | |
| 0.58%, 5/31/16 (a)(b) | 35,000,000 | | 35,000,000 |
| | | 75,318,545 |
| TOTAL YANKEE DOLLARS | | | |
| (COST $75,318,545) | | | 75,318,545 |
| 10 HSBC FAMILY OF FUNDS | See notes to financial statements. |
| HSBC PRIME MONEY MARKET FUND |
| Schedule of Portfolio Investments—as of October 31, 2015 (concluded) |
| Time Deposits – 12.3% |
| | | | | |
| Principal | | Amortized | |
| Amount ($) | | Cost ($) | |
| Australia & New Zealand Bank, | | | | | |
| 0.10%, 11/2/15 | 100,000,000 | | | 100,000,000 | |
| Credit Agricole CIB, N.Y., | | | | | |
| 0.06%, 11/2/15 | 310,000,000 | | | 310,000,000 | |
| DNB NOR Bank, | | | | | |
| 0.05%, 11/2/15 | 140,000,000 | | | 140,000,000 | |
| Natixis, 0.06%, 11/2/15 | 119,000,000 | | | 119,000,000 | |
| National Bank of Kuwait, | | | | | |
| 0.08%, 11/2/15 | 50,000,000 | | | 50,000,000 | |
| Nordea Bank AB, 0.05%, 11/2/15 | 75,000,000 | | | 75,000,000 | |
| TOTAL TIME DEPOSITS | | | | | |
| (COST $794,000,000) | | | | 794,000,000 | |
| TOTAL INVESTMENT | | | | | |
| SECURITIES | | | | | |
| (COST $6,512,336,328) – 100.6% | | | | 6,512,336,328 | |
| Other Assets | | | | | |
| (Liabilities) – (0.6)% | | | | (39,616,558 | ) |
| NET ASSETS – 100% | | | $ | 6,472,719,770 | |
____________________
| (a) | | Variable rate security. The rate presented represents the rate in effect on October 31, 2015. These securities are deemed to have a maturity remaining until the next adjustment of the interest rate or the longer of the demand period or time to the next readjustment. |
| (b) | | Rule 144A security or other security which is restricted as to resale to institutional investors. This security has been deemed liquid by the Investment Adviser based on procedures approved by the Board of Trustees. |
| (c) | | Rate presented represents the effective yield at time of purchase. |
MTN – Medium Term Note
LLC – Limited Liability Company |
| See notes to financial statements. | HSBC FAMILY OF FUNDS 11 |
| HSBC U.S. GOVERNMENT MONEY MARKET FUND |
| Schedule of Portfolio Investments—as of October 31, 2015 |
| U.S. Government and Government Agency Obligations — 62.0% |
| | | | |
| Principal | | Amortized |
| Amount ($) | | Cost ($) |
| Federal Farm Credit Bank — 9.8% | | | |
| 0.09%, 1/8/16 (a) | 100,000,000 | | 99,997,239 |
| 0.14%, 9/21/16 (a) | 65,000,000 | | 65,000,000 |
| 0.15%, 3/15/16 (a) | 40,000,000 | | 39,999,251 |
| 0.15%, 4/18/16 (a) | 50,000,000 | | 49,998,803 |
| 0.15%, 8/10/16 (a) | 50,000,000 | | 49,996,138 |
| 0.16%, 3/10/16 (b) | 75,000,000 | | 74,956,667 |
| 0.17%, 4/15/16 (a) | 50,000,000 | | 49,997,634 |
| 0.17%, 6/23/16 (a) | 30,000,000 | | 29,986,326 |
| 0.20%, 4/10/17 (a) | 50,000,000 | | 49,992,720 |
| 0.21%, 7/8/16 (a) | 10,000,000 | | 10,005,564 |
| 0.25%, 7/29/16 (a) | 65,000,000 | | 65,004,881 |
| 0.28%, 9/19/16 (a) | 25,743,000 | | 25,749,897 |
| | | 610,685,120 |
| Federal Home Loan Bank — 25.8% | | | |
| 0.02%, 11/6/15 (b) | 184,170,000 | | 184,169,361 |
| 0.02%, 11/9/15 (b) | 177,000,000 | | 176,999,213 |
| 0.03%, 11/25/15 (b) | 196,850,000 | | 196,846,062 |
| 0.04%, 11/3/15 (b) | 100,000,000 | | 99,999,667 |
| 0.04%, 11/4/15 (b) | 93,000,000 | | 92,999,574 |
| 0.06%, 11/30/15 (b) | 100,000,000 | | 99,995,167 |
| 0.10%, 1/4/16 (b) | 200,000,000 | | 199,962,666 |
| 0.14%, 1/8/16 (a) | 100,000,000 | | 99,999,060 |
| 0.15%, 1/9/17 (a) | 85,000,000 | | 85,000,000 |
| 0.16%, 2/9/16 (a) | 98,000,000 | | 98,000,000 |
| 0.19%, 8/21/17 (a) | 100,000,000 | | 100,000,000 |
| 0.19%, 10/7/16 (a) | 50,000,000 | | 50,000,000 |
| 0.26%, 12/16/15 (b) | 130,000,000 | | 129,957,250 |
| | | 1,613,928,020 |
| Federal Home Loan Mortgage Corp. — 16.6% | | |
| 0.14%, 8/17/16 (a) | 100,000,000 | | 100,000,000 |
| 0.16%, 2/18/16 (a) | 115,000,000 | | 114,997,598 |
| 0.17%, 2/4/16 (b) | 75,000,000 | | 74,966,354 |
| 0.17%, 2/9/16 (b) | 150,000,000 | | 149,927,083 |
| 0.18%, 6/15/16 (a) | 75,000,000 | | 74,992,868 |
| 0.19%, 11/25/15 (a) | 75,000,000 | | 75,000,000 |
| 0.19%, 7/21/16 (a) | 147,100,000 | | 147,112,538 |
| 0.20%, 1/13/17 (a) | 232,500,000 | | 232,472,390 |
| 0.24%, 1/5/16 (b) | 71,875,000 | | 71,843,854 |
| | | 1,041,312,685 |
| Federal National Mortgage Association — 9.8% | | | |
| 0.05%, 12/14/15 (b) | 91,599,000 | | 91,593,530 |
| 0.08%, 11/12/15 (b) | 73,000,000 | | 72,997,993 |
| 0.15%, 12/15/15 (b) | 75,000,000 | | 74,986,250 |
| 0.16%, 3/16/16 (b) | 75,000,000 | | 74,954,667 |
| 0.20%, 10/5/17 (a) | 100,000,000 | | 99,980,423 |
| 0.21%, 8/16/17 (a) | 50,000,000 | | 49,990,943 |
| 0.21%, 1/26/17 (a) | 100,000,000 | | 99,987,382 |
| 0.22%, 8/26/16 (a) | 50,000,000 | | 50,035,330 |
| | | 614,526,518 |
| TOTAL U.S. GOVERNMENT | | | |
| AND GOVERNMENT AGENCY | | | |
| OBLIGATIONS | | | |
| COST $3,880,452,343) | | | 3,880,452,343 |
| | | | |
| U.S. Treasury Obligations — 3.2% |
| | | | |
| U.S. Treasury Notes — 3.2% | | | |
| 0.38%, 1/15/16 | 75,000,000 | | 75,031,390 |
| 2.13%, 2/29/16 | 125,000,000 | | 125,769,694 |
| | | 200,801,084 |
| TOTAL U.S. TREASURY | | | |
| OBLIGATIONS | | | |
| (COST $200,801,084) | | | 200,801,084 |
| |
| Repurchase Agreements — 21.6% |
| | | |
| BNP Paribas, 0.07%, 11/2/15, | | | |
| Purchased on 10/30/15, with | | | |
| maturity value of $400,002,333, | | | |
| collateralized by various U.S. | | | |
| Treasury Obligations, | | | |
| 0.00%-4.62%, 04/30/16-08/15/44, | | | |
| fair value $408,000,000 | 400,000,000 | | 400,000,000 |
| BNP Paribas, 0.09%, 11/2/15, | | | |
| Purchased on 10/30/15, with | | | |
| maturity value of $100,000,750, | | | |
| collateralized by various U.S. | | | |
| Government and Government | | | |
| Agency Obligations, | | | |
| 0.00%-8.00%, 11/25/15-09/20/45, | | | |
| fair value $102,000,000 | 100,000,000 | | 100,000,000 |
| Citigroup Global Markets, | | | |
| 0.10%, 11/2/15, Purchased on | | | |
| 10/30/15, with maturity value | | | |
| of $100,000,833, collateralized | | | |
| by various U.S. Government | | | |
| and Government Agency | | | |
| Obligations, 0.00%-1.88%, | | | |
| 04/27/16-08/15/45, fair value | | | |
| $102,000,000 | 100,000,000 | | 100,000,000 |
| Goldman Sachs, 0.07%, 11/2/15, | | | |
| Purchased on 10/30/15, with | | | |
| maturity value of $100,000,583, | | | |
| collateralized by various U.S. | | | |
| Government and Government | | | |
| Agency Obligations, | | | |
| 2.09%-2.93%, 02/01/42-02/01/45, | | | |
| fair value $102,000,000 | 100,000,000 | | 100,000,000 |
| Goldman Sachs, 0.07%, 11/4/15, | | | |
| Purchased on 10/30/15, with | | | |
| maturity value of $50,000,583, | | | |
| collateralized by various U.S. | | | |
| Government and Government | | | |
| Agency Obligations, | | | |
| 4.00%-6.00%, 12/15/39-08/20/45, | | | |
| fair value $51,000,000 | 50,000,000 | | 50,000,000 |
| Merrill Lynch Pierce Fenner & | | | |
| Smith, 0.07%, 11/2/15, Purchased | | | |
| on 10/30/15, with maturity value | | | |
| of $200,001,167, collateralized by | | | |
| various U.S. Treasury Obligations, | | | |
| 0.05%-2.05%, 07/15/16-07/31/16, | | | |
| fair value $204,000,096 | 200,000,000 | | 200,000,000 |
| 12 HSBC FAMILY OF FUNDS | See notes to financial statements. |
| HSBC U.S. GOVERNMENT MONEY MARKET FUND |
| Schedule of Portfolio Investments—as of October 31, 2015 (concluded) |
| Repurchase Agreements, continued |
| |
| Principal | | Amortized |
| Amount ($) | | Cost ($) |
| Societe’ Generale, 0.09%, 11/2/15, | | | | |
| Purchased on 10/30/15, with | | | | |
| maturity value of $200,001,500, | | | | |
| collateralized by various U.S. | | | | |
| Government and Government | | | | |
| Agency Obligations, | | | | |
| 0.00%-9.25%, 10/31/15-02/15/44, | | | | |
| fair value $204,000,017 | 200,000,000 | | | 200,000,000 |
| Toronto Dominion Bank, 0.07%, | | | | |
| 11/2/15, Purchased on | | | | |
| 10/30/15, with maturity value | | | | |
| of $200,001,167, collateralized | | | | |
| by various U.S. Treasury | | | | |
| Obligations, 0.00%-2.00%, | | | | |
| 03/24/16-02/28/21, fair value | | | | |
| $204,000,007 | 200,000,000 | | | 200,000,000 |
| TOTAL REPURCHASE AGREEMENTS | | | |
| (COST $1,350,000,000) | | | | 1,350,000,000 |
| TOTAL INVESTMENT SECURITIES | | | | |
| (COST $5,431,253,427) – 86.8% | | | | 5,431,253,427 |
| Other Assets (Liabilities) – 13.2% | | | | 826,668,121 |
| NET ASSETS – 100% | | | $ | 6,257,921,548 |
____________________
| (a) | Variable rate security. The rate presented represents the rate in effect on October 31, 2015. These securities are deemed to have a maturity remaining until the next adjustment of the interest rate or the longer of the demand period or time to the next readjustment. |
| (b) | Discount note. Rate presented represents the effective yield at time of purchase. |
| See notes to financial statements. | HSBC FAMILY OF FUNDS 13 |
| HSBC U.S. TREASURY MONEY MARKET FUND |
| Schedule of Portfolio Investments—as of October 31, 2015 |
| U.S. Treasury Obligations – 92.0% |
| | | | | |
| Principal | | Amortized |
| Amount ($) | | Cost ($) |
| U.S. Treasury Bills – 11.2% | | | | |
| 0.00%, 12/10/15 (a) | 20,000,000 | | | 19,999,978 |
| 0.01%, 11/27/15 (a) | 40,000,000 | | | 39,999,682 |
| 0.02%, 12/3/15 (a) | 40,000,000 | | | 39,999,431 |
| 0.06%, 1/7/16 (a) | 60,000,000 | | | 59,993,300 |
| | | | 159,992,391 |
| U.S. Treasury Notes – 80.8% | | | | |
| 0.07%, 1/31/16 (b) | 130,000,000 | | | 129,995,273 |
| 0.07%, 10/31/16 (b) | 40,000,000 | | | 39,990,692 |
| 0.09%, 4/30/16 (b) | 25,000,000 | | | 25,000,126 |
| 0.09%, 7/31/16 (b) | 45,000,000 | | | 45,002,394 |
| 0.09%, 4/30/17 (b) | 50,000,000 | | | 49,999,240 |
| 0.10%, 1/31/17 (b) | 55,000,000 | | | 54,998,037 |
| 0.25%, 11/30/15 | 155,000,000 | | | 155,022,505 |
| 0.25%, 12/15/15 | 120,000,000 | | | 120,033,752 |
| 0.38%, 3/15/16 | 67,000,000 | | | 67,019,524 |
| 0.63%, 7/15/16 | 10,000,000 | | | 10,019,173 |
| 1.38%, 11/30/15 | 325,000,000 | | | 325,337,128 |
| 2.00%, 4/30/16 | 70,000,000 | | | 70,591,662 |
| 2.63%, 4/30/16 | 50,000,000 | | | 50,573,520 |
| 3.25%, 6/30/16 | 10,000,000 | | | 10,192,929 |
| | | | 1,153,775,955 |
| TOTAL U.S. TREASURY OBLIGATIONS (Cost $1,313,768,346) | | | | 1,313,768,346 |
| TOTAL INVESTMENT SECURITIES (Cost $1,313,768,346) – 92.0% | | | | 1,313,768,346 |
| Other Assets (Liabilities) – 8.0% | | | | 114,098,703 |
| NET ASSETS – 100% | | | $ | 1,427,867,049 |
____________________
| (a) | Discount note. Rate presented represents the effective yield at time of purchase. |
| (b) | Variable rate security. The rate presented represents the rate in effect on October 31, 2015. These securities are deemed to have a maturity remaining until the next adjustment of the interest rate or the longer of the demand period or time to the next readjustment. |
| 14 HSBC FAMILY OF FUNDS | See notes to financial statements. |
HSBC FAMILY OF FUNDS
Statements of Assets & Liabilities — as of October 31, 2015
| | | HSBC U.S. | | HSBC |
| HSBC Prime | | Government | | U.S. Treasury |
| Money Market | | Money Market | | Money Market |
| Fund | | Fund | | Fund |
| Assets: | | | | | | | | | | | | | | | |
| Investments, at amortized cost | | $ | 6,512,336,328 | | | | | $ | 4,081,253,427 | | | | $ | 1,313,768,346 | |
| Repurchase agreements, at cost | | | — | | | | | | 1,350,000,000 | | | | | — | |
| Total Investments | | | 6,512,336,328 | | | | | | 5,431,253,427 | | | | | 1,313,768,346 | |
| Cash | | | 500,847 | | | | | | 425,556,814 | | | | | 7,776,049 | |
| Interest receivable | | | 1,323,150 | | | | | | 1,722,729 | | | | | 4,417,930 | |
| Receivable for investments sold | | | — | | | | | | 400,000,000 | | | | | 102,000,000 | |
| Receivable from Investment Adviser | | | — | | | | | | — | | | | | 15,153 | |
| Prepaid expenses and other assets | | | 130,704 | | | | | | 166,132 | | | | | 86,194 | |
| Total Assets | | | 6,514,291,029 | | | | | | 6,258,699,102 | | | | | 1,428,063,672 | |
| | | | | | | | | | | | | | | |
| Liabilities: | | | | | | | | | | | | | | | |
| Dividends payable | | | 297,463 | | | | | | 38,610 | | | | | — | |
| Payable for investments purchased | | | 40,318,545 | | | | | | — | | | | | — | |
| Accrued expenses and other liabilities: | | | | | | | | | | | | | | | |
| Investment Management | | | 345,220 | | | | | | 81,039 | | | | | — | |
| Administration | | | 281,132 | | | | | | 213,284 | | | | | 45,044 | |
| Compliance Services | | | — | | | | | | 815 | | | | | 8,197 | |
| Accounting | | | 10,894 | | | | | | 10,579 | | | | | 9,506 | |
| Custodian fees | | | 59,134 | | | | | | 69,923 | | | | | 16,417 | |
| Transfer Agent | | | 15,785 | | | | | | 12,726 | | | | | 13,018 | |
| Trustee | | | 52,139 | | | | | | 68,644 | | | | | 13,733 | |
| Other | | | 190,947 | | | | | | 281,934 | | | | | 90,708 | |
| Total Liabilities | | | 41,571,259 | | | | | | 777,554 | | | | | 196,623 | |
| Net Assets | | $ | 6,472,719,770 | | | | | $ | 6,257,921,548 | | | | $ | 1,427,867,049 | |
| | | | | | | | | | | | | | | | |
| Composition of Net Assets: | | | | | | | | | | | | | | | |
| Capital | | | 6,472,713,901 | | | | | | 6,257,915,455 | | | | | 1,427,854,843 | |
| Accumulated net investment income/(distributions in excess of | | | | | | | | | | | | | | | |
| net investment income) | | | (4 | ) | | | | | 7 | | | | | — | |
| Accumulated net realized gains/(losses) from investments | | | 5,873 | | | | | | 6,086 | | | | | 12,206 | |
| Net Assets | | $ | 6,472,719,770 | | | | | $ | 6,257,921,548 | | | | $ | 1,427,867,049 | |
| | | | | | | | | | | | | | | | |
| Net Assets: | | | | | | | | | | | | | | | |
| Class A | | $ | 27,597,432 | | | | | $ | 929,445 | | | | $ | — | |
| Class B | | | — | | | | | | 48,767 | | | | | — | |
| Class C | | | 40,451 | | | | | | — | | | | | — | |
| Class D | | | 1,194,510,870 | | | | | | 888,084,381 | | | | | 280,031,662 | |
| Class I | | | 4,747,505,857 | | | | | | 1,589,264,194 | | | | | 384,362,743 | |
| Class Y | | | 503,065,160 | | | | | | 3,779,594,761 | | | | | 763,472,644 | |
| | $ | 6,472,719,770 | | | | | $ | 6,257,921,548 | | | | $ | 1,427,867,049 | |
| | | | | | | | | | | | | | | | |
| Shares Outstanding: | | | | | | | | | | | | | | | |
| ($0.001 par value, unlimited number of shares authorized): | | | | | | | | | | | | | | | |
| Class A | | | 27,598,013 | | | | | | 929,454 | | | | | — | |
| Class B | | | — | | | | | | 48,754 | | | | | — | |
| Class C | | | 40,451 | | | | | | — | | | | | — | |
| Class D | | | 1,194,449,604 | | | | | | 887,902,056 | | | | | 280,029,307 | |
| Class I | | | 4,747,580,106 | | | | | | 1,589,373,943 | | | | | 384,394,586 | |
| Class Y | | | 503,060,053 | | | | | | 3,779,661,609 | | | | | 763,435,920 | |
| Net Asset Value, Offering Price and Redemption Price per share: | | | | | | | | | | | | | | | |
| Class A | | $ | 1.00 | | | | | $ | 1.00 | | | | $ | — | |
| Class B (a) | | $ | — | | | | | $ | 1.00 | | | | $ | — | |
| Class C (a) | | $ | 1.00 | | | | | $ | — | | | | $ | — | |
| Class D | | $ | 1.00 | | | | | $ | 1.00 | | | | $ | 1.00 | |
| Class I | | $ | 1.00 | | | | | $ | 1.00 | | | | $ | 1.00 | |
| Class Y | | $ | 1.00 | | | | | $ | 1.00 | | | | $ | 1.00 | |
____________________
| (a) | Redemption Price per share varies by length of time shares are held. |
| See notes to financial statements. | HSBC FAMILY OF FUNDS 15 |
HSBC FAMILY OF FUNDS
Statements of Operations—For the year ended October 31, 2015
| | | | | | | U.S. | | | | | | |
| | | | | | | Government | | U.S. Treasury |
| Prime Money | | Money Market | | Money Market |
| Market Fund | | Fund | | Fund |
| Investment Income: | | | | | | | | | | | | | | | | | |
| Interest | | $ | 12,794,947 | | | | | $ | 6,383,162 | | | | | $ | 992,134 | | |
| Total Investment Income | | | 12,794,947 | | | | | | 6,383,162 | | | | | | 992,134 | | |
| | | | | | | | | | | | | | | | | | |
| Expenses: | | | | | | | | | | | | | | | | | |
| Investment Management | | | 5,338,340 | | | | | | 6,384,798 | | | | | | 1,807,955 | | |
| Advisory Services: | | | | | | | | | | | | | | | | | |
| Operational Support - Class A Shares | | | 29,216 | | | | | | 364 | | | | | | — | | |
| Operational Support - Class B Shares | | | — | | | | | | 48 | | | | | | — | | |
| Operational Support - Class C Shares | | | 13 | | | | | | — | | | | | | — | | |
| Operational Support - Class D Shares | | | 1,245,881 | | | | | | 778,232 | | | | | | 302,030 | | |
| Operational Support - Class Y Shares | | | 490,347 | | | | | | 3,982,169 | | | | | | 944,996 | | |
| Administration: | | | | | | | | | | | | | | | | | |
| Class A Shares | | | 14,060 | | | | | | 175 | | | | | | — | | |
| Class B Shares | | | — | | | | | | 25 | | | | | | — | | |
| Class C Shares | | | 7 | | | | | | — | | | | | | — | | |
| Class D Shares | | | 596,900 | | | | | | 374,493 | | | | | | 146,002 | | |
| Class I Shares | | | 1,729,046 | | | | | | 782,093 | | | | | | 266,473 | | |
| Class Y Shares | | | 235,520 | | | | | | 1,918,810 | | | | | | 457,164 | | |
| Distribution: | | | | | | | | | | | | | | | | | |
| Class B Shares | | | — | | | | | | 366 | | | | | | — | | |
| Class C Shares | | | 96 | | | | | | — | | | | | | — | | |
| Shareholder Servicing: | | | | | | | | | | | | | | | | | |
| Class A Shares | | | 116,867 | | | | | | 1,464 | | | | | | — | | |
| Class B Shares | | | — | | | | | | 121 | | | | | | — | | |
| Class C Shares | | | 32 | | | | | | — | | | | | | — | | |
| Class D Shares | | | 3,114,645 | | | | | | 1,945,594 | | | | | | 755,096 | | |
| Accounting | | | 73,235 | | | | | | 67,339 | | | | | | 58,877 | | |
| Compliance Services | | | 101,679 | | | | | | 136,227 | | | | | | 46,383 | | |
| Custodian | | | 274,281 | | | | | | 402,779 | | | | | | 103,046 | | |
| Printing | | | 256,800 | | | | | | 88,727 | | | | | | 2,736 | | |
| Professional | | | 557,565 | | | | | | 665,889 | | | | | | 223,640 | | |
| Transfer Agent | | | 50,219 | | | | | | 39,634 | | | | | | 37,719 | | |
| Trustee | | | 336,113 | | | | | | 381,812 | | | | | | 114,601 | | |
| Registration fees | | | 79,670 | | | | | | 71,986 | | | | | | 64,570 | | |
| Other | | | 432,070 | | | | | | 468,092 | | | | | | 180,870 | | |
| Total expenses before fee and expense reductions | | | 15,072,602 | | | | | | 18,491,237 | | | | | | 5,512,158 | | |
| Fees voluntarily reduced/reimbursed by Investment Adviser | | | (3,278,386 | ) | | | | | (11,011,245 | ) | | | | | (3,476,330 | ) | |
| Fees voluntarily reduced by Administrator | | | (41,248 | ) | | | | | (819,939 | ) | | | | | (232,190 | ) | |
| Fees voluntarily reduced by Distributor | | | (96 | ) | | | | | (366 | ) | | | | | — | | |
| Fees voluntarily reduced by Shareholder Servicing Agent | | | (3,231,544 | ) | | | | | (1,947,178 | ) | | | | | (755,096 | ) | |
| Custody earnings credits | | | (31,493 | ) | | | | | (244,800 | ) | | | | | (56,408 | ) | |
| Net Expenses | | | 8,489,835 | | | | | | 4,467,709 | | | | | | 992,134 | | |
| Net Investment Income | | | 4,305,112 | | | | | | 1,915,453 | | | | | | — | | |
| | | | | | | | | | | | | | | | | | |
| Realized/Unrealized Gains/(Losses) from Investments: | | | | | | | | | | | | | | | | | |
| Net realized gains/(losses) from investments | | | 5,873 | | | | | | 58,725 | | | | | | 36,870 | | |
| Net realized/unrealized gains (losses) on investments | | | 5,873 | | | | | | 58,725 | | | | | | 36,870 | | |
| Change in Net Assets Resulting from Operations | | $ | 4,310,985 | | | | | $ | 1,974,178 | | | | | $ | 36,870 | | |
| 16 HSBC FAMILY OF FUNDS | See notes to financial statements. |
HSBC FAMILY OF FUNDS
Statements of Changes in Net Assets
| HSBC Prime | | HSBC U.S. Government |
| Money Market Fund | | Money Market Fund |
| Year Ended | Year Ended | | Year Ended | Year Ended |
| October 31, 2015 | October 31, 2014 | | October 31, 2015 | October 31, 2014 |
| Investment Activities: | | | | | | | | | | | | | | | | | | | | | |
| Operations: | | | | | | | | | | | | | | | | | | | | | |
| Net investment income | | $ | 4,305,112 | | | | $ | 1,796,183 | | | | | $ | 1,915,453 | | | | $ | 1,016,513 | | |
| Net realized gains/(losses) from investments | | | 5,873 | | | | | 3,685 | | | | | | 58,725 | | | | | 37,784 | | |
| Change in net assets resulting from operations | | | 4,310,985 | | | | | 1,799,868 | | | | | | 1,974,178 | | | | | 1,054,297 | | |
| | | | | | | | | | | | | | | | | | | | | | |
| Distributions: | | | | | | | | | | | | | | | | | | | | | |
| Net investment income: | | | | | | | | | | | | | | | | | | | | | |
| Class A | | | (10,951 | ) | | | | (9,126 | ) | | | | | (109 | ) | | | | (40 | ) | |
| Class B | | | — | | | | | (2 | ) | | | | | (15 | ) | | | | (10 | ) | |
| Class C | | | (7 | ) | | | | — | | | | | | — | | | | | — | | |
| Class D | | | (468,417 | ) | | | | (252,975 | ) | | | | | (233,083 | ) | | | | (218,907 | ) | |
| Class I | | | (3,640,197 | ) | | | | (1,418,944 | ) | | | | | (487,824 | ) | | | | (205,861 | ) | |
| Class Y | | | (185,564 | ) | | | | (115,117 | ) | | | | | (1,194,417 | ) | | | | (591,695 | ) | |
| Net realized gains: | | | | | | | | | | | | | | | | | | | | | |
| Class A | | | (4 | ) | | | | (42 | ) | | | | | — | | | | | — | | |
| Class D | | | (181 | ) | | | | (1,243 | ) | | | | | — | | | | | — | | |
| Class I | | | (1,017 | ) | | | | (9,297 | ) | | | | | — | | | | | — | | |
| Class Y | | | (70 | ) | | | | (575 | ) | | | | | — | | | | | — | | |
| Change in net assets from distributions | | | (4,306,408 | ) | | | | (1,807,321 | ) | | | | | (1,915,448 | ) | | | | (1,016,513 | ) | |
| | | | | | | | | | | | | | | | | | | | | | |
| Change in net assets resulting from | | | | | | | | | | | | | | | | | | | | | |
| capital transactions | | | 1,558,164,115 | | | | | (84,796,567 | ) | | | | | 660,883,397 | | | | | 1,363,811,133 | | |
| Change in net assets | | | 1,558,168,692 | | | | | (84,804,020 | ) | | | | | 660,942,127 | | | | | 1,363,848,917 | | |
| | | | | | | | | | | | | | | | | | | | | | |
| Net Assets: | | | | | | | | | | | | | | | | | | | | | |
| Beginning of period | | | 4,914,551,078 | | | | | 4,999,355,098 | | | | | | 5,596,979,421 | | | | | 4,233,130,504 | | |
| End of period | | $ | 6,472,719,770 | | | | $ | 4,914,551,078 | | | | | $ | 6,257,921,548 | | | | $ | 5,596,979,421 | | |
| Accumulated net investment income/(distributions in | | | | | | | | | | | | | | | | | | | | | |
| excess of net investment income) | | $ | (4 | ) | | | $ | 19 | | | | | $ | 7 | | | | $ | — | | |
| See notes to financial statements. | HSBC FAMILY OF FUNDS 17 |
HSBC FAMILY OF FUNDS
Statements of Changes in Net Assets (continued)
| HSBC Prime | | HSBC U.S. Government |
| Money Market Fund | | Money Market Fund |
| Year Ended | Year Ended | | Year Ended | Year Ended |
| October 31, 2015 | October 31, 2014 | | October 31, 2015 | October 31, 2014 |
| Capital Transactions*: | | | | | | | | | | | | | | | | | | | | | |
| Class A | | | | | | | | | | | | | | | | | | | | | |
| Proceeds from shares issued | | $ | 2,840,168 | | | | $ | 9,041,523 | | | | | $ | 940,017 | | | | $ | 67,819 | | |
| Dividends reinvested | | | 365 | | | | | 254 | | | | | | 108 | | | | | 40 | | |
| Value of shares redeemed | | | (21,263,006 | ) | | | | (5,180,190 | ) | | | | | (164,851 | ) | | | | (341,827 | ) | |
| Class A Shares capital transactions | | | (18,422,473 | ) | | | | 3,861,587 | | | | | | 775,274 | | | | | (273,968 | ) | |
| | | | | | | | | | | | | | | | | | | | | | |
| Class B | | | | | | | | | | | | | | | | | | | | | |
| Dividends reinvested | | | — | | | | | 2 | | | | | | 15 | | | | | 9 | | |
| Value of shares redeemed | | | (2,060 | ) | | | | (26,152 | ) | | | | | — | | | | | — | | |
| Class B Shares capital transactions | | | (2,060 | ) | | | | (26,150 | ) | | | | | 15 | | | | | 9 | | |
| | | | | | | | | | | | | | | | | | | | | | |
| Class C | | | | | | | | | | | | | | | | | | | | | |
| Proceeds from shares issued | | | 81,602 | | | | | — | | | | | | — | | | | | — | | |
| Dividends reinvested | | | 6 | | | | | — | | | | | | — | | | | | — | | |
| Value of shares redeemed | | | (41,157 | ) | | | | (2 | ) | | | | | — | | | | | — | | |
| Class C Shares capital transactions | | | 40,451 | | | | | (2 | ) | | | | | — | | | | | — | | |
| | | | | | | | | | | | | | | | | | | | | | |
| Class D | | | | | | | | | | | | | | | | | | | | | |
| Proceeds from shares issued | | | 5,142,934,572 | | | | | 3,840,328,913 | | | | | | 2,487,351,997 | | | | | 3,358,282,437 | | |
| Dividends reinvested | | | 331,373 | | | | | 181,297 | | | | | | 67,153 | | | | | 56,872 | | |
| Value of shares redeemed | | | (5,143,901,199 | ) | | | | (3,933,440,467 | ) | | | | | (2,326,630,455 | ) | | | | (3,301,950,708 | ) | |
| Class D Shares capital transactions | | | (635,254 | ) | | | | (92,930,257 | ) | | | | | 160,788,695 | | | | | 56,388,601 | | |
| | | | | | | | | | | | | | | | | | | | | | |
| Class I | | | | | | | | | | | | | | | | | | | | | |
| Proceeds from shares issued | | | 29,866,205,840 | | | | | 22,241,726,280 | | | | | | 10,758,223,000 | | | | | 11,154,518,735 | | |
| Dividends reinvested | | | 2,060,912 | | | | | 1,064,404 | | | | | | 287,532 | | | | | 121,097 | | |
| Value of shares redeemed | | | (28,273,253,988 | ) | | | | (22,211,352,195 | ) | | | | | (10,580,351,583 | ) | | | | (10,900,453,771 | ) | |
| Class I Shares capital transactions | | | 1,595,012,764 | | | | | 31,438,489 | | | | | | 178,158,949 | | | | | 254,186,061 | | |
| | | | | | | | | | | | | | | | | | | | | | |
| Class Y | | | | | | | | | | | | | | | | | | | | | |
| Proceeds from shares issued | | | 1,331,197,615 | | | | | 1,878,381,292 | | | | | | 21,862,447,049 | | | | | 15,656,415,797 | | |
| Dividends reinvested | | | 181,732 | | | | | 111,082 | | | | | | 1,192,843 | | | | | 589,217 | | |
| Value of shares redeemed | | | (1,349,208,660 | ) | | | | (1,905,632,608 | ) | | | | | (21,542,479,428 | ) | | | | (14,603,494,584 | ) | |
| Class Y Shares capital transactions | | | (17,829,313 | ) | | | | (27,140,234 | ) | | | | | 321,160,464 | | | | | 1,053,510,430 | | |
| Change in net assets resulting from | | | | | | | | | | | | | | | | | | | | | |
| capital transactions | | $ | 1,558,164,115 | | | | $ | (84,796,567 | ) | | | | $ | 660,883,397 | | | | $ | 1,363,811,133 | | |
____________________
* Share transactions are at net asset value of $1.00 per share.
| 18 HSBC FAMILY OF FUNDS | See notes to financial statements. |
HSBC FAMILY OF FUNDS
Statements of Changes in Net Assets (continued)
| HSBC U.S. Treasury |
| Money Market Fund |
| Year ended | | Year ended |
| October 31, 2015 | | October 31, 2014 |
| Investment Activities: | | | | | | | | | | | |
| Operations: | | | | | | | | | | | |
| Net investment income | | $ | — | | | | | $ | 109,274 | | |
| Net realized gains/(losses) from investment transactions | | | 36,870 | | | | | | 24,736 | | |
| Change in net assets resulting from operations | | | 36,870 | | | | | | 134,010 | | |
| | | | | | | | | | | | |
| Distributions: | | | | | | | | | | | |
| Net investment income: | | | | | | | | | | | |
| Class D | | | — | | | | | | (17,135 | ) | |
| Class I | | | — | | | | | | (30,899 | ) | |
| Class Y | | | — | | | | | | (61,240 | ) | |
| Change in net assets from distributions | | | — | | | | | | (109,274 | ) | |
| Change in net assets resulting from capital transactions | | | (431,134,675 | ) | | | | | (713,380,764 | ) | |
| | | | | | | | | | | | |
| Change in net assets | | | (431,097,805 | ) | | | | | (713,356,028 | ) | |
| | | | | | | | | | | | |
| Net Assets: | | | | | | | | | | | |
| Beginning of period | | | 1,858,964,854 | | | | | | 2,572,320,882 | | |
| End of period | | $ | 1,427,867,049 | | | | | $ | 1,858,964,854 | | |
| Accumulated net investment income/(distributions in excess of net investment income) | | $ | — | | | | | $ | — | | |
| See notes to financial statements. | HSBC FAMILY OF FUNDS 19 |
HSBC FAMILY OF FUNDS
Statements of Changes in Net Assets (continued)
| HSBC U.S. Treasury |
| Money Market Fund |
| Year ended | | Year ended |
| October 31, 2015 | | October 31, 2014 |
| CAPITAL TRANSACTIONS*: | | | | | | | | | | | |
| Class A | | | | | | | | | | | |
| Value of shares redeemed | | $ | — | | | | | $ | (5,091 | ) | |
| Class A Shares capital transactions | | | — | | | | | | (5,091 | ) | |
| | | | | | | | | | | | |
| Class D | | | | | | | | | | | |
| Proceeds from shares issued | | | 1,120,322,048 | | | | | | 1,461,835,451 | | |
| Dividends reinvested | | | — | | | | | | 10,599 | | |
| Value of shares redeemed | | | (1,479,236,109 | ) | | | | | (1,340,756,281 | ) | |
| Class D Shares capital transactions | | | (358,914,061 | ) | | | | | 121,089,769 | | |
| | | | | | | | | | | | |
| Class I | | | | | | | | | | | |
| Proceeds from shares issued | | | 4,050,846,479 | | | | | | 4,553,135,785 | | |
| Dividends reinvested | | | — | | | | | | 21,831 | | |
| Value of shares redeemed | | | (3,930,207,887 | ) | | | | | (5,375,630,639 | ) | |
| Class I Shares capital transactions | | | 120,638,592 | | | | | | (822,473,023 | ) | |
| | | | | | | | | | | | |
| Class Y | | | | | | | | | | | |
| Proceeds from shares issued | | | 1,145,300,679 | | | | | | 1,277,728,090 | | |
| Dividends reinvested | | | — | | | | | | 60,084 | | |
| Value of shares redeemed | | | (1,338,159,885 | ) | | | | | (1,289,780,593 | ) | |
| Class Y Shares capital transactions | | | (192,859,206 | ) | | | | | (11,992,419 | ) | |
| Change in net assets resulting from capital transactions | | $ | (431,134,675 | ) | | | | $ | (713,380,764 | ) | |
____________________
* Share transactions are at net asset value of $1.00 per share.
| 20 HSBC FAMILY OF FUNDS | See notes to financial statements. |
| HSBC PRIME MONEY MARKET FUND |
| Financial Highlights |
Selected data for a share outstanding throughout the periods indicated.
| | | | Investment Activities | | Distributions | | | | | | Ratios/Supplementary Data |
| | Net Asset
Value,
Beginning
of Period | | Net
Investment
Income | | Net
Realized and
Unrealized
Gains
(Losses)
from
Investments | | Total from
Investment
Activities | | Net
Investment
Income | | Net
Realized
Gains from
Investment
Transactions | | Total
Distributions | | Net
Asset
Value,
End of
Period | | Total
Return(a) | | Net Assets at
End of Period
(000’s) | | Ratio of Net
Expenses to
Average Net
Assets(b) | | Ratio of Net
Investment
Income to
Average Net
Assets(b) | | Ratio of
Expenses
to Average
Net Assets
(Excluding
Fee
Reductions)(b) |
| CLASS A SHARES | | | | | | | | | | | | | | | | | | | | | | | | | | | | | | | | | | | | | | | | | | | | | | | | | | | | | | | | | | |
| Year Ended October 31, 2015 | | | $ | 1.00 | | | | $ | — | | | $ | — | | | $ | — | | | $ | — | | | $ | — | | | $ | — | | | $ | 1.00 | | | | 0.04 | % | | | $ | 27,597 | | | | 0.20 | % | | | | 0.04 | % | | | | 0.69 | % | |
| Year Ended October 31, 2014 | | | | 1.00 | | | | | —(c) | | | | — | | | | — | | | | — | | | | — | | | | — | | | | 1.00 | | | | 0.02 | % | | | | 46,020 | | | | 0.19 | % | | | | 0.02 | % | | | | 0.69 | % | |
| Year Ended October 31, 2013 | | | | 1.00 | | | | | —(c) | | | | — | | | | — | | | | — | | | | — | | | | — | | | | 1.00 | | | | 0.01 | % | | | | 42,158 | | | | 0.23 | % | | | | 0.01 | % | | | | 0.68 | % | |
| Year Ended October 31, 2012 | | | | 1.00 | | | | | — | | | | — | | | | — | | | | — | | | | — | | | | — | | | | 1.00 | | | | 0.01 | % | | | | 33,546 | | | | 0.30 | % | | | | 0.01 | % | | | | 0.69 | % | |
| Year Ended October 31, 2011 | | | | 1.00 | | | | | —(c) | | | | — | | | | — | | | | — | | | | — | | | | — | | | | 1.00 | | | | 0.01 | % | | | | 27,763 | | | | 0.26 | % | | | | 0.01 | % | | | | 0.68 | % | |
| CLASS B SHARES | | | | | | | | | | | | | | | | | | | | | | | | | | | | | | | | | | | | | | | | | | | | | | | | | | | | | | | | | | |
| Period Ended October 31, 2015(d) | | | $ | 1.00 | | | | | — | | | | — | | | | — | | | | — | | | | — | | | | — | | | $ | 1.00 | | | | — | | | | $ | — | | | | 0.18 | % | | | | — | % | | | | 1.24 | % | |
| Year Ended October 31, 2014 | | | | 1.00 | | | | | —(c) | | | | — | | | | — | | | | — | | | | — | | | | — | | | | 1.00 | | | | 0.02 | % | | | | 2 | | | | 0.18 | % | | | | 0.02 | % | | | | 1.28 | % | |
| Year Ended October 31, 2013 | | | | 1.00 | | | | | —(c) | | | | — | | | | — | | | | — | | | | — | | | | — | | | | 1.00 | | | | 0.01 | % | | | | 28 | | | | 0.24 | % | | | | 0.01 | % | | | | 1.28 | % | |
| Year Ended October 31, 2012 | | | | 1.00 | | | | | — | | | | — | | | | — | | | | — | | | | — | | | | — | | | | 1.00 | | | | 0.01 | % | | | | 41 | | | | 0.29 | % | | | | 0.01 | % | | | | 1.29 | % | |
| Year Ended October 31, 2011 | | | | 1.00 | | | | | —(c) | | | | — | | | | — | | | | — | | | | — | | | | — | | | | 1.00 | | | | 0.01 | % | | | | 132 | | | | 0.26 | % | | | | 0.01 | % | | | | 1.28 | % | |
| CLASS C SHARES | | | | | | | | | | | | | | | | | | | | | | | | | | | | | | | | | | | | | | | | | | | | | | | | | | | | | | | | | | |
| Period Ended October 31, 2015(e) | | | $ | 1.00 | | | | | — | | | | — | | | | — | | | | — | | | | — | | | | — | | | $ | 1.00 | | | | 0.01 | % | | | $ | 40 | | | | 0.22 | % | | | | 0.05 | % | | | | 1.29 | % | |
| Year Ended October 31,2014(f) | | | | 1.00 | | | | | —(c) | | | | — | | | | — | | | | — | | | | — | | | | — | | | | 1.00 | | | | — | % | | | | — | | | | — | % | | | | — | % | | | | — | % | |
| Year Ended October 31, 2013 | | | | 1.00 | | | | | —(c) | | | | — | | | | — | | | | — | | | | — | | | | — | | | | 1.00 | | | | 0.01 | % | | | | — | (g) | | | 0.23 | % | | | | 0.07 | % | | | | 1.26 | % | |
| Year Ended October 31, 2012 | | | | 1.00 | | | | | — | | | | — | | | | — | | | | — | | | | — | | | | — | | | | 1.00 | | | | 0.06 | % | | | | 6 | | | | 0.25 | % | | | | 0.06 | % | | | | 1.29 | % | |
| Year Ended October 31, 2011 | | | | 1.00 | | | | | —(c) | | | | — | | | | — | | | | — | | | | — | | | | — | | | | 1.00 | | | | 0.01 | % | | | | 6 | | | | 0.25 | % | | | | 0.01 | % | | | | 1.28 | % | |
| CLASS D SHARES | | | | | | | | | | | | | | | | | | | | | | | | | | | | | | | | | | | | | | | | | | | | | | | | | | | | | | | | | | |
| Year Ended October 31, 2015 | | | $ | 1.00 | | | | | — | | | | — | | | | — | | | | — | | | | — | | | | — | | | $ | 1.00 | | | | 0.04 | % | | | $ | 1,194,511 | | | | 0.20 | % | | | | 0.04 | % | | | | 0.54 | % | |
| Year Ended October 31, 2014 | | | | 1.00 | | | | | —(c) | | | | — | | | | — | | | | — | | | | — | | | | — | | | | 1.00 | | | | 0.02 | % | | | | 1,195,145 | | | | 0.19 | % | | | | 0.02 | % | | | | 0.54 | % | |
| Year Ended October 31, 2013 | | | | 1.00 | | | | | —(c) | | | | — | | | | — | | | | — | | | | — | | | | — | | | | 1.00 | | | | 0.01 | % | | | | 1,288,077 | | | | 0.23 | % | | | | 0.01 | % | | | | 0.53 | % | |
| Year Ended October 31, 2012 | | | | 1.00 | | | | | — | | | | — | | | | — | | | | — | | | | — | | | | — | | | | 1.00 | | | | 0.01 | % | | | | 1,303,827 | | | | 0.30 | % | | | | 0.01 | % | | | | 0.54 | % | |
| Year Ended October 31, 2011 | | | | 1.00 | | | | | —(c) | | | | — | | | | — | | | | — | | | | — | | | | — | | | | 1.00 | | | | 0.01 | % | | | | 1,591,614 | | | | 0.26 | % | | | | 0.01 | % | | | | 0.53 | % | |
| CLASS I SHARES | | | | | | | | | | | | | | | | | | | | | | | | | | | | | | | | | | | | | | | | | | | | | | | | | | | | | | | | | | |
| Year Ended October 31, 2015 | | | $ | 1.00 | | | | | — | | | | — | | | | — | | | | — | | | | — | | | | — | | | $ | 1.00 | | | | 0.10 | % | | | $ | 4,747,506 | | | | 0.14 | % | | | | 0.10 | % | | | | 0.19 | % | |
| Year Ended October 31, 2014 | | | | 1.00 | | | | | —(c) | | | | — | | | | — | | | | — | | | | — | | | | — | | | | 1.00 | | | | 0.05 | % | | | | 3,152,490 | | | | 0.16 | % | | | | 0.05 | % | | | | 0.19 | % | |
| Year Ended October 31, 2013 | | | | 1.00 | | | | | —(c) | | | | — | | | | — | | | | — | | | | — | | | | — | | | | 1.00 | | | | 0.08 | % | | | | 3,121,056 | | | | 0.17 | % | | | | 0.08 | % | | | | 0.18 | % | |
| Year Ended October 31, 2012 | | | | 1.00 | | | | | — | | | | — | | | | — | | | | — | | | | — | | | | — | | | | 1.00 | | | | 0.14 | % | | | | 3,025,688 | | | | 0.17 | % | | | | 0.14 | % | | | | 0.19 | % | |
| Year Ended October 31, 2011 | | | | 1.00 | | | | | —(c) | | | | — | | | | — | | | | — | | | | — | | | | — | | | | 1.00 | | | | 0.10 | % | | | | 4,309,346 | | | | 0.17 | % | | | | 0.10 | % | | | | 0.18 | % | |
| See notes to financial statements. | HSBC FAMILY OF FUNDS 21 |
| HSBC PRIME MONEY MARKET FUND |
| Financial Highlights (continued) |
| | | | | Investment Activities | | Distributions | | | | | | | Ratios/Supplementary Data |
| | | Net Asset
Value,
Beginning
of Period | | Net
Investment
Income | | Net
Realized and
Unrealized
Gains
(Losses)
from
Investments | | Total from
Investment
Activities | | Net
Investment
Income | | Net
Realized
Gains from
Investment
Transactions | | Total
Distributions | | Net
Asset
Value,
End of
Period | | Total
Return(a) | | Net Assets at
End of Period
(000’s) | | Ratio of Net
Expenses to
Average Net
Assets(b) | | Ratio of Net
Investment
Income to
Average Net
Assets(b) | | Ratio of
Expenses
to Average
Net Assets
(Excluding
Fee
Reductions)(b) |
| CLASS Y SHARES | | | | | | | | | | | | | | | | | | | | | | | | | | | | | | | | | | | | | |
| Year Ended October 31, 2015 | | | $ | 1.00 | | | | — | | | — | | — | | — | | — | | — | | | $ | 1.00 | | | 0.04% | | | $ | 503,065 | | | 0.20% | | 0.04% | | 0.29% |
| Year Ended October 31, 2014 | | | | 1.00 | | | | —(c) | | | — | | — | | — | | — | | — | | | | 1.00 | | | 0.02% | | | | 520,894 | | | 0.19% | | 0.02% | | 0.29% |
| Year Ended October 31, 2013 | | | | 1.00 | | | | —(c) | | | — | | — | | — | | — | | — | | | | 1.00 | | | 0.01% | | | | 548,035 | | | 0.23% | | 0.01% | | 0.28% |
| Year Ended October 31, 2012 | | | | 1.00 | | | | — | | | — | | — | | — | | — | | — | | | | 1.00 | | | 0.03% | | | | 617,308 | | | 0.28% | | 0.03% | | 0.29% |
| Year Ended October 31, 2011 | | | | 1.00 | | | | —(c) | | | — | | — | | — | | — | | — | | | | 1.00 | | | 0.01% | | | | 642,290 | | | 0.26% | | 0.02% | | 0.28% |
| (a) | | Not annualized for periods less than one year. Total return calculations do not include any sales or redemption charges. |
| (b) | | Annualized for periods less than one year. |
| (c) | | Calculated based on average shares outstanding. |
| (d) | | Class B Shares were operational during a portion of the year only. Amounts reflect performance for a period of time the class had operations, which was 3 days during the period from November 1, 2014 to November 3, 2014. The net asset value reflected represents the last day the class had operations. |
| (e) | | Class C Shares were operational during a portion of the year only. Amounts reflect performance for a period of time the class had operations, which was 102 days during the period from July 22, 2015 to October 31, 2015. |
| (f) | | Class C Shares were operational during a portion of the year only. Amounts reflect performance for a period of time the class had operations, which was 213 days during the period. The net asset value reflected represents the last day the class had operations. |
| (g) | | Less than $500 |
Amounts designated as “—” are $0 or have been rounded to $0.
| 22 HSBC FAMILY OF FUNDS | See notes to financial statements. |
| HSBC U.S. GOVERNMENT MONEY MARKET FUND |
| Financial Highlights (continued) |
Selected data for a share outstanding throughout the periods indicated.
| | | | Investment Activities | | Distributions | | | | | | Ratios/Supplementary Data |
| | Net Asset
Value,
Beginning
of Period | | Net
Investment
Income | | Net
Realized and
Unrealized
Gains
(Losses)
from
Investments | | Total from
Investment
Activities | | Net
Investment
Income | | Net
Realized
Gains from
Investment
Transactions | | Total
Distributions | | Net
Asset
Value,
End of
Period | | Total
Return(a) | | Net Assets at
End of Period
(000’s) | | Ratio of Net
Expenses to
Average Net
Assets(b) | | Ratio of Net
Investment
Income to
Average Net
Assets(b) | | Ratio of
Expenses
to Average
Net Assets
(Excluding
Fee
Reductions)(b) |
| CLASS A SHARES | | | | | | | | | | | | | | | | | | | | | | | | | | | | | | | | | | | | | | | | | | | | | | | | | | | | | | | | | | | | | | | | | |
| Year Ended October 31, 2015 | | | $ | 1.00 | | | | $ | — | | | | $ | — | | | | $ | — | | | | $ | — | | | | $ | — | | | | $ | — | | | | $ | 1.00 | | | | 0.03 | % | | | | $ | 929 | | | | 0.08 | % | | | | 0.03 | % | | | | 0.69 | % | |
| Year Ended October 31, 2014 | | | | 1.00 | | | | | — | | | | | — | | | | | — | | | | | — | | | | | — | | | | | — | | | | | 1.00 | | | | 0.02 | % | | | | | 154 | | | | 0.07 | % | | | | 0.02 | % | | | | 0.69 | % | |
| Year Ended October 31, 2013 | | | | 1.00 | | | | | — | | | | | — | | | | | — | | | | | — | | | | | — | | | | | — | | | | | 1.00 | | | | 0.01 | % | | | | | 428 | | | | 0.17 | % | | | | 0.01 | % | | | | 0.68 | % | |
| Year Ended October 31, 2012 | | | | 1.00 | | | | | — | | | | | — | | | | | — | | | | | — | | | | | — | | | | | — | | | | | 1.00 | | | | 0.01 | % | | | | | 238 | | | | 0.14 | % | | | | 0.01 | % | | | | 0.69 | % | |
| Year Ended October 31, 2011 | | | | 1.00 | | | | | — | | | | | — | | | | | — | | | | | — | | | | | — | | | | | — | | | | | 1.00 | | | | 0.01 | % | | | | | 3,995 | | | | 0.16 | % | | | | 0.01 | % | | | | 0.68 | % | |
| CLASS B SHARES | | | | | | | | | | | | | | | | | | | | | | | | | | | | | | | | | | | | | | | | | | | | | | | | | | | | | | | | | | | | | | | | | |
| Year Ended October 31, 2015 | | | $ | 1.00 | | | | | — | | | | | — | | | | | — | | | | | — | | | | | — | | | | | — | | | | $ | 1.00 | | | | 0.03 | % | | | | $ | 49 | | | | 0.07 | % | | | | 0.03 | % | | | | 1.27 | % | |
| Year Ended October 31, 2014 | | | | 1.00 | | | | | — | | | | | — | | | | | — | | | | | — | | | | | — | | | | | — | | | | | 1.00 | | | | 0.02 | % | | | | | 49 | | | | 0.07 | % | | | | 0.02 | % | | | | 1.28 | % | |
| Year Ended October 31, 2013 | | | | 1.00 | | | | | — | | | | | — | | | | | — | | | | | — | | | | | — | | | | | — | | | | | 1.00 | | | | 0.01 | % | | | | | 49 | | | | 0.14 | % | | | | 0.01 | % | | | | 1.28 | % | |
| Year Ended October 31, 2012 | | | | 1.00 | | | | | — | | | | | — | | | | | — | | | | | — | | | | | — | | | | | — | | | | | 1.00 | | | | 0.01 | % | | | | | 76 | | | | 0.16 | % | | | | 0.01 | % | | | | 1.29 | % | |
| Year Ended October 31, 2011 | | | | 1.00 | | | | | — | | | | | — | | | | | — | | | | | — | | | | | — | | | | | — | | | | | 1.00 | | | | 0.01 | % | | | | | 94 | | | | 0.17 | % | | | | 0.01 | % | | | | 1.28 | % | |
| CLASS C SHARES | | | | | | | | | | | | | | | | | | | | | | | | | | | | | | | | | | | | | | | | | | | | | | | | | | | | | | | | | | | | | | | | | |
| Year Ended October 31, 2015(c) | | | $ | 1.00 | | | | | — | | | | | — | | | | | — | | | | | — | | | | | — | | | | | — | | | | $ | 1.00 | | | | — | % | | | | $ | — | | | | — | % | | | | — | % | | | | — | % | |
| Year Ended October 31, 2014(c) | | | | 1.00 | | | | | — | | | | | — | | | | | — | | | | | — | | | | | — | | | | | — | | | | | 1.00 | | | | — | % | | | | | — | | | | — | % | | | | — | % | | | | — | % | |
| Year Ended October 31, 2013(c) | | | | 1.00 | | | | | — | | | | | — | | | | | — | | | | | — | | | | | — | | | | | — | | | | | 1.00 | | | | — | % | | | | | — | | | | — | % | | | | — | % | | | | — | % | |
| Year Ended October 31, 2012(c) | | | | 1.00 | | | | | — | | | | | — | | | | | — | | | | | — | | | | | — | | | | | — | | | | | 1.00 | | | | — | % | | | | | — | | | | — | % | | | | — | % | | | | — | % | |
| Year Ended October 31, 2011(c) | | | | 1.00 | | | | | — | | | | | — | | | | | — | | | | | — | | | | | — | | | | | — | | | | | 1.00 | | | | — | % | | | | | — | | | | — | % | | | | — | % | | | | — | % | |
| CLASS D SHARES | | | | | | | | | | | | | | | | | | | | | | | | | | | | | | | | | | | | | | | | | | | | | | | | | | | | | | | | | | | | | | | | | |
| Year Ended October 31, 2015 | | | $ | 1.00 | | | | | — | | | | | — | | | | | — | | | | | — | | | | | — | | | | | — | | | | $ | 1.00 | | | | 0.03 | % | | | | $ | 888,084 | | | | 0.07 | % | | | | 0.03 | % | | | | 0.53 | % | |
| Year Ended October 31, 2014 | | | | 1.00 | | | | | — | | | | | — | | | | | — | | | | | — | | | | | — | | | | | — | | | | | 1.00 | | | | 0.02 | % | | | | | 727,290 | | | | 0.06 | % | | | | 0.02 | % | | | | 0.54 | % | |
| Year Ended October 31, 2013 | | | | 1.00 | | | | | — | | | | | — | | | | | — | | | | | — | | | | | — | | | | | — | | | | | 1.00 | | | | 0.01 | % | | | | | 670,893 | | | | 0.13 | % | | | | 0.01 | % | | | | 0.53 | % | |
| Year Ended October 31, 2012 | | | | 1.00 | | | | | — | | | | | — | | | | | — | | | | | — | | | | | — | | | | | — | | | | | 1.00 | | | | 0.01 | % | | | | | 614,499 | | | | 0.16 | % | | | | 0.01 | % | | | | 0.54 | % | |
| Year Ended October 31, 2011 | | | | 1.00 | | | | | — | | | | | — | | | | | — | | | | | — | | | | | — | | | | | — | | | | | 1.00 | | | | 0.01 | % | | | | | 746,458 | | | | 0.17 | % | | | | 0.01 | % | | | | 0.53 | % | |
| See notes to financial statements. | HSBC FAMILY OF FUNDS 23 |
| HSBC U.S. GOVERNMENT MONEY MARKET FUND |
| Financial Highlights (continued) |
| | | | Investment Activities | | Distributions | | | | | | Ratios/Supplementary Data |
| | Net Asset
Value,
Beginning
of Period | | Net
Investment
Income | | Net
Realized and
Unrealized
Gains
(Losses)
from
Investments | | Total from
Investment
Activities | | Net
Investment
Income | | Net
Realized
Gains from
Investment
Transactions | | Total
Distributions | | Net
Asset
Value,
End of
Period | | Total
Return(a) | | Net Assets at
End of Period
(000’s) | | Ratio of Net
Expenses to
Average Net
Assets(b) | | Ratio of Net
Investment
Income to
Average Net
Assets(b) | | Ratio of
Expenses
to Average
Net Assets
(Excluding
Fee
Reductions)(b) |
| CLASS I SHARES | | | | | | | | | | | | | | | | | | | | | | | | | | | | | | | | | | | | | | | | | | | | | | | | | |
| Year Ended October 31, 2015 | | | $ | 1.00 | | | | $ | — | | | | $ | — | | | | $ | — | | | | $ | — | | | | $ | — | | | | $ | — | | | $ | 1.00 | | | 0.03% | | | $ | 1,589,264 | | | 0.07% | | 0.03% | | 0.18% |
| Year Ended October 31, 2014 | | | | 1.00 | | | | | — | | | | | — | | | | | — | | | | | — | | | | | — | | | | | — | | | | 1.00 | | | 0.02% | | | | 1,411,088 | | | 0.06% | | 0.02% | | 0.19% |
| Year Ended October 31, 2013 | | | | 1.00 | | | | | — | | | | | — | | | | | — | | | | | — | | | | | — | | | | | — | | | | 1.00 | | | 0.01% | | | | 1,156,894 | | | 0.13% | | 0.02% | | 0.18% |
| Year Ended October 31, 2012 | | | | 1.00 | | | | | — | | | | | — | | | | | — | | | | | — | | | | | — | | | | | — | | | | 1.00 | | | 0.02% | | | | 1,873,166 | | | 0.16% | | 0.01% | | 0.19% |
| Year Ended October 31, 2011 | | | | 1.00 | | | | | — | | | | | — | | | | | — | | | | | — | | | | | — | | | | | — | | | | 1.00 | | | 0.03% | | | | 1,645,764 | | | 0.16% | | 0.03% | | 0.18% |
| CLASS Y SHARES | | | | | | | | | | | | | | | | | | | | | | | | | | | | | | | | | | | | | | | | | | | | | | | | | | | | |
| Year Ended October 31, 2015 | | | $ | 1.00 | | | | | — | | | | | — | | | | | — | | | | | — | | | | | — | | | | | — | | | $ | 1.00 | | | 0.03% | | | $ | 3,779,595 | | | 0.07% | | 0.03% | | 0.28% |
| Year Ended October 31, 2014 | | | | 1.00 | | | | | — | | | | | — | | | | | — | | | | | — | | | | | — | | | | | — | | | | 1.00 | | | 0.02% | | | | 3,458,399 | | | 0.06% | | 0.02% | | 0.29% |
| Year Ended October 31, 2013 | | | | 1.00 | | | | | — | | | | | — | | | | | — | | | | | — | | | | | — | | | | | — | | | | 1.00 | | | 0.01% | | | | 2,404,867 | | | 0.13% | | 0.01% | | 0.28% |
| Year Ended October 31, 2012 | | | | 1.00 | | | | | — | | | | | — | | | | | — | | | | | — | | | | | — | | | | | — | | | | 1.00 | | | 0.01% | | | | 2,505,448 | | | 0.17% | | 0.01% | | 0.29% |
| Year Ended October 31, 2011 | | | | 1.00 | | | | | — | | | | | — | | | | | — | | | | | — | | | | | — | | | | | — | | | | 1.00 | | | 0.01% | | | | 1,711,397 | | | 0.17% | | 0.01% | | 0.28% |
| (a) | Not annualized for periods less than one year. Total return calculations do not include any sales or redemption charges. |
| (b) | Annualized for periods less than one year. |
| (c) | During the period the class had no operations. The net assets values reflected represent the last day the class had shareholders. |
Amounts designated as “—” are $0 or have been rounded to $0. |
| 24 HSBC FAMILY OF FUNDS | See notes to financial statements. |
| HSBC U.S. TREASURY MONEY MARKET FUND |
| Financial Highlights (continued) |
Selected data for a share outstanding throughout the periods indicated.
| | | | Investment Activities | | Distributions | | | | | | Ratios/Supplementary Data |
| | | Net Asset
Value,
Beginning
of Period | | Net
Investment
Income | | Net
Realized and
Unrealized
Gains
(Losses)
from
Investments | | Total from
Investment
Activities | | Net
Investment
Income | | Net
Realized
Gains from
Investment
Transactions | | Total
Distributions | | Net
Asset
Value,
End of
Period | | Total
Return(a) | | Net Assets at
End of Period
(000’s) | | Ratio
of Net
Expenses
to Average
Net
Assets(b) | | Ratio of Net
Investment
Income to
Average
Net
Assets(b) | | Ratio of
Expenses
to Average
Net Assets
(Excluding
Fee
Reductions)(b) |
| CLASS A SHARES | | | | | | | | | | | | | | | | | | | | | | | | | | | | | | | | | | | | | | | | | | | | | | | | | | | | | | | | | | | | | | | | | |
| Year Ended October 31, 2015(c) | | | $ | 1.00 | | | | $ | — | | | | $ | — | | | | $ | — | | | | $ | — | | | | $ | — | | | | $ | — | | | | $ | 1.00 | | | | — | % | | | | $ | — | | | | — | % | | | | — | % | | | | — | % | |
| Year Ended October 31, 2014(d) | | | | 1.00 | | | | | — | | | | | — | | | | | — | | | | | — | | | | | — | | | | | — | | | | | 1.00 | | | | — | % | | | | | — | | | | — | % | | | | — | % | | | | — | % | |
| Year Ended October 31, 2013 | | | | 1.00 | | | | | — | | | | | — | | | | | — | | | | | — | | | | | — | | | | | — | | | | | 1.00 | | | | — | % | | | | | 5 | | | | 0.10 | % | | | | — | % | | | | 0.69 | % | |
| Year Ended October 31, 2012 | | | | 1.00 | | | | | — | | | | | — | | | | | — | | | | | — | | | | | — | | | | | — | | | | | 1.00 | | | | — | % | | | | | 5 | | | | 0.05 | % | | | | — | % | | | | 0.70 | % | |
| Year Ended October 31, 2011 | | | | 1.00 | | | | | —(e) | | | | | — | | | | | — | | | | | — | | | | | — | | | | | — | | | | | 1.00 | | | | 0.01 | % | | | | | 613 | | | | 0.11 | % | | | | 0.01 | % | | | | 0.68 | % | |
| CLASS C SHARES | | | | | | | | | | | | | | | | | | | | | | | | | | | | | | | | | | | | | | | | | | | | | | | | | | | | | | | | | | | | | | | | | |
| Year Ended October 31, 2015(c) | | | $ | 1.00 | | | | | — | | | | | — | | | | | — | | | | | — | | | | | — | | | | | — | | | | $ | 1.00 | | | | — | % | | | | $ | — | | | | — | % | | | | — | % | | | | — | % | |
| Year Ended October 31, 2014(c) | | | | 1.00 | | | | | — | | | | | — | | | | | — | | | | | — | | | | | — | | | | | — | | | | | 1.00 | | | | — | % | | | | | — | | | | — | % | | | | — | % | | | | — | % | |
| Year Ended October 31, 2013(c) | | | | 1.00 | | | | | — | | | | | — | | | | | — | | | | | — | | | | | — | | | | | — | | | | | 1.00 | | | | — | % | | | | | — | | | | — | % | | | | — | % | | | | — | % | |
| Year Ended October 31, 2012(c) | | | | 1.00 | | | | | — | | | | | — | | | | | — | | | | | — | | | | | — | | | | | — | | | | | 1.00 | | | | — | % | | | | | — | | | | — | % | | | | — | % | | | | — | % | |
| Year Ended October 31, 2011(c) | | | | 1.00 | | | | | —(e) | | | | | — | | | | | — | | | | | — | | | | | — | | | | | — | | | | | 1.00 | | | | — | % | | | | | — | | | | — | % | | | | — | % | | | | — | % | |
| CLASS D SHARES | | | | | | | | | | | | | | | | | | | | | | | | | | | | | | | | | | | | | | | | | | | | | | | | | | | | | | | | | | | | | | | | | |
| Year Ended October 31, 2015 | | | $ | 1.00 | | | | | — | | | | | — | | | | | — | | | | | — | | | | | — | | | | | — | | | | $ | 1.00 | | | | — | % | | | | $ | 280,032 | | | | 0.06 | % | | | | — | % | | | | 0.54 | % | |
| Year Ended October 31, 2014 | | | | 1.00 | | | | | — | | | | | — | | | | | — | | | | | — | | | | | — | | | | | — | | | | | 1.00 | | | | 0.01 | % | | | | | 638,939 | | | | 0.06 | % | | | | — | % | | | | 0.54 | % | |
| Year Ended October 31, 2013 | | | | 1.00 | | | | | — | | | | | — | | | | | — | | | | | — | | | | | — | | | | | — | | | | | 1.00 | | | | — | % | | | | | 517,845 | | | | 0.09 | % | | | | — | % | | | | 0.53 | % | |
| Year Ended October 31, 2012 | | | | 1.00 | | | | | — | | | | | — | | | | | — | | | | | — | | | | | — | | | | | — | | | | | 1.00 | | | | — | % | | | | | 662,063 | | | | 0.08 | % | | | | — | % | | | | 0.54 | % | |
| Year Ended October 31, 2011 | | | | 1.00 | | | | | —(e) | | | | | — | | | | | — | | | | | — | | | | | — | | | | | — | | | | | 1.00 | | | | 0.01 | % | | | | | 619,940 | | | | 0.10 | % | | | | 0.01 | % | | | | 0.53 | % | |
| CLASS I SHARES | | | | | | | | | | | | | | | | | | | | | | | | | | | | | | | | | | | | | | | | | | | | | | | | | | | | | | | | | | | | | | | | | |
| Year Ended October 31, 2015 | | | $ | 1.00 | | | | | — | | | | | — | | | | | — | | | | | — | | | | | — | | | | | — | | | | $ | 1.00 | | | | — | % | | | | $ | 384,363 | | | | 0.05 | % | | | | — | % | | | | 0.19 | % | |
| Year Ended October 31, 2014 | | | | 1.00 | | | | | — | | | | | — | | | | | — | | | | | — | | | | | — | | | | | — | | | | | 1.00 | | | | 0.01 | % | | | | | 263,714 | | | | 0.06 | % | | | | 0.01 | % | | | | 0.19 | % | |
| Year Ended October 31, 2013 | | | | 1.00 | | | | | — | | | | | — | | | | | — | | | | | — | | | | | — | | | | | — | | | | | 1.00 | | | | — | % | | | | | 1,086,181 | | | | 0.09 | % | | | | — | % | | | | 0.18 | % | |
| Year Ended October 31, 2012 | | | | 1.00 | | | | | — | | | | | — | | | | | — | | | | | — | | | | | — | | | | | — | | | | | 1.00 | | | | — | % | | | | | 555,287 | | | | 0.08 | % | | | | — | % | | | | 0.19 | % | |
| Year Ended October 31, 2011 | | | | 1.00 | | | | | —(e) | | | | | — | | | | | — | | | | | — | | | | | — | | | | | — | | | | | 1.00 | | | | 0.01 | % | | | | | 982,974 | | | | 0.10 | % | | | | 0.01 | % | | | | 0.18 | % | |
See notes to financial statements. | HSBC FAMILY OF FUNDS 25 |
| HSBC U.S. TREASURY MONEY MARKET FUND |
| Financial Highlights (continued) |
| | | | Investment Activities | | Distributions | | | | | | Ratios/Supplementary Data |
| | | Net Asset
Value,
Beginning
of Period | | Net
Investment
Income | | Net
Realized and
Unrealized
Gains
(Losses)
from
Investments | | Total from
Investment
Activities | | Net
Investment
Income | | Net
Realized
Gains from
Investment
Transactions | | Total
Distributions | | Net
Asset
Value,
End of
Period | | Total
Return(a) | | Net Assets at
End of Period
(000’s) | | Ratio
of Net
Expenses
to Average
Net
Assets(b) | | Ratio of Net
Investment
Income to
Average
Net
Assets(b) | | Ratio of
Expenses
to Average
Net Assets
(Excluding
Fee
Reductions)(b) |
| CLASS Y SHARES | | | | | | | | | | | | | | | | | | | | | | | | | | | | | | | | | | | | | | | | | | | | | | | | | | |
| Year Ended October 31, 2015 | | | $ | 1.00 | | | | | — | | | — | | — | | — | | — | | — | | | $ | 1.00 | | | | — | % | | | | $ | 763,473 | | | | 0.06 | % | | | | — | % | | | | 0.29 | % | |
| Year Ended October 31, 2014 | | | | 1.00 | | | | | — | | | — | | — | | — | | — | | — | | | | 1.00 | | | | 0.01 | % | | | | | 956,312 | | | | 0.06 | % | | | | 0.01 | % | | | | 0.29 | % | |
| Year Ended October 31, 2013 | | | | 1.00 | | | | | — | | | — | | — | | — | | — | | — | | | | 1.00 | | | | — | % | | | | | 968,290 | | | | 0.09 | % | | | | — | % | | | | 0.28 | % | |
| Year Ended October 31, 2012 | | | | 1.00 | | | | | — | | | — | | — | | — | | — | | — | | | | 1.00 | | | | — | % | | | | | 1,156,631 | | | | 0.09 | % | | | | — | % | | | | 0.29 | % | |
| Year Ended October 31, 2011 | | | | 1.00 | | | | | — | (e) | | — | | — | | — | | — | | — | | | | 1.00 | | | | 0.01 | % | | | | | 999,521 | | | | 0.09 | % | | | | 0.01 | % | | | | 0.28 | % | |
| (a) | | Not annualized for periods less than one year. Total return calculations do not include any sales or redemption charges. |
| (b) | | Annualized for periods less than one year. |
| (c) | | During the period the class had no operations. The net assets values reflected represent the last day the class had shareholders. |
| (d) | | Class A Shares were operational during a portion of the year only. Amounts reflect performance for a period of time the class had operations, which was 201 days during the period. The net asset value reflected represents the last day the class had operations. |
| (e) | | Calculated based on average shares outstanding. |
Amounts designated as “—” are $0 or have been rounded to $0. |
| 26 HSBC FAMILY OF FUNDS | See notes to financial statements. |
| HSBC FAMILY OF FUNDS |
| Notes to Financial Statements—as of October 31, 2015 |
1. Organization:
The HSBC Funds Trust (the “Trust”), a Massachusetts business trust organized on April 22, 1987 is registered under the Investment Company Act of 1940, as amended (the “Act”), as an open-end management investment company. As of October 31, 2015, the Trust is composed of 17 separate operational funds, each a series of the HSBC Family of Funds which also includes the HSBC Advisor Funds Trust and the HSBC Portfolios (the “Trusts”). The accompanying financial statements are presented for the following three funds (individually a “Fund,’’ collectively the “Funds’’):
| | Fund | | | Short Name | |
| HSBC Prime Money Market Fund | | Prime Money Market Fund |
| | | |
| | HSBC U.S. Government Money Market Fund | | U.S. Government Money Market Fund |
| | | |
| HSBC U.S. Treasury Money Market Fund | | U.S. Treasury Money Market Fund |
All the Funds are diversified funds. Financial statements for all other funds of the Trusts are published separately.
The Funds are money market funds and seek to maintain a stable net asset value of $1.00 per share, although it is possible to lose money by investing in the Funds. The Funds are authorized to issue an unlimited number of shares of beneficial interest with a par value of $ 0.001 per share. The Funds are authorized to issue seven classes of shares: Class A Shares, Class B Shares, Class C Shares, Class D Shares, Class E Shares, Class I Shares and Class Y Shares. The Class B Shares of the Funds are offered without any front-end sales charge but will be subject to a contingent deferred sales charge (“CDSC’’) ranging from a maximum of 4.00% if redeemed less than one year after purchase to 0.00% if redeemed more than four years after purchase. Class C Shares of the Funds are offered without any front-end sales charge but will be subject to a maximum CDSC of 1.00% if redeemed less than one year after purchase. No sales charges are assessed with respect to Class A, Class D, Class E, Class I or Class Y Shares of the Funds. Each class of shares in each Fund has identical rights and privileges, except with respect to arrangements pertaining to shareholder servicing and/or distribution, class-related expenses, voting rights on matters affecting a single class of shares, and exchange privileges. As of October 31, 2015, Class E Shares were not operational but are available for purchase. Class B Shares may no longer be purchased or acquired by any new or existing Class B shareholder, except through dividend and/or capital gains reinvestment.
Under the Trust’s organizational documents, the Funds’ officers and Trustees are indemnified against certain liabilities arising out of the performance of their duties to the Funds. In addition, in the normal course of business, the Trust may enter into contracts with its service providers, which also provide for indemnifications by the Funds. The Funds’ maximum exposure under these arrangements is unknown as this would involve future claims that may be made against the Funds. However, based on experience, the Trust expects that risk of loss to be remote.
The Funds are investment companies and follow accounting and reporting guidance under Financial Accounting Standards Board (“FASB”) Accounting Standards Codification (“ASC”) Topic 946, “Financial Services-Investment Companies.”
2. Significant Accounting Policies:
The following is a summary of the significant accounting policies followed by the Funds in the preparation of their financial statements. The policies are in conformity with U.S. generally accepted accounting principles (“GAAP’’). The preparation of financial statements requires management to make certain estimates and assumptions that affect the reported amounts of assets and liabilities and disclosure of contingent assets and liabilities at the date of the financial statements and the reported amounts of increases and decreases in net assets from operations during the reporting period. Actual results could differ from those estimates.
| HSBC FAMILY OF FUNDS |
| Notes to Financial Statements—as of October 31, 2015 (continued) |
Securities Valuation:
Investments of the Funds are valued using the amortized cost method pursuant to Rule 2a-7 under the Act, which approximates fair value. Fair value is defined as the price that would be received to sell an asset or paid to transfer a liability in an orderly transaction between market participants at the measurement date. The valuation techniques used to determine fair value are further described in Note 3 below.
Investment Transactions and Related Income:
Investment transactions are accounted for no later than one business day after trade date. However, for financial reporting purposes, investment transactions are accounted for on trade date. Investment gains and losses are calculated on the identified cost basis. Interest income is recognized on the accrual basis and includes, where applicable, the amortization or accretion of premium or discount. Dividend income is recorded on the ex-dividend date.
Restricted Securities:
A restricted security is a security which has been purchased through a private offering and cannot be resold to the general public without prior registration under the Securities Act of 1933 (the “1933 Act”) or pursuant to the resale limitations provided by Rule 144 under the 1933 Act, or another exemption from the registration requirements of the 1933 Act. Certain restricted securities may be resold in transactions exempt from registration, normally to qualified institutional buyers, and may be deemed liquid by the Investment Adviser (as defined in Note 4) based on procedures established by the Board of Trustee (“Board”). Therefore, not all restricted securities are considered illiquid. At October 31, 2015, all restricted securities held were deemed liquid.
Repurchase Agreements:
The Funds (except the U.S. Treasury Money Market Fund) may enter into repurchase agreements with an entity which is a member of the Federal Reserve System or which is a “primary dealer’’ (as designated by the Federal Reserve Bank of New York) in U.S. government obligations. The U.S. Treasury Money Market Fund may temporarily invest in repurchase agreements collateralized by U.S. Treasury Obligations. The repurchase price generally equals the price paid by a Money Market Fund plus interest negotiated on the basis of current short-term rates, which may be more or less than the rate on the underlying portfolio securities. The seller, under a repurchase agreement, is required to maintain the collateral held pursuant to the agreement, with a fair value equal to or greater than the repurchase price (including accrued interest). Securities subject to repurchase agreements are held by the Money Market Funds’ custodian or another qualified custodian or in the Federal Reserve/Treasury book-entry system. Master Repurchase Agreements (“MRA”) permit the Money Market Fund, under certain circumstances, including an event of default (such as bankruptcy or insolvency), to offset receivables under the MRA with collateral posted by the counterparty and create one net payment due to or from the Money Market Fund. However, bankruptcy or insolvency laws of a particular jurisdiction may impose restrictions on or prohibitions against such a right of offset in the event of the MRA counterparty’s bankruptcy or insolvency. Pursuant to terms of the MRA, the Money Market Fund receives securities as collateral with a market value in excess of the repurchase price to be received by the Money Market Fund upon the maturity of the transaction. Upon bankruptcy or insolvency of the MRA counterparty, the Money Market Fund would recognize a liability with respect to such excess collateral to reflect the Money Market Fund’s obligation under bankruptcy law to return the excess to the counterparty. There is potential for loss to a Money Market Fund in the event the Money Market Fund is delayed or prevented from exercising its rights to dispose of the collateral securities, including the risk of a possible decline in the fair value of the underlying securities during the period while the Money Market Fund seeks to assert its rights.
| HSBC FAMILY OF FUNDS |
| Notes to Financial Statements—as of October 31, 2015 (continued) |
The following table is a summary of each Fund’s open repurchase agreement which are subject to offset under a MRA on a net basis as of October 31, 2015:
| | | | Value of | | Value of | | |
| | | | Repurchase | | Collateral | | Net |
| Fund | | | Agreements | | Received | | Amount |
| U.S. Government Money Market Fund | | $1,350,000,000 | | $1,350,000,000 | | $— |
Cash:
Cash is held in deposit accounts at the Funds’ Custodian and is a significant portion of the net assets, which may exceed the amount insured by the Federal Deposit Insurance Corporation (“FDIC”). To the extent that such balances exceed FDIC insurance limits, the Funds are subject to the creditworthiness of the Custodian.
Allocations:
Expenses directly attributable to a Fund are charged to that Fund. Expenses not directly attributable to a Fund are allocated proportionately among the applicable series within the Trusts in relation to the net assets of each fund or on another reasonable basis. Class specific expenses are charged directly to the class incurring the expense. In addition, income, expenses (other than class specific expenses), and unrealized and realized gains and losses are allocated to each class based on relative net assets on a daily basis.
Distributions to Shareholders:
Dividends to shareholders from net investment income, if any, are declared daily and paid monthly from each Fund. Distributions from net realized gains, if any, are declared and paid at least annually by the Funds. Additional distributions are also made to the Funds’ shareholders to the extent necessary to avoid the federal excise tax on certain undistributed income and net realized gains of regulated investment companies.
The amount and character of net investment income and net realized gains distributed are determined in accordance with federal income tax regulations, which may differ from GAAP. These “book/tax’’ differences are either considered temporary or permanent in nature. To the extent these differences are permanent in nature (e.g., reclassification of market discounts, certain gain/loss, paydowns, and distributions), such amounts are reclassified within the composition of net assets based on their federal tax-basis treatment; temporary differences (e.g., wash losses and post-October loss deferrals) do not require reclassification. To the extent distributions to shareholders from net investment income and net realized gains exceed net investment income and net realized gains for tax purposes, they are reported as distributions of capital.
Federal Income Taxes:
Each Fund is a separate taxable entity for federal income tax purposes. Each Fund has qualified and intends to continue to qualify each year as a “regulated investment company’’ under Subchapter M of the Internal Revenue Code, as amended, and to distribute substantially all of its taxable net investment income and net realized gains, if any, to its shareholders. Accordingly, no provision for federal income or excise tax is required.
Management of the Funds has reviewed tax positions taken in tax years that remain subject to examination by all major tax jurisdictions, including federal (i.e., the last four tax year ends and the interim tax period since then, as applicable). Management believes that there is no tax liability resulting from unrecognized tax benefits related to uncertain tax positions taken.
New Accounting Pronouncements:
In August 2014, the FASB issued Accounting Standards Update No. 2014-15 “Presentation of Financial Statements–Going Concern (Subtopic 205-40)” (“ASU 2014-15”), which requires management to evaluate whether there are conditions or events, considered in the aggregate, that raise substantial doubt about the entity’s ability to continue as a going concern. ASU 2014-15 is effective prospectively for annual periods ending after December 15, 2016, and interim periods thereafter.
| HSBC FAMILY OF FUNDS |
| Notes to Financial Statements—as of October 31, 2015 (continued) |
In May 2015, the FASB issued Accounting Standards Update No. 2015-07 “Fair Value Measurement (Topic 820)” (“ASU 2015-07”), which removes the requirement to categorize within the fair value hierarchy all investments for which fair value is measured using the NAV per share practical expedient. ASU 2015-07 also removes the requirement to make certain disclosures for all investments that may be measured at fair value using the NAV per share practical expedient. The ASU is effective for annual periods beginning after December 15, 2015 and interim periods within those annual periods.
Management is currently evaluating the implications of these ASUs and their impact on the financial statements and related disclosures have not yet been determined.
3. Investment Valuation Summary
The valuation techniques employed by the Funds, as described below, maximize the use of observable inputs and minimize the use of unobservable inputs in determining fair value. The Funds’ investments are classified within the fair value hierarchy based on the lowest level of input that is significant to the fair value measurement. The inputs used for valuing the Funds’ investments are summarized in the three broad levels listed below:
| ● | Level 1: quoted prices in active markets for identical assets |
| ● | Level 2: other significant observable inputs (including quoted prices for similar securities, interest rates, prepayments speeds, credit risk, etc.) |
| ● | Level 3: significant unobservable inputs (including a Fund’s own assumptions in determining the fair value of investments) |
Changes in valuation techniques may result in transfers in or out of an assigned level within the disclosure hierarchy. The Funds determine transfers between fair value hierarchy levels at the reporting period end. There were no transfers between levels as of October 31, 2015, from the valuation input levels used on October 31, 2014. The inputs or methodology used for valuing investments are not necessarily an indication of the risk associated with investing in those investments.
Investments of the Funds are valued using the amortized cost method pursuant to Rule 2a-7 under the Act, which approximates fair value, and are typically categorized as Level 2 in the fair value hierarchy. The amortized cost method involves valuing an instrument at its cost initially and thereafter assuming a constant amortization to maturity of any discounts or premium, regardless of the impact of fluctuating interest rates on the market value of the instrument. The amortized cost method that may result in periods during which value, as determined by amortized cost, is higher or lower than the price a Fund holding the instrument would receive if it sold the instrument. The fair value of securities in the Funds can be expected to vary with changes in prevailing interest rates.
Investments in other money market funds are priced at net asset value as reported by such companies and are typically categorized as Level 1 in the fair value hierarchy.
Repurchase agreements are valued at original cost and are typically categorized as Level 2 in the fair value hierarchy.
For the year ended October 31, 2015, there were no Level 3 investments for which significant unobservable inputs were used to determine fair value. As of October 31, 2015, all investments were categorized as Level 2 in the fair value hierarchy. The breakdown of investment categorization is disclosed in the Schedule of Portfolio Investments for each Fund.
4. Related Party Transactions and Other Agreements and Plans:
Investment Management:
HSBC Global Asset Management (USA) Inc. (“HSBC’’ or the “Investment Adviser’’), a wholly owned subsidiary of HSBC Bank USA, N.A., a national bank organized under the laws of the United States, acts as Investment Adviser to the Funds. As Investment Adviser, HSBC manages the investments of the Funds and
| HSBC FAMILY OF FUNDS |
| Notes to Financial Statements—as of October 31, 2015 (continued) |
continuously reviews, supervises and administers the Funds’ investments pursuant to an Investment Advisory Contract. For its services as investment adviser, HSBC receives a fee from each Fund, accrued daily and paid monthly, based on the average daily net assets of each respective Fund, at an annual rate of 0.10%.
HSBC also provides operational support services to the Funds pursuant to an Operational Support Services Agreement. For its services in this capacity, HSBC is entitled to receive a fee, accrued daily and paid monthly, based on the average daily net assets of Class A Shares, Class B Shares, Class C Shares, Class D Shares and Class Y Shares, at an annual rate of 0.10%.
The Bank of New York Mellon (the “Servicer”) provides recordkeeping, reporting and processing services to the Prime Money Market Fund, U.S. Government Money Market Fund and U.S. Treasury Money Market Fund, Class I Shares. The Servicer is paid by the Investment Adviser and not by the Funds, for these services.
Administration:
HSBC also serves as Administrator to the Trusts. Under the terms of the Administration Agreement, HSBC receives from the Funds (as well as other funds in the Trusts combined) a fee, accrued daily and paid monthly, at an annual rate of:
| | Based on Average Daily Net Assets of | | | Fee Rate(%) |
| Up to $10 billion | | 0.0550 |
| In excess of $10 billion but not exceeding $20 billion | | 0.0350 |
| | In excess of $20 billion but not exceeding $50 billion | | 0.0275 |
| In excess of $50 billion | | 0.0250 |
The fee rates and breakpoints are determined on the basis of the aggregate average daily net assets of the Trusts. The total administration fee paid to HSBC is allocated to each series based upon its proportionate share of the aggregate net assets of the Trusts, subject to certain allocations in cases where one fund invests some or all of its assets in another fund. An amount equal to 50% of the administration fee is deemed to be class specific and is based on the daily net assets.
Pursuant to a Sub-Administration Agreement with HSBC, Citi Fund Services Ohio, Inc. (“Citi’’), a wholly-owned subsidiary of Citigroup, Inc., serves as the Trusts’ Sub-Administrator, subject to the general supervision by the Board and HSBC. For these services, Citi is entitled to a fee, payable by HSBC, at an annual rate equivalent to the fee rates set forth above subject to certain reductions associated with services provided to new funds, minus 0.02% which is retained by HSBC.
Under a Compliance Services Agreement between the Trusts and Citi (the “CCO Agreement’’), Citi makes an employee available to serve as the Trusts’ Chief Compliance Officer (the “CCO’’). Under the CCO Agreement, Citi also provides infrastructure and support in implementing the written policies and procedures comprising the Trusts’ compliance program, including support services to the CCO. For the services provided under the CCO Agreement, the Trusts paid Citi $300,447 for the year ended October 31, 2015, plus reimbursement of certain out of pocket expenses. Expenses incurred by each Fund are reflected on the Statements of Operations as “Compliance Services.’’ Citi pays the salary and other compensation earned by individuals performing these services, as employees of Citi.
Distribution Arrangements:
Foreside Distribution Services, L.P. (“Foreside’’), a wholly-owned subsidiary of Foreside Financial Group LLC, serves the Trust as Distributor (the “Distributor’’). The Trust has adopted a non-compensatory Distribution Plan and Agreement (the “Distribution Plan’’) pursuant to Rule 12b-1 of the Act. The Distribution Plan provides for reimbursement of expenses incurred by the Distributor related to distribution and marketing, at a rate not to exceed 0.25%, 1.00%, 1.00% and 0.25% of the average daily net assets of Class A Shares (currently not being charged), Class B Shares (currently charging 0.75%), Class C Shares (currently charging 0.75%) and Class D Shares (currently not being charged) of the Funds, respectively. For the year ended October 31, 2015,
| HSBC FAMILY OF FUNDS |
| Notes to Financial Statements—as of October 31, 2015 (continued) |
Foreside, as Distributor, also received $148,790, $0, and $15,776 in commissions from sales of the Trusts, for Class A Shares, Class B Shares, and Class C Shares, respectively of which $45, $0, and $0 were reallocated to HSBC-affiliated brokers and dealers, for Class A Shares, Class B Shares, and Class C Shares, respectively.
Expenses reduced during the year ended October 31, 2015 are reflected on the Statements of Operations as “Fees voluntarily reduced by Distributor.’’
Shareholder Servicing:
The Trust has adopted a Shareholder Services Plan, which provides for payments to shareholder servicing agents (which primarily consist of HSBC and its affiliates) for providing various shareholder services. As disclosed in the Statement of Operations, for the current fiscal year the entire amount of the Shareholder Servicing Fees have been waived by those shareholder servicing agents, including HSBC and its affiliates. For performing these services, the shareholder servicing agents receive a fee that is computed daily and paid monthly up to 0.60%, 0.25%, 0.25%, 0.25% and 0.10% of the average daily net assets of Class A Shares (currently charging 0.40%), Class B Shares, Class C Shares, Class D Shares and Class E Shares of the Funds, respectively. The aggregate fees paid to the Distributor pursuant to the Distribution Plan and to shareholder servicing agents pursuant to the Shareholder Services Plan may not exceed, in the aggregate, 0.60%, 1.00%, 1.00%, 0.25% and 0.10% annually of each Fund’s average daily net assets of Class A Shares, Class B Shares, Class C Shares, Class D Shares and Class E Shares, respectively. Expenses reduced during the year ended October 31, 2015 are reflected on the Statements of Operations as “Fees voluntarily reduced by Shareholder Servicing Agent.’’
The Distributor has entered into shareholder services contracts with affiliated and unaffiliated financial intermediaries who provide shareholder services and other related services to their clients or customers who invest in the Funds under which the Distributor will pay all or a portion of such fees earned to financial intermediaries for performing such services.
Fund Accounting and Transfer Agency:
Citi provides fund accounting services for each Fund. As fund accountant, Citi receives an annual fee per fund and share class, subject to certain minimums and reimbursement of certain expenses. Citi receives additional fees paid by the Trust for regulatory administration services, blue sky exemption services and money market fund reporting services. Until March 31, 2015, Citi also provided transfer agency services for each Fund. As transfer agent, Citi received a fee based on the number of funds and shareholder accounts, subject to certain minimums, reductions associated with services provided to new funds and reimbursement of certain expenses. Effective March 31, 2015, transfer agent services are provided under the terms of a separate transfer agency services agreement with Citi. Citi’s rights and obligations under the transfer agency services agreement, in turn, were assigned to SunGard Investor Services LLC (“SIS”), effective March 31, 2015. The transfer agency services, and fees charged for such services, are unchanged as a result of the separate agreement or the assignment to SIS.
Independent Trustees:
For the period January 1, 2015 through October 31, 2015, the Trusts paid each Independent Trustee an annual retainer of $100,000. The Trusts paid a fee of $12,000 for each regular meeting of the Board of Trustees attended and a fee of $3,000 for each special meeting attended. The Trusts paid each Committee Chair an annual retainer of $12,000, with the exception of the Chair of the Audit Committee, who received a retainer of $15,000. The Trusts also paid the Chairman of the Board, an additional annual retainer of $30,000.
Prior to January 1, 2015, the Trusts paid each Independent Trustee an annual retainer of $100,000. The Trusts paid a fee of $10,000 for each regular meeting of the Board of Trustees attended and a fee of $3,000 for each special meeting attended. The Trusts paid each Committee Chair an annual retainer of $3,000, with the exception of the Chair of the Audit Committee, who received a retainer of $6,000. The Trusts also paid the Chairman of the Board, an additional annual retainer of $24,000. In addition, for time expended on Board duties outside normal meetings, which is authorized by the Board, a Trustee was compensated at the rate of $500 per hour, up to a maximum of $3,000 per day.
| HSBC FAMILY OF FUNDS |
| Notes to Financial Statements—as of October 31, 2015 (continued) |
Fee Reductions:
The Investment Adviser has contractually agreed to limit through March 1, 2016 the annual total expenses, exclusive of interest, taxes, brokerage commissions, and extraordinary expenses, of certain classes of the Funds. Each affected Fund Class has its own expense limitations based on the average daily net assets for any full fiscal year as follows:
| | | | Contractual |
| | | | | Expense |
| Fund | | | Class | | Limitations(%) |
| Prime Money Market Fund | | E | | | 0.25 | * | |
| Prime Money Market Fund | | I | | | 0.20 | | |
| U.S. Government Money Market Fund | | E | | | 0.25 | * | |
| U.S. Government Money Market Fund | | I | | | 0.20 | | |
| U.S. Treasury Money Market Fund | | E | | | 0.25 | * | |
| U.S. Treasury Money Market Fund | | I | | | 0.20 | | |
____________________
* As of October 31, 2015, Class E Shares were not operational.
Any amounts contractually waived or reimbursed by the Investment Adviser will be subject to repayment by the respective Fund to the Investment Adviser within three years to the extent that the repayment will not cause the Fund’s operating expenses to exceed the contractual expense limit that was in effect at the time of such waiver or reimbursement. At October 31, 2015, there were no remaining contractual reimbursements that are subject to repayment by the Funds in subsequent years.
The Administrator and Citi may voluntarily waive/reimburse fees to help support the expense limits of the Funds. In addition, HSBC, in its role as Investment Adviser and Administrator, may waive/reimburse additional fees at its discretion. Any voluntary fee waivers/reimbursements are not subject to recoupment in subsequent fiscal periods. Voluntary waivers/reimbursements may be stopped at any time. Amounts waived/reimbursed by the Investment Adviser and Administrator are reported separately on the Statements of Operations, as applicable. During the year ended October 31, 2015, Citi voluntarily reduced its sub-administration fees by $269,207 and HSBC also waived their fees.
During the year ended October 31, 2015, the following amounts of expenses were waived:
| Fund | | | Class A ($) | | Class B ($) | | Class C ($) | | Class D ($) | | Class I ($) | | Class Y ($) |
| Prime Money Market Fund | | | 135,223 | | | | — | | | | 37 | | | 3,878,799 | | 480,050 | | 297,830 |
| U.S. Government Money Market Fund | | | 1,864 | | | | 172 | | | | — | | | 2,801,626 | | 162,398 | | 4,380,366 |
| U.S. Treasury Money Market Fund | | | — | | | | — | | | | — | | | 1,087,316 | | 56,073 | | 1,039,467 |
The Funds have entered into an arrangement with their custodian whereby credits realized as a result of uninvested cash balances are used to reduce a portion of the Funds’ custodian expenses. Expenses reduced during the year ended October 31, 2015 are reflected on the Statements of Operations as “Custody earnings credits,” as applicable.
Overdraft Facility:
The Funds have entered into an arrangement with their custodian whereby an unsecured overdraft facility is made available to meet unanticipated end-of-day liquidity needs of the Funds which cannot be fulfilled by trading activities. The interest rate on overdraft amounts is calculated at an annual rate of 0.50% plus the Federal Funds Rate.
| HSBC FAMILY OF FUNDS |
| Notes to Financial Statements—as of October 31, 2015 (continued) |
5. Federal Income Tax Information:
At October 31, 2015, the cost basis of securities for federal income tax purposes, gross unrealized appreciation, gross unrealized depreciation and net unrealized appreciation/depreciation were as follows:
| | | | | | | | | | Net Unrealized |
| | | | | Tax Unrealized | | Tax Unrealized | | Appreciation/ |
| | | Tax Cost ($) | | Appreciation ($) | | Depreciation ($) | | (Depreciation) ($) |
| Prime Money Market Fund | | 6,512,336,328 | | — | | | — | | | | | — | | |
| U.S. Government Money Market Fund | | 5,431,253,427 | | — | | | — | | | | | — | | |
| U.S. Treasury Money Market Fund | | 1,313,770,130 | | — | | | (1,784 | ) | | | | (1,784 | ) | |
The tax character of dividends paid by the Funds during the tax year ended October 31, 2015 was as follows:
| | | Dividends paid from |
| | | | Net | | | | | | | | |
| | | | Long Term | | Total | | | | Total |
| | Ordinary | | Capital | | Taxable | | Tax Exempt | | Dividends |
| | Income ($) | | Gains ($) | | Dividends ($) | | Distributions ($) | | Paid ($)(1) |
| Prime Money Market Fund | 4,052,224 | | — | | | 4,052,224 | | | — | | 4,052,224 |
| U.S. Government Money Market Fund | 1,911,422 | | — | | | 1,911,422 | | | — | | 1,911,422 |
| U.S. Treasury Money Market Fund | — | | — | | | — | | | — | | — |
The tax character of dividends paid by the Funds during the tax year ended October 31, 2014 was as follows:
| | | | Dividends paid from |
| | | | | Net | | | | | | | | |
| | | | | Long Term | | Total | | | | Total |
| | | Ordinary | | Capital | | Taxable | | Tax Exempt | | Dividends |
| | | Income ($) | | Gains ($) | | Dividends ($) | | Distributions ($) | | Paid ($)(1) |
| Prime Money Market Fund | | 1,861,766 | | — | | | 1,861,766 | | | — | | 1,861,766 |
| U.S. Government Money Market Fund | | 1,021,643 | | — | | | 1,021,643 | | | — | | 1,021,643 |
| U.S. Treasury Money Market Fund | | 109,274 | | — | | | 109,274 | | | — | | 109,274 |
____________________
| (1) | | Total dividends paid may differ from the amount reported in the Statement of Changes in Net Assets because dividends are recognized when actually paid for tax purposes. |
As of the tax year ended October 31, 2015, the components of accumulated earnings/(deficit) on a tax basis for the Funds were as follows:
| | | | | | | | | | | | | | | | | | | | | Accumulated | | | | | | | Total |
| | Undistributed | | Undistributed | | Undistributed | | | | | | | | | | | Capital | | Unrealized | | Accumulated |
| | | Ordinary | | Tax Exempt | | Long Term | | Accumulated | | Dividends | | and Other | | Appreciation/ | | Earnings/ |
| | Income ($) | | Income ($) | | Capital Gains ($) | | Earnings ($) | | Payable ($) | | Losses ($) | | (Depreciation) ($) | | (Deficit) ($) |
| Prime Money Market Fund | | | 303,332 | | | — | | | — | | | | 303,332 | | | | (297,463 | ) | | | — | | | — | | | | | 5,869 | |
| U.S. Government Money | | | | | | | | | | | | | | | | | | | | | | | | | | | | | | |
| Market Fund | | | 39,114 | | | — | | | 5,589 | | | | 44,703 | | | | (38,610 | ) | | | — | | | — | | | | | 6,093 | |
| U.S. Treasury Money | | | | | | | | | | | | | | | | | | | | | | | | | | | | | | |
| Market Fund | | | 13,990 | | | — | | | — | | | | 13,990 | | | | — | | | | — | | | (1,784 | ) | | | | 12,206 | |
6. Significant Shareholders:
The Funds each have one or more shareholders, which are accounts maintained by financial intermediaries on behalf of their clients, that own a significant portion of the Fund’s outstanding shares. Significant shareholder transactions by these shareholders may impact the Funds’ performance.
Notes to Financial Statements—as of October 31, 2015 (continued)
7. Legal and Regulatory Matters:
On July 23, 2014, the SEC voted to amend the rules under the Act that currently govern the operations of the Funds. The majority of these amendments, except for certain disclosure enhancements, will not take effect until October 2016. A significant change resulting from these amendments is a requirement that institutional (i.e., not retail as defined in the amendments) prime, including institutional municipal money market funds, transact fund shares based on a market-based net asset value (NAV) per share, although other types of money market funds may continue to transact fund shares at an NAV calculated using the amortized cost valuation method. Among other requirements, the amendments also will permit a money market fund or, in certain circumstances, require a money market fund (other than a government money market fund which satisfies the requirements of the amended rules) to impose liquidity fees on all redemptions, and permit a money market fund to limit (or gate) redemptions for up to 10 business days in any 90-day period. The degree to which a money market fund will be impacted by the rule amendments will depend upon the type of fund and type of investors (retail or institutional). At this time, management is evaluating the implications of these amendments and their impact on the Funds, including potential effects on each Fund’s operations and returns.
8. Subsequent Events:
At a meeting of the Board of Trustees of the Trusts held on December 17-18, 2015, the Trustees of the Trusts approved on behalf of each Trust and each of the Funds a form of Agreement and Plan of Reorganization (the “Plan”) and other proposals subject to shareholder approval. The Plan will be submitted to a vote of shareholders of the Funds at a special meeting of shareholders to be held in 2016. The Plan calls for the reorganization and redomiciliation of the Funds, which are series of either a Massachusetts business trust (the Trust and Advisor Trust) or a New York trust (the Portfolio Trust), with and into corresponding “shell” series (“New Funds”) of a single newly formed Delaware statutory trust (the “Redomiciliation”). If approved by shareholders, the Redomiciliation is expected to occur in the second calendar quarter of 2016. Upon completion of the Redomiciliation, shareholders of the Funds would own shares of the corresponding class of the New Funds that are equal in value to the shares of the Fund that were held by the shareholders immediately prior to the closing of the Redomiciliation. In addition, the respective share classes of each of the New Funds would assume the performance, financial and other historical information of those of the corresponding Fund. The Redomiciliation is not expected to have an impact on the continuing operations of the Funds. Additional information about the Plan and the other proposals will be included in the Trusts’ proxy statement that is expected to be mailed to shareholders in March 2016.
On November 30, 2015, SunGard Investor Services LLC announced that its acquisition by Fidelity National Information Services was completed. The transfer agency services, and fees charged for such services, are unchanged as a result of the acquisition.
Management has evaluated events and transactions through the date the financial statements were issued, for purposes of recognition or disclosure in these financial statements and there are no additional subsequent events to report.
HSBC FAMILY OF FUNDS 35
Report of Independent Registered Public Accounting Firm
To the Board of Trustees and Shareholders of HSBC Funds
In our opinion, the accompanying statements of assets and liabilities, including the schedules of portfolio investments, and the related statements of operations and of changes in net assets and the financial highlights present fairly, in all material respects, the financial position of each of HSBC Prime Money Market Fund, HSBC U.S. Government Money Market Fund and HSBC U.S. Treasury Money Market Fund (the ”Funds”, each a portfolio of HSBC Funds) at October 31, 2015, and the results of each of their operations, the changes in each of their net assets and the financial highlights for the year then ended, in conformity with accounting principles generally accepted in the United States of America. These financial statements and financial highlights (hereafter referred to as “financial statements”) are the responsibility of the Funds’ management. Our responsibility is to express an opinion on these financial statements based on our audit. We conducted our audit of these financial statements in accordance with the standards of the Public Company Accounting Oversight Board (United States). Those standards require that we plan and perform the audit to obtain reasonable assurance about whether the financial statements are free of material misstatement. An audit includes examining, on a test basis, evidence supporting the amounts and disclosures in the financial statements, assessing the accounting principles used and significant estimates made by management, and evaluating the overall financial statement presentation. We believe that our audit, which included confirmation of securities at October 31, 2015 by correspondence with the custodian and brokers, provides a reasonable basis for our opinion. The accompanying statements of changes in net assets for the year ended October 31, 2014 and the financial highlights for each of the periods ended on or prior to October 31, 2014 were audited by other auditors whose report dated December 23, 2014 expressed an unqualified opinion on those statements and financial highlights.
PricewaterhouseCoopers LLP
New York, New York
December 29, 2015
36 HSBC FAMILY OF FUNDS
| HSBC INVESTOR FAMILY OF FUNDS |
Other Federal Income Tax Information—as of October 31, 2015 (Unaudited)
During the year ended October 31, 2015, the following Fund declared capital gain distributions:
| | Short Term Capital Gain | | Long Term Capital Gain |
| Distributions ($) | | Distributions ($) |
| Prime Money Market Fund | 1,272 | | — |
During the year ended October 31, 2015, the following Funds designated the maximum amount allowable as interest-related dividends for certain non-U.S. resident investors:
| Qualified Interest Income (%) |
| Prime Money Market Fund | 100.00 |
| U.S. Government Money Market Fund | 100.00 |
HSBC FAMILY OF FUNDS 37
Table of Shareholder Expenses—as of October 31, 2015 (Unaudited)
As a shareholder of the Funds, you incur two types of costs: (1) transaction costs, including sales charges (loads) on purchases, redemption fees and exchange fees; and (2) ongoing costs, including management fees, distribution fees and other Fund expenses. These examples are intended to help you understand your ongoing costs (in dollars) of investing in the Funds and to compare the cost with the ongoing costs of investing in other mutual funds.
These examples are based on an investment of $1,000 invested at the beginning of the period and held for the entire period from May 1, 2015 through October 31, 2015.
Actual Example
The table below provides information about actual account values and actual expenses. You may use the information below, together with the amount you invested, to estimate the expenses that you paid over the period. Simply divide your account value by $1,000 (for example, an $8,600 account value divided by $1,000 = 8.6), then multiply the result by the number in the table under the heading entitled “Expenses Paid During Period” to estimate the expenses you paid on your account during this period.
| | | | | | | | | | Annualized |
| | | | | Beginning | | Ending | | Expenses Paid | | Expense Ratio |
| | | | | Account Value | | Account Value | | During Period* | | During Period |
| | | | 5/1/15 | | 10/31/15 | | 5/1/15 - 10/31/15 | | 5/1/15 - 10/31/15 |
| Prime Money Market Fund | | Class A Shares | | 1,000.00 | | 1,000.20 | | 1.06 | | 0.21% |
| | Class C Shares** | | 1,000.00 | | 1,000.10 | | 1.11 | | 0.22% |
| | Class D Shares | | 1,000.00 | | 1,000.20 | | 1.06 | | 0.21% |
| | Class I Shares | | 1,000.00 | | 1,000.60 | | 0.66 | | 0.13% |
| | Class Y Shares | | 1,000.00 | | 1,000.20 | | 1.06 | | 0.21% |
| U.S. Government Money | | | | | | | | | | |
| Market Fund | | Class A Shares | | 1,000.00 | | 1,000.20 | | 0.40 | | 0.08% |
| | Class B Shares | | 1,000.00 | | 1,000.20 | | 0.40 | | 0.08% |
| | Class D Shares | | 1,000.00 | | 1,000.20 | | 0.40 | | 0.08% |
| | Class I Shares | | 1,000.00 | | 1,000.20 | | 0.40 | | 0.08% |
| | Class Y Shares | | 1,000.00 | | 1,000.20 | | 0.40 | | 0.08% |
| U.S. Treasury Money | | | | | | | | | | |
| Market Fund | | Class D Shares | | 1,000.00 | | 1,000.00 | | 0.30 | | 0.06% |
| | Class I Shares | | 1,000.00 | | 1,000.00 | | 0.30 | | 0.06% |
| | Class Y Shares | | 1,000.00 | | 1,000.00 | | 0.30 | | 0.06% |
____________________
| * | | Expenses are equal to the average account value over the period, multiplied by the Fund’s annualized expense ratio, multiplied by 184/365 (to reflect the one half year period). |
| ** | | Information shown reflects values using the expense ratio and rate of return for the period July 22, 2015 to October 31, 2015 (number of operational days in period). |
38 HSBC FAMILY OF FUNDS
Table of Shareholder Expenses—as of October 31, 2015 (Unaudited) (continued)
Hypothetical Example for Comparison Purposes
The table below provides information about hypothetical account values and hypothetical expenses based on each Fund’s actual expense ratio and an assumed rate of return of 5% per year before expenses, which is not the Fund’s actual return. The hypothetical account values and expenses may not be used to estimate the actual ending account balance or expenses you paid for the period. You may use this information to compare this 5% hypothetical example with the 5% hypothetical examples that appear in the shareholder reports of other funds.
Please note that the expenses shown in the table are meant to highlight your ongoing costs only and do not reflect any transactional costs, such as sales charges (loads), redemption fees, or exchange fees. Therefore, the table is useful in comparing ongoing costs only, and will not help you determine the relative total costs of owning different funds. In addition, if these transactional costs were included, your costs would have been higher.
| | | | | | | | | | | Annualized |
| | | | Beginning | | Ending | | Expenses Paid | | Expense Ratio |
| | | | Account Value | | Account Value | | During Period* | | During Period |
| | | | 5/1/15 | | 10/31/15 | | 5/1/15 - 10/31/15 | | 5/1/15 - 10/31/15 |
| Prime Money Market Fund | | Class A Shares | | 1,000.00 | | 1,024.15 | | 1.07 | | 0.21% |
| | Class C Shares | | 1,000.00 | | 1,024.10 | | 1.12 | | 0.22% |
| | Class D Shares | | 1,000.00 | | 1,024.15 | | 1.07 | | 0.21% |
| | Class I Shares | | 1,000.00 | | 1,024.55 | | 0.66 | | 0.13% |
| | Class Y Shares | | 1,000.00 | | 1,024.15 | | 1.07 | | 0.21% |
| U.S. Government Money | | | | | | | | | | |
| Market Fund | | Class A Shares | | 1,000.00 | | 1,024.80 | | 0.41 | | 0.08% |
| | Class B Shares | | 1,000.00 | | 1,024.80 | | 0.41 | | 0.08% |
| | Class D Shares | | 1,000.00 | | 1,024.80 | | 0.41 | | 0.08% |
| | Class I Shares | | 1,000.00 | | 1,024.80 | | 0.41 | | 0.08% |
| | Class Y Shares | | 1,000.00 | | 1,024.80 | | 0.41 | | 0.08% |
| U.S. Treasury Money | | | | | | | | | | |
| Market Fund | | Class D Shares | | 1,000.00 | | 1,024.90 | | 0.31 | | 0.06% |
| | Class I Shares | | 1,000.00 | | 1,024.90 | | 0.31 | | 0.06% |
| | Class Y Shares | | 1,000.00 | | 1,024.90 | | 0.31 | | 0.06% |
____________________
| * | | Expenses are equal to the average account value over the period, multiplied by the Fund’s annualized expense ratio, multiplied by 184/365 (to reflect the one half year period). |
HSBC FAMILY OF FUNDS 39
Board of Trustees and Officers (Unaudited)
MANAGEMENT OF THE TRUST
The following table contains information regarding the HSBC Family of Funds’ Board of Trustees (“Trustees”). Asterisks indicate those Trustees who are “interested persons,” as defined in the Investment Company Act of 1940, as amended, of the HSBC Family of Funds. The HSBC Family of Funds’ Statement of Additional Information includes additional information about the Trustees and is available, without charge, upon request by calling (888) 525-5757.
| | | | | | | | Portfolios in | | |
| | Position(s) | | Term of Office | | | | Fund Complex | | |
| | | Held with | | and Length of | | Principal Occupation(s) During Past | | Overseen By | | Other Directorships |
| Name, Address, Age | | Funds | | Time Served | | 5 Years | | Trustee* | | Held by Trustee |
| NON-INTERESTED TRUSTEES | | | | | | | |
| |
MARCIA L. BECK
P.O. Box 182845
Columbus, OH
43218-3035
Age: 60 | | Trustee | | Indefinite; 2008
to present | | Private Investor (1999 – present); Executive Vice President, Prudential Investments (1997 – 1999); President and Trustee, The Goldman Sachs Mutual Funds (1992 – 1996) | | 24 | | None |
| | | | | | | | | | | |
SUSAN C. GAUSE
P.O. Box 182845
Columbus, OH
43218-3035
Age: 63 | | Trustee | | Indefinite; 2013
to present | | Private Investor (2003 – present); Chief Executive Officer, Dresdner RCM Global Investors and Allianz Dresdner Asset Management (2000 – 2002); Board Member, Dresdner Global Asset Management Board (2000 – 2002); Chief Operating Officer and Senior Managing Director, Dresdner RCM Global Investors (1998 – 2000); Global Chief Financial Officer, Dresdner RCM Global Investors (1996 – 1998) | | 24 | | Met Investors Series
Trust and Metropolitan
Series Fund |
| | | | | | | | | | | |
SUSAN S. HUANG
P.O. Box 182845
Columbus, OH
43218-3035
Age: 61 | | Trustee | | Indefinite; 2008
to present | | Private Investor (2000- present); Senior Vice President, Schroder Investment Management (2001 – 2004); Managing Director, Chase Asset Management (1995-2000) | | 24 | | None |
| | | | | | | | | | | |
THOMAS F. ROBARDS
P.O. Box 182845
Columbus, OH
43218-3035
Age: 69 | | Chairman and
Trustee | | Indefinite; 2005
to present | | Partner, Robards & Co. LLC (investment and advisory services) (2005-present); Chief Financial Officer, American Museum of Natural History (2003- 2004); Chief Financial Officer, Datek Online Holdings (2000-2003); Executive Vice President and Chief Financial Officer, Republic New York Corporation (1976-2000) | | 24 | | Ellington Financial LLC
(NYSE listed financial
services); Ellington
Residential Mortgage
REIT (NYSE listed real
estate investment trust) |
| | | | | | | | | | | |
| INTERESTED TRUSTEE | | | | | | | | | | |
| |
DEBORAH HAZELL
452 Fifth Avenue
New York
NY 10018
Age: 52 | | Trustee | | Indefinite; 2011
to present | | Chief Executive Officer, HSBC Global Asset Management (USA) Inc. (2011-present); President and Chief Executive Officer, Fisher Francis Trees & Watts (“FFTW”) (investment adviser), 2008-2011; Client Service, Business Development and Marketing Group, FFTW (1999-2008) | | 24 | | None |
____________________
| * | | Includes the HSBC Funds, the HSBC Advisor Funds Trust and the HSBC Portfolios. |
40 HSBC FAMILY OF FUNDS
Board of Trustees and Officers (Unaudited) (continued)
| | | | Term of Office and | | |
| Name, Address, Age | | Position(s) Held Funds | | Length of Time Served | | Principal Occupation(s) During Past 5 Years |
| OFFICERS | | | | | | |
| |
RICHARD A. FABIETTI
452 Fifth Avenue
New York, NY 10018
Age: 57 | | President | | One year; 2004 to
present | | Senior Vice President, HSBC Global Asset Management (USA) Inc. (1998 - present) |
| |
JAMES D. LEVY
452 Fifth Avenue
New York, NY 10018
Age: 52 | | Vice President | | One year; 2014 to
present | | Vice President, Product Management, HSBC Global Asset Management (USA) Inc. (2014 – present); Vice President, Product Development, GE Asset Management Inc. (2007 – 2014) |
| | | | | | | |
SCOTT RHODES*
3435 Stelzer Road
Columbus, OH 43219-3035
Age: 56 | | Treasurer | | One year; 2014 to
present | | Senior Vice President, Citi (2010 - present); Manager, Treasurer of Mutual Funds, and Broker-Dealer Treasurer and Financial & Operations Principal, GE Asset Management Inc. (2005 – 2010) |
| | | | | | | |
IOANNIS TZOUGANATOS*
100 Summer Street,
Suite 1500
Boston, MA 02110
Age: 39 | | Secretary | | One Year; 2015 to
present | | Vice President, Regulatory Administration, Citi (2008-present) |
| | | | | | | |
HEATHER MELITO-DEZAN*
100 Summer Street
Suite 1500
Boston, MA 02110
Age: 38 | | Assistant Secretary | | One year; 2014 to
present | | Assistant Vice President, Regulatory Administration, Citi (2013 - present); Senior Specialist, Regulatory Administration, NGAM (2010-2013); Vice President and Manager. Regulatory Administration, BNY Mellon (2004-2010) |
| | | | | | | |
CHARLES L. BOOTH*
3435 Stelzer Road
Columbus, OH 43219-3035
Age: 55 | | Chief Compliance Officer | | One year;
2015 to present | | Director and Compliance Officer, CCO Services, Citi (1988 - present) |
____________________
| * | | Mr. Rhodes, Mr. Tzouganatos, Ms. Melito-Dezan, and Mr. Booth also are officers of other investment companies of which Citi (or an affiliate) is the administrator or sub-administrator. |
HSBC FAMILY OF FUNDS 41
Other Information (Unaudited):
Information regarding how the Funds voted proxies relating to portfolio securities during the most recent 12-month period ended June 30th is available (i) without charge, upon request, by calling 1-800-525-5757 for HSBC Bank USA and HSBC Brokerage (USA) Inc. clients and 1-800-782-8183 for all other shareholders; (ii) on the Funds’ website at www.investorfunds.us.hsbc.com; and (iii) on the Security and Exchange Commission’s (“Commission”) website at http://www.sec.gov.
The Funds file their complete schedules of portfolio holdings with the Commission for the first and third quarters of each fiscal year on Form N-Q. The Funds’ Forms N-Q are available on the Commission’s website at http://www.sec.gov. The Funds’ Forms N-Q may be reviewed and copied at the Commission’s Public Reference Room in Washington, D.C. and information on the operation of the Public Reference Room may be obtained by calling 1-800-SEC-0330. The Funds’ Schedules of Investments will be available no later than 60 days after each period end, without charge, on the Funds’ website at www.investorfunds.us.hsbc.com.
Each Fund will disclose on its website at www.investorfunds.us.hsbc.com, within five business days after the end of each month, a complete schedule of portfolio holdings and information regarding the weighted average maturity of the Fund. In addition, each Fund will file with the Commission on Form N-MFP, within five business days after the end of each month, more detailed portfolio holdings information. The Funds’ Forms N-MFP will be available on the Commission’s website at http://www.sec.gov, on a delayed basis, and the Funds’ website will also contain a link to these filings.
An investment in a Fund is not a deposit of HSBC Bank USA, National Association, and is not insured or guaranteed by the Federal Deposit Insurance Corporation or any other government agency.
42 HSBC FAMILY OF FUNDS
HSBC FAMILY OF FUNDS: INVESTMENT ADVISER AND ADMINISTRATOR HSBC Global Asset Management (USA) Inc.
452 Fifth Avenue
New York, NY 10018 SHAREHOLDER SERVICING AGENTS For HSBC Bank USA, N.A. and
HSBC Securities (USA) Inc. Clients:
HSBC Bank USA, N.A.
452 Fifth Avenue
New York, NY 10018
1-888-525-5757 For All Other Shareholders: HSBC Funds
P.O. Box 182845
Columbus, OH 43218
1-800-782-8183 TRANSFER AGENT SunGard Investor Services, LLC
3435 Stelzer Road
Columbus, OH 43219 DISTRIBUTOR Foreside Distribution Services, L.P.
690 Taylor Road, Suite 150
Gahanna, Ohio 43230 | CUSTODIAN The Northern Trust Company
50 South LaSalle Street
Chicago, IL 60603 INDEPENDENT REGISTERED PUBLIC ACCOUNTING FIRM PricewaterhouseCoopers LLP
300 Madison Avenue
New York, NY 10017 LEGAL COUNSEL Dechert LLP
1900 K Street, N.W.
Washington, D.C. 20006 |

| Investment products: |
| ARE NOT A | ARE NOT | ARE NOT |
| BANK DEPOSIT | FDIC | INSURED BY |
| OR OBLIGATION | INSURED | ANY FEDERAL |
| OF THE BANK | | GOVERNMENT |
| OR ANY OF ITS | | AGENCY |
| AFFILIATES | | |
| ARE NOT GUARANTEED BY | MAY LOSE |
| THE BANK OR ANY OF ITS | VALUE |
| AFFILIATES | | |
Investment products are offered by HSBC Securities (USA) Inc. (HSI), member NYSE/FINRA/SIPC. HSI is an affiliate of HSBC Bank USA, N.A. Investment products: Are not a deposit or other obligation of the bank or any of its affiliates; Not FDIC insured or insured by any federal government agency of the United States; Not guaranteed by the bank or any of its affiliates; and are subject to investment risk, including possible loss of principal invested.
Investors should consider the investment objectives, risks, charges, and expenses of the investment company carefully before investing. The prospectus contains this and other important information about the investment company. For clients of HSBC Securities (USA) Inc., please call 1-888-525-5757 for more information. For other investors and prospective investors, please call the Funds directly at 1-800-782-8183 or visit our website at www.investorfunds.us.hsbc.com. Investors should read the prospectus carefully before investing or sending money.
HSBC Global Asset Management (USA) Inc.
HSBC World Selection™ Funds
Annual Report
October 31, 2015
| WORLD SELECTION FUNDS | Class A | | Class B | | Class C |
| Aggressive Strategy Fund | HAAGX | | HBAGX | | HCAGX |
| Balanced Strategy Fund | HAGRX | | HSBGX | | HCGRX |
| Moderate Strategy Fund | HSAMX | | HSBMX | | HSCMX |
| Conservative Strategy Fund | HACGX | | HBCGX | | HCCGX |
| Income Strategy Fund | HINAX | | HINBX | | HINCX |
HSBC World Selection Funds
Annual Report - October 31, 2015
| Glossary of Terms | | |
| Commentary From the Investment Manager | | 3 |
| Portfolio Reviews | | 4 |
| Portfolio Composition | | 14 |
| | | |
| Schedules of Portfolio Investments | | |
| Aggressive Strategy Fund | | 15 |
| Balanced Strategy Fund | | 16 |
| Moderate Strategy Fund | | 17 |
| Conservative Strategy Fund | | 18 |
| Income Strategy Fund | | 19 |
| Statements of Assets and Liabilities | | 20 |
| Statements of Operations | | 21 |
| Statements of Changes in Net Assets | | 22 |
| Financial Highlights | | 28 |
| Notes to Financial Statements | | 33 |
| Report of Independent Registered Public Accounting Firm | | 42 |
| Other Federal Income Tax Information | | 43 |
| Table of Shareholder Expenses | | 44 |
| Board of Trustees and Officers | | 46 |
| Other Information | | 48 |
The World Selection Funds (the “Funds”) are “fund of funds” which aim to provide superior risk adjusted returns relative to a single asset class investment over the long term by investing primarily in underlying funds. The underlying funds may include mutual funds managed by HSBC Global Asset Management (USA) Inc. (the “Adviser”), mutual funds managed by investment advisers that are not associated with the Adviser and exchange traded funds (“ETFs”) (collectively, “Underlying Funds”). The Funds may also purchase or hold exchange traded notes (“ETNs”). The Funds’ broadly diversified investment approach across various asset classes and investment styles aims to contribute to achieving their objectives. Each World Selection Fund has a strategic asset allocation which represents a carefully constructed blend of asset classes, regions and currencies to meet longer term investment goals.
Barclays Emerging Markets USD Aggregate Index is a flagship hard currency Emergency Markets debt benchmark that includes fixed and floating-rate US dollar-denominated debt issued from sovereign, quasi-sovereign, and corporate EM issuers. Country eligibility and classification as Emerging Markets is rules-based and reviewed annually using World Bank income group and International Monetary Fund country classification.
Barclays Euro Aggregate Bond Index is an index tracks fixed-rate, investment-grade Euro-denominated securities. Inclusion is based on the currency of the issue, and not the domicile of the issuer. The principal sectors in the index are Treasury, Corporate, Government-Related and Securitised. Securities in the index are part of the Pan-European Aggregate and the Global Aggregate Indices.
Barclays U.S. Aggregate Bond Index is an index generally representative of investment-grade, USD-denominated, fixed-rate debt issues, taxable bond market, including Treasuries, government-related and corporate securities, asset-backed, mortgage-backed and commercial mortgage-backed securities, with maturities of at least one year.
Barclays U.S. Corporate High-Yield Bond Index is an index that measures the non-investment-grade, USD-denominated, fixed-rate, taxable corporate bond market. Securities are classified as high-yield if the middle rating of Moody’s, Fitch, and S&P is Ba1/BB+/BB+ or below. The index excludes emerging markets debt.
BofA Merrill Lynch U.S. High Yield Master II Index is an index that tracks the performance of USD-denominated, below investment-grade corporate debt publicly issued in the U.S. domestic market.
Citigroup U.S. Domestic 3-Month Treasury Bill Index is a market value-weighted index of public obligations of the U.S. Treasury with maturities of three months.
MSCI All Country World Index (“MSCI ACWI Index”) is an equity index which captures the large- and mid-cap representation across 23 Developed Markets (DM) countries—Australia, Austria, Belgium, Canada, Denmark, Finland, France, Germany, Hong Kong, Ireland, Israel, Netherlands, New Zealand, Norway, Portugal, Singapore, Spain, Sweden, Switzerland and the UK (excluding the U.S.)—and 23 emerging market country—Brazil, Chile, China, Colombia, Czech Republic, Egypt, Greece, Hungary, India, Indonesia, Korea, Malaysia, Peru, Philippines, Poland, Russia, Qatar, South Africa, Taiwan, Thailand, Turkey and United Arab Emirates.
MSCl Europe Australasia and Far East (“MSCI EAFE”) Index is an equity index which captures the large- and mid-cap representation across Developed Markets countries: Australia, Austria, Belgium, Denmark, Finland, France, Germany, Hong Kong, Ireland, Israel, Italy, Japan, the Netherlands, New Zealand, Norway, Portugal, Singapore, Spain, Sweden, Switzerland and the UK (excluding the U.S. and Canada).
MSCI Emerging Markets (“MSCI EM”) Index is an index that captures the large- and mid-cap representation across 23 Emerging Markets (EM) countries: Brazil, Chile, China, Colombia, Czech Republic, Egypt, Greece, Hungary, India, Indonesia, Korea, Malaysia, Mexico, Peru, Philippines, Poland, Qatar, Russia, South Africa, Taiwan, Thailand, Turkey and United Arab Emirates.
MSCI Golden Dragon Index is an index that captures the equity market performance of large- and mid-cap China securities (H shares, B shares, Red-Chips and P-Chips) and non-domestic China securities listed in Hong Kong and Taiwan.
MSCI World Index is a free float adjusted market capitalization weighted index that is designed to measure the equity market performance of developed markets. The MSCI World Index consists of the following 23 developed market country indexes: Australia, Austria, Belgium, Canada, Denmark, Finland, France, Germany, Hong Kong, Ireland, Israel, Italy, Japan, Netherlands, New Zealand, Norway, Portugal, Singapore, Spain, Sweden, Switzerland, the United Kingdom, and the United States.
Standard & Poor’s 500 (“S&P 500”) Index is an index that is widely regarded as a gauge of the U.S. equities market. This index includes 500 leading companies in leading industries of the U.S. economy. The S&P 500 Index focuses on the large-cap segment of the market, with approximately 80% coverage of U.S. equities.
Securities indices are unmanaged and assume reinvestment of all distributions and interest payments and do not take in account brokerage fees or expenses. Securities in the Funds do not match those in the indices and performance of the Funds will differ. Investors cannot invest directly in an index.
2 HSBC FAMILY OF FUNDS
| Commentary From the Investment Manager |
HSBC Global Asset Management (USA) Inc.
Global Economic Review
The global economy faced significant headwinds during the 12-month period from November 1, 2014, to October 31, 2015. Slowing economic growth in China and other emerging economies led equities lower. Developed economies fared better, however: The U.S. economy showed signs of continued recovery and the eurozone economy regained its footing after several years of slow growth.
Commodity prices generally remained low during the period, continuing a period of consolidation that began in 2011. Oil prices declined sharply early in the period, however. These declines added to existing pressures on oil-exporting emerging economies and oil-dependent sectors. Energy companies saw diminished earnings and oil and mining production declined.
Central bank policy in many economies was a source of investor uncertainty. China took steps to devalue its currency in August, triggering a dive in its stock market. However, several important monetary programs in other economies benefited equities. Quantitative easing programs in Europe and Japan both improved liquidity and helped buoy equity markets.
Throughout much of the period, investors anticipated action by the U.S. Federal Reserve (the Fed) to raise the federal funds rate—a key factor in lending rates—above the target range of between 0.00% and 0.25%. However, the Fed decided multiple times during the period to keep rates at near-zero levels, due in part to concerns about turbulence in foreign markets and the relatively slow economic recovery in the U.S. The Fed’s delays added to investor uncertainty.
The U.S. economy grew at a slower rate than in recent years. Early in 2015, harsh winter weather on the East Coast dealt a blow to consumer consumption and a West Coast dockworkers’ strike slowed international trade. Growth picked up later in the period but some key areas of the economy showed signs of weakness. In particular, industrial production, manufacturing, and business confidence declined during the period. Meanwhile, low oil and gas prices hurt the energy sector but also contributed to a sharp uptick in auto sales.
Other areas of the U.S. economy showed signs of improvement throughout the period. The labor market continued to improve, consumer confidence hit multi-year highs, and the housing market remained robust.
Global inflation remained low during the period. A strong U.S. dollar, which rose rapidly early in the period and remained strong through October 2015, encouraged U.S. imports and discouraged exports. The strong dollar took a toll on commodity-dependent economies and posed challenges for emerging market issuers of dollar-denominated debt.
China’s ongoing transition to slower economic growth had a profound impact on economies throughout the world, exacerbated by a sharp downturn in Chinese equities and currency depreciation.
Economic growth picked up in the eurozone during the period, supported by the European Central Bank’s accommodative monetary policy and improving credit conditions. However, the debt crisis in Greece continued to undermine European economic recovery early in the period.
Japanese stocks rallied throughout much of the period as the nation’s economic growth improved in large part due to Prime Minister Shinzo Abe’s economic plan, known as “Abenomics.” The program involved higher taxes, structural reforms, and quantitative easing. Japanese equities gave up much of their gains in August 2015, however, in-step with many other global equity markets. Additionally, in that month a sharp decline in Chinese equities fueled fears that a slowing economy in China could jeopardize the global economic recovery.
Geopolitical turmoil weighed on the global economy during the period, and particularly affected countries such as Russia. Conflict in the Ukraine led to stronger economic sanctions against Russia, dealing a further blow to an economy already hard hit by low oil prices. Inflation soared in Russia while exports plummeted.
Market Review
Global equities made modest but inconsistent gains during the first half of the period, but lost ground in most cases during the late summer and fall. Volatility spiked in August as a Chinese stock sell-off spread to emerging markets and triggered volatility throughout the world. The MSCI EM Index1 finished the period with a 14.22% loss. The MSCI Golden Dragon Index1 of large- and mid-cap securities in China, Hong Kong and Taiwan also fell, posting a -2.99% return. Developed markets fared better despite the increased volatility, with the MSCI World Index1 returning 2.33% on relatively strong gains late in the period.
U.S. equities performed modestly well for the period; the S&P 500 Index1 of large-company stocks returned 5.20%. Robust merger and acquisition activity, as well as strong corporate earnings growth, helped fuel those gains. Performance was uneven across sectors, however. The energy sector saw the largest losses during the period due to declining oil prices, and health care stocks performed poorly.
Fixed income markets in developed economies made modest gains. U.S. interest rates decreased in late 2014 and early 2015, boosting the performance of U.S. Treasuries and many other categories of bonds. Rates rose slightly over the next several months in anticipation of higher interest rates, only to decline as the Fed chose to postpone a rate increase. The Barclays U.S. Aggregate Bond Index1, which tracks the broad investment-grade fixed-income market, returned 1.96% for the 12-month period through October 31. Meanwhile the Barclays U.S. Corporate High-Yield Bond Index1 declined 1.94% for the same period.
Fixed-income markets in Europe rallied throughout the period, fueled by the European Central Bank’s bond-buying program and assurances from its president that it would expand stimulus efforts and further lower interest rates if necessary. The Barclays Euro Aggregate Bond Index1 returned 3.35%.
Emerging markets debt experienced volatility during the period caused by a strengthening U.S. dollar and an ongoing decline in commodity prices. Monetary easing measures from some central banks served to lower government bond yields in developed and emerging markets countries, however, which helped boost returns. The Barclays Emerging Markets USD Aggregate Index1 returned 0.02% during the 12-month period.
1 For additional information, please refer to the Glossary of Terms.
HSBC FAMILY OF FUNDS 3
| Portfolio Reviews (Unaudited) |
Aggressive Strategy Fund
(Class A Shares, Class B Shares and Class C Shares)
by Rayman Bovell, CFA, Senior Vice President and Head of Wealth Portfolio Management
The Aggressive Strategy Fund (the “Fund”) is a “fund of funds” which seeks long-term growth of capital by investing primarily in underlying funds. The underlying funds may include mutual funds managed by HSBC Global Asset Management (USA) Inc. (the “Adviser”), mutual funds managed by investment advisers that are not associated with the Adviser and exchange traded funds (“ETFs”) (collectively, “Underlying Funds”). The Fund may invest in both actively-managed and passively-managed Underlying Funds to implement the Adviser’s investment views. The Fund may also purchase or hold exchange traded notes (“ETNs”).
Investment Concerns
Allocation Risk: The risk that the Adviser’s target asset and sector allocations and changes in target asset and sector allocations cause the Fund to underperform other similar funds or cause you to lose money, and that the Fund may not achieve its target asset and sector allocations.
Underlying Fund Selection Risk: The risk that the Fund may invest in Underlying Funds that underperform other similar funds or the markets more generally, due to poor investment decisions by the investment adviser(s) for the Underlying Funds or otherwise. Underlying Funds also have their own expenses, which the Fund bears in addition to its own expenses.
Equity Securities Risk: A portion of the assets of the Fund is allocated to Underlying Funds investing primarily in equity securities. Therefore, the value of the Fund may increase or decrease as a result of its indirect interest in equity securities.
Fixed Income Securities Risk: A portion of the assets of the Fund is allocated to Underlying Funds investing primarily in fixed income securities. Therefore, the value of the Fund may increase or decrease as a result of its indirect interest in fixed income securities.
Foreign Securities/Emerging Markets Risk: Foreign securities, including those of emerging market issuers, are subject to additional risks including international trade, currency, political, and regulatory risks. Securities of emerging market issuers generally have more risk than securities issued by issuers in more developed foreign markets.
REIT Risk: Investments in the Funds are subject to the risks related to direct investment in real estate, such as real estate risk, regulatory risks, concentration risk, and diversification risk.
For a complete description of these and other risks associated with investment in a mutual fund, please refer to the Fund’s prospectus.
Market Commentary
The Fund returned -1.90% (without sales charge) for the Class A Shares for the year ended October 31, 2015. That compared to a 5.20% total return for the Fund’s primary benchmark, the S&P 500 Index1.
The Fund measured performance against several additional reference indices for the year ended October 31, 2015: the MSCI ACWI Index1 (0.50% total return), the MSCI EAFE Index1 (0.37% total return), Barclays U.S. Aggregate Bond Index1 (1.96% total return), BofA Merrill Lynch U.S. High Yield Master II Index1 (-2.05% total return) and Citigroup U.S. Domestic 3-Month Treasury Bill Index1 (0.02% total return).
Portfolio Performance
Global equity markets were mixed during the 12-month period. International stocks underperformed domestic stocks in U.S. dollar terms early in the period while domestic stocks generally traded in a range through the first quarter of 2015. Early in the period, investors worried about a modest downturn in U.S. economic growth, as well as the Federal Reserve’s (the Fed) decision to keep interest rates at near-zero levels. Meanwhile, continued economic weakness in Europe and China also muted the performance of global equity markets. Valuations for U.S. stocks improved into early summer amid improving economic data and relatively strong corporate earnings results.
As the period wore on, volatility increased in the global equity markets, due in part to China’s slowing economy and currency depreciation, disappointing data in other emerging markets, and further declines in commodities prices. Meanwhile, investors also reacted negatively to the Fed’s decision in September to postpone an interest rate increase. That decision fueled worries that the U.S. economic recovery remained sluggish.
Global bond yields remained relatively low throughout the 12-month period, reflecting investors’ uncertainty over the health of global economies and the Fed’s reluctance to raise interest rates. Investors during the second half of the period sought out areas of relative safety in the fixed income market, favoring U.S. Government bonds over higher yielding corporate issues. The yield on the 10-year Treasury bond rallied somewhat toward the end of the period, but still finished slightly lower than where it started at the beginning of the period.
The relative outperformance of U.S. stocks has helped the Fund’s absolute returns as we favored domestic equities over international equities. However, as the Fund is a multi-asset portfolio and includes many asset classes to achieve its risk/return profile, the Fund did not capture the full benefit from the strength of domestic equity markets. At the same time, the Fund underperformed its fixed income performance indices during the 12-month period because of the volatility in the energy space, which contributed to weak returns in credit sectors such as high-yield bonds.†
The Fund continues to maintain positions in property investments such as REITs as we believe property continues to offer reasonably attractive long-run prospective returns relative to core developed market government bonds.†
In the Fund’s fixed income holdings, we favored investment-grade corporate debt and high-yield securities over Treasury bonds. We continue to feel such issues offer higher yields and more appealing valuations than Treasuries. However, this preference had an adverse impact on absolute returns as government bonds outperformed for the period.†
We continued to see attractive valuations in the equity markets, leading to a bias toward stocks over bonds despite the lingering risks of a weaker global economy.†
| † | Portfolio composition is subject to change. |
| 1 | For additional information, please refer to the Glossary of Terms. |
Past performance does not guarantee future results. The performance data quoted represents past performance and current returns may be lower or higher. Total return figures include change in share price, reinvestment of dividends and capital gains and do not reflect taxes that a shareholder would pay on Fund distributions or on the redemption of Fund shares. Investment return and principal value will fluctuate so that an investor’s shares, when redeemed may be worth more or less than the original cost. To obtain performance information current to the most recent month end, please call 1-800-782-8183.
4 HSBC FAMILY OF FUNDS
| Portfolio Reviews (Unaudited) |
Aggressive Strategy Fund

The charts above represent a historical 10-year performance comparison of a hypothetical $10,000 investment in the indicated share class versus a similar investment in the Fund’s benchmark and represents the reinvestment of dividends and capital gains in the Fund.
| | | | | | Average Annual | | Expense |
| Fund Performance | | | | | | Total Return (%) | | Ratio (%)4 |
| | Inception | | 1 | | 5 | | 10 | | | | |
| As of October 31, 2015 | | Date | | Year | | Year | | Year | | Gross | | Net |
| Aggressive Strategy Fund Class A1 | | | 2/14/05 | | | -6.82 | | 5.60 | | 4.78 | | 1.65 | | 1.65 |
| Aggressive Strategy Fund Class B2 | | | 2/9/05 | | | -5.58 | | 5.88 | | 4.85 | | 2.40 | | 2.40 |
| Aggressive Strategy Fund Class C3 | | | 6/9/05 | | | -3.40 | | 5.88 | | 4.94 | | 2.40 | | 2.40 |
| S&P 500 Index5 | | | — | | | 5.20 | | 14.33 | | 7.85 | | N/A | | N/A |
| MSCI ACWI Index5 | | | — | | | 0.50 | | 8.26 | | 6.22 | | N/A | | N/A |
| MSCI EAFE Index5 | | | — | | | 0.37 | | 5.28 | | 4.53 | | N/A | | N/A |
| Barclays U.S. Aggregate Bond Index5 | | | — | | | 1.96 | | 3.03 | | 4.72 | | N/A | | N/A |
| BofA Merrill Lynch U.S. High Yield Master II Index5 | | | — | | | -2.05 | | 6.01 | | 7.48 | | N/A | | N/A |
| Citigroup U.S. Domestic 3-Month Treasury Bill Index5 | | | — | | | 0.02 | | 0.05 | | 1.23 | | N/A | | N/A |
Past performance does not guarantee future results. The performance data quoted represents past performance and current returns may be lower or higher. Total return figures include change in share price, reinvestment of dividends and capital gains and do not reflect the taxes that a shareholder would pay on Fund distributions or on the redemption of Fund shares. Investment return and principal value will fluctuate so that an investor’s shares, when redeemed may be worth more or less than the original cost. To obtain performance information current to the most recent month end, please call 1-800-782-8183.
The performance above reflects any fee waivers that have been in effect during the applicable periods, as well as any expense reimbursements that have periodically been made. Absent such waivers and reimbursements, returns would have been lower.
Certain returns shown include monies received by series of HSBC Portfolios (the “Portfolios”), in which the Fund invests, in respect of one-time class action settlements. As a result, the Fund’s total returns for those periods were higher than they would have been had the Portfolios not received the payments.
| 1 | Reflects the maximum sales charge of 5.00%. |
| 2 | Reflects the applicable contingent deferred sales charge, maximum of 4.00%. |
| 3 | Reflects the applicable contingent deferred sales charge, maximum of 1.00%. |
| 4 | Reflects the expense ratios as reported in the prospectus dated February 27, 2015. The expense ratios reflected include Acquired Fund fees and expenses. Additional information pertaining to the October 31, 2015 expense ratios can be found in the financial highlights. Expenses of the Underlying Funds are reflected in realized and unrealized gain (loss) on investments in the accompanying Statement of Operations, and are not included in the expense ratios shown in the accompanying Financial Highlights. |
| 5 | For additional information, please refer to the Glossary of Terms. |
The Fund’s performance is primarily measured against the S&P 500 Index, an unmanaged index that is widely regarded as a gauge of the U.S. equities market. This index includes 500 leading companies in leading industries of the U.S. economy. Although the S&P 500 Index focuses on the large-cap segment of the market, with approximately 80% coverage of U.S. equities, it is also an ideal proxy for the total market. The performance of the index does not reflect the deduction of expenses associated with a mutual fund, such as investment management and fund accounting fees. The Fund’s performance reflects the deduction of fees for these value-added services. Investors cannot invest directly in an index.
HSBC FAMILY OF FUNDS 5
| Portfolio Reviews (Unaudited) |
Balanced Strategy Fund
(Class A Shares, Class B Shares and Class C Shares)
by Rayman Bovell, CFA, Senior Vice President and Head of Wealth Portfolio Management
The Balanced Strategy Fund (the “Fund”) is a “fund of funds” which seeks long-term growth of capital by investing primarily in underlying funds. The underlying funds may include mutual funds managed by HSBC Global Asset Management (USA) Inc. (the “Adviser”), mutual funds managed by investment advisers that are not associated with the Adviser and exchange traded funds (“ETFs”) (collectively, “Underlying Funds”). The Fund may invest in both actively-managed and passively-managed Underlying Funds to implement the Adviser’s investment views. The Fund may also purchase or hold exchange traded notes (“ETNs”).
Investment Concerns
Allocation Risk: The risk that the Adviser’s target asset and sector allocations and changes in target asset and sector allocations cause the Fund to underperform other similar funds or cause you to lose money, and that the Fund may not achieve its target asset and sector allocations.
Underlying Fund Selection Risk: The risk that the Fund may invest in Underlying Funds that underperform other similar funds or the markets more generally, due to poor investment decisions by the investment adviser(s) for the Underlying Funds or otherwise. Underlying Funds also have their own expenses, which the Fund bears in addition to its own expenses.
Equity Securities Risk: A portion of the assets of the Fund is allocated to Underlying Funds investing primarily in equity securities. Therefore, the value of the Fund may increase or decrease as a result of its indirect interest in equity securities.
Fixed Income Securities Risk: A portion of the assets of the Fund is allocated to Underlying Funds investing primarily in fixed income securities. Therefore, the value of the Fund may increase or decrease as a result of its indirect interest in fixed income securities.
Foreign Securities/Emerging Markets Risk: Foreign securities, including those of emerging market issuers, are subject to additional risks including international trade, currency, political, and regulatory risks. Securities of emerging market issuers generally have more risk than securities issued by issuers in more developed foreign markets.
REIT Risk: Investments in the Funds are subject to the risks related to direct investment in real estate, such as real estate risk, regulatory risks, concentration risk, and diversification risk.
For a complete description of these and other risks associated with investment in a mutual fund, please refer to the Fund’s prospectus.
Market Commentary
The Fund returned -2.06% (without sales charge) for the Class A Shares for the year ended October 31, 2015. That compared to a 5.20% total return for the Fund’s primary benchmark, the S&P 500 Index1.
The Fund measured performance against several additional reference indices for the year ended October 31, 2015: the MSCI ACWI Index1 (0.50% total return), the MSCI EAFE Index1 (0.37% total return), Barclays U.S. Aggregate Bond Index1 (1.96% total return), BofA Merrill Lynch U.S. High Yield Master II Index1 (-2.05% total return) and Citigroup U.S. Domestic 3-Month Treasury Bill Index1 (0.02% total return).
Portfolio Performance
Global equity markets were mixed during the 12-month period. International stocks underperformed domestic stocks in U.S. dollar terms early in the period while domestic stocks generally traded in a range through the first quarter of 2015. Early in the period, investors worried about a modest downturn in U.S. economic growth, as well as the Federal Reserve’s (the Fed) decision to keep interest rates at near-zero levels. Meanwhile, continued economic weakness in Europe and China also muted the performance of global equity markets. Valuations for U.S. stocks improved into early summer amid improving economic data and relatively strong corporate earnings results.
As the period wore on, volatility increased in the global equity markets, due in part to China’s slowing economy and currency depreciation, disappointing data in other emerging markets, and further declines in commodities prices. Meanwhile, investors also reacted negatively to the Fed’s decision in September to postpone an interest rate increase. That decision fueled worries that the U.S. economic recovery remained sluggish.
Global bond yields remained relatively low throughout the 12-month period, reflecting investors’ uncertainty over the health of global economies and the Fed’s reluctance to raise interest rates. Investors during the second half of the period sought out areas of relative safety in the fixed income market, favoring U.S. Government bonds over higher yielding corporate issues. The yield on the 10-year Treasury bond rallied somewhat toward the end of the period, but still finished slightly lower than where it started at the beginning of the period.
The relative outperformance of U.S. stocks has helped the Fund’s absolute returns as we favored domestic equities over international equities. However, as the Fund is a multi-asset portfolio and includes many asset classes to achieve its risk/return profile, the Fund did not capture the full benefit from the strength of domestic equity markets. At the same time, the Fund underperformed its fixed income performance indices during the 12-month period because of the volatility in the energy space, which contributed to weak returns in credit sectors such as high-yield bonds.†
The Fund continues to maintain positions in property investments such as REITs as we believe property continues to offer reasonably attractive long-run prospective returns relative to core developed market government bonds.†
In the Fund’s fixed income holdings, we favored investment-grade corporate debt and high-yield securities over Treasury bonds. We continue to feel such issues offer higher yields and more appealing valuations than Treasuries. However, this preference had an adverse impact on absolute returns as government bonds outperformed for the period.†
We continued to see attractive valuations in the equity markets, leading to a bias toward stocks over bonds despite the lingering risks of a weaker global economy.†
| † | | Portfolio composition is subject to change. |
| 1 | | For additional information, please refer to the Glossary of Terms. |
Past performance does not guarantee future results. The performance data quoted represents past performance and current returns may be lower or higher. Total return figures include change in share price, reinvestment of dividends and capital gains and do not reflect taxes that a shareholder would pay on Fund distributions or on the redemption of Fund shares. Investment return and principal value will fluctuate so that an investor’s shares, when redeemed may be worth more or less than the original cost. To obtain performance information current to the most recent month end, please call 1-800-782-8183.
6 HSBC FAMILY OF FUNDS
| Portfolio Reviews (Unaudited) |
Balanced Strategy Fund

The charts above represent a historical 10-year performance comparison of a hypothetical $10,000 investment in the indicated share class versus a similar investment in the Fund’s benchmark and represents the reinvestment of dividends and capital gains in the Fund.
| | | | | | Average Annual | | Expense |
| Fund Performance | | | | | | Total Return (%) | | Ratio (%)4 |
| | Inception | | 1 | | 5 | | 10 | | | | |
| As of October 31, 2015 | | Date | | Year | | Year | | Year | | Gross | | Net |
| Balanced Strategy Fund Class A1 | | | 2/8/05 | | | -6.95 | | 4.81 | | 4.61 | | 1.37 | | 1.37 |
| Balanced Strategy Fund Class B2 | | | 2/1/05 | | | -6.05 | | 5.09 | | 4.68 | | 2.12 | | 2.12 |
| Balanced Strategy Fund Class C3 | | | 4/27/05 | | | -3.66 | | 5.10 | | 4.76 | | 2.12 | | 2.12 |
| S&P 500 Index5 | | | — | | | 5.20 | | 14.33 | | 7.85 | | N/A | | N/A |
| MSCI ACWI Index5 | | | — | | | 0.50 | | 8.26 | | 6.22 | | N/A | | N/A |
| MSCI EAFE Index5 | | | — | | | 0.37 | | 5.28 | | 4.53 | | N/A | | N/A |
| Barclays U.S. Aggregate Bond Index5 | | | — | | | 1.96 | | 3.03 | | 4.72 | | N/A | | N/A |
| BofA Merrill Lynch U.S. High Yield Master II Index5 | | | — | | | -2.05 | | 6.01 | | 7.48 | | N/A | | N/A |
| Citigroup U.S. Domestic 3-Month Treasury Bill Index5 | | | — | | | 0.02 | | 0.05 | | 1.23 | | N/A | | N/A |
Past performance does not guarantee future results. The performance data quoted represents past performance and current returns may be lower or higher. Total return figures include change in share price, reinvestment of dividends and capital gains and do not reflect the taxes that a shareholder would pay on Fund distributions or on the redemption of Fund shares. Investment return and principal value will fluctuate so that an investor’s shares, when redeemed may be worth more or less than the original cost. To obtain performance information current to the most recent month end, please call 1-800-782-8183.
The performance above reflects any fee waivers that have been in effect during the applicable periods, as well as any expense reimbursements that have periodically been made. Absent such waivers and reimbursements, returns would have been lower.
Certain returns shown include monies received by series of HSBC Portfolios (the “Portfolios”), in which the Fund invests, in respect of one-time class action settlements. As a result, the Fund’s total returns for those periods were higher than they would have been had the Portfolios not received the payments.
| 1 | | Reflects the maximum sales charge of 5.00%. |
| 2 | | Reflects the applicable contingent deferred sales charge, maximum of 4.00%. |
| 3 | | Reflects the applicable contingent deferred sales charge, maximum of 1.00%. |
| 4 | | Reflects the expense ratios as reported in the prospectus dated February 27, 2015. The expense ratios reflected include Acquired Fund fees and expenses. Additional information pertaining to the October 31, 2015 expense ratios can be found in the financial highlights. Expenses of the Underlying Funds are reflected in realized and unrealized gain (loss) on investments in the accompanying Statement of Operations, and are not included in the expense ratios shown in the accompanying Financial Highlights. |
| 5 | | For additional information, please refer to the Glossary of Terms. |
The Fund’s performance is primarily measured against the S&P 500 Index, an unmanaged index that is widely regarded as a gauge of the U.S. equities market. This index includes 500 leading companies in leading industries of the U.S. economy. Although the S&P 500 Index focuses on the large-cap segment of the market, with approximately 80% coverage of U.S. equities, it is also an ideal proxy for the total market. The performance of the index does not reflect the deduction of expenses associated with a mutual fund, such as investment management and fund accounting fees. The Fund’s performance reflects the deduction of fees for these value-added services. Investors cannot invest directly in an index.
HSBC FAMILY OF FUNDS 7
| Portfolio Reviews (Unaudited) |
Moderate Strategy Fund
(Class A Shares, Class B Shares and Class C Shares)
by Rayman Bovell, CFA, Senior Vice President and Head of Wealth Portfolio Management
The Moderate Strategy Fund (the “Fund”) is a “fund of funds” which seeks high total return consisting of long-term growth of capital and current income by investing primarily in underlying funds. The underlying funds may include mutual funds managed by HSBC Global Asset Management (USA) Inc. (the “Adviser”), mutual funds managed by investment advisers that are not associated with the Adviser and exchange traded funds (“ETFs”) (collectively, “Underlying Funds”). The Fund may invest in both actively-managed and passively-managed Underlying Funds to implement the Adviser’s investment views. The Fund may also purchase or hold exchange traded notes (“ETNs”).
Investment Concerns
Allocation Risk: The risk that the Adviser’s target asset and sector allocations and changes in target asset and sector allocations cause the Fund to underperform other similar funds or cause you to lose money, and that the Fund may not achieve its target asset and sector allocations.
Underlying Fund Selection Risk: The risk that the Fund may invest in Underlying Funds that underperform other similar funds or the markets more generally, due to poor investment decisions by the investment adviser(s) for the Underlying Funds or otherwise. Underlying Funds also have their own expenses, which the Fund bears in addition to its own expenses.
Equity Securities Risk: A portion of the assets of the Fund is allocated to Underlying Funds investing primarily in equity securities. Therefore, the value of the Fund may increase or decrease as a result of its indirect interest in equity securities.
Fixed Income Securities Risk: A portion of the assets of the Fund is allocated to Underlying Funds investing primarily in fixed income securities. Therefore, the value of the Fund may increase or decrease as a result of its indirect interest in fixed income securities.
Foreign Securities/Emerging Markets Risk: Foreign securities, including those of emerging market issuers, are subject to additional risks including international trade, currency, political, and regulatory risks. Securities of emerging market issuers generally have more risk than securities issued by issuers in more developed foreign markets.
REIT Risk: Investments in the Funds are subject to the risks related to direct investment in real estate, such as real estate risk, regulatory risks, concentration risk, and diversification risk.
For a complete description of these and other risks associated with investment in a mutual fund, please refer to the Fund’s prospectus.
Market Commentary
The Fund returned -1.62% (without sales charge) for the Class A Shares for the year ended October 31, 2015. That compared to a 1.96% total return for the Fund’s primary benchmark, the Barclays U.S. Aggregate Bond Index1.
The Fund measured performance against several additional reference indices for the year ended October 31, 2015: the MSCI ACWI Index1 (0.50% total return) the S&P 500 Index1 (5.20% total return), MSCI EAFE Index1 (0.37% total return), BofA Merrill Lynch U.S. High Yield Master II Index1 (-2.05% total return) and Citigroup U.S. Domestic 3-Month Treasury Bill Index1 (0.02% total return).
Portfolio Performance
Global equity markets were mixed during the 12-month period. International stocks underperformed domestic stocks in U.S. dollar terms early in the period while domestic stocks generally traded in a range through the first quarter of 2015. Early in the period, investors worried about a modest downturn in U.S. economic growth, as well as the Federal Reserve’s (the Fed) decision to keep interest rates at near-zero levels. Meanwhile, continued economic weakness in Europe and China also muted the performance of global equity markets. Valuations for U.S. stocks improved into early summer amid improving economic data and relatively strong corporate earnings results.
As the period wore on, volatility increased in the global equity markets, due in part to China’s slowing economy and currency depreciation, disappointing data in other emerging markets, and further declines in commodities prices. Meanwhile, investors also reacted negatively to the Fed’s decision in September to postpone an interest rate increase. That decision fueled worries that the U.S. economic recovery remained sluggish.
Global bond yields remained relatively low throughout the 12-month period, reflecting investors’ uncertainty over the health of global economies and the Fed’s reluctance to raise interest rates. Investors during the second half of the period sought out areas of relative safety in the fixed income market, favoring U.S. Government bonds over higher yielding corporate issues. The yield on the 10-year Treasury bond rallied somewhat toward the end of the period, nonetheless still finished slightly lower than where it started at the beginning of the period.
The relative outperformance of U.S. stocks has helped the Fund’s absolute returns as we favored domestic equities over international equities. However, as the Fund is a multi-asset portfolio and includes many asset classes to achieve its risk/return profile, the Fund did not capture the full benefit from the strength of domestic equity markets. At the same time, the Fund underperformed its fixed income performance indices during the 12-month period because of the volatility in the energy space, which contributed to weak returns in credit sectors such as high-yield bonds.†
The Fund continues to maintain positions in property investments such as REITs as we believe property continues to offer reasonably attractive long-run prospective returns relative to core developed market government bonds.†
In the Fund’s fixed income holdings, we favored investment-grade corporate debt and high-yield securities over Treasury bonds. We continue to feel such issues offer higher yields and more appealing valuations than Treasuries. However, this preference had an adverse impact on absolute returns as government bonds outperformed for the period.†
We continued to see attractive valuations in the equity markets, leading to a bias toward stocks over bonds despite the lingering risks of a weaker global economy.†
| † | | Portfolio composition is subject to change. |
| 1 | | For additional information, please refer to the Glossary of Terms. |
Past performance does not guarantee future results. The performance data quoted represents past performance and current returns may be lower or higher. Total return figures include change in share price, reinvestment of dividends and capital gains and do not reflect taxes that a shareholder would pay on Fund distributions or on the redemption of Fund shares. Investment return and principal value will fluctuate so that an investor’s shares, when redeemed may be worth more or less than the original cost. To obtain performance information current to the most recent month end, please call 1-800-782-8183.
8 HSBC FAMILY OF FUNDS
| Portfolio Reviews (Unaudited) |
Moderate Strategy Fund
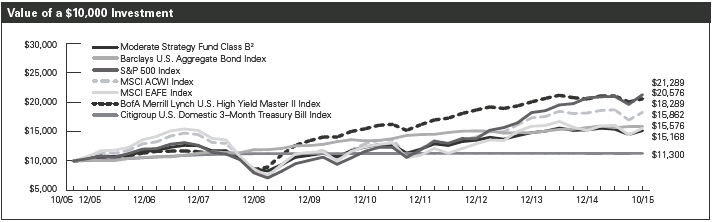
The charts above represent a historical 10-year performance comparison of a hypothetical $10,000 investment in the indicated share class versus a similar investment in the Fund’s benchmark and represents the reinvestment of dividends and capital gains in the Fund.
| | | | Average Annual | | Expense |
| Fund Performance | | | | Total Return (%) | | Ratio (%)4 |
| | Inception | | 1 | | 5 | | 10 | | | | |
| As of October 31, 2015 | | Date | | Year | | Year | | Year | | Gross | | Net |
| Moderate Strategy Fund Class A1 | | 2/3/05 | | -6.53 | | 3.81 | | 4.20 | | 1.39 | | 1.39 |
| Moderate Strategy Fund Class B2 | | 2/1/05 | | -5.83 | | 4.09 | | 4.25 | | 2.14 | | 2.14 |
| Moderate Strategy Fund Class C3 | | 6/9/05 | | -3.28 | | 4.09 | | 4.34 | | 2.14 | | 2.14 |
| Barclays U.S. Aggregate Bond Index5 | | — | | 1.96 | | 3.03 | | 4.72 | | N/A | | N/A |
| S&P 500 Index5 | | — | | 5.20 | | 14.33 | | 7.85 | | N/A | | N/A |
| MSCI ACWI Index5 | | — | | 0.50 | | 8.26 | | 6.22 | | N/A | | N/A |
| MSCI EAFE Index5 | | — | | 0.37 | | 5.28 | | 4.53 | | N/A | | N/A |
| BofA Merrill Lynch U.S. High Yield Master II Index5 | | — | | -2.05 | | 6.01 | | 7.48 | | N/A | | N/A |
| Citigroup U.S. Domestic 3-Month Treasury Bill Index5 | | — | | 0.02 | | 0.05 | | 1.23 | | N/A | | N/A |
Past performance does not guarantee future results. The performance data quoted represents past performance and current returns may be lower or higher. Total return figures include change in share price, reinvestment of dividends and capital gains and do not reflect the taxes that a shareholder would pay on Fund distributions or on the redemption of Fund shares. Investment return and principal value will fluctuate so that an investor’s shares, when redeemed may be worth more or less than the original cost. To obtain performance information current to the most recent month end, please call 1-800-782-8183.
The performance above reflects any fee waivers that have been in effect during the applicable periods, as well as any expense reimbursements that have periodically been made. Absent such waivers and reimbursements, returns would have been lower.
Certain returns shown include monies received by series of HSBC Portfolios (the “Portfolios”), in which the Fund invests, in respect of one-time class action settlements. As a result, the Fund’s total returns for those periods were higher than they would have been had the Portfolios not received the payments.
| 1 | | Reflects the maximum sales charge of 5.00%. |
| 2 | | Reflects the applicable contingent deferred sales charge, maximum of 4.00%. |
| 3 | | Reflects the applicable contingent deferred sales charge, maximum of 1.00%. |
| 4 | | Reflects the expense ratios as reported in the prospectus dated February 27, 2015. The expense ratios reflected include Acquired Fund fees and expenses. Additional information pertaining to the October 31, 2015 expense ratios can be found in the financial highlights. Expenses of the Underlying Funds are reflected in realized and unrealized gain (loss) on investments in the accompanying Statement of Operations, and are not included in the expense ratios shown in the accompanying Financial Highlights. |
| 5 | | For additional information, please refer to the Glossary of Terms. |
The Fund’s performance is primarily measured against the Barclays U.S. Aggregate Bond Index, an unmanaged index generally representative of investment-grade, USD-denominated, fixed-rate debt issues, taxable bond market, including Treasuries, government-related and corporate securities, asset-backed, mortgage-backed and commercial mortgage-backed securities, with maturities of at least one year. The performance of the index does not reflect the deduction of expenses associated with a mutual fund, such as investment management and fund accounting fees. The Fund’s performance reflects the deduction of fees for these value-added services. Investors cannot invest directly in an index.
HSBC FAMILY OF FUNDS 9
| Portfolio Reviews (Unaudited) |
Conservative Strategy Fund
(Class A Shares, Class B Shares and Class C Shares)
by Rayman Bovell, CFA, Senior Vice President and Head of Wealth Portfolio Management
The Conservative Strategy Fund (the “Fund”) is a “fund of funds” which seeks high total return consisting of long-term growth of capital and current income by investing primarily in underlying funds. The underlying funds may include mutual funds managed by HSBC Global Asset Management (USA) Inc. (the “Adviser”), mutual funds managed by investment advisers that are not associated with the Adviser and exchange traded funds (“ETFs”) (collectively, “Underlying Funds”). The Fund may invest in both actively-managed and passively-managed Underlying Funds to implement the Adviser’s investment views. The Fund may also purchase or hold exchange traded notes (“ETNs”).
Investment Concerns
Allocation Risk: The risk that the Adviser’s target asset and sector allocations and changes in target asset and sector allocations cause the Fund to underperform other similar funds or cause you to lose money, and that the Fund may not achieve its target asset and sector allocations.
Underlying Fund Selection Risk: The risk that the Fund may invest in Underlying Funds that underperform other similar funds or the markets more generally, due to poor investment decisions by the investment adviser(s) for the Underlying Funds or otherwise. Underlying Funds also have their own expenses, which the Fund bears in addition to its own expenses.
Equity Securities Risk: A portion of the assets of the Fund is allocated to Underlying Funds investing primarily in equity securities. Therefore, the value of the Fund may increase or decrease as a result of its indirect interest in equity securities.
Fixed Income Securities Risk: A portion of the assets of the Fund is allocated to Underlying Funds investing primarily in fixed income securities. Therefore, the value of the Fund may increase or decrease as a result of its indirect interest in fixed income securities.
Foreign Securities/Emerging Markets Risk: Foreign securities, including those of emerging market issuers, are subject to additional risks including international trade, currency, political, and regulatory risks. Securities of emerging market issuers generally have more risk than securities issued by issuers in more developed foreign markets.
REIT Risk: Investments in the Funds are subject to the risks related to direct investment in real estate, such as real estate risk, regulatory risks, concentration risk, and diversification risk.
For a complete description of these and other risks associated with investment in a mutual fund, please refer to the Fund’s prospectus.
Market Commentary
The Fund returned -1.37% (without sales charge) for the Class A Shares for the year ended October 31, 2015. That compared to an 1.96% total return for the Fund’s primary benchmark, the Barclays U.S. Aggregate Bond Index1.
The Fund measured performance against several additional reference indices for the year ended October 31, 2015: the MSCI ACWI Index1 (0.50% total return) the S&P 500 Index1 (5.20% total return), MSCI EAFE Index1 (0.37% total return), BofA Merrill Lynch U.S. High Yield Master II Index1 (-2.05% total return) and Citigroup U.S. Domestic 3-Month Treasury Bill Index1 (0.02% total return).
Portfolio Performance
Global equity markets were mixed during the 12-month period. International stocks underperformed domestic stocks in U.S. dollar terms early in the period while domestic stocks generally traded in a range through the first quarter of 2015. Early in the period, investors worried about a modest downturn in U.S. economic growth, as well as the Federal Reserve’s (the Fed) decision to keep interest rates at near-zero levels. Meanwhile, continued economic weakness in Europe and China also muted the performance of global equity markets. Valuations for U.S. stocks improved into early summer amid improving economic data and relatively strong corporate earnings results.
As the period wore on, volatility increased in the global equity markets, due in part to China’s slowing economy and currency depreciation, disappointing data in other emerging markets, and further declines in commodities prices. Meanwhile, investors also reacted negatively to the Fed’s decision in September to postpone an interest rate increase. That decision fueled worries that the U.S. economic recovery remained sluggish.
Global bond yields remained relatively low throughout the 12-month period, reflecting investors’ uncertainty over the health of global economies and the Fed’s reluctance to raise interest rates. Investors during the second half of the period sought out areas of relative safety in the fixed income market, favoring U.S. Government bonds over higher yielding corporate issues. The yield on the 10-year Treasury bond rallied somewhat toward the end of the period, but still finished slightly lower than where it started at the beginning of the period.
The relative outperformance of U.S. stocks has helped the Fund’s absolute returns as we favored domestic equities over international equities. However, as the Fund is a multi-asset portfolio and includes many asset classes to achieve its risk/return profile, the Fund did not capture the full benefit from the strength of domestic equity markets. At the same time, the Fund underperformed its fixed income performance indices during the 12-month period because of the volatility in the energy space, which contributed to weak returns in credit sectors such as high-yield bonds.†
The Fund continues to maintain positions in property investments such as REITs as we believe property continues to offer reasonably attractive long-run prospective returns relative to core developed market government bonds.†
In the Fund’s fixed income holdings, we favored investment-grade corporate debt and high-yield securities over Treasury bonds. We continue to feel such issues offer higher yields and more appealing valuations than Treasuries. However, this preference had an adverse impact on absolute returns as government bonds outperformed for the period.†
We continued to see attractive valuations in the equity markets, leading to a bias toward stocks over bonds despite the lingering risks of a weaker global economy.†
| † | | Portfolio composition is subject to change. |
| 1 | | For additional information, please refer to the Glossary of Terms. |
Past performance does not guarantee future results. The performance data quoted represents past performance and current returns may be lower or higher. Total return figures include change in share price, reinvestment of dividends and capital gains and do not reflect taxes that a shareholder would pay on Fund distributions or on the redemption of Fund shares. Investment return and principal value will fluctuate so that an investor’s shares, when redeemed may be worth more or less than the original cost. To obtain performance information current to the most recent month end, please call 1-800-782-8183.
10 HSBC FAMILY OF FUNDS
| Portfolio Reviews (Unaudited) |
Conservative Strategy Fund

The charts above represent a historical 10-year performance comparison of a hypothetical $10,000 investment in the indicated share class versus a similar investment in the Fund’s benchmark and represents the reinvestment of dividends and capital gains in the Fund.
| | | | Average Annual | | Expense |
| Fund Performance | | | | Total Return (%) | | Ratio (%)4 |
| | Inception | | 1 | | 5 | | 10 | | | | |
| As of October 31, 2015 | | Date | | Year | | Year | | Year | | Gross | | Net |
| Conservative Strategy Fund Class A1 | | 2/23/05 | | -6.27 | | 2.81 | | 3.65 | | 1.58 | | 1.58 |
| Conservative Strategy Fund Class B2 | | 2/17/05 | | -5.61 | | 3.13 | | 3.73 | | 2.33 | | 2.33 |
| Conservative Strategy Fund Class C3 | | 4/19/05 | | -2.91 | | 3.12 | | 3.85 | | 2.33 | | 2.33 |
| Barclays U.S. Aggregate Bond Index5 | | — | | 1.96 | | 3.03 | | 4.72 | | N/A | | N/A |
| S&P 500 Index5 | | — | | 5.20 | | 14.33 | | 7.85 | | N/A | | N/A |
| MSCI ACWI Index5 | | — | | 0.50 | | 8.26 | | 6.22 | | N/A | | N/A |
| MSCI EAFE Index5 | | — | | 0.37 | | 5.28 | | 4.53 | | N/A | | N/A |
| BofA Merrill Lynch U.S. High Yield Master II Index5 | | — | | -2.05 | | 6.01 | | 7.48 | | N/A | | N/A |
| Citigroup U.S. Domestic 3-Month Treasury Bill Index5 | | — | | 0.02 | | 0.05 | | 1.23 | | N/A | | N/A |
Past performance does not guarantee future results. The performance data quoted represents past performance and current returns may be lower or higher. Total return figures include change in share price, reinvestment of dividends and capital gains and do not reflect the taxes that a shareholder would pay on Fund distributions or on the redemption of Fund shares. Investment return and principal value will fluctuate so that an investor’s shares, when redeemed may be worth more or less than the original cost. To obtain performance information current to the most recent month end, please call 1-800-782-8183.
The performance above reflects any fee waivers that have been in effect during the applicable periods, as well as any expense reimbursements that have periodically been made. Absent such waivers and reimbursements, returns would have been lower.
Certain returns shown include monies received by series of HSBC Portfolios (the “Portfolios”), in which the Fund invests, in respect of one-time class action settlements. As a result, the Fund’s total returns for those periods were higher than they would have been had the Portfolios not received the payments.
| 1 | | Reflects the maximum sales charge of 5.00%. |
| 2 | | Reflects the applicable contingent deferred sales charge, maximum of 4.00%. |
| 3 | | Reflects the applicable contingent deferred sales charge, maximum of 1.00%. |
| 4 | | Reflects the expense ratios as reported in the prospectus dated February 27, 2015. The expense ratios reflected include Acquired Fund fees and expenses. Additional information pertaining to the October 31, 2015 expense ratios can be found in the financial highlights. Expenses of the Underlying Funds are reflected in realized and unrealized gain (loss) on investments in the accompanying Statement of Operations, and are not included in the expense ratios shown in the accompanying Financial Highlights. |
| 5 | | For additional information, please refer to the Glossary of Terms. |
The Fund’s performance is primarily measured against the Barclays U.S. Aggregate Bond Index, an unmanaged index generally representative of investment-grade, USD-denominated, fixed-rate debt issues, taxable bond market, including Treasuries, government-related and corporate securities, asset-backed, mortgage-backed and commercial mortgage-backed securities, with maturities of at least one year. The performance of the index does not reflect the deduction of expenses associated with a mutual fund, such as investment management and fund accounting fees. The Fund’s performance reflects the deduction of fees for these value-added services. Investors cannot invest directly in an index.
HSBC FAMILY OF FUNDS 11
| Portfolio Reviews (Unaudited) |
| Income Strategy Fund |
| (Class A Shares, Class B Shares and Class C Shares) |
by Rayman Bovell, CFA, Senior Vice President and Head of Wealth Portfolio Management
The Income Strategy Fund (the “Fund”) is a “fund of funds” which primarily seeks current income and secondarily seeks to provide long-term growth of capital by investing primarily in underlying funds. The underlying funds may include mutual funds managed by HSBC Global Asset Management (USA) Inc. (the “Adviser”), mutual funds managed by investment advisers that are not associated with the Adviser and exchange traded funds (“ETFs”) (collectively, “Underlying Funds”). The Fund may invest in both actively-managed and passively-managed Underlying Funds to implement the Adviser’s investment views. The Fund may also purchase or hold exchange traded notes (“ETNs”).
Investment Concerns
Allocation Risk: The risk that the Adviser’s target asset and sector allocations and changes in target asset and sector allocations cause the Fund to underperform other similar funds or cause you to lose money, and that the Fund may not achieve its target asset and sector allocations.
Underlying Fund Selection Risk: The risk that the Fund may invest in Underlying Funds that underperform other similar funds or the markets more generally, due to poor investment decisions by the investment adviser(s) for the Underlying Funds or otherwise. Underlying Funds also have their own expenses, which the Fund bears in addition to its own expenses.
Equity Securities Risk: A portion of the assets of the Fund is allocated to Underlying Funds investing primarily in equity securities. Therefore, the value of the Fund may increase or decrease as a result of its indirect interest in equity securities.
Fixed Income Securities Risk: A portion of the assets of the Fund is allocated to Underlying Funds investing primarily in fixed income securities. Therefore, the value of the Fund may increase or decrease as a result of its indirect interest in fixed income securities.
Foreign Securities/Emerging Markets Risk: Foreign securities, including those of emerging market issuers, are subject to additional risks including international trade, currency, political, and regulatory risks. Securities of emerging market issuers generally have more risk than securities issued by issuers in more developed foreign markets.
REIT Risk: Investments in the Funds are subject to the risks related to direct investment in real estate, such as real estate risk, regulatory risks, concentration risk, and diversification risk.
For a complete description of these and other risks associated with investment in a mutual fund, please refer to the Fund’s prospectus.
Market Commentary
The Fund returned -0.50% (without sales charge) for the Class A Shares for the year ended October 31, 2015. That compared to a 1.96% total return for the Fund’s primary benchmark, the Barclays U.S. Aggregate Bond Index1.
The Fund measured performance against several additional reference indices for the year ended October 31, 2015: the MSCI ACWI Index1 (0.50% total return), the S&P 500 Index1 (5.20% total return), MSCI EAFE Index (0.37% total return), BofA Merrill Lynch U.S. High Yield Master II Index1 (-2.05% total return) and Citigroup U.S. Domestic 3-Month Treasury Bill Index1 (0.02% total return).
Portfolio Performance
Global equity markets were mixed during the 12-month period. International stocks underperformed domestic stocks in U.S. dollar terms early in the period while domestic stocks generally traded in a range through the first quarter of 2015. Early in the period, investors worried about a modest downturn in U.S. economic growth, as well as the Federal Reserve’s (the Fed) decision to keep interest rates at near-zero levels. Meanwhile, continued economic weakness in Europe and China also muted the performance of global equity markets. Valuations for U.S. stocks improved into early summer amid improving economic data and relatively strong corporate earnings results.
As the period wore on, volatility increased in the global equity markets, due in part to China’s slowing economy and currency depreciation, disappointing data in other emerging markets, and further declines in commodities prices. Meanwhile, investors also reacted negatively to the Fed’s decision in September to postpone an interest rate increase. That decision fueled worries that the U.S. economic recovery remained sluggish.
Global bond yields remained relatively low throughout the 12-month period, reflecting investors’ uncertainty over the health of global economies and the Fed’s reluctance to raise interest rates. Investors during the second half of the period sought out areas of relative safety in the fixed income market, favoring U.S. Government bonds over higher yielding corporate issues. The yield on the 10-year Treasury bond rallied somewhat toward the end of the period, nevertheless still finished slightly lower than where it started at the beginning of the period.
The relative outperformance of U.S. stocks has helped the Fund’s absolute returns as we favored domestic equities over international equities. However, as the Fund is a multi-asset portfolio and includes many asset classes to achieve its risk/return profile, the Fund did not capture the full benefit from the strength of domestic equity markets. At the same time, the Fund underperformed its fixed income performance indices during the 12-month period because of the volatility in the energy space, which contributed to weak returns in credit sectors such as high-yield bonds.†
In the Fund’s fixed income holdings, we favored investment-grade corporate debt and high-yield securities over Treasury bonds. We continue to feel such issues offer higher yields and more appealing valuations than Treasuries. However, this preference had an adverse impact on absolute returns as government bonds outperformed for the period.†
| † | Portfolio composition is subject to change. |
| 1 | For additional information, please refer to the Glossary of Terms. |
Past performance does not guarantee future results. The performance data quoted represents past performance and current returns may be lower or higher. Total return figures include change in share price, reinvestment of dividends and capital gains and do not reflect taxes that a shareholder would pay on Fund distributions or on the redemption of Fund shares. Investment return and principal value will fluctuate so that an investor’s shares, when redeemed may be worth more or less than the original cost. To obtain performance information current to the most recent month end, please call 1-800-782-8183.
12 HSBC FAMILY OF FUNDS
| Portfolio Reviews (Unaudited) |
| Income Strategy Fund |
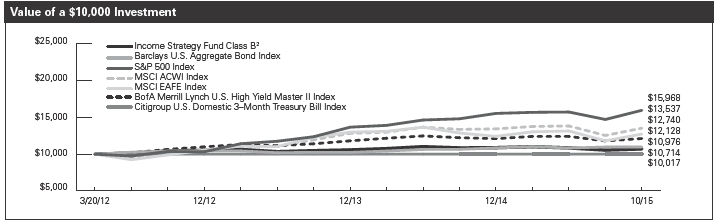
The charts above represent a historical since inception performance comparison of a hypothetical $10,000 investment in the indicated share class versus a similar investment in the Fund’s benchmark and represents the reinvestment of dividends and capital gains in the Fund.
| | | | Average Annual | | Expense |
| Fund Performance | | | | Total Return (%) | | Ratio (%)4 |
| | Inception | | 1 | | Since | | | | |
| As of October 31, 2015 | | Date | | Year | | Inception | | Gross | | Net |
| Income Strategy Fund Class A1 | | 3/20/12 | | -5.25 | | | 1.58 | | | | 10.41 | | 1.78 |
| Income Strategy Fund Class B2 | | 3/20/12 | | -5.13 | | | 1.92 | | | | 11.16 | | 2.53 |
| Income Strategy Fund Class C3 | | 3/20/12 | | -2.14 | | | 2.18 | | | | 11.16 | | 2.53 |
| Barclays U.S. Aggregate Bond Index5 | | — | | 1.96 | | | 2.61 | 6 | | | N/A | | N/A |
| S&P 500 Index5 | | — | | 5.20 | | | 13.83 | 6 | | | N/A | | N/A |
| MSCI ACWI Index5 | | — | | 0.50 | | | 8.74 | 6 | | | N/A | | N/A |
| MSCI EAFE Index5 | | — | | 0.37 | | | 6.93 | 6 | | | N/A | | N/A |
| BofA Merrill Lynch U.S. High Yield Master II Index5 | | — | | -2.05 | | | 5.48 | 6 | | | N/A | | N/A |
| Citigroup U.S. Domestic 3-Month Treasury Bill Index5 | | — | | 0.02 | | | 0.05 | 6 | | | N/A | | N/A |
Past performance does not guarantee future results. The performance data quoted represents past performance and current returns may be lower or higher. Total return figures include change in share price, reinvestment of dividends and capital gains and do not reflect the taxes that a shareholder would pay on Fund distributions or on the redemption of Fund shares. Investment return and principal value will fluctuate so that an investor’s shares, when redeemed may be worth more or less than the original cost. To obtain performance information current to the most recent month end, please call 1-800-782-8183.
The performance above reflects any fee waivers that have been in effect during the applicable periods, as well as any expense reimbursements that have periodically been made. Absent such waivers and reimbursements, returns would have been lower. Currently, contractual fee waivers are in effect for the Fund through March 1, 2016.
| 1 | Reflects the maximum sales charge of 4.75%. |
| 2 | Reflects the applicable contingent deferred sales charge, maximum of 4.00%. |
| 3 | Reflects the applicable contingent deferred sales charge, maximum of 1.00%. |
| 4 | Reflects the expense ratios as reported in the prospectus dated February 27, 2015. The Adviser has entered into a contractual expense limitation agreement with the Fund under which it will limit total expenses of the Fund (excluding interest, taxes, brokerage commissions, extraordinary expenses and estimated indirect expenses attributable to the Fund’s investments in investment companies other than the HSBC Growth Portfolio and HSBC Opportunity Portfolio) to an annual rate of 1.50%, 2.25% and 2.25% for Class A Shares, Class B Shares and Class C Shares, respectively. The expense limitation shall be in effect until March 1, 2016. The expense ratios reflected include Acquired Fund fees and expenses. Additional information pertaining to the October 31, 2015 expense ratios can be found in the financial highlights. Expenses of the Underlying Funds are reflected in realized and unrealized gain (loss) on investments in the accompanying Statement of Operations, and are not included in the expense ratios shown in the accompanying Financial Highlights. |
| 5 | For additional information, please refer to the Glossary of Terms. |
| 6 | Return for the period March 20, 2012 to October 31, 2015. |
The Fund’s performance is primarily measured against the Barclays U.S. Aggregate Bond Index, an unmanaged index generally representative of investment-grade, USD-denominated, fixed-rate debt issues, taxable bond market, including Treasuries, government-related and corporate securities, asset-backed, mortgage-backed and commercial mortgage-backed securities, with maturities of at least one year. The performance of the index does not reflect the deduction of expenses associated with a mutual fund, such as investment management and fund accounting fees. The Fund’s performance reflects the deduction of fees for these value-added services. Investors cannot invest directly in an index.
HSBC FAMILY OF FUNDS 13
| Portfolio Reviews |
| Portfolio Composition* |
| October 31, 2015 (Unaudited) |
| HSBC Aggressive Strategy Fund | | |
| | | Percentage of |
| Investment Allocation | | Investments at Value(%) |
| Global Equity | | 92.7 |
| Alternatives | | 5.1 |
| Cash | | 2.2 |
| Total | | 100.0 |
| |
| HSBC Balanced Strategy Fund | | |
| | | Percentage of |
| Investment Allocation | | Investments at Value(%) |
| Global Equity | | 74.1 |
| Fixed Income | | 19.5 |
| Alternatives | | 5.1 |
| Cash | | 1.3 |
| Total | | 100.0 |
| |
| HSBC Moderate Strategy Fund | | |
| | | Percentage of |
| Investment Allocation | | Investments at Value(%) |
| Global Equity | | 50.4 |
| Fixed Income | | 42.5 |
| Alternatives | | 5.1 |
| Cash | | 2.0 |
| Total | | 100.0 |
| |
| HSBC Conservative Strategy Fund |
| | | Percentage of |
| Investment Allocation | | Investments at Value(%) |
| Fixed Income | | 68.9 |
| Global Equity | | 26.7 |
| Alternatives | | 3.2 |
| Cash | | 1.2 |
| Total | | 100.0 |
| |
| HSBC Income Strategy Fund | | |
| | | Percentage of |
| Investment Allocation | | Investments at Value(%) |
| Fixed Income | | 75.8 |
| Global Equity | | 22.8 |
| Cash | | 1.4 |
| Total | | 100.0 |
____________________
| * | Portfolio composition is subject to change. |
14 HSBC FAMILY OF FUNDS
| HSBC AGGRESSIVE STRATEGY FUND |
| Schedule of Portfolio Investments—as of October 31, 2015 |
| Affiliated Investment Company—2.2% | | | | | |
| | | | | |
| | Shares | | Value ($) |
| HSBC Prime Money Market Fund, | | | | | |
| Class I Shares, 0.07% (a) | | 351,984 | | | 351,984 |
| TOTAL AFFILIATED INVESTMENT | | | | | |
| COMPANY (COST $351,984) | | | | | 351,984 |
| |
| Unaffiliated Investment Companies—63.8% | | | |
| |
| Vanguard 500 Index Fund, | | | | | |
| Admiral Shares | | 28,562 | | | 5,485,968 |
| Vanguard FTSE All World ex-U.S. Index | | | | | |
| Fund, Admiral Shares | | 159,758 | | | 4,509,966 |
| TOTAL UNAFFILIATED INVESTMENT | | | | | |
| COMPANIES (COST $10,181,651) | | | | | 9,995,934 |
| |
| Exchange Traded Funds—33.8% | | | | | |
| |
| PowerShares FTSE RAFI Developed | | | | | |
| Markets ex-U.S. Portfolio | | 43,202 | | | 1,656,797 |
| PowerShares FTSE RAFI Emerging | | | | | |
| Markets Portfolio | | 19,201 | | | 294,351 |
| PowerShares FTSE RAFI | | | | | |
| U.S. 1000 Portfolio | | 28,656 | | | 2,556,975 |
| SPDR Dow Jones Global Real | | | | | |
| Estate ETF | | 16,698 | | | 797,663 |
| TOTAL EXCHANGE TRADED | | | | | |
| FUNDS (COST $5,546,836) | | | | | 5,305,786 |
| TOTAL INVESTMENT | | | | | |
| SECURITIES—99.8% | | | | | |
| (COST $16,080,471) | | | | | 15,653,704 |
| Other Assets (Liabilities)—0.2% | | | | | 34,616 |
| NET ASSETS—100% | | | | $ | 15,688,320 |
____________________
| (a) | The rate represents the annualized one-day yield that was in effect on October 31, 2015. |
ETF - Exchange Traded Fund
SPDR - Standard & Poor’s Depositary Receipt |
| See notes to financial statements. | HSBC FAMILY OF FUNDS 15 |
| HSBC BALANCED STRATEGY FUND |
| Schedule of Portfolio Investments—as of October 31, 2015 |
| Affiliated Investment Companies—9.4% | | | | |
| | | | | | |
| | Shares | | Value ($) |
| HSBC Emerging Markets Debt Fund, | | | | | | |
| Class I Shares | | 211,225 | | | 2,093,238 | |
| HSBC Emerging Markets Local | | | | | | |
| Debt Fund, Class I Shares | | 168,939 | | | 1,140,336 | |
| HSBC Prime Money Market Fund, | | | | | | |
| Class I Shares, 0.07% (a) | | 524,523 | | | 524,523 | |
| TOTAL AFFILIATED INVESTMENT | | | | | | |
| COMPANIES (COST $4,030,334) | | | | | 3,758,097 | |
| | | | | | | |
| Unaffiliated Investment Companies—62.4% | | | | |
| |
| Columbia High Yield Bond Fund, | | | | | | |
| Class Z Shares | | 1,595,753 | | | 4,595,770 | |
| Vanguard 500 Index Fund, | | | | | | |
| Admiral Shares | | 57,009 | | | 10,949,771 | |
| Vanguard FTSE All World ex-U.S. | | | | | | |
| Index Fund, Admiral Shares | | 332,884 | | | 9,397,326 | |
| TOTAL UNAFFILIATED INVESTMENT | | | | | | |
| COMPANIES (COST $25,411,662) | | | | | 24,942,867 | |
| | | | | | | |
| Exchange Traded Funds—28.4% | | | | | | |
| |
| PowerShares FTSE RAFI Developed | | | | | | |
| Markets ex-U.S. Portfolio | | 88,185 | | | 3,381,895 | |
| PowerShares FTSE RAFI Emerging | | | | | | |
| Markets Portfolio | | 39,281 | | | 602,178 | |
| PowerShares FTSE RAFI | | | | | | |
| U.S. 1000 Portfolio | | 59,648 | | | 5,322,391 | |
| SPDR Dow Jones Global Real | | | | | | |
| Estate ETF | | 42,951 | | | 2,051,769 | |
| TOTAL EXCHANGE TRADED | | | | | | |
| FUNDS (COST $11,851,717) | | | | | 11,358,233 | |
| TOTAL INVESTMENT | | | | | | |
| SECURITIES—100.2% | | | | | | |
| (COST $41,293,713) | | | | | 40,059,197 | |
| Other Assets (Liabilities)—(0.2)% | | | | | (62,017 | ) |
| NET ASSETS—100% | | | | $ | 39,997,180 | |
____________________
| (a) | The rate represents the annualized one-day yield that was in effect on October 31, 2015. |
ETF - Exchange Traded Fund |
SPDR - Standard & Poor’s Depositary Receipt |
| 16 HSBC FAMILY OF FUNDS | See notes to financial statements. |
| HSBC MODERATE STRATEGY FUND |
| Schedule of Portfolio Investments—as of October 31, 2015 |
| Affiliated Investment Companies—10.1% | | | | |
| | | | |
| | Shares | | Value ($) |
| HSBC Emerging Markets Debt Fund, | | | | | | |
| Class I Shares | | 194,977 | | | 1,932,219 | |
| HSBC Emerging Markets Local | | | | | | |
| Debt Fund, Class I Shares | | 160,167 | | | 1,081,130 | |
| HSBC Prime Money Market Fund, | | | | | | |
| Class I Shares, 0.07% (a) | | 741,957 | | | 741,957 | |
| TOTAL AFFILIATED INVESTMENT | | | | | | |
| COMPANIES (COST $4,076,093) | | | | | 3,755,306 | |
| | | | | | | |
| Unaffiliated Investment Companies—46.3% | | | | |
| |
| Columbia High Yield Bond Fund, | | | | | | |
| Class Z Shares | | 1,504,590 | | | 4,333,218 | |
| Vanguard 500 Index Fund, | | | | | | |
| Admiral Shares | | 36,302 | | | 6,972,446 | |
| Vanguard FTSE All World ex-U.S. | | | | | | |
| Index Fund, Admiral Shares | | 206,511 | | | 5,829,802 | |
| TOTAL UNAFFILIATED INVESTMENT | | | | | | |
| COMPANIES (COST $17,436,344) | | | | | 17,135,466 | |
| | | | | | | |
| Exchange Traded Funds—43.8% | | | | | | |
| |
| iShares 1-3 Year Treasury Bond ETF | | 4,981 | | | 422,538 | |
| iShares 3-7 Year Treasury Bond ETF | | 4,612 | | | 571,473 | |
| iShares 7-10 Year Treasury Bond ETF | | 1,109 | | | 118,685 | |
| iShares iBoxx $ Investment Grade | | | | | | |
| Corporate Bond | | 31,963 | | | 3,721,133 | |
| PowerShares FTSE RAFI Developed | | | | | | |
| Markets ex-U.S. Portfolio | | 55,670 | | | 2,134,945 | |
| PowerShares FTSE RAFI Emerging | | | | | | |
| Markets Portfolio | | 24,319 | | | 372,810 | |
| PowerShares FTSE RAFI U.S. | | | | | | |
| 1000 Portfolio | | 37,516 | | | 3,347,552 | |
| SPDR Barclays Intermediate Term | | | | | | |
| Corporate Bond ETF | | 106,802 | | | 3,630,200 | |
| SPDR Dow Jones Global Real | | | | | | |
| Estate ETF | | 39,679 | | | 1,895,466 | |
| TOTAL EXCHANGE TRADED | | | | | | |
| FUNDS (COST $16,602,758) | | | | | 16,214,802 | |
| TOTAL INVESTMENT | | | | | | |
| SECURITIES—100.2% | | | | | | |
| (COST $38,115,195) | | | | | 37,105,574 | |
| Other Assets (Liabilities)—(0.2)% | | | | | (57,200 | ) |
| NET ASSETS—100% | | | | $ | 37,048,374 | |
____________________
| (a) | The rate represents the annualized one-day yield that was in effect on October 31, 2015. |
ETF - Exchange Traded Fund
SPDR - Standard & Poor’s Depositary Receipt |
| See notes to financial statements. | HSBC FAMILY OF FUNDS 17 |
| HSBC CONSERVATIVE STRATEGY FUND |
| Schedule of Portfolio Investments—as of October 31, 2015 |
| Affiliated Investment Companies—5.6% | | | | |
| | | | | |
| | Shares | | Value ($) |
| HSBC Emerging Markets Debt Fund, | | | | | | |
| Class I Shares | | 75,012 | | | 743,366 | |
| HSBC Prime Money Market Fund, | | | | | | |
| Class I Shares, 0.07% (a) | | 192,666 | | | 192,666 | |
| TOTAL AFFILIATED INVESTMENT | | | | | | |
| COMPANIES (COST $955,755) | | | | | 936,032 | |
| | | | | |
| Unaffiliated Investment Companies—31.7% | | | | |
| |
| Columbia High Yield Bond Fund, | | | | | | |
| Class Z Shares | | 751,977 | | | 2,165,693 | |
| Vanguard 500 Index Fund, | | | | | | |
| Admiral Shares | | 8,695 | | | 1,669,997 | |
| Vanguard FTSE All World ex-U.S. | | | | | | |
| Index Fund, Admiral Shares | | 51,754 | | | 1,461,024 | |
| TOTAL UNAFFILIATED INVESTMENT | | | | | | |
| COMPANIES (COST $5,383,826) | | | | | 5,296,714 | |
| | | | | | | |
| Exchange Traded Funds—62.7% | | | | | | |
| |
| iShares 1-3 Year Treasury Bond ETF | | 16,024 | | | 1,359,316 | |
| iShares 20+ Year Treasury Bond ETF | | 1,322 | | | 162,315 | |
| iShares 3-7 Year Treasury Bond ETF | | 12,189 | | | 1,510,339 | |
| iShares 7-10 Year Treasury Bond ETF | | 3,649 | | | 390,516 | |
| iShares iBoxx $ Investment Grade | | | | | | |
| Corporate Bond | | 21,973 | | | 2,558,097 | |
| PowerShares FTSE RAFI Developed | | | | | | |
| Markets ex-U.S. Portfolio | | 13,692 | | | 525,088 | |
| PowerShares FTSE RAFI U.S. | | | | | | |
| 1000 Portfolio | | 9,201 | | | 821,005 | |
| SPDR Barclays Intermediate Term | | | | | | |
| Corporate Bond ETF | | 77,439 | | | 2,632,152 | |
| SPDR Dow Jones Global Real | | | | | | |
| Estate ETF | | 11,156 | | | 532,922 | |
| TOTAL EXCHANGE TRADED | | | | | | |
| FUNDS (COST $10,570,521) | | | | | 10,491,750 | |
| TOTAL INVESTMENT | | | | | | |
| SECURITIES—100.0% | | | | | | |
| (COST $16,910,102) | | | | | 16,724,496 | |
| Other Assets (Liabilities)— –% | | | | | (7,519 | ) |
| NET ASSETS—100% | | | | $ | 16,716,977 | |
____________________
| (a) | The rate represents the annualized one-day yield that was in effect on October 31, 2015. |
ETF - Exchange Traded Fund
SPDR - Standard & Poor’s Depositary Receipt |
| 18 HSBC FAMILY OF FUNDS | See notes to financial statements. |
| HSBC INCOME STRATEGY FUND |
| Schedule of Portfolio Investments—as of October 31, 2015 |
| Affiliated Investment Companies—2.5% | | | | |
| | | | | |
| | Shares | | Value ($) |
| HSBC Emerging Markets Debt Fund, | | | | | | |
| Class I Shares | | 1,144 | | | 11,340 | |
| HSBC Prime Money Market Fund, | | | | | | |
| Class I Shares, 0.07% (a) | | 15,915 | | | 15,915 | |
| TOTAL AFFILIATED INVESTMENT | | | | | | |
| COMPANIES (COST $27,197) | | | | | 27,255 | |
| | | | | |
| Unaffiliated Investment Companies—29.0% | | | | |
| |
| Columbia High Yield Bond Fund, | | | | | | |
| Class Z Shares | | 49,072 | | | 141,329 | |
| Vanguard 500 Index Fund, Admiral Shares | | 495 | | | 95,013 | |
| Vanguard FTSE All World ex-U.S. | | | | | | |
| Index Fund, Admiral Shares | | 2,898 | | | 81,811 | |
| TOTAL UNAFFILIATED INVESTMENT | | | | | | |
| COMPANIES (COST $325,351) | | | | | 318,153 | |
| | | | | | | |
| Exchange Traded Funds—70.3% | | | | | | |
| |
| iShares 1-3 Year Treasury Bond ETF | | 2,547 | | | 216,062 | |
| iShares 20+ Year Treasury Bond ETF | | 225 | | | 27,626 | |
| iShares 3-7 Year Treasury Bond ETF | | 1,965 | | | 243,482 | |
| iShares 7-10 Year Treasury Bond ETF | | 570 | | | 61,001 | |
| iShares iBoxx $ Investment Grade | | | | | | |
| Corporate Bond | | 583 | | | 67,873 | |
| PowerShares FTSE RAFI Developed | | | | | | |
| Markets ex-U.S. Portfolio | | 853 | | | 32,713 | |
| PowerShares FTSE RAFI U.S. | | | | | | |
| 1000 Portfolio | | 509 | | | 45,418 | |
| SPDR Barclays Intermediate Term | | | | | | |
| Corporate Bond ETF | | 2,315 | | | 78,687 | |
| TOTAL EXCHANGE TRADED | | | | | | |
| FUNDS (COST $771,019) | | | | | 772,862 | |
| TOTAL INVESTMENT | | | | | | |
| SECURITIES—101.8% | | | | | | |
| (COST $1,123,567) | | | | | 1,118,270 | |
| Other Assets (Liabilities)—(1.8)% | | | | | (19,609 | ) |
| NET ASSETS—100% | | | | $ | 1,098,661 | |
____________________
| (a) | The rate represents the annualized one-day yield that was in effect on October 31, 2015. |
ETF - Exchange Traded Fund
SPDR - Standard & Poor’s Depositary Receipt |
| See notes to financial statements. | HSBC FAMILY OF FUNDS 19 |
HSBC WORLD SELECTION FUNDS
Statements of Assets and Liabilities—as of October 31, 2015
| | Aggressive | | Balanced | | Moderate | | Conservative | | Income |
| | Strategy | | Strategy | | Strategy | | Strategy | | Strategy |
| | Fund | | Fund | | Fund | | Fund | | Fund |
| Assets: | | | | | | | | | | | | | | | | | | | | | | | | | | | | | | |
| Investments in Affiliated Investment Companies, at value(a) | | | $ | 351,984 | | | | | $ | 3,758,097 | | | | | $ | 3,755,306 | | | | | $ | 936,032 | | | | | $ | 27,255 | | |
| Investments in non-affiliates, at value | | | | 15,301,720 | | | | | | 36,301,100 | | | | | | 33,350,268 | | | | | | 15,788,464 | | | | | | 1,091,015 | | |
| Total Investments | | | | 15,653,704 | | | | | | 40,059,197 | | | | | | 37,105,574 | | | | | | 16,724,496 | | | | | | 1,118,270 | | |
| Interest and dividends receivable | | | | — | | | | | | 7 | | | | | | 6 | | | | | | 3 | | | | | | 656 | | |
| Receivable for capital shares issued | | | | 100 | | | | | | 2,004 | | | | | | 1,323 | | | | | | 725 | | | | | | 125 | | |
| Receivable for investments sold | | | | 88,702 | | | | | | 57,740 | | | | | | 33,487 | | | | | | 44,587 | | | | | | — | | |
| Receivable from Investment Adviser | | | | — | | | | | | — | | | | | | — | | | | | | — | | | | | | 12,797 | | |
| Prepaid expenses | | | | 3,478 | | | | | | 4,192 | | | | | | 3,568 | | | | | | 2,724 | | | | | | 1,452 | | |
| Total Assets | | | | 15,745,984 | | | | | | 40,123,140 | | | | | | 37,143,958 | | | | | | 16,772,535 | | | | | | 1,133,300 | | |
| Liabilities: | | | | | | | | | | | | | | | | | | | | | | | | | | | | | | |
| Payable for capital shares redeemed | | | | — | | | | | | 38,561 | | | | | | 12,441 | | | | | | — | | | | | | 2,934 | | |
| Accrued expenses and other payables: | | | | | | | | | | | | | | | | | | | | | | | | | | | | | | |
| Investment Management | | | | 9,040 | | | | | | 8,437 | | | | | | 7,833 | | | | | | 3,555 | | | | | | — | | |
| Administration | | | | 624 | | | | | | 1,592 | | | | | | 1,476 | | | | | | 670 | | | | | | 44 | | |
| Distribution fees | | | | 3,029 | | | | | | 9,023 | | | | | | 7,741 | | | | | | 5,575 | | | | | | 577 | | |
| Shareholder Servicing | | | | 3,310 | | | | | | 8,444 | | | | | | 7,841 | | | | | | 3,553 | | | | | | 229 | | |
| Compliance Services | | | | 10 | | | | | | 25 | | | | | | 18 | | | | | | 7 | | | | | | 2 | | |
| Accounting | | | | 7,596 | | | | | | 7,651 | | | | | | 7,691 | | | | | | 7,593 | | | | | | 7,672 | | |
| Custodian | | | | 1,436 | | | | | | 3,109 | | | | | | 3,363 | | | | | | 3,359 | | | | | | 1,898 | | |
| Transfer Agent | | | | 15,083 | | | | | | 23,525 | | | | | | 21,930 | | | | | | 13,230 | | | | | | 9,145 | | |
| Trustee | | | | 149 | | | | | | 375 | | | | | | 339 | | | | | | 164 | | | | | | 6 | | |
| Other | | | | 17,387 | | | | | | 25,218 | | | | | | 24,911 | | | | | | 17,852 | | | | | | 12,132 | | |
| Total Liabilities | | | | 57,664 | | | | | | 125,960 | | | | | | 95,584 | | | | | | 55,558 | | | | | | 34,639 | | |
| Net Assets | | | $ | 15,688,320 | | | | | $ | 39,997,180 | | | | | $ | 37,048,374 | | | | | $ | 16,716,977 | | | | | $ | 1,098,661 | | |
| | | | | | | | | | | | | | | | | | | | | | | | | | | | | | | |
| Composition of Net Assets: | | | | | | | | | | | | | | | | | | | | | | | | | | | | | | |
| Capital | | | | 16,129,522 | | | | | | 41,307,945 | | | | | | 38,264,970 | | | | | | 17,102,860 | | | | | | 1,118,260 | | |
| Accumulated net investment income/(loss) | | | | 26,472 | | | | | | 254,306 | | | | | | — | | | | | | — | | | | | | — | | |
| Accumulated net realized gains/(losses) from investments | | | | (40,907 | ) | | | | | (330,555 | ) | | | | | (206,975 | ) | | | | | (200,277 | ) | | | | | (14,302 | ) | |
| Net unrealized appreciation (depreciation) on investments | | | | (426,767 | ) | | | | | (1,234,516 | ) | | | | | (1,009,621 | ) | | | | | (185,606 | ) | | | | | (5,297 | ) | |
| Net Assets | | | $ | 15,688,320 | | | | | $ | 39,997,180 | | | | | $ | 37,048,374 | | | | | $ | 16,716,977 | | | | | $ | 1,098,661 | | |
| | | | | | | | | | | | | | | | | | | | | | | | | | | | | | | |
| Net Assets: | | | | | | | | | | | | | | | | | | | | | | | | | | | | | | |
| Class A Shares | | | $ | 10,879,721 | | | | | $ | 25,765,487 | | | | | $ | 24,840,994 | | | | | $ | 7,991,294 | | | | | $ | 192,008 | | |
| Class B Shares | | | | 3,795,462 | | | | | | 10,308,772 | | | | | | 8,304,725 | | | | | | 5,729,110 | | | | | | 328,318 | | |
| Class C Shares | | | | 1,013,137 | | | | | | 3,922,921 | | | | | | 3,902,655 | | | | | | 2,996,573 | | | | | | 578,335 | | |
| Total | | | $ | 15,688,320 | | | | | $ | 39,997,180 | | | | | $ | 37,048,374 | | | | | $ | 16,716,977 | | | | | $ | 1,098,661 | | |
| Shares Outstanding: | | | | | | | | | | | | | | | | | | | | | | | | | | | | | | |
| ($0.001 par value, unlimited number of shares authorized): | | | | | | | | | | | | | | | | | | | | | | | | | | | | | | |
| Class A Shares | | | | 950,447 | | | | | | 2,307,237 | | | | | | 2,279,580 | | | | | | 755,096 | | | | | | 19,156 | | |
| Class B Shares | | | | 355,457 | | | | | | 926,849 | | | | | | 762,786 | | | | | | 550,588 | | | | | | 32,817 | | |
| Class C Shares | | | | 95,502 | | | | | | 352,412 | | | | | | 372,629 | | | | | | 278,597 | | | | | | 57,831 | | |
| Net Asset Value, Offering Price and Redemption | | | | | | | | | | | | | | | | | | | | | | | | | | | | | | |
| Price per share: | | | | | | | | | | | | | | | | | | | | | | | | | | | | | | |
| Class A Shares | | | $ | 11.45 | | | | | $ | 11.17 | | | | | $ | 10.90 | | | | | $ | 10.58 | | | | | $ | 10.02 | | |
| Class B Shares(b) | | | $ | 10.68 | | | | | $ | 11.12 | | | | | $ | 10.89 | | | | | $ | 10.41 | | | | | $ | 10.00 | | |
| Class C Shares(b) | | | $ | 10.61 | | | | | $ | 11.13 | | | | | $ | 10.47 | | | | | $ | 10.76 | | | | | $ | 10.00 | | |
| Maximum Sales Charge: | | | | | | | | | | | | | | | | | | | | | | | | | | | | | | |
| Class A Shares | | | | 5.00 | % | | | | | 5.00 | % | | | | | 5.00 | % | | | | | 5.00 | % | | | | | 4.75 | % | |
| Maximum Offering Price per share (Net Asset Value / | | | | | | | | | | | | | | | | | | | | | | | | | | | | | | |
| (100%-maximum sales charge)) | | | | | | | | | | | | | | | | | | | | | | | | | | | | | | |
| Class A Shares | | | $ | 12.05 | | | | | $ | 11.76 | | | | | $ | 11.47 | | | | | $ | 11.14 | | | | | $ | 10.52 | | |
| Investments in Affiliated Investment Companies, at cost (a) | | | $ | 351,984 | | | | | $ | 4,030,334 | | | | | $ | 4,076,393 | | | | | $ | 955,755 | | | | | $ | 27,197 | | |
| Total Investments, at cost | | | $ | 16,080,471 | | | | | $ | 41,293,713 | | | | | $ | 38,115,195 | | | | | $ | 16,910,102 | | | | | $ | 1,123,567 | | |
____________________
| (a) | Investments in affiliated investment companies include the HSBC Prime Money Market Fund, Class I Shares, HSBC Emerging Markets Debt Fund, Class I Shares and the HSBC Emerging Markets Local Debt Fund, Class I Shares (See Note 1). |
| (b) | Redemption Price per share varies by length of time shares are held. |
| 20 | HSBC WORLD SELECTION FUNDS | See notes to financial statements. |
HSBC WORLD SELECTION FUNDS
Statements of Operations—For the Year Ended October 31, 2015
| | Aggressive | | Balanced | | Moderate | | Conservative | | Income |
| | Strategy | | Strategy | | Strategy | | Strategy | | Strategy |
| | Fund | | Fund | | Fund | | Fund | | Fund |
| Investment Income: | | | | | | | | | | | | | | | | | | | | | | | | | | | | | | |
| Investment income from non-affiliated investments | | | $ | 394,415 | | | | | $ | 1,038,485 | | | | | $ | 998,732 | | | | | $ | 447,925 | | | | | $ | 25,224 | | |
| Investment income from affiliated investments(a) | | | | 295 | | | | | | 101,774 | | | | | | 93,272 | | | | | | 29,829 | | | | | | 166 | | |
| Total Investment Income | | | | 394,710 | | | | | | 1,140,259 | | | | | | 1,092,004 | | | | | | 477,754 | | | | | | 25,390 | | |
| | | | | | | | | | | | | | | | | | | | | | | | | | | | | | | |
| Expenses: | | | | | | | | | | | | | | | | | | | | | | | | | | | | | | |
| Investment Management | | | | 42,263 | | | | | | 109,383 | | | | | | 99,927 | | | | | | 46,264 | | | | | | 3,153 | | |
| Administration: | | | | | | | | | | | | | | | | | | | | | | | | | | | | | | |
| Class A Shares | | | | 5,418 | | | | | | 12,995 | | | | | | 12,374 | | | | | | 4,032 | | | | | | 115 | | |
| Class B Shares | | | | 2,102 | | | | | | 5,645 | | | | | | 4,757 | | | | | | 3,184 | | | | | | 178 | | |
| Class C Shares | | | | 607 | | | | | | 2,393 | | | | | | 2,077 | | | | | | 1,677 | | | | | | 312 | | |
| Distribution: | | | | | | | | | | | | | | | | | | | | | | | | | | | | | | |
| Class B Shares | | | | 32,748 | | | | | | 87,944 | | | | | | 74,063 | | | | | | 49,639 | | | | | | 2,786 | | |
| Class C Shares | | | | 9,447 | | | | | | 37,313 | | | | | | 32,394 | | | | | | 26,111 | | | | | | 4,873 | | |
| Shareholder Servicing: | | | | | | | | | | | | | | | | | | | | | | | | | | | | | | |
| Class A Shares | | | | 28,175 | | | | | | 67,588 | | | | | | 64,376 | | | | | | 20,979 | | | | | | 532 | | |
| Class B Shares | | | | 10,916 | | | | | | 29,323 | | | | | | 24,692 | | | | | | 16,546 | | | | | | 929 | | |
| Class C Shares | | | | 3,149 | | | | | | 12,438 | | | | | | 10,799 | | | | | | 8,704 | | | | | | 1,624 | | |
| Accounting | | | | 46,146 | | | | | | 46,556 | | | | | | 46,400 | | | | | | 46,307 | | | | | | 46,866 | | |
| Compliance Services | | | | 379 | | | | | | 1,026 | | | | | | 927 | | | | | | 434 | | | | | | 30 | | |
| Custodian | | | | 2,621 | | | | | | 9,091 | | | | | | 9,839 | | | | | | 7,059 | | | | | | 4,038 | | |
| Printing | | | | 12,471 | | | | | | 26,152 | | | | | | 28,406 | | | | | | 13,423 | | | | | | 1,742 | | |
| Professional | | | | 21,294 | | | | | | 23,824 | | | | | | 23,360 | | | | | | 21,274 | | | | | | 19,493 | | |
| Transfer Agent | | | | 47,002 | | | | | | 74,599 | | | | | | 69,172 | | | | | | 40,837 | | | | | | 27,519 | | |
| Trustee | | | | 964 | | | | | | 2,370 | | | | | | 2,135 | | | | | | 1,086 | | | | | | 63 | | |
| Registration fees | | | | 13,780 | | | | | | 15,137 | | | | | | 12,970 | | | | | | 11,923 | | | | | | 14,267 | | |
| Other | | | | 14,173 | | | | | | 28,406 | | | | | | 32,174 | | | | | | 17,670 | | | | | | 5,302 | | |
| Total expenses before fee and expense reductions | | | | 293,655 | | | | | | 592,183 | | | | | | 550,842 | | | | | | 337,149 | | | | | | 133,822 | | |
| Fees voluntarily reduced/reimbursed by Investment Adviser | | | | — | | | | | | — | | | | | | — | | | | | | — | | | | | | (7,500 | ) | |
| Fees contractually reduced/reimbursed by Investment Adviser | | | | — | | | | | | — | | | | | | — | | | | | | — | | | | | | (107,253 | ) | |
| Net Expenses | | | | 293,655 | | | | | | 592,183 | | | | | | 550,842 | | | | | | 337,149 | | | | | | 19,069 | | |
| | | | | | | | | | | | | | | | | | | | | | | | | | | | | | | |
| Net Investment Income | | | | 101,055 | | | | | | 548,076 | | | | | | 541,162 | | | | | | 140,605 | | | | | | 6,321 | | |
| | | | | | | | | | | | | | | | | | | | | | | | | | | | | | | |
| Realized/Unrealized Gains/(Losses) from Investments: | | | | | | | | | | | | | | | | | | | | | | | | | | | | | | |
| Net realized gains (losses) from affiliated investment securities(a) | | | | — | | | | | | (354,669 | ) | | | | | (288,619 | ) | | | | | (250,148 | ) | | | | | (17,963 | ) | |
| Net realized gains/(losses) from non-affiliated investment securities | | | | (39,333 | ) | | | | | 29,544 | | | | | | 47,857 | | | | | | 30,943 | | | | | | 3,579 | | |
| Change in unrealized appreciation/depreciation on affiliated | | | | | | | | | | | | | | | | | | | | | | | | | | | | | | |
| investments(a) | | | | — | | | | | | (188,907 | ) | | | | | (205,826 | ) | | | | | 39,112 | | | | | | 5,050 | | |
| Change in unrealized appreciation/depreciation on non-affiliated | | | | | | | | | | | | | | | | | | | | | | | | | | | | | | |
| investments | | | | (411,726 | ) | | | | | (1,034,004 | ) | | | | | (842,083 | ) | | | | | (266,203 | ) | | | | | (10,953 | ) | |
| Net realized/unrealized gains (losses) on investments | | | | (451,059 | ) | | | | | (1,548,036 | ) | | | | | (1,288,671 | ) | | | | | (446,296 | ) | | | | | (20,287 | ) | |
| Change in Net Assets Resulting from Operations | | | $ | (350,004 | ) | | | | $ | (999,960 | ) | | | | $ | (747,509 | ) | | | | $ | (305,691 | ) | | | | $ | (13,966 | ) | |
____________________
| (a) | Represents amounts from Affiliated Investment Companies. |
| See notes to financial statements. | HSBC FAMILY OF FUNDS 21 |
HSBC WORLD SELECTION FUNDS
Statements of Changes in Net Assets
| | Aggressive Strategy Fund | | Balanced Strategy Fund |
| | For the | For the | | For the | For the |
| | year ended | year ended | | year ended | year ended |
| | October 31, | October 31, | | October 31, | October 31, |
| | 2015 | 2014 | | 2015 | 2014 |
| Investment Activities: | | | | | | | | | | | | | | | | | | | | | | |
| Operations: | | | | | | | | | | | | | | | | | | | | | | |
| Net investment income (loss) | | | $ | 101,055 | | | | $ | 111,432 | | | | | $ | 548,076 | | | | $ | 653,480 | | |
| Net realized gains (losses) from investments | | | | (39,333 | ) | | | | 4,064,648 | | | | | | (325,125 | ) | | | | 7,545,571 | | |
| Change in unrealized appreciation/depreciation on investments | | | | (411,726 | ) | | | | (3,043,886 | ) | | | | | (1,222,911 | ) | | | | (5,432,454 | ) | |
| Change in net assets resulting from operations | | | | (350,004 | ) | | | | 1,132,194 | | | | | | (999,960 | ) | | | | 2,766,597 | | |
| | | | | | | | | | | | | | | | | | | | | | | |
| Distributions: | | | | | | | | | | | | | | | | | | | | | | |
| Net investment income: | | | | | | | | | | | | | | | | | | | | | | |
| Class A Shares | | | | (89,983 | ) | | | | (125,982 | ) | | | | | (458,031 | ) | | | | (601,570 | ) | |
| Class B Shares | | | | (2,298 | ) | | | | (22,045 | ) | | | | | (104,570 | ) | | | | (194,300 | ) | |
| Class C Shares | | | | (1,109 | ) | | | | (7,596 | ) | | | | | (50,243 | ) | | | | (70,394 | ) | |
| | | | | | | | | | | | | | | | | | | | | | | |
| Net realized gains: | | | | | | | | | | | | | | | | | | | | | | |
| Class A Shares | | | | (2,780,772 | ) | | | | (621,343 | ) | | | | | (4,885,859 | ) | | | | (1,716,444 | ) | |
| Class B Shares | | | | (1,234,084 | ) | | | | (323,193 | ) | | | | | (2,251,068 | ) | | | | (905,303 | ) | |
| Class C Shares | | | | (396,410 | ) | | | | (97,829 | ) | | | | | (971,532 | ) | | | | (326,412 | ) | |
| Change in net assets resulting from distributions: | | | | (4,504,656 | ) | | | | (1,197,988 | ) | | | | | (8,721,303 | ) | | | | (3,814,423 | ) | |
| Change in net assets resulting from capital transactions | | | | 2,723,456 | | | | | (497,317 | ) | | | | | 2,703,035 | | | | | (1,859,479 | ) | |
| Change in net assets | | | | (2,131,204 | ) | | | | (563,111 | ) | | | | | (7,018,228 | ) | | | | (2,907,305 | ) | |
| | | | | | | | | | | | | | | | | | | | | | | |
| Net Assets: | | | | | | | | | | | | | | | | | | | | | | |
| Beginning of period | | | | 17,819,524 | | | | | 18,382,635 | | | | | | 47,015,408 | | | | | 49,922,713 | | |
| End of period | | | $ | 15,688,320 | | | | $ | 17,819,524 | | | | | $ | 39,997,180 | | | | $ | 47,015,408 | | |
| Accumulated net investment income (loss) | | | $ | 26,472 | | | | $ | 33,050 | | | | | $ | 254,306 | | | | $ | 392,920 | | |
| 22 | HSBC WORLD SELECTION FUNDS | See notes to financial statements. |
HSBC WORLD SELECTION FUNDS
Statements of Changes in Net Assets (continued)
| | Aggressive Strategy Fund | | Balanced Strategy Fund |
| | For the | For the | | For the | For the |
| | year ended | year ended | | year ended | year ended |
| | October 31, | October 31, | | October 31, | October 31, |
| | 2015 | 2014 | | 2015 | 2014 |
| CAPITAL TRANSACTIONS: | | | | | | | | | | | | | | | | | | | | | | |
| Class A Shares: | | | | | | | | | | | | | | | | | | | | | | |
| Proceeds from shares issued | | | $ | 1,054,014 | | | | $ | 1,137,853 | | | | | $ | 2,679,082 | | | | $ | 2,651,835 | | |
| Dividends reinvested | | | | 2,859,172 | | | | | 738,248 | | | | | | 5,307,793 | | | | | 2,260,504 | | |
| Value of shares redeemed | | | | (1,316,520 | ) | | | | (1,597,773 | ) | | | | | (4,546,288 | ) | | | | (4,811,452 | ) | |
| Class A Shares capital transactions | | | | 2,596,666 | | | | | 278,328 | | | | | | 3,440,587 | | | | | 100,887 | | |
| | | | | | | | | | | | | | | | | | | | | | | |
| Class B Shares: | | | | | | | | | | | | | | | | | | | | | | |
| Proceeds from shares issued | | | | — | | | | | 73,338 | | | | | | — | | | | | 475 | | |
| Dividends reinvested | | | | 1,236,811 | | | | | 337,771 | | | | | | 2,339,086 | | | | | 1,079,533 | | |
| Value of shares redeemed | | | | (1,022,539 | ) | | | | (1,054,906 | ) | | | | | (2,577,052 | ) | | | | (3,166,192 | ) | |
| Class B Shares capital transactions | | | | 214,272 | | | | | (643,797 | ) | | | | | (237,966 | ) | | | | (2,086,184 | ) | |
| | | | | | | | | | | | | | | | | | | | | | | |
| Class C Shares: | | | | | | | | | | | | | | | | | | | | | | |
| Proceeds from shares issued | | | | 141,003 | | | | | 440,052 | | | | | | 474,541 | | | | | 1,147,426 | | |
| Dividends reinvested | | | | 394,721 | | | | | 104,719 | | | | | | 1,021,651 | | | | | 388,793 | | |
| Value of shares redeemed | | | | (623,206 | ) | | | | (676,619 | ) | | | | | (1,995,778 | ) | | | | (1,410,401 | ) | |
| Class C Shares capital transactions | | | | (87,482 | ) | | | | (131,848 | ) | | | | | (499,586 | ) | | | | 125,818 | | |
| Change in net assets resulting from capital transactions | | | $ | 2,723,456 | | | | $ | (497,317 | ) | | | | $ | 2,703,035 | | | | $ | (1,859,479 | ) | |
| | | | | | | | | | | | | | | | | | | | | | | |
| Share Transactions: | | | | | | | | | | | | | | | | | | | | | | |
| Class A Shares: | | | | | | | | | | | | | | | | | | | | | | |
| Issued | | | | 86,242 | | | | | 74,806 | | | | | | 230,497 | | | | | 190,821 | | |
| Reinvested | | | | 243,059 | | | | | 49,119 | | | | | | 460,929 | | | | | 165,449 | | |
| Redeemed | | | | (111,107 | ) | | | | (104,652 | ) | | | | | (391,180 | ) | | | | (346,985 | ) | |
| Change in Class A Shares | | | | 218,194 | | | | | 19,273 | | | | | | 300,246 | | | | | 9,285 | | |
| | | | | | | | | | | | | | | | | | | | | | | |
| Class B Shares: | | | | | | | | | | | | | | | | | | | | | | |
| Issued | | | | — | | | | | 5,037 | | | | | | — | | | | | 35 | | |
| Reinvested | | | | 112,747 | | | | | 23,692 | | | | | | 204,082 | | | | | 79,275 | | |
| Redeemed | | | | (90,918 | ) | | | | (72,815 | ) | | | | | (219,749 | ) | | | | (227,641 | ) | |
| Change in Class B Shares | | | | 21,829 | | | | | (44,086 | ) | | | | | (15,667 | ) | | | | (148,331 | ) | |
| | | | | | | | | | | | | | | | | | | | | | | |
| Class C Shares: | | | | | | | | | | | | | | | | | | | | | | |
| Issued | | | | 12,267 | | | | | 30,220 | | | | | | 40,971 | | | | | 82,463 | | |
| Reinvested | | | | 36,214 | | | | | 7,371 | | | | | | 88,994 | | | | | 28,509 | | |
| Redeemed | | | | (56,864 | ) | | | | (46,903 | ) | | | | | (173,537 | ) | | | | (101,318 | ) | |
| Change in Class C Shares | | | | (8,383 | ) | | | | (9,312 | ) | | | | | (43,572 | ) | | | | 9,654 | | |
| See notes to financial statements. | HSBC WORLD SELECTION FUNDS 23 |
HSBC WORLD SELECTION FUNDS
Statements of Changes in Net Assets (continued)
| | Moderate Strategy Fund | | Conservative Strategy Fund |
| | For the | For the | | For the | For the |
| | year ended | year ended | | year ended | year ended |
| | October 31, | October 31, | | October 31, | October 31, |
| | 2015 | 2014 | | 2015 | 2014 |
| Investment Activities: | | | | | | | | | | | | | | | | | | | | | | |
| Operations: | | | | | | | | | | | | | | | | | | | | | | |
| Net investment income (loss) | | | $ | 541,162 | | | | $ | 594,884 | | | | | $ | 140,605 | | | | $ | 198,342 | | |
| Net realized gains (losses) from investments | | | | (240,762 | ) | | | | 4,716,047 | | | | | | (219,205 | ) | | | | 1,761,266 | | |
| Change in unrealized appreciation/depreciation on investments | | | | (1,047,909 | ) | | | | (3,237,786 | ) | | | | | (227,091 | ) | | | | (1,173,488 | ) | |
| Change in net assets resulting from operations | | | | (747,509 | ) | | | | 2,073,145 | | | | | | (305,691 | ) | | | | 786,120 | | |
| | | | | | | | | | | | | | | | | | | | | | | |
| Distributions: | | | | | | | | | | | | | | | | | | | | | | |
| Net investment income: | | | | | | | | | | | | | | | | | | | | | | |
| Class A Shares | | | | (393,275 | ) | | | | (518,008 | ) | | | | | (89,868 | ) | | | | (164,641 | ) | |
| Class B Shares | | | | (76,388 | ) | | | | (180,213 | ) | | | | | (28,843 | ) | | | | (95,421 | ) | |
| Class C Shares | | | | (45,060 | ) | | | | (59,408 | ) | | | | | (13,698 | ) | | | | (40,105 | ) | |
| | | | | | | | | | | | | | | | | | | | | | | |
| Net realized gains: | | | | | | | | | | | | | | | | | | | | | | |
| Class A Shares | | | | (3,039,598 | ) | | | | (956,549 | ) | | | | | (713,806 | ) | | | | (266,455 | ) | |
| Class B Shares | | | | (1,334,759 | ) | | | | (588,364 | ) | | | | | (610,705 | ) | | | | (261,544 | ) | |
| Class C Shares | | | | (546,873 | ) | | | | (166,900 | ) | | | | | (317,991 | ) | | | | (99,233 | ) | |
| | | | | | | | | | | | | | | | | | | | | | | |
| Tax return of capital: | | | | | | | | | | | | | | | | | | | | | | |
| Class A Shares | | | | (37,732 | ) | | | | — | | | | | | (14,413 | ) | | | | — | | |
| Class B Shares | | | | (14,442 | ) | | | | — | | | | | | (12,322 | ) | | | | — | | |
| Class C Shares | | | | (7,251 | ) | | | | — | | | | | | (6,297 | ) | | | | — | | |
| Change in net assets resulting from distributions | | | | (5,495,378 | ) | | | | (2,469,442 | ) | | | | | (1,807,943 | ) | | | | (927,399 | ) | |
| Change in net assets resulting from capital transactions | | | | 644,762 | | | | | (1,143,302 | ) | | | | | (1,188,317 | ) | | | | (1,758,899 | ) | |
| Change in net assets | | | | (5,598,125 | ) | | | | (1,539,599 | ) | | | | | (3,301,951 | ) | | | | (1,900,178 | ) | |
| | | | | | | | | | | | | | | | | | | | | | | |
| Net Assets: | | | | | | | | | | | | | | | | | | | | | | |
| Beginning of period | | | | 42,646,499 | | | | | 44,186,098 | | | | | | 20,018,928 | | | | | 21,919,106 | | |
| End of period | | | $ | 37,048,374 | | | | $ | 42,646,499 | | | | | $ | 16,716,977 | | | | $ | 20,018,928 | | |
| Accumulated net investment income (loss) | | | $ | — | | | | $ | 60,189 | | | | | $ | — | | | | $ | 17,745 | | |
| 24 | HSBC WORLD SELECTION FUNDS | See notes to financial statements. |
HSBC WORLD SELECTION FUNDS
Statements of Changes in Net Assets (continued)
| | Moderate Strategy Fund | | Conservative Strategy Fund |
| | For the | For the | | For the | For the |
| | year ended | year ended | | year ended | year ended |
| | October 31, | October 31, | | October 31, | October 31, |
| | 2015 | 2014 | | 2015 | 2014 |
| CAPITAL TRANSACTIONS: | | | | | | | | | | | | | | | | | | | | | | |
| Class A Shares: | | | | | | | | | | | | | | | | | | | | | | |
| Proceeds from shares issued | | | $ | 2,491,348 | | | | $ | 3,783,606 | | | | | $ | 1,067,645 | | | | $ | 1,125,196 | | |
| Dividends reinvested | | | | 3,460,959 | | | | | 1,455,757 | | | | | | 815,740 | | | | | 418,085 | | |
| Value of shares redeemed | | | | (3,507,761 | ) | | | | (3,421,674 | ) | | | | | (1,743,457 | ) | | | | (1,963,367 | ) | |
| Class A Shares capital transactions | | | | 2,444,546 | | | | | 1,817,689 | | | | | | 139,928 | | | | | (420,086 | ) | |
| | | | | | | | | | | | | | | | | | | | | | | |
| Class B Shares: | | | | | | | | | | | | | | | | | | | | | | |
| Proceeds from shares issued | | | | — | | | | | 74,587 | | | | | | — | | | | | 85,666 | | |
| Dividends reinvested | | | | 1,420,898 | | | | | 750,669 | | | | | | 651,337 | | | | | 350,101 | | |
| Value of shares redeemed | | | | (3,308,126 | ) | | | | (4,244,328 | ) | | | | | (1,449,663 | ) | | | | (2,277,803 | ) | |
| Class B Shares capital transactions | | | | (1,887,228 | ) | | | | (3,419,072 | ) | | | | | (798,326 | ) | | | | (1,842,036 | ) | |
| | | | | | | | | | | | | | | | | | | | | | | |
| Class C Shares: | | | | | | | | | | | | | | | | | | | | | | |
| Proceeds from shares issued | | | | 477,526 | | | | | 1,322,591 | | | | | | 285,367 | | | | | 1,063,444 | | |
| Dividends reinvested | | | | 599,151 | | | | | 223,060 | | | | | | 337,789 | | | | | 135,061 | | |
| Value of shares redeemed | | | | (989,233 | ) | | | | (1,087,570 | ) | | | | | (1,153,075 | ) | | | | (695,282 | ) | |
| Class C Shares capital transactions | | | | 87,444 | | | | | 458,081 | | | | | | (529,919 | ) | | | | 503,223 | | |
| Change in net assets resulting from capital transactions | | | $ | 644,762 | | | | $ | (1,143,302 | ) | | | | $ | (1,188,317 | ) | | | $ | (1,758,899 | ) | |
| | | | | | | | | | | | | | | | | | | | | | | |
| Share Transactions: | | | | | | | | | | | | | | | | | | | | | | |
| Class A Shares: | | | | | | | | | | | | | | | | | | | | | | |
| Issued | | | | 219,835 | | | | | 299,334 | | | | | | 97,582 | | | | | 95,415 | | |
| Reinvested | | | | 309,559 | | | | | 116,634 | | | | | | 75,648 | | | | | 36,023 | | |
| Redeemed | | | | (309,945 | ) | | | | (270,651 | ) | | | | | (158,732 | ) | | | | (166,514 | ) | |
| Change in Class A Shares | | | | 219,449 | | | | | 145,317 | | | | | | 14,498 | | | | | (35,076 | ) | |
| | | | | | | | | | | | | | | | | | | | | | | |
| Class B Shares: | | | | | | | | | | | | | | | | | | | | | | |
| Issued | | | | — | | | | | 5,927 | | | | | | — | | | | | 7,363 | | |
| Reinvested | | | | 127,065 | | | | | 60,400 | | | | | | 61,321 | | | | | 30,671 | | |
| Redeemed | | | | (292,501 | ) | | | | (335,611 | ) | | | | | (136,064 | ) | | | | (196,203 | ) | |
| Change in Class B Shares | | | | (165,436 | ) | | | | (269,284 | ) | | | | | (74,743 | ) | | | | (158,169 | ) | |
| | | | | | | | | | | | | | | | | | | | | | | |
| Class C Shares: | | | | | | | | | | | | | | | | | | | | | | |
| Issued | | | | 42,994 | | | | | 107,417 | | | | | | 25,045 | | | | | 88,880 | | |
| Reinvested | | | | 55,695 | | | | | 18,488 | | | | | | 30,785 | | | | | 11,475 | | |
| Redeemed | | | | (91,903 | ) | | | | (88,651 | ) | | | | | (103,355 | ) | | | | (58,325 | ) | |
| Change in Class C Shares | | | | 6,786 | | | | | 37,254 | | | | | | (47,525 | ) | | | | 42,030 | | |
See notes to financial statements | HSBC WORLD SELECTION FUNDS | 25 |
HSBC WORLD SELECTION FUNDS
Statements of Changes in Net Assets (continued)
| Income Strategy Fund |
| For the | For the |
| year ended | year ended |
| October 31, | October 31, |
| 2015 | 2014 |
| Investment Activities: | | | | | | | | | | |
| Operations: | | | | | | | | | | |
| Net investment income (loss) | | $ | 6,321 | | | | $ | 10,732 | | |
| Net realized gains (losses) from investments | | | (14,384 | ) | | | | 26,240 | | |
| Change in unrealized appreciation/depreciation on investments | | | (5,903 | ) | | | | 2,562 | | |
| Change in net assets resulting from operations | | | (13,966 | ) | | | | 39,534 | | |
| | | | | | | | | | | |
| Distributions: | | | | | | | | | | |
| Net investment income: | | | | | | | | | | |
| Class A Shares | | | (2,317 | ) | | | | (5,190 | ) | |
| Class B Shares | | | (779 | ) | | | | (3,967 | ) | |
| Class C Shares | | | (1,400 | ) | | | | (6,306 | ) | |
| | | | | | | | | | | |
| Net realized gains: | | | | | | | | | | |
| Class A Shares | | | (3,735 | ) | | | | (5,792 | ) | |
| Class B Shares | | | (5,659 | ) | | | | (7,485 | ) | |
| Class C Shares | | | (10,430 | ) | | | | (11,635 | ) | |
| | | | | | | | | | | |
| Tax return of capital: | | | | | | | | | | |
| Class A Shares | | | (837 | ) | | | | — | | |
| Class B Shares | | | (1,319 | ) | | | | — | | |
| Class C Shares | | | (2,319 | ) | | | | — | | |
| Change in net assets resulting from distributions | | | (28,795 | ) | | | | (40,375 | ) | |
| Change in net assets resulting from capital transactions | | | (207,774 | ) | | | | (6,442 | ) | |
| Change in net assets | | | (250,535 | ) | | | | (7,283 | ) | |
| | | | | | | | | | | |
| Net Assets: | | | | | | | | | | |
| Beginning of period | | | 1,349,196 | | | | | 1,356,479 | | |
| End of period | | $ | 1,098,661 | | | | $ | 1,349,196 | | |
| Accumulated net investment income (loss) | | $ | — | | | | $ | (9 | ) | |
| 26 | HSBC WORLD SELECTION FUNDS | See notes to financial statements. |
HSBC WORLD SELECTION FUNDS
Statements of Changes in Net Assets (continued)
| Income Strategy Fund |
| For the | For the |
| year ended | year ended |
| October 31, | October 31, |
| 2015 | 2014 |
| CAPITAL TRANSACTIONS: | | | | | | | | | | |
| Class A Shares: | | | | | | | | | | |
| Proceeds from shares issued | | $ | 4,019 | | | | $ | 57,178 | | |
| Dividends reinvested | | | 6,890 | | | | | 10,974 | | |
| Value of shares redeemed | | | (103,979 | ) | | | | (86,228 | ) | |
| Class A Shares capital transactions | | | (93,070 | ) | | | | (18,076 | ) | |
| | | | | | | | | | | |
| Class B Shares: | | | | | | | | | | |
| Dividends reinvested | | | 7,488 | | | | | 10,775 | | |
| Value of shares redeemed | | | (46,463 | ) | | | | (32,606 | ) | |
| Class B Shares capital transactions | | | (38,975 | ) | | | | (21,831 | ) | |
| | | | | | | | | | | |
| Class C Shares: | | | | | | | | | | |
| Proceeds from shares issued | | | 59,778 | | | | | 155,229 | | |
| Dividends reinvested | | | 14,143 | | | | | 17,761 | | |
| Value of shares redeemed | | | (149,650 | ) | | | | (139,525 | ) | |
| Class C Shares capital transactions | | | (75,729 | ) | | | | 33,465 | | |
| Change in net assets resulting from capital transactions | | $ | (207,774 | ) | | | $ | (6,442 | ) | |
| | | | | | | | | | | |
| Share Transactions: | | | | | | | | | | |
| Class A Shares: | | | | | | | | | | |
| Issued | | | 391 | | | | | 5,553 | | |
| Reinvested | | | 679 | | | | | 1,080 | | |
| Redeemed | | | (10,221 | ) | | | | (8,370 | ) | |
| Change in Class A Shares | | | (9,151 | ) | | | | (1,737 | ) | |
| | | | | | | | | | | |
| Class B Shares: | | | | | | | | | | |
| Reinvested | | | 739 | | | | | 1,067 | | |
| Redeemed | | | (4,717 | ) | | | | (3,179 | ) | |
| Change in Class B Shares | | | (3,978 | ) | | | | (2,112 | ) | |
| | | | | | | | | | | |
| Class C Shares: | | | | | | | | | | |
| Issued | | | 5,835 | | | | | 15,093 | | |
| Reinvested | | | 1,397 | | | | | 1,758 | | |
| Redeemed | | | (14,778 | ) | | | | (13,698 | ) | |
| Change in Class C Shares | | | (7,546 | ) | | | | 3,153 | | |
| See notes to financial statements. | HSBC WORLD SELECTION FUNDS | 27 |
AGGRESSIVE STRATEGY FUND |
Financial Highlights |
Selected data for a share outstanding throughout the periods indicated*
| | | | Investment Activities | | Distributions | | | | | | Ratios/Supplementary Data |
| | Net Asset
Value,
Beginning
of Period | | Net
Investment
Income
(Loss)(a) | | Net
Realized and
Unrealized
Gains
(Losses) from
Investments | | Total from
Investment
Activities | | Net
Investment
Income | | Net Realized
Gains from
Investment
Transactions | | Total
Distributions | | Net Asset
Value, End
of Period | | Total
Return(b) | | Net Assets
at End
of Period
(000’s) | | Ratio of Net
Expenses
to Average
Net
Assets | | Ratio of Net
Investment
Income
(Loss) to
Average
Net Assets | | Ratio of
Expenses
to Average
Net Assets
(Excluding
Fee
Reductions) | | Portfolio
Turnover
(c) |
| CLASS A SHARES |
| Year Ended October 31, 2015 | | | $ | 15.53 | | | | $ | 0.10 | | | | | $ | (0.32 | ) | | | | $ | (0.22 | ) | | | | $ | (0.09 | ) | | | | $ | (3.77 | ) | | | | $ | (3.86 | ) | | | | $ | 11.45 | | | | (1.90 | )% | | | | $ | 10,880 | | | | 1.49 | % | | | | 0.85 | % | | | | 1.49 | % | | | | 7 | % | |
| Year Ended October 31, 2014 | | | | 15.58 | | | | | 0.14 | | | | | | 0.85 | | | | | | 0.99 | | | | | | (0.17 | ) | | | | | (0.87 | ) | | | | | (1.04 | ) | | | | | 15.53 | | | | 6.64 | % | | | | | 11,375 | | | | 1.42 | % | | | | 0.89 | % | | | | 1.42 | % | | | | 116 | %(d) | |
| Year Ended October 31, 2013 | | | | 12.77 | | | | | 0.12 | | | | | | 2.73 | | | | | | 2.85 | | | | | | (0.04 | ) | | | | | — | | | | | | (0.04 | ) | | | | | 15.58 | | | | 22.38 | % | | | | | 11,106 | | | | 1.50 | % | | | | 0.86 | % | | | | 1.50 | % | | | | 37 | % | |
| Year Ended October 31, 2012 | | | | 11.96 | | | | | 0.02 | | | | | | 0.89 | | | | | | 0.91 | | | | | | (0.10 | ) | | | | | — | | | | | | (0.10 | ) | | | | | 12.77 | | | | 7.72 | % | | | | | 10,136 | | | | 1.50 | % | | | | 0.16 | % | | | | 1.66 | % | | | | 71 | % | |
| Year Ended October 31, 2011 | | | | 12.03 | | | | | 0.10 | | | | | | (0.07 | ) | | | | | 0.03 | | | | | | (0.10 | ) | | | | | — | | | | | | (0.10 | ) | | | | | 11.96 | | | | 0.20 | %(e) | | | | | 9,217 | | | | 1.50 | % | | | | 0.77 | % | | | | 1.61 | % | | | | 71 | % | |
| CLASS B SHARES |
| Year Ended October 31, 2015 | | | | 14.75 | | | | | 0.01 | | | | | | (0.30 | ) | | | | | (0.29 | ) | | | | | (0.01 | ) | | | | | (3.77 | ) | | | | | (3.78 | ) | | | | | 10.68 | | | | (2.69 | )% | | | | | 3,795 | | | | 2.24 | % | | | | 0.10 | % | | | | 2.24 | % | | | | 7 | % | |
| Year Ended October 31, 2014 | | | | 14.84 | | | | | 0.02 | | | | | | 0.82 | | | | | | 0.84 | | | | | | (0.06 | ) | | | | | (0.87 | ) | | | | | (0.93 | ) | | | | | 14.75 | | | | 5.90 | % | | | | | 4,920 | | | | 2.17 | % | | | | 0.15 | % | | | | 2.17 | % | | | | 116 | %(d) | |
| Year Ended October 31, 2013 | | | | 12.22 | | | | | 0.01 | | | | | | 2.61 | | | | | | 2.62 | | | | | | — | | | | | | — | | | | | | — | | | | | | 14.84 | | | | 21.44 | % | | | | | 5,604 | | | | 2.25 | % | | | | 0.11 | % | | | | 2.25 | % | | | | 37 | % | |
| Year Ended October 31, 2012 | | | | 11.45 | | | | | (0.07 | ) | | | | | 0.85 | | | | | | 0.78 | | | | | | (0.01 | ) | | | | | — | | | | | | (0.01 | ) | | | | | 12.22 | | | | 6.87 | % | | | | | 5,870 | | | | 2.25 | % | | | | (0.57 | )% | | | | 2.40 | % | | | | 71 | % | |
| Year Ended October 31, 2011 | | | | 11.54 | | | | | — | | | | | | (0.06 | ) | | | | | (0.06 | ) | | | | | (0.03 | ) | | | | | — | | | | | | (0.03 | ) | | | | | 11.45 | | | | (0.53 | )%(e) | | | | | 6,750 | | | | 2.25 | % | | | | 0.02 | % | | | | 2.36 | % | | | | 71 | % | |
| CLASS C SHARES |
| Year Ended October 31, 2015 | | | | 14.68 | | | | | 0.01 | | | | | | (0.30 | ) | | | | | (0.29 | ) | | | | | (0.01 | ) | | | | | (3.77 | ) | | | | | (3.78 | ) | | | | | 10.61 | | | | (2.68 | )% | | | | | 1,013 | | | | 2.24 | % | | | | 0.10 | % | | | | 2.24 | % | | | | 7 | % | |
| Year Ended October 31, 2014 | | | | 14.78 | | | | | 0.02 | | | | | | 0.82 | | | | | | 0.84 | | | | | | (0.07 | ) | | | | | (0.87 | ) | | | | | (0.94 | ) | | | | | 14.68 | | | | 5.89 | % | | | | | 1,525 | | | | 2.17 | % | | | | 0.16 | % | | | | 2.17 | % | | | | 116 | %(d) | |
| Year Ended October 31, 2013 | | | | 12.17 | | | | | 0.02 | | | | | | 2.59 | | | | | | 2.61 | | | | | | — | | | | | | — | | | | | | — | | | | | | 14.78 | | | | 21.45 | % | | | | | 1,673 | | | | 2.25 | % | | | | 0.12 | % | | | | 2.25 | % | | | | 37 | % | |
| Year Ended October 31, 2012 | | | | 11.43 | | | | | (0.07 | ) | | | | | 0.85 | | | | | | 0.78 | | | | | | (0.04 | ) | | | | | — | | | | | | (0.04 | ) | | | | | 12.17 | | | | 6.83 | % | | | | | 1,713 | | | | 2.25 | % | | | | (0.56 | )% | | | | 2.40 | % | | | | 71 | % | |
| Year Ended October 31, 2011 | | | | 11.53 | | | | | — | | | | | | (0.05 | ) | | | | | (0.05 | ) | | | | | (0.05 | ) | | | | | — | | | | | | (0.05 | ) | | | | | 11.43 | | | | (0.46 | )%(e) | | | | | 1,884 | | | | 2.25 | % | | | | — | % | | | | 2.35 | % | | | | 71 | % | |
| * | The per share amounts and percentages reflect income and expenses assuming inclusion of the Fund’s proportionate share of the income and expenses of the master HSBC Portfolios that the fund invested in as part of a master-feeder structure during the fiscal years ended October 31, 2011, 2012, 2013 and 2014. The Fund does not include expenses of the affiliated and unaffiliated investment companies in which the Fund invests. |
| (a) | Calculated based on average shares outstanding. |
| (b) | Total return calculations do not include any sales or redemption charges. |
| (c) | Portfolio turnover is calculated on the basis of the Fund as a whole without distinguishing between the classes of shares issued. For the fiscal years ended October 31, 2011, 2012, 2013 and 2014, the portfolio turnover rate was calculated by aggregating the results of multiplying the Fund’s investment percentage in the master HSBC Portfolios, affiliated and unaffiliated investment companies by their corresponding portfolio turnover rates. |
| (d) | The portfolio turnover rate for the year ended October 31, 2014 was higher than prior years primarily due to a realignment of the fund’s investments. |
| (e) | During the year ended October 31, 2011, certain HSBC Portfolios, in which the Fund invested, received monies related to certain nonrecurring litigation settlements. The corresponding impact to the total return was 0.08%, 0.08% and 0.08% for Class A Shares, Class B Shares and Class C Shares, respectively. |
| Amounts designated as “—“ are $0 or have been rounded to $0. |
| 28 | HSBC WORLD SELECTION FUNDS | See notes to financial statements. |
BALANCED STRATEGY FUND |
Financial Highlights |
Selected data for a share outstanding throughout the periods indicated*
| | | | Investment Activities | | Distributions | | | | | | Ratios/Supplementary Data |
| | Net Asset
Value,
Beginning
of Period | | Net
Investment
Income
(Loss)(a) | | Net
Realized and
Unrealized
Gains
(Losses) from
Investments | | Total from
Investment
Activities | | Net
Investment
Income | | Net Realized
Gains from
Investment
Transactions | | Total
Distributions | | Net Asset
Value, End
of Period | | Total
Return(b) | | Net Assets
at End of
Period
(000’s) | | Ratio of Net
Expenses
to Average
Net
Assets | | Ratio of Net
Investment
Income
(Loss) to
Average Net
Assets | | Ratio of
Expenses
to Average
Net Assets
(Excluding
Fee
Reductions) | | Portfolio
Turnover
(c) |
| CLASS A SHARES |
| Year Ended October 31, 2015 | | | $ | 14.07 | | | | $ | 0.18 | | | | $ | (0.43 | ) | | | | $ | (0.25 | ) | | | | $ | (0.19 | ) | | | | $ | (2.46 | ) | | | | $ | (2.65 | ) | | | | $ | 11.17 | | | | (2.06 | )% | | | | $ | 25,765 | | | | 1.07 | % | | | | 1.55 | % | | | | 1.07 | % | | | | 16 | % | |
| Year Ended October 31, 2014 | | | | 14.39 | | | | | 0.23 | | | | | 0.59 | | | | | | 0.82 | | | | | | (0.28 | ) | | | | | (0.86 | ) | | | | | (1.14 | ) | | | | | 14.07 | | | | 6.07 | % | | | | | 28,245 | | | | 1.06 | % | | | | 1.64 | % | | | | 1.06 | % | | | | 105 | %(d) | |
| Year Ended October 31, 2013 | | | | 12.66 | | | | | 0.24 | | | | | 1.72 | | | | | | 1.96 | | | | | | (0.23 | ) | | | | | — | | | | | | (0.23 | ) | | | | | 14.39 | | | | 15.76 | % | | | | | 28,746 | | | | 1.04 | % | | | | 1.79 | % | | | | 1.04 | % | | | | 35 | % | |
| Year Ended October 31, 2012 | | | | 12.07 | | | | | 0.23 | | | | | 0.75 | | | | | | 0.98 | | | | | | (0.39 | ) | | | | | — | | | | | | (0.39 | ) | | | | | 12.66 | | | | 8.51 | % | | | | | 29,490 | | | | 1.15 | % | | | | 1.89 | % | | | | 1.15 | % | | | | 62 | % | |
| Year Ended October 31, 2011 | | | | 12.09 | | | | | 0.32 | | | | | (0.06 | ) | | | | | 0.26 | | | | | | (0.28 | ) | | | | | — | | | | | | (0.28 | ) | | | | | 12.07 | | | | 2.08 | %(e) | | | | | 28,262 | | | | 1.12 | % | | | | 2.60 | % | | | | 1.14 | % | | | | 74 | % | |
| CLASS B SHARES |
| Year Ended October 31, 2015 | | | | 14.02 | | | | | 0.09 | | | | | (0.44 | ) | | | | | (0.35 | ) | | | | | (0.09 | ) | | | | | (2.46 | ) | | | | | (2.55 | ) | | | | | 11.12 | | | | (2.88 | )% | | | | | 10,309 | | | | 1.82 | % | | | | 0.78 | % | | | | 1.82 | % | | | | 16 | % | |
| Year Ended October 31, 2014 | | | | 14.33 | | | | | 0.12 | | | | | 0.60 | | | | | | 0.72 | | | | | | (0.17 | ) | | | | | (0.86 | ) | | | | | (1.03 | ) | | | | | 14.02 | | | | 5.33 | % | | | | | 13,212 | | | | 1.81 | % | | | | 0.90 | % | | | | 1.81 | % | | | | 105 | %(d) | |
| Year Ended October 31, 2013 | | | | 12.60 | | | | | 0.14 | | | | | 1.72 | | | | | | 1.86 | | | | | | (0.13 | ) | | | | | — | | | | | | (0.13 | ) | | | | | 14.33 | | | | 14.89 | % | | | | | 15,633 | | | | 1.80 | % | | | | 1.05 | % | | | | 1.80 | % | | | | 35 | % | |
| Year Ended October 31, 2012 | | | | 12.01 | | | | | 0.14 | | | | | 0.75 | | | | | | 0.89 | | | | | | (0.30 | ) | | | | | — | | | | | | (0.30 | ) | | | | | 12.60 | | | | 7.66 | % | | | | | 16,805 | | | | 1.91 | % | | | | 1.18 | % | | | | 1.91 | % | | | | 62 | % | |
| Year Ended October 31, 2011 | | | | 12.05 | | | | | 0.23 | | | | | (0.07 | ) | | | | | 0.16 | | | | | | (0.20 | ) | | | | | — | | | | | | (0.20 | ) | | | | | 12.01 | | | | 1.30 | %(e) | | | | | 18,799 | | | | 1.87 | % | | | | 1.85 | % | | | | 1.90 | % | | | | 74 | % | |
| CLASS C SHARES |
| Year Ended October 31, 2015 | | | | 14.04 | | | | | 0.09 | | | | | (0.44 | ) | | | | | (0.35 | ) | | | | | (0.10 | ) | | | | | (2.46 | ) | | | | | (2.56 | ) | | | | | 11.13 | | | | (2.87 | )% | | | | | 3,923 | | | | 1.82 | % | | | | 0.75 | % | | | | 1.82 | % | | | | 16 | % | |
| Year Ended October 31, 2014 | | | | 14.35 | | | | | 0.13 | | | | | 0.59 | | | | | | 0.72 | | | | | | (0.17 | ) | | | | | (0.86 | ) | | | | | (1.03 | ) | | | | | 14.04 | | | | 5.33 | % | | | | | 5,559 | | | | 1.81 | % | | | | 0.90 | % | | | | 1.81 | % | | | | 105 | %(d) | |
| Year Ended October 31, 2013 | | | | 12.62 | | | | | 0.14 | | | | | 1.72 | | | | | | 1.86 | | | | | | (0.13 | ) | | | | | — | | | | | | (0.13 | ) | | | | | 14.35 | | | | 14.87 | % | | | | | 5,544 | | | | 1.80 | % | | | | 1.04 | % | | | | 1.80 | % | | | | 35 | % | |
| Year Ended October 31, 2012 | | | | 12.04 | | | | | 0.14 | | | | | 0.76 | | | | | | 0.90 | | | | | | (0.32 | ) | | | | | — | | | | | | (0.32 | ) | | | | | 12.62 | | | | 7.77 | % | | | | | 5,908 | | | | 1.91 | % | | | | 1.18 | % | | | | 1.91 | % | | | | 62 | % | |
| Year Ended October 31, 2011 | | | | 12.09 | | | | | 0.23 | | | | | (0.07 | ) | | | | | 0.16 | | | | | | (0.21 | ) | | | | | — | | | | | | (0.21 | ) | | | | | 12.04 | | | | 1.25 | %(e) | | | | | 6,427 | | | | 1.87 | % | | | | 1.85 | % | | | | 1.90 | % | | | | 74 | % | |
| * | The per share amounts and percentages reflect income and expenses assuming inclusion of the Fund’s proportionate share of the income and expenses of the master HSBC Portfolios that the fund invested in as part of a master-feeder structure during the fiscal years ended October 31, 2011, 2012, 2013 and 2014. The Fund does not include expenses of the affiliated and unaffiliated investment companies in which the Fund invests. |
| (a) | Calculated based on average shares outstanding. |
| (b) | Total return calculations do not include any sales or redemption charges. |
| (c) | Portfolio turnover is calculated on the basis of the Fund as a whole without distinguishing between the classes of shares issued. For the fiscal years ended October 31, 2011, 2012, 2013 and 2014, the portfolio turnover rate was calculated by aggregating the results of multiplying the Fund’s investment percentage in the master HSBC Portfolios, affiliated and unaffiliated investment companies by their corresponding portfolio turnover rates. |
| (d) | The portfolio turnover rate for the year ended October 31, 2014 was higher than prior years primarily due to a realignment of the fund’s investments. |
| (e) | During the year ended October 31, 2011, certain HSBC Portfolios, in which the Fund invested, received monies related to certain nonrecurring litigation settlements. The corresponding impact to the total return was 0.06%, 0.06% and 0.06% for Class A Shares, Class B Shares and Class C Shares, respectively. |
| Amounts designated as “—“ are $0 or have been rounded to $0. |
See notes to financial statements. | HSBC WORLD SELECTION FUNDS | 29 |
| MODERATE STRATEGY FUND |
| Financial Highlights |
Selected data for a share outstanding throughout the periods indicated*
| | | | | | Investment Activities | | Distributions | | | | | | | | | Ratios/Supplementary Data |
| | | | | | | | | | Net | | | | | | | | | | | | | | | | | | | | | | | | | | | | | | | | | | | | | Ratio of | | | |
| | | | | | | | | | Realized and | | | | | | | | | | | | | | | | | | | | | | | | | | | | | | | | | | | Ratio of Net | | Expenses | | | |
| | | | | | | | | | Unrealized | | | | | | | | | | | | | | | | | | | | | | | | | | | | | | | | | Ratio of Net | | Investment | | to Average | | | |
| | Net Asset | | Net | | Gains | | | | | | | | | | Net Realized | | Tax | | | | | | Net Asset | | | | | Net Assets | | Expenses | | Income | | Net Assets | | | |
| | Value, | | Investment | | (Losses) | | Total from | | Net | | Gains from | | Return | | | | | | Value, | | | | | at End of | | to Average | | (Loss) to | | (Excluding | | Portfolio |
| | Beginning | | Income | | from | | Investment | | Investment | | Investment | | of | | Total | | End of | | Total | | Period | | Net | | Average Net | | Fee | | Turnover |
| | of Period | | (Loss)(a) | | Investments | | Activities | | Income | | Transactions | | Capital | | Distributions | | Period | | Return(b) | | (000’s) | | Assets | | Assets | | Reductions) | | (c) |
| CLASS A SHARES | | | | | | | | | | | | | | | | | | | | | | | | | | | | | | | | | | | | | | | | | | | | | | | | | | | | |
| Year Ended October 31, 2015 | | $ | 12.76 | | | $ | 0.18 | | | $ | (0.37 | ) | | $ | (0.19 | ) | | $ | (0.17 | ) | | $ | (1.48 | ) | | $ | (0.02 | ) | | $ | (1.67 | ) | | $ | 10.90 | | | (1.62 | )% | | $ | 24,841 | | | 1.11% | | 1.62% | | 1.11% | | 31 | % |
| Year Ended October 31, 2014 | | | 12.88 | | | | 0.21 | | | | 0.43 | | | | 0.64 | | | | (0.26 | ) | | | (0.50 | ) | | | — | | | | (0.76 | ) | | | 12.76 | | | 5.21 | % | | | 26,294 | | | 1.09% | | 1.68% | | 1.09% | | 102 | %(d) |
| Year Ended October 31, 2013 | | | 11.88 | | | | 0.23 | | | | 1.04 | | | | 1.27 | | | | (0.27 | ) | | | — | | | | — | | | | (0.27 | ) | | | 12.88 | | | 10.80 | % | | | 24,671 | | | 1.08% | | 1.86% | | 1.08% | | 30 | % |
| Year Ended October 31, 2012 | | | 11.29 | | | | 0.26 | | | | 0.65 | | | | 0.91 | | | | (0.32 | ) | | | — | | | | — | | | | (0.32 | ) | | | 11.88 | | | 8.24 | % | | | 25,175 | | | 1.16% | | 2.30% | | 1.16% | | 61 | % |
| Year Ended October 31, 2011 | | | 11.48 | | | | 0.37 | | | | (0.12 | ) | | | 0.25 | | | | (0.44 | ) | | | — | | | | — | | | | (0.44 | ) | | | 11.29 | | | 2.19 | %(e) | | | 23,719 | | | 1.06% | | 3.16% | | 1.09% | | 63 | % |
| CLASS B SHARES | | | | | | | | | | | | | | | | | | | | | | | | | | | | | | | | | | | | | | | | | | | | | | | | | | | | |
| Year Ended October 31, 2015 | | | 12.75 | | | | 0.10 | | | | (0.38 | ) | | | (0.28 | ) | | | (0.08 | ) | | | (1.48 | ) | | | (0.02 | ) | | | (1.58 | ) | | | 10.89 | | | (2.42 | )% | | | 8,305 | | | 1.86% | | 0.88% | | 1.86% | | 31 | % |
| Year Ended October 31, 2014 | | | 12.87 | | | | 0.12 | | | | 0.42 | | | | 0.54 | | | | (0.16 | ) | | | (0.50 | ) | | | — | | | | (0.66 | ) | | | 12.75 | | | 4.42 | % | | | 11,831 | | | 1.84% | | 0.93% | | 1.84% | | 102 | %(d) |
| Year Ended October 31, 2013 | | | 11.87 | | | | 0.14 | | | | 1.04 | | | | 1.18 | | | | (0.18 | ) | | | — | | | | — | | | | (0.18 | ) | | | 12.87 | | | 10.04 | % | | | 15,407 | | | 1.83% | | 1.12% | | 1.83% | | 30 | % |
| Year Ended October 31, 2012 | | | 11.28 | | | | 0.19 | | | | 0.63 | | | | 0.82 | | | | (0.23 | ) | | | — | | | | — | | | | (0.23 | ) | | | 11.87 | | | 7.43 | % | | | 17,615 | | | 1.92% | | 1.64% | | 1.92% | | 61 | % |
| Year Ended October 31, 2011 | | | 11.46 | | | | 0.28 | | | | (0.10 | ) | | | 0.18 | | | | (0.36 | ) | | | — | | | | — | | | | (0.36 | ) | | | 11.28 | | | 1.51 | %(e) | | | 20,323 | | | 1.81% | | 2.40% | | 1.84% | | 63 | % |
| CLASS C SHARES | | | | | | | | | | | | | | | | | | | | | | | | | | | | | | | | | | | | | | | | | | | | | | | | | | | | |
| Year Ended October 31, 2015 | | | 12.36 | | | | 0.10 | | | | (0.38 | ) | | | (0.28 | ) | | | (0.11 | ) | | | (1.48 | ) | | | (0.02 | ) | | | (1.61 | ) | | | 10.47 | | | (2.44 | )% | | | 3,903 | | | 1.86% | | 0.88% | | 1.86% | | 31 | % |
| Year Ended October 31, 2014 | | | 12.50 | | | | 0.11 | | | | 0.42 | | | | 0.53 | | | | (0.17 | ) | | | (0.50 | ) | | | — | | | | (0.67 | ) | | | 12.36 | | | 4.46 | % | | | 4,521 | | | 1.84% | | 0.93% | | 1.84% | | 102 | %(d) |
| Year Ended October 31, 2013 | | | 11.55 | | | | 0.13 | | | | 1.01 | | | | 1.14 | | | | (0.19 | ) | | | — | | | | — | | | | (0.19 | ) | | | 12.50 | | | 9.96 | % | | | 4,109 | | | 1.83% | | 1.10% | | 1.83% | | 30 | % |
| Year Ended October 31, 2012 | | | 10.98 | | | | 0.18 | | | | 0.62 | | | | 0.80 | | | | (0.23 | ) | | | — | | | | — | | | | (0.23 | ) | | | 11.55 | | | 7.49 | % | | | 3,329 | | | 1.91% | | 1.64% | | 1.91% | | 61 | % |
| Year Ended October 31, 2011 | | | 11.18 | | | | 0.27 | | | | (0.11 | ) | | | 0.16 | | | | (0.36 | ) | | | — | | | | — | | | | (0.36 | ) | | | 10.98 | | | 1.42 | %(e) | | | 3,859 | | | 1.81% | | 2.40% | | 1.84% | | 63 | % |
| * | | The per share amounts and percentages reflect income and expenses assuming inclusion of the Fund’s proportionate share of the income and expenses of the master HSBC Portfolios that the fund invested in as part of a master-feeder structure during the fiscal years ended October 31, 2011, 2012, 2013 and 2014. The Fund does not include expenses of the affiliated and unaffiliated investment companies in which the Fund invests. |
| (a) | | Calculated based on average shares outstanding. |
| (b) | | Total return calculations do not include any sales or redemption charges. |
| (c) | | Portfolio turnover is calculated on the basis of the Fund as a whole without distinguishing between the classes of shares issued. For the fiscal years ended October 31, 2011, 2012, 2013 and 2014, the portfolio turnover rate was calculated by aggregating the results of multiplying the Fund’s investment percentage in the master HSBC Portfolios, affiliated and unaffiliated investment companies by their corresponding portfolio turnover rates. |
| (d) | | The portfolio turnover rate for the year ended October 31, 2014 was higher than prior years primarily due to a realignment of the fund’s investments. |
| (e) | | During the year ended October 31, 2011, certain HSBC Portfolios, in which the Fund invested, received monies related to certain nonrecurring litigation settlements. The corresponding impact to the total return was 0.04%, 0.04% and 0.04% for Class A Shares, Class B Shares and Class C Shares, respectively. |
| Amounts designated as “—“ are $0 or have been rounded to $0. |
| 30 HSBC WORLD SELECTION FUNDS | See notes to financial statements. |
| CONSERVATIVE STRATEGY FUND |
| Financial Highlights |
Selected data for a share outstanding throughout the periods indicated*
| | | | | Investment Activities | | Distributions | | | | | | | Ratios/Supplementary Data |
| | | | | | | | | | | | | | | | | | | | | | | | | | | | | | | | Ratio of | | |
| | | | | | | | Net | | | | | | | | | | | | | | | | | | | | | | Ratio of Net | | Expenses | | |
| | | | | | | | Realized and | | | | | | | | | | | | | | | | | | | | Ratio of Net | | Investment | | to Average | | |
| | Net Asset | | Net | | Unrealized | | | | | | Net Realized | | Tax | | | | | | | | | Net Assets | | Expenses | | Income | | Net Assets | | |
| | Value, | | Investment | | Gains | | Total from | | Net | | Gains from | | Return | | | | Net Asset | | | | at End of | | to Average | | (Loss) to | | (Excluding | | Portfolio |
| | Beginning | | Income | | (Losses) from | | Investment | | Investment | | Investment | | of | | Total | | Value, End | | Total | | Period | | Net | | Average Net | | Fee | | Turnover |
| | of Period | | (Loss)(a) | | Investments | | Activities | | Income | | Transactions | | Capital | | Distributions | | of Period | | Return(b) | | (000’s) | | Assets | | Assets | | Reductions) | | (c) |
| CLASS A SHARES | | | | | | | | | | | | | | | | | | | | | | | | | | | | | | | | | | | | | | | | | | | | | | | | | | | | | | | |
| Year Ended October 31, 2015 | | $ | 11.86 | | | $ | 0.13 | | | $ | (0.28 | ) | | $ | (0.15 | ) | | $ | (0.12 | ) | | $ | (0.99 | ) | | $ | (0.02 | ) | | $ | (1.13 | ) | | $ | 10.58 | | | (1.37 | )% | | $ | 7,991 | | | 1.41 | % | | 1.17 | % | | 1.41 | % | | 31 | % |
| Year Ended October 31, 2014 | | | 11.93 | | | | 0.16 | | | | 0.33 | | | | 0.49 | | | | (0.21 | ) | | | (0.35 | ) | | | — | | | | (0.56 | ) | | | 11.86 | | | 4.32 | % | | | 8,783 | | | 1.33 | % | | 1.38 | % | | 1.33 | % | | 104 | %(d) |
| Year Ended October 31, 2013 | | | 11.47 | | | | 0.20 | | | | 0.51 | | | | 0.71 | | | | (0.25 | ) | | | — | | | | — | | | | (0.25 | ) | | | 11.93 | | | 6.28 | % | | | 9,255 | | | 1.26 | % | | 1.75 | % | | 1.26 | % | | 31 | % |
| Year Ended October 31, 2012 | | | 10.95 | | | | 0.27 | | | | 0.58 | | | | 0.85 | | | | (0.33 | ) | | | — | | | | — | | | | (0.33 | ) | | | 11.47 | | | 8.00 | % | | | 9,933 | | | 1.34 | % | | 2.40 | % | | 1.34 | % | | 59 | % |
| Year Ended October 31, 2011 | | | 11.15 | | | | 0.36 | | | | (0.10 | ) | | | 0.26 | | | | (0.46 | ) | | | — | | | | — | | | | (0.46 | ) | | | 10.95 | | | 2.40 | %(e) | | | 8,946 | | | 1.19 | % | | 3.21 | % | | 1.22 | % | | 54 | % |
| CLASS B SHARES | | | | | | | | | | | | | | | | | | | | | | | | | | | | | | | | | | | | | | | | | | | | | | | | | | | | | | | |
| Year Ended October 31, 2015 | | | 11.69 | | | | 0.05 | | | | (0.27 | ) | | | (0.22 | ) | | | (0.05 | ) | | | (0.99 | ) | | | (0.02 | ) | | | (1.06 | ) | | | 10.41 | | | (2.05 | )% | | | 5,729 | | | 2.16 | % | | 0.42 | % | | 2.16 | % | | 31 | % |
| Year Ended October 31, 2014 | | | 11.77 | | | | 0.07 | | | | 0.33 | | | | 0.40 | | | | (0.13 | ) | | | (0.35 | ) | | | — | | | | (0.48 | ) | | | 11.69 | | | 3.56 | % | | | 7,308 | | | 2.08 | % | | 0.63 | % | | 2.08 | % | | 104 | %(d) |
| Year Ended October 31, 2013 | | | 11.33 | | | | 0.12 | | | | 0.50 | | | | 0.62 | | | | (0.18 | ) | | | — | | | | — | | | | (0.18 | ) | | | 11.77 | | | 5.50 | % | | | 9,222 | | | 2.01 | % | | 1.00 | % | | 2.01 | % | | 31 | % |
| Year Ended October 31, 2012 | | | 10.82 | | | | 0.18 | | | | 0.58 | | | | 0.76 | | | | (0.25 | ) | | | — | | | | — | | | | (0.25 | ) | | | 11.33 | | | 7.21 | % | | | 9,810 | | | 2.10 | % | | 1.67 | % | | 2.10 | % | | 59 | % |
| Year Ended October 31, 2011 | | | 11.02 | | | | 0.27 | | | | (0.09 | ) | | | 0.18 | | | | (0.38 | ) | | | — | | | | — | | | | (0.38 | ) | | | 10.82 | | | 1.68 | %(e) | | | 8,995 | | | 1.94 | % | | 2.46 | % | | 1.97 | % | | 54 | % |
| CLASS C SHARES | | | | | | | | | | | | | | | | | | | | | | | | | | | | | | | | | | | | | | | | | | | | | | | | | | | | | | | |
| Year Ended October 31, 2015 | | | 12.04 | | | | 0.05 | | | | (0.28 | ) | | | (0.23 | ) | | | (0.04 | ) | | | (0.99 | ) | | | (0.02 | ) | | | (1.05 | ) | | | 10.76 | | | (2.01 | )% | | | 2,997 | | | 2.17 | % | | 0.42 | % | | 2.17 | % | | 31 | % |
| Year Ended October 31, 2014 | | | 12.12 | | | | 0.08 | | | | 0.32 | | | | 0.40 | | | | (0.13 | ) | | | (0.35 | ) | | | — | | | | (0.48 | ) | | | 12.04 | | | 3.47 | % | | | 3,927 | | | 2.08 | % | | 0.63 | % | | 2.08 | % | | 104 | %(d) |
| Year Ended October 31, 2013 | | | 11.66 | | | | 0.12 | | | | 0.52 | | | | 0.64 | | | | (0.18 | ) | | | — | | | | — | | | | (0.18 | ) | | | 12.12 | | | 5.53 | % | | | 3,442 | | | 2.01 | % | | 0.98 | % | | 2.01 | % | | 31 | % |
| Year Ended October 31, 2012 | | | 11.12 | | | | 0.19 | | | | 0.60 | | | | 0.79 | | | | (0.25 | ) | | | — | | | | — | | | | (0.25 | ) | | | 11.66 | | | 7.28 | % | | | 2,897 | | | 2.08 | % | | 1.69 | % | | 2.08 | % | | 59 | % |
| Year Ended October 31, 2011 | | | 11.33 | | | | 0.28 | | | | (0.10 | ) | | | 0.18 | | | | (0.39 | ) | | | — | | | | — | | | | (0.39 | ) | | | 11.12 | | | 1.57 | %(e) | | | 2,486 | | | 1.94 | % | | 2.49 | % | | 1.96 | % | | 54 | % |
| * | The per share amounts and percentages reflect income and expenses assuming inclusion of the Fund’s proportionate share of the income and expenses of the master HSBC Portfolios that the fund invested in as part of a master-feeder structure during the fiscal years ended October 31, 2011, 2012, 2013 and 2014. The Fund does not include expenses of the affiliated and unaffiliated investment companies in which the Fund invests. |
| (a) | Calculated based on average shares outstanding. |
| (b) | Total return calculations do not include any sales or redemption charges. |
| (c) | Portfolio turnover is calculated on the basis of the Fund as a whole without distinguishing between the classes of shares issued. For the fiscal years ended October 31, 2011, 2012, 2013 and 2014, the portfolio turnover rate was calculated by aggregating the results of multiplying the Fund’s investment percentage in the master HSBC Portfolios, affiliated and unaffiliated investment companies by their corresponding portfolio turnover rates. |
| (d) | The portfolio turnover rate for the year ended October 31, 2014 was higher than prior years primarily due to a realignment of the fund’s investments |
| (e) | During the year ended October 31, 2011, certain HSBC Portfolios, in which the Fund invested, received monies related to certain nonrecurring litigation settlements. The corresponding impact to the total return was 0.02%, 0.02% and 0.02% for Class A Shares, Class B Shares and Class C Shares, respectively. |
Amounts designated as “—“ are $0 or have been rounded to $0. |
See notes to financial statements . | HSBC WORLD SELECTION FUNDS 31 |
| INCOME STRATEGY FUND |
| Financial Highlights |
Selected data for a share outstanding throughout the periods indicated*
| | | | | Investment Activities | | Distributions | | | | | | | Ratios/Supplementary Data |
| | | | | | | | Net
Realized | | | | | | | | | | | | | | | | | | | | | | Ratio
of Net | | Ratio of | | |
| | | | | | | | and | | | | | | | | | | | | | | | | | | | | | | Investment | | Expenses | | |
| | | | | | | | Unrealized | | | | | | | | | | | | Net | | | | Net | | Ratio | | Income | | to Average | | |
| | Net Asset | | Net | | Gains | | | | | | Net Realized | | Tax | | | | Asset | | | | Assets | | of Net | | (Loss) to | | Net Assets | | |
| | Value, | | Investment | | (Losses) | | Total from | | Net | | Gains from | | Return | | | | Value, | | Total | | at End of | | Expenses | | Average | | (Excluding | | Portfolio |
| | Beginning | | Income | | from | | Investment | | Investment | | Investment | | of | | Total | | End of | | Return | | Period | | to Average | | Net | | Fee | | Turnover |
| | of Period | | (Loss)(a) | | Investments | | Activities | | Income | | Transactions | | Capital | | Distributions | | Period | | (b) | | (000’s) | | Net Assets | | Assets | | Reductions) | | (c) |
| CLASS A SHARES | | | | | | | | | | | | | | | | | | | | | | | | | | | | | | | | | | | | | | | | | | | | | | | | | | | | | | | |
| Year Ended October 31, 2015 | | $ | 10.36 | | | $ | 0.11 | | | $ | (0.16 | ) | | $ | (0.05 | ) | | $ | (0.10 | ) | | $ | (0.15 | ) | | $ | (0.04 | ) | | $ | (0.29 | ) | | $ | 10.02 | | | (0.50 | )% | | $ | 192 | | | 0.95 | % | | 1.06 | % | | 9.98 | % | | 26 | % |
| Year Ended October 31, 2014 | | | 10.36 | | | | 0.14 | | | | 0.23 | | | | 0.37 | | | | (0.18 | ) | | | (0.19 | ) | | | — | | | | (0.37 | ) | | | 10.36 | | | 3.69 | % | | | 293 | | | 1.50 | % | | 1.39 | % | | 10.14 | % | | 118 | %(d) |
| Year Ended October 31, 2013 | | | 10.43 | | | | 0.18 | | | | 0.08 | | | | 0.26 | | | | (0.30 | ) | | | (0.03 | ) | | | — | | | | (0.33 | ) | | | 10.36 | | | 2.57 | % | | | 311 | | | 1.50 | % | | 1.72 | % | | 13.61 | % | | 48 | % |
| Period Ended October 31, 2012(e) | | | 10.00 | | | | 0.10 | | | | 0.40 | | | | 0.50 | | | | (0.07 | ) | | | — | | | | — | | | | (0.07 | ) | | | 10.43 | | | 5.02 | % | | | 337 | | | 1.50 | % | | 1.58 | % | | 29.67 | % | | 31 | % |
| CLASS B SHARES | | | | | | | | | | | | | | | | | | | | | | | | | | | | | | | | | | | | | | | | | | | | | | | | | | | | | | | |
| Year Ended October 31, 2015 | | | 10.34 | | | | 0.04 | | | | (0.17 | ) | | | (0.13 | ) | | | (0.02 | ) | | | (0.15 | ) | | | (0.04 | ) | | | (0.21 | ) | | | 10.00 | | | (1.26 | )% | | | 328 | | | 1.65 | % | | 0.37 | % | | 10.77 | % | | 26 | % |
| Year Ended October 31, 2014 | | | 10.34 | | | | 0.07 | | | | 0.22 | | | | 0.29 | | | | (0.10 | ) | | | (0.19 | ) | | | — | | | | (0.29 | ) | | | 10.34 | | | 2.93 | % | | | 380 | | | 2.25 | % | | 0.65 | % | | 10.88 | % | | 118 | %(d) |
| Year Ended October 31, 2013 | | | 10.41 | | | | 0.10 | | | | 0.08 | | | | 0.18 | | | | (0.22 | ) | | | (0.03 | ) | | | — | | | | (0.25 | ) | | | 10.34 | | | 1.81 | % | | | 402 | | | 2.25 | % | | 0.97 | % | | 14.39 | % | | 48 | % |
| Period Ended October 31, 2012(e) | | | 10.00 | | | | 0.06 | | | | 0.39 | | | | 0.45 | | | | (0.04 | ) | | | — | | | | — | | | | (0.04 | ) | | | 10.41 | | | 4.52 | % | | | 348 | | | 2.25 | % | | 0.89 | % | | 26.84 | % | | 31 | % |
| CLASS C SHARES | | | | | | | | | | | | | | | | | | | | | | | | | | | | | | | | | | | | | | | | | | | | | | | | | | | | | | | |
| Year Ended October 31, 2015 | | | 10.33 | | | | 0.04 | | | | (0.16 | ) | | | (0.12 | ) | | | (0.02 | ) | | | (0.15 | ) | | | (0.04 | ) | | | (0.21 | ) | | | 10.00 | | | (1.17 | )% | | | 578 | | | 1.64 | % | | 0.37 | % | | 10.76 | % | | 26 | % |
| Year Ended October 31, 2014 | | | 10.33 | | | | 0.06 | | | | 0.23 | | | | 0.29 | | | | (0.10 | ) | | | (0.19 | ) | | | — | | | | (0.29 | ) | | | 10.33 | | | 2.93 | % | | | 676 | | | 2.25 | % | | 0.62 | % | | 10.84 | % | | 118 | %(d) |
| Year Ended October 31, 2013 | | | 10.41 | | | | 0.09 | | | | 0.09 | | | | 0.18 | | | | (0.23 | ) | | | (0.03 | ) | | | — | | | | (0.26 | ) | | | 10.33 | | | 1.75 | % | | | 643 | | | 2.25 | % | | 0.84 | % | | 14.49 | % | | 48 | % |
| Period Ended October 31, 2012(e) | | | 10.00 | | | | 0.06 | | | | 0.39 | | | | 0.45 | | | | (0.04 | ) | | | — | | | | — | | | | (0.04 | ) | | | 10.41 | | | 4.47 | % | | | 232 | | | 2.25 | % | | 0.90 | % | | 27.00 | % | | 31 | % |
| * | The expense ratios reflected do not include expenses of the affiliated and unaffiliated investment companies, in which the Fund invests. |
| (a) | Calculated based on average shares outstanding. |
| (b) | Not annualized for periods less than one year. Total return calculations do not include any sales or redemption charges. |
| (c) | Portfolio turnover is calculated on the basis of the Fund as a whole without distinguishing between the classes of shares issued. |
| (d) | The portfolio turnover rate for the year ended October 31, 2014 was higher than prior years primarily due to a realignment of the fund’s investments. |
| (e) | Commencement of operations on March 20, 2012. |
Amounts designated as “—“ are $0 or have been rounded to $0. |
| 32 HSBC WORLD SELECTION FUNDS | See notes to financial statements. |
| HSBC WORLD SELECTION FUNDS |
| Notes to Financial Statements—as of October 31, 2015 |
1. Organization:
The HSBC Funds (the “Trust”), a Massachusetts business trust organized on April 22, 1987, is registered under the Investment Company Act of 1940, as amended (the “Act”), as an open-end management investment company. As of October 31, 2015, the Trust is composed of 17 separate operational funds, each a series of the HSBC Family of Funds, which also includes the HSBC Advisor Funds Trust and the HSBC Portfolios (collectively the “Trusts”). The accompanying financial statements are presented for the following five funds (individually a “Fund,” collectively the “Funds” or the “World Selection Funds”):
| Fund | | |
| Aggressive Strategy Fund | |
| Balanced Strategy Fund | |
| Moderate Strategy Fund | |
| Conservative Strategy Fund | |
| Income Strategy Fund | |
All of the World Selection Funds are diversified funds. Financial statements for all other funds of the Trusts are published separately.
Each of the World Selection Funds is a “fund of funds,” meaning that it seeks to achieve its investment objective by investing primarily in a combination of mutual funds managed by HSBC Global Asset Management (USA) Inc. (the “Adviser”) (the “Affiliated Underlying Funds”), as well as mutual funds managed by other investment advisers and exchange-traded funds (“Unaffiliated Underlying Funds” and, together with the Affiliated Underlying Funds, the “Underlying Funds”). Each Fund may invest in both actively managed and passively managed Underlying Funds to implement the Adviser’s views. Each World Selection Fund may also purchase and hold Exchange Traded Notes (“ETNs”), which are debt securities issued by financial institutions that pay returns based on the performance of a market index or other reference asset. The Underlying Funds may include private equity funds and real estate funds that are organized as mutual funds or Exchange Traded Funds (“ETFs”). Each World Selection Fund invests according to the investment objectives and strategies described in its Prospectus.
The World Selection Funds are authorized to issue an unlimited number of shares of beneficial interest with a par value of $ 0.001 per share. Each Fund offers three classes of shares: Class A Shares, Class B Shares and Class C Shares. Class A Shares of the World Selection Funds (except, the Income Strategy Fund) have a maximum sales charge of 5.00% as a percentage of the original purchase price. The Class A Shares of the Income Strategy Fund have a maximum sales charge of 4.75% as a percentage of the original purchase price. Class B Shares of the World Selection Funds are offered without any front-end sales charge, but will be subject to a contingent deferred sales charge (“CDSC”) ranging from a maximum of 4.00% if redeemed less than one year after purchase to 0.00% if redeemed more than four years after purchase. Class C Shares of the World Selection Funds are offered without any front-end sales charge, but will be subject to a maximum CDSC of 1.00% if redeemed less than one year after purchase. Each class of shares in the World Selection Funds has identical rights and privileges except with respect to arrangements pertaining to shareholder servicing and/or distribution, class-related expenses, voting rights on matters affecting a single class of shares, and exchange privileges of each class of shares. Class B Shares may no longer be purchased or acquired by any new or existing Class B shareholder, except through dividend and/or capital gains reinvestment.
Under the Trust’s organizational documents, the World Selection Funds’ officers and Trustees are indemnified against certain liabilities arising out of the performance of their duties to the World Selection Funds. In addition, in the normal course of business, the Trust enters into contracts with its service providers, which also provide for indemnifications by the World Selection Funds. The World Selection Funds’ maximum exposure under these arrangements is unknown as this would involve any future claims that may be made against the World Selection Funds. However, based on experience, the Trust expects the risk of loss to be remote.
The Funds are investment companies and follow accounting and reporting guidance under Financial Accounting Standards Board (“FASB”) Accounting Standards Codification (“ASC”) Topic 946, “Financial Services-Investment Companies.”
HSBC WORLD SELECTION FUNDS 33
| HSBC WORLD SELECTION FUNDS |
| Notes to Financial Statements—as of October 31, 2015 (continued) |
2. Significant Accounting Policies:
The following is a summary of the significant accounting policies followed by the World Selection Funds in the preparation of their financial statements. The policies are in conformity with generally accepted accounting principles in the United States of America (“GAAP”). The preparation of financial statements requires management to make certain estimates and assumptions that affect the reported amounts of assets and liabilities and disclosure of contingent assets and liabilities at the date of the financial statements and the reported amounts of increases and decreases in net assets from operations during the reporting period. Actual results could differ from those estimates.
Securities Valuation:
The World Selection Funds record their investments at fair value. Fair value is defined as the price that would be received to sell an asset or paid to transfer a liability in an orderly transaction between market participants at the measurement date. The valuation techniques used to determine fair value in funds in which the World Selection Funds are invested are described in their respective notes to financial statements. Valuation techniques employed by the World Selection Funds’ are further described in Note 3 below.
Investment Transactions and Related Income:
Changes in holdings of the Underlying Funds for each World Selection Fund are reflected not later than one business day after trade date. However, for financial reporting purposes, changes in holdings of the Underlying Funds are accounted for on trade date. Dividend income and realized gain distributions from the Underlying Funds are recorded on the ex-dividend date. Investment gains and losses are calculated on the identified cost basis. Each World Selection Fund indirectly bears its proportionate share of fees and expenses incurred by the Underlying Funds in which it is invested. Expenses of the Underlying Funds are reflected on the Statements of Operations as realized and unrealized gain (loss) on investments. In addition, the World Selection Funds accrue their own expenses daily.
Allocations:
Expenses directly attributable to a Fund are charged to that Fund. Expenses not directly attributable to a Fund are allocated proportionately among the applicable series within the Trusts in relation to the net assets of each fund or on another reasonable basis. Class specific expenses are charged directly to the class incurring the expense. In addition, income, expenses (other than class specific expenses), and unrealized and realized gains and losses are allocated to each class based on relative net assets on a daily basis.
Distributions to Shareholders:
Dividends to shareholders from net investment income, if any, are declared and distributed monthly in the case of the Income Strategy Fund, quarterly in the case of the Moderate Strategy Fund and Conservative Strategy Fund, and annually in the case of the Aggressive Strategy Fund and Balanced Strategy Fund.
The World Selection Funds’ net realized gains, if any, are distributed to shareholders at least annually. Additional distributions are also made to the World Selection Funds’ shareholders to the extent necessary to avoid the federal excise tax on certain undistributed income and net capital gains of regulated investment companies.
The amount and character of net investment income and net realized gains distributions are determined in accordance with federal income tax regulations which may differ from GAAP. These “book/tax” differences are either considered temporary or permanent in nature. To the extent these differences are permanent in nature (e.g., reclassification of market discounts, certain gain/loss, and certain distributions), such amounts are reclassified within the composition of net assets; temporary differences (e.g., wash losses and post-October loss deferrals) do not require reclassification. The World Selection Funds may utilize equalization accounting for tax purposes and designate earnings and profits, including net realized gains distributed to shareholders on redemption of shares, as a part of the dividends paid deduction for income tax purposes. To the extent distributions to shareholders from net investment income and net realized gains exceed net investment income and net realized gains for tax purposes, they are reported as distributions of capital.
34 HSBC WORLD SELECTION FUNDS
| HSBC WORLD SELECTION FUNDS |
| Notes to Financial Statements—as of October 31, 2015 (continued) |
Federal Income Taxes:
Each Fund is a separate taxable entity for federal income tax purposes. Each Fund has qualified and intends to continue to qualify each year as a “regulated investment company” under Subchapter M of the Internal Revenue Code, as amended, and to distribute substantially all of its taxable net investment income and net realized gains, if any, to its shareholders. Accordingly, no provision for federal income or excise tax is required.
Management of the Funds has reviewed tax positions taken in tax years that remain subject to examination by all major tax jurisdictions, including federal (i.e., the last four tax year ends and the interim tax period since then, as applicable). Management believes that there is no tax liability resulting from unrecognized tax benefits related to uncertain tax positions taken.
New Accounting Pronouncements:
In August 2014, the FASB issued Accounting Standards Update No. 2014-15 “Presentation of Financial Statements–Going Concern (Subtopic 205-40)” (“ASU 2014-15”), which requires management to evaluate whether there are conditions or events, considered in the aggregate, that raise substantial doubt about the entity’s ability to continue as a going concern. ASU 2014-15 is effective prospectively for annual periods ending after December 15, 2016, and interim periods thereafter.
In May 2015, the FASB issued Accounting Standards Update No. 2015-07 “Fair Value Measurement (Topic 820)” (“ASU 2015-07”), which removes the requirement to categorize within the fair value hierarchy all investments for which fair value is measured using the NAV per share practical expedient. ASU 2015-07 also removes the requirement to make certain disclosures for all investments that may be measured at fair value using the NAV per share practical expedient. The ASU is effective for annual periods beginning after December 15, 2015 and interim periods within those annual periods.
Management is currently evaluating the implications of these ASUs and their impact on the financial statements and related disclosures has not yet been determined.
3. Investment Valuation Summary
The valuation techniques employed by the World Selection Funds, as described below, maximize the use of observable inputs and minimize the use of unobservable inputs in determining fair value. The Funds’ investments are classified within the fair value hierarchy based on the lowest level of input that is significant to the fair value measurement. The inputs used for valuing the World Selection Funds’ investments are summarized in the three broad levels listed below:
| ● | Level 1: quoted prices in active markets for identical assets |
| | |
| ● | Level 2: other significant observable inputs (including quoted prices for similar securities, interest rates, prepayment speeds, credit risk, etc.) |
| | |
| ● | Level 3: significant unobservable inputs (including a Fund’s own assumptions in determining the fair value of investments) |
Changes in valuation techniques may result in transfers in or out of an assigned level within the disclosure hierarchy. The Funds determine transfers between fair value hierarchy levels at the reporting period end. There were no transfers between levels as of October 31, 2015, from the valuation input levels used on October 31, 2014. The inputs or methodology used for valuing investments are not necessarily an indication of the risk associated with investing in those investments.
The World Selection Funds record their investments in mutual funds at the net asset value reported by those funds and are typically categorized as Level 1 in the fair value hierarchy.
The World Selection Funds record their investments in exchange traded funds at the last sale price on a national securities exchange, or in the absence of recorded sales, at the readily available closing bid price on such exchanges, or at the quoted bid price in the over-the-counter market and are typically categorized as Level 1 in the fair value hierarchy.
HSBC WORLD SELECTION FUNDS 35
| HSBC WORLD SELECTION FUNDS |
Notes to Financial Statements—as of October 31, 2015 (continued)
For the year ended October 31, 2015, there were no Level 3 investments for which significant unobservable inputs were used to determine fair value. As of October 31, 2015, all investments were categorized as Level 1 in the fair value hierarchy. The breakdown of investment categorization is disclosed in the Schedule of Portfolio Investments for each fund.
4. Related Party Transactions and Other Agreements and Plans:
Investment Management:
HSBC Global Asset Management (USA), Inc. (“HSBC” or the “Investment Adviser”), a wholly owned subsidiary of HSBC Bank USA, N.A., a national bank organized under the laws of the United States, acts as Investment Adviser to the World Selection Funds. As Investment Adviser, HSBC manages the investments of the World Selection Funds and continuously reviews, supervises and administers the World Selection Funds’ investments pursuant to an Investment Advisory Contract. For its services as Investment Adviser, HSBC is entitled to receive a fee, computed daily and paid monthly, based on average daily net assets, at an annual rate of 0.25% for each Fund.
Administration:
HSBC also serves the World Selection Funds as Administrator. Under the terms of the Administration Agreement, HSBC receives from the World Selection Funds (as well as other funds in the Trusts combined) a fee, accrued daily and paid monthly, at an annual rate of:
| Based on Average Daily Net Assets of | | | Fee Rate(%) |
| Up to $10 billion | | 0.0550 |
| In excess of $10 billion but not exceeding $20 billion | | 0.0350 |
| In excess of $20 billion but not exceeding $50 billion | | 0.0275 |
| In excess of $50 billion | | 0.0250 |
The fee rates and breakpoints are determined on the basis of the aggregate average daily net assets of the Trusts. The total administration fee paid to HSBC is allocated to each series of the Trusts based upon its proportionate share of the aggregate net assets of the Trusts. An amount equal to 50% of the administration fee is deemed to be class specific and is based on the daily net assets.
Pursuant to a Sub-Administration Agreement with HSBC, Citi Fund Services Ohio, Inc. (“Citi”), a wholly-owned subsidiary of Citigroup, Inc., serves as the Sub-Administrator for the Trusts subject to the general supervision by the Trusts’ Board of Trustees (the “Board”) and HSBC. For these services, Citi is entitled to a fee, payable by HSBC, at an annual rate equivalent to the fee rates set forth above subject to certain reductions associated with services provided to new funds minus 0.02%, which is retained by HSBC.
Under a Compliance Services Agreement between the Trusts and Citi (the “CCO Agreement”), Citi makes an employee available to serve as the Trusts’ Chief Compliance Officer (the “CCO��). Under the CCO Agreement, Citi also provides infrastructure and support in implementing the written policies and procedures comprising the Trusts’ compliance program, including support services to the CCO. For the services provided under the CCO Agreement, the Trusts paid Citi $300,447 for the year ended October 31, 2015, plus reimbursement of certain out of pocket expenses. Expenses incurred by each Fund are reflected on the Statements of Operations as “Compliance Services.” Citi pays the salary and other compensation earned by individuals performing these services, as employees of Citi.
Distribution Arrangements:
Foreside Distribution Services, L.P. (“Foreside”), a wholly-owned subsidiary of Foreside Financial Group LLC, serves the Trust as Distributor (the “Distributor”). The Trust has adopted a non-compensatory Distribution Plan and Agreement (the “Distribution Plan”) pursuant to Rule 12b-1 of the Act. The Distribution Plan provides for reimbursement of expenses incurred by the Distributor related to distribution and marketing, at a rate not to exceed 0.25%, 1.00%, and 1.00% of the average daily net assets of Class A Shares (currently not being charged), Class B Shares (currently charging 0.75%), and Class C Shares (currently charging 0.75%) of the World Selection Funds, respectively. For the year ended October 31, 2015, Foreside, as Distributor, also
36 HSBC WORLD SELECTION FUNDS
| HSBC WORLD SELECTION FUNDS |
Notes to Financial Statements—as of October 31, 2015 (continued)
received $148,790, $0, and $15,776 in commissions from sales of the Trusts, for Class A Shares, Class B Shares, and Class C Shares, respectively of which $45, $0, and $0 were reallocated to HSBC-affiliated brokers and dealers, for Class A Shares, Class B Shares, and Class C Shares, respectively.
Shareholder Servicing:
The Trust has adopted a Shareholder Services Plan which provides for payments to shareholder servicing agents for providing various shareholder services. For performing these services, the shareholder servicing agents receive a fee that is computed daily and paid monthly up to 0.25% of the average daily net assets of each of the Class A Shares, Class B Shares and Class C Shares of the World Selection Funds. The fees paid to the Distributor pursuant to the Distribution Plan and to shareholder servicing agents pursuant to the Shareholder Services Plan currently are not intended to exceed, in the aggregate, 0.50% of the average daily net assets of Class A Shares and 1.00% of the average daily net assets of Class B Shares and Class C Shares.
The Distributor has entered into shareholder services contracts with affiliated and unaffiliated financial intermediaries who provide shareholder services and other related services to their clients or customers who invest in the Funds under which the Distributor will pay all or a portion of such fees earned to financial intermediaries for performing such services.
Fund Accounting and Transfer Agency:
Citi provides fund accounting services for each Fund. As fund accountant, Citi receives an annual fee per Fund and share class, subject to minimums, reductions associated with services provided to new funds and reimbursement of certain expenses. Citi receives additional fees paid by the Trust for regulatory administration services and blue sky exemption services. Until March 31, 2015, Citi also provided transfer agency services for each Fund. As transfer agent, Citi received a fee based on the number of funds and shareholder accounts, subject to certain minimums, reductions associated with services provided to new funds and reimbursement of certain expenses. Effective March 31, 2015, transfer agent services were provided under the terms of a separate transfer agency services agreement with Citi. Citi’s rights and obligations under the transfer agency services agreement, in turn, were assigned to SunGard Investor Services LLC (“SIS”), effective March 31, 2015. The transfer agency services, and fees charged for such services, are unchanged as a result of the separate agreement or the assignment to SIS.
Independent Trustees:
For the period January 1, 2015 through October 31, 2015, the Trusts paid each Independent Trustee an annual retainer of $100,000. The Trusts paid a fee of $12,000 for each regular meeting of the Board of Trustees attended and a fee of $3,000 for each special meeting attended. The Trusts paid each Committee Chair an annual retainer of $12,000, with the exception of the Chair of the Audit Committee, who received a retainer of $15,000. The Trusts also paid the Chairman of the Board, an additional annual retainer of $30,000.
Prior to January 1, 2015, the Trusts paid each Independent Trustee an annual retainer of $100,000. The Trusts paid a fee of $10,000 for each regular meeting of the Board of Trustees attended and a fee of $3,000 for each special meeting attended. The Trusts paid each Committee Chair an annual retainer of $3,000, with the exception of the Chair of the Audit Committee, who received a retainer of $6,000. The Trusts also paid the Chairman of the Board, an additional annual retainer of $24,000. In addition, for time expended on Board duties outside normal meetings, which is authorized by the Board, a Trustee was compensated at the rate of $500 per hour, up to a maximum of $3,000 per day.
Fee Reductions:
The Investment Adviser has agreed to contractually limit through March 1, 2016 the total annual expenses, exclusive of interest, taxes, brokerage commissions, extraordinary expense and estimated indirect expenses attributable to the Funds’ investments in investment companies other than the HSBC Growth Portfolio and the HSBC Opportunity Portfolio. Each Fund Class has its own expense limitations based on the average daily net assets for any full fiscal year as follows: Class A Shares 1.50%, Class B Shares 2.25%, Class C Shares 2.25%.
HSBC WORLD SELECTION FUNDS 37
| HSBC WORLD SELECTION FUNDS |
Notes to Financial Statements—as of October 31, 2015 (continued)
Any amounts contractually waived or reimbursed by the Investment Adviser will be subject to repayment by the respective Fund to the Investment Adviser within three years to the extent that the repayment will not cause the Fund’s operating expenses to exceed the contractual expense limit that was in effect at the time of such waiver or reimbursement. During the year ended October 31, 2015, the Investment Adviser did not recapture any of its prior contractual waivers or reimbursements. As of October 31, 2015, the repayments that may potentially be made by the Funds are as follows:
| Fund | | | 2018 ($) | | 2017 ($) | | 2016 ($) | | Total ($) |
| Aggressive Strategy Fund | | — | | — | | 421 | | 421 |
| Income Strategy Fund | | 107,253 | | 114,923 | | 138,725 | | 360,901 |
____________________
| * | | The year listed above the amounts is the fiscal year ending in which the amounts will no longer be able to be recouped. |
The Administrator and Citi may voluntarily waive/reimburse fees to help support the expense limits of the Funds. In addition, HSBC, in its role as Investment Adviser and Administrator, may waive/reimburse additional fees at its discretion. Any voluntary fee waivers/reimbursements are not subject to recoupment in subsequent fiscal periods. Voluntary waivers/reimbursements may be stopped at any time. Amounts waived/reimbursed by the Investment Adviser, Administrator, and Citi are reported separately on the Statements of Operations, as applicable.
Affiliated Transactions:
A summary of each Fund’s investment in affiliated investment companies for the year ended October 31, 2015 is as follows:
| | | | | | | | | | | | | | | | | | | | | | | | Change in | | | | | | | | | | |
| | | | | | | | | | | | Proceeds | | | | | | | | Unrealized | | | | | | | | | | |
| | Value | | Purchases | | from | | Realized | | Appreciation | | Value | | Dividend |
| | 10/31/2014 | | at Cost | | Sales | | Gain(Loss) | | (Depreciation) | | 10/31/2015 | | Income |
| Aggressive Strategy Fund | | | | | | | | | | | | | | | | | | | | | | | | | | | | | | | | | | | | | | |
| HSBC Prime Money Market Fund - Class I | | | $ | 357,358 | | | | $ | 2,451,321 | | | | $ | (2,456,695 | ) | | | | $ | — | | | | | $ | — | | | | | $ | 351,984 | | | | $ | 295 | |
| | |
| Balanced Strategy Fund | | | | | | | | | | | | | | | | | | | | | | | | | | | | | | | | | | | | | | |
| HSBC Prime Money Market Fund - Class I | | | | 942,118 | | | | | 6,522,206 | | | | | (6,939,801 | ) | | | | | — | | | | | | — | | | | | | 524,523 | | | | | 544 | |
| HSBC Emerging Markets Debt Fund - Class I | | | | 2,358,877 | | | | | 141,608 | | | | | (300,715 | ) | | | | | (28,115 | ) | | | | | (78,417 | ) | | | | | 2,093,238 | | | | | 101,230 | |
| HSBC Emerging Markets Local Debt Fund - Class I | | | | 2,275,867 | | | | | 349,965 | | | | | (1,048,453 | ) | | | | | (326,554 | ) | | | | | (110,489 | ) | | | | | 1,140,336 | | | | | — | |
| | |
| Moderate Strategy Fund | | | | | | | | | | | | | | | | | | | | | | | | | | | | | | | | | | | | | | |
| HSBC Prime Money Market Fund - Class I | | | | 855,338 | | | | | 5,611,871 | | | | | (5,725,252 | ) | | | | | — | | | | | | — | | | | | | 741,957 | | | | | 794 | |
| HSBC Emerging Markets Debt Fund - Class I | | | | 2,142,360 | | | | | 111,131 | | | | | (224,249 | ) | | | | | (25,781 | ) | | | | | (71,242 | ) | | | | | 1,932,219 | | | | | 92,478 | |
| HSBC Emerging Markets Local Debt Fund - Class I | | | | 2,075,630 | | | | | 2,534,738 | | | | | (3,131,816 | ) | | | | | (262,838 | ) | | | | | (134,584 | ) | | | | | 1,081,130 | | | | | — | |
| | |
| Conservative Strategy Fund | | | | | | | | | | | | | | | | | | | | | | | | | | | | | | | | | | | | | | |
| HSBC Prime Money Market Fund - Class I | | | | 397,285 | | | | | 3,134,901 | | | | | (3,339,520 | ) | | | | | — | | | | | | — | | | | | | 192,666 | | | | | 306 | |
| HSBC Emerging Markets Debt Fund - Class I | | | | — | | | | | 843,193 | | | | | (78,772 | ) | | | | | (1,332 | ) | | | | | (19,723 | ) | | | | | 743,366 | | | | | 29,523 | |
| HSBC Emerging Markets Local Debt Fund - Class I | | | | 972,377 | | | | | 148,476 | | | | | (930,872 | ) | | | | | (248,816 | ) | | | | | 58,835 | | | | | | — | | | | | — | |
| | |
| Income Strategy Fund | | | | | | | | | | | | | | | | | | | | | | | | | | | | | | | | | | | | | | |
| HSBC Prime Money Market Fund - Class I | | | | 20,778 | | | | | 441,865 | | | | | (446,728 | ) | | | | | — | | | | | | — | | | | | | 15,915 | | | | | 13 | |
| HSBC Emerging Markets Debt Fund - Class I | | | | — | | | | | 11,557 | | | | | (272 | ) | | | | | (2 | ) | | | | | 57 | | | | | | 11,340 | | | | | 153 | |
| HSBC Emerging Markets Local Debt Fund - Class I | | | | 65,717 | | | | | 13,100 | | | | | (65,849 | ) | | | | | (17,961 | ) | | | | | 4,993 | | | | | | — | | | | | — | |
38 HSBC WORLD SELECTION FUNDS
| HSBC WORLD SELECTION FUNDS |
Notes to Financial Statements—as of October 31, 2015 (continued)
5. Investment Transactions:
Cost of purchases and proceeds from sales of securities (excluding securities maturing less than one year from acquisition) for the year ended October 31, 2015 were as follows:
| Fund | | | Purchases ($) | | Sales ($) |
| Aggressive Strategy Fund | | 1,083,058 | | | 2,812,146 | |
| Balanced Strategy Fund | | 7,074,588 | | | 12,069,585 | |
| Moderate Strategy Fund | | 12,222,861 | | | 16,385,799 | |
| Conservative Strategy Fund | | 5,712,240 | | | 8,358,074 | |
| Income Strategy Fund | | 322,891 | | | 530,399 | |
6. Federal Income Tax Information:
At October 31, 2015, the cost basis of securities for federal income tax purposes, gross unrealized appreciation, gross unrealized depreciation and net unrealized appreciation/depreciation were as follows:
| | | | | | | | | | | | | Net Unrealized |
| | | | Tax Unrealized | | Tax Unrealized | | Appreciation/ |
| | Tax Cost ($) | | Appreciation ($) | | Depreciation ($) | | (Depreciation) ($) |
| Aggressive Strategy Fund | | 16,099,601 | | | 408,054 | | | | (853,951 | ) | | | | (445,897 | ) | |
| Balanced Strategy Fund | | 41,466,879 | | | 790,881 | | | | (2,198,563 | ) | | | | (1,407,682 | ) | |
| Moderate Strategy Fund | | 38,209,124 | | | 513,953 | | | | (1,617,503 | ) | | | | (1,103,550 | ) | |
| Conservative Strategy Fund | | 16,924,096 | | | 185,787 | | | | (385,387 | ) | | | | (199,600 | ) | |
| Income Strategy Fund | | 1,126,008 | | | 13,037 | | | | (20,775 | ) | | | | (7,738 | ) | |
____________________
| * | | The difference between book-basis unrealized appreciation (depreciation) is attributable primarily to tax deferral of losses on wash sales and the realization for tax purposes of unrealized gains/losses on investments in passive foreign investment companies. |
The tax character of dividends paid by the Funds during the tax year ended October 31, 2015 was as follows:
| | Dividends paid from | |
| | | | | | Net Long Term | | Total Taxable | | Return of | | Total Dividends |
| | Ordinary Income ($) | | Capital Gains ($) | | Dividends ($) | | Capital ($) | | Paid ($)(1) |
| Aggressive Strategy Fund | | | 944,259 | | | | 3,560,397 | | | | 4,504,656 | | | | — | | | | 4,504,656 | |
| Balanced Strategy Fund | | | 2,407,707 | | | | 6,313,596 | | | | 8,721,303 | | | | — | | | | 8,721,303 | |
| Moderate Strategy Fund | | | 1,656,456 | | | | 3,779,497 | | | | 5,435,953 | | | | 59,425 | | | | 5,495,378 | |
| Conservative Strategy Fund | | | 485,188 | | | | 1,289,723 | | | | 1,774,911 | | | | 33,032 | | | | 1,807,943 | |
| Income Strategy Fund | | | 10,373 | | | | 13,955 | | | | 24,328 | | | | 4,475 | | | | 28,803 | |
____________________
| (1) | | Total dividends paid may differ from the amount reported in the Statement of Changes in Net Assets because dividends are recognized when actually paid for tax purposes. |
HSBC WORLD SELECTION FUNDS 39
| HSBC WORLD SELECTION FUNDS |
Notes to Financial Statements—as of October 31, 2015 (continued)
The tax character of dividends paid by the Funds during the tax year ended October 31, 2014 was as follows:
| | Dividends paid from |
| | | | | | Net Long Term | | Total Taxable | | Return of | | Total Dividends |
| | Ordinary Income ($) | | Capital Gains ($) | | Dividends ($) | | Capital ($) | | Paid ($)(1) |
| Aggressive Strategy Fund | | | 155,623 | | | | 1,042,365 | | | | 1,197,988 | | | — | | | 1,197,988 | |
| Balanced Strategy Fund | | | 1,005,907 | | | | 2,808,516 | | | | 3,814,423 | | | — | | | 3,814,423 | |
| Moderate Strategy Fund | | | 757,629 | | | | 1,711,813 | | | | 2,469,442 | | | — | | | 2,469,442 | |
| Conservative Strategy Fund | | | 376,902 | | | | 550,497 | | | | 927,399 | | | — | | | 927,399 | |
| Income Strategy Fund | | | 32,983 | | | | 7,386 | | | | 40,369 | | | — | | | 40,369 | |
____________________
| (1) | | Total dividends paid may differ from the amount reported in the Statement of Changes in Net Assets because dividends are recognized when actually paid for tax purposes. |
As of the tax year ended October 31, 2015, the components of accumulated earnings/(deficit) on a tax basis for the Funds were as follows:
| Undistributed | | Undistributed | | Undistributed | | | | | | | | Accumulated | | Unrealized | | Total
Accumulated |
| Ordinary | | Tax Exempt | | Long Term | | Accumulated | | Dividends | | Capital and | | Appreciation/ | | Earnings/ |
| Income ($) | | Income ($) | | Capital Gains ($) | | Earnings ($) | | Payable ($) | | Other Losses ($) | | (Depreciation) ($)(1) | | (Deficit) ($) |
| Aggressive Strategy Fund | | 26,472 | | | — | | — | | | 26,472 | | | — | | | (21,777 | ) | | | | (445,897 | ) | | | | (441,202 | ) | |
| Balanced Strategy Fund | | 254,306 | | | — | | — | | | 254,306 | | | — | | | (157,389 | ) | | | | (1,407,682 | ) | | | | (1,310,765 | ) | |
| Moderate Strategy Fund | | — | | | — | | — | | | — | | | — | | | (113,045 | ) | | | | (1,103,550 | ) | | | | (1,216,595 | ) | |
| Conservative Strategy Fund | | — | | | — | | — | | | — | | | — | | | (186,283 | ) | | | | (199,600 | ) | | | | (385,883 | ) | |
| Income Strategy Fund | | — | | | — | | — | | | — | | | — | | | (11,861 | ) | | | | (7,738 | ) | | | | (19,599 | ) | |
____________________
| (1) | | The differences between book-basis and tax-basis unrealized appreciation/depreciation are attributable primarily to: tax deferral of losses on wash sales, the realization for tax purposes of unrealized gains/losses on certain derivative instruments, the difference between book and tax amortization methods for premium and market discount, the realization for tax purposes of unrealized gains/losses on investments in passive foreign investment companies and the return of capital adjustments from real estate investment trusts. |
CLCFs not subject to expiration:
| | Short Term | | Long Term | | |
| | Amount ($) | | Amount ($) | | Total ($) |
| Aggressive Strategy Fund | | | 8,536 | | | | 13,241 | | | 21,777 |
| Balanced Strategy Fund | | | — | | | | 157,389 | | | 157,389 |
| Moderate Strategy Fund | | | — | | | | 113,045 | | | 113,045 |
| Conservative Strategy Fund | | | — | | | | 186,283 | | | 186,283 |
| Income Strategy Fund | | | — | | | | 11,861 | | | 11,861 |
7. Significant Shareholders:
The Funds each have one or more shareholders, which are accounts maintained by financial intermediaries on behalf of their clients, that own a significant portion of the Fund’s outstanding shares, respectively. Significant shareholder transactions by these shareholders may impact the Funds’ performance.
40 HSBC WORLD SELECTION FUNDS
| HSBC WORLD SELECTION FUNDS |
Notes to Financial Statements—as of October 31, 2015 (continued)
8. Subsequent Events:
At a meeting of the Board of Trustees of the Trusts held on December 17-18, 2015, the Trustees of the Trusts approved on behalf of each Trust and each of the Funds a form of Agreement and Plan of Reorganization (the “Plan”) and other proposals subject to shareholder approval. The Plan will be submitted to a vote of shareholders of the Funds at a special meeting of shareholders to be held in 2016. The Plan calls for the reorganization and redomiciliation of the Funds, which are series of either a Massachusetts business trust (the Trust and Advisor Trust) or a New York trust (the Portfolio Trust), with and into corresponding “shell” series (“New Funds”) of a single newly formed Delaware statutory trust (the “Redomiciliation”). If approved by shareholders, the Redomiciliation is expected to occur in the second calendar quarter of 2016. Upon completion of the Redomiciliation, shareholders of the Funds would own shares of the corresponding class of the New Funds that are equal in value to the shares of the Fund that were held by the shareholders immediately prior to the closing of the Redomiciliation. In addition, the respective share classes of each of the New Funds would assume the performance, financial and other historical information of those of the corresponding Fund. The Redomiciliation is not expected to have an impact on the continuing operations of the Funds. Additional information about the Plan and the other proposals will be included in the Trusts’ proxy statement that is expected to be mailed to shareholders in March 2016.
On November 30, 2015, SunGard Investor Services LLC announced that its acquisition by Fidelity National Information Services was completed. The transfer agency services, and fees charged for such services, are unchanged as a result of the acquisition.
Management has evaluated events and transactions through the date the financial statements were issued, for purposes of recognition or disclosure in these financial statements and there are no additional subsequent events to report.
HSBC WORLD SELECTION FUNDS 41
Report of Independent Registered Public Accounting Firm
To the Board of Trustees and Shareholders of HSBC Funds
In our opinion, the accompanying statements of assets and liabilities, including the schedules of portfolio investments, and the related statements of operations and of changes in net assets and the financial highlights present fairly, in all material respects, the financial position of each of Aggressive Strategy Fund, Balanced Strategy Fund, Moderate Strategy Fund, Conservative Strategy Fund and Income Strategy Fund (each an HSBC World Selection Fund and a portfolio of HSBC Funds, and collectively hereafter referred to as the “Funds”) at October 31, 2015, and the results of each of their operations, the changes in each of their net assets and the financial highlights for the year then ended, in conformity with accounting principles generally accepted in the United States of America. These financial statements and financial highlights (hereafter referred to as “financial statements”) are the responsibility of the Funds’ management. Our responsibility is to express an opinion on these financial statements based on our audit. We conducted our audit of these financial statements in accordance with the standards of the Public Company Accounting Oversight Board (United States). Those standards require that we plan and perform the audit to obtain reasonable assurance about whether the financial statements are free of material misstatement. An audit includes examining, on a test basis, evidence supporting the amounts and disclosures in the financial statements, assessing the accounting principles used and significant estimates made by management, and evaluating the overall financial statement presentation. We believe that our audit, which included confirmation of securities at October 31, 2015 by correspondence with the custodian and transfer agents, provides a reasonable basis for our opinion. The accompanying statements of changes in net assets for the year ended October 31, 2014 and the financial highlights for each of the years or periods ended on or prior to October 31, 2014 were audited by other auditors whose report dated December 23, 2014 expressed an unqualified opinion on those statements and financial highlights.
PricewaterhouseCoopers LLP
New York, New York
December 29, 2015
42 HSBC WORLD SELECTION FUNDS
| HSBC WORLD SELECTION FUNDS |
| Other Federal Income Tax Information—as of October 31, 2015 (Unaudited) |
During the year ended October 31, 2015, the following World Selection Funds declared capital gain distributions:
| | Short Term Capital Gain | | Long Term Capital Gain |
| | Distributions ($) | | Distributions ($) |
| Aggressive Strategy Fund | | | 836,518 | | | | 3,560,397 | |
| Balanced Strategy Fund | | | 1,768,375 | | | | 6,313,596 | |
| Moderate Strategy Fund | | | 1,107,837 | | | | 3,779,497 | |
| Conservative Strategy Fund | | | 344,387 | | | | 1,289,723 | |
| Income Strategy Fund | | | 4,035 | | | | 13,955 | |
For the year ended October 31, 2015, the following percentages of the total ordinary income dividends paid by the World Selection Funds qualify for the corporate dividends received deduction available to corporate shareholders:
| | Dividends Received Deduction (%) |
| Aggressive Strategy Fund | | 21.34 |
| Balanced Strategy Fund | | 17.55 |
| Moderate Strategy Fund | | 19.30 |
| Conservative Strategy Fund | | 16.15 |
| Income Strategy Fund | | 36.39 |
For the year ended October 31, 2015, dividends paid by the World Selection Funds may be subject to a maximum tax rate of 15%, as provided for by the Jobs and Growth Tax Relief Reconciliation Act of 2003. The World Selection Funds intend to designate the maximum amount allowable as taxed at a maximum rate of 15%. Complete information will be reported in conjunction with your 2014 Form 1099-DIV:
| | Qualified Dividend Income (%) |
| Aggressive Strategy Fund | | 30.59 |
| Balanced Strategy Fund | | 28.23 |
| Moderate Strategy Fund | | 44.26 |
| Conservative Strategy Fund | | 39.66 |
| Income Strategy Fund | | 67.31 |
HSBC WORLD SELECTION FUNDS 43
| HSBC WORLD SELECTION FUNDS |
| Table of Shareholder Expenses—as of October 31, 2015 (Unaudited) |
As a shareholder of the World Selection Funds, you incur two types of costs: (1) transaction costs, including sales charges (loads) on purchases, redemption fees and exchange fees; and (2) ongoing costs, including management fees; distribution and/or shareholder servicing fees and other Fund expenses. These examples are intended to help you understand your ongoing costs (in dollars) of investing in the Funds and to with the ongoing costs of investing in other mutual funds.
These examples are intended to help you understand your ongoing costs (in dollars) of investing in the World Selection Funds and to compare these costs with the ongoing costs of investing in other mutual funds.
These examples are based on an investment of $1,000 invested at the beginning of the period and held for the entire period from May 1, 2015 through October 31, 2015.
Actual Example
The table below provides information about actual account values and actual expenses. You may use the information below, together with the amount you invested, to estimate the expenses that you paid over the period. Simply divide your account value by $1,000 (for example, an $8,600 account value divided by $1,000 = 8.6), then multiply the result by the number in the table under the heading entitled “Expenses Paid During Period” to estimate the expenses you paid on your account during this period.
| | | | | | | | | | | | | | | | | | | Annualized |
| | | | Beginning | | Ending | | Expenses Paid | | Expense Ratio |
| | | | Account Value | | Account Value | | During Period* | | During Period |
| | | | 5/1/15 | | 10/31/15 | | 5/1/15 - 10/31/15 | | 5/1/15 - 10/31/15 |
| Aggressive Strategy Fund | | Class A Shares | | | $ | 1,000.00 | | | | $ | 947.10 | | | | $ | 7.21 | | | | 1.47 | % | |
| | Class B Shares | | | | 1,000.00 | | | | | 943.50 | | | | | 10.92 | | | | 2.23 | % | |
| | Class C Shares | | | | 1,000.00 | | | | | 944.00 | | | | | 10.98 | | | | 2.24 | % | |
| Balanced Strategy Fund | | Class A Shares | | | | 1,000.00 | | | | | 950.60 | | | | | 5.06 | | | | 1.03 | % | |
| | | Class B Shares | | | | 1,000.00 | | | | | 947.20 | | | | | 8.74 | | | | 1.78 | % | |
| | Class C Shares | | | | 1,000.00 | | | | | 947.20 | | | | | 8.79 | | | | 1.79 | % | |
| Moderate Strategy Fund | | Class A Shares | | | | 1,000.00 | | | | | 959.80 | | | | | 5.38 | | | | 1.09 | % | |
| | Class B Shares | | | | 1,000.00 | | | | | 956.30 | | | | | 9.07 | | | | 1.84 | % | |
| | Class C Shares | | | | 1,000.00 | | | | | 955.90 | | | | | 9.07 | | | | 1.84 | % | |
| Conservative Strategy Fund | | Class A Shares | | | | 1,000.00 | | | | | 970.50 | | | | | 6.71 | | | | 1.35 | % | |
| | Class B Shares | | | | 1,000.00 | | | | | 967.20 | | | | | 10.41 | | | | 2.10 | % | |
| | Class C Shares | | | | 1,000.00 | | | | | 967.20 | | | | | 10.41 | | | | 2.10 | % | |
| Income Strategy Fund | | Class A Shares | | | | 1,000.00 | | | | | 981.40 | | | | | 1.60 | | | | 0.32 | % | |
| | Class B Shares | | | | 1,000.00 | | | | | 977.40 | | | | | 5.13 | | | | 1.03 | % | |
| | Class C Shares | | | | 1,000.00 | | | | | 977.40 | | | | | 4.83 | | | | 0.97 | % | |
____________________
| * | Expenses are equal to the average account value over the period, multiplied by the Funds’ annualized expense ratio, multiplied by 184/365 (to reflect the one half year period). |
44 HSBC WORLD SELECTION FUNDS
| HSBC WORLD SELECTION FUNDS |
| Table of Shareholder Expenses—as of October 31, 2015 (Unaudited) (Continued) |
Hypothetical Example for Comparison Purposes
The table below provides information about hypothetical account values and hypothetical expenses based on the Fund’s actual expense ratio and an assumed rate of return of 5% per year before expenses, which is not the Fund’s actual return. The hypothetical account values and expenses may not be used to estimate the actual ending account balance or expenses you paid for the period. You may use this information to compare this 5% hypothetical example with the 5% hypothetical examples that appear in the shareholder reports of other funds.
Please note that the expenses shown in the table are meant to highlight your ongoing costs only and do not reflect any transactional costs, such as sales charges (loads), redemption fees, or exchange fees. Therefore, the table is useful in comparing ongoing costs only, and will not help you determine the relative total costs of owning different funds. In addition, if these transactional costs were included, your costs would have been higher.
| | | | | | | | | | | | | | | | | | | Annualized |
| | | | Beginning | | Ending | | Expenses Paid | | Expense Ratio |
| | | | Account Value | | Account Value | | During Period* | | During Period |
| | | | 5/1/15 | | 10/31/15 | | 5/1/15 - 10/31/15 | | 5/1/15 - 10/31/15 |
| Aggressive Strategy Fund | | Class A Shares | | | $ | 1,000.00 | | | | $ | 1,017.80 | | | | $ | 7.48 | | | | 1.47 | % | |
| | Class B Shares | | | | 1,000.00 | | | | | 1,013.96 | | | | | 11.32 | | | | 2.23 | % | |
| | Class C Shares | | | | 1,000.00 | | | | | 1,013.91 | | | | | 11.37 | | | | 2.24 | % | |
| Balanced Strategy Fund | | Class A Shares | | | | 1,000.00 | | | | | 1,020.01 | | | | | 5.24 | | | | 1.03 | % | |
| | Class B Shares | | | | 1,000.00 | | | | | 1,016.23 | | | | | 9.05 | | | | 1.78 | % | |
| | | Class C Shares | | | | 1,000.00 | | | | | 1,016.18 | | | | | 9.10 | | | | 1.79 | % | |
| Moderate Strategy Fund | | Class A Shares | | | | 1,000.00 | | | | | 1,019.71 | | | | | 5.55 | | | | 1.09 | % | |
| | Class B Shares | | | | 1,000.00 | | | | | 1,015.93 | | | | | 9.35 | | | | 1.84 | % | |
| | Class C Shares | | | | 1,000.00 | | | | | 1,015.93 | | | | | 9.35 | | | | 1.84 | % | |
| Conservative Strategy Fund | | Class A Shares | | | | 1,000.00 | | | | | 1,018.40 | | | | | 6.87 | | | | 1.35 | % | |
| | Class B Shares | | | | 1,000.00 | | | | | 1,014.62 | | | | | 10.66 | | | | 2.10 | % | |
| | Class C Shares | | | | 1,000.00 | | | | | 1,014.62 | | | | | 10.66 | | | | 2.10 | % | |
| Income Strategy Fund | | Class A Shares | | | | 1,000.00 | | | | | 1,023.59 | | | | | 1.63 | | | | 0.32 | % | |
| | Class B Shares | | | | 1,000.00 | | | | | 1,020.01 | | | | | 5.24 | | | | 1.03 | % | |
| | Class C Shares | | | | 1,000.00 | | | | | 1,020.32 | | | | | 4.94 | | | | 0.97 | % | |
____________________
| * | Expenses are equal to the average account value over the period, multiplied by the Funds’ annualized expense ratio, multiplied by 184/365 (to reflect the one half year period). |
HSBC WORLD SELECTION FUNDS 45
| HSBC WORLD SELECTION FUNDS |
| Board of Trustees and Officers (Unaudited) |
MANAGEMENT OF THE TRUST
The following table contains information regarding the HSBC Family of Funds’ Board of Trustees (“Trustees”). Asterisks indicate those Trustees who are “interested persons,” as defined in the Investment Company Act of 1940, as amended, of the HSBC Family of Funds. The HSBC Family of Funds’ Statement of Additional Information includes additional information about the Trustees and is available, without charge, upon request by calling (888) 525-5757.
| | | | | | | | Portfolios in | | |
| | Position(s) | | Term of Office | | | | Fund Complex | | |
| Name | | Held with | | and Length of | | Principal Occupation(s) | | Overseen By | | Other Directorships |
| Address, Age | | Funds | | Time Served | | During Past 5 Years | | Trustee* | | Held by Trustee |
| NON-INTERESTED TRUSTEES | | | | | | | |
| |
MARCIA L. BECK
P.O. Box 182845
Columbus, OH
43218-3035
Age: 60 | | Trustee | | Indefinite;
2008
to present | | Private Investor (1999 – present); Executive Vice President, Prudential Investments (1997 – 1999); President and Trustee, The Goldman Sachs Mutual Funds (1992 – 1996) | | 24 | | None |
| | | | | | | | | | | |
SUSAN C. GAUSE
P.O. Box 182845
Columbus, OH
43218-3035
Age: 63 | | Trustee | | Indefinite;
2013
to present | | Private Investor (2003 - present); Chief Executive Officer, Dresdner RCM Global Investors and Allianz Dresdner Asset Management (2000 - 2002); Board Member, Dresdner Global Asset Management Board (2000 - 2002); Chief Operating Officer and Senior Managing Director, Dresdner RCM Global Investors (1998 - 2000); Global Chief Financial Officer, Dresdner RCM Global Investors (1996 - 1998) | | 24 | | Met Investors Series
Trust and Metropolitan
Series Fund |
| | | | | | | | | | | |
SUSAN S. HUANG
P.O. Box 182845
Columbus, OH
43218-3035
Age: 61 | | Trustee | | Indefinite;
2008
to present | | Private Investor (2000-present); Senior Vice President, Schroder Investment Management (2001 – 2004); Managing Director, Chase Asset Management (1995-2000) | | 24 | | None |
| | | | | | | | | | | |
THOMAS F. ROBARDS
P.O. Box 182845
Columbus, OH
43218-3035
Age: 69 | | Chairman and
Trustee | | Indefinite;
2005
to present | | Partner, Robards & Co. LLC (investment and advisory services) (2005-present); Chief Financial Officer, American Museum of Natural History (2003- 2004); Chief Financial Officer, Datek Online Holdings (2000-2003); Executive Vice President and Chief Financial Officer, Republic New York Corporation (1976-2000) | | 24 | | Ellington Financial LLC
(NYSE listed financial
services); Ellington
Residential Mortgage
REIT (NYSE listed real
estate investment trust) |
| | | | | | | | | | | |
| INTERESTED TRUSTEE | | | | | | | | | | |
| |
DEBORAH HAZELL
452 Fifth Avenue
New York
NY 10018
Age: 52 | | Trustee | | Indefinite;
2011
to present | | Chief Executive Officer, HSBC Global Asset Management (USA) Inc. (2011-present); President and Chief Executive Officer, Fisher Francis Trees & Watts (“FFTW”) (investment adviser), 2008-2011; Client Service, Business Development and Marketing Group, FFTW (1999-2008) | | 24 | | None |
____________________
| * | Includes the HSBC Funds, the HSBC Advisor Funds Trust and the HSBC Portfolios. |
46 HSBC WORLD SELECTION FUNDS
| HSBC WORLD SELECTION FUNDS |
| Board of Trustees and Officers (Unaudited) (continued) |
| Name, Address, Age | | Position(s) Held
Funds | | Term of Office and
Length of Time Served | | Principal Occupation(s)
During Past 5 Years |
| OFFICERS | | | | | | |
| |
RICHARD A. FABIETTI
452 Fifth Avenue
New York, NY 10018
Age: 57 | | President | | One year; 2004 to
present | | Senior Vice President, HSBC Global Asset Management (USA) Inc. (1998 - present) |
| |
JAMES D. LEVY
452 Fifth Avenue
New York, NY 10018
Age: 52 | | Vice President | | One year; 2014 to
present | | Vice President, Product Management, HSBC Global Asset Management (USA) Inc. (2014 – present); Vice President, Product Development, GE Asset Management Inc. (2007 – 2014) |
| | | | | | | |
SCOTT RHODES*
3435 Stelzer Road
Columbus, OH 43219-3035
Age: 56 | | Treasurer | | One year; 2014 to
present | | Senior Vice President, Citi (2010 - present); Manager, Treasurer of Mutual Funds, and Broker-Dealer Treasurer and Financial & Operations Principal, GE Asset Management Inc. (2005 – 2010) |
| | | | | | | |
IOANNIS TZOUGANATOS*
100 Summer Street, Suite 1500
Boston, MA 02110
Age: 39 | | Secretary | | One Year; 2015 to
present | | Vice President, Regulatory Administration, Citi (2008-present) |
| | | | | | | |
HEATHER MELITO-DEZAN*
100 Summer Street
Suite 1500
Boston, MA 02110
Age: 38 | | Assistant Secretary | | One year; 2014 to
present | | Assistant Vice President, Regulatory Administration, Citi (2013 - present); Senior Specialist, Regulatory Administration, NGAM (2010-2013); Vice President and Manager. Regulatory Administration, BNY Mellon (2004-2010) |
| | | | | | | |
CHARLES L. BOOTH*
3435 Stelzer Road
Columbus, OH 43219-3035
Age: 55 | | Chief Compliance
Officer | | One year;
2015 to present | | Director and Compliance Officer, CCO Services, Citi (1988 - present) |
____________________
| * | Mr. Rhodes, Mr. Tzouganatos, Ms. Melito-Dezan, and Mr. Booth also are officers of other investment companies of which Citi (or an affiliate) is the administrator or sub-administrator. |
HSBC WORLD SELECTION FUNDS 47
Other Information (Unaudited):
Information regarding how the Funds voted proxies relating to portfolio securities during the most recent 12-month period ended June 30th is available (i) without charge, upon request, by calling 1-800-525-5757 for HSBC Bank USA and HSBC Brokerage (USA) Inc. clients and 1-800-782-8183 for all other shareholders; (ii) on the Funds’ website at www.investorfunds.us.hsbc.com; and (iii) on the Security and Exchange Commission’s (“Commission”) website at http://www.sec.gov.
The Funds file their complete schedules of portfolio holdings with the Commission for the first and third quarters of each fiscal year on Form N-Q. The Funds’ Forms N-Q are available on the Commission’s website at http://www.sec.gov. The Funds’ Forms N-Q may be reviewed and copied at the Commission’s Public Reference Room in Washington, D.C. and information on the operation of the Public Reference Room may be obtained by calling 1-800-SEC-0330. The Funds’ Schedules of Investments will be available no later than 60 days after each period end, without charge, on the Funds’ website at www.investorfunds.us.hsbc.com.
An investment in a Fund is not a deposit of HSBC Bank USA, National Association, and is not insured or guaranteed by the Federal Deposit Insurance Corporation or any other government agency.
48 HSBC WORLD SELECTION FUNDS
HSBC FAMILY OF FUNDS:
INVESTMENT ADVISER AND ADMINISTRATOR
HSBC Global Asset Management (USA) Inc.
452 Fifth Avenue
New York, NY 10018

Investment products:
ARE NOT A
BANK DEPOSIT
OR OBLIGATION
OF THE BANK
OR ANY OF ITS
AFFILIATES | ARE NOT
FDIC
INSURED | ARE NOT
INSURED BY
ANY FEDERAL
GOVERNMENT
AGENCY |
ARE NOT GUARANTEED BY
THE BANK OR ANY OF ITS
AFFILIATES | MAY LOSE
VALUE |
SHAREHOLDER SERVICING AGENTS
For HSBC Bank USA, N.A. and
HSBC Securities (USA) Inc. Clients
HSBC Bank USA, N.A.
452 Fifth Avenue
New York, NY 10018
1-888-525-5757
For All Other Shareholders
HSBC Funds
P.O. Box 182845
Columbus, OH 43218
1-800-782-8183
TRANSFER AGENT
SunGard Investor Services, LLC
3435 Stelzer Road
Columbus, OH 43219
DISTRIBUTOR
Foreside Distribution Services, L.P.
690 Taylor Road, Suite 150
Gahanna, OH 43230
CUSTODIAN
The Northern Trust Company
50 South LaSalle Street
Chicago, IL 60603
INDEPENDENT REGISTERED PUBLIC ACCOUNTING FIRM
PricewaterhouseCoopers LLP
300 Madison Avenue
New York, NY 10017
LEGAL COUNSEL
Dechert LLP
1900 K Street, N.W.
Washington, D.C. 20006
Investment products are offered by HSBC Securities (USA) Inc. (HSI), member NYSE/FINRA/SIPC. HSI is an affiliate of HSBC Bank USA, N.A. Investment products: Are not a deposit or other obligation of the bank or any of its affiliates; Not FDIC insured or insured by any federal government agency of the United States; Not guaranteed by the bank or any of its affiliates; and are subject to investment risk, including possible loss of principal invested.
Investors should consider the investment objectives, risks, charges, and expenses of the investment company carefully before investing. The prospectus contains this and other important information about the investment company. For clients of HSBC Securities (USA) Inc., please call 1-888-525-5757 for more information. For other investors and prospective investors, please call the Funds directly at 1-800-782-8183 or visit our website at www.investorfunds.us.hsbc.com. Investors should read the prospectus carefully before investing or sending money.
HSBC Global Asset Management (USA) Inc.
HSBC Funds
Annual Report
October 31, 2015
| EQUITY FUNDS | | Class A | | Class B | | Class C | | Class I |
| HSBC Growth Fund | | HOTAX | | HOTBX | | HOTCX | | HOTYX |
| HSBC Opportunity Fund | | HSOAX | | HOPBX | | HOPCX | | RESCX |
| Table of Contents |
| HSBC Family of Funds |
| Annual Report - October 31, 2015 |
| Glossary of Terms | | |
| Commentary From the Investment Manager | | 3 |
| Portfolio Reviews | | 4 |
| Statements of Assets and Liabilities | | 8 |
| Statements of Operations | | 9 |
| Statements of Changes in Net Assets | | 10 |
| Financial Highlights | | 14 |
| Notes to Financial Statements | | 17 |
| Report of Independent Registered Public Accounting Firm | | 25 |
| Other Federal Income Tax Information | | 26 |
| Table of Shareholder Expenses | | 27 |
| | | |
| HSBC Portfolios | | |
| Portfolio Composition | | 29 |
| | | |
| Schedules of Portfolio Investments | | |
| HSBC Growth Portfolio | | 30 |
| HSBC Opportunity Portfolio | | 32 |
| Statements of Assets and Liabilities | | 34 |
| Statements of Operations | | 35 |
| Statements of Changes in Net Assets | | 36 |
| Financial Highlights | | 37 |
| Notes to Financial Statements | | 38 |
| Report of Independent Registered Public Accounting Firm | | 44 |
| Table of Shareholder Expenses | | 45 |
| Board of Trustees and Officers | | 46 |
| Other Information | | 48 |
Barclays Emerging Markets USD Aggregate Index is a flagship hard currency Emergency Markets debt benchmark that includes fixed and floating-rate US dollar-denominated debt issued from sovereign, quasi-sovereign, and corporate EM issuers. Country eligibility and classification as Emerging Markets is rules-based and reviewed annually using World Bank income group and International Monetary Fund country classification.
Barclays Euro Aggregate Bond Index is an index tracks fixed-rate, investment-grade Euro-denominated securities. Inclusion is based on the currency of the issue, and not the domicile of the issuer. The principal sectors in the index are Treasury, Corporate, Government-Related and Securitised. Securities in the index are part of the Pan-European Aggregate and the Global Aggregate Indices.
Barclays U.S. Aggregate Bond Index is an index that is generally representative of investment-grade, USD-denominated, fixed-rate debt issues, taxable bond market, including Treasuries, government-related and corporate securities, asset-backed, mortgage-backed and commercial mortgage-backed securities, with maturities of at least one year.
Barclays U.S. Corporate High-Yield Bond Index is an index that measures the non-investment grade, USD-denominated, fixed-rate, taxable corporate bond market. Securities are classified as high-yield if the middle rating of Moody’s, Fitch, and S&P is Ba1/BB+/BB+ or below. The index excludes emerging markets debt.
Lipper Large-Cap Growth Funds Average is an equally weighted average of mutual funds that, by portfolio practice, invest at least 75% of their equity assets in companies with market capitalizations (on a three-year weighted basis) above Lipper’s U.S. Diversified Equity large-cap floor. Large-cap growth funds typically have an above-average price-to-earnings ratio, price-to-book ratio, and three-year sales-per-share growth value, compared to the S&P 500 Index.
Lipper Mid-Cap Growth Funds Average is an equally weighted average of mutual funds that, by portfolio practice, invest at least 75% of their equity assets in companies with market capitalizations (on a three-year weighted basis) below Lipper’s U.S. Diversified Equity large-cap floor. Mid-cap growth funds typically have an above-average price-to-earnings ratio, price-to-book ratio, and three-year sales-per-share growth value, compared to the S&P MidCap 400 Index.
MSCI Emerging Markets (“MSCI EM”) Index is an index that captures the large- and mid-cap representation across 23 Emerging Markets (EM) countries: Brazil, Chile, China, Colombia, Czech Republic, Egypt, Greece, Hungary, India, Indonesia, Korea, Malaysia, Mexico, Peru, Philippines, Poland, Qatar, Russia, South Africa, Taiwan, Thailand, Turkey and United Arab Emirates.
MSCI Golden Dragon Index is an index that captures the equity market performance of large- and mid-cap China securities (H shares, B shares, Red-Chips and P-Chips) and non-domestic China securities listed in Hong Kong and Taiwan.
MSCI World Index is a free float adjusted market capitalization weighted index that is designed to measure the equity market performance of developed markets. The MSCI World Index consists of the following 23 developed market country indexes: Australia, Austria, Belgium, Canada, Denmark, Finland, France, Germany, Hong Kong, Ireland, Israel, Italy, Japan, Netherlands, New Zealand, Norway, Portugal, Singapore, Spain, Sweden, Switzerland, the United Kingdom, and the United States.
Russell 1000® Growth Index is an index that measures the performance of the large-cap growth segment of the U.S. equity universe. It includes those Russell 1000 companies with higher price-to-book ratios and higher forecasted growth values.
Russell 2500™ Growth Index is an index that measures the performance of the small- to mid-cap growth segment of the U.S. equity universe. It includes those Russell 2500 companies with higher price-to-book ratios and higher forecasted growth values.
Standard & Poor’s 500 (“S&P 500”) Index is an index that is widely regarded as a gauge of the U.S. equities market. This index includes 500 leading companies in leading industries of the U.S. economy. The S&P 500 Index focuses on the large-cap segment of the market, with approximately 80% coverage of U.S. equities.
Lipper is an independent mutual fund performance monitor whose results are based on total return and do not reflect a sales charge.
Securities indices are unmanaged and assume reinvestment of all distributions and interest payments and do not take in account brokerage fees or expenses. Securities in the Funds do not match those in the indices and performance of the Funds will differ. Investors cannot invest directly in an index.
2 HSBC FAMILY OF FUNDS
| Commentary From the Investment Manager |
| HSBC Global Asset Management (USA) Inc. |
Global Economic Review
The global economy faced significant headwinds during the 12-month period from November 1, 2014, to October 31, 2015. Slowing economic growth in China and other emerging economies led equities lower. Developed economies fared better, however: The U.S. economy showed signs of continued recovery and the eurozone economy regained its footing after several years of slow growth.
Commodity prices generally remained low during the period, continuing a period of consolidation that began in 2011. Oil prices declined sharply early in the period, however. These declines added to existing pressures on oil-exporting emerging economies and oil-dependent sectors. Energy companies saw diminished earnings and oil and mining production declined.
Central bank policy in many economies was a source of investor uncertainty. China took steps to devalue its currency in August, triggering a dive in its stock market. However, several important monetary programs in other economies benefited equities. Quantitative easing programs in Europe and Japan both improved liquidity and helped buoy equity markets.
Throughout much of the period, investors anticipated action by the U.S. Federal Reserve (the Fed) to raise the federal funds rate—a key factor in lending rates—above the target range of between 0.00% and 0.25%. However, the Fed decided multiple times during the period to keep rates at near-zero levels, due in part to concerns about turbulence in foreign markets and the relatively slow economic recovery in the U.S. The Fed’s delays added to investor uncertainty.
The U.S. economy grew at a slower rate than in recent years. Early in 2015, harsh winter weather on the East Coast dealt a blow to consumer consumption and a West Coast dockworkers’ strike slowed international trade. Growth picked up later in the period but some key areas of the economy showed signs of weakness. In particular, industrial production, manufacturing, and business confidence declined during the period. Meanwhile, low oil and gas prices hurt the energy sector but also contributed to a sharp uptick in auto sales.
Other areas of the U.S. economy showed signs of improvement throughout the period. The labor market continued to improve, consumer confidence hit multi-year highs, and the housing market remained robust.
Global inflation remained low during the period. A strong U.S. dollar, which rose rapidly early in the period and remained strong through October 2015, encouraged U.S. imports and discouraged exports. The strong dollar took a toll on commodity-dependent economies and posed challenges for emerging market issuers of dollar-denominated debt.
China’s ongoing transition to slower economic growth had a profound impact on economies throughout the world, exacerbated by a sharp downturn in Chinese equities and currency depreciation.
Economic growth picked up in the eurozone during the period, supported by the European Central Bank’s accommodative monetary policy and improving credit conditions. However, the debt crisis in Greece continued to undermine European economic recovery early in the period.
Japanese stocks rallied throughout much of the period as the nation’s economic growth improved in large part due to Prime Minister Shinzo Abe’s economic plan, known as “Abenomics.” The program involved higher taxes, structural reforms, and quantitative easing. Japanese equities gave up much of their gains in August 2015, however, in-step with many other global equity markets. Additionally, in that month a sharp decline in Chinese equities fueled fears that a slowing economy in China could jeopardize the global economic recovery.
Geopolitical turmoil weighed on the global economy during the period, and particularly affected countries such as Russia. Conflict in the Ukraine led to stronger economic sanctions against Russia, dealing a further blow to an economy already hard hit by low oil prices. Inflation soared in Russia while exports plummeted.
Market Review
Global equities made modest but inconsistent gains during the first half of the period, but lost ground in most cases during the late summer and fall. Volatility spiked in August as a Chinese stock sell-off spread to emerging markets and triggered volatility throughout the world. The MSCI EM Index1 finished the period with a 14.22% loss. The MSCI Golden Dragon Index1 of large- and mid-cap securities in China, Hong Kong and Taiwan also fell, posting a -2.99% return. Developed markets fared better despite the increased volatility, with the MSCI World Index1 returning 2.33% on relatively strong gains late in the period.
U.S. equities performed modestly well for the period; the S&P 500 Index1 of large-company stocks returned 5.20%. Robust merger and acquisition activity, as well as strong corporate earnings growth, helped fuel those gains. Performance was uneven across sectors, however. The energy sector saw the largest losses during the period due to declining oil prices, and health care stocks performed poorly.
Fixed income markets in developed economies made modest gains. U.S. interest rates decreased in late 2014 and early 2015, boosting the performance of U.S. Treasuries and many other categories of bonds. Rates rose slightly over the next several months in anticipation of higher interest rates, only to decline as the Fed chose to postpone a rate increase. The Barclays U.S. Aggregate Bond Index1, which tracks the broad investment-grade fixed-income market, returned 1.96% for the 12-month period through October 31. Meanwhile the Barclays U.S. Corporate High-Yield Bond Index1 declined 1.94% for the same period.
Fixed-income markets in Europe rallied throughout the period, fueled by the European Central Bank’s bond-buying program and assurances from its president that it would expand stimulus efforts and further lower interest rates if necessary. The Barclays Euro Aggregate Bond Index1 returned 3.35%.
Emerging markets debt experienced volatility during the period caused by a strengthening U.S. dollar and an ongoing decline in commodity prices. Monetary easing measures from some central banks served to lower government bond yields in developed and emerging markets countries, however, which helped boost returns. The Barclays Emerging Markets USD Aggregate Index1 returned 0.02% during the 12-month period.
| 1 | | For additional information, please refer to the Glossary of Terms. |
HSBC FAMILY OF FUNDS 3
| Portfolio Reviews (Unaudited) |
| HSBC Growth Fund |
(Class A Shares, Class B Shares, Class C Shares and Class I Shares) |
by Clark J. Winslow, CEO/Portfolio Manager
Justin H. Kelly, CFA, CIO/Portfolio Manager
Patrick M. Burton, CFA, Managing Director/Portfolio Manager
Winslow Capital Management, LLC
The HSBC Growth Fund (the “Fund”) seeks long-term growth of capital. Under normal market conditions, the Fund invests primarily in U.S. and foreign equity securities of high-quality companies with market capitalizations generally in excess of $2 billion, which the subadviser believes have the potential to generate superior levels of long-term profitability and growth. The Fund utilizes a two-tier structure, commonly known as a “master-feeder” structure, in which the Fund invests all of its investable assets in the HSBC Growth Portfolio (the “Portfolio”). The Portfolio employs Winslow Capital Management, LLC as its subadviser.
Investment Concerns
Equity securities (stocks) are more volatile and carry more risk than other forms of investments, including investments in high-grade fixed income securities.
The growth investment style may fall out of favor in the marketplace and result in significant declines in the value of the Portfolio’s securities. Securities of companies considered to be growth investments may have rapid price swings in the event of earnings disappointments or during periods of market, political, regulatory and economic uncertainty.
There are risks associated with investing in foreign companies, such as erratic market conditions, economic and political instability and fluctuations in currency and exchange rates. For a complete description of these and other risks associated with investment in a mutual fund, please refer to the Fund’s prospectus.
Market Commentary
For the year ended October 31, 2015, the Fund returned 8.15% (without sales charge) for the Class A Shares and 8.44% for the Class I Shares. That compared to a 9.18% total return for the Russell 1000® Growth Index1, the Fund’s primary performance benchmark, and a 7.90% total return for the Lipper Large-Cap Growth Funds Average1.
Portfolio Performance
The equity markets during the period were influenced by several factors, including slowing economic growth in China and weak prices for commodities such as oil. Inflation and interest rates continued to be low across developed countries, and the Federal Reserve (the Fed) decided to keep U.S. interest rates at near-zero levels. However, modest economic growth and strong corporate earnings and robust mergers-and-acquisition activity fueled modest gains among domestic stocks. In this environment, U.S. large-cap growth equities performed well during this period.
Stock selection in the health care and financials sectors dragged on the Fund’s relative performance. In the health care sector, the Fund was hurt by holdings of a specialty pharmaceuticals firm, which underperformed amid questions about industry-wide pharmaceutical pricing practices and company-specific issues surrounding accounting and operating practices. Meanwhile, the Fed’s decisions to leave interest rates unchanged negatively affected some companies in the financials sector. Additionally, the Fund’s relative performance was hurt by an underweight in the consumer staples sector, which performed well as investors sought stability during the period from rising market volatility.†
The Fund’s relative performance benefited from underweight investments in the energy and industrial sectors. Falling commodity prices contributed to poor performance in these sectors. The Fund also benefited from stock selection in the consumer discretionary and telecommunications sectors. Among consumer discretionary stocks, the Fund’s exposure to an athletic apparel company with strong global revenue growth boosted relative returns.†
| † | | Portfolio composition is subject to change. |
| 1 | | For additional information, please refer to the Glossary of Terms. |
Past performance does not guarantee future results. The performance data quoted represents past performance and current returns may be lower or higher. Total return figures include change in share price, reinvestment of dividends and capital gains and do not reflect taxes that a shareholder would pay on Fund distributions or on the redemption of Fund shares. Investment return and principal value will fluctuate so that an investor’s shares, when redeemed may be worth more or less than the original cost. To obtain performance information current to the most recent month end, please call 1-800-782-8183.
4 HSBC FAMILY OF FUNDS
| Portfolio Reviews (Unaudited) |
| HSBC Growth Fund |
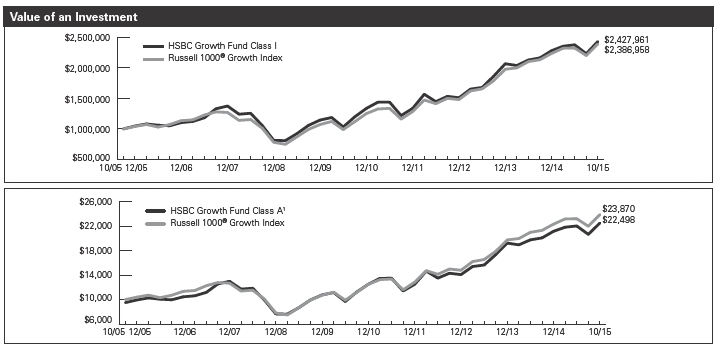
The charts above represent a historical 10-year performance comparison of a hypothetical investment in the indicated share class versus a similar investment in the Fund’s benchmark and represents the reinvestment of dividends and capital gains in the Fund.
| | | | Average Annual | | Expense |
| Fund Performance | | | | Total Return (%) | | Ratio (%)6 |
| | Inception | | | | | | | | | | |
| As of October 31, 2015 | | Date | | 1 Year | | 5 Year | | 10 Year | | Gross | | Net |
| HSBC Growth Fund Class A1 | | 5/7/045 | | 2.76 | | 12.89 | | 8.45 | | 1.33 | | 1.20 |
| HSBC Growth Fund Class B2 | | 5/7/045 | | 3.77 | | 13.21 | | 8.51 | | 2.08 | | 1.95 |
| HSBC Growth Fund Class C3 | | 5/7/045 | | 6.48 | | 13.20 | | 8.19 | | 2.08 | | 1.95 |
| HSBC Growth Fund Class I | | 5/7/045 | | 8.44 | | 14.36 | | 9.28 | | 1.08 | | 0.95 |
| Russell 1000® Growth Index4 | | — | | 9.18 | | 15.30 | | 9.09 | | N/A | | N/A |
| Lipper Large-Cap Growth Funds Average4 | | — | | 7.90 | | 13.81 | | 8.09 | | N/A | | N/A |
Past performance does not guarantee future results. The performance data quoted represents past performance and current returns may be lower or higher. Total return figures include change in share price, reinvestment of dividends and capital gains and do not reflect the taxes that a shareholder would pay on Fund distributions or on the redemption of Fund shares. Investment return and principal value will fluctuate so that an investor’s shares, when redeemed may be worth more or less than the original cost. To obtain performance information current to the most recent month end, please call 1-800-782-8183.
The performance above reflects any fee waivers that have been in effect during the applicable periods, as well as any expense reimbursements that have periodically been made. Absent such waivers and reimbursements, returns would have been lower. Currently, contractual fee waivers are in effect for the Fund through March 1, 2016.
Certain returns shown include monies received by the Portfolio, in which the Fund invests, in respect of one-time class action settlements and a one-time reimbursement from HSBC Global Asset Management (USA) Inc. (the “Adviser”) to the Fund related to past marketing arrangements. As a result, the Fund’s total returns for those periods were higher than they would have been had the Portfolio and the Fund not received the payments.
| 1 | | Reflects the maximum sales charge of 5.00%. |
| 2 | | Reflects the applicable contingent deferred sales charge, maximum of 4.00%. |
| 3 | | Reflects the applicable contingent deferred sales charge, maximum of 1.00%. |
| 4 | | For additional information, please refer to the Glossary of Terms. |
| 5 | | The HSBC Growth Fund was initially offered for purchase effective May 7, 2004; however, no shareholder activity occurred until May 10, 2004. |
| 6 | | Reflects the expense ratios as reported in the prospectus dated February 27, 2015. The Adviser has entered into a contractual expense limitation agreement with the Fund under which it will limit total expenses of the Fund (excluding interest, taxes, brokerage commissions, extraordinary expenses and estimated indirect expenses attributable to the Fund’s investments in investment companies other than the Portfolio) to an annual rate of 1.20%, 1.95%, 1.95% and 0.95% for Class A Shares, Class B Shares, Class C Shares and Class I Shares, respectively. The expense limitation shall be in effect until March 1, 2016. Additional information pertaining to the October 31, 2015 expense ratios can be found in the financial highlights. |
The Fund’s performance is measured against the Russell 1000® Growth Index, an unmanaged index that measures the performance of the large-cap growth segment of the U.S. equity universe. It includes those Russell 1000 companies with higher price-to-book ratios and higher forecasted growth values. The performance of the index does not reflect the deduction of expenses associated with a mutual fund, such as investment management and fund accounting fees. The Fund’s performance reflects the deduction of fees for these value-added services. Investors cannot invest directly in an index.
HSBC FAMILY OF FUNDS 5
| Portfolio Reviews (Unaudited) |
| HSBC Opportunity Fund (Advisor) |
| (Class I Shares) |
| HSBC Opportunity Fund |
| (Class A Shares, Class B Shares and Class C Shares) |
|
by William A. Muggia, Committee Lead/Portfolio Manager
Ethan J. Myers, CFA, Portfolio Manager
John M. Montgomery, Portfolio Manager
D. Hamlen Thompson, Portfolio Manager
Bruce N. Jacobs, CFA, Portfolio Manager
Westfield Capital Management Company, L.P.
The HSBC Opportunity Fund and HSBC Opportunity Fund (Advisor) (collectively the “Fund”) seek long-term growth of capital by investing, under normal market conditions, primarily in equity securities of small- and mid-cap companies. Small- and mid-cap companies generally are defined as those that have market capitalizations within the range of market capitalizations represented in the Russell 2500™ Growth Index. The Fund may also invest in equity securities of larger, more established companies and may invest up to 20% of its assets in securities of foreign companies. The Fund employs a two-tier structure, commonly referred to as a “master-feeder” structure, in which the Fund invests all of its investable assets in the HSBC Opportunity Portfolio (the “Portfolio”). The Portfolio employs Westfield Capital Management Company, L.P. as its subadviser.
Investment Concerns
Equity securities (stocks) are more volatile and carry more risk than other forms of investments, including investments in high-grade fixed income securities.
Small- to mid-capitalization funds typically carry additional risks since smaller companies generally have a higher risk of failure, and historically, their stocks have experienced a greater degree of market volatility than stocks on average.
The growth investment style may fall out of favor in the marketplace and result in significant declines in the value of the Portfolio’s securities. Securities of companies considered to be growth investments may have rapid price swings in the event of earnings disappointments or during periods of market, political, regulatory and economic uncertainty.
There are risks associated with investing in foreign companies, such as erratic market conditions, economic and political instability and fluctuations in currency and exchange rates.
For a complete description of these and other risks associated with investment in a mutual fund, please refer to the Fund’s prospectus.
Market Commentary
For the year ended October 31, 2015, the Class I Shares of the HSBC Opportunity Fund (Advisor) produced a -1.69% total return, and the Class A Shares of the Fund produced a -2.21% total return (without sales charge). The Russell 2500™ Growth Index1, the Fund’s primary performance benchmark, and the Lipper Mid-Cap Growth Funds Average1 returned 4.17% and 2.90%, respectively.
Portfolio Performance
Global equity markets were challenged by economic weakness in Europe and China, and a glut in U.S. shale oil production contributed to weakness in energy prices. That led to poor performance among many areas of the energy market. In addition the economic weakness outside of the United States contributed to a decline in the materials sector as investors reacted to poor earnings posted by materials producers. However, U.S. stocks performed relatively well due in part to robust mergers-and-acquisition activity within health care and better-than-expected corporate earnings growth in the consumer discretionary and information technology sectors.
The Fund underperformed its benchmark for the 12-month period. The largest detractor from the Fund’s relative returns was stock selection in the health care sector, particularly individual holdings of pharmaceutical firms and health care facilities. The Fund was hurt by exposure to Pacira Pharmaceuticals, which posted weak quarterly results in April and investors responded negatively to unclear sales projections and news of a potential competitor to the firm’s popular pain treatment.†
Meanwhile, the Fund’s holdings in the consumer discretionary and information technology sectors boosted relative returns. These holdings benefited from improving confidence and spending on the part of the U.S. consumer.
Among consumer discretionary stocks, the Fund’s holdings of a cosmetics retailer added to relative returns as the company enjoyed strong online and in-store sales growth.†
| † | | Portfolio composition is subject to change. |
| 1 | | For additional information, please refer to the Glossary of Terms. |
Past performance does not guarantee future results. The performance data quoted represents past performance and current returns may be lower or higher. Total return figures include change in share price, reinvestment of dividends and capital gains and do not reflect taxes that a shareholder would pay on Fund distributions or on the redemption of Fund shares. Investment return and principal value will fluctuate so that an investor’s shares, when redeemed may be worth more or less than the original cost. To obtain performance information current to the most recent month end, please call 1-800-782-8183.
6 HSBC FAMILY OF FUNDS
| Portfolio Reviews (Unaudited) |
| HSBC Opportunity Fund |
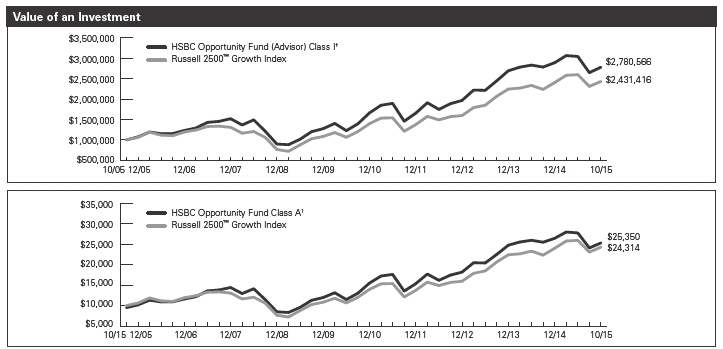
The charts above represent a historical 10-year performance comparison of a hypothetical investment in the indicated share class versus a similar investment in the Fund’s benchmark and represents the reinvestment of dividends and capital gains in the Fund.
| | | | Average Annual | | Expense |
| Fund Performance | | | | Total Return (%) | | Ratio (%)5 |
| | Inception | | | | | | | | | | |
| As of October 31, 2015 | | Date | | 1 Year | | 5 Year | | 10 Year | | Gross | | Net |
| HSBC Opportunity Fund Class A1 | | 9/23/96 | | -7.13 | | 11.68 | | 9.75 | | 1.86 | | 1.65 |
| HSBC Opportunity Fund Class B2 | | 1/6/98 | | -5.86 | | 11.99 | | 9.81 | | 2.61 | | 2.40 |
| HSBC Opportunity Fund Class C3 | | 11/4/98 | | -3.68 | | 11.98 | | 9.49 | | 2.61 | | 2.40 |
| HSBC Opportunity Fund (Advisor) Class I† | | 9/3/96 | | -1.69 | | 13.40 | | 10.77 | | 1.00 | | 1.00 |
| Russell 2500™ Growth Index4 | | — | | 4.17 | | 14.25 | | 9.29 | | N/A | | N/A |
| Lipper Mid-Cap Growth Funds Average4 | | — | | 2.90 | | 12.25 | | 7.95 | | N/A | | N/A |
Past performance does not guarantee future results. The performance data quoted represents past performance and current returns may be lower or higher. Total return figures include change in share price, reinvestment of dividends and capital gains and do not reflect the taxes that a shareholder would pay on Fund distributions or on the redemption of Fund shares. Investment return and principal value will fluctuate so that an investor’s shares, when redeemed may be worth more or less than the original cost. To obtain performance information current to the most recent month end, please call 1-800-782-8183.
The performance above reflects any fee waivers that have been in effect during the applicable periods, as well as any expense reimbursements that have periodically been made. Absent such waivers and reimbursements, returns would have been lower. Currently, contractual fee waivers are in effect for the Fund through March 1, 2016 for Class A Shares, Class B Shares and Class C Shares.
Certain returns shown include monies received by the Portfolio, in which the Fund invests, in respect of one-time class action settlements and a one-time reimbursement from HSBC Global Asset Management (USA) Inc. (the “Adviser”) to the Fund related to past marketing arrangements. As a result, the Fund’s total returns for those periods were higher than they would have been had the Portfolio and the Fund not received the payments.
| † | | The Class I Shares are issued by a series of HSBC Advisor Funds Trust, also named the HSBC (Advisor) Fund. |
| 1 | | Reflects the maximum sales charge of 5.00%. |
| 2 | | Reflects the applicable contingent deferred sales charge, maximum of 4.00%. |
| 3 | | Reflects the applicable contingent deferred sales charge, maximum of 1.00%. |
| 4 | | For additional information, please refer to the Glossary of Terms. |
| 5 | | Reflects the expense ratios as reported in the prospectus dated February 27, 2015. The Adviser has entered into a contractual expense limitation agreement with the Fund under which it will limit total expenses of the Fund (excluding interest, taxes, brokerage commissions, extraordinary expenses and estimated indirect expenses attributable to the Fund’s investments in investment companies other than the Portfolio) to an annual rate of 1.65%, 2.40%, and 2.40% for Class A Shares, Class B Shares, and Class C Shares, respectively. The expense limitation shall be in effect until March 1, 2016. Additional information pertaining to the October 31, 2015 expense ratios can be found in the financial highlights. |
The Fund’s performance is measured against the Russell 2500™ Growth Index, an unmanaged index that measures the performance of the small- to mid-cap growth segment of the U.S. equity universe. It includes those Russell 2500 companies with higher price-to-book ratios and higher forecasted growth values. The performance for the index does not reflect the deduction of expenses associated with a mutual fund, such as investment management and fund accounting fees. The Fund’s performance reflects the deduction of fees for these value-added services. Investors cannot invest directly in an index.
HSBC FAMILY OF FUNDS 7
HSBC FAMILY OF FUNDS
Statements of Assets and Liabilities—as of October 31, 2015
| | | | | | | | | | | | | Opportunity |
| Growth | | Opportunity | | Fund |
| Fund | | Fund | | (Advisor) |
| Assets: | | | | | | | | | | | | | | | | | |
| Investments in Affiliated Portfolios | | $ | 77,523,631 | | | | | $ | 17,632,731 | | | | | $ | 219,962,011 | | |
| Receivable for capital shares issued | | | 20,264 | | | | | | 1,279 | | | | | | 39,271 | | |
| Receivable from Investment Adviser | | | — | | | | | | 952 | | | | | | — | | |
| Prepaid expenses | | | 10,652 | | | | | | 5,925 | | | | | | 6,685 | | |
| Total Assets | | | 77,554,547 | | | | | | 17,640,887 | | | | | | 220,007,967 | | |
| | | | | | | | | | | | | | | | | | |
| Liabilities: | | | | | | | | | | | | | | | | | |
| Payable for capital shares redeemed | | | 34,572 | | | | | | 72 | | | | | | 100,897 | | |
| Accrued expenses and other payables: | | | | | | | | | | | | | | | | | |
| Investment Management | | | 8,677 | | | | | | — | | | | | | — | | |
| Administration | | | 1,500 | | | | | | 346 | | | | | | 4,328 | | |
| Distribution fees | | | 513 | | | | | | 633 | | | | | | — | | |
| Shareholder Servicing | | | 2,847 | | | | | | 2,801 | | | | | | — | | |
| Compliance Services | | | 7 | | | | | | 6 | | | | | | 11 | | |
| Accounting | | | 4,000 | | | | | | 3,166 | | | | | | 1,498 | | |
| Transfer Agent | | | 17,914 | | | | | | 15,768 | | | | | | 21,535 | | |
| Trustee | | | 353 | | | | | | 82 | | | | | | 1,025 | | |
| Other | | | 20,077 | | | | | | 21,589 | | | | | | 33,058 | | |
| Total Liabilities | | | 90,460 | | | | | | 44,463 | | | | | | 162,352 | | |
| Net Assets | | $ | 77,464,087 | | | | | $ | 17,596,424 | | | | | $ | 219,845,615 | | |
| | | | | | | | | | | | | | | | | | |
| Composition of Net Assets: | | | | | | | | | | | | | | | | | |
| Capital | | | 52,132,853 | | | | | | 15,723,119 | | | | | | 195,911,715 | | |
| Accumulated net investment income/(loss) | | | (182,413 | ) | | | | | (160,996 | ) | | | | | (617,681 | ) | |
| Accumulated net realized gains/(losses) from investments | | | 7,300,752 | | | | | | (192,900 | ) | | | | | (1,323,547 | ) | |
| Net unrealized appreciation (depreciation) on investments | | | 18,212,895 | | | | | | 2,227,201 | | | | | | 25,875,128 | | |
| Net Assets | | $ | 77,464,087 | | | | | $ | 17,596,424 | | | | | $ | 219,845,615 | | |
| | | | | | | | | | | | | | | | | | |
| Net Assets: | | | | | | | | | | | | | | | | | |
| Class A Shares | | $ | 13,265,336 | | | | | $ | 16,592,876 | | | | | $ | — | | |
| Class B Shares | | | 170,335 | | | | | | 178,336 | | | | | | — | | |
| Class C Shares | | | 658,654 | | | | | | 825,212 | | | | | | — | | |
| Class I Shares | | | 63,369,762 | | | | | | — | | | | | | 219,845,615 | | |
| Total | | $ | 77,464,087 | | | | | $ | 17,596,424 | | | | | $ | 219,845,615 | | |
| | | | | | | | | | | | | | | | | | |
| Shares Outstanding: | | | | | | | | | | | | | | | | | |
| ($0.001 par value, unlimited number of shares authorized): | | | | | | | | | | | | | | | | | |
| Class A Shares | | | 654,980 | | | | | | 1,605,487 | | | | | | — | | |
| Class B Shares | | | 10,001 | | | | | | 25,343 | | | | | | — | | |
| Class C Shares | | | 38,319 | | | | | | 112,732 | | | | | | — | | |
| Class I Shares | | | 3,033,788 | | | | | | — | | | | | | 16,025,684 | | |
| | | | | | | | | | | | | | | | | | |
| Net Asset Value, Offering Price and Redemption Price per share: | | | | | | | | | | | | | | | | | |
| Class A Shares | | $ | 20.25 | | | | | $ | 10.34 | | | | | $ | — | | |
| Class B Shares(a) | | $ | 17.03 | | | | | $ | 7.04 | | | | | $ | — | | |
| Class C Shares(a) | | $ | 17.19 | | | | | $ | 7.32 | | | | | $ | — | | |
| Class I Shares | | $ | 20.89 | | | | | $ | — | | | | | $ | 13.72 | | |
| Maximum Sales Charge: | | | | | | | | | | | | | | | | | |
| Class A Shares | | | 5.00 | % | | | | | 5.00 | % | | | | | — | % | |
| Maximum Offering Price per share | | | | | | | | | | | | | | | | | |
| (Net Asset Value / (100%-maximum sales charge)) | | | | | | | | | | | | | | | | | |
| Class A Shares | | $ | 21.32 | | | | | $ | 10.88 | | | | | $ | — | | |
____________________
| (a) | | Redemption Price per share varies by length of time shares are held. |
| 8 HSBC FAMILY OF FUNDS | See notes to financial statements. |
HSBC FAMILY OF FUNDS
Statements of Operations—For the year ended October 31, 2015
| | | | | | | | | | | | | Opportunity |
| Growth | | Opportunity | | Fund |
| Fund | | Fund | | (Advisor) |
| Investment Income: | | | | | | | | | | | | | | | | | |
| Investment Income from Affiliated Portfolios | | $ | 576,159 | | | | | $ | 128,290 | | | | | $ | 1,478,226 | | |
| Expenses from Affiliated Portfolios | | | (551,268 | ) | | | | | (164,405 | ) | | | | | (1,894,258 | ) | |
| Total Investment Income | | | 24,891 | | | | | | (36,115 | ) | | | | | (416,032 | ) | |
| | | | | | | | | | | | | | | | | | |
| Expenses: | | | | | | | | | | | | | | | | | |
| Administration: | | | | | | | | | | | | | | | | | |
| Class A Shares | | | 3,171 | | | | | | 4,226 | | | | | | — | | |
| Class B Shares | | | 56 | | | | | | 63 | | | | | | — | | |
| Class C Shares | | | 158 | | | | | | 198 | | | | | | — | | |
| Class I Shares | | | 15,041 | | | | | | — | | | | | | 51,691 | | |
| Distribution: | | | | | | | | | | | | | | | | | |
| Class B Shares | | | 1,750 | | | | | | 1,961 | | | | | | — | | |
| Class C Shares | | | 4,937 | | | | | | 6,186 | | | | | | — | | |
| Shareholder Servicing: | | | | | | | | | | | | | | | | | |
| Class A Shares | | | 32,632 | | | | | | 39,034 | | | | | | — | | |
| Class B Shares | | | 583 | | | | | | 654 | | | | | | — | | |
| Class C Shares | | | 1,646 | | | | | | 2,062 | | | | | | — | | |
| Accounting | | | 23,999 | | | | | | 18,998 | | | | | | 8,997 | | |
| Compliance Services | | | 815 | | | | | | 203 | | | | | | 2,231 | | |
| Printing | | | 14,510 | | | | | | 5,471 | | | | | | 17,055 | | |
| Professional | | | 21,875 | | | | | | 17,374 | | | | | | 26,919 | | |
| Transfer Agent | | | 55,122 | | | | | | 50,324 | | | | | | 61,581 | | |
| Administrative Services | | | 21,610 | | | | | | 5,917 | | | | | | 29,935 | | |
| Trustee | | | 2,344 | | | | | | 564 | | | | | | 6,496 | | |
| Registration fees | | | 31,526 | | | | | | 26,934 | | | | | | 20,572 | | |
| Other | | | 7,625 | | | | | | 7,321 | | | | | | 14,916 | | |
| Total expenses before fee and expense reductions | | | 239,400 | | | | | | 187,490 | | | | | | 240,393 | | |
| Fees voluntarily reduced/reimbursed by Investment Adviser | | | — | | | | | | (18,712 | ) | | | | | — | | |
| Fees contractually reduced/reimbursed by Investment Adviser | | | (18,904 | ) | | | | | (34,993 | ) | | | | | — | | |
| Net Expenses | | | 220,496 | | | | | | 133,785 | | | | | | 240,393 | | |
| | | | | | | | | | | | | | | | | | |
| Net Investment Income (Loss) | | | (195,605 | ) | | | | | (169,900 | ) | | | | | (656,425 | ) | |
| | | | | | | | | | | | | | | | | | |
| Realized/Unrealized Gains/(Losses) from Investments: | | | | | | | | | | | | | | | | | |
| Net realized gains/(losses) from investments from Affiliated Portfolios | | | 9,076,016 | | | | | | (126,642 | ) | | | | | (1,250,197 | ) | |
| Change in unrealized appreciation/depreciation on investments from Affiliated Portfolios | | | (2,676,864 | ) | | | | | (71,319 | ) | | | | | (3,000,512 | ) | |
| | | | | | | | | | | | | | | | | | |
| Net realized/unrealized gains (losses) on investments from Affiliated Portfolios | | | 6,399,152 | | | | | | (197,961 | ) | | | | | (4,250,709 | ) | |
| Change in Net Assets Resulting from Operations | | $ | 6,203,547 | | | | | $ | (367,861 | ) | | | | $ | (4,907,134 | ) | |
| See notes to financial statements. | HSBC FAMILY OF FUNDS 9 |
HSBC FAMILY OF FUNDS
Statements of Changes in Net Assets
| Growth Fund | | Opportunity Fund |
| For the | For the | | For the | For the |
| year ended | year ended | | year ended | year ended |
| October 31, 2015 | October 31, 2014 | | October 31, 2015 | October 31, 2014 |
| Investment Activities: | | | | | | | | | | | | | | | | | | | | | |
| Operations: | | | | | | | | | | | | | | | | | | | | | |
| Net investment income (loss) | | $ | (195,605 | ) | | | $ | (190,388 | ) | | | | $ | (169,900 | ) | | | $ | (182,586 | ) | |
| Net realized gains (losses) from investments | | | 9,076,016 | | | | | 12,286,957 | | | | | | (126,642 | ) | | | | 3,388,218 | | |
| Change in unrealized appreciation/depreciation | | | | | | | | | | | | | | | | | | | | | |
| on investments | | | (2,676,864 | ) | | | | (838,892 | ) | | | | | (71,319 | ) | | | | (1,436,875 | ) | |
| Change in net assets resulting from operations | | | 6,203,547 | | | | | 11,257,677 | | | | | | (367,861 | ) | | | | 1,768,757 | | |
| | | | | | | | | | | | | | | | | | | | | | |
| Distributions: | | | | | | | | | | | | | | | | | | | | | |
| Net realized gains: | | | | | | | | | | | | | | | | | | | | | |
| Class A Shares | | | (2,019,395 | ) | | | | (1,473,999 | ) | | | | | (3,049,523 | ) | | | | (1,492,680 | ) | |
| Class B Shares | | | (54,222 | ) | | | | (61,772 | ) | | | | | (79,546 | ) | | | | (63,060 | ) | |
| Class C Shares | | | (115,977 | ) | | | | (91,036 | ) | | | | | (180,411 | ) | | | | (103,788 | ) | |
| Class I Shares | | | (9,610,318 | ) | | | | (7,953,745 | ) | | | | | — | | | | | — | | |
| Change in net assets resulting from | | | | | | | | | | | | | | | | | | | | | |
| distributions | | | (11,799,912 | ) | | | | (9,580,552 | ) | | | | | (3,309,480 | ) | | | | (1,659,528 | ) | |
| Change in net assets resulting from | | | | | | | | | | | | | | | | | | | | | |
| capital transactions | | | 4,231,099 | | | | | (5,327,302 | ) | | | | | 4,007,938 | | | | | 1,706,742 | | |
| Change in net assets | | | (1,365,266 | ) | | | | (3,650,177 | ) | | | | | 330,597 | | | | | 1,815,971 | | |
| | | | | | | | | | | | | | | | | | | | | | |
| Net Assets: | | | | | | | | | | | | | | | | | | | | | |
| Beginning of period | | | 78,829,353 | | | | | 82,479,530 | | | | | | 17,265,827 | | | | | 15,449,856 | | |
| End of period | | $ | 77,464,087 | | | | $ | 78,829,353 | | | | | $ | 17,596,424 | | | | $ | 17,265,827 | | |
| Accumulated net investment income (loss) | | $ | (182,413 | ) | | | $ | (191,800 | ) | | | | $ | (160,996 | ) | | | $ | (62,315 | ) | |
| 10 HSBC FAMILY OF FUNDS | See notes to financial statements. |
HSBC FAMILY OF FUNDS
Statements of Changes in Net Assets (continued)
| Growth Fund | | Opportunity Fund |
| For the | For the | | For the | For the |
| year ended | year ended | | year ended | year ended |
| October 31, 2015 | October 31, 2014 | | October 31, 2015 | October 31, 2014 |
| CAPITAL TRANSACTIONS: | | | | | | | | | | | | | | | | | | | | | |
| Class A Shares: | | | | | | | | | | | | | | | | | | | | | |
| Proceeds from shares issued | | $ | 911,998 | | | | $ | 496,557 | | | | | $ | 5,620,192 | | | | $ | 1,938,423 | | |
| Dividends reinvested | | | 1,980,018 | | | | | 1,426,628 | | | | | | 3,006,950 | | | | | 1,468,888 | | |
| Value of shares redeemed | | | (2,152,764 | ) | | | | (1,492,047 | ) | | | | | (4,754,026 | ) | | | | (1,701,878 | ) | |
| Class A Shares capital transactions | | | 739,252 | | | | | 431,138 | | | | | | 3,873,116 | | | | | 1,705,433 | | |
| | | | | | | | | | | | | | | | | | | | | | |
| Class B Shares: | | | | | | | | | | | | | | | | | | | | | |
| Dividends reinvested | | | 54,223 | | | | | 61,488 | | | | | | 79,546 | | | | | 63,060 | | |
| Value of shares redeemed | | | (156,812 | ) | | | | (228,368 | ) | | | | | (157,482 | ) | | | | (190,960 | ) | |
| Class B Shares capital transactions | | | (102,589 | ) | | | | (166,880 | ) | | | | | (77,936 | ) | | | | (127,900 | ) | |
| | | | | | | | | | | | | | | | | | | | | | |
| Class C Shares: | | | | | | | | | | | | | | | | | | | | | |
| Proceeds from shares issued | | | 169,529 | | | | | 195,573 | | | | | | 169,225 | | | | | 219,440 | | |
| Dividends reinvested | | | 115,977 | | | | | 89,319 | | | | | | 180,411 | | | | | 102,306 | | |
| Value of shares redeemed | | | (324,235 | ) | | | | (126,331 | ) | | | | | (136,878 | ) | | | | (192,537 | ) | |
| Class C Shares capital transactions | | | (38,729 | ) | | | | 158,561 | | | | | | 212,758 | | | | | 129,209 | | |
| | | | | | | | | | | | | | | | | | | | | | |
| Class I Shares: | | | | | | | | | | | | | | | | | | | | | |
| Proceeds from shares issued | | | 7,960,947 | | | | | 12,675,493 | | | | | | — | | | | | — | | |
| Dividends reinvested | | | 9,568,372 | | | | | 7,911,912 | | | | | | — | | | | | — | | |
| Value of shares redeemed | | | (13,896,154 | ) | | | | (26,337,526 | ) | | | | | — | | | | | — | | |
| Class I Shares capital transactions | | | 3,633,165 | | | | | (5,750,121 | ) | | | | | — | | | | | — | | |
| Change in net assets resulting from capital transactions | | $ | 4,231,099 | | | | $ | (5,327,302 | ) | | | | $ | 4,007,938 | | | | $ | 1,706,742 | | |
| | | | | | | | | | | | | | | | | | | | | | |
| SHARE TRANSACTIONS: | | | | | | | | | | | | | | | | | | | | | |
| Class A Shares: | | | | | | | | | | | | | | | | | | | | | |
| Issued | | | 46,411 | | | | | 24,260 | | | | | | 501,383 | | | | | 154,943 | | |
| Reinvested | | | 103,395 | | | | | 70,451 | | | | | | 276,374 | | | | | 121,096 | | |
| Redeemed | | | (106,044 | ) | | | | (70,856 | ) | | | | | (428,289 | ) | | | | (135,770 | ) | |
| Change in Class A Shares | | | 43,762 | | | | | 23,855 | | | | | | 349,468 | | | | | 140,269 | | |
| | | | | | | | | | | | | | | | | | | | | | |
| Class B Shares: | | | | | | | | | | | | | | | | | | | | | |
| Reinvested | | | 3,345 | | | | | 3,464 | | | | | | 10,677 | | | | | 6,968 | | |
| Redeemed | | | (9,435 | ) | | | | (12,832 | ) | | | | | (20,497 | ) | | | | (20,434 | ) | |
| Change in Class B Shares | | | (6,090 | ) | | | | (9,368 | ) | | | | | (9,820 | ) | | | | (13,466 | ) | |
| | | | | | | | | | | | | | | | | | | | | | |
| Class C Shares: | | | | | | | | | | | | | | | | | | | | | |
| Issued | | | 10,255 | | | | | 10,381 | | | | | | 20,593 | | | | | 22,638 | | |
| Reinvested | | | 7,089 | | | | | 4,996 | | | | | | 23,278 | | | | | 10,965 | | |
| Redeemed | | | (18,438 | ) | | | | (6,864 | ) | | | | | (14,948 | ) | | | | (19,935 | ) | |
| Change in Class C Shares | | | (1,094 | ) | | | | 8,513 | | | | | | 28,923 | | | | | 13,668 | | |
| | | | | | | | | | | | | | | | | | | | | | |
| Class I Shares: | | | | | | | | | | | | | | | | | | | | | |
| Issued | | | 385,567 | | | | | 602,647 | | | | | | — | | | | | — | | |
| Reinvested | | | 485,458 | | | | | 382,218 | | | | | | — | | | | | — | | |
| Redeemed | | | (676,361 | ) | | | | (1,244,759 | ) | | | | | — | | | | | — | | |
| Change in Class I Shares | | | 194,664 | | | | | (259,894 | ) | | | | | — | | | | | — | | |
| See notes to financial statements. | HSBC FAMILY OF FUNDS 11 |
HSBC FAMILY OF FUNDS
Statements of Changes in Net Assets (continued)
| Opportunity Fund (Advisor) |
| For the | For the |
| year ended | year ended |
| October 31, 2015 | October 31, 2014 |
| Investment Activities: | | | | | | | | | | |
| Operations: | | | | | | | | | | |
| Net investment income (loss) | | $ | (656,425 | ) | | | $ | (1,025,940 | ) | |
| Net realized gains (losses) from investments | | | (1,250,197 | ) | | | | 43,323,713 | | |
| Change in unrealized appreciation/depreciation on investments | | | (3,000,512 | ) | | | | (18,084,143 | ) | |
| Change in net assets resulting from operations | | | (4,907,134 | ) | | | | 24,213,630 | | |
| | | | | | | | | | | |
| Distributions: | | | | | | | | | | |
| Net investment income: | | | | | | | | | | |
| Class I Shares | | | — | | | | | (433,947 | ) | |
| Net realized gains: | | | | | | | | | | |
| Class I Shares | | | (42,957,976 | ) | | | | (21,203,571 | ) | |
| Change in net assets resulting from distributions | | | (42,957,976 | ) | | | | (21,637,518 | ) | |
| Change in net assets resulting from capital transactions | | | 62,474,171 | | | | | (5,660,696 | ) | |
| Change in net assets | | | 14,609,061 | | | | | (3,084,584 | ) | |
| | | | | | | | | | | |
| Net Assets: | | | | | | | | | | |
| Beginning of period | | | 205,236,554 | | | | | 208,321,138 | | |
| End of period | | $ | 219,845,615 | | | | $ | 205,236,554 | | |
| Accumulated net investment income (loss) | | $ | (617,681 | ) | | | $ | (587,018 | ) | |
| 12 HSBC FAMILY OF FUNDS | See notes to financial statements. |
HSBC FAMILY OF FUNDS
Statements of Changes in Net Assets (continued)
| Opportunity Fund (Advisor) |
| For the | For the |
| year ended | year ended |
| October 31, 2015 | October 31, 2014 |
| | | | | | | | | | | |
| CAPITAL TRANSACTIONS: | | | | | | | | | | |
| Class I Shares: | | | | | | | | | | |
| Proceeds from shares issued | | $ | 53,094,557 | | | | $ | 23,221,586 | | |
| Dividends reinvested | | | 42,818,632 | | | | | 21,593,694 | | |
| Value of shares redeemed | | | (33,439,018 | ) | | | | (50,475,976 | ) | |
| Class I Shares capital transactions | | | 62,474,171 | | | | | (5,660,696 | ) | |
| Change in net assets resulting from capital transactions | | $ | 62,474,171 | | | | $ | (5,660,696 | ) | |
| | | | | | | | | | | |
| SHARE TRANSACTIONS: | | | | | | | | | | |
| Class I Shares: | | | | | | | | | | |
| Issued | | | 3,581,286 | | | | | 1,349,096 | | |
| Reinvested | | | 2,979,724 | | | | | 1,308,790 | | |
| Redeemed | | | (2,286,235 | ) | | | | (2,969,584 | ) | |
| Change in Class I Shares | | | 4,274,775 | | | | | (311,698 | ) | |
| See notes to financial statements. | HSBC FAMILY OF FUNDS 13 |
| HSBC GROWTH FUND |
| Financial Highlights |
Select data for a share outstanding throughout the periods indicated.*
| | | | Investment Activities | | Distributions | | | | | | Ratios/Supplementary Data |
| | | | | | | | | | | | | | | | | | | | | | | | | | | | | Ratio | | | | |
| | | | | | | | | | | | | | | | | | | | | | | | | | | | | of Net | | Ratio | | |
| | | | | | | Net Realized | | | | | | | | | | | | Net | | | | Net | | Ratio | | Investment | | of Expenses | | |
| | Net Asset | | Net | | and Unrealized | | | | | | | | Net Realized | | | | Asset | | | | Assets | | of Net | | Income | | to Average | | |
| | Value, | | Investment | | Gains | | Total from | | Net | | Gains from | | | | Value, | | | | at End | | Expenses | | (Loss) to | | Net Assets | | Portfolio |
| | Beginning | | Income | | (Losses) from | | Investment | | Investment | | Investment | | Total | | End of | | Total | | of Period | | to Average | | Average | | (Excluding Fee | | Turnover |
| | of Period | | (Loss)(a) | | Investments | | Activities | | Income | | Transactions | | Distributions | | Period | | Return(b) | | (000’s) | | Net Assets | | Net Assets | | Reductions) | | (c) |
| Class A Shares | | | | | | | | | | | | | | | | | | | | | | | | | | | | | | | | | | | | | | | | | | | | | | | | | | |
| Year Ended October 31, 2015 | | $ | 22.09 | | | $ | (0.09 | ) | | $ | 1.69 | | | $ | 1.60 | | | $ | — | | | $ | (3.44 | ) | | $ | (3.44 | ) | | $ | 20.25 | | 8.15 | %(d) | | $ | 13,265 | | | 1.20 | % | | (0.45 | )% | | 1.22 | % | | 68 | % |
| Year Ended October 31, 2014 | | | 21.73 | | | | (0.09 | ) | | | 3.03 | | | | 2.94 | | | | — | | | | (2.58 | ) | | | (2.58 | ) | | | 22.09 | | 14.59 | % | | | 13,504 | | | 1.20 | % | | (0.44 | )% | | 1.21 | % | | 68 | % |
| Year Ended October 31, 2013 | | | 17.69 | | | | (0.01 | ) | | | 5.34 | | | | 5.33 | | | | — | | | | (1.29 | ) | | | (1.29 | ) | | | 21.73 | | 32.24 | %(d) | | | 12,761 | | | 1.20 | % | | (0.05 | )% | | 1.21 | % | | 75 | % |
| Year Ended October 31, 2012 | | | 16.59 | | | | (0.06 | ) | | | 1.16 | | | | 1.10 | | | | — | | | | — | | | | — | | | | 17.69 | | 6.63 | %(d) | | | 11,327 | | | 1.20 | % | | (0.36 | )% | | 1.27 | % | | 53 | % |
| Year Ended October 31, 2011 | | | 15.02 | | | | (0.07 | ) | | | 1.64 | | | | 1.57 | | | | — | | | | — | | | | — | | | | 16.59 | | 10.45 | %(d) | | | 15,349 | | | 1.18 | % | | (0.45 | )% | | 1.18 | % | | 56 | % |
| Class B Shares | | | | | | | | | | | | | | | | | | | | | | | | | | | | | | | | | | | | | | | | | | | | | | | | | | |
| Year Ended October 31, 2015 | | | 19.24 | | | | (0.20 | ) | | | 1.43 | | | | 1.23 | | | | — | | | | (3.44 | ) | | | (3.44 | ) | | | 17.03 | | 7.32 | %(d) | | | 170 | | | 1.95 | % | | (1.18 | )% | | 1.97 | % | | 68 | % |
| Year Ended October 31, 2014 | | | 19.36 | | | | (0.21 | ) | | | 2.67 | | | | 2.46 | | | | — | | | | (2.58 | ) | | | (2.58 | ) | | | 19.24 | | 13.81 | % | | | 310 | | | 1.95 | % | | (1.17 | )% | | 1.96 | % | | 68 | % |
| Year Ended October 31, 2013 | | | 16.02 | | | | (0.12 | ) | | | 4.75 | | | | 4.63 | | | | — | | | | (1.29 | ) | | | (1.29 | ) | | | 19.36 | | 31.16 | %(d) | | | 493 | | | 1.95 | % | | (0.72 | )% | | 1.96 | % | | 75 | % |
| Year Ended October 31, 2012 | | | 15.13 | | | | (0.17 | ) | | | 1.06 | | | | 0.89 | | | | — | | | | — | | | | — | | | | 16.02 | | 5.88 | %(d) | | | 621 | | | 1.95 | % | | (1.10 | )% | | 2.03 | % | | 53 | % |
| Year Ended October 31, 2011 | | | 13.80 | | | | (0.18 | ) | | | 1.51 | | | | 1.33 | | | | — | | | | — | | | | — | | | | 15.13 | | 9.64 | %(d) | | | 962 | | | 1.93 | % | | (1.19 | )% | | 1.93 | % | | 56 | % |
| Class C Shares | | | | | | | | | | | | | | | | | | | | | | | | | | | | | | | | | | | | | | | | | | | | | | | | | | |
| Year Ended October 31, 2015 | | | 19.38 | | | | (0.21 | ) | | | 1.46 | | | | 1.25 | | | | — | | | | (3.44 | ) | | | (3.44 | ) | | | 17.19 | | 7.37 | %(d) | | | 659 | | | 1.95 | % | | (1.20 | )% | | 1.97 | % | | 68 | % |
| Year Ended October 31, 2014 | | | 19.49 | | | | (0.22 | ) | | | 2.69 | | | | 2.47 | | | | — | | | | (2.58 | ) | | | (2.58 | ) | | | 19.38 | | 13.76 | % | | | 764 | | | 1.95 | % | | (1.19 | )% | | 1.96 | % | | 68 | % |
| Year Ended October 31, 2013 | | | 16.12 | | | | (0.14 | ) | | | 4.80 | | | | 4.66 | | | | — | | | | (1.29 | ) | | | (1.29 | ) | | | 19.49 | | 31.15 | %(d) | | | 602 | | | 1.95 | % | | (0.81 | )% | | 1.96 | % | | 75 | % |
| Year Ended October 31, 2012 | | | 15.23 | | | | (0.18 | ) | | | 1.07 | | | | 0.89 | | | | — | | | | — | | | | — | | | | 16.12 | | 5.84 | %(d) | | | 482 | | | 1.95 | % | | (1.14 | )% | | 2.03 | % | | 53 | % |
| Year Ended October 31, 2011 | | | 13.89 | | | | (0.18 | ) | | | 1.52 | | | | 1.34 | | | | — | | | | — | | | | — | | | | 15.23 | | 9.65 | %(d) | | | 251 | | | 1.94 | % | | (1.21 | )% | | 1.94 | % | | 56 | % |
| Class I Shares | | | | | | | | | | | | | | | | | | | | | | | | | | | | | | | | | | | | | | | | | | | | | | | | | | |
| Year Ended October 31, 2015 | | | 22.63 | | | | (0.04 | ) | | | 1.74 | | | | 1.70 | | | | — | | | | (3.44 | ) | | | (3.44 | ) | | | 20.89 | | 8.44 | %(d) | | | 63,370 | | | 0.95 | % | | (0.20 | )% | | 0.98 | % | | 68 | % |
| Year Ended October 31, 2014 | | | 22.14 | | | | (0.04 | ) | | | 3.11 | | | | 3.07 | | | | — | | | | (2.58 | ) | | | (2.58 | ) | | | 22.63 | | 14.94 | % | | | 64,252 | | | 0.95 | % | | (0.18 | )% | | 0.96 | % | | 68 | % |
| Year Ended October 31, 2013 | | | 17.99 | | | | 0.04 | | | | 5.42 | | | | 5.46 | | | | (0.02 | ) | | | (1.29 | ) | | | (1.31 | ) | | | 22.14 | | 32.49 | %(d) | | | 68,624 | | | 0.95 | % | | 0.20 | % | | 0.96 | % | | 75 | % |
| Year Ended October 31, 2012 | | | 16.83 | | | | (0.02 | ) | | | 1.18 | | | | 1.16 | | | | — | | | | — | | | | — | | | | 17.99 | | 6.89 | %(d) | | | 57,916 | | | 0.95 | % | | (0.12 | )% | | 1.04 | % | | 53 | % |
| Year Ended October 31, 2011 | | | 15.19 | | | | (0.04 | ) | | | 1.68 | | | | 1.64 | | | | — | | | | — | | | | — | | | | 16.83 | | 10.80 | %(d) | | | 57,222 | | | 0.94 | % | | (0.22 | )% | | 0.94 | % | | 56 | % |
| * | The per share amounts and percentages reflect income and expenses assuming inclusion of the Fund’s proportionate share of the income and expenses of the HSBC Growth Portfolio. |
| (a) | Calculated based on average shares outstanding. |
| (b) | Total return calculations do not include any sales or redemption charges. |
| (c) | Portfolio turnover rate is calculated on the basis of the respective Portfolio in which the Fund invests all of its investable assets. Portfolio turnover is calculated on the basis of the Fund as a whole without distinguishing between the classes of shares issued. |
| (d) | The Portfolio, in which the Fund invests, received monies related to certain nonrecurring litigation settlements. The corresponding impact to the total return was 0.28%, 0.12%, 0.16% and 0.11% for the years ended October 31, 2011, 2012, 2013 and 2015, respectively. |
Amounts designated as “-” are $0 or have been rounded to $0.
| 14 HSBC FAMILY OF FUNDS | See notes to financial statements. |
| HSBC OPPORTUNITY FUND |
| Financial Highlights |
Select data for a share outstanding throughout the periods indicated.*
| | | | | Investment Activities | | Distributions | | | | | | Ratios/Supplementary Data |
| | | | | | | | | | | | | | | | | | | | | | | | | | | Ratio | | | | |
| | | | | | | | | | | | | | | | | | | | | | | | | | | of Net | | Ratio | | |
| | | | | | | Net Realized | | | | | | | | | | | Net | | | | Net | | Ratio | | Investment | | of Expenses | | |
| | Net Asset | | Net | | and Unrealized | | | | | | | Net Realized | | | | Asset | | | | Assets | | of Net | | Income | | to Average | | |
| | Value, | | Investment | | Gains | | Total from | | Net | | Gains from | | | | Value, | | | | at End | | Expense | | (Loss) to | | Net Assets | | Portfolio |
| | Beginning | | Income | | (Losses) from | | Investment | | Investment | | Investment | | Total | | End of | | Total | | of Period | | to Average | | Average | | (Excluding Fee | | Turnover |
| | of Period | | (Loss)(a) | | Investments | | Activities | | Income | | Transactions | | Distributions | | Period | | Return(b) | | (000’s) | | Net Assets | | Net Assets | | Reductions) | | (c) |
| Class A Shares | | | | | | | | | | | | | | | | | | | | | | | | | | | | | | | | | | | | | | | | | | | | | | | | | |
| Year Ended October 31, 2015 | | $ | 12.83 | | | $ | (0.10 | ) | | $ | (0.07 | ) | | $ | (0.17 | ) | | $ | — | | $ | (2.32 | ) | | $ | (2.32 | ) | | $ | 10.34 | | (2.21 | )% | | $ | 16,593 | | | 1.55 | % | | (0.86 | )% | | 1.84 | % | | 63 | % |
| Year Ended October 31, 2014 | | | 12.78 | | | | (0.13 | ) | | | 1.53 | | | | 1.40 | | | | — | | | (1.35 | ) | | | (1.35 | ) | | | 12.83 | | 11.57 | % | | | 16,110 | | | 1.55 | % | | (1.04 | )% | | 1.86 | % | | 66 | % |
| Year Ended October 31, 2013 | | | 10.13 | | | | (0.06 | ) | | | 3.34 | | | | 3.28 | | | | — | | | (0.63 | ) | | | (0.63 | ) | | | 12.78 | | 34.02 | %(d) | | | 14,259 | | | 1.55 | % | | (0.49 | )% | | 2.01 | % | | 70 | % |
| Year Ended October 31, 2012 | | | 10.63 | | | | (0.05 | ) | | | 1.11 | | | | 1.06 | | | | — | | | (1.56 | ) | | | (1.56 | ) | | | 10.13 | | 12.08 | %(d) | | | 10,204 | | | 1.55 | % | | (0.51 | )% | | 2.20 | % | | 59 | % |
| Year Ended October 31, 2011 | | | 9.67 | | | | (0.07 | ) | | | 1.19 | | | | 1.12 | | | | — | | | (0.16 | ) | | | (0.16 | ) | | | 10.63 | | 11.59 | %(d) | | | 11,145 | | | 1.55 | % | | (0.62 | )% | | 1.85 | % | | 69 | % |
| Class B Shares | | | | | | | | | | | | | | | | | | | | | | | | | | | | | | | | | | | | | | | | | | | | | | | | | |
| Year Ended October 31, 2015 | | | 9.51 | | | | (0.13 | ) | | | (0.02 | ) | | | (0.15 | ) | | | — | | | (2.32 | ) | | | (2.32 | ) | | | 7.04 | | (2.90 | )% | | | 178 | | | 2.30 | % | | (1.61 | )% | | 2.60 | % | | 63 | % |
| Year Ended October 31, 2014 | | | 9.87 | | | | (0.16 | ) | | | 1.15 | | | | 0.99 | | | | — | | | (1.35 | ) | | | (1.35 | ) | | | 9.51 | | 10.74 | % | | | 334 | | | 2.30 | % | | (1.74 | )% | | 2.60 | % | | 66 | % |
| Year Ended October 31, 2013 | | | 8.01 | | | | (0.11 | ) | | | 2.60 | | | | 2.49 | | | | — | | | (0.63 | ) | | | (0.63 | ) | | | 9.87 | | 33.10 | %(d) | | | 480 | | | 2.30 | % | | (1.24 | )% | | 2.77 | % | | 70 | % |
| Year Ended October 31, 2012 | | | 8.80 | | | | (0.10 | ) | | | 0.87 | | | | 0.77 | | | | — | | | (1.56 | ) | | | (1.56 | ) | | | 8.01 | | 11.15 | %(d) | | | 499 | | | 2.30 | % | | (1.25 | )% | | 2.99 | % | | 59 | % |
| Year Ended October 31, 2011 | | | 8.09 | | | | (0.12 | ) | | | 0.99 | | | | 0.87 | | | | — | | | (0.16 | ) | | | (0.16 | ) | | | 8.80 | | 10.75 | %(d) | | | 536 | | | 2.30 | % | | (1.36 | )% | | 2.64 | % | | 69 | % |
| Class C Shares | | | | | | | | | | | | | | | | | | | | | | | | | | | | | | | | | | | | | | | | | | | | | | | | | |
| Year Ended October 31, 2015 | | | 9.80 | | | | (0.13 | ) | | | (0.03 | ) | | | (0.16 | ) | | | — | | | (2.32 | ) | | | (2.32 | ) | | | 7.32 | | (2.93 | )% | | | 825 | | | 2.30 | % | | (1.61 | )% | | 2.62 | % | | 63 | % |
| Year Ended October 31, 2014 | | | 10.14 | | | | (0.17 | ) | | | 1.18 | | | | 1.01 | | | | — | | | (1.35 | ) | | | (1.35 | ) | | | 9.80 | | 10.64 | % | | | 822 | | | 2.30 | % | | (1.77 | )% | | 2.61 | % | | 66 | % |
| Year Ended October 31, 2013 | | | 8.21 | | | | (0.11 | ) | | | 2.67 | | | | 2.56 | | | | — | | | (0.63 | ) | | | (0.63 | ) | | | 10.14 | | 33.15 | %(d) | | | 711 | | | 2.30 | % | | (1.21 | )% | | 2.76 | % | | 70 | % |
| Year Ended October 31, 2012 | | | 8.98 | | | | (0.10 | ) | | | 0.89 | | | | 0.79 | | | | — | | | (1.56 | ) | | | (1.56 | ) | | | 8.21 | | 11.14 | %(d) | | | 545 | | | 2.30 | % | | (1.19 | )% | | 3.03 | % | | 59 | % |
| Year Ended October 31, 2011 | | | 8.25 | | | | (0.13 | ) | | | 1.02 | | | | 0.89 | | | | — | | | (0.16 | ) | | | (0.16 | ) | | | 8.98 | | 10.79 | %(d) | | | 437 | | | 2.30 | % | | (1.38 | )% | | 2.64 | % | | 69 | % |
| * | The per share amounts and percentages reflect income and expenses assuming inclusion of the Fund’s proportionate share of the income and expenses of the HSBC Opportunity Portfolio. |
| (a) | Calculated based on average shares outstanding. |
| (b) | Total return calculations do not include any sales or redemption charges. |
| (c) | Portfolio turnover rate is calculated on the basis of the respective Portfolio in which the Fund invests all of its investable assets. Portfolio turnover is calculated on the basis of the Fund as a whole without distinguishing between the classes of shares issued. |
| (d) | The Portfolio, in which the Fund invests, received monies related to certain nonrecurring litigation settlements. The corresponding impact to the total return was 0.10%, 0.10% and 0.13% for the years ended October 31, 2011, 2012 and 2013, respectively. |
Amounts designated as “-” are $0 or have been rounded to $0.
| See notes to financial statements. | HSBC FAMILY OF FUNDS 15 |
| HSBC OPPORTUNITY FUND (ADVISOR) |
| Financial Highlights |
Select data for a share outstanding throughout the periods indicated.*
| | | | Investment Activities | | Distributions | | | | | | Ratios/Supplementary Data |
| | | | | | | | | | | | | | | | | | | | | | | | | | | | Ratio | | | | |
| | | | | | | | | | | | | | | | | | | | | | | | | | | | of Net | | Ratio | | |
| | | | | | | Net Realized | | | | | | | | | | | | Net | | | | Net | | Ratio | | Investment | | of Expenses | | |
| | Net Asset | | Net | | and Unrealized | | | | | | | | Net Realized | | | | Asset | | | | Assets | | of Net | | Income | | to Average | | |
| | Value, | | Investment | | Gains | | Total from | | Net | | Gains from | | | | Value, | | | | at End | | Expenses | | (Loss) to | | Net Assets | | Portfolio |
| | Beginning | | Income | | (Losses) from | | Investment | | Investment | | Investment | | Total | | End of | | Total | | of Period | | to Average | | Average | | (Excluding Fee | | Turnover |
| | of Period | | (Loss)(a) | | Investments | | Activities | | Income | | Transactions | | Distributions | | Period | | Return(b) | | (000’s) | | Net Assets | | Net Assets | | Reductions) | | (c) |
| Class I Shares | | | | | | | | | | | | | | | | | | | | | | | | | | | | | | | | | | | | | | | | | | | | | | | | | |
| Year Ended October 31, 2015 | | $ | 17.47 | | | $ | (0.05 | ) | | $ | (0.08 | ) | | $ | (0.13 | ) | | $ | — | | | $ | (3.62 | ) | | $ | (3.62 | ) | | $ | 13.72 | | (1.69 | )% | | $ | 219,846 | | 0.99 | % | | (0.30 | )% | | 0.99 | % | | 63 | % |
| Year Ended October 31, 2014 | | | 17.27 | | | | (0.08 | ) | | | 2.07 | | | | 1.99 | | | | (0.04 | ) | | | (1.75 | ) | | | (1.79 | ) | | | 17.47 | | 12.16 | % | | | 205,237 | | 1.00 | % | | (0.49 | )% | | 1.00 | % | | 66 | % |
| Year Ended October 31, 2013 | | | 13.40 | | | | 0.01 | | | | 4.47 | | | | 4.48 | | | | — | | | | (0.61 | ) | | | (0.61 | ) | | | 17.27 | | 34.70 | %(d) | | | 208,321 | | 0.99 | % | | 0.07 | % | | 0.99 | % | | 70 | % |
| Year Ended October 31, 2012 | | | 14.02 | | | | (0.01 | ) | | | 1.46 | | | | 1.45 | | | | — | | | | (2.07 | ) | | | (2.07 | ) | | | 13.40 | | 12.50 | %(d) | | | 135,098 | | 1.08 | % | | (0.01 | )% | | 1.08 | % | | 59 | % |
| Year Ended October 31, 2011 | | | 12.77 | | | | (0.01 | ) | | | 1.57 | | | | 1.56 | | | | — | | | | (0.31 | ) | | | (0.31 | ) | | | 14.02 | | 12.25 | %(d) | | | 122,017 | | 1.01 | % | | (0.07 | )% | | 1.01 | % | | 69 | % |
| * | The per share amounts and percentages reflect income and expenses assuming inclusion of the Fund’s proportionate share of the income and expenses of the HSBC Opportunity Portfolio. |
| (a) | Calculated based on average shares outstanding. |
| (b) | Total return calculations do not include any sales or redemption charges. |
| (c) | Portfolio turnover rate is calculated on the basis of the respective Portfolio in which the Fund invests all of its investable assets. Portfolio turnover is calculated on the basis of the Fund as a whole without distinguishing between the classes of shares issued. |
| (d) | The Portfolio, in which the Fund invests, received monies related to certain nonrecurring litigation settlements. The corresponding impact to the total return was 0.10%, 0.10% and 0.13% for the years ended October 31, 2011, 2012 and 2013, respectively. |
Amounts designated as “-” are $0 or have been rounded to $0.
| 16 HSBC FAMILY OF FUNDS | See notes to financial statements. |
| HSBC FAMILY OF FUNDS |
| Notes to Financial Statements—as of October 31, 2015 |
1. Organization:
The HSBC Funds (the “Trust”), a Massachusetts business trust organized on April 22, 1987, and the HSBC Advisor Funds Trust (the “Advisor Trust”), a Massachusetts business trust organized on April 5, 1996, are registered under the Investment Company Act of 1940, as amended (the “Act”), as open-end management investment companies. As of October 31, 2015, the Trust is composed of 17 separate operational funds and the Advisor Trust is composed of one operational fund, each a series of the HSBC Family of Funds, which also includes the HSBC Portfolios (the “Portfolio Trust”) (collectively the “Trusts”). The accompanying financial statements are presented for the following three funds (individually a “Fund”, collectively the “Funds”) of the Trust and Advisor Trust:
| Fund | | Short Name | | Trust | |
| HSBC Growth Fund | Growth Fund | Trust |
| HSBC Opportunity Fund | Opportunity Fund | Trust |
| HSBC Opportunity Fund (Advisor) | Opportunity Fund (Advisor) | Advisor Trust |
All the Funds are diversified funds. Financial statements for all other funds of the Trusts are published separately.
Each Fund utilizes a master-feeder fund structure and seeks to achieve its investment objectives by investing all of its investable assets in its respective Portfolio (as defined below).
| | Proportionate |
| | Ownership |
| | Interest on |
| Fund | | Respective Portfolio | | October 31, 2015 (%) |
| HSBC Growth Fund | HSBC Growth Portfolio | | 100.0 | |
| HSBC Opportunity Fund | HSBC Opportunity Portfolio | | 7.4 | |
| HSBC Opportunity Fund (Advisor) | HSBC Opportunity Portfolio | | 92.6 | |
The HSBC Growth Portfolio and HSBC Opportunity Portfolio (individually a “Portfolio”, collectively the “Portfolios”) are diversified series of the Portfolio Trust. The Portfolios operate as master funds in master-feeder arrangements and also may receive investments from certain fund of funds.
The financial statements of the Portfolios, including the Schedules of Portfolio Investments, are included elsewhere in this report. The financial statements of the Portfolios should be read in conjunction with the financial statements of the Funds.
The Funds are authorized to issue an unlimited number of shares of beneficial interest with a par value of $0.001 per share. The Growth Fund offers four classes of shares: Class A Shares, Class B Shares, Class C Shares, and Class I Shares. The Opportunity Fund offers three classes of shares: Class A Shares, Class B Shares, and Class C Shares. The Opportunity Fund (Advisor) offers one class of shares: Class I Shares. Class A Shares of the Funds have a maximum sales charge of 5.00% as a percentage of the original purchase price. Class B Shares of the Funds are offered without any front-end sales charge but will be subject to a contingent deferred sales charge (“CDSC”) ranging from a maximum of 4.00% if redeemed less than one year after purchase to 0.00% if redeemed more than four years after purchase. Class C Shares of the Funds are offered without any front-end sales charge but will be subject to a maximum CDSC of 1.00% if redeemed less than one year after purchase. No sales charges are assessed with respect to Class I Shares of the Funds. Each class of shares in the Funds has identical rights and privileges except with respect to arrangements pertaining to shareholder servicing and/or distribution, class-related expenses, voting rights on matters affecting a single class of shares, and the exchange privilege of each class of shares. Class B Shares of the Funds may no longer be purchased or acquired by any new or existing Class B shareholder, except through dividend and/or capital gains reinvestment.
HSBC FAMILY OF FUNDS 17
| HSBC FAMILY OF FUNDS |
Notes to Financial Statements—as of October 31, 2015 (continued) |
Under the Trusts’ organizational documents, the Trusts’ officers and Trustees are indemnified against certain liabilities arising out of the performance of their duties to the Funds. In addition, in the normal course of business, the Trusts enter into contracts with service providers, which also provide for indemnifications by the Funds. The Funds’ maximum exposure under these arrangements is unknown, as this would involve any future claims that may be made against the Funds. However, based on experience, the Trusts expect that risk of loss to be remote.
The Funds are investment companies and follow accounting and reporting guidance under Financial Accounting Standards Board (“FASB”) Accounting Standards Codification (“ASC”) Topic 946, “Financial Services-Investment Companies.”
2. Significant Accounting Policies:
The following is a summary of the significant accounting policies followed by the Funds in the preparation of their financial statements. The policies are in conformity with U.S. generally accepted accounting principles (“GAAP’’). The preparation of financial statements requires management to make certain estimates and assumptions that affect the reported amounts of assets and liabilities and disclosure of contingent assets and liabilities at the date of the financial statements and the reported amounts of increases and decreases in net assets from operations during the reporting period. Actual results could differ from those estimates.
Securities Valuation:
The Funds record their investments at fair value. Fair value is defined as the price that would be received to sell an asset or paid to transfer a liability in an orderly transaction between market participants at the measurement date. The valuation techniques used to determine fair value are further described in Note 3 below.
Investment Transactions and Related Income:
The Funds record investments into the Portfolios on a trade date basis. The Funds record daily their proportionate share of income, expenses, changes in unrealized appreciation and depreciation and realized gains and losses derived from their respective Portfolios. In addition, the Funds accrue their own expenses daily as incurred.
Allocations:
Expenses directly attributable to a Fund are charged to that Fund. Expenses not directly attributable to a Fund are allocated proportionately among the applicable series within the Trusts in relation to the net assets of each fund or on another reasonable basis. Class specific expenses are charged directly to the class incurring the expense. In addition, income, expenses (other than class specific expenses), and unrealized and realized gains and losses are allocated to each class based on relative net assets on a daily basis.
Distributions to Shareholders:
Dividends to shareholders from net investment income, if any, are declared and distributed semi annually in the case of the Funds.
The Funds’ net realized gains, if any, are distributed to shareholders at least annually. Additional distributions are also made to the Funds’ shareholders to the extent necessary to avoid the federal excise tax on certain undistributed income and net capital gains of regulated investment companies.
The amount and character of net investment income and net realized gains distributions are determined in accordance with federal income tax regulations which may differ from GAAP. These “book/tax” differences are either considered temporary or permanent in nature. To the extent these differences are permanent in nature (e.g., reclassification of market discounts, certain gain/loss, and certain distributions), such amounts are reclassified within the composition of net assets; temporary differences (e.g., wash losses and post-October loss deferrals) do not require reclassification. The Funds may utilize equalization accounting for tax purposes and designate earnings and profits, including net realized gains distributed to shareholders on redemption of shares, as a part of the dividends paid deduction for income tax purposes. To the extent distributions to shareholders from net investment income and net realized gains exceed net investment income and net realized gains for tax purposes, they are reported as distributions of capital.
18 HSBC FAMILY OF FUNDS
| HSBC FAMILY OF FUNDS |
Notes to Financial Statements—as of October 31, 2015 (continued) |
Federal Income Taxes:
Each Fund is a separate taxable entity for federal income tax purposes. Each Fund has qualified and intends to continue to qualify each year as a “regulated investment company’’ under Subchapter M of the Internal Revenue Code, as amended, and to distribute substantially all of its taxable net investment income and net realized gains, if any, to its shareholders. Accordingly, no provision for federal income or excise tax is required.
Management of the Funds has reviewed tax positions taken in tax years that remain subject to examination by all major tax jurisdictions, including federal (i.e., the last four tax year ends and the interim tax period since then, as applicable). Management believes that there is no tax liability resulting from unrecognized tax benefits related to uncertain tax positions taken.
New Accounting Pronouncements:
In August 2014, the FASB issued Accounting Standards Update No. 2014-15 “Presentation of Financial Statements–Going Concern (Subtopic 205-40)” (“ASU 2014-15”), which requires management to evaluate whether there are conditions or events, considered in the aggregate, that raise substantial doubt about the entity’s ability to continue as a going concern. ASU 2014-15 is effective prospectively for annual periods ending after December 15, 2016, and interim periods thereafter.
In May 2015, the FASB issued Accounting Standards Update No. 2015-07 “Fair Value Measurement (Topic 820)” (“ASU 2015-07”), which removes the requirement to categorize within the fair value hierarchy all investments for which fair value is measured using the NAV per share practical expedient. ASU 2015-07 also removes the requirement to make certain disclosures for all investments that may be measured at fair value using the NAV per share practical expedient. The ASU is effective for annual periods beginning after December 15, 2015 and interim periods within those annual periods.
Management is currently evaluating the implications of these ASUs and their impact on the financial statements and related disclosures has not yet been determined.
3. Investment Valuation Summary
The valuation techniques employed by the Funds, as described below, maximize the use of observable inputs and minimize the use of unobservable inputs in determining fair value. The Funds’ investments are classified within the fair value hierarchy based on the lowest level of input that is significant to the fair value measurement. The inputs used for valuing the Funds’ investments are summarized in the three broad levels listed below:
| ● | Level 1: quoted prices in active markets for identical assets |
| |
| ● | Level 2: other significant observable inputs (including quoted prices for similar securities, interest rates, prepayments speeds, credit risk, etc.) |
| |
| ● | Level 3: significant unobservable inputs (including a Fund’s own assumptions in determining the fair value of investments) |
Changes in valuation techniques may result in transfers in or out of an assigned level within the disclosure hierarchy. The Funds determine transfers between fair value hierarchy levels at the reporting period end. There were no transfers between levels as of October 31, 2015, from the valuation input levels used on October 31, 2014. The inputs or methodology used for valuing investments are not necessarily an indication of the risk associated with investing in those investments.
HSBC FAMILY OF FUNDS 19
| HSBC FAMILY OF FUNDS |
Notes to Financial Statements—as of October 31, 2015 (continued) |
The Funds record their investments in their respective Portfolios at fair value, which represents their proportionate ownership of the value of the Portfolios’ net assets. These investments are typically categorized as Level 2 in the fair value hierarchy. The underlying securities of the Portfolios are recorded at fair value, as discussed more fully in the Notes to Financial Statements of the Portfolios included elsewhere in this report.
For the year ended October 31, 2015, there were no Level 3 investments for which significant unobservable inputs were used to determine fair value. As of October 31, 2015, all investments were categorized as Level 2 in the fair value hierarchy.
4. Related Party Transactions and Other Agreements and Plans:
Investment Management:
HSBC Global Asset Management (USA) Inc. (“HSBC” or the “Investment Adviser”), a wholly-owned subsidiary of HSBC Bank USA, N.A., a national bank organized under the laws of the United States, acts as Investment Adviser to the Portfolios. As Investment Adviser, HSBC manages the investments of the Portfolios and continuously reviews, supervises, and administers the Portfolios’ investments. The Funds are not directly charged any investment management fees.
Administration:
HSBC also serves the Funds as Administrator. Under the terms of the Administration Agreement, HSBC receives from the Funds (as well as other funds in the Trusts combined) a fee, accrued daily and paid monthly, at an annual rate of:
| Based on Average Daily Net Assets of | | Fee Rate (%) |
| Up to $10 billion | 0.0550 |
| In excess of $10 billion but not exceeding $20 billion | 0.0350 |
| In excess of $20 billion but not exceeding $50 billion | 0.0275 |
| In excess of $50 billion | 0.0250 |
The fee rates and breakpoints are determined on the basis of the aggregate average daily net assets of the Trusts. The total administration fee paid to HSBC is allocated to each series based upon its proportionate share of the aggregate net assets of the Trusts. For assets invested in the Portfolios by the Funds, the Portfolios pay half of the administration fee and the Funds pay half, for a combination of the total fee rate as set forth above. An amount equal to 50% of the administration fee is deemed to be class specific and is based on the daily net assets.
Pursuant to a Sub-Administration Agreement with HSBC, Citi Fund Services Ohio, Inc. (“Citi”), a wholly-owned subsidiary of Citigroup, Inc., serves as the Trusts’ Sub-Administrator, subject to the general supervision by the Trusts’ Board of Trustees (the “Board”) and HSBC. For these services, Citi is entitled to a fee, payable by HSBC, at an annual rate equivalent to the fee rates set forth above subject to certain reductions associated with services provided to new funds, minus 0.02% which is retained by HSBC.
Under a Compliance Services Agreement between the Trusts and Citi (the “CCO Agreement”), Citi makes an employee available to serve as the Trusts’ Chief Compliance Officer (the “CCO”). Under the CCO Agreement, Citi also provides infrastructure and support in implementing the written policies and procedures comprising the Trusts’ compliance program, including support services to the CCO. For the services provided under the CCO Agreement, the Trusts paid Citi $300,447 for the year ended October 31, 2015, plus reimbursement of certain out-of-pocket expenses. Expenses incurred by each Fund are reflected on the Statements of Operations as “Compliance Services.” Citi pays the salary and other compensation earned by individuals performing these services, as employees of Citi.
20 HSBC FAMILY OF FUNDS
| HSBC FAMILY OF FUNDS |
Notes to Financial Statements—as of October 31, 2015 (continued) |
Distribution Arrangements:
Foreside Distribution Services, L.P. (“Foreside’’), a wholly-owned subsidiary of Foreside Financial Group LLC, serves the Trust as Distributor (the “Distributor’’). The Trust has adopted a non-compensatory Distribution Plan and Agreement (the “Distribution Plan’’) pursuant to Rule 12b-1 of the Act. The Distribution Plan provides for reimbursement of expenses incurred by the Distributor related to distribution and marketing, at a rate not to exceed 0.25%, 1.00%, and 1.00% of the average daily net assets of Class A Shares (currently not being charged), Class B Shares (currently charging 0.75%), and Class C Shares (currently charging 0.75%) of the Funds, respectively. For the year ended October 31, 2015, Foreside, as Distributor, also received $148,790, $0, and $15,776 in commissions from sales of the Trusts, for Class A Shares, Class B Shares, and Class C Shares, respectively of which $45, $0, and $0 were reallocated to HSBC-affiliated brokers and dealers, for Class A Shares, Class B Shares, and Class C Shares, respectively.
Shareholder Servicing:
The Trust has adopted a Shareholder Services Plan, which provides for payments to shareholder servicing agents for providing various shareholder services. For performing these services, the shareholder servicing agents receive a fee that is computed daily and paid monthly up to 0.25%, 0.25%, and 0.25% of the average daily net assets of Class A Shares, Class B Shares, and Class C Shares of the Funds, respectively. The fees paid to the Distributor pursuant to the Distribution Plan and to shareholder servicing agents pursuant to the Shareholder Services Plan will not exceed in the aggregate 0.50% of the average daily net assets of Class A Shares, and 1.00% of the average daily net assets of Class B Shares and Class C Shares.
The Distributor has entered into shareholder services contracts with affiliated and unaffiliated financial intermediaries who provide shareholder services and other related services to their clients or customers who invest in the Funds under which the Distributor will pay all or a portion of such fees earned to financial intermediaries for performing such services.
Fund Accounting and Transfer Agency:
Citi provides fund accounting services for each Fund. As fund accountant, Citi receives an annual fee per Fund and share class, subject to minimums, reductions associated with services provided to new funds and reimbursement of certain expenses. Citi receives additional fees paid by the Trust and Advisor Trust for regulatory administration services and blue sky exemption services. Until March 31, 2015, Citi also provided transfer agency services for each Fund. As transfer agent, Citi received a fee based on the number of funds and shareholder accounts, subject to certain minimums, reductions associated with services provided to new funds and reimbursement of certain expenses. Effective March 31, 2015, transfer agent services were provided under the terms of a separate transfer agency services agreement with Citi. Citi’s rights and obligations under the transfer agency services agreement, in turn, were assigned to SunGard Investor Services LLC (“SIS”), effective March 31, 2015. The transfer agency services, and fees charged for such services, are unchanged as a result of the separate agreement or the assignment to SIS.
Independent Trustees:
For the period January 1, 2015 through October 31, 2015 the Trusts paid each Independent Trustee an annual retainer of $100,000. The Trusts paid a fee of $12,000 for each regular meeting of the Board of Trustees attended and a fee of $3,000 for each special meeting attended. The Trusts paid each Committee Chair an annual retainer of $12,000, with the exception of the Chair of the Audit Committee, who received a retainer of $15,000. The Trusts also paid the Chairman of the Board an additional annual retainer of $30,000.
Prior to January 1, 2015, the Trusts paid each Independent Trustee an annual retainer of $100,000. The Trusts paid a fee of $10,000 for each regular meeting of the Board of Trustees attended and a fee of $3,000 for each special meeting attended. The Trusts paid each Committee Chair an annual retainer of $3,000, with the exception of the Chair of the Audit Committee, who received a retainer of $6,000. The Trusts also paid the Chairman of the Board, an additional annual retainer of $24,000. In addition, for time expended on Board duties outside normal meetings, which is authorized by the Board, a Trustee was compensated at the rate of $500 per hour, up to a maximum of $3,000 per day.
HSBC FAMILY OF FUNDS 21
| HSBC FAMILY OF FUNDS |
Notes to Financial Statements—as of October 31, 2015 (continued) |
Other:
The Funds pay fees to certain intermediaries or financial institutions for record keeping, sub-accounting services, transfer agency and other administrative services as reflected on the Statements of Operations as “Administrative Services.”
Fee Reductions:
The Investment Adviser has contractually agreed to limit, through March 1, 2016, the annual total expenses, exclusive of interest, taxes, brokerage commissions, extraordinary expenses, and estimated indirect expenses attributed to a Fund’s investment in investment companies of certain Funds. Each affected Fund Class has its own expense limitation based on the average daily net assets for any full fiscal year as follows:
| | | | Current Contractual |
| | | | Expense |
| Fund | | | Class | | Limitation(%) |
| Growth Fund | | A | | 1.20 |
| Growth Fund | | B | | 1.95 |
| Growth Fund | | C | | 1.95 |
| Growth Fund | | I | | 0.95 |
| Opportunity Fund | | A | | 1.65 |
| Opportunity Fund | | B | | 2.40 |
| Opportunity Fund | | C | | 2.40 |
| Opportunity Fund (Advisor) | | I | | 1.10 |
Any amounts contractually waived or reimbursed by the Investment Adviser will be subject to repayment by the respective Fund to the Investment Adviser within three years to the extent that the repayment will not cause the Fund’s operating expenses to exceed the contractual expense limit that was in effect at the time of such waiver or reimbursement. During the year ended October 31, 2015, the Investment Adviser did not recapture any of its prior contractual waivers or reimbursements. As of October 31, 2015, the repayments that may potentially be made by the Funds are as follows:
| Fund | | | 2018($) | | 2017($) | | 2016($) | | Total($) |
| Growth Fund | | 18,904 | | 6,785 | | 5,267 | | 30,956 |
| Opportunity Fund | | 34,993 | | 34,544 | | 46,445 | | 115,982 |
____________________
* The year listed above the amounts is the fiscal year ending in which the amounts will no longer be able to be recouped.
The Administrator and Citi may voluntarily waive/reimburse fees to help support the expense limits of the Funds. In addition, HSBC, in its role as Investment Adviser and Administrator, may waive/reimburse additional fees at its discretion. Any voluntary fee waivers/reimbursements are not subject to recoupment in subsequent fiscal periods. Voluntary waivers/reimbursements may be stopped at any time. Amounts waived/reimbursed by the Investment Adviser, Administrator and Citi are reported separately on the Statements of Operations, as applicable.
5. Investment Transactions:
Contributions to and withdrawals from the respective Portfolios for the year ended October 31, 2015 totaled:
| Fund | | | Contributions ($) | | Withdrawals ($) |
| Growth Fund | | | 4,661,525 | | | | 12,493,383 | |
| Opportunity Fund | | | 4,506,928 | | | | 3,928,473 | |
| Opportunity Fund (Advisor) | | | 40,758,900 | | | | 21,422,971 | |
22 HSBC FAMILY OF FUNDS
| HSBC FAMILY OF FUNDS |
Notes to Financial Statements—as of October 31, 2015 (continued) |
6. Federal Income Tax Information:
The tax character of dividends paid by the Funds during the tax year ended October 31, 2015 was as follows:
| | Dividends paid from |
| | | | | | | | | | | | Total |
| | Ordinary | | Net Long Term | | Total Taxable | | Return of | | Dividends |
| | Income ($) | | Capital Gains ($) | | Dividends ($) | | Capital ($) | | Paid ($)(1) |
| Growth Fund | | — | | | 11,799,912 | | | 11,799,912 | | — | | 11,799,912 |
| Opportunity Fund | | 572,116 | | | 2,737,364 | | | 3,309,480 | | — | | 3,309,480 |
| Opportunity Fund (Advisor) | | 8,144,105 | | | 34,813,856 | | | 42,957,961 | | 15 | | 42,957,976 |
The tax character of dividends paid by the Funds during the tax year ended October 31, 2014 was as follows:
| | Dividends paid from |
| | | | | | | | | | | | Total |
| | Ordinary | | Net Long Term | | Total Taxable | | Return of | | Dividends |
| | Income ($) | | Capital Gains ($) | | Dividends ($) | | Capital ($) | | Paid ($)(1) |
| Growth Fund | | 848,249 | | | 8,732,303 | | | 9,580,552 | | — | | 9,580,552 |
| Opportunity Fund | | 29,031 | | | 1,630,497 | | | 1,659,528 | | — | | 1,659,528 |
| Opportunity Fund (Advisor) | | 2,223,373 | | | 19,414,145 | | | 21,637,518 | | — | | 21,637,518 |
____________________
| (1) | Total dividends paid may differ from the amount reported in the Statement of Changes in Net Assets because dividends are recognized when actually paid for tax purposes. |
As of the tax year ended October 31, 2015, the components of accumulated earnings/(deficit) on a tax basis for the Funds were as follows:
| | | | | | Undistributed | | | | | | | | Accumulated | | Unrealized | | Total |
| | Undistributed | | Undistributed | | Long Term | | | | | | | | Capital and | | Appreciation/ | | Accumulated |
| | Ordinary | | Tax Exempt | | Capital | | Accumulated | | Dividends | | Other | | (Depreciation) | | Earnings/ |
| | | Income ($) | | Income ($) | | Gains ($) | | Earnings ($) | | Payable ($) | | Losses ($) | | ($)(1) | | (Deficit) ($) |
| Growth Fund | | — | | — | | | 8,022,994 | | | | 8,022,994 | | | — | | | (182,413) | | | | 17,490,653 | | | | 25,331,234 | |
| Opportunity Fund | | — | | — | | | — | | | | — | | | — | | | (254,288) | | | | 2,127,593 | | | | 1,873,305 | |
| Opportunity Fund | | | | | | | | | | | | | | | | | | | | | | | | | | |
| (Advisor) | | — | | — | | | — | | | | — | | | — | | | (1,482,280) | | | | 25,416,180 | | | | 23,933,900 | |
____________________
| (1) | The differences between book-basis and tax-basis unrealized appreciation/depreciation are attributable primarily to: tax deferral of losses on wash sales, the realization for tax purposes of unrealized gains/losses on certain derivative instruments, the difference between book and tax amortization methods for premium and market discount, the realization for tax purposes of unrealized gains/losses on investments in passive foreign investment companies and the return of capital adjustments from real estate investment trusts. |
As of the tax year ended October 31, 2015, the Funds have net capital loss carryforwards (“CLCFs”) as summarized in the tables below. CLCFs subjects to expiration are applied as short-term capital loss regardless of whether the originating capital loss was short-term or long-term. CLCFs that are not subject to expiration must be utilized before those that are subject to expiration. The Board does not intend to authorize a distribution of any realized gain for the Funds until any applicable CLCF has been offset or expires.
CLCFs not subject to expiration:
| | Short Term | | Long Term | | |
| | | Amount ($) | | Amount ($) | | Total ($) |
| Opportunity Fund | | | 93,292 | | | | — | | | 93,292 |
| Opportunity Fund (Advisor) | | | — | | | | 864,599 | | | 864,599 |
HSBC FAMILY OF FUNDS 23
| HSBC FAMILY OF FUNDS |
| Notes to Financial Statements—as of October 31, 2015 (continued) |
Under current law, capital losses and specified ordinary losses realized after October 31 and non-specified ordinary losses incurred after December 31 (ordinary losses collectively known as “late year ordinary loss”) may be deferred and treated as occurring on the first business day of the following fiscal year. As of the tax year ended October 31, 2015, the following Funds had deferred losses, which will be treated as arising on the first day of the fiscal year ending October 31, 2016.
| Late Year |
| Ordinary Losses |
| ($) |
| Growth Fund | 182,413 |
| Opportunity Fund | 160,996 |
| Opportunity Fund (Advisor) | 617,681 |
7. Significant Shareholders:
The Funds each have one or more shareholders, which are accounts maintained by financial intermediaries on behalf of their clients, that own a significant portion of the Fund’s outstanding shares, respectively. Significant shareholder transactions by these shareholders may impact the Funds’ performance.
8. Subsequent Events:
At a meeting on December 17-18, 2015, the Trust’s Board of Trustees approved a plan of liquidation to close the HSBC Growth Fund. The liquidation of the HSBC Growth Fund is expected to be effective on or about February 12, 2016. Effective December 18, 2015, the Fund will no longer sell shares to new investors or existing shareholders (except through reinvested dividends), including through exchanges into the Fund from other funds of the Trust. Investors may continue to redeem shares of the Fund.
At a meeting of the Board of Trustees of the Trusts held on December 17-18, 2015, the Trustees of the Trusts approved on behalf of each Trust and each of the Funds a form of Agreement and Plan of Reorganization (the “Plan”) and other proposals subject to shareholder approval. The Plan will be submitted to a vote of shareholders of the Funds at a special meeting of shareholders to be held in 2016. The Plan calls for the reorganization and redomiciliation of the Funds, which are series of either a Massachusetts business trust (the Trust and Advisor Trust) or a New York trust (the Portfolio Trust), with and into corresponding “shell” series (“New Funds”) of a single newly formed Delaware statutory trust (the “Redomiciliation”). If approved by shareholders, the Redomiciliation is expected to occur in the second calendar quarter of 2016. Upon completion of the Redomiciliation, shareholders of the Funds would own shares of the corresponding class of the New Funds that are equal in value to the shares of the Fund that were held by the shareholders immediately prior to the closing of the Redomiciliation. In addition, the respective share classes of each of the New Funds would assume the performance, financial and other historical information of those of the corresponding Fund. The Redomiciliation is not expected to have an impact on the continuing of operations of the Funds. Additional information about the Plan and the other proposals will be included in the Trusts’ proxy statement that is expected to be mailed to shareholders in March 2016.
On November 30, 2015, SunGard Investor Services LLC announced that its acquisition by Fidelity National Information Services was completed. The transfer agency services, and fees charged for such services, are unchanged as a result of the acquisition.
Management has evaluated events and transactions through the date the financial statements were issued, for purposes of recognition or disclosure in these financial statements and there are no additional subsequent events to report.
24 HSBC FAMILY OF FUNDS
Report of Independent Registered Public Accounting Firm
To the Board of Trustees and Shareholders of HSBC Funds and
HSBC Advisor Funds Trust
In our opinion, the accompanying statements of assets and liabilities and the related statements of operations and of changes in net assets and the financial highlights present fairly, in all material respects, the financial position of each of HSBC Growth Fund and HSBC Opportunity Fund (each a portfolio of HSBC Funds) and HSBC Opportunity Fund (Advisor) (a portfolio of HSBC Advisor Funds Trust) (collectively, the “Funds”) at October 31, 2015, and the results of each of their operations, the changes in each of their net assets and the financial highlights for the year then ended, in conformity with accounting principles generally accepted in the United States of America. These financial statements and financial highlights (hereafter referred to as “financial statements”) are the responsibility of the Funds’ management. Our responsibility is to express an opinion on these financial statements based on our audit. We conducted our audit of these financial statements in accordance with the standards of the Public Company Accounting Oversight Board (United States). Those standards require that we plan and perform the audit to obtain reasonable assurance about whether the financial statements are free of material misstatement. An audit includes examining, on a test basis, evidence supporting the amounts and disclosures in the financial statements, assessing the accounting principles used and significant estimates made by management, and evaluating the overall financial statement presentation. We believe that our audit provides a reasonable basis for our opinion. The accompanying statements of changes in net assets for the year ended October 31, 2014 and the financial highlights for each of the periods ended on or prior to October 31, 2014 were audited by other auditors whose report dated December 23, 2014 expressed an unqualified opinion on those statements and financial highlights.
As discussed in Note 8 to the financial statements, the Board of Trustees has approved a plan of liquidation to close the HSBC Growth Fund.
PricewaterhouseCoopers LLP
New York, New York
December 29, 2015
HSBC FAMILY OF FUNDS 25
| HSBC FAMILY OF FUNDS |
| Other Federal Income Tax Information—as of October 31, 2015 (Unaudited) |
During the year ended October 31, 2015, the following Funds declared capital gain distributions:
| | Short Term | | Long Term |
| | Capital Gain | | Capital Gain |
| | Distributions ($) | | Distributions ($) |
| Growth Fund | | | — | | | | 11,799,912 | |
| Opportunity Fund | | | 572,116 | | | | 2,737,364 | |
| Opportunity Fund (Advisor) | | | 8,144,105 | | | | 34,813,856 | |
For the year ended October 31, 2015, the following percentages of the total ordinary income dividends paid by the Funds qualify for the corporate dividends received deduction available to corporate shareholders:
| Dividends |
| Received |
| Deduction (%) |
| Opportunity Fund | 21.61 |
| Opportunity Fund (Advisor) | 17.73 |
For the year ended October 31, 2015, dividends paid by the Funds may be subject to a maximum tax rate of 15%, as provided for by the Jobs and Growth Tax Relief Reconciliation Act of 2003. The Fund intends to designate the maximum amount allowable as taxed at a maximum rate of 15%. Complete information will be reported in conjunction with your 2014 Form 1099-DIV:
| Qualified |
| Dividend |
| Income (%) |
| Opportunity Fund | 22.45 |
| Opportunity Fund (Advisor) | 18.41 |
26 HSBC FAMILY OF FUNDS
| HSBC FAMILY OF FUNDS |
| Table of Shareholder Expenses—as of October 31, 2015 (Unaudited) |
As a shareholder of the Funds, you incur two types of costs: (1) transaction costs, including sales charges (loads) on purchases, redemption fees and exchange fees; and (2) ongoing costs, including management fees, distribution fees and/or shareholder servicing fees and other Fund expenses (including expenses allocated from the Portfolios). These examples are intended to help you understand your ongoing costs (in dollars) of investing in the Funds and to compare these cost with the ongoing costs of investing in other mutual funds.
These examples are based on an investment of $1,000 invested at the beginning of the period and held for the entire period from May 1, 2015 through October 31, 2015.
Actual Example
The table below provides information about actual account values and actual expenses. You may use the information below, together with the amount you invested, to estimate the expenses that you paid over the period. Simply divide your account value by $1,000 (for example, an $8,600 account value divided by $1,000 = 8.6), then multiply the result by the number in the table under the heading entitled “Expenses Paid During Period” to estimate the expenses you paid on your account during this period.
| | | | | | | | | | | | | | | | | | | Annualized |
| | | | Beginning | | Ending | | Expenses Paid | | Expense Ratio |
| | | | Account Value | | Account Value | | During Period* | | During Period |
| | | | 5/1/15 | | 10/31/15 | | 5/1/15 - 10/31/15 | | 5/1/15 - 10/31/15 |
| Growth Fund | | Class A Shares | | | $ | 1,000.00 | | | | $ | 1,034.70 | | | | $ | 6.15 | | | 1.20% |
| | | Class B Shares | | | | 1,000.00 | | | | | 1,030.90 | | | | | 9.98 | | | 1.95% |
| | Class C Shares | | | | 1,000.00 | | | | | 1,031.20 | | | | | 9.98 | | | 1.95% |
| | Class I Shares | | | | 1,000.00 | | | | | 1,036.20 | | | | | 4.88 | | | 0.95% |
| Opportunity Fund | | Class A Shares | | | | 1,000.00 | | | | | 920.70 | | | | | 7.50 | | | 1.55% |
| | Class B Shares | | | | 1,000.00 | | | | | 916.70 | | | | | 11.11 | | | 2.30% |
| | Class C Shares | | | | 1,000.00 | | | | | 916.10 | | | | | 11.11 | | | 2.30% |
| Opportunity Fund (Advisor) | | Class I Shares | | | | 1,000.00 | | | | | 922.70 | | | | | 4.80 | | | 0.99% |
____________________
| * | Expenses are equal to the average account value over the period, multiplied by the Fund’s annualized expense ratio, multiplied by 184/365 (to reflect the one half year period). |
HSBC FAMILY OF FUNDS 27
| HSBC FAMILY OF FUNDS |
| Table of Shareholder Expenses—as of October 31, 2015 (Unaudited) (continued) |
Hypothetical Example for Comparison Purposes
The table below provides information about hypothetical account values and hypothetical expenses based on each Fund’s actual expense ratio and an assumed rate of return of 5% per year before expenses, which is not the Fund’s actual return. The hypothetical account values and expenses may not be used to estimate the actual ending account balance or expenses you paid for the period. You may use this information to compare this 5% hypothetical example with the 5% hypothetical examples that appear in the shareholder reports of other funds.
Please note that the expenses shown in the table are meant to highlight your ongoing costs only and do not reflect any transactional costs, such as sales charges (loads), redemption fees, or exchange fees. Therefore, the table is useful in comparing ongoing costs only, and will not help you determine the relative total costs of owning different funds. In addition, if these transactional costs were included, your costs would have been higher.
| | | | | | | | | | | | | | | | | | | Annualized |
| | | | Beginning | | Ending | | Expenses Paid | | Expense Ratio |
| | | | Account Value | | Account Value | | During Period* | | During Period |
| | | | 5/1/15 | | 10/31/15 | | 5/1/15 - 10/31/15 | | 5/1/15 - 10/31/15 |
| Growth Fund | | Class A Shares | | | $ | 1,000.00 | | | | $ | 1,019.16 | | | | $ | 6.11 | | | 1.20% |
| | Class B Shares | | | | 1,000.00 | | | | | 1,015.38 | | | | | 9.91 | | | 1.95% |
| | Class C Shares | | | | 1,000.00 | | | | | 1,015.38 | | | | | 9.91 | | | 1.95% |
| | | Class I Shares | | | | 1,000.00 | | | | | 1,020.42 | | | | | 4.84 | | | 0.95% |
| Opportunity Fund | | Class A Shares | | | | 1,000.00 | | | | | 1,017.39 | | | | | 7.88 | | | 1.55% |
| | Class B Shares | | | | 1,000.00 | | | | | 1,013.61 | | | | | 11.67 | | | 2.30% |
| | Class C Shares | | | | 1,000.00 | | | | | 1,013.61 | | | | | 11.67 | | | 2.30% |
| Opportunity Fund (Advisor) | | Class I Shares | | | | 1,000.00 | | | | | 1,020.21 | | | | | 5.04 | | | 0.99% |
____________________
| * | Expenses are equal to the average account value over the period, multiplied by the Fund’s annualized expense ratio, multiplied by 184/365 (to reflect the one half year period). |
28 HSBC FAMILY OF FUNDS
| Portfolio Reviews |
Portfolio Composition*
October 31, 2015 (Unaudited) |
| HSBC Growth Portfolio |
| Percentage of |
| Investment Allocation | Investments at Value (%) |
| Internet Software & Services | | 12.9 | |
| IT Services | | 9.5 | |
| Software | | 9.1 | |
| Biotechnology | | 9.0 | |
| Internet & Catalog Retail | | 8.9 | |
| Health Care Equipment & Supplies | | 4.6 | |
| Hotels, Restaurants & Leisure | | 4.2 | |
| Chemicals | | 4.3 | |
| Textiles, Apparel & Luxury Goods | | 4.2 | |
| Specialty Retail | | 4.1 | |
| Technology Hardware, Storage & Peripherals | | 3.6 | |
| Food & Staples Retailing | | 2.8 | |
| Pharmaceuticals | | 2.8 | |
| Health Care Providers & Services | | 2.8 | |
| Media | | 2.7 | |
| Industrial Conglomerates | | 2.5 | |
| Real Estate Investment Trusts (REITs) | | 2.0 | |
| Wireless Telecommunication Services | | 1.7 | |
| Airlines | | 1.6 | |
| Life Sciences Tools & Services | | 1.3 | |
| Road & Rail | | 1.2 | |
| Semiconductors & Semiconductor Equipment | | 1.2 | |
| Investment Company | | 1.1 | |
| Auto Components | | 0.7 | |
| Automobiles | | 0.6 | |
| Capital Markets | | 0.3 | |
| Oil, Gas & Consumable Fuels | | 0.3 | |
| Total | | 100.0 | |
| HSBC Opportunity Portfolio |
| Percentage of |
| Investment Allocation | Investments at Value (%) |
| Biotechnology | | 9.0 | |
| Specialty Retail | | 8.5 | |
| Software | | 5.8 | |
| Investment Company | | 5.3 | |
| Machinery | | 4.9 | |
| IT Services | | 4.9 | |
| Household Durables | | 4.6 | |
| Hotels, Restaurants & Leisure | | 4.5 | |
| Health Care Equipment & Supplies | | 4.1 | |
| Pharmaceuticals | | 3.7 | |
| Building Products | | 3.3 | |
| Communications Equipment | | 3.0 | |
| Chemicals | | 2.7 | |
| Professional Services | | 2.6 | |
| Capital Markets | | 2.7 | |
| Diversified Consumer Services | | 2.5 | |
| Media | | 2.1 | |
| Insurance | | 2.0 | |
| Life Sciences Tools & Services | | 2.0 | |
| Oil, Gas & Consumable Fuels | | 2.0 | |
| Semiconductors & Semiconductor Equipment | | 1.9 | |
| Internet Software & Services | | 1.9 | |
| Banks | | 1.7 | |
| Road & Rail | | 1.7 | |
| Commercial Services & Supplies | | 1.5 | |
| Health Care Technology | | 1.6 | |
| Real Estate Investment Trusts (REITs) | | 1.5 | |
| Health Care Providers & Services | | 1.4 | |
| Aerospace & Defense | | 1.3 | |
| Electronic Equipment, Instruments & | | | |
| Components | | 1.3 | |
| Real Estate Management & Development | | 1.4 | |
| Airlines | | 1.1 | |
| Trading Companies & Distributors | | 1.0 | |
| Leisure Products | | 0.5 | |
| Total | | 100.0 | |
____________________
* Portfolio composition is subject to change.
HSBC PORTFOLIOS 29
| HSBC GROWTH PORTFOLIO |
| Schedule of Portfolio Investments—as of October 31, 2015 |
| Common Stocks – 99.4% | | | | |
| | | | |
| | Shares | | Value ($) |
| Airlines – 1.6% | | | | |
| Delta Air Lines, Inc. | | 24,600 | | 1,250,664 |
| Auto Components – 0.7% | | | | |
| Delphi Automotive plc | | 6,400 | | 532,416 |
| Automobiles – 0.6% | | | | |
| Tesla Motors, Inc. (a) | | 2,100 | | 434,553 |
| Biotechnology – 9.1% | | | | |
| AbbVie, Inc. | | 10,700 | | 637,185 |
| Alexion Pharmaceuticals, Inc. (a) | | 8,365 | | 1,472,239 |
| BioMarin Pharmaceutical, Inc. (a) | | 2,520 | | 294,941 |
| Celgene Corp. (a) | | 17,950 | | 2,202,644 |
| Gilead Sciences, Inc. | | 10,450 | | 1,129,959 |
| Regeneron Pharmaceuticals, Inc. (a) | | 805 | | 448,699 |
| Vertex Pharmaceuticals, Inc. (a) | | 6,895 | | 860,082 |
| | | | 7,045,749 |
| Capital Markets – 0.3% | | | | |
| The Charles Schwab Corp. | | 7,700 | | 235,004 |
| Chemicals – 4.3% | | | | |
| Ecolab, Inc. | | 10,650 | | 1,281,727 |
| PPG Industries, Inc. | | 10,160 | | 1,059,282 |
| Sherwin-Williams Co. | | 3,745 | | 999,278 |
| | | | 3,340,287 |
| Food & Staples Retailing – 2.9% | | | | |
| Costco Wholesale Corp. | | 5,900 | | 932,908 |
| CVS Health Corp. | | 12,950 | | 1,279,201 |
| | | | 2,212,109 |
| Health Care Equipment & Supplies – 4.7% | | |
| Boston Scientific Corp. (a) | | 58,100 | | 1,062,068 |
| DexCom, Inc. (a) | | 9,180 | | 764,878 |
| Edwards Lifesciences Corp. (a) | | 5,360 | | 842,324 |
| Medtronic plc | | 12,750 | | 942,480 |
| | | | 3,611,750 |
| Health Care Providers & Services – 2.8% | | | | |
| Envision Healthcare Holdings, Inc. (a) | | 23,900 | | 673,980 |
| UnitedHealth Group, Inc. | | 13,000 | | 1,531,140 |
| | | | 2,205,120 |
| Hotels, Restaurants & Leisure – 4.3% | | | | |
| Chipotle Mexican Grill, Inc. (a) | | 1,260 | | 806,690 |
| Hilton Worldwide Holdings, Inc. | | 43,700 | | 1,092,063 |
| Starbucks Corp. | | 22,400 | | 1,401,568 |
| | | | 3,300,321 |
| Industrial Conglomerates – 2.5% | | | | |
| Danaher Corp. | | 13,200 | | 1,231,691 |
| General Electric Co. | | 25,400 | | 734,568 |
| | | | 1,966,259 |
| Internet & Catalog Retail – 8.9% | | | | |
| Amazon.com, Inc. (a) | | 5,685 | | 3,558,242 |
| Ctrip.com International Ltd., ADR (a) | | 6,900 | | 641,493 |
| Netflix, Inc. (a) | | 5,780 | | 626,436 |
| The Priceline Group, Inc. (a) | | 1,430 | | 2,079,563 |
| | | | 6,905,734 |
| Internet Software & Services – 12.9% | | | | |
| Alibaba Group Holding Ltd., ADR (a) | | 11,550 | | 968,237 |
| Alphabet, Inc., Class A (a) | | 2,630 | | 1,939,336 |
| Alphabet, Inc., Class C (a) | | 2,663 | | 1,892,887 |
| Costar Group, Inc. (a) | | 3,695 | | 750,344 |
| Facebook, Inc., Class A (a) | | 26,750 | | 2,727,697 |
| LinkedIn Corp., Class A (a) | | 7,175 | | 1,728,242 |
| | | | 10,006,743 |
| IT Services – 9.4% | | | | |
| First Data Corp., Class A (a) | | 71,200 | | 1,127,808 |
| MasterCard, Inc., Class A | | 17,100 | | 1,692,729 |
| PayPal Holdings, Inc. (a) | | 29,200 | | 1,051,492 |
| Visa, Inc., Class A | | 44,000 | | 3,413,520 |
| | | | 7,285,549 |
| Life Sciences Tools & Services – 1.3% | | | | |
| Quintiles Transnational | | | | |
| Holdings, Inc. (a) | | 15,500 | | 986,575 |
| Media – 2.7% | | | | |
| Liberty Global plc, Class C (a) | | 16,250 | | 692,900 |
| The Walt Disney Co. | | 12,300 | | 1,399,002 |
| | | | 2,091,902 |
| Oil, Gas & Consumable Fuels – 0.3% | | | | |
| Concho Resources, Inc. (a) | | 2,300 | | 266,593 |
| Pharmaceuticals — 2.8% | | | | |
| Allergan plc (a) | | 2,040 | | 629,279 |
| Bristol-Myers Squibb Co. | | 23,900 | | 1,576,205 |
| | | | 2,205,484 |
| Real Estate Investment Trusts (REITs) – 2.0% | | |
| American Tower Corp. | | 14,900 | | 1,523,227 |
| Road & Rail – 1.2% | | | | |
| Union Pacific Corp. | | 10,450 | | 933,708 |
| Semiconductors & Semiconductor Equipment – 1.2% |
| Avago Technologies Ltd. | | 7,800 | | 960,414 |
| Software – 9.2% | | | | |
| Adobe Systems, Inc. (a) | | 21,000 | | 1,861,861 |
| Intuit, Inc. | | 11,050 | | 1,076,602 |
| Microsoft Corp. | | 13,600 | | 715,904 |
| Mobileye NV (a) | | 20,600 | | 937,712 |
| Salesforce.com, Inc. (a) | | 15,000 | | 1,165,650 |
| ServiceNow, Inc. (a) | | 10,000 | | 816,500 |
| Workday, Inc., Class A (a) | | 6,900 | | 544,893 |
| | | | 7,119,122 |
| 30 HSBC PORTFOLIOS | See notes to financial statements. |
| HSBC GROWTH PORTFOLIO |
| Schedule of Portfolio Investments—as of October 31, 2015 (concluded) |
| Common Stocks, continued | | | | | |
| | | | | | |
| | Shares | | Value ($) | |
| Specialty Retail – 4.2% | | | | | |
| L Brands, Inc. | | 8,050 | | 772,639 | |
| The Home Depot, Inc. | | 12,600 | | 1,557,864 | |
| Ulta Salon, Cosmetics & | | | | | |
| Fragrance, Inc. (a) | | 5,120 | | 890,675 | |
| | | | 3,221,178 | |
| Technology Hardware, Storage & Peripherals – 3.6% | |
| Apple, Inc. | | 23,180 | | 2,770,010 | |
| Textiles, Apparel & Luxury Goods – 4.2% | | | | | |
| Lululemon Athletica, Inc. (a) | | 10,800 | | 531,036 | |
| NIKE, Inc., Class B | | 18,000 | | 2,358,540 | |
| Under Armour, Inc., Class A (a) | | 4,200 | | 399,336 | |
| | | | 3,288,912 | |
| Wireless Telecommunication Services — 1.7% | | | |
| SBA Communications Corp., | | | | | |
| Class A (a) | | 11,200 | | 1,333,024 | |
| TOTAL COMMON STOCKS | | | | | |
| (COST $58,819,512) | | | | 77,032,407 | |
| | | | | | |
| Investment Company — 1.1% | | | | | |
| | | | | | |
| Northern Institutional Diversified Assets | | | | | |
| Portfolio, Institutional Shares, | | | | | |
| 0.01% (b) | | 883,466 | | 883,466 | |
| TOTAL INVESTMENT COMPANY | | | | | |
| (COST $883,466) | | | | 883,466 | |
| TOTAL INVESTMENT SECURITIES | | | | | |
| (COST $59,702,978) – 100.5% | | | | 77,915,873 | |
| Other Assets (Liabilities) – (0.5)% | | | | (392,242 | ) |
| NET ASSETS – 100% | | | | 77,523,631 | |
____________________
| (a) | | Represents non-income producing security. |
| (b) | | The rate represents the annualized one-day yield that was in effect on October 31, 2015. |
ADR – American Depositary Receipt
| See notes to financial statements. | HSBC PORTFOLIOS 31 |
| HSBC OPPORTUNITY PORTFOLIO |
| Schedule of Portfolio Investments—as of October 31, 2015 |
| Common Stocks – 96.4% | | | | |
| | | | | |
| | Shares | | Value ($) |
| Aerospace & Defense – 1.4% | | | | |
| TransDigm Group, Inc. (a) | | 14,695 | | 3,230,696 |
| Airlines – 1.2% | | | | |
| Allegiant Travel Co. | | 13,857 | | 2,736,065 |
| Banks – 1.7% | | | | |
| First Republic Bank | | 61,590 | | 4,022,443 |
| Biotechnology – 9.1% | | | | |
| ACADIA Pharmaceuticals, Inc. (a) | | 33,950 | | 1,182,139 |
| ARIAD Pharmaceuticals, Inc. (a) | | 389,950 | | 2,667,258 |
| Medivation, Inc. (a) | | 110,880 | | 4,663,613 |
| Merrimack Pharmaceuticals, Inc. (a) | | 241,210 | | 2,252,901 |
| Neurocrine Biosciences, Inc. (a) | | 48,870 | | 2,399,028 |
| Prothena Corp. plc (a) | | 8,790 | | 452,773 |
| PTC Therapeutics, Inc. (a) | | 67,105 | | 1,668,901 |
| Puma Biotechnology, Inc. (a) | | 8,050 | | 663,481 |
| United Therapeutics Corp. (a) | | 38,790 | | 5,687,779 |
| | | | 21,637,873 |
| Building Products – 3.4% | | | | |
| A.O. Smith Corp. | | 15,570 | | 1,196,087 |
| Builders FirstSource, Inc. (a) | | 164,830 | | 1,948,291 |
| Lennox International, Inc. | | 36,625 | | 4,864,166 |
| | | | 8,008,544 |
| Capital Markets – 2.7% | | | | |
| Affiliated Managers Group, Inc. (a) | | 11,925 | | 2,149,601 |
| Raymond James Financial, Inc. | | 78,790 | | 4,342,116 |
| | | | 6,491,717 |
| Chemicals – 2.8% | | | | |
| PolyOne Corp. | | 55,750 | | 1,864,280 |
| RPM, Inc. | | 26,050 | | 1,190,746 |
| W.R. Grace & Co. (a) | | 35,130 | | 3,523,539 |
| | | | 6,578,565 |
| Commercial Services & Supplies – 1.6% | | | | |
| Knoll, Inc. | | 160,910 | | 3,739,548 |
| Communications Equipment – 3.0% | | | | |
| CommScope Holding Co., Inc. (a) | | 37,940 | | 1,230,394 |
| Palo Alto Networks, Inc. (a) | | 37,000 | | 5,957,000 |
| | | | 7,187,394 |
| Diversified Consumer Services – 2.5% | | | | |
| Nord Anglia Education, Inc. (a) | | 124,790 | | 2,445,884 |
| Service Corp. International | | 125,990 | | 3,560,477 |
| | | | 6,006,361 |
| Electronic Equipment, Instruments & Components – 1.4% |
| Ingram Micro, Inc. | | 108,580 | | 3,233,512 |
| Health Care Equipment & Supplies – 4.2% | | |
| Align Technology, Inc. (a) | | 67,530 | | 4,420,514 |
| DENTSPLY International, Inc. | | 55,355 | | 3,368,352 |
| Wright Medical Group NV (a) | | 114,688 | | 2,216,928 |
| | | | 10,005,794 |
| Health Care Providers & Services – 1.5% | | | | |
| Team Health Holdings, Inc. (a) | | 58,550 | | 3,493,679 |
| Health Care Technology – 1.6% | | | | |
Allscripts Healthcare Solutions,
Inc. (a) | | 272,810 | | 3,835,709 |
| Hotels, Restaurants & Leisure – 4.5% | | | | |
| Jack in the Box, Inc. | | 49,290 | | 3,673,584 |
| Sonic Corp. | | 96,200 | | 2,745,548 |
| Vail Resorts, Inc. | | 38,285 | | 4,370,998 |
| | | | 10,790,130 |
| Household Durables – 4.7% | | | | |
| Harman International Industries, Inc. | | 22,090 | | 2,429,016 |
| Jarden Corp. (a) | | 104,832 | | 4,696,474 |
| Tempur Sealy International, Inc. (a) | | 52,130 | | 4,057,799 |
| | | | 11,183,289 |
| Insurance – 2.1% | | | | |
| Assurant, Inc. | | 60,080 | | 4,898,322 |
| Internet Software & Services – 1.9% | | | | |
| Costar Group, Inc. (a) | | 22,030 | | 4,473,632 |
| IT Services – 5.0% | | | | |
| Genpact Ltd. (a) | | 73,560 | | 1,822,817 |
| Sabre Corp. | | 106,690 | | 3,128,151 |
| Total System Services, Inc. | | 86,140 | | 4,518,043 |
| VeriFone Systems, Inc. (a) | | 82,020 | | 2,472,083 |
| | | | 11,941,094 |
| Leisure Products – 0.5% | | | | |
| Polaris Industries, Inc. | | 9,720 | | 1,091,945 |
| Life Sciences Tools & Services – 2.0% | | | | |
| Mettler-Toledo International, Inc. (a) | | 15,409 | | 4,792,045 |
| Machinery – 5.0% | | | | |
| Middleby Corp. (a) | | 34,420 | | 4,025,075 |
| Snap-on, Inc. | | 27,320 | | 4,532,114 |
| WABCO Holdings, Inc. (a) | | 29,990 | | 3,365,778 |
| | | | 11,922,967 |
| Media – 2.1% | | | | |
| Interpublic Group of Cos., Inc. | | 51,930 | | 1,190,755 |
Nexstar Broadcasting Group, Inc.,
Class A | | 71,750 | | 3,819,252 |
| | | | 5,010,007 |
| 32 | HSBC PORTFOLIOS | See notes to financial statements. |
| HSBC OPPORTUNITY PORTFOLIO |
Schedule of Portfolio Investments—as of October 31, 2015 (concluded) |
| Common Stocks, continued | | | | | | |
| | | | | | | |
| | Shares | | Value ($) | |
| Oil, Gas & Consumable Fuels – 2.0% | | | | | | |
| Tesoro Corp. | | 44,105 | | | 4,716,148 | |
| Pharmaceuticals – 3.7% | | | | | | |
| Jazz Pharmaceuticals plc (a) | | 41,033 | | | 5,633,010 | |
| Pacira Pharmaceuticals, Inc. (a) | | 64,960 | | | 3,244,752 | |
| | | | | 8,877,762 | |
| Professional Services – 2.7% | | | | | | |
| IHS, Inc., Class A (a) | | 33,110 | | | 3,957,970 | |
| Robert Half International, Inc. | | 46,090 | | | 2,427,099 | |
| | | | | 6,385,069 | |
| Real Estate Investment Trusts (REITs) – 1.5% | | | | |
| Starwood Property Trust, Inc. | | 177,210 | | | 3,560,149 | |
| Real Estate Management & Development – 1.4% | | | | |
| Jones Lang LaSalle, Inc. | | 20,530 | | | 3,422,556 | |
| Road & Rail – 1.7% | | | | | | |
| Genesee & Wyoming, Inc., | | | | | | |
| Class A (a) | | 36,730 | | | 2,464,583 | |
| Werner Enterprises, Inc. | | 62,880 | | | 1,663,805 | |
| | | | | 4,128,388 | |
| Semiconductors & Semiconductor Equipment – 1.9% | |
| On Semiconductor Corp. (a) | | 374,650 | | | 4,121,150 | |
| Qorvo, Inc. (a) | | 11,650 | | | 511,785 | |
| | | | | 4,632,935 | |
| Software – 5.9% | | | | | | |
| Fortinet, Inc. (a) | | 117,950 | | | 4,052,762 | |
| QLIK Technologies, Inc. (a) | | 82,120 | | | 2,576,104 | |
| ServiceNow, Inc. (a) | | 63,600 | | | 5,192,941 | |
| Splunk, Inc. (a) | | 37,890 | | | 2,127,902 | |
| | | | | 13,949,709 | |
| Specialty Retail – 8.7% | | | | | | |
| Asbury Automotive Group, Inc. (a) | | 41,765 | | | 3,307,788 | |
| Restoration Hardware Holdings, | | | | | | |
| Inc. (a) | | 44,480 | | | 4,585,443 | |
| Signet Jewelers Ltd. | | 25,560 | | | 3,858,026 | |
| Ulta Salon, Cosmetics & | | | | | | |
| Fragrance, Inc. (a) | | 34,420 | | | 5,987,703 | |
| Williams-Sonoma, Inc. | | 39,144 | | | 2,886,870 | |
| | | | | 20,625,830 | |
| Trading Companies & Distributors – 1.0% | | | | |
| HD Supply Holdings, Inc. (a) | | 78,390 | | | 2,335,238 | |
| TOTAL COMMON STOCKS | | | | | | |
| (COST $200,831,870) | | | | | 228,945,115 | |
| | | | | | | |
| Investment Company – 5.4% | | | | | | |
| | | | | | | |
| Northern Institutional Government | | | | | | |
| Select Portfolio, Institutional Shares, | | | | | | |
| 0.01% (b) | | 12,771,487 | | | 12,771,487 | |
| TOTAL INVESTMENT COMPANY | | | | | | |
| (COST $12,771,487) | | | | | 12,771,487 | |
| TOTAL INVESTMENT SECURITIES | | | | | | |
| (COST $213,603,357) – 101.7% | | | | | 241,716,602 | |
| Other Assets (Liabilities) – (1.7)% | | | | | (4,121,860 | ) |
| NET ASSETS – 100% | | | | $ | 237,594,742 | |
____________________
| (a) | | Represents non-income producing security. |
| (b) | | The rate represents the annualized one-day yield that was in effect on October 31, 2015. |
| See notes to financial statements. | HSBC PORTFOLIOS 33 |
HSBC PORTFOLIOS
Statements of Assets and Liabilities—as of October 31, 2015
| HSBC | | HSBC |
| Growth | | Opportunity |
| Portfolio | | Portfolio |
| Assets: | | | | | | | | | |
| Investment securities, at value | | $ | 77,915,873 | | | | $ | 241,716,602 | |
| Dividends receivable | | | 16,838 | | | | | 28,626 | |
| Receivable for investments sold | | | 1,103,874 | | | | | 2,116,908 | |
| Prepaid expenses | | | 502 | | | | | 1,194 | |
| Total Assets | | | 79,037,087 | | | | | 243,863,330 | |
| | | | | | | | | | |
| Liabilities: | | | | | | | | | |
| Payable for investments purchased | | | 1,448,603 | | | | | 6,069,784 | |
| Accrued expenses and other liabilities: | | | | | | | | | |
| Investment Management | | | 11,140 | | | | | 49,611 | |
| Sub-Advisory | | | 25,463 | | | | | 109,143 | |
| Administration | | | 1,501 | | | | | 4,674 | |
| Compliance Services | | | 10 | | | | | 15 | |
| Accounting | | | 6,883 | | | | | 6,820 | |
| Custodian | | | 3,497 | | | | | 6,162 | |
| Trustee | | | 335 | | | | | 1,157 | |
| Other | | | 16,024 | | | | | 21,222 | |
| Total Liabilities | | $ | 1,513,456 | | | | $ | 6,268,588 | |
| | | | | | | | | | |
| Applicable to investors’ beneficial interest | | $ | 77,523,631 | | | | $ | 237,594,742 | |
| Total Investments, at cost | | $ | 59,702,978 | | | | $ | 213,603,357 | |
| 34 HSBC PORTFOLIOS | | See notes to financial statements. |
HSBC PORTFOLIOS
Statements of Operations—For the year ended October 31, 2015
| Growth | | Opportunity |
| Portfolio | | Portfolio |
| Investment Income: | | | | | | | | | | | |
| Dividends | | $ | 577,554 | | | | | $ | 1,606,516 | | |
| Foreign tax withholding | | | (1,395 | ) | | | | | — | | |
| Total Investment Income | | | 576,159 | | | | | | 1,606,516 | | |
| | | | | | | | | | | | |
| Expenses: | | | | | | | | | | | |
| Investment Management Fees | | | 134,559 | | | | | | 586,260 | | |
| Sub-Advisory Fees | | | 307,511 | | | | | | 1,289,776 | | |
| Administration | | | 18,482 | | | | | | 56,343 | | |
| Accounting | | | 41,867 | | | | | | 41,871 | | |
| Compliance Services | | | 811 | | | | | | 2,437 | | |
| Custodian | | | 13,950 | | | | | | 23,341 | | |
| Printing | | | 2,723 | | | | | | 9,819 | | |
| Professional | | | 25,079 | | | | | | 30,765 | | |
| Trustee | | | 2,328 | | | | | | 7,109 | | |
| Other | | | 3,958 | | | | | | 10,942 | | |
| Total Expenses | | | 551,268 | | | | | | 2,058,663 | | |
| | | | | | | | | | | | |
| Net Investment Income (Loss) | | $ | 24,891 | | | | | $ | (452,147 | ) | |
| | | | | | | | | | | | |
| Net Realized/Unrealized Gains/(Losses) from Investments: | | | | | | | | | | | |
| Net realized gains (losses) from investment securities | | | 9,076,017 | | | | | | (1,376,839 | ) | |
| Change in unrealized appreciation/depreciation on investments | | | (2,676,864 | ) | | | | | (3,071,831 | ) | |
| | | | | | | | | | | | |
| Net realized/unrealized gains (losses) on investments | | | 6,399,153 | | | | | | (4,448,670 | ) | |
| Change in Net Assets Resulting from Operations | | $ | 6,424,044 | | | | | $ | (4,900,817 | ) | |
| See notes to financial statements. | HSBC PORTFOLIOS 35 |
HSBC PORTFOLIOS
Statements of Changes in Net Assets
| | Growth Portfolio | | Opportunity Portfolio |
| | For the | For the | | For the | For the |
| | year ended | year ended | | year ended | year ended |
| | October 31, 2015 | October 31, 2014 | | October 31, 2015 | October 31, 2014 |
| Investment Activities: | | | | | | | | | | | | | | | | | | | | | | |
| Operations: | | | | | | | | | | | | | | | | | | | | | | |
| Net investment income (loss) | | | $ | 24,891 | | | | $ | 63,233 | | | | | $ | (452,147 | ) | | | $ | (846,122 | ) | |
| Net realized gains (losses) from investments | | | | 9,076,017 | | | | | 16,100,579 | | | | | | (1,376,839 | ) | | | | 48,125,818 | | |
| Change in unrealized appreciation/depreciation on | | | | | | | | | | | | | | | | | | | | | | |
| investments | | | | (2,676,864 | ) | | | | (4,167,672 | ) | | | | | (3,071,831 | ) | | | | (20,630,917 | ) | |
| Change in net assets resulting from operations | | | | 6,424,044 | | | | | 11,996,140 | | | | | | (4,900,817 | ) | | | | 26,648,779 | | |
| Proceeds from contributions | | | | 4,661,525 | | | | | 6,730,596 | | | | | | 45,265,828 | | | | | 17,143,763 | | |
| Value of withdrawals | | | | (12,493,383 | ) | | | | (28,479,757 | ) | | | | | (25,351,444 | ) | | | | (48,280,031 | ) | |
| Charge in net assets resulting from transactions | | | | | | | | | | | | | | | | | | | | | | |
| in investors’ beneficial interest | | | | (7,831,858 | ) | | | | (21,749,161 | ) | | | | | 19,914,384 | | | | | (31,136,268 | ) | |
| Change in net assets | | | | (1,407,814 | ) | | | | (9,753,021 | ) | | | | | 15,013,567 | | | | | (4,487,489 | ) | |
| | | | | | | | | | | | | | | | | | | | | | | |
| Net Assets: | | | | | | | | | | | | | | | | | | | | | | |
| Beginning of period | | | | 78,931,445 | | | | | 88,684,466 | | | | | | 222,581,175 | | | | | 227,068,664 | | |
| End of period | | | $ | 77,523,631 | | | | $ | 78,931,445 | | | | | $ | 237,594,742 | | | | $ | 222,581,175 | | |
| 36 HSBC PORTFOLIOS | See notes to financial statements. |
| HSBC PORTFOLIOS |
| Financial Highlights |
| | | | | | | Ratios/Supplementary Data |
| | | | | | | | | | | | | | | | | | | Ratio of | | |
| | | | | | | | | | | | | | Ratio of Net | | Expenses | | |
| | | | | | | | | | | | Ratio of Net | | Investment | | to Average | | |
| | | | | | | Net Assets at | | Expenses to | | Income (Loss) | | Net Assets | | |
| | Total | | End of Period | | Average Net | | to Average Net | | (Excluding Fee | | Portfolio |
| | Return | | (000’s) | | Assets | | Assets | | Reductions) | | Turnover |
| GROWTH PORTFOLIO | | | | | | | | | | | | | | | | | | | | | |
| Year Ended October 31, 2015 | | | 8.67 | % | | | | $ | 77,524 | | | 0.72% | | | 0.03 | % | | | 0.72% | | 68% |
| Year Ended October 31, 2014 | | | 15.22 | % | | | | | 78,931 | | | 0.69% | | | 0.07 | % | | | 0.69% | | 68% |
| Year Ended October 31, 2013 | | | 32.84 | % | | | | | 88,684 | | | 0.69% | | | 0.46 | % | | | 0.69% | | 75% |
| Year Ended October 31, 2012 | | | 7.18 | % | | | | | 79,018 | | | 0.71% | | | 0.13 | % | | | 0.71% | | 53% |
| Year Ended October 31, 2011 | | | 11.07 | % | | | | | 105,289 | | | 0.66% | | | 0.07 | % | | | 0.66% | | 56% |
| OPPORTUNITY PORTFOLIO | | | | | | | | | | | | | | | | | | | | | |
| Year Ended October 31, 2015 | | | (1.57 | )% | | | | $ | 237,595 | | | 0.88% | | | (0.19 | )% | | | 0.88% | | 63% |
| Year Ended October 31, 2014 | | | 12.26 | % | | | | | 222,581 | | | 0.88% | | | (0.37 | )% | | | 0.88% | | 66% |
| Year Ended October 31, 2013 | | | 34.84 | % | | | | | 227,069 | | | 0.89% | | | 0.17 | % | | | 0.89% | | 70% |
| Year Ended October 31, 2012 | | | 12.71 | % | | | | | 150,059 | | | 0.91% | | | 0.15 | % | | | 0.91% | | 59% |
| Year Ended October 31, 2011 | | | 12.40 | % | | | | | 141,324 | | | 0.88% | | | 0.05 | % | | | 0.88% | | 69% |
See notes to financial statements. | HSBC PORTFOLIOS 37 |
| HSBC PORTFOLIOS |
| Notes to Financial Statements—as of October 31, 2015 |
1. Organization:
The HSBC Portfolios (the “Portfolios Trust”), is an open-end management investment company organized as a New York trust under the laws of the State of New York on November 1, 1994. The Portfolios Trust contains the following master funds (individually a “Portfolio,” collectively the “Portfolios”):
| Portfolio | | Short Name | |
| HSBC Growth Portfolio | Growth Portfolio |
| HSBC Opportunity Portfolio | Opportunity Portfolio |
The Portfolios operate as master funds in master-feeder arrangements, in which other feeder funds invest all or part of their investable assets in the Portfolios. The Declaration of Trust permits the Board of Trustees (the “Board”) to issue an unlimited number of beneficial interests in the Portfolios.
The Portfolios are diversified series of the Portfolios Trust and are part of the HSBC Family of Funds, which also includes HSBC Advisor Funds Trust and HSBC Funds (collectively the “Trusts”). Financial statements for all other funds of the Trusts are published separately.
The following represents each feeder fund’s proportionate ownership interest in the Portfolios:
| | | | Proportionate |
| | | | Ownership Interest on |
| Feeder Fund | | | Respective Portfolio | | October 31, 2015 (%) |
| HSBC Growth Fund | | HSBC Growth Portfolio | | | 100.0 | |
| HSBC Opportunity Fund | | HSBC Opportunity Portfolio | | | 7.4 | |
| HSBC Opportunity Fund (Advisor) | | HSBC Opportunity Portfolio | | | 92.6 | |
Under the Portfolios Trust’s organizational documents, the Portfolios Trust’s officers and Trustees are indemnified against certain liabilities arising out of the performance of their duties to the Portfolios. In addition, in the normal course of business, the Portfolios Trust may enter into contracts with its service providers, which also provide for indemnifications by the Portfolios. The Portfolios’ maximum exposure under these arrangements is unknown as this would involve any future claims that may be made against the Portfolios. However, based on experience, the Portfolios Trust expects that risk of loss to be remote.
The Portfolios are investment companies and follow accounting and reporting guidance under Financial Accounting Standards Board (“FASB”) Accounting Standards Codification (“ASC”) Topic 946, “Financial Services-Investment Companies.”
2. Significant Accounting Policies:
The following is a summary of the significant accounting policies followed by the Portfolios in the preparation of their financial statements. The policies are in conformity with U.S. generally accepted accounting principles (“GAAP’’). The preparation of financial statements requires management to make certain estimates and assumptions that affect the reported amounts of assets and liabilities and disclosure of contingent assets and liabilities at the date of the financial statements and the reported amounts of increases and decreases in net assets from operations during the reporting period. Actual results could differ from those estimates.
Securities Valuation:
The Portfolios record their investments at fair value. Fair value is defined as the price that would be received to sell an asset or paid to transfer a liability in an orderly transaction between market participants at the measurement date. The valuation techniques used to determine fair value are further described in Note 3 below.
38 HSBC PORTFOLIOS
| HSBC PORTFOLIOS |
| Notes to Financial Statements—as of October 31, 2015 (continued) |
Investment Transactions and Related Income:
Investment transactions are accounted for no later than one business day after trade date. However, for financial reporting purposes, investment transactions are accounted for on trade date. Investment gains and losses are calculated on the identified cost basis. Interest income is recognized on the accrual basis and includes, where applicable, the amortization or accretion of premium or discount. Dividend income is recorded on the ex-dividend date.
The Portfolios make an allocation of their net investment income and realized gains and losses from securities transactions to their investors in proportion to their investment in the Portfolios.
Expense Allocations:
Expenses directly attributable to a Portfolio are charged to that Portfolio. Expenses not directly attributable to a Portfolio are allocated proportionately among the applicable portfolios or funds within the Trusts in relation to the net assets or on another reasonable basis.
Federal Income Taxes:
The Opportunity Portfolio is treated as a partnership for U.S. federal income tax purposes. Accordingly, the Opportunity Portfolio passes through all of its net investment income and gains and losses to its feeder funds, and is therefore not subject to U.S. federal income tax. As such, investors in the Opportunity Portfolio are allocated for tax purposes their respective share of the Opportunity Portfolio’s ordinary income and realized gains or losses. It is intended that the Opportunity Portfolio will be managed in such a way that an investor will be able to satisfy the requirements of the Internal Revenue Code, as amended, applicable to regulated investment companies. The Growth Portfolio is a disregarded entity for U.S. federal income tax purposes and the assets, liabilities, income, expenses and capital gains or losses of the Growth Portfolio are treated as those of the sole remaining feeder fund.
Management of the Portfolios has reviewed tax positions taken in tax years that remain subject to examination by all major tax jurisdictions, including federal (i.e., the last four tax year ends and the interim tax period since then, as applicable). Management believes that there is no tax liability resulting from unrecognized tax benefits related to uncertain tax positions taken.
New Accounting Pronouncements:
In August 2014, the FASB issued Accounting Standards Update No. 2014-15 “Presentation of Financial Statements–Going Concern (Subtopic 205-40)” (“ASU 2014-15”), which requires management to evaluate whether there are conditions or events, considered in the aggregate, that raise substantial doubt about the entity’s ability to continue as a going concern. ASU 2014-15 is effective prospectively for annual periods ending after December 15, 2016, and interim periods thereafter.
In May 2015, the FASB issued Accounting Standards Update No. 2015-07 “Fair Value Measurement (Topic 820)” (“ASU 2015-07”), which removes the requirement to categorize within the fair value hierarchy all investments for which fair value is measured using the NAV per share practical expedient. ASU 2015-07 also removes the requirement to make certain disclosures for all investments that may be measured at fair value using the NAV per share practical expedient. The ASU is effective for annual periods beginning after December 15, 2015 and interim periods within those annual periods.
Management is currently evaluating the implications of these ASUs and their impact on the financial statements and related disclosures have not yet been determined.
HSBC PORTFOLIOS 39
| HSBC PORTFOLIOS |
Notes to Financial Statements—as of October 31, 2015 (continued) |
3. Investment Valuation Summary:
The valuation techniques employed by the Portfolios, as described below, maximize the use of observable inputs and minimize the use of unobservable inputs in determining fair value. The Portfolios’ investments are classified within the fair value hierarchy based on the lowest level of input that is significant to the fair value measurement. The inputs used for valuing the Portfolios’ investments are summarized in the three broad levels listed below:
| ● | Level 1: quoted prices in active markets for identical assets |
| |
| ● | Level 2: other significant observable inputs (including quoted prices for similar securities, interest rates, prepayments speeds, credit risk, etc.) |
| |
| ● | Level 3: significant unobservable inputs (including a Portfolio’s own assumptions in determining the fair value of investments) |
Changes in valuation techniques may result in transfers in or out of an assigned level within the disclosure hierarchy. The Portfolios determine transfers between fair value hierarchy levels at the reporting period end. There were no transfers between levels as of October 31, 2015, from the valuation input levels used on October 31, 2014. The inputs or methodology used for valuing investments are not necessarily an indication of the risk associated with investing in those investments.
Exchange traded domestic equity securities are valued at the last sales price on a national securities exchange, or in the absence of recorded sales, at the readily available closing bid price on such exchanges, or at the quoted bid price in the over-the-counter market and are typically categorized as Level 1 in the fair value hierarchy.
Shares of exchange traded and closed-end registered investment companies are valued in the same manner as other equity securities and are typically categorized as Level 1 in the fair value hierarchy. Mutual funds are valued at their net asset values (“NAVs”), as reported by such companies and are typically categorized as Level 1 in the fair value hierarchy.
Securities or other assets for which market quotations are not readily available, or are deemed unreliable due to a significant event or otherwise, are valued pursuant to procedures adopted by the Trusts’ Board (“Procedures”). Depending on the source and relative significance of valuation inputs, these instruments may be classified as Level 2 or Level 3 in the fair value hierarchy. Examples of potentially significant events that could affect the value of an individual security and thus require pricing under the Procedures include corporate actions by the issuer, announcements by the issuer relating to its earnings or products, regulatory news, natural disasters, and litigation. Examples of potentially significant events that could affect multiple securities held by a Portfolio include governmental actions, natural disasters, and armed conflicts. Fair value pricing may require subjective determinations about the value of a security. While the Portfolios Trust’s policy is intended to result in a calculation of a Portfolio’s NAV that fairly reflects security values as of the time of pricing, the Portfolios Trust cannot ensure that fair values determined would accurately reflect the price that a Portfolio could obtain for a security if it were to dispose of that security as of the time of pricing. The prices used by a Portfolio may differ from the value that would be realized if the securities were sold and the differences could be material to the financial statements.
For the year ended October 31, 2015, there were no Level 3 investments for which significant unobservable inputs were used to determine fair value. As of October 31, 2015, all investments were categorized as Level 1 in the fair value hierarchy. The breakdown of investment categorization is disclosed in the Schedule of Portfolio Investment for each Portfolio.
40 HSBC PORTFOLIOS
| HSBC PORTFOLIOS |
| Notes to Financial Statements—as of October 31, 2015 (continued) |
4. Related Party Transactions and Other Agreements and Plans:
Investment Management:
HSBC Global Asset Management (USA) Inc. (“HSBC” or the “Investment Adviser”), a wholly owned subsidiary of HSBC Bank USA, N.A., a national bank organized under the laws of the United States, acts as the Investment Adviser to the Portfolios pursuant to an investment management contract with the Portfolios Trust. As Investment Adviser, HSBC manages the investments of the Portfolios and continuously reviews, supervises, and administers the Portfolios’ investments. Winslow Capital Management, LLC. (“Winslow”) and Westfield Capital Management Company, L.P. (“Westfield”) serve as subadvisers for the Growth Portfolio and Opportunity Portfolio, respectively, and are paid for their services directly by the respective Portfolios.
For their services, the Investment Adviser and Winslow receive in aggregate, from the Growth Portfolio, a fee, accrued daily and paid monthly, at an annual rate of:
| Based on Average Daily Net Assets of all Sub-Adviser serviced funds and separate accounts affiliated | | |
| with HSBC: | | Fee Rate(%) |
| Up to $250 million | | 0.575 |
| In excess of $250 million but not exceeding $500 million | | 0.525 |
| In excess of $500 million but not exceeding $750 million | | 0.475 |
| In excess of $750 million but not exceeding $1 billion | | 0.425 |
| In excess of $1 billion | | 0.375 |
____________________
| * | The Growth Portfolio may pay the Investment Adviser and Winslow an aggregate maximum fee of up to 0.68%. Currently, the Investment Adviser’s contractual fee is 0.175% and Winslow’s maximum contractual fee is 0.40%. Accordingly, the current aggregate maximum fee rate is 0.575%. |
For their services, the Investment Adviser and Westfield receive in aggregate, a fee, accrued daily and paid monthly, at an annual rate of 0.80% of the Opportunity Portfolio’s average daily net assets. Currently, the Investment Adviser’s contractual fee is 0.25% and Westfield’s contractual fee is 0.55%.
Administration:
HSBC also serves the Portfolios as Administrator. Under the terms of the Administration Agreement, HSBC receives from the Portfolios (as well as other funds in the Trusts combined) a fee, accrued daily and paid monthly, at an annual rate of:
| Based on Average Daily Net Assets of | | | Fee Rate(%) |
| Up to $10 billion | | 0.0550 |
| In excess of $10 billion but not exceeding $20 billion | | 0.0350 |
| In excess of $20 billion but not exceeding $50 billion | | 0.0275 |
| In excess of $50 billion | | 0.0250 |
The fee rates and breakpoints are determined on the basis of the aggregate average daily net assets of the Trusts, however, the assets of the funds of the HSBC Funds and HSBC Advisor Fund that invest in the Portfolios are not double-counted. The total administration fee paid to HSBC is allocated to each series based upon its proportionate share of the aggregate net assets of the Trusts. For assets invested in the Portfolios by the HSBC Funds and HSBC Advisor Funds Trust, the Portfolios pay half of the administration fee and the other funds pay half of the administration fee, for a combination of the total fee rate set forth above.
Pursuant to a Sub-Administration Agreement with HSBC, Citi Fund Services Ohio, Inc. (“Citi”), a wholly-owned subsidiary of Citigroup, Inc., serves as the Trusts’ Sub-Administrator subject to the general supervision by the Trusts’ Board and HSBC. For these services, Citi is entitled to a fee, payable by HSBC, at an annual rate equivalent to the fee rates set forth above subject to certain reductions associated with services provided to new portfolios, minus 0.02% which is retained by HSBC.
HSBC PORTFOLIOS 41
| HSBC PORTFOLIOS |
| Notes to Financial Statements—as of October 31, 2015 (continued) |
Under a Compliance Services Agreement between the Trusts and Citi (the “CCO Agreement”), Citi makes an employee available to serve as the Trusts’ Chief Compliance Officer (the “CCO”). Under the CCO Agreement, Citi also provides infrastructure and support in implementing the written policies and procedures comprising the Trusts’ compliance program, including support services to the CCO. For the services provided under the CCO Agreement, the Trusts paid Citi $300,447 for the year ended October 31, 2015, plus reimbursement of certain out-of-pocket expenses. Expenses incurred by each Portfolio are reflected on the Statements of Operations as “Compliance Services.” Citi pays the salary and other compensation earned by individuals performing these services, as employees of Citi.
Fund Accounting:
Citi provides fund accounting services for the Portfolios Trust. For its services to the Portfolios, Citi receives an annual fee per portfolio, including reimbursement of certain expenses that, is accrued daily and paid monthly. Citi receives additional fees paid by the Trust for regulatory administration services.
Independent Trustees:
For the period January 1, 2015 through October 31, 2015, the Trusts paid each Independent Trustee an annual retainer of $100,000. The Trusts paid a fee of $12,000 for each regular meeting of the Board of Trustees attended and a fee of $3,000 for each special meeting attended. The Trusts paid each Committee Chair an annual retainer of $12,000, with the exception of the Chair of the Audit Committee, who received a retainer of $15,000. The Trusts also paid the Chairman of the Board, an additional annual retainer of $30,000.
Prior to January 1, 2015, the Trusts paid each Independent Trustee an annual retainer of $100,000. The Trusts paid a fee of $10,000 for each regular meeting of the Board of Trustees attended and a fee of $3,000 for each special meeting attended. The Trusts paid each Committee Chair an annual retainer of $3,000, with the exception of the Chair of the Audit Committee, who received a retainer of $6,000. The Trusts also paid the Chairman of the Board, an additional annual retainer of $24,000. In addition, for time expended on Board duties outside normal meetings, which is authorized by the Board, a Trustee was compensated at the rate of $500 per hour, up to a maximum of $3,000 per day.
Other:
The Portfolios may purchase securities from an underwriting syndicate in which the principal underwriter or members of the syndicate are affiliated with the Adviser. For the year ended October 31, 2015, the Portfolios purchased the following amounts of such securities:
| Purchases ($) |
| Growth Portfolio | 1,393,500 |
The Adviser and its affiliates may have lending, banking, brokerage, underwriting, or other business relationships with the issuers of the securities in which the Portfolios invest.
5. Investment Transactions:
Cost of purchases and proceeds from sales of securities (excluding securities maturing less than one year from acquisition) for the year ended October 31, 2015 were as follows:
| | | Purchases ($) | | Sales ($) |
| Growth Portfolio | | 51,679,119 | | 58,710,765 |
| Opportunity Portfolio | | 163,244,050 | | 143,144,294 |
For the year ended October 31, 2015, there were no long-term U.S. government securities held by the Portfolios.
42 HSBC PORTFOLIOS
| HSBC PORTFOLIOS |
| Notes to Financial Statements—as of October 31, 2015 (continued) |
6. Federal Income Tax Information:
At October 31, 2015, the cost basis of securities for federal income tax purposes, gross unrealized appreciation, gross unrealized depreciation and net unrealized appreciation/depreciation were as follows:
| | | | | | | | Net Unrealized |
| | | | | Tax Unrealized | | Tax Unrealized | | Appreciation/ |
| | Tax Cost ($) | | Appreciation ($) | | Depreciation ($) | | (Depreciation) ($)* |
| Growth Portfolio | | 60,032,978 | | 18,261,249 | | (770,596) | | 17,490,653 |
| Opportunity Portfolio | | 214,440,808 | | 38,867,547 | | (11,591,753) | | 27,275,794 |
____________________
| * | The difference between book-basis unrealized appreciation (depreciation) is attributable primarily to tax deferral of losses on wash sales. |
7. Subsequent Events:
At a meeting on December 17-18, 2015, the Trust’s Board of Trustees approved a plan of liquidation to close the HSBC Growth Portfolio. The liquidation of the HSBC Growth Portfolio is expected to be effective on or about February 12, 2016.
At a meeting of the Board of Trustees of the Trusts held on December 17-18, 2015, the Trustees of the Trusts approved on behalf of each Trust and each of the Funds a form of Agreement and Plan of Reorganization (the “Plan”) and other proposals subject to shareholder approval. The Plan will be submitted to a vote of shareholders of the Funds at a special meeting of shareholders to be held in 2016. The Plan calls for the reorganization and redomiciliation of the Funds, which are series of either a Massachusetts business trust (the Trust and Advisor Trust) or a New York trust (the Portfolio Trust), with and into corresponding “shell” series (“New Funds”) of a single newly formed Delaware statutory trust (the “Redomiciliation”). If approved by shareholders, the Redomiciliation is expected to occur in the second calendar quarter of 2016. Upon completion of the Redomiciliation, shareholders of the Funds would own shares of the corresponding class of the New Funds that are equal in value to the shares of the Fund that were held by the shareholders immediately prior to the closing of the Redomiciliation. In addition, the respective share classes of each of the New Funds would assume the performance, financial and other historical information of those of the corresponding Fund. The Redomiciliation is not expected to have an impact on the continuing operations of the Funds. Additional information about the Plan and the other proposals will be included in the Trusts’ proxy statement that is expected to be mailed to shareholders in March 2016.
On November 30, 2015, SunGard Investor Services LLC announced that its acquisition by Fidelity National Information Services was completed. The transfer agency services, and fees charged for such services, are unchanged as a result of the acquisition.
Management has evaluated events and transactions through the date the financial statements were issued, for purposes of recognition or disclosure in these financial statements and there are no additional subsequent events to report.
HSBC PORTFOLIOS 43
Report of Independent Registered Public Accounting Firm
To the Board of Trustees and Shareholders of HSBC Portfolios
In our opinion, the accompanying statements of assets and liabilities, including the schedules of portfolio investments, and the related statements of operations and of changes in net assets and the financial highlights present fairly, in all material respects, the financial position of each of HSBC Growth Portfolio and HSBC Opportunity Portfolio (each a portfolio of HSBC Portfolios and hereafter referred to as the “Funds”) at October 31, 2015, and the results of each of their operations, the changes in each of their net assets and the financial highlights for the year then ended, in conformity with accounting principles generally accepted in the United States of America. These financial statements and financial highlights (hereafter referred to as “financial statements”) are the responsibility of the Funds’ management. Our responsibility is to express an opinion on these financial statements based on our audit. We conducted our audit of these financial statements in accordance with the standards of the Public Company Accounting Oversight Board (United States). Those standards require that we plan and perform the audit to obtain reasonable assurance about whether the financial statements are free of material misstatement. An audit includes examining, on a test basis, evidence supporting the amounts and disclosures in the financial statements, assessing the accounting principles used and significant estimates made by management, and evaluating the overall financial statement presentation. We believe that our audit, which included confirmation of securities at October 31, 2015 by correspondence with the custodian and brokers, provides a reasonable basis for our opinion. The accompanying statements of changes in net assets for the year ended October 31, 2014 and the financial highlights for each of the periods ended on or prior to October 31, 2014 were audited by other auditors whose report dated December 23, 2014 expressed an unqualified opinion on those statements and financial highlights.
As discussed in Note 7 to the financial statements, the Board of Trustees has approved a plan of liquidation to close the HSBC Growth Portfolio.
PricewaterhouseCoopers LLP
New York, New York
December 29, 2015
44 HSBC PORTFOLIOS
| HSBC PORTFOLIOS |
| Table of Shareholder Expenses—as of October 31, 2015 (Unaudited) |
As a shareholder of the Portfolios, you incur ongoing costs, including management fees and other Fund expenses.
These examples are intended to help you understand your ongoing costs (in dollars) of investing in the Portfolios and to compare these costs with the ongoing costs of investing in other mutual funds.
These examples are based on an investment of $1,000 invested at the beginning of the period and held for the entire period from May 1, 2015 through October 31, 2015.
Actual Example
The table below provides information about actual account values and actual expenses. You may use the information below, together with the amount you invested, to estimate the expenses that you paid over the period. Simply divide your account value by $1,000 (for example, an $8,600 account value divided by $1,000 = 8.6), then multiply the result by the number in the table under the heading entitled “Expenses Paid During Period” to estimate the expenses you paid on your account during this period.
| | | | | | | | | | | | | | | | | Annualized |
| | Beginning | | Ending | | Expenses Paid | | Expense Ratio |
| | | Account Value | | Account Value | | During Period* | | During Period |
| | 5/1/15 | | 10/31/15 | | 5/1/15 - 10/31/15 | | 5/1/15 - 10/31/15 |
| Growth Portfolio | | | $ | 1,000.00 | | | | $ | 1,037.30 | | | | $ | 3.70 | | | | 0.72 | % | |
| Opportunity Portfolio | | | | 1,000.00 | | | | | 923.20 | | | | | 4.27 | | | | 0.88 | % | |
____________________
| * | Expenses are equal to the average account value over the period, multiplied by the Portfolio’s annualized expense ratio, multiplied by 184/365 (to reflect the one half year period). |
Hypothetical Example for Comparison Purposes
The table below provides information about hypothetical account values and hypothetical expenses based on each Portfolio’s actual expense ratio and an assumed rate of return of 5% per year before expenses, which is not the Portfolio’s actual return. The hypothetical account values and expenses may not be used to estimate the actual ending account balance or expenses you paid for the period. You may use this information to compare this 5% hypothetical example with the 5% hypothetical examples that appear in the shareholder reports of other funds.
Please note that the expenses shown in the table are meant to highlight your ongoing costs only and do not reflect any transactional costs, such as sales charges (loads), redemption fees, or exchange fees. Therefore, the table is useful in comparing ongoing costs only, and will not help you determine the relative total costs of owning different funds. In addition, if these transactional costs were included, your costs would have been higher.
| | | | | | | | | | | | | | | | | Annualized |
| | Beginning | | Ending | | Expenses Paid | | Expense Ratio |
| | Account Value | | Account Value | | During Period* | | During Period |
| | 5/1/15 | | 10/31/15 | | 5/1/15 - 10/31/15 | | 5/1/15 - 10/31/15 |
| Growth Portfolio | | | $ | 1,000.00 | | | | $ | 1,021.58 | | | | $ | 3.67 | | | | 0.72 | % | |
| Opportunity Portfolio | | | | 1,000.00 | | | | | 1,020.77 | | | | | 4.48 | | | | 0.88 | % | |
____________________
| * | Expenses are equal to the average account value over the period, multiplied by the Portfolio’s annualized expense ratio, multiplied by 184/365 (to reflect the one half year period). |
HSBC PORTFOLIOS 45
| HSBC PORTFOLIOS |
| Board of Trustees and Officers (Unaudited) |
MANAGEMENT OF THE TRUST
The following table contains information regarding the HSBC Family of Funds’ Board of Trustees (“Trustees”). Asterisks indicate those Trustees who are “interested persons,” as defined in the Investment Company Act of 1940, as amended, of the HSBC Family of Funds. The HSBC Family of Funds’ Statement of Additional Information includes additional information about the Trustees and is available, without charge, upon request by calling (888) 525-5757.
| | | | | | | | Portfolios in | | |
| | Position(s) | | Term of Office | | | | Fund Complex | | |
| Name, | | Held with | | and Length of | | Principal Occupation(s) | | Overseen By | | Other Directorships |
| Address, Age | | Funds | | Time Served | | During Past 5 Years | | Trustee* | | Held by Trustee |
| NON-INTERESTED | | | | | | | | | | |
| TRUSTEES | | | | | | | | | | |
| |
MARCIA L. BECK
P.O. Box 182845
Columbus, OH
43218-3035
Age: 60 | | Trustee | | Indefinite; 2008
to present | | Private Investor (1999 – present); Executive Vice President, Prudential Investments (1997 – 1999); President and Trustee, The Goldman Sachs Mutual Funds (1992 – 1996) | | 24 | | None |
| |
SUSAN C. GAUSE
P.O. Box 182845
Columbus, OH
43218-3035
Age: 63 | | Trustee | | Indefinite; 2013
to present | | Private Investor (2003 – present); Chief Executive Officer, Dresdner RCM Global Investors and Allianz Dresdner Asset Management (2000 – 2002); Board Member, Dresdner Global Asset Management Board (2000 – 2002); Chief Operating Officer and Senior Managing Director, Dresdner RCM Global Investors (1998 – 2000); Global Chief Financial Officer, Dresdner RCM Global Investors (1996 – 1998) | | 24 | | Met Investors Series
Trust and Metropolitan
Series Fund |
| |
SUSAN S. HUANG
P.O. Box 182845
Columbus, OH
43218-3035
Age: 61 | | Trustee | | Indefinite; 2008
to present | | Private Investor (2000-present); Senior Vice President, Schroder Investment Management (2001 – 2004); Managing Director, Chase Asset Management (1995-2000) | | 24 | | None |
| |
THOMAS F. ROBARDS
P.O. Box 182845
Columbus, OH
43218-3035
Age: 69 | | Chairman and
Trustee | | Indefinite; 2005
to present | | Partner, Robards & Co. LLC (investment and advisory services) (2005-present); Chief Financial Officer, American Museum of Natural History (2003-2004); Chief Financial Officer, Datek Online Holdings (2000-2003); Executive Vice President and Chief Financial Officer, Republic New York Corporation (1976-2000) | | 24 | | Ellington Financial LLC
(NYSE listed financial
services); Ellington
Residential Mortgage
REIT (NYSE listed real
estate investment trust) |
| |
| INTERESTED TRUSTEE | | | | | | | | | | |
| |
DEBORAH HAZELL
452 Fifth Avenue
New York
NY 10018
Age: 52 | | Trustee | | Indefinite; 2011
to present | | Chief Executive Officer, HSBC Global Asset Management (USA) Inc. (2011-present); President and Chief Executive Officer, Fisher Francis Trees & Watts (“FFTW”) (investment adviser), 2008-2011; Client Service, Business Development and Marketing Group, FFTW (1999-2008) | | 24 | | None |
____________________
* Includes the HSBC Funds, the HSBC Advisor Funds Trust and the HSBC Portfolios.
46 HSBC PORTFOLIOS
| HSBC PORTFOLIOS |
| Board of Trustees and Officers (Unaudited) (continued) |
| | Position(s) Held | | Term of Office and | | Principal Occupation(s) |
| Name, Address, Age | | Funds | | Length of Time Served | | During Past 5 Years |
| OFFICERS |
| |
RICHARD A. FABIETTI
452 Fifth Avenue
New York, NY 10018
Age: 57 | | President | | One year; 2004 to
present | | Senior Vice President, HSBC Global Asset Management (USA) Inc. (1998 - present) |
| |
JAMES D. LEVY
452 Fifth Avenue
New York, NY 10018
Age: 52 | | Vice President | | One year; 2014 to
present | | Vice President, Product Management, HSBC Global Asset Management (USA) Inc. (2014 – present); Vice President, Product Development, GE Asset Management Inc. (2007 – 2014) |
| |
SCOTT RHODES*
3435 Stelzer Road
Columbus, OH 43219-3035
Age: 56 | | Treasurer | | One year; 2014 to
present | | Senior Vice President, Citi (2010 - present); Manager, Treasurer of Mutual Funds, and Broker-Dealer Treasurer and Financial & Operations Principal, GE Asset Management Inc. (2005 – 2010) |
| |
IOANNIS TZOUGANATOS*
100 Summer Street,
Suite 1500
Boston, MA 02110
Age: 39 | | Secretary | | One Year; 2015 to
present | | Vice President, Regulatory Administration, Citi (2008-present) |
| |
HEATHER MELITO-DEZAN*
100 Summer Street
Suite 1500
Boston, MA 02110
Age: 38 | | Assistant Secretary | | One year; 2014 to
present | | Assistant Vice President, Regulatory Administration, Citi (2013 - present); Senior Specialist, Regulatory Administration, NGAM (2010-2013); Vice President and Manager. Regulatory Administration, BNY Mellon (2004-2010) |
| |
CHARLES L. BOOTH*
3435 Stelzer Road
Columbus, OH 43219-3035
Age: 55 | | Chief Compliance Officer | | One year; 2015 to
present | | Director and Compliance Officer, CCO Services, Citi (1988 - present) |
____________________
| * | Mr. Rhodes, Mr. Tzouganatos, Ms. Melito-Dezan, and Mr. Booth also are officers of other investment companies of which Citi (or an affiliate) is the administrator or sub-administrator. |
HSBC PORTFOLIOS 47
Other Information (Unaudited):
Information regarding how the Funds voted proxies relating to portfolio securities during the most recent 12-month period ended June 30th is available (i) without charge, upon request, by calling 1-800-525-5757 for HSBC Bank USA and HSBC Brokerage (USA) Inc. clients and 1-800-782-8183 for all other shareholders; (ii) on the Funds’ website at www.investorfunds.us.hsbc.com; and (iii) on the Security and Exchange Commission’s (“Commission”) website at http://www.sec.gov.
The Funds file their complete schedules of portfolio holdings with the Commission for the first and third quarters of each fiscal year on Form N-Q. The Funds’ Forms N-Q are available on the Commission’s website at http://www.sec.gov. The Funds’ Forms N-Q may be reviewed and copied at the Commission’s Public Reference Room in Washington, D.C. and information on the operation of the Public Reference Room may be obtained by calling 1-800-SEC-0330. The Funds’ Schedules of Investments will be available no later than 60 days after each period end, without charge, on the Funds’ website at www.investorfunds.us.hsbc.com.
An investment in a Fund is not a deposit of HSBC Bank USA, National Association, and is not insured or guaranteed by the Federal Deposit Insurance Corporation or any other government agency.
48 HSBC PORTFOLIOS
HSBC FAMILY OF FUNDS:
INVESTMENT ADVISER AND ADMINISTRATOR
HSBC Global Asset Management (USA) Inc.
452 Fifth Avenue
New York, NY 10018
SUB-ADVISERS
HSBC Growth Portfolio
Winslow Capital Management, LLC
4720 IDS Tower
80 South Eighth Street
Minneapolis, MN 55402
HSBC Opportunity Portfolio
Westfield Capital Management Company, L.P.
One Financial Center
Boston, MA 02111

Investment products:
ARE NOT A
BANK DEPOSIT
OR OBLIGATION
OF THE BANK
OR ANY OF ITS
AFFILIATES | ARE NOT
FDIC
INSURED | ARE NOT
INSURED BY
ANY FEDERAL
GOVERNMENT
AGENCY |
ARE NOT GUARANTEED BY
THE BANK OR ANY OF ITS
AFFILIATES | MAY LOSE
VALUE |
SHAREHOLDER SERVICING AGENTS
For HSBC Bank USA, N.A. and
HSBC Securities (USA) Inc. Clients
HSBC Bank USA, N.A.
452 Fifth Avenue
New York, NY 10018
1-888-525-5757
For All Other Shareholders
HSBC Funds
P.O. Box 182845
Columbus, OH 43218
1-800-782-8183
TRANSFER AGENT
SunGard Investor Services, LLC
3435 Stelzer Road
Columbus, OH 43219
DISTRIBUTOR
Foreside Distribution Services, L.P.
690 Taylor Road, Suite 150
Gahanna, OH 43230
CUSTODIAN
The Northern Trust Company
50 South LaSalle Street
Chicago, IL 60603
INDEPENDENT REGISTERED PUBLIC ACCOUNTING FIRM
PricewaterhouseCoopers LLP
300 Madison Avenue
New York, NY 10017
LEGAL COUNSEL
Dechert LLP
1900 K Street, N.W.
Washington, D.C. 20006
Investment products are offered by HSBC Securities (USA) Inc. (HSI), member NYSE/FINRA/SIPC. HSI is an affiliate of HSBC Bank USA, N.A. Investment products: Are not a deposit or other obligation of the bank or any of its affiliates; Not FDIC insured or insured by any federal government agency of the United States; Not guaranteed by the bank or any of its affiliates; and are subject to investment risk, including possible loss of principal invested.
Investors should consider the investment objectives, risks, charges, and expenses of the investment company carefully before investing. The prospectus contains this and other important information about the investment company. For clients of HSBC Securities (USA) Inc., please call 1-888-525-5757 for more information. For other investors and prospective investors, please call the Funds directly at 1-800-782-8183 or visit our website at www.investorfunds.us.hsbc.com. Investors should read the prospectus carefully before investing or sending money.
HSBC Global Asset Management (USA) Inc.
HSBC Funds
Annual Report
October 31, 2015
| EMERGING MARKET FUNDS | | Class A | | Class I | | Class S |
| HSBC Emerging Markets Debt Fund | | HCGAX | | HCGIX | | HBESX |
| HSBC Emerging Markets Local Debt Fund | | HBMAX | | HBMIX | | HBMSX |
| HSBC Frontier Markets Fund | | HSFAX | | HSFIX | | — |
| HSBC Total Return Fund | | HTRAX | | HTRIX | | HTRSX |
| HSBC Asia ex-Japan Smaller Companies Equity Fund | | HAJAX | | HAJIX | | HAJSX |
| HSBC Global High Yield Bond Fund | | HBYAX | | HBYIX | | — |
| HSBC Global High Income Bond Fund | | HBIAX | | HBIIX | | — |

HSBC Family of Funds
Annual Report - October 31, 2015
| Glossary of Terms | | |
| Commentary From the Investment Manager | | 3 |
| Portfolio Reviews | | 4 |
| Portfolio Composition | | 18 |
| | | |
| Schedules of Portfolio Investments | | |
| HSBC Emerging Markets Debt Fund | | 20 |
| HSBC Emerging Markets Local Debt Fund | | 24 |
| HSBC Frontier Markets Fund | | 30 |
| HSBC Total Return Fund | | 32 |
| HSBC Asia ex-Japan Smaller Companies Equity Fund | | 40 |
| HSBC Global High Yield Bond Fund | | 42 |
| HSBC Global High Income Bond Fund | | 49 |
| Statements of Assets and Liabilities | | 56 |
| Statements of Operations | | 60 |
| Statements of Changes in Net Assets | | 62 |
| Financial Highlights | | 68 |
| Notes to Financial Statements | | 75 |
| Report of Independent Registered Public Accounting Firm | | 98 |
| Other Federal Income Tax Information | | 99 |
| Investment Adviser Contract Approval | | 100 |
| Table of Shareholder Expenses | | 102 |
| Board of Trustees and Officers | | 104 |
| Other Information | | 106 |
Barclays Emerging Markets USD Aggregate Index is a flagship hard currency Emergency Markets debt benchmark that includes fixed and floating-rate US dollar-denominated debt issued from sovereign, quasi-sovereign, and corporate EM issuers. Country eligibility and classification as Emerging Markets is rules-based and reviewed annually using World Bank income group and International Monetary Fund country classification.
Barclays Euro Aggregate Bond Index is an index that tracks fixed-rate, investment-grade Euro-denominated securities. Inclusion is based on the currency of the issue, and not the domicile of the issuer. The principal sectors in the index are Treasury, Corporate, Government-Related and Securitised. Securities in the index are part of the Pan-European Aggregate and the Global Aggregate Indices.
Barclays Global Aggregate Index is a broad-based measure of the global investment-grade fixed income markets. The three major components of this index are the U.S. Aggregate, the Pan-European Aggregate, and the Asian-Pacific Aggregate Indices. The index also includes Eurodollar and Euro-Yen corporate bonds, Canadian government, agency and corporate securities, and USD investment grade 144A securities.
Barclays High Income Bond Composite Index is comprised of indexes across US, Euro and EM markets. Components include: 20% Barclays US Corporate Baa, 15% Barclays High Yield Ba, 15% Barclays Euro Aggregate Corporate Baa USD Hedged, 15% Barclays Euro HY BB Rating Only USD Hedged, and 35% Barclays EM USD Aggregate Index.
Barclays U.S. Aggregate Bond Index is an index generally representative of investment-grade, USD-denominated, fixed-rate debt issues, taxable bond market, including Treasuries, government-related and corporate securities, asset-backed, mortgage-backed and commercial mortgage-backed securities, with maturities of at least one year.
Barclays U.S. Corporate High-Yield Bond Index is an index that measures the non-investment grade, USD-denominated, fixed-rate, taxable corporate bond market. Securities are classified as high-yield if the middle rating of Moody’s, Fitch, and S&P is Ba1/BB+/BB+ or below. The index excludes emerging markets debt.
BofA Merrill Lynch BB-B Global High Yield Constrained Index is an index that tracks the performance of the United States Dollar, Canadian Dollar, British Pound and Euro denominated below investment-grade corporate debt publicly issued in the major domestic or eurobond markets.
BofA Merrill Lynch 3-Month LIBOR Constant Maturity Index is an index that tracks the performance of a synthetic asset paying LIBOR to a stated maturity. The index is based on the assumed purchase at par of a synthetic instrument having exactly its stated maturity and with a coupon equal to that day’s fixing rate. That issue is assumed to be sold the following business day (priced at a yield equal to the current day fixing rate) and rolled into a new instrument.
J.P. Morgan Emerging Markets Bond Index Global is an index that tracks returns for USD-denominated debt instruments issued by emerging market sovereign and quasi-sovereign entities; Brady bonds; loans; Eurobonds; and local market instruments.
J.P. Morgan Government Bond Index–Emerging Markets Global Diversified is an unmanaged comprehensive global emerging markets fixed income index, and consists of regularly traded, liquid fixed-rate, domestic currency government bonds to which international investors can gain exposure.
MSCI All Country Asia ex Japan Small Cap Index is a free float-adjusted market capitalization-weighted small call index of the stock markets of two developed markets and eight emerging markets: Hong Kong, Singapore, China, India, Indonesia, Malaysia, the Philippines, South Korea, Taiwan and Thailand.
MSCI Europe Australasia and Far East (“MSCI EAFE”) Index is an equity index which captures the large- and mid-cap representation across Developed Markets countries: Australia, Austria, Belgium, Denmark, Finland, France, Germany, Hong Kong, Ireland, Israel, Italy, Japan, the Netherlands, New Zealand, Norway, Portugal, Singapore, Spain, Sweden, Switzerland and the UK (excluding the U.S. and Canada).
MSCI Emerging Markets (“MSCI EM”) Index is an index that captures the large- and mid-cap representation across 23 Emerging Markets (EM) countries: Brazil, Chile, China, Colombia, Czech Republic, Egypt, Greece, Hungary, India, Indonesia, Korea, Malaysia, Mexico, Peru, Philippines, Poland, Qatar, Russia, South Africa, Taiwan, Thailand, Turkey and United Arab Emirates.
MSCI Frontier Markets Index is an index which captures the large- and mid-cap representation across 24 Frontier Markets countries: Argentina, Bahrain, Bangladesh, Bulgaria, Croatia, Estonia, Jordan, Kenya, Kuwait, Lebanon, Lithuania, Kazakhstan, Mauritius, Morocco, Nigeria, Oman, Pakistan, Romania, Serbia, Slovenia, Sri Lanka, Tunisia, Ukraine and Vietnam.
MSCI Golden Dragon Index is an index that captures the equity market performance of large- and mid-cap China securities (H shares, B shares, Red-Chips and P-Chips) and non-domestic China securities listed in Hong Kong and Taiwan.
MSCI Select Frontier and Emerging Markets Capped Index is an index developed by MSCI for HSBC and is a customized capped version of the MSCI Frontier Emerging Markets (FEM) Index. The MSCI FEM Index is a free float-adjusted market capitalization index designed to measure equity market performance in the 24 countries within the MSCI Frontier Markets Index and six small emerging market “crossover” countries (namely Colombia, Egypt, Philippines, Peru, Qatar and UAE) that are also included within the MSCI Emerging Markets Index.
MSCI World Index is a free float adjusted market capitalization weighted index that is designed to measure the equity market performance of developed markets. The MSCI World Index consists of the following 23 developed market country indexes: Australia, Austria, Belgium, Canada, Denmark, Finland, France, Germany, Hong Kong, Ireland, Israel, Italy, Japan, Netherlands, New Zealand, Norway, Portugal, Singapore, Spain, Sweden, Switzerland, the United Kingdom, and the United States.
Standard & Poor’s 500 (“S&P 500”) Index is an index that is widely regarded as a gauge of the U.S. equities market. This index includes 500 leading companies in leading industries of the U.S. economy. The S&P 500 Index focuses on the large-cap segment of the market, with approximately 80% coverage of U.S. equities.
Securities indices are unmanaged and assume reinvestment of all distributions and interest payments and do not take in account brokerage fees or expenses. Securities in the Funds do not match those in the indices and performance of the Funds will differ. Investors cannot invest directly in an index.
2 HSBC FAMILY OF FUNDS
| Commentary From the Investment Manager |
HSBC Global Asset Management (USA) Inc.
Global Economic Review
The global economy faced significant headwinds during the 12-month period from November 1, 2014, to October 31, 2015. Slowing economic growth in China and other emerging economies led equities lower. Developed economies fared better, however: The U.S. economy showed signs of continued recovery and the eurozone economy regained its footing after several years of slow growth.
Commodity prices generally remained low during the period, continuing a period of consolidation that began in 2011. Oil prices declined sharply early in the period, however. These declines added to existing pressures on oil-exporting emerging economies and oil-dependent sectors. Energy companies saw diminished earnings and oil and mining production declined.
Central bank policy in many economies was a source of investor uncertainty. China took steps to devalue its currency in August, triggering a dive in its stock market. However, several important monetary programs in other economies benefited equities. Quantitative easing programs in Europe and Japan both improved liquidity and helped buoy equity markets.
Throughout much of the period, investors anticipated action by the U.S. Federal Reserve (the Fed) to raise the federal funds rate—a key factor in lending rates—above the target range of between 0.00% and 0.25%. However, the Fed decided multiple times during the period to keep rates at near-zero levels, due in part to concerns about turbulence in foreign markets and the relatively slow economic recovery in the U.S. The Fed’s delays added to investor uncertainty.
The U.S. economy grew at a slower rate than in recent years. Early in 2015, harsh winter weather on the East Coast dealt a blow to consumer consumption and a West Coast dockworkers’ strike slowed international trade. Growth picked up later in the period but some key areas of the economy showed signs of weakness. In particular, industrial production, manufacturing, and business confidence declined during the period. Meanwhile, low oil and gas prices hurt the energy sector but also contributed to a sharp uptick in auto sales.
Other areas of the U.S. economy showed signs of improvement throughout the period. The labor market continued to improve, consumer confidence hit multi-year highs, and the housing market remained robust.
Global inflation remained low during the period. A strong U.S. dollar, which rose rapidly early in the period and remained strong through October 2015, encouraged U.S. imports and discouraged exports. The strong dollar took a toll on commodity-dependent economies and posed challenges for emerging market issuers of dollar-denominated debt.
China’s ongoing transition to slower economic growth had a profound impact on economies throughout the world, exacerbated by a sharp downturn in Chinese equities and currency depreciation.
Economic growth picked up in the eurozone during the period, supported by the European Central Bank’s accommodative monetary policy and improving credit conditions. However, the debt crisis in Greece continued to undermine European economic recovery early in the period.
Japanese stocks rallied throughout much of the period as the nation’s economic growth improved in large part due to Prime Minister Shinzo Abe’s economic plan, known as “Abenomics.” The program involved higher taxes, structural reforms, and quantitative easing. Japanese equities gave up much of their gains in August 2015, however, in-step with many other global equity markets. Additionally, in that month a sharp decline in Chinese equities fueled fears that a slowing economy in China could jeopardize the global economic recovery.
Geopolitical turmoil weighed on the global economy during the period, and particularly affected countries such as Russia. Conflict in the Ukraine led to stronger economic sanctions against Russia, dealing a further blow to an economy already hard hit by low oil prices. Inflation soared in Russia while exports plummeted.
Market Review
Global equities made modest but inconsistent gains during the first half of the period, but lost ground in most cases during the late summer and fall. Volatility spiked in August as a Chinese stock sell-off spread to emerging markets and triggered volatility throughout the world. The MSCI EM Index1 finished the period with a 14.22% loss. The MSCI Golden Dragon Index1 of large- and mid-cap securities in China, Hong Kong and Taiwan also fell, posting a -2.99% return. Developed markets fared better despite the increased volatility, with the MSCI World Index1 returning 2.33% on relatively strong gains late in the period.
U.S. equities performed modestly well for the period; the S&P 500 Index1 of large-company stocks returned 5.20%. Robust merger and acquisition activity, as well as strong corporate earnings growth, helped fuel those gains. Performance was uneven across sectors, however. The energy sector saw the largest losses during the period due to declining oil prices, and health care stocks performed poorly.
Fixed income markets in developed economies made modest gains. U.S. interest rates decreased in late 2014 and early 2015, boosting the performance of U.S. Treasuries and many other categories of bonds. Rates rose slightly over the next several months in anticipation of higher interest rates, only to decline as the Fed chose to postpone a rate increase. The Barclays U.S. Aggregate Bond Index1, which tracks the broad investment-grade fixed-income market, returned 1.96% for the 12-month period through October 31. Meanwhile the Barclays U.S. Corporate High-Yield Bond Index1 declined 1.94% for the same period.
Fixed-income markets in Europe rallied throughout the period, fueled by the European Central Bank’s bond-buying program and assurances from its president that it would expand stimulus efforts and further lower interest rates if necessary. The Barclays Euro Aggregate Bond Index1 returned 3.35%.
Emerging markets debt experienced volatility during the period caused by a strengthening U.S. dollar and an ongoing decline in commodity prices. Monetary easing measures from some central banks served to lower government bond yields in developed and emerging markets countries, however, which helped boost returns. The Barclays Emerging Markets USD Aggregate Index1 returned 0.02% during the 12-month period.
1 For additional information, please refer to the Glossary of Terms.
HSBC FAMILY OF FUNDS 3
| Portfolio Reviews (Unaudited) |
HSBC Emerging Markets Debt Fund
(Class A Shares, Class I Shares and Class S Shares) |
by Nishant Upadhyay, Senior Vice President/Portfolio Manager*
Lisa Chua, CFA, Senior Vice President/Portfolio Manager
Vinayak Potti, Vice President/Portfolio Manager
The HSBC Emerging Markets Debt Fund (the “Fund”) seeks to maximize total return (comprised of capital appreciation and income). Under normal market conditions, the Fund invests at least 80% of its net assets in fixed income instruments of issuers that economically are tied to emerging markets. The Fund will invest in instruments issued by foreign governments and corporations. Investments will generally be made in U.S. dollar denominated instruments, but the Fund will also seek to invest in emerging market local currency denominated instruments.
Investment Concerns
Bond funds will tend to experience smaller fluctuations in value than stock funds. However, investors in any bond fund should anticipate fluctuations in price, especially for longer term issues and in environments of rising interest rates. Investments in a bond fund are subject to possible loss due to the financial failure of underlying securities and their inability to meet their debt obligations.
High yield, lower rated securities involve greater price volatility and present greater risk than higher rated fixed income securities. At times, due to market conditions, the Fund may be unable to sell certain of its portfolio securities without a substantial drop in price. Prices of fixed income securities are generally inversely correlated to interest rates. Investments in the Fund are subject to possible loss due to the financial failure of underlying securities and their inability to meet their debt obligations. These risks may increase the Fund’s share price volatility.
International investing involves increased risk and volatility. An investment in international funds entails the special risks of international investing, including currency exchange fluctuation, government regulations and intervention, and the potential for political and economic instability.
Prices of securities in emerging markets can fluctuate more significantly than the prices of companies in more developed countries. Securities of emerging market issuers generally have more risk than securities issued by issuers in more developed markets. The less developed the country, the greater effect the risks may have on an investment, and as a result, an investment may exhibit a higher degree of volatility than either the general domestic securities market or the securities markets of developed foreign countries.
Derivatives may be riskier than other types of investments and could result in losses that significantly exceed the Fund’s original investment.
For a complete description of these and other risks associated with investment in a mutual fund, please refer to the Fund’s prospectus.
Market Commentary
For the year ended October 31, 2015, the Fund returned -0.52% (without sales charge) for the Class A Shares, -0.11% for the Class I Shares. Class S Shares returned 5.90% from their inception on April 7, 2011 through June 24, 2015. That compared to a -0.50% total return for the 12-month period ended October 31, 2015 and 5.62% for the period from April 7, 2011 through June 24, 2015 for the Fund’s benchmark, the J.P. Morgan Emerging Markets Bond Index Global.1
Portfolio Performance
Emerging markets debt experienced mostly negative performance during the period, driven by declining commodity prices and the expectation of eventual monetary policy tightening in the United States. Hard currency sovereign bonds declined modestly overall, with the high-yield segment underperforming debt from investment-grade countries.
The Fund’s exposure to Brazilian assets, including sovereign and corporate bonds, detracted from performance. These assets suffered losses due to Brazil’s deteriorating fiscal situation, rising political gridlock and a corruption scandal involving the state-owned company Petrobras.†
Overweight exposure to Venezuela in the first half of the period detracted from relative returns, as the continued decline in oil prices and a decline in Venezuela’s oil reserves increased investors’ concerns about the country’s ability to repay its debt. Underweight exposure to Argentina hurt relative performance when results of that country’s presidential election boosted investor optimism about the potential for economic reforms.†
The Fund’s defensive positioning—including an allocation to cash and a focus on investment-grade hard currency bonds—contributed to relative performance during the period. For example, the Fund benefited from overweight exposure to hard currency debt of select investment-grade rated countries, such as Colombia, Indonesia, Mexico, Turkey, and South Africa. Relatively attractive yields in these countries provided a cushion against widening credit spreads.†
Off-benchmark exposure to local currencies also boosted relative performance. For example, long exposure to the Russian ruble early in 2015 contributed to performance as the currency rebounded following emergency monetary policy tightening by Russia’s central bank. We achieved this currency position with forward currency exchange contracts.†
The Fund at times used credit default swaps to achieve its positions in specific countries during the period.†
† Portfolio composition is subject to change.
1 For additional information, please refer to the Glossary of Terms.
* On November 3, 2015, Guillermo Ossés resigned as portfolio manager to the Fund and Nishant Upadhyay was appointed as portfolio manager of the Fund. In addition, effective May 18, 2015, Phil Yuhn resigned as portfolio manager to the Fund.
Past performance does not guarantee future results. The performance data quoted represents past performance and current returns may be lower or higher. Total return figures include change in share price, reinvestment of dividends and capital gains and do not reflect taxes that a shareholder would pay on Fund distributions or on the redemption of Fund shares. Investment return and principal value will fluctuate so that an investor’s shares, when redeemed may be worth more or less than the original cost. To obtain performance information current to the most recent month end, please call 1-800-782-8183.
4 HSBC FAMILY OF FUNDS
| Portfolio Reviews (Unaudited) |
| HSBC Emerging Markets Debt Fund |

The charts above represent a historical since inception performance comparison of a hypothetical investment in the indicated share class versus a similar investment in the Fund’s benchmark and represents the reinvestment of dividends and capital gains in the Fund.
| | | | Average Annual | | Expense |
| Fund Performance | | | | Total Return (%) | | Ratio (%)3 |
| | Inception | | 1 | | Since | | | | |
| As of October 31, 2015 | | Date | | Year | | Inception | | Gross | | Net |
| HSBC Emerging Markets Debt Fund Class A1 | | 4/7/11 | | -5.27 | | 3.83 | | 1.55 | | 1.24 |
| HSBC Emerging Markets Debt Fund Class I | | 4/7/11 | | -0.11 | | 5.32 | | 1.20 | | 0.89 |
| HSBC Emerging Markets Debt Fund Class S4 | | 4/7/11 | | — | | 5.90 | | 1.10 | | 0.79 |
| J.P. Morgan Emerging Markets Bond Index Global2 | | — | | -0.50 | | 5.62 | | N/A | | N/A |
Past performance does not guarantee future results. The performance data quoted represents past performance and current returns may be lower or higher. Total return figures include change in share price, reinvestment of dividends and capital gains and do not reflect the taxes that a shareholder would pay on Fund distributions or on the redemption of Fund shares. Investment return and principal value will fluctuate so that an investor’s shares, when redeemed may be worth more or less than the original cost. To obtain performance information current to the most recent month end, please call 1-800-782-8183.
The performance above reflects any fee waivers that have been in effect during the applicable periods, as well as any expense reimbursements that have periodically been made. Absent such waivers and reimbursements, returns would have been lower. Currently, contractual fee waivers are in effect for the Fund through March 1, 2016.
| 1 | | Reflects the maximum sales charge of 4.75%. |
| 2 | | For additional information, please refer to the Glossary of Terms. |
| 3 | | Reflects the expense ratio as reported in the prospectus dated February 27, 2015. HSBC Global Asset Management (USA) Inc. has entered into a contractual expense limitation agreement with the Fund under which it will limit total expenses of the Fund (excluding interest, taxes, brokerage commissions, extraordinary expenses and estimated indirect expenses attributable to the Fund’s investments in investment companies) to an annual rate of 1.20%, 0.85% and 0.75% for Class A Shares, Class I Shares and Class S Shares, respectively. The expense limitation shall be in effect until March 1, 2016. The expense ratios reflected include Acquired Fund fees and expenses. Additional information pertaining to the October 31, 2015 expense ratios can be found in the financial highlights. |
| 4 | | Class S Shares were operational during a portion of the period presented. The amount reflects performance for the period of time the Class had operations, which was 236 days for the year ended October 31, 2015. The class was operational during the entire period ended October 31, 2011 and the entire years ended October 31, 2012 through 2014. |
The performance of the Fund is measured against the J.P. Morgan Emerging Markets Bond Index Global, an unmanaged index that tracks returns for USD-denominated debt instruments issued by emerging market and sovereign quasi-sovereign entities, Brady bonds, loans, Eurobonds, and local market markets. The performance of the index does not reflect the deduction of expenses associated with a mutual fund, such as investment management and fund accounting fees. The Fund’s performance reflects the deduction of fees for these value-added services. Investors cannot invest directly in an index.
HSBC FAMILY OF FUNDS 5
| Portfolio Reviews (Unaudited) |
HSBC Emerging Markets Local Debt Fund
(Class A Shares, Class I Shares and Class S Shares) |
by Nishant Upadhyay, Senior Vice President/Portfolio Manager*
Lisa Chua, CFA, Senior Vice President/Portfolio Manager
Abdelak Aijriou, Vice President/Portfolio Manager
The HSBC Emerging Markets Local Debt Fund (the “Fund”) seeks maximum total return (comprised of capital appreciation and income). Under normal market conditions, the Fund invests at least 80% of its net assets, plus borrowings for investment purposes, in debt instruments issued by foreign governments, government agencies or corporations and denominated in local currencies of countries with emerging securities markets. The Fund may also invest in instruments denominated in U.S. dollars.
Investment Concerns
Bond funds will tend to experience smaller fluctuations in value than stock funds. However, investors in any bond fund should anticipate fluctuations in price, especially for longer term issues and in environments of rising interest rates. Investments in a bond fund are subject to possible loss due to the financial failure of underlying securities and their inability to meet their debt obligations.
High yield, lower rated securities involve greater price volatility and present greater risk than higher rated fixed income securities. At times, due to market conditions, the Fund may be unable to sell certain of its portfolio securities without a substantial drop in price. Prices of fixed income securities are generally inversely correlated to interest rates. Investments in the Fund are subject to possible loss due to the financial failure of underlying securities and their inability to meet their debt obligations. These risks may increase the Fund’s share price volatility.
International investing involves increased risk and volatility. An investment in international funds entails the special risks of international investing, including currency exchange fluctuation, government regulations and intervention, and the potential for political and economic instability.
Prices of securities in emerging markets can fluctuate more significantly than the prices of companies in more developed countries. Securities of emerging market issuers generally have more risk than securities issued by issuers in more developed markets. The less developed the country, the greater effect the risks may have on an investment, and as a result, an investment may exhibit a higher degree of volatility than either the general domestic securities market or the securities markets of developed foreign countries.
Derivatives may be riskier than other types of investments and could result in losses that significantly exceed the Fund’s original investment.
For a complete description of these and other risks associated with investment in a mutual fund, please refer to the Fund’s prospectus.
Market Commentary
For the year ended October 31, 2015, the Fund returned -18.46% (without sales charge) for the Class A Shares, -18.14% for the Class I Shares. Class S Shares returned -3.60% from their inception on April 7, 2011 through June 24, 2015. That compared to a -17.42% total return for the 12-month period ended October 31, 2015 and 5.02% for the period from April 7, 2011 through June 24, 2015 for the Fund’s benchmark, the J. P. Morgan Government Bond Index-Emerging Markets Global Diversified.1
Portfolio Performance
Emerging markets local debt experienced negative performance during the period, driven by declining commodity prices, a stronger U.S. dollar, as well as China’s decision in August to devalue its currency, the yuan. As a result, local bonds and local currencies suffered significant declines.
Some of the Fund’s currency positions detracted from relative performance during the period. For example, an overweight position in the Brazilian real in the last quarter of the period hurt relative returns when Standard & Poor’s downgraded the country’s credit rating due its deteriorating fiscal condition. The Fund’s short allocation to the Israeli shekel also detracted from performance as the currency delivered a slightly positive return given continued strength in trade dynamics.†
However, the Fund’s underweight position to emerging markets currencies during the period contributed to relative performance. For example, an underweight exposure to the Mexican peso in the last few months of 2014 and in the summer of 2015 boosted relative returns, as the currency weakened in anticipation of eventual tightening in U.S. monetary policy.†
The strategy’s long exposure to the Russian ruble early in 2015 also contributed to performance when the currency rebounded following emergency monetary policy tightening by Russia’s central bank.
The Fund benefited from the use of derivatives such as interest rate swap agreements and forward foreign currency exchange contracts.†
† Portfolio composition is subject to change.
1 For additional information, please refer to the Glossary of Terms.
* On November 3, 2015, Guillermo Ossés resigned as portfolio manager to the Fund and Nishant Upadhyay was appointed as portfolio manager of the Fund. In addition, effective May 18, 2015, Phil Yuhn resigned as portfolio manager to the Fund.
Past performance does not guarantee future results. The performance data quoted represents past performance and current returns may be lower or higher. Total return figures include change in share price, reinvestment of dividends and capital gains and do not reflect taxes that a shareholder would pay on Fund distributions or on the redemption of Fund shares. Investment return and principal value will fluctuate so that an investor’s shares, when redeemed may be worth more or less than the original cost. To obtain performance information current to the most recent month end, please call 1-800-782-8183.
6 HSBC FAMILY OF FUNDS
| Portfolio Reviews (Unaudited) |
| HSBC Emerging Markets Local Debt Fund |

The charts above represent a historical since inception performance comparison of a hypothetical investment in the indicated share class versus a similar investment in the Fund’s benchmark and represents the reinvestment of dividends and capital gains in the Fund.
| | | | Average Annual | | Expense |
| Fund Performance | | | | Total Return (%) | | Ratio (%)3 |
| | Inception | | 1 | | Since | | | | |
| As of October 31, 2015 | | Date | | Year | | Inception | | Gross | | Net |
| HSBC Emerging Markets Local Debt Fund Class A1 | | 4/7/11 | | -22.34 | | -6.57 | | 1.85 | | 1.25 |
| HSBC Emerging Markets Local Debt Fund Class I | | 4/7/11 | | -18.14 | | -5.22 | | 1.50 | | 0.90 |
| HSBC Emerging Markets Local Debt Fund Class S4 | | 4/7/11 | | — | | -3.60 | | 1.40 | | 0.80 |
| J.P. Morgan Government Bond Index–Emerging Markets Global Diversified2 | | — | | -17.42 | | -5.02 | | N/A | | N/A |
Past performance does not guarantee future results. The performance data quoted represents past performance and current returns may be lower or higher. Total return figures include change in share price, reinvestment of dividends and capital gains and do not reflect the taxes that a shareholder would pay on Fund distributions or on the redemption of Fund shares. Investment return and principal value will fluctuate so that an investor’s shares, when redeemed may be worth more or less than the original cost. To obtain performance information current to the most recent month end, please call 1-800-782-8183.
The performance above reflects any fee waivers that have been in effect during the applicable periods, as well as any expense reimbursements that have periodically been made. Absent such waivers and reimbursements, returns would have been lower. Currently, contractual fee waivers are in effect for the Fund through March 1, 2016.
| 1 | | Reflects the maximum sales charge of 4.75%. |
| 2 | | For additional information, please refer to the Glossary of Terms. |
| 3 | | Reflects the expense ratio as reported in the prospectus dated February 27, 2015. HSBC Global Asset Management (USA) Inc. has entered into a contractual expense limitation agreement with the Fund under which it will limit total expenses of the Fund (excluding interest, taxes, brokerage commissions, extraordinary expenses and estimated indirect expenses attributable to the Fund’s investments in investment companies) to an annual rate of 1.20%, 0.85% and 0.75% for Class A Shares, Class I Shares and Class S Shares, respectively. The expense limitation shall be in effect until March 1, 2016. The expense ratios reflected include Acquired Fund fees and expenses. Additional information pertaining to the October 31, 2015 expense ratios can be found in the financial highlights. |
| 4 | | Class S Shares were operational during a portion of the period presented. The amount reflects performance for the period of time the Class had operations, which was 238 days for the year ended October 31, 2015. The class was operational during the entire period ended October 31, 2011 and the entire years ended October 31, 2012 through 2014. |
The performance of the Fund is measured against the J.P. Morgan Government Bond Index-Emerging Markets Global Diversified, a comprehensive global emerging markets fixed income index consisting of regularly traded, liquid fixed-rate, domestic currency government bonds to which international investors can gain exposure. This index is unmanaged and does not reflect the fees and expenses associated with a mutual fund such as investment management and fund accounting fees. The Fund’s performance reflects the deduction of fees for these value-added services. Investors cannot invest directly in an index.
HSBC FAMILY OF FUNDS 7
| Portfolio Reviews (Unaudited) |
HSBC Frontier Markets Fund
(Class A Shares and Class I Shares) |
by Chris Turner, Portfolio Manager*
The HSBC Frontier Markets Fund (the “Fund”) seeks long-term capital appreciation. Under normal market conditions, the Fund invests at least 80% of its net assets, plus any borrowings for investment purposes, in issuers located in “frontier market countries”. The term “frontier market countries” encompasses those countries that are at an earlier stage of economic, political or financial development, even by emerging markets standards.
Investment Concerns
Equity securities (stocks) may be more volatile and carry more risk than other forms of investments, including investments in high-grade fixed income securities.
International investing involves increased risk and volatility. An investment in international funds entails the special risks of international investing, including currency exchange fluctuation, government regulations and intervention, and the potential for political and economic instability.
Frontier market countries generally have smaller economies and even less developed capital markets or legal and political systems than traditional emerging market countries. As a result, the risks of investing in emerging market countries are magnified in frontier market countries. The magnification of risks are the result of: the potential for extreme price volatility and illiquidity in frontier markets; government ownership or control of parts of the private sector and of certain companies; trade barriers, exchange controls, managed adjustments in relative currency values and other protectionist measures imposed or negotiated by the countries with which frontier market countries trade; and the relatively new and unsettled securities laws in many frontier market countries.
Prices of securities in emerging markets can fluctuate more significantly than the prices of companies in more developed countries. Securities of emerging market issuers generally have more risk than securities issued by issuers in more developed markets. The less developed the country, the greater effect the risks may have on an investment, and as a result, an investment may exhibit a higher degree of volatility than either the general domestic securities market or the securities markets of developed foreign countries.
Derivatives may be riskier than other types of investments and could result in losses that significantly exceed the Fund’s original investment.
For a complete description of these and other risks associated with investment in a mutual fund, please refer to the Fund’s prospectus.
Market Commentary
For the year ended October 31, 2015, the Fund returned -11.67% (without sales charge) for the Class A Shares and -11.42% for the Class I Shares. That compared to -17.30% return for the Fund’s primary performance index, the MSCI Select Frontier and Emerging Markets Capped Index, and a -17.41% total return for the MSCI Frontier Markets Index1.
Portfolio Performance
Frontier markets, along with emerging markets, had a challenging year, with investor concerns over global growth deceleration, falling commodity prices, currency weakness and asset class outflows all taking their toll. The asset class, as represented by the industry standard MSCI Frontier Markets Index, declined by -17.41 % over the year. Only three countries within the ‘industry standard’ index managed to achieve positive returns while the vast majority of countries generated large negative returns. Many of the net oil (and gas) producing countries such as Kazakhstan, Nigeria, Saudi Arabia, Kuwait, United Arab Emirates (UAE) and Qatar performed poorly while a number of oil importing countries, including the Philippines, Vietnam and Pakistan, fared better.
Strong relative performance was a result of stock selection within Pakistan and the UAE. In Pakistan, exposure to a conglomerate with diverse interests, including fertilizer and petrochemicals, supported the Fund’s relative performance. Specifically, the company benefited from lower energy costs and a more positive outlook for the Pakistani economy. Another significant contributor in Pakistan was an off-index cement company, which similarly benefited from a favorable political economy as well as the introduction of tax incentives for the cement sector that boosted performance. In the UAE, exposure to an off-index diversified health care company aided relative returns as the company benefited from the introduction of mandatory health care insurance in Dubai in early 2014 and a low penetration of medical care in the country.†
The main detractor from relative performance was Nigeria, where both stock selection and asset allocation detracted value. With the Nigerian economy weakening significantly in more recent quarters, our exposure to a second-tier commercial bank suffered disproportionately more than other economically sensitive banks. Stock selection within Saudi Arabia, an off-index country, also detracted from relative performance; in particular, our position in a travel company with large exposure to government clientele detracted value, as investors were concerned that lower oil prices for Saudi Arabia could threaten earnings for the company. Exposure to a Saudi Arabian petrochemical producer also hurt relative performance as the global oil price collapsed, as did the end market prices for the petrochemical sector, which damaged profit margins for the company.
At the end of October 2015, the Fund was overweight to the UAE, Pakistan, Saudi Arabia and Georgia, and underweight to Morocco, Qatar, Philippines, and Argentina. From a sector perspective, the Fund was overweight to utilities, consumer discretionary and materials, and underweight to telecommunications, energy, and financials.†
† Portfolio composition is subject to change.
1 For additional information, please refer to the Glossary of Terms.
* On September 17, 2015, Andrew Brudenell resigned as portfolio manager to the Fund.
Past performance does not guarantee future results. The performance data quoted represents past performance and current returns may be lower or higher. Total return figures include change in share price, reinvestment of dividends and capital gains and do not reflect taxes that a shareholder would pay on Fund distributions or on the redemption of Fund shares. Investment return and principal value will fluctuate so that an investor’s shares, when redeemed may be worth more or less than the original cost. To obtain performance information current to the most recent month end, please call 1-800-782-8183.
8 HSBC FAMILY OF FUNDS
| Portfolio Reviews (Unaudited) |
| HSBC Frontier Markets Fund |
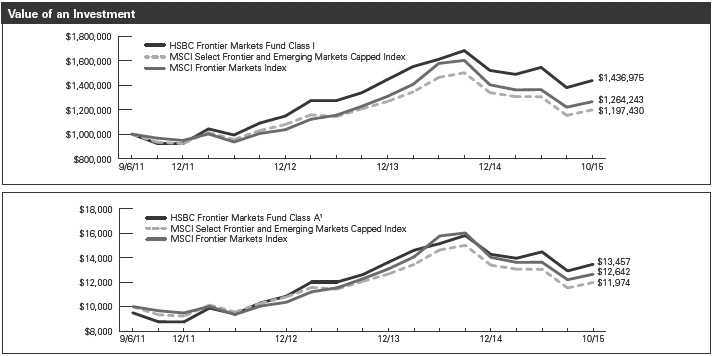
The charts above represent a historical since inception performance comparison of a hypothetical investment in the indicated share class versus a similar investment in the Fund’s benchmark and represents the reinvestment of dividends and capital gains in the Fund.
| | | | Average Annual | | Expense |
| Fund Performance | | | | Total Return (%) | | Ratio (%)3 |
| | Inception | | | | Since | | | | |
| As of October 31, 2015 | | Date | | 1 Year | | Inception | | Gross | | Net |
| HSBC Frontier Markets Fund Class A1 | | 9/6/11 | | -16.11 | | 7.41 | | 2.30 | | 2.25 |
| HSBC Frontier Markets Fund Class I | | 9/6/11 | | -11.42 | | 9.13 | | 1.95 | | 1.90 |
| MSCI Select Frontier and Emerging Markets Capped Index2 | | — | | -17.30 | | 4.43 | | N/A | | N/A |
| MSCI Frontier Markets Index2 | | — | | -17.41 | | 5.81 | | N/A | | N/A |
Past performance does not guarantee future results. The performance data quoted represents past performance and current returns may be lower or higher. Total return figures include change in share price, reinvestment of dividends and capital gains and do not reflect the taxes that a shareholder would pay on Fund distributions or on the redemption of Fund shares. Investment return and principal value will fluctuate so that an investor’s shares, when redeemed may be worth more or less than the original cost. To obtain performance information current to the most recent month end, please call 1-800-782-8183.
The performance above reflects any fee waivers that have been in effect during the applicable periods, as well as any expense reimbursements that have periodically been made. Absent such waivers and reimbursements, returns would have been lower. Currently, contractual fee waivers are in effect for the Fund through March 1, 2016.
| 1 | | Reflects the maximum sales charge of 5.00%. |
| 2 | | For additional information, please refer to the Glossary of Terms. |
| 3 | | Reflects the expense ratio as reported in the prospectus dated February 27, 2015. HSBC Global Asset Management (USA) Inc. has entered into a contractual expense limitation agreement with the Fund under which it will limit total expenses of the Fund (excluding interest, taxes, brokerage commissions, extraordinary expenses and estimated indirect expenses attributable to the Fund’s investments in investment companies) to an annual rate of 2.20% and 1.85% for Class A Shares and Class I Shares, respectively. The expense limitation shall be in effect until March 1, 2016. The expense ratios reflected include Acquired Fund fees and expenses. Additional information pertaining to the October 31, 2015 expense ratios can be found in the financial highlights. |
The performance of the Fund is measured against the MSCI Select Frontier and Emerging Markets Capped Index and the MSCI Frontier Markets Index. The MSCI Select Frontier and Emerging Markets Capped Index was developed by MSCI for HSBC and is a customized capped version of the MSCI Frontier Emerging Markets (FEM) Index. The MSCI FEM Index is a free float-adjusted market capitalization index designed to measure equity market performance in the 24 countries within the MSCI Frontier Markets Index and six small emerging market “crossover” countries (namely Colombia, Egypt, Philippines, Peru, Qatar, and UAE) that are included within the MSCI Emerging Markets Index. The MSCI Frontier Markets Index captures large- and mid-cap representation across 24 Frontier Markets countries: Argentina, Bahrain, Bangladesh, Bulgaria, Croatia, Estonia, Jordan, Kenya, Kuwait, Lebanon, Lithuania, Kazakhstan, Mauritius, Morocco, Nigeria, Oman, Pakistan, Romania, Serbia, Slovenia, Sri Lanka, Tunisia, Ukraine, and Vietnam. The indexes are unmanaged and their performance does not reflect the deduction of expenses associated with a mutual fund, such as investment management and fund accounting fees. The Fund’s performance reflects the deduction of fees for these value-added services. Investors cannot invest directly in an index.
HSBC FAMILY OF FUNDS 9
| Portfolio Reviews (Unaudited) |
HSBC Total Return Fund
(Class A Shares, Class I Shares and Class S Shares) |
by Nishant Upadhyay, Senior Vice President/Portfolio Manager*
Lisa Chua, CFA, Senior Vice President/Portfolio Manager
The HSBC Total Fund (the “Fund”) seeks maximum total return (comprised of capital appreciation and income). Under normal market conditions, the Fund invests its assets (excluding U.S. cash and U.S. cash equivalents) primarily in instruments of issuers that are economically tied to emerging market countries, including in derivative instruments such as futures (including interest rate futures), forwards (including non-deliverable forwards), swaps (including interest rate and total return swaps), options (including interest rate options), swaptions and credit default swaps.
Investment Concerns
Bond funds will tend to experience smaller fluctuations in value than stock funds. However, investors in any bond fund should anticipate fluctuations in price, especially for longer term issues and in environments of rising interest rates. Investments in a bond fund are subject to possible loss due to the financial failure of underlying securities and their inability to meet their debt obligations.
High yield, lower rated securities involve greater price volatility and present greater risk than higher rated fixed income securities. At times, due to market conditions, the Fund may be unable to sell certain of its portfolio securities without a substantial drop in price. Prices of fixed income securities are generally inversely correlated to interest rates. Investments in the Fund are subject to possible loss due to the financial failure of underlying securities and their inability to meet their debt obligations. These risks may increase the Fund’s share price volatility.
International investing involves increased risk and volatility. An investment in international funds entails the special risks of international investing, including currency exchange fluctuation, government regulations and intervention, and the potential for political and economic instability.
Prices of securities in emerging markets can fluctuate more significantly than the prices of companies in more developed countries. Securities of emerging market issuers generally have more risk than securities issued by issuers in more developed markets. The less developed the country, the greater effect the risks may have on an investment, and as a result, an investment may exhibit a higher degree of volatility than either the general domestic securities market or the securities markets of developed foreign countries.
Derivatives may be riskier than other types of investments and could result in losses that significantly exceed the Fund’s original investment.
For a complete description of these and other risks associated with investment in a mutual fund, please refer to the Fund’s prospectus.
Market Commentary
For the year ended October 31, 2015, the Fund returned -0.07% (without sales charge) for the Class A Shares, 0.21% for the Class I Shares and 0.31% for the Class S Shares. That compared to the 0.26% total return for the Fund’s benchmark, the BofA Merrill Lynch 3-Month LIBOR Constant Maturity Index1, for the same period.
Portfolio Performance
Emerging markets debt experienced mostly negative performance during the period, driven by declining commodity prices and the expectation of eventual monetary policy tightening in the United States. Hard currency sovereign bonds declined modestly overall, with the high yield segment underperforming debt from investment grade countries. Local currencies fell sharply, driven in part by China’s decision in August to devalue its currency, the yuan. As a result, bonds denominated in local currencies suffered significant declines.
The Fund’s exposure to Brazilian assets, including sovereign and corporate bonds, as well as local bonds and currency, detracted from overall performance. These assets suffered losses due to Brazil’s deteriorating fiscal situation, rising political gridlock, and a corruption scandal involving the state-owned company Petrobras.†
During this period, the Fund’s defensive positioning—including an allocation to cash, a focus on investment-grade hard currency bonds and short or neutral exposure to currencies—cushioned the Fund’s losses. In particular, short exposure to the Mexican peso in the last few months of 2014 and in the summer of 2015 contributed to performance, as the currency weakened in anticipation of eventual tightening in U.S. monetary policy. Long exposure to the Russian ruble early in 2015 also contributed to performance, as the currency rebounded following emergency monetary policy tightening by Russia’s central bank. We achieved these positions through the use of forward foreign currency exchange contracts.†
Exposure to hard currency debt of select investment-grade rated countries, such as Colombia, Indonesia, Mexico and Turkey, also contributed to performance, as relatively attractive yields in these countries provided a cushion against widening credit spreads.†
† Portfolio composition is subject to change.
1 For additional information, please refer to the Glossary of Terms.
| * | | On November 3, 2015, Guillermo Ossés resigned as portfolio manager to the Fund and Nishant Upadhyay was appointed as portfolio manager of the Fund. In addition, effective May 18, 2015, Phil Yuhn resigned as portfolio manager to the Fund. |
Past performance does not guarantee future results. The performance data quoted represents past performance and current returns may be lower or higher. Total return figures include change in share price, reinvestment of dividends and capital gains and do not reflect taxes that a shareholder would pay on Fund distributions or on the redemption of Fund shares. Investment return and principal value will fluctuate so that an investor’s shares, when redeemed may be worth more or less than the original cost. To obtain performance information current to the most recent month end, please call 1-800-782-8183.
10 HSBC FAMILY OF FUNDS
| Portfolio Reviews (Unaudited) |
| HSBC Total Return Fund |

The charts above represent a historical since inception performance comparison of a hypothetical investment in the indicated share class versus a similar investment in the Fund’s benchmark and represents the reinvestment of dividends and capital gains in the Fund.
| | | | Average Annual | | Expense |
| Fund Performance | | | | Total Return (%) | | Ratio (%)3 |
| | Inception | | | | Since | | | | |
| As of October 31, 2015 | | Date | | 1 Year | | Inception | | Gross | | Net |
| HSBC Total Return Fund Class A1 | | 3/30/12 | | -4.85 | | 0.54 | | 1.67 | | 1.67 |
| HSBC Total Return Fund Class I | | 3/30/12 | | 0.21 | | 2.26 | | 1.32 | | 1.32 |
| HSBC Total Return Fund Class S | | 3/30/12 | | 0.31 | | 2.36 | | 1.22 | | 1.22 |
| BofA Merrill Lynch 3-Month LIBOR Constant Maturity Index2 | | — | | 0.26 | | 0.31 | | N/A | | N/A |
Past performance does not guarantee future results. The performance data quoted represents past performance and current returns may be lower or higher. Total return figures include change in share price, reinvestment of dividends and capital gains and do not reflect the taxes that a shareholder would pay on Fund distributions or on the redemption of Fund shares. Investment return and principal value will fluctuate so that an investor’s shares, when redeemed may be worth more or less than the original cost. To obtain performance information current to the most recent month end, please call 1-800-782-8183.
The performance above reflects any fee waivers that have been in effect during the applicable periods, as well as any expense reimbursements that have periodically been made. Absent such waivers and reimbursements, returns would have been lower.
| 1 | | Reflects the maximum sales charge of 4.75%. |
| 2 | | For additional information, please refer to the Glossary of Terms. |
| 3 | | Reflects the expense ratio as reported in the prospectus dated February 27, 2015. The expense ratios reflected include Acquired Fund fees and expenses. Additional information pertaining to the October 31, 2015 expense ratios can be found in the financial highlights. |
The performance of the Fund is measured against the BofA Merrill Lynch 3-Month LIBOR Constant Maturity Index which tracks the performance of a synthetic asset paying LIBOR to a stated maturity. The index is based on the assumed purchase at par of a synthetic instrument having exactly its stated maturity and with a coupon equal to that day’s fixing rate. That issue is assumed to be sold the following business day (priced at a yield equal to the current day fixing rate) and rolled into a new instrument. The index is unmanaged and the performance of the index does not reflect the deduction of expenses associated with a mutual fund, such as investment management and fund accounting fees. The Fund’s performance reflects the deduction of fees for these value-added services. Investors cannot invest directly in an index.
HSBC FAMILY OF FUNDS 11
| Portfolio Reviews (Unaudited) |
| HSBC Asia ex-Japan Smaller Companies Equity Fund |
| (Class A Shares, Class I Shares and Class S Shares) |
by Sanjiv Duggal, Head of Asian & Indian Equities/Portfolio Manager
Elina Fung, Investment Director of Equities/Portfolio Manager
The HSBC Asia ex-Japan Smaller Companies Equity Fund (the “Fund”) seeks long-term capital appreciation. Under normal market conditions, the Fund invests at least 80% of its net assets, plus any borrowings for investment purposes, in equity of, and equity-related instruments related to, smaller companies that are economically tied to Asia (excluding Japan).
Investment Concerns
Equity securities (stocks) may be more volatile and carry more risk than other forms of investments, including investments in high-grade fixed income securities.
International investing involves increased risk and volatility. An investment in international funds entails the special risks of international investing, including currency exchange fluctuation, government regulations and intervention, and the potential for political and economic instability.
Because the Fund invests in a single region, its shares do not represent a complete investment program. As a diversified fund, the value of the shares may fluctuate more than shares invested in a broader range of industries and companies because of concentration in a specific region.
Prices of securities in emerging markets can fluctuate more significantly than the prices of companies in more developed countries. Securities of emerging market issuers generally have more risk than securities issued by issuers in more developed markets. The less developed the country, the greater effect the risks may have on an investment, and as a result, an investment may exhibit a higher degree of volatility than either the general domestic securities market or the securities markets of developed foreign countries.
Small- to mid-capitalization funds typically carry additional risks since smaller companies generally have a higher risk of failure, and historically, their stocks have experienced a greater degree of market volatility than stocks on average.
Derivatives may be riskier than other types of investments and could result in losses that significantly exceed the Fund’s original investment.
For a complete description of these and other risks associated with investment in a mutual fund, please refer to the Fund’s prospectus.
Market Commentary
Since the Fund’s inception on November 11, 2014 through October 31, 2015, the Fund returned -3.82% (without sales charge) for the Class A Shares, -3.49% for the Class I Shares and -3.48% for the Class S Shares. That compared to a -4.40% total return for the Fund’s benchmark, the MSCI All Country Asia ex Japan Small Cap Index1, for the same period.
Portfolio Performance
Overall, the Asian small-cap equities market was negative during the period, driven by concerns over slowing economic growth in China, a potential interest rate hike by the U.S. Federal Reserve, and a weakening of many Asian currencies against the U.S. dollar. The Fund had negative absolute returns amid this broader market downtrend, but outperformed the benchmark.
The Fund’s relative outperformance was largely the result of stock selection. Investments in the consumer discretionary sector, particularly among companies in India and Hong Kong/China, contributed significantly to relative performance. A stake in an Indian home textile manufacturer was a notable contributor, as the company’s stock rallied on strong earnings and an expanding market share. Meanwhile, the Fund’s selections in the information technology sector were also beneficial, primarily due to increasing demand for semiconductors and safety components in the automobile industry.†
An underweight position and stock selection in Korea was the major detractor from relative performance during the period. While Korean small caps were the best performers during the period, our bottom-up stock selection process led to a lower exposure than that of the benchmark to this part of the regional market.†
† Portfolio composition is subject to change.
1 For additional information, please refer to the Glossary of Terms.
Past performance does not guarantee future results. The performance data quoted represents past performance and current returns may be lower or higher. Total return figures include change in share price, reinvestment of dividends and capital gains and do not reflect taxes that a shareholder would pay on Fund distributions or on the redemption of Fund shares. Investment return and principal value will fluctuate so that an investor’s shares, when redeemed may be worth more or less than the original cost. To obtain performance information current to the most recent month end, please call 1-800-782-8183.
12 HSBC FAMILY OF FUNDS
| Portfolio Reviews (Unaudited) |
| HSBC Asia ex-Japan Smaller Companies Equity Fund |

The charts above represent a historical since inception performance comparison of a hypothetical investment in the indicated share class versus a similar investment in the Fund’s benchmark and represents the reinvestment of dividends and capital gains in the Fund.
| | | | Aggregate | | Expense |
| Fund Performance | | | | Total Return (%) | | Ratio (%)3 |
| | Inception | | Since | | | | |
| As of October 31, 2015 | | Date | | Inception | | Gross | | Net |
| HSBC Asia ex-Japan Smaller Companies Equity Class A1 | | 11/11/14 | | -8.66 | | 2.41 | | 1.75 |
| HSBC Asia ex-Japan Smaller Companies Equity Class I | | 11/11/14 | | -3.49 | | 2.06 | | 1.40 |
| HSBC Asia ex-Japan Smaller Companies Equity Class S | | 11/11/14 | | -3.48 | | 1.96 | | 1.30 |
| MSCI All Country Asia ex Japan Small Cap Index2 | | — | | -4.40 | | N/A | | N/A |
Past performance does not guarantee future results. The performance data quoted represents past performance and current returns may be lower or higher. Total return figures include change in share price, reinvestment of dividends and capital gains and do not reflect the taxes that a shareholder would pay on Fund distributions or on the redemption of Fund shares. Investment return and principal value will fluctuate so that an investor’s shares, when redeemed may be worth more or less than the original cost. To obtain performance information current to the most recent month end, please call 1-800-782-8183.
The performance above reflects any fee waivers that have been in effect during the applicable periods, as well as any expense reimbursements that have periodically been made. Absent such waivers and reimbursements, returns would have been lower. Currently, contractual fee waivers are in effect for the Fund through March 1, 2016.
| 1 | | Reflects the maximum sales charge of 5.00%. |
| 2 | | For additional information, please refer to the Glossary of Terms. |
| 3 | | Reflects the expense ratio as reported in the prospectus dated February 27, 2015. HSBC Global Asset Management (USA) Inc. has entered into a contractual expense limitation agreement with the Fund under which it will limit total expenses of the Fund (excluding interest, taxes, brokerage commissions, extraordinary expenses and estimated indirect expenses attributable to the Fund’s investments in investment companies) to an annual rate of 1.75%, 1.40% and 1.30% for Class A Shares, Class I Shares and Class I Shares, respectively. The expense limitation shall be in effect until March 1, 2016. The expense ratios reflected include Acquired Fund fees and expenses. Additional information pertaining to the October 31, 2015 expense ratios can be found in the financial highlights. |
The performance of the Fund is measured against the MSCI All Country Asia ex-Japan Small Cap Index, which is a free float-adjusted market capitalization-weighted small cap index of the stock markets of two developed markets and eight emerging markets: Hong Kong, Singapore, China, India, Indonesia, Malaysia, the Philippines, South Korea, Taiwan and Thailand. The index is unmanaged and its performance does not reflect the deduction of expenses associated with a mutual fund, such as investment management and fund accounting fees. The Fund’s performance reflects the deduction of fees for these value-added services. Investors cannot invest directly in an index.
HSBC FAMILY OF FUNDS 13
| Portfolio Reviews (Unaudited) |
| HSBC Global High Yield Bond Fund |
| (Class A Shares and Class I Shares) |
by Mary Bowers/Senior Portfolio Manager
Rick Liu, CFA/Portfolio Manager
Lisa Chua, CFA/Portfolio Manager
The HSBC Global High Yield Bond Fund (the “Fund”) seeks to maximize total return (comprised of capital appreciation and income). Under normal market conditions, the Fund invests at least 80% of its net assets, plus any borrowings for investment purposes, in a globally diversified portfolio of high yield securities.
Investment Concerns
Bond funds will tend to experience smaller fluctuations in value than stock funds. However, investors in any bond fund should anticipate fluctuations in price, especially for longer term issues and in environments of rising interest rates. Investments in a bond fund are subject to possible loss due to the financial failure of underlying securities and their inability to meet their debt obligations.
High yield, lower rated securities involve greater price volatility and present greater risk than higher rated fixed income securities. At times, due to market conditions, the Fund may be unable to sell certain of its portfolio securities without a substantial drop in price. Prices of fixed income securities are generally inversely correlated to interest rates. Investments in the Fund are subject to possible loss due to the financial failure of underlying securities and their inability to meet their debt obligations. These risks may increase the Fund’s share price volatility.
International investing involves increased risk and volatility. An investment in international funds entails the special risks of international investing, including currency exchange fluctuation, government regulations and intervention, and the potential for political and economic instability.
Prices of securities in emerging markets can fluctuate more significantly than the prices of companies in more developed countries. Securities of emerging market issuers generally have more risk than securities issued by issuers in more developed markets. The less developed the country, the greater effect the risks may have on an investment, and as a result, an investment may exhibit a higher degree of volatility than either the general domestic securities market or the securities markets of developed foreign countries.
Derivatives may be riskier than other types of investments and could result in losses that significantly exceed the Fund’s original investment.
For a complete description of these and other risks associated with investment in a mutual fund, please refer to the Fund’s prospectus.
Market Commentary
Since the Fund’s inception on July 14, 2015 through October 31, 2015, the Fund returned -2.23% (without sales charge) for the Class A Shares and -2.15% for the Class I Shares. That compared to a -1.36% total return for the Fund’s benchmark, the BofA Merrill Lynch BB-B Global High Yield Constrained Index1, for the same period.
Portfolio Performance
Fixed income markets faced a challenging environment during the roughly three-and-a-half-month period. Uncertainty over the timing of the U.S. Federal Reserve’s (the Fed) anticipated interest rate increases coupled with concerns over the slowing Chinese economy led to a sell-off in the credit markets in August and September, led by commodity related issuers. Credit markets rebounded somewhat late in the period as investors’ risk appetites returned amid dovish comments by the Fed, improving economic indicators, and technical factors such as lack of new high yield bond issuances.
The Fund’s relative performance was hurt by the exposure to cash as the Fund’s initial investments were being invested during the ramp-up period in July, before the broad sell-off in the credit markets. Additionally, relative performance suffered from the Fund’s emerging market investments. In particular, exposure to Brazil dragged on relative performance as the country continued to deal with difficult economic conditions amid a global economic slowdown.†
The Fund’s relative performance was boosted by investments in Europe. A defensive position in this region helped, as the European credit markets were volatile during the period.†
The Fund maintained some derivative exposure during the period, including currency forwards used to hedge non-USD exposure. However, that derivative exposure did not materially affect performance.†
† Portfolio composition is subject to change.
1 For additional information, please refer to the Glossary of Terms.
Past performance does not guarantee future results. The performance data quoted represents past performance and current returns may be lower or higher. Total return figures include change in share price, reinvestment of dividends and capital gains and do not reflect taxes that a shareholder would pay on Fund distributions or on the redemption of Fund shares. Investment return and principal value will fluctuate so that an investor’s shares, when redeemed may be worth more or less than the original cost. To obtain performance information current to the most recent month end, please call 1-800-782-8183.
14 HSBC FAMILY OF FUNDS
| Portfolio Reviews (Unaudited) |
| HSBC Global High Yield Bond Fund |
| | | | Aggregate | | Expense |
| Fund Performance | | | | Total Return (%) | | Ratio (%)3 |
| | Inception | | Since | | | | |
| As of October 31, 2015 | | Date | | Inception | | Gross | | Net |
| HSBC Global High Yield Bond Class A1 | | 7/14/15 | | -6.89 | | 1.65 | | 1.15 |
| HSBC Global High Yield Bond Class I | | 7/14/15 | | -2.15 | | 1.30 | | 0.80 |
| BofA Merrill Lynch BB-B Global High Yield Constrained Index2 | | — | | -1.36 | | N/A | | N/A |
Past performance does not guarantee future results. The performance data quoted represents past performance and current returns may be lower or higher. Total return figures include change in share price, reinvestment of dividends and capital gains and do not reflect the taxes that a shareholder would pay on Fund distributions or on the redemption of Fund shares. Investment return and principal value will fluctuate so that an investor’s shares, when redeemed may be worth more or less than the original cost. To obtain performance information current to the most recent month end, please call 1-800-782-8183.
The performance above reflects any fee waivers that have been in effect during the applicable periods, as well as any expense reimbursements that have periodically been made. Absent such waivers and reimbursements, returns would have been lower. Currently, contractual fee waivers are in effect for the Fund through April 24, 2016.
| 1 | | Reflects the maximum sales charge of 4.75%. |
| 2 | | For additional information, please refer to the Glossary of Terms. |
| 3 | | Reflects the expense ratio as reported in the prospectus dated April 24, 2015. HSBC Global Asset Management (USA) Inc. has entered into a contractual expense limitation agreement with the Fund under which it will limit total expenses of the Fund (excluding interest, taxes, brokerage commissions, extraordinary expenses and estimated indirect expenses attributable to the Fund’s investments in investment companies) to an annual rate of 1.15% and 0.80% for Class A Shares and Class I Shares, respectively. The expense limitation shall be in effect until April 24, 2016. The expense ratios reflected include Acquired Fund fees and expenses. Additional information pertaining to the October 31, 2015 expense ratios can be found in the financial highlights. |
The performance of the Fund is measured against the BofA Merrill Lynch BB-B Global High Yield Constrained Index, which tracks the performance of USC, CAD GBP and EUR denominated below investment-grade corporate debt publicly issued in he major domestic or eurobond markets. The index is unmanaged and its performance does not reflect the deduction of expenses associated with a mutual fund, such as investment management and fund accounting fees. The Fund’s performance reflects the deduction of fees for these value-added services. Investors cannot invest directly in an index.
HSBC FAMILY OF FUNDS 15
| Portfolio Reviews (Unaudited) |
| HSBC Global High Income Bond Fund |
| (Class A Shares and Class I Shares) |
by Jerry Samet/Senior Portfolio Manager
Rick Liu, CFA/Portfolio Manager
Lisa Chua, CFA/Portfolio Manager
The HSBC Global High Income Bond Fund (the “Fund”) seeks to provide a high level of current income. Under normal market conditions, the Fund invests at least 80% of its net assets, plus any borrowings for investment purposes, in a globally diversified portfolio of higher yielding securities.
Investment Concerns
Bond funds will tend to experience smaller fluctuations in value than stock funds. However, investors in any bond fund should anticipate fluctuations in price, especially for longer term issues and in environments of rising interest rates. Investments in a bond fund are subject to possible loss due to the financial failure of underlying securities and their inability to meet their debt obligations.
International investing involves increased risk and volatility. An investment in international funds entails the special risks of international investing, including currency exchange fluctuation, government regulations and intervention, and the potential for political and economic instability.
Prices of securities in emerging markets can fluctuate more significantly than the prices of companies in more developed countries. Securities of emerging market issuers generally have more risk than securities issued by issuers in more developed markets. The less developed the country, the greater effect the risks may have on an investment, and as a result, an investment may exhibit a higher degree of volatility than either the general domestic securities market or the securities markets of developed foreign countries.
Derivatives may be riskier than other types of investments and could result in losses that significantly exceed the Fund’s original investment.
For a complete description of these and other risks associated with investment in a mutual fund, please refer to the Fund’s prospectus.
Market Commentary
Since the Fund’s inception on July 14, 2015 through October 31, 2015, the Fund returned -0.93% (without sales charge) for the Class A Shares and -0.84% for the Class I Shares. That compared to a 1.82% and 0.42% total return for the Fund’s benchmarks, the Barclays Global Aggregate Index1 and Barclays High Income Bond Composite Index1, respectively for the same period.
Portfolio Performance
Fixed income markets faced a challenging environment during the roughly three-and-a-half-month period. Uncertainty over the timing of the U.S. Federal Reserve’s (the Fed) anticipated interest rate increases coupled with concerns over the slowing Chinese economy led to a sell-off in the credit markets in August and September, led by commodity related issuers. Credit markets rebounded somewhat late in the period as investors’ risk appetites returned amid dovish comments by the Fed, improving economic indicators, and technical factors such as lack of new high yield bond issuances.
The Fund’s relative performance was hurt by the exposure to cash as the Fund’s initial investments were being invested during the ramp-up period in July, before the broad sell-off in the credit markets. Additionally, relative performance also suffered from the Fund’s emerging market investments. In particular, exposure to Brazil dragged on relative results as the country continued to deal with difficult economic conditions amid a global economic slowdown.†
The Fund’s relative performance was boosted by an overweight position in U.S. securities, and an underweight position in emerging markets debt. In particular, U.S. BBB-rated assets outperformed emerging markets assets.†
The Fund maintained some derivative exposure during the period, including currency forwards used to hedge non-USD exposure. However, that derivative exposure did not materially affect performance.†
We continued to see attractive valuations in the equity markets, leading to a bias toward stocks over bonds despite the lingering risks of a weaker global economy.†
† Portfolio composition is subject to change.
1 For additional information, please refer to the Glossary of Terms.
Past performance does not guarantee future results. The performance data quoted represents past performance and current returns may be lower or higher. Total return figures include change in share price, reinvestment of dividends and capital gains and do not reflect taxes that a shareholder would pay on Fund distributions or on the redemption of Fund shares. Investment return and principal value will fluctuate so that an investor’s shares, when redeemed may be worth more or less than the original cost. To obtain performance information current to the most recent month end, please call 1-800-782-8183.
16 HSBC FAMILY OF FUNDS
| Portfolio Reviews (Unaudited) |
| HSBC Global High Income Bond Fund |
| | | | Aggregate | | Expense |
| Fund Performance | | | | Total Return (%) | | Ratio (%)3 |
| | Inception | | Since | | | | |
| As of October 31, 2015 | | Date | | Inception | | Gross | | Net |
| HSBC Global High Income Bond Fund Class A1 | | 7/14/15 | | -5.64 | | 1.56 | | 1.15 |
| HSBC Global High Income Bond Fund Class I | | 7/14/15 | | -0.84 | | 1.21 | | 0.80 |
| Barclays Global Aggregate Index | | — | | 1.82 | | N/A | | N/A |
| Barclays High Income Bond Composite Index2 | | — | | 0.42 | | N/A | | N/A |
Past performance does not guarantee future results. The performance data quoted represents past performance and current returns may be lower or higher. Total return figures include change in share price, reinvestment of dividends and capital gains and do not reflect the taxes that a shareholder would pay on Fund distributions or on the redemption of Fund shares. Investment return and principal value will fluctuate so that an investor’s shares, when redeemed may be worth more or less than the original cost. To obtain performance information current to the most recent month end, please call 1-800-782-8183.
The performance above reflects any fee waivers that have been in effect during the applicable periods, as well as any expense reimbursements that have periodically been made. Absent such waivers and reimbursements, returns would have been lower. Currently, contractual fee waivers are in effect for the Fund through April 24, 2016.
| 1 | | Reflects the maximum sales charge of 4.75%. |
| 2 | | For additional information, please refer to the Glossary of Terms. |
| 3 | | Reflects the expense ratio as reported in the prospectus dated April 24, 2015. HSBC Global Asset Management (USA) Inc. has entered into a contractual expense limitation agreement with the Fund under which it will limit total expenses of the Fund (excluding interest, taxes, brokerage commissions, extraordinary expenses and estimated indirect expenses attributable to the Fund’s investments in investment companies) to an annual rate of 1.15% and 0.80% for Class A Shares and Class I Shares, respectively. The expense limitation shall be in effect until April 24, 2016. The expense ratios reflected include Acquired Fund fees and expenses. Additional information pertaining to the October 31, 2015 expense ratios can be found in the financial highlights. |
The performance of the Fund is measured against the Barclays Global Aggregate Index and the Barclays High Income Bond Composite Index. The Barclays Global Aggregate Index provides a broad-based measure of the global investment-grade fixed income markets. The three major components of this index are the U.S. Aggregate, the Pan-European Aggregate, and the Asian-Pacific Aggregate Indices. The index also includes Eurodollar and Euro-Yen corporate bonds, Canadian government, agency and corporate securities, and USD investment grade 144A securities. The Barclays High Income Bond Composite Index is comprised of indexes across US, Euro and EM markets. Components include: 20% Barclays US Corporate Baa, 15% Barclays High Yield Ba, 15% Barclays Euro Aggregate Corporate Baa USD Hedged, 15% Barclays Euro HY BB Rating Only USD Hedged, and 35% Barclays EM USD Aggregate Index. The indexes are unmanaged and their performance does not reflect the deduction of expenses associated with a mutual fund, such as investment management and fund accounting fees. The Fund’s performance reflects the deduction of fees for these value-added services. Investors cannot invest directly in an index.
HSBC FAMILY OF FUNDS 17
| Portfolio Reviews |
| Portfolio Composition* |
October 31, 2015 (Unaudited) |
| HSBC Emerging Markets Debt Fund | |
| Country | Percentage of Investments at Value† (%) |
| Turkey | | 14.2 | |
| Mexico | | 13.9 | |
| Indonesia | | 11.6 | |
| Brazil | | 10.6 | |
| United States | | 8.4 | |
| Colombia | | 7.8 | |
| Venezuela | | 5.2 | |
| Netherlands | | 4.4 | |
| China | | 4.1 | |
| Kazakhstan | | 3.9 | |
| Republic of Serbia | | 2.3 | |
| Sri Lanka | | 2.1 | |
| Panama | | 2.1 | |
| South Africa | | 2.1 | |
| Chile | | 2.1 | |
| Croatia | | 1.7 | |
| Peru | | 1.3 | |
| Uruguay | | 1.0 | |
| El Salvador | | 0.6 | |
| Romania | | 0.6 | |
| | | 100.0 | |
| | |
| HSBC Emerging Markets Local Debt Fund | |
| Country | Percentage of Investments at Value† (%) |
| Indonesia | | 17.4 | |
| Brazil | | 14.8 | |
| Turkey | | 14.7 | |
| Poland | | 13.1 | |
| Colombia | | 7.2 | |
| South Africa | | 6.2 | |
| Peru | | 5.9 | |
| Romania | | 5.6 | |
| Russian Federation | | 4.9 | |
| Malaysia | | 4.0 | |
| Thailand | | 2.6 | |
| Mexico | | 1.9 | |
| China | | 1.7 | |
| | 100.0 | |
| | |
| HSBC Frontier Markets Fund | |
| Country | Percentage of Investments at Value† (%) |
| Pakistan | | 12.3 | |
| United Arab Emirates | | 10.5 | |
| Argentina | | 7.9 | |
| Philippines | | 7.9 | |
| Kuwait | | 7.6 | |
| Nigeria | | 6.7 | |
| Qatar | | 5.0 | |
| Vietnam | | 4.7 | |
| Oman | | 3.9 | |
| Colombia | | 3.8 | |
| Georgia | | 3.8 | |
| Romania | | 3.8 | |
| Saudi Arabia | | 3.6 | |
| Egypt | | 3.3 | |
| Peru | | 3.0 | |
| Sri Lanka | | 2.9 | |
| Morocco | | 2.4 | |
| Croatia | | 2.0 | |
| Cambodia | | 1.6 | |
| Kazakhstan | | 1.5 | |
| Kenya | | 1.4 | |
| South Korea | | 0.4 | |
| | | 100.0 | |
| | |
| HSBC Total Return Fund | |
| Country | Percentage of Investments at Value† (%) |
| United States | | 27.6 | |
| Mexico | | 20.4 | |
| Brazil | | 11.7 | |
| Colombia | | 8.9 | |
| Turkey | | 6.8 | |
| China | | 4.8 | |
| Indonesia | | 4.7 | |
| South Africa | | 4.2 | |
| Netherlands | | 3.8 | |
| Peru | | 1.8 | |
| Hong Kong | | 0.7 | |
| Israel | | 0.7 | |
| Panama | | 0.7 | |
| Chile | | 0.5 | |
| Costa Rica | | 0.5 | |
| Republic of Serbia | | 0.5 | |
| South Korea | | 0.4 | |
| Gabon | | 0.3 | |
| Uruguay | | 0.2 | |
| Malaysia | | 0.2 | |
| Barbados | | 0.1 | |
| Namibia | | 0.1 | |
| Lithuania | | 0.1 | |
| Kazakhstan | | 0.1 | |
| India | | 0.1 | |
| Russian Federation | | 0.1 | |
| | 100.0 | |
18 HSBC FAMILY OF FUNDS
| Portfolio Reviews |
| Portfolio Composition* (continued) |
October 31, 2015 (Unaudited) |
| HSBC Asia ex-Japan Smaller Companies Equity Fund | |
| Country | Percentage of Investments at Value† (%) |
| Hong Kong | | 29.9 | |
| China | | 19.4 | |
| Korea, Republic Of | | 16.8 | |
| Taiwan, Province of China | | 16.3 | |
| Indonesia | | 4.9 | |
| Thailand | | 4.4 | |
| Singapore | | 3.6 | |
| Malaysia | | 2.4 | |
| Philippines | | 2.3 | |
| | | 100.0 | |
| | |
| HSBC Global High Yield Bond Fund | |
| Country | Percentage of Investments at Value† (%) |
| United States | | 63.5 | |
| Luxembourg | | 6.0 | |
| France | | 5.6 | |
| Netherlands | | 5.0 | |
| Brazil | | 3.5 | |
| Canada | | 3.5 | |
| United Kingdom | | 2.4 | |
| Bermuda | | 1.9 | |
| Germany | | 1.9 | |
| Ireland (Republic of) | | 1.0 | |
| Colombia | | 0.9 | |
| Russian Federation | | 0.9 | |
| Denmark | | 0.8 | |
| Guatemala | | 0.7 | |
| Turkey | | 0.7 | |
| Venezuela | | 0.7 | |
| Sweden | | 0.5 | |
| Austria | | 0.5 | |
| | | 100.0 | |
| | |
| HSBC Global High Income Bond Fund | |
| Country | Percentage of Investments at Value† (%) |
| United States | | 43.8 | |
| France | | 8.3 | |
| Netherlands | | 5.5 | |
| Brazil | | 4.8 | |
| Luxembourg | | 3.9 | |
| Germany | | 3.6 | |
| United Kingdom | | 3.6 | |
| China | | 3.5 | |
| Mexico | | 3.0 | |
| Turkey | | 2.4 | |
| Italy | | 1.9 | |
| Colombia | | 1.8 | |
| Indonesia | | 1.7 | |
| Canada | | 1.6 | |
| Hong Kong | | 1.5 | |
| Russian Federation | | 1.3 | |
| Spain | | 1.2 | |
| Chile | | 0.9 | |
| Kazakhstan | | 0.9 | |
| Bermuda | | 0.7 | |
| Guatemala | | 0.7 | |
| Venezuela | | 0.6 | |
| Ireland (Republic of) | | 0.5 | |
| South Africa | | 0.5 | |
| Guernsey | | 0.5 | |
| Belgium | | 0.5 | |
| Singapore | | 0.4 | |
| Austria | | 0.4 | |
| | 100.0 | |
____________________
| * | | Portfolio composition is subject to change. |
| † | | Excludes any instruments used for cash management. |
HSBC FAMILY OF FUNDS 19
| HSBC EMERGING MARKETS DEBT FUND | |
| Schedule of Portfolio Investments—as of October 31, 2015 | |
| Yankee Dollars — 74.4% | | | |
| | | | |
| Principal | | |
| Amount($) | | Value($) |
| Brazil — 8.6% | | | |
| Banco Votorantim, Registered, | | | |
| 5.25%, 2/11/16 | 200,000 | | 200,000 |
| Caixa Economica Federal, | | | |
| 4.50%, 10/3/18 | 150,000 | | 144,375 |
| Federal Republic of Brazil, | | | |
| 4.88%, 1/22/21 | 200,000 | | 196,700 |
| Federal Republic of Brazil, | | | |
| 7.13%, 1/20/37 | 200,000 | | 194,500 |
| Federal Republic of Brazil, | | | |
| 5.63%, 1/7/41 | 220,000 | | 179,850 |
| Odebrecht Finance Ltd., Registered, | | | |
| 4.38%, 4/25/25 | 200,000 | | 120,400 |
| | | 1,035,825 |
| Chile — 1.7% | | | |
| CorpBanca SA, 3.13%, 1/15/18 | 200,000 | | 200,526 |
| China — 3.3% | | | |
| CNOOC Finance (2014) ULC, | | | |
| 4.25%, 4/30/24 | 200,000 | | 205,391 |
| Sinopec Capital (2013) Ltd., | | | |
| 3.13%, 4/24/23 | 200,000 | | 192,535 |
| | | 397,926 |
| Colombia — 6.3% | | | |
| Republic of Colombia, | | | |
| 7.38%, 1/27/17 | 100,000 | | 107,350 |
| Republic of Colombia, | | | |
| 7.38%, 3/18/19 | 200,000 | | 228,800 |
| Republic of Colombia, | | | |
| 4.38%, 7/12/21 | 200,000 | | 205,800 |
| Republic of Colombia, | | | |
| 7.38%, 9/18/37 | 100,000 | | 116,000 |
| Republic of Colombia, | | | |
| 6.13%, 1/18/41 | 100,000 | | 102,750 |
| | | 760,700 |
| Croatia — 1.4% | | | |
| Croatia, Registered, 6.75%, 11/5/19 | 150,000 | | 163,172 |
| El Salvador — 0.5% | | | |
| Republic of El Salvador, Registered, | | | |
| 7.75%, 1/24/23 | 60,000 | | 60,900 |
| Indonesia — 9.4% | | | |
| Republic of Indonesia, | | | |
| 6.88%, 1/17/18 | 200,000 | | 219,706 |
| Republic of Indonesia, Registered, | | | |
| 5.88%, 3/13/20 | 200,000 | | 221,906 |
| Republic of Indonesia, Registered, | | | |
| 3.75%, 4/25/22 | 220,000 | | 217,810 |
| Republic of Indonesia, Registered, | | | |
| 3.38%, 4/15/23 | 225,000 | | 214,384 |
| Republic of Indonesia, Registered, | | | |
| 8.50%, 10/12/35 | 100,000 | | 131,120 |
| Republic of Indonesia, Registered, | | | |
| 7.75%, 1/17/38 | 100,000 | | 123,450 |
| | | 1,128,376 |
| Kazakhstan — 3.1% | | | |
| KazMunayGas National Co. JSC, | | | |
| Registered, MTN, | | | |
| 4.40%, 4/30/23 | 200,000 | | 176,000 |
| Republic of Kazakhstan, Registered, | | | |
| 5.13%, 7/21/25 | 200,000 | | 198,905 |
| | | 374,905 |
| Mexico — 11.3% | | | |
| Petroleos Mexicanos, | | | |
| 4.88%, 1/24/22 | 400,000 | | 407,100 |
| Petroleos Mexicanos, | | | |
| 6.38%, 1/23/45 | 200,000 | | 189,500 |
| United Mexican States, Series G, | | | |
| 3.50%, 1/21/21 | 205,000 | | 210,843 |
| United Mexican States, | | | |
| 3.63%, 3/15/22 | 90,000 | | 92,160 |
| United Mexican States, Series A, | | | |
| 6.05%, 1/11/40 | 160,000 | | 180,800 |
| United Mexican States, | | | |
| 5.55%, 1/21/45 | 260,000 | | 275,274 |
| | | 1,355,677 |
| Netherlands — 3.6% | | | |
| Majapahit Holding BV, Registered, | | | |
| 7.75%, 10/17/16 | 300,000 | | 314,250 |
| Petrobras Brasileiro SA, | | | |
| 6.85%, 6/5/15 | 50,000 | | 34,310 |
| Petrobras Global Finance BV, | | | |
| 6.25%, 3/17/24 | 100,000 | | 80,095 |
| | | 428,655 |
| Panama — 1.7% | | | |
| Republic of Panama, 4.00%, 9/22/24, | | | |
| Callable 6/24/24 @ 100 (a) | 200,000 | | 202,000 |
| Peru — 1.1% | | | |
| Republic of Peru, 4.13%, 8/25/27 | 50,000 | | 50,250 |
| Republic of Peru, 6.55%, 3/14/37 | 65,000 | | 78,488 |
| | | 128,738 |
| Republic of Serbia — 1.9% | | | |
| Republic of Serbia, Registered, | | | |
| 7.25%, 9/28/21 | 200,000 | | 228,580 |
| Romania — 0.5% | | | |
| Republic of Romania, | | | |
| 6.13%, 1/22/44 | 50,000 | | 59,173 |
| South Africa — 1.7% | | | |
| Republic of South Africa, | | | |
| 4.67%, 1/17/24 | 200,000 | | 202,000 |
| Sri Lanka — 1.7% | | | |
| Bank of Ceylon, Registered, | | | |
| 6.88%, 5/3/17 | 200,000 | | 205,000 |
| 20 HSBC FAMILY OF FUNDS | | See notes to financial statements. |
| HSBC EMERGING MARKETS DEBT FUND |
| Schedule of Portfolio Investments—as of October 31, 2015 (continued) |
| Yankee Dollars, continued | | | | |
| | | | | |
| | Principal | | | |
| | Amount($) | | Value($) |
| Turkey — 11.6% | | | | |
| Republic of Turkey, 7.00%, 9/26/16 | 300,000 | | | 313,590 |
| Republic of Turkey, 7.50%, 7/14/17 | 200,000 | | | 216,710 |
| Republic of Turkey, 5.63%, 3/30/21 | 550,000 | | | 591,249 |
| Republic of Turkey, 5.13%, 3/25/22 | 200,000 | | | 209,180 |
| Republic of Turkey, 7.38%, 2/5/25 | 50,000 | | | 59,804 |
| | | | 1,390,533 |
| Uruguay — 0.8% | | | | |
| Republic of Uruguay, PIK, | | | | |
| 7.88%, 1/15/33 | 60,000 | | | 76,500 |
| Republica Oriental del Uruguay, | | | | |
| 5.10%, 6/18/50 | 25,000 | | | 22,438 |
| | | | | 98,938 |
| Venezuela — 4.2% | | | | |
| Bolivarian Republic of Venezuela, | | | | |
| 7.65%, 4/21/25 | 120,000 | | | 45,300 |
| Bolivarian Republic of Venezuela, | | | | |
| 9.25%, 5/7/28 | 380,000 | | | 149,150 |
| Petroleos de Venezuela SA, | | | | |
| Registered, 6.00%, 5/16/24 | 280,000 | | | 100,450 |
| Republic of Venezuela, | | | | |
| 9.25%, 9/15/27 | 400,000 | | | 175,000 |
| Republic of Venezuela, Registered, | | | | |
| 6.00%, 12/9/20 | 100,000 | | | 37,750 |
| | | | | 507,650 |
| TOTAL YANKEE DOLLARS | | | | |
| (COST $9,278,095) | | | | 8,929,274 |
| |
| Corporate Bonds — 0.7% | | | | |
| |
| Southern Copper Corp., | | | | |
| 5.25%, 11/8/42 | 25,000 | | | 20,258 |
| Southern Copper Corp., | | | | |
| 5.88%, 4/23/45 | 75,000 | | | 65,628 |
| | | | 85,886 |
| TOTAL CORPORATE BONDS | | | | |
| (COST $96,653) | | | | 85,886 |
| |
| U.S. Treasury Obligations — 6.1% | | | | |
| |
| U.S. Treasury Bonds — 0.8% | | | | |
| 3.00%, 5/15/45 | 100,000 | | | 101,335 |
| U.S. Treasury Notes — 5.3% | | | | |
| 1.38%, 4/30/20 | 300,000 | | | 298,828 |
| 2.00%, 8/15/25 | 338,000 | | | 333,663 |
| | | | 632,491 |
| TOTAL U.S. TREASURY OBLIGATIONS | | | | |
| (COST $736,924) | | | | 733,826 |
| | | | | |
| Investment Companies — 18.5% | | | | |
| | | | | |
| Shares | | Value($) |
| Northern Institutional Diversified | | | | |
| Assets Portfolio, Institutional | | | | |
| Shares, 0.01% (b) | 2,225,175 | | | 2,225,175 |
| TOTAL INVESTMENT COMPANIES | | | | |
| (COST $2,225,175) | | | | 2,225,175 |
| TOTAL INVESTMENT SECURITIES | | | | |
| (COST $12,336,847) — 99.7% | | | | 11,974,161 |
| Other Assets (Liabilities) — 0.3% | | | | 34,341 |
| NET ASSETS — 100% | | | $ | 12,008,502 |
____________________
| (a) | | Represents next call date. Additional subsequent call dates and amounts may apply to this security. |
| (b) | | The rate represents the annualized one-day yield that was in effect on October 31, 2015. |
MTN — Medium Term Note
ULC — Unlimited Liability Co.
PIK — Payment-in-Kind
The Fund invested, as a percentage of net assets at value, in the following industries, as of October 31, 2015:
| | Percentage of Net Assets |
| Industry | at Value (%) |
| Sovereign Bonds | | 52.9 | |
| Investment Companies | | 18.6 | |
| Oil, Gas & Consumable Fuels | | 11.5 | |
| Banks | | 6.3 | |
| U.S. Treasury Obligation | | 6.1 | |
| Electric Utilities | | 2.6 | |
| Construction & Engineering | | 1.0 | |
| Metals & Mining | | 0.7 | |
| Total | | 99.7 | |
| See notes to financial statements. | | HSBC FAMILY OF FUNDS 21 |
| HSBC EMERGING MARKETS DEBT FUND |
| Schedule of Portfolio Investments—as of October 31, 2015 (continued) |
Futures Contracts Sold
| | | | | | | | | | | | | Unrealized |
| | | | Expiration | | Number of | | Notional | | Appreciation/ |
| Description | | | Type | | Date | | Contracts | | Value | | (Depreciation) |
| 10-Year U.S. Treasury Note December Future | | Short | | 12/21/15 | | 3 | | | $ | 383,063 | | | | $ | 666 | |
| | | | | | | | | $ | 383,063 | | | | $ | 666 | |
Credit Default Swap Agreements - Buy Protection(a)
At October 31, 2015, the Fund’s open credit default swap agreements were as follows:
| | | | | | | | | | | | | | Upfront | | | | | |
| | | | | | | Implied Credit | | | | | | | | Premiums | | Unrealized |
| | | | | | Spread at | | Notional | | Fixed | | | | Paid/ | | Appreciation/ |
| | | | Expiration | | October 31, 2015 | | Amount | | Rate | | Value | | (Received) | | (Depreciation) |
| Underlying Instrument | | | Counterparty | | Date | | (%)(b) | | ($)(c) | | (%) | | ($) | | ($) | | ($) |
| | JPMorgan Chase | | | | | | | | | | | | | | | | | | | |
| Republic of Panama | | Bank N.A. | | 12/20/20 | | 1.65 | | 250,000 | | 1.00 | | 6,920 | | | 7,223 | | | | (303 | ) | |
| | | | | | | | | | | | 6,920 | | | 7,223 | | | | (303 | ) | |
Credit Default Swap Agreements - Sell Protection(a)
At October 31, 2015, the Fund’s open credit default swap agreements were as follows:
| | | | | | | | | | | | | | | | Upfront | | | | | |
| | | | | | | Implied Credit | | | | | | | | | Premiums | | Unrealized |
| | | | | | Spread at | | Notional | | Fixed | | | | | Paid/ | | Appreciation/ |
| | | | Expiration | | October 31, 2015 | | Amount | | Rate | | Value | | (Received) | | (Depreciation) |
| Underlying Instrument | | | Counterparty | | Date | | (%)(b) | | ($)(c) | | (%) | | ($) | | ($) | | ($) |
| Federative | | | | | | | | | | | | | | | | | | | | | | | |
| Republic of Brazil | | Barclays Bank PLC | | 9/20/16 | | 1.99 | | 350,000 | | 1.00 | | (2,492 | ) | | | (7,424 | ) | | | | 4,932 | | |
| Federative | | | | | | | | | | | | | | | | | | | | | | | |
| Republic of Brazil | | Barclays Bank PLC | | 6/20/18 | | 3.69 | | 300,000 | | 1.00 | | (19,283 | ) | | | (8,671 | ) | | | | (10,612 | ) | |
| Federative | | Credit Suisse | | | | | | | | | | | | | | | | | | | | | |
| Republic of Brazil | | International | | 9/20/20 | | 4.31 | | 125,000 | | 1.00 | | (17,373 | ) | | | (11,547 | ) | | | | (5,826 | ) | |
| Federative | | | | | | | | | | | | | | | | | | | | | | | |
| Republic of Brazil | | Bank of America | | 9/20/20 | | 4.31 | | 125,000 | | 1.00 | | (17,373 | ) | | | (12,166 | ) | | | | (5,207 | ) | |
| Republic of Peru | | Credit Suisse | | | | | | | | | | | | | | | | | | | | | |
| | International | | 9/20/20 | | 1.64 | | 125,000 | | 1.00 | | (3,618 | ) | | | (2,370 | ) | | | | (1,248 | ) | |
| Russian Federation | | Barclays Bank PLC | | 9/20/20 | | 2.65 | | 125,000 | | 1.00 | | (9,244 | ) | | | (14,079 | ) | | | | 4,835 | | |
| United Mexican States | | Credit Suisse | | | | | | | | | | | | | | | | | | | | | |
| | International | | 9/20/20 | | 1.44 | | 225,000 | | 1.00 | | (4,368 | ) | | | (4,856 | ) | | | | 488 | | |
| | | | | | | | | | | | (73,751 | ) | | | (61,113 | ) | | | | (12,638 | ) | |
| (a) | | When a credit event occurs as defined under the terms of the swap agreement, the Fund as a seller of credit protection will either (i) pay to the buyer of protection an amount equal to the par value of the defaulted reference entity and take delivery of the reference entity or (ii) pay a net amount equal to the par value of the defaulted reference entity less its recovery value. Alternatively, the Fund as a buyer of credit protection will either (i) receive from the seller of protection an amount equal to the par value of the defaulted reference entity and deliver the reference entity to the seller or (ii) receive a net amount equal to the par value of the defaulted reference entity less its recovery value. |
| (b) | | Implied credit spread, represented in absolute terms, utilized in determining the fair value of the credit default swap agreements as of period end serve as an indicator of the current status of the payment/performance risk and represents the likelihood or risk of default for the credit derivative. The implied credit spread of a referenced entity reflects the cost of buying/selling protection and may include upfront payments required to be made to enter into the agreement. Generally, wider credit spreads represent a perceived deterioration of the referenced entity’s credit soundness and a greater likelihood or risk of default or other credit event occurring as defined under the terms of the swap agreement. |
| (c) | | The notional amount represents the maximum potential amount of future payments that the Fund may receive as a buyer of credit protection if a credit event occurs, as defined under the terms of the swap agreement. Alternatively, the notional amount represents the maximum potential amount of payment the Fund could be required to make as a seller of credit protection if a credit event occurs, as defined under the terms of the swap agreement. |
| 22 HSBC FAMILY OF FUNDS | | See notes to financial statements. |
| HSBC EMERGING MARKETS DEBT FUND |
| Schedule of Portfolio Investments—as of October 31, 2015 (continued) |
At October 31, 2015, the Fund’s open forward foreign currency exchange contracts were as follows:
| | | | | | | | | | | | Net |
| | | | | | | Contract | | | | | | Unrealized |
| | | | | | Amount | | Contract | | | | Appreciation/ |
| | | | Delivery | | (Local | | Value | | Value | | (Depreciation) |
| Short Contracts | | | Counterparty | | Date | | Currency) | | ($) | | ($) | | ($) |
| Brazilian Real | | Barclays Bank PLC | | 12/2/15 | | 214,192 | | 59,055 | | 54,950 | | | 4,105 | | |
| Brazilian Real | | Standard Chartered Bank | | 12/2/15 | | 320,792 | | 88,848 | | 82,297 | | | 6,551 | | |
| Korean Won | | Barclays Bank PLC | | 1/22/16 | | 130,477,850 | | 115,000 | | 114,376 | | | 624 | | |
| Mexican Peso | | Bank of America | | 11/3/15 | | 8,333,351 | | 503,069 | | 504,502 | | | (1,433 | ) | |
| Thai Baht | | Standard Chartered Bank | | 11/6/15 | | 4,312,260 | | 120,000 | | 121,241 | | | (1,241 | ) | |
| Thai Baht | | Standard Chartered Bank | | 3/11/16 | | 4,312,260 | | 120,303 | | 120,765 | | | (462 | ) | |
| Turkish Lira | | Standard Chartered Bank | | 2/5/16 | | 357,293 | | 117,711 | | 119,217 | | | (1,506 | ) | |
| | | | | | | | | 1,123,986 | | 1,117,348 | | | 6,638 | | |
| | | | | | | | | | | | Net |
| | | | | | Contract | | | | | | Unrealized |
| | | | | | Amount | | Contract | | | | Appreciation/ |
| | | | Delivery | | (Local | | Value | | Value | | (Depreciation) |
| Long Contracts | | | Counterparty | | Date | | Currency) | | ($) | | ($) | | ($) |
| Brazilian Real | | Bank of America | | 12/2/15 | | 21,876 | | 6,000 | | 5,612 | | | (388 | ) | |
| Brazilian Real | | Credit Suisse International | | 12/2/15 | | 135,864 | | 37,000 | | 34,855 | | | (2,145 | ) | |
| Brazilian Real | | JPMorgan Chase Bank N.A. | | 12/2/15 | | 163,879 | | 45,000 | | 42,042 | | | (2,958 | ) | |
| Brazilian Real | | Standard Chartered Bank | | 12/2/15 | | 1,237,393 | | 341,380 | | 317,447 | | | (23,933 | ) | |
| Brazilian Real | | UBS AG | | 12/2/15 | | 340,507 | | 95,000 | | 87,355 | | | (7,645 | ) | |
| Indonesian Rupiah | | Bank of America | | 12/11/15 | | 210,000,000 | | 14,000 | | 15,182 | | | 1,182 | | |
| Indonesian Rupiah | | Barclays Bank PLC | | 12/11/15 | | 619,715,000 | | 41,000 | | 44,802 | | | 3,802 | | |
| Indonesian Rupiah | | Credit Suisse International | | 12/11/15 | | 302,000,000 | | 20,000 | | 21,833 | | | 1,833 | | |
| Indonesian Rupiah | | JPMorgan Chase Bank N.A. | | 12/11/15 | | 271,890,000 | | 18,000 | | 19,656 | | | 1,656 | | |
| Indonesian Rupiah | | Standard Chartered Bank | | 12/11/15 | | 407,780,000 | | 27,000 | | 29,480 | | | 2,480 | | |
| Mexican Peso | | Bank of America | | 11/3/15 | | 102,123 | | 6,000 | | 6,183 | | | 183 | | |
| Mexican Peso | | Barclays Bank PLC | | 11/3/15 | | 1,192,508 | | 70,000 | | 72,195 | | | 2,195 | | |
| Mexican Peso | | JPMorgan Chase Bank N.A. | | 11/3/15 | | 3,006,063 | | 177,000 | | 181,988 | | | 4,988 | | |
| Mexican Peso | | Standard Chartered Bank | | 11/3/15 | | 4,032,656 | | 238,000 | | 244,138 | | | 6,138 | | |
| Mexican Peso | | Bank of America | | 3/7/16 | | 8,333,351 | | 498,660 | | 500,068 | | | 1,408 | | |
| South African Rand | | Bank of America | | 12/15/15 | | 159,444 | | 12,000 | | 11,437 | | | (563 | ) | |
| South African Rand | | JPMorgan Chase Bank N.A. | | 12/15/15 | | 531,980 | | 40,000 | | 38,159 | | | (1,841 | ) | |
| South African Rand | | Standard Chartered Bank | | 12/15/15 | | 916,763 | | 69,000 | | 65,760 | | | (3,240 | ) | |
| Thai Baht | | Standard Chartered Bank | | 11/6/15 | | 4,312,260 | | 121,370 | | 121,241 | | | (129 | ) | |
| Turkish Lira | | Barclays Bank PLC | | 2/5/16 | | 357,293 | | 112,469 | | 119,216 | | | 6,747 | | |
| Turkish Lira | | Standard Chartered Bank | | 2/5/16 | | 396,287 | | 130,000 | | 132,228 | | | 2,228 | | |
| | | | | | | | 2,118,879 | | 2,110,877 | | | (8,002 | ) | |
| See notes to financial statements. | | HSBC FAMILY OF FUNDS 23 |
| HSBC EMERGING MARKETS LOCAL DEBT FUND |
| Schedule of Portfolio Investments—as of October 31, 2015 |
| Foreign Bonds — 76.2% | | | |
| | | |
| | Principal | | |
| Amount† | | Value ($) |
| Brazil — 11.5% | | | |
| Letra Tesouro Nacional, | | | |
| 13.36%, 1/1/16 | 1,583,000 | | 401,320 |
| Nota do Tesouro Nacional, | | | |
| 3.35%, 1/1/21 | 6,000,000 | | 1,310,293 |
| | | 1,711,613 |
| Colombia — 5.6% | | | |
| Titulos de Tesoreria Bond, Series B, | | | |
| 10.00%, 7/24/24 | 2,133,400,000 | | 836,982 |
| Indonesia — 13.6% | | | |
| Indonesia Government, Series FR30, | | | |
| 10.75%, 5/15/16 | 6,400,000,000 | | 474,232 |
| Indonesia Government, Series FR60, | | | |
| 6.25%, 4/15/17 | 4,240,000,000 | | 300,794 |
| Indonesia Government, Series FR69, | | | |
| 7.88%, 4/15/19 | 4,300,000,000 | | 305,688 |
| Indonesia Government, Series FR70, | | | |
| 8.38%, 3/15/24 | 1,572,000,000 | | 111,975 |
| Indonesia Government, Series FR40, | | | |
| 11.00%, 9/15/25 | 2,000,000,000 | | 164,124 |
| Indonesia Government, Series FR56, | | | |
| 8.38%, 9/15/26 | 9,605,000,000 | | 673,816 |
| | | | 2,030,629 |
| Malaysia — 3.1% | | | |
| Malaysian Government, Series 0315, | | | |
| 3.66%, 10/15/20 | 950,000 | | 220,685 |
| Malaysian Government, Series 0111, | | | |
| 4.16%, 7/15/21 | 5,000 | | 1,174 |
| Malaysian Government, Series 0115, | | | |
| 3.96%, 9/15/25 | 700,000 | | 160,664 |
| Malaysian Government, Series 0310, | | | |
| 4.50%, 4/15/30 | 350,000 | | 82,524 |
| | | 465,047 |
| Mexico — 1.5% | | | |
| Mexican Bonos Desarrollo, | | | |
| 8.00%, 6/11/20 (a) | 1,880,000 | | 127,101 |
| Mexican Bonos Desarrollo, | | | |
| Series M30, 8.50%, 11/18/38 (a) | 1,290,000 | | 94,284 |
| | | 221,385 |
| Peru — 4.5% | | | |
| Republic of Peru, Registered, | | | |
| 7.84%, 8/12/20 | 1,179,000 | | 386,847 |
| Republic of Peru, Registered, | | | |
| 5.20%, 9/12/23 | 1,060,000 | | 293,691 |
| | | | 680,538 |
| Poland — 10.1% | | | |
| Poland Government Bond, | | | |
| 5.25%, 10/25/17 | 3,980,000 | | 1,103,000 |
| Poland Government Bond, | | | |
| Series 0719, 3.25%, 7/25/19 | 808,000 | | 219,346 |
| Poland Government Bond, | | | |
| Series 1020, 5.25%, 10/25/20 | 650,000 | | 193,179 |
| | | 1,515,525 |
| Romania — 4.3% | | | |
| Romania Government Bond, | | | |
| 6.75%, 6/11/17 | 1,300,000 | | 350,040 |
| Romania Government Bond, | | | |
| Series 5Y, 5.90%, 7/26/17 | 650,000 | | 173,773 |
| Romania Government Bond, | | | |
| Series 10YR, 5.95%, 6/11/21 | 420,000 | | 121,551 |
| | | 645,364 |
| Russian Federation — 3.8% | | | |
| Russia Government Bond, | | | |
| Series 6203, 6.90%, 8/3/16 (a) | 1,700,000 | | 26,055 |
| Russia Government Bond, | | | |
| Series 6208, 7.50%, 2/27/19 (a) | 19,000,000 | | 278,021 |
| Russia Government Bond, | | | |
| Series 6215, 7.00%, 8/16/23 (a) | 11,100,000 | | 147,842 |
| Russia Government Bond, | | | |
| Series 6207, 8.15%, 2/3/27 (a) | 8,000,000 | | 111,555 |
| | | 563,473 |
| South Africa — 4.8% | | | |
| Republic of South Africa, | | | |
| Series R159, 13.50%, 9/15/16 | 30,000 | | 2,290 |
| Republic of South Africa, | | | |
| Series R186, 10.50%, 12/21/26 | 2,800,000 | | 233,725 |
| Republic of South Africa, | | | |
| Series R209, 6.25%, 3/31/36 | 8,847,000 | | 479,007 |
| | | 715,022 |
| Thailand — 2.0% | | | |
| Thailand Government Bond, | | | |
| 3.85%, 12/12/25 | 4,100,000 | | 127,429 |
| Thailand Government Bond | | | |
| 4.88%, 6/22/29 | 4,900,000 | | 169,122 |
| | | 296,551 |
| Turkey — 11.4% | | | |
| Turkey Government Bond, | | | |
| 8.20%, 11/16/16 (a) | 100,000 | | 33,676 |
| Turkey Government Bond, | | | |
| Series 5YR, 9.00%, 3/8/17 (a) | 2,230,000 | | 755,193 |
| Turkey Government Bond, | | | |
| 7.40%, 2/5/20 (a) | 600,000 | | 189,192 |
| Turkey Government Bond, | | | |
| 9.50%, 1/12/22 (a) | 990,000 | | 334,925 |
| Turkey Government Bond, | | | |
| 8.50%, 9/14/22 (a) | 406,000 | | 130,249 |
| Turkey Government Bond, | | | |
| 8.80%, 9/27/23 (a) | 800,000 | | 261,040 |
| | | 1,704,275 |
| TOTAL FOREIGN BONDS | | | |
| (COST $13,421,558) | | | 11,386,404 |
| 24 HSBC FAMILY OF FUNDS | | See notes to financial statements. |
| HSBC EMERGING MARKETS LOCAL DEBT FUND |
Schedule of Portfolio Investments—as of October 31, 2015 (continued) |
| Yankee Dollar — 1.3% | | | |
| | | | |
| | Principal | | |
| Amount | | Value ($) |
| China — 1.3% | | | |
| CNOOC Finance (2013) Ltd., | | | |
| 1.13%, 5/9/16 | 200,000 | | 199,737 |
| TOTAL YANKEE DOLLAR | | | |
| (COST $199,876) | | | 199,737 |
| |
| Investment Companies — 17.3% | | | |
| | | | |
| | Shares | | |
| Northern Institutional Diversified | | | |
| Assets Portfolio, Institutional | | | |
| Shares, 0.01% (b) | 2,575,256 | | 2,575,256 |
| TOTAL INVESTMENT COMPANIES | | | |
| (COST $2,575,256) | | | 2,575,256 |
| TOTAL INVESTMENT SECURITIES | | | |
| (COST $16,196,690) — 94.8% | | | 14,161,397 |
| Other Assets (Liabilities) — 5.2% | | | 779,075 |
| NET ASSETS — 100% | | | 14,940,472 |
____________________
| † | | The principal amount is disclosed in local currency and the value is disclosed in U.S. Dollars. |
| (a) | | Variable rate security. The interest rates on these securities are adjusted periodically to reflect then-current short-term interest rates. The rates presented represent the rates in effect on October 31, 2015. The maturity dates presented reflect the final maturity dates. However, some of these securities may contain put or demand features that allow the Fund to require the issuer to repurchase the security from the fund within various time periods, including daily, weekly, monthly, or semi-annually. |
| (b) | | The rate represents the annualized one-day yield that was in effect on October 31, 2015. |
The Fund invested, as a percentage of net assets at value, in the following industries, as of October 31, 2015:
| | Percentage of Net Assets |
| Industry | at Value (%) |
| Sovereign Bonds | | 76.2 | |
| Investment Companies | | 17.3 | |
| Oil, Gas & Consumable Fuels | | 1.3 | |
| Total | | 94.8 | |
| See notes to financial statements. | | HSBC FAMILY OF FUNDS 25 |
| HSBC EMERGING MARKETS LOCAL DEBT FUND |
Schedule of Portfolio Investments—as of October 31, 2015 (continued) |
Interest Rate Swap Agreements
At October 31, 2015, the Fund’s open interest rate swap agreements were as follows:
| Pay/ | | | | | | | | | | | | | | | | | | | Unrealized |
| Receive | | | | Fixed | | | | | | Notional | | Notional | | | | | Appreciation/ |
| Floating | | | Floating Rate | | Rate | | Expiration | | | | Amount | | Amount | | Value | | (Depreciation) |
| Rate | | | Index | | (%) | | Date | | Counterparty | | (Local) | | ($) | | ($) | | ($) |
| | 3-Month ZAR- | | | | | | JPMorgan Chase | | | | | | | | | | | | | | |
| Pay | | JIBAR-SAFEX | | 6.27 | | 11/12/15 | | Bank N.A. | | 16,600,000 | | ZAR | | 1,200,376 | | (93 | ) | | | (93 | ) | |
| Pay | | 1-Year BRL CDI | | 12.97 | | 1/2/17 | | Barclays Bank PLC | | 6,174,842 | | BRL | | 1,601,443 | | (38,671 | ) | | | (38,671 | ) | |
| | | | | | | | Credit Suisse | | | | | | | | | | | | | | |
| Pay | | 1-Year BRL CDI | | 17.20 | | 1/2/17 | | International | | 5,000,000 | | BRL | | 1,296,748 | | 21,967 | | | | 21,967 | | |
| | 3-Month ZAR- | | | | | | | | | | | | | | | | | | | | |
| Pay | | JIBAR-SAFEX | | 5.98 | | 1/24/18 | | Barclays Bank PLC | | 20,000,000 | | ZAR | | 1,446,236 | | (31,599 | ) | | | (31,599 | ) | |
| | 3-Month MYR- | | | | | | | | | | | | | | | | | | | | |
| Pay | | KLIBOR-BRM | | 3.24 | | 5/3/18 | | Standard Chartered Bank | | 1,500,000 | | MYR | | 349,487 | | (6,237 | ) | | | (6,237 | ) | |
| | 1-Month MXN-TIIE- | | | | | | JPMorgan Chase | | | | | | | | | | | | | | |
| Pay | | Banxico | | 5.35 | | 5/7/19 | | Bank N.A. | | 24,000,000 | | MXN | | 1,453,251 | | 23,781 | | | | 23,781 | | |
| | | | | | | | Credit Suisse | | | | | | | | | | | | | | |
| Pay | | 1-Year BRL CDI | | 12.98 | | 1/4/21 | | International | | 2,255,034 | | BRL | | 584,842 | | (37,226 | ) | | | (37,226 | ) | |
| | | | | | | | | | | | | | | | (68,078 | ) | | | (68,078 | ) | |
At October 31, 2015, the Fund’s open forward foreign currency exchange contracts were as follows:
| | | | | | | | | | | | Net |
| | | | | | Contract | | | | | | Unrealized |
| | | | | | | Amount | | Contract | | | | Appreciation/ |
| | | | | Delivery | | (Local | | Value | | Value | | (Depreciation) |
| Short Contracts | | | Counterparty | | Date | | Currency) | | ($) | | ($) | | ($) |
| Brazilian Real | | Barclays Bank PLC | | 12/2/15 | | 8,523,729 | | 2,398,822 | | 2,186,712 | | | 212,110 | | |
| Brazilian Real | | Credit Suisse | | 12/2/15 | | 2,657,224 | | 764,153 | | 681,695 | | | 82,458 | | |
| Brazilian Real | | Standard Chartered Bank | | 12/2/15 | | 412,225 | | 113,602 | | 105,754 | | | 7,848 | | |
| Chilean Peso | | JPMorgan Chase Bank N.A. | | 12/4/15 | | 291,931,230 | | 447,000 | | 420,907 | | | 26,093 | | |
| Colombian Peso | | Credit Suisse | | 1/14/16 | | 549,612,000 | | 189,000 | | 188,013 | | | 987 | | |
| Colombian Peso | | Standard Chartered Bank | | 1/14/16 | | 252,822,000 | | 87,000 | | 86,486 | | | 514 | | |
| European Euro | | Standard Chartered Bank | | 2/16/16 | | 114,861 | | 129,028 | | 126,568 | | | 2,460 | | |
| Indonesian Rupiah | | Barclays Bank PLC | | 11/16/15 | | 1,420,869,761 | | 104,649 | | 103,461 | | | 1,188 | | |
| Indonesian Rupiah | | Barclays Bank PLC | | 11/16/15 | | 5,222,779,400 | | 370,000 | | 380,297 | | | (10,297 | ) | |
| Indonesian Rupiah | | Barclays Bank PLC | | 12/11/15 | | 2,911,060,771 | | 209,429 | | 210,452 | | | (1,023 | ) | |
| Indonesian Rupiah | | Credit Suisse First Boston | | 12/11/15 | | 21,659,458,355 | | 1,566,348 | | 1,565,849 | | | 499 | | |
| Indonesian Rupiah | | Standard Chartered Bank | | 12/11/15 | | 1,340,100,000 | | 96,549 | | 96,881 | | | (332 | ) | |
| Israeli Shekel | | Standard Chartered Bank | | 1/20/16 | | 2,453,905 | | 651,421 | | 635,210 | | | 16,211 | | |
| Japanese Yen | | Standard Chartered Bank | | 1/29/16 | | 51,364,274 | | 430,000 | | 426,491 | | | 3,509 | | |
| Korean Won | | Barclays Bank PLC | | 1/22/16 | | 339,459,520 | | 284,090 | | 297,569 | | | (13,479 | ) | |
| Korean Won | | Barclays Bank PLC | | 1/22/16 | | 158,842,600 | | 140,000 | | 139,241 | | | 759 | | |
| Malaysian Ringgit | | Barclays Bank PLC | | 1/13/16 | | 713,320 | | 165,017 | | 165,397 | | | (380 | ) | |
| Malaysian Ringgit | | Barclays Bank PLC | | 1/13/16 | | 504,660 | | 120,000 | | 117,015 | | | 2,985 | | |
| Malaysian Ringgit | | JPMorgan Chase Bank N.A. | | 1/13/16 | | 832,640 | | 200,000 | | 193,064 | | | 6,936 | | |
| Mexican Peso | | Bank of America | | 11/3/15 | | 28,605,775 | | 1,726,880 | | 1,731,802 | | | (4,922 | ) | |
| Mexican Peso | | Barclays Bank PLC | | 11/3/15 | | 9,079,904 | | 553,942 | | 549,700 | | | 4,242 | | |
| Mexican Peso | | JPMorgan Chase Bank N.A. | | 11/3/15 | | 2,406,637 | | 143,000 | | 145,698 | | | (2,698 | ) | |
| Peruvian Nuevo | | Barclays Bank PLC | | 11/16/15 | | 194,190 | | 60,000 | | 59,183 | | | 817 | | |
| Peruvian Nuevo | | Credit Suisse | | 11/16/15 | | 2,066,709 | | 639,848 | | 629,867 | | | 9,981 | | |
| Peruvian Nuevo | | Credit Suisse | | 3/16/16 | | 1,279,299 | | 382,566 | | 381,419 | | | 1,147 | | |
| Philippine Peso | | Credit Suisse | | 1/15/16 | | 10,076,943 | | 220,261 | | 214,447 | | | 5,814 | | |
| Polish Zloty | | JPMorgan Chase Bank N.A. | | 1/25/16 | | 1,431,377 | | 379,419 | | 369,715 | | | 9,704 | | |
| 26 HSBC FAMILY OF FUNDS | | See notes to financial statements. |
| HSBC EMERGING MARKETS LOCAL DEBT FUND |
| Schedule of Portfolio Investments—as of October 31, 2015 (continued) |
| | | | | | | | | | | | | | | | | | | | Net |
| | | | | | | | Contract | | | | | | | | | | Unrealized |
| | | | | | | | Amount | | Contract | | | | | | Appreciation/ |
| | | | Delivery | | (Local | | Value | | Value | | (Depreciation) |
| Short Contracts | | | Counterparty | | Date | | Currency) | | ($) | | ($) | | ($) |
| Romanian Leu | | JPMorgan Chase Bank N.A. | | | 11/10/15 | | | | 394,225 | | | | 100,000 | | | | 97,792 | | | | 2,208 | | |
| Romanian Leu | | Standard Chartered Bank | | | 11/10/15 | | | | 827,304 | | | | 204,667 | | | | 205,222 | | | | (555 | ) | |
| Romanian Leu | | Barclays Bank PLC | | | 3/21/16 | | | | 1,161,530 | | | | 288,744 | | | | 288,061 | | | | 683 | | |
| Russian Ruble | | Barclays Bank PLC | | | 11/20/15 | | | | 3,308,037 | | | | 52,000 | | | | 51,638 | | | | 362 | | |
| Russian Ruble | | Barclays Bank PLC | | | 11/20/15 | | | | 23,016,130 | | | | 345,000 | | | | 359,280 | | | | (14,280 | ) | |
| Russian Ruble | | JPMorgan Chase Bank N.A. | | | 11/20/15 | | | | 2,373,709 | | | | 37,678 | | | | 37,053 | | | | 625 | | |
| Singapore Dollar | | Barclays Bank PLC | | | 1/29/16 | | | | 428,100 | | | | 300,000 | | | | 304,849 | | | | (4,849 | ) | |
| South African Rand | | Barclays Bank PLC | | | 11/30/15 | | | | 1,993,230 | | | | 142,249 | | | | 143,400 | | | | (1,151 | ) | |
| South African Rand | | Standard Chartered Bank | | | 11/30/15 | | | | 2,593,180 | | | | 196,976 | | | | 186,563 | | | | 10,413 | | |
| South African Rand | | JPMorgan Chase Bank N.A. | | | 12/15/15 | | | | 2,705,874 | | | | 205,046 | | | | 194,094 | | | | 10,952 | | |
| Taiwanese Dollar | | Standard Chartered Bank | | | 2/17/16 | | | | 12,018,547 | | | | 370,943 | | | | 370,569 | | | | 374 | | |
| Thai Baht | | Standard Chartered Bank | | | 11/6/15 | | | | 13,345,607 | | | | 368,051 | | | | 375,216 | | | | (7,165 | ) | |
| Thai Baht | | Standard Chartered Bank | | | 11/6/15 | | | | 58,889,381 | | | | 1,680,988 | | | | 1,655,693 | | | | 25,295 | | |
| Turkish Lira | | Barclays Bank PLC | | | 2/5/16 | | | | 2,506,448 | | | | 788,985 | | | | 836,319 | | | | (47,334 | ) | |
| | | | | | | | | | | | | 17,653,351 | | | | 17,314,642 | | | | 338,709 | | |
| See notes to financial statements. | HSBC FAMILY OF FUNDS 27 |
| HSBC EMERGING MARKETS LOCAL DEBT FUND |
| Schedule of Portfolio Investments—as of October 31, 2015 (continued) |
| | | | | | | | | | | | | | | | Net |
| | | | | | Contract | | | | | | | | | | Unrealized |
| | | | | | Amount | | Contract | | | | | | Appreciation/ |
| | | | Delivery | | (Local | | Value | | Value | | (Depreciation) |
| Long Contracts | | | Counterparty | | Date | | Currency) | | ($) | | ($) | | ($) |
| Brazilian Real | | Barclays Bank PLC | | 12/2/15 | | 10,035,943 | | | 2,890,293 | | | | 2,574,661 | | | | (315,632 | ) | |
| Brazilian Real | | Barclays Bank PLC | | 12/2/15 | | 294,476 | | | 75,000 | | | | 75,546 | | | | 546 | | |
| Brazilian Real | | Credit Suisse | | 12/2/15 | | 1,568,155 | | | 450,000 | | | | 402,301 | | | | (47,699 | ) | |
| Brazilian Real | | Standard Chartered Bank | | 12/2/15 | | 519,621 | | | 127,000 | | | | 133,305 | | | | 6,305 | | |
| Brazilian Real | | UBS AG | | 12/2/15 | | 362,345 | | | 100,000 | | | | 92,957 | | | | (7,043 | ) | |
| Chilean Peso | | Credit Suisse | | 12/4/15 | | 132,184,182 | | | 197,442 | | | | 190,583 | | | | (6,859 | ) | |
| Chilean Peso | | JPMorgan Chase Bank | | 12/4/15 | | 51,476,620 | | | 74,000 | | | | 74,219 | | | | 219 | | |
| Chilean Peso | | Standard Chartered Bank | | 12/4/15 | | 115,527,600 | | | 171,000 | | | | 166,568 | | | | (4,432 | ) | |
| Colombian Peso | | JPMorgan Chase Bank | | 1/14/16 | | 219,296,685 | | | 74,347 | | | | 75,018 | | | | 671 | | |
| Colombian Peso | | Barclays Bank PLC | | 1/14/16 | | 777,894,950 | | | 249,628 | | | | 266,105 | | | | 16,477 | | |
| European Euro | | JPMorgan Chase Bank | | 11/3/15 | | 65,996 | | | 75,471 | | | | 72,565 | | | | (2,906 | ) | |
| Hungarian Forint | | Standard Chartered Bank | | 2/9/16 | | 147,575,738 | | | 523,876 | | | | 522,355 | | | | (1,521 | ) | |
| Indonesian Rupiah | | Barclays Bank PLC | | 11/16/15 | | 2,911,060,771 | | | 211,560 | | | | 211,969 | | | | 409 | | |
| Indonesian Rupiah | | JPMorgan Chase Bank | | 11/16/15 | | 941,886,133 | | | 65,088 | | | | 68,583 | | | | 3,495 | | |
| Indonesian Rupiah | | JPMorgan Chase Bank | | 11/16/15 | | 2,790,702,257 | | | 203,300 | | | | 203,205 | | | | (95 | ) | |
| Indonesian Rupiah | | Bank of America | | 12/11/15 | | 225,000,000 | | | 15,000 | | | | 16,266 | | | | 1,266 | | |
| Indonesian Rupiah | | Barclays Bank PLC | | 12/11/15 | | 3,632,320,000 | | | 256,000 | | | | 262,595 | | | | 6,595 | | |
| Indonesian Rupiah | | Credit Suisse | | 12/11/15 | | 347,300,000 | | | 23,000 | | | | 25,108 | | | | 2,108 | | |
| Indonesian Rupiah | | Credit Suisse First Boston | | 12/11/15 | | 2,537,080,000 | | | 182,000 | | | | 183,416 | | | | 1,416 | | |
| Indonesian Rupiah | | JPMorgan Chase Bank | | 12/11/15 | | 1,713,005,000 | | | 121,000 | | | | 123,840 | | | | 2,840 | | |
| Indonesian Rupiah | | Standard Chartered Bank | | 12/11/15 | | 3,665,580,000 | | | 248,000 | | | | 264,999 | | | | 16,999 | | |
| Indonesian Rupiah | | UBS AG | | 12/11/15 | | 5,509,262,500 | | | 395,000 | | | | 398,287 | | | | 3,287 | | |
| Israeli Shekel | | Barclays Bank PLC | | 1/20/16 | | 307,474 | | | 80,000 | | | | 79,592 | | | | (408 | ) | |
| Israeli Shekel | | JPMorgan Chase Bank | | 1/20/16 | | 433,472 | | | 111,000 | | | | 112,207 | | | | 1,207 | | |
| Japanese Yen | | Standard Chartered Bank | | 1/29/16 | | 51,184,426 | | | 428,000 | | | | 424,998 | | | | (3,002 | ) | |
| Malaysian Ringgit | | Barclays Bank PLC | | 1/13/16 | | 2,289,860 | | | 549,324 | | | | 530,950 | | | | (18,374 | ) | |
| Malaysian Ringgit | | Standard Chartered Bank | | 1/13/16 | | 4,157,325 | | | 1,073,412 | | | | 963,959 | | | | (109,453 | ) | |
| Mexican Peso | | Barclays Bank PLC | | 11/3/15 | | 28,221,773 | | | 1,742,979 | | | | 1,708,553 | | | | (34,426 | ) | |
| Mexican Peso | | Barclays Bank PLC | | 11/3/15 | | 260,000 | | | 15,453 | | | | 15,740 | | | | 287 | | |
| Mexican Peso | | Credit Suisse | | 11/3/15 | | 7,578,675 | | | 450,000 | | | | 458,815 | | | | 8,815 | | |
| Mexican Peso | | JPMorgan Chase Bank | | 11/3/15 | | 4,031,868 | | | 238,296 | | | | 244,090 | | | | 5,794 | | |
| 28 HSBC FAMILY OF FUNDS | See notes to financial statements. |
| HSBC EMERGING MARKETS LOCAL DEBT FUND |
| Schedule of Portfolio Investments—as of October 31, 2015 (continued) |
| | | | | | | | | | | | | | | | Net |
| | | | | | Contract | | | | | | | | | | Unrealized |
| | | | | | Amount | | | Contract | | | | | | | Appreciation/ |
| | | | Delivery | | (Local | | | Value | | | | Value | | | (Depreciation) |
| Long Contracts | | | Counterparty | | Date | | Currency) | | ($) | | ($) | | ($) |
| Mexican Peso | | Bank of America | | 3/7/16 | | 28,605,775 | | | 1,711,742 | | | | 1,716,580 | | | | 4,838 | | |
| Peruvian Nuevo | | Barclays Bank PLC | | 11/16/15 | | 335,000 | | | 100,000 | | | | 102,097 | | | | 2,097 | | |
| Peruvian Nuevo | | Credit Suisse | | 11/16/15 | | 1,279,299 | | | 391,223 | | | | 389,889 | | | | (1,334 | ) | |
| Peruvian Nuevo | | Standard Chartered Bank | | 11/16/15 | | 646,600 | | | 200,000 | | | | 197,063 | | | | (2,937 | ) | |
| Phillippine Peso | | JPMorgan Chase Bank | | 1/15/16 | | 2,358,350 | | | 50,000 | | | | 50,188 | | | | 188 | | |
| Polish Zloty | | Barclays Bank PLC | | 1/25/16 | | 791,135 | | | 207,576 | | | | 204,345 | | | | (3,231 | ) | |
| Polish Zloty | | Standard Chartered Bank | | 1/25/16 | | 30,000 | | | 7,900 | | | | 7,749 | | | | (151 | ) | |
| Romanian Leu | | Barclays Bank PLC | | 11/10/15 | | 1,161,530 | | | 288,974 | | | | 288,130 | | | | (844 | ) | |
| Romanian Leu | | Standard Chartered Bank | | 11/10/15 | | 60,000 | | | 15,223 | | | | 14,884 | | | | (339 | ) | |
| Russian Ruble | | Barclays Bank PLC | | 11/20/15 | | 11,933,904 | | | 191,298 | | | | 186,288 | | | | (5,010 | ) | |
| Russian Ruble | | Credit Suisse | | 11/20/15 | | 2,660,000 | | | 40,000 | | | | 41,522 | | | | 1,522 | | |
| Russian Ruble | | UBS AG | | 11/20/15 | | 14,103,973 | | | 239,945 | | | | 220,162 | | | | (19,783 | ) | |
| Russian Ruble | | JPMorgan Chase Bank | | 3/23/16 | | 2,373,709 | | | 36,390 | | | | 35,824 | | | | (566 | ) | |
| South African Rand | | Standard Chartered Bank | | 11/30/15 | | 2,800,000 | | | 217,967 | | | | 201,442 | | | | (16,525 | ) | |
| South African Rand | | Barclays Bank PLC | | 12/15/15 | | 912,940 | | | 70,000 | | | | 65,486 | | | | (4,514 | ) | |
| South African Rand | | Standard Chartered Bank | | 12/15/15 | | 16,122,287 | | | 1,251,050 | | | | 1,156,460 | | | | (94,590 | ) | |
| Thai Baht | | Standard Chartered Bank | | 11/6/15 | | 64,855,993 | | | 1,900,193 | | | | 1,823,448 | | | | (76,745 | ) | |
| Thai Baht | | Standard Chartered Bank | | 11/6/15 | | 7,378,996 | | | 205,000 | | | | 207,463 | | | | 2,463 | | |
| Thai Baht | | Standard Chartered Bank | | 3/11/16 | | 35,911,731 | | | 1,002,342 | | | | 1,005,710 | | | | 3,368 | | |
| Turkish Lira | | Barclays Bank PLC | | 2/5/16 | | 849,250 | | | 283,982 | | | | 283,367 | | | | (615 | ) | |
| Turkish Lira | | Standard Chartered Bank | | 2/5/16 | | 30,000 | | | 9,674 | | | | 10,010 | | | | 336 | | |
| Turkish Lira | | Standard Chartered Bank | | 2/5/16 | | 2,175,051 | | | 729,889 | | | | 725,743 | | | | (4,146 | ) | |
| | | | | | | | | 20,566,837 | | | | 19,877,205 | | | | (689,632 | ) | |
| See notes to financial statements. | HSBC FAMILY OF FUNDS 29 |
| HSBC FRONTIER MARKETS FUND |
| Schedule of Portfolio Investments—as of October 31, 2015 |
| Common Stocks — 88.8% | | | | |
| | | | | |
| | Shares | | Value ($) |
| Argentina — 7.9% | | | | |
| Banco Macro SA, ADR (a) | | 77,595 | | 4,789,939 |
| Grupo Financiero Galicia SA, ADR | | 196,975 | | 5,269,082 |
| YPF Sociedad Anonima, ADR | | 51,253 | | 1,094,764 |
| | | | 11,153,785 |
| Cambodia — 1.6% | | | | |
| NagaCorp Ltd. | | 3,098,000 | | 2,198,467 |
| Colombia — 3.8% | | | | |
| Banco Davivienda SA | | 405,431 | | 3,334,726 |
| Cemex Latam Holdings SA (a) | | 585,187 | | 2,036,839 |
| | | | 5,371,565 |
| Croatia — 2.0% | | | | |
| Hrvatski Telekom dd | | 53,016 | | 1,137,260 |
| Ledo dd | | 1,252 | | 1,723,942 |
| | | | 2,861,202 |
| Egypt — 3.3% | | | | |
| Centamin plc | | 2,537,262 | | 2,487,358 |
Commercial International Bank,
Registered, GDR | | 375,493 | | 2,196,634 |
| | | | 4,683,992 |
| Georgia — 3.8% | | | | |
| Bank of Georgia Holdings plc | | 133,806 | | 4,124,977 |
| TBC Bank JSC, Registered, GDR | | 148,583 | | 1,228,781 |
| | | | 5,353,758 |
| Kazakhstan — 1.5% | | | | |
Halyk Savings Bank of Kazakhstan
JSC, Registered, GDR | | 345,616 | | 2,125,538 |
| Kenya — 1.4% | | | | |
| Safaricom Ltd. | | 13,841,200 | | 1,947,267 |
| Kuwait — 7.6% | | | | |
| Kuwait Projects Co. (Holding) KSC | | 1,988,796 | | 3,743,771 |
| Mabanee Co. SAKC | | 730,141 | | 2,073,716 |
| Mobile Telecommunications Co. | | 1,115,000 | | 1,380,862 |
| National Bank of Kuwait SAK | | 1,331,354 | | 3,605,384 |
| | | | 10,803,733 |
| Morocco — 2.4% | | | | |
| Attijariwafa Bank | | 100,200 | | 3,329,548 |
| Nigeria — 6.7% | | | | |
| Dangote Cement plc | | 3,435,345 | | 2,814,676 |
| Diamond Bank plc | | 106,627,229 | | 1,403,977 |
| Guaranty Trust Bank plc | | 11,251,260 | | 1,305,617 |
| Nestle Foods Nigeria plc | | 170,719 | | 707,834 |
| Nigerian Breweries plc | | 1,627,470 | | 1,119,305 |
| Zenith Bank plc | | 24,092,871 | | 2,131,041 |
| | | | 9,482,450 |
| Oman — 3.8% | | | | |
| Bank Muscat SAOG | | 2,567,173 | | 3,574,967 |
| Ooredoo | | 890,908 | | 1,768,391 |
| | | | 5,343,358 |
| Pakistan — 12.3% | | | | |
| D.G. Khan Cement Co. Ltd. | | 1,561,500 | | 2,083,333 |
| Engro Corp. Ltd. | | 1,327,697 | | 3,846,519 |
| Engro Fertilizers Ltd. | | 984,830 | | 854,397 |
| Lucky Cement Ltd. | | 273,400 | | 1,387,580 |
| MCB Bank Ltd. | | 854,869 | | 1,984,564 |
| Nishat Mills Ltd. (a) | | 2,785,700 | | 2,718,355 |
| The Hub Power Co. Ltd. | | 2,142,192 | | 2,117,415 |
| United Bank Ltd. | | 1,639,500 | | 2,550,955 |
| | | | 17,543,118 |
| Peru — 3.0% | | | | |
| Credicorp Ltd. | | 37,500 | | 4,244,250 |
| Philippines — 7.8% | | | | |
| Energy Development Corp. | | 19,363,700 | | 2,746,741 |
| First Gen Corp. | | 7,246,000 | | 3,916,339 |
| Robinsons Land Corp. | | 3,888,100 | | 2,541,676 |
| Vista Land & Lifescapes, Inc. | | 15,994,600 | | 1,903,224 |
| | | | 11,107,980 |
| Qatar — 5.0% | | | | |
| Gulf International Services QSC | | 48,689 | | 857,408 |
| Industries Qatar QSC | | 100 | | 3,379 |
| Qatar Electricity & Water Co. | | 38,912 | | 2,272,717 |
| Qatar National Bank | | 79,538 | | 3,987,826 |
| | | | 7,121,330 |
| Romania — 3.8% | | | | |
| BRD - Groupe Societe Generale (a) | | 289,007 | | 838,907 |
| Electrica SA | | 565,961 | | 1,651,252 |
| SIF 5 Oltenia Craiova | | 6,703,000 | | 2,847,033 |
| | | | 5,337,192 |
| South Korea — 0.4% | | | | |
| Kolao Holdings | | 44,243 | | 527,858 |
| Sri Lanka — 2.9% | | | | |
| John Keells Holdings plc | | 3,331,891 | | 4,127,044 |
| United Arab Emirates — 7.8% | | | | |
| Al Noor Hospitals Group plc | | 73,320 | | 1,329,063 |
| DP World Ltd. | | 122,187 | | 2,469,399 |
| Emaar Properties PJSC | | 1,593,642 | | 2,798,604 |
| Emirates NBD PJSC | | 329,214 | | 806,700 |
| Gulf Marine Services plc | | 977,741 | | 1,755,762 |
| NMC Health plc | | 113,534 | | 1,333,512 |
| Union National Bank PJSC | | 474,026 | | 722,738 |
| | | | 11,215,778 |
TOTAL COMMON STOCKS
(COST $142,469,040) | | | | 125,879,213 |
| 30 HSBC FAMILY OF FUNDS | | See notes to financial statements. |
| HSBC FRONTIER MARKETS FUND |
| Schedule of Portfolio Investments—as of October 31, 2015 (continued) |
| Convertible Corporate Bonds — 0.2% |
| | | | |
| | Principal | | | |
| | Amount ($) | | Value ($) |
| Oman — 0.2% | | | | | |
| Bank Muscat SAOG, | | | | | |
| 0.35%, 3/19/18 | | 383,981 | | | 93,775 |
| Bank Muscat SAOG, | | | | | |
| 0.45%, 3/20/16 | | 45,141 | | | 13,018 |
| Bank Muscat SAOG, | | | | | |
| 0.45%, 3/20/17 | | 270,600 | | | 70,304 |
| Renaissance Services SAOG, | | | | | |
| 0.38%, 7/25/17 | | 95,205 | | | 35,866 |
| | | | | | 212,963 |
| TOTAL CONVERTIBLE CORPORATE | | | | | |
| BONDS (COST $293,578) | | | | | 212,963 |
| |
| Participatory Notes — 10.7% | | | | | |
| | | | | | |
| | Shares | | Value ($) |
| Saudi Arabia — 3.5% | | | | | |
| Al Tayyar Travel Group Holding Co., | | | | | |
| 5/24/18, (Merrill Lynch | | | | | |
| International & Co.) (a) | | 132,488 | | | 2,306,520 |
| Jarir Marketing Co., 1/17/17, | | | | | |
| (Credit Suisse AG) | | 14,450 | | | 624,267 |
| Samba Financial Group, 9/27/16, | | | | | |
| (Deutsche Bank AG) | | 344,489 | | | 2,089,733 |
| | | | | 5,020,520 |
| United Arab Emirates — 2.5% | | | | | |
| Aramex PJSC, 3/30/16, | | | | | |
| (Merrill Lynch International & Co.) | | 4,220,314 | | | 3,550,538 |
| Vietnam — 4.7% | | | | | |
| PetroVietnam Drilling & Well Services | | | | | |
| JSC, 9/6/16, (JPMorgan Chase) (a) | | 926,195 | | | 1,527,676 |
| Vietnam Dairy Products JSC, | | | | | |
| 1/20/15, (Citigroup Global | | | | | |
| Markets Holding, Inc.) | | 447,137 | | | 2,364,850 |
| Vietnam Dairy Products JSC, 2/22/18, | | | | | |
| (JPMorgan Chase) | | 527,579 | | | 2,790,297 |
| | | | | 6,682,823 |
| TOTAL PARTICIPATORY NOTES | | | | | |
| (COST $18,119,293) | | | | | 15,253,881 |
| TOTAL INVESTMENT SECURITIES | | | | | |
| (COST $160,881,911) — 99.7% | | | | | 141,346,057 |
| Other Assets (Liabilities) — 0.3% | | | | | 420,239 |
| NET ASSETS — 100% | | | | $ | 141,766,296 |
____________________
(a) Represents non-income producing security.
ADR — American Depositary Receipt
GDR — Global Depository Receipt
The Fund invested, as a percentage of net assets at value, in the following industries, as of October 31, 2015:
| | Percentage of Net Assets |
| Industry | | at Value (%) |
| Banks | | | 39.3 | |
| Real Estate Management & Development | | | 6.6 | |
| Independent Power and | | | | |
| Renewable Electricity Producers | | | 6.2 | |
| Construction Materials | | | 5.9 | |
| Food Products | | | 5.4 | |
| Wireless Telecommunication Services | | | 3.6 | |
| Chemicals | | | 3.3 | |
| Hotels, Restaurants & Leisure | | | 3.2 | |
| Energy Equipment & Services | | | 2.9 | |
| Industrial Conglomerates | | | 2.9 | |
| Diversified Financial Services | | | 2.6 | |
| Air Freight & Logistics | | | 2.5 | |
| Capital Markets | | | 2.0 | |
| Health Care Providers & Services | | | 1.9 | |
| Textiles, Apparel & Luxury Goods | | | 1.9 | |
| Metals & Mining | | | 1.8 | |
| Transportation Infrastructure | | | 1.7 | |
| Multi-Utilities | | | 1.6 | |
| Electric Utilities | | | 1.2 | |
| Oil, Gas & Consumable Fuels | | | 0.8 | |
| Diversified Telecommunication Services | | | 0.8 | |
| Beverages | | | 0.8 | |
| Specialty Retail | | | 0.8 | |
| Total | | | 99.7 | |
| See notes to financial statements. | HSBC FAMILY OF FUNDS 31 |
| HSBC TOTAL RETURN FUND |
| Schedule of Portfolio Investments—as of October 31, 2015 |
| Foreign Bonds — 18.1%† |
| | | | | |
| | Principal | | |
| | Amount ($) | | Value ($) |
| Brazil — 5.1% | | | | |
| Letra Tesouro Nacional, | | | | |
| 13.36%, 1/1/16 | | 25,350,000 | | 6,426,690 |
| Nota do Tesouro Nacional, | | | | |
| 2.27%, 1/1/21 | | 255,000,000 | | 55,687,455 |
| | | | 62,114,145 |
| Mexico — 12.8% | | | | |
| Mexican Bonos Desarrollo, | | | | |
| 6.25%, 6/16/16 (a) | | 1,604,200,000 | | 98,798,076 |
| Mexican Bonos Desarrollo, | | | | |
| Series M, 6.50%, 6/10/21 (a) | | 1,000,000 | | 63,786 |
| Mexican Bonos Desarrollo, Series | | | | |
| M30, 10.00%, 11/20/36 (a) | | 711,800 | | 59,389 |
| Mexican Cetes, Series BI, | | | | |
| 2/18/16 | | 9,500,000,000 | | 56,960,768 |
| | | | 155,882,019 |
| South Africa — 0.2% | | | | |
| Republic of South Africa, Series | | | | |
| R203, 8.25%, 9/15/17 | | 35,115,000 | | 2,592,802 |
| TOTAL FOREIGN BONDS | | | | |
| (COST $241,900,352) | | | | 220,588,966 |
| | | | | |
| Yankee Dollars — 39.3% |
| | | | | |
| Barbados — 0.1% | | | | |
| Columbus International, Inc., | | | | |
| 7.38%, 3/30/21, Callable | | | | |
| 3/30/18 @ 103.68 (b) | | 1,100,000 | | 1,144,000 |
| Brazil — 4.1% | | | | |
| Banco Votorantim, Registered, | | | | |
| 5.25%, 2/11/16 | | 200,000 | | 200,000 |
| Caixa Economica Federal, | | | | |
| 4.50%, 10/3/18 | | 1,200,000 | | 1,155,000 |
| Caixa Economica Federal, | | | | |
| Registered, 2.38%, 11/6/17 | | 3,750,000 | | 3,520,313 |
| Caixa Economica Federal, | | | | |
| Registered, 4.50%, 10/3/18 | | 700,000 | | 673,750 |
| Centrais Eletricas Brasileiras SA, | | | | |
| Registered, 6.88%, 7/30/19 | | 780,000 | | 695,175 |
| Centrais Eletricas Brasileiras SA, | | | | |
| Registered, 5.75%, 10/27/21 | | 3,175,000 | | 2,527,300 |
| Federal Republic of Brazil, | | | | |
| 6.00%, 1/17/17 | | 10,900,000 | | 11,357,799 |
| Federal Republic of Brazil, | | | | |
| 5.88%, 1/15/19 | | 8,890,000 | | 9,476,740 |
| Federal Republic of Brazil, | | | | |
| 4.88%, 1/22/21 | | 7,225,000 | | 7,105,788 |
| Federal Republic of Brazil, | | | | |
| 2.63%, 1/5/23 | | 5,065,000 | | 4,183,690 |
| Federal Republic of Brazil, | | | | |
| 4.25%, 1/7/25 | | 1,825,000 | | 1,617,406 |
| Marfrig Overseas Ltd., | | | | |
| Registered, 9.50%, 5/4/20, | | | | |
| Callable 12/19/15 @ 104.75 (b) | | 1,100,000 | | 1,100,000 |
| Odebrecht Finance Ltd., | | | | |
| Registered, 4.38%, 4/25/25 | | 200,000 | | 120,400 |
| Odebrecht Finance Ltd., | | | | |
| Registered, 5.25%, 6/27/29 | | 4,295,000 | | 2,474,994 |
| Odebrecht Oil & Gas Finance Ltd., | | | | |
| 7.00%, 12/29/49 (a) | | 4,700,000 | | 1,175,000 |
| Odebrecht Drilling Norbe | | | | |
| VIII/IX Ltd., Registered, | | | | |
| 6.35%, 6/30/21, Callable | | | | |
| 6/30/20 @ 100 (b) | | 303,400 | | 148,666 |
| Odebrecht Finance Ltd., | | | | |
| Registered, 7.13%, 6/26/42, | | | | |
| Callable 12/26/41 @ 100 (b) | | 830,000 | | 493,850 |
| Petrobras International Finance Co., | | | | |
| 7.88%, 3/15/19 | | 800,000 | | 758,000 |
| Petrobras International Finance Co., | | | | |
| 5.38%, 1/27/21 | | 730,000 | | 594,038 |
| | | | 49,377,909 |
| Chile — 0.4% | | | | |
| Banco del Estado de Chile, | | | | |
| 2.00%, 11/9/17 | | 2,600,000 | | 2,612,793 |
| CorpBanca SA, 3.13%, 1/15/18 | | 1,975,000 | | 1,980,196 |
| Empresa Nacional de Petroleo, | | | | |
| Registered, 4.75%, 12/6/21 | | 465,000 | | 483,939 |
| | | | | 5,076,928 |
| China — 3.7% | | | | |
| CNOOC Curtis Funding No.1 | | | | |
| Pty Ltd., 4.50%, 10/3/23 | | 1,425,000 | | 1,490,463 |
| CNOOC Finance (2013) Ltd., | | | | |
| 1.13%, 5/9/16 | | 1,300,000 | | 1,298,293 |
| CNOOC Finance (2014) ULC, | | | | |
| 4.25%, 4/30/24 | | 1,000,000 | | 1,026,959 |
| CNPC (HK) Overseas Capital Ltd., | | | | |
| Registered, 3.13%, 4/28/16 | | 2,000,000 | | 2,016,210 |
| CNPC General Capital Ltd., | | | | |
| 1.45%, 4/16/16 | | 800,000 | | 800,354 |
| CNPC General Capital Ltd., | | | | |
| Registered, 1.45%, 4/16/16 | | 4,450,000 | | 4,451,789 |
| CNPC General Capital Ltd., | | | | |
| Registered, 2.75%, 4/19/17 | | 3,794,000 | | 3,846,702 |
| Industrial & Commercial Bank | | | | |
| of China, Series MTN, | | | | |
| 2.35%, 11/13/17 | | 2,300,000 | | 2,316,565 |
| Sinopec Capital (2013) Ltd., | | | | |
| 1.25%, 4/24/16 | | 3,300,000 | | 3,301,931 |
| Sinopec Capital (2013) Ltd., | | | | |
| 1.25%, 4/24/16 | | 3,375,000 | | 3,376,829 |
| Sinopec Capital (2013) Ltd., | | | | |
| 1.88%, 4/24/18 | | 3,700,000 | | 3,677,149 |
| Sinopec Group Overseas 2014, | | | | |
| 1.75%, 4/10/17 | | 1,800,000 | | 1,799,545 |
| 32 HSBC FAMILY OF FUNDS | See notes to financial statements. |
| HSBC TOTAL RETURN FUND |
| Schedule of Portfolio Investments—as of October 31, 2015 (continued) |
| Yankee Dollars, continued |
| | | | | |
| | Principal | | |
| | Amount ($) | | Value ($) |
| China (continued) | | | | |
| Sinopec Group Overseas | | | | |
| Development (2012) Ltd., | | | | |
| Registered, 3.90%, 5/17/22 | | 10,000,000 | | 10,288,259 |
| Sinopec Group Overseas | | | | |
| Development (2013) Ltd., | | | | |
| 4.38%, 10/17/23 | | 5,400,000 | | 5,651,516 |
| | | | 45,342,564 |
| Colombia — 6.9% | | | | |
| Banco Davivienda SA, Registered, | | | | |
| 2.95%, 1/29/18 | | 4,780,000 | | 4,747,496 |
| Banco de Bogota SA, Registered, | | | | |
| 5.00%, 1/15/17 | | 600,000 | | 621,000 |
| Grupo Aval Ltd., Registered, | | | | |
| 5.25%, 2/1/17 | | 8,440,000 | | 8,648,468 |
| Grupo Aval Ltd., Registered, | | | | |
| 4.75%, 9/26/22 | | 380,000 | | 370,462 |
| Republic of Colombia, | | | | |
| 7.38%, 1/27/17 | | 29,410,000 | | 31,571,634 |
| Republic of Colombia, | | | | |
| 7.38%, 3/18/19 | | 26,185,000 | | 29,955,640 |
| Republic of Colombia, | | | | |
| 4.38%, 7/12/21 | | 7,230,000 | | 7,439,670 |
| Republic of Colombia, | | | | |
| 6.13%, 1/18/41 | | 1,330,000 | | 1,366,575 |
| | | | 84,720,945 |
| Costa Rica — 0.4% | | | | |
| Costa Rica Government | | | | |
| International Bond, Registered, | | | | |
| 4.25%, 1/26/23 | | 3,140,000 | | 2,826,000 |
| Costa Rica Government | | | | |
| International Bond, Registered, | | | | |
| 4.38%, 4/30/25 | | 970,000 | | 839,050 |
| Republic of Costa Rica, | | | | |
| 4.25%, 1/26/23 | | 1,200,000 | | 1,080,000 |
| | | | 4,745,050 |
| Gabon — 0.2% | | | | |
| Gabonese Republic, | | | | |
| 6.38%, 12/12/24 | | 2,200,000 | | 1,892,000 |
| Gabonese Republic, Registered, | | | | |
| 6.38%, 12/12/24 | | 900,000 | | 774,000 |
| | | | 2,666,000 |
| Hong Kong — 0.6% | | | | |
| State Grid Overseas Investment, | | | | |
| Registered, 1.75%, 5/22/18 | | 7,000,000 | | 6,964,888 |
| India — 0.1% | | | | |
| ICICI Bank Ltd., 5.00%, 1/15/16 | | 250,000 | | 251,722 |
| ICICI Bank Ltd., 4.75%, 11/25/16 | | 600,000 | | 619,004 |
| | | | 870,726 |
| Indonesia — 3.7% | | | | |
| PT Pertamina (Persero) Tbk, | | | | |
| 4.30%, 5/20/23 | | 1,300,000 | | 1,228,167 |
| PT Pertamina Tbk, Registered, | | | | |
| 4.88%, 5/3/22 | | 1,300,000 | | 1,279,850 |
| Republic of Indonesia, | | | | |
| 5.88%, 1/15/24 | | 3,700,000 | | 4,085,218 |
| Republic of Indonesia, Registered, | | | | |
| 7.50%, 1/15/16 | | 4,323,000 | | 4,373,532 |
| Republic of Indonesia, Registered, | | | | |
| 6.88%, 3/9/17 | | 3,300,000 | | 3,532,650 |
| Republic of Indonesia, Registered, | | | | |
| 11.63%, 3/4/19 | | 6,340,000 | | 8,117,495 |
| Republic of Indonesia, Registered, | | | | |
| 5.88%, 3/13/20 | | 1,800,000 | | 1,997,158 |
| Republic of Indonesia, Registered, | | | | |
| 4.88%, 5/5/21 | | 12,160,000 | | 12,775,392 |
| Republic of Indonesia, Registered, | | | | |
| 3.75%, 4/25/22 | | 5,115,000 | | 5,064,075 |
| Republic of Indonesia, Registered, | | | | |
| 5.38%, 10/17/23 | | 1,740,000 | | 1,864,692 |
| Republic of Indonesia, Registered, | | | | |
| 5.25%, 1/17/42 | | 425,000 | | 403,538 |
| | | | 44,721,767 |
| Israel — 0.5% | | | | |
| Delek & Avner (Tamar Bond) Ltd., | | | | |
| 2.80%, 12/30/16 | | 1,000,000 | | 990,000 |
| Israel Electric Corp. Ltd., | | | | |
| Registered, 5.63%, 6/21/18 | | 5,000,000 | | 5,328,800 |
| | | | 6,318,800 |
| Kazakhstan — 0.1% | | | | |
| Development Bank of Kazakhstan, | | | | |
| 4.13%, 12/10/22 | | 1,000,000 | | 874,976 |
| Lithuania — 0.1% | | | | |
| Republic of Lithuania, Registered, | | | | |
| 7.38%, 2/11/20 | | 870,000 | | 1,044,740 |
| Malaysia — 0.1% | | | | |
| Petronas Capital Ltd., | | | | |
| 3.13%, 3/18/22 | | 1,580,000 | | 1,547,613 |
| Mexico — 3.1% | | | | |
| Comision Federal de Electricidad, | | | | |
| 4.88%, 1/15/24 | | 1,600,000 | | 1,636,000 |
| Petroleos Mexicanos, | | | | |
| 3.50%, 7/18/18 | | 4,500,000 | | 4,576,500 |
| Petroleos Mexicanos, | | | | |
| 5.50%, 1/21/21 | | 6,650,000 | | 7,098,875 |
| Petroleos Mexicanos, | | | | |
| 4.88%, 1/18/24 | | 250,000 | | 249,800 |
| United Mexican States, | | | | |
| 3.63%, 3/15/22 | | 2,604,000 | | 2,666,496 |
| United Mexican States, | | | | |
| 4.00%, 10/2/23 | | 8,560,000 | | 8,833,920 |
| United Mexican States, | | | | |
| 3.60%, 1/30/25 | | 2,340,000 | | 2,328,300 |
| United Mexican States, Series A, | | | | |
| 6.05%, 1/11/40 | | 4,170,000 | | 4,712,100 |
| See notes to financial statements. | HSBC FAMILY OF FUNDS 33 |
| HSBC TOTAL RETURN FUND |
| Schedule of Portfolio Investments—as of October 31, 2015 (continued) |
| Yankee Dollars, continued |
| | | | | |
| | Principal | | |
| | Amount ($) | | Value ($) |
| Mexico (continued) | | | | |
| United Mexican States, | | | | |
| 4.75%, 3/8/44 | | 330,000 | | 313,500 |
| United Mexican States, | | | | |
| 5.55%, 1/21/45 | | 2,170,000 | | 2,297,488 |
| United Mexican States, | | | | |
| 4.60%, 1/23/46 | | 3,080,000 | | 2,860,550 |
| | | | 37,573,529 |
| Namibia — 0.1% | | | | |
| Namibia International Bond, | | | | |
| Registered, 5.50%, 11/3/21 | | 1,090,000 | | 1,138,047 |
| Netherlands — 3.0% | | | | |
| Majapahit Holding BV, | | | | |
| 7.25%, 6/28/17 | | 1,880,000 | | 2,006,900 |
| Majapahit Holding BV, Registered, | | | | |
| 7.75%, 10/17/16 | | 3,314,000 | | 3,471,415 |
| Marfrig Holding Europe BV, | | | | |
| Registered, 6.88%, 6/24/19, | | | | |
| Callable 6/24/17 @ 103.43 (b) | | 1,900,000 | | 1,733,750 |
| Petrobras Brasileiro SA, | | | | |
| 6.85%, 6/5/15 | | 1,465,000 | | 1,005,283 |
| Petrobras Global Finance BV, | | | | |
| 3.25%, 3/17/17 | | 3,580,000 | | 3,411,740 |
| Petrobras Global Finance BV, | | | | |
| 4.38%, 5/20/23 | | 6,440,000 | | 4,693,150 |
| Petrobras Global Finance BV, | | | | |
| 6.25%, 3/17/24 | | 24,595,000 | | 19,699,365 |
| | | | 36,021,603 |
| Panama — 0.5% | | | | |
| Republic of Panama, | | | | |
| 5.20%, 1/30/20 | | 5,240,000 | | 5,737,800 |
| Republic of Panama, | | | | |
| 6.70%, 1/26/36 | | 360,000 | | 445,500 |
| | | | 6,183,300 |
| Peru — 1.4% | | | | |
| BBVA Banco Continental SA, | | | | |
| Registered, 2.25%, 7/29/16 | | 6,400,000 | | 6,441,600 |
| Continental Senior Trust, | | | | |
| Registered, 5.75%, 1/18/17 | | 5,050,000 | | 5,201,500 |
| Republic of Peru, | | | | |
| 4.13%, 8/25/27 | | 3,500,000 | | 3,517,500 |
| Republic of Peru, | | | | |
| 6.55%, 3/14/37 | | 1,660,000 | | 2,004,450 |
| | | | 17,165,050 |
|
| Republic of Serbia — 0.4% | | | | |
| Republic of Serbia, | | | | |
| 5.88%, 12/3/18 | | 2,800,000 | | 2,972,536 |
| Republic of Serbia, | | | | |
| 4.88%, 2/25/20 | | 925,000 | | 953,906 |
| Republic of Serbia, Registered, | | | | |
| 5.25%, 11/21/17 | | 410,000 | | 427,170 |
| | | | 4,353,612 |
| Russian Federation — 0.1% | | | | |
| Gazprom OAO Via Gaz Capital SA, | | | | |
| Registered, 8.15%, 4/11/18 | | 370,000 | | 400,407 |
| Gazprom OAO Via Gaz Capital SA, | | | | |
| Registered, 4.95%, 7/19/22 | | 260,000 | | 250,900 |
| Russian Federation, Registered, | | | | |
| 4.88%, 9/16/23 | | 200,000 | | 206,740 |
| | | | 858,047 |
| South Africa — 3.1% | | | | |
| Eskom Holdings SOC Ltd., | | | | |
| 6.75%, 8/6/23 | | 800,000 | | 742,800 |
| Republic of South Africa, | | | | |
| 6.88%, 5/27/19 | | 25,230,000 | | 28,131,450 |
| Republic of South Africa, | | | | |
| 5.50%, 3/9/20 | | 4,375,000 | | 4,703,125 |
| Republic of South Africa, | | | | |
| 5.88%, 5/30/22 | | 3,400,000 | | 3,735,750 |
| | | | 37,313,125 |
| South Korea — 0.3% | | | | |
| Export-Import Bank of Korea, | | | | |
| 1.07%, 1/14/17 (a) | | 3,600,000 | | 3,606,646 |
| Turkey — 5.2% | | | | |
| Republic of Turkey, | | | | |
| 7.00%, 9/26/16 | | 41,500,000 | | 43,379,950 |
| Republic of Turkey, | | | | |
| 7.50%, 7/14/17 | | 2,860,000 | | 3,098,953 |
| Republic of Turkey, | | | | |
| 6.75%, 4/3/18 | | 3,300,000 | | 3,588,750 |
| Republic of Turkey, | | | | |
| 7.50%, 11/7/19 | | 2,540,000 | | 2,909,443 |
| Republic of Turkey, | | | | |
| 6.25%, 9/26/22 | | 5,500,000 | | 6,105,000 |
| Turkiye Halk Bankasi AS, | | | | |
| 3.88%, 2/5/20 | | 2,500,000 | | 2,390,625 |
| Turkiye Is Bankasi AS, | | | | |
| 3.88%, 11/7/17 | | 1,000,000 | | 1,007,500 |
| Turkiye Is Bankasi AS, | | | | |
| 5.50%, 4/21/19 | | 1,450,000 | | 1,500,750 |
| Turkiye Vakiflar Bankasi TAO, | | | | |
| 5.00%, 10/31/18 | | 800,000 | | 811,802 |
| | | | | 64,792,773 |
| United States — 0.9% | | | | |
| Pemex Project Funding Master | | | | |
| Trust, 5.75%, 3/1/18 | | 10,000,000 | | 10,621,500 |
| Uruguay — 0.2% | | | | |
| Republica Oriental del Uruguay, | | | | |
| 4.50%, 8/14/24 | | 1,755,000 | | 1,825,200 |
| TOTAL YANKEE DOLLARS | | | | |
| (COST $483,180,345) | | | | 476,869,338 |
| 34 HSBC FAMILY OF FUNDS | See notes to financial statements. |
| HSBC TOTAL RETURN FUND |
| Schedule of Portfolio Investments—as of October 31, 2015 (continued) |
| U.S. Treasury Obligations — 20.7% |
| | | |
| | Principal | | |
| | Amount ($) | | Value ($) |
| U.S. Treasury Bills — 13.7% | | | | |
| 0.10% (c), 3/10/16 | | 74,000,000 | | 73,973,804 |
| 0.13% (c), 3/24/16 | | 52,870,000 | | 52,841,397 |
| 0.18% (c), 3/31/16 | | 39,382,000 | | 39,352,660 |
| | | | 166,167,861 |
| U.S. Treasury Notes — 7.0% | | | | |
| 1.25%, 1/31/20 | | 29,800,000 | | 29,595,125 |
| 1.38%, 2/29/20 | | 11,870,000 | | 11,846,818 |
| 1.38%, 3/31/20 | | 4,000,000 | | 3,986,668 |
| 2.13%, 5/15/25 | | 39,500,000 | | 39,432,100 |
| | | | 84,860,711 |
| TOTAL U.S. TREASURY | | | | |
| OBLIGATIONS | | | | |
| (COST $250,116,796) | | | | 251,028,572 |
| |
| Affiliated Investment Company — 2.1% |
| | | |
| | Shares | | Value ($) |
| HSBC Prime Money Market Fund, | | | | |
| Class I Shares, 0.07% (d) | | 25,000,000 | | 25,000,000 |
| TOTAL AFFILIATED | | | | |
| INVESTMENT COMPANY | | | | |
| (COST $25,000,000) | | | | 25,000,000 |
| | | |
| Investment Companies — 19.2% | | |
| | | |
| Northern Institutional Diversified | | | | |
| Assets Portfolio, Institutional | | | | |
| Shares, 0.01% (d) | | 233,566,623 | | 233,566,623 |
| TOTAL INVESTMENT | | | | |
| COMPANIES (COST | | | | |
| $233,566,623) | | | | 233,566,623 |
| TOTAL INVESTMENT | | | | |
| SECURITIES (COST | | | | |
| $1,233,764,116) — 99.4% | | | | 1,207,053,499 |
| Other Assets | | | | |
| (Liabilities) — 0.6% | | | | 7,632,578 |
| NET ASSETS — 100% | | | | $1,214,686,077 |
____________________
| † | | The principal amount is disclosed in local currency and the value is disclosed in U.S. Dollars. |
| (a) | | Variable rate security. The interest rates on these securities are adjusted periodically to reflect then-current short-term interest rates. The rates presented represent the rates in effect on October 31, 2015. The maturity dates presented reflect the final maturity dates. However, some of these securities may contain put or demand features that allow the Fund to require the issuer to repurchase the security from the fund within various time periods, including daily, weekly, monthly, or semi-annually. |
| (b) | | Represents next call date. Additional subsequent call dates and amounts may apply to this security. |
| (c) | | Rate presented represents the effective yield at time of purchase. |
| (d) | | The rate represents the annualized one-day yield that was in effect on October 31, 2015. |
| MTN — Medium Term Note |
| ULC — Unlimited Liability Co. |
The Fund invested, as a percentage of net assets at value, in the following industries, as of October 31, 2015:
| Percentage of Net Assets |
| Industry | at Value (%) |
| Sovereign Bonds | | 41.5 | |
| U.S. Treasury Obligation | �� | 20.7 | |
| Investment Companies | | 19.2 | |
| Oil, Gas & Consumable Fuels | | 8.3 | |
| Banks | | 3.9 | |
| Affiliated Investment Company | | 2.1 | |
| Electric Utilities | | 2.0 | |
| Sovereign | | 1.0 | |
| Food Products | | 0.2 | |
| Construction & Engineering | | 0.2 | |
| Media | | 0.1 | |
| Energy Equipment & Services | | 0.1 | |
| Diversified Financial Services | | 0.1 | |
| Industrial Conglomerates | | 0.0 | |
| Total | | 99.4 | |
| See notes to financial statements. | HSBC FAMILY OF FUNDS 35 |
| HSBC TOTAL RETURN FUND |
| Schedule of Portfolio Investments—as of October 31, 2015 (continued) |
Futures Contracts Sold
| | | | | | | | | | Unrealized |
| | | | Expiration | | Number of | | Notional | | Appreciation/ |
| Description | | | Type | | Date | | Contracts | | Value | | (Depreciation) |
| 10-Year U.S. Treasury Note December Future | | Short | | 12/21/15 | | 930 | | $118,749,375 | | | $ | (74,642 | ) | |
| | | | | | | | $118,749,375 | | | $ | (74,642 | ) | |
Interest Rate Swap Agreements
At October 31, 2015, the Fund’s open interest rate swap agreements were as follows:
| | | | | | | | | | | | | | | | | | Unrealized |
| Pay/Receive | | | | Fixed | | | | | | Notional | | Notional | | | | Appreciation/ |
| Floating | | | | Rate | | Expiration | | | | Amount | | Amount | | Value | | (Depreciation) |
| Rate | | Floating Rate Index | | (%) | | Date | | Counterparty | | (Local) | | ($) | | ($) | | ($) |
| | | | | | | | | Barclays | | | | | | | | | | | | | |
| Pay | | 1-Year BRL CDI | | 13.87 | | 1/2/17 | | Bank PLC | | 96,238,551 | BRL | | 24,959,425 | | (350,115 | ) | | | (350,115 | ) | |
| | | | | | | | Standard | | | | | | | | | | | | | |
| Receive | | 3-Month LIBOR BBA | | 1.96 | | 5/17/22 | | Chartered Bank | | 1,200,000 | USD | | 1,200,000 | | (26,673 | ) | | | (26,673 | ) | |
| | | | | | | | Barclays | | | | | | | | | | | | | |
| Receive | | 3-Month LIBOR BBA | | 1.77 | | 8/10/22 | | Bank PLC | | 13,000,000 | USD | | 13,000,000 | | (42,743 | ) | | | (42,743 | ) | |
| | | | | | | | | | | | | | | (419,531 | ) | | | (419,531 | ) | |
Credit Default Swap Agreements - Buy Protection(a)
At October 31, 2015, the Fund’s open credit default swap agreements were as follows:
| | | | | | | | | | | | | | | | | Upfront | | | | | |
| | | | | | Implied Credit | | | | | | | | | Premiums | | Unrealized |
| | | | | | Spread at | | Notional | | Fixed | | | | | Paid/ | | Appreciation/ |
| | | | Expiration | | October 31, | | Amount | | Rate | | Value | | (Received) | | (Depreciation) |
| Underlying Instrument | | Counterparty | | Date | | 2015 (%)(b) | | ($)(c) | | (%) | | ($) | | ($) | | ($) |
| CDX Emerging Markets | | | | | | | | | | | | | | | | | | | | | | | | | |
| Index, Series 23 | | Barclays Bank PLC | | 6/20/20 | | | 3.22 | | | 42,630,000 | | 1.00 | | 3,847,973 | | | | 4,199,055 | | | | | (351,082 | ) | |
| Emirate of Abu Dhabi | | | | | | | | | | | | | | | | | | | | | | | | | |
| United Arab Emirates | | Barclays Bank PLC | | 6/20/18 | | | 0.44 | | | 4,400,000 | | 1.00 | | (72,464 | ) | | | (72,021 | ) | | | | (443 | ) | |
| | JPMorgan Chase | | | | | | | | | | | | | | | | | | | | | | | |
| Republic of Korea | | Bank N.A. | | 9/20/17 | | | 0.20 | | | 100,000 | | 1.00 | | (1,636 | ) | | | 1,211 | | | | | (2,847 | ) | |
| | JPMorgan Chase | | | | | | | | | | | | | | | | | | | | | | | |
| Republic of Korea | | Bank N.A. | | 9/20/17 | | | 0.23 | | | 5,000,000 | | 1.00 | | (81,809 | ) | | | 12,068 | | | | | (93,877 | ) | |
| | JPMorgan Chase | | | | | | | | | | | | | | | | | | | | | | | |
| Republic of Korea | | Bank N.A. | | 6/20/18 | | | 0.30 | | | 5,500,000 | | 1.00 | | (109,513 | ) | | | (65,689 | ) | | | | (43,824 | ) | |
| | JPMorgan Chase | | | | | | | | | | | | | | | | | | | | | | | |
| Republic of Korea | | Bank N.A. | | 6/20/18 | | | 0.30 | | | 6,000,000 | | 1.00 | | (119,469 | ) | | | (77,634 | ) | | | | (41,835 | ) | |
| | JPMorgan Chase | | | | | | | | | | | | | | | | | | | | | | | |
| Republic of Korea | | Bank N.A. | | 6/20/18 | | | 0.30 | | | 7,000,000 | | 1.00 | | (139,380 | ) | | | (45,513 | ) | | | | (93,867 | ) | |
| | JPMorgan Chase | | | | | | | | | | | | | | | | | | | | | | | |
| Republic of Korea | | Bank N.A. | | 6/20/18 | | | 0.30 | | | 7,000,000 | | 1.00 | | (139,379 | ) | | | (59,599 | ) | | | | (79,780 | ) | |
| | Credit Suisse | | | | | | | | | | | | | | | | | | | | | | | |
| Republic of Korea | | International | | 6/20/18 | | | 0.30 | | | 6,000,000 | | 1.00 | | (119,469 | ) | | | (63,927 | ) | | | | (55,542 | ) | |
| Republic of Korea | | Barclays Bank PLC | | 12/20/18 | | | 0.36 | | | 5,500,000 | | 1.00 | | (121,360 | ) | | | (97,481 | ) | | | | (23,879 | ) | |
| | JPMorgan Chase | | | | | | | | | | | | | | | | | | | | | | | |
| Republic of Korea | | Bank N.A | | 12/20/18 | | | 0.36 | | | 10,500,000 | | 1.00 | | (231,686 | ) | | | (191,452 | ) | | | | (40,234 | ) | |
| Republic of Korea | | Barclays Bank PLC | | 12/20/18 | | | 0.36 | | | 5,500,000 | | 1.00 | | (121,360 | ) | | | (97,533 | ) | | | | (23,827 | ) | |
| | JPMorgan Chase | | | | | | | | | | | | | | | | | | | | | | | |
| Republic of Philippines | | Bank N.A | | 9/20/17 | | | 0.41 | | | 1,700,000 | | 1.00 | | (22,252 | ) | | | 38,756 | | | | | (61,008 | ) | |
| State of Qatar | | Barclays Bank PLC | | 9/20/17 | | | 0.36 | | | 6,250,000 | | 1.00 | | (85,717 | ) | | | 74,259 | | | | | (159,976 | ) | |
| | | | | | | | | | | | | | 2,482,479 | | | | 3,554,500 | | | | | (1,072,021 | ) | |
| 36 HSBC FAMILY OF FUNDS | See notes to financial statements. |
| HSBC TOTAL RETURN FUND |
| Schedule of Portfolio Investments—as of October 31, 2015 (continued) |
Credit Default Swap Agreements - Sell Protection(a)
At October 31, 2015, the Fund’s open credit default swap agreements were as follows:
| | | | | | | | | | | | | | | Upfront | | | | | |
| | | | | | Implied Credit | | | | | | | | | Premiums | | Unrealized |
| | | | | | Spread at | | Notional | | | | | | | Paid/ | | Appreciation/ |
| | | | Expiration | | October 31, | | Amount | | Fixed | | Value | | (Received) | | (Depreciation) |
| Underlying Instrument | | Counterparty | | Date | | 2015 (%)(b) | | ($)(c) | | Rate (%) | | ($) | | ($) | | ($) |
| Federative Republic | | Credit Suisse | | | | | | | | | | | | | | | | | | | | | |
| of Brazil | | International | | 6/20/18 | | 3.69 | | 14,000,000 | | 1.00 | | (899,887 | ) | | | (297,736 | ) | | | | (602,151 | ) | |
| Federative Republic | | | | | | | | | | | | | | | | | | | | | | | |
| of Brazil | | Barclays Bank PLC | | 6/20/18 | | 3.69 | | 2,500,000 | | 1.00 | | (160,764 | ) | | | (39,915 | ) | | | | (120,849 | ) | |
| Federative Republic | | Credit Suisse | | | | | | | | | | | | | | | | | | | | | |
| of Brazil | | International | | 6/20/18 | | 3.69 | | 4,500,000 | | 1.00 | | (289,249 | ) | | | (96,534 | ) | | | | (192,715 | ) | |
| Federative Republic | | JPMorgan Chase | | | | | | | | | | | | | | | | | | | | | |
| of Brazil | | Bank N.A | | 6/20/18 | | 3.57 | | 2,500,000 | | 1.00 | | (160,694 | ) | | | (46,715 | ) | | | | (113,979 | ) | |
| Federative Republic | | | | | | | | | | | | | | | | | | | | | | | |
| of Brazil | | Barclays Bank PLC | | 6/20/20 | | 4.24 | | 9,000,000 | | 1.00 | | (1,175,627 | ) | | | (833,656 | ) | | | | (341,971 | ) | |
| Federative Republic | | | | | | | | | | | | | | | | | | | | | | | |
| of Brazil | | Barclays Bank PLC | | 6/20/20 | | 4.18 | | 28,200,000 | | 1.00 | | (3,682,064 | ) | | | (2,794,732 | ) | | | | (887,332 | ) | |
| Federative Republic | | | | | | | | | | | | | | | | | | | | | | | |
| of Brazil | | Barclays Bank PLC | | 6/20/20 | | 4.24 | | 5,500,000 | | 1.00 | | (718,439 | ) | | | (492,196 | ) | | | | (226,243 | ) | |
| Federative Republic | | Credit Suisse | | | | | | | | | | | | | | | | | | | | | |
| of Brazil | | International | | 6/20/20 | | 4.24 | | 20,000,000 | | 1.00 | | (2,611,393 | ) | | | (1,236,268 | ) | | | | (1,375,125 | ) | |
| Federative Republic | | | | | | | | | | | | | | | | | | | | | | | |
| of Brazil | | Barclays Bank PLC | | 9/20/20 | | 4.31 | | 5,450,000 | | 1.00 | | (757,470 | ) | | | (565,326 | ) | | | | (192,144 | ) | |
| Federative Republic | | Credit Suisse | | | | | | | | | | | | | | | | | | | | | |
| of Brazil | | International | | 9/20/20 | | 4.31 | | 1,800,000 | | 1.00 | | (250,174 | ) | | | (183,479 | ) | | | | (66,695 | ) | |
| People’s Republic | | JPMorgan Chase | | | | | | | | | | | | | | | | | | | | | |
| of China | | Bank N.A | | 6/20/18 | | 0.47 | | 5,500,000 | | 1.00 | | 73,285 | | | | 71,224 | | | | | 2,061 | | |
| People’s Republic | | JPMorgan Chase | | | | | | | | | | | | | | | | | | | | | |
| of China | | Bank N.A | | 6/20/18 | | 0.47 | | 6,000,000 | | 1.00 | | 79,947 | | | | 83,677 | | | | | (3,730 | ) | |
| People’s Republic | | Credit Suisse | | | | | | | | | | | | | | | | | | | | | |
| of China | | International | | 6/20/18 | | 0.47 | | 6,000,000 | | 1.00 | | 79,947 | | | | 37,634 | | | | | 42,313 | | |
| | | Credit Suisse | | | | | | | | | | | | | | | | | | | | | |
| Republic of Colombia | | International | | 6/20/20 | | 1.93 | | 10,000,000 | | 1.00 | | (411,761 | ) | | | (216,616 | ) | | | | (195,145 | ) | |
| | | JPMorgan Chase | | | | | | | | | | | | | | | | | | | | | |
| Republic of Peru | | Bank N.A | | 6/20/17 | | 0.86 | | 100,000 | | 1.00 | | 391 | | | | (3,224 | ) | | | | 3,615 | | |
| Republic of Peru | | Bank of America | | 3/20/20 | | 1.52 | | 5,000,000 | | 1.00 | | (106,277 | ) | | | (52,494 | ) | | | | (53,783 | ) | |
| | | Credit Suisse | | | | | | | | | | | | | | | | | | | | | |
| Republic of Peru | | International | | 6/20/20 | | 1.58 | | 5,000,000 | | 1.00 | | (125,846 | ) | | | (84,791 | ) | | | | (41,055 | ) | |
| Republic of | | | | | | | | | | | | | | | | | | | | | | | |
| South Africa | | Barclays Bank PLC | | 12/20/17 | | 1.52 | | 3,500,000 | | 1.00 | | (39,090 | ) | | | (88,148 | ) | | | | 49,058 | | |
| Republic of | | JPMorgan Chase | | | | | | | | | | | | | | | | | | | | | |
| South Africa | | Bank N.A | | 12/20/17 | | 1.52 | | 3,500,000 | | 1.00 | | (39,090 | ) | | | (99,897 | ) | | | | 60,807 | | |
| Republic of | | JPMorgan Chase | | | | | | | | | | | | | | | | | | | | | |
| South Africa | | Bank N.A | | 9/20/18 | | 1.57 | | 13,000,000 | | 1.00 | | (302,138 | ) | | | (716,665 | ) | | | | 414,527 | | |
| Republic of | | JPMorgan Chase | | | | | | | | | | | | | | | | | | | | | |
| South Africa | | Bank N.A | | 3/20/19 | | 1.66 | | 12,700,000 | | 1.00 | | (408,037 | ) | | | (725,926 | ) | | | | 317,889 | | |
| Republic of | | | | | | | | | | | | | | | | | | | | | | | |
| South Africa | | Bank of America | | 3/20/20 | | 2.04 | | 6,000,000 | | 1.00 | | (316,653 | ) | | | (254,676 | ) | | | | (61,977 | ) | |
| Republic of Turkey | | Barclays Bank PLC | | 6/20/19 | | 2.07 | | 10,500,000 | | 1.00 | | (392,276 | ) | | | (724,262 | ) | | | | 331,986 | | |
| | | | | | | | | | | | (12,613,359 | ) | | | (9,360,721 | ) | | | | (3,252,638 | ) | |
| (a) | | When a credit event occurs as defined under the terms of the swap agreement, the Fund as a seller of credit protection will either (i) pay to the buyer of protection an amount equal to the par value of the defaulted reference entity and take delivery of the reference entity or (ii) pay a net amount equal to the par value of the defaulted reference entity less its recovery value. Alternatively, the Fund as a buyer of credit protection will either (i) receive from the seller of protection an amount equal to the par value of the defaulted reference entity and deliver the reference entity to the seller or (ii) receive a net amount equal to the par value of the defaulted reference entity less its recovery value. |
| (b) | | Implied credit spread, represented in absolute terms, utilized in determining the fair value of the credit default swap agreements as of period end serve as an indicator of the current status of the payment/performance risk and represents the likelihood or risk of default for the credit derivative. The implied credit spread of a referenced entity reflects the cost of buying/selling protection and may include upfront payments required to be made to enter into the agreement. Generally, wider credit spreads represent a perceived deterioration of the referenced entity’s credit soundness and a greater likelihood or risk of default or other credit event occurring as defined under the terms of the swap agreement. |
| (c) | | The notional amount represents the maximum potential amount of future payments that the Fund may receive as a buyer of credit protection if a credit event occurs, as defined under the terms of the swap agreement. Alternatively, the notional amount represents the maximum potential amount of payment the Fund could be required to make as a seller of credit protection if a credit event occurs, as defined under the terms of the swap agreement. |
| See notes to financial statements. | HSBC FAMILY OF FUNDS 37 |
| HSBC TOTAL RETURN FUND |
| Schedule of Portfolio Investments—as of October 31, 2015 (continued) |
At October 31, 2015, the Fund’s open forward foreign currency exchange contracts were as follows:
| | | | | | Contract | | | | | | Net Unrealized |
| | | | | | Amount | | Contract | | | | Appreciation/ |
| | | | Delivery | | (Local | | Value | | Value | | (Depreciation) |
| Short Contracts | | | Counterparty | | Date | | Currency) | | ($) | | ($) | | ($) |
| Brazilian Real | | Barclays Bank PLC | | 12/2/15 | | 389,068,841 | | 107,461,438 | | 99,813,245 | | | 7,648,193 | | |
| Brazilian Real | | Credit Suisse First Boston | | 12/2/15 | | 51,191,140 | | 14,000,000 | | 13,132,776 | | | 867,224 | | |
| Brazilian Real | | Standard Chartered Bank | | 12/2/15 | | 52,187,938 | | 14,382,073 | | 13,388,498 | | | 993,575 | | |
| European Euro | | Standard Chartered Bank | | 2/16/16 | | 34,914,226 | | 39,220,711 | | 38,473,005 | | | 747,706 | | |
| Indonesian Rupiah | | Standard Chartered Bank | | 11/16/15 | | 381,064,500,000 | | 27,000,000 | | 27,747,212 | | | (747,212 | ) | |
| Indonesian Rupiah | | Barclays Bank PLC | | 12/11/15 | | 381,064,500,000 | | 27,414,712 | | 27,548,677 | | | (133,965 | ) | |
| Israeli Shekel | | Standard Chartered Bank | | 1/20/16 | | 102,161,721 | | 27,120,181 | | 26,445,243 | | | 674,938 | | |
| Japanese Yen | | Standard Chartered Bank | | 1/29/16 | | 7,259,085,886 | | 60,770,000 | | 60,274,140 | | | 495,860 | | |
| Korean Won | | Barclays Bank PLC | | 1/22/16 | | 69,718,627,700 | | 58,346,830 | | 61,115,070 | | | (2,768,240 | ) | |
| Mexican Peso | | Bank of America | | 11/3/15 | | 1,118,830,756 | | 67,541,851 | | 67,734,303 | | | (192,452 | ) | |
| Mexican Peso | | Barclays Bank PLC | | 11/3/15 | | 284,068,179 | | 17,287,833 | | 17,197,561 | | | 90,272 | | |
| Mexican Peso | | Credit Suisse First Boston | | 11/3/15 | | 700,503,874 | | 42,738,669 | | 42,408,685 | | | 329,984 | | |
| Mexican Peso | | Standard Chartered Bank | | 11/3/15 | | 936,700,000 | | 56,281,920 | | 56,708,060 | | | (426,140 | ) | |
| Mexican Peso | | Standard Chartered Bank | | 6/16/16 | | 1,678,000,000 | | 107,716,010 | | 99,911,190 | | | 7,804,820 | | |
| South African Rand | | Standard Chartered Bank | | 12/15/15 | | 40,826,999 | | 3,172,335 | | 2,928,540 | | | 243,795 | | |
| Thai Baht | | Standard Chartered Bank | | 11/6/15 | | 944,098,142 | | 27,490,000 | | 26,543,624 | | | 946,376 | | |
| Thai Baht | | Standard Chartered Bank | | 3/11/16 | | 944,098,142 | | 26,338,350 | | 26,439,532 | | | (101,182 | ) | |
| | | | | | | | 724,282,913 | | 707,809,361 | | | 16,473,552 | | |
| 38 HSBC FAMILY OF FUNDS | | See notes to financial statements. |
| HSBC TOTAL RETURN FUND |
| Schedule of Portfolio Investments—as of October 31, 2015 (continued) |
| | | | | | Contract | | | | | | Net Unrealized |
| | | | | | | Amount | | Contract | | | | Appreciation/ |
| | | | Delivery | | (Local | | Value | | | | (Depreciation) |
| Long Contracts | | | Counterparty | | Date | | Currency) | | ($) | | Value ($) | | ($) |
| Brazilian Real | | Bank of America | | 12/2/15 | | 126,267,539 | | 35,990,000 | | 32,393,169 | | | (3,596,831 | ) | |
| Brazilian Real | | Barclays Bank PLC | | 12/2/15 | | 53,418,185 | | 14,579,000 | | 13,704,111 | | | (874,889 | ) | |
| Brazilian Real | | Credit Suisse First Boston | | 12/2/15 | | 124,396,523 | | 37,337,291 | | 31,913,172 | | | (5,424,119 | ) | |
| Brazilian Real | | JPMorgan Chase Bank N.A. | | 12/2/15 | | 166,586,949 | | 45,982,000 | | 42,736,869 | | | (3,245,131 | ) | |
| Brazilian Real | | Standard Chartered Bank | | 12/2/15 | | 218,388,556 | | 59,828,000 | | 56,026,256 | | | (3,801,744 | ) | |
| Brazilian Real | | UBS AG | | 12/2/15 | | 15,440,327 | | 4,513,000 | | 3,961,122 | | | (551,878 | ) | |
| European Euro | | Standard Chartered Bank | | 2/16/16 | | 33,999,287 | | 39,124,000 | | 37,464,806 | | | (1,659,194 | ) | |
| Hungarian Forint | | Standard Chartered Bank | | 2/9/16 | | 4,961,983 | | 17,614 | | 17,563 | | | (51 | ) | |
| Indonesian Rupiah | | Barclays Bank PLC | | 11/16/15 | | 381,064,500,000 | | 27,693,641 | | 27,747,212 | | | 53,571 | | |
| Indonesian Rupiah | | Barclays Bank PLC | | 12/11/15 | | 91,396,500,000 | | 6,540,000 | | 6,607,419 | | | 67,419 | | |
| Indonesian Rupiah | | Credit Suisse First Boston | | 12/11/15 | | 79,764,680,000 | | 5,722,000 | | 5,766,508 | | | 44,508 | | |
| Indonesian Rupiah | | Standard Chartered Bank | | 12/11/15 | | 33,509,920,000 | | 2,416,000 | | 2,422,566 | | | 6,566 | | |
| Indonesian Rupiah | | UBS AG | | 12/11/15 | | 173,771,902,500 | | 12,459,000 | | 12,562,666 | | | 103,666 | | |
| Japanese Yen | | Standard Chartered Bank | | 1/29/16 | | 7,290,107,134 | | 60,959,000 | | 60,531,718 | | | (427,282 | ) | |
| Mexican Peso | | Bank of America | | 11/3/15 | | 24,866,951 | | 1,461,000 | | 1,505,452 | | | 44,452 | | |
| Mexican Peso | | Barclays Bank PLC | | 11/3/15 | | 1,268,820,759 | | 75,234,000 | | 76,814,735 | | | 1,580,735 | | |
| Mexican Peso | | Barclays Bank PLC | | 11/3/15 | | 333,342,107 | | 20,426,000 | | 20,180,617 | | | (245,383 | ) | |
| Mexican Peso | | Credit Suisse First Boston | | 11/3/15 | | 333,295,127 | | 20,426,000 | | 20,177,773 | | | (248,227 | ) | |
| Mexican Peso | | JPMorgan Chase Bank N.A. | | 11/3/15 | | 346,252,430 | | 20,287,000 | | 20,962,211 | | | 675,211 | | |
| Mexican Peso | | Standard Chartered Bank | | 11/3/15 | | 335,333,642 | | 20,426,000 | | 20,301,185 | | | (124,815 | ) | |
| Mexican Peso | | Standard Chartered Bank | | 11/3/15 | | 398,191,794 | | 23,380,000 | | 24,106,634 | | | 726,634 | | |
| Mexican Peso | | Bank of America | | 3/7/16 | | 1,118,830,756 | | 66,949,751 | | 67,138,957 | | | 189,206 | | |
| South African Rand | | Bank of America | | 12/15/15 | | 120,999,660 | | 8,890,000 | | 8,679,363 | | | (210,637 | ) | |
| South African Rand | | Barclays Bank PLC | | 12/15/15 | | 346,747,099 | | 25,770,000 | | 24,872,333 | | | (897,667 | ) | |
| South African Rand | | JPMorgan Chase Bank N.A. | | 12/15/15 | | 167,374,208 | | 12,585,000 | | 12,005,831 | | | (579,169 | ) | |
| South African Rand | | Standard Chartered Bank | | 12/15/15 | | 1,065,836,687 | | 78,840,034 | | 76,452,968 | | | (2,387,066 | ) | |
| Thai Baht | | Standard Chartered Bank | | 11/6/15 | | 944,098,142 | | 26,571,859 | | 26,543,624 | | | (28,235 | ) | |
| Turkish Lira | | Barclays Bank PLC | | 2/5/16 | | 338,873,366 | | 106,671,294 | | 113,070,940 | | | 6,399,646 | | |
| | | | | | | | 861,078,484 | | 846,667,780 | | | (14,410,704 | ) | |
| See notes to financial statements. | HSBC FAMILY OF FUNDS 39 |
| HSBC ASIA EX-JAPAN SMALLER COMPANIES EQUITY FUND |
| Schedule of Portfolio Investments—as of October 31, 2015 |
| Common Stocks — 85.0% | | | | |
| | | | | |
| | Shares | | Value ($) |
| China — 16.5% | | | | |
| 3SBio, Inc. (a) | | 51,000 | | 57,841 |
| Aupu Group Holding Co. Ltd. | | 756,000 | | 201,915 |
| Beijing Capital Land Ltd., H Shares | | 246,000 | | 118,709 |
| Best Pacific International Holdings Ltd., | | | | |
| Class H | | 170,000 | | 72,603 |
| China Meidong Auto Holdings Ltd. | | 258,000 | | 30,626 |
| China Railway Construction Corp. Ltd., | | | | |
| Class H | | 55,500 | | 83,496 |
| Citic Telecom International | | | | |
| Holdings Ltd. | | 242,000 | | 100,542 |
| Jiashili Group Ltd. (b) | | 394,000 | | 191,652 |
| Man Wah Holdings Ltd. | | 196,800 | | 225,482 |
| Sinosoft Technology Group Ltd. | | 224,000 | | 127,746 |
| Texhong Textile Group Ltd. | | 127,000 | | 94,221 |
| West China Cement Ltd. | | 1,030,000 | | 178,081 |
| Xtep International Holdings Ltd. | | 224,500 | | 116,444 |
| | | | | 1,599,358 |
| Hong Kong — 25.5% | | | | |
| China High Speed Transmission | | | | |
| Equipment Group Co. Ltd. (a) | | 232,000 | | 208,939 |
| China Resources Land Ltd. | | 75,555 | | 197,409 |
| Chu Kong Shipping Enterprises | | | | |
| Group Co. Ltd. | | 294,000 | | 88,006 |
| COSCO International | | | | |
| Holdings Ltd. (b)(c) | | 204,000 | | 115,550 |
| D&G Technology | | | | |
| Holding Co. Ltd. (a) | | 366,000 | | 68,946 |
| Dream International Ltd. (b) | | 744,000 | | 139,193 |
| EGL Holdings Co. Ltd. | | 238,000 | | 71,550 |
| Esprit Holdings Ltd. | | 56,800 | | 63,979 |
| Far East Consortium | | | | |
| International Ltd. | | 280,000 | | 102,240 |
| Franshion Properties China Ltd. | | 546,000 | | 150,759 |
| Haitong International Securities | | | | |
| Group Ltd. | | 112,000 | | 62,283 |
| Kingmaker Footwear Holdings Ltd. | | 200,000 | | 48,256 |
| Melco International | | | | |
| Development Ltd. | | 27,000 | | 42,013 |
| Nexteer Automotive Group Ltd. | | 268,000 | | 286,313 |
| Shenzhen Investment Ltd. | | 356,000 | | 144,689 |
| Texwinca Holdings Ltd. | | 124,000 | | 120,793 |
| Tianjin Development Holdings Ltd. | | 144,000 | | 93,642 |
| TK Group Holdings Ltd. | | 242,000 | | 69,630 |
| Valuetronics Holdings Ltd. | | 382,000 | | 115,915 |
| Varitronix International Ltd. | | 146,000 | | 100,028 |
| VST Holdings Ltd. | | 628,000 | | 184,744 |
| | | | 2,474,877 |
| Indonesia — 4.1% | | | | |
| PT Adhi Karya Persero Tbk | | 608,200 | | 99,180 |
| PT Pakuwon Jati Tbk | | 4,569,600 | | 142,351 |
| PT Panin Financial Tbk (a) | | 5,960,000 | | 95,447 |
| PT Tiphone Mobile Indonesia Tbk | | 1,251,200 | | 64,047 |
| | | | 401,025 |
| Korea, Republic Of — 14.3% | | | | |
| Dongbu Insurance Co. Ltd. | | 2,791 | | 167,475 |
| ISC Co. Ltd. | | 1,757 | | 39,459 |
| KIWOOM Securities Co. Ltd. | | 1,297 | | 66,790 |
| Kolon Industries, Inc. | | 3,096 | | 168,665 |
| Medy-Tox, Inc. | | 309 | | 131,987 |
| Modetour Network, Inc. | | 4,106 | | 131,476 |
| Nongshim Co. Ltd. | | 302 | | 97,761 |
| NS Shopping Co. Ltd. | | 549 | | 93,675 |
| PS Tec Co. Ltd. | | 19,415 | | 127,231 |
| SK Innovation Co. Ltd. (a) | | 878 | | 91,274 |
| TES Co. Ltd. | | 6,826 | | 73,056 |
| Vieworks Co. Ltd. | | 3,104 | | 104,701 |
| Yuhan Corp. | | 378 | | 93,845 |
| | | | 1,387,395 |
| Malaysia — 2.0% | | | | |
| Berjaya Auto Berhad | | 330,680 | | 161,796 |
| Prestariang Berhad | | 66,600 | | 36,310 |
| | | | 198,106 |
| Philippines — 2.0% | | | | |
| Cosco Capital, Inc. | | 87,900 | | 13,990 |
| EEI Corp. | | 367,200 | | 59,069 |
| First Philippine Holdings Corp. | | 78,320 | | 118,207 |
| | | | 191,266 |
| Singapore — 3.0% | | | | |
| Hutchison Port Holdings Trust | | 330,400 | | 183,372 |
| Innovalues Ltd. | | 198,400 | | 110,490 |
| | | | 293,862 |
| Taiwan, Province of China — 13.9% | | | | |
| Cathay Financial Holding Co. Ltd. | | 66,000 | | 94,344 |
| Chin-Poon Industrial Co. Ltd. | | 80,000 | | 107,948 |
| Cleanaway Co. Ltd. | | 21,000 | | 103,512 |
| E Ink Holdings, Inc. (a) | | 164,000 | | 80,333 |
| E.Sun Financial Holding Co. Ltd. | | 187,038 | | 112,649 |
| King Yuan Electronics Co. Ltd. | | 219,000 | | 140,333 |
| Phison Electronics Corp. | | 12,000 | | 87,061 |
| Posiflex Technology, Inc. | | 23,770 | | 125,953 |
| Radiant Opto-Electronics Corp. | | 18,000 | | 56,007 |
| San Fang Chemical Industry Co. Ltd. | | 65,920 | | 82,146 |
| Topco Scientific Co. Ltd. | | 60,680 | | 96,460 |
| WT Microelectronics Co. Ltd. | | 164,340 | | 184,541 |
| Zippy Technology Corp. | | 65,000 | | 76,594 |
| | | | 1,347,881 |
| Thailand — 3.7% | | | | |
| Amata Corp. Public Co. Ltd. | | 188,800 | | 72,738 |
| Banpu Public Co. Ltd., Registered | | 155,600 | | 94,953 |
| KCE Electronics PCL | | 111,600 | | 193,793 |
| | | | 361,484 |
| TOTAL COMMON STOCKS | | | | |
| (COST $8,683,389) | | | | 8,255,254 |
| 40 HSBC FAMILY OF FUNDS | | See notes to financial statements. |
| HSBC ASIA EX-JAPAN SMALLER COMPANIES EQUITY FUND |
| Schedule of Portfolio Investments—as of October 31, 2015 (continued) |
| Exchange-Traded Funds — 9.8% | | | | | |
| | | | | | |
| | Shares | | Value ($) |
| iShares MSCI India Small-Cap ETF | | 14,103 | | | 476,963 |
| Market Vectors India | | | | | |
| Small-Cap Index ETF | | 11,152 | | | 476,748 |
| TOTAL EXCHANGE-TRADED FUNDS | | | | | |
| (COST $925,961) | | | | | 953,711 |
| | | | | | |
| Investment Companies — 4.7% | | | | | |
| | | | | | |
| | Shares | | Value ($) |
| Northern Institutional Diversified | | | | | |
| Assets Portfolio, Institutional | | | | | |
| Shares, 0.01% (d) | | 457,484 | | | 457,484 |
| TOTAL INVESTMENT COMPANIES | | | | | |
| (COST $457,484) | | | | | 457,484 |
| TOTAL INVESTMENT SECURITIES | | | | | |
| (COST $10,066,834) — 99.5% | | | | | 9,666,449 |
| Other Assets (Liabilities) — 0.5% | | | | | 46,991 |
| NET ASSETS — 100% | | | | $ | 9,713,440 |
____________________
| (a) | | Represents non-income producing security. |
| (b) | | Illiquid securities: The aggregate value of illiquid securities represents 4.6% of net assets of the fund. |
| (c) | | Security was valued in good faith pursuant to procedures approved by the Board of Trustees as of October 31, 2015. The total of all such securities represents 1.2% of net assets of the fund. |
| (d) | | The rate represents the annualized one-day yield that was in effect on October 31, 2015. |
ETF — Exchange-Traded Fund |
The Fund invested, as a percentage of net assets at value, in the following industries, as of October 31, 2015:
| Percentage of Net Assets |
| Industry | at Value (%) |
| Electronic Equipment, | | | |
| Instruments & Components | | 10.1 | |
| Exchange-Traded Funds | | 9.8 | |
| Real Estate Management & | | | |
| Development | | 9.6 | |
| Semiconductors & | | | |
| Semiconductor Equipment | | 6.1 | |
| Investment Companies | | 4.7 | |
| Textiles, Apparel & Luxury Goods | | 4.7 | |
| Household Durables | | 4.4 | |
| Electrical Equipment | | 4.2 | |
| Auto Components | | 4.1 | |
| Insurance | | 3.7 | |
| Specialty Retail | | 3.3 | |
| Transportation Infrastructure | | 3.1 | |
| Food Products | | 3.0 | |
| Chemicals | | 2.6 | |
| Construction & Engineering | | 2.5 | |
| Hotels, Restaurants & Leisure | | 2.5 | |
| Oil, Gas & Consumable Fuels | | 1.9 | |
| Construction Materials | | 1.8 | |
| Health Care Technology | | 1.4 | |
| Machinery | | 1.4 | |
| Leisure Products | | 1.4 | |
| Capital Markets | | 1.3 | |
| Software | | 1.3 | |
| Banks | | 1.2 | |
| Electric Utilities | | 1.2 | |
| Commercial Services & Supplies | | 1.1 | |
| Health Care Equipment & Supplies | | 1.1 | |
| Internet & Catalog Retail | | 1.0 | |
| Multi-Utilities | | 1.0 | |
| Diversified Telecommunication | | | |
| Services | | 1.0 | |
| Pharmaceuticals | | 1.0 | |
| Marine | | 0.9 | |
| Biotechnology | | 0.6 | |
| Diversified Consumer Services | | 0.4 | |
| Food & Staples Retailing | | 0.1 | |
| Total | | 99.5 | |
| See notes to financial statements. | HSBC FAMILY OF FUNDS 41 |
| HSBC GLOBAL HIGH YIELD BOND FUND |
| Schedule of Portfolio Investments—as of October 31, 2015 |
| Foreign Bonds — 17.2% | | | | |
| | | | | |
| | Principal | | |
| | Amount† | | Value ($) |
| Denmark — 0.7% | | | | |
| DONG Energy A/S, 6.25%, 12/31/99, | | | | |
| Callable 6/26/33 @ 100 (a),(b) | | 50,000 | | 59,923 |
| TDC A/S, 3.50%, 12/31/99, | | | | |
| Callable 2/26/21 @ 100 (a),(b) | | 100,000 | | 103,079 |
| | | | 163,002 |
| France — 4.4% | | | | |
| Accor SA, 4.13%, 6/30/49, | | | | |
| Callable 6/30/20 @ 100 (a),(b) | | 100,000 | | 109,126 |
| AXA SA, Series E, 3.94%, 11/29/49, | | | | |
| Callable 11/7/24 @ 100 (a),(b) | | 100,000 | | 108,741 |
| Credit Agricole SA, 6.50%, 4/29/49, | | | | |
| Callable 6/23/21 @ 100 (a),(b) | | 100,000 | | 110,781 |
| Credit Agricole SA, 7.87%, 10/29/49, | | | | |
| Callable 10/26/19 @ 100 (a),(b) | | 100,000 | | 129,287 |
| Crown International Holdings, | | | | |
| Registered, 4.00%, 7/15/22, | | | | |
| Callable 4/15/22 @ 100 (b) | | 100,000 | | 114,761 |
| Electricite de France SA, Series E, | | | | |
| 5.38%, 1/29/49, Callable | | | | |
| 1/29/25 @ 100 (a),(b) | | 100,000 | | 115,749 |
| Europcar Groupe SA, 5.75%, 6/15/22, | | | | |
| Callable 6/15/18 @ 102.88 (b) | | 100,000 | | 114,349 |
| GDF SUEZ, 4.75%, 7/29/49, | | | | |
| Callable 7/10/21 @ 100 (a),(b) | | 100,000 | | 117,573 |
| Lafarge SA, Series E, | | | | |
| 6.75%, 12/16/19 | | 50,000 | | 64,724 |
| Orange SA, 4.25%, 2/28/49, | | | | |
| Callable 2/7/20 @ 100 (a),(b) | | 100,000 | | 114,465 |
| | | | | 1,099,556 |
| Germany — 1.7% | | | | |
| Allianz SE, 4.75%, 10/29/49, | | | | |
| Callable 10/24/23 @ 100 (a),(b) | | 100,000 | | 119,346 |
| Commerzbank AG, Series E, | | | | |
| 7.75%, 3/16/21 | | 100,000 | | 133,052 |
| Unitymedia GmbH, | | | | |
| Registered, 6.25%, 1/15/29, | | | | |
| Callable 1/15/21 @ 103.13 (b) | | 125,000 | | 152,556 |
| | | | | 404,954 |
| Luxembourg — 3.9% | | | | |
| CNH Industrial Finance Europe SA, | | | | |
| Series E, 6.25%, 3/9/18 | | 100,000 | | 117,614 |
| FMC Finance VIII SA, Registered, | | | | |
| 6.50%, 9/15/18 | | 50,000 | | 63,053 |
| HeidelbergCement Finance | | | | |
| Luxembourg SA, 7.50%, 7/3/20 | | 125,000 | | 169,406 |
| KION Finance SA, Registered, | | | | |
| 6.75%, 2/15/20, Callable | | | | |
| 2/15/16 @ 103.38 (b) | | 100,000 | | 115,085 |
| Picard Bondco SA, Registered, | | | | |
| 7.75%, 2/1/20, Callable | | | | |
| 8/1/16 @ 105.81 (b) | | 100,000 | | 117,451 |
| SIG Combibloc Holdings GmbH, | | | | |
| Registered, 7.75%, 2/15/23, | | | | |
| Callable 2/15/18 @ 103.88 (b) | | 100,000 | | 116,053 |
| Talanx AG, Series E, 8.37%, | | | | |
| 6/15/42, Callable 6/15/22 | | | | |
| @ 100 (a),(b) | | 100,000 | | 140,398 |
| Telenet Finance III Luxembourg | | | | |
| SCA, Registered, 6.63%, 2/15/21, | | | | |
| Callable 2/15/16 @ 103.31 (b) | | 100,000 | | 114,783 |
| | | | | 953,843 |
| Netherlands — 3.6% | | | | |
| Carlson Wagonlit BV, Registered, | | | | |
| 7.50%, 6/15/19, Callable | | | | |
| 6/15/16 @ 103.75 (b) | | 100,000 | | 115,330 |
| Gas Natural Fenosa Finance BV, | | | | |
| 4.13%, 11/29/49, Callable | | | | |
| 11/18/22 @ 100 (a),(b) | | 100,000 | | 107,795 |
| Koninklijke KPN NV, 6.12%, 3/29/49, | | | | |
| Callable 9/14/18 @ 100 (a),(b) | | 100,000 | | 115,888 |
| LGE Holdco VI BV, Registered, | | | | |
| 7.13%, 5/15/24, Callable | | | | |
| 5/15/19 @ 103.56 (b) | | 100,000 | | 119,417 |
| Rabobank Nederland, Registered, | | | | |
| 6.88%, 3/19/20 | | 100,000 | | 130,015 |
| Telefonica SA, 7.62%, 9/29/49, | | | | |
| Callable 9/18/21 @ 100 (a),(b) | | 100,000 | | 120,286 |
| Volkswagen AG, 5.13%, 9/29/49, | | | | |
| Callable 9/2/23 @ 100 (a),(b) | | 50,000 | | 54,907 |
| Vonovia Finance BV, 4.62%, 4/8/74, | | | | |
| Callable 4/8/19 @ 100 (a),(b) | | 100,000 | | 112,562 |
| | | | | 876,200 |
| Sweden — 0.4% | | | | |
| Volvo Treasury AB, 4.20%, 6/10/75, | | | | |
| Callable 6/10/20 @ 100 (a),(b) | | 100,000 | | 109,263 |
| United Kingdom — 1.6% | | | | |
| Aviva plc, Series E, 3.38%, 12/4/45, | | | | |
| Callable 12/4/25 @ 100 (a),(b) | | 100,000 | | 105,166 |
| Rexam plc, 6.75%, 6/29/67, | | | | |
| Callable 6/29/17 @ 100 (a),(b) | | 50,000 | | 54,975 |
| The Royal Bank of Scotland plc, | | | | |
| Series E, 10.50%, 3/16/22, | | | | |
| Callable 3/16/17 @ 100 (a),(b) | | 100,000 | | 122,890 |
| Virgin Media Finance plc, | | | | |
| Registered, 4.50%, 1/15/25, | | | | |
| Callable 1/15/20 @ 102.25 (b) | | 100,000 | | 106,102 |
| | | | | 389,133 |
| United States — 0.9% | | | | |
| Jarden Corp., Registered, | | | | |
| 3.75%, 10/1/21 | | 100,000 | | 112,150 |
| Sealed Air Corp., 4.50%, 9/15/23, | | | | |
| Callable 6/15/23 @ 100 (b) | | 100,000 | | 115,461 |
| | | | | 227,611 |
| TOTAL FOREIGN BONDS | | | | |
| (COST $4,302,619) | | | | 4,223,562 |
| 42 HSBC FAMILY OF FUNDS | | See notes to financial statements. |
| HSBC GLOBAL HIGH YIELD BOND FUND |
| Schedule of Portfolio Investments—as of October 31, 2015 (continued) |
| Yankee Dollars — 16.1% | | | | |
| |
| | Principal | | |
| | Amount | | Value ($) |
| Austria — 0.4% | | | | |
| JBS Investments SA, Registered, | | | | |
| 7.75%, 10/28/20, Callable | | | | |
| 10/28/17 @ 103.87 (b) | | 100,000 | | 106,550 |
| Bermuda — 1.7% | | | | |
| Aircastle Ltd., 7.63%, 4/15/20 | | 105,000 | | 121,143 |
| Aircastle Ltd., 5.50%, 2/15/22 | | 105,000 | | 111,038 |
| Viking Cruises Ltd., 8.50%, | | | | |
| 10/15/22, Callable | | | | |
| 10/15/17 @ 104.25 (b) | | 175,000 | | 190,313 |
| | | | | 422,494 |
| Brazil — 3.2% | | | | |
| Federal Republic of Brazil, | | | | |
| 2.63%, 1/5/23 | | 200,000 | | 165,200 |
| GTL Trade Finance, Inc., Registered, | | | | |
| 5.89%, 4/29/24, Callable | | | | |
| 1/29/24 @ 100 (b) | | 150,000 | | 125,747 |
| Marfrig Overseas Ltd., Registered, | | | | |
| 9.50%, 5/4/20, Callable | | | | |
| 12/19/15 @ 104.75 (b) | | 100,000 | | 100,000 |
| Odebrecht Drilling Norbe VIII/IX | | | | |
| Ltd., Registered, 6.35%, 6/30/21, | | | | |
| Callable 6/30/20 @ 100 (b) | | 82,000 | | 40,180 |
| Petrobras Brasileiro SA, | | | | |
| 5.75%, 1/20/20 | | 400,000 | | 341,999 |
| | | | | 773,126 |
| Canada — 3.2% | | | | |
| Cascades, Inc., 5.75%, 7/15/23, | | | | |
| Callable 7/15/18 @ 104.31 (b) | | 90,000 | | 86,400 |
| First Quantum Minerals Ltd., 6.75%, | | | | |
| 2/15/20, Callable | | | | |
| 2/15/17 @ 103.38 (b) | | 101,000 | | 76,886 |
| HudBay Minerals, Inc., 9.50%, | | | | |
| 10/1/20, Callable | | | | |
| 10/1/16 @ 104.75 (b) | | 90,000 | | 78,525 |
| Lundin Mining Corp., 7.50%, | | | | |
| 11/1/20, Callable | | | | |
| 11/1/17 @ 103.75 (b) | | 100,000 | | 100,999 |
| Lundin Mining Corp., 7.88%, | | | | |
| 11/1/22, Callable | | | | |
| 11/1/18 @ 103.93 (b)(c) | | 20,000 | | 20,050 |
| Teck Resources Ltd., | | | | |
| 3.15%, 1/15/17 | | 44,000 | | 41,800 |
| Teck Resources Ltd., | | | | |
| 3.85%, 8/15/17 | | 40,000 | | 37,000 |
| Valeant Pharmaceuticals | | | | |
| International, Inc., 5.88%, 5/15/23, | | | | |
| Callable 5/15/18 @ 102.94 (b) | | 175,000 | | 147,000 |
| Valeant Pharmaceuticals | | | | |
| International, Inc., 6.13%, 4/15/25, | | | | |
| Callable 4/15/20 @ 103.06 (b)(c) | | 139,000 | | 116,586 |
| VPII Escrow Corp., 7.50%, 7/15/21, | | | | |
| Callable 7/15/16 @ 105.63 (b) | | 75,000 | | 67,829 |
| | | | | 773,075 |
| Colombia — 0.8% | | | | |
| Grupo Aval Ltd., Registered, 4.75%, | | | | |
| 9/26/22 | | 200,000 | | 194,980 |
| France — 0.5% | | | | |
| Credit Agricole SA, Registered, | | | | |
| 8.37%, 12/31/49, Callable | | | | |
| 10/13/19 @ 100 (a),(b) | | 100,000 | | 113,260 |
| Guatemala — 0.7% | | | | |
| Comcel Trust, Registered, | | | | |
| 6.88%, 2/6/24, | | | | |
| Callable 2/6/19 @ 103.44 (b) | | 200,000 | | 159,500 |
| Ireland (Republic of) — 0.9% | | | | |
| Endo Ltd., 6.00%, 7/15/23, | | | | |
| Callable 7/15/18 @ 104.5 (b) | | 220,000 | | 220,000 |
| Luxembourg — 1.4% | | | | |
| ArcelorMittal, 10.60%, 6/1/19 | | 150,000 | | 165,750 |
| Intelsat Jackson Holdings SA, | | | | |
| 7.25%, 4/1/19, | | | | |
| Callable 12/10/15 @ 103.62 (b) | | 50,000 | | 47,000 |
| Intelsat Jackson Holdings SA, | | | | |
| 6.63%, 12/15/22, Callable | | | | |
| 12/15/17 @ 103.31 (b) | | 95,000 | | 75,050 |
| Intelsat Luxembourg SA, | | | | |
| 6.75%, 6/1/18, | | | | |
| Callable 6/1/16 @ 103.38 (b) | | 75,000 | | 66,563 |
| | | | | 354,363 |
| Netherlands — 0.8% | | | | |
| Schaeffler Holdings Finance BV, | | | | |
| 6.88%, 8/15/18, Callable | | | | |
| 12/10/15 @ 103.44 (b) | | 200,000 | | 207,000 |
| Russian Federation — 0.8% | | | | |
| Gazprom OAO Via Gaz Capital SA, | | | | |
| Registered, 4.95%, 7/19/22 | | 200,000 | | 193,000 |
| Turkey — 0.6% | | | | |
| Akbank TAS, Registered, | | | | |
| 3.88%, 10/24/17 | | 150,000 | | 151,313 |
| United Kingdom — 0.5% | | | | |
| Royal Bank of Scotland Group plc, | | | | |
| 7.65%, 8/29/49, | | | | |
| Callable 9/30/31 @ 100 (a),(b) | | 100,000 | | 124,500 |
| Venezuela — 0.6% | | | | |
| Petroleos de Venezuela SA, | | | | |
| Registered, 6.00%, 11/15/26 | | 400,000 | | 141,360 |
| TOTAL YANKEE DOLLARS | | | | |
| (COST $4,232,460) | | | | 3,934,521 |
| See notes to financial statements. | HSBC FAMILY OF FUNDS 43 |
| HSBC GLOBAL HIGH YIELD BOND FUND |
| Schedule of Portfolio Investments—as of October 31, 2015 (continued) |
| Corporate Bonds — 55.7% | | | | |
| |
| | Principal | | |
| | Amount† | | Value ($) |
| Acadia Healthcare Co., Inc., | | | | |
| 5.63%, 2/15/23, Callable | | | | |
| 2/15/18 @ 104.22 | | 120,000 | | 120,150 |
| Ahern Rentals, Inc., 7.38%, 5/15/23, | | | | |
| Callable 5/15/18 @ 105.53 | | 75,000 | | 69,750 |
| Alere, Inc., 6.38%, 7/1/23, | | | | |
| Callable 7/1/18 @ 104.78 | | 100,000 | | 104,000 |
| Ally Financial, Inc., 4.13%, 3/30/20 | | 175,000 | | 180,687 |
| Ally Financial, Inc., 7.50%, 9/15/20 | | 87,000 | | 101,736 |
| Ally Financial, Inc., 8.00%, 3/15/20 | | 87,000 | | 102,878 |
| Alphabet Holding Co., Inc., 7.75%, | | | | |
| 11/1/17, Callable 12/10/15 @ 101 | | 35,000 | | 34,388 |
| AMC Entertainment, Inc., | | | | |
| 5.75%, 6/15/25, | | | | |
| Callable 6/15/20 @ 102.88 | | 130,000 | | 130,975 |
| American Express Co., | | | | |
| 5.20%, 12/31/49, | | | | |
| Callable 11/15/19 @ 100 (a) | | 75,000 | | 75,000 |
| Antero Resources Corp., | | | | |
| 6.00%, 12/1/20, | | | | |
| Callable 12/1/15 @ 104.5 | | 85,000 | | 81,600 |
| Asbury Automotive Group, Inc., | | | | |
| 6.00%, 12/15/24, | | | | |
| Callable 12/15/19 @ 103 (c) | | 40,000 | | 42,300 |
| Bank of America Corp., | | | | |
| 8.12%, 12/29/49, | | | | |
| Callable 5/15/18 @ 100 (a) | | 100,000 | | 104,375 |
| Beazer Homes USA, Inc., | | | | |
| 5.75%, 6/15/19, | | | | |
| Callable 3/15/19 @ 100 | | 100,000 | | 96,250 |
| Blue Cube Spinco, Inc., | | | | |
| 9.75%, 10/15/23, | | | | |
| Callable 10/15/20 @ 102.44 (c) | | 36,000 | | 38,790 |
| Blue Cube Spinco, Inc., | | | | |
| 10.00%, 10/15/25, | | | | |
| Callable 10/15/20 @ 105 (c) | | 27,000 | | 29,295 |
| Blue Racer Midstream LLC, 6.13%, | | | | |
| 11/15/22, Callable 11/15/17 @ | | | | |
| 104.59 | . | 42,000 | | 39,270 |
| Boyd Gaming Corp., | | | | |
| 6.88%, 5/15/23, | | | | |
| Callable 5/15/18 @ 105.15 | | 115,000 | | 121,900 |
| Building Materials Corp., | | | | |
| 6.00%, 10/15/25, | | | | |
| Callable 10/15/20 @ 103 (c) | | 18,000 | | 19,125 |
| Cablevision Systems Corp., | | | | |
| 8.63%, 9/15/17 | | 125,000 | | 133,438 |
| Calumet Specialty Products Partners | | | | |
| LP, 6.50%, 4/15/21, | | | | |
| Callable 4/15/17 @ 103.25 | | 160,000 | | 148,799 |
| Capital One Financial Corp., | | | | |
| 5.55%, 12/31/49, | | | | |
| Callable 6/1/20 @ 100 (a) | | 70,000 | | 70,131 |
| Carmike Cinemas, Inc., | | | | |
| 6.00%, 6/15/23, | | | | |
| Callable 6/15/18 @ 104.5 | | 110,000 | | 113,982 |
| Carrizo Oil & Gas, Inc., | | | | |
| 7.50%, 9/15/20, | | | | |
| Callable 9/15/16 @ 103.75 | | 80,000 | | 79,800 |
| CCO Holdings LLC, 6.63%, 1/31/22, | | | | |
| Callable 1/31/17 @ 103.31 | | 165,000 | | 174,899 |
| Cemex Finance LLC, Registered, | | | | |
| 9.38%, 10/12/22, Callable | | | | |
| 10/12/17 @ 104.69 | | 200,000 | | 217,500 |
| Citigroup, Inc., 5.80%, 11/29/49, | | | | |
| Callable 11/15/19 @ 100 (a) | | 85,000 | | 84,469 |
| CommScope Technologies Finance | | | | |
| LLC, 6.00%, 6/15/25, | | | | |
| Callable 6/15/20 @ 103 | | 130,000 | | 131,950 |
| Community Health Systems, Inc., | | | | |
| 6.88%, 2/1/22, | | | | |
| Callable 2/1/18 @ 103.44 | | 50,000 | | 50,375 |
| Community Health Systems, Inc., | | | | |
| 8.00%, 11/15/19, | | | | |
| Callable 11/15/15 @ 104 | | 50,000 | | 52,000 |
| Concho Resources, Inc., | | | | |
| 6.50%, 1/15/22, | | | | |
| Callable 1/15/17 @ 103.25 | | 110,000 | | 113,988 |
| Dana Holding Corp., 6.00%, | | | | |
| 9/15/23, Callable 9/15/18 @ 103 | | 125,000 | | 129,375 |
| DaVita HealthCare Partners, Inc., | | | | |
| 5.13%, 7/15/24, | | | | |
| Callable 7/15/19 @ 102.56 | | 165,000 | | 167,784 |
| DCP Midstream LLC, | | | | |
| 8.13%, 8/16/30 | | 120,000 | | 119,254 |
| DISH DBS Corp., 5.88%, 7/15/22 | | 120,000 | | 117,600 |
| Dollar Tree, Inc., 5.25%, 3/1/20, | | | | |
| Callable 3/1/17 @ 102.63 | | 50,000 | | 52,125 |
| Dollar Tree, Inc., 5.75%, 3/1/23, | | | | |
| Callable 3/1/18 @ 104 | | 50,000 | | 52,688 |
| Dynegy, Inc., 7.63%, 11/1/24, | | | | |
| Callable 11/1/19 @ 103.81 | | 130,000 | | 130,325 |
| Eldorado Resorts, Inc., 7.00%, 8/1/23, | | | | |
| Callable 8/1/18 @ 105.25 | | 135,000 | | 136,688 |
| Energy Transfer Equity LP, 5.88%, | | | | |
| 1/15/24, Callable 10/15/23 @ 100 | | 85,000 | | 82,346 |
| Energy Transfer Equity LP, | | | | |
| 7.50%, 10/15/20 | | 100,000 | | 107,520 |
| EP Energy LLC/ Everest Acquisition | | | | |
| Finance, Inc., 6.38%, 6/15/23, | | | | |
| Callable 6/15/18 @ 104.78 | | 100,000 | | 75,500 |
| EP Energy LLC/ Everest Acquisition | | | | |
| Finance, Inc., 9.38%, 5/1/20, | | | | |
| Callable 5/1/16 @ 104.68 | | 135,000 | | 117,450 |
| Fifth Third Bancorp, | | | | |
| 4.90%, 12/29/49, | | | | |
| Callable 9/30/19 @ 100 (a) | | 60,000 | | 56,700 |
| First Data Corp., 6.75%, 11/1/20, | | | | |
| Callable 11/1/15 @ 100 | | 120,000 | | 126,450 |
| First Data Corp., 7.00%, 12/1/23, | | | | |
| Callable 12/1/18 @ 103.5 (c) | | 200,000 | | 204,000 |
| First Data Corp., 8.25%, 1/15/21, | | | | |
| Callable 1/15/16 @ 104.12 | | 10,000 | | 10,488 |
| First Quality Finance Co., Inc., | | | | |
| 4.63%, 5/15/21, | | | | |
| Callable 5/15/16 @ 103.46 (c) | | 35,000 | | 32,463 |
| Frontier Communications Corp., | | | | |
| 8.88%, 9/15/20, | | | | |
| Callable 6/15/20 @ 100 (c) | | 107,000 | | 111,079 |
| Frontier Communications Corp., | | | | |
| 10.50%, 9/15/22, | | | | |
| Callable 6/15/22 @ 100 (c) | | 32,000 | | 33,200 |
| 44 HSBC FAMILY OF FUNDS | | See notes to financial statements. |
| HSBC GLOBAL HIGH YIELD BOND FUND |
| Schedule of Portfolio Investments—as of October 31, 2015 (continued) |
| Corporate Bonds, continued | | | | |
| |
| | | Principal | | |
| | Amount | | Value ($) |
| Genesis Energy LP, 5.75%, 2/15/21, | | | | |
| Callable 2/15/17 @ 102.88 | | 115,000 | | 107,525 |
| Genesis Energy LP, 6.75%, 8/1/22, | | | | |
| Callable 8/1/18 @ 103.38 | | 23,000 | | 22,425 |
| Golden Nugget Escrow, Inc., | | | | |
| 8.50%, 12/1/21, | | | | |
| Callable 12/1/17 @ 104.25 | | 100,000 | | 103,500 |
| Halcon Resources Corp., | | | | |
| 8.63%, 2/1/20, | | | | |
| Callable 2/1/17 @ 104.31 | | 50,000 | | 43,125 |
| Halcon Resources Corp., | | | | |
| 8.88%, 5/15/21, | | | | |
| Callable 11/15/16 @ 104.44 | | 75,000 | | 25,172 |
| HCA Holdings, Inc., | | | | |
| 5.25%, 4/15/25, | | | | |
| Callable 10/15/20 @ 105 | | 150,000 | | 155,250 |
| HCA Holdings, Inc., | | | | |
| 6.50%, 2/15/20 | | 70,000 | | 78,313 |
| HCA Holdings, Inc., | | | | |
| 8.00%, 10/1/18 | | 65,000 | | 73,694 |
| HD Supply, Inc., 5.25%, 12/15/21, | | | | |
| Callable 12/15/17 @ 103.94 | | 40,000 | | 42,000 |
| HD Supply, Inc., 11.50%, 7/15/20, | | | | |
| Callable 10/15/16 @ 105.75 | | 100,000 | | 113,375 |
| Infor, Inc., 5.75%, 8/15/20, | | | | |
| Callable 8/15/17 @ 102.87 (c) | | 5,000 | | 5,100 |
| Infor, Inc., 6.50%, 5/15/22 | | 125,000 | | 118,438 |
| International Lease Finance Corp., | | | | |
| 5.88%, 8/15/22 | | 75,000 | | 82,313 |
| International Lease Finance Corp., | | | | |
| 8.25%, 12/15/20 | | 75,000 | | 89,625 |
| International Lease Finance Corp., | | | | |
| 8.88%, 9/1/17 | | 150,000 | | 166,499 |
| Jaguar Holding Co. II, | | | | |
| 6.38%, 8/1/23, | | | | |
| Callable 8/1/18 @ 104.78 (c) | | 93,000 | | 93,116 |
| Jarden Corp., 5.00%, 11/15/23, | | | | |
| Callable 11/15/18 @ 103.75 (c) | | 8,000 | | 8,220 |
| JPMorgan Chase & Co., | | | | |
| 5.30%, 12/31/49, | | | | |
| Callable 5/1/20 @ 100 (a) | | 60,000 | | 60,180 |
| JPMorgan Chase & Co., | | | | |
| 6.00%, 12/29/49, | | | | |
| Callable 8/1/23 @ 100 (a) | | 60,000 | | 60,870 |
| KB Home, 7.50%, 9/15/22 | | 100,000 | | 102,500 |
| Kindred Healthcare, Inc., 6.38%, | | | | |
| 4/15/22, Callable | | | | |
| 4/15/17 @ 104.78 | | 215,000 | | 203,175 |
| Kinetic Concepts, Inc., 10.50%, | | | | |
| 11/1/18, Callable | | | | |
| 11/1/15 @ 105.25 | | 90,000 | | 95,031 |
| L Brands, Inc., 6.63%, 4/1/21 | | 65,000 | | 73,613 |
| L Brands, Inc., 6.88%, 11/1/35 (c) | | 10,000 | | 10,425 |
| L Brands, Inc., 6.95%, 3/1/33 | | 60,000 | | 62,550 |
| Landry's, Inc., 9.38%, 5/1/20, | | | | |
| Callable 12/10/15 @ 107.03 | | 170,000 | | 182,325 |
| Laredo Petroleum, Inc., | | | | |
| 5.63%, 1/15/22, | | | | |
| Callable 1/15/17 @ 104.21 | | 45,000 | | 42,300 |
| Laredo Petroleum, Inc., | | | | |
| 7.38%, 5/1/22, | | | | |
| Callable 5/1/17 @ 103.69 | | 105,000 | | 103,688 |
| Level 3 Financing, Inc., | | | | |
| 5.13%, 5/1/23, | | | | |
| Callable 5/1/18 @ 102.56 | | 90,000 | | 91,013 |
| Level 3 Financing, Inc., 5.38%, | | | | |
| 1/15/24, Callable | | | | |
| 1/15/19 @ 102.56 (c) | | 24,000 | | 24,300 |
| Level 3 Financing, Inc., 8.63%, | | | | |
| 7/15/20, Callable | | | | |
| 1/15/16 @ 104.31 | | 80,000 | | 84,500 |
| MGM Resorts International, | | | | |
| 7.75%, 3/15/22 | | 90,000 | | 99,900 |
| MGM Resorts International, | | | | |
| 11.38%, 3/1/18 | | 85,000 | | 100,300 |
| Morgan Stanley, 5.45%, 7/29/49, | | | | |
| Callable 7/15/19 @ 100 (a) | | 100,000 | | 98,375 |
| MPH Acquisition Holdings LLC, | | | | |
| 6.63%, 4/1/22, | | | | |
| Callable 4/1/17 @ 104.97 (c) | | 192,000 | | 195,840 |
| MSCI, Inc., 5.75%, 8/15/25, | | | | |
| Callable 8/15/20 @ 102.87 (c) | | 38,000 | | 40,071 |
| National CineMedia LLC, | | | | |
| 7.88%, 7/15/21, | | | | |
| Callable 7/15/16 @ 103.94 | | 120,000 | | 126,600 |
| Navient Corp., | | | | |
| 7.25%, 1/25/22, MTN | | 50,000 | | 49,469 |
| Navient Corp., | | | | |
| 8.00%, 3/25/20, MTN | | 100,000 | | 106,000 |
| NBTY, Inc., 9.00%, 10/1/18, | | | | |
| Callable 12/10/15 @ 104.5 | | 35,000 | | 35,830 |
| Outfront Media Capital LLC, | | | | |
| 5.25%, 2/15/22, | | | | |
| Callable 2/15/17 @ 103.94 | | 130,000 | | 133,575 |
| Owens-Brockway Packaging, Inc., | | | | |
| 5.00%, 1/15/22 | | 90,000 | | 91,744 |
| Owens-Brockway Packaging, Inc., | | | | |
| 5.88%, 8/15/23 (c) | | 45,000 | | 47,756 |
| Owens-Brockway Packaging, Inc., | | | | |
| 6.38%, 8/15/25 (c) | | 27,000 | | 28,755 |
| PBF Holding Co. LLC, | | | | |
| 8.25%, 2/15/20, | | | | |
| Callable 2/15/16 @ 104.13 | | 175,000 | | 183,749 |
| PBF Logistics LP, 6.88%, 5/15/23 | | 100,000 | | 93,000 |
| Peninsula Gaming LLC, | | | | |
| 8.38%, 2/15/18, | | | | |
| Callable 12/10/15 @ 104.19 | | 75,000 | | 78,000 |
| Penske Automotive Group, Inc., | | | | |
| 5.75%, 10/1/22, | | | | |
| Callable 10/1/17 @ 102.88 | | 85,000 | | 87,762 |
| Pinnacle Entertainment, Inc., | | | | |
| 6.38%, 8/1/21, | | | | |
| Callable 8/1/16 @ 104.78 | | 205,000 | | 218,324 |
| Plastipak Holdings, Inc., | | | | |
| 6.50%, 10/1/21, | | | | |
| Callable 10/1/16 @ 104.88 | | 90,000 | | 89,100 |
| Platform Specialty Products Corp., | | | | |
| 6.50%, 2/1/22, | | | | |
| Callable 2/1/18 @ 103.25 (c) | | 80,000 | | 68,000 |
| See notes to financial statements. | | HSBC FAMILY OF FUNDS 45 |
| HSBC GLOBAL HIGH YIELD BOND FUND |
| Schedule of Portfolio Investments—as of October 31, 2015 (continued) |
| Corporate Bonds, continued | | | | |
| |
| | Principal | | |
| | | Amount | | Value ($) |
| Regal Entertainment Group, | | | | |
| 5.75%, 6/15/23, | | | | |
| Callable 6/15/18 @ 102.88 | | 85,000 | | 85,000 |
| Resolute Forest Products, Inc., | | | | |
| 5.88%, 5/15/23, | | | | |
| Callable 5/15/17 @ 104.41 | | 105,000 | | 77,700 |
| Reynolds Group Issuer, Inc., | | | | |
| 7.13%, 4/15/19, | | | | |
| Callable 12/7/15 @ 101.78 | | 100,000 | | 101,813 |
| Reynolds Group Issuer, Inc., 9.88%, | | | | |
| 8/15/19, Callable | | | | |
| 12/10/15 @ 104.94 | | 117,000 | | 123,142 |
| Rite Aid Corp., 6.13%, 4/1/23, | | | | |
| Callable 4/1/18 @ 104.59 | | 110,000 | | 118,525 |
| Rose Rock Midstream LP, 5.63%, | | | | |
| 11/15/23, Callable | | | | |
| 5/15/19 @ 102.81 | | 161,000 | | 140,070 |
| RSI Home Products, Inc., 6.50%, | | | | |
| 3/15/23, Callable | | | | |
| 3/15/18 @ 104.88 | | 90,000 | | 93,150 |
| Sanchez Energy Corp., | | | | |
| 6.13%, 1/15/23, | | | | |
| Callable 7/15/18 @ 103.06 | | 195,000 | | 141,374 |
| Sealed Air Corp., 5.13%, 12/1/24, | | | | |
| Callable 9/1/24 @ 100 | | 47,000 | | 48,293 |
| Select Medical Holdings Corp., | | | | |
| 6.38%, 6/1/21, | | | | |
| Callable 6/1/16 @ 104.78 | | 170,000 | | 150,450 |
| Seminole Hard Rock Entertainment, | | | | |
| Inc., 5.88%, 5/15/21 (c) | | 55,000 | | 54,863 |
| Service Corp. International, | | | | |
| 5.38%, 5/15/24, | | | | |
| Callable 5/15/19 @ 102.69 | | 15,000 | | 15,994 |
| Sirius XM Radio, Inc., | | | | |
| 6.00%, 7/15/24, | | | | |
| Callable 7/15/19 @ 103 | | 175,000 | | 184,765 |
| Smithfield Foods, Inc., | | | | |
| 5.25%, 8/1/18, | | | | |
| Callable 12/10/15 @ 102 | | 150,000 | | 153,188 |
| Sprint Communications, Inc., | | | | |
| 6.00%, 11/15/22 | | 125,000 | | 106,811 |
| Sprint Communications, Inc., | | | | |
| 8.38%, 8/15/17 | | 115,000 | | 117,731 |
| Sprint Corp., 7.88%, 9/15/23 | | 115,000 | | 106,088 |
| Steel Dynamics, Inc., | | | | |
| 6.38%, 8/15/22, | | | | |
| Callable 8/15/17 @ 103.19 | | 100,000 | | 102,750 |
| Targa Resources Partners LP, | | | | |
| 4.25%, 11/15/23, | | | | |
| Callable 5/15/18 @ 102.31 | | 70,000 | | 61,250 |
| Targa Resources Partners LP, | | | | |
| 6.63%, 10/1/20, Callable 10/1/16 | | | | |
| @ 103.31 | | 75,000 | | 74,438 |
| Taylor Morrison Communities, Inc., | | | | |
| 5.88%, 4/15/23, | | | | |
| Callable 1/15/23 @ 100 | | 110,000 | | 111,100 |
| Tenet Healthcare Corp., | | | | |
| 6.00%, 10/1/20 | | 100,000 | | 108,000 |
| Tenet Healthcare Corp., | | | | |
| 8.13%, 4/1/22 | | 200,000 | | 211,499 |
| The Chemours Co., 6.63%, 5/15/23, | | | | |
| Callable 5/15/18 @ 104.97 | | 75,000 | | 55,969 |
| The Goldman Sachs Group, Inc., | | | | |
| 5.37%, 12/31/49, | | | | |
| Callable 5/10/20 @ 100 (a) | | 70,000 | | 69,741 |
| The Manitowoc Co., Inc., | | | | |
| 5.88%, 10/15/22, | | | | |
| Callable 10/15/17 @ 102.94 | | 135,000 | | 139,388 |
| T-Mobile US, Inc., 6.50%, 1/15/24, | | | | |
| Callable 1/15/19 @ 103.25 | | 150,000 | | 152,250 |
| T-Mobile US, Inc., 6.63%, 4/28/21, | | | | |
| Callable 4/28/17 @ 103.32 | | 150,000 | | 155,250 |
| Tribune Media Co., 5.88%, 7/15/22, | | | | |
| Callable 7/15/18 @ 102.94 | | 110,000 | | 113,025 |
| United Rentals North America, Inc., | | | | |
| 4.63%, 7/15/23, | | | | |
| Callable 7/15/18 @ 103.47 | | 87,000 | | 87,380 |
| United Rentals North America, Inc., | | | | |
| 6.13%, 6/15/23, | | | | |
| Callable 12/15/17 @ 103.06 | | 87,000 | | 90,785 |
| Univision Communications, Inc., | | | | |
| 5.13%, 5/15/23, | | | | |
| Callable 5/15/18 @ 102.56 | | 175,000 | | 173,250 |
| Univision Communications, Inc., | | | | |
| 6.75%, 9/15/22, | | | | |
| Callable 9/15/17 @ 103.37 (c) | | 15,000 | | 15,844 |
| Virgin Media Communications Ltd., | | | | |
| 6.38%, 4/15/23, | | | | |
| Callable 4/15/18 @ 103.18 | | 200,000 | | 205,999 |
| Wells Fargo & Co., 7.98%, 3/29/49, | | | | |
| Callable 3/15/18 @ 100 (a) | | 75,000 | | 79,875 |
| Windstream Services LLC, | | | | |
| 7.75%, 10/1/21, | | | | |
| Callable 10/1/16 @ 103.88 | | 150,000 | | 129,328 |
| Wise Metals Group LLC, | | | | |
| 8.75%, 12/15/18, | | | | |
| Callable 6/15/16 @ 104.38 | | 150,000 | | 141,750 |
| WPX Energy, Inc., 7.50%, 8/1/20, | | | | |
| Callable 7/1/20 @ 100 | | 100,000 | | 94,750 |
| Zayo Group LLC, 6.00%, 4/1/23, | | | | |
| Callable 4/1/18 @ 104.5 | | 125,000 | | 127,438 |
| Zebra Technologies Corp., | | | | |
| 7.25%, 10/15/22, | | | | |
| Callable 10/15/17 @ 105.43 | | 100,000 | | 108,875 |
| | | | | 13,652,036 |
| TOTAL CORPORATE BONDS | | | | |
| (COST $14,013,607) | | | | 13,652,036 |
| |
| Exchange Traded Fund — 0.8% | | | | |
| |
| | | Shares | | |
| SPDR Barclays | | | | |
| High Yield Bond ETF | | 5,521 | | 201,351 |
| TOTAL EXCHANGE TRADED | | | | |
| FUND (COST $211,438) | | | | 201,351 |
| 46 HSBC FAMILY OF FUNDS | | See notes to financial statements. |
| HSBC GLOBAL HIGH YIELD BOND FUND |
| Schedule of Portfolio Investments—as of October 31, 2015 (continued) |
| Investment Companies — 9.4% | | | |
| | | | |
| Shares | | Value ($) |
| Northern Institutional Diversified | | | |
| Assets Portfolio, Institutional | | | |
| Shares, 0.01%(d) | 2,307,352 | | 2,307,352 |
| TOTAL INVESTMENT COMPANIES | | | |
| (COST $2,307,352) | | | 2,307,352 |
| TOTAL INVESTMENT SECURITIES | | | |
| (COST $25,067,476) — 99.2% | | | 24,318,822 |
| Other Assets (Liabilities) — 0.8% | | | 199,218 |
| NET ASSETS — 100% | | | $24,518,040 |
____________________
| † | | The principal amount is disclosed in local currency and the value is disclosed in U.S. Dollars. |
| (a) | | Variable rate security. The interest rates on these securities are adjusted periodically to reflect then-current short-term interest rates. The rates presented represent the rates in effect on October 31, 2015. The maturity dates presented reflect the final maturity dates. However, some of these securities may contain put or demand features that allow the Fund to require the issuer to repurchase the security from the fund within various time periods, including daily, weekly, monthly, or semi-annually. |
| (b) | | Represents next call date. Additional subsequent call dates and amounts may apply to this security. |
| (c) | | Rule 144A security or other security which is restricted as to resale to institutional investors. This security has been deemed liquid by the Investment Adviser based on procedures approved by the Board of Trustees. |
| (d) | | The rate represents the annualized one-day yield that was in effect on October 31, 2015. |
ETF — Exchange-Traded Fund
MTN — Medium Term Note
SPDR — Standard & Poor's Depositary Receipt
LLC — Limited Liability Company
The Fund invested, as a percentage of net assets at value, in the following industries, as of October 31, 2015:
| | Percentage of Net Assets |
| Industry | at Value (%) |
| Oil, Gas & Consumable Fuels | | 11.6 | |
| Investment Companies | | 9.4 | |
| Media | | 7.6 | |
| Banks | | 6.5 | |
| Health Care Providers & Services | | 6.3 | |
| Hotels, Restaurants & Leisure | | 6.1 | |
| Diversified Telecommunication Services | | 5.8 | |
| Trading Companies & Distributors | | 4.2 | |
| Containers & Packaging | | 3.8 | |
| Metals & Mining | | 3.7 | |
| Wireless Telecommunication Services | | 3.7 | |
| Diversified Financial Services | | 3.1 | |
| Consumer Finance | | 2.7 | |
| Pharmaceuticals | | 2.4 | |
| Specialty Retail | | 1.7 | |
| Machinery | | 1.6 | |
| Food Products | | 1.4 | |
| Insurance | | 1.3 | |
| IT Services | | 1.3 | |
| Household Durables | | 1.3 | |
| Construction Materials | | 1.2 | |
| Real Estate Management & | | | |
| Development | | 1.0 | |
| Auto Components | | 1.0 | |
| Electric Utilities | | 0.9 | |
| Exchange Traded Fund | | 0.8 | |
| Chemicals | | 0.8 | |
| Health Care Equipment & Supplies | | 0.8 | |
| Capital Markets | | 0.7 | |
| Sovereign Bonds | | 0.7 | |
| Multi-Utilities | | 0.5 | |
| Distributors | | 0.5 | |
| Building Products | | 0.5 | |
| Communications Equipment | | 0.5 | |
| Independent Power and Renewable | | | |
| Electricity Producers | | 0.5 | |
| Food & Staples Retailing | | 0.5 | |
| Software | | 0.5 | |
| Life Sciences Tools & Services | | 0.4 | |
| Multiline Retail | | 0.4 | |
| Electronic Equipment, | | | |
| Instruments & Components | | 0.4 | |
| Paper & Forest Products | | 0.3 | |
| Personal Products | | 0.3 | |
| Automobiles | | 0.2 | |
| Energy Equipment & Services | | 0.2 | |
| Commercial Services & Supplies | | 0.1 | |
| Total | | 99.2 | |
| See notes to financial statements. | | HSBC FAMILY OF FUNDS 47 |
| HSBC GLOBAL HIGH YIELD BOND FUND |
| Schedule of Portfolio Investments—as of October 31, 2015 (continued) |
At October 31, 2015, the Fund's open forward foreign currency exchange contracts were as follows:
| | | | | | | | | | | | | | Net Unrealized |
| | | | | | | Contract | | Contract | | | | Appreciation/ |
| | | | Delivery | | Amount | | Value | | Value | | (Depreciation) |
| Short Contracts | | | Counterparty | | Date | | (Local Currency) | | ($) | | ($) | | ($) |
| Brazilian Real | | UBS AG | | 12/2/15 | | | 111,427 | | | 30,599 | | 28,586 | | | 2,013 | | |
| European Euro | | UBS AG | | 11/3/15 | | | 3,988,527 | | | 4,470,807 | | 4,385,565 | | | 85,242 | | |
| European Euro | | UBS AG | | 12/2/15 | | | 3,876,527 | | | 4,269,569 | | 4,264,025 | | | 5,544 | | |
| Mexican Peso | | Bank of America | | 11/3/15 | | | 987,189 | | | 59,595 | | 59,765 | | | (170 | ) | |
| | | | | | | | | | 8,830,570 | | 8,737,941 | | | 92,629 | | |
| | | | | | | | | | | | | | Net Unrealized |
| | | | | | Contract | | Contract | | | | Appreciation/ |
| | | | Delivery | | Amount | | Value | | Value | | (Depreciation) |
| Long Contracts | | | Counterparty | | Date | | (Local Currency) | | ($) | | ($) | | ($) |
| Brazilian Real | | Bank of America | | 12/2/15 | | | 109,380 | | | 30,000 | | 28,061 | | | (1,939 | ) | |
| Brazilian Real | | UBS AG | | 12/2/15 | | | 441,705 | | | 130,000 | | 113,317 | | | (16,683 | ) | |
| European Euro | | UBS AG | | 11/3/15 | | | 112,000 | | | 125,723 | | 123,149 | | | (2,574 | ) | |
| Indonesian Rupiah | | UBS AG | | 12/11/15 | | | 415,050,000 | | | 30,000 | | 30,006 | | | 6 | | |
| Mexican Peso | | Bank of America | | 11/3/15 | | | 987,189 | | | 58,000 | | 59,765 | | | 1,765 | | |
| Mexican Peso | | Bank of America | | 3/7/16 | | | 987,189 | | | 59,072 | | 59,239 | | | 167 | | |
| South African Rand | | Bank of America | | 12/15/15 | | | 385,323 | | | 29,000 | | 27,639 | | | (1,361 | ) | |
| Turkish Lira | | UBS AG | | 2/5/16 | | | 88,350 | | | 27,783 | | 29,479 | | | 1,696 | | |
| | | | | | | | | | 489,578 | | 470,655 | | | (18,923 | ) | |
| 48 HSBC FAMILY OF FUNDS | | See notes to financial statements. |
| HSBC GLOBAL HIGH INCOME BOND FUND |
| Schedule of Portfolio Investments—as of October 31, 2015 |
| Foreign Bonds — 24.0% | | | | |
| |
| | | | Principal | | |
| | | Amount† | | Value ($) |
| Belgium — 0.4% | | | | |
| AG Insurance SA-NV, 3.50%, | | | | |
| 6/30/47, Callable 6/30/27 | | | | |
| @ 100 (a),(b) | | 100,000 | | 99,673 |
| China — 0.7% | | | | |
| Hutchison Whampoa Ltd., 3.75%, | | | | |
| 5/29/49, Callable 5/10/18 | | | | |
| @ 100 (a),(b) | | 150,000 | | 165,750 |
| France — 6.5% | | | | |
| AXA SA, Series E, 3.94%, 11/29/49, | | | | |
| Callable 11/7/24 @ 100 (a),(b) | | 100,000 | | 108,741 |
| Banque Federative du Credit Mutuel | | | | |
| SA, Series E, 3.00%, 5/21/24 | | 100,000 | | 114,876 |
| BPCE SA, 2.75%, 7/8/26, | | | | |
| Callable 7/8/21 @ 100 (a),(b) | | 200,000 | | 222,452 |
| Credit Agricole SA, 6.50%, 4/29/49, | | | | |
| Callable 6/23/21 @ 100 (a),(b) | | 150,000 | | 166,171 |
| Crown International Holdings, | | | | |
| Registered, 4.00%, 7/15/22, | | | | |
| Callable 4/15/22 @ 100 (b) | | 100,000 | | 114,761 |
| Electricite de France SA, | | | | |
| Series E, 5.38%, 1/29/49, | | | | |
| Callable 1/29/25 @ 100 (a),(b) | | 100,000 | | 115,749 |
| GDF SUEZ, Series N10, 3.88%, | | | | |
| 6/2/49, Callable 6/2/24 | | | | |
| @ 100 (a),(b) | | 100,000 | | 110,657 |
| GDF SUEZ, 4.75%, 7/29/49, | | | | |
| Callable 7/10/21 @ 100 (a),(b) | | 100,000 | | 117,572 |
| Lafarge SA, Series E, | | | | |
| 6.75%, 12/16/19 | | 100,000 | | 129,448 |
| Novalis SAS, Registered, 3.00%, | | | | |
| 4/30/22, Callable 4/30/18 | | | | |
| @ 101.5 (b) | | 100,000 | | 106,388 |
| Orange SA, 4.25%, 2/28/49, | | | | |
| Callable 2/7/20 @ 100 (a),(b) | | 100,000 | | 114,465 |
| Societe Generale, 2.50%, 9/16/26, | | | | |
| Callable 9/16/21 @ 100 (a),(b) | | 100,000 | | 108,398 |
| VINCI SA, 6.34%, 11/29/49, | | | | |
| Callable 11/13/15 @ 100 (a),(b) | | 100,000 | | 110,104 |
| | | | | 1,639,782 |
| Germany — 2.8% | | | | |
| Bayer AG, 3.00%, 7/1/75, | | | | |
| Callable 7/1/20 @ 100 (a),(b) | | 150,000 | | 166,575 |
| Bertelsmann SE & Co. KGaA, | | | | |
| 3.00%, 4/23/75, Callable 4/23/23 | | | | |
| @ 100 (a),(b) | | 100,000 | | 104,409 |
| Commerzbank AG, Series E, | | | | |
| 7.75%, 3/16/21 | | 100,000 | | 133,052 |
| TUI AG, Registered, 4.50%, 10/1/19, | | | | |
| Callable 10/1/16 @ 102.25 (b) | | 100,000 | | 115,201 |
| Unitymedia GmbH, Registered, | | | | |
| 6.25%, 1/15/29, Callable 1/15/21 | | | | |
| @ 103.13 (b) | | 150,000 | | 183,067 |
| | | | | 702,304 |
| Guernsey — 0.4% | | | | |
| Credit Suisse Group Funding Ltd., | | | | |
| Series E, 1.25%, 4/14/22 | | 100,000 | | 106,451 |
| Ireland (Republic of) — 0.5% | | | | |
| Bank of Ireland, Series E, 4.25%, | | | | |
| 6/11/24, Callable 6/11/19 | | | | |
| @ 100 (a),(b) | | 100,000 | | 113,218 |
| Italy — 1.7% | | | | |
| Enel SpA, 5.00%, 1/15/75, | | | | |
| Callable 1/15/20 @ 100 (a),(b) | | 100,000 | | 115,470 |
| EXOR SpA, 2.50%, 10/8/24 | | 100,000 | | 109,900 |
| Intesa Sanpaolo SpA, Series E, | | | | |
| 6.63%, 9/13/23 | | 150,000 | | 200,661 |
| | | | | 426,031 |
| Luxembourg — 2.7% | | | | |
| CNH Industrial Finance Europe SA, | | | | |
| Series E, 6.25%, 3/9/18 | | 150,000 | | 176,421 |
| HeidelbergCement AG, | | | | |
| 8.50%, 10/31/19 | | 150,000 | | 206,190 |
| Talanx AG, Series E, 8.37%, 6/15/42, | | | | |
| Callable 6/15/22 @ 100 (a),(b) | | 200,000 | | 280,795 |
| | | | | 663,406 |
| Netherlands — 4.2% | | | | |
| Aegon NV, Series E, 4.00%, 4/25/44, | | | | |
| Callable 4/25/24 @ 100 (a),(b) | | 100,000 | | 109,760 |
| Alliander NV, 3.25%, 11/29/49, | | | | |
| Callable 11/27/18 @ 100 (a),(b) | | 100,000 | | 113,799 |
| Fresenius SE & Co. KGaA, | | | | |
| Registered, 3.00%, 2/1/21 | | 100,000 | | 117,152 |
| Rabobank Nederland, Registered, | | | | |
| 6.88%, 3/19/20 | | 200,000 | | 260,031 |
| Telefonica SA, 7.62%, 9/29/49, | | | | |
| Callable 9/18/21 @ 100 (a),(b) | | 100,000 | | 120,286 |
| Volkswagen AG, 5.13%, 9/29/49, | | | | |
| Callable 9/2/23 @ 100 (a),(b) | | 175,000 | | 192,173 |
| Wolters Kluwer NV, 2.50%, 5/13/24, | | | | |
| Callable 2/13/24 @ 100 (b) | | 100,000 | | 116,787 |
| | | | | 1,029,988 |
| Spain — 1.1% | | | | |
| Mapfre SA, 5.92%, 7/24/37, | | | | |
| Callable 7/24/17 @ 100 (a),(b) | | 150,000 | | 171,855 |
| Santander Issuances, Series E, | | | | |
| 2.50%, 3/18/25 | | 100,000 | | 104,774 |
| | | | | 276,629 |
| United Kingdom — 1.6% | | | | |
| FCE Bank plc, Series E, | | | | |
| 1.11%, 5/13/20 | | 100,000 | | 108,975 |
| Rexam plc, 6.75%, 6/29/67, | | | | |
| Callable 6/29/17 @ 100 (a),(b) | | 125,000 | | 137,438 |
| The Royal Bank of Scotland plc, | | | | |
| Series E, 10.50%, 3/16/22, | | | | |
| Callable 3/16/17 @ 100 (a),(b) | | 125,000 | | 153,612 |
| | | | | 400,025 |
| See notes to financial statements. | | HSBC FAMILY OF FUNDS 49 |
| HSBC GLOBAL HIGH INCOME BOND FUND |
| Schedule of Portfolio Investments—as of October 31, 2015 (continued) |
| Foreign Bonds†, continued | | | | |
| | | | | |
| | | | Principal | | |
| | | | Amount | | Value ($) |
| United States — 1.4% | | | | |
| Discovery Communications, Inc., | | | | |
| 1.90%, 3/19/27, Callable 12/19/26 | | | | |
| | @ 100 (b) | | 100,000 | | 96,855 |
| The Goldman Sachs Group, Inc., | | | | |
| 4.75%, 10/12/21 | | 100,000 | | 128,328 |
| ZF North America Capital, Inc., | | | | |
| 2.25%, 4/26/19 | | 100,000 | | 110,043 |
| | | | | | 335,226 |
| TOTAL FOREIGN BONDS | | | | |
| (COST $6,035,717) | | | | 5,958,483 |
| |
| Yankee Dollars — 27.6% | | | | |
| |
| Austria — 0.3% | | | | |
| JBS Investments SA, Registered, | | | | |
| 7.75%, 10/28/20, Callable 10/28/17 | | | | |
| @ 103.87 (b) | | 75,000 | | 79,913 |
| Bermuda — 0.6% | | | | |
| Aircastle Ltd., 5.50%, 2/15/22 | | 100,000 | | 105,750 |
| Viking Cruises Ltd., 8.50%, 10/15/22, | | | | |
| Callable 10/15/17 @ 104.25 (b) | | 50,000 | | 54,375 |
| | | | | 160,125 |
| Brazil — 4.4% | | | | |
| Federal Republic of Brazil, | | | | |
| 2.63%, 1/5/23 | | 500,000 | | 412,999 |
| GTL Trade Finance, Inc., Registered, | | | | |
| 5.89%, 4/29/24, Callable 1/29/24 | | | | |
| @ 100 (b) | | 150,000 | | 125,747 |
| Marfrig Overseas Ltd., Registered, | | | | |
| 9.50%, 5/4/20, Callable 12/19/15 | | | | |
| @ 104.75 (b) | | 100,000 | | 100,000 |
| Odebrecht Drilling Norbe VIII/IX | | | | |
| Ltd., Registered, 6.35%, 6/30/21, | | | | |
| Callable 6/30/20 @ 100 (b) | | 164,000 | | 80,360 |
| Petrobras Brasileiro SA, | | | | |
| 5.75%, 1/20/20 | | 400,000 | | 342,000 |
| | | | | 1,061,106 |
| Canada — 1.4% | | | | |
| Cascades, Inc., 5.75%, 7/15/23, | | | | |
| Callable 7/15/18 @ 104.31 (b) | | 25,000 | | 24,000 |
| First Quantum Minerals Ltd., | | | | |
| 6.75%, 2/15/20, Callable 2/15/17 | | | | |
| @ 103.38 (b) | | 13,000 | | 9,896 |
| Glencore Finance Canada Ltd., | | | | |
| 6.00%, 11/15/41 | | 100,000 | | 79,069 |
| Lundin Mining Corp., 7.50%, 11/1/20, | | | | |
| Callable 11/1/17 @ 103.75 (b) | | 25,000 | | 25,250 |
| Lundin Mining Corp., 7.88%, 11/1/22, | | | | |
| Callable 11/1/18 @ 103.93 (b)(c) | | 7,000 | | 7,018 |
| Teck Resources Ltd., | | | | |
| 3.15%, 1/15/17 | | 30,000 | | 28,500 |
| Teck Resources Ltd., | | | | |
| 3.85%, 8/15/17 | | 22,000 | | 20,350 |
| The Toronto-Dominion Bank, | | | | |
| Series G, 1.75%, 7/23/18 | | 100,000 | | 100,478 |
| Valeant Pharmaceuticals International, | | | | |
| Inc., 5.88%, 5/15/23, Callable | | | | |
| 5/15/18 @ 102.94 (b) | | 75,000 | | 63,000 |
| | | | | 357,561 |
| Chile — 0.8% | | | | |
| CorpBanca SA, 3.13%, 1/15/18 | | 200,000 | | 200,526 |
| China — 2.4% | | | | |
| China Overseas Land & Investment | | | | |
| Ltd., 4.25%, 5/8/19 | | 200,000 | | 207,803 |
| CNOOC Finance (2013) Ltd., | | | | |
| 3.00%, 5/9/23 | | 200,000 | | 189,347 |
| Sinopec Group Overseas | | | | |
| Development (2012) Ltd., | | | | |
| Registered, 3.90%, 5/17/22 | | 200,000 | | 205,765 |
| | | | | 602,915 |
| Colombia — 1.6% | | | | |
| Grupo Aval Ltd., Registered, | | | | |
| 4.75%, 9/26/22 | | 200,000 | | 194,980 |
| Republic of Colombia, | | | | |
| 4.38%, 7/12/21 | | 200,000 | | 205,800 |
| | | | | 400,780 |
| France — 0.9% | | | | |
| Electricite de France SA, 5.25%, | | | | |
| 1/29/49, Callable 1/29/23 | | | | |
| @ 100 (a),(b) | | 100,000 | | 99,500 |
| Orange SA, 5.50%, 2/6/44, | | | | |
| Callable 8/6/43 @ 100 (b) | | 100,000 | | 111,329 |
| | | | | 210,829 |
| Germany — 0.4% | | | | |
| Deutsche Bank AG, | | | | |
| 2.95%, 8/20/20 | | 100,000 | | 100,303 |
| Guatemala — 0.6% | | | | |
| Comcel Trust, Registered, | | | | |
| 6.88%, 2/6/24, Callable 2/6/19 | | | | |
| @ 103.44 (b) | | 200,000 | | 159,500 |
| Hong Kong — 1.3% | | | | |
| CITIC Ltd., Series E, | | | | |
| 6.88%, 1/21/18 | | 300,000 | | 327,009 |
| Indonesia — 1.5% | | | | |
| Republic of Indonesia, | | | | |
| Registered, 3.38%, 4/15/23 | | 400,000 | | 381,127 |
| Kazakhstan — 0.8% | | | | |
| Republic of Kazakhstan, Registered, | | | | |
| 5.13%, 7/21/25 | | 200,000 | | 198,905 |
| Luxembourg — 0.8% | | | | |
| Actavis Funding SCS, 4.75%, | | | | |
| 3/15/45, Callable | | | | |
| 9/15/44 @ 100 (b) | | 100,000 | | 96,163 |
| ArcelorMittal, 10.60%, 6/1/19 | | 100,000 | | 110,500 |
| | | | | 206,663 |
| 50 HSBC FAMILY OF FUNDS | | See notes to financial statements. |
| HSBC GLOBAL HIGH INCOME BOND FUND |
| Schedule of Portfolio Investments—as of October 31, 2015 (continued) |
| Yankee Dollars, continued | | | | |
| | | | | |
| | | | Principal | | |
| | | Amount | | Value ($) |
| Mexico — 2.8% | | | | |
| Petroleos Mexicanos, | | | | |
| 4.88%, 1/24/22 | | 500,000 | | 508,875 |
| United Mexican States, | | | | |
| 4.00%, 10/2/23 | | 146,000 | | 150,672 |
| | | | | 659,547 |
| Netherlands — 0.7% | | | | |
| LyondellBasell Industries NV, | | | | |
| 4.63%, 2/26/55, | | | | |
| Callable 8/26/54 @ 100 (b) | | 100,000 | | 86,653 |
| Petrobras Brasileiro SA, | | | | |
| 6.85%, 6/5/15 | | 100,000 | | 68,620 |
| Sensata Technologies BV, | | | | |
| 5.63%, 11/1/24 (c) | | 25,000 | | 25,438 |
| | | | | 180,711 |
| Russian Federation — 1.2% | | | | |
| Gazprom OAO Via Gaz Capital SA, | | | | |
| Registered, 4.95%, 7/19/22 | | 300,000 | | 289,500 |
| Singapore — 0.4% | | | | |
| Flextronics International Ltd., | | | | |
| 4.75%, 6/15/25, Callable | | | | |
| 3/15/25 @ 100 (b) | | 100,000 | | 97,500 |
| South Africa — 0.4% | | | | |
| Republic of South Africa, | | | | |
| 5.88%, 5/30/22 | | 100,000 | | 109,875 |
| Turkey — 2.1% | | | | |
| Akbank TAS, Registered, | | | | |
| 3.88%, 10/24/17 | | 300,000 | | 302,625 |
| Republic of Turkey, 7.00%, 3/11/19 | | 200,000 | | 223,150 |
| | | | | 525,775 |
| United Kingdom — 1.6% | | | | |
| Imperial Tobacco Group plc, | | | | |
| 3.75%, 7/21/22, | | | | |
| Callable 5/21/22 @ 100 (b) | | 200,000 | | 202,503 |
| Santander UK Group Holdings plc, | | | | |
| 4.75%, 9/15/25 (c) | | 200,000 | | 199,832 |
| | | | | 402,335 |
| Venezuela — 0.6% | | | | |
| Petroleos de Venezuela SA, | | | | |
| Registered, 6.00%, 11/15/26 | | 400,000 | | 141,360 |
| TOTAL YANKEE DOLLARS | | | | |
| (COST $7,113,583) | | | | 6,853,865 |
| |
| Corporate Bonds — 38.1% | | | | |
| | | | | |
| AbbVie, Inc., 2.50%, 5/14/20, | | | | |
| Callable 4/14/20 @ 100 | | 100,000 | | 98,895 |
| Airgas, Inc., 3.05%, 8/1/20, | | | | |
| Callable 7/1/20 @ 100 | | 50,000 | | 50,595 |
| Alcoa, Inc., 6.15%, 8/15/20 | | 40,000 | | 42,200 |
| Ally Financial, Inc., | | | | |
| 4.13%, 3/30/20 | | 200,000 | | 206,499 |
| Amazon.com, Inc., 4.95%, | | | | |
| 12/5/44, Callable 6/5/44 @ 100 | | 100,000 | | 104,361 |
| American Express Co., | | | | |
| 5.20%, 12/31/49, | | | | |
| Callable 11/15/19 @ 100 (a) | | 75,000 | | 75,000 |
| American Express Credit Corp., | | | | |
| 1.11%, 11/5/18, | | | | |
| Callable 10/15/18 @ 100 (a) | | 50,000 | | 49,971 |
| Amgen, Inc., 4.40%, 5/1/45, | | | | |
| Callable 11/1/44 @ 100 | | 100,000 | | 92,727 |
| Antero Resources Corp., | | | | |
| 6.00%, 12/1/20, | | | | |
| Callable 12/1/15 @ 104.5 | | 50,000 | | 48,000 |
| Asbury Automotive Group, Inc., | | | | |
| 6.00%, 12/15/24, | | | | |
| Callable 12/15/19 @ 103 (c) | | 10,000 | | 10,575 |
| Autonation, Inc., 4.50%, | | | | |
| 10/1/25, Callable 7/1/25 @ 100 | | 40,000 | | 40,982 |
| Ball Corp., 5.25%, 7/1/25 | | 50,000 | | 50,813 |
| Bank of America Corp., | | | | |
| 3.88%, 8/1/25, MTN | | 100,000 | | 101,785 |
| Bank of America Corp., | | | | |
| 8.12%, 12/29/49, | | | | |
| Callable 5/15/18 @ 100 (a) | | 75,000 | | 78,281 |
| Baxalta, Inc., 2.88%, 6/23/20, | | | | |
| Callable 5/23/20 @ 100 | | 100,000 | | 99,905 |
| Belden, Inc., 5.25%, 7/15/24, | | | | |
| Callable 7/15/19 @ 102.62 (c) | | 25,000 | | 23,750 |
| Biogen, Inc., 5.20%, 9/15/45, | | | | |
| Callable 3/15/45 @ 100 | | 40,000 | | 40,387 |
| Blue Cube Spinco, Inc., | | | | |
| 9.75%, 10/15/23, | | | | |
| Callable 10/15/20 @ 102.44 (c) | | 31,000 | | 33,403 |
| Blue Cube Spinco, Inc., | | | | |
| 10.00%, 10/15/25, | | | | |
| Callable 10/15/20 @ 105 (c) | | 8,000 | | 8,680 |
| Blue Racer Midstream LLC, | | | | |
| 6.13%, 11/15/22, | | | | |
| Callable 11/15/17 @ 104.59 | | 14,000 | | 13,090 |
| Building Materials Corp., | | | | |
| 6.00%, 10/15/25, | | | | |
| Callable 10/15/20 @ 103 (c) | | 15,000 | | 15,938 |
| Capital One Financial Corp., | | | | |
| 4.20%, 10/29/25, | | | | |
| Callable 9/29/25 @ 100 | | 35,000 | | 35,015 |
| Capital One Financial Corp., | | | | |
| 5.55%, 12/31/49, | | | | |
| Callable 6/1/20 @ 100 (a) | | 50,000 | | 50,094 |
| Carrizo Oil & Gas, Inc., | | | | |
| 7.50%, 9/15/20, | | | | |
| Callable 9/15/16 @ 103.75 | | 20,000 | | 19,950 |
| CCO Holdings LLC, | | | | |
| 6.63%, 1/31/22, | | | | |
| Callable 1/31/17 @ 103.31 | | 75,000 | | 79,500 |
| CCO Safari II LLC, | | | | |
| 6.48%, 10/23/45, | | | | |
| Callable 4/23/45 @ 100 | | 100,000 | | 103,674 |
| Celgene Corp., 5.00%, 8/15/45, | | | | |
| Callable 2/15/45 @ 100 | | 45,000 | | 45,199 |
| See notes to financial statements. | | HSBC FAMILY OF FUNDS 51 |
| HSBC GLOBAL HIGH INCOME BOND FUND |
| Schedule of Portfolio Investments—as of October 31, 2015 (continued) |
| Corporate Bonds, continued | | | | |
| |
| | Principal | | |
| | Amount | | Value ($) |
| Cemex Finance LLC, | | | | |
| Registered, 9.38%, 10/12/22, | | | | |
| Callable 10/12/17 @ 104.69 | | 200,000 | | 217,500 |
| Citigroup, Inc., 7/30/18 (a) | | 100,000 | | 99,857 |
| Citigroup, Inc., 5.80%, 11/29/49, | | | | |
| Callable 11/15/19 @ 100 (a) | | 50,000 | | 49,688 |
| Clearwater Paper Corp., | | | | |
| 5.38%, 2/1/25 | | 40,000 | | 39,600 |
| Columbia Pipeline Group, Inc., | | | | |
| 4.50%, 6/1/25, | | | | |
| Callable 3/1/25 @ 100 | | 100,000 | | 96,272 |
| CommScope Technologies Finance | | | | |
| LLC, 6.00%, 6/15/25, | | | | |
| Callable 6/15/20 @ 103 | | 25,000 | | 25,375 |
| Community Health Systems, Inc., | | | | |
| 6.88%, 2/1/22, | | | | |
| Callable 2/1/18 @ 103.44 | | 50,000 | | 50,375 |
| Concho Resources, Inc., | | | | |
| 6.50%, 1/15/22, | | | | |
| Callable 1/15/17 @ 103.25 | | 50,000 | | 51,813 |
| Continental Resources, | | | | |
| 4.90%, 6/1/44, | | | | |
| Callable 12/1/43 @ 100 | | 100,000 | | 75,862 |
| Daimler Finance NA LLC, | | | | |
| 1.60%, 8/3/17 | | 150,000 | | 149,405 |
| Dana Holding Corp., | | | | |
| 6.00%, 9/15/23, | | | | |
| Callable 9/15/18 @ 103 | | 50,000 | | 51,750 |
| DaVita Healthcare Partners, Inc., | | | | |
| 5.00%, 5/1/25, | | | | |
| Callable 5/1/20 @ 102.5 | | 20,000 | | 19,854 |
| DCP Midstream LLC, | | | | |
| 8.13%, 8/16/30 | | 35,000 | | 34,782 |
| DDR Corp., 3.63%, 2/1/25, | | | | |
| Callable 11/1/24 @ 100 | | 100,000 | | 94,896 |
| Devon Energy Corp., | | | | |
| 5.00%, 6/15/45, | | | | |
| Callable 12/15/44 @ 100 | | 100,000 | | 91,799 |
| DIRECTV Holdings LLC, | | | | |
| 4.45%, 4/1/24, | | | | |
| Callable 1/1/24 @ 100 | | 100,000 | | 103,153 |
| Discover Financial Services, 3.95%, | | | | |
| 11/6/24, Callable 8/6/24 @ 100 | | 100,000 | | 99,282 |
| DISH DBS Corp., | | | | |
| 5.88%, 7/15/22 | | 50,000 | | 49,000 |
| Dollar Tree, Inc., 5.25%, 3/1/20, | | | | |
| Callable 3/1/17 @ 102.63 | | 50,000 | | 52,125 |
| Dominion Resources, Inc., 3.90%, | | | | |
| 10/1/25, Callable 7/1/25 @ 100 | | 40,000 | | 40,576 |
| Endo Finance LLC, 5.38%, 1/15/23, | | | | |
| Callable 7/15/17 @ 104.03 | | 50,000 | | 49,035 |
| Energy Transfer Equity LP, | | | | |
| 5.88%, 1/15/24, | | | | |
| Callable 10/15/23 @ 100 | | 25,000 | | 24,219 |
| Energy Transfer Partners LP, 3.60%, | | | | |
| 2/1/23, Callable 11/1/22 @ 100 | | 100,000 | | 88,446 |
| Enterprise Products Partners LP, | | | | |
| 7.03%, 1/15/68, | | | | |
| Callable 1/15/18 @ 100 (a) | | 100,000 | | 105,625 |
| EP Energy LLC/ Everest Acquisition | | | | |
| Finance, Inc., 6.38%, 6/15/23, | | | | |
| Callable 6/15/18 @ 104.78 | | 50,000 | | 37,750 |
| Fidelity National Information | | | | |
| Services, Inc., 3.63%, 10/15/20, | | | | |
| Callable 9/15/20 @ 100 | | 85,000 | | 86,528 |
| Fifth Third Bancorp, | | | | |
| 4.90%, 12/29/49, | | | | |
| Callable 9/30/19 @ 100 (a) | | 50,000 | | 47,250 |
| Fifth Third BanCorp, 2.88%, | | | | |
| 7/27/20, Callable 6/27/20 @ 100 | | 110,000 | | 110,801 |
| First Horizon National Corp., | | | | |
| 3.50%, 12/15/20, | | | | |
| Callable 11/15/20 @ 100 | | 50,000 | | 49,840 |
| First Quality Finance Co., Inc., | | | | |
| 4.63%, 5/15/21, | | | | |
| Callable 5/15/16 @ 103.46 (c) | | 10,000 | | 9,275 |
| Ford Motor Credit Co. LLC, | | | | |
| 2.24%, 6/15/18 | | 200,000 | | 199,346 |
| Freeport-McMoRan, Inc., | | | | |
| 2.30%, 11/14/17 | | 100,000 | | 94,000 |
| Fresenius Medical Care AG & Co. | | | | |
| KGaA, 5.88%, 1/31/22 | | 50,000 | | 54,500 |
| Frontier Communications Corp., | | | | |
| 10.50%, 9/15/22, | | | | |
| Callable 6/15/22 @ 100 (c) | | 31,000 | | 32,163 |
| General Motors Financial Co., Inc., | | | | |
| 3.10%, 1/15/19, | | | | |
| Callable 7/15/18 @ 100 | | 40,000 | | 40,161 |
| General Motors Financial Co., Inc., | | | | |
| 4.30%, 7/13/25, | | | | |
| Callable 4/13/25 @ 100 | | 150,000 | | 152,716 |
| Genesis Energy LP, 5.75%, 2/15/21, | | | | |
| Callable 2/15/17 @ 102.88 | | 25,000 | | 23,375 |
| Genesis Energy LP, 6.75%, 8/1/22, | | | | |
| Callable 8/1/18 @ 103.38 | | 23,000 | | 22,425 |
| Gilead Sciences, Inc., 4.75%, 3/1/46, | | | | |
| Callable 9/1/45 @ 100 | | 40,000 | | 40,513 |
| Greif, Inc., 7.75%, 8/1/19 | | 30,000 | | 33,638 |
| Group 1 Automotive, Inc., | | | | |
| 5.00%, 6/1/22, | | | | |
| Callable 6/1/17 @ 103.75 | | 50,000 | | 50,500 |
| HCA Holdings, Inc., 5.25%, 4/15/25, | | | | |
| Callable 10/15/20 @ 105 | | 100,000 | | 103,500 |
| HealthSouth Corp., 5.75%, 11/1/24, | | | | |
| Callable 11/1/17 @ 102.87 (c) | | 2,000 | | 2,000 |
| HealthSouth Corp., 5.75%, 11/1/24, | | | | |
| Callable 11/1/17 @ 102.88 | | 25,000 | | 25,000 |
| Hewlett Packard Enterprise Co., | | | | |
| 3.60%, 10/15/20, | | | | |
| Callable 9/15/20 @ 100 (c) | | 42,000 | | 42,308 |
| HJ Heinz Corp II, 1.60%, 6/30/17 | | 150,000 | | 150,132 |
| Host Hotels & Resorts LP, 4.50%, | | | | |
| 2/1/26, Callable 11/1/25 @ 100 | | 50,000 | | 50,263 |
| Hyundai Capital America, | | | | |
| 1.88%, 8/9/16 | | 100,000 | | 100,304 |
| IHS, Inc., 5.00%, 11/1/22, | | | | |
| Callable 8/1/22 @ 100 | | 25,000 | | 25,250 |
| Infor, Inc., 5.75%, 8/15/20, | | | | |
| Callable 8/15/17 @ 102.87 (c) | | 2,000 | | 2,040 |
| 52 HSBC FAMILY OF FUNDS | | See notes to financial statements. |
| HSBC GLOBAL HIGH INCOME BOND FUND |
| Schedule of Portfolio Investments—as of October 31, 2015 (continued) |
| Corporate Bonds, continued | | | | |
| |
| | Principal | | |
| | Amount | | Value ($) |
| International Lease Finance Corp., | | | | |
| 5.88%, 8/15/22 | | 100,000 | | 109,750 |
| Jarden Corp., 5.00%, 11/15/23, | | | | |
| Callable 11/15/18 @ 103.75 (c) | | 8,000 | | 8,220 |
| Kilroy Realty Corp., 4.38%, 10/1/25, | | | | |
| Callable 7/1/25 @ 100 | | 40,000 | | 40,552 |
| Kimco Realty Corp., 3.40%, 11/1/22, | | | | |
| Callable 9/1/22 @ 100 | | 40,000 | | 40,002 |
| Kinder Morgan, Inc., 3.05%, 12/1/19, | | | | |
| Callable 11/1/19 @ 100 | | 150,000 | | 145,425 |
| Kinder Morgan, Inc., 5.05%, 2/15/46, | | | | |
| Callable 8/15/45 @ 100 | | 100,000 | | 79,345 |
| Kindred Healthcare, Inc., | | | | |
| 6.38%, 4/15/22, | | | | |
| Callable 4/15/17 @ 104.78 | | 50,000 | | 47,250 |
| L Brands, Inc., 6.88%, 11/1/35 (c) | | 3,000 | | 3,128 |
| L Brands, Inc., 6.95%, 3/1/33 | | 50,000 | | 52,124 |
| Lear Corp., 5.25%, 1/15/25, | | | | |
| Callable 1/15/20 @ 102.63 | | 50,000 | | 51,000 |
| Lennar Corp., 4.75%, 5/30/25, | | | | |
| Callable 2/28/25 @ 100 | | 70,000 | | 69,300 |
| Lennar Corp., 4.88%, 12/15/23, | | | | |
| Callable 9/15/23 @ 100 | | 20,000 | | 19,925 |
| Level 3 Financing, Inc., 5.13%, 5/1/23, | | | | |
| Callable 5/1/18 @ 102.56 | | 25,000 | | 25,281 |
| Level 3 Financing, Inc., | | | | |
| 5.38%, 1/15/24, | | | | |
| Callable 1/15/19 @ 102.56 (c) | | 11,000 | | 11,138 |
| LifePoint Health, Inc., 5.50%, 12/1/21, | | | | |
| Callable 12/1/16 @ 104.13 | | 50,000 | | 50,750 |
| Marathon Oil Corp., 2.70%, 6/1/20, | | | | |
| Callable 5/1/20 @ 100 | | 100,000 | | 97,092 |
| Markwest Energy Partners LP, | | | | |
| 4.88%, 12/1/24, | | | | |
| Callable 9/1/24 @ 100 | | 50,000 | | 47,250 |
| Microsoft Corp., 4.45%, 11/3/45, | | | | |
| Callable 5/3/55 @ 100 | | 40,000 | | 40,695 |
| Microsoft Corp., 4.75%, 11/3/55, | | | | |
| Callable 5/3/55 @ 100 | | 40,000 | | 40,253 |
| MSCI, Inc., 5.75%, 8/15/25, Callable | | | | |
| 8/15/20 @ 102.87 (c) | | 11,000 | | 11,600 |
| National CineMedia LLC, 6.00%, | | | | |
| 4/15/22, Callable 4/15/17 @ 103 | | 30,000 | | 31,236 |
| Navient Corp., 8.00%, | | | | |
| 3/25/20, MTN | | 150,000 | | 159,000 |
| NextEra Energy Capital, | | | | |
| 2.06%, 9/1/17 | | 100,000 | | 100,498 |
| Noble Energy, Inc., 5.05%, 11/15/44, | | | | |
| Callable 5/15/44 @ 100 | | 100,000 | | 91,281 |
| Norfolk Southern Corp., | | | | |
| 4.65%, 1/15/46, | | | | |
| Callable 7/15/45 @ 100 | | 20,000 | | 20,018 |
| Omega Healthcare Investors, Inc., | | | | |
| 5.25%, 1/15/26, | | | | |
| Callable 10/15/25 @ 100 (c) | | 65,000 | | 67,111 |
| Outfront Media Capital LLC, | | | | |
| 5.25%, 2/15/22, | | | | |
| Callable 2/15/17 @ 103.94 | | 25,000 | | 25,688 |
| Owens Corning, Inc., | | | | |
| 4.20%, 12/15/22, | | | | |
| Callable 9/15/22 @ 100 | | 100,000 | | 101,144 |
| Owens-Brockway Packaging, Inc., | | | | |
| 5.00%, 1/15/22 | | 50,000 | | 50,969 |
| Owens-Brockway Packaging, Inc., | | | | |
| 5.88%, 8/15/23 (c) | | 9,000 | | 9,551 |
| Owens-Brockway Packaging, Inc., | | | | |
| 6.38%, 8/15/25 (c) | | 5,000 | | 5,325 |
| PBF Holding Co. LLC, | | | | |
| 8.25%, 2/15/20, | | | | |
| Callable 2/15/16 @ 104.13 | | 75,000 | | 78,750 |
| Penske Automotive Group, Inc., | | | | |
| 5.75%, 10/1/22, | | | | |
| Callable 10/1/17 @ 102.88 | | 25,000 | | 25,813 |
| Penske Truck Leasing Co. LP, | | | | |
| 3.20%, 7/15/20, | | | | |
| Callable 6/15/20 @ 100 | | 100,000 | | 100,422 |
| Philip Morris International, Inc., | | | | |
| 1.25%, 8/11/17 | | 50,000 | | 50,179 |
| Platform Specialty Products Corp., | | | | |
| 6.50%, 2/1/22, | | | | |
| Callable 2/1/18 @ 103.25 | | 50,000 | | 42,500 |
| Prologis LP, 4.50%, 8/15/17 | | 100,000 | | 105,374 |
| Quintiles Transnational Corp., | | | | |
| 4.88%, 5/15/23, | | | | |
| Callable 5/15/18 @ 103.66 | | 25,000 | | 25,703 |
| Rabobank Capital Funding Trust III, | | | | |
| 5.25%, 12/29/49, | | | | |
| Callable 10/21/16 @ 100 | | 100,000 | | 101,860 |
| Resolute Forest Products, Inc., | | | | |
| 5.88%, 5/15/23, | | | | |
| Callable 5/15/17 @ 104.41 | | 50,000 | | 37,000 |
| Reynolds American, Inc., | | | | |
| 5.85%, 8/15/45, | | | | |
| Callable 2/12/45 @ 100 | | 100,000 | | 110,850 |
| Reynolds Group Issuer, Inc., | | | | |
| 7.13%, 4/15/19, | | | | |
| Callable 12/7/15 @ 101.78 | | 100,000 | | 101,812 |
| Rose Rock Midstream LP, | | | | |
| 5.63%, 11/15/23, | | | | |
| Callable 5/15/19 @ 102.81 | | 50,000 | | 43,500 |
| Sealed Air Corp., 5.50%, 9/15/25, | | | | |
| Callable 6/15/25 @ 100 | | 25,000 | | 26,375 |
| Service Corp. International, | | | | |
| 5.38%, 5/15/24, | | | | |
| Callable 5/15/19 @ 102.69 | | 33,000 | | 35,186 |
| Sirius XM Radio, Inc., 6.00%, | | | | |
| 7/15/24, Callable 7/15/19 @ 103 | | 75,000 | | 79,185 |
| SM Energy Co., 5.63%, 6/1/25, | | | | |
| Callable 6/1/20 @ 102.81 | | 50,000 | | 45,625 |
| Southern Copper Corp., | | | | |
| 6.75%, 4/16/40 | | 100,000 | | 95,492 |
| Sprint Communications, Inc., | | | | |
| 9.00%, 11/15/18 (c) | | 10,000 | | 10,994 |
| Sprint Corp., 7.88%, 9/15/23 | | 100,000 | | 92,250 |
| Steel Dynamics, Inc., | | | | |
| 6.38%, 8/15/22, | | | | |
| Callable 8/15/17 @ 103.19 | | 50,000 | | 51,375 |
| Synchrony Financial, 4.50%, 7/23/25, | | | | |
| Callable 4/24/25 @ 100 | | 100,000 | | 101,344 |
| Targa Resources Partners LP, | | | | |
| 6.75%, 3/15/24, | | | | |
| Callable 9/15/19 @ 103.37 (c) | | 20,000 | | 19,675 |
| See notes to financial statements. | HSBC FAMILY OF FUNDS | 53 |
| HSBC GLOBAL HIGH INCOME BOND FUND |
| Schedule of Portfolio Investments—as of October 31, 2015 (continued) |
| Corporate Bonds, continued |
| |
| | Principal | | | |
| | Amount† | | Value ($) |
| Taylor Morrison Communities, Inc., | | | | | |
| 5.88%, 4/15/23, | | | | | |
| Callable 1/15/23 @ 100 | | 50,000 | | | 50,500 |
| TEGNA, Inc., 5.50%, 9/15/24, | | | | | |
| Callable 9/15/19 @ 102.75 | | 30,000 | | | 30,450 |
| Tenet Healthcare Corp., | | | | | |
| 6.00%, 10/1/20 | | 50,000 | | | 54,000 |
| The Chemours Co., 6.63%, 5/15/23, | | | | | |
| Callable 5/15/18 @ 104.97 | | 25,000 | | | 18,656 |
| The Goldman Sachs Group, Inc., | | | | | |
| 5.37%, 12/31/49, | | | | | |
| Callable 5/10/20 @ 100 (a) | | 50,000 | | | 49,815 |
| The Williams Cos., Inc., | | | | | |
| 4.55%, 6/24/24, | | | | | |
| Callable 3/24/24 @ 100 | | 100,000 | | | 83,725 |
| Time Warner Cable, Inc., | | | | | |
| 4.50%, 9/15/42, | | | | | |
| Callable 3/15/42 @ 100 | | 100,000 | | | 81,086 |
| T-Mobile US, Inc., 6.50%, 1/15/24, | | | | | |
| Callable 1/15/19 @ 103.25 | | 100,000 | | | 101,500 |
| T-Mobile US, Inc., 6.63%, 4/28/21, | | | | | |
| Callable 4/28/17 @ 103.32 | | 50,000 | | | 51,750 |
| Toll Bros Finance Corp., | | | | | |
| 4.88%, 11/15/25, | | | | | |
| Callable 8/15/25 @ 100 | | 20,000 | | | 19,975 |
| Tribune Media Co., 5.88%, 7/15/22, | | | | | |
| Callable 7/15/18 @ 102.94 | | 50,000 | | | 51,375 |
| Twenty-First Century Fox, Inc., | | | | | |
| 3.70%, 10/15/25, | | | | | |
| Callable 7/15/25 @ 100 (c) | | 65,000 | | | 65,036 |
| United Rentals North America, Inc., | | | | | |
| 6.13%, 6/15/23, | | | | | |
| Callable 12/15/17 @ 103.06 | | 50,000 | | | 52,175 |
| UnitedHealth Group, Inc., | | | | | |
| 1.45%, 7/17/17 | | 100,000 | | | 100,573 |
| Univision Communications, Inc., | | | | | |
| 5.13%, 5/15/23, | | | | | |
| Callable 5/15/18 @ 102.56 | | 50,000 | | | 49,500 |
| Verizon Communications, Inc., | | | | | |
| 3.65%, 9/14/18 | | 100,000 | | | 105,472 |
| Verizon Communications, Inc., | | | | | |
| 4.27%, 1/15/36 | | 150,000 | | | 136,737 |
| Walgreens Boots Alliance, Inc., | | | | | |
| 4.80%, 11/18/44, | | | | | |
| Callable 5/18/44 @ 100 | | 100,000 | | | 92,178 |
| Wells Fargo & Co., | | | | | |
| 4.30%, 7/22/27 | | 100,000 | | | 103,245 |
| Wells Fargo & Co., | | | | | |
| 7.98%, 3/29/49, | | | | | |
| Callable 3/15/18 @ 100 (a) | | 50,000 | | | 53,250 |
| Windstream Services LLC, | | | | | |
| 7.75%, 10/1/21, Callable | | | | | |
| 10/1/16 @ 103.88 | | 25,000 | | | 21,555 |
| WPX Energy, Inc., 8.25%, 8/1/23, | | | | | |
| Callable 6/1/23 @ 100 | | 50,000 | | | 47,000 |
| | | | | 9,417,854 |
| TOTAL CORPORATE BONDS | | | | | |
| (COST $9,505,044) | | | | | 9,417,854 |
| Exchange Traded Fund — 0.6% | | | | | |
| | | | | |
| | Shares | | Value ($) |
| SPDR Barclays High Yield | | | | | |
| Bond ETF | | 4,255 | | | 155,180 |
| TOTAL EXCHANGE TRADED FUND | | | | | |
| (COST $162,954) | | | | | 155,180 |
| | | | | | |
| Investment Companies — 8.5% | | | | | |
| | | | | | |
| Northern Institutional Diversified | | | | | |
| Assets Portfolio, Institutional | | | | | |
| Shares, 0.01% (d) | | 2,106,153 | | | 2,106,153 |
| TOTAL INVESTMENT COMPANIES | | | | | |
| (COST $2,106,153) | | | | | 2,106,153 |
| TOTAL INVESTMENT SECURITIES | | | | | |
| (COST $24,923,450) — 98.8% | | | | | 24,491,535 |
| Other Assets | | | | | |
| (Liabilities) — 1.2% | | | | | 303,155 |
| NET ASSETS — 100% | | | | $ | 24,794,690 |
____________________
| † | | The principal amount is disclosed in local currency and the value is disclosed in U.S. Dollars. |
| (a) | | Variable rate security. The interest rates on these securities are adjusted periodically to reflect then-current short-term interest rates. The rates presented represent the rates in effect on October 31, 2015. The maturity dates presented reflect the final maturity dates. However, some of these securities may contain put or demand features that allow the Fund to require the issuer to repurchase the security from the fund within various time periods, including daily, weekly, monthly, or semi-annually. |
| (b) | | Represents next call date. Additional subsequent call dates and amounts may apply to this security. |
| (c) | | Rule 144A security or other security which is restricted as to resale to institutional investors. This security has been deemed liquid by the Investment Adviser based on procedures approved by the Board of Trustees. |
| (d) | | The rate represents the annualized one-day yield that was in effect on October 31, 2015. |
| ETF — Exchange-Traded Fund |
| MTN — Medium Term Note |
| SPDR — Standard & Poor’s Depositary Receipt |
| LLC — Limited Liability Company |
| 54 HSBC FAMILY OF FUNDS | See notes to financial statements. |
| HSBC GLOBAL HIGH INCOME BOND FUND |
| Schedule of Portfolio Investments—as of October 31, 2015 (continued) |
The Fund invested, as a percentage of net assets at value, in the following industries, as of October 31, 2015:
| Percentage of Net Assets |
| Industry | at Value (%) |
| Oil, Gas & Consumable Fuels | | 13.8 | |
| Banks | | 13.1 | |
| Investment Companies | | 8.5 | |
| Sovereign Bonds | | 5.0 | |
| Consumer Finance | | 4.6 | |
| Diversified Financial Services | | 4.5 | |
| Media | | 3.8 | |
| Diversified Telecommunication | | | |
| Services | | 3.2 | |
| Metals & Mining | | 2.7 | |
| Pharmaceuticals | | 2.5 | |
| Auto Components | | 2.5 | |
| Containers & Packaging | | 2.2 | |
| Wireless Telecommunication | | | |
| Services | | 2.1 | |
| Industrial Conglomerates | | 2.1 | |
| Health Care Providers & Services | | 2.0 | |
| Insurance | | 1.9 | |
| Sovereign | | 1.9 | |
| Electric Utilities | | 1.8 | |
| Real Estate Investment Trusts | | 1.7 | |
| Multi-Utilities | | 1.6 | |
| Capital Markets | | 1.5 | |
| Construction Materials | | 1.4 | |
| Food Products | | 1.3 | |
| Trading Companies & Distributors | | 1.0 | |
| Real Estate Management & | | | |
| Development | | 1.0 | |
| Biotechnology | | 1.0 | |
| Chemicals | | 0.9 | |
| Automobiles | | 0.8 | |
| Building Products | | 0.8 | |
| Specialty Retail | | 0.7 | |
| Hotels, Restaurants & Leisure | | 0.7 | |
| Tobacco | | 0.6 | |
| Electronic Equipment, Instruments | | | |
| & Components | | 0.6 | |
| Commercial Services & Supplies | | 0.6 | |
| Exchange Traded Fund | | 0.6 | |
| Road & Rail | | 0.5 | |
| Food & Staples Retailing | | 0.4 | |
| Internet & Catalog Retail | | 0.4 | |
| Construction & Engineering | | 0.4 | |
| Software | | 0.4 | |
| IT Services | | 0.3 | |
| Paper & Forest Products | | 0.3 | |
| Energy Equipment & Services | | 0.3 | |
| Household Durables | | 0.2 | |
| Technology Hardware, Storage & | | | |
| Peripherals | | 0.2 | |
| Multiline Retail | | 0.2 | |
| Professional Services | | 0.1 | |
| Communications Equipment | | 0.1 | |
| Personal Products | | 0.0 | |
| Total | | 98.8 | |
At October 31, 2015, the Fund’s open forward foreign currency exchange contracts were as follows:
| | | | | | Contract | | | | | | | | | | Net Unrealized |
| | | | | | Amount | | Contract | | | | | | Appreciation/ |
| | | | Delivery | | (Local | | Value | | Value | | (Depreciation) |
| Short Contracts | | | Counterparty | | Date | | Currency) | | ($) | | ($) | | ($) |
| Brazilian Real | | UBS AG | | 12/2/15 | | | 546,675 | | | | 150,124 | | | | 140,246 | | | | 9,878 | |
| European Euro | | UBS AG | | 11/3/15 | | | 5,579,755 | | | | 6,254,442 | | | | 6,135,193 | | | | 119,249 | |
| European Euro | | UBS AG | | 12/2/15 | | | 5,458,755 | | | | 6,012,218 | | | | 6,004,412 | | | | 7,806 | |
| | | | | | | | | | | 12,416,784 | | | | 12,279,851 | | | | 136,933 | |
| | | | | | Contract | | | | | | | | | | Net Unrealized |
| | | | | | Amount | | | | | | | | | | Appreciation/ |
| | | | Delivery | | (Local | | Contract | | Value | | (Depreciation) |
| Long Contracts | | | Counterparty | | Date | | Currency) | | Value ($) | | ($) | | ($) |
| Brazilian Real | | UBS AG | | 12/2/15 | | 796,855 | | | 220,000 | | | | 204,428 | | | | (15,572 | ) | |
| European Euro | | UBS AG | | 11/3/15 | | 121,000 | | | 135,801 | | | | 133,045 | | | | (2,756 | ) | |
| Turkish Lira | | UBS AG | | 2/5/16 | | 206,150 | | | 64,827 | | | | 68,786 | | | | 3,959 | | |
| | | | | | | | | 420,628 | | | | 406,259 | | | | (14,369 | ) | |
| See notes to financial statements. | HSBC FAMILY OF FUNDS 55 |
HSBC FAMILY OF FUNDS
Statements of Assets and Liabilities—as of October 31, 2015
| | Emerging | | Emerging | | Frontier | | Total |
| | Markets | | Markets Local | | Markets | | Return |
| | Debt Fund | | Debt Fund | | Fund | | Fund |
| Assets: | | | | | | | | | | | | | | | | | | | | |
| Investments in Affiliated Investment Companies, at value(a) | | | $ | — | | | | $ | — | | | | $ | — | | | | $ | 25,000,000 | |
| Investments in non-affiliates, at value | | | | 11,974,161 | | | | | 14,161,397 | | | | | 141,346,057 | | | | | 1,182,053,499 | |
| Total Investments | | | | 11,974,161 | | | | | 14,161,397 | | | | | 141,346,057 | | | | | 1,207,053,499 | |
| Segregated cash for collateral | | | | — | | | | | 590,000 | | | | | — | | | | | 19,500,000 | |
| Segregated cash with brokers | | | | 4,050 | | | | | — | | | | | — | | | | | 1,255,500 | |
| Foreign currency, at value | | | | 12,051 | | | | | 486,231 | | | | | 705,132 | | | | | 142,132 | |
| Unrealized appreciation on forward foreign currency | | | | | | | | | | | | | | | | | | | | |
| exchange contracts | | | | 46,120 | | | | | 540,726 | | | | | — | | | | | 30,734,357 | |
| Unrealized appreciation on swap agreements | | | | 10,255 | | | | | 45,748 | | | | | — | | | | | 1,222,256 | |
| Interest and dividends receivable | | | | 128,475 | | | | | 133,434 | | | | | 260,497 | | | | | 8,822,987 | |
| Premiums paid on swap agreements | | | | 7,223 | | | | | — | | | | | — | | | | | 4,517,884 | |
| Receivable for capital shares issued | | | | 4,554 | | | | | 8,276 | | | | | — | | | | | 881,084 | |
| Receivable for investments sold | | | | — | | | | | — | | | | | 579,481 | | | | | — | |
| Reclaims receivable | | | | — | | | | | 12,795 | | | | | — | | | | | 90,734 | |
| Receivable from Investment Adviser | | | | 4,217 | | | | | 25,371 | | | | | — | | | | | — | |
| Prepaid expenses | | | | 11,093 | | | | | 13,832 | | | | | 18,829 | | | | | 36,942 | |
| Total Assets | | | | 12,202,199 | | | | | 16,017,810 | | | | | 142,909,996 | | | | | 1,274,257,376 | |
| Liabilities: | | | | | | | | | | | | | | | | | | | | |
| Cash overdraft | | | | — | | | | | — | | | | | 217,377 | | | | | — | |
| Cash received as collateral for derivatives | | | | — | | | | | — | | | | | — | | | | | 11,780,000 | |
| Dividends payable | | | | 3,448 | | | | | 529 | | | | | — | | | | | 529,863 | |
| Unrealized depreciation on forward foreign currency | | | | | | | | | | | | | | | | | | | | |
| exchange contracts | | | | 47,484 | | | | | 891,649 | | | | | — | | | | | 28,671,509 | |
| Unrealized depreciation on swap agreements | | | | 23,196 | | | | | 113,826 | | | | | — | | | | | 5,966,446 | |
| Premiums received on swap agreements | | | | 61,113 | | | | | — | | | | | — | | | | | 10,324,105 | |
| Payable for capital shares redeemed | | | | 10,716 | | | | | 6,905 | | | | | 542,594 | | | | | 740,641 | |
| Variation margin on futures contracts | | | | 234 | | | | | — | | | | | — | | | | | 72,656 | |
| Accrued expenses and other payables: | | | | | | | | | | | | | | | | | | | | |
| Investment Management | | | | — | | | | | — | | | | | 155,917 | | | | | 979,178 | |
| Administration | | | | 482 | | | | | 597 | | | | | 6,023 | | | | | 49,833 | |
| Shareholder Servicing | | | | 172 | | | | | 32 | | | | | 4,322 | | | | | 1,580 | |
| Compliance Services | | | | 11 | | | | | 86 | | | | | 75 | | | | | 287 | |
| Accounting | | | | 9,046 | | | | | 8,866 | | | | | 8,746 | | | | | 9,749 | |
| Custodian | | | | 3,498 | | | | | 15,674 | | | | | 155,000 | | | | | 85,000 | |
| Transfer Agent | | | | 10,028 | | | | | 10,298 | | | | | 16,853 | | | | | 249,066 | |
| Trustee | | | | 126 | | | | | 119 | | | | | 1,321 | | | | | 11,657 | |
| Other | | | | 24,143 | | | | | 28,757 | | | | | 35,472 | | | | | 99,729 | |
| Total Liabilities | | | | 193,697 | | | | | 1,077,338 | | | | | 1,143,700 | | | | | 59,571,299 | |
| Net Assets | | | $ | 12,008,502 | | | | $ | 14,940,472 | | | | $ | 141,766,296 | | | | $ | 1,214,686,077 | |
| | | | | | | | | | | | | | | | | | | | | |
| 56 | HSBC FAMILY OF FUNDS | See notes to financial statements. |
HSBC FAMILY OF FUNDS
Statements of Assets and Liabilities—as of October 31, 2015 (continued)
| | Emerging | | Emerging | | Frontier | | Total |
| | Markets | | Markets Local | | Markets | | Return |
| | Debt Fund | | Debt Fund | | Fund | | Fund |
| Composition of Net Assets: | | | | | | | | | | | | | | | | | | | | | | | | |
| Capital | | | $ | 12,377,239 | | | | | $ | 18,945,970 | | | | | $ | 164,797,686 | | | | | $ | 1,221,284,900 | | |
| Accumulated net investment income/(loss) | | | | 107,300 | | | | | | (337,467 | ) | | | | | 3,920,258 | | | | | | 23,828,441 | | |
| Accumulated net realized gains/(losses) from investments | | | | (99,544 | ) | | | | | (1,193,821 | ) | | | | | (7,415,533 | ) | | | | | (911,904 | ) | |
| Net unrealized appreciation (depreciation) on investments | | | | (376,493 | ) | | | | | (2,474,210 | ) | | | | | (19,536,115 | ) | | | | | (29,515,360 | ) | |
| Net Assets | | | $ | 12,008,502 | | | | | $ | 14,940,472 | | | | | $ | 141,766,296 | | | | | $ | 1,214,686,077 | | |
| | | | | | | | | | | | | | | | | | | | | | | | | |
| Net Assets: | | | | | | | | | | | | | | | | | | | | | | | | |
| Class A Shares | | | $ | 741,563 | | | | | $ | 153,862 | | | | | $ | 21,756,321 | | | | | $ | 7,562,192 | | |
| Class I Shares | | | | 11,266,939 | | | | | | 14,786,610 | | | | | | 120,009,975 | | | | | | 1,181,044,622 | | |
| Class S Shares | | | | — | | | | | | — | | | | | | — | | | | | | 26,079,263 | | |
| Total | | | $ | 12,008,502 | | | | | $ | 14,940,472 | | | | | $ | 141,766,296 | | | | | $ | 1,214,686,077 | | |
| Shares Outstanding: | | | | | | | | | | | | | | | | | | | | | | | | |
| ($0.001 par value, unlimited number of shares authorized): | | | | | | | | | | | | | | | | | | | | | | | | |
| Class A Shares | | | | 75,017 | | | | | | 22,769 | | | | | | 1,797,241 | | | | | | 741,675 | | |
| Class I Shares | | | | 1,136,943 | | | | | | 2,190,209 | | | | | | 9,845,145 | | | | | | 115,535,188 | | |
| Class S Shares | | | | — | | | | | | — | | | | | | — | | | | | | 2,550,792 | | |
| Net Asset Value, Offering Price and Redemption Price per share: | | | | | | | | | | | | | | | | | | | | | | | | |
| Class A Shares | | | $ | 9.89 | | | | | $ | 6.76 | | | | | $ | 12.11 | | | | | $ | 10.20 | | |
| Class I Shares | | | $ | 9.91 | | | | | $ | 6.75 | | | | | $ | 12.19 | | | | | $ | 10.22 | | |
| Class S Shares | | | $ | — | | | | | $ | — | | | | | $ | — | | | | | $ | 10.22 | | |
| Maximum Sales Charge: | | | | | | | | | | | | | | | | | | | | | | | | |
| Class A Shares | | | | 4.75% | | | | | | 4.75% | | | | | | 5.00% | | | | | | 4.75% | | |
| Maximum Offering Price per share (Net Asset | | | | | | | | | | | | | | | | | | | | | | | | |
| Value / (100%-maximum sales charge)) | | | | | | | | | | | | | | | | | | | | | | | | |
| Class A Shares | | | $ | 10.38 | | | | | $ | 7.10 | | | | | $ | 12.75 | | | | | $ | 10.71 | | |
| Total Investments, at cost | | | $ | 12,336,847 | | | | | $ | 16,196,690 | | | | | $ | 160,881,911 | | | | | $ | 1,233,764,116 | | |
| Foreign currency, at cost | | | $ | 12,219 | | | | | $ | 509,484 | | | | | $ | 707,794 | | | | | $ | 148,192 | | |
(a) Investments in affiliated investment companies include the HSBC Prime Money Market Fund, I shares.
| See notes to financial statements. | HSBC FAMILY OF FUNDS | 57 |
HSBC FAMILY OF FUNDS
Statements of Assets and Liabilities—as of October 31, 2015 (continued)
| | Asia ex-Japan | | | | | | | | | | |
| | Smaller | | Global High | | Global High |
| | Companies | | Yield Bond | | Income Bond |
| | Equity Fund | | Fund | | Fund |
| Assets: | | | | | | | | | | | | | | | |
| Investments securities, at value | | | $ | 9,666,449 | | | | $ | 24,318,822 | | | | $ | 24,491,535 | |
| Total Investments | | | | 9,666,449 | | | | | 24,318,822 | | | | | 24,491,535 | |
| Foreign currency, at value | | | | 168,843 | | | | | 48,990 | | | | | 50,272 | |
| Unrealized appreciation on forward foreign currency exchange contracts | | | | — | | | | | 96,433 | | | | | 140,892 | |
| Interest and dividends receivable | | | | 4,698 | | | | | 393,970 | | | | | 330,019 | |
| Receivable for investments sold | | | | 23,719 | | | | | 233,137 | | | | | 157,124 | |
| Reclaims receivable | | | | 159 | | | | | — | | | | | 849 | |
| Receivable from Investment Adviser | | | | 16,590 | | | | | — | | | | | — | |
| Prepaid expenses | | | | 12,048 | | | | | 24,432 | | | | | 24,443 | |
| Total Assets | | | | 9,892,506 | | | | | 25,115,784 | | | | | 25,195,134 | |
| Liabilities: | | | | | | | | | | | | | | | |
| Cash received as collateral for derivatives | | | | — | | | | | 110,000 | | | | | 110,000 | |
| Unrealized depreciation on forward foreign currency exchange contracts | | | | — | | | | | 22,727 | | | | | 18,328 | |
| Payable for investments purchased | | | | 114,569 | | | | | 384,251 | | | | | 197,678 | |
| Accrued expenses and other payables: | | | | | | | | | | | | | | | |
| Investment Management | | | | — | | | | | 31,685 | | | | | 27,522 | |
| Administration | | | | 387 | | | | | 727 | | | | | 738 | |
| Shareholder Servicing | | | | 59 | | | | | 56 | | | | | 55 | |
| Compliance Services | | | | 8 | | | | | — | | | | | — | |
| Accounting | | | | 9,840 | | | | | 1,840 | | | | | 1,630 | |
| Custodian | | | | 16,442 | | | | | 11,708 | | | | | 9,620 | |
| Transfer Agent | | | | 12,449 | | | | | 1,288 | | | | | 1,288 | |
| Trustee | | | | 90 | | | | | 262 | | | | | 269 | |
| Other | | | | 25,222 | | | | | 33,200 | | | | | 33,316 | |
| Total Liabilities | | | | 179,066 | | | | | 597,744 | | | | | 400,444 | |
| Net Assets | | | $ | 9,713,440 | | | | $ | 24,518,040 | | | | $ | 24,794,690 | |
| | | | | | | | | | | | | | | | |
| 58 | HSBC FAMILY OF FUNDS | See notes to financial statements. |
HSBC FAMILY OF FUNDS
Statements of Assets and Liabilities—as of October 31, 2015 (continued)
| | Asia ex-Japan | | | | | | |
| | Smaller | | Global High | | | Global High |
| | Companies | | Yield Bond | | | Income Bond |
| | Equity Fund | | Fund | | | Fund |
| Composition of Net Assets: | | | | | | | | | | | | | | | | | | | |
| Capital | | | $ | 10,081,222 | | | | | $ | 25,284,164 | | | | | | $ | 25,168,700 | | |
| Accumulated net investment income/(loss) | | | | 122,961 | | | | | | (436 | ) | | | | | | (43,404 | ) | |
| Accumulated net realized gains/(losses) from investments | | | | (92,463 | ) | | | | | (83,537 | ) | | | | | | (11,423 | ) | |
| Net unrealized appreciation (depreciation) on investments | | | | (398,280 | ) | | | | | (682,151 | ) | | | | | | (319,183 | ) | |
| Net Assets | | | $ | 9,713,440 | | | | | $ | 24,518,040 | | | | | | $ | 24,794,690 | | |
| | | | | | | | | | | | | | | | | | | | |
| Net Assets: | | | | | | | | | | | | | | | | | | | |
| Class A Shares | | | $ | 156,176 | | | | | $ | 140,140 | | | | | | $ | 99,076 | | |
| Class I Shares | | | | 9,460,722 | | | | | | 24,377,900 | | | | | | | 24,695,614 | | |
| Class S Shares | | | | 96,542 | | | | | | — | | | | | | | — | | |
| Total | | | $ | 9,713,440 | | | | | $ | 24,518,040 | | | | | | $ | 24,794,690 | | |
| Shares Outstanding: | | | | | | | | | | | | | | | | | | | |
| ($0.001 par value, unlimited number of shares authorized): | | | | | | | | | | | | | | | | | | | |
| Class A Shares | | | | 16,279 | | | | | | 14,489 | | | | | | | 10,079 | | |
| Class I Shares | | | | 983,036 | | | | | | 2,519,676 | | | | | | | 2,511,825 | | |
| Class S Shares | | | | 10,023 | | | | | | — | | | | | | | — | | |
| Net Asset Value, Offering Price and Redemption Price per share: | | | | | | | | | | | | | | | | | | | |
| Class A Shares(a) | | | $ | 9.59 | | | | | $ | 9.67 | | | | | | $ | 9.83 | | |
| Class I Shares(a) | | | $ | 9.62 | | | | | $ | 9.68 | | | | | | $ | 9.83 | | |
| Class S Shares(a) | | | $ | 9.63 | | | | | $ | — | | | | | | $ | — | | |
| Maximum Sales Charge: | | | | | | | | | | | | | | | | | | | |
| Class A Shares | | | | 5.00% | | | | | | 4.75% | | | | | | | 4.75% | | |
| Maximum Offering Price per share (Net Asset Value / (100%-maximum sales charge)) | | | | | | | | | | | | | | | | | | | |
| Class A Shares | | | $ | 10.09 | | | | | $ | 10.15 | | | | | | $ | 10.32 | | |
| Total Investments, at cost | | | $ | 10,066,834 | | | | | $ | 25,067,476 | | | | | | $ | 24,923,450 | | |
| Foreign currency, at cost | | | $ | 166,766 | | | | | $ | 49,719 | | | | | | $ | 51,149 | | |
(a) Redemption Price per share varies by length of time shares are held.
| See notes to financial statements. | HSBC FAMILY OF FUNDS | 59 |
HSBC FAMILY OF FUNDS
Statements of Operations—For the year ended October 31, 2015
| | | | | | | | Emerging | | | | | | | | | | | | |
| | Emerging | | Markets | | Frontier | | Total |
| | Markets | | Local Debt | | Markets | | Return |
| | Debt Fund | | Fund | | Fund | | Fund |
| Investment Income: | | | | | | | | | | | | | | | | | | | | | | | | |
| Interest | | | $ | 1,552,063 | | | | | $ | 1,845,877 | | | | | $ | 188,200 | | | | | $ | 20,770,822 | | |
| Dividends | | | | 492 | | | | | | 290 | | | | | | 6,651,713 | | | | | | 40,560 | | |
| Investment income from affiliated investments | | | | — | | | | | | — | | | | | | — | | | | | | 23,388 | | |
| Foreign tax withholding | | | | — | | | | | | (32,452 | ) | | | | | (438,039 | ) | | | | | — | | |
| Total Investment Income | | | | 1,552,555 | | | | | | 1,813,715 | | | | | | 6,401,874 | | | | | | 20,834,770 | | |
| Expenses: | | | | | | | | | | | | | | | | | | | | | | | | |
| Investment Management | | | | 161,431 | | | | | | 162,869 | | | | | | 2,450,053 | | | | | | 10,488,392 | | |
| Advisory Services: | | | | | | | | | | | | | | | | | | | | | | | | |
| Operational Support - Class A Shares | | | | 2,117 | | | | | | 459 | | | | | | 55,336 | | | | | | 3,902 | | |
| Operational Support - Class I Shares | | | | 31,145 | | | | | | 32,286 | | | | | | 168,335 | | | | | | 1,205,704 | | |
| Administration: | | | | | | | | | | | | | | | | | | | | | | | | |
| Class A Shares | | | | 521 | | | | | | 110 | | | | | | 13,295 | | | | | | 949 | | |
| Class S Shares | | | | 39 | | | | | | 28 | | | | | | — | | | | | | 12,648 | | |
| Class I Shares | | | | 14,986 | | | | | | 15,534 | | | | | | 80,769 | | | | | | 580,323 | | |
| Shareholder Servicing: | | | | | | | | | | | | | | | | | | | | | | | | |
| Class A Shares | | | | 2,428 | | | | | | 362 | | | | | | 68,148 | | | | | | 4,967 | | |
| Accounting | | | | 63,031 | | | | | | 60,891 | | | | | | 65,005 | | | | | | 72,106 | | |
| Compliance Services | | | | 795 | | | | | | 906 | | | | | | 4,609 | | | | | | 26,107 | | |
| Custodian | | | | 16,468 | | | | | | 114,400 | | | | | | 638,235 | | | | | | 359,741 | | |
| Printing | | | | 2,785 | | | | | | 12,194 | | | | | | 18,673 | | | | | | 91,944 | | |
| Professional | | | | 43,191 | | | | | | 42,968 | | | | | | 60,611 | | | | | | 176,588 | | |
| Transfer Agent | | | | 29,916 | | | | | | 30,581 | | | | | | 53,030 | | | | | | 715,222 | | |
| Trustee | | | | 2,216 | | | | | | 1,953 | | | | | | 11,813 | | | | | | 71,974 | | |
| Registration fees | | | | 39,169 | | | | | | 37,043 | | | | | | 31,117 | | | | | | 47,362 | | |
| Other | | | | 11,655 | | | | | | 24,824 | | | | | | 23,888 | | | | | | 111,084 | | |
| Total expenses before fee and expense reductions | | | | 421,893 | | | | | | 537,408 | | | | | | 3,742,917 | | | | | | 13,969,013 | | |
| Fees contractually reduced/reimbursed by Investment Adviser | | | | (144,542 | ) | | | | | (260,390 | ) | | | | | (24,057 | ) | | | | | — | | |
| Fees voluntarily reduced/reimbursed by Investment Adviser | | | | — | | | | | | — | | | | | | — | | | | | | (17,780 | ) | |
| Net Expenses | | | | 277,351 | | | | | | 277,018 | | | | | | 3,718,860 | | | | | | 13,951,233 | | |
| | | | | | | | | | | | | | | | | | | | | | | | | |
| Net Investment Income | | | | 1,275,204 | | | | | | 1,536,697 | | | | | | 2,683,014 | | | | | | 6,883,537 | | |
| | | | | | | | | | | | | | | | | | | | | | | | | |
| Realized/Unrealized Gains/(Losses) from Investments: | | | | | | | | | | | | | | | | | | | | | | | | |
| Net realized gains/(losses) from investment securities and foreign | | | | | | | | | | | | | | | | | | | | | | | | |
| currency transactions | | | | (181,306 | ) | | | | | (7,211,913 | ) | | | | | (5,406,004 | ) | | | | | (1,967,686 | ) | |
| Net realized gains (losses) from swap agreements | | | | 80,715 | | | | | | (4,151 | ) | | | | | — | | | | | | 2,780,294 | | |
| Net realized gains (losses) from futures contracts | | | | 11,811 | | | | | | — | | | | | | — | | | | | | (602,727 | ) | |
| Net realized gains (losses) from forward foreign currency | | | | | | | | | | | | | | | | | | | | | | | | |
| exchange contracts | | | | 130,023 | | | | | | (189,203 | ) | | | | | — | | | | | | 42,248,147 | | |
| Change in unrealized appreciation/depreciation on investments | | | | (1,340,632 | ) | | | | | (466,253 | ) | | | | | (24,896,568 | ) | | | | | (46,095,093 | ) | |
| Net realized/unrealized gains (losses) on investments | | | | (1,299,389 | ) | | | | | (7,871,520 | ) | | | | | (30,302,572 | ) | | | | | (3,637,065 | ) | |
| Change in Net Assets Resulting from Operations | | | $ | (24,185 | ) | | | | $ | (6,334,823 | ) | | | | $ | (27,619,558 | ) | | | | $ | 3,246,472 | | |
| 60 | HSBC FAMILY OF FUNDS | See notes to financial statements. |
HSBC FAMILY OF FUNDS
Statements of Operations—For the year ended October 31, 2015 (continued)
| | Asia ex-Japan | | | | | | | | | | | | |
| | Smaller | | Global | | Global |
| | Companies | | High Yield | | High Income |
| | Equity Fund(a) | | Bond Fund(b) | | Bond Fund(b) |
| Investment Income: | | | | | | | | | | | | | | | | | | |
| Interest | | | $ | — | | | | | $ | 378,434 | | | | | $ | 292,845 | | |
| Dividends | | | | 293,470 | | | | | | 5,746 | | | | | | 5,746 | | |
| Foreign tax withholding | | | | (23,558 | ) | | | | | — | | | | | | — | | |
| Total Investment Income | | | | 269,912 | | | | | | 384,180 | | | | | | 298,591 | | |
| Expenses: | | | | | | | | | | | | | | | | | | |
| Investment Management | | | | 99,014 | | | | | | 47,530 | | | | | | 47,989 | | |
| Advisory Services: | | | | | | | | | | | | | | | | | | |
| Operational Support - Class A Shares | | | | 299 | | | | | | 36 | | | | | | 29 | | |
| Operational Support - Class I Shares | | | | 9,653 | | | | | | — | | | | | | — | | |
| Administration: | | | | | | | | | | | | | | | | | | |
| Class A Shares | | | | 62 | | | | | | 9 | | | | | | 7 | | |
| Class S Shares | | | | 40 | | | | | | — | | | | | | — | | |
| Class I Shares | | | | 3,943 | | | | | | 1,769 | | | | | | 1,789 | | |
| Shareholder Servicing: | | | | | | | | | | | | | | | | | | |
| Class A Shares | | | | 176 | | | | | | 64 | | | | | | 55 | | |
| Accounting | | | | 57,625 | | | | | | 5,054 | | | | | | 5,054 | | |
| Compliance Services | | | | 207 | | | | | | 67 | | | | | | 67 | | |
| Custodian | | | | 69,447 | | | | | | 11,707 | | | | | | 9,620 | | |
| Printing | | | | 1,258 | | | | | | 832 | | | | | | 842 | | |
| Professional | | | | 44,075 | | | | | | 39,900 | | | | | | 39,925 | | |
| Transfer Agent | | | | 22,407 | | | | | | 1,288 | | | | | | 1,288 | | |
| Trustee | | | | 500 | | | | | | 554 | | | | | | 564 | | |
| Registration fees | | | | 23,772 | | | | | | 10,228 | | | | | | 10,227 | | |
| Other | | | | 2,120 | | | | | | 1,280 | | | | | | 1,180 | | |
| Total expenses before fee and expense reductions | | | | 334,598 | | | | | | 120,318 | | | | | | 118,636 | | |
| Fees contractually reduced/reimbursed by Investment Adviser | | | | (195,564 | ) | | | | | (61,706 | ) | | | | | (59,476 | ) | |
| Net Expenses | | | | 139,034 | | | | | | 58,612 | | | | | | 59,160 | | |
| | | | | | | | | | | | | | | | | | | |
| Net Investment Income | | | | 130,878 | | | | | | 325,568 | | | | | | 239,431 | | |
| | | | | | | | | | | | | | | | | | | |
| Realized/Unrealized Gains/(Losses) from Investments: | | | | | | | | | | | | | | | | | | |
| Net realized gains/(losses) from investment securities and foreign currency transactions | | | | (92,483 | ) | | | | | (93,046 | ) | | | | | (19,896 | ) | |
| Net realized gains (losses) from forward foreign currency exchange contracts | | | | — | | | | | | (74,742 | ) | | | | | (105,663 | ) | |
| Change in unrealized appreciation/depreciation on investments | | | | (398,280 | ) | | | | | (682,151 | ) | | | | | (319,183 | ) | |
| Net realized/unrealized gains (losses) on investments | | | | (490,763 | ) | | | | | (849,939 | ) | | | | | (444,742 | ) | |
| Change in Net Assets Resulting from Operations | | | $ | (359,885 | ) | | | | $ | (524,371 | ) | | | | $ | (205,311 | ) | |
| (a) | Commenced operations on November 11, 2014. |
| (b) | Commenced operations on July 14, 2015. |
| See notes to financial statements. | HSBC FAMILY OF FUNDS | 61 |
HSBC FAMILY OF FUNDS
Statements of Changes in Net Assets
| | Emerging Markets Debt Fund | | Emerging Markets Local Debt Fund |
| | For the | | For the | | For the | | For the |
| | year ended | | year ended | | year ended | | year ended |
| | | October 31, | | October 31, | | October 31, | | October 31, |
| | 2015 | | 2014 | | 2015 | | 2014 |
| Investment Activities: | | | | | | | | | | | | | | | | | | | | | | | | |
| Operations: | | | | | | | | | | | | | | | | | | | | | | | | |
| Net investment income (loss) | | | $ | 1,275,204 | | | | | $ | 1,687,760 | | | | | $ | 1,536,697 | | | | | $ | 1,691,662 | | |
| Net realized gains (losses) from investments | | | | 41,243 | | | | | | 119,542 | | | | | | (7,405,267 | ) | | | | | (2,122,116 | ) | |
| Change in unrealized appreciation/depreciation | | | | | | | | | | | | | | | | | | | | | | | | |
| on investments | | | | (1,340,632 | ) | | | | | 468,780 | | | | | | (466,253 | ) | | | | | (281,747 | ) | |
| Change in net assets resulting from operations | | | | (24,185 | ) | | | | | 2,276,082 | | | | | | (6,334,823 | ) | | | | | (712,201 | ) | |
| | | | | | | | | | | | | | | | | | | | | | | | |
| Distributions: | | | | | | | | | | | | | | | | | | | | | | | | |
| Net investment income: | | | | | | | | | | | | | | | | | | | | | | | | |
| Class A Shares | | | | (44,498 | ) | | | | | (49,423 | ) | | | | | — | | | | | | (361 | ) | |
| Class I Shares | | | | (1,280,018 | ) | | | | | (1,707,510 | ) | | | | | — | | | | | | (170,351 | ) | |
| Class S Shares | | | | (3,208 | ) | | | | | (5,267 | ) | | | | | — | | | | | | (578 | ) | |
| Net realized gains: | | | | | | | | | | | | | | | | | | | | | | | | |
| Class A Shares | | | | — | | | | | | (15,670 | ) | | | | | — | | | | | | — | | |
| Class I Shares | | | | — | | | | | | (633,396 | ) | | | | | — | | | | | | — | | |
| Class S Shares | | | | — | | | | | | (1,859 | ) | | | | | — | | | | | | — | | |
| Tax Return of capital: | | | | | | | | | | | | | | | | | | | | | | | | |
| Class A Shares | | | | — | | | | | | — | | | | | | (8,557 | ) | | | | | (16,439 | ) | |
| Class I Shares | | | | — | | | | | | — | | | | | | (1,284,487 | ) | | | | | (1,376,779 | ) | |
| Class S Shares | | | | — | | | | | | — | | | | | | (2,175 | ) | | | | | (3,907 | ) | |
| Change in net assets resulting from distributions | | | | (1,327,724 | ) | | | | | (2,413,125 | ) | | | | | (1,295,219 | ) | | | | | (1,568,415 | ) | |
| Change in net assets resulting from capital transactions | | | | (28,801,053 | ) | | | | | 109,447 | | | | | | (18,396,960 | ) | | | | | 12,291,590 | | |
| Change in net assets | | | | (30,152,962 | ) | | | | | (27,596 | ) | | | | | (26,027,002 | ) | | | | | 10,010,974 | | |
| | | | | | | | | | | | | | | | | | | | | | | | | |
| Net Assets: | | | | | | | | | | | | | | | | | | | | | | | | |
| Beginning of period | | | | 42,161,464 | | | | | | 42,189,060 | | | | | | 40,967,474 | | | | | | 30,956,500 | | |
| End of period | | | $ | 12,008,502 | | | | | $ | 42,161,464 | | | | | $ | 14,940,472 | | | | | $ | 40,967,474 | | |
| Accumulated net investment income (loss) | | | $ | 107,300 | | | | | $ | 31,173 | | | | | $ | (337,467 | ) | | | | $ | (501,019 | ) | |
| 62 | HSBC FAMILY OF FUNDS | See notes to financial statements. |
HSBC FAMILY OF FUNDS
Statements of Changes in Net Assets (continued)
| | Emerging Markets Debt Fund | | Emerging Markets Local Debt Fund |
| | For the | | For the | | For the | | For the |
| | year ended | | year ended | | year ended | | year ended |
| | October 31, | | October 31, | | October 31, | | October 31, |
| | 2015 | | 2014 | | 2015 | | 2014 |
| CAPITAL TRANSACTIONS: | | | | | | | | | | | | | | | | | | | | | | | | |
| Class A Shares: | | | | | | | | | | | | | | | | | | | | | | | | |
| Proceeds from shares issued | | | $ | 154,619 | | | | | $ | 1,317,378 | | | | | $ | — | | | | | $ | 18,340 | | |
| Dividends reinvested | | | | 44,441 | | | | | | 64,385 | | | | | | 8,557 | | | | | | 16,800 | | |
| Value of shares redeemed | | | | (599,630 | ) | | | | | (1,245,728 | ) | | | | | (90,981 | ) | | | | | (1,045,684 | ) | |
| Class A Shares capital transactions | | | | (400,570 | ) | | | | | 136,035 | | | | | | (82,424 | ) | | | | | (1,010,544 | ) | |
| | | | | | | | | | | | | | | | | | | | | | | | | |
| Class I Shares: | | | | | | | | | | | | | | | | | | | | | | | | |
| Proceeds from shares issued | | | | 3,340,762 | | | | | | 5,053,501 | | | | | | 11,655,479 | | | | | | 16,115,741 | | |
| Dividends reinvested | | | | 1,243,140 | | | | | | 2,287,432 | | | | | | 1,275,940 | | | | | | 1,485,405 | | |
| Value of shares redeemed | | | | (32,860,286 | ) | | | | | (7,374,648 | ) | | | | | (31,162,475 | ) | | | | | (4,303,497 | ) | |
| Class I Shares capital transactions | | | | (28,276,384 | ) | | | | | (33,715 | ) | | | | | (18,231,056 | ) | | | | | 13,297,649 | | |
| | | | | | | | | | | | | | | | | | | | | | | | | |
| Class S Shares: | | | | | | | | | | | | | | | | | | | | | | | | |
| Dividends reinvested | | | | 3,207 | | | | | | 7,127 | | | | | | 2,175 | | | | | | 4,485 | | |
| Value of shares redeemed | | | | (127,306 | ) | | | | | — | | | | | | (85,655 | ) | | | | | — | | |
| Class S Shares capital transactions | | | | (124,099 | ) | | | | | 7,127 | | | | | | (83,480 | ) | | | | | 4,485 | | |
| Change in net assets resulting from capital transactions | | | $ | (28,801,053 | ) | | | | $ | 109,447 | | | | | $ | (18,396,960 | ) | | | | $ | 12,291,590 | | |
| | | | | | | | | | | | | | | | | | | | | | | | | |
| SHARE TRANSACTIONS: | | | | | | | | | | | | | | | | | | | | | | | | |
| Class A Shares: | | | | | | | | | | | | | | | | | | | | | | | | |
| Issued | | | | 15,268 | | | | | | 127,866 | | | | | | — | | | | | | 2,070 | | |
| Reinvested | | | | 4,424 | | | | | | 6,308 | | | | | | 1,137 | | | | | | 1,924 | | |
| Redeemed | | | | (59,903 | ) | | | | | (118,921 | ) | | | | | (12,125 | ) | | | | | (119,549 | ) | |
| Change in Class A Shares | | | | (40,211 | ) | | | | | 15,253 | | | | | | (10,988 | ) | | | | | (115,555 | ) | |
| | | | | | | | | | | | | | | | | | | | | | | | | |
| Class I Shares: | | | | | | | | | | | | | | | | | | | | | | | | |
| Issued | | | | 329,261 | | | | | | 489,573 | | | | | | 1,532,825 | | | | | | 1,825,237 | | |
| Reinvested | | | | 122,734 | | | | | | 224,351 | | | | | | 168,030 | | | | | | 170,380 | | |
| Redeemed | | | | (3,244,276 | ) | | | | | (713,562 | ) | | | | | (4,224,989 | ) | | | | | (501,310 | ) | |
| Change in Class I Shares | | | | (2,792,281 | ) | | | | | 362 | | | | | | (2,524,134 | ) | | | | | 1,494,307 | | |
| | | | | | | | | | | | | | | | | | | | | | | | | |
| Class S Shares: | | | | | | | | | | | | | | | | | | | | | | | | |
| Reinvested | | | | 315 | | | | | | 698 | | | | | | 278 | | | | | | 514 | | |
| Redeemed | | | | (12,567 | ) | | | | | — | | | | | | (11,421 | ) | | | | | — | | |
| Change in Class S Shares | | | | (12,252 | ) | | | | | 698 | | | | | | (11,143 | ) | | | | | 514 | | |
| See notes to financial statements. | HSBC FAMILY OF FUNDS 63 |
HSBC FAMILY OF FUNDS
Statements of Changes in Net Assets (continued)
| | Frontier Markets Fund | | Total Return Fund |
| | For the | | For the | | For the | | For the |
| | year ended | | year ended | | year ended | | year ended |
| | October 31, | | October 31, | | October 31, | | October 31, |
| | 2015 | | 2014 | | 2015 | | 2014 |
| Investment Activities: | | | | | | | | | | | | | | | | | | | | | | | | |
| Operations: | | | | | | | | | | | | | | | | | | | | | | | | |
| Net investment income (loss) | | | $ | 2,683,014 | | | | | $ | 2,308,945 | | | | | $ | 6,883,537 | | | | | $ | 6,098,801 | | |
| Net realized gains (losses) from investments | | | | (5,406,004 | ) | | | | | 14,885,299 | | | | | | 42,458,028 | | | | | | 6,974,679 | | |
| Change in unrealized appreciation/depreciation | | | | | | | | | | | | | | | | | | | | | | | | |
| on investments | | | | (24,896,568 | ) | | | | | 1,420,799 | | | | | | (46,095,093 | ) | | | | | 25,243,393 | | |
| Change in net assets resulting from operations | | | | (27,619,558 | ) | | | | | 18,615,043 | | | | | | 3,246,472 | | | | | | 38,316,873 | | |
| | | | | | | | | | | | | | | | | | | | | | | | | |
| Distributions: | | | | | | | | | | | | | | | | | | | | | | | | |
| Net investment income: | | | | | | | | | | | | | | | | | | | | | | | | |
| Class A Shares | | | | (192,858 | ) | | | | | (71,759 | ) | | | | | (13,796 | ) | | | | | (5,181 | ) | |
| Class I Shares | | | | (2,097,889 | ) | | | | | (385,005 | ) | | | | | (20,026,731 | ) | | | | | (14,452,971 | ) | |
| Class S Shares | | | | — | | | | | | — | | | | | | (485,550 | ) | | | | | (531,317 | ) | |
| Net realized gains: | | | | | | | | | | | | | | | | | | | | | | | | |
| Class A Shares | | | | (2,154,630 | ) | | | | | (578,597 | ) | | | | | — | | | | | | (1,252 | ) | |
| Class I Shares | | | | (13,201,594 | ) | | | | | (2,118,899 | ) | | | | | — | | | | | | (2,832,439 | ) | |
| Class S Shares | | | | — | | | | | | — | | | | | | — | | | | | | (107,420 | ) | |
| Change in net assets resulting from distributions | | | | (17,646,971 | ) | | | | | (3,154,260 | ) | | | | | (20,526,077 | ) | | | | | (17,930,580 | ) | |
| Change in net assets resulting from capital transactions | | | | (31,420,476 | ) | | | | | 114,377,387 | | | | | | 179,640,060 | | | | | | 364,367,661 | | |
| Change in net assets | | | | (76,687,005 | ) | | | | | 129,838,170 | | | | | | 162,360,455 | | | | | | 384,753,954 | | |
| | | | | | | | | | | | | | | | | | | | | | | | | |
| Net Assets: | | | | | | | | | | | | | | | | | | | | | | | | |
| Beginning of period | | | | 218,453,301 | | | | | | 88,615,131 | | | | | | 1,052,325,622 | | | | | | 667,571,668 | | |
| End of period | | | $ | 141,766,296 | | | | | $ | 218,453,301 | | | | | $ | 1,214,686,077 | | | | | $ | 1,052,325,622 | | |
| Accumulated net investment income (loss) | | | $ | 3,920,258 | | | | | $ | 2,032,915 | | | | | $ | 23,828,441 | | | | | $ | 5,155,511 | | |
| 64 HSBC FAMILY OF FUNDS | See notes to financial statements. |
HSBC FAMILY OF FUNDS
Statements of Changes in Net Assets (continued)
| | Frontier Markets Fund | | Total Return Fund |
| | For the | | For the | | For the | | For the |
| | year ended | | year ended | | year ended | | year ended |
| | October 31, | | October 31, | | October 31, | | October 31, |
| | 2015 | | 2014 | | 2015 | | 2014 |
| CAPITAL TRANSACTIONS: | | | | | | | | | | | | | | | | | | | | | | | | |
| Class A Shares: | | | | | | | | | | | | | | | | | | | | | | | | |
| Proceeds from shares issued | | | $ | 8,927,723 | | | | | $ | 33,231,316 | | | | | $ | 7,659,251 | | | | | $ | 143,789 | | |
| Dividends reinvested | | | | 2,249,394 | | | | | | 607,857 | | | | | | 12,614 | | | | | | 5,740 | | |
| Value of shares redeemed | | | | (26,837,153 | ) | | | | | (11,405,859 | ) | | | | | (427,800 | ) | | | | | (21,327 | ) | |
| Class A Shares capital transactions | | | | (15,660,036 | ) | | | | | 22,433,314 | | | | | | 7,244,065 | | | | | | 128,202 | | |
| | | | | | | | | | | | | | | | | | | | | | | | | |
| Class I Shares: | | | | | | | | | | | | | | | | | | | | | | | | |
| Proceeds from shares issued | | | | 91,482,671 | | | | | | 126,821,683 | | | | | | 640,885,915 | | | | | | 563,843,623 | | |
| Dividends reinvested | | | | 1,511,793 | | | | | | 510,429 | | | | | | 1,113,194 | | | | | | 846,570 | | |
| Value of shares redeemed | | | | (108,754,904 | ) | | | | | (35,388,039 | ) | | | | | (470,091,164 | ) | | | | | (201,089,471 | ) | |
| Class I Shares capital transactions | | | | (15,760,440 | ) | | | | | 91,944,073 | | | | | | 171,907,945 | | | | | | 363,600,722 | | |
| | | | | | | | | | | | | | | | | | | | | | | | | |
| Class S Shares: | | | | | | | | | | | | | | | | | | | | | | | | |
| Proceeds from shares issued | | | | — | | | | | | — | | | | | | 2,500 | | | | | | — | | |
| Dividends reinvested | | | | — | | | | | | — | | | | | | 485,550 | | | | | | 638,737 | | |
| Class S Shares capital transactions | | | | — | | | | | | — | | | | | | 488,050 | | | | | | 638,737 | | |
| Change in net assets resulting from capital transactions | | | $ | (31,420,476 | ) | | | | $ | 114,377,387 | | | | | $ | 179,640,060 | | | | | $ | 364,367,661 | | |
| | | | | | | | | | | | | | | | | | | | | | | | | |
| SHARE TRANSACTIONS: | | | | | | | | | | | | | | | | | | | | | | | | |
| Class A Shares: | | | | | | | | | | | | | | | | | | | | | | | | |
| Issued | | | | 695,088 | | | | | | 2,316,230 | | | | | | 742,837 | | | | | | 14,209 | | |
| Reinvested | | | | 176,285 | | | | | | 46,015 | | | | | | 1,229 | | | | | | 577 | | |
| Redeemed | | | | (2,072,641 | ) | | | | | (768,292 | ) | | | | | (41,537 | ) | | | | | (2,099 | ) | |
| Change in Class A Shares | | | | (1,201,268 | ) | | | | | 1,593,953 | | | | | | 702,529 | | | | | | 12,687 | | |
| | | | | | | | | | | | | | | | | | | | | | | | | |
| Class I Shares: | | | | | | | | | | | | | | | | | | | | | | | | |
| Issued | | | | 6,940,980 | | | | | | 8,673,067 | | | | | | 61,908,735 | | | | | | 55,260,351 | | |
| Reinvested | | | | 118,017 | | | | | | 38,436 | | | | | | 107,846 | | | | | | 84,650 | | |
| Redeemed | | | | (8,728,956 | ) | | | | | (2,542,059 | ) | | | | | (45,305,188 | ) | | | | | (19,839,964 | ) | |
| Change in Class I Shares | | | | (1,669,959 | ) | | | | | 6,169,444 | | | | | | 16,711,393 | | | | | | 35,505,037 | | |
| | | | | | | | | | | | | | | | | | | | | | | | | |
| Class S Shares: | | | | | | | | | | | | | | | | | | | | | | | | |
| Issued | | | | — | | | | | | — | | | | | | 244 | | | | | | — | | |
| Reinvested | | | | — | | | | | | — | | | | | | 47,047 | | | | | | 63,904 | | |
| Change in Class S Shares | | | | — | | | | | | — | | | | | | 47,291 | | | | | | 63,904 | | |
| See notes to financial statements. | HSBC FAMILY OF FUNDS 65 |
HSBC FAMILY OF FUNDS
Statements of Changes in Net Assets (continued)
| | Asia ex-Japan | | Global | | Global |
| | Smaller Companies | | High Yield | | High Income |
| | Equity Fund | | Bond Fund | | Bond Fund |
| | For the period | | For the period | | For the period |
| | Nov. 11, 2014(a) | | July 14, 2015(a) | | July 14, 2015(a) |
| | through | | through | | through |
| | Oct. 31, 2015 | | Oct. 31, 2015 | | Oct. 31, 2015 |
| Investment Activities: | | | | | | | | | | | | | | | | | | |
| Operations: | | | | | | | | | | | | | | | | | | |
| Net investment income (loss) | | | $ | 130,878 | | | | | $ | 325,568 | | | | | $ | 239,431 | | |
| Net realized gains (losses) from investments | | | | (92,483 | ) | | | | | (167,788 | ) | | | | | (125,559 | ) | |
| Change in unrealized appreciation/depreciation on investments | | | | (398,280 | ) | | | | | (682,151 | ) | | | | | (319,183 | ) | |
| Change in net assets resulting from operations | | | | (359,885 | ) | | | | | (524,371 | ) | | | | | (205,311 | ) | |
| | | | | | | | | | | | | | | | | | | |
| Distributions: | | | | | | | | | | | | | | | | | | |
| Net investment income: | | | | | | | | | | | | | | | | | | |
| Class A Shares | | | | (270 | ) | | | | | (1,378 | ) | | | | | (769 | ) | |
| Class I Shares | | | | (19,892 | ) | | | | | (285,521 | ) | | | | | (213,068 | ) | |
| Class S Shares | | | | (213 | ) | | | | | — | | | | | | — | | |
| Change in net assets resulting from distributions | | | | (20,375 | ) | | | | | (286,899 | ) | | | | | (213,837 | ) | |
| Change in net assets resulting from capital transactions | | | | 10,093,700 | | | | | | 25,329,310 | | | | | | 25,213,838 | | |
| Change in net assets | | | | 9,713,440 | | | | | | 24,518,040 | | | | | | 24,794,690 | | |
| | | | | | | | | | | | | | | | | | | |
| Net Assets: | | | | | | | | | | | | | | | | | | |
| Beginning of period | | | | — | | | | | | — | | | | | | — | | |
| End of period | | | $ | 9,713,440 | | | | | $ | 24,518,040 | | | | | $ | 24,794,690 | | |
| Accumulated net investment income (loss) | | | $ | 122,961 | | | | | $ | (436 | ) | | | | $ | (43,404 | ) | |
____________________
(a) Commencement of operations.
| 66 HSBC FAMILY OF FUNDS | See notes to financial statements. |
HSBC FAMILY OF FUNDS
Statements of Changes in Net Assets (continued)
| | Asia ex-Japan | | Global | | Global |
| | Smaller Companies | | High Yield | | High Income |
| | Equity Fund | | Bond Fund | | Bond Fund |
| | For the period | | For the period | | For the period |
| | Nov. 11, 2014(a) | | July 14, 2015(a) | | July 14, 2015(a) |
| | through | | through | | through |
| | Oct. 31, 2015 | | Oct. 31, 2015 | | Oct. 31, 2015 |
| CAPITAL TRANSACTIONS: | | | | | | | | | | | | | | | |
| Class A Shares: | | | | | | | | | | | | | | | |
| Proceeds from shares issued | | | $ | 163,325 | | | | $ | 142,411 | | | | $ | 100,000 | |
| Dividends reinvested | | | | 270 | | | | | 1,378 | | | | | 769 | |
| Class A Shares capital transactions | | | | 163,595 | | | | | 143,789 | | | | | 100,769 | |
| | | | | | | | | | | | | | | | |
| Class I Shares: | | | | | | | | | | | | | | | |
| Proceeds from shares issued | | | | 9,810,000 | | | | | 24,900,000 | | | | | 24,900,000 | |
| Dividends reinvested | | | | 19,892 | | | | | 285,521 | | | | | 213,069 | |
| Class I Shares capital transactions | | | | 9,829,892 | | | | | 25,185,521 | | | | | 25,113,069 | |
| | | | | | | | | | | | | | | | |
| Class S Shares: | | | | | | | | | | | | | | | |
| Proceeds from shares issued | | | | 100,000 | | | | | — | | | | | — | |
| Dividends reinvested | | | | 213 | | | | | — | | | | | — | |
| Class S Shares capital transactions | | | | 100,213 | | | | | — | | | | | — | |
| Change in net assets resulting from capital transactions | | | $ | 10,093,700 | | | | $ | 25,329,310 | | | | $ | 25,213,838 | |
| | | | | | | | | | | | | | | | |
| SHARE TRANSACTIONS: | | | | | | | | | | | | | | | |
| Class A Shares: | | | | | | | | | | | | | | | |
| Issued | | | | 16,250 | | | | | 14,345 | | | | | 10,000 | |
| Reinvested | | | | 29 | | | | | 144 | | | | | 79 | |
| Change in Class A Shares | | | | 16,279 | | | | | 14,489 | | | | | 10,079 | |
| | | | | | | | | | | | | | | | |
| Class I Shares: | | | | | | | | | | | | | | | |
| Issued | | | | 980,911 | | | | | 2,490,000 | | | | | 2,490,000 | |
| Reinvested | | | | 2,125 | | | | | 29,676 | | | | | 21,825 | |
| Change in Class I Shares | | | | 983,036 | | | | | 2,519,676 | | | | | 2,511,825 | |
| | | | | | | | | | | | | | | | |
| Class S Shares: | | | | | | | | | | | | | | | |
| Issued | | | | 10,000 | | | | | — | | | | | — | |
| Reinvested | | | | 23 | | | | | — | | | | | — | |
| Change in Class S Shares | | | | 10,023 | | | | | — | | | | | — | |
____________________
(a) Commencement of operations.
| See notes to financial statements. | HSBC FAMILY OF FUNDS 67 |
| HSBC EMERGING MARKETS DEBT FUND |
| Financial Highlights |
Selected data for a share outstanding throughout the periods indicated.
| | | | | | Investment Activities | | Distributions | | | | | | | | | | Ratios/Supplementary Data |
| | | | | | | | | | Net Realized | | | | | | | | | | | | | | | | | | | | | | | | | | | | | | Ratio of Net | | Ratio of | | |
| | | | | | | | | | and | | | | | | | | | | | | | | | | | | | | | | | | Net | | | | Investment | | Expenses | | |
| | Net Asset | | Net | | Unrealized | | | | | | | | | | Net Realized | | | | | | | | | | | | | | Assets | | Ratio of Net | | Income | | to Average | | |
| | Value, | | Investment | | Gains | | Total from | | Net | | Gains from | | | | | | Net Asset | | | | | | at End of | | Expenses to | | (Loss) to | | Net Assets | | Portfolio |
| | Beginning | | Income | | (Losses) from | | Investment | | Investment | | Investment | | Total | | Value, End | | Total | | Period | | Average Net | | Average Net | | (Excluding Fee | | Turnover |
| | of Period | | (Loss) | | Investments | | Activities | | Income | | Transactions | | Distributions | | of Period | | Return(a) | | (000’s) | | Assets(b) | | Assets(b) | | Reductions)(b) | | (a)(c) |
| CLASS A SHARES | | | | | | | | | | | | | | | | | | | | | | | | | | | | | | | | | | | | | | | | | | | | | | | | | | | | | | | | | | | | | | | | |
| Year Ended October 31, 2015 | | | $ | 10.37 | | | | $ | 0.37 | (d) | | | | $ | (0.42 | ) | | | | $ | (0.05 | ) | | | | $ | (0.43 | ) | | | | $ | — | | | | | $ | (0.43 | ) | | | | $ | 9.89 | | | | (0.52 | )% | | | | $ | 742 | | | 1.20% | | 3.64% | | 1.84% | | 90% |
| Year Ended October 31, 2014 | | | | 10.42 | | | | | 0.37 | | | | | | 0.13 | | | | | | 0.50 | | | | | | (0.39 | ) | | | | | (0.16 | ) | | | | | (0.55 | ) | | | | | 10.37 | | | | 5.07 | % | | | | | 1,195 | | | 1.20% | | 3.59% | | 1.51% | | 51% |
| Year Ended October 31, 2013 | | | | 11.42 | | | | | 0.43 | | | | | | (0.74 | ) | | | | | (0.31 | ) | | | | | (0.47 | ) | | | | | (0.22 | ) | | | | | (0.69 | ) | | | | | 10.42 | | | | (2.84 | )% | | | | | 1,042 | | | 1.20% | | 3.92% | | 1.48% | | 53% |
| Year Ended October 31, 2012 | | | | 10.23 | | | | | 0.47 | | | | | | 1.21 | | | | | | 1.68 | | | | | | (0.49 | ) | | | | | — | | | | | | (0.49 | ) | | | | | 11.42 | | | | 16.90 | % | | | | | 482 | | | 1.20% | | 4.32% | | 1.55% | | 54% |
| Period Ended October 31, 2011(e) | | | | 10.00 | | | | | 0.25 | | | | | | 0.25 | | | | | | 0.50 | | | | | | (0.27 | ) | | | | | — | | | | | | (0.27 | ) | | | | | 10.23 | | | | 5.02 | % | | | | | 355 | | | 1.20% | | 4.81% | | 1.38% | | 10% |
| CLASS I SHARES | | | | | | | | | | | | | | | | | | | | | | | | | | | | | | | | | | | | | | | | | | | | | | | | | | | | | | | | | | | | | | | | |
| Year Ended October 31, 2015 | | | | 10.39 | | | | | 0.40 | (d) | | | | | (0.41 | ) | | | | | (0.01 | ) | | | | | (0.47 | ) | | | | | — | | | | | | (0.47 | ) | | | | | 9.91 | | | | (0.11 | )% | | | | | 11,267 | | | 0.85% | | 3.97% | | 1.29% | | 90% |
| Year Ended October 31, 2014 | | | | 10.44 | | | | | 0.41 | | | | | | 0.13 | | | | | | 0.54 | | | | | | (0.43 | ) | | | | | (0.16 | ) | | | | | (0.59 | ) | | | | | 10.39 | | | | 5.43 | % | | | | | 40,839 | | | 0.85% | | 3.99% | | 1.16% | | 51% |
| Year Ended October 31, 2013 | | | | 11.44 | | | | | 0.45 | | | | | | (0.72 | ) | | | | | (0.27 | ) | | | | | (0.51 | ) | | | | | (0.22 | ) | | | | | (0.73 | ) | | | | | 10.44 | | | | (2.52 | )% | | | | | 41,027 | | | 0.85% | | 4.19% | | 1.13% | | 53% |
| Year Ended October 31, 2012 | | | | 10.25 | | | | | 0.51 | | | | | | 1.20 | | | | | | 1.71 | | | | | | (0.52 | ) | | | | | — | | | | | | (0.52 | ) | | | | | 11.44 | | | | 17.19 | % | | | | | 39,751 | | | 0.85% | | 4.68% | | 1.28% | | 54% |
| Period Ended October 31, 2011(e) | | | | 10.00 | | | | | 0.29 | | | | | | 0.24 | | | | | | 0.53 | | | | | | (0.28 | ) | | | | | — | | | | | | (0.28 | ) | | | | | 10.25 | | | | 5.34 | % | | | | | 34,257 | | | 0.85% | | 5.07% | | 1.12% | | 10% |
| CLASS S SHARES | | | | | | | | | | | | | | | | | | | | | | | | | | | | | | | | | | | | | | | | | | | | | | | | | | | | | | | | | | | | | | | | |
| Period Ended October 31, 2015(f) | | | | 10.40 | | | | | 0.41 | (d) | | | | | (0.42 | ) | | | | | (0.01 | ) | | | | | (0.26 | ) | | | | | — | | | | | | (0.26 | ) | | | | | 10.13 | | | | (0.09 | )% | | | | | — | | | 0.75% | | 4.06% | | 1.04% | | 90% |
| Year Ended October 31, 2014 | | | | 10.44 | | | | | 0.42 | | | | | | 0.14 | | | | | | 0.56 | | | | | | (0.44 | ) | | | | | (0.16 | ) | | | | | (0.60 | ) | | | | | 10.40 | | | | 5.64 | % | | | | | 127 | | | 0.75% | | 4.09% | | 1.06% | | 51% |
| Year Ended October 31, 2013 | | | | 11.44 | | | | | 0.47 | | | | | | (0.73 | ) | | | | | (0.26 | ) | | | | | (0.52 | ) | | | | | (0.22 | ) | | | | | (0.74 | ) | | | | | 10.44 | | | | (2.42 | )% | | | | | 121 | | | 0.75% | | 4.29% | | 1.03% | | 53% |
| Year Ended October 31, 2012 | | | | 10.25 | | | | | 0.52 | | | | | | 1.20 | | | | | | 1.72 | | | | | | (0.53 | ) | | | | | — | | | | | | (0.53 | ) | | | | | 11.44 | | | | 17.30 | % | | | | | 124 | | | 0.75% | | 4.78% | | 1.18% | | 54% |
| Period Ended October 31, 2011(e) | | | | 10.00 | | | | | 0.30 | | | | | | 0.23 | | | | | | 0.53 | | | | | | (0.28 | ) | | | | | — | | | | | | (0.28 | ) | | | | | 10.25 | | | | 5.39 | % | | | | | 105 | | | 0.75% | | 5.14% | | 1.02% | | 10% |
| (a) | Not annualized for periods less than one year. Total return calculations do not include any sales or redemption charges. |
| (b) | Annualized for periods less than one year. |
| (c) | Portfolio turnover is calculated on the basis of the Fund as a whole without distinguishing between the classes of shares issued. |
| (d) | Calculated based on average shares outstanding. |
| (e) | Commencement of operations on April 7, 2011. |
| (f) | Class S Shares were operational during a portion of the year only. Amounts reflect performance for the period of time the class had operations, which was 236 days during the period. The net asset value from November 1, 2014 to June 24, 2015 reflected represents the last day the class had shareholders. |
Amounts designated as “-” are $0 or have been rounded to $0. |
| 68 HSBC FAMILY OF FUNDS | See notes to financial statements. |
| HSBC EMERGING MARKETS LOCAL DEBT FUND |
| Financial Highlights |
Selected data for a share outstanding throughout the periods indicated.
| | | | Investment Activities | | Distributions | | | | | | Ratios/Supplementary Data |
| | | | | | Net Realized | | | | | | | | | | | | | | | | | | | | Ratio of Net | | Ratio of | | |
| | | | | | and | | | | | | | | | | | | | | | | Net | | | | Investment | | Expenses | | |
| | Net Asset | | Net | | Unrealized | | | | | | Net Realized | | Tax | | | | | | | | Assets | | Ratio of Net | | Income | | to Average | | |
| | Value, | | Investment | | Gains | | Total from | | Net | | Gains from | | Return | | | | Net Asset | | | | at End of | | Expenses to | | (Loss) to | | Net Assets | | Portfolio |
| | Beginning | | Income | | (Losses) from | | Investment | | Investment | | Investment | | of | | Total | | Value, End | | Total | | Period | | Average Net | | Average Net | | (Excluding Fee | | Turnover |
| | of Period | | (Loss) | | Investments | | Activities | | Income | | Transactions | | Capital | | Distributions | | of Period | | Return(a) | | (000’s) | | Assets(b) | | Assets(b) | | Reductions)(b) | | (a)(c) |
| CLASS A SHARES | | | | | | | | | | | | | | | | | | | | | | | | | | | | | | | | | | | | | | | | | | | | | | | | | | | | | | | | | | | | | | | | | | | | | | | | | |
| Year Ended October 31, 2015 | | | $ | 8.61 | | | | $ | 0.34 | (d) | | | | $ | (1.90 | ) | | | | $ | (1.56 | ) | | | | $ | — | | | | | $ | — | | | | | $ | (0.29 | ) | | | | $ | (0.29 | ) | | | | $ | 6.76 | | | | (18.46 | )% | | | | $ | 154 | | | 1.20% | | 4.44% | | 1.99% | | | 186 | % | |
| Year Ended October 31, 2014 | | | | 9.15 | | | | | 0.36 | (d) | | | | | (0.54 | ) | | | | | (0.18 | ) | | | | | — | | | | | | — | | | | | | (0.36 | ) | | | | | (0.36 | ) | | | | | 8.61 | | | | (1.91 | )% | | | | | 291 | | | 1.20% | | 4.08% | | 1.79% | | | 199 | % | |
| Year Ended October 31, 2013 | | | | 9.86 | | | | | 0.24 | (d) | | | | | (0.69 | ) | | | | | (0.45 | ) | | | | | (0.19 | ) | | | | | (0.05 | ) | | | | | (0.02 | ) | | | | | (0.26 | ) | | | | | 9.15 | | | | (4.60 | )% | | | | | 1,366 | | | 1.20% | | 2.49% | | 1.69% | | | 86 | % | |
| Year Ended October 31, 2012 | | | | 9.54 | | | | | 0.21 | | | | | | 0.21 | | | | | | 0.42 | | | | | | (0.10 | ) | | | | | — | | | | | | — | | | | | | (0.10 | ) | | | | | 9.86 | | | | 4.47 | % | | | | | 2,053 | | | 1.20% | | 2.13% | | 1.94% | | | 43 | % | |
| Period Ended October 31, 2011(e) | | | | 10.00 | | | | | 0.12 | | | | | | (0.46 | ) | | | | | (0.34 | ) | | | | | (0.09 | ) | | | | | — | | | | | | (0.03 | ) | | | | | (0.12 | ) | | | | | 9.54 | | | | (3.43 | )% | | | | | 1,807 | | | 1.20% | | 2.29% | | 1.66% | | | 66 | % | |
| CLASS I SHARES | | | | | | | | | | | | | | | | | | | | | | | | | | | | | | | | | | | | | | | | | | | | | | | | | | | | | | | | | | | | | | | | | | | | | | | | | |
| Year Ended October 31, 2015 | | | | 8.61 | | | | | 0.36 | (d) | | | | | (1.90 | ) | | | | | (1.54 | ) | | | | | — | | | | | | — | | | | | | (0.32 | ) | | | | | (0.32 | ) | | | | | 6.75 | | | | (18.14 | )% | | | | | 14,787 | | | 0.85% | | 4.73% | | 1.65% | | | 186 | % | |
| Year Ended October 31, 2014 | | | | 9.16 | | | | | 0.44 | (d) | | | | | (0.59 | ) | | | | | (0.15 | ) | | | | | (0.04 | ) | | | | | — | | | | | | (0.36 | ) | | | | | (0.40 | ) | | | | | 8.61 | | | | (1.55 | )% | | | | | 40,581 | | | 0.85% | | 5.01% | | 1.45% | | | 199 | % | |
| Year Ended October 31, 2013 | | | | 9.87 | | | | | 0.28 | (d) | | | | | (0.70 | ) | | | | | (0.42 | ) | | | | | (0.22 | ) | | | | | (0.05 | ) | | | | | (0.02 | ) | | | | | (0.29 | ) | | | | | 9.16 | | | | (4.25 | )% | | | | | 29,493 | | | 0.85% | | 2.87% | | 1.34% | | | 86 | % | |
| Year Ended October 31, 2012 | | | | 9.55 | | | | | 0.24 | | | | | | 0.21 | | | | | | 0.45 | | | | | | (0.13 | ) | | | | | — | | | | | | — | | | | | | (0.13 | ) | | | | | 9.87 | | | | 4.80 | % | | | | | 30,602 | | | 0.85% | | 2.47% | | 1.62% | | | 43 | % | |
| Period Ended October 31, 2011(e) | | | | 10.00 | | | | | 0.13 | | | | | | (0.45 | ) | | | | | (0.32 | ) | | | | | (0.10 | ) | | | | | — | | | | | | (0.03 | ) | | | | | (0.13 | ) | | | | | 9.55 | | | | (3.21 | )% | | | | | 24,086 | | | 0.85% | | 2.46% | | 1.32% | | | 66 | % | |
| CLASS S SHARES | | | | | | | | | | | | | | | | | | | | | | | | | | | | | | | | | | | | | | | | | | | | | | | | | | | | | | | | | | | | | | | | | | | | | | | | | |
| Period Ended October 31, 2015(f) | | | | 8.61 | | | | | 0.35 | (d) | | | | | (1.27 | ) | | | | | (0.92 | ) | | | | | — | | | | | | — | | | | | | (0.19 | ) | | | | | (0.19 | ) | | | | | 7.50 | | | | (10.72 | )% | | | | | — | | | 0.75% | | 4.51% | | 1.35% | | | 186 | % | |
| Year Ended October 31, 2014 | | | | 9.16 | | | | | 0.44 | (d) | | | | | (0.58 | ) | | | | | (0.14 | ) | | | | | (0.05 | ) | | | | | — | | | | | | (0.36 | ) | | | | | (0.41 | ) | | | | | 8.61 | | | | (1.46 | )% | | | | | 96 | | | 0.75% | | 5.05% | | 1.34% | | | 199 | % | |
| Year Ended October 31, 2013 | | | | 9.87 | | | | | 0.29 | (d) | | | | | (0.70 | ) | | | | | (0.41 | ) | | | | | (0.23 | ) | | | | | (0.05 | ) | | | | | (0.02 | ) | | | | | (0.30 | ) | | | | | 9.16 | | | | (4.16 | )% | | | | | 97 | | | 0.75% | | 2.97% | | 1.24% | | | 86 | % | |
| Year Ended October 31, 2012 | | | | 9.55 | | | | | 0.25 | | | | | | 0.21 | | | | | | 0.46 | | | | | | (0.14 | ) | | | | | — | | | | | | — | | | | | | (0.14 | ) | | | | | 9.87 | | | | 4.89 | % | | | | | 102 | | | 0.75% | | 2.59% | | 1.51% | | | 43 | % | |
| Period Ended October 31, 2011(e) | | | | 10.00 | | | | | 0.14 | | | | | | (0.45 | ) | | | | | (0.31 | ) | | | | | (0.11 | ) | | | | | — | | | | | | (0.03 | ) | | | | | (0.14 | ) | | | | | 9.55 | | | | (3.16 | )% | | | | | 97 | | | 0.75% | | 2.58% | | 1.22% | | | 66 | % | |
| (a) | Not annualized for periods less than one year. Total return calculations do not include any sales or redemption charges. |
| (b) | Annualized for periods less than one year. |
| (c) | Portfolio turnover is calculated on the basis of the Fund as a whole without distinguishing between the classes of shares issued. |
| (d) | Calculated based on average shares outstanding. |
| (e) | Commencement of operations on April 7, 2011. |
| (f) | Class S Shares were operational during a portion of the year only. Amounts reflect performance for the period of time the class had operations, which was 238 days during the period from November 1, 2014 to June 26, 2015. The net asset value reflected represents the last day the class had shareholders. |
Amounts designated as “-” are $0 or have been rounded to $0. |
| See notes to financial statements. | HSBC FAMILY OF FUNDS 69 |
| HSBC FRONTIER MARKETS FUND |
| Financial Highlights |
Selected data for a share outstanding throughout the periods indicated.
| | | | Investment Activities | | Distributions | | | | | | Ratios/Supplementary Data |
| | | | | | Net Realized | | | | | | | | | | | | | | | | | | Ratio of Net | | Ratio of | | |
| | | | | | and | | | | | | | | | | | | | | Net | | | | Investment | | Expenses | | |
| | Net Asset | | Net | | Unrealized | | | | | | Net Realized | | | | | | | | Assets | | Ratio of Net | | Income | | to Average | | |
| | Value, | | Investment | | Gains | | Total from | | Net | | Gains from | | | | Net Asset | | | | at End of | | Expenses to | | (Loss) to | | Net Assets | | Portfolio |
| | Beginning | | Income | | (Losses) from | | Investment | | Investment | | Investment | | Total | | Value, End | | Total | | Period | | Average Net | | Average Net | | (Excluding Fee | | Turnover |
| | of Period | | (Loss) | | Investments | | Activities | | Income | | Transactions | | Distributions | | of Period | | Return(a) | | (000’s) | | Assets(b) | | Assets(b) | | Reductions)(b) | | (a)(c) |
| CLASS A SHARES | | | | | | | | | | | | | | | | | | | | | | | | | | | | | | | | | | | | | | | | | | | | | | | | | | | | | | | | | | | | | | | | | | | | | | |
| Year Ended October 31, 2015 | | | $ | 14.95 | | | | $ | 0.12 | (d) | | | | $ | (1.81 | ) | | | | $ | (1.69 | ) | | | | $ | (0.09 | ) | | | | $ | (1.06 | ) | | | | $ | (1.15 | ) | | | | $ | 12.11 | | | | (11.67 | )% | | | | $ | 21,756 | | | 2.20% | | | 0.96 | % | | | 2.20% | | | 66 | % | |
| Year Ended October 31, 2014 | | | | 13.06 | | | | | 0.20 | (d) | | | | | 2.14 | | | | | | 2.34 | | | | | | (0.05 | ) | | | | | (0.40 | ) | | | | | (0.45 | ) | | | | | 14.95 | | | | 18.38 | % | | | | | 44,837 | | | 2.20% | | | 1.38 | % | | | 2.24% | | | 64 | % | |
| Year Ended October 31, 2013 | | | | 10.93 | | | | | 0.08 | (d) | | | | | 2.45 | | | | | | 2.53 | | | | | | (0.40 | ) | | | | | — | | | | | | (0.40 | ) | | | | | 13.06 | | | | 23.85 | % | | | | | 18,342 | | | 2.20% | | | 0.60 | % | | | 2.69% | | | 44 | % | |
| Year Ended October 31, 2012 | | | | 9.66 | | | | | 0.16 | (d) | | | | | 1.12 | | | | | | 1.28 | | | | | | (0.01 | ) | | | | | — | | | | | | (0.01 | ) | | | | | 10.93 | | | | 13.27 | % | | | | | 1,409 | | | 2.20% | | | 1.51 | % | | | 3.79% | | | 26 | % | |
| Period Ended October 31, 2011(e) | | | | 10.00 | | | | | — | | | | | | (0.34 | ) | | | | | (0.34 | ) | | | | | — | | | | | | — | | | | | | — | | | | | | 9.66 | | | | (3.40 | )% | | | | | 97 | | | 2.30% | | | (0.26 | )% | | | 2.57% | | | 6 | % | |
| CLASS I SHARES | | | | | | | | | | | | | | | | | | | | | | | | | | | | | | | | | | | | | | | | | | | | | | | | | | | | | | | | | | | | | | | | | | | | | | |
| Year Ended October 31, 2015 | | | | 15.08 | | | | | 0.19 | (d) | | | | | (1.85 | ) | | | | | (1.66 | ) | | | | | (0.17 | ) | | | | | (1.06 | ) | | | | | (1.23 | ) | | | | | 12.19 | | | | (11.42 | )% | | | | | 120,010 | | | 1.85% | | | 1.44 | % | | | 1.86% | | | 66 | % | |
| Year Ended October 31, 2014 | | | | 13.15 | | | | | 0.23 | (d) | | | | | 2.17 | | | | | | 2.40 | | | | | | (0.07 | ) | | | | | (0.40 | ) | | | | | (0.47 | ) | | | | | 15.08 | | | | 18.77 | % | | | | | 173,616 | | | 1.85% | | | 1.57 | % | | | 1.90% | | | 64 | % | |
| Year Ended October 31, 2013 | | | | 10.97 | | | | | 0.15 | (d) | | | | | 2.43 | | | | | | 2.58 | | | | | | (0.40 | ) | | | | | — | | | | | | (0.40 | ) | | | | | 13.15 | | | | 24.25 | % | | | | | 70,273 | | | 1.85% | | | 1.20 | % | | | 2.38% | | | 44 | % | |
| Year Ended October 31, 2012 | | | | 9.67 | | | | | 0.29 | (d) | | | | | 1.03 | | | | | | 1.32 | | | | | | (0.02 | ) | | | | | — | | | | | | (0.02 | ) | | | | | 10.97 | | | | 13.68 | % | | | | | 16,375 | | | 1.85% | | | 2.83 | % | | | 2.79% | | | 26 | % | |
| Period Ended October 31, 2011(e) | | | | 10.00 | | | | | — | | | | | | (0.33 | ) | | | | | (0.33 | ) | | | | | — | | | | | | — | | | | | | — | | | | | | 9.67 | | | | (3.30 | )% | | | | | 14,407 | | | 1.96% | | | 0.09 | % | | | 2.23% | | | 6 | % | |
| (a) | Not annualized for periods less than one year. Total return calculations do not include any sales or redemption charges. |
| (b) | Annualized for periods less than one year. |
| (c) | Portfolio turnover is calculated on the basis of the Fund as a whole without distinguishing between the classes of shares issued. |
| (d) | Calculated based on average shares outstanding. |
| (e) | Commencement of operations on September 6, 2011. |
Amounts designated as “-” are $0 or have been rounded to $0. |
| 70 HSBC FAMILY OF FUNDS | See notes to financial statements. |
| HSBC TOTAL RETURN FUND |
| Financial Highlights |
Selected data for a share outstanding throughout the periods indicated.
| | | | Investment Activities | | Distributions | | | | | | Ratios/Supplementary Data |
| | | | | | Net Realized | | | | | | | | | | | | | | | | | | Ratio of Net | | Ratio of | | |
| | | | | | and | | | | | | | | | | | | | | Net | | | | Investment | | Expenses | | |
| | Net Asset | | Net | | Unrealized | | | | | | Net Realized | | | | Net Asset | | | | Assets | | Ratio of Net | | Income | | to Average | | |
| | Value, | | Investment | | Gains | | Total from | | Net | | Gains from | | | | Value, | | | | at End of | | Expenses to | | (Loss) to | | Net Assets | | Portfolio |
| | Beginning | | Income | | (Losses) from | | Investment | | Investment | | Investment | | Total | | End | | Total | | Period | | Average Net | | Average Net | | (Excluding Fee | | Turnover |
| | of Period | | (Loss)(a) | | Investments | | Activities | | Income | | Transactions | | Distributions | | of Period | | Return(b) | | (000’s) | | Assets(c) | | Assets(c) | | Reductions)(c) | | (b)(d) |
| CLASS A SHARES | | | | | | | | | | | | | | | | | | | | | | | | | | | | | | | | | | | | | | | | | | | | | | | | | | | | | | | | | | | | | | | |
| Year Ended October 31, 2015 | | | $ | 10.36 | | | | $ | 0.05 | | | | $ | (0.06 | ) | | | | $ | (0.01 | ) | | | | $ | (0.15 | ) | | | | $ | — | | | | | $ | (0.15 | ) | | | | $ | 10.20 | | | | (0.07 | )% | | | | $ | 7,562 | | | 1.52% | | 0.52% | | 1.52% | | 26% |
| Year Ended October 31, 2014 | | | | 10.13 | | | | | 0.04 | | | | | 0.41 | | | | | | 0.45 | | | | | | (0.18 | ) | | | | | (0.04 | ) | | | | | (0.22 | ) | | | | | 10.36 | | | | 4.50 | % | | | | | 406 | | | 1.52% | | 0.44% | | 1.52% | | 77% |
| Year Ended October 31, 2013 | | | | 10.32 | | | | | 0.10 | | | | | (0.21 | ) | | | | | (0.11 | ) | | | | | (0.05 | ) | | | | | (0.03 | ) | | | | | (0.08 | ) | | | | | 10.13 | | | | (1.06 | )% | | | | | 268 | | | 1.47% | | 0.94% | | 1.47% | | 64% |
| Period Ended October 31, 2012(e) | | | | 10.00 | | | | | 0.03 | | | | | 0.33 | | | | | | 0.36 | | | | | | (0.04 | ) | | | | | — | | | | | | (0.04 | ) | | | | | 10.32 | | | | 3.62 | % | | | | | 256 | | | 1.60% | | 0.56% | | 1.61% | | 83% |
| CLASS I SHARES | | | | | | | | | | | | | | | | | | | | | | | | | | | | | | | | | | | | | | | | | | | | | | | | | | | | | | | | | | | | | | | |
| Year Ended October 31, 2015 | | | | 10.38 | | | | | 0.06 | | | | | (0.04 | ) | | | | | 0.02 | | | | | | (0.18 | ) | | | | | — | | | | | | (0.18 | ) | | | | | 10.22 | | | | 0.21 | % | | | | | 1,181,045 | | | 1.13% | | 0.56% | | 1.13% | | 26% |
| Year Ended October 31, 2014 | | | | 10.15 | | | | | 0.08 | | | | | 0.40 | | | | | | 0.48 | | | | | | (0.21 | ) | | | | | (0.04 | ) | | | | | (0.25 | ) | | | | | 10.38 | | | | 4.85 | % | | | | | 1,025,926 | | | 1.17% | | 0.77% | | 1.17% | | 77% |
| Year Ended October 31, 2013 | | | | 10.33 | | | | | 0.13 | | | | | (0.20 | ) | | | | | (0.07 | ) | | | | | (0.08 | ) | | | | | (0.03 | ) | | | | | (0.11 | ) | | | | | 10.15 | | | | (0.66 | )% | | | | | 642,545 | | | 1.18% | | 1.33% | | 1.18% | | 64% |
| Period Ended October 31, 2012(e) | | | | 10.00 | | | | | 0.07 | | | | | 0.31 | | | | | | 0.38 | | | | | | (0.05 | ) | | | | | — | | | | | | (0.05 | ) | | | | | 10.33 | | | | 3.82 | % | | | | | 348,443 | | | 1.18% | | 1.08% | | 1.18% | | 83% |
| CLASS S SHARES | | | | | | | | | | | | | | | | | | | | | | | | | | | | | | | | | | | | | | | | | | | | | | | | | | | | | | | | | | | | | | | |
| Year Ended October 31, 2015 | | | | 10.38 | | | | | 0.07 | | | | | (0.04 | ) | | | | | 0.03 | | | | | | (0.19 | ) | | | | | — | | | | | | (0.19 | ) | | | | | 10.22 | | | | 0.31 | % | | | | | 26,079 | | | 1.03% | | 0.65% | | 1.03% | | 26% |
| Year Ended October 31, 2014 | | | | 10.15 | | | | | 0.10 | | | | | 0.39 | | | | | | 0.49 | | | | | | (0.22 | ) | | | | | (0.04 | ) | | | | | (0.26 | ) | | | | | 10.38 | | | | 4.94 | % | | | | | 25,994 | | | 1.07% | | 0.95% | | 1.07% | | 77% |
| Year Ended October 31, 2013 | | | | 10.33 | | | | | 0.18 | | | | | (0.24 | ) | | | | | (0.06 | ) | | | | | (0.09 | ) | | | | | (0.03 | ) | | | | | (0.12 | ) | | | | | 10.15 | | | | (0.57 | )% | | | | | 24,758 | | | 1.12% | | 1.80% | | 1.12% | | 64% |
| Period Ended October 31, 2012(e) | | | | 10.00 | | | | | 0.05 | | | | | 0.34 | | | | | | 0.39 | | | | | | (0.06 | ) | | | | | — | | | | | | (0.06 | ) | | | | | 10.33 | | | | 3.87 | % | | | | | 104 | | | 1.15% | | 0.91% | | 1.48% | | 83% |
| (a) | Calculated based on average shares outstanding. |
| (b) | Not annualized for periods less than one year. Total return calculations do not include any sales or redemption charges. |
| (c) | Annualized for periods less than one year. |
| (d) | Portfolio turnover is calculated on the basis of the Fund as a whole without distinguishing between the classes of shares issued. |
| (e) | Commencement of operations on March 30, 2012. |
Amounts designated as “-” are $0 or have been rounded to $0. |
| See notes to financial statements. | HSBC FAMILY OF FUNDS 71 |
| HSBC ASIA EX-JAPAN SMALLER COMPANIES EQUITY FUND |
| Financial Highlights |
Selected data for a share outstanding throughout the period indicated.
| | | | Investment Activities | | Distributions | | | | | | Ratios/Supplementary Data |
| | Net Asset
Value,
Beginning
of Period | | Net
Investment
Income
(Loss) | | Net Realized
and
Unrealized
Gains
(Losses) from
Investments | | Total from
Investment
Activities | | Net
Investment
Income | | Net Realized
Gains from
Investment
Transactions | | Total
Distributions | | Net Asset
Value, End
of Period | | Total
Return(a) | | Net
Assets
at End
of Period
(000’s) | | Ratio of Net
Expenses to
Average Net
Assets(b) | | Ratio of Net
Investment
Income
(Loss) to
Average Net
Assets(b) | | Ratio of
Expenses
to Average
Net Assets
(Excluding Fee
Reductions)(b) | | Portfolio
Turnover
(a)(c) |
| CLASS A SHARES | | | | | | | | | | | | | | | | | | | | | | | | | | | | | | | | | | | | | | | | | | | | | | | |
| Period Ended October 31, 2015(d) | | $ | 10.00 | | | $ | 0.10 | (e) | | $ | (0.49 | ) | | $ | (0.39 | ) | | $ | (0.02 | ) | | | $— | | | $ | (0.02 | ) | | $ | 9.59 | | | (3.82 | )% | | $ | 156 | | | 1.75% | | 1.03% | | 3.64% | | 146% |
| CLASS I SHARES | | | | | | | | | | | | | | | | | | | | | | | | | | | | | | | | | | | | | | | | | | | | | | | |
| Period Ended October 31, 2015(d) | | | 10.00 | | | | 0.13 | (e) | | | (0.49 | ) | | | (0.36 | ) | | | (0.02 | ) | | | — | | | | (0.02 | ) | | | 9.62 | | | (3.49 | )% | | | 9,461 | | | 1.40% | | 1.33% | | 3.38% | | 146% |
| CLASS S SHARES | | | | | | | | | | | | | | | | | | | | | | | | | | | | | | | | | | | | | | | | | | | | | | | |
| Period Ended October 31, 2015(d) | | | 10.00 | | | | 0.14 | (e) | | | (0.49 | ) | | | (0.35 | ) | | | (0.02 | ) | | | — | | | | (0.02 | ) | | | 9.63 | | | (3.48 | )% | | | 97 | | | 1.30% | | 1.43% | | 3.28% | | 146% |
| (a) | Not annualized for periods less than one year. Total return calculations do not include any sales or redemption charges. |
| (b) | Annualized for periods less than one year. |
| (c) | Portfolio turnover is calculated on the basis of the Fund as a whole without distinguishing between the classes of shares issued. |
| (d) | Commencement of operations on November 11, 2014. |
| (e) | Calculated based on average shares outstanding. |
Amounts designated as “-” are $0 or have been rounded to $0. |
72 HSBC FAMILY OF FUNDS | See notes to financial statements. |
| HSBC GLOBAL HIGH YIELD BOND FUND |
| Financial Highlights |
Selected data for a share outstanding throughout the period indicated.
| | | | Investment Activities | | Distributions | | | | | | Ratios/Supplementary Data |
| | Net Asset
Value,
Beginning
of Period | | Net
Investment
Income
(Loss) | | Net Realized
and
Unrealized
Gains
(Losses) from
Investments | | Total from
Investment
Activities | | Net
Investment
Income | | Net Realized
Gains from
Investment
Transactions | | Total
Distributions | | Net Asset
Value, End
of Period | | Total
Return(a) | | Net Assets
at End of
Period
(000’s) | | Ratio of Net
Expenses to
Average Net
Assets(b) | | Ratio of Net
Investment
Income
(Loss) to
Average Net
Assets(b) | | Ratio of
Expenses
to Average
Net Assets
(Excluding Fee
Reductions)(b) | | Portfolio
Turnover
(a)(c) |
| CLASS A SHARES | | | | | | | | | | | | | | | | | | | | | | | | | | | | | | | | | | | | | | | | | | | | | | |
| Period Ended October 31, 2015(d) | | $ | 10.00 | | | $ | 0.12 | (e) | | $ | (0.34 | ) | | $ | (0.22 | ) | | $ | (0.11 | ) | | $ | — | | | $ | (0.11 | ) | | $ | 9.67 | | | (2.23)% | | $ | 140 | | | 1.15% | | 4.13% | | 1.93% | | 31% |
| CLASS I SHARES | | | | | | | | | | | | | | | | | | | | | | | | | | | | | | | | | | | | | | | | | | | | | | |
| Period Ended October 31, 2015(d) | | | 10.00 | | | | 0.13 | (e) | | | (0.34 | ) | | | (0.21 | ) | | | (0.11 | ) | | | — | | | | (0.11 | ) | | | 9.68 | | | (2.15)% | | | 24,378 | | | 0.80% | | 4.45% | | 1.64% | | 31% |
| (a) | Not annualized for periods less than one year. Total return calculations do not include any sales or redemption charges. |
| (b) | Annualized for periods less than one year. |
| (c) | Portfolio turnover is calculated on the basis of the Fund as a whole without distinguishing between the classes of shares issued. |
| (d) | Commencement of operations on July 14, 2015. |
| (e) | Calculated based on average shares outstanding. |
Amounts designated as “-” are $0 or have been rounded to $0. |
| See notes to financial statements. | HSBC FAMILY OF FUNDS 73 |
| HSBC GLOBAL HIGH INCOME BOND FUND |
| Financial Highlights |
Selected data for a share outstanding throughout the period indicated.
| | | | Investment Activities | | Distributions | | | | | | Ratios/Supplementary Data |
| | Net Asset
Value,
Beginning
of Period | | Net
Investment
Income
(Loss) | | Net Realized
and
Unrealized
Gains
(Losses) from
Investments | | Total from
Investment
Activities | | Net
Investment
Income | | Net Realized
Gains from
Investment
Transactions | | Total
Distributions | | Net Asset
Value, End
of Period | | Total
Return(a) | | Net
Assets
at End
of Period
(000’s) | | Ratio of Net
Expenses to
Average Net
Assets(b) | | Ratio of Net
Investment
Income
(Loss) to
Average Net
Assets(b) | | Ratio of
Expenses
to Average
Net Assets
(Excluding Fee
Reductions)(b) | | Portfolio
Turnover
(a)(c) |
| CLASS A SHARES | | | | | | | | | | | | | | | | | | | | | | | | | | | | | | | | | | | | | | | | | | | | | | |
| Period Ended October 31, 2015(d) | | $ | 10.00 | | | $ | 0.09 | (e) | | $ | (0.18 | ) | | $ | (0.09 | ) | | $ | (0.08 | ) | | $ | — | | | $ | (0.08 | ) | | $ | 9.83 | | | (0.93)% | | $ | 99 | | | 1.15% | | 2.89% | | 1.89% | | 24% |
| CLASS I SHARES | | | | | | | | | | | | | | | | | | | | | | | | | | | | | | | | | | | | | | | | | | | | | | |
| Period Ended October 31, 2015(d) | | | 10.00 | | | | 0.10 | (e) | | | (0.18 | ) | | | (0.08 | ) | | | (0.09 | ) | | | — | | | | (0.09 | ) | | | 9.83 | | | (0.84)% | | | 24,696 | | | 0.80% | | 3.24% | | 1.61% | | 24% |
| (a) | Not annualized for periods less than one year. Total return calculations do not include any sales or redemption charges. |
| (b) | Annualized for periods less than one year. |
| (c) | Portfolio turnover is calculated on the basis of the Fund as a whole without distinguishing between the classes of shares issued. |
| (d) | Commencement of operations on July 14, 2015. |
| (e) | Calculated based on average shares outstanding. |
Amounts designated as “-” are $0 or have been rounded to $0. |
74 HSBC FAMILY OF FUNDS | See notes to financial statements. |
| HSBC FAMILY OF FUNDS |
| Notes to Financial Statements — as of October 31, 2015 |
1. Organization:
The HSBC Funds (the “Trust”), a Massachusetts business trust organized on April 22, 1987, is registered under the Investment Company Act of 1940, as amended (the “Act”), as an open-end management investment company. As of October 31, 2015, the Trust is composed of 17 separate operational funds, each a series of the HSBC Family of Funds, which also includes the HSBC Advisor Funds Trust and the HSBC Portfolios (the “Trusts”). The accompanying financial statements are presented for the following seven funds (individually a “Fund,” collectively the “Funds”):
| Fund | | | Short Name | |
| HSBC Emerging Markets Debt Fund | | Emerging Markets Debt Fund |
| HSBC Emerging Markets Local Debt Fund | | Emerging Markets Local Debt Fund |
| HSBC Frontier Markets Fund | | Frontier Markets Fund |
| HSBC Total Return Fund | | Total Return Fund |
| HSBC Asia ex-Japan Smaller Companies Equity Fund | | Asia ex-Japan Smaller Companies Equity Fund HSBC |
| HSBC Global High Yield Bond Fund | | Global High Yield Bond Fund |
| HSBC Global High Income Bond Fund | | Global High Income Bond Fund |
The Emerging Markets Debt Fund, the Emerging Markets Local Debt Fund and the Total Return Fund are non-diversified funds. The Frontier Markets Fund, the Asia ex-Japan Smaller Companies Equity Fund, the Global High Yield Bond Fund and Global High Income Bond Fund are diversified funds. Financial statements for all other funds of the Trusts are published separately. The Funds are authorized to issue an unlimited number of shares of beneficial interest with a par value of $ 0.001 per share. The Emerging Markets Debt Fund, the Emerging Markets Local Debt Fund and the Total Return Fund (“Debt Funds”) are authorized to issue three classes of shares: Class A Shares, Class I Shares, and Class S Shares. Class A Shares of the Debt Funds have a maximum sales charge of 4.75% as a percentage of the original purchase price. The Frontier Markets Fund, Asia ex-Japan Smaller Companies Equity Fund, Global High Yield Bond Fund and Global High Income Bond Fund are authorized to issue two classes of shares: Class A Shares and Class I Shares. Class A Shares of the Frontier Markets Fund and Asia ex-Japan Smaller Companies Equity Fund have a maximum sales charge of 5.00% as a percentage of the original purchase price. Each class of shares in each Fund has identical rights and privileges, except with respect to arrangements pertaining to shareholder servicing and/or distribution, class-related expenses, voting rights on matters affecting a single class of shares, and exchange privileges of each class of shares. Effective as of April 30, 2014, the Frontier Markets Fund has been closed to new investors, subject to certain exceptions.
The Asia ex-Japan Smaller Companies Equity Fund commenced operations on November 11, 2014 and had no operations prior to commencement. The Global High Yield Bond Fund and Global High Income Bond Fund commenced operations on July 14, 2015 and had no operations prior to commencement.
Under the Trust’s organizational documents, the Funds’ officers and Trustees are indemnified against certain liabilities arising out of the performance of their duties to the Funds. In addition, in the normal course of business, the Trust enters into contracts with its service providers, which also provide for indemnifications by the Funds. The Funds’ maximum exposure under these arrangements is unknown as this would involve future claims that may be made against the Funds. However, based on experience, the Trust expects the risk of loss to be remote.
The Funds are investment companies and follow accounting and reporting guidance under Financial Accounting Standards Board (“FASB”) Accounting Standards Codification (“ASC”) Topic 946, “Financial Services-Investment Companies”.
HSBC FAMILY OF FUNDS 75
| HSBC FAMILY OF FUNDS |
| Notes to Financial Statements — as of October 31, 2015 (continued) |
2. Significant Accounting Policies:
The following is a summary of the significant accounting policies followed by the Funds in the preparation of their financial statements. The policies are in conformity with U.S. generally accepted accounting principles (“GAAP”). The preparation of financial statements requires management to make certain estimates and assumptions that affect the reported amounts of assets and liabilities and disclosure of contingent assets and liabilities at the date of the financial statements and the reported amounts of increases and decreases in net assets from operations during the reporting period. Actual results could differ from those estimates.
Securities Valuation:
The Funds record their investments at fair value. Fair value is defined as the price that would be received to sell an asset or paid to transfer a liability in an orderly transaction between market participants at the measurement date. The valuation techniques used to determine fair value are further described in Note 3 below.
Investment Transactions and Related Income:
Investment transactions are accounted for no later than one business day after trade date. However, for financial reporting purposes, investment transactions are accounted for on trade date. Investment gains and losses are calculated on the identified cost basis. Interest income is recognized on the accrual basis and includes, where applicable, the amortization or accretion of premium or discount based on effective yield. Dividend income is recorded on the ex-dividend date except in the case of foreign securities, in which case dividends are recorded as soon as such information becomes available.
Foreign Currency Translation:
The accounting records of the Funds are maintained in U.S. dollars. Foreign currency amounts are translated into U.S. dollars at the current rate of exchange to determine the value of investments, assets and liabilities. Purchases and sales of securities, and income and expenses are translated at the prevailing rate of exchange on the respective dates of such transactions. The Funds do not isolate the portion of the results of operations resulting from changes in foreign exchange rates on investments from fluctuations arising from changes in market prices of securities held. Such fluctuations are included with the net realized and unrealized gain or loss from investments and foreign currencies.
Income received by the Funds from sources within foreign countries may be subject to withholding and other income or similar taxes imposed by such countries. The Funds may be subject to foreign taxes on gains in investments or currency repatriation. The Funds accrue foreign capital gains taxes, as applicable, based on their current interpretation of tax rules in the foreign markets in which they invest. Such tax accrual is based in part on actual and estimated realized gains. Estimated realized gains are subject to change and such change could be material. However, management’s conclusions may be subject to future review and change based on changes in, or the interpretation of, the accounting standards or tax laws and regulations.
Restricted and Illiquid Securities:
A restricted security is a security which has been purchased through a private offering and cannot be resold to the general public without prior registration under the Securities Act of 1933 (the “1933 Act”) or pursuant to the resale limitations provided by Rule 144 under the 1933 Act, or another exemption from the registration requirements of the 1933 Act. Certain restricted securities may be resold in transactions exempt from registration, normally to qualified institutional buyers, and may be deemed liquid by the Investment Adviser (as defined in Note 4) based on procedures established by the Board of Trustees (the “Board”). Therefore, not all restricted securities are considered illiquid. Disposal of these securities may involve time consuming negotiations and expense. Prompt sale at the current valuation may be difficult and could adversely affect the net assets of the Funds. At October 31, 2015, all restricted securities held were deemed liquid.
Participation Notes and Participatory Notes:
The Frontier Markets Fund and Asia ex-Japan Smaller Companies Equity Fund may invest in participation notes or participatory notes (“P-notes”). P-notes are participation interest notes that are issued by banks or broker-dealers and are designed to offer a return linked to a particular underlying equity, debt, currency or market. If the P-note were held to maturity, the issuer would pay to, or receive from, the purchaser the difference between the nominal value of the underlying instrument at the time of purchase and that instrument’s value at maturity. The holder of a P-note that is linked to a particular underlying security or instrument may be entitled to receive any dividends paid in connection with that underlying security or instrument, but typically does
76 HSBC FAMILY OF FUNDS
| HSBC FAMILY OF FUNDS |
| Notes to Financial Statements — as of October 31, 2015 (continued) |
not receive voting rights as it would if it directly owned the underlying security or instrument. Investments in P-notes involve the same risks associated with a direct investment in the underlying securities, instruments or markets that they seek to replicate. In addition, there can be no assurance that there will be a trading market for a P-note or that the trading price of a P-note will equal the underlying value of the security, instrument or market that it seeks to replicate. Due to liquidity and transfer restrictions, the secondary markets on which a P-note is traded may be less liquid than the market for other securities, or may be completely illiquid, which may also affect the ability of a Fund to accurately value a P-note. P-notes typically constitute general unsecured contractual obligations of the banks or broker- dealers that issue them, which subjects the Funds that holds them to counterparty risk (and this risk may be amplified if the Fund purchases P-notes from only a small number of issuers).
Derivative Instruments:
All open derivative positions at year end are reflected on the Funds’ Schedule of Portfolio Investments. The following is a description of the derivative instruments utilized by the Funds, including the primary underlying risk exposure related to each instrument type.
Forward Foreign Currency Exchange Contracts:
Each Fund may enter into forward foreign currency exchange contracts. The Funds may enter into forward foreign currency exchange contracts in connection with planned purchases or sales of securities, to hedge the U.S. dollar value of securities denominated in a particular currency or to enhance return. The forward foreign currency exchange contracts are adjusted by the daily exchange rate of the underlying currency and any gains or losses are recorded for financial statement purposes as unrealized gains or losses until the contract settlement date.
The Funds could be exposed to risks if the counterparties to the contracts are unable to meet the terms of their contracts and from unanticipated movements in the value of a foreign currency relative to the U.S. dollar.
The Funds remain subject to credit risk with respect to the amount they expect to receive from counterparties. However, the Funds have sought to mitigate these risks by generally requiring the posting of collateral to a Fund at prearranged exposure levels to cover a Fund’s exposure to the counterparty. Forward foreign currency exchange contracts may involve credit or market risk in excess of the amounts reflected on the Statement of Assets and Liabilities.
During the year ended October 31, 2015, the Funds entered into forward foreign currency exchange contracts to gain exposure to certain markets and for hedging purposes. The notional amount of forward foreign currency exchange contracts outstanding as of October 31, 2015 and the monthly average notional amount for these contracts during the year ended October 31, 2015 were as follows:
| | Outstanding | | Monthly Average |
| | Notional Amount ($) | | Notional Amount ($) |
| | Long | | Short | | Long | | Short |
| Forward Foreign Currency Exchange Contracts: | | | | | | | | | | |
| Emerging Markets Debt Fund | | 2,118,878 | | (1,123,987 | ) | | 2,006,999 | | (1,397,653 | ) |
| Emerging Markets Local Debt Fund | | 20,566,836 | | (17,653,351 | ) | | 30,047,106 | | (26,553,788 | ) |
| Total Return Fund | | 861,078,484 | | (724,282,913 | ) | | 611,185,858 | | (675,452,787 | ) |
| Global High Yield Bond Fund | | 489,579 | | (8,830,570 | ) | | 459,591 | | (6,902,867 | ) |
| Global High Income Bond Fund | | 420,628 | | (12,416,784 | ) | | 451,496 | | (9,647,090 | ) |
Options Contracts:
The Funds may purchase or write put and call options on securities, indices, foreign currencies and derivative instruments. When purchasing options, the Funds pay a premium which is recorded as the cost basis in the investment and which is subsequently marked to market to reflect the current value of the option. Premiums paid for purchasing options that expire are treated as realized losses. When an option is exercised or closed, premiums paid for purchasing options are offset against proceeds to determine the realized gain or loss on the transaction. When writing options, the Funds receive a premium which is recorded as a liability and
HSBC FAMILY OF FUNDS 77
| HSBC FAMILY OF FUNDS |
| Notes to Financial Statements — as of October 31, 2015 (continued) |
which is subsequently marked to market to reflect the current value of the option written. Premiums received from writing options that expire are treated as realized gains. Premiums received from writing options that are either exercised or closed are offset against the proceeds received or the amount paid on the transaction to determine the realized gains or losses.
The Funds may purchase or write put and call options on foreign currencies for the purpose of protecting against declines in the dollar value of foreign portfolio securities and against increases in the U.S. dollar cost of foreign securities to be acquired. The Funds could be exposed to risks if the counterparties to the contracts are unable to meet the terms of their contracts and from unanticipated movements in the value of a foreign currency relative to the U.S. dollar.
The Funds may enter into interest rate swaption agreements for hedging purposes. A swaption is an option to enter into a pre-defined swap agreement by some specified date in the future. The writer of the swaption becomes the counterparty to the swap if the buyer exercises their option. The interest rate swaption agreement will specify whether the buyer of the swaption will be a fixed rate receiver or a fixed rate buyer. The Funds could be exposed to risks if the counterparties to the contracts are unable to meet the terms of their contracts and from unanticipated movements in interest rates.
The Funds remain subject to credit risk with respect to the amount they expect to receive from counterparties. However, the Funds have sought to mitigate these risks by generally requiring the posting of collateral to a Fund at prearranged exposure levels to cover a Fund’s exposure to the counterparty. Options contracts may involve credit or market risk in excess of the amounts reflected on the Statement of Assets and Liabilities.
The Funds did not invest in options during the year ended October 31, 2015.
Futures Contracts:
The Funds may invest in futures contracts for the purpose of hedging existing portfolio securities or securities they intend to purchase against fluctuations in fair value caused by changes in prevailing market interest conditions. Upon entering into futures contracts, the Funds are required to pledge to the broker an amount of cash and/or other assets equal to a certain percentage of the contract amount (initial margin deposit). Subsequent payments, known as “variation margin”, are made or received each day, depending on the daily fluctuations in the fair value of the underlying security. The Funds recognize an unrealized gain or loss equal to the daily variation margin. Should market conditions move unexpectedly, the Funds may not achieve the anticipated benefits of the futures contracts and may realize a loss. Futures contracts involve, to varying degrees, elements of market risk (generally equity price risk related to stock futures, interest rate risk related to bond futures, and foreign currency risk related to currency futures) and exposure to loss in excess of the amounts reflected on the Statements of Assets and Liabilities as variation margin. The primary risks associated with the use of futures contracts are the imperfect correlation between the change in market value of the securities held by the Funds and the prices of futures contracts, the possibility of an illiquid market, and the inability of the counterparty to meet the terms of the contract. During the year ended October 31, 2015, the Emerging Markets Debt Fund and the Total Return Fund invested in futures contracts to gain exposure to certain markets and for hedging purposes. The gross notional amount of futures contracts outstanding as of October 31, 2015, and the monthly average notional amount for these contracts for the year ended October 31, 2015 were as follows:
| | Outstanding | | Monthly Average |
| | Notional Amount ($) | | Notional Amount ($) |
| Futures Contracts: | | Short | | Short |
| Emerging Markets Debt Fund | | 383,063 | | 480,540 |
| Total Return Fund | | 118,749,375 | | 115,485,664 |
Swap Agreements:
The Funds may enter into swap contracts and other similar instruments in accordance with their investment objectives and policies. A swap is an agreement to exchange the return generated by one instrument for the return generated by another instrument. The payment streams are calculated by reference to a specified index and agreed upon notional amount. The term specified index includes currencies, fixed interest rates, prices and total return on interest rate indices, fixed income indices, stock indices and commodity indices.
78 HSBC FAMILY OF FUNDS
| HSBC FAMILY OF FUNDS |
| Notes to Financial Statements — as of October 31, 2015 (continued) |
The Funds will usually enter into swaps on a net basis, which means that the two return streams are netted out in a cash settlement on the payment date or dates specified in the instrument, with a Fund receiving or paying only the net amount of the two returns. Upfront receipts and payments are recorded as a liability or asset, respectively. These upfront receipts and payments are amortized to gains or losses over the life of the swap agreement. Until a swap agreement is settled in cash, the gain or loss on the notional amount plus income on the instruments, less the interest paid by the Fund on the notional amount, is recorded as “unrealized appreciation or depreciation on swap agreements” and, when cash is exchanged, the gain or loss realized is recorded as “realized gains or losses on swap agreements”. A Fund’s obligations under a swap agreement will be accrued daily (offset against any amounts owing to the Fund) and any accrued but unpaid net amounts owed to a swap counterparty will be covered by the maintenance of a segregated account consisting of cash, U.S. government securities, or other liquid securities or by pledging such securities as collateral.
Interest rate swaps involve the exchange of commitments to pay and receive interest based on a notional amount and are subject to interest rate risk exposure. Interest rate swaps do not involve the delivery of securities, other underlying assets or principal. Accordingly, the risk of loss with respect to interest rate swaps is limited to the net amount of interest payments that a Fund is contractually obligated to make. If the other party to an interest rate swap defaults, a Fund’s risk of loss consists of the net amount of interest payments that the Fund is contractually entitled to receive.
Credit default swap agreements involve one party making a stream of payments (referred to as the buyer of protection) to another party (the seller of protection) in exchange for the right to receive a specified return in the event of a default or other credit event for the referenced entity, obligation or index and are subject to credit risk exposure. The maximum potential amount of future payments that a Fund as a seller of protection could be required to make under a credit default swap agreement would be an amount equal to the notional amount of the agreement. Notional amounts of each individual credit default swap agreement outstanding for which a Fund is the seller of protection are disclosed in the Schedules of Portfolio Investments. These potential amounts would be partially offset by any recovery values of the respective referenced obligations, upfront payments received upon entering into the agreement, or net amounts received from the settlement of buy protection credit default swap agreements entered into by a Fund for the same referenced entity or entities.
The Funds remain subject to credit risk with respect to the amount they expect to receive from counterparties. However, the Funds have sought to mitigate these risks by generally requiring the posting of collateral to a Fund at pre-arranged exposure levels to cover a Fund’s exposure to the counterparty. Swap agreements may involve credit or market risk in excess of the amounts reflected on the Statement of Assets and Liabilities.
The use of swaps is a highly specialized activity that involves investment techniques and risks different from those associated with ordinary portfolio securities transactions. If the Investment Adviser is incorrect in its forecasts of market values, interest rates and currency exchange rates, the investment performance of a Fund would be less favorable than it would have been if this investment technique were not used.
During the year ended October 31, 2015, the Emerging Markets Local Debt Fund and the Total Return Fund entered into interest rate swap agreements to manage their exposure to interest rates and as a substitute for investing directly in securities. The Emerging Markets Debt Fund and Total Return Fund also entered into credit default swap agreements primarily to manage and/or gain exposure to credit risk. The notional amount of swap agreements outstanding as of October 31, 2015 and the monthly average notional amount for these agreements during the year ended October 31, 2015 were as follows:
| | Outstanding | | Monthly Average |
| | Notional Amount ($) | | Notional Amount ($) |
| Interest Rate Swap Agreements: | | | | |
| Emerging Markets Local Debt Fund | | 7,932,383 | | 17,508,551 |
| Total Return Fund | | 39,159,425 | | 203,317,753 |
| | Outstanding | | Monthly Average |
| | Notional Amount ($) | | Notional Amount ($) |
| | Buy Protection | | Sell Protection | | Buy Protection | | Sell Protection |
| Credit Default Swap Agreements: | | | | | | | | | | |
| Emerging Markets Debt Fund | | 250,000 | | (1,375,000 | ) | | 20,833 | | (2,427,083 | ) |
| Total Return Fund | | 113,080,000 | | (180,250,000 | ) | | 113,877,500 | | (142,262,500 | ) |
| HSBC FAMILY OF FUNDS |
| Notes to Financial Statements — as of October 31, 2015 (continued) |
Summary of Derivative Instruments:
The following is a summary of the fair values of derivative instruments on the Statements of Assets and Liabilities, categorized by risk exposure, as of October 31, 2015:
| | Assets | | Liabilities |
| | Unrealized | | | | | | | | | | Unrealized | | | | | | | | |
| | Appreciation | | | | | | | | | | Depreciation | | | | | | | | |
| | on Forward | | Variation | | | | on Forward | | Variation | | | | |
| | Foreign Currency | | Margin | | Swap | | Foreign Currency | | Margin | | Swap |
| | Exchange | | on Futures | | agreements, | | Exchange | | on Futures | | agreements, |
| Fund | | Contracts ($) | | Contracts ($) | | at value | | Contracts ($) | | Contracts ($) | | at value |
| Foreign Exchange Rate Risk Exposure: | | | | | | | | | | | | | | | | | | | | | | | | |
| Emerging Markets Debt Fund | | | 46,120 | | | | — | | | | — | | | | 47,484 | | | | — | | | | — | |
| Emerging Market Local Debt Fund | | | 540,726 | | | | — | | | | — | | | | 891,649 | | | | — | | | | — | |
| Total Return Fund | | | 30,734,357 | | | | — | | | | — | | | | 28,671,509 | | | | — | | | | — | |
| Global High Yield Bond Fund | | | 96,433 | | | | — | | | | | | | | 22,727 | | | | | | | | | |
| Global High Income Bond Fund | | | 140,892 | | | | — | | | | | | | | 18,328 | | | | | | | | | |
| | | | | | | | | | | | | | | | | | | | | | | | | |
| Credit Contracts Risk Exposure: | | | | | | | | | | | | | | | | | | | | | | | | |
| Emerging Markets Debt Fund | | | — | | | | — | | | | 6,920 | | | | — | | | | — | | | | 73,751 | |
| Total Return Fund | | | — | | | | — | | | | 4,081,543 | | | | — | | | | — | | | | 14,212,423 | |
| | | | | | | | | | | | | | | | | | | | | | | | | |
| Interest Rate Risk Exposure: | | | | | | | | | | | | | | | | | | | | | | | | |
| Emerging Markets Debt Fund | | | — | | | | 666 | | | | — | | | | — | | | | — | | | | (303 | ) |
| Emerging Market Local Debt Fund | | | — | | | | — | | | | 45,748 | | | | — | | | | — | | | | 113,826 | |
| Total Return Fund | | | — | | | | — | | | | — | | | | — | | | | 74,642 | | | | 419,531 | |
____________________
| ^ | | Includes cumulative appreciation/depreciation on futures contracts as reported in the Schedule of Investments. Only current outstanding variation margin is reported on the Statement of Assets and Liabilities. |
The following is a summary of the effect of derivative instruments on the Statements of Operations, categorized by risk exposure, for the year ended October 31, 2015:
| | | | | | | | | | | | | | Net Change in Unrealized |
| | | | | | | | | | | | | | Appreciation/Depreciation |
| | Realized Gain (Loss) on Derivatives | | on Derivatives Recognized |
| | Recognized as a Result from Operations | | as a Result from Operations |
| | Net Realized | | | | | | | | | | | | |
| | Gains (Losses) | | | | | | | | | | | | |
| | from Forward | | Net Realized | | Net Realized | | Change in |
| | Foreign Currency | | Gains (Losses) | | Gains (Losses) | | Unrealized |
| | Exchange | | from Futures | | from Swap | | Appreciation/Depreciation |
| Fund | | Contracts ($) | | Contracts ($) | | Agreements ($) | | on Investments ($) |
| Foreign Exchange Rate Risk Exposure: | | | | | | | | | | | | | | | | |
| Emerging Markets Debt Fund | | | 130,023 | | | | — | | | | — | | | | (1,288 | ) |
| Emerging Market Local Debt Fund | | | (189,203 | ) | | | — | | | | — | | | | (469,034 | ) |
| Total Return Fund | | | 42,248,147 | | | | — | | | | — | | | | (7,725,310 | ) |
| Global High Yield Bond Fund | | | (74,742 | ) | | | | | | | | | | | 73,706 | |
| Global High Income Bond Fund | | | (105,663 | ) | | | | | | | | | | | 122,564 | |
| | | | | | | | | | | | | | | | | |
| Credit Contracts Risk Exposure: | | | | | | | | | | | | | | | | |
| Emerging Markets Debt Fund | | | — | | | | — | | | | 80,715 | | | | (66,302 | ) |
| Total Return Fund | | | — | | | | | | | | 3,637,264 | | | | (6,680,021 | ) |
| | | | | | | | | | | | | | | | | |
| Interest Rate Risk Exposure: | | | | | | | | | | | | | | | | |
| Emerging Markets Debt Fund | | | — | | | | 11,811 | | | | — | | | | (363 | ) |
| Emerging Market Local Debt Fund | | | — | | | | — | | | | (4,151 | ) | | | (46,103 | ) |
| Total Return Fund | | | — | | | | (602,727 | ) | | | (856,970 | ) | | | (1,545,053 | ) |
80 HSBC FAMILY OF FUNDS
| HSBC FAMILY OF FUNDS |
Notes to Financial Statements — as of October 31, 2015 (continued) |
The Funds are generally subject to master netting arrangements that allow for amounts owed between each Fund and the counterparty to be netted. The party that has the larger payable pays the excess of the larger amount over the smaller amount to the other party. The master netting arrangements do not apply to amounts owed to/from different counterparties. For financial reporting purposes, the Funds do not offset derivative assets and derivative liabilities that are subject to legally enforceable master netting arrangements in the Statements of Assets and Liabilities. The tables below present the gross and net amounts of the assets and liabilities with any offsets to reflect the Funds’ ability to reflect the master netting arrangements at October 31, 2015 in the Statement of Assets and Liabilities.
As of October 31, 2015, each Fund’s derivative assets and liabilities by type are as follows:
| | Emerging Markets | | Emerging Markets Local | | | | | | | |
| | Debt Fund | | Debt Fund | | Total Return Fund |
| | Assets* | | Liabilities* | | Assets* | | Liabilities* | | Assets* | | Liabilities* |
| Derivative Financial Instruments: | | | | | | | | | | | | | | | | | | | | |
| Futures contracts | | $ | — | | $ | 234 | | | $ | — | | $ | — | | $ | — | | $ | 72,656 | |
| Forward currency contracts | | | 46,120 | | | 47,484 | | | | 540,726 | | | 891,649 | | | 30,734,357 | | | 28,671,509 | |
| Swap agreements | | | 6,920 | | | 73,751 | | | | 45,748 | | | 113,826 | | | 4,081,543 | | | 14,631,954 | |
| Total derivative assets and liabilities | | | | | | | | | | | | | | | | | | | | |
| in the Statement of Assets | | | | | | | | | | | | | | | | | | | | |
| and Liabilities | | | 53,040 | | | 121,469 | | | | 586,474 | | | 1,005,475 | | | 34,815,900 | | | 43,376,119 | |
| Derivative assets and liabilities | | | | | | | | | | | | | | | | | | | | |
| not subject to a master | | | | | | | | | | | | | | | | | | | | |
| netting agreement or similar | | | | | | | | | | | | | | | | | | | | |
| agreement (“MNA”) | | | — | | | (234 | ) | | | — | | | — | | | — | | | (72,656 | ) |
| Total assets and liabilities subject | | | | | | | | | | | | | | | | | | | | |
| to a MNA | | $ | 53,040 | | $ | 121,235 | | | $ | 586,474 | | $ | 1,005,475 | | $ | 34,815,900 | | $ | 43,303,463 | |
| |
| | Global High Yield | | Global High Income | | | | | | | |
| | Bond Fund | | Bond Fund | | | | | | | |
| | Assets* | | Liabilities* | | Assets* | | Liabilities* | | | | | | | |
| Derivative Financial Instruments: | | | | | | | | | | | | | | | | | | | | |
| Forward currency contracts | | $ | 96,433 | | $ | 22,727 | | | $ | 140,892 | | $ | 18,328 | | | | | | | |
| Total derivative assets and liabilities | | | | | | | | | | | | | | | | | | | | |
| in the Statement of Assets | | | | | | | | | | | | | | | | | | | | |
| and Liabilities | | | 96,433 | | | 22,727 | | | | 140,892 | | | 18,328 | | | | | | | |
| Derivatives not subject to a | | | | | | | | | | | | | | | | | | | | |
| master netting agreement or | | | | | | | | | | | | | | | | | | | | |
| similar agreement (“MNA”) | | | — | | | — | | | | — | | | — | | | | | | | |
| Total assets and liabilities subject | | | | | | | | | | | | | | | | | | | | |
| to a MNA | | $ | 96,433 | | $ | 22,727 | | | $ | 140,892 | | $ | 18,328 | | | | | | | |
____________________
* Amounts are based on a contract level and due to offsetting provisions, may not agree to the Statements of Assets and Liabilities.
HSBC FAMILY OF FUNDS 81
| HSBC FAMILY OF FUNDS |
Notes to Financial Statements — as of October 31, 2015 (continued) |
The following table represents each Fund’s derivative assets by counterparty net of amounts available for offset under a master netting arrangement and net of the related collateral received by each Fund as of October 31, 2015:
| | Derivative Assets | | Derivatives | | Non-cash | | | | |
| | Subject to a MNA | | Available | | Collateral | | Cash Collateral | | Net Amount of |
| Counterparty | | | by Counterparty | | for Offset | | Received (a)(b) | | Received (a)(b) | | Derivative Assets |
| Emerging Markets Debt Fund: | | | | | | | | | | | | | | | | | | | | | | | | | |
| Bank of America | | | $ | 2,773 | | | $ | (2,773 | ) | | | $ | — | | | | $ | — | | | | | $ | — | |
| Barclays Bank PLC | | | | 17,473 | | | | (17,473 | ) | | | | — | | | | | — | | | | | | — | |
| Credit Suisse International | | | | 1,833 | | | | (1,833 | ) | | | | — | | | | | — | | | | | | — | |
| JPMorgan Chase Bank N.A. | | | | 13,564 | | | | (4,799 | ) | | | | — | | | | | — | | | | | | 8,765 | |
| Standard Chartered Bank | | | | 17,397 | | | | (17,397 | ) | | | | — | | | | | — | | | | | | — | |
| Total | | | $ | 53,040 | | | $ | (44,275 | ) | | | $ | — | | | | $ | — | | | | | $ | 8,765 | |
| Emerging Markets Local Debt Fund: | | | | | | | | | | | | | | | | | | | | | | | | | |
| Bank of America | | | $ | 6,104 | | | $ | (4,922 | ) | | | $ | — | | | | $ | — | | | | | $ | 1,182 | |
| Barclays Bank PLC | | | | 249,561 | | | | (249,561 | ) | | | | — | | | | | — | | | | | | — | |
| Credit Suisse International | | | | 136,714 | | | | (93,118 | ) | | | | — | | | | | — | | | | | | 43,596 | |
| JPMorgan Chase Bank N.A. | | | | 94,713 | | | | (6,358 | ) | | | | — | | | | | — | | | | | | 88,355 | |
| Standard Chartered Bank | | | | 96,095 | | | | (96,095 | ) | | | | — | | | | | — | | | | | | — | |
| UBS AG | | | | 3,287 | | | | (3,287 | ) | | | | — | | | | | — | | | | | | — | |
| Total | | | $ | 586,474 | | | $ | (453,341 | ) | | | $ | — | | | | $ | — | | | | | $ | 133,133 | |
| Total Return Fund: | | | | | | | | | | | | | | | | | | | | | | | | | |
| Bank of America | | | $ | 233,658 | | | $ | (233,658 | ) | | | $ | — | | | | $ | — | | | | | $ | — | |
| Barclays Bank PLC | | | | 19,687,809 | | | | (12,639,633 | ) | | | | — | | | | | (7,048,176 | ) | | | | | — | |
| Credit Suisse International | | | | 1,321,663 | | | | (1,321,663 | ) | | | | — | | | | | — | | | | | | — | |
| JPMorgan Chase Bank N.A. | | | | 828,834 | | | | (828,834 | ) | | | | — | | | | | — | | | | | | — | |
| Standard Chartered Bank | | | | 12,640,270 | | | | (9,729,594 | ) | | | | — | | | | | (2,910,676 | ) | | | | | — | |
| UBS AG | | | | 103,666 | | | | (103,666 | ) | | | | — | | | | | — | | | | | | — | |
| Total | | | $ | 34,815,900 | | | $ | (24,857,048 | ) | | | $ | — | | | | $ | (9,958,852 | ) | | | | $ | — | |
| | |
| Global High Yield Bond Fund: | | | | | | | | | | | | | | | | | | | | | | | | | |
| Bank of America | | | $ | 1,932 | | | $ | (1,932 | ) | | | $ | — | | | | $ | — | | | | | $ | — | |
| UBS AG | | | | 94,501 | | | | (19,257 | ) | | | | — | | | | | (75,244 | ) | | | | | — | |
| Total | | | $ | 96,433 | | | $ | (21,189 | ) | | | $ | — | | | | $ | (75,244 | ) | | | | $ | — | |
| Global High Income Bond Fund: | | | | | | | | | | | | | | | | | | | | | | | | | |
| UBS AG | | | $ | 140,892 | | | $ | (18,328 | ) | | | $ | — | | | | $ | (110,000 | ) | | | | $ | 12,564 | |
| Total | | | $ | 140,892 | | | $ | (18,328 | ) | | | $ | — | | | | $ | (110,000 | ) | | | | $ | 12,564 | |
82 HSBC FAMILY OF FUNDS
| HSBC FAMILY OF FUNDS |
Notes to Financial Statements — as of October 31, 2015 (continued) |
The following table represents each Fund’s derivative liabilities by counterparty net of amounts available for offset under a master netting arrangement and net of the related collateral pledged by each Fund as of October 31, 2015:
| | Derivative | | | | | | | | | | | | | | | | |
| | Liabilities | | | | | | | | | | | | | | | | |
| | Subject to a | | Derivatives | | Non-cash | | Cash | | Net Amount of |
| | MNA | | Available for | | Collateral | | Collateral | | Derivative |
| Counterparty | | by Counterparty | | Offset | | Pledged (a) | | Pledged (a) | | Liabilities |
| Emerging Markets Debt Fund: | | | | | | | | | | | | | | | | | | | | | |
| Bank of America | | | $ | 19,757 | | | | $ | (2,773 | ) | | | $ | — | | $ | — | | | $ | 16,984 |
| Barclays Bank PLC | | | | 31,019 | | | | | (17,473 | ) | | | | — | | | — | | | | 13,546 |
| Credit Suisse International | | | | 27,504 | | | | | (1,833 | ) | | | | — | | | — | | | | 25,671 |
| JPMorgan Chase Bank N.A. | | | | 4,799 | | | | | (4,799 | ) | | | | — | | | — | | | | — |
| Standard Chartered Bank | | | | 30,511 | | | | | (17,397 | ) | | | | — | | | — | | | | 13,114 |
| UBS AG | | | | 7,645 | | | | | — | | | | | — | | | — | | | | 7,645 |
| Total | | | $ | 121,235 | | | | $ | (44,275 | ) | | | $ | — | | $ | — | | | $ | 76,960 |
| Emerging Markets | | | | | | | | | | | | | | | | | | | | | |
| Local Debt Fund: | | | | | | | | | | | | | | | | | | | | | |
| Bank of America | | | $ | 4,922 | | | | $ | (4,922 | ) | | | $ | — | | $ | — | | | $ | — |
| Barclays Bank PLC | | | | 546,121 | | | | | (249,561 | ) | | | | — | | | (270,000 | ) | | | 26,560 |
| Credit Suisse International | | | | 93,118 | | | | | (93,118 | ) | | | | — | | | — | | | | — |
| JPMorgan Chase Bank N.A. | | | | 6,358 | | | | | (6,358 | ) | | | | — | | | — | | | | — |
| Standard Chartered Bank | | | | 328,130 | | | | | (96,095 | ) | | | | — | | | (232,035 | ) | | | — |
| UBS AG | | | | 26,826 | | | | | (3,287 | ) | | | | — | | | (20,000 | ) | | | 3,539 |
| Total | | | $ | 1,005,475 | | | | $ | (453,341 | ) | | | $ | — | | $ | (522,035 | ) | | $ | 30,099 |
| Total Return Fund: | | | | | | | | | | | | | | | | | | | | | |
| Bank of America | | | $ | 4,422,850 | | | | $ | (233,658 | ) | | | $ | — | | $ | (3,850,000 | ) | | $ | 339,192 |
| Barclays Bank PLC | | | | 12,639,633 | | | | | (12,639,633 | ) | | | | — | | | — | | | | — |
| Credit Suisse International | | | | 10,380,125 | | | | | (1,321,663 | ) | | | | — | | | (9,058,462 | ) | | | — |
| JPMorgan Chase Bank N.A. | | | | 5,579,383 | | | | | (828,834 | ) | | | | — | | | (4,750,549 | ) | | | — |
| Standard Chartered Bank | | | | 9,729,594 | | | | | (9,729,594 | ) | | | | — | | | — | | | | — |
| UBS AG | | | | 551,878 | | | | | (103,666 | ) | | | | — | | | (448,212 | ) | | | — |
| Total | | | $ | 43,303,463 | | | | $ | (24,857,048 | ) | | | $ | — | | $ | (18,107,223 | ) | | $ | 339,192 |
| |
| Global High Yield Bond Fund: | | | | | | | | | | | | | | | | | | | | | |
| Bank of America | | | $ | 3,470 | | | | $ | (1,932 | ) | | | $ | — | | $ | — | | | $ | 1,538 |
| UBS AG | | | | 19,257 | | | | | (19,257 | ) | | | | — | | | — | | | | — |
| Total | | | $ | 22,727 | | | | $ | (21,189 | ) | | | $ | — | | $ | — | | | $ | 1,538 |
| Global High Income Bond Fund: | | | | | | | | | | | | | | | | | | | | | |
| UBS AG | | | $ | 18,328 | | | | $ | (18,328 | ) | | | $ | — | | $ | — | | | $ | — |
| Total | | | $ | 18,328 | | | | $ | (18,328 | ) | | | $ | — | | $ | — | | | $ | — |
____________________
| (a) | The actual collateral received or pledged may be in excess of the amounts shown in the table. The table only reflects collateral amounts up to the amount of the financial instrument disclosed on the Statement of Assets and Liabilities. |
HSBC FAMILY OF FUNDS 83
| HSBC FAMILY OF FUNDS |
Notes to Financial Statements — as of October 31, 2015 (continued) |
Pursuant to each Fund’s ISDA Master Agreement for trading OTC derivatives (“ISDA”), each Fund must notify counterparties if its net asset value declines below a predetermined level over specified periods. In the event a Fund’s net asset value declines below one of the predetermined levels, the decline may trigger an Additional Termination Event under the ISDA (“NAV Decline Trigger Event”) whereby each counterparty would have the right to declare an Early Termination Date, terminate the ISDA, and close-out all outstanding derivatives positions according to the close-out procedures of the ISDA. Pursuant to the terms of the ISDA, following a NAV Decline Trigger Event, counterparties may agree to waive their right to declare an Early Termination Date and thereby waive their right to terminate the ISDA and close-out any outstanding derivatives positions
During the year ending October 31, 2015, the Emerging Markets Debt Fund and Emerging Markets Local Debt Fund experienced a decline in their net assets due to the June 2015 removal of HSBC Group seed capital. The resultant decline for each Fund exceeded certain predetermined levels in each respective ISDA and resulted in the occurrence of one or more NAV Decline Trigger Events. However, none of the Funds’ counterparties have declared an Early Termination Date and as such have not terminated any ISDAs or closed-out any derivatives positions. As per market practice, the Funds, through their Investment Adviser, will send NAV Decline Trigger Event waiver letters whereby each counterparty agrees to waive its right to declare an Early Termination Date, terminate the ISDA, and close out outstanding derivatives positions following the NAV Decline Trigger Event.
In addition to the provisions relating to Additional Termination Events, under the terms of the Credit Support Annex to the ISDA, parties to an ISDA are required to post collateral to the other party if any of their derivatives positions are in a position of net liability. If either party fails to post required collateral and such failure is not remedied following subsequent notice, the failure to post collateral may be an Additional Termination Event and the other party may declare an Early Termination Event, terminate the ISDA, and close out any outstanding derivatives position. As of October 31, 2015, for derivatives positions where the Funds were in a position of net liability, collateral has been posted and the collateral balance is included in the Statement of Assets and Liabilities.
Allocations:
Expenses directly attributable to a Fund are charged to that Fund. Expenses not directly attributable to a Fund are allocated proportionately among the applicable series within the Trusts in relation to the net assets of each fund or on another reasonable basis. Class specific expenses are charged directly to the class incurring the expense. In addition, income, expenses (other than class specific expenses), and unrealized and realized gains and losses are allocated to each class based on relative net assets on a daily basis.
Distributions to Shareholders:
Dividends to shareholders from net investment income, if any, are declared and distributed monthly in the case of the Funds except for the Frontier Markets Fund and Asia ex-Japan Smaller Companies Fund, which distribute annually. Distributions from net realized gains, if any, are declared and paid at least annually by the Funds. Additional distributions are also made to the Funds’ shareholders to the extent necessary to avoid the federal excise tax on certain undistributed income and net realized gains of regulated investment companies.
The amount and character of net investment income and net realized gains distributions are determined in accordance with federal income tax regulations which may differ from GAAP. These “book/tax” differences are either considered temporary or permanent in nature. To the extent these differences are permanent in nature (e.g., certain gain/loss, differing treatment on certain swap agreements, and certain distributions), such amounts are reclassified within the composition of net assets; temporary differences (e.g., wash losses and the realization for tax purposes of unrealized gains/losses on investments in passive foreign investment companies) do not require reclassification. The Funds may utilize equalization accounting for tax purposes and designate earnings and profits, including net realized gains distributed to shareholders on redemption of shares, as a part of the dividends paid deduction for income tax purposes. To the extent distributions to shareholders from net investment income and net realized gains exceed net investment income and net realized gains for tax purposes, they are reported as distributions of capital.
84 HSBC FAMILY OF FUNDS
| HSBC FAMILY OF FUNDS |
Notes to Financial Statements — as of October 31, 2015 (continued) |
Federal Income Taxes:
Each Fund is a separate taxable entity for federal income tax purposes. Each Fund has qualified and intends to continue to qualify each year as a “regulated investment company” under Subchapter M of the Internal Revenue Code, as amended, and to distribute substantially all of its taxable net investment income and net realized gains, if any, to its shareholders. Accordingly, no provision for federal income or excise tax is required.
Management of the Funds has reviewed tax positions taken in tax years that remain subject to examination by all major tax jurisdictions, including federal (i.e., the last four tax year ends and the interim tax period since then, as applicable). Management believes that there is no tax liability resulting from unrecognized tax benefits related to uncertain tax positions taken.
New Accounting Pronouncements:
In August 2014, the FASB issued Accounting Standards Update No. 2014-15 “Presentation of Financial Statements–Going Concern (Subtopic 205-40)” (“ASU 2014-15”), which requires management to evaluate whether there are conditions or events, considered in the aggregate, that raise substantial doubt about the entity’s ability to continue as a going concern. ASU 2014-15 is effective prospectively for annual periods ending after December 15, 2016, and interim periods thereafter.
In May 2015, the FASB issued Accounting Standards Update No. 2015-07 “Fair Value Measurement (Topic 820)” (“ASU 2015-07”), which removes the requirement to categorize within the fair value hierarchy all investments for which fair value is measured using the NAV per share practical expedient. ASU 2015-07 also removes the requirement to make certain disclosures for all investments that may be measured at fair value using the NAV per share practical expedient. The ASU is effective for annual periods beginning after December 15, 2015 and interim periods within those annual periods.
Management is currently evaluating the implications of these ASUs and their impact on the financial statements and related disclosures have not yet been determined.
3. Investment Valuation Summary:
The valuation techniques employed by the Funds, as described below, maximize the use of observable inputs and minimize the use of unobservable inputs in determining fair value. The Funds’ investments are classified within the fair value hierarchy based on the lowest level of input that is significant to the fair value measurement. The inputs used for valuing the Funds’ investments are summarized in the three broad levels listed below:
| ● | Level 1: quoted prices in active markets for identical assets
|
| ● | Level 2: other significant observable inputs (including quoted prices for similar securities, interest rates, prepayment speeds, credit risk, etc.)
|
| ● | Level 3: significant unobservable inputs (including a Fund’s own assumptions in determining the fair value of investments) |
Changes in valuation techniques may result in transfers in or out of an assigned level within the disclosure hierarchy. The Funds determine transfers between fair value hierarchy levels at the reporting period end. The inputs or methodology used for valuing investments are not necessarily an indication of the risk associated with investing in those investments.
Bonds and other fixed income securities (other than short-term obligations but including listed issues) are valued at the bid price as of the time net asset value is determined on the basis of valuations furnished by a pricing service, the use of which has been approved by the Funds’ Board of Trustees. In making such valuations, the pricing service utilizes both dealer-supplied valuations and matrix techniques which take into account appropriate factors such as the institutional-size trading in similar groups of securities, yield, quality, coupon rate, maturity, type of issue, trading characteristics other than market data and without exclusive reliance upon quoted prices or exchanges or over-the-counter prices, since such valuations are believed to reflect more accurately the fair value of such securities and are typically categorized as Level 2 in the fair value hierarchy.
HSBC FAMILY OF FUNDS 85
| HSBC FAMILY OF FUNDS |
Notes to Financial Statements — as of October 31, 2015 (continued) |
Exchange traded, domestic equity securities are valued at the last sale price on a national securities exchange, or in the absence of recorded sales, at the readily available closing bid price on such exchanges, or at the quoted bid price in the over-the-counter market and are typically categorized as Level 1 in the fair value hierarchy.
Exchange traded, foreign equity securities are valued in the appropriate currency on the last quoted sale price, or in the absence of recorded sales, at the readily available closing bid price on such exchange. If no sale is available because the country is on holiday the previous day’s last quoted sales price would be utilized. These securities are typically categorized as Level 1 in the fair value hierarchy. Foreign equity securities that are not exchange traded are valued in the appropriate currency at the average of the quoted bid and asked prices in the over-the-counter market and are typically categorized as Level 2 in the fair value hierarchy.
Rights and warrants are valued at the last sales price on a national securities exchange. If these instruments are not scheduled to trade for a certain period they are generally valued intrinsically based on the terms of the issuance and the price of the underlying security. The time value of the warrants may also be considered by the Advisor. These instruments are typically categorized as Level 1 in the fair value hierarchy unless intrinsic value is used then would be categorized as Level 2 in the fair value hierarchy.
P-notes are valued by taking the last sales price of the underlying security on its primary exchange. In the absence of a recorded sale on the underlying security the readily available closing bid price on such exchange will be used. If no sale is available because the country is on holiday the previous day’s last quoted sales price would be utilized. All local prices will be converted to U.S. dollars using the foreign currency exchange rate as of the close of regular trading on the New York Stock Exchange. These instruments are typically categorized as Level 2 in the fair value hierarchy.
Mutual funds are valued at their net asset values, as reported by such companies and are typically categorized as Level 1 in the fair value hierarchy.
Exchange traded futures contracts and options contracts are valued at their settlement price on the exchange on which they are traded and are typically categorized as Level 1 in the fair value hierarchy.
Forward foreign currency exchange contracts are valued at the current day’s interpolated foreign exchange rate, as calculated using the current day’s spot rate, and the prevailing forward rates and converted to U.S. dollars at the exchange rate of such currencies against the U.S. dollar, as of the close of regular trading on the New York Stock Exchange, as provided by an approved pricing service, and are typically categorized as Level 2 in the fair value hierarchy. Non-exchange traded derivatives, such as swaps and options, are generally valued by using a valuation provided by an approved independent pricing service and are typically categorized as Level 2 in the fair value hierarchy.
Securities or other assets for which market quotations are not readily available, or are deemed unreliable due to a significant event or otherwise, are valued pursuant to procedures adopted by the Trusts’ Board (“Procedures”). Depending on the source and relative significance of valuation inputs, these instruments may be classified as Level 2 or Level 3 in the fair value hierarchy. Examples of potentially significant events that could affect the value of an individual security and thus require pricing under the Procedures include corporate actions by the issuer, announcements by the issuer relating to its earnings or products, regulatory news, natural disasters, and litigation. Examples of potentially significant events that could affect multiple securities held by a Fund include governmental actions, natural disasters, and armed conflicts. Fair value pricing may require subjective determinations about the value of a security. While the Trust’s policy is intended to result in a calculation of a Fund’s net asset value (“NAV”) that fairly reflects security values as of the time of pricing, the Trust cannot ensure that fair values determined would accurately reflect the price that a Fund could obtain for a security if it were to dispose of that security as of the time of pricing. The prices used by a Fund may differ from the value that would be realized if the securities were sold and the differences could be material to the financial statements.
In addition, if events materially affecting the value of foreign securities occur between the time when the exchange on which they are traded closes and the time when the Funds’ NAV is calculated, such securities may be valued using fair value pricing in accordance with procedures adopted by the Board. Management identifies possible fluctuations in foreign securities by monitoring the rise or fall in the value of a designated benchmark
86 HSBC FAMILY OF FUNDS
| HSBC FAMILY OF FUNDS |
Notes to Financial Statements — as of October 31, 2015 (continued) |
index. In the event of a rise or fall greater than predetermined levels, the Funds may use a systematic valuation model provided by an independent third party to value its foreign securities, rather than local market closing prices. When a Fund uses such a valuation model, the value assigned to the Fund’s foreign securities may not be the quoted or published prices of the investment on their primary markets or exchanges and are typically categorized as Level 2 in the fair value hierarchy. The valuation of these securities may represent a transfer between Levels 1 and 2. The number of days on which fair value prices will be used will depend on market activity and it is possible that fair value prices will be used by the Funds to a significant extent.
The only transfers between fair value hierarchy Levels 1 and 2 as of October 31, 2015 are related to the use of the systematic valuation model to value foreign securities in the Frontier Markets Fund.
The following is a summary of the valuation inputs used as of October 31, 2015 in valuing the Funds’ investments based upon the three levels defined above. The breakdown of country descriptions is disclosed in the Schedule of Portfolio Investments for each Fund:
| | LEVEL 1 ($) | | LEVEL 2 ($) | | LEVEL 3 ($) | | Total ($) |
| Emerging Markets Debt Fund | | | | | | | | | | |
| Investment Securities: | | | | | | | | | | |
| Yankee Dollars | | — | | 8,929,274 | | | — | | 8,929,274 | |
| Corporate Bonds | | — | | 85,886 | | | — | | 85,886 | |
| Investment Company | | 2,225,175 | | — | | | — | | 2,225,175 | |
| U.S. Treasury Obligations | | — | | 733,826 | | | — | | 733,826 | |
| Total Investment Securities | | 2,225,175 | | 9,748,986 | | | — | | 11,974,161 | |
| Other Financial Instruments: (a) | | | | | | | | | | |
| Futures Contracts | | 666 | | — | | | — | | 666 | |
| Credit Default Swaps | | — | | (12,941 | ) | | — | | (12,941 | ) |
| Forward Currency Contracts | | — | | (1,364 | ) | | — | | (1,364 | ) |
| Total Investments | | 2,225,841 | | 9,734,681 | | | — | | 11,960,522 | |
| |
| Emerging Markets Local Debt Fund | | | | | | | | | | |
| Investment Securities: | | | | | | | | | | |
| Foreign Bonds | | — | | 11,386,404 | | | — | | 11,386,404 | |
| Yankee Dollar | | — | | 199,737 | | | — | | 199,737 | |
| Investment Company | | 2,575,256 | | — | | | — | | 2,575,256 | |
| Total Investment Securities | | 2,575,256 | | 11,586,141 | | | — | | 14,161,397 | |
| Other Financial Instruments: (a) | | | | | | | | | | |
| Interest Rate Swaps | | — | | (68,078 | ) | | — | | (68,078 | ) |
| Forward Currency Contracts | | — | | (350,923 | ) | | — | | (350,923 | ) |
| Total Investments | | 2,575,256 | | 11,167,140 | | | — | | 13,742,396 | |
| |
| Frontier Markets Fund | | | | | | | | | | |
| Investment Securities: | | | | | | | | | | |
| Common Stocks | | 125,879,213 | | — | | | — | | 125,879,213 | |
| Convertible Corporate Bonds | | — | | 212,963 | | | — | | 212,963 | |
| Participatory Notes | | — | | 15,253,881 | | | — | | 15,253,881 | |
| Total Investment Securities | | 125,879,213 | | 15,466,844 | | | — | | 141,346,057 | |
HSBC FAMILY OF FUNDS 87
| HSBC FAMILY OF FUNDS |
Notes to Financial Statements — as of October 31, 2015 (continued) |
| | LEVEL 1 ($) | | LEVEL 2 ($) | | LEVEL 3 ($) | �� | Total ($) |
| Total Return Fund | | | | | | | | | | | |
| Investment Securities: | | | | | | | | | | | |
| Foreign Bonds | | — | | | 220,588,966 | | | — | | 220,588,966 | |
| Yankee Dollars | | — | | | 476,869,338 | | | — | | 476,869,338 | |
| Affiliated Investment Company | | 25,000,000 | | | — | | | — | | 25,000,000 | |
| Investment Company | | 233,566,623 | | | — | | | — | | 233,566,623 | |
| U.S. Treasury Obligations | | — | | | 251,028,572 | | | — | | 251,028,572 | |
| Total Investment Securities | | 258,566,623 | | | 948,486,876 | | | — | | 1,207,053,499 | |
| Other Financial Instruments: (a) | | | | | | | | | | | |
| Futures Contracts | | (74,642 | ) | | — | | | — | | (74,642 | ) |
| Interest Rate Swaps | | — | | | (419,531 | ) | | — | | (419,531 | ) |
| Credit Default Swaps | | — | | | (4,324,659 | ) | | — | | (4,324,659 | ) |
| Forward Currency Contracts | | — | | | 2,062,848 | | | — | | 2,062,848 | |
| Total Investments | | 258,491,981 | | | 945,805,534 | | | — | | 1,204,297,515 | |
| |
| Asia ex-Japan Smaller Companies Equity Fund | | | | | | | | | |
| Investment Securities: | | | | | | | | | | | |
| Common Stocks: | | | | | | | | | | | |
| Hong Kong | | 2,359,327 | | | 115,550 | | | — | | 2,474,877 | |
| Other Common Stocks | | 5,780,377 | | | — | | | — | | 5,780,377 | |
| Exchange Traded Funds | | 953,711 | | | — | | | — | | 953,711 | |
| Investment Company | | 457,484 | | | — | | | — | | 457,484 | |
| Total Investment Securities | | 9,550,899 | | | 115,550 | | | — | | 9,666,449 | |
| Global High Yield Bond Fund | | | | | | | | | | | |
| Investment Securities: | | | | | | | | | | | |
| Foreign Bonds | | — | | | 4,223,562 | | | — | | 4,223,562 | |
| Yankee Dollars | | — | | | 3,934,521 | | | — | | 3,934,521 | |
| Corporate Bonds | | — | | | 13,652,036 | | | — | | 13,652,036 | |
| Exchange Traded Fund | | 201,351 | | | — | | | — | | 201,351 | |
| Investment Company | | 2,307,352 | | | — | | | — | | 2,307,352 | |
| Total Investment Securities | | 2,508,703 | | | 21,810,119 | | | — | | 24,318,822 | |
| Other Financial Instruments: (a) | | | | | | | | | | | |
| Forward Currency Contracts | | — | | | 73,706 | | | — | | 73,706 | |
| Total Investments | | 2,508,703 | | | 21,833,825 | | | — | | 24,392,528 | |
88 HSBC FAMILY OF FUNDS
| HSBC FAMILY OF FUNDS |
Notes to Financial Statements — as of October 31, 2015 (continued) |
| | LEVEL 1 ($) | | LEVEL 2 ($) | | LEVEL 3 ($) | | Total ($) |
| Global High Income Bond Fund | | | | | | | | |
| Investment Securities: | | | | | | | | |
| Foreign Bonds | | — | | 5,958,483 | | — | | 5,958,483 |
| Yankee Dollars | | — | | 6,853,865 | | — | | 6,853,865 |
| Corporate Bonds | | — | | 9,417,854 | | — | | 9,417,854 |
| Exchange Traded Fund | | 155,180 | | — | | — | | 155,180 |
| Investment Company | | 2,106,153 | | — | | — | | 2,106,153 |
| Total Investment Securities | | 2,261,333 | | 22,230,202 | | — | | 24,491,535 |
| Other Financial Instruments: (a) | | | | | | | | |
| Forward Currency Contracts | | — | | 122,564 | | — | | 122,564 |
| Total Investments | | 2,261,333 | | 22,352,766 | | — | | 24,614,099 |
____________________
| (a) | Other financial instruments would include any derivative instruments, such as forward foreign currency contracts, futures contracts, and swap agreements. These instruments are generally recorded in the financial statements at the unrealized gain or loss on the investment. |
4. Related Party Transactions and Other Agreements and Plans:
Investment Management:
HSBC Global Asset Management (USA) Inc. (“HSBC’’ or the “Investment Adviser’’), a wholly owned subsidiary of HSBC Bank USA, N.A., a national bank organized under the laws of the United States, acts as Investment Adviser to the Funds. As Investment Adviser, HSBC manages the investments of the Funds and continuously reviews, supervises and administers the Funds’ investments pursuant to an Investment Advisory Contract. For its services in this capacity, HSBC receives a fee from each Fund, accrued daily and paid monthly, based on the average daily net assets of each respective Fund, at annual rate of:
| Fund | | Fee Rate(%) |
| Emerging Markets Debt Fund | 0.50 |
| Emerging Markets Local Debt Fund | 0.50 |
| Frontier Markets Fund | 1.25 |
| Total Return Fund | 0.85 |
| Asia ex-Japan Smaller Companies Equity Fund | 1.00 |
| Global High Yield Bond Fund | 0.65 |
| Global High Income Bond Fund | 0.65 |
HSBC Global Asset Management (UK) Limited (“AMEU”) acts as sub-adviser to the Frontier Markets Fund. Effective April 9, 2015, AMEU receives a fee, accrued daily and paid monthly, based on average daily net assets of the Fund at an annual rate of 0.625% from the fees paid to the Investment Adviser. Prior to April 9, 2015, AMEU received a fee, accrued daily and paid monthly, based on average daily net assets of the Fund at an annual rate of 0.70% from the fees paid to the Investment Adviser.
HSBC Global Asset Management (Hong Kong) Limited (“AMHK”) acts as sub-adviser to the Asia ex-Japan Smaller Companies Equity Fund. AMHK receives a fee, accrued daily and paid monthly, based on average daily net assets of the Asia ex-Japan Smaller Companies Equity Fund at an annual rate of 0.50% from the fees paid to the Investment Adviser.
HSBC FAMILY OF FUNDS 89
HSBC FAMILY OF FUNDS |
Notes to Financial Statements — as of October 31, 2015 (continued) |
HSBC Global Asset Management (France) (“AMFR”) acts as sub-adviser to the Global High Yield Bond Fund and Global High Income Bond Fund. AMFR is expected to receive a fee, accrued daily and paid monthly, based on average daily net assets of each Fund at an annual rate of 0.325% from the fees paid to the Investment Adviser. As of October 31, 2015, AMFR has not been allocated assets to manage.
HSBC also provides support services to the Funds pursuant to a Support Services Agreement. For its services in this capacity, HSBC is entitled to a fee, accrued daily and paid monthly, based on the average daily net assets of Class A Shares and Class I Shares, at an annual rate of:
| | Class A | | Class I |
| | Fee Rate (%) | | Fee Rate (%) |
| Emerging Markets Debt Fund | | 0.20 | | 0.10 |
| Emerging Markets Local Debt Fund | | 0.20 | | 0.10 |
| Frontier Markets Fund | | 0.20 | | 0.10 |
| Total Return Fund | | 0.20 | | 0.10 |
| Asia ex-Japan Smaller Companies Equity Fund | | 0.20 | | 0.10 |
| Global High Yield Bond Fund | | 0.10 | | — |
| Global High Income Bond Fund | | 0.10 | | — |
Administration:
HSBC serves the Funds as Administrator. Under the terms of the Administration Agreement, HSBC receives from the Funds (as well as other funds in the Trusts combined) a fee, accrued daily and paid monthly, at an annual rate of:
| Based on Average Daily Net Assets of | | | Fee Rate(%) |
| Up to $10 billion | | 0.0550 |
| In excess of $10 billion but not exceeding $20 billion | | 0.0350 |
| In excess of $20 billion but not exceeding $50 billion | | 0.0275 |
| In excess of $50 billion | | 0.0250 |
The fee rates and breakpoints are determined on the basis of the aggregate average daily net assets of the Trusts. The total administration fee paid to HSBC is allocated to each series based upon its proportionate share of the aggregate net assets of the Trusts, subject to certain allocations in cases where one fund invests some or all of its assets in another fund. An amount equal to 50% of the administration fee is deemed to be class specific and is based on the daily net assets.
Pursuant to a Sub-Administration Agreement with HSBC, Citi Fund Services Ohio, Inc. (“Citi’’), a wholly-owned subsidiary of Citigroup, Inc., serves as Trust’s Sub-Administrator, subject to the general supervision by the Trusts’ Board and HSBC. For these services, Citi is entitled to a fee, payable by HSBC, at an annual rate equivalent to the fee rates set forth above subject to certain reductions associated with services provided to new funds, minus 0.02%, which is retained by HSBC.
Under a Compliance Services Agreement between the Trusts and Citi (the “CCO Agreement’’), Citi makes an employee available to serve as the Trusts’ Chief Compliance Officer (the “CCO’’). Under the CCO Agreement, Citi also provides infrastructure and support in implementing the written policies and procedures comprising the Trusts’ compliance program, including support services to the CCO. For the services provided under the CCO Agreement, the Trusts paid Citi $300,447 for the year ended October 31, 2015, plus reimbursement of certain out of pocket expenses. Expenses incurred by each Fund are reflected on the Statements of Operations as “Compliance Services.’’ Citi pays the salary and other compensation earned by individuals performing these services, as employees of Citi.
90 HSBC FAMILY OF FUNDS
HSBC FAMILY OF FUNDS |
Notes to Financial Statements — as of October 31, 2015 (continued) |
Distribution Arrangements:
Foreside Distribution Services, L.P. (“Foreside”), a wholly-owned subsidiary of Foreside Financial Group LLC, serves the Trust as Distributor (the “Distributor’’). The Trust has adopted a non-compensatory Distribution Plan and Agreement (the “Distribution Plan’’) pursuant to Rule 12b-1 of the Act. The Distribution Plan provides for reimbursement of expenses incurred by the Distributor related to distribution and marketing, at a rate not to exceed 0.25% of the average daily net assets of Class A Shares (currently not being charged). For the year ended October 31, 2015, Foreside, as Distributor, also received $148,780 in commissions from sales of Trusts for Class A Shares, of which $45 were reallocated to HSBC-affiliated brokers and dealers for Class A Shares.
Shareholder Servicing:
The Trust has adopted a Shareholder Services Plan, which provides for payments to shareholder servicing agents for providing various shareholder services. For performing these services, the shareholder servicing agents receive a fee that is computed daily and paid monthly up to 0.25% of the average daily net assets of Class A Shares. The fees paid to the Distributor pursuant to the Distribution Plan and to shareholder servicing agents pursuant to the Shareholder Services Plan may not exceed, in the aggregate, 0.50% annually of each Fund’s average daily net assets of Class A Shares.
The Distributor has entered into shareholder services contracts with affiliated and unaffiliated financial intermediaries who provide shareholder services and other related services to their clients or customers who invest in the Funds under which the Distributor will pay all or a portion of such fees earned to financial intermediaries for performing such services.
Fund Accounting and Transfer Agency:
Citi provides fund accounting services for each Fund. As fund accountant, Citi receives an annual fee per Fund and share class, subject to minimums, reductions associated with services provided to new funds and reimbursement of certain expenses. Citi receives additional fees paid by the Trust for regulatory administration services and blue sky exemption services. Until March 31, 2015, Citi also provided transfer agency services for each Fund. As transfer agent, Citi received a fee based on the number of funds and shareholder accounts, subject to certain minimums, reductions associated with services provided to new funds and reimbursement of certain expenses. Effective March 31, 2015, transfer agent services were provided under the terms of a separate transfer agency services agreement with Citi. Citi’s rights and obligations under the transfer agency services agreement, in turn, were assigned to SunGard Investor Services LLC (“SIS”), effective March 31, 2015. The transfer agency services, and fees charged for such services, are unchanged as a result of the separate agreement or the assignment to SIS.
Independent Trustees:
For the period January 1, 2015 through October 31, 2015, the Trusts paid each Independent Trustee an annual retainer of $100,000. The Trusts paid a fee of $12,000 for each regular meeting of the Board of Trustees attended and a fee of $3,000 for each special meeting attended. The Trusts paid each Committee Chair an annual retainer of $12,000, with the exception of the Chair of the Audit Committee, who received a retainer of $15,000. The Trusts also paid the Chairman of the Board, an additional annual retainer of $30,000.
Prior to January 1, 2015, the Trusts paid each Independent Trustee an annual retainer of $100,000. The Trusts paid a fee of $10,000 for each regular meeting of the Board of Trustees attended and a fee of $3,000 for each special meeting attended. The Trusts paid each Committee Chair an annual retainer of $3,000, with the exception of the Chair of the Audit Committee, who received a retainer of $6,000. The Trusts also paid the Chairman of the Board, an additional annual retainer of $24,000. In addition, for time expended on Board duties outside normal meetings, which is authorized by the Board, a Trustee was compensated at the rate of $500 per hour, up to a maximum of $3,000 per day.
HSBC FAMILY OF FUNDS 91
HSBC FAMILY OF FUNDS |
Notes to Financial Statements — as of October 31, 2015 (continued) |
Fee Reductions:
The Investment Adviser has agreed to contractually limit, through April 16, 2016 for the Global High Yield Bond Fund and Global High Income Bond Fund and March 1, 2016 for all other funds, the total annual expenses, exclusive of interest, taxes, brokerage commissions, extraordinary expenses, and indirect expenses attributable to the Fund’s investments in investment companies, of the Funds. Each Fund Class has its own expense limitations based on the average daily net assets for any full fiscal year as follows:
| | | | Current |
| | | | Contractual |
| Fund | | | Class | | Expense Limitation (%) |
| Emerging Markets Debt Fund | | A | | 1.20 |
| Emerging Markets Debt Fund | | I | | 0.85 |
| Emerging Markets Debt Fund | | S | | 0.75 |
| Emerging Markets Local Debt Fund | | A | | 1.20 |
| Emerging Markets Local Debt Fund | | I | | 0.85 |
| Emerging Markets Local Debt Fund | | S | | 0.75 |
| Frontier Markets Fund | | A | | 2.20 |
| Frontier Markets Fund | | I | | 1.85 |
| Total Return Fund | | A | | 1.60 |
| Total Return Fund | | I | | 1.25 |
| Total Return Fund | | S | | 1.15 |
| Asia ex-Japan Smaller Companies Equity Fund | | A | | 1.75 |
| Asia ex-Japan Smaller Companies Equity Fund | | I | | 1.40 |
| Asia ex-Japan Smaller Companies Equity Fund | | S | | 1.30 |
| Global High Yield Bond Fund | | A | | 1.15 |
| Global High Yield Bond Fund | | I | | 0.80 |
| Global High Income Bond Fund | | A | | 1.15 |
| Global High Income Bond Fund | | I | | 0.80 |
Any amounts contractually waived or reimbursed by the Investment Adviser will be subject to repayment by the respective Fund to the Investment Adviser within three years to the extent that the repayment will not cause the Fund’s operating expenses to exceed the contractual expense limit that was in effect at the time of such waiver or reimbursement. During the year ended October 31, 2015, the Investment Adviser did not recapture any of its prior contractual waivers or reimbursements. As of October 31, 2015, the repayments that may potentially be made by the Funds are as follows:
| | 2018($) | | 2017($) | | 2016($) | | Total($) |
| Emerging Markets Debt Fund | | 144,542 | | 133,012 | | 112,179 | | 389,733 |
| Emerging Markets Local Debt Fund | | 260,390 | | 202,644 | | 159,629 | | 622,663 |
| Frontier Markets Fund | | 24,057 | | 68,988 | | 201,653 | | 294,698 |
| Asia ex-Japan Smaller Companies Equity Fund | | 195,564 | | — | | — | | 195,564 |
| Global High Yield Bond Fund | | 61,706 | | — | | — | | 61,706 |
| Global High Income Bond Fund | | 59,476 | | — | | — | | 59,476 |
____________________
* The year listed above the amounts is the fiscal year ending in which the amounts will no longer be able to be recouped.
92 HSBC FAMILY OF FUNDS
HSBC FAMILY OF FUNDS |
Notes to Financial Statements — as of October 31, 2015 (continued) |
The Administrator and Citi may voluntarily waive/reimburse fees to help support the expense limits of the Funds. In addition, HSBC, in its role as Investment Adviser and Administrator, may waive/reimburse additional fees at its discretion. Any voluntary fee waivers/reimbursements are not subject to recoupment in subsequent fiscal periods. Voluntary waivers/reimbursements may be stopped at any time. Amounts waived/reimbursed by the Investment Adviser, Administrator, and Citi are reported separately on the Statements of Operations, as applicable.
Other:
The Funds may purchase securities from an underwriting syndicate in which the principal underwriter or members of the syndicate are affiliated with the Adviser. For the year ended October 31, 2015, the Funds purchased the following amounts of such securities:
| | Purchases($) |
| Emerging Markets Debt Fund | | 500,000 |
| Total Return Fund | | 7,880,000 |
| Global High Yield Bond Fund | | 290,000 |
| Global High Income Bond Fund | | 754,000 |
The Funds may use related party broker-dealers. For the year-ended October 31, 2015, the Asia ex-Japan Smaller Companies Equity Fund incurred $4 of brokerage commissions with broker-dealers affiliated with the Adviser.
The Adviser and its affiliates may have lending, banking, brokerage, underwriting, or other business relationships with the issuers of the securities in which the Funds invest.
The Adviser has borne all the costs of the offering and organization of the Asia ex-Japan Smaller Companies Equity Fund, Global High Yield Bond Fund and Global High Income Bond Fund.
During the year ended October 31, 2015, the Adviser and its affiliates redeemed 3,129,163 and 2,843,667 shares of the Emerging Markets Debt Fund and the Emerging Markets Local Debt Fund, respectively, at net asset values of $31,698,054 and $21,327,503, respectively.
5. Investment Transactions:
Cost of purchases and proceeds from sales of securities (excluding securities maturing less than one year from acquisition) for the year ended October 31, 2015 were as follows:
| | Purchases($) | | Sales($) |
| Emerging Markets Debt Fund | | 18,377,026 | | 42,399,696 |
| Emerging Markets Local Debt Fund | | 47,683,333 | | 60,617,002 |
| Frontier Markets Fund | | 123,025,218 | | 155,266,544 |
| Total Return Fund | | 413,459,008 | | 152,679,123 |
| Asia ex-Japan Smaller Companies Equity Fund | | 23,669,598 | | 13,970,505 |
| Global High Yield Bond Fund | | 29,515,646 | | 6,633,692 |
| Global High Income Bond Fund | | 26,012,800 | | 3,246,424 |
For the year ended October 31, 2015, purchases sales of long-term U.S. government securities were as follows:
| | Purchases($) | | Sales($) |
| Emerging Markets Debt Fund | | 5,331,472 | | 5,506,200 |
| Total Return Fund | | 83,851,316 | | — |
| Global High Income Bond Fund | | 2,073,464 | | 2,077,197 |
HSBC FAMILY OF FUNDS 93
HSBC FAMILY OF FUNDS |
Notes to Financial Statements — as of October 31, 2015 (continued) |
6. Investment Risks:
Foreign Securities Risk: Investments in foreign securities are generally considered riskier than investments in U.S. securities. Foreign securities, including those of emerging and frontier market issuers, are subject to additional risks, including international trade, political and regulatory risks.
Emerging Markets Risk: The prices of securities in emerging markets can fluctuate more significantly than the prices of companies in more developed countries. Securities of emerging market issuers generally have more risk than securities issued by issuers in more developed markets. The less developed the country, the greater affect the risks may have in an investment, and as a result, an investment may exhibit a higher degree of volatility than either the general domestic securities market or the securities markets of developed foreign countries.
Frontier Market Countries Risk: Frontier market countries generally have smaller economies and even less developed capital markets or legal and political systems than traditional emerging market countries. As a result, the risks of investing in emerging market countries are magnified in frontier market countries. The magnification of risks are the result of: the potential for extreme price volatility and illiquidity in frontier markets; government ownership or control of parts of private sector and of certain companies; trade barriers, exchange controls, managed adjustments in relative currency values and other protectionist measures imposed or negotiated by the countries with which frontier market countries trade; and the relatively new and unsettled securities laws in many frontier market countries.
High-Yield Securities Risk: Investments in high-yield securities (commonly referred to as “junk bonds”) are considered speculative investments and have significantly higher credit risk than investment-grade securities and tend to be less liquid than higher rated securities. The prices of high-yield securities, which may be more volatile than higher rated securities of similar maturity, may be more vulnerable to adverse market, economic, social or political conditions.
Derivatives Risk: The term “derivatives” covers a broad range of investments, including swaps, futures and currency forwards. In general, a derivative refers to any financial instrument whose value is derived, at least in part, from the price of another security or a specified index, asset or rate. The use of derivatives presents risks different from, and possibly greater than, the risks associated with investing directly in traditional securities. The use of derivatives can lead to losses because of adverse movements in the price or value of the underlying asset, index or rate, which may be magnified by certain features of the derivatives. These risks are heightened when derivatives are used to enhance a Fund’s return or as a substitute for a position or security, rather than solely to hedge (or offset) the risk of a position or security held by a Fund. The success of the Fund’s derivatives strategies will also be affected by its ability to assess and predict the impact of market or economic developments on the underlying asset, index or rate and the derivative itself, without the benefit of observing the performance of the derivative under all possible market conditions. Derivatives involve the risk of mispricing or improper valuation and the risk that changes in the value of the derivative may not correlate perfectly with the underlying asset, index or rate. Certain derivative positions may be difficult to close out when a Fund’s portfolio manager may believe it would be appropriate to do so. Also, suitable derivative transactions may not be available in all circumstances and there can be no assurance that a Fund will engage in these transactions to reduce exposure to other risks when that would be beneficial.
Swap Risk: The use of swap agreements, which are agreements to exchange the return generated by one instrument for the return generated by another instrument (or index), and similar instruments involves risks that are different from those associated with ordinary portfolio securities transactions. For example, a Fund bears the risk of loss of the amount expected to be received under a swap agreement in the event of the default or bankruptcy of a swap agreement counterparty. Swap agreements may also subject a Fund to the risk that the counterparty to the transaction may not meet its obligations, causing the Fund’s value to decrease. Swap agreements may also be considered illiquid.
Concentration of Market Risk: The Total Return Fund’s investment concentration in Brazilian securities and related derivatives may carry certain risks not ordinarily associated with investments that are less concentrated in a specific region or issuer. The risks include future political and economic developments that may adversely affect the value of the Fund’s securities and related derivatives.
94 HSBC FAMILY OF FUNDS
HSBC FAMILY OF FUNDS |
Notes to Financial Statements — as of October 31, 2015 (continued) |
7. Federal Income Tax Information:
At October 31, 2015, the cost basis of securities for federal income tax purposes, gross unrealized appreciation, gross unrealized depreciation and net unrealized appreciation/depreciation were as follows:
| | | | | | | | | | | | | Net Unrealized |
| | | | Tax Unrealized | | Tax Unrealized | | Appreciation/ |
| | Tax Cost ($) | | Appreciation ($) | | Depreciation ($) | | (Depreciation) ($)* |
| Emerging Markets Debt Fund | | 12,342,978 | | | 119,288 | | | | (488,105 | ) | | | | (368,817 | ) | |
| Emerging Markets Local | | | | | | | | | | | | | | | | |
| Debt Fund | | 16,610,049 | | | 17,261 | | | | (2,465,913 | ) | | | | (2,448,652 | ) | |
| Frontier Markets Fund | | 163,057,570 | | | 6,049,583 | | | | (27,761,096 | ) | | | | (21,711,513 | ) | |
| Total Return Fund | | 1,235,351,734 | | | 4,708,282 | | | | (33,006,517 | ) | | | | (28,298,235 | ) | |
| Asia ex-Japan Smaller Companies | | | | | | | | | | | | | | | | |
| Equity Fund | | 10,106,108 | | | 444,712 | | | | (884,371 | ) | | | | (439,659 | ) | |
| Global High Yield Bond Fund | | 25,067,476 | | | 103,152 | | | | (851,806 | ) | | | | (748,654 | ) | |
| Global High Income Bond Fund | | 24,923,450 | | | 152,550 | | | | (584,465 | ) | | | | (431,915 | ) | |
____________________
| * | The difference between book-basis unrealized appreciation (depreciation) is attributable primarily to tax deferral of losses on wash sales and the realization for tax purposes of unrealized gains/losses on investments in passive foreign investment companies. |
The tax character of dividends paid by the Funds during the tax year ended October 31, 2015 was as follows:
| | Dividends paid from |
| | Ordinary | | Net Long Term | | Total Taxable | | Return of | | Total Dividends |
| | Income ($) | | Capital Gains ($) | | Dividends ($) | | Capital ($) | | Paid ($)(1) |
| Emerging Markets Debt Fund | | 1,325,881 | | | — | | | 1,325,881 | | — | | | 1,325,881 | |
| Emerging Markets Local Debt Fund | | — | | | — | | | — | | 1,296,621 | | | 1,296,621 | |
| Frontier Markets Fund | | 12,526,182 | | | 5,120,789 | | | 17,646,971 | | — | | | 17,646,971 | |
| Total Return Fund | | 20,937,291 | | | — | | | 20,937,291 | | — | | | 20,937,291 | |
| Asia ex-Japan Smaller Companies | | | | | | | | | | | | | | |
| Equity Fund | | 20,375 | | | — | | | 20,375 | | — | | | 20,375 | |
| Global High Yield Bond Fund | | 286,899 | | | — | | | 286,899 | | — | | | 286,899 | |
| Global High Income Bond Fund | | 213,837 | | | — | | | 213,837 | | — | | | 213,837 | |
The tax character of dividends paid by the Funds during the tax year ended October 31, 2014 was as follows:
| | Dividends paid from |
| | Ordinary | | Net Long Term | | Total Taxable | | Return of | | Total Dividends |
| | Income ($) | | Capital Gains ($) | | Dividends ($) | | Capital ($) | | Paid ($)(1) |
| Emerging Markets Debt Fund | | 1,925,592 | | | 650,922 | | | 2,576,514 | | — | | | 2,576,514 | |
| Emerging Markets Local Debt Fund | | 296,960 | | | — | | | 296,960 | | 1,397,125 | | | 1,694,085 | |
| Frontier Markets Fund | | 724,960 | | | 2,429,300 | | | 3,154,260 | | — | | | 3,154,260 | |
| Total Return Fund | | 17,508,616 | | | 127,940 | | | 17,636,556 | | — | | | 17,636,556 | |
____________________
| (1) | Total dividends paid may differ from the amount reported in the Statement of Changes in Net Assets because dividends are recognized when actually paid for tax purposes. |
HSBC FAMILY OF FUNDS 95
HSBC FAMILY OF FUNDS |
Notes to Financial Statements — as of October 31, 2015 (continued) |
As of the tax year ended October 31, 2015, the components of accumulated earnings/(deficit) on a tax basis for the Funds were as follows:
| | | | | | Undistributed | | | | | | | Accumulated | | | | | Total |
| | Undistributed | | Undistributed | | Long Term | | | | | | | Capital and | | Unrealized | | Accumulated |
| | Ordinary | | Tax Exempt | | Capital | | Accumulated | | Dividends | | Other | | Appreciation/ | | Earnings/ |
| | Income ($) | | Income ($) | | Gains ($) | | Earnings ($) | | Payable ($)* | | Losses ($) | | (Depreciation) ($) | | (Deficit) ($) |
| Emerging Markets Debt Fund | | 239,935 | | — | | — | | 239,935 | | (3,448 | ) | | (218,749 | ) | | (386,475 | ) | | (368,737 | ) |
| Emerging Markets Local Debt Fund | | — | | — | | — | | — | | (529 | ) | | (1,356,854 | ) | | (2,648,115 | ) | | (4,005,498 | ) |
| Frontier Markets Fund | | 4,166,428 | | — | | — | | 4,166,428 | | — | | | (5,486,198 | ) | | (21,711,620 | ) | | (23,031,390 | ) |
| Total Return Fund | | 28,322,751 | | — | | — | | 28,322,751 | | (529,863 | ) | | — | | | (34,391,711 | ) | | (6,598,823 | ) |
| Asia ex-Japan Smaller Companies | | | | | | | | | | | | | | | | | | | | |
| Equity Fund | | 145,930 | | — | | — | | 145,930 | | — | | | (76,166 | ) | | (437,546 | ) | | (367,782 | ) |
| Global High Yield Bond Fund | | 73,264 | | | | | | 73,264 | | | | | (83,537 | ) | | (755,850 | ) | | (766,123 | ) |
| Global High Income Bond Fund | | 79,160 | | | | | | 79,160 | | | | | (11,423 | ) | | (441,747 | ) | | (374,010 | ) |
____________________
| * | Dividends payable may differ from the amounts reported in the Statements of Assets and Liabilities because dividends payable on a tax basis include those dividends that will be reinvested. The differences between book-basis and tax-basis unrealized appreciation/depreciation are attributable primarily to: tax deferral of losses on wash sales, the realization for tax purposes of unrealized gains/losses on certain derivative instruments, the difference between book and tax amortization methods for premium and market discount, the realization for tax purposes of unrealized gains/losses on investments in passive foreign investment companies and the return of capital adjustments from real estate investment trusts. |
As of the tax year ended October 31, 2015, the Funds have net capital loss carryforwards (“CLCFs”) as summarized in the tables below. CLCFs subjects to expiration are applied as short-term capital loss regardless of whether the originating capital loss was short-term or long-term. CLCFs that are not subject to expiration must be utilized before those that are subject to expiration. The Board does not intend to authorize a distribution of any realized gain for the Funds until any applicable CLCF has been offset or expires.
CLCFs not subject to expiration:
| | Short Term | | Long Term | | |
| | Amount ($) | | Amount ($) | | Total ($) |
| Emerging Markets Debt Fund | | — | | 218,749 | | 218,749 |
| Emerging Markets Local Debt Fund | | 605,102 | | 751,752 | | 1,356,854 |
| Frontier Markets Fund | | 2,675,507 | | 2,810,691 | | 5,486,198 |
| Total Return Fund | | — | | — | | — |
| Asia ex-Japan Smaller Companies Equity Fund | | 76,166 | | — | | 76,166 |
| Global High Yield Bond Fund | | 83,537 | | | | 83,537 |
| Global High Income Bond Fund | | 11,423 | | — | | 11,423 |
Under current law, capital losses and specified ordinary losses realized after October 31 and non-specified ordinary losses incurred after December 31 (ordinary losses collectively known as “late year ordinary loss”) may be deferred and treated as occurring on the first business day of the following fiscal year. As of the tax year ended October 31, 2015, the Funds had no deferred losses.
8. Significant Shareholders:
The beneficial ownership, either directly or indirectly, of more than 25% of the voting securities of a Fund creates presumptions of control of the Fund, under section 2 (a)(9) of the 1940 Act. As of October 31, 2015, the Global High Yield Bond Fund, Global High Income Bond Fund and Asia ex-Japan Smaller Companies Equity Fund had individual shareholder accounts and/or omnibus shareholder accounts (composed of a group of individual shareholders), each of which is affiliated with the Investment Adviser, and representing ownership in excess of 90% of each Fund, respectively.
96 HSBC FAMILY OF FUNDS
HSBC FAMILY OF FUNDS |
Notes to Financial Statements — as of October 31, 2015 (continued) |
The Emerging Markets Debt Fund, Emerging Markets Local Debt Fund, Frontier Markets Fund and Total Return Fund each have one or more shareholders, which are accounts maintained by financial intermediaries on behalf of their clients, that own a significant portion of the Fund’s outstanding shares, respectively. Significant shareholder transactions by these shareholders may impact the Funds’ performance.
9. Subsequent Events:
At a meeting of the Board of Trustees of the Trusts held on December 17-18, 2015, the Trustees of the Trusts approved on behalf of each Trust and each of the Funds a form of Agreement and Plan of Reorganization (the “Plan”) and other proposals subject to shareholder approval. The Plan will be submitted to a vote of shareholders of the Funds at a special meeting of shareholders to be held in 2016. The Plan calls for the reorganization and redomiciliation of the Funds, which are series of either a Massachusetts business trust (the Trust and Advisor Trust) or a New York trust (the Portfolio Trust), with and into corresponding “shell” series (“New Funds”) of a single newly formed Delaware statutory trust (the “Redomiciliation”). If approved by shareholders, the Redomiciliation is expected to occur in the second calendar quarter of 2016. Upon completion of the Redomiciliation, shareholders of the Funds would own shares of the corresponding class of the New Funds that are equal in value to the shares of the Fund that were held by the shareholders immediately prior to the closing of the Redomiciliation. In addition, the respective share classes of each of the New Funds would assume the performance, financial and other historical information of those of the corresponding Fund. The Redomiciliation is not expected to have an impact on the continuing operations of the Funds. Additional information about the Plan and the other proposals will be included in the Trusts’ proxy statement that is expected to be mailed to shareholders in March 2016.
On November 30, 2015, SunGard Investor Services LLC announced that its acquisition by Fidelity National Information Services was completed. The transfer agency services, and fees charged for such services, are unchanged as a result of the acquisition.
Management has evaluated events and transactions through the date the financial statements were issued, for purposes of recognition or disclosure in these financial statements and there are no additional subsequent events to report.
HSBC FAMILY OF FUNDS 97
Report of Independent Registered Public Accounting Firm
To the Board of Trustees and Shareholders of
HSBC Funds
In our opinion, the accompanying statements of assets and liabilities, including the schedules of portfolio investments, and the related statements of operations and of changes in net assets and the financial highlights of each of HSBC Emerging Markets Debt Fund, HSBC Emerging Markets Local Debt Fund, HSBC Frontier Markets Fund and HSBC Total Return Fund, each as of and for the year ended October 31, 2015, and HSBC Asia ex-Japan Smaller Companies Equity Fund, HSBC Global High Yield Bond Fund and HSBC Global High Income Bond Fund, each as of October 31, 2015 and for the period from commencement of operations on November 11, 2014, July 14, 2015 and July 14, 2015, respectively, through October 31, 2015, (each a Portfolio of HSBC Funds and collectively the “Funds”) present fairly, in all material respects, the financial position of each of the Funds at October 31, 2015, and the results of each of their operations, the changes in each of their net assets and the financial highlights for the periods indicated above, in conformity with accounting principles generally accepted in the United States of America. These financial statements and financial highlights (hereafter referred to as “financial statements”) are the responsibility of the Funds’ management. Our responsibility is to express an opinion on these financial statements based on our audit. We conducted our audit of these financial statements in accordance with the standards of the Public Company Accounting Oversight Board (United States). Those standards require that we plan and perform the audit to obtain reasonable assurance about whether the financial statements are free of material misstatement. An audit includes examining, on a test basis, evidence supporting the amounts and disclosures in the financial statements, assessing the accounting principles used and significant estimates made by management, and evaluating the overall financial statement presentation. We believe that our audit, which included confirmation of securities at October 31, 2015 by correspondence with the custodian and brokers, provides a reasonable basis for our opinion. The accompanying statements of changes in net assets for the year ended October 31, 2014 and the financial highlights for each of the periods ended on or prior to October 31, 2014 were audited by other auditors whose report dated December 23, 2014 expressed an unqualified opinion on those statements and financial highlights.
PricewaterhouseCoopers LLP
New York, New York
December 29, 2015
98 HSBC FAMILY OF FUNDS
HSBC FAMILY OF FUNDS |
Other Federal Income Tax Information — as of October 31, 2015 (Unaudited) |
During the year ended October 31, 2015, the following Funds declared capital gain distributions:
| | | Short Term Capital Gain | | Long Term Capital Gain |
| | Distributions ($) | | Distributions ($) |
| Frontier Markets Fund | | 10,235,410 | | 5,120,789 |
During the year ended October 31, 2015, the following Funds designated the maximum amount allowable as interest-related dividends for certain non-U.S. resident investors:
| | Qualified Interest Income (%) |
| Emerging Markets Debt Fund | | | 24.71 | |
| Emerging Markets Local Debt Fund | | | 5.13 | |
| Total Return Fund | | | 15.37 | |
| Global High Yield Bond Fund | | | 83.02 | |
| Global High Income Bond Fund | | | 66.58 | |
For the year ended October 31, 2015, dividends paid by the Funds may be subject to a maximum tax rate of 15%, as provided for by the Jobs and Growth Tax Relief Reconciliation Act of 2003. The Funds intend to designate the maximum amount allowable as taxed at a maximum rate of 15%. Complete information will be reported in conjunction with your 2015 Form 1099-DIV:
| | Qualified Dividend Income (%) |
| Frontier Markets Fund | | | 16.94 | |
| Asia ex-Japan Smaller Companies Equity Fund | | | 9.16 | |
The following Funds intend to elect to pass through to shareholders the income tax credit for taxes paid to foreign countries. Foreign source income and foreign tax expense per outstanding share on October 31, 2015 are as follows:
| | Foreign Source Income | | Foreign Tax Expense |
| | Per Share ($) | | Per Share ($) |
| Emerging Markets Local Debt Fund | | 0.12 | | | — | |
| Frontier Markets Fund | | 0.53 | | | 0.04 | |
| Asia ex-Japan Smaller Companies Equity Fund | | 0.27 | | | 0.02 | |
The pass-through of this foreign tax credit will only affect those persons who are shareholders on the dividend record date in December 2015. These shareholders will receive more detailed information along with their 2015 Form 1099-DIV.
HSBC FAMILY OF FUNDS 99
| HSBC FAMILY OF FUNDS |
Investment Adviser Contract Approval (Unaudited) |
Investment Adviser Contract Approval (HSBC Asia ex-Japan Smaller Companies Equity Fund)
Section 15(c) of the Investment Company Act of 1940, as amended (the “1940 Act”), generally requires that a majority of the trustees of a mutual fund who are not “interested persons” of the fund or the investment adviser, as defined in the 1940 Act (the “Independent Trustees”), review and approve the investment advisory agreement at an in person meeting for an initial period of up to two years and thereafter on an annual basis. A summary of the material factors considered by the Independent Trustees and the Board of Trustees (the “Board”) of HSBC Funds (the “Trust”) in connection with the initial approval of the investment advisory and sub-advisory agreements for the HSBC Asia ex-Japan Smaller Companies Equity Fund (the “New Fund”), as well as the conclusions the Independent Trustees and Board made as a result of those considerations, are set forth below.
Nature, Extent, and Quality of Services to be Provided by the Adviser and Sub-Adviser. The Board examined at an in-person meeting held in March 2014 the nature, quality and extent of the investment advisory and administrative support services that will be provided by HSBC Global Asset Management (USA) Inc. (the “Adviser”) to the New Fund, as well as the quality and experience of the Adviser’s personnel. In this regard, the Board considered the capabilities and performance of the Adviser’s oversight with respect to the investment sub-advisers (“Sub-Advisers”) of certain of the HSBC Funds (the “Funds”). The Board also considered the nature, quality and extent of the administrative support services that the Adviser provides to the Funds, including the Adviser’s oversight and management of the Funds’ other service providers.
The Board also took note of: (i) the long-term relationship between the Adviser and the Funds; (ii) the Adviser’s reputation and financial condition; (iii) the stabilization during the period in the decline of the HSBC Family of Funds’ net assets, the role of the growth of certain Funds in this stabilization, and the Board’s perspective on the role of the stabilization in the improving economics of the Adviser’s business; (iv) structural changes made by the Adviser that have improved the overall efficiency of the fund complex; and (v) the business strategy of the Adviser and its parent company, including potential new distribution initiatives and fund offerings, and their commitment to the Funds’ business. In addition, the Board considered the Adviser’s performance in fulfilling its responsibilities for overseeing its own and the Sub-Advisers’ compliance with the Funds’ compliance policies and procedures and investment objectives.
The Board also examined the nature, quality and extent of the services that HSBC Global Asset Management (Hong Kong) Limited (“AMHK”), the proposed sub-adviser to the New Fund, provides to HGIF Asia ex-Japan Equity Smaller Companies Fund (the “HGIF Fund”), a fund registered in Luxembourg, and the RMB Fixed Income Fund. In this regard, the Board considered the investment performance of the HGIF Fund, as described in the report of the executive session, and the portfolio risk characteristics achieved by AMHK and AMHK’s portfolio management teams, their experience, and the quality of their compliance programs, among other factors. The Board satisfactorily noted AMHK’s ongoing investment in 1940 Act compliance programs and oversight, in its role as Sub-Adviser to the RMB Fixed Income Fund.
Based on these considerations, the Board concluded that it was satisfied with the nature, quality and extent of the services that will be provided by the Adviser and AMHK, and that the services to be provided supported approval of the Agreements associated with the New Fund.
Investment Performance of the Fund, Adviser and AMHK. The Board considered the investment performance of the portfolio on which the New Fund would be based over various periods of time, as compared to one or more benchmark indices. The Board noted the HGIF Fund’s 5-star Morningstar rating and reviewed the portfolio’s performance.
Costs of Services and Profits Realized by the Adviser and AMHK. The Board considered the costs of the services to be provided by the Adviser and AMHK and the expense ratios of the New Fund more generally. The Board also considered the contractual advisory fees under the Advisory Contract and compared those fees to the fees of similar funds, which had been compiled by the Adviser with information sourced from Lipper. The Board determined that the New Fund’s advisory fees were comparable to other competitive funds, noting the resources, expertise and experience that will be provided to the New Fund by the Adviser and AMHK.
100 HSBC FAMILY OF FUNDS
| HSBC FAMILY OF FUNDS |
Investment Adviser Contract Approval (Unaudited) (continued) |
The Board also compared the advisory fees under the Advisory Contract with those of other accounts managed by the Adviser, and evaluated information provided as to why advisory fees may differ between mutual funds and other advisory relationships, including increased shareholder activity. In this regard, the Board concluded that differences in advisory fees assessed between the Fund and other accounts managed by the Adviser did not preclude approval of the Advisory Contract.
With respect to the administrative services that will be provided by the Adviser, the Board considered the fees charged for such services and evaluated the fees payable to the Adviser and those payable to other providers of administrative services to the New Fund. The Board also considered the relative split of the administration fee between the Adviser and Citi Fund Services Ohio, Inc. (“Citi”), as sub-administrator, and other factors relevant to its consideration of these arrangements including Citi’s capability to provide sub-administration services to the New Fund. The Board further discussed the extent to which the non-advisory services to be provided by the Adviser under the Advisory Contract differed from those to be provided under the Administration Agreement or other agreements. With respect to the Support Services Agreement, the Board noted the Adviser’s description of the services it provides, and discussed the extent to which they may differ from services to be provided under other agreements.
The Board also considered the costs of the services to be provided by AMHK; the relative portions of the total advisory fees to be paid to the AMHK and retained by the Adviser in its capacity as the New Fund’s primary investment adviser; and the services to be provided by the Adviser and AMHK. In addition, the Board discussed the distinction between the services to be provided by the Adviser to the New Fund pursuant to the Advisory Contract and the services to be provided by AMHK pursuant to the Sub-Advisory Contract.
The Board concluded that the advisory fees payable to the Adviser and AMHK were not unreasonable in light of the factors set forth above.
Other Relevant Considerations. The Board also considered the extent to which the Adviser and AMHK are expected to achieve economies of scale, whether the New Fund’s expense structure permits economies of scale to be shared with the New Fund’s shareholders and, if so, the extent to which the New Fund’s shareholders may benefit from these economies of scale. The Board considered certain information provided by the Adviser and AMHK with respect to the benefits they are expected to derive from their relationships with the New Fund.
HSBC FAMILY OF FUNDS 101
| HSBC FAMILY OF FUNDS |
Table of Shareholder Expenses—as of October 31, 2015 (Unaudited) |
As a shareholder of the Funds, you incur two types of costs: (1) transaction costs, including sales charges (loads) on purchases, redemption fees and exchange fees; and (2) ongoing costs, including management fees, distribution fees and other Fund expenses. These examples are intended to help you understand your ongoing costs (in dollars) of investing in the Funds and to compare the cost with the ongoing costs of investing in other mutual funds.
These examples are based on an investment of $1,000 invested at the beginning of the period and held for the entire period from May 1, 2015 through October 31, 2015.
Actual Example
The table below provides information about actual account values and actual expenses. You may use the information below, together with the amount you invested, to estimate the expenses that you paid over the period. Simply divide your account value by $1,000 (for example, an $8,600 account value divided by $1,000 = 8.6), then multiply the result by the number in the table under the heading entitled “Expenses Paid During Period” to estimate the expenses you paid on your account during this period.
| | | Beginning | | | | | | | | | Annualized |
| | | Account | | Ending | | Expenses Paid | | Expense Ratio |
| | | Value | | Account Value | | During Period* | | During Period |
| | | 5/1/15 | | 10/31/15 | | 5/1/15 - 10/31/15 | | 5/1/15 - 10/31/15 |
| Emerging Markets Debt Fund | Class A | | $ | 1,000.00 | | | $ | 979.80 | | | | $ | 5.99 | | | | 1.20 | % | |
| Class I | | | 1,000.00 | | | | 981.30 | | | | | 4.24 | | | | 0.85 | % | |
| Emerging Markets Local Debt Fund | Class A | | | 1,000.00 | | | | 883.20 | | | | | 5.70 | | | | 1.20 | % | |
| | Class I | | | 1,000.00 | | | | 885.20 | | | | | 4.04 | | | | 0.85 | % | |
| Frontier Markets Fund | Class A | | | 1,000.00 | | | | 903.10 | | | | | 10.74 | | | | 2.24 | % | |
| Class I | | | 1,000.00 | | | | 904.30 | | | | | 9.02 | | | | 1.88 | % | |
| Total Return Fund | Class A | | | 1,000.00 | | | | 978.70 | | | | | 7.63 | | | | 1.53 | % | |
| Class I | | | 1,000.00 | | | | 979.90 | | | | | 5.79 | | | | 1.16 | % | |
| Class S | | | 1,000.00 | | | | 980.40 | | | | | 5.29 | | | | 1.06 | % | |
| Asia ex-Japan Smaller Companies | | | | | | | | | | | | | | | | | | | |
| Equity Fund | Class A | | | 1,000.00 | | | | 839.90 | | | | | 8.12 | | | | 1.75 | % | |
| | Class I | | | 1,000.00 | | | | 841.00 | | | | | 6.50 | | | | 1.40 | % | |
| | Class S | | | 1,000.00 | | | | 841.00 | | | | | 6.03 | | | | 1.30 | % | |
| Global High Yield | | | | | | | | | | | | | | | | | | | |
| Bond Fund** | Class A | | | 1,000.00 | | | | 977.70 | | | | | 3.43 | | | | 1.15 | % | |
| | Class I | | | 1,000.00 | | | | 978.50 | | | | | 2.39 | | | | 0.80 | % | |
| Global High Income | | | | | | | | | | | | | | | | | | | |
| Bond Fund** | Class A | | | 1,000.00 | | | | 990.70 | | | | | 3.45 | | | | 1.15 | % | |
| Class I | | | 1,000.00 | | | | 991.60 | | | | | 2.40 | | | | 0.80 | % | |
____________________
| * | Expenses are equal to the average account value over the period, multiplied by the Fund’s annualized expense ratio, multiplied by 184/365 (to reflect the one half year period). |
| ** | Expenses are equal to the average account value over the period, multiplied by the Fund’s annualized expense ratio, multiplied by 110/365 (to reflect the stub period 7/14/2015 to 10/31/2015). |
102 HSBC FAMILY OF FUNDS
| HSBC FAMILY OF FUNDS |
Table of Shareholder Expenses—as of October 31, 2015 (Unaudited) (continued) |
Hypothetical Example for Comparison Purposes
The table below provides information about hypothetical account values and hypothetical expenses based on each Fund’s actual expense ratio and an assumed rate of return of 5% per year before expenses, which is not the Fund’s actual return. The hypothetical account values and expenses may not be used to estimate the actual ending account balance or expenses you paid for the period. You may use this information to compare this 5% hypothetical example with the 5% hypothetical examples that appear in the shareholder reports of other funds.
Please note that the expenses shown in the table are meant to highlight your ongoing costs only and do not reflect any transactional costs, such as sales charges (loads), redemption fees, or exchange fees. Therefore, the table is useful in comparing ongoing costs only, and will not help you determine the relative total costs of owning different funds. In addition, if these transactional costs were included, your costs would have been higher.
| | | Beginning | | | | | | | | | | | Annualized |
| | | Account | | Ending | | Expenses Paid | | Expense Ratio |
| | | Value | | Account Value | | During Period* | | During Period |
| | | 5/1/15 | | 10/31/15 | | 5/1/15 - 10/31/15 | | 5/1/15 - 10/31/15 |
| Emerging Markets Debt Fund | Class A | | $ | 1,000.00 | | | $ | 1,019.16 | | | | $6.11 | | | | 1.20 | % | |
| Class I | | | 1,000.00 | | | | 1,020.92 | | | | 4.33 | | | | 0.85 | % | |
| Emerging Markets Local Debt Fund | Class A | | | 1,000.00 | | | | 1,019.16 | | | | 6.11 | | | | 1.20 | % | |
| Class I | | | 1,000.00 | | | | 1,020.92 | | | | 4.33 | | | | 0.85 | % | |
| Frontier Markets Fund | Class A | | | 1,000.00 | | | | 1,013.91 | | | | 11.37 | | | | 2.24 | % | |
| Class I | | | 1,000.00 | | | | 1,015.73 | | | | 9.55 | | | | 1.88 | % | |
| Total Return Fund | Class A | | | 1,000.00 | | | | 1,017.49 | | | | 7.78 | | | | 1.53 | % | |
| Class I | | | 1,000.00 | | | | 1,019.36 | | | | 5.90 | | | | 1.16 | % | |
| Class S | | | 1,000.00 | | | | 1,019.86 | | | | 5.40 | | | | 1.06 | % | |
| Asia ex-Japan Smaller Companies | | | | | | | | | | | | | | | | | | |
| Equity Fund | Class A | | | 1,000.00 | | | | 1,016.38 | | | | 8.89 | | | | 1.75 | % | |
| Class I | | | 1,000.00 | | | | 1,018.15 | | | | 7.12 | | | | 1.40 | % | |
| Class S | | | 1,000.00 | | | | 1,018.65 | | | | 6.61 | | | | 1.30 | % | |
| Global High Yield Bond Fund | Class A | | | 1,000.00 | | | | 1,019.41 | | | | 5.85 | | | | 1.15 | % | |
| Class I | | | 1,000.00 | | | | 1,021.17 | | | | 4.08 | | | | 0.80 | % | |
| Global High Income | | | | | | | | | | | | | | | | | | |
| Bond Fund | Class A | | | 1,000.00 | | | | 1,019.41 | | | | 5.85 | | | | 1.15 | % | |
| Class I | | | 1,000.00 | | | | 1,021.17 | | | | 4.08 | | | | 0.80 | % | |
____________________
| * | Expenses are equal to the average account value over the period, multiplied by the Fund’s annualized expense ratio, multiplied by 184/365 (to reflect the one half year period). |
|
HSBC FAMILY OF FUNDS 103
| HSBC FAMILY OF FUNDS |
Board of Trustees and Officers (Unaudited) |
MANAGEMENT OF THE TRUST
The following table contains information regarding the HSBC Family of Funds’ Board of Trustees (“Trustees”). Asterisks indicate those Trustees who are “interested persons,” as defined in the Investment Company Act of 1940, as amended, of the HSBC Family of Funds. The HSBC Family of Funds’ Statement of Additional Information includes additional information about the Trustees and is available, without charge, upon request by calling (888) 525-5757.
| | | | | | | | Portfolios in | | |
| | Position(s) | | Term of Office | | | | Fund Complex | | Other |
| Name, | | Held with | | and Length of | | Principal Occupation(s) | | Overseen By | | Directorships |
| Address, Age | | Funds | | Time Served | | During Past 5 Years | | Trustee* | | Held by Trustee |
NON-INTERESTED
TRUSTEES | | | | | | | | | | |
| | | | | | | | | | | |
MARCIA L. BECK
P.O. Box 182845
Columbus, OH
43218-3035
Age: 60 | | Trustee | | Indefinite;
2008 to present | | Private Investor (1999 – present); Executive Vice President, Prudential Investments (1997 – 1999); President and Trustee, The Goldman Sachs Mutual Funds (1992 – 1996) | | 24 | | None |
| | | | | | | | | | | |
SUSAN C. GAUSE
P.O. Box 182845
Columbus, OH
43218-3035
Age: 63 | | Trustee | | Indefinite;
2013 to present | | Private Investor (2003 - present); Chief Executive Officer, Dresdner RCM Global Investors and Allianz Dresdner Asset Management (2000 - 2002); Board Member, Dresdner Global Asset Management Board (2000 - 2002); Chief Operating Officer and Senior Managing Director, Dresdner RCM Global Investors (1998 - 2000); Global Chief Financial Officer, Dresdner RCM Global Investors (1996 - 1998) | | 24 | | Met Investors Series
Trust and Metropolitan
Series Fund |
| | | | | | | | | | | |
SUSAN S. HUANG
P.O. Box 182845
Columbus, OH
43218-3035
Age: 61 | | Trustee | | Indefinite;
2008 to present | | Private Investor (2000 – present); Senior Vice President, Schroder Investment Management (2001 – 2004); Managing Director, Chase Asset Management (1995-2000) | | 24 | | None |
| | | | | | | | | | | |
THOMAS F. ROBARDS
P.O. Box 182845
Columbus, OH
43218-3035
Age: 69 | | Chairman and
Trustee | | Indefinite;
2005 to present | | Partner, Robards & Co. LLC (investment and advisory services) (2005-present); Chief Financial Officer, American Museum of Natural History (2003- 2004); Chief Financial Officer, Datek Online Holdings (2000-2003); Executive Vice President and Chief Financial Officer, Republic New York Corporation (1976-2000) | | 24 | | Ellington Financial LLC
(NYSE listed financial
services); Ellington
Residential Mortgage
REIT (NYSE listed real
estate investment trust) |
| | | | | | | | | | | |
INTERESTED TRUSTEE | | | | | | | | | | |
| | | | | | | | | | | |
DEBORAH HAZELL
452 Fifth Avenue
New York
NY 10018
Age: 52 | | Trustee | | Indefinite;
2011 to present | | Chief Executive Officer, HSBC Global Asset Management (USA) Inc. (2011-present); President and Chief Executive Officer, Fisher Francis Trees & Watts (“FFTW”) (investment adviser), 2008-2011; Client Service, Business Development and Marketing Group, FFTW (1999-2008) | | 24 | | None |
____________________
| * | Includes the HSBC Funds, the HSBC Advisor Funds Trust and the HSBC Portfolios. |
|
104 HSBC FAMILY OF FUNDS
| HSBC FAMILY OF FUNDS |
Board of Trustees and Officers (Unaudited) (continued) |
| | Position(s) Held | | Term of Office and | | Principal Occupation(s) |
| Name, Address, Age | | Funds | | Length of Time Served | | During Past 5 Years |
OFFICERS | | | | | | |
| | | | | | | |
RICHARD A. FABIETTI
452 Fifth Avenue
New York, NY 10018
Age: 57 | | President | | One year; 2004 to
present | | Senior Vice President, HSBC Global Asset Management (USA) Inc. (1998 - present) |
| | | | | | | |
JAMES D. LEVY
452 Fifth Avenue
New York, NY 10018
Age: 52 | | Vice President | | One year; 2014 to
present | | Vice President, Product Management, HSBC Global Asset Management (USA) Inc. (2014 – present); Vice President, Product Development, GE Asset Management Inc. (2007 – 2014) |
| | | | | | | |
SCOTT RHODES*
3435 Stelzer Road
Columbus, OH 43219-3035
Age: 56 | | Treasurer | | One year; 2014 to
present | | Senior Vice President, Citi (2010 - present); Manager, Treasurer of Mutual Funds, and Broker-Dealer Treasurer and Financial & Operations Principal, GE Asset Management Inc. (2005 – 2010) |
| | | | | | | |
IOANNIS TZOUGANATOS*
100 Summer Street, Suite
1500
Boston, MA 02110
Age: 39 | | Secretary | | One Year; 2015 to
present | | Vice President, Regulatory Administration, Citi (2008-present) |
| | | | | | | |
HEATHER MELITO-DEZAN*
100 Summer Street
Suite 1500
Boston, MA 02110
Age: 38 | | Assistant Secretary | | One year; 2014 to
present | | Assistant Vice President, Regulatory Administration, Citi (2013 - present); Senior Specialist, Regulatory Administration, NGAM (2010-2013); Vice President and Manager. Regulatory Administration, BNY Mellon (2004-2010) |
| | | | | | | |
CHARLES L. BOOTH*
3435 Stelzer Road
Columbus, OH 43219-3035
Age: 55 | | Chief Compliance
Officer | | One year; 2015 to
present | | Director and Compliance Officer, CCO Services, Citi (1988 - present) |
____________________
| * | Mr. Rhodes, Mr. Tzouganatos, Ms. Melito-Dezan, and Mr. Booth also are officers of other investment companies of which Citi (or an affiliate) is the administrator or sub-administrator. |
HSBC FAMILY OF FUNDS 105
Other Information (Unaudited):
A description of the policies and procedures the Funds use to determine how to vote proxies relating to portfolio securities of each Fund, and information regarding how the Funds voted proxies relating to portfolio securities during the most recent 12-month period ended June 30th is available (i) without charge, upon request, by calling 1-800-525-5757 for HSBC Bank USA and HSBC Brokerage (USA) Inc. clients and 1-800-782-8183 for all other shareholders; (ii) on the Funds’ website at ww.emfunds.us.hsbc.com or at www.investorfunds.us.hsbc.com; and (iii) on the Securities and Exchange Commission’s (“Commission”) website at http://www.sec.gov.
The Funds file their complete schedules of portfolio holdings with the Commission for the first and third quarters of each fiscal year on Form N-Q. The Funds’ Forms N-Q are available on the Commission’s website at http://www.sec.gov. The Funds’ Forms N-Q may be reviewed and copied at the Commission’s Public Reference Room in Washington, D.C. and information on the operation of the Public Reference Room may be obtained by calling 1-800-SEC-0330. The Funds’ Schedules of Investments will be available no later than 60 days after each period end, without charge, on the Funds’ website at www.emfunds.us.hsbc.com or at www.investorfunds.us.hsbc.com.
An investment in a Fund is not a deposit of HSBC Bank USA, N.A., and is not insured or guaranteed by the Federal Deposit Insurance Corporation or any other government agency.
106 HSBC FAMILY OF FUNDS
HSBC FAMILY OF FUNDS:
INVESTMENT ADVISER AND ADMINISTRATOR
HSBC Global Asset Management (USA) Inc.
452 Fifth Avenue
New York, NY 10018
SUB-ADVISERS
HSBC Frontier Markets Fund
HSBC Global High Yield Bond Fund
HSBC Global High Income Bond Fund
HSBC Global Asset Management (UK) Limited
78 St. James Street
London, United Kingdom, SW1A 1EJ
HSBC Asia ex-Japan Smaller Companies Equity Fund
HSBC Global Asset Management (Hong Kong) Limited
Level 22, HSBC Main Building
1 Queen’s Road Central, Hong Kong
HSBC Global High Yield Bond Fund
HSBC Global High Income Bond Fund
HSBC Global Asset Management (France)
4 place de la Pyramide
Immcuble Ile-de-France
92800 Put eaux La
Défence 9, France
SHAREHOLDER SERVICING AGENTS
For HSBC Bank USA, N.A. and
HSBC Securities (USA) Inc. Clients:
HSBC Bank USA, N.A.
452 Fifth Avenue
New York, NY 10018
1-888-525-5757
For All Other Shareholders:
HSBC Funds
P.O. Box 182845
Columbus, OH 43218
1-800-782-8183
TRANSFER AGENT
SunGard Investor Services, LLC
3435 Stelzer Road
Columbus, OH 43219
DISTRIBUTOR
Foreside Distribution Services, L.P.
690 Taylor Road, Suite 150
Gahanna, Ohio 43230
CUSTODIAN
The Northern Trust Company
50 South LaSalle Street
Chicago, IL 60603
INDEPENDENT REGISTERED PUBLIC ACCOUNTING FIRM
PricewaterhouseCoopers LLP
300 Madison Avenue
New York, NY 10017
LEGAL COUNSEL
Dechert LLP
1900 K Street, N.W.
Washington, D.C. 20006

| Investment products: |
ARE NOT A
BANK DEPOSIT
OR OBLIGATION
OF THE BANK
OR ANY OF ITS
AFFILIATES | ARE NOT
FDIC
INSURED | ARE NOT
INSURED BY
ANY FEDERAL
GOVERNMENT
AGENCY |
ARE NOT GUARANTEED BY
THE BANK OR ANY OF ITS
AFFILIATES | MAY LOSE
VALUE |
Investment products are offered by HSBC Securities (USA) Inc. (HSI), member NYSE/FINRA/SIPC. HSI is an affiliate of HSBC Bank USA, N.A. Investment products: Are not a deposit or other obligation of the bank or any of its affiliates; Not FDIC insured or insured by any federal government agency of the United States; Not guaranteed by the bank or any of its affiliates; and are subject to investment risk, including possible loss of principal invested.
Investors should consider the investment objectives, risks, charges, and expenses of the investment company carefully before investing. The prospectus contains this and other important information about the investment company. For clients of HSBC Securities (USA) Inc., please call 1-888-525-5757 for more information. For other investors and prospective investors, please call the Funds directly at 1-800-782-8183 or visit our website at www.emfunds.us.hsbc.com. Investors should read the prospectus carefully before investing or sending money.
Item 2. Code of Ethics.
(a) The registrant has adopted a code of ethics that applies to the registrant’s principal executive officer, principal financial officer, principal accounting officer or controller, or persons performing similar functions. This code of ethics is included as an Exhibit.
(b) During the period covered by the report, with respect to the registrant's code of ethics that applies to its principal executive officer, principal financial officer, principal accounting officer or controller, or persons performing similar functions; there have been no amendments to, nor any waivers granted from, a provision that relates to any element of the code of ethics definition enumerated in paragraph (b) of this Item 2.
Item 3. Audit Committee Financial Expert.
3(a)(1) The registrant’s board of directors has determined that the registrant has at least one audit committee financial expert serving on its audit committee.
3(a)(2) The audit committee financial experts are Tom Robards and Marcia Beck, who are “independent” for purposes of this Item 3 of Form N-CSR.
Item 4. Principal Accountant Fees and Services. |
| (a) Audit Fees, |
| | 2014 | | $183,823 |
| 2015 | | $360,233 |
| (b) Audit-Related Fees, |
| | 2014 | | $5,833 |
| 2015 | | $0 |
| | | | |
| 2014 – Fees of $5,833 relate to the consent of N-1A filing. |
| |
| (c) Tax Fees, |
| | 2014 | | $95,000 |
| 2015 | | $162,000 |
| |
| Fees for both 2014 and 2015 relate to the preparation of federal income and excise tax returns and the review of excise tax distributions. |
| (d) All Other Fees, |
| | 2014 | | $0 |
| 2015 | | $0 |
(e)(1) The audit committee is required to pre-approve all audit and permitted non-audit services performed by the registrant’s independent auditors in accordance with the audit committee charter and the Investment Company Act of 1940.
| (e)(2) | | |
| | 2014 | | 0% |
| 2015 | | 0% |
| |
| (f) Not applicable. |
| |
| (g) Non-Audit Fees. |
| | 2014 | | $0 |
| 2015 | | $10,965,000 |
| | | | |
| | Fees for 2015 represent PricewaterhouseCoopers LLP services provided to HSBC Bank and affiliates related to general corporate, state and local tax assistance, accounting matters and various advisory projects. |
(h) The audit committee considered the nonaudit services rendered to the registrant’s investment adviser and any entity controlling, controlled by, or under common control with the investment adviser, and believes the services are compatible with the principal accountant’s independence.
Item 5. Audit Committee of Listed Registrants.
Not applicable.
Item 6. Investments.
(a) Included as a part of the report to shareholders filed under Item 1.
(b) Not applicable.
Item 7. Disclosure of Proxy Voting Policies and Procedures for Closed-End Management Investment Companies.
Not applicable.
Item 8. Portfolio Managers of Closed-End Management Investment Companies.
Not applicable.
Item 9. Purchases of Equity Securities by Closed-End Management Investment Company and Affiliated Purchasers.
Not applicable.
Item 10. Submission of Matters to a Vote of Security Holders.
Not applicable.
Item 11. Controls and Procedures.
(a)The registrant’s principal executive officer and principal financial officer have concluded, based on their evaluation of the registrant's disclosure controls and procedures as conducted within 90 days of the filing date of this report, that these disclosure controls and procedures are adequately designed and are operating effectively to ensure that information required to be disclosed by the registrant on Form N-CSR is recorded, processed, summarized and reported within the time periods specified in the Securities and Exchange Commission's rules and forms.
(b)There were no changes in the registrant’s internal control over financial reporting (as defined in Rule 30a-3(d) under the Act (17 CFR 270.30a-3(d)) that occurred during the second fiscal quarter of the period covered by this report that have materially affected or are reasonably likely to materially affect, the registrant’s internal control over financial reporting.
Item 12. Exhibits.
(a)(1) The code of ethics that is the subject of the disclosure required by Item 2 is attached hereto.
(a)(2) Certifications pursuant to Rule 30a-2(a) are attached hereto.
(a)(3) Not applicable.
(b) Certifications pursuant to Rule 30a-2(b) are furnished herewith.
SIGNATURES
Pursuant to the requirements of the Securities Exchange Act of 1934 and the Investment Company Act of 1940, the registrant has duly caused this report to be signed on its behalf by the undersigned, thereunto duly authorized.
| By (Signature and Title) | /s/ Richard A. Fabietti |
| Richard A. Fabietti |
| President |
Pursuant to the requirements of the Securities Exchange Act of 1934 and the Investment Company Act of 1940, this report has been signed below by the following persons on behalf of the registrant and in the capacities and on the dates indicated.
| By (Signature and Title) | /s/ Richard A. Fabietti |
| Richard A. Fabietti |
| President |
| By (Signature and Title) | /s/ Scott Rhodes |
| Scott Rhodes |
| Treasurer |