UNITED STATES
SECURITIES AND EXCHANGE COMMISSION
Washington, D.C. 20549
FORM N-CSR
CERTIFIED SHAREHOLDER REPORT OF REGISTERED
MANAGEMENT INVESTMENT COMPANIES
Investment Company Act file number: 811-04782
HSBC FUNDS
(Exact name of registrant as specified in charter)
452 FIFTH AVENUE
NEW YORK, NY 10018
(Address of principal executive offices) (Zip code)
CITI FUND SERVICES
3435 STELZER ROAD
COLUMBUS, OH 43219
(Name and address of agent for service)
Registrant’s telephone number, including area code: 1-800-782-8183
Date of fiscal year end: October 31 Date of reporting period: October 31, 2013 |
Item 1. Reports to Stockholders.
HSBC Global Asset Management (USA) Inc.
HSBC Funds
Annual Report
October 31, 2013
| MONEY MARKET FUNDS | | Class A | | Class B | | Class C | | Class D | | Class E | | Class I | | Class Y |
| HSBC Prime Money Market Fund | | REAXX | | HSMXX | | HMMXX | | HIMXX | | HMEXX | | HSIXX | | RMYXX |
| HSBC U.S. Government Money Market Fund | | FTRXX | | HUBXX | | HUMXX | | HGDXX | | HGEXX | | HGIXX | | RGYXX |
| HSBC U.S. Treasury Money Market Fund | | HWAXX | | HTBXX | | HUCXX | | HTDXX | | HTEXX | | HBIXX | | HTYXX |

| Table of Contents |
HSBC Family of Funds
Annual Report - October 31, 2013 |
| Glossary of Terms | |
| President’s Message | 4 |
| Commentary From the Investment Manager | 5 |
| Portfolio Reviews | 6 |
| Portfolio Composition | 9 |
| Schedules of Portfolio Investments | |
| HSBC Prime Money Market Fund | 10 |
| HSBC U.S. Government Money Market Fund | 13 |
| HSBC U.S. Treasury Money Market Fund | 15 |
| Statements of Assets and Liabilities | 16 |
| Statements of Operations | 17 |
| Statements of Changes in Net Assets | 18 |
| Financial Highlights | 22 |
| Notes to Financial Statements | 28 |
| Report of Independent Registered Public Accounting Firm | 37 |
| Other Federal Income Tax Information | 38 |
| Table of Shareholder Expenses | 39 |
| Board of Trustees and Officers | 41 |
| Other Information | 43 |
Barclays U.S. Aggregate Bond Index is an unmanaged index generally representative of investment-grade, USD-denominated, fixed-rate debt issues, taxable bond market, including Treasuries, government-related and corporate securities, asset-backed, mortgage-backed and commercial mortgage-backed securities, with maturities of at least one year.
Barclays U.S. Corporate High-Yield Bond Index is an unmanaged index that measures the non-investment grade, USD-denominated, fixed-rate, taxable corporate bond market. Securities are classified as high-yield if the middle rating of Moody’s, Fitch, and S&P is Ba1/BB+/BB+ or below. The index excludes emerging markets debt.
Gross Domestic Product (“GDP”) measures the market value of the goods and services produced by labor and property in the United States.
Lipper Money Market Funds Average is an equally weighted average of mutual funds that invest in high-quality financial instruments rated in the top two grades with dollar-weighted average maturities of less than 90 days. These funds intend to keep a constant net asset value.
Lipper U.S. Government Money Market Funds Average is an equally weighted average of mutual funds that invest principally in financial instruments issued or guaranteed by the U.S. government, its agencies, or its instrumentalities, with dollar-weighted average maturities of less than 90 days. These funds intend to keep a constant net asset value.
Lipper U.S. Treasury Money Market Funds Average is an equally weighted average of mutual funds that invest principally in U.S. Treasury obligations with dollar-weighted average maturities of less than 90 days. These funds intend to keep a constant net asset value.
Morgan Stanley Capital International Europe Australasia and Far East (“MSCI EAFE”) Index is an unmanaged equity index which captures large and mid cap representation across Developed Markets countries: Australia, Austria, Belgium, Denmark, Finland, France, Germany, Greece, Hong Kong, Ireland, Israel, Italy, Japan, the Netherlands, New Zealand, Norway, Portugal, Singapore, Spain, Sweden, Switzerland and the UK (excluding the US and Canada). With 910 constituents, the index covers approximately 85% of the free float-adjusted market capitalization in each country.
Morgan Stanley Capital International Emerging Market (“MSCI EM”) Index is an unmanaged index that captures large and mid cap representation across 21 Emerging Markets (EM) countries: Brazil, Chile, China, Colombia, Czech Republic, Egypt, Hungary, India, Indonesia, Korea, Malaysia, Mexico, Morocco, Peru, Philippines, Poland, Russia, South Africa, Taiwan, Thailand and Turkey. With 818 constituents, the index covers approximately 85% of the free float-adjusted market capitalization in each country.
Russell 2000® Index is an unmanaged index that measures the performance of the small-cap segment of the U.S. equity universe. The Russell 2000® Index is a subset of the Russell 3000® Index representing approximately 10% of the total market capitalization of that index. It includes approximately 2000 of the smallest securities based on a combination of their market cap and current index membership.
Standard & Poor’s 500 (“S&P 500”) Index is an unmanaged index that is widely regarded as a gauge of the U.S. equities market. This index includes 500 leading companies in leading industries of the U.S. economy. The S&P 500 Index focuses on the large-cap segment of the market, with approximately 75% coverage of U.S. equities.
Lipper is an independent mutual fund performance monitor whose results are based on total return and do not reflect a sales charge.
Securities indices assume reinvestment of all distributions and interest payments and do not take in account brokerage fees or expenses. Securities in the Funds do not match those in the indices and performance of the Funds will differ. Investors cannot invest directly in an index.
Dear Shareholder,
We are pleased to send to you the HSBC Funds annual report, covering the fiscal year ended October 31, 2013. This report contains detailed information about your Funds’ portfolio of investments and operating results. We encourage you to review it carefully.
This report includes commentary from the Funds’ portfolio managers in which they discuss the investment markets and their respective Fund’s performance. The portfolio manager commentary is accompanied by the Fund’s return for the period, listed alongside the returns of its benchmark index and peer group average for comparative purposes.
In closing, we would like to thank you for investing in the HSBC Funds. We continue to focus the HSBC Fund Family on investment solutions to assist our shareholders in reaching their financial goals. We appreciate the trust you place in us, and will continue working to earn it. Please contact us at any time with questions or concerns.
Sincerely,

Richard A. Fabietti
President
4 HSBC FAMILY OF FUNDS
| Commentary From the Investment Manager |
HSBC Global Asset Management (USA) Inc. |
U.S. Economic Review
Economic growth picked up pace in developing economies throughout the world during the 12-month period between November 1, 2012 and October 31, 2013. Many major economies, including the United States, reported improved economic data during the period, indicating new momentum for a modest but sustained recovery. The U.S. equity markets made strong gains during the period, boosted by improvements in the labor and housing markets and healthy corporate profits. Markets continued to benefit from the Federal Reserve Board’s (the “Fed”) decision to maintain the federal funds rate—a key factor in lending rates—at a historically low target range between 0.00% and 0.25%. Economic headwinds remained, however, including relatively high unemployment in some areas, low consumer spending and reduced government spending caused by sequestration.
Investor confidence declined mid-year due in part to expectations that the Fed would begin tapering its bond purchasing program. Concerns about the impact of tapering diminished, however, when the Fed announced in September that it would delay winding down its stimulus efforts until the unemployment rate fell significantly lower. The first shutdown of the U.S. government in 17 years occurred in October. This political crisis, along with the related standoff over raising the country’s borrowing limit, was another factor weighing on investor sentiment. The uncertainty surrounding the crisis dragged on equities, although markets regained momentum once a political deal was struck that reopened the government and raised the debt ceiling. Broad U.S. stock market indices ended the period significantly above where they were positioned 12 months earlier.
Improving political circumstances in the eurozone and positive economic data helped boost stocks in developed economies across the world. The economies of both Japan and Europe transitioned out of recession. Progress was made toward alleviating the sovereign debt crisis in Europe. The European Central Bank’s aggressive efforts, including its government bond-buying program known as Outright Monetary Transactions, reassured investors. Still, many developments in Europe revealed ongoing economic weaknesses, including a controversial bailout in Cyprus, political uncertainty in Italy and high unemployment throughout the eurozone.
Economic growth in many emerging markets slowed during the period, as concerns grew about rising inflation and potential decreases in global liquidity. In addition, signs of softening in China’s economy led to a fall in commodity prices, which dragged on stocks throughout emerging markets. Central banks in both India and Brazil fought rising inflation by raising interest rates.
The recovery of the U.S. housing market remained robust. New home sales and housing starts increased, though the pace of growth slowed late in the period. Although the unemployment rate gradually edged downward, it remained well above pre-recession levels. Moreover, the number of long-term unemployed individuals, including those who dropped out of the labor market entirely, remained high. Real income grew at a modest pace, but consumer spending remained weak, consumer confidence dropped sharply and personal savings rates slowed. Economic activity in the manufacturing sector expanded during the period, though the rate of growth slowed.
U.S. Gross Domestic Product1 growth increased each quarter during the period, expanding at a rate of 0.1% during the fourth quarter of 2012 and quickening to a rate of 2.8% in the third quarter of 2013, according to preliminary estimates.
Market Review
The period began with U.S. markets retreating slightly due to the political face-off over the “fiscal cliff” and concerns about ongoing turmoil related to eurozone sovereign debt.
Equities then regained momentum in the first quarter of 2013 and began a steady rally that persisted through the duration of the period with only a few brief interruptions. The strong performance of equities was undeterred by uncertainty about government policy and concerns that the onset of automatic budget cuts—known as sequestration—would undermine economic growth. A political compromise that avoided the direst consequences of the fiscal cliff, along with improvement in the housing market, helped buoy investor confidence and fuel gains in the equity markets.
During the middle of the period equity prices fell as investors anticipated an imminent decrease in central bank liquidity. Stocks rebounded after the Fed delayed tapering its bond-purchasing program, with the S&P 500 Index1 hitting a then-record high following the announcement. Equities ended the period in a rally that was spurred by the political deal that partially resolved the government shutdown and a second standoff over the debt ceiling.
Small- and mid-cap stocks outperformed large-cap stocks during the period, and emerging markets generally underperformed developed economies. The Russell 2000® Index1 of small-company stocks returned 36.28% and the MSCI Emerging Market Index1 of emerging market stocks returned 6.90%.
Stocks in developed economies rose. Japanese equities performed well due to optimism regarding its central bank’s ambitious monetary easing schedule, which aimed to double the size of the monetary base over the next two years. International stocks made strong gains, slightly outperforming U.S. markets. The S&P 500 Index of large-company U.S. stocks returned 27.18% for the 12 months through October 2013. That compared to a 27.40% return for the MSCI EAFE Index1 of international stocks in developed markets.
Rising interest rates, widening credit spreads and uncertainty about government policy resulted in weak performance in the U.S. fixed-income market during the period. Yields on U.S. Treasury bonds increased during the period, sending prices lower. Investment-grade corporate bonds also declined. Investors sought the more attractive yields offered by high-yield corporate bonds and high-yield municipal bonds, which were among the best-performing fixed-income sectors during the period. The Barclays U.S. Aggregate Bond Index1, which tracks the broad investment-grade fixed-income market, returned -1.08% for the 12 months through October, while the Barclays U.S. Corporate High-Yield Bond Index1 returned 8.87%. Fixed-income markets in Europe generated modest returns, while fixed-income in emerging markets ended the period significantly lower, despite a modest rebound in the final months of the period.
1 For additional information, please refer to the Glossary of Terms.
HSBC FAMILY OF FUNDS 5
| Portfolio Reviews (Unaudited) |
| | | |
HSBC Prime Money Market Fund
(Class A Shares, Class B Shares, Class C Shares, Class D Shares, Class I Shares and Class Y Shares) by John Chiodi
Senior Portfolio Manager | | Moody’s and Standard & Poor’s
have assigned an “Aaa-mf” and
“AAAm” rating to the HSBC Prime
Money Market Fund.1 |
Investment Concerns
An investment in the Fund is not insured or guaranteed by the FDIC or any other government agency. Although the Fund seeks to preserve the value of your investment at $1.00 per share, it is possible to lose money by investing in the Fund.
For a complete description of these and other risks associated with investment in a mutual fund, please refer to the Fund’s prospectus.
Portfolio Performance
Prime money market yields fell and remained at low levels during the 12-month period ended October 31, 2013.
Several factors contributed to the low-yield environment. Early in the period, the Federal Reserve Board ended Operation Twist, a stimulus program through which it sold short-dated Treasuries and bought long-dated Treasuries in order to lower long-term bond yields and boost economic growth. The supply of available collateral for repurchase agreements (“repos”) on dealers’ balance sheets fell significantly when that program ended. That development led to lower yields on short-term repos.
In addition, new regulations incentivized broker/dealers to issue more long-term securities and fewer short-term securities. This development reduced the supply of short-term issues, which prime money market funds are mandated to favor in their portfolios, and caused yields on those securities to fall.
Yields also remained low due to continued concerns about the relatively weak economic recovery. In that environment, investors believed that the Federal Reserve will keep short-term interest rates at their current low levels well into 2014, and perhaps longer, in order to help stimulate the economy.
Given the projections of continued low interest rates, we looked to capture the additional yield available on longer-term securities by maintaining a relatively long weighted average maturity during the period. We also continued to favor high-quality issues with, in our opinion, superior credit fundamentals in order to provide strong market liquidity.†
† Portfolio composition is subject to change.
| | | | | | Average Annual | | | | | | | | | Expense |
| Fund Performance | | | | | | Total Return (%) | | | | | | | Yield (%)2 | | Ratio (%)3 |
| | Inception | | 1 | | 5 | | 10 | | Since | | 7-Day | | | | |
| As of October 31, 2013 | | Date | | Year | | Year | | Year | | Inception | | Average | | Gross | | Net |
| Class A | | 11/13/98 | | 0.01 | | 0.07 | | 1.47 | | | 2.08 | | | | 0.01 | | 0.69 | | 0.69 |
| Class B4 | | 4/4/01 | | -3.99 | | 0.04 | | 1.17 | | | 1.16 | | | | 0.01 | | 1.29 | | 1.29 |
| Class C5 | | 3/23/01 | | -0.99 | | 0.05 | | 1.18 | | | 1.15 | | | | 0.00 | | 1.29 | | 1.29 |
| Class D | | 4/1/99 | | 0.01 | | 0.09 | | 1.55 | | | 2.12 | | | | 0.01 | | 0.54 | | 0.54 |
| Class I | | 1/9/02 | | 0.08 | | 0.23 | | 1.81 | | | 1.77 | | | | 0.03 | | 0.19 | | 0.19 |
| Class Y | | 11/12/98 | | 0.01 | | 0.14 | | 1.70 | | | 2.37 | | | | 0.01 | | 0.29 | | 0.29 |
| Lipper Money Market | | | | | | | | | | | | | | | | | | | |
| Funds Average6 | | — | | 0.01 | | 0.09 | | 1.42 | | | 2.04 | 7 | | | N/A | | N/A | | N/A |
Past performance does not guarantee future results. The performance data quoted represents past performance and current returns may be lower or higher. Total return figures include change in share price, reinvestment of dividends and capital gains and do not reflect taxes that a shareholder would pay on Fund distributions or on the redemption of Fund shares. Investment return and principal value will fluctuate so that an investor’s shares, when redeemed may be worth more or less than the original cost. To obtain performance information current to the most recent month end, please call 1-800-782-8183.
The performance above reflects any fee waivers that have been in effect during the applicable periods, as well as any expense reimbursements that have periodically been made. Absent such waivers and reimbursements, returns would have been lower.
Certain returns shown include monies received by the Fund in respect of a one-time payment in respect of a class action settlement and a one-time reimbursement from HSBC Global Asset Management (USA) Inc. related to past marketing arrangements. As a result, the Fund’s total returns for those periods were higher than they would have been had the Fund not received the payments.
| 1 | The “Aaa-mf” and “AAAm” money market fund rating is historical and reflects Moody’s and Standard & Poor’s opinion as to the quality of the Fund’s investments, liquidity management, and operations and trading support. Periodic reviews are conducted to ensure a secure operations environment. Moody’s and Standard & Poor’s ratings represent an opinion only, not a recommendation to buy or sell. Obligations rated A-1+, A-1 or P-1 are rated in the highest short-term rating category by Standard & Poor’s (A-1+ or A-1) or Moody’s Investor Service (P-1). The obligor’s capacity to meet its financial commitments on these obligations is regarded to be “extremely strong” (A-1+), “strong” (A-1) or “superior” (P-1). |
| 2 | The seven-day yield quotation more closely reflects the current earnings of the money market fund than the total return quotation. The seven-day yield reflects voluntary fee waivers/expense reimbursements. Without the voluntary fee waivers/expense reimbursements, the yields would have been -0.51%, -1.11%, -1.11%, -0.36%, -0.01% and -0.11% for Class A Shares, Class B Shares, Class C Shares, Class D Shares, Class I Shares and Class Y Shares, respectively. |
| 3 | Reflects the expense ratio as reported in the prospectus dated February 28, 2013. |
| 4 | Reflects the applicable contingent deferred sales charge, maximum of 4.00%. Class B Shares were operational during a portion of the periods presented. Amounts reflect performance for the period of time the Class had operations, which was 211 and 147 days for the years ended October 31, 2001 and 2002, respectively. The Class was operational during the entire fiscal years from October 31, 2003 through 2013. |
| 5 | Reflects the applicable contingent deferred sales charge, maximum of 1.00%. Class C Shares were operational during a portion of the periods presented. Amounts reflect performance for the period of time the Class had operations, which was 201 days for the year ended October 31, 2001. The Class was operational during the entire fiscal years from October 31, 2002 through 2013. |
| 6 | For additional information, please refer to the Glossary of Terms. |
| 7 | Return for the period October 31, 1998 to October 31, 2013. |
6 HSBC FAMILY OF FUNDS
| Portfolio Reviews (Unaudited) |
| | | |
HSBC U.S. Government Money Market Fund
(Class A Shares, Class B Shares, Class C Shares, Class D Shares, Class I Shares and Class Y Shares) by John Chiodi
Senior Portfolio Manager | | Moody’s and Standard & Poor’s
have assigned an “Aaa-mf” and
“AAAm” rating to the
HSBC U.S. Government
Money Market Fund.1 |
Investment Concerns
An investment in the Fund is not insured or guaranteed by the FDIC or any other government agency. Although the Fund seeks to preserve the value of your investment at $1.00 per share, it is possible to lose money by investing in the Fund.
For a complete description of these and other risks associated with investment in a mutual fund, please refer to the Fund’s prospectus.
Portfolio Performance
U.S. government money market securities offered historically low yields during much of the 12-month period through October 31, 2013, despite a temporary spike in yields during the debt ceiling crisis.
Concerns about the weakness of the economic recovery prompted the Federal Reserve Board to maintain its low interest rate policy throughout the period in an effort to stimulate economic growth. The federal funds rate (a key short-term interest rate) remained within a range of 0.00% to 0.25% throughout the period.
During the period, the Federal Reserve Board ended Operation Twist, a program it had implemented to lower long-term bond yields and to help stimulate economic growth by simultaneously selling short-dated Treasuries and buying long-dated Treasuries. The supply of available collateral for repurchase agreements (“repos”) on dealers’ balance sheets fell significantly when that program ended, a development that lead to lower yields on short-term repos.
In addition, issuance of eligible money market securities by government agencies was limited during the period, as those agencies preferred to issue longer-term securities. The result of that low supply was further downward pressure on yields.
That said, toward the end of the period, the debt ceiling debate and government shutdown had a significant impact on money market securities. Yields on short-term government agency issues rose temporarily as investors worried about the potential for the government to default on its debt payments if Congress did not raise the debt ceiling.
The Fund maintained a relatively long weighted average maturity based on our outlook that interest rates would remain low for the near future. That approach enabled the Fund to capture the additional yield available from longer-term issues. We favored LIBOR-based floating rate notes for their relatively attractive yields. We also took advantage of temporary rate increases during the debt ceiling debate by investing in securities with relatively high yields.†
| † | | Portfolio composition is subject to change. |
| | | | | | Average Annual | | | | | | | | Expense |
| Fund Performance | | | | | | Total Return (%) | | | | | | Yield (%)2 | | Ratio (%)3 |
| | Inception | | 1 | | 5 | | 10 | | | Since | | | 7-Day | | | | |
| As of October 31, 2013 | | Date | | Year | | Year | | Year | | Inception | | Average | | Gross | | Net |
| Class A | | 5/3/90 | | 0.01 | | 0.04 | | 1.37 | | | 2.94 | | | 0.01 | | 0.69 | | 0.69 |
| Class B4 | | 9/11/98 | | -3.99 | | 0.03 | | 1.27 | | | 1.76 | | | 0.01 | | 1.29 | | 1.29 |
| Class C5 | | 11/20/06 | | — | | — | | — | | | 1.39 | | | — | | 1.29 | | 1.29 |
| Class D | | 4/1/99 | | 0.01 | | 0.05 | | 1.45 | | | 1.97 | | | 0.01 | | 0.54 | | 0.54 |
| Class I6 | | 12/24/03 | | 0.01 | | 0.11 | | — | | | 1.38 | | | 0.01 | | 0.19 | | 0.19 |
| Class Y | | 7/1/96 | | 0.01 | | 0.08 | | 1.59 | | | 2.61 | | | 0.01 | | 0.29 | | 0.29 |
| Lipper U.S. Government | | | | | | | | | | | | | | | | | | |
| Money Market Funds Average7 | | — | | 0.01 | | 0.05 | | 1.36 | | | 2.96 | 8 | | N/A | | N/A | | N/A |
Past performance does not guarantee future results. The performance data quoted represents past performance and current returns may be lower or higher. Total return figures include change in share price, reinvestment of dividends and capital gains and do not reflect taxes that a shareholder would pay on Fund distributions or on the redemption of Fund shares. Investment return and principal value will fluctuate so that an investor’s shares, when redeemed may be worth more or less than the original cost. To obtain performance information current to the most recent month end, please call 1-800-782-8183.
The performance above reflects any fee waivers that have been in effect during the applicable periods, as well as any expense reimbursements that have periodically been made. Absent such waivers and reimbursements, returns would have been lower.
Certain returns shown include monies received by the Fund in respect of a one-time payment in respect of a class action settlement and a one-time reimbursement from HSBC Global Asset Management (USA) Inc. related to past marketing arrangements. As a result, the Fund’s total returns for those periods were higher than they would have been had the Fund not received the payments.
| 1 | | The “Aaa-mf ” and “AAAm” money market fund rating is historical and reflects Moody’s and Standard & Poor’s opinion as to the quality of the Fund’s investments, liquidity management, and operations and trading support. Periodic reviews are conducted to ensure a secure operations environment. Moody’s and Standard & Poor’s ratings represent an opinion only, not a recommendation to buy or sell. Obligations rated A-1+, A-1 or P-1 are rated in the highest short-term rating category by Standard & Poor’s (A-1+ or A-1) or Moody’s Investor Service (P-1). The obligor’s capacity to meet its financial commitments on these obligations is regarded to be “extremely strong” (A-1+), “strong” (A-1) or “superior” (P-1). |
| 2 | | The seven-day yield quotation more closely reflects the current earnings of the money market fund than the total return quotation. The seven-day yield reflects voluntary fee waivers/expense reimbursements. Without the voluntary fee waivers/expense reimbursements, the yields would have been -0.48%, -1.08%, -0.33%, 0.02% and -0.08% for Class A Shares, Class B Shares, Class D Shares, Class I Shares and Class Y Shares, respectively. |
| 3 | | Reflects the expense ratio as reported in the prospectus dated February 28, 2013. |
| 4 | | Reflects the applicable contingent deferred sales charge, maximum of 4.00%. |
| 5 | | Reflects the applicable contingent deferred sales charge, maximum of 1.00%. Class C Shares were operational during a portion of the periods presented. Amounts reflect performance for the period of time the Class had operations, which was 346, 362 and 351 days during the years end October 31, 2006, 2009 and 2010, respectively. The Class was not operational during the entire fiscal years ended October 31, 2007, 2008, 2011, 2012 and 2013, respectively. |
| 6 | | Class I Shares were operational during a portion of the periods presented. Amounts reflect performance for the period of time the Class had operations, which was 10, 89, 136 and 357 days during the years ended October 31, 2004, 2005, 2006 and 2007, respectively. The Class was operational during the entire years ended October 31, 2008 through 2013. |
| 7 | | For additional information, please refer to the Glossary of Terms. |
| 8 | | Return for the period April 30, 1990 to October 31, 2013. |
| |
| Portfolio Reviews (Unaudited) |
| | | |
HSBC U.S. Treasury Money Market Fund
(Class A Shares, Class B Shares, Class C Shares, Class D Shares, Class I Shares and Class Y Shares) by John Chiodi
Senior Portfolio Manager | | Moody’s and Standard & Poor’s
have assigned an “Aaa-mf” and
“AAAm” rating to the
HSBC U.S. Government
Money Market Fund.1 |
Investment ConcernsAn investment in the Fund is not insured or guaranteed by the FDIC or any other government agency. Although the Fund seeks to preserve the value of your investment at $1.00 per share, it is possible to lose money by investing in the fund. The Fund’s income may be subject to the federal alternative minimum tax and to certain state and local taxes.
For a complete description of these and other risks associated with investment in a mutual fund, please refer to the Fund’s prospectus.
Portfolio Performance
Treasury bill yields generally remained low during the 12-month period ended October 31, 2013, apart from a temporary spike in yields during the October debt ceiling standoff that caused investors to worry about the possibility of the government defaulting on its debts.
Federal Reserve Board policy had a major impact on Treasury bill yields. The Fed kept the federal funds rate (a key short-term interest rate that influences T-bill yields) between 0.00% and 0.25% during the period in order to help stimulate the economy. Investors remained confident during the period that the Fed would not raise rates in the near future given the continued relative weakness of the economic recovery.
Additionally, supply-and-demand factors also impacted money market yields. Demand for Treasuries rose near the end of each calendar quarter-end, as institutional investors shifted assets into short-term, liquid securities to improve the quality of their balance sheets. That increase in demand near the end of each quarter pushed up Treasury prices, causing Treasury yields (which move in the opposite direction of prices) to fall. The Fed later increased the supply of Treasury bills by issuing cash management bills, and Treasury yields rose due to that increase in supply.
We positioned the Fund with a relatively long weighted average maturity early in the period, which enabled the Fund to lock in the relatively high yields offered by longer-term securities. We strategically positioned the Fund with a relatively short weighted average maturity in anticipation of the Treasury’s issuance of T-bills in February. The Fund shortened its weighted average maturity during the debt ceiling debate in October to ensure adequate liquidity was available and avoided securities maturing in October as much as possible.†
The Fund maintained its barbell strategy, in which the Fund’s holdings are concentrated among very short-term securities (such as Treasury bills with maturities of around one month) and longer-term issues (including Treasury coupons maturing in about one year). This approach enabled the Fund to take advantage when short-term rates rose and to ensure adequate liquidity, while still capturing the additional yield on longer-term money market securities.†
| † | | Portfolio composition is subject to change. |
| | | | | | Average Annual | | | | | | | | Expense |
| Fund Performance | | | | | | Total Return (%) | | | | | | Yield (%)2 | | Ratio (%)3 |
| | Inception | | 1 | | 5 | | 10 | | Since | | 7-Day | | | | |
| As of October 31, 2013 | | Date | | Year | | Year | | Year | | Inception | | Average | | Gross | | Net |
| Class A | | 5/24/01 | | 0.00 | | 0.02 | | 1.16 | | | 1.13 | | | 0.00 | | 0.69 | | 0.69 |
| Class B4 | | 8/12/04 | | -4.00 | | 0.02 | | — | | | 1.00 | | | 0.00 | | 1.29 | | 1.29 |
| Class C5 | | 12/24/03 | | — | | — | | — | | | 0.04 | | | — | | 1.29 | | 1.29 |
| Class D | | 5/14/01 | | 0.00 | | 0.02 | | 1.23 | | | 1.22 | | | 0.00 | | 0.54 | | 0.54 |
| Class I6 | | 12/30/03 | | 0.00 | | 0.03 | | — | | | 1.33 | | | 0.00 | | 0.19 | | 0.19 |
| Class Y | | 5/11/01 | | 0.00 | | 0.02 | | 1.36 | | | 1.38 | | | 0.00 | | 0.29 | | 0.29 |
| Lipper U.S. Treasury | | | | | | | | | | | | | | | | | | |
| Money Market Funds Average7 | | — | | 0.01 | | 0.02 | | 1.22 | | | 1.25 | 8 | | N/A | | N/A | | N/A |
Past performance does not guarantee future results. The performance data quoted represents past performance and current returns may be lower or higher. Total return figures include change in share price, reinvestment of dividends and capital gains and do not reflect taxes that a shareholder would pay on Fund distributions or on the redemption of Fund shares. Investment return and principal value will fluctuate so that an investor’s shares, when redeemed may be worth more or less than the original cost. To obtain performance information current to the most recent month end, please call 1-800-782-8183.
The performance above reflects any fee waivers that have been in effect during the applicable periods, as well as any expense reimbursements that have periodically been made. Absent such waivers and reimbursements, returns would have been lower.
Certain returns shown include monies received by the Fund in respect of a one-time payment in respect of a class action settlement and a one-time reimbursement from HSBC Global Asset Management (USA) Inc. related to past marketing arrangements. As a result, the Fund’s total returns for those periods were higher than they would have been had the Fund not received the payments.
| 1 | | The “Aaa-mf ” and “AAAm” money market fund rating is historical and reflects Moody’s and Standard & Poor’s opinion as to the quality of the Fund’s investments, liquidity management, and operations and trading support. Periodic reviews are conducted to ensure a secure operations environment. Moody’s and Standard & Poor’s ratings represent an opinion only, not a recommendation to buy or sell. Obligations rated A-1+, A-1 or P-1 are rated in the highest short-term rating category by Standard & Poor’s (A-1+ or A-1) or Moody’s Investor Service (P-1). The obligor’s capacity to meet its financial commitments on these obligations is regarded to be “extremely strong” (A-1+), “strong” (A-1) or “superior” (P-1). |
| 2 | | The seven-day yield quotation typically more closely reflects the current earnings of the money market fund than the total return quotation. The seven-day yield reflects voluntary fee waivers/expense reimbursements. Without the voluntary fee waivers/expense reimbursements, the yields would have been -0.49%, -0.34%, 0.01% and -0.09% for Class A Shares, Class D Shares, Class I Shares and Class Y Shares, respectively. |
| 3 | | Reflects the expense ratio as reported in the prospectus dated February 28, 2013. |
| 4 | | Reflects the applicable contingent deferred sales charge, maximum of 4.00%. Class B Shares were operational during a portion of the year ended October 31, 2013. Amounts reflect performance for the period of time the Class had operations, which was 249 days during the year ended October 31, 2013. The Class was operational since inception through the years ended October 31, 2012. |
| 5 | | Reflects the applicable contingent deferred sales charge, maximum of 1.00%. Class C Shares were operational during a portion of the periods presented. Amounts reflect performance for the period of time the Class had operations, which was 26 and 351 days during the years ended October 31, 2008 and 2010, respectively. The Class was operational during the entire years ended October 31, 2005, 2006, 2007 and 2009. The Class was not operational during the entire years ended October 31, 2011, 2012 and 2013, respectively. |
| 6 | | Class I Shares were operational during a portion of the periods presented. Amounts reflect performance for the period of time the Class had operations, which was 13 and 280 days during the years ended October 31, 2004 and 2005, respectively. The Class was operational during the entire years ended October 31, 2006, 2007, 2008, 2009, 2010, 2011, 2012 and 2013, respectively. |
| 7 | | For additional information, please refer to the Glossary of Terms. |
| 8 | | Return for the period April 30, 2001 to October 31, 2013. |
| |
| Portfolio Reviews |
| Portfolio Composition* |
| October 31, 2013 |
| HSBC Prime Money Market Fund |
| Investment Allocation | | Percentage of Investments at Value (%) |
| Certificates of Deposit | | | 42.3 | |
| Commercial Paper and | | | | |
| Notes | | | 29.0 | |
| U.S. Treasury Obligations | | | 14.7 | |
| Time Deposits | | | 5.3 | |
| Yankee Dollars | | | 4.2 | |
| Corporate Obligations | | | 3.9 | |
| U.S. Government and | | | | |
| Government Agency | | | | |
| Obligations | | | 0.6 | |
| Total | | | 100.0 | |
| | |
| HSBC U.S. Government Money Market Fund |
| Investment Allocation | | Percentage of Investments at Value (%) |
| U.S. Treasury Obligations | | | 57.3 | |
| Repurchase Agreements | | | 26.0 | |
| U.S. Government and | | | | |
| Government Agency | | | | |
| Obligations | | | 16.7 | |
| Total | | | 100.0 | |
| | |
| HSBC U.S. Treasury Money Market Fund |
| Investment Allocation | | Percentage of Investments at Value (%) |
| U.S. Treasury Obligations | | | 100.0 | |
| Total | | | 100.0 | |
____________________
| * | | Portfolio composition is subject to change. |
| HSBC PRIME MONEY MARKET FUND |
Schedule of Portfolio Investments—as of October 31, 2013 |
| Certificates of Deposit – 39.5% | | | | |
| | Principal | | Amortized |
| | Amount ($) | | Cost ($) |
| Banking – 39.5% | | | | |
| Bank of Montreal Chicago, | | | | |
| 0.17%, 12/12/13 | | 100,000,000 | | 100,000,000 |
| Bank of Montreal Chicago, | | | | |
| 0.17%, 12/20/13 | | 75,000,000 | | 74,999,996 |
| Bank of Nova Scotia Houston, | | | | |
| 0.18%, 12/5/13 (a) | | 45,000,000 | | 45,000,000 |
| Bank of Nova Scotia Houston, | | | | |
| 0.24%, 3/18/14 (a) | | 50,000,000 | | 50,000,000 |
| Bank of Tokyo-Mitsubishi UFJ, N.Y., | | | | |
| 0.18%, 12/3/13 | | 70,000,000 | | 70,000,000 |
| Bank of Tokyo-Mitsubishi UFJ, N.Y., | | | | |
| 0.24%, 12/11/13 | | 35,000,000 | | 35,000,000 |
| Bank of Tokyo-Mitsubishi UFJ, N.Y., | | | | |
| 0.21%, 1/13/14 | | 30,000,000 | | 30,000,000 |
| Bank of Tokyo-Mitsubishi UFJ, N.Y., | | | | |
| 0.42%, 2/12/14 | | 50,000,000 | | 50,000,000 |
| Bank of Tokyo-Mitsubishi UFJ, N.Y., | | | | |
| 0.86%, 3/7/14 (a) | | 5,800,000 | | 5,808,273 |
| Credit Agricole CIB, N.Y., | | | | |
| 0.12%, 11/1/13 | | 80,000,000 | | 80,000,000 |
| Credit Industriel et Commercial, N.Y., | | | | |
| 0.12%, 11/1/13 | | 90,000,000 | | 90,000,000 |
| Credit Industriel et Commercial, N.Y., | | | | |
| 0.15%, 11/1/13 | | 50,000,000 | | 50,000,000 |
| Credit Industriel et Commercial, N.Y., | | | | |
| 0.23%, 11/1/13 | | 55,000,000 | | 55,000,000 |
| Credit Suisse, N.Y., | | | | |
| 0.46%, 12/6/13 (a) | | 50,000,000 | | 50,000,000 |
| Credit Suisse, N.Y., | | | | |
| 0.25%, 4/22/14 | | 60,000,000 | | 60,001,428 |
| Deutsche Bank, N.Y., | | | | |
| 0.25%, 4/30/14 (a) | | 100,000,000 | | 100,000,000 |
| DnB NOR Bank ASA, N.Y., | | | | |
| 0.23%, 11/19/13 | | 35,000,000 | | 35,000,000 |
| DnB NOR Bank ASA, N.Y., | | | | |
| 0.23%, 12/3/13 | | 10,000,000 | | 10,000,000 |
| JPMorgan Chase Bank N.A., | | | | |
| 0.29%, 7/28/14 (a) | | 50,000,000 | | 50,000,000 |
| Mizuho Corporate Bank, N.Y., | | | | |
| 0.21%, 11/26/13 | | 20,000,000 | | 20,000,138 |
| Mizuho Corporate Bank, N.Y., | | | | |
| 0.22%, 1/24/14 | | 75,000,000 | | 75,000,000 |
| National Australia Bank Ltd., | | | | |
| 0.22%, 6/18/14 (a) | | 60,000,000 | | 60,000,000 |
| National Australia Bank, N.Y., | | | | |
| 1.44%, 1/30/14 (a) | | 14,075,000 | | 14,117,610 |
| Nordea Bank Finland, N.Y., | | | | |
| 0.25%, 1/3/14 | | 90,000,000 | | 90,000,000 |
| Norinchukin Bank, N.Y., | | | | |
| 0.10%, 11/1/13 | | 150,000,000 | | 150,000,000 |
| Norinchukin Bank, N.Y., | | | | |
| 0.22%, 12/4/13 | | 90,000,000 | | 90,002,377 |
| Norinchukin Bank, N.Y., | | | | |
| 0.27%, 1/29/14 (a) | | 13,850,000 | | 13,851,608 |
| Royal Bank of Canada, N.Y., | | | | |
| 0.31%, 2/3/14 (a) | | 65,000,000 | | 65,000,000 |
| Royal Bank of Canada, N.Y., | | | | |
| 0.30%, 2/19/14 (a) | | 35,000,000 | | 35,000,000 |
| Shinhan Bank, N.Y., | | | | |
| 0.38%, 11/20/13 | | 20,000,000 | | 20,000,000 |
| Skandinaviska Enskilda Bank, N.Y., | | | | |
| 0.17%, 11/6/13 | | 55,000,000 | | 55,000,000 |
| Sumitomo Mitsui Banking Corp., | | | | |
| N.Y., 0.16%, 11/1/13 | | 10,000,000 | | 10,000,000 |
| Sumitomo Mitsui Banking Corp., | | | | |
| N.Y., 0.21%, 1/29/14 | | 85,000,000 | | 85,000,000 |
| Svenska Handelsbanken, N.Y., | | | | |
| 0.22%, 12/2/13 | | 25,000,000 | | 25,000,428 |
| Svenska Handelsbanken, N.Y., | | | | |
| 0.22%, 3/24/14 | | 30,000,000 | | 30,000,590 |
| Toronto Dominion Bank, N.Y., | | | | |
| 0.22%, 11/15/13 (a) | | 65,000,000 | | 65,000,000 |
| Toronto Dominion Bank, N.Y., | | | | |
| 0.22%, 6/17/14 (a) | | 13,000,000 | | 13,000,000 |
| Toronto Dominion Bank, N.Y., | | | | |
| 0.24%, 7/28/14 (a) | | 20,000,000 | | 20,000,000 |
| |
| TOTAL CERTIFICATES | | | | |
| OF DEPOSIT | | | | |
| (COST $1,976,782,448) | | | | 1,976,782,448 |
| |
| Commercial Paper and Notes – 27.1% | | |
| |
| Banking – 14.0% | | | | |
| ANZ New Zealand International Ltd., | | | | |
| 0.28%, 4/15/14 (a)(c) | | 25,000,000 | | 25,000,000 |
| Australia & New Zealand | | | | |
| Banking Group Ltd., | | | | |
| 0.31%, 5/12/14 (a)(c) | | 25,000,000 | | 25,000,000 |
| Bank of Tokyo-Mitsubishi UFJ, N.Y., | | | | |
| 0.12%, 11/1/13 (b) | | 50,000,000 | | 50,000,000 |
| Commonwealth Bank of Australia, | | | | |
| N.Y., 0.31%, 11/15/13 (a)(c) | | 30,000,000 | | 30,001,666 |
| Commonwealth Bank of Australia, | | | | |
| N.Y., 0.23%, 11/21/13 (b)(c) | | 65,000,000 | | 64,991,875 |
| Commonwealth Bank of Australia, | | | | |
| N.Y., 0.26%, 5/16/14 (a)(c) | | 10,000,000 | | 10,000,000 |
| Commonwealth Bank of Australia, | | | | |
| N.Y., 0.25%, 9/11/14 (a)(c) | | 40,000,000 | | 40,000,000 |
| Credit Agricole North America, Inc., | | | | |
| 0.14%, 11/1/13 (b) | | 21,000,000 | | 21,000,000 |
| DBS Bank Ltd., | | | | |
| 0.24%, 1/10/14 (b)(c) | | 24,000,000 | | 23,988,800 |
| DnB NOR Bank ASA, N.Y., | | | | |
| 0.20%, 12/23/13 (b)(c) | | 30,000,000 | | 29,991,333 |
| National Australia | | | | |
| Funding Delaware, Inc., | | | | |
| 0.22%, 2/20/14 (b)(c) | | 20,000,000 | | 19,986,742 |
| Nordea Bank AB, | | | | |
| 0.18%, 11/18/13 (b)(c) | | 50,000,000 | | 49,995,750 |
| Societe Generale N.A., | | | | |
| 0.24%, 11/1/13 (b) | | 65,000,000 | | 65,000,000 |
| Societe Generale N.A., | | | | |
| 0.24%, 12/6/13 (b) | | 30,000,000 | | 29,993,146 |
| Sumitomo Mitsui Banking Corp., | | | | |
| N.Y., 0.12%, 11/1/13 (b)(c) | | 12,160,000 | | 12,160,000 |
| Svenska Handelsbanken, Inc., | | | | |
| 0.25%, 2/4/14 (b)(c) | | 20,000,000 | | 19,986,806 |
| 10 | HSBC FAMILY OF FUNDS | See notes to financial statements. |
| HSBC PRIME MONEY MARKET FUND |
Schedule of Portfolio Investments—as of October 31, 2013 (continued) |
| Commercial Paper and Notes, continued | | |
| | Principal | | Amortized |
| | Amount ($) | | Cost ($) |
| Banking, continued | | | | |
| United Overseas Bank Ltd., | | | | |
| 0.19%, 11/25/13 (b)(c) | | 30,000,000 | | 29,996,200 |
| United Overseas Bank Ltd., | | | | |
| 0.22%, 3/10/14 (b)(c) | | 25,000,000 | | 24,980,292 |
| Westpac Banking Corp., | | | | |
| 0.31%, 1/8/14 (a)(c) | | 15,000,000 | | 15,000,000 |
| Westpac Securities NZ Ltd., | | | | |
| 0.34%, 11/29/13 (a)(c) | | 85,000,000 | | 85,011,205 |
| Westpac Securities NZ Ltd., | | | | |
| 0.29%, 4/11/14 (a)(c) | | 29,000,000 | | 29,000,482 |
| | | | 701,084,297 |
| |
| Diversified – 3.6% | | | | |
| Caisse des Depots et | | | | |
| Consignations, | | | | |
| 0.20%, 11/29/13 (c) | | 30,000,000 | | 29,995,450 |
| Caisse des Depots et | | | | |
| Consignations, | | | | |
| 0.24%, 1/2/14 (c) | | 20,000,000 | | 19,991,906 |
| Caisse des Depots et | | | | |
| Consignations, | | | | |
| 0.35%, 8/29/14 (b)(c) | | 30,000,000 | | 29,912,208 |
| Erste Abwicklungsanstalt, | | | | |
| 0.20%, 2/5/14 (b)(c) | | 85,000,000 | | 84,954,667 |
| Erste Abwicklungsanstalt, | | | | |
| 0.35%, 2/12/14 (b)(c) | | 15,000,000 | | 14,984,979 |
| | | | 179,839,210 |
| Finance – 9.5% | | | | |
| Antalis US Funding Corp., | | | | |
| 0.30%, 11/8/13 (b)(c) | | 17,440,000 | | 17,438,983 |
| ASB Finance Ltd., Series GB, | | | | |
| 0.30%, 9/2/14 (a)(c) | | 25,000,000 | | 25,000,000 |
| Caisse Centrale Desjardins | | | | |
| du Quebec, | | | | |
| 0.13%, 11/1/13 (b)(c) | | 15,000,000 | | 15,000,000 |
| Caisse Centrale Desjardins | | | | |
| du Quebec, | | | | |
| 0.19%, 11/15/13 (b)(c) | | 30,000,000 | | 29,997,842 |
| Caisse Centrale Desjardins | | | | |
| du Quebec, | | | | |
| 0.24%, 2/19/14 (b)(c) | | 20,000,000 | | 19,985,333 |
| Collateralized CP Co. LLC, | | | | |
| 0.16%, 1/6/14 (b) | | 25,000,000 | | 24,992,667 |
| Collateralized CP II Co. LLC, | | | | |
| 0.17%, 12/19/13 (b)(c) | | 60,000,000 | | 59,986,400 |
| MetLife Short Term Funding LLC, | | | | |
| 0.16%, 12/10/13 (b)(c) | | 22,000,000 | | 21,996,187 |
| Natixis US Finance Co. LLC, | | | | |
| 0.14%, 11/1/13 (b) | | 95,000,000 | | 95,000,000 |
| Rabobank USA Financial Corp., | | | | |
| 0.21%, 4/2/14 (b) | | 70,000,000 | | 69,937,934 |
| Toyota Motor Credit Corp., | | | | |
| 0.27%, 11/8/13 (b) | | 50,000,000 | | 49,997,375 |
| Toyota Motor Credit Corp., | | | | |
| 0.24%, 2/4/14 (b) | | 23,000,000 | | 22,985,433 |
| Toyota Motor Credit Corp., | | | | |
| 0.28%, 5/9/14 (b) | | 20,000,000 | | 19,970,600 |
| | | | | 472,288,754 |
| |
| TOTAL COMMERCIAL | | | | |
| PAPER AND NOTES | | | | |
| (COST $1,353,212,261) | | | | 1,353,212,261 |
| |
| Corporate Obligations – 3.6% | | | | |
| Banking – 2.9% | | | | |
| JPMorgan Chase Bank N.A., | | | | |
| Series BKNT, 0.35%, 4/17/14, | | | | |
| Callable 12/9/13 @ 100 (a) | | 25,000,000 | | 25,000,000 |
| JPMorgan Chase Bank N.A., | | | | |
| Series 1, 0.37%, 10/21/14, Callable | | | | |
| 12/20/13 @ 100 (a) | | 20,000,000 | | 20,000,000 |
| Wells Fargo Bank N.A, | | | | |
| 0.30%, 10/15/14, MTN (a) | | 60,000,000 | | 60,000,000 |
| Wells Fargo Bank N.A., | | | | |
| 0.31%, 10/7/14 (a) | | 40,000,000 | | 40,000,000 |
| | | | | 145,000,000 |
| Finance – 0.6% | | | | |
| General Electric Capital Corp., | | | | |
| 5.90%, 5/13/14 | | 8,580,000 | | 8,835,715 |
| General Electric Capital | | | | |
| Corp., Series A, | | | | |
| 5.50%, 6/4/14, MTN | | 19,848,000 | | 20,455,099 |
| | | | | 29,290,814 |
| Household Products – 0.1% | | | | |
| The Procter & Gamble Co., | | | | |
| 0.70%, 8/15/14 | | 7,250,000 | | 7,274,329 |
| TOTAL CORPORATE | | | | |
| OBLIGATIONS | | | | |
| (COST $181,565,143) | | | | 181,565,143 |
| |
| Yankee Dollars – 3.9% | | | | |
| Banking – 3.4% | | | | |
| Barclays Bank plc, | | | | |
| 2.38%, 1/13/14 | | 12,100,000 | | 12,149,598 |
| National Australia Bank Ltd., | | | | |
| 0.97%, 11/8/13 (a)(c) | | 15,800,000 | | 15,802,538 |
| Royal Bank of Canada, | | | | |
| 0.48%, 12/20/13, MTN (a) | | 50,000,000 | | 50,022,616 |
| Toronto Dominion Bank, | | | | |
| 0.72%, 11/1/13, MTN (a) | | 42,870,000 | | 42,870,000 |
| Westpac Banking Corp., | | | | |
| 0.98%, 3/31/14 (a)(c) | | 15,750,000 | | 15,795,802 |
| Westpac Banking Corp., | | | | |
| 0.40%, 10/1/14, MTN, | | | | |
| Callable 12/31/13 @ 100 (d) | | 35,000,000 | | 35,000,000 |
| | | | 171,640,554 |
| See notes to financial statements. | HSBC FAMILY OF FUNDS | 11 |
| HSBC PRIME MONEY MARKET FUND |
Schedule of Portfolio Investments—as of October 31, 2013 (continued) |
| Commercial Paper and Notes, continued | | |
| | Principal | | Amortized |
| | Amount ($) | | Cost ($) |
| Commercial Banks – 0.5% | | | | |
| Commonwealth Bank of Australia, | | | | |
| 0.98%, 3/17/14 (a)(c) | | 12,500,000 | | 12,534,265 |
| Commonwealth Bank of Australia, | | | | |
| 2.13%, 3/17/14 (c) | | 10,000,000 | | 10,068,205 |
| | | | | 22,602,470 |
| |
| TOTAL YANKEE DOLLARS | | | | |
| (COST $194,243,024) | | | | 194,243,024 |
| |
| U.S. Government and Government Agency Obligations – 0.6% |
| Federal Farm Credit Bank – 0.6% | | | | |
| 0.19%, 12/20/13(a), Series 2 | | 30,000,000 | | 30,000,000 |
| | | | | |
| TOTAL U.S. GOVERNMENT | | | | |
| AND GOVERNMENT | | | | |
| AGENCY OBLIGATIONS | | | | |
| (COST $30,000,000) | | | | 30,000,000 |
| |
| U.S. Treasury Obligations – 13.8% | | | | |
| U.S. Treasury Bills – 7.0% | | | | |
| 0.24%, 11/7/13(b) | | 150,000,000 | | 149,994,033 |
| 0.15%, 11/14/13(b) | | 100,000,000 | | 99,994,746 |
| 0.16%, 11/29/13(b) | | 100,000,000 | | 99,987,556 |
| | | | | 349,976,335 |
| U.S. Treasury Notes – 6.8% | | | | |
| 4.25%, 11/15/13 | | 50,000,000 | | 50,076,662 |
| 1.50%, 12/31/13 | | 35,000,000 | | 35,073,959 |
| 1.88%, 2/28/14 | | 50,000,000 | | 50,275,907 |
| 1.75%, 3/31/14 | | 50,000,000 | | 50,321,428 |
| 2.25%, 5/31/14 | | 50,000,000 | | 50,606,053 |
| 2.38%, 8/31/14 | | 50,000,000 | | 50,914,764 |
| 2.38%, 9/30/14 | | 50,000,000 | | 50,994,186 |
| | | | | 338,262,959 |
| |
| TOTAL U.S. TREASURY | | | | |
| OBLIGATIONS | | | | |
| (COST $688,239,294) | | | | 688,239,294 |
| | | | | |
| Time Deposits – 5.0% | | | | |
| | | | | |
| Abbey National Treasury | | | | |
| Services plc, 0.10%, 11/1/13 | | 100,000,000 | | 100,000,000 |
| ABN AMRO Bank NV, | | | | |
| 0.12%, 11/1/13 | | 150,000,000 | | 150,000,000 |
|
| TOTAL TIME DEPOSITS | | | | |
| (COST $250,000,000) | | | | 250,000,000 |
| |
| TOTAL INVESTMENT | | | | |
| SECURITIES (COST | | | | |
| $4,674,042,170) — 93.5% | | | | 4,674,042,170 |
____________________
| Percentages indicated are based on net assets of $4,999,355,098. |
| (a) | | Variable rate security. The interest rates on these securities are adjusted periodically to reflect then-current short-term interest rates. The rates presented represent the rates in effect on October 31, 2013. The maturity dates presented reflect the final maturity dates. However, some of these securities may contain put or demand features that allow the Fund to require the issuer to repurchase the security from the fund within various time periods, including daily, weekly, monthly, or semi-annually. |
| (b) | | Rate presented represents the effective yield at time of purchase. |
| (c) | | Rule 144A security or other security which is restricted as to resale to institutional investors. This security has been deemed liquid by the Investment Adviser based on procedures approved by the Board of Trustees. |
| (d) | | Step Bond. Income recognition is on the effective yield method for Step Bonds. |
LLC — Limited Liability Company
MTN — Medium Term Note |
| 12 | HSBC FAMILY OF FUNDS | See notes to financial statements. |
| HSBC U.S. GOVERNMENT MONEY MARKET FUND |
Schedule of Portfolio Investments—as of October 31, 2013 |
| U.S. Government and Government Agency Obligations – 16.6% |
| | Principal | | Amortized |
| | Amount ($) | | Cost ($) |
| Federal Farm Credit Bank – 3.5% | | | | |
| 0.19%, 12/13/13 | | 7,500,000 | | 7,500,064 |
| 0.19%, 12/20/13(a), Series 2 | | 6,000,000 | | 6,000,000 |
| 0.23%, 12/30/13(a) | | 8,000,000 | | 8,000,522 |
| 0.18%, 1/14/14(a) | | 7,500,000 | | 7,499,848 |
| 0.03%, 2/10/14(a) | | 18,000,000 | | 17,995,885 |
| 0.11%, 3/26/14(a), Series 1 | | 23,500,000 | | 23,500,153 |
| 0.12%, 6/6/14(a) | | 30,000,000 | | 29,998,188 |
| 0.16%, 6/11/14 | | 15,000,000 | | 14,998,880 |
| 0.11%, 10/24/14(a), Series 1 | | 18,000,000 | | 17,999,092 |
| 0.18%, 2/27/15(a) | | 3,695,000 | | 3,696,483 |
| 0.21%, 7/24/15(a) | | 7,500,000 | | 7,509,217 |
| | | | 144,698,332 |
| Federal Home Loan Bank – 7.5% | | | | |
| 0.13%, 11/8/13 | | 6,850,000 | | 6,849,910 |
| 0.10%, 11/20/13, Series 2 | | 25,000,000 | | 24,999,905 |
| 0.38%, 11/27/13 | | 11,000,000 | | 11,002,082 |
| 0.13%, 12/6/13 | | 11,550,000 | | 11,549,252 |
| 0.13%, 12/10/13 | | 7,000,000 | | 6,999,569 |
| 0.34%, 12/18/13 | | 4,300,000 | | 4,300,704 |
| 0.16%, 12/20/13(a) | | 30,000,000 | | 30,001,630 |
| 0.16%, 3/3/14(b) | | 45,000,000 | | 44,976,362 |
| 0.17%, 3/24/14(b) | | 15,000,000 | | 14,990,169 |
| 0.13%, 3/27/14 | | 18,000,000 | | 17,997,349 |
| 0.11%, 6/5/14(a) | | 75,000,000 | | 74,997,478 |
| 0.10%, 6/27/14(a), Series 1 | | 15,000,000 | | 14,999,019 |
| 0.19%, 7/22/14 | | 25,000,000 | | 24,997,658 |
| 0.13%, 7/25/14 | | 15,000,000 | | 14,994,887 |
| 0.11%, 9/2/14(a) | | 15,000,000 | | 14,999,372 |
| | | | 318,655,346 |
| Federal Home Loan Mortgage Corp. – 4.2% | | |
| 0.15%, 12/20/13(b) | | 19,000,000 | | 18,996,121 |
| 0.16%, 10/16/15(a) | | 160,000,000 | | 160,000,000 |
| | | | | 178,996,121 |
| Federal National Mortgage Association – 1.4% | | |
| 0.09%, 2/5/14(b) | | 12,734,000 | | 12,730,842 |
| 0.88%, 8/28/14 | | 7,500,000 | | 7,543,200 |
| 0.63%, 10/30/14 | | 31,573,000 | | 31,718,687 |
| 0.46%, 11/21/14(a), Series 1 | | 6,000,000 | | 6,022,416 |
| 0.34%, 1/27/15(a) | | 3,065,000 | | 3,073,639 |
| | | | | 61,088,784 |
|
| TOTAL U.S. GOVERNMENT | | | | |
| AND GOVERNMENT | | | | |
| AGENCY OBLIGATIONS | | | | |
| (COST $703,438,583) | | | | 703,438,583 |
| | | | | |
| U.S. Treasury Obligations – 57.2% | | | | |
| |
| U.S. Treasury Bills – 30.8% | | | | |
| 0.21%, 11/14/13(b) | | 725,000,000 | | 724,943,820 |
| 0.10%, 11/21/13(b) | | 280,000,000 | | 279,984,047 |
| 0.12%, 12/5/13(b) | | 150,000,000 | | 149,983,354 |
| 0.13%, 4/24/14(b) | | 150,000,000 | | 149,907,563 |
| | | | | 1,304,818,784 |
| |
| U.S. Treasury Notes – 26.4% | | | | |
| 0.50%, 11/15/13 | | 425,000,000 | | 425,057,626 |
| 4.25%, 11/15/13 | | 30,000,000 | | 30,046,403 |
| 2.00%, 11/30/13 | | 215,000,000 | | 215,305,058 |
| 0.75%, 12/15/13 | | 50,000,000 | | 50,032,305 |
| 1.25%, 2/15/14 | | 75,000,000 | | 75,229,947 |
| 1.75%, 3/31/14 | | 15,000,000 | | 15,096,123 |
| 1.25%, 4/15/14 | | 15,000,000 | | 15,073,456 |
| 2.38%, 9/30/14 | | 200,000,000 | | 203,980,839 |
| 0.50%, 10/15/14 | | 34,500,000 | | 34,624,651 |
| 4.25%, 11/15/14 | | 50,000,000 | | 52,117,946 |
| | | | 1,116,564,354 |
| |
| TOTAL U.S. TREASURY | | | | |
| OBLIGATIONS | | | | |
| (COST $2,421,383,138) | | | | 2,421,383,138 |
| |
| Repurchase Agreements – 26.0% | | | | |
| |
| Merrill Lynch Pierce, Fenner | | | | |
| & Smith, Inc. purchased on | | | | |
| 10/31/13, 0.09%, due on | | | | |
| 11/7/13 with a maturity value | | | | |
| of $150,002,625, collateralized | | | | |
| by various U.S. Government | | | | |
| and Government Agency | | | | |
| Obligations, 2.39%-3.00%, | | | | |
| 4/1/33-4/1/43, fair value | | | | |
| $153,000,001 | . | 150,000,000 | | 150,000,000 |
| Barclays Capital Group, purchased | | | | |
| on 10/31/13, 0.07%, due on | | | | |
| 11/7/13 with a maturity value | | | | |
| of $250,003,403, collateralized | | | | |
| by various U.S. Government | | | | |
| and Government Agency | | | | |
| Obligations, 3.50%-5.00%, | | | | |
| 2/15/39-10/20/62, fair value | | | | |
| $255,000,001 | | 250,000,000 | | 250,000,000 |
| BNP Paribas, purchased on | | | | |
| 10/31/13, 0.11%, due on | | | | |
| 11/1/13 with a maturity value | | | | |
| of $250,000,764, collateralized | | | | |
| by various U.S. Government | | | | |
| and Government Agency | | | | |
| Obligations, 3.00%-4.50%, | | | | |
| 2/1/27-5/1/43, fair value | | | | |
| $255,000,000 | | 250,000,000 | | 250,000,000 |
| See notes to financial statements. | HSBC FAMILY OF FUNDS | 13 |
| HSBC U.S. GOVERNMENT MONEY MARKET FUND |
Schedule of Portfolio Investments—as of October 31, 2013 (continued) |
| Repurchase Agreements, continued | | |
| | Principal | | Amortized |
| | Amount ($) | | Cost ($) |
| Citigroup Global Markets, purchased | | | | |
| on 10/31/13, 0.10%, due on | | | | |
| 11/1/13 with a maturity value | | | | |
| of $250,000,694, collateralized by | | | | |
| various U.S. Government | | | | |
| and Government Agency | | | | |
| Obligations, 1.95%-6.50%, | | | | |
| 11/1/19-10/1/43, fair value | | | | |
| $255,000,000 | | 250,000,000 | | 250,000,000 |
| Deutsche Bank, purchased | | | | |
| on 10/31/13, 0.12%, due on | | | | |
| 11/1/13 with a maturity value | | | | |
| of $200,000,667, collateralized | | | | |
| by various U.S. Government | | | | |
| and Government Agency | | | | |
| Obligations, 3.00%-4.00%, | | | | |
| 11/1/26-8/1/43, fair value | | | | |
| $204,000,000 | | 200,000,000 | | 200,000,000 |
| |
| TOTAL REPURCHASE | | | | |
| AGREEMENTS | | | | |
| (COST $1,100,000,000) | | | | 1,100,000,000 |
| |
| TOTAL INVESTMENT | | | | |
| SECURITIES (COST | | | | |
| $4,224,821,721) — 99.8% | | | | 4,224,821,721 |
____________________
| Percentages indicated are based on net assets of $4,233,130,504. |
| (a) | | Variable rate security. The rate presented represents the rate in effect at October 31, 2013. These securities are deemed to have a maturity remaining until the next adjustment of the interest rate or the longer of the demand period or time to the next readjustment. |
| (b) | | Discount note. Rate presented represents the effective yield at time of purchase. |
| 14 | HSBC FAMILY OF FUNDS | See notes to financial statements. |
| HSBC U.S. TREASURY MONEY MARKET FUND |
| Schedule of Portfolio Investments–as of October 31, 2013 |
| U.S. Treasury Obligations – 99.5% |
| | Principal | | Amortized |
| | Amount ($) | | Cost ($) |
| U.S. Treasury Bills – 52.2% | | | | |
| 0.14%, 11/7/13 (a) | | 217,000,000 | | 216,996,142 |
| 0.14%, 11/14/13 (a) | | 908,000,000 | | 907,950,029 |
| 0.16%, 11/29/13 (a) | | 75,000,000 | | 74,990,667 |
| 0.05%, 12/19/13 (a) | | 75,000,000 | | 74,995,001 |
| 0.03%, 1/2/14 (a) | | 70,000,000 | | 69,996,082 |
| | | | | 1,344,927,921 |
| U.S. Treasury Notes – 47.3% | | | | |
| 0.50%, 11/15/13 | | 325,000,000 | | 325,054,584 |
| 4.25%, 11/15/13 | | 125,000,000 | | 125,200,270 |
| 2.00%, 11/30/13 | | 225,000,000 | | 225,336,259 |
| 0.75%, 12/15/13 | | 65,000,000 | | 65,050,462 |
| 1.00%, 1/15/14 | | 150,000,000 | | 150,280,534 |
| 4.00%, 2/15/14 | | 10,000,000 | | 10,112,855 |
| 0.25%, 2/28/14 | | 40,000,000 | | 40,012,571 |
| 1.25%, 3/15/14 | | 125,000,000 | | 125,532,255 |
| 0.63%, 7/15/14 | | 30,000,000 | | 30,095,755 |
| 2.38%, 8/31/14 | | 25,000,000 | | 25,457,708 |
| 2.38%, 10/31/14 | | 25,000,000 | | 25,557,816 |
| 4.25%, 11/15/14 | | 65,000,000 | | 67,757,229 |
| | | | | 1,215,448,298 |
| |
| TOTAL U.S. TREASURY OBLIGATIONS (COST $2,560,376,219) | | | | 2,560,376,219 |
| |
| TOTAL INVESTMENT SECURITIES — 99.5% | | | | 2,560,376,219 |
____________________
Percentages indicated are based on net assets of $2,572,320,882. |
| (a) | | Discount note. Rate presented represents the effective yield at time of purchase. |
| See notes to financial statements. | HSBC FAMILY OF FUNDS 15 |
HSBC FAMILY OF FUNDS
Statements of Assets and Liabilities—as of October 31, 2013
| | | | | | U.S. | | | | | | |
| Prime | | Government | | U.S. Treasury |
| Money Market | | Money Market | | Money Market |
| Fund | | Fund | | Fund |
| Assets: | | | | | | | | | | | | | | | | |
| Investments, at value and amortized cost | | $ | 4,674,042,170 | | | | $ | 3,124,821,721 | | | | | $ | 2,560,376,219 | | |
| Repurchase agreements, at value and cost | | | — | | | | | 1,100,000,000 | | | | | | — | | |
| Total Investments | | | 4,674,042,170 | | | | | 4,224,821,721 | | | | | | 2,560,376,219 | | |
| Cash | | | 322,081,559 | | | | | 3,566,463 | | | | | | 4,733,511 | | |
| Interest receivable | | | 4,034,903 | | | | | 5,300,727 | | | | | | 7,467,502 | | |
| Receivable for capital shares issued | | | 78,396 | | | | | 35,021 | | | | | | — | | |
| Prepaid expenses | | | 103,900 | | | | | 107,809 | | | | | | 73,083 | | |
| Total Assets | | | 5,000,340,928 | | | | | 4,233,831,741 | | | | | | 2,572,650,315 | | |
| | | | | | |
| Liabilities: | | | | | | | | | | | | | | | | |
| Dividends payable | | | 97,723 | | | | | 39,714 | | | | | | — | | |
| Accrued expenses and other liabilities: | | | | | | | | | | | | | | | | |
| Investment Management | | | 376,642 | | | | | 275,690 | | | | | | 117,076 | | |
| Administration | | | 204,269 | | | | | 153,503 | | | | | | 77,925 | | |
| Compliance Services | | | 259 | | | | | 47 | | | | | | 130 | | |
| Accounting | | | 373 | | | | | 252 | | | | | | 451 | | |
| Custodian | | | 71,446 | | | | | 58,670 | | | | | | 33,530 | | |
| Transfer Agent | | | 8,154 | | | | | 6,034 | | | | | | 6,055 | | |
| Trustee | | | 15,190 | | | | | 4,454 | | | | | | 130 | | |
| Other | | | 211,774 | | | | | 162,873 | | | | | | 94,136 | | |
| Total Liabilities | | | 985,830 | | | | | 701,237 | | | | | | 329,433 | | |
| Net Assets | | $ | 4,999,355,098 | | | | $ | 4,233,130,504 | | | | | $ | 2,572,320,882 | | |
| | | | | | |
| Composition of Net Assets: | | | | | | | | | | | | | | | | |
| Capital | | | 4,999,346,354 | | | | | 4,233,220,928 | | | | | | 2,572,370,281 | | |
| Accumulated net realized gains (losses) from investments | | | 8,744 | | | | | (90,424 | ) | | | | | (49,399 | ) | |
| Net Assets | | $ | 4,999,355,098 | | | | $ | 4,233,130,504 | | | | | $ | 2,572,320,882 | | |
| | | | | | |
| Net Assets: | | | | | | | | | | | | | | | | |
| Class A Shares | | $ | 42,158,371 | | | | $ | 428,135 | | | | | $ | 5,099 | | |
| Class B Shares | | | 28,181 | | | | | 48,741 | | | | | | — | | |
| Class C Shares | | | 2 | | | | | — | | | | | | — | | |
| Class D Shares | | | 1,288,077,154 | | | | | 670,892,508 | | | | | | 517,845,253 | | |
| Class I Shares | | | 3,121,056,022 | | | | | 1,156,893,808 | | | | | | 1,086,180,728 | | |
| Class Y Shares | | | 548,035,368 | | | | | 2,404,867,312 | | | | | | 968,289,802 | | |
| | | $ | 4,999,355,098 | | | | $ | 4,233,130,504 | | | | | $ | 2,572,320,882 | | |
| Shares Outstanding | | | | | | | | | | | | | | | | |
| ($0.001 par value, unlimited number of shares authorized): | | | | | | | | | | | | | | | | |
| Class A Shares | | | 42,158,898 | | | | | 428,148 | | | | | | 5,091 | | |
| Class B Shares | | | 28,210 | | | | | 48,730 | | | | | | — | | |
| Class C Shares | | | 2 | | | | | — | | | | | | — | | |
| Class D Shares | | | 1,288,015,088 | | | | | 670,724,760 | | | | | | 517,853,599 | | |
| Class I Shares | | | 3,121,128,793 | | | | | 1,157,028,933 | | | | | | 1,086,229,016 | | |
| Class Y Shares | | | 548,029,587 | | | | | 2,404,990,715 | | | | | | 968,287,545 | | |
| Net Asset Value, Offering Price and Redemption Price per share: | | | | | | | | | | | | | | | | |
| Class A Shares | | $ | 1.00 | | | | $ | 1.00 | | | | | $ | 1.00 | | |
| Class B Shares(a) | | $ | 1.00 | | | | $ | 1.00 | | | | | $ | — | | |
| Class C Shares(a) | | $ | 1.00 | | | | $ | — | | | | | $ | — | | |
| Class D Shares | | $ | 1.00 | | | | $ | 1.00 | | | | | $ | 1.00 | | |
| Class I Shares | | $ | 1.00 | | | | $ | 1.00 | | | | | $ | 1.00 | | |
| Class Y Shares | | $ | 1.00 | | | | $ | 1.00 | | | | | $ | 1.00 | | |
____________________ (a) Redemption Price per share varies by length of time shares are held.
| 16 HSBC FAMILY OF FUNDS | See notes to financial statements. |
HSBC FAMILY OF FUNDS
Statements of Operations—For the year ended October 31, 2013
| | | | | | | U.S. | | | | | | |
| Prime | | Government | | U.S. Treasury |
| Money Market | | Money Market | | Money Market |
| Fund | | Fund | | Fund |
| Investment Income: | | | | | | | | | | | | | | | | | |
| Interest | | $ | 12,606,310 | | | | | $ | 6,812,816 | | | | | $ | 2,335,533 | | |
| Total Investment Income | | | 12,606,310 | | | | | | 6,812,816 | | | | | | 2,335,533 | | |
| | | | | | |
| Expenses: | | | | | | | | | | | | | | | | | |
| Investment Management | | | 5,131,209 | | | | | | 4,745,532 | | | | | | 2,566,350 | | |
| Advisory Services: | | | | | | | | | | | | | | | | | |
| Operational Support - Class A Shares | | | 40,057 | | | | | | 18,952 | | | | | | 4 | | |
| Operational Support - Class B Shares | | | 32 | | | | | | 61 | | | | | | — | | |
| Operational Support - Class C Shares | | | 2 | | | | | | — | | | | | | — | | |
| Operational Support - Class D Shares | | | 1,359,346 | | | | | | 614,527 | | | | | | 656,884 | | |
| Operational Support - Class Y Shares | | | 619,399 | | | | | | 2,566,083 | | | | | | 1,343,234 | | |
| Administration: | | | | | | | | | | | | | | | | | |
| Class A Shares | | | 19,937 | | | | | | 9,312 | | | | | | 2 | | |
| Class B Shares | | | 15 | | | | | | 31 | | | | | | — | | |
| Class D Shares | | | 675,695 | | | | | | 305,595 | | | | | | 325,809 | | |
| Class I Shares | | | 1,546,685 | | | | | | 768,238 | | | | | | 281,884 | | |
| Class Y Shares | | | 308,099 | | | | | | 1,274,738 | | | | | | 667,932 | | |
| Distribution: | | | | | | | | | | | | | | | | | |
| Class B Shares | | | 241 | | | | | | 459 | | | | | | 5 | | |
| Class C Shares | | | 10 | | | | | | — | | | | | | — | | |
| Shareholder Servicing: | | | | | | | | | | | | | | | | | |
| Class A Shares | | | 160,114 | | | | | | 75,809 | | | | | | 22 | | |
| Class B Shares | | | 80 | | | | | | 152 | | | | | | 2 | | |
| Class C Shares | | | 3 | | | | | | — | | | | | | — | | |
| Class D Shares | | | 3,396,688 | | | | | | 1,536,330 | | | | | | 1,642,223 | | |
| Accounting | | | 77,399 | | | | | | 68,524 | | | | | | 66,255 | | |
| Compliance Services | | | 110,467 | | | | | | 100,146 | | | | | | 54,603 | | |
| Custodian | | | 306,828 | | | | | | 272,011 | | | | | | 155,093 | | |
| Printing | | | 161,588 | | | | | | 53,656 | | | | | | 13,772 | | |
| Professional | | | 407,211 | | | | | | 362,247 | | | | | | 216,569 | | |
| Transfer Agent | | | 49,211 | | | | | | 36,333 | | | | | | 36,424 | | |
| Trustee | | | 322,451 | | | | | | 300,630 | | | | | | 154,014 | | |
| Registration fees | | | 81,964 | | | | | | 79,344 | | | | | | 77,694 | | |
| Other | | | 274,538 | | | | | | 159,470 | | | | | | 119,978 | | |
| Total expenses before fee reductions | | | 15,049,269 | | | | | | 13,348,180 | | | | | | 8,378,753 | | |
| Fees voluntarily reduced/reimbursed by Investment Adviser | | | (1,474,820 | ) | | | | | (4,977,753 | ) | | | | | (4,055,018 | ) | |
| Fees voluntarily reduced by Administrator | | | (6,088 | ) | | | | | (489,242 | ) | | | | | (325,686 | ) | |
| Fees voluntarily reduced/reimbursed by Distributor | | | (251 | ) | | | | | (459 | ) | | | | | (5 | ) | |
| Fees voluntarily reduced/reimbursed by Shareholder Servicing Agent | | | (3,550,514 | ) | | | | | (1,612,291 | ) | | | | | (1,642,247 | ) | |
| Fees paid indirectly | | | — | | | | | | (31,032 | ) | | | | | (20,264 | ) | |
| Net Expenses | | | 10,017,596 | | | | | | 6,237,403 | | | | | | 2,335,533 | | |
| | | | | | |
| Net Investment Income | | | 2,588,714 | | | | | | 575,413 | | | | | | — | | |
| | | | | | |
| Net realized gains (losses) from investments | | | 8,744 | | | | | | (86,858 | ) | | | | | (37,989 | ) | |
| Change In Net Assets Resulting From Operations | | $ | 2,597,458 | | | | | $ | 488,555 | | | | | $ | (37,989 | ) | |
| See notes to financial statements. | HSBC FAMILY OF FUNDS 17 |
HSBC FAMILY OF FUNDS
Statements of Changes in Net Assets
| Prime | | U.S. Government |
| Money Market Fund | | Money Market Fund |
| For the | For the | | For the | For the |
| year ended | year ended | | year ended | year ended |
| October 31, 2013 | October 31, 2012 | | October 31, 2013 | October 31, 2012 |
| Investment Activities: | | | | | | | | | | | | | | | | | | | | |
| Operations: | | | | | | | | | | | | | | | | | | | | |
| Net investment income | | $ | 2,588,714 | | | | $ | 5,657,344 | | | | | $ | 575,413 | | | | $ | 589,074 | |
| Net realized gains (losses) from investments | | | 8,744 | | | | | 24,826 | | | | | | (86,858 | ) | | | | 2,240 | |
| Change in net assets resulting from operations | | | 2,597,458 | | | | | 5,682,170 | | | | | | 488,555 | | | | | 591,314 | |
| | | | | | |
| Dividends: | | | | | | | | | | | | | | | | | | | | |
| Net investment income: | | | | | | | | | | | | | | | | | | | | |
| Class A Shares | | | (4,311 | ) | | | | (2,958 | ) | | | | | (1,885 | ) | | | | (169 | ) |
| Class B Shares | | | (4 | ) | | | | (7 | ) | | | | | (6 | ) | | | | (8 | ) |
| Class C Shares | | | (1 | ) | | | | (4 | ) | | | | | — | | | | | — | |
| Class D Shares | | | (145,852 | ) | | | | (143,373 | ) | | | | | (62,841 | ) | | | | (64,809 | ) |
| Class I Shares | | | (2,366,911 | ) | | | | (5,344,845 | ) | | | | | (248,433 | ) | | | | (290,312 | ) |
| Class Y Shares | | | (71,635 | ) | | | | (166,157 | ) | | | | | (262,248 | ) | | | | (233,776 | ) |
| Net realized gains: | | | | | | | | | | | | | | | | | | | | |
| Class A Shares | | | (78 | ) | | | | — | | | | | | — | | | | | (35 | ) |
| Class B Shares | | | — | | | | | — | | | | | | — | | | | | (1 | ) |
| Class D Shares | | | (2,967 | ) | | | | — | | | | | | — | | | | | (7,445 | ) |
| Class I Shares | | | (7,143 | ) | | | | — | | | | | | — | | | | | (19,650 | ) |
| Class Y Shares | | | (1,258 | ) | | | | — | | | | | | — | | | | | (18,416 | ) |
| Change in net assets resulting from | | | | | | | | | | | | | | | | | | | | |
| shareholder dividends | | | (2,600,160 | ) | | | | (5,657,344 | ) | | | | | (575,413 | ) | | | | (634,621 | ) |
| | | | | | |
| Change in net assets resulting from | | | | | | | | | | | | | | | | | | | | |
| capital transactions | | | 18,941,569 | | | | | (1,590,758,408 | ) | | | | | (760,210,896 | ) | | | | 885,763,811 | |
| Change in net assets | | | 18,938,867 | | | | | (1,590,733,582 | ) | | | | | (760,297,754 | ) | | | | 885,720,504 | |
| | | | | | |
| Net Assets: | | | | | | | | | | | | | | | | | | | | |
| Beginning of period | | | 4,980,416,231 | | | | | 6,571,149,813 | | | | | | 4,993,428,258 | | | | | 4,107,707,754 | |
| End of period | | $ | 4,999,355,098 | | | | $ | 4,980,416,231 | | | | | $ | 4,233,130,504 | | | | $ | 4,993,428,258 | |
| Accumulated net investment income | | $ | — | | | | $ | — | | | | | $ | — | | | | $ | 2 | |
| 18 HSBC FAMILY OF FUNDS | See notes to financial statements. |
HSBC FAMILY OF FUNDS
Statements of Changes in Net Assets (continued)
| Prime | | U.S. Government |
| Money Market Fund | | Money Market Fund |
| For the | For the | | For the | For the |
| year ended | year ended | | year ended | year ended |
| October 31, 2013 | October 31, 2012 | | October 31, 2013 | October 31, 2012 |
| CAPITAL TRANSACTIONS:* | | | | | | | | | | | | | | | | | | | | | |
| Class A Shares: | | | | | | | | | | | | | | | | | | | | | |
| Proceeds from shares issued | | $ | 10,044,534 | | | | $ | 11,405,354 | | | | | $ | 100,773,881 | | | | $ | 12,635,616 | | |
| Dividends reinvested | | | 149 | | | | | 102 | | | | | | 385 | | | | | 18 | | |
| Value of shares redeemed | | | (1,432,410 | ) | | | | (5,622,050 | ) | | | | | (100,584,674 | ) | | | | (16,391,097 | ) | |
| Class A Shares capital transactions | | | 8,612,273 | | | | | 5,783,406 | | | | | | 189,592 | | | | | (3,755,463 | ) | |
| | | | | | |
| Class B Shares: | | | | | | | | | | | | | | | | | | | | | |
| Proceeds from shares issued | | | — | | | | | 19,430 | | | | | | — | | | | | — | | |
| Dividends reinvested | | | 4 | | | | | 6 | | | | | | 6 | | | | | 9 | | |
| Value of shares redeemed | | | (13,118 | ) | | | | (110,006 | ) | | | | | (27,646 | ) | | | | (17,135 | ) | |
| Class B Shares capital transactions | | | (13,114 | ) | | | | (90,570 | ) | | | | | (27,640 | ) | | | | (17,126 | ) | |
| | | | | | |
| Class C Shares: | | | | | | | | | | | | | | | | | | | | | |
| Proceeds from shares issued | | | 373 | | | | | 745 | | | | | | — | | | | | — | | |
| Dividends reinvested | | | 1 | | | | | 4 | | | | | | — | | | | | — | | |
| Value of shares redeemed | | | (6,130 | ) | | | | (777 | ) | | | | | — | | | | | — | | |
| Class C Shares capital transactions | | | (5,756 | ) | | | | (28 | ) | | | | | — | | | | | — | | |
| | | | | | |
| Class D Shares: | | | | | | | | | | | | | | | | | | | | | |
| Proceeds from shares issued | | | 5,119,755,763 | | | | | 5,747,496,581 | | | | | | 2,284,815,817 | | | | | 2,112,895,877 | | |
| Dividends reinvested | | | 109,668 | | | | | 112,060 | | | | | | 29,381 | | | | | 41,463 | | |
| Value of shares redeemed | | | (5,135,614,581 | ) | | | | (6,035,401,728 | ) | | | | | (2,228,438,235 | ) | | | | (2,244,889,380 | ) | |
| Class D Shares capital transactions | | | (15,749,150 | ) | | | | (287,793,087 | ) | | | | | 56,406,963 | | | | | (131,952,040 | ) | |
| | | | | | |
| Class I Shares: | | | | | | | | | | | | | | | | | | | | | |
| Proceeds from shares issued | | | 26,195,455,773 | | | | | 37,580,221,468 | | | | | | 10,153,237,542 | | | | | 15,350,488,166 | | |
| Dividends reinvested | | | 1,231,509 | | | | | 2,814,430 | | | | | | 152,717 | | | | | 206,034 | | |
| Value of shares redeemed | | | (26,101,317,973 | ) | | | | (38,866,710,107 | ) | | | | | (10,869,649,354 | ) | | | | (15,123,273,533 | ) | |
| Class I Shares capital transactions | | | 95,369,309 | | | | | (1,283,674,209 | ) | | | | | (716,259,095 | ) | | | | 227,420,667 | | |
| | | | | | |
| Class Y Shares: | | | | | | | | | | | | | | | | | | | | | |
| Proceeds from shares issued | | | 1,790,806,941 | | | | | 2,112,812,015 | | | | | | 20,359,087,706 | | | | | 16,530,799,457 | | |
| Dividends reinvested | | | 66,154 | | | | | 146,189 | | | | | | 259,866 | | | | | 250,271 | | |
| Value of shares redeemed | | | (1,860,145,088 | ) | | | | (2,137,942,124 | ) | | | | | (20,459,868,288 | ) | | | | (15,736,981,955 | ) | |
| Class Y Shares capital transactions | | | (69,271,993 | ) | | | | (24,983,920 | ) | | | | | (100,520,716 | ) | | | | 794,067,773 | | |
| Change in net assets resulting from | | | | | | | | | | | | | | | | | | | | | |
| capital transactions | | $ | 18,941,569 | | | | $ | (1,590,758,408 | ) | | | | $ | (760,210,896 | ) | | | $ | 885,763,811 | | |
____________________
* Share transactions are at net asset value of $1.00 per share.
| See notes to financial statements. | HSBC FAMILY OF FUNDS 19 |
HSBC FAMILY OF FUNDS
Statements of Changes in Net Assets (continued)
| U.S. Treasury |
| Money Market Fund |
| For the | | For the |
| year ended | | year ended |
| October 31, 2013 | | October 31, 2012 |
| Investment Activities: | | | | | | | | | | | |
| Operations: | | | | | | | | | | | |
| Net investment income | | $ | — | | | | | $ | 9 | | |
| Net realized gains (losses) from investments transactions | | | (37,989 | ) | | | | | 8,482 | | |
| Change in net assets resulting from operations | | | (37,989 | ) | | | | | 8,491 | | |
| | | | | | | | | | | | |
| Dividends: | | | | | | | | | | | |
| Net realized gains: | | | | | | | | | | | |
| Class D Shares | | | — | | | | | | (6,485 | ) | |
| Class I Shares | | | — | | | | | | (6,826 | ) | |
| Class Y Shares | | | — | | | | | | (10,955 | ) | |
| Change in net assets resulting from shareholder dividends | | | — | | | | | | (24,266 | ) | |
| Change in net assets resulting from capital transactions | | | 198,372,690 | | | | | | (229,081,790 | ) | |
| | | | | | | | | | | | |
| Change in net assets | | | 198,334,701 | | | | | | (229,097,565 | ) | |
| | | | | | | | | | | | |
| Net Assets: | | | | | | | | | | | |
| Beginning of period | | | 2,373,986,181 | | | | | | 2,603,083,746 | | |
| End of period | | $ | 2,572,320,882 | | | | | $ | 2,373,986,181 | | |
| Accumulated net investment income | | $ | — | | | | | $ | 9 | | |
| 20 HSBC FAMILY OF FUNDS | See notes to financial statements. |
HSBC FAMILY OF FUNDS
Statements of Changes in Net Assets (continued)
| U.S. Treasury |
| Money Market Fund |
| For the | | For the |
| year ended | | year ended |
| October 31, 2013 | | October 31, 2012 |
| CAPITAL TRANSACTIONS:* | | | | | | | | | | | |
| Class A Shares: | | | | | | | | | | | |
| Value of shares redeemed | | $ | — | | | | | $ | (607,887 | ) | |
| Class A Shares capital transactions | | | — | | | | | | (607,887 | ) | |
| | | | |
| Class B Shares: | | | | | | | | | | | |
| Value of shares redeemed | | | (1,031 | ) | | | | | (34,382 | ) | |
| Class B Shares capital transactions | | | (1,031 | ) | | | | | (34,382 | ) | |
| | | | |
| Class C Shares: | | | | | | | | | | | |
| Proceeds from shares issued | | | — | | | | | | 114,177 | | |
| Value of shares redeemed | | | — | | | | | | (114,177 | ) | |
| Class C Shares capital transactions | | | — | | | | | | — | | |
| | | | |
| Class D Shares: | | | | | | | | | | | |
| Proceeds from shares issued | | | 2,077,685,254 | | | | | | 1,836,487,946 | | |
| Dividends reinvested | | | — | | | | | | 2,757 | | |
| Value of shares redeemed | | | (2,221,893,975 | ) | | | | | (1,794,363,660 | ) | |
| Class D Shares capital transactions | | | (144,208,721 | ) | | | | | 42,127,043 | | |
| | | | |
| Class I Shares: | | | | | | | | | | | |
| Proceeds from shares issued | | | 5,092,587,899 | | | | | | 2,342,393,162 | | |
| Dividends reinvested | | | — | | | | | | 3,734 | | |
| Value of shares redeemed | | | (4,561,678,583 | ) | | | | | (2,770,079,317 | ) | |
| Class I Shares capital transactions | | | 530,909,316 | | | | | | (427,682,421 | ) | |
| | | | |
| Class Y Shares: | | | | | | | | | | | |
| Proceeds from shares issued | | | 1,876,855,817 | | | | | | 1,844,352,806 | | |
| Dividends reinvested | | | — | | | | | | 10,587 | | |
| Value of shares redeemed | | | (2,065,182,691 | ) | | | | | (1,687,247,536 | ) | |
| Class Y Shares capital transactions | | | (188,326,874 | ) | | | | | 157,115,857 | | |
| Change in net assets resulting from capital transactions | | $ | 198,372,690 | | | | | $ | (229,081,790 | ) | |
____________________
* Share transactions are at net asset value of $1.00 per share.
| See notes to financial statements. | HSBC FAMILY OF FUNDS 21 |
| HSBC PRIME MONEY MARKET FUND |
| Financial Highlights |
Selected data for a share outstanding throughout the periods indicated.
| | | | | | | Investment Activities | | Dividends | | | | | | | | | | Ratios/Supplementary Data |
| | | | | | | | | | | | Net | | | | | | | | | | | | | | | | | | | | | | | | | | | | | | Ratio of | | | | | | | Ratios of |
| | | | | | | | | | | | Realized and | | | | | | | | | | | | | | | | | | | | | | | | | | | | | | Expenses | | | | | | | Expenses |
| | | | | | | | | | | | Unrealized | | | | | | Net | | | | Net | | | | | | | | | | | | | | to Average | | Ratio of Net | | to Average |
| | Net Asset | | | | | | | Gains | | | | | | Realized | | | | Asset | | | | | | | | | Ratio of Net | | Net Assets | | Investment | | Net Assets |
| | Value, | | Net | | (Losses) | | Total from | | Net | | Gains from | | | | Value, | | | | | Net Assets at | | Expenses to | | (Excluding | | Income to | | (Excluding |
| | Beginning | | Investment | | from | | Investment | | Investment | | Investment | | Total | | End of | | Total | | End of Period | | Average Net | | Fees Paid | | Average Net | | Fee |
| | of Period | | Income | | Investments | | Activities | | Income | | Transactions | | Dividends | | Period | | Return(a) | | (000’s) | | Assets | | Indirectly) | | Assets | | Reductions) |
| CLASS A SHARES | | | | | | | | | | | | | | | | | | | | | | | | | | | | | | | | | | | | | | | | | | | | | | | | | | | | | | | |
| Year Ended October 31, 2009 | | | $ | 1.00 | | | | — | (b) | | | —(b) | | —(b) | | —(b) | | | — | | | | —(b) | | | $ | 1.00 | | | 0.32 | %(c) | | $ | 343,265 | | | | 0.55 | %(c) | | | | 0.55 | %(c) | | | | 0.31 | %(c) | | | | 0.69 | %(c) | |
| Year Ended October 31, 2010 | | | | 1.00 | | | | — | (b)(d) | | | —(b) | | —(b) | | —(b) | | | — | | | | —(b) | | | | 1.00 | | | 0.01 | %(e) | | | 32,943 | | | | 0.29 | % | | | | 0.29 | % | | | | 0.01 | %(e) | | | | 0.67 | % | |
| Year Ended October 31, 2011 | | | | 1.00 | | | | — | (b)(d) | | | —(b) | | —(b) | | —(b) | | | — | | | | —(b) | | | | 1.00 | | | 0.01 | % | | | 27,763 | | | | 0.26 | % | | | | 0.26 | % | | | | 0.01 | % | | | | 0.68 | % | |
| Year Ended October 31, 2012 | | | | 1.00 | | | | — | (b) | | | —(b) | | —(b) | | —(b) | | | — | | | | —(b) | | | | 1.00 | | | 0.01 | % | | | 33,546 | | | | 0.30 | % | | | | 0.30 | % | | | | 0.01 | % | | | | 0.69 | % | |
| Year Ended October 31, 2013 | | | | 1.00 | | | | — | (b)(d) | | | —(b) | | —(b) | | —(b) | | | — | (b) | | | —(b) | | | | 1.00 | | | 0.01 | % | | | 42,158 | | | | 0.23 | % | | | | 0.23 | % | | | | 0.01 | % | | | | 0.68 | % | |
| CLASS B SHARES | | | | | | | | | | | | | | | | | | | | | | | | | | | | | | | | | | | | | | | | | | | | | | | | | | | | | | | |
| Year Ended October 31, 2009 | | | $ | 1.00 | | | | — | (b) | | | —(b) | | —(b) | | — | | | — | | | | — | | | $ | 1.00 | | | 0.17 | %(c) | | $ | 312 | | | | 0.68 | %(c) | | | | 0.68 | %(c) | | | | 0.13 | %(c) | | | | 1.30 | %(c) | |
| Year Ended October 31, 2010 | | | | 1.00 | | | | — | (b)(d) | | | —(b) | | —(b) | | —(b) | | | — | | | | —(b) | | | | 1.00 | | | 0.01 | %(e) | | | 226 | | | | 0.29 | % | | | | 0.29 | % | | | | 0.01 | %(e) | | | | 1.27 | % | |
| Year Ended October 31, 2011 | | | | 1.00 | | | | — | (b)(d) | | | —(b) | | —(b) | | —(b) | | | — | | | | —(b) | | | | 1.00 | | | 0.01 | % | | | 132 | | | | 0.26 | % | | | | 0.26 | % | | | | 0.01 | % | | | | 1.28 | % | |
| Year Ended October 31, 2012 | | | | 1.00 | | | | — | (b) | | | —(b) | | —(b) | | —(b) | | | — | | | | —(b) | | | | 1.00 | | | 0.01 | % | | | 41 | | | | 0.29 | % | | | | 0.29 | % | | | | 0.01 | % | | | | 1.29 | % | |
| Year Ended October 31, 2013 | | | | 1.00 | | | | — | (b)(d) | | | —(b) | | —(b) | | —(b) | | | — | (b) | | | —(b) | | | | 1.00 | | | 0.01 | % | | | 28 | | | | 0.24 | % | | | | 0.24 | % | | | | 0.01 | % | | | | 1.28 | % | |
| CLASS C SHARES | | | | | | | | | | | | | | | | | | | | | | | | | | | | | | | | | | | | | | | | | | | | | | | | | | | | | | | |
| Year Ended October 31, 2009 | | | $ | 1.00 | | | | — | (b) | | | —(b) | | —(b) | | —(b) | | | — | | | | —(b) | | | $ | 1.00 | | | 0.17 | %(c) | | $ | 259,364 | | | | 0.74 | %(c) | | | | 0.74 | %(c) | | | | 0.19 | %(c) | | | | 1.29 | %(c) | |
| Year Ended October 31, 2010 | | | | 1.00 | | | | — | (b)(d) | | | —(b) | | —(b) | | —(b) | | | — | | | | —(b) | | | | 1.00 | | | 0.01 | %(e) | | | 44 | | | | 0.29 | % | | | | 0.29 | % | | | | 0.01 | %(e) | | | | 1.27 | % | |
| Year Ended October 31, 2011 | | | | 1.00 | | | | — | (b)(d) | | | —(b) | | —(b) | | —(b) | | | — | | | | —(b) | | | | 1.00 | | | 0.01 | % | | | 6 | | | | 0.25 | % | | | | 0.25 | % | | | | 0.01 | % | | | | 1.28 | % | |
| Year Ended October 31, 2012 | | | | 1.00 | | | | — | (b) | | | —(b) | | —(b) | | —(b) | | | — | | | | —(b) | | | | 1.00 | | | 0.06 | % | | | 6 | | | | 0.25 | % | | | | 0.25 | % | | | | 0.06 | % | | | | 1.29 | % | |
| Year Ended October 31, 2013 | | | | 1.00 | | | | — | (b)(d) | | | —(b) | | —(b) | | —(b) | | | — | (b) | | | —(b) | | | | 1.00 | | | 0.01 | % | | | — | (f) | | | 0.23 | % | | | | 0.23 | % | | | | 0.07 | % | | | | 1.26 | % | |
| CLASS D SHARES | | | | | | | | | | | | | | | | | | | | | | | | | | | | | | | | | | | | | | | | | | | | | | | | | | | | | | | |
| Year Ended October 31, 2009 | | | $ | 1.00 | | | | — | (b) | | | —(b) | | —(b) | | —(b) | | | — | | | | —(b) | | | $ | 1.00 | | | 0.40 | %(c) | | $ | 1,994,448 | | | | 0.49 | %(c) | | | | 0.49 | %(c) | | | | 0.42 | %(c) | | | | 0.54 | %(c) | |
| Year Ended October 31, 2010 | | | | 1.00 | | | | — | (b)(d) | | | —(b) | | —(b) | | —(b) | | | — | | | | —(b) | | | | 1.00 | | | 0.01 | %(e) | | | 1,695,222 | | | | 0.29 | % | | | | 0.29 | % | | | | 0.01 | %(e) | | | | 0.52 | % | |
| Year Ended October 31, 2011 | | | | 1.00 | | | | — | (b)(d) | | | —(b) | | —(b) | | —(b) | | | — | | | | —(b) | | | | 1.00 | | | 0.01 | % | | | 1,591,614 | | | | 0.26 | % | | | | 0.26 | % | | | | 0.01 | % | | | | 0.53 | % | |
| Year Ended October 31, 2012 | | | | 1.00 | | | | — | (b) | | | —(b) | | —(b) | | —(b) | | | — | | | | —(b) | | | | 1.00 | | | 0.01 | % | | | 1,303,827 | | | | 0.30 | % | | | | 0.30 | % | | | | 0.01 | % | | | | 0.54 | % | |
| Year Ended October 31, 2013 | | | | 1.00 | | | | — | (b)(d) | | | —(b) | | —(b) | | —(b) | | | — | (b) | | | —(b) | | | | 1.00 | | | 0.01 | % | | | 1,288,077 | | | | 0.23 | % | | | | 0.23 | % | | | | 0.01 | % | | | | 0.53 | % | |
| 22 HSBC FAMILY OF FUNDS | See notes to financial statements. |
| HSBC PRIME MONEY MARKET FUND |
Financial Highlights (continued) |
| | | | Investment Activities | | Dividends | | | | | | Ratios/Supplementary Data |
| | Net Asset
Value,
Beginning
of Period | | Net
Investment
Income | | Net
Realized and
Unrealized
Gains
(Losses)
from
Investments | | Total from
Investment
Activities | | Net
Investment
Income | | Net
Realized
Gains from
Investment
Transactions | | Total
Dividends | | Net
Asset
Value,
End of
Period | | Total
Return(a) | | Net Assets at
End of Period
(000’s) | | Ratio of Net
Expenses to
Average Net
Assets | | Ratio of
Expenses
to Average
Net Assets
(Excluding
Fees Paid
Indirectly) | | Ratio of Net
Investment
Income to
Average Net
Assets | | Ratios of
Expenses
to Average
Net Assets
(Excluding
Fee
Reductions) |
| CLASS I SHARES | | | | | | | | | | | | | | | | | | | | | | | | | | | | |
| Year Ended October 31, 2009 | | | $ | 1.00 | | | | 0.01 | | | | | — | (b) | | | | 0.01 | | | | | (0.01 | ) | | | | — | | | | | (0.01 | ) | | | | $ | 1.00 | | | | 0.69 | %(c) | | | | $ | 7,189,613 | | | | 0.18 | %(c) | | | | 0.18 | %(c) | | | | 0.55 | %(c) | | | | 0.19 | %(c) | |
| Year Ended October 31, 2010 | | | | 1.00 | | | | — | (b)(d) | | | | — | (b) | | | | — | (b) | | | | — | (b) | | | | — | | | | | — | (b) | | | | | 1.00 | | | | 0.14 | %(e) | | | | | 4,679,632 | | | | 0.17 | % | | | | 0.17 | % | | | | 0.14 | %(e) | | | | 0.17 | % | |
| Year Ended October 31, 2011 | | | | 1.00 | | | | — | (b)(d) | | | | — | (b) | | | | — | (b) | | | | — | (b) | | | | — | | | | | — | (b) | | | | | 1.00 | | | | 0.10 | % | | | | | 4,309,346 | | | | 0.17 | % | | | | 0.17 | % | | | | 0.10 | % | | | | 0.18 | % | |
| Year Ended October 31, 2012 | | | | 1.00 | | | | — | (b) | | | | — | (b) | | | | — | (b) | | | | — | (b) | | | | — | | | | | — | (b) | | | | | 1.00 | | | | 0.14 | % | | | | | 3,025,688 | | | | 0.17 | % | | | | 0.17 | % | | | | 0.14 | % | | | | 0.19 | % | |
| Year Ended October 31, 2013 | | | | 1.00 | | | | — | (b)(d) | | | | — | (b) | | | | — | (b) | | | | — | (b) | | | | — | (b) | | | | — | (b) | | | | | 1.00 | | | | 0.08 | % | | | | | 3,121,056 | | | | 0.17 | % | | | | 0.17 | % | | | | 0.08 | % | | | | 0.18 | % | |
| CLASS Y SHARES | | | | | | | | | | | | | | | | | | | | | | | | | | | | | | | | | | | | | | | | | | | | | | | | | | | | | | | | | | | | | | | | | | | | | | |
| Year Ended October 31, 2009 | | | $ | 1.00 | | | | 0.01 | | | | | — | (b) | | | | 0.01 | | | | | (0.01 | ) | | | | — | | | | | (0.01 | ) | | | | $ | 1.00 | | | | 0.58 | %(c) | | | | $ | 1,194,680 | | | | 0.29 | %(c) | | | | 0.29 | %(c) | | | | 0.68 | %(c) | | | | 0.29 | %(c) | |
| Year Ended October 31, 2010 | | | | 1.00 | | | | — | (b)(d) | | | | — | (b) | | | | — | (b) | | | | — | (b) | | | | — | | | | | — | (b) | | | | | 1.00 | | | | 0.05 | %(e) | | | | | 1,107,571 | | | | 0.26 | % | | | | 0.26 | % | | | | 0.04 | %(e) | | | | 0.27 | % | |
| Year Ended October 31, 2011 | | | | 1.00 | | | | — | (b)(d) | | | | — | (b) | | | | — | (b) | | | | — | (b) | | | | — | | | | | — | (b) | | | | | 1.00 | | | | 0.01 | % | | | | | 642,290 | | | | 0.26 | % | | | | 0.26 | % | | | | 0.02 | % | | | | 0.28 | % | |
| Year Ended October 31, 2012 | | | | 1.00 | | | | — | (b) | | | | — | (b) | | | | — | (b) | | | | — | (b) | | | | — | | | | | — | (b) | | | | | 1.00 | | | | 0.03 | % | | | | | 617,308 | | | | 0.28 | % | | | | 0.28 | % | | | | 0.03 | % | | | | 0.29 | % | |
| Year Ended October 31, 2013 | | | | 1.00 | | | | — | (b)(d) | | | | — | (b) | | | | — | (b) | | | | — | (b) | | | | — | (b) | | | | — | (b) | | | | | 1.00 | | | | 0.01 | % | | | | | 548,035 | | | | 0.23 | % | | | | 0.23 | % | | | | 0.01 | % | | | | 0.28 | % | |
| (a) | Total returns do not include redemption charges. |
| (b) | Represents less than $0.005 or $(0.005). |
| (c) | Included in the ratios are the Treasury Guarantee Program fees incurred by the Fund during the period. Without these fees, the gross and net expense ratios would have been decreased by 0.03% and the total return and net investment income ratio would have increased by 0.03%. |
| (d) | Calculated based on average shares outstanding. |
| (e) | During the year ended October 31, 2010, the Fund received a distribution from a “fair fund” established by the SEC in connection with a consent order against BISYS Fund Services, Inc. (See Note 6 in Notes to Financial Statements). The corresponding impact to the net income ratio and the total return was less than 0.005%. |
| (f) | Less than $500. |
| See notes to financial statements. | HSBC FAMILY OF FUNDS 23 |
| HSBC U.S. GOVERNMENT MONEY MARKET FUND |
Financial Highlights (continued) |
Selected data for a share outstanding throughout the periods indicated.
| | | | Investment Activities | | Dividends | | | | | | Ratios/Supplementary Data |
| | Net Asset
Value,
Beginning
of Period | | Net
Investment
Income | | Net
Realized and
Unrealized
Gains
(Losses)
from
Investments | | Total from
Investment
Activities | | Net
Investment
Income | | Net
Realized
Gains from
Investment
Transactions | | Total
Dividends | | Net
Asset
Value,
End of
Period | | Total
Return(a) | | Net Assets
at End of
Period (000’s) | | Ratio of Net
Expenses to
Average Net
Assets(b) | | Ratio of
Expenses
to Average
Net Assets
(Excluding
Fees Paid
Indirectly)(b) | | Ratio of Net
Investment
Income to
Average Net
Assets(b) | | Ratios of
Expenses
to Average
Net Assets
(Excluding
Fee
Reductions)
(b) |
| CLASS A SHARES | | | | | | | | | | | | | | | | | | | | | | | | | | | | | | | | | | | | | | | | | | | | | | | | | | | | | | | | | | | | | | | | | | | | | | | |
| Year Ended October 31, 2009 | | | $ | 1.00 | | | | — | (c) | | | | — | (c) | | | | — | (c) | | | | — | (c) | | | | — | (c) | | | | — | (c) | | | | $ | 1.00 | | | | 0.14 | %(d) | | | | $ | 574,577 | | | | | 0.52 | %(d) | | | | 0.52 | %(d) | | | | 0.14 | %(d) | | | | 0.72 | %(d) | |
| Year Ended October 31, 2010 | | | | 1.00 | | | | — | | | | | — | | | | | — | | | | | — | (c) | | | | — | (c) | | | | — | (c) | | | | | 1.00 | | | | 0.02 | %(e) | | | | | 25,926 | | | | | 0.23 | % | | | | 0.23 | % | | | | 0.01 | %(e) | | | | 0.67 | % | |
| Year Ended October 31, 2011 | | | | 1.00 | | | | — | (c) | | | | — | (c) | | | | — | (c) | | | | — | (c) | | | | — | | | | | — | (c) | | | | | 1.00 | | | | 0.01 | % | | | | | 3,995 | | | | | 0.16 | % | | | | 0.16 | % | | | | 0.01 | % | | | | 0.68 | % | |
| Year Ended October 31, 2012 | | | | 1.00 | | | | — | (c) | | | | — | (c) | | | | — | (c) | | | | — | (c) | | | | — | (c) | | | | — | (c) | | | | | 1.00 | | | | 0.01 | % | | | | | 238 | | | | | 0.14 | % | | | | 0.15 | % | | | | 0.01 | % | | | | 0.69 | % | |
| Year Ended October 31, 2013 | | | | 1.00 | | | | — | (c) | | | | — | (c) | | | | — | (c) | | | | — | (c) | | | | — | | | | | — | (c) | | | | | 1.00 | | | | 0.01 | % | | | | | 428 | | | | | 0.17 | % | | | | 0.17 | % | | | | 0.01 | % | | | | 0.68 | % | |
| CLASS B SHARES | | | | | | | | | | | | | | | | | | | | | | | | | | | | | | | | | | | | | | | | | | | | | | | | | | | | | | | | | | | | | | | | | | | | | | | |
| Year Ended October 31, 2009 | | | $ | 1.00 | | | | — | (c) | | | | — | (c) | | | | — | (c) | | | | — | (c) | | | | — | (c) | | | | — | (c) | | | | $ | 1.00 | | | | 0.08 | %(d) | | | | $ | 84 | | | | | 0.54 | %(d) | | | | 0.54 | %(d) | | | | 0.08 | %(d) | | | | 1.30 | %(d) | |
| Year Ended October 31, 2010 | | | | 1.00 | | | | — | (c) | | | | — | (c) | | | | — | (c) | | | | — | (c) | | | | — | (c) | | | | — | (c) | | | | | 1.00 | | | | 0.02 | %(e) | | | | | 88 | | | | | 0.22 | % | | | | 0.22 | % | | | | 0.01 | %(e) | | | | 1.27 | % | |
| Year Ended October 31, 2011 | | | | 1.00 | | | | — | (c) | | | | — | (c) | | | | — | (c) | | | | — | (c) | | | | — | | | | | — | (c) | | | | | 1.00 | | | | 0.01 | % | | | | | 94 | | | | | 0.17 | % | | | | 0.17 | % | | | | 0.01 | % | | | | 1.28 | % | |
| Year Ended October 31, 2012 | | | | 1.00 | | | | — | (c) | | | | — | (c) | | | | — | (c) | | | | — | (c) | | | | — | (c) | | | | — | (c) | | | | | 1.00 | | | | 0.01 | % | | | | | 76 | | | | | 0.16 | % | | | | 0.16 | % | | | | 0.01 | % | | | | 1.29 | % | |
| Year Ended October 31, 2013 | | | | 1.00 | | | | — | (c) | | | | — | (c) | | | | — | (c) | | | | — | (c) | | | | — | | | | | — | (c) | | | | | 1.00 | | | | 0.01 | % | | | | | 49 | | | | | 0.14 | % | | | | 0.14 | % | | | | 0.01 | % | | | | 1.28 | % | |
| CLASS C SHARES | | | | | | | | | | | | | | | | | | | | | | | | | | | | | | | | | | | | | | | | | | | | | | | | | | | | | | | | | | | | | | | | | | | | | | | |
| Year Ended October 31, 2009(f) | | | $ | 1.00 | | | | — | (c) | | | | — | (c) | | | | — | (c) | | | | — | (c) | | | | — | (c) | | | | — | (c) | | | | $ | 1.00 | | | | 0.08 | %(d) | | | | $ | 229 | | | | | 0.50 | %(d) | | | | 0.50 | %(d) | | | | 0.04 | %(d) | | | | 1.32 | %(d) | |
| Year Ended October 31, 2010(g) | | | | 1.00 | | | | — | (c) | | | | — | (c) | | | | — | (c) | | | | — | (c) | | | | — | (c) | | | | — | (c) | | | | | 1.00 | | | | 0.02 | %(e) | | | | | — | (h) | | | | 0.23 | % | | | | 0.23 | % | | | | 0.01 | %(e) | | | | 1.27 | % | |
| Year Ended October 31, 2011(i) | | | | 1.00 | | | | — | | | | | — | | | | | — | | | | | — | | | | | — | | | | | — | | | | | | 1.00 | | | | — | % | | | | | — | | | | | — | % | | | | — | % | | | | — | % | | | | — | % | |
| Year Ended October 31, 2012(i) | | | | 1.00 | | | | — | | | | | — | | | | | — | | | | | — | | | | | — | | | | | — | | | | | | 1.00 | | | | — | % | | | | | — | | | | | — | % | | | | — | % | | | | — | % | | | | — | % | |
| Year Ended October 31, 2013(i) | | | | 1.00 | | | | — | | | | | — | | | | | — | | | | | — | | | | | — | | | | | — | | | | | | 1.00 | | | | — | % | | | | | — | | | | | — | % | | | | — | % | | | | — | % | | | | — | % | |
| CLASS D SHARES | | | | | | | | | | | | | | | | | | | | | | | | | | | | | | | | | | | | | | | | | | | | | | | | | | | | | | | | | | | | | | | | | | | | | | | |
| Year Ended October 31, 2009 | | | $ | 1.00 | | | | — | (c) | | | | — | (c) | | | | — | (c) | | | | — | (c) | | | | — | (c) | | | | — | (c) | | | | $ | 1.00 | | | | 0.18 | %(d) | | | | $ | 767,551 | | | | | 0.48 | %(d) | | | | 0.48 | %(d) | | | | 0.21 | %(d) | | | | 0.58 | %(d) | |
| Year Ended October 31, 2010 | | | | 1.00 | | | | — | (c) | | | | — | (c) | | | | — | (c) | | | | — | (c) | | | | — | (c) | | | | — | (c) | | | | | 1.00 | | | | 0.02 | %(e) | | | | | 922,510 | | | | | 0.22 | % | | | | 0.22 | % | | | | 0.02 | %(e) | | | | 0.52 | % | |
| Year Ended October 31, 2011 | | | | 1.00 | | | | — | (c) | | | | — | (c) | | | | — | (c) | | | | — | (c) | | | | — | | | | | — | (c) | | | | | 1.00 | | | | 0.01 | % | | | | | 746,458 | | | | | 0.17 | % | | | | 0.17 | % | | | | 0.01 | % | | | | 0.53 | % | |
| Year Ended October 31, 2012 | | | | 1.00 | | | | — | (c) | | | | — | (c) | | | | — | (c) | | | | — | (c) | | | | — | (c) | | | | — | (c) | | | | | 1.00 | | | | 0.01 | % | | | | | 614,499 | | | | | 0.16 | % | | | | 0.16 | % | | | | 0.01 | % | | | | 0.54 | % | |
| Year Ended October 31, 2013 | | | | 1.00 | | | | — | (c) | | | | — | (c) | | | | — | (c) | | | | — | (c) | | | | — | | | | | — | (c) | | | | | 1.00 | | | | 0.01 | % | | | | | 670,893 | | | | | 0.13 | % | | | | 0.13 | % | | | | 0.01 | % | | | | 0.53 | % | |
| 24 HSBC FAMILY OF FUNDS | See notes to financial statements. |
| HSBC U.S. GOVERNMENT MONEY MARKET FUND |
Financial Highlights (continued) |
| | | | Investment Activities | | Dividends | | | | | | Ratios/Supplementary Data |
| | Net Asset
Value,
Beginning
of Period | | Net
Investment
Income | | Net
Realized and
Unrealized
Gains
(Losses)
from
Investments | | Total from
Investment
Activities | | Net
Investment
Income | | Net
Realized
Gains from
Investment
Transactions | | Total
Dividends | | Net
Asset
Value,
End of
Period | | Total
Return(a) | | Net Assets
at End of
Period (000’s) | | Ratio of Net
Expenses to
Average Net
Assets(b) | | Ratio of
Expenses
to Average
Net Assets
(Excluding
Fees Paid
Indirectly)(b) | | Ratio of Net
Investment
Income to
Average Net
Assets(b) | | Ratios of
Expenses
to Average
Net Assets
(Excluding
Fee
Reductions)
(b) |
| CLASS I SHARES | | | | | | | | | | | | | | | | | | | | | | | | | | | | |
| Year Ended October 31, 2009 | | | $ | 1.00 | | | | — | (c) | | | | — | (c) | | | | — | (c) | | | | — | (c) | | | | — | (c) | | | | — | (c) | | | | $ | 1.00 | | | | 0.43 | %(d) | | | | $8,176,980 | | | | 0.22 | %(d) | | | | 0.22 | %(d) | | | | 0.38 | %(d) | | | | 0.22 | %(d) | |
| Year Ended October 31, 2010 | | | | 1.00 | | | | — | (c) | | | | — | (c) | | | | — | (c) | | | | — | (c) | | | | — | (c) | | | | — | (c) | | | | | 1.00 | | | | 0.08 | %(e) | | | | 5,100,891 | | | | 0.16 | % | | | | 0.16 | % | | | | 0.07 | %(e) | | | | 0.17 | % | |
| Year Ended October 31, 2011 | | | | 1.00 | | | | — | (c) | | | | — | (c) | | | | — | (c) | | | | — | (c) | | | | — | | | | | — | (c) | | | | | 1.00 | | | | 0.03 | % | | | | 1,645,764 | | | | 0.16 | % | | | | 0.16 | % | | | | 0.03 | % | | | | 0.18 | % | |
| Year Ended October 31, 2012 | | | | 1.00 | | | | — | (c) | | | | — | (c) | | | | — | (c) | | | | — | (c) | | | | — | (c) | | | | — | (c) | | | | | 1.00 | | | | 0.02 | % | | | | 1,873,166 | | | | 0.16 | % | | | | 0.16 | % | | | | 0.01 | % | | | | 0.19 | % | |
| Year Ended October 31, 2013 | | | | 1.00 | | | | — | (c) | | | | — | (c) | | | | — | (c) | | | | — | (c) | | | | — | | | | | — | (c) | | | | | 1.00 | | | | 0.01 | % | | | | 1,156,894 | | | | 0.13 | % | | | | 0.13 | % | | | | 0.02 | % | | | | 0.18 | % | |
| CLASS Y SHARES | | | | | | | | | | | | | | | | | | | | | | | | | | | | | | | | | | | | | | | | | | | | | | | | | | | | | | | | | | | | | | | | | | | | | |
| Year Ended October 31, 2009 | | | $ | 1.00 | | | | — | (c) | | | | — | (c) | | | | — | (c) | | | | — | (c) | | | | — | (c) | | | | — | (c) | | | | $ | 1.00 | | | | 0.32 | %(d) | | | | $3,370,299 | | | | 0.33 | %(d) | | | | 0.33 | %(d) | | | | 0.38 | %(d) | | | | 0.33 | %(d) | |
| Year Ended October 31, 2010 | | | | 1.00 | | | | — | (c) | | | | — | (c) | | | | — | (c) | | | | — | (c) | | | | — | (c) | | | | — | (c) | | | | | 1.00 | | | | 0.02 | %(e) | | | | 2,918,347 | | | | 0.22 | % | | | | 0.22 | % | | | | 0.02 | %(e) | | | | 0.27 | % | |
| Year Ended October 31, 2011 | | | | 1.00 | | | | — | (c) | | | | — | (c) | | | | — | (c) | | | | — | (c) | | | | — | | | | | — | (c) | | | | | 1.00 | | | | 0.01 | % | | | | 1,711,397 | | | | 0.17 | % | | | | 0.17 | % | | | | 0.01 | % | | | | 0.28 | % | |
| Year Ended October 31, 2012 | | | | 1.00 | | | | — | (c) | | | | — | (c) | | | | — | (c) | | | | — | (c) | | | | — | (c) | | | | — | (c) | | | | | 1.00 | | | | 0.01 | % | | | | 2,505,448 | | | | 0.17 | % | | | | 0.17 | % | | | | 0.01 | % | | | | 0.29 | % | |
| Year Ended October 31, 2013 | | | | 1.00 | | | | — | (c) | | | | — | (c) | | | | — | (c) | | | | — | (c) | | | | — | | | | | — | (c) | | | | | 1.00 | | | | 0.01 | % | | | | 2,404,867 | | | | 0.13 | % | | | | 0.13 | % | | | | 0.01 | % | | | | 0.28 | % | |
| (a) | Not annualized for periods less than one year. Total return calculations do not include any sales or redemption charges. |
| (b) | Annualized for periods less than one year. |
| (c) | Represents less than $0.005 or $(0.005). |
| (d) | Included in the ratios are the Treasury Guarantee Program fees incurred by the Fund during the period. Without these fees, the gross and net expense ratios would have been decreased by 0.06% and the total return and net investment income ratio would have increased by 0.06%. |
| (e) | During the year ended October 31, 2010, the Fund received a distribution from a “fair fund” established by the SEC in connection with a consent order against BISYS Fund Services, Inc. (See Note 6 in Notes to Financial Statements). The corresponding impact to the net income ratio and the total return was less than 0.005%. |
| (f) | Class C Shares were operational during a portion of the year only. Amounts reflect performance for the period of time the class had operations, which was 362 days during the period. |
| (g) | Class C Shares were operational during a portion of the year only. Amounts reflect performance for the period of time the class had operations, which was 351 days during the period. |
| (h) | Less than $500. |
| (i) | During the period the class had no operations. The net asset values reflected represent the last day the class had shareholders. |
| See notes to financial statements. | HSBC FAMILY OF FUNDS 25 |
| HSBC U.S. TREASURY MONEY MARKET FUND |
Financial Highlights (continued) |
Selected data for a share outstanding throughout the periods indicated.
| | | | Investment Activities | | Dividends | | | | | | Ratios/Supplementary Data |
| | Net Asset
Value,
Beginning
of Period | | Net
Investment
Income | | Net
Realized and
Unrealized
Gains
(Losses)
from
Investments | | Total from
Investment
Activities | | Net
Investment
Income | | Net
Realized
Gains from
Investment
Transactions | | Total
Dividends | | Net
Asset
Value,
End of
Period | | Total
Return(a) | | Net Assets
at End of
Period (000’s) | | Ratio
of Net
Expenses
to Average
Net
Assets(b) | | Ratio of
Expenses
to Average
Net Assets
(Excluding
Fees Paid
Indirectly)
(b) | | Ratio of Net
Investment
Income to
Average
Net Assets
(b) | | Ratios of
Expenses
to Average
Net Assets
(Excluding
Fee
Reductions)
(b) |
| CLASS A SHARES | | | | | | | | | | | | | | | | | | | | | | | | | | | | |
| Year Ended October 31, 2009 | | | $ | 1.00 | | | | — | (c) | | | | — | (c) | | | | — | (c) | | | | — | (c) | | | | — | (c) | | | | — | (c) | | | | $ | 1.00 | | | | 0.07 | % | | | | $ | 385,994 | | | | 0.24 | % | | | | 0.24 | % | | | | 0.07 | % | | | | 0.66 | % | |
| Year Ended October 31, 2010 | | | | 1.00 | | | | — | (c)(d) | | | | — | (c) | | | | — | (c) | | | | — | (c) | | | | — | | | | | — | (c) | | | | | 1.00 | | | | 0.01 | %(e) | | | | | 32,973 | | | | 0.14 | % | | | | 0.14 | % | | | | 0.01 | %(e) | | | | 0.67 | % | |
| Year Ended October 31, 2011 | | | | 1.00 | | | | — | (c)(d) | | | | — | (c) | | | | — | (c) | | | | — | (c) | | | | — | (c) | | | | — | (c) | | | | | 1.00 | | | | 0.01 | % | | | | | 613 | | | | 0.11 | % | | | | 0.12 | % | | | | 0.01 | % | | | | 0.68 | % | |
| Year Ended October 31, 2012 | | | | 1.00 | | | | — | (c) | | | | — | (c) | | | | — | (c) | | | | — | | | | | — | (c) | | | | — | (c) | | | | | 1.00 | | | | — | % | | | | | 5 | | | | 0.05 | % | | | | 0.06 | % | | | | — | % | | | | 0.70 | % | |
| Year Ended October 31, 2013 | | | | 1.00 | | | | — | (c) | | | | — | (c) | | | | — | (c) | | | | — | | | | | — | | | | | — | | | | | | 1.00 | | | | — | % | | | | | 5 | | | | 0.10 | % | | | | 0.10 | % | | | | — | % | | | | 0.69 | % | |
| CLASS B SHARES | | | | | | | | | | | | | | | | | | | | | | | | | | | | | | | | | | | | | | | | | | | | | | | | | | | | | | | | | | | | | | | | | | | | | | |
| Year Ended October 31, 2009 | | | $ | 1.00 | | | | — | (c) | | | | — | (c) | | | | — | (c) | | | | — | (c) | | | | — | (c) | | | | — | (c) | | | | $ | 1.00 | | | | 0.07 | % | | | | $ | 60 | | | | 0.24 | % | | | | 0.24 | % | | | | 0.07 | % | | | | 1.26 | % | |
| Year Ended October 31, 2010 | | | | 1.00 | | | | — | (c)(d) | | | | — | (c) | | | | — | (c) | | | | — | (c) | | | | — | | | | | — | (c) | | | | | 1.00 | | | | 0.01 | %(e) | | | | | 50 | | | | 0.14 | % | | | | 0.14 | % | | | | 0.01 | %(e) | | | | 1.27 | % | |
| Year Ended October 31, 2011 | | | | 1.00 | | | | — | (c)(d) | | | | — | (c) | | | | — | (c) | | | | — | (c) | | | | — | (c) | | | | — | (c) | | | | | 1.00 | | | | 0.01 | % | | | | | 35 | | | | 0.10 | % | | | | 0.10 | % | | | | 0.01 | % | | | | 1.28 | % | |
| Year Ended October 31, 2012 | | | | 1.00 | | | | — | (c) | | | | — | (c) | | | | — | (c) | | | | — | | | | | — | (c) | | | | — | (c) | | | | | 1.00 | | | | — | % | | | | | 1 | | | | 0.06 | % | | | | 0.06 | % | | | | — | % | | | | 1.29 | % | |
| Year Ended October 31, 2013(f) | | | | 1.00 | | | | — | (c) | | | | — | (c) | | | | — | (c) | | | | — | | | | | — | | | | | — | | | | | | 1.00 | | | | — | % | | | | | — | | | | 0.02 | % | | | | 0.02 | % | | | | — | % | | | | 0.76 | % | |
| CLASS C SHARES | | | | | | | | | | | | | | | | | | | | | | | | | | | | | | | | | | | | | | | | | | | | | | | | | | | | | | | | | | | | | | | | | | | | | | |
| Year Ended October 31, 2009 | | | $ | 1.00 | | | | — | (c) | | | | — | (c) | | | | — | (c) | | | | — | (c) | | | | — | (c) | | | | — | (c) | | | | $ | 1.00 | | | | 0.07 | % | | | | $ | 7,138 | | | | 0.22 | % | | | | 0.22 | % | | | | 0.04 | % | | | | 1.26 | % | |
| Year Ended October 31, 2010(g) | | | | 1.00 | | | | — | (c)(d) | | | | — | (c) | | | | — | (c) | | | | — | (c) | | | | — | | | | | — | (c) | | | | | 1.00 | | | | 0.01 | %(e) | | | | | — | (h) | | | 0.13 | % | | | | 0.13 | % | | | | — | %(e) | | | | 1.27 | % | |
| Year Ended October 31, 2011(i) | | | | 1.00 | | | | — | (d) | | | | — | | | | | — | | | | | — | | | | | — | | | | | — | | | | | | 1.00 | | | | — | % | | | | | — | | | | — | % | | | | — | % | | | | — | % | | | | — | % | |
| Year Ended October 31, 2012(i) | | | | 1.00 | | | | — | | | | | — | | | | | — | | | | | — | | | | | — | | | | | — | | | | | | 1.00 | | | | — | % | | | | | — | | | | — | % | | | | — | % | | | | — | % | | | | — | % | |
| Year Ended October 31, 2013(i) | | | | 1.00 | | | | — | | | | | — | | | | | — | | | | | — | | | | | — | | | | | — | | | | | | 1.00 | | | | — | % | | | | | — | | | | — | % | | | | — | % | | | | — | % | | | | — | % | |
| CLASS D SHARES | | | | | | | | | | | | | | | | | | | | | | | | | | | | | | | | | | | | | | | | | | | | | | | | | | | | | | | | | | | | | | | | | | | | | | |
| Year Ended October 31, 2009 | | | $ | 1.00 | | | | — | (c) | | | | — | (c) | | | | — | (c) | | | | — | (c) | | | | — | (c) | | | | — | (c) | | | | $ | 1.00 | | | | 0.07 | % | | | | $ | 955,652 | | | | 0.23 | % | | | | 0.23 | % | | | | 0.06 | % | | | | 0.51 | % | |
| Year Ended October 31, 2010 | | | | 1.00 | | | | — | (c)(d) | | | | — | (c) | | | | — | (c) | | | | — | (c) | | | | — | | | | | — | (c) | | | | | 1.00 | | | | 0.01 | %(e) | | | | | 726,244 | | | | 0.14 | % | | | | 0.14 | % | | | | 0.01 | %(e) | | | | 0.52 | % | |
| Year Ended October 31, 2011 | | | | 1.00 | | | | — | (c)(d) | | | | — | (c) | | | | — | (c) | | | | — | (c) | | | | — | (c) | | | | — | (c) | | | | | 1.00 | | | | 0.01 | % | | | | | 619,940 | | | | 0.10 | % | | | | 0.10 | % | | | | 0.01 | % | | | | 0.53 | % | |
| Year Ended October 31, 2012 | | | | 1.00 | | | | — | (c) | | | | — | (c) | | | | — | (c) | | | | — | | | | | — | (c) | | | | — | (c) | | | | | 1.00 | | | | — | % | | | | | 662,063 | | | | 0.08 | % | | | | 0.09 | % | | | | — | % | | | | 0.54 | % | |
| Year Ended October 31, 2013 | | | | 1.00 | | | | — | (c) | | | | — | (c) | | | | — | (c) | | | | — | | | | | — | | | | | — | | | | | | 1.00 | | | | — | % | | | | | 517,845 | | | | 0.09 | % | | | | 0.09 | % | | | | — | % | | | | 0.53 | % | |
| 26 HSBC FAMILY OF FUNDS | See notes to financial statements. |
| HSBC U.S. TREASURY MONEY MARKET FUND |
Financial Highlights (continued) |
| | | | Investment Activities | | Dividends | | | | | | Ratios/Supplementary Data |
| | Net Asset
Value,
Beginning
of Period | | Net
Investment
Income | | Net
Realized and
Unrealized
Gains
(Losses)
from
Investments | | Total from
Investment
Activities | | Net
Investment
Income | | Net
Realized
Gains from
Investment
Transactions | | Total
Dividends | | Net
Asset
Value,
End of
Period | | Total
Return(a) | | Net Assets
at End of
Period (000’s) | | Ratio
of Net
Expenses
to Average
Net
Assets(b) | | Ratio of
Expenses
to Average
Net Assets
(Excluding
Fees Paid
Indirectly)
(b) | | Ratio of Net
Investment
Income to
Average
Net Assets
(b) | | Ratios of
Expenses
to Average
Net Assets
(Excluding
Fee
Reductions)
(b) |
| CLASS I SHARES | | | | | | | | | | | | | | | | | | | | | | | | | | | | |
| Year Ended October 31, 2009 | | | $ | 1.00 | | | | — | (c) | | | | — | (c) | | | | — | (c) | | | | — | (c) | | | | — | (c) | | | | — | (c) | | | | $ | 1.00 | | | | 0.14 | % | | | | $ | 3,322,962 | | | | 0.16 | % | | | | 0.16 | % | | | | 0.14 | % | | | | 0.16 | % | |
| Year Ended October 31, 2010 | | | | 1.00 | | | | — | (c)(d) | | | | — | (c) | | | | — | (c) | | | | — | (c) | | | | — | | | | | — | (c) | | | | | 1.00 | | | | 0.01 | %(e) | | | | | 1,379,042 | | | | 0.13 | % | | | | 0.13 | % | | | | 0.01 | %(e) | | | | 0.17 | % | |
| Year Ended October 31, 2011 | | | | 1.00 | | | | — | (c)(d) | | | | — | (c) | | | | — | (c) | | | | — | (c) | | | | — | (c) | | | | — | (c) | | | | | 1.00 | | | | 0.01 | % | | | | | 982,974 | | | | 0.10 | % | | | | 0.10 | % | | | | 0.01 | % | | | | 0.18 | % | |
| Year Ended October 31, 2012 | | | | 1.00 | | | | — | (c) | | | | — | (c) | | | | — | (c) | | | | — | | | | | — | (c) | | | | — | (c) | | | | | 1.00 | | | | — | % | | | | | 555,287 | | | | 0.08 | % | | | | 0.08 | % | | | | — | % | | | | 0.19 | % | |
| Year Ended October 31, 2013 | | | | 1.00 | | | | — | (c) | | | | — | (c) | | | | — | (c) | | | | — | | | | | — | | | | | — | | | | | | 1.00 | | | | — | % | | | | | 1,086,181 | | | | 0.09 | % | | | | 0.09 | % | | | | — | % | | | | 0.18 | % | |
| CLASS Y SHARES | | | | | | | | | | | | | | | | | | | | | | | | | | | | | | | | | | | | | | | | | | | | | | | | | | | | | | | | | | | | | | | | | | | | | | |
| Year Ended October 31, 2009 | | | $ | 1.00 | | | | — | (c) | | | | — | (c) | | | | — | (c) | | | | — | (c) | | | | — | (c) | | | | — | (c) | | | | $ | 1.00 | | | | 0.08 | % | | | | $ | 996,309 | | | | 0.22 | % | | | | 0.22 | % | | | | 0.08 | % | | | | 0.26 | % | |
| Year Ended October 31, 2010 | | | | 1.00 | | | | — | (c)(d) | | | | — | (c) | | | | — | (c) | | | | — | (c) | | | | — | | | | | — | (c) | | | | | 1.00 | | | | 0.01 | %(e) | | | | | 1,147,150 | | | | 0.14 | % | | | | 0.14 | % | | | | 0.01 | %(e) | | | | 0.27 | % | |
| Year Ended October 31, 2011 | | | | 1.00 | | | | — | (c)(d) | | | | — | (c) | | | | — | (c) | | | | — | (c) | | | | — | (c) | | | | — | (c) | | | | | 1.00 | | | | 0.01 | % | | | | | 999,521 | | | | 0.09 | % | | | | 0.10 | % | | | | 0.01 | % | | | | 0.28 | % | |
| Year Ended October 31, 2012 | | | | 1.00 | | | | — | (c) | | | | — | (c) | | | | — | (c) | | | | — | | | | | — | (c) | | | | — | (c) | | | | | 1.00 | | | | — | % | | | | | 1,156,631 | | | | 0.09 | % | | | | 0.09 | % | | | | — | % | | | | 0.29 | % | |
| Year Ended October 31, 2013 | | | | 1.00 | | | | — | (c) | | | | — | (c) | | | | — | (c) | | | | — | | | | | — | | | | | — | | | | | | 1.00 | | | | — | % | | | | | 968,290 | | | | 0.09 | % | | | | 0.09 | % | | | | — | % | | | | 0.28 | % | |
| (a) | Not annualized for periods less than one year. Total return calculations do not include any sales or redemption charges. |
| (b) | Annualized for periods less than one year. |
| (c) | Represents less than $0.005 or $(0.005). |
| (d) | Calculated based on average shares outstanding. |
| (e) | During the year ended October 31, 2010, the Fund received a distribution from a “fair fund” established by the SEC in connection with a consent order against BISYS Fund Services, Inc. (See Note 6 in Notes to Financial Statements). The corresponding impact to the net income ratio and the total return was less than 0.005%. |
| (f) | Class B shares were operational during a portion of the year only. Amounts reflect performance for the period of time the class had operations, which was 249 days during the period. The net asset value reflected represents the last day the class had operations. |
| (g) | Class C Shares were operational during a portion of the year only. Amounts reflect performance for the period of time the class had operations, which was 351 days during the period. |
| (h) | Less than $500. |
| (i) | During the period the class had no operations. The net asset values reflected represent the last day the class had shareholders. |
| See notes to financial statements. | HSBC FAMILY OF FUNDS 27 |
| HSBC FAMILY OF FUNDS |
Notes to Financial Statements—as of October 31, 2013 |
1. Organization:
The HSBC Funds (the “Trust’’), a Massachusetts business trust organized on April 22, 1987, is registered under the Investment Company Act of 1940, as amended (the “Act’’), as an open-end management investment company. As of October 31, 2013, the Trust is comprised of 15 separate operational funds, each a series of the HSBC Family of Funds, which also includes the HSBC Advisor Funds Trust and the HSBC Portfolios (the “Trusts’’). The accompanying financial statements are presented for the following 3 funds (individually a “Fund,’’ collectively the “Funds’’):
| Fund | | Short Name | |
| HSBC Prime Money Market Fund | Prime Money Market Fund |
| HSBC U.S. Government Money Market Fund | U.S. Government Money Market Fund |
| HSBC U.S. Treasury Money Market Fund | U.S. Treasury Money Market Fund |
All the Funds are diversified funds. Financial statements for all other funds of the Trusts are published separately.
The Funds are authorized to issue an unlimited number of shares of beneficial interest with a par value of $ 0.001 per share. The Funds are authorized to issue seven classes of shares: Class A Shares, Class B Shares, Class C Shares, Class D Shares, Class E Shares, Class I Shares and Class Y Shares. The Class B Shares of the Funds are offered without any front-end sales charge but will be subject to a contingent deferred sales charge (“CDSC’’) ranging from a maximum of 4.00% if redeemed less than one year after purchase to 0.00% if redeemed more than four years after purchase. Class C Shares of the Funds are offered without any front-end sales charge but will be subject to a maximum CDSC of 1.00% if redeemed less than one year after purchase. No sales charges are assessed with respect to Class A, Class D, Class E, Class I or Class Y Shares of the Funds. Each class of shares in each Fund has identical rights and privileges, except with respect to arrangements pertaining to shareholder servicing and/or distribution, class-related expenses, voting rights on matters affecting a single class of shares, and exchange privileges. As of October 31, 2013, Class E Shares were not operational. Effective as of August 1, 2013, Class B Shares may no longer be purchased or acquired by any new or existing Class B shareholder, except through dividend and/or capital gains reinvestment.
Under the Trust’s organizational documents, the Funds’ officers and Trustees are indemnified against certain liabilities arising out of the performance of their duties to the Funds. In addition, in the normal course of business, the Trust enters into contracts with its service providers, which also provide for indemnifications by the Funds. The Funds’ maximum exposure under these arrangements is unknown as this would involve future claims that may be made against the Funds. However, based on experience, the Trust expects that risk of loss to be remote.
2. Significant Accounting Policies:
The following is a summary of the significant accounting policies followed by the Funds in the preparation of their financial statements. The policies are in conformity with U.S. generally accepted accounting principles (“GAAP’’). The preparation of financial statements requires management to make certain estimates and assumptions that affect the reported amounts of assets and liabilities and disclosure of contingent assets and liabilities at the date of the financial statements and the reported amounts of increases and decreases in net assets from operations during the reporting period. Actual results could differ from those estimates.
Securities Valuation:
Investments of the Funds are valued using the amortized cost method pursuant to Rule 2a-7 under the Act, which approximates fair value. Fair value is defined as the price that would be received to sell an asset or paid to transfer a liability in an orderly transaction between market participants at the measurement date. The valuation techniques used to determine fair value are further described in Note 3 below.
28 HSBC FAMILY OF FUNDS
| HSBC FAMILY OF FUNDS |
Notes to Financial Statements—as of October 31, 2013 (continued) |
Investment Transactions and Related Income:
Investment transactions are accounted for no later than one business day after trade date. However, for financial reporting purposes, investment transactions are accounted for on trade date. Investment gains and losses are calculated on the identified cost basis. Interest income is recognized on the accrual basis and includes, where applicable, the amortization or accretion of premium or discount. Dividend income is recorded on the ex-dividend date.
Restricted and Illiquid Securities:
A restricted security is a security which has been purchased through a private offering and cannot be resold to the general public without prior registration under the Securities Act of 1933 (the “1933 Act’’) or pursuant to the resale limitations provided by Rule 144 under the 1933 Act, or another exemption from the registration requirements of the 1933 Act. Certain restricted securities may be resold in transactions exempt from registration, normally to qualified institutional buyers, and may be deemed liquid by the Investment Adviser (as defined in Note 4) based on procedures established by the Board of Trustees (the “Board’’). Therefore, not all restricted securities are considered illiquid. At October 31, 2013, the Funds did not hold any restricted securities that were deemed illiquid. The restricted securities held as of October 31, 2013 are identified below:
| Acquisition | | Acquisition | | Principal | | Fair | | % of |
| Prime Money Market Fund | | Date | | Cost | | Amount | | Value | | Net Assets |
| Antalis US Funding Corp., 0.30%, 11/8/13 | 8/7/2013 | | | $ | 17,426,629 | | | | $ | 17,440,000 | | | | $ | 17,438,983 | | | | 0.3 | % | |
| ANZ New Zealand International Ltd., 0.28%, 4/15/14 | 4/15/2013 | | | | 25,000,000 | | | | | 25,000,000 | | | | | 25,000,000 | | | | 0.5 | % | |
| ASB Finance Ltd., Series GB, 0.30%, 9/2/14 | 8/29/2013 | | | | 25,000,000 | | | | | 25,000,000 | | | | | 25,000,000 | | | | 0.5 | % | |
| Australia & New Zealand Banking Group Ltd., 0.31%, 5/12/14 | 4/11/2013 | | | | 25,000,000 | | | | | 25,000,000 | | | | | 25,000,000 | | | | 0.5 | % | |
| Caisse Centrale Desjardins du Quebec, 0.13%, 11/1/13 | 10/1/2013 | | | | 14,998,321 | | | | | 15,000,000 | | | | | 15,000,000 | | | | 0.3 | % | |
| Caisse Centrale Desjardins du Quebec, 0.19%, 11/15/13 | 8/15/2013 | | | | 29,985,817 | | | | | 30,000,000 | | | | | 29,997,842 | | | | 0.6 | % | |
| Caisse Centrale Desjardins du Quebec, 0.24%, 2/19/14 | 9/10/2013 | | | | 19,978,400 | | | | | 20,000,000 | | | | | 19,985,333 | | | | 0.4 | % | |
| Caisse des Depots et Consignations, 0.20%, 11/29/13 | 7/30/2013 | | | | 29,980,175 | | | | | 30,000,000 | | | | | 29,995,450 | | | | 0.6 | % | |
| Caisse des Depots et Consignations, 0.24%, 1/2/14 | 7/26/2013 | | | | 19,979,111 | | | | | 20,000,000 | | | | | 19,991,906 | | | | 0.4 | % | |
| Caisse des Depots et Consignations, 0.35%, 8/29/14 | 9/6/2013 | | | | 29,896,750 | | | | | 30,000,000 | | | | | 29,912,208 | | | | 0.6 | % | |
| Collateralized CP II Co. LLC, 0.17%, 12/19/13 | 9/17/2013 | | | | 59,973,933 | | | | | 60,000,000 | | | | | 59,986,400 | | | | 1.2 | % | |
| Commonwealth Bank of Australia, 0.26%, 5/16/14 | 5/17/13 | | | | 10,000,000 | | | | | 10,000,000 | | | | | 10,000,000 | | | | 0.2 | % | |
| Commonwealth Bank of Australia, 0.98%, 3/17/14 | 2/14/2013 | | | | 12,597,257 | | | | | 12,500,000 | | | | | 12,534,265 | | | | 0.3 | % | |
| Commonwealth Bank of Australia, 2.13%, 3/17/14 | 5/21/2013 | | | | 10,147,900 | | | | | 10,000,000 | | | | | 10,068,205 | | | | 0.2 | % | |
| Commonwealth Bank of Australia, N.Y., 0.23%, 11/21/13 | 5/22/2013 | | | | 64,925,656 | | | | | 65,000,000 | | | | | 64,991,875 | | | | 1.3 | % | |
| Commonwealth Bank of Australia, N.Y., 0.25%, 9/11/14 | 9/11/2013 | | | | 40,000,000 | | | | | 40,000,000 | | | | | 40,000,000 | | | | 0.8 | % | |
| Commonwealth Bank of Australia, N.Y., 0.31%, 11/15/13 | 9/11/2013 | | | | 30,007,140 | | | | | 30,000,000 | | | | | 30,001,666 | | | | 0.6 | % | |
| DBS Bank Ltd., 0.24%, 1/10/14 | 7/9/2013 | | | | 23,970,560 | | | | | 24,000,000 | | | | | 23,988,800 | | | | 0.5 | % | |
| DnB NOR Bank ASA, N.Y., 0.20%, 12/23/13 | 9/4/2013 | | | | 29,981,667 | | | | | 30,000,000 | | | | | 29,991,333 | | | | 0.6 | % | |
| Erste Abwicklungsanstalt, 0.20%, 2/5/14 | 9/3/2013 | | | | 84,927,750 | | | | | 85,000,000 | | | | | 84,954,667 | | | | 1.7 | % | |
| Erste Abwicklungsanstalt, 0.35%, 2/12/14 | 2/12/2013 | | | | 14,947,208 | | | | | 15,000,000 | | | | | 14,984,979 | | | | 0.3 | % | |
| MetLife Short Term Funding LLC, 0.16%, 12/10/13 | 9/16/2013 | | | | 21,991,689 | | | | | 22,000,000 | | | | | 21,996,187 | | | | 0.4 | % | |
| National Australia Bank Ltd., 0.97%, 11/8/13 | 10/18/2013 | | | | 15,807,612 | | | | | 15,800,000 | | | | | 15,802,538 | | | | 0.3 | % | |
| National Australia Funding Delaware, Inc., 0.22%, 2/20/14 | 8/20/2013 | | | | 19,978,022 | | | | | 20,000,000 | | | | | 19,986,742 | | | | 0.4 | % | |
| Nordea Bank AB, 0.18%, 11/18/13 | 8/19/2013 | | | | 49,977,500 | | | | | 50,000,000 | | | | | 49,995,750 | | | | 1.0 | % | |
| Sumitomo Mitsui Banking Corp., N.Y., 0.12%, 11/1/13 | 10/25/2013 | | | | 12,159,716 | | | | | 12,160,000 | | | | | 12,160,000 | | | | 0.2 | % | |
| Svenska Handelsbanken, Inc., 0.25%, 2/4/14 | 8/8/2013 | | | | 19,975,000 | | | | | 20,000,000 | | | | | 19,986,806 | | | | 0.4 | % | |
| United Overseas Bank Ltd., 0.19%, 11/25/13 | 8/20/2013 | | | | 29,984,800 | | | | | 30,000,000 | | | | | 29,996,200 | | | | 0.6 | % | |
| United Overseas Bank Ltd., 0.22%, 3/10/14 | 10/23/2013 | | | | 24,978,917 | | | | | 25,000,000 | | | | | 24,980,292 | | | | 0.5 | % | |
| Westpac Banking Corp., 0.31%, 1/8/14 | 1/8/2013 | | | | 15,000,000 | | | | | 15,000,000 | | | | | 15,000,000 | | | | 0.3 | % | |
| Westpac Banking Corp., 0.98%, 3/31/14 | 3/22/2013 | | | | 15,862,008 | | | | | 15,750,000 | | | | | 15,795,802 | | | | 0.3 | % | |
| Westpac Securities NZ Ltd., 0.29%, 4/11/14 | 4/25/2013 | | | | 29,001,044 | | | | | 29,000,000 | | | | | 29,000,482 | | | | 0.6 | % | |
| Westpac Securities NZ Ltd., 0.34%, 11/29/13 | 9/25/2013 | | | | 85,026,010 | | | | | 85,000,000 | | | | | 85,011,205 | | | | 1.7 | % | |
HSBC FAMILY OF FUNDS 29
| HSBC FAMILY OF FUNDS |
Notes to Financial Statements—as of October 31, 2013 (continued) |
Repurchase Agreements:
The Funds (except U.S. Treasury Money Market Fund) may enter into repurchase agreements with an entity which is a member of the Federal Reserve System or which is a “primary dealer’’ (as designated by the Federal Reserve Bank of New York) in U.S. government obligations. The U.S. Treasury Money Market Fund may temporarily invest in repurchase agreements collateralized by U.S. Treasury Obligations. The repurchase price generally equals the price paid by a Fund plus interest negotiated on the basis of current short-term rates, which may be more or less than the rate on the underlying portfolio securities. The seller, under a repurchase agreement, is required to maintain the collateral held pursuant to the agreement, with a fair value equal to or greater than the repurchase price (including accrued interest). Collateral subject to repurchase agreements is held by the Funds’ custodian or another qualified custodian or in the Federal Reserve/ Treasury book-entry system. In the event of counterparty default, the Fund has the right to use the collateral to offset losses incurred. There is potential for loss to a Fund in the event the Fund is delayed or prevented from exercising its rights to dispose of the collateral securities, including the risk of a possible decline in the fair value of the underlying securities during the period while the Fund seeks to assert its rights.
Allocations:
Expenses directly attributable to a Fund are charged to that Fund. Expenses not directly attributable to a Fund are allocated proportionately among the applicable series within the Trusts in relation to the net assets of each fund or on another reasonable basis. Class specific expenses are charged directly to the class incurring the expense. In addition, income, expenses (other than class specific expenses), and unrealized and realized gains and losses are allocated to each class based on relative net assets on a daily basis.
Dividends to Shareholders:
Dividends to shareholders from net investment income, if any, are declared daily and paid monthly from each Fund. Dividends from net realized gains, if any, are declared and paid at least annually by the Funds. Additional distributions are also made to the Funds’ shareholders to the extent necessary to avoid the federal excise tax on certain undistributed income and net realized gains of regulated investment companies.
The amount and character of net investment income and net realized gain distributions are determined in accordance with federal income tax regulations, which may differ from GAAP. These “book/tax’’ differences are either considered temporary or permanent in nature. To the extent these differences are permanent in nature (e.g., reclassification of market discounts, certain gain/loss, paydowns, and distributions), such amounts are reclassified within the composition of net assets based on their federal tax-basis treatment; temporary differences (e.g., wash losses and post-October loss deferrals) do not require reclassification. To the extent distributions to shareholders from net investment income and net realized gains exceed net investment income and net realized gains for tax purposes, they are reported as distributions of capital.
Federal Income Taxes:
Each Fund is a separate taxable entity for federal income tax purposes. Each Fund has qualified and intends to continue to qualify each year as a “regulated investment company’’ under Subchapter M of the Internal Revenue Code, as amended, and to distribute substantially all of its taxable net investment income and net realized gains, if any, to its shareholders. Accordingly, no provision for federal income or excise tax is required.
Management of the Funds has reviewed tax positions taken in tax years that remain subject to examination by all major tax jurisdictions, including federal (i.e., the last four tax year ends and the interim tax period since then, as applicable). Management believes that there is no tax liability resulting from unrecognized tax benefits related to uncertain tax positions taken.
30 HSBC FAMILY OF FUNDS
| HSBC FAMILY OF FUNDS |
| Notes to Financial Statements—as of October 31, 2013 (continued) |
New Accounting Pronouncements:
In January 2013, the Financial Accounting Standards Board issued Accounting Standards Update (“ASU”) No. 2013-01 “Clarifying the Scope of Disclosures about Offsetting Assets and Liabilities” (“ASU 2013-01”), which amended Accounting Standards Codification Subtopic 210-20, Balance Sheet Offsetting. ASU 2013-01 clarified the scope of ASU No. 2011-11 “Disclosures about Offsetting Assets and Liabilities” (“ASU 2011-11”). ASU 2011-11 requires an entity to disclose information about offsetting and related arrangements to enable users of the financial statements to understand the effect of those arrangements on the entity’s financial position. ASU 2013-01 clarifies the scope of ASU 2011-11 as applying to derivatives accounted for in accordance with Topic 815, Derivatives and Hedging, including bifurcated embedded derivatives, repurchase agreements and reverse repurchase agreements, and securities borrowing and securities lending transactions that are offset either in accordance with other requirements of GAAP or subject to an enforceable master netting arrangement or similar agreement. The guidance in ASU 2013-01 and ASU 2011-11 is effective for interim and annual periods beginning on or after January 1, 2013. Management is evaluating any impact ASU 2013-01 and ASU 2011-11 may have on the Funds’ financial statements.
3. Investment Valuation Summary:
The valuation techniques employed by the Funds, as described below, maximize the use of observable inputs and minimize the use of unobservable inputs in determining fair value. The inputs used for valuing the Funds’ investments are summarized in the three broad levels listed below:
- Level 1: quoted prices in active markets for identical assets
- Level 2: other significant observable inputs (including quoted prices for similar securities, interest rates, prepayment speeds, credit risk, etc.)
- Level 3: significant unobservable inputs (including a Fund’s own assumptions in determining the fair value of investments)
Changes in valuation techniques may result in transfers in or out of an assigned level within the disclosure hierarchy. The Funds determine transfers between fair value hierarchy levels at the reporting period end. The inputs or methodology used for valuing investments are not necessarily an indication of the risk associated with investing in those investments.
Investments of the Funds are valued using the amortized cost method pursuant to Rule 2a-7 under the Act, which approximates fair value and are typically categorized as Level 2 in the fair value hierarchy. The amortized cost method involves valuing an instrument at its cost initially and thereafter assuming a constant amortization to maturity of any discounts or premium, regardless of the impact of fluctuating interest rates on the market value of the instrument. The amortized cost method may result in periods during which value, as determined by amortized cost, is higher or lower than the price a Fund holding the instrument would receive if it sold the instrument. The fair value of securities in the Funds can be expected to vary with changes in prevailing interest rates.
Investments in other money market funds are priced at net asset value as reported by such companies and are typically categorized as Level 1 in the fair value hierarchy.
Repurchase agreements are valued at original cost and are typically categorized as Level 2 in the fair value hierarchy.
For the year ended October 31, 2013, there were no Level 3 investments for which significant unobservable inputs were used to determine fair value.
HSBC FAMILY OF FUNDS 31
| HSBC FAMILY OF FUNDS |
| Notes to Financial Statements—as of October 31, 2013 (continued) |
The following is a summary of the valuation inputs used as of October 31, 2013 in valuing the Funds’ investments based upon the three levels defined above. The breakdown of investment categorization is disclosed in the Schedule of Portfolio Investments for each Fund:
| | LEVEL 1($) | | LEVEL 2($) | | LEVEL 3($) | | Total($) |
| Prime Money Market Fund | | | | | | | | | | | | |
| Investment Securities: | | | | | | | | | | | | |
| Certificates of Deposit | | | — | | | 1,976,782,448 | | | — | | | 1,976,782,448 |
| Commercial Paper and Notes | | | — | | | 1,353,212,261 | | | — | | | 1,353,212,261 |
| Corporate Obligations | | | — | | | 181,565,143 | | | — | | | 181,565,143 |
| Yankee Dollars | | | — | | | 194,243,024 | | | — | | | 194,243,024 |
| U.S. Government and Government | | | | | | | | | | | | |
| Agency Obligations | | | — | | | 30,000,000 | | | — | | | 30,000,000 |
| U.S. Treasury Obligations | | | — | | | 688,239,294 | | | — | | | 688,239,294 |
| Time Deposits | | | — | | | 250,000,000 | | | — | | | 250,000,000 |
| Total Investment Securities | | | — | | | 4,674,042,170 | | | — | | | 4,674,042,170 |
| | | | | | | | | | | | | |
| U.S. Government Money Market Fund | | | | | | | | | | | | |
| Investment Securities: | | | | | | | | | | | | |
| U.S. Government and Government | | | | | | | | | | | | |
| Agency Obligations | | | — | | | 703,438,583 | | | — | | | 703,438,583 |
| U.S. Treasury Obligations | | | — | | | 2,421,383,138 | | | — | | | 2,421,383,138 |
| Repurchase Agreements | | | — | | | 1,100,000,000 | | | — | | | 1,100,000,000 |
| Total Investment Securities | | | — | | | 4,224,821,721 | | | — | | | 4,224,821,721 |
| | | | | | | | | | | | | |
| U.S. Treasury Money Market Fund | | | | | | | | | | | | |
| Investment Securities: | | | | | | | | | | | | |
| U.S. Treasury Obligations | | | — | | | 2,560,376,219 | | | — | | | 2,560,376,219 |
| Total Investment Securities | | | — | | | 2,560,376,219 | | | — | | | 2,560,376,219 |
4. Related Party Transactions and Other Agreements and Plans:
Investment Management:
HSBC Global Asset Management (USA) Inc. (“HSBC’’ or the “Investment Adviser’’), a wholly owned subsidiary of HSBC Bank USA, N.A., a national bank organized under the laws of the United States, acts as Investment Adviser to the Funds. As Investment Adviser, HSBC manages the investments of the Funds and continuously reviews, supervises and administers the Funds’ investments pursuant to an Investment Advisory Contract. For its services as investment adviser, HSBC receives a fee from each Fund, accrued daily and paid monthly, based on the average daily net assets of each respective Fund, at an annual rate of 0.10%.
32 HSBC FAMILY OF FUNDS
| HSBC FAMILY OF FUNDS |
| Notes to Financial Statements—as of October 31, 2013 (continued) |
HSBC also provides operational support services to the Funds pursuant to an Operational Support Services Agreement. For its services in this capacity, HSBC receives a fee, accrued daily and paid monthly, based on the average daily net assets of Class A Shares, Class B Shares, Class C Shares, Class D Shares and Class Y Shares, at an annual rate of:
| Fund | | | Fee Rate(%) |
| Prime Money Market Fund | | 0.10 |
| U.S. Government Money Market Fund | | 0.10 |
| U.S. Treasury Money Market Fund | | 0.10 |
The Bank of New York Mellon (the “Servicer”) provides recordkeeping, reporting and processing services to the Prime Money Market Fund, U.S. Government Money Market Fund and U.S. Treasury Money Market Fund, Class I Shares. The Servicer is paid by the Investment Adviser from its profits and not by the Funds, for these services.
Administration:
HSBC also serves the Funds as Administrator. Under the terms of the Administration Agreement, HSBC receives from the Funds (as well as other funds in the Trusts combined) a fee, accrued daily and paid monthly, at an annual rate of:
| Based on Combined Average Daily Net Assets of | | | Fee Rate(%) |
| Up to $10 billion | 0.0550 |
| In excess of $10 billion but not exceeding $20 billion | | 0.0350 |
| In excess of $20 billion but not exceeding $50 billion | | 0.0275 |
| In excess of $50 billion | | 0.0250 |
The fee rates and breakpoints are determined on the basis of the aggregate average daily net assets of the Trusts. The total administration fee paid to HSBC is allocated to each series based upon its proportionate share of the aggregate net assets of the Trusts, subject to certain allocations in cases where one fund invests some or all of its assets in another fund. An amount equal to 50% of the administration fee is deemed to be class specific.
Pursuant to a Sub-Administration Agreement with HSBC, Citi Fund Services Ohio, Inc. (“Citi’’), a wholly-owned subsidiary of Citigroup, Inc., serves as the Trusts’ Sub-Administrator, subject to the general supervision by the Trusts’ Board and HSBC. For these services, Citi is entitled to a fee, payable by HSBC, at an annual rate equivalent to the fee rates set forth above subject to certain reductions associated with services provided to new funds, minus 0.02% which is retained by HSBC. During the year ended October 31, 2013, Citi voluntarily reduced its sub-administration fees by $217,136.
Under a Compliance Services Agreement between the Trusts and Citi (the “CCO Agreement’’), Citi makes an employee available to serve as the Trusts’ Chief Compliance Officer (the “CCO’’). Under the CCO Agreement, Citi also provides infrastructure and support in implementing the written policies and procedures comprising the Trusts’ compliance program, including support services to the CCO. For the services provided under the CCO Agreement, the Trusts paid Citi $287,560 for the year ended October 31, 2013, plus reimbursement of certain out of pocket expenses. Expenses incurred by each Fund are reflected on the Statements of Operations as “Compliance Services.’’ Citi pays the salary and other compensation earned by individuals performing these services, as employees of Citi.
Distribution Arrangements:
Foreside Distribution Services, L.P. (“Foreside’’), a wholly-owned subsidiary of Foreside Financial Group LLC, serves the Trust as Distributor (the “Distributor’’). The Trust has adopted a non-compensatory Distribution Plan and Agreement (the “Distribution Plan’’) pursuant to Rule 12b-1 of the Act. The Distribution Plan provides for reimbursement of expenses incurred by the Distributor related to distribution and marketing, at a rate not to exceed 0.25%, 1.00%, 1.00% and 0.25% of the average daily net assets of Class A Shares (currently not being charged), Class B Shares (currently charging 0.75%), Class C Shares (currently charging 0.75%) and
HSBC FAMILY OF FUNDS 33
| HSBC FAMILY OF FUNDS |
| Notes to Financial Statements—as of October 31, 2013 (continued) |
Class D Shares (currently not being charged) of the Funds, respectively. For the year ended October 31, 2013, Foreside, as Distributor, also received $213,520, $105,439, and $49,940 in commissions from sales of the Trusts, for Class A Shares, Class B Shares, and Class C Shares, respectively of which $584, $89, and $0 were reallocated to HSBC-affiliated brokers and dealers, for Class A Shares, Class B Shares, and Class C Shares, respectively. Expenses reduced during the year ended October 31, 2013 are reflected on the Statements of Operations as “Fees voluntarily reduced by Distributor.’’
Shareholder Servicing:
The Trust has adopted a Shareholder Services Plan, which provides for payments to shareholder servicing agents (which primarily consist of HSBC and its affiliates) for providing various shareholder services. For performing these services, the shareholder servicing agents receive a fee that is computed daily and paid monthly up to 0.60%, 0.25%, 0.25%, 0.25% and 0.10% of the average daily net assets of Class A Shares (currently charging 0.40%), Class B Shares, Class C Shares, Class D Shares and Class E Shares (expected to charge 0.05%) of the Funds, respectively. The aggregate fees paid to the Distributor pursuant to the Distribution Plan and to shareholder servicing agents pursuant to the Shareholder Services Plan may not exceed, in the aggregate, 0.85%, 1.00%, 1.00%, 0.50% and 0.10% annually of each Fund’s average daily net assets of Class A Shares, Class B Shares, Class C Shares, Class D Shares and Class E Shares, respectively. Expenses reduced during the year ended October 31, 2013 are reflected on the Statements of Operations as “Fees voluntarily reduced by Shareholder Servicing Agent.’’
Fund Accounting and Transfer Agency:
Citi provides fund accounting and transfer agency services for each Fund. As transfer agent, Citi receives a fee based on the number of funds and shareholder accounts, subject to certain minimums, reductions associated with services provided to new funds and reimbursement of certain expenses. As fund accountant, Citi receives an annual fee per Fund and share class, subject to minimums, reductions associated with services provided to new funds and reimbursement of certain expenses. Citi receives additional fees paid by the Trust for blue sky exemption services and money market fund reporting services.
Independent Trustees:
The Trusts pay each Independent Trustee an annual retainer of $100,000. The Trusts pay a fee of $10,000 for each regular meeting of the Board attended and a fee of $ 3,000 for each special meeting attended. The Trusts pay each Committee Chair an annual retainer of $ 3,000, with the exception of the Chair of the Audit Committee, who receives a retainer of $ 6,000. The Trusts also pay the Chairman of the Board, an additional annual retainer of $24,000. In addition, for time expended on Board duties outside normal meetings, which is authorized by the Board, a Trustee is compensated at the rate of $ 500 per hour, up to a maximum of $ 3,000 per day.
Fee Reductions:
The Investment Adviser has agreed to contractually limit through March 1, 2014 the annual total expenses, exclusive of interest, taxes, brokerage commissions, and extraordinary expenses, of certain classes of the Funds. Each affected Fund Class has its own expense limitations based on the average daily net assets for any full fiscal year as follows:
| | | Contractual |
| | | Expense |
| Fund | | Class | | Limitations(%) |
| Prime Money Market Fund | E | | | 0.25 | * | |
| Prime Money Market Fund | I | | | 0.20 | | |
| U.S. Government Money Market Fund | E | | | 0.25 | * | |
| U.S. Government Money Market Fund | I | | | 0.20 | | |
| U.S. Treasury Money Market Fund | E | | | 0.25 | * | |
| U.S. Treasury Money Market Fund | I | | | 0.20 | | |
____________________
| | | | | | |
* As of October 31, 2013, Class E Shares were not operational. | | | | | | |
34 HSBC FAMILY OF FUNDS
| HSBC FAMILY OF FUNDS |
| Notes to Financial Statements—as of October 31, 2013 (continued) |
Any amounts contractually waived or reimbursed by the Investment Adviser will be subject to repayment by the respective Fund to the Investment Adviser within three years to the extent that the repayment will not cause the Fund’s operating expenses to exceed the contractual expense limit that was in effect at the time of such waiver or reimbursement. At October 31, 2013, there were no remaining contractual reimbursements that are subject to repayment by the Funds in subsequent years.
The Administrator and Citi may voluntarily waive/reimburse fees to help support the expense limits of the Funds. In addition, HSBC, in its role as Investment Adviser and Administrator, may waive/reimburse additional fees at its discretion. Any voluntary fee waivers/reimbursements are not subject to recoupment in subsequent fiscal periods. Voluntary waivers/reimbursements may be stopped at any time. Amounts waived/reimbursed by the Investment Adviser, Administrator and Citi are reported separately on the Statements of Operations, as applicable.
The Funds have entered into an arrangement with their custodian whereby credits realized as a result of uninvested cash balances are used to reduce a portion of the Funds’ custodian expenses. Expenses reduced during the year ended October 31, 2013 are reflected on the Statements of Operations as “Fees paid indirectly,” as applicable.
5. Federal Income Tax Information:
At October 31, 2013, the cost basis of securities for federal income tax purposes, gross unrealized appreciation, gross unrealized depreciation and net unrealized appreciation/depreciation were as follows:
| | | | | | | | | Net Unrealized |
| | | | Tax Unrealized | | Tax Unrealized | | Appreciation/ |
| | Tax Cost ($) | | Appreciation ($) | | Depreciation ($) | | (Depreciation) ($) |
| Prime Money Market Fund | | 4,674,044,583 | | — | | (2,413 | ) | | (2,413 | ) |
| U.S. Government Money Market Fund | | 4,224,870,236 | | — | | (48,515 | ) | | (48,515 | ) |
| U.S Treasury Money Market Fund | | 2,560,404,902 | | — | | (28,683 | ) | | (28,683 | ) |
The tax character of dividends paid by the Funds as of the tax year ended October 31, 2013 was as follows:
| Dividends paid from |
| | | Net | | | | | | |
| | | Long Term | | Total | | Tax | | Total |
| Ordinary | | Capital | | Taxable | | Exempt | | Dividends |
| Income($) | | Gains($) | | Dividends($) | | Distributions($) | | Paid($)(1) |
| Prime Money Market Fund | 2,947,993 | | 148 | | 2,948,141 | | — | | 2,948,141 |
| U.S. Government Money Market Fund | 619,866 | | — | | 619,866 | | — | | 619,866 |
The tax character of dividends paid by the Funds as of the tax year ended October 31, 2012 was as follows:
| Dividends paid from |
| | | Net | | | | | | |
| | | Long Term | | Total | | Tax | | Total |
| Ordinary | | Capital | | Taxable | | Exempt | | Dividends |
| Income($) | | Gains($) | | Dividends($) | | Distributions($) | | Paid($)(1) |
| Prime Money Market Fund | 5,507,290 | | — | | 5,507,290 | | — | | 5,507,290 |
| U.S. Government Money Market Fund | 584,227 | | — | | 584,227 | | — | | 584,227 |
| U.S. Treasury Money Market Fund | 24,266 | | — | | 24,266 | | — | | 24,266 |
____________________
|
| (1) | | Total dividends paid may differ from the amount reported in the Statement of Changes in Net Assets because dividends are recognized when actually paid for tax purposes. |
HSBC FAMILY OF FUNDS 35
| HSBC FAMILY OF FUNDS |
| Notes to Financial Statements—as of October 31, 2013 (continued) |
As of the tax year ended October 31, 2013, the components of accumulated earnings/(deficit) on a tax basis for the Funds were as follows:
| | | | | | | | | | | | | | | | | | | Accumulated | | | | | | | Total |
| | Undistributed | | Undistributed | | Undistributed | | | | | | | | Capital | | Unrealized | | Accumulated |
| | Ordinary | | Tax Exempt | | Long Term | | Accumulated | | Dividends | | | and Other | | Appreciation/ | | Earnings/ |
| | Income($) | | Income($) | | Capital Gains($) | | Earnings($) | | Payable($) | | Losses($) | | (Depreciation)($) | | (Deficit)($) |
| Prime Money Market Fund | | | 108,880 | | | — | | — | | | 108,880 | | | | (97,723 | ) | | | | — | | | | | (2,413 | ) | | | | 8,744 | | |
| U.S. Government Money | | | | | | | | | | | | | | | | | | | | | | | | | | | | | | | | |
| Market Fund | | | 39,714 | | | — | | — | | | 39,714 | | | | (39,714 | ) | | | | (41,909 | ) | | | | (48,515 | ) | | | | (90,424 | ) | |
| U.S. Treasury Money | | | | | | | | | | | | | | | | | | | | | | | | | | | | | | | | |
| Market Fund | | | — | | | — | | — | | | — | | | | — | | | | | (20,716 | ) | | | | (28,683 | ) | | | | (49,399 | ) | |
As of the tax year ended October 31, 2013, the Funds have net capital loss carryforwards (“CLCFs”) as summarized in the tables below. CLCFs subject to expiration are applied as short-term capital loss regardless of whether the originating capital loss was short-term or long-term. CLCFs that are not subject to expiration must be utilized before those that are subject to expiration. The Board does not intend to authorize a distribution of any realized gain for the Funds until any applicable CLCF has been offset or expires.
CLCFs not subject to expiration:
| Short Term | | Long Term | | |
| Amount($) | | Amount($) | | Total($) |
| U.S. Government Money Market Fund | | 41,909 | | | | — | | | 41,909 |
| U.S. Treasury Money Market Fund | | 9,306 | | | | 11,410 | | | 20,716 |
6. Legal and Regulatory Matters:
On September 26, 2006 BISYS Fund Services, Inc. (“BISYS’’), an affiliate of BISYS Fund Services Ohio, Inc. which provided various services to the Funds, reached a settlement with the Securities and Exchange Commission (the “SEC’’) regarding the SEC’s investigation related to BISYS’ past payment of certain marketing and other expenses with respect to certain of its mutual fund clients. The related settlement monies were received by the Funds during the year ended October 31, 2010. The corresponding impact to the net income ratio and total return for the year ended October 31, 2010 are disclosed in the Funds’ Financial Highlights.
7. Subsequent Events:
Management has evaluated events and transactions through the date the financial statements were issued, for purposes of recognition or disclosure in these financial statements and there are no subsequent events to report.
36 HSBC FAMILY OF FUNDS
Report of Independent Registered Public Accounting Firm
To the Shareholders and Board of Trustees of
HSBC Funds:
We have audited the accompanying statements of assets and liabilities of HSBC Prime Money Market Fund, HSBC U.S. Government Money Market Fund and HSBC U.S. Treasury Money Market Fund (the Funds), including the schedules of portfolio investments, as of October 31, 2013, and the related statements of operations for the year then ended, the statements of changes in net assets for each of the years in the two-year period then ended, and the financial highlights for each of the years in the five-year period then ended. These financial statements and financial highlights are the responsibility of the Funds’ management. Our responsibility is to express an opinion on these financial statements and financial highlights based on our audits.
We conducted our audits in accordance with the standards of the Public Company Accounting Oversight Board (United States). Those standards require that we plan and perform the audit to obtain reasonable assurance about whether the financial statements and financial highlights are free of material misstatement. An audit includes examining, on a test basis, evidence supporting the amounts and disclosures in the financial statements. Our procedures included confirmation of securities owned as of October 31, 2013, by correspondence with custodians and brokers or by other appropriate auditing procedures. An audit also includes assessing the accounting principles used and significant estimates made by management, as well as evaluating the overall financial statement presentation. We believe that our audits provide a reasonable basis for our opinion.
In our opinion, the financial statements and financial highlights referred to above present fairly, in all material respects, the financial position of the Funds as of October 31, 2013, the results of their operations for the year then ended, the changes in their net assets for each of the years in the two-year period then ended, and the financial highlights for each of the years in the five-year period then ended, in conformity with U.S. generally accepted accounting principles.

Columbus, Ohio
December 27, 2013
HSBC FAMILY OF FUNDS 37
| HSBC FAMILY OF FUNDS |
| Other Federal Income Tax Information—as of October 31, 2013 (Unaudited) |
During the year ended October 31, 2013, the following Fund declared capital gain distributions:
| Short Term Capital Gain | | Long Term Capital Gain |
| Distributions ($) | | Distributions ($) |
| Prime Money Market Fund | 11,299 | | 148 |
During the year ended October 31, 2013, the following Fund designated the maximum amount allowable as interest-related dividends for certain non-U.S. resident investors:
| Qualified Interest Income (%) |
| Prime Money Market Fund | 100.00 |
| U.S. Government Money Market Fund | 100.00 |
38 HSBC FAMILY OF FUNDS
| HSBC FAMILY OF FUNDS |
| Table of Shareholder Expenses—as of October 31, 2013 (Unaudited) |
As a shareholder of the Funds, you incur two types of costs: (1) transaction costs, including sales charges (loads) on purchases, redemption fees and exchange fees; and (2) ongoing costs, including management fees, distribution fees and other Fund expenses. These examples are intended to help you understand your ongoing costs (in dollars) of investing in the Funds and to compare the cost with the ongoing costs of investing in other mutual funds.
These examples are based on an investment of $1,000 invested at the beginning of the period and held for the entire period from May 1, 2013 through October 31, 2013 (unless otherwise noted).
Actual Example
The table below provides information about actual account values and actual expenses. You may use the information below, together with the amount you invested, to estimate the expenses that you paid over the period. Simply divide your account value by $1,000 (for example, an $8,600 account value divided by $1,000 = 8.6), then multiply the result by the number in the table under the heading entitled “Expenses Paid During Period” to estimate the expenses you paid on your account during this period.
| | | | | | | | | | Annualized |
| | | | Beginning | | Ending | | Expenses Paid | | Expense Ratio |
| | | | Account Value | | Account Value | | During Period* | | During Period |
| | | | 5/1/13 | | 10/31/13 | | 5/1/13 - 10/31/13 | | 5/1/13 - 10/31/13 |
| Prime Money Market Fund | | Class A Shares | | 1,000.00 | | 1,000.00 | | 1.06 | | 0.21% |
| | Class B Shares | | 1,000.00 | | 1,000.10 | | 1.01 | | 0.20% |
| | Class C Shares | | 1,000.00 | | 1,000.00 | | 0.76 | | 0.15% |
| | Class D Shares | | 1,000.00 | | 1,000.00 | | 1.01 | | 0.20% |
| | Class I Shares | | 1,000.00 | | 1,000.20 | | 0.86 | | 0.17% |
| | Class Y Shares | | 1,000.00 | | 1,000.00 | | 1.06 | | 0.21% |
| U.S. Government Money | | | | | | | | | | |
| Market Fund | | Class A Shares | | 1,000.00 | | 1,000.10 | | 0.50 | | 0.10% |
| | Class B Shares | | 1,000.00 | | 1,000.00 | | 0.50 | | 0.10% |
| | Class D Shares | | 1,000.00 | | 1,000.10 | | 0.50 | | 0.10% |
| | Class I Shares | | 1,000.00 | | 1,000.10 | | 0.45 | | 0.09% |
| | Class Y Shares | | 1,000.00 | | 1,000.10 | | 0.50 | | 0.10% |
| U.S. Treasury Money | | | | | | | | | | |
| Market Fund | | Class A Shares | | 1,000.00 | | 1,000.00 | | 0.40 | | 0.08% |
| | Class B Shares** | | 1,000.00 | | 1,000.00 | | 0.06 | | 0.03% |
| | Class D Shares | | 1,000.00 | | 1,000.00 | | 0.35 | | 0.07% |
| | Class I Shares | | 1,000.00 | | 1,000.00 | | 0.35 | | 0.07% |
| | Class Y Shares | | 1,000.00 | | 1,000.00 | | 0.35 | | 0.07% |
____________________
| * | | Expenses are equal to the average account value over the period, multiplied by the Fund’s annualized expense ratio, multiplied by 184/365 (to reflect the one half year period). |
| ** | | Information shown reflects values using the expense ratio and rate of return for the period May 1, 2013 to July 7, 2013 (number of operational days in period). |
HSBC FAMILY OF FUNDS 39
| HSBC FAMILY OF FUNDS |
| Table of Shareholder Expenses—as of October 31, 2013 (Unaudited) (continued) |
Hypothetical Example for Comparison Purposes
The table below provides information about hypothetical account values and hypothetical expenses based on each Fund’s actual expense ratio and an assumed rate of return of 5% per year before expenses, which is not the Fund's actual return. The hypothetical account values and expenses may not be used to estimate the actual ending account balance or expenses you paid for the period. You may use this information to compare this 5% hypothetical example with the 5% hypothetical examples that appear in the shareholder reports of other funds.
Please note that the expenses shown in the table are meant to highlight your ongoing costs only and do not reflect any transactional costs, such as sales charges (loads), redemption fees, or exchange fees. Therefore, the table is useful in comparing ongoing costs only, and will not help you determine the relative total costs of owning different funds. In addition, if these transactional costs were included, your costs would have been higher.
| | | | | | | | | | Annualized |
| | | | Beginning | | Ending | | Expenses Paid | | Expense Ratio |
| | | | Account Value | | Account Value | | During Period* | | During Period |
| | | | 5/1/13 | | 10/31/13 | | 5/1/13 - 10/31/13 | | 5/1/13 - 10/31/13 |
| Prime Money Market Fund | | Class A Shares | | 1,000.00 | | 1,024.15 | | 1.07 | | 0.21% |
| | Class B Shares | | 1,000.00 | | 1,024.20 | | 1.02 | | 0.20% |
| | Class C Shares | | 1,000.00 | | 1,024.45 | | 0.77 | | 0.15% |
| | Class D Shares | | 1,000.00 | | 1,024.20 | | 1.02 | | 0.20% |
| | Class I Shares | | 1,000.00 | | 1,024.35 | | 0.87 | | 0.17% |
| | Class Y Shares | | 1,000.00 | | 1,024.15 | | 1.07 | | 0.21% |
| U.S. Government Money | | | | | | | | | | |
| Market Fund | | Class A Shares | | 1,000.00 | | 1,024.70 | | 0.51 | | 0.10% |
| | Class B Shares | | 1,000.00 | | 1,024.70 | | 0.51 | | 0.10% |
| | Class D Shares | | 1,000.00 | | 1,024.70 | | 0.51 | | 0.10% |
| | Class I Shares | | 1,000.00 | | 1,024.75 | | 0.46 | | 0.09% |
| | Class Y Shares | | 1,000.00 | | 1,024.70 | | 0.51 | | 0.10% |
| U.S. Treasury Money | | | | | | | | | | |
| Market Fund | | Class A Shares | | 1,000.00 | | 1,024.80 | | 0.41 | | 0.08% |
| | Class B Shares** | | 1,000.00 | | 1,009.26 | | 0.06 | | 0.03% |
| | Class D Shares | | 1,000.00 | | 1,024.85 | | 0.36 | | 0.07% |
| | Class I Shares | | 1,000.00 | | 1,024.85 | | 0.36 | | 0.07% |
| | Class Y Shares | | 1,000.00 | | 1,024.85 | | 0.36 | | 0.07% |
____________________
| * | | Expenses are equal to the average account value over the period, multiplied by the Fund’s annualized expense ratio, multiplied by 184/365 (to reflect the one half year period). |
| ** | | Information shown reflects values using the expense ratio for the period from May 1, 2013 to July 7, 2013 (number of operational days in period) and has been annualized to reflect values for the period May 1, 2013 to October 31, 2013. |
40 HSBC FAMILY OF FUNDS
| HSBC FAMILY OF FUNDS |
| Board of Trustees and Officers (Unaudited) |
MANAGEMENT OF THE TRUST
The following table contains information regarding the HSBC Family of Funds’ Board of Trustees (“Trustees”). Asterisks indicate those Trustees who are “interested persons,” as defined in the Investment Company Act of 1940, as amended, of the HSBC Family of Funds. The HSBC Family of Funds’ Statement of Additional Information includes additional information about the Trustees and is available, without charge, upon request by calling (888) 525-5757.
| | | | | | | | Portfolios in | | |
| | Position(s) | | Term of Office | | | | Fund Complex | | Other |
| Name, | | Held with | | and Length of | | Principal Occupation(s) | | Overseen By | | Directorships |
| Address, Age | | Funds | | Time Served | | During Past 5 Years | | Trustee* | | Held by Trustee |
| NON-INTERESTED | | | | | | | | | | |
| TRUSTEES | | | | | | | | | | |
| | | | | | | | | | | |
MARCIA L. BECK
P.O. Box 182845
Columbus, OH
43218-3035
Age: 58 | | Trustee | | Indefinite;
2008 to present | | Private Investor (June 1999 – present); Executive Vice President, Prudential Investments (1997 – 1999); President and Trustee, The Goldman Sachs Mutual Funds (1992 – 1996) | | 21 | | None |
| | | | | | | | | | | |
SUSAN C. GAUSE
P.O. Box 182845
Columbus, OH
43218-3035
Age: 60 | | Trustee | | Indefinite;
2013 to present | | Since 2003, Private Investor; Independent Trustee of Met Investors Series Trust (2008-2012); Chief Executive Officer, Dresdner RCM Global Investors and Allianz Dresdner Asset Management (2000-2002); Board Member of Dresdner Global Asset Management Board (2000-2002); Chief Operating Officer and Senior Managing Director of Dresdner RCM Global Investors (1998-2000) | | 21 | | Since 2012, Trustee,
Metropolitan Series Fund |
| | | | | | | | | | | |
SUSAN S. HUANG
P.O. Box 182845
Columbus, OH
43218-3035
Age: 59 | | Trustee | | Indefinite;
2008 to present | | Private Investor (2000- present); Senior Vice President, Schroder Investment Management (2001 – 2004); Managing Director, Chase Asset Management (1995-2000) | | 21 | | None |
| | | | | | | | | | | |
ALAN S. PARSOW
P.O. Box 182845
Columbus, OH
43218-3035
Age: 63 | | Trustee | | Indefinite;
1987 to present | | General Partner, Elkhorn Partners, L.P. (a private investment partnership) (1989 – present) | | 21 | | None |
| | | | | | | | | | | |
THOMAS F. ROBARDS
P.O. Box 182845
Columbus, OH
43218-3035
Age: 67 | | Trustee | | Indefinite;
2005 to present | | Partner, Robards & Co. LLC (investment and advisory services) (2005-present); Chief Financial Officer, American Museum of Natural History (2003- 2004); Chief Financial Officer, Datek Online Holdings (2000-2003); Previously EVP and CFO Republic New York Corporation | | 21 | | Overseas Shipholding
Group (energy
transportation);
Ellington Financial LLC
(NYSE listed financial services);
Ellington Residential
Mortgage REIT (NYSE
listed real estate
investment trust) |
| | | | | | | | | | | |
MICHAEL SEELY
P.O. Box
182845
Columbus, OH
43218-3035
Age: 68 | | Chairman and
Trustee | | Indefinite;
1987 to present | | Private Investor (2003-present); General Partner, Global Multi Manager Partners (1999-2003); President of Investor Access Corporation (1981-2003) | | 21 | | None |
| | | | | | | | | | | |
INTERESTED TRUSTEE | | | | | | | | | | |
| | | | | | | | | | | |
DEBORAH HAZELL
452 Fifth Avenue
New York
NY 10018
Age: 50 | | Trustee | | Indefinite;
2011 to present | | CEO, HSBC Global Asset Management (USA) Inc. (2011-present); President and CEO, Fisher Francis Trees & Watts (“FFTW”) (investment advisor), February 2008-June 2011; Head of Client Service, Business Development and Marketing Group, FFTW (October 1999-February 2008) | | 21 | | None |
____________________
* | | Includes the Trust, the HSBC Advisor Fund Trust and the HSBC Portfolios. |
HSBC FAMILY OF FUNDS 41
| HSBC FAMILY OF FUNDS |
| Board of Trustees and Officers (Unaudited) (continued) |
| | Position(s) Held | | Term of Office and | | Principal Occupation(s) |
| Name, Address, Age | | Funds | | Length of Time Served | | During Past 5 Years |
OFFICERS | | | | | | |
| | | | | | | |
RICHARD A. FABIETTI
452 Fifth Avenue
New York, NY 10018
Age: 55 | | President | | One year;
2004 to present | | Senior Vice President, Head of Product Management, HSBC Global Asset Management (USA) Inc. (1998 - present) |
| | | | | | | |
STEPHEN SIVILLO
452 Fifth Avenue
New York, NY 10018
Age: 42 | | Vice President | | One year;
2010 to present | | Vice President of Product Administration, HSBC Global Asset Management (USA) Inc. (2010 - present); Chief Compliance Officer, Managers Funds (2009 – 2010); Director, Mutual Fund Compliance, AllianceBernstein (2007-2009) |
| | | | | | | |
TY EDWARDS*
3435 Stelzer Road
Columbus, OH 43219-3035
Age: 47 | | Treasurer | | One year;
2010 to present | | Senior Vice President, Citi Fund Services (2010– present); Director, Product Management, Columbia Management (2007-2009); Deputy Treasurer, Columbia Funds, (2006-2007) |
| | | | | | | |
JENNIFER A. ENGLISH*
100 Summer Street
Suite 1500
Boston, MA 02110
Age: 41 | | Secretary | | One year;
2008 to present | | Senior Vice President, Regulatory Administration, Citi (2005 - present) |
| | | | | | | |
FREDERICK J. SCHMIDT*
1 Rexcorp Plaza
Uniondale,
NY 11556
Age: 54 | | Chief Compliance
Officer | | One year;
2004 to present | | Director and Chief Compliance Officer, CCO Services, Citi (2004 - present) |
____________________
* | | Mr. Edwards, Mr. Schmidt, and Ms. English also are officers of other investment companies of which Citi (or an affiliate) is the administrator or sub-administrator. |
42 HSBC FAMILY OF FUNDS
Other Information (Unaudited):
Information regarding how the Funds voted proxies relating to portfolio securities during the most recent 12-month period ended June 30th is available (i) without charge, upon request, by calling 1-800-525-5757 for HSBC Bank USA and HSBC Brokerage (USA) Inc. clients and 1-800-782-8183 for all other shareholders; (ii) on the Funds’ website at www.investorfunds.us.hsbc.com; and (iii) on the Security and Exchange Commission’s (“Commission”) website at http://www.sec.gov.
The Funds file their complete schedules of portfolio holdings with the Commission for the first and third quarters of each fiscal year on Form N-Q. The Funds’ Forms N-Q are available on the Commission’s website at http://www.sec.gov. The Funds’ Forms N-Q may be reviewed and copied at the Commission’s Public Reference Room in Washington, D.C. and information on the operation of the Public Reference Room may be obtained by calling 1-800-SEC-0330. The Funds’ Schedules of Investments will be available no later than 60 days after each period end, without charge, on the Funds’ website at www.investorfunds.us.hsbc.com.
Each Fund will disclose on its website at www.investorfunds.us.hsbc.com, within five business days after the end of each month, a complete schedule of portfolio holdings and information regarding the weighted average maturity of the Fund. In addition, each Fund will file with the Commission on Form N-MFP, within five business days after the end of each month, more detailed portfolio holdings information. The Funds’ Forms N-MFP will be available on the Commission’s website at http://www.sec.gov, on a delayed basis, and the Funds’ website will also contain a link to these filings.
An investment in a Fund is not a deposit of HSBC Bank USA, National Association, and is not insured or guaranteed by the Federal Deposit Insurance Corporation or any other government agency.
HSBC FAMILY OF FUNDS 43
HSBC FAMILY OF FUNDS: INVESTMENT ADVISER AND ADMINISTRATOR HSBC Global Asset Management (USA) Inc.
452 Fifth Avenue
New York, NY 10018 SHAREHOLDER SERVICING AGENTS For HSBC Bank USA, N.A. and
HSBC Securities (USA) Inc. Clients:
HSBC Bank USA, N.A.
452 Fifth Avenue
New York, NY 10018
1-888-525-5757 For All Other Shareholders: HSBC Funds
P.O. Box 182845
Columbus, OH 43218
1-800-782-8183 TRANSFER AGENT Citi Fund Services
3435 Stelzer Road
Columbus, OH 43219 DISTRIBUTOR Foreside Distribution Services, L.P.
690 Taylor Road, Suite 150
Gahanna, Ohio 43230 | | CUSTODIAN The Northern Trust Company
50 South LaSalle Street
Chicago, IL 60603 INDEPENDENT REGISTERED PUBLIC ACCOUNTING FIRM KPMG LLP
191 West Nationwide Blvd., Suite 500
Columbus, OH 43215 LEGAL COUNSEL Dechert LLP
1900 K Street, N.W.
Washington, D.C. 20006 |
| | | |
| | | |
| | | |
| | | |
| | | |
| | | |
| | | |
| | | |
| | | |
| | | |
 | | |
Investment products:
ARE NOT A
BANK DEPOSIT
OR OBLIGATION
OF THE BANK
OR ANY OF ITS
AFFILIATES | ARE NOT
FDIC
INSURED | ARE NOT
INSURED BY
ANY FEDERAL
GOVERNMENT
AGENCY |
ARE NOT GUARANTEED BY
THE BANK OR ANY OF ITS
AFFILIATES | MAY LOSE
VALUE |
Investment products are offered by HSBC Securities (USA) Inc. (HSI), member NYSE/FINRA/SIPC. HSI is an affiliate of HSBC Bank USA, N.A. Investment products: Are not a deposit or other obligation of the bank or any of its affiliates; Not FDIC insured or insured by any federal government agency of the United States; Not guaranteed by the bank or any of its affiliates; and are subject to investment risk, including possible loss of principal invested.
HSBC Global Asset Management (USA) Inc.
HSBC Funds
Annual Report
October 31, 2013
| EMERGING MARKET FUNDS | | Class A | | Class I | | Class S |
| HSBC Emerging Markets Debt Fund | | HCGAX | | HCGIX | | HBESX |
| HSBC Emerging Markets Local Debt Fund | | HBMAX | | HBMIX | | HBMSX |
| HSBC Frontier Markets Fund | | HSFAX | | HSFIX | | — |
| HSBC Total Return Fund | | HTRAX | | HTRIX | | HTRSX |
| HSBC RMB Fixed Income Fund | | HRMBX | | HRMRX | | HRMSX |

| Table of Contents |
| HSBC Family of Funds |
Annual Report - October 31, 2013 |
| Glossary of Terms | | |
| President’s Message | | 4 |
| Commentary From the Investment Manager | | 5 |
| Portfolio Reviews | | 6 |
| Portfolio Composition | | 16 |
| Schedules of Portfolio Investments | | |
| HSBC Emerging Markets Debt Fund | | 18 |
| HSBC Emerging Markets Local Debt Fund | | 23 |
| HSBC Frontier Markets Fund | | 27 |
| HSBC Total Return Fund | | 29 |
| HSBC RMB Fixed Income Fund | | 36 |
| Statements of Assets and Liabilities | | 38 |
| Statements of Operations | | 40 |
| Statements of Changes in Net Assets | | 41 |
| Financial Highlights | | 47 |
| Notes to Financial Statements | | 52 |
| Report of Independent Registered Public Accounting Firm | | 70 |
| Other Federal Income Tax Information | | 71 |
| Table of Shareholder Expenses | | 72 |
| Board of Trustees and Officers | | 74 |
| Other Information | | 76 |
Barclays U.S. Aggregate Bond Index is an unmanaged index generally representative of investment-grade, USD-denominated, fixed-rate debt issues, taxable bond market, including Treasuries, government-related and corporate securities, asset-backed, mortgage-backed and commercial mortgage-backed securities, with maturities of at least one year.
Barclays U.S. Corporate High-Yield Bond Index is an unmanaged index that measures the non-investment grade, USD-denominated, fixed-rate, taxable corporate bond market. Securities are classified as high-yield if the middle rating of Moody’s, Fitch, and S&P is Ba1/BB+/BB+ or below. The index excludes emerging markets debt.
BofA Merrill Lynch 3-Month LIBOR Constant Maturity Index tracks the performance of a synthetic asset paying LIBOR to a stated maturity. The index is based on the assumed purchase at par of a synthetic instrument having exactly its stated maturity and with a coupon equal to that day’s fixing rate. That issue is assumed to be sold the following business day (priced at a yield equal to the current day fixing rate) and rolled into a new instrument.
Gross Domestic Product (“GDP”) measures the market value of the goods and services produced by labor and property in the United States.
HSBC Offshore Renminbi Bond Index tracks total return performance of renminbi-denominated and renminbi-settled bonds and certificates of deposit issued outside the People’s Republic of China.
J.P. Morgan Emerging Local Markets Index Plus is an unmanaged index that tracks total returns for local-currency-denominated money market instruments in 22 emerging markets countries with at least US$10 billion of external trade.
J.P. Morgan Emerging Markets Bond Index Global is an unmanaged index that tracks returns for USD-denominated debt instruments issued by emerging market sovereign and quasi-sovereign entities; Brady bonds, loans, Eurobonds and local market instruments.
J.P. Morgan Government Bond Index – Emerging Markets Global Diversified is an unmanaged comprehensive global emerging markets fixed income index, and consists of regularly traded, liquid fixed-rate, domestic currency government bonds to which international investors can gain exposure.
Morgan Stanley Capital International Europe Australasia and Far East (“MSCI EAFE”) Index is an unmanaged equity index which captures large and mid cap representation across Developed Markets countries: Australia, Austria, Belgium, Denmark, Finland, France, Germany, Greece, Hong Kong, Ireland, Israel, Italy, Japan, the Netherlands, New Zealand, Norway, Portugal, Singapore, Spain, Sweden, Switzerland and the UK (excluding the US and Canada). With 910 constituents, the index covers approximately 85% of the free float-adjusted market capitalization in each country.
Morgan Stanley Capital International Emerging Market (“MSCI EM”) Index is an unmanaged index that captures large and mid cap representation across 21 Emerging Markets (EM) countries: Brazil, Chile, China, Colombia, Czech Republic, Egypt, Hungary, India, Indonesia, Korea, Malaysia, Mexico, Morocco, Peru, Philippines, Poland, Russia, South Africa, Taiwan, Thailand and Turkey. With 818 constituents, the index covers approximately 85% of the free float-adjusted market capitalization in each country.
Morgan Stanley Capital International (“MSCI”) Frontier Markets Index is an unmanaged index which captures large- and mid-cap representation across 25 Frontier Markets (FM) countries. The index includes 142 constituents, covering about 85% of the free float-adjusted market capitalization in each country.
Morgan Stanley Capital International (“MSCI”) Frontier Emerging Markets Capped Index is an unmanaged index and was developed for MSCI by HSBC and is a customized capped version of the MSCI Frontier Emerging Markets (FME) Index. The MSCI FME index is a free float-adjusted market capitalization index designed to measure equity market performance in all countries from the MSCI Frontier Markets Index and the lower size spectrum of the MSCI Emerging Markets Index. The Index consists of 25 frontier markets and five emerging markets.
Russell 2000® Index is an unmanaged index that measures the performance of the small-cap segment of the U.S. equity universe. The Russell 2000® Index is a subset of the Russell 3000® Index representing approximately 10% of the total market capitalization of that index. It includes approximately 2000 of the smallest securities based on a combination of their market cap and current index membership.
Standard & Poor’s 500 (“S&P 500”) Index is an unmanaged index that is widely regarded as a gauge of the U.S. equities market. This index includes 500 leading companies in leading industries of the U.S. economy. The S&P 500 Index focuses on the large-cap segment of the market, with approximately 75% coverage of U.S. equities.
Securities indices assume reinvestment of all distributions and interest payments and do not take in account brokerage fees or expenses. Securities in the Funds do not match those in the indices and performance of the Funds will differ. Investors cannot invest directly in an index.
Dear Shareholder,
We are pleased to send to you the HSBC Funds annual report, covering the fiscal year ended October 31, 2013. This report contains detailed information about your Funds’ portfolio of investments and operating results. We encourage you to review it carefully.
This report includes commentary from the Funds’ portfolio managers in which they discuss the investment markets and their respective Fund’s performance. The portfolio manager commentary is accompanied by the Fund’s return for the period, listed alongside the returns of its benchmark index and peer group average for comparative purposes.
In closing, we would like to thank you for investing in the HSBC Funds. We continue to focus the HSBC Fund Family on investment solutions to assist our shareholders in reaching their financial goals. We appreciate the trust you place in us, and will continue working to earn it. Please contact us at any time with questions or concerns.
Sincerely,

Richard A. Fabietti
President
4 HSBC FAMILY OF FUNDS
| Commentary From the Investment Manager |
| HSBC Global Asset Management (USA) Inc. |
U.S. Economic Review
Economic growth picked up pace in developing economies throughout the world during the 12-month period between November 1, 2012 and October 31, 2013. Many major economies, including the United States, reported improved economic data during the period, indicating new momentum for a modest but sustained recovery. The U.S. equity markets made strong gains during the period, boosted by improvements in the labor and housing markets and healthy corporate profits. Markets continued to benefit from the Federal Reserve Board’s (the “Fed”) decision to maintain the federal funds rate—a key factor in lending rates—at a historically low target range between 0.00% and 0.25%. Economic headwinds remained, however, including relatively high unemployment in some areas, low consumer spending and reduced government spending caused by sequestration.
Investor confidence declined mid-year due in part to expectations that the Fed would begin tapering its bond purchasing program. Concerns about the impact of tapering diminished, however, when the Fed announced in September that it would delay winding down its stimulus efforts until the unemployment rate fell significantly lower. The first shutdown of the U.S. government in 17 years occurred in October. This political crisis, along with the related standoff over raising the country’s borrowing limit, was another factor weighing on investor sentiment. The uncertainty surrounding the crisis dragged on equities, although markets regained momentum once a political deal was struck that reopened the government and raised the debt ceiling. Broad U.S. stock market indices ended the period significantly above where they were positioned 12 months earlier.
Improving political circumstances in the eurozone and positive economic data helped boost stocks in developed economies across the world. The economies of both Japan and Europe transitioned out of recession. Progress was made toward alleviating the sovereign debt crisis in Europe. The European Central Bank’s aggressive efforts, including its government bond-buying program known as Outright Monetary Transactions, reassured investors. Still, many developments in Europe revealed ongoing economic weaknesses, including a controversial bailout in Cyprus, political uncertainty in Italy and high unemployment throughout the eurozone.
Economic growth in many emerging markets slowed during the period, as concerns grew about rising inflation and potential decreases in global liquidity. In addition, signs of softening in China’s economy led to a fall in commodity prices, which dragged on stocks throughout emerging markets. Central banks in both India and Brazil fought rising inflation by raising interest rates.
The recovery of the U.S. housing market remained robust. New home sales and housing starts increased, though the pace of growth slowed late in the period. Although the unemployment rate gradually edged downward, it remained well above pre-recession levels. Moreover, the number of long-term unemployed individuals, including those who dropped out of the labor market entirely, remained high. Real income grew at a modest pace, but consumer spending remained weak, consumer confidence dropped sharply and personal savings rates slowed. Economic activity in the manufacturing sector expanded during the period, though the rate of growth slowed.
U.S. Gross Domestic Product1 growth increased each quarter during the period, expanding at a rate of 0.1% during the fourth quarter of 2012 and quickening to a rate of 2.8% in the third quarter of 2013, according to preliminary estimates.
Market Review
The period began with U.S. markets retreating slightly due to the political face-off over the “fiscal cliff” and concerns about ongoing turmoil related to eurozone sovereign debt.
Equities then regained momentum in the first quarter of 2013 and began a steady rally that persisted through the duration of the period with only a few brief interruptions. The strong performance of equities was undeterred by uncertainty about government policy and concerns that the onset of automatic budget cuts—known as sequestration—would undermine economic growth. A political compromise that avoided the direst consequences of the fiscal cliff, along with improvement in the housing market, helped buoy investor confidence and fuel gains in the equity markets.
During the middle of the period equity prices fell as investors anticipated an imminent decrease in central bank liquidity. Stocks rebounded after the Fed delayed tapering its bond-purchasing program, with the S&P 500 Index1 hitting a then-record high following the announcement. Equities ended the period in a rally that was spurred by the political deal that partially resolved the government shutdown and a second standoff over the debt ceiling.
Small- and mid-cap stocks outperformed large-cap stocks during the period, and emerging markets generally underperformed developed economies. The Russell 2000® Index1 of small-company stocks returned 36.28% and the MSCI Emerging Market Index1 of emerging market stocks returned 6.90%.
Stocks in developed economies rose. Japanese equities performed well due to optimism regarding its central bank’s ambitious monetary easing schedule, which aimed to double the size of the monetary base over the next two years. International stocks made strong gains, slightly outperforming U.S. markets. The S&P 500 Index of large-company U.S. stocks returned 27.18% for the 12 months through October 2013. That compared to a 27.40% return for the MSCI EAFE Index1 of international stocks in developed markets.
Rising interest rates, widening credit spreads and uncertainty about government policy resulted in weak performance in the U.S. fixed-income market during the period. Yields on U.S. Treasury bonds increased during the period, sending prices lower. Investment-grade corporate bonds also declined. Investors sought the more attractive yields offered by high-yield corporate bonds and high-yield municipal bonds, which were among the best-performing fixed-income sectors during the period. The Barclays U.S. Aggregate Bond Index1, which tracks the broad investment-grade fixed-income market, returned -1.08% for the 12 months through October, while the Barclays U.S. Corporate High-Yield Bond Index1 returned 8.87%. Fixed-income markets in Europe generated modest returns, while fixed-income in emerging markets ended the period significantly lower, despite a modest rebound in the final months of the period.
1 For additional information, please refer to the Glossary of Terms.
HSBC FAMILY OF FUNDS 5
| Portfolio Reviews (Unaudited) |
HSBC Emerging Markets Debt Fund
(Class A Shares, Class I Shares and Class S Shares) |
by Guillermo Ossés, Managing Director, Head of Emerging Markets Debt Portfolio Management
Lisa Chua, CFA, Senior Vice President, Portfolio Manager
Binqi Liu, Vice President, Portfolio Manager
Phil Yuhn, Senior Vice President, Portfolio Engineer
The HSBC Emerging Markets Debt Fund (the “Fund”) seeks to maximize total return (comprised of capital appreciation and income). Under normal market conditions, the Fund invests at least 80% of its net assets in fixed income instruments of issuers that economically are tied to emerging markets. The Fund will invest in instruments issued by foreign governments and corporations. Investments will generally be made in U.S. dollar denominated instruments, but the Fund will also seek to invest in emerging market local currency denominated instruments.
Investment Concerns
Equity securities (stocks) are more volatile and carry more risk than other forms of investments, including investments in high-grade fixed income securities.
Bond funds will tend to experience smaller fluctuations in value than stock funds. However, investors in any bond fund should anticipate fluctuations in price, especially for longer term issues and in environments of rising interest rates. Investments in a bond fund are subject to possible loss due to the financial failure of underlying securities and their inability to meet their client obligations.
High yield, lower rated securities involve greater price volatility and present greater risk than higher rated fixed income securities. At times, due to market conditions, the Fund may be unable to sell certain of its portfolio securities without a substantial drop in price. Prices of fixed income securities are generally inversely correlated to interest rates. Investments in the Fund are subject to possible loss due to the financial failure of underlying securities and their inability to meet their debt obligations. These risks may increase the Fund’s share price volatility.
International investing involves increased risk and volatility. An investment in international funds entails the special risks of international investing, including currency exchange fluctuation, government regulations, and the potential for political and economic instability.
Prices of securities in emerging markets can fluctuate more significantly than the prices of companies in more developed countries. Securities of emerging market issuers generally have more risk than securities issued by issuers in more developed markets. The less developed the country, the greater affect the risks may have on an investment, and as a result, an investment may exhibit a higher degree of volatility than either the general domestic securities market or the securities markets of developed foreign countries.
Derivatives may be riskier than other types of investments and could result in losses that significantly exceed the Fund’s original investment.
For a complete description of these and other risks associated with investment in a mutual fund, please refer to the Fund’s prospectus.
Market Commentary
The Fund returned -2.84% (without sales charge) for the Class A Shares, -2.52% for the Class I Shares and -2.42% for the Class S Shares for the year ended October 31, 2013. That compared to a -2.58% total return for the Fund’s benchmark, the J.P. Morgan Emerging Markets Bond Index Global1, for the same period.
Portfolio Performance
Emerging markets were volatile during the period as investors reacted to policy changes and political issues around the world. Investor confidence was strong early in 2013 due to the continued global economic recovery and positive developments such as the resolution of the “fiscal cliff” negotiations in the United States and the Bank of Japan’s announcement of a new stimulus policy. On the heels of this rally, the market was taken by surprise in May when U.S. payroll numbers came in stronger than expected and the U.S. Federal Reserve signaled a potential tapering of its quantitative easing program. This news resulted in a spike in U.S. Treasury yields and a repricing of fixed-income assets globally. Hardest hit were investment-grade sovereign emerging debt assets, which are more closely correlated to U.S. Treasuries than are other sectors of emerging market debt. However, emerging markets debt rallied in September and October, after the U.S. Federal Reserve said it would delay its tapering plan.
The Fund’s performance benefitted from a defensive position that we adopted early in the period because of what we believed were stretched asset valuations and a crowded technical position in emerging market debt. For example, underweight positions in investment-grade sovereigns such as Brazil, Russia and Indonesia contributed to relative performance when prices for those bonds fell.†
Off-benchmark exposure to hard-currency corporate bonds also boosted the Fund’s relative return over the period. These corporate bonds outperformed sovereign debt, thanks to their shorter durations and lower sensitivity to U.S. Treasuries.†
Our underweight position to certain high-yield countries such as Argentina hurt the Fund’s relative performance. We chose to underweight Argentina due to concerns surrounding the country’s deteriorating fundamentals of the country, however, its bond market rallied late in the period as investors grew confident about a pending court decision regarding the country’s debt payment obligations. The Fund benefited from the use of derivatives such as swap agreements and forward foreign currency exchange contracts. However, exposure to futures transactions reduced the Fund’s returns during the 12-month period.†
| † | Portfolio composition is subject to change. |
| 1 | For additional information, please refer to the Glossary of Terms. |
Past performance does not guarantee future results. The performance data quoted represents past performance and current returns may be lower or higher. Total return figures include change in share price, reinvestment of dividends and capital gains and do not reflect taxes that a shareholder would pay on Fund distributions or on the redemption of Fund shares. Investment return and principal value will fluctuate so that an investor’s shares, when redeemed may be worth more or less than the original cost. To obtain performance information current to the most recent month end, please call 1-800-782-8183.
6 HSBC FAMILY OF FUNDS
| Portfolio Reviews (Unaudited) |
HSBC Emerging Markets Debt Fund |

The charts above represent a historical since inception performance comparison of a hypothetical $10,000 investment in the indicated share class versus a similar investment in the Fund’s benchmark and represents the reinvestment of dividends and capital gains in the Fund.
| | | | Average Annual | | Expense |
| Fund Performance | | | | Total Return (%) | | Ratio (%)2 |
| | Inception | | 1 | | Since | | | | |
| As of October 31, 2013 | | Date | | Year | | Inception | | Gross | | Net |
| HSBC Emerging Markets Debt Fund Class A1 | | 4/7/11 | | -7.46 | | 5.09 | | 1.63 | | 1.20 |
| HSBC Emerging Markets Debt Fund Class I | | 4/7/11 | | -2.52 | | 7.47 | | 1.28 | | 0.85 |
| HSBC Emerging Markets Debt Fund Class S | | 4/7/11 | | -2.42 | | 7.57 | | 1.18 | | 0.75 |
| J.P. Morgan Emerging Markets Bond Index Global | | — | | -2.58 | | 7.47 | | N/A | | N/A |
Past performance does not guarantee future results. The performance data quoted represents past performance and current returns may be lower or higher. Total return figures include change in share price, reinvestment of dividends and capital gains and do not reflect the taxes that a shareholder would pay on Fund distributions or on the redemption of Fund shares. Investment return and principal value will fluctuate so that an investor’s shares, when redeemed may be worth more or less than the original cost. To obtain performance information current to the most recent month end, please call 1-800-782-8183.
The performance above reflects any fee waivers that have been in effect during the applicable periods, as well as any expense reimbursements that have periodically been made. Absent such waivers and reimbursements, returns would have been lower. Currently, contractual fee waivers are in effect for the Fund through March 1, 2014.
| 1 | Reflects the maximum sales charge of 4.75%. |
| 2 | Reflects the expense ratio as reported in the prospectus dated February 28, 2013. HSBC Global Asset Management (USA) Inc. has entered into a contractual expense limitation agreement with the Fund under which it will limit total expenses of the Fund (excluding interest, taxes, brokerage commissions, extraordinary expenses and estimated indirect expenses attributable to the Fund’s investments in investment companies) to an annual rate of 1.20%, 0.85% and 0.75% for Class A Shares, Class I Shares and Class S Shares, respectively. The expense limitation shall be in effect until March 1, 2014. Additional information pertaining to the October 31, 2013 expense ratios can be found in the financial highlights. |
The Fund’s performance is measured against the J.P. Morgan Emerging Markets Bond Index Global, an unmanaged index that tracks returns for USD-denominated debt instruments issued by emerging market and sovereign quasi-sovereign entities; Brady bonds, loans, Eurobonds and local market markets. The performance of the index does not reflect the deduction of expenses associated with a mutual fund, such as investment management and fund accounting fees. The Fund’s performance reflects the deduction of fees for these value-added services. Investors cannot invest directly in an index.
HSBC FAMILY OF FUNDS 7
| Portfolio Reviews (Unaudited) |
HSBC Emerging Markets Local Debt Fund
(Class A Shares, Class I Shares and Class S Shares) |
by Guillermo Ossés, Managing Director, Head of Emerging Markets Debt Portfolio Management
Lisa Chua, CFA, Senior Vice President, Portfolio Manager
Binqi Liu, Vice President, Portfolio Manager
Phil Yuhn, Senior Vice President, Portfolio Engineer
The HSBC Emerging Markets Local Debt Fund (the “Fund”) seeks maximum total return (comprised of capital appreciation and income). Under normal market conditions, the Fund invests at least 80% of its net assets, plus borrowings for investment purposes, in debt instruments issued by foreign governments, government agencies or corporations and denominated in local currencies of countries with emerging securities markets. The Fund may also invest in instruments denominated in U.S. dollars.
Investment Concerns
Equity securities (stocks) are more volatile and carry more risk than other forms of investments, including investments in high-grade fixed income securities.
Bond funds will tend to experience smaller fluctuations in value than stock funds. However, investors in any bond fund should anticipate fluctuations in price, especially for longer term issues and in environments of rising interest rates. Investments in a bond fund are subject to possible loss due to the financial failure of underlying securities and their inability to meet their client obligations.
High yield, lower rated securities involve greater price volatility and present greater risk than higher rated fixed income securities. At times, due to market conditions, the Fund may be unable to sell certain of its portfolio securities without a substantial drop in price. Prices of fixed income securities are generally inversely correlated to interest rates. Investments in the Fund are subject to possible loss due to the financial failure of underlying securities and their inability to meet their debt obligations. These risks may increase the Fund’s share price volatility.
International investing involves increased risk and volatility. An investment in international funds entails the special risks of international investing, including currency exchange fluctuation, government regulations, and the potential for political and economic instability.
Prices of securities in emerging markets can fluctuate more significantly than the prices of companies in more developed countries. Securities of emerging market issuers generally have more risk than securities issued by issuers in more developed markets. The less developed the country, the greater affect the risks may have on an investment, and as a result, an investment may exhibit a higher degree of volatility than either the general domestic securities market or the securities markets of developed foreign countries.
Derivatives may be riskier than other types of investments and could result in losses that significantly exceed the Fund’s original investment.
For a complete description of these and other risks associated with investment in a mutual fund, please refer to the Fund’s prospectus.
Market Commentary
The Fund returned -4.60% (without sales charge) for the Class A Shares, -4.25% for the Class I Shares and -4.16% for the Class S Shares for the year ended October 31, 2013. That compared to a -1.60% total return for the Fund’s primary performance benchmark, the J.P. Morgan Government Bond Index-Emerging Markets Global Diversified1, for the same period.
Portfolio Performance
Emerging markets were volatile during the period as investors reacted to policy changes and political issues around the world. Investor confidence was strong early in 2013 due to the continued global economic recovery and positive developments such as the resolution of the “fiscal cliff” negotiations in the United States and the Bank of Japan’s announcement of a new stimulus policy. On the heels of this rally, the market was taken by surprise in May when U.S. payroll numbers came in stronger than expected and the U.S. Federal Reserve signaled a potential tapering of its quantitative easing program. This news resulted in a spike in U.S. Treasury yields and a repricing of fixed-income assets globally. Hardest hit were investment-grade sovereign emerging debt assets, which are more closely correlated to U.S. Treasuries than are other sectors of emerging market debt. However, emerging markets debt rallied in September and October, after the U.S. Federal Reserve said it would delay its tapering plan.
During the first half of the 12-month period, the Fund changed its benchmark from an equally weighted blend of the JP Morgan GBI-EM Global Diversified Index and the JP Morgan Emerging Local Markets Index Plus to only the JP Morgan GBI-EM Global Diversified Index. Transaction costs related to rebalancing the portfolio in response to this change detracted slightly from the Fund’s relative performance.
The Fund’s exposure to select locally denominated bonds hurt relative performance during the period. For example, an overweight position to longer-duration South African bonds detracted from the Fund’s performance when those assets underperformed shorter-duration bonds. The Fund also increased its position in local Polish bonds in May, which detracted from performance when that market experienced a sell-off in May and June.†
An underweight position in the Hungarian forint also hurt performance, as currencies rallied late in the period when investors became more comfortable taking on more risk.†
However, the Fund’s exposure to select emerging markets local currencies, which we achieved by holding forward currency exchange contracts, boosted relative performance during the period. Most significantly, the Fund benefited from its exposure to the Brazilian real, the Chinese renminbi and the South African rand when those currencies outperformed the U.S. dollar. Overweight positions in locally denominated bonds in Brazil and Mexico also improved the Fund’s relative performance.†
The Fund also gained exposure to local interest rates during the period through the use of interest rate swaps. The use of these derivatives did not have a meaningful impact on performance during the period.†
| † | Portfolio composition is subject to change. |
| 1 | For additional information, please refer to the Glossary of Terms. |
Past performance does not guarantee future results. The performance data quoted represents past performance and current returns may be lower or higher. Total return figures include change in share price, reinvestment of dividends and capital gains and do not reflect taxes that a shareholder would pay on Fund distributions or on the redemption of Fund shares. Investment return and principal value will fluctuate so that an investor’s shares, when redeemed may be worth more or less than the original cost. To obtain performance information current to the most recent month end, please call 1-800-782-8183.
8 HSBC FAMILY OF FUNDS
| Portfolio Reviews (Unaudited) |
HSBC Emerging Markets Local Debt Fund |

The charts above represent a historical since inception performance comparison of a hypothetical $10,000 investment in the indicated share class versus a similar investment in the Fund’s benchmark and represents the reinvestment of dividends and capital gains in the Fund.
| | | | Average Annual | | Expense |
| Fund Performance | | | | Total Return (%) | | Ratio (%)3 |
| | Inception | | 1 | | Since | | | | |
| As of October 31, 2013 | | Date | | Year | | Inception | | Gross | | Net |
| HSBC Emerging Markets Local Debt Fund Class A1 | | 4/7/11 | | -9.12 | | -3.33 | | 2.11 | | 1.34 |
| HSBC Emerging Markets Local Debt Fund Class I | | 4/7/11 | | -4.25 | | -1.13 | | 1.76 | | 0.99 |
| HSBC Emerging Markets Local Debt Fund Class S | | 4/7/11 | | -4.16 | | -1.04 | | 1.66 | | 0.89 |
| Emerging Markets Debt Blend Portfolio Index2 | | — | | -0.48 | | 0.22 | | N/A | | N/A |
| J.P. Morgan Government Bond Index–Emerging Markets Global Diversified2 | | — | | -1.60 | | 1.54 | | N/A | | N/A |
| J.P. Morgan Emerging Local Markets Index Plus2 | | — | | 0.53 | | -1.17 | | N/A | | N/A |
Past performance does not guarantee future results. The performance data quoted represents past performance and current returns may be lower or higher. Total return figures include change in share price, reinvestment of dividends and capital gains and do not reflect the taxes that a shareholder would pay on Fund distributions or on the redemption of Fund shares. Investment return and principal value will fluctuate so that an investor’s shares, when redeemed may be worth more or less than the original cost. To obtain performance information current to the most recent month end, please call 1-800-782-8183.
The performance above reflects any fee waivers that have been in effect during the applicable periods, as well as any expense reimbursements that have periodically been made. Absent such waivers and reimbursements, returns would have been lower. Currently, contractual fee waivers are in effect for the Fund through March 1, 2014.
| 1 | Reflects the maximum sales charge of 4.75%. |
| 2 | For additional information, please refer to the Glossary of Terms. |
| 3 | Reflects the expense ratio as reported in the prospectus dated February 28, 2013. HSBC Global Asset Management (USA) Inc. has entered into a contractual expense limitation agreement with the Fund under which it will limit total expenses of the Fund (excluding interest, taxes, brokerage commissions, extraordinary expenses and estimated indirect expenses attributable to the Fund’s investments in investment companies) to an annual rate of 1.20%, 0.85% and 0.75% for Class A Shares, Class I Shares and Class S Shares, respectively. The expense limitation shall be in effect until March 1, 2014. The expense ratios reflected include Acquired Fund fees and expenses. Additional information pertaining to the October 31, 2013 expense ratios can be found in the financial highlights. |
Effective December 26, 2012, the Fund no longer compares its performance to the Emerging Markets Debt Blend Portfolio Index. The Fund’s performance is now compared to the J.P. Morgan Government Bond Index-Emerging Markets Global Diversified Index. The Emerging Markets Debt Blend Portfolio Index consisted of a 50%/50% blend of the J.P. Morgan Government Bond Index-Emerging Markets Global Diversified Index and the J.P. Morgan Emerging Local Markets Index Plus. The Fund’s current benchmark, the J.P. Morgan Government Bond Index-Emerging Markets Global Diversified Index, is a comprehensive global emerging markets fixed income index consisting of regularly traded, liquid fixed-rate, domestic currency government bonds to which international investors can gain exposure. These indices are unmanaged and do not reflect the fees and expenses associated with a mutual fund. Investors cannot directly invest in an index.
HSBC FAMILY OF FUNDS 9
| Portfolio Reviews (Unaudited) |
HSBC Frontier Markets Fund
(Class A Shares and Class I Shares) |
by Andrew Brudenell, Senior Portfolio Manager
Chris Turner, Portfolio Manager
The HSBC Frontier Markets Fund (the “Fund”) seeks long-term capital appreciation. Under normal market conditions, the Fund invests at least 80% of its net assets, plus any borrowings for investment purposes, in issuers located in “frontier market countries.” The term “frontier market countries” encompasses those countries that are at an earlier stage of economic, political or financial development, even by emerging markets standards.
Investment Concerns
Equity securities (stocks) are more volatile and carry more risk than other forms of investments, including investments in high-grade fixed income securities.
Foreign securities can be subject to greater risks than U.S. investments, including currency fluctuations, less liquid trading markets, greater price volatility, political and economic instability, less publicly available information, and changes in tax or currency laws or monetary policy. These risks are likely to be greater for emerging markets than in developed markets.
Frontier market countries generally have smaller economies and even less developed capital markets or legal and political systems than traditional emerging market countries. As a result, the risks of investing in emerging market countries are magnified in frontier market countries. The magnification of risks are the result of: the potential for extreme price volatility and illiquidity in frontier markets; government ownership or control of parts of private sector and of certain companies; trade barriers, exchange controls, managed adjustments in relative currency values and other protectionist measures imposed or negotiated by the countries with which frontier market countries trade; and the relatively new and unsettled securities laws in many frontier market countries.
Prices of securities in emerging markets can fluctuate more significantly than the prices of companies in more developed countries. Securities of emerging market issuers generally have more risk than securities issued by issuers in more developed markets. The less developed the country, the greater affect the risks may have on an investment, and as a result, an investment may exhibit a higher degree of volatility than either the general domestic securities market or the securities markets of developed foreign countries.
Derivatives may be riskier than other types of investments and could result in losses that significantly exceed the Fund’s original investment.
For a complete description of these and other risks associated with investment in a mutual fund, please refer to the Fund’s prospectus.
Market Commentary
The Fund returned 23.85% (without sales charge) for the Class A Shares and 24.25% for the Class I Shares for the year ended October 31, 2013. That compared to a 20.80% total return for the MSCI Frontier Emerging Markets Capped Index1, the Fund’s primary performance benchmark, and a 26.02% total return for the MSCI Frontier Markets Index1.
Portfolio Performance
Frontier markets performed well during the 12-month period, despite volatility in the global equity markets. Frontier equity markets outperformed both their larger emerging market peers and developed markets. A number of factors contributed to this outperformance; including strong performance from countries such as the United Arab Emirates (UAE) and Saudi Arabia, which benefited from a growing consumer base. General elections in Pakistan and a peaceful election in Kenya also boosted these countries’ equity markets, which contributed to the overall strong performance for frontier markets.
The largest contributor to the Fund’s relative outperformance of the benchmark was its exposure to the UAE. The country’s equity market benefited from an announcement in the summer that MSCI would upgrade the country to emerging market status in May 2014. The Fund’s overweight holdings of a bank, a medical facilities operator and real estate developer were notable beneficiaries of strong UAE market performance during period. Each company also benefited from positive fundamentals, including regularly beating market expectations.
The Fund also benefited from its investment in an off-benchmark Eastern European bank. The bank rebounded from poor performance at the end of 2012 in response to subsiding political fears in the region and improved financial forecasts. The Fund’s overweight position in Pakistan also made a positive contribution to the strategy. That performance was attributable to several factors, including strong corporate results, a finalized loan agreement with the IMF and an election that marked the first transition of power from one democratically elected government to another. Exposure to shares of a UAE-based hospital group, which held an initial public offering during the period, also benefited the Fund’s performance.†
The Fund’s relative performance suffered due to an underweight exposure to Argentina held in response to what we saw as an unattractive regulatory and economic environment. Signs that the country’s political landscape may improve, based on voting trends in election primaries, pushed equity markets higher. A bumper soy bean crop also supported the country’s economic recovery, which further boosted the performance of Argentinian equities.†
| † | Portfolio composition is subject to change. |
| 1 | For additional information, please refer to the Glossary of Terms. |
Past performance does not guarantee future results. The performance data quoted represents past performance and current returns may be lower or higher. Total return figures include change in share price, reinvestment of dividends and capital gains and do not reflect taxes that a shareholder would pay on Fund distributions or on the redemption of Fund shares. Investment return and principal value will fluctuate so that an investor’s shares, when redeemed may be worth more or less than the original cost. To obtain performance information current to the most recent month end, please call 1-800-782-8183.
10 HSBC FAMILY OF FUNDS
| Portfolio Reviews (Unaudited) |
HSBC Frontier Markets Fund |

The charts above represent a historical since inception performance comparison of a hypothetical $10,000 investment in the indicated share class versus a similar investment in the Fund’s benchmark and represents the reinvestment of dividends and capital gains in the Fund.
| | | | Average Annual | | Expense |
| Fund Performance | | | | Total Return (%) | | Ratio (%)3 |
| | Inception | | | | Since | | | | |
| As of October 31, 2013 | | Date | | 1 Year | | Inception | | Gross | | Net |
| HSBC Frontier Markets Fund Class A1 | | 9/6/11 | | 17.61 | | 12.38 | | 3.17 | | 2.23 |
| HSBC Frontier Markets Fund Class I | | 9/6/11 | | 24.254 | | 15.52 | | 2.82 | | 1.88 |
| MSCI Frontier Emerging Markets Capped Index2 | | — | | 20.80 | | 11.24 | | N/A | | N/A |
| MSCI Frontier Markets Index2 | | — | | 26.02 | | 11.23 | | N/A | | N/A |
Past performance does not guarantee future results. The performance data quoted represents past performance and current returns may be lower or higher. Total return figures include change in share price, reinvestment of dividends and capital gains and do not reflect the taxes that a shareholder would pay on Fund distributions or on the redemption of Fund shares. Investment return and principal value will fluctuate so that an investor’s shares, when redeemed may be worth more or less than the original cost. To obtain performance information current to the most recent month end, please call 1-800-782-8183.
The performance above reflects any fee waivers that have been in effect during the applicable periods, as well as any expense reimbursements that have periodically been made. Absent such waivers and reimbursements, returns would have been lower. Currently, contractual fee waivers are in effect for the Fund through March 1, 2014. Investments in an initial public offering during the current fiscal year ended October 31, 2013 has benefited the Fund’s overall performance by approximately 0.15%. This effect on performance is not typical and may not continue in the future.
| 1 | Reflects the maximum sales charge of 5.00%. |
| 2 | For additional information, please refer to the Glossary of Terms. |
| 3 | Reflects the expense ratio as reported in the prospectus dated February 28, 2013. HSBC Global Asset Management (USA) Inc. has entered into a contractual expense limitation agreement with the Fund under which it will limit total expenses of the Fund (excluding interest, taxes, brokerage commissions, extraordinary expenses and estimated indirect expenses attributable to the Fund’s investments in investment companies) to an annual rate of 2.20% and 1.85% for Class A Shares and Class I Shares, respectively. The expense limitation shall be in effect until March 1, 2014. Additional information pertaining to the October 31, 2013 expense ratios can be found in the financial highlights. |
| 4 | The recent appreciation in the stock market has helped produce short-term returns that are not typical and may not continue in the future. Because of ongoing market volatility, Fund performance may be subject to substantial short-term changes. |
The performance of the Fund is measured against the MSCI Frontier Markets Index and the MSCI Frontier Emerging Markets Capped Index. The Morgan Stanley Capital International (“MSCI”) Frontier Markets Index captures large- and mid-cap representation across 25 Frontier Markets (FM) countries. The index includes 142 constituents, covering about 85% of the free float-adjusted market capitalization in each country. The MSCI Frontier Emerging Markets Capped Index was developed for MSCI by HSBC and is a customized capped version of the MSCI Frontier Emerging Markets (FME) Index. The MSCI FME index is a free float-adjusted market capitalization index designed to measure equity market performance in all countries from the MSCI Frontier Markets Index and the lower size spectrum of the MSCI Emerging Markets Index. The Index consists of 25 frontier markets and five emerging markets. The indexes are unmanaged and the performance of the indexes does not reflect the deduction of expenses associated with a mutual fund, such as investment management and fund accounting fees. The Fund’s performance reflects the deduction of fees for these value-added services. Investors cannot invest directly in an index.
HSBC FAMILY OF FUNDS 11
| Portfolio Reviews (Unaudited) |
HSBC Total Return Fund
(Class A Shares, Class I Shares and Class S Shares) |
by Guillermo Ossés, Managing Director, Head of Emerging Markets Debt Portfolio Management
Lisa Chua, CFA, Senior Vice President, Portfolio Manager
Binqi Liu, Vice President, Portfolio Manager
Phil Yuhn, Senior Vice President, Portfolio Engineer
The HSBC Total Fund (the “Fund”) seeks maximum total return (comprised of capital appreciation and income). Under normal market conditions, the Fund invests its assets (excluding U.S. cash and U.S. cash equivalents) primarily in instruments of issuers that are economically tied to emerging market countries, including in derivative instruments such as futures (including interest rate futures), forwards (including non-deliverable forwards), swaps (including interest rate and total return swaps), options (including interest rate options), swaptions and credit default swaps.
Investment Concerns
Equity securities (stocks) are more volatile and carry more risk than other forms of investments, including investments in high-grade fixed income securities.
Bond funds will tend to experience smaller fluctuations in value than stock funds. However, investors in any bond fund should anticipate fluctuations in price, especially for longer term issues and in environments of rising interest rates. Investments in a bond fund are subject to possible loss due to the financial failure of underlying securities and their inability to meet their client obligations.
High yield, lower rated securities involve greater price volatility and present greater risk than higher rated fixed income securities. At times, due to market conditions, the Fund may be unable to sell certain of its portfolio securities without a substantial drop in price. Prices of fixed income securities are generally inversely correlated to interest rates. Investments in the Fund are subject to possible loss due to the financial failure of underlying securities and their inability to meet their debt obligations. These risks may increase the Fund’s share price volatility.
International investing involves increased risk and volatility. An investment in international funds entails the special risks of international investing, including currency exchange fluctuation, government regulations, and the potential for political and economic instability.
Prices of securities in emerging markets can fluctuate more significantly than the prices of companies in more developed countries. Securities of emerging market issuers generally have more risk than securities issued by issuers in more developed markets. The less developed the country, the greater affect the risks may have on an investment, and as a result, an investment may exhibit a higher degree of volatility than either the general domestic securities market or the securities markets of developed foreign countries.
Derivatives may be riskier than other types of investments and could result in losses that significantly exceed the Fund’s original investment.
For a complete description of these and other risks associated with investment in a mutual fund, please refer to the Fund’s prospectus.
Market Commentary
The Fund returned -1.06% (without sales charge) for the Class A Shares, -0.66% for the Class I Shares and -0.57% for the Class S Shares for the year ended October 31, 2013. That compared to the 0.30% total return for the Funds benchmark, the BofA Merrill Lynch 3-Month LIBOR Constant Maturity Index1, for the same period.
Portfolio Performance
Emerging markets were volatile during the period as investors reacted to policy changes and political issues around the world. Investor confidence was strong early in 2013, but the market was taken by surprise in May when the U.S. Federal Reserve signaled a potential tapering of its quantitative easing program. This news resulted in a spike in U.S. Treasury yields and a repricing of fixed-income assets globally. Hardest hit were investment-grade sovereign emerging debt assets, which are more closely correlated to U.S. Treasuries than are other sectors of emerging market debt. However, emerging markets debt rallied in September and October, after the U.S. Federal Reserve said it would delay its tapering plan.
Exposure to investment-grade sovereign debt detracted from the Fund’s performance during the period. The most significant impact came in May and June when investment-grade sovereigns and longer-dated bonds underperformed due to their higher sensitivity to the rise in U.S. Treasury yields and the subsequent sell-off in emerging markets assets. As a result, exposure to external debt from Brazil and Mexico detracted from the Fund’s performance during this time. The Fund’s short positions to the Hungarian forint and the euro also hurt performance when currencies rallied in September and October as investors became willing to take on more risk.†
However, exposure to select emerging markets currencies, achieved through forward currency exchange contracts, helped returns during the period. We chose to increase exposure to the Brazilian real, the Mexican peso and the South African rand during May and June after valuations improved after the market correction related to the rise in U.S. Treasury yields. This positioning contributed to the Fund’s performance when emerging market currencies rallied late in the period.
The Fund held a short position to a credit default swap index as a hedge to protect the hard currency exposure from risks in high-yield countries such as Argentina, Venezuela and Ukraine, which had a higher probability of default. The Fund also gained exposure to local interest rates through the use of interest rate swaps.†
The Fund benefited from exposure to derivatives such as swap agreements and futures transactions. However, the Fund’s performance suffered slightly from its use of options transactions during the period.†
| † | Portfolio composition is subject to change. |
| 1 | For additional information, please refer to the Glossary of Terms. |
Past performance does not guarantee future results. The performance data quoted represents past performance and current returns may be lower or higher. Total return figures include change in share price, reinvestment of dividends and capital gains and do not reflect taxes that a shareholder would pay on Fund distributions or on the redemption of Fund shares. Investment return and principal value will fluctuate so that an investor’s shares, when redeemed may be worth more or less than the original cost. To obtain performance information current to the most recent month end, please call 1-800-782-8183.
12 HSBC FAMILY OF FUNDS
| Portfolio Reviews (Unaudited) |
HSBC Total Return Fund |
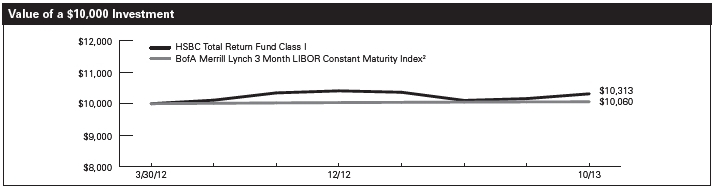

The charts above represent a historical since inception performance comparison of a hypothetical $10,000 investment in the indicated share class versus a similar investment in the Fund’s benchmark and represents the reinvestment of dividends and capital gains in the Fund.
| | | Average Annual | | | Expense |
| Fund Performance | | | Total Return (%) | | | Ratio (%)3 |
| Inception | | | | Since | | | | |
| As of October 31, 2013 | Date | | 1 Year | | Inception | | Gross | | Net |
| HSBC Total Return Fund Class A1 | 3/30/12 | | -5.72 | | | -1.49 | | | 1.57 | | 1.57 |
| HSBC Total Return Fund Class I | 3/30/12 | | -0.66 | | | 1.96 | | | 1.22 | | 1.22 |
| HSBC Total Return Fund Class S | 3/30/12 | | -0.57 | | | 2.05 | | | 1.12 | | 1.12 |
| BofA Merrill Lynch 3 Month LIBOR Constant Maturity Index2 | — | | 0.30 | | | 0.38 | | | N/A | | N/A |
Past performance does not guarantee future results. The performance data quoted represents past performance and current returns may be lower or higher. Total return figures include change in share price, reinvestment of dividends and capital gains and do not reflect the taxes that a shareholder would pay on Fund distributions or on the redemption of Fund shares. Investment return and principal value will fluctuate so that an investor’s shares, when redeemed may be worth more or less than the original cost. To obtain performance information current to the most recent month end, please call 1-800-782-8183.
The performance above reflects any fee waivers that have been in effect during the applicable periods, as well as any expense reimbursements that have periodically been made. Absent such waivers and reimbursements, returns would have been lower.
| 1 | | Reflects the maximum sales charge of 4.75%. |
| 2 | | For additional information, please refer to the Glossary of Terms. |
| 3 | | Reflects the expense ratio as reported in the prospectus dated February 28, 2013. The expense ratios reflected include Acquired Fund fees and expenses. Additional information pertaining to the October 31, 2013 expense ratios can be found in the financial highlights. |
The performance of the Fund is measured against the BofA Merrill Lynch 3-Month LIBOR Constant Maturity Index which tracks the performance of a synthetic asset paying LIBOR to a stated maturity. The index is based on the assumed purchase at par of a synthetic instrument having exactly its stated maturity and with a coupon equal to that day’s fixing rate. That issue is assumed to be sold the following business day (priced at a yield equal to the current day fixing rate) and rolled into a new instrument. The index is unmanaged and the performance of the index does not reflect the deduction of expenses associated with a mutual fund, such as investment management and fund accounting fees. The Fund’s performance reflects the deduction of fees for these value-added services. Investors cannot invest directly in an index.
HSBC FAMILY OF FUNDS 13
| Portfolio Reviews (Unaudited) |
HSBC RMB Fixed Income Fund
(Class A Shares, Class I Shares and Class S Shares) |
by Cecilia Chan, Fixed Income CIO, Asia-Pacific
Jim Veneau, Investment Director, Asian Fixed Income
Alfred Mui, Investment Director, Asian Fixed Income
Gregory Suen, Associate Director, Fixed Income
The HSBC RMB Fixed Income Fund (the “Fund”) seeks to maximize total return by investing principally in debt instruments that provide exposure to Renminbi (“RMB”), the official currency of the People’s Republic of China (“China”). The Fund’s portfolio management team follows a top-down approach in which country credits, currencies, and local rate curves are analyzed based on their fundamental attractiveness. The team seeks to identify risk differentiation across issuers while attempting to manage credit, liquidity and interest rate risks. This investment process allows the team to capture potential opportunities in the growing offshore RMB fixed income market and take advantage of the currency’s potential appreciation. In order to gain such exposure, the Fund may invest in RMB-denominated debt instruments, including RMB-denominated deposits in Hong Kong or US dollar-denominated instruments, as well as derivative instruments, with underlying currency exposure to RMB.
Investment Concerns
Bond funds will tend to experience smaller fluctuations in value than stock funds. However, investors in any bond fund should anticipate fluctuations in price, especially for longer term issues and in environments of rising interest rates. Investments in a bond fund are subject to possible loss due to the financial failure of underlying securities and their inability to meet their client obligations.
High yield, lower rated securities involve greater price volatility and present greater risk than higher rated fixed income securities. At times, due to market conditions, the Fund may be unable to sell certain of its portfolio securities without a substantial drop in price. Prices of fixed income securities are generally inversely correlated to interest rates. Investments in the Fund are subject to possible loss due to the financial failure of underlying securities and their inability to meet their debt obligations. These risks may increase the Fund’s share price volatility.
International investing involves increased risk and volatility. An investment in international funds entails the special risks of international investing, including currency exchange fluctuation, government regulations, and the potential for political and economic instability.
Prices of securities in emerging markets can fluctuate more significantly than the prices of companies in more developed countries. Securities of emerging market issuers generally have more risk than securities issued by issuers in more developed markets. The less developed the country, the greater affect the risks may have on an investment, and as a result, an investment may exhibit a higher degree of volatility than either the general domestic securities market or the securities markets of developed foreign countries.
Derivatives may be riskier than other types of investments and could result in losses that significantly exceed the Fund’s original investment.
For a complete description of these and other risks associated with investment in a mutual fund, please refer to the Fund’s prospectus.
Market Commentary
The Fund returned 5.96% (without sales charge) for the Class A Shares and 6.31% for the Class I Shares for the year ended October 31, 2013. That compared to a 7.00% total return for the HSBC Offshore Renminbi Bond Index1, the Fund’s primary performance benchmark, and a 0.53% total return for the J.P. Morgan Emerging Local Markets Index Plus1.
Portfolio Performance
The market for offshore debt instruments denominated in the renminbi, the official currency of the People’s Republic of China, performed well during the period. Solid credit fundamentals and relatively short durations meant that the offshore RMB market was less affected by the volatility that struck other emerging markets during the summer of 2013. In addition the market benefited from the relative strength of the RMB against the U.S. dollar.
Early in the period we avoided investing in some of the longer-dated bonds in the market, because we felt that their higher yields did not justify taking on the additional risk that they represented. That positioning hurt the Fund’s performance relative to its primary benchmark due to the higher total yield that these bonds offered.†
The Fund’s performance benefited from careful credit selection, particularly among bonds in the Hong Kong and Chinese property sectors, which we believed were undervalued. We also increased the Fund’s exposure to higher-yielding bonds during a period of relative market weakness in the summer of 2013. These investments boosted the Fund’s relative performance later in the period, when the market rallied strongly and higher-yielding bonds performed particularly well.†
† | | Portfolio composition is subject to change. |
1 | | For additional information, please refer to the Glossary of Terms. |
Past performance does not guarantee future results. The performance data quoted represents past performance and current returns may be lower or higher. Total return figures include change in share price, reinvestment of dividends and capital gains and do not reflect taxes that a shareholder would pay on Fund distributions or on the redemption of Fund shares. Investment return and principal value will fluctuate so that an investor’s shares, when redeemed may be worth more or less than the original cost. To obtain performance information current to the most recent month end, please call 1-800-782-8183.
14 HSBC FAMILY OF FUNDS
| Portfolio Reviews (Unaudited) |
HSBC RMB Fixed Income Fund |


The charts above represent a historical since inception performance comparison of a hypothetical $10,000 investment in the indicated share class versus a similar investment in the Fund’s benchmark and represents the reinvestment of dividends and capital gains in the Fund. The hypothetical performance for the HSBC Offshore Renminbi Bond Index was calculated based on 5/31/2012 as the inception date for the index.
| | | Average Annual | | Expense |
| Fund Performance | | | Total Return (%) | | Ratio (%)3 |
| Inception | | 1 | | Since | | | | |
| As of October 31, 2013 | Date | | Year | | Inception | | Gross | | Net |
| HSBC RMB Fixed Income Class A1 | 6/8/12 | | 0.93 | | 2.97 | | 2.54 | | 1.45 |
| HSBC RMB Fixed Income Class I | 6/8/12 | | 6.31 | | 6.99 | | 2.19 | | 1.10 |
| HSBC RMB Fixed Income Class S | 6/8/12 | | 6.41 | | 7.09 | | 2.09 | | 1.00 |
| HSBC Offshore Renminbi Bond Index2 | — | | 7.00 | | 7.85 | | N/A | | N/A |
| J.P. Morgan Emerging Local Markets Index Plus2 | — | | 0.53 | | 3.93 | | N/A | | N/A |
Past performance does not guarantee future results. The performance data quoted represents past performance and current returns may be lower or higher. Total return figures include change in share price, reinvestment of dividends and capital gains and do not reflect the taxes that a shareholder would pay on Fund distributions or on the redemption of Fund shares. Investment return and principal value will fluctuate so that an investor’s shares, when redeemed may be worth more or less than the original cost. To obtain performance information current to the most recent month end, please call 1-800-782-8183.
The performance above reflects any fee waivers that have been in effect during the applicable periods, as well as any expense reimbursements that have periodically been made. Absent such waivers and reimbursements, returns would have been lower. Currently, contractual fee waivers are in effect for the Fund through March 1, 2014.
| 1 | Reflects the maximum sales charge of 4.75%. |
| 2 | For additional information, please refer to the Glossary of Terms. |
| 3 | Reflects the expense ratio as reported in the prospectus dated February 28, 2013. HSBC Global Asset management (USA) Inc. has entered into a contractual expense limitation agreement with the Fund under which it will limit total expenses of the Fund (excluding interest, taxes, brokerage commissions, extraordinary expenses and estimated indirect expenses attributable to the Fund’s investments in investment company companies) to an annual rate of 1.45%, 1.10% and 1.00% for Class A Shares, Class I Shares and Class S Shares. The expense limitation shall be in effect until March 1, 2014. |
The performance of the Fund is measured against the HSBC Offshore Renminbi Bond Index and the J.P. Morgan Emerging Local Markets Index Plus. The HSBC Offshore Renminbi Bond Index tracks total return performance of renminbi-denominated and renminbi-settled bonds and certificates of deposit issued outside the People’s Republic of China. The J.P. Morgan Emerging Markets Bond Index Plus tracks total returns for local-currency-denominated money market instruments in 22 emerging markets countries with at least US$10 billion of external trade. The indexes are unmanaged and the performance of the indexes do not reflect the deduction of expenses associated with a mutual fund, such as investment management and fund accounting fees. The Fund’s performance reflects the deduction of fees for these value-added services. Investors cannot invest directly in an index.
HSBC FAMILY OF FUNDS 15
| Portfolio Reviews |
Portfolio Composition* (Unaudited)
October 31, 2013 |
| HSBC Emerging Markets Debt Fund† | |
| Country | Percentage of Investments at Value(%) |
| Russian Federation | | 12.9 | |
| Mexico | | 12.1 | |
| Turkey | | 11.2 | |
| Indonesia | | 10.4 | |
| Brazil | | 8.5 | |
| United States | | 5.6 | |
| Venezuela | | 5.1 | |
| South Africa | | 4.5 | |
| Colombia | | 4.4 | |
| Panama | | 3.5 | |
| Croatia | | 2.5 | |
| Peru | | 2.2 | |
| Poland | | 2.1 | |
| China | | 2.1 | |
| Philippines | | 1.7 | |
| Hungary | | 1.3 | |
| Chile | | 1.0 | |
| Lithuania | | 1.0 | |
| Kazakhstan | | 0.9 | |
| Uruguay | | 0.9 | |
| Romania | | 0.7 | |
| El Salvador | | 0.6 | |
| Iraq | | 0.5 | |
| Ireland (Republic of) | | 0.5 | |
| Nigeria | | 0.5 | |
| Namibia | | 0.5 | |
| Republic of Serbia | | 0.5 | |
| Sri Lanka | | 0.5 | |
| Slovenia | | 0.5 | |
| Paraguay | | 0.4 | |
| Malaysia | | 0.3 | |
| Lebanon | | 0.3 | |
| Dominican Republic | | 0.3 | |
| | 100.0 | |
| | |
| HSBC Emerging Markets Local Debt Fund† | |
| Country | Percentage of Investments at Value(%) |
| United States | | 23.6 | |
| Russian Federation | | 13.4 | |
| Thailand | | 11.1 | |
| Turkey | | 10.3 | |
| Brazil | | 10.0 | |
| Indonesia | | 7.6 | |
| Poland | | 4.9 | |
| Malaysia | | 4.7 | |
| Mexico | | 4.6 | |
| South Africa | | 3.4 | |
| Peru | | 3.1 | |
| Colombia | | 1.5 | |
| Luxembourg | | 1.1 | |
| China | | 0.7 | |
| | 100.0 | |
| | | |
| HSBC Frontier Markets Fund† | | | |
| Country | Percentage of Investments at Value(%) |
| United Arab Emirates | | 13.7 | |
| Qatar | | 14.2 | |
| Nigeria | | 11.2 | |
| Pakistan | | 10.0 | |
| Saudi Arabia | | 8.2 | |
| Kuwait | | 6.5 | |
| Vietnam | | 4.0 | |
| Oman | | 3.9 | |
| Philippines | | 3.6 | |
| Colombia | | 2.7 | |
| Georgia | | 2.7 | |
| United States | | 2.7 | |
| Peru | | 2.6 | |
| Panama | | 2.1 | |
| Kazakhstan | | 1.8 | |
| Estonia | | 1.5 | |
| Romania | | 1.5 | |
| Sri Lanka | | 1.5 | |
| Turkmenistan | | 1.5 | |
| Egypt | | 1.2 | |
| Cambodia | | 1.1 | |
| Kenya | | 1.0 | |
| Croatia | | 0.6 | |
| Lebanon | | 0.2 | |
| Ukraine | | 0.0 | |
| | 100.0 | |
| |
| HSBC Total Return Fund† | |
| Country | Percentage of Investments at Value(%) |
| United States | | 25.2 | |
| Mexico | | 12.9 | |
| Brazil | | 10.3 | |
| Colombia | | 10.1 | |
| Russian Federation | | 9.6 | |
| Turkey | | 7.7 | |
| Indonesia | | 5.2 | |
| South Africa | | 5.0 | |
| China | | 3.4 | |
| Peru | | 2.7 | |
| Kazakhstan | | 2.2 | |
| Chile | | 1.2 | |
| Croatia | | 1.0 | |
| Namibia | | 0.6 | |
| Panama | | 0.5 | |
| Slovenia | | 0.5 | |
| Iraq | | 0.4 | |
| Uruguay | | 0.3 | |
| India | | 0.2 | |
| Luxembourg | | 0.2 | |
| Costa Rica | | 0.2 | |
| Canada | | 0.2 | |
| Lithuania | | 0.2 | |
| Dominican Republic | | 0.1 | |
| Republic of Serbia | | 0.1 | |
| | 100.0 | |
16 HSBC FAMILY OF FUNDS
| Portfolio Reviews |
Portfolio Composition* (Unaudited) (continued)
October 31, 2013 |
| HSBC RMB Fixed Income Fund† |
| Country | Percentage of Investments at Value(%) |
| China | | 38.6 | |
| Hong Kong | | 32.5 | |
| United States | | 6.0 | |
| Singapore | | 6.0 | |
| Japan | | 4.8 | |
| France | | 3.7 | |
| Australia | | 2.4 | |
| South Korea | | 2.4 | |
| Brazil | | 2.4 | |
| Germany | | 1.2 | |
| | 100.0 | |
____________________
| * | | Portfolio composition is subject to change. |
| † | | Excludes any instruments used for cash management. |
HSBC FAMILY OF FUNDS 17
| HSBC EMERGING MARKETS DEBT FUND |
| Schedule of Portfolio Investments—as of October 31, 2013 |
| Corporate Obligation – 0.0% | | | |
| | | |
| Principal | | |
| Amount ($) | | Value ($) |
| Pemex Project Funding Master Trust, | | | |
| 6.63%, 6/15/35 | 10,000 | | 10,850 |
| |
| TOTAL CORPORATE OBLIGATION | | | |
| (COST $10,894) | | | 10,850 |
| |
| Yankee Dollars – 94.7% | | | |
| |
| Brazil – 8.5% | | | |
| Banco ABC Brasil SA, | | | |
| 7.88%, 4/8/20 | 100,000 | | 104,000 |
| Banco do Brasil SA, Registered, | | | |
| 5.88%, 1/26/22 | 450,000 | | 452,700 |
| Banco Nacional de Desenvolvimento | | | |
| Economico e Social, | | | |
| 5.75%, 9/26/23 (a) | 200,000 | | 207,500 |
| Banco Votorantim, Registered, | | | |
| 5.25%, 2/11/16, MTN | 200,000 | | 209,048 |
| Caixa Economica Federal, | | | |
| 4.50%, 10/3/18 (a) | 150,000 | | 150,750 |
| Federal Republic of Brazil, | | | |
| 2.63%, 1/5/23 | 600,000 | | 535,500 |
| Federal Republic of Brazil, | | | |
| 4.25%, 1/7/25 | 650,000 | | 635,050 |
| Federal Republic of Brazil, | | | |
| 7.13%, 1/20/37 | 540,000 | | 648,000 |
| Federal Republic of Brazil, | | | |
| 5.63%, 1/7/41 | 300,000 | | 306,000 |
| Petrobras International Finance Co., | | | |
| 5.75%, 1/20/20 | 50,000 | | 52,813 |
| Vale Overseas Ltd., | | | |
| 6.88%, 11/21/36 | 100,000 | | 104,001 |
| Votorantim Cimentos SA, Registered, | | | |
| 7.25%, 4/5/41 | 200,000 | | 197,000 |
| | | 3,602,362 |
| Chile – 1.0% | | | |
| CorpBanca SA, 3.13%, 1/15/18 | 200,000 | | 188,337 |
| Empresa Nacional de Petroleo, | | | |
| Registered, 4.75%, 12/6/21 | 220,000 | | 221,854 |
| | | 410,191 |
| China – 2.1% | | | |
| CNOOC Curtis Funding No.1 Pty Ltd., | | | |
| 4.50%, 10/3/23 (a) | 200,000 | | 203,166 |
| Sinopec Capital (2013) Ltd., | | | |
| 3.13%, 4/24/23 (a) | 200,000 | | 183,441 |
| Sinopec Group Overseas Development | | | |
| (2013) Ltd., 4.38%, 10/17/23 (a) | 500,000 | | 501,661 |
| | | 888,268 |
| Colombia – 4.4% | | | |
| Bancolombia SA, 5.95%, 6/3/21 | 100,000 | | 105,600 |
| Grupo Aval Ltd., Registered, | | | |
| 4.75%, 9/26/22 | 200,000 | | 187,750 |
| Republic of Colombia, | | | |
| 4.38%, 7/12/21 | 490,000 | | 518,910 |
| Republic of Colombia, 2.63%, 3/15/23, | | | |
| Callable 12/15/22 @ 100.00 | 200,000 | | 180,900 |
| Republic of Colombia, | | | |
| 4.00%, 2/26/24 | 200,000 | | 199,500 |
| Republic of Colombia, | | | |
| 8.13%, 5/21/24 | 300,000 | | 397,500 |
| Republic of Colombia, | | | |
| 6.13%, 1/18/41 | 250,000 | | 283,125 |
| | | 1,873,285 |
| Croatia – 2.6% | | | |
| Croatia, Registered, | | | |
| 6.75%, 11/5/19 | 500,000 | | 545,000 |
| Croatia, Registered, | | | |
| 6.63%, 7/14/20 | 100,000 | | 108,000 |
| Croatia, Registered, | | | |
| 6.38%, 3/24/21 | 400,000 | | 424,500 |
| | | 1,077,500 |
| Dominican Republic – 0.3% | | | |
| Dominican Republic, | | | |
| 7.50%, 5/6/21 | 100,000 | | 110,650 |
| El Salvador – 0.6% | | | |
| Republic of El Salvador, | | | |
| 7.75%, 1/24/23 | 225,000 | | 253,688 |
| Hungary – 1.3% | | | |
| Republic of Hungary, | | | |
| 6.38%, 3/29/21 | 130,000 | | 141,213 |
| Republic of Hungary, | | | |
| 5.38%, 2/21/23 | 300,000 | | 298,815 |
| Republic of Hungary, | | | |
| 7.63%, 3/29/41 | 80,000 | | 90,100 |
| | | 530,128 |
| Indonesia – 10.4% | | | |
| Majapahit Holding BV, | | | |
| 8.00%, 8/7/19 | 125,000 | | 144,844 |
| PT Pertamina (Persero) Tbk, | | | |
| 4.30%, 5/20/23 (a) | 200,000 | | 182,500 |
| PT Pertamina Tbk, Registered, | | | |
| 4.88%, 5/3/22 | 400,000 | | 385,000 |
| Republic of Indonesia, | | | |
| 6.88%, 1/17/18 | 575,000 | | 652,625 |
| Republic of Indonesia, | | | |
| 3.38%, 4/15/23 (a) | 350,000 | | 315,000 |
| Republic of Indonesia, | | | |
| 5.38%, 10/17/23 (a) | 500,000 | | 526,250 |
| Republic of Indonesia, Registered, | | | |
| 5.88%, 3/13/20 | 1,150,000 | | 1,259,250 |
| Republic of Indonesia, Registered, | | | |
| 3.75%, 4/25/22 | 525,000 | | 494,812 |
| Republic of Indonesia, Registered, | | | |
| 8.50%, 10/12/35 | 100,000 | | 129,500 |
| Republic of Indonesia, Registered, | | | |
| 6.63%, 2/17/37 | 175,000 | | 190,750 |
| Republic of Indonesia, Registered, | | | |
| 7.75%, 1/17/38 | 100,000 | | 121,875 |
| | | 4,402,406 |
18 HSBC FAMILY OF FUNDS | See notes to financial statements. |
| HSBC EMERGING MARKETS DEBT FUND |
| Schedule of Portfolio Investments—as of October 31, 2013 (continued) |
| Yankee Dollars, continued | | | |
| | | | |
| Principal | | |
| Amount ($) | | Value ($) |
| Iraq – 0.5% | | | |
| Republic of Iraq, Registered, | | | |
| 5.80%, 1/15/28, Callable | | | |
| 12/23/13 @ 100.00 | 250,000 | | 217,500 |
| Ireland (Republic of) – 0.5% | | | |
| Vnesheconombank, Registered, | | | |
| 5.38%, 2/13/17 | 200,000 | | 213,640 |
| Kazakhstan – 0.9% | | | |
| Development Bank of Kazakhstan, | | | |
| 4.13%, 12/10/22 (a) | 200,000 | | 184,500 |
| Kazakhstan Temir Zholy, Registered, | | | |
| 6.95%, 7/10/42 | 200,000 | | 209,250 |
| | | 393,750 |
| Lebanon – 0.3% | | | |
| Republic of Lebanon, Registered, | | | |
| Series 42, 8.25%, 4/12/21, MTN | 100,000 | | 111,000 |
| Lithuania – 1.0% | | | |
| Republic of Lithuania, Registered, | | | |
| 6.13%, 3/9/21 | 150,000 | | 171,938 |
| Republic of Lithuania, Registered, | | | |
| 6.63%, 2/1/22 | 200,000 | | 237,500 |
| | | 409,438 |
| Malaysia – 0.3% | | | |
| Petronas Capital Ltd., | | | |
| 5.25%, 8/12/19 | 100,000 | | 112,505 |
| Mexico – 12.1% | | | |
| Banco Santander SA, | | | |
| 4.13%, 11/9/22 (a) | 150,000 | | 143,437 |
| Comision Federal de Electricidad, | | | |
| 4.88%, 1/15/24 (a) | 200,000 | | 202,750 |
| Petroleos Mexicanos, | | | |
| 5.50%, 1/21/21 | 1,000,000 | | 1,090,000 |
| Petroleos Mexicanos, | | | |
| 6.50%, 6/2/41 | 200,000 | | 213,000 |
| Petroleos Mexicanos, | | | |
| 5.50%, 6/27/44 | 30,000 | | 28,050 |
| United Mexican States, | | | |
| 4.00%, 10/2/23 | 1,360,000 | | 1,381,080 |
| United Mexican States, Series A, | | | |
| 7.50%, 4/8/33, MTN | 100,000 | | 132,000 |
| United Mexican States, Series A, | | | |
| 6.75%, 9/27/34, MTN | 90,000 | | 110,250 |
| United Mexican States, Series A, | | | |
| 6.05%, 1/11/40 | 1,606,000 | | 1,818,795 |
| | | 5,119,362 |
| Namibia – 0.5% | | | |
| Namibia International Bond, | | | |
| Registered, 5.50%, 11/3/21 | 200,000 | | 210,500 |
| Nigeria – 0.5% | | | |
| Republic of Nigeria, | | | |
| 6.38%, 7/12/23 (a) | 200,000 | | 211,500 |
| Panama – 3.5% | | | |
| Republic of Panama, | | | |
| 5.20%, 1/30/20 | 875,000 | | 967,750 |
| Republic of Panama, | | | |
| 7.13%, 1/29/26 | 200,000 | | 248,500 |
| Republic of Panama, | | | |
| 6.70%, 1/26/36 | 95,000 | | 112,338 |
| Republic of Panama, | | | |
| 4.30%, 4/29/53 | 200,000 | | 163,200 |
| | | 1,491,788 |
| |
| Paraguay – 0.5% | | | |
| Republic of Paraguay, | | | |
| 4.63%, 1/25/23 (b) | 200,000 | | 189,000 |
| Peru – 2.2% | | | |
| Banco de Credito del Peru, Registered, | | | |
| 4.25%, 4/1/23 | 70,000 | | 66,675 |
| Republic of Peru, 7.13%, 3/30/19 | 100,000 | | 121,800 |
| Republic of Peru, 7.35%, 7/21/25 | 100,000 | | 128,900 |
| Republic of Peru, 8.75%, 11/21/33 | 110,000 | | 160,380 |
| Republic of Peru, 6.55%, 3/14/37 | 390,000 | | 464,685 |
| | | 942,440 |
| Philippines – 1.7% | | | |
| Power Sector Assets & Liabilities | | | |
| Management Corp., Registered, | | | |
| 7.25%, 5/27/19 | 100,000 | | 121,000 |
| Republic of Philippines, | | | |
| 6.50%, 1/20/20 | 175,000 | | 210,000 |
| Republic of Philippines, | | | |
| 4.00%, 1/15/21 | 250,000 | | 266,563 |
| Republic of Philippines, | | | |
| 7.75%, 1/14/31 | 100,000 | | 134,500 |
| | | 732,063 |
| Poland – 2.1% | | | |
| Republic of Poland, 5.13%, 4/21/21 | 465,000 | | 513,244 |
| Republic of Poland, 5.00%, 3/23/22 | 350,000 | | 382,812 |
| | | 896,056 |
| Republic of Serbia – 0.5% | | | |
| Republic of Serbia, Registered, | | | |
| 7.25%, 9/28/21 | 200,000 | | 208,000 |
| Romania – 0.7% | | | |
| Romania, Registered, | | | |
| 6.75%, 2/7/22, MTN | 260,000 | | 300,300 |
| Russian Federation – 12.8% | | | |
| Alfa Issuance Ltd., Series E, | | | |
| 8.00%, 3/18/15, MTN | 100,000 | | 107,120 |
| Gazprom OAO, Registered, | | | |
| 9.25%, 4/23/19 | 125,000 | | 155,938 |
| Gazprom OAO, Registered, | | | |
| 6.51%, 3/7/22, MTN | 100,000 | | 109,750 |
| Gazprom OAO, Registered, | | | |
| 7.29%, 8/16/37, MTN | 100,000 | | 111,000 |
| RSHB Capital SA, 6.30%, 5/15/17 | 475,000 | | 511,812 |
| Russia Foreign Bond, | | | |
| 4.88%, 9/16/23 (a) | 400,000 | | 419,600 |
See notes to financial statements. | HSBC FAMILY OF FUNDS 19 |
| HSBC EMERGING MARKETS DEBT FUND |
| Schedule of Portfolio Investments—as of October 31, 2013 (continued) |
| Yankee Dollars, continued | | | |
| | | | |
| Principal | | |
| Amount ($) | | Value ($) |
| Russian Federation, continued | | | |
| Russia Foreign Bond, Registered, | | | |
| 7.50%, 3/31/30 | 2,727,725 | | 3,246,129 |
| RZD Capital Ltd., Series E, | | | |
| 5.74%, 4/3/17, MTN | 500,000 | | 538,125 |
| Sberbank, Registered, | | | |
| 5.18%, 6/28/19 | 200,000 | | 212,220 |
| | | 5,411,694 |
| Slovenia – 0.5% | | | |
| Republic of Slovenia, | | | |
| 5.85%, 5/10/23 (a) | 200,000 | | 195,000 |
| South Africa – 4.6% | | | |
| Republic of South Africa, | | | |
| 6.88%, 5/27/19 | 350,000 | | 404,250 |
| Republic of South Africa, | | | |
| 5.50%, 3/9/20 | 175,000 | | 189,875 |
| Republic of South Africa, | | | |
| 5.88%, 5/30/22 | 200,000 | | 219,000 |
| Republic of South Africa, | | | |
| 4.67%, 1/17/24 | 640,000 | | 632,000 |
| Republic of South Africa, | | | |
| 5.88%, 9/16/25 | 450,000 | | 479,902 |
| | | 1,925,027 |
| Sri Lanka – 0.5% | | | |
| Bank of Ceylon, Registered, | | | |
| 6.88%, 5/3/17 | 200,000 | | 205,000 |
| Turkey – 11.3% | | | |
| Republic of Turkey, 5.63%, 3/30/21 | 1,975,000 | | 2,108,312 |
| Republic of Turkey, 5.13%, 3/25/22 | 1,175,000 | | 1,203,200 |
| Republic of Turkey, 7.38%, 2/5/25 | 290,000 | | 339,300 |
| Republic of Turkey, 6.75%, 5/30/40 | 100,000 | | 109,000 |
| Republic of Turkey, 6.00%, 1/14/41 | 600,000 | | 603,000 |
| Turkiye Is Bankasi AS, | | | |
| 3.88%, 11/7/17 (a) | 200,000 | | 194,760 |
| Turkiye Vakiflar Bankasi TAO, | | | |
| 5.00%, 10/31/18 (a) | 200,000 | | 199,010 |
| | | 4,756,582 |
| Uruguay – 0.9% | | | |
| Republic of Uruguay, | | | |
| 7.63%, 3/21/36 | 40,000 | | 51,300 |
| Republic of Uruguay, PIK, | | | |
| 7.88%, 1/15/33 | 260,000 | | 340,210 |
| | | 391,510 |
| Venezuela – 5.1% | | | |
| Bolivarian Republic of Venezuela, | | | |
| 7.65%, 4/21/25 | 275,000 | | 201,162 |
| Bolivarian Republic of Venezuela, | | | |
| 9.25%, 5/7/28 | 550,000 | | 437,250 |
| Republic of Venezuela, | | | |
| 7.00%, 12/1/18 | 100,000 | | 83,250 |
| Republic of Venezuela, | | | |
| 7.75%, 10/13/19 | 1,490,000 | | 1,221,800 |
| Republic of Venezuela, Registered, | | | |
| 8.25%, 10/13/24 | 200,000 | | 152,500 |
| Republic of Venezuela, Registered, | | | |
| 7.00%, 3/31/38 | 100,000 | | 66,900 |
| | | 2,162,862 |
| | | |
| TOTAL YANKEE DOLLARS | | | |
| (COST $39,600,980) | | | 39,954,995 |
| |
| U.S. Treasury Obligation – 0.6% | | | |
| |
| Shares or | | |
| Principal | | |
| Amount ($) | | |
| U.S. Treasury Notes – 0.6% | | | |
| 2.50%, 8/15/23 | 225,000 | | 224,156 |
| TOTAL U.S. TREASURY | | | |
| OBLIGATION (COST $222,612) | | | 224,156 |
| |
| Investment Companies – 5.5% | | | |
| | | | |
| Northern Institutional Diversified | | | |
| Assets Portfolio, Institutional | | | |
| Shares, 0.01% (c) | 2,310,542 | | 2,310,542 |
| TOTAL INVESTMENT COMPANIES | | | |
| (COST $2,310,542) | | | 2,310,542 |
| TOTAL INVESTMENT SECURITIES | | | |
| (COST $42,145,028) — 100.8% | | | 42,500,543 |
____________________
Percentages indicated are based on net assets of $42,189,060. |
(a) | | Rule 144A security or other security which is restricted as to resale to institutional investors. This security has been deemed liquid by the Investment Adviser based on procedures approved by the Board of Trustees. |
(b) | | Rule 144A security or other security which is restricted as to resale to institutional investors. This security has been deemed illiquid by the Investment Adviser based on procedures approved by the Board of Trustees. |
(c) | | The rate represents the annualized one-day yield that was in effect on October 31, 2013. |
MTN — Medium Term Note
PIK — Payment-in-Kind
The Fund invested, as a percentage of net assets at value, in the following industries, as of October 31, 2013:
| Percentage of Net Assets |
| Industry | at Value (%) |
| Sovereign Bonds | | 70.6 | |
| Diversified Financial Services | | 11.5 | |
| Oil, Gas & Consumable Fuels | | 6.2 | |
| Investment Companies | | 5.5 | |
| Commercial Banks | | 5.1 | |
| Electrical Equipment | | 0.8 | |
| U.S. Treasury Obligation | | 0.6 | |
| Energy Equipment & Services | | 0.3 | |
| Metals & Mining | | 0.2 | |
| | 100.8 | |
20 HSBC FAMILY OF FUNDS | See notes to financial statements. |
| HSBC EMERGING MARKETS DEBT FUND |
| Schedule of Portfolio Investments—as of October 31, 2013 (continued) |
Futures Contracts Purchased
| | | | | | | | | | | Unrealized |
| | | | | | Number of | | Notional | | Appreciation/ |
| Description | | | Type | | Expiration Date | | Contracts | | Value | | (Depreciation) |
| 10-Year U.S. Treasury Note December Future | | Long | | 12/20/13 | | 21 | | $ | 2,674,547 | | | $91,503 | |
| | | | | | | | $ | 2,674,547 | | | $91,503 | |
Credit Default Swap Agreements - Sell Protection(a)
At October 31, 2013, the Fund’s open credit default swap agreements were as follows:
| | | | | | | | | | | | | | | Upfront | | | | |
| | | | | | Implied Credit | | | | | | | | | Premiums | | Unrealized |
| | | | | | Spread at | | Notional | | Fixed | | | | | Paid/ | | Appreciation/ |
| | | | Expiration | | October 31, 2013 | | Amount | | Rate | | Value | | (Received) | | (Depreciation) |
| Underlying Instrument | | Counterparty | | Date | | (%) (b) | | ($)(c) | | (%) | | ($) | | ($) | | ($) |
| Federative | | JPMorgan | | | | | | | | | | | | | | | | | | | |
| Republic of Brazil | | Chase Bank N.A. | | 06/20/18 | | 1.62 | | 500,000 | | 1.00 | | (13,068 | ) | | | (9,814 | ) | | | (3,254 | ) |
| |
| Federative | | Barclays Bank PLC | | | | | | | | | | | | | | | | | | | |
| Republic of Brazil | | | | 06/20/18 | | 1.62 | | 300,000 | | 1.00 | | (7,841 | ) | | | (8,671 | ) | | | 830 | |
| |
| Federative | | Barclays Bank PLC | | | | | | | | | | | | | | | | | | | |
| Republic of Brazil | | | | 09/20/16 | | 1.33 | | 550,000 | | 1.00 | | (2,827 | ) | | | (11,666 | ) | | | 8,839 | |
| |
| Peoples Republic of | | JPMorgan | | | | | | | | | | | | | | | | | | | |
| China | | Chase Bank N.A. | | 09/20/16 | | 0.41 | | 500,000 | | 1.00 | | 9,367 | | | | (3,227 | ) | | | 12,594 | |
| |
| Peoples Republic of | | JPMorgan | | | | | | | | | | | | | | | | | | | |
| China | | Chase Bank N.A. | | 09/20/16 | | 0.41 | | 500,000 | | 1.00 | | 9,366 | | | | (4,641 | ) | | | 14,007 | |
| | | | | | | | | | | | | (5,003 | ) | | | (38,019 | ) | | | 33,016 | |
| (a) | When a credit event occurs as defined under the terms of the swap agreement, the Fund as a seller of credit protection will either (i) pay to the buyer of protection an amount equal to the par value of the defaulted reference entity and take delivery of the reference entity or (ii) pay a net amount equal to the par value of the defaulted reference entity less its recovery value. |
| (b) | Implied credit spread, represented in absolute terms, utilized in determining the fair value of the credit default swap agreements as of period end serve as an indicator of the current status of the payment/performance risk and represent the likelihood or risk of default for the credit derivative. The implied credit spread of a referenced entity reflects the cost of buying/selling protection and may include upfront payments required to be made to enter into the agreement. Generally, wider credit spreads represent a perceived deterioration of the referenced entity’s credit soundness and a greater likelihood or risk of default or other credit event occurring as defined under the terms of the swap agreement. |
| (c) | The notional amount represents the maximum potential amount of future payments that the Fund could be required to make as a seller of credit protection if a credit event occurs, as defined under the terms of the swap agreement. |
| |
| See notes to financial statements. | HSBC FAMILY OF FUNDS | 21 |
| HSBC EMERGING MARKETS DEBT FUND |
| Schedule of Portfolio Investments—as of October 31, 2013 (continued) |
At October 31, 2013, the Fund’s open forward foreign currency exchange contracts were as follows:
| | | | | | Contract | | | | | | Unrealized |
| | | | | | Amount | | Contract | | | | Appreciation/ |
| | | | Delivery | | (Local | | Value | | | | (Depreciation) |
| Short Contracts | | | Counterparty | | | Date | | Currency) | | ($) | | Value ($) | | ($) |
| Brazilian Real | | Barclays Bank PLC | | 2/4/14 | | 453,915 | | 204,062 | | 198,175 | | | 5,887 | |
| Brazilian Real | | Standard Chartered Bank | | 11/4/13 | | 453,915 | | 210,000 | | 202,488 | | | 7,512 | |
| Brazilian Real | | Standard Chartered Bank | | 11/4/13 | | 905,848 | | 404,577 | | 404,091 | | | 486 | |
| Indian Rupee | | Barclays Bank PLC | | 1/16/14 | | 7,537,488 | | 120,000 | | 120,499 | | | (499 | ) |
| Mexican Peso | | Barclays Bank PLC | | 11/14/13 | | 1,573,920 | | 122,057 | | 120,517 | | | 1,540 | |
| South African Rand | | Standard Chartered Bank | | 12/9/13 | | 23,898 | | 2,429 | | 2,369 | | | 60 | |
| | | | | | | | 1,063,125 | | 1,048,139 | | | 14,986 | |
| |
| | | | | | Contract | | | | | | Unrealized |
| | | | | | Amount | | Contract | | | | Appreciation/ |
| | | | Delivery | | (Local | | Value | | | | (Depreciation) |
| Long Contracts | | | Counterparty | | | Date | | Currency) | | ($) | | Value ($) | | ($) |
| Brazilian Real | | Barclays Bank PLC | | 11/4/13 | | 453,915 | | 208,409 | | 202,488 | | | (5,921 | ) |
| Brazilian Real | | Barclays Bank PLC | | 11/4/13 | | 905,848 | | 398,000 | | 404,091 | | | 6,091 | |
| Brazilian Real | | Standard Chartered Bank | | 2/4/14 | | 905,848 | | 396,502 | | 395,485 | | | (1,017 | ) |
| Indian Rupee | | Standard Chartered Bank | | 1/16/14 | | 7,563,600 | | 120,000 | | 120,916 | | | 916 | |
| Mexican Peso | | Barclays Bank PLC | | 1/16/14 | | 1,573,920 | | 121,454 | | 119,917 | | | (1,537 | ) |
| Mexican Peso | | Standard Chartered Bank | | 11/14/13 | | 1,573,920 | | 120,000 | | 120,517 | | | 517 | |
| South African Rand | | Standard Chartered Bank | | 12/9/13 | | 23,898 | | 2,317 | | 2,369 | | | 52 | |
| South African Rand | | Standard Chartered Bank | | 1/30/14 | | 23,898 | | 2,411 | | 2,351 | | | (60 | ) |
| | | | | | | | 1,369,093 | | 1,368,134 | | | (959 | ) |
| 22 | HSBC FAMILY OF FUNDS | See notes to financial statements. |
| HSBC EMERGING MARKETS LOCAL DEBT FUND |
| Schedule of Portfolio Investments—as of October 31, 2013 |
| Foreign Bonds – 67.8%† | | | | |
| | | | | |
| | Principal | | |
| | Amount ($) | | Value ($) |
| Brazil – 9.2% | | | | |
| Nota do Tesouro Nacional, | | | | |
| Series F, 10.00%, 1/1/17 | | 6,400,000 | | 2,846,543 |
| Colombia – 1.5% | | | | |
| Republic of Colombia, | | | | |
| 9.85%, 6/28/27 | | 650,000,000 | | 458,460 |
| Indonesia – 7.4% | | | | |
| Indonesia Government, | | | | |
| Series FR28, 10.00%, 7/15/17 | | 9,100,000,000 | | 882,130 |
| Indonesia Government, | | | | |
| Series FR56, 8.38%, 9/15/26 | | 9,605,000,000 | | 890,481 |
| Indonesia Government, | | | | |
| Series FR65, 6.63%, 5/15/33 | | 6,890,000,000 | | 521,414 |
| | | | | 2,294,025 |
| Malaysia – 4.5% | | | | |
| Malaysian Government, | | | | |
| Series 0111, 4.16%, 7/15/21 | | 305,000 | | 99,946 |
| Malaysian Government, | | | | |
| Series 0112, 3.42%, 8/15/22 | | 3,850,000 | | 1,199,072 |
| Malaysian Government, | | | | |
| Series 0412, 4.13%, 4/15/32 | | 340,000 | | 108,013 |
| | | | | 1,407,031 |
| Mexico – 4.5% | | | | |
| Mexican Bonos Desarr, | | | | |
| Series M, 8.00%, 12/7/23 (a) | | 11,400,000 | | 998,170 |
| Mexican Bonos Desarr, | | | | |
| Series M30, 8.50%, 11/18/38 (a) | | 2,600,000 | | 225,358 |
| Mexican Bonos Desarr, | | | | |
| Series M, 7.75%, 11/13/42 (a) | | 2,000,000 | | 160,624 |
| | | | | 1,384,152 |
| Peru – 3.0% | | | | |
| Peru Bono Soberano, | | | | |
| 9.91%, 5/5/15 | | 515,000 | | 201,912 |
| Republic of Peru, Registered, | | | | |
| 6.95%, 8/12/31 | | 1,500,000 | | 583,276 |
| Republic of Peru, Registered, | | | | |
| 6.90%, 8/12/37 | | 400,000 | | 154,530 |
| | | | | 939,718 |
| Poland – 4.8% | | | | |
| Poland Government Bond, | | | | |
| Series 1021, 5.75%, 10/25/21 | | 1,040,000 | | 375,784 |
| Poland Government Bond, | | | | |
| Series 0922, 5.75%, 9/23/22 | | 660,000 | | 239,809 |
| Poland Government Bond, | | | | |
| Series 0429, 5.75%, 4/25/29 | | 2,350,000 | | 863,567 |
| | | | | 1,479,160 |
| Russian Federation – 11.1% | | | | |
| Russia Foreign Bond, | | | | |
| 7.85%, 3/10/18 | | 100,000,000 | | 3,246,347 |
| Russia Government Bond, | | | | |
| Series 6206, 7.40%, 6/14/17 (a) | | 6,000,000 | | 192,627 |
| | | | 3,438,974 |
| South Africa – 3.3% | | | | |
| Republic of South Africa, | | | | |
| Series R203, 8.25%, 9/15/17 | | 2,477,000 | | 261,055 |
| Republic of South Africa, | | | | |
| Series R213, 7.00%, 2/28/31 | | 1,800,000 | | 153,065 |
| Republic of South Africa, | | | | |
| Series R209, 6.25%, 3/31/36 | | 8,000,000 | | 597,892 |
| | | | | 1,012,012 |
| Thailand – 10.7% | | | | |
| Thailand Government Bond, | | | | |
| 4.13%, 11/18/16 | | 91,500,000 | | 3,032,410 |
| Thailand Government Bond, | | | | |
| 3.63%, 6/16/23 | | 9,000,000 | | 283,365 |
| | | | | 3,315,775 |
| Turkey – 7.9% | | | | |
| Turkey Government Bond, | | | | |
| Series 5Y, 6.30%, 2/14/18 (a) | | 2,500,000 | | 1,175,535 |
| Turkey Government Bond, | | | | |
| Series CPI, 3.00%, 1/6/21 | | 240,000 | | 153,980 |
| Turkey Government Bond, | | | | |
| 9.50%, 1/12/22 (a) | | 590,000 | | 311,125 |
| Turkey Government Bond, | | | | |
| Series CPI, 3.00%, 2/23/22 | | 1,400,000 | | 812,009 |
| | | | | 2,452,649 |
| TOTAL FOREIGN BONDS | | | | |
| (COST $22,879,380) | | | | 21,028,499 |
| |
| Yankee Dollars – 6.1% | | | | |
| |
| Brazil – 0.5% | | | | |
| Petrobras Global Finance BV, | | | | |
| 2.00%, 5/20/16 | | 150,000 | | 149,055 |
| China – 0.7% | | | | |
| CNOOC Finance (2013) Ltd., | | | | |
| 1.13%, 5/9/16 | | 200,000 | | 198,813 |
| Luxembourg – 1.0% | | | | |
| VTB Bank OJSC (VTB Capital SA), | | | | |
| Registered, 6.47%, 3/4/15 | | 300,000 | | 316,860 |
| Russian Federation – 1.9% | | | | |
| Alfa Issuance Ltd., | | | | |
| Series E, 8.00%, 3/18/15, MTN | | 300,000 | | 321,360 |
| Sberbank of Russia (SB Capital SA), | | | | |
| 5.50%, 7/7/15 | | 250,000 | | 264,688 |
| | | | | 586,048 |
| Turkey – 2.0% | | | | |
| Republic of Turkey, 7.00%, 9/26/16 | | 565,000 | | 629,523 |
| TOTAL YANKEE DOLLARS | | | | |
| (COST $1,891,695) | | | | 1,880,299 |
| See notes to financial statements. | HSBC FAMILY OF FUNDS | 23 |
| HSBC EMERGING MARKETS LOCAL DEBT FUND |
| Schedule of Portfolio Investments—as of October 31, 2013 (continued) |
| U.S. Treasury Obligations – 3.3% | | | | |
| | | | |
| | Shares or | | |
| | Principal | | |
| | Amount ($) | | Value ($) |
| U.S. Treasury Bills – 2.5% | | | | |
| 0.05%, 6/26/14(b) | | 750,000 | | 749,642 |
| U.S. Treasury Bonds – 0.8% | | | | |
| 3.13%, 2/15/43 | | 280,000 | | 253,575 |
| TOTAL U.S. TREASURY OBLIGATIONS | | | | |
| (COST $1,043,462) | | | | 1,003,217 |
| |
| Investment Companies – 19.7% | | | | |
| |
| Northern Institutional Diversified | | | | |
| Assets Portfolio, Institutional | | | | |
| Shares, 0.01% (c) | | 6,091,520 | | 6,091,520 |
| TOTAL INVESTMENT COMPANIES | | | | |
| (COST $6,091,520) | | | | 6,091,520 |
| TOTAL INVESTMENT SECURITIES | | | | |
| (COST $31,906,057) — 96.9% | | | | 30,003,535 |
____________________
| Percentages indicated are based on net assets of $30,956,500. |
| † | | The principal amount is disclosed in local currency and the value is disclosed in U.S. Dollars. |
| (a) | | Variable rate security. The interest rates on these securities are adjusted periodically to reflect then-current short-term interest rates. The rates presented represent the rates in effect on October 31, 2013. The maturity dates presented reflect the final maturity dates. However, some of these securities may contain put or demand features that allow the Fund to require the issuer to repurchase the security from the fund within various time periods, including daily, weekly, monthly, or semi-annually. |
| (b) | | Discount note. Rate presented represents the effective yield at time of purchase. |
| (c) | | The rate represents the annualized one-day yield that was in effect on October 31, 2013. |
MTN — Medium Term Note |
The Fund invested, as a percentage of net assets at value, in the following industries, as of October 31, 2013:
| | Percentage of Net Assets |
| Industry | | at Value (%) |
| Sovereign Bonds | | | 69.9 | |
| Investment Companies | | | 19.7 | |
| U.S. Treasury Obligations | | | 3.3 | |
| Diversified Financial Services | | | 3.0 | |
| Commercial Banks | | | 1.0 | |
| | | 96.9 | |
Interest Rate Swap Agreements
At October 31, 2013, $350,000 of cash was segregated for forward foreign currency exchange contracts and swap agreements. At October 31, 2013, the Fund’s open interest rate swap agreements were as follows:
| Pay/ | | | | | | | | | | | | | | | | | | | Unrealized |
| Receive | | | | Fixed | | | | | | Notional | | Notional | | | | | Appreciation/ |
| Floating | | | | | Rate | | Expiration | | | | Amount | | Amount | | Value | | (Depreciation) |
| Rate | | | Floating Rate Index | | (%) | | Date | | Counterparty | | (Local) | | ($) | | ($) | | ($) |
| | 3-Month MYR- | | | | | | | | | | | | | | | | | | | |
| Pay | | KLIBOR-BNM | | 3.24 | | 5/3/18 | | Standard Charter Bank | | 1,500,000 | | MYR | | 475,571 | | (7,500 | ) | | | (7,500 | ) |
| | | | | | | | JPMorgan | | | | | | | | | | | | | |
| Pay | | 1-Year BRL CDI | | 9.96 | | 1/2/15 | | Chase Bank N.A. | | 5,100,000 | | BRL | | 2,277,192 | | (15,502 | ) | | | (15,502 | ) |
| | 1-Month | | | | | | Credit Suisse | | | | | | | | | | | | | |
| Pay | | MXN-TIIE-Banxico | | 6.38 | | 7/11/23 | | International | | 14,000,000 | | MXN | | 1,073,175 | | (8,886 | ) | | | (8,886 | ) |
| Pay | | 1-Year BRL CDI | | 9.71 | | 1/2/15 | | Barclays Bank PLC | | 5,700,000 | | BRL | | 2,545,097 | | (24,393 | ) | | | (24,393 | ) |
| | 3-Month ZAR- | | | | | | JPMorgan | | | | | | | | | | | | | |
| Pay | | JIBAR-SAFEX | | 5.94 | | 8/8/15 | | Chase Bank N.A. | | 17,000,000 | | ZAR | | 1,695,135 | | 8,115 | | | | 8,115 | |
| | 1-Month | | | | | | | | | | | | | | | | | | | |
| Pay | | MXN-TIIE-Banxico | | 4.33 | | 9/8/15 | | Barclays Bank PLC | | 24,603,000 | | MXN | | 1,885,952 | | (6,279 | ) | | | (6,279 | ) |
| | 1-Month | | | | | | JPMorgan | | | | | | | | | | | | | |
| Pay | | MXN-TIIE-Banxico | | 6.47 | | 9/12/23 | | Chase Bank N.A. | | 6,000,000 | | MXN | | 459,932 | | (2,012 | ) | | | (2,012 | ) |
| Pay | | 1-Year BRL CDI | | 10.94 | | 1/4/16 | | Barclays Bank PLC | | 5,700,000 | | BRL | | 2,545,097 | | (12,354 | ) | | | (12,354 | ) |
| | 1-Month | | | | | | | | | | | | | | | | | | | |
| Pay | | MXN-TIIE-Banxico | | 6.21 | | 10/6/23 | | Barclays Bank PLC | | 10,000,000 | | MXN | | 766,554 | | (19,104 | ) | | | (19,104 | ) |
| | 1-Month | | | | | | | | | | | | | | | | | | | |
| Pay | | MXN-TIIE-Banxico | | 6.69 | | 12/23/21 | | Barclays Bank PLC | | 6,250,000 | | MXN | | 479,096 | | 15,396 | | | | 15,396 | |
| | | | | | | | JPMorgan | | | | | | | | | | | | | |
| Pay | | 1-Year BRL CDI | | 10.44 | | 1/2/14 | | Chase Bank N.A. | | 2,200,000 | | BRL | | 982,318 | | 38,238 | | | | 38,238 | |
| Pay | | 1-Year BRL CDI | | 10.02 | | 1/4/21 | | Barclays Bank PLC | | 2,400,000 | | BRL | | 1,071,620 | | (54,874 | ) | | | (54,874 | ) |
| | 1-Year ZAR- | | | | | | | | | | | | | | | | | | | |
| Pay | | JIBAR-SAFEX | | 5.98 | | 1/24/18 | | Barclays Bank PLC | | 20,000,000 | | ZAR | | 1,994,276 | | (60,373 | ) | | | (60,373 | ) |
| | 3-Month MYR- | | | | | | | | | | | | | | | | | | | |
| Pay | | KLIBOR-BNM | | 3.52 | | 1/25/18 | | Standard Charter Bank | | 2,200,000 | | MYR | | 697,505 | | (1,826 | ) | | | (1,826 | ) |
| | | | | | | | | | | | | | | | (151,354 | ) | | | (151,354 | ) |
| 24 | HSBC FAMILY OF FUNDS | See notes to financial statements. |
| HSBC EMERGING MARKETS LOCAL DEBT FUND |
| Schedule of Portfolio Investments—as of October 31, 2013 (continued) |
At October 31, 2013, the Fund’s open forward foreign currency exchange contracts were as follows:
| | | | | | Contract | | | | | | Unrealized |
| | | | | | Amount | | Contract | | | | Appreciation/ |
| | | | Delivery | | (Local | | Value | | Value | | (Depreciation) |
| Short Contracts | | | Counterparty | | Date | | Currency) | | ($) | | ($) | | ($) |
| Brazilian Real | | Barclays Bank PLC | | 11/4/13 | | 183,976 | | 80,000 | | 82,070 | | | (2,070 | ) |
| Brazilian Real | | Barclays Bank PLC | | 2/4/14 | | 328,104 | | 147,000 | | 143,247 | | | 3,753 | |
| Brazilian Real | | Barclays Bank PLC | | 2/4/14 | | 994,290 | | 446,992 | | 434,098 | | | 12,894 | |
| Brazilian Real | | JPMorgan Chase Bank N.A. | | 11/4/13 | | 2,811,820 | | 1,150,972 | | 1,254,329 | | | (103,357 | ) |
| Brazilian Real | | Standard Chartered Bank | | 11/4/13 | | 994,290 | | 460,000 | | 443,544 | | | 16,456 | |
| Brazilian Real | | Standard Chartered Bank | | 11/4/13 | | 2,610,813 | | 1,166,062 | | 1,164,661 | | | 1,401 | |
| Chinese Yuan | | JPMorgan Chase Bank N.A. | | 2/20/14 | | 430,290 | | 70,000 | | 70,346 | | | (346 | ) |
| Chinese Yuan | | Standard Chartered Bank | | 11/5/13 | | 4,199,925 | | 683,804 | | 688,983 | | | (5,179 | ) |
| Colombian Peso | | Barclays Bank PLC | | 12/6/13 | | 66,395,000 | | 35,000 | | 34,987 | | | 13 | |
| Colombian Peso | | Standard Chartered Bank | | 12/6/13 | | 2,335,738,345 | | 1,236,822 | | 1,230,834 | | | 5,988 | |
| European Euro | | Barclays Bank PLC | | 12/16/13 | | 45,473 | | 60,559 | | 61,738 | | | (1,179 | ) |
| Hungarian Forint | | Standard Chartered Bank | | 12/18/13 | | 69,861,800 | | 326,000 | | 320,092 | | | 5,908 | |
| Indian Rupee | | Barclays Bank PLC | | 1/16/14 | | 18,843,720 | | 300,000 | | 301,247 | | | (1,247 | ) |
| Indonesian Rupiah | | Barclays Bank PLC | | 2/7/14 | | 752,700,000 | | 65,000 | | 65,696 | | | (696 | ) |
| Indonesian Rupiah | | Standard Chartered Bank | | 11/4/13 | | 2,318,060,000 | | 217,148 | | 205,644 | | | 11,504 | |
| Indonesian Rupiah | | Standard Chartered Bank | | 2/7/14 | | 400,160,000 | | 34,304 | | 34,926 | | | (622 | ) |
| Korean Won | | JPMorgan Chase Bank N.A. | | 11/4/13 | | 651,600,000 | | 600,000 | | 614,244 | | | (14,244 | ) |
| Korean Won | | JPMorgan Chase Bank N.A. | | 2/6/14 | | 651,600,000 | | 602,998 | | 612,119 | | | (9,121 | ) |
| Malaysian Ringgit | | Standard Chartered Bank | | 11/4/13 | | 6,729,436 | | 2,116,175 | | 2,132,958 | | | (16,783 | ) |
| Mexican Peso | | Barclays Bank PLC | | 11/14/13 | | 3,895,800 | | 300,000 | | 298,306 | | | 1,694 | |
| Mexican Peso | | Barclays Bank PLC | | 1/16/14 | | 3,895,800 | | 300,625 | | 296,821 | | | 3,804 | |
| Peruvian Nuevo Sol | | Standard Chartered Bank | | 12/9/13 | | 1,357,373 | | 479,976 | | 487,633 | | | (7,657 | ) |
| Peruvian Nuevo Sol | | Standard Chartered Bank | | 2/20/14 | | 1,357,373 | | 486,863 | | 484,394 | | | 2,469 | |
| Philippine Peso | | Standard Chartered Bank | | 11/8/13 | | 8,118,880 | | 188,155 | | 187,995 | | | 160 | |
| Polish Zloty | | Standard Chartered Bank | | 12/20/13 | | 252,880 | | 81,443 | | 81,876 | | | (433 | ) |
| Russian Ruble | | Standard Chartered Bank | | 2/6/14 | | 13,936,495 | | 424,020 | | 427,760 | | | (3,740 | ) |
| South African Rand | | Standard Chartered Bank | | 12/9/13 | | 23,973,193 | | 2,436,796 | | 2,376,847 | | | 59,949 | |
| Thai Baht | | Standard Chartered Bank | | 11/18/13 | | 2,981,100 | | 95,000 | | 95,749 | | | (749 | ) |
| Thai Baht | | Standard Chartered Bank | | 11/18/13 | | 18,474,450 | | 580,000 | | 593,376 | | | (13,376 | ) |
| Thai Baht | | Standard Chartered Bank | | 11/18/13 | | 33,450,258 | | 1,108,542 | | 1,074,380 | | | 34,162 | |
| Thai Baht | | Standard Chartered Bank | | 1/30/14 | | 52,063,608 | | 1,661,781 | | 1,664,667 | | | (2,886 | ) |
| Taiwan Dollar | | JPMorgan Chase Bank N.A. | | 2/7/14 | | 8,872,500 | | 304,270 | | 302,777 | | | 1,493 | |
| Taiwan Dollar | | Standard Chartered Bank | | 11/1/13 | | 8,872,500 | | 300,000 | | 302,012 | | | (2,012 | ) |
| | | | | | | | 18,546,307 | | 18,570,356 | | | (24,049 | ) |
| See notes to financial statements. | HSBC FAMILY OF FUNDS | 25 |
| HSBC EMERGING MARKETS LOCAL DEBT FUND |
| Schedule of Portfolio Investments—as of October 31, 2013 (continued) |
| | | | | | Contract | | | | | | Unrealized |
| | | | | | Amount | | Contract | | | | Appreciation/ |
| | | | Delivery | | (Local | | Value | | Value | | (Depreciation) |
| Long Contracts | | | Counterparty | | Date | | Currency) | | ($) | | ($) | | ($) |
| Brazilian Real | | Barclays Bank PLC | | 11/4/13 | | 994,290 | | 456,515 | | 443,544 | | | (12,971 | ) |
| Brazilian Real | | Standard Chartered Bank | | 11/4/13 | | 4,536,969 | | 1,932,271 | | 2,023,902 | | | 91,631 | |
| Brazilian Real | | Standard Chartered Bank | | 11/4/13 | | 1,069,640 | | 440,000 | | 477,157 | | | 37,157 | |
| Brazilian Real | | Standard Chartered Bank | | 2/4/14 | | 2,610,813 | | 1,142,788 | | 1,139,857 | | | (2,931 | ) |
| Chilean Peso | | Barclays Bank PLC | | 12/18/13 | | 20,850,000 | | 39,946 | | 40,441 | | | 495 | |
| Chilean Peso | | Standard Chartered Bank | | 12/18/13 | | 305,462,040 | | 600,000 | | 592,481 | | | (7,519 | ) |
| Chinese Yuan | | Standard Chartered Bank | | 11/5/13 | | 4,199,925 | | 677,571 | | 688,983 | | | 11,412 | |
| Chinese Yuan | | Standard Chartered Bank | | 2/20/14 | | 4,199,925 | | 683,192 | | 686,620 | | | 3,428 | |
| Colombian Peso | | Standard Chartered Bank | | 12/6/13 | | 2,402,133,345 | | 1,227,143 | | 1,265,821 | | | 38,678 | |
| Colombian Peso | | Standard Chartered Bank | | 2/28/14 | | 2,335,738,345 | | 1,228,237 | | 1,222,836 | | | (5,401 | ) |
| Hungarian Forint | | Standard Chartered Bank | | 12/18/13 | | 259,444,812 | | 1,167,855 | | 1,188,721 | | | 20,866 | |
| Indian Rupee | | JPMorgan Chase Bank N.A. | | 1/16/14 | | 19,376,000 | | 280,000 | | 309,757 | | | 29,757 | |
| Indonesian Rupiah | | Standard Chartered Bank | | 11/4/13 | | 400,160,000 | | 35,133 | | 35,500 | | | 367 | |
| Indonesian Rupiah | | Credit Suisse | | 11/4/13 | | 1,917,900,000 | | 180,000 | | 170,145 | | | (9,855 | ) |
| Korean Won | | JPMorgan Chase Bank N.A. | | 11/4/13 | | 651,600,000 | | 606,422 | | 614,244 | | | 7,822 | |
| Malaysian Ringgit | | Barclays Bank PLC | | 11/4/13 | | 1,783,375 | | 550,000 | | 565,257 | | | 15,257 | |
| Malaysian Ringgit | | JPMorgan Chase Bank N.A. | | 2/10/14 | | 224,588 | | 70,000 | | 70,714 | | | 714 | |
| Malaysian Ringgit | | Standard Chartered Bank | | 11/4/13 | | 4,946,061 | | 1,509,326 | | 1,567,701 | | | 58,375 | |
| Malaysian Ringgit | | Standard Chartered Bank | | 2/10/14 | | 493,865 | | 156,000 | | 155,500 | | | (500 | ) |
| Malaysian Ringgit | | Standard Chartered Bank | | 2/10/14 | | 6,729,436 | | 2,105,449 | | 2,118,848 | | | 13,399 | |
| Mexican Peso | | Barclays Bank PLC | | 1/16/14 | | 10,127,278 | | 786,646 | | 771,596 | | | (15,050 | ) |
| Mexican Peso | | Barclays Bank PLC | | 11/14/13 | | 3,895,800 | | 302,117 | | 298,306 | | | (3,811 | ) |
| Mexican Peso | | Standard Chartered Bank | | 1/16/14 | | 19,545,065 | | 1,445,640 | | 1,489,136 | | | 43,496 | |
| Peruvian Nuevo Sol | | Standard Chartered Bank | | 12/9/13 | | 1,357,373 | | 490,912 | | 487,632 | | | (3,280 | ) |
| Philippine Peso | | Credit Suisse | | 11/8/13 | | 8,118,880 | | 186,942 | | 187,995 | | | 1,053 | |
| Philippine Peso | | Standard Chartered Bank | | 2/25/14 | | 8,118,880 | | 188,679 | | 188,255 | | | (424 | ) |
| Polish Zloty | | JPMorgan Chase Bank N.A. | | 12/20/13 | | 4,116,441 | | 1,292,040 | | 1,332,786 | | | 40,746 | |
| Romanian Leu | | Standard Chartered Bank | | 12/18/13 | | 1,113,572 | | 324,278 | | 340,620 | | | 16,342 | |
| Russian Ruble | | Barclays Bank PLC | | 2/6/14 | | 990,525 | | 30,000 | | 30,403 | | | 403 | |
| Singapore Dollar | | JPMorgan Chase Bank N.A. | | 1/16/14 | | 743,683 | | 595,237 | | 598,872 | | | 3,635 | |
| South African Rand | | Standard Chartered Bank | | 12/9/13 | | 1,219,413 | | 122,798 | | 120,900 | | | (1,898 | ) |
| South African Rand | | Standard Chartered Bank | | 12/9/13 | | 22,753,780 | | 2,206,534 | | 2,255,947 | | | 49,413 | |
| South African Rand | | Standard Chartered Bank | | 1/30/14 | | 23,973,193 | | 2,417,871 | | 2,358,002 | | | (59,869 | ) |
| Thai Baht | | Standard Chartered Bank | | 11/18/13 | | 2,842,200 | | 90,000 | | 91,288 | | | 1,288 | |
| Thai Baht | | Standard Chartered Bank | | 11/18/13 | | 52,063,608 | | 1,668,705 | | 1,672,217 | | | 3,512 | |
| Turkish Lira | | Barclays Bank PLC | | 1/15/14 | | 206,896 | | 103,000 | | 102,316 | | | (684 | ) |
| Turkish Lira | | Standard Chartered Bank | | 1/15/14 | | 1,129,570 | | 562,339 | | 558,603 | | | (3,736 | ) |
| Taiwan Dollar | | JPMorgan Chase Bank N.A. | | 11/1/13 | | 8,872,500 | | 302,816 | | 302,012 | | | (804 | ) |
| | | | | | | | 28,204,402 | | 28,564,915 | | | 360,513 | |
| 26 | HSBC FAMILY OF FUNDS | See notes to financial statements. |
| HSBC FRONTIER MARKETS FUND |
| Schedule of Portfolio Investments—as of October 31, 2013 |
| Common Stocks – 83.0% | | | | |
| | | | |
| | Shares | | Value ($) |
| Cambodia – 1.0% | | | | |
| NagaCorp Ltd. | | 992,000 | | 916,149 |
| Colombia – 2.2% | | | | |
| Banco Davivienda SA | | 114,094 | | 1,496,698 |
| Ecopetrol SA | | 175,062 | | 416,365 |
| | | | 1,913,063 |
| Croatia – 0.6% | | | | |
| Hrvatski Telekom dd | | 18,622 | | 552,963 |
| Egypt – 1.1% | | | | |
| Centamin plc * | | 744,375 | | 599,080 |
| Global Telecom Holding SAE* | | 119,093 | | 408,894 |
| | | | 1,007,974 |
| Estonia – 1.5% | | | | |
| Tallink Group Ltd. | | 1,026,555 | | 1,342,093 |
| Georgia – 2.6% | | | | |
| Bank of Georgia Holdings plc | | 73,916 | | 2,339,241 |
| Kazakhstan – 1.7% | | | | |
| KazMunaiGas Exploration | | | | |
| Production GDR (a) | | 108,164 | | 1,534,847 |
| Kenya – 1.0% | | | | |
| Safaricom Ltd.(b) | | 8,117,600 | | 899,312 |
| Kuwait – 6.4% | | | | |
| Kuwait Projects Co. (Holding) KSC | | 926,875 | | 2,007,078 |
| Mabanee Co. SAKC | | 327,550 | | 1,418,569 |
| Mobile Telecommunications Co. | | 522,500 | | 1,316,915 |
| National Bank of Kuwait | | 285,350 | | 921,791 |
| | | | 5,664,353 |
| Lebanon – 0.2% | | | | |
| Banque Audi SAL - | | | | |
| Audi Saradar Group | | 22,987 | | 141,370 |
| Nigeria – 11.0% | | | | |
| Dangote Cement plc | | 988,769 | | 1,183,781 |
| Diamond Bank plc * | | 27,506,532 | | 1,152,605 |
| FBN Holdings plc | | 15,787,370 | | 1,611,565 |
| Guaranty Trust Bank plc | | 8,705,082 | | 1,387,767 |
| Nestle Foods Nigeria plc | | 199,204 | | 1,380,746 |
| Nigerian Breweries plc | | 1,343,588 | | 1,481,587 |
| Zenith Bank plc | | 11,563,348 | | 1,569,468 |
| | | | 9,767,519 |
| Oman – 3.8% | | | | |
| Bank Muscat SAOG | | 1,304,717 | | 2,026,548 |
| Renaissance Services SAOG * | | 723,963 | | 1,323,818 |
| | | | 3,350,366 |
| Pakistan – 9.9% | | | | |
| Bank Alfalah Ltd. | | 2,341,500 | | 498,145 |
| D.G. Khan Cement Co. Ltd. | | 2,696,500 | | 1,808,197 |
| Engro Corp. Ltd. * | | 1,487,200 | | 1,765,684 |
| MCB Bank Ltd. | | 241,745 | | 637,350 |
| Pakistan Petroleum Ltd. | | 757,350 | | 1,449,257 |
| The Hub Power Co. Ltd. | | 2,387,192 | | 1,399,874 |
| United Bank Ltd. | | 1,021,700 | | 1,179,408 |
| | | | | 8,737,915 |
| Panama – 2.1% | | | | |
| Copa Holdings SA, Class A | | 12,248 | | 1,831,566 |
| Peru – 2.6% | | | | |
| Credicorp Ltd. | | 16,800 | | 2,294,880 |
| Philippines – 3.5% | | | | |
| Cebu Air, Inc. | | 785,700 | | 959,391 |
| Security Bank Corp. | | 341,870 | | 1,099,998 |
| SM Investments Corp. | | 53,245 | | 1,055,040 |
| | | | | 3,114,429 |
| Qatar – 13.9% | | | | |
| Doha Bank QSC | | 93,110 | | 1,407,075 |
| Gulf International Services QSC | | 78,702 | | 1,267,190 |
| Industries Qatar QSC | | 57,197 | | 2,506,642 |
| Qatar Electricity & Water Co. | | 24,126 | | 1,054,000 |
| Qatar Islamic Bank | | 36,477 | | 678,525 |
| Qatar National Bank | | 65,354 | | 2,980,839 |
| Qatar Telecom (QTEL) QSC | | 62,817 | | 2,399,111 |
| | | | | 12,293,382 |
| Romania – 1.5% | | | | |
| SIF 5 Oltenia Craiova | | 2,564,547 | | 1,320,247 |
| Sri Lanka – 1.5% | | | | |
| John Keells Holdings plc | | 757,458 | | 1,294,365 |
| Turkmenistan – 1.5% | | | | |
| Dragon Oil plc | | 142,987 | | 1,350,210 |
| Ukraine – 0.0% | | | | |
| EastCoal, Inc. *(b) | | 36,050 | | 2,939 |
| EastCoal, Inc. *(b) | | 181,908 | | 15,676 |
| | | | | 18,615 |
| United Arab Emirates – 13.4% | | | | |
| Al Noor Hospitals Group plc * | | 27,903 | | 380,241 |
| DP World Ltd. | | 113,316 | | 1,915,041 |
| Emaar Properties PJSC | | 2,016,816 | | 3,338,572 |
| First Gulf Bank PJSC | | 408,798 | | 1,803,079 |
| National Bank of Abu Dhabi | | 411,818 | | 1,401,542 |
| NMC Health plc | | 265,040 | | 1,539,463 |
| Union National Bank PJSC | | 1,061,845 | | 1,459,968 |
| | | | 11,837,906 |
| TOTAL COMMON STOCKS | | | | |
| (COST $70,069,095) | | | | 73,522,765 |
| |
| Preferred Stock – 0.5% | | | | |
| |
| Colombia – 0.5% | | | | |
| Bancolombia SA, | | 33,887 | | 474,623 |
| TOTAL PREFERRED STOCK | | | | |
| (COST $500,820) | | | | 474,623 |
| See notes to financial statements. | HSBC FAMILY OF FUNDS | 27 |
| HSBC FRONTIER MARKETS FUND |
| Schedule of Portfolio Investments—as of October 31, 2013 (continued) |
| Convertible Corporate Bonds – 0.1% | | | | |
| | | | |
| | Shares or | | |
| | Principal | | |
| | Amount ($) | | Value ($) |
| Oman – 0.1% | | | | |
| Bank Muscat SAOG, 4.50%, 3/20/16 | | 45,141 | | 12,311 |
| Renaissance Services SAOG, | | | | |
| 3.75%, 7/25/17 | | 142,800 | | 38,946 |
| TOTAL CONVERTIBLE CORPORATE | | | | |
| BONDS (COST $59,301) | | | | 51,257 |
| |
| Warrants – 0.0% | | | | |
| |
| Sri Lanka – 0.0% | | | | |
| John Keells Holdings plc *(b) | | 30,868 | | 9,200 |
| John Keells Holdings plc *(b) | | 30,868 | | 6,841 |
| | | | 16,041 |
|
| Ukraine – 0.0% | | | | |
| EastCoal, Inc. *(b) | | 360,500 | | — |
| TOTAL WARRANTS | | | | |
| (COST $—) | | | | 16,041 |
| |
| Participatory Notes – 12.0% | | | | |
| |
| Saudi Arabia – 8.1% | | | | |
| Etihad Etisalat Co., 9/27/16, | | | | |
| (Deutsche Bank AG) | | 56,106 | | 1,256,640 |
| Samba Financial Group, 9/27/16, | | | | |
| (Deutsche Bank AG) | | 168,848 | | 2,237,557 |
| Saudi Dairy & Foodstuff Co., 3/25/15, | | | | |
| (Bank of America Corp.) * | | 12,126 | | 295,149 |
| Saudi Dairy & Foodstuff Co., 4/30/15, | | | | |
| (Citigroup Global Markets | | | | |
| Holding, Inc.) * | | 31,592 | | 768,223 |
| United Electronics Co., 2/13/15, | | | | |
| (Citigroup Global Markets | | | | |
| Holding, Inc.) | | 32,456 | | 887,087 |
| Yanbu National Petrochemical Co., | | | | |
| 10/14/15, (Credit Suisse AG) | | 100,576 | | 1,736,425 |
| | | | 7,181,081 |
|
| Vietnam – 3.9% | | | | |
| PetroVietnam Drilling & Well Services | | | | |
| JSC, 9/6/16, (JPMorgan Chase) * | | 541,980 | | 1,620,520 |
| Vietnam Dairy Products JSC, 1/20/15, | | | | |
| (Citigroup Global | | | | |
| Markets Holding, Inc.) | | 279,599 | | 1,861,011 |
| | | | | 3,481,531 |
| TOTAL PARTICIPATORY NOTES | | | | |
| (COST $10,160,058) | | | | 10,662,612 |
| |
| Investment Companies – 2.6% | | | | |
| |
| Northern Institutional Diversified | | | | |
| Assets Portfolio, Institutional | | | | |
| Shares, 0.01% (c) | | 2,324,522 | | 2,324,522 |
| TOTAL INVESTMENT COMPANIES | | | | |
| (COST $2,324,522) | | | | 2,324,522 |
| TOTAL INVESTMENT SECURITIES | | | | |
| (COST $83,113,796) — 98.2% | | | | 87,051,820 |
____________________
| Percentages indicated are based on net assets of $88,615,131. |
| * | | Represents non-income producing security. |
| (a) | | Rule 144A security or other security which is restricted as to resale to institutional investors. This security has been deemed liquid by the Investment Adviser based on procedures approved by the Board of Trustees. |
| (b) | | Security was valued in good faith pursuant to procedures approved by the Board of Trustees as of October 31, 2013. The total of all such securities represents 1.05% of net assets of the Fund. |
| (c) | | The rate represents the annualized one-day yield that was in effect on October 31, 2013. |
GDR — Global Depositary Receipt |
The Fund invested, as a percentage of net assets at value, in the following industries, as of October 31, 2013:
| | Percentage of Net Assets |
| Industry | | at Value (%) |
| Commercial Banks | | | 38.4 | |
| Oil, Gas & Consumable Fuels | | | 9.5 | |
| Diversified Financial Services | | | 5.4 | |
| Food Products | | | 4.9 | |
| Energy Equipment & Services | | | 4.3 | |
| Construction Materials | | | 3.4 | |
| Wireless Telecommunication Services | | | 3.4 | |
| Airlines | | | 3.1 | |
| Real Estate Management & Development | | | 3.0 | |
| Diversified Telecommunication Services | | | 2.7 | |
| Industrial Conglomerates | | | 2.7 | |
| Investment Companies | | | 2.6 | |
| Hotels, Restaurants & Leisure | | | 2.3 | |
| Health Care Providers & Services | | | 2.2 | |
| Chemicals | | | 2.0 | |
| Beverages | | | 1.7 | |
| Marine | | | 1.6 | |
| Independent Power Producers & | | | | |
| Energy Traders | | | 1.6 | |
| Capital Markets | | | 1.5 | |
| Multi-Utilities | | | 1.2 | |
| Metals & Mining | | | 0.7 | |
| | | 98.2 | |
| 28 | HSBC FAMILY OF FUNDS | See notes to financial statements. |
| HSBC TOTAL RETURN FUND |
| Schedule of Portfolio Investments—as of October 31, 2013 |
| Foreign Bonds – 7.9%† | | | |
| | | | |
| Principal | | |
| Amount ($) | | Value ($) |
| Mexico – 7.3% | | | |
| Mexican Bonos Desarr, Series M, | | | |
| 6.50%, 6/10/21 (a) | 1,000,000 | | 80,290 |
| Mexican Bonos Desarr, Series M20, | | | |
| 10.00%, 12/5/24 (a) | 240,000,000 | | 24,234,768 |
| Mexican Bonos Desarr, Series M30, | | | |
| 10.00%, 11/20/36 (a) | 711,800 | | 70,648 |
| Mexican Cetes, Series BI, 0.00%, | | | |
| 11/14/13 (b) | 3,200,000,000 | | 24,496,359 |
| | | | 48,882,065 |
| South Africa – 0.6% | | | |
| Republic of South Africa, | | | |
| Series R203, 8.25%, 9/15/17 | 35,115,000 | | 3,700,824 |
| TOTAL FOREIGN BONDS | | | |
| (COST $54,642,044) | | | 52,582,889 |
| |
| Yankee Dollars – 64.2% | | | |
| |
| Brazil – 9.9% | | | |
| Banco Bradesco SA, Registered, | | | |
| 4.10%, 3/23/15 | 9,000,000 | | 9,270,000 |
| Banco do Brasil SA, Registered, | | | |
| 5.88%, 1/26/22 | 200,000 | | 201,200 |
| Banco do Estado do Rio Grande | | | |
| do Sul SA, Registered, | | | |
| 7.38%, 2/2/22 | 1,900,000 | | 1,961,750 |
| Banco Nacional de Desenvolvimento | | | |
| Economico e Social, | | | |
| 5.75%, 9/26/23 (c) | 2,200,000 | | 2,282,500 |
| Banco Votorantim, Registered, | | | |
| 5.25%, 2/11/16, MTN | 200,000 | | 209,048 |
| Caixa Economica Federal, | | | |
| 4.50%, 10/3/18 (c) | 2,200,000 | | 2,211,000 |
| Caixa Economica Federal, | | | |
| Registered, 2.38%, 11/6/17 | 3,750,000 | | 3,562,500 |
| Centrais Eletricas Brasileiras SA, | | | |
| Registered, 6.88%, 7/30/19 | 2,160,000 | | 2,359,800 |
| Centrais Eletricas Brasileiras SA, | | | |
| Registered, 5.75%, 10/27/21 | 2,775,000 | | 2,733,375 |
| Federal Republic of Brazil, | | | |
| 6.00%, 1/17/17 | 5,900,000 | | 6,658,150 |
| Federal Republic of Brazil, | | | |
| 2.63%, 1/5/23 | 14,025,000 | | 12,517,312 |
| Federal Republic of Brazil, | | | |
| 11.00%, 8/17/40, | | | |
| Callable 8/17/15 @ 100.00 | 900,000 | | 1,049,850 |
| Petrobras International Finance Co., | | | |
| 6.13%, 10/6/16 | 15,014,000 | | 16,445,165 |
| Petrobras International Finance Co., | | | |
| 7.88%, 3/15/19 | 800,000 | | 931,794 |
| Petrobras International Finance Co., | | | |
| 5.75%, 1/20/20 | 1,950,000 | | 2,059,711 |
| Votorantim Cimentos SA, | | | |
| Registered, 7.25%, 4/5/41 | 1,600,000 | | 1,576,000 |
| | | | 66,029,155 |
| Canada – 0.2% | | | |
| Harvest Operations Corp., 2.13%, | | | |
| 5/14/18 (c) | 1,100,000 | | 1,074,909 |
| Chile – 1.1% | | | |
| Banco del Estado de Chile, | | | |
| 2.00%, 11/9/17 (c) | 2,600,000 | | 2,553,509 |
| Codelco, Inc., Registered, | | | |
| 7.50%, 1/15/19 | 1,300,000 | | 1,575,812 |
| CorpBanca SA, 3.13%, 1/15/18 | 2,400,000 | | 2,260,039 |
| Empresa Nacional de Petroleo, | | | |
| Registered, 4.75%, 12/6/21 | 1,100,000 | | 1,109,272 |
| | | 7,498,632 |
| China – 3.3% | | | |
| CNOOC Curtis Funding No.1 | | | |
| Pty Ltd., 4.50%, 10/3/23 (c) | 1,425,000 | | 1,447,558 |
| CNOOC Finance (2013) Ltd., | | | |
| 1.13%, 5/9/16 | 1,300,000 | | 1,292,284 |
| CNPC General Capital Ltd., | | | |
| 1.45%, 4/16/16 (c) | 800,000 | | 796,820 |
| Sinopec Capital (2013) Ltd., | | | |
| 1.25%, 4/24/16 (c) | 3,300,000 | | 3,280,296 |
| Sinopec Group Overseas | | | |
| Development (2012) Ltd., | | | |
| Registered, 3.90%, 5/17/22 | 10,000,000 | | 9,883,110 |
| Sinopec Group Overseas | | | |
| Development (2013) Ltd., | | | |
| 4.38%, 10/17/23 (c) | 5,400,000 | | 5,417,933 |
| | | | 22,118,001 |
| Colombia – 9.7% | | | |
| Banco Davivienda SA, Registered, | | | |
| 2.95%, 1/29/18 | 5,000,000 | | 4,875,000 |
| Banco de Bogota SA, Registered, | | | |
| 5.00%, 1/15/17 | 2,200,000 | | 2,317,700 |
| Bancolombia SA, 6.13%, 7/26/20 | 1,200,000 | | 1,266,000 |
| Bancolombia SA, 5.95%, 6/3/21 | 1,500,000 | | 1,584,000 |
| Grupo Aval Ltd., Registered, | | | |
| 5.25%, 2/1/17 | 3,410,000 | | 3,580,500 |
| Grupo Aval Ltd., Registered, | | | |
| 4.75%, 9/26/22 | 1,150,000 | | 1,079,563 |
| Republic of Colombia, | | | |
| 8.25%, 12/22/14 | 1,040,000 | | 1,120,600 |
| Republic of Colombia, | | | |
| 7.38%, 1/27/17 | 21,505,000 | | 25,128,592 |
| Republic of Colombia, | | | |
| 7.38%, 3/18/19 | 13,500,000 | | 16,503,750 |
| Republic of Colombia, | | | |
| 4.38%, 7/12/21 | 4,760,000 | | 5,040,840 |
| Republic of Colombia, | | | |
| 2.63%, 3/15/23, | | | |
| Callable 12/15/22 @ 100.00 | 750,000 | | 678,375 |
| Republic of Colombia, | | | |
| 6.13%, 1/18/41 | 1,330,000 | | 1,506,225 |
| | | 64,681,145 |
| Costa Rica – 0.2% | | | |
| Republic of Costa Rica, | | | |
| 4.25%, 1/26/23 (c) | 1,200,000 | | 1,140,000 |
| See notes to financial statements. | HSBC FAMILY OF FUNDS | 29 |
| HSBC TOTAL RETURN FUND |
| Schedule of Portfolio Investments—as of October 31, 2013 (continued) |
| Yankee Dollars, continued | | | |
| | | | |
| Principal | | |
| Amount ($) | | Value ($) |
| Croatia – 1.0% | | | |
| Croatia, Registered, | | | |
| 6.25%, 4/27/17 | 900,000 | | 960,228 |
| Croatia, Registered, | | | |
| 6.75%, 11/5/19 | 2,640,000 | | 2,877,600 |
| Croatia, Registered, | | | |
| 6.63%, 7/14/20 | 400,000 | | 432,000 |
| Croatia, Registered, | | | |
| 6.38%, 3/24/21 | 2,260,000 | | 2,398,425 |
| | | 6,668,253 |
| Dominican Republic – 0.1% | | | |
| Dominican Republic, | | | |
| 7.50%, 5/6/21 | 600,000 | | 663,900 |
| India – 0.2% | | | |
| Vedanta Resources plc, Registered, | | | |
| 6.75%, 6/7/16 | 1,400,000 | | 1,459,500 |
| Indonesia – 5.0% | | | |
| PT Pertamina (Persero) Tbk, | | | |
| 4.30%, 5/20/23 (c) | 1,300,000 | | 1,186,250 |
| PT Pertamina Tbk, Registered, | | | |
| 4.88%, 5/3/22 | 1,300,000 | | 1,251,250 |
| Republic of Indonesia, | | | |
| 3.38%, 4/15/23 (c) | 1,800,000 | | 1,620,000 |
| Republic of Indonesia, Registered, | | | |
| 7.25%, 4/20/15 | 4,784,000 | | 5,154,760 |
| Republic of Indonesia, Registered, | | | |
| 7.50%, 1/15/16 | 4,323,000 | | 4,841,760 |
| Republic of Indonesia, Registered, | | | |
| 6.88%, 3/9/17 | 1,750,000 | | 1,990,625 |
| Republic of Indonesia, Registered, | | | |
| 5.88%, 3/13/20 | 2,990,000 | | 3,274,050 |
| Republic of Indonesia, Registered, | | | |
| 4.88%, 5/5/21 | 7,260,000 | | 7,532,250 |
| Republic of Indonesia, Registered, | | | |
| 3.75%, 4/25/22 | 2,000,000 | | 1,885,000 |
| Republic of Indonesia, Registered, | | | |
| 5.38%, 10/17/23, MTN | 4,500,000 | | 4,744,035 |
| | | 33,479,980 |
| Iraq – 0.4% | | | |
| Republic of Iraq, Registered, | | | |
| 5.80%, 1/15/28, | | | |
| Callable 12/23/13 @ 100.00 | 2,675,000 | | 2,327,250 |
| Kazakhstan – 2.1% | | | |
| Development Bank of Kazakhstan, | | | |
| 4.13%, 12/10/22 (c) | 1,750,000 | | 1,614,375 |
| KazMunaiGaz Finance Sub B.V., | | | |
| Registered, 11.75%, 1/23/15 | 11,281,000 | | 12,606,518 |
| | | 14,220,893 |
| Lithuania – 0.2% | | | |
| Republic of Lithuania, Registered, | | | |
| 7.38%, 2/11/20 | 870,000 | | 1,057,050 |
| Luxembourg – 0.2% | | | |
| VTB Bank OJSC (VTB Capital SA), | | | |
| Registered, 6.47%, 3/4/15 | 1,150,000 | | 1,214,630 |
| VTB Bank OJSC (VTB Capital SA), | | | |
| Registered, 6.00%, 4/12/17 | 200,000 | | 213,000 |
| | | 1,427,630 |
| Mexico – 5.1% | | | |
| Banco Santander SA, | | | |
| 4.13%, 11/9/22 (c) | 1,100,000 | | 1,051,875 |
| Comision Federal de Electricidad, | | | |
| 4.88%, 1/15/24 (c) | 1,600,000 | | 1,622,000 |
| Petroleos Mexicanos, | | | |
| 4.88%, 3/15/15 | 2,000,000 | | 2,100,000 |
| United Mexican States, | | | |
| 5.63%, 1/15/17 | 7,410,000 | | 8,314,020 |
| United Mexican States, | | | |
| 4.00%, 10/2/23 | 8,290,000 | | 8,418,495 |
| United Mexican States, | | | |
| Series A, 6.05%, 1/11/40 | 10,890,000 | | 12,332,925 |
| | | 33,839,315 |
| Namibia – 0.5% | | | |
| Namibia International Bond, | | | |
| Registered, 5.50%, 11/3/21 | 3,400,000 | | 3,578,500 |
| Panama – 0.5% | | | |
| Republic of Panama, | | | |
| 5.20%, 1/30/20 | 3,190,000 | | 3,528,140 |
| Peru – 2.6% | | | |
| Banco de Credito del Peru, | | | |
| Registered, 5.38%, 9/16/20 | 780,000 | | 824,850 |
| BBVA Banco Continental SA, | | | |
| Registered, 2.25%, 7/29/16 | 5,000,000 | | 4,987,500 |
| Continental Senior Trust, | | | |
| Registered, 5.75%, 1/18/17 | 3,150,000 | | 3,421,813 |
| Corp. Financiera de Desarrollo SA, | | | |
| Registered, 4.75%, 2/8/22 | 200,000 | | 201,000 |
| El Fondo MIVIVIENDA SA, | | | |
| Registered, 3.50%, 1/31/23 | 975,000 | | 892,125 |
| Republic of Peru, | | | |
| 8.38%, 5/3/16 (c) | 4,525,000 | | 5,271,625 |
| Republic of Peru, | | | |
| 6.55%, 3/14/37 | 1,660,000 | | 1,977,890 |
| | | 17,576,803 |
| Republic of Serbia – 0.1% | | | |
| Republic of Serbia, Registered, | | | |
| 5.25%, 11/21/17 | 410,000 | | 407,950 |
| Russian Federation – 9.3% | | | |
| AK Transneft OAO, Registered, | | | |
| 5.67%, 3/5/14 | 400,000 | | 406,440 |
| Alfa Bank OJSC, Registered, | | | |
| 7.88%, 9/25/17 | 1,200,000 | | 1,345,488 |
| Alfa Bank OJSC, Registered, | | | |
| 7.75%, 4/28/21 | 500,000 | | 543,750 |
| Alfa Issuance Ltd., Series E, | | | |
| 8.00%, 3/18/15, MTN | 450,000 | | 482,040 |
| 30 | HSBC FAMILY OF FUNDS | See notes to financial statements. |
| HSBC TOTAL RETURN FUND |
| Schedule of Portfolio Investments—as of October 31, 2013 (continued) |
| Yankee Dollars, continued | | | |
| | | | |
| Principal | | |
| Amount ($) | | Value ($) |
| Russian Federation, continued | | | |
| Gazprom OAO, Registered, | | | |
| Series 2009/2, 10.50%, | | | |
| 3/25/14, MTN | 10,000,000 | | 10,357,400 |
| Gazprom OAO, Registered, | | | |
| 8.13%, 7/31/14 | 3,601,000 | | 3,787,172 |
| Gazprom OAO, Registered, | | | |
| Series 7, 6.21%,11/22/16, MTN | 4,600,000 | | 5,063,220 |
| Gazprom OAO, Registered, | | | |
| 9.25%, 4/23/19 | 2,050,000 | | 2,557,375 |
| Gazprom OAO, Registered, | | | |
| 6.00%, 1/23/21 | 1,200,000 | | 1,281,000 |
| Gazprom OAO, Registered, | | | |
| 6.51%, 3/7/22, MTN | 11,100,000 | | 12,182,250 |
| Russia Foreign Bond, | | | |
| 4.88%, 9/16/23 (c) | 2,400,000 | | 2,517,600 |
| Russia Foreign Bond, Registered, | | | |
| 7.50%, 3/31/30 | 8,265,400 | | 9,836,239 |
| Russian Agricultural Bank OJSC, | | | |
| Registered, 7.13%, 1/14/14 | 503,000 | | 508,332 |
| Russian Federation, Registered, | | | |
| 3.25%, 4/4/17 | 1,600,000 | | 1,674,000 |
| RZD Capital Ltd., Registered, | | | |
| 5.70%, 4/5/22 | 300,000 | | 314,250 |
| Sberbank of Russia (SB Capital SA), | | | |
| Registered, 4.95%, 2/7/17 | 5,600,000 | | 5,950,000 |
| Sibur Securities Ltd., | | | |
| 3.91%, 1/31/18 (c) | 3,100,000 | | 3,030,250 |
| | | 61,836,806 |
| Slovenia – 0.5% | | | |
| Republic of Slovenia, | | | |
| 5.85%, 5/10/23 (c) | 3,400,000 | | 3,315,000 |
| South Africa – 4.3% | | | |
| Eskom Holdings SOC Ltd., | | | |
| 6.75%, 8/6/23 (c) | 2,450,000 | | 2,529,625 |
| Republic of South Africa, | | | |
| 6.88%, 5/27/19 | 6,100,000 | | 7,045,500 |
| Republic of South Africa, | | | |
| 5.50%, 3/9/20 | 15,670,000 | | 17,001,950 |
| Republic of South Africa, | | | |
| 5.88%, 9/16/25 | 1,200,000 | | 1,279,740 |
| Transnet SOC Ltd., Registered, | | | |
| 4.50%, 2/10/16 | 800,000 | | 833,240 |
| | | 28,690,055 |
| Turkey – 7.4% | | | |
| Akbank TAS, Registered, | | | |
| 5.13%, 7/22/15 | 9,080,000 | | 9,309,270 |
| Republic of Turkey, | | | |
| 9.50%, 1/15/14 | 906,000 | | 919,345 |
| Republic of Turkey, | | | |
| 7.25%, 3/15/15 | 18,392,000 | | 19,633,460 |
| Republic of Turkey, | | | |
| 7.50%, 7/14/17 | 3,600,000 | | 4,122,000 |
| Republic of Turkey, | | | |
| 7.50%, 11/7/19 | 100,000 | | 117,750 |
| Republic of Turkey, | | | |
| 5.63%, 3/30/21 | 2,638,000 | | 2,816,065 |
| Republic of Turkey, | | | |
| 5.13%, 3/25/22 | 660,000 | | 675,840 |
| Republic of Turkey, | | | |
| 6.25%, 9/26/22 | 4,800,000 | | 5,292,000 |
| Turkiye Halk Bankasi AS, | | | |
| 3.88%, 2/5/20 (c) | 2,500,000 | | 2,270,325 |
| Turkiye Is Bankasi AS, | | | |
| 3.88%, 11/7/17 (c) | 1,000,000 | | 973,800 |
| Turkiye Is Bankasi AS, | | | |
| 5.50%, 4/21/19 (c) | 1,450,000 | | 1,466,313 |
| Turkiye Vakiflar Bankasi TAO, | | | |
| 5.00%, 10/31/18 (c) | 800,000 | | 796,040 |
| Turkiye Vakiflar Bankasi TAO, | | | |
| 6.00%, 11/1/22 (c) | 1,400,000 | | 1,310,750 |
| | | 49,702,958 |
| Uruguay – 0.3% | | | |
| Republica Oriental del Uruguay, | | | |
| 4.50%, 8/14/24 | 1,755,000 | | 1,812,037 |
| Republica Oriental del Uruguay, | | | |
| 6.88%, 9/28/25 | 275,000 | | 326,563 |
| | | 2,138,600 |
| TOTAL YANKEE DOLLARS | | | |
| (COST $433,430,334) | | | 428,460,425 |
| |
| Shares or | | |
| Principal | | |
| | Amount ($) | | |
| |
| U.S. Treasury Obligations – 14.0% | | | |
| |
| U.S. Treasury Bonds – 1.6% | | | |
| 3.13%, 2/15/43 | 11,830,000 | | 10,713,544 |
| U.S. Treasury Notes – 12.3% | | | |
| 1.75%, 5/15/23 | 88,350,000 | | 82,517,486 |
| TOTAL U.S. TREASURY | | | |
| OBLIGATIONS | | | |
| (COST $97,143,299) | | | 93,231,030 |
| |
| Investment Companies – 10.3% | | | |
| | | | |
| Northern Institutional Diversified | | | |
| Assets Portfolio, Institutional | | | |
| Shares, 0.01% (d) | 69,101,935 | | 69,101,935 |
| TOTAL INVESTMENT COMPANIES | | | |
| (COST $69,101,935) | | | 69,101,935 |
| TOTAL INVESTMENT SECURITIES | | | |
| (COST $654,317,612) — 96.4% | | | 643,376,279 |
| See notes to financial statements. | HSBC FAMILY OF FUNDS | 31 |
| HSBC TOTAL RETURN FUND |
| Schedule of Portfolio Investments—as of October 31, 2013 (continued) |
____________________
| Percentages indicated are based on net assets of $667,571,668. |
| † | The principal amount is disclosed in local currency and the value is disclosed in U.S. Dollars. |
| (a) | Variable rate security. The interest rates on these securities are adjusted periodically to reflect then-current short-term interest rates. The rates presented represent the rates in effect on October 31, 2013. The maturity dates presented reflect the final maturity dates. However, some of these securities may contain put or demand features that allow the Fund to require the issuer to repurchase the security from the fund within various time periods, including daily, weekly, monthly, or semi-annually. |
| (b) | Zero-Coupon Security. |
| (c) | Rule 144A security or other security which is restricted as to resale to institutional investors. This security has been deemed liquid by the Investment Adviser based on procedures approved by the Board of Trustees. |
| (d) | The rate represents the annualized one-day yield that was in effect on October 31, 2013. |
| MTN — Medium Term Note |
The Fund invested, as a percentage of net assets at value, in the following industries, as of October 31, 2013:
| Percentage of Net Assets |
| Industry | at Value (%) |
| Sovereign Bonds | 43.1 | |
| U.S. Treasury Obligations | 14.0 | |
| Investment Companies | 10.3 | |
| Oil, Gas & Consumable Fuels | 10.2 | |
| Commercial Banks | 8.5 | |
| Diversified Financial Services | 7.5 | |
| Energy Equipment & Services | 2.1 | |
| Metals & Mining | 0.5 | |
| Industrial Conglomerates | 0.2 | |
| 96.4 | |
Futures Contracts
At October 31, 2013, the Fund’s open futures contracts were as follows:
| | | | | | | | | | Unrealized |
| | | Expiration | | Number of | | Notional | | Appreciation/ |
| Description | | Type | | Date | | Contracts | | Value | | (Depreciation) |
| 10-Year U.S. Treasury Note December Future | Short | | 12/20/13 | | 356 | | $ | 45,339,938 | | $(1,499,848) |
Interest Rate Swap Agreements
At October 31, 2013, $9,510,000 of cash was segregated for forward foreign currency exchange contracts and swap agreements. At October 31, 2013, the Fund’s open interest rate swap agreements were as follows:
| | | | | | | | | | | | | | | | | | | | Upfront | | | | | |
| | | | | | | | | | | | | | | | | | | | Premiums | | Unrealized |
| Pay/Receive | | | | Fixed | | | | | | Notional | | Notional | | | | | Paid/ | | Appreciation/ |
| Floating | | | | Rate | | Expiration | | | | Amount | | Amount | | Value | | (Received) | | (Depreciation) |
| Rate | | Floating Rate Index | | (%) | | Date | | Counterparty | | (Local) | | ($) | | ($) | | ($) | | ($) |
| | | | | | | | | Barclays Bank | | | | | | | | | | | | | | | | | | |
| Pay | | 1-Year BRL CDI | | 9.71 | % | | 1/2/15 | | PLC | | 120,800,000 | | BRL | | 53,938,203 | | (516,969 | ) | | | — | | | | | (516,969 | ) |
| | | | | | | | | Credit Suisse | | | | | | | | | | | | | | | | | | |
| Pay | | 1-Year BRL CDI | | 9.93 | % | | 1/2/15 | | International | | 272,600,000 | | BRL | | 121,718,164 | | (864,720 | ) | | | — | | | | | (864,720 | ) |
| | 1-Month | | | | | | | Credit Suisse | | | | | | | | | | | | | | | | | | |
| Receive | | MXN-TIIE-Banxico | | 4.29 | % | | 9/9/15 | | International | | 194,337,000 | | MXN | | 14,896,975 | | (39,357 | ) | | | (753 | ) | | | | (38,604 | ) |
| | 1-Month | | | | | | | Standard | | | | | | | | | | | | | | | | | | |
| Pay | | MXN-TIIE-Banxico | | 6.50 | % | | 9/13/23 | | Charter Bank | | 48,000,000 | | MXN | | 3,679,458 | | (8,102 | ) | | | — | | | | | (8,102 | ) |
| | 1-Month | | | | | | | Barclays Bank | | | | | | | | | | | | | | | | | | |
| Receive | | MXN-TIIE-Banxico | | 5.31 | % | | 9/20/18 | | PLC | | 124,000,000 | | MXN | | 9,505,266 | | (14,641 | ) | | | — | | | | | (14,641 | ) |
| | 1-Month | | | | | | | Standard | | | | | | | | | | | | | | | | | | |
| Pay | | MXN-TIIE-Banxico | | 6.54 | % | | 9/14/23 | | Charter Bank | | 71,000,000 | | MXN | | 5,442,531 | | 3,988 | | | | — | | | | | 3,988 | |
| | 1-Month | | | | | | | Standard | | | | | | | | | | | | | | | | | | |
| Receive | | MXN-TIIE-Banxico | | 5.30 | % | | 9/20/18 | | Charter Bank | | 124,000,000 | | MXN | | 9,505,266 | | (10,422 | ) | | | — | | | | | (10,422 | ) |
| | 1-Month | | | | | | | Barclays Bank | | | | | | | | | | | | | | | | | | |
| Receive | | MXN-TIIE-Banxico | | 5.30 | % | | 9/20/18 | | PLC | | 124,000,000 | | MXN | | 9,505,266 | | (10,422 | ) | | | — | | | | | (10,422 | ) |
| | 1-Month | | | | | | | Barclays Bank | | | | | | | | | | | | | | | | | | |
| Pay | | MXN-TIIE-Banxico | | 6.54 | % | | 9/14/23 | | PLC | | 71,000,000 | | MXN | | 5,442,531 | | 3,988 | | | | — | | | | | 3,988 | |
| | 1-Month | | | | | | | Barclays Bank | | | | | | | | | | | | | | | | | | |
| Pay | | MXN-TIIE-Banxico | | 6.54 | % | | 9/14/23 | | PLC | | 71,000,000 | | MXN | | 5,442,531 | | 3,988 | | | | — | | | | | 3,988 | |
| | | | | | | | | Standard | | | | | | | | | | | | | | | | | | |
| Receive | | 3-Month LIBOR BBA | | 1.96 | % | | 5/17/22 | | Charter Bank | | 1,200,000 | | USD | | 1,200,000 | | 34,198 | | | | — | | | | | 34,198 | |
| | | | | | | | | Barclays Bank | | | | | | | | | | | | | | | | | | |
| Receive | | 3-Month LIBOR BBA | | 1.77 | % | | 8/10/22 | | PLC | | 13,000,000 | | USD | | 13,000,000 | | 698,884 | | | | — | | | | | 698,884 | |
| | | | | | | | | | | | | | | | | (719,587 | ) | | | (753 | ) | | | | (718,834 | ) |
| 32 | HSBC FAMILY OF FUNDS | See notes to financial statements. |
| HSBC TOTAL RETURN FUND |
| Schedule of Portfolio Investments—as of October 31, 2013 (continued) |
Credit Default Swap Agreements - Buy Protection(a)
At October 31, 2013, the Fund’s open credit default swap agreements were as follows:
| | | | | | | | | | | | | | | Upfront | | | | | | |
| | | | | | Implied Credit | | | | | | | | | Premiums | | Unrealized |
| | | | | | Spread at | | Notional | | Fixed | | | | | Paid/ | | Appreciation/ |
| | | | Expiration | | October 31, | | Amount | | Rate | | Value | | (Received) | | (Depreciation) |
| Underlying Instrument | | Counterparty | | Date | | 2013 (%) (b) | | ($) (c) | | (%) | | ($) | | ($) | | ($) |
| | JPMorgan Chase | | | | | | | | | | | | | | | | | | | | |
| Republic of Korea | | Bank N.A. | | 6/20/18 | | 0.54 | | 5,500,000 | | 1.00 | | (125,129 | ) | | (65,689 | ) | | | | (59,440 | ) | |
| | JPMorgan Chase | | | | | | | | | | | | | | | | | | | | |
| Republic of Korea | | Bank N.A. | | 6/20/18 | | 0.54 | | 7,000,000 | | 1.00 | | (159,255 | ) | | (45,513 | ) | | | | (113,742 | ) | |
| | JPMorgan Chase | | | | | | | | | | | | | | | | | | | | |
| Republic of Korea | | Bank N.A. | | 6/20/18 | | 0.54 | | 7,000,000 | | 1.00 | | (159,255 | ) | | (59,599 | ) | | | | (99,656 | ) | |
| | JPMorgan Chase | | | | | | | | | | | | | | | | | | | | |
| Republic of Korea | | Bank N.A. | | 6/20/18 | | 0.54 | | 6,000,000 | | 1.00 | | (136,504 | ) | | (77,634 | ) | | | | (58,870 | ) | |
| | Barclays Bank | | | | | | | | | | | | | | | | | | | | |
| Emirate of Abu Dhabi | | PLC | | 6/20/18 | | 0.57 | | 4,400,000 | | 1.00 | | (102,743 | ) | | (72,021 | ) | | | | (30,722 | ) | |
| | Credit Suisse | | | | | | | | | | | | | | | | | | | | |
| Republic of Korea | | International | | 6/20/18 | | 0.54 | | 6,000,000 | | 1.00 | | (136,504 | ) | | (63,927 | ) | | | | (72,577 | ) | |
| | JPMorgan Chase | | | | | | | | | | | | | | | | | | | | |
| CDX.EM 20 | | Bank N.A. | | 12/20/18 | | 2.71 | | 22,000,000 | | 5.00 | | (2,449,465 | ) | | (2,134,000 | ) | | | | (315,465 | ) | |
| | Barclays Bank | | | | | | | | | | | | | | | | | | | | |
| CDX.EM 20 | | PLC | | 12/20/18 | | 2.71 | | 17,000,000 | | 5.00 | | (1,892,769 | ) | | (1,681,725 | ) | | | | (211,044 | ) | |
| | Credit Suisse | | | | | | | | | | | | | | | | | | | | |
| CDX.EM 20 | | International | | 12/20/18 | | 2.71 | | 4,400,000 | | 5.00 | | (489,893 | ) | | (426,800 | ) | | | | (63,093 | ) | |
| | Credit Suisse | | | | | | | | | | | | | | | | | | | | |
| CDX.EM 20 | | International | | 12/20/18 | | 2.71 | | 11,000,000 | | 5.00 | | (1,224,733 | ) | | (1,083,500 | ) | | | | (141,233 | ) | |
| | Credit Suisse | | | | | | | | | | | | | | | | | | | | |
| CDX.EM 20 | | International | | 12/20/18 | | 2.71 | | 4,300,000 | | 5.00 | | (478,759 | ) | | (427,850 | ) | | | | (50,909 | ) | |
| | Credit Suisse | | | | | | | | | | | | | | | | | | | | |
| CDX.EM 20 | | International | | 12/20/18 | | 2.71 | | 4,400,000 | | 5.00 | | (489,893 | ) | | (435,600 | ) | | | | (54,293 | ) | |
| | JPMorgan Chase | | | | | | | | | | | | | | | | | | | | |
| Republic of Korea | | Bank N.A. | | 9/20/17 | | 0.39 | | 100,000 | | 1.00 | | (2,529 | ) | | 1,211 | | | | | (3,740 | ) | |
| | Barclays Bank | | | | | | | | | | | | | | | | | | | | |
| State of Qatar | | PLC | | 9/20/17 | | 0.49 | | 6,250,000 | | 1.00 | | (131,617 | ) | | 74,259 | | | | | (205,876 | ) | |
| Republic of the | | JPMorgan Chase | | | | | | | | | | | | | | | | | | | | |
| Philippines | | Bank N.A. | | 9/20/17 | | 0.69 | | 1,700,000 | | 1.00 | | (29,627 | ) | | 38,756 | | | | | (68,383 | ) | |
| | JPMorgan Chase | | | | | | | | | | | | | | | | | | | | |
| Republic of Korea | | Bank N.A. | | 9/20/17 | | 0.42 | | 5,000,000 | | 1.00 | | (126,466 | ) | | 12,067 | | | | | (138,533 | ) | |
| | Barclays Bank | | | | | | | | | | | | | | | | | | | | |
| Republic of South Africa | | PLC | | 12/20/17 | | 1.61 | | 3,500,000 | | 1.00 | | 80,253 | | | 93,237 | | | | | (12,984 | ) | |
| | JPMorgan Chase | | | | | | | | | | | | | | | | | | | | |
| Republic of Turkey | | Bank N.A. | | 12/20/17 | | 1.61 | | 3,500,000 | | 1.00 | | 80,253 | | | 89,748 | | | | | (9,495 | ) | |
| | | | | | | | | | | | (7,974,635 | ) | | (6,264,580 | ) | | | | (1,710,055 | ) | |
| See notes to financial statements. | HSBC FAMILY OF FUNDS | 33 |
| HSBC TOTAL RETURN FUND |
| Schedule of Portfolio Investments—as of October 31, 2013 (continued) |
Credit Default Swap Agreements - Sell Protection(a)
At October 31, 2013, the Fund’s open credit default swap agreements were as follows:
| | | | | | | | | | | | | | | Upfront | | | | | | |
| | | | | | Implied Credit | | | | | | | | | Premiums | | Unrealized |
| | | | | | Spread at | | Notional | | Fixed | | | | | Paid/ | | Appreciation/ |
| | | | | Expiration | | October 31, | | Amount | | Rate | | Value | | (Received) | | (Depreciation) |
| Underlying Instrument | | Counterparty | | Date | | 2013 (%) (b) | | ($) (c) | | (%) | | ($) | | ($) | | ($) |
| People’s Republic of | | JPMorgan | | | | | | | | | | | | | | | | | | | | |
| China | | Chase Bank N.A. | | 6/20/18 | | 0.71 | | 5,500,000 | | 1.00 | | 78,544 | | | 71,224 | | | | | 7,320 | | |
| Federative Republic | | | | | | | | | | | | | | | | | | | | | | |
| of Brazil | | Barclays Bank PLC | | 6/20/18 | | 1.62 | | 2,500,000 | | 1.00 | | (65,410 | ) | | (39,915 | ) | | | | (25,495 | ) | |
| Federative Republic | | JPMorgan | | | | | | | | | | | | | | | | | | | | |
| of Brazil | | Chase Bank N.A. | | 6/20/18 | | 1.56 | | 2,500,000 | | 1.00 | | (65,341 | ) | | (46,715 | ) | | | | (18,626 | ) | |
| Federative Republic | | Credit Suisse | | | | | | | | | | | | | | | | | | | | |
| of Brazil | | International | | 6/20/18 | | 1.62 | | 14,000,000 | | 1.00 | | (365,907 | ) | | (297,735 | ) | | | | (68,172 | ) | |
| People’s Republic | | JPMorgan | | | | | | | | | | | | | | | | | | | | |
| of China | | Chase Bank N.A. | | 6/20/18 | | 0.71 | | 6,000,000 | | 1.00 | | 85,685 | | | 83,678 | | | | | 2,007 | | |
| People’s Republic | | Credit Suisse | | | | | | | | | | | | | | | | | | | | |
| of China | | International | | 6/20/18 | | 0.71 | | 6,000,000 | | 1.00 | | 85,685 | | | 37,634 | | | | | 48,051 | | |
| Federative Republic | | Credit Suisse | | | | | | | | | | | | | | | | | | | | |
| of Brazil | | International | | 6/20/18 | | 1.62 | | 4,500,000 | | 1.00 | | (117,613 | ) | | (96,534 | ) | | | | (21,079 | ) | |
| | | Credit Suisse | | | | | | | | | | | | | | | | | | | | |
| Republic of Indonesia | | International | | 6/20/18 | | 1.81 | | 3,800,000 | | 1.00 | | (117,923 | ) | | (207,184 | ) | | | | 89,261 | | |
| | | JPMorgan | | | | | | | | | | | | | | | | | | | | |
| Republic of Indonesia | | Chase Bank N.A. | | 9/20/18 | | 1.81 | | 500,000 | | 1.00 | | (18,400 | ) | | (26,156 | ) | | | | 7,756 | | |
| | | Credit Suisse | | | | | | | | | | | | | | | | | | | | |
| Republic of Indonesia | | International | | 9/20/18 | | 1.90 | | 1,800,000 | | 1.00 | | (66,239 | ) | | (120,906 | ) | | | | 54,667 | | |
| | JPMorgan Chase | | | | | | | | | | | | | | | | | | | | |
| Republic of South Africa | | Bank N.A. | | 9/20/18 | | 1.82 | | 13,000,000 | | 1.00 | | (472,588 | ) | | (716,665 | ) | | | | 244,077 | | |
| Federative Republic | | | | | | | | | | | | | | | | | | | | | | |
| of Brazil | | Barclays Bank PLC | | 12/20/18 | | 1.74 | | 3,000,000 | | 1.00 | | (101,390 | ) | | (85,040 | ) | | | | (16,350 | ) | |
| Federative Republic | | JPMorgan | | | | | | | | | | | | | | | | | | | | |
| of Brazil | | Chase Bank N.A. | | 12/20/18 | | 1.74 | | 10,000,000 | | 1.00 | | (337,965 | ) | | (297,825 | ) | | | | (40,140 | ) | |
| | JPMorgan | | | | | | | | | | | | | | | | | | | | |
| Republic of Peru | | Chase Bank N.A. | | 6/20/17 | | 1.23 | | 100,000 | | 1.00 | | 277 | | | (3,224 | ) | | | | 3,501 | | |
| Republic of Turkey | | Barclays Bank PLC | | 12/20/17 | | 1.61 | | 3,500,000 | | 1.00 | | (78,904 | ) | | (88,148 | ) | | | | 9,244 | | |
| | JPMorgan | | | | | | | | | | | | | | | | | | | | |
| Republic of South Africa | | Chase Bank N.A. | | 12/20/17 | | 1.61 | | 3,500,000 | | 1.00 | | (78,904 | ) | | (99,897 | ) | | | | 20,993 | | |
| | | | | | | | | | | | (1,636,393 | ) | | (1,933,408 | ) | | | | 297,015 | | |
| (a) | | When a credit event occurs as defined under the terms of the swap agreement, the Fund as a seller of credit protection will either (i) pay to the buyer of protection an amount equal to the par value of the defaulted reference entity and take delivery of the reference entity or (ii) pay a net amount equal to the par value of the defaulted reference entity less its recovery value. Alternatively, the Fund as a buyer of credit protection will either (i) receive from the seller of protection an amount equal to the par value of the defaulted reference entity and deliver the reference entity to the seller or (ii) receive a net amount equal to the par value of the defaulted reference entity less its recovery value. |
|
| (b) | | Implied credit spread, represented in absolute terms, utilized in determining the fair value of the credit default swap agreements as of period end serves as an indicator of the current status of the payment/performance risk and represents the likelihood or risk of default for the credit derivative. The implied credit spread of a referenced entity reflects the cost of buying/selling protection and may include upfront payments required to be made to enter into the agreement. Generally, wider credit spreads represent a perceived deterioration of the referenced entity’s credit soundness and a greater likelihood or risk of default or other credit event occurring as defined under the terms of the swap agreement. |
|
| (c) | | The notional amount represents the maximum potential amount of future payments that the Fund may receive as a buyer of credit protection if a credit event occurs, as defined under the terms of the swap agreement. Alternatively, the notional amount represents the maximum potential amount the Fund could be required to make as a seller of credit protection if a credit event occurs, as defined under the terms of the swap agreement. |
| |
| 34 | HSBC FAMILY OF FUNDS | See notes to financial statements. |
| HSBC TOTAL RETURN FUND |
| Schedule of Portfolio Investments—as of October 31, 2013 (continued) |
At October 31, 2013, the Fund’s open forward foreign currency exchange contracts were as follows:
| | | | | | Contract | | | | | | Unrealized |
| | | | | | Amount | | Contract | | | | Appreciation/ |
| | | | Delivery | | (Local | | Value | | Value | | (Depreciation) |
| Short Contracts | | Counterparty | | Date | | Currency) | | ($) | | ($) | | ($) |
| Brazilian Real | | Barclays Bank PLC | | 11/4/13 | | 3,610,529 | | 1,570,000 | | 1,610,625 | | | (40,625 | ) | |
| Brazilian Real | | Barclays Bank PLC | | 11/4/13 | | 57,180,060 | | 26,460,000 | | 25,507,524 | | | 952,476 | | |
| Brazilian Real | | Barclays Bank PLC | | 2/4/13 | | 57,180,060 | | 25,705,835 | | 24,964,278 | | | 741,557 | | |
| Brazilian Real | | Standard Chartered Bank | | 11/4/13 | | 118,346,351 | | 52,856,789 | | 52,793,271 | | | 63,518 | | |
| Chinese Yuan | | Standard Chartered Bank | | 11/5/13 | | 149,467,470 | | 24,335,309 | | 24,519,618 | | | (184,309 | ) | |
| European Euro | | Barclays Bank PLC | | 12/16/13 | | 3,153,421 | | 4,341,000 | | 4,281,403 | | | 59,597 | | |
| European Euro | | Barclays Bank PLC | | 12/16/13 | | 20,844,319 | | 27,760,109 | | 28,300,347 | | | (540,238 | ) | |
| Hungarian Forint | | Credit Suisse | | 12/18/13 | | 5,788,628,234 | | 25,975,446 | | 26,522,256 | | | (546,810 | ) | |
| Hungarian Forint | | Credit Suisse | | 12/18/13 | | 1,103,756,280 | | 5,151,000 | | 5,057,175 | | | 93,825 | | |
| Indian Rupee | | Barclays Bank PLC | | 1/16/14 | | 753,748,800 | | 12,000,000 | | 12,049,896 | | | (49,896 | ) | |
| Mexican Peso | | Barclays Bank PLC | | 11/14/13 | | 64,930,000 | | 5,000,000 | | 4,971,762 | | | 28,238 | | |
| Mexican Peso | | Barclays Bank PLC | | 11/14/13 | | 320,000,000 | | 25,647,191 | | 24,502,756 | | | 1,144,435 | | |
| Mexican Peso | | Barclays Bank PLC | | 1/16/14 | | 390,992,430 | | 30,171,497 | | 29,789,671 | | | 381,826 | | |
| Mexican Peso | | Credit Suisse | | 11/14/13 | | 68,335,290 | | 5,260,000 | | 5,232,509 | | | 27,491 | | |
| Mexican Peso | | Standard Chartered Bank | | 11/14/13 | | 257,727,140 | | 20,120,000 | | 19,734,454 | | | 385,546 | | |
| Polish Zloty | | Credit Suisse | | 12/20/13 | | 89,477,438 | | 28,112,805 | | 28,970,248 | | | (857,443 | ) | |
| Polish Zloty | | Standard Chartered Bank | | 11/5/13 | | 54,127,120 | | 17,802,046 | | 17,574,491 | | | 227,555 | | |
| South African Rand | | Barclays Bank PLC | | 1/30/14 | | 232,942,449 | | 23,300,000 | | 22,912,211 | | | 387,789 | | |
| South African Rand | | Standard Chartered Bank | | 12/9/13 | | 459,369,099 | | 46,693,341 | | 45,544,630 | | | 1,148,711 | | |
| Turkish Lira | | Standard Chartered Bank | | 1/15/14 | | 29,271,719 | | 14,572,469 | | 14,475,656 | | | 96,813 | | |
| | | | | | | | 422,834,837 | | 419,314,781 | | | 3,520,056 | | |
| | | | | | Contract | | | | | | Unrealized |
| | | | | | Amount | | Contract | | | | Appreciation/ |
| | | | Delivery | | (Local | | Value | | Value | | (Depreciation) |
| Long Contracts | | Counterparty | | Date | | Currency) | | ($) | | ($) | | ($) |
| Brazilian Real | | Barclays Bank PLC | | 11/4/13 | | 16,954,525 | | 6,970,000 | | 7,563,265 | | | 593,265 | | |
| Brazilian Real | | Barclays Bank PLC | | 11/4/13 | | 57,180,060 | | 26,253,471 | | 25,507,524 | | | (745,947 | ) | |
| Brazilian Real | | Standard Chartered Bank | | 11/4/13 | | 105,002,355 | | 44,719,913 | | 46,840,631 | | | 2,120,718 | | |
| Brazilian Real | | Standard Chartered Bank | | 2/4/14 | | 118,346,351 | | 51,801,782 | | 51,668,908 | | | (132,874 | ) | |
| Chilean Peso | | Credit Suisse | | 12/18/13 | | 6,611,932,000 | | 13,040,000 | | 12,824,649 | | | (215,351 | ) | |
| Chinese Yuan | | Standard Chartered Bank | | 11/5/13 | | 149,467,470 | | 24,113,490 | | 24,519,618 | | | 406,128 | | |
| Chinese Yuan | | Standard Chartered Bank | | 2/20/14 | | 149,467,470 | | 24,313,537 | | 24,435,537 | | | 122,000 | | |
| Indian Rupee | | Standard Chartered Bank | | 1/16/14 | | 768,454,000 | | 11,177,512 | | 12,284,982 | | | 1,107,470 | | |
| Mexican Peso | | Barclays Bank PLC | | 11/14/13 | | 390,992,430 | | 30,321,243 | | 29,938,726 | | | (382,517 | ) | |
| Mexican Peso | | Standard Chartered Bank | | 1/16/14 | | 283,464,056 | | 20,966,276 | | 21,597,096 | | | 630,820 | | |
| Polish Zloty | | Credit Suisse | | 2/4/14 | | 33,577,600 | | 10,924,874 | | 10,842,940 | | | (81,934 | ) | |
| Polish Zloty | | JPMorgan Chase Bank N.A. | | 12/20/13 | | 1,401,980 | | 445,361 | | 453,921 | | | 8,560 | | |
| Polish Zloty | | Standard Chartered Bank | | 2/4/14 | | 54,127,120 | | 17,704,222 | | 17,478,828 | | | (225,394 | ) | |
| Russian Ruble | | Standard Chartered Bank | | 2/6/14 | | 3,999,150 | | 121,675 | | 122,748 | | | 1,073 | | |
| South African Rand | | Credit Suisse | | 12/9/13 | | 457,920,605 | | 44,736,284 | | 45,401,017 | | | 664,733 | | |
| South African Rand | | Standard Chartered Bank | | 12/9/13 | | 1,448,494 | | 145,867 | | 143,612 | | | (2,255 | ) | |
| South African Rand | | Standard Chartered Bank | | 1/30/14 | | 459,369,099 | | 46,330,720 | | 45,183,528 | | | (1,147,192 | ) | |
| Turkish Lira | | Barclays Bank PLC | | 1/15/14 | | 19,280,408 | | 9,604,667 | | 9,534,683 | | | (69,984 | ) | |
| Turkish Lira | | Standard Chartered Bank | | 1/15/14 | | 10,416,319 | | 5,213,373 | | 5,151,151 | | | (62,222 | ) | |
| | | | | | | | 388,904,267 | | 391,493,364 | | | 2,589,097 | | |
| See notes to financial statements. | HSBC FAMILY OF FUNDS | 35 |
| HSBC RMB FIXED INCOME FUND |
| Schedule of Portfolio Investments—as of October 31, 2013 |
| Foreign Bonds – 86.5%† | | | |
| | | | |
| Principal | | |
| Amount ($) | | Value ($) |
| Australia – 2.4% | | | |
| Australia & New Zealand Banking | | | |
| Group Ltd., Series E, | | | |
| 2.90%, 8/14/15, MTN (a) | 2,000,000 | | 330,039 |
| Brazil – 2.3% | | | |
| Banco BTG Pactual SA, Series G, | | | |
| 4.10%, 3/26/16, MTN (a) | 2,000,000 | | 322,854 |
| China – 33.2% | | | |
| Baosteel Group Corp. Ltd., | | | |
| Registered, 4.15%, 3/1/17 (a) | 2,000,000 | | 333,865 |
| Beijing Enterprises Water Group Ltd., | | | |
| 3.75%, 6/30/14 (a) | 3,000,000 | | 492,204 |
| Big Will Investments Ltd., Registered, | | | |
| 7.00%, 4/29/14 (a) | 2,000,000 | | 332,561 |
| Bitronic Ltd., 4.00%, 12/12/15 (a) | 3,000,000 | | 492,185 |
| China Guangdong Nuclear Power | | | |
| Holding Co. Ltd., Registered, | | | |
| 3.75%, 11/1/15 (a) | 2,000,000 | | 329,741 |
| China Shanshui Cement Group Ltd., | | | |
| 6.50%, 7/22/14 (a) | 2,000,000 | | 331,718 |
| Huaneng Power International, Inc., | | | |
| 3.85%, 2/5/16 (a) | 2,000,000 | | 328,982 |
| ICBC Luxembourg SA, | | | |
| 2.60%, 5/28/14 | 2,000,000 | | 328,617 |
| Intime Department Store | | | |
| (Group) Co. Ltd., Registered, | | | |
| 4.65%, 7/21/14 (a) | 2,000,000 | | 328,526 |
| Kaisa Group Holdings Ltd., | | | |
| 6.88%, 4/22/16 | 2,000,000 | | 328,618 |
| New World China Land Ltd., | | | |
| 8.50%, 4/11/15 (a) | 2,000,000 | | 347,819 |
| Right Century Ltd., | | | |
| 1.85%, 6/3/14 (a) | 2,000,000 | | 325,366 |
| The Export-Import Bank of China, | | | |
| 2.70%, 4/7/14 (a) | 2,000,000 | | 328,323 |
| | | 4,628,525 |
| France – 3.6% | | | |
| Veolia Environnement SA, Series E, | | | |
| 4.50%, 6/28/17, MTN (a) | 3,000,000 | | 504,747 |
| Germany – 1.2% | | | |
| BSH Bosch und Siemens | | | |
| Hausgerate GmbH, Registered, | | | |
| 3.80%, 7/24/17 (a) | 1,000,000 | | 165,977 |
| Hong Kong – 31.9% | | | |
| BECL Investment Holding Ltd., | | | |
| 4.75%, 2/21/14 (a) | 3,000,000 | | 493,308 |
| China Resources Power | | | |
| Holdings Co. Ltd., Series A, | | | |
| 2.90%, 11/12/13 (a) | 2,000,000 | | 328,247 |
| Dorsett Hospitality | | | |
| International Ltd., Series E, | | | |
| 6.00%, 4/3/18, MTN (a) | 2,000,000 | | 320,662 |
| Eastern Air Overseas (Hong Kong) | | | |
| Corp. Ltd., 4.00%, 8/8/14 (a) | 2,000,000 | | 328,361 |
| Galaxy Entertainment Group Ltd., | | | |
| 4.63%, 12/16/13 (a) | 3,000,000 | | 492,295 |
| Gemdale International Holdings Ltd., | | | |
| 9.15%, 7/26/15 (a) | 2,000,000 | | 347,905 |
| Lafarge Shui On Cement Ltd., | | | |
| Registered, 9.00%, 11/14/14 (a) | 2,000,000 | | 343,853 |
| Lai Fung Holdings Ltd., | | | |
| 6.88%, 4/25/18 | 2,000,000 | | 318,296 |
| Noble Group Ltd., Series E, | | | |
| 4.00%, 1/30/16, MTN | 1,000,000 | | 164,396 |
| Rainbow Days Ltd., Registered, | | | |
| 3.00%, 6/30/16 (a) | 2,000,000 | | 321,767 |
| Silvery Castle Ltd., | | | |
| 2.75%, 7/14/14 (a) | 2,000,000 | | 326,411 |
| Singamas Container Holdings Ltd., | | | |
| Registered, 4.75%, 4/14/14 (a) | 2,000,000 | | 327,901 |
| SK Global Chemical Co. Ltd., | | | |
| 4.13%, 9/26/16 | 2,000,000 | | 332,791 |
| | | 4,446,193 |
| Japan – 2.4% | | | |
| Mitsui & Co. Ltd., Series E, | | | |
| 4.25%, 3/1/17, MTN (a) | 2,000,000 | | 334,985 |
| Singapore – 2.4% | | | |
| Global Logistic Properites Ltd., | | | |
| Registered, 3.38%, 5/11/16 (a) | 2,000,000 | | 327,379 |
| South Korea – 2.4% | | | |
| The Korea Development | | | |
| Bank, Series E, | | | |
| 2.75%, 11/14/13, MTN (a) | 2,000,000 | | 328,302 |
| United States – 4.7% | | | |
| Caterpillar Financial Services Corp., | | | |
| Registered, 3.35%, 11/26/14 | 2,000,000 | | 329,667 |
| Yum! Brands, Inc., Registered, | | | |
| 2.38%, 9/29/14 (a) | 2,000,000 | | 325,713 |
| | | | 655,380 |
| TOTAL FOREIGN BONDS | | | |
| (COST $11,542,590) | | | 12,044,381 |
| |
| Certificates of Deposit – 10.6% | | | |
| | | | |
| China – 4.7% | | | |
| China Construction Bank (Asia) | | | |
| Corp. Ltd., Series FXCD, | | | |
| 2.75%, 3/11/14 | 2,000,000 | | 329,206 |
| China Development Bank Corp., | | | |
| 2.90%, 6/25/14 (a) | 2,000,000 | | 329,442 |
| | | 658,648 |
| Japan – 2.4% | | | |
| Sumitomo Mitsui Banking Corp., | | | |
| 1.10%, 4/22/14 (a) | 2,000,000 | | 325,497 |
| Singapore – 3.5% | | | |
| Oversea-Chinese Banking Corp. Ltd., | | | |
| 1.10%, 3/28/14 (a) | 3,000,000 | | 488,394 |
| TOTAL CERTIFICATES OF DEPOSIT | | | |
| (COST $1,413,124) | | | 1,472,539 |
| 36 | HSBC FAMILY OF FUNDS | See notes to financial statements. |
| HSBC RMB FIXED INCOME FUND |
| Schedule of Portfolio Investments—as of October 31, 2013 (continued) |
| Investment Companies – 1.2% |
| | | | | |
| | Shares | | Value ($) |
| Northern Institutional Diversified | | | | |
| Assets Portfolio, Institutional | | | | |
| Shares, 0.01% (b) | | 168,744 | | 168,744 |
| TOTAL INVESTMENT COMPANIES | | | | |
| (COST $168,744) | | | | 168,744 |
| TOTAL INVESTMENT SECURITIES | | | | |
| (COST $13,124,458) — 98.3% | | | | 13,685,664 |
____________________
Percentages indicated are based on net assets of $13,925,855. |
| † | | The principal amount is disclosed in local currency and the value is disclosed in U.S. Dollars. |
| (a) | | Variable rate security. The interest rates on these securities are adjusted periodically to reflect then-current short-term interest rates. The rates presented represent the rates in effect on October 31, 2013. The maturity dates presented reflect the final maturity dates. However, some of these securities may contain put or demand features that allow the Fund to require the issuer to repurchase the security from the fund within various time periods, including daily, weekly, monthly, or semi-annually. |
| (b) | | The rate represents the annualized one-day yield that was in effect on October 31, 2013. |
MTN — Medium Term Note |
The Fund invested, as a percentage of net assets at value, in the following industries, as of October 31, 2013:
| | Percentage of Net Assets |
| Industry | | at Value (%) |
| Diversified Financial Services | | | 56.8 | |
| Commercial Banks | | | 9.5 | |
| Energy Equipment & Services | | | 8.3 | |
| Construction Materials | | | 4.8 | |
| Industrial Conglomerates | | | 4.8 | |
| Specialty Retail | | | 4.7 | |
| Diversified Telecommunication Services | | | 3.5 | |
| Oil, Gas & Consumable Fuels | | | 2.4 | |
| Diversified Consumer Services | | | 2.3 | |
| Investment Companies | | | 1.2 | |
| | | 98.3 | |
| See notes to financial statements. | HSBC FAMILY OF FUNDS 37 |
HSBC FAMILY OF FUNDS
Statements of Assets and Liabilities – as of October 31, 2013
| | | Emerging | | Emerging | | Frontier | | Total | | RMB Fixed |
| | | Markets | | Markets Local | | Markets | | Return | | Income |
| | | | Debt Fund | | Debt Fund | | Fund | | Fund | | Fund |
| Assets: | | | | | | | | | | | | | | | | | | | | | | | | | |
| Investments securities, at value | | | $ | 42,500,543 | | | | $ | 30,003,535 | | | | $ | 87,051,820 | | | | $ | 643,376,279 | | | | $ | 13,685,664 | |
| Cash | | | | — | | | | | — | | | | | — | | | | | — | | | | | — | |
| Segregated cash for collateral | | | | — | | | | | 350,000 | | | | | — | | | | | 9,510,000 | | | | | — | |
| Segregated cash with brokers | | | | 39,410 | | | | | — | | | | | — | | | | | 651,162 | | | | | — | |
| Foreign currency, at value | | | | 14,915 | | | | | 509,779 | | | | | 208,277 | | | | | 75,740 | | | | | 59,325 | |
| Unrealized appreciation on forward foreign currency | | | | | | | | | | | | | | | | | | | | | | | | | |
| exchange contracts | | | | 23,061 | | | | | 650,894 | | | | | — | | | | | 11,394,144 | | | | | — | |
| Unrealized appreciation on swap agreements | | | | 36,270 | | | | | 61,749 | | | | | — | | | | | 1,231,923 | | | | | — | |
| Interest and dividends receivable | | | | 463,376 | | | | | 297,658 | | | | | 101,810 | | | | | 6,919,565 | | | | | 135,969 | |
| Premiums paid on swap agreements | | | | — | | | | | — | | | | | — | | | | | 501,814 | | | | | — | |
| Receivable for capital shares issued | | | | 49,345 | | | | | 6,125 | | | | | 1,084,921 | | | | | 3,122,300 | | | | | 19,058 | |
| Receivable for investments sold | | | | — | | | | | — | | | | | 809,566 | | | | | 17,768,440 | | | | | — | |
| Reclaims receivable | | | | — | | | | | 48,332 | | | | | 513 | | | | | 113,838 | | | | | — | |
| Receivable from Investment Adviser | | | | — | | | | | 7,890 | | | | | — | | | | | — | | | | | 31,058 | |
| Variation margin on futures contracts | | | | — | | | | | — | | | | | — | | | | | 55,625 | | | | | — | |
| Prepaid expenses | | | | 11,850 | | | | | 16,653 | | | | | 15,307 | | | | | 16,975 | | | | | 19,127 | |
| Total Assets | | | | 43,138,770 | | | | | 31,952,615 | | | | | 89,272,214 | | | | | 694,737,805 | | | | | 13,950,201 | |
| Liabilities: | | | | | | | | | | | | | | | | | | | | | | | | | |
| Cash overdraft | | | | — | | | | | 420,000 | | | | | — | | | | | 5,710,000 | | | | | — | |
| Dividends payable | | | | 1,318 | | | | | 3,734 | | | | | — | | | | | 592,068 | | | | | 1,720 | |
| Unrealized depreciation on forward foreign currency | | | | | | | | | | | | | | | | | | | | | | | | | |
| exchange contracts | | | | 9,034 | | | | | 314,430 | | | | | — | | | | | 5,284,991 | | | | | — | |
| Unrealized depreciation on swap agreements | | | | 3,254 | | | | | 213,103 | | | | | — | | | | | 3,363,797 | | | | | — | |
| Payable for investments purchased | | | | 845,587 | | | | | — | | | | | 475,775 | | | | | 1,113,550 | | | | | — | |
| Premiums received on swap agreements | | | | 38,019 | | | | | — | | | | | — | | | | | 8,700,555 | | | | | — | |
| | Payable for capital shares redeemed | | | | 12,831 | | | | | 5,611 | | | | | 36,779 | | | | | 1,703,138 | | | | | — | |
| Variation margin on futures contracts | | | | 3,281 | | | | | — | | | | | — | | | | | — | | | | | — | |
| Accrued expenses and other liabilities: | | | | | | | | | | | | | | | | | | | | | | | | | |
| Investment Management | | | | 8,173 | | | | | — | | | | | 29,333 | | | | | 533,935 | | | | | — | |
| Administration | | | | 1,765 | | | | | 1,316 | | | | | 3,562 | | | | | 28,153 | | | | | 587 | |
| Shareholder Servicing | | | | 840 | | | | | 677 | | | | | 7,223 | | | | | 456 | | | | | 865 | |
| Compliance Services | | | | 12 | | | | | 6 | | | | | 46 | | | | | 115 | | | | | 2 | |
| Accounting | | | | 156 | | | | | 293 | | | | | 908 | | | | | — | | | | | 207 | |
| Custodian | | | | 5,300 | | | | | 19,401 | | | | | 78,514 | | | | | 31,396 | | | | | 3,100 | |
| Transfer Agent | | | | 5,304 | | | | | 4,627 | | | | | 4,751 | | | | | 42,798 | | | | | 4,574 | |
| Trustee | | | | 125 | | | | | 70 | | | | | 753 | | | | | 1,685 | | | | | 42 | |
| Other | | | | 14,711 | | | | | 12,847 | | | | | 19,439 | | | | | 59,500 | | | | | 13,249 | |
| Total Liabilities | | | | 949,710 | | | | | 996,115 | | | | | 657,083 | | | | | 27,166,137 | | | | | 24,346 | |
| Net Assets | | | $ | 42,189,060 | | | | $ | 30,956,500 | | | | $ | 88,615,131 | | | | $ | 667,571,668 | | | | $ | 13,925,855 | |
| |
| 38 HSBC FAMILY OF FUNDS | See notes to financial statements. |
HSBC FAMILY OF FUNDS
Statements of Assets and Liabilities – as of October 31, 2013 (continued)
| Emerging | | Emerging | | Frontier | | Total | | RMB Fixed |
| Markets | | Markets Local | | Markets | | Return | | Income |
| Debt Fund | | Debt Fund | | Fund | | Fund | | Fund |
| Composition of Net Assets: | | | | | | | | | | | | | | | | | | | | | | | | | | |
| Capital | | | 41,068,845 | | | | | 33,121,550 | | | | | | 81,840,775 | | | | | 671,343,424 | | | | | | 13,293,503 | |
| Accumulated net investment income (loss) | | | 11,283 | | | | | (497,249 | ) | | | | | 286,049 | | | | | 187,549 | | | | | | 70,399 | |
| Accumulated net realized gains (losses) | | | | | | | | | | | | | | | | | | | | | | | | | | |
| from investments | | | 613,573 | | | | | 58,409 | | | | | | 2,548,653 | | | | | 4,704,355 | | | | | | 332 | |
| Unrealized appreciation/depreciation on investments | | | 495,359 | | | | | (1,726,210 | ) | | | | | 3,939,654 | | | | | (8,663,660 | ) | | | | | 561,621 | |
| Net Assets | | $ | 42,189,060 | | | | $ | 30,956,500 | | | | | $ | 88,615,131 | | | | $ | 667,571,668 | | | | | $ | 13,925,855 | |
| | | | | | | | | | |
| Net Assets: | | | | | | | | | | | | | | | | | | | | | | | | | | |
| Class A Shares | | $ | 1,041,546 | | | | $ | 1,365,967 | | | | | $ | 18,341,837 | | | | $ | 268,071 | | | | | $ | 2,959,277 | |
| Class I Shares | | | 41,026,852 | | | | | 29,493,174 | | | | | | 70,273,294 | | | | | 642,545,191 | | | | | | 10,856,479 | |
| Class S Shares | | | 120,662 | | | | | 97,359 | | | | | | — | | | | | 24,758,406 | | | | | | 110,099 | |
| | $ | 42,189,060 | | | | $ | 30,956,500 | | | | | $ | 88,615,131 | | | | $ | 667,571,668 | | | | | $ | 13,925,855 | |
| Shares Outstanding | | | | | | | | | | | | | | | | | | | | | | | | | | |
| ($0.001 par value, unlimited number of | | | | | | | | | | | | | | | | | | | | | | | | | | |
| shares authorized): | | | | | | | | | | | | | | | | | | | | | | | | | | |
| Class A Shares | | | 99,975 | | | | | 149,312 | | | | | | 1,404,556 | | | | | 26,459 | | | | | | 281,217 | |
| Class I Shares | | | 3,928,862 | | | | | 3,220,036 | | | | | | 5,345,660 | | | | | 63,318,758 | | | | | | 1,030,789 | |
| Class S Shares | | | 11,554 | | | | | 10,629 | | | | | | — | | | | | 2,439,597 | | | | | | 10,453 | |
| Net Asset Value, Offering Price and Redemption Price | | | | | | | | | | | | | | | | | | | | | | | | | | |
| per share: | | | | | | | | | | | | | | | | | | | | | | | | | | |
| Class A Shares | | $ | 10.42 | | | | $ | 9.15 | | | | | $ | 13.06 | | | | $ | 10.13 | | | | | $ | 10.52 | |
| Class I Shares | | $ | 10.44 | | | | $ | 9.16 | | | | | $ | 13.15 | | | | $ | 10.15 | | | | | $ | 10.53 | |
| Class S Shares | | $ | 10.44 | | | | $ | 9.16 | | | | | $ | — | | | | $ | 10.15 | | | | | $ | 10.53 | |
| Maximum Sales Charge - Class A Shares | | | 4.75% | | | | | 4.75% | | | | | | 5.00% | | | | | 4.75% | | | | | | 4.75% | |
| Maximum Offering Price per share (Net Asset Value/ | | | | | | | | | | | | | | | | | | | | | | | | | | |
| (100%-maximum sales charge)) - Class A Shares | | $ | 10.94 | | | | $ | 9.61 | | | | | $ | 13.75 | | | | $ | 10.64 | | | | | $ | 11.04 | |
| Total Investments, at cost | | $ | 42,145,028 | | | | $ | 31,906,057 | | | | | $ | 83,113,796 | | | | $ | 654,317,612 | | | | | $ | 13,124,458 | |
| Foreign currency, at cost | | $ | 13,617 | | | | $ | 514,401 | | | | | $ | 207,346 | | | | $ | 74,670 | | | | | $ | 59,355 | |
See notes to financial statements. | HSBC FAMILY OF FUNDS 39 |
HSBC FAMILY OF FUNDS
Statements of Operations—For the period ended October 31, 2013
| | | | | | Emerging | | | | | | | | | | RMB |
| Emerging | | Markets | | Frontier | | Total | | Fixed |
| Markets | | Local Debt | | Markets | | Return | | Income |
| Debt Fund | | Fund | | Fund | | Fund | | Fund |
| Investment Income: | | | | | | | | | | | | | | | | | | | | | | | | |
| Interest | | $ | 2,043,333 | | | | $ | 1,236,180 | | | | | $ | 22,882 | | | | | $ | 13,168,129 | | | | | $ | 574,419 | | |
| Dividends | | | 137 | | | | | 937 | | | | | | 1,236,409 | | | | | | 13,903 | | | | | | 27 | | |
| Foreign tax withholding | | | — | | | | | (34,666 | ) | | | | | (95,322 | ) | | | | | — | | | | | | (439 | ) | |
| Total Investment Income | | | 2,043,470 | | | | | 1,202,451 | | | | | | 1,163,969 | | | | | | 13,182,032 | | | | | | 574,007 | | |
| Expenses: | | | | | | | | | | | | | | | | | | | | | | | | | | | | |
| Investment Management | | | 202,403 | | | | | 161,481 | | | | | | 481,999 | | | | | | 4,431,150 | | | | | | 71,617 | | |
| Advisory Services: | | | | | | | | | | | | | | | | | | | | | | | | | | | | |
| Operational Support - Class A Shares | | | 1,265 | | | | | 3,290 | | | | | | 15,035 | | | | | | 501 | | | | | | 4,836 | | |
| Operational Support - Class I Shares | | | 39,726 | | | | | 30,551 | | | | | | 31,042 | | | | | | 510,246 | | | | | | 10,497 | | |
| Administration: | | | | | | | | | | | | | | | | | | | | | | | | | | | | |
| Class A Shares | | | 315 | | | | | 816 | | | | | | 3,764 | | | | | | 124 | | | | | | 1,213 | | |
| Class I Shares | | | 19,761 | | | | | 15,198 | | | | | | 15,477 | | | | | | 253,951 | | | | | | 5,272 | | |
| Class S Shares | | | 61 | | | | | 50 | | | | | | — | | | | | | 5,457 | | | | | | 54 | | |
| Shareholder Servicing: | | | | | | | | | | | | | | | | | | | | | | | | | | | | |
| Class A Shares | | | 1,514 | | | | | 4,037 | | | | | | 18,376 | | | | | | 502 | | | | | | 5,932 | | |
| Accounting | | | 65,357 | | | | | 57,982 | | | | | | 61,278 | | | | | | 68,996 | | | | | | 56,953 | | |
| Audit | | | 20,614 | | | | | 20,614 | | | | | | 21,797 | | | | | | 14,842 | | | | | | 20,590 | | |
| Compliance Services | | | 822 | | | | | 645 | | | | | | 699 | | | | | | 10,041 | | | | | | 225 | | |
| Custodian | | | 20,324 | | | | | 65,439 | | | | | | 217,379 | | | | | | 157,208 | | | | | | 12,359 | | |
| Printing | | | 6,263 | | | | | 7,683 | | | | | | 3,329 | | | | | | 151,363 | | | | | | 2,058 | | |
| Transfer Agent | | | 31,672 | | | | | 27,875 | | | | | | 27,339 | | | | | | 367,313 | | | | | | 28,803 | | |
| Trustee | | | 2,587 | | | | | 2,050 | | | | | | 2,520 | | | | | | 28,813 | | | | | | 796 | | |
| Registration fees | | | 36,360 | | | | | 34,460 | | | | | | 30,249 | | | | | | 72,723 | | | | | | 57,972 | | |
| Other | | | 9,521 | | | | | 7,726 | | | | | | 14,916 | | | | | | 111,277 | | | | | | 3,346 | | |
| Total expenses before fee reductions | | | 458,565 | | | | | 439,897 | | | | | | 945,199 | | | | | | 6,184,507 | | | | | | 282,523 | | |
| Fees contractually reduced/reimbursed by | | | | | | | | | | | | | | | | | | | | | | | | | | | | |
| Investment Adviser | | | (112,179 | ) | | | | (159,629 | ) | | | | | (201,653 | ) | | | | | — | | | | | | (130,790 | ) | |
| Net Expenses | | | 346,386 | | | | | 280,268 | | | | | | 743,546 | | | | | | 6,184,507 | | | | | | 151,733 | | |
| | | | | | | | | | |
| Net Investment Income (Loss) | | | 1,697,084 | | | | | 922,183 | | | | | | 420,423 | | | | | | 6,997,525 | | | | | | 422,274 | | |
| | | | | | | | | | |
| Net Realized/Unrealized Gains (Losses) from Investments: | | | | | | | | | | | | | | | | | | | | | | | | | | | | |
| Net realized gains (losses) from investment securities and | | | | | | | | | | | | | | | | | | | | | | | | | | | | |
| foreign currency transactions | | | 589,578 | | | | | (382,267 | ) | | | | | 3,094,156 | | | | | | 330,752 | | | | | | 59,668 | | |
| Net realized gains (losses) from swap agreements | | | 38,683 | | | | | (70,319 | ) | | | | | — | | | | | | 1,995,299 | | | | | | — | | |
| Net realized gains (losses) from futures transactions | | | (52,363 | ) | | | | — | | | | | | — | | | | | | 2,792,335 | | | | | | — | | |
| Net realized gains (losses) from options transactions | | | — | | | | | (21,251 | ) | | | | | — | | | | | | (12,985 | ) | | | | | — | | |
| Net realized gains (losses) from forward foreign currency | | | | | | | | | | | | | | | | | | | | | | | | | | | | |
| exchange contracts | | | 39,161 | | | | | (67,998 | ) | | | | | (37,785 | ) | | | | | (3,376,735 | ) | | | | | 863 | | |
| Change in unrealized appreciation/depreciation on investments | | | (3,278,914 | ) | | | | (1,801,503 | ) | | | | | 2,477,159 | | | | | | (11,628,547 | ) | | | | | 303,021 | | |
| Net realized/unrealized gains (losses) from investments | | | (2,663,855 | ) | | | | (2,343,338 | ) | | | | | 5,533,530 | | | | | | (9,899,881 | ) | | | | | 363,552 | | |
| Change In Net Assets Resulting From Operations | | $ | (966,771 | ) | | | $ | (1,421,155 | ) | | | | $ | 5,953,953 | | | | | $ | (2,902,356 | ) | | | | $ | 785,826 | | |
| 40 HSBC FAMILY OF FUNDS | See notes to financial statements. |
HSBC FAMILY OF FUNDS
Statements of Changes in Net Assets
| Emerging Markets Debt Fund | | Emerging Markets Local Debt Fund |
| For the | | For the | | For the | | For the |
| year ended | | year ended | | year ended | | year ended |
| October 31, | | October 31, | | October 31, | | October 31, |
| 2013 | | 2012 | | 2013 | | 2012 |
| Investment Activities: | | | | | | | | | | | | | | | | | | | | | | | |
| Operations: | | | | | | | | | | | | | | | | | | | | | | | |
| Net investment income (loss) | | $ | 1,697,084 | | | | | $ | 1,753,907 | | | | | $ | 922,183 | | | | | $ | 696,005 | | |
| Net realized gains (losses) from investments | | | 615,059 | | | | | | 990,534 | | | | | | (541,835 | ) | | | | | (19,291 | ) | |
| Change in unrealized appreciation/depreciation | | | | | | | | | | | | | | | | | | | | | | | |
| from investments | | | (3,278,914 | ) | | | | | 3,109,845 | | | | | | (1,801,503 | ) | | | | | 986,694 | | |
| Change in net assets resulting from operations | | | (966,771 | ) | | | | | 5,854,286 | | | | | | (1,421,155 | ) | | | | | 1,663,408 | | |
| | | | | | | | |
| Dividends: | | | | | | | | | | | | | | | | | | | | | | | |
| Net investment income: | | | | | | | | | | | | | | | | | | | | | | | |
| Class A Shares | | | (28,486 | ) | | | | | (18,843 | ) | | | | | (31,726 | ) | | | | | (19,827 | ) | |
| Class I Shares | | | (1,845,859 | ) | | | | | (1,790,370 | ) | | | | | (710,776 | ) | | | | | (364,422 | ) | |
| Class S Shares | | | (5,796 | ) | | | | | (5,580 | ) | | | | | (2,435 | ) | | | | | (1,447 | ) | |
| Net realized gains: | | | | | | | | | | | | | | | | | | | | | | | |
| Class A Shares | | | (9,441 | ) | | | | | (82 | ) | | | | | (10,809 | ) | | | | | — | | |
| Class I Shares | | | (772,828 | ) | | | | | (7,859 | ) | | | | | (163,733 | ) | | | | | — | | |
| Class S Shares | | | (2,419 | ) | | | | | (24 | ) | | | | | (546 | ) | | | | | — | | |
| Return of capital: | | | | | | | | | | | | | | | | | | | | | | | |
| Class A Shares | | | — | | | | | | — | | | | | | (2,645 | ) | | | | | — | | |
| Class I Shares | | | — | | | | | | — | | | | | | (59,258 | ) | | | | | — | | |
| Class S Shares | | | — | | | | | | — | | | | | | (203 | ) | | | | | — | | |
| Change in net assets resulting from shareholder dividends | | | (2,664,829 | ) | | | | | (1,822,758 | ) | | | | | (982,131 | ) | | | | | (385,696 | ) | |
| Change in net assets resulting from capital transactions | | | 5,464,579 | | | | | | 1,607,083 | | | | | | 603,018 | | | | | | 5,488,843 | | |
| Change in Net Assets | | | 1,832,979 | | | | | | 5,638,611 | | | | | | (1,800,268 | ) | | | | | 6,766,555 | | |
| | | | | | | | |
| Net Assets: | | | | | | | | | | | | | | | | | | | | | | | |
| Beginning of period | | | 40,356,081 | | | | | | 34,717,470 | | | | | | 32,756,768 | | | | | | 25,990,213 | | |
| End of period | | $ | 42,189,060 | | | | | $ | 40,356,081 | | | | | $ | 30,956,500 | | | | | $ | 32,756,768 | | |
| Accumulated net investment income (loss) | | $ | 11,283 | | | | | $ | 156,381 | | | | | $ | (497,249 | ) | | | | $ | (98,794 | ) | |
| See notes to financial statements. | HSBC FAMILY OF FUNDS 41 |
HSBC FAMILY OF FUNDS
Statements of Changes in Net Assets (continued)
| Emerging Markets Debt Fund | | Emerging Markets Local Debt Fund |
| For the | | For the | | For the | | For the |
| year ended | | year ended | | year ended | | year ended |
| October 31, | | October 31, | | October 31, | | October 31, |
| 2013 | | 2012 | | 2013 | | 2012 |
| CAPITAL TRANSACTIONS: | | | | | | | | | | | | | | | | | | | | | | | |
| Class A Shares: | | | | | | | | | | | | | | | | | | | | | | | |
| Proceeds from shares issued | | $ | 844,418 | | | | | $ | 114,676 | | | | | $ | 73,088 | | | | | $ | 317,157 | | |
| Dividends reinvested | | | 36,938 | | | | | | 18,862 | | | | | | 45,180 | | | | | | 19,823 | | |
| Value of shares redeemed | | | (279,434 | ) | | | | | (53,069 | ) | | | | | (696,802 | ) | | | | | (165,752 | ) | |
| Class A Shares capital transactions | | | 601,922 | | | | | | 80,469 | | | | | | (578,534 | ) | | | | | 171,228 | | |
| | | | | | | | |
| Class I Shares: | | | | | | | | | | | | | | | | | | | | | | | |
| Proceeds from shares issued | | | 5,475,189 | | | | | | 4,722,544 | | | | | | 2,185,689 | | | | | | 5,310,513 | | |
| Dividends reinvested | | | 2,599,125 | | | | | | 1,789,564 | | | | | | 915,562 | | | | | | 363,845 | | |
| Value of shares redeemed | | | (3,219,872 | ) | | | | | (4,991,098 | ) | | | | | (1,922,883 | ) | | | | | (358,190 | ) | |
| Class I Shares capital transactions | | | 4,854,442 | | | | | | 1,521,010 | | | | | | 1,178,368 | | | | | | 5,316,168 | | |
| | | | | | | | |
| Class S Shares: | | | | | | | | | | | | | | | | | | | | | | | |
| Proceeds from shares issued | | | — | | | | | | — | | | | | | — | | | | | | 39 | | |
| Dividends reinvested | | | 8,215 | | | | | | 5,604 | | | | | | 3,184 | | | | | | 1,447 | | |
| Value of shares redeemed | | | — | | | | | | — | | | | | | — | | | | | | (39 | ) | |
| Class S Shares capital transactions | | | 8,215 | | | | | | 5,604 | | | | | | 3,184 | | | | | | 1,447 | | |
| Change in net assets resulting from capital transactions | | $ | 5,464,579 | | | | | $ | 1,607,083 | | | | | $ | 603,018 | | | | | $ | 5,488,843 | | |
| | | | | | | | |
| SHARE TRANSACTIONS: | | | | | | | | | | | | | | | | | | | | | | | |
| Class A Shares: | | | | | | | | | | | | | | | | | | | | | | | |
| Issued | | | 79,794 | | | | | | 10,704 | | | | | | 7,292 | | | | | | 34,067 | | |
| Reinvested | | | 3,422 | | | | | | 1,763 | | | | | | 4,760 | | | | | | 2,080 | | |
| Redeemed | | | (25,425 | ) | | | | | (4,945 | ) | | | | | (70,968 | ) | | | | | (17,278 | ) | |
| Change in Class A Shares | | | 57,791 | | | | | | 7,522 | | | | | | (58,916 | ) | | | | | 18,869 | | |
| | | | | | | | |
| Class I Shares: | | | | | | | | | | | | | | | | | | | | | | | |
| Issued | | | 514,194 | | | | | | 439,010 | | | | | | 224,421 | | | | | | 577,774 | | |
| Reinvested | | | 236,733 | | | | | | 167,373 | | | | | | 96,859 | | | | | | 38,045 | | |
| Redeemed | | | (296,599 | ) | | | | | (475,609 | ) | | | | | (201,361 | ) | | | | | (37,005 | ) | |
| Change in Class I Shares | | | 454,328 | | | | | | 130,774 | | | | | | 119,919 | | | | | | 578,814 | | |
| | | | | | | | |
| Class S Shares: | | | | | | | | | | | | | | | | | | | | | | | |
| Issued | | | — | | | | | | — | | | | | | — | | | | | | 4 | | |
| Reinvested | | | 748 | | | | | | 524 | | | | | | 337 | | | | | | 151 | | |
| Redeemed | | | — | | | | | | — | | | | | | — | | | | | | (4 | ) | |
| Change in Class S Shares | | | 748 | | | | | | 524 | | | | | | 337 | | | | | | 151 | | |
| 42 HSBC FAMILY OF FUNDS | See notes to financial statements. |
HSBC FAMILY OF FUNDS
Statements of Changes in Net Assets (continued)
| Frontier Markets Fund | | Total Return Fund |
| For the | | For the | | For the | | For the |
| year ended | | year ended | | year ended | | period ended |
| October 31, | | October 31, | | October 31, | | October 31, |
| 2013 | | 2012 | | 2013 | | 2012(a) |
| Investment Activities: | | | | | | | | | | | | | | | | | | | | | | | |
| Operations: | | | | | | | | | | | | | | | | | | | | | | | |
| Net investment income (loss) | | $ | 420,423 | | | | | $ | 430,206 | | | | | $ | 6,997,525 | | | | | $ | 897,423 | | |
| Net realized gains (losses) from investments | | | 3,056,371 | | | | | | (304,677 | ) | | | | | 1,728,666 | | | | | | 1,650,456 | | |
| Change in unrealized appreciation/depreciation on investments | | | 2,477,159 | | | | | | 1,859,842 | | | | | | (11,628,547 | ) | | | | | 2,964,887 | | |
| Change in net assets resulting from operations | | | 5,953,953 | | | | | | 1,985,371 | | | | | | (2,902,356 | ) | | | | | 5,512,766 | | |
| | | | | | | | |
| Dividends: | | | | | | | | | | | | | | | | | | | | | | | |
| Net investment income: | | | | | | | | | | | | | | | | | | | | | | | |
| Class A Shares | | | (55,553 | ) | | | | | (102 | ) | | | | | (1,371 | ) | | | | | (872 | ) | |
| Class I Shares | | | (594,074 | ) | | | | | (28,979 | ) | | | | | (4,173,501 | ) | | | | | (1,117,289 | ) | |
| Class S Shares | | | — | | | | | | — | | | | | | (100,910 | ) | | | | | (566 | ) | |
| Net realized gains: | | | | | | | | | | | | | | | | | | | | | | | |
| Class A Shares | | | — | | | | | | — | | | | | | (687 | ) | | | | | — | | |
| Class I Shares | | | — | | | | | | — | | | | | | (994,711 | ) | | | | | — | | |
| Class S Shares | | | — | | | | | | — | | | | | | (273 | ) | | | | | — | | |
| Change in net assets resulting from shareholder dividends | | | (649,627 | ) | | | | | (29,081 | ) | | | | | (5,271,453 | ) | | | | | (1,118,727 | ) | |
| Change in net assets resulting from capital transactions | | | 65,526,260 | | | | | | 1,324,387 | | | | | | 326,942,558 | | | | | | 344,408,880 | | |
| Change in Net Assets | | | 70,830,586 | | | | | | 3,280,677 | | | | | | 318,768,749 | | | | | | 348,802,919 | | |
| | | | | | | | | | | | | | | | | | | | | | | | |
| Net Assets: | | | | | | | | | | | | | | | | | | | | | | | |
| Beginning of period | | | 17,784,545 | | | | | | 14,503,868 | | | | | | 348,802,919 | | | | | | — | | |
| End of period | | $ | 88,615,131 | | | | | $ | 17,784,545 | | | | | $ | 667,571,668 | | | | | $ | 348,802,919 | | |
| Accumulated net investment income (loss) | | $ | 286,049 | | | | | $ | 568,629 | | | | | $ | 187,549 | | | | | $ | 209,007 | | |
____________________
| (a) | Commenced operations on March 30, 2012. |
| See notes to financial statements. | HSBC FAMILY OF FUNDS 43 |
HSBC FAMILY OF FUNDS
Statements of Changes in Net Assets (continued)
| Frontier Markets Fund | | Total Return Fund |
| For the | | For the | | For the | | For the |
| year ended | | year ended | | year ended | | period ended |
| October 31, | | October 31, | | October 31, | | October 31, |
| 2013 | | 2012 | | 2013 | | 2012(a) |
| CAPITAL TRANSACTIONS: | | | | | | | | | | | | | | | | | | | | | | | |
| Class A Shares: | | | | | | | | | | | | | | | | | | | | | | | |
| Proceeds from shares issued | | $ | 20,178,523 | | | | | $ | 1,295,654 | | | | | $ | 128,377 | | | | | $ | 251,147 | | |
| Dividends reinvested | | | 54,520 | | | | | | 102 | | | | | | 1,907 | | | | | | 858 | | |
| Value of shares redeemed | | | (4,091,405 | ) | | | | | (348 | ) | | | | | (115,220 | ) | | | | | — | | |
| Class A Shares capital transactions | | | 16,141,638 | | | | | | 1,295,408 | | | | | | 15,064 | | | | | | 252,005 | | |
| | | | | | | | |
| Class I Shares: | | | | | | | | | | | | | | | | | | | | | | | |
| Proceeds from shares issued | | | 50,334,400 | | | | | | — | | | | | | 557,303,774 | | | | | | 355,170,152 | | |
| Dividends reinvested | | | 594,074 | | | | | | 28,979 | | | | | | 212,870 | | | | | | 53,217 | | |
| Value of shares redeemed | | | (1,543,852 | ) | | | | | — | | | | | | (255,586,928 | ) | | | | | (11,167,060 | ) | |
| Class I Shares capital transactions | | | 49,384,622 | | | | | | 28,979 | | | | | | 301,929,716 | | | | | | 344,056,309 | | |
| | | | | | | | | | | | | | | | | | | | | | | | |
| Class S Shares: | | | | | | | | | | | | | | | | | | | | | | | |
| Proceeds from shares issued | | | — | | | | | | — | | | | | | 25,001,000 | | | | | | 100,000 | | |
| Dividends reinvested | | | — | | | | | | — | | | | | | 101,183 | | | | | | 566 | | |
| Value of shares redeemed | | | — | | | | | | — | | | | | | (104,405 | ) | | | | | — | | |
| Class S Shares capital transactions | | | — | | | | | | — | | | | | | 24,997,778 | | | | | | 100,566 | | |
| Change in net assets resulting from capital transactions | | $ | 65,526,260 | | | | | $ | 1,324,387 | | | | | $ | 326,942,558 | | | | | $ | 344,408,880 | | |
| | | | | | | | |
| SHARE TRANSACTIONS: | | | | | | | | | | | | | | | | | | | | | | | |
| Class A Shares: | | | | | | | | | | | | | | | | | | | | | | | |
| Issued | | | 1,601,677 | | | | | | 118,945 | | | | | | 12,697 | | | | | | 24,776 | | |
| Reinvested | | | 5,020 | | | | | | 11 | | | | | | 186 | | | | | | 84 | | |
| Redeemed | | | (331,062 | ) | | | | | (35 | ) | | | | | (11,284 | ) | | | | | — | | |
| Change in Class A Shares | | | 1,275,635 | | | | | | 118,921 | | | | | | 1,599 | | | | | | 24,860 | | |
| | | | | | | | |
| Class I Shares: | | | | | | | | | | | | | | | | | | | | | | | |
| Issued | | | 3,918,149 | | | | | | — | | | | | | 54,781,199 | | | | | | 34,798,480 | | |
| Reinvested | | | 54,502 | | | | | | 3,150 | | | | | | 20,907 | | | | | | 5,198 | | |
| Redeemed | | | (120,141 | ) | | | | | — | | | | | | (25,200,517 | ) | | | | | (1,086,509 | ) | |
| Change in Class I Shares | | | 3,852,510 | | | | | | 3,150 | | | | | | 29,601,589 | | | | | | 33,717,169 | | |
| | | | | | | | |
| Class S Shares: | | | | | | | | | | | | | | | | | | | | | | | |
| Issued | | | — | | | | | | — | | | | | | 2,429,641 | | | | | | 10,000 | | |
| Reinvested | | | — | | | | | | — | | | | | | 10,078 | | | | | | 55 | | |
| Redeemed | | | — | | | | | | — | | | | | | (10,177 | ) | | | | | — | | |
| Change in Class S Shares | | | — | | | | | | — | | | | | | 2,429,542 | | | | | | 10,055 | | |
____________________
| (a) | | Commenced operations on March 30, 2012. |
| 44 HSBC FAMILY OF FUNDS | See notes to financial statements. |
HSBC FAMILY OF FUNDS
Statements of Changes in Net Assets (continued)
| RMB Fixed Income Fund |
| For the | | For the |
| year ended | | period ended |
| October 31, | | October 31, |
| 2013 | | 2012(b) |
| Investment Activities: | | | | | | | | | | | |
| Operations: | | | | | | | | | | | |
| Net investment income (loss) | | $ | 422,274 | | | | | $ | 104,312 | | |
| Net realized gains (losses) from investments | | | 60,531 | | | | | | 9,607 | | |
| Change in unrealized appreciation/depreciation on investments | | | 303,021 | | | | | | 258,600 | | |
| Change in net assets resulting from operations | | | 785,826 | | | | | | 372,519 | | |
| | | | | | | | | | | | |
| Dividends: | | | | | | | | | | | |
| Net investment income: | | | | | | | | | | | |
| Class A Shares | | | (75,699 | ) | | | | | (9,438 | ) | |
| Class I Shares | | | (359,216 | ) | | | | | (87,437 | ) | |
| Class S Shares | | | (3,758 | ) | | | | | (926 | ) | |
| Net realized gains: | | | | | | | | | | | |
| Class A Shares | | | (1 | ) | | | | | — | | |
| Class I Shares | | | (6 | ) | | | | | — | | |
| Class S Shares | | | —(c | ) | | | | | — | | |
| Change in net assets resulting from shareholder dividends | | | (438,680 | ) | | | | | (97,801 | ) | |
| Change in net assets resulting from capital transactions | | | 1,811,342 | | | | | | 11,492,649 | | |
| Change in Net Assets | | | 2,158,488 | | | | | | 11,767,367 | | |
| | | | | | | | | | | | |
| Net Assets: | | | | | | | | | | | |
| Beginning of period | | | 11,767,367 | | | | | | — | | |
| End of period | | $ | 13,925,855 | | | | | $ | 11,767,367 | | |
| Accumulated net investment income (loss) | | $ | 70,399 | | | | | $ | 26,606 | | |
____________________
|
| (b) | Commenced operations on June 8, 2012. |
| (c) | Amount is less than $0.50. |
| |
| See notes to financial statements. | HSBC FAMILY OF FUNDS 45 |
HSBC FAMILY OF FUNDS
Statements of Changes in Net Assets (continued)
| RMB Fixed Income Fund |
| For the | | For the |
| year ended | | period ended |
| October 31, | | October 31, |
| 2013 | | 2012(b) |
| CAPITAL TRANSACTIONS: | | | | | | | | | | |
| Class A Shares: | | | | | | | | | | |
| Proceeds from shares issued | | $ | 1,338,025 | | | | | $ | 1,496,245 | |
| Dividends reinvested | | | 62,209 | | | | | | 8,041 | |
| Value of shares redeemed | | | (31,872 | ) | | | | | — | |
| Class A Shares capital transactions | | | 1,368,362 | | | | | | 1,504,286 | |
| | | | | | | | | | | |
| Class I Shares: | | | | | | | | | | |
| Proceeds from shares issued | | | 80,000 | | | | | | 9,800,000 | |
| Dividends reinvested | | | 359,222 | | | | | | 87,437 | |
| Value of shares redeemed | | | — | | | | | | — | |
| Class I Shares capital transactions | | | 439,222 | | | | | | 9,887,437 | |
| | | | | | | | | | | |
| Class S Shares: | | | | | | | | | | |
| Proceeds from shares issued | | | — | | | | | | 100,000 | |
| Dividends reinvested | | | 3,758 | | | | | | 926 | |
| Value of shares redeemed | | | — | | | | | | — | |
| Class S Shares capital transactions | | | 3,758 | | | | | | 100,926 | |
| Change in net assets resulting from capital transactions | | $ | 1,811,342 | | | | | $ | 11,492,649 | |
| | | | | | | | | | | |
| SHARE TRANSACTIONS: | | | | | | | | | | |
| Class A Shares: | | | | | | | | | | |
| Issued | | | 128,908 | | | | | | 148,592 | |
| Reinvested | | | 5,986 | | | | | | 792 | |
| Redeemed | | | (3,061 | ) | | | | | — | |
| Change in Class A Shares | | | 131,833 | | | | | | 149,384 | |
| | | | | | | | | | | |
| Class I Shares: | | | | | | | | | | |
| Issued | | | 7,625 | | | | | | 980,000 | |
| Reinvested | | | 34,545 | | | | | | 8,619 | |
| Redeemed | | | — | | | | | | — | |
| Change in Class I Shares | | | 42,170 | | | | | | 988,619 | |
| | | | | | | | | | | |
| Class S Shares: | | | | | | | | | | |
| Issued | | | — | | | | | | 10,000 | |
| Reinvested | | | 362 | | | | | | 91 | |
| Redeemed | | | — | | | | | | — | |
| Change in Class S Shares | | | 362 | | | | | | 10,091 | |
____________________
| | | | | | | | | | |
(b) Commenced operations on June 8, 2012. | | | | | | | | | | |
| 46 HSBC FAMILY OF FUNDS | See notes to financial statements. |
| HSBC EMERGING MARKETS DEBT FUND |
Financial Highlights Selected data for a share outstanding throughout the periods indicated. |
| | | | Investment Activities | | Dividends | | | | | | Ratios/Supplementary Data |
| | Net Asset
Value,
Beginning
of Period | | Net
Investment
Income
(Loss) | | Net Realized
and
Unrealized
Gains
(Losses) from
Investments | | Total from
Investment
Activities | | Net
Investment
Income | | Net Realized
Gains from
Investment
Transactions | | Total
Dividends | | Net Asset
Value, End
of Period | | Total
Return(a) | | Net
Assets
at End of
Period
(000’s) | | Ratio of Net
Expenses to
Average Net
Assets(b) | | Ratio of Net
Investment
Income
(Loss) to
Average Net
Assets(b) | | Ratios of
Expenses
to Average
Net Assets
(Excluding Fee
Reductions)(b) | | Portfolio
Turnover
(a)(c) |
| CLASS A SHARES | | | | | | | | | | | | | | | | | | | | | | | | | | | | | | | | | | | | | | | | | | | | | | | | |
| Period Ended October 31, 2011(d) | | | $ | 10.00 | | | 0.25 | | | 0.25 | | | | | 0.50 | | | | (0.27) | | | — | | | | (0.27) | | | $ | 10.23 | | | | 5.02 | % | | | | $355 | | | 1.20% | | 4.81% | | 1.38% | | 10% |
| Year Ended October 31, 2012 | | | $ | 10.23 | | | 0.47 | | | 1.21 | | | | | 1.68 | | | | (0.49) | | | — | (e) | | | (0.49) | | | $ | 11.42 | | | | 16.90 | % | | | | $482 | | | 1.20% | | 4.32% | | 1.55% | | 54% |
| Year Ended October 31, 2013 | | | $ | 11.42 | | | 0.43 | | | (0.74 | ) | | | | (0.31 | ) | | | (0.47) | | | (0.22 | ) | | | (0.69) | | | $ | 10.42 | | | | (2.84 | )% | | | | $1,042 | | | 1.20% | | 3.92% | | 1.48% | | 53% |
| CLASS I SHARES | | | | | | | | | | | | | | | | | | | | | | | | | | | | | | | | | | | | | | | | | | | | | | | | |
| Period Ended October 31, 2011(d) | | | $ | 10.00 | | | 0.29 | | | 0.24 | | | | | 0.53 | | | | (0.28) | | | — | | | | (0.28) | | | $ | 10.25 | | | | 5.34 | % | | | | $34,257 | | | 0.85% | | 5.07% | | 1.12% | | 10% |
| Year Ended October 31, 2012 | | | $ | 10.25 | | | 0.51 | | | 1.20 | | | | | 1.71 | | | | (0.52) | | | — | (e) | | | (0.52) | | | $ | 11.44 | | | | 17.19 | % | | | | $39,751 | | | 0.85% | | 4.68% | | 1.28% | | 54% |
| Year Ended October 31, 2013 | | | $ | 11.44 | | | 0.45 | | | (0.72 | ) | | | | (0.27 | ) | | | (0.51) | | | (0.22 | ) | | | (0.73) | | | $ | 10.44 | | | | (2.52 | )% | | | | $41,027 | | | 0.85% | | 4.19% | | 1.13% | | 53% |
| CLASS S SHARES | | | | | | | | | | | | | | | | | | | | | | | | | | | | | | | | | | | | | | | | | | | | | | | | |
| Period Ended October 31, 2011(d) | | | $ | 10.00 | | | 0.30 | | | 0.23 | | | | | 0.53 | | | | (0.28) | | | — | | | | (0.28) | | | $ | 10.25 | | | | 5.39 | % | | | | $105 | | | 0.75% | | 5.14% | | 1.02% | | 10% |
| Year Ended October 31, 2012 | | | $ | 10.25 | | | 0.52 | | | 1.20 | | | | | 1.72 | | | | (0.53) | | | — | (e) | | | (0.53) | | | $ | 11.44 | | | | 17.30 | % | | | | $124 | | | 0.75% | | 4.78% | | 1.18% | | 54% |
| Year Ended October 31, 2013 | | | $ | 11.44 | | | 0.47 | | | (0.73 | ) | | | | (0.26 | ) | | | (0.52) | | | (0.22 | ) | | | (0.74) | | | $ | 10.44 | | | | (2.42 | )% | | | | $121 | | | 0.75% | | 4.29% | | 1.03% | | 53% |
| (a) | Not annualized for periods less than one year. Total return calculations do not include any redemption charges. |
| (b) | Annualized for periods less than one year. |
| (c) | Portfolio turnover rate is calculated on the basis of the Fund as a whole without the distinguishing between the classes of shares issued. |
| (d) | Commenced operations on April 7, 2011. |
| (e) | Represents less than $0.005 or $(0.005). |
| | |
| See notes to financial statements. | HSBC FAMILY OF FUNDS 47 |
| HSBC EMERGING MARKETS LOCAL DEBT FUND |
Financial Highlights Selected data for a share outstanding throughout the periods indicated. |
| | | | Investment Activities | | Dividends | | | | | | Ratios/Supplementary Data |
| | Net Asset
Value,
Beginning
of Period | | Net
Investment
Income
(Loss) | | Net Realized
and
Unrealized
Gains
(Losses) from
Investments | | Total from
Investment
Activities | | Net
Investment
Income | | Net Realized
Gains from
Investment
Transactions | | Return
of
Capital | | Total
Dividends | | Net Asset
Value, End
of Period | | Total
Return(a) | | Net
Assets
at End of
Period
(000’s) | | Ratio of Net
Expenses to
Average Net
Assets(b) | | Ratio of Net
Investment
Income
(Loss) to
Average Net
Assets(b) | | Ratios of
Expenses
to Average
Net Assets
(Excluding Fee
Reductions)(b) | | Portfolio
Turnover
(a)(c) |
| CLASS A SHARES | | | | | | | | | | | | | | | | | | | | | | | | | | | | | | | | | | | | | | | | | | | | | | | | | | | | | | | |
| Period Ended October 31, 2011(d) | | | $10.00 | | | | 0.12 | | | | | (0.46 | ) | | | | (0.34 | ) | | | (0.09) | | | — | | | | | (0.03 | ) | | | (0.12) | | | $ | 9.54 | | | | (3.43 | )% | | | | $1,807 | | | 1.20% | | 2.29% | | 1.66% | | 66% |
| Year Ended October 31, 2012 | | | $9.54 | | | | 0.21 | | | | | 0.21 | | | | | 0.42 | | | | (0.10) | | | — | | | | | — | | | | (0.10) | | | $ | 9.86 | | | | 4.47 | % | | | | $2,053 | | | 1.20% | | 2.13% | | 1.94% | | 43% |
| Year Ended October 31, 2013 | | | $9.86 | | | | 0.24 | (e) | | | | (0.69 | ) | | | | (0.45 | ) | | | (0.19) | | | (0.05 | ) | | | | (0.02 | ) | | | (0.26) | | | $ | 9.15 | | | | (4.60 | )% | | | | $1,366 | | | 1.20% | | 2.49% | | 1.69% | | 86% |
| CLASS I SHARES | | | | | | | | | | | | | | | | | | | | | | | | | | | | | | | | | | | | | | | | | | | | | | | | | | | | | | | |
| Period Ended October 31, 2011(d) | | | $10.00 | | | | 0.13 | | | | | (0.45 | ) | | | | (0.32 | ) | | | (0.10) | | | — | | | | | (0.03 | ) | | | (0.13) | | | $ | 9.55 | | | | (3.21 | )% | | | | $24,086 | | | 0.85% | | 2.46% | | 1.32% | | 66% |
| Year Ended October 31, 2012 | | | $9.55 | | | | 0.24 | | | | | 0.21 | | | | | 0.45 | | | | (0.13) | | | — | | | | | — | | | | (0.13) | | | $ | 9.87 | | | | 4.80 | % | | | | $30,602 | | | 0.85% | | 2.47% | | 1.62% | | 43% |
| Year Ended October 31, 2013 | | | $9.87 | | | | 0.28 | (e) | | | | (0.70 | ) | | | | (0.42 | ) | | | (0.22) | | | (0.05 | ) | | | | (0.02 | ) | | | (0.29) | | | $ | 9.16 | | | | (4.25 | )% | | | | $29,493 | | | 0.85% | | 2.87% | | 1.34% | | 86% |
| CLASS S SHARES | | | | | | | | | | | | | | | | | | | | | | | | | | | | | | | | | | | | | | | | | | | | | | | | | | | | | | | |
| Period Ended October 31, 2011(d) | | | $10.00 | | | | 0.14 | | | | | (0.45 | ) | | | | (0.31 | ) | | | (0.11) | | | — | | | | | (0.03 | ) | | | (0.14) | | | $ | 9.55 | | | | (3.16 | )% | | | | $97 | | | 0.75% | | 2.58% | | 1.22% | | 66% |
| Year Ended October 31, 2012 | | | $9.55 | | | | 0.25 | | | | | 0.21 | | | | | 0.46 | | | | (0.14) | | | — | | | | | — | | | | (0.14) | | | $ | 9.87 | | | | 4.89 | % | | | | $102 | | | 0.75% | | 2.59% | | 1.51% | | 43% |
| Year Ended October 31, 2013 | | | $9.87 | | | | 0.29 | (e) | | | | (0.70 | ) | | | | (0.41 | ) | | | (0.23) | | | (0.05 | ) | | | | (0.02 | ) | | | (0.30) | | | $ | 9.16 | | | | (4.16 | )% | | | | $97 | | | 0.75% | | 2.97% | | 1.24% | | 86% |
| (a) | Not annualized for periods less than one year. Total return calculations do not include any redemption charges. |
| (b) | Annualized for periods less than one year. |
| (c) | Portfolio turnover rate is calculated on the basis of the Fund as a whole without distinguishing between the classes of shares issued. |
| (d) | Commenced operations on April 7, 2011. |
| (e) | Calculated based on average shares outstanding. |
48 HSBC FAMILY OF FUNDS | See notes to financial statements. |
| HSBC FRONTIER MARKETS FUND |
Financial Highlights Selected data for a share outstanding throughout the periods indicated. |
| | | | Investment Activities | | Dividends | | | | | | Ratios/Supplementary Data |
| | Net Asset
Value,
Beginning
of Period | | Net
Investment
Income
(Loss) | | Net Realized
and
Unrealized
Gains
(Losses) from
Investments | | Total from
Investment
Activities | | Net
Investment
Income | | Total
Dividends | | Net Asset
Value, End
of Period | | Total
Return(a) | | Net
Assets
at End of
Period
(000’s) | | Ratio of Net
Expenses to
Average Net
Assets(b) | | Ratio of Net
Investment
Income
(Loss) to
Average Net
Assets(b) | | Ratios of
Expenses
to Average
Net Assets
(Excluding Fee
Reductions)(b) | | Portfolio
Turnover
(a)(c) |
| CLASS A SHARES | | | | | | | | | | | | | | | | | | | | | | | | | | | | | | | | | | | | | | | | | | | | | | | | | | | | | | | | |
| Period Ended October 31, 2011(d) | | | $10.00 | | | | — | (e) | | | | (0.34 | ) | | | | (0.34 | ) | | | | — | | | | | — | | | | | $9.66 | | | | (3.40 | )% | | | | $97 | | | 2.30% | | | (0.26 | )% | | | 2.57% | | | 6 | % | |
| Year Ended October 31, 2012 | | | $9.66 | | | | 0.16 | (f) | | | | 1.12 | | | | | 1.28 | | | | | (0.01 | ) | | | | (0.01 | ) | | | | $10.93 | | | | 13.27 | % | | | | $1,409 | | | 2.20% | | | 1.51 | % | | | 3.79% | | | 26 | % | |
| Year Ended October 31, 2013 | | | $10.93 | | | | 0.08 | (f) | | | | 2.45 | | | | | 2.53 | | | | | (0.40 | ) | | | | (0.40 | ) | | | | $13.06 | | | | 23.85 | % | | | | $18,342 | | | 2.20% | | | 0.60 | % | | | 2.69% | | | 44 | % | |
| CLASS I SHARES | | | | | | | | | | | | | | | | | | | | | | | | | | | | | | | | | | | | | | | | | | | | | | | | | | | | | | | | |
| Period Ended October 31, 2011(d) | | | $10.00 | | | | — | (e) | | | | (0.33 | ) | | | | (0.33 | ) | | | | — | | | | | — | | | | | $9.67 | | | | (3.30 | )% | | | | $14,407 | | | 1.96% | | | 0.09 | % | | | 2.23% | | | 6 | % | |
| Year Ended October 31, 2012 | | | $9.67 | | | | 0.29 | (f) | | | | 1.03 | | | | | 1.32 | | | | | (0.02 | ) | | | | (0.02 | ) | | | | $10.97 | | | | 13.68 | % | | | | $16,375 | | | 1.85% | | | 2.83 | % | | | 2.79% | | | 26 | % | |
| Year Ended October 31, 2013 | | | $10.97 | | | | 0.15 | (f) | | | | 2.43 | | | | | 2.58 | | | | | (0.40 | ) | | | | (0.40 | ) | | | | $13.15 | | | | 24.25 | % | | | | $70,273 | | | 1.85% | | | 1.20 | % | | | 2.38% | | | 44 | % | |
| (a) | Not annualized for periods less than one year. Total return calculations do not include any redemption charges. |
| (b) | Annualized for periods less than one year. |
| (c) | Portfolio turnover rate is calculated on the basis of the Fund as a whole without distinguishing between the classes of shares issued. |
| (d) | Commenced operations on September 6, 2011. |
| (e) | Represents less than $0.005 or $(0.005). |
| (f) | Calculated based on average shares outstanding. |
| See notes to financial statements. | HSBC FAMILY OF FUNDS 49 |
| | |
| HSBC TOTAL RETURN FUND |
Financial Highlights Selected data for a share outstanding throughout the periods indicated. |
| | | | Investment Activities | | Dividends | | | | | | Ratios/Supplementary Data |
| | Net Asset
Value,
Beginning
of Period | | Net
Investment
Income
(Loss)(a) | | Net Realized
and
Unrealized
Gains
(Losses) from
Investment | | Total from
Investment
Activities | | Net
Investment
Income | | Net Realized
Gains from
Investment
Transactions | | Total
Dividends | | Net Asset
Value, End
of Period | | Total
Return(b) | | Net
Assets at
End of
Period
(000’s) | | Ratio of Net
Expenses to
Average Net
Assets(c) | | Ratio of Net
Investment
Income
(Loss) to
Average Net
Assets(c) | | Ratios of
Expenses
to Average
Net Assets
(Excluding Fee
Reductions)(c) | | Portfolio
Turnover
(b)(d) |
| CLASS A SHARES | | | | | | | | | | | | | | | | | | | | | | | | | | | | | | | | | | | | | | | | | | | | | | | | | | | |
| Period Ended October 31, 2012(e) | | | $ | 10.00 | | | 0.03 | | | 0.33 | | | | | 0.36 | | | | (0.04) | | | — | | | | | (0.04 | ) | | | | $ | 10.32 | | | | 3.62 | % | | | | $256 | | | 1.60% | | 0.56% | | 1.61% | | 83% |
| Year Ended October 31, 2013 | | | $ | 10.32 | | | 0.10 | | | (0.21 | ) | | | | (0.11 | ) | | | (0.05) | | | (0.03 | ) | | | | (0.08 | ) | | | | $ | 10.13 | | | | (1.06 | )% | | | | $268 | | | 1.47% | | 0.94% | | 1.47% | | 64% |
| CLASS I SHARES | | | | | | | | | | | | | | | | | | | | | | | | | | | | | | | | | | | | | | | | | | | | | | | | | | | |
| Period Ended October 31, 2012(e) | | | $ | 10.00 | | | 0.07 | | | 0.31 | | | | | 0.38 | | | | (0.05) | | | — | | | | | (0.05 | ) | | | | $ | 10.33 | | | | 3.82 | % | | | | $348,443 | | | 1.18% | | 1.08% | | 1.18% | | 83% |
| Year Ended October 31, 2013 | | | $ | 10.33 | | | 0.13 | | | (0.20 | ) | | | | (0.07 | ) | | | (0.08) | | | (0.03 | ) | | | | (0.11 | ) | | | | $ | 10.15 | | | | (0.66 | )% | | | | $642,545 | | | 1.18% | | 1.33% | | 1.18% | | 64% |
| CLASS S SHARES | | | | | | | | | | | | | | | | | | | | | | | | | | | | | | | | | | | | | | | | | | | | | | | | | | | |
| Period Ended October 31, 2012(e) | | | $ | 10.00 | | | 0.05 | | | 0.34 | | | | | 0.39 | | | | (0.06) | | | — | | | | | (0.06 | ) | | | | $ | 10.33 | | | | 3.87 | % | | | | $104 | | | 1.15% | | 0.91% | | 1.48% | | 83% |
| Year Ended October 31, 2013 | | | $ | 10.33 | | | 0.18 | | | (0.24 | ) | | | | (0.06 | ) | | | (0.09) | | | (0.03 | ) | | | | (0.12 | ) | | | | $ | 10.15 | | | | (0.57 | )% | | | | $24,758 | | | 1.12% | | 1.80% | | 1.12% | | 64% |
| (a) | Calculated using average share method. |
| (b) | Not annualized for periods less than one year. Total return calculations do not include any sales or redemption charges. |
| (c) | Annualized for periods less than one year. |
| (d) | Portfolio turnover rate is calculated on the basis of the Fund as a whole without distinguishing between the classes of shares issued. |
| (e) | Commenced operations on March 30, 2012. |
| | |
| 50 HSBC FAMILY OF FUNDS | See notes to financial statements. |
| | |
| HSBC RMB FIXED INCOME FUND |
Financial Highlights Selected data for a share outstanding throughout the periods indicated. |
| | | | Investment Activities | | Dividends | | | | | | Ratios/Supplementary Data |
| | Net Asset
Value,
Beginning of
Period | | Net
Investment
Income
(Loss) | | Net Realized
and
Unrealized
Gains
(Losses) from
Investments | | Total from
Investment
Activities | | Net
Investment
Income | | Net Realized
Gains from
Investment
Transactions | | Total
Dividends | | Net Asset
Value, End
of Period | | Total
Return(a) | | Net
Assets at
End of
Period
(000’s) | | Ratio of Net
Expenses to
Average Net
Assets(b) | | Ratio of Net
Investment
Income
(Loss) to
Average Net
Assets(b) | | Ratios of
Expenses
to Average
Net Assets
(Excluding Fee
Reductions)(b) | | Portfolio
Turnover
(a)(c) |
| CLASS A SHARES | | | | | | | | | | | | | | | | | | | | | | | | | | | | | | | | | | | | | | | | | | |
| Period Ended October 31, 2012(d) | | | $ | 10.00 | | | | 0.10 | (e) | | | 0.22 | | 0.32 | | (0.08) | | | — | | | | (0.08) | | | $ | 10.24 | | | 3.24% | | | $1,530 | | | 1.45% | | 2.54% | | 3.26% | | —% |
| Year Ended October 31, 2013 | | | $ | 10.24 | | | | 0.31 | | | | 0.29 | | 0.60 | | (0.32) | | | — | (f) | | | (0.32) | | | $ | 10.52 | | | 5.96% | | | $2,959 | | | 1.45% | | 2.97% | | 2.50% | | —% |
| CLASS I SHARES | | | | | | | | | | | | | | | | | | | | | | | | | | | | | | | | | | | | | | | | | | |
| Period Ended October 31, 2012(d) | | | $ | 10.00 | | | | 0.10 | (e) | | | 0.24 | | 0.34 | | (0.09) | | | — | | | | (0.09) | | | $ | 10.25 | | | 3.40% | | | $10,134 | | | 1.10% | | 2.43% | | 2.26% | | —% |
| Year Ended October 31, 2013 | | | $ | 10.25 | | | | 0.34 | | | | 0.30 | | 0.64 | | (0.36) | | | — | (f) | | | (0.36) | | | $ | 10.53 | | | 6.31% | | | $10,856 | | | 1.10% | | 3.30% | | 2.09% | | —% |
| CLASS S SHARES | | | | | | | | | | | | | | | | | | | | | | | | | | | | | | | | | | | | | | | | | | |
| Period Ended October 31, 2012(d) | | | $ | 10.00 | | | | 0.10 | (e) | | | 0.24 | | 0.34 | | (0.09) | | | — | | | | (0.09) | | | $ | 10.25 | | | 3.44% | | | $103 | | | 1.00% | | 2.53% | | 2.16% | | —% |
| Year Ended October 31, 2013 | | | $ | 10.25 | | | | 0.35 | | | | 0.30 | | 0.65 | | (0.37) | | | — | (f) | | | (0.37) | | | $ | 10.53 | | | 6.41% | | | $110 | | | 1.00% | | 3.40% | | 1.99% | | —% |
| (a) | Not annualized for periods less than one year. Total return calculations do not include any sales or redemption charges. |
| (b) | Annualized for periods less than one year. |
| (c) | Portfolio turnover rate is calculated on the basis of the Fund as a whole without distinguishing between the classes of shares issued. |
| (d) | Commenced operations on June 8, 2012. |
| (e) | Calculated based on average shares outstanding. |
| (f) | Represents less than $0.005 or $(0.005). |
| See notes to financial statements. | HSBC FAMILY OF FUNDS 51 |
| | |
| HSBC FAMILY OF FUNDS |
Notes to Financial Statements — as of October 31, 2013 |
1. Organization:
The HSBC Funds (the “Trust’’), a Massachusetts business trust organized on April 22, 1987, is registered under the Investment Company Act of 1940, as amended (the “Act’’), as an open-end management investment company. As of October 31, 2013, the Trust is comprised of 15 separate operational funds, each a series of the HSBC Family of Funds, which also includes the HSBC Advisor Funds Trust and the HSBC Portfolios (the “Trusts’’). The accompanying financial statements are presented for the following 5 funds (individually a “Fund,’’ collectively the “Funds’’ or the “Emerging Markets Funds’’):
| Fund | | Short Name | |
| HSBC Emerging Markets Debt Fund | Emerging Markets Debt Fund |
| HSBC Emerging Markets Local Debt Fund | Emerging Markets Local Debt Fund |
| HSBC Frontier Markets Fund | Frontier Markets Fund |
| HSBC Total Return Fund | Total Return Fund |
| HSBC RMB Fixed Income Fund | RMB Fixed Income Fund |
Each of the Funds is a non-diversified fund. Financial statements for all other funds of the Trusts are published separately.
The Funds are authorized to issue an unlimited number of shares of beneficial interest with a par value of $ 0.001 per share. The Emerging Markets Debt Fund, the Emerging Markets Local Debt Fund, the Total Return Fund and the RMB Fixed Income Fund (“Debt Funds’’) are authorized to issue three classes of shares: Class A Shares, Class I Shares, and Class S Shares. Class A Shares of the Debt Funds have a maximum sales charge of 4.75% as a percentage of the original purchase price. The Frontier Markets Fund is authorized to issue two classes of shares: Class A Shares and Class I Shares. Class A Shares of the Frontier Markets Fund have a maximum sales charge of 5.00% as a percentage of the original purchase price. Each class of shares in each Fund has identical rights and privileges, except with respect to arrangements pertaining to shareholder servicing and/or distribution, class-related expenses, voting rights on matters affecting a single class of shares, and exchange privileges of each class of shares.
Under the Trust’s organizational documents, the Funds’ officers and Trustees are indemnified against certain liabilities arising out of the performance of their duties to the Funds. In addition, in the normal course of business, the Trust enters into contracts with its service providers, which also provide for indemnifications by the Funds. The Funds’ maximum exposure under these arrangements is unknown as this would involve future claims that may be made against the Funds. However, based on experience, the Trust expects the risk of loss to be remote.
2. Significant Accounting Policies:
The following is a summary of the significant accounting policies followed by the Funds in the preparation of their financial statements. The policies are in conformity with U.S. generally accepted accounting principles (“GAAP’’). The preparation of financial statements requires management to make certain estimates and assumptions that affect the reported amounts of assets and liabilities and disclosure of contingent assets and liabilities at the date of the financial statements and the reported amounts of increases and decreases in net assets from operations during the reporting period. Actual results could differ from those estimates.
Securities Valuation:
The Funds record their investments at fair value. Fair value is defined as the price that would be received to sell an asset or paid to transfer a liability in an orderly transaction between market participants at the measurement date. The valuation techniques used to determine fair value are further described in Note 3 below.
52 HSBC FAMILY OF FUNDS
| HSBC FAMILY OF FUNDS |
Notes to Financial Statements — as of October 31, 2013 (continued) |
Investment Transactions and Related Income:
Investment transactions are accounted for no later than one business day after trade date. However, for financial reporting purposes, investment transactions are accounted for on trade date. Investment gains and losses are calculated on the identified cost basis. Interest income is recognized on the accrual basis and includes, where applicable, the amortization or accretion of premium or discount. Dividend income is recorded on the ex-dividend date except in the case of foreign securities, in which case dividends are recorded as soon as such information becomes available.
Foreign Currency Translation:
The accounting records of the Funds are maintained in U.S. dollars. Foreign currency amounts are translated into U.S. dollars at the current rate of exchange to determine the value of investments, assets and liabilities. Purchases and sales of securities, and income and expenses are translated at the prevailing rate of exchange on the respective dates of such transactions. The Funds do not isolate the portion of the results of operations resulting from changes in foreign exchange rates on investments from fluctuations arising from changes in market prices of securities held. Such fluctuations are included with the net realized and unrealized gain or loss from investments and foreign currencies.
Income received by the Funds from sources within foreign countries may be subject to withholding and other income or similar taxes imposed by such countries. The Funds accrue such taxes, as applicable, based on their current interpretation of tax rules in the foreign markets in which they invest.
Restricted and Illiquid Securities:
A restricted security is a security which has been purchased through a private offering and cannot be resold to the general public without prior registration under the Securities Act of 1933 (the “1933 Act’’) or pursuant to the resale limitations provided by Rule 144 under the 1933 Act, or another exemption from the registration requirements of the 1933 Act. Certain restricted securities may be resold in transactions exempt from registration, normally to qualified institutional buyers, and may be deemed liquid by the Investment Adviser (as defined in Note 4) based on procedures established by the Board of Trustees (the “Board’’). Therefore, not all restricted securities are considered illiquid. At October 31, 2013, all restricted securities held were deemed liquid (except as noted below). The restricted securities held as of October 31, 2013 are identified below:
| | | | | | | | | | % |
| | Acquisition | | Acquisition | | Principal | | Fair | | of Net |
| | Date | | Cost | | Amount ($) | | Value ($) | | Assets |
| Emerging Markets Debt Fund | | | | | | | | | | | |
| Banco Nacional de Desenvolvimento Economico e Social, 5.75%, 9/26/23 | | 9/19/2013 | | 199,774 | | 200,000 | | 207,500 | | 0.5 | % |
| Banco Santander SA, 4.13%, 11/9/22 | | 11/6/2012 | | 147,275 | | 150,000 | | 143,437 | | 0.3 | % |
| Caixa Economica Federal, 4.50%, 10/3/18 | | 9/26/2013 | | 149,000 | | 150,000 | | 150,750 | | 0.4 | % |
| CNOOC Curtis Funding No.1 Pty Ltd., 4.50%, 10/3/23 | | 9/26/2013 | | 200,000 | | 200,000 | | 203,166 | | 0.5 | % |
| Comision Federal de Electricidad, 4.88%, 1/15/24 | | 10/17/2013 | | 198,854 | | 200,000 | | 202,750 | | 0.5 | % |
| Development Bank of Kazakhstan, 4.13%, 12/10/22 | | 11/26/2012 | | 196,764 | | 200,000 | | 184,500 | | 0.4 | % |
| PT Pertamina (Persero) Tbk, 4.30%, 5/20/23 | | 5/13/2013 | | 200,000 | | 200,000 | | 182,500 | | 0.4 | % |
| Republic of Indonesia, 3.38%, 4/15/23 | | 4/8/2013 | | 346,336 | | 350,000 | | 315,000 | | 0.7 | % |
| Republic of Indonesia, 5.38%, 10/17/23 | | 7/17/2013 | | 515,000 | | 500,000 | | 526,250 | | 1.2 | % |
| Republic of Nigeria, 6.38%, 7/12/23 | | 7/2/2013 | | 196,386 | | 200,000 | | 211,500 | | 0.5 | % |
| Republic of Paraguay, 4.63%, 1/25/23 * | | 1/17/2013 | | 200,000 | | 200,000 | | 189,000 | | 0.4 | % |
| Republic of Slovenia, 5.85%, 5/10/23 | | 5/2/2013 | | 197,768 | | 200,000 | | 195,000 | | 0.5 | % |
| Russia Foreign Bond, 4.88%, 9/16/23 | | 9/9/2013 | | 400,124 | | 400,000 | | 419,600 | | 1.0 | % |
| Sinopec Capital (2013) Ltd., 3.13%, 4/24/23 | | 4/19/2013 | | 197,880 | | 200,000 | | 183,441 | | 0.4 | % |
| Sinopec Group Overseas Development (2013) Ltd., 4.38%, 10/17/23 | | 10/9/2013 | | 499,464 | | 500,000 | | 501,661 | | 1.2 | % |
| Turkiye Is Bankasi AS, 3.88%, 11/7/17 | | 11/1/2012 | | 198,654 | | 200,000 | | 194,760 | | 0.5 | % |
| Turkiye Vakiflar Bankasi TAO, 5.00%, 10/31/18 | | 10/24/2013 | | 198,700 | | 200,000 | | 199,010 | | 0.5 | % |
HSBC FAMILY OF FUNDS 53
| HSBC FAMILY OF FUNDS |
Notes to Financial Statements — as of October 31, 2013 (continued) |
| | | | | | | | | | % |
| | Acquisition | | Acquisition | | Principal | | Fair | | of Net |
| | Date | | Cost | | Amount ($) | | Value ($) | | Assets |
| Frontier Markets Fund | | | | | | | | | | | |
| KazMunaiGas Exploration Production GDR | | 9/6/2011 | | 1,723,320 | | 108,164 | | 1,534,847 | | 1.7 | % |
| | | | | | | | | | | | |
| Total Return Fund | | | | | | | | | | | |
| Banco del Estado de Chile, 2.00%, 11/9/17 | | 5/7/2013 | | 2,616,744 | | 2,600,000 | | 2,553,509 | | 0.4 | % |
| Banco Nacional de Desenvolvimento Economico e Social, 5.75%, 9/26/23 | | 9/19/2013 | | 2,197,514 | | 2,200,000 | | 2,282,500 | | 0.3 | % |
| Banco Santander SA, 4.13%, 11/9/22 | | 11/6/2012 | | 1,080,013 | | 1,100,000 | | 1,051,875 | | 0.2 | % |
| Caixa Economica Federal, 4.50%, 10/3/18 | | 9/26/2013 | | 2,185,326 | | 2,200,000 | | 2,211,000 | | 0.3 | % |
| CNOOC Curtis Funding No.1 Pty Ltd., 4.50%, 10/3/23 | | 9/26/2013 | | 1,425,000 | | 1,425,000 | | 1,447,558 | | 0.2 | % |
| CNPC General Capital Ltd., 1.45%, 4/16/16 | | 4/9/2013 | | 799,184 | | 800,000 | | 796,820 | | 0.1 | % |
| Comision Federal de Electricidad, 4.88%, 1/15/24 | | 10/17/2013 | | 1,590,832 | | 1,600,000 | | 1,622,000 | | 0.2 | % |
| Development Bank of Kazakhstan, 4.13%, 12/10/22 | | 11/29/2012 | | 1,743,000 | | 1,750,000 | | 1,614,375 | | 0.2 | % |
| Eskom Holdings SOC Ltd., 6.75%, 8/6/23 | | 7/30/2013 | | 2,428,122 | | 2,450,000 | | 2,529,625 | | 0.4 | % |
| Harvest Operations Corp., 2.13%, 5/14/18 | | 5/7/2013 | | 1,096,007 | | 1,100,000 | | 1,074,909 | | 0.2 | % |
| PT Pertamina (Persero) Tbk, 4.30%, 5/20/23 | | 5/13/2013 | | 1,300,000 | | 1,300,000 | | 1,186,250 | | 0.2 | % |
| Republic of Costa Rica, 4.25%, 1/26/23 | | 11/16/2012 | | 1,199,868 | | 1,200,000 | | 1,140,000 | | 0.2 | % |
| Republic of Indonesia, 3.38%, 4/15/23 | | 4/8/2013 | | 1,781,154 | | 1,800,000 | | 1,620,000 | | 0.2 | % |
| Republic of Peru, 8.38%, 5/3/16 | | 5/21/2013 | | 5,416,706 | | 4,525,000 | | 5,271,625 | | 0.8 | % |
| Republic of Slovenia, 5.85%, 5/10/23 | | 5/2/2013 | | 3,362,056 | | 3,400,000 | | 3,315,000 | | 0.5 | % |
| Russia Foreign Bond, 4.88%, 9/16/23 | | 9/9/2013 | | 2,355,888 | | 2,400,000 | | 2,517,600 | | 0.4 | % |
| Sibur Securities Ltd., 3.91%, 1/31/18 | | 1/24/2013 | | 3,100,000 | | 3,100,000 | | 3,030,250 | | 0.5 | % |
| Sinopec Capital (2013) Ltd., 1.25%, 4/24/16 | | 4/18/2013 | | 3,291,387 | | 3,300,000 | | 3,280,296 | | 0.5 | % |
| Sinopec Group Overseas Development (2013) Ltd., 4.38%, 10/17/23 | | 10/9/2013 | | 5,362,848 | | 5,400,000 | | 5,417,933 | | 0.8 | % |
| Turkiye Halk Bankasi AS, 3.88%, 2/5/20 | | 1/29/2013 | | 2,472,525 | | 2,500,000 | | 2,270,325 | | 0.3 | % |
| Turkiye Is Bankasi AS, 3.88%, 11/7/17 | | 11/1/2012 | | 993,270 | | 1,000,000 | | 973,800 | | 0.1 | % |
| Turkiye Is Bankasi AS, 5.50%, 4/21/19 | | 10/10/2013 | | 1,442,272 | | 1,450,000 | | 1,466,313 | | 0.2 | % |
| Turkiye Vakiflar Bankasi TAO, 5.00%, 10/31/18 | | 10/24/2013 | | 794,800 | | 800,000 | | 796,040 | | 0.1 | % |
| Turkiye Vakiflar Bankasi TAO, 6.00%, 11/1/22 | | 12/3/2012 | | 1,452,724 | | 1,400,000 | | 1,310,750 | | 0.2 | % |
____________________
* As of October 31, 2013 this restricted security was deemed illiquid by the Investment Adviser.
Participation Notes and Participatory Notes:
The Frontier Markets Fund may invest in participation notes or participatory notes (“P-notes”). P-notes are participation interest notes that are issued by banks or broker-dealers and are designed to offer a return linked to a particular underlying equity, debt, currency or market. If the P-note was held to maturity, the issuer would pay to, or receive from, the purchaser the difference between the nominal value of the underlying instrument at the time of purchase and that instrument’s value at maturity. The holder of a P-note that is linked to a particular underlying security or instrument may be entitled to receive any dividends paid in connection with that underlying security or instrument, but typically does not receive voting rights as it would if it directly owned the underlying security or instrument. P-notes involve transaction costs. Investments in P-notes involve the same risks associated with a direct investment in the underlying securities, instruments or markets that they seek to replicate. In addition, there can be no assurance that there will be a trading market for a P-note or that the trading price of a P-note will equal the underlying value of the security, instrument or market that it seeks to replicate. Due to liquidity and transfer restrictions, the secondary markets on which a P-note is traded may be less liquid than the market for other securities, or may be completely illiquid, which may also affect the ability of the Fund to accurately value a P-note. P-notes typically constitute general unsecured contractual obligations of the banks or broker- dealers that issue them, which subjects the Fund that holds them to counterparty risk (and this risk may be amplified if the Fund purchases P-notes from only a small number of issuers).
54 HSBC FAMILY OF FUNDS
| HSBC FAMILY OF FUNDS |
Notes to Financial Statements — as of October 31, 2013 (continued) |
Derivative Instruments:
All open derivative positions at year end are reflected on the Funds’ Schedule of Portfolio Investments. The following is a description of the derivative instruments utilized by the Funds, including the primary underlying risk exposure related to each instrument type.
Forward Foreign Currency Exchange Contracts:
Each Fund may enter into forward foreign currency exchange contracts. The Funds may enter into forward foreign currency exchange contracts in connection with planned purchases or sales of securities, to hedge the U.S. dollar value of securities denominated in a particular currency or to enhance return. The forward foreign currency exchange contracts are adjusted by the daily exchange rate of the underlying currency and any gains or losses are recorded for financial statement purposes as unrealized gains or losses until the contract settlement date.
The Funds could be exposed to risks if the counterparties to the contracts are unable to meet the terms of their contracts and from unanticipated movements in the value of a foreign currency relative to the U.S. dollar.
The Funds remain subject to credit risk with respect to the amount they expect to receive from counterparties. However, the Funds have sought to mitigate these risks by generally requiring the posting of collateral to a Fund at prearranged exposure levels to cover a Fund’s exposure to the counterparty.
During the year ended October 31, 2013, the Funds entered into forward foreign currency exchange contracts to gain exposure to certain markets and for hedging purposes. The notional amount of forward foreign currency exchange contracts outstanding as of October 31, 2013 and the monthly average notional amount for these contracts during the year ended October 31, 2013 were as follows:
| | Outstanding | | Monthly Average |
| | Notional Amount ($) | | Notional Amount ($) |
| Forward Foreign Currency Exchange Contracts: | | | | | | | | |
| Emerging Markets Debt Fund | | | 3,666,908 | | | | 611,998 | |
| Emerging Markets Local Debt Fund | | | 57,440,322 | | | | 43,525,024 | |
| Frontier Markets Fund | | | — | | | | 109,700 | |
| Total Return Fund | | | 974,398,634 | | | | 372,870,846 | |
Options Contracts:
The Funds may purchase or write put and call options on securities, indices, foreign currencies and derivative instruments. When purchasing options, the Funds pay a premium which is recorded as the cost basis in the investment and which is subsequently marked to market to reflect the current value of the option. Premiums paid for purchasing options that expire are treated as realized losses. When an option is exercised or closed, premiums paid for purchasing options are offset against proceeds to determine the realized gain or loss on the transaction. When writing options, the Funds receive a premium which is recorded as a liability and which is subsequently marked to market to reflect the current value of the option written. Premiums received from writing options that expire are treated as realized gains. Premiums received from writing options that are either exercised or closed are offset against the proceeds received or the amount paid on the transaction to determine the realized gains or losses.
The Funds may purchase or write put and call options on foreign currencies for the purpose of protecting against declines in the dollar value of foreign portfolio securities and against increases in the U.S. dollar cost of foreign securities to be acquired. The Funds could be exposed to risks if the counterparties to the contracts are unable to meet the terms of their contracts and from unanticipated movements in the value of a foreign currency relative to the U.S. dollar.
The Funds may enter into interest rate swaption agreements for hedging purposes. A swaption is an option to enter into a pre-defined swap agreement by some specified date in the future. The writer of the swaption becomes the counterparty to the swap if the buyer exercises their option. The interest rate swaption
HSBC FAMILY OF FUNDS 55
| HSBC FAMILY OF FUNDS |
Notes to Financial Statements — as of October 31, 2013 (continued) |
agreement will specify whether the buyer of the swaption will be a fixed rate receiver or a fixed rate buyer. The Funds could be exposed to risks if the counterparties to the contracts are unable to meet the terms of their contracts and from unanticipated movements in interest rates.
The Funds remain subject to credit risk with respect to the amount they expect to receive from counterparties. However, the Funds have sought to mitigate these risks by generally requiring the posting of collateral to an Emerging Markets Fund at prearranged exposure levels to cover an Emerging Markets Fund’s exposure to the counterparty.
During the year ended October 31, 2013, the Emerging Markets Local Debt Fund and the Total Return Fund invested in options on foreign currencies for the purpose of protecting against declines in the U.S. dollar value of foreign portfolio securities and against increases in the U.S. dollar cost of foreign securities to be acquired. The Emerging Markets Local Debt Fund also entered into interest rate swaption agreements for hedging purposes.
The Emerging Markets Local Debt Fund and the Total Return Fund had the following transactions in purchased call and put options during the year ended October 31, 2013:
| | Number of | | | | | | |
| Emerging Markets Local Debt Fund | | Contracts | | Cost |
| Options outstanding at October 31, 2012 | | | 3,270,000 | | | | | $ | 35,411 | | |
| Options expired | | | (3,270,000 | ) | | | | | (35,411 | ) | |
| Options outstanding at October 31, 2013 | | | — | | | | | $ | — | | |
| | |
| | Number of | | | | | | |
| Total Return Fund | | Contracts | | Cost |
| Options outstanding at October 31, 2012 | | | 500,000 | | | | | $ | 12,985 | | |
| Options expired | | | (500,000 | ) | | | | | (12,985 | ) | |
| Options outstanding at October 31, 2013 | | | — | | | | | $ | — | | |
| |
| The Emerging Markets Local Debt Fund had the following transactions in written call and put options during the period ended October 31, 2013: |
| | | | | | | | | | | | |
| | Number of | | Premiums |
| Emerging Markets Local Debt Fund | | Contracts | | Received |
| Options outstanding at October 31, 2012 | | | — | | | | | $ | — | | |
| Options written | | | (3,000,000 | ) | | | | | (14,160 | ) | |
| Options expired | | | 3,000,000 | | | | | | 14,160 | | |
| Options outstanding at October 31, 2013 | | | — | | | | | $ | — | | |
| | | | | | | | | | | | |
| Futures Contracts: | | | | | | | | | | | |
The Funds may invest in futures contracts for the purpose of hedging existing portfolio securities or securities they intend to purchase against fluctuations in fair value caused by changes in prevailing market interest conditions. Upon entering into futures contracts, the Funds are required to pledge to the broker an amount of cash and/or other assets equal to a certain percentage of the contract amount (initial margin deposit). Subsequent payments, known as “variation margin”, are made or received each day, depending on the daily fluctuations in the fair value of the underlying security. The Funds recognize an unrealized gain or loss equal to the daily variation margin. Should market conditions move unexpectedly, the Funds may not achieve the anticipated benefits of the futures contracts and may realize a loss. Futures contracts involve, to varying degrees, elements of market risk (generally equity price risk related to stock futures, interest rate risk related to bond futures, and foreign currency risk related to currency futures) and exposure to loss in excess of the variation margin. The primary risks associated with the use of futures contracts are the imperfect correlation between the change in market value of the securities held by the Funds and the prices of futures contracts,
56 HSBC FAMILY OF FUNDS
| HSBC FAMILY OF FUNDS |
Notes to Financial Statements — as of October 31, 2013 (continued) |
the possibility of an illiquid market, and the inability of the counterparty to meet the terms of the contract. During the year ended October 31, 2013, the Emerging Markets Debt Fund and the Total Return Fund invested in futures contracts to gain exposure to certain markets and for hedging purposes. The gross notional amount of futures contracts outstanding as of October 31, 2013 and the monthly average notional amount for these contracts for the year ended October 31, 2013 were as follows:
| Outstanding | | Monthly Average |
| Futures Contacts: | Notional Amount ($) | | Notional Amount ($) |
| Emerging Markets Debt Fund | | 2,674,547 | | | | 673,859 | |
| Total Return Fund | | 45,339,938 | | | | 35,484,767 | |
Swap Agreements:
The Funds may enter into swap contracts and other similar instruments in accordance with their investment objectives and policies. A swap is an agreement to exchange the return generated by one instrument for the return generated by another instrument. The payment streams are calculated by reference to a specified index and agreed upon notional amount. The term specified index includes currencies, fixed interest rates, prices and total return on interest rate indices, fixed income indices, stock indices and commodity indices.
The Funds will usually enter into swaps on a net basis, which means that the two return streams are netted out in a cash settlement on the payment date or dates specified in the instrument, with a Fund receiving or paying only the net amount of the two returns. Upfront receipts and payments are recorded as deferred income (liability) or deferred expense (asset), as the case may be. These upfront receipts and payments are amortized to income or expense over the life of the swap agreement. Until a swap agreement is settled in cash, the gain or loss on the notional amount plus income on the instruments, less the interest paid by the Fund on the notional amount, is recorded as “unrealized appreciation or depreciation on swap agreements” and, when cash is exchanged, the gain or loss realized is recorded as “realized gains or losses on swap agreements”. A Fund’s obligations under a swap agreement will be accrued daily (offset against any amounts owing to the Fund) and any accrued but unpaid net amounts owed to a swap counterparty will be covered by the maintenance of a segregated account consisting of cash, U.S. government securities, or other liquid securities or by pledging such securities as collateral.
Interest rate swaps involve the exchange of commitments to pay and receive interest based on a notional amount and are subject to interest rate risk exposure. Interest rate swaps do not involve the delivery of securities, other underlying assets or principal. Accordingly, the risk of loss with respect to interest rate swaps is limited to the net amount of interest payments that a Fund is contractually obligated to make. If the other party to an interest rate swap defaults, a Fund’s risk of loss consists of the net amount of interest payments that the Fund is contractually entitled to receive.
Credit default swap agreements involve one party making a stream of payments (referred to as the buyer of protection) to another party (the seller of protection) in exchange for the right to receive a specified return in the event of a default or other credit event for the referenced entity, obligation or index and are subject to credit risk exposure. The maximum potential amount of future payments that a Fund as a seller of protection could be required to make under a credit default swap agreement would be an amount equal to the notional amount of the agreement. Notional amounts of each individual credit default swap agreement outstanding as of October 31, 2013 for which a Fund is the seller of protection are disclosed in the Schedules of Portfolio Investments. These potential amounts would be partially offset by any recovery values of the respective referenced obligations, upfront payments received upon entering into the agreement, or net amounts received from the settlement of buy protection credit default swap agreements entered into by a Fund for the same referenced entity or entities.
The Funds remain subject to credit risk with respect to the amount they expect to receive from counterparties. However, the Funds have sought to mitigate these risks by generally requiring the posting of collateral to a Fund at pre-arranged exposure levels to cover a Fund’s exposure to the counterparty.
HSBC FAMILY OF FUNDS 57
| HSBC FAMILY OF FUNDS |
Notes to Financial Statements — as of October 31, 2013 (continued) |
The use of swaps is a highly specialized activity that involves investment techniques and risks different from those associated with ordinary portfolio securities transactions. If the Investment Adviser is incorrect in its forecasts of market values, interest rates and currency exchange rates, the investment performance of a Fund would be less favorable than it would have been if this investment technique were not used.
During the year ended October 31, 2013, the Emerging Markets Local Debt Fund and the Total Return Fund entered into interest rate swap agreements to manage their exposure to interest rates and as a substitute for investing directly in securities. The Emerging Markets Debt Fund and Total Return Fund also entered into credit default swap agreements primarily to manage and/or gain exposure to credit risk. The notional amount of swap agreements outstanding as of October 31, 2013 and the monthly average notional amount for these agreements during the year ended October 31, 2013 were as follows:
| | Outstanding | | Monthly Average |
| | Notional Amount ($) | | Notional Amount ($) |
| Interest Rate Swap Agreements: | | | | | | | | |
| Emerging Markets Local Debt Fund | | | 18,948,522 | | | | 11,844,553 | |
| Total Return Fund | | | 253,276,193 | | | | 74,711,419 | |
| | | | | | | | | |
| Credit Default Swap Agreements: | | | | | | | | |
| Emerging Markets Debt Fund | | | 2,350,000 | | | | 1,947,917 | |
| Total Return Fund | | | 199,250,000 | | | | 85,866,667 | |
| | | | | | | | | |
Summary of Derivative Instruments: |
| | | | | | | | | |
Fair Values of Derivative Instruments on the Statements of Assets and Liabilities as of October 31, 2013: |
| | Assets | | Liabilities |
| | Unrealized | | | | | | | | | | Unrealized | | | | | | | | |
| | Appreciation | | Variation | | | | | | Depreciation | | Variation | | | | |
| | on Forward | | Margin on | | Unrealized | | on Forward | | Margin | | Unrealized |
| | Foreign Currency | | Futures | | Appreciation | | Foreign Currency | | on Futures | | Depreciation |
| | Exchange | | Contracts^ | | on Swap | | Exchange | | Contracts^ | | on Swap |
| Fund | | Contracts ($) | | ($) | | Agreements ($) | | Contracts ($) | | ($) | | Agreements ($) |
| Foreign Exchange Rate Risk Exposure: | | | | | | | | | | | | | | | | | | | | | | | | |
| Emerging Markets Debt Fund | | | 23,061 | | | | — | | | | — | | | | 9,034 | | | | — | | | | — | |
| Emerging Market Local Debt Fund | | | 650,894 | | | | — | | | | — | | | | 314,430 | | | | — | | | | — | |
| Total Return Fund | | | 11,394,144 | | | | — | | | | — | | | | 5,284,991 | | | | — | | | | — | |
| | | | | | | | | | | | | | | | | | | | | | | | | |
| Credit Contracts Risk Exposure: | | | | | | | | | | | | | | | | | | | | | | | | |
| Emerging Markets Debt Fund | | | — | | | | — | | | | 36,270 | | | | — | | | | — | | | | 3,254 | |
| Total Return Fund | | | — | | | | — | | | | 486,877 | | | | — | | | | — | | | | 1,899,917 | |
| | | | | | | | | | | | | | | | | | | | | | | | | |
| Interest Rate Risk Exposure: | | | | | | | | | | | | | | | | | | | | | | | | |
| Emerging Markets Debt Fund | | | — | | | | 91,503 | | | | — | | | | — | | | | — | | | | — | |
| Emerging Market Local Debt Fund | | | — | | | | — | | | | 61,749 | | | | — | | | | — | | | | 213,103 | |
| Total Return Fund | | | — | | | | — | | | | 745,046 | | | | — | | | | 1,499,848 | | | | 1,463,880 | |
____________________
| ^ | Includes cumulative appreciation/depreciation on futures contracts as reported in the Schedule of Portfolio Investments. Only current day’s variation margin is reported on the Statement of Assets and Liabilities. |
58 HSBC FAMILY OF FUNDS
| HSBC FAMILY OF FUNDS |
Notes to Financial Statements — as of October 31, 2013 (continued) |
The Effect of Derivative Instruments on the Statements of Operations for the year ended October 31, 2013:
| | Realized Gain (Loss) on Derivatives
Recognized as a Result from Operations | | Net Change in Unrealized
Appreciation/Depreciation
on Derivatives Recognized
as a Result from Operations |
Fund | | Net Realized
Gains (Losses)
from Forward
Foreign Currency
Exchange
Contracts ($) | | Net Realized
Gains (Losses)
from Futures
Transactions ($) | | Net Realized
Gains (Losses)
from Swap
Agreements ($) | | Net Realized
Gains (Losses)
from Options
Transactions ($) | | Change in
Unrealized
Appreciation/Depreciation
on Investments ($) |
| Foreign Exchange Rate Risk Exposure: | | | | | | | | | | | |
| Emerging Markets Debt Fund | | | 39,161 | | | | | — | | | | | — | | | | | — | | | | | 14,181 | | |
| Emerging Markets Local Debt Fund | | | (67,998 | ) | | | | — | | | | | — | | | | | (21,251 | ) | | | | 129,468 | | |
| Frontier Markets Fund | | | (37,785 | ) | | | | — | | | | | — | | | | | — | | | | | — | | |
| Total Return Fund | | | (3,376,735 | ) | | | | — | | | | | — | | | | | (12,985 | ) | | | | 6,174,638 | | |
| RMB Fixed Income Fund | | | 863 | | | | | — | | | | | — | | | | | — | | | | | — | | |
| | |
| Credit Contracts Risk Exposure: | | | | | | | | | | | | | | | | | | | | | | | | | |
| Emerging Markets Debt Fund | | | — | | | | | — | | | | | 38,683 | | | | | — | | | | | (36,570 | ) | |
| Total Return Fund | | | — | | | | | | | | | | 532,955 | | | | | — | | | | | (1,437,928 | ) | |
| | |
| Interest Rate Risk Exposure: | | | | | | | | | | | | | | | | | | | | | | | | | |
| Emerging Markets Debt Fund | | | — | | | | | (52,363 | ) | | | | — | | | | | — | | | | | 91,503 | | |
| Emerging Markets Local Debt Fund | | | — | | | | | — | | | | | (70,319 | ) | | | | — | | | | | (280,760 | ) | |
| Total Return Fund | | | — | | | | | 2,792,335 | | | | | 1,462,344 | | | | | — | | | | | (2,053,263 | ) | |
Allocations:
Expenses directly attributable to a Fund are charged to that Fund. Expenses not directly attributable to a Fund are allocated proportionately among the applicable series within the Trusts in relation to the net assets of each fund or on another reasonable basis. Class specific expenses are charged directly to the class incurring the expense. In addition, income, expenses (other than class specific expenses), and unrealized and realized gains and losses are allocated to each class based on relative net assets on a daily basis.
Dividends to Shareholders:
Dividends to shareholders from net investment income, if any, are declared and distributed monthly in the case of the Funds, and annually in the case of the Frontier Markets Fund. Dividends from net realized gains, if any, are declared and paid at least annually by the Funds. Additional distributions are also made to the Funds’ shareholders to the extent necessary to avoid the federal excise tax on certain undistributed income and net realized gains of regulated investment companies.
The amount and character of net investment income and net realized gains distributions are determined in accordance with federal income tax regulations which may differ from GAAP. These “book/tax’’ differences are either considered temporary or permanent in nature. To the extent these differences are permanent in nature (e.g., certain gain/loss, differing treatment on certain swap agreements, and certain distributions), such amounts are reclassified within the composition of net assets; temporary differences (e.g., wash losses and the realization for tax purposes of unrealized gains/losses on investments in passive foreign investment companies) do not require reclassification. The Funds may utilize equalization accounting for tax purposes and designate earnings and profits, including net realized gains distributed to shareholders on redemption of shares, as a part of the dividends paid deduction for income tax purposes. To the extent distributions to shareholders from net investment income and net realized gains exceed net investment income and net realized gains for tax purposes, they are reported as distributions of capital.
HSBC FAMILY OF FUNDS 59
| HSBC FAMILY OF FUNDS |
Notes to Financial Statements — as of October 31, 2013 (continued) |
Federal Income Taxes:
Each Fund is a separate taxable entity for federal income tax purposes. Each Fund has qualified and intends to continue to qualify each year as a “regulated investment company’’ under Subchapter M of the Internal Revenue Code, as amended, and to distribute substantially all of its taxable net investment income and net realized gains, if any, to its shareholders. Accordingly, no provision for federal income or excise tax is required.
Management of the Funds has reviewed tax positions taken in tax years that remain subject to examination by all major tax jurisdictions, including federal (i.e., the last four tax year ends and the interim tax period since then, as applicable). Management believes that there is no tax liability resulting from unrecognized tax benefits related to uncertain tax positions taken.
New Accounting Pronouncements:
In January 2013, the Financial Accounting Standards Board issued Accounting Standards Update (“ASU”) No. 2013-01 “Clarifying the Scope of Disclosures about Offsetting Assets and Liabilities” (“ASU 2013-01”), which amended Accounting Standards Codification Subtopic 210-20, Balance Sheet Offsetting. ASU 2013-01 clarified the scope of ASU No. 2011-11 “Disclosures about Offsetting Assets and Liabilities” (“ASU 2011-11”). ASU 2011-11 requires an entity to disclose information about offsetting and related arrangements to enable users of the financial statements to understand the effect of those arrangements on the entity’s financial position. ASU 2013-01 clarifies the scope of ASU 2011-11 as applying to derivatives accounted for in accordance with Topic 815, Derivatives and Hedging, including bifurcated embedded derivatives, repurchase agreements and reverse repurchase agreements, and securities borrowing and securities lending transactions that are offset either in accordance with other requirements of GAAP or subject to an enforceable master netting arrangement or similar agreement. The guidance in ASU 2013-01 and ASU 2011-11 is effective for interim and annual periods beginning on or after January 1, 2013. Management is evaluating any impact ASU 2013-01 and ASU 2011-11 may have on the Funds’ financial statements.
3. Investment Valuation Summary:
The valuation techniques employed by the Funds, as described below, maximize the use of observable inputs and minimize the use of unobservable inputs in determining fair value. The inputs used for valuing the Funds’ investments are summarized in the three broad levels listed below:
Level 1: quoted prices in active markets for identical assets
Level 2: other significant observable inputs (including quoted prices for similar securities, interest rates, prepayment speeds, credit risk, etc.)
Level 3: significant unobservable inputs (including a Fund’s own assumptions in determining the fair value of investments)
Changes in valuation techniques may result in transfers in or out of an assigned level within the disclosure hierarchy. The Funds determine transfers between fair value hierarchy levels at the reporting period end. The inputs or methodology used for valuing investments are not necessarily an indication of the risk associated with investing in those investments.
Bonds and other fixed income securities (other than short-term obligations but including listed issues) are valued at the bid price as of the time net asset value is determined on the basis of valuations furnished by a pricing service, the use of which has been approved by the Funds’ Board. In making such valuations, the pricing service utilizes both dealer-supplied valuations and matrix techniques which take into account appropriate factors such as the institutional-size trading in similar groups of securities, yield, quality, coupon rate, maturity, type of issue, trading characteristics other than market data and without exclusive reliance upon quoted prices or exchanges or over-the-counter prices, since such valuations are believed to reflect more accurately the fair value of such securities and are typically categorized as Level 2 in the fair value hierarchy.
Exchange traded, domestic equity securities are valued at the last sale price on a national securities exchange, or in the absence of recorded sales, at the readily available closing bid price on such exchanges, or at the quoted bid price in the over-the-counter market and are typically categorized as Level 1 in the fair value hierarchy.
60 HSBC FAMILY OF FUNDS
| HSBC FAMILY OF FUNDS |
| Notes to Financial Statements — as of October 31, 2013 (continued) |
Exchange traded, foreign equity securities are valued in the appropriate currency on the last quoted sale price and are typically categorized as Level 1 in the fair value hierarchy. Foreign equity securities that are not exchange traded are valued in the appropriate currency at the average of the quoted bid and asked prices in the over-the-counter market and are typically categorized as Level 2 in the fair value hierarchy.
Mutual funds are valued at their net asset values, as reported by such companies and are typically categorized as Level 1 in the fair value hierarchy.
Exchange traded futures contracts are valued at their settlement price on the exchange on which they are traded and are typically categorized as Level 1 in the fair value hierarchy.
Forward foreign currency exchange contracts are valued at the current day’s interpolated foreign exchange rate, as calculated using the current day’s spot rate, and the 30 to 720 day forward rates and converted to U.S. dollars at the exchange rate of such currencies against the U.S. dollar, as of the close of regular trading on the New York Stock Exchange, as provided by an approved pricing service, and are typically categorized as Level 2 in the fair value hierarchy. Non-exchange traded derivatives, such as swaps and options, are generally valued by using a valuation provided by an approved independent pricing service and are typically categorized as Level 2 in the fair value hierarchy.
Securities or other assets for which market quotations are not readily available, or are deemed unreliable due to a significant event or otherwise, are valued pursuant to procedures adopted by the Trusts’ Board (“Procedures”). Depending on the source and relative significance of valuation inputs, these instruments may be classified as Level 2 or Level 3 in the fair value hierarchy. Examples of potentially significant events that could affect the value of an individual security and thus require pricing under the Procedures include corporate actions by the issuer, announcements by the issuer relating to its earnings or products, regulatory news, natural disasters, and litigation. Examples of potentially significant events that could affect multiple securities held by a Fund include governmental actions, natural disasters, and armed conflicts. Fair value pricing may require subjective determinations about the value of a security. While the Trust’s policy is intended to result in a calculation of a Fund’s net asset value (“NAV”) that fairly reflects security values as of the time of pricing, the Trust cannot ensure that fair values determined would accurately reflect the price that a Fund could obtain for a security if it were to dispose of that security as of the time of pricing. The prices used by a Fund may differ from the value that would be realized if the securities were sold and the differences could be material to the financial statements.
In addition, if events materially affecting the value of foreign securities occur between the time when the exchange on which they are traded closes and the time when the Funds’ NAV are calculated, such securities may be valued using fair value pricing in accordance with procedures adopted by the Board. Management identifies possible fluctuations in foreign securities by monitoring the rise or fall in the value of a designated benchmark index. In the event of a rise or fall greater than predetermined levels, the Funds may use a systematic valuation model provided by an independent third party to value its foreign securities, rather than local market closing prices. When a Fund uses such a valuation model, the value assigned to the Fund’s foreign securities may not be the quoted or published prices of the investments on their primary markets or exchanges and are typically categorized as Level 2 in the fair value hierarchy. The valuation of these securities may represent a transfer between Levels 1 and 2. The number of days on which fair value prices will be used will depend on market activity and it is possible that fair value prices will be used by the Funds to a significant extent.
HSBC FAMILY OF FUNDS 61
| HSBC FAMILY OF FUNDS |
| Notes to Financial Statements — as of October 31, 2012 (continued) |
The following is a summary of the valuation inputs used as of October 31, 2013 in valuing the Funds’ investments based upon the three levels defined above. The breakdown of country descriptions is disclosed in the Schedule of Portfolio Investments for each Fund:
| | LEVEL 1 ($) | | LEVEL 2 ($) | | LEVEL 3 ($) | | Total ($) |
| Emerging Markets Debt Fund | | | | | | | | | | |
| Investment Securities: | | | | | | | | | | |
| Corporate Obligation | | — | | 10,850 | | | — | | 10,850 | |
| Yankee Dollars | | — | | 39,954,995 | | | — | | 39,954,995 | |
| U.S. Treasury Obligation | | — | | 224,156 | | | — | | 224,156 | |
| Investment Companies | | 2,310,542 | | — | | | — | | 2,310,542 | |
| Total Investment Securities | | 2,310,542 | | 40,190,001 | | | — | | 42,500,543 | |
| Other Financial Instruments:(a) | | | | | | | | | | |
| Credit Default Swap Agreements | | — | | 33,016 | | | — | | 33,016 | |
| Forward Foreign Currency Contracts | | — | | 14,027 | | | — | | 14,027 | |
| Futures Contracts | | 91,503 | | — | | | — | | 91,503 | |
| Total Investments | | 91,503 | | 47,043 | | | — | | 138,546 | |
| Emerging Markets Local Debt | | | | | | | | | | |
| Investment Securities: | | | | | | | | | | |
| Foreign Bonds | | — | | 21,028,499 | | | — | | 21,028,499 | |
| Yankee Dollars | | — | | 1,880,299 | | | — | | 1,880,299 | |
| U.S. Treasury Obligations | | — | | 1,003,217 | | | — | | 1,003,217 | |
| Investment Companies | | 6,091,520 | | — | | | — | | 6,091,520 | |
| Total Investment Securities | | 6,091,520 | | 23,912,015 | | | — | | 30,003,535 | |
| Other Financial Instruments:(a) | | | | | | | | | | |
| Interest Rate Swap Agreements | | — | | (151,354 | ) | | — | | (151,354 | ) |
| Forward Foreign Currency Contracts | | — | | 336,464 | | | — | | 336,464 | |
| Total Investments | | — | | 185,110 | | | — | | 185,110 | |
| Frontier Markets Fund | | | | | | | | | | |
| Investment Securities: | | | | | | | | | | |
| Common Stocks | | | | | | | | | | |
| Metals & Mining | | 599,080 | | 18,615 | | | — | | 617,695 | |
| Other Common Stocks | | 72,905,070 | | — | | | — | | 72,905,070 | |
| Convertible Corporate Bonds | | — | | 51,257 | | | — | | 51,257 | |
| Participatory Notes | | — | | 10,662,612 | | | — | | 10,662,612 | |
| Investment Companies | | 2,324,522 | | — | | | — | | 2,324,522 | |
| Preferred Stock | | 474,623 | | — | | | — | | 474,623 | |
| Warrants | | — | | 16,041 | | | — | (b) | 16,041 | |
| Total Investment Securities | | 76,303,295 | | 10,748,525 | | | — | | 87,051,820 | |
62 HSBC FAMILY OF FUNDS
| HSBC FAMILY OF FUNDS |
| Notes to Financial Statements — as of October 31, 2013 (continued) |
| LEVEL 1 ($) | | LEVEL 2 ($) | | LEVEL 3 ($) | | Total ($) |
| Total Return Fund | | | | | | | | | | |
| Investment Securities: | | | | | | | | | | |
| Foreign Bonds | — | | | 52,582,889 | | | — | | 52,582,889 | |
| Yankee Dollars | — | | | 428,460,425 | | | — | | 428,460,425 | |
| U.S. Treasury Obligations | — | | | 93,231,030 | | | — | | 93,231,030 | |
| Investment Companies | 69,101,935 | | | — | | | — | | 69,101,935 | |
| Total Investment Securities | 69,101,935 | | | 574,274,344 | | | — | | 643,376,279 | |
| Other Financial Instruments:(a) | | | | | | | | | | |
| Interest Rate Swap Agreements | — | | | (718,834 | ) | | — | | (718,834 | ) |
| Credit Default Swap Agreements | — | | | (1,413,040 | ) | | — | | (1,413,040 | ) |
| Forward Foreign Currency Contracts | — | | | 6,109,153 | | | — | | 6,109,153 | |
| Futures Contracts | (1,499,848 | ) | | — | | | — | | (1,499,848 | ) |
| Total Investments | (1,499,848 | ) | | 3,977,279 | | | — | | 2,477,431 | |
| |
| RMB Fixed Income Fund | | | | | | | | | | |
| Investment Securities: | | | | | | | | | | |
| Foreign Bonds | — | | | 12,044,381 | | | — | | 12,044,381 | |
| Certificates of Deposit | — | | | 1,472,539 | | | — | | 1,472,539 | |
| Investment Companies | 168,744 | | | — | | | — | | 168,744 | |
| Total Investment Securities | 168,744 | | | 13,516,920 | | | — | | 13,685,664 | |
____________________
| (a) | | Other financial instruments would include any derivative instruments, such as forward foreign currency contracts, futures contracts and swap agreements. These investments are generally recorded in the financial statements at the unrealized gain or loss on the investment. |
| | | |
| (b) | | Security was received as part of a private placement offering. The underlying stock price is trading significantly below the strike price of the warrants and the warrants are non-transferable. Security valued at $0 in good faith pursuant to procedures approved by the Board of Trustees as of October 31, 2013. |
4. Related Party Transactions and Other Agreements and Plans:
Investment Management:
HSBC Global Asset Management (USA) Inc. (“HSBC’’ or the “Investment Adviser’’), a wholly owned subsidiary of HSBC Bank USA, N.A., a national bank organized under the laws of the United States, acts as Investment Adviser to the Funds. As Investment Adviser, HSBC manages the investments of the Funds and continuously reviews, supervises and administers the Funds’ investments pursuant to an Investment Advisory Contract. For its services in this capacity, HSBC receives a fee from each Fund, accrued daily and paid monthly, based on the average daily net assets of Class A Shares, Class I Shares and Class S Shares of each respective Fund, at annual rate of:
| Fund | | Fee Rate(%) |
| Emerging Markets Debt Fund | 0.50 |
| Emerging Markets Local Debt Fund | 0.50 |
| Frontier Markets Fund | 1.25 |
| Total Return Fund | 0.85 |
| RMB Fixed Income Fund | 0.55 |
HSBC Global Asset Management (UK) Limited (“AMEU”) acts as sub-adviser to the Frontier Markets Fund. AMEU receives a fee, accrued daily and paid monthly, based on average daily net assets of the Fund at an annual rate of 0.70% from the fees paid to the Investment Adviser.
HSBC FAMILY OF FUNDS 63
| HSBC FAMILY OF FUNDS |
|
| Notes to Financial Statements — as of October 31, 2013 (continued) |
|
HSBC Global Asset Management (Hong Kong) Limited (“AMHK”) acts as sub-adviser to the RMB Fixed Income Fund. AMHK receives a fee, accrued daily and paid monthly, based on average daily net assets of the Fund at an annual rate of 0.275% from the fees paid to the Investment Adviser.
HSBC also provides support services to the Funds pursuant to a Support Services Agreement. For its services in this capacity, HSBC receives a fee, accrued daily and paid monthly, based on the average daily net assets of Class A Shares and Class I Shares, at an annual rate of 0.20% and 0.10%, respectively.
Administration:
HSBC serves the Funds as Administrator. Under the terms of the Administration Agreement, HSBC receives from the Funds (as well as other funds in the Trusts combined) a fee, accrued daily and paid monthly, at an annual rate of:
| Based on Combined Average Daily Net Assets of | | Fee Rate(%) |
| Up to $10 billion | 0.0550 |
| In excess of $10 billion but not exceeding $20 billion | 0.0350 |
| In excess of $20 billion but not exceeding $ 50 billion | 0.0275 |
| In excess of $50 billion | 0.0250 |
The fee rates and breakpoints are determined on the basis of the aggregate average daily net assets of the Trusts. The total administration fee paid to HSBC is allocated to each series based upon its proportionate share of the aggregate net assets of the Trusts, subject to certain allocations in cases where one fund invests some or all of its assets in another fund. An amount equal to 50% of the administration fee is deemed to be class specific.
Pursuant to a Sub-Administration Agreement with HSBC, Citi Fund Services Ohio, Inc. (“Citi’’), a wholly-owned subsidiary of Citigroup, Inc., serves as the Trusts’ Sub-Administrator, subject to the general supervision by the Trusts’ Board and HSBC. For these services, Citi is entitled to a fee, payable by HSBC, at an annual rate equivalent to the fee rates set forth above subject to certain reductions associated with services provided to new funds, minus 0.02%, which is retained by HSBC.
Under a Compliance Services Agreement between the Trusts and Citi (the “CCO Agreement’’), Citi makes an employee available to serve as the Trusts’ Chief Compliance Officer (the “CCO’’). Under the CCO Agreement, Citi also provides infrastructure and support in implementing the written policies and procedures comprising the Trusts’ compliance program, including support services to the CCO. For the services provided under the CCO Agreement, the Trusts paid Citi $287,560 for the year ended October 31, 2013, plus reimbursement of certain out of pocket expenses. Expenses incurred by each Fund are reflected on the Statements of Operations as “Compliance Services.’’ Citi pays the salary and other compensation earned by individuals performing these services, as employees of Citi.
Distribution Arrangements:
Foreside Distribution Services, L.P. (“Foreside”), a wholly-owned subsidiary of Foreside Financial Group LLC, serves the Trust as Distributor (the “Distributor’’). The Trust has adopted a non-compensatory Distribution Plan and Agreement (the “Distribution Plan’’) pursuant to Rule 12b-1 of the Act. The Distribution Plan provides for reimbursement of expenses incurred by the Distributor related to distribution and marketing, at a rate not to exceed 0.25% of the average daily net assets of Class A Shares (currently not being charged). For the year ended October 31, 2013, Foreside, as Distributor, also received $ 213,520 in commissions from sales of the Trusts for Class A Shares, of which $584 were reallocated to HSBC-affiliated brokers and dealers for Class A Shares.
Shareholder Servicing:
The Trust has adopted a Shareholder Services Plan, which provides for payments to shareholder servicing agents (which primarily consist of HSBC and its affiliates) for providing various shareholder services. For performing these services, the shareholder servicing agents receive a fee that is computed daily and paid monthly up to
64 HSBC FAMILY OF FUNDS
| HSBC FAMILY OF FUNDS |
| Notes to Financial Statements — as of October 31, 2013 (continued) |
0.25% of the average daily net assets of Class A Shares. The aggregate fees paid to the Distributor pursuant to the Distribution Plan and to shareholder servicing agents pursuant to the Shareholder Services Plan may not exceed, in the aggregate, 0.50% annually of each Fund’s average daily net assets of Class A Shares.
Fund Accounting and Transfer Agency:
Citi provides fund accounting and transfer agency services for each Fund. As transfer agent, Citi receives a fee based on the number of funds and shareholder accounts, subject to certain minimums, reductions associated with services provided to new funds and reimbursement of certain expenses. As fund accountant, Citi receives an annual fee per Fund and share class, subject to minimums, reductions associated with services provided to new funds and reimbursement of certain expenses. Citi receives additional fees paid by the Trust for blue sky exemption services.
Independent Trustees:
The Trusts pay each Independent Trustee an annual retainer of $100,000. The Trusts pay a fee of $10,000 for each regular meeting of the Board attended and a fee of $ 3,000 for each special meeting attended. The Trusts pay each Committee Chair an annual retainer of $ 3,000, with the exception of the Chair of the Audit Committee, who receives a retainer of $ 6,000. The Trusts also pay the Chairman of the Board, an additional annual retainer of $24,000. In addition, for time expended on Board duties outside normal meetings, which is authorized by the Board, a Trustee is compensated at the rate of $ 500 per hour, up to a maximum of $ 3,000 per day.
Fee Reductions:
The Investment Adviser has agreed to contractually limit, through March 1, 2014, the total annual expenses, exclusive of interest, taxes, brokerage commissions, extraordinary expenses, and indirect expenses attributable to the Fund’s investments in investment companies, of the Funds. Each Fund Class has its own expense limitations based on the average daily net assets for any full fiscal year as follows:
| | | | Current |
| | | | Contractual |
| Fund | | | Class | | Expense Limitation(%) |
| Emerging Markets Debt Fund | | A | | 1.20 |
| Emerging Markets Debt Fund | | I | | 0.85 |
| Emerging Markets Debt Fund | | S | | 0.75 |
| Emerging Markets Local Debt Fund | | A | | 1.20 |
| Emerging Markets Local Debt Fund | | I | | 0.85 |
| Emerging Markets Local Debt Fund | | S | | 0.75 |
| Frontier Markets Fund | | A | | 2.20 |
| Frontier Markets Fund | | I | | 1.85 |
| Total Return Fund | | A | | 1.60 |
| Total Return Fund | | I | | 1.25 |
| Total Return Fund | | S | | 1.15 |
| RMB Fixed Income Fund | | A | | 1.45 |
| RMB Fixed Income Fund | | I | | 1.10 |
| RMB Fixed Income Fund | | S | | 1.00 |
Any amounts contractually waived or reimbursed by the Investment Adviser will be subject to repayment by the respective Fund to the Investment Adviser within three years to the extent that the repayment will not cause the Fund’s operating expenses to exceed the contractual expense limit that was in effect at the time
HSBC FAMILY OF FUNDS 65
| HSBC FAMILY OF FUNDS |
| Notes to Financial Statements — as of October 31, 2013 (continued) |
of such waiver or reimbursement. During the year ended October 31, 2013, the Investment Adviser did not recapture any of its prior contractual waivers or reimbursements. As of October 31, 2013, the repayments that may potentially be made by the Funds are as follows:
| 2016($) | | 2015($) | | 2014($) | | Total ($) |
| Emerging Markets Debt Fund | 112,179 | | 159,226 | | 31,279 | | 302,684 |
| Emerging Markets Local Debt Fund | 159,629 | | 218,089 | | 41,089 | | 418,807 |
| Frontier Markets Fund | 201,653 | | 145,285 | | 5,922 | | 352,860 |
| Total Return Fund | — | | 207 | | N/A | | 207 |
| RMB Fixed Income Fund | 130,790 | | 51,659 | | N/A | | 182,449 |
The Administrator and Citi may voluntarily waive/reimburse fees to help support the expense limits of the Funds. In addition, HSBC, in its role as Investment Adviser and Administrator, may waive/reimburse additional fees at its discretion. Any voluntary fee waivers/reimbursements are not subject to recoupment in subsequent fiscal periods. Voluntary waivers/reimbursements may be stopped at any time. Amounts waived/reimbursed by the Investment Adviser, Administrator, and Citi are reported separately on the Statements of Operations, as applicable.
5. Investment Transactions:
Cost of purchases and proceeds from sales of securities (excluding securities maturing less than one year from acquisition) for the year ended October 31, 2013 were as follows:
| Purchases($) | | Sales($) |
| Emerging Markets Debt Fund | 19,652,112 | | 13,496,789 |
| Emerging Markets Local Debt Fund | 25,944,392 | | 18,421,435 |
| Frontier Markets Fund | 78,727,023 | | 16,625,243 |
| Total Return Fund | 503,641,700 | | 178,664,318 |
| RMB Fixed Income Fund | 4,040,286 | | — |
For the period ended October 31, 2013, purchases and sales on long-term U.S. government securities were as follows:
| Purchases($) | | Sales($) |
| Emerging Markets Debt Fund | 4,614,547 | | 6,993,807 |
| Emerging Markets Local Debt Fund | 1,722,047 | | 1,433,697 |
| Total Return Fund | 112,849,675 | | 23,109,929 |
6. Investment Risks:
Foreign Securities Risk: Investments in foreign securities are generally considered riskier than investments in U.S. securities. Foreign securities, including those of emerging and frontier market issuers, are subject to additional risks, including international trade, political and regulatory risks.
Emerging Markets Risk: The prices of securities in emerging markets can fluctuate more significantly than the prices of companies in more developed countries. Securities of emerging market issuers generally have more risk than securities issued by issuers in more developed markets. The less developed the country, the greater affect the risks may have in an investment, and as a result, an investment may exhibit a higher degree of volatility than either the general domestic securities market or the securities markets of more developed foreign countries.
Frontier Market Countries Risk: Frontier market countries generally have smaller economies and even less developed capital markets or legal and political systems than traditional emerging market countries. As a result, the risks of investing in emerging market countries are magnified in frontier market countries. The magnification
66 HSBC FAMILY OF FUNDS
| HSBC FAMILY OF FUNDS |
| Notes to Financial Statements — as of October 31, 2013 (continued) |
of risks are the result of: the potential for extreme price volatility and illiquidity in frontier markets; government ownership or control of parts of private sector and of certain companies; trade barriers, exchange controls, managed adjustments in relative currency values and other protectionist measures imposed or negotiated by the countries with which frontier market countries trade; and the relatively new and unsettled securities laws in many frontier market countries.
Concentration of Credit Risk: The RMB Fixed Income Fund is likely to be more volatile than the performance of other mutual funds due to its focused investment in instruments having exposure to China. Because the Fund concentrates its investments in China, the Fund’s performance is expected to be closely tied to social, political, and economic conditions within China and to be more volatile than the performance of more geographically diversified funds.
Derivatives Risk: The term “derivatives” covers a broad range of investments, including futures and currency forwards. In general, a derivative refers to any financial instrument whose value is derived, at least in part, from the price of another security or a specified index, asset or rate. The use of derivatives presents risks different from, and possibly greater than, the risks associated with investing directly in traditional securities. The use of derivatives can lead to losses because of adverse movements in the price or value of the underlying asset, index or rate, which may be magnified by certain features of the derivatives. These risks are heightened when derivatives are used to enhance a Fund’s return or as a substitute for a position or security, rather than solely to hedge (or offset) the risk of a position or security held by a Fund. The success of a Fund’s derivatives strategies will also be affected by its ability to assess and predict the impact of market or economic developments on the underlying asset, index or rate and the derivative itself, without the benefit of observing the performance of the derivative under all possible market conditions. Derivatives involve the risk of mispricing or improper valuation and the risk that changes in the value of the derivative may not correlate perfectly with the underlying asset, index or rate. Certain derivative positions may be difficult to close out when a Fund’s portfolio manager may believe it would be appropriate to do so. Also, suitable derivative transactions may not be available in all circumstances and there can be no assurance that a Fund will engage in these transactions to reduce exposure to other risks when that would be beneficial.
Swap Risk: The use of swap agreements, which are agreements to exchange the return generated by one instrument for the return generated by another instrument (or index), and similar instruments involves risks that are different from those associated with ordinary portfolio securities transactions. For example, a Fund bears the risk of loss of the amount expected to be received under a swap agreement in the event of the default or bankruptcy of a swap agreement counterparty. Swap agreements may also subject a Fund to the risk that the counterparty to the transaction may not meet its obligations, causing the Fund’s value to decrease. Swap agreements may also be considered illiquid.
7. Federal Income Tax Information:
At October 31, 2013, the cost basis of securities for federal income tax purposes, gross unrealized appreciation, gross unrealized depreciation and net unrealized appreciation/depreciation were as follows:
| | | | | | | | | | | | | | Net Unrealized |
| | | | | Tax Unrealized | | Tax Unrealized | | Appreciation/ |
| Tax Cost ($) | | Appreciation ($) | | Depreciation ($) | | (Depreciation) ($)* |
| Emerging Markets Debt Fund | | 42,144,821 | | | | 965,867 | | | | (610,145 | ) | | | | 355,722 | | |
| Emerging Markets Local Debt Fund | | 32,010,961 | | | | 175,034 | | | | (2,182,460 | ) | | | | (2,007,426 | ) | |
| Frontier Markets Fund | | 83,433,339 | | | | 5,979,059 | | | | (2,360,578 | ) | | | | 3,618,481 | | |
| Total Return Fund | | 654,700,573 | | | | 2,566,132 | | | | (13,890,426 | ) | | | | (11,324,294 | ) | |
| RMB Fixed Income Fund | | 13,124,458 | | | | 566,388 | | | | (5,182 | ) | | | | 561,206 | | |
____________________
| * | | The difference between book-basis unrealized appreciation (depreciation) is attributable primarily to tax deferral of losses on wash sales and the realization for tax purposes of unrealized gains/losses on investments in passive foreign investment companies. |
HSBC FAMILY OF FUNDS 67
| HSBC FAMILY OF FUNDS |
| Notes to Financial Statements — as of October 31, 2013 (continued) |
The tax character of dividends paid by the Funds as of the tax year ended October 31, 2013 was as follows:
| Dividends paid from |
| Ordinary | | Net Long Term | | Total Taxable | | Return of | | Total Dividends |
| Income ($) | | Capital Gains ($) | | Dividends ($) | | Capital ($) | | Paid ($)(1) |
| Emerging Markets Debt Fund | 2,039,967 | | | 608,594 | | | | 2,648,561 | | | | — | | | | 2,648,561 | |
| Emerging Markets Local Debt Fund | 802,596 | | | 22,983 | | | | 825,579 | | | | 62,106 | | | | 887,685 | |
| Frontier Markets Fund | 649,627 | | | — | | | | 649,627 | | | | — | | | | 649,627 | |
| Total Return Fund | 4,959,505 | | | — | | | | 4,959,505 | | | | — | | | | 4,959,505 | |
| RMB Fixed Income Fund | 430,780 | | | — | | | | 430,780 | | | | — | | | | 430,780 | |
The tax character of dividends paid by the Funds as of the tax year ended October 31, 2012 was as follows:
| Dividends paid from |
| Ordinary | | Net Long Term | | Total Taxable | | Return of | | Total Dividends |
| Income ($) | | Capital Gains ($) | | Dividends ($) | | Capital ($) | | Paid ($)(1) |
| Emerging Markets Debt Fund | 1,823,427 | | — | | | 1,823,427 | | | — | | | 1,823,427 | |
| Emerging Markets Local Debt Fund | 379,720 | | — | | | 379,720 | | | — | | | 379,720 | |
| Frontier Markets Fund | 29,081 | | — | | | 29,081 | | | — | | | 29,081 | |
| Total Return Fund | 783,622 | | — | | | 783,622 | | | — | | | 783,622 | |
| RMB Fixed Income Fund | 62,740 | | — | | | 62,740 | | | — | | | 62,740 | |
____________________
| (1) | | Total dividends paid may differ from the amount reported in the Statement of Changes in Net Assets because dividends are recognized when actually paid for tax purposes. |
As of the tax year ended October 31, 2013, the components of accumulated earnings/(deficit) on a tax basis for the Funds were as follows:
| | | | | | | | | | | | | | | | Total |
| | Undistributed | | Undistributed | | Undistributed | | | | | | Accumulated | | Unrealized | | Accumulated |
| | Ordinary | | Tax Exempt | | Long Term | | Accumulated | | Dividends | | Capital and | | Appreciation/ | | Earnings/ |
| | Income ($) | | Income ($) | | Capital Gains ($) | | Earnings ($) | | Payable ($)* | | Other Losses ($) | | (Depreciation)($) | | (Deficit) ($) |
| Emerging Markets | | | | | | | | | | | | | | | | | | | | | | | | | | | | | | | |
| Debt Fund | | | 256,931 | | | — | | | 650,922 | | | | 907,853 | | | | (164,994 | ) | | | — | | | 377,356 | | | | | 1,120,215 | | |
| Emerging Markets | | | | | | | | | | | | | | | | | | | | | | | | | | | | | | | |
| Local Debt Fund | | | — | | | — | | | — | | | | — | | | | (127,602 | ) | | | — | | | (2,037,448 | ) | | | | (2,165,050 | ) | |
| Frontier Markets | | | | | | | | | | | | | | | | | | | | | | | | | | | | | | | |
| Fund | | | 724,950 | | | — | | | 2,429,295 | | | | 3,154,245 | | | | — | | | | — | | | 3,620,111 | | | | | 6,774,356 | | |
| Total Return Fund | | | 10,403,605 | | | — | | | 127,940 | | | | 10,531,545 | | | | (647,053 | ) | | | — | | | (13,656,248 | ) | | | | (3,771,756 | ) | |
| RMB Fixed | | | | | | | | | | | | | | | | | | | | | | | | | | | | | | | |
| Income Fund | | | 113,692 | | | — | | | — | | | | 113,692 | | | | (42,961 | ) | | | — | | | 561,621 | | | | | 632,352 | | |
____________________
| * | | Dividends payable may differ from the amount reported in the Statements of Assets and Liabilities because dividends payable on a tax basis include those dividends that will be reinvested. |
During the latest tax year ended October 31, 2013, the following Fund utilized capital loss carryforwards to offset capital gains realized:
| Fund | | Amount ($) |
| Frontier Markets Fund | 553,182 |
68 HSBC FAMILY OF FUNDS
| HSBC FAMILY OF FUNDS |
| Notes to Financial Statements — as of October 31, 2013 (continued) |
8. Ownership and Principal Holders
The beneficial ownership, either directly or indirectly, of more than 25% of the voting securities of a Fund creates presumptions of control of the Fund, under section 2 (a)(9) of the Act. As of October 31, 2013, the Emerging Markets Local Debt Fund and RMB Fixed Income Fund had individual shareholder accounts and/or omnibus shareholder accounts (comprised of a group of individual shareholders), each of which is affiliated with the Investment Adviser, and representing ownership in excess of 75% of each Fund, respectively.
9. Subsequent Events:
Management has evaluated events and transactions through the date the financial statements were issued, for purposes of recognition or disclosure in these financial statements and there are no subsequent events to report.
HSBC FAMILY OF FUNDS 69
Report of Independent Registered Public Accounting Firm
To the Shareholders and Board of Trustees of
HSBC Funds:
We have audited the accompanying statements of assets and liabilities of HSBC Emerging Markets Debt Fund, HSBC Emerging Markets Local Debt Fund, HSBC Frontier Markets Fund, HSBC Total Return Fund and HSBC RMB Fixed Income Fund (the Funds), including the schedules of portfolio investments, as of October 31, 2013, and the related statements of operations for the year then ended, the statements of changes in net assets for each of the years or periods in the two-year period then ended, and the financial highlights for each of the years or periods in the three-year period then ended. These financial statements and financial highlights are the responsibility of the Funds’ management. Our responsibility is to express an opinion on these financial statements and financial highlights based on our audits.
We conducted our audits in accordance with the standards of the Public Company Accounting Oversight Board (United States). Those standards require that we plan and perform the audit to obtain reasonable assurance about whether the financial statements and financial highlights are free of material misstatement. An audit includes examining, on a test basis, evidence supporting the amounts and disclosures in the financial statements. Our procedures included confirmation of securities owned as of October 31, 2013, by correspondence with custodians and brokers or by other appropriate auditing procedures. An audit also includes assessing the accounting principles used and significant estimates made by management, as well as evaluating the overall financial statement presentation. We believe that our audits provide a reasonable basis for our opinion.
In our opinion, the financial statements and financial highlights referred to above present fairly, in all material respects, the financial position of the Funds as of October 31, 2013, the results of their operations for the year then ended, the changes in their net assets for each of the years or periods in the two-year period then ended, and the financial highlights for each of the years or periods in the three-year period then ended, in conformity with U.S. generally accepted accounting principles.

Columbus, Ohio
December 27, 2013
70 HSBC FAMILY OF FUNDS
| HSBC FAMILY OF FUNDS |
| Other Federal Income Tax Information — as of October 31, 2013 (Unaudited) |
During the year ended October 31, 2013, the following Funds declared capital gain distributions:
| Short Term | | Long Term |
| Capital Gain | | Capital Gain |
| Distributions ($) | | Distributions ($) |
| Emerging Markets Debt Fund | | 176,091 | | | | 608,594 | |
| Emerging Markets Local Debt Fund | | 413,214 | | | | 22,983 | |
| Total Return Fund | | 995,672 | | | | — | |
| RMB Fixed Income Fund | | 7 | | | | — | |
For the year ended October 31, 2013, dividends paid by the following Fund may be subject to a maximum tax rate of 15%, as provided for by the Jobs and Growth Tax Relief Reconciliation Act of 2003. The intends to designate the maximum amount allowable as taxed at a maximum rate of 15%. Complete information will be reported in conjunction with your 2013 Form 1099-DIV:
| Qualified |
| Dividend |
| Income (%) |
| Frontier Markets Fund | 29.59 |
The following Funds intend to elect to pass through to shareholders the income tax credit for taxes paid to foreign countries. Foreign source income and foreign tax expense per outstanding share on October 31, 2013 are as follows:
| Foreign Source Income | | Foreign Tax Expense |
| | Per Share ($) | | Per Share ($) |
| Emerging Markets Local Debt Fund | 0.40 | | 0.01 |
| Frontier Markets Fund | 0.17 | | 0.01 |
The pass-through of this foreign tax credit will only affect those persons who are shareholders on the dividend record date in December 2013. These shareholders will receive more detailed information along with their 2013 Form 1099-DIV.
HSBC FAMILY OF FUNDS 71
| HSBC FAMILY OF FUNDS |
| Table of Shareholder Expenses — as of October 31, 2013 (Unaudited) |
As a shareholder of the Funds, you incur two types of costs: (1) transaction costs, including sales charges (loads) on purchases, redemption fees and exchange fees; and (2) ongoing costs, including management fees, distribution fees and other Fund expenses. These examples are intended to help you understand your ongoing costs (in dollars) of investing in the Funds and to compare the cost with the ongoing costs of investing in other mutual funds.
These examples are based on an investment of $1,000 invested at the beginning of the period and held for the entire period from May 1, 2013 through October 31, 2013.
Actual Example
The table below provides information about actual account values and actual expenses. You may use the information below, together with the amount you invested, to estimate the expenses that you paid over the period. Simply divide your account value by $1,000 (for example, an $8,600 account value divided by $1,000 = 8.6), then multiply the result by the number in the table under the heading entitled “Expenses Paid During Period” to estimate the expenses you paid on your account during this period.
| | | | Beginning | | | | | | | | | | | | | Annualized |
| | | | Account | | Ending | | Expenses Paid | | Expense Ratio |
| | | | Value | | Account Value | | During Period* | | During Period |
| | | | 5/1/13 | | 10/31/13 | | 5/1/13 - 10/31/13 | | 5/1/13 - 10/31/13 |
| Emerging Markets Debt Fund | | Class A | | | $1,000.00 | | | | $ | 944.70 | | | | $ | 5.88 | | | | 1.20% |
| | Class I | | | 1,000.00 | | | | | 945.40 | | | | | 4.17 | | | | 0.85% |
| | Class S | | | 1,000.00 | | | | | 945.90 | | | | | 3.68 | | | | 0.75% |
| Emerging Markets Local Debt Fund | | Class A | | | 1,000.00 | | | | | 912.40 | | | | | 5.78 | | | | 1.20% |
| | Class I | | | 1,000.00 | | | | | 914.20 | | | | | 4.10 | | | | 0.85% |
| | Class S | | | 1,000.00 | | | | | 914.60 | | | | | 3.62 | | | | 0.75% |
| Frontier Markets Fund | | Class A | | | 1,000.00 | | | | | 1,047.30 | | | | | 11.35 | | | | 2.20% |
| | Class I | | | 1,000.00 | | | | | 1,049.50 | | | | | 9.56 | | | | 1.85% |
| Total Return Fund | | Class A | | | 1,000.00 | | | | | 990.20 | | | | | 7.93 | | | | 1.58% |
| | Class I | | | 1,000.00 | | | | | 992.90 | | | | | 6.18 | | | | 1.23% |
| | Class S | | | 1,000.00 | | | | | 993.40 | | | | | 5.68 | | | | 1.13% |
| RMB Fixed Income Fund | | Class A | | | 1,000.00 | | | | | 1,019.30 | | | | | 7.38 | | | | 1.45% |
| | Class I | | | 1,000.00 | | | | | 1,021.00 | | | | | 5.60 | | | | 1.10% |
| | Class S | | | 1,000.00 | | | | | 1,021.50 | | | | | 5.10 | | | | 1.00% |
____________________
| * | | Expenses are equal to the average account value over the period, multiplied by the Fund’s annualized expense ratio, multiplied by 184/365 (to reflect the one half year period). |
72 HSBC FAMILY OF FUNDS
| HSBC FAMILY OF FUNDS |
| Table of Shareholder Expenses — as of October 31, 2013 (Unaudited) (continued) |
Hypothetical Example for Comparison Purposes
The table below provides information about hypothetical account values and hypothetical expenses based on each Fund’s actual expense ratio and an assumed rate of return of 5% per year before expenses, which is not the Fund’s actual return. The hypothetical account values and expenses may not be used to estimate the actual ending account balance or expenses you paid for the period. You may use this information to compare this 5% hypothetical example with the 5% hypothetical examples that appear in the shareholder reports of other funds.
Please note that the expenses shown in the table are meant to highlight your ongoing costs only and do not reflect any transactional costs, such as sales charges (loads), redemption fees, or exchange fees. Therefore, the table is useful in comparing ongoing costs only, and will not help you determine the relative total costs of owning different funds. In addition, if these transactional costs were included, your costs would have been higher.
| | | | | | | | | | | | | | | | | | Annualized |
| | | | Beginning | | Ending | | Expenses Paid | | Expense Ratio |
| | | | Account Value | | Account Value | | During Period* | | During Period |
| | | | 5/1/13 | | 10/31/13 | | 5/1/13 - 10/31/13 | | 5/1/13 - 10/31/13 |
| Emerging Markets Debt Fund | | Class A | | | $1,000.00 | | | | $ | 1,019.16 | | | | $ | 6.11 | | | | 1.20 | % | |
| | Class I | | | 1,000.00 | | | | | 1,020.92 | | | | | 4.33 | | | | 0.85 | % | |
| | Class S | | | 1,000.00 | | | | | 1,021.42 | | | | | 3.82 | | | | 0.75 | % | |
| Emerging Markets Local Debt Fund | | Class A | | | 1,000.00 | | | | | 1,019.16 | | | | | 6.11 | | | | 1.20 | % | |
| | Class I | | | 1,000.00 | | | | | 1,020.92 | | | | | 4.33 | | | | 0.85 | % | |
| | Class S | | | 1,000.00 | | | | | 1,021.42 | | | | | 3.82 | | | | 0.75 | % | |
| Frontier Markets Fund | | Class A | | | 1,000.00 | | | | | 1,014.12 | | | | | 11.17 | | | | 2.20 | % | |
| | Class I | | | 1,000.00 | | | | | 1,015.88 | | | | | 9.40 | | | | 1.85 | % | |
| Total Return Fund | | Class A | | | 1,000.00 | | | | | 1,017.24 | | | | | 8.03 | | | | 1.58 | % | |
| | Class I | | | 1,000.00 | | | | | 1,019.00 | | | | | 6.26 | | | | 1.23 | % | |
| | Class S | | | 1,000.00 | | | | | 1,019.51 | | | | | 5.75 | | | | 1.13 | % | |
| RMB Fixed Income Fund | | Class A | | | 1,000.00 | | | | | 1,017.90 | | | | | 7.37 | | | | 1.45 | % | |
| | Class I | | | 1,000.00 | | | | | 1,019.66 | | | | | 5.60 | | | | 1.10 | % | |
| | Class S | | | 1,000.00 | | | | | 1,020.16 | | | | | 5.09 | | | | 1.00 | % | |
____________________
| * | | Expenses are equal to the average account value over the period, multiplied by the Fund’s annualized expense ratio, multiplied by 184/365 (to reflect the one half year period). |
HSBC FAMILY OF FUNDS 73
| HSBC FAMILY OF FUNDS |
| Board of Trustees and Officers (Unaudited) |
MANAGEMENT OF THE TRUST
The following table contains information regarding the HSBC Family of Funds’ Board of Trustees (“Trustees”). Asterisks indicate those Trustees who are “interested persons,” as defined in the Investment Company Act of 1940, as amended, of the HSBC Family of Funds. The HSBC Family of Funds’ Statement of Additional Information includes additional information about the Trustees and is available, without charge, upon request by calling (888) 525-5757.
| | | | | | | | Portfolios in | | |
| | Position(s) | | Term of Office | | | | Fund Complex | | Other |
| Name, | | Held with | | and Length of | | Principal Occupation(s) | | Overseen By | | Directorships |
| Address, Age | | Funds | | Time Served | | During Past 5 Years | | Trustee* | | Held by Trustee |
| NON-INTERESTED | | | | | | | | | | |
| TRUSTEES | | | | | | | | | | |
| | | | | | | | | | | |
MARCIA L. BECK
P.O. Box 182845
Columbus, OH
43218-3035
Age: 58 | | Trustee | | Indefinite;
2008 to present | | Private Investor (June 1999 – present); Executive Vice President, Prudential Investments (1997 – 1999); President and Trustee, The Goldman Sachs Mutual Funds (1992 – 1996) | | 21 | | None |
| | | | | | | | | | | |
SUSAN C. GAUSE
P.O. Box 182845
Columbus, OH
43218-3035
Age: 60 | | Trustee | | Indefinite;
2013 to present | | Since 2003, Private Investor; Independent Trustee of Met Investors Series Trust (2008-2012); Chief Executive Officer, Dresdner RCM Global Investors and Allianz Dresdner Asset Management (2000-2002); Board Member of Dresdner Global Asset Management Board (2000-2002); Chief Operating Officer and Senior Managing Director of Dresdner RCM Global Investors (1998-2000) | | 21 | | Since 2012, Trustee,
Metropolitan Series Fund |
| | | | | | | | | | | |
SUSAN S. HUANG
P.O. Box 182845
Columbus, OH
43218-3035
Age: 59 | | Trustee | | Indefinite;
2008 to present | | Private Investor (2000- present); Senior Vice President, Schroder Investment Management (2001 – 2004); Managing Director, Chase Asset Management (1995-2000) | | 21 | | None |
| | | | | | | | | | | |
ALAN S. PARSOW
P.O. Box 182845
Columbus, OH
43218-3035
Age: 63 | | Trustee | | Indefinite;
1987 to present | | General Partner, Elkhorn Partners, L.P. (a private investment partnership) (1989 – present) | | 21 | | None |
| | | | | | | | | | | |
THOMAS F. ROBARDS
P.O. Box 182845
Columbus, OH
43218-3035
Age: 67 | | Trustee | | Indefinite;
2005 to present | | Partner, Robards & Co. LLC (investment and advisory services) (2005-present); Chief Financial Officer, American Museum of Natural History (2003-2004); Chief Financial Officer, Datek Online Holdings (2000-2003); Previously EVP and CFO Republic New York Corporation | | 21 | | Overseas
Shipholding Group
(energy transportation);
Ellington Financial LLC
(NYSE listed financial
services); Ellington
Residential Mortgage
REIT (NYSE listed real
estate investment trust) |
| | | | | | | | | | | |
MICHAEL SEELY
P.O. Box
182845
Columbus, OH
43218-3035
Age: 68 | | Chairman and
Trustee | | Indefinite;
1987 to present | | Private Investor (2003-present); General Partner, Global Multi Manager Partners (1999-2003); President of Investor Access Corporation (1981-2003) | | 21 | | None |
| | | | | | | | | | | |
INTERESTED TRUSTEE | | | | | | | | | | |
| | | | | | | | | | | |
DEBORAH HAZELL
452 Fifth Avenue
New York
NY 10018
Age: 50 | | Trustee | | Indefinite;
2011 to present | | CEO, HSBC Global Asset Management (USA) Inc. (2011-present); President and CEO, Fisher Francis Trees & Watts (“FFTW”) (investment advisor), February 2008-June 2011; Head of Client Service, Business Development and Marketing Group, FFTW (October 1999-February 2008) | | 21 | | None |
____________________
* | | Includes the Trust, the HSBC Advisor Fund Trust and the HSBC Portfolios. |
74 HSBC FAMILY OF FUNDS
| HSBC FAMILY OF FUNDS |
| Board of Trustees and Officers (Unaudited) (continued) |
| | Position(s) Held | | Term of Office and | | Principal Occupation(s) |
| Name, Address, Age | | Funds | | Length of Time Served | | During Past 5 Years |
OFFICERS | | | | | | |
| | | | | | | |
RICHARD A. FABIETTI
452 Fifth Avenue
New York, NY 10018
Age: 55 | | President | | One year;
2004 to present | | Senior Vice President, Head of Product Management, HSBC Global Asset Management (USA) Inc. (1998 - present) |
| | | | | | | |
STEPHEN SIVILLO
452 Fifth Avenue
New York, NY 10018
Age: 42 | | Vice President | | One year;
2010 to present | | Vice President of Product Administration, HSBC Global Asset Management (USA) Inc. (2010 - present); Chief Compliance Officer, Managers Funds (2009 – 2010); Director, Mutual Fund Compliance, AllianceBernstein (2007-2009) |
| | | | | | | |
TY EDWARDS*
3435 Stelzer Road
Columbus, OH 43219-3035
Age: 47 | | Treasurer | | One year;
2010 to present | | Senior Vice President, Citi Fund Services (2010– present); Director, Product Management, Columbia Management (2007-2009); Deputy Treasurer, Columbia Funds, (2006-2007) |
| | | | | | | |
JENNIFER A. ENGLISH*
100 Summer Street
Suite 1500
Boston,
MA 02110
Age: 41 | | Secretary | | One year;
2008 to present | | Senior Vice President, Regulatory Administration, Citi (2005 - present) |
| | | | | | | |
FREDERICK J. SCHMIDT*
1 Rexcorp Plaza
Uniondale, NY 11556
Age: 54 | | Chief Compliance
Officer | | One year;
2004 to present | | Director and Chief Compliance Officer, CCO Services, Citi (2004 - present) |
____________________
* | | Mr. Edwards, Mr. Schmidt, and Ms. English also are officers of other investment companies of which Citi (or an affiliate) is the administrator or sub-administrator. |
HSBC FAMILY OF FUNDS 75
Other Information (Unaudited):
A description of the policies and procedures the Funds use to determine how to vote proxies relating to portfolio securities of each Fund, and information regarding how the Funds voted proxies relating to portfolio securities during the most recent 12-month period ended June 30th is available (i) without charge, upon request, by calling 1-800-525-5757 for HSBC Bank USA and HSBC Brokerage (USA) Inc. clients and 1-800-782-8183 for all other shareholders; (ii) on the Funds’ website at www.emfunds.us.hsbc.com or at www.investorfunds.us.hsbc.com; and (iii) on the Securities and Exchange Commission’s (“Commission”) website at http://www.sec.gov.
The Funds file their complete schedules of portfolio holdings with the Commission for the first and third quarters of each fiscal year on Form N-Q. The Funds’ Forms N-Q are available on the Commission’s website at http://www.sec.gov. The Funds’ Forms N-Q may be reviewed and copied at the Commission’s Public Reference Room in Washington, D.C. and information on the operation of the Public Reference Room may be obtained by calling 1-800-SEC-0330. The Funds’ Schedules of Investments will be available no later than 60 days after each period end, without charge, on the Funds’ website at www.emfunds.us.hsbc.com or at www.investorfunds.us.hsbc.com.
An investment in a Fund is not a deposit of HSBC Bank USA, N.A., and is not insured or guaranteed by the Federal Deposit Insurance Corporation or any other government agency.
76 HSBC FAMILY OF FUNDS
HSBC FAMILY OF FUNDS: INVESTMENT ADVISER AND ADMINISTRATOR HSBC Global Asset Management (USA) Inc.
452 Fifth Avenue
New York, NY 10018 SHAREHOLDER SERVICING AGENTS For HSBC Bank USA, N.A. and
HSBC Securities (USA) Inc. Clients:
HSBC Bank USA, N.A.
452 Fifth Avenue
New York, NY 10018
1-888-525-5757 For All Other Shareholders: HSBC Funds
P.O. Box 182845
Columbus, OH 43218
1-800-782-8183 TRANSFER AGENT Citi Fund Services
3435 Stelzer Road
Columbus, OH 43219 DISTRIBUTOR Foreside Distribution Services, L.P.
690 Taylor Road, Suite 150
Gahanna, Ohio 43230 | | CUSTODIAN The Northern Trust Company
50 South LaSalle Street
Chicago, IL 60603 INDEPENDENT REGISTERED PUBLIC ACCOUNTING FIRM KPMG LLP
191 West Nationwide Blvd., Suite 500
Columbus, OH 43215 LEGAL COUNSEL Dechert LLP
1900 K Street, N.W.
Washington, D.C. 20006 |
| | | |
| | | |
| | | |
| | | |
| | | |
| | | |
| | | |
| | | |
| | | |
| | | |
| | |
Investment products:
ARE NOT A
BANK DEPOSIT
OR OBLIGATION
OF THE BANK
OR ANY OF ITS
AFFILIATES | ARE NOT
FDIC
INSURED | ARE NOT
INSURED BY
ANY FEDERAL
GOVERNMENT
AGENCY |
ARE NOT GUARANTEED BY
THE BANK OR ANY OF ITS
AFFILIATES | MAY LOSE
VALUE |
Investment products are offered by HSBC Securities (USA) Inc. (HSI), member NYSE/FINRA/SIPC. HSI is an affiliate of HSBC Bank USA, N.A. Investment products: Are not a deposit or other obligation of the bank or any of its affiliates; Not FDIC insured or insured by any federal government agency of the United States; Not guaranteed by the bank or any of its affiliates; and are subject to investment risk, including possible loss of principal invested.
HSBC Global Asset Management (USA) Inc.
HSBC World Selection™ Funds
Annual Report
October 31, 2013
| WORLD SELECTION FUNDS | Class A | | Class B | | Class C |
| Aggressive Strategy Fund | HAAGX | | HBAGX | | HCAGX |
| Balanced Strategy Fund | HAGRX | | HSBGX | | HCGRX |
| Moderate Strategy Fund | HSAMX | | HSBMX | | HSCMX |
| Conservative Strategy Fund | HACGX | | HBCGX | | HCCGX |
| Income Strategy Fund | HINAX | | HINBX | | HINCX |

| Table of Contents |
| HSBC World Selection Funds |
| Annual Report - October 31, 2013 |
| Glossary of Terms | |
| President’s Message | 4 |
| Commentary From the Investment Manager | 5 |
| Portfolio Reviews | 6 |
| Portfolio Composition | 16 |
| | |
| Schedules of Portfolio Investments | |
| Aggressive Strategy Fund | 18 |
| Balanced Strategy Fund | 19 |
| Moderate Strategy Fund | 20 |
| Conservative Strategy Fund | 21 |
| Income Strategy Fund | 22 |
| Statements of Assets and Liabilities | 23 |
| Statements of Operations | 24 |
| Statements of Changes in Net Assets | 25 |
| Financial Highlights | 31 |
| Notes to Financial Statements | 36 |
| Report of Independent Registered Public Accounting Firm | 46 |
| Other Federal Income Tax Information | 47 |
| Table of Shareholder Expenses | 48 |
| |
| HSBC Portfolios | |
| Schedules of Portfolio Investments | |
| HSBC Growth Portfolio | 50 |
| HSBC Opportunity Portfolio | 52 |
| Statements of Assets and Liabilities | 54 |
| Statements of Operations | 55 |
| Statements of Changes in Net Assets | 56 |
| Financial Highlights | 57 |
| Notes to Financial Statements | 58 |
| Report of Independent Registered Public Accounting Firm | 63 |
| Table of Shareholder Expenses | 64 |
| Board of Trustees and Officers | 65 |
| Other Information | 67 |
The World Selection Funds (the “Funds”) are “fund of funds” which aim to provide superior risk adjusted returns relative to a single asset class investment over the long term by investing primarily in underlying funds. The underlying funds may include mutual funds managed by HSBC Global Asset Management (USA) Inc. (the “Adviser”), mutual funds managed by investment advisers that are not associated with the Adviser and exchange traded funds (“ETFs”) (collectively, “Underlying Funds”). The Funds may also purchase or hold exchange traded notes (“ETNs”). The Funds’ broadly diversified investment approach across various asset classes and investment styles aims to contribute to achieving their objectives. Each World Selection Fund has a strategic asset allocation which represents a carefully constructed blend of asset classes, regions and currencies to meet longer term investment goals.
Barclays U.S. Aggregate Bond Index is an unmanaged index generally representative of investment-grade, USD-denominated, fixed-rate debt issues, taxable bond market, including Treasuries, government-related and corporate securities, asset-backed, mortgage-backed and commercial mortgage-backed securities, with maturities of at least one year.
Barclays U.S. Corporate High-Yield Bond Index is an unmanaged index that measures the non-investment grade, USD-denominated, fixed-rate, taxable corporate bond market. Securities are classified as high-yield if the middle rating of Moody’s, Fitch, and S&P is Ba1/BB+/BB+ or below. The index excludes emerging markets debt.
BofA Merrill Lynch U.S. High Yield Master II Index is an unmanaged index that tracks the performance of USD-denominated, below investment grade corporate debt publicly issued in the U.S. domestic market.
Citigroup U.S. Domestic 3-Month Treasury Bill Index is an unmanaged market value-weighted index of public obligations of the U.S. Treasury with maturities of three months.
Gross Domestic Product (“GDP”) measures the market value of the goods and services produced by labor and property in the United States.
Morgan Stanley Capital International Europe Australasia and Far East (“MSCI EAFE”) Index is an unmanaged equity index which captures large and mid cap representation across Developed Markets countries: Australia, Austria, Belgium, Denmark, Finland, France, Germany, Greece, Hong Kong, Ireland, Israel, Italy, Japan, the Netherlands, New Zealand, Norway, Portugal, Singapore, Spain, Sweden, Switzerland and the UK (excluding the US and Canada). With 910 constituents, the index covers approximately 85% of the free float-adjusted market capitalization in each country.
Morgan Stanley Capital International Emerging Market (“MSCI EM”) Index is an unmanaged index that captures large and mid cap representation across 21 Emerging Markets (EM) countries: Brazil, Chile, China, Colombia, Czech Republic, Egypt, Hungary, India, Indonesia, Korea, Malaysia, Mexico, Morocco, Peru, Philippines, Poland, Russia, South Africa, Taiwan, Thailand and Turkey. With 818 constituents, the index covers approximately 85% of the free float-adjusted market capitalization in each country.
Russell 2000® Index is an unmanaged index that measures the performance of the small-cap segment of the U.S. equity universe. The Russell 2000® Index is a subset of the Russell 3000® Index representing approximately 10% of the total market capitalization of that index. It includes approximately 2000 of the smallest securities based on a combination of their market cap and current index membership.
Standard & Poor’s 500 (“S&P 500”) Index is an unmanaged index that is widely regarded as a gauge of the U.S. equities market. This index includes 500 leading companies in leading industries of the U.S. economy. The S&P 500 Index focuses on the large-cap segment of the market, with approximately 75% coverage of U.S. equities.
Securities indices assume reinvestment of all distributions and interest payments and do not take in account brokerage fees or expenses. Securities in the Funds do not match those in the indices and performance of the Funds will differ. Investors cannot invest directly in an index.
Dear Shareholder,
We are pleased to send to you the HSBC Funds annual report, covering the fiscal year ended October 31, 2013. This report contains detailed information about your Funds’ portfolio of investments and operating results. We encourage you to review it carefully.
This report includes commentary from the Funds’ portfolio managers in which they discuss the investment markets and their respective Fund’s performance. The portfolio manager commentary is accompanied by the Fund’s return for the period, listed alongside the returns of its benchmark index and peer group average for comparative purposes.
In closing, we would like to thank you for investing in the HSBC Funds. We continue to focus the HSBC Fund Family on investment solutions to assist our shareholders in reaching their financial goals. We appreciate the trust you place in us, and will continue working to earn it. Please contact us at any time with questions or concerns.
Sincerely,

| Richard A. Fabietti |
| President |
4 HSBC FAMILY OF FUNDS
| Commentary From the Investment Manager |
| HSBC Global Asset Management (USA) Inc. |
U.S. Economic Review
Economic growth picked up pace in developing economies throughout the world during the 12-month period between November 1, 2012 and October 31, 2013. Many major economies, including the United States, reported improved economic data during the period, indicating new momentum for a modest but sustained recovery. The U.S. equity markets made strong gains during the period, boosted by improvements in the labor and housing markets and healthy corporate profits. Markets continued to benefit from the Federal Reserve Board’s (the “Fed”) decision to maintain the federal funds rate—a key factor in lending rates—at a historically low target range between 0.00% and 0.25%. Economic headwinds remained, however, including relatively high unemployment in some areas, low consumer spending and reduced government spending caused by sequestration.
Investor confidence declined mid-year due in part to expectations that the Fed would begin tapering its bond purchasing program. Concerns about the impact of tapering diminished, however, when the Fed announced in September that it would delay winding down its stimulus efforts until the unemployment rate fell significantly lower. The first shutdown of the U.S. government in 17 years occurred in October. This political crisis, along with the related standoff over raising the country’s borrowing limit, was another factor weighing on investor sentiment. The uncertainty surrounding the crisis dragged on equities, although markets regained momentum once a political deal was struck that reopened the government and raised the debt ceiling. Broad U.S. stock market indices ended the period significantly above where they were positioned 12 months earlier.
Improving political circumstances in the eurozone and positive economic data helped boost stocks in developed economies across the world. The economies of both Japan and Europe transitioned out of recession. Progress was made toward alleviating the sovereign debt crisis in Europe. The European Central Bank’s aggressive efforts, including its government bond-buying program known as Outright Monetary Transactions, reassured investors. Still, many developments in Europe revealed ongoing economic weaknesses, including a controversial bailout in Cyprus, political uncertainty in Italy and high unemployment throughout the eurozone.
Economic growth in many emerging markets slowed during the period, as concerns grew about rising inflation and potential decreases in global liquidity. In addition, signs of softening in China’s economy led to a fall in commodity prices, which dragged on stocks throughout emerging markets. Central banks in both India and Brazil fought rising inflation by raising interest rates.
The recovery of the U.S. housing market remained robust. New home sales and housing starts increased, though the pace of growth slowed late in the period. Although the unemployment rate gradually edged downward, it remained well above pre-recession levels. Moreover, the number of long-term unemployed individuals, including those who dropped out of the labor market entirely, remained high. Real income grew at a modest pace, but consumer spending remained weak, consumer confidence dropped sharply and personal savings rates slowed. Economic activity in the manufacturing sector expanded during the period, though the rate of growth slowed.
U.S. Gross Domestic Product1 growth increased each quarter during the period, expanding at a rate of 0.1% during the fourth quarter of 2012 and quickening to a rate of 2.8% in the third quarter of 2013, according to preliminary estimates.
Market Review
The period began with U.S. markets retreating slightly due to the political face-off over the “fiscal cliff” and concerns about ongoing turmoil related to eurozone sovereign debt.
Equities then regained momentum in the first quarter of 2013 and began a steady rally that persisted through the duration of the period with only a few brief interruptions. The strong performance of equities was undeterred by uncertainty about government policy and concerns that the onset of automatic budget cuts—known as sequestration—would undermine economic growth. A political compromise that avoided the direst consequences of the fiscal cliff, along with improvement in the housing market, helped buoy investor confidence and fuel gains in the equity markets.
During the middle of the period equity prices fell as investors anticipated an imminent decrease in central bank liquidity. Stocks rebounded after the Fed delayed tapering its bond-purchasing program, with the S&P 500 Index1 hitting a then-record high following the announcement. Equities ended the period in a rally that was spurred by the political deal that partially resolved the government shutdown and a second standoff over the debt ceiling.
Small- and mid-cap stocks outperformed large-cap stocks during the period, and emerging markets generally underperformed developed economies. The Russell 2000® Index1 of small-company stocks returned 36.28% and the MSCI Emerging Market Index1 of emerging market stocks returned 6.90%.
Stocks in developed economies rose. Japanese equities performed well due to optimism regarding its central bank’s ambitious monetary easing schedule, which aimed to double the size of the monetary base over the next two years. International stocks made strong gains, slightly outperforming U.S. markets. The S&P 500 Index of large-company U.S. stocks returned 27.18% for the 12 months through October 2013. That compared to a 27.40% return for the MSCI EAFE Index1 of international stocks in developed markets.
Rising interest rates, widening credit spreads and uncertainty about government policy resulted in weak performance in the U.S. fixed-income market during the period. Yields on U.S. Treasury bonds increased during the period, sending prices lower. Investment-grade corporate bonds also declined. Investors sought the more attractive yields offered by high-yield corporate bonds and high-yield municipal bonds, which were among the best-performing fixed-income sectors during the period. The Barclays U.S. Aggregate Bond Index1, which tracks the broad investment-grade fixed-income market, returned -1.08% for the 12 months through October, while the Barclays U.S. Corporate High-Yield Bond Index1 returned 8.87%. Fixed-income markets in Europe generated modest returns, while fixed-income in emerging markets ended the period significantly lower, despite a modest rebound in the final months of the period.
1 For additional information, please refer to the Glossary of Terms.
HSBC FAMILY OF FUNDS 5
| Portfolio Reviews (Unaudited) |
| Aggressive Strategy Fund |
| (Class A Shares, Class B Shares and Class C Shares) |
by Randeep Brar, CFA, Senior Vice President/Portfolio Manager
Caroline Hitch, Senior Portfolio Manager
The Aggressive Strategy Fund (the “Fund”) is a “fund of funds” which seeks long-term growth of capital by investing primarily in underlying funds. The underlying funds may include mutual funds managed by HSBC Global Asset Management (USA) Inc. (the “Adviser”), mutual funds managed by investment advisers that are not associated with the Adviser and exchange traded funds (“ETFs”) (collectively, “Underlying Funds”). The Fund may also purchase or hold exchange traded notes (“ETNs”).
Investment Concerns
Allocation Risk: The risk that the Adviser’s target asset and sector allocations and changes in target asset and sector allocations cause the Fund to underperform other similar funds or cause you to lose money, and that the Fund may not achieve its target asset and sector allocations.
Underlying Fund Selection Risk: The risk that the Fund may invest in Underlying Funds that underperform other similar funds or the markets more generally, due to poor investment decisions by the investment adviser(s) for the Underlying Funds or otherwise. Underlying Funds also have their own expenses, which the Fund bears in addition to its own expenses.
Equity Securities Risk: A portion of the assets of the Fund is allocated to Underlying Funds investing primarily in equity securities. Therefore, the value of the Fund may increase or decrease as a result of its indirect interest in equity securities.
Fixed Income Securities Risk: A portion of the assets of the Fund is allocated to Underlying Funds investing primarily in fixed income securities. Therefore, the value of the Fund may increase or decrease as a result of its indirect interest in fixed income securities.
Foreign Securities/Emerging Markets Risk: Foreign securities, including those of emerging market issuers, are subject to additional risks including international trade, currency, political, and regulatory risks. Securities of emerging market issuers generally have more risk than securities issued by issuers in more developed foreign markets. For a complete description of these and other risks associated with investment in a mutual fund, please refer to the Fund’s prospectus.
Market Commentary
The Fund returned 22.38% (without sales charge) for the Class A Shares for the year ended October 31, 2013. That compared to a 27.18% total return for the Fund’s primary benchmark, the S&P 500 Index1.
The Fund measures performance against several additional reference indices for the year ended October 31, 2013: the MSCI EAFE Index1 (27.40% total return), Barclays U.S. Aggregate Bond Index1 (-1.08% total return), Bank of America/Merrill Lynch U.S. High Yield Master II Index1 (8.83% total return) and Citigroup U.S. Domestic 3-Month Treasury Bill Index1 (0.06% total return).
Portfolio Performance
Economic activity across the developed world gained momentum during the 12 months through October 31, 2013. Accommodative monetary policies in the U.S., Europe, and Japan helped fuel modest economic growth, and investors’ appetites for riskier asset classes such as equities grew during the period.
However, global financial markets closely watched U.S. policy developments during the period. In particular, the U.S. Federal Reserve (the Fed) signaled midway through the period that it might begin tapering its ongoing stimulus efforts. That led to considerable volatility in the global financial markets. However, market sentiment surged later in the period when the Fed announced it would keep its stimulus efforts intact.
In Europe, considerable progress was made in bringing the eurozone debt crisis under control. In the second quarter of 2013, the eurozone economy grew by an estimated 0.3%, ending a period of six consecutive quarters of recession.
Emerging markets lagged their developed market peers during the period. Such markets were very sensitive to Fed policy and the prospect of declining global liquidity if accommodative monetary policies were tightened.
The Fund did benefit from its overweight position in U.S. and international equities. However, as the Fund is a multi-asset portfolio and includes many asset classes to achieve its risk/return profile, the Fund did not capture the full benefit of the strong performance of U.S. and international equities. At the same time, the Fund performed better than its reference fixed-income indices, including the Barclays U.S. Aggregate Bond Index, which performed poorly during the 12-month period.
In this environment, the Fund was positioned with a modest overweight in developed market equities. We believed developed market equities offered appealing valuations, particularly compared to developed market government bonds, which were trading at historically low yields. The Fund’s allocation to domestic equities was the primary driver of returns during the period. In addition, the Fund benefited from its neutral weighting to emerging markets equities, as such stocks considerably underperformed their developed market peers during the period.
The Fund began the period with an underweight position in U.S. aggregate bonds, and its exposure to these bonds was reduced several times during the period as Treasury yields remained at historical lows. That strategy added value to the Fund’s overall performance during the period. Additionally, the Fund benefited from its overweight position in U.S. high-yield credit, as investors searching for yield sparked demand for such securities.
The portfolio’s exposure to alternative investments was little changed during the period. The Fund benefited from an underweight position in commodities, which performed very poorly. An overweight position in property benefited the Fund, as did the portfolio’s private equity allocation, which performed very well during the period.†
| † | | Portfolio composition is subject to change. |
| 1 | | For additional information, please refer to the Glossary of Terms. |
Past performance does not guarantee future results. The performance data quoted represents past performance and current returns may be lower or higher. Total return figures include change in share price, reinvestment of dividends and capital gains and do not reflect taxes that a shareholder would pay on Fund distributions or on the redemption of Fund shares. Investment return and principal value will fluctuate so that an investor’s shares, when redeemed may be worth more or less than the original cost. To obtain performance information current to the most recent month end, please call 1-800-782-8183.
6 HSBC FAMILY OF FUNDS
| Portfolio Reviews (Unaudited) |
| Aggressive Strategy Fund |

The charts above represent a historical since inception performance comparison of a hypothetical $10,000 investment in the indicated share class versus a similar investment in the Fund’s benchmark and represents the reinvestment of dividends and capital gains in the Fund.
| | | | | | Average Annual | | Expense |
| Fund Performance | | | | | | Total Return (%) | | Ratio (%)4 |
| | Inception | | 1 | | 5 | | Since | | | | |
| As of October 31, 2013 | | Date | | Year | | Year | | Inception | | Gross | | Net |
| Aggressive Strategy Fund Class A1 | | | 2/14/05 | | | 16.28 | | | 11.84 | | 5.67 | | | 2.26 | | 2.10 |
| Aggressive Strategy Fund Class B2 | | | 2/9/05 | | | 17.44 | | | 12.14 | | 5.77 | | | 3.01 | | 2.85 |
| Aggressive Strategy Fund Class C3 | | | 6/9/05 | | | 20.45 | 7 | | 12.16 | | 6.06 | | | 3.01 | | 2.85 |
| S&P 500 Index5 | | | — | | | 27.18 | | | 15.17 | | 6.76 | 6 | | N/A | | N/A |
| MSCI EAFE Index5 | | | — | | | 27.40 | | | 12.52 | | 6.12 | 6 | | N/A | | N/A |
| Barclays U.S. Aggregate Bond Index5 | | | — | | | -1.08 | | | 6.09 | | 4.67 | 6 | | N/A | | N/A |
| BofA Merrill Lynch U.S. High Yield Master II Index5 | | | — | | | 8.83 | | | 18.03 | | 8.22 | 6 | | N/A | | N/A |
| Citigroup U.S. Domestic 3-Month Treasury Bill Index5 | | | — | | | 0.06 | | | 0.12 | | 1.66 | 6 | | N/A | | N/A |
Past performance does not guarantee future results. The performance data quoted represents past performance and current returns may be lower or higher. Total return figures include change in share price, reinvestment of dividends and capital gains and do not reflect the taxes that a shareholder would pay on Fund distributions or on the redemption of Fund shares. Investment return and principal value will fluctuate so that an investor’s shares, when redeemed may be worth more or less than the original cost. To obtain performance information current to the most recent month end, please call 1-800-782-8183.
The performance above reflects any fee waivers that have been in effect during the applicable periods, as well as any expense reimbursements that have periodically been made. Absent such waivers and reimbursements, returns would have been lower. Currently, contractual fee waivers are in effect for the Fund through March 1, 2014.
Certain returns shown include monies received by series of HSBC Portfolios (the “Portfolios”), in which the Fund invests, in respect of one-time class action settlements. As a result, the Fund’s total returns for those periods were higher than they would have been had the Portfolios not received the payments.
| 1 | | Reflects the maximum sales charge of 5.00%. |
| 2 | | Reflects the applicable contingent deferred sales charge, maximum of 4.00%. |
| 3 | | Reflects the applicable contingent deferred sales charge, maximum of 1.00%. |
| 4 | | Reflects the expense ratios as reported in the prospectus dated February 28, 2013. The Adviser has entered into a contractual expense limitation agreement with the Fund under which it will limit total expenses of the Fund (excluding interest, taxes, brokerage commissions, extraordinary expenses and estimated indirect expenses attributable to the Fund’s investments in investment companies other than the HSBC Growth Portfolio and the HSBC Opportunity Portfolio) to an annual rate of 1.50%, 2.25%, and 2.25% for Class A Shares, Class B Shares and Class C Shares, respectively. The expense limitation shall be in effect until March 1, 2014. The expense ratios reflected include Acquired Fund fees and expenses. Additional information pertaining to the October 31, 2013 expense ratios can be found in the financial highlights. |
| 5 | | For additional information, please refer to the Glossary of Terms. |
| 6 | | Return for the period February 9, 2005 to October 31, 2013. |
| 7 | | The recent appreciation in the stock market has helped to produce short-term returns that are not typical and may not continue in the future. Because of ongoing market volatility, fund performance may be subject to substantial short-term changes. |
The Fund’s performance is primarily measured against the S&P 500 Index, an unmanaged index that is widely regarded as a gauge of the U.S. equities market. This index includes 500 leading companies in leading industries of the U.S. economy. Although the S&P 500 Index focuses on the large-cap segment of the market, with approximately 75% coverage of U.S. equities, it is also an ideal proxy for the total market. The performance of the index does not reflect the deduction of expenses associated with a mutual fund, such as investment management and fund accounting fees. The Fund’s performance reflects the deduction of fees for these value-added services. Investors cannot invest directly in an index.
HSBC FAMILY OF FUNDS 7
| Portfolio Reviews (Unaudited) |
| Balanced Strategy Fund |
| (Class A Shares, Class B Shares and Class C Shares) |
by Randeep Brar, CFA, Senior Vice President/Portfolio Manager
Caroline Hitch, Senior Portfolio Manager
The Balanced Strategy Fund (the “Fund”) is a “fund of funds” which seeks long-term growth of capital by investing primarily in underlying funds. The underlying funds may include mutual funds managed by HSBC Global Asset Management (USA) Inc. (the “Adviser”), mutual funds managed by investment advisers that are not associated with the Adviser and exchange traded funds (“ETFs”) (collectively, “Underlying Funds”). The Fund may also purchase or hold exchange traded notes (“ETNs”).
Investment Concerns
Allocation Risk: The risk that the Adviser’s target asset and sector allocations and changes in target asset and sector allocations cause the Fund to underperform other similar funds or cause you to lose money, and that the Fund may not achieve its target asset and sector allocations.
Underlying Fund Selection Risk: The risk that the Fund may invest in Underlying Funds that underperform other similar funds or the markets more generally, due to poor investment decisions by the investment adviser(s) for the Underlying Funds or otherwise. Underlying Funds also have their own expenses, which the Fund bears in addition to its own expenses.
Equity Securities Risk: A portion of the assets of the Fund is allocated to Underlying Funds investing primarily in equity securities. Therefore, the value of the Fund may increase or decrease as a result of its indirect interest in equity securities.
Fixed Income Securities Risk: A portion of the assets of the Fund is allocated to Underlying Funds investing primarily in fixed income securities. Therefore, the value of the Fund may increase or decrease as a result of its indirect interest in fixed income securities.
Foreign Securities/Emerging Markets Risk: Foreign securities, including those of emerging market issuers, are subject to additional risks including international trade, currency, political, and regulatory risks. Securities of emerging market issuers generally have more risk than securities issued by issuers in more developed foreign markets. For a complete description of these and other risks associated with investment in a mutual fund, please refer to the Fund’s prospectus.
Market Commentary
The Fund returned 15.76% (without sales charge) for the Class A Shares for the year ended October 31, 2013. That compared to a 27.18% total return for the Fund’s primary benchmark, the S&P 500 Index1.
The Fund measures performance against several additional reference indices for the year ended October 31, 2013: the MSCI EAFE Index1 (27.40% total return), Barclays U.S. Aggregate Bond Index1 (-1.08% total return), Bank of America/Merrill Lynch U.S. High Yield Master II Index1 (8.83% total return) and Citigroup U.S. Domestic 3-Month Treasury Bill Index1 (0.06% total return).
Portfolio Performance
Economic activity across the developed world gained momentum during the 12 months through October 31, 2013. Accommodative monetary policies in the U.S., Europe, and Japan helped fuel modest economic growth, and investors’ appetites for riskier asset classes such as equities grew during the period.
However, global financial markets closely watched U.S. policy developments during the period. In particular, the U.S. Federal Reserve (the Fed) signaled midway through the period that it might begin tapering its ongoing stimulus efforts. That led to considerable volatility in the global financial markets. However, market sentiment surged later in the period when the Fed announced it would keep its stimulus efforts intact.
In Europe, considerable progress was made in bringing the eurozone debt crisis under control. In the second quarter of 2013, the eurozone economy grew by an estimated 0.3%, ending a period of six consecutive quarters of recession.
Emerging markets lagged their developed market peers during the period. Such markets were very sensitive to Fed policy and the prospect of declining global liquidity if accommodative monetary policies were tightened.
The Fund did benefit from its overweight position in U.S. and international equities. However, as the Fund is a multi-asset portfolio and includes many asset classes to achieve its risk/return profile, the Fund did not capture the full benefit of the strong performance of U.S. and international equities. At the same time, the Fund performed better than its reference fixed-income indices, including the Barclays U.S. Aggregate Bond Index, which performed poorly during the 12-month period.
In this environment, the Fund was positioned with a modest overweight in developed market equities. We believed developed market equities offered appealing valuations, particularly compared to developed market government bonds, which were trading at historically low yields. The Fund’s allocation to domestic equities was the primary driver of returns during the period. Additionally, the Fund benefited from its neutral weighting to emerging markets equities, as such stocks considerably underperformed their developed market peers during the period.
The Fund began the period with an underweight position in U.S. aggregate bonds, and its exposure to these bonds was reduced several times during the period as Treasury yields remained at historical lows. That strategy added value to the Fund’s overall performance during the period. The Fund also benefited from its overweight positions in U.S. investment grade and high-yield credit, and its exposure to both hard and local currency emerging markets debt.
The portfolio’s exposure to alternative investments was little changed during the period. The Fund benefited from an underweight position in commodities, which performed very poorly. An overweight position in property benefited the Fund, as did the portfolio’s private equity allocation, which performed very well during the period.†
| † | | Portfolio composition is subject to change. |
| 1 | | For additional information, please refer to the Glossary of Terms. |
Past performance does not guarantee future results. The performance data quoted represents past performance and current returns may be lower or higher. Total return figures include change in share price, reinvestment of dividends and capital gains and do not reflect taxes that a shareholder would pay on Fund distributions or on the redemption of Fund shares. Investment return and principal value will fluctuate so that an investor’s shares, when redeemed may be worth more or less than the original cost. To obtain performance information current to the most recent month end, please call 1-800-782-8183.
8 HSBC FAMILY OF FUNDS
| Portfolio Reviews (Unaudited) |
| Balanced Strategy Fund |
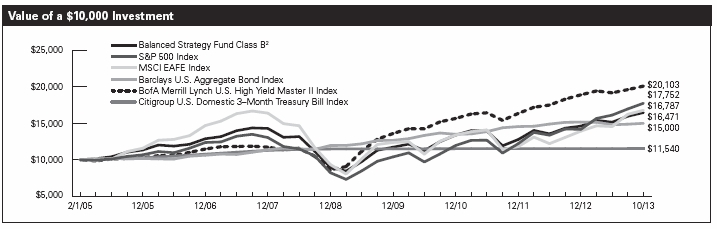
The charts above represent a historical since inception performance comparison of a hypothetical $10,000 investment in the indicated share class versus a similar investment in the Fund’s benchmark and represents the reinvestment of dividends and capital gains in the Fund.
| | | | Average Annual | | Expense |
| Fund Performance | | | | Total Return (%) | | Ratio (%)4 |
| | Inception | | 1 | | 5 | | Since | | | | |
| As of October 31, 2013 | | Date | | Year | | Year | | Inception | | Gross | | Net |
| Balanced Strategy Fund Class A1 | | 2/8/05 | | 9.94 | | 11.24 | | 5.68 | | | 1.77 | | 1.77 |
| Balanced Strategy Fund Class B2 | | 2/1/05 | | 10.89 | | 11.52 | | 5.87 | | | 2.52 | | 2.52 |
| Balanced Strategy Fund Class C3 | | 4/27/05 | | 13.87 | | 11.52 | | 6.17 | | | 2.52 | | 2.52 |
| S&P 500 Index5 | | — | | 27.18 | | 15.17 | | 6.78 | 6 | | N/A | | N/A |
| MSCI EAFE Index5 | | — | | 27.40 | | 12.52 | | 6.10 | 6 | | N/A | | N/A |
| Barclays U.S. Aggregate Bond Index5 | | — | | -1.08 | | 6.09 | | 4.75 | 6 | | N/A | | N/A |
| BofA Merrill Lynch U.S. High Yield Master II Index5 | | — | | 8.83 | | 18.03 | | 8.31 | 6 | | N/A | | N/A |
| Citigroup U.S. Domestic 3-Month Treasury Bill Index5 | | — | | 0.06 | | 0.12 | | 1.65 | 6 | | N/A | | N/A |
Past performance does not guarantee future results. The performance data quoted represents past performance and current returns may be lower or higher. Total return figures include change in share price, reinvestment of dividends and capital gains and do not reflect the taxes that a shareholder would pay on Fund distributions or on the redemption of Fund shares. Investment return and principal value will fluctuate so that an investor’s shares, when redeemed may be worth more or less than the original cost. To obtain performance information current to the most recent month end, please call 1-800-782-8183.
The performance above reflects any fee waivers that have been in effect during the applicable periods, as well as any expense reimbursements that have periodically been made. Absent such waivers and reimbursements, returns would have been lower.
Certain returns shown include monies received by series of HSBC Portfolios (the “Portfolios”), in which the Fund invests, in respect of one-time class action settlements. As a result, the Fund’s total returns for those periods were higher than they would have been had the Portfolios not received the payments.
| 1 | | Reflects the maximum sales charge of 5.00%. |
| 2 | | Reflects the applicable contingent deferred sales charge, maximum of 4.00%. |
| 3 | | Reflects the applicable contingent deferred sales charge, maximum of 1.00%. |
| 4 | | Reflects the expense ratios as reported in the prospectus dated February 28, 2013. The expense ratios reflected include Acquired Fund fees and expenses. Additional information pertaining to the October 31, 2013 expense ratios can be found in the financial highlights. |
| 5 | | For additional information, please refer to the Glossary of Terms. |
| 6 | | Return for the period February 1, 2005 to October 31, 2013. |
The Fund’s performance is primarily measured against the S&P 500 Index, an unmanaged index that is widely regarded as a gauge of the U.S. equities market. This index includes 500 leading companies in leading industries of the U.S. economy. Although the S&P 500 Index focuses on the large-cap segment of the market, with approximately 75% coverage of U.S. equities, it is also an ideal proxy for the total market. The performance of the index does not reflect the deduction of expenses associated with a mutual fund, such as investment management and fund accounting fees. The Fund’s performance reflects the deduction of fees for these value-added services. Investors cannot invest directly in an index.
HSBC FAMILY OF FUNDS 9
| Portfolio Reviews (Unaudited) |
Moderate Strategy Fund
(Class A Shares, Class B Shares and Class C Shares)
by Randeep Brar, CFA, Senior Vice President/Portfolio Manager
Caroline Hitch, Senior Portfolio Manager
The Moderate Strategy Fund (the “Fund”) is a “fund of funds” which seeks long-term growth of capital by investing primarily in underlying funds. The underlying funds may include mutual funds managed by HSBC Global Asset Management (USA) Inc. (the “Adviser”), mutual funds managed by investment advisers that are not associated with the Adviser and exchange traded funds (“ETFs”) (collectively, “Underlying Funds”). The Fund may also purchase or hold exchange traded notes (“ETNs”).
Investment Concerns
Allocation Risk: The risk that the Adviser’s target asset and sector allocations and changes in target asset and sector allocations cause the Fund to underperform other similar funds or cause you to lose money, and that the Fund may not achieve its target asset and sector allocations.
Underlying Fund Selection Risk: The risk that the Fund may invest in Underlying Funds that underperform other similar funds or the markets more generally, due to poor investment decisions by the investment adviser(s) for the Underlying Funds or otherwise. Underlying Funds also have their own expenses, which the Fund bears in addition to its own expenses.
Equity Securities Risk: A portion of the assets of the Fund is allocated to Underlying Funds investing primarily in equity securities. Therefore, the value of the Fund may increase or decrease as a result of its indirect interest in equity securities.
Fixed Income Securities Risk: A portion of the assets of the Fund is allocated to Underlying Funds investing primarily in fixed income securities. Therefore, the value of the Fund may increase or decrease as a result of its indirect interest in fixed income securities.
Foreign Securities/Emerging Markets Risk: Foreign securities, including those of emerging market issuers, are subject to additional risks including international trade, currency, political, and regulatory risks. Securities of emerging market issuers generally have more risk than securities issued by issuers in more developed foreign markets. For a complete description of these and other risks associated with investment in a mutual fund, please refer to the Fund’s prospectus.
Market Commentary
The Fund returned 10.80% (without sales charge) for the Class A Shares for the year ended October 31, 2013. That compared to a -1.08% total return for the Fund’s primary benchmark, the Barclays U.S. Aggregate Bond Index1.
The Fund measures performance against several additional reference indices for the year ended October 31, 2013: the S&P 500 Index1 (27.18% total return), MSCI EAFE Index1 (27.40% total return), Bank of America/Merrill Lynch U.S. High Yield Master II Index1 (8.83% total return) and Citigroup U.S. Domestic 3-Month Treasury Bill Index1 (0.06% total return).
Portfolio Performance
Economic activity across the developed world gained momentum during the 12 months through October 31, 2013. Accommodative monetary policies in the U.S., Europe and Japan helped fuel modest economic growth, and investors’ appetites for riskier asset classes such as equities grew during the period.
However, global financial markets closely watched U.S. policy developments during the period. In particular, the U.S. Federal Reserve (the “Fed”) signaled midway through the period that it may begin tapering its ongoing stimulus efforts, including its large-scale purchases of assets such as Treasury bonds. That led to considerable volatility in the global financial markets. However, market sentiment surged later in the period when the Fed announced it would keep its stimulus efforts intact.
In Europe, considerable progress was made in bringing the eurozone debt crisis under control. In the second quarter of 2013, the eurozone economy grew by an estimated 0.3%, ending a period of six consecutive quarters of recession. Additionally, Japanese equities performed extremely well during the period thanks in large part to government stimulus efforts in that country.
Emerging markets lagged their developed market peers during the period. Such markets were very sensitive to Fed policy and the prospect of declining global liquidity if accommodative monetary policies were tightened. What’s more, a number of prominent emerging economies also had to contend with growth and inflation concerns. For instance, economic activity in China—the world’s largest emerging economy—showed signs of softening before posting strong growth late in the period.
In this environment, the Fund was positioned with a modest overweight in developed market equities. We believed developed market equities offered appealing valuations, particularly compared to developed market government bonds, which were trading at historically low yields. The Fund’s allocation to domestic equities was the primary driver of returns during the period. The Fund also benefited from its neutral weighting to emerging markets equities, as such stocks considerably underperformed their developed market peers during the period.†
The Fund began the period with an underweight position in U.S. aggregate bonds, and its exposure to these bonds was reduced several times during the period as Treasury yields remained at historical lows. That strategy added value to the Fund’s overall performance. The Fund benefited from its overweight positions in U.S. investment grade and high-yield credit, and its exposure to both hard and local currency emerging markets debt.†
There was very little change to the portfolio’s exposure to alternative investments during the period. The Fund benefited from an underweight position in commodities, which performed very poorly. An overweight position in property benefited the Fund, as did the portfolio’s private equity allocation, which performed very well during the period.†
| † | | Portfolio composition is subject to change. |
| 1 | | For additional information, please refer to the Glossary of Terms. |
Past performance does not guarantee future results. The performance data quoted represents past performance and current returns may be lower or higher. Total return figures include change in share price, reinvestment of dividends and capital gains and do not reflect taxes that a shareholder would pay on Fund distributions or on the redemption of Fund shares. Investment return and principal value will fluctuate so that an investor’s shares, when redeemed may be worth more or less than the original cost. To obtain performance information current to the most recent month end, please call 1-800-782-8183.
10 HSBC FAMILY OF FUNDS
| Portfolio Reviews (Unaudited) |
| Moderate Strategy Fund |
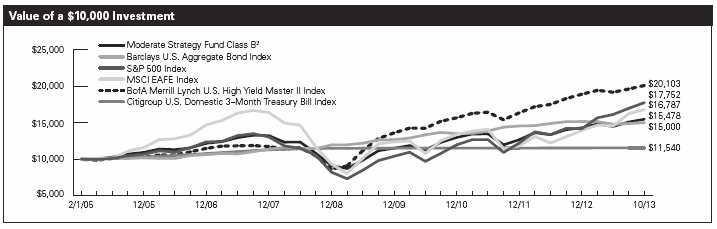
The charts above represent a historical since inception performance comparison of a hypothetical $10,000 investment in the indicated share class versus a similar investment in the Fund’s benchmark and represents the reinvestment of dividends and capital gains in the Fund.
| | | | Average Annual | | Expense |
| Fund Performance | | | | Total Return (%) | | Ratio (%)4 |
| | Inception | | 1 | | 5 | | Since | | | | |
| As of October 31, 2013 | | Date | | Year | | Year | | Inception | | Gross | | Net |
| Moderate Strategy Fund Class A1 | | 2/3/05 | | 5.22 | | 9.77 | | 4.98 | | | 1.79 | | 1.79 |
| Moderate Strategy Fund Class B2 | | 2/1/05 | | 6.04 | | 10.09 | | 5.12 | | | 2.54 | | 2.54 |
| Moderate Strategy Fund Class C3 | | 6/9/05 | | 8.96 | | 10.09 | | 5.13 | | | 2.54 | | 2.54 |
| Barclays U.S. Aggregate Bond Index5 | | — | | -1.08 | | 6.09 | | 4.75 | 6 | | N/A | | N/A |
| S&P 500 Index5 | | — | | 27.18 | | 15.17 | | 6.78 | 6 | | N/A | | N/A |
| MSCI EAFE Index5 | | — | | 27.40 | | 12.52 | | 6.10 | 6 | | N/A | | N/A |
| BofA Merrill Lynch U.S. High Yield Master II Index5 | | — | | 8.83 | | 18.03 | | 8.31 | 6 | | N/A | | N/A |
| Citigroup U.S. Domestic 3-Month Treasury Bill Index5 | | — | | 0.06 | | 0.12 | | 1.65 | 6 | | N/A | | N/A |
Past performance does not guarantee future results. The performance data quoted represents past performance and current returns may be lower or higher. Total return figures include change in share price, reinvestment of dividends and capital gains and do not reflect the taxes that a shareholder would pay on Fund distributions or on the redemption of Fund shares. Investment return and principal value will fluctuate so that an investor’s shares, when redeemed may be worth more or less than the original cost. To obtain performance information current to the most recent month end, please call 1-800-782-8183.
The performance above reflects any fee waivers that have been in effect during the applicable periods, as well as any expense reimbursements that have periodically been made. Absent such waivers and reimbursements, returns would have been lower.
Certain returns shown include monies received by series of HSBC Portfolios (the “Portfolios”), in which the Fund invests, in respect of one-time class action settlements. As a result, the Fund’s total returns for those periods were higher than they would have been had the Portfolios not received the payments.
| 1 | | Reflects the maximum sales charge of 5.00%. |
| 2 | | Reflects the applicable contingent deferred sales charge, maximum of 4.00%. |
| 3 | | Reflects the applicable contingent deferred sales charge, maximum of 1.00%. |
| 4 | | Reflects the expense ratios as reported in the prospectus dated February 28, 2013. The expense ratios reflected include Acquired Fund fees and expenses. Additional information pertaining to the October 31, 2013 expense ratios can be found in the financial highlights. |
| 5 | | For additional information, please refer to Glossary of Terms. |
| 6 | | Return for the period February 1, 2005 to October 31, 2013. |
The Fund’s performance is primarily measured against the Barclays U.S. Aggregate Bond Index is an unmanaged index generally representative of investment-grade, USD-denominated, fixed-rate debt issues, taxable bond market, including Treasuries, government-related and corporate securities, asset-backed, mortgage-backed and commercial mortgage-backed securities, with maturities of at least one year. The performance of the index does not reflect the deduction of expenses associated with a mutual fund, such as investment management and fund accounting fees. The Fund’s performance reflects the deduction of fees for these value-added services. Investors cannot invest directly in an index.
HSBC FAMILY OF FUNDS 11
| Portfolio Reviews (Unaudited) |
Conservative Strategy Fund
(Class A Shares, Class B Shares and Class C Shares)
by Randeep Brar, CFA, Senior Vice President/Portfolio Manager
Caroline Hitch, Senior Portfolio Manager
The Conservative Strategy Fund (the “Fund”) is a “fund of funds” which seeks long-term growth of capital by investing primarily in underlying funds. The underlying funds may include mutual funds managed by HSBC Global Asset Management (USA) Inc. (the “Adviser”), mutual funds managed by investment advisers that are not associated with the Adviser and exchange traded funds (“ETFs”) (collectively, “Underlying Funds”). The Fund may also purchase or hold exchange traded notes (“ETNs”).
Investment Concerns
Allocation Risk: The risk that the Adviser’s target asset and sector allocations and changes in target asset and sector allocations cause the Fund to underperform other similar funds or cause you to lose money, and that the Fund may not achieve its target asset and sector allocations.
Underlying Fund Selection Risk: The risk that the Fund may invest in Underlying Funds that underperform other similar funds or the markets more generally, due to poor investment decisions by the investment adviser(s) for the Underlying Funds or otherwise. Underlying Funds also have their own expenses, which the Fund bears in addition to its own expenses.
Equity Securities Risk: A portion of the assets of the Fund is allocated to Underlying Funds investing primarily in equity securities. Therefore, the value of the Fund may increase or decrease as a result of its indirect interest in equity securities.
Fixed Income Securities Risk: A portion of the assets of the Fund is allocated to Underlying Funds investing primarily in fixed income securities. Therefore, the value of the Fund may increase or decrease as a result of its indirect interest in fixed income securities.
Foreign Securities/Emerging Markets Risk: Foreign securities, including those of emerging market issuers, are subject to additional risks including international trade, currency, political, and regulatory risks. Securities of emerging market issuers generally have more risk than securities issued by issuers in more developed foreign markets. For a complete description of these and other risks associated with investment in a mutual fund, please refer to the Fund’s prospectus.
Market Commentary
The Fund returned 6.28% (without sales charge) for the Class A Shares for the year ended October 31, 2013. That compared to a -1.08% total return for the Fund’s primary benchmark, the Barclays U.S. Aggregate Bond Index1.
The Fund measures performance against several additional reference indices for the year ended October 31, 2013: the S&P 500 Index1 (27.18% total return), MSCI EAFE Index1 (27.40% total return), Bank of America/Merrill Lynch U.S. High Yield Master II Index1 (8.83% total return) and Citigroup U.S. Domestic 3-Month Treasury Bill Index1 (0.06% total return).
Portfolio Performance
Economic activity across the developed world gained momentum during the 12 months through October 31, 2013. Accommodative monetary policies in the U.S., Europe and Japan helped fuel modest economic growth, and investors’ appetites for riskier asset classes such as equities grew during the period.
However, global financial markets closely watched U.S. policy developments during the period. In particular, the U.S. Federal Reserve (the “Fed”) signaled midway through the period that it may begin tapering its ongoing stimulus efforts, including its large-scale purchases of assets such as Treasury bonds. That led to considerable volatility in the global financial markets. However, market sentiment surged later in the period when the Fed announced it would keep its stimulus efforts intact.
In Europe, considerable progress was made in bringing the eurozone debt crisis under control. In the second quarter of 2013, the eurozone economy grew by an estimated 0.3%, ending a period of six consecutive quarters of recession. Additionally, Japanese equities performed extremely well during the period thanks in large part to government stimulus efforts in that country.
Emerging markets lagged their developed market peers during the period. Such markets were very sensitive to Fed policy and the prospect of declining global liquidity if accommodative monetary policies were tightened. What’s more, a number of prominent emerging economies also had to contend with growth and inflation concerns. For instance, economic activity in China—the world’s largest emerging economy—showed signs of softening before posting strong growth late in the period.
In this environment, the Fund was positioned with a modest overweight in developed market equities. We believed developed market equities offered appealing valuations, particularly compared to developed market government bonds, which were trading at historically low yields. The Fund’s allocation to domestic equities was the primary driver of returns during the period. The Fund benefited from its neutral weighting to emerging markets equities, as such stocks considerably underperformed their developed market peers during the period.†
The Fund began the period with an underweight position in U.S. aggregate bonds, and its exposure to these bonds was reduced several times during the period as Treasury yields remained at historical lows. That strategy added value to the Fund’s overall performance. The Fund benefited from its overweight positions in U.S. investment-grade and high-yield credit, and its exposure to both hard and local currency emerging markets debt.†
There was very little change to the portfolio’s exposure to alternative investments during the period. The Fund benefited from an underweight position in commodities, which performed very poorly. An overweight position in property benefited the Fund, as did the portfolio’s private equity allocation, which performed very well during the period.†
| † | | Portfolio composition is subject to change. |
| 1 | | For additional information, please refer to the Glossary of Terms. |
Past performance does not guarantee future results. The performance data quoted represents past performance and current returns may be lower or higher. Total return figures include change in share price, reinvestment of dividends and capital gains and do not reflect taxes that a shareholder would pay on Fund distributions or on the redemption of Fund shares. Investment return and principal value will fluctuate so that an investor’s shares, when redeemed may be worth more or less than the original cost. To obtain performance information current to the most recent month end, please call 1-800-782-8183.
12 HSBC FAMILY OF FUNDS
| Portfolio Reviews (Unaudited) |
| Conservative Strategy Fund |
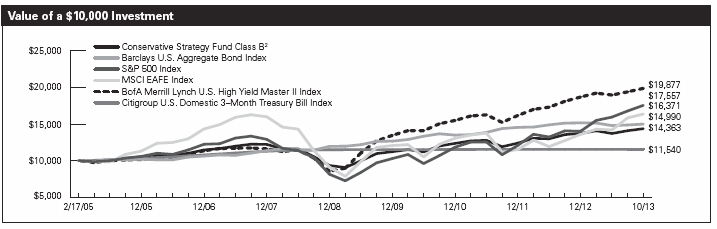
The charts above represent a historical since inception performance comparison of a hypothetical $10,000 investment in the indicated share class versus a similar investment in the Fund’s benchmark and represents the reinvestment of dividends and capital gains in the Fund.
| | | | Average Annual | | Expense |
| Fund Performance | | | | Total Return (%) | | Ratio (%)4 |
| | Inception | | 1 | | 5 | | Since | | | | |
| As of October 31, 2013 | | Date | | Year | | Year | | Inception | | Gross | | Net |
| Conservative Strategy Fund Class A1 | | 2/23/05 | | 1.00 | | 7.87 | | 4.22 | | | 1.97 | | 1.97 |
| Conservative Strategy Fund Class B2 | | 2/17/05 | | 1.50 | | 8.17 | | 4.25 | | | 2.72 | | 2.72 |
| Conservative Strategy Fund Class C3 | | 4/19/05 | | 4.53 | | 8.18 | | 4.73 | | | 2.72 | | 2.72 |
| Barclays U.S. Aggregate Bond Index5 | | — | | -1.08 | | 6.09 | | 4.76 | 6 | | N/A | | N/A |
| S&P 500 Index5 | | — | | 27.18 | | 15.17 | | 6.68 | 6 | | N/A | | N/A |
| MSCI EAFE Index5 | | — | | 27.40 | | 12.52 | | 5.83 | 6 | | N/A | | N/A |
| BofA Merrill Lynch U.S. High Yield Master II Index5 | | — | | 8.83 | | 18.03 | | 8.22 | 6 | | N/A | | N/A |
| Citigroup U.S. Domestic 3-Month Treasury Bill Index5 | | — | | 0.06 | | 0.12 | | 1.66 | 6 | | N/A | | N/A |
Past performance does not guarantee future results. The performance data quoted represents past performance and current returns may be lower or higher. Total return figures include change in share price, reinvestment of dividends and capital gains and do not reflect the taxes that a shareholder would pay on Fund distributions or on the redemption of Fund shares. Investment return and principal value will fluctuate so that an investor’s shares, when redeemed may be worth more or less than the original cost. To obtain performance information current to the most recent month end, please call 1-800-782-8183.
The performance above reflects any fee waivers that have been in effect during the applicable periods, as well as any expense reimbursements that have periodically been made. Absent such waivers and reimbursements, returns would have been lower.
Certain returns shown include monies received by aeries of HSBC Portfolios (the “Portfolios”), in which the Fund invests, in respect of one-time class action settlements. As a result, the Fund’s total returns for those periods were higher than they would have been had the Portfolios not received the payments.
| 1 | | Reflects the maximum sales charge of 5.00%. |
| 2 | | Reflects the applicable contingent deferred sales charge, maximum of 4.00%. |
| 3 | | Reflects the applicable contingent deferred sales charge, maximum of 1.00%. |
| 4 | | Reflects the expense ratios as reported in the prospectus dated February 28, 2013. The expense ratios reflected include Acquired Fund fees and expenses. Additional information pertaining to the October 31, 2013 expense ratios can be found in the financial highlights. |
| 5 | | For additional information, please refer to the Glossary of Terms. |
| 6 | | Return for the period February 17, 2005 to October 31, 2013. |
The Fund’s performance is primarily measured against the Barclays U.S. Aggregate Bond Index is an unmanaged index generally representative of investment-grade, USD-denominated, fixed-rate debt issues, taxable bond market, including Treasuries, government-related and corporate securities, asset-backed, mortgage-backed and commercial mortgage-backed securities, with maturities of at least one year. The performance of the index does not reflect the deduction of expenses associated with a mutual fund, such as investment management and fund accounting fees. The Fund’s performance reflects the deduction of fees for these value-added services. Investors cannot invest directly in an index.
HSBC FAMILY OF FUNDS 13
| Portfolio Reviews (Unaudited) |
Income Strategy Fund
(Class A Shares, Class B Shares and Class C Shares)
Randeep Brar, CFA, Senior Vice President/Portfolio Manager
Caroline Hitch, Senior Portfolio Manager
The Income Strategy Fund (the “Fund”) is a “fund of funds” which primarily seeks current income and secondarily seeks to provide long-term growth of capital by investing primarily in underlying funds. The underlying funds may include mutual funds managed by HSBC Global Asset Management (USA) Inc. (the “Adviser”), mutual funds managed by investment advisers that are not associated with the Adviser and exchange traded funds (“ETFs”) (collectively, “Underlying Funds”). The Fund may also purchase or hold exchange traded notes (“ETNs”).
Investment Concerns
Allocation Risk: The risk that the Adviser’s target asset and sector allocations and changes in target asset and sector allocations cause the Fund to underperform other similar funds or cause you to lose money, and that the Fund may not achieve its target asset and sector allocations.
Underlying Fund Selection Risk: The risk that the Fund may invest in Underlying Funds that underperform other similar funds or the markets more generally, due to poor investment decisions by the investment adviser(s) for the Underlying Funds or otherwise. Underlying Funds also have their own expenses, which the Fund bears in addition to its own expenses.
Equity Securities Risk: A portion of the assets of the Fund is allocated to Underlying Funds investing primarily in equity securities. Therefore, the value of the Fund may increase or decrease as a result of its indirect interest in equity securities.
Fixed Income Securities Risk: A portion of the assets of the Fund is allocated to Underlying Funds investing primarily in fixed income securities. Therefore, the value of the Fund may increase or decrease as a result of its indirect interest in fixed income securities.
Foreign Securities/Emerging Markets Risk: Foreign securities, including those of emerging market issuers, are subject to additional risks including international trade, currency, political, and regulatory risks. Securities of emerging market issuers generally have more risk than securities issued by issuers in more developed foreign markets.
The net asset value per share of this Fund will fluctuate as the value of the securities in the portfolio changes.
For a complete description of these and other risks associated with investment in a mutual fund, please refer to the Fund’s prospectus.
Market Commentary
The Fund returned 2.57% (without sales charge) for the Class A Shares for the year ended October 31, 2013. That compared to a -1.08% total return for the Fund’s primary benchmark, Barclays U.S. Aggregate Bond Index1, for the same period.
The Fund measures performance against several additional reference indices for the year ended October 31, 2013: the S&P 500 Index1 (27.18% total return), MSCI EAFE Index1 (27.40% total return), Bank of America/Merrill Lynch U.S. High Yield Master II Index1 (8.83% total return) and Citigroup U.S. Domestic 3-Month Treasury Bill Index1 (0.06% total return).
Portfolio Performance
Economic activity across the developed world gained momentum during the 12 months through October 31, 2013. Accommodative monetary policies in the U.S., Europe and Japan helped fuel modest economic growth, and investors’ appetites for riskier asset classes such as equities grew during the period.
However, global financial markets closely watched U.S. policy developments during the period. In particular, the U.S. Federal Reserve (the “Fed”) signaled midway through the period that it may begin tapering its ongoing stimulus efforts, including its large-scale purchases of assets such as Treasury bonds. That led to considerable volatility in the global financial markets. However, market sentiment surged later in the period when the Fed announced it would keep its stimulus efforts intact.
In Europe, considerable progress was made in bringing the eurozone debt crisis under control. In the second quarter of 2013, the eurozone economy grew by an estimated 0.3%, ending a period of six consecutive quarters of recession. Additionally, Japanese equities performed extremely well during the period thanks in large part to government stimulus efforts in that country.
Emerging markets lagged their developed market peers during the period. Such markets were very sensitive to Fed policy and the prospect of declining global liquidity if accommodative monetary policies were tightened. What’s more, a number of prominent emerging economies also had to contend with growth and inflation concerns. For instance, economic activity in China—the world’s largest emerging economy—showed signs of softening before posting strong growth late in the period.
In this environment, the Fund was positioned with a modest overweight in developed market equities. We believed developed market equities offered appealing valuations, particularly compared to developed market government bonds, which were trading at historically low yields. The Fund’s allocation to domestic equities was the primary driver of returns during the period. The Fund benefited from its neutral weighting to emerging markets equities, as such stocks considerably underperformed their developed market peers during the period.†
The Fund began the period with an underweight position in U.S. aggregate bonds, and its exposure to these bonds was reduced several times during the period as Treasury yields remained at historical lows. That strategy added value to the Fund’s overall performance. The Fund benefited from its overweight positions in U.S. investment grade and high-yield credit, and its exposure to both hard and local currency emerging markets debt.†
| † | | Portfolio composition is subject to change. |
| 1 | | For additional information, please refer to the Glossary of Terms. |
Past performance does not guarantee future results. The performance data quoted represents past performance and current returns may be lower or higher. Total return figures include change in share price, reinvestment of dividends and capital gains and do not reflect taxes that a shareholder would pay on Fund distributions or on the redemption of Fund shares. Investment return and principal value will fluctuate so that an investor’s shares, when redeemed may be worth more or less than the original cost. To obtain performance information current to the most recent month end, please call 1-800-782-8183.
14 HSBC FAMILY OF FUNDS
| Portfolio Reviews (Unaudited) |
| Income Strategy Fund |

The charts above represent a historical since inception performance comparison of a hypothetical $10,000 investment in the indicated share class versus a similar investment in the Fund’s benchmark and represents the reinvestment of dividends and capital gains in the Fund.
| | | | Average Annual | | Expense |
| Fund Performance | | | | Total Return (%) | | Ratio (%)4 |
| | Inception | | 1 | | Since | | | | |
| As of October 31, 2013 | | Date | | Year | | Inception | | Gross | | Net |
| Income Strategy Fund Class A1 | | 3/20/12 | | | -2.30 | | | 1.59 | | | 26.49 | | 1.90 |
| Income Strategy Fund Class B2 | | 3/20/12 | | | -2.16 | | | 2.09 | | | 27.24 | | 2.65 |
| Income Strategy Fund Class C3 | | 3/20/12 | | | 0.76 | | | 3.84 | | | 27.24 | | 2.65 |
| Barclays U.S. Aggregate Bond Index5 | | — | | | -1.08 | | | 2.08 | 6 | | N/A | | N/A |
| S&P 500 Index5 | | — | | | 27.18 | | | 17.32 | 6 | | N/A | | N/A |
| MSCI EAFE Index5 | | — | | | 27.40 | | | 16.03 | 6 | | N/A | | N/A |
| BofA Merrill Lynch U.S. High Yield Master II Index5 | | — | | | 8.83 | | | 10.19 | 6 | | N/A | | N/A |
| Citigroup U.S. Domestic 3-Month Treasury Bill Index5 | | — | | | 0.06 | | | 0.07 | 6 | | N/A | | N/A |
Past performance does not guarantee future results. The performance data quoted represents past performance and current returns may be lower or higher. Total return figures include change in share price, reinvestment of dividends and capital gains and do not reflect the taxes that a shareholder would pay on Fund distributions or on the redemption of Fund shares. Investment return and principal value will fluctuate so that an investor’s shares, when redeemed may be worth more or less than the original cost. To obtain performance information current to the most recent month end, please call 1-800-782-8183.
The performance above reflects any fee waivers that have been in effect during the applicable periods, as well as any expense reimbursements that have periodically been made. Absent such waivers and reimbursements, returns would have been lower. Currently, contractual fee waivers are in effect for the Fund through March 1, 2014.
| 1 | | Reflects the maximum sales charge of 4.75%. |
| 2 | | Reflects the applicable contingent deferred sales charge, maximum of 4.00%. |
| 3 | | Reflects the applicable contingent deferred sales charge, maximum of 1.00%. |
| 4 | | Reflects the expense ratios as reported in the prospectus dated February 28, 2013. HSBC Global Asset Management (USA) Inc. has entered into a contractual expense limitation agreement with the Fund under which it will limit total expenses of the Fund (excluding interest, taxes, brokerage commissions, extraordinary expenses and estimated indirect expenses attributable to the Fund’s investments in investment companies other then the HSBC Growth Portfolio and HSBC Opportunity Portfolio) to an annual rate of 1.50%, 2.25% and 2.25% for Class A Shares, Class B Shares and Class C Shares, respectively. The expense limitation shall be in effect until March 1, 2014. The expense ratios reflected include Acquired Fund fees and expenses. Additional information pertaining to the October 31, 2013 expense ratios can be found in the financial highlights. |
| 5 | | For additional information, please refer to the Glossary of Terms. |
| 6 | | Return for the period March 21, 2012 to October 31, 2013. |
The Fund’s performance is primarily measured against the Barclays U.S. Aggregate Bond Index is an unmanaged index generally representative of investment-grade, USD-denominated, fixed-rate debt issues, taxable bond market, including Treasuries, government-related and corporate securities, asset-backed, mortgage-backed and commercial mortgage-backed securities, with maturities of at least one year. The performance of the index does not reflect the deduction of expenses associated with a mutual fund, such as investment management and fund accounting fees. The Fund’s performance reflects the deduction of fees for these value-added services. Investors cannot invest directly in an index.
HSBC FAMILY OF FUNDS 15
Portfolio Composition*
October 31, 2013 (Unaudited)
| Aggressive Strategy Fund | | |
| | Percentage of |
| Investment Allocation | | Investments at Value(%) |
| Domestic Equities | | 57.8 |
| International Equities | | 30.6 |
| Fixed Income | | 6.8 |
| Alternatives | | 4.6 |
| Cash | | 0.2 |
| Total | | 100.0 |
| |
| Balanced Strategy Fund | | |
| | Percentage of |
| Investment Allocation | | Investments at Value(%) |
| Domestic Equities | | 41.4 |
| International Equities | | 33.2 |
| Fixed Income | | 18.5 |
| Alternatives | | 6.5 |
| Cash | | 0.4 |
| Total | | 100.0 |
| |
| Moderate Strategy Fund | | |
| | Percentage of |
| Investment Allocation | | Investments at Value(%) |
| Fixed Income | | 33.0 |
| Domestic Equities | | 28.1 |
| International Equities | | 27.9 |
| Alternatives | | 10.2 |
| Cash | | 0.8 |
| Total | | 100.0 |
| |
| Conservative Strategy Fund | | |
| | Percentage of |
| Investment Allocation | | Investments at Value(%) |
| Fixed Income | | 49.9 |
| Domestic Equities | | 17.6 |
| International Equities | | 26.0 |
| Alternatives | | 5.2 |
| Cash | | 1.3 |
| Total | | 100.0 |
| |
| Income Strategy Fund | | |
| | Percentage of |
| Investment Allocation | | Investments at Value(%) |
| Fixed Income | | 67.4 |
| International Equities | | 22.4 |
| Domestic Equities | | 8.9 |
| Cash | | 1.3 |
| Total | | 100.0 |
| HSBC Growth Portfolio | | | | |
| | Percentage of |
| Investment Allocation | | Investments at Value (%) |
| Internet Software & Services | | | 9.4 | |
| Biotechnology | | | 9.1 | |
| Internet & Catalog Retail | | | 6.8 | |
| IT Services | | | 6.4 | |
| Specialty Retail | | | 5.9 | |
| Media | | | 5.0 | |
| Chemicals | | | 4.1 | |
| Oil, Gas & Consumable Fuels | | | 4.1 | |
| Road & Rail | | | 4.1 | |
| Hotels, Restaurants & Leisure | | | 3.8 | |
| Capital Markets | | | 3.7 | |
| Software | | | 3.4 | |
| Aerospace & Defense | | | 3.2 | |
| Textiles, Apparel & Luxury Goods | | | 3.2 | |
| Computers & Peripherals | | | 3.1 | |
| Semiconductors & Semiconductor | | | | |
| Equipment | | | 3.1 | |
| Machinery | | | 2.7 | |
| Food & Staples Retailing | | | 2.4 | |
| Pharmaceuticals | | | 2.1 | |
| Health Care Technology | | | 1.7 | |
| Communications Equipment | | | 1.5 | |
| Real Estate Investment Trusts (REITs) | | | 1.5 | |
| Energy Equipment & Services | | | 1.5 | |
| Wireless Telecommunication Services | | | 1.4 | |
| Diversified Financial Services | | | 1.2 | |
| Auto Components | | | 1.2 | |
| Personal Products | | | 1.1 | |
| Trading Companies & Distributors | | | 1.0 | |
| Health Care Providers & Services | | | 0.9 | |
| Airlines | | | 0.7 | |
| Investment Companies | | | 0.7 | |
| | | 100.0 | |
____________________
* Portfolio composition is subject to change.
16 HSBC FAMILY OF FUNDS
| Portfolio Reviews |
| Portfolio Composition* (continued) | |
| October 31, 2013 (Unaudited) | |
| HSBC Opportunity Portfolio | | | |
| | Percentage of |
| Investment Allocation | | Investments at Value (%) |
| Specialty Retail | | 8.1 | |
| IT Services | | 6.8 | |
| Chemicals | | 6.2 | |
| Household Durables | | 5.5 | |
| Oil, Gas & Consumable Fuels | | 5.1 | |
| Biotechnology | | 5.0 | |
| Health Care Equipment & Supplies | | 3.7 | |
| Life Sciences Tools & Services | | 3.4 | |
| Trading Companies & Distributors | | 3.3 | |
| Software | | 3.2 | |
| Aerospace & Defense | | 3.1 | |
| Semiconductors & Semiconductor | | | |
| Equipment | | 3.0 | |
| Investment Companies | | 2.9 | |
| Commercial Banks | | 2.8 | |
| Containers & Packaging | | 2.7 | |
| Pharmaceuticals | | 2.7 | |
| Electrical Equipment | | 2.7 | |
| Internet Software & Services | | 2.6 | |
| Machinery | | 2.1 | |
| Professional Services | | 2.1 | |
| Insurance | | 2.0 | |
| Energy Equipment & Services | | 1.9 | |
| Health Care Providers & Services | | 1.9 | |
| Hotels, Restaurants & Leisure | | 1.9 | |
| Media | | 1.6 | |
| Commercial Services & Supplies | | 1.6 | |
| Capital Markets | | 1.6 | |
| Diversified Consumer Services | | 1.5 | |
| Auto Components | | 1.5 | |
| Road & Rail | | 1.3 | |
| Distributors | | 1.1 | |
| Real Estate Investment Trusts (REITs) | | 1.1 | |
| Real Estate Management & | | | |
| Development | | 1.1 | |
| Health Care Technology | | 0.8 | |
| Construction Materials | | 0.8 | |
| Communications Equipment | | 0.7 | |
| Electronic Equipment, | | | |
| Instruments & Components | | 0.6 | |
| | 100.0 | |
____________________
| * | | Portfolio composition is subject to change. |
HSBC FAMILY OF FUNDS 17
| HSBC AGGRESSIVE STRATEGY FUND |
| Schedule of Portfolio Investments—as of October 31, 2013 |
| Affiliated Investment Companies—1.4% | | |
| | | | | |
| | Shares | | Value ($) |
| HSBC Emerging Markets Debt Fund, | | | | |
| Class I Shares | | 21,418 | | 223,608 |
| HSBC Prime Money Market Fund, | | | | |
| Class I Shares, 0.03%(a) | | 42,491 | | 42,491 |
| TOTAL AFFILIATED INVESTMENT | | | | |
| COMPANIES (COST $259,917) | | | | 266,099 |
| |
| Affiliated Portfolios���11.5% | | | | |
| |
| HSBC Growth Portfolio | | | | 1,364,526 |
| HSBC Opportunity Portfolio | | | | 749,215 |
| TOTAL AFFILIATED PORTFOLIOS | | | | 2,113,741 |
| |
| Unaffiliated Investment Companies—41.9% | | |
| |
| Artisan Value Fund, Investor Shares | | 66,389 | | 916,172 |
| Brookfield Global Listed Real Estate | | | | |
| Fund, Institutional Shares | | 9,665 | | 123,319 |
| Brown Advisory Growth Equity Fund, | | | | |
| Institutional Shares | | 50,513 | | 911,751 |
| Columbia High Yield Bond Fund, | | | | |
| Class Z Shares | | 209,553 | | 626,565 |
| CRM Small/Mid Cap Value Fund, | | | | |
| Institutional Shares | | 39,042 | | 746,490 |
| Delaware Emerging Markets Fund, | | | | |
| Institutional Shares | | 60,380 | | 995,667 |
| JPMorgan Equity Income Fund, | | | | |
| Select Shares | | 108,831 | | 1,383,248 |
| JPMorgan High Yield Fund, | | | | |
| Select Shares | | 76,718 | | 630,621 |
| Principal Global Real Estate Securities | | | | |
| Fund, Institutional Shares | | 13,779 | | 121,115 |
| Trilogy Emerging Markets Equity Fund, | | | | |
| Institutional Shares | | 140,404 | | 1,234,152 |
| TOTAL UNAFFILIATED INVESTMENT | | | | |
| COMPANIES (COST $6,770,550) | | | | 7,689,100 |
| | | | | |
| Exchange Traded Funds—45.6% | | | | |
| |
| iShares MSCI EAFE Index Fund | | 41,029 | | 2,702,990 |
| iShares MSCI Emerging Markets | | | | |
| Index Fund | | 5,673 | | 240,876 |
| PowerShares Global Listed Private | | | | |
| Equity Portfolio ETF | | 70,068 | | 847,823 |
| SPDR S&P 500 ETF Trust | | 26,103 | | 4,587,080 |
| TOTAL EXCHANGE TRADED | | | | |
| FUNDS (COST $7,103,708) | | | | 8,378,769 |
| TOTAL INVESTMENT | | | | |
| SECURITIES—100.4% | | | | 18,447,709 |
____________________
Percentages indicated are based on net assets of $18,382,635. |
| (a) | | The rate represents the annualized one-day yield that was in effect on October 31, 2013. |
| ETF | | Exchange Traded Fund |
| SPDR | | Standard & Poor’s Depositary Receipt |
| 18 | HSBC FAMILY OF FUNDS | See notes to financial statements. |
| HSBC BALANCED STRATEGY FUND |
| Schedule of Portfolio Investments—as of October 31, 2013 |
| Affiliated Investment Companies—10.3% | | |
| | | | | |
| | Shares | | Value ($) |
| HSBC Emerging Markets Debt Fund, | | | | |
| Class I Shares | | 333,017 | | 3,476,695 |
| HSBC Emerging Markets Local Debt | | | | |
| Fund, Class I Shares | | 160,626 | | 1,471,336 |
| HSBC Prime Money Market Fund, | | | | |
| Class I Shares, 0.03%(a) | | 188,332 | | 188,332 |
| TOTAL AFFILIATED INVESTMENT | | | | |
| COMPANIES (COST $5,236,386) | | | | 5,136,363 |
| |
| Affiliated Portfolios—8.3% | | | | |
| |
| HSBC Growth Portfolio | | | | 2,677,899 |
| HSBC Opportunity Portfolio | | | | 1,470,039 |
| TOTAL AFFILIATED PORTFOLIOS | | | | 4,147,938 |
| |
| Unaffiliated Investment Companies—45.7% | | |
| |
| Artisan Value Fund, Investor Shares | | 128,817 | | 1,777,679 |
| Brookfield Global Listed Real Estate | | | | |
| Fund, Institutional Shares | | 78,112 | | 996,707 |
| Brown Advisory Growth Equity Fund, | | | | |
| Institutional Shares | | 98,963 | | 1,786,290 |
| Columbia High Yield Bond Fund, | | | | |
| Class Z Shares | | 1,111,635 | | 3,323,789 |
| CRM Small/Mid Cap Value Fund, | | | | |
| Institutional Shares | | 76,575 | | 1,464,116 |
| Delaware Emerging Markets Fund, | | | | |
| Institutional Shares | | 81,451 | | 1,343,133 |
| Janus Flexible Bond Fund, | | | | |
| Institutional Shares | | 28,013 | | 296,378 |
| JPMorgan Equity Income Fund, | | | | |
| Select Shares | | 210,589 | | 2,676,581 |
| JPMorgan High Yield Fund, | | | | |
| Select Shares | | 404,216 | | 3,322,657 |
| Lord Abbett Core Fixed Income Fund, | | | | |
| Institutional Shares | | 38,232 | | 414,050 |
| Metropolitan West Total Return Bond, | | | | |
| Institutional Shares | | 27,723 | | 296,909 |
| PIMCO Commodity RealReturn | | | | |
| Strategy Fund, Institutional Shares | | 271,531 | | 1,534,151 |
| PIMCO Total Return Fund, | | | | |
| Institutional Shares | | 50,106 | | 546,153 |
| Principal Global Real Estate Securities | | | | |
| Fund, Institutional Shares | | 111,739 | | 982,188 |
| T. Rowe Price New Income Fund, | | | | |
| Retail Shares | | 43,686 | | 414,147 |
| Trilogy Emerging Markets Equity Fund, | | | | |
| Institutional Shares | | 188,611 | | 1,657,888 |
| TOTAL UNAFFILIATED INVESTMENT | | | | |
| COMPANIES (COST $21,665,513) | | | | 22,832,816 |
| | | | | |
| Exchange Traded Funds—35.9% | | | | |
| |
| iShares iBoxx $ Investment Grade | | | | |
| Corporate Bond Fund | | 5,443 | | 627,034 |
| iShares MSCI EAFE Index Fund | | 93,336 | | 6,148,976 |
| iShares MSCI Emerging Markets | | | | |
| Index Fund | | 12,425 | | 527,565 |
| PowerShares Global Listed Private | | | | |
| Equity Portfolio ETF | | 140,393 | | 1,698,755 |
| SPDR S&P 500 ETF Trust | | 50,648 | | 8,900,373 |
| TOTAL EXCHANGE TRADED | | | | |
| FUNDS (COST $15,308,567) | | | | 17,902,703 |
| TOTAL INVESTMENT | | | | |
| SECURITIES—100.2% | | | | 50,019,820 |
____________________
Percentages indicated are based on net assets of $49,922,713. |
| (a) | | The rate represents the annualized one-day yield that was in effect on October 31, 2013. |
| ETF | | Exchange Traded Fund |
| SPDR | | Standard & Poor’s Depositary Receipt |
| See notes to financial statements. | HSBC FAMILY OF FUNDS | 19 |
| HSBC MODERATE STRATEGY FUND |
| Schedule of Portfolio Investments—as of October 31, 2013 |
| Affiliated Investment Companies—12.2% | | |
| | | | | |
| | Shares | | Value ($) |
| HSBC Emerging Markets Debt Fund, | | | | |
| Class I Shares | | 310,161 | | 3,238,081 |
| HSBC Emerging Markets Local Debt | | | | |
| Fund, Class I Shares | | 193,511 | | 1,772,558 |
| HSBC Prime Money Market Fund, | | | | |
| Class I Shares, 0.03%(a) | | 357,947 | | 357,947 |
| TOTAL AFFILIATED INVESTMENT | | | | |
| COMPANIES (COST $5,403,702) | | | | 5,368,586 |
| |
| Affiliated Portfolios—5.6% | | | | |
| |
| HSBC Growth Portfolio | | | | 1,598,762 |
| HSBC Opportunity Portfolio | | | | 884,337 |
| TOTAL AFFILIATED PORTFOLIOS | | | | 2,483,099 |
| |
| Unaffiliated Investment Companies—55.2% | | |
| |
| Artisan Value Fund, Investor Shares | | 77,493 | | 1,069,409 |
| ASG Global Alternatives Fund, | | | | |
| Class Y Shares | | 30,090 | | 350,248 |
| Brookfield Global Listed Real Estate | | | | |
| Fund, Institutional Shares | | 66,485 | | 848,349 |
| Brown Advisory Growth Equity Fund, | | | | |
| Institutional Shares | | 59,536 | | 1,074,617 |
| Columbia High Yield Bond Fund, | | | | |
| Class Z Shares | | 972,907 | | 2,908,992 |
| CRM Small/Mid Cap Value Fund, | | | | |
| Institutional Shares | | 45,515 | | 870,241 |
| Delaware Emerging Markets Fund, | | | | |
| Institutional Shares | | 53,234 | | 877,827 |
| Janus Flexible Bond Fund, | | | | |
| Institutional Shares | | 116,842 | | 1,236,188 |
| JPMorgan Equity Income Fund, | | | | |
| Select Shares | | 128,265 | | 1,630,247 |
| JPMorgan High Yield Fund, | | | | |
| Select Shares | | 354,871 | | 2,917,043 |
| Lord Abbett Core Fixed Income Fund, | | | | |
| Institutional Shares | | 163,938 | | 1,775,444 |
| Metropolitan West Total Return Bond, | | | | |
| Institutional Shares | | 115,632 | | 1,238,422 |
| PIMCO Commodity RealReturn | | | | |
| Strategy Fund, Institutional Shares | | 280,262 | | 1,583,480 |
| PIMCO Total Return Fund, | | | | |
| Institutional Shares | | 213,954 | | 2,332,103 |
| Principal Global Real Estate Securities | | | | |
| Fund, Institutional Shares | | 95,190 | | 836,720 |
| T. Rowe Price New Income Fund, | | | | |
| Retail Shares | | 185,347 | | 1,757,090 |
| Trilogy Emerging Markets Equity Fund, | | | | |
| Institutional Shares | | 123,258 | | 1,083,438 |
| TOTAL UNAFFILIATED INVESTMENT | | | | |
| COMPANIES (COST $23,948,828) | | | | 24,389,858 |
| | | | | |
| Exchange Traded Funds—27.2% | | | | |
| |
| iShares iBoxx $ Investment Grade | | | | |
| Corporate Bond | | 3,834 | | 441,677 |
| iShares MSCI EAFE ETF | | 76,811 | | 5,060,309 |
| iShares MSCI Emerging Markets ETF | | 7,346 | | 311,911 |
| PowerShares Global Listed Private | | | | |
| Equity Portfolio ETF | | 74,219 | | 898,050 |
| SPDR S&P 500 ETF Trust | | 30,198 | | 5,306,694 |
| TOTAL EXCHANGE TRADED | | | | |
| FUNDS (COST $10,248,627) | | | | 12,018,641 |
| TOTAL INVESTMENT | | | | |
| SECURITIES—100.2% | | | | 44,260,184 |
____________________
Percentages indicated are based on net assets of $44,186,098. |
| (a) | | The rate represents the annualized one-day yield that was in effect on October 31, 2013. |
| ETF | | Exchange Traded Fund |
| SPDR | | Standard & Poor’s Depositary Receipt |
| 20 | HSBC FAMILY OF FUNDS | See notes to financial statements. |
| HSBC CONSERVATIVE STRATEGY FUND |
| Schedule of Portfolio Investments—as of October 31, 2013 |
| Affiliated Investment Companies—12.6% | | |
| | | | | |
| | Shares | | Value ($) |
| HSBC Emerging Markets Debt Fund, | | | | |
| Class I Shares | | 142,821 | | 1,491,047 |
| HSBC Emerging Markets Local Debt | | | | |
| Fund, Class I Shares | | 108,300 | | 992,027 |
| HSBC Prime Money Market Fund, | | | | |
| Class I Shares, 0.03%(a) | | 284,508 | | 284,508 |
| TOTAL AFFILIATED INVESTMENT | | | | |
| COMPANIES (COST $2,792,418) | | | | 2,767,582 |
| |
| Affiliated Portfolios—3.5% | | | | |
| |
| HSBC Growth Portfolio | | | | 502,224 |
| HSBC Opportunity Portfolio | | | | 267,527 |
| TOTAL AFFILIATED PORTFOLIOS | | | | 769,751 |
| |
| Unaffiliated Investment Companies—64.9% | | |
| |
| Artisan Value Fund, Investor Shares | | 23,928 | | 330,202 |
| ASG Global Alternatives Fund, | | | | |
| Class Y Shares | | 37,092 | | 431,746 |
| Brookfield Global Listed Real Estate | | | | |
| Fund, Institutional Shares | | 33,145 | | 422,931 |
| Brown Advisory Growth Equity Fund, | | | | |
| Institutional Shares | | 18,385 | | 331,857 |
| Columbia High Yield Bond Fund, | | | | |
| Class Z Shares | | 450,392 | | 1,346,672 |
| CRM Small/Mid Cap Value Fund, | | | | |
| Institutional Shares | | 14,050 | | 268,642 |
| Delaware Emerging Markets Fund, | | | | |
| Institutional Shares | | 7,652 | | 126,189 |
| Janus Flexible Bond Fund, | | | | |
| Institutional Shares | | 112,563 | | 1,190,912 |
| JPMorgan Equity Income Fund, | | | | |
| Select Shares | | 39,583 | | 503,095 |
| JPMorgan High Yield Fund, | | | | |
| Select Shares | | 163,489 | | 1,343,876 |
| Lord Abbett Core Fixed Income Fund, | | | | |
| Institutional Shares | | 153,506 | | 1,662,473 |
| Metropolitan West Total Return Bond, | | | | |
| Institutional Shares | | 111,396 | | 1,193,054 |
| PIMCO Commodity RealReturn | | | | |
| Strategy Fund, Institutional Shares | | 113,598 | | 641,831 |
| PIMCO Total Return Fund, | | | | |
| Institutional Shares | | 204,624 | | 2,230,406 |
| Principal Global Real Estate Securities | | | | |
| Fund, Institutional Shares | | 47,403 | | 416,672 |
| T. Rowe Price New Income Fund, | | | | |
| Retail Shares | | 175,196 | | 1,660,854 |
| Trilogy Emerging Markets Equity Fund, | | | | |
| Institutional Shares | | 14,556 | | 127,950 |
| TOTAL UNAFFILIATED INVESTMENT | | | | |
| COMPANIES (COST $13,945,824) | | | | 14,229,362 |
| | | | | |
| Exchange Traded Funds—19.2% | | | | |
| |
| iShares iBoxx $ Investment Grade | | | | |
| Corporate Bond | | 2,796 | | 322,099 |
| iShares MSCI EAFE ETF | | 32,330 | | 2,129,901 |
| PowerShares Global Listed Private | | | | |
| Equity Portfolio ETF | | 6,440 | | 77,924 |
| SPDR S&P 500 ETF Trust | | 9,500 | | 1,669,435 |
| TOTAL EXCHANGE TRADED | | | | |
| FUNDS (COST $3,572,550) | | | | 4,199,359 |
| TOTAL INVESTMENT | | | | |
| SECURITIES—100.2% | | | | 21,966,054 |
____________________
Percentages indicated are based on net assets of $21,919,106. |
| (a) | | The rate represents the annualized one-day yield that was in effect on October 31, 2013. |
| ETF | | Exchange Traded Fund |
| SPDR | | Standard & Poor’s Depositary Receipt |
| See notes to financial statements. | HSBC FAMILY OF FUNDS | 21 |
| HSBC INCOME STRATEGY FUND |
| Schedule of Portfolio Investments—as of October 31, 2013 |
| Affiliated Investment Companies—10.5% | | |
| | | | | |
| | Shares | | Value ($) |
| HSBC Emerging Markets Debt Fund, | | | | |
| Class I Shares | | 6,139 | | 64,096 |
| HSBC Emerging Markets Local Debt | | | | |
| Fund, Class I Shares | | 6,828 | | 62,548 |
| HSBC Prime Money Market Fund, | | | | |
| Class I Shares, 0.03%(a) | | 16,773 | | 16,773 |
| TOTAL AFFILIATED INVESTMENT | | | | |
| COMPANIES (COST $148,734) | | | | 143,417 |
| |
| Unaffiliated Investment Companies—86.5% | | |
| |
| Brookfield Global Listed Real Estate | | | | |
| Fund, Institutional Shares | | 2,468 | | 31,493 |
| Columbia High Yield Bond Fund, | | | | |
| Class Z Shares | | 19,576 | | 58,532 |
| Eaton Vance Floating - Rate Fund, | | | | |
| Institutional Shares | | 5,794 | | 53,135 |
| Federated Strategic Value Dividend Fund, | | | | |
| Institutional Shares | | 10,189 | | 59,099 |
| Janus Flexible Bond Fund, | | | | |
| Institutional Shares | | 10,049 | | 106,319 |
| JPMorgan Equity Income Fund, | | | | |
| Select Shares | | 4,664 | | 59,276 |
| JPMorgan High Yield Fund, | | | | |
| Select Shares | | 7,122 | | 58,545 |
| Lord Abbett Core Fixed Income Fund, | | | | |
| Institutional Shares | | 13,858 | | 150,078 |
| Metropolitan West Total Return Bond, | | | | |
| Institutional Shares | | 9,981 | | 106,894 |
| PIMCO Total Return Fund, | | | | |
| Institutional Shares | | 18,238 | | 198,795 |
| Principal Global Real Estate Securities | | | | |
| Fund, Institutional Shares | | 3,556 | | 31,255 |
| T. Rowe Price International Growth & | | | | |
| Income Fund, Retail Shares | | 7,163 | | 110,596 |
| T. Rowe Price New Income Fund, | | | | |
| Retail Shares | | 15,732 | | 149,140 |
| TOTAL UNAFFILIATED INVESTMENT | | | | |
| COMPANIES (COST $1,169,208) | | | | 1,173,157 |
| |
| Exchange Traded Fund—1.5% | | | | |
| |
| iShares iBoxx $ Investment Grade | | | | |
| Corporate Bond | | 174 | | 20,045 |
| TOTAL EXCHANGE TRADED | | | | |
| FUNDS (COST $20,633) | | | | 20,045 |
| TOTAL INVESTMENT | | | | |
| SECURITIES—98.5% | | | | 1,336,619 |
____________________
Percentages indicated are based on net assets of $1,356,479. |
| (a) | | The rate represents the annualized one-day yield that was in effect on October 31, 2013. |
| 22 | HSBC FAMILY OF FUNDS | See notes to financial statements. |
HSBC WORLD SELECTION FUNDS
Statements of Assets and Liabilities—as of October 31, 2013
| | Aggressive | | Balanced | | Moderate | | Conservative | | Income |
| | Strategy | | Strategy | | Strategy | | Strategy | | Strategy |
| | Fund | | Fund | | Fund | | Fund | | Fund |
| Assets: | | | | | | | | | | | | | | | | | | | | | | | | | | | | | | |
| Investments in Affiliated Portfolios | | | $ | 2,113,741 | | | | | $ | 4,147,938 | | | | | $ | 2,483,099 | | | | | $ | 769,751 | | | | | $ | — | | |
| Investments in Affiliated Investment Companies, at value(a) | | | | 266,099 | | | | | | 5,136,363 | | | | | | 5,368,586 | | | | | | 2,767,582 | | | | | | 143,417 | | |
| Investments in non-affiliates, at value | | | | 16,067,869 | | | | | | 40,735,519 | | | | | | 36,408,499 | | | | | | 18,428,721 | | | | | | 1,193,202 | | |
| Total Investments | | | | 18,447,709 | | | | | | 50,019,820 | | | | | | 44,260,184 | | | | | | 21,966,054 | | | | | | 1,336,619 | | |
| Cash | | | | — | | | | | | — | | | | | | — | | | | | | 465 | | | | | | — | | |
| Interest and dividends receivable | | | | — | | | | | | 34 | | | | | | — | | | | | | — | | | | | | 2,922 | | |
| Receivable for capital shares issued | | | | 13,193 | | | | | | 38,401 | | | | | | 13,227 | | | | | | 10,575 | | | | | | 100 | | |
| Receivable for investments sold | | | | — | | | | | | 261,410 | | | | | | 178,105 | | | | | | — | | | | | | 10,478 | | |
| Reclaims receivable | | | | 74 | | | | | | 138 | | | | | | 123 | | | | | | 42 | | | | | | — | | |
| Receivable from Investment Adviser | | | | — | | | | | | — | | | | | | — | | | | | | — | | | | | | 26,290 | | |
| Prepaid expenses and other assets | | | | 5,333 | | | | | | 5,171 | | | | | | 5,551 | | | | | | 4,699 | | | | | | 3,319 | | |
| Total Assets | | | | 18,466,309 | | | | | | 50,324,974 | | | | | | 44,457,190 | | | | | | 21,981,835 | | | | | | 1,379,728 | | |
| Liabilities: | | | | | | | | | | | | | | | | | | | | | | | | | | | | | | |
| Cash overdraft | | | | — | | | | | | 230,861 | | | | | | 177,940 | | | | | | — | | | | | | — | | |
| Income payable | | | | — | | | | | | — | | | | | | — | | | | | | — | | | | | | 2 | | |
| Payable for investments purchased | | | | — | | | | | | 30,371 | | | | | | — | | | | | | 465 | | | | | | — | | |
| Payable for capital shares redeemed | | | | 41,103 | | | | | | 55,945 | | | | | | 11,741 | | | | | | 10,315 | | | | | | 120 | | |
| Accrued expenses and other liabilities: | | | | | | | | | | | | | | | | | | | | | | | | | | | | | | |
| Investment Management | | | | 3,457 | | | | | | 10,544 | | | | | | 9,364 | | | | | | 4,680 | | | | | | — | | |
| Administration | | | | 387 | | | | | | 1,052 | | | | | | 934 | | | | | | 467 | | | | | | 57 | | |
| Distribution | | | | 4,708 | | | | | | 13,746 | | | | | | 12,859 | | | | | | 8,250 | | | | | | 793 | | |
| Shareholder Servicing | | | | 3,427 | | | | | | 8,771 | | | | | | 8,280 | | | | | | 3,978 | | | | | | 495 | | |
| Compliance Services | | | | 1 | | | | | | 3 | | | | | | 2 | | | | | | 2 | | | | | | 3 | | |
| Accounting | | | | 220 | | | | | | 219 | | | | | | 219 | | | | | | 219 | | | | | | 219 | | |
| Custodian | | | | 5,381 | | | | | | 9,647 | | | | | | 9,574 | | | | | | 8,456 | | | | | | 6,594 | | |
| Transfer Agent | | | | 9,733 | | | | | | 17,339 | | | | | | 17,327 | | | | | | 9,881 | | | | | | 4,507 | | |
| Trustee | | | | 17 | | | | | | 44 | | | | | | 38 | | | | | | 21 | | | | | | 18 | | |
| Other | | | | 15,240 | | | | | | 23,719 | | | | | | 22,814 | | | | | | 15,995 | | | | | | 10,441 | | |
| Total Liabilities | | | | 83,674 | | | | | | 402,261 | | | | | | 271,092 | | | | | | 62,729 | | | | | | 23,249 | | |
| Net Assets | | | $ | 18,382,635 | | | | | $ | 49,922,713 | | | | | $ | 44,186,098 | | | | | $ | 21,919,106 | | | | | $ | 1,356,479 | | |
| | | | | | | | | | | | | | | | | | | | | | | | | | | | | | | |
| Composition of Net Assets: | | | | | | | | | | | | | | | | | | | | | | | | | | | | | | |
| Capital | | | | 14,333,194 | | | | | | 41,329,930 | | | | | | 39,312,430 | | | | | | 20,242,637 | | | | | | 1,336,953 | | |
| Accumulated net investment income (loss) | | | | 19,297 | | | | | | 421,721 | | | | | | 71,162 | | | | | | 46,289 | | | | | | (3 | ) | |
| Accumulated net realized gains (losses) from investments | | | | 1,001,299 | | | | | | 2,750,213 | | | | | | 1,526,432 | | | | | | 415,207 | | | | | | 21,485 | | |
| Unrealized appreciation/depreciation on investments | | | | 3,028,845 | | | | | | 5,420,849 | | | | | | 3,276,074 | | | | | | 1,214,973 | | | | | | (1,956 | ) | |
| Net Assets | | | $ | 18,382,635 | | | | | $ | 49,922,713 | | | | | $ | 44,186,098 | | | | | $ | 21,919,106 | | | | | $ | 1,356,479 | | |
| | | | | | | | | | | | | | | | | | | | | | | | | | | | | | | |
| Net Assets: | | | | | | | | | | | | | | | | | | | | | | | | | | | | | | |
| Class A Shares | | | $ | 11,105,731 | | | | | $ | 28,745,711 | | | | | $ | 24,670,870 | | | | | $ | 9,254,692 | | | | | $ | 311,218 | | |
| Class B Shares | | | | 5,603,935 | | | | | | 15,632,859 | | | | | | 15,406,610 | | | | | | 9,222,391 | | | | | | 402,196 | | |
| Class C Shares | | | | 1,672,969 | | | | | | 5,544,143 | | | | | | 4,108,618 | | | | | | 3,442,023 | | | | | | 643,065 | | |
| | | $ | 18,382,635 | | | | | $ | 49,922,713 | | | | | $ | 44,186,098 | | | | | $ | 21,919,106 | | | | | $ | 1,356,479 | | |
| Shares Outstanding | | | | | | | | | | | | | | | | | | | | | | | | | | | | | | |
| ($0.001 par value, unlimited number of shares authorized): | | | | | | | | | | | | | | | | | | | | | | | | | | | | | | |
| Class A Shares | | | | 712,980 | | | | | | 1,997,706 | | | | | | 1,914,814 | | | | | | 775,674 | | | | | | 30,044 | | |
| Class B Shares | | | | 377,714 | | | | | | 1,090,847 | | | | | | 1,197,506 | | | | | | 783,500 | | | | | | 38,907 | | |
| Class C Shares | | | | 113,197 | | | | | | 386,330 | | | | | | 328,589 | | | | | | 284,092 | | | | | | 62,224 | | |
| Net Asset Value, Offering Price and Redemption | | | | | | | | | | | | | | | | | | | | | | | | | | | | | | |
| Price per share: | | | | | | | | | | | | | | | | | | | | | | | | | | | | | | |
| Class A Shares | | | $ | 15.58 | | | | | $ | 14.39 | | | | | $ | 12.88 | | | | | $ | 11.93 | | | | | $ | 10.36 | | |
| Class B Shares(b) | | | $ | 14.84 | | | | | $ | 14.33 | | | | | $ | 12.87 | | | | | $ | 11.77 | | | | | $ | 10.34 | | |
| Class C Shares(b) | | | $ | 14.78 | | | | | $ | 14.35 | | | | | $ | 12.50 | | | | | $ | 12.12 | | | | | $ | 10.33 | | |
| Maximum Sales Charge—Class A Shares | | | | 5.00 | % | | | | | 5.00 | % | | | | | 5.00 | % | | | | | 5.00 | % | | | | | 4.75 | % | |
| Maximum Offering Price per share (Net Asset Value/ | | | | | | | | | | | | | | | | | | | | | | | | | | | | | | |
| (100%-maximum sales charge))—Class A Shares | | | $ | 16.40 | | | | | $ | 15.15 | | | | | $ | 13.56 | | | | | $ | 12.56 | | | | | $ | 10.88 | | |
| Investments in Affiliated Investment Companies, at cost(a) | | | $ | 259,917 | | | | | $ | 5,236,386 | | | | | $ | 5,403,702 | | | | | $ | 2,792,418 | | | | | $ | 148,734 | | |
| Investments in non-affiliates, at cost | | | $ | 13,874,258 | | | | | $ | 36,974,080 | | | | | $ | 34,197,455 | | | | | $ | 17,518,374 | | | | | $ | 1,189,841 | | |
____________________
| (a) | | Investment in the affiliated investment companies include the HSBC Prime Money Market Fund, Class I Shares, HSBC Emerging Markets Debt Fund, Class I Shares and HSBC Emerging Markets Local Debt Fund, Class I Shares (See Note 1). |
| (b) | | Redemption Price per share varies by length of time shares are held. |
| See notes to financial statements. | HSBC WORLD SELECTION FUNDS | 23 |
HSBC WORLD SELECTION FUNDS
Statements of Operations—For the year ender October 31, 2013
| | Aggressive | | Balanced | | Moderate | | Conservative | | Income |
| | Strategy | | Strategy | | Strategy | | Strategy | | Strategy |
| | Fund | | Fund | | Fund | | Fund | | Fund |
| Investment Income: | | | | | | | | | | | | | | | | | | | | | | | | | | | | | | |
| Investment income from non-affiliated investments | | | $ | 390,177 | | | | | $ | 1,196,694 | | | | | $ | 1,106,166 | | | | | $ | 573,954 | | | | | $ | 32,548 | | |
| Investment income from affiliated investments(a) | | | | 37,593 | | | | | | 274,359 | | | | | | 222,116 | | | | | | 100,905 | | | | | | 3,620 | | |
| Tax reclaims from affiliated portfolios | | | | 24 | | | | | | 52 | | | | | | 46 | | | | | | 13 | | | | | | — | | |
| Expenses from affiliated portfolios | | | | (18,894 | ) | | | | | (39,296 | ) | | | | | (24,004 | ) | | | | | (7,494 | ) | | | | | — | | |
| Total Investment Income | | | | 408,900 | | | | | | 1,404,809 | | | | | | 1,304,324 | | | | | | 667,378 | | | | | | 36,168 | | |
| | | | | | | | | | | | | | | | | | | | | | | | | | | | | | | |
| Expenses: | | | | | | | | | | | | | | | | | | | | | | | | | | | | | | |
| Investment Management | | | | 45,246 | | | | | | 127,157 | | | | | | 112,877 | | | | | | 56,024 | | | | | | 2,846 | | |
| Administration: | | | | | | | | | | | | | | | | | | | | | | | | | | | | | | |
| Class A Shares | | | | 2,684 | | | | | | 7,194 | | | | | | 6,201 | | | | | | 2,431 | | | | | | 164 | | |
| Class B Shares | | | | 1,404 | | | | | | 4,015 | | | | | | 4,134 | | | | | | 2,403 | | | | | | 192 | | |
| Class C Shares | | | | 414 | | | | | | 1,442 | | | | | | 896 | | | | | | 740 | | | | | | 211 | | |
| Distribution: | | | | | | | | | | | | | | | | | | | | | | | | | | | | | | |
| Class B Shares | | | | 42,320 | | | | | | 120,988 | | | | | | 124,587 | | | | | | 72,385 | | | | | | 2,859 | | |
| Class C Shares | | | | 12,468 | | | | | | 43,374 | | | | | | 26,927 | | | | | | 22,238 | | | | | | 3,147 | | |
| Shareholder Servicing: | | | | | | | | | | | | | | | | | | | | | | | | | | | | | | |
| Class A Shares | | | | 26,746 | | | | | | 71,443 | | | | | | 61,785 | | | | | | 24,222 | | | | | | 704 | | |
| Class B Shares | | | | 14,110 | | | | | | 40,349 | | | | | | 41,551 | | | | | | 24,148 | | | | | | 901 | | |
| Class C Shares | | | | 4,159 | | | | | | 14,482 | | | | | | 8,995 | | | | | | 7,437 | | | | | | 1,049 | | |
| Accounting | | | | 22,909 | | | | | | 22,969 | | | | | | 22,975 | | | | | | 22,959 | | | | | | 48,859 | | |
| Audit | | | | 16,476 | | | | | | 15,075 | | | | | | 16,610 | | | | | | 16,532 | | | | | | 16,186 | | |
| Compliance Services | | | | 107 | | | | | | 391 | | | | | | 340 | | | | | | 145 | | | | | | 12 | | |
| Custodian | | | | 22,981 | | | | | | 41,047 | | | | | | 39,321 | | | | | | 33,262 | | | | | | 22,493 | | |
| Printing | | | | 11,285 | | | | | | 7,351 | | | | | | 12,323 | | | | | | 4,313 | | | | | | 791 | | |
| Transfer Agent | | | | 60,509 | | | | | | 109,088 | | | | | | 103,832 | | | | | | 60,963 | | | | | | 27,286 | | |
| Trustee | | | | 463 | | | | | | 1,311 | | | | | | 1,164 | | | | | | 576 | | | | | | 45 | | |
| Registration fees | | | | 18,408 | | | | | | 16,722 | | | | | | 18,718 | | | | | | 13,974 | | | | | | 32,343 | | |
| Other | | | | 5,309 | | | | | | 12,561 | | | | | | 12,073 | | | | | | 5,293 | | | | | | 1,809 | | |
| Total expenses before fee reductions | | | | 307,998 | | | | | | 656,959 | | | | | | 615,309 | | | | | | 370,045 | | | | | | 161,897 | | |
| Fees contractually reduced/reimbursed by Investment Adviser | | | | (421 | ) | | | | | — | | | | | | — | | | | | | — | | | | | | (138,725 | ) | |
| Net Expenses | | | | 307,577 | | | | | | 656,959 | | | | | | 615,309 | | | | | | 370,045 | | | | | | 23,172 | | |
| | | | | | | | | | | | | | | | | | | | | | | | | | | | | | | |
| Net Investment Income (Loss) | | | | 101,323 | | | | | | 747,850 | | | | | | 689,015 | | | | | | 297,333 | | | | | | 12,996 | | |
| | | | | | | | | | | | | | | | | | | | | | | | | | | | | | | |
| Net Realized/Unrealized Gains (Losses) from Investments: | | | | | | | | | | | | | | | | | | | | | | | | | | | | | | |
| Net realized gains (losses) from affiliated investment securities(a) | | | | 498,052 | | | | | | 1,227,389 | | | | | | 796,398 | | | | | | 247,317 | | | | | | 1,944 | | |
| Net realized gains (losses) from non-affiliated investment securities | | | | 798,090 | | | | | | 1,735,660 | | | | | | 1,115,253 | | | | | | 318,792 | | | | | | 30,054 | | |
| Net realized gains distributions from affiliated underlying funds | | | | 3,414 | | | | | | 73,037 | | | | | | 69,669 | | | | | | 33,240 | | | | | | — | | |
| Net realized gains distributions from non-affiliated underlying funds | | | | 29,764 | | | | | | 151,174 | | | | | | 248,209 | | | | | | 193,591 | | | | | | — | | |
| Change in unrealized appreciation/depreciation on affiliated investments(a) | | | | 184,853 | | | | | | (135,212 | ) | | | | | (282,921 | ) | | | | | (154,094 | ) | | | | | (8,116 | ) | |
| Change in unrealized appreciation/depreciation on non-affiliated investments | | | | 1,980,851 | | | | | | 3,498,648 | | | | | | 1,852,183 | | | | | | 336,892 | | | | | | (11,891 | ) | |
| Net realized/unrealized gains (losses) from investments | | | | 3,495,024 | | | | | | 6,550,696 | | | | | | 3,798,791 | | | | | | 975,738 | | | | | | 11,991 | | |
| Change In Net Assets Resulting From Operations | | | $ | 3,596,347 | | | | | $ | 7,298,546 | | | | | $ | 4,487,806 | | | | | $ | 1,273,071 | | | | | $ | 24,987 | | |
____________________
| (a) | | Represents amounts allocated from Affiliated Investment Companies and Affiliated Portfolios. |
| 24 | HSBC WORLD SELECTION FUNDS | See notes to financial statements. |
HSBC WORLD SELECTION FUNDS
Statements of Changes in Net Assets
| Aggressive Strategy Fund | | Balanced Strategy Fund |
| For the | For the | | For the | For the |
| year ended | year ended | | year ended | year ended |
| October 31, | October 31, | | October 31, | October 31, |
| 2013 | 2012 | | 2013 | 2012 |
| Investment Activities: | | | | | | | | | | | | | | | | | | | | | |
| Operations: | | | | | | | | | | | | | | | | | | | | | |
| Net investment income (loss) | | $ | 101,323 | | | | $ | (30,313 | ) | | | | $ | 747,850 | | | | $ | 829,128 | | |
| Net realized gains (losses) from investments | | | 1,329,320 | | | | | 435,511 | | | | | | 3,187,260 | | | | | 1,339,315 | | |
| Change in unrealized appreciation/depreciation on investments | | | 2,165,704 | | | | | 869,238 | | | | | | 3,363,436 | | | | | 2,007,609 | | |
| Change in net assets resulting from operations | | | 3,596,347 | | | | | 1,274,436 | | | | | | 7,298,546 | | | | | 4,176,052 | | |
| | | | | | | | | | | | | | | | | | | | | | |
| Dividends: | | | | | | | | | | | | | | | | | | | | | |
| Net investment income: | | | | | | | | | | | | | | | | | | | | | |
| Class A Shares | | | (31,802 | ) | | | | (77,670 | ) | | | | | (526,976 | ) | | | | (912,343 | ) | |
| Class B Shares | | | — | | | | | (8,596 | ) | | | | | (168,352 | ) | | | | (454,511 | ) | |
| Class C Shares | | | — | | | | | (6,139 | ) | | | | | (59,678 | ) | | | | (174,260 | ) | |
| Change in net assets resulting from shareholder dividends | | | (31,802 | ) | | | | (92,405 | ) | | | | | (755,006 | ) | | | | (1,541,114 | ) | |
| Change in net assets resulting from capital transactions | | | (2,901,389 | ) | | | | (1,313,685 | ) | | | | | (8,823,314 | ) | | | | (3,920,082 | ) | |
| Change in net assets | | | 663,156 | | | | | (131,654 | ) | | | | | (2,279,774 | ) | | | | (1,285,144 | ) | |
| | | | | | | | | | | | | | | | | | | | | | |
| Net Assets: | | | | | | | | | | | | | | | | | | | | | |
| Beginning of period | | | 17,719,479 | | | | | 17,851,133 | | | | | | 52,202,487 | | | | | 53,487,631 | | |
| End of period | | $ | 18,382,635 | | | | $ | 17,719,479 | | | | | $ | 49,922,713 | | | | $ | 52,202,487 | | |
| Accumulated net investment income (loss) | | $ | 19,297 | | | | $ | (63,840 | ) | | | | $ | 421,721 | | | | $ | 320,543 | | |
| See notes to financial statements. | HSBC WORLD SELECTION FUNDS 25 |
HSBC WORLD SELECTION FUNDS
Statements of Changes in Net Assets (continued)
| Aggressive Strategy Fund | | Balanced Strategy Fund |
| For the | For the | | For the | For the |
| year ended | year ended | | year ended | year ended |
| October 31, | October 31, | | October 31, | October 31, |
| 2013 | 2012 | | 2013 | 2012 |
| CAPITAL TRANSACTIONS: | | | | | | | | | | | | | | | | | | | | | |
| Class A Shares: | | | | | | | | | | | | | | | | | | | | | |
| Proceeds from shares issued | | $ | 1,119,903 | | | | $ | 2,113,457 | | | | | $ | 3,539,929 | | | | $ | 5,462,023 | | |
| Dividends reinvested | | | 31,467 | | | | | 76,522 | | | | | | 512,520 | | | | | 896,978 | | |
| Value of shares redeemed | | | (2,321,459 | ) | | | | (1,916,446 | ) | | | | | (8,512,370 | ) | | | | (6,605,601 | ) | |
| Class A Shares capital transactions | | | (1,170,089 | ) | | | | 273,533 | | | | | | (4,459,921 | ) | | | | (246,600 | ) | |
| | | | | | | | | | | | | | | | | | | | | | |
| Class B Shares: | | | | | | | | | | | | | | | | | | | | | |
| Proceeds from shares issued | | | 222,109 | | | | | 692,637 | | | | | | 670,001 | | | | | 2,081,326 | | |
| Dividends reinvested | | | — | | | | | 8,454 | | | | | | 166,080 | | | | | 449,537 | | |
| Value of shares redeemed | | | (1,586,642 | ) | | | | (2,003,556 | ) | | | | | (4,094,807 | ) | | | | (5,369,321 | ) | |
| Class B Shares capital transactions | | | (1,364,533 | ) | | | | (1,302,465 | ) | | | | | (3,258,726 | ) | | | | (2,838,458 | ) | |
| | | | | | | | | | | | | | | | | | | | | | |
| Class C Shares: | | | | | | | | | | | | | | | | | | | | | |
| Proceeds from shares issued | | | 216,625 | | | | | 280,202 | | | | | | 1,158,773 | | | | | 980,626 | | |
| Dividends reinvested | | | — | | | | | 6,111 | | | | | | 58,220 | | | | | 170,621 | | |
| Value of shares redeemed | | | (583,392 | ) | | | | (571,066 | ) | | | | | (2,321,660 | ) | | | | (1,986,271 | ) | |
| Class C Shares capital transactions | | | (366,767 | ) | | | | (284,753 | ) | | | | | (1,104,667 | ) | | | | (835,024 | ) | |
| Change in net assets resulting from capital transactions | | $ | (2,901,389 | ) | | | $ | (1,313,685 | ) | | | | $ | (8,823,314 | ) | | | $ | (3,920,082 | ) | |
| | | | | | | | | | | | | | | | | | | | | | |
| SHARE TRANSACTIONS: | | | | | | | | | | | | | | | | | | | | | |
| Class A Shares: | | | | | | | | | | | | | | | | | | | | | |
| Issued | | | 80,079 | | | | | 170,638 | | | | | | 264,663 | | | | | 449,415 | | |
| Reinvested | | | 2,391 | | | | | 6,672 | | | | | | 40,135 | | | | | 78,890 | | |
| Redeemed | | | (163,112 | ) | | | | (154,093 | ) | | | | | (636,383 | ) | | | | (540,992 | ) | |
| Change in Class A Shares | | | (80,642 | ) | | | | 23,217 | | | | | | (331,585 | ) | | | | (12,687 | ) | |
| | | | | | | | | | | | | | | | | | | | | | |
| Class B Shares: | | | | | | | | | | | | | | | | | | | | | |
| Issued | | | 16,573 | | | | | 58,381 | | | | | | 50,599 | | | | | 170,500 | | |
| Reinvested | | | — | | | | | 765 | | | | | | 12,975 | | | | | 39,468 | | |
| Redeemed | | | (119,259 | ) | | | | (168,348 | ) | | | | | (306,391 | ) | | | | (442,138 | ) | |
| Change in Class B Shares | | | (102,686 | ) | | | | (109,202 | ) | | | | | (242,817 | ) | | | | (232,170 | ) | |
| | | | | | | | | | | | | | | | | | | | | | |
| Class C Shares: | | | | | | | | | | | | | | | | | | | | | |
| Issued | | | 15,890 | | | | | 23,588 | | | | | | 86,274 | | | | | 80,512 | | |
| Reinvested | | | — | | | | | 556 | | | | | | 4,545 | | | | | 14,967 | | |
| Redeemed | | | (43,405 | ) | | | | (48,318 | ) | | | | | (172,661 | ) | | | | (160,924 | ) | |
| Change in Class C Shares | | | (27,515 | ) | | | | (24,174 | ) | | | | | (81,842 | ) | | | | (65,445 | ) | |
| 26 HSBC WORLD SELECTION FUNDS | See notes to financial statements. |
HSBC WORLD SELECTION FUNDS
Statements of Changes in Net Assets (continued)
| Moderate Strategy Fund | | Conservative Strategy Fund |
| For the | For the | | For the | For the |
| year ended | year ended | | year ended | year ended |
| October 31, | October 31, | | October 31, | October 31, |
| 2013 | 2012 | | 2013 | 2012 |
| Investment Activities: | | | | | | | | | | | | | | | | | | | | | |
| Operations: | | | | | | | | | | | | | | | | | | | | | |
| Net investment income (loss) | | $ | 689,015 | | | | $ | 927,899 | | | | | $ | 297,333 | | | | $ | 436,646 | | |
| Net realized gains (losses) from investments | | | 2,229,529 | | | | | 1,043,026 | | | | | | 792,940 | | | | | 130,546 | | |
| Change in unrealized appreciation/depreciation on investments | | | 1,569,262 | | | | | 1,583,173 | | | | | | 182,798 | | | | | 1,028,581 | | |
| Change in net assets resulting from operations | | | 4,487,806 | | | | | 3,554,098 | | | | | | 1,273,071 | | | | | 1,595,773 | | |
| | | | | | | | | | | | | | | | | | | | | | |
| Dividends: | | | | | | | | | | | | | | | | | | | | | |
| Net investment income: | | | | | | | | | | | | | | | | | | | | | |
| Class A Shares | | | (535,629 | ) | | | | (657,742 | ) | | | | | (210,889 | ) | | | | (283,394 | ) | |
| Class B Shares | | | (246,797 | ) | | | | (398,779 | ) | | | | | (148,678 | ) | | | | (215,487 | ) | |
| Class C Shares | | | (55,954 | ) | | | | (78,368 | ) | | | | | (43,828 | ) | | | | (57,748 | ) | |
| Change in net assets resulting from shareholder dividends | | | (838,380 | ) | | | | (1,134,889 | ) | | | | | (403,395 | ) | | | | (556,629 | ) | |
| Change in net assets resulting from capital transactions | | | (5,581,708 | ) | | | | (4,201,200 | ) | | | | | (1,590,952 | ) | | | | 1,174,324 | | |
| Change in net assets | | | (1,932,282 | ) | | | | (1,781,991 | ) | | | | | (721,276 | ) | | | | 2,213,468 | | |
| | | | | | | | | | | | | | | | | | | | | | |
| Net Assets: | | | | | | | | | | | | | | | | | | | | | |
| Beginning of period | | | 46,118,380 | | | | | 47,900,371 | | | | | | 22,640,382 | | | | | 20,426,914 | | |
| End of period | | $ | 44,186,098 | | | | $ | 46,118,380 | | | | | $ | 21,919,106 | | | | $ | 22,640,382 | | |
| Accumulated net investment income (loss) | | $ | 71,162 | | | | $ | 43,306 | | | | | $ | 46,289 | | | | $ | 16,781 | | |
| See notes to financial statements. | HSBC WORLD SELECTION FUNDS 27 |
HSBC WORLD SELECTION FUNDS
Statements of Changes in Net Assets (continued)
| Moderate Strategy Fund | | Conservative Strategy Fund |
| For the | For the | | For the | For the |
| year ended | year ended | | year ended | year ended |
| October 31, | October 31, | | October 31, | October 31, |
| 2013 | 2012 | | 2013 | 2012 |
| CAPITAL TRANSACTIONS: | | | | | | | | | | | | | | | | | | | | | |
| Class A Shares: | | | | | | | | | | | | | | | | | | | | | |
| Proceeds from shares issued | | $ | 3,831,691 | | | | $ | 5,814,895 | | | | | $ | 1,655,437 | | | | $ | 2,466,524 | | |
| Dividends reinvested | | | 523,791 | | | | | 648,574 | | | | | | 198,276 | | | | | 267,600 | | |
| Value of shares redeemed | | | (6,879,650 | ) | | | | (6,285,101 | ) | | | | | (2,914,887 | ) | | | | (2,212,701 | ) | |
| Class A Shares capital transactions | | | (2,524,168 | ) | | | | 178,368 | | | | | | (1,061,174 | ) | | | | 521,423 | | |
| | | | | | | | | | | | | | | | | | | | | | |
| Class B Shares: | | | | | | | | | | | | | | | | | | | | | |
| Proceeds from shares issued | | | 893,722 | | | | | 1,837,722 | | | | | | 981,218 | | | | | 1,972,436 | | |
| Dividends reinvested | | | 241,511 | | | | | 392,486 | | | | | | 142,306 | | | | | 204,146 | | |
| Value of shares redeemed | | | (4,683,399 | ) | | | | (5,898,444 | ) | | | | | (2,079,054 | ) | | | | (1,807,237 | ) | |
| Class B Shares capital transactions | | | (3,548,166 | ) | | | | (3,668,236 | ) | | | | | (955,530 | ) | | | | 369,345 | | |
| | | | | | | | | | | | | | | | | | | | | | |
| Class C Shares: | | | | | | | | | | | | | | | | | | | | | |
| Proceeds from shares issued | | | 1,491,199 | | | | | 682,092 | | | | | | 1,262,554 | | | | | 1,056,887 | | |
| Dividends reinvested | | | 53,892 | | | | | 77,318 | | | | | | 42,276 | | | | | 54,627 | | |
| Value of shares redeemed | | | (1,054,465 | ) | | | | (1,470,742 | ) | | | | | (879,078 | ) | | | | (827,958 | ) | |
| Class C Shares capital transactions | | | 490,626 | | | | | (711,332 | ) | | | | | 425,752 | | | | | 283,556 | | |
| Change in net assets resulting from capital transactions | | $ | (5,581,708 | ) | | | $ | (4,201,200 | ) | | | | $ | (1,590,952 | ) | | | $ | 1,174,324 | | |
| | | | | | | | | | | | | | | | | | | | | | |
| SHARE TRANSACTIONS: | | | | | | | | | | | | | | | | | | | | | |
| Class A Shares: | | | | | | | | | | | | | | | | | | | | | |
| Issued | | | 309,439 | | | | | 505,703 | | | | | | 141,736 | | | | | 223,077 | | |
| Reinvested | | | 42,928 | | | | | 58,105 | | | | | | 17,175 | | | | | 24,607 | | |
| Redeemed | | | (556,132 | ) | | | | (546,616 | ) | | | | | (249,249 | ) | | | | (198,821 | ) | |
| Change in Class A Shares | | | (203,765 | ) | | | | 17,192 | | | | | | (90,338 | ) | | | | 48,863 | | |
| | | | | | | | | | | | | | | | | | | | | | |
| Class B Shares: | | | | | | | | | | | | | | | | | | | | | |
| Issued | | | 72,673 | | | | | 160,345 | | | | | | 85,320 | | | | | 180,184 | | |
| Reinvested | | | 19,864 | | | | | 35,603 | | | | | | 12,485 | | | | | 19,128 | | |
| Redeemed | | | (378,804 | ) | | | | (514,301 | ) | | | | | (180,032 | ) | | | | (164,720 | ) | |
| Change in Class B Shares | | | (286,267 | ) | | | | (318,353 | ) | | | | | (82,227 | ) | | | | 34,592 | | |
| | | | | | | | | | | | | | | | | | | | | | |
| Class C Shares: | | | | | | | | | | | | | | | | | | | | | |
| Issued | | | 123,399 | | | | | 61,003 | | | | | | 106,168 | | | | | 93,307 | | |
| Reinvested | | | 4,542 | | | | | 7,205 | | | | | | 3,602 | | | | | 4,973 | | |
| Redeemed | | | (87,560 | ) | | | | (131,493 | ) | | | | | (74,185 | ) | | | | (73,251 | ) | |
| Change in Class C Shares | | | 40,381 | | | | | (63,285 | ) | | | | | 35,585 | | | | | 25,029 | | |
| 28 HSBC WORLD SELECTION FUNDS | See notes to financial statements. |
HSBC WORLD SELECTION FUNDS
Statements of Changes in Net Assets (continued)
| Income Strategy Fund |
| For the | For the |
| year ended | period ended |
| October 31, | October 31, |
| 2013 | 2012(a) |
| Investment Activities: | | | | | | | | | | |
| Operations: | | | | | | | | | | |
| Net investment income (loss) | | $ | 12,996 | | | | $ | 3,609 | | |
| Net realized gains (losses) from investments | | | 31,998 | | | | | 2,837 | | |
| Change in unrealized appreciation/depreciation from investments | | | (20,007 | ) | | | | 18,051 | | |
| Change in net assets resulting from operations | | | 24,987 | | | | | 24,497 | | |
| | | | | | | | | | | |
| Dividends: | | | | | | | | | | |
| Net investment income: | | | | | | | | | | |
| Class A Shares | | | (9,746 | ) | | | | (1,852 | ) | |
| Class B Shares | | | (8,155 | ) | | | | (687 | ) | |
| Class C Shares | | | (6,165 | ) | | | | (536 | ) | |
| | | | | | | | | | | |
| Net realized gains: | | | | | | | | | | |
| Class A Shares | | | (1,059 | ) | | | | — | | |
| Class B Shares | | | (1,181 | ) | | | | — | | |
| Class C Shares | | | (842 | ) | | | | — | | |
| Change in net assets resulting from shareholder dividends | | | (27,148 | ) | | | | (3,075 | ) | |
| Change in net assets resulting from capital transactions | | | 441,756 | | | | | 895,462 | | |
| Change in net assets | | | 439,595 | | | | | 916,884 | | |
| | | | | | | | | | | |
| Net Assets: | | | | | | | | | | |
| Beginning of period | | | 916,884 | | | | | — | | |
| End of period | | $ | 1,356,479 | | | | $ | 916,884 | | |
| Accumulated net investment income (loss) | | $ | (3 | ) | | | $ | 7,921 | | |
____________________
(a) Commenced operations on March 20, 2012.
| See notes to financial statements. | HSBC WORLD SELECTION FUNDS 29 |
HSBC WORLD SELECTION FUNDS
Statements of Changes in Net Assets (continued)
| Income Strategy Fund |
| For the | For the |
| year ended | period ended |
| October 31, | October 31, |
| 2013 | 2012(a) |
| CAPITAL TRANSACTIONS: | | | | | | | | | | |
| Class A Shares: | | | | | | | | | | |
| Proceeds from shares issued | | $ | 104,917 | | | | $ | 429,058 | | |
| Dividends reinvested | | | 10,780 | | | | | 1,851 | | |
| Value of shares redeemed | | | (141,000 | ) | | | | (103,668 | ) | |
| Class A Shares capital transactions | | | (25,303 | ) | | | | 327,241 | | |
| | | | | | | | | | | |
| Class B Shares: | | | | | | | | | | |
| Proceeds from shares issued | | | 65,346 | | | | | 349,020 | | |
| Dividends reinvested | | | 8,530 | | | | | 644 | | |
| Value of shares redeemed | | | (17,586 | ) | | | | (7,223 | ) | |
| Class B Shares capital transactions | | | 56,290 | | | | | 342,441 | | |
| | | | | | | | | | | |
| Class C Shares: | | | | | | | | | | |
| Proceeds from shares issued | | | 505,835 | | | | | 226,393 | | |
| Dividends reinvested | | | 6,873 | | | | | 536 | | |
| Value of shares redeemed | | | (101,939 | ) | | | | (1,149 | ) | |
| Class C Shares capital transactions | | | 410,769 | | | | | 225,780 | | |
| Change in net assets resulting from capital transactions | | $ | 441,756 | | | | $ | 895,462 | | |
| | | | | | | | | | | |
| SHARE TRANSACTIONS: | | | | | | | | | | |
| Class A Shares: | | | | | | | | | | |
| Issued | | | 10,151 | | | | | 42,276 | | |
| Reinvested | | | 1,048 | | | | | 179 | | |
| Redeemed | | | (13,472 | ) | | | | (10,138 | ) | |
| Change in Class A Shares | | | (2,273 | ) | | | | 32,317 | | |
| | | | | | | | | | | |
| Class B Shares: | | | | | | | | | | |
| Issued | | | 6,335 | | | | | 34,074 | | |
| Reinvested | | | 830 | | | | | 62 | | |
| Redeemed | | | (1,693 | ) | | | | (701 | ) | |
| Change in Class B Shares | | | 5,472 | | | | | 33,435 | | |
| | | | | | | | | | | |
| Class C Shares: | | | | | | | | | | |
| Issued | | | 49,258 | | | | | 22,294 | | |
| Reinvested | | | 670 | | | | | 52 | | |
| Redeemed | | | (9,936 | ) | | | | (114 | ) | |
| Change in Class C Shares | | | 39,992 | | | | | 22,232 | | |
____________________
(a) Commenced operations on March 20, 2012.
| 30 HSBC WORLD SELECTION FUNDS | See notes to financial statements. |
| AGGRESSIVE STRATEGY FUND |
Financial Highlights Selected data for a share outstanding throughout the periods indicated.* |
| | | | Investment Activities | | Dividends | | | | | | Ratios/Supplemental Data |
| | Net Asset
Value,
Beginning
of Period | | Net
Investment
Income
(Loss)(a) | | Net
Realized and
Unrealized
Gains
(Losses) from
Investments | | Total from
Investment
Activities | | Net
Investment
Income | | Total
Dividends | | Net Asset
Value, End
of Period | | Total
Return(b) | | Net Assets
at End
of Period
(000’s) | | Ratio of Net
Expenses
to Average
Net Assets | | Ratio of Net
Investment
Income
(Loss) to
Average
Net Assets | | Ratios of
Expenses
to Average
Net Assets
(Excluding
Fee
Reductions) | | Portfolio
Turnover
(c) |
| CLASS A SHARES | | | | | | | | | | | | | | | | | | | | | | | | | | | | | | | | | | | | | | | | | | | | | | | | | | | | | | | | |
| Year Ended October 31, 2009 | | | $ | 8.62 | | | | 0.01 | | | | | 1.57 | | | | | 1.58 | | | | | — | | | | | — | | | | | $ | 10.20 | | | | 18.33 | %(d) | | | | $ | 5,426 | | | 1.50% | | | 0.09 | % | | | 2.16% | | 53% |
| Year Ended October 31, 2010 | | | | 10.20 | | | | 0.03 | | | | | 1.80 | | | | | 1.83 | | | | | — | | | | | — | | | | | | 12.03 | | | | 17.94 | %(e) | | | | | 7,886 | | | 1.50% | | | 0.24 | % | | | 2.00% | | 50% |
| Year Ended October 31, 2011 | | | | 12.03 | | | | 0.10 | | | | | (0.07 | ) | | | | 0.03 | | | | | (0.10 | ) | | | | (0.10 | ) | | | | | 11.96 | | | | 0.20 | %(f) | | | | | 9,217 | | | 1.50% | | | 0.77 | % | | | 1.61% | | 71% |
| Year Ended October 31, 2012 | | | | 11.96 | | | | 0.02 | | | | | 0.89 | | | | | 0.91 | | | | | (0.10 | ) | | | | (0.10 | ) | | | | | 12.77 | | | | 7.72 | % | | | | | 10,136 | | | 1.50% | | | 0.16 | % | | | 1.66% | | 71% |
| Year Ended October 31, 2013 | | | | 12.77 | | | | 0.12 | | | | | 2.73 | | | | | 2.85 | | | | | (0.04 | ) | | | | (0.04 | ) | | | | | 15.58 | | | | 22.38 | % | | | | | 11,106 | | | 1.50% | | | 0.86 | % | | | 1.50% | | 37% |
| CLASS B SHARES | | | | | | | | | | | | | | | | | | | | | | | | | | | | | | | | | | | | | | | | | | | | | | | | | | | | | | | | |
| Year Ended October 31, 2009 | | | $ | 8.39 | | | | (0.06 | ) | | | | 1.53 | | | | | 1.47 | | | | | — | | | | | — | | | | | $ | 9.86 | | | | 17.52 | %(d) | | | | $ | 3,767 | | | 2.25% | | | (0.66 | )% | | | 2.91% | | 53% |
| Year Ended October 31, 2010 | | | | 9.86 | | | | (0.05 | ) | | | | 1.73 | | | | | 1.68 | | | | | — | | | | | — | | | | | | 11.54 | | | | 17.04 | %(e) | | | | | 5,519 | | | 2.25% | | | (0.51 | )% | | | 2.75% | | 50% |
| Year Ended October 31, 2011 | | | | 11.54 | | | | — | (h) | | | | (0.06 | ) | | | | (0.06 | ) | | | | (0.03 | ) | | | | (0.03 | ) | | | | | 11.45 | | | | (0.53 | )%(f) | | | | | 6,750 | | | 2.25% | | | 0.02 | % | | | 2.36% | | 71% |
| Year Ended October 31, 2012 | | | | 11.45 | | | | (0.07 | ) | | | | 0.85 | | | | | 0.78 | | | | | (0.01 | ) | | | | (0.01 | ) | | | | | 12.22 | | | | 6.87 | % | | | | | 5,870 | | | 2.25% | | | (0.57 | )% | | | 2.40% | | 71% |
| Year Ended October 31, 2013 | | | | 12.22 | | | | 0.01 | | | | | 2.61 | | | | | 2.62 | | | | | — | | | | | — | | | | | | 14.84 | | | | 21.44 | %(g) | | | | | 5,604 | | | 2.25% | | | 0.11 | % | | | 2.25% | | 37% |
| CLASS C SHARES | | | | | | | | | | | | | | | | | | | | | | | | | | | | | | | | | | | | | | | | | | | | | | | | | | | | | | | | |
| Year Ended October 31, 2009 | | | $ | 8.39 | | | | (0.05 | ) | | | | 1.51 | | | | | 1.46 | | | | | — | | | | | — | | | | | $ | 9.85 | | | | 17.40 | %(d) | | | | $ | 289 | | | 2.25% | | | (0.59 | )% | | | 2.93% | | 53% |
| Year Ended October 31, 2010 | | | | 9.85 | | | | (0.05 | ) | | | | 1.73 | | | | | 1.68 | | | | | — | | | | | — | | | | | | 11.53 | | | | 17.06 | %(e) | | | | | 698 | | | 2.25% | | | (0.47 | )% | | | 2.76% | | 50% |
| Year Ended October 31, 2011 | | | | 11.53 | | | | — | (h) | | | | (0.05 | ) | | | | (0.05 | ) | | | | (0.05 | ) | | | | (0.05 | ) | | | | | 11.43 | | | | (0.46 | )%(f) | | | | | 1,884 | | | 2.25% | | | — | %(i) | | | 2.35% | | 71% |
| Year Ended October 31, 2012 | | | | 11.43 | | | | (0.07 | ) | | | | 0.85 | | | | | 0.78 | | | | | (0.04 | ) | | | | (0.04 | ) | | | | | 12.17 | | | | 6.83 | % | | | | | 1,713 | | | 2.25% | | | (0.56 | )% | | | 2.40% | | 71% |
| Year Ended October 31, 2013 | | | | 12.17 | | | | 0.02 | | | | | 2.59 | | | | | 2.61 | | | | | — | | | | | — | | | | | | 14.78 | | | | 21.45 | %(g) | | | | | 1,673 | | | 2.25% | | | 0.12 | % | | | 2.25% | | 37% |
| * | The per share amounts and percentages reflect income and expenses assuming inclusion of the Fund’s proportionate share of the income and expenses of the applicable HSBC Portfolios, the Fund does not include expenses of the affiliated and unaffiliated investment companies, in which the Fund invests. |
| (a) | Calculated based on average shares outstanding. |
| (b) | Total return calculations do not include any sales or redemption charges. |
| (c) | Portfolio turnover rate is calculated by aggregating the results of multiplying the Fund’s investment percentage in the respective Portfolios, affiliated and unaffiliated investment companies by their corresponding portfolio turnover rates. Portfolio turnover rate is calculated on the basis of the Fund as a whole without distinguishing between classes of shares issued. |
| (d) | During the year ended October 31, 2009, certain HSBC Portfolios, in which the Fund invests, received monies related to certain nonrecurring litigation settlements. The corresponding impact to the total return was 0.11%, 0.11% and 0.11% for Class A Shares, Class B Shares and Class C Shares, respectively. |
| (e) | During the year ended October 31, 2010, certain HSBC Portfolios, in which the Fund invests, received monies related to certain nonrecurring litigation settlements. The corresponding impact to the total return was 0.09%, 0.09% and 0.09% for Class A Shares, Class B Shares and Class C Shares, respectively. |
| (f) | During the year ended October 31, 2011, certain HSBC Portfolios, in which the Fund invests, received monies related to certain nonrecurring litigation settlements. The corresponding impact to the total return was 0.08%, 0.08% and 0.08% for Class A Shares, Class B Shares and Class C Shares, respectively. |
| (g) | Rounds to less than $0.01 or $(0.01). |
| (h) | Rounds to less than 0.005% or (0.005)%. |
| | |
| See notes to financial statements. | HSBC WORLD SELECTION FUNDS 31 |
| BALANCED STRATEGY FUND |
Financial Highlights Selected data for a share outstanding throughout the periods indicated.* |
| | | | Investment Activities | | Dividends | | | | | | Ratios/Supplemental Data |
| | Net Asset
Value,
Beginning
of Period | | Net
Investment
Income
(Loss)(a) | | Net
Realized and
Unrealized
Gains
(Losses) from
Investments | | Total from
Investment
Activities | | Net
Investment
Income | | Total
Dividends | | Net Asset
Value, End
of Period | | Total
Return(b) | | Net Assets
at End
of Period
(000’s) | | Ratio of Net
Expenses
to Average
Net Assets | | Ratio of Net
Investment
Income
(Loss) to
Average
Net Assets | | Ratios of
Expenses
to Average
Net Assets
(Excluding
Fee
Reductions) | | Portfolio
Turnover
(c) |
| CLASS A SHARES | | | | | | | | | | | | | | | | | | | | | | | | | | | | | | | | | | | | | | | | | |
| Year Ended October 31, 2009 | | | $ | 8.81 | | | 0.07 | | | 1.55 | | | | 1.62 | | (0.09) | | (0.09) | | | $ | 10.34 | | | | 18.66 | %(d) | | | | $ | 15,304 | | | 1.50% | | 0.84% | | 1.57% | | 48% |
| Year Ended October 31, 2010 | | | | 10.34 | | | 0.19 | | | 1.64 | | | | 1.83 | | (0.08) | | (0.08) | | | | 12.09 | | | | 17.79 | %(e) | | | | | 21,642 | | | 1.25% | | 1.72% | | 1.30% | | 53% |
| Year Ended October 31, 2011 | | | | 12.09 | | | 0.32 | | | (0.06 | ) | | | 0.26 | | (0.28) | | (0.28) | | | | 12.07 | | | | 2.08 | %(f) | | | | | 28,262 | | | 1.12% | | 2.60% | | 1.14% | | 74% |
| Year Ended October 31, 2012 | | | | 12.07 | | | 0.23 | | | 0.75 | | | | 0.98 | | (0.39) | | (0.39) | | | | 12.66 | | | | 8.51 | % | | | | | 29,490 | | | 1.15% | | 1.89% | | 1.15% | | 62% |
| Year Ended October 31, 2013 | | | | 12.66 | | | 0.24 | | | 1.72 | | | | 1.96 | | (0.23) | | (0.23) | | | | 14.39 | | | | 15.76 | % | | | | | 28,746 | | | 1.04% | | 1.79% | | 1.04% | | 35% |
| CLASS B SHARES | | | | | | | | | | | | | | | | | | | | | | | | | | | | | | | | | | | | | | | | | |
| Year Ended October 31, 2009 | | | $ | 8.76 | | | 0.01 | | | 1.55 | | | | 1.56 | | (0.01) | | (0.01) | | | $ | 10.31 | | | | 17.80 | %(d) | | | | $ | 11,196 | | | 2.25% | | 0.07% | | 2.31% | | 48% |
| Year Ended October 31, 2010 | | | | 10.31 | | | 0.11 | | | 1.64 | | | | 1.75 | | (0.01) | | (0.01) | | | | 12.05 | | | | 17.01 | %(e) | | | | | 15,593 | | | 2.00% | | 0.97% | | 2.05% | | 53% |
| Year Ended October 31, 2011 | | | | 12.05 | | | 0.23 | | | (0.07 | ) | | | 0.16 | | (0.20) | | (0.20) | | | | 12.01 | | | | 1.30 | %(f) | | | | | 18,799 | | | 1.87% | | 1.85% | | 1.90% | | 74% |
| Year Ended October 31, 2012 | | | | 12.01 | | | 0.14 | | | 0.75 | | | | 0.89 | | (0.30) | | (0.30) | | | | 12.60 | | | | 7.66 | % | | | | | 16,805 | | | 1.91% | | 1.18% | | 1.91% | | 62% |
| Year Ended October 31, 2013 | | | | 12.60 | | | 0.14 | | | 1.72 | | | | 1.86 | | (0.13) | | (0.13) | | | | 14.33 | | | | 14.89 | % | | | | | 15,633 | | | 1.80% | | 1.05% | | 1.80% | | 35% |
| CLASS C SHARES | | | | | | | | | | | | | | | | | | | | | | | | | | | | | | | | | | | | | | | | | |
| Year Ended October 31, 2009 | | | $ | 8.80 | | | 0.01 | | | 1.55 | | | | 1.56 | | (0.01) | | (0.01) | | | $ | 10.35 | | | | 17.81 | %(d) | | | | $ | 1,507 | | | 2.25% | | 0.06% | | 2.30% | | 48% |
| Year Ended October 31, 2010 | | | | 10.35 | | | 0.12 | | | 1.63 | | | | 1.75 | | (0.01) | | (0.01) | | | | 12.09 | | | | 16.96 | %(e) | | | | | 3,497 | | | 2.01% | | 1.04% | | 2.06% | | 53% |
| Year Ended October 31, 2011 | | | | 12.09 | | | 0.23 | | | (0.07 | ) | | | 0.16 | | (0.21) | | (0.21) | | | | 12.04 | | | | 1.25 | %(f) | | | | | 6,427 | | | 1.87% | | 1.85% | | 1.90% | | 74% |
| Year Ended October 31, 2012 | | | | 12.04 | | | 0.14 | | | 0.76 | | | | 0.90 | | (0.32) | | (0.32) | | | | 12.62 | | | | 7.77 | % | | | | | 5,908 | | | 1.91% | | 1.18% | | 1.91% | | 62% |
| Year Ended October 31, 2013 | | | | 12.62 | | | 0.14 | | | 1.72 | | | | 1.86 | | (0.13) | | (0.13) | | | | 14.35 | | | | 14.87 | % | | | | | 5,544 | | | 1.80% | | 1.04% | | 1.80% | | 35% |
| * | The per share amounts and percentages reflect income and expenses assuming inclusion of the Fund’s proportionate share of the income and expenses of the applicable HSBC Portfolios, the Fund does not include expenses of the affiliated and unaffiliated investment companies, in which the Fund invests. |
| (a) | Calculated based on average shares outstanding. |
| (b) | Total return calculations do not include any sales or redemption charges. |
| (c) | Portfolio turnover rate is calculated by aggregating the results of multiplying the Fund’s investment percentage in the respective Portfolios, affiliated and unaffiliated investment companies by their corresponding portfolio turnover rates. Portfolio turnover rate is calculated on the basis of the Fund as a whole without distinguishing between classes of shares issued. |
| (d) | During the year ended October 31, 2009, certain HSBC Portfolios, in which the Fund invests, received monies related to certain nonrecurring litigation settlements. The corresponding impact to the total return was 0.11%, 0.11% and 0.11% for Class A Shares, Class B Shares and Class C Shares, respectively. |
| (e) | During the year ended October 31, 2010, certain HSBC Portfolios, in which the Fund invests, received monies related to certain nonrecurring litigation settlements. The corresponding impact to the total return was 0.07%, 0.07% and 0.07% for Class A Shares, Class B Shares and Class C Shares, respectively. |
| (f) | During the year ended October 31, 2011, certain HSBC Portfolios, in which the Fund invests, received monies related to certain nonrecurring litigation settlements. The corresponding impact to the total return was 0.06%, 0.06% and 0.06% for Class A Shares, Class B Shares and Class C Shares, respectively. |
| | |
32 HSBC WORLD SELECTION FUNDS | See notes to financial statements. |
| MODERATE STRATEGY FUND |
Financial Highlights Selected data for a share outstanding throughout the periods indicated. |
| | | | Investment Activities | | Dividends | | | | | | Ratios/Supplemental Data |
| | Net Asset
Value,
Beginning
of Period | | Net
Investment
Income
(Loss)(a) | | Net
Realized and
Unrealized
Gains
(Losses) from
Investments | | Total from
Investment
Activities | | Net
Investment
Income | | Total
Dividends | | Net Asset
Value, End
of Period | | Total
Return(b) | | Net Assets
at End of
Period
(000’s) | | Ratio of Net
Expenses
to Average
Net Assets | | Ratio of Net
Investment
Income
(Loss) to
Average
Net Assets | | Ratios of
Expenses
to Average
Net Assets
(Excluding
Fee
Reductions) | | Portfolio
Turnover
(c) |
| CLASS A SHARES | | | | | | | | | | | | | | | | | | | | | | | | | | |
| Year Ended October 31, 2009 | | | $ | 8.69 | | | | 0.13 | | | | 1.39 | | | | | 1.52 | | | | (0.12 | ) | | | | (0.12 | ) | | | | $ | 10.09 | | | | 17.75 | %(d) | | | | $ | 15,909 | | | | 1.44 | % | | | | 1.47 | % | | | | 1.49 | % | | | | 41 | % | |
| Year Ended October 31, 2010 | | | | 10.09 | | | | 0.25 | | | | 1.38 | | | | | 1.63 | | | | (0.24 | ) | | | | (0.24 | ) | | | | | 11.48 | | | | 16.39 | %(e) | | | | | 18,921 | | | | 1.14 | % | | | | 2.33 | % | | | | 1.19 | % | | | | 67 | % | |
| Year Ended October 31, 2011 | | | | 11.48 | | | | 0.37 | | | | (0.12 | ) | | | | 0.25 | | | | (0.44 | ) | | | | (0.44 | ) | | | | | 11.29 | | | | 2.19 | %(f) | | | | | 23,719 | | | | 1.06 | % | | | | 3.16 | % | | | | 1.09 | % | | | | 63 | % | |
| Year Ended October 31, 2012 | | | | 11.29 | | | | 0.26 | | | | 0.65 | | | | | 0.91 | | | | (0.32 | ) | | | | (0.32 | ) | | | | | 11.88 | | | | 8.24 | % | | | | | 25,175 | | | | 1.16 | % | | | | 2.30 | % | | | | 1.16 | % | | | | 61 | % | |
| Year Ended October 31, 2013 | | | | 11.88 | | | | 0.23 | | | | 1.04 | | | | | 1.27 | | | | (0.27 | ) | | | | (0.27 | ) | | | | | 12.88 | | | | 10.80 | % | | | | | 24,671 | | | | 1.08 | % | | | | 1.86 | % | | | | 1.08 | % | | | | 30 | % | |
| CLASS B SHARES | | | | | | | | | | | | | | | | | | | | | | | | | | | | | | | | | | | | | | | | | | | | | | | | | | | | | | | | | | | | | | | |
| Year Ended October 31, 2009 | | | $ | 8.69 | | | | 0.06 | | | | 1.39 | | | | | 1.45 | | | | (0.06 | ) | | | | (0.06 | ) | | | | $ | 10.08 | | | | 16.82 | %(d) | | | | $ | 14,230 | | | | 2.19 | % | | | | 0.71 | % | | | | 2.24 | % | | | | 41 | % | |
| Year Ended October 31, 2010 | | | | 10.08 | | | | 0.17 | | | | 1.38 | | | | | 1.55 | | | | (0.17 | ) | | | | (0.17 | ) | | | | | 11.46 | | | | 15.61 | %(e) | | | | | 18,362 | | | | 1.89 | % | | | | 1.59 | % | | | | 1.94 | % | | | | 67 | % | |
| Year Ended October 31, 2011 | | | | 11.46 | | | | 0.28 | | | | (0.10 | ) | | | | 0.18 | | | | (0.36 | ) | | | | (0.36 | ) | | | | | 11.28 | | | | 1.51 | %(f) | | | | | 20,323 | | | | 1.81 | % | | | | 2.40 | % | | | | 1.84 | % | | | | 63 | % | |
| Year Ended October 31, 2012 | | | | 11.28 | | | | 0.19 | | | | 0.63 | | | | | 0.82 | | | | (0.23 | ) | | | | (0.23 | ) | | | | | 11.87 | | | | 7.43 | % | | | | | 17,615 | | | | 1.92 | % | | | | 1.64 | % | | | | 1.92 | % | | | | 61 | % | |
| Year Ended October 31, 2013 | | | | 11.87 | | | | 0.14 | | | | 1.04 | | | | | 1.18 | | | | (0.18 | ) | | | | (0.18 | ) | | | | | 12.87 | | | | 10.04 | % | | | | | 15,407 | | | | 1.83 | % | | | | 1.12 | % | | | | 1.83 | % | | | | 30 | % | |
| CLASS C SHARES | | | | | | | | | | | | | | | | | | | | | | | | | | | | | | | | | | | | | | | | | | | | | | | | | | | | | | | | | | | | | | | |
| Year Ended October 31, 2009 | | | $ | 8.49 | | | | 0.06 | | | | 1.35 | | | | | 1.41 | | | | (0.06 | ) | | | | (0.06 | ) | | | | $ | 9.84 | | | | 16.75 | %(d) | | | | $ | 1,488 | | | | 2.19 | % | | | | 0.72 | % | | | | 2.24 | % | | | | 41 | % | |
| Year Ended October 31, 2010 | | | | 9.84 | | | | 0.17 | | | | 1.35 | | | | | 1.52 | | | | (0.18 | ) | | | | (0.18 | ) | | | | | 11.18 | | | | 15.55 | %(e) | | | | | 2,544 | | | | 1.90 | % | | | | 1.59 | % | | | | 1.95 | % | | | | 67 | % | |
| Year Ended October 31, 2011 | | | | 11.18 | | | | 0.27 | | | | (0.11 | ) | | | | 0.16 | | | | (0.36 | ) | | | | (0.36 | ) | | | | | 10.98 | | | | 1.42 | %(f) | | | | | 3,859 | | | | 1.81 | % | | | | 2.40 | % | | | | 1.84 | % | | | | 63 | % | |
| Year Ended October 31, 2012 | | | | 10.98 | | | | 0.18 | | | | 0.62 | | | | | 0.80 | | | | (0.23 | ) | | | | (0.23 | ) | | | | | 11.55 | | | | 7.49 | % | | | | | 3,329 | | | | 1.91 | % | | | | 1.64 | % | | | | 1.91 | % | | | | 61 | % | |
| Year Ended October 31, 2013 | | | | 11.55 | | | | 0.13 | | | | 1.01 | | | | | 1.14 | | | | (0.19 | ) | | | | (0.19 | ) | | | | | 12.50 | | | | 9.96 | % | | | | | 4,109 | | | | 1.83 | % | | | | 1.10 | % | | | | 1.83 | % | | | | 30 | % | |
| * | The per share amounts and percentages reflect income and expenses assuming inclusion of the Fund’s proportionate share of the income and expenses of the applicable HSBC Portfolios, the Fund does not include expenses of the affiliated and unaffiliated investment companies, in which the Fund invests. |
| (a) | Calculated based on average shares outstanding. |
| (b) | Total return calculations do not include any sales or redemption charges. |
| (c) | Portfolio turnover rate is calculated by aggregating the results of multiplying the Fund’s investment percentage in the respective Portfolios, affiliated and unaffiliated investment companies by their corresponding portfolio turnover rates. Portfolio turnover rate is calculated on the basis of the Fund as a whole without distinguishing between classes of shares issued. |
| (d) | During the year ended October 31, 2009, certain HSBC Portfolios, in which the Fund invests, received monies related to certain nonrecurring litigation settlements. The corresponding impact to the total return was 0.09%, 0.09% and 0.09% for Class A Shares, Class B Shares and Class C Shares, respectively. |
| (e) | During the year ended October 31, 2010, certain HSBC Portfolios, in which the Fund invests, received monies related to certain nonrecurring litigation settlements. The corresponding impact to the total return was 0.06%, 0.06% and 0.06% for Class A Shares, Class B Shares and Class C Shares, respectively. |
| (f) | During the year ended October 31, 2011, certain HSBC Portfolios, in which the Fund invests, received monies related to certain nonrecurring litigation settlements. The corresponding impact to the total return was 0.04%, 0.04% and 0.04% for Class A Shares, Class B Shares and Class C Shares, respectively. |
| See notes to financial statements. | HSBC WORLD SELECTION FUNDS 33 |
| CONSERVATIVE STRATEGY FUND |
Financial Highlights Selected data for a share outstanding throughout the periods indicated.* |
| | | | Investment Activities | | Dividends | | | | | | Ratios/Supplemental Data |
| | Net Asset
Value,
Beginning
of Period | | Net
Investment
Income
(Loss)(a) | | Net
Realized and
Unrealized
Gains
(Losses) from
Investments | | Total from
Investment
Activities | | Net
Investment
Income | | Total
Dividends | | Net Asset
Value, End
of Period | | Total
Return(b) | | Net Assets
at End of
Period
(000’s) | | Ratio of Net
Expenses
to Average
Net Assets | | Ratio of Net
Investment
Income
(Loss) to
Average
Net Assets | | Ratios of
Expenses
to Average
Net Assets
(Excluding
Fee
Reductions) | | Portfolio
Turnover
(c) |
| CLASS A SHARES | | | | | | | | | | | | | | | | | | | | | | | | | | |
| Year Ended October 31, 2009 | | | $ | 8.84 | | | | 0.14 | | | | 1.16 | | | | | 1.30 | | | | (0.13 | ) | | | | (0.13 | ) | | | | $ | 10.01 | | | | 14.95 | %(d) | | | | $ | 5,059 | | | | 1.50 | % | | | | 1.53 | % | | | | 1.62 | % | | | | 34 | % | |
| Year Ended October 31, 2010 | | | | 10.01 | | | | 0.26 | | | | 1.11 | | | | | 1.37 | | | | (0.23 | ) | | | | (0.23 | ) | | | | | 11.15 | | | | 13.86 | %(e) | | | | | 7,139 | | | | 1.38 | % | | | | 2.42 | % | | | | 1.43 | % | | | | 78 | % | |
| Year Ended October 31, 2011 | | | | 11.15 | | | | 0.36 | | | | (0.10 | ) | | | | 0.26 | | | | (0.46 | ) | | | | (0.46 | ) | | | | | 10.95 | | | | 2.40 | %(f) | | | | | 8,946 | | | | 1.19 | % | | | | 3.21 | % | | | | 1.22 | % | | | | 54 | % | |
| Year Ended October 31, 2012 | | | | 10.95 | | | | 0.27 | | | | 0.58 | | | | | 0.85 | | | | (0.33 | ) | | | | (0.33 | ) | | | | | 11.47 | | | | 8.00 | % | | | | | 9,933 | | | | 1.34 | % | | | | 2.40 | % | | | | 1.34 | % | | | | 59 | % | |
| Year Ended October 31, 2013 | | | | 11.47 | | | | 0.20 | | | | 0.51 | | | | | 0.71 | | | | (0.25 | ) | | | | (0.25 | ) | | | | | 11.93 | | | | 6.28 | % | | | | | 9,255 | | | | 1.26 | % | | | | 1.75 | % | | | | 1.26 | % | | | | 31 | % | |
| CLASS B SHARES | | | | | | | | | | | | | | | | | | | | | | | | | | | | | | | | | | | | | | | | | | | | | | | | | | | | | | | | | | | | | | | |
| Year Ended October 31, 2009 | | | $ | 8.76 | | | | 0.07 | | | | 1.15 | | | | | 1.22 | | | | (0.07 | ) | | | | (0.07 | ) | | | | $ | 9.91 | | | | 14.05 | %(d) | | | | $ | 4,907 | | | | 2.25 | % | | | | 0.77 | % | | | | 2.38 | % | | | | 34 | % | |
| Year Ended October 31, 2010 | | | | 9.91 | | | | 0.17 | | | | 1.10 | | | | | 1.27 | | | | (0.16 | ) | | | | (0.16 | ) | | | | | 11.02 | | | | 12.94 | %(e) | | | | | 7,411 | | | | 2.14 | % | | | | 1.68 | % | | | | 2.19 | % | | | | 78 | % | |
| Year Ended October 31, 2011 | | | | 11.02 | | | | 0.27 | | | | (0.09 | ) | | | | 0.18 | | | | (0.38 | ) | | | | (0.38 | ) | | | | | 10.82 | | | | 1.68 | %(f) | | | | | 8,995 | | | | 1.94 | % | | | | 2.46 | % | | | | 1.97 | % | | | | 54 | % | |
| Year Ended October 31, 2012 | | | | 10.82 | | | | 0.18 | | | | 0.58 | | | | | 0.76 | | | | (0.25 | ) | | | | (0.25 | ) | | | | | 11.33 | | | | 7.21 | % | | | | | 9,810 | | | | 2.10 | % | | | | 1.67 | % | | | | 2.10 | % | | | | 59 | % | |
| Year Ended October 31, 2013 | | | | 11.33 | | | | 0.12 | | | | 0.50 | | | | | 0.62 | | | | (0.18 | ) | | | | (0.18 | ) | | | | | 11.77 | | | | 5.50 | % | | | | | 9,222 | | | | 2.01 | % | | | | 1.00 | % | | | | 2.01 | % | | | | 31 | % | |
| CLASS C SHARES | | | | | | | | | | | | | | | | | | | | | | | | | | | | | | | | | | | | | | | | | | | | | | | | | | | | | | | | | | | | | | | |
| Year Ended October 31, 2009 | | | $ | 9.00 | | | | 0.07 | | | | 1.18 | | | | | 1.25 | | | | (0.07 | ) | | | | (0.07 | ) | | | | $ | 10.18 | | | | 13.97 | %(d) | | | | $ | 485 | | | | 2.25 | % | | | | 0.78 | % | | | | 2.37 | % | | | | 34 | % | |
| Year Ended October 31, 2010 | | | | 10.18 | | | | 0.18 | | | | 1.14 | | | | | 1.32 | | | | (0.17 | ) | | | | (0.17 | ) | | | | | 11.33 | | | | 13.07 | %(e) | | | | | 1,323 | | | | 2.16 | % | | | | 1.71 | % | | | | 2.21 | % | | | | 78 | % | |
| Year Ended October 31, 2011 | | | | 11.33 | | | | 0.28 | | | | (0.10 | ) | | | | 0.18 | | | | (0.39 | ) | | | | (0.39 | ) | | | | | 11.12 | | | | 1.57 | %(f) | | | | | 2,486 | | | | 1.94 | % | | | | 2.49 | % | | | | 1.96 | % | | | | 54 | % | |
| Year Ended October 31, 2012 | | | | 11.12 | | | | 0.19 | | | | 0.60 | | | | | 0.79 | | | | (0.25 | ) | | | | (0.25 | ) | | | | | 11.66 | | | | 7.28 | % | | | | | 2,897 | | | | 2.08 | % | | | | 1.69 | % | | | | 2.08 | % | | | | 59 | % | |
| Year Ended October 31, 2013 | | | | 11.66 | | | | 0.12 | | | | 0.52 | | | | | 0.64 | | | | (0.18 | ) | | | | (0.18 | ) | | | | | 12.12 | | | | 5.53 | % | | | | | 3,442 | | | | 2.01 | % | | | | 0.98 | % | | | | 2.01 | % | | | | 31 | % | |
| * | The per share amounts and percentages reflect income and expenses assuming inclusion of the Fund’s proportionate share of the income and expenses of the applicable HSBC Portfolios, the Fund does not include expenses of the affiliated and unaffiliated investment companies, in which the Fund invests. |
| (a) | Calculated based on average shares outstanding. |
| (b) | Total return calculations do not include any sales or redemption charges. |
| (c) | Portfolio turnover rate is calculated by aggregating the results of multiplying the Fund’s investment percentage in the respective Portfolios, affiliated and unaffiliated investment companies by their corresponding portfolio turnover rates. Portfolio turnover rate is calculated on the basis of the Fund as a whole without distinguishing between classes of shares issued. |
| (d) | During the year ended October 31, 2009, certain HSBC Portfolios, in which the Fund invests, received monies related to certain nonrecurring litigation settlements. The corresponding impact to the total return was 0.08%, 0.08% and 0.08% for Class A Shares, Class B Shares and Class C Shares, respectively. |
| (e) | During the year ended October 31, 2010, certain HSBC Portfolios, in which the Fund invests, received monies related to certain nonrecurring litigation settlements. The corresponding impact to the total return was 0.05%, 0.05% and 0.05% for Class A Shares, Class B Shares and Class C Shares, respectively. |
| (f) | During the year ended October 31, 2011, certain HSBC Portfolios, in which the Fund invests, received monies related to certain nonrecurring litigation settlements. The corresponding impact to the total return was 0.02%, 0.02% and 0.02% for Class A Shares, Class B Shares and Class C Shares, respectively. |
| 34 HSBC WORLD SELECTION FUNDS | See notes to financial statements. |
| INCOME STRATEGY FUND |
Financial Highlights Selected data for a share outstanding throughout the periods indicated.* |
| | | | Investment Activities | | Dividends | | | | | | Ratios/Supplemental Data |
| | Net Asset
Value,
Beginning
of Period | | Net
Investment
Income
(Loss)(a) | | Net
Realized and
Unrealized
Gains
(Losses) from
Investments | | Total from
Investment
Activities | | Net
Investment
Income | | Net
Realized
Gains from
Investment
Transactions | | Total
Dividends | | Net Asset
Value, End
of Period | | Total
Return
(b) | | Net Assets
at End of
Period
(000’s) | | Ratio of Net
Expenses
to Average
Net Assets
(c) | | Ratio of Net
Investment
Income
(Loss) to
Average
Net Assets
(c) | | Ratios of
Expenses
to Average
Net Assets
(Excluding
Fee
Reductions)
(c) | | Portfolio
Turnover
(b)(d) |
| CLASS A SHARES | | | | | | | | | | | | | | | | | | | | | | | | | | | | | |
| Period Ended October 31, 2012(e) | | | $ | 10.00 | | | | 0.10 | | | | 0.40 | | | | 0.50 | | | | (0.07 | ) | | | | — | | | | | (0.07 | ) | | | | $ | 10.43 | | | | 5.02 | % | | | | $ | 337 | | | | 1.50 | % | | | | 1.58 | % | | | | 29.67 | % | | | | 31 | % | |
| Year Ended October 31, 2013 | | | | 10.43 | | | | 0.18 | | | | 0.08 | | | | 0.26 | | | | (0.30 | ) | | | | (0.03 | ) | | | | (0.33 | ) | | | | | 10.36 | | | | 2.57 | % | | | | $ | 311 | | | | 1.50 | % | | | | 1.72 | % | | | | 13.61 | % | | | | 48 | % | |
| CLASS B SHARES | | | | | | | | | | | | | | | | | | | | | | | | | | | | | | | | | | | | | | | | | | | | | | | | | | | | | | | | | | | | | | | | | | | |
| Period Ended October 31, 2012(e) | | | $ | 10.00 | | | | 0.06 | | | | 0.39 | | | | 0.45 | | | | (0.04 | ) | | | | — | | | | | (0.04 | ) | | | | $ | 10.41 | | | | 4.52 | % | | | | $ | 348 | | | | 2.25 | % | | | | 0.89 | % | | | | 26.84 | % | | | | 31 | % | |
| Year Ended October 31, 2013 | | | | 10.41 | | | | 0.10 | | | | 0.08 | | | | 0.18 | | | | (0.22 | ) | | | | (0.03 | ) | | | | (0.25 | ) | | | | | 10.34 | | | | 1.81 | % | | | | $ | 402 | | | | 2.25 | % | | | | 0.97 | % | | | | 14.39 | % | | | | 48 | % | |
| CLASS C SHARES | | | | | | | | | | | | | | | | | | | | | | | | | | | | | | | | | | | | | | | | | | | | | | | | | | | | | | | | | | | | | | | | | | | |
| Period Ended October 31, 2012(e) | | | $ | 10.00 | | | | 0.06 | | | | 0.39 | | | | 0.45 | | | | (0.04 | ) | | | | — | | | | | (0.04 | ) | | | | $ | 10.41 | | | | 4.47 | % | | | | $ | 232 | | | | 2.25 | % | | | | 0.90 | % | | | | 27.00 | % | | | | 31 | % | |
| Year Ended October 31, 2013 | | | | 10.41 | | | | 0.09 | | | | 0.09 | | | | 0.18 | | | | (0.23 | ) | | | | (0.03 | ) | | | | (0.26 | ) | | | | | 10.33 | | | | 1.75 | % | | | | $ | 643 | | | | 2.25 | % | | | | 0.84 | % | | | | 14.49 | % | | | | 48 | % | |
| * | The expense ratios reflected do not include expenses of the affiliated and unaffiliated investment companies, in which the Fund invests. |
| (a) | Calculated based on average shares outstanding. |
| (b) | Not annualized for periods less than one year. Total return calculations do not include any sales or redemption charges. |
| (c) | Annualized for periods less than one year. |
| (d) | Portfolio turnover rate is calculated on the basis of the Fund as a whole without the distinguishing between the classes of shares issued. |
| (e) | Commenced operations on March 20, 2012. |
| See notes to financial statements. | HSBC WORLD SELECTION FUNDS 35 |
| HSBC WORLD SELECTION FUNDS |
Notes to Financial Statements—as of October 31, 2013 |
1. Organization:
The HSBC Funds (the “Trust”), a Massachusetts business trust organized on April 22, 1987, is registered under the Investment Company Act of 1940, as amended (the “Act”), as an open-end management investment company. As of October 31, 2013, the Trust is comprised of 15 separate operational funds, each a series of the HSBC Family of Funds, which also includes the HSBC Advisor Funds Trust and the HSBC Portfolios (collectively the “Trusts”). The accompanying financial statements are presented for the following 5 funds (individually a “Fund,” collectively the “Funds” or the “World Selection Funds”):
| Fund | |
| Aggressive Strategy Fund |
| Balanced Strategy Fund |
| Moderate Strategy Fund |
| Conservative Strategy Fund |
| Income Strategy Fund |
All of the World Selection Funds are diversified funds. Financial statements for all other funds of the Trusts are published separately.
The World Selection Funds, excluding the Income Strategy Fund, (collectively the “World Selection Feeder Funds”), currently invest in the HSBC Growth Portfolio and HSBC Opportunity Portfolio (individually a “Portfolio,” collectively the “Portfolios”), each of which is a diversified series of the HSBC Portfolios (the “Portfolio Trust”). The Portfolios operate as master funds in master-feeder arrangements in addition to receiving investments from the World Selection Feeder Funds.
The financial statements of the Portfolios, including the Schedules of Portfolio Investments, are included elsewhere in this report. The financial statements of the Portfolios should be read in conjunction with the financial statements of the World Selection Funds.
| Proportionate | | Proportionate |
| Ownership Interest | | Ownership Interest |
| in HSBC Growth Portfolio | | in HSBC Opportunity Portfolio |
| on October 31, 2013 (%) | | on October 31, 2013 (%) |
| Aggressive Strategy Fund | 1.5 | | 0.3 |
| Balanced Strategy Fund | 3.0 | | 0.6 |
| Moderate Strategy Fund | 1.8 | | 0.4 |
| Conservative Strategy Fund | 0.6 | | 0.1 |
Each of the World Selection Funds is a “fund of funds,” meaning that it seeks to achieve its investment objective by investing primarily in a combination of mutual funds managed by HSBC Global Asset Management (USA) Inc. (the “Adviser”) (the “Affiliated Underlying Funds”), as well as mutual funds managed by other investment advisers and exchange-traded funds (“Unaffiliated Underlying Funds” and, together with the Affiliated Underlying Funds, the “Underlying Funds”). Each World Selection Fund may also purchase and hold Exchange Traded Notes (“ETNs”), which are debt securities issued by financial institutions that pay returns based on the performance of a market index or other reference asset. The Underlying Funds may include private equity funds and real estate funds that are organized as mutual funds or Exchange Traded Funds (“ETFs”). Each World Selection Fund invests according to the investment objectives and strategies described in its Prospectus.
The World Selection Funds are authorized to issue an unlimited number of shares of beneficial interest with a par value of $ 0.001 per share. Each Fund offers three classes of shares: Class A Shares, Class B Shares and Class C Shares. Class A Shares of the World Selection Funds (except, the Income Strategy Fund) have a maximum sales charge of 5.00% as a percentage of the original purchase price. The Class A Shares of the
36 HSBC WORLD SELECTION FUNDS
| HSBC WORLD SELECTION FUNDS |
Notes to Financial Statements—as of October 31, 2013 (continued) |
Income Strategy Fund have a maximum sales charge of 4.75% as a percentage of the original purchase price. Class B Shares of the World Selection Funds are offered without any front-end sales charge, but will be subject to a contingent deferred sales charge (“CDSC”) ranging from a maximum of 4.00% if redeemed less than one year after purchase to 0.00% if redeemed more than four years after purchase. Class C Shares of the World Selection Funds are offered without any front-end sales charge, but will be subject to a maximum CDSC of 1.00% if redeemed less than one year after purchase. Each class of shares in the World Selection Funds has identical rights and privileges except with respect to arrangements pertaining to shareholder servicing and/or distribution, class-related expenses, voting rights on matters affecting a single class of shares, and exchange privileges of each class of shares. Effective as of August 1, 2013, Class B Shares may no longer be purchased or acquired by any new or existing Class B shareholder, except through dividend and/or capital gains reinvestment.
Under the Trust’s organizational documents, the World Selection Funds’ officers and Trustees are indemnified against certain liabilities arising out of the performance of their duties to the World Selection Funds. In addition, in the normal course of business, the Trust enters into contracts with its service providers, which also provide for indemnifications by the World Selection Funds. The World Selection Funds’ maximum exposure under these arrangements is unknown as this would involve any future claims that may be made against the World Selection Funds. However, based on experience, the Trust expects the risk of loss to be remote.
2. Significant Accounting Policies:
The following is a summary of the significant accounting policies followed by the World Selection Funds in the preparation of their financial statements. The policies are in conformity with U.S. generally accepted accounting principles (“GAAP’’). The preparation of financial statements requires management to make certain estimates and assumptions that affect the reported amounts of assets and liabilities and disclosure of contingent assets and liabilities at the date of the financial statements and the reported amounts of increases and decreases in net assets from operations during the reporting period. Actual results could differ from those estimates.
Securities Valuation:
The World Selection Funds record their investments in the Underlying Funds at the net asset value reported by those funds. The World Selection Feeder Funds record their investments in the Portfolios at fair value. The underlying securities of the Portfolios are recorded at fair value, as more fully discussed in the notes to those financial statements. Fair value is defined as the price that would be received to sell an asset or paid to transfer a liability in an orderly transaction between market participants at the measurement date. The valuation techniques used to determine fair value in funds or Portfolios in which the World Selection Funds are invested are described in their respective notes to financial statements. Valuation techniques employed by the World Selection Funds’ are further described in Note 3 below.
Investment Transactions and Related Income:
The World Selection Feeder Funds record daily their proportionate income, expenses, unrealized appreciation and depreciation and realized gains and losses derived from their respective Portfolios. Dividend income is recorded on the ex-dividend date for the Underlying Funds. Changes in holdings of the Underlying Funds for each World Selection Fund are reflected not later than one business day after trade date. However, for financial reporting purposes, changes in holdings of the Underlying Funds are accounted for on trade date. In addition, the World Selection Funds accrue their own expenses daily.
HSBC WORLD SELECTION FUNDS 37
| HSBC WORLD SELECTION FUNDS |
Notes to Financial Statements—as of October 31, 2013 (continued) |
Allocations:
Expenses directly attributable to a Fund are charged to that Fund. Expenses not directly attributable to a Fund are allocated proportionately among the applicable series within the Trusts in relation to the net assets of each fund or on another reasonable basis. Class specific expenses are charged directly to the class incurring the expense. In addition, income, expenses (other than class specific expenses), and unrealized and realized gains and losses are allocated to each class based on relative net assets on a daily basis.
Dividends to Shareholders:
Dividends to shareholders from net investment income, if any, are declared and distributed monthly in the case of the Income Strategy Fund, quarterly in the case of the Moderate Strategy Fund and Conservative Strategy Fund, and annually in the case of the Aggressive Strategy Fund and Balanced Strategy Fund.
The World Selection Funds’ net realized gains, if any, are distributed to shareholders at least annually. Additional distributions are also made to the World Selection Funds’ shareholders to the extent necessary to avoid the federal excise tax on certain undistributed income and net capital gains of regulated investment companies.
The amount and character of net investment income and net realized gains distributions are determined in accordance with federal income tax regulations which may differ from GAAP. These “book/tax” differences are either considered temporary or permanent in nature. To the extent these differences are permanent in nature (e.g., reclassification of market discounts, certain gain/loss, paydowns, and certain distributions), such amounts are reclassified within the composition of net assets; temporary differences (e.g., wash losses and post-October loss deferrals) do not require reclassification. The World Selection Funds may utilize equalization accounting for tax purposes and designate earnings and profits, including net realized gains distributed to shareholders on redemption of shares, as a part of the dividends paid deduction for income tax purposes. To the extent distributions to shareholders from net investment income and net realized gains exceed net investment income and net realized gains for tax purposes, they are reported as distributions of capital.
Federal Income Taxes:
Each Fund is a separate taxable entity for federal income tax purposes. Each Fund has qualified and intends to continue to qualify each year as a “regulated investment company” under Subchapter M of the Internal Revenue Code, as amended, and to distribute substantially all of its taxable net investment income and net realized gains, if any, to its shareholders. Accordingly, no provision for federal income or excise tax is required.
Management of the Funds has reviewed tax positions taken in tax years that remain subject to examination by all major tax jurisdictions, including federal (i.e., the last four tax year ends and the interim tax period since then, as applicable). Management believes that there is no tax liability resulting from unrecognized tax benefits related to uncertain tax positions taken.
38 HSBC WORLD SELECTION FUNDS
| HSBC WORLD SELECTION FUNDS |
Notes to Financial Statements—as of October 31, 2013 (continued) |
New Accounting Pronouncements:
In January 2013, the Financial Accounting Standards Board issued Accounting Standards Update (“ASU”) No. 2013-01 “Clarifying the Scope of Disclosures about Offsetting Assets and Liabilities” (“ASU 2013-01”), which amended Accounting Standards Codification Subtopic 210-20, Balance Sheet Offsetting. ASU 2013-01 clarified the scope of ASU No. 2011-11 “Disclosures about Offsetting Assets and Liabilities” (“ASU 2011-11”). ASU 2011-11 requires an entity to disclose information about offsetting and related arrangements to enable users of the financial statements to understand the effect of those arrangements on the entity’s financial position. ASU 2013-01 clarifies the scope of ASU 2011-11 as applying to derivatives accounted for in accordance with Topic 815, Derivatives and Hedging, including bifurcated embedded derivatives, repurchase agreements and reverse repurchase agreements, and securities borrowing and securities lending transactions that are offset either in accordance with other requirements of GAAP or subject to an enforceable master netting arrangement or similar agreement. The guidance in ASU 2013-01 and ASU 2011-11 is effective for interim and annual periods beginning on or after January 1, 2013. Management is evaluating any impact ASU 2013-01 and ASU 2011-11 may have on the World Selection Funds’ financial statements.
3. Investment Valuation Summary:
The valuation techniques employed by the World Selection Funds, as described below, maximize the use of observable inputs and minimize the use of unobservable inputs in determining fair value. The inputs used for valuing the World Selection Funds’ investments are summarized in the three broad levels listed below:
Level 1: quoted prices in active markets for identical assets
Level 2: other significant observable inputs (including quoted prices for similar securities, interest rates, prepayment speeds, credit risk, etc.)
Level 3: significant unobservable inputs (including a Fund’s own assumptions in determining the fair value of investments)
Changes in valuation techniques may result in transfers in or out of an assigned level within the disclosure hierarchy. The Funds determine transfers between fair value hierarchy levels at the reporting period end. The inputs or methodology used for valuing investments are not necessarily an indication of the risk associated with investing in those investments.
The World Selection Funds record their investments in the Underlying Funds at the net asset value reported by those funds and are typically categorized as Level 1 in the fair value hierarchy. The World Selection Feeder Funds record their investments in their respective Portfolios at fair value and are typically categorized as a Level 2 in the fair value hierarchy. The underlying securities of the Portfolios are recorded at fair value, as discussed more fully in the Notes to Financial Statements of the Portfolios included elsewhere in this report.
For the year ended October 31, 2013, there were no Level 3 investments for which significant unobservable inputs were used to determine fair value.
HSBC WORLD SELECTION FUNDS 39
| HSBC WORLD SELECTION FUNDS |
Notes to Financial Statements—as of October 31, 2013 (continued) |
The following is a summary of the valuation inputs used as of October 31, 2013 in valuing the World Selection Funds’ investments based upon the three levels defined above:
| | LEVEL 1($) | | LEVEL 2($) | | LEVEL 3($) | | Total($) |
| Aggressive Strategy Fund | | | | | | | | |
| Investment Securities: | | | | | | | | |
| Affiliated Investment Companies | | 266,099 | | — | | — | | 266,099 |
| Affiliated Portfolios(a) | | — | | 2,113,741 | | — | | 2,113,741 |
| Unaffiliated Investment Companies | | 7,689,100 | | — | | — | | 7,689,100 |
| Exchange Traded Funds | | 8,378,769 | | — | | — | | 8,378,769 |
| Total Investment Securities | | 16,333,968 | | 2,113,741 | | — | | 18,447,709 |
| Balanced Strategy Fund | | | | | | | | |
| Investment Securities: | | | | | | | | |
| Affiliated Investment Companies | | 5,136,363 | | — | | — | | 5,136,363 |
| Affiliated Portfolios(a) | | — | | 4,147,938 | | — | | 4,147,938 |
| Unaffiliated Investment Companies | | 22,832,816 | | — | | — | | 22,832,816 |
| Exchange Traded Funds | | 17,902,703 | | — | | — | | 17,902,703 |
| Total Investment Securities | | 45,871,882 | | 4,147,938 | | — | | 50,019,820 |
| Moderate Strategy Fund | | | | | | | | |
| Investment Securities: | | | | | | | | |
| Affiliated Investment Companies | | 5,368,586 | | — | | — | | 5,368,586 |
| Affiliated Portfolios(a) | | — | | 2,483,099 | | — | | 2,483,099 |
| Unaffiliated Investment Companies | | 24,389,858 | | — | | — | | 24,389,858 |
| Exchange Traded Funds | | 12,018,641 | | — | | — | | 12,018,641 |
| Total Investment Securities | | 41,777,085 | | 2,483,099 | | — | | 44,260,184 |
| Conservative Strategy Fund | | | | | | | | |
| Investment Securities: | | | | | | | | |
| Affiliated Investment Companies | | 2,767,582 | | — | | — | | 2,767,582 |
| Affiliated Portfolios(a) | | — | | 769,751 | | — | | 769,751 |
| Unaffiliated Investment Companies | | 14,229,362 | | — | | — | | 14,229,362 |
| Exchange Traded Funds | | 4,199,359 | | — | | — | | 4,199,359 |
| Total Investment Securities | | 21,196,303 | | 769,751 | | — | | 21,966,054 |
| Income Strategy Fund | | | | | | | | |
| Investment Securities: | | | | | | | | |
| Affiliated Investment Companies | | 143,417 | | — | | — | | 143,417 |
| Unaffiliated Investment Companies | | 1,173,157 | | — | | — | | 1,173,157 |
| Exchange Traded Funds | | 20,045 | | — | | — | | 20,045 |
| Total Investment Securities | | 1,336,619 | | — | | — | | 1,336,619 |
____________________
| (a) | Investments in Affiliated Portfolios represent ownership interests in the Portfolios. Due to the Funds’ master-feeder structure, the inputs used for valuing these instruments are categorized as Level 2. |
40 HSBC WORLD SELECTION FUNDS
| HSBC WORLD SELECTION FUNDS |
| Notes to Financial Statements—as of October 31, 2013 (continued) |
4. Related Party Transactions and Other Agreements and Plans:
Investment Management:
HSBC Global Asset Management (USA), Inc. (“HSBC” or the “Investment Adviser”), a wholly owned subsidiary of HSBC Bank USA, N.A., a national bank organized under the laws of the United States, acts as Investment Adviser to the World Selection Funds. As Investment Adviser, HSBC manages the investments of the World Selection Funds and continuously reviews, supervises and administers the World Selection Funds’ investments pursuant to an Investment Advisory Contract. For its services as Investment Adviser, HSBC is entitled to receive a fee, computed daily and paid monthly, based on average daily net assets, at an annual rate of 0.25% for each Fund.
Administration:
HSBC serves the World Selection Funds as Administrator. Under the terms of the Administration Agreement, HSBC receives from the World Selection Funds (as well as other funds in the Trusts combined) a fee, accrued daily and paid monthly, at an annual rate of:
| Based on Combined Average Daily Net Assets of | | | Fee Rate(%) |
| Up to $10 billion | | 0.0550 |
| In excess of $10 billion but not exceeding $20 billion | | 0.0350 |
| In excess of $20 billion but not exceeding $50 billion | | 0.0275 |
| In excess of $50 billion | | 0.0250 |
The fee rates and breakpoints are determined on the basis of the aggregate average daily net assets of the Trusts. The total administration fee paid to HSBC is allocated to each series of the Trusts based upon its proportionate share of the aggregate net assets of the Trusts. For assets invested in the Portfolios by World Selection Feeder Funds, the Portfolios pay half of the administration fee and the World Selection Feeder Funds pay half, for a combination of the total fee rate set forth above. Certain administration fees of the Portfolios also may be reduced by treating them as apportioned in part to other funds making investments in the Portfolios in master-feeder structures. An amount equal to 50% of the administration fee is deemed to be class specific.
Pursuant to a Sub-Administration Agreement with HSBC, Citi Fund Services Ohio, Inc. (“Citi’’), a wholly-owned subsidiary of Citigroup, Inc., serves as the Sub-Administrator for the Trusts subject to the general supervision by the Trusts’ Board of Trustees (the “Board”) and HSBC. For these services, Citi is entitled to a fee, payable by HSBC, at an annual rate equivalent to the fee rates set forth above subject to certain reductions associated with services provided to new funds minus 0.02%, which is retained by HSBC.
Under a Compliance Services Agreement between the Trusts and Citi (the “CCO Agreement”), Citi makes an employee available to serve as the Trusts’ Chief Compliance Officer (the “CCO”). Under the CCO Agreement, Citi also provides infrastructure and support in implementing the written policies and procedures comprising the Trusts’ compliance program, including support services to the CCO. For the services provided under the CCO Agreement, the Trusts paid Citi $287,560 for the year ended October 31, 2013, plus reimbursement of certain out of pocket expenses. Expenses incurred by each Fund are reflected on the Statements of Operations as “Compliance Services.” Citi pays the salary and other compensation earned by individuals performing these services, as employees of Citi.
HSBC WORLD SELECTION FUNDS 41
| HSBC WORLD SELECTION FUNDS |
| Notes to Financial Statements—as of October 31, 2013 (continued) |
Distribution Arrangements:
Foreside Distribution Services, L.P. (“Foreside”), a wholly-owned subsidiary of Foreside Financial Group LLC, serves the Trust as Distributor (the “Distributor”). The Trust has adopted a non-compensatory Distribution Plan and Agreement (the “Distribution Plan”) pursuant to Rule 12b-1 of the Act. The Distribution Plan provides for reimbursement of expenses incurred by the Distributor related to distribution and marketing, at a rate not to exceed 0.25%, 1.00%, and 1.00% of the average daily net assets of Class A Shares (currently not being charged), Class B Shares (currently charging 0.75%), and Class C Shares (currently charging 0.75%) of the World Selection Funds, respectively. For the year ended October 31, 2013, Foreside, as Distributor, also received $213,520, $105,439, and $49,940 in commissions from sales of the Trusts, for Class A Shares, Class B Shares, and Class C Shares, respectively of which $584, $89, and $0 were reallocated to HSBC-affiliated brokers and dealers, for Class A Shares, Class B Shares, and Class C Shares, respectively.
Shareholder Servicing:
The Trust has adopted a Shareholder Services Plan which provides for payments to shareholder servicing agents (which currently consist of HSBC and its affiliates) for providing various shareholder services. For performing these services, the shareholder servicing agents receive a fee that is computed daily and paid monthly up to 0.25% of the average daily net assets of each of the Class A Shares, Class B Shares and Class C Shares of the World Selection Funds. The fees paid to the Distributor pursuant to the Distribution Plan and to shareholder servicing agents pursuant to the Shareholder Services Plan currently will not exceed, in the aggregate, 0.25% of the average daily net assets of Class A Shares and 1.00% of the average daily net assets of Class B Shares and Class C Shares.
Fund Accounting and Transfer Agency:
Citi provides fund accounting and transfer agency services for each Fund. As transfer agent, Citi receives a fee based on the number of funds and shareholder accounts, subject to certain minimums, reductions associated with services provided to new funds and reimbursement of certain expenses. As fund accountant, Citi receives an annual fee per Fund and share class, subject to minimums, reductions associated with services provided to new funds and reimbursement of certain expenses. Citi receives additional fees paid by the Trust for blue sky exemption services.
Independent Trustees:
The Trusts pay each Independent Trustee an annual retainer of $100,000. The Trusts pay a fee of $10,000 for each regular meeting of the Board attended and a fee of $3,000 for each special meeting attended. The Trusts pay each Committee Chair an annual retainer of $3,000, with the exception of the Chair of the Audit Committee, who receives a retainer of $6,000. The Trusts also pay the Chairman of the Board an additional annual retainer of $24,000. In addition, for time expended on Board duties outside normal meetings, which is authorized by the Board, a Trustee is compensated at the rate of $500 per hour, up to a maximum of $3,000 per day.
Fee Reductions:
The Investment Adviser has agreed to contractually limit through March 1, 2014 the total annual expenses, exclusive of interest, taxes, brokerage commissions, extraordinary expenses and estimated indirect expenses attributable to the Funds’ investments in investment companies other than the HSBC Growth Portfolio and the HSBC Opportunity Portfolio. Each Fund Class has its own expense limitations based on the average daily net assets for any full fiscal year as follows: Class A Shares 1.50%, Class B Shares 2.25%, Class C Shares 2.25%.
42 HSBC WORLD SELECTION FUNDS
| HSBC WORLD SELECTION FUNDS |
| Notes to Financial Statements—as of October 31, 2013 (continued) |
Any amounts contractually waived or reimbursed by the Investment Adviser will be subject to repayment by the respective Fund to the Investment Adviser within three years to the extent that the repayment will not cause the Fund’s operating expenses to exceed the contractual expense limit that was in effect at the time of such waiver or reimbursement. During the year ended October 31, 2013, the Investment Adviser did not recapture any of its prior contractual waivers or reimbursements. As of October 31, 2013, the repayments that may potentially be made by the Funds are as follows:
| Fund | | | 2016($) | | 2015($) | | 2014($) | | Total |
| Aggressive Strategy Fund | | 421 | | 27,768 | | 19,298 | | 47,487 |
| Income Strategy Fund | | 138,725 | | 77,417 | | N/A | | 216,142 |
The Administrator and Citi may voluntarily waive/reimburse fees to help support the expense limits of the Funds. In addition, HSBC, in its role as Investment Adviser and Administrator, may waive/reimburse additional fees at its discretion. Any voluntary fee waivers/reimbursements are not subject to recoupment in subsequent fiscal periods. Voluntary waivers/reimbursements may be stopped at any time. Amounts waived/reimbursed by the Investment Adviser, Administrator, and Citi are reported separately on the Statements of Operations, as applicable.
Affiliated Transactions:
A summary of each Fund’s investment in affiliated investment companies (excluding investments in the Affiliated Portfolios) for the year ended October 31, 2013 are as follows:
| | | | | | | | | | | | Net | | Change in | | | | | | | | |
| | | | | | | | | | Proceeds | | Capital and | | Unrealized | | | | | | | | |
| | Value | | Purchases | | from | | Realized | | Appreciation | | Value | | Dividend |
| | 10/31/2012 | | at Cost | | Sales | | Gain (Loss) | | (Depreciation) | | 10/31/2013 | | Income |
| | ($) | | ($) | | ($) | | ($) | | ($) | | ($) | | ($) |
| Aggressive Strategy Fund | | | | | | | | | | | | | | | | | | | | | | | | | | | | | | | |
| HSBC Prime Money Market Fund - Class I | | | 13,222 | | | | 571,643 | | | | (542,374 | ) | | | | — | | | | | — | | | | | 42,491 | | | | 17 | |
| HSBC Emerging Markets Debt Fund - Class I | | | 126,737 | | | | 238,229 | | | | (133,815 | ) | | | | (8,732 | ) | | | | 1,189 | | | | | 223,608 | | | | 6,191 | |
| HSBC Emerging Markets Local Debt Fund -Class I | | | 177,882 | | | | 26,230 | | | | (189,161 | ) | | | | (1,737 | ) | | | | (13,214 | ) | | | | — | | | | 2,617 | |
| Balanced Strategy Fund | | | | | | | | | | | | | | | | | | | | | | | | | | | | | | | |
| HSBC Prime Money Market Fund - Class I | | | 7,556 | | | | 2,067,514 | | | | (1,886,738 | ) | | | | — | | | | | — | | | | | 188,332 | | | | 297 | |
| HSBC Emerging Markets Debt Fund - Class I | | | 3,360,039 | | | | 1,385,304 | | | | (1,010,307 | ) | | | | 78,840 | | | | | (337,181 | ) | | | | 3,476,695 | | | | 145,801 | |
| HSBC Emerging Markets Local Debt Fund - Class I | | | 1,855,546 | | | | 358,400 | | | | (626,313 | ) | | | | 33,372 | | | | | (149,669 | ) | | | | 1,471,336 | | | | 41,061 | |
| Moderate Strategy Fund | | | | | | | | | | | | | | | | | | | | | | | | | | | | | | | |
| HSBC Prime Money Market Fund - Class I | | | 444,668 | | | | 1,807,980 | | | | (1,894,701 | ) | | | | — | | | | | — | | | | | 357,947 | | | | 508 | |
| HSBC Emerging Markets Debt Fund - Class I | | | 3,137,780 | | | | 1,028,962 | | | | (728,282 | ) | | | | 103,379 | | | | | (303,758 | ) | | | | 3,238,081 | | | | 136,996 | |
| HSBC Emerging Markets Local Debt Fund - Class I | | | 2,064,417 | | | | 385,335 | | | | (541,929 | ) | | | | 28,053 | | | | | (163,318 | ) | | | | 1,772,558 | | | | 47,747 | |
| Conservative Strategy Fund | | | | | | | | | | | | | | | | | | | | | | | | | | | | | | | |
| HSBC Prime Money Market Fund - Class I | | | 251,847 | | | | 963,128 | | | | (930,467 | ) | | | | — | | | | | — | | | | | 284,508 | | | | 260 | |
| HSBC Emerging Markets Debt Fund - Class I | | | 1,427,385 | | | | 528,541 | | | | (357,924 | ) | | | | 31,760 | | | | | (138,715 | ) | | | | 1,491,047 | | | | 62,242 | |
| HSBC Emerging Markets Local Debt Fund - Class I | | | 1,138,041 | | | | 142,679 | | | | (209,511 | ) | | | | 10,340 | | | | | (89,522 | ) | | | | 992,027 | | | | 26,985 | |
| Income Strategy Fund | | | | | | | | | | | | | | | | | | | | | | | | | | | | | | | |
| HSBC Prime Money Market Fund - Class I | | | 13,077 | | | | 229,722 | | | | (226,026 | ) | | | | — | | | | | — | | | | | 16,773 | | | | 16 | |
| HSBC Emerging Markets Debt Fund - Class I | | | 37,955 | | | | 41,751 | | | | (12,488 | ) | | | | 429 | | | | | (3,551 | ) | | | | 64,096 | | | | 2,106 | |
| HSBC Emerging Markets Local Debt Fund -Class I | | | 47,112 | | | | 39,180 | | | | (19,626 | ) | | | | 447 | | | | | (4,565 | ) | | | | 62,548 | | | | 1,497 | |
HSBC WORLD SELECTION FUNDS 43
| HSBC WORLD SELECTION FUNDS |
| Notes to Financial Statements—as of October 31, 2013 (continued) |
5. Investment Transactions:
Cost of purchases and proceeds from sales of securities (excluding securities maturing less than one year from acquisition) for the year ended October 31, 2013 were as follows:
| Fund | | | Purchases($) | | Sales($) |
| Aggressive Strategy Fund | | 5,093,809 | | 6,713,132 |
| Balanced Strategy Fund | | 14,292,199 | | 20,104,586 |
| Moderate Strategy Fund | | 11,329,834 | | 14,951,499 |
| Conservative Strategy Fund | | 6,164,269 | | 6,937,692 |
| Income Strategy Fund | | 1,007,422 | | 523,784 |
Contributions and withdrawals of the respective Portfolios for the year ended October 31, 2013 totaled:
| Fund | | | Contributions($) | | Withdrawals($) |
| Aggressive Strategy Fund | | | 1,954,968 | | | | 5,160,230 | |
| Balanced Strategy Fund | | | 5,876,909 | | | | 16,216,761 | |
| Moderate Strategy Fund | | | 4,470,891 | | | | 11,596,026 | |
| Conservative Strategy Fund | | | 2,898,142 | | | | 5,364,850 | |
6. Federal Income Tax Information:
At October 31, 2013, the cost basis of securities (which excludes investments in the Affiliated Portfolios) for federal income tax purposes, gross unrealized appreciation, gross unrealized depreciation and net unrealized appreciation/depreciation were as follows:
| | | | | | | | | | | | | Net Unrealized |
| | | | Tax Unrealized | | Tax Unrealized | | Appreciation/ |
| | Tax Cost($) | | Appreciation($) | | Depreciation($) | | (Depreciation)($) |
| Aggressive Strategy Fund | | 14,161,086 | | | 2,231,796 | | | | (58,914 | ) | | | | 2,172,882 | | |
| Balanced Strategy Fund | | 42,375,327 | | | 4,599,486 | | | | (1,102,931 | ) | | | | 3,496,555 | | |
| Moderate Strategy Fund | | 39,746,871 | | | 3,161,982 | | | | (1,131,768 | ) | | | | 2,030,214 | | |
| Conservative Strategy Fund | | 20,522,237 | | | 1,149,918 | | | | (475,852 | ) | | | | 674,066 | | |
| Income Strategy Fund | | 1,342,001 | | | 23,252 | | | | (28,634 | ) | | | | (5,382 | ) | |
The tax character of dividends paid by the World Selection Funds as of the tax year ended October 31, 2013, was as follows:
| | Dividends paid from |
| | | | | | Net Long Term | | Total Taxable | | Return of | | Total Dividends |
| | Ordinary Income($) | | Capital Gains($) | | Dividends($) | | Capital($) | | Paid($)(1) |
| Aggressive Strategy Fund | | | 31,802 | | | — | | | 31,802 | | | — | | | 31,802 | |
| Balanced Strategy Fund | | | 755,006 | | | — | | | 755,006 | | | — | | | 755,006 | |
| Moderate Strategy Fund | | | 838,380 | | | — | | | 838,380 | | | — | | | 838,380 | |
| Conservative Strategy Fund | | | 403,395 | | | — | | | 403,395 | | | — | | | 403,395 | |
| Income Strategy Fund | | | 27,813 | | | — | | | 27,813 | | | — | | | 27,813 | |
44 HSBC WORLD SELECTION FUNDS
| HSBC WORLD SELECTION FUNDS |
| Notes to Financial Statements—as of October 31, 2013 (continued) |
The tax character of dividends paid by the World Selection Funds as of the tax year ended October 31, 2012, was as follows:
| | Dividends paid from |
| | | | Net Long Term | | Total Taxable | | Return of | | Total Dividends |
| | Ordinary Income($) | | Capital Gains($) | | Dividends($) | | Capital($) | | Paid($)(1) |
| Aggressive Strategy Fund | | | 92,405 | | | — | | | 92,405 | | | — | | | 92,405 | |
| Balanced Strategy Fund | | | 1,541,114 | | | — | | | 1,541,114 | | | — | | | 1,541,114 | |
| Moderate Strategy Fund | | | 1,134,889 | | | — | | | 1,134,889 | | | ��� | | | 1,134,889 | |
| Conservative Strategy Fund | | | 556,629 | | | — | | | 556,629 | | | — | | | 556,629 | |
| Income Strategy Fund | | | 2,407 | | | — | | | 2,407 | | | — | | | 2,407 | |
____________________
| (1) | | Total dividends paid may differ from the amount reported in the Statement of Changes in Net Assets because dividends are recognized when actually paid for tax purposes. |
As of the tax year ended October 31, 2013, the components of accumulated earnings/(deficit) on a tax basis for the World Selection Funds were as follows:
| | | | | | | | | | | | | | | | | | | | | | | | | Total |
| | Undistributed | | Undistributed | | Undistributed | | | | | | | | Accumulated | | Unrealized | | Accumulated |
| | Ordinary | | Tax Exempt | | Long Term | | Accumulated | | Dividends | | Capital and | | Appreciation/ | | Earnings/ |
| | Income($) | | Income($) | | Capital Gains($) | | Earnings($) | | Payable($) | | Other Losses($) | | (Depreciation)($)(1) | | (Deficit)($) |
| Aggressive Strategy Fund | | | 19,139 | | | — | | | 1,042,364 | | | | 1,061,503 | | | — | | — | | | 2,987,938 | | | | | 4,049,441 | |
| Balanced Strategy Fund | | | 561,014 | | | — | | | 2,808,513 | | | | 3,369,527 | | | — | | — | | | 5,223,256 | | | | | 8,592,783 | |
| Moderate Strategy Fund | | | 70,957 | | | — | | | 1,711,810 | | | | 1,782,767 | | | — | | — | | | 3,090,901 | | | | | 4,873,668 | |
| Conservative Strategy Fund | | | 122,965 | | | — | | | 550,496 | | | | 673,461 | | | — | | — | | | 1,003,008 | | | | | 1,676,469 | |
| Income Strategy Fund | | | 17,522 | | | — | | | 7,386 | | | | 24,908 | | | — | | — | | | (5,382 | ) | | | | 19,526 | |
____________________
| (1) | | The differences between book-basis and tax-basis unrealized appreciation/depreciation are attributable primarily to: tax deferral of losses on wash sales, the realization for tax purposes of unrealized gains/losses on certain derivative instruments, the difference between book and tax amortization methods for premium and market discount, the realization for tax purposes of unrealized gains/losses on investments in passive foreign investment companies and the return of capital adjustments from real estate investment trusts. |
During the latest tax year ended October 31, 2013, the following Funds utilized capital loss carryforwards to offset capital gains realized:
| | Amount ($) |
| Aggressive Strategy Fund | | 290,415 |
| Balanced Strategy Fund | | 265,735 |
| Moderate Strategy Fund | | 472,739 |
| Conservative Strategy Fund | | 126,294 |
7. Subsequent Events:
Management has evaluated events and transactions through the date the financial statements were issued, for purposes of recognition or disclosure in these financial statements and there are no subsequent events to report.
HSBC WORLD SELECTION FUNDS 45
Report of Independent Registered Public Accounting Firm
To the Shareholders and Board of Trustees of
HSBC Funds:
We have audited the accompanying statements of assets and liabilities of HSBC World Selection Funds – Aggressive Strategy Fund, Balanced Strategy Fund, Moderate Strategy Fund, Conservative Strategy Fund and Income Strategy Fund (the Funds), including the schedules of portfolio investments, as of October 31, 2013, and the related statements of operations for the year then ended, the statements of changes in net assets for each of the years or periods in the two-year period then ended and the financial highlights for each of the years or periods in the five-year period then ended. These financial statements and financial highlights are the responsibility of the Funds’ management. Our responsibility is to express an opinion on these financial statements and financial highlights based on our audits.
We conducted our audits in accordance with the standards of the Public Company Accounting Oversight Board (United States). Those standards require that we plan and perform the audit to obtain reasonable assurance about whether the financial statements and financial highlights are free of material misstatement. An audit includes examining, on a test basis, evidence supporting the amounts and disclosures in the financial statements. Our procedures included confirmation of securities owned as of October 31, 2013, by correspondence with the custodian, transfer agents, or by other appropriate auditing procedures. An audit also includes assessing the accounting principles used and significant estimates made by management, as well as evaluating the overall financial statement presentation. We believe that our audits provide a reasonable basis for our opinion.
In our opinion, the financial statements and financial highlights referred to above present fairly, in all material respects, the financial position of the Funds as of October 31, 2013, the results of their operations for the year then ended, the changes in their net assets for each of the years or periods in the two-year period then ended, and the financial highlights for each of the years or periods in the five-year period then ended, in conformity with U.S. generally accepted accounting principles.

Columbus, Ohio
December 27, 2013
46 HSBC WORLD SELECTION FUNDS
| HSBC WORLD SELECTION FUNDS |
| Other Federal Income Tax Information—as of October 31, 2013 (Unaudited) |
During the year ended October 31, 2013, the following World Selection Fund declared capital gain distributions:
| | | Short Term Capital Gain | | Long Term Capital Gain |
| | Distributions ($) | | Distributions ($) |
| Income Strategy Fund | | 6,075 | | — |
For the year ended October 31, 2013, the following percentages of the total ordinary income dividends paid by the World Selection Funds qualify for the corporate dividends received deduction available to corporate shareholders:
| | Dividends Received Deduction (%) |
| Aggressive Strategy Fund | | | 100.00 | |
| Balanced Strategy Fund | | | 31.18 | |
| Moderate Strategy Fund | | | 22.42 | |
| Conservative Strategy Fund | | | 12.05 | |
| Income Strategy Fund | | | 6.05 | |
For the year ended October 31, 2013, dividends paid by the World Selection Funds may be subject to a maximum tax rate of 15%, as provided for by the Jobs and Growth Tax Relief Reconciliation Act of 2003. The World Selection Funds intend to designate the maximum amount allowable as taxed at a maximum rate of 15%. Complete information will be reported in conjunction with your 2013 Form 1099-DIV:
| | Qualified Dividend Income (%) |
| Aggressive Strategy Fund | | | 100.00 | |
| Balanced Strategy Fund | | | 44.11 | |
| Moderate Strategy Fund | | | 45.85 | |
| Conservative Strategy Fund | | | 22.80 | |
| Income Strategy Fund | | | 6.86 | |
HSBC WORLD SELECTION FUNDS 47
| HSBC WORLD SELECTION FUNDS |
| Table of Shareholder Expenses—as of October 31, 2013 (Unaudited) |
As a shareholder of the World Selection Funds, you incur two types of costs: (1) transaction costs, including sales charges (loads) on purchases, redemption fees and exchange fees; and (2) ongoing costs, including management fees, distribution and/or shareholder servicing fees and other World Selection Fund expenses (including expenses allocated from the Portfolios). These examples are intended to help you understand your ongoing costs (in dollars) of investing in the World Selection Funds and to compare these costs with the ongoing costs of investing in other mutual funds.
These examples are based on an investment of $1,000 invested at the beginning of the period and held for the entire period from May 1, 2013 through October 31, 2013.
Actual Example
The table below provides information about actual account values and actual expenses. You may use the information below, together with the amount you invested, to estimate the expenses that you paid over the period. Simply divide your account value by $1,000 (for example, an $8,600 account value divided by $1,000 = 8.6), then multiply the result by the number in the table under the heading entitled ”Expenses Paid During Period” to estimate the expenses you paid on your account during this period.
| | | | | | | | | | | | | | | | | | | Annualized |
| | | | Beginning | | Ending | | Expenses Paid | | Expense Ratio |
| | | | Account Value | | Account Value | | During Period* | | During Period |
| | | | 5/1/13 | | 10/31/13 | | 5/1/13 - 10/31/13 | | 5/1/13 - 10/31/13 |
| Aggressive Strategy Fund | | Class A Shares | | | $ | 1,000.00 | | | | $ | 1,086.50 | | | | $ | 7.99 | | | 1.52% |
| | Class B Shares | | | | 1,000.00 | | | | | 1,082.40 | | | | | 11.91 | | | 2.27% |
| | Class C Shares | | | | 1,000.00 | | | | | 1,082.00 | | | | | 11.91 | | | 2.27% |
| Balanced Strategy Fund | | Class A Shares | | | | 1,000.00 | | | | | 1,051.10 | | | | | 5.48 | | | 1.06% |
| | Class B Shares | | | | 1,000.00 | | | | | 1,047.50 | | | | | 9.39 | | | 1.82% |
| | Class C Shares | | | | 1,000.00 | | | | | 1,047.40 | | | | | 9.39 | | | 1.82% |
| Moderate Strategy Fund | | Class A Shares | | | | 1,000.00 | | | | | 1,026.50 | | | | | 5.67 | | | 1.11% |
| | Class B Shares | | | | 1,000.00 | | | | | 1,023.30 | | | | | 9.49 | | | 1.86% |
| | Class C Shares | | | | 1,000.00 | | | | | 1,022.90 | | | | | 9.48 | | | 1.86% |
| Conservative Strategy Fund | | Class A Shares | | | | 1,000.00 | | | | | 1,004.50 | | | | | 6.62 | | | 1.31% |
| | Class B Shares | | | | 1,000.00 | | | | | 1,001.50 | | | | | 10.39 | | | 2.06% |
| | Class C Shares | | | | 1,000.00 | | | | | 1,001.70 | | | | | 10.44 | | | 2.07% |
| Income Strategy Fund | | Class A Shares | | | | 1,000.00 | | | | | 985.30 | | | | | 7.51 | | | 1.50% |
| | Class B Shares | | | | 1,000.00 | | | | | 981.60 | | | | | 11.24 | | | 2.25% |
| | Class C Shares | | | | 1,000.00 | | | | | 980.80 | | | | | 11.23 | | | 2.25% |
____________________
| * | | Expenses are equal to the average account value over the period multiplied by the Fund’s annualized expense ratio, multiplied by 184/365 (to reflect the one half year period). |
48 HSBC WORLD SELECTION FUNDS
| HSBC WORLD SELECTION FUNDS |
| Table of Shareholder Expenses—as of October 31, 2013 (Unaudited) (continued) |
Hypothetical Example for Comparison Purposes
The table below provides information about hypothetical account values and hypothetical expenses based on the World Selection Fund’s actual expense ratio and an assumed rate of return of 5% per year before expenses, which is not the World Selection Fund’s actual return. The hypothetical account values and expenses may not be used to estimate the actual ending account balance or expenses you paid for the period. You may use this information to compare this 5% hypothetical example with the 5% hypothetical examples that appear in the shareholder reports of other funds.
Please note that the expenses shown in the table are meant to highlight your ongoing costs only and do not reflect any transactional costs, such as sales charges (loads), redemption fees, or exchange fees. Therefore, the table is useful in comparing ongoing costs only, and will not help you determine the relative total costs of owning different funds. In addition, if these transactional costs were included, your costs would have been higher.
| | | | | | | | | | | | | | | | | | | Annualized |
| | | | Beginning | | Ending | | Expenses Paid | | Expense Ratio |
| | | | Account Value | | Account Value | | During Period* | | During Period |
| | | | 5/1/13 | | 10/31/13 | | 5/1/13 - 10/31/13 | | 5/1/13 - 10/31/13 |
| Aggressive Strategy Fund | | Class A Shares | | | $ | 1,000.00 | | | | $ | 1,017.54 | | | | $ | 7.73 | | | 1.52% |
| | Class B Shares | | | | 1,000.00 | | | | | 1,013.76 | | | | | 11.52 | | | 2.27% |
| | Class C Shares | | | | 1,000.00 | | | | | 1,013.76 | | | | | 11.52 | | | 2.27% |
| Balanced Strategy Fund | | Class A Shares | | | | 1,000.00 | | | | | 1,019.86 | | | | | 5.40 | | | 1.06% |
| | Class B Shares | | | | 1,000.00 | | | | | 1,016.03 | | | | | 9.25 | | | 1.82% |
| | Class C Shares | | | | 1,000.00 | | | | | 1,016.03 | | | | | 9.25 | | | 1.82% |
| Moderate Strategy Fund | | Class A Shares | | | | 1,000.00 | | | | | 1,019.61 | | | | | 5.65 | | | 1.11% |
| | Class B Shares | | | | 1,000.00 | | | | | 1,015.83 | | | | | 9.45 | | | 1.86% |
| | Class C Shares | | | | 1,000.00 | | | | | 1,015.83 | | | | | 9.45 | | | 1.86% |
| Conservative Strategy Fund | | Class A Shares | | | | 1,000.00 | | | | | 1,018.60 | | | | | 6.67 | | | 1.31% |
| | Class B Shares | | | | 1,000.00 | | | | | 1,014.82 | | | | | 10.46 | | | 2.06% |
| | Class C Shares | | | | 1,000.00 | | | | | 1,014.77 | | | | | 10.51 | | | 2.07% |
| Income Strategy Fund | | Class A Shares | | | | 1,000.00 | | | | | 1,017.64 | | | | | 7.63 | | | 1.50% |
| | Class B Shares | | | | 1,000.00 | | | | | 1,013.86 | | | | | 11.42 | | | 2.25% |
| | Class C Shares | | | | 1,000.00 | | | | | 1,013.86 | | | | | 11.42 | | | 2.25% |
____________________
| * | | Expenses are equal to the average account value over the period multiplied by the Fund’s annualized expense ratio, multiplied by 184/365 (to reflect the one half year period). |
HSBC WORLD SELECTION FUNDS 49
| HSBC GROWTH PORTFOLIO |
| Schedule of Portfolio Investments—as of October 31, 2013 |
| Common Stocks – 98.9% | | | | |
| | | | | |
| | Shares | | Value ($) |
| Aerospace & Defense – 3.1% | | | | |
| Precision Castparts Corp. | | 6,300 | | 1,596,735 |
| United Technologies Corp. | | 11,250 | | 1,195,312 |
| | | | 2,792,047 |
| Airlines – 0.7% | | | | |
| Delta Air Lines, Inc. | | 23,050 | | 608,059 |
| Auto Components – 1.2% | | | | |
| BorgWarner, Inc. | | 10,200 | | 1,051,926 |
| Biotechnology – 9.1% | | | | |
| Alexion Pharmaceuticals, Inc. (a) | | 7,300 | | 897,535 |
| Amgen, Inc. | | 13,850 | | 1,606,600 |
| Biogen Idec, Inc. (a) | | 6,900 | | 1,684,911 |
| Celgene Corp. (a) | | 14,050 | | 2,086,284 |
| Gilead Sciences, Inc. (a) | | 25,650 | | 1,820,894 |
| | | | 8,096,224 |
| Capital Markets – 3.7% | | | | |
| BlackRock, Inc. | | 5,365 | | 1,613,846 |
| Morgan Stanley | | 45,900 | | 1,318,707 |
| The Charles Schwab Corp. | | 13,800 | | 312,570 |
| | | | 3,245,123 |
| Chemicals – 4.1% | | | | |
| Ecolab, Inc. | | 9,500 | | 1,007,000 |
| Monsanto Co. | | 25,149 | | 2,637,627 |
| | | | 3,644,627 |
| Communications Equipment – 1.5% | | | | |
| F5 Networks, Inc. (a) | | 6,200 | | 505,362 |
| Qualcomm, Inc. | | 12,350 | | 857,955 |
| | | | 1,363,317 |
| Computers & Peripherals – 3.1% | | | | |
| Apple, Inc. | | 5,210 | | 2,721,444 |
| Diversified Financial Services – 1.2% | | | | |
| American Express Co. | | 13,100 | | 1,071,580 |
| Energy Equipment & Services – 1.5% | | | | |
| Schlumberger Ltd. | | 14,000 | | 1,312,080 |
| Food & Staples Retailing – 2.4% | | | | |
| Costco Wholesale Corp. | | 6,900 | | 814,200 |
| CVS Caremark Corp. | | 15,400 | | 958,804 |
| Whole Foods Market, Inc. | | 5,400 | | 340,902 |
| | | | 2,113,906 |
| Health Care Providers & Services – 0.9% | | | | |
| Catamaran Corp. (a) | | 16,400 | | 770,144 |
| Health Care Technology – 1.7% | | | | |
| athenahealth, Inc. (a) | | 3,600 | | 480,636 |
| Cerner Corp. (a) | | 18,000 | | 1,008,540 |
| | | | 1,489,176 |
| Hotels, Restaurants & Leisure – 3.8% | | | | |
| Chipotle Mexican Grill, Inc. (a) | | 1,170 | | 616,555 |
| Starbucks Corp. | | 23,200 | | 1,880,360 |
| Wynn Resorts Ltd. | | 5,200 | | 864,500 |
| | | | 3,361,415 |
| Internet & Catalog Retail – 6.8% | | | | |
| Amazon.com, Inc. (a) | | 8,235 | | 2,997,787 |
| Priceline.com, Inc. (a) | | 2,920 | | 3,077,184 |
| | | | 6,074,971 |
| Internet Software & Services – 9.4% | | | | |
| Baidu, Inc. (a) | | 4,400 | | 707,960 |
| eBay, Inc. (a) | | 30,150 | | 1,589,206 |
| Facebook, Inc., Class A(a) | | 35,100 | | 1,764,126 |
| Google, Inc., Class A(a) | | 3,550 | | 3,658,559 |
| LinkedIn Corp., Class A(a) | | 2,900 | | 648,643 |
| | | | 8,368,494 |
| IT Services – 6.3% | | | | |
| Cognizant Technology Solutions Corp., | | | | |
| Class A(a) | | 12,100 | | 1,051,853 |
| MasterCard, Inc., Class A | | 1,955 | | 1,401,930 |
| Visa, Inc., Class A | | 16,100 | | 3,166,387 |
| | | | 5,620,170 |
| Machinery – 2.7% | | | | |
| Danaher Corp. | | 33,000 | | 2,378,970 |
| Media – 5.0% | | | | |
| CBS Corp., Class B | | 19,600 | | 1,159,144 |
| Liberty Global plc, Class A(a) | | 11,700 | | 916,929 |
| The Walt Disney Co. | | 14,400 | | 987,696 |
| Twenty-First Century Fox, Inc., Class A | | 39,750 | | 1,354,680 |
| | | | 4,418,449 |
| Oil, Gas & Consumable Fuels – 4.1% | | | | |
| EOG Resources, Inc. | | 4,300 | | 767,120 |
| Noble Energy, Inc. | | 14,000 | | 1,049,020 |
| Pioneer Natural Resources Co. | | 4,700 | | 962,466 |
| Range Resources Corp. | | 11,400 | | 863,094 |
| | | | 3,641,700 |
| Personal Products – 1.1% | | | | |
| The Estee Lauder Cos., Inc., Class A | | 13,150 | | 933,124 |
| Pharmaceuticals – 2.1% | | | | |
| Bristol-Myers Squibb Co. | | 15,400 | | 808,808 |
| Zoetis, Inc. | | 34,000 | | 1,076,440 |
| | | | 1,885,248 |
| Real Estate Investment Trusts (REITs) – 1.5% | | |
| American Tower Corp. | | 16,700 | | 1,325,145 |
| Road & Rail – 4.1% | | | | |
| The Kansas City Southern Railway Co. | | 3,600 | | 437,472 |
| Union Pacific Corp. | | 21,150 | | 3,202,110 |
| | | | 3,639,582 |
| 50 | HSBC PORTFOLIOS | See notes to financial statements. |
| HSBC GROWTH PORTFOLIO |
| Schedule of Portfolio Investments—as of October 31, 2013 (continued) |
| Common Stocks, continued | | | | |
| | | | | |
| | Shares | | Value ($) |
| Semiconductors & Semiconductor Equipment – 3.0% |
| Applied Materials, Inc. | | 47,800 | | 853,230 |
| ARM Holdings plc ADR | | 20,100 | | 948,519 |
| NXP Semiconductors NV (a) | | 21,250 | | 895,050 |
| | | | 2,696,799 |
| Software – 3.4% | | | | |
| Salesforce.com, Inc. (a) | | 47,150 | | 2,515,924 |
| ServiceNow, Inc. (a) | | 8,700 | | 475,107 |
| | | | 2,991,031 |
| Specialty Retail – 5.9% | | | | |
| Best Buy Co., Inc. | | 7,350 | | 314,580 |
| Dollar General Corp. (a) | | 22,300 | | 1,288,494 |
| Lowe’s Cos., Inc | | 22,300 | | 1,110,094 |
| Ross Stores, Inc. | | 12,600 | | 974,610 |
| Ulta Salon, Cosmetics & Fragrance, | | | | |
| Inc. (a) | | 11,700 | | 1,507,545 |
| | | | 5,195,323 |
| Textiles, Apparel & Luxury Goods – 3.1% | | | | |
| Lululemon Athletica, Inc. (a) | | 8,500 | | 586,925 |
| NIKE, Inc., Class B | | 18,300 | | 1,386,408 |
| Ralph Lauren Corp. | | 4,900 | | 811,636 |
| | | | 2,784,969 |
| Trading Companies & Distributors – 1.0% | | |
| W. W. Grainger, Inc. | | 3,365 | | 905,084 |
| Wireless Telecommunication Services – 1.4% | | |
| SBA Communications Corp., | | | | |
| Class A(a) | | 14,250 | | 1,246,448 |
| TOTAL COMMON STOCKS | | | | |
| (COST $62,689,144) | | | | 87,746,575 |
| |
| Investment Companies – 0.7% | | | | |
| |
| Northern Institutional Diversified Assets | | | | |
| Portfolio, Institutional Shares, | | | | |
| 0.01% (b) | | 606,946 | | 606,946 |
| TOTAL INVESTMENT COMPANIES | | | | |
| (COST $606,946) | | | | 606,946 |
| TOTAL INVESTMENT SECURITIES | | | | |
| (COST $63,296,090) — 99.6% | | | | 88,353,521 |
___________________
Percentages indicated are based on net assets of $88,684,466.
| (a) | Represents non-income producing security. |
| (b) | The rate represents the annualized one-day yield that was in effect on October 31, 2013. |
ADR American Depositary Receipt
| See notes to financial statements. | HSBC PORTFOLIOS | 51 |
| HSBC OPPORTUNITY PORTFOLIO |
| Schedule of Portfolio Investments—as of October 31, 2013 |
| Common Stocks – 96.4% | | | | |
| | | | | |
| | Shares | | Value ($) |
| | | | | |
| Aerospace & Defense – 3.1% | | | | |
| BE Aerospace, Inc. (a) | | 46,990 | | 3,813,708 |
| TransDigm Group, Inc. | | 22,385 | | 3,255,003 |
| | | | 7,068,711 |
| Auto Components – 1.5% | | | | |
| Gentex Corp. | | 114,150 | | 3,360,576 |
| Biotechnology – 4.9% | | | | |
| ACADIA Pharmaceuticals, Inc. (a) | | 102,800 | | 2,336,644 |
| Alkermes plc (a) | | 124,810 | | 4,392,064 |
| Cubist Pharmaceuticals, Inc. (a) | | 72,520 | | 4,496,240 |
| | | | 11,224,948 |
| Capital Markets – 1.6% | | | | |
| Raymond James Financial, Inc. | | 77,760 | | 3,549,744 |
| Chemicals – 6.2% | | | | |
| Celanese Corp., Series A | | 19,010 | | 1,064,750 |
| Cytec Industries, Inc. | | 35,570 | | 2,955,511 |
| Huntsman Corp. | | 153,470 | | 3,563,573 |
| Rockwood Holdings, Inc. | | 42,700 | | 2,700,775 |
| The Scotts Mircale-Gro Co. | | 63,830 | | 3,748,098 |
| | | | 14,032,707 |
| Commercial Banks – 2.8% | | | | |
| Comerica, Inc. | | 59,470 | | 2,575,051 |
| First Republic Bank | | 74,640 | | 3,811,865 |
| | | | 6,386,916 |
| Commercial Services & Supplies – 1.6% | | | | |
| Waste Connections, Inc. | | 83,135 | | 3,553,190 |
| Communications Equipment – 0.7% | | | | |
| JDS Uniphase Corp. (a) | | 118,500 | | 1,551,165 |
| Construction Materials – 0.7% | | | | |
| Martin Marietta Materials, Inc. | | 17,245 | | 1,691,562 |
| Containers & Packaging – 2.7% | | | | |
| Crown Holdings, Inc. (a) | | 48,790 | | 2,127,244 |
| Packaging Corp. of America | | 65,400 | | 4,073,112 |
| | | | 6,200,356 |
| Distributors – 1.1% | | | | |
| LKQ Corp. (a) | | 78,070 | | 2,578,652 |
| Diversified Consumer Services – 1.5% | | | | |
| Service Corp. International | | 188,540 | | 3,395,605 |
| Electrical Equipment – 2.7% | | | | |
| Generac Holdings, Inc. | | 43,690 | | 2,156,102 |
| Hubbell, Inc., Class B | | 36,500 | | 3,925,210 |
| | | | 6,081,312 |
| Electronic Equipment, Instruments & Components – 0.6% |
| IPG Photonics Corp. | | 19,110 | | 1,266,420 |
| Energy Equipment & Services – 1.9% | | | | |
| Rowan Cos. plc, Class A(a) | | 116,860 | | 4,216,309 |
| Health Care Equipment & Supplies – 3.7% | | |
| ArthroCare Corp. (a) | | 61,740 | | 2,311,546 |
| IDEXX Laboratories, Inc. (a) | | 30,700 | | 3,311,302 |
| Wright Medical Group, Inc. (a) | | 99,300 | | 2,697,981 |
| | | | 8,320,829 |
| Health Care Providers & Services – 1.9% | | |
| Community Health Systems, Inc. | | 96,490 | | 4,209,859 |
| Health Care Technology – 0.8% | | | | |
| Allscripts Healthcare Solutions, Inc. (a) | | 134,470 | | 1,859,720 |
| Hotels, Restaurants & Leisure – 1.8% | | | | |
| Arcos Dorados Holdings, Inc., Class A | | 113,250 | | 1,363,530 |
| Brinker International, Inc. | | 63,240 | | 2,809,121 |
| | | | 4,172,651 |
| Household Durables – 5.4% | | | | |
| Harman International Industries, Inc. | | 29,540 | | 2,393,331 |
| Jarden Corp. (a) | | 70,115 | | 3,881,566 |
| NVR, Inc. (a) | | 2,427 | | 2,226,336 |
| Taylor Morrison Home Corp., Class A(a) | | 95,750 | | 2,129,480 |
| Tempur Sealy International, Inc. (a) | | 44,480 | | 1,705,808 |
| | | | 12,336,521 |
| Insurance – 1.9% | | | | |
| Everest Re Group Ltd. | | 10,390 | | 1,597,358 |
| Genworth Financial, Inc., Class A(a) | | 194,860 | | 2,831,316 |
| | | | 4,428,674 |
| Internet Software & Services – 2.6% | | | | |
| MercadoLibre, Inc. | | 24,020 | | 3,233,933 |
| Pandora Media, Inc. (a) | | 105,680 | | 2,655,738 |
| | | | 5,889,671 |
| IT Services – 6.9% | | | | |
| Alliance Data Systems Corp. (a) | | 29,245 | | 6,932,820 |
| FleetCor Technologies, Inc. (a) | | 29,575 | | 3,411,476 |
| Genpact Ltd. (a) | | 111,310 | | 2,207,277 |
| Total System Services, Inc. | | 100,930 | | 3,010,742 |
| | | | 15,562,315 |
| Life Sciences Tools & Services – 3.3% | | | | |
| Covance, Inc. (a) | | 35,000 | | 3,124,100 |
| Mettler-Toledo International, Inc. (a) | | 18,120 | | 4,483,975 |
| | | | 7,608,075 |
| Machinery – 2.1% | | | | |
| Lincoln Electric Holdings, Inc. | | 34,780 | | 2,408,167 |
| The Timken Co. | | 44,450 | | 2,347,405 |
| | | | 4,755,572 |
| Media – 1.6% | | | | |
| Manchester United plc, Class A(a) | | 84,360 | | 1,375,068 |
| Nexstar Broadcasting Group, Inc., | | | | |
| Class A | | 51,270 | | 2,275,875 |
| | | | 3,650,943 |
| 52 | HSBC PORTFOLIOS | See notes to financial statements. |
| HSBC OPPORTUNITY PORTFOLIO |
| Schedule of Portfolio Investments—as of October 31, 2013 (continued) |
| Common Stocks, continued | | | | |
| | | | | |
| | Shares | | Value ($) |
| Oil, Gas & Consumable Fuels – 5.0% | | | | |
| CONSOL Energy, Inc. | | 72,100 | | 2,631,650 |
| Denbury Resources, Inc. (a) | | 140,980 | | 2,677,210 |
| Tesoro Corp. | | 124,510 | | 6,087,294 |
| | | | 11,396,154 |
| Pharmaceuticals – 2.7% | | | | |
| ViroPharma, Inc. (a) | | 157,970 | | 6,132,395 |
| Professional Services – 2.0% | | | | |
| IHS, Inc., Class A(a) | | 22,515 | | 2,455,261 |
| Robert Half International, Inc. | | 56,730 | | 2,185,807 |
| | | | 4,641,068 |
| Real Estate Investment Trusts (REITs) – 1.1% | | |
| Starwood Property Trust, Inc. | | 96,270 | | 2,473,176 |
| Real Estate Management & Development – 1.1% | | |
| Jones Lang LaSalle, Inc. | | 25,440 | | 2,421,888 |
| Road & Rail – 1.3% | | | | |
| Landstar System, Inc. | | 52,290 | | 2,891,114 |
| Semiconductors & Semiconductor Equipment – 3.0% |
| Avago Technologies Ltd. | | 37,670 | | 1,711,348 |
| NXP Semiconductors NV (a) | | 80,230 | | 3,379,288 |
| Skyworks Solutions, Inc. (a) | | 66,800 | | 1,722,104 |
| | | | 6,812,740 |
| Software – 3.2% | | | | |
| Concur Technologies, Inc. (a) | | 21,270 | | 2,224,842 |
| Informatica Corp. (a) | | 58,240 | | 2,248,064 |
| QLIK Technologies, Inc. (a) | | 108,820 | | 2,757,499 |
| | | | 7,230,405 |
| Specialty Retail – 8.1% | | | | |
| Best Buy Co., Inc. | | 118,510 | | 5,072,228 |
| GNC Holdings, Inc., Class A | | 30,610 | | 1,800,480 |
| Signet Jewelers Ltd. | | 45,130 | | 3,369,406 |
| Tractor Supply Co. | | 35,170 | | 2,509,380 |
| Urban Outfitters, Inc. (a) | | 93,210 | | 3,530,795 |
| Williams-Sonoma, Inc. | | 42,094 | | 2,207,409 |
| | | | 18,489,698 |
| Trading Companies & Distributors – 3.3% | | |
| United Rentals, Inc. (a) | | 47,670 | | 3,079,005 |
| WESCO International, Inc. (a) | | 52,080 | | 4,450,757 |
| | | | 7,529,762 |
| TOTAL COMMON STOCKS | | | | |
| (COST $167,155,410) | | | | 218,971,403 |
| | | | | |
| Investment Companies – 2.9% | | | | |
| | | | | |
| Northern Institutional Government | | | | |
| Select Portfolio, Institutional Shares, | | | | |
| 0.01% (b) | | 6,563,134 | | 6,563,134 |
| TOTAL INVESTMENT COMPANIES | | | | |
| (COST $6,563,134) | | | | 6,563,134 |
| TOTAL INVESTMENT SECURITIES | | | | |
| (COST $173,718,544) — 99.3% | | | | 225,534,537 |
____________________
Percentages indicated are based on net assets of $227,068,664.
| (a) | Represents non-income producing security. |
| (b) | The rate represents the annualized one-day yield that was in effect on October 31, 2013. |
| |
| See notes to financial statements. | HSBC PORTFOLIOS | 53 |
HSBC PORTFOLIOS
Statements of Assets and Liabilities—as of October 31, 2013
| | | Growth | | | | Opportunity | |
| | | Portfolio | | | | Portfolio | |
| Assets: | | | | | | | | | | |
| Investments in non-affiliates, at value | | | $ | 88,353,521 | | | | $ | 225,534,537 | |
| Dividends receivable | | | | 19,861 | | | | | 32,244 | |
| Receivable for investments sold | | | | 1,517,261 | | | | | 2,269,970 | |
| Prepaid expenses | | | | 594 | | | | | 1,339 | |
| Total Assets | | | | 89,891,237 | | | | | 227,838,090 | |
| | | | | | | | | | | |
| Liabilities: | | | | | | | | | | |
| Payable for investments purchased | | | | 1,134,982 | | | | | 584,366 | |
| Accrued expenses and other liabilities: | | | | | | | | | | |
| Investment Management | | | | 49,082 | | | | | 150,660 | |
| Administration | | | | 2,318 | | | | | 5,839 | |
| Compliance Services | | | | 8 | | | | | 27 | |
| Accounting | | | | 212 | | | | | 223 | |
| Custodian | | | | 5,200 | | | | | 6,773 | |
| Trustee | | | | 83 | | | | | 346 | |
| Other | | | | 14,886 | | | | | 21,192 | |
| Total Liabilities | | | | 1,206,771 | | | | | 769,426 | |
| | | | | | | | | | | |
| Applicable to investors’ beneficial interest | | | $ | 88,684,466 | | | | $ | 227,068,664 | |
| Total Investments, at cost | | | $ | 63,296,090 | | | | $ | 173,718,544 | |
| 54 | HSBC PORTFOLIOS | See notes to financial statements. |
HSBC PORTFOLIOS
Statements of Operations—For the year ended October 31, 2013
| | Growth | | Opportunity |
| | | Portfolio | | Portfolio |
| Investment Income: | | | | | | | | | | |
| Dividends | | | $ | 975,963 | | | | $ | 1,973,053 | |
| Total Investment Income | | | | 975,963 | | | | | 1,973,053 | |
| | | | | | | | | | | |
| Expenses: | | | | | | | | | | |
| Investment Management | | | | 472,689 | | | | | 1,486,877 | |
| Administration | | | | 26,895 | | | | | 58,975 | |
| Accounting | | | | 44,063 | | | | | 44,249 | |
| Compliance Services | | | | 719 | | | | | 1,518 | |
| Custodian | | | | 9,900 | | | | | 13,555 | |
| Printing | | | | 1,791 | | | | | 4,180 | |
| Professional | | | | 20,043 | | | | | 25,426 | |
| Trustee | | | | 2,176 | | | | | 4,700 | |
| Other | | | | 4,584 | | | | | 9,513 | |
| Total Expenses | | | | 582,860 | | | | | 1,648,993 | |
| | | | | | | | | | | |
| Net Investment Income (Loss) | | | | 393,103 | | | | | 324,060 | |
| | | | | | | | | | | |
| Net Realized/Unrealized Gains (Losses) from Investments: | | | | | | | | | | |
| Net realized gains (losses) from investment securities | | | | 12,024,769 | | | | | 24,604,589 | |
| Change in unrealized appreciation/depreciation on investments | | | | 11,744,016 | | | | | 30,628,121 | |
| | | | | | | | | | | |
| Net realized/unrealized gains (losses) from investments | | | | 23,768,785 | | | | | 55,232,710 | |
| Change In Net Assets Resulting From Operations | | | $ | 24,161,888 | | | | $ | 55,556,770 | |
| See notes to financial statements. | HSBC PORTFOLIOS | 55 |
HSBC PORTFOLIOS
Statements of Changes in Net Assets
| | Growth | | Opportunity |
| | Portfolio | | Portfolio |
| | For the | | For the | | For the | | For the |
| | year ended | | year ended | | year ended | | year ended |
| | October 31, 2013 | | October 31, 2012 | | October 31, 2013 | | October 31, 2012 |
| Investment Activities: | | | | | | | | | | | | | | | | | | | | |
| Operations: | | | | | | | | | | | | | | | | | | | | |
| Net investment income (loss) | | | $ | 393,103 | | | | $ | 116,496 | | | | $ | 324,060 | | | | $ | 224,890 | |
| Net realized gains (losses) from investments | | | | 12,024,769 | | | | | 12,654,581 | | | | | 24,604,589 | | | | | 8,826,465 | |
| Change in unrealized appreciation/depreciation | | | | | | | | | | | | | | | | | | | | |
| from investments | | | | 11,744,016 | | | | | (6,525,872 | ) | | | | 30,628,121 | | | | | 8,291,618 | |
| Change in net assets resulting from operations | | | | 24,161,888 | | | | | 6,245,205 | | | | | 55,556,770 | | | | | 17,342,973 | |
| Proceeds from contributions | | | | 5,010,619 | | | | | 10,142,030 | | | | | 37,719,433 | | | | | 15,884,698 | |
| Value of withdrawals | | | | (19,506,375 | ) | | | | (42,657,788 | ) | | | | (16,266,064 | ) | | | | (24,493,548 | ) |
| Change in net assets resulting from transactions | | | | | | | | | | | | | | | | | | | | |
| in investors’ beneficial interest | | | | (14,495,756 | ) | | | | (32,515,758 | ) | | | | 21,453,369 | | | | | (8,608,850 | ) |
| Change in net assets | | | | 9,666,132 | | | | | (26,270,553 | ) | | | | 77,010,139 | | | | | 8,734,123 | |
| | | | | | | | | | | | | | | | | | | | | |
| Net Assets: | | | | | | | | | | | | | | | | | | | | |
| Beginning of period | | | | 79,018,334 | | | | | 105,288,887 | | | | | 150,058,525 | | | | | 141,324,402 | |
| End of period | | | $ | 88,684,466 | | | | $ | 79,018,334 | | | | $ | 227,068,664 | | | | $ | 150,058,525 | |
| 56 | HSBC PORTFOLIOS | See notes to financial statements. |
| HSBC PORTFOLIOS |
| Financial Highlights |
Selected data for a share outstanding throughout the periods indicated.
| | | | | | | Ratios/Supplementary Data |
| | | | | | | | | | | | | | | | | | | | | | Ratios of | | | | | |
| | | | | | | | | | | | | | | | | Ratio of Net | | Expenses | | | | | |
| | | | | | | | | | | | Ratio of Net | | Investment | | to Average | | | | | |
| | | | | | | Net Assets at | | Expenses to | | Income (Loss) | | Net Assets | | | | | |
| | Total | | End of Period | | Average Net | | to Average Net | | (Excluding Fee | | Portfolio |
| | | Return | | (000’s) | | Assets | | Assets | | Reductions) | | Turnover |
| GROWTH PORTFOLIO | | | | | | | | | | | | | | | | | | | | | | | | |
| Year Ended October 31, 2009 | | | 19.31 | % | | | | $ | 88,163 | | | | 0.69 | % | | | | 0.17 | % | | | 0.69% | | | 66 | % | |
| Year Ended October 31, 2010 | | | 20.34 | % | | | | $ | 98,751 | | | | 0.68 | % | | | | (0.04 | )% | | | 0.68% | | | 89 | % | |
| Year Ended October 31, 2011 | | | 11.07 | % | | | | $ | 105,289 | | | | 0.66 | % | | | | 0.07 | % | | | 0.66% | | | 56 | % | |
| Year Ended October 31, 2012 | | | 7.18 | % | | | | $ | 79,018 | | | | 0.71 | % | | | | 0.13 | % | | | 0.71% | | | 53 | % | |
| Year Ended October 31, 2013 | | | 32.84 | % | | | | $ | 88,684 | | | | 0.69 | % | | | | 0.46 | % | | | 0.69% | | | 75 | % | |
| OPPORTUNITY PORTFOLIO | | | | | | | | | | | | | | | | | | | | | | | | | | | |
| Year Ended October 31, 2009 | | | 15.41 | % | | | | $ | 129,748 | | | | 0.90 | % | | | | (0.37 | )% | | | 0.90% | | | 65 | % | |
| Year Ended October 31, 2010 | | | 28.74 | % | | | | $ | 139,402 | | | | 0.89 | % | | | | (0.35 | )% | | | 0.89% | | | 68 | % | |
| Year Ended October 31, 2011 | | | 12.40 | % | | | | $ | 141,324 | | | | 0.88 | % | | | | 0.05 | % | | | 0.88% | | | 69 | % | |
| Year Ended October 31, 2012 | | | 12.71 | % | | | | $ | 150,059 | | | | 0.91 | % | | | | 0.15 | % | | | 0.91% | | | 59 | % | |
| Year Ended October 31, 2013 | | | 34.84 | % | | | | $ | 227,069 | | | | 0.89 | % | | | | 0.17 | % | | | 0.89% | | | 70 | % | |
| See notes to financial statements. | HSBC PORTFOLIOS | 57 |
| HSBC PORTFOLIOS |
| Notes to Financial Statements—as of October 31, 2013 |
1. Organization:
The HSBC Portfolios (the “Portfolio Trust”), is an open-end management investment company organized as a New York trust under the laws of the State of New York on November 1, 1994. The Portfolio Trust contains the following master funds (individually a “Portfolio,” collectively the “Portfolios”):
| Portfolio | | Short Name |
| HSBC Growth Portfolio | | Growth Portfolio |
| HSBC Opportunity Portfolio | | Opportunity Portfolio |
The Portfolios operate as master funds in master-feeder arrangements, in which other funds invest all or part of their investable assets in the Portfolios. The Portfolios also receive investments from funds of funds. The Declaration of Trust permits the Board of Trustees (the “Board”) to issue an unlimited number of beneficial interests in the Portfolios.
The Portfolios are diversified series of the Portfolio Trust and are part of the HSBC Family of Funds, which also includes the HSBC Advisor Funds Trust and HSBC Funds (collectively, the “Trusts”). Financial statements for all other funds of the Trusts are published separately.
Under the Portfolio Trust’s organizational documents, the Portfolio Trust’s officers and Trustees are indemnified against certain liabilities arising out of the performance of their duties to the Portfolios. In addition, in the normal course of business, the Portfolio Trust enters into contracts with its service providers, which also provide for indemnifications by the Portfolios. The Portfolios’ maximum exposure under these arrangements is unknown as this would involve any future claims that may be made against the Portfolios. However, based on experience, the Portfolio Trust expects that risk of loss to be remote.
2. Significant Accounting Policies:
The following is a summary of the significant accounting policies followed by the Portfolios in the preparation of their financial statements. The policies are in conformity with U.S. generally accepted accounting principles (“GAAP”). The preparation of financial statements requires management to make certain estimates and assumptions that affect the reported amounts of assets and liabilities and disclosure of contingent assets and liabilities at the date of the financial statements and the reported amounts of increases and decreases in net assets from operations during the reporting period. Actual results could differ from those estimates.
Securities Valuation:
The Portfolios record their investments at fair value. Fair value is defined as the price that would be received to sell an asset or paid to transfer a liability in an orderly transaction between market participants at the measurement date. The valuation techniques used to determine fair value are further described in Note 3 below.
Investment Transactions and Related Income:
Investment transactions are accounted for no later than one business day after trade date. However, for financial reporting purposes, investment transactions are accounted for on trade date. Investment gains and losses are calculated on the identified cost basis. Interest income is recognized on the accrual basis and includes, where applicable, the amortization or accretion of premium or discount. Dividend income is recorded on the ex-dividend date.
Expense Allocations:
Expenses directly attributable to a Portfolio are charged to that Portfolio. Expenses not directly attributable to a Portfolio are allocated proportionally among the applicable portfolios or funds within the Trusts in relation to net assets or on another reasonable basis.
| HSBC PORTFOLIOS |
| Notes to Financial Statements — as of October 31, 2013 (continued) |
Federal Income Taxes:
Each Portfolio will be treated as a partnership for U.S. federal income tax purposes. Accordingly, each Portfolio passes through all of its net investment income and gains and losses to its feeder funds, and is therefore not subject to U.S. federal income tax. As such, investors in the Portfolios will be taxed on their respective share of the Portfolios’ ordinary income and realized gains. It is intended that the Portfolios will be managed in such a way that an investor will be able to satisfy the requirements of the Internal Revenue Code, as amended, applicable to regulated investment companies.
Management of the Portfolios has reviewed tax positions taken in tax years that remain subject to examination by all major tax jurisdictions, including federal (i.e., the last four tax year ends and the interim tax period since then, as applicable). Management believes that there is no tax liability resulting from unrecognized tax benefits related to uncertain tax positions taken.
New Accounting Pronouncements:
In January 2013, the Financial Accounting Standards Board issued Accounting Standards Update (“ASU”) No. 2013-01 “Clarifying the Scope of Disclosures about Offsetting Assets and Liabilities” (“ASU 2013-01”) which amended Accounting Standards Codification Subtopic 210-20, Balance Sheet Offsetting. ASU 2013-01 clarified the scope of ASU No. 2011-11 “Disclosures about Offsetting Assets and Liabilities” (“ASU 2011-11”). ASU 2011-11 requires an entity to disclose information about offsetting and related arrangements to enable users of the financial statements to understand the effect of those arrangements on the entity’s financial position. ASU 2013-01 clarifies the scope of ASU 2011-11 as applying to derivatives accounted for in accordance with Topic 815, Derivatives and Hedging, including bifurcated embedded derivatives, repurchase agreements and reverse repurchase agreements, and securities borrowing and securities lending transactions that are offset either in accordance with other requirements of GAAP or subject to an enforceable master netting arrangement or similar agreement. The guidance in ASU 2013-01 and ASU 2011-11 is effective for interim and annual periods beginning on or after January 1, 2013. Management is evaluating any impact ASU 2013-01 and ASU 2011-11 may have on the Portfolios’ financial statements.
3. Investment Valuation Summary:
The valuation techniques employed by the Portfolios, as described below, maximize the use of observable inputs and minimize the use of unobservable inputs in determining fair value. The inputs used for valuing the Portfolios’ investments are summarized in the three broad levels listed below:
- Level 1: quoted prices in active markets for identical assets
- Level 2: other significant observable inputs (including quoted prices for similar securities, interest rates, prepayment speeds, credit risk, etc.)
- Level 3: significant unobservable inputs (including a Portfolio’s own assumptions in determining the fair value of investments)
Changes in valuation techniques may result in transfers in or out of an assigned level within the disclosure hierarchy. The Portfolios determine transfers between fair value hierarchy levels at the reporting period end. The inputs or methodology used for valuing investments are not necessarily an indication of the risk associated with investing in those investments.
Exchange traded, domestic equity securities are valued at the last sale price on a national securities exchange, or in the absence of recorded sales, at the readily available closing bid price on such exchanges, or at the quoted bid price in the over-the-counter market and are typically categorized as Level 1 in the fair value hierarchy.
Shares of exchange traded and closed-end registered investment companies are valued in the same manner as other equity securities and are typically categorized as Level 1 in the fair value hierarchy. Mutual funds are valued at their net asset values, as reported by such companies and are typically categorized as Level 1 in the fair value hierarchy.
HSBC PORTFOLIOS 59
| HSBC PORTFOLIOS |
| Notes to Financial Statements — as of October 31, 2013 (continued) |
Repurchase agreements are valued at original cost and are typically categorized as Level 2 in the fair value hierarchy.
Securities or other assets for which market quotations are not readily available, or are deemed unreliable due to a significant event or otherwise, are valued pursuant to procedures adopted by the Trusts’ Board (“Procedures”). Depending on the source and relative significance of valuation inputs, these instruments may be classified as Level 2 or Level 3 in the fair value hierarchy. Examples of potentially significant events that could affect the value of an individual security and thus require pricing under the Procedures include corporate actions by the issuer, announcements by the issuer relating to its earnings or products, regulatory news, natural disasters, and litigation. Examples of potentially significant events that could affect multiple securities held by a Portfolio include governmental actions, natural disasters, and armed conflicts. Fair value pricing may require subjective determinations about the value of a security. While the Portfolio Trust’s policy is intended to result in a calculation of a Portfolio’s net asset value that fairly reflects security values as of the time of pricing, the Portfolio Trust cannot ensure that fair values determined would accurately reflect the price that a Portfolio could obtain for a security if it were to dispose of that security as of the time of pricing. The prices used by a Portfolio may differ from the value that would be realized if the securities were sold and the differences could be material to the financial statements.
For the year ended October 31, 2013, there were no Level 3 investments for which significant unobservable inputs were used to determine fair value.
The following is a summary of the valuation inputs used as of October 31, 2013 in valuing the Portfolios’ investments based upon the three levels defined above. The breakdown of investment categorization is disclosed in the Schedule of Portfolio Investments for each Portfolio:
| | LEVEL 1 ($) | | LEVEL 2 ($) | | LEVEL 3 ($) | | Total ($) |
| Growth Portfolio | | | | | | | | |
| Investment Securities: | | | | | | | | |
| Common Stocks | | 87,746,575 | | — | | — | | 87,746,575 |
| Investment Companies | | 606,946 | | — | | — | | 606,946 |
| Total Investment Securities | | 88,353,521 | | — | | — | | 88,353,521 |
| |
| Opportunity Portfolio | | | | | | | | |
| Investment Securities: | | | | | | | | |
| Common Stocks | | 218,971,403 | | — | | — | | 218,971,403 |
| Investment Companies | | 6,563,134 | | — | | — | | 6,563,134 |
| Total Investment Securities | | 225,534,537 | | — | | — | | 225,534,537 |
4. Related Party Transactions and Other Agreements:
Investment Management:
HSBC Global Asset Management (USA) Inc. (“HSBC” or the “Investment Adviser”), a wholly owned subsidiary of HSBC Bank USA, N.A., a national bank organized under the laws of the United States, acts as the Investment Adviser to the Portfolios pursuant to an investment management contract with the Portfolio Trust. As Investment Adviser, HSBC manages the investments of the Portfolios and continuously reviews, supervises, and administers the Portfolios’ investments. Winslow Capital Management, Inc. (“Winslow”) and Westfield Capital Management Company, L.P. (“Westfield”) serve as subadvisers for the Growth Portfolio and Opportunity Portfolio, respectively, and are paid for their services directly by the respective Portfolios.
60 HSBC PORTFOLIOS
| HSBC PORTFOLIOS |
| Notes to Financial Statements — as of October 31, 2013 (continued) |
For their services, the Investment Adviser and Winslow receive in aggregate, from the Growth Portfolio, a fee, accrued daily and paid monthly, at an annual rate of:
| Based on Average Daily Net Assets of all Sub-Adviser serviced funds and separate accounts affiliated | | |
| with HSBC: | | Fee Rate(%)* |
| Up to $250 million | | 0.575 |
| In excess of $250 million but not exceeding $500 million | | 0.525 |
| In excess of $500 million but not exceeding $750 million | | 0.475 |
| In excess of $750 million but not exceeding $1 billion | | 0.425 |
| In excess of $1 billion | | 0.375 |
____________________
| * | | The Growth Portfolio may pay the Investment Adviser and Winslow an aggregate maximum fee of up to 0.68%. Currently, the Investment Adviser’s contractual fee is 0.175% and Winslow’s maximum contractual fee is 0.40%. Accordingly, the current aggregate maximum fee rate is 0.575%. |
For their services, the Investment Adviser and Westfield receive in aggregate, a fee, accrued daily and paid monthly, at an annual rate of 0.80% of the Opportunity Portfolio’s average daily net assets.
Administration:
HSBC serves the Portfolios as Administrator. Under the terms of the Administration Agreement, HSBC receives from the Portfolios (as well as other funds in the Trusts combined) a fee, accrued daily and paid monthly at an annual rate of:
| Based on Combined Average Daily Net Assets of | | Fee Rate(%) |
| Up to $10 billion | | 0.0550 |
| In excess of $10 billion but not exceeding $20 billion | | 0.0350 |
| In excess of $20 billion but not exceeding $50 billion | | 0.0275 |
| In excess of $50 billion | | 0.0250 |
The fee rates and breakpoints are determined on the basis of the aggregate average daily net assets of the Trusts, however, the assets of the funds of the HSBC Funds and HSBC Advisor Funds Trust that invest in the Portfolios are not double-counted. The total administration fee paid to HSBC is allocated to each series based upon its proportionate share of the aggregate net assets of the Trusts. For assets invested in the Portfolios by the funds of the HSBC Funds and HSBC Advisor Funds Trust, the Portfolios pay half of the administration fee and the other funds pay half of the administration fee, for a combination of the total fee rate set forth above.
Pursuant to a Sub-Administration Agreement with HSBC, Citi Fund Services Ohio, Inc. (“Citi”), a wholly-owned subsidiary of Citigroup, Inc., serves as the Trusts’ Sub-Administrator subject to the general supervision by the Trusts’ Board and HSBC. For these services, Citi is entitled to a fee, payable by HSBC, at an annual rate equivalent to the fee rates set forth above subject to certain reductions associated with services provided to new portfolios, minus 0.02% which is retained by HSBC.
Under a Compliance Services Agreement between the Trusts and Citi (the “CCO Agreement”), Citi makes an employee available to serve as the Trusts’ Chief Compliance Officer (the “CCO”). Under the CCO Agreement, Citi also provides infrastructure and support in implementing the written policies and procedures comprising the Trusts’ compliance program, including support services to the CCO. For the services provided under the CCO Agreement, the Trusts paid Citi $287,560 for the year ended October 31, 2013, plus reimbursement of certain out of pocket expenses. Expenses incurred by each Portfolio are reflected on the Statements of Operations as “Compliance Services.” Citi pays the salary and other compensation earned by individuals performing these services, as employees of Citi.
Fund Accounting:
Citi provides fund accounting services for the Portfolio Trust. For its services to the Portfolios, Citi receives an annual fee per portfolio, including reimbursement of certain expenses, that is accrued daily and paid monthly.
HSBC PORTFOLIOS 61
| HSBC PORTFOLIOS |
| Notes to Financial Statements — as of October 31, 2013 (continued) |
Independent Trustees:
The Trusts pay each Independent Trustee an annual retainer of $100,000. The Trusts pay a fee of $10,000 for each regular meeting of the Board attended and a fee of $ 3,000 for each special meeting attended. The Trusts pay each Committee Chair an annual retainer of $ 3,000, with the exception of the Chair of the Audit Committee, who receives a retainer of $ 6,000. The Trusts also pay the Chairman of the Board an additional annual retainer of $24,000. In addition, for time expended on Board duties outside normal meetings, which is authorized by the Board, a Trustee is compensated at the rate of $ 500 per hour, up to a maximum of $ 3,000 per day.
5. Investment Transactions:
Cost of purchases and proceeds from sales of securities (excluding securities maturing less than one year from acquisition) for the year ended October 31, 2013 were as follow:
| | Purchases ($) | | Sales ($) |
| Growth Portfolio | | | 62,055,996 | | | | 74,114,396 | |
| Opportunity Portfolio | | | 144,039,393 | | | | 126,127,698 | |
For the year ended October 31, 2013, there were no long-term U.S. government securities held by the Portfolio Trust.
6. Federal Income Tax Information:
At October 31, 2013, the cost basis of securities for federal income tax purposes, gross unrealized appreciation, gross unrealized depreciation and net unrealized appreciation/depreciation were as follows:
| | | | | | | | | | | | Net Unrealized |
| | | | | Tax Unrealized | | Tax Unrealized | | Appreciation/ |
| Tax Cost ($) | | Appreciation ($) | | Depreciation ($) | | (Depreciation) ($)* |
| Growth Portfolio | | 59,903,953 | | | 28,711,719 | | | (262,151 | ) | | | 28,449,568 |
| Opportunity Portfolio | | 174,027,654 | | | 53,521,776 | | | (2,014,893 | ) | | | 51,506,883 |
____________________
| * | | The difference between book-basis unrealized appreciation (depreciation) is attributable primarily to tax deferral of losses on wash sales. |
7. Subsequent Events:
Management has evaluated events and transactions through the date the financial statements were issued, for purposes of recognition or disclosure in these financial statements and there are no subsequent events to report.
62 HSBC PORTFOLIOS
Report of Independent Registered Public Accounting Firm
To the Shareholders and Board of Trustees of
HSBC Portfolios:
We have audited the accompanying statements of assets and liabilities of HSBC Portfolios – HSBC Growth Portfolio and HSBC Opportunity Portfolio (the Funds), including the schedules of portfolio investments, as of October 31, 2013, and the related statements of operations for the year then ended, the statements of changes in net assets for each of the years in the two-year period then ended, and the financial highlights for each of the years in the five-year period then ended. These financial statements and financial highlights are the responsibility of the Funds’ management. Our responsibility is to express an opinion on these financial statements and financial highlights based on our audits.
We conducted our audits in accordance with the standards of the Public Company Accounting Oversight Board (United States). Those standards require that we plan and perform the audit to obtain reasonable assurance about whether the financial statements and financial highlights are free of material misstatement. An audit includes examining, on a test basis, evidence supporting the amounts and disclosures in the financial statements. Our procedures included confirmation of securities owned as of October 31, 2013, by correspondence with custodians and brokers or by other appropriate auditing procedures. An audit also includes assessing the accounting principles used and significant estimates made by management, as well as evaluating the overall financial statement presentation. We believe that our audits provide a reasonable basis for our opinion.
In our opinion, the financial statements and financial highlights referred to above present fairly, in all material respects, the financial position of the Funds as of October 31, 2013, the results of their operations for the year then ended, the changes in their net assets for each of the years in the two-year period then ended, and the financial highlights for each of the years in the five-year period then ended, in conformity with U.S. generally accepted accounting principles.

Columbus, Ohio
December 27, 2013
HSBC PORTFOLIOS 63
| HSBC PORTFOLIOS |
| Table of Shareholder Expenses — as of October 31, 2013 (continued) |
As a shareholder of the Portfolios, you incur ongoing costs, including management fees and other Fund expenses.
These examples are intended to help you understand your ongoing costs (in dollars) of investing in the Portfolios and to compare these costs with the ongoing costs of investing in other mutual funds.
These examples are based on an investment of $1,000 invested at the beginning of the period and held for the entire period from May 1, 2013 through October 31, 2013.
Actual Example
The table below provides information about actual account values and actual expenses. You may use the information below, together with the amount you invested, to estimate the expenses that you paid over the period. Simply divide your account value by $1,000 (for example, an $8,600 account value divided by $1,000 = 8.6), then multiply the result by the number in the table under the heading entitled “Expenses Paid During Period” to estimate the expenses you paid on your account during this period.
| | | | | | | | | | | | | Annualized |
| Beginning | | Ending | | Expenses Paid | | Expense Ratio |
| Account Value | | Account Value | | During Period* | | During Period |
| 5/1/13 | | 10/31/13 | | 5/1/13 - 10/31/13 | | 5/1/13 - 10/31/13 |
| Growth Portfolio | | $1,000.00 | | | | $1,170.40 | | | | $3.61 | | | 0.66% |
| Opportunity Portfolio | | 1,000.00 | | | | 1,139.50 | | | | 4.75 | | | 0.88% |
Hypothetical Example for Comparison Purposes
The table below provides information about hypothetical account values and hypothetical expenses based on each Portfolio’s actual expense ratio and an assumed rate of return of 5% per year before expenses, which is not the Portfolio’s actual return. The hypothetical account values and expenses may not be used to estimate the actual ending account balance or expenses you paid for the period. You may use this information to compare this 5% hypothetical example with the 5% hypothetical examples that appear in the shareholder reports of other funds.
Please note that the expenses shown in the table are meant to highlight your ongoing costs only and do not reflect any transactional costs, such as sales charges (loads), redemption fees, or exchange fees. Therefore, the table is useful in comparing ongoing costs only, and will not help you determine the relative total costs of owning different funds. In addition, if these transactional costs were included, your costs would have been higher.
| | | | | | | | | | | | | Annualized |
| Beginning | | Ending | | Expenses Paid | | Expense Ratio |
| Account Value | | Account Value | | During Period* | | During Period |
| 5/1/13 | | 10/31/13 | | 5/1/13 - 10/31/13 | | 5/1/13 - 10/31/13 |
| Growth Portfolio | | $1,000.00 | | | | $1,021.88 | | | | $3.36 | | | 0.66% |
| Opportunity Portfolio | | 1,000.00 | | | | 1,020.77 | | | | 4.48 | | | 0.88% |
____________________
* | | Expenses are equal to the average account value over the period, multiplied by the Portfolio's annualized expense ratio, multiplied by 184/365 (to reflect the one half year period). |
64 HSBC PORTFOLIOS
| HSBC PORTFOLIOS |
| Board of Trustees and Officers (Unaudited) |
MANAGEMENT OF THE TRUST
The following table contains information regarding the HSBC Family of Funds’ Board of Trustees (“Trustees”). Asterisks indicate those Trustees who are “interested persons,” as defined in the Investment Company Act of 1940, as amended, of the HSBC Family of Funds. The HSBC Family of Funds’ Statement of Additional Information includes additional information about the Trustees and is available, without charge, upon request by calling (888) 525-5757.
| | | | | | | | Portfolios in | | |
| | Position(s) | | Term of Office | | | | Fund Complex | | Other |
| Name, | | Held with | | and Length of | | Principal Occupation(s) | | Overseen By | | Directorships |
| Address, Age | | Funds | | Time Served | | During Past 5 Years | | Trustee* | | Held by Trustee |
| NON-INTERESTED | | | | | | | | | | |
| TRUSTEES | | | | | | | | | | |
| | | | | | | | | | | |
MARCIA L. BECK
P.O. Box 182845
Columbus, OH
43218-3035
Age: 58 | | Trustee | | Indefinite;
2008 to present | | Private Investor (June 1999 – present); Executive Vice President, Prudential Investments (1997 – 1999); President and Trustee, The Goldman Sachs Mutual Funds (1992 – 1996) | | 21 | | None |
| | | | | | | | | | | |
SUSAN C. GAUSE
P.O. Box 182845
Columbus, OH
43218-3035
Age: 60 | | Trustee | | Indefinite;
2013 to present | | Since 2003, Private Investor; Independent Trustee of Met Investors Series Trust (2008-2012); Chief Executive Officer, Dresdner RCM Global Investors and Allianz Dresdner Asset Management (2000-2002); Board Member of Dresdner Global Asset Management Board (2000-2002); Chief Operating Officer and Senior Managing Director of Dresdner RCM Global Investors (1998-2000) | | 21 | | Since 2012, Trustee,
Metropolitan Series Fund |
| | | | | | | | | | | |
SUSAN S. HUANG
P.O. Box 182845
Columbus, OH
43218-3035
Age: 59 | | Trustee | | Indefinite;
2008 to present | | Private Investor (2000-present); Senior Vice President, Schroder Investment Management (2001 – 2004); Managing Director, Chase Asset Management (1995-2000) | | 21 | | None |
| | | | | | | | | | | |
ALAN S. PARSOW
P.O. Box 182845
Columbus, OH
43218-3035
Age: 63 | | Trustee | | Indefinite;
1987 to present | | General Partner, Elkhorn Partners, L.P. (a private investment partnership) (1989 – present) | | 21 | | None |
| | | | | | | | | | | |
THOMAS F. ROBARDS
P.O. Box 182845
Columbus, OH
43218-3035
Age: 67 | | Trustee | | Indefinite;
2005 to present | | Partner, Robards & Co. LLC (investment and advisory services) (2005-present); Chief Financial Officer, American Museum of Natural History (2003-2004); Chief Financial Officer, Datek Online Holdings (2000-2003); Previously EVP and CFO Republic New York Corporation | | 21 | | Overseas Shipholding
Group (energy
transportation);
Ellington Financial LLC
(NYSE listed financial
services) Ellington
Residential Mortgage
REIT (NYSE listed real
estate investment trust) |
| | | | | | | | | | | |
MICHAEL SEELY
P.O. Box 182845
Columbus, OH
43218-3035
Age: 68 | | Chairman and
Trustee | | Indefinite;
1987 to present | | Private Investor (2003-present); General Partner, Global Multi Manager Partners (1999-2003); President of Investor Access Corporation (1981-2003) | | 21 | | None |
| | | | | | | | | | | |
INTERESTED TRUSTEE | | | | | | | | | | |
| | | | | | | | | | | |
DEBORAH HAZELL
452 Fifth Avenue
New York
NY 10018
Age: 50 | | Trustee | | Indefinite;
2011 to present | | CEO, HSBC Global Asset Management (USA) Inc. (2011-present); President and CEO, Fisher Francis Trees & Watts (“FFTW”) (investment advisor), February 2008-June 2011; Head of Client Service, Business Development and Marketing Group, FFTW (October 1999-February 2008) | | 21 | | None |
____________________
* | | Includes the Trust, the HSBC Advisor Fund Trust and the HSBC Portfolios. |
HSBC PORTFOLIOS 65
| HSBC PORTFOLIOS |
| Board of Trustees and Officers (Unaudited) (continued) |
| | Position(s) Held | | Term of Office and | | Principal Occupation(s) |
| Name, Address, Age | | with Funds | | Length of Time Served | | During Past 5 Years |
OFFICERS | | | | | | |
| | | | | | | |
RICHARD A. FABIETTI
452 Fifth Avenue
New York, NY 10018
Age: 55 | | President | | One year;
2004 to present | | Senior Vice President, Head of Product Management, HSBC Global Asset Management (USA) Inc. (1998 - present) |
| | | | | | | |
STEPHEN SIVILLO
452 Fifth Avenue
New York, NY 10018
Age: 42 | | Vice President | | One year;
2010 to present | | Vice President of Product Administration, HSBC Global Asset Management (USA) Inc. (2010 - present); Chief Compliance Officer, Managers Funds (2009 – 2010); Director, Mutual Fund Compliance, AllianceBernstein (2007-2009) |
| | | | | | | |
TY EDWARDS*
3435 Stelzer Road
Columbus, OH 43219-3035
Age: 47 | | Treasurer | | One year;
2010 to present | | Senior Vice President, Citi Fund Services (2010–present); Director, Product Management, Columbia Management (2007-2009); Deputy Treasurer, Columbia Funds, (2006-2007) |
| | | | | | | |
JENNIFER A. ENGLISH*
100 Summer Street
Suite 1500
Boston, MA 02110
Age: 41 | | Secretary | | One year;
2008 to present | | Senior Vice President, Regulatory Administration, Citi (2005 - present) |
| | | | | | | |
FREDERICK J. SCHMIDT*
1 Rexcorp Plaza
Uniondale, NY 11556
Age: 54 | | Chief Compliance
Officer | | One year;
2004 to present | | Director and Chief Compliance Officer, CCO Services, Citi (2004 - present) |
____________________
* | | Mr. Edwards, Mr. Schmidt, and Ms. English also are officers of other investment companies of which Citi (or an affiliate) is the administrator or sub-administrator. |
66 HSBC PORTFOLIOS
Other Information (Unaudited):
Information regarding how the Funds voted proxies relating to portfolio securities during the most recent 12-month period ended June 30th is available (i) without charge, upon request, by calling 1-800-525-5757 for HSBC Bank USA and HSBC Brokerage (USA) Inc. clients and 1-800-782-8183 for all other shareholders; (ii) on the Funds’ website at www.investorfunds.us.hsbc.com; and (iii) on the Security and Exchange Commission’s (“Commission”) website at http://www.sec.gov.
The Funds file their complete schedules of portfolio holdings with the Commission for the first and third quarters of each fiscal year on Form N-Q. The Funds’ Forms N-Q are available on the Commission’s website at http://www.sec.gov. The Funds’ Forms N-Q may be reviewed and copied at the Commission’s Public Reference Room in Washington, D.C. and information on the operation of the Public Reference Room may be obtained by calling 1-800-SEC-0330. The Funds’ Schedules of Investments will be available no later than 60 days after each period end, without charge, on the Funds’ website at www.investorfunds.us.hsbc.com.
An investment in a Fund is not a deposit of HSBC Bank USA, National Association, and is not insured or guaranteed by the Federal Deposit Insurance Corporation or any other government agency.
HSBC PORTFOLIOS 67
HSBC FAMILY OF FUNDS: INVESTMENT ADVISER AND ADMINISTRATOR HSBC Global Asset Management (USA) Inc.
452 Fifth Avenue
New York, NY 10018 SUB-ADVISERS HSBC Growth Portfolio
Winslow Capital Management, LLC
4720 IDS Tower
80 South Eighth Street
Minneapolis, MN 55402 HSBC Opportunity Portfolio
Westfield Capital Management Company, L.P.
One Financial Center
Boston, MA 02111 | | SHAREHOLDER SERVICING AGENTS For HSBC Bank USA, N.A. and
HSBC Securities (USA) Inc. Clients HSBC Bank USA, N.A.
452 Fifth Avenue
New York, NY 10018
1-888-525-5757 For All Other Shareholders HSBC Funds
P.O. Box 182845
Columbus, OH 43218
1-800-782-8183 TRANSFER AGENT Citi Fund Services
3435 Stelzer Road
Columbus, OH 43219 DISTRIBUTOR Foreside Distribution Services, L.P.
690 Taylor Road, Suite 150
Gahanna, OH 43230 CUSTODIAN The Northern Trust Company
50 South LaSalle Street
Chicago, IL 60603 INDEPENDENT REGISTERED PUBLIC ACCOUNTING FIRM KPMG LLP
191 West Nationwide Blvd., Suite 500
Columbus, OH 43215 LEGAL COUNSEL Dechert LLP
1900 K Street, N.W.
Washington, D.C. 20006 |
| | |
 | | |
Investment products:
ARE NOT A
BANK DEPOSIT
OR OBLIGATION
OF THE BANK
OR ANY OF ITS
AFFILIATES | ARE NOT
FDIC
INSURED | ARE NOT
INSURED BY
ANY FEDERAL
GOVERNMENT
AGENCY |
ARE NOT GUARANTEED BY
THE BANK OR ANY OF ITS
AFFILIATES | MAY LOSE
VALUE |
Investment products are offered by HSBC Securities (USA) Inc. (HSI), member NYSE/FINRA/SIPC. HSI is an affiliate of HSBC Bank USA, N.A. Investment products: Are not a deposit or other obligation of the bank or any of its affiliates; Not FDIC insured or insured by any federal government agency of the United States; Not guaranteed by the bank or any of its affiliates; and are subject to investment risk, including possible loss of principal invested.
HSBC Global Asset Management (USA) Inc.
HSBC Funds
Annual Report
October 31, 2013
| EQUITY FUNDS | | Class A | | Class B | | Class C | | Class I |
| HSBC Growth Fund | | HOTAX | | HOTBX | | HOTCX | | HOTYX |
| HSBC Opportunity Fund | | HSOAX | | HOPBX | | HOPCX | | RESCX |

HSBC Family of Funds
Annual Report - October 31, 2013
| Glossary of Terms | | |
| President’s Message | | 4 |
| Commentary From the Investment Manager | | 5 |
| Portfolio Reviews | | 6 |
| Portfolio Composition | | 10 |
| Statements of Assets and Liabilities | | 11 |
| Statements of Operations | | 12 |
| Statements of Changes in Net Assets | | 13 |
| Financial Highlights | | 17 |
| Notes to Financial Statements | | 20 |
| Report of Independent Registered Public Accounting Firm | | 28 |
| Other Federal Income Tax Information | | 29 |
| Table of Shareholder Expenses | | 30 |
| | | |
| HSBC Portfolios | | |
| Schedules of Portfolio Investments | | |
| HSBC Growth Portfolio | | 32 |
| HSBC Opportunity Portfolio | | 34 |
| Statements of Assets and Liabilities | | 36 |
| Statements of Operations | | 37 |
| Statements of Changes in Net Assets | | 38 |
| Financial Highlights | | 39 |
| Notes to Financial Statements | | 40 |
| Report of Independent Registered Public Accounting Firm | | 45 |
| Table of Shareholder Expenses | | 46 |
| Board of Trustees and Officers | | 47 |
| Other Information | | 49 |
Barclays U.S. Aggregate Bond Index is an unmanaged index generally representative of investment-grade, USD-denominated, fixed-rate debt issues, taxable bond market, including Treasuries, government-related and corporate securities, asset-backed, mortgage-backed and commercial mortgage-backed securities, with maturities of at least one year.
Barclays U.S. Corporate High-Yield Bond Index is an unmanaged index that measures the non-investment grade, USD-denominated, fixed-rate, taxable corporate bond market. Securities are classified as high-yield if the middle rating of Moody’s, Fitch, and S&P is Ba1/BB+/BB+ or below. The index excludes emerging markets debt.
Gross Domestic Product (“GDP”) measures the market value of the goods and services produced by labor and property in the United States.
Lipper Large-Cap Growth Funds Average is an equally weighted average of mutual funds that, by portfolio practice, invest at least 75% of their equity assets in companies with market capitalizations (on a three-year weighted basis) above Lipper’s U.S. Diversified Equity large-cap floor. Large-cap growth funds typically have an above-average price-to-earnings ratio, price-to-book ratio, and three-year sales-per-share growth value, compared to the S&P 500 Index.
Lipper Mid-Cap Growth Funds Average is an equally weighted average of mutual funds that, by portfolio practice, invest at least 75% of their equity assets in companies with market capitalizations (on a three-year weighted basis) below Lipper’s U.S. Diversified Equity large-cap floor. Mid-cap growth funds typically have an above-average price-to-earnings ratio, price-to-book ratio, and three-year sales-per-share growth value, compared to the S&P MidCap 400 Index.
Morgan Stanley Capital International Europe Australasia and Far East (“MSCI EAFE”) Index is an unmanaged equity index which captures large and mid cap representation across Developed Markets countries: Australia, Austria, Belgium, Denmark, Finland, France, Germany, Greece, Hong Kong, Ireland, Israel, Italy, Japan, the Netherlands, New Zealand, Norway, Portugal, Singapore, Spain, Sweden, Switzerland and the UK (excluding the US and Canada). With 910 constituents, the index covers approximately 85% of the free float-adjusted market capitalization in each country.
Morgan Stanley Capital International Emerging Market (“MSCI EM”) Index is an unmanaged index that captures large and mid cap representation across 21 Emerging Markets (EM) countries: Brazil, Chile, China, Colombia, Czech Republic, Egypt, Hungary, India, Indonesia, Korea, Malaysia, Mexico, Morocco, Peru, Philippines, Poland, Russia, South Africa, Taiwan, Thailand and Turkey. With 818 constituents, the index covers approximately 85% of the free float-adjusted market capitalization in each country.
Russell 1000® Growth Index is an unmanaged index that measures the performance of the large-cap growth segment of the U.S. equity universe. It includes those Russell 1000 companies with higher price-to-book ratios and higher forecasted growth values.
Russell 2000® Index is an unmanaged index that measures the performance of the small-cap segment of the U.S. equity universe. The Russell 2000® Index is a subset of the Russell 3000® Index representing approximately 10% of the total market capitalization of that index. It includes approximately 2000 of the smallest securities based on a combination of their market cap and current index membership.
Russell 2500™ Growth Index is an unmanaged index that measures the performance of the small- to mid-cap growth segment of the U.S. equity universe. It includes those Russell 2500 companies with higher price-to-book ratios and higher forecasted growth values.
Standard & Poor’s 500 (“S&P 500”) Index is an unmanaged index that is widely regarded as a gauge of the U.S. equities market. This index includes 500 leading companies in leading industries of the U.S. economy. The S&P 500 Index focuses on the large-cap segment of the market, with approximately 75% coverage of U.S. equities.
Lipper is an independent mutual fund performance monitor whose results are based on total return and do not reflect a sales charge.
Securities indices assume reinvestment of all distributions and interest payments and do not take in account brokerage fees or expenses. Securities in the Funds do not match those in the indices and performance of the Funds will differ. Investors cannot invest directly in an index.
Dear Shareholder,
We are pleased to send to you the HSBC Funds annual report, covering the fiscal year ended October 31, 2013. This report contains detailed information about your Funds’ portfolio of investments and operating results. We encourage you to review it carefully.
This report includes commentary from the Funds’ portfolio managers in which they discuss the investment markets and their respective Fund’s performance. The portfolio manager commentary is accompanied by the Fund’s return for the period, listed alongside the returns of its benchmark index and peer group average for comparative purposes.
In closing, we would like to thank you for investing in the HSBC Funds. We continue to focus the HSBC Fund Family on investment solutions to assist our shareholders in reaching their financial goals. We appreciate the trust you place in us, and will continue working to earn it. Please contact us at any time with questions or concerns.
Sincerely,

Richard A. Fabietti
President
4 HSBC FAMILY OF FUNDS
| Commentary From the Investment Manager |
| HSBC Global Asset Management (USA) Inc. |
U.S. Economic Review
Economic growth picked up pace in developing economies throughout the world during the 12-month period between November 1, 2012 and October 31, 2013. Many major economies, including the United States, reported improved economic data during the period, indicating new momentum for a modest but sustained recovery. The U.S. equity markets made strong gains during the period, boosted by improvements in the labor and housing markets and healthy corporate profits. Markets continued to benefit from the Federal Reserve Board’s (the “Fed”) decision to maintain the federal funds rate—a key factor in lending rates—at a historically low target range between 0.00% and 0.25%. Economic headwinds remained, however, including relatively high unemployment in some areas, low consumer spending and reduced government spending caused by sequestration.
Investor confidence declined mid-year due in part to expectations that the Fed would begin tapering its bond purchasing program. Concerns about the impact of tapering diminished, however, when the Fed announced in September that it would delay winding down its stimulus efforts until the unemployment rate fell significantly lower. The first shutdown of the U.S. government in 17 years occurred in October. This political crisis, along with the related standoff over raising the country’s borrowing limit, was another factor weighing on investor sentiment. The uncertainty surrounding the crisis dragged on equities, although markets regained momentum once a political deal was struck that reopened the government and raised the debt ceiling. Broad U.S. stock market indices ended the period significantly above where they were positioned 12 months earlier.
Improving political circumstances in the eurozone and positive economic data helped boost stocks in developed economies across the world. The economies of both Japan and Europe transitioned out of recession. Progress was made toward alleviating the sovereign debt crisis in Europe. The European Central Bank’s aggressive efforts, including its government bond-buying program known as Outright Monetary Transactions, reassured investors. Still, many developments in Europe revealed ongoing economic weaknesses, including a controversial bailout in Cyprus, political uncertainty in Italy and high unemployment throughout the eurozone.
Economic growth in many emerging markets slowed during the period, as concerns grew about rising inflation and potential decreases in global liquidity. In addition, signs of softening in China’s economy led to a fall in commodity prices, which dragged on stocks throughout emerging markets. Central banks in both India and Brazil fought rising inflation by raising interest rates.
The recovery of the U.S. housing market remained robust. New home sales and housing starts increased, though the pace of growth slowed late in the period. Although the unemployment rate gradually edged downward, it remained well above pre-recession levels. Moreover, the number of long-term unemployed individuals, including those who dropped out of the labor market entirely, remained high. Real income grew at a modest pace, but consumer spending remained weak, consumer confidence dropped sharply and personal savings rates slowed. Economic activity in the manufacturing sector expanded during the period, though the rate of growth slowed.
U.S. Gross Domestic Product1 growth increased each quarter during the period, expanding at a rate of 0.1% during the fourth quarter of 2012 and quickening to a rate of 2.8% in the third quarter of 2013, according to preliminary estimates.
Market Review
The period began with U.S. markets retreating slightly due to the political face-off over the “fiscal cliff” and concerns about ongoing turmoil related to eurozone sovereign debt.
Equities then regained momentum in the first quarter of 2013 and began a steady rally that persisted through the duration of the period with only a few brief interruptions. The strong performance of equities was undeterred by uncertainty about government policy and concerns that the onset of automatic budget cuts—known as sequestration—would undermine economic growth. A political compromise that avoided the direst consequences of the fiscal cliff, along with improvement in the housing market, helped buoy investor confidence and fuel gains in the equity markets.
During the middle of the period equity prices fell as investors anticipated an imminent decrease in central bank liquidity. Stocks rebounded after the Fed delayed tapering its bond-purchasing program, with the S&P 500 Index1 hitting a then-record high following the announcement. Equities ended the period in a rally that was spurred by the political deal that partially resolved the government shutdown and a second standoff over the debt ceiling.
Small- and mid-cap stocks outperformed large-cap stocks during the period, and emerging markets generally underperformed developed economies. The Russell 2000® Index1 of small-company stocks returned 36.28% and the MSCI Emerging Market Index1 of emerging market stocks returned 6.90%.
Stocks in developed economies rose. Japanese equities performed well due to optimism regarding its central bank’s ambitious monetary easing schedule, which aimed to double the size of the monetary base over the next two years. International stocks made strong gains, slightly outperforming U.S. markets. The S&P 500 Index of large-company U.S. stocks returned 27.18% for the 12 months through October 2013. That compared to a 27.40% return for the MSCI EAFE Index1 of international stocks in developed markets.
Rising interest rates, widening credit spreads and uncertainty about government policy resulted in weak performance in the U.S. fixed-income market during the period. Yields on U.S. Treasury bonds increased during the period, sending prices lower. Investment-grade corporate bonds also declined. Investors sought the more attractive yields offered by high-yield corporate bonds and high-yield municipal bonds, which were among the best-performing fixed-income sectors during the period. The Barclays U.S. Aggregate Bond Index1, which tracks the broad investment-grade fixed-income market, returned -1.08% for the 12 months through October, while the Barclays U.S. Corporate High-Yield Bond Index1 returned 8.87%. Fixed-income markets in Europe generated modest returns, while fixed-income in emerging markets ended the period significantly lower, despite a modest rebound in the final months of the period.
1 For additional information, please refer to the Glossary of Terms.
HSBC FAMILY OF FUNDS 5
| Portfolio Reviews (Unaudited) |
HSBC Growth Fund
(Class A Shares, Class B Shares, Class C Shares and Class I Shares)
by Clark J. Winslow, CEO/Portfolio Manager
Justin H. Kelly, CFA, CIO/Portfolio Manager
Patrick M. Burton, Managing Director/Portfolio Manager
Winslow Capital Management, LLC
The HSBC Growth Fund (the “Fund”) seeks long-term growth of capital. Under normal market conditions, the Fund invests primarily in U.S. and foreign equity securities of high-quality companies with market capitalization generally in excess of $2 billion, which the subadviser believes have the potential to generate superior levels of long-term profitability and growth. The Fund utilizes a two-tier structure, commonly known as a “master-feeder” structure, in which the Fund invests all of its investable assets in the HSBC Growth Portfolio (the “Portfolio”). The Portfolio employs Winslow Capital Management, LLC as its subadviser.
Investment Concerns
Equity securities (stocks) are more volatile and carry more risk than other forms of investments, including investments in high-grade fixed income securities.
The growth investment style may fall out of favor in the marketplace and result in significant declines in the value of the Portfolio’s securities. Securities of companies considered to be growth investments may have rapid price swings in the event of earnings disappointments or during periods of market, political, regulatory and economic uncertainty.
For a complete description of these and other risks associated with investment in a mutual fund, please refer to the Fund’s prospectus.
Market Commentary
The Fund returned 32.17%* (without sales charge) for the Class A Shares and 32.49%* for the Class I Shares for the year ended October 31, 2013. That compared to a 28.30% total return for the Russell 1000® Growth Index1, the Fund’s primary performance benchmark, and a 29.24% total return for the Lipper Large-Cap Growth Funds Average1.
Portfolio Performance
Stocks performed well during the period as investors gained confidence that the U.S. economy was not headed back into recession and that the risk of sovereign default in Portugal, Spain, and Italy was receding. As concerns about systematic risk waned, company fundamentals returned as a main driver of equity prices. Stable, dividend-paying companies that had performed well in the riskier environment appeared relatively overvalued to the Fund’s portfolio managers later in the period. As a result, investors began to favor shares of smaller, growth-oriented companies, which outperformed their larger counterparts during the final four months of the period.
In this environment, the Fund outperformed its Russell benchmark primarily due to stock selection in the consumer discretionary and information technology sectors. For example, an investment in an online travel company that posted strong earnings contributed to the gains in the portfolio’s consumer discretionary holdings. Similarly, a cloud-based relationship company that reported strong earnings boosted performance among the portfolio’s information technology holdings.†
Moreover, the Fund benefited from moves made during the period to increase holdings of smaller, growth-oriented companies in anticipation of declining systematic risk. Additionally, a long-standing decision to underweight consumer staples boosted the Fund’s performance when the sector suffered as investors shifted away from defensive investments.†
However, sector-weighting decisions detracted from the Fund’s performance. For instance, an overweight position in the financial sector hurt the Fund when that sector underperformed. Stock selection in the financial and industrial sectors also detracted from the Fund’s returns. For example, legal risks caused an investment in a financial content and analytics provider to underperform, while an investment in a shipping and delivery company underperformed due to slower than anticipated overnight business. Both stocks were sold during the period.†
| * | | The recent appreciation in the stock market has helped to produce short-term returns that are not typical and may not continue in the future. Because of ongoing market volatility, fund performance may be subject to substantial short-term changes. |
| † | | Portfolio composition is subject to change. |
| 1 | | For additional information, please refer to the Glossary of Terms. |
Past performance does not guarantee future results. The performance data quoted represents past performance and current returns may be lower or higher. Total return figures include change in share price, reinvestment of dividends and capital gains and do not reflect taxes that a shareholder would pay on Fund distributions or on the redemption of Fund shares. Investment return and principal value will fluctuate so that an investor’s shares, when redeemed may be worth more or less than the original cost. To obtain performance information current to the most recent month end, please call 1-800-782-8183.
6 HSBC FAMILY OF FUNDS
| Portfolio Reviews (Unaudited) |
| HSBC Growth Fund | |
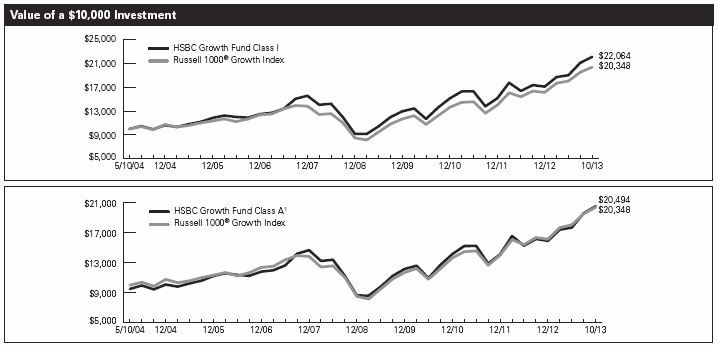
The charts above represent a historical since inception performance comparison of a hypothetical $10,000 investment in the indicated share class versus a similar investment in the Fund’s benchmark and represents the reinvestment of dividends and capital gains in the Fund.
| | | | Average Annual | | Expense |
| Fund Performance | | | | Total Return (%) | | Ratio (%)6 |
| | | | | | | | | Since | | | | |
| As of October 31, 2013 | | Inception Date | | 1 Year | | 5 Year | | Inception | | Gross | | Net |
| HSBC Growth Fund Class A1 | | 5/7/045 | | 25.64 | 9 | | 16.06 | | 7.87 | | | 1.40 | | 1.20 |
| HSBC Growth Fund Class B2 | | 5/7/045 | | 27.16 | 9 | | 16.36 | | 7.93 | | | 2.15 | | 1.95 |
| HSBC Growth Fund Class C3 | | 5/7/045 | | 30.15 | 9 | | 16.36 | | 7.64 | | | 2.15 | | 1.95 |
| HSBC Growth Fund Class I | | 5/7/045 | | 32.49 | 9 | | 17.55 | | 8.71 | | | 1.15 | | 0.95 |
| Russell 1000® Growth Index4 | | — | | 28.30 | | | 17.51 | | 7.79 | 7 | | N/A | | N/A |
| Lipper Large-Cap Growth Funds Average4 | | — | | 29.24 | | | 15.72 | | 7.05 | 8 | | N/A | | N/A |
Past performance does not guarantee future results. The performance data quoted represents past performance and current returns may be lower or higher. Total return figures include change in share price, reinvestment of dividends and capital gains and do not reflect the taxes that a shareholder would pay on Fund distributions or on the redemption of Fund shares. Investment return and principal value will fluctuate so that an investor’s shares, when redeemed may be worth more or less than the original cost. To obtain performance information current to the most recent month end, please call 1-800-782-8183.
The performance above reflects any fee waivers that have been in effect during the applicable periods, as well as any expense reimbursements that have periodically been made. Absent such waivers and reimbursements, returns would have been lower. Currently, contractual fee waivers are in effect for the Fund through March 1, 2014.
Certain returns shown include monies received by the Portfolio, in which the Fund invests, in respect of one-time class action settlements and a one-time reimbursement from HSBC Global Asset Management (USA) Inc. (the “Adviser”) to the Fund related to past marketing arrangements. As a result, the Fund’s total returns for those periods were higher than they would have been had the Portfolio and the Fund not received the payments. Investment in initial public offerings during the current fiscal year ended October 31, 2013 have benefited the Fund’s overall performance by approximately 0.06%. This effect on performance is not typical and may not continue in the future.
| 1 | | Reflects the maximum sales charge of 5.00%. |
| 2 | | Reflects the applicable contingent deferred sales charge, maximum of 4.00%. |
| 3 | | Reflects the applicable contingent deferred sales charge, maximum of 1.00%. |
| 4 | | For additional information, please refer to the Glossary of Terms. |
| 5 | | The HSBC Growth Fund was initially offered for purchase effective May 7, 2004; however, no shareholder activity occurred until May 10, 2004. |
| 6 | | Reflects the expense ratios as reported in the prospectus dated February 28, 2013. The Adviser has entered into a contractual expense limitation agreement with the Fund under which it will limit total expenses of the Fund (excluding interest, taxes, brokerage commissions, extraordinary expenses and estimated indirect expenses attributable to the Fund’s investments in investment companies) to an annual rate of 1.20%, 1.95%, 1.95% and 0.95% for Class A Shares, Class B Shares, Class C Shares and Class I Shares, respectively. The expense limitation shall be in effect until March 1, 2014. Additional information pertaining to the October 31, 2013 expense ratios can be found in the financial highlights. |
| 7 | | Return for the period May 10, 2004 to October 31, 2013. |
| 8 | | Return for the period April 30, 2004 to October 31, 2013. |
| 9 | | The recent appreciation in the stock market has helped to produce short-term returns that are not typical and may not continue in the future. Because of ongoing market volatility, fund performance may be subject to substantial short-term changes. |
The Fund’s performance is measured against the Russell 1000® Growth Index, an unmanaged index that measures the performance of the large-cap growth segment of the U.S. equity universe. It includes those Russell 1000 companies with higher price-to-book ratios and higher forecasted growth values. The performance of the index does not reflect the deduction of expenses associated with a mutual fund, such as investment management and fund accounting fees. The Fund’s performance reflects the deduction of fees for these value-added services. Investors cannot invest directly in an index.
HSBC FAMILY OF FUNDS 7
| Portfolio Reviews (Unaudited) |
HSBC Opportunity Fund (Advisor)
(Class I Shares)
HSBC Opportunity Fund
(Class A Shares, Class B Shares and Class C Shares)
by William A. Muggia, Committee Lead/Portfolio Manager
Ethan J. Myers, CFA, Portfolio Manager
John M. Montgomery, Portfolio Manager
Hamlen Thompson, Portfolio Manager
Bruce N. Jacobs, CFA, Portfolio Manager
Westfield Capital Management Company, L.P.
The HSBC Opportunity Fund and HSBC Opportunity Fund (Advisor) (collectively the “Fund”) seek long-term growth of capital by investing in equity securities of small- and mid-cap companies. Small- and mid-cap companies generally are defined as those that have market capitalizations within the range of market capitalizations represented in the Russell 2500™ Growth Index. The Fund may also invest in equity securities of larger, more established companies and may invest up to 20% of its assets in securities of foreign companies. The Fund employs a two-tier structure, commonly referred to as a “master-feeder” structure, in which the Fund invests all of its investable assets in the HSBC Opportunity Portfolio (the “Portfolio”). The Portfolio employs Westfield Capital Management Company, L.P. as its subadviser.
Investment Concerns
Equity securities (stocks) are more volatile and carry more risk than other forms of investments, including investments in high-grade fixed income securities.
Small- to mid-capitalization funds typically carry additional risks since smaller companies generally have a higher risk of failure, and historically, their stocks have experienced a greater degree of market volatility than stocks on average.
The growth investment style may fall out of favor in the marketplace and result in significant declines in the value of the Portfolio’s securities. Securities of companies considered to be growth investments may have rapid price swings in the event of earnings disappointments or during periods of market, political, regulatory and economic uncertainty.
There are risks associated with investing in foreign companies, such as erratic market conditions, economic and political instability and fluctuations in currency and exchange rates.
For a complete description of these and other risks associated with investment in a mutual fund, please refer to the Fund’s prospectus.
Market Commentary
For the year ended October 31, 2013, the Class I Shares of the HSBC Opportunity Fund (Advisor) produced a 34.70%* total return, and the Class A Shares of the Fund produced a 34.02%* total return (without sales charge). The Russell 2500™ Growth Index1, the Fund’s primary performance benchmark, and the Lipper Mid-Cap Growth Funds Average1 returned 37.60% and 32.81%, respectively.
Portfolio Performance
U.S. equities continued to post strong returns for the period as investors brushed off concerns about interest rate volatility and worries about a potential U.S. government shutdown. The continuing stimulus efforts by the Federal Reserve, as well as signs of a gradually improving employment picture, helped boost investor confidence during the period. In this environment, small-cap stocks outperformed their large-cap counterparts. The information technology and financial sectors benefited the most from this growing confidence among investors, and were two of the strongest contributors to the Fund’s absolute returns.
The Fund lagged its benchmark for the period. Stock selection in the Fund’s energy holdings was a major detractor. In particular, the Fund was hurt by holdings of an oil field services company that underperformed when it missed analysts’ earnings expectations. The Fund’s sub-sector weighting in consumer discretionary further detracted from relative performance. An overweight position in the apparel retail sub-industry dragged on relative returns, as retailers were hurt by shifting consumer confidence during the period. The Fund was also hurt by underweight positions in Internet retailers and automobile manufacturers, which performed relatively well during the period.†
However, strong stock selection in the information technology and materials sectors helped offset a portion of the Fund’s underperformance. Shares of a payment processor that consistently exceeded earnings expectations provided the biggest boost to the Fund’s relative performance. In the materials sector, stock selection across multiple subsectors—namely paper packaging, commodity chemicals, and fertilizers and agricultural chemicals—contributed to the Fund’s relative performance. In particular, holdings of a cardboard packaging manufacturer contributed positively as that company executed a strategic acquisition near the end of the period, which helped boost its earnings.†
Furthermore, holdings of a specialty retail store and consumer electronics retailer helped offset some of the negative effects of sector weighting in the consumer discretionary sector. An underweight position in the gold sub-industry helped to boost the Fund’s relative performance, since gold prices fell, as investors grew more confident in the sustainability of the economic recovery.†
| * | | The recent appreciation in the stock market has helped to produce short-term returns that are not typical and may not continue in the future. Because of ongoing market volatility, fund performance may be subject to substantial short-term changes. |
| † | | Portfolio composition is subject to change. |
| 1 | | For additional information, please refer to the Glossary of Terms. |
Past performance does not guarantee future results. The performance data quoted represents past performance and current returns may be lower or higher. Total return figures include change in share price, reinvestment of dividends and capital gains and do not reflect taxes that a shareholder would pay on Fund distributions or on the redemption of Fund shares. Investment return and principal value will fluctuate so that an investor’s shares, when redeemed may be worth more or less than the original cost. To obtain performance information current to the most recent month end, please call 1-800-782-8183.
8 HSBC FAMILY OF FUNDS
| Portfolio Reviews (Unaudited) |
HSBC Opportunity Fund |

The charts above represent a historical 10-year performance comparison of a hypothetical $10,000 investment in the indicated share class versus a similar investment in the Fund’s benchmark and represents the reinvestment of dividends and capital gains in the Fund.
| | | | | | Average Annual | | | | | | Expense |
| Fund Performance | | | | | | Total Return (%) | | | | | | Ratio (%)5 |
| As of October 31, 2013 | | Inception Date | | 1 Year | | 5 Year | | 10 Year | | Gross | | Net |
| HSBC Opportunity Fund Class A1 | | 9/23/96 | | 27.356 | | 18.54 | | | 10.75 | | | 2.20 | | 1.65 |
| HSBC Opportunity Fund Class B2 | | 1/6/98 | | 29.106 | | 18.84 | | | 10.82 | | | 2.95 | | 2.40 |
| HSBC Opportunity Fund Class C3 | | 11/4/98 | | 32.156 | | 18.86 | | | 10.51 | | | 2.95 | | 2.40 |
| HSBC Opportunity Fund Class I† | | 9/3/96 | | 34.706 | | 20.36 | | | 11.79 | | | 1.08 | | 1.08 |
| Russell 2500™ Growth Index4 | | — | | 37.60 | | 20.87 | | | 9.85 | | | N/A | | N/A |
| Lipper Mid-Cap Growth Funds Average4 | | — | | 32.81 | | 18.15 | | | 8.69 | | | N/A | | N/A |
Past performance does not guarantee future results. The performance data quoted represents past performance and current returns may be lower or higher. Total return figures include change in share price, reinvestment of dividends and capital gains and do not reflect the taxes that a shareholder would pay on Fund distributions or on the redemption of Fund shares. Investment return and principal value will fluctuate so that an investor’s shares, when redeemed may be worth more or less than the original cost. To obtain performance information current to the most recent month end, please call 1-800-782-8183.
The performance above reflects any fee waivers that have been in effect during the applicable periods, as well as any expense reimbursements that have periodically been made. Absent such waivers and reimbursements, returns would have been lower. Currently, contractual fee waivers are in effect for the Fund through March 1, 2014 for Class A Shares, Class B Shares and Class C Shares.
Certain returns shown include monies received by the Portfolio, in which the Fund invests, in respect of one-time class action settlements and a one-time reimbursement from HSBC Global Asset Management (USA) Inc. (the “Adviser”) to the Fund related to past marketing arrangements. As a result, the Fund’s total returns for those periods were higher than they would have been had the Portfolio and the Fund not received the payments.
| † | | The Class I Shares are issued by a series of HSBC Advisor Funds Trust, also named the HSBC Opportunity Fund. |
| 1 | | Reflects the maximum sales charge of 5.00%. |
| 2 | | Reflects the applicable contingent deferred sales charge, maximum of 4.00%. |
| 3 | | Reflects the applicable contingent deferred sales charge, maximum of 1.00%. |
| 4 | | For additional information, please refer to the Glossary of Terms. |
| 5 | | Reflects the expense ratios as reported in the prospectus dated February 28, 2013. The Adviser has entered into a contractual expense limitation agreement with the Fund under which it will limit total expenses of the Fund (excluding interest, taxes, brokerage commissions, extraordinary expenses and estimated indirect expenses attributable to the Fund’s investments in investment companies other than the Portfolio) to an annual rate of 1.65%, 2.40%, and 2.40% for Class A Shares, Class B Shares, and Class C Shares, respectively. The expense limitation shall be in effect until March 1, 2014. Additional information pertaining to the October 31, 2013 expense ratios can be found in the financial highlights. |
| 6 | | The recent appreciation in the stock market has helped to produce short-term returns that are not typical and may not continue in the future. Because of ongoing market volatility, fund performance may be subject to substantial short-term changes. |
The Fund’s performance is measured against the Russell 2500™ Growth Index, an unmanaged index that measures the performance of the small- to mid-cap growth segment of the U.S. equity universe. It includes those Russell 2500 companies with higher price-to-book ratios and higher forecasted growth values. The performance for the index does not reflect the deduction of expenses associated with a mutual fund, such as investment management and fund accounting fees. The Fund’s performance reflects the deduction of fees for these value-added services. Investors cannot invest directly in an index.
HSBC FAMILY OF FUNDS 9
| Portfolio Reviews |
| Portfolio Composition* |
| October 31, 2013 (Unaudited) |
| HSBC Growth Portfolio | | |
| Percentage of |
| Investment Allocation | Investments at Value (%) |
| Internet Software & Services | 9.4 | |
| Biotechnology | 9.1 | |
| Internet & Catalog Retail | 6.8 | |
| IT Services | 6.4 | |
| Specialty Retail | 5.9 | |
| Media | 5.0 | |
| Chemicals | 4.1 | |
| Oil, Gas & Consumable Fuels | 4.1 | |
| Road & Rail | 4.1 | |
| Hotels, Restaurants & Leisure | 3.8 | |
| Capital Markets | 3.7 | |
| Software | 3.4 | |
| Aerospace & Defense | 3.2 | |
| Textiles, Apparel & Luxury Goods | 3.2 | |
| Computers & Peripherals | 3.1 | |
| Semiconductors & Semiconductor | | |
| Equipment | 3.1 | |
| Machinery | 2.7 | |
| Food & Staples Retailing | 2.4 | |
| Pharmaceuticals | 2.1 | |
| Health Care Technology | 1.7 | |
| Communications Equipment | 1.5 | |
| Real Estate Investment Trusts (REITs) | 1.5 | |
| Energy Equipment & Services | 1.5 | |
| Wireless Telecommunication Services | 1.4 | |
| Diversified Financial Services | 1.2 | |
| Auto Components | 1.2 | |
| Personal Products | 1.1 | |
| Trading Companies & Distributors | 1.0 | |
| Health Care Providers & Services | 0.9 | |
| Airlines | 0.7 | |
| Investment Companies | 0.7 | |
| 100.0 | |
| HSBC Opportunity Portfolio | | |
| Percentage of |
| Investment Allocation | Investments at Value (%) |
| Specialty Retail | 8.1 | |
| IT Services | 6.8 | |
| Chemicals | 6.2 | |
| Household Durables | 5.5 | |
| Oil, Gas & Consumable Fuels | 5.1 | |
| Biotechnology | 5.0 | |
| Health Care Equipment & Supplies | 3.7 | |
| Life Sciences Tools & Services | 3.4 | |
| Trading Companies & Distributors | 3.3 | |
| Software | 3.2 | |
| Aerospace & Defense | 3.1 | |
| Semiconductors & Semiconductor | | |
| Equipment | 3.0 | |
| Investment Companies | 2.9 | |
| Commercial Banks | 2.8 | |
| Containers & Packaging | 2.7 | |
| Pharmaceuticals | 2.7 | |
| Electrical Equipment | 2.7 | |
| Internet Software & Services | 2.6 | |
| Machinery | 2.1 | |
| Professional Services | 2.1 | |
| Insurance | 2.0 | |
| Energy Equipment & Services | 1.9 | |
| Health Care Providers & Services | 1.9 | |
| Hotels, Restaurants & Leisure | 1.9 | |
| Media | 1.6 | |
| Commercial Services & Supplies | 1.6 | |
| Capital Markets | 1.6 | |
| Diversified Consumer Services | 1.5 | |
| Auto Components | 1.5 | |
| Road & Rail | 1.3 | |
| Distributors | 1.1 | |
| Real Estate Investment Trusts (REITs) | 1.1 | |
| Real Estate Management & | | |
| Development | 1.1 | |
| Health Care Technology | 0.8 | |
| Construction Materials | 0.8 | |
| Communications Equipment | 0.7 | |
| Electronic Equipment, | | |
| Instruments & Components | 0.6 | |
| 100.0 | |
____________________
| * | | Portfolio composition is subject to change. |
10 HSBC FAMILY OF FUNDS
HSBC FAMILY OF FUNDS
Statements of Assets and Liabilities — as of October 31, 2013
| | | | | | | | | | | | | | Opportunity |
| | Growth | | Opportunity | | Fund |
| | Fund | | Fund | | (Advisor) |
| Assets: | | | | | | | | | | | | | | | | | | |
| Investments in Affiliated Portfolios | | | $ | 82,541,055 | | | | | $ | 15,489,119 | | | | | $ | 208,208,427 | | |
| Receivable for capital shares issued | | | | 70,519 | | | | | | 4,512 | | | | | | 204,270 | | |
| Receivable from Investment Adviser | | | | — | | | | | | 5,872 | | | | | | — | | |
| Prepaid expenses | | | | 13,198 | | | | | | 5,280 | | | | | | 6,891 | | |
| Total Assets | | | | 82,624,772 | | | | | | 15,504,783 | | | | | | 208,419,588 | | |
| | | | | | | | | | | | | | | | | | | |
| Liabilities: | | | | | | | | | | | | | | | | | | |
| Payable for capital shares redeemed | | | | 81,215 | | | | | | 25,608 | | | | | | 46,940 | | |
| Accrued expenses and other liabilities: | | | | | | | | | | | | | | | | | | |
| Investment Management | | | | 22,883 | | | | | | — | | | | | | — | | |
| Administration | | | | 1,730 | | | | | | 320 | | | | | | 4,306 | | |
| Distribution | | | | 700 | | | | | | 760 | | | | | | — | | |
| Shareholder Servicing | | | | 2,985 | | | | | | 6,919 | | | | | | — | | |
| Compliance Services | | | | 8 | | | | | | 1 | | | | | | 24 | | |
| Accounting | | | | — | | | | | | — | | | | | | 1 | | |
| Transfer Agent | | | | 15,719 | | | | | | 8,174 | | | | | | 12,353 | | |
| Trustee | | | | 92 | | | | | | 21 | | | | | | 322 | | |
| Other | | | | 19,910 | | | | | | 13,124 | | | | | | 34,504 | | |
| Total Liabilities | | | | 145,242 | | | | | | 54,927 | | | | | | 98,450 | | |
| Net Assets | | | $ | 82,479,530 | | | | | $ | 15,449,856 | | | | | $ | 208,321,138 | | |
| | | | | | | | | | | | | | | | | | | |
| Composition of Net Assets: | | | | | | | | | | | | | | | | | | |
| Capital | | | | 47,816,585 | | | | | | 10,080,559 | | | | | | 139,710,690 | | |
| Accumulated net investment income (loss) | | | | (99,109 | ) | | | | | 2,125 | | | | | | 152,233 | | |
| Accumulated net realized gains (losses) from investments | | | | 13,033,403 | | | | | | 1,631,777 | | | | | | 21,498,432 | | |
| Unrealized appreciation/depreciation on investments | | | | 21,728,651 | | | | | | 3,735,395 | | | | | | 46,959,783 | | |
| Net Assets | | | $ | 82,479,530 | | | | | $ | 15,449,856 | | | | | $ | 208,321,138 | | |
| | | | | | | | | | | | | | | | | | | |
| Net Assets: | | | | | | | | | | | | | | | | | | |
| Class A Shares | | | $ | 12,760,503 | | | | | $ | 14,258,647 | | | | | $ | — | | |
| Class B Shares | | | | 492,917 | | | | | | 480,139 | | | | | | — | | |
| Class C Shares | | | | 602,299 | | | | | | 711,070 | | | | | | — | | |
| Class I Shares | | | | 68,623,811 | | | | | | — | | | | | | 208,321,138 | | |
| | | $ | 82,479,530 | | | | | $ | 15,449,856 | | | | | $ | 208,321,138 | | |
| | | | | | | | | | | | | | | | | | | |
| Shares Outstanding | | | | | | | | | | | | | | | | | | |
| ($0.001 par value, unlimited number of shares authorized): | | | | | | | | | | | | | | | | | | |
| Class A Shares | | | | 587,363 | | | | | | 1,115,750 | | | | | | — | | |
| Class B Shares | | | | 25,459 | | | | | | 48,629 | | | | | | — | | |
| Class C Shares | | | | 30,900 | | | | | | 70,141 | | | | | | — | | |
| Class I Shares | | | | 3,099,018 | | | | | | — | | | | | | 12,062,607 | | |
| | | | | | | | | | | | | | | | | | | |
| Net Asset Value, Offering Price and Redemption Price per share: | | | | | | | | | | | | | | | | | | |
| Class A Shares | | | $ | 21.73 | | | | | $ | 12.78 | | | | | $ | — | | |
| Class B Shares(a) | | | $ | 19.36 | | | | | $ | 9.87 | | | | | $ | — | | |
| Class C Shares(a) | | | $ | 19.49 | | | | | $ | 10.14 | | | | | $ | — | | |
| Class I Shares | | | $ | 22.14 | | | | | $ | — | | | | | $ | 17.27 | | |
| Maximum Sales Charge - Class A Shares | | | | 5.00 | % | | | | | 5.00 | % | | | | | — | % | |
| Maximum Offering Price per share | | | | | | | | | | | | | | | | | | |
| (Net Asset Value/(100%-maximum sales charge)) - Class A Shares | | | $ | 22.87 | | | | | $ | 13.45 | | | | | $ | — | | |
____________________
| (a) | | Redemption Price per share varies by length of time shares are held. |
| See notes to financial statements. | HSBC FAMILY OF FUNDS | 11 |
HSBC FAMILY OF FUNDS
Statements of Operations — For the year ended October 31, 2013
| | | | | | | | | | | | | | Opportunity |
| | Growth | | Opportunity | | Fund |
| | Fund | | Fund | | (Advisor) |
| Investment Income: | | | | | | | | | | | | | | | | | | |
| Investment Income from Affiliated Portfolios | | | $ | 877,071 | | | | | $ | 138,747 | | | | | $ | 1,795,937 | | |
| Expenses from Affiliated Portfolios | | | | (525,304 | ) | | | | | (115,917 | ) | | | | | (1,500,945 | ) | |
| Total Investment Income | | | | 351,767 | | | | | | 22,830 | | | | | | 294,992 | | |
| | | | | | | | | | | | | | | | | | | |
| Expenses: | | | | | | | | | | | | | | | | | | |
| Administration: | | | | | | | | | | | | | | | | | | |
| Class A Shares | | | | 2,917 | | | | | | 2,944 | | | | | | — | | |
| Class B Shares | | | | 130 | | | | | | 119 | | | | | | — | | |
| Class C Shares | | | | 137 | | | | | | 182 | | | | | | — | | |
| Class I Shares | | | | 15,792 | | | | | | — | | | | | | 42,091 | | |
| Distribution: | | | | | | | | | | | | | | | | | | |
| Class B Shares | | | | 3,967 | | | | | | 3,603 | | | | | | — | | |
| Class C Shares | | | | 4,117 | | | | | | 5,447 | | | | | | — | | |
| Shareholder Servicing: | | | | | | | | | | | | | | | | | | |
| Class A Shares | | | | 29,132 | | | | | | 28,974 | | | | | | — | | |
| Class B Shares | | | | 1,323 | | | | | | 1,202 | | | | | | — | | |
| Class C Shares | | | | 1,372 | | | | | | 1,808 | | | | | | — | | |
| Accounting | | | | 23,949 | | | | | | 18,950 | | | | | | 9,001 | | |
| Audit | | | | 16,973 | | | | | | 17,915 | | | | | | 17,998 | | |
| Compliance Services | | | | 649 | | | | | | 109 | | | | | | 1,426 | | |
| Printing | | | | 77 | | | | | | 2,382 | | | | | | 6,617 | | |
| Transfer Agent | | | | 96,259 | | | | | | 50,527 | | | | | | 64,598 | | |
| Trustee | | | | 1,958 | | | | | | 334 | | | | | | 4,273 | | |
| Registration fees | | | | 35,000 | | | | | | 15,867 | | | | | | 14,920 | | |
| Other | | | | 11,412 | | | | | | 4,676 | | | | | | 20,266 | | |
| Total expenses before fee reductions | | | | 245,164 | | | | | | 155,039 | | | | | | 181,190 | | |
| Fees voluntarily reduced by Investment Adviser | | | | — | | | | | | (13,058 | ) | | | | | — | | |
| Fees contractually reduced by Investment Adviser | | | | (5,267 | ) | | | | | (46,445 | ) | | | | | — | | |
| Net Expenses | | | | 239,897 | | | | | | 95,536 | | | | | | 181,190 | | |
| | | | | | | | | | | | | | | | | | | |
| Net Investment Income (Loss) | | | | 111,870 | | | | | | (72,706 | ) | | | | | 113,802 | | |
| | | | | | | | | | | | | | | | | | | |
| Net Realized/Unrealized Gains (Losses) from Investments: (a) | | | | | | | | | | | | | | | | | | |
| Net realized gains (losses) from investment securities | | | | 9,661,220 | | | | | | 1,860,103 | | | | | | 22,059,925 | | |
| Change in unrealized appreciation/depreciation on investments | | | | 11,851,661 | | | | | | 2,027,660 | | | | | | 28,194,578 | | |
| | | | | | | | | | | | | | | | | | | |
| Net realized/unrealized gains (losses) from investments | | | | 21,512,881 | | | | | | 3,887,763 | | | | | | 50,254,503 | | |
| Change In Net Assets Resulting From Operations | | | $ | 21,624,751 | | | | | $ | 3,815,057 | | | | | $ | 50,368,305 | | |
____________________
| (a) | | Represents amounts allocated from the respective Affiliated Portfolios. |
| 12 | HSBC FAMILY OF FUNDS | See notes to financial statements. |
HSBC FAMILY OF FUNDS
Statements of Changes in Net Assets
| | Growth Fund | | Opportunity Fund |
| | For the | For the | | For the | For the |
| | year ended | year ended | | year ended | year ended |
| | October 31, 2013 | October 31, 2012 | | October 31, 2013 | October 31, 2012 |
| Investment Activities: | | | | | | | | | | | | | | | | | | | | | | |
| Operations: | | | | | | | | | | | | | | | | | | | | | | |
| Net investment income (loss) | | | $ | 111,870 | | | | $ | (133,004 | ) | | | | $ | (72,706 | ) | | | $ | (67,015 | ) | |
| Net realized gains (losses) from investments | | | | 9,661,220 | | | | | 8,364,394 | | | | | | 1,860,103 | | | | | 786,559 | | |
| Change in unrealized appreciation/depreciation | | | | | | | | | | | | | | | | | | | | | | |
| on investments | | | | 11,851,661 | | | | | (3,332,031 | ) | | | | | 2,027,660 | | | | | 610,433 | | |
| Change in net assets resulting from operations | | | | 21,624,751 | | | | | 4,899,359 | | | | | | 3,815,057 | | | | | 1,329,977 | | |
| | | | | | | | | | | | | | | | | | | | | | | |
| Dividends: | | | | | | | | | | | | | | | | | | | | | | |
| Net investment income: | | | | | | | | | | | | | | | | | | | | | | |
| Class I Shares | | | | (77,975 | ) | | | | — | | | | | | — | | | | | — | | |
| Net realized gains: | | | | | | | | | | | | | | | | | | | | | | |
| Class A Shares | | | | (789,480 | ) | | | | — | | | | | | (613,652 | ) | | | | (1,598,939 | ) | |
| Class B Shares | | | | (47,389 | ) | | | | — | | | | | | (37,922 | ) | | | | (93,318 | ) | |
| Class C Shares | | | | (38,688 | ) | | | | — | | | | | | (41,509 | ) | | | | (76,609 | ) | |
| Class I Shares | | | | (4,180,730 | ) | | | | — | | | | | | — | | | | | — | | |
| Change in net assets resulting from shareholder dividends | | | | (5,134,262 | ) | | | | — | | | | | | (693,083 | ) | | | | (1,768,866 | ) | |
| Change in net assets resulting from capital transactions | | | | (4,356,680 | ) | | | | (8,338,642 | ) | | | | | 1,079,236 | | | | | (429,918 | ) | |
| Change in net assets | | | | 12,133,809 | | | | | (3,439,283 | ) | | | | | 4,201,210 | | | | | (868,807 | ) | |
| | | | | | | | | | | | | | | | | | | | | | | |
| Net Assets: | | | | | | | | | | | | | | | | | | | | | | |
| Beginning of period | | | | 70,345,721 | | | | | 73,785,004 | | | | | | 11,248,646 | | | | | 12,117,453 | | |
| End of period | | | $ | 82,479,530 | | | | $ | 70,345,721 | | | | | $ | 15,449,856 | | | | $ | 11,248,646 | | |
| Accumulated net investment income (loss) | | | $ | (99,109 | ) | | | $ | (133,004 | ) | | | | $ | 2,125 | | | | $ | (49,006 | ) | |
| See notes to financial statements. | HSBC FAMILY OF FUNDS | 13 |
HSBC FAMILY OF FUNDS
Statements of Changes in Net Assets (continued)
| | Growth Fund | | Opportunity Fund |
| | For the | For the | | For the | For the |
| | year ended | year ended | | year ended | year ended |
| | October 31, 2013 | October 31, 2012 | | October 31, 2013 | October 31, 2012 |
| CAPITAL TRANSACTIONS: | | | | | | | | | | | | | | | | | | | | | | |
| Class A Shares: | | | | | | | | | | | | | | | | | | | | | | |
| Proceeds from shares issued | | | $ | 513,267 | | | | $ | 871,476 | | | | | $ | 3,386,291 | | | | $ | 772,149 | | |
| Dividends reinvested | | | | 760,894 | | | | | — | | | | | | 601,275 | | | | | 1,562,653 | | |
| Value of shares redeemed | | | | (2,349,534 | ) | | | | (5,909,138 | ) | | | | | (2,790,702 | ) | | | | (2,900,653 | ) | |
| Class A Shares capital transactions | | | | (1,075,373 | ) | | | | (5,037,662 | ) | | | | | 1,196,864 | | | | | (565,851 | ) | |
| | | | | | | | | | | | | | | | | | | | | | | |
| Class B Shares: | | | | | | | | | | | | | | | | | | | | | | |
| Proceeds from shares issued | | | | 18,851 | | | | | 111,305 | | | | | | 22,345 | | | | | 69,230 | | |
| Dividends reinvested | | | | 47,204 | | | | | — | | | | | | 37,922 | | | | | 93,292 | | |
| Value of shares redeemed | | | | (290,302 | ) | | | | (516,256 | ) | | | | | (182,066 | ) | | | | (160,269 | ) | |
| Class B Shares capital transactions | | | | (224,247 | ) | | | | (404,951 | ) | | | | | (121,799 | ) | | | | 2,253 | | |
| | | | | | | | | | | | | | | | | | | | | | | |
| Class C Shares: | | | | | | | | | | | | | | | | | | | | | | |
| Proceeds from shares issued | | | | 51,639 | | | | | 261,486 | | | | | | 365,351 | | | | | 112,981 | | |
| Dividends reinvested | | | | 38,495 | | | | | — | | | | | | 41,448 | | | | | 76,317 | | |
| Value of shares redeemed | | | | (81,414 | ) | | | | (42,587 | ) | | | | | (402,628 | ) | | | | (55,618 | ) | |
| Class C Shares capital transactions | | | | 8,720 | | | | | 218,899 | | | | | | 4,171 | | | | | 133,680 | | |
| | | | | | | | | | | | | | | | | | | | | | | |
| Class I Shares: | | | | | | | | | | | | | | | | | | | | | | |
| Proceeds from shares issued | | | | 9,187,688 | | | | | 17,658,774 | | | | | | — | | | | | — | | |
| Dividends reinvested | | | | 4,246,858 | | | | | — | | | | | | — | | | | | — | | |
| Value of shares redeemed | | | | (16,500,326 | ) | | | | (20,773,702 | ) | | | | | — | | | | | — | | |
| Class I Shares capital transactions | | | | (3,065,780 | ) | | | | (3,114,928 | ) | | | | | — | | | | | — | | |
| Change in net assets resulting from capital transactions | | | $ | (4,356,680 | ) | | | $ | (8,338,642 | ) | | | | $ | 1,079,236 | | | | $ | (429,918 | ) | |
| | | | | | | | | | | | | | | | | | | | | | | |
| SHARE TRANSACTIONS: | | | | | | | | | | | | | | | | | | | | | | |
| Class A Shares: | | | | | | | | | | | | | | | | | | | | | | |
| Issued | | | | 27,668 | | | | | 49,445 | | | | | | 295,105 | | | | | 77,300 | | |
| Reinvested | | | | 45,103 | | | | | — | | | | | | 59,888 | | | | | 175,974 | | |
| Redeemed | | | | (125,574 | ) | | | | (334,366 | ) | | | | | (246,880 | ) | | | | (293,635 | ) | |
| Change in Class A Shares | | | | (52,803 | ) | | | | (284,921 | ) | | | | | 108,113 | | | | | (40,361 | ) | |
| | | | | | | | | | | | | | | | | | | | | | | |
| Class B Shares: | | | | | | | | | | | | | | | | | | | | | | |
| Issued | | | | 1,163 | | | | | 6,924 | | | | | | 2,603 | | | | | 8,496 | | |
| Reinvested | | | | 3,120 | | | | | — | | | | | | 4,862 | | | | | 13,196 | | |
| Redeemed | | | | (17,588 | ) | | | | (31,749 | ) | | | | | (21,126 | ) | | | | (20,335 | ) | |
| Change in Class B Shares | | | | (13,305 | ) | | | | (24,825 | ) | | | | | (13,661 | ) | | | | 1,357 | | |
| | | | | | | | | | | | | | | | | | | | | | | |
| Class C Shares: | | | | | | | | | | | | | | | | | | | | | | |
| Issued | | | | 3,117 | | | | | 16,065 | | | | | | 40,827 | | | | | 14,173 | | |
| Reinvested | | | | 2,526 | | | | | — | | | | | | 5,175 | | | | | 10,526 | | |
| Redeemed | | | | (4,667 | ) | | | | (2,629 | ) | | | | | (42,252 | ) | | | | (6,916 | ) | |
| Change in Class C Shares | | | | 976 | | | | | 13,436 | | | | | | 3,750 | | | | | 17,783 | | |
| | | | | | | | | | | | | | | | | | | | | | | |
| Class I Shares: | | | | | | | | | | | | | | | | | | | | | | |
| Issued | | | | 491,350 | | | | | 981,882 | | | | | | — | | | | | — | | |
| Reinvested | | | | 247,171 | | | | | — | | | | | | — | | | | | — | | |
| Redeemed | | | | (859,037 | ) | | | | (1,163,041 | ) | | | | | — | | | | | — | | |
| Change in Class I Shares | | | | (120,516 | ) | | | | (181,159 | ) | | | | | — | | | | | — | | |
| 14 | HSBC FAMILY OF FUNDS | See notes to financial statements. |
HSBC FAMILY OF FUNDS
Statements of Changes in Net Assets (continued)
| | Opportunity Fund (Advisor) |
| | For the | For the |
| | year ended | year ended |
| | October 31, 2013 | October 31, 2012 |
| Investment Activities: | | | | | | | | | | | |
| Operations: | | | | | | | | | | | |
| Net investment income (loss) | | | $ | 113,802 | | | | $ | (19,624 | ) | |
| Net realized gains (losses) from investments | | | | 22,059,925 | | | | | 7,509,207 | | |
| Change in unrealized appreciation/depreciation on investments | | | | 28,194,578 | | | | | 7,623,444 | | |
| Change in net assets resulting from operations | | | | 50,368,305 | | | | | 15,113,027 | | |
| | | | | | | | | | | | |
| Dividends: | | | | | | | | | | | |
| Net realized gains: | | | | | | | | | | | |
| Class I Shares | | | | (6,472,825 | ) | | | | (18,686,312 | ) | |
| Change in net assets resulting from shareholder dividends | | | | (6,472,825 | ) | | | | (18,686,312 | ) | |
| Change in net assets resulting from capital transactions | | | | 29,328,028 | | | | | 16,653,597 | | |
| Change in net assets | | | | 73,223,508 | | | | | 13,080,312 | | |
| | | | | | | | | | | | |
| Net Assets: | | | | | | | | | | | |
| Beginning of period | | | | 135,097,630 | | | | | 122,017,318 | | |
| End of period | | | $ | 208,321,138 | | | | $ | 135,097,630 | | |
| Accumulated net investment income (loss) | | | $ | 152,233 | | | | $ | 38,431 | | |
| See notes to financial statements. | HSBC FAMILY OF FUNDS | 15 |
HSBC FAMILY OF FUNDS
Statements of Changes in Net Assets (continued)
| | Opportunity Fund (Advisor) |
| | For the | For the |
| | year ended | year ended |
| | October 31, 2013 | October 31, 2012 |
| CAPITAL TRANSACTIONS: | | | | | | | | | | | |
| Class I Shares: | | | | | | | | | | | |
| Proceeds from shares issued | | | $ | 43,552,792 | | | | $ | 20,813,526 | | |
| Dividends reinvested | | | | 6,463,988 | | | | | 17,155,964 | | |
| Value of shares redeemed | | | | (20,688,752 | ) | | | | (21,315,893 | ) | |
| Class I Shares capital transactions | | | | 29,328,028 | | | | | 16,653,597 | | |
| Change in net assets resulting from capital transactions | | | $ | 29,328,028 | | | | $ | 16,653,597 | | |
| | | | | | | | | | | | |
| SHARE TRANSACTIONS: | | | | | | | | | | | |
| Class I Shares: | | | | | | | | | | | |
| Issued | | | | 2,895,000 | | | | | 1,554,122 | | |
| Reinvested | | | | 478,814 | | | | | 1,465,070 | | |
| Redeemed | | | | (1,392,961 | ) | | | | (1,642,101 | ) | |
| Change in Class I Shares | | | | 1,980,853 | | | | | 1,377,091 | | |
| 16 | HSBC FAMILY OF FUNDS | See notes to financial statements. |
| HSBC GROWTH FUND |
| Financial Highlights |
Selected data for a share outstanding throughout the periods indicated.*
| | | | | | | Investment Activities | | Dividends | | | | | | | Ratios/Supplementary Data |
| | Net Asset
Value,
Beginning
of Period | | Net
Investment
Income
(Loss)(a) | | Net Realized
and Unrealized
Gains
(Losses) from
Investments | | Total from
Investment
Activities | | Net
Investment
Income | | Net Realized
Gains from
Investment
Transactions | | Total
Dividends | | Net
Asset
Value,
End of
Period | | Total
Return(b) | | Net
Assets
at End
of Period
(000’s) | | Ratio
of Net
Expenses
to Average
Net Assets | | Ratio of Net
Investment
Income
(Loss) to
Average
Net Assets | | Ratios
of Expenses
to Average
Net Assets
(Excluding Fee
Reductions) | | Portfolio
Turnover
(c) |
| CLASS A SHARES | | | | | | | | | | | | | | | | | | | | | | | | | | | | | | | | | | | | | | | | | | | | | | | | | | | | | | | | | | | | | | |
| Year Ended October 31, 2009 | | | $ | 10.55 | | | | (0.04 | ) | | | 2.03 | | 1.99 | | | — | | | | | — | | | | | — | | | | | $ | 12.54 | | | 18.86 | %(d) | | | $ | 15,896 | | | | 1.20 | % | | | | (0.33 | )% | | | | 1.31 | % | | | | 66 | % | |
| Year Ended October 31, 2010 | | | | 12.54 | | | | (0.07 | ) | | | 2.55 | | 2.48 | | | — | | | | | — | | | | | — | | | | | | 15.02 | | | 19.78 | %(e)(f) | | | | 16,452 | | | | 1.20 | % | | | | (0.54 | )%(f) | | | | 1.23 | % | | | | 89 | % | |
| Year Ended October 31, 2011 | | | | 15.02 | | | | (0.07 | ) | | | 1.64 | | 1.57 | | | — | | | | | — | | | | | — | | | | | | 16.59 | | | 10.45 | %(g) | | | | 15,349 | | | | 1.18 | % | | | | (0.45 | )% | | | | 1.18 | % | | | | 56 | % | |
| Year Ended October 31, 2012 | | | | 16.59 | | | | (0.06 | ) | | | 1.16 | | 1.10 | | | — | | | | | — | | | | | — | | | | | | 17.69 | | | 6.63 | %(h) | | | | 11,327 | | | | 1.20 | % | | | | (0.36 | )% | | | | 1.27 | % | | | | 53 | % | |
| Year Ended October 31, 2013 | | | | 17.69 | | | | (0.01 | ) | | | 5.34 | | 5.33 | | | — | | | | | (1.29 | ) | | | | (1.29 | ) | | | | | 21.73 | | | 32.24 | %(i) | | | | 12,761 | | | | 1.20 | % | | | | (0.05 | )% | | | | 1.21 | % | | | | 75 | % | |
| CLASS B SHARES | | | | | | | | | | | | | | | | | | | | | | | | | | | | | | | | | | | | | | | | | | | | | | | | | | | | | | | | | | | | | | |
| Year Ended October 31, 2009 | | | $ | 9.85 | | | | (0.10 | ) | | | 1.85 | | 1.75 | | | — | | | | | — | | | | | — | | | | | $ | 11.60 | | | 17.87 | %(d) | | | $ | 2,059 | | | | 1.95 | % | | | | (1.06 | )% | | | | 2.06 | % | | | | 66 | % | |
| Year Ended October 31, 2010 | | | | 11.60 | | | | (0.16 | ) | | | 2.36 | | 2.20 | | | — | | | | | — | | | | | — | | | | | | 13.80 | | | 18.97 | %(e)(f) | | | | 1,213 | | | | 1.95 | % | | | | (1.28 | )%(f) | | | | 1.98 | % | | | | 89 | % | |
| Year Ended October 31, 2011 | | | | 13.80 | | | | (0.18 | ) | | | 1.51 | | 1.33 | | | — | | | | | — | | | | | — | | | | | | 15.13 | | | 9.64 | %(g) | | | | 962 | | | | 1.93 | % | | | | (1.19 | )% | | | | 1.93 | % | | | | 56 | % | |
| Year Ended October 31, 2012 | | | | 15.13 | | | | (0.17 | ) | | | 1.06 | | 0.89 | | | — | | | | | — | | | | | — | | | | | | 16.02 | | | 5.88 | %(h) | | | | 621 | | | | 1.95 | % | | | | (1.10 | )% | | | | 2.03 | % | | | | 53 | % | |
| Year Ended October 31, 2013 | | | | 16.02 | | | | (0.12 | ) | | | 4.75 | | 4.63 | | | — | | | | | (1.29 | ) | | | | (1.29 | ) | | | | | 19.36 | | | 31.16 | %(i) | | | | 493 | | | | 1.95 | % | | | | (0.72 | )% | | | | 1.96 | % | | | | 75 | % | |
| CLASS C SHARES | | | | | | | | | | | | | | | | | | | | | | | | | | | | | | | | | | | | | | | | | | | | | | | | | | | | | | | | | | | | | | |
| Year Ended October 31, 2009 | | | $ | 9.91 | | | | (0.12 | ) | | | 1.89 | | 1.77 | | | — | | | | | — | | | | | — | | | | | $ | 11.68 | | | 17.86 | %(d) | | | $ | 120 | | | | 1.95 | % | | | | (1.12 | )% | | | | 2.05 | % | | | | 66 | % | |
| Year Ended October 31, 2010 | | | | 11.68 | | | | (0.17 | ) | | | 2.38 | | 2.21 | | | — | | | | | — | | | | | — | | | | | | 13.89 | | | 18.92 | %(e)(f) | | | | 184 | | | | 1.95 | % | | | | (1.30 | )%(f) | | | | 1.99 | % | | | | 89 | % | |
| Year Ended October 31, 2011 | | | | 13.89 | | | | (0.18 | ) | | | 1.52 | | 1.34 | | | — | | | | | — | | | | | — | | | | | | 15.23 | | | 9.65 | %(g) | | | | 251 | | | | 1.94 | % | | | | (1.21 | )% | | | | 1.94 | % | | | | 56 | % | |
| Year Ended October 31, 2012 | | | | 15.23 | | | | (0.18 | ) | | | 1.07 | | 0.89 | | | — | | | | | — | | | | | — | | | | | | 16.12 | | | 5.84 | %(h) | | | | 482 | | | | 1.95 | % | | | | (1.14 | )% | | | | 2.03 | % | | | | 53 | % | |
| Year Ended October 31, 2013 | | | | 16.12 | | | | (0.14 | ) | | | 4.80 | | 4.66 | | | — | | | | | (1.29 | ) | | | | (1.29 | ) | | | | | 19.49 | | | 31.15 | %(i) | | | | 602 | | | | 1.95 | % | | | | (0.81 | )% | | | | 1.96 | % | | | | 75 | % | |
| CLASS I SHARES | | | | | | | | | | | | | | | | | | | | | | | | | | | | | | | | | | | | | | | | | | | | | | | | | | | | | | | | | | | | | | |
| Year Ended October 31, 2009 | | | $ | 10.62 | | | | (0.01 | ) | | | 2.04 | | 2.03 | | | — | | | | | — | | | | | — | | | | | $ | 12.65 | | | 19.11 | %(d) | | | $ | 39,400 | | | | 0.95 | % | | | | (0.08 | )% | | | | 1.06 | % | | | | 66 | % | |
| Year Ended October 31, 2010 | | | | 12.65 | | | | (0.04 | ) | | | 2.58 | | 2.54 | | | — | | | | | — | | | | | — | | | | | | 15.19 | | | 20.08 | %(e)(f) | | | | 49,474 | | | | 0.95 | % | | | | (0.30 | )%(f) | | | | 0.99 | % | | | | 89 | % | |
| Year Ended October 31, 2011 | | | | 15.19 | | | | (0.04 | ) | | | 1.68 | | 1.64 | | | — | | | | | — | | | | | — | | | | | | 16.83 | | | 10.80 | %(g) | | | | 57,222 | | | | 0.94 | % | | | | (0.22 | )% | | | | 0.94 | % | | | | 56 | % | |
| Year Ended October 31, 2012 | | | | 16.83 | | | | (0.02 | ) | | | 1.18 | | 1.16 | | | — | | | | | — | | | | | — | | | | | | 17.99 | | | 6.89 | %(h) | | | | 57,916 | | | | 0.95 | % | | | | (0.12 | )% | | | | 1.04 | % | | | | 53 | % | |
| Year Ended October 31, 2013 | | | | 17.99 | | | | 0.04 | | | | 5.42 | | 5.46 | | | (0.02 | ) | | | | (1.29 | ) | | | | (1.31 | ) | | | | | 22.14 | | | 32.49 | %(i) | | | | 68,624 | | | | 0.95 | % | | | | 0.20 | % | | | | 0.96 | % | | | | 75 | % | |
| * | | The per share amounts and percentages reflect income and expenses assuming inclusion of the Fund’s proportionate share of the income and expenses of the HSBC Growth Portfolio. |
| (a) | | Calculated based on average shares outstanding. |
| (b) | | Total return calculations do not include any sales or redemption charges. |
| (c) | | Portfolio turnover rate is calculated on the basis of the respective Portfolio in which the Fund invests all of its investable assets. Portfolio turnover rate is calculated on the basis of the Fund as a whole without distinguishing between the classes of shares issued. |
| (d) | | During the year ended October 31, 2009, the Portfolio, in which the Fund invests, received monies related to certain nonrecurring litigation settlements. The corresponding impact to the total return was 0.50%, 0.54%, 0.53% and 0.49% for Class A Shares, Class B Shares, Class C Shares and Class I Shares, respectively. |
| (e) | | During the year ended October 31, 2010, the Portfolio, in which the Fund invests, received monies related to certain nonrecurring litigation settlements. The corresponding impact to the total return was 0.17%, 0.17%, 0.17% and 0.17% for Class A Shares, Class B Shares, Class C Shares and Class I Shares, respectively. |
| (f) | | During the year ended October 31, 2010, the Fund received a distribution from a “fair fund” established by the SEC in connection with a consent order against BISYS Fund Services, Inc. (See Note 7 in the Notes to Financial Statements). The corresponding impact to the net income ratio and the total return was 0.02%, 0.02%, 0.02% and 0.02% for Class A Shares, Class B Shares, Class C Shares and Class I Shares, respectively. |
| (g) | | During the year ended October 31, 2011, the Portfolio, in which the Fund invests, received monies related to certain nonrecurring litigation settlements. The corresponding impact to the total return was 0.28%, 0.28%, 0.28% and 0.28% for Class A Shares, Class B Shares, Class C Shares and Class I Shares, respectively. |
| (h) | | During the year ended October 31, 2012, the Portfolio, in which the Fund invests, received monies related to certain nonrecurring litigation settlements. The corresponding impact to the total return was 0.12%, 0.12%, 0.12% and 0.12% for Class A Shares, Class B Shares, Class C Shares and Class I Shares, respectively. |
| (i) | | During the year ended October 31, 2013, the Portfolio, in which the Fund invests, received monies related to certain nonrecurring litigation settlements. The corresponding impact to the total return was 0.16%, 0.16%, 0.16% and 0.16% for Class A Shares, Class B Shares, Class C Shares and Class I Shares, respectively. |
See notes to financial statements. | HSBC FAMILY OF FUNDS 17 |
| HSBC OPPORTUNITY FUND |
| Financial Highlights |
Selected data for a share outstanding throughout the periods indicated.*
| | | | | | | Investment Activities | | Dividends | | | | | | | | | | Ratios/Supplementary Data |
| | Net Asset
Value,
Beginning
of Period | | Net
Investment
Income
(Loss)(a) | | Net Realized
and
Unrealized
Gains
(Losses)
from
Investments | | Total from
Investment
Activities | | Net Realized
Gains from
Investment
Transactions | | Total
Dividends | | Net
Asset
Value,
End of
Period | | Total
Return(b) | | Net
Assets
at End
of Period
(000’s) | | Ratio
of Net
Expenses
to
Average
Net
Assets | | Ratio
of Net
Investment
Income
(Loss) to
Average
Net Assets | | Ratios
of Expenses
to Average
Net Assets
(Excluding Fee
Reductions) | | Portfolio
Turnover
(c) |
| CLASS A SHARES | | | | | | | | | | | | | | | | | | | | | | | | | | | | | | | | | | | | | | | | | | | | | | | | | | | | | | | | | |
| Year Ended October 31, 2009 | | | $ | 7.09 | | | | (0.07 | ) | | | 0.97 | | 0.90 | | | (0.43 | ) | | | | (0.43 | ) | | | | $ | 7.56 | | | 14.85 | % | | | $ | 9,687 | | | | 1.55 | % | | | | (1.02 | )% | | | | 2.30 | % | | | | 65 | % | |
| Year Ended October 31, 2010 | | | | 7.56 | | | | (0.09 | ) | | | 2.20 | | 2.11 | | | — | | | | | — | | | | | | 9.67 | | | 27.91 | %(d)(e) | | | | 11,282 | | | | 1.55 | % | | | | (1.00 | )%(e) | | | | 2.07 | % | | | | 68 | % | |
| Year Ended October 31, 2011 | | | | 9.67 | | | | (0.07 | ) | | | 1.19 | | 1.12 | | | (0.16 | ) | | | | (0.16 | ) | | | | | 10.63 | | | 11.59 | %(f) | | | | 11,145 | | | | 1.55 | % | | | | (0.62 | )% | | | | 1.85 | % | | | | 69 | % | |
| Year Ended October 31, 2012 | | | | 10.63 | | | | (0.05 | ) | | | 1.11 | | 1.06 | | | (1.56 | ) | | | | (1.56 | ) | | | | | 10.13 | | | 12.08 | %(g) | | | | 10,204 | | | | 1.55 | % | | | | (0.51 | )% | | | | 2.20 | % | | | | 59 | % | |
| Year Ended October 31, 2013 | | | | 10.13 | | | | (0.06 | ) | | | 3.34 | | 3.28 | | | (0.63 | ) | | | | (0.63 | ) | | | | | 12.78 | | | 34.02 | %(h) | | | | 14,259 | | | | 1.55 | % | | | | (0.49 | )% | | | | 2.01 | % | | | | 70 | % | |
| CLASS B SHARES | | | | | | | | | | | | | | | | | | | | | | | | | | | | | | | | | | | | | | | | | | | | | | | | | | | | | | | | | |
| Year Ended October 31, 2009 | | | $ | 6.10 | | | | (0.10 | ) | | | 0.80 | | 0.70 | | | (0.43 | ) | | | | (0.43 | ) | | | | $ | 6.37 | | | 13.92 | % | | | $ | 1,082 | | | | 2.30 | % | | | | (1.77 | )% | | | | 3.10 | % | | | | 65 | % | |
| Year Ended October 31, 2010 | | | | 6.37 | | | | (0.13 | ) | | | 1.85 | | 1.72 | | | — | | | | | — | | | | | | 8.09 | | | 27.00 | %(d)(e) | | | | 658 | | | | 2.30 | % | | | | (1.78 | )%(e) | | | | 2.86 | % | | | | 68 | % | |
| Year Ended October 31, 2011 | | | | 8.09 | | | | (0.12 | ) | | | 0.99 | | 0.87 | | | (0.16 | ) | | | | (0.16 | ) | | | | | 8.80 | | | 10.75 | %(f) | | | | 536 | | | | 2.30 | % | | | | (1.36 | )% | | | | 2.64 | % | | | | 69 | % | |
| Year Ended October 31, 2012 | | | | 8.80 | | | | (0.10 | ) | | | 0.87 | | 0.77 | | | (1.56 | ) | | | | (1.56 | ) | | | | | 8.01 | | | 11.15 | %(g) | | | | 499 | | | | 2.30 | % | | | | (1.25 | )% | | | | 2.99 | % | | | | 59 | % | |
| Year Ended October 31, 2013 | | | | 8.01 | | | | (0.11 | ) | | | 2.60 | | 2.49 | | | (0.63 | ) | | | | (0.63 | ) | | | | | 9.87 | | | 33.10 | %(h) | | | | 480 | | | | 2.30 | % | | | | (1.24 | )% | | | | 2.77 | % | | | | 70 | % | |
| CLASS C SHARES | | | | | | | | | | | | | | | | | | | | | | | | | | | | | | | | | | | | | | | | | | | | | | | | | | | | | | | | | |
| Year Ended October 31, 2009 | | | $ | 6.21 | | | | (0.10 | ) | | | 0.81 | | 0.71 | | | (0.43 | ) | | | | (0.43 | ) | | | | $ | 6.49 | | | 13.83 | % | | | $ | 267 | | | | 2.30 | % | | | | (1.78 | )% | | | | 3.08 | % | | | | 65 | % | |
| Year Ended October 31, 2010 | | | | 6.49 | | | | (0.13 | ) | | | 1.89 | | 1.76 | | | — | | | | | — | | | | | | 8.25 | | | 27.12 | %(d)(e) | | | | 341 | | | | 2.30 | % | | | | (1.75 | )%(e) | | | | 2.86 | % | | | | 68 | % | |
| Year Ended October 31, 2011 | | | | 8.25 | | | | (0.13 | ) | | | 1.02 | | 0.89 | | | (0.16 | ) | | | | (0.16 | ) | | | | | 8.98 | | | 10.79 | %(f) | | | | 437 | | | | 2.30 | % | | | | (1.38 | )% | | | | 2.64 | % | | | | 69 | % | |
| Year Ended October 31, 2012 | | | | 8.98 | | | | (0.10 | ) | | | 0.89 | | 0.79 | | | (1.56 | ) | | | | (1.56 | ) | | | | | 8.21 | | | 11.14 | %(g) | | | | 545 | | | | 2.30 | % | | | | (1.19 | )% | | | | 3.03 | % | | | | 59 | % | |
| Year Ended October 31, 2013 | | | | 8.21 | | | | (0.11 | ) | | | 2.67 | | 2.56 | | | (0.63 | ) | | | | (0.63 | ) | | | | | 10.14 | | | 33.15 | %(h) | | | | 711 | | | | 2.30 | % | | | | (1.21 | )% | | | | 2.76 | % | | | | 70 | % | |
| * | | The per share amounts and percentages reflect income and expenses assuming inclusion of the Fund’s proportionate share of the income and expenses of the HSBC Opportunity Portfolio. |
| (a) | | Calculated based on average shares outstanding. |
| (b) | | Total return calculations do not include any sales or redemption charges. |
| (c) | | Portfolio turnover rate is calculated on the basis of the respective Portfolio in which the Fund invests all of its investable assets. Portfolio turnover rate is calculated on the basis of the Fund as a whole without distinguishing between the classes of shares issued. |
| (d) | | During the year ended October 31, 2010, the Portfolio, in which the Fund invests, received monies related to certain nonrecurring litigation settlements. The corresponding impact to the total return was 0.15%, 0.15% and 0.15% for Class A Shares, Class B Shares and Class C Shares, respectively. |
| (e) | | During the year ended October 31, 2010, the Fund received a distribution from a “fair fund” established by the SEC in connection with a consent order against BISYS Fund Services, Inc. (See Note 7 in the Notes to Financial Statements). Corresponding impact to the net income ratio and the total return was 0.01%, 0.01% and 0.01% for Class A Shares, Class B Shares and Class C Shares, respectively. |
| (f) | | During the year ended October 31, 2011, the Portfolio, in which the Fund invests, received monies related to certain nonrecurring litigation settlements. The corresponding impact to the total return was 0.10%, 0.10% and 0.10% for Class A Shares, Class B Shares and Class C Shares, respectively. |
| (g) | | During the year ended October 31, 2012, the Portfolio, in which the Fund invests, received monies related to certain nonrecurring litigation settlements. The corresponding impact to the total return was 0.10%, 0.10% and 0.10% for Class A Shares, Class B Shares and Class C Shares, respectively. |
| (h) | | During the year ended October 31, 2013, the Portfolio, in which the Fund invests, received monies related to certain nonrecurring litigation settlements. The corresponding impact to the total return was 0.13%, 0.13% and 0.13% for Class A Shares, Class B Shares and Class C Shares, respectively. |
18 HSBC FAMILY OF FUNDS | See notes to financial statements. |
| HSBC OPPORTUNITY FUND (ADVISOR) |
| Financial Highlights |
Selected data for a share outstanding throughout the periods indicated.*
| | | | | | | Investment Activities | | Dividends | | | | | | | | | | Ratios/Supplementary Data |
| | Net Asset
Value,
Beginning
of Period | | Net
Investment
Income
(Loss) | | Net Realized
and
Unrealized
Gains
(Losses)
from
Investments | | Total from
Investment
Activities | | Net Realized
Gains from
Investment
Transactions | | Total
Dividends | | Net
Asset
Value,
End of
Period | | Total
Return(a) | | Net
Assets
at End of
Period
(000’s) | | Ratio
of Net
Expenses
to
Average
Net
Assets | | Ratio
of Net
Investment
Income
(Loss) to
Average
Net Assets | | Ratios
of Expenses
to Average
Net Assets
(Excluding Fee
Reductions) | | Portfolio
Turnover
(b) |
| CLASS I SHARES | | | | | | | | | | | | | | | | | | | | | | | | | | | | | | | | | | | | | | | | | | | | | | | | | | | | | | | | | |
| Year Ended October 31, 2009 | | | $ | 8.91 | | | | (0.04 | ) | | | 1.32 | | 1.28 | | | (0.26 | ) | | | | (0.26 | ) | | | | $ | 9.93 | | | 15.47 | % | | | $ | 100,285 | | | | 1.02 | % | | | | (0.50 | )% | | | | 1.02 | % | | | | 65 | % | |
| Year Ended October 31, 2010 | | | | 9.93 | | | | (0.06 | ) | | | 2.90 | | 2.84 | | | — | | | | | — | | | | | | 12.77 | | | 28.60 | %(c)(d) | | | | 117,064 | | | | 1.01 | % | | | | (0.46 | )%(d) | | | | 1.01 | % | | | | 68 | % | |
| Year Ended October 31, 2011 | | | | 12.77 | | | | (0.01 | ) | | | 1.57 | | 1.56 | | | (0.31 | ) | | | | (0.31 | ) | | | | | 14.02 | | | 12.25 | %(e) | | | | 122,017 | | | | 1.01 | % | | | | (0.07 | )% | | | | 1.01 | % | | | | 69 | % | |
| Year Ended October 31, 2012 | | | | 14.02 | | | | (0.01 | ) | | | 1.46 | | 1.45 | | | (2.07 | ) | | | | (2.07 | ) | | | | | 13.40 | | | 12.50 | %(f) | | | | 135,098 | | | | 1.08 | % | | | | (0.01 | )% | | | | 1.08 | % | | | | 59 | % | |
| Year Ended October 31, 2013 | | | | 13.40 | | | | 0.01 | | | | 4.47 | | 4.48 | | | (0.61 | ) | | | | (0.61 | ) | | | | | 17.27 | | | 34.70 | %(g) | | | | 208,321 | | | | 0.99 | % | | | | 0.07 | % | | | | 0.99 | % | | | | 70 | % | |
| * | | The per share amounts and percentages reflect income and expense assuming inclusion of the Fund’s proportionate share of the income and expenses of the HSBC Opportunity Portfolio. |
| (a) | | Total return calculations do not include any sales or redemption charges. |
| (b) | | Portfolio turnover rate is calculated on the basis of the respective Portfolio in which the Fund invests all of its investable assets. Portfolio turnover rate is calculated on the basis of the Fund as a whole without distinguishing between the classes of shares issued. |
| (c) | | During the year ended October 31, 2010, the Portfolio, in which the Fund invests, received monies related to certain nonrecurring litigation settlements. The corresponding impact to the total return was 0.15% for Class I Shares. |
| (d) | | During the year ended October 31, 2010, the Fund received a distribution from a “fair fund” established by the SEC in connection with a consent order against BISYS Fund Services, Inc. (See Note 7 in the Notes to Financial Statements). The corresponding impact to the net income ratio and the total return was 0.01% for the Class I Shares. |
| (e) | | During the year ended October 31, 2011, the Portfolio, in which the Fund invests, received monies related to certain nonrecurring litigation settlements. The corresponding impact to the total return was 0.10% for Class I Shares. |
| (f) | | During the year ended October 31, 2012, the Portfolio, in which the Fund invests, received monies related to certain nonrecurring litigation settlements. The corresponding impact to the total return was 0.10% for Class I Shares. |
| (g) | | During the year ended October 31, 2013, the Portfolio, in which the Fund invests, received monies related to certain nonrecurring litigation settlements. The corresponding impact to the total return was 0.13% for Class I Shares. |
See notes to financial statements. | HSBC FAMILY OF FUNDS 19 |
| HSBC FAMILY OF FUNDS |
| Notes to Financial Statements — as of October 31, 2013 |
1. Organization:
The HSBC Funds (the “Trust”), a Massachusetts business trust organized on April 22, 1987, and the HSBC Advisor Funds Trust (the “Advisor Trust”), a Massachusetts business trust organized on April 5, 1996, are registered under the Investment Company Act of 1940, as amended (the “Act”), as open-end management investment companies. As of October 31, 2013, the Trust is comprised of 15 separate operational funds and the Advisor Trust is comprised of 1 operational fund, each a series of the HSBC Family of Funds, which also includes the HSBC Portfolios (the “Portfolio Trust”) (collectively the “Trusts”). The accompanying financial statements are presented for the following 3 funds (individually a “Fund”, collectively the “Funds”) of the Trust and Advisor Trust:
| Fund | | | Short Name | | | Trust | |
| HSBC Growth Fund | | Growth Fund | | Trust |
| HSBC Opportunity Fund | | Opportunity Fund | | Trust |
| HSBC Opportunity Fund (Advisor) | | Opportunity Fund (Advisor) | | Advisor Trust |
All the Funds are diversified funds. Financial statements for all other funds of the Trusts are published separately.
Each Fund utilizes a master-feeder fund structure and seeks to achieve its investment objectives by investing all of its investable assets in its respective Portfolio (as defined below).
| | | | Proportionate |
| | | | Ownership |
| | | | Interest on |
| Fund | | | Respective Portfolio | | | October 31, 2013(%) |
| Growth Fund | | HSBC Growth Portfolio | | | 93.1 | |
| Opportunity Fund | | HSBC Opportunity Portfolio | | | 6.8 | |
| Opportunity Fund (Advisor) | | HSBC Opportunity Portfolio | | | 91.7 | |
The HSBC Growth Portfolio and HSBC Opportunity Portfolio (individually a “Portfolio”, collectively the “Portfolios”) are diversified series of the Portfolio Trust. The Portfolios operate as master funds in master-feeder arrangements and also may receive investments from certain fund of funds.
The financial statements of the Portfolios, including the Schedules of Portfolio Investments, are included elsewhere in this report. The financial statements of the Portfolios should be read in conjunction with the financial statements of the Funds.
The Funds are authorized to issue an unlimited number of shares of beneficial interest with a par value of $ 0.001 per share. The Growth Fund offers four classes of shares: Class A Shares, Class B Shares, Class C Shares, and Class I Shares. The Opportunity Fund offers three classes of shares: Class A Shares, Class B Shares, and Class C Shares. The Opportunity Fund (Advisor) offers one class of shares: Class I Shares. Class A Shares of the Funds have a maximum sales charge of 5.00% as a percentage of the original purchase price. Class B Shares of the Funds are offered without any front-end sales charge but will be subject to a contingent deferred sales charge (“CDSC”) ranging from a maximum of 4.00% if redeemed less than one year after purchase to 0.00% if redeemed more than four years after purchase. Class C Shares of the Funds are offered without any front-end sales charge but will be subject to a maximum CDSC of 1.00% if redeemed less than one year after purchase. No sales charges are assessed with respect to Class I Shares of the Funds. Each class of shares in the Funds has identical rights and privileges except with respect to arrangements pertaining to shareholder servicing and/or distribution, class-related expenses, voting rights on matters affecting a single class of shares, and the exchange privilege of each class of shares. Effective as of August 1, 2013, Class B Shares of the Funds may no longer be purchased or acquired by any new or existing Class B shareholder, except through dividend and/or capital gains reinvestment.
20 HSBC FAMILY OF FUNDS
| HSBC FAMILY OF FUNDS |
| Notes to Financial Statements — as of October 31, 2013 (continued) |
Under the Trusts’ organizational documents, the Trusts’ officers and Trustees are indemnified against certain liabilities arising out of the performance of their duties to the Funds. In addition, in the normal course of business, the Trusts enter into contracts with service providers, which also provide for indemnifications by the Funds. The Funds’ maximum exposure under these arrangements is unknown, as this would involve any future claims that may be made against the Funds. However, based on experience, the Trusts expect that risk of loss to be remote.
2. Significant Accounting Policies:
The following is a summary of the significant accounting policies followed by the Funds in the preparation of their financial statements. The policies are in conformity with U.S. generally accepted accounting principles (“GAAP”). The preparation of financial statements requires management to make certain estimates and assumptions that affect the reported amounts of assets and liabilities and disclosure of contingent assets and liabilities at the date of the financial statements and the reported amounts of increases and decreases in net assets from operations during the reporting period. Actual results could differ from those estimates.
Securities Valuation:
The Funds record their investments at fair value. Fair value is defined as the price that would be received to sell an asset or paid to transfer a liability in an orderly transaction between market participants at the measurement date. The valuation techniques used to determine fair value are further described in Note 3 below.
Investment Transactions and Related Income:
The Funds record investments into the Portfolios on a trade date basis. The Funds record daily their proportionate share of income, expenses, changes in unrealized appreciation and depreciation and realized gains and losses derived from their respective Portfolios. In addition, the Funds accrue their own expenses daily as incurred.
Allocations:
Expenses directly attributable to a Fund are charged to that Fund. Expenses not directly attributable to a Fund are allocated proportionately among the applicable series within the Trusts in relation to the net assets of each fund or on another reasonable basis. Class specific expenses are charged directly to the class incurring the expense. In addition, income, expenses (other than class specific expenses), and unrealized and realized gains and losses are allocated to each class based on relative net assets on a daily basis.
Dividends to Shareholders:
Dividends to shareholders from net investment income, if any, are declared and distributed semi-annually in the case of the Funds.
The Funds’ net realized gains, if any, are distributed to shareholders at least annually. Additional distributions are also made to the Funds’ shareholders to the extent necessary to avoid the federal excise tax on certain undistributed income and net capital gains of regulated investment companies.
The amount and character of net investment income and net realized gains distributions are determined in accordance with federal income tax regulations which may differ from GAAP. These “book/tax” differences are either considered temporary or permanent in nature. To the extent these differences are permanent in nature (e.g., reclassification of market discounts, certain gain/loss, paydowns, and certain distributions), such amounts are reclassified within the composition of net assets; temporary differences (e.g., wash losses and post-October loss deferrals) do not require reclassification. The Funds may utilize equalization accounting for tax purposes and designate earnings and profits, including net realized gains distributed to shareholders on redemption of shares, as a part of the dividends paid deduction for income tax purposes. To the extent distributions to shareholders from net investment income and net realized gains exceed net investment income and net realized gains for tax purposes, they are reported as distributions of capital.
HSBC FAMILY OF FUNDS 21
| HSBC FAMILY OF FUNDS |
| Notes to Financial Statements — as of October 31, 2013 (continued) |
Federal Income Taxes:
Each Fund is a separate taxable entity for federal income tax purposes. Each Fund has qualified and intends to continue to qualify each year as a “regulated investment company” under Subchapter M of the Internal Revenue Code, as amended, and to distribute substantially all of its taxable net investment income and net realized gains, if any, to its shareholders. Accordingly, no provision for federal income or excise tax is required.
Management of the Funds has reviewed tax positions taken in tax years that remain subject to examination by all major tax jurisdictions, including federal (i.e., the last four tax year ends and the interim tax period since then, as applicable). Management believes that there is no tax liability resulting from unrecognized tax benefits related to uncertain tax positions taken.
New Accounting Pronouncements:
In January 2013, the Financial Accounting Standards Board issued Accounting Standards Update (“ASU”) No. 2013-01 “Clarifying the Scope of Disclosures about Offsetting Assets and Liabilities” (“ASU 2013-01”), which amended Accounting Standards Codification Subtopic 210-20, Balance Sheet Offsetting. ASU 2013-01 clarified the scope of ASU No. 2011-11 “Disclosures about Offsetting Assets and Liabilities” (“ASU 2011-11”). ASU 2011-11 requires an entity to disclose information about offsetting and related arrangements to enable users of the financial statements to understand the effect of those arrangements on the entity’s financial position. ASU 2013-01 clarifies the scope of ASU 2011-11 as applying to derivatives accounted for in accordance with Topic 815, Derivatives and Hedging, including bifurcated embedded derivatives, repurchase agreements and reverse repurchase agreements, and securities borrowing and securities lending transactions that are offset either in accordance with other requirements of GAAP or subject to an enforceable master netting arrangement or similar agreement. The guidance in ASU 2013-01 and ASU 2011-11 is effective for interim and annual periods beginning on or after January 1, 2013. Management is evaluating any impact ASU 2013-01 and ASU 2011-11 may have on the Funds’ financial statements.
3. Investment Valuation Summary:
The valuation techniques employed by the Funds, as described below, maximize the use of observable inputs and minimize the use of unobservable inputs in determining fair value. The inputs used for valuing the Funds’ investments are summarized in the three broad levels listed below:
- Level 1: quoted prices in active markets for identical assets
- Level 2: other significant observable inputs (including quoted prices for similar securities, interest rates, prepayment speeds, credit risk, etc.)
- Level 3: significant unobservable inputs (including a Fund’s own assumptions in determining the fair value of investments)
Changes in valuation techniques may result in transfers in or out of an assigned level within the disclosure hierarchy. The Funds determine transfers between fair value hierarchy levels at the reporting period end. The inputs or methodology used for valuing investments are not necessarily an indication of the risk associated with investing in those investments.
The Funds record their investments in their respective Portfolios at fair value, which is typically categorized as Level 2 in the fair value hierarchy. The underlying securities of the Portfolios are recorded at fair value, as discussed more fully in the Notes to Financial Statements of the Portfolios included elsewhere in this report.
22 HSBC FAMILY OF FUNDS
| HSBC FAMILY OF FUNDS |
| Notes to Financial Statements — as of October 31, 2013 (continued) |
For the year ended October 31, 2013, there were no Level 3 investments for which significant unobservable inputs were used to determine fair value. The following is a summary of the valuation inputs used as of October 31, 2013 in valuing the Funds’ investments based upon the three levels defined above:
| | LEVEL 1 ($) | | LEVEL 2 ($) | | LEVEL 3 ($) | | Total ($) |
| Growth Fund | | | | | | | | |
| Investment Securities: | | | | | | | | |
| Affiliated Portfolios(a) | | — | | 82,541,055 | | — | | 82,541,055 |
| Total Investment Companies | | — | | 82,541,055 | | — | | 82,541,055 |
| |
| Opportunity Fund | | | | | | | | |
| Investment Securities: | | | | | | | | |
| Affiliated Portfolios(a) | | — | | 15,489,119 | | — | | 15,489,119 |
| Total Investment Companies | | — | | 15,489,119 | | — | | 15,489,119 |
| |
| Opportunity Fund (Advisor) | | | | | | | | |
| Investment Companies: | | | | | | | | |
| Affiliated Portfolios(a) | | — | | 208,208,427 | | — | | 208,208,427 |
| Total Investment Companies | | — | | 208,208,427 | | — | | 208,208,427 |
____________________
| (a) | | Investments in Affiliated Portfolios represent ownership interests in the Portfolios. Due to the Funds’ master-feeder structure, the inputs used for valuing these instruments are categorized as Level 2. |
4. Related Party Transactions and Other Agreements and Plans:
Investment Management:
HSBC Global Asset Management (USA) Inc. (“HSBC” or the “Investment Adviser”), a wholly owned subsidiary of HSBC Bank USA, N.A., a national bank organized under the laws of the United States, acts as Investment Adviser to the Portfolios. As Investment Adviser, HSBC manages the investments of the Portfolios and continuously reviews, supervises, and administers the Portfolios’ investments. The Funds are not directly charged any investment management fees.
Administration:
HSBC serves the Funds as Administrator. Under the terms of the Administration Agreement, HSBC receives from the Funds (as well as other funds in the Trusts combined) a fee, accrued daily and paid monthly, at an annual rate of:
| Based on Combined Average Daily Net Assets of | | | Fee Rate(%) |
| Up to $10 billion | | 0.0550 |
| In excess of $10 billion but not exceeding $20 billion | | 0.0350 |
| In excess of $20 billion but not exceeding $50 billion | | 0.0275 |
| In excess of $50 billion | | 0.0250 |
The fee rates and breakpoints are determined on the basis of the aggregate average daily net assets of the Trusts. The total administration fee paid to HSBC is allocated to each series based upon its proportionate share of the aggregate net assets of the Trusts. For assets invested in the Portfolios by the Funds, the Portfolios pay half of the administration fee and the Funds pay half, for a combination of the total fee rate as set forth above. Certain administration fees of the Portfolios also may be reduced by treating them as apportioned in part to other funds making investments in the Portfolios. An amount equal to 50% of the administration fee is deemed to be class specific.
HSBC FAMILY OF FUNDS 23
| HSBC FAMILY OF FUNDS |
| Notes to Financial Statements — as of October 31, 2013 (continued) |
Pursuant to a Sub-Administration Agreement with HSBC, Citi Fund Services Ohio, Inc. (“Citi”), a wholly-owned subsidiary of Citigroup, Inc., serves as the Trusts’ Sub-Administrator, subject to the general supervision by the Trusts’ Board of Trustees (the “Board”) and HSBC. For these services, Citi is entitled to a fee, payable by HSBC, at an annual rate equivalent to the fee rates set forth above subject to certain reductions associated with services provided to new funds, minus 0.02% which is retained by HSBC.
Under a Compliance Services Agreement between the Trusts and Citi (the “CCO Agreement”), Citi makes an employee available to serve as the Trusts’ Chief Compliance Officer (the “CCO”). Under the CCO Agreement, Citi also provides infrastructure and support in implementing the written policies and procedures comprising the Trusts’ compliance program, including support services to the CCO. For the services provided under the CCO Agreement, the Trusts paid Citi $287,560 for the year ended October 31, 2013, plus reimbursement of certain out of pocket expenses. Expenses incurred by each Fund are reflected on the Statements of Operations as “Compliance Services.” Citi pays the salary and other compensation earned by individuals performing these services, as employees of Citi.
Distribution Arrangements:
Foreside Distribution Services, L.P. (“Foreside”), a wholly-owned subsidiary of Foreside Financial Group LLC, serves the Trust as Distributor (the “Distributor”). The Trust has adopted a non-compensatory Distribution Plan and Agreement (the “Distribution Plan”) pursuant to Rule 12b-1 of the Act. The Distribution Plan provides for reimbursement of expenses incurred by the Distributor related to distribution and marketing, at a rate not to exceed 0.25%, 1.00%, and 1.00% of the average daily net assets of Class A Shares (currently not being charged), Class B Shares (currently charging 0.75%), and Class C Shares (currently charging 0.75%) of the Funds, respectively. For the year ended October 31, 2013, Foreside, as Distributor, also received $213,520, $105,439, and $49,940 in commissions from sales of the Trusts, for Class A Shares, Class B Shares, and Class C Shares, respectively of which $584, $89, and $0 were reallocated to HSBC-affiliated brokers and dealers, for Class A Shares, Class B Shares, and Class C Shares, respectively.
Shareholder Servicing:
The Trust has adopted a Shareholder Services Plan, which provides for payments to shareholder servicing agents (which primarily consist of HSBC and its affiliates) for providing various shareholder services. For performing these services, the shareholder servicing agents receive a fee that is computed daily and paid monthly up to 0.25%, 0.25%, and 0.25% of the average daily net assets of Class A Shares, Class B Shares, and Class C Shares of the Funds, respectively. The fees paid to the Distributor pursuant to the Distribution Plan and to shareholder servicing agents pursuant to the Shareholder Services Plan will not exceed in the aggregate 0.25% of the average daily net assets of Class A Shares, and 1.00% of the average daily net assets of Class B Shares and Class C Shares.
Fund Accounting and Transfer Agency:
Citi provides fund accounting and transfer agency services for each Fund. As transfer agent, Citi receives a fee based on the number of funds and shareholder accounts, subject to certain minimums, reductions associated with services provided to new funds and reimbursement of certain expenses. As fund accountant, Citi receives an annual fee per Fund and share class, subject to minimums, reductions associated with services provided to new funds and reimbursement of certain expenses. Citi receives additional fees paid by the Trust and the Advisor Trust for blue sky exemption services.
Independent Trustees:
The Trusts pay each Independent Trustee an annual retainer of $100,000. The Trusts pay a fee of $10,000 for each regular meeting of the Board attended and a fee of $ 3,000 for each special meeting attended. The Trusts pay each Committee Chair an annual retainer of $ 3,000, with the exception of the Chair of the Audit Committee, who receives a retainer of $ 6,000. The Trusts also pay the Chairman of the Board, an additional annual retainer of $24,000. In addition, for time expended on Board duties outside normal meetings, which is authorized by the Board, a Trustee is compensated at the rate of $ 500 per hour, up to a maximum of $3,000 per day.
24 HSBC FAMILY OF FUNDS
| HSBC FAMILY OF FUNDS |
| Notes to Financial Statements — as of October 31, 2013 (continued) |
Fee Reductions:
The Investment Adviser has agreed to contractually limit, through March 1, 2014, the annual total expenses, exclusive of interest, taxes, brokerage commissions, extraordinary expenses, and estimated indirect expenses attributed to a Fund’s investment in investment companies of certain Funds. Each affected Fund Class has its own expense limitations based on the average daily net assets for any full fiscal year as follows:
| | | | Current Contractual |
| | | | Expense |
| Fund | | | Class | | Limitation(%) |
| Growth Fund | | A | | 1.20 |
| Growth Fund | | B | | 1.95 |
| Growth Fund | | C | | 1.95 |
| Growth Fund | | I | | 0.95 |
| Opportunity Fund | | A | | 1.65 |
| Opportunity Fund | | B | | 2.40 |
| Opportunity Fund | | C | | 2.40 |
| Opportunity Fund (Advisor) | | I | | 1.10 |
Any amounts contractually waived or reimbursed by the Investment Adviser will be subject to repayment by the respective Fund to the Investment Adviser within three years to the extent that the repayment will not cause the Fund’s operating expenses to exceed the contractual expense limit that was in effect at the time of such waiver or reimbursement. During the year ended October 31, 2013, the Investment Adviser did not recapture any of its prior contractual waivers or reimbursements. As of October 31, 2013, the repayments that may potentially be made by the Funds are as follows:
| Fund | | | 2016($) | | 2015($) | | 2014($) | | Total |
| Growth Fund | | 5,267 | | 65,181 | | — | | 70,448 |
| Opportunity Fund | | 46,445 | | 65,241 | | 27,228 | | 138,914 |
The Administrator and Citi may voluntarily waive/reimburse fees to help support the expense limits of the Funds. In addition, HSBC, in its role as Investment Adviser and Administrator, may waive/reimburse additional fees at its discretion. Any voluntary fee waivers/reimbursements are not subject to recoupment in subsequent fiscal periods. Voluntary waivers/reimbursements may be stopped at any time. Amounts waived/reimbursed by the Investment Adviser, Administrator and Citi are reported separately on the Statements of Operations, as applicable.
5. Investment Transactions:
Contributions and withdrawals of the respective Portfolios for the year ended October 31, 2013 totaled:
| Fund | | | Contributions($) | | Withdrawals($) |
| Growth Fund | | | 4,105,330 | | | | 13,848,759 | |
| Opportunity Fund | | | 2,826,611 | | | | 2,492,440 | |
| Opportunity Fund (Advisor) | | | 34,440,619 | | | | 11,972,238 | |
HSBC FAMILY OF FUNDS 25
| HSBC FAMILY OF FUNDS |
| Notes to Financial Statements — as of October 31, 2013 (continued) |
6. Federal Income Tax Information:
The tax character of dividends paid by the Funds for the tax year ended October 31, 2013 was as follows:
| | Dividends paid from |
| | | | | | | | | | | | | | | | Total |
| | Ordinary | | Net Long Term | | Total Taxable | | Return of | | Dividends |
| | Income ($) | | Capital Gains ($) | | Dividends ($) | | Capital ($) | | Paid ($)(1) |
| Growth Fund | | | 77,975 | | | | 5,056,287 | | | | 5,134,262 | | | — | | 5,134,262 |
| Opportunity Fund | | | — | | | | 693,083 | | | | 693,083 | | | — | | 693,083 |
| Opportunity Fund (Advisor) | | | — | | | | 6,472,825 | | | | 6,472,825 | | | — | | 6,472,825 |
The tax character of dividends paid by the Funds for the tax year ended October 31, 2012 was as follows:
| | Dividends paid from |
| | | | | | | | | | | | Total |
| | Ordinary | | Net Long Term | | Total Taxable | | Return of | | Dividends |
| | Income ($) | | Capital Gains ($) | | Dividends ($) | | Capital ($) | | Paid ($)(1) |
| Opportunity Fund | | 122,612 | | | 1,646,254 | | | 1,768,866 | | — | | 1,768,866 |
| Opportunity Fund (Advisor) | | 2,322,165 | | | 16,364,147 | | | 18,686,312 | | — | | 18,686,312 |
____________________
| (1) | | Total dividends paid may differ from the amount reported in the Statement of Changes in Net Assets because dividends are recognized when actually paid for tax purposes. |
As of the tax year October 31, 2013, the components of accumulated earnings/(deficit) on a tax basis for the Funds were as follows:
| | | | | | | | Undistributed | | | | | | | | Accumulated | | Unrealized | | Total |
| | Undistributed | | Undistributed | | Long Term | | | | | | | | Capital and | | Appreciation/ | | Accumulated |
| | Ordinary | | Tax Exempt | | Capital | | Accumulated | | Dividends | | Other | | (Depreciation) | | Earnings/ |
| | Income ($) | | Income ($) | | Gains ($) | | Earnings ($) | | Payable ($) | | Losses ($) | | ($)(1) | | (Deficit) ($) |
| Growth Fund | | | 848,249 | | | — | | | 8,732,299 | | | | 9,580,548 | | | — | | (99,109) | | | | 21,764,615 | | | | 31,246,054 | |
| Opportunity Fund | | | 61,565 | | | — | | | 1,630,496 | | | | 1,692,061 | | | — | | — | | | | 3,677,236 | | | | 5,369,297 | |
| Opportunity Fund | | | | | | | | | | | | | | | | | | | | | | | | | | | |
| (Advisor) | | | 2,210,509 | | | — | | | 19,414,139 | | | | 21,624,648 | | | — | | — | | | | 46,985,800 | | | | 68,610,448 | |
____________________
| (1) | | The differences between book-basis and tax-basis unrealized appreciation/depreciation are attributable primarily to: tax deferral of losses on wash sales, the realization for tax purposes of unrealized gains/losses on certain derivative instruments, the difference between book and tax amortization methods for premium and market discount, the realization for tax purposes of unrealized gains/losses on investments in passive foreign investment companies and the return of capital adjustments from real estate investment trusts. |
Under current law, capital losses and specified ordinary losses realized after October 31st and non-specified ordinary losses incurred after December 31st (ordinary losses collectively known as “late year ordinary loss”) may be deferred and treated as occurring on the first business day of the following fiscal year. As of the tax year ended October 31, 2013, the following Funds had deferred losses, which will be treated as arising on the first day of the fiscal year ending October 31, 2014.
| Late Year |
| Ordinary Losses ($) |
| Growth Fund | 99,109 |
26 HSBC FAMILY OF FUNDS
| HSBC FAMILY OF FUNDS |
| Notes to Financial Statements — as of October 31, 2013 (continued) |
7. Legal and Regulatory Matters:
On September 26, 2006 BISYS Fund Services, Inc. (“BISYS”), an affiliate of BISYS Fund Services Ohio, Inc. which provided various services to the Funds, reached a settlement with the Securities and Exchange Commission (the “SEC”) regarding the SEC’s investigation related to BISYS’ past payment of certain marketing and other expenses with respect to certain of its mutual fund clients. The related settlement monies were received by the Funds during the year ended October 31, 2010. The corresponding impact to the net income ratio and total return for the year ended October 31, 2010 are disclosed in the Funds’ Financial Highlights.
8. Subsequent Events:
Management has evaluated events and transactions through the date the financial statements were issued, for purposes of recognition or disclosure in these financial statements and there are no subsequent events to report.
HSBC FAMILY OF FUNDS 27
REPORT OF INDEPENDENT REGISTERED PUBLIC ACCOUNTING FIRM
To the Shareholders and Board of Trustees of HSBC Funds and
HSBC Advisor Funds Trust:
We have audited the accompanying statements of assets and liabilities of HSBC Growth Fund, HSBC Opportunity Fund and HSBC Opportunity Fund (Advisor) (the Funds), as of October 31, 2013, and the related statements of operations for the year then ended, the statements of changes in net assets for each of the years in the two-year period then ended, and the financial highlights for each of the years in the five-year period then ended. These financial statements and financial highlights are the responsibility of the Funds’ management. Our responsibility is to express an opinion on these financial statements and financial highlights based on our audits.
We conducted our audits in accordance with the standards of the Public Company Accounting Oversight Board (United States). Those standards require that we plan and perform the audit to obtain reasonable assurance about whether the financial statements and financial highlights are free of material misstatement. An audit includes examining, on a test basis, evidence supporting the amounts and disclosures in the financial statements. Our procedures included confirmation of securities owned as of October 31, 2013, by correspondence with the transfer agent of the HSBC Portfolios. An audit also includes assessing the accounting principles used and significant estimates made by management, as well as evaluating the overall financial statement presentation. We believe that our audits provide a reasonable basis for our opinion.
In our opinion, the financial statements and financial highlights referred to above present fairly, in all material respects, the financial position of the Funds as of October 31, 2013, the results of their operations for the year then ended, the changes in their net assets for each of the years in the two-year period then ended, and the financial highlights for each of the years in the five-year period then ended, in conformity with U.S. generally accepted accounting principles.

Columbus, Ohio
December 27, 2013
28 HSBC FAMILY OF FUNDS
| HSBC FAMILY OF FUNDS |
| Other Federal Income Tax Information — as of October 31, 2013 (Unaudited) |
During the year ended October 31, 2013, the following Funds declared capital gain distributions:
| | Short Term | | Long Term |
| | Capital Gain | | Capital Gain |
| | Distributions ($) | | Distributions ($) |
| Growth Fund | | — | | | 5,056,287 | |
| Opportunity Fund | | — | | | 693,083 | |
| Opportunity Fund (Advisor) | | — | | | 6,472,825 | |
For the year ended October 31, 2013, the following percentages of the total ordinary income dividends paid by the Fund qualify for the corporate dividends received deduction available to corporate shareholders:
| | Dividends |
| | Received |
| | Deduction (%) |
| Growth Fund | | 87.17 |
For the year ended October 31, 2013, dividends paid by the following Fund may be subject to a maximum tax rate of 15%, as provided for by the Jobs and Growth Tax Relief Reconciliation Act of 2003. The Fund intends to designate the maximum amount allowable as taxed at a maximum rate of 15%. Complete information will be reported in conjunction with your 2013 Form 1099-DIV:
| | Qualified |
| | Dividend |
| | Income (%) |
| Growth Fund | | 79.00 |
HSBC FAMILY OF FUNDS 29
| HSBC FAMILY OF FUNDS |
| Table of Shareholder Expenses — as of October 31, 2013 (Unaudited) |
As a shareholder of the Funds, you incur two types of costs: (1) transaction costs, including sales charges (loads) on purchases, redemption fees and exchange fees; and (2) ongoing costs, including management fees, distribution fees and/or shareholder servicing fees and other Fund expenses (including expenses allocated from the Portfolios). These examples are intended to help you understand your ongoing costs (in dollars) of investing in the Funds and to compare these costs with the ongoing costs of investing in other mutual funds.
These examples are based on an investment of $1,000 invested at the beginning of the period and held for the entire period from May 1, 2013 through October 31, 2013.
Actual Example
The table below provides information about actual account values and actual expenses. You may use the information below, together with the amount you invested, to estimate the expenses that you paid over the period. Simply divide your account value by $1,000 (for example, an $8,600 account value divided by $1,000 = 8.6), then multiply the result by the number in the table under the heading entitled “Expenses Paid During Period” to estimate the expenses you paid on your account during this period.
| | | | | | | | | | | | | | | | | | | Annualized |
| | | | Beginning | | Ending | | Expenses Paid | | Expense Ratio |
| | | | Account Value | | Account Value | | During Period* | | During Period |
| | | | 5/1/13 | | 10/31/13 | | 5/1/13 - 10/31/13 | | 5/1/13 - 10/31/13 |
| Growth Fund | | Class A Shares | | | $ | 1,000.00 | | | | $ | 1,167.70 | | | | $ | 6.56 | | | 1.20 | % |
| | Class B Shares | | | | 1,000.00 | | | | | 1,162.80 | | | | | 10.63 | | | 1.95 | % |
| | Class C Shares | | | | 1,000.00 | | | | | 1,162.90 | | | | | 10.63 | | | 1.95 | % |
| | Class I Shares | | | | 1,000.00 | | | | | 1,168.30 | | | | | 5.19 | | | 0.95 | % |
| Opportunity Fund | | Class A Shares | | | | 1,000.00 | | | | | 1,136.00 | | | | | 8.35 | | | 1.55 | % |
| | Class B Shares | | | | 1,000.00 | | | | | 1,131.90 | | | | | 12.36 | | | 2.30 | % |
| | Class C Shares | | | | 1,000.00 | | | | | 1,131.70 | | | | | 12.36 | | | 2.30 | % |
| Opportunity Fund (I Shares) | | Class I Shares | | | | 1,000.00 | | | | | 1,138.40 | | | | | 5.28 | | | 0.98 | % |
____________________
| * | | Expenses are equal to the average account value over the period, multiplied by the Fund’s annualized expense ratio, multiplied by 184/365 (to reflect the one half year period). |
30 HSBC FAMILY OF FUNDS
| HSBC FAMILY OF FUNDS |
| Table of Shareholder Expenses — as of October 31, 2013 (Unaudited) (continued) |
Hypothetical Example for Comparison Purposes
The table below provides information about hypothetical account values and hypothetical expenses based on each Fund��s actual expense ratio and an assumed rate of return of 5% per year before expenses, which is not the Fund’s actual return. The hypothetical account values and expenses may not be used to estimate the actual ending account balance or expenses you paid for the period. You may use this information to compare this 5% hypothetical example with the 5% hypothetical examples that appear in the shareholder reports of other funds.
Please note that the expenses shown in the table are meant to highlight your ongoing costs only and do not reflect any transactional costs, such as sales charges (loads), redemption fees, or exchange fees. Therefore, the table is useful in comparing ongoing costs only, and will not help you determine the relative total costs of owning different funds. In addition, if these transactional costs were included, your costs would have been higher.
| | | | | | | | | | | | | | | | | | | Annualized |
| | | | Beginning | | Ending | | Expenses Paid | | Expense Ratio |
| | | | Account Value | | Account Value | | During Period* | | During Period |
| | | | 5/1/13 | | 10/31/13 | | 5/1/13 - 10/31/13 | | 5/1/13 - 10/31/13 |
| Growth Fund | | Class A Shares | | | $ | 1,000.00 | | | | $ | 1,019.16 | | | | $ | 6.11 | | | 1.20 | % |
| | Class B Shares | | | | 1,000.00 | | | | | 1,015.38 | | | | | 9.91 | | | 1.95 | % |
| | Class C Shares | | | | 1,000.00 | | | | | 1,015.38 | | | | | 9.91 | | | 1.95 | % |
| | Class I Shares | | | | 1,000.00 | | | | | 1,020.42 | | | | | 4.84 | | | 0.95 | % |
| Opportunity Fund | | Class A Shares | | | | 1,000.00 | | | | | 1,017.39 | | | | | 7.88 | | | 1.55 | % |
| | Class B Shares | | | | 1,000.00 | | | | | 1,013.61 | | | | | 11.67 | | | 2.30 | % |
| | Class C Shares | | | | 1,000.00 | | | | | 1,013.61 | | | | | 11.67 | | | 2.30 | % |
| Opportunity Fund (I Shares) | | Class I Shares | | | | 1,000.00 | | | | | 1,020.27 | | | | | 4.99 | | | 0.98 | % |
____________________
| * | | Expenses are equal to the average account value over the period, multiplied by the Fund’s annualized expense ratio, multiplied by 184/365 (to reflect the one half year period). |
HSBC FAMILY OF FUNDS 31
| HSBC GROWTH PORTFOLIO |
| Schedule of Portfolio Investments — as of October 31, 2013 |
| Common Stocks – 98.9% | | | | |
| | | | | |
| | Shares | | Value ($) |
| Aerospace & Defense – 3.1% | | | | |
| Precision Castparts Corp. | | 6,300 | | 1,596,735 |
| United Technologies Corp. | | 11,250 | | 1,195,312 |
| | | | 2,792,047 |
| Airlines – 0.7% | | | | |
| Delta Air Lines, Inc. | | 23,050 | | 608,059 |
| Auto Components – 1.2% | | | | |
| BorgWarner, Inc. | | 10,200 | | 1,051,926 |
| Biotechnology – 9.1% | | | | |
| Alexion Pharmaceuticals, Inc. (a) | | 7,300 | | 897,535 |
| Amgen, Inc. | | 13,850 | | 1,606,600 |
| Biogen Idec, Inc. (a) | | 6,900 | | 1,684,911 |
| Celgene Corp. (a) | | 14,050 | | 2,086,284 |
| Gilead Sciences, Inc. (a) | | 25,650 | | 1,820,894 |
| | | | 8,096,224 |
| Capital Markets – 3.7% | | | | |
| BlackRock, Inc. | | 5,365 | | 1,613,846 |
| Morgan Stanley | | 45,900 | | 1,318,707 |
| The Charles Schwab Corp. | | 13,800 | | 312,570 |
| | | | 3,245,123 |
| Chemicals – 4.1% | | | | |
| Ecolab, Inc. | | 9,500 | | 1,007,000 |
| Monsanto Co. | | 25,149 | | 2,637,627 |
| | | | 3,644,627 |
| Communications Equipment – 1.5% | | | | |
| F5 Networks, Inc. (a) | | 6,200 | | 505,362 |
| Qualcomm, Inc. | | 12,350 | | 857,955 |
| | | | 1,363,317 |
| Computers & Peripherals – 3.1% | | | | |
| Apple, Inc. | | 5,210 | | 2,721,444 |
| Diversified Financial Services – 1.2% | | | | |
| American Express Co. | | 13,100 | | 1,071,580 |
| Energy Equipment & Services – 1.5% | | | | |
| Schlumberger Ltd. | | 14,000 | | 1,312,080 |
| Food & Staples Retailing – 2.4% | | | | |
| Costco Wholesale Corp. | | 6,900 | | 814,200 |
| CVS Caremark Corp. | | 15,400 | | 958,804 |
| Whole Foods Market, Inc. | | 5,400 | | 340,902 |
| | | | 2,113,906 |
| Health Care Providers & Services – 0.9% | | | | |
| Catamaran Corp. (a) | | 16,400 | | 770,144 |
| Health Care Technology – 1.7% | | | | |
| athenahealth, Inc. (a) | | 3,600 | | 480,636 |
| Cerner Corp. (a) | | 18,000 | | 1,008,540 |
| | | | 1,489,176 |
| Hotels, Restaurants & Leisure – 3.8% | | | | |
| Chipotle Mexican Grill, Inc. (a) | | 1,170 | | 616,555 |
| Starbucks Corp. | | 23,200 | | 1,880,360 |
| Wynn Resorts Ltd. | | 5,200 | | 864,500 |
| | | | 3,361,415 |
| Internet & Catalog Retail – 6.8% | | | | |
| Amazon.com, Inc. (a) | | 8,235 | | 2,997,787 |
| Priceline.com, Inc. (a) | | 2,920 | | 3,077,184 |
| | | | 6,074,971 |
| Internet Software & Services – 9.4% | | | | |
| Baidu, Inc. (a) | | 4,400 | | 707,960 |
| eBay, Inc. (a) | | 30,150 | | 1,589,206 |
| Facebook, Inc., Class A(a) | | 35,100 | | 1,764,126 |
| Google, Inc., Class A(a) | | 3,550 | | 3,658,559 |
| LinkedIn Corp., Class A(a) | | 2,900 | | 648,643 |
| | | | 8,368,494 |
| IT Services – 6.3% | | | | |
| Cognizant Technology Solutions Corp., | | | | |
| Class A(a) | | 12,100 | | 1,051,853 |
| MasterCard, Inc., Class A | | 1,955 | | 1,401,930 |
| Visa, Inc., Class A | | 16,100 | | 3,166,387 |
| | | | 5,620,170 |
| Machinery – 2.7% | | | | |
| Danaher Corp. | | 33,000 | | 2,378,970 |
| Media – 5.0% | | | | |
| CBS Corp., Class B | | 19,600 | | 1,159,144 |
| Liberty Global plc, Class A(a) | | 11,700 | | 916,929 |
| The Walt Disney Co. | | 14,400 | | 987,696 |
| tt Century Fox, Inc., Class A | | 39,750 | | 1,354,680 |
| | | | 4,418,449 |
| Oil, Gas & Consumable Fuels – 4.1% | | | | |
| EOG Resources, Inc. | | 4,300 | | 767,120 |
| Noble Energy, Inc. | | 14,000 | | 1,049,020 |
| Pioneer Natural Resources Co. | | 4,700 | | 962,466 |
| Range Resources Corp. | | 11,400 | | 863,094 |
| | | | 3,641,700 |
| Personal Products – 1.1% | | | | |
| The Estee Lauder Cos., Inc., Class A | | 13,150 | | 933,124 |
| Pharmaceuticals – 2.1% | | | | |
| Bristol-Myers Squibb Co. | | 15,400 | | 808,808 |
| Zoetis, Inc. | | 34,000 | | 1,076,440 |
| | | | 1,885,248 |
| Real Estate Investment Trusts (REITs) – 1.5% | | |
| American Tower Corp. | | 16,700 | | 1,325,145 |
| Road & Rail – 4.1% | | | | |
| The Kansas City Southern Railway Co. | | 3,600 | | 437,472 |
| Union Pacific Corp. | | 21,150 | | 3,202,110 |
| | | | 3,639,582 |
| 32 HSBC PORTFOLIOS | See notes to financial statements. |
| HSBC GROWTH PORTFOLIO |
| Schedule of Portfolio Investments — as of October 31, 2013 (continued) |
| Common Stocks, continued | | | |
| | | | |
| Shares | | Value ($) |
| Semiconductors & Semiconductor Equipment – 3.0% |
| Applied Materials, Inc. | 47,800 | | 853,230 |
| ARM Holdings plc ADR | 20,100 | | 948,519 |
| NXP Semiconductors NV (a) | 21,250 | | 895,050 |
| | | 2,696,799 |
| Software – 3.4% | | | |
| Salesforce.com, Inc. (a) | 47,150 | | 2,515,924 |
| ServiceNow, Inc. (a) | 8,700 | | 475,107 |
| | | 2,991,031 |
| Specialty Retail – 5.9% | | | |
| Best Buy Co., Inc. | 7,350 | | 314,580 |
| Dollar General Corp. (a) | 22,300 | | 1,288,494 |
| Lowe’s Cos., Inc. | 22,300 | | 1,110,094 |
| Ross Stores, Inc. | 12,600 | | 974,610 |
| Ulta Salon, Cosmetics & Fragrance, | | | |
| Inc. (a) | 11,700 | | 1,507,545 |
| | | 5,195,323 |
| Textiles, Apparel & Luxury Goods – 3.1% | | | |
| Lululemon Athletica, Inc. (a) | 8,500 | | 586,925 |
| NIKE, Inc., Class B | 18,300 | | 1,386,408 |
| Ralph Lauren Corp. | 4,900 | | 811,636 |
| | | 2,784,969 |
| Trading Companies & Distributors – 1.0% | | |
| W. W. Grainger, Inc. | 3,365 | | 905,084 |
| Wireless Telecommunication Services – 1.4% | | |
| SBA Communications Corp., | | | |
| Class A(a) | 14,250 | | 1,246,448 |
| TOTAL COMMON STOCKS | | | |
| (COST $62,689,144) | | | 87,746,575 |
| |
| Investment Companies – 0.7% | | | |
| | | | |
| Northern Institutional Diversified Assets | | | |
| Portfolio, Institutional Shares, | | | |
| 0.01% (b) | 606,946 | | 606,946 |
| TOTAL INVESTMENT COMPANIES | | | |
| (COST $606,946) | | | 606,946 |
| TOTAL INVESTMENT SECURITIES | | | |
| (COST $63,296,090) — 99.6% | | | 88,353,521 |
____________________
| Percentages indicated are based on net assets of $88,684,466. |
| | | |
| (a) | | Represents non-income producing security. |
| (b) | | The rate represents the annualized one-day yield that was in effect on October 31, 2013. |
ADR American Depositary Receipt
| See notes to financial statements. | HSBC PORTFOLIOS | 33 |
| HSBC OPPORTUNITY PORTFOLIO |
| Schedule of Portfolio Investments — as of October 31, 2013 |
| Common Stocks – 96.4% | | | | |
| | | | | |
| | Shares | | Value ($) |
| Aerospace & Defense – 3.1% | | | | |
| BE Aerospace, Inc. (a) | | 46,990 | | 3,813,708 |
| TransDigm Group, Inc. | | 22,385 | | 3,255,003 |
| | | | 7,068,711 |
| Auto Components – 1.5% | | | | |
| Gentex Corp. | | 114,150 | | 3,360,576 |
| Biotechnology – 4.9% | | | | |
| ACADIA Pharmaceuticals, Inc. (a) | | 102,800 | | 2,336,644 |
| Alkermes plc (a) | | 124,810 | | 4,392,064 |
| Cubist Pharmaceuticals, Inc. (a) | | 72,520 | | 4,496,240 |
| | | | 11,224,948 |
| Capital Markets – 1.6% | | | | |
| Raymond James Financial, Inc. | | 77,760 | | 3,549,744 |
| Chemicals – 6.2% | | | | |
| Celanese Corp., Series A | | 19,010 | | 1,064,750 |
| Cytec Industries, Inc. | | 35,570 | | 2,955,511 |
| Huntsman Corp. | | 153,470 | | 3,563,573 |
| Rockwood Holdings, Inc. | | 42,700 | | 2,700,775 |
| The Scotts Mircale-Gro Co. | | 63,830 | | 3,748,098 |
| | | | 14,032,707 |
| Commercial Banks – 2.8% | | | | |
| Comerica, Inc. | | 59,470 | | 2,575,051 |
| First Republic Bank | | 74,640 | | 3,811,865 |
| | | | 6,386,916 |
| Commercial Services & Supplies – 1.6% | | | | |
| Waste Connections, Inc. | | 83,135 | | 3,553,190 |
| Communications Equipment – 0.7% | | | | |
| JDS Uniphase Corp. (a) | | 118,500 | | 1,551,165 |
| Construction Materials – 0.7% | | | | |
| Martin Marietta Materials, Inc. | | 17,245 | | 1,691,562 |
| Containers & Packaging – 2.7% | | | | |
| Crown Holdings, Inc. (a) | | 48,790 | | 2,127,244 |
| Packaging Corp. of America | | 65,400 | | 4,073,112 |
| | | | 6,200,356 |
| Distributors – 1.1% | | | | |
| LKQ Corp. (a) | | 78,070 | | 2,578,652 |
| Diversified Consumer Services – 1.5% | | | | |
| Service Corp. International | | 188,540 | | 3,395,605 |
| Electrical Equipment – 2.7% | | | | |
| Generac Holdings, Inc. | | 43,690 | | 2,156,102 |
| Hubbell, Inc., Class B | | 36,500 | | 3,925,210 |
| | | | 6,081,312 |
| Electronic Equipment, Instruments & Components – 0.6% |
| IPG Photonics Corp. | | 19,110 | | 1,266,420 |
| Energy Equipment & Services – 1.9% | | | | |
| Rowan Cos. plc, Class A(a) | | 116,860 | | 4,216,309 |
| Health Care Equipment & Supplies – 3.7% | | | | |
| ArthroCare Corp. (a) | | 61,740 | | 2,311,546 |
| IDEXX Laboratories, Inc. (a) | | 30,700 | | 3,311,302 |
| Wright Medical Group, Inc. (a) | | 99,300 | | 2,697,981 |
| | | | 8,320,829 |
| Health Care Providers & Services – 1.9% | | | | |
| Community Health Systems, Inc. | | 96,490 | | 4,209,859 |
| Health Care Technology – 0.8% | | | | |
| Allscripts Healthcare Solutions, Inc. (a) | | 134,470 | | 1,859,720 |
| Hotels, Restaurants & Leisure – 1.8% | | | | |
| Arcos Dorados Holdings, Inc., Class A | | 113,250 | | 1,363,530 |
| Brinker International, Inc. | | 63,240 | | 2,809,121 |
| | | | 4,172,651 |
| Household Durables – 5.4% | | | | |
| Harman International Industries, Inc. | | 29,540 | | 2,393,331 |
| Jarden Corp. (a) | | 70,115 | | 3,881,566 |
| NVR, Inc. (a) | | 2,427 | | 2,226,336 |
| Taylor Morrison Home Corp., Class A(a) | | 95,750 | | 2,129,480 |
| Tempur Sealy International, Inc. (a) | | 44,480 | | 1,705,808 |
| | | | 12,336,521 |
| Insurance – 1.9% | | | | |
| Everest Re Group Ltd. | | 10,390 | | 1,597,358 |
| Genworth Financial, Inc., Class A(a) | | 194,860 | | 2,831,316 |
| | | | 4,428,674 |
| Internet Software & Services – 2.6% | | | | |
| MercadoLibre, Inc. | | 24,020 | | 3,233,933 |
| Pandora Media, Inc. (a) | | 105,680 | | 2,655,738 |
| | | | 5,889,671 |
| IT Services – 6.9% | | | | |
| Alliance Data Systems Corp. (a) | | 29,245 | | 6,932,820 |
| FleetCor Technologies, Inc. (a) | | 29,575 | | 3,411,476 |
| Genpact Ltd. (a) | | 111,310 | | 2,207,277 |
| Total System Services, Inc. | | 100,930 | | 3,010,742 |
| | | | 15,562,315 |
| Life Sciences Tools & Services – 3.3% | | | | |
| Covance, Inc. (a) | | 35,000 | | 3,124,100 |
| Mettler-Toledo International, Inc. (a) | | 18,120 | | 4,483,975 |
| | | | 7,608,075 |
| Machinery – 2.1% | | | | |
| Lincoln Electric Holdings, Inc. | | 34,780 | | 2,408,167 |
| The Timken Co. | | 44,450 | | 2,347,405 |
| | | | 4,755,572 |
| Media – 1.6% | | | | |
| Manchester United plc, Class A(a) | | 84,360 | | 1,375,068 |
| Nexstar Broadcasting Group, Inc., | | | | |
| Class A | | 51,270 | | 2,275,875 |
| | | | 3,650,943 |
| 34 | HSBC PORTFOLIOS | See notes to financial statements. |
| HSBC OPPORTUNITY PORTFOLIO |
| Schedule of Portfolio Investments — as of October 31, 2013 (continued) |
| Common Stocks, continued | | | | |
| | | | | |
| | Shares | | Value ($) |
| Oil, Gas & Consumable Fuels – 5.0% | | | | |
| CONSOL Energy, Inc. | | 72,100 | | 2,631,650 |
| Denbury Resources, Inc. (a) | | 140,980 | | 2,677,210 |
| Tesoro Corp. | | 124,510 | | 6,087,294 |
| | | | 11,396,154 |
| Pharmaceuticals – 2.7% | | | | |
| ViroPharma, Inc. (a) | | 157,970 | | 6,132,395 |
| Professional Services – 2.0% | | | | |
| IHS, Inc., Class A(a) | | 22,515 | | 2,455,261 |
| Robert Half International, Inc. | | 56,730 | | 2,185,807 |
| | | | 4,641,068 |
| Real Estate Investment Trusts (REITs) – 1.1% | | |
| Starwood Property Trust, Inc. | | 96,270 | | 2,473,176 |
| Real Estate Management & Development – 1.1% | | |
| Jones Lang LaSalle, Inc. | | 25,440 | | 2,421,888 |
| Road & Rail – 1.3% | | | | |
| Landstar System, Inc. | | 52,290 | | 2,891,114 |
| Semiconductors & Semiconductor Equipment – 3.0% |
| Avago Technologies Ltd. | | 37,670 | | 1,711,348 |
| NXP Semiconductors NV (a) | | 80,230 | | 3,379,288 |
| Skyworks Solutions, Inc. (a) | | 66,800 | | 1,722,104 |
| | | | 6,812,740 |
| Software – 3.2% | | | | |
| Concur Technologies, Inc. (a) | | 21,270 | | 2,224,842 |
| Informatica Corp. (a) | | 58,240 | | 2,248,064 |
| QLIK Technologies, Inc. (a) | | 108,820 | | 2,757,499 |
| | | | 7,230,405 |
| Specialty Retail – 8.1% | | | | |
| Best Buy Co., Inc. | | 118,510 | | 5,072,228 |
| GNC Holdings, Inc., Class A | | 30,610 | | 1,800,480 |
| Signet Jewelers Ltd. | | 45,130 | | 3,369,406 |
| Tractor Supply Co. | | 35,170 | | 2,509,380 |
| Urban Outfitters, Inc. (a) | | 93,210 | | 3,530,795 |
| Williams-Sonoma, Inc. | | 42,094 | | 2,207,409 |
| | | | 18,489,698 |
| Trading Companies & Distributors – 3.3% | | |
| United Rentals, Inc. (a) | | 47,670 | | 3,079,005 |
| WESCO International, Inc. (a) | | 52,080 | | 4,450,757 |
| | | | 7,529,762 |
| TOTAL COMMON STOCKS | | | | |
| (COST $167,155,410) | | | | 218,971,403 |
| | | | | |
| Investment Companies – 2.9% | | | | |
| | | | | |
| Northern Institutional Government | | | | |
| Select Portfolio, Institutional Shares, | | | | |
| 0.01% (b) | | 6,563,134 | | 6,563,134 |
| TOTAL INVESTMENT COMPANIES | | | | |
| (COST $6,563,134) | | | | 6,563,134 |
| TOTAL INVESTMENT SECURITIES | | | | |
| (COST $173,718,544) — 99.3% | | | | 225,534,537 |
____________________
| Percentages indicated are based on net assets of $227,068,664. |
| | | |
| (a) | | Represents non-income producing security. |
| (b) | | The rate represents the annualized one-day yield that was in effect on October 31, 2013. |
| See notes to financial statements. | HSBC PORTFOLIOS | 35 |
HSBC PORTFOLIOS
Statements of Assets and Liabilities — as of October 31, 2013
| | Growth | | Opportunity |
| | Portfolio | | Portfolio |
| Assets: | | | | | | | | | | |
| Investments in non-affiliates, at value | | | $ | 88,353,521 | | | | $ | 225,534,537 | |
| Dividends receivable | | | | 19,861 | | | | | 32,244 | |
| Receivable for investments sold | | | | 1,517,261 | | | | | 2,269,970 | |
| Prepaid expenses | | | | 594 | | | | | 1,339 | |
| Total Assets | | | | 89,891,237 | | | | | 227,838,090 | |
| | | | | | | | | | | |
| Liabilities: | | | | | | | | | | |
| Payable for investments purchased | | | | 1,134,982 | | | | | 584,366 | |
| Accrued expenses and other liabilities: | | | | | | | | | | |
| Investment Management | | | | 49,082 | | | | | 150,660 | |
| Administration | | | | 2,318 | | | | | 5,839 | |
| Compliance Services | | | | 8 | | | | | 27 | |
| Accounting | | | | 212 | | | | | 223 | |
| Custodian | | | | 5,200 | | | | | 6,773 | |
| Trustee | | | | 83 | | | | | 346 | |
| Other | | | | 14,886 | | | | | 21,192 | |
| Total Liabilities | | | | 1,206,771 | | | | | 769,426 | |
| | | | | | | | | | | |
| Applicable to investors’ beneficial interest | | | $ | 88,684,466 | | | | $ | 227,068,664 | |
| Total Investments, at cost | | | $ | 63,296,090 | | | | $ | 173,718,544 | |
| 36 | HSBC PORTFOLIOS | See notes to financial statements. |
HSBC PORTFOLIOS
Statements of Operations — For the year ended October 31, 2013
| | Growth | | Opportunity |
| | Portfolio | | Portfolio |
| Investment Income: | | | | | | | | | | |
| Dividends | | | $ | 975,963 | | | | $ | 1,973,053 | |
| Total Investment Income | | | | 975,963 | | | | | 1,973,053 | |
| | | | | | | | | | | |
| Expenses: | | | | | | | | | | |
| Investment Management | | | | 472,689 | | | | | 1,486,877 | |
| Administration | | | | 26,895 | | | | | 58,975 | |
| Accounting | | | | 44,063 | | | | | 44,249 | |
| Compliance Services | | | | 719 | | | | | 1,518 | |
| Custodian | | | | 9,900 | | | | | 13,555 | |
| Printing | | | | 1,791 | | | | | 4,180 | |
| Professional | | | | 20,043 | | | | | 25,426 | |
| Trustee | | | | 2,176 | | | | | 4,700 | |
| Other | | | | 4,584 | | | | | 9,513 | |
| Total Expenses | | | | 582,860 | | | | | 1,648,993 | |
| | | | | | | | | | | |
| Net Investment Income (Loss) | | | | 393,103 | | | | | 324,060 | |
| | | | | | | | | | | |
| Net Realized/Unrealized Gains (Losses) from Investments: | | | | | | | | | | |
| Net realized gains (losses) from investment securities | | | | 12,024,769 | | | | | 24,604,589 | |
| Change in unrealized appreciation/depreciation on investments | | | | 11,744,016 | | | | | 30,628,121 | |
| | | | | | | | | | | |
| Net realized/unrealized gains (losses) from investments | | | | 23,768,785 | | | | | 55,232,710 | |
| Change In Net Assets Resulting From Operations | | | $ | 24,161,888 | | | | $ | 55,556,770 | |
| See notes to financial statements. | HSBC PORTFOLIOS | 37 |
HSBC PORTFOLIOS
Statements of Changes in Net Assets
| | Growth | | Opportunity |
| | Portfolio | | Portfolio |
| | For the | | For the | | For the | | For the |
| | year ended | | year ended | | year ended | | year ended |
| | October 31, 2013 | | October 31, 2012 | | October 31, 2013 | | October 31, 2012 |
| Investment Activities: | | | | | | | | | | | | | | | | | | | | | | | | |
| Operations: | | | | | | | | | | | | | | | | | | | | | | | | |
| Net investment income (loss) | | | $ | 393,103 | | | | | $ | 116,496 | | | | | $ | 324,060 | | | | | $ | 224,890 | | |
| Net realized gains (losses) from investments | | | | 12,024,769 | | | | | | 12,654,581 | | | | | | 24,604,589 | | | | | | 8,826,465 | | |
| Change in unrealized appreciation/depreciation | | | | | | | | | | | | | | | | | | | | | | | | |
| from investments | | | | 11,744,016 | | | | | | (6,525,872 | ) | | | | | 30,628,121 | | | | | | 8,291,618 | | |
| Change in net assets resulting from operations | | | | 24,161,888 | | | | | | 6,245,205 | | | | | | 55,556,770 | | | | | | 17,342,973 | | |
| Proceeds from contributions | | | | 5,010,619 | | | | | | 10,142,030 | | | | | | 37,719,433 | | | | | | 15,884,698 | | |
| Value of withdrawals | | | | (19,506,375 | ) | | | | | (42,657,788 | ) | | | | | (16,266,064 | ) | | | | | (24,493,548 | ) | |
| Change in net assets resulting from transactions | | | | | | | | | | | | | | | | | | | | | | | | |
| in investors’ beneficial interest | | | | (14,495,756 | ) | | | | | (32,515,758 | ) | | | | | 21,453,369 | | | | | | (8,608,850 | ) | |
| Change in net assets | | | | 9,666,132 | | | | | | (26,270,553 | ) | | | | | 77,010,139 | | | | | | 8,734,123 | | |
| | | | | | | | | | | | | | | | | | | | | | | | | |
| Net Assets: | | | | | | | | | | | | | | | | | | | | | | | | |
| Beginning of period | | | | 79,018,334 | | | | | | 105,288,887 | | | | | | 150,058,525 | | | | | | 141,324,402 | | |
| End of period | | | $ | 88,684,466 | | | | | $ | 79,018,334 | | | | | $ | 227,068,664 | | | | | $ | 150,058,525 | | |
| 38 | HSBC PORTFOLIOS | See notes to financial statements. |
| HSBC PORTFOLIOS |
| Financial Highlights |
Selected data for a share outstanding throughout the periods indicated.
| | | | | Ratios/Supplementary Data |
| | | | | | | | | | | | | | | | | | | | Ratios of | | | | | |
| | | | | | | | | | | | | | | Ratio of Net | | Expenses | | | | | |
| | | | | | | | | | Ratio of Net | | Investment | | to Average | | | | | |
| | | | | Net Assets at | | Expenses to | | Income (Loss) | | Net Assets | | | | | |
| | Total | | End of Period | | Average Net | | to Average Net | | (Excluding Fee | | Portfolio |
| | Return | | (000’s) | | Assets | | Assets | | Reductions) | | Turnover |
| GROWTH PORTFOLIO | | | | | | | | | | | | | | | | | | | | | | | | | | | | |
| Year Ended October 31, 2009 | | 19.31 | % | | | $ | 88,163 | | | | 0.69 | % | | | | 0.17 | % | | | | 0.69 | % | | | | 66 | % | |
| Year Ended October 31, 2010 | | 20.34 | % | | | $ | 98,751 | | | | 0.68 | % | | | | (0.04 | )% | | | | 0.68 | % | | | | 89 | % | |
| Year Ended October 31, 2011 | | 11.07 | % | | | $ | 105,289 | | | | 0.66 | % | | | | 0.07 | % | | | | 0.66 | % | | | | 56 | % | |
| Year Ended October 31, 2012 | | 7.18 | % | | | $ | 79,018 | | | | 0.71 | % | | | | 0.13 | % | | | | 0.71 | % | | | | 53 | % | |
| Year Ended October 31, 2013 | | 32.84 | % | | | $ | 88,684 | | | | 0.69 | % | | | | 0.46 | % | | | | 0.69 | % | | | | 75 | % | |
| OPPORTUNITY PORTFOLIO | | | | | | | | | | | | | | | | | | | | | | | | | | | | |
| Year Ended October 31, 2009 | | 15.41 | % | | | $ | 129,748 | | | | 0.90 | % | | | | (0.37 | )% | | | | 0.90 | % | | | | 65 | % | |
| Year Ended October 31, 2010 | | 28.74 | % | | | $ | 139,402 | | | | 0.89 | % | | | | (0.35 | )% | | | | 0.89 | % | | | | 68 | % | |
| Year Ended October 31, 2011 | | 12.40 | % | | | $ | 141,324 | | | | 0.88 | % | | | | 0.05 | % | | | | 0.88 | % | | | | 69 | % | |
| Year Ended October 31, 2012 | | 12.71 | % | | | $ | 150,059 | | | | 0.91 | % | | | | 0.15 | % | | | | 0.91 | % | | | | 59 | % | |
| Year Ended October 31, 2013 | | 34.84 | % | | | $ | 227,069 | | | | 0.89 | % | | | | 0.17 | % | | | | 0.89 | % | | | | 70 | % | |
| See notes to financial statements. | HSBC PORTFOLIOS | 39 |
| HSBC PORTFOLIOS |
| Notes to Financial Statements — as of October 31, 2013 |
1. Organization:
The HSBC Portfolios (the “Portfolio Trust”), is an open-end management investment company organized as a New York trust under the laws of the State of New York on November 1, 1994. The Portfolio Trust contains the following master funds (individually a “Portfolio,” collectively the “Portfolios”):
| Portfolio | | | Short Name | |
| HSBC Growth Portfolio | | Growth Portfolio |
| HSBC Opportunity Portfolio | | Opportunity Portfolio |
The Portfolios operate as master funds in master-feeder arrangements, in which other funds invest all or part of their investable assets in the Portfolios. The Portfolios also receive investments from funds of funds. The Declaration of Trust permits the Board of Trustees (the “Board”) to issue an unlimited number of beneficial interests in the Portfolios.
The Portfolios are diversified series of the Portfolio Trust and are part of the HSBC Family of Funds, which also includes the HSBC Advisor Funds Trust and HSBC Funds (collectively, the “Trusts”). Financial statements for all other funds of the Trusts are published separately.
Under the Portfolio Trust’s organizational documents, the Portfolio Trust’s officers and Trustees are indemnified against certain liabilities arising out of the performance of their duties to the Portfolios. In addition, in the normal course of business, the Portfolio Trust enters into contracts with its service providers, which also provide for indemnifications by the Portfolios. The Portfolios’ maximum exposure under these arrangements is unknown as this would involve any future claims that may be made against the Portfolios. However, based on experience, the Portfolio Trust expects that risk of loss to be remote.
2. Significant Accounting Policies:
The following is a summary of the significant accounting policies followed by the Portfolios in the preparation of their financial statements. The policies are in conformity with U.S. generally accepted accounting principles (“GAAP”). The preparation of financial statements requires management to make certain estimates and assumptions that affect the reported amounts of assets and liabilities and disclosure of contingent assets and liabilities at the date of the financial statements and the reported amounts of increases and decreases in net assets from operations during the reporting period. Actual results could differ from those estimates.
Securities Valuation:
The Portfolios record their investments at fair value. Fair value is defined as the price that would be received to sell an asset or paid to transfer a liability in an orderly transaction between market participants at the measurement date. The valuation techniques used to determine fair value are further described in Note 3 below.
Investment Transactions and Related Income:
Investment transactions are accounted for no later than one business day after trade date. However, for financial reporting purposes, investment transactions are accounted for on trade date. Investment gains and losses are calculated on the identified cost basis. Interest income is recognized on the accrual basis and includes, where applicable, the amortization or accretion of premium or discount. Dividend income is recorded on the ex-dividend date.
Expense Allocations:
Expenses directly attributable to a Portfolio are charged to that Portfolio. Expenses not directly attributable to a Portfolio are allocated proportionally among the applicable portfolios or funds within the Trusts in relation to net assets or on another reasonable basis.
40 HSBC PORTFOLIOS
| HSBC PORTFOLIOS |
| Notes to Financial Statements — as of October 31, 2013 (continued) |
Federal Income Taxes:
Each Portfolio will be treated as a partnership for U.S. federal income tax purposes. Accordingly, each Portfolio passes through all of its net investment income and gains and losses to its feeder funds, and is therefore not subject to U.S. federal income tax. As such, investors in the Portfolios will be taxed on their respective share of the Portfolios’ ordinary income and realized gains. It is intended that the Portfolios will be managed in such a way that an investor will be able to satisfy the requirements of the Internal Revenue Code, as amended, applicable to regulated investment companies.
Management of the Portfolios has reviewed tax positions taken in tax years that remain subject to examination by all major tax jurisdictions, including federal (i.e., the last four tax year ends and the interim tax period since then, as applicable). Management believes that there is no tax liability resulting from unrecognized tax benefits related to uncertain tax positions taken.
New Accounting Pronouncements:
In January 2013, the Financial Accounting Standards Board issued Accounting Standards Update (“ASU”) No. 2013-01 “Clarifying the Scope of Disclosures about Offsetting Assets and Liabilities” (“ASU 2013-01”) which amended Accounting Standards Codification Subtopic 210-20, Balance Sheet Offsetting. ASU 2013-01 clarified the scope of ASU No. 2011-11 “Disclosures about Offsetting Assets and Liabilities” (“ASU 2011-11”). ASU 2011-11 requires an entity to disclose information about offsetting and related arrangements to enable users of the financial statements to understand the effect of those arrangements on the entity’s financial position. ASU 2013-01 clarifies the scope of ASU 2011-11 as applying to derivatives accounted for in accordance with Topic 815, Derivatives and Hedging, including bifurcated embedded derivatives, repurchase agreements and reverse repurchase agreements, and securities borrowing and securities lending transactions that are offset either in accordance with other requirements of GAAP or subject to an enforceable master netting arrangement or similar agreement. The guidance in ASU 2013-01 and ASU 2011-11 is effective for interim and annual periods beginning on or after January 1, 2013. Management is evaluating any impact ASU 2013-01 and ASU 2011-11 may have on the Portfolios’ financial statements.
3. Investment Valuation Summary:
The valuation techniques employed by the Portfolios, as described below, maximize the use of observable inputs and minimize the use of unobservable inputs in determining fair value. The inputs used for valuing the Portfolios’ investments are summarized in the three broad levels listed below:
- Level 1: quoted prices in active markets for identical assets
- Level 2: other significant observable inputs (including quoted prices for similar securities, interest rates, prepayment speeds, credit risk, etc.)
- Level 3: significant unobservable inputs (including a Portfolio’s own assumptions in determining the fair value of investments)
Changes in valuation techniques may result in transfers in or out of an assigned level within the disclosure hierarchy. The Portfolios determine transfers between fair value hierarchy levels at the reporting period end. The inputs or methodology used for valuing investments are not necessarily an indication of the risk associated with investing in those investments.
Exchange traded, domestic equity securities are valued at the last sale price on a national securities exchange, or in the absence of recorded sales, at the readily available closing bid price on such exchanges, or at the quoted bid price in the over-the-counter market and are typically categorized as Level 1 in the fair value hierarchy.
Shares of exchange traded and closed-end registered investment companies are valued in the same manner as other equity securities and are typically categorized as Level 1 in the fair value hierarchy. Mutual funds are valued at their net asset values, as reported by such companies and are typically categorized as Level 1 in the fair value hierarchy.
HSBC PORTFOLIOS 41
| HSBC PORTFOLIOS |
| Notes to Financial Statements — as of October 31, 2013 (continued) |
Repurchase agreements are valued at original cost and are typically categorized as Level 2 in the fair value hierarchy.
Securities or other assets for which market quotations are not readily available, or are deemed unreliable due to a significant event or otherwise, are valued pursuant to procedures adopted by the Trusts’ Board (“Procedures”). Depending on the source and relative significance of valuation inputs, these instruments may be classified as Level 2 or Level 3 in the fair value hierarchy. Examples of potentially significant events that could affect the value of an individual security and thus require pricing under the Procedures include corporate actions by the issuer, announcements by the issuer relating to its earnings or products, regulatory news, natural disasters, and litigation. Examples of potentially significant events that could affect multiple securities held by a Portfolio include governmental actions, natural disasters, and armed conflicts. Fair value pricing may require subjective determinations about the value of a security. While the Portfolio Trust’s policy is intended to result in a calculation of a Portfolio’s net asset value that fairly reflects security values as of the time of pricing, the Portfolio Trust cannot ensure that fair values determined would accurately reflect the price that a Portfolio could obtain for a security if it were to dispose of that security as of the time of pricing. The prices used by a Portfolio may differ from the value that would be realized if the securities were sold and the differences could be material to the financial statements.
For the year ended October 31, 2013, there were no Level 3 investments for which significant unobservable inputs were used to determine fair value.
The following is a summary of the valuation inputs used as of October 31, 2013 in valuing the Portfolios’ investments based upon the three levels defined above. The breakdown of investment categorization is disclosed in the Schedule of Portfolio Investments for each Portfolio:
| | LEVEL 1 ($) | | LEVEL 2 ($) | | LEVEL 3 ($) | | Total ($) |
| Growth Portfolio | | | | | | | | |
| Investment Securities: | | | | | | | | |
| Common Stocks | | 87,746,575 | | — | | — | | 87,746,575 |
| Investment Companies | | 606,946 | | — | | — | | 606,946 |
| Total Investment Securities | | 88,353,521 | | — | | — | | 88,353,521 |
| |
| Opportunity Portfolio | | | | | | | | |
| Investment Securities: | | | | | | | | |
| Common Stocks | | 218,971,403 | | — | | — | | 218,971,403 |
| Investment Companies | | 6,563,134 | | — | | — | | 6,563,134 |
| Total Investment Securities | | 225,534,537 | | — | | — | | 225,534,537 |
4. Related Party Transactions and Other Agreements:
Investment Management:
HSBC Global Asset Management (USA) Inc. (“HSBC” or the “Investment Adviser”), a wholly owned subsidiary of HSBC Bank USA, N.A., a national bank organized under the laws of the United States, acts as the Investment Adviser to the Portfolios pursuant to an investment management contract with the Portfolio Trust. As Investment Adviser, HSBC manages the investments of the Portfolios and continuously reviews, supervises, and administers the Portfolios’ investments. Winslow Capital Management, LLC (“Winslow”) and Westfield Capital Management Company, L.P. (“Westfield”) serve as subadvisers for the Growth Portfolio and Opportunity Portfolio, respectively, and are paid for their services directly by the respective Portfolios.
42 HSBC PORTFOLIOS
| HSBC PORTFOLIOS |
| Notes to Financial Statements — as of October 31, 2013 (continued) |
For their services, the Investment Adviser and Winslow receive in aggregate, from the Growth Portfolio, a fee, accrued daily and paid monthly, at an annual rate of:
| Based on Average Daily Net Assets of all Sub-Adviser serviced funds and separate accounts affiliated | | | |
| with HSBC: | | | Fee Rate(%)* |
| Up to $250 million | | 0.575 |
| In excess of $250 million but not exceeding $500 million | | 0.525 |
| In excess of $500 million but not exceeding $750 million | | 0.475 |
| In excess of $750 million but not exceeding $1 billion | | 0.425 |
| In excess of $1 billion | | 0.375 |
____________________
| * | | The Growth Portfolio may pay the Investment Adviser and Winslow an aggregate maximum fee of up to 0.68%. Currently, the Investment Adviser’s contractual fee is 0.175% and Winslow’s maximum contractual fee is 0.40%. Accordingly, the current aggregate maximum fee rate is 0.575%. |
For their services, the Investment Adviser and Westfield receive in aggregate, a fee, accrued daily and paid monthly, at an annual rate of 0.80% of the Opportunity Portfolio’s average daily net assets.
Administration:
HSBC serves the Portfolios as Administrator. Under the terms of the Administration Agreement, HSBC receives from the Portfolios (as well as other funds in the Trusts combined) a fee, accrued daily and paid monthly at an annual rate of:
| Based on Combined Average Daily Net Assets of | | | Fee Rate(%) |
| Up to $10 billion | | 0.0550 |
| In excess of $10 billion but not exceeding $20 billion | | 0.0350 |
| In excess of $20 billion but not exceeding $50 billion | | 0.0275 |
| In excess of $50 billion | | 0.0250 |
The fee rates and breakpoints are determined on the basis of the aggregate average daily net assets of the Trusts, however, the assets of the funds of the HSBC Funds and HSBC Advisor Funds Trust that invest in the Portfolios are not double-counted. The total administration fee paid to HSBC is allocated to each series based upon its proportionate share of the aggregate net assets of the Trusts. For assets invested in the Portfolios by the funds of the HSBC Funds and HSBC Advisor Funds Trust, the Portfolios pay half of the administration fee and the other funds pay half of the administration fee, for a combination of the total fee rate set forth above.
Pursuant to a Sub-Administration Agreement with HSBC, Citi Fund Services Ohio, Inc. (“Citi”), a wholly-owned subsidiary of Citigroup, Inc., serves as the Trusts’ Sub-Administrator subject to the general supervision by the Trusts’ Board and HSBC. For these services, Citi is entitled to a fee, payable by HSBC, at an annual rate equivalent to the fee rates set forth above subject to certain reductions associated with services provided to new portfolios, minus 0.02% which is retained by HSBC.
Under a Compliance Services Agreement between the Trusts and Citi (the “CCO Agreement”), Citi makes an employee available to serve as the Trusts’ Chief Compliance Officer (the “CCO”). Under the CCO Agreement, Citi also provides infrastructure and support in implementing the written policies and procedures comprising the Trusts’ compliance program, including support services to the CCO. For the services provided under the CCO Agreement, the Trusts paid Citi $287,560 for the year ended October 31, 2013, plus reimbursement of certain out of pocket expenses. Expenses incurred by each Portfolio are reflected on the Statements of Operations as “Compliance Services.” Citi pays the salary and other compensation earned by individuals performing these services, as employees of Citi.
Fund Accounting:
Citi provides fund accounting services for the Portfolio Trust. For its services to the Portfolios, Citi receives an annual fee per portfolio, including reimbursement of certain expenses, that is accrued daily and paid monthly.
HSBC PORTFOLIOS 43
| HSBC PORTFOLIOS |
| Notes to Financial Statements — as of October 31, 2013 (continued) |
Independent Trustees:
The Trusts pay each Independent Trustee an annual retainer of $100,000. The Trusts pay a fee of $10,000 for each regular meeting of the Board attended and a fee of $ 3,000 for each special meeting attended. The Trusts pay each Committee Chair an annual retainer of $ 3,000, with the exception of the Chair of the Audit Committee, who receives a retainer of $ 6,000. The Trusts also pay the Chairman of the Board an additional annual retainer of $24,000. In addition, for time expended on Board duties outside normal meetings, which is authorized by the Board, a Trustee is compensated at the rate of $ 500 per hour, up to a maximum of $ 3,000 per day.
5. Investment Transactions:
Cost of purchases and proceeds from sales of securities (excluding securities maturing less than one year from acquisition) for the year ended October 31, 2013 were as follow:
| | Purchases ($) | | Sales ($) |
| Growth Portfolio | | 62,055,996 | | 74,114,396 |
| Opportunity Portfolio | | 144,039,393 | | 126,127,698 |
For the year ended October 31, 2013, there were no long-term U.S. government securities held by the Portfolio Trust.
6. Federal Income Tax Information:
At October 31, 2013, the cost basis of securities for federal income tax purposes, gross unrealized appreciation, gross unrealized depreciation and net unrealized appreciation/depreciation were as follows:
| | | | | | | | | | | Net Unrealized |
| | | | Tax Unrealized | | Tax Unrealized | | Appreciation/ |
| | Tax Cost ($) | | Appreciation ($) | | Depreciation ($) | | (Depreciation) ($)* |
| Growth Portfolio | | 59,903,953 | | 28,711,719 | | | (262,151 | ) | | | 28,449,568 |
| Opportunity Portfolio | | 174,027,654 | | 53,521,776 | | | (2,014,893 | ) | | | 51,506,883 |
____________________
| * | | The difference between book-basis unrealized appreciation (depreciation) is attributable primarily to tax deferral of losses on wash sales. |
7. Subsequent Events:
Management has evaluated events and transactions through the date the financial statements were issued, for purposes of recognition or disclosure in these financial statements and there are no subsequent events to report.
44 HSBC PORTFOLIOS
Report of Independent Registered Public Accounting Firm
To the Shareholders and Board of Trustees of
HSBC Portfolios:
We have audited the accompanying statements of assets and liabilities of HSBC Portfolios – HSBC Growth Portfolio and HSBC Opportunity Portfolio (the Funds), including the schedules of portfolio investments, as of October 31, 2013, and the related statements of operations for the year then ended, the statements of changes in net assets for each of the years in the two-year period then ended, and the financial highlights for each of the years in the five-year period then ended. These financial statements and financial highlights are the responsibility of the Funds’ management. Our responsibility is to express an opinion on these financial statements and financial highlights based on our audits.
We conducted our audits in accordance with the standards of the Public Company Accounting Oversight Board (United States). Those standards require that we plan and perform the audit to obtain reasonable assurance about whether the financial statements and financial highlights are free of material misstatement. An audit includes examining, on a test basis, evidence supporting the amounts and disclosures in the financial statements. Our procedures included confirmation of securities owned as of October 31, 2013, by correspondence with custodians and brokers or by other appropriate auditing procedures. An audit also includes assessing the accounting principles used and significant estimates made by management, as well as evaluating the overall financial statement presentation. We believe that our audits provide a reasonable basis for our opinion.
In our opinion, the financial statements and financial highlights referred to above present fairly, in all material respects, the financial position of the Funds as of October 31, 2013, the results of their operations for the year then ended, the changes in their net assets for each of the years in the two-year period then ended, and the financial highlights for each of the years in the five-year period then ended, in conformity with U.S. generally accepted accounting principles.
 Columbus, Ohio
December 27, 2013HSBC PORTFOLIOS 45
| HSBC PORTFOLIOS |
| Table of Shareholder Expenses — as of October 31, 2013 (Unaudited) |
As a shareholder of the Portfolios, you incur ongoing costs, including management fees and other Fund expenses.
These examples are intended to help you understand your ongoing costs (in dollars) of investing in the Portfolios and to compare these costs with the ongoing costs of investing in other mutual funds.
These examples are based on an investment of $1,000 invested at the beginning of the period and held for the entire period from May 1, 2013 through October 31, 2013.
Actual Example
The table below provides information about actual account values and actual expenses. You may use the information below, together with the amount you invested, to estimate the expenses that you paid over the period. Simply divide your account value by $1,000 (for example, an $8,600 account value divided by $1,000 = 8.6), then multiply the result by the number in the table under the heading entitled “Expenses Paid During Period” to estimate the expenses you paid on your account during this period.
| | | | | | | | | | | | | | | | | Annualized |
| | Beginning | | Ending | | Expenses Paid | | Expense Ratio |
| | Account Value | | Account Value | | During Period* | | During Period |
| | 5/1/13 | | 10/31/13 | | 5/1/13 - 10/31/13 | | 5/1/13 - 10/31/13 |
| Growth Portfolio | | | $ | 1,000.00 | | | | $ | 1,170.40 | | | | $ | 3.61 | | | | 0.66 | % | |
| Opportunity Portfolio | | | | 1,000.00 | | | | | 1,139.50 | | | | | 4.75 | | | | 0.88 | % | |
Hypothetical Example for Comparison Purposes
The table below provides information about hypothetical account values and hypothetical expenses based on each Portfolio’s actual expense ratio and an assumed rate of return of 5% per year before expenses, which is not the Portfolio’s actual return. The hypothetical account values and expenses may not be used to estimate the actual ending account balance or expenses you paid for the period. You may use this information to compare this 5% hypothetical example with the 5% hypothetical examples that appear in the shareholder reports of other funds.
Please note that the expenses shown in the table are meant to highlight your ongoing costs only and do not reflect any transactional costs, such as sales charges (loads), redemption fees, or exchange fees. Therefore, the table is useful in comparing ongoing costs only, and will not help you determine the relative total costs of owning different funds. In addition, if these transactional costs were included, your costs would have been higher.
| | | | | | | | | | | | | | | | | Annualized |
| | Beginning | | Ending | | Expenses Paid | | Expense Ratio |
| | Account Value | | Account Value | | During Period* | | During Period |
| | 5/1/13 | | 10/31/13 | | 5/1/13 - 10/31/13 | | 5/1/13 - 10/31/13 |
| Growth Portfolio | | | $ | 1,000.00 | | | | $ | 1,021.88 | | | | $ | 3.36 | | | | 0.66 | % | |
| Opportunity Portfolio | | | | 1,000.00 | | | | | 1,020.77 | | | | | 4.48 | | | | 0.88 | % | |
____________________
| * | | Expenses are equal to the average account value over the period, multiplied by the Portfolio's annualized expense ratio, multiplied by 184/365 (to reflect the one half year period). |
46 HSBC PORTFOLIOS
| HSBC PORTFOLIOS |
| Board of Trustees and Officers (Unaudited) |
MANAGEMENT OF THE TRUST
The following table contains information regarding the HSBC Family of Funds’ Board of Trustees (“Trustees”). Asterisks indicate those Trustees who are “interested persons,” as defined in the Investment Company Act of 1940, as amended, of the HSBC Family of Funds. The HSBC Family of Funds’ Statement of Additional Information includes additional information about the Trustees and is available, without charge, upon request by calling (888) 525-5757.
| | | | | | | | Portfolios in | | |
| | Position(s) | | Term of Office | | | | Fund Complex | | Other |
| Name, | | Held with | | and Length of | | Principal Occupation(s) | | Overseen By | | Directorships |
| Address, Age | | Funds | | Time Served | | During Past 5 Years | | Trustee* | | Held by Trustee |
| NON-INTERESTED | | | | | | | | | | |
| TRUSTEES | | | | | | | | | | |
| | | | | | | | | | | |
MARCIA L. BECK
P.O. Box 182845
Columbus, OH
43218-3035
Age: 58 | | Trustee | | Indefinite;
2008 to present | | Private Investor (June 1999 – present); Executive Vice President, Prudential Investments (1997 – 1999); President and Trustee, The Goldman Sachs Mutual Funds (1992 – 1996) | | 21 | | None |
| | | | | | | | | | | |
SUSAN C. GAUSE
P.O. Box 182845
Columbus, OH
43218-3035
Age: 60 | | Trustee | | Indefinite;
2013 to present | | Since 2003, Private Investor; Independent Trustee of Met Investors Series Trust (2008-2012); Chief Executive Officer, Dresdner RCM Global Investors and Allianz Dresdner Asset Management (2000-2002); Board Member of Dresdner Global Asset Management Board (2000-2002); Chief Operating Officer and Senior Managing Director of Dresdner RCM Global Investors (1998-2000)
| | 21 | | Since 2012, Trustee,
Metropolitan Series Fund
|
| | | | | | | | | | |
SUSAN S. HUANG
P.O. Box 182845
Columbus, OH
43218-3035
Age: 59 | | Trustee | | Indefinite;
2008 to present | | Private Investor (2000- present); Senior Vice President, Schroder Investment Management (2001 – 2004); Managing Director, Chase Asset Management (1995-2000) | | 21 | | None |
| | | | | | | | | | | |
ALAN S. PARSOW
P.O. Box 182845
Columbus, OH
43218-3035
Age: 63 | | Trustee | | Indefinite;
1987 to present | | General Partner, Elkhorn Partners, L.P. (a private investment partnership) (1989 – present) | | 21 | | None |
| | | | | | | | | | | |
THOMAS F. ROBARDS
P.O. Box 182845
Columbus, OH
43218-3035
Age: 67 | | Trustee | | Indefinite;
2005 to present | | Partner, Robards & Co. LLC (investment and advisory services) (2005-present); Chief Financial Officer, American Museum of Natural History (2003- 2004); Chief Financial Officer, Datek Online Holdings (2000-2003); Previously EVP and CFO Republic New York Corporation | | 21 | | Overseas Shipholding
Group (energy transportation);
Ellington
Financial LLC (NYSE
listed financial services);
Ellington Residential
Mortgage REIT (NYSE
listed real estate
investment trust) |
| | | | | | | | | | | |
MICHAEL SEELY
P.O. Box 182845
Columbus, OH
43218-3035
Age: 68 | | Chairman and
Trustee | | Indefinite;
1987 to present | | Private Investor (2003-present); General Partner, Global Multi Manager Partners (1999-2003); President of Investor Access Corporation (1981-2003) | | 21 | | None |
| | | | | | | | | | | |
| | | | | | | | | | | |
INTERESTED TRUSTEE | | | | | | | | | | |
| | | | | | | | | | | |
DEBORAH HAZELL
452 Fifth Avenue
New York
NY 10018
Age: 50 | | Trustee | | Indefinite;
2011 to present | | CEO, HSBC Global Asset Management (USA) Inc. (2011-present); President and CEO, Fisher Francis Trees & Watts (“FFTW”) (investment advisor), February 2008-June 2011; Head of Client Service, Business Development and Marketing Group, FFTW (October 1999-February 2008) | | 21 | | None |
____________________
| * | | Includes the Trust, the HSBC Advisor Fund Trust and the HSBC Portfolios. |
HSBC PORTFOLIOS 47
| HSBC PORTFOLIOS |
| Board of Trustees and Officers (Unaudited) (continued) | |
| | Position(s) Held | | Term of Office and | | Principal Occupation(s) |
| Name, Address, Age | | with Funds | | Length of Time Served | | During Past 5 Years |
| OFFICERS | | | | | | |
| | | | | | | |
RICHARD A. FABIETTI
452 Fifth Avenue
New York, NY 10018
Age: 55 | | President | | One year;
2004 to present | | Senior Vice President, Head of Product Management, HSBC Global Asset Management (USA) Inc.
(1998 - present) |
| | | | | | | |
STEPHEN SIVILLO
452 Fifth Avenue
New York, NY 10018
Age: 42 | | Vice President | | One year;
2010 to present | | Vice President of Product Administration, HSBC Global Asset Management (USA) Inc. (2010 - present); Chief Compliance Officer, Managers Funds (2009 – 2010); Director, Mutual Fund Compliance, AllianceBernstein (2007-2009) |
| | | | | | | |
TY EDWARDS*
3435 Stelzer Road
Columbus, OH 43219-3035
Age: 47 | | Treasurer | | One year;
2010 to present | | Senior Vice President, Citi Fund Services (2010– present); Director, Product Management, Columbia Management (2007-2009); Deputy Treasurer, Columbia Funds, (2006-2007) |
| | | | | | | |
JENNIFER A. ENGLISH*
100 Summer Street
Suite 1500
Boston, MA 02110
Age: 41 | | Secretary | | One year;
2008 to present | | Senior Vice President, Regulatory Administration, Citi (2005 - present) |
| | | | | | | |
FREDERICK J. SCHMIDT*
1 Rexcorp Plaza
Uniondale, NY 11556
Age: 54 | | Chief Compliance
Officer | | One year;
2004 to present | | Director and Chief Compliance Officer, CCO Services, Citi (2004 - present) |
____________________
| * | | Mr. Edwards, Mr. Schmidt, and Ms. English also are officers of other investment companies of which Citi (or an affiliate) is the administrator or sub-administrator. |
48 HSBC PORTFOLIOS
Other Information (Unaudited):
Information regarding how the Funds voted proxies relating to portfolio securities during the most recent 12-month period ended June 30th is available (i) without charge, upon request, by calling 1-800-525-5757 for HSBC Bank USA and HSBC Brokerage (USA) Inc. clients and 1-800-782-8183 for all other shareholders; (ii) on the Funds’ website at www.investorfunds.us.hsbc.com; and (iii) on the Security and Exchange Commission’s (“Commission”) website at http://www.sec.gov.
The Funds file their complete schedules of portfolio holdings with the Commission for the first and third quarters of each fiscal year on Form N-Q. The Funds’ Forms N-Q are available on the Commission’s website at http://www.sec.gov. The Funds’ Forms N-Q may be reviewed and copied at the Commission’s Public Reference Room in Washington, D.C. and information on the operation of the Public Reference Room may be obtained by calling 1-800-SEC-0330. The Funds’ Schedules of Investments will be available no later than 60 days after each period end, without charge, on the Funds’ website at www.investorfunds.us.hsbc.com.
An investment in a Fund is not a deposit of HSBC Bank USA, National Association, and is not insured or guaranteed by the Federal Deposit Insurance Corporation or any other government agency.
HSBC PORTFOLIOS 49
HSBC FAMILY OF FUNDS: INVESTMENT ADVISER AND ADMINISTRATOR HSBC Global Asset Management (USA) Inc.
452 Fifth Avenue
New York, NY 10018 SUB-ADVISERS HSBC Growth Portfolio
Winslow Capital Management, LLC
4720 IDS Tower
80 South Eighth Street
Minneapolis, MN 55402 HSBC Opportunity Portfolio
Westfield Capital Management Company, L.P.
One Financial Center
Boston, MA 02111 | SHAREHOLDER SERVICING AGENTS For HSBC Bank USA, N.A. and
HSBC Securities (USA) Inc. Clients HSBC Bank USA, N.A.
452 Fifth Avenue
New York, NY 10018
1-888-525-5757 For All Other Shareholders HSBC Funds
P.O. Box 182845
Columbus, OH 43218
1-800-782-8183 TRANSFER AGENT Citi Fund Services
3435 Stelzer Road
Columbus, OH 43219 DISTRIBUTOR Foreside Distribution Services, L.P.
690 Taylor Road, Suite 150
Gahanna, OH 43230 CUSTODIAN The Northern Trust Company
50 South LaSalle Street
Chicago, IL 60603 INDEPENDENT REGISTERED PUBLIC ACCOUNTING FIRM KPMG LLP
191 West Nationwide Blvd., Suite 500
Columbus, OH 43215 LEGAL COUNSEL Dechert LLP
1900 K Street, N.W.
Washington, D.C. 20006 |

| Investment products: |
ARE NOT A
BANK DEPOSIT
OR OBLIGATION
OF THE BANK
OR ANY OF ITS
AFFILIATES | ARE NOT
FDIC
INSURED | ARE NOT
INSURED BY
ANY FEDERAL
GOVERNMENT
AGENCY |
ARE NOT GUARANTEED BY
THE BANK OR ANY OF ITS
AFFILIATES | MAY LOSE
VALUE |
Investment products are offered by HSBC Securities (USA) Inc. (HSI), member NYSE/FINRA/SIPC. HSI is an affiliate of HSBC Bank USA, N.A. Investment products: Are not a deposit or other obligation of the bank or any of its affiliates; Not FDIC insured or insured by any federal government agency of the United States; Not guaranteed by the bank or any of its affiliates; and are subject to investment risk, including possible loss of principal invested.
Item 2. Code of Ethics.
(a) The registrant has adopted a code of ethics that applies to the registrant’s principal executive officer, principal financial officer, principal accounting officer or controller, or persons performing similar functions. This code of ethics is included as an Exhibit.
(b) During the period covered by the report, with respect to the registrant's code of ethics that applies to its principal executive officer, principal financial officer, principal accounting officer or controller, or persons performing similar functions; there have been no amendments to, nor any waivers granted from, a provision that relates to any element of the code of ethics definition enumerated in paragraph (b) of this Item 2.
Item 3. Audit Committee Financial Expert.
3(a)(1) The registrant’s board of directors has determined that the registrant has at least one audit committee financial expert serving on its audit committee.
3(a)(2) The audit committee financial expert is Thomas Robards, who is “independent” for purposes of this Item 3 of Form N-CSR.
Item 4. Principal Accountant Fees and Services.
(a) Audit Fees,
2012 $184,855
2013 $176,323
(b) Audit-Related Fees,
2012 $5,950
2013 $5,833
2012 – Fees of $5,950 relate to the consent of N-1A filing.
2013 – Fees of $5,833 relate to the consent of N-1A filing.
(c) Tax Fees,
2012 $110,130
2013 $101,875
Fees for both 2012 and 2013 relate to the preparation of federal income and excise tax returns and the review of excise tax distributions.
(d) All Other Fees,
2012 $ 0
2013 $ 0
(e)(1) The audit committee is required to pre-approve all audit and permitted non-audit services performed by the registrant’s independent auditors in accordance with the audit committee charter and the Investment Company Act of 1940.
(e)(2)
2012 0%
2013 0%
(f) Not applicable.
(g) Non-Audit Fees.
2012 $116,080
2013 $107,708
(h) The audit committee considered the nonaudit services rendered to the registrant’s investment adviser and any entity controlling, controlled by, or under common control with the investment adviser, and believes the services are compatible with the principal accountant’s independence.
Item 5. Audit Committee of Listed Registrants.
Not applicable.
Item 6. Investments.
(a) Included as a part of the report to shareholders filed under Item 1.
(b) Not applicable.
Item 7. Disclosure of Proxy Voting Policies and Procedures for Closed-End Management Investment Companies.
Not applicable.
Item 8. Portfolio Managers of Closed-End Management Investment Companies.
Not applicable.
Item 9. Purchases of Equity Securities by Closed-End Management Investment Company and Affiliated Purchasers.
Not applicable.
Item 10. Submission of Matters to a Vote of Security Holders.
Not applicable.
Item 11. Controls and Procedures.
(a)The registrant’s principal executive officer and principal financial officer have concluded, based on their evaluation of the registrant's disclosure controls and procedures as conducted within 90 days of the filing date of this report, that these disclosure controls and procedures are adequately designed and are operating effectively to ensure that information required to be disclosed by the registrant on Form N-CSR is recorded, processed, summarized and reported within the time periods specified in the Securities and Exchange Commission's rules and forms.
(b)There were no changes in the registrant’s internal control over financial reporting (as defined in Rule 30a-3(d) under the Act (17 CFR 270.30a-3(d)) that occurred during the second fiscal quarter of the period covered by this report that have materially affected or are reasonably likely to materially affect, the registrant’s internal control over financial reporting.
Item 12. Exhibits.
(a)(1) The code of ethics that is the subject of the disclosure required by Item 2 is attached hereto.
(a)(2) Certifications pursuant to Rule 30a-2(a) are attached hereto.
(a)(3) Not applicable.
(b) Certifications pursuant to Rule 30a-2(b) are furnished herewith.
SIGNATURES
Pursuant to the requirements of the Securities Exchange Act of 1934 and the Investment Company Act of 1940, the registrant has duly caused this report to be signed on its behalf by the undersigned, thereunto duly authorized.
| By (Signature and Title) | | /s/ Richard A. Fabietti |
| | Richard A. Fabietti |
| | President |
Pursuant to the requirements of the Securities Exchange Act of 1934 and the Investment Company Act of 1940, this report has been signed below by the following persons on behalf of the registrant and in the capacities and on the dates indicated.
| By (Signature and Title) | | /s/ Richard A. Fabietti |
| | Richard A. Fabietti |
| | President |
| By (Signature and Title) | | /s/ Ty Edwards |
| | Ty Edwards |
| | Treasurer |