UNITED STATES
SECURITIES AND EXCHANGE COMMISSION
Washington, D.C. 20549
FORM N-CSR
CERTIFIED SHAREHOLDER REPORT OF REGISTERED
MANAGEMENT INVESTMENT COMPANIES
Investment Company Act file number: 811-04782
HSBC FUNDS
(Exact name of registrant as specified in charter)
452 FIFTH AVENUE
NEW YORK, NY 10018
(Address of principal executive offices) (Zip code)
CITI FUND SERVICES
3435 STELZER ROAD
COLUMBUS, OH 43219
(Name and address of agent for service)
Registrant’s telephone number, including area code: 1-800-782-8183
| | Date of fiscal year end: October 31 |
| |
| Date of reporting period: October 31, 2012 |
Item 1. Reports to Stockholders.
HSBC Global Asset Management (USA) Inc.
HSBC Funds
Annual Report
October 31, 2012
| EQUITY FUNDS | Class A | | Class B | | Class C | | Class I |
| HSBC Growth Fund | HOTAX | | HOTBX | | HOTCX | | HOTYX |
| HSBC Opportunity Fund | HSOAX | | HOPBX | | HOPCX | | RESCX |

HSBC Family of Funds
Annual Report - October 31, 2012
| Glossary of Terms | | |
| Chairman’s Message | | 4 |
| President’s Message | | 5 |
| Commentary From the Investment Manager | | 6 |
| Portfolio Reviews | | 8 |
| Portfolio Composition | | 12 |
| Statements of Assets and Liabilities | | 13 |
| Statements of Operations | | 14 |
| Statements of Changes in Net Assets | | 15 |
| Financial Highlights | | 19 |
| Notes to Financial Statements | | 22 |
| Report of Independent Registered Public Accounting Firm | | 30 |
| Other Federal Income Tax Information | | 31 |
| Table of Shareholder Expenses | | 32 |
| | | |
| HSBC Portfolios | | |
| Schedules of Portfolio Investments | | |
| HSBC Growth Portfolio | | 34 |
| HSBC Opportunity Portfolio | | 36 |
| Statements of Assets and Liabilities | | 38 |
| Statements of Operations | | 39 |
| Statements of Changes in Net Assets | | 40 |
| Financial Highlights | | 41 |
| Notes to Financial Statements | | 42 |
| Report of Independent Registered Public Accounting Firm | | 47 |
| Table of Shareholder Expenses | | 48 |
| Board of Trustees and Officers | | 50 |
| Other Information | | 52 |
Barclays U.S. Aggregate Bond Index is an unmanaged index generally representative of investment-grade, fixed-rate debt issues, including government, corporate, asset-backed, and mortgage-backed securities, with maturities of at least one year.
Barclays U.S. High-Yield Corporate Bond Index is an unmanaged index that measures the non-investment grade, USD-denominated, fixed-rate, taxable corporate bond market. Securities are classified as high-yield if the middle rating of Moody’s, Fitch, and S&P is Ba1/BB+/BB+ or below. The index excludes emerging markets debt.
Gross Domestic Product (“GDP”) measures the market value of the goods and services produced by labor and property in the United States.
Lipper Large-Cap Growth Funds Average is an equally weighted average of mutual funds that, by portfolio practice, invest at least 75% of their equity assets in companies with market capitalizations (on a three-year weighted basis) above Lipper’s U.S. Diversified Equity large-cap floor. Large-cap growth funds typically have an above-average price-to-earnings ratio, price-to-book ratio, and three-year sales-per-share growth value, compared to the S&P 500 Index.
Lipper Mid-Cap Growth Funds Average is an equally weighted average of mutual funds that, by portfolio practice, invest at least 75% of their equity assets in companies with market capitalizations (on a three-year weighted basis) below Lipper’s U.S. Diversified Equity large-cap floor. Mid-cap growth funds typically have an above-average price-to-earnings ratio, price-to-book ratio, and three-year sales-per-share growth value, compared to the S&P MidCap 400 Index.
Morgan Stanley Capital International Europe Australasia and Far East (“MSCI EAFE”) Index is an unmanaged free float-adjusted market capitalization index that is designed to measure the equity market performance of developed markets, excluding the U.S. & Canada. The MSCI EAFE Index consists of the following 22 developed market countries: Australia, Austria, Belgium, Denmark, Finland, France, Germany, Greece, Hong Kong, Ireland, Israel, Italy, Japan, the Netherlands, New Zealand, Norway, Portugal, Singapore, Spain, Sweden, Switzerland, and the United Kingdom.
Russell 1000® Growth Index is an unmanaged index that measures the performance of the large-cap growth segment of the U.S. equity universe. It includes those Russell 1000 companies with higher price-to-book ratios and higher forecasted growth values.
Russell 2000® Index is an unmanaged index that measures the performance of the small-cap segment of the U.S. equity universe. The Russell 2000® Index is a subset of the Russell 3000® Index representing approximately 10% of the total market capitalization of that index. It includes approximately 2000 of the smallest securities based on a combination of their market cap and current index membership.
Russell 2500™ Growth Index is an unmanaged index that measures the performance of the small- to mid-cap growth segment of the U.S. equity universe. It includes those Russell 2500 companies with higher price-to-book ratios and higher forecasted growth values.
Standard & Poor’s MidCap 400 Index is an unmanaged index that is the most widely used index for mid-sized companies. The S&P MidCap 400 covers 7% of the U.S. equities market, and is part of a series of S&P U.S. indices that can be used as building blocks for portfolio composition.
Standard & Poor’s 500 (“S&P 500”) Index is an unmanaged index that is widely regarded as a gauge of the U.S. equities market. This index includes 500 leading companies in leading industries of the U.S. economy. The S&P 500 Index focuses on the large-cap segment of the market, with approximately 75% coverage of U.S. equities.
Lipper is an independent mutual fund performance monitor whose results are based on total return and do not reflect a sales charge.
Securities indices assume reinvestment of all distributions and interest payments and do not take in account brokerage fees or expenses. Securities in the Funds do not match those in the indices and performance of the Funds will differ. Investors cannot invest directly in an index.
December 20, 2012
To Our Shareholders:
These are challenging times for investors.
Perhaps the central reason is the slow but remorseless unwinding of a multi-decade build-up in global debt, following the recent sharp decline in the global economy. Much of this debt has been devalued—including, for example, debt associated with U.S. housing stock or Greek government debt.
Despite these modest declines, U.S. private debt—which includes household debt from such things as credit cards and mortgages—remains high. Some historical perspective: In 1951, private sector debt stood at just 53% of the U.S. Gross Domestic Product1 (GDP); today, that debt stands at 159%—a very high level, though down from its 2007 peak of 179%.
The turning point appears to be 2007. In that year, aggressive monetary and fiscal policies were enacted in the U.S. to stimulate the flagging economy. The result has been soaring government debt. Projections from the Congressional Budget Office suggest that the ratio of federal debt to GDP could reach 100% by the middle of the next decade—and that doesn’t reflect the increasing cost of entitlement programs.
These increasing claims on national income are worrisome, profoundly so, and have sparked intense and important debate—between Keynesians and monetarists; between free market capitalists and fans of European-style welfare economies; and, most recently, between Democrats and Republicans in the recent election.
So far, these growing claims by government on private sector income and wealth have failed to push interest rates higher. However, they have arguably, tempered the kind of growth and employment gains one would historically associate with recovery. In fact, the Federal Reserve’s Quantative Easing programs and “Operation Twist” have pushed rates to low levels, frustrating investors’ search for yield and leading our advisor and service providers to absorb about $17 million in fee waivers last year. Without these waivers our money market funds would have provided lower yields. Thus, it is no surprise that total money market fund assets have declined.
Regulators and others, parsing the entrails of the sharp recession, have proposed to change the regulation of such funds in order to prevent a future “run” on the funds during any period of economic upheaval. Proposals include a floating NAV, and variations of stable net asset value that include capital buffers.
Our other funds performed well in this difficult environment, as the following pages show.
Furthermore, the fund group continued to nourish its strategy of providing top-notch emerging market asset management products. Our most recent offering is the HSBC RMB Fixed Income Fund, which affords access to the Renminbi, the official offshore currency of the People’s Republic of China, through a portfolio of “Dim Sum” bonds. As the leading international bank in mainland China, HSBC is uniquely positioned to manage such a vehicle.
On behalf of my colleagues, I thank our investment advisor and portfolio managers, our other service providers, and you, our shareholders, for your support. We will continue to work hard to merit that confidence.
Sincerely,

Michael Seely
Chairman, HSBC Funds
1 For additional information, please refer to the Glossary of Terms.
This literature must be preceded or accompanied by an effective prospectus for the HSBC Funds. Investors should consider the investment objectives, risks, charges, and expenses of the investment company carefully before investing. The prospectus contains this and other important information about the investment company. To obtain more information, for clients of HSBC Securities (USA) Inc., please call 1-888-525-5757 or visit www.investorfunds.us.hsbc.com. For other investors and prospective investors, please call the Funds directly at 1-888-936-4722. Investors should read the prospectus carefully before investing or sending money.
4 HSBC FAMILY OF FUNDS
Dear Shareholder,
We are please to send to you the HSBC Funds annual report, covering the Funds’ fiscal year ended October 31, 2012. This report offers detailed information about your Funds’ investments and results. We encourage you to review it carefully.
Inside these pages you will find a letter from the Funds’ Chairman, Michael Seely, in which he comments on recent market developments. The report also includes commentary from the Funds’ portfolio managers in which they discuss the investment markets and their respective Fund’s performance. Each commentary is accompanied by the Fund’s return for the period, listed alongside the returns of its benchmark index and peer group average for comparative purposes.
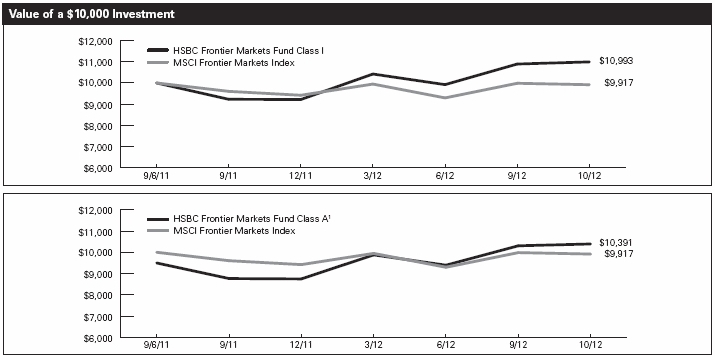
On June 8 of this year we continued to expand our emerging markets funds offering by launching the HSBC RMB Fixed Income Fund. This Fund gives investors exposure to the Chinese Renminbi (“RMB”) bond market, sometimes referred to as the “dim sum” bond market. The Fund joins the HSBC Emerging Markets Local Debt Fund, HSBC Emerging Markets Debt Fund, HSBC Total Return Fund and the HSBC Frontier Markets Fund in our emerging markets segment.
In closing, we would like to thank you for investing through the HSBC Funds. We continue to focus the HSBC Fund Family investment solutions to assist our shareholders in reaching their financial goals. We appreciate the trust you place in us, and will continue working to earn it. Please contact us at any time with questions or concerns.
Sincerely,

Richard A. Fabietti
President
HSBC FAMILY OF FUNDS 5
| Commentary From the Investment Manager |
HSBC Global Asset Management (USA) Inc.
U.S. Economic Review
The global economy made only moderate progress in its ongoing recovery from a historic downturn during the 12-month period between November 1, 2011 and October 31, 2012. Governments around the world fueled the turnaround with aggressive monetary stimulus as policymakers struggled to revive growth against a backdrop, at least in the developed world, of bloated public debt. The Federal Reserve Board (the “Fed”) maintained the federal funds rate—a key factor in lending rates—at a historically low target range between 0.00% to 0.25%, and announced that it would keep the rate in that range until at least 2015.
The period began among concerns that the eurozone debt crisis would cause a new global recession. The situation in Europe improved somewhat during the first months of 2012, largely due to the European Central Bank’s (ECB) efforts to support liquidity. However, the prospect of another global recession loomed throughout much of the period as numerous economic indicators, such as industrial production and unemployment growth, proved disappointing. Although the U.S. economy continued to expand during the period, the pace of its growth slowed.
We believe the ECB helped to stem a liquidity crisis and alleviate fears of deepening credit problems in the eurozone. In December 2011 the ECB began distributing inexpensive loans to European banks as part of its long-term refinancing operation (LTRO) and in March 2012 began doling out an even larger amount of money in similar loans. The LTRO appeared to stabilize financial markets in the short term; nevertheless, significant uncertainties remain regarding the long-term prospects of European economies to regain their competitiveness and prevent default. The ability of Italy and Spain to reestablish market confidence remained in doubt; in addition, the long-term impact of austerity programs on economic growth raised concerns.
Slowing growth in major world economies, including the U.S. and China, presented a significant setback for the global economy. U.S. Gross Domestic Product (“GDP”)1 increased at an annualized rate of 4.1% during the last quarter of 2011, then slowed to 2.7% or less for the remainder of the period under review. Industrial production growth was weak in both developed and emerging markets. U.S. consumer confidence improved somewhat, although real income growth and consumer savings were low. While job growth remained slow, during the last quarter of the period the unemployment rate fell below 8% for the first time in four years. During the period, the U.S. housing market showed significant signs of improvement as sales increased and inventory declined. Towards the end of the period, better economic news was seen from China, the world’s second-largest economy, leading many commentators to suggest that Chinese economic growth had turned a corner. One positive consequence of the slowdown in the global economy was a decrease in the rate of inflation in both developed and emerging economies.
Market Review
U.S. stocks posted strong gains. The first two months of the period were characterized by high volatility, as investors responded to ongoing debt problems and slowing economic growth. Equities began a strong rally in the final weeks of 2011 that continued throughout much of the period, with the exception of a pullback during the late spring. Stocks’ robust performance, despite economic setbacks, was supported in part by the actions of central banks, including the ECB’s launch of a new bond buying scheme it described as “unlimited” and the Fed’s third round of “quantitative easing.” The S&P 500 Index1 of large-company stocks returned 15.21% for the 12 months through October 2012. Small-cap shares slightly outperformed mid- and large-caps: For the same period, the Russell 2000® Index1 of small-company stocks returned 12.08%, and the S&P 400 MidCap Index1 returned 12.11%.
The debt crisis in Europe, along with slowing growth in developing economies, led to less impressive performance for foreign stocks. The Morgan Stanley Capital International Europe Australasia and Far East (“MSCI EAFE”) Index1 of international stocks in developed markets returned 4.61% for the 12-month period.
Fixed-income securities generated significant gains during the period, as global economic worries continued to drive demand for lower-risk assets. Yields on U.S. government bonds reached record lows as an increasing number of investors pursued a flight to safety. Low inflation, healthy corporate balance sheets, consumer and corporate deleveraging and a stabilizing housing market supported gains in corporate fixed-income markets, including both investment and high yield bonds. For the 12-month period the Barclays U.S. Aggregate Bond Index1, which tracks the broad investment-grade fixed-income market, returned 5.25%, while the Barclays U.S. High-Yield Corporate Bond Index1 returned 13.61%.
1 For additional information, please refer to the Glossary of Terms.
6 HSBC FAMILY OF FUNDS
| Portfolio Reviews (Unaudited)(Unaudited) |
HSBC Growth Fund
(Class A Shares, Class B Shares, Class C Shares and Class I Shares)
by Clark J. Winslow, CEO and CIO/Portfolio Manager
Justin H. Kelly, CFA, Senior Managing Director/Portfolio Manager
R. Bartlett Wear, CFA, Senior Managing Director/Portfolio Manager
Winslow Capital Management, Inc.
The HSBC Growth Fund (the “Fund”) seeks long-term growth of capital. Under normal market conditions, the Fund invests primarily in U.S. and foreign equity securities of high quality companies with market capitalization generally in excess of $2 billion, which the subadviser believes have the potential to generate superior levels of long-term profitability and growth. The Fund utilizes a two-tier structure, commonly known as a “master-feeder” structure, in which the Fund invests all of its investable assets in the HSBC Growth Portfolio (the “Portfolio”). The Portfolio employs Winslow Capital Management, Inc. as its subadviser.
Investment Concerns
Equity securities (stocks) are more volatile and carry more risk than other forms of investments, including investments in high-grade fixed income securities.
The growth investment style may fall out of favor in the marketplace and result in significant declines in the value of the Portfolio’s securities. Securities of companies considered to be growth investments may have rapid price swings in the event of earnings disappointments or during periods of market, political, regulatory and economic uncertainty.
For a complete description of these and other risks associated with investment in a mutual fund, please refer to the Fund’s prospectus.
Market Commentary
The Fund returned 6.69% (without sales charge) for the Class A Shares and 6.89% for the Class I Shares for the year ended October 31, 2012. That compared to a 13.02% total return for the Russell 1000® Growth Index1, the Fund’s primary performance benchmark, and a 10.12% total return for the Lipper Large-Cap Growth Funds Average1.
Portfolio Performance
The period began with investors expecting moderate economic growth, although it remained slow during the 12-month period. Moreover, investors were concerned about the continuing eurozone debt crisis and potential fiscal issues in the U.S.
Stocks performed relatively well in that environment, which helped the Fund’s absolute return. However, the Fund lagged its benchmark due to several factors. In particular, we chose to avoid a number of individual stocks in defensive sectors. We believed that the business models of the underlying companies were inconsistent with the Fund’s growth investment philosophy. That strategy hurt the Fund’s relative returns as those defensive stocks performed well during the period.*
Additionally, the Fund’s relative returns suffered from individual stock selection in several sectors, including consumer discretionary and information technology.*
Stock selection in the materials and telecommunications sectors contributed positively to the Fund’s performance relative to its benchmark. In addition, an underweight position in the energy sector benefited relative performance, as this sector lagged the broader market.*
| * | | Portfolio composition is subject to change. |
| 1 | | For additional information, please refer to the Glossary of Terms. |
Past performance does not guarantee future results. The performance data quoted represents past performance and current returns may be lower or higher. Total return figures include change in share price, reinvestment of dividends and capital gains and do not reflect taxes that a shareholder would pay on Fund distributions or on the redemption of Fund shares. Investment return and principal value will fluctuate so that an investor’s shares, when redeemed may be worth more or less than the original cost. To obtain performance information current to the most recent month end, please call 1-800-782-8183.
8 HSBC FAMILY OF FUNDS
| Portfolio Reviews (Unaudited) |
HSBC Growth Fund

The charts above represent a historical since inception performance comparison of a hypothetical $10,000 investment in the indicated share class versus a similar investment in the Fund’s benchmark and represents the reinvestment of dividends and capital gains in the Fund.
| | | | Average Annual | | Expense |
| Fund Performance | | | | Total Return (%) | | Ratio (%)6 |
| | | | | | | | Since | | | | |
| As of October 31, 2012 | | Inception Date | | 1 Year | | 5 Year | | Inception | | Gross | | Net |
| HSBC Growth Fund Class A1 | | 5/7/045 | | 1.37 | | -0.31 | | | 5.31 | | | | 1.30 | | 1.19 |
| HSBC Growth Fund Class B2 | | 5/7/045 | | 1.88 | | -0.03 | | | 5.38 | | | | 2.05 | | 1.94 |
| HSBC Growth Fund Class C3 | | 5/7/045 | | 4.84 | | -0.03 | | | 5.16 | | | | 2.05 | | 1.94 |
| HSBC Growth Fund Class I | | 5/7/045 | | 6.89 | | 0.96 | | | 6.20 | | | | 1.05 | | 0.94 |
| Russell 1000® Growth Index4 | | — | | 13.02 | | 1.95 | | | 5.59 | 7 | | | N/A | | N/A |
| Lipper Large-Cap Growth Funds Average4 | | — | | 10.12 | | -0.12 | | | 4.61 | 8 | | | N/A | | N/A |
Past performance does not guarantee future results. The performance data quoted represents past performance and current returns may be lower or higher. Total return figures include change in share price, reinvestment of dividends and capital gains and do not reflect the taxes that a shareholder would pay on Fund distributions or on the redemption of Fund shares. Investment return and principal value will fluctuate so that an investor’s shares, when redeemed may be worth more or less than the original cost. To obtain performance information current to the most recent month end, please call 1-800-782-8183.
The performance above reflects any fee waivers that have been in effect during the applicable periods, as well as any expense reimbursements that have periodically been made. Absent such waivers and reimbursements, returns would have been lower. Currently, contractual fee waivers are in effect for the Fund through March 1, 2013.
Certain returns shown include monies received by the Portfolio, in which the Fund invests, in respect of one-time class action settlements and a one-time reimbursement from HSBC Global Asset Management (USA) Inc. (the “Adviser”) to the Fund related to past marketing arrangements. As a result, the Fund’s total returns for those periods were higher than they would have been had the Portfolio and the Fund not received the payments.
| 1 | | Reflects the maximum sales charge of 5.00%. |
| 2 | | Reflects the applicable contingent deferred sales charge maximum of 4.00%. |
| 3 | | Reflects the applicable contingent deferred sales charge maximum of 1.00%. |
| 4 | | For additional information, please refer to the Glossary of Terms. |
| 5 | | The HSBC Growth Fund was initially offered for purchase effective May 7, 2004, however, no shareholder activity occurred until May 10, 2004. |
| 6 | | Reflects the expense ratio as reported in the prospectus dated February 28, 2012. The Adviser has entered into a contractual expense limitation agreement with the Fund under which it will limit total expenses of the Fund (excluding interest, taxes, brokerage commissions, extraordinary expenses) to an annual rate of 1.20%, 1.95%, 1.95% and 0.95% for Class A Shares, Class B Shares, Class C Shares and Class I Shares, respectively. The expense limitation shall be in effect until March 1, 2013. |
| 7 | | Return for the period May 10, 2004 to October 31, 2012. |
| 8 | | Return for the period April 30, 2004 to October 31, 2012. |
The Fund’s performance is measured against the Russell 1000® Growth Index, an unmanaged index that measures the performance of the large-cap growth segment of the U.S. equity universe. It includes those Russell 1000 companies with higher price-to-book ratios and higher forecasted growth values. The performance of the index does not reflect the deduction of expenses associated with a mutual fund, such as investment management and fund accounting fees. The Fund’s performance reflects the deduction of fees for these value-added services. Investors cannot invest directly in an index.
HSBC FAMILY OF FUNDS 9
| Portfolio Reviews (Unaudited) |
HSBC Opportunity Fund (Advisor)
(Class I Shares)
HSBC Opportunity Fund
(Class A Shares, Class B Shares and Class C Shares) |
by William A. Muggia, Committee Lead/Portfolio Manager
Ethan J. Myers, CFA, Portfolio Manager
John M. Montgomery, Portfolio Manager
Hamlen Thompson, Portfolio Manager
Bruce N. Jacobs, CFA, Portfolio Manager
Westfield Capital Management Company, L.P.
The HSBC Opportunity Fund and HSBC Opportunity Fund (Advisor) (collectively the “Fund”) seeks long-term growth of capital by investing in equity securities of small and mid-cap companies. Small and mid-cap companies generally are defined as those that have market capitalizations within the range of market capitalizations represented in the Russell 2500™ Growth Index. The Fund may also invest in equity securities of larger, more established companies and may invest up to 20% of its assets in securities of foreign companies. The Fund employs a two-tier structure, commonly referred to as a “master-feeder” structure, in which the Fund invests all of its investable assets in the HSBC Opportunity Portfolio (the “Portfolio”). The Portfolio employs Westfield Capital Management Company, L.P. as its subadviser.
Investment Concerns
Equity securities (stocks) are more volatile and carry more risk than other forms of investments, including investments in high-grade fixed income securities.
Small to mid-capitalization funds typically carry additional risks since smaller companies generally have a higher risk of failure, and historically, their stocks have experienced a greater degree of market volatility than stocks on average.
The growth investment style may fall out of favor in the marketplace and result in significant declines in the value of the Portfolio’s securities. Securities of companies considered to be growth investments may have rapid price swings in the event of earnings disappointments or during periods of market, political, regulatory and economic uncertainty.
There are risks associated with investing in foreign companies, such as erratic market conditions, economic and political instability and fluctuations in currency and exchange rates.
For a complete description of these and other risks associated with investment in a mutual fund, please refer to the Fund’s prospectus.
Market Commentary
For the year ended October 31, 2012, the Class I Shares of the HSBC Opportunity Fund (Advisor) produced a 12.50% total return, and the Class A Shares of the Fund produced a 12.08% total return (without sales charge). The Russell 2500™ Growth Index1, the Fund’s primary performance benchmark, and the Lipper Mid-Cap Growth Funds Average1 returned 10.08% and 6.78%, respectively.
Portfolio Performance
U.S. equities delivered double-digit gains during the 12-month period. Among the period’s best performers were stocks that are considered “defensive”—such as those within the consumer staples, health care and telecommunication services sectors. Additionally stocks in the industrials and materials sectors performed well, while information technology and energy stocks lagged the broader market during the period.
The Fund benefited from the strong performance in the stock market. The consumer discretionary sector was the Fund’s top-performing sector during the period, and was helped by strong performance among retail and homebuilding holdings.*
The Fund’s outperformance of its benchmark was primarily driven by strong stock selection across six economic sectors. The biggest contribution was provided by select investments within the consumer discretionary, information technology, materials, and energy sectors.*
During the 12-month period, the Fund benefited from an underweight position in the information technology sector relative to the benchmark, as that sector lagged the broader market. We positioned the Fund with an overweight position in the industrials sector to take advantage of a recovery in the domestic economy, particularly in the areas of housing, commercial construction and trucking. That contributed to the Fund’s relative return. In addition, investments in the financial sector—particularly among regional banks, reinsurance firms and investment banks—boosted the Fund’s performance relative to its benchmark, as did an investment in a company through its initial public offering (IPO).*
However, the Fund was hurt by individual holdings in the health care sector. Those stocks included shares of biotechnology and pharmaceutical firms. The Fund’s relative performance was hurt by its sole holding in the telecommunication services sector, which was sold due to deteriorating fundamentals.*
| * | Portfolio composition is subject to change. |
| 1 | For additional information, please refer to the Glossary of Terms. |
Past performance does not guarantee future results. The performance data quoted represents past performance and current returns may be lower or higher. Total return figures include change in share price, reinvestment of dividends and capital gains and do not reflect taxes that a shareholder would pay on Fund distributions or on the redemption of Fund shares. Investment return and principal value will fluctuate so that an investor’s shares, when redeemed may be worth more or less than the original cost. To obtain performance information current to the most recent month end, please call 1-800-782-8183.
10 HSBC FAMILY OF FUNDS
| Portfolio Reviews (Unaudited) |
| HSBC Opportunity Fund |
| |
|
The charts above represent a historical 10-year performance comparison of a hypothetical $10,000 investment in the indicated share class versus a similar investment in the Fund’s benchmark and represents the reinvestment of dividends and capital gains in the Fund. |
| Fund Performance | | | | | | Average Annual
Total Return (%) | | Expense
Ratio (%)5 |
| As of October 31, 2012 | | Inception Date | | 1 Year | | 5 Year | | 10 Year | | Gross | | Net |
| HSBC Opportunity Fund Class A1 | | | 9/23/96 | | | 6.47 | | 2.29 | | 10.62 | | 1.85 | | 1.65 |
| HSBC Opportunity Fund Class B2 | | | 1/6/98 | | | 7.51 | | 2.56 | | 10.67 | | 2.60 | | 2.40 |
| HSBC Opportunity Fund Class C3 | | | 11/4/98 | | | 10.23 | | 2.57 | | 10.35 | | 2.60 | | 2.40 |
| HSBC Opportunity Fund Class I† | | | 9/3/96 | | | 12.50 | | 3.91 | | 11.68 | | 1.01 | | 1.01 |
| Russell 2500™ Growth Index4 | | | — | | | 10.08 | | 2.04 | | 10.40 | | N/A | | N/A |
| Lipper Mid-Cap Growth Funds Average4 | | | — | | | 6.78 | | 0.00 | | 8.41 | | N/A | | N/A |
Past performance does not guarantee future results. The performance data quoted represents past performance and current returns may be lower or higher. Total return figures include change in share price, reinvestment of dividends and capital gains and do not reflect the taxes that a shareholder would pay on Fund distributions or on the redemption of Fund shares. Investment return and principal value will fluctuate so that an investor’s shares, when redeemed may be worth more or less than the original cost. To obtain performance information current to the most recent month end, please call 1-800-782-8183.
The performance above reflects any fee waivers that have been in effect during the applicable periods, as well as any expense reimbursements that have periodically been made. Absent such waivers and reimbursements, returns would have been lower. Currently, contractual fee waivers are in effect for the Fund through March 1, 2013 for Class A Shares, Class B Shares and Class C Shares.
Certain returns shown include monies received by the Portfolio, in which the Fund invests, in respect of one-time class action settlements and a one-time reimbursement from HSBC Global Asset Management (USA) Inc. (the “Adviser”) to the Fund related to past marketing arrangements. As a result, the Fund’s total returns for those periods were higher than they would have been had the Portfolio and the Fund not received the payments.
| † | The Class I Shares are issued by a series of HSBC Advisor Funds Trust, also named the HSBC Opportunity Fund. |
| 1 | Reflects the maximum sales charge of 5.00%. |
| 2 | Reflects the applicable contingent deferred sales charge, maximum of 4.00%. |
| 3 | Reflects the applicable contingent deferred sales charge, maximum of 1.00%. |
| 4 | For additional information, please refer to the Glossary of Terms. |
| 5 | Reflects the expense ratio as reported in the prospectus dated February 28, 2012. The Adviser has entered into a contractual expense limitation agreement with the Fund under which it will limit total expenses of the Fund (excluding interest, taxes, brokerage commissions, extraordinary expenses and estimated indirect expenses attributable to the Fund’s investments in investment companies other than the Portfolio) to an annual rate of 1.65%, 2.40%, and 2.40% for Class A Shares, Class B Shares, and Class C Shares, respectively. The expense limitation shall be in effect until March 1, 2013. Additional information pertaining to the October 31, 2012 expense ratios can be found in the financial highlights. |
The Fund’s performance is measured against the Russell 2500™ Growth Index, an unmanaged index that measures the performance of the small- to mid-cap growth segment of the U.S. equity universe. It includes those Russell 2500 companies with higher price-to-book ratios and higher forecasted growth values. The performance for the index does not reflect the deduction of expenses associated with a mutual fund, such as investment management and fund accounting fees. The Fund’s performance reflects the deduction of fees for these value-added services. Investors cannot invest directly in an index.
HSBC FAMILY OF FUNDS 11
| Portfolio Reviews |
| Portfolio Composition* |
| October 31, 2012 (Unaudited) |
| HSBC Growth Portfolio | | |
| | Percentage of |
| Investment Allocation | | Investments at Value (%) |
| Computers & Peripherals | | 8.1 |
| IT Services | | 8.0 |
| Internet Software & Services | | 5.4 |
| Specialty Retail | | 4.8 |
| Biotechnology | | 4.5 |
| Internet & Catalog Retail | | 4.4 |
| Chemicals | | 4.4 |
| Health Care Providers & Services | | 4.2 |
| Health Care Equipment & Supplies | | 4.1 |
| Investment Companies | | 3.9 |
| Road & Rail | | 3.9 |
| Machinery | | 3.9 |
| Hotels, Restaurants & Leisure | | 3.8 |
| Textiles, Apparel & Luxury Goods | | 3.4 |
| Aerospace & Defense | | 3.4 |
| Software | | 3.3 |
| Communications Equipment | | 3.3 |
| Oil, Gas & Consumable Fuels | | 3.2 |
| Capital Markets | | 2.8 |
| Food & Staples Retailing | | 2.7 |
| Media | | 1.8 |
| Energy Equipment & Services | | 1.8 |
| Real Estate Investment Trusts (REITs) | | 1.6 |
| Health Care Technology | | 1.4 |
| Construction & Engineering | | 1.3 |
| Wireless Telecommunication Services | | 1.3 |
| Business Services | | 1.3 |
| Auto Components | | 1.1 |
| Personal Products | | 0.8 |
| Diversified Financial Services | | 0.6 |
| Household Durables | | 0.5 |
| Trading Companies & Distributors | | 0.4 |
| Semiconductors & Semiconductor Equipment | | 0.3 |
| Pharmaceuticals | | 0.3 |
| Total | | 100.0 |
| HSBC Opportunity Portfolio | | |
| | Percentage of |
| Investment Allocation | | Investments at Value (%) |
| Specialty Retail | | 11.3 |
| Software | | 6.5 |
| Health Care Equipment & Supplies | | 6.3 |
| Machinery | | 5.6 |
| Oil, Gas & Consumable Fuels | | 5.4 |
| IT Services | | 4.7 |
| Chemicals | | 4.2 |
| Health Care Providers & Services | | 4.2 |
| Trading Companies & Distributors | | 4.2 |
| Capital Markets | | 3.6 |
| Aerospace & Defense | | 3.4 |
| Commercial Banks | | 3.3 |
| Investment Companies | | 3.2 |
| Semiconductors & Semiconductor Equipment | | 3.1 |
| Containers & Packaging | | 3.1 |
| Road & Rail | | 2.9 |
| Food Products | | 2.6 |
| Insurance | | 2.2 |
| Electrical Equipment | | 2.1 |
| Commercial Services & Supplies | | 2.1 |
| Life Sciences Tools & Services | | 2.0 |
| Real Estate Management & Development | | 1.9 |
| Biotechnology | | 1.8 |
| Energy Equipment & Services | | 1.7 |
| Professional Services | | 1.5 |
| Communications Equipment | | 1.4 |
| Pharmaceuticals | | 1.2 |
| Building Products | | 1.2 |
| Textiles, Apparel & Luxury Goods | | 1.1 |
| Household Durables | | 0.9 |
| Media | | 0.7 |
Electronic Equipment, Instruments
& Components | | 0.6 |
| Total | | 100.0 |
____________________
| * | Portfolio composition is subject to change. |
12 HSBC FAMILY OF FUNDS
HSBC FAMILY OF FUNDS
Statements of Assets and Liabilities—as of October 31, 2012
| | | Growth
Fund | | | | Opportunity
Fund | | | | Opportunity
Fund
(Advisor) | |
| Assets: | | | | | | | | | | | | | | | | | | |
| Investments in Affiliated Portfolios | | | $ | 70,419,837 | | | | | $ | 11,244,356 | | | | | $ | 135,190,550 | | |
| Receivable for capital shares issued | | | | 89,577 | | | | | | 585 | | | | | | 55,692 | | |
| Receivable from Investment Adviser | | | | 33,656 | | | | | | 30,599 | | | | | | — | | |
| Prepaid expenses and other assets | | | | 15,359 | | | | | | 4,566 | | | | | | 3,343 | | |
| Total Assets | | | | 70,558,429 | | | | | | 11,280,106 | | | | | | 135,249,585 | | |
| Liabilities: | | | | | | | | | | | | | | | | | | |
| Payable for capital shares redeemed | | | | 148,427 | | | | | | 6,147 | | | | | | 59,653 | | |
| Accrued expenses and other liabilities: | | | | | | | | | | | | | | | | | | |
| Administration | | | | 1,503 | | | | | | 235 | | | | | | 2,806 | | |
| Distribution | | | | 703 | | | | | | 661 | | | | | | — | | |
| Shareholder Servicing | | | | 2,589 | | | | | | 2,256 | | | | | | — | | |
| Compliance Service | | | | 8 | | | | | | 1 | | | | | | 1 | | |
| Accounting | | | | 50 | | | | | | 50 | | | | | | — | | |
| Transfer Agent | | | | 4,180 | | | | | | 3,107 | | | | | | 3,107 | | |
| Trustee | | | | 70 | | | | | | 10 | | | | | | 156 | | |
| Other | | | | 55,178 | | | | | | 18,993 | | | | | | 86,232 | | |
| Total Liabilities | | | | 212,708 | | | | | | 31,460 | | | | | | 151,955 | | |
| Net Assets | | | $ | 70,345,721 | | | | | $ | 11,248,646 | | | | | $ | 135,097,630 | | |
| | | | | | | | | | | | | | | | | | | |
| Composition of Net Assets: | | | | | | | | | | | | | | | | | | |
| Capital | | | | 52,173,265 | | | | | | 9,001,323 | | | | | | 110,382,662 | | |
| Accumulated net investment income (loss) | | | | (133,004 | ) | | | | | (49,006 | ) | | | | | 38,431 | | |
| Accumulated net realized gains (losses) from investments | | | | 8,428,470 | | | | | | 588,594 | | | | | | 5,911,332 | | |
| Unrealized appreciation/depreciation on investments | | | | 9,876,990 | | | | | | 1,707,735 | | | | | | 18,765,205 | | |
| Net Assets | | | $ | 70,345,721 | | | | | $ | 11,248,646 | | | | | $ | 135,097,630 | | |
| | | | | | | | | | | | | | | | | | | |
| Net Assets: | | | | | | | | | | | | | | | | | | |
| Class A Shares | | | $ | 11,326,595 | | | | | $ | 10,204,216 | | | | | $ | — | | |
| Class B Shares | | | | 620,847 | | | | | | 499,195 | | | | | | — | | |
| Class C Shares | | | | 482,231 | | | | | | 545,235 | | | | | | — | | |
| Class I Shares | | | | 57,916,048 | | | | | | — | | | | | | 135,097,630 | | |
| | | $ | 70,345,721 | | | | | $ | 11,248,646 | | | | | $ | 135,097,630 | | |
| | | | | | | | | | | | | | | | | | |
| Shares Outstanding | | | | | | | | | | | | | | | | | | |
| ($0.001 par value, unlimited number of shares authorized): | | | | | | | | | | | | | | | | | | |
| Class A Shares | | | | 640,166 | | | | | | 1,007,637 | | | | | | — | | |
| Class B Shares | | | | 38,764 | | | | | | 62,290 | | | | | | — | | |
| Class C Shares | | | | 29,924 | | | | | | 66,391 | | | | | | — | | |
| Class I Shares | | | | 3,219,534 | | | | | | — | | | | | | 10,081,754 | | |
| | | | | | | | | | | | | | | | | | | |
| Net Asset Value, Offering Price and Redemption Price per share: | | | | | | | | | | | | | | | | | | |
| Class A Shares | | | $ | 17.69 | | | | | $ | 10.13 | | | | | $ | — | | |
| Class B Shares(a) | | | $ | 16.02 | | | | | $ | 8.01 | | | | | $ | — | | |
| Class C Shares(a) | | | $ | 16.12 | | | | | $ | 8.21 | | | | | $ | — | | |
| Class I Shares | | | $ | 17.99 | | | | | $ | — | | | | | $ | 13.40 | | |
| Maximum Sales Charge - Class A Shares | | | | 5.00 | % | | | | | 5.00 | % | | | | | — | % | |
| Maximum Offering Price per share | | | | | | | | | | | | | | | | | | |
| (Net Asset Value/(100%-maximum sales charge)) - Class A Shares | | | $ | 18.62 | | | | | $ | 10.66 | | | | | $ | — | | |
____________________
| (a) | Redemption Price per share varies by length of time shares are held. |
See notes to financial statements. | HSBC FAMILY OF FUNDS 13 |
HSBC FAMILY OF FUNDS
Statements of Operations—For the year ended October 31, 2012
| Growth
Fund | | Opportunity
Fund | | Opportunity
Fund
(Advisor) |
| Investment Income: | | | | | | | | | | | | | | | | | |
| Investment Income from Affiliated Portfolios(a) | | $ | 617,367 | | | | | $ | 123,258 | | | | | $ | 1,404,196 | | |
| Foreign tax withholding from Affiliated Portfolios(a) | | | (1,123 | ) | | | | | — | | | | | | — | | |
| Expenses from Affiliated Portfolios(a) | | | (526,974 | ) | | | | | (107,849 | ) | | | | | (1,198,434 | ) | |
| Total Investment Income (Loss) | | | 89,270 | | | | | | 15,409 | | | | | | 205,762 | | |
| | | | | | | | | | | | | | | | | | |
| Expenses: | | | | | | | | | | | | | | | | | |
| Administration: | | | | | | | | | | | | | | | | | |
| Class A Shares | | | 3,395 | | | | | | 2,613 | | | | | | — | | |
| Class B Shares | | | 186 | | | | | | 121 | | | | | | — | | |
| Class C Shares | | | 85 | | | | | | 115 | | | | | | — | | |
| Class I Shares | | | 14,196 | | | | | | — | | | | | | 31,697 | | |
| Distribution: | | | | | | | | | | | | | | | | | |
| Class B Shares | | | 5,570 | | | | | | 3,583 | | | | | | — | | |
| Class C Shares | | | 2,585 | | | | | | 3,496 | | | | | | — | | |
| Shareholder Servicing: | | | | | | | | | | | | | | | | | |
| Class A Shares | | | 32,711 | | | | | | 22,891 | | | | | | — | | |
| Class B Shares | | | 1,875 | | | | | | 1,212 | | | | | | — | | |
| Class C Shares | | | 864 | | | | | | 1,173 | | | | | | — | | |
| Accounting | | | 24,050 | | | | | | 19,049 | | | | | | 9,000 | | |
| Audit | | | 16,868 | | | | | | 18,343 | | | | | | 17,839 | | |
| Compliance Service | | | 630 | | | | | | 96 | | | | | | 1,054 | | |
| Printing | | | 40,155 | | | | | | 9,610 | | | | | | 67,815 | | |
| Transfer Agent | | | 92,192 | | | | | | 51,546 | | | | | | 63,627 | | |
| Trustee | | | 1,839 | | | | | | 305 | | | | | | 3,311 | | |
| Registration fees | | | 37,682 | | | | | | 21,608 | | | | | | 11,233 | | |
| Other | | | 12,572 | | | | | | 3,720 | | | | | | 19,810 | | |
| Total expenses before fee reductions | | | 287,455 | | | | | | 159,481 | | | | | | 225,386 | | |
| Fees voluntarily reduced by Investment Adviser | | | — | | | | | | (11,816 | ) | | | | | — | | |
| Fees contractually reduced by Investment Adviser | | | (65,181 | ) | | | | | (65,241 | ) | | | | | — | | |
| Net Expenses | | | 222,274 | | | | | | 82,424 | | | | | | 225,386 | | |
| | | | | | | | | | | | | | | | | | |
| Net Investment Income (Loss) | | | (133,004 | ) | | | | | (67,015 | ) | | | | | (19,624 | ) | |
| | | | | | | | | | | | | | | | | | |
| Net Realized/Unrealized Gains (Losses) from Investments:(a) | | | | | | | | | | | | | | | | | |
| Net realized gains (losses) from investment securities | | | 8,364,394 | | | | | | 786,559 | | | | | | 7,509,207 | | |
| Change in unrealized appreciation/depreciation on investments | | | (3,332,031 | ) | | | | | 610,433 | | | | | | 7,623,444 | | |
| | | | | | | | | | | | | | | | | | |
| Net realized/unrealized gains from investments | | | 5,032,363 | | | | | | 1,396,992 | | | | | | 15,132,651 | | |
| Change In Net Assets Resulting From Operations | | $ | 4,899,359 | | | | | $ | 1,329,977 | | | | | $ | 15,113,027 | | |
____________________
| (a) | Represents amounts allocated from the respective Affiliated Portfolios. |
14 HSBC FAMILY OF FUNDS | See notes to financial statements. |
HSBC FAMILY OF FUNDS
Statements of Changes in Net Assets
| Growth Fund | | Opportunity Fund |
| For the
year ended
October 31, 2012 | For the
year ended
October 31, 2011 | | For the
year ended
October 31, 2012 | For the
year ended
October 31, 2011 |
| Investment Activities: | | | | | | | | | | | | | | | | | | | | | |
| Operations: | | | | | | | | | | | | | | | | | | | | | |
| Net investment income (loss) | | $ | (133,004 | ) | | | $ | (211,298 | ) | | | | $ | (67,015 | ) | | | $ | (91,095 | ) | |
| Net realized gains (losses) from investments | | | 8,364,394 | | | | | 6,871,855 | | | | | | 786,559 | | | | | 1,941,921 | | |
| Change in unrealized appreciation/depreciation | | | | | | | | | | | | | | | | | | | | | |
| on investments | | | (3,332,031 | ) | | | | 383,956 | | | | | | 610,433 | | | | | (495,829 | ) | |
| Change in net assets resulting from operations | | | 4,899,359 | | | | | 7,044,513 | | | | | | 1,329,977 | | | | | 1,354,997 | | |
| | | | | | | | | | | | | | | | | | | | | | |
| Dividends: | | | | | | | | | | | | | | | | | | | | | |
| Net realized gains: | | | | | | | | | | | | | | | | | | | | | |
| Class A Shares | | | — | | | | | — | | | | | | (1,598,939 | ) | | | | (183,592 | ) | |
| Class B Shares | | | — | | | | | — | | | | | | (93,318 | ) | | | | (11,590 | ) | |
| Class C Shares | | | — | | | | | — | | | | | | (76,609 | ) | | | | (6,561 | ) | |
| Change in net assets resulting from shareholder dividends | | | — | | | | | — | | | | | | (1,768,866 | ) | | | | (201,743 | ) | |
| Change in net assets resulting from capital transactions | | | (8,338,642 | ) | | | | (582,610 | ) | | | | | (429,918 | ) | | | | (1,316,886 | ) | |
| Change in net assets | | | (3,439,283 | ) | | | | 6,461,903 | | | | | | (868,807 | ) | | | | (163,632 | ) | |
| | | | | | | | | | | | | | | | | | | | | | |
| Net Assets: | | | | | | | | | | | | | | | | | | | | | |
| Beginning of period | | | 73,785,004 | | | | | 67,323,101 | | | | | | 12,117,453 | | | | | 12,281,085 | | |
| End of period | | $ | 70,345,721 | | | | $ | 73,785,004 | | | | | $ | 11,248,646 | | | | $ | 12,117,453 | | |
| Accumulated net investment income (loss) | | $ | (133,004 | ) | | | $ | — | | | | | $ | (49,006 | ) | | | $ | — | | |
See notes to financial statements. | HSBC FAMILY OF FUNDS 15 |
HSBC FAMILY OF FUNDS
Statements of Changes in Net Assets (continued)
| Growth Fund | | Opportunity Fund |
| For the
year ended
October 31, 2012 | For the
year ended
October 31, 2011 | | For the
year ended
October 31, 2012 | For the
year ended
October 31, 2011 |
| CAPITAL TRANSACTIONS: | | | | | | | | | | | | | | | | | | | | | |
| Class A Shares: | | | | | | | | | | | | | | | | | | | | | |
| Proceeds from shares issued | | $ | 871,476 | | | | $ | 1,036,796 | | | | | $ | 772,149 | | | | $ | 2,442,156 | | |
| Dividends reinvested | | | — | | | | | — | | | | | | 1,562,653 | | | | | 182,620 | | |
| Value of shares redeemed | | | (5,909,138 | ) | | | | (3,859,930 | ) | | | | | (2,900,653 | ) | | | | (3,824,914 | ) | |
| Class A Shares capital transactions | | | (5,037,662 | ) | | | | (2,823,134 | ) | | | | | (565,851 | ) | | | | (1,200,138 | ) | |
| | | | | | | | | | | | | | | | | | | | | | |
| Class B Shares: | | | | | | | | | | | | | | | | | | | | | |
| Proceeds from shares issued | | | 111,305 | | | | | 79,343 | | | | | | 69,230 | | | | | 53,441 | | |
| Dividends reinvested | | | — | | | | | — | | | | | | 93,292 | | | | | 11,521 | | |
| Value of shares redeemed | | | (516,256 | ) | | | | (448,436 | ) | | | | | (160,269 | ) | | | | (249,484 | ) | |
| Class B Shares capital transactions | | | (404,951 | ) | | | | (369,093 | ) | | | | | 2,253 | | | | | (184,522 | ) | |
| | | | | | | | | | | | | | | | | | | | | | |
| Class C Shares: | | | | | | | | | | | | | | | | | | | | | |
| Proceeds from shares issued | | | 261,486 | | | | | 81,604 | | | | | | 112,981 | | | | | 97,064 | | |
| Dividends reinvested | | | — | | | | | — | | | | | | 76,317 | | | | | 6,561 | | |
| Value of shares redeemed | | | (42,587 | ) | | | | (36,230 | ) | | | | | (55,618 | ) | | | | (35,851 | ) | |
| Class C Shares capital transactions | | | 218,899 | | | | | 45,374 | | | | | | 133,680 | | | | | 67,774 | | |
| | | | | | | | | | | | | | | | | | | | | | |
| Class I Shares: | | | | | | | | | | | | | | | | | | | | | |
| Proceeds from shares issued | | | 17,658,774 | | | | | 15,376,187 | | | | | | — | | | | | — | | |
| Value of shares redeemed | | | (20,773,702 | ) | | | | (12,811,944 | ) | | | | | — | | | | | — | | |
| Class I Shares capital transactions | | | (3,114,928 | ) | | | | 2,564,243 | | | | | | — | | | | | — | | |
| Change in net assets resulting from capital transactions | | $ | (8,338,642 | ) | | | $ | (582,610 | ) | | | | $ | (429,918 | ) | | | $ | (1,316,886 | ) | |
| | | | | | | | | | | | | | | | | | | | | | |
| SHARE TRANSACTIONS: | | | | | | | | | | | | | | | | | | | | | |
| Class A Shares: | | | | | | | | | | | | | | | | | | | | | |
| Issued | | | 49,445 | | | | | 61,592 | | | | | | 77,300 | | | | | 210,382 | | |
| Reinvested | | | — | | | | | — | | | | | | 175,974 | | | | | 17,099 | | |
| Redeemed | | | (334,366 | ) | | | | (232,059 | ) | | | | | (293,635 | ) | | | | (346,398 | ) | |
| Change in Class A Shares | | | (284,921 | ) | | | | (170,467 | ) | | | | | (40,361 | ) | | | | (118,917 | ) | |
| | | | | | | | | | | | | | | | | | | | | | |
| Class B Shares: | | | | | | | | | | | | | | | | | | | | | |
| Issued | | | 6,924 | | | | | 5,111 | | | | | | 8,496 | | | | | 5,840 | | |
| Reinvested | | | — | | | | | — | | | | | | 13,196 | | | | | 1,296 | | |
| Redeemed | | | (31,749 | ) | | | | (29,395 | ) | | | | | (20,335 | ) | | | | (27,608 | ) | |
| Change in Class B Shares | | | (24,825 | ) | | | | (24,284 | ) | | | | | 1,357 | | | | | (20,472 | ) | |
| | | | | | | | | | | | | | | | | | | | | | |
| Class C Shares: | | | | | | | | | | | | | | | | | | | | | |
| Issued | | | 16,065 | | | | | 5,756 | | | | | | 14,173 | | | | | 10,495 | | |
| Reinvested | | | — | | | | | — | | | | | | 10,526 | | | | | 723 | | |
| Redeemed | | | (2,629 | ) | | | | (2,539 | ) | | | | | (6,916 | ) | | | | (3,974 | ) | |
| Change in Class C Shares | | | 13,436 | | | | | 3,217 | | | | | | 17,783 | | | | | 7,244 | | |
| | | | | | | | | | | | | | | | | | | | | | |
| Class I Shares: | | | | | | | | | | | | | | | | | | | | | |
| Issued | | | 981,882 | | | | | 909,571 | | | | | | — | | | | | — | | |
| Redeemed | | | (1,163,041 | ) | | | | (765,583 | ) | | | | | — | | | | | — | | |
| Change in Class I Shares | | | (181,159 | ) | | | | 143,988 | | | | | | — | | | | | — | | |
16 HSBC FAMILY OF FUNDS | See notes to financial statements. |
HSBC FAMILY OF FUNDS
Statements of Changes in Net Assets (continued)
| Opportunity Fund (Advisor) |
| For the
year ended
October 31, 2012 | For the
year ended
October 31, 2011 |
| Investment Activities: | | | | | | | | | | |
| Operations: | | | | | | | | | | |
| Net investment income (loss) | | $ | (19,624 | ) | | | $ | (91,185 | ) | |
| Net realized gains (losses) from investments | | | 7,509,207 | | | | | 19,552,882 | | |
| Change in unrealized appreciation/depreciation on investments | | | 7,623,444 | | | | | (4,003,173 | ) | |
| Change in net assets resulting from operations | | | 15,113,027 | | | | | 15,458,524 | | |
| | | | | | | | | | | |
| Dividends: | | | | | | | | | | |
| Net realized gains: | | | | | | | | | | |
| Class I Shares | | | (18,686,312 | ) | | | | (2,935,113 | ) | |
| Change in net assets resulting from shareholder dividends | | | (18,686,312 | ) | | | | (2,935,113 | ) | |
| Change in net assets resulting from capital transactions | | | 16,653,597 | | | | | (7,570,425 | ) | |
| Change in net assets | | | 13,080,312 | | | | | 4,952,986 | | |
| | | | | | | | | | | |
| Net Assets: | | | | | | | | | | |
| Beginning of period | | | 122,017,318 | | | | | 117,064,332 | | |
| End of period | | $ | 135,097,630 | | | | $ | 122,017,318 | | |
| Accumulated net investment income (loss) | | $ | 38,431 | | | | $ | — | | |
See notes to financial statements. | HSBC FAMILY OF FUNDS 17 |
HSBC FAMILY OF FUNDS
Statements of Changes in Net Assets (continued)
| | Opportunity Fund (Advisor) |
| | For the | For the |
| | year ended | year ended |
| | October 31, 2012 | October 31, 2011 |
| CAPITAL TRANSACTIONS: | | | | | | | | | | | |
| Class I Shares: | | | | | | | | | | | |
| Proceeds from shares issued | | | | 20,813,526 | | | | | 18,642,358 | | |
| Dividends reinvested | | | | 17,155,964 | | | | | 2,626,240 | | |
| Value of shares redeemed | | | | (21,315,893 | ) | | | | (28,839,023 | ) | |
| Class I Shares capital transactions | | | | 16,653,597 | | | | | (7,570,425 | ) | |
| Change in net assets resulting from capital transactions | | | $ | 16,653,597 | | | | $ | (7,570,425 | ) | |
| | | | | | | | | | | | |
| SHARE TRANSACTIONS: | | | | | | | | | | | |
| Class I Shares: | | | | | | | | | | | |
| Issued | | | | 1,554,122 | | | | | 1,309,527 | | |
| Reinvested | | | | 1,465,070 | | | | | 187,589 | | |
| Redeemed | | | | (1,642,101 | ) | | | | (1,963,117 | ) | |
| Change in Class I Shares | | | | 1,377,091 | | | | | (466,001 | ) | |
| 18 HSBC FAMILY OF FUNDS | See notes to financial statements. |
| HSBC GROWTH FUND |
Financial Highlights |
Selected data for a share outstanding throughout the periods indicated. *
| | | | | | | Investment Activities | | Dividends | | | | | | | | | | Ratios/Supplementary Data |
| | | | | | | | | | | | | | | | | | | | | | | | | | | | | | | | | | | | | | | | | | | | | | | | | Ratios of | | | | | |
| | | | | | | | | Net Realized | | | | | | | Net | | | | | | | | | | | | | | | | | | | | | | Ratio of Net | | Expenses to | | | | | |
| | Net Asset | | Net | | and Unrealized | | | | | | | Realized | | | | | | | Net Asset | | | | | Net Assets | | Ratio of Net | | Investment | | Average Net | | | | | |
| | Value, | | Investment | | Gains | | Total from | | Gains from | | | | | | | Value, | | | | | at End of | | Expenses to | | Income (Loss) | | Assets | | | | | |
| | Beginning | | Income | | (Losses) from | | Investment | | Investment | | Total | | End of | | Total | | Period | | Average Net | | to Average Net | | (Excluding Fee | | Portfolio |
| �� | of Period | | (Loss)(a) | | Investments | | Activities | | Transactions | | Dividends | | Period | | Return(b) | | (000’s) | | Assets | | Assets | | Reductions) | | Turnover(c) |
| CLASS A SHARES | | | | | | | | | | | | | | | | | | | | | | | | | | | | | | | | | | | | | | | | | | | | | | | | | | | | | | |
| Year Ended October 31, 2008 | | | $ | 17.95 | | | (0.05) | | | (6.51 | ) | | | | (6.56 | ) | | | | (0.84 | ) | | | | (0.84 | ) | | | | $ | 10.55 | | | (38.23 | )%(d) | | | $ | 17,180 | | | 1.20% | | | (0.36 | )% | | | 1.22% | | | 158 | % | |
| Year Ended October 31, 2009 | | | | 10.55 | | | (0.04) | | | 2.03 | | | | | 1.99 | | | | | — | | | | | — | | | | | | 12.54 | | | 18.86 | %(e) | | | | 15,896 | | | 1.20% | | | (0.33 | )% | | | 1.31% | | | 66 | % | |
| Year Ended October 31, 2010 | | | | 12.54 | | | (0.07) | | | 2.55 | | | | | 2.48 | | | | | — | | | | | — | | | | | | 15.02 | | | 19.78 | %(f)(g) | | | | 16,452 | | | 1.20% | | | (0.54 | )%(g) | | | 1.23% | | | 89 | % | |
| Year Ended October 31, 2011 | | | | 15.02 | | | (0.07) | | | 1.64 | | | | | 1.57 | | | | | — | | | | | — | | | | | | 16.59 | | | 10.45 | %(h) | | | | 15,349 | | | 1.18% | | | (0.45 | )% | | | 1.18% | | | 56 | % | |
| Year Ended October 31, 2012 | | | | 16.59 | | | (0.06) | | | 1.16 | | | | | 1.10 | | | | | — | | | | | — | | | | | | 17.69 | | | 6.63 | %(i) | | | | 11,327 | | | 1.20% | | | (0.36 | )% | | | 1.27% | | | 53 | % | |
| CLASS B SHARES | | | | | | | | | | | | | | | | | | | | | | | | | | | | | | | | | | | | | | | | | | | | | | | | | | | | | | |
| Year Ended October 31, 2008 | | | $ | 16.92 | | | (0.16) | | | (6.07 | ) | | | | (6.23 | ) | | | | (0.84 | ) | | | | (0.84 | ) | | | | $ | 9.85 | | | (38.62 | )%(d) | | | $ | 2,839 | | | 1.95% | | | (1.20 | )% | | | 1.96% | | | 158 | % | |
| Year Ended October 31, 2009 | | | | 9.85 | | | (0.10) | | | 1.85 | | | | | 1.75 | | | | | — | | | | | — | | | | | | 11.60 | | | 17.87 | %(e) | | | | 2,059 | | | 1.95% | | | (1.06 | )% | | | 2.06% | | | 66 | % | |
| Year Ended October 31, 2010 | | | | 11.60 | | | (0.16) | | | 2.36 | | | | | 2.20 | | | | | — | | | | | — | | | | | | 13.80 | | | 18.97 | %(f)(g) | | | | 1,213 | | | 1.95% | | | (1.28 | )%(g) | | | 1.98% | | | 89 | % | |
| Year Ended October 31, 2011 | | | | 13.80 | | | (0.18) | | | 1.51 | | | | | 1.33 | | | | | — | | | | | — | | | | | | 15.13 | | | 9.64 | %(h) | | | | 962 | | | 1.93% | | | (1.19 | )% | | | 1.93% | | | 56 | % | |
| Year Ended October 31, 2012 | | | | 15.13 | | | (0.17) | | | 1.06 | | | | | 0.89 | | | | | — | | | | | — | | | | | | 16.02 | | | 5.88 | %(i) | | | | 621 | | | 1.95% | | | (1.10 | )% | | | 2.03% | | | 53 | % | |
| CLASS C SHARES | | | | | | | | | | | | | | | | | | | | | | | | | | | | | | | | | | | | | | | | | | | | | | | | | | | | | | |
| Year Ended October 31, 2008 | | | $ | 17.02 | | | (0.16) | | | (6.11 | ) | | | | (6.27 | ) | | | | (0.84 | ) | | | | (0.84 | ) | | | | $ | 9.91 | | | (38.63 | )%(d) | | | $ | 72 | | | 1.95% | | | (1.13 | )% | | | 1.97% | | | 158 | % | |
| Year Ended October 31, 2009 | | | | 9.91 | | | (0.12) | | | 1.89 | | | | | 1.77 | | | | | — | | | | | — | | | | | | 11.68 | | | 17.86 | %(e) | | | | 120 | | | 1.95% | | | (1.12 | )% | | | 2.05% | | | 66 | % | |
| Year Ended October 31, 2010 | | | | 11.68 | | | (0.17) | | | 2.38 | | | | | 2.21 | | | | | — | | | | | — | | | | | | 13.89 | | | 18.92 | %(f)(g) | | | | 184 | | | 1.95% | | | (1.30 | )%(g) | | | 1.99% | | | 89 | % | |
| Year Ended October 31, 2011 | | | | 13.89 | | | (0.18) | | | 1.52 | | | | | 1.34 | | | | | — | | | | | �� | | | | | | 15.23 | | | 9.65 | %(h) | | | | 251 | | | 1.94% | | | (1.21 | )% | | | 1.94% | | | 56 | % | |
| Year Ended October 31, 2012 | | | | 15.23 | | | (0.18) | | | 1.07 | | | | | 0.89 | | | | | — | | | | | — | | | | | | 16.12 | | | 5.84 | %(i) | | | | 482 | | | 1.95% | | | (1.14 | )% | | | 2.03% | | | 53 | % | |
| CLASS I SHARES | | | | | | | | | | | | | | | | | | | | | | | | | | | | | | | | | | | | | | | | | | | | | | | | | | | | | | |
| Year Ended October 31, 2008 | | | $ | 18.02 | | | (0.02) | | | (6.54 | ) | | | | (6.56 | ) | | | | (0.84 | ) | | | | (0.84 | ) | | | | $ | 10.62 | | | (38.07 | )%(d) | | | $ | 38,868 | | | 0.95% | | | (0.16 | )% | | | 0.97% | | | 158 | % | |
| Year Ended October 31, 2009 | | | | 10.62 | | | (0.01) | | | 2.04 | | | | | 2.03 | | | | | — | | | | | — | | | | | | 12.65 | | | 19.11 | %(e) | | | | 39,400 | | | 0.95% | | | (0.08 | )% | | | 1.06% | | | 66 | % | |
| Year Ended October 31, 2010 | | | | 12.65 | | | (0.04) | | | 2.58 | | | | | 2.54 | | | | | — | | | | | — | | | | | | 15.19 | | | 20.08 | %(f)(g) | | | | 49,474 | | | 0.95% | | | (0.30 | )%(g) | | | 0.99% | | | 89 | % | |
| Year Ended October 31, 2011 | | | | 15.19 | | | (0.04) | | | 1.68 | | | | | 1.64 | | | | | — | | | | | — | | | | | | 16.83 | | | 10.80 | %(h) | | | | 57,222 | | | 0.94% | | | (0.22 | )% | | | 0.94% | | | 56 | % | |
| Year Ended October 31, 2012 | | | | 16.83 | | | (0.02) | | | 1.18 | | | | | 1.16 | | | | | — | | | | | — | | | | | | 17.99 | | | 6.89 | %(i) | | | | 57,916 | | | 0.95% | | | (0.12 | )% | | | 1.04% | | | 53 | % | |
| * | | The per share amounts and percentages reflect income and expenses assuming inclusion of the Fund’s proportionate share of the income and expenses of the HSBC Growth Portfolio. |
| (a) | | Calculated based on average shares outstanding. |
| (b) | | Total return calculations do not include any sales or redemption charges. |
| (c) | | Portfolio Turnover rate is calculated on the basis of the Portfolio in which the Fund invests all of its investable assets. Portfolio turnover rate is calculated on the basis of the Fund as a whole without distinguishing between the classes of shares issued. |
| (d) | | During the year ended October 31, 2008, the respective Portfolio, in which the Fund invests, received monies related to certain nonrecurring litigation settlements. The corresponding impact to the total return was 0.19%, 0.19%, 0.19% and 0.19% for Class A Shares, Class B Shares, Class C Shares and Class I Shares, respectively. |
| (e) | | During the year ended October 31, 2009, the respective Portfolio, in which the Fund invests, received monies related to certain nonrecurring litigation settlements. The corresponding impact to the total return was 0.50%, 0.54%, 0.53% and 0.49% for Class A Shares, Class B Shares, Class C Shares and Class I Shares, respectively. |
| (f) | | During the year ended October 31, 2010, the Portfolio, in which the Fund invests, received monies related to certain nonrecurring litigation settlements. The corresponding impact to the total return was 0.17%, 0.17%, 0.17% and 0.17% for Class A Shares, Class B Shares, Class C Shares and Class I Shares, respectively. |
| (g) | | During the year ended October 31, 2010, the Fund received a distribution from a “fair fund” established by the SEC in connection with a consent order against BISYS Fund Services, Inc. (See Note 7 in the Notes to Financial Statements). The corresponding impact to the net income ratio and the total return was 0.02%, 0.02%, 0.02% and 0.02% for Class A Shares, Class B Shares, Class C Shares and Class I Shares, respectively. |
| (h) | | During the year ended October 31, 2011, the Portfolio, in which the Fund invests, received monies related to certain nonrecurring litigation settlements. The corresponding impact to the total return was 0.28%, 0.28%, 0.28% and 0.28% for Class A Shares, Class B Shares, Class C Shares and Class I Shares, respectively. |
| (i) | | During the year ended October 31, 2012, the Portfolio, in which the Fund invests, received monies related to certain nonrecurring litigation settlements. The corresponding impact to the total return was 0.12%, 0.12%, 0.12% and 0.12% for Class A Shares, Class B Shares, Class C Shares and Class I Shares, respectively. |
See notes to financial statements. | HSBC FAMILY OF FUNDS 19 |
| HSBC OPPORTUNITY FUND |
Financial Highlights |
Selected data for a share outstanding throughout the periods indicated. *
| | | | | | | Investment Activities | | Dividends | | | | | | | | | | Ratios/Supplementary Data |
| | | | | | | | | | | | | | | | | | | | | | | | | | | | | | | | | | | | | | | | | | | | | | | | | Ratios of | | |
| | | | | | | | | Net Realized | | | | | | | Net | | | | | | | | | | | | | | | | | | | | | | Ratio of Net | | Expenses | | |
| | Net Asset | | Net | | and Unrealized | | | | | | | Realized | | | | | | | Net Asset | | | | | Net Assets | | Ratio of Net | | Investment | | to Average | | |
| | Value, | | Investment | | Gains | | Total from | | Gains from | | | | | | | Value, | | | | | at End of | | Expenses to | | Income (Loss) | | Net Assets | | |
| | Beginning | | Income | | (Losses) from | | Investment | | Investment | | Total | | End of | | Total | | Period | | Average Net | | to Average Net | | (Excluding Fee | | Portfolio |
| | of Period | | (Loss)(a) | | Investments | | Activities | | Transactions | | Dividends | | Period | | Return(b) | | (000’s) | | Assets | | Assets | | Reductions) | | Turnover(c) |
| CLASS A SHARES | | | | | | | | | | | | | | | | | | | | | | | | | | | | | | | | | | | | | | | | | | | | | | | | | | | |
| Year Ended October 31, 2008 | | | $ | 16.41 | | | (0.12) | | | (4.04 | ) | | | | (4.16 | ) | | | | (5.16 | ) | | | | (5.16 | ) | | | | $ | 7.09 | | | (35.84 | )% | | | $ | 9,600 | | | 1.55% | | | (1.13 | )% | | | 1.82% | | 80% |
| Year Ended October 31, 2009 | | | | 7.09 | | | (0.07) | | | 0.97 | | | | | 0.90 | | | | | (0.43 | ) | | | | (0.43 | ) | | | | | 7.56 | | | 14.85 | % | | | | 9,687 | | | 1.55% | | | (1.02 | )% | | | 2.30% | | 65% |
| Year Ended October 31, 2010 | | | | 7.56 | | | (0.09) | | | 2.20 | | | | | 2.11 | | | | | — | | | | | — | | | | | | 9.67 | | | 27.91 | %(d)(e) | | | | 11,282 | | | 1.55% | | | (1.00 | )%(e) | | | 2.07% | | 68% |
| Year Ended October 31, 2011 | | | | 9.67 | | | (0.07) | | | 1.19 | | | | | 1.12 | | | | | (0.16 | ) | | | | (0.16 | ) | | | | | 10.63 | | | 11.59 | %(f) | | | | 11,145 | | | 1.55% | | | (0.62 | )% | | | 1.85% | | 69% |
| Year Ended October 31, 2012 | | | | 10.63 | | | (0.05) | | | 1.11 | | | | | 1.06 | | | | | (1.56 | ) | | | | (1.56 | ) | | | | | 10.13 | | | 12.08 | %(g) | | | | 10,204 | | | 1.55% | | | (0.51 | )% | | | 2.20% | | 59% |
| CLASS B SHARES | | | | | | | | | | | | | | | | | | | | | | | | | | | | | | | | | | | | | | | | | | | | | | | | | | | |
| Year Ended October 31, 2008 | | | $ | 14.94 | | | (0.18) | | | (3.50 | ) | | | | (3.68 | ) | | | | (5.16 | ) | | | | (5.16 | ) | | | | $ | 6.10 | | | (36.30 | )% | | | $ | 1,578 | | | 2.29% | | | (1.88 | )% | | | 2.58% | | 80% |
| Year Ended October 31, 2009 | | | | 6.10 | | | (0.10) | | | 0.80 | | | | | 0.70 | | | | | (0.43 | ) | | | | (0.43 | ) | | | | | 6.37 | | | 13.92 | % | | | | 1,082 | | | 2.30% | | | (1.77 | )% | | | 3.10% | | 65% |
| Year Ended October 31, 2010 | | | | 6.37 | | | (0.13) | | | 1.85 | | | | | 1.72 | | | | | — | | | | | — | | | | | | 8.09 | | | 27.00 | %(d)(e) | | | | 658 | | | 2.30% | | | (1.78 | )%(e) | | | 2.86% | | 68% |
| Year Ended October 31, 2011 | | | | 8.09 | | | (0.12) | | | 0.99 | | | | | 0.87 | | | | | (0.16 | ) | | | | (0.16 | ) | | | | | 8.80 | | | 10.75 | %(f) | | | | 536 | | | 2.30% | | | (1.36 | )% | | | 2.64% | | 69% |
| Year Ended October 31, 2012 | | | | 8.80 | | | (0.10) | | | 0.87 | | | | | 0.77 | | | | | (1.56 | ) | | | | (1.56 | ) | | | | | 8.01 | | | 11.15 | %(g) | | | | 499 | | | 2.30% | | | (1.25 | )% | | | 2.99% | | 59% |
| CLASS C SHARES | | | | | | | | | | | | | | | | | | | | | | | | | | | | | | | | | | | | | | | | | | | | | | | | | | | |
| Year Ended October 31, 2008 | | | $ | 15.11 | | | (0.17) | | | (3.57 | ) | | | | (3.74 | ) | | | | (5.16 | ) | | | | (5.16 | ) | | | | $ | 6.21 | | | (36.27 | )% | | | $ | 189 | | | 2.30% | | | (1.88 | )% | | | 2.58% | | 80% |
| Year Ended October 31, 2009 | | | | 6.21 | | | (0.10) | | | 0.81 | | | | | 0.71 | | | | | (0.43 | ) | | | | (0.43 | ) | | | | | 6.49 | | | 13.83 | % | | | | 267 | | | 2.30% | | | (1.78 | )% | | | 3.08% | | 65% |
| Year Ended October 31, 2010 | | | | 6.49 | | | (0.13) | | | 1.89 | | | | | 1.76 | | | | | — | | | | | — | | | | | | 8.25 | | | 27.12 | %(d)(e) | | | | 341 | | | 2.30% | | | (1.75 | )%(e) | | | 2.86% | | 68% |
| Year Ended October 31, 2011 | | | | 8.25 | | | (0.13) | | | 1.02 | | | | | 0.89 | | | | | (0.16 | ) | | | | (0.16 | ) | | | | | 8.98 | | | 10.79 | %(f) | | | | 437 | | | 2.30% | | | (1.38 | )% | | | 2.64% | | 69% |
| Year Ended October 31, 2012 | | | | 8.98 | | | (0.10) | | | 0.89 | | | | | 0.79 | | | | | (1.56 | ) | | | | (1.56 | ) | | | | | 8.21 | | | 11.14 | %(g) | | | | 545 | | | 2.30% | | | (1.19 | )% | | | 3.03% | | 59% |
| * | The per share amounts and percentages reflect income and expenses assuming inclusion of the Fund’s proportionate share of the income and expenses of the HSBC Opportunity Portfolio. |
| (a) | Calculated based on average shares outstanding. |
| (b) | Total return calculations do not include any sales or redemption charges. |
| (c) | Portfolio Turnover rate is calculated on the basis of the respective Portfolio in which the Fund invests all of its investable assets. Portfolio turnover rate is calculated on the basis of the Fund as a whole without distinguishing between the classes of shares issued. |
| (d) | During the year ended October 31, 2010, the respective Portfolio, in which the Fund invests, received monies related to certain nonrecurring litigation settlements. The corresponding impact to the total return was 0.15%, 0.15% and 0.15% for Class A Shares, Class B Shares and Class C Shares, respectively. |
| (e) | During the year ended October 31, 2010, the Fund received a distribution from a “fair fund” established by the SEC in connection with a consent order against BISYS Fund Services, Inc. (See Note 7 in the Notes to Financial Statements). Corresponding impact to the net income ratio and the total return was 0.01%, 0.01% and 0.01% for Class A Shares, Class B Shares and Class C Shares, respectively. |
| (f) | During the year ended October 31, 2011, the Portfolio, in which the Fund invests, received monies related to certain nonrecurring litigation settlements. The corresponding impact to the total return was 0.10%, 0.10% and 0.10% for Class A Shares, Class B Shares and Class C Shares, respectively. |
| (g) | During the year ended October 31, 2012, the Portfolio, in which the Fund invests, received monies related to certain nonrecurring litigation settlements. The corresponding impact to the total return was 0.10%, 0.10% and 0.10% for Class A Shares, Class B Shares and Class C Shares, respectively. |
20 HSBC FAMILY OF FUNDS | See notes to financial statements. |
| HSBC OPPORTUNITY FUND (ADVISOR) |
Financial Highlights |
Selected data for a share outstanding throughout the periods indicated. *
| | | | | | | Investment Activities | | Dividends | | | | | | | | | | Ratios/Supplementary Data |
| | | | | | | | | | | | | | | | | | | | | | | | | | | | | | | | | | | | | | | | | | | | | | | | | Ratios of | | |
| | | | | | | | | Net Realized | | | | | | | Net | | | | | | | | | | | | | | | | | | | | | | Ratio of Net | | Expenses to | | |
| | Net Asset | | Net | | and Unrealized | | | | | | | Realized | | | | | | | Net Asset | | | | | Net Assets | | Ratio of Net | | Investment | | Average | | |
| | Value, | | Investment | | Gains | | Total from | | Gains from | | | | | | | Value, | | | | | at End of | | Expenses to | | Income (Loss) | | Net Assets | | |
| | Beginning | | Income | | (Losses) from | | Investment | | Investment | | Total | | End of | | Total | | Period | | Average Net | | to Average Net | | (Excluding Fee | | Portfolio |
| | of Period | | (Loss) | | Investments | | Activities | | Transactions | | Dividends | | Period | | Return(a) | | (000’s) | | Assets | | Assets | | Reductions) | | Turnover(b) |
| CLASS I SHARES | | | | | | | | | | | | | | | | | | | | | | | | | | | | | | | | | | | | | | | | | | | | | | | | | | | |
| Year Ended October 31, 2008 | | | $ | 18.94 | | | (0.07) | | | (4.99 | ) | | | | (5.06 | ) | | | | (4.97 | ) | | | | (4.97 | ) | | | | $ | 8.91 | | | (35.39 | )% | | | $ | 97,841 | | | 0.97% | | | (0.55 | )% | | | 0.97% | | 80% |
| Year Ended October 31, 2009 | | | | 8.91 | | | (0.04) | | | 1.32 | | | | | 1.28 | | | | | (0.26 | ) | | | | (0.26 | ) | | | | | 9.93 | | | 15.47 | % | | | | 100,285 | | | 1.02% | | | (0.50 | )% | | | 1.02% | | 65% |
| Year Ended October 31, 2010 | | | | 9.93 | | | (0.06) | | | 2.90 | | | | | 2.84 | | | | | — | | | | | — | | | | | | 12.77 | | | 28.60 | %(c)(d) | | | | 117,064 | | | 1.01% | | | (0.46 | )%(d) | | | 1.01% | | 68% |
| Year Ended October 31, 2011 | | | | 12.77 | | | (0.01) | | | 1.57 | | | | | 1.56 | | | | | (0.31 | ) | | | | (0.31 | ) | | | | | 14.02 | | | 12.25 | %(e) | | | | 122,017 | | | 1.01% | | | (0.07 | )% | | | 1.01% | | 69% |
| Year Ended October 31, 2012 | | | | 14.02 | | | (0.01) | | | 1.46 | | | | | 1.45 | | | | | (2.07 | ) | | | | (2.07 | ) | | | | | 13.40 | | | 12.50 | %(f) | | | | 135,098 | | | 1.08% | | | (0.01 | )% | | | 1.08% | | 59% |
| * | | The per share amounts and percentages reflect income and expense assuming inclusion of the Fund’s proportionate share of the income and expenses of the HSBC Opportunity Portfolio. |
| (a) | | Total return calculations do not include any sales or redemption charges. |
| (b) | | Portfolio Turnover rate is calculated on the basis of the respective Portfolio in which the Fund invests all of its investable assets. Portfolio turnover rate is calculated on the basis of the Fund as a whole without distinguishing between the classes of shares issued. |
| (c) | | During the year ended October 31, 2010, the respective Portfolio, in which the Fund invests, received monies related to certain nonrecurring litigation settlements. The corresponding impact to the total return was 0.15% for Class I Shares. |
| (d) | | During the year ended October 31, 2010, Fund received a distribution from a “fair fund” established by the SEC in connection with a consent order against BISYS Fund Services, Inc. (See Note 7 in the Notes to Financial Statements). The corresponding impact to the net income ratio and the total return was 0.01% for the Class I Shares. |
| (e) | | During the year ended October 31, 2011, the Portfolio, in which the Fund invests, received monies related to certain nonrecurring litigation settlements. The corresponding impact to the total return was 0.10% for Class I Shares. |
| (f) | | During the year ended October 31, 2012, the Portfolio, in which the Fund invests, received monies related to certain nonrecurring litigation settlements. The corresponding impact to the total return was 0.10% for Class I Shares. |
See notes to financial statements. | HSBC FAMILY OF FUNDS 21 |
| HSBC FAMILY OF FUNDS |
Notes to Financial Statements—as of October 31, 2012 |
1. Organization:
The HSBC Funds (formerly, HSBC Investor Funds) (the “Trust”), a Massachusetts business trust organized on April 22, 1987, and the HSBC Advisor Fund Trust (the “Advisor Trust”), a Massachusetts business trust organized on April 5, 1996, are registered under the Investment Company Act of 1940, as amended (the “Act”), as an open-end management investment companies. As of October 31, 2012, the Trust is comprised of 17 separate operational funds and the Advisor Trust is comprised of 1 operational fund, each a series of the HSBC Family of Funds (formerly, HSBC Investor Family of Funds), which also includes the HSBC Portfolios (formerly, HSBC Investor Portfolios) (the “Portfolio Trust”) (collectively the “Trusts”). The accompanying financial statements are presented for the following 3 funds (individually a “Fund”, collectively the “Funds”) of the Trust and Advisor Trust:
| Fund | | | Short Name | | | Trust | |
| HSBC Growth Fund (formerly, HSBC Investor | | | | |
| Growth Fund) | | Growth Fund | | Trust |
| HSBC Opportunity Fund (formerly, HSBC Investor | | | | |
| Opportunity Fund) | | Opportunity Fund | | Trust |
| HSBC Opportunity Fund (Advisor) (formerly, | | | | |
| HSBC Investor Opportunity Fund (Advisor)) | | Opportunity Fund (Advisor) | | Advisor Trust |
All the Funds are diversified funds. Financial statements for all other funds of the Trusts are published separately.
Each Fund utilizes a master-feeder fund structure and seeks to achieve its investment objectives by investing all of its investable assets in its respective Portfolio (as defined below).
| | | | Proportionate |
| | | | Ownership |
| | | | Interest on |
| Fund | | | Respective Portfolio | | | October 31, 2012(%) |
| Growth Fund | | HSBC Growth Portfolio (formerly, HSBC | | | | |
| | Investor Growth Portfolio) | | | 89.1 | |
| Opportunity Fund | | HSBC Opportunity Portfolio (formerly, HSBC | | | | |
| | | Investor Opportunity Portfolio) | | | 7.5 | |
| Opportunity Fund (Advisor) | | HSBC Opportunity Portfolio (formerly, HSBC | | | | |
| | Investor Opportunity Portfolio) | | | 90.1 | |
The HSBC Growth Portfolio and HSBC Opportunity Portfolio (individually a “Portfolio”, collectively the “Portfolios”) are diversified series of the Portfolio Trust. The Portfolios operate as master funds in master-feeder arrangements and also may receive investments from certain fund of funds.
The financial statements of the Portfolios, including the Schedules of Portfolio Investments, are included elsewhere in this report. The financial statements of the Portfolios should be read in conjunction with the financial statements of the Funds.
The Funds are authorized to issue an unlimited number of shares of beneficial interest with a par value of $0.001 per share. The Growth Fund offers four classes of shares: Class A Shares, Class B Shares, Class C Shares, and Class I Shares. The Opportunity Fund offers three classes of shares: Class A Shares, Class B Shares, and Class C Shares. Class A Shares of the Funds have a maximum sales charge of 5.00% as a percentage of the original purchase price. Class B Shares of the Funds are offered without any front-end sales charge but will be subject to a contingent deferred sales charge (“CDSC”) ranging from a maximum of 4.00% if redeemed less than one year after purchase to 0.00% if redeemed more than four years after purchase. Class C Shares of the Funds are offered without any front-end sales charge but will be subject to a maximum CDSC of 1.00% if redeemed less than one year after purchase. No sales charges are assessed with respect to Class I Shares of the Funds. Each class of shares in the Funds has identical rights and privileges except with respect to arrangements pertaining to shareholder servicing or distribution, class-related expenses, voting rights on matters affecting a single class of shares, and the exchange privilege of each class of shares.
22 HSBC FAMILY OF FUNDS
| HSBC FAMILY OF FUNDS |
Notes to Financial Statements—as of October 31, 2012 (continued) |
Under the Trusts’ organizational documents, the Trusts’ officers and Trustees are indemnified against certain liabilities arising out of the performance of their duties to the Funds. In addition, in the normal course of business, the Trusts enter into contracts with service providers, which also provide for indemnifications by the Funds. The Funds’ maximum exposure under these arrangements is unknown, as this would involve any future claims that may be made against the Funds. However, based on experience, the Trusts expect that risk of loss to be remote.
2. Significant Accounting Policies:
The following is a summary of the significant accounting policies followed by the Funds in the preparation of their financial statements. The policies are in conformity with U.S. generally accepted accounting principles (“GAAP”). The preparation of financial statements requires management to make certain estimates and assumptions that affect the reported amounts of assets and liabilities and disclosure of contingent assets and liabilities at the date of the financial statements and the reported amounts of increases and decreases in net assets from operations during the reporting period. Actual results could differ from those estimates.
Securities Valuation:
The Funds record their investments at fair value. Fair value is defined as the price that would be received to sell an asset or paid to transfer a liability in an orderly transaction between market participants at the measurement date. The valuation techniques used to determine fair value are further described in Note 3 below.
Investment Transactions and Related Income:
The Funds record investments into the Portfolios on a trade date basis. The Funds record daily their proportionate share of income, expenses, changes in unrealized appreciation and depreciation and realized gains and losses derived from their respective Portfolios. In addition, the Funds accrue their own expenses daily as incurred.
Allocations:
Expenses directly attributable to a Fund are charged to that Fund. Expenses not directly attributable to a Fund are allocated proportionately among the applicable series within the Trusts in relation to the net assets of each fund or on another reasonable basis. Class specific expenses are charged directly to the class incurring the expense. In addition, income, expenses (other than class specific expenses), and unrealized and realized gains and losses are allocated to each class based on relative net assets on a daily basis.
Dividends to Shareholders:
Dividends to shareholders from net investment income, if any, are declared and distributed semi-annually in the case of the Growth Fund, Opportunity Fund and Opportunity (Advisor) Fund.
The Funds’ net realized gains, if any, are distributed to shareholders at least annually. Additional distributions are also made to the Funds’ shareholders to the extent necessary to avoid the federal excise tax on certain undistributed income and net capital gains of regulated investment companies.
The amount and character of net investment income and net realized gains distributions are determined in accordance with federal income tax regulations which may differ from GAAP. These “book/tax” differences are either considered temporary or permanent in nature. To the extent these differences are permanent in nature (e.g., reclassification of market discounts, certain gain/loss, paydowns, and certain distributions), such amounts are reclassified within the composition of net assets; temporary differences (e.g., wash losses and post-October loss deferrals) do not require reclassification. The Funds may utilize equalization accounting for tax purposes and designate earnings and profits, including net realized gains distributed to shareholders on redemption of shares, as a part of the dividends paid deduction for income tax purposes. To the extent distributions to shareholders from net investment income and net realized gains exceed net investment income and net realized gains for tax purposes, they are reported as distributions of capital.
HSBC FAMILY OF FUNDS 23
| HSBC FAMILY OF FUNDS |
Notes to Financial Statements—as of October 31, 2012 (continued) |
Federal Income Taxes:
Each Fund is a separate taxable entity for federal income tax purposes. Each Fund has qualified and intends to continue to qualify each year as a “regulated investment company” under Subchapter M of the Internal Revenue Code, as amended, and to distribute substantially all of its taxable net investment income and net realized gains, if any, to its shareholders. Accordingly, no provision for federal income or excise tax is required.
Management of the Funds has reviewed tax positions taken in tax years that remain subject to examination by all major tax jurisdictions, including federal (i.e., the last four tax year ends and the interim tax period since then, as applicable). Management believes that there is no tax liability resulting from unrecognized tax benefits related to uncertain tax positions taken.
3. Investment Valuation Summary:
The valuation techniques employed by the Funds, as described below, maximize the use of observable inputs and minimize the use of unobservable inputs in determining fair value. The inputs used for valuing the Funds’ investments are summarized in the three broad levels listed below:
- Level 1: quoted prices in active markets for identical assets
- Level 2: other significant observable inputs (including quoted prices for similar securities, interest rates, prepayment speeds, credit risk, etc.)
- Level 3: significant unobservable inputs (including a Fund’s own assumptions in determining the fair value of investments)
Changes in valuation techniques may result in transfers in or out of an assigned level within the disclosure hierarchy. The Funds determine transfers between fair value hierarchy levels at the reporting period end. The inputs or methodology used for valuing investments is not necessarily an indication of the risk associated with investing in those investments.
The Funds record their investments in their respective Portfolios at fair value, which is typically categorized as Level 2 in the fair value hierarchy. The underlying securities of the Portfolios are recorded at fair value, as more fully discussed in the Notes to Financial Statements of the Portfolios included in this report.
For the year ended October 31, 2012, there were no Level 3 investments for which significant unobservable inputs were used to determine fair value.
24 HSBC FAMILY OF FUNDS
| HSBC FAMILY OF FUNDS |
Notes to Financial Statements—as of October 31, 2012 (continued) |
The following is a summary of the valuation inputs used as of October 31, 2012 in valuing the Funds’ investments based upon three levels defined above:
| | LEVEL 1 ($) | | LEVEL 2 ($) | | LEVEL 3 ($) | | Total ($) |
| Growth Fund | | | | | | | | |
| Investment Securities: | | | | | | | | |
| Affiliated Portfolio (a) | | — | | 70,419,837 | | — | | 70,419,837 |
| Total Investment Securities | | — | | 70,419,837 | | — | | 70,419,837 |
| |
| Opportunity Fund | | | | | | | | |
| Investment Securities: | | | | | | | | |
| Affiliated Portfolio (a) | | — | | 11,244,356 | | — | | 11,244,356 |
| Total Investment Securities | | — | | 11,244,356 | | — | | 11,244,356 |
| |
| Opportunity Fund(Advisor) | | | | | | | | |
| Investment Securities: | | | | | | | | |
| Affiliated Portfolio (a) | | — | | 135,190,550 | | — | | 135,190,550 |
| Total Investment Securities | | — | | 135,190,550 | | — | | 135,190,550 |
____________________
| (a) | | Investments in Affiliated Portfolios represent ownership interests in the Portfolios. Due to the Funds’ master-feeder structure, the inputs used for valuing these instruments are categorized as Level 2. |
New Accounting Pronouncements:
In December 2011, the Financial Accounting Standards Board issued ASU No. 2011-11 “Disclosures about Offsetting Assets and Liabilities” requiring disclosure of both gross and net information related to offsetting and related arrangements enabling users of its financial statements to understand the effect of those arrangements on the entity’s financial position. The objective of this disclosure is to facilitate comparison between those entities that prepare their financial statements on the basis of U.S. GAAP and those entities that prepare their financial statements on the basis of IFRSs. ASU No. 2011-11 is effective for interim and annual periods beginning on or after January 1, 2013. Adoption of ASU No. 2011-11 will have no effect on the Funds’ net assets. At this time, management is evaluating any impact ASU No. 2011-11 may have on the Funds’ financial statements disclosures.
4. Related Party Transactions and Other Agreements and Plans:
Investment Management:
HSBC Global Asset Management (USA) Inc. (“HSBC” or the “Investment Adviser”), a wholly owned subsidiary of HSBC Bank USA, N.A., a national bank organized under the laws of the United States, acts as Investment Adviser to the Portfolios. As Investment Adviser, HSBC manages the investments of the Portfolios and continuously reviews, supervises, and administers the Portfolios’ investments. The Funds are not directly charged any investment management fees.
Administration:
HSBC serves the Funds as Administrator. Under the terms of the Administration Agreement, HSBC receives from the Funds of the Trusts a fee, accrued daily and paid monthly, at an annual rate of:
| Based on Average Daily Net Assets of | | | Fee Rate(%) |
| Up to $10 billion | | 0.0550 |
| In excess of $10 billion but not exceeding $20 billion | | 0.0350 |
| In excess of $20 billion but not exceeding $50 billion | | 0.0275 |
| In excess of $50 billion | | 0.0250 |
HSBC FAMILY OF FUNDS 25
| HSBC FAMILY OF FUNDS |
| Notes to Financial Statements—as of October 31, 2012 (continued) |
The fee breakpoints are determined on the basis of the aggregate average daily net assets of the Trusts. The fee is allocated to each series based upon its proportionate share of the aggregate net assets of the Trusts. For assets invested in the Portfolios by the Funds, the Portfolios pay half of the administration fee and the Funds pay half, for a combination of the total fee rate above subject to certain reductions associated with services provided to new funds. Certain administration fees of the Portfolios also may be reduced by treating them as apportioned in part to other funds making investments in the Portfolios. An amount equal to 50% of the administration fee is deemed to be class specific.
Pursuant to a Sub-Administration Agreement with HSBC, Citi Fund Services Ohio, Inc. (“Citi”), a wholly-owned subsidiary of Citigroup, Inc., serves as the Trusts’ Sub-Administrator, subject to the general supervision by the Trusts’ Board of Trustees (the “Board”) and HSBC. For these services, Citi is entitled to a fee, payable by HSBC, at an annual rate equivalent to the fee rates set forth above subject to certain reductions associated with services provided to new funds, minus 0.02% which is retained by HSBC.
Under a Compliance Services Agreement between the Trust and Citi (the “CCO Agreement”), Citi makes an employee available to serve as the Trusts’ Chief Compliance Officer (the “CCO”). Under the CCO Agreement, Citi also provides infrastructure and support in implementing the written policies and procedures comprising the Trusts’ compliance program, including support services to the CCO. For the services provided under the CCO Agreement, the Trusts paid Citi $281,280 for the year ended October 31, 2012, plus reimbursement of certain out of pocket expenses. Expenses incurred by each Fund are reflected on the Statements of Operations as “Compliance Service.” Citi pays the salary and other compensation earned by individuals performing these services, as employees of Citi.
Distribution Arrangements:
Foreside Distribution Services, L.P. (“Foreside”), a wholly-owned subsidiary of Foreside Financial Group LLC, serves the Trust as Distributor (the “Distributor”). The Trust has adopted a non-compensatory Distribution Plan and Agreement (the “Distribution Plan”) pursuant to Rule 12b-1 of the Act. The Distribution Plan provides for reimbursement of expenses incurred by the Distributor related to distribution and marketing, at a rate not to exceed 0.25%, 1.00%, and 1.00% of the average daily net assets of Class A Shares (currently not being charged), Class B Shares (currently charging 0.75%), and Class C Shares (currently charging 0.75%) of the Funds, respectively. For the year ended October 31, 2012, Foreside, as Distributor, also received $346,561, $261,621 and $34,163 in commissions from sales of the Trusts, for Class A Shares, Class B Shares, and Class C Shares, respectively of which $25, $12 and $0 were reallocated to HSBC-affiliated brokers and dealers, for Class A Shares, Class B Shares, and Class C Shares, respectively.
Shareholder Servicing:
The Trust has adopted a Shareholder Services Plan, which provides for payments to shareholder servicing agents (which primarily consist of HSBC and its affiliates) for providing various shareholder services. For performing these services, the shareholder servicing agents receive a fee that is computed daily and paid monthly up to 0.25%, 0.25%, and 0.25% of the average daily net assets of Class A Shares, Class B Shares, and Class C Shares of the Funds, respectively. The aggregate fees paid to the Distributor pursuant to the Distribution Plan and to shareholder servicing agents pursuant to the Shareholder Services Plan currently are not intended to exceed 0.25% of the average daily net assets of Class A Shares, and 1.00% of the average daily net assets of Class B Shares and Class C Shares.
Fund Accounting and Transfer Agency:
Citi provides fund accounting and transfer agency services for each Fund. As transfer agent, Citi receives a fee based on the number of funds and shareholder accounts, subject to certain minimums, reductions associated with services to new funds and reimbursement of certain expenses. As fund accountant, Citi receives an annual fee per series and share class, subject to minimums, reductions associated with services provided to new funds and reimbursement of certain expenses. Citi receives additional fees paid by the Trust and the Advisor Trust for blue sky exemption services.
| HSBC FAMILY OF FUNDS |
| Notes to Financial Statements—as of October 31, 2012 (continued) |
Independent Trustees:
Prior to January 1, 2012, the Trusts, in the aggregate, paid each Independent Trustee an annual retainer of $63,000, a fee of $5,000 for each regular meeting of the Board of Trustees attended, a fee of $3,000 for each special telephonic meeting attended, and a fee of $5,000 for each special in-person meeting attended. The Trusts also paid each Independent Trustee an annual retainer of $3,000 for each Committee on which such Trustee served as a Committee member as well as a fee of $3,000 for each Committee meeting attended. Additionally, the Trusts paid each Committee Chair an annual retainer of $6,000, with the exception of the Chair of the Audit Committee, who received a retainer of $8,000. The Trusts also paid the Chairman of the Board, an additional annual retainer of $20,000, as well as an additional $4,000 for each regular meeting of the Board attended. In addition, for time expended on Board duties outside normal meetings, which is authorized by the Board, a Trustee was compensated at the rate of $500 per hour, up to a maximum of $3,000 per day.
Effective January 1, 2012, the Trusts pay each Independent Trustee an annual retainer of $100,000. The Trusts pay a fee of $10,000 for each regular meeting of the Board of Trustees attended and a fee of $3,000 for each special meeting attended. The Trusts pay each Committee Chair an annual retainer of $3,000, with the exception of the Chair of the Audit Committee, who receives a retainer of $6,000. The Trusts also pay the Chairman of the Board, an additional annual retainer of $24,000. In addition, for time expended on Board duties outside normal meetings, which is authorized by the Board, a Trustee is compensated at the rate of $500 per hour, up to a maximum of $3,000 per day.
Fee Reductions:
The Investment Adviser has agreed to contractually limit, through March 1, 2013, the total expenses, exclusive of interest, taxes, brokerage commissions and extraordinary expenses, of certain Funds. Each affected Fund Class has its own expense limitations based on the average daily net assets for any full fiscal year as follows:
| | | | Current Contractual |
| | | | Expense |
| Fund | | | Class | | Limitation(%) |
| Growth Fund | | A | | | 1.20 | |
| Growth Fund | | B | | | 1.95 | |
| Growth Fund | | C | | | 1.95 | |
| Growth Fund | | I | | | 0.95 | |
| Opportunity Fund | | A | | | 1.65 | |
| Opportunity Fund | | B | | | 2.40 | |
| Opportunity Fund | | C | | | 2.40 | |
| Opportunity Fund (Advisor) | | I | | | 1.10 | |
Any amounts contractually waived or reimbursed by the Investment Adviser will be subject to repayment by the Fund to the Investment Adviser within three years to the extent that the repayment will not cause the Fund’s operating expenses to exceed the contractual expense limit that was in effect at the time of such waiver or reimbursement. During the year ended October 31, 2012, the Investment Adviser did not recapture any of its prior contractual waivers or reimbursements. As of October 31, 2012, the repayments that may potentially be made by the Funds are as follows:
| Fund | | | 2015($)* | | 2014($)* | | 2013($)* | | Total |
| Growth Fund | | | 65,181 | | | | — | | | | 22,001 | | | | 87,182 | |
| Opportunity Fund | | | 65,241 | | | | 27,228 | | | | 49,041 | | | | 141,510 | |
____________________
* | | The year listed above the amounts is the fiscal year ending in which the amounts will no longer be able to be recouped. |
| HSBC FAMILY OF FUNDS |
| Notes to Financial Statements—as of October 31, 2012 (continued) |
The Administrator and Citi may voluntarily waive/reimburse fees to help support the expense limits of the Funds. In addition, HSBC, in its role as Investment Adviser and Administrator, may waive/reimburse additional fees at its discretion. Any voluntary fee waivers/reimbursements are not subject to recoupment in subsequent fiscal periods. Voluntary waivers/reimbursements may be stopped at any time. Amounts waived/reimbursed by the Investment Adviser, Administrator and Citi are reported separately on the Statements of Operations, as applicable.
5. Investment Transactions:
Contributions and withdrawals of the respective Portfolios for the year ended October 31, 2012 totaled:
| Fund | | Contributions($) | | Withdrawals($) |
| Growth Fund | | 6,884,450 | | | | 16,014,732 | |
| Opportunity Fund | | 585,381 | | | | 2,920,181 | |
| Opportunity Fund (Advisor) | | 13,896,138 | | | | 16,173,685 | |
6. Federal Income Tax Information:
The tax character of dividends paid by the Funds for the year ended October 31, 2012 was as follows:
| Dividends paid from |
| | | | | Net Long Term | | Total |
| Ordinary Income($) | | Capital Gains($) | | Dividends Paid($)* |
| Growth Fund | | — | | | | — | | | | — | |
| Opportunity Fund | | 122,612 | | | | 1,646,254 | | | | 1,768,866 | |
| Opportunity Fund (Advisor) | | 2,322,165 | | | | 16,364,147 | | | | 18,686,312 | |
The tax character of dividends paid by the Funds for the year ended October 31, 2011 was as follows:
| Dividends paid from |
| | | Net Long Term | | Total |
| Ordinary Income($) | | Capital Gains($) | | Dividends Paid($)* |
| Growth Fund | — | | | — | | | | — | |
| Opportunity Fund | — | | | 201,743 | | | | 201,743 | |
| Opportunity Fund (Advisor) | — | | | 2,935,113 | | | | 2,935,113 | |
____________________
| * | | Total dividends paid may differ from the amount reported in the Statements of Changes in Net Assets because dividends are recognized when actually paid for tax purposes. |
As of October 31, 2012, the components of accumulated earnings/(deficit) on a tax basis for the Funds were as follows:
| | | | | | Undistributed | | | | | | | | Accumulated | | | | | | Total |
| | Undistributed | | Undistributed | | Long Term | | | | | | | | Capital and | | Unrealized | | Accumulated |
| | Ordinary | | Tax Exempt | | Capital | | Accumulated | | Dividends | | Other | | Appreciation/ | | Earnings/ |
| | Income($) | | Income($) | | Gains($) | | Earnings($) | | Payable($) | | Losses($) | | (Depreciation)($)(1) | | (Deficit)($) |
| Growth Fund | | — | | — | | | 5,056,284 | | | | 5,056,284 | | | — | | | (133,004 | ) | | | | 9,832,284 | | | | 14,755,564 | |
| Opportunity Fund | | — | | — | | | 693,082 | | | | 693,082 | | | — | | | (52,380 | ) | | | | 1,606,621 | | | | 2,247,323 | |
| Opportunity Fund | | | | | | | | | | | | | | | | | | | | | | | | | | | |
| (Advisor) | | — | | — | | | 6,472,823 | | | | 6,472,823 | | | — | | | — | | | | | 18,242,145 | | | | 24,714,968 | |
____________________
| (1) | | The differences between book-basis and tax-basis unrealized appreciation/depreciation are attributable primarily to: tax deferral of losses on wash sales, the realization for tax purposes of unrealized gains/losses on certain derivative instruments, the difference between book and tax amortization methods for premium and market discount, the realization for tax purposes of unrealized gains/losses on investments in passive foreign investment companies, and the return of capital adjustments from real estate investment trusts. |
| HSBC FAMILY OF FUNDS |
| Notes to Financial Statements—as of October 31, 2012 (continued) |
Under current law, capital losses and specified ordinary losses realized after October 31st and non-specified ordinary losses incurred after December 31st (ordinary losses collectively known as “late year ordinary loss”) my be deferred and treated as occurring on the first business day of the following fiscal year. The following Fund had deferred losses, which will be treated as arising on the first day of the fiscal year to end October 31, 2013.
| Late Year |
| Ordinary Losses($) |
| Growth Fund | | 133,004 | |
| Opportunity Fund | | 52,380 | |
For the year ended October 31, 2012, the following Funds utilized capital loss carryforwards to offset capital gains realized:
| Fund | | Amount($) |
| Growth Fund | 3,269,773 |
7. Legal and Regulatory Matters:
On September 26, 2006 BISYS Fund Services, Inc. (“BISYS”), an affiliate of BISYS Fund Services Ohio, Inc. which provided various services to the Funds, reached a settlement with the Securities and Exchange Commission (the “SEC”) regarding the SEC’s investigation related to BISYS’ past payment of certain marketing and other expenses with respect to certain of its mutual fund clients. The related settlement monies were received by the Funds during the year ended October 31, 2010. The corresponding impact to the net income ratio and total return for the year ended October 31, 2010 are disclosed in the Funds’ Financial Highlights.
8. Subsequent Events:
Management has evaluated events and transactions through the date the financial statements were issued, for purposes of recognition or disclosure in these financial statements and there are no subsequent events to report.
REPORT OF INDEPENDENT REGISTERED PUBLIC ACCOUNTING FIRM
To the Shareholders and Board of Trustees of HSBC Funds and
HSBC Advisor Funds Trust:
We have audited the accompanying statements of assets and liabilities of HSBC Growth Fund, HSBC Opportunity Fund and HSBC Opportunity Fund (Advisor) (formerly known as HSBC Investor Growth Fund, HSBC Investor Opportunity Fund and HSBC Investor Opportunity Fund (Advisor)) (the Funds), as of October 31, 2012, and the related statements of operations for the year then ended, the statements of changes in net assets for each of the years in the two-year period then ended, and the financial highlights for each of the years in the five-year period then ended. These financial statements and financial highlights are the responsibility of the Funds’ management. Our responsibility is to express an opinion on these financial statements and financial highlights based on our audits.
We conducted our audits in accordance with the standards of the Public Company Accounting Oversight Board (United States). Those standards require that we plan and perform the audit to obtain reasonable assurance about whether the financial statements and financial highlights are free of material misstatement. An audit includes examining, on a test basis, evidence supporting the amounts and disclosures in the financial statements. Our procedures included confirmation of securities owned as of October 31, 2012, by correspondence with the transfer agent of the HSBC Portfolios. An audit also includes assessing the accounting principles used and significant estimates made by management, as well as evaluating the overall financial statement presentation. We believe that our audits provide a reasonable basis for our opinion.
In our opinion, the financial statements and financial highlights referred to above present fairly, in all material respects, the financial position of the Funds as of October 31, 2012, the results of their operations for the year then ended, the changes in their net assets for each of the years in the two-year period then ended, and the financial highlights for each of the years in the five-year period then ended, in conformity with U.S. generally accepted accounting principles.

Columbus, Ohio
December 21, 2012
| HSBC FAMILY OF FUNDS |
| Other Federal Income Tax Information—as of October 31, 2012 (Unaudited) |
During the year ended October 31, 2012, the following Funds declared net short term capital gain distributions:
| Fund | | Amount |
| Opportunity Fund | $ | 122,612 | |
| Opportunity Fund (Advisor) | | 2,322,165 | |
During the year ended October 31, 2012, the following Funds declared net long term capital gain distributions:
| Fund | | Amount |
| Opportunity Fund | $ | 1,646,254 | |
| Opportunity Fund (Advisor) | | 16,364,147 | |
For the year ended October 31, 2012, the following percentages of the total ordinary income dividends paid by the Funds qualify for the corporate dividends received deduction available to corporate shareholders:
| Dividends Received |
| Fund | | Deduction |
| Opportunity Fund | | 81.10 | % | |
| Opportunity Fund (Advisor) | | 42.05 | % | |
For the year ended October 31, 2012, dividends paid by the Funds may be subject to a maximum tax rate of 15%, as provided for by the Jobs and Growth Tax Relief Reconciliation Act of 2003. The Funds intend to designate the maximum amount allowable as taxed at a maximum rate of 15%. Complete information will be reported in conjunction with your 2012 Form 1099-DIV:
| Qualified Dividend |
| Fund | | Income |
| Opportunity Fund | | 85.74 | % | |
| Opportunity Fund (Advisor) | | 44.45 | % | |
| HSBC FAMILY OF FUNDS |
| Table of Shareholder Expenses—as of October 31, 2012 (Unaudited) |
As a shareholder of the Funds, you incur two types of costs: (1) transaction costs, including sales charges (loads) on purchases, redemption fees and exchange fees; and (2) ongoing costs, including management fees, distribution fees and /or shareholder servicing fees and other Fund expenses (including expenses allocated from the Portfolios). These examples are intended to help you understand your ongoing costs (in dollars) of investing in the Funds and to compare these cost with the ongoing costs of investing in other mutual funds.
These examples are based on an investment of $1,000 invested at the beginning of the period and held for the entire period from May 1, 2012 through October 31, 2012.
Actual Example
The table below provides information about actual account values and actual expenses. You may use the information below, together with the amount you invested, to estimate the expenses that you paid over the period. Simply divide your account value by $1,000 (for example, an $8,600 account value divided by $1,000 = 8.6), then multiply the result by the number in the table under the heading entitled “Expenses Paid During Period” to estimate the expenses you paid on your account during this period.
| | | | | | | | | | | | | | | | | | | Annualized |
| | | | Beginning | | Ending | | Expenses Paid | | Expense Ratio |
| | | | Account Value | | Account Value | | During Period* | | During Period |
| | | | 5/1/12 | | 10/31/12 | | 5/1/12 - 10/31/12 | | 5/1/12 - 10/31/12 |
| Growth Fund | | Class A Shares | | | $ | 1,000.00 | | | | $ | 948.00 | | | | $ | 5.88 | | | | 1.20 | % | |
| | Class B Shares | | | | 1,000.00 | | | | | 944.60 | | | | | 9.53 | | | | 1.95 | % | |
| | Class C Shares | | | | 1,000.00 | | | | | 944.30 | | | | | 9.53 | | | | 1.95 | % | |
| | Class I Shares | | | | 1,000.00 | | | | | 948.80 | | | | | 4.65 | | | | 0.95 | % | |
| Opportunity Fund | | Class A Shares | | | | 1,000.00 | | | | | 988.30 | | | | | 7.75 | | | | 1.55 | % | |
| | Class B Shares | | | | 1,000.00 | | | | | 984.00 | | | | | 11.47 | | | | 2.30 | % | |
| | Class C Shares | | | | 1,000.00 | | | | | 984.40 | | | | | 11.47 | | | | 2.30 | % | |
| Opportunity Fund (I Shares) | | Class I Shares | | | | 1,000.00 | | | | | 990.40 | | | | | 5.55 | | | | 1.11 | % | |
____________________
* | | Expenses are equal to the average account value over the period, multiplied by the Fund’s annualized expense ratio, multiplied by 184/366 (to reflect the one half year period). |
| HSBC FAMILY OF FUNDS |
| Table of Shareholder Expenses—as of October 31, 2012 (Unaudited) (continued) |
Hypothetical Example for Comparison Purposes
The table below provides information about hypothetical account values and hypothetical expenses based on each Fund's actual expense ratio and an assumed rate of return of 5% per year before expenses, which is not the Fund's actual return. The hypothetical account values and expenses may not be used to estimate the actual ending account balance or expenses you paid for the period. You may use this information to compare this 5% hypothetical example with the 5% hypothetical examples that appear in the shareholder reports of other funds.
Please note that the expenses shown in the table are meant to highlight your ongoing costs only and do not reflect any transactional costs, such as sales charges (loads), redemption fees, or exchange fees. Therefore, the table is useful in comparing ongoing costs only, and will not help you determine the relative total costs of owning different funds. In addition, if these transactional costs were included, your costs would have been higher.
| | | | | | | | | | | | | | | | | | | Annualized |
| | | | Beginning | | Ending | | Expenses Paid | | Expense Ratio |
| | | | Account Value | | Account Value | | During Period* | | During Period |
| | | | 5/1/12 | | 10/31/12 | | 5/1/12 - 10/31/12 | | 5/1/12 - 10/31/12 |
| Growth Fund | | Class A Shares | | | $ | 1,000.00 | | | | $ | 1,019.10 | | | | $ | 6.09 | | | | 1.20 | % | |
| | Class B Shares | | | | 1,000.00 | | | | | 1,015.33 | | | | | 9.88 | | | | 1.95 | % | |
| | | Class C Shares | | | | 1,000.00 | | | | | 1,015.33 | | | | | 9.88 | | | | 1.95 | % | |
| | Class I Shares | | | | 1,000.00 | | | | | 1,020.36 | | | | | 4.82 | | | | 0.95 | % | |
| Opportunity Fund | | Class A Shares | | | | 1,000.00 | | | | | 1,017.34 | | | | | 7.86 | | | | 1.55 | % | |
| | Class B Shares | | | | 1,000.00 | | | | | 1,013.57 | | | | | 11.64 | | | | 2.30 | % | |
| | Class C Shares | | | | 1,000.00 | | | | | 1,013.57 | | | | | 11.64 | | | | 2.30 | % | |
| Opportunity Fund (I Shares) | | Class I Shares | | | | 1,000.00 | | | | | 1,019.56 | | | | | 5.63 | | | | 1.11 | % | |
____________________
| * | | Expenses are equal to the average account value over the period, multiplied by the Fund’s annualized expense ratio, multiplied by 184/366 (to reflect the one half year period). |
| HSBC GROWTH PORTFOLIO |
| Schedule of Portfolio Investments—as of October 31, 2012 |
| Common Stocks – 96.2% |
| | | | |
| Shares | | Value ($) |
| Aerospace & Defense – 3.4% | | | |
| Precision Castparts Corp. | 7,700 | | 1,332,639 |
| United Technologies Corp. | 17,300 | | 1,352,168 |
| | | 2,684,807 |
| Auto Components – 1.1% | | | |
| BorgWarner, Inc. (a) | 13,200 | | 868,824 |
| Biotechnology – 4.5% | | | |
| Biogen Idec, Inc. (a) | 8,700 | | 1,202,514 |
| Celgene Corp. (a) | 17,600 | | 1,290,432 |
| Gilead Sciences, Inc. (a) | 15,900 | | 1,067,844 |
| | | 3,560,790 |
| Business Services – 1.3% | | | |
| MasterCard, Inc., Class A | 2,195 | | 1,011,741 |
| Capital Markets – 2.8% | | | |
| BlackRock, Inc. | 4,800 | | 910,464 |
| Franklin Resources, Inc. | 10,200 | | 1,303,560 |
| | | 2,214,024 |
| Chemicals – 4.4% | | | |
| Ecolab, Inc. | 18,000 | | 1,252,800 |
| Monsanto Co. | 25,899 | | 2,229,127 |
| | | 3,481,927 |
| Communications Equipment – 3.3% | | | |
| QUALCOMM, Inc. | 44,500 | | 2,606,588 |
| Computers & Peripherals – 8.0% | | | |
| Apple, Inc. | 9,325 | | 5,549,307 |
| EMC Corp. (a) | 32,200 | | 786,324 |
| | | 6,335,631 |
| Construction & Engineering – 1.3% | | | |
| Fluor Corp. | 19,100 | | 1,066,735 |
| Diversified Financial Services – 0.6% | | | |
| IntercontinentalExchange, Inc. (a) | 3,400 | | 445,400 |
| Energy Equipment & Services – 1.8% | | | |
| FMC Technologies, Inc. (a) | 13,800 | | 564,420 |
| Schlumberger Ltd. | 12,300 | | 855,219 |
| | | 1,419,639 |
| Food & Staples Retailing – 2.7% | | | |
| Costco Wholesale Corp. | 9,000 | | 885,870 |
| CVS Caremark Corp. | 26,700 | | 1,238,880 |
| | | 2,124,750 |
| Health Care Equipment & Supplies – 4.1% | | | |
| Covidien plc | 19,700 | | 1,082,515 |
| Edwards Lifesciences Corp. (a) | 9,800 | | 850,934 |
| Intuitive Surgical, Inc. (a) | 2,380 | | 1,290,484 |
| | | 3,223,933 |
| Health Care Providers & Services – 4.2% | | | |
| Express Scripts Holding Co. (a) | 34,750 | | 2,138,515 |
| UnitedHealth Group, Inc. | 21,200 | | 1,187,200 |
| | | 3,325,715 |
| Health Care Technology – 1.4% | | | |
| Cerner Corp. (a) | 14,300 | | 1,089,517 |
| Hotels, Restaurants & Leisure – 3.8% | | | |
| Las Vegas Sands Corp. | 19,200 | | 891,648 |
| Starbucks Corp. | 27,300 | | 1,253,070 |
| Yum! Brands, Inc. | 11,800 | | 827,298 |
| | | 2,972,016 |
| Household Durables – 0.5% | | | |
| Lennar Corp., Class A | 10,600 | | 397,182 |
| Internet & Catalog Retail – 4.5% | | | |
| Amazon.com, Inc. (a) | 7,150 | | 1,664,663 |
| Priceline.com, Inc. (a) | 3,230 | | 1,853,277 |
| | | 3,517,940 |
| Internet Software & Services – 5.5% | | | |
| eBay, Inc. (a) | 26,100 | | 1,260,369 |
| Facebook, Inc., Class A(a) | 22,200 | | 468,753 |
| Google, Inc., Class A(a) | 2,895 | | 1,967,934 |
| VeriSign, Inc. (a) | 16,500 | | 611,655 |
| | | 4,308,711 |
| IT Services – 8.0% | | | |
| International Business Machines Corp. | 12,400 | | 2,412,172 |
| Teradata Corp. (a) | 9,800 | | 669,438 |
| Visa, Inc., Class A | 23,200 | | 3,219,232 |
| | | 6,300,842 |
| Machinery – 3.9% | | | |
| Danaher Corp. | 44,300 | | 2,291,639 |
| Illinois Tool Works, Inc. | 13,000 | | 797,290 |
| | | 3,088,929 |
| Media – 1.8% | | | |
| CBS Corp., Class B | 20,300 | | 657,720 |
| Sirius XM Radio, Inc. (a) | 276,900 | | 775,320 |
| | | 1,433,040 |
| Oil, Gas & Consumable Fuels – 3.2% | | | |
| Cabot Oil & Gas Corp. | 17,300 | | 812,754 |
| Concho Resources, Inc. (a) | 11,000 | | 947,320 |
| Range Resources Corp. | 12,100 | | 790,856 |
| | | 2,550,930 |
| Personal Products – 0.8% | | | |
| The Estee Lauder Cos., Inc., Class A | 10,700 | | 659,334 |
| Pharmaceuticals – 0.3% | | | |
| Allergan, Inc. | 2,600 | | 233,792 |
| Real Estate Investment Trusts (REITs) – 1.6% | | |
| American Tower Corp. | 16,600 | | 1,249,814 |
| 34 HSBC PORTFOLIOS | See notes to financial statements. |
| HSBC GROWTH PORTFOLIO |
| Schedule of Portfolio Investments—as of October 31, 2012 (continued) |
| Common Stocks, continued |
| | | | |
| Shares | | Value ($) |
| Road & Rail – 3.9% | | | |
| Union Pacific Corp. | 25,200 | | 3,100,356 |
| Semiconductors & Semiconductor Equipment – 0.3% |
| Altera Corp. | 7,800 | | 237,744 |
| Software – 3.3% | | | |
| Intuit, Inc. | 14,300 | | 849,706 |
| Salesforce.com, Inc. (a) | 12,200 | | 1,780,956 |
| | | 2,630,662 |
| Specialty Retail – 4.8% | | | |
| Dollar General Corp. (a) | 20,600 | | 1,001,572 |
| Ross Stores, Inc. | 12,500 | | 761,875 |
| The Gap, Inc. | 25,800 | | 921,576 |
| The Home Depot, Inc. | 6,800 | | 417,384 |
| Ulta Salon, Cosmetics & Fragrance, Inc. | 7,700 | | 710,094 |
| | | 3,812,501 |
| Textiles, Apparel & Luxury Goods – 3.4% | | |
| Coach, Inc. | 14,500 | | 812,725 |
| Michael Kors Holdings Ltd. (a) | 15,700 | | 858,633 |
| Ralph Lauren Corp. | 6,800 | | 1,045,092 |
| | | 2,716,450 |
| Trading Companies & Distributors – 0.4% | | |
| W. W. Grainger, Inc. | 1,600 | | 322,256 |
| Wireless Telecommunication Services – 1.3% | | |
| SBA Communications Corp., Class A(a) | 15,800 | | 1,052,754 |
| TOTAL COMMON STOCKS | | | |
| (COST $62,731,859) | | | 76,045,274 |
| |
| Investment Company – 4.0% |
| | | | |
| Northern Institutional Diversified Assets | | | |
| Portfolio, Institutional Shares, | | | |
| 0.01% (b) | 3,113,192 | | 3,113,192 |
| TOTAL INVESTMENT COMPANY | | | |
| (COST $3,113,192) | | | 3,113,192 |
| TOTAL INVESTMENT SECURITIES | | | |
| (COST $65,845,051) — 100.2% | | | 79,158,466 |
____________________
Percentages indicated are based on net assets of $79,018,334. |
| | | |
| (a) | | Represents non-income producing security. |
| (b) | | The rate represents the annualized one-day yield that was in effect on October 31, 2012. |
| See notes to financial statements. | HSBC PORTFOLIOS 35 |
| HSBC OPPORTUNITY PORTFOLIO |
| Schedule of Portfolio Investments—as of October 31, 2012 |
| Common Stocks – 96.7% |
| | | | |
| Shares | | Value ($) |
| Aerospace & Defense – 3.4% | | | |
| BE Aerospace, Inc. (a) | 50,130 | | 2,260,362 |
| TransDigm Group, Inc. | 21,130 | | 2,814,727 |
| | | 5,075,089 |
| Biotechnology – 1.8% | | | |
| Alkermes plc (a) | 73,880 | | 1,368,996 |
| Cubist Pharmaceuticals, Inc. (a) | 32,130 | | 1,378,377 |
| | | 2,747,373 |
| Building Products – 1.1% | | | |
| Owens Corning, Inc. (a) | 51,400 | | 1,726,526 |
| Capital Markets – 3.6% | | | |
| Lazard Ltd., Class A | 92,260 | | 2,717,980 |
| Raymond James Financial, Inc. | 69,860 | | 2,664,460 |
| | | 5,382,440 |
| Chemicals – 4.2% | | | |
| Celanese Corp., Series A | 36,260 | | 1,377,517 |
| Cytec Industries, Inc. | 31,780 | | 2,187,100 |
| Georgia Gulf Corp. | 34,140 | | 1,208,215 |
| Westlake Chemical Corp. | 20,485 | | 1,558,089 |
| | | 6,330,921 |
| Commercial Banks – 3.3% | | | |
| Comerica, Inc. | 88,500 | | 2,638,185 |
| First Horizon National Corp. | 1 | | 9 |
| First Republic Bank | 67,060 | | 2,303,511 |
| | | 4,941,705 |
| Commercial Services & Supplies – 2.1% | | | |
| Waste Connections, Inc. | 94,065 | | 3,088,154 |
| Communications Equipment – 1.4% | | | |
| JDS Uniphase Corp. (a) | 138,580 | | 1,342,840 |
| Riverbed Technology, Inc. (a) | 43,320 | | 800,121 |
| | | 2,142,961 |
| Containers & Packaging – 3.1% | | | |
| Crown Holdings, Inc. (a) | 76,040 | | 2,908,530 |
| Packaging Corp. of America | 48,610 | | 1,714,475 |
| | | 4,623,005 |
| Electrical Equipment – 2.1% | | | |
| Hubbell, Inc., Class B | 37,580 | | 3,146,198 |
| Electronic Equipment, Instruments & Components – 0.6% |
| Jabil Circuit, Inc. | 48,850 | | 847,059 |
| Energy Equipment & Services – 1.7% | | | |
| Rowan Cos. plc, Class A(a) | 78,140 | | 2,477,819 |
| Food Products – 2.6% | | | |
| Ralcorp Holdings, Inc. (a) | 54,790 | | 3,955,290 |
| Health Care Equipment & Supplies – 6.3% | | |
| Conceptus, Inc. (a) | 38,650 | | 728,166 |
| DENTSPLY International, Inc. | 96,900 | | 3,569,796 |
| Hologic, Inc. (a) | 109,430 | | 2,256,446 |
| IDEXX Laboratories, Inc. (a) | 22,000 | | 2,116,400 |
| Volcano Corp. (a) | 26,100 | | 746,982 |
| | | 9,417,790 |
| Health Care Providers & Services – 4.2% | | | |
| Coventry Health Care, Inc. | 109,270 | | 4,768,543 |
| Owens & Minor, Inc. | 52,110 | | 1,483,571 |
| | | 6,252,114 |
| Household Durables – 0.9% | | | |
| NVR, Inc. (a) | 1,436 | | 1,297,771 |
| Insurance – 2.2% | | | |
| Everest Re Group Ltd. | 22,975 | | 2,551,373 |
| Genworth Financial, Inc., Class A(a) | 136,280 | | 812,229 |
| | | 3,363,602 |
| IT Services – 4.7% | | | |
| Alliance Data Systems Corp. (a) | 31,580 | | 4,517,519 |
| FleetCor Technologies, Inc. (a) | 53,690 | | 2,545,443 |
| | | 7,062,962 |
| Life Sciences Tools & Services – 2.0% | | | |
| Mettler-Toledo International, Inc. (a) | 18,130 | | 3,070,678 |
| Machinery – 5.6% | | | |
| Crane Co. | 41,964 | | 1,761,649 |
| Gardner Denver, Inc. | 29,280 | | 2,029,982 |
| IDEX Corp. | 59,290 | | 2,521,604 |
| The Timken Co. | 54,010 | | 2,132,855 |
| | | 8,446,090 |
| Media – 0.7% | | | |
| Manchester United plc, Class A(a) | 85,800 | | 1,080,222 |
| Oil, Gas & Consumable Fuels – 5.4% | | | |
| Denbury Resources, Inc. (a) | 175,320 | | 2,687,656 |
| Tesoro Corp. | 144,010 | | 5,430,617 |
| | | 8,118,273 |
| Pharmaceuticals – 1.2% | | | |
| Elan Corp. plc ADR (a) | 167,700 | | 1,811,160 |
| Professional Services – 1.5% | | | |
| IHS, Inc., Class A(a) | 25,815 | | 2,178,528 |
| Real Estate Management & Development – 1.9% | | |
| Jones Lang LaSalle, Inc. | 37,530 | | 2,917,582 |
| Road & Rail – 2.9% | | | |
| Hertz Global Holdings, Inc. (a) | 145,380 | | 1,929,193 |
| Landstar System, Inc. | 46,710 | | 2,365,861 |
| | | 4,295,054 |
| 36 HSBC PORTFOLIOS | See notes to financial statements. |
| HSBC OPPORTUNITY PORTFOLIO |
| Schedule of Portfolio Investments—as of October 31, 2012 (continued) |
| Common Stocks, continued |
| | | |
| Shares | | Value ($) |
| Semiconductors & Semiconductor Equipment – 3.1% |
| NXP Semiconductors NV (a) | 120,500 | | 2,923,330 |
| Skyworks Solutions, Inc. (a) | 76,060 | | 1,779,804 |
| | | 4,703,134 |
| Software – 6.5% | | | |
| Concur Technologies, Inc. (a) | 10,370 | | 686,805 |
| Fortinet, Inc. (a) | 120,020 | | 2,324,788 |
| Informatica Corp. (a) | 76,000 | | 2,062,640 |
| Nuance Communications, Inc. (a) | 132,620 | | 2,952,121 |
| QLIK Technologies, Inc. (a) | 91,220 | | 1,679,360 |
| | | 9,705,714 |
| Specialty Retail – 11.4% | | | |
| American Eagle Outfitters, Inc. | 143,200 | | 2,988,584 |
| Foot Locker, Inc. | 117,110 | | 3,923,185 |
| GNC Holdings, Inc., Class A | 27,550 | | 1,065,359 |
| O’Reilly Automotive, Inc. (a) | 15,250 | | 1,306,620 |
| Signet Jewelers Ltd. | 63,980 | | 3,311,605 |
| Tractor Supply Co. | 15,900 | | 1,530,216 |
| Williams-Sonoma, Inc. | 63,280 | | 2,925,434 |
| | | 17,051,003 |
| Textiles, Apparel & Luxury Goods – 1.1% | | |
| Michael Kors Holdings Ltd. (a) | 29,900 | | 1,635,231 |
| Trading Companies & Distributors – 4.1% | | |
| Beacon Roofing Supply, Inc. (a) | 30,480 | | 985,723 |
| United Rentals, Inc. (a) | 53,940 | | 2,193,200 |
| WESCO International, Inc. (a) | 46,970 | | 3,047,414 |
| | | 6,226,337 |
| TOTAL COMMON STOCKS | | | |
| (COST $123,929,913) | | | 145,117,785 |
| | | | |
| Investment Company – 3.2% |
| | | | |
| Northern Institutional Government | | | |
| Select Portfolio, Institutional Shares, | | | |
| 0.01% (b) | 4,802,550 | | 4,802,550 |
| TOTAL INVESTMENT COMPANY | | | |
| (COST $4,802,550) | | | 4,802,550 |
| TOTAL INVESTMENTS SECURITIES | | | |
| (COST $128,732,463) — 99.9% | | | 149,920,335 |
____________________
Percentages indicated are based on net assets of $150,058,525. |
| | | |
| (a) | | Represents non-income producing security. |
| (b) | | The rate represents the annualized one-day yield that was in effect on October 31, 2012. |
ADR American Depositary Receipt
| See notes to financial statements. | HSBC PORTFOLIOS 37 | |
HSBC PORTFOLIOS
Statements of Assets and Liabilities—as of October 31, 2012
| | Growth | | | | Opportunity | |
| | Portfolio | | | | Portfolio | |
| Assets: | | | | | | | | | |
| Investments in non-affiliates, at value | | $ | 79,158,466 | | | | $ | 149,920,335 | |
| Dividends receivable | | | 12,747 | | | | | 302,586 | |
| Receivable for investments sold | | | 406,110 | | | | | — | |
| Prepaid expenses and other assets | | | 323 | | | | | 582 | |
| Total Assets | | | 79,577,646 | | | | | 150,223,503 | |
| | | | | | | | | | |
| Liabilities: | | | | | | | | | |
| Payable for investments purchased | | | 397,255 | | | | | 23,734 | |
| Accrued expenses and other liabilities: | | | | | | | | | |
| Investment Management | | | 131,575 | | | | | 101,785 | |
| Administration | | | 2,231 | | | | | 4,122 | |
| Compliance Service | | | 11 | | | | | 53 | |
| Accounting | | | 60 | | | | | 55 | |
| Custodian | | | 3,653 | | | | | 16,545 | |
| Trustee | | | 70 | | | | | 172 | |
| Other | | | 24,457 | | | | | 18,512 | |
| Total Liabilities | | | 559,312 | | | | | 164,978 | |
| | | | | | | | | | |
| Applicable to investors’ beneficial interest | | $ | 79,018,334 | | | | $ | 150,058,525 | |
| Total Investments, at cost | | $ | 65,845,051 | | | | $ | 128,732,463 | |
| 38 HSBC PORTFOLIOS | See notes to financial statements. |
HSBC PORTFOLIOS
Statements of Operations—For the year ended October 31, 2012
| Growth | | Opportunity |
| Portfolio | | Portfolio |
| Investment Income: | | | | | | | | | | |
| Dividends | | $ | 749,933 | | | | | $ | 1,569,670 | |
| Foreign tax withholding | | | (1,261 | ) | | | | | — | |
| Total Investment Income | | | 748,672 | | | | | | 1,569,670 | |
| | | | | | | | | | | |
| Expenses: | | | | | | | | | | |
| Investment Management | | | 512,293 | | | | | | 1,180,005 | |
| Administration | | | 27,586 | | | | | | 45,956 | |
| Accounting | | | 44,566 | | | | | | 44,443 | |
| Compliance Service | | | 775 | | | | | | 1,239 | |
| Custodian | | | 15,446 | | | | | | 33,744 | |
| Printing | | | 3,731 | | | | | | 6,228 | |
| Professional | | | 17,377 | | | | | | 17,184 | |
| Trustee | | | 2,279 | | | | | | 3,755 | |
| Other | | | 8,123 | | | | | | 12,226 | |
| Total Expenses | | | 632,176 | | | | | | 1,344,780 | |
| | | | | | | | | | | |
| Net Investment Income (Loss) | | | 116,496 | | | | | | 224,890 | |
| | | | | | | | | | | |
| Net Realized/Unrealized Gains (Losses) from Investments: | | | | | | | | | | |
| Net realized gains (losses) from investment securities | | | 12,654,581 | | | | | | 8,826,465 | |
| Change in unrealized appreciation/depreciation on investments | | | (6,525,872 | ) | | | | | 8,291,618 | |
| | | | | | | | | | | |
| Net realized/unrealized gains from investments | | | 6,128,709 | | | | | | 17,118,083 | |
| Change In Net Assets Resulting From Operations | | $ | 6,245,205 | | | | | $ | 17,342,973 | |
| See notes to financial statements. | HSBC PORTFOLIOS 39 |
HSBC PORTFOLIOS
Statements of Changes in Net Assets
| Growth | | Opportunity |
| Portfolio | | Portfolio |
| For the | | For the | | For the | | For the |
| year ended | | year ended | | year ended | | year ended |
| October 31, 2012 | | October 31, 2011 | | October 31, 2012 | | October 31, 2011 |
| Investment Activities: | | | | | | | | | | | | | | | | | | | | | | | |
| Operations: | | | | | | | | | | | | | | | | | | | | | | | |
| Net investment income (loss) | | $ | 116,496 | | | | | $ | 69,416 | | | | | $ | 224,890 | | | | | $ | 79,759 | | |
| Net realized gains (losses) from investments | | | 12,654,581 | | | | | | 10,568,671 | | | | | | 8,826,465 | | | | | | 24,005,437 | | |
| Change in unrealized appreciation/depreciation | | | | | | | | | | | | | | | | | | | | | | | |
| from investments | | | (6,525,872 | ) | | | | | 387,197 | | | | | | 8,291,618 | | | | | | (5,303,339 | ) | |
| Change in net assets resulting from operations | | | 6,245,205 | | | | | | 11,025,284 | | | | | | 17,342,973 | | | | | | 18,781,857 | | |
| Proceeds from contributions | | | 10,142,030 | | | | | | 20,411,483 | | | | | | 15,884,698 | | | | | | 16,493,895 | | |
| Value of withdrawals | | | (42,657,788 | ) | | | | | (24,898,681 | ) | | | | | (24,493,548 | ) | | | | | (33,352,902 | ) | |
| Change in net assets resulting from transactions | | | | | | | | | | | | | | | | | | | | | | | |
| in investors’ beneficial interest | | | (32,515,758 | ) | | | | | (4,487,198 | ) | | | | | (8,608,850 | ) | | | | | (16,859,007 | ) | |
| Change in net assets | | | (26,270,553 | ) | | | | | 6,538,086 | | | | | | 8,734,123 | | | | | | 1,922,850 | | |
| | | | | | | | | | | | | | | | | | | | | | | | |
| Net Assets: | | | | | | | | | | | | | | | | | | | | | | | |
| Beginning of period | | | 105,288,887 | | | | | | 98,750,801 | | | | | | 141,324,402 | | | | | | 139,401,552 | | |
| End of period | | $ | 79,018,334 | | | | | $ | 105,288,887 | | | | | $ | 150,058,525 | | | | | $ | 141,324,402 | | |
| 40 HSBC PORTFOLIOS | See notes to financial statements. |
| HSBC PORTFOLIO |
| Financial Highlights |
Selected data for a share outstanding throughout the periods indicated.
| | | | | Ratio/Supplementary Data |
| | | | | | | | | | | | | | | | Ratio of | | | |
| | | | | | | | | | | | | Ratio of Net | | Expenses | | | |
| | | | | | | | | | Ratio of Net | | Investment | | to Average | | | |
| | | | | Net Assets at | | Expenses to | | Income (Loss) | | Net Assets | | | |
| | Total | | End of Period | | Average Net | | to Average Net | | (Excluding Fee | | Portfolio |
| | Return | | (000’s) | | Assets | | Assets | | Reductions) | | Turnover |
| GROWTH PORTFOLIO | | | | | | | | | | | | | | | | | | | | |
| Year Ended October 31, 2008 | | (37.75 | )%(a) | | | $ | 81,942 | | | 0.62 | % | | 0.19 | % | | 0.62 | % | | 158 | % |
| Year Ended October 31, 2009 | | 19.31 | % | | | $ | 88,163 | | | 0.69 | % | | 0.17 | % | | 0.69 | % | | 66 | % |
| Year Ended October 31, 2010 | | 20.34 | % | | | $ | 98,751 | | | 0.68 | % | | (0.04 | )% | | 0.68 | % | | 89 | % |
| Year Ended October 31, 2011 | | 11.07 | % | | | $ | 105,289 | | | 0.66 | % | | 0.07 | % | | 0.66 | % | | 56 | % |
| Year Ended October 31, 2012 | | 7.18 | % | | | $ | 79,018 | | | 0.71 | % | | 0.13 | % | | 0.71 | % | | 53 | % |
| OPPORTUNITY PORTFOLIO | | | | | | | | | | | | | | | | | | | | |
| Year Ended October 31, 2008 | | (35.30 | )% | | | $ | 127,970 | | | 0.87 | % | | (0.46 | )% | | 0.87 | % | | 80 | % |
| Year Ended October 31, 2009 | | 15.41 | % | | | $ | 129,748 | | | 0.90 | % | | (0.37 | )% | | 0.90 | % | | 65 | % |
| Year Ended October 31, 2010 | | 28.74 | % | | | $ | 139,402 | | | 0.89 | % | | (0.35 | )% | | 0.89 | % | | 68 | % |
| Year Ended October 31, 2011 | | 12.40 | % | | | $ | 141,324 | | | 0.88 | % | | 0.05 | % | | 0.88 | % | | 69 | % |
| Year Ended October 31, 2012 | | 12.71 | % | | | $ | 150,059 | | | 0.91 | % | | 0.15 | % | | 0.91 | % | | 59 | % |
| (a) | | During the year ended October 31, 2008, Winslow Capital Management, Inc. reimbursed $64,658 to the Growth Portfolio related to violations of certain investment policies and limitations. The corresponding impact to the total return was 0.08%. |
See notes to financial statements. | HSBC PORTFOLIOS 41 |
| HSBC PORTFOLIOS |
| Notes to Financial Statements—as of October 31, 2012 |
1. Organization:
The HSBC Portfolios (formerly, HSBC Investor Portfolios) (the “Portfolio Trust”), is an open-end management investment company organized as a New York trust under the laws of the State of New York on November 1, 1994. The Portfolio Trust contains the following master funds (individually a “Portfolio,” collectively the “Portfolios”):
| Portfolio | | | Short Name | |
| HSBC Growth Portfolio (formerly, HSBC Investor Growth Portfolio) | | Growth Portfolio |
| HSBC Opportunity Portfolio (formerly, HSBC Investor Opportunity Portfolio) | | Opportunity Portfolio |
The Portfolios operate as master funds in master-feeder arrangements, in which other funds invest all or part of their investable assets in the Portfolios. The Portfolios also receive investments from funds of funds. The Declaration of Trust permits the Board of Trustees (the “Board”) to issue an unlimited number of beneficial interests in the Portfolios.
The Portfolios are diversified series of the Portfolio Trust and are part of the HSBC Family of Funds (formerly, HSBC Investor Family of Funds), which also includes HSBC Advisor Funds Trust and HSBC Funds (formerly, HSBC Investor Funds) (collectively, the “Trusts”). Financial statements for all other funds of the Trusts are published separately.
Under the Portfolio Trust’s organizational documents, the Portfolio Trust’s officers and Trustees are indemnified against certain liabilities arising out of the performance of their duties to the Portfolios. In addition, in the normal course of business, the Portfolio Trust may enter into contracts with its service providers, which also provide for indemnifications by the Portfolios. The Portfolios’ maximum exposure under these arrangements is unknown as this would involve any future claims that may be made against the Portfolios. However, based on experience, the Portfolio Trust expects that risk of loss to be remote.
2. Significant Accounting Policies:
The following is a summary of the significant accounting policies followed by the Portfolios in the preparation of their financial statements. The policies are in conformity with U.S. generally accepted accounting principles (“GAAP”). The preparation of financial statements requires management to make certain estimates and assumptions that affect the reported amounts of assets and liabilities and disclosure of contingent assets and liabilities at the date of the financial statements and the reported amounts of increases and decreases in net assets from operations during the reporting period. Actual results could differ from those estimates.
Securities Valuation:
The Portfolios record their investments at fair value. Fair value is defined as the price that would be received to sell an asset or paid to transfer a liability in an orderly transaction between market participants at the measurement date. The valuation techniques used to determine fair value are further described in Note 3 below.
Investment Transactions and Related Income:
Investment transactions are accounted for not later than on the business day after trade date. However, for financial reporting purposes, investment transactions are accounted for on trade date. Investment gains and losses are calculated on the identified cost basis. Interest income is recognized on the accrual basis and includes, where applicable, the amortization or accretion of premium or discount. Dividend income is recorded on the ex-dividend date.
Expense Allocations:
Expenses directly attributable to a Portfolio are charged to that Portfolio. Expenses not directly attributable to a Portfolio are allocated proportionally among the applicable portfolios or funds within the HSBC Family of Funds in relation to net assets or on another reasonable basis.
42 HSBC PORTFOLIOS
| HSBC PORTFOLIOS |
| Notes to Financial Statements—as of October 31, 2012 (continued) |
Federal Income Taxes:
Each Portfolio will be treated as a partnership for U.S. federal income tax purposes. Accordingly, each Portfolio passes through all of its net investment income and gains and losses to its feeder funds, and is therefore not subject to U.S. federal income tax. As such, investors in the Portfolios will be taxed on their respective share of the Portfolios’ ordinary income and realized gains. It is intended that the Portfolios will be managed in such a way that an investor will be able to satisfy the requirements of the Internal Revenue Code, as amended, applicable to regulated investment companies.
Management of the Portfolios has reviewed tax positions taken in tax years that remain subject to examination by all major tax jurisdictions, including federal (i.e., the last four tax year ends and the interim tax period since then, as applicable). Management believes that there is no tax liability resulting from unrecognized tax benefits related to uncertain tax positions taken.
3. Investment Valuation Summary:
The valuation techniques employed by the Portfolios, as described below, maximize the use of observable inputs and minimize the use of unobservable inputs in determining fair value. The inputs used for valuing the Portfolios’ investments are summarized in the three broad levels listed below:
- Level 1: quoted prices in active markets for identical assets
- Level 2: other significant observable inputs (including quoted prices for similar securities, interest rates, prepayment speeds, credit risk, etc.)
- Level 3: significant unobservable inputs (including the Portfolio’s own assumptions in determining the fair value of investments)
Changes in valuation techniques may result in transfers in or out of an assigned level within the disclosure hierarchy. The Funds determine transfers between fair value hierarchy levels at the reporting period end. The inputs or methodology used for valuing investments is not necessarily an indication of the risk associated with investing in those investments.
Exchange traded, domestic equity securities are valued at the last sale price on a national securities exchange, or in the absence of recorded sales, at the readily available closing bid price on such exchanges, or at the quoted bid price in the over-the-counter market and are typically categorized as Level 1 in the fair value hierarchy.
Shares of exchange traded and closed-end registered investment companies are valued in the same manner as other equity securities and are typically categorized as Level 1 in the fair value hierarchy. Mutual funds are valued at their net asset values, as reported by such companies and are typically categorized as Level 1 in the fair value hierarchy.
Repurchase agreements are valued at original cost and are typically categorized as Level 2 in the fair value hierarchy.
Securities or other assets for which market quotations are not readily available, or are deemed unreliable due to a significant event, are valued pursuant to procedures adopted by the Trusts’ Board (“Procedures”). Depending on the source and relative significance of valuation inputs, these instruments may be classified as Level 2 or Level 3 in the fair value hierarchy. Examples of potentially significant events that could affect the value of an individual security and thus require pricing under the procedures include corporate actions by the issuer, announcements by the issuer relating to its earnings or products, regulatory news, natural disasters, and litigation. Examples of potentially significant events that could affect multiple securities held by a Portfolio include governmental actions, natural disasters, and armed conflicts.
For the year ended October 31, 2012, there were no Level 3 investments for which significant unobservable inputs were used to determine fair value.
HSBC PORTFOLIOS 43
| HSBC PORTFOLIOS |
| Notes to Financial Statements—as of October 31, 2012 (continued) |
The following is a summary of the valuation inputs used as of October 31, 2012 in valuing the Portfolios’ investments based upon three levels defined above:
| LEVEL 1 ($) | | LEVEL 2 ($) | | LEVEL 3 ($) | | Total ($) |
| Growth Portfolio | | | | | | | |
| Investment Securities: | | | | | | | |
| Common Stocks (a) | 76,045,274 | | — | | — | | 76,045,274 |
| Investment Company | 3,113,192 | | — | | — | | 3,113,192 |
| Total Investment Securities | 79,158,466 | | — | | — | | 79,158,466 |
| |
| Opportunity Portfolio | | | | | | | |
| Investment Securities: | | | | | | | |
| Common Stocks (a) | 145,117,785 | | — | | — | | 145,117,785 |
| Investment Company | 4,802,550 | | — | | — | | 4,802,550 |
| Total Investment Securities | 149,920,335 | | — | | — | | 149,920,335 |
____________________
| (a) | | For detailed investment categorizations, see the accompanying Schedules of Portfolio Investments. |
New Accounting Pronouncements:
In December 2011, the Financial Accounting Standards Board issued ASU No. 2011-11 “Disclosures about Offsetting Assets and Liabilities” requiring disclosure of both gross and net information related to offsetting and related arrangements enabling users of its financial statements to understand the effect of those arrangements on the entity’s financial position. The objective of this disclosure is to facilitate comparison between those entities that prepare their financial statements on the basis of U.S. GAAP and those entities that prepare their financial statements on the basis of IFRSs. ASU No. 2011-11 is effective for interim and annual periods beginning on or after January 1, 2013. Adoption of ASU No. 2011-11 will have no effect on the Portfolios’ net assets. At this time, management is evaluating any impact ASU No. 2011-11 may have on the Portfolios’ financial statements disclosures.
4. Related Party Transactions and Other Agreements:
Investment Management:
HSBC Global Asset Management (USA) Inc. (“HSBC” or the “Investment Adviser”), a wholly owned subsidiary of HSBC Bank USA, N.A., a national bank organized under the laws of the United States, acts as the Investment Adviser to the Portfolios pursuant to an investment management contract with the Portfolio Trust. As Investment Adviser, HSBC manages the investments of the Portfolios and continuously reviews, supervises, and administers the Portfolios’ investments. Winslow Capital Management, Inc. (“Winslow”) and Westfield Capital Management Company, L.P. (“Westfield”) serve as subadvisers for the Growth Portfolio and Opportunity Portfolio, respectively, and are paid for their services directly by the respective Portfolios.
44 HSBC PORTFOLIOS
| HSBC PORTFOLIOS |
| Notes to Financial Statements—as of October 31, 2012 (continued) |
For their services, the Investment Adviser and Winslow receive in aggregate, from the Growth Portfolio, a fee, accrued daily and paid monthly, at an annual rate of:
| Based on Average Daily Net Assets of all Sub-Adviser serviced funds and separate accounts affiliated | | |
| with HSBC: | | | Fee Rate(%)* |
| Up to $250 million | | 0.575 |
| In excess of $250 million but not exceeding $500 million | | 0.525 |
| In excess of $500 million but not exceeding $750 million | | 0.475 |
| In excess of $750 million but not exceeding $1 billion | | 0.425 |
| In excess of $1 billion | | 0.375 |
____________________
| * | | The Growth Portfolio may pay the Investment Adviser and Winslow an aggregate maximum fee of up to 0.68%. Currently, the Investment Adviser’s contractual fee is 0.175% and Winslow’s maximum contractual fee is 0.40%. Accordingly, the current aggregate maximum fee rate is 0.575%. |
For their services, the Investment Adviser and Westfield receive in aggregate, a fee, accrued daily and paid monthly, at an annual rate of 0.80% of the Opportunity Portfolio’s average daily net assets.
Any voluntary fee waivers/reimbursements are not subject to recoupment in subsequent fiscal periods. Voluntary waiver/reimbursements may be stopped at any time.
Administration:
HSBC serves the Trusts as Administrator. Under the terms of the Administration Agreement, HSBC receives from the Trusts a fee, accrued daily and paid monthly at an annual rate of:
| Based on Average Daily Net Assets of | | | Fee Rate(%) |
| Up to $10 billion | | 0.0550 |
| In excess of $10 billion but not exceeding $20 billion | | 0.0350 |
| In excess of $20 billion but not exceeding $50 billion | | 0.0275 |
| In excess of $50 billion | | 0.0250 |
The fee rates and breakpoints are determined on the basis of the aggregate average daily net assets of the Trusts, however, the assets of the Portfolios and HSBC Funds and HSBC Advisor Fund that invest in the Portfolios are not double-counted. The total administration fee paid to HSBC is allocated to each series based upon its proportionate share of the aggregate net assets of the Trusts. For assets invested in the Portfolios by the HSBC Funds and HSBC Advisor Fund, the Portfolios pay half of the administration fee and the other funds pay half of the administration fee, for a combination of the total fee rate set forth above.
Pursuant to a Sub-Administration Agreement with HSBC, Citi Fund Services Ohio, Inc. (“Citi”), a wholly-owned subsidiary of Citigroup, Inc., serves as the Trusts’ Sub-Administrator subject to the general supervision by the Trusts’ Board and HSBC. For these services, Citi is entitled to a fee, payable by HSBC, at an annual rate equivalent to the fee rates set forth above subject to certain reductions associated with services provided to new portfolios, minus 0.02% which is retained by HSBC.
Under a Compliance Services Agreement between the Trusts and Citi (the “CCO Agreement”), Citi makes an employee available to serve as the Trusts’ Chief Compliance Officer (the “CCO”). Under the CCO Agreement, Citi also provides infrastructure and support in implementing the written policies and procedures comprising the Trusts’ compliance program, including support services to the CCO. For the services provided under the CCO Agreement, the Trusts paid Citi $281,280 for the year ended October 31, 2012, plus reimbursement of certain expenses. Expenses incurred by each Portfolio are reflected on the Statements of Operations as “Compliance Services.” Citi pays the salary and other compensation earned by individuals as employees of Citi.
HSBC PORTFOLIOS 45
| HSBC PORTFOLIOS |
| Notes to Financial Statements—as of October 31, 2012 (continued) |
Fund Accounting:
Citi provides fund accounting services for the Portfolio Trust. For its services to the Portfolios, Citi receives an annual fee per portfolio, including reimbursement of certain expenses, that is accrued daily and paid monthly.
Independent Trustees:
Prior to January 1, 2012, the Trusts, in the aggregate, paid each Independent Trustee an annual retainer of $63,000, a fee of $5,000 for each regular meeting of the Board of Trustees attended, a fee of $3,000 for each special telephonic meeting attended, and a fee of $5,000 for each special in-person meeting attended. The Trusts also paid each Independent Trustee an annual retainer of $3,000 for each Committee on which such Trustee served as a Committee member as well as a fee of $3,000 for each Committee meeting attended. Additionally, the Trusts paid each Committee Chair an annual retainer of $6,000, with the exception of the Chair of the Audit Committee, who received a retainer of $8,000. The Trusts also paid the Chairman of the Board, an additional annual retainer of $20,000, as well as an additional $4,000 for each regular meeting of the Board attended. In addition, for time expended on Board duties outside normal meetings, which is authorized by the Board, a Trustee was compensated at the rate of $500 per hour, up to a maximum of $3,000 per day.
Effective January 1, 2012, the Trusts pay each Independent Trustee an annual retainer of $100,000. The Trusts pay a fee of $10,000 for each regular meeting of the Board of Trustees attended and a fee of $3,000 for each special meeting attended. The Trusts pay each Committee Chair an annual retainer of $3,000, with the exception of the Chair of the Audit Committee, who receives a retainer of $6,000. The Trusts also pay the Chairman of the Board, an additional annual retainer of $24,000. In addition, for time expended on Board duties outside normal meetings, which is authorized by the Board, a Trustee is compensated at the rate of $500 per hour, up to a maximum of $3,000 per day.
5. Investment Transactions:
Cost of purchases and proceeds from sales of securities (excluding securities maturing less than one year from acquisition) for the year ended October 31, 2012 were as follows:
| Portfolio Name | | Purchases($) | | Sales($) |
| Growth Portfolio | 46,467,415 | | 78,190,349 |
| Opportunity Portfolio | 83,879,531 | | 91,164,123 |
For the year ended October 31, 2012, there were no long-term U.S. government securities held by the Portfolio Trust.
6. Federal Income Tax Information:
At October 31, 2012, the cost basis of securities for federal income tax purposes, gross unrealized appreciation, gross unrealized depreciation and net unrealized appreciation/depreciation were as follows:
| | | | | | | | Net Unrealized |
| | | Tax Unrealized | | Tax Unrealized | | Appreciation |
| Fund | | Tax Cost($) | | Appreciation($) | | Depreciation($) | | (Depreciation)($)* |
| Growth Portfolio | 62,543,316 | | 17,313,687 | | (698,537 | ) | | 16,615,150 |
| Opportunity Portfolio | 129,645,392 | | 26,834,599 | | (6,559,656 | ) | | 20,274,943 |
____________________
| * | | The difference between book-basis unrealized appreciation (depreciation) is attributable primarily to tax deferral of losses on wash sales. |
7. Subsequent Events:
Management has evaluated events and transactions through the date the financial statements were issued, for purposes of recognition or disclosure in these financial statements and there are no subsequent events to report.
46 HSBC PORTFOLIOS
Report of Independent Registered Public Accounting Firm
To the Shareholders and Board of Trustees of
HSBC Portfolios:
We have audited the accompanying statements of assets and liabilities of HSBC Portfolios - HSBC Growth Portfolio and HSBC Opportunity Portfolio (formerly known as HSBC Investor Growth Portfolio and HSBC Investor Opportunity Portfolio) (the Funds), including the schedules of portfolio investments, as of October 31, 2012, and the related statements of operations for the year then ended, the statements of changes in net assets for each of the years in the two-year period then ended, and the financial highlights for each of the years in the five-year period then ended. These financial statements and financial highlights are the responsibility of the Funds’ management. Our responsibility is to express an opinion on these financial statements and financial highlights based on our audits.
We conducted our audits in accordance with the standards of the Public Company Accounting Oversight Board (United States). Those standards require that we plan and perform the audit to obtain reasonable assurance about whether the financial statements and financial highlights are free of material misstatement. An audit includes examining, on a test basis, evidence supporting the amounts and disclosures in the financial statements. Our procedures included confirmation of securities owned as of October 31, 2012, by correspondence with the custodian or brokers or by other appropriate auditing procedures. An audit also includes assessing the accounting principles used and significant estimates made by management, as well as evaluating the overall financial statement presentation. We believe that our audits provide a reasonable basis for our opinion.
In our opinion, the financial statements and financial highlights referred to above present fairly, in all material respects, the financial position of the Funds as of October 31, 2012, the results of their operations for the year then ended, the changes in their net assets for each of the years in the two-year period then ended, and the financial highlights for each of the years in the five-year period then ended, in conformity with U.S. generally accepted accounting principles.

Columbus, Ohio
December 21, 2012
HSBC PORTFOLIOS 47
| HSBC PORTFOLIOS |
| Table of Shareholder Expenses—as of October 31, 2012 |
As a shareholder of the Portfolios, you incur ongoing costs, including management fees and other Fund expenses.
These examples are intended to help you understand your ongoing costs (in dollars) of investing in the Portfolios and to compare these costs with the ongoing costs of investing in other mutual funds.
These examples are based on an investment of $1,000 invested at the beginning of the period and held for the entire period from May 1, 2012 through October 31, 2012.
Actual Example
The table below provides information about actual account values and actual expenses. You may use the information below, together with the amount you invested, to estimate the expenses that you paid over the period. Simply divide your account value by $1,000 (for example, an $8,600 account value divided by $1,000 = 8.6), then multiply the result by the number in the table under the heading entitled “Expenses Paid During Period” to estimate the expenses you paid on your account during this period.
| | | | | | | | | | | Annualized |
| | Beginning | | Ending | | Expenses Paid | | Expense Ratio |
| | Account Value | | Account Value | | During Period* | | During Period |
| | 5/1/12 | | 10/31/12 | | 5/1/12 - 10/31/12 | | 5/1/12 - 10/31/12 |
| Growth Portfolio | | $ | 1,000.00 | | $ | 991.20 | | $ | 3.65 | | 0.73 | % |
| Opportunity Portfolio | | | 1,000.00 | | | 950.20 | | | 4.51 | | 0.92 | % |
____________________
| * | | Expenses are equal to the average account value over the period, multiplied by the Portfolio’s annualized expense ratio, multiplied by 184/366 (to reflect the one half year period). |
Hypothetical Example for Comparison Purposes
The table below provides information about hypothetical account values and hypothetical expenses based on each Portfolio’s actual expense ratio and an assumed rate of return of 5% per year before expenses, which is not the Portfolio’s actual return. The hypothetical account values and expenses may not be used to estimate the actual ending account balance or expenses you paid for the period. You may use this information to compare this 5% hypothetical example with the 5% hypothetical examples that appear in the shareholder reports of other funds.
Please note that the expenses shown in the table are meant to highlight your ongoing costs only and do not reflect any transactional costs, such as sales charges (loads), redemption fees, or exchange fees. Therefore, the table is useful in comparing ongoing costs only, and will not help you determine the relative total costs of owning different funds. In addition, if these transactional costs were included, your costs would have been higher.
| | | | | | | | | | | Annualized |
| | Beginning | | Ending | | Expenses Paid | | Expense Ratio |
| | Account Value | | Account Value | | During Period* | | During Period |
| | 5/1/12 | | 10/31/12 | | 5/1/12 - 10/31/12 | | 5/1/12 - 10/31/12 |
| Growth Portfolio | | $ | 1,000.00 | | $ | 1,021.47 | | $ | 3.71 | | 0.73 | % |
| Opportunity Portfolio | | | 1,000.00 | | | 1,020.51 | | | 4.67 | | 0.92 | % |
____________________
| * | | Expenses are equal to the average account value over the period, multiplied by the Portfolio’s annualized expense ratio, multiplied by 184/366 (to reflect the one half year period). |
48 HSBC PORTFOLIOS
| HSBC PORTFOLIOS |
| Board of Trustees and Officers (Unaudited) |
MANAGEMENT OF THE TRUST
The following table contains information regarding the HSBC Family of Funds’ Board of Trustees (“Trustees”). Asterisks indicate those Trustees who are “interested persons,” as defined in the Investment Company Act of 1940, as amended, of the HSBC Family of Funds. The HSBC Family of Funds’ Statement of Additional Information includes additional information about the Trustees and is available, without charge, upon request by calling (888) 525-5757.
| | | | | | | | Portfolios in | | |
| | Position(s) | | Term of Office | | | | Fund Complex | | Other |
| Name, | | Held with | | and Length of | | Principal Occupation(s) | | Overseen By | | Directorships |
| Address, Age | | Funds | | Time Served | | During Past 5 Years | | Trustee* | | Held by Trustee |
| NON-INTERESTED | | | | | | | | | | |
| TRUSTEES | | | | | | | | | | |
| | | | | | | | | | | |
MARCIA L. BECK
P.O. Box 182845
Columbus, OH
43218-3035
Age: 57 | | Trustee | | Indefinite;
2008 to present | | Private Investor (June 1999 – present); Executive Vice President, Prudential Investments (1997 – 1999); President and Trustee, The Goldman Sachs Mutual Funds (1992 – 1996) | | 23 | | None |
| | | | | | | | | | | |
SUSAN S. HUANG
P.O. Box 182845
Columbus, OH
43218-3035
Age: 58 | | Trustee | | Indefinite;
2008 to present | | Private Investor (2000- present); Senior Vice President, Schroder Investment Management (2001 – 2004); Managing Director, Chase Asset Management (1995-2000) | | 23 | | None |
| | | | | | | | | | | |
ALAN S. PARSOW
P.O. Box 182845
Columbus, OH
43218-3035
Age: 62 | | Trustee | | Indefinite;
1987 to present | | General Partner, Elkhorn Partners, L.P. (a private investment partnership) (1989 – present) | | 23 | | None |
| | | | | | | | | | | |
THOMAS F. ROBARDS
P.O. Box 182845
Columbus, OH
43218-3035
Age: 66 | | Trustee | | Indefinite;
2005 to present | | Partner, Robards & Co. LLC (investment and advisory services) (2005-present); Chief Financial Officer, American Museum of Natural History (2003- 2004); Chief Financial Officer, Datek Online Holdings (2000-2003); Previously EVP and CFO Republic New York Corporation | | 23 | | Overseas Shipholding Group (NYSE listed energy transportation); Ellington Financial LLC (NYSE listed financial services) |
| | | | | | | | | | | |
MICHAEL SEELY
P.O. Box 182845
Columbus, OH
43218-3035
Age: 67 | | Chairman and
Trustee | | Indefinite;
1987 to present | | Private Investor (2003-present); General Partner, Global Multi Manager Partners (1999-2003); President of Investor Access Corporation (1981-2003) | | 23 | | None |
| | | | | | | | | | | |
INTERESTED TRUSTEE | | | | | | | | | | |
| | | | | | | | | | | |
DEBORAH HAZELL
452 Fifth Avenue
New York
NY 10018
Age: 49 | | Trustee | | Indefinite;
2011 to present | | CEO, HSBC Global Asset Management (USA) Inc. (2011-present); President and CEO, Fisher Francis Trees & Watts (“FFTW”) (investment advisor), February 2008-June 2011; Client Service, Business Development and Marketing Group, FFTW (October 1999-February 2008) | | 23 | | None |
____________________
| | |
| * | | Includes the Trust, the HSBC Advisor Fund Trust and the HSBC Portfolios. |
50 HSBC PORTFOLIOS
| HSBC PORTFOLIOS |
| Board of Trustees and Officers (Unaudited) (continued) |
| | Position(s) Held | | Term of Office and | | Principal Occupation(s) |
| Name, Address, Age | | with Funds | | Length of Time Served | | During Past 5 Years |
OFFICERS | | | | | | |
| | | | | | | |
RICHARD A. FABIETTI
452 Fifth Avenue
New York, NY 10018
Age: 54 | | President | | One year;
2004 to present | | Senior Vice President, Head of Product Management, HSBC Global Asset Management (USA) Inc.
(1998 - present) |
| | | | | | | |
STEPHEN SIVILLO
452 Fifth Avenue
New York, NY 10018
Age: 41 | | Vice President | | One year;
2010 to present | | Vice President of Product Administration, HSBC Global Asset Management (USA) Inc. (2010 - present); Chief Compliance Officer, Managers Funds (2009 – 2010); Director, Mutual Fund Compliance, AllianceBernstein (2007-2009); Assistant Vice President, Compliance, AllianceBernstein (2005-2007) |
| | | | | | | |
TY EDWARDS*
3435 Stelzer Road
Columbus, OH 43219-3035
Age: 46 | | Treasurer | | One year;
2010 to present | | Senior Vice President, Citi Fund Services (2010– present); Director, Product Management, Columbia Management (2007-2009); Deputy Treasurer, Columbia Funds, (2006-2007); Director, Fund Administration, Columbia Management (2004-2007) |
| | | | | | | |
JENNIFER A. ENGLISH*
100 Summer Street
Suite 1500
Boston, MA 02110
Age: 40 | | Secretary | | One year;
2008 to present | | Senior Vice President, Regulatory Administration, Citi (2005 - present) |
| | | | | | | |
DANIO MASTROPIERI*
100 Summer Street
Suite 1500
Boston, MA 02110
Age: 40 | | Assistant Secretary | | One year;
December 2012 to present | | Vice President, Regulatory Administration, Citi (2007 - present) |
| | | | | | | |
FREDERICK J. SCHMIDT*
1 Rexcorp Plaza
Uniondale, NY 11556
Age: 53 | | Chief Compliance Officer | | One year; 2004 to present | | Director and Chief Compliance Officer, CCO Services, Citi (2004 - present) |
____________________
| * | | Mr. Edwards, Mr. Schmidt, Ms. English and Mr. Mastropieri also are officers of other investment companies of which Citi (or an affiliate) is the administrator or sub-administrator. |
HSBC PORTFOLIOS 51
Other Information (Unaudited):
Information regarding how the Funds voted proxies relating to portfolio securities during the most recent 12-month period ended June 30th is available (i) without charge, upon request, by calling 1-800-525-5757 for HSBC Bank USA and HSBC Brokerage (USA) Inc. clients and 1-800-782-8183 for all other shareholders; (ii) on the Funds’ website at www.investorfunds.us.hsbc.com; and (iii) on the Security and Exchange Commission’s (“Commission”) website at http://www.sec.gov.
The Funds file their complete schedules of portfolio holdings with the Commission for the first and third quarters of each fiscal year on Form N-Q. The Funds’ Forms N-Q are available on the Commission’s website at http://www.sec.gov. The Funds’ Forms N-Q may be reviewed and copied at the Commission’s Public Reference Room in Washington, D.C. and information on the operation of the Public Reference Room may be obtained by calling 1-800-SEC-0330. The Funds’ Schedules of Investments will be available no later than 60 days after each period end, without charge, on the Funds’ website at www.investorfunds.us.hsbc.com.
An investment in a Fund is not a deposit of HSBC Bank USA, National Association, and is not insured or guaranteed by the Federal Deposit Insurance Corporation or any other government agency.
52 HSBC PORTFOLIOS
HSBC FAMILY OF FUNDS:
INVESTMENT ADVISER AND ADMINISTRATOR
HSBC Global Asset Management (USA) Inc.
452 Fifth Avenue
New York, NY 10018
SUB-ADVISERS
HSBC Growth Portfolio
Winslow Capital Management, Inc.
4720 IDS Tower
80 South Eighth Street
Minneapolis, MN 55402
HSBC Opportunity Portfolio
Westfield Capital Management Company, L.P.
One Financial Center
Boston, MA 02111
SHAREHOLDER SERVICING AGENTS
For HSBC Bank USA, N.A. and
HSBC Securities (USA) Inc. Clients
HSBC Bank USA, N.A.
452 Fifth Avenue
New York, NY 10018
1-888-525-5757
For All Other Shareholders
HSBC Funds
P.O. Box 182845
Columbus, OH 43218
1-800-782-8183
TRANSFER AGENT
Citi Fund Services
3435 Stelzer Road
Columbus, OH 43219
DISTRIBUTOR
Foreside Distribution Services, L.P.
690 Taylor Road, Suite 150
Gahanna, OH 43230
CUSTODIAN
The Northern Trust Company
50 South LaSalle Street
Chicago, IL 60603
INDEPENDENT REGISTERED PUBLIC ACCOUNTING FIRM
KPMG LLP
191 West Nationwide Blvd., Suite 500
Columbus, OH 43215
LEGAL COUNSEL
Dechert LLP
1775 I Street, N.W.
Washington, D.C. 20006

The HSBC Family of Funds are distributed by Foreside Distribution Services, L.P. This document must be preceded or accompanied by a current prospectus for the HSBC Funds, which you should read carefully before you invest or send money.
| — NOT FDIC INSURED | — NO BANK GUARANTEE | — MAY LOSE VALUE |
HSBC Global Asset Management (USA) Inc.
HSBC World Selection™ Funds
Annual Report
October 31, 2012
| WORLD SELECTION FUNDS | Class A | | Class B | | Class C |
| Aggressive Strategy Fund | HAAGX | | HBAGX | | HCAGX |
| Balanced Strategy Fund | HAGRX | | HSBGX | | HCGRX |
| Moderate Strategy Fund | HSAMX | | HSBMX | | HSCMX |
| Conservative Strategy Fund | HACGX | | HBCGX | | HCCGX |
| Income Strategy Fund | HINAX | | HINBX | | HINCX |
HSBC World Selection Funds
Annual Report - October 31, 2012
| Glossary of Terms | | |
| Chairman’s Message | | 4 |
| President’s Message | | 5 |
| Commentary From the Investment Manager | | 6 |
| Portfolio Reviews | | 8 |
| Portfolio Composition | | 18 |
| | | |
| Schedules of Portfolio Investments | | |
| Aggressive Strategy Fund | | 20 |
| Balanced Strategy Fund | | 21 |
| Moderate Strategy Fund | | 22 |
| Conservative Strategy Fund | | 23 |
| Income Strategy Fund | | 24 |
| Statements of Assets and Liabilities | | 26 |
| Statements of Operations | | 27 |
| Statements of Changes in Net Assets | | 28 |
| Financial Highlights | | 34 |
| Notes to Financial Statements | | 39 |
| Report of Independent Registered Public Accounting Firm | | 48 |
| Other Federal Income Tax Information | | 49 |
| Table of Shareholder Expenses | | 50 |
| |
| HSBC Portfolios | | |
| Schedules of Portfolio Investments | | |
| HSBC Growth Portfolio | | 52 |
| HSBC Opportunity Portfolio | | 54 |
| Statements of Assets and Liabilities | | 56 |
| Statements of Operations | | 57 |
| Statements of Changes in Net Assets | | 58 |
| Financial Highlights | | 59 |
| Notes to Financial Statements | | 60 |
| Report of Independent Registered Public Accounting Firm | | 65 |
| Table of Shareholder Expenses | | 66 |
| Board of Trustees and Officers | | 68 |
| Other Information | | 70 |
The World Selection Funds (the “Funds”) are “fund of funds” which aim to provide superior risk adjusted returns relative to a single asset class investment over the long term by investing primarily in underlying funds. The underlying funds may include mutual funds managed by HSBC Global Asset Management (USA) Inc. (the “Adviser”), mutual funds managed by investment advisers that are not associated with the Adviser and exchange traded funds (“ETFs”) (collectively, “Underlying Funds”). The Funds may also purchase or hold exchange traded notes (“ETNs”). The Funds’ broadly diversified investment approach across various asset classes and investment styles aims to contribute to achieving their objectives. Each World Selection Fund has a strategic asset allocation which represents a carefully constructed blend of asset classes, regions and currencies to meet the longer term investment goals.
BofA Merrill Lynch U.S. High Yield Master II Index is an unmanaged index that tracks the performance of USD-denominated, below investment grade corporate debt publicly issued in the U.S. domestic market.
Barclays U.S. Aggregate Bond Index is an unmanaged index generally representative of investment-grade, fixed-rate debt issues, including government, corporate, asset-backed, and mortgage-backed securities, with maturities of at least one year.
Barclays U.S. High-Yield Corporate Bond Index is an unmanaged index that measures the non-investment grade, USD-denominated, fixed-rate, taxable corporate bond market. Securities are classified as high-yield if the middle rating of Moody’s, Fitch, and S&P is Ba1/BB+/BB+ or below. The index excludes emerging markets debt.
Citigroup U.S. Domestic 3-Month Treasury Bill Index is an unmanaged market value-weighted index of public obligations of the U.S. Treasury with maturities of three months.
Gross Domestic Product (“GDP”) measures the market value of the goods and services produced by labor and property in the United States.
Morgan Stanley Capital International Europe Australasia and Far East (“MSCI EAFE”) Index is an unmanaged free float-adjusted market capitalization index that is designed to measure the equity market performance of developed markets, excluding the U.S. & Canada. The MSCI EAFE Index consists of the following 22 developed market countries: Australia, Austria, Belgium, Denmark, Finland, France, Germany, Greece, Hong Kong, Ireland, Israel, Italy, Japan, the Netherlands, New Zealand, Norway, Portugal, Singapore, Spain, Sweden, Switzerland, and the United Kingdom.
Russell 2000® Index is an unmanaged index that measures the performance of the small-cap segment of the U.S. equity universe. The Russell 2000® Index is a subset of the Russell 3000® Index representing approximately 10% of the total market capitalization of that index. It includes approximately 2000 of the smallest securities based on a combination of their market cap and current index membership.
Standard & Poor’s MidCap 400 Index is an unmanaged index that is the most widely used index for mid-sized companies. The S&P MidCap 400 covers 7% of the U.S. equities market, and is part of a series of S&P U.S. indices that can be used as building blocks for portfolio composition.
Standard & Poor’s 500 (“S&P 500”) Index is an unmanaged index that is widely regarded as a gauge of the U.S. equities market. This index includes 500 leading companies in leading industries of the U.S. economy. The S&P 500 Index focuses on the large-cap segment of the market, with approximately 75% coverage of U.S. equities.
Securities indices assume reinvestment of all distributions and interest payments and do not take in account brokerage fees or expenses. Securities in the Funds do not match those in the indices and performance of the Funds will differ. Investors cannot invest directly in an index.
December 20, 2012
To Our Shareholders:
These are challenging times for investors.
Perhaps the central reason is the slow but remorseless unwinding of a multi-decade build-up in global debt, following the recent sharp decline in the global economy. Much of this debt has been devalued—including, for example, debt associated with U.S. housing stock or Greek government debt.
Despite these modest declines, U.S. private debt—which includes household debt from such things as credit cards and mortgages—remains high. Some historical perspective: In 1951, private sector debt stood at just 53% of the U.S. Gross Domestic Product1 (GDP); today, that debt stands at 159%—a very high level, though down from its 2007 peak of 179%.
The turning point appears to be 2007. In that year, aggressive monetary and fiscal policies were enacted in the U.S. to stimulate the flagging economy. The result has been soaring government debt. Projections from the Congressional Budget Office suggest that the ratio of federal debt to GDP could reach 100% by the middle of the next decade—and that doesn’t reflect the increasing cost of entitlement programs.
These increasing claims on national income are worrisome, profoundly so, and have sparked intense and important debate—between Keynesians and monetarists; between free market capitalists and fans of European-style welfare economies; and, most recently, between Democrats and Republicans in the recent election.
So far, these growing claims by government on private sector income and wealth have failed to push interest rates higher. However, they have arguably, tempered the kind of growth and employment gains one would historically associate with recovery. In fact, the Federal Reserve’s Quantative Easing programs and “Operation Twist” have pushed rates to low levels, frustrating investors’ search for yield and leading our advisor and service providers to absorb about $17 million in fee waivers last year. Without these waivers our money market funds would have provided lower yields. Thus, it is no surprise that total money market fund assets have declined.
Regulators and others, parsing the entrails of the sharp recession, have proposed to change the regulation of such funds in order to prevent a future “run” on the funds during any period of economic upheaval. Proposals include a floating NAV, and variations of stable net asset value that include capital buffers.
Our other funds performed well in this difficult environment, as the following pages show.
Furthermore, the fund group continued to nourish its strategy of providing top-notch emerging market asset management products. Our most recent offering is the HSBC RMB Fixed Income Fund, which affords access to the Renminbi, the official offshore currency of the People’s Republic of China, through a portfolio of “Dim Sum” bonds. As the leading international bank in mainland China, HSBC is uniquely positioned to manage such a vehicle.
On behalf of my colleagues, I thank our investment advisor and portfolio managers, our other service providers, and you, our shareholders, for your support. We will continue to work hard to merit that confidence.
Sincerely,

| Michael Seely |
| Chairman, HSBC Funds |
1 For additional information, please refer to the Glossary of Terms.
This literature must be preceded or accompanied by an effective prospectus for the HSBC Funds. Investors should consider the investment objectives, risks, charges, and expenses of the investment company carefully before investing. The prospectus contains this and other important information about the investment company. To obtain more information, for clients of HSBC Securities (USA) Inc., please call 1-888-525-5757 or visit www.investorfunds.us.hsbc.com. For other investors and prospective investors, please call the Funds directly at 1-888-936-4722. Investors should read the prospectus carefully before investing or sending money.
4 HSBC FAMILY OF FUNDS
Dear Shareholder,
We are please to send to you the HSBC Funds annual report, covering the Funds’ fiscal year ended October 31, 2012. This report offers detailed information about your Funds’ investments and results. We encourage you to review it carefully.
Inside these pages you will find a letter from the Funds’ Chairman, Michael Seely, in which he comments on recent market developments. The report also includes commentary from the Funds’ portfolio managers in which they discuss the investment markets and their respective Fund’s performance. Each commentary is accompanied by the Fund’s return for the period, listed alongside the returns of its benchmark index and peer group average for comparative purposes.
On June 8 of this year we continued to expand our emerging markets funds offering by launching the HSBC RMB Fixed Income Fund. This Fund gives investors exposure to the Chinese Renminbi (“RMB”) bond market, sometimes referred to as the “dim sum” bond market. The Fund joins the HSBC Emerging Markets Local Debt Fund, HSBC Emerging Markets Debt Fund, HSBC Total Return Fund and the HSBC Frontier Markets Fund in our emerging markets segment.
In closing, we would like to thank you for investing through the HSBC Funds. We continue to focus the HSBC Fund Family investment solutions to assist our shareholders in reaching their financial goals. We appreciate the trust you place in us, and will continue working to earn it. Please contact us at any time with questions or concerns.
Sincerely,

| Richard A. Fabietti |
| President |
HSBC FAMILY OF FUNDS 5
| Commentary From the Investment Manager |
HSBC Global Asset Management (USA) Inc.
U.S. Economic Review
The global economy made only moderate progress in its ongoing recovery from a historic downturn during the 12-month period between November 1, 2011 and October 31, 2012. Governments around the world fueled the turnaround with aggressive monetary stimulus as policymakers struggled to revive growth against a backdrop, at least in the developed world, of bloated public debt. The Federal Reserve Board (the “Fed”) maintained the federal funds rate—a key factor in lending rates—at a historically low target range between 0.00% to 0.25%, and announced that it would keep the rate in that range until at least 2015.
The period began among concerns that the eurozone debt crisis would cause a new global recession. The situation in Europe improved somewhat during the first months of 2012, largely due to the European Central Bank’s (ECB) efforts to support liquidity. However, the prospect of another global recession loomed throughout much of the period as numerous economic indicators, such as industrial production and unemployment growth, proved disappointing. Although the U.S. economy continued to expand during the period, the pace of its growth slowed.
We believe the ECB helped to stem a liquidity crisis and alleviate fears of deepening credit problems in the eurozone. In December 2011 the ECB began distributing inexpensive loans to European banks as part of its long-term refinancing operation (LTRO) and in March 2012 began doling out an even larger amount of money in similar loans. The LTRO appeared to stabilize financial markets in the short term; nevertheless, significant uncertainties remain regarding the long-term prospects of European economies to regain their competitiveness and prevent default. The ability of Italy and Spain to reestablish market confidence remained in doubt; in addition, the long-term impact of austerity programs on economic growth raised concerns.
Slowing growth in major world economies, including the U.S. and China, presented a significant setback for the global economy. U.S. Gross Domestic Product (“GDP”)1 increased at an annualized rate of 4.1% during the last quarter of 2011, then slowed to 2.7% or less for the remainder of the period under review. Industrial production growth was weak in both developed and emerging markets. U.S. consumer confidence improved somewhat, although real income growth and consumer savings were low. While job growth remained slow, during the last quarter of the period the unemployment rate fell below 8% for the first time in four years. During the period, the U.S. housing market showed significant signs of improvement as sales increased and inventory declined. Towards the end of the period, better economic news was seen from China, the world’s second-largest economy, leading many commentators to suggest that Chinese economic growth had turned a corner. One positive consequence of the slowdown in the global economy was a decrease in the rate of inflation in both developed and emerging economies.
Market Review
U.S. stocks posted strong gains. The first two months of the period were characterized by high volatility, as investors responded to ongoing debt problems and slowing economic growth. Equities began a strong rally in the final weeks of 2011 that continued throughout much of the period, with the exception of a pullback during the late spring. Stocks’ robust performance, despite economic setbacks, was supported in part by the actions of central banks, including the ECB’s launch of a new bond buying scheme it described as “unlimited” and the Fed’s third round of “quantitative easing.” The S&P 500 Index1 of large-company stocks returned 15.21% for the 12 months through October 2012. Small-cap shares slightly outperformed mid- and large-caps: For the same period, the Russell 2000® Index1 of small-company stocks returned 12.08%, and the S&P 400 MidCap Index1 returned 12.11%.
The debt crisis in Europe, along with slowing growth in developing economies, led to less impressive performance for foreign stocks. The Morgan Stanley Capital International Europe Australasia and Far East (“MSCI EAFE”) Index1 of international stocks in developed markets returned 4.61% for the 12-month period.
Fixed-income securities generated significant gains during the period, as global economic worries continued to drive demand for lower-risk assets. Yields on U.S. government bonds reached record lows as an increasing number of investors pursued a flight to safety. Low inflation, healthy corporate balance sheets, consumer and corporate deleveraging and a stabilizing housing market supported gains in corporate fixed-income markets, including both investment and high yield bonds. For the 12-month period the Barclays U.S. Aggregate Bond Index1, which tracks the broad investment-grade fixed-income market, returned 5.25%, while the Barclays U.S. High-Yield Corporate Bond Index1 returned 13.61%.
1 For additional information, please refer to the Glossary of Terms.
6 HSBC FAMILY OF FUNDS
| Portfolio Reviews (Unaudited) |
Aggressive Strategy Fund
(Class A Shares, Class B Shares and Class C Shares)
by Randeep Brar, CFA, Senior Vice President/Portfolio Manager
Caroline Hitch, Senior Portfolio Manager
The Aggressive Strategy Fund (the ���Fund”) is a “fund of funds” which seeks long-term growth of capital by investing primarily in underlying funds. The underlying funds may include mutual funds managed by HSBC Global Asset Management (USA) Inc. (the “Adviser”), mutual funds managed by investment advisers that are not associated with the Adviser and exchange traded funds (“ETFs”) (collectively, “Underlying Funds”). The Fund may also purchase or hold exchange traded notes (“ETNs”).
Investment Concerns
Allocation Risk: The risk that the Adviser’s target asset and sector allocations and changes in target asset and sector allocations cause the Fund to underperform other similar funds or cause you to lose money, and that the Fund may not achieve its target asset and sector allocations.
Underlying Fund Selection Risk: The risk that the Fund may invest in Underlying Funds that underperform other similar funds or the markets more generally, due to poor investment decisions by the investment adviser(s) for the Underlying Funds or otherwise. Underlying Funds also have their own expenses, which the Fund bears in addition to its own expenses.
Equity Securities Risk: A portion of the assets of the Fund is allocated to Underlying Funds investing primarily in equity securities. Therefore, the value of the Fund may increase or decrease as a result of its indirect interest in equity securities.
Fixed Income Securities Risk: A portion of the assets of the Fund is allocated to Underlying Funds investing primarily in fixed income securities. Therefore, the value of the Fund may increase or decrease as a result of its indirect interest in fixed income securities.
Foreign Securities/Emerging Markets Risk: Foreign securities, including those of emerging market issuers, are subject to additional risks including international trade, currency, political, and regulatory risks. Securities of emerging market issuers generally have more risk than securities issued by issuers in more developed foreign markets.
For a complete description of these and other risks associated with investment in a mutual fund, please refer to the Fund’s prospectus.
Market Commentary
The Fund returned 7.72% (without sales charge) for the Class A Shares for the 12-month period ended October 31, 2012. That compared to a 15.21% total return for the Fund’s primary benchmark, the S&P 500 Index1.
The Fund measures performance against several additional reference indices: the MSCI EAFE Index1 (5.15% return for the 12 months through October 31, 2012), Barclays U.S. Aggregate Bond Index1 (5.25% return), Bank of America/Merrill Lynch U.S. High Yield Master II Index1 (13.18% return) and Citigroup U.S. Domestic 3-Month Treasury Bill Index1 (0.06% return).
Portfolio Performance
Investors during the 12-month period were concerned by a range of global economic issues, including the continuing eurozone debt crisis, China’s economic slowdown and U.S. fiscal issues. Those concerns contributed to considerable volatility in the financial markets during the period.
Still, most major equity markets posted positive returns during the 12 months through October 31, 2012. That performance was driven primarily by strong returns during the first and third quarters in 2012 and extended to other “risky” asset classes such as high-yield bonds. The financial markets during the period also benefited from various central bank actions including the U.S. Federal Reserve’s decision to launch a third round of quantitative easing and a new bond buying program outlined by the European Central Bank (ECB) to stem the eurozone debt crisis.
In that environment, the Fund enjoyed positive absolute performance, and the period was rewarding for investors. The Fund benefited from its strategic allocation to riskier asset classes, which performed well in absolute terms during the period. In particular, the Fund’s high allocation to small-, mid- and large-cap U.S. equities (55%-60% of the Fund’s total portfolio) contributed substantially to its total return during the period. An overweight position in emerging market equities held for most of the period was less successful in relative terms. However, we continued to believe that companies in emerging regions offered attractive valuations against a strengthening macroeconomic picture.*
Within the Fund’s fixed-income segment, we favored corporate bonds—such as U.S. high-yield bonds—over government bonds. We believed corporate bonds offered better total return potential than other options in the fixed-income market. That strategy benefited the Fund’s absolute performance during the period. The Fund’s exposure to emerging market debt was beneficial. In absolute terms, the Fund benefited from its exposure to alternative asset classes, particularly global property and private equity, during the period.*
| * | | Portfolio composition is subject to change. |
| 1 | | For additional information, please refer to the Glossary of Terms. |
Past performance does not guarantee future results. The performance data quoted represents past performance and current returns may be lower or higher. Total return figures include change in share price, reinvestment of dividends and capital gains and do not reflect taxes that a shareholder would pay on Fund distributions or on the redemption of Fund shares. Investment return and principal value will fluctuate so that an investor’s shares, when redeemed may be worth more or less than the original cost. To obtain performance information current to the most recent month end, please call 1-800-782-8183.
8 HSBC FAMILY OF FUNDS
| Portfolio Reviews (Unaudited) |
Aggressive Strategy Fund
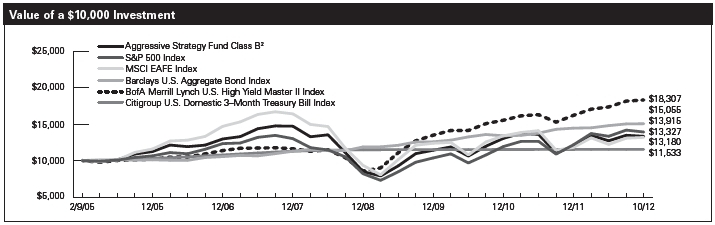
The charts above represent a historical since inception performance comparison of a hypothetical $10,000 investment in the indicated share class versus a similar investment in the Fund’s benchmark and represents the reinvestment of dividends and capital gains in the Fund.
| | | | | | Average Annual | | Expense |
| Fund Performance | | | | | | Total Return (%) | | Ratio (%)4 |
| | Inception | | 1 | | 5 | | Since | | | | |
| As of October 31, 2012 | | Date | | Year | | Year | | Inception | | Gross | | Net |
| Aggressive Strategy Fund Class A1 | | | 2/14/05 | | | 2.33 | | -3.30 | | 3.67 | | | 2.19 | | 1.88 |
| Aggressive Strategy Fund Class B2 | | | 2/9/05 | | | 2.87 | | -3.03 | | 3.79 | | | 2.94 | | 2.63 |
| Aggressive Strategy Fund Class C3 | | | 6/9/05 | | | 5.83 | | -3.03 | | 4.02 | | | 2.94 | | 2.63 |
| S&P 500 Index5 | | | — | | | 15.21 | | 0.36 | | 4.37 | 6 | | N/A | | N/A |
| MSCI EAFE Index5 | | | — | | | 5.15 | | -5.35 | | 3.64 | 6 | | N/A | | N/A |
| Barclays U.S. Aggregate Bond Index5 | | | — | | | 5.25 | | 6.38 | | 5.44 | 6 | | N/A | | N/A |
| BofA Merrill Lynch U.S. High Yield Master II Index5 | | | — | | | 13.18 | | 9.12 | | 8.14 | 6 | | N/A | | N/A |
| Citigroup U.S. Domestic 3-Month Treasury Bill Index5 | | | — | | | 0.06 | | 0.57 | | 1.86 | 6 | | N/A | | N/A |
Past performance does not guarantee future results. The performance data quoted represents past performance and current returns may be lower or higher. Total return figures include change in share price, reinvestment of dividends and capital gains and do not reflect the taxes that a shareholder would pay on Fund distributions or on the redemption of Fund shares. Investment return and principal value will fluctuate so that an investor’s shares, when redeemed may be worth more or less than the original cost. To obtain performance information current to the most recent month end, please call 1-800-782-8183.
The performance above reflects any fee waivers that have been in effect during the applicable periods, as well as any expense reimbursements that have periodically been made. Absent such waivers and reimbursements, returns would have been lower. Currently, contractual fee waivers are in effect for the Fund through March 1, 2013.
Certain returns shown include monies received by series of HSBC Portfolios (formerly, HSBC Investor Portfolios) (the “Portfolios”), in which the Fund invests, in respect of one-time class action settlements. As a result, the Fund’s total returns for those periods were higher than they would have been had the Portfolios not received the payments.
| 1 | | Reflects the maximum sales charge of 5.00%. |
| 2 | | Reflects the applicable contingent deferred sales charge, maximum of 4.00%. |
| 3 | | Reflects the applicable contingent deferred sales charge, maximum of 1.00%. |
| 4 | | Reflects the expense ratio as reported in the prospectus dated February 28, 2012. The Adviser has entered into a contractual expense limitation agreement with the Fund under which it will limit total expenses of the Fund (excluding interest, taxes, brokerage commissions, extraordinary expenses and estimated indirect expenses attributable to the Fund’s investments in investment companies other than the HSBC Growth Portfolio and the HSBC Opportunity Portfolio) to an annual rate of 1.50%, 2.25%, and 2.25% for Class A Shares, Class B Shares and Class C Shares, respectively. The expense limitation shall be in effect until March 1, 2013. The expense ratios reflected include Acquired Fund fees and expenses. Additional information pertaining to the October 31, 2012 expense ratios can be found in the financial highlights. |
| 5 | | For additional information, please refer to the Glossary of Terms. |
| 6 | | Return for the period February 9, 2005 to October 31, 2012. |
The Fund’s performance is primarily measured against the S&P 500 Index, an unmanaged index that is widely regarded as a gauge of the U.S. equities market. This index includes 500 leading companies in leading industries of the U.S. economy. Although the S&P 500 Index focuses on the large-cap segment of the market, with approximately 75% coverage of U.S. equities, it is also an ideal proxy for the total market. The Fund’s performance reflects the deduction of fees for these value-added services. Investors cannot invest directly in an index.
HSBC FAMILY OF FUNDS 9
| Portfolio Reviews (Unaudited) |
Balanced Strategy Fund
(Class A Shares, Class B Shares and Class C Shares)
by Randeep Brar, CFA, Senior Vice President/Portfolio Manager
Caroline Hitch, Senior Portfolio Manager
The Balanced Strategy Fund (the “Fund”) is a “fund of funds” which seeks long-term growth of capital by investing primarily in underlying funds. The underlying funds may include mutual funds managed by HSBC Global Asset Management (USA) Inc. (the “Adviser”), mutual funds managed by investment advisers that are not associated with the Adviser and exchange traded funds (“ETFs”) (collectively, “Underlying Funds”). The Fund may also purchase or hold exchange traded notes (“ETNs”).
Investment Concerns
Allocation Risk: The risk that the Adviser’s target asset and sector allocations and changes in target asset and sector allocations cause the Fund to underperform other similar funds or cause you to lose money, and that the Fund may not achieve its target asset and sector allocations.
Underlying Fund Selection Risk: The risk that the Fund may invest in Underlying Funds that underperform other similar funds or the markets more generally, due to poor investment decisions by the investment adviser(s) for the Underlying Funds or otherwise. Underlying Funds also have their own expenses, which the Fund bears in addition to its own expenses.
Equity Securities Risk: A portion of the assets of the Fund is allocated to Underlying Funds investing primarily in equity securities. Therefore, the value of the Fund may increase or decrease as a result of its indirect interest in equity securities.
Fixed Income Securities Risk: A portion of the assets of the Fund is allocated to Underlying Funds investing primarily in fixed income securities. Therefore, the value of the Fund may increase or decrease as a result of its indirect interest in fixed income securities.
Foreign Securities/Emerging Markets Risk: Foreign securities, including those of emerging market issuers, are subject to additional risks including international trade, currency, political, and regulatory risks. Securities of emerging market issuers generally have more risk than securities issued by issuers in more developed foreign markets.
For a complete description of these and other risks associated with investment in a mutual fund, please refer to the Fund’s prospectus.
Market Commentary
The Fund returned 8.51% (without sales charge) for the Class A Shares for the 12-month period ended October 31, 2012. That compared to a 15.21% total return for the Fund’s primary benchmark, the S&P 500 Index1.
The Fund measures performance against several additional reference indices: the MSCI EAFE Index1 (5.15% return for the 12 months through October 31, 2012), Barclays U.S. Aggregate Bond Index1 (5.25% return), Bank of America/Merrill Lynch U.S. High Yield Master II Index1 (13.18% return) and Citigroup U.S. Domestic 3-Month Treasury Bill Index1 (0.06% return).
Portfolio Performance
Investors during the 12-month period were concerned by a range of global economic issues, including the continuing eurozone debt crisis, China’s economic slowdown and U.S. fiscal issues. Those concerns contributed to considerable volatility in the financial markets during the period.
Still, most major equity markets posted positive returns during the 12 months through October 31, 2012. That performance was driven primarily by strong returns during the first and third quarters in 2012 and extended to other “risky” asset classes such as high-yield bonds. The financial markets during the period also benefited from various central bank actions including the U.S. Federal Reserve’s decision to launch a third round of quantitative easing and a new bond buying program outlined by the European Central Bank (ECB) to stem the eurozone debt crisis.
In that environment, the Fund enjoyed positive absolute performance, and the period was rewarding for investors. The Fund benefited from its strategic allocation to riskier asset classes, which performed well in absolute terms during the period. In particular, the Fund’s allocation to small-, mid- and large-cap U.S. equities (40%-45% of the Fund’s total portfolio) contributed substantially to its total return during the period. The overweight position in emerging market equities held for most of the period was less successful in relative terms. However, we continued to believe that companies in emerging regions offered attractive valuations against a strengthening macroeconomic picture.*
Within the Fund’s fixed-income segment, we favored corporate bonds—such as U.S. high-yield bonds—over government bonds. We believed corporate bonds offered better total return potential than other options in the fixed-income market. That strategy benefited the Fund’s absolute performance during the period. The Fund’s exposure to emerging market debt was beneficial. In absolute terms, the Fund benefited from its exposure to alternative asset classes, particularly global property and private equity, during the period.*
| * | | Portfolio composition is subject to change. |
| 1 | | For additional information, please refer to the Glossary of Terms. |
Past performance does not guarantee future results. The performance data quoted represents past performance and current returns may be lower or higher. Total return figures include change in share price, reinvestment of dividends and capital gains and do not reflect taxes that a shareholder would pay on Fund distributions or on the redemption of Fund shares. Investment return and principal value will fluctuate so that an investor’s shares, when redeemed may be worth more or less than the original cost. To obtain performance information current to the most recent month end, please call 1-800-782-8183.
10 HSBC FAMILY OF FUNDS
| Portfolio Reviews (Unaudited) |
Balanced Strategy Fund |
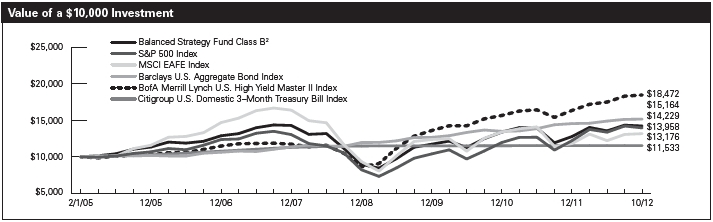
The charts above represent a historical since inception performance comparison of a hypothetical $10,000 investment in the indicated share class versus a similar investment in the Fund’s benchmark and represents the reinvestment of dividends and capital gains in the Fund.
| Average Annual | | Expense |
| Fund Performance | Total Return (%) | | Ratio (%)4 |
| Inception | | 1 | | 5 | | Since | | | | |
| As of October 31, 2012 | Date | | Year | | Year | | Inception | | Gross | | Net |
| Balanced Strategy Fund Class A1 | | 2/8/05 | | | | 3.04 | | | | -1.34 | | | | 4.44 | | | | 1.79 | | 1.79 |
| Balanced Strategy Fund Class B2 | | 2/1/05 | | | | 3.66 | | | | -1.07 | | | | 4.66 | | | | 2.54 | | 2.54 |
| Balanced Strategy Fund Class C3 | | 4/27/05 | | | | 6.77 | | | | -1.06 | | | | 4.95 | | | | 2.54 | | 2.54 |
| S&P 500 Index5 | | — | | | | 15.21 | | | | 0.36 | | | | 4.40 | 6 | | | N/A | | N/A |
| MSCI EAFE Index5 | | — | | | | 5.15 | | | | -5.35 | | | | 3.62 | 6 | | | N/A | | N/A |
| Barclays U.S. Aggregate Bond Index5 | | — | | | | 5.25 | | | | 6.38 | | | | 5.52 | 6 | | | N/A | | N/A |
| BofA Merrill Lynch U.S. High Yield Master II Index5 | | — | | | | 13.18 | | | | 9.12 | | | | 8.25 | 6 | | | N/A | | N/A |
| Citigroup U.S. Domestic 3-Month Treasury Bill Index5 | | — | | | | 0.06 | | | | 0.57 | | | | 1.86 | 6 | | | N/A | | N/A |
Past performance does not guarantee future results. The performance data quoted represents past performance and current returns may be lower or higher. Total return figures include change in share price, reinvestment of dividends and capital gains and do not reflect the taxes that a shareholder would pay on Fund distributions or on the redemption of Fund shares. Investment return and principal value will fluctuate so that an investor’s shares, when redeemed may be worth more or less than the original cost. To obtain performance information current to the most recent month end, please call 1-800-782-8183.
The performance above reflects any fee waivers that have been in effect during the applicable periods, as well as any expense reimbursements that have periodically been made. Absent such waivers and reimbursements, returns would have been lower.
Certain returns shown include monies received by series of HSBC Portfolios (formerly, HSBC Investor Portfolios) (the “Portfolios”), in which the Fund invests, in respect of one-time class action settlements. As a result, the Fund’s total returns for those periods were higher than they would have been had the Portfolios not received the payments.
| 1 | | Reflects the maximum sales charge of 5.00%. |
| 2 | | Reflects the applicable contingent deferred sales charge, maximum of 4.00%. |
| 3 | | Reflects the applicable contingent deferred sales charge, maximum of 1.00%. |
| 4 | | Reflects the expense ratio as reported in the prospectus dated February 28, 2012. The expense ratios reflected include Acquired Fund fees and expenses. Additional information pertaining to the October 31, 2012 expense ratios can be found in the financial highlights. |
| 5 | | For additional information, please refer to the Glossary of Terms. |
| 6 | | Return for the period February 1, 2005 to October 31, 2012. |
The Fund’s performance is primarily measured against the S&P 500 Index, an unmanaged index that is widely regarded as a gauge of the U.S. equities market. This index includes 500 leading companies in leading industries of the U.S. economy. Although the S&P 500 focuses on the large-cap segment of the market, with approximately 75% coverage of U.S. equities, it is also an ideal proxy for the total market. The Fund’s performance reflects the deduction of fees for these value-added services. Investors cannot invest directly in an index.
| Portfolio Reviews (Unaudited) |
Moderate Strategy Fund
(Class A Shares, Class B Shares and Class C Shares) |
by Randeep Brar, CFA, Senior Vice President/Portfolio Manager
Caroline Hitch, Senior Portfolio Manager
The Moderate Strategy Fund (the “Fund”) is a “fund of funds” which seeks long-term growth of capital by investing primarily in underlying funds. The underlying funds may include mutual funds managed by HSBC Global Asset Management (USA) Inc. (the “Adviser”), mutual funds managed by investment advisers that are not associated with the Adviser and exchange traded funds (“ETFs”) (collectively, “Underlying Funds”). The Fund may also purchase or hold exchange traded notes (“ETNs”).
Investment Concerns
Allocation Risk: The risk that the Adviser’s target asset and sector allocations and changes in target asset and sector allocations cause the Fund to underperform other similar funds or cause you to lose money, and that the Fund may not achieve its target asset and sector allocations.
Underlying Fund Selection Risk: The risk that the Fund may invest in Underlying Funds that underperform other similar funds or the markets more generally, due to poor investment decisions by the investment adviser(s) for the Underlying Funds or otherwise. Underlying Funds also have their own expenses, which the Fund bears in addition to its own expenses.
Equity Securities Risk: A portion of the assets of the Fund is allocated to Underlying Funds investing primarily in equity securities. Therefore, the value of the Fund may increase or decrease as a result of its indirect interest in equity securities.
Fixed Income Securities Risk: A portion of the assets of the Fund is allocated to Underlying Funds investing primarily in fixed income securities. Therefore, the value of the Fund may increase or decrease as a result of its indirect interest in fixed income securities.
Foreign Securities/Emerging Markets Risk: Foreign securities, including those of emerging market issuers, are subject to additional risks including international trade, currency, political, and regulatory risks. Securities of emerging market issuers generally have more risk than securities issued by issuers in more developed foreign markets.
For a complete description of these and other risks associated with investment in a mutual fund, please refer to the Fund’s prospectus.
Market Commentary
The Fund returned 8.24% (without sales charge) for the Class A Shares for the 12-month period ended October 31, 2012. That compared to a 15.21% total return for the Fund’s primary benchmark, the S&P 500 Index1.
The Fund measures performance against several additional reference indices: the MSCI EAFE Index1 (5.15% return for the 12 months through October 31, 2012), Barclays U.S. Aggregate Bond Index1 (5.25% return), Bank of America/Merrill Lynch U.S. High Yield Master II Index1 (13.18% return) and Citigroup U.S. Domestic 3-Month Treasury Bill Index1 (0.06% return).
Portfolio Performance
Investors during the 12-month period were concerned by a range of global economic issues, including the continuing eurozone debt crisis, China’s economic slowdown and U.S. fiscal issues. Those concerns contributed to considerable volatility in the financial markets during the period.
Still, most major equity markets posted positive returns during the 12 months through October 31, 2012. That performance was driven primarily by strong returns during the first and third quarters in 2012 and extended to other “risky” asset classes such as high-yield bonds. The financial markets during the period also benefited from various central bank actions including the U.S. Federal Reserve’s decision to launch a third round of quantitative easing and a new bond buying program outlined by the European Central Bank (ECB) to stem the eurozone debt crisis.
In that environment, the Fund enjoyed positive absolute performance, and the period was rewarding for investors. The Fund benefited from its strategic allocation to riskier asset classes, which performed well in absolute terms during the period. In particular, the Fund’s allocation to small-, mid-, and large-cap U.S. equities (25%-35% of the Fund’s total portfolio) contributed substantially to its total return during the period. An overweight position in emerging market equities held for most of the period was less successful in relative terms. However, we continued to believe that companies in emerging regions offered attractive valuations against a strengthening macroeconomic picture.*
The Fund’s allocation to U.S. fixed-income securities (20%-25% of the Fund’s total portfolio) and U.S. high-yield debt (10%-15% of the Fund’s total portfolio) also benefited performance during the period. Within the Fund’s fixed-income segment, we favored corporate bonds—such as U.S. high-yield bonds—over government bonds. We believed corporate bonds offered better total return potential than other options in the fixed-income market. That strategy benefited the Fund’s absolute performance. The Fund’s exposure to emerging market debt was beneficial. In absolute terms, the Fund benefited from its exposure to alternative asset classes, particularly global property and private equity, during the period.*
* | | Portfolio composition is subject to change. |
1 | | For additional information, please refer to the Glossary of Terms. |
Past performance does not guarantee future results. The performance data quoted represents past performance and current returns may be lower or higher. Total return figures include change in share price, reinvestment of dividends and capital gains and do not reflect taxes that a shareholder would pay on Fund distributions or on the redemption of Fund shares. Investment return and principal value will fluctuate so that an investor’s shares, when redeemed may be worth more or less than the original cost. To obtain performance information current to the most recent month end, please call 1-800-782-8183.
| Portfolio Reviews (Unaudited) |
| Moderate Strategy Fund | |
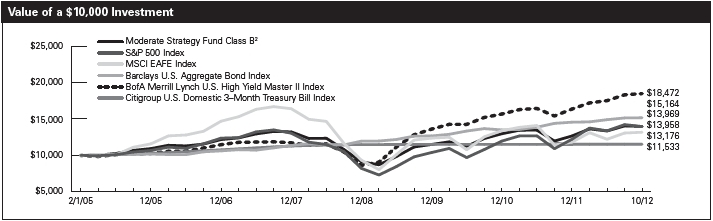
The charts above represent a historical since inception performance comparison of a hypothetical $10,000 investment in the indicated share class versus a similar investment in the Fund’s benchmark and represents the reinvestment of dividends and capital gains in the Fund.
| Average Annual | | Expense |
| Fund Performance | Total Return (%) | | Ratio (%)4 |
| Inception | | 1 | | 5 | | Since | | | | |
| As of October 31, 2012 | Date | | Year | | Year | | Inception | | Gross | | Net |
| Moderate Strategy Fund Class A1 | 2/3/05 | | | 2.86 | | | | -0.03 | | | | 4.25 | | | | 1.80 | | 1.80 |
| Moderate Strategy Fund Class B2 | 2/1/05 | | | 3.43 | | | | 0.26 | | | | 4.41 | | | | 2.55 | | 2.55 |
| Moderate Strategy Fund Class C3 | 6/9/05 | | | 6.49 | | | | 0.27 | | | | 4.39 | | | | 2.55 | | 2.55 |
| S&P 500 Index5 | — | | | 15.21 | | | | 0.36 | | | | 4.40 | 6 | | | N/A | | N/A |
| MSCI EAFE Index5 | — | | | 5.15 | | | | -5.35 | | | | 3.62 | 6 | | | N/A | | N/A |
| Barclays U.S. Aggregate Bond Index5 | — | | | 5.25 | | | | 6.38 | | | | 5.52 | 6 | | | N/A | | N/A |
| BofA Merrill Lynch U.S. High Yield Master II Index5 | — | | | 13.18 | | | | 9.12 | | | | 8.25 | 6 | | | N/A | | N/A |
| Citigroup U.S. Domestic 3-Month Treasury Bill Index5 | — | | | 0.06 | | | | 0.57 | | | | 1.86 | 6 | | | N/A | | N/A |
Past performance does not guarantee future results. The performance data quoted represents past performance and current returns may be lower or higher. Total return figures include change in share price, reinvestment of dividends and capital gains and do not reflect the taxes that a shareholder would pay on Fund distributions or on the redemption of Fund shares. Investment return and principal value will fluctuate so that an investor’s shares, when redeemed may be worth more or less than the original cost. To obtain performance information current to the most recent month end, please call 1-800-782-8183.
The performance above reflects any fee waivers that have been in effect during the applicable periods, as well as any expense reimbursements that have periodically been made. Absent such waivers and reimbursements, returns would have been lower.
Certain returns shown include monies received by series of HSBC Portfolios (formerly, HSBC Investor Portfolios) (the “Portfolios”), in which the Fund invests, in respect of one-time class action settlements. As a result, the Fund’s total returns for those periods were higher than they would have been had the Portfolios not received the payments.
| 1 | | Reflects the maximum sales charge of 5.00%. |
| 2 | | Reflects the applicable contingent deferred sales charge, maximum of 4.00%. |
| 3 | | Reflects the applicable contingent deferred sales charge, maximum of 1.00%. |
| 4 | | Reflects the expense ratio as reported in the prospectus dated February 28, 2012. The expense ratios reflected include Acquired Fund fees and expenses. Additional information pertaining to the October 31, 2012 expense ratios can be found in the financial highlights. |
| 5 | | For additional information, please refer to Glossary of Terms. |
| 6 | | Return for the period February 1, 2005 to October 31, 2012. |
The Fund’s performance is primarily measured against the S&P 500 Index, an unmanaged index that is widely regarded as a gauge of the U.S. equities market. This index includes 500 leading companies in leading industries of the U.S. economy. Although the S&P 500 focuses on the large-cap segment of the market, with approximately 75% coverage of U.S. equities, it is also an ideal proxy for the total market. The Fund’s performance reflects the deduction of fees for these value-added services. Investors cannot invest directly in an index.
| Portfolio Reviews (Unaudited) |
Conservative Strategy Fund
(Class A Shares, Class B Shares and Class C Shares) |
by Randeep Brar, CFA, Senior Vice President/Portfolio Manager
Caroline Hitch, Senior Portfolio Manager
The Conservative Strategy Fund (the “Fund”) is a “fund of funds” which seeks long-term growth of capital by investing primarily in underlying funds. The underlying funds may include mutual funds managed by HSBC Global Asset Management (USA) Inc. (the “Adviser”), mutual funds managed by investment advisers that are not associated with the Adviser and exchange traded funds (“ETFs”) (collectively, “Underlying Funds”). The Fund may also purchase or hold exchange traded notes (“ETNs”).
Investment Concerns
Allocation Risk: The risk that the Adviser’s target asset and sector allocations and changes in target asset and sector allocations cause the Fund to underperform other similar funds or cause you to lose money, and that the Fund may not achieve its target asset and sector allocations.
Underlying Fund Selection Risk: The risk that the Fund may invest in Underlying Funds that underperform other similar funds or the markets more generally, due to poor investment decisions by the investment adviser(s) for the Underlying Funds or otherwise. Underlying Funds also have their own expenses, which the Fund bears in addition to its own expenses.
Equity Securities Risk: A portion of the assets of the Fund is allocated to Underlying Funds investing primarily in equity securities. Therefore, the value of the Fund may increase or decrease as a result of its indirect interest in equity securities.
Fixed Income Securities Risk: A portion of the assets of the Fund is allocated to Underlying Funds investing primarily in fixed income securities. Therefore, the value of the Fund may increase or decrease as a result of its indirect interest in fixed income securities.
Foreign Securities/Emerging Markets Risk: Foreign securities, including those of emerging market issuers, are subject to additional risks including international trade, currency, political, and regulatory risks. Securities of emerging market issuers generally have more risk than securities issued by issuers in more developed foreign markets.
For a complete description of these and other risks associated with investment in a mutual fund, please refer to the Fund’s prospectus.
Market Commentary
The Fund returned 8.00% (without sales charge) for the Class A Shares for the 12-month period ended October 31, 2012. That compared to a 15.21% total return for the Fund’s primary benchmark, the S&P 500 Index1.
The Fund measures performance against several additional reference indices: the MSCI EAFE Index1 (5.15% return for the 12 months through October 31, 2012), Barclays U.S. Aggregate Bond Index1 (5.25% return), Bank of America/Merrill Lynch U.S. High Yield Master II Index1 (13.18% return) and Citigroup U.S. Domestic 3-Month Treasury Bill Index1 (0.06% return).
Portfolio Performance
Investors during the 12-month period were concerned by a range of global economic issues, including the continuing eurozone debt crisis, China’s economic slowdown and U.S. fiscal issues. Those concerns contributed to considerable volatility in the financial markets during the period.
Still, most major equity markets posted positive returns during the 12 months through October 31, 2012. That performance was driven primarily by strong returns during the first and third quarters in 2012 and extended to other “risky” asset classes such as high-yield bonds. The financial markets during the period also benefited from various central bank actions including the U.S. Federal Reserve’s decision to launch a third round of quantitative easing and a new bond buying program outlined by the European Central Bank (ECB) to stem the eurozone debt crisis.
In that environment, the Fund enjoyed positive absolute performance, and the period was rewarding for investors. The Fund benefited from its strategic allocation to riskier asset classes that performed well in absolute terms. The Fund’s allocation to small-, mid-, and large-cap U.S. equities (15%-20% of the Fund’s total portfolio) contributed substantially to its total return during the period.*
The Fund’s allocation to U.S. fixed-income securities (about 40% of the Fund’s total portfolio) and U.S. high-yield debt (10%-15% of the Fund’s total portfolio) also benefited performance during the period. Within the Fund’s fixed-income segment, we favored corporate bonds—such as U.S. high-yield bonds—over government bonds. We believed corporate bonds offered better total return potential than other options in the fixed-income market. That strategy benefited the Fund’s absolute performance during the period. The Fund’s exposure to emerging market debt was beneficial. In absolute terms, the Fund benefited from its exposure to alternative asset classes, particularly global property and private equity, during the period.*
| * | | Portfolio composition is subject to change. |
| 1 | | For additional information, please refer to the Glossary of Terms. |
Past performance does not guarantee future results. The performance data quoted represents past performance and current returns may be lower or higher. Total return figures include change in share price, reinvestment of dividends and capital gains and do not reflect taxes that a shareholder would pay on Fund distributions or on the redemption of Fund shares. Investment return and principal value will fluctuate so that an investor’s shares, when redeemed may be worth more or less than the original cost. To obtain performance information current to the most recent month end, please call 1-800-782-8183.
| Portfolio Reviews (Unaudited) |
| Conservative Strategy Fund | |
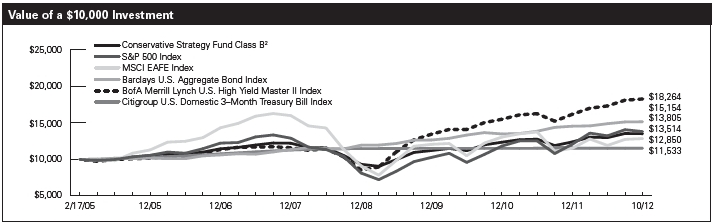
The charts above represent a historical since inception performance comparison of a hypothetical $10,000 investment in the indicated share class versus a similar investment in the Fund’s benchmark and represents the reinvestment of dividends and capital gains in the Fund.
| Average Annual | | Expense |
| Fund Performance | Total Return (%) | | Ratio (%)4 |
| Inception | | 1 | | 5 | | Since | | | | |
| As of October 31, 2012 | Date | | | Year | | | | Year | | | Inception | | Gross | | Net |
| Conservative Strategy Fund Class A1 | 2/23/05 | | | 2.56 | | | | 1.11 | | | | 3.95 | | | | 1.95 | | 1.95 |
| Conservative Strategy Fund Class B2 | 2/17/05 | | | 3.21 | | | | 1.37 | | | | 3.99 | | | | 2.70 | | 2.70 |
| Conservative Strategy Fund Class C3 | 4/19/05 | | | 6.28 | | | | 1.38 | | | | 4.53 | | | | 2.70 | | 2.70 |
| S&P 500 Index5 | — | | | 15.21 | | | | 0.36 | | | | 4.28 | 6 | | | N/A | | N/A |
| MSCI EAFE Index5 | — | | | 5.15 | | | | -5.35 | | | | 3.31 | 6 | | | N/A | | N/A |
| Barclays U.S. Aggregate Bond Index5 | — | | | 5.25 | | | | 6.38 | | | | 5.55 | 6 | | | N/A | | N/A |
| BofA Merrill Lynch U.S. High Yield Master II Index5 | — | | | 13.18 | | | | 9.12 | | | | 8.14 | 6 | | | N/A | | N/A |
| Citigroup U.S. Domestic 3-Month Treasury Bill Index5 | — | | | 0.06 | | | | 0.57 | | | | 1.87 | 6 | | | N/A | | N/A |
Past performance does not guarantee future results. The performance data quoted represents past performance and current returns may be lower or higher. Total return figures include change in share price, reinvestment of dividends and capital gains and do not reflect the taxes that a shareholder would pay on Fund distributions or on the redemption of Fund shares. Investment return and principal value will fluctuate so that an investor’s shares, when redeemed may be worth more or less than the original cost. To obtain performance information current to the most recent month end, please call 1-800-782-8183.
The performance above reflects any fee waivers that have been in effect during the applicable periods, as well as any expense reimbursements that have periodically been made. Absent such waivers and reimbursements, returns would have been lower.
Certain returns shown include monies received by the Portfolios, in which the Fund invests, in respect of one-time class action settlements. As a result, the Fund’s total returns for those periods were higher than they would have been had the Portfolios not received the payments.
| 1 | | Reflects the maximum sales charge of 5.00%. |
| 2 | | Reflects the applicable contingent deferred sales charge, maximum of 4.00%. |
| 3 | | Reflects the applicable contingent deferred sales charge, maximum of 1.00%. |
| 4 | | Reflects the expense ratio as reported in the prospectus dated February 28, 2012. The expense ratios reflected include Acquired Fund fees and expenses. Additional information pertaining to the October 31, 2012 expense ratios can be found in the financial highlights. |
| 5 | | For additional information, please refer to the Glossary of Terms. |
| 6 | | Return for the period February 17, 2005 to October 31, 2012. |
The Fund’s performance is primarily measured against the S&P 500 Index, an unmanaged index that is widely regarded as a gauge of the U.S. equities market. This index includes 500 leading companies in leading industries of the U.S. economy. Although the S&P 500 focuses on the large-cap segment of the market, with approximately 75% coverage of U.S. equities, it is also an ideal proxy for the total market. The Fund’s performance reflects the deduction of fees for these value-added services. Investors cannot invest directly in an index.
| Portfolio Reviews (Unaudited) |
Income Strategy Fund
(Class A Shares, Class B Shares and Class C Shares) |
Randeep Brar, CFA, Senior Vice President/Portfolio Manager
Caroline Hitch, Senior Portfolio Manager
The Income Strategy Fund (the “Fund”) is a “fund of funds” which primarily seeks current income and secondarily seeks to provide long-term growth of capital by investing primarily in underlying funds. The underlying funds may include mutual funds managed by HSBC Global Asset Management (USA) Inc. (the “Adviser”), mutual funds managed by investment advisers that are not associated with the Adviser and exchange traded funds (“ETFs”) (collectively, “Underlying Funds”). The Fund may also purchase or hold exchange traded notes (“ETNs”).
Investment Concerns
Allocation Risk: The risk that the Adviser’s target asset and sector allocations and changes in target asset and sector allocations cause the Fund to underperform other similar funds or cause you to lose money, and that the Fund may not achieve its target asset and sector allocations.
Underlying Fund Selection Risk: The risk that the Fund may invest in Underlying Funds that underperform other similar funds or the markets more generally, due to poor investment decisions by the investment adviser(s) for the Underlying Funds or otherwise. Underlying Funds also have their own expenses, which the Fund bears in addition to its own expenses.
Equity Securities Risk: A portion of the assets of the Fund is allocated to Underlying Funds investing primarily in equity securities. Therefore, the value of the Fund may increase or decrease as a result of its indirect interest in equity securities.
Fixed Income Securities Risk: A portion of the assets of the Fund is allocated to Underlying Funds investing primarily in fixed income securities. Therefore, the value of the Fund may increase or decrease as a result of its indirect interest in fixed income securities.
Foreign Securities/Emerging Markets Risk: Foreign securities, including those of emerging market issuers, are subject to additional risks including international trade, currency, political, and regulatory risks. Securities of emerging market issuers generally have more risk than securities issued by issuers in more developed foreign markets.
The net asset value per share of this Fund will fluctuate as the value of the securities in the portfolio changes.
For a complete description of these and other risks associated with investment in a mutual fund, please refer to the Fund’s prospectus.
Market Commentary
The Fund returned 5.02% (without sales charge) for the Class A Shares for the period between its inception on March 20, 2012 and October 31, 2012. That compared to a 1.78% total return for the Fund’s primary benchmark, the S&P 500 Index1, during the same period.
The Fund measures performance against several additional reference indices: the MSCI EAFE Index1 (-0.20% return for the period between March 20, 2012 and October 31, 2012), Barclays U.S. Aggregate Bond Index1 (4.51% return), Bank of America/Merrill Lynch U.S. High Yield Master II Index1 (7.49% return) and Citigroup U.S. Domestic 3-Month Treasury Bill Index1 (0.05% return).
Portfolio Performance
Investors during the 12-month period were concerned by a range of global economic issues, including the continuing eurozone debt crisis, China’s economic slowdown and U.S. fiscal issues. Those concerns contributed to considerable volatility in the financial markets during the period.
Still, most major equity markets posted positive returns during the 12 months through October 31, 2012. That performance was driven primarily by strong returns during the first and third quarters in 2012 and extended to other “risky” asset classes such as high-yield bonds. The financial markets during the period also benefited from various central bank actions including the U.S. Federal Reserve’s decision to launch a third round of quantitative easing and a new bond buying program outlined by the European Central Bank (ECB) to stem the eurozone debt crisis.
The Fund’s allocation to U.S. fixed-income securities (40%-45% of the Fund’s total portfolio) contributed substantially to its total return during the period. In the fixed-income market, we favored corporate bonds—such as U.S. high-yield bonds—over government bonds. We believed corporate bonds offered better total return potential than other options in the fixed-income market. That strategy benefited the Fund’s absolute performance. The Fund’s exposure to emerging market debt was beneficial. In absolute terms, the Fund benefited from its exposure to global property during the period.*
* | | Portfolio composition is subject to change. |
1 | | For additional information, please refer to the Glossary of Terms. |
Past performance does not guarantee future results. The performance data quoted represents past performance and current returns may be lower or higher. Total return figures include change in share price, reinvestment of dividends and capital gains and do not reflect taxes that a shareholder would pay on Fund distributions or on the redemption of Fund shares. Investment return and principal value will fluctuate so that an investor’s shares, when redeemed may be worth more or less than the original cost. To obtain performance information current to the most recent month end, please call 1-800-782-8183.
| Portfolio Reviews (Unaudited) |
| Income Strategy Fund | |
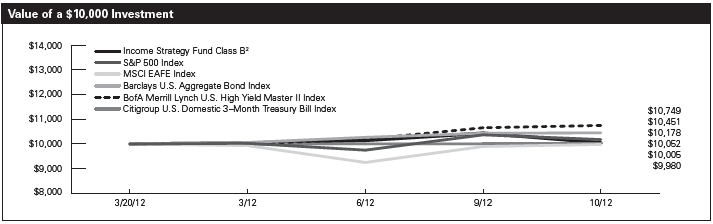
The charts above represent a historical since inception performance comparison of a hypothetical $10,000 investment in the indicated share class versus a similar investment in the Fund’s benchmark and represents the reinvestment of dividends and capital gains in the Fund.
| Aggregate | | Expense |
| Fund Performance | Total Return (%) | | Ratio (%)4 |
| Inception | | Since | | | | | | |
| As of October 31, 2012 | Date | | Inception | | Gross | | Net |
| Income Strategy Fund Class A1 | 3/20/12 | | | 0.02 | | | | | 2.25 | | | 2.10 |
| Income Strategy Fund Class B2 | 3/20/12 | | | 0.52 | | | | | 3.00 | | | 2.85 |
| Income Strategy Fund Class C3 | 3/20/12 | | | 3.47 | | | | | 3.00 | | | 2.85 |
| S&P 500 Index5 | — | | | 1.78 | 6 | | | | N/A | | | N/A |
| MSCI EAFE Index5 | — | | | -0.20 | 6 | | | | N/A | | | N/A |
| Barclays U.S. Aggregate Bond Index5 | — | | | 4.51 | 6 | | | | N/A | | | N/A |
| BofA Merrill Lynch U.S. High Yield Master II Index5 | — | | | 7.49 | 6 | | | | N/A | | | N/A |
| Citigroup U.S. Domestic 3-Month Treasury Bill Index5 | — | | | 0.05 | 6 | | | | N/A | | | N/A |
Past performance does not guarantee future results. The performance data quoted represents past performance and current returns may be lower or higher. Total return figures include change in share price, reinvestment of dividends and capital gains and do not reflect the taxes that a shareholder would pay on Fund distributions or on the redemption of Fund shares. Investment return and principal value will fluctuate so that an investor’s shares, when redeemed may be worth more or less than the original cost. To obtain performance information current to the most recent month end, please call 1-800-782-8183.
The performance above reflects any fee waivers that have been in effect during the applicable periods, as well as any expense reimbursements that have periodically been made. Absent such waivers and reimbursements, returns would have been lower. Currently, contractual fee waivers are in effect for the Fund through March 1, 2013.
Certain returns shown include monies received by the Portfolios, in which the Fund invests, in respect of one-time class action settlements. As a result, the Fund’s total returns for those periods were higher than they would have been had the Portfolios not received the payments.
| 1 | | Reflects the maximum sales charge of 4.75%. |
| 2 | | Reflects the applicable contingent deferred sales charge, maximum of 4.00%. |
| 3 | | Reflects the applicable contingent deferred sales charge, maximum of 1.00%. |
| 4 | | Reflects the expense ratio as reported in the prospectus dated February 28, 2012. HSBC Global Asset Management (USA) Inc. has entered into a contractual expense limitation agreement with the Fund under which it will limit total expenses of the Fund (excluding interest, taxes, brokerage commissions, extraordinary expenses and estimated indirect expenses attributable to the Fund’s investments in investment companies) to an annual rate of 1.50%, 2.25% and 2.25% for Class A Shares, Class B Shares and Class C Shares, respectively. The expense limitation shall be in effect until March 1, 2013. The expense ratios reflected include Acquired Fund fees and expenses. Additional information pertaining to the October 31, 2012 expense ratios can be found in the financial highlights. |
| 5 | | For additional information, please refer to the Glossary of Terms. |
| 6 | | Return for the period March 21, 2012 to October 31, 2012. |
The Fund’s performance is primarily measured against the S&P 500 Index, an unmanaged index that is widely regarded as a gauge of the U.S. equities market. This index includes 500 leading companies in leading industries of the U.S. economy. Although the S&P 500 focuses on the large-cap segment of the market, with approximately 75% coverage of U.S. equities, it is also an ideal proxy for the total market. The Fund’s performance reflects the deduction of fees for these value-added services. Investors cannot invest directly in an index.
| Portfolio Reviews |
Portfolio Composition*
October 31, 2012 (Unaudited) |
| Aggressive Strategy Fund | | | |
| | Percentage of |
| Investment Allocation | Investments at Value (%) |
| Domestic Equities | | 59.5 | |
| International Equities | | 26.2 | |
| Fixed Income | | 9.0 | |
| Alternatives | | 5.2 | |
| Cash | | 0.1 | |
| Total | | 100.0 | |
| | |
| Balanced Strategy Fund | | | |
| | Percentage of |
| Investment Allocation | Investments at Value (%) |
| Domestic Equities | | 43.4 | |
| International Equities | | 25.5 | |
| Fixed income | | 21.6 | |
| Alternatives | | 9.4 | |
| Cash | | 0.1 | |
| Total | | 100.0 | |
| | |
| Moderate Strategy Fund | | | |
| | Percentage of |
| Investment Allocation | Investments at Value (%) |
| Fixed Income | | 35.8 | |
| Domestic Equities | | 29.5 | |
| International Equities | | 24.6 | |
| Alternatives | | 9.1 | |
| Cash | | 1.0 | |
| Total | | 100.0 | |
| | |
| Conservative Strategy Fund | | | |
| | Percentage of |
| Investment Allocation | Investments at Value (%) |
| Fixed Income | | 53.3 | |
| Domestic Equities | | 18.2 | |
| International Equities | | 19.4 | |
| Alternatives | | 8.0 | |
| Cash | | 1.1 | |
| Total | | 100.0 | |
| | |
| Income Strategy Fund | | | |
| | Percentage of |
| Investment Allocation | Investments at Value (%) |
| Fixed Income | | 67.8 | |
| International Equities | | 14.8 | |
| Domestic Equities | | 8.8 | |
| Cash | | 7.2 | |
| Alternatives | | 1.4 | |
| Total | | 100.0 | |
| | | | |
| HSBC Growth Portfolio | | | |
| | Percentage of |
| Investment Allocation | Investments at Value (%) |
| Computers & Peripherals | | 8.1 | |
| IT Services | | 8.0 | |
| Internet Software & Services | | 5.4 | |
| Specialty Retail | | 4.8 | |
| Biotechnology | | 4.5 | |
| Internet & Catalog Retail | | 4.4 | |
| Chemicals | | 4.4 | |
| Health Care Providers & | | | |
| Services | | 4.2 | |
| Health Care Equipment & | | | |
| Supplies | | 4.1 | |
| Investment Companies | | 3.9 | |
| Road & Rail | | 3.9 | |
| Machinery | | 3.9 | |
| Hotels, Restaurants & Leisure | | 3.8 | |
| Textiles, Apparel & Luxury | | | |
| Goods | | 3.4 | |
| Aerospace & Defense | | 3.4 | |
| Software | | 3.3 | |
| Communications Equipment | | 3.3 | |
| Oil, Gas & Consumable Fuels | | 3.2 | |
| Capital Markets | | 2.8 | |
| Food & Staples Retailing | | 2.7 | |
| Media | | 1.8 | |
| Energy Equipment & Services | | 1.8 | |
| Real Estate Investment Trusts | | | |
| (REITs) | | 1.6 | |
| Health Care Technology | | 1.4 | |
| Construction & Engineering | | 1.3 | |
| Wireless Telecommunication | | | |
| Services | | 1.3 | |
| Business Services | | 1.3 | |
| Auto Components | | 1.1 | |
| Personal Products | | 0.8 | |
| Diversified Financial Services | | 0.6 | |
| Household Durables | | 0.5 | |
| Trading Companies & | | | |
| Distributors | | 0.4 | |
| Semiconductors & | | | |
| Semiconductor Equipment | | 0.3 | |
| Pharmaceuticals | | 0.3 | |
| Total | | 100.0 | |
____________________
| * | | Portfolio composition is subject to change. |
| Portfolio Reviews |
Portfolio Composition* (continued)
October 31, 2012 (Unaudited) | |
| HSBC Opportunity Portfolio | | | |
| Percentage of |
| Investment Allocation | Investments at Value (%) |
| Specialty Retail | | 11.3 | |
| Software | | 6.5 | |
| Health Care Equipment & | | | |
| Supplies | | 6.3 | |
| Machinery | | 5.6 | |
| Oil, Gas & Consumable Fuels | | 5.4 | |
| IT Services | | 4.7 | |
| Chemicals | | 4.2 | |
| Health Care Providers & | | | |
| Services | | 4.2 | |
| Trading Companies & | | | |
| Distributors | | 4.2 | |
| Capital Markets | | 3.6 | |
| Aerospace & Defense | | 3.4 | |
| Commercial Banks | | 3.3 | |
| Investment Companies | | 3.2 | |
| Semiconductors & | | | |
| Semiconductor Equipment | | 3.1 | |
| Containers & Packaging | | 3.1 | |
| Road & Rail | | 2.9 | |
| Food Products | | 2.6 | |
| Insurance | | 2.2 | |
| Electrical Equipment | | 2.1 | |
| Commercial Services & | | | |
| Supplies | | 2.1 | |
| Life Sciences Tools & Services | | 2.0 | |
| Real Estate Management & | | | |
| Development | | 1.9 | |
| Biotechnology | | 1.8 | |
| Energy Equipment & Services | | 1.7 | |
| Professional Services | | 1.5 | |
| Communications Equipment | | 1.4 | |
| Pharmaceuticals | | 1.2 | |
| Building Products | | 1.2 | |
| Textiles, Apparel & Luxury | | | |
| Goods | | 1.1 | |
| Household Durables | | 0.9 | |
| Media | | 0.7 | |
| Electronic Equipment, | | | |
| Instruments & Components | | 0.6 | |
| Total | | 100.0 | |
____________________
| * | | Portfolio composition is subject to change. |
| HSBC AGGRESSIVE STRATEGY FUND |
| Schedule of Portfolio Investments—as of October 31, 2012 |
| Affiliated Investment Companies—1.8% | | | | |
| | | | | |
| | Shares | | Value ($) |
| HSBC Emerging Markets Debt Fund, | | | | |
| Class I Shares | | 11,078 | | 126,737 |
| HSBC Emerging Markets Local Debt | | | | |
| Fund, Class I Shares | | 18,023 | | 177,882 |
| HSBC Prime Money Market Fund, | | | | |
| Class I Shares, 0.16%(a) | | 13,222 | | 13,222 |
| TOTAL AFFILIATED INVESTMENT | | | | |
| COMPANIES (COST $299,635) | | | | 317,841 |
| |
| Affiliated Portfolios—14.2% | | | | |
| |
| HSBC Growth Portfolio | | | | 1,775,216 |
| HSBC Opportunity Portfolio | | | | 746,179 |
| TOTAL AFFILIATED PORTFOLIOS | | | | 2,521,395 |
| |
| Unaffiliated Investment Companies—49.5% | | |
| |
| Artisan Value Fund, Class IV Shares | | 105,448 | | 1,173,639 |
| Brown Advisory Growth Equity Fund, | | | | |
| Institutional Shares | | 82,312 | | 1,179,538 |
| Columbia High Yield Bond Fund, | | | | |
| Class Z Shares | | 242,351 | | 707,665 |
| CRM Small/Mid Cap Value Fund, | | | | |
| Institutional Shares | | 50,369 | | 747,992 |
| Delaware Emerging Markets Fund, | | | | |
| Class I Shares | | 72,597 | | 980,066 |
| Dreyfus Global Real Estate Securities | | | | |
| Fund, Class I Shares | | 5,098 | | 41,705 |
| EII Global Property Fund, | | | | |
| Institutional Shares | | 3,787 | | 61,879 |
| Janus Flexible Bond Fund, | | | | |
| Institutional Shares | | 2,463 | | 27,290 |
| JPMorgan Equity Income Fund, | | | | |
| Class I Shares | | 171,328 | | 1,780,099 |
| JPMorgan High Yield Fund, | | | | |
| Select Shares | | 87,586 | | 709,454 |
| Lord Abbett Core Fixed | | | | |
| Income Fund, Institutional Shares | | 3,314 | | 37,780 |
| Metropolitan West Total Return Bond | | | | |
| Fund, Institutional Shares | | 2,509 | | 27,766 |
| Northern Institutional Diversified | | | | |
| Assets Portfolio, 0.01%(a) | | 8,252 | | 8,252 |
| PIMCO Total Return Fund, | | | | |
| Institutional Shares | | 4,407 | | 51,077 |
| T. Rowe Price New Income Fund, | | | | |
| Retail Shares | | 3,730 | | 37,185 |
| Trilogy Emerging Markets Equity Fund, | | | | |
| Institutional Shares | | 139,326 | | 1,196,807 |
| TOTAL UNAFFILIATED INVESTMENT | | | | |
| COMPANIES (COST $8,665,325) | | | | 8,768,194 |
| | | | | |
| Exchange Traded Funds—34.7% | | | | |
| |
| iShares MSCI EAFE Index Fund | | 35,454 | | 1,899,271 |
| iShares MSCI Emerging Markets | | | | |
| Index Fund | | 5,318 | | 218,623 |
| PowerShares Global Listed Private | | | | |
| Equity Portfolio ETF | | 89,734 | | 869,522 |
| SPDR S&P 500 ETF Trust | | 22,345 | | 3,154,667 |
| TOTAL EXCHANGE TRADED | | | | |
| FUNDS (COST $6,032,192) | | | | 6,142,083 |
| TOTAL INVESTMENT | | | | |
| SECURITIES—100.2% | | | | 17,749,513 |
______________________
Percentages indicated are based on net assets of $17,719,479.
| (a) | | The rate represents the annualized one-day yield that was in effect on October 31, 2012. |
| ETF | | Exchange Traded Fund |
| SPDR | | Standard & Poor’s Depositary Receipt |
| 20 HSBC FAMILY OF FUNDS | See notes to financial statements. |
| HSBC BALANCED STRATEGY FUND |
| Schedule of Portfolio Investments—as of October 31, 2012 |
| Affiliated Investment Companies—10.0% | | |
| | | | |
| | Shares | | Value ($) |
| HSBC Emerging Markets Debt Fund, | | | | |
| Class I Shares | | 293,710 | | 3,360,039 |
| HSBC Emerging Markets Local Debt | | | | |
| Fund, Class I Shares | | 187,999 | | 1,855,546 |
| HSBC Prime Money Market Fund, | | | | |
| Class I Shares, 0.16%(a) | | 7,556 | | 7,556 |
| TOTAL AFFILIATED INVESTMENT | | | | |
| COMPANIES (COST $4,836,314) | | | | 5,223,141 |
| | | | | |
| Affiliated Portfolios—10.4% | | | | |
| | | | | |
| HSBC Growth Portfolio | | | | 3,824,374 |
| HSBC Opportunity Portfolio | | | | 1,624,550 |
| TOTAL AFFILIATED PORTFOLIOS | | | | 5,448,924 |
| | | | | |
| Unaffiliated Investment Companies—53.7% | | |
| | | | | |
| Artisan Value Fund, Class IV Shares | | 227,496 | | 2,532,033 |
| Brown Advisory Growth Equity Fund, | | | | |
| Institutional Shares | | 178,174 | | 2,553,228 |
| Columbia High Yield Bond Fund, | | | | |
| Class Z Shares | | 1,175,885 | | 3,433,583 |
| CRM Small/Mid Cap Value Fund, | | | | |
| Institutional Shares | | 108,410 | | 1,609,891 |
| Delaware Emerging Markets Fund, | | | | |
| Class I Shares | | 108,478 | | 1,464,449 |
| Dreyfus Global Real Estate Securities | | | | |
| Fund, Class I Shares | | 55,301 | | 452,358 |
| EII Global Property Fund, | | | | |
| Institutional Shares | | 43,222 | | 706,244 |
| Janus Flexible Bond Fund, | | | | |
| Institutional Shares | | 50,653 | | 561,240 |
| JPMorgan Equity Income Fund, | | | | |
| Class I Shares | | 368,891 | | 3,832,780 |
| JPMorgan High Yield Fund, | | | | |
| Select Shares | | 424,964 | | 3,442,207 |
| Lord Abbett Core Fixed Income Fund, | | | | |
| Institutional Shares | | 68,813 | | 784,464 |
| Metropolitan West Total Return Bond | | | | |
| Fund, Institutional Shares | | 51,863 | | 574,120 |
| Northern Institutional Diversified | | | | |
| Assets Portfolio, Institutional Shares, | | | | |
| 0.01%(a) | | 63,560 | | 63,560 |
| PIMCO Commodity RealReturn | | | | |
| Strategy Fund, Institutional Shares | | 350,739 | | 2,409,579 |
| PIMCO Total Return Fund, | | | | |
| Institutional Shares | | 90,502 | | 1,048,916 |
| T. Rowe Price New Income Fund, | | | | |
| Retail Shares | | 79,799 | | 795,595 |
| Trilogy Emerging Markets Equity Fund, | | | | |
| Institutional Shares | | 202,901 | | 1,742,917 |
| TOTAL UNAFFILIATED | | | | |
| INVESTMENT COMPANIES | | | | |
| (COST $28,035,238) | | | | 28,007,164 |
| | | | | |
| Exchange Traded Funds—26.3% | | | | |
| | | | | |
| iShares iBoxx $ Investment Grade | | | | |
| Corporate Bond Fund | | 5,505 | | 677,225 |
| iShares MSCI EAFE Index Fund | | 73,713 | | 3,948,805 |
| iShares MSCI Emerging Markets | | | | |
| Index Fund | | 13,515 | | 555,602 |
| PowerShares Global Listed Private | | | | |
| Equity Portfolio ETF | | 189,053 | | 1,831,924 |
| SPDR S&P 500 ETF Trust | | 47,714 | | 6,736,263 |
| TOTAL EXCHANGE TRADED | | | | |
| FUNDS (COST $13,458,954) | | | | 13,749,819 |
| TOTAL INVESTMENT | | | | |
| SECURITIES—100.4% | | | | 52,429,048 |
____________________
Percentages indicated are based on net assets of $52,202,487.
| (a) | | The rate represents the annualized one-day yield that was in effect on October 31, 2012. |
| ETF | | Exchange Traded Fund |
| SPDR | | Standard & Poor’s Depositary Receipt |
| See notes to financial statements. | HSBC FAMILY OF FUNDS 21 |
| HSBC MODERATE STRATEGY FUND |
| Schedule of Portfolio Investments—as of October 31, 2012 |
| Affiliated Investment Companies—12.2% | | |
| | | |
| | Shares | | Value ($) |
|
| HSBC Emerging Markets Debt Fund, | | | | |
| Class I Shares | | 274,281 | | 3,137,780 |
| HSBC Emerging Markets Local Debt | | | | |
| Fund, Class I Shares | | 209,161 | | 2,064,417 |
| HSBC Prime Money Market Fund, | | | | |
| Class I Shares, 0.16%(a) | | 444,668 | | 444,668 |
| TOTAL AFFILIATED | | | | |
| INVESTMENT COMPANIES | | | | |
| (COST $5,214,905) | | | | 5,646,865 |
| |
| Affiliated Portfolios—7.1% | | | | |
| |
| HSBC Growth Portfolio | | | | 2,304,691 |
| HSBC Opportunity Portfolio | | | | 960,963 |
| TOTAL AFFILIATED | | | | |
| PORTFOLIOS | | | | 3,265,654 |
| |
| Unaffiliated Investment Companies—60.9% | | |
| |
| Artisan Value Fund, | | | | |
| Class IV Shares | | 137,438 | | 1,529,684 |
| ASG Global Alternatives Fund, | | | | |
| Class Y Shares | | 32,207 | | 334,950 |
| Brown Advisory Growth Equity | | | | |
| Fund, Institutional Shares | | 107,181 | | 1,535,900 |
| Columbia High Yield Bond Fund, | | | | |
| Class Z Shares | | 1,034,597 | | 3,021,022 |
| CRM Small/Mid Cap Value Fund, | | | | |
| Institutional Shares | | 64,397 | | 956,296 |
| Delaware Emerging Markets Fund, | | | | |
| Class I Shares | | 68,293 | | 921,953 |
| Dreyfus Global Real Estate | | | | |
| Securities Fund, Class I Shares | | 41,803 | | 341,945 |
| EII Global Property Fund, | | | | |
| Institutional Shares | | 37,251 | | 608,690 |
| Janus Flexible Bond Fund, | | | | |
| Institutional Shares | | 134,731 | | 1,492,814 |
| JPMorgan Equity Income Fund, | | | | |
| Class I Shares | | 223,595 | | 2,323,153 |
| JPMorgan High Yield Fund, | | | | |
| Select Shares | | 370,698 | | 3,002,655 |
| Lord Abbett Core Fixed Income | | | | |
| Fund, Institutional Shares | | 186,008 | | 2,120,495 |
| Metropolitan West Total Return | | | | |
| Bond Fund, Institutional Shares | | 137,436 | | 1,521,413 |
| PIMCO Commodity RealReturn | | | | |
| Strategy Fund, Institutional Shares | | 331,335 | | 2,276,275 |
| PIMCO Total Return Fund, | | | | |
| Institutional Shares | | 243,868 | | 2,826,426 |
| T. Rowe Price New Income Fund, | | | | |
| Retail Shares | | 212,874 | | 2,122,353 |
| Trilogy Emerging Markets Equity | | | | |
| Fund, Institutional Shares | | 131,205 | | 1,127,052 |
| TOTAL UNAFFILIATED | | | | |
| INVESTMENT COMPANIES | | | | |
| (COST $27,915,040) | | | | 28,063,076 |
| | | | | |
| Exchange Traded Funds—20.1% | | | | |
| |
| iShares iBoxx $ Investment Grade | | | | |
| Corporate Bond Fund | | 3,742 | | 460,341 |
| iShares MSCI EAFE Index Fund | | 64,697 | | 3,465,818 |
| iShares MSCI Emerging Markets | | | | |
| Index Fund | | 7,912 | | 325,262 |
| PowerShares Global Listed Private | | | | |
| Equity Portfolio ETF | | 102,086 | | 989,213 |
| SPDR S&P 500 ETF Trust | | 28,638 | | 4,043,113 |
| TOTAL EXCHANGE TRADED | | | | |
| FUNDS (COST $9,072,922) | | | | 9,283,747 |
| TOTAL INVESTMENT | | | | |
| SECURITIES—100.3% | | | | 46,259,342 |
____________________
Percentages indicated are based on net assets of $46,118,380.
| (a) | | The rate represents the annualized one-day yield that was in effect on October 31, 2012. |
| ETF | | Exchange Traded Fund |
| SPDR | | Standard & Poor’s Depositary Receipt |
| 22 HSBC FAMILY OF FUNDS | See notes to financial statements. |
| HSBC CONSERVATIVE STRATEGY FUND |
| Schedule of Portfolio Investments—as of October 31, 2012 |
| Affiliated Investment Companies—12.4% | | |
| | | | | |
| �� | Shares | | Value ($) |
| HSBC Emerging Markets Debt Fund, | | | | |
| Class I Shares | | 124,771 | | 1,427,385 |
| HSBC Emerging Markets Local Debt | | | | |
| Fund, Class I Shares | | 115,303 | | 1,138,041 |
| HSBC Prime Money Market Fund, | | | | |
| Class I Shares, 0.16%(a) | | 251,847 | | 251,847 |
| TOTAL AFFILIATED | | | | |
| INVESTMENT COMPANIES | | | | |
| (COST $2,613,872) | | | | 2,817,273 |
| |
| Affiliated Portfolios—4.4% | | | | |
| |
| HSBC Growth Portfolio | | | | 694,215 |
| HSBC Opportunity Portfolio | | | | 291,927 |
| TOTAL AFFILIATED PORTFOLIOS | | | | 986,142 |
| |
| Unaffiliated Investment Companies—70.1% | | |
| |
| Artisan Value Fund, Class IV Shares | | 41,676 | | 463,854 |
| ASG Global Alternatives Fund, | | | | |
| Class Y Shares | | 43,066 | | 447,885 |
| Brown Advisory Growth Equity Fund, | | | | |
| Institutional Shares | | 32,152 | | 460,738 |
| Columbia High Yield Bond Fund, | | | | |
| Class Z Shares | | 455,001 | | 1,328,602 |
| CRM Small/Mid Cap Value Fund, | | | | |
| Institutional Shares | | 19,734 | | 293,051 |
| Delaware Emerging Markets Fund, | | | | |
| Class I Shares | | 7,905 | | 106,724 |
| Dreyfus Global Real Estate | | | | |
| Securities Fund, Class I Shares | | 22,163 | | 181,296 |
| EII Global Property Fund, | | | | |
| Institutional Shares | | 16,989 | | 277,597 |
| Janus Flexible Bond Fund, | | | | |
| Institutional Shares | | 123,796 | | 1,371,662 |
| JPMorgan Equity Income Fund, | | | | |
| Class I Shares | | 67,550 | | 701,839 |
| JPMorgan High Yield Fund, | | | | |
| Select Shares | | 164,570 | | 1,333,018 |
| Lord Abbett Core Fixed Income Fund, | | | | |
| Institutional Shares | | 168,146 | | 1,916,862 |
| Metropolitan West Total Return Bond | | | | |
| Fund, Institutional Shares | | 123,860 | | 1,371,128 |
| PIMCO Commodity RealReturn | | | | |
| Strategy Fund, Institutional Shares | | 146,387 | | 1,005,676 |
| PIMCO Total Return Fund, | | | | |
| Institutional Shares | | 221,864 | | 2,571,398 |
| T. Rowe Price New Income Fund, | | | | |
| Retail Shares | | 192,149 | | 1,915,730 |
| Trilogy Emerging Markets Equity Fund, | | | | |
| Institutional Shares | | 14,903 | | 128,019 |
| TOTAL UNAFFILIATED | | | | |
| INVESTMENT COMPANIES | | | | |
| (COST $15,406,767) | | | | 15,875,079 |
| | | | | |
| Exchange Traded Funds—13.7% | | | | |
| |
| iShares iBoxx $ Investment Grade | | | | |
| Corporate Bond Fund | | 2,798 | | 344,210 |
| iShares MSCI EAFE Index Fund | | 26,950 | | 1,443,712 |
| PowerShares Global Listed Private | | | | |
| Equity Portfolio ETF | | 8,558 | | 82,927 |
| SPDR S&P 500 ETF Trust | | 8,741 | | 1,234,054 |
| TOTAL EXCHANGE TRADED | | | | |
| FUNDS (COST $2,999,759) | | | | 3,104,903 |
| TOTAL INVESTMENT | | | | |
| SECURITIES—100.6% | | | | 22,783,397 |
____________________
Percentages indicated are based on net assets of $22,640,382.
| (a) | | The rate represents the annualized one-day yield that was in effect on October 31, 2012. |
| ETF | | Exchange Traded Fund |
| SPDR | | Standard & Poor’s Depositary Receipt |
| See notes to financial statements. | HSBC FAMILY OF FUNDS 23 |
| HSBC INCOME STRATEGY FUND |
| Schedule of Portfolio Investments—as of October 31, 2012 |
| Affiliated Investment Companies—10.7% | | |
| | | | | |
| | Shares | | Value ($) |
| HSBC Emerging Markets Debt Fund, | | | | |
| Class I Shares | | 3,318 | | 37,955 |
| HSBC Emerging Markets Local Debt | | | | |
| Fund, Class I Shares | | 4,473 | | 47,112 |
| HSBC Prime Money Market Fund, Class I | | | | |
| Shares, 0.16%(a) | | 13,077 | | 13,077 |
| TOTAL AFFILIATED INVESTMENT | | | | |
| COMPANIES (COST $95,344) | | | | 98,144 |
| |
| Unaffiliated Investment Companies—92.1% | | |
| |
| Columbia High Yield Bond Fund, | | | | |
| Class Z Shares | | 14,546 | | 42,473 |
| Dreyfus Global Real Estate Securities | | | | |
| Fund, Class I Shares | | 1,050 | | 8,590 |
| EII Global Property Fund, | | | | |
| Institutional Shares | | 789 | | 12,889 |
| Federated Strategic Value Dividend Fund, | | | | |
| Institutional Shares | | 16,444 | | 83,698 |
| Janus Flexible Bond Fund, | | | | |
| Institutional Shares | | 7,467 | | 82,734 |
| JPMorgan High Yield Fund, | | | | |
| Select Shares | | 5,137 | | 41,609 |
| Lord Abbett Core Fixed Income Fund, | | | | |
| Institutional Shares | | 10,162 | | 115,843 |
| Metropolitan West Total Return Bond | | | | |
| Fund, Institutional Shares | | 7,471 | | 82,705 |
| Northern Institutional Diversified | | | | |
| Assets Portfolio, Institutional Shares, | | | | |
| 0.01%(a) | | 55,746 | | 55,746 |
| PIMCO Total Return Fund, | | | | |
| Institutional Shares | | 13,320 | | 154,383 |
| T. Rowe Price International Growth & | | | | |
| Income Fund | | 3,794 | | 47,729 |
| T. Rowe Price New Income Fund, | | | | |
| Retail Shares | | 11,608 | | 115,730 |
| TOTAL UNAFFILIATED INVESTMENT | | | | |
| COMPANIES (COST $829,310) | | | | 844,129 |
| |
| Exchange Traded Fund – 1.3% | | | | |
| |
| iShares iBoxx $ Investment Grade | | | | |
| Corporate Bond Fund | | 98 | | 12,056 |
| TOTAL EXCHANGE TRADED FUND | | | | |
| (COST $11,624) | | | | 12,056 |
| TOTAL INVESTMENT | | | | |
| SECURITIES—104.1% | | | | 954,329 |
____________________
Percentages indicated are based on net assets of $916,884.
| (a) | | The rate represents the annualized one-day yield that was in effect on October 31, 2012. |
| 24 HSBC FAMILY OF FUNDS | See notes to financial statements. |
| HSBC WORLD SELECTION FUNDS |
| Statements of Assets and Liabilities—as of October 31, 2012 |
| | | Aggressive | | Balanced | | Moderate | | Conservative | | Income |
| | | Strategy | | Strategy | | Strategy | | Strategy | | Strategy |
| | | Fund | | Fund | | Fund | | Fund | | Fund |
| Assets: | | | | | | | | | | | | | | | | | | | | | | | | | | | | | | |
| Investments in Affiliated Portfolios | | | $ | 2,521,395 | | | | | $ | 5,448,924 | | | | | $ | 3,265,654 | | | | | $ | 986,142 | | | | | $ | — | | |
| Investments in Affiliated Investment Companies, at value(a) | | | | 317,841 | | | | | | 5,223,141 | | | | | | 5,646,865 | | | | | | 2,817,273 | | | | | | 98,144 | | |
| Investments in non-affiliates, at value | | | | 14,910,277 | | | | | | 41,756,983 | | | | | | 37,346,823 | | | | | | 18,979,982 | | | | | | 856,185 | | |
| Total Investments | | | | 17,749,513 | | | | | | 52,429,048 | | | | | | 46,259,342 | | | | | | 22,783,397 | | | | | | 954,329 | | |
| Interest and dividends receivable | | | | 653 | | | | | | 14,299 | | | | | | 13,771 | | | | | | 6,483 | | | | | | 2,008 | | |
| Receivable for capital shares issued | | | | 1,413 | | | | | | 7,380 | | | | | | 707 | | | | | | 6,074 | | | | | | 773 | | |
| Receivable for investments sold | | | | 34,276 | | | | | | 37,838 | | | | | | 52,060 | | | | | | 42,195 | | | | | | — | | |
| Reclaims receivable | | | | 555 | | | | | | 1,112 | | | | | | 985 | | | | | | 311 | | | | | | — | | |
| Receivable from Investment Adviser | | | | 10,306 | | | | | | — | | | | | | — | | | | | | — | | | | | | 32,771 | | |
| Prepaid expenses and other assets | | | | 5,806 | | | | | | 5,268 | | | | | | 5,757 | | | | | | 3,950 | | | | | | 18,555 | | |
| Total Assets | | | | 17,802,522 | | | | | | 52,494,945 | | | | | | 46,332,622 | | | | | | 22,842,410 | | | | | | 1,008,436 | | |
| Liabilities: | | | | | | | | | | | | | | | | | | | | | | | | | | | | | | |
| Cash overdraft | | | | 5,407 | | | | | | 20,744 | | | | | | 29,018 | | | | | | 35,248 | | | | | | — | | |
| Income payable | | | | — | | | | | | — | | | | | | — | | | | | | — | | | | | | 668 | | |
| Payable for investments purchased | | | | 29,964 | | | | | | 56,009 | | | | | | 13,782 | | | | | | 7,226 | | | | | | 54,892 | | |
| Payable for capital shares redeemed | | | | 7,812 | | | | | | 117,153 | | | | | | 82,503 | | | | | | 105,812 | | | | | | — | | |
| Accrued expenses and other liabilities: | | | | | | | | | | | | | | | | | | | | | | | | | | | | | | |
| Investment Management | | | | — | | | | | | 11,239 | | | | | | 9,875 | | | | | | 4,859 | | | | | | — | | |
| Administration | | | | 375 | | | | | | 1,102 | | | | | | 968 | | | | | | 476 | | | | | | 35 | | |
| Distribution | | | | 4,891 | | | | | | 14,645 | | | | | | 13,495 | | | | | | 8,063 | | | | | | 326 | | |
| Shareholder Servicing | | | | 3,825 | | | | | | 11,239 | | | | | | 9,875 | | | | | | 4,725 | | | | | | 198 | | |
| Compliance Service | | | | 49 | | | | | | 51 | | | | | | 52 | | | | | | 50 | | | | | | 92 | | |
| Accounting | | | | 59 | | | | | | 59 | | | | | | 59 | | | | | | 54 | | | | | | 54 | | |
| Custodian | | | | 6,696 | | | | | | 9,010 | | | | | | 9,534 | | | | | | 8,498 | | | | | | 19,303 | | |
| Transfer Agent | | | | 3,241 | | | | | | 4,564 | | | | | | 4,176 | | | | | | 2,532 | | | | | | 2,000 | | |
| Trustee | | | | 19 | | | | | | 55 | | | | | | 46 | | | | | | 25 | | | | | | 260 | | |
| Other | | | | 20,705 | | | | | | 46,588 | | | | | | 40,859 | | | | | | 24,460 | | | | | | 13,724 | | |
| Total Liabilities | | | | 83,043 | | | | | | 292,458 | | | | | | 214,242 | | | | | | 202,028 | | | | | | 91,552 | | |
| Net Assets | | | $ | 17,719,479 | | | | | $ | 52,202,487 | | | | | $ | 46,118,380 | | | | | $ | 22,640,382 | | | | | $ | 916,884 | | |
| | | | | | | | | | | | | | | | | | | | | | | | | | | | | | | |
| Composition of Net Assets: | | | | | | | | | | | | | | | | | | | | | | | | | | | | | | |
| Capital | | | | 17,234,585 | | | | | | 50,153,244 | | | | | | 44,894,138 | | | | | | 21,833,590 | | | | | | 888,075 | | |
| Accumulated net investment income (loss) | | | | (63,840 | ) | | | | | 320,543 | | | | | | 43,306 | | | | | | 16,781 | | | | | | 7,921 | | |
| Accumulated net realized gains (losses) from investments | | | | (314,407 | ) | | | | | (328,713 | ) | | | | | (525,876 | ) | | | | | (242,164 | ) | | | | | 2,837 | | |
| Unrealized appreciation/depreciation on investments | | | | 863,141 | | | | | | 2,057,413 | | | | | | 1,706,812 | | | | | | 1,032,175 | | | | | | 18,051 | | |
| Net Assets | | | $ | 17,719,479 | | | | | $ | 52,202,487 | | | | | $ | 46,118,380 | | | | | $ | 22,640,382 | | | | | $ | 916,884 | | |
| | | | | | | | | | | | | | | | | | | | | | | | | | | | | | | |
| Net Assets: | | | | | | | | | | | | | | | | | | | | | | | | | | | | | | |
| Class A Shares | | | $ | 10,136,411 | | | | | $ | 29,489,509 | | | | | $ | 25,174,901 | | | | | $ | 9,933,358 | | | | | $ | 337,191 | | |
| Class B Shares | | | | 5,870,299 | | | | | | 16,805,411 | | | | | | 17,614,923 | | | | | | 9,809,554 | | | | | | 348,168 | | |
| Class C Shares | | | | 1,712,769 | | | | | | 5,907,567 | | | | | | 3,328,556 | | | | | | 2,897,470 | | | | | | 231,525 | | |
| | | | $ | 17,719,479 | | | | | $ | 52,202,487 | | | | | $ | 46,118,380 | | | | | $ | 22,640,382 | | | | | $ | 916,884 | | |
| Shares Outstanding | | | | | | | | | | | | | | | | | | | | | | | | | | | | | | |
| ($0.001 par value, unlimited number of shares authorized): | | | | | | | | | | | | | | | | | | | | | | | | | | | | | | |
| Class A Shares | | | | 793,622 | | | | | | 2,329,291 | | | | | | 2,118,579 | | | | | | 866,012 | | | | | | 32,317 | | |
| Class B Shares | | | | 480,400 | | | | | | 1,333,664 | | | | | | 1,483,773 | | | | | | 865,727 | | | | | | 33,435 | | |
| Class C Shares | | | | 140,712 | | | | | | 468,172 | | | | | | 288,208 | | | | | | 248,507 | | | | | | 22,232 | | |
| Net Asset Value, Offering Price and Redemption | | | | | | | | | | | | | | | | | | | | | | | | | | | | | | |
| Price per share: | | | | | | | | | | | | | | | | | | | | | | | | | | | | | | |
| Class A Shares | | | $ | 12.77 | | | | | $ | 12.66 | | | | | $ | 11.88 | | | | | $ | 11.47 | | | | | $ | 10.43 | | |
| Class B Shares(b) | | | $ | 12.22 | | | | | $ | 12.60 | | | | | $ | 11.87 | | | | | $ | 11.33 | | | | | $ | 10.41 | | |
| Class C Shares(b) | | | $ | 12.17 | | | | | $ | 12.62 | | | | | $ | 11.55 | | | | | $ | 11.66 | | | | | $ | 10.41 | | |
| Maximum Sales Charge—Class A Shares | | | | 5.00 | % | | | | | 5.00 | % | | | | | 5.00 | % | | | | | 5.00 | % | | | | | 4.75 | % | |
| Maximum Offering Price per share (Net Asset Value/ | | | | | | | | | | | | | | | | | | | | | | | | | | | | | | |
| (100%-maximum sales charge))—Class A Shares | | | $ | 13.44 | | | | | $ | 13.33 | | | | | $ | 12.51 | | | | | $ | 12.07 | | | | | $ | 10.95 | | |
| Investments in Affiliated Investments Companies, at cost(a) | | | $ | 299,635 | | | | | $ | 4,836,314 | | | | | $ | 5,214,905 | | | | | $ | 2,613,872 | | | | | $ | 95,344 | | |
| Investments in non-affiliates, at cost | | | | 14,697,517 | | | | | | 41,494,192 | | | | | | 36,987,962 | | | | | | 18,406,526 | | | | | | 840,934 | | |
____________________
| (a) | | The investment in affiliated investment companies includes the HSBC Prime Money Market Fund, Class I Shares, HSBC Emerging Markets Debt Fund, Class I Shares and HSBC Emerging Markets Local Debt Fund, Class I Shares (See Note 1). |
| (b) | | Redemption Price per share varies by length of time shares are held. |
| 26 HSBC WORLD SELECTION FUNDS | See notes to financial statements. |
| HSBC WORLD SELECTION FUNDS |
| Statements of Operations—For the year ended October 31, 2012 |
| | Aggressive | | Balanced | | Moderate | | Conservative | | Income |
| | Strategy | | Strategy | | Strategy | | Strategy | | Strategy |
| | Fund | | Fund | | Fund | | Fund | | Fund (a) |
| Investment Income: | | | | | | | | | | | | | | | | | | | | | | | | | | | | | | |
| Investment income from non-affiliates | | | $ | 241,222 | | | | | $ | 1,329,920 | | | | | $ | 1,389,342 | | | | | $ | 715,704 | | | | | $ | 8,340 | | |
| Investment Income from Affiliated Portfolios(b) | | | | 55,715 | | | | | | 121,385 | | | | | | 75,953 | | | | | | 22,028 | | | | | | — | | |
| Investment Income from Affiliated | | | | | | | | | | | | | | | | | | | | | | | | | | | | | | |
| Investment Companies | | | | 2,918 | | | | | | 172,683 | | | | | | 178,633 | | | | | | 82,348 | | | | | | 807 | | |
| Tax reclaims from Affiliated Portfolios(b) | | | | 93 | | | | | | 175 | | | | | | 155 | | | | | | 60 | | | | | | — | | |
| Foreign tax withholding from Affiliated Portfolios(b) | | | | (731 | ) | | | | | (1,461 | ) | | | | | (1,215 | ) | | | | | (429 | ) | | | | | — | | |
| Expenses from Affiliated Portfolios(b) | | | | (36,246 | ) | | | | | (78,041 | ) | | | | | (49,437 | ) | | | | | (14,619 | ) | | | | | — | | |
| Total Investment Income (Loss) | | | | 262,971 | | | | | | 1,544,661 | | | | | | 1,593,431 | | | | | | 805,092 | | | | | | 9,147 | | |
| | | | | | | | | | | | | | | | | | | | | | | | | | | | | | | |
| Expenses: | | | | | | | | | | | | | | | | | | | | | | | | | | | | | | |
| Investment Management | | | | 44,763 | | | | | | 132,468 | | | | | | 117,185 | | | | | | 54,599 | | | | | | 728 | | |
| Administration: | | | | | | | | | | | | | | | | | | | | | | | | | | | | | | |
| Class A Shares | | | | 2,330 | | | | | | 6,952 | | | | | | 5,823 | | | | | | 2,349 | | | | | | 60 | | |
| Class B Shares | | | | 1,553 | | | | | | 4,283 | | | | | | 4,593 | | | | | | 2,282 | | | | | | 37 | | |
| Class C Shares | | | | 434 | | | | | | 1,538 | | | | | | 880 | | | | | | 641 | | | | | | 33 | | |
| Distribution: | | | | | | | | | | | | | | | | | | | | | | | | | | | | | | |
| Class B Shares | | | | 47,604 | | | | | | 131,842 | | | | | | 140,900 | | | | | | 70,285 | | | | | | 558 | | |
| Class C Shares | | | | 12,875 | | | | | | 46,707 | | | | | | 26,389 | | | | | | 18,894 | | | | | | 508 | | |
| Shareholder Servicing: | | | | | | | | | | | | | | | | | | | | | | | | | | | | | | |
| Class A Shares | | | | 23,222 | | | | | | 68,362 | | | | | | 57,442 | | | | | | 22,799 | | | | | | 156 | | |
| Class B Shares | | | | 15,986 | | | | | | 44,271 | | | | | | 47,452 | | | | | | 23,607 | | | | | | 145 | | |
| Class C Shares | | | | 4,369 | | | | | | 15,812 | | | | | | 9,037 | | | | | | 6,557 | | | | | | 169 | | |
| Accounting | | | | 23,057 | | | | | | 23,104 | | | | | | 23,116 | | | | | | 23,092 | | | | | | 19,147 | | |
| Compliance Service | | | | 199 | | | | | | 493 | | | | | | 443 | | | | | | 231 | | | | | | 94 | | |
| Custodian | | | | 23,238 | | | | | | 34,353 | | | | | | 36,051 | | | | | | 32,097 | | | | | | 22,540 | | |
| Printing | | | | 25,957 | | | | | | 65,767 | | | | | | 60,450 | | | | | | 25,710 | | | | | | 6,179 | | |
| Professional | | | | 9,954 | | | | | | 5,409 | | | | | | 4,873 | | | | | | 9,617 | | | | | | 13,657 | | |
| Transfer Agent | | | | 58,235 | | | | | | 102,453 | | | | | | 98,388 | | | | | | 52,660 | | | | | | 9,653 | | |
| Trustee | | | | 448 | | | | | | 1,315 | | | | | | 1,162 | | | | | | 529 | | | | | | 264 | | |
| Registration fees | | | | 22,993 | | | | | | 22,623 | | | | | | 24,408 | | | | | | 18,088 | | | | | | 7,472 | | |
| Other | | | | 3,835 | | | | | | 7,781 | | | | | | 6,940 | | | | | | 4,409 | | | | | | 1,555 | | |
| Total expenses before fee reductions | | | | 321,052 | | | | | | 715,533 | | | | | | 665,532 | | | | | | 368,446 | | | | | | 82,955 | | |
| �� Fees contractually reduced/reimbursed by Investment Adviser | | | | (27,768 | ) | | | | | — | | | | | | — | | | | | | — | | | | | | (77,417 | ) | |
| Net Expenses | | | | 293,284 | | | | | | 715,533 | | | | | | 665,532 | | | | | | 368,446 | | | | | | 5,538 | | |
| | | | | | | | | | | | | | | | | | | | | | | | | | | | | | | |
| Net Investment Income (Loss) | | | | (30,313 | ) | | | | | 829,128 | | | | | | 927,899 | | | | | | 436,646 | | | | | | 3,609 | | |
| | | | | | | | | | | | | | | | | | | | | | | | | | | | | | | |
| Net Realized/Unrealized Gains (Losses) from Investments: | | | | | | | | | | | | | | | | | | | | | | | | | | | | | | |
| Net realized gains (losses) from affiliated investment securities(b) | | | | 155,951 | | | | | | 610,483 | | | | | | 369,479 | | | | | | 40,268 | | | | | | 406 | | |
| Net realized gains (losses) from non-affiliated investment securities | | | | 74,440 | | | | | | 208,970 | | | | | | 221,293 | | | | | | (88,844 | ) | | | | | 2,431 | | |
| Net realized gains distributions from affiliated underlying funds | | | | — | | | | | | 657 | | | | | | 774 | | | | | | 343 | | | | | | — | | |
| Net realized gains distributions from non-affiliated underlying funds | | | | 205,120 | | | | | | 519,205 | | | | | | 451,480 | | | | | | 178,779 | | | | | | — | | |
| Change in unrealized appreciation/depreciation on affiliated investments(b) | | | | 109,509 | | | | | | 441,827 | | | | | | 344,869 | | | | | | 210,655 | | | | | | 2,800 | | |
| Change in unrealized appreciation/depreciation on investments | | | | 759,729 | | | | | | 1,565,782 | | | | | | 1,238,304 | | | | | | 817,926 | | | | | | 15,251 | | |
| Net realized/unrealized gains from investments | | | | 1,304,749 | | | | | | 3,346,924 | | | | | | 2,626,199 | | | | | | 1,159,127 | | | | | | 20,888 | | |
| Change In Net Assets Resulting From Operations | | | $ | 1,274,436 | | | | | $ | 4,176,052 | | | | | $ | 3,554,098 | | | | | $ | 1,595,773 | | | | | $ | 24,497 | | |
____________________
| (a) | | Represents period from March 20, 2012 (commencement of operations) to October 31, 2012. |
| (b) | | Represents amounts allocated from Affiliated Investment Companies and Affiliated Portfolios. |
| See notes to financial statements. | HSBC WORLD SELECTION FUNDS 27 |
| HSBC WORLD SELECTION FUNDS |
| Statements of Changes in Net Assets | |
| | Aggressive Strategy Fund | | Balanced Strategy Fund |
| | For the | | For the | | For the | | For the |
| | year ended | | year ended | | year ended | | year ended |
| | October 31, | | October 31, | | October 31, | | October 31, |
| | 2012 | | 2011 | | 2012 | | 2011 |
| Investment Activities: | | | | | | | | | | | | | | | | | | | | | | | | |
| Operations: | | | | | | | | | | | | | | | | | | | | | | | | |
| Net investment income (loss) | | | $ | (30,313 | ) | | | | $ | 71,845 | | | | | $ | 829,128 | | | | | $ | 1,133,159 | | |
| Net realized gains (losses) from investments | | | | 435,511 | | | | | | 809,496 | | | | | | 1,339,315 | | | | | | 2,228,606 | | |
| Change in unrealized appreciation/depreciation on investments | | | | 869,238 | | | | | | (1,208,746 | ) | | | | | 2,007,609 | | | | | | (3,222,925 | ) | |
| Change in net assets resulting from operations | | | | 1,274,436 | | | | | | (327,405 | ) | | | | | 4,176,052 | | | | | | 138,840 | | |
| | | | | | | | | | | | | | | | | | | | | | | | | |
| Dividends: | | | | | | | | | | | | | | | | | | | | | | | | |
| Net investment income: | | | | | | | | | | | | | | | | | | | | | | | | |
| Class A Shares | | | | (77,670 | ) | | | | | (68,444 | ) | | | | | (912,343 | ) | | | | | (529,559 | ) | |
| Class B Shares | | | | (8,596 | ) | | | | | (15,713 | ) | | | | | (454,511 | ) | | | | | (273,352 | ) | |
| Class C Shares | | | | (6,139 | ) | | | | | (3,532 | ) | | | | | (174,260 | ) | | | | | (57,612 | ) | |
| Change in net assets resulting from shareholder dividends | | | | (92,405 | ) | | | | | (87,689 | ) | | | | | (1,541,114 | ) | | | | | (860,523 | ) | |
| Change in net assets resulting from capital transactions | | | | (1,313,685 | ) | | | | | 4,163,237 | | | | | | (3,920,082 | ) | | | | | 13,476,718 | | |
| Change in net assets | | | | (131,654 | ) | | | | | 3,748,143 | | | | �� | | (1,285,144 | ) | | | | | 12,755,035 | | |
| | | | | | | | | | | | | | | | | | | | | | | | | |
| Net Assets: | | | | | | | | | | | | | | | | | | | | | | | | |
| Beginning of period | | | | 17,851,133 | | | | | | 14,102,990 | | | | | | 53,487,631 | | | | | | 40,732,596 | | |
| End of period | | | $ | 17,719,479 | | | | | $ | 17,851,133 | | | | | $ | 52,202,487 | | | | | $ | 53,487,631 | | |
| Accumulated net investment income (loss) | | | $ | (63,840 | ) | | | | $ | 25,441 | | | | | $ | 320,543 | | | | | $ | 894,326 | | |
| 28 HSBC WORLD SELECTION FUNDS | See notes to financial statements. |
| HSBC WORLD SELECTION FUNDS |
| Statements of Changes in Net Assets (continued) |
| | Aggressive Strategy Fund | | Balanced Strategy Fund |
| | For the | For the | | For the | For the |
| | year ended | year ended | | year ended | year ended |
| | October 31, | October 31, | | October 31, | October 31, |
| | 2012 | 2011 | | 2012 | 2011 |
| CAPITAL TRANSACTIONS: | | | | | | | | | | | | | | | | | | | | | | |
| Class A Shares: | | | | | | | | | | | | | | | | | | | | | | |
| Proceeds from shares issued | | | $ | 2,113,457 | | | | $ | 2,908,333 | | | | | $ | 5,462,023 | | | | $ | 9,775,737 | | |
| Dividends reinvested | | | | 76,522 | | | | | 67,390 | | | | | | 896,978 | | | | | 519,067 | | |
| Value of shares redeemed | | | | (1,916,446 | ) | | | | (1,486,297 | ) | | | | | (6,605,601 | ) | | | | (3,350,884 | ) | |
| Class A Shares capital transactions | | | | 273,533 | | | | | 1,489,426 | | | | | | (246,600 | ) | | | | 6,943,920 | | |
| | | | | | | | | | | | | | | | | | | | | | | |
| Class B Shares: | | | | | | | | | | | | | | | | | | | | | | |
| Proceeds from shares issued | | | | 692,637 | | | | | 2,495,049 | | | | | | 2,081,326 | | | | | 6,586,320 | | |
| Dividends reinvested | | | | 8,454 | | | | | 15,477 | | | | | | 449,537 | | | | | 271,439 | | |
| Value of shares redeemed | | | | (2,003,556 | ) | | | | (1,134,162 | ) | | | | | (5,369,321 | ) | | | | (3,415,315 | ) | |
| Class B Shares capital transactions | | | | (1,302,465 | ) | | | | 1,376,364 | | | | | | (2,838,458 | ) | | | | 3,442,444 | | |
| | | | | | | | | | | | | | | | | | | | | | | |
| Class C Shares: | | | | | | | | | | | | | | | | | | | | | | |
| Proceeds from shares issued | | | | 280,202 | | | | | 1,367,118 | | | | | | 980,626 | | | | | 3,926,550 | | |
| Dividends reinvested | | | | 6,111 | | | | | 3,495 | | | | | | 170,621 | | | | | 55,493 | | |
| Value of shares redeemed | | | | (571,066 | ) | | | | (73,166 | ) | | | | | (1,986,271 | ) | | | | (891,689 | ) | |
| Class C Shares capital transactions | | | | (284,753 | ) | | | | 1,297,447 | | | | | | (835,024 | ) | | | | 3,090,354 | | |
| Change in net assets resulting from capital transactions | | | $ | (1,313,685 | ) | | | $ | 4,163,237 | | | | | $ | (3,920,082 | ) | | | $ | 13,476,718 | | |
| | | | | | | | | | | | | | | | | | | | | | | |
| SHARE TRANSACTIONS: | | | | | | | | | | | | | | | | | | | | | | |
| Class A Shares: | | | | | | | | | | | | | | | | | | | | | | |
| Issued | | | | 170,638 | | | | | 228,057 | | | | | | 449,415 | | | | | 780,155 | | |
| Reinvested | | | | 6,672 | | | | | 5,344 | | | | | | 78,890 | | | | | 42,166 | | |
| Redeemed | | | | (154,093 | ) | | | | (118,554 | ) | | | | | (540,992 | ) | | | | (269,840 | ) | |
| Change in Class A Shares | | | | 23,217 | | | | | 114,847 | | | | | | (12,687 | ) | | | | 552,481 | | |
| | | | | | | | | | | | | | | | | | | | | | | |
| Class B Shares: | | | | | | | | | | | | | | | | | | | | | | |
| Issued | | | | 58,381 | | | | | 203,126 | | | | | | 170,500 | | | | | 523,809 | | |
| Reinvested | | | | 765 | | | | | 1,275 | | | | | | 39,468 | | | | | 22,032 | | |
| Redeemed | | | | (168,348 | ) | | | | (93,254 | ) | | | | | (442,138 | ) | | | | (273,997 | ) | |
| Change in Class B Shares | | | | (109,202 | ) | | | | 111,147 | | | | | | (232,170 | ) | | | | 271,844 | | |
| | | | | | | | | | | | | | | | | | | | | | | |
| Class C Shares: | | | | | | | | | | | | | | | | | | | | | | |
| Issued | | | | 23,588 | | | | | 109,935 | | | | | | 80,512 | | | | | 311,276 | | |
| Reinvested | | | | 556 | | | | | 288 | | | | | | 14,967 | | | | | 4,490 | | |
| Redeemed | | | | (48,318 | ) | | | | (5,872 | ) | | | | | (160,924 | ) | | | | (71,338 | ) | |
| Change in Class C Shares | | | | (24,174 | ) | | | | 104,351 | | | | | | (65,445 | ) | | | | 244,428 | | |
| See notes to financial statements. | HSBC WORLD SELECTION FUNDS 29 |
| HSBC WORLD SELECTION FUNDS |
| Statements of Changes in Net Assets (continued) | |
| | Moderate Strategy Fund | | Conservative Strategy Fund |
| | For the | For the | | For the | For the |
| | year ended | year ended | | year ended | year ended |
| | October 31, | October 31, | | October 31, | October 31, |
| | 2012 | 2011 | | 2012 | 2011 |
| Investment Activities: | | | | | | | | | | | | | | | | | | | | | | |
| Operations: | | | | | | | | | | | | | | | | | | | | | | |
| Net investment income (loss) | | | $ | 927,899 | | | | $ | 1,266,033 | | | | | $ | 436,646 | | | | $ | 525,517 | | |
| Net realized gains (losses) from investments | | | | 1,043,026 | | | | | 2,274,619 | | | | | | 130,546 | | | | | 703,084 | | |
| Change in unrealized appreciation/depreciation on investments | | | | 1,583,173 | | | | | (2,997,283 | ) | | | | | 1,028,581 | | | | | (942,081 | ) | |
| Change in net assets resulting from operations | | | | 3,554,098 | | | | | 543,369 | | | | | | 1,595,773 | | | | | 286,520 | | |
| | | | | | | | | | | | | | | | | | | | | | | |
| Dividends: | | | | | | | | | | | | | | | | | | | | | | |
| Net investment income: | | | | | | | | | | | | | | | | | | | | | | |
| Class A Shares | | | | (657,742 | ) | | | | (817,383 | ) | | | | | (283,394 | ) | | | | (330,918 | ) | |
| Class B Shares | | | | (398,779 | ) | | | | (622,935 | ) | | | | | (215,487 | ) | | | | (300,422 | ) | |
| Class C Shares | | | | (78,368 | ) | | | | (109,972 | ) | | | | | (57,748 | ) | | | | (62,316 | ) | |
| Change in net assets resulting from shareholder dividends | | | | (1,134,889 | ) | | | | (1,550,290 | ) | | | | | (556,629 | ) | | | | (693,656 | ) | |
| Change in net assets resulting from capital transactions | | | | (4,201,200 | ) | | | | 9,079,682 | | | | | | 1,174,324 | | | | | 4,961,528 | | |
| Change in net assets | | | | (1,781,991 | ) | | | | 8,072,761 | | | | | | 2,213,468 | | | | | 4,554,392 | | |
| | | | | | | | | | | | | | | | | | | | | | | |
| Net Assets: | | | | | | | | | | | | | | | | | | | | | | |
| Beginning of period | | | | 47,900,371 | | | | | 39,827,610 | | | | | | 20,426,914 | | | | | 15,872,522 | | |
| End of period | | | $ | 46,118,380 | | | | $ | 47,900,371 | | | | | $ | 22,640,382 | | | | $ | 20,426,914 | | |
| Accumulated net investment income (loss) | | | $ | 43,306 | | | | $ | 83,661 | | | | | $ | 16,781 | | | | $ | 42,867 | | |
| 30 HSBC WORLD SELECTION FUNDS | See notes to financial statements. |
HSBC WORLD SELECTION FUNDS
Statements of Changes in Net Assets (continued)
| Moderate Strategy Fund | | Conservative Strategy Fund |
| For the | For the | | For the | For the |
| year ended | year ended | | year ended | year ended |
| October 31, | October 31, | | October 31, | October 31, |
| 2012 | 2011 | | 2012 | 2011 |
| CAPITAL TRANSACTIONS: | | | | | | | | | | | | | | | | | | | | | |
| Class A Shares: | | | | | | | | | | | | | | | | | | | | | |
| Proceeds from shares issued | | $ | 5,814,895 | | | | $ | 7,463,817 | | | | | $ | 2,466,524 | | | | $ | 3,277,051 | | |
| Dividends reinvested | | | 648,574 | | | | | 808,567 | | | | | | 267,600 | | | | | 315,473 | | |
| Value of shares redeemed | | | (6,285,101 | ) | | | | (3,002,506 | ) | | | | | (2,212,701 | ) | | | | (1,601,095 | ) | |
| Class A Shares capital transactions | | | 178,368 | | | | | 5,269,878 | | | | | | 521,423 | | | | | 1,991,429 | | |
| | | | | | | | | | | | | | | | | | | | | | |
| Class B Shares: | | | | | | | | | | | | | | | | | | | | | |
| Proceeds from shares issued | | | 1,837,722 | | | | | 5,517,359 | | | | | | 1,972,436 | | | | | 3,315,754 | | |
| Dividends reinvested | | | 392,486 | | | | | 614,242 | | | | | | 204,146 | | | | | 292,525 | | |
| Value of shares redeemed | | | (5,898,444 | ) | | | | (3,739,911 | ) | | | | | (1,807,237 | ) | | | | (1,849,847 | ) | |
| Class B Shares capital transactions | | | (3,668,236 | ) | | | | 2,391,690 | | | | | | 369,345 | | | | | 1,758,432 | | |
| | | | | | | | | | | | | | | | | | | | | | |
| Class C Shares: | | | | | | | | | | | | | | | | | | | | | |
| Proceeds from shares issued | | | 682,092 | | | | | 2,129,489 | | | | | | 1,056,887 | | | | | 1,363,626 | | |
| Dividends reinvested | | | 77,318 | | | | | 108,644 | | | | | | 54,627 | | | | | 61,050 | | |
| Value of shares redeemed | | | (1,470,742 | ) | | | | (820,019 | ) | | | | | (827,958 | ) | | | | (213,009 | ) | |
| Class C Shares capital transactions | | | (711,332 | ) | | | | 1,418,114 | | | | | | 283,556 | | | | | 1,211,667 | | |
| Change in net assets resulting from capital transactions | | $ | (4,201,200 | ) | | | $ | 9,079,682 | | | | | $ | 1,174,324 | | | | $ | 4,961,528 | | |
| | | | | | | | | | | | | | | | | | | | | | |
| SHARE TRANSACTIONS: | | | | | | | | | | | | | | | | | | | | | |
| Class A Shares: | | | | | | | | | | | | | | | | | | | | | |
| Issued | | | 505,703 | | | | | 639,024 | | | | | | 223,077 | | | | | 291,544 | | |
| Reinvested | | | 58,105 | | | | | 70,518 | | | | | | 24,607 | | | | | 28,698 | | |
| Redeemed | | | (546,616 | ) | | | | (256,954 | ) | | | | | (198,821 | ) | | | | (143,569 | ) | |
| Change in Class A Shares | | | 17,192 | | | | | 452,588 | | | | | | 48,863 | | | | | 176,673 | | |
| | | | | | | | | | | | | | | | | | | | | | |
| Class B Shares: | | | | | | | | | | | | | | | | | | | | | |
| Issued | | | 160,345 | | | | | 469,305 | | | | | | 180,184 | | | | | 298,990 | | |
| Reinvested | | | 35,603 | | | | | 53,442 | | | | | | 19,128 | | | | | 26,862 | | |
| Redeemed | | | (514,301 | ) | | | | (322,256 | ) | | | | | (164,720 | ) | | | | (166,957 | ) | |
| Change in Class B Shares | | | (318,353 | ) | | | | 200,491 | | | | | | 34,592 | | | | | 158,895 | | |
| | | | | | | | | | | | | | | | | | | | | | |
| Class C Shares: | | | | | | | | | | | | | | | | | | | | | |
| Issued | | | 61,003 | | | | | 186,946 | | | | | | 93,307 | | | | | 119,890 | | |
| Reinvested | | | 7,205 | | | | | 9,716 | | | | | | 4,973 | | | | | 5,467 | | |
| Redeemed | | | (131,493 | ) | | | | (72,771 | ) | | | | | (73,251 | ) | | | | (18,682 | ) | |
| Change in Class C Shares | | | (63,285 | ) | | | | 123,891 | | | | | | 25,029 | | | | | 106,675 | | |
| See notes to financial statements. | HSBC WORLD SELECTION FUNDS 31 |
HSBC WORLD SELECTION FUNDS
Statements of Changes in Net Assets (continued)
| Income Strategy Fund |
| For the |
| period ended |
| October 31, |
| 2012(a) |
| Investment Activities: | | | | | |
| Operations: | | | | | |
| Net investment income (loss) | | $ | 3,609 | | |
| Net realized gains (losses) from investment transactions | | | 2,837 | | |
| Change in unrealized appreciation/depreciation from investments and foreign currencies | | | 18,051 | | |
| Change in net assets resulting from operations | | | 24,497 | | |
| | | | | | |
| Dividends: | | | | | |
| Net investment income: | | | | | |
| Class A Shares | | | (1,852 | ) | |
| Class B Shares | | | (687 | ) | |
| Class C Shares | | | (536 | ) | |
| Change in net assets resulting from shareholder dividends | | | (3,075 | ) | |
| Change in net assets resulting from capital transactions | | | 895,462 | | |
| Change in net assets | | | 916,884 | | |
| | | | | | |
| Net Assets: | | | | | |
| Beginning of period | | | — | | |
| End of period | | $ | 916,884 | | |
| Accumulated net investment income (loss) | | $ | 7,921 | | |
____________________
(a) Commenced operations on March 20, 2012.
| 32 HSBC WORLD SELECTION FUNDS | | See notes to financial statements. |
HSBC WORLD SELECTION FUNDS
Statements of Changes in Net Assets (continued)
| Income Strategy Fund |
| For the |
| period ended |
| October 31, |
| 2012(a) |
| CAPITAL TRANSACTIONS: | | | | | |
| Class A Shares: | | | | | |
| Proceeds from shares issued | | $ | 429,058 | | |
| Dividends reinvested | | | 1,851 | | |
| Value of shares redeemed | | | (103,668 | ) | |
| Class A Shares capital transactions | | | 327,241 | | |
| | | | | | |
| Class B Shares: | | | | | |
| Proceeds from shares issued | | | 349,020 | | |
| Dividends reinvested | | | 644 | | |
| Value of shares redeemed | | | (7,223 | ) | |
| Class B Shares capital transactions | | | 342,441 | | |
| | | | | | |
| Class C Shares: | | | | | |
| Proceeds from shares issued | | | 226,393 | | |
| Dividends reinvested | | | 536 | | |
| Value of shares redeemed | | | (1,149 | ) | |
| Class C Shares capital transactions | | | 225,780 | | |
| Change in net assets resulting from capital transactions | | $ | 895,462 | | |
| | | | | | |
| SHARE TRANSACTIONS: | | | | | |
| Class A Shares: | | | | | |
| Issued | | | 42,276 | | |
| Reinvested | | | 179 | | |
| Redeemed | | | (10,138 | ) | |
| Change in Class A Shares | | | 32,317 | | |
| | | | | | |
| Class B Shares: | | | | | |
| Issued | | | 34,074 | | |
| Reinvested | | | 62 | | |
| Redeemed | | | (701 | ) | |
| Change in Class B Shares | | | 33,435 | | |
| | | | | | |
| Class C Shares: | | | | | |
| Issued | | | 22,294 | | |
| Reinvested | | | 52 | | |
| Redeemed | | | (114 | ) | |
| Change in Class C Shares | | | 22,232 | | |
____________________
(a) Commenced operations on March 20, 2012.
| See notes to financial statements. | HSBC WORLD SELECTION FUNDS 33 |
| AGGRESSIVE STRATEGY FUND |
Financial Highlights |
Selected data for a share outstanding throughout the periods indicated.*
| | | | | | | Investment Activities | | Dividends | | | | | | | | | | Ratios/Supplementary Data |
| | | | | | | | | | | | | | | | | | | | | | | | | | | | | | | | | | | | | | | | | | | | | | | | | | | | | | | | | Ratios of | | |
| | | | | | | | | | | | Net | | | | | | | | | | | | | | | | | | | | | | | | | | | | | | | | | | | | | Ratio of Net | | Expenses | | |
| | | | | | | | | | | | Realized and | | | | | | | | | | | | Net | | | | | | | | | | | | | | | | | | | | | | Investment | | to Average | | |
| | Net Asset | | Net | | Unrealized | | | | | | | | | | | | Realized | | | | | | | | | | | | | | | Net Assets | | Ratio of Net | | Income | | Net Assets | | |
| | Value, | | Investment | | Gains | | Total from | | Net | | Gains from | | | | | | | Net Asset | | | | | at End | | Expenses to | | (Loss) to | | (Excluding | | Portfolio |
| | Beginning | | Income | | (Losses) from | | Investment | | Investment | | Investment | | Total | | Value, End | | Total | | of Period | | Average | | Average | | Fee | | Turnover |
| | of Period | | (Loss)(a) | | Investments | | Activities | | Income | | Transactions | | Dividends | | of Period | | Return(b) | | (000’s) | | Net Assets | | Net Assets | | Reductions) | | (c) |
| CLASS A SHARES | | | | | | | | | | | | | | | | | | | | | | | | | | | | | | | | | | | | | | | | | | | | | | | | | | | | | | | | | | | |
| Year Ended October 31, 2008 | | | $ | 15.55 | | | | 0.02 | | | | | (6.05 | ) | | | | (6.03 | ) | | | | — | | | | | (0.90 | ) | | | | (0.90 | ) | | | | $ | 8.62 | | | (40.92 | )%(d) | | | $ | 4,572 | | | 1.50% | | | 0.13 | % | | | 1.98% | | 72% |
| Year Ended October 31, 2009 | | | | 8.62 | | | | 0.01 | | | | | 1.57 | | | | | 1.58 | | | | | — | | | | | — | | | | | — | | | | | | 10.20 | | | 18.33 | %(e) | | | | 5,426 | | | 1.50% | | | 0.09 | % | | | 2.16% | | 53% |
| Year Ended October 31, 2010 | | | | 10.20 | | | | 0.03 | | | | | 1.80 | | | | | 1.83 | | | | | — | | | | | — | | | | | — | | | | | | 12.03 | | | 17.94 | %(f) | | | | 7,886 | | | 1.50% | | | 0.24 | % | | | 2.00% | | 50% |
| Year Ended October 31, 2011 | | | | 12.03 | | | | 0.10 | | | | | (0.07 | ) | | | | 0.03 | | | | | (0.10 | ) | | | | — | | | | | (0.10 | ) | | | | | 11.96 | | | 0.20 | %(g) | | | | 9,217 | | | 1.50% | | | 0.77 | % | | | 1.61% | | 71% |
| Year Ended October 31, 2012 | | | | 11.96 | | | | 0.02 | | | | | 0.89 | | | | | 0.91 | | | | | (0.10 | ) | | | | — | | | | | (0.10 | ) | | | | | 12.77 | | | 7.72 | % | | | | 10,136 | | | 1.50% | | | 0.16 | % | | | 1.66% | | 71% |
| CLASS B SHARES | | | | | | | | | | | | | | | | | | | | | | | | | | | | | | | | | | | | | | | | | | | | | | | | | | | | | | | | | | | |
| Year Ended October 31, 2008 | | | $ | 15.27 | | | | (0.08 | ) | | | | (5.90 | ) | | | | (5.98 | ) | | | | — | | | | | (0.90 | ) | | | | (0.90 | ) | | | | $ | 8.39 | | | (41.36 | )%(d) | | | $ | 3,166 | | | 2.25% | | | (0.62 | )% | | | 2.73% | | 72% |
| Year Ended October 31, 2009 | | | | 8.39 | | | | (0.06 | ) | | | | 1.53 | | | | | 1.47 | | | | | — | | | | | — | | | | | — | | | | | | 9.86 | | | 17.52 | %(e) | | | | 3,767 | | | 2.25% | | | (0.66 | )% | | | 2.91% | | 53% |
| Year Ended October 31, 2010 | | | | 9.86 | | | | (0.05 | ) | | | | 1.73 | | | | | 1.68 | | | | | — | | | | | — | | | | | — | | | | | | 11.54 | | | 17.04 | %(f) | | | | 5,519 | | | 2.25% | | | (0.51 | )% | | | 2.75% | | 50% |
| Year Ended October 31, 2011 | | | | 11.54 | | | | — | (h) | | | | (0.06 | ) | | | | (0.06 | ) | | | | (0.03 | ) | | | | — | | | | | (0.03 | ) | | | | | 11.45 | | | (0.53 | )%(g) | | | | 6,750 | | | 2.25% | | | 0.02 | % | | | 2.36% | | 71% |
| Year Ended October 31, 2012 | | | | 11.45 | | | | (0.07 | ) | | | | 0.85 | | | | | 0.78 | | | | | (0.01 | ) | | | | — | | | | | (0.01 | ) | | | | | 12.22 | | | 6.87 | % | | | | 5,870 | | | 2.25% | | | (0.57 | )% | | | 2.40% | | 71% |
| CLASS C SHARES | | | | | | | | | | | | | | | | | | | | | | | | | | | | | | | | | | | | | | | | | | | | | | | | | | | | | | | | | | | |
| Year Ended October 31, 2008 | | | $ | 15.26 | | | | (0.08 | ) | | | | (5.89 | ) | | | | (5.97 | ) | | | | — | | | | | (0.90 | ) | | | | (0.90 | ) | | | | $ | 8.39 | | | (41.32 | )%(d) | | | $ | 319 | | | 2.25% | | | (0.64 | )% | | | 2.73% | | 72% |
| Year Ended October 31, 2009 | | | | 8.39 | | | | (0.05 | ) | | | | 1.51 | | | | | 1.46 | | | | | — | | | | | — | | | | | — | | | | | | 9.85 | | | 17.40 | %(e) | | | | 289 | | | 2.25% | | | (0.59 | )% | | | 2.93% | | 53% |
| Year Ended October 31, 2010 | | | | 9.85 | | | | (0.05 | ) | | | | 1.73 | | | | | 1.68 | | | | | — | | | | | — | | | | | — | | | | | | 11.53 | | | 17.06 | %(f) | | | | 698 | | | 2.25% | | | (0.47 | )% | | | 2.76% | | 50% |
| Year Ended October 31, 2011 | | | | 11.53 | | | | — | (h) | | | | (0.05 | ) | | | | (0.05 | ) | | | | (0.05 | ) | | | | — | | | | | (0.05 | ) | | | | | 11.43 | | | (0.46 | )%(g) | | | | 1,884 | | | 2.25% | | | — | %(i) | | | 2.35% | | 71% |
| Year Ended October 31, 2012 | | | | 11.43 | | | | (0.07 | ) | | | | 0.85 | | | | | 0.78 | | | | | (0.04 | ) | | | | — | | | | | (0.04 | ) | | | | | 12.17 | | | 6.83 | % | | | | 1,713 | | | 2.25% | | | (0.56 | )% | | | 2.40% | | 71% |
| * | | The per share amounts and percentages reflect income and expenses assuming inclusion of the Fund’s proportionate share of the income and expenses of the applicable HSBC Portfolios, the Fund does not include expenses of the affiliated and unaffiliated investment companies, in which the Fund invests. |
| (a) | | Calculated based on average shares outstanding. |
| (b) | | Total return calculations do not include any sales or redemption charges. |
| (c) | | Portfolio turnover rate is calculated by aggregating the results of multiplying the Fund’s investment percentage in the respective Portfolios, affiliated and unaffiliated investment companies by their corresponding portfolio turnover rates. Portfolio turnover rate is calculated on the basis of the Fund as a whole without distinguishing between classes of shares issued. |
| (d) | | During the year ended October 31, 2008, certain HSBC Portfolios, in which the Fund invests, received monies related to certain nonrecurring litigation settlements. The responding impact to the total return was 0.11%, 0.11% and 0.11% for Class A Shares, Class B Shares and Class C Shares, respectively. |
| (e) | | During the year ended October 31, 2009, certain HSBC Portfolios, in which the Fund invests, received monies related to certain nonrecurring litigation settlements. The corresponding impact to the total return was 0.11%, 0.11% and 0.11% for Class A Shares, Class B Shares and Class C Shares, respectively. |
| (f) | | During the year ended October 31, 2010, certain HSBC Portfolios, in which the Fund invests, received monies related to certain nonrecurring litigation settlements. The corresponding impact to the total return was 0.09%, 0.09% and 0.09% for Class A Shares, Class B Shares and Class C Shares, respectively. |
| (g) | | During the year ended October 31, 2011, certain HSBC Portfolios, in which the Fund invests, received monies related to certain nonrecurring litigation settlements. The corresponding impact to the total return was 0.08%, 0.08% and 0.08% for Class A Shares, Class B Shares and Class C Shares, respectively. |
| (h) | | Rounds to less than $0.01 or $(0.01). |
| (i) | | Rounds to less than 0.005% or (0.005)%. |
34 HSBC WORLD SELECTION FUNDS | See notes to financial statements. |
| BALANCED STRATEGY FUND |
Financial Highlights |
Selected data for a share outstanding throughout the periods indicated.*
| | | | | | | Investment Activities | | Dividends | | | | | | | | | | Ratios/Supplementary Data |
| | | | | | | | | | | | | | | | | | | | | | | | | | | | | | | | | | | | | | | | | | | | | | | | Ratios of | | |
| | | | | | | | | Net | | | | | | | | | | | | | | | | | | | | | | | | | | | | | | | | | | | | Expenses | | |
| | | | | | | | | Realized and | | | | | | | | | | | | Net | | | | | | | | | | | | | | | | | | | Ratio of Net | | to Average | | |
| | Net Asset | | Net | | Unrealized | | | | | | | | | | | | Realized | | | | | | | | | | | | Net Assets | | Ratio of Net | | Investment | | Net Assets | | |
| | Value, | | Investment | | Gains | | Total from | | Net | | Gains from | | | | Net Asset | | | | | at End of | | Expenses | | Income to | | (Excluding | | Portfolio |
| | Beginning | | Income | | (Losses) from | | Investment | | Investment | | Investment | | Total | | Value, End | | Total | | Period | | to Average | | Average | | Fee | | Turnover |
| | of Period | | (Loss)(a) | | Investments | | Activities | | Income | | Transactions | | Dividends | | of Period | | Return(b) | | (000’s) | | Net Assets | | Net Assets | | Reductions) | | (c) |
| CLASS A SHARES | | | | | | | | | | | | | | | | | | | | | | | | | | | | | | | | | | | | | | | | | | | | | | | | | | |
| Year Ended October 31, 2008 | | | $ | 14.73 | | | 0.12 | | | (5.21 | ) | | | | (5.09 | ) | | | | (0.09 | ) | | | | (0.74 | ) | | | (0.83) | | | $ | 8.81 | | | (36.43 | )%(d) | | | $ | 13,908 | | | 1.50% | | 0.98% | | 1.53% | | 79% |
| Year Ended October 31, 2009 | | | | 8.81 | | | 0.07 | | | 1.55 | | | | | 1.62 | | | | | (0.09 | ) | | | | — | | | | (0.09) | | | | 10.34 | | | 18.66 | %(e) | | | | 15,304 | | | 1.50% | | 0.84% | | 1.57% | | 48% |
| Year Ended October 31, 2010 | | | | 10.34 | | | 0.19 | | | 1.64 | | | | | 1.83 | | | | | (0.08 | ) | | | | — | | | | (0.08) | | | | 12.09 | | | 17.79 | %(f) | | | | 21,642 | | | 1.25% | | 1.72% | | 1.30% | | 53% |
| Year Ended October 31, 2011 | | | | 12.09 | | | 0.32 | | | (0.06 | ) | | | | 0.26 | | | | | (0.28 | ) | | | | — | | | | (0.28) | | | | 12.07 | | | 2.08 | %(g) | | | | 28,262 | | | 1.12% | | 2.60% | | 1.14% | | 74% |
| Year Ended October 31, 2012 | | | | 12.07 | | | 0.23 | | | 0.75 | | | | | 0.98 | | | | | (0.39 | ) | | | | — | | | | (0.39) | | | | 12.66 | | | 8.51 | % | | | | 29,490 | | | 1.15% | | 1.89% | | 1.15% | | 62% |
| CLASS B SHARES | | | | | | | | | | | | | | | | | | | | | | | | | | | | | | | | | | | | | | | | | | | | | | | | | | |
| Year Ended October 31, 2008 | | | $ | 14.67 | | | 0.03 | | | (5.20 | ) | | | | (5.17 | ) | | | | — | (h) | | | | (0.74 | ) | | | (0.74) | | | $ | 8.76 | | | (36.95 | )%(d) | | | $ | 9,516 | | | 2.25% | | 0.24% | | 2.28% | | 79% |
| Year Ended October 31, 2009 | | | | 8.76 | | | 0.01 | | | 1.55 | | | | | 1.56 | | | | | (0.01 | ) | | | | — | | | | (0.01) | | | | 10.31 | | | 17.80 | %(e) | | | | 11,196 | | | 2.25% | | 0.07% | | 2.31% | | 48% |
| Year Ended October 31, 2010 | | | | 10.31 | | | 0.11 | | | 1.64 | | | | | 1.75 | | | | | (0.01 | ) | | | | — | | | | (0.01) | | | | 12.05 | | | 17.01 | %(f) | | | | 15,593 | | | 2.00% | | 0.97% | | 2.05% | | 53% |
| Year Ended October 31, 2011 | | | | 12.05 | | | 0.23 | | | (0.07 | ) | | | | 0.16 | | | | | (0.20 | ) | | | | — | | | | (0.20) | | | | 12.01 | | | 1.30 | %(g) | | | | 18,799 | | | 1.87% | | 1.85% | | 1.90% | | 74% |
| Year Ended October 31, 2012 | | | | 12.01 | | | 0.14 | | | 0.75 | | | | | 0.89 | | | | | (0.30 | ) | | | | — | | | | (0.30) | | | | 12.60 | | | 7.66 | % | | | | 16,805 | | | 1.91% | | 1.18% | | 1.91% | | 62% |
| CLASS C SHARES | | | | | | | | | | | | | | | | | | | | | | | | | | | | | | | | | | | | | | | | | | | | | | | | | | |
| Year Ended October 31, 2008 | | | $ | 14.74 | | | 0.03 | | | (5.22 | ) | | | | (5.19 | ) | | | | (0.01 | ) | | | | (0.74 | ) | | | (0.75) | | | $ | 8.80 | | | (36.94 | )%(d) | | | $ | 937 | | | 2.25% | | 0.25% | | 2.29% | | 79% |
| Year Ended October 31, 2009 | | | | 8.80 | | | 0.01 | | | 1.55 | | | | | 1.56 | | | | | (0.01 | ) | | | | — | | | | (0.01) | | | | 10.35 | | | 17.81 | %(e) | | | | 1,507 | | | 2.25% | | 0.06% | | 2.30% | | 48% |
| Year Ended October 31, 2010 | | | | 10.35 | | | 0.12 | | | 1.63 | | | | | 1.75 | | | | | (0.01 | ) | | | | — | | | | (0.01) | | | | 12.09 | | | 16.96 | %(f) | | | | 3,497 | | | 2.01% | | 1.04% | | 2.06% | | 53% |
| Year Ended October 31, 2011 | | | | 12.09 | | | 0.23 | | | (0.07 | ) | | | | 0.16 | | | | | (0.21 | ) | | | | — | | | | (0.21) | | | | 12.04 | | | 1.25 | %(g) | | | | 6,427 | | | 1.87% | | 1.85% | | 1.90% | | 74% |
| Year Ended October 31, 2012 | | | | 12.04 | | | 0.14 | | | 0.76 | | | | | 0.90 | | | | | (0.32 | ) | | | | — | | | | (0.32) | | | | 12.62 | | | 7.77 | % | | | | 5,908 | | | 1.91% | | 1.18% | | 1.91% | | 62% |
| * | | The per share amounts and percentages reflect income and expenses assuming inclusion of the Fund’s proportionate share of the income and expenses of the applicable HSBC Portfolios, the Fund does not include expenses of the affiliated and unaffiliated investment companies, in which the Fund invests. |
| (a) | | Calculated based on average shares outstanding. |
| (b) | | Total return calculations do not include any sales or redemption charges. |
| (c) | | Portfolio turnover rate is calculated by aggregating the results of multiplying the Fund’s investment percentage in the respective Portfolios, affiliated and unaffiliated investment companies by their corresponding portfolio turnover rates. Portfolio turnover rate is calculated on the basis of the Fund as a whole without distinguishing between classes of shares issued. |
| (d) | | During the year ended October 31, 2008, certain HSBC Portfolios, in which Fund invests, received monies related to certain nonrecurring litigation settlements. The corresponding impact to the total return was 0.15%, 0.15% and 0.15% for Class A Shares, Class B Shares and Class C Shares, respectively. |
| (e) | | During the year ended October 31, 2009, certain HSBC Portfolios, in which the Fund invests, received monies related to certain nonrecurring litigation settlements. The corresponding impact to the total return was 0.11%, 0.11% and 0.11% for Class A Shares, Class B Shares and Class C Shares, respectively. |
| (f) | | During the year ended October 31, 2010, certain HSBC Portfolios, in which the Fund invests, received monies related to certain nonrecurring litigation settlements. The corresponding impact to the total return was 0.07%, 0.07% and 0.07% for Class A Shares, Class B Shares and Class C Shares, respectively. |
| (g) | | During the year ended October 31, 2011, certain HSBC Portfolios, in which the Fund invests, received monies related to certain nonrecurring litigation settlements. The corresponding impact to the total return was 0.06%, 0.06% and 0.06% for Class A Shares, Class B Shares and Class C Shares, respectively. |
| (h) | | Rounds to less than $0.01 or $(0.01). |
| See notes to financial statements. | HSBC WORLD SELECTION FUNDS 35 |
| MODERATE STRATEGY FUND |
Financial Highlights |
Selected data for a share outstanding throughout the periods indicated.*
| | | | | | | Investment Activities | | Dividends | | | | | | | | | Ratios/Supplementary Data |
| | | | | | | | | | | | | | | | | | | | | | | | | | | | | | | | | | | | | | | | | | | | | | | | | Ratios of | | |
| | | | | | | | | Net | | | | | | | | | | | | | | | | | | | | | | | | | | | | | | | | | | | | | Expenses | | |
| | | | | | | | | Realized and | | | | | | | | | Net | | | | | | | | | | | | | | | | | | | | | | | Ratio of Net | | to Average | | |
| | Net Asset | | Net | | Unrealized | | | | | | | | | Realized | | | | | | | | | | | | | | | | Net Assets | | Ratio of Net | | Investment | | Net Assets | | |
| | Value, | | Investment | | Gains | | Total from | | Net | | Gains from | | Return | | | | Net Asset | | | | | at End of | | Expenses | | Income to | | (Excluding | | Portfolio |
| | Beginning | | Income | | (Losses) from | | Investment | | Investment | | Investment | | of | | Total | | Value, End | | Total | | Period | | to Average | | Average | | Fee | | Turnover |
| | of Period | | (Loss)(a) | | Investments | | Activities | | Income | | Transactions | | Capital | | Dividends | | of Period | | Return(b) | | (000’s) | | Net Assets | | Net Assets | | Reductions) | | (c) |
| CLASS A SHARES | | | | | | | | | | | | | | | | | | | | | | | | | | | | | | | | | | | | | | | | | | | | | | | | | | | |
| Year Ended October 31, 2008 | | | $ | 13.27 | | | 0.20 | | | (4.08 | ) | | | | (3.88 | ) | | | (0.19) | | | (0.50 | ) | | | | (0.01 | ) | | | (0.70) | | | 8.69 | | | (30.65 | )%(d) | | | $ | 14,226 | | | 1.48% | | 1.75% | | 1.48% | | 80% |
| Year Ended October 31, 2009 | | | | 8.69 | | | 0.13 | | | 1.39 | | | | | 1.52 | | | | (0.12) | | | — | | | | | — | | | | (0.12) | | | 10.09 | | | 17.75 | %(e) | | | | 15,909 | | | 1.44% | | 1.47% | | 1.49% | | 41% |
| Year Ended October 31, 2010 | | | | 10.09 | | | 0.25 | | | 1.38 | | | | | 1.63 | | | | (0.24) | | | — | | | | | — | | | | (0.24) | | | 11.48 | | | 16.39 | %(f) | | | | 18,921 | | | 1.14% | | 2.33% | | 1.19% | | 67% |
| Year Ended October 31, 2011 | | | | 11.48 | | | 0.37 | | | (0.12 | ) | | | | 0.25 | | | | (0.44) | | | — | | | | | — | | | | (0.44) | | | 11.29 | | | 2.19 | %(g) | | | | 23,719 | | | 1.06% | | 3.16% | | 1.09% | | 63% |
| Year Ended October 31, 2012 | | | | 11.29 | | | 0.26 | | | 0.65 | | | | | 0.91 | | | | (0.32) | | | — | | | | | — | | | | (0.32) | | | 11.88 | | | 8.24 | % | | | | 25,175 | | | 1.16% | | 2.30% | | 1.16% | | 61% |
| CLASS B SHARES | | | | | | | | | | | | | | | | | | | | | | | | | | | | | | | | | | | | | | | | | | | | | | | | | | | |
| Year Ended October 31, 2008 | | | $ | 13.27 | | | 0.11 | | | (4.08 | ) | | | | (3.97 | ) | | | (0.10) | | | (0.50 | ) | | | | (0.01 | ) | | | (0.61) | | | 8.69 | | | (31.17 | )%(d) | | | $ | 12,354 | | | 2.23% | | 1.00% | | 2.23% | | 80% |
| Year Ended October 31, 2009 | | | | 8.69 | | | 0.06 | | | 1.39 | | | | | 1.45 | | | | (0.06) | | | — | | | | | — | | | | (0.06) | | | 10.08 | | | 16.82 | %(e) | | | | 14,230 | | | 2.19% | | 0.71% | | 2.24% | | 41% |
| Year Ended October 31, 2010 | | | | 10.08 | | | 0.17 | | | 1.38 | | | | | 1.55 | | | | (0.17) | | | — | | | | | — | | | | (0.17) | | | 11.46 | | | 15.61 | %(f) | | | | 18,362 | | | 1.89% | | 1.59% | | 1.94% | | 67% |
| Year Ended October 31, 2011 | | | | 11.46 | | | 0.28 | | | (0.10 | ) | | | | 0.18 | | | | (0.36) | | | — | | | | | — | | | | (0.36) | | | 11.28 | | | 1.51 | %(g) | | | | 20,323 | | | 1.81% | | 2.40% | | 1.84% | | 63% |
| Year Ended October 31, 2012 | | | | 11.28 | | | 0.19 | | | 0.63 | | | | | 0.82 | | | | (0.23) | | | — | | | | | — | | | | (0.23) | | | 11.87 | | | 7.43 | % | | | | 17,615 | | | 1.92% | | 1.64% | | 1.92% | | 61% |
| CLASS C SHARES | | | | | | | | | | | | | | | | | | | | | | | | | | | | | | | | | | | | | | | | | | | | | | | | | | | |
| Year Ended October 31, 2008 | | | $ | 12.97 | | | 0.11 | | | (3.97 | ) | | | | (3.86 | ) | | | (0.11) | | | (0.50 | ) | | | | (0.01 | ) | | | (0.62) | | | 8.49 | | | (31.09 | )%(d) | | | $ | 1,408 | | | 2.23% | | 1.00% | | 2.23% | | 80% |
| Year Ended October 31, 2009 | | | | 8.49 | | | 0.06 | | | 1.35 | | | | | 1.41 | | | | (0.06) | | | — | | | | | — | | | | (0.06) | | | 9.84 | | | 16.75 | %(e) | | | | 1,488 | | | 2.19% | | 0.72% | | 2.24% | | 41% |
| Year Ended October 31, 2010 | | | | 9.84 | | | 0.17 | | | 1.35 | | | | | 1.52 | | | | (0.18) | | | — | | | | | — | | | | (0.18) | | | 11.18 | | | 15.55 | %(f) | | | | 2,544 | | | 1.90% | | 1.59% | | 1.95% | | 67% |
| Year Ended October 31, 2011 | | | | 11.18 | | | 0.27 | | | (0.11 | ) | | | | 0.16 | | | | (0.36) | | | — | | | | | — | | | | (0.36) | | | 10.98 | | | 1.42 | %(g) | | | | 3,859 | | | 1.81% | | 2.40% | | 1.84% | | 63% |
| Year Ended October 31, 2012 | | | | 10.98 | | | 0.18 | | | 0.62 | | | | | 0.80 | | | | (0.23) | | | — | | | | | — | | | | (0.23) | | | 11.55 | | | 7.49 | % | | | | 3,329 | | | 1.91% | | 1.64% | | 1.91% | | 61% |
| * | | The per share amounts and percentages reflect income and expenses assuming inclusion of the Fund’s proportionate share of the income and expenses of the applicable HSBC Portfolios, the Fund does not include expenses of the affiliated and unaffiliated investment companies, in which the Fund invests. |
| (a) | | Calculated based on average shares outstanding. |
| (b) | | Total return calculations do not include any sales or redemption charges. |
| (c) | | Portfolio turnover rate is calculated by aggregating the results of multiplying the Fund’s investment percentage in the respective Portfolios, affiliated and unaffiliated investment companies by their corresponding portfolio turnover rates. Portfolio turnover rate is calculated on the basis of the Fund as a whole without distinguishing between classes of shares issued. |
| (d) | | During the year ended October 31, 2008, certain HSBC Portfolios, in which the Fund invests, received monies related to certain nonrecurring litigation settlements. The corresponding impact to the total return was 0.19%, 0.19% and 0.19% for Class A Shares, Class B Shares and Class C Shares, respectively. |
| (e) | | During the year ended October 31, 2009, certain HSBC Portfolios, in which the Fund invests, received monies related to certain nonrecurring litigation settlements. The corresponding impact to the total return was 0.09%, 0.09% and 0.09% for Class A Shares, Class B Shares and Class C Shares, respectively. |
| (f) | | During the year ended October 31, 2010, certain HSBC Portfolios, in which the Fund invests, received monies related to certain nonrecurring litigation settlements. The corresponding impact to the total return was 0.06%, 0.06% and 0.06% for Class A Shares, Class B Shares and Class C Shares, respectively. |
| (g) | | During the year ended October 31, 2011, certain HSBC Portfolios, in which the Fund invests, received monies related to certain nonrecurring litigation settlements. The corresponding impact to the total return was 0.04%, 0.04% and 0.04% for Class A Shares, Class B Shares and Class C Shares, respectively. |
36 HSBC WORLD SELECTION FUNDS | See notes to financial statements. |
| CONSERVATIVE STRATEGY FUND |
Financial Highlights |
Selected data for a share outstanding throughout the periods indicated.*
| | | | | | | Investment Activities | | Dividends | | | | | | | | | | Ratios/Supplementary Data |
| | | | | | | | | | | | | | | | | | | | | | | | | | | | | | | | | | | | | | | | | | | | | Ratios of | | |
| | | | | | | | | Net | | | | | | | | | | | | | | | | | | | | | | | | | | | | | | | | | Expenses | | |
| | | | | | | | | Realized and | | | | | | | | | Net | | | | | | | | | | | | | | | | | | | Ratio of Net | | to Average | | |
| | Net Asset | | Net | | Unrealized | | | | | | | | | Realized | | | | | | | | | | | | Net Assets | | Ratio of Net | | Investment | | Net Assets | | |
| | Value, | | Investment | | Gains | | Total from | | Net | | Gains from | | | | Net Asset | | | | | at End of | | Expenses | | Income to | | (Excluding | | Portfolio |
| | Beginning | | Income | | (Losses) from | | Investment | | Investment | | Investment | | Total | | Value, End | | Total | | Period | | to Average | | Average | | Fee | | Turnover |
| | of Period | | (Loss)(a) | | Investments | | Activities | | Income | | Transactions | | Dividends | | of Period | | Return(b) | | (000’s) | | Net Assets | | Net Assets | | Reductions) | | (c) |
| CLASS A SHARES | | | | | | | | | | | | | | | | | | | | | | | | | | | | | | | | | | | | | | | | | | | | | | | |
| Year Ended October 31, 2008 | | | $ | 12.04 | | | 0.24 | | | (2.93 | ) | | | | (2.69 | ) | | | (0.25) | | | (0.26 | ) | | | (0.51) | | | $ | 8.84 | | | (23.17 | )%(d) | | | $ | 4,747 | | | 1.50% | | 2.24% | | 1.72% | | 69% |
| Year Ended October 31, 2009 | | | | 8.84 | | | 0.14 | | | 1.16 | | | | | 1.30 | | | | (0.13) | | | — | | | | (0.13) | | | | 10.01 | | | 14.95 | %(e) | | | | 5,059 | | | 1.50% | | 1.53% | | 1.62% | | 34% |
| Year Ended October 31, 2010 | | | | 10.01 | | | 0.26 | | | 1.11 | | | | | 1.37 | | | | (0.23) | | | — | | | | (0.23) | | | | 11.15 | | | 13.86 | %(f) | | | | 7,139 | | | 1.38% | | 2.42% | | 1.43% | | 78% |
| Year Ended October 31, 2011 | | | | 11.15 | | | 0.36 | | | (0.10 | ) | | | | 0.26 | | | | (0.46) | | | — | | | | (0.46) | | | | 10.95 | | | 2.40 | %(g) | | | | 8,946 | | | 1.19% | | 3.21% | | 1.22% | | 54% |
| Year Ended October 31, 2012 | | | | 10.95 | | | 0.27 | | | 0.58 | | | | | 0.85 | | | | (0.33) | | | — | | | | (0.33) | | | | 11.47 | | | 8.00 | % | | | | 9,933 | | | 1.34% | | 2.40% | | 1.34% | | 59% |
| CLASS B SHARES | | | | | | | | | | | | | | | | | | | | | | | | | | | | | | | | | | | | | | | | | | | | | | | |
| Year Ended October 31, 2008 | | | $ | 11.94 | | | 0.16 | | | (2.91 | ) | | | | (2.75 | ) | | | (0.17) | | | (0.26 | ) | | | (0.43) | | | $ | 8.76 | | | (23.76 | )%(d) | | | $ | 4,348 | | | 2.25% | | 1.48% | | 2.48% | | 69% |
| Year Ended October 31, 2009 | | | | 8.76 | | | 0.07 | | | 1.15 | | | | | 1.22 | | | | (0.07) | | | — | | | | (0.07) | | | | 9.91 | | | 14.05 | %(e) | | | | 4,907 | | | 2.25% | | 0.77% | | 2.38% | | 34% |
| Year Ended October 31, 2010 | | | | 9.91 | | | 0.17 | | | 1.10 | | | | | 1.27 | | | | (0.16) | | | — | | | | (0.16) | | | | 11.02 | | | 12.94 | %(f) | | | | 7,411 | | | 2.14% | | 1.68% | | 2.19% | | 78% |
| Year Ended October 31, 2011 | | | | 11.02 | | | 0.27 | | | (0.09 | ) | | | | 0.18 | | | | (0.38) | | | — | | | | (0.38) | | | | 10.82 | | | 1.68 | %(g) | | | | 8,995 | | | 1.94% | | 2.46% | | 1.97% | | 54% |
| Year Ended October 31, 2012 | | | | 10.82 | | | 0.18 | | | 0.58 | | | | | 0.76 | | | | (0.25) | | | — | | | | (0.25) | | | | 11.33 | | | 7.21 | % | | | | 9,810 | | | 2.10% | | 1.67% | | 2.10% | | 59% |
| CLASS C SHARES | | | | | | | | | | | | | | | | | | | | | | | | | | | | | | | | | | | | | | | | | | | | | | | |
| Year Ended October 31, 2008 | | | $ | 12.25 | | | 0.16 | | | (2.98 | ) | | | | (2.82 | ) | | | (0.17) | | | (0.26 | ) | | | (0.43) | | | $ | 9.00 | | | (23.73 | )%(d) | | | $ | 430 | | | 2.25% | | 1.46% | | 2.48% | | 69% |
| Year Ended October 31, 2009 | | | | 9.00 | | | 0.07 | | | 1.18 | | | | | 1.25 | | | | (0.07) | | | — | | | | (0.07) | | | | 10.18 | | | 13.97 | %(e) | | | | 485 | | | 2.25% | | 0.78% | | 2.37% | | 34% |
| Year Ended October 31, 2010 | | | | 10.18 | | | 0.18 | | | 1.14 | | | | | 1.32 | | | | (0.17) | | | — | | | | (0.17) | | | | 11.33 | | | 13.07 | %(f) | | | | 1,323 | | | 2.16% | | 1.71% | | 2.21% | | 78% |
| Year Ended October 31, 2011 | | | | 11.33 | | | 0.28 | | | (0.10 | ) | | | | 0.18 | | | | (0.39) | | | — | | | | (0.39) | | | | 11.12 | | | 1.57 | %(g) | | | | 2,486 | | | 1.94% | | 2.49% | | 1.96% | | 54% |
| Year Ended October 31, 2012 | | | | 11.12 | | | 0.19 | | | 0.60 | | | | | 0.79 | | | | (0.25) | | | — | | | | (0.25) | | | | 11.66 | | | 7.28 | % | | | | 2,897 | | | 2.08% | | 1.69% | | 2.08% | | 59% |
| * | | The per share amounts and percentages reflect income and expenses assuming inclusion of the Fund’s proportionate share of the income and expenses of the applicable HSBC Portfolios, the Fund does not include expenses of the affiliated and unaffiliated investment companies, in which the Fund invests. |
| (a) | | Calculated based on average shares outstanding. |
| (b) | | Total return calculations do not include any sales or redemption charges. |
| (c) | | Portfolio turnover rate is calculated by aggregating the results of multiplying the Fund’s investment percentage in the respective Portfolios, affiliated and unaffiliated investment companies by their corresponding portfolio turnover rates. Portfolio turnover rate is calculated on the basis of the Fund as a whole without distinguishing between classes of shares issued. |
| (d) | | During the year ended October 31, 2008, certain HSBC Portfolios, in which the Fund invests, received monies related to certain nonrecurring litigation settlements. The corresponding impact to the total return was 0.19%, 0.19% and 0.19% for Class A Shares, Class B Shares and Class C Shares, respectively. |
| (e) | | During the year ended October 31, 2009, certain HSBC Portfolios, in which the Fund invests, received monies related to certain nonrecurring litigation settlements. The corresponding impact to the total return was 0.08%, 0.08% and 0.08% for Class A Shares, Class B Shares and Class C Shares, respectively. |
| (f) | | During the year ended October 31, 2010, certain HSBC Portfolios, in which the Fund invests, received monies related to certain nonrecurring litigation settlements. The corresponding impact to the total return was 0.05%, 0.05% and 0.05% for Class A Shares, Class B Shares and Class C Shares, respectively. |
| (g) | | During the year ended October 31, 2011, certain HSBC Portfolios, in which the Fund invests, received monies related to certain nonrecurring litigation settlements. The corresponding impact to the total return was 0.02%, 0.02% and 0.02% for Class A Shares, Class B Shares and Class C Shares, respectively. |
| See notes to financial statements. | HSBC WORLD SELECTION FUNDS 37 |
| INCOME STRATEGY FUND |
Financial Highlights |
Selected data for a share outstanding throughout the period indicated.*
| | | | Investment Activities | | Dividends | | | | | | | | | Ratios/Supplementary Data |
| | | | | | Net | | | | | | | | | | | | | | | | | | | | | | | | Ratios of | | |
| | | | | | Realized and | | | | | | | | | | | | | | | | | | | | | | Ratio of Net | | Expenses | | |
| | | | | | Unrealized | | | | | | | | | | | | | | | | | | | | | | Investment | | to Average | | |
| | | | | | Gains | | | | | | | | | | | | | | | | | | | | Ratio of Net | | Income | | Net Assets | | |
| | Net Asset | | Net | | (Losses) from | | | | | | | | Net Asset | | | | Net Assets | | Expenses | | (Loss) to | | (Excluding | | |
| | Value, | | Investment | | Investments | | Total from | | Net | | | | Value, | | Total | | at End of | | to Average | | Average | | Fee | | Portfolio |
| | Beginning | | Income | | and Foreign | | Investment | | Investment | | Total | | End of | | Return | | Period | | Net | | Net | | Reductions) | | Turnover |
| | of Period | | (Loss)(a) | | Currencies | | Activities | | Income | | Dividends | | Period | | (b)(c) | | (000’s) | | Assets(d) | | Assets(d) | | (d) | | (c)(e) |
| CLASS A SHARES | | | | | | | | | | | | | | | | | | | | | | | | | | | | | | | | |
| Period Ended October 31, 2012(f) | | $10.00 | | 0.10 | | 0.40 | | 0.50 | | (0.07) | | (0.07) | | | $ | 10.43 | | | 5.02% | | | $ | 337 | | | 1.50% | | 1.58% | | 29.67% | | 31% |
| CLASS B SHARES | | | | | | | | | | | | | | | | | | | | | | | | | | | | | | | | |
| Period Ended October 31, 2012(f) | | $10.00 | | 0.06 | | 0.39 | | 0.45 | | (0.04) | | (0.04) | | | | 10.41 | | | 4.52% | | | | 348 | | | 2.25% | | 0.89% | | 26.84% | | 31% |
| CLASS C SHARES | | | | | | | | | | | | | | | | | | | | | | | | | | | | | | | | |
| Period Ended October 31, 2012(f) | | $10.00 | | 0.06 | | 0.39 | | 0.45 | | (0.04) | | (0.04) | | | | 10.41 | | | 4.47% | | | | 232 | | | 2.25% | | 0.90% | | 27.00% | | 31% |
| * | | The expense ratios reflected do not include expenses of the affiliated and unaffiliated investment companies, in which the Fund invests. |
| (a) | | Calculated based on average shares outstanding. |
| (b) | | Total return calculations do not include any sales or redemption charges. |
| (c) | | Not annualized for periods less than one year. |
| (d) | | Annualized for periods less than one year. |
| (e) | | Portfolio turnover rate is calculated on the basis of the Fund as a whole without the distinguishing between the classes of shares issued. |
| (f) | | Commenced operations on March 20, 2012. |
38 HSBC WORLD SELECTION FUNDS | See notes to financial statements. |
| HSBC WORLD SELECTION FUNDS |
Notes to Financial Statements—as of October 31, 2012 |
1. Organization:
The HSBC Funds (formerly, HSBC Investor Funds) (the “Trust’’), a Massachusetts business trust organized on April 22, 1987, is registered under the Investment Company Act of 1940, as amended (the “Act’’), as an open-end management investment company. As of October 31, 2012, the Trust is comprised of 17 separate operational funds, each a series of the HSBC Family of Funds (formerly, HSBC Investor Family of Funds), which also includes the HSBC Advisor Fund Trust and the HSBC Portfolios (formerly, HSBC Investor Portfolios) (collectively the “Trusts’’). The accompanying financial statements are presented for the following 5 funds (individually a “Fund’’, collectively the “World Selection Funds’’):
| Fund | |
| Aggressive Strategy Fund |
| Balanced Strategy Fund |
| Moderate Strategy Fund |
| Conservative Strategy Fund |
| Income Strategy Fund |
All of the World Selection Funds are diversified funds. Financial statements for all other funds of the Trusts are published separately.
The World Selection Funds, excluding the Income Strategy Fund, (“World Selection Feeder Funds”) currently invest in the HSBC Growth Portfolio (formerly, HSBC Investor Growth Portfolio) and HSBC Opportunity Portfolio (formerly, HSBC Investor Opportunity Portfolio) (individually a “Portfolio,” collectively the “Portfolios”), each of which is a diversified series of the HSBC Portfolios (the “Portfolio Trust”). The Portfolios operate as master funds in master-feeder arrangements in addition to receiving investments from the World Selection Feeder Funds.
The financial statements of the Portfolios, including the Schedules of Portfolio Investments, are included elsewhere in this report. The financial statements of the Portfolios should be read in conjunction with the financial statements of the World Selection Feeder Funds.
| | Proportionate | | Proportionate |
| | Ownership | | Ownership |
| | Interest in Growth Portfolio | | Interest in Opportunity Portfolio |
| Fund | | | on October 31, 2012(%) | | on October 31, 2012(%) |
| Aggressive Strategy Fund | | 2.2% | | 0.5% |
| Balanced Strategy Fund | | 4.8% | | 1.1% |
| Moderate Strategy Fund | | 2.9% | | 0.6% |
| Conservative Strategy Fund | | 0.9% | | 0.2% |
Each of the World Selection Funds is a “fund of funds,” meaning that it seeks to achieve its investment objective by investing primarily in a combination of mutual funds managed by HSBC Global Asset Management (USA) Inc. (the “Adviser”) (the “Affiliated Underlying Funds”), as well as mutual funds managed by other investment advisers and exchange-traded funds (“Unaffiliated Underlying Funds” and, together with the Affiliated Underlying Funds, the “Underlying Funds”). Each World Selection Fund may also purchase and hold Exchange Traded Notes (“ETNs”), which are debt securities issued by financial institutions that pay returns based on the performance of a market index or other reference asset. The Underlying Funds may include private equity funds and real estate funds that are organized as mutual funds or Exchange Traded Funds (“ETFs”). Each World Selection Fund invests according to the investment objectives and strategies described in its Prospectus.
The World Selection Funds are authorized to issue an unlimited number of shares of beneficial interest with a par value of $0.001 per share. Each Fund offers three classes of shares: Class A Shares, Class B Shares and Class C Shares. Class A Shares of the World Selection Funds (except, the Income Strategy Fund) have a maximum sales charge of 5.00% as a percentage of the original purchase price. The Income Strategy Fund has a maximum sales charge of 4.75% as a percentage of the original purchase price. Class B Shares of the World
HSBC WORLD SELECTION FUNDS 39
| HSBC WORLD SELECTION FUNDS |
Notes to Financial Statements—as of October 31, 2012 (continued) |
Selection Funds are offered without any front-end sales charge, but will be subject to a contingent deferred sales charge (“CDSC”) ranging from a maximum of 4.00% if redeemed less than one year after purchase to 0.00% if redeemed more than four years after purchase. Class C Shares of the World Selection Funds are offered without any front-end sales charge, but will be subject to a maximum CDSC of 1.00% if redeemed less than one year after purchase. Each class of shares in the World Selection Funds has identical rights and privileges except with respect to arrangements pertaining to shareholder servicing or distribution, class-related expenses, voting rights on matters affecting a single class of shares, and the exchange privileges of each class of shares.
Under the Trust’s organizational documents, the World Selection Funds’ officers and Trustees are indemnified against certain liabilities arising out of the performance of their duties to the World Selection Funds. In addition, in the normal course of business, the Trust enters into contracts with its service providers, which also provide for indemnifications by the World Selection Funds. The World Selection Funds’ maximum exposure under these arrangements is unknown as this would involve any future claims that may be made against the World Selection Funds. However, based on experience, the Trust expects the risk of loss to be remote.
2. Significant Accounting Policies:
The following is a summary of the significant accounting policies followed by the World Selection Funds in the preparation of their financial statements. The policies are in conformity with U.S. generally accepted accounting principles (“GAAP’’). The preparation of financial statements requires management to make certain estimates and assumptions that affect the reported amounts of assets and liabilities and disclosure of contingent assets and liabilities at the date of the financial statements and the reported amounts of increases and decreases in net assets from operations during the reporting period. Actual results could differ from those estimates.
Securities Valuation:
The World Selection Funds record their investments in the Underlying Funds at the net asset value reported by those funds. The World Selection Feeder Funds record their investments in the Portfolios at fair value. The underlying securities of the Portfolios are recorded at fair value, as more fully discussed in the notes to those financial statements. Fair value is defined as the price that would be received to sell an asset or paid to transfer a liability in an orderly transaction between market participants at the measurement date. The valuation techniques used to determine fair value in funds or Portfolios in which the World Selection Funds are invested are described in their respective notes to financial statements.
Investment Transactions and Related Income:
The World Selection Feeder Funds record daily their proportionate income, expenses and unrealized/ realized gains and losses derived from their respective Portfolios. Dividend income is recorded on the ex-dividend date for the Underlying Funds. Changes in holdings of the Underlying Funds for each World Selection Fund are reflected not later than one business day after trade date. However, for financial reporting purposes, changes in holdings of the Underlying Funds are accounted for on trade date. In addition, the World Selection Funds accrue their own expenses daily.
Allocations:
Expenses directly attributable to a Fund are charged to that Fund. Expenses not directly attributable to a Fund are allocated proportionately among the applicable series within the Trusts in relation to the net assets of each fund or on another reasonable basis. Class specific expenses are charged directly to the class incurring the expense. In addition, income, expenses (other than class specific expenses), and unrealized and realized gains and losses are allocated to each class based on relative net assets on a daily basis.
Dividends to Shareholders:
Dividends to shareholders from net investment income, if any, are declared and distributed monthly in the case of the Income Strategy Fund, quarterly in the case of the Moderate Strategy Fund and Conservative Strategy Fund, and annually in the case of the Aggressive Strategy Fund and Balanced Strategy Fund.
40 HSBC WORLD SELEC TION FUNDS
| HSBC WORLD SELECTION FUNDS |
| Notes to Financial Statements—as of October 31, 2012 (continued) |
The World Selection Funds’ net realized gains, if any, are distributed to shareholders at least annually. Additional distributions are also made to the World Selection Funds’ shareholders to the extent necessary to avoid the federal excise tax on certain undistributed income and net capital gains of regulated investment companies.
The amount and character of net investment income and net realized gains distributions are determined in accordance with federal income tax regulations which may differ from GAAP. These “book/tax’’ differences are either considered temporary or permanent in nature. To the extent these differences are permanent in nature (e.g., reclassification of market discounts, certain gain/loss, paydowns, and certain distributions), such amounts are reclassified within the composition of net assets; temporary differences (e.g., wash losses and post-October loss deferrals) do not require reclassification. The World Selection Funds may utilize equalization accounting for tax purposes and designate earnings and profits, including net realized gains distributed to shareholders on redemption of shares, as a part of the dividends paid deduction for income tax purposes. To the extent distributions to shareholders from net investment income and net realized gains exceed net investment income and net realized gains for tax purposes, they are reported as distributions of capital.
Federal Income Taxes:
Each Fund is a separate taxable entity for federal income tax purposes. Each Fund has qualified and intends to continue to qualify each year as a “regulated investment company’’ under Subchapter M of the Internal Revenue Code, as amended, and to distribute substantially all of its taxable net investment income and net realized gains, if any, to its shareholders. Accordingly, no provision for federal income or excise tax is required.
Management of the Funds has reviewed tax positions taken in tax years that remain subject to examination by all major tax jurisdictions, including federal (i.e., the last four tax year ends and the interim tax period since then, as applicable). Management believes that there is no tax liability resulting from unrecognized tax benefits related to uncertain tax positions taken.
3. Investment Valuation Summary:
The valuation techniques employed by the World Selection Funds, as described below, maximize the use of observable inputs and minimize the use of unobservable inputs in determining fair value. The inputs used for valuing the World Selection Funds’ investments are summarized in the three broad levels listed below:
- Level 1: quoted prices in active markets for identical assets
- Level 2: other significant observable inputs (including quoted prices for similar securities, interest rates, prepayment speeds, credit risk, etc.)
- Level 3: significant unobservable inputs (including the Fund’s own assumptions in determining the fair value of investments)
Changes in valuation techniques may result in transfers in or out of an assigned level within the disclosure hierarchy. The Funds determine transfers between fair value hierarchy levels at the reporting period end. The inputs or methodology used for valuing investments is not necessarily an indication of the risk associated with investing in those investments.
The World Selection Funds record their investments in the Underlying Funds at the net asset value reported by those funds and are typically categorized as Level 1 in the fair value hierarchy. The World Selection Feeder Funds record their investments in their respective Portfolios at fair value and are typically categorized as a Level 2 in the fair value hierarchy. The underlying securities of the Portfolios are recorded at fair value, as discussed more fully in the Notes to Financial Statements of the Portfolios included in this report.
For the year ended October 31, 2012, there were no Level 3 investments for which significant unobservable inputs were used to determine fair value.
HSBC WORLD SELECTION FUNDS 41
| HSBC WORLD SELECTION FUNDS |
| Notes to Financial Statements—as of October 31, 2012 (continued) |
The following is a summary of the valuation inputs used as of October 31, 2012 in valuing the World Selection Funds’ investments based upon the three levels defined above:
| | LEVEL 1($) | | LEVEL 2($) | | LEVEL 3($) | | Total($) |
| Aggressive Strategy Fund | | | | | | | | |
| Investment Securities: | | | | | | | | |
| Affiliated Investment Company | | 317,841 | | — | | — | | 317,841 |
| Affiliated Portfolios (a) | | — | | 2,521,395 | | — | | 2,521,395 |
| Unaffiliated Investment Companies | | 8,768,194 | | — | | — | | 8,768,194 |
| Exchange Traded Funds | | 6,142,083 | | — | | — | | 6,142,083 |
| Total Investment Securities | | 15,228,118 | | 2,521,395 | | — | | 17,749,513 |
| Balanced Strategy Fund | | | | | | | | |
| Investment Securities: | | | | | | | | |
| Affiliated Investment Companies | | 5,223,141 | | — | | — | | 5,223,141 |
| Affiliated Portfolios (a) | | — | | 5,448,924 | | — | | 5,448,924 |
| Unaffiliated Investment Companies | | 28,007,164 | | — | | — | | 28,007,164 |
| Exchange Traded Funds | | 13,749,819 | | — | | — | | 13,749,819 |
| Total Investment Securities | | 46,980,124 | | 5,448,924 | | — | | 52,429,048 |
| Moderate Strategy Fund | | | | | | | | |
| Investment Securities: | | | | | | | | |
| Affiliated Investment Companies | | 5,646,865 | | — | | — | | 5,646,865 |
| Affiliated Portfolios (a) | | — | | 3,265,654 | | — | | 3,265,654 |
| Unaffiliated Investment Companies | | 28,063,076 | | — | | — | | 28,063,076 |
| Exchange Traded Funds | | 9,283,747 | | — | | — | | 9,283,747 |
| Total Investment Securities | | 42,993,688 | | 3,265,654 | | — | | 46,259,342 |
| Conservative Strategy Fund | | | | | | | | |
| Investment Securities: | | | | | | | | |
| Affiliated Investment Companies | | 2,817,273 | | — | | — | | 2,817,273 |
| Affiliated Portfolios (a) | | — | | 986,142 | | — | | 986,142 |
| Unaffiliated Investment Companies | | 15,875,079 | | — | | — | | 15,875,079 |
| Exchange Traded Funds | | 3,104,903 | | — | | — | | 3,104,903 |
| Total Investment Securities | | 21,797,255 | | 986,142 | | — | | 22,783,397 |
| Income Strategy Fund | | | | | | | | |
| Investment Securities: | | | | | | | | |
| Affiliated Investment Companies | | 98,144 | | — | | — | | 98,144 |
| Unaffiliated Investment Companies | | 844,129 | | — | | — | | 844,129 |
| Exchange Traded Funds | | 12,056 | | — | | — | | 12,056 |
| Total Investment Securities | | 954,329 | | — | | — | | 954,329 |
____________________
| (a) | | Investments in Affiliated Portfolios represent ownership interests in the Portfolios. Due to the Funds’ master-feeder structure, the inputs used for valuing these instruments are categorized as Level 2. |
42 HSBC WORLD SELECTION FUNDS
| HSBC WORLD SELECTION FUNDS |
| Notes to Financial Statements—as of October 31, 2012 (continued) |
New Accounting Pronouncements:
In December 2011, the Financial Accounting Standards Board issued ASU No. 2011-11 “Disclosures about Offsetting Assets and Liabilities” requiring disclosure of both gross and net information related to offsetting and related arrangements enabling users of its financial statements to understand the effect of those arrangements on the entity’s financial position. The objective of this disclosure is to facilitate comparison between those entities that prepare their financial statements on the basis of U.S. GAAP and those entities that prepare their financial statements on the basis of IFRSs. ASU No. 2011-11 is effective for interim and annual periods beginning on or after January 1, 2013. Adoption of ASU No. 2011-11 will have no effect on the Funds’ net assets. At this time, management is evaluating any impact ASU No. 2011-11 may have on the Funds’ financial statements disclosures.
4. Related Party Transactions:
Investment Management:
HSBC Global Asset Management (USA), Inc. (“HSBC” or the “Investment Adviser”), a wholly owned subsidiary of HSBC Bank USA, N.A., a national bank organized under the laws of the United States, acts as investment adviser to the World Selection Funds. As Investment Adviser, HSBC manages the investments of the World Selection Funds and continuously reviews, supervises and administers the World Selection Funds’ investments pursuant to an Investment Advisory Contract. For its services as Investment Adviser, HSBC is entitled to receive a fee, computed daily and paid monthly, based on average daily net assets, at an annual rate of 0.25% for each Fund.
Administration:
HSBC serves the Trusts as Administrator. Under the terms of the Administration Agreement, HSBC received from the Trusts a fee, accrued daily and paid monthly, at an annual rate of:
| Based on Average Daily Net Assets of | | | Fee Rate(%) |
| Up to $10 billion | | 0.0550 |
| In excess of $10 billion but not exceeding $20 billion | | 0.0350 |
| In excess of $20 billion but not exceeding $50 billion | | 0.0275 |
| In excess of $50 billion | | 0.0250 |
The fee breakpoints are determined on the basis of the aggregate average daily net assets of the Trusts. The fee is allocated to each series of the Trusts based upon its proportionate share of the aggregate net assets. For assets invested in the Portfolios by World Selection Feeder Funds, the Portfolios pay half of the administration fee and the World Selection Feeder Funds pay half, for a combination of the total fee rate above. Certain administration fees of the Portfolios also may be reduced by treating them as apportioned in part to other funds making investments in the Portfolios in master-feeder structures. An amount equal to 50% of the administration fee is deemed to be class-specific.
Pursuant to a Sub-Administration Agreement with HSBC, Citi Fund Services Ohio, Inc. (“Citi’’), a wholly-owned subsidiary of Citigroup, Inc., serves as the Sub-Administrator for the Trusts subject to the general supervision by the Trusts’ Board (the “Board’’) and HSBC. For these services, Citi is entitled to a fee, payable by HSBC, at an annual rate equivalent to the fee rates set forth above subject to certain reductions associated with services provided to new funds minus 0.02%, which is retained by HSBC.
Under a Compliance Services Agreement between the Trusts and Citi (the “CCO Agreement’’), Citi makes an employee available to serve as the Trusts’ Chief Compliance Officer (the “CCO’’). Under the CCO Agreement, Citi also provides infrastructure and support in implementing the written policies and procedures comprising the Trusts’ compliance program, including support services to the CCO. For the services provided under the CCO Agreement, the Trusts paid Citi $281,280 for the year ended October 31, 2012, plus reimbursement of certain out of pocket expenses. Expenses incurred by each Fund are reflected on the Statements of Operations as “Compliance Services.’’ Citi pays the salary and other compensation earned by individuals performing these services, as employees of Citi.
HSBC WORLD SELECTION FUNDS 43
| HSBC WORLD SELECTION FUNDS |
| Notes to Financial Statements—as of October 31, 2012 (continued) |
Distribution Arrangements:
Foreside Distribution Services, L.P. (“Foreside”), a wholly-owned subsidiary of Foreside Financial Group LLC, serves the Trusts as Distributor (the “Distributor’’). The Trust has adopted a non-compensatory Distribution Plan and Agreement (the “Distribution Plan’’) pursuant to Rule 12b-1 of the Act. The Distribution Plan provides for reimbursement of expenses incurred by the Distributor related to distribution and marketing, at a rate not to exceed 0.25%, 1.00%, and 1.00% of the average daily net assets of Class A Shares (currently not being charged), Class B Shares (currently charging 0.75%), and Class C Shares (currently charging 0.75%) of the World Selection Funds, respectively. For the year ended October 31, 2012, Foreside, as Distributor, also received $346,561, $261,621, and $34,163 in commissions from sales of the Trusts, for Class A Shares, Class B Shares, and Class C Shares, respectively of which $25, $12, and $0 were reallocated to HSBC-affiliated brokers and dealers, for Class A Shares, Class B Shares, and Class C Shares, respectively.
Shareholder Servicing:
The Trust has adopted a Shareholder Services Plan which provides for payments to shareholder servicing agents (which currently consist of HSBC and its affiliates) for providing various shareholder services. For performing these services, the shareholder servicing agents receive a fee that is computed daily and paid monthly up to 0.25% of the average daily net assets of each of the Class A Shares, Class B Shares and Class C Shares of the World Selection Funds. The fees paid to the Distributor pursuant to the Distribution Plan and to shareholder servicing agents pursuant to the Shareholder Services Plan currently are not intended to exceed, in the aggregate, 0.25% of the average daily net assets of Class A Shares and 1.00% of the average daily net assets of Class B Shares and Class C Shares.
Fund Accounting and Transfer Agency:
Citi provides fund accounting and transfer agency services for each Fund. As transfer agent, Citi receives a fee based on the number of funds and shareholder accounts, subject to certain minimums, reductions associated with services provided to new funds and reimbursement of certain expenses. As fund accountant, Citi receives an annual fee per series and share class, subject to minimums, reductions associated with services provided to new funds and reimbursement of certain expenses. Citi receives additional fees paid by the Trust for blue sky exemption services.
Independent Trustees:
Prior to January 1, 2012, the Trusts, in the aggregate, paid each Independent Trustee an annual retainer of $63,000, a fee of $5,000 for each regular meeting of the Board of Trustees attended, a fee of $3,000 for each special telephonic meeting attended, and a fee of $5,000 for each special in-person meeting attended. The Trusts also paid each Independent Trustee an annual retainer of $3,000 for each Committee on which such Trustee served as a Committee member as well as a fee of $3,000 for each Committee meeting attended. Additionally, the Trusts paid each Committee Chair an annual retainer of $6,000, with the exception of the Chair of the Audit Committee, who received a retainer of $8,000. The Trusts also paid the Chairman of the Board, an additional annual retainer of $20,000, as well as an additional $4,000 for each regular meeting of the Board attended. In addition, for time expended on Board duties outside normal meetings, which is authorized by the Board, a Trustee was compensated at the rate of $500 per hour, up to a maximum of $3,000 per day.
Effective January 1, 2012, the Trusts pay each Independent Trustee an annual retainer of $100,000. The Trusts pay a fee of $10,000 for each regular meeting of the Board of Trustees attended and a fee of $3,000 for each special meeting attended. The Trusts pay each Committee Chair an annual retainer of $3,000, with the exception of the Chair of the Audit Committee, who receives a retainer of $6,000. The Trusts also pay the Chairman of the Board, an additional annual retainer of $24,000. In addition, for time expended on Board duties outside normal meetings, which is authorized by the Board, a Trustee is compensated at the rate of $500 per hour, up to a maximum of $3,000 per day.
Fee Reductions:
The Investment Adviser has agreed to contractually limit from March 1, 2012 through March 1, 2013 the total expenses, exclusive of interest, taxes, brokerage commissions, estimated indirect expenses attributable to the Fund’s investments in investment companies other than the HSBC Growth Portfolio and the HSBC
44 HSBC WORLD SELECTION FUNDS
| HSBC WORLD SELECTION FUNDS |
| Notes to Financial Statements—as of October 31, 2012 (continued) |
Opportunity Portfolio, and extraordinary expenses of the World Selection Funds. Each Fund Class has its own expense limitations based on the average daily net assets for any full fiscal year as follows: Class A Shares 1.50%, Class B Shares 2.25%, Class C Shares 2.25%.
Any amounts contractually waived or reimbursed by the Investment Adviser will be subject to repayment by the respective Fund to the Investment Adviser within three years to the extent that the repayment will not cause the Fund’s operating expenses to exceed the contractual expense limit that was in effect at the time of such waiver or reimbursement. During the year ended October 31, 2012, the Investment Adviser did not recapture any of its prior contractual waivers or reimbursements. As of October 31, 2012, the repayments that may potentially be made by the Funds are as follows:
| Fund | | | 2015($) | | 2014($)* | | 2013($)* | | Total |
| Aggressive Strategy Fund | | 27,768 | | 19,298 | | 56,869 | | 103,935 |
| Income Strategy Fund | | 77,417 | | N/A | | N/A | | 77,417 |
____________________
| * | | The year listed above the amounts is the fiscal year ending in which the amounts will no longer be recoupable. |
The Administrator and Citi may voluntarily waive/reimburse fees to help support the expense limits of each Fund. In addition, HSBC, in its role as Investment Adviser and Administrator, may waive/reimburse additional fees at its discretion. Any voluntary fee waivers/reimbursements are not subject to recoupment in subsequent fiscal periods. Voluntary waivers/reimbursements may be stopped at any time. Amounts waived/reimbursed by the Investment Adviser, Administrator, and Citi are reported separately on the Statements of Operations, as applicable.
5. Investment Transactions:
Cost of purchases and proceeds from sales of securities (excluding securities maturing less than one year from acquisition) for the year ended October 31, 2012 were as follows:
| Fund | | | Purchases($) | | Sales($) |
| Aggressive Strategy Fund | | 17,584,777 | | 9,729,354 |
| Balanced Strategy Fund | | 43,640,692 | | 26,717,167 |
| Moderate Strategy Fund | | 34,220,178 | | 24,498,341 |
| Conservative Strategy Fund | | 16,734,590 | | 11,653,841 |
| Income Strategy Fund | | 994,933 | | 130,314 |
Contributions and withdrawals of the respective Portfolios for the year ended October 31, 2012 totaled:
| Fund | | | Contributions($) | | Withdrawals($) |
| Aggressive Strategy Fund | | 11,257,257 | | 12,960,328 |
| Balanced Strategy Fund | | 29,114,859 | | 35,165,361 |
| Moderate Strategy Fund | | 18,486,305 | | 24,432,712 |
| Conservative Strategy Fund | | 8,823,369 | | 8,521,980 |
HSBC WORLD SELECTION FUNDS 45
| HSBC WORLD SELECTION FUNDS |
| Notes to Financial Statements—as of October 31, 2012 (continued) |
6. Federal Tax Information:
At October 31, 2012, the cost basis of securities (which excludes investments in the Affiliated Portfolios) for federal income tax purposes, gross unrealized appreciation, gross unrealized depreciation and net unrealized appreciation/depreciation were as follows:
| | | | | | | | | | | | | Net Unrealized |
| | | | Tax Unrealized | | Tax Unrealized | | Appreciation/ |
| Fund | | | Tax Cost($) | | Appreciation($) | | Depreciation($) | | (Depreciation)($) |
| Aggressive Strategy Fund | | 15,002,427 | | | 502,236 | | | | (276,545 | ) | | | | 225,691 | |
| Balanced Strategy Fund | | 46,350,811 | | | 1,797,432 | | | | (1,168,119 | ) | | | | 629,313 | |
| Moderate Strategy Fund | | 42,210,532 | | | 1,642,141 | | | | (858,985 | ) | | | | 783,156 | |
| Conservative Strategy Fund | | 21,133,907 | | | 923,988 | | | | (260,640 | ) | | | | 663,348 | |
| Income Strategy Fund | | 936,523 | | | 18,051 | | | | (245 | ) | | | | 17,806 | |
The tax character of dividends paid by the World Selection Funds as of the year ended October 31, 2012, was as follows:
| | Dividends paid from |
| | | | | | Net Long Term | | Total Taxable | | Total Dividends |
| | Ordinary Income($) | | Capital Gains($) | | Dividends($) | | Paid($)(1) |
| Aggressive Strategy Fund | | | 92,405 | | | — | | | 92,405 | | | | 92,405 | |
| Balanced Strategy Fund | | | 1,541,114 | | | — | | | 1,541,114 | | | | 1,541,114 | |
| Moderate Strategy Fund | | | 1,134,889 | | | — | | | 1,134,889 | | | | 1,134,889 | |
| Conservative Strategy Fund | | | 556,629 | | | — | | | 556,629 | | | | 556,629 | |
| Income Strategy Fund | | | 2,407 | | | — | | | 2,407 | | | | 2,407 | |
The tax character of dividends paid by the World Selection Funds as of the latest tax year ended October 31, 2011, was as follows:
| | Dividends paid from |
| | | | | | Net Long Term | | Total Taxable | | Total Dividends |
| | Ordinary Income($) | | Capital Gains($) | | Dividends($) | | Paid($)(1) |
| Aggressive Strategy Fund | | | 87,689 | | | — | | | 87,689 | | | | 87,689 | |
| Balanced Strategy Fund | | | 860,523 | | | — | | | 860,523 | | | | 860,523 | |
| Moderate Strategy Fund | | | 1,550,290 | | | — | | | 1,550,290 | | | | 1,550,290 | |
| Conservative Strategy Fund | | | 693,656 | | | — | | | 693,656 | | | | 693,656 | |
____________________
| (1) | | Total dividends paid may differ from the amount reported in the Statements of Changes in Net Assets because dividends are recognized when actually paid for tax purposes. |
As of October 31, 2012, the components of accumulated earnings/(deficit) on a tax basis for the World Selection Funds were as follows:
| | | | | | | | | | | | | | | | | | | | | | | | | | | | Total |
| | Undistributed | | Undistributed | | Undistributed | | | | | | | | | | | Accumulated | | Unrealized | | Accumulated |
| | Ordinary | | Tax Exempt | | Long Term | | Accumulated | | Distributions | | Capital and | | Appreciation/ | | Earnings/ |
| | Income($) | | Income($) | | Capital Gains($) | | Earnings($) | | Payable($) | | Other Losses($) | | (Depreciation)($)(2) | | (Deficit)($) |
| Aggressive Strategy Fund | | | — | | | — | | — | | | — | | | | — | | | | | (354,485 | ) | | | | 839,379 | | | | 484,894 | |
| Balanced Strategy Fund | | | 320,044 | | | — | | — | | | 320,044 | | | | — | | | | | (265,735 | ) | | | | 1,994,934 | | | | 2,049,243 | |
| Moderate Strategy Fund | | | 43,008 | | | — | | — | | | 43,008 | | | | — | | | | | (472,739 | ) | | | | 1,653,973 | | | | 1,224,242 | |
| Conservative Strategy Fund | | | 16,694 | | | — | | — | | | 16,694 | | | | — | | | | | (126,294 | ) | | | | 916,392 | | | | 806,792 | |
| Income Strategy Fund | | | 11,671 | | | — | | — | | | 11,671 | | | | (668 | ) | | | | — | | | | | 17,806 | | | | 28,809 | |
____________________
| (2) | | The differences between book-basis and tax-basis unrealized appreciation/depreciation are attributable primarily to: tax deferral of losses on wash sales, the realization for tax purposes of unrealized gains/losses on certain derivative instruments, the difference between book and tax amortization methods for premium and market discount, the realization for tax purposes of unrealized gains/losses on investments in passive foreign investment companies, and the return of capital adjustments from real estate investment trusts. |
46 HSBC WORLD SELECTION FUNDS
| HSBC WORLD SELECTION FUNDS |
| Notes to Financial Statements—as of October 31, 2012 (continued) |
As of the end of the tax year ended October 31, 2012, the Funds have net capital loss carryforwards (“CLCFs”) as summarized in the tables below. CLCFs subjects to expiration are applied as short-term capital loss regardless of whether the originating capital loss was short-term or long-term. CLCFs that are not subject to expiration must be utilized before those that are subject to expiration. As a result of the Regulated Investment Company Modernization Act of 2010 (the “RIC Modernization Act”) ordering rule, capital loss carryforwards incurred in taxable years beginning prior to the effective date of the RIC Modernization Act have an increased likelihood to expire unused.
CLCFs subject to expiration:
| | Short Term | | |
| Fund | | | Amount($) | | Expires |
| Aggressive Strategy Fund | | | 290,416 | | | 2017 |
| Balanced Strategy Fund | | | 265,735 | | | 2017 |
| Moderate Strategy Fund | | | 472,739 | | | 2017 |
| Conservative Strategy Fund | | | 18,849 | | | 2017 |
| CLCFs not subject to expiration: | | | | | | |
| | Short Term | | Long Term | | |
| Fund | | | Amount($) | | Amount($) | | Total($) |
| Conservative Strategy Fund | | 32,459 | | 74,986 | | 107,445 |
For the year October 31, 2012, the following Funds utilized capital loss carryforwards to offset capital gains realized:
| Fund | | | Amount($) |
| Aggressive Strategy Fund | | 88,538 |
| Balanced Strategy Fund | | 641,948 |
| Moderate Strategy Fund | | 236,751 |
Under current law, capital losses and specified ordinary losses realized after October 31st and non-specified ordinary losses incurred after December 31st (ordinary losses collectively known as “late year ordinary loss”) my be deferred and treated as occuring on the first business day of the following fiscal year. The following Fund had deferred losses, which will be treated as arising on the first day of the fiscal year to end October 31, 2013.
| | Late Year |
| | Ordinary Losses |
| Aggressive Strategy Fund | | $64,069 |
7. Subsequent Events:
Management has evaluated events and transactions through the date the financial statements were issued, for purposes of recognition or disclosure in these financial statements and there are no subsequent events to report.
HSBC WORLD SELECTION FUNDS 47
Report of Independent Registered Public Accounting Firm
To the Shareholders and Board of Trustees of
HSBC Funds:
We have audited the accompanying statements of assets and liabilities of HSBC World Selection Funds – Aggressive Strategy Fund, Balanced Strategy Fund, Moderate Strategy Fund, Conservative Strategy Fund and Income Strategy Fund (the Funds), including the schedules of portfolio investments, as of October 31, 2012, and the related statements of operations for the year or period then ended, the statements of changes in net assets for each of the years or periods in the two-year period then ended and the financial highlights for each of the years or periods in the five-year period then ended. These financial statements and financial highlights are the responsibility of the Funds’ management. Our responsibility is to express an opinion on these financial statements and financial highlights based on our audits.
We conducted our audits in accordance with the standards of the Public Company Accounting Oversight Board (United States). Those standards require that we plan and perform the audit to obtain reasonable assurance about whether the financial statements and financial highlights are free of material misstatement. An audit includes examining, on a test basis, evidence supporting the amounts and disclosures in the financial statements. Our procedures included confirmation of securities owned as of October 31, 2012, by correspondence with the custodian, transfer agents, or by other appropriate auditing procedures. An audit also includes assessing the accounting principles used and significant estimates made by management, as well as evaluating the overall financial statement presentation. We believe that our audits provide a reasonable basis for our opinion.
In our opinion, the financial statements and financial highlights referred to above present fairly, in all material respects, the financial position of the Funds as of October 31, 2012, the results of their operations for the year or period then ended, the changes in their net assets for each of the years or periods in the two-year period then ended, and the financial highlights for each of the years or periods in the five-year period then ended, in conformity with U.S. generally accepted accounting principles.

| Columbus, Ohio |
| December 21, 2012 |
48 HSBC WORLD SELECTION FUNDS
| HSBC WORLD SELECTION FUNDS |
| Other Federal Income Tax Information—as of October 31, 2012 (Unaudited) |
For the year ended October 31, 2012, the following percentages of the total ordinary income dividends paid by the Funds qualify for the corporate dividends received deduction available to corporate shareholders:
| | Dividends |
| Fund | | | Received Deduction |
| Aggressive Strategy Fund | | 98.68 | % |
| Balanced Strategy Fund | | 21.14 | % |
| Moderate Strategy Fund | | 15.07 | % |
| Conservative Strategy Fund | | 9.06 | % |
| Income Strategy Fund | | 7.50 | % |
For the year ended October 31, 2012, dividends paid by the Funds may be subject to a maximum tax rate of 15%, as provided for by the Jobs and Growth Tax Relief Reconciliation Act of 2003. The Funds intend to designate the maximum amount allowable as taxed at a maximum rate of 15%. Complete information will be reported in conjunction with your 2012 Form 1099-DIV:
| | Qualified |
| Fund | | | Dividend Income |
| Aggressive Strategy Fund | | 100.00 | % |
| Balanced Strategy Fund | | 26.93 | % |
| Moderate Strategy Fund | | 8.50 | % |
| Conservative Strategy Fund | | 4.51 | % |
HSBC WORLD SELECTION FUNDS 49
| HSBC WORLD SELECTION FUNDS |
| Table of Shareholder Expenses—as of October 31, 2012 (Unaudited) |
As a shareholder of the World Selection Funds, you incur two types of costs: (1) transaction costs, including sales charges (loads) on purchases, redemption fees and exchange fees; and (2) ongoing costs, including management fees; distribution and/or shareholder servicing fees and other Fund expenses (including expenses allocated from the Portfolios). These examples are intended to help you understand your ongoing costs (in dollars) of investing in the Funds and to with the ongoing costs of investing in other mutual funds.
These examples are based on an investment of $1,000 invested at the beginning of the period and held for the entire period from May 1, 2012 through October 31, 2012.
Actual Example
The table below provides information about actual account values and actual expenses. You may use the information below, together with the amount you invested, to estimate the expenses that you paid over the period. Simply divide your account value by $1,000 (for example, an $8,600 account value divided by $1,000 = 8.6), then multiply the result by the number in the table under the heading entitled ”Expenses Paid During Period” to estimate the expenses you paid on your account during this period.
| | | | | | | | | | | | | | | | | | | Annualized |
| | | | Beginning | | Ending | | Expenses Paid | | Expense Ratio |
| | | | Account Value | | Account Value | | During Period* | | During Period |
| | | | 5/1/12 | | 10/31/12 | | 5/1/12 - 10/31/12 | | 5/1/12 - 10/31/12 |
| Aggressive Strategy Fund | | Class A Shares | | | $ | 1,000.00 | | | | $ | 999.20 | | | | $ | 7.54 | | | 1.50 | % |
| | Class B Shares | | | | 1,000.00 | | | | | 995.90 | | | | | 11.29 | | | 2.25 | % |
| | Class C Shares | | | | 1,000.00 | | | | | 995.90 | | | | | 11.29 | | | 2.25 | % |
| Balanced Strategy Fund | | Class A Shares | | | | 1,000.00 | | | | | 1,016.90 | | | | | 5.78 | | | 1.14 | % |
| | Class B Shares | | | | 1,000.00 | | | | | 1,012.90 | | | | | 9.61 | | | 1.90 | % |
| | Class C Shares | | | | 1,000.00 | | | | | 1,012.80 | | | | | 9.56 | | | 1.89 | % |
| Moderate Strategy Fund | | Class A Shares | | | | 1,000.00 | | | | | 1,022.90 | | | | | 6.00 | | | 1.18 | % |
| | Class B Shares | | | | 1,000.00 | | | | | 1,019.90 | | | | | 9.85 | | | 1.94 | % |
| | Class C Shares | | | | 1,000.00 | | | | | 1,019.80 | | | | | 9.70 | | | 1.91 | % |
| Conservative Strategy Fund | | Class A Shares | | | | 1,000.00 | | | | | 1,029.60 | | | | | 6.99 | | | 1.37 | % |
| | Class B Shares | | | | 1,000.00 | | | | | 1,026.10 | | | | | 10.95 | | | 2.15 | % |
| | Class C Shares | | | | 1,000.00 | | | | | 1,026.40 | | | | | 10.75 | | | 2.11 | % |
| Income Strategy Fund | | Class A Shares | | | | 1,000.00 | | | | | 1,037.00 | | | | | 7.68 | | | 1.50 | % |
| | Class B Shares | | | | 1,000.00 | | | | | 1,033.50 | | | | | 11.50 | | | 2.25 | % |
| | Class C Shares | | | | 1,000.00 | | | | | 1,033.10 | | | | | 11.50 | | | 2.25 | % |
____________________
| * | | Expenses are equal to the average account value over the period multiplied by the Fund’s annualized expense ratio, multiplied by 184/366 (to reflect the one half year period). |
50 HSBC WORLD SELECTION FUNDS
| HSBC WORLD SELECTION FUNDS |
| Table of Shareholder Expenses—as of October 31, 2012 (Unaudited) (continued) |
Hypothetical Example for Comparison Purposes
The table below provides information about hypothetical account values and hypothetical expenses based on the Fund’s actual expense ratio and an assumed rate of return of 5% per year before expenses, which is not the Fund’s actual return. The hypothetical account values and expenses may not be used to estimate the actual ending account balance or expenses you paid for the period. You may use this information to compare this 5% hypothetical example with the 5% hypothetical examples that appear in the shareholder reports of other funds.
Please note that the expenses shown in the table are meant to highlight your ongoing costs only and do not reflect any transactional costs, such as sales charges (loads), redemption fees, or exchange fees. Therefore, the table is useful in comparing ongoing costs only, and will not help you determine the relative total costs of owning different funds. In addition, if these transactional costs were included, your costs would have been higher.
| | | | | | | | | | | | | | | Annualized |
| | | | Beginning | | Ending | | Expenses Paid | | Expense Ratio |
| | | | Account Value | | Account Value | | During Period* | | During Period |
| | | | 5/1/12 | | 10/31/12 | | 5/1/12 - 10/31/12 | | 5/1/12 - 10/31/12 |
| Aggressive Strategy Fund | | Class A Shares | | $ | 1,000.00 | | $ | 1,017.60 | | | $ | 7.61 | | | 1.50 | % |
| | Class B Shares | | | 1,000.00 | | | 1,013.83 | | | | 11.39 | | | 2.25 | % |
| | Class C Shares | | | 1,000.00 | | | 1,013.83 | | | | 11.39 | | | 2.25 | % |
| Balanced Strategy Fund | | Class A Shares | | | 1,000.00 | | | 1,019.41 | | | | 5.79 | | | 1.14 | % |
| | Class B Shares | | | 1,000.00 | | | 1,015.58 | | | | 9.63 | | | 1.90 | % |
| | Class C Shares | | | 1,000.00 | | | 1,015.63 | | | | 9.58 | | | 1.89 | % |
| Moderate Strategy Fund | | Class A Shares | | | 1,000.00 | | | 1,019.20 | | | | 5.99 | | | 1.18 | % |
| | Class B Shares | | | 1,000.00 | | | 1,015.38 | | | | 9.83 | | | 1.94 | % |
| | Class C Shares | | | 1,000.00 | | | 1,015.53 | | | | 9.68 | | | 1.91 | % |
| Conservative Strategy Fund | | Class A Shares | | | 1,000.00 | | | 1,018.25 | | | | 6.95 | | | 1.37 | % |
| | Class B Shares | | | 1,000.00 | | | 1,014.33 | | | | 10.89 | | | 2.15 | % |
| | Class C Shares | | | 1,000.00 | | | 1,014.53 | | | | 10.68 | | | 2.11 | % |
| Income Strategy Fund | | Class A Shares | | | 1,000.00 | | | 1,017.60 | | | | 7.61 | | | 1.50 | % |
| | Class B Shares | | | 1,000.00 | | | 1,013.83 | | | | 11.39 | | | 2.25 | % |
| | Class C Shares | | | 1,000.00 | | | 1,013.83 | | | | 11.39 | | | 2.25 | % |
____________________
| | |
| * | | Expenses are equal to the average account value over the period multiplied by the Fund's annualized expense ratio, multiplied by 184/366 (to reflect the one half year period). |
HSBC WORLD SELECTION FUNDS 51
| HSBC GROWTH PORTFOLIO |
| Schedule of Portfolio Investments—as of October 31, 2012 |
| Common Stocks – 96.2% | | | |
| | | | |
| Shares | | Value ($) |
| Aerospace & Defense – 3.4% | | | |
| Precision Castparts Corp. | 7,700 | | 1,332,639 |
| United Technologies Corp. | 17,300 | | 1,352,168 |
| | | 2,684,807 |
| Auto Components – 1.1% | | | |
| BorgWarner, Inc. (a) | 13,200 | | 868,824 |
| Biotechnology – 4.5% | | | |
| Biogen Idec, Inc. (a) | 8,700 | | 1,202,514 |
| Celgene Corp. (a) | 17,600 | | 1,290,432 |
| Gilead Sciences, Inc. (a) | 15,900 | | 1,067,844 |
| | | 3,560,790 |
| Business Services – 1.3% | | | |
| MasterCard, Inc., Class A | 2,195 | | 1,011,741 |
| Capital Markets – 2.8% | | | |
| BlackRock, Inc. | 4,800 | | 910,464 |
| Franklin Resources, Inc. | 10,200 | | 1,303,560 |
| | | 2,214,024 |
| Chemicals – 4.4% | | | |
| Ecolab, Inc. | 18,000 | | 1,252,800 |
| Monsanto Co. | 25,899 | | 2,229,127 |
| | | 3,481,927 |
| Communications Equipment – 3.3% | | | |
| QUALCOMM, Inc. | 44,500 | | 2,606,588 |
| Computers & Peripherals – 8.0% | | | |
| Apple, Inc. | 9,325 | | 5,549,307 |
| EMC Corp. (a) | 32,200 | | 786,324 |
| | | 6,335,631 |
| Construction & Engineering – 1.3% | | | |
| Fluor Corp. | 19,100 | | 1,066,735 |
| Diversified Financial Services – 0.6% | | | |
| IntercontinentalExchange, Inc. (a) | 3,400 | | 445,400 |
| Energy Equipment & Services – 1.8% | | | |
| FMC Technologies, Inc. (a) | 13,800 | | 564,420 |
| Schlumberger Ltd. | 12,300 | | 855,219 |
| | | 1,419,639 |
| Food & Staples Retailing – 2.7% | | | |
| Costco Wholesale Corp. | 9,000 | | 885,870 |
| CVS Caremark Corp. | 26,700 | | 1,238,880 |
| | | 2,124,750 |
| Health Care Equipment & Supplies – 4.1% | | | |
| Covidien plc | 19,700 | | 1,082,515 |
| Edwards Lifesciences Corp. (a) | 9,800 | | 850,934 |
| Intuitive Surgical, Inc. (a) | 2,380 | | 1,290,484 |
| | | 3,223,933 |
| Health Care Providers & Services – 4.2% | | | |
| Express Scripts Holding Co. (a) | 34,750 | | 2,138,515 |
| UnitedHealth Group, Inc. | 21,200 | | 1,187,200 |
| | | 3,325,715 |
| Health Care Technology – 1.4% | | | |
| Cerner Corp. (a) | 14,300 | | 1,089,517 |
| Hotels, Restaurants & Leisure – 3.8% | | | |
| Las Vegas Sands Corp. | 19,200 | | 891,648 |
| Starbucks Corp. | 27,300 | | 1,253,070 |
| Yum! Brands, Inc. | 11,800 | | 827,298 |
| | | 2,972,016 |
| Household Durables – 0.5% | | | |
| Lennar Corp., Class A | 10,600 | | 397,182 |
| Internet & Catalog Retail – 4.5% | | | |
| Amazon.com, Inc. (a) | 7,150 | | 1,664,663 |
| Priceline.com, Inc. (a) | 3,230 | | 1,853,277 |
| | | 3,517,940 |
| Internet Software & Services – 5.5% | | | |
| eBay, Inc. (a) | 26,100 | | 1,260,369 |
| Facebook, Inc., Class A(a) | 22,200 | | 468,753 |
| Google, Inc., Class A(a) | 2,895 | | 1,967,934 |
| VeriSign, Inc. (a) | 16,500 | | 611,655 |
| | | 4,308,711 |
| IT Services – 8.0% | | | |
| International Business Machines Corp. | 12,400 | | 2,412,172 |
| Teradata Corp. (a) | 9,800 | | 669,438 |
| Visa, Inc., Class A | 23,200 | | 3,219,232 |
| | | 6,300,842 |
| Machinery – 3.9% | | | |
| Danaher Corp. | 44,300 | | 2,291,639 |
| Illinois Tool Works, Inc. | 13,000 | | 797,290 |
| | | 3,088,929 |
| Media – 1.8% | | | |
| CBS Corp., Class B | 20,300 | | 657,720 |
| Sirius XM Radio, Inc. (a) | 276,900 | | 775,320 |
| | | 1,433,040 |
| Oil, Gas & Consumable Fuels – 3.2% | | | |
| Cabot Oil & Gas Corp. | 17,300 | | 812,754 |
| Concho Resources, Inc. (a) | 11,000 | | 947,320 |
| Range Resources Corp. | 12,100 | | 790,856 |
| | | 2,550,930 |
| Personal Products – 0.8% | | | |
| The Estee Lauder Cos., Inc., Class A | 10,700 | | 659,334 |
| Pharmaceuticals – 0.3% | | | |
| Allergan, Inc. | 2,600 | | 233,792 |
| Real Estate Investment Trusts (REITs) – 1.6% | | |
| American Tower Corp. | 16,600 | | 1,249,814 |
| 52 HSBC PORTFOLIOS | See notes to financial statements. |
| HSBC GROWTH PORTFOLIO |
| Schedule of Portfolio Investments—as of October 31, 2012 (continued) |
| Common Stocks, continued | | | |
| | | | |
| Shares | | Value ($) |
| Road & Rail – 3.9% | | | |
| Union Pacific Corp. | 25,200 | | 3,100,356 |
| Semiconductors & Semiconductor Equipment – 0.3% |
| Altera Corp. | 7,800 | | 237,744 |
| Software – 3.3% | | | |
| Intuit, Inc. | 14,300 | | 849,706 |
| Salesforce.com, Inc. (a) | 12,200 | | 1,780,956 |
| | | 2,630,662 |
| Specialty Retail – 4.8% | | | |
| Dollar General Corp. (a) | 20,600 | | 1,001,572 |
| Ross Stores, Inc. | 12,500 | | 761,875 |
| The Gap, Inc. | 25,800 | | 921,576 |
| The Home Depot, Inc. | 6,800 | | 417,384 |
| Ulta Salon, Cosmetics & Fragrance, Inc. | 7,700 | | 710,094 |
| | | 3,812,501 |
| Textiles, Apparel & Luxury Goods – 3.4% | | |
| Coach, Inc. | 14,500 | | 812,725 |
| Michael Kors Holdings Ltd. (a) | 15,700 | | 858,633 |
| Ralph Lauren Corp. | 6,800 | | 1,045,092 |
| | | 2,716,450 |
| Trading Companies & Distributors – 0.4% | | |
| W. W. Grainger, Inc. | 1,600 | | 322,256 |
| Wireless Telecommunication Services – 1.3% | | |
| SBA Communications Corp., Class A(a) | 15,800 | | 1,052,754 |
| TOTAL COMMON STOCKS | | | |
| (COST $62,731,859) | | | 76,045,274 |
| |
| Investment Company – 4.0% | | | |
| | | | |
| Northern Institutional Diversified Assets | | | |
| Portfolio, Institutional Shares, | | | |
| 0.01% (b) | 3,113,192 | | 3,113,192 |
| TOTAL INVESTMENT COMPANY | | | |
| (COST $3,113,192) | | | 3,113,192 |
| TOTAL INVESTMENT SECURITIES | | | |
| (COST $65,845,051) — 100.2% | | | 79,158,466 |
____________________
| Percentages indicated are based on net assets of $79,018,334. |
| |
| (a) | Represents non-income producing security. |
| (b) | The rate represents the annualized one-day yield that was in effect on October 31, 2012. |
| See notes to financial statements. | HSBC PORTFOLIOS 53 |
| HSBC OPPORTUNITY PORTFOLIO |
| Schedule of Portfolio Investments—as of October 31, 2012 |
| Common Stocks – 96.7% | | | |
| | | | |
| Shares | | Value ($) |
| Aerospace & Defense – 3.4% | | | |
| BE Aerospace, Inc. (a) | 50,130 | | 2,260,362 |
| TransDigm Group, Inc. | 21,130 | | 2,814,727 |
| | | 5,075,089 |
| Biotechnology – 1.8% | | | |
| Alkermes plc (a) | 73,880 | | 1,368,996 |
| Cubist Pharmaceuticals, Inc. (a) | 32,130 | | 1,378,377 |
| | | 2,747,373 |
| Building Products – 1.1% | | | |
| Owens Corning, Inc. (a) | 51,400 | | 1,726,526 |
| Capital Markets – 3.6% | | | |
| Lazard Ltd., Class A | 92,260 | | 2,717,980 |
| Raymond James Financial, Inc. | 69,860 | | 2,664,460 |
| | | 5,382,440 |
| Chemicals – 4.2% | | | |
| Celanese Corp., Series A | 36,260 | | 1,377,517 |
| Cytec Industries, Inc. | 31,780 | | 2,187,100 |
| Georgia Gulf Corp. | 34,140 | | 1,208,215 |
| Westlake Chemical Corp. | 20,485 | | 1,558,089 |
| | | 6,330,921 |
| Commercial Banks – 3.3% | | | |
| Comerica, Inc. | 88,500 | | 2,638,185 |
| First Horizon National Corp. | 1 | | 9 |
| First Republic Bank | 67,060 | | 2,303,511 |
| | | 4,941,705 |
| Commercial Services & Supplies – 2.1% | | | |
| Waste Connections, Inc. | 94,065 | | 3,088,154 |
| Communications Equipment – 1.4% | | | |
| JDS Uniphase Corp. (a) | 138,580 | | 1,342,840 |
| Riverbed Technology, Inc. (a) | 43,320 | | 800,121 |
| | | 2,142,961 |
| Containers & Packaging – 3.1% | | | |
| Crown Holdings, Inc. (a) | 76,040 | | 2,908,530 |
| Packaging Corp. of America | 48,610 | | 1,714,475 |
| | | 4,623,005 |
| Electrical Equipment – 2.1% | | | |
| Hubbell, Inc., Class B | 37,580 | | 3,146,198 |
| Electronic Equipment, Instruments & Components – 0.6% |
| Jabil Circuit, Inc. | 48,850 | | 847,059 |
| Energy Equipment & Services – 1.7% | | | |
| Rowan Cos. plc, Class A(a) | 78,140 | | 2,477,819 |
| Food Products – 2.6% | | | |
| Ralcorp Holdings, Inc. (a) | 54,790 | | 3,955,290 |
| Health Care Equipment & Supplies – 6.3% | | |
| Conceptus, Inc. (a) | 38,650 | | 728,166 |
| DENTSPLY International, Inc. | 96,900 | | 3,569,796 |
| Hologic, Inc. (a) | 109,430 | | 2,256,446 |
| IDEXX Laboratories, Inc. (a) | 22,000 | | 2,116,400 |
| Volcano Corp. (a) | 26,100 | | 746,982 |
| | | 9,417,790 |
| Health Care Providers & Services – 4.2% | | | |
| Coventry Health Care, Inc. | 109,270 | | 4,768,543 |
| Owens & Minor, Inc. | 52,110 | | 1,483,571 |
| | | 6,252,114 |
| Household Durables – 0.9% | | | |
| NVR, Inc. (a) | 1,436 | | 1,297,771 |
| Insurance – 2.2% | | | |
| Everest Re Group Ltd. | 22,975 | | 2,551,373 |
| Genworth Financial, Inc., Class A(a) | 136,280 | | 812,229 |
| | | 3,363,602 |
| IT Services – 4.7% | | | |
| Alliance Data Systems Corp. (a) | 31,580 | | 4,517,519 |
| FleetCor Technologies, Inc. (a) | 53,690 | | 2,545,443 |
| | | 7,062,962 |
| Life Sciences Tools & Services – 2.0% | | | |
| Mettler-Toledo International, Inc. (a) | 18,130 | | 3,070,678 |
| Machinery – 5.6% | | | |
| Crane Co. | 41,964 | | 1,761,649 |
| Gardner Denver, Inc. | 29,280 | | 2,029,982 |
| IDEX Corp. | 59,290 | | 2,521,604 |
| The Timken Co. | 54,010 | | 2,132,855 |
| | | 8,446,090 |
| Media – 0.7% | | | |
| Manchester United plc, Class A(a) | 85,800 | | 1,080,222 |
| Oil, Gas & Consumable Fuels – 5.4% | | | |
| Denbury Resources, Inc. (a) | 175,320 | | 2,687,656 |
| Tesoro Corp. | 144,010 | | 5,430,617 |
| | | 8,118,273 |
| Pharmaceuticals – 1.2% | | | |
| Elan Corp. plc ADR (a) | 167,700 | | 1,811,160 |
| Professional Services – 1.5% | | | |
| IHS, Inc., Class A(a) | 25,815 | | 2,178,528 |
| Real Estate Management & Development – 1.9% | | |
| Jones Lang LaSalle, Inc. | 37,530 | | 2,917,582 |
| Road & Rail – 2.9% | | | |
| Hertz Global Holdings, Inc. (a) | 145,380 | | 1,929,193 |
| Landstar System, Inc. | 46,710 | | 2,365,861 |
| | | 4,295,054 |
| 54 HSBC PORTFOLIOS | See notes to financial statements. |
| HSBC OPPORTUNITY PORTFOLIO |
| Schedule of Portfolio Investments—as of October 31, 2012 (continued) |
| Common Stocks, continued | | | |
| | | | |
| Shares | | Value ($) |
| Semiconductors & Semiconductor Equipment – 3.1% |
| NXP Semiconductors NV (a) | 120,500 | | 2,923,330 |
| Skyworks Solutions, Inc. (a) | 76,060 | | 1,779,804 |
| | | 4,703,134 |
| Software – 6.5% | | | |
| Concur Technologies, Inc. (a) | 10,370 | | 686,805 |
| Fortinet, Inc. (a) | 120,020 | | 2,324,788 |
| Informatica Corp. (a) | 76,000 | | 2,062,640 |
| Nuance Communications, Inc. (a) | 132,620 | | 2,952,121 |
| QLIK Technologies, Inc. (a) | 91,220 | | 1,679,360 |
| | | 9,705,714 |
| Specialty Retail – 11.4% | | | |
| American Eagle Outfitters, Inc. | 143,200 | | 2,988,584 |
| Foot Locker, Inc. | 117,110 | | 3,923,185 |
| GNC Holdings, Inc., Class A | 27,550 | | 1,065,359 |
| O’Reilly Automotive, Inc. (a) | 15,250 | | 1,306,620 |
| Signet Jewelers Ltd. | 63,980 | | 3,311,605 |
| Tractor Supply Co. | 15,900 | | 1,530,216 |
| Williams-Sonoma, Inc. | 63,280 | | 2,925,434 |
| | | 17,051,003 |
| Textiles, Apparel & Luxury Goods – 1.1% | | |
| Michael Kors Holdings Ltd. (a) | 29,900 | | 1,635,231 |
| Trading Companies & Distributors – 4.1% | | |
| Beacon Roofing Supply, Inc. (a) | 30,480 | | 985,723 |
| United Rentals, Inc. (a) | 53,940 | | 2,193,200 |
| WESCO International, Inc. (a) | 46,970 | | 3,047,414 |
| | | 6,226,337 |
| TOTAL COMMON STOCKS | | | |
| (COST $123,929,913) | | | 145,117,785 |
| |
| Investment Company – 3.2% | | | |
| | | | |
| Northern Institutional Government | | | |
| Select Portfolio, Institutional Shares, | | | |
| 0.01% (b) | 4,802,550 | | 4,802,550 |
| TOTAL INVESTMENT COMPANY | | | |
| (COST $4,802,550) | | | 4,802,550 |
| TOTAL INVESTMENTS SECURITIES | | | |
| (COST $128,732,463) — 99.9% | | | 149,920,335 |
____________________
| Percentages indicated are based on net assets of $150,058,525. |
| |
| (a) | Represents non-income producing security. |
| (b) | The rate represents the annualized one-day yield that was in effect on October 31, 2012. |
ADR American Depositary Receipt
| See notes to financial statements. | HSBC PORTFOLIOS 55 |
HSBC PORTFOLIOS
Statements of Assets and Liabilities—as of October 31, 2012
| Growth | | Opportunity |
| Portfolio | | Portfolio |
| Assets: | | | | | | | | | |
| Investments in non-affiliates, at value | | $ | 79,158,466 | | | | $ | 149,920,335 | |
| Dividends receivable | | | 12,747 | | | | | 302,586 | |
| Receivable for investments sold | | | 406,110 | | | | | — | |
| Prepaid expenses and other assets | | | 323 | | | | | 582 | |
| Total Assets | | | 79,577,646 | | | | | 150,223,503 | |
| | | | | | | | | | |
| Liabilities: | | | | | | | | | |
| Payable for investments purchased | | | 397,255 | | | | | 23,734 | |
| Accrued expenses and other liabilities: | | | | | | | | | |
| Investment Management | | | 131,575 | | | | | 101,785 | |
| Administration | | | 2,231 | | | | | 4,122 | |
| Compliance Service | | | 11 | | | | | 53 | |
| Accounting | | | 60 | | | | | 55 | |
| Custodian | | | 3,653 | | | | | 16,545 | |
| Trustee | | | 70 | | | | | 172 | |
| Other | | | 24,457 | | | | | 18,512 | |
| Total Liabilities | | | 559,312 | | | | | 164,978 | |
| | | | | | | | | | |
| Applicable to investors’ beneficial interest | | $ | 79,018,334 | | | | $ | 150,058,525 | |
| Total Investments, at cost | | $ | 65,845,051 | | | | $ | 128,732,463 | |
| 56 HSBC PORTFOLIOS | See notes to financial statements. |
HSBC PORTFOLIOS
Statements of Operations—For the year ended October 31, 2012
| Growth | | Opportunity |
| Portfolio | | Portfolio |
| Investment Income: | | | | | | | | | | |
| Dividends | | $ | 749,933 | | | | | $ | 1,569,670 | |
| Foreign tax withholding | | | (1,261 | ) | | | | | — | |
| Total Investment Income | | | 748,672 | | | | | | 1,569,670 | |
| | | | | | | | | | | |
| Expenses: | | | | | | | | | | |
| Investment Management | | | 512,293 | | | | | | 1,180,005 | |
| Administration | | | 27,586 | | | | | | 45,956 | |
| Accounting | | | 44,566 | | | | | | 44,443 | |
| Compliance Service | | | 775 | | | | | | 1,239 | |
| Custodian | | | 15,446 | | | | | | 33,744 | |
| Printing | | | 3,731 | | | | | | 6,228 | |
| Professional | | | 17,377 | | | | | | 17,184 | |
| Trustee | | | 2,279 | | | | | | 3,755 | |
| Other | | | 8,123 | | | | | | 12,226 | |
| Total Expenses | | | 632,176 | | | | | | 1,344,780 | |
| | | | | | | | | | | |
| Net Investment Income (Loss) | | | 116,496 | | | | | | 224,890 | |
| | | | | | | | | | | |
| Net Realized/Unrealized Gains (Losses) from Investments: | | | | | | | | | | |
| Net realized gains (losses) from investment securities | | | 12,654,581 | | | | | | 8,826,465 | |
| Change in unrealized appreciation/depreciation on investments | | | (6,525,872 | ) | | | | | 8,291,618 | |
| | | | | | | | | | | |
| Net realized/unrealized gains from investments | | | 6,128,709 | | | | | | 17,118,083 | |
| Change In Net Assets Resulting From Operations | | $ | 6,245,205 | | | | | $ | 17,342,973 | |
| See notes to financial statements. | HSBC PORTFOLIOS 57 |
HSBC PORTFOLIOS
Statements of Changes in Net Assets
| Growth | | Opportunity |
| Portfolio | | Portfolio |
| For the | | For the | | For the | | For the |
| year ended | | year ended | | year ended | | year ended |
| October 31, 2012 | | October 31, 2011 | | October 31, 2012 | | October 31, 2011 |
| Investment Activities: | | | | | | | | | | | | | | | | | | | |
| Operations: | | | | | | | | | | | | | | | | | | | |
| Net investment income (loss) | | $ | 116,496 | | | | $ | 69,416 | | | | $ | 224,890 | | | | $ | 79,759 | |
| Net realized gains (losses) from investments | | | 12,654,581 | | | | | 10,568,671 | | | | | 8,826,465 | | | | | 24,005,437 | |
| Change in unrealized appreciation/depreciation | | | | | | | | | | | | | | | | | | | |
| from investments | | | (6,525,872 | ) | | | | 387,197 | | | | | 8,291,618 | | | | | (5,303,339 | ) |
| Change in net assets resulting from operations | | | 6,245,205 | | | | | 11,025,284 | | | | | 17,342,973 | | | | | 18,781,857 | |
| Proceeds from contributions | | | 10,142,030 | | | | | 20,411,483 | | | | | 15,884,698 | | | | | 16,493,895 | |
| Value of withdrawals | | | (42,657,788 | ) | | | | (24,898,681 | ) | | | | (24,493,548 | ) | | | | (33,352,902 | ) |
| Change in net assets resulting from transactions | | | | | | | | | | | | | | | | | | | |
| in investors’ beneficial interest | | | (32,515,758 | ) | | | | (4,487,198 | ) | | | | (8,608,850 | ) | | | | (16,859,007 | ) |
| Change in net assets | | | (26,270,553 | ) | | | | 6,538,086 | | | | | 8,734,123 | | | | | 1,922,850 | |
| | | | | | | | | | | | | | | | | | | | |
| Net Assets: | | | | | | | | | | | | | | | | | | | |
| Beginning of period | | | 105,288,887 | | | | | 98,750,801 | | | | | 141,324,402 | | | | | 139,401,552 | |
| End of period | | $ | 79,018,334 | | | | $ | 105,288,887 | | | | $ | 150,058,525 | | | | $ | 141,324,402 | |
| 58 HSBC PORTFOLIOS | See notes to financial statements. |
| HSBC PORTFOLIO |
| Financial Highlights |
Selected data for a share outstanding throughout the periods indicated.
| | | | Ratio/Supplementary Data |
| | | | | | | | | | | | | | | Ratio of | | | |
| | | | | | | | | | | | Ratio of Net | | Expenses | | | |
| | | | | | | | | Ratio of Net | | Investment | | to Average | | | |
| | | | Net Assets at | | Expenses to | | Income (Loss) | | Net Assets | | | |
| Total | | End of Period | | Average Net | | to Average Net | | (Excluding Fee | | Portfolio |
| Return | | (000’s) | | Assets | | Assets | | Reductions) | | Turnover |
| GROWTH PORTFOLIO | | | | | | | | | | | | | | | | | | | |
| Year Ended October 31, 2008 | (37.75 | )%(a) | | | $ | 81,942 | | | 0.62 | % | | 0.19 | % | | 0.62 | % | | 158 | % |
| Year Ended October 31, 2009 | 19.31 | % | | | $ | 88,163 | | | 0.69 | % | | 0.17 | % | | 0.69 | % | | 66 | % |
| Year Ended October 31, 2010 | 20.34 | % | | | $ | 98,751 | | | 0.68 | % | | (0.04 | )% | | 0.68 | % | | 89 | % |
| Year Ended October 31, 2011 | 11.07 | % | | | $ | 105,289 | | | 0.66 | % | | 0.07 | % | | 0.66 | % | | 56 | % |
| Year Ended October 31, 2012 | 7.18 | % | | | $ | 79,018 | | | 0.71 | % | | 0.13 | % | | 0.71 | % | | 53 | % |
| OPPORTUNITY PORTFOLIO | | | | | | | | | | | | | | | | | | | |
| Year Ended October 31, 2008 | (35.30 | )% | | | $ | 127,970 | | | 0.87 | % | | (0.46 | )% | | 0.87 | % | | 80 | % |
| Year Ended October 31, 2009 | 15.41 | % | | | $ | 129,748 | | | 0.90 | % | | (0.37 | )% | | 0.90 | % | | 65 | % |
| Year Ended October 31, 2010 | 28.74 | % | | | $ | 139,402 | | | 0.89 | % | | (0.35 | )% | | 0.89 | % | | 68 | % |
| Year Ended October 31, 2011 | 12.40 | % | | | $ | 141,324 | | | 0.88 | % | | 0.05 | % | | 0.88 | % | | 69 | % |
| Year Ended October 31, 2012 | 12.71 | % | | | $ | 150,059 | | | 0.91 | % | | 0.15 | % | | 0.91 | % | | 59 | % |
(a) | During the year ended October 31, 2008, Winslow Capital Management, Inc. reimbursed $64,658 to the Growth Portfolio related to violations of certain investment policies and limitations. The corresponding impact to the total return was 0.08%. |
| See notes to financial statements. | HSBC PORTFOLIOS 59 |
| HSBC PORTFOLIOS |
| Notes to Financial Statements—as of October 31, 2012 |
1. Organization:
The HSBC Portfolios (formerly, HSBC Investor Portfolios) (the “Portfolio Trust”), is an open-end management investment company organized as a New York trust under the laws of the State of New York on November 1, 1994. The Portfolio Trust contains the following master funds (individually a “Portfolio,” collectively the “Portfolios”):
| Portfolio | | Short Name | |
| HSBC Growth Portfolio (formerly, HSBC Investor Growth Portfolio) | Growth Portfolio |
| HSBC Opportunity Portfolio (formerly, HSBC Investor Opportunity Portfolio) | Opportunity Portfolio |
The Portfolios operate as master funds in master-feeder arrangements, in which other funds invest all or part of their investable assets in the Portfolios. The Portfolios also receive investments from funds of funds. The Declaration of Trust permits the Board of Trustees (the “Board”) to issue an unlimited number of beneficial interests in the Portfolios.
The Portfolios are diversified series of the Portfolio Trust and are part of the HSBC Family of Funds (formerly, HSBC Investor Family of Funds), which also includes HSBC Advisor Funds Trust and HSBC Funds (formerly, HSBC Investor Funds) (collectively, the “Trusts”). Financial statements for all other funds of the Trusts are published separately.
Under the Portfolio Trust’s organizational documents, the Portfolio Trust’s officers and Trustees are indemnified against certain liabilities arising out of the performance of their duties to the Portfolios. In addition, in the normal course of business, the Portfolio Trust may enter into contracts with its service providers, which also provide for indemnifications by the Portfolios. The Portfolios’ maximum exposure under these arrangements is unknown as this would involve any future claims that may be made against the Portfolios. However, based on experience, the Portfolio Trust expects that risk of loss to be remote.
2. Significant Accounting Policies:
The following is a summary of the significant accounting policies followed by the Portfolios in the preparation of their financial statements. The policies are in conformity with U.S. generally accepted accounting principles (“GAAP”). The preparation of financial statements requires management to make certain estimates and assumptions that affect the reported amounts of assets and liabilities and disclosure of contingent assets and liabilities at the date of the financial statements and the reported amounts of increases and decreases in net assets from operations during the reporting period. Actual results could differ from those estimates.
Securities Valuation:
The Portfolios record their investments at fair value. Fair value is defined as the price that would be received to sell an asset or paid to transfer a liability in an orderly transaction between market participants at the measurement date. The valuation techniques used to determine fair value are further described in Note 3 below.
Investment Transactions and Related Income:
Investment transactions are accounted for not later than on the business day after trade date. However, for financial reporting purposes, investment transactions are accounted for on trade date. Investment gains and losses are calculated on the identified cost basis. Interest income is recognized on the accrual basis and includes, where applicable, the amortization or accretion of premium or discount. Dividend income is recorded on the ex-dividend date.
Expense Allocations:
Expenses directly attributable to a Portfolio are charged to that Portfolio. Expenses not directly attributable to a Portfolio are allocated proportionally among the applicable portfolios or funds within the HSBC Family of Funds in relation to net assets or on another reasonable basis.
60 HSBC PORTFOLIOS
| HSBC PORTFOLIOS |
| Notes to Financial Statements—as of October 31, 2012 (continued) |
Federal Income Taxes:
Each Portfolio will be treated as a partnership for U.S. federal income tax purposes. Accordingly, each Portfolio passes through all of its net investment income and gains and losses to its feeder funds, and is therefore not subject to U.S. federal income tax. As such, investors in the Portfolios will be taxed on their respective share of the Portfolios’ ordinary income and realized gains. It is intended that the Portfolios will be managed in such a way that an investor will be able to satisfy the requirements of the Internal Revenue Code, as amended, applicable to regulated investment companies.
Management of the Portfolios has reviewed tax positions taken in tax years that remain subject to examination by all major tax jurisdictions, including federal (i.e., the last four tax year ends and the interim tax period since then, as applicable). Management believes that there is no tax liability resulting from unrecognized tax benefits related to uncertain tax positions taken.
3. Investment Valuation Summary:
The valuation techniques employed by the Portfolios, as described below, maximize the use of observable inputs and minimize the use of unobservable inputs in determining fair value. The inputs used for valuing the Portfolios’ investments are summarized in the three broad levels listed below:
- Level 1: quoted prices in active markets for identical assets
- Level 2: other significant observable inputs (including quoted prices for similar securities, interest rates, prepayment speeds, credit risk, etc.)
- Level 3: significant unobservable inputs (including the Portfolio’s own assumptions in determining the fair value of investments)
Changes in valuation techniques may result in transfers in or out of an assigned level within the disclosure hierarchy. The Funds determine transfers between fair value hierarchy levels at the reporting period end. The inputs or methodology used for valuing investments is not necessarily an indication of the risk associated with investing in those investments.
Exchange traded, domestic equity securities are valued at the last sale price on a national securities exchange, or in the absence of recorded sales, at the readily available closing bid price on such exchanges, or at the quoted bid price in the over-the-counter market and are typically categorized as Level 1 in the fair value hierarchy.
Shares of exchange traded and closed-end registered investment companies are valued in the same manner as other equity securities and are typically categorized as Level 1 in the fair value hierarchy. Mutual funds are valued at their net asset values, as reported by such companies and are typically categorized as Level 1 in the fair value hierarchy.
Repurchase agreements are valued at original cost and are typically categorized as Level 2 in the fair value hierarchy.
Securities or other assets for which market quotations are not readily available, or are deemed unreliable due to a significant event, are valued pursuant to procedures adopted by the Trusts’ Board (“Procedures”). Depending on the source and relative significance of valuation inputs, these instruments may be classified as Level 2 or Level 3 in the fair value hierarchy. Examples of potentially significant events that could affect the value of an individual security and thus require pricing under the procedures include corporate actions by the issuer, announcements by the issuer relating to its earnings or products, regulatory news, natural disasters, and litigation. Examples of potentially significant events that could affect multiple securities held by a Portfolio include governmental actions, natural disasters, and armed conflicts.
For the year ended October 31, 2012, there were no Level 3 investments for which significant unobservable inputs were used to determine fair value.
HSBC PORTFOLIOS 61
| HSBC PORTFOLIOS |
| Notes to Financial Statements—as of October 31, 2012 (continued) |
The following is a summary of the valuation inputs used as of October 31, 2012 in valuing the Portfolios’ investments based upon three levels defined above:
| | LEVEL 1 ($) | | LEVEL 2 ($) | | LEVEL 3 ($) | | Total ($) |
| Growth Portfolio | | | | | | | | |
| Investment Securities: | | | | | | | | |
| Common Stocks (a) | | 76,045,274 | | — | | — | | 76,045,274 |
| Investment Company | | 3,113,192 | | — | | — | | 3,113,192 |
| Total Investment Securities | | 79,158,466 | | — | | — | | 79,158,466 |
| |
| Opportunity Portfolio | | | | | | | | |
| Investment Securities: | | | | | | | | |
| Common Stocks (a) | | 145,117,785 | | — | | — | | 145,117,785 |
| Investment Company | | 4,802,550 | | — | | — | | 4,802,550 |
| Total Investment Securities | | 149,920,335 | | — | | — | | 149,920,335 |
____________________
| (a) | | For detailed investment categorizations, see the accompanying Schedules of Portfolio Investments. |
New Accounting Pronouncements:
In December 2011, the Financial Accounting Standards Board issued ASU No. 2011-11 “Disclosures about Offsetting Assets and Liabilities” requiring disclosure of both gross and net information related to offsetting and related arrangements enabling users of its financial statements to understand the effect of those arrangements on the entity’s financial position. The objective of this disclosure is to facilitate comparison between those entities that prepare their financial statements on the basis of U.S. GAAP and those entities that prepare their financial statements on the basis of IFRSs. ASU No. 2011-11 is effective for interim and annual periods beginning on or after January 1, 2013. Adoption of ASU No. 2011-11 will have no effect on the Portfolios’ net assets. At this time, management is evaluating any impact ASU No. 2011-11 may have on the Portfolios’ financial statements disclosures.
4. Related Party Transactions and Other Agreements:
Investment Management:
HSBC Global Asset Management (USA) Inc. (“HSBC” or the “Investment Adviser”), a wholly owned subsidiary of HSBC Bank USA, N.A., a national bank organized under the laws of the United States, acts as the Investment Adviser to the Portfolios pursuant to an investment management contract with the Portfolio Trust. As Investment Adviser, HSBC manages the investments of the Portfolios and continuously reviews, supervises, and administers the Portfolios’ investments. Winslow Capital Management, Inc. (“Winslow”) and Westfield Capital Management Company, L.P. (“Westfield”) serve as subadvisers for the Growth Portfolio and Opportunity Portfolio, respectively, and are paid for their services directly by the respective Portfolios.
62 HSBC PORTFOLIOS
| HSBC PORTFOLIOS |
| Notes to Financial Statements—as of October 31, 2012 (continued) |
For their services, the Investment Adviser and Winslow receive in aggregate, from the Growth Portfolio, a fee, accrued daily and paid monthly, at an annual rate of:
| Based on Average Daily Net Assets of all Sub-Adviser serviced funds and separate accounts affiliated | | |
| with HSBC: | | Fee Rate(%)* |
| Up to $250 million | | 0.575 |
| In excess of $250 million but not exceeding $500 million | | 0.525 |
| In excess of $500 million but not exceeding $750 million | | 0.475 |
| In excess of $750 million but not exceeding $1 billion | | 0.425 |
| In excess of $1 billion | | 0.375 |
____________________
| * | | The Growth Portfolio may pay the Investment Adviser and Winslow an aggregate maximum fee of up to 0.68%. Currently, the Investment Adviser’s contractual fee is 0.175% and Winslow’s maximum contractual fee is 0.40%. Accordingly, the current aggregate maximum fee rate is 0.575%. |
For their services, the Investment Adviser and Westfield receive in aggregate, a fee, accrued daily and paid monthly, at an annual rate of 0.80% of the Opportunity Portfolio’s average daily net assets.
Any voluntary fee waivers/reimbursements are not subject to recoupment in subsequent fiscal periods. Voluntary waiver/reimbursements may be stopped at any time.
Administration:
HSBC serves the Trusts as Administrator. Under the terms of the Administration Agreement, HSBC receives from the Trusts a fee, accrued daily and paid monthly at an annual rate of:
| Based on Average Daily Net Assets of | | | Fee Rate(%) |
| Up to $10 billion | | 0.0550 |
| In excess of $10 billion but not exceeding $20 billion | | 0.0350 |
| In excess of $20 billion but not exceeding $50 billion | | 0.0275 |
| In excess of $50 billion | | 0.0250 |
The fee rates and breakpoints are determined on the basis of the aggregate average daily net assets of the Trusts, however, the assets of the Portfolios and HSBC Funds and HSBC Advisor Fund that invest in the Portfolios are not double-counted. The total administration fee paid to HSBC is allocated to each series based upon its proportionate share of the aggregate net assets of the Trusts. For assets invested in the Portfolios by the HSBC Funds and HSBC Advisor Fund, the Portfolios pay half of the administration fee and the other funds pay half of the administration fee, for a combination of the total fee rate set forth above.
Pursuant to a Sub-Administration Agreement with HSBC, Citi Fund Services Ohio, Inc. (“Citi”), a wholly-owned subsidiary of Citigroup, Inc., serves as the Trusts’ Sub-Administrator subject to the general supervision by the Trusts’ Board and HSBC. For these services, Citi is entitled to a fee, payable by HSBC, at an annual rate equivalent to the fee rates set forth above subject to certain reductions associated with services provided to new portfolios, minus 0.02% which is retained by HSBC.
Under a Compliance Services Agreement between the Trusts and Citi (the “CCO Agreement”), Citi makes an employee available to serve as the Trusts’ Chief Compliance Officer (the “CCO”). Under the CCO Agreement, Citi also provides infrastructure and support in implementing the written policies and procedures comprising the Trusts’ compliance program, including support services to the CCO. For the services provided under the CCO Agreement, the Trusts paid Citi $281,280 for the year ended October 31, 2012, plus reimbursement of certain expenses. Expenses incurred by each Portfolio are reflected on the Statements of Operations as “Compliance Services.” Citi pays the salary and other compensation earned by individuals as employees of Citi.
HSBC PORTFOLIOS 63
| HSBC PORTFOLIOS |
| Notes to Financial Statements—as of October 31, 2012 (continued) |
Fund Accounting:
Citi provides fund accounting services for the Portfolio Trust. For its services to the Portfolios, Citi receives an annual fee per portfolio, including reimbursement of certain expenses, that is accrued daily and paid monthly.
Independent Trustees:
Prior to January 1, 2012, the Trusts, in the aggregate, paid each Independent Trustee an annual retainer of $63,000, a fee of $5,000 for each regular meeting of the Board of Trustees attended, a fee of $3,000 for each special telephonic meeting attended, and a fee of $5,000 for each special in-person meeting attended. The Trusts also paid each Independent Trustee an annual retainer of $3,000 for each Committee on which such Trustee served as a Committee member as well as a fee of $3,000 for each Committee meeting attended. Additionally, the Trusts paid each Committee Chair an annual retainer of $6,000, with the exception of the Chair of the Audit Committee, who received a retainer of $8,000. The Trusts also paid the Chairman of the Board, an additional annual retainer of $20,000, as well as an additional $4,000 for each regular meeting of the Board attended. In addition, for time expended on Board duties outside normal meetings, which is authorized by the Board, a Trustee was compensated at the rate of $500 per hour, up to a maximum of $3,000 per day.
Effective January 1, 2012, the Trusts pay each Independent Trustee an annual retainer of $100,000. The Trusts pay a fee of $10,000 for each regular meeting of the Board of Trustees attended and a fee of $3,000 for each special meeting attended. The Trusts pay each Committee Chair an annual retainer of $3,000, with the exception of the Chair of the Audit Committee, who receives a retainer of $6,000. The Trusts also pay the Chairman of the Board, an additional annual retainer of $24,000. In addition, for time expended on Board duties outside normal meetings, which is authorized by the Board, a Trustee is compensated at the rate of $500 per hour, up to a maximum of $3,000 per day.
5. Investment Transactions:
Cost of purchases and proceeds from sales of securities (excluding securities maturing less than one year from acquisition) for the year ended October 31, 2012 were as follows:
| Portfolio Name | | | Purchases($) | | Sales($) |
| Growth Portfolio | | 46,467,415 | | 78,190,349 |
| Opportunity Portfolio | | 83,879,531 | | 91,164,123 |
For the year ended October 31, 2012, there were no long-term U.S. government securities held by the Portfolio Trust.
6. Federal Income Tax Information:
At October 31, 2012, the cost basis of securities for federal income tax purposes, gross unrealized appreciation, gross unrealized depreciation and net unrealized appreciation/depreciation were as follows:
| | | | | | | | | | | | | Net Unrealized |
| | | | Tax Unrealized | | Tax Unrealized | | Appreciation |
| Fund | | | Tax Cost($) | | Appreciation($) | | Depreciation($) | | (Depreciation)($)* |
| Growth Portfolio | | 62,543,316 | | | 17,313,687 | | | | (698,537 | ) | | | | 16,615,150 | |
| Opportunity Portfolio | | 129,645,392 | | | 26,834,599 | | | | (6,559,656 | ) | | | | 20,274,943 | |
____________________
| * | | The difference between book-basis unrealized appreciation (depreciation) is attributable primarily to tax deferral of losses on wash sales. |
7. Subsequent Events:
Management has evaluated events and transactions through the date the financial statements were issued, for purposes of recognition or disclosure in these financial statements and there are no subsequent events to report.
64 HSBC PORTFOLIOS
Report of Independent Registered Public Accounting Firm
To the Shareholders and Board of Trustees of
HSBC Portfolios:
We have audited the accompanying statements of assets and liabilities of HSBC Portfolios - HSBC Growth Portfolio and HSBC Opportunity Portfolio (formerly known as HSBC Investor Growth Portfolio and HSBC Investor Opportunity Portfolio) (the Funds), including the schedules of portfolio investments, as of October 31, 2012, and the related statements of operations for the year then ended, the statements of changes in net assets for each of the years in the two-year period then ended, and the financial highlights for each of the years in the five-year period then ended. These financial statements and financial highlights are the responsibility of the Funds’ management. Our responsibility is to express an opinion on these financial statements and financial highlights based on our audits.
We conducted our audits in accordance with the standards of the Public Company Accounting Oversight Board (United States). Those standards require that we plan and perform the audit to obtain reasonable assurance about whether the financial statements and financial highlights are free of material misstatement. An audit includes examining, on a test basis, evidence supporting the amounts and disclosures in the financial statements. Our procedures included confirmation of securities owned as of October 31, 2012, by correspondence with the custodian or brokers or by other appropriate auditing procedures. An audit also includes assessing the accounting principles used and significant estimates made by management, as well as evaluating the overall financial statement presentation. We believe that our audits provide a reasonable basis for our opinion.
In our opinion, the financial statements and financial highlights referred to above present fairly, in all material respects, the financial position of the Funds as of October 31, 2012, the results of their operations for the year then ended, the changes in their net assets for each of the years in the two-year period then ended, and the financial highlights for each of the years in the five-year period then ended, in conformity with U.S. generally accepted accounting principles.
 Columbus, Ohio
December 21, 2012HSBC PORTFOLIOS 65
| HSBC PORTFOLIOS |
| Table of Shareholder Expenses—as of October 31, 2012 |
As a shareholder of the Portfolios, you incur ongoing costs, including management fees and other Fund expenses.
These examples are intended to help you understand your ongoing costs (in dollars) of investing in the Portfolios and to compare these costs with the ongoing costs of investing in other mutual funds.
These examples are based on an investment of $1,000 invested at the beginning of the period and held for the entire period from May 1, 2012 through October 31, 2012.
Actual Example
The table below provides information about actual account values and actual expenses. You may use the information below, together with the amount you invested, to estimate the expenses that you paid over the period. Simply divide your account value by $1,000 (for example, an $8,600 account value divided by $1,000 = 8.6), then multiply the result by the number in the table under the heading entitled “Expenses Paid During Period” to estimate the expenses you paid on your account during this period.
| | | | | | | | | | | | | | | | | Annualized |
| | Beginning | | Ending | | Expenses Paid | | Expense Ratio |
| | Account Value | | Account Value | | During Period* | | During Period |
| | 5/1/12 | | 10/31/12 | | 5/1/12 - 10/31/12 | | 5/1/12 - 10/31/12 |
| Growth Portfolio | | | $ | 1,000.00 | | | | $ | 991.20 | | | | $ | 3.65 | | | 0.73 | % |
| Opportunity Portfolio | | | | 1,000.00 | | | | | 950.20 | | | | | 4.51 | | | 0.92 | % |
____________________
| * | | Expenses are equal to the average account value over the period, multiplied by the Portfolio’s annualized expense ratio, multiplied by 184/366 (to reflect the one half year period). |
Hypothetical Example for Comparison Purposes
The table below provides information about hypothetical account values and hypothetical expenses based on each Portfolio’s actual expense ratio and an assumed rate of return of 5% per year before expenses, which is not the Portfolio’s actual return. The hypothetical account values and expenses may not be used to estimate the actual ending account balance or expenses you paid for the period. You may use this information to compare this 5% hypothetical example with the 5% hypothetical examples that appear in the shareholder reports of other funds.
Please note that the expenses shown in the table are meant to highlight your ongoing costs only and do not reflect any transactional costs, such as sales charges (loads), redemption fees, or exchange fees. Therefore, the table is useful in comparing ongoing costs only, and will not help you determine the relative total costs of owning different funds. In addition, if these transactional costs were included, your costs would have been higher.
| | | | | | | | | | | | | | | | | Annualized |
| | Beginning | | Ending | | Expenses Paid | | Expense Ratio |
| | Account Value | | Account Value | | During Period* | | During Period |
| | 5/1/12 | | 10/31/12 | | 5/1/12 - 10/31/12 | | 5/1/12 - 10/31/12 |
| Growth Portfolio | | | $ | 1,000.00 | | | | $ | 1,021.47 | | | | $ | 3.71 | | | 0.73 | % |
| Opportunity Portfolio | | | | 1,000.00 | | | | | 1,020.51 | | | | | 4.67 | | | 0.92 | % |
____________________
| * | | Expenses are equal to the average account value over the period, multiplied by the Portfolio’s annualized expense ratio, multiplied by 184/366 (to reflect the one half year period). |
66 HSBC PORTFOLIOS
| HSBC PORTFOLIOS |
| Board of Trustees and Officers (Unaudited) |
MANAGEMENT OF THE TRUST
The following table contains information regarding the HSBC Family of Funds’ Board of Trustees (“Trustees”). Asterisks indicate those Trustees who are “interested persons,” as defined in the Investment Company Act of 1940, as amended, of the HSBC Family of Funds. The HSBC Family of Funds’ Statement of Additional Information includes additional information about the Trustees and is available, without charge, upon request by calling (888) 525-5757.
| | | | | | | | Portfolios in | | |
| | Position(s) | | Term of Office | | | | Fund Complex | | Other |
| Name, | | Held with | | and Length of | | Principal Occupation(s) | | Overseen By | | Directorships |
| Address, Age | | Funds | | Time Served | | During Past 5 Years | | Trustee* | | Held by Trustee |
| NON-INTERESTED | | | | | | | | | | |
| TRUSTEES | | | | | | | | | | |
| | | | | | | | | | | |
MARCIA L. BECK
P.O. Box 182845
Columbus, OH
43218-3035
Age: 57 | | Trustee | | Indefinite;
2008 to present | | Private Investor (June 1999 – present); Executive Vice President, Prudential Investments (1997 – 1999); President and Trustee, The Goldman Sachs Mutual Funds (1992 – 1996) | | 23 | | None |
| | | | | | | | | | | |
SUSAN S. HUANG
P.O. Box 182845
Columbus, OH
43218-3035
Age: 58 | | Trustee | | Indefinite;
2008 to present | | Private Investor (2000- present); Senior Vice President, Schroder Investment Management (2001 – 2004); Managing Director, Chase Asset Management (1995-2000) | | 23 | | None |
| | | | | | | | | | | |
ALAN S. PARSOW
P.O. Box 182845
Columbus, OH
43218-3035
Age: 62 | | Trustee | | Indefinite;
1987 to present | | General Partner, Elkhorn Partners, L.P. (a private investment partnership) (1989 – present) | | 23 | | None |
| | | | | | | | | | | |
THOMAS F. ROBARDS
P.O. Box 182845
Columbus, OH
43218-3035
Age: 66 | | Trustee | | Indefinite;
2005 to present | | Partner, Robards & Co. LLC (investment and advisory services) (2005-present); Chief Financial Officer, American Museum of Natural History (2003- 2004); Chief Financial Officer, Datek Online Holdings (2000-2003); Previously EVP and CFO Republic New York Corporation | | 23 | | Overseas Shipholding Group (NYSE listed energy transportation); Ellington Financial LLC (NYSE listed financial services) |
| | | | | | | | | | | |
MICHAEL SEELY
P.O. Box 182845
Columbus, OH
43218-3035
Age: 67 | | Chairman and
Trustee | | Indefinite;
1987 to present | | Private Investor (2003-present); General Partner, Global Multi Manager Partners (1999-2003); President of Investor Access Corporation (1981-2003) | | 23 | | None |
| | | | | | | | | | | |
INTERESTED TRUSTEE | | | | | | | | | | |
| | | | | | | | | | | |
DEBORAH HAZELL
452 Fifth Avenue
New York
NY 10018
Age: 49 | | Trustee | | Indefinite;
2011 to present | | CEO, HSBC Global Asset Management (USA) Inc. (2011-present); President and CEO, Fisher Francis Trees & Watts (“FFTW”) (investment advisor), February 2008-June 2011; Client Service, Business Development and Marketing Group, FFTW (October 1999-February 2008) | | 23 | | None |
____________________
| * | | Includes the Trust, the HSBC Advisor Fund Trust and the HSBC Portfolios. |
68 HSBC PORTFOLIOS
| HSBC PORTFOLIOS |
| Board of Trustees and Officers (Unaudited) (continued) |
| | Position(s) Held | | Term of Office and | | Principal Occupation(s) |
| Name, Address, Age | | with Funds | | Length of Time Served | | During Past 5 Years |
OFFICERS | | | | | | |
| | | | | | | |
RICHARD A. FABIETTI
452 Fifth Avenue
New York, NY 10018
Age: 54 | | President | | One year;
2004 to present | | Senior Vice President, Head of Product Management, HSBC Global Asset Management (USA) Inc.
(1998 - present) |
| | | | | | | |
STEPHEN SIVILLO
452 Fifth Avenue
New York, NY 10018
Age: 41 | | Vice President | | One year;
2010 to present | | Vice President of Product Administration, HSBC Global Asset Management (USA) Inc. (2010 - present); Chief Compliance Officer, Managers Funds (2009 – 2010); Director, Mutual Fund Compliance, AllianceBernstein (2007-2009); Assistant Vice President, Compliance, AllianceBernstein (2005-2007) |
| | | | | | | |
TY EDWARDS*
3435 Stelzer Road
Columbus, OH 43219-3035
Age: 46 | | Treasurer | | One year;
2010 to present | | Senior Vice President, Citi Fund Services (2010– present); Director, Product Management, Columbia Management (2007-2009); Deputy Treasurer, Columbia Funds, (2006-2007); Director, Fund Administration, Columbia Management (2004-2007) |
| | | | | | | |
JENNIFER A. ENGLISH*
100 Summer Street
Suite 1500
Boston, MA 02110
Age: 40 | | Secretary | | One year;
2008 to present | | Senior Vice President, Regulatory Administration, Citi (2005 - present) |
| | | | | | | |
DANIO MASTROPIERI*
100 Summer Street
Suite 1500
Boston, MA 02110
Age: 40 | | Assistant Secretary | | One year;
December 2012
to present | | Vice President, Regulatory Administration, Citi (2007 - present) |
| | | | | | | |
FREDERICK J. SCHMIDT*
1 Rexcorp Plaza
Uniondale, NY 11556
Age: 53 | | Chief Compliance
Officer | | One year;
2004 to present | | Director and Chief Compliance Officer, CCO Services, Citi (2004 - present) |
____________________
| * | | Mr. Edwards, Mr. Schmidt, Ms. English and Mr. Mastropieri also are officers of other investment companies of which Citi (or an affiliate) is the administrator or sub-administrator. |
HSBC PORTFOLIOS 69
Other Information (Unaudited):
Information regarding how the Funds voted proxies relating to portfolio securities during the most recent 12-month period ended June 30th is available (i) without charge, upon request, by calling 1-800-525-5757 for HSBC Bank USA and HSBC Brokerage (USA) Inc. clients and 1-800-782-8183 for all other shareholders; (ii) on the Funds’ website at www.investorfunds.us.hsbc.com; and (iii) on the Security and Exchange Commission’s (“Commission”) website at http://www.sec.gov.
The Funds file their complete schedules of portfolio holdings with the Commission for the first and third quarters of each fiscal year on Form N-Q. The Funds’ Forms N-Q are available on the Commission’s website at http://www.sec.gov. The Funds’ Forms N-Q may be reviewed and copied at the Commission’s Public Reference Room in Washington, D.C. and information on the operation of the Public Reference Room may be obtained by calling 1-800-SEC-0330. The Funds’ Schedules of Investments will be available no later than 60 days after each period end, without charge, on the Funds’ website at www.investorfunds.us.hsbc.com.
An investment in a Fund is not a deposit of HSBC Bank USA, National Association, and is not insured or guaranteed by the Federal Deposit Insurance Corporation or any other government agency.
70 HSBC PORTFOLIOS
HSBC FAMILY OF FUNDS: INVESTMENT ADVISER AND ADMINISTRATOR HSBC Global Asset Management (USA) Inc.
452 Fifth Avenue
New York, NY 10018 SUB-ADVISERS HSBC Growth Portfolio
Winslow Capital Management, Inc.
4720 IDS Tower
80 South Eighth Street
Minneapolis, MN 55402 HSBC Opportunity Portfolio
Westfield Capital Management Company, L.P.
One Financial Center
Boston, MA 02111 | SHAREHOLDER SERVICING AGENTS For HSBC Bank USA, N.A. and
HSBC Securities (USA) Inc. Clients HSBC Bank USA, N.A.
452 Fifth Avenue
New York, NY 10018
1-888-525-5757 For All Other Shareholders HSBC Funds
P.O. Box 182845
Columbus, OH 43218
1-800-782-8183 TRANSFER AGENT Citi Fund Services
3435 Stelzer Road
Columbus, OH 43219 DISTRIBUTOR Foreside Distribution Services, L.P.
690 Taylor Road, Suite 150
Gahanna, OH 43230 CUSTODIAN The Northern Trust Company
50 South LaSalle Street
Chicago, IL 60603 INDEPENDENT REGISTERED PUBLIC ACCOUNTING FIRM KPMG LLP
191 West Nationwide Blvd., Suite 500
Columbus, OH 43215 LEGAL COUNSEL Dechert LLP
1775 I Street, N.W.
Washington, D.C. 20006 |

The HSBC Family of Funds are distributed by Foreside Distribution Services, L.P. This document must be preceded or accompanied by a current prospectus for the HSBC Funds, which you should read carefully before you invest or send money.
| — NOT FDIC INSURED | | — NO BANK GUARANTEE | | — MAY LOSE VALUE |
HSBC Global Asset Management (USA) Inc.
HSBC Funds
Annual Report
October 31, 2012
| MONEY MARKET FUNDS | | Class A | | Class B | | Class C | | Class D | | Class E | | Class I | | Class Y |
| HSBC New York Tax-Free Money Market Fund | | RNTXX | | HNBXX | | HNCXX | | HNYXX | | RYEXX | | — | | RYYXX |
| HSBC Prime Money Market Fund | | REAXX | | HSMXX | | HMMXX | | HIMXX | | HMEXX | | HSIXX | | RMYXX |
| HSBC Tax-Free Money Market Fund | | HBAXX | | HBBXX | | HBCXX | | HBDXX | | HBEXX | | HCIXX | | HBYXX |
| HSBC U.S. Government Money Market Fund | | FTRXX | | HUBXX | | HUMXX | | HGDXX | | HGEXX | | HGIXX | | RGYXX |
| HSBC U.S. Treasury Money Market Fund | | HWAXX | | HTBXX | | HUCXX | | HTDXX | | HTEXX | | HBIXX | | HTYXX |

| Table of Contents |
| HSBC Family of Funds |
| Annual Report - October 31, 2012 |
| Glossary of Terms | | |
| Chairman’s Message | | 4 |
| President’s Message | | 5 |
| Commentary From the Investment Manager | | 6 |
| Portfolio Reviews | | 7 |
| Portfolio Composition | | 12 |
| | | |
| Schedules of Portfolio Investments | | |
| | | |
| HSBC New York Tax-Free Money Market Fund | | 13 |
| HSBC Prime Money Market Fund | | 17 |
| HSBC Tax-Free Money Market Fund | | 21 |
| HSBC U.S. Government Money Market Fund | | 25 |
| HSBC U.S. Treasury Money Market Fund | | 27 |
| Statements of Assets and Liabilities | | 28 |
| Statements of Operations | | 30 |
| Statements of Changes in Net Assets | | 32 |
| Financial Highlights | | 38 |
| Notes to Financial Statements | | 46 |
| Report of Independent Registered Public Accounting Firm | | 55 |
| Other Federal Income Tax Information | | 56 |
| Table of Shareholder Expenses | | 57 |
| Board of Trustees and Officers | | 59 |
| Other Information | | 61 |
Barclays U.S. Aggregate Bond Index is an unmanaged index generally representative of investment-grade, fixed-rate debt issues, including government, corporate, asset-backed, and mortgage-backed securities, with maturities of at least one year.
Barclays U.S. High-Yield Corporate Bond Index is an unmanaged index that measures the non-investment grade, USD-denominated, fixed-rate, taxable corporate bond market. Securities are classified as high-yield if the middle rating of Moody’s, Fitch, and S&P is Ba1/BB+/BB+ or below. The index excludes emerging markets debt.
Gross Domestic Product (“GDP”) measures the market value of the goods and services produced by labor and property in the United States.
Lipper Money Market Funds Average is an equally weighted average of mutual funds that invest in high-quality financial instruments rated in the top two grades with dollar-weighted average maturities of less than 90 days. These funds intend to keep a constant net asset value.
Lipper New York Tax-Exempt Money Market Funds Average is an equally weighted average of mutual funds that invest in New York municipal obligations with dollar-weighted average maturities of less than 90 days. These funds intend to keep a constant net asset value.
Lipper Tax Exempt Money Market Funds Average is an equally weighted average of mutual funds that invest in high-quality municipal obligations with dollar-weighted average maturities of less than 90 days. These funds intend to keep a constant net asset value.
Lipper U.S. Government Money Market Funds Average is an equally weighted average of mutual funds that invest principally in financial instruments issued or guaranteed by the U.S. government, its agencies, or its instrumentalities, with dollar-weighted average maturities of less than 90 days. These funds intend to keep a constant net asset value.
Lipper U.S. Treasury Money Market Funds Average is an equally weighted average of mutual funds that invest principally in U.S. Treasury obligations with dollar-weighted average maturities of less than 90 days. These funds intend to keep a constant net asset value.
Morgan Stanley Capital International Europe Australasia and Far East (“MSCI EAFE”) Index is an unmanaged free float-adjusted market capitalization index that is designed to measure the equity market performance of developed markets, excluding the U.S. & Canada. The MSCI EAFE Index consists of the following 22 developed market countries: Australia, Austria, Belgium, Denmark, Finland, France, Germany, Greece, Hong Kong, Ireland, Israel, Italy, Japan, the Netherlands, New Zealand, Norway, Portugal, Singapore, Spain, Sweden, Switzerland, and the United Kingdom.
Standard & Poor’s MidCap 400 Index is an unmanaged index that is the most widely used index for mid-sized companies. The S&P MidCap 400 covers 7% of the U.S. equities market, and is part of a series of S&P U.S. indices that can be used as building blocks for portfolio composition.
Standard & Poor’s 500 (“S&P 500”) Index is an unmanaged index that is widely regarded as a gauge of the U.S. equities market. This index includes 500 leading companies in leading industries of the U.S. economy. The S&P 500 Index focuses on the large-cap segment of the market, with approximately 75% coverage of U.S. equities.
Russell 2000® Index is an unmanaged index that measures the performance of the small-cap segment of the U.S. equity universe. The Russell 2000® Index is a subset of the Russell 3000® Index representing approximately 10% of the total market capitalization of that index. It includes approximately 2000 of the smallest securities based on a combination of their market cap and current index membership.
Lipper is an independent mutual fund performance monitor whose results are based on total return and do not reflect a sales charge.
Securities indices assume reinvestment of all distributions and interest payments and do not take in account brokerage fees or expenses. Securities in the Funds do not match those in the indices and performance of the Funds will differ. Investors cannot invest directly in an index.
December 20, 2012
To Our Shareholders:
These are challenging times for investors.
Perhaps the central reason is the slow but remorseless unwinding of a multi-decade build-up in global debt, following the recent sharp decline in the global economy. Much of this debt has been devalued—including, for example, debt associated with U.S. housing stock or Greek government debt.
Despite these modest declines, U.S. private debt—which includes household debt from such things as credit cards and mortgages—remains high. Some historical perspective: In 1951, private sector debt stood at just 53% of the U.S. Gross Domestic Product1 (GDP); today, that debt stands at 159%—a very high level, though down from its 2007 peak of 179%.
The turning point appears to be 2007. In that year, aggressive monetary and fiscal policies were enacted in the U.S. to stimulate the flagging economy. The result has been soaring government debt. Projections from the Congressional Budget Office suggest that the ratio of federal debt to GDP could reach 100% by the middle of the next decade—and that doesn’t reflect the increasing cost of entitlement programs.
These increasing claims on national income are worrisome, profoundly so, and have sparked intense and important debate—between Keynesians and monetarists; between free market capitalists and fans of European-style welfare economies; and, most recently, between Democrats and Republicans in the recent election.
So far, these growing claims by government on private sector income and wealth have failed to push interest rates higher. However, they have arguably, tempered the kind of growth and employment gains one would historically associate with recovery. In fact, the Federal Reserve’s Quantative Easing programs and “Operation Twist” have pushed rates to low levels, frustrating investors’ search for yield and leading our advisor and service providers to absorb about $17 million in fee waivers last year. Without these waivers our money market funds would have provided lower yields. Thus, it is no surprise that total money market fund assets have declined.
Regulators and others, parsing the entrails of the sharp recession, have proposed to change the regulation of such funds in order to prevent a future “run” on the funds during any period of economic upheaval. Proposals include a floating NAV, and variations of stable net asset value that include capital buffers.
Our other funds performed well in this difficult environment, as the following pages show.
Furthermore, the fund group continued to nourish its strategy of providing top-notch emerging market asset management products. Our most recent offering is the HSBC RMB Fixed Income Fund, which affords access to the Renminbi, the official offshore currency of the People’s Republic of China, through a portfolio of “Dim Sum” bonds. As the leading international bank in mainland China, HSBC is uniquely positioned to manage such a vehicle.
On behalf of my colleagues, I thank our investment advisor and portfolio managers, our other service providers, and you, our shareholders, for your support. We will continue to work hard to merit that confidence.
Sincerely,

Michael Seely
Chairman, HSBC Funds
| 1 | | For additional information, please refer to the Glossary of Terms. |
This literature must be preceded or accompanied by an effective prospectus for the HSBC Funds. Investors should consider the investment objectives, risks, charges, and expenses of the investment company carefully before investing. The prospectus contains this and other important information about the investment company. To obtain more information, for clients of HSBC Securities (USA) Inc., please call 1-888-525-5757 or visit www.investorfunds.us.hsbc.com. For other investors and prospective investors, please call the Funds directly at 1-888-936-4722. Investors should read the prospectus carefully before investing or sending money.
Dear Shareholder,
We are please to send to you the HSBC Funds annual report, covering the Funds’ fiscal year ended October 31, 2012. This report offers detailed information about your Funds’ investments and results. We encourage you to review it carefully.
Inside these pages you will find a letter from the Funds’ Chairman, Michael Seely, in which he comments on recent market developments. The report also includes commentary from the Funds’ portfolio managers in which they discuss the investment markets and their respective Fund’s performance. Each commentary is accompanied by the Fund’s return for the period, listed alongside the returns of its benchmark index and peer group average for comparative purposes.
On June 8 of this year we continued to expand our emerging markets funds offering by launching the HSBC RMB Fixed Income Fund. This Fund gives investors exposure to the Chinese Renminbi (“RMB”) bond market, sometimes referred to as the “dim sum” bond market. The Fund joins the HSBC Emerging Markets Local Debt Fund, HSBC Emerging Markets Debt Fund, HSBC Total Return Fund and the HSBC Frontier Markets Fund in our emerging markets segment.
In closing, we would like to thank you for investing through the HSBC Funds. We continue to focus the HSBC Fund Family investment solutions to assist our shareholders in reaching their financial goals. We appreciate the trust you place in us, and will continue working to earn it. Please contact us at any time with questions or concerns.
Sincerely,

Richard A. Fabietti
President
| Commentary From the Investment Manager |
| HSBC Global Asset Management (USA) Inc. |
U.S. Economic Review
The global economy made only moderate progress in its ongoing recovery from a historic downturn during the 12-month period between November 1, 2011 and October 31, 2012. Governments around the world fueled the turnaround with aggressive monetary stimulus as policymakers struggled to revive growth against a backdrop, at least in the developed world, of bloated public debt. The Federal Reserve Board (the “Fed”) maintained the federal funds rate—a key factor in lending rates—at a historically low target range between 0.00% to 0.25%, and announced that it would keep the rate in that range until at least 2015.
The period began among concerns that the eurozone debt crisis would cause a new global recession. The situation in Europe improved somewhat during the first months of 2012, largely due to the European Central Bank’s (ECB) efforts to support liquidity. However, the prospect of another global recession loomed throughout much of the period as numerous economic indicators, such as industrial production and unemployment growth, proved disappointing. Although the U.S. economy continued to expand during the period, the pace of its growth slowed.
We believe the ECB helped to stem a liquidity crisis and alleviate fears of deepening credit problems in the eurozone. In December 2011 the ECB began distributing inexpensive loans to European banks as part of its long-term refinancing operation (LTRO) and in March 2012 began doling out an even larger amount of money in similar loans. The LTRO appeared to stabilize financial markets in the short term; nevertheless, significant uncertainties remain regarding the long-term prospects of European economies to regain their competitiveness and prevent default. The ability of Italy and Spain to reestablish market confidence remained in doubt; in addition, the long-term impact of austerity programs on economic growth raised concerns.
Slowing growth in major world economies, including the U.S. and China, presented a significant setback for the global economy. U.S. Gross Domestic Product (“GDP”)1 increased at an annualized rate of 4.1% during the last quarter of 2011, then slowed to 2.7% or less for the remainder of the period under review. Industrial production growth was weak in both developed and emerging markets. U.S. consumer confidence improved somewhat, although real income growth and consumer savings were low. While job growth remained slow, during the last quarter of the period the unemployment rate fell below 8% for the first time in four years. During the period, the U.S. housing market showed significant signs of improvement as sales increased and inventory declined. Towards the end of the period, better economic news was seen from China, the world’s second-largest economy, leading many commentators to suggest that Chinese economic growth had turned a corner. One positive consequence of the slowdown in the global economy was a decrease in the rate of inflation in both developed and emerging economies.
Market Review
U.S. stocks posted strong gains. The first two months of the period were characterized by high volatility, as investors responded to ongoing debt problems and slowing economic growth. Equities began a strong rally in the final weeks of 2011 that continued throughout much of the period, with the exception of a pullback during the late spring. Stocks’ robust performance, despite economic setbacks, was supported in part by the actions of central banks, including the ECB’s launch of a new bond buying scheme it described as “unlimited” and the Fed’s third round of “quantitative easing.” The S&P 500 Index1 of large-company stocks returned 15.21% for the 12 months through October 2012. Small-cap shares slightly outperformed mid- and large-caps: For the same period, the Russell 2000® Index1 of small-company stocks returned 12.08%, and the S&P 400 MidCap Index1 returned 12.11%.
The debt crisis in Europe, along with slowing growth in developing economies, led to less impressive performance for foreign stocks. The Morgan Stanley Capital International Europe Australasia and Far East (“MSCI EAFE”) Index1 of international stocks in developed markets returned 4.61% for the 12-month period.
Fixed-income securities generated significant gains during the period, as global economic worries continued to drive demand for lower-risk assets. Yields on U.S. government bonds reached record lows as an increasing number of investors pursued a flight to safety. Low inflation, healthy corporate balance sheets, consumer and corporate deleveraging and a stabilizing housing market supported gains in corporate fixed-income markets, including both investment and high yield bonds. For the 12-month period the Barclays U.S. Aggregate Bond Index1, which tracks the broad investment-grade fixed-income market, returned 5.25%, while the Barclays U.S. High-Yield Corporate Bond Index1 returned 13.61%.
| 1 | | For additional information, please refer to the Glossary of Terms. |
| Portfolio Reviews (Unaudited) |
HSBC New York Tax-Free Money Market Fund
(Class A Shares, Class B Shares, Class C Shares, Class D Shares and Class Y Shares) |
by Jason Moshos
Senior Portfolio Manager
Investment Concerns
An investment in the Fund is not insured or guaranteed by the FDIC or any other government agency. Although the Fund seeks to preserve the value of your investment at $1.00 per share, it is possible to lose money by investing in the Fund. The Fund’s income may be subject to the federal alternative minimum tax and to certain state and local taxes. Regional funds may be subject to additional risk, since the majority of issues they invest in are located in one geographical area.
For a complete description of these and other risks associated with investment in a mutual fund, please refer to the Fund’s prospectus.
Portfolio Performance
For the year ended October 31, 2012, yields on tax-free money market securities remained at historically low levels, driven in part by the Federal Reserve Board’s pledge to keep interest rates low through 2014 in an effort to boost economic growth. The federal funds rate—a key short-term interest rate that impacts yields on money market securities—ranged between 0.00% to 0.25% throughout the period.
The credit quality of many municipal securities weakened during the period, as continued high unemployment and declining tax receipts put budgetary constraints on New York state and local governments. Those budget issues caused investors to worry that municipalities might fail to meet their financial obligations. To pursue the Fund’s primary goal of capital preservation in that environment, the Fund adopted a defensive stance by emphasizing high-quality issues and deemphasizing lower rated securities. To further enhance liquidity, management positioned the Fund with a weighted-average maturity shorter than that of its peers.*
During the period the supply of tax-free money market securities was low, which resulted in low absolute yields on these securities. Many municipalities reined in their spending and borrowing plans in the face of the weak economy. Municipalities that did borrow typically preferred longer-term debt to short-term debt due to extremely low interest rates during the period. Supply was further constrained by high demand for tax-free securities from taxable money market funds and other nontraditional buyers, which favored tax-free securities because of their high yields relative to taxable money market securities.
* Portfolio composition is subject to change.
| | | | | | Average Annual | | | | | | Expense |
| Fund Performance | | | | | | Total Return (%) | | | | Yield (%)1 | | Ratio (%)2 |
| | Inception | | 1 | | 5 | | 10 | | Since | | 7-Day | | | | |
| As of October 31, 2012 | | Date | | Year | | Year | | Year | | Inception | | Average | | Gross | | Net |
| Class A | | 11/17/94 | | 0.00 | | 0.43 | | 1.00 | | 1.73 | | 0.00 | | 0.66 | | 0.66 |
| Class B3 | | 4/29/98 | | — | | — | | — | | 0.89 | | — | | 1.26 | | 1.26 |
| Class C4 | | 3/19/01 | | — | | — | | — | | 0.77 | | — | | 1.26 | | 1.26 |
| Class D | | 4/1/99 | | 0.00 | | 0.47 | | 1.10 | | 1.43 | | 0.00 | | 0.51 | | 0.51 |
| Class Y | | 7/1/96 | | 0.00 | | 0.55 | | 1.27 | | 1.87 | | 0.00 | | 0.26 | | 0.26 |
| Lipper New York Tax-Exempt | | | | | | | | | | | | | | | | |
| Money Market Funds Average5 | | — | | 0.01 | | 0.49 | | 1.12 | | 1.856 | | N/A | | N/A | | N/A |
Past performance does not guarantee future results. The performance data quoted represents past performance and current returns may be lower or higher. Total return figures include change in share price, reinvestment of dividends and capital gains and do not reflect taxes that a shareholder would pay on Fund distributions or on the redemption of Fund shares. Investment return and principal value will fluctuate so that an investor’s shares, when redeemed may be worth more or less than the original cost. To obtain performance information current to the most recent month end, please call 1-800-782-8183.
The performance above reflects any fee waivers that have been in effect during the applicable periods, as well as any expense reimbursements that have periodically been made. Absent such waivers and reimbursements, returns would have been lower.
Certain returns shown include monies received by the Fund in respect of a one-time payment in respect of a class action settlement and a one-time reimbursement from HSBC Global Asset Management (USA) Inc. related to past marketing arrangements. As a result, the Fund’s total returns for those periods were higher than they would have been had the Fund not received the payments.
| 1 | | The seven-day yield quotation more closely reflects the current earnings of the money market fund than the total return quotation. The seven-day yield reflects voluntary fee waivers/expense reimbursements. Without the voluntary fee waivers/expense reimbursements, the yields would have been -0.67%, -0.52% and -0.27% for Class A Shares, Class D Shares and Class Y Shares, respectively. |
| 2 | | Reflects the expense ratio as reported in the prospectus dated February 28, 2012. |
| 3 | | Reflects the applicable contingent deferred sales charge, maximum of 4.00%. Class B Shares were operational during a portion of the periods presented. Amounts reflect performance for the period of time the Class had operations, which was 190 days during the year ended October 31, 2010. The Class was operational during the entire years ended October 31, 2001, 2002, 2003, 2004, 2005, 2006, 2007, 2008 and 2009. The Class was not operational during the entire years ended October 31, 2011, and October 31, 2012. |
| 4 | | Reflects the applicable contingent deferred sales charge, maximum of 1.00%. Class C Shares were operational during a portion of the periods presented. Amounts reflect performance for the period of time the Class had operations, which was 227, 145, 81 and 81 days during the years ended October 31, 2001, 2002, 2003 and 2004, respectively. The Class had no operations during the entire years ended October 31, 2005, 2006, 2007, 2008, 2009, 2010, 2011 and 2012, respectively. |
| 5 | | For additional information, please refer to the Glossary of Terms. |
| 6 | | Return for the period October 31, 1994 to October 31, 2012. |
| Portfolio Reviews (Unaudited) |
HSBC Prime Money Market Fund
(Class A Shares, Class B Shares, Class C Shares, Class D Shares, Class I Shares and Class Y Shares)
by John Chiodi
Senior Portfolio Manager | Moody’s and Standard & Poor’s
have assigned an “Aaa” and
“AAAm” rating to the HSBC Prime
Money Market Fund.1 |
Investment Concerns
An investment in the Fund is not insured or guaranteed by the FDIC or any other government agency. Although the Fund seeks to preserve the value of your investment at $1.00 per share, it is possible to lose money by investing in the Fund.
For a complete description of these and other risks associated with investment in a mutual fund, please refer to the Fund’s prospectus.
Portfolio Performance
Yields on money market securities remained low throughout the 12-month period ended October 31, 2012, due largely to concerns about economic weakness in Europe and the U.S.
Early in the period, the Eurozone debt crisis and concerns about its potential impact on European banks pushed yields on short-term issues higher. Nevertheless as the European Central Bank began to address the debt crisis and work to increase liquidity for troubled banks—which included the use of long-term refinancing obligations—investors’ confidence in European issuers increased, and yields slowly fell during the rest of the period.
Low yields on money market securities were also driven by weak economic growth and fears of a double-dip recession in the U.S. The Fed maintained a low interest rate policy and pledged to keep rates low through 2014 in the wake of continued economic uncertainty. During the period the Fed also extended its “Operation Twist” program, which aims to put downward pressure on long-term interest rates and boost economic growth.
The Fund maintained a relatively long weighted-average maturity during the period in order to capture the additional yield available from longer-term securities. Early in the period, the Fund favored Treasury securities, which offered relative safety from economic uncertainty in Europe and the U.S. As the period progressed and investor confidence improved, we slightly increased the Fund’s position in short-term commercial paper issued by financial institutions.*
In addition, we continued to emphasize high-quality issues. We removed from our approved issuers list a number of financial institutions that credit rating agency Moody’s had placed on its negative watch list during the period.
* Portfolio composition is subject to change.
| | | | | | | | | Average Annual | | | | | | | | | Expense |
| Fund Performance | | | | | | | | | Total Return (%) | | | | | | | Yield (%)2 | | Ratio (%)3 |
| | Inception | | 1 | | 5 | | 10 | | Since | | 7-Day | | | | |
| As of October 31, 2012 | | Date | | Year | | Year | | Year | | Inception | | Average | | Gross | | Net |
| Class A | | | 11/13/98 | | | | | 0.01 | | | 0.61 | | 1.54 | | | 2.23 | | | | 0.01 | | 0.68 | | 0.68 |
| Class B4 | | | 4/4/01 | | | | - | 3.99 | | | 0.46 | | 1.22 | | | 1.26 | | | | 0.01 | | 1.28 | | 1.28 |
| Class C5 | | | 3/23/01 | | | | - | 0.94 | | | 0.47 | | 1.21 | | | 1.25 | | | | 0.01 | | 1.28 | | 1.28 |
| Class D | | | 4/1/99 | | | | | 0.01 | | | 0.65 | | 1.63 | | | 2.27 | | | | 0.01 | | 0.53 | | 0.53 |
| Class I | | | 1/9/02 | | | | | 0.14 | | | 0.85 | | 1.93 | | | 1.93 | | | | 0.15 | | 0.18 | | 0.18 |
| Class Y | | | 11/12/98 | | | | | 0.03 | | | 0.75 | | 1.81 | | | 2.54 | | | | 0.03 | | 0.28 | | 0.28 |
| Lipper Money Market | | | | | | | | | | | | | | | | | | | | | | | | |
| Funds Average6 | | | — | | | | | 0.02 | | | 0.61 | | 1.45 | | | 2.16 | 7 | | | N/A | | N/A | | N/A |
Past performance does not guarantee future results. The performance data quoted represents past performance and current returns may be lower or higher. Total return figures include change in share price, reinvestment of dividends and capital gains and do not reflect taxes that a shareholder would pay on Fund distributions or on the redemption of Fund shares. Investment return and principal value will fluctuate so that an investor’s shares, when redeemed may be worth more or less than the original cost. To obtain performance information current to the most recent month end, please call 1-800-782-8183.
The performance above reflects any fee waivers that have been in effect during the applicable periods, as well as any expense reimbursements that have periodically been made. Absent such waivers and reimbursements, returns would have been lower.
Certain returns shown include monies received by the Fund in respect of a one-time payment in respect of a class action settlement and a one-time reimbursement from HSBC Global Asset Management (USA) Inc. related to past marketing arrangements. As a result, the Fund’s total returns for those periods were higher than they would have been had the Fund not received the payments.
| 1 | | The “Aaa” and “AAAm” money market fund rating is historical and reflects Moody’s and Standard & Poor’s opinion as to the quality of the Fund’s investments, liquidity management, and operations and trading support. Periodic reviews are conducted to ensure a secure operations environment. Moody’s and Standard & Poor’s ratings represent an opinion only, not a recommendation to buy or sell. Obligations rated A-1+, A-1 or P-1 are rated in the highest short-term rating category by Standard & Poor’s (A-1+ or A-1) or Moody’s Investor Service (P-1). The obligor’s capacity to meet its financial commitments on these obligations is regarded to be “extremely strong” (A-1+), “strong” (A-1) or “superior” (P-1). |
| 2 | | The seven-day yield quotation more closely reflects the current earnings of the money market fund than the total return quotation. The seven-day yield reflects voluntary fee waivers/expense reimbursements. Without the voluntary fee waivers/expense reimbursements, the yields would have been -0.38%, -0.98%, -0.98%, -0.23%, 0.12% and 0.02% for Class A Shares, Class B Shares, Class C Shares, Class D Shares, Class I Shares and Class Y Shares, respectively. |
| 3 | | Reflects the expense ratio as reported in the prospectus dated February 28, 2012. |
| 4 | | Reflects the applicable contingent deferred sales charge, maximum of 4.00%. Class B Shares were operational during a portion of the periods presented. Amounts reflect performance for the period of time the Class had operations, which was 147 and 211 days for the years ended October 31, 2002 and 2001, respectively. The Class was operational during the entire years ended October 31, 2003, 2004, 2005, 2006, 2007, 2008, 2009, 2010, 2011 and 2012, respectively. |
| 5 | | Reflects the applicable contingent deferred sales charge, maximum of 1.00%. Class C Shares were operational during a portion of the periods presented. Amounts reflect performance for the period of time the Class had operations, which was 201 days for the year ended October 31, 2001. The Class was operational during the entire years ended October 31, 2002, 2003, 2004, 2005, 2006, 2007, 2008, 2009, 2010, 2011 and 2012, respectively. |
| 6 | | For additional information, please refer to the Glossary of Terms. |
| 7 | | Return for the period October 31, 1998 to October 31, 2012. |
| Portfolio Reviews (Unaudited) |
| HSBC Tax-Free Money Market Fund | |
| (Class A Shares, Class C Shares, Class D Shares, Class I Shares and Class Y Shares) | |
by Jason Moshos
Senior Portfolio Manager
Investment Concerns
An investment in the Fund is not insured or guaranteed by the FDIC or any other government agency. Although the Fund seeks to preserve the value of your investment at $1.00 per share, it is possible to lose money by investing in the Fund. The Fund’s income may be subject to the federal alternative minimum tax and to certain state and local taxes.
For a complete description of these and other risks associated with investment in a mutual fund, please refer to the Fund’s prospectus.
Portfolio Performance
Yields on tax-free money market securities remained low by historical standards during the 12-month period ended October 31, 2012. For example, the federal funds rate—a key short-term interest rate that influences yields on money market securities—remained within a range of 0.00% to 0.25% throughout the period.
State and local governments faced budget pressures during the period, which were driven by continued difficulties in the labor market and declining tax revenues. The credit quality of many municipal bonds weakened in that environment, as investors feared that municipalities may not be able to meet their financial obligations.
To pursue the Fund’s primary goal of capital preservation in this challenging environment, the managers favored high-quality issues and deemphasized low-quality securities. The managers maintained a weighted-average maturity for the period that was in line with that of its peers.*
The period was characterized by a low supply of tax-free money market securities, which kept yields low on an absolute basis. The lack of supply was due in part to municipalities issuing less new debt than usual due to their already tight budgets. When municipalities did issue new debt, they generally chose to lock in low interest rates for an extended period of time by issuing longer-term debt. Low supply was driven by the high yields on tax-free securities relative to comparable taxable money market securities. Those high yields created demand from nontraditional buyers such as taxable money market funds.
* Portfolio composition is subject to change.
| | | | | | | | Average Annual | | | | | | | | | | | Expense |
| Fund Performance | | | | | | | | Total Return (%) | | | | | | | Yield (%)1 | | Ratio (%)2 |
| | Inception | | 1 | | 5 | | Since | | 7-Day | | | | |
| As of October 31, 2012 | | Date | | Year | | Year | | Inception | | Average | | Gross | | Net |
| Class A3 | | | 8/27/04 | | | — | | — | | | 0.41 | | | | | — | | | 0.83 | | 0.83 |
| Class C4 | | | 7/30/07 | | | — | | — | | | 0.09 | | | | | — | | | 1.43 | | 1.43 |
| Class D | | | 8/24/04 | | | 0.00 | | 0.49 | | | 1.23 | | | | | 0.00 | | | 0.68 | | 0.68 |
| Class I5 | | | 6/25/04 | | | — | | — | | | 0.27 | | | | | — | | | 0.33 | | 0.33 |
| Class Y | | | 6/8/04 | | | 0.00 | | 0.60 | | | 1.39 | | | | | 0.00 | | | 0.43 | | 0.43 |
| Lipper Tax-Exempt Money | | | | | | | | | | | | | | | | | | | | | |
| Market Funds Average6 | | | — | | | 0.01 | | 0.49 | | | 1.21 | 7 | | | | N/A | | | N/A | | N/A |
Past performance does not guarantee future results. The performance data quoted represents past performance and current returns may be lower or higher. Total return figures include change in share price, reinvestment of dividends and capital gains and do not reflect taxes that a shareholder would pay on Fund distributions or on the redemption of Fund shares. Investment return and principal value will fluctuate so that an investor’s shares, when redeemed may be worth more or less than the original cost. To obtain performance information current to the most recent month end, please call 1-800-782-8183.
The performance above reflects any fee waivers that have been in effect during the applicable periods, as well as any expense reimbursements that have periodically been made. Absent such waivers and reimbursements, returns would have been lower.
Certain returns shown include monies received by the Fund in respect of a one-time payment in respect of a class action settlement. As a result, the Fund’s total returns for those periods were higher than they would have been had the Fund not received the payment.
| 1 | | The seven-day yield quotation more closely reflects the current earnings of the money market fund than the total return quotation. The seven-day yield reflects voluntary fee waivers/expense reimbursements. Without the voluntary fee waivers/expense reimbursements, the yields would have been -0.82% and -0.57% for Class D Shares and Class Y Shares, respectively. |
| 2 | | Reflects the expense ratio as reported in the prospectus dated February 28, 2012. |
| 3 | | Class A Shares were operational during a portion of the periods presented. Amounts reflect performance for the period of time the Class had operations, which was 5, 78, 24 and 262 days during the years ended October 31, 2004, 2006, 2007 and 2009, respectively and 141 days for the year ended October 31, 2011. The Class was operational during the entire year ended October 31, 2010. The Class was not operational during the entire year ended October 31, 2012. |
| 4 | | Reflects the applicable contingent deferred sales charge, maximum of 1.00%. Class C Shares were operational during a portion of the periods presented. Amounts reflect performance for the period of time the Class had operations, which was 15 days during the year ended October 31, 2007. The Class had no operations during the entire years ended October 31, 2008, 2009, 2010, 2011 and 2012, respectively. |
| 5 | | Class I Shares were operational during a portion of the periods presented. Amounts reflect performance for the period of time the Class had operations, which was 40, 27 and 51 days during the years ended October 31, 2004, 2005 and 2010, respectively. The Class had no operations during the entire years ended October 31, 2006, 2007, 2008, 2009, 2011, and 2012, respectively. |
| 6 | | For additional information, please refer to the Glossary of Terms. |
| 7 | | Return for the period May 31, 2004 to October 31, 2012. |
| Portfolio Reviews (Unaudited) |
HSBC U.S. Government Money Market Fund
(Class A Shares, Class B Shares, Class C Shares, Class D Shares, Class I Shares and Class Y Shares) by John Chiodi
Senior Portfolio Manager | Moody’s and Standard & Poor’s
have assigned an “Aaa” and
“AAAm” rating to the
HSBC U.S. Government
Money Market Fund.1 |
Investment Concerns
An investment in the Fund is not insured or guaranteed by the FDIC or any other government agency. Although the Fund seeks to preserve the value of your investment at $1.00 per share, it is possible to lose money by investing in the Fund.
For a complete description of these and other risks associated with investment in a mutual fund, please refer to the Fund’s prospectus.
Portfolio Performance
Yields on U.S. government money market securities remained low for the 12-month period ended October 31, 2012. The federal funds rate (a key short-term interest rate) remained within a range of 0.00% to 0.25% throughout the period.
Low yields resulted from several factors, including the continuing debt crisis in Europe and concerns about slow economic growth in the U.S. Investors in that environment favored highly liquid short-term securities. That demand pushed down yields on short-term repurchase agreements (“repos”) and other money market securities. As the period progressed, however, the European Central Bank took steps to improve conditions in Europe, while the U.S. Federal Reserve pledged to keep interest rates low through 2014. These developments boosted investor confidence, reducing demand for short-term issues. In addition, the supply of Treasury securities rose during the second half of the period. These factors helped yields on repos to rise.
The Fund maintained a relative long weighted-average maturity, which enabled the Fund to capture additional yield. The majority of the longer-term securities in the Fund were Treasury securities and repos. Treasuries replaced much of the Fund’s previous holdings in securities issued by Government-Sponsored Enterprises (GSEs), which have shrunk in supply as GSEs increasingly seek longer-term funding.*
* Portfolio composition is subject to change.
| | | | | | | | | | | Average Annual | | | | | | | | | Expense |
| Fund Performance | | | | | | | | | | | Total Return (%) | | | | | | | Yield (%)2 | | Ratio (%)3 |
| | Inception | | 1 | | 5 | | 10 | | Since | | 7-Day | | | | |
| As of October 31, 2012 | | Date | | Year | | Year | | Year | | Inception | | Average | | Gross | | Net |
| Class A | | | 5/3/90 | | | | | 0.01 | | | 0.47 | | 1.42 | | | 3.07 | | | | 0.01 | | 0.68 | | 0.68 |
| Class B4 | | | 9/11/98 | | | | - | 3.99 | | | 0.36 | | 1.30 | | | 1.89 | | | | 0.01 | | 1.28 | | 1.28 |
| Class C5 | | | 11/20/06 | | | | | — | | | — | | — | | | 1.39 | | | | — | | 1.28 | | 1.28 |
| Class D | | | 4/1/99 | | | | | 0.01 | | | 0.51 | | 1.52 | | | 2.12 | | | | 0.01 | | 0.53 | | 0.53 |
| Class I6 | | | 12/24/03 | | | | | 0.02 | | | 0.65 | | — | | | 1.59 | | | | 0.05 | | 0.18 | | 0.18 |
| Class Y | | | 7/1/96 | | | | | 0.01 | | | 0.59 | | 1.68 | | | 2.77 | | | | 0.01 | | 0.28 | | 0.28 |
| Lipper U.S. Government | | | | | | | | | | | | | | | | | | | | | | | | |
| Money Market Funds Average7 | | | — | | | | | 0.01 | | | 0.50 | | 1.42 | | | 3.08 | 8 | | | N/A | | N/A | | N/A |
Past performance does not guarantee future results. The performance data quoted represents past performance and current returns may be lower or higher. Total return figures include change in share price, reinvestment of dividends and capital gains and do not reflect taxes that a shareholder would pay on Fund distributions or on the redemption of Fund shares. Investment return and principal value will fluctuate so that an investor’s shares, when redeemed may be worth more or less than the original cost. To obtain performance information current to the most recent month end, please call 1-800-782-8183.
The performance above reflects any fee waivers that have been in effect during the applicable periods, as well as any expense reimbursements that have periodically been made. Absent such waivers and reimbursements, returns would have been lower.
Certain returns shown include monies received by the Fund in respect of a one-time payment in respect of a class action settlement and a one-time reimbursement from HSBC Global Asset Management (USA) Inc. related to past marketing arrangements. As a result, the Fund’s total returns for those periods were higher than they would have been had the Fund not received the payments.
| 1 | | The “Aaa” and “AAAm” money market fund rating is historical and reflects Moody’s and Standard & Poor’s opinion as to the quality of the Fund’s investments, liquidity management, and operations and trading support. Periodic reviews are conducted to ensure a secure operations environment. Moody’s and Standard & Poor’s ratings represent an opinion only, not a recommendation to buy or sell. Obligations rated A-1+, A-1 or P-1 are rated in the highest short-term rating category by Standard & Poor’s (A-1+ or A-1) or Moody’s Investor Service (P-1). The obligor’s capacity to meet its financial commitments on these obligations is regarded to be “extremely strong” (A-1+), “strong” (A-1) or “superior” (P-1). |
| 2 | | The seven-day yield quotation more closely reflects the current earnings of the money market fund than the total return quotation. The seven-day yield reflects voluntary fee waivers/expense reimbursements. Without the voluntary fee waivers/expense reimbursements, the yields would have been -0.45%, -1.05%, -0.30%, 0.05% and -0.05% for Class A Shares, Class B Shares, Class D Shares, Class I Shares and Class Y Shares, respectively. |
| 3 | | Reflects the expense ratio as reported in the prospectus dated February 28, 2012. |
| 4 | | Reflects the applicable contingent deferred sales charge, maximum of 4.00%. |
| 5 | | Reflects the applicable contingent deferred sales charge, maximum of 1.00%. Class C Shares were operational during a portion of the periods presented. Amounts reflect performance for the period of time the Class had operations, which was 346, 362 and 351 days during the years end October 31, 2006, 2009 and 2010, respectively. The Class was not operational during the entire years ended October 31, 2007, 2008, 2011, and 2012, respectively. |
| 6 | | Class I Shares were operational during a portion of the periods presented. Amounts reflect performance for the period of time the Class had operations, which was 10, 89, 136 and 357 days during the years ended October 31, 2004, 2005, 2006 and 2007, respectively. The Class was operational during the entire years ended October 31, 2008, 2009, 2010, 2011, and 2012, respectively. |
| 7 | | For additional information, please refer to the Glossary of Terms. |
| 8 | | Return for the period April 30, 1990 to October 31, 2012. |
| Portfolio Reviews (Unaudited) |
HSBC U.S. Treasury Money Market Fund
(Class A Shares, Class B Shares, Class C Shares, Class D Shares, Class I Shares and Class Y Shares) | Standard & Poor’s has assigned
an “AAA” rating to the HSBC U.S.
Treasury Money Market Fund.1 |
by John Chiodi
Senior Portfolio Manager
Investment Concerns
An investment in the Fund is not insured or guaranteed by the FDIC or any other government agency. Although the Fund seeks to preserve the value of your investment at $1.00 per share, it is possible to lose money by investing in the fund. The Fund’s income may be subject to the federal alternative minimum tax and to certain state and local taxes.
For a complete description of these and other risks associated with investment in a mutual fund, please refer to the Fund’s prospectus.
Portfolio Performance
Yields on U.S. Treasury bills remained low during the 12-month period ended October 31, 2012. Weaker than expected conditions in the U.S. labor and housing markets lead to fears that the economy could slide back into recession.
In that environment, the Fed kept the federal funds rate (a key short-term interest rate) low—it ranged between 0.00% and 0.25% during the period. The Fed pledged to maintain a policy of low interest rates through 2014 in an effort to boost economic growth, and implemented a number of strategies designed to keep interest rates low.
The supply of and demand for Treasury bills had a significant impact on yields as well. The end of 2011 saw rising demand for Treasuries, as institutional investors typically shift assets into short-term, liquid securities toward the end of each year to improve the quality of their balance sheets. That demand pushed down Treasury yields at year end and into 2012. However, increased supply later in the period caused Treasury yields to rise.
The Fund maintained a relatively long weighted-average maturity, which enabled the Fund to lock in additional yield available on longer-term securities. The Fund also employed a barbell strategy that concentrates holdings among very short-term securities and longer-term issues. This approach enabled the Fund to take advantage of the rise in short-term rates when the supply of Treasury bills increased, while still capturing the additional yield on longer-term money market securities.*
* Portfolio composition is subject to change.
| | | | | | | | | | | Average Annual | | | | | | | | | Expense |
| Fund Performance | | | | | | | | | | | Total Return (%) | | | | | | | Yield (%)2 | | Ratio (%)3 |
| | Inception | | 1 | | 5 | | 10 | | Since | | 7-Day | | | | |
| As of October 31, 2012 | | Date | | Year | | Year | | Year | | Inception | | Average | | Gross | | Net |
| Class A | | | 5/24/01 | | | | | 0.00 | | | 0.29 | | 1.19 | | | 1.23 | | | | 0.00 | | 0.68 | | 0.68 |
| Class B4 | | | 8/12/04 | | | | - | 4.00 | | | 0.19 | | — | | | 1.08 | | | | 0.00 | | 1.28 | | 1.28 |
| Class C5 | | | 12/24/03 | | | | | — | | | — | | — | | | 0.04 | | | | — | | 1.28 | | 1.28 |
| Class D | | | 5/14/01 | | | | | 0.00 | | | 0.32 | | 1.28 | | | 1.33 | | | | 0.00 | | 0.53 | | 0.53 |
| Class I6 | | | 12/30/03 | | | | | 0.00 | | | 0.41 | | — | | | 1.68 | | | | 0.00 | | 0.18 | | 0.18 |
| Class Y | | | 5/11/01 | | | | | 0.00 | | | 0.37 | | 1.43 | | | 1.50 | | | | 0.00 | | 0.28 | | 0.28 |
| Lipper U.S. Treasury | | | | | | | | | | | | | | | | | | | | | | | | |
| Money Market Funds Average7 | | | — | | | | | 0.01 | | | 0.33 | | 1.27 | | | 1.34 | 8 | | | N/A | | N/A | | N/A |
Past performance does not guarantee future results. The performance data quoted represents past performance and current returns may be lower or higher. Total return figures include change in share price, reinvestment of dividends and capital gains and do not reflect taxes that a shareholder would pay on Fund distributions or on the redemption of Fund shares. Investment return and principal value will fluctuate so that an investor’s shares, when redeemed may be worth more or less than the original cost. To obtain performance information current to the most recent month end, please call 1-800-782-8183.
The performance above reflects any fee waivers that have been in effect during the applicable periods, as well as any expense reimbursements that have periodically been made. Absent such waivers and reimbursements, returns would have been lower.
Certain returns shown include monies received by the Fund in respect of a one-time payment in respect of a class action settlement and a one-time reimbursement from HSBC Global Asset Management (USA) Inc. related to past marketing arrangements. As a result, the Fund’s total returns for those periods were higher than they would have been had the Fund not received the payments.
| 1 | | The “AAA” money market fund rating is historical and reflects Standard & Poor’s opinion as to the quality of the Fund’s investments, liquidity management, and operations and trading support. Periodic reviews are conducted to ensure a secure operations environment. Standard & Poor’s rating represent an opinion only, not a recommendation to buy or sell. Obligations rated A-1+, A-1 or P-1 are rated in the highest short-term rating category by Standard & Poor’s (A-1+ or A-1) or Moody’s Investor Service (P-1). The obligor’s capacity to meet its financial commitments on these obligations is regarded to be “extremely strong” (A-1+), “strong” (A-1) or “superior” (P-1). |
| 2 | | The seven-day yield quotation typically more closely reflects the current earnings of the money market fund than the total return quotation. The seven-day yield reflects voluntary fee waivers/expense reimbursements. Without the voluntary fee waivers/expense reimbursements, the yields would have been -0.53%, -1.13%, -0.38%, -0.03% and -0.13% for Class A Shares, Class B Shares, Class D Shares, Class I Shares and Class Y Shares, respectively. |
| 3 | | Reflects the expense ratio as reported in the prospectus dated February 28, 2012. |
| 4 | | Reflects the applicable contingent deferred sales charge, maximum of 4.00%. |
| 5 | | Reflects the applicable contingent deferred sales charge, maximum of 1.00%. Class C Shares were operational during a portion of the periods presented. Amounts reflect performance for the period of time the Class had operations, which was 26 and 351 days during the years ended October 31, 2008 and 2010, respectively. The Class was operational during the entire years ended October 31, 2005, 2006, 2007 and 2009. The Class was not operational during the entire years ended October 31, 2011 and October 31, 2012. |
| 6 | | Class I Shares were operational during a portion of the periods presented. Amounts reflect performance for the period of time the Class had operations, which was 13 and 280 days during the years ended October 31, 2004 and 2005, respectively. The Class was operational during the entire years ended October 31, 2006, 2007, 2008, 2009, 2010, 2011, and 2012, respectively. |
| 7 | | For additional information, please refer to the Glossary of Terms. |
| 8 | | Return for the period April 30, 2001 to October 31, 2012. |
| Portfolio Reviews |
| Portfolio Composition* |
| October 31, 2012 (Unaudited) |
| HSBC New York Tax-Free Money Market Fund |
| | Percentage of |
| Investment Allocation | | Investments at Value (%) |
| Variable Rate Demand Notes | | | 96.4 | |
| Municipal Bonds | | | 3.6 | |
| Total | | | 100.0 | |
| | |
| HSBC Prime Money Market Fund |
| | | Percentage of |
| Investment Allocation | | Investments at Value (%) |
| Commercial Paper and Notes | | | 42.1 | |
| Certificates of Deposit | | | 22.9 | |
| Repurchase Agreements | | | 17.3 | |
| U.S. Treasury Obligations | | | 7.0 | |
| Variable Rate Demand Notes | | | 3.8 | |
| Yankee Dollars | | | 3.4 | |
| Time Deposits | | | 2.5 | |
| Corporate Obligations | | | 1.0 | |
| Total | | | 100.0 | |
| | |
| HSBC Tax-Free Money Market Fund |
| | | Percentage of |
| Investment Allocation | | Investments at Value (%) |
| Variable Rate Demand Notes | | | 86.3 | |
| Municipal Bonds | | | 11.8 | |
| Commercial Paper and Notes | | | 1.9 | |
| Total | | | 100.0 | |
| |
| HSBC U.S. Government Money Market Fund |
| | | Percentage of |
| Investment Allocation | | Investments at Value (%) |
| Repurchase Agreements | | | 55.7 | |
| U.S. Treasury Obligations | | | 24.4 | |
| U.S. Government and | | | | |
| Government Agency Obligations | | | 19.9 | |
| Total | | | 100.0 | |
| | |
| HSBC U.S. Treasury Money Market Fund |
| | | Percentage of |
| Investment Allocation | | Investments at Value (%) |
| U.S. Treasury Obligations | | | 100.0 | |
| Total | | | 100.0 | |
____________________
* Portfolio composition is subject to change.
| HSBC NEW YORK TAX-FREE MONEY MARKET FUND |
| Schedule of Portfolio Investments—as of October 31, 2012 |
| Variable Rate Demand Notes – 94.3% |
| | | | | |
| | Principal | | Amortized |
| | Amount ($) | | Cost ($) |
| New York – 93.2% | | | | |
| Albany IDA Civic Facility Revenue, | | | | |
| Series A, 0.23%, 6/1/38, | | | | |
| (LOC TD Bank N.A.) (a) | | 5,755,000 | | 5,755,000 |
| Albany IDA Civic Facility Revenue, | | | | |
| Series A, 0.23%, 7/1/38, | | | | |
| (LOC TD Banknorth N.A.) (a) | | 4,100,000 | | 4,100,000 |
| Albany IDA Housing Revenue | | | | |
| Department of Public Work, | | | | |
| 0.25%, 8/15/35, AMT, (Credit | | | | |
| Support FNMA) (a) | | 1,000,000 | | 1,000,000 |
| Buffalo Municipal Water Finance | | | | |
| Authority Water Systems Revenue, | | | | |
| 0.20%, 7/1/35, (LOC JPMorgan | | | | |
| Chase Bank) (a) | | 5,250,000 | | 5,250,000 |
| Dutchess County IDA Civic Facility | | | | |
| Revenue, Series A, 0.20%, 7/1/38, | | | | |
| (LOC TD Bank N.A.) (a) | | 3,900,000 | | 3,900,000 |
| Long Island Power Authority Electrical | | | | |
| Systems Revenue, Series 2, | | | | |
| Sub-series 2-B, 0.24%, 5/1/33, | | | | |
| (LOC Bayerische Landesbank) (a) | | 8,000,000 | | 8,000,000 |
| Long Island Power Authority Electrical | | | | |
| Systems Revenue, Series C, 0.18%, | | | | |
| 5/1/33, (LOC Barclays Bank plc) (a) | | 5,000,000 | | 5,000,000 |
| Long Island Power Authority Electrical | | | | |
| Systems Revenue, Sub-series 1-B, | | | | |
| 0.22%, 5/1/33, (LOC State Street | | | | |
| Bank & Trust Co.) (a) | | 2,500,000 | | 2,500,000 |
| Metropolitan Transportation Authority | | | | |
| Dedicated Tax Fund Revenue, | | | | |
| Series A-2, 0.20%, 11/1/31, | | | | |
| (LOC Bank of Tokyo-Mitsubishi | | | | |
| UFJ Ltd.) (a) | | 5,500,000 | | 5,500,000 |
| Metropolitan Transportation Authority | | | | |
| Dedicated Tax Fund Revenue, | | | | |
| Sub-series B-1, 0.20%, 11/1/22, (LOC | | | | |
| State Street Bank & Trust Co.) (a) | | 2,000,000 | | 2,000,000 |
| Metropolitan Transportation Authority | | | | |
| Revenue, Sub-series B-1, 0.21%, | | | | |
| 11/1/34, (LOC Scotiabank) (a) | | 5,000 | | 5,000 |
| Metropolitan Transportation Authority | | | | |
| Revenue, Sub-series E-3, 0.20%, | | | | |
| 11/1/35, (LOC PNC Bank N.A.) (a) | | 4,000,000 | | 4,000,000 |
| Monroe County IDA Civic Facility | | | | |
| Revenue, 0.23%, 6/1/36, (LOC | | | | |
| JPMorgan Chase Bank) (a) | | 1,900,000 | | 1,900,000 |
| Monroe County IDA Civic Facility | | | | |
| Revenue, 0.20%, 2/1/38, (LOC | | | | |
| JPMorgan Chase Bank) (a) | | 1,700,000 | | 1,700,000 |
| Monroe County IDA Civic Facility | | | | |
| Revenue, 0.21%, 4/1/38, (LOC | | | | |
| JPMorgan Chase Bank) (a) | | 2,100,000 | | 2,100,000 |
| Nassau County IDA Civic Facility | | | | |
| Revenue, 1.17%, 6/1/19, AMT, (LOC | | | | |
| Fleet Bank N.A.) (a)(b) | | 1,125,000 | | 1,125,000 |
| Nassau County Interim Finance | | | | |
| Authority Sales Tax Revenue, Series | | | | |
| B, 0.21%, 11/15/21, (LOC Sumitomo | | | | |
| Mitsui Banking Corp.) (a) | | 5,000,000 | | 5,000,000 |
| New York City Capital Resources Corp. | | | | |
| Revenue, Series B1, 0.25%, 7/1/37, | | | | |
| (LOC Bank of America N.A.) (a) | | 2,000,000 | | 2,000,000 |
| New York City GO, 0.21%, 9/1/35, | | | | |
| (LOC Royal Bank of Scotland) (a) | | 3,000,000 | | 3,000,000 |
| New York City GO, Series H, | | | | |
| Sub-series H-3, 0.24%, 8/1/14, | | | | |
| (Credit Support AGM, SPA State | | | | |
| Street Bank & Trust Co.) (a) | | 1,000,000 | | 1,000,000 |
| New York City GO, Series H, | | | | |
| Sub-series H-3, 0.24%, 8/1/19, | | | | |
| (Credit Support AGM, SPA State | | | | |
| Street Bank & Trust Co.) (a) | | 1,800,000 | | 1,800,000 |
| New York City GO, Series H, | | | | |
| Sub-series H-3, 0.24%, 8/1/21, | | | | |
| (Credit Support AGM, SPA State | | | | |
| Street Bank & Trust Co.) (a) | | 1,000,000 | | 1,000,000 |
| New York City GO, Series I, | | | | |
| Sub-series I-6, 0.24%, 4/1/36, (LOC | | | | |
| California State Teacher’s Retirement | | | | |
| System) (a) | | 3,000,000 | | 3,000,000 |
| New York City GO, Sub-series C-4, | | | | |
| 0.20%, 8/1/20, (LOC Bank of Tokyo- | | | | |
| Mitsubishi UFJ Ltd.) (a) | | 3,000,000 | | 3,000,000 |
| New York City GO, | | | | |
| Sub-series D-3, 0.20%, 10/1/39, | | | | |
| (LOC Bank of New York) (a) | | 2,000,000 | | 2,000,000 |
| New York City GO, | | | | |
| Sub-series D-4, 0.27%, 12/1/32, | | | | |
| (SPA Calyon Bank) (a) | | 3,000,000 | | 3,000,000 |
| New York City GO, | | | | |
| Sub-series G-4, 0.20%, 3/1/39, | | | | |
| (LIQ FAC Barclays Bank plc) (a) | | 2,000,000 | | 2,000,000 |
| New York City GO, | | | | |
| Sub-series G-4, 0.20%, 4/1/42, | | | | |
| (LOC PNC Bank N.A.) (a) | | 4,000,000 | | 4,000,000 |
| New York City Health & Hospital Corp. | | | | |
| Revenue, Series D, 0.24%, 2/15/26, | | | | |
| (Credit Support GO of Corp., | | | | |
| LOC JPMorgan Chase & Co.) (a) | | 2,000,000 | | 2,000,000 |
| New York City Housing Development | | | | |
| Corp. Multi-family Housing Revenue, | | | | |
| Series A, 0.22%, 9/15/28, AMT, | | | | |
| (Credit Support FNMA, LIQ FAC | | | | |
| FNMA) (a) | | 1,000,000 | | 1,000,000 |
| New York City Housing Development | | | | |
| Corp. Multi-family Housing Revenue, | | | | |
| Series A, 0.22%, 4/1/31, (Credit | | | | |
| Support FHLMC) (a) | | 1,135,000 | | 1,135,000 |
| New York City Housing Development | | | | |
| Corp. Multi-family Mortgage | | | | |
| Revenue, 0.21%, 11/1/46, | | | | |
| (Credit Support FHLMC, LIQ FAC | | | | |
| FHLMC) (a) | | 2,000,000 | | 2,000,000 |
| New York City Housing Development | | | | |
| Corp. Multi-family Mortgage | | | | |
| Revenue, Series A, 0.20%, | | | | |
| 12/15/37, AMT, (Credit Support | | | | |
| FNMA, LIQ FAC FNMA) (a) | | 2,000,000 | | 2,000,000 |
| See notes to financial statements. | HSBC FAMILY OF FUNDS 13 |
| HSBC NEW YORK TAX-FREE MONEY MARKET FUND |
| Schedule of Portfolio Investments—as of October 31, 2012 (continued) | |
| Variable Rate Demand Notes, continued |
| |
| | Principal | | Amortized |
| | Amount ($) | | Cost ($) |
| New York, continued | | | | |
| New York City Housing Development | | | | |
| Corp. Multi-family Mortgage | | | | |
| Revenue, Series A, 0.24%, 11/1/39, | | | | |
| AMT, (LOC Citibank N.A.) (a) | | 3,000,000 | | 3,000,000 |
| New York City Housing Development | | | | |
| Corp. Multi-family Mortgage | | | | |
| Revenue, Series A, 0.20%, 10/15/41, | | | | |
| (Credit Support FNMA, LIQ FAC | | | | |
| FNMA) (a) | | 3,000,000 | | 3,000,000 |
| New York City IDA Civic Facility | | | | |
| Revenue, 0.26%, 12/1/36, (LOC | | | | |
| JPMorgan Chase Bank) (a) | | 2,000,000 | | 2,000,000 |
| New York City IDA Special Facility | | | | |
| Revenue, 0.21%, 7/1/24, (LOC | | | | |
| Citibank N.A.) (a) | | 5,000,000 | | 5,000,000 |
| New York City Municipal Water | | | | |
| Finance Authority Water & Sewer | | | | |
| System Revenue, Series AA-1, | | | | |
| 0.20%, 6/15/46, (LIQ FAC PNC | | | | |
| Bank N.A.) (a) | | 6,000,000 | | 6,000,000 |
| New York City Municipal Water | | | | |
| Finance Authority Water & Sewer | | | | |
| System Revenue, Series CC, 0.20%, | | | | |
| 6/15/41, (SPA Barclays Bank plc) (a) | | 5,000,000 | | 5,000,000 |
| New York City Municipal Water | | | | |
| Finance Authority Water & | | | | |
| Sewer System Revenue, | | | | |
| Series DD-3B, 0.23%, 6/15/43, | | | | |
| (SPA California State Teacher’s | | | | |
| Retirement System) (a) | | 3,100,000 | | 3,100,000 |
| New York City Municipal Water | | | | |
| Finance Authority Water & Sewer | | | | |
| System Revenue, Sub-series B-2, | | | | |
| 0.20%, 6/15/24, (SPA Lloyds TSB | | | | |
| Bank plc) (a) | | 4,000,000 | | 4,000,000 |
| New York City Municipal Water | | | | |
| Finance Authority Water & Sewer | | | | |
| System Revenue, Sub-series B-4, | | | | |
| 0.22%, 6/15/45, (SPA Northern | | | | |
| Trust Co.) (a) | | 4,000,000 | | 4,000,000 |
| New York City Transitional Finance | | | | |
| Authority Revenue, Series 1, Sub- | | | | |
| series 1-D, 0.24%, 11/1/22, (SPA | | | | |
| Landesbank Hessen-Thuringen) (a) | | 3,000,000 | | 3,000,000 |
| New York City Transitional Finance | | | | |
| Authority Revenue, Series 3, Sub- | | | | |
| series 3-G, 0.20%, 11/1/22, (SPA | | | | |
| Bank of New York) (a) | | 3,000,000 | | 3,000,000 |
| New York City Transitional Finance | | | | |
| Authority Revenue, Series 3, Sub- | | | | |
| series 3-H, 0.23%, 11/1/22, (SPA | | | | |
| Royal Bank of Canada) (a) | | 2,290,000 | | 2,290,000 |
| New York City Transitional Finance | | | | |
| Authority Revenue, Series A, | | | | |
| Sub-series 3-B, 0.18%, 11/1/29, | | | | |
| (LOC Bank of Tokyo-Mitsubishi | | | | |
| UFJ Ltd.) (a) | | 3,000,000 | | 3,000,000 |
| New York City Transitional Finance | | | | |
| Authority Revenue, Series A2, | | | | |
| 0.17%, 11/15/27, (SPA Bank of | | | | |
| Nova Scotia) (a) | | 3,000,000 | | 3,000,000 |
| New York City Transitional Finance | | | | |
| Authority Revenue, Sub-series 2-D, | | | | |
| 0.20%, 11/1/22, (LIQ FAC Lloyds | | | | |
| TSB Bank plc) (a) | | 3,000,000 | | 3,000,000 |
| New York City Transitional Finance | | | | |
| Authority Revenue, Sub-series | | | | |
| 2-F, 0.25%, 11/1/22, (LIQ FAC | | | | |
| Bayerische Landesbank) (a) | | 2,000,000 | | 2,000,000 |
| New York City Transitional Finance | | | | |
| Authority Revenue, Sub-series 2C, | | | | |
| 0.19%, 11/1/22, (LIQ FAC Lloyds | | | | |
| TSB Bank plc) (a) | | 2,000,000 | | 2,000,000 |
| New York City Transitional Finance | | | | |
| Authority Revenue, Sub-series A-4, | | | | |
| 0.20%, 8/1/39, (SPA Northern Trust | | | | |
| Co.) (a) | | 1,000,000 | | 1,000,000 |
| New York City Transitional Finance | | | | |
| Authority Revenue, Sub-series A-6, | | | | |
| 0.23%, 8/1/39, (LOC California State | | | | |
| Teacher’s Retirement System) (a) | | 3,000,000 | | 3,000,000 |
| New York City Transitional Finance | | | | |
| Authority Revenue, Sub-series C-2, | | | | |
| 0.24%, 8/1/31, (SPA Landesbank | | | | |
| Hessen-Thuringen) (a) | | 2,000,000 | | 2,000,000 |
| New York City Trust for Cultural | | | | |
| Resources Revenue, 0.16%, 4/1/26, | | | | |
| (LOC Wells Fargo Bank N.A.) (a) | | 4,800,000 | | 4,800,000 |
| New York City Trust for Cultural | | | | |
| Resources Revenue, Series B-1, | | | | |
| 0.20%, 11/1/38, (LOC U.S. Bank | | | | |
| N.A.) (a) | | 3,000,000 | | 3,000,000 |
| New York State Dormitory Authority | | | | |
| Revenue, Series D, 0.23%, 7/1/34, | | | | |
| (Credit Support XLCA, LOC TD Bank | | | | |
| N.A.) (a) | | 4,425,000 | | 4,425,000 |
| New York State Dormitory Authority | | | | |
| Revenue, Non State Supported Debt, | | | | |
| 0.23%, 1/1/39, (LOC TD Banknorth | | | | |
| N.A.) (a) | | 3,700,000 | | 3,700,000 |
| New York State Dormitory Authority | | | | |
| Revenue, Non State Supported Debt, | | | | |
| Series A, 0.20%, 11/15/36, (Credit | | | | |
| Support FNMA, LIQ FAC FNMA) (a) | | 5,000,000 | | 5,000,000 |
| New York State Dormitory Authority | | | | |
| Revenue, Non State Supported Debt, | | | | |
| Series B, 0.20%, 5/15/39, (LOC | | | | |
| Bayerische Landesbank) (a) | | 4,000,000 | | 4,000,000 |
| New York State Dormitory Authority | | | | |
| Revenue, Non State Supported Debt, | | | | |
| Series B-1, 0.19%, 7/1/24, (LOC | | | | |
| Wells Fargo Bank N.A.) (a) | | 2,000,000 | | 2,000,000 |
| New York State Dormitory Authority | | | | |
| Revenue, Non State Supported Debt, | | | | |
| Series B-2, 0.22%, 7/1/37, (LOC U.S. | | | | |
| Bank N.A.) (a) | | 5,000,000 | | 5,000,000 |
| New York State Energy Research & | | | | |
| Development Authority Facilities | | | | |
| Revenue, 0.22%, 11/1/39, AMT, | | | | |
| (LOC Mizuho Corporate Bank) (a) | | 4,000,000 | | 4,000,000 |
| 14 HSBC FAMILY OF FUNDS | See notes to financial statements. |
| HSBC NEW YORK TAX-FREE MONEY MARKET FUND |
| Schedule of Portfolio Investments—as of October 31, 2012 (continued) |
| Variable Rate Demand Notes, continued |
| |
| | Principal | | Amortized |
| | Amount ($) | | Cost ($) |
| New York, continued | | | | |
| New York State Energy Research & | | | | |
| Development Authority Facilities | | | | |
| Revenue, Series C2, 0.21%, | | | | |
| 11/1/39, AMT, (LOC Mizuho | | | | |
| Corporate Bank) (a) | | 4,000,000 | | 4,000,000 |
| New York State Energy Research | | | | |
| & Development Authority | | | | |
| Facilities Revenue, Sub-series | | | | |
| A-1, 0.20%, 5/1/39, (LOC Mizuho | | | | |
| Corporate Bank) (a) | | 4,000,000 | | 4,000,000 |
| New York State Housing Finance | | | | |
| Agency Revenue, 0.18%, 11/15/37, | | | | |
| (Credit Support FNMA) (a) | | 3,000,000 | | 3,000,000 |
| New York State Housing Finance | | | | |
| Agency Revenue, 0.22%, 5/15/28, | | | | |
| AMT, (Credit Support FNMA, | | | | |
| LOC FNMA) (a) | | 4,000,000 | | 4,000,000 |
| New York State Housing Finance | | | | |
| Agency Revenue, Series A, 0.22%, | | | | |
| 11/1/32, AMT, (Credit Support | | | | |
| FHLMC, LIQ FAC FHLMC) (a) | | 2,050,000 | | 2,050,000 |
| New York State Housing Finance Agency | | | | |
| Revenue, Series A, 0.20%, 5/15/34, | | | | |
| (Credit Support FNMA) (a) | | 1,400,000 | | 1,400,000 |
| New York State Housing Finance | | | | |
| Agency Revenue, Series A, 0.20%, | | | | |
| 5/1/45, (Credit Support FHLMC, LIQ | | | | |
| FAC FHLMC) (a) | | 2,500,000 | | 2,500,000 |
| New York State Urban Development | | | | |
| Corp. Revenue, Series A1, 0.19%, | | | | |
| 1/1/30, (LOC Wachovia | | | | |
| Bank N.A.) (a) | | 7,000,000 | | 7,000,000 |
| Onondaga County Trust Cultural | | | | |
| Resource Revenue, Series A, 0.18%, | | | | |
| 12/1/29, (LOC Wells Fargo | | | | |
| Bank N.A.) (a) | | 5,000,000 | | 5,000,000 |
| Ramapo Housing Authority Revenue, | | | | |
| Series A, 0.23%, 12/15/38, AMT, | | | | |
| (Credit Support FNMA, LIQ FAC | | | | |
| FNMA) (a) | | 5,000,000 | | 5,000,000 |
| Rockland County IDA Civic Facility | | | | |
| Revenue, 0.18%, 12/1/32, (LOC | | | | |
| Wells Fargo Bank N.A.) (a) | | 5,000,000 | | 5,000,000 |
| Rockland County IDA Revenue, | | | | |
| 0.19%, 7/1/20, (LOC TD | | | | |
| Banknorth N.A.) (a)(b) | | 2,390,000 | | 2,390,000 |
| Suffolk County IDA Civic Facility | | | | |
| Revenue, 0.52%, 8/1/18, AMT, (LOC | | | | |
| JPMorgan Chase Bank) (a) | | 1,660,000 | | 1,660,000 |
| Suffolk County IDA Revenue, 0.21%, | | | | |
| 1/1/21, (LOC JPMorgan | | | | |
| Chase Bank) (a)(b) | | 4,545,000 | | 4,545,000 |
| Suffolk County Water Authority | | | | |
| Revenue, 0.25%, 1/15/13, (SPA Bank | | | | |
| of Nova Scotia) (a) | | 4,900,000 | | 4,900,000 |
| Syracuse New York IDA Civic Facility | | | | |
| Revenue, Series A, 0.21%, 12/1/35, | | | | |
| (LOC JPMorgan Chase Bank) (a) | | 1,000,000 | | 1,000,000 |
| Triborough Bridge & Tunnel Authority | | | | |
| Revenue, Series A-2, 0.20%, | | | | |
| 11/1/35, (Credit Support GO of | | | | |
| Authority, LOC California State | | | | |
| Teacher’s Retirement System) (a) | | 3,000,000 | | 3,000,000 |
| Triborough Bridge & Tunnel Authority | | | | |
| Revenue, Series B, 0.19%, 1/1/32, | | | | |
| (LOC State Street Bank & | | | | |
| Trust Co.) (a) | | 6,000,000 | | 6,000,000 |
| Triborough Bridge & Tunnel Authority | | | | |
| Revenue, Series B-2B, 0.22%, | | | | |
| 1/1/32, (LOC California State | | | | |
| Teacher’s Retirement System) (a) | | 2,000,000 | | 2,000,000 |
| Triborough Bridge & Tunnel Authority | | | | |
| Revenue, Series B-3, 0.22%, 1/1/33, | | | | |
| (Credit Support GO of Authority, | | | | |
| LOC U.S. Bank N.A.) (a) | | 2,500,000 | | 2,500,000 |
| Westchester County IDA Civic Facility | | | | |
| Revenue, 0.20%, 11/1/24, (LOC | | | | |
| Commerce Bank N.A.) (a) | | 2,060,000 | | 2,060,000 |
| | | | 264,090,000 |
| Puerto Rico – 1.1% | | | | |
| Puerto Rico Commonwealth GO, | | | | |
| Series C-5-2, 0.21%, 7/1/20, | | | | |
| (Credit Support AGM, LOC Barclays | | | | |
| Bank plc) (a) | | 3,000,000 | | 3,000,000 |
| TOTAL VARIABLE RATE DEMAND | | | | |
| NOTES (COST $267,090,000) | | | | 267,090,000 |
| |
| Municipal Bonds – 3.5% |
| |
| New York – 3.5% | | | | |
| Metropolitan Transportation Authority | | | | |
| Revenue, Series F, 5.25%, 11/15/27, | | | | |
| (Credit Support NATL-RE), | | | | |
| prerefunded 11/15/12 @ 100 | | 3,100,000 | | 3,106,011 |
| New York State Dormitory Authority | | | | |
| Revenue, 5.38%, 5/1/23, | | | | |
| prerefunded 5/1/13 @ 100 | | 1,000,000 | | 1,025,639 |
| New York State Environmental | | | | |
| Facilities Corp. Personal Income Tax | | | | |
| Revenue, Series A, 5.25%, 1/1/19, | | | | |
| (Credit Support FGIC), prerefunded | | | | |
| 1/1/13@ 100 | | 2,310,000 | | 2,329,562 |
| New York State Urban Development | | | | |
| Corp. Personal Income Tax Revenue, | | | | |
| Series C-1, 5.00%, 3/15/24, | | | | |
| prerefunded 3/15/13 @ 100 | | 3,500,000 | | 3,562,643 |
| TOTAL MUNICIPAL BONDS | | | | |
| (COST $10,023,855) | | | | 10,023,855 |
| TOTAL INVESTMENT SECURITIES | | | | |
| (COST $277,113,855)—97.8% | | | | 277,113,855 |
| See notes to financial statements. | HSBC FAMILY OF FUNDS 15 |
| HSBC NEW YORK TAX-FREE MONEY MARKET FUND |
| Schedule of Portfolio Investments—as of October 31, 2012 (continued) | |
____________________
Percentages indicated are based on net assets of $283,208,121.
| (a) | | Variable rate security. The rate presented represents the rate in effect at October 31, 2012. These securities are deemed to have a maturity remaining until the next adjustment of the interest rate or the longer of the demand period or time to the next readjustment. |
| (b) | | Rule 144A security or other security which is restricted as to resale to institutional investors. This security has been deemed liquid by the Investment Adviser based on procedures approved by the Board of Trustees. |
| AGM | — Assured Guaranty Municipal Corporation |
| AMT | — Interest on security is subject to federal alternative minimum tax |
| FGIC | — Financial Guaranty Insurance Company |
| FHLMC | — Federal Home Loan Mortgage Corporation |
| FNMA | — Federal National Mortgage Association |
| GO | — General Obligation |
| IDA | — Industrial Development Agency |
| LIQ FAC | — Liquidity Facility |
| LOC | — Letter of Credit |
| NATL-RE | — Reinsurance provided by the National Public Finance Guarantee Corporation |
| SPA | — Standby Purchase Agreement |
| XLCA | — XL Capital Assurance |
| 16 HSBC FAMILY OF FUNDS | See notes to financial statements. |
| HSBC PRIME MONEY MARKET FUND |
| Schedule of Portfolio Investments—as of October 31, 2012 |
| Certificates of Deposit – 22.9% | | | | |
| | | | | |
| | | Principal | | Amortized |
| | Amount ($) | | Cost ($) |
| Banking – 22.9% | | | | |
| Bank of Montreal Chicago, | | | | |
| 0.33%, 12/7/12 | | 65,000,000 | | 65,000,000 |
| Bank of Nova Scotia Houston, | | | | |
| 0.26%, 4/19/13 (a) | | 50,000,000 | | 50,000,000 |
| Bank of Tokyo-Mitsubishi UFJ, N.Y., | | | | |
| 0.49%, 11/9/12 | | 50,000,000 | | 50,000,000 |
| Bank of Tokyo-Mitsubishi UFJ, N.Y., | | | | |
| 0.79%, 2/14/13 (a) | | 45,000,000 | | 45,000,000 |
| Bank of Tokyo-Mitsubishi UFJ, N.Y., | | | | |
| 0.77%, 8/16/13 (a) | | 44,000,000 | | 44,000,000 |
| Canadian Imperial | | | | |
| Bank of Commerce, | | | | |
| 0.64%, 11/5/12 (a) | | 10,000,000 | | 10,000,457 |
| Commonwealth Bank of Australia, | | | | |
| 1.14%, 6/14/13 (a) | | 8,000,000 | | 8,036,314 |
| Credit Agricole CIB, N.Y., | | | | |
| 0.47%, 12/4/12 | | 25,000,000 | | 25,000,000 |
| Credit Industriel et | | | | |
| Commercial, N.Y., | | | | |
| 0.24%, 11/19/12 | | 50,000,000 | | 50,000,000 |
| Credit Industriel et | | | | |
| Commercial, N.Y., | | | | |
| 0.47%, 1/7/13 | | 50,000,000 | | 49,999,982 |
| DnB NOR Bank ASA, N.Y., | | | | |
| 0.22%, 1/22/13 | | 75,000,000 | | 75,000,000 |
| National Australia Bank, N.Y., | | | | |
| 0.58%, 2/15/13 (a) | | 70,000,000 | | 70,000,000 |
| National Bank of Canada, N.Y., | | | | |
| 0.31%, 11/9/12 (a) | | 50,000,000 | | 50,000,000 |
| Norinchukin Bank, N.Y., | | | | |
| 0.37%, 11/21/12 | | 100,000,000 | | 100,000,000 |
| Rabobank Nederland, N.Y., | | | | |
| 0.52%, 3/26/13 (a) | | 50,000,000 | | 50,000,000 |
| Royal Bank of Canada, N.Y., | | | | |
| 0.77%, 11/28/12 | | 25,000,000 | | 25,011,033 |
| Royal Bank of Canada, N.Y., | | | | |
| 0.45%, 12/21/12 (a) | | 18,000,000 | | 18,006,393 |
| Royal Bank of Canada, N.Y., | | | | |
| 0.49%, 2/15/13 (a) | | 70,000,000 | | 70,000,000 |
| Royal Bank of Canada, N.Y., | | | | |
| 0.47%, 3/4/13 (a) | | 45,000,000 | | 45,000,000 |
| Svenska Handelsbanken, N.Y., | | | | |
| 0.36%, 2/1/13 | | 50,000,000 | | 50,000,000 |
| Toronto Dominion Bank, N.Y., | | | | |
| 0.20%, 1/22/13 | | 85,000,000 | | 85,000,000 |
| Toronto Dominion Bank, N.Y., | | | | |
| 0.29%, 5/13/13 (a) | | 65,000,000 | | 65,000,000 |
| Toronto Dominion Bank, N.Y., | | | | |
| 0.31%, 7/26/13 (a) | | 40,000,000 | | 40,000,000 |
| TOTAL CERTIFICATES | | | | |
| OF DEPOSIT | | | | |
| (COST $1,140,054,180) | | | | 1,140,054,179 |
| | | | | |
| Commercial Paper and Notes – 42.1% | | |
| |
| Banking – 22.1% | | | | |
| Bank of Nova Scotia Houston, | | | | |
| 0.20%, 1/23/13 (b) | | 150,000,000 | | 149,930,833 |
| Bank of Tokyo-Mitsubishi UFJ, | | | | |
| N.Y., 0.47%, 3/4/13 (b) | | 15,000,000 | | 14,975,913 |
| Banque et Caisse d’Epargne, | | | | |
| 0.29%, 1/9/13 (b) | | 20,000,000 | | 19,988,883 |
| BPCE, 0.42%, 12/3/12 (b)(c) | | 25,000,000 | | 24,990,667 |
| BPCE, 0.25%, 4/1/13 (b)(c) | | 80,000,000 | | 79,917,678 |
| Commonwealth | | | | |
| Bank of Australia, N.Y., | | | | |
| 0.22%, 1/23/13 (b)(c) | | 75,000,000 | | 74,961,958 |
| Commonwealth | | | | |
| Bank of Australia, N.Y., | | | | |
| 0.45%, 9/5/13 (a)(c) | | 65,000,000 | | 65,000,000 |
| Credit Agricole North America, Inc., | | | | |
| 0.49%, 1/4/13 (b) | | 50,000,000 | | 49,956,445 |
| Credit Suisse, N.Y., | | | | |
| 0.21%, 12/17/12 (b) | | 40,000,000 | | 39,989,267 |
| DnB NOR Bank ASA, N.Y., | | | | |
| 0.26%, 11/9/12 (b)(c) | | 25,000,000 | | 24,998,556 |
| Kookmin Bank, N.Y., | | | | |
| 0.44%, 12/17/12 (b)(c) | | 20,000,000 | | 19,988,756 |
| Kookmin Bank, N.Y., | | | | |
| 0.44%, 12/18/12 (b)(c) | | 10,000,000 | | 9,994,256 |
| National Australia Bank, N.Y., | | | | |
| 0.42%, 8/21/13 (a)(c) | | 50,000,000 | | 50,000,000 |
| Skandinaviska Enskilda Banken AB, | | | | |
| 0.29%, 12/17/12 (b)(c) | | 55,000,000 | | 54,979,620 |
| Societe Generale N.A., | | | | |
| 0.21%, 11/2/12 (b) | | 150,000,000 | | 149,999,125 |
| Sumitomo Mitsui | | | | |
| Banking Corp., N.Y., | | | | |
| 0.32%, 11/7/12 (b)(c) | | 50,000,000 | | 49,997,333 |
| Sumitomo Mitsui | | | | |
| Banking Corp., N.Y., | | | | |
| 0.31%, 12/3/12 (b)(c) | | 60,000,000 | | 59,983,467 |
| The Export-Import Bank of Korea, | | | | |
| 0.26%, 12/14/12 (b) | | 15,000,000 | | 14,995,342 |
| U.S. Bank N.A., | | | | |
| 0.20%, 12/14/12 | | 100,000,000 | | 100,000,000 |
| Westpac Securities NZ Ltd., | | | | |
| 0.54%, 7/5/13 (a) | | 45,000,000 | | 45,000,000 |
| | | | 1,099,648,099 |
| Diversified – 4.5% | | | | |
| Caisse des Depots | | | | |
| et Consignations, | | | | |
| 0.23%, 1/15/13 (b)(c) | | 20,000,000 | | 19,990,417 |
| Erste Abwicklungsanstalt, | | | | |
| 0.35%, 11/1/12 (b) | | 50,000,000 | | 50,000,000 |
| Erste Abwicklungsanstalt, | | | | |
| 0.60%, 1/15/13 (b) | | 25,000,000 | | 24,968,750 |
| Erste Abwicklungsanstalt, | | | | |
| 0.47%, 1/24/13 (b) | | 35,000,000 | | 34,961,616 |
| Erste Abwicklungsanstalt, | | | | |
| 0.62%, 4/15/13 (b) | | 20,000,000 | | 19,943,167 |
| Erste Abwicklungsanstalt, | | | | |
| 0.71%, 6/27/13 (b) | | 25,000,000 | | 24,884,306 |
| See notes to financial statements. | HSBC FAMILY OF FUNDS 17 |
| HSBC PRIME MONEY MARKET FUND |
| Schedule of Portfolio Investments—as of October 31, 2012 (continued) |
| Commercial Paper and Notes, continued | | |
| | | | | |
| | | Principal | | Amortized |
| | Amount ($) | | Cost ($) |
| Diversified, continued | | | | |
| Nordea North America, Inc., | | | | |
| 0.40%, 1/23/13 (b) | | 50,000,000 | | 49,954,465 |
| | | | | 224,702,721 |
| Finance – 15.5% | | | | |
| Antalis US Funding Corp., | | | | |
| 0.22%, 11/2/12 (b)(c) | | 20,000,000 | | 19,999,878 |
| Barclays US Funding LLC, | | | | |
| 0.35%, 11/16/12 (b) | | 65,000,000 | | 64,990,521 |
| Barclays US Funding LLC, | | | | |
| 0.35%, 11/21/12 (b) | | 50,000,000 | | 49,990,278 |
| Caisse d’Amortissement | | | | |
| de la Dette Sociale, | | | | |
| 0.78%, 12/21/12 (b) | | 50,000,000 | | 49,945,834 |
| Deutsche Bank Financial LLC, | | | | |
| 0.32%, 11/7/12 (b) | | 50,000,000 | | 49,997,333 |
| Deutsche Bank Financial LLC, | | | | |
| 0.47%, 3/25/13 (b) | | 35,000,000 | | 34,934,200 |
| Deutsche Bank Financial LLC, | | | | |
| 0.43%, 4/17/13 (b) | | 75,000,000 | | 74,850,396 |
| Gemini Securitization Corp. LLC, | | | | |
| 0.42%, 11/1/12 (b)(c) | | 57,000,000 | | 57,000,000 |
| ING (US) Funding LLC, | | | | |
| 0.40%, 11/1/12 (b) | | 38,000,000 | | 38,000,000 |
| ING (US) Funding LLC, | | | | |
| 0.37%, 11/16/12 (b) | | 27,400,000 | | 27,395,776 |
| ING (US) Funding LLC, | | | | |
| 0.35%, 12/12/12 (b) | | 40,000,000 | | 39,984,056 |
| LMA Americas LLC, | | | | |
| 0.35%, 11/7/12 (b)(c) | | 17,000,000 | | 16,999,008 |
| Mizuho Funding LLC, | | | | |
| 0.33%, 11/7/12 (b)(c) | | 45,000,000 | | 44,997,525 |
| Mizuho Funding LLC, | | | | |
| 0.25%, 1/24/13 (b)(c) | | 60,000,000 | | 59,965,700 |
| Nieuw Amsterdam | | | | |
| Receivables Corp., | | | | |
| 0.25%, 1/9/13 (b)(c) | | 20,000,000 | | 19,990,417 |
| Rabobank USA Financial Corp., | | | | |
| 0.37%, 3/25/13 (b) | | 45,000,000 | | 44,933,400 |
| Royal Park Investment | | | | |
| Funding Corp., | | | | |
| 0.77%, 1/7/13 (b)(c) | | 29,000,000 | | 28,958,442 |
| Toyota Motor Credit Corp., | | | | |
| 0.63%, 2/26/13 (b) | | 50,000,000 | | 49,897,625 |
| | | | 772,830,389 |
| TOTAL COMMERCIAL | | | | |
| PAPER AND NOTES | | | | |
| (COST $2,097,181,209) | | | | 2,097,181,209 |
| |
| Corporate Obligations – 1.0% | | | | |
| |
| Finance – 1.0% | | | | |
| General Electric Capital Corp., | | | | |
| 2.80%, 1/8/13, MTN | | 23,468,000 | | 23,573,410 |
| MetLife Global Funding I, | | | | |
| 5.13%, 4/10/13 | | 26,267,000 | | 26,804,447 |
| TOTAL CORPORATE | | | | |
| OBLIGATIONS | | | | |
| (COST $50,377,857) | | | | 50,377,857 |
| |
| Yankee Dollars – 3.4% | | | | |
| | | | | |
| Banking – 1.9% | | | | |
| KfW, 0.22%, 6/17/13 (a) | | 25,000,000 | | 24,997,050 |
| Westpac Banking Corp., | | | | |
| 0.63%, 11/26/12 (a) | | 19,000,000 | | 19,005,761 |
| Westpac Banking Corp., | | | | |
| 0.81%, 6/14/13 (a) | | 15,000,000 | | 15,037,097 |
| Westpac Banking Corp., | | | | |
| 0.49%, 10/1/13, MTN (d) | | 35,000,000 | | 35,000,000 |
| | | | | 94,039,908 |
| Commercial Banks – 1.5% | | | | |
| ANZ National International Ltd., | | | | |
| 2.38%, 12/21/12 | | 50,000,000 | | 50,140,144 |
| ANZ National International Ltd., | | | | |
| 6.20%, 7/19/13 | | 18,625,000 | | 19,389,110 |
| Commonwealth Bank of Australia, | | | | |
| 0.93%, 3/19/13 (a) | | 5,000,000 | | 5,010,601 |
| | | | 74,539,855 |
| TOTAL YANKEE DOLLARS | | | | |
| (COST $168,579,763) | | | | 168,579,763 |
| |
| Variable Rate Demand Notes – 3.8% | | |
| |
| California – 0.4% | | | | |
| Berkeley California Revenue, | | | | |
| 0.18%, 7/1/38, (LOC Wells | | | | |
| Fargo Bank N.A.) (a) | | 8,805,000 | | 8,805,000 |
| California State Infrastructure & | | | | |
| Economic Development Bank | | | | |
| Revenue, 0.19%, 11/15/37, | | | | |
| (LOC U.S. Bank N.A.) (a) | | 9,300,000 | | 9,300,000 |
| | | | 18,105,000 |
| Idaho – 0.3% | | | | |
| Power County Industrial | | | | |
| Development Corp. Exempt | | | | |
| Facilities Revenue, 0.26%, | | | | |
| 4/1/14, AMT, (LOC Wells | | | | |
| Fargo Bank N.A.) (a) | | 16,000,000 | | 16,000,000 |
| Illinois – 0.5% | | | | |
| Illinois Development Finance | | | | |
| Authority Solid Waste Disposal | | | | |
| Revenue, 0.25%, 9/1/27, | | | | |
| AMT, (LOC Wells Fargo | | | | |
| Bank N.A.) (a) | | 24,900,000 | | 24,900,000 |
| Indiana – 0.3% | | | | |
| Indiana State Finance Authority | | | | |
| Hospital Revenue, Series D, | | | | |
| 0.19%, 3/1/33, (LOC Northern | | | | |
| Trust Co.) (a) | | 12,645,000 | | 12,645,000 |
| Kentucky – 0.2% | | | | |
| Kentucky State Economic | | | | |
| Development Finance | | | | |
| Authority, Series B-4, 0.19%, | | | | |
| 8/15/38, (LOC Branch | | | | |
| Banking & Trust) (a) | | 9,655,000 | | 9,655,000 |
| 18 HSBC FAMILY OF FUNDS | See notes to financial statements. |
| HSBC PRIME MONEY MARKET FUND |
| Schedule of Portfolio Investments—as of October 31, 2012 (continued) |
| Variable Rate Demand Notes – 3.8% | | |
| |
| | | Principal | | Amortized |
| | Amount ($) | | Cost ($) |
| Ohio – 0.5% | | | | |
| Cleveland Ohio Economic & | | | | |
| Community Development | | | | |
| Revenue, 0.19%, 12/1/33, (LOC | | | | |
| PNC Bank N.A.) (a) | | 8,665,000 | | 8,665,000 |
| Ohio State Water Development | | | | |
| Authority Revenue, 0.22%, | | | | |
| 11/1/25, (LOC Northern | | | | |
| Trust Co.) (a) | | 6,100,000 | | 6,100,000 |
| Warren County Ohio Health | | | | |
| Care Facilities Revenue, | | | | |
| 0.20%, 7/1/31, (LOC U.S. | | | | |
| Bank N.A.) (a) | | 8,900,000 | | 8,900,000 |
| | | | 23,665,000 |
| Oregon – 0.3% | | | | |
| Clackamas County Oregon | | | | |
| Hospital Facility Authority | | | | |
| Revenue, Series B, | | | | |
| 0.21%, 6/1/37, (LOC U.S. | | | | |
| Bank N.A.) (a) | | 16,700,000 | | 16,700,000 |
| Pennsylvania – 0.3% | | | | |
| Bucks County Pennsylvania | | | | |
| Industrial Development | | | | |
| Authority Hospital Revenue, | | | | |
| Series B, 0.20%, 7/1/39, | | | | |
| (LOC PNC Bank N.A.) (a) | | 13,500,000 | | 13,500,000 |
| South Carolina – 0.3% | | | | |
| South Carolina State Housing | | | | |
| Finance & Development | | | | |
| Authority Multi-family Rental | | | | |
| Housing Improvement | | | | |
| Revenue, 0.26%, 7/15/39, | | | | |
| AMT, (LOC Wells Fargo | | | | |
| Bank N.A.) (a) | | 17,250,000 | | 17,250,000 |
| Texas – 0.7% | | | | |
| San Antonio Empowerment | | | | |
| Zone Development Corp. | | | | |
| Contract Revenue, 0.24%, | | | | |
| 10/1/37, AMT, (LOC U.S. | | | | |
| Bank N.A.) (a) | | 18,000,000 | | 18,000,000 |
| Tarrant County Texas Cultural | | | | |
| Educational Facilities | | | | |
| Finance Corp. Hospital | | | | |
| Revenue, Series E, 0.21%, | | | | |
| 11/15/50, (LOC Wells Fargo | | | | |
| Bank N.A.) (a) | | 19,400,000 | | 19,400,000 |
| | | | 37,400,000 |
| TOTAL VARIABLE RATE | | | | |
| DEMAND NOTES | | | | |
| (COST $189,820,000) | | | | 189,820,000 |
| | | | | |
| U.S. Treasury Obligations – 7.0% | | | | |
| |
| U.S. Treasury Notes – 7.0% | | | | |
| 0.75%, 3/31/13 | | 100,000,000 | | 100,212,438 |
| 1.13%, 6/15/13 | | 95,000,000 | | 95,513,512 |
| 0.75%, 9/15/13 | | 50,000,000 | | 50,235,995 |
| 0.13%, 9/30/13 | | 50,000,000 | | 49,963,581 |
| 4.25%, 11/15/13 | | 50,000,000 | | 52,089,499 |
| TOTAL U.S. TREASURY | | | | |
| OBLIGATIONS | | | | |
| (COST $348,015,025) | | | | 348,015,025 |
| |
| Repurchase Agreements – 17.3% | | | | |
| |
| Barclays Capital Group, purchased | | | | |
| on 10/26/12, 0.19%, due | | | | |
| on 11/2/12 with a maturity | | | | |
| value of $260,009,606, | | | | |
| collateralized by various U.S. | | | | |
| Government and Government | | | | |
| Agency Obligations, 4.50%- | | | | |
| 5.50%, 12/1/39-8/1/41, fair | | | | |
| value $265,200,000 | | 260,000,000 | | 260,000,000 |
| Deutsche Bank, purchased | | | | |
| on 10/31/12, 0.35%, due | | | | |
| on 11/1/12 with a maturity | | | | |
| value of $250,002,431, | | | | |
| collateralized by various U.S. | | | | |
| Government and Government | | | | |
| Agency Obligations, 3.00%- | | | | |
| 4.00%, 10/1/32-3/1/42, fair | | | | |
| value $255,000,001 | | 250,000,000 | | 250,000,000 |
| Goldman Sachs, purchased | | | | |
| on 10/26/12, 0.20%, due | | | | |
| on 11/2/12 with a maturity | | | | |
| value of $250,009,722, | | | | |
| collateralized by various U.S. | | | | |
| Government and Government | | | | |
| Agency Obligations, 1.20%- | | | | |
| 6.75%, 8/20/13-3/15/31, fair | | | | |
| value $255,000,722 | | 250,000,000 | | 250,000,000 |
| Goldman Sachs, purchased | | | | |
| on 10/31/12, 0.24%, due | | | | |
| on 11/1/12 with a maturity | | | | |
| value of $100,002,000, | | | | |
| collateralized by various | | | | |
| U.S. Treasury Obligations, | | | | |
| 0.00%-2.63%, 11/15/12- | | | | |
| 5/15/23, $102,000,001 | | 100,000,000 | | 100,000,000 |
| TOTAL REPURCHASE | | | | |
| AGREEMENTS | | | | |
| (COST $860,000,000) | | | | 860,000,000 |
| |
| Time Deposit – 2.4% | | | | |
| |
| BNP Paribas, 0.12%, 11/1/12 | | 123,000,000 | | 123,000,000 |
| TOTAL TIME DEPOSIT | | | | |
| (COST $123,000,000) | | | | 123,000,000 |
| TOTAL INVESTMENT | | | | |
| SECURITIES (COST | | | | |
| $4,977,028,033) — 99.9% | | | | 4,977,028,033 |
| See notes to financial statements. | HSBC FAMILY OF FUNDS 19 |
| HSBC PRIME MONEY MARKET FUND |
| Schedule of Portfolio Investments—as of October 31, 2012 (continued) |
____________________
| Percentages indicated are based on net assets of $4,980,416,231. |
| (a) | Variable rate security. The interest rates on these securities are adjusted periodically to reflect then-current short-term interest rates. The rates presented represent the rates in effect on October 31, 2012. The maturity dates presented reflect the final maturity dates. However, some of these securities may contain put or demand features that allow the Fund to require the issuer to repurchase the security from the fund within various time periods, including daily, weekly, monthly, or semi-annually. |
| (b) | Rate presented represents the effective yield at time of purchase. |
| (c) | Rule 144A security or other security which is restricted as to resale to institutional investors. This security has been deemed liquid by the Investment Adviser based on procedures approved by the Board of Trustees. |
| (d) | Step Bond. Income recognition is on the effective yield method for Step Bonds. |
| AMT | — | Interest on security is subject to federal alternative minimum tax |
| LLC | — | Limited Liability Company |
| LOC | — | Letter of Credit |
| MTN | — | Medium Term Note |
| 20 HSBC FAMILY OF FUNDS | See notes to financial statements. |
| HSBC TAX-FREE MONEY MARKET FUND |
| Schedule of Portfolio Investments—as of October 31, 2012 |
| Commercial Paper and Notes – 1.9% | | |
| | | | | |
| | Principal | | Amortized |
| | Amount ($) | | Cost ($) |
| Wyoming – 1.9% | | | | |
| Sweetwater County Wyoming | | | | |
| Pollution Control Revenue, | | | | |
| 0.17%, 11/2/12, | | | | |
| (LOC Barclays Bank plc) | | 2,000,000 | | 2,000,000 |
| TOTAL COMMERCIAL | | | | |
| PAPER AND NOTES | | | | |
| (COST $2,000,000) | | | | 2,000,000 |
| |
| Variable Rate Demand Notes – 84.9% | | |
| |
| Alabama – 1.0% | | | | |
| Mobile Alabama Industrial | | | | |
| Development Board Dock & | | | | |
| Wharf Revenue, Series A, | | | | |
| 0.26%, 6/1/32, (LOC Bayerische | | | | |
| Landesbank) (a) | | 1,000,000 | | 1,000,000 |
| California – 5.3% | | | | |
| ABAG Finance Authority for | | | | |
| Nonprofit Corps. Multi-family | | | | |
| Revenue, 0.24%, 5/15/38, | | | | |
| AMT, (Credit Support FNMA, | | | | |
| LIQ FAC FNMA) (a) | | 1,500,000 | | 1,500,000 |
| Bay Area Toll Authority California | | | | |
| Toll Bridge Revenue, Series E-1, | | | | |
| 0.18%, 4/1/45, (LOC Bank of | | | | |
| Tokyo-Mitsubishi UFJ Ltd.) (a) | | 1,000,000 | | 1,000,000 |
| California State GO, Series A2, | | | | |
| 0.21%, 5/1/34, (LOC State | | | | |
| Street Bank & Trust Co., | | | | |
| California State Teacher’s | | | | |
| Retirement System) (a) | | 2,000,000 | | 2,000,000 |
| California State Infrastructure & | | | | |
| Economic Development Bank | | | | |
| Revenue, Series B, 0.24%, | | | | |
| 11/1/26, (LOC Mizuho | | | | |
| Corporate Bank) (a) | | 1,045,000 | | 1,045,000 |
| | | | 5,545,000 |
| Colorado – 1.6% | | | | |
| Broomfield Colorado Urban | | | | |
| Renewal Authority Tax Increment | | | | |
| Revenue, 0.85%, 12/1/30, | | | | |
| (LOC BNP Paribas) (a) | | 645,000 | | 645,000 |
| Colorado Housing & Finance | | | | |
| Authority Multi-family Revenue, | | | | |
| 0.22%, 2/15/28, (Credit Support | | | | |
| FNMA, LIQ FAC FNMA) (a) | | 1,000,000 | | 1,000,000 |
| | | | 1,645,000 |
| Connecticut – 1.4% | | | | |
| Connecticut State Development | | | | |
| Authority Revenue, 0.22%, | | | | |
| 8/1/23, AMT, (LOC Bank | | | | |
| of Montreal) (a) | | 1,500,000 | | 1,500,000 |
| District of Columbia – 1.1% | | | | |
| Metropolitan Washington District | | | | |
| of Columbia Airport Authority | | | | |
| System Revenue, Sub-series | | | | |
| C-2, 0.21%, 10/1/39, (LOC | | | | |
| Barclays Bank plc) (a) | | 1,200,000 | | 1,200,000 |
| Florida – 3.4% | | | | |
| Orlando & Orange County Florida | | | | |
| Expressway Authority Revenue, | | | | |
| Series D, 0.21%, 7/1/32, (Credit | | | | |
| Support AGM, LOC Barclays | | | | |
| Bank plc) (a) | | 1,500,000 | | 1,500,000 |
| Polk County Florida Industrial | | | | |
| Development Authority Revenue, | | | | |
| 0.28%, 10/1/19, AMT, (LOC | | | | |
| Branch Banking & Trust) (a) | | 2,045,000 | | 2,045,000 |
| | | | 3,545,000 |
| Georgia – 3.3% | | | | |
| Fulton County Georgia | | | | |
| Development Authority Revenue, | | | | |
| 0.21%, 5/1/26, (LOC Branch | | | | |
| Banking & Trust) (a) | | 2,125,000 | | 2,125,000 |
| Roswell Georgia Housing | | | | |
| Authority Multi-family Revenue, | | | | |
| 0.22%, 6/15/25, (Credit | | | | |
| Support FNMA) (a) | | 1,400,000 | | 1,400,000 |
| | | | 3,525,000 |
| Illinois – 2.4% | | | | |
| Illinois Finance Authority Revenue, | | | | |
| Series A, 0.22%, 11/1/45, | | | | |
| (LOC Northern Trust Co.) (a) | | 1,500,000 | | 1,500,000 |
| Illinois State Educational | | | | |
| Facilities Authority Revenue, | | | | |
| 0.20%, 4/1/31, (LOC PNC | | | | |
| Bank N.A.) (a) | | 1,000,000 | | 1,000,000 |
| | | | 2,500,000 |
| Indiana – 6.8% | | | | |
| Indiana State Finance Authority | | | | |
| Environmental Revenue, | | | | |
| Series A-5, 0.20%, 10/1/40, | | | | |
| (LOC Sumitomo Mitsui | | | | |
| Banking Corp.) (a) | | 1,000,000 | | 1,000,000 |
| Indiana State Finance Authority | | | | |
| Revenue, Series A, 0.20%, | | | | |
| 7/1/36, (LOC Northern | | | | |
| Trust Co.) (a) | | 900,000 | | 900,000 |
| Indianapolis Indiana Multi-family | | | | |
| Housing Revenue, 0.20%, | | | | |
| 5/15/38, (Credit Support FNMA, | | | | |
| LIQ FAC FNMA) (a) | | 1,500,000 | | 1,500,000 |
| Lawrenceburg Indiana Pollution | | | | |
| Control Revenue, 0.19%, 10/1/19, | | | | |
| (LOC Bank of Nova Scotia) (a) | | 1,750,000 | | 1,750,000 |
| Lawrenceburg Indiana Pollution | | | | |
| Control Revenue, Series H, | | | | |
| 0.21%, 11/1/21, (LOC Bank of | | | | |
| Nova Scotia) (a) | | 2,000,000 | | 2,000,000 |
| | | | 7,150,000 |
| Kansas – 2.8% | | | | |
| Olathe Kansas Industrial | | | | |
| Revenue, Series A, 0.35%, | | | | |
| 3/1/27, AMT, (LOC Svenska | | | | |
| Handelsbanken) (a)(b) | | 1,000,000 | | 1,000,000 |
| See notes to financial statements. | HSBC FAMILY OF FUNDS 21 |
| HSBC TAX-FREE MONEY MARKET FUND |
| Schedule of Portfolio Investments—as of October 31, 2012 (continued) |
| Variable Rate Demand Notes, continued | | |
| | | | | |
| | Principal | | Amortized |
| | Amount ($) | | Cost ($) |
| Kansas, continued | | | | |
| Wichita Kansas Hospital | | | | |
| Revenue, Series B-1, 0.24%, | | | | |
| 11/15/39, (LOC JPMorgan | | | | |
| Chase & Co.) (a) | | 2,000,000 | | 2,000,000 |
| | | | 3,000,000 |
| Louisiana – 2.0% | | | | |
| East Baton Rouge Parish Louisiana | | | | |
| Pollution Control Revenue, | | | | |
| 0.20%, 11/1/19 (a) | | 1,120,000 | | 1,120,000 |
| Louisiana Public Facilities | | | | |
| Authority Revenue, Series B-1, | | | | |
| 0.18%, 7/1/47, (LOC Bank | | | | |
| of New York) (a) | | 1,000,000 | | 1,000,000 |
| | | | 2,120,000 |
| Maryland – 1.6% | | | | |
| Montgomery County Maryland | | | | |
| Housing Opportunities | | | | |
| Commission Multi-family | | | | |
| Revenue, Series B, 0.24%, | | | | |
| 5/1/26, (LOC Bank of | | | | |
| America N.A.) (a) | | 1,700,000 | | 1,700,000 |
| Massachusetts – 1.9% | | | | |
| Massachusetts State Development | | | | |
| Finance Agency Revenue, | | | | |
| Series A, 0.22%, 9/1/37, | | | | |
| (LOC JPMorgan Chase | | | | |
| Bank N.A.) (a) | | 2,000,000 | | 2,000,000 |
| Minnesota – 4.1% | | | | |
| St. Paul Minnesota Port Authority | | | | |
| District Cooling Revenue, | | | | |
| Series 9-BB, 0.23%, 3/1/29, | | | | |
| (LOC Deutsche Bank A.G.) (a) | | 2,070,000 | | 2,070,000 |
| St. Paul Minnesota Port Authority | | | | |
| District Heating Revenue, | | | | |
| Series 7-Q, 0.23%, 12/1/28, | | | | |
| (LOC Deutsche Bank A.G.) (a) | | 2,300,000 | | 2,300,000 |
| | | | 4,370,000 |
| Missouri – 1.9% | | | | |
| Kansas City Missouri Special | | | | |
| Obligation Revenue, Series E, | | | | |
| 0.22%, 4/15/34, (LOC Sumitomo | | | | |
| Mitsui Banking Corp.) (a) | | 2,000,000 | | 2,000,000 |
| Nebraska – 0.9% | | | | |
| Saline County Nebraska | | | | |
| Hospital Authority No. 1 | | | | |
| Hospital Revenue, Series C, | | | | |
| 0.21%, 6/1/31, (LOC U.S. | | | | |
| Bank N.A.) (a) | | 985,000 | | 985,000 |
| Nevada – 1.5% | | | | |
| Nevada State Housing Division | | | | |
| Multi-family Revenue, | | | | |
| 0.23%, 10/1/37, AMT, | | | | |
| (Credit Support FHLMC, | | | | |
| LIQ FAC FHLMC) (a) | | 1,600,000 | | 1,600,000 |
| New Mexico – 1.0% | | | | |
| New Mexico Educational | | | | |
| Assistance Foundation Revenue, | | | | |
| Series A-1, 0.22%, 4/1/34, AMT, | | | | |
| (Credit Support Guaranteed | | | | |
| Student Loans, LOC Royal Bank | | | | |
| of Canada) (a) | | 1,000,000 | | 1,000,000 |
| New York – 5.0% | | | | |
| New York City GO, Sub-series G-4, | | | | |
| 0.20%, 4/1/42, (LOC PNC | | | | |
| Bank N.A.) (a) | | 1,000,000 | | 1,000,000 |
| New York State Energy | | | | |
| Research & Development | | | | |
| Authority Revenue, | | | | |
| Sub-series A-2, 0.19%, | | | | |
| 5/1/39, (LOC Mizuho | | | | |
| Corporate Bank) (a) | | 1,500,000 | | 1,500,000 |
| Triborough Bridge & Tunnel | | | | |
| Authority Revenue, Series B, | | | | |
| 0.19%, 1/1/32, (LOC State | | | | |
| Street Bank & Trust Co.) (a) | | 1,000,000 | | 1,000,000 |
| Triborough Bridge & Tunnel | | | | |
| Authority Revenue, | | | | |
| Series B-2B, 0.22%, 1/1/32, | | | | |
| (LOC California State Teacher’s | | | | |
| Retirement System) (a) | | 1,800,000 | | 1,800,000 |
| | | | 5,300,000 |
| Ohio – 5.2% | | | | |
| Cuyahoga County Ohio Hospital | | | | |
| Revenue, 0.20%, 2/1/35, | | | | |
| (LOC PNC Bank N.A.) (a) | | 1,500,000 | | 1,500,000 |
| Hamilton County Ohio Health | | | | |
| Care Revenue, Series B, | | | | |
| 0.23%, 1/1/37, (LOC PNC | | | | |
| Bank N.A.) (a) | | 500,000 | | 500,000 |
| Ohio State Air Quality | | | | |
| Development Authority | | | | |
| Revenue, Series C, | | | | |
| 0.20%, 2/1/26, (LOC Bank of | | | | |
| Tokyo-Mitsubishi UFJ Ltd.) (a) | | 2,000,000 | | 2,000,000 |
| Ohio State Air Quality | | | | |
| Development Authority Revenue, | | | | |
| Series B, 0.24%, 10/1/33, | | | | |
| (LOC Bank of Nova Scotia, | | | | |
| Guaranty Agreement FirstEnergy | | | | |
| Solutions Corp.) (a) | | 1,500,000 | | 1,500,000 |
| | | | 5,500,000 |
| Oregon – 2.2% | | | | |
| Oregon State Business | | | | |
| Development Commission | | | | |
| Revenue, Series 230, | | | | |
| 0.24%, 4/1/41, AMT, | | | | |
| (LOC U.S. Bank N.A.) (a) | | 2,300,000 | | 2,300,000 |
| Pennsylvania – 6.6% | | | | |
| Beaver County Pennsylvania | | | | |
| Industrial Development Authority | | | | |
| Revenue, Series B, 0.21%, | | | | |
| 11/1/25, (LOC UBS A.G.) (a) | | 2,000,000 | | 2,000,000 |
| 22 HSBC FAMILY OF FUNDS | See notes to financial statements. |
| HSBC TAX-FREE MONEY MARKET FUND |
| Schedule of Portfolio Investments—as of October 31, 2012 (continued) |
| Variable Rate Demand Notes, continued | | |
| | | | | |
| | Principal | | Amortized |
| | | Amount ($) | | Cost ($) |
| Pennsylvania, continued | | | | |
| Haverford Township | | | | |
| Pennsylvania School District GO, | | | | |
| 0.22%, 3/1/30, (Credit Support | | | | |
| State Aid Withholding, LOC TD | | | | |
| Bank N.A.) (a) | | 1,000,000 | | 1,000,000 |
| Philadelphia Pennsylvania | | | | |
| School District GO, Series F, | | | | |
| 0.21%, 9/1/30, (Credit Support | | | | |
| State Aid Withholding, LOC TD | | | | |
| Bank N.A.) (a) | | 2,000,000 | | 2,000,000 |
| Southeastern Pennsylvania | | | | |
| Transportation Authority | | | | |
| Revenue, 0.21%, 3/1/22, | | | | |
| (LOC PNC Bank N.A.) (a) | | 2,000,000 | | 2,000,000 |
| | | | 7,000,000 |
| Rhode Island – 1.2% | | | | |
| Rhode Island State Industrial | | | | |
| Facilities Corp. Marine Term | | | | |
| Revenue, 0.23%, 2/1/25 (a) | | 1,300,000 | | 1,300,000 |
| South Carolina – 3.0% | | | | |
| North Charleston South Carolina | | | | |
| Certificates of Participation, | | | | |
| 0.22%, 9/1/19, (LOC Bank of | | | | |
| America N.A.) (a) | | 2,000,000 | | 2,000,000 |
| South Carolina Jobs Economic | | | | |
| Development Authority Revenue, | | | | |
| 0.21%, 3/1/23, (LOC Branch | | | | |
| Banking & Trust) (a) | | 1,150,000 | | 1,150,000 |
| | | | 3,150,000 |
| Texas – 4.3% | | | | |
| Austin Texas Water & Wastewater | | | | |
| System Revenue, 0.20%, 5/15/31, | | | | |
| (LOC Bank of Tokyo-Mitsubishi | | | | |
| UFJ Ltd., LOC Sumitomo Mitsui | | | | |
| Banking Corp.) (a) | | 500,000 | | 500,000 |
| Harris County Texas | | | | |
| Hospital District Revenue, | | | | |
| 0.21%, 2/15/42, (LOC | | | | |
| JPMorgan Chase Bank) (a) | | 1,000,000 | | 1,000,000 |
| Houston Texas Utility | | | | |
| System Revenue, Series B-3, | | | | |
| 0.19%, 5/15/34, (LOC Sumitomo | | | | |
| Mitsui Banking Corp.) (a) | | 1,000,000 | | 1,000,000 |
| Tarrant County Texas Cultural | | | | |
| Education Facilities Finance | | | | |
| Corp. Hospital Revenue, | | | | |
| Series C, 0.18%, 11/15/50, | | | | |
| (LOC Northern Trust Co.) (a) | | 2,000,000 | | 2,000,000 |
| | | | 4,500,000 |
| Utah – 1.0% | | | | |
| Utah State Transit Authority | | | | |
| Sales Tax Revenue, | | | | |
| Sub-series B, 0.26%, 6/15/36, | | | | |
| (LOC BNP Paribas) (a) | | 1,000,000 | | 1,000,000 |
| Virginia – 1.8% | | | | |
| Virginia State Commonwealth | | | | |
| University Health System | | | | |
| Authority Revenue, Series B, | | | | |
| 0.23%, 7/1/30, (Credit Support | | | | |
| AMBAC, LOC Wachovia | | | | |
| Bank N.A.) (a) | | 1,925,000 | | 1,925,000 |
| Washington – 2.8% | | | | |
| Washington State Housing Finance | | | | |
| Commission Multi-family | | | | |
| Housing Revenue, 0.22%, | | | | |
| 7/1/44, (Credit Support FHLMC, | | | | |
| LIQ FAC FHLMC) (a) | | 1,800,000 | | 1,800,000 |
| Washington State Housing Finance | | | | |
| Commission Nonprofit Revenue, | | | | |
| 0.21%, 11/1/25, (LOC U.S. | | | | |
| Bank N.A.) (a) | | 1,200,000 | | 1,200,000 |
| | | | 3,000,000 |
| Wisconsin – 2.2% | | | | |
| Wisconsin State Health & | | | | |
| Educational Facilities | | | | |
| Authority Revenue, Series B, | | | | |
| 0.26%, 4/1/35, (LOC U.S. | | | | |
| Bank N.A.) (a) | | 1,500,000 | | 1,500,000 |
| Wisconsin State Health & | | | | |
| Educational Facilities Authority | | | | |
| Revenue, 0.21%, 2/1/38, (LOC | | | | |
| BMO Harris Bank N.A.) (a) | | 805,000 | | 805,000 |
| | | | 2,305,000 |
| Wyoming – 5.6% | | | | |
| Gillette Wyoming Pollution | | | | |
| Control Revenue, 0.19%, 1/1/18, | | | | |
| (LOC Barclays Bank plc) (a) | | 1,600,000 | | 1,600,000 |
| Lincoln County Wyoming | | | | |
| Pollution Control Revenue, | | | | |
| 0.20%, 8/1/15 (a) | | 1,000,000 | | 1,000,000 |
| Lincoln County Wyoming | | | | |
| Pollution Control Revenue, | | | | |
| 0.21%, 1/1/16, (LOC Wells | | | | |
| Fargo Bank N.A.) (a) | | 1,300,000 | | 1,300,000 |
| Sweetwater County Wyoming | | | | |
| Pollution Control Revenue, | | | | |
| Series B, 0.20%, 12/1/20, (LOC | | | | |
| Wells Fargo Bank N.A.) (a) | | 2,000,000 | | 2,000,000 |
| | | | 5,900,000 |
| TOTAL VARIABLE RATE | | | | |
| DEMAND NOTES | | | | |
| (COST $89,865,000) | | | | 89,565,000 |
| |
| Municipal Bonds – 11.6% | | | | |
| |
| Arizona – 1.0% | | | | |
| Arizona State School Facilities | | | | |
| Board Certificates of | | | | |
| Participation, Series A, | | | | |
| 5.25%, 9/1/17, (Credit | | | | |
| Support NATL-RE), | | | | |
| prerefunded 3/1/13 @ 100 | | 1,080,000 | | 1,097,925 |
| See notes to financial statements. | HSBC FAMILY OF FUNDS 23 |
| HSBC TAX-FREE MONEY MARKET FUND |
| Schedule of Portfolio Investments—as of October 31, 2012 (continued) |
| Municipal Bonds, continued | | | | |
| | | | | |
| | Principal | | Amortized |
| | | Amount ($) | | Cost ($) |
| Georgia – 1.1% | | | | |
| Georgia Municipal Electric | | | | |
| Authority Revenue, Series A, | | | | |
| 5.25%, 11/1/15, (Credit Support | | | | |
| NATL-RE), prerefunded | | | | |
| 11/1/12 @ 100 | | 1,115,000 | | 1,115,000 |
| Illinois – 4.8% | | | | |
| Chicago Illinois Metropolitan | | | | |
| Water Reclamation District- | | | | |
| Greater Chicago GO, Series C, | | | | |
| 5.38%, 12/1/15, prerefunded | | | | |
| 12/1/12 @ 100 | | 1,500,000 | | 1,506,281 |
| Chicago Illinois Metropolitan | | | | |
| Water Reclamation District- | | | | |
| Greater Chicago GO, Series C, | | | | |
| 5.38%, 12/1/16, prerefunded | | | | |
| 12/1/12 @ 100 | | 1,500,000 | | 1,506,350 |
| Du Page Cook & Will Counties | | | | |
| Illinois Community College | | | | |
| District GO, Series A, | | | | |
| 5.25%, 6/1/16, prerefunded | | | | |
| 6/1/13 @ 100 | | 2,000,000 | | 2,058,466 |
| | | | 5,071,097 |
| Michigan – 0.5% | | | | |
| Van Buren Township Michigan | | | | |
| Local Development Authority | | | | |
| GO, 5.25%, 4/1/23, | | | | |
| (Credit Support FGIC), | | | | |
| prerefunded 4/1/13 @ 100 | | 500,000 | | 510,193 |
| Texas – 1.5% | | | | |
| Waco Texas GO, 4.50%, 2/1/25, | | | | |
| prerefunded 2/1/13 @ 100 | | 1,600,000 | | 1,617,273 |
| Virginia – 1.7% | | | | |
| Hampton Virginia Convention | | | | |
| Center Revenue, 5.13%, | | | | |
| 1/15/28, (Credit Support | | | | |
| AMBAC), prerefunded | | | | |
| 1/15/13 @ 100 | | 1,800,000 | | 1,817,953 |
| Washington – 1.0% | | | | |
| Pierce County Washington School | | | | |
| District GO, 5.25%, 12/1/22, | | | | |
| (Credit Support NATL-RE | | | | |
| FGIC, School Board Guaranty), | | | | |
| prerefunded 12/1/12 @ 100 | | 1,000,000 | | 1,004,133 |
| TOTAL MUNICIPAL BONDS | | | | |
| (COST $12,233,574) | | | | 12,233,574 |
| TOTAL INVESTMENT | | | | |
| SECURITIES (COST | | | | |
| $103,798,574) — 98.4% | | | | 103,798,574 |
____________________
| Percentages indicated are based on net assets of $105,492,836. |
| (a) | Variable rate security. The rate presented represents the rate in effect at October 31, 2012. These securities are deemed to have a maturity remaining until the next adjustment of the interest rate or the longer of the demand period or time to the next readjustment. |
| (b) | Rule 144A security or other security which is restricted as to resale to institutional investors. This security has been deemed liquid by the Investment Adviser based on procedures approved by the Board of Trustees. |
| AGM | — | Assured Guaranty Municipal Corporation |
| AMBAC | — | American Municipal Bond Assurance Corporation |
| AMT | — | Interest on security is subject to federal alternative minimum tax |
| FGIC | — | Financial Guaranty Insurance Company |
| FHLMC | — | Federal Home Loan Mortgage Corporation |
| FNMA | — | Federal National Mortgage Association |
| GO | — | General Obligation |
| LIQ FAC | — | Liquidity Facility |
| LOC | — | Letter of Credit |
| NATL-RE | — | Reinsurance provided by the National Public Finance Guarantee Corporation |
| 24 HSBC FAMILY OF FUNDS | See notes to financial statements. |
| HSBC U.S. GOVERNMENT MONEY MARKET FUND |
| Schedule of Portfolio Investments—as of October 31, 2012 |
| U.S. Government and Government Agency | | |
| Obligations – 19.1% | | | | |
| | | | | |
| | Principal | | Amortized |
| | | Amount ($) | | Cost ($) |
| Federal Farm Credit Bank – 12.6% | | | | |
| 0.30%, 2/11/13(a), Series 4 | | 39,000,000 | | 39,013,224 |
| 0.18%, 3/8/13(a) | | 80,000,000 | | 79,997,178 |
| 0.25%, 3/28/13(a), Series 1 | | 40,000,000 | | 40,009,800 |
| 0.20%, 4/2/13(a) | | 108,500,000 | | 108,500,000 |
| 0.19%, 5/3/13(a) | | 150,000,000 | | 150,000,000 |
| 0.33%, 6/19/13(a) | | 75,000,000 | | 75,067,030 |
| 0.20%, 7/2/13(a), Series 1 | | 85,000,000 | | 85,000,000 |
| 0.19%, 10/16/13(a) | | 50,000,000 | | 50,000,000 |
| | | | 627,587,232 |
| Federal Home Loan Bank – 2.3% | | | | |
| 0.26%, 4/10/13 | | 92,400,000 | | 92,395,949 |
| 0.30%, 6/4/13, Callable | | | | |
| 12/4/12 @ 100 | | 25,000,000 | | 25,000,000 |
| | | | 117,395,949 |
| Federal National Mortgage Association – 4.2% | | |
| 0.14%, 11/21/12(b) | | 30,000,000 | | 29,997,667 |
| 0.37%, 12/3/12(a) | | 99,200,000 | | 99,214,108 |
| 0.29%, 3/14/13(a) | | 82,750,000 | | 82,758,939 |
| | | | 211,970,714 |
| TOTAL U.S. GOVERNMENT | | | | |
| AND GOVERNMENT | | | | |
| AGENCY OBLIGATIONS | | | | |
| (COST $956,953,895) | | | | 956,953,895 |
| | | |
| U.S. Treasury Obligations – 23.5% | | |
| | | | | |
| U.S. Treasury Notes – 23.5% | | | | |
| 4.00%, 11/15/12 | | 75,000,000 | | 75,109,197 |
| 3.38%, 11/30/12 | | 10,000,000 | | 10,025,561 |
| 3.88%, 2/15/13 | | 63,000,000 | | 63,674,171 |
| 0.63%, 2/28/13 | | 100,000,000 | | 100,143,489 |
| 1.38%, 3/15/13 | | 50,000,000 | | 50,214,257 |
| 0.75%, 3/31/13 | | 175,000,000 | | 175,379,237 |
| 1.75%, 4/15/13 | | 200,000,000 | | 201,396,259 |
| 3.13%, 4/30/13 | | 50,000,000 | | 50,715,058 |
| 1.13%, 6/15/13 | | 49,000,000 | | 49,263,797 |
| 1.00%, 7/15/13 | | 50,000,000 | | 50,264,323 |
| 4.25%, 8/15/13 | | 65,000,000 | | 67,056,459 |
| 0.13%, 9/30/13 | | 50,000,000 | | 49,963,677 |
| 3.13%, 9/30/13 | | 125,000,000 | | 128,324,030 |
| 2.75%, 10/31/13 | | 50,000,000 | | 51,265,770 |
| 0.50%, 11/15/13 | | 50,000,000 | | 50,148,800 |
| TOTAL U.S. TREASURY | | | | |
| OBLIGATIONS | | | | |
| (COST $1,172,944,085) | | | | 1,172,944,085 |
| | | | | |
| Repurchase Agreements – 53.8% | | | | |
| |
| Bank of America Corp., purchased | | | | |
| on 10/31/12, 0.32%, due on | | | | |
| 11/1/12 with a maturity value of | | | | |
| $400,003,556, collateralized by | | | | |
| various U.S. Government and | | | | |
| Government Agency Obligations, | | | | |
| 2.24%-3.50%, 5/1/42-10/1/42, | | | | |
| fair value $408,000,001 | | 400,000,000 | | 400,000,000 |
| Barclays Capital Group, purchased | | | | |
| on 10/26/12, 0.19%, due on | | | | |
| 11/2/12 with a maturity value | | | | |
| of $220,008,128, collateralized | | | | |
| by various U.S. Government | | | | |
| and Government Agency | | | | |
| Obligations, 4.50%, 8/1/41, fair | | | | |
| value $224,400,001 | | 220,000,000 | | 220,000,000 |
| Barclays Capital Group, purchased | | | | |
| on 10/31/12, 0.31%, due on | | | | |
| 11/1/12 with a maturity value of | | | | |
| $200,001,722, collateralized by | | | | |
| various U.S. Government and | | | | |
| Government Agency Obligations, | | | | |
| 3.50%-4.00%, 11/1/41-9/1/42, | | | | |
| fair value $204,000,001 | | 200,000,000 | | 200,000,000 |
| Barclays Capital Group, purchased | | | | |
| on 10/31/12, 0.32%, due on | | | | |
| 11/1/12 with a maturity value of | | | | |
| $125,001,111, collateralized by | | | | |
| various U.S. Treasury Obligations, | | | | |
| 0.38%-2.25%, 12/10/12-12/19/12, | | | | |
| fair value $127,500,001 | | 125,000,000 | | 125,000,000 |
| BNP Paribas, purchased on | | | | |
| 10/31/12, 0.22%, due on | | | | |
| 11/7/12 with a maturity value of | | | | |
| $240,010,267, collateralized by | | | | |
| various U.S. Government and | | | | |
| Government Agency Obligations, | | | | |
| 1.13%-6.00%, 11/1/20-10/1/42, | | | | |
| fair value $244,800,000 | | 240,000,000 | | 240,000,000 |
| BNP Paribas, purchased on | | | | |
| 10/31/12, 0.30%, due on | | | | |
| 11/1/12 with a maturity value of | | | | |
| $100,000,833, collateralized by | | | | |
| various U.S. TreasuryObligations, | | | | |
| 0.00%, 1/15/30-4/15/30, fair | | | | |
| value $102,000,318 | | 100,000,000 | | 100,000,000 |
| Citigroup Global Markets, | | | | |
| purchased on 10/31/12, | | | | |
| 0.32%, due on 11/1/12 with a | | | | |
| maturity value of $300,002,667, | | | | |
| collateralized by various U.S. | | | | |
| Government and Government | | | | |
| Agency Obligations, 3.50%- | | | | |
| 5.00%, 6/15/25-8/15/42, fair | | | | |
| value $306,000,001 | | 300,000,000 | | 300,000,000 |
| Deutsche Bank, purchased on | | | | |
| 10/31/12, 0.35%, due on | | | | |
| 11/1/12 with a maturity value of | | | | |
| $250,002,431, collateralized by | | | | |
| various U.S. TreasuryObligations, | | | | |
| 0.13%-2.38%, 1/15/22-1/15/25, | | | | |
| fair value $255,000,100 | | 250,000,000 | | 250,000,000 |
| See notes to financial statements. | HSBC FAMILY OF FUNDS 25 |
| HSBC U.S. GOVERNMENT MONEY MARKET FUND |
| Schedule of Portfolio Investments—as of October 31, 2012 (continued) | |
| Repurchase Agreements, continued | | |
| |
| Principal | | Amortized |
| Amount ($) | | Cost ($) |
| Greenwich Capital Markets, Inc., | | | |
| purchased on 10/31/12, | | | |
| 0.25%, due on 11/1/12 with a | | | |
| maturity value of $150,001,042, | | | |
| collateralized by various | | | |
| U.S. Treasury Obligations, | | | |
| 0.75%-2.25%, 10/31/17-7/31/18, | | | |
| fair value $153,003,515 | 150,000,000 | | 150,000,000 |
| Greenwich Capital Markets, Inc., | | | |
| purchased on 10/31/12, 0.26%, | | | |
| due on 11/1/12 with a maturity | | | |
| value of $350,002,528, | | | |
| collateralized by U.S. Treasury | | | |
| Obligations, 1.00%, 6/30/19, | | | |
| fair value $357,003,612 | 350,000,000 | | 350,000,000 |
| Greenwich Capital Markets, Inc., | | | |
| purchased on 10/31/12, 0.35%, | | | |
| due on 11/1/12 with a maturity | | | |
| value of $350,003,403, | | | |
| collateralized by various | | | |
| U.S. Treasury Obligations, | | | |
| 0.00%, 1/7/13-4/22/13, fair | | | |
| value $357,000,089 | 350,000,000 | | 350,000,000 |
| TOTAL REPURCHASE | | | |
| AGREEMENTS | | | |
| (COST $2,685,000,000) | | | 2,685,000,000 |
| TOTAL INVESTMENT | | | |
| SECURITIES (COST | | | |
| $4,814,897,980) — 96.4% | | | 4,814,897,980 |
____________________
| Percentages indicated are based on net assets of $4,993,428,258. |
| (a) | Variable rate security. The rate presented represents the rate in effect at October 31, 2012. These securities are deemed to have a maturity remaining until the next adjustment of the interest rate or the longer of the demand period or time to the next readjustment. |
| (b) | Discount note. Rate presented represents the effective yield at time of purchase. |
| 26 HSBC FAMILY OF FUNDS | See notes to financial statements. |
| HSBC U.S. TREASURY MONEY MARKET FUND |
| Schedule of Portfolio Investments—as of October 31, 2012 |
| U.S. Treasury Obligations – 99.1% | | | |
| | | | |
| Principal | | Amortized |
| Amount ($) | | Cost ($) |
| U.S. Treasury Bills – 62.8% | | | |
| 0.10%, 11/1/12(a) | 117,000,000 | | 117,000,000 |
| 0.12%, 11/8/12(a) | 325,000,000 | | 324,992,749 |
| 0.12%, 11/15/12(a) | 500,000,000 | | 499,976,190 |
| 0.12%, 11/23/12(a) | 350,000,000 | | 349,974,487 |
| 0.13%, 1/31/13(a) | 200,000,000 | | 199,934,278 |
| | | 1,491,877,704 |
| U.S. Treasury Notes – 36.3% | | | |
| 1.38%, 11/15/12 | 100,000,000 | | 100,046,782 |
| 4.00%, 11/15/12 | 75,000,000 | | 75,109,238 |
| 0.50%, 11/30/12 | 40,000,000 | | 40,010,596 |
| 3.38%, 11/30/12 | 40,000,000 | | 40,102,309 |
| 0.63%, 12/31/12 | 50,000,000 | | 50,037,802 |
| 1.38%, 1/15/13 | 165,000,000 | | 165,411,014 |
| 0.63%, 1/31/13 | 20,000,000 | | 20,020,970 |
| 3.88%, 2/15/13 | 50,000,000 | | 50,533,872 |
| 0.63%, 2/28/13 | 50,000,000 | | 50,078,592 |
| 2.75%, 2/28/13 | 25,000,000 | | 25,209,797 |
| 1.38%, 3/15/13 | 70,000,000 | | 70,317,032 |
| 3.13%, 4/30/13 | 25,000,000 | | 25,358,335 |
| 3.50%, 5/31/13 | 25,000,000 | | 25,479,483 |
| 1.13%, 6/15/13 | 45,000,000 | | 45,248,459 |
| 4.25%, 8/15/13 | 75,000,000 | | 77,384,589 |
| | | 860,348,870 |
| TOTAL INVESTMENT SECURITIES — 99.1% | | | 2,352,226,574 |
____________________
Percentages indicated are based on net assets of $2,373,986,181.
(a) Discount note. Rate presented represents the effective yield at time of purchase.
| See notes to financial statements. | HSBC FAMILY OF FUNDS 27 |
HSBC FAMILY OF FUNDS
Statements of Assets and Liabilities—as of October 31, 2012
| | New York | | | | | | | | | | | | | |
| | Tax-Free | | | | Prime | | | | Tax-Free | |
| | Money Market | | | | Money Market | | | | Money Market | |
| | Fund | | | | Fund | | | | Fund | |
| Assets: | | | | | | | | | | | | | | | | | | |
| Investments, at value and amortized cost | | | $ | 277,113,855 | | | | | $ | 4,117,028,033 | | | | | $ | 103,798,574 | | |
| Repurchase agreements, at value and cost | | | | — | | | | | | 860,000,000 | | | | | | — | | |
| Total Investments | | | | 277,113,855 | | | | | | 4,977,028,033 | | | | | | 103,798,574 | | |
| Cash | | | | 5,867,261 | | | | | | 1,079,315 | | | | | | 1,435,844 | | |
| Interest receivable | | | | 220,558 | | | | | | 3,739,254 | | | | | | 234,827 | | |
| Receivable for capital shares issued | | | | — | | | | | | 221,922 | | | | | | — | | |
| Receivable from Investment Adviser | | | | 41,009 | | | | | | — | | | | | | 15,912 | | |
| Receivable from Administrator | | | | — | | | | | | — | | | | | | 9,932 | | |
| Prepaid expenses and other assets | | | | 26,397 | | | | | | 88,098 | | | | | | 24,549 | | |
| Total Assets | | | | 283,269,080 | | | | | | 4,982,156,622 | | | | | | 105,519,638 | | |
| Liabilities: | | | | | | | | | | | | | | | | | | |
| Dividends payable | | | | — | | | | | | 445,704 | | | | | | — | | |
| Accrued expenses and other liabilities: | | | | | | | | | | | | | | | | | | |
| Investment Management | | | | — | | | | | | 498,391 | | | | | | — | | |
| Administration | | | | 13,374 | | | | | | 217,947 | | | | | | — | | |
| Shareholder Servicing | | | | — | | | | | | 29,735 | | | | | | — | | |
| Compliance Service | | | | 169 | | | | | | — | | | | | | 158 | | |
| Accounting | | | | 5,690 | | | | | | — | | | | | | — | | |
| Custodian | | | | 6,346 | | | | | | 74,413 | | | | | | 2,542 | | |
| Transfer Agent | | | | 2,651 | | | | | | 3,486 | | | | | | 2,874 | | |
| Trustee | | | | 499 | | | | | | 17,484 | | | | | | 87 | | |
| Other | | | | 32,230 | | | | | | 453,231 | | | | | | 21,141 | | |
| Total Liabilities | | | | 60,959 | | | | | | 1,740,391 | | | | | | 26,802 | | |
| Net Assets | | | $ | 283,208,121 | | | | | $ | 4,980,416,231 | | | | | $ | 105,492,836 | | |
| | | | | | | | | | | | | | | | | | |
| Composition of Net Assets: | | | | | | | | | | | | | | | | | | |
| Capital | | | | 283,208,120 | | | | | | 4,980,404,785 | | | | | | 105,492,835 | | |
| Undistributed (distributions in excess of ) net investment income | | | | 1 | | | | | | — | | | | | | 1 | | |
| Accumulated net realized gains (losses) from investments | | | | — | | | | | | 11,446 | | | | | | — | | |
| Net Assets | | | $ | 283,208,121 | | | | | $ | 4,980,416,231 | | | | | $ | 105,492,836 | | |
| | | | | | | | | | | | | | | | | | |
| Net Assets: | | | | | | | | | | | | | | | | | | |
| Class A Shares | | | $ | 145,634 | | | | | $ | 33,546,135 | | | | | $ | — | | |
| Class B Shares | | | | — | | | | | | 41,295 | | | | | | — | | |
| Class C Shares | | | | — | | | | | | 5,759 | | | | | | — | | |
| Class D Shares | | | | 187,325,938 | | | | | | 1,303,826,958 | | | | | | 86,660,446 | | |
| Class I Shares | | | | — | | | | | | 3,025,687,834 | | | | | | — | | |
| Class Y Shares | | | | 95,736,549 | | | | | | 617,308,250 | | | | | | 18,832,390 | | |
| | | $ | 283,208,121 | | | | | $ | 4,980,416,231 | | | | | $ | 105,492,836 | | |
| Shares Outstanding | | | | | | | | | | | | | | | | | | |
| ($0.001 par value, unlimited number of shares authorized): | | | | | | | | | | | | | | | | | | |
| Class A Shares | | | | 145,634 | | | | | | 33,546,625 | | | | | | — | | |
| Class B Shares | | | | — | | | | | | 41,324 | | | | | | — | | |
| Class C Shares | | | | — | | | | | | 5,758 | | | | | | — | | |
| Class D Shares | | | | 187,329,417 | | | | | | 1,303,764,238 | | | | | | 86,658,600 | | |
| Class I Shares | | | | — | | | | | | 3,025,759,484 | | | | | | — | | |
| Class Y Shares | | | | 95,739,622 | | | | | | 617,301,580 | | | | | | 18,833,868 | | |
| Net Asset Value, Offering Price and Redemption Price per share: | | | | | | | | | | | | | | | | | | |
| Class A Shares | | | $ | 1.00 | | | | | $ | 1.00 | | | | | $ | — | | |
| Class B Shares(a) | | | $ | — | | | | | $ | 1.00 | | | | | $ | — | | |
| Class C Shares(a) | | | $ | — | | | | | $ | 1.00 | | | | | $ | — | | |
| Class D Shares | | | $ | 1.00 | | | | | $ | 1.00 | | | | | $ | 1.00 | | |
| Class I Shares | | | $ | — | | | | | $ | 1.00 | | | | | $ | — | | |
| Class Y Shares | | | $ | 1.00 | | | | | $ | 1.00 | | | | | $ | 1.00 | | |
____________________
(a) Redemption Price per share varies by length of time shares are held.
| 28 HSBC FAMILY OF FUNDS | | See notes to financial statements. |
HSBC FAMILY OF FUNDS
Statements of Assets and Liabilities—as of October 31, 2012 (continued)
| | U.S. | | | | | | | |
| | Government | | | | U.S. Treasury | |
| | Money Market | | | | Money Market | |
| | Fund | | | | Fund | |
| Assets: | | | | | | | | | | | |
| �� Investments, at value and amortized cost | | $ | 2,129,897,980 | | | | | $ | 2,352,226,574 | | |
| Repurchase agreements, at value and cost | | | 2,685,000,000 | | | | | | — | | |
| Total Investments | | | 4,814,897,980 | | | | | | 2,352,226,574 | | |
| Cash | | | 175,223,683 | | | | | | 216,428,275 | | |
| Interest receivable | | | 4,289,629 | | | | | | 5,427,233 | | |
| Receivable for capital shares issued | | | 58,867 | | | | | | — | | |
| Receivable from Investment Adviser | | | — | | | | | | 113,993 | | |
| Prepaid expenses and other assets | | | 95,989 | | | | | | 59,865 | | |
| Total Assets | | | 4,994,566,148 | | | | | | 2,574,255,940 | | |
| Liabilities: | | | | | | | | | | | |
| Dividends payable | | | 84,167 | | | | | | — | | |
| Payable for investments purchased | | | — | | | | | | 199,934,278 | | |
| Accrued expenses and other liabilities: | | | | | | | | | | | |
| Investment Management | | | 267,437 | | | | | | — | | |
| Administration | | | 192, 374 | | | | | | 71,333 | | |
| Compliance Service | | | 2,640 | | | | | | — | | |
| Accounting | | | 132 | | | | | | — | | |
| Custodian | | | 57,963 | | | | | | 20,684 | | |
| Transfer Agent | | | 2,764 | | | | | | 2,770 | | |
| Trustee | | | 14,195 | | | | | | 5,589 | | |
| Other | | | 516,218 | | | | | | 235,105 | | |
| Total Liabilities | | | 1,137,890 | | | | | | 200,269,759 | | |
| Net Assets | | $ | 4,993,428,258 | | | | | $ | 2,373,986,181 | | |
| | | | | | | | | | | | |
| Composition of Net Assets: | | | | | | | | | | | |
| Capital | | | 4,993,431,822 | | | | | | 2,373,997,582 | | |
| Undistributed (distributions in excess of) net investment income | | | 2 | | | | | | 9 | | |
| Accumulated net realized gains (losses) from investments | | | (3,566 | ) | | | | | (11,410 | ) | |
| Net Assets | | $ | 4,993,428,258 | | | | | $ | 2,373,986,181 | | |
| | | | | | | | | | | | |
| Net Assets: | | | | | | | | | | | |
| Class A Shares | | $ | 238,425 | | | | | $ | 5,099 | | |
| Class B Shares | | | 76,382 | | | | | | 1,030 | | |
| Class D Shares | | | 614,499,182 | | | | | | 662,062,897 | | |
| Class I Shares | | | 1,873,166,017 | | | | | | 555,286,654 | | |
| Class Y Shares | | | 2,505,448,252 | | | | | | 1,156,630,501 | | |
| | $ | 4,993,428,258 | | | | | $ | 2,373,986,181 | | |
| Shares Outstanding | | | | | | | | | | | |
| ($0.001 par value, unlimited number of shares authorized): | | | | | | | | | | | |
| Class A Shares | | | 238,556 | | | | | | 5,091 | | |
| Class B Shares | | | 76,370 | | | | | | 1,031 | | |
| Class D Shares | | | 614,317,797 | | | | | | 662,062,320 | | |
| Class I Shares | | | 1,873,288,028 | | | | | | 555,319,700 | | |
| Class Y Shares | | | 2,505,511,431 | | | | | | 1,156,614,419 | | |
| Net Asset Value, Offering Price and Redemption Price per share: | | | | | | | | | | | |
| Class A Shares | | $ | 1.00 | | | | | $ | 1.00 | | |
| Class B Shares(a) | | $ | 1.00 | | | | | $ | 1.00 | | |
| Class D Shares | | $ | 1.00 | | | | | $ | 1.00 | | |
| Class I Shares | | $ | 1.00 | | | | | $ | 1.00 | | |
| Class Y Shares | | $ | 1.00 | | | | | $ | 1.00 | | |
____________________
(a) Redemption Price per share varies by length of time shares are held.
| See notes to financial statements. | HSBC FAMILY OF FUNDS 29 |
HSBC FAMILY OF FUNDS
Statements of Operations—For the year ended October 31, 2012
| | New York | | | | | | | | | | | | | | | |
| | Tax-Free | | | | Prime | | | | Tax-Free | |
| | Money Market | | | | Money Market | | | | Money Market | |
| | Fund | | | | Fund | | | | Fund | |
| Investment Income: | | | | | | | | | | | | | | | | | | | | |
| Interest | | | $ | 589,002 | | | | | | $ | 18,284,475 | | | | | | $ | 228,177 | | |
| Dividends | | | | 22 | | | | | | | — | | | | | | | — | | |
| Total Investment Income | | | | 589,024 | | | | | | | 18,284,475 | | | | | | | 228,177 | | |
| | | | | | | | | | | | | | | | | | | | | |
| Expenses: | | | | | | | | | | | | | | | | | | | | |
| Investment Management | | | | 357,685 | | | | | | | 5,920,409 | | | | | | | 120,113 | | |
| Advisory Services: | | | | | | | | | | | | | | | | | | | | |
| Operational Support - Class A Shares | | | | 107 | | | | | | | 29,241 | | | | | | | — | | |
| Operational Support - Class B Shares | | | | — | | | | | | | 64 | | | | | | | — | | |
| Operational Support - Class C Shares | | | | — | | | | | | | 7 | | | | | | | — | | |
| Operational Support - Class D Shares | | | | 117,613 | | | | | | | 1,416,568 | | | | | | | 92,072 | | |
| Operational Support - Class Y Shares | | | | 61,124 | | | | | | | 615,762 | | | | | | | 28,041 | | |
| Administration: | | | | | | | | | | | | | | | | | | | | |
| Class A Shares | | | | 105 | | | | | | | 14,345 | | | | | | | — | | |
| Class B Shares | | | | — | | | | | | | 32 | | | | | | | — | | |
| Class D Shares | | | | 118,087 | | | | | | | 693,767 | | | | | | | 45,070 | | |
| Class I Shares | | | | — | | | | | | | 1,888,886 | | | | | | | — | | |
| Class Y Shares | | | | 60,716 | | | | | | | 301,668 | | | | | | | 13,733 | | |
| Distribution: | | | | | | | | | | | | | | | | | | | | |
| Class B Shares | | | | — | | | | | | | 480 | | | | | | | — | | |
| Class C Shares | | | | — | | | | | | | 46 | | | | | | | — | | |
| Shareholder Servicing: | | | | | | | | | | | | | | | | | | | | |
| Class A Shares | | | | 848 | | | | | | | 116,684 | | | | | | | — | | |
| Class B Shares | | | | — | | | | | | | 158 | | | | | | | — | | |
| Class C Shares | | | | — | | | | | | | 14 | | | | | | | — | | |
| Class D Shares | | | | 588,069 | | | | | | | 3,536,821 | | | | | | | 230,212 | | |
| Accounting | | | | 82,475 | | | | | | | 78,175 | | | | | | | 76,093 | | |
| Compliance Service | | | | 8,110 | | | | | | | 119,780 | | | | | | | 2,632 | | |
| Custodian | | | | 24,191 | | | | | | | 292,156 | | | | | | | 10,853 | | |
| Printing | | | | 23,022 | | | | | | | 285,203 | | | | | | | 4,481 | | |
| Transfer Agent | | | | 33,315 | | | | | | | 62,974 | | | | | | | 34,857 | | |
| Trustee | | | | 20,261 | | | | | | | 347,715 | | | | | | | 6,842 | | |
| Registration fees | | | | 56,943 | | | | | | | 104,978 | | | | | | | 71,336 | | |
| Other | | | | 75,883 | | | | | | | 1,134,788 | | | | | | | 46,679 | | |
| Total expenses before fee reductions | | | | 1,628,554 | | | | | | | 16,960,721 | | | | | | | 783,014 | | |
| Fees voluntarily reduced/reimbursed by Investment Adviser | | | | (415,682 | ) | | | | | | (920,071 | ) | | | | | | (322,126 | ) | |
| Fees voluntarily reduced/reimbursed by Administrator | | | | (31,491 | ) | | | | | | — | | | | | | | (2,150 | ) | |
| Fees voluntarily reduced/reimbursed by Distributor | | | | — | | | | | | | (525 | ) | | | | | | — | | |
| Fees voluntarily reduced/reimbursed by Shareholder Servicing Agent | | | | (588,917 | ) | | | | | | (3,412,405 | ) | | | | | | (229,173 | ) | |
| Fees paid indirectly | | | | (3,440 | ) | | | | | | (589 | ) | | | | | | (1,388 | ) | |
| Net Expenses | | | | 589,024 | | | | | | | 12,627,131 | | | | | | | 228,177 | | |
| | | | | | | | | | | | | | | | | | | | | |
| Net Investment Income (Loss) | | | | — | | | | | | | 5,657,344 | | | | | | | — | | |
| | | | | | | | | | | | | | | | | | | | | |
| Net realized gains (losses) from investments | | | | — | | | | | | | 24,826 | | | | | | | — | | |
| Change In Net Assets Resulting From Operations | | | $ | — | | | | | | $ | 5,682,170 | | | | | | $ | — | | |
| 30 HSBC FAMILY OF FUNDS | | See notes to financial statements. |
HSBC FAMILY OF FUNDS
Statements of Operations—For the year ended October 31, 2012 (continued)
| | U.S. | | | | U.S. | |
| | Government | | | | Treasury | |
| | Money Market | | | | Money Market | |
| | Fund | | | | Fund | |
| Investment Income: | | | | | | | | | | | | | |
| Interest | | | $ | 8,626,017 | | | | | | $ | 1,965,859 | | |
| Total Investment Income | | | | 8,626,017 | | | | | | | 1,965,859 | | |
| | | | | | | | | | | | | | |
| Expenses: | | | | | | | | | | | | | |
| Investment Management | | | | 4,956,347 | | | | | | | 2,316,716 | | |
| Advisory Services: | | | | | | | | | | | | | |
| Operational Support - Class A Shares | | | | 1,692 | | | | | | | 66 | | |
| Operational Support - Class B Shares | | | | 85 | | | | | | | 19 | | |
| Operational Support - Class C Shares | | | | — | | | | | | | 1 | | |
| Operational Support - Class D Shares | | | | 647,926 | | | | | | | 565,857 | | |
| Operational Support - Class Y Shares | | | | 2,336,471 | | | | | | | 1,119,789 | | |
| Administration: | | | | | | | | | | | | | |
| Class A Shares | | | | 818 | | | | | | | 31 | | |
| Class B Shares | | | | 40 | | | | | | | 9 | | |
| Class C Shares | | | | — | | | | | | | 1 | | |
| Class D Shares | | | | 317,466 | | | | | | | 276,907 | | |
| Class I Shares | | | | 966,885 | | | | | | | 309,451 | | |
| Class Y Shares | | | | 1,145,559 | | | | | | | 548,789 | | |
| Distribution: | | | | | | | | | | | | | |
| Class B Shares | | | | 630 | | | | | | | 142 | | |
| Class C Shares | | | | — | | | | | | | 19 | | |
| Shareholder Servicing: | | | | | | | | | | | | | |
| Class A Shares | | | | 6,770 | | | | | | | 267 | | |
| Class B Shares | | | | 209 | | | | | | | 47 | | |
| Class C Shares | | | | — | | | | | | | 3 | | |
| Class D Shares | | | | 1,619,836 | | | | | | | 1,414,661 | | |
| Accounting | | | | 68,207 | | | | | | | 66,323 | | |
| Compliance Service | | | | 96,860 | | | | | | | 47,314 | | |
| Custodian | | | | 248,291 | | | | | | | 97,680 | | |
| Printing | | | | 105,428 | | | | | | | 18,952 | | |
| Transfer Agent | | | | 51,168 | | | | | | | 42,234 | | |
| Trustee | | | | 295,359 | | | | | | | 136,846 | | |
| Registration fees | | | | 76,008 | | | | | | | 53,064 | | |
| Other | | | | 1,052,123 | | | | | | | 510,002 | | |
| Total expenses before fee reductions | | | | 13,994,178 | | | | | | | 7,525,190 | | |
| Fees voluntarily reduced/reimbursed by Investment Adviser | | | | (3,844,068 | ) | | | | | | (3,784,582 | ) | |
| Fees voluntarily reduced/reimbursed by Administrator | | | | (453,241 | ) | | | | | | (306,356 | ) | |
| Fees voluntarily reduced/reimbursed by Distributor | | | | (630 | ) | | | | | | (152 | ) | |
| Fees voluntarily reduced/reimbursed by Shareholder Servicing Agent | | | | (1,626,815 | ) | | | | | | (1,414,978 | ) | |
| Fees paid indirectly | | | | (32,481 | ) | | | | | | (53,272 | ) | |
| Net Expenses | | | | 8,036,943 | | | | | | | 1,965,850 | | |
| | | | | | | | | | | | | | |
| Net Investment Income (Loss) | | | | 589,074 | | | | | | | 9 | | |
| | | | | | | | | | | | | | |
| Net realized gains (losses) from investments | | | | 2,240 | | | | | | | 8,482 | | |
| Change In Net Assets Resulting From Operations | | | $ | 591,314 | | | | | | $ | 8,491 | | |
| See notes to financial statements. | HSBC FAMILY OF FUNDS 31 |
HSBC FAMILY OF FUNDS
Statements of Changes in Net Assets
| New York Tax-Free | | Prime |
| Money Market Fund | | Money Market Fund |
| | For the | For the | | | | For the | | | For the | |
| | year ended | year ended | | | | year ended | | | year ended | |
| | October 31, 2012 | October 31, 2011 | | | | October 31, 2012 | | | October 31, 2011 | |
| Investment Activities: | | | | | | | | | | | | | | | | | | | | | | | | | |
| Operations: | | | | | | | | | | | | | | | | | | | | | | | | | |
| Net investment income (loss) | | | $ | — | | | | $ | 40,079 | | | | | | $ | 5,657,344 | | | | | $ | 5,030,518 | | | |
| Net realized gains (losses) from investments | | | | — | | | | | — | | | | | | | 24,826 | | | | | | 186,929 | | | |
| Change in net assets resulting from operations | | | | — | | | | | 40,079 | | | | | | | 5,682,170 | | | | | 5,217,447 | | | |
| | | | | | | | | | | | | | | | | | | | | | | | | |
| Dividends: | | | | | | | | | | | | | | | | | | | | | | | | | |
| Net investment income: | | | | | | | | | | | | | | | | | | | | | | | | | |
| Class A Shares | | | | — | | | | | (104 | ) | | | | | | (2,958 | ) | | | | | (2,420 | ) | | |
| Class B Shares | | | | — | | | | | — | | | | | | | (7 | ) | | | | | (18 | ) | | |
| Class C Shares | | | | — | | | | | — | | | | | | | (4 | ) | | | | | (8 | ) | | |
| Class D Shares | | | | — | | | | | (29,578 | ) | | | | | | (143,373 | ) | | | | | (174,840 | ) | | |
| Class I Shares | | | | — | | | | | — | | | | | | | (5,344,845 | ) | | | | (4,730,216 | ) | | |
| Class Y Shares | | | | — | | | | | (10,398 | ) | | | | | | (166,157 | ) | | | | | (126,895 | ) | | |
| Change in net assets resulting from | | | | | | | | | | | | | | | | | | | | | | | | | |
| shareholder dividends | | | | — | | | | | (40,080 | ) | | | | | | (5,657,344 | ) | | | | (5,034,397 | ) | | |
| | | | | | | | | | | | | | | | | | | | | | | | | |
| Change in net assets resulting from | | | | | | | | | | | | | | | | | | | | | | | | | |
| capital transactions | | | | (244,839,081 | ) | | | | 27,291,715 | | | | | | | (1,590,758,408 | ) | | | | (944,671,396 | ) | | |
| Change in net assets | | | | (244,839,081 | ) | | | | 27,291,714 | | | | | | | (1,590,733,582 | ) | | | | (944,488,346 | ) | | |
| | | | | | | | | | | | | | | | | | | | | | | | | |
| Net Assets: | | | | | | | | | | | | | | | | | | | | | | | | | |
| Beginning of period | | | | 528,047,202 | | | | 500,755,488 | | | | | | | 6,571,149,813 | | | | | 7,515,638,159 | | | |
| End of period | | | $ | 283,208,121 | | | | $ | 528,047,202 | | | | | | $ | 4,980,416,231 | | | | | $ | 6,571,149,813 | | | |
| Accumulated net investment income (loss) | | | $ | 1 | | | | $ | 1 | | | | | | $ | — | | | | | $ | — | | | |
| 32 HSBC FAMILY OF FUNDS | | See notes to financial statements. |
HSBC FAMILY OF FUNDS
Statements of Changes in Net Assets (continued)
| | New York Tax-Free | | | | | Prime | |
| | Money Market Fund | | | | | Money Market Fund | |
| | For the | | | For the | | | | For the | | | For the | |
| | year ended | | | year ended | | | | year ended | | | year ended | |
| | October 31, 2012 | | | October 31, 2011 | | | | October 31, 2012 | | | October 31, 2011 | |
| CAPITAL TRANSACTIONS: | | | | | | | | | | | | | | | | | | | | | | | | | |
| Class A Shares: | | | | | | | | | | | | | | | | | | | | | | | | | |
| Proceeds from shares issued | | | $ | 150,000 | | | | | | $ | 2,560,641 | | | | | | $ | 11,405,354 | | | | $ | 35,520,209 | | |
| Dividends reinvested | | | | — | | | | | | | 100 | | | | | | | 102 | | | | | 127 | | |
| Value of shares redeemed | | | | (200,000 | ) | | | | | | (16,927,984 | ) | | | | | | (5,622,050 | ) | | | | (40,700,451 | ) | |
| Class A Shares capital transactions | | | | (50,000 | ) | | | | | | (14,367,243 | ) | | | | | | 5,783,406 | | | | | (5,180,115 | ) | |
| | | | | | | | | | | | | | | | | | | | | | | | | | |
| Class B Shares: | | | | | | | | | | | | | | | | | | | | | | | | | |
| Proceeds from shares issued | | | | — | | | | | | | — | | | | | | | 19,430 | | | | | 21,964 | | |
| Dividends reinvested | | | | — | | | | | | | — | | | | | | | 6 | | | | | 13 | | |
| Value of shares redeemed | | | | — | | | | | | | — | | | | | | | (110,006 | ) | | | | (115,996 | ) | |
| Class B Shares capital transactions | | | | — | | | | | | | — | | | | | | | (90,570 | ) | | | | (94,019 | ) | |
| | | | | | | | | | | | | | | | | | | | | | | | | | |
| Class C Shares: | | | | | | | | | | | | | | | | | | | | | | | | | |
| Proceeds from shares issued | | | | — | | | | | | | — | | | | | | | 745 | | | | | 148,117 | | |
| Dividends reinvested | | | | — | | | | | | | — | | | | | | | 4 | | | | | 8 | | |
| Value of shares redeemed | | | | — | | | | | | | — | | | | | | | (777 | ) | | | | (186,363 | ) | |
| Class C Shares capital transactions | | | | — | | | | | | | — | | | | | | | (28 | ) | | | | (38,238 | ) | |
| | | | | | | | | | | | | | | | | | | | | | | | | | |
| Class D Shares: | | | | | | | | | | | | | | | | | | | | | | | | | |
| Proceeds from shares issued | | | | 589,072,353 | | | | | | | 1,089,562,960 | | | | | | | 5,747,496,581 | | | | | 6,469,859,849 | | |
| Dividends reinvested | | | | — | | | | | | | 22,219 | | | | | | | 112,060 | | | | | 136,446 | | |
| Value of shares redeemed | | | | (821,794,410 | ) | | | | | | (1,050,431,214 | ) | | | | | | (6,035,401,728 | ) | | | | (6,574,729,064 | ) | |
| Class D Shares capital transactions | | | | (232,722,057 | ) | | | | | | 39,153,965 | | | | | | | (287,793,087 | ) | | | | (104,732,769 | ) | |
| | | | | | | | | | | | | | | | | | | | | | | | | | |
| Class I Shares: | | | | | | | | | | | | | | | | | | | | | | | | | |
| Proceeds from shares issued | | | | — | | | | | | | — | | | | | | | 37,580,221,468 | | | | | 42,931,122,838 | | |
| Dividends reinvested | | | | — | | | | | | | — | | | | | | | 2,814,430 | | | | | 2,548,860 | | |
| Value of shares redeemed | | | | — | | | | | | | — | | | | | | | (38,866,710,107 | ) | | | | (43,303,107,094 | ) | |
| Class I Shares capital transactions | | | | — | | | | | | | — | | | | | | | (1,283,674,209 | ) | | | | (369,435,396 | ) | |
| | | | | | | | | | | | | | | | | | | | | | | | | | |
| Class Y Shares: | | | | | | | | | | | | | | | | | | | | | | | | | |
| Proceeds from shares issued | | | | 350,447,077 | | | | | | | 611,549,903 | | | | | | | 2,112,812,015 | | | | | 2,135,069,470 | | |
| Dividends reinvested | | | | — | | | | | | | 7,717 | | | | | | | 146,189 | | | | | 117,129 | | |
| Value of shares redeemed | | | | (362,514,101 | ) | | | | | | (609,052,627 | ) | | | | | | (2,137,942,124 | ) | | | | (2,600,377,458 | ) | |
| Class Y Shares capital transactions | | | | (12,067,024 | ) | | | | | | 2,504,993 | | | | | | | (24,983,920 | ) | | | | (465,190,859 | ) | |
| Change in net assets resulting from | | | | | | | | | | | | | | | | | | | | | | | | | |
| capital transactions | | | $ | (244,839,081 | ) | | | | | $ | 27,291,715 | | | | | | $ | (1,590,758,408 | ) | | | $ | (944,671,396 | ) | |
| See notes to financial statements. | HSBC FAMILY OF FUNDS 33 |
HSBC FAMILY OF FUNDS
Statements of Changes in Net Assets (continued)
| | Tax-Free | | | | U.S. Government | |
| | Money Market Fund | | | | Money Market Fund | |
| | For the | | | For the | | | | For the | | | | For the | |
| | year ended | | | year ended | | | | year ended | | | | year ended | |
| | October 31, 2012 | | | October 31, 2011 | | | | October 31, 2012 | | | | October 31, 2011 | |
| Investment Activities: | | | | | | | | | | | | | | | | | | | | | | | | | | | | | | |
| Operations: | | | | | | | | | | | | | | | | | | | | | | | | | | | | | | |
| Net investment income (loss) | | | $ | — | | | | | | $ | 11,489 | | | | | | | $ | 589,074 | | | | | | | $ | 1,248,618 | | | |
| Net realized gains (losses) from investments | | | | — | | | | | | | — | | | | | | | | 2,240 | | | | | | | | 220,254 | | | |
| Change in net assets resulting from operations | | | | — | | | | | | | 11,489 | | | | | | | | 591,314 | | | | | | | | 1,468,872 | | | |
| | | | | | | | | | | | | | | | | | | | | | | | | | | | | | | |
| Dividends: | | | | | | | | | | | | | | | | | | | | | | | | | | | | | | |
| Net investment income: | | | | | | | | | | | | | | | | | | | | | | | | | | | | | | |
| Class A Shares | | | | — | | | | | | | — | | | | | | | | (169 | ) | | | | | | | (869 | ) | | |
| Class B Shares | | | | — | | | | | | | — | | | | | | | | (8 | ) | | | | | | | (8 | ) | | |
| Class D Shares | | | | — | | | | | | | (6,019 | ) | | | | | | | (64,809 | ) | | | | | | | (79,461 | ) | | |
| Class I Shares | | | | — | | | | | | | — | | | | | | | | (290,312 | ) | | | | | | | (886,348 | ) | | |
| Class Y Shares | | | | — | | | | | | | (5,469 | ) | | | | | | | (233,776 | ) | | | | | | | (282,432 | ) | | |
| Net realized gains: | | | | | | | | | | | | | | | | | | | | | | | | | | | | | | |
| Class A Shares | | | | — | | | | | | | — | | | | | | | | (35 | ) | | | | | | | — | | | |
| Class B Shares | | | | — | | | | | | | — | | | | | | | | (1 | ) | | | | | | | — | | | |
| Class D Shares | | | | — | | | | | | | (1,194 | ) | | | | | | | (7,445 | ) | | | | | | | — | | | |
| Class I Shares | | | | — | | | | | | | — | | | | | | | | (19,650 | ) | | | | | | | — | | | |
| Class Y Shares | | | | — | | | | | | | (585 | ) | | | | | | | (18,416 | ) | | | | | | | — | | | |
| Change in net assets resulting from | | | | | | | | | | | | | | | | | | | | | | | | | | | | | | |
| shareholder dividends | | | | — | | | | | | | (13,267 | ) | | | | | | | (634,621 | ) | | | | | | | (1,249,118 | ) | | |
| | | | | | | | | | | | | | | | | | | | | | | | | | | | | | | |
| Change in net assets resulting from | | | | | | | | | | | | | | | | | | | | | | | | | | | | | | |
| capital transactions | | | | (15,126,186 | ) | | | | | | 15,452,934 | | | | | | | | 885,763,811 | | | | | | | | (4,860,273,121 | ) | | |
| Change in net assets | | | | (15,126,186 | ) | | | | | | 15,451,156 | | | | | | | | 885,720,504 | | | | | | | | (4,860,053,367 | ) | | |
| | | | | | | | | | | | | | | | | | | | | | | | | | | | | | | |
| Net Assets: | | | | | | | | | | | | | | | | | | | | | | | | | | | | | | |
| Beginning of period | | | | 120,619,022 | | | | | | | 105,167,866 | | | | | | | | 4,107,707,754 | | | | | | | | 8,967,761,121 | | | |
| End of period | | | $ | 105,492,836 | | | | | | $ | 120,619,022 | | | | | | | $ | 4,993,428,258 | | | | | | | $ | 4,107,707,754 | | | |
| Accumulated net investment income (loss) | | | $ | 1 | | | | | | $ | 1 | | | | | | | $ | 2 | | | | | | | $ | 2 | | | |
| 34 HSBC FAMILY OF FUNDS | | See notes to financial statements. |
HSBC FAMILY OF FUNDS
Statements of Changes in Net Assets (continued)
| | Tax-Free | | | | U.S. Government | |
| | Money Market Fund | | | | Money Market Fund | |
| | For the | | | For the | | | | For the | | | For the | |
| | year ended | | | year ended | | | | year ended | | | year ended | |
| | October 31, 2012 | | | October 31, 2011 | | | | October 31, 2012 | | | October 31, 2011 | |
| CAPITAL TRANSACTIONS: | | | | | | | | | | | | | | | | | | | | | | | | | | | | | |
| Class A Shares: | | | | | | | | | | | | | | | | | | | | | | | | | | | | | |
| Proceeds from shares issued | | | $ | — | | | | | | $ | — | | | | | | | $ | 12,635,616 | | | | | | $ | 31,276,415 | | | |
| Dividends reinvested | | | | — | | | | | | | — | | | | | | | | 18 | | | | | | | 79 | | | |
| Value of shares redeemed | | | | — | | | | | | | (255 | ) | | | | | | | (16,391,097 | ) | | | | | | (53,208,562 | ) | | |
| Class A Shares capital transactions | | | | — | | | | | | | (255 | ) | | | | | | | (3,755,463 | ) | | | | | | (21,932,068 | ) | | |
| | | | | | | | | | | | | | | | | | | | | | | | | | | | | | |
| Class B Shares: | | | | | | | | | | | | | | | | | | | | | | | | | | | | | |
| Proceeds from shares issued | | | | — | | | | | | | — | | | | | | | | — | | | | | | | 72,864 | | | |
| Dividends reinvested | | | | — | | | | | | | — | | | | | | | | 9 | | | | | | | 8 | | | |
| Value of shares redeemed | | | | — | | | | | | | — | | | | | | | | (17,135 | ) | | | | | | (67,324 | ) | | |
| Class B Shares capital transactions | | | | — | | | | | | | — | | | | | | | | (17,126 | ) | | | | | | 5,548 | | | |
| | | | | | | | | | | | | | | | | | | | | | | | | | | | | | |
| Class C Shares: | | | | | | | | | | | | | | | | | | | | | | | | | | | | | |
| Value of shares redeemed | | | | — | | | | | | | — | | | | | | | | — | | | | | | | (3 | ) | | |
| Class C Shares capital transactions | | | | — | | | | | | | — | | | | | | | | — | | | | | | | (3 | ) | | |
| | | | | | | | | | | | | | | | | | | | | | | | | | | | | | |
| Class D Shares: | | | | | | | | | | | | | | | | | | | | | | | | | | | | | |
| Proceeds from shares issued | | | | 232,816,627 | | | | | | 217,131,493 | | | | | | | | 2,112,895,877 | | | | | | | 3,459,519,344 | | | |
| Dividends reinvested | | | | — | | | | | | | 2,418 | | | | | | | | 41,463 | | | | | | | 50,828 | | | |
| Value of shares redeemed | | | | (226,118,806 | ) | | | | | | (211,158,639 | ) | | | | | | | (2,244,889,380 | ) | | | | | | (3,635,390,571 | ) | | |
| Class D Shares capital transactions | | | | 6,697,821 | | | | | | | 5,975,272 | | | | | | | | (131,952,040 | ) | | | | | | (175,820,399 | ) | | |
| | | | | | | | | | | | | | | | | | | | | | | | | | | | | |
| Class I Shares: | | | | | | | | | | | | | | | | | | | | | | | | | | | | | |
| Proceeds from shares issued | | | | — | | | | | | | — | | | | | | | | 15,350,488,166 | | | | | | | 24,356,407,905 | | | |
| Dividends reinvested | | | | — | | | | | | | — | | | | | | | | 206,034 | | | | | | | 640,334 | | | |
| Value of shares redeemed | | | | — | | | | | | | — | | | | | | | | (15,123,273,533 | ) | | | | | | (27,812,865,292 | ) | | |
| Class I Shares capital transactions | | | | — | | | | | | | — | | | | | | | | 227,420,667 | | | | | | | (3,455,817,053 | ) | | |
| | | | | | | | | | | | | | | | | | | | | | | | | | | | | | |
| Class Y Shares: | | | | | | | | | | | | | | | | | | | | | | | | | | | | | |
| Proceeds from shares issued | | | | 151,658,520 | | | | | | 213,868,994 | | | | | | | | 16,530,799,457 | | | | | | | 18,153,063,238 | | | |
| Dividends reinvested | | | | — | | | | | | | 900 | | | | | | | | 250,271 | | | | | | | 276,177 | | | |
| Value of shares redeemed | | | | (173,482,527 | ) | | | | | | (204,391,977 | ) | | | | | | | (15,736,981,955 | ) | | | | | | (19,360,048,561 | ) | | |
| Class Y Shares capital transactions | | | | (21,824,007 | ) | | | | | | 9,477,917 | | | | | | | | 794,067,773 | | | | | | | (1,206,709,146 | ) | | |
| Change in net assets resulting from | | | | | | | | | | | | | | | | | | | | | | | | | | | | | |
| capital transactions | | | $ | (15,126,186 | ) | | | | | $ | 15,452,934 | | | | | | | $ | 885,763,811 | | | | | | $ | (4,860,273,121 | ) | | |
| See notes to financial statements. | HSBC FAMILY OF FUNDS 35 |
HSBC FAMILY OF FUNDS
Statements of Changes in Net Assets (continued)
| | U.S. Treasury | |
| | Money Market Fund | |
| | For the | | | | For the | |
| | year ended | | | | year ended | |
| | October 31, 2012 | | | | October 31, 2011 | |
| Investment Activities: | | | | | | | | | | | | | | | |
| Operations: | | | | | | | | | | | | | | | |
| Net investment income (loss) | | | $ | 9 | | | | | | | $ | 276,251 | | | |
| Net realized gains (losses) from investments | | | | 8,482 | | | | | | | | 4,376 | | | |
| Change in net assets resulting from operations | | | | 8,491 | | | | | | | | 280,627 | | | |
| | | | | | | | | | | | | | | | |
| Dividends: | | | | | | | | | | | | | | | |
| Net investment income: | | | | | | | | | | | | | | | |
| Class A Shares | | | | — | | | | | | | | (212 | ) | | |
| Class B Shares | | | | — | | | | | | | | (5 | ) | | |
| Class D Shares | | | | — | | | | | | | | (73,082 | ) | | |
| Class I Shares | | | | — | | | | | | | | (108,964 | ) | | |
| Class Y Shares | | | | — | | | | | | | | (93,694 | ) | | |
| Net realized gains: | | | | | | | | | | | | | | | |
| Class A Shares | | | | — | | | | | | | | (2 | ) | | |
| Class B Shares | | | | — | | | | | | | | (1 | ) | | |
| Class D Shares | | | | (6,485 | ) | | | | | | | (8,821 | ) | | |
| Class I Shares | | | | (6,826 | ) | | | | | | | (22,434 | ) | | |
| Class Y Shares | | | | (10,955 | ) | | | | | | | (12,621 | ) | | |
| Change in net assets resulting from shareholder dividends | | | | (24,266 | ) | | | | | | | (319,836 | ) | | |
| | | | | | | | | | | | | | | |
| Change in net assets resulting from capital transactions | | | | (229,081,790 | ) | | | | | | | (682,335,435 | ) | | |
| | | | | | | | | | | | | | | | |
| Change in net assets | | | | (229,097,565 | ) | | | | | | | (682,374,644 | ) | | |
| | | | | | | | | | | | | | | | |
| Net Assets: | | | | | | | | | | | | | | | |
| Beginning of period | | | | 2,603,083,746 | | | | | | | | 3,285,458,390 | | | |
| End of period | | | $ | 2,373,986,181 | | | | | | | $ | 2,603,083,746 | | | |
| Accumulated net investment income (loss) | | | $ | 9 | | | | | | | $ | — | | | |
| 36 HSBC FAMILY OF FUNDS | | See notes to financial statements. |
HSBC FAMILY OF FUNDS
Statements of Changes in Net Assets (continued)
| | U.S. Treasury |
| | Money Market Fund |
| | For the | | For the |
| | year ended | | year ended |
| | October 31, 2012 | | October 31, 2011 |
| CAPITAL TRANSACTIONS: | | | | | | | | | | |
| Class A Shares: | | | | | | | | | | |
| Proceeds from shares issued | | | $ | — | | | | $ | 1,775,885 | |
| Dividends reinvested | | | | — | | | | | 187 | |
| Value of shares redeemed | | | | (607,887 | ) | | | | (34,165,775 | ) |
| Class A Shares capital transactions | | | | (607,887 | ) | | | | (32,389,703 | ) |
| | | | | | | | | | | |
| Class B Shares: | | | | | | | | | | |
| Proceeds from shares issued | | | | — | | | | | 1,031 | |
| Dividends reinvested | | | | — | | | | | 6 | |
| Value of shares redeemed | | | | (34,382 | ) | | | | (15,915 | ) |
| Class B Shares capital transactions | | | | (34,382 | ) | | | | (14,878 | ) |
| | | | | | | | | | | |
| Class C Shares: | | | | | | | | | | |
| Proceeds from shares issued | | | | 114,177 | | | | | — | |
| Value of shares redeemed | | | | (114,177 | ) | | | | (41 | ) |
| Class C Shares capital transactions | | | | — | | | | | (41 | ) |
| | | | | | | | | | | |
| Class D Shares: | | | | | | | | | | |
| Proceeds from shares issued | | | | 1,836,487,946 | | | | | 2,802,057,554 | |
| Dividends reinvested | | | | 2,757 | | | | | 49,431 | |
| Value of shares redeemed | | | | (1,794,363,660 | ) | | | | (2,908,396,536 | ) |
| Class D Shares capital transactions | | | | 42,127,043 | | | | | (106,289,551 | ) |
| | | | | | | | | | | |
| Class I Shares: | | | | | | | | | | |
| Proceeds from shares issued | | | | 2,342,393,162 | | | | | 8,121,397,977 | |
| Dividends reinvested | | | | 3,734 | | | | | 75,052 | |
| Value of shares redeemed | | | | (2,770,079,317 | ) | | | | (8,517,488,640 | ) |
| Class I Shares capital transactions | | | | (427,682,421 | ) | | | | (396,015,611 | ) |
| | | | | | | | | | | |
| Class Y Shares: | | | | | | | | | | |
| Proceeds from shares issued | | | | 1,844,352,806 | | | | | 2,033,753,306 | |
| Dividends reinvested | | | | 10,587 | | | | | 101,736 | |
| Value of shares redeemed | | | | (1,687,247,536 | ) | | | | (2,181,480,693 | ) |
| Class Y Shares capital transactions | | | | 157,115,857 | | | | | (147,625,651 | ) |
| Change in net assets resulting from capital transactions | | | $ | (229,081,790 | ) | | | $ | (682,335,435 | ) |
| See notes to financial statements. | HSBC FAMILY OF FUNDS | | 37 |
| HSBC NEW YORK TAX-FREE MONEY MARKET FUND |
| Financial Highlights |
| |
| Selected data for a share outstanding throughout the periods indicated. |
| | | | | | Investment Activities | | Dividends | | | | | | | | | Ratios/Supplementary Data |
| | | | | | | | | Net | | | | | | | | | | | | | | | | | | | | | | | | | Ratio | | Ratio of | | Ratio of | | Ratios of |
| | | | | | | | | Realized and | | | | | | | | | | | | | | | | | | | | | | | | | of Net | | Expenses | | Net | | Expenses |
| | | | | | | | | Unrealized | | | | | | | | | | | | | | | | | | | | | | | | | Expenses | | to Average | | Investment | | to Average |
| | Net Asset | | Net | | Gains | | | | | | | | Net Realized | | | | | | | | | | | | Net Assets | | to | | Net Assets | | Income | | Net Assets |
| | Value, | | Investment | | (Losses) | | Total from | | Net | | Gains from | | | | | Net Asset | | | | | at End of | | Average | | (Excluding | | to Average | | (Excluding |
| | Beginning | | Income | | from | | Investment | | Investment | | Investment | | Total | | Value, End | | Total | | Period | | Net | | Fees Paid | | Net | | Fee |
| | of Period | | (Loss) | | Investments | | Activities | | Income | | Transactions | | Dividends | | of Period | | Return(a) | | (000’s) | | Assets | | Indirectly) | | Assets | | Reductions) |
| CLASS A SHARES | | | | | | | | | | | | | | | | | | | | | | | | | | | | | | | | | | | | | | | | | | | | | |
| Year Ended October 31, 2008 | | | $1.00 | | | 0.02 | | | — | | | 0.02 | | | (0.02 | ) | | — | | | (0.02 | ) | | | $1.00 | | | 1.94 | % | | $ | 45,791 | | | 0.63 | % | | 0.63 | % | | 2.09 | % | | 0.63 | % |
| Year Ended October 31, 2009 | | | 1.00 | | | — | (b) | | — | | | — | (b) | | — | (b) | | — | (b) | | — | (b) | | | 1.00 | | | 0.18 | %(c) | | | 40,698 | | | 0.49 | %(c) | | 0.49 | %(c) | | 0.21 | %(c) | | 0.67 | %(c) |
| Year Ended October 31, 2010 | | | 1.00 | | | — | (b) | | — | (b) | | — | (b) | | — | (b) | | — | | | — | (b) | | | 1.00 | | | 0.02 | %(d) | | | 14,564 | | | 0.23 | % | | 0.23 | % | | 0.02 | %(d) | | 0.64 | % |
| Year Ended October 31, 2011 | | | 1.00 | | | — | (b) | | — | (b) | | — | (b) | | — | (b) | | — | | | — | (b) | | | 1.00 | | | 0.01 | % | | | 196 | | | 0.22 | % | | 0.22 | % | | 0.01 | % | | 0.66 | % |
| Year Ended October 31, 2012 | | | 1.00 | | | — | | | — | | | — | | | — | | | — | | | — | | | | 1.00 | | | — | % | | | 146 | | | 0.17 | % | | 0.17 | % | | — | % | | 0.69 | % |
| CLASS B SHARES | | | | | | | | | | | | | | | | | | | | | | | | | | | | | | | | | | | | | | | | | | | | | |
| Year Ended October 31, 2008 | | | $1.00 | | | 0.01 | | | — | | | 0.01 | | | (0.01 | ) | | — | | | (0.01 | ) | | | $1.00 | | | 1.33 | % | | $ | 35 | | | 1.23 | % | | 1.23 | % | | 1.30 | % | | 1.23 | % |
| Year Ended October 31, 2009 | | | 1.00 | | | — | (b) | | — | | | — | (b) | | — | (b) | | — | (b) | | — | (b) | | | 1.00 | | | 0.08 | %(c) | | | 21 | | | 0.65 | %(c) | | 0.65 | %(c) | | 0.08 | %(c) | | 1.27 | %(c) |
| Year Ended October 31, 2010(e) | | | 1.00 | | | — | (b) | | — | (b) | | — | (b) | | — | (b) | | — | | | — | (b) | | | 1.00 | | | 0.01 | %(d) | | | — | | | 0.22 | % | | 0.22 | % | | 0.02 | %(d) | | 1.24 | % |
| Year Ended October 31, 2011(f) | | | 1.00 | | | — | | | — | | | — | | | — | | | — | | | — | | | | 1.00 | | | — | % | | | — | | | — | % | | —% | | | — | % | | —% | |
| Year Ended October 31, 2012(f) | | | 1.00 | | | — | | | — | | | — | | | — | | | — | | | — | | | | 1.00 | | | — | % | | | — | | | — | % | | —% | | | — | % | | —% | |
| CLASS C SHARES | | | | | | | | | | | | | | | | | | | | | | | | | | | | | | | | | | | | | | | | | | | | | |
| Year Ended October 31, 2008(g) | | | $1.00 | | | — | | | — | | | — | | | — | | | — | | | — | | | | $1.00 | | | — | % | | $ | — | (h) | | — | % | | —% | | | — | % | | —% | |
| Year Ended October 31, 2009(f) | | | 1.00 | | | — | | | — | | | — | | | — | | | — | | | — | | | | 1.00 | | | — | % | | | — | | | — | % | | —% | | | — | % | | —% | |
| Year Ended October 31, 2010(f) | | | 1.00 | | | — | | | — | | | — | | | — | | | — | | | — | | | | 1.00 | | | — | % | | | — | | | — | % | | —% | | | — | % | | —% | |
| Year Ended October 31, 2011(f) | | | 1.00 | | | — | | | — | | | — | | | — | | | — | | | — | | | | 1.00 | | | — | % | | | — | | | — | % | | —% | | | — | % | | —% | |
| Year Ended October 31, 2012(f) | | | 1.00 | | | — | | | — | | | — | | | — | | | — | | | — | | | | 1.00 | | | — | % | | | — | | | — | % | | —% | | | — | % | | —% | |
| CLASS D SHARES | | | | | | | | | | | | | | | | | | | | | | | | | | | | | | | | | | | | | | | | | | | | | |
| Year Ended October 31, 2008 | | | $1.00 | | | 0.02 | | | — | | | 0.02 | | | (0.02 | ) | | — | | | (0.02 | ) | | | $1.00 | | | 2.09 | % | | $ | 586,791 | | | 0.48 | % | | 0.48 | % | | 1.99 | % | | 0.48 | % |
| Year Ended October 31, 2009 | | | 1.00 | | | — | (b) | | — | | | — | (b) | | — | (b) | | — | (b) | | — | (b) | | | 1.00 | | | 0.25 | %(c) | | | 423,061 | | | 0.43 | %(c) | | 0.43 | %(c) | | 0.26 | %(c) | | 0.52 | %(c) |
| Year Ended October 31, 2010 | | | 1.00 | | | — | (b) | | — | (b) | | — | (b) | | — | (b) | | — | | | — | (b) | | | 1.00 | | | 0.02 | %(d) | | | 380,888 | | | 0.23 | % | | 0.23 | % | | 0.02 | %(d) | | 0.49 | % |
| Year Ended October 31, 2011 | | | 1.00 | | | — | (b) | | — | (b) | | — | (b) | | — | (b) | | — | | | — | (b) | | | 1.00 | | | 0.01 | % | | | 420,048 | | | 0.19 | % | | 0.19 | % | | 0.01 | % | | 0.51 | % |
| Year Ended October 31, 2012 | | | 1.00 | | | — | | | — | | | — | | | — | | | — | | | — | | | | 1.00 | | | — | % | | | 187,326 | | | 0.16 | % | | 0.16 | % | | — | % | | 0.54 | % |
| CLASS Y SHARES | | | | | | | | | | | | | | | | | | | | | | | | | | | | | | | | | | | | | | | | | | | | | |
| Year Ended October 31, 2008 | | | $1.00 | | | 0.02 | | | — | | | 0.02 | | | (0.02 | ) | | — | | | (0.02 | ) | | | $1.00 | | | 2.35 | % | | $ | 319,797 | | | 0.23 | % | | 0.23 | % | | 2.27 | % | | 0.23 | % |
| Year Ended October 31, 2009 | | | 1.00 | | | — | (b) | | — | | | — | (b) | | — | (b) | | — | (b) | | — | (b) | | | 1.00 | | | 0.40 | %(c) | | | 210,706 | | | 0.26 | %(c) | | 0.26 | %(c) | | 0.39 | %(c) | | 0.27 | %(c) |
| Year Ended October 31, 2010 | | | 1.00 | | | — | (b) | | — | (b) | | — | (b) | | — | (b) | | — | | | — | (b) | | | 1.00 | | | 0.02 | %(d) | | | 105,303 | | | 0.22 | % | | 0.22 | % | | 0.02 | %(d) | | 0.24 | % |
| Year Ended October 31, 2011 | | | 1.00 | | | — | (b) | | — | (b) | | — | (b) | | — | (b) | | — | | | — | (b) | | | 1.00 | | | 0.01 | % | | | 107,804 | | | 0.19 | % | | 0.19 | % | | 0.01 | % | | 0.26 | % |
| Year Ended October 31, 2012 | | | 1.00 | | | — | | | — | | | — | | | — | | | — | | | — | | | | 1.00 | | | — | % | | | 95,737 | | | 0.17 | % | | 0.17 | % | | — | % | | 0.29 | % |
| (a) | Not annualized for periods less than one year. Total return calculations do not include any redemption charges. |
| (b) | Represents less than $0.005 or $(0.005). |
| (c) | Included in the ratios is the Treasury Guarantee Program fees incurred by the Fund during the period. Without these fees, the gross and net expense ratios would have been decreased by 0.04% and the total return and net investment income ratio would have increased by 0.04%. |
| (d) | During the year ended October 31, 2010, the Fund received a distribution from a “fair fund” established by the SEC in connection with a consent order against BISYS Fund Services, Inc. (See Note 7 in Notes to Financial Statements). The corresponding impact to the net income ratio and the total return was less than 0.005%. |
| (e) | Class B Shares were operational during a portion of the year only. Amounts reflect performance for the period of time the class had operations, which was 190 days during the period. The net asset value, end of period, presented is as of the last day during the class had operations. |
| (f) | During the period the class had no operations. The net asset values reflected represent the last day the class had shareholders. |
| (g) | During the year ended, Class C Shares had no operations. Net assets at the end of the period represent seed money. The net asset values reflected represent the last day the class had shareholders. |
| (h) | Less than $500. |
| 38 | | HSBC FAMILY OF FUNDS | See notes to financial statements. |
| HSBC PRIME MONEY MARKET FUND |
| Financial Highlights |
| |
| Selected data for a share outstanding throughout the periods indicated. |
| | | | | Investment Activities | | Dividends | | | | | | | | | Ratios/Supplementary Data |
| | | | | | | Net | | | | | | | | | | | | | | | | | | | | | | | | |
| | | | | | | Realized | | | | | | | | | | | | | | | | | | | | Ratio of | | Ratio of | | Ratios of |
| | | | | | | and | | | | | | | | | | | | | | | | | | | | Expenses | | Net | | Expenses |
| | | | | | | Unrealized | | | | | | | | Net | | | | | | | | | | to Average | | Investment | | to Average |
| | Net Asset | | Net | | Gains | | | | | | | | Asset | | | | Net Assets | | Ratio of Net | | Net Assets | | Income | | Net Assets |
| | Value, | | Investment | | (Losses) | | Total from | | Net | | | | Value, | | | | at End of | | Expenses to | | (Excluding | | to Average | | (Excluding |
| | Beginning | | Income | | from | | Investment | | Investment | | Total | | End of | | Total | | Period | | Average Net | | Fees Paid | | Net | | Fee |
| | of Period | | (Loss) | | Investments | | Activities | | Income | | Dividends | | Period | | Return(a) | | (000’s) | | Assets | | Indirectly) | | Assets | | Reductions) |
| CLASS A SHARES | | | | | | | | | | | | | | | | | | | | | | | | | | | | | | | | | | | | | | | | | | | |
| Year Ended October 31, 2008 | | | $1.00 | | | 0.03 | | | — | (b) | | 0.03 | | | (0.03 | ) | | (0.03 | ) | | | $1.00 | | | 2.71 | %(c) | | | $ | 308,499 | | | 0.67 | % | | 0.67 | % | | 2.73 | % | | 0.67 | % |
| Year Ended October 31, 2009 | | | 1.00 | | | — | (b) | | — | (b) | | — | (b) | | — | (b) | | — | (b) | | | 1.00 | | | 0.32 | %(d) | | | | 343,265 | | | 0.55 | %(d) | | 0.55 | %(d) | | 0.31 | %(d) | | 0.69 | %(d) |
| Year Ended October 31, 2010 | | | 1.00 | | | — | (b)(e) | | — | (b) | | — | (b) | | — | (b) | | — | (b) | | | 1.00 | | | 0.01 | %(f) | | | | 32,943 | | | 0.29 | % | | 0.29 | % | | 0.01 | %(f) | | 0.67 | % |
| Year Ended October 31, 2011 | | | 1.00 | | | — | (b)(e) | | — | (b) | | — | (b) | | — | (b) | | — | (b) | | | 1.00 | | | 0.01 | % | | | | 27,763 | | | 0.26 | % | | 0.26 | % | | 0.01 | % | | 0.68 | % |
| Year Ended October 31, 2012 | | | 1.00 | | | — | (b) | | — | (b) | | — | (b) | | — | (b) | | — | (b) | | | 1.00 | | | 0.01 | % | | | | 33,546 | | | 0.30 | % | | 0.30 | % | | 0.01 | % | | 0.69 | % |
| CLASS B SHARES | | | | | | | | | | | | | | | | | | | | | | | | | | | | | | | | | | | | | | | | | | | |
| Year Ended October 31, 2008 | | | $1.00 | | | 0.02 | | | — | (b) | | 0.02 | | | (0.02 | ) | | (0.02 | ) | | | $1.00 | | | 2.10 | %(c) | | | $ | 199 | | | 1.27 | % | | 1.27 | % | | 2.08 | % | | 1.27 | % |
| Year Ended October 31, 2009 | | | 1.00 | | | — | (b) | | — | (b) | | — | (b) | | — | | | — | | | | 1.00 | | | 0.17 | %(d) | | | | 312 | | | 0.68 | %(d) | | 0.68 | %(d) | | 0.13 | %(d) | | 1.30 | %(d) |
| Year Ended October 31, 2010 | | | 1.00 | | | — | (b)(e) | | — | (b) | | — | (b) | | — | (b) | | — | (b) | | | 1.00 | | | 0.01 | %(f) | | | | 226 | | | 0.29 | % | | 0.29 | % | | 0.01 | %(f) | | 1.27 | % |
| Year Ended October 31, 2011 | | | 1.00 | | | — | (b)(e) | | — | (b) | | — | (b) | | — | (b) | | — | (b) | | | 1.00 | | | 0.01 | % | | | | 132 | | | 0.26 | % | | 0.26 | % | | 0.01 | % | | 1.28 | % |
| Year Ended October 31, 2012 | | | 1.00 | | | — | (b) | | — | (b) | | — | (b) | | — | (b) | | — | (b) | | | 1.00 | | | 0.01 | % | | | | 41 | | | 0.29 | % | | 0.29 | % | | 0.01 | % | | 1.29 | % |
| CLASS C SHARES | | | | | | | | | | | | | | | | | | | | | | | | | | | | | | | | | | | | | | | | | | | |
| Year Ended October 31, 2008 | | | $1.00 | | | 0.02 | | | — | (b) | | 0.02 | | | (0.02 | ) | | (0.02 | ) | | | $1.00 | | | 2.10 | %(c) | | | $ | 316,779 | | | 1.27 | % | | 1.27 | % | | 2.04 | % | | 1.27 | % |
| Year Ended October 31, 2009 | | | 1.00 | | | — | (b) | | — | (b) | | — | (b) | | — | (b) | | — | (b) | | | 1.00 | | | 0.17 | %(d) | | | | 259,364 | | | 0.74 | %(d) | | 0.74 | %(d) | | 0.19 | %(d) | | 1.29 | %(d) |
| Year Ended October 31, 2010 | | | 1.00 | | | — | (b)(e) | | — | (b) | | — | (b) | | — | (b) | | — | (b) | | | 1.00 | | | 0.01 | %(f) | | | | 44 | | | 0.29 | % | | 0.29 | % | | 0.01 | %(f) | | 1.27 | % |
| Year Ended October 31, 2011 | | | 1.00 | | | — | (b)(e) | | — | (b) | | — | (b) | | — | (b) | | — | (b) | | | 1.00 | | | 0.01 | % | | | | 6 | | | 0.25 | % | | 0.25 | % | | 0.01 | % | | 1.28 | % |
| Year Ended October 31, 2012 | | | 1.00 | | | — | (b) | | — | (b) | | — | (b) | | — | (b) | | — | (b) | | | 1.00 | | | 0.06 | % | | | | 6 | | | 0.25 | % | | 0.25 | % | | 0.06 | % | | 1.29 | % |
| CLASS D SHARES | | | | | | | | | | | | | | | | | | | | | | | | | | | | | | | | | | | | | | | | | | | |
| Year Ended October 31, 2008 | | | $1.00 | | | 0.03 | | | — | (b) | | 0.03 | | | (0.03 | ) | | (0.03 | ) | | | $1.00 | | | 2.86 | %(c) | | | $ | 2,720,592 | | | 0.52 | % | | 0.52 | % | | 2.89 | % | | 0.52 | % |
| Year Ended October 31, 2009 | | | 1.00 | | | — | (b) | | — | (b) | | — | (b) | | — | (b) | | — | (b) | | | 1.00 | | | 0.40 | %(d) | | | | 1,994,448 | | | 0.49 | %(d) | | 0.49 | %(d) | | 0.42 | %(d) | | 0.54 | %(d) |
| Year Ended October 31, 2010 | | | 1.00 | | | — | (b)(e) | | — | (b) | | — | (b) | | — | (b) | | — | (b) | | | 1.00 | | | 0.01 | %(f) | | | | 1,695,222 | | | 0.29 | % | | 0.29 | % | | 0.01 | %(f) | | 0.52 | % |
| Year Ended October 31, 2011 | | | 1.00 | | | — | (b)(e) | | — | (b) | | — | (b) | | — | (b) | | — | (b) | | | 1.00 | | | 0.01 | % | | | | 1,591,614 | | | 0.26 | % | | 0.26 | % | | 0.01 | % | | 0.53 | % |
| Year Ended October 31, 2012 | | | 1.00 | | | — | (b) | | — | (b) | | — | (b) | | — | (b) | | — | (b) | | | 1.00 | | | 0.01 | % | | | | 1,303,827 | | | 0.30 | % | | 0.30 | % | | 0.01 | % | | 0.54 | % |
| CLASS I SHARES | | | | | | | | | | | | | | | | | | | | | | | | | | | | | | | | | | | | | | | | | | | |
| Year Ended October 31, 2008 | | | $1.00 | | | 0.03 | | | — | (b) | | 0.03 | | | (0.03 | ) | | (0.03 | ) | | | $1.00 | | | 3.23 | %(c) | | | $ | 2,954,253 | | | 0.16 | % | | 0.16 | % | | 3.14 | % | | 0.17 | % |
| Year Ended October 31, 2009 | | | 1.00 | | | 0.01 | | | — | (b) | | 0.01 | | | (0.01 | ) | | (0.01 | ) | | | 1.00 | | | 0.69 | %(d) | | | | 7,189,613 | | | 0.18 | %(d) | | 0.18 | %(d) | | 0.55 | %(d) | | 0.19 | %(d) |
| Year Ended October 31, 2010 | | | 1.00 | | | — | (b)(e) | | — | (b) | | — | (b) | | — | (b) | | — | (b) | | | 1.00 | | | 0.14 | %(f) | | | | 4,679,632 | | | 0.17 | % | | 0.17 | % | | 0.14 | %(f) | | 0.17 | % |
| Year Ended October 31, 2011 | | | 1.00 | | | — | (b)(e) | | — | (b) | | — | (b) | | — | (b) | | — | (b) | | | 1.00 | | | 0.10 | % | | | | 4,309,346 | | | 0.17 | % | | 0.17 | % | | 0.10 | % | | 0.18 | % |
| Year Ended October 31, 2012 | | | 1.00 | | | — | (b) | | — | (b) | | — | (b) | | — | (b) | | — | (b) | | | 1.00 | | | 0.14 | % | | | | 3,025,688 | | | 0.17 | % | | 0.17 | % | | 0.14 | % | | 0.19 | % |
See notes to financial statements. | HSBC FAMILY OF FUNDS | | 39 |
| HSBC PRIME MONEY MARKET FUND |
| Financial Highlights (continued) |
| | | | | Investment Activities | | Dividends | | | | | | Ratios/Supplementary Data |
| | | | | | | Net | | | | | | | | | | | | | | | | | | | | |
| | | | | | | Realized | | | | | | | | | | | | | | | | Ratio of | | Ratio of | | Ratios of |
| | | | | | | and | | | | | | | | | | | | | | | | Expenses | | Net | | Expenses |
| | | | | | | Unrealized | | | | | | | | Net | | | | | | | | to Average | | Investment | | to Average |
| | Net Asset | | Net | | Gains | | | | | | | | Asset | | | | Net Assets | | Ratio of Net | | Net Assets | | Income | | Net Assets |
| | Value, | | Investment | | (Losses) | | Total from | | Net | | | | Value, | | | | at End of | | Expenses to | | (Excluding | | to Average | | (Excluding |
| | Beginning | | Income | | from | | Investment | | Investment | | Total | | End of | | Total | | Period | | Average Net | | Fees Paid | | Net | | Fee |
| | of Period | | (Loss) | | Investments | | Activities | | Income | | Dividends | | Period | | Return(a) | | (000’s) | | Assets | | Indirectly) | | Assets | | Reductions) |
| CLASS Y SHARES | | | | | | | | | | | | | | | | | | | | | | | | | | | | | | | | | | | | | | | | |
| Year Ended October 31, 2008 | | | $1.00 | | | 0.03 | | | — | (b) | | 0.03 | | | (0.03 | ) | | (0.03 | ) | | $ | 1.00 | | 3.12 | %(c) | | $ | 2,236,927 | | 0.27 | % | | 0.27 | % | | 2.96 | % | | 0.27 | % |
| Year Ended October 31, 2009 | | | 1.00 | | | 0.01 | | | — | (b) | | 0.01 | | | (0.01 | ) | | (0.01 | ) | | | 1.00 | | 0.58 | %(d) | | | 1,194,680 | | 0.29 | %(d) | | 0.29 | %(d) | | 0.68 | %(d) | | 0.29 | %(d) |
| Year Ended October 31, 2010 | | | 1.00 | | | — | (b)(e) | | — | (b) | | — | (b) | | — | (b) | | — | (b) | | | 1.00 | | 0.05 | %(f) | | | 1,107,571 | | 0.26 | % | | 0.26 | % | | 0.04 | %(f) | | 0.27 | % |
| Year Ended October 31, 2011 | | | 1.00 | | | — | (b)(e) | | — | (b) | | — | (b) | | — | (b) | | — | (b) | | | 1.00 | | 0.01 | % | | | 642,290 | | 0.26 | % | | 0.26 | % | | 0.02 | % | | 0.28 | % |
| Year Ended October 31, 2012 | | | 1.00 | | | — | (b) | | — | (b) | | — | (b) | | — | (b) | | — | (b) | | | 1.00 | | 0.03 | % | | | 617,308 | | 0.28 | % | | 0.28 | % | | 0.03 | % | | 0.29 | % |
| (a) | Total returns do not include redemption charges. |
| (b) | Represents less than $0.005 or $(0.005). |
| (c) | During the year ended October 31, 2008, an affiliate of the Fund’s investment adviser purchased certain defaulted securities at $16,746,382, in excess of their fair value on the purchase date. The corresponding impact of this excess amount to the total returns were 0.20%, 0.20%, 0.20%, 0.20%, 0.20% and 0.20% for Class A Shares, Class B Shares, Class C Shares, Class D Shares, Class I Shares and Class Y Shares, respectively. |
| (d) | Included in the ratios is the Treasury Guarantee Program fess incurred by the Fund during the period. Without these fees, the gross and net expense ratios would have been decreased by 0.03% and the total return and net investment income ratio would have increased by 0.03%. |
| (e) | Calculated based on average shares outstanding. |
| (f) | During the year ended October 31, 2010, the Fund received a distribution from a “fair fund” established by the SEC in connection with a consent order against BISYS Fund Services, Inc. (See Note 7 in Notes to Financial Statements). The corresponding impact to the net income ratio and the total return was less than 0.005%. |
| 40 | | HSBC FAMILY OF FUNDS | See notes to financial statements. |
| HSBC TAX-FREE MONEY MARKET FUND |
| Financial Highlights |
| |
| Selected data for a share outstanding throughout the periods indicated. |
| | | | | Investment Activities | | Dividends | | | | | | | Ratios/Supplementary Data |
| | | | | | | Net | | | | | | | | | | | | | | | | | | Ratio of | | Ratio of | | Ratio of | | Ratios of |
| | | | | | | Realized | | | | | | | | | | | | | | | | | | Net | | Expenses to | | Net | | Expenses |
| | | | | | | and | | | | | | | | | | | | | | | | | | Expenses | | Average Net | | Investment | | to Average |
| | | | | | Unrealized | | | | | | | | | | Net | | | | | | to | | Assets | | Income | | Net Assets |
| | Net Asset | | Net | | Gains | | | | | | Net Realized | | | | Asset | | | | Net Assets | | Average | | (Excluding | | (Loss) to | | (Excluding |
| | Value, | | Investment | | (Losses) | | Total from | | Net | | Gains from | | | | Value, | | | | at End of | | Net | | Fees Paid | | Average | | Fee |
| | Beginning | | Income | | from | | Investment | | Investment | | Investment | | Total | | End of | | Total | | Period | | Assets | | Indirectly) | | Net Assets | | Reductions) |
| | of Period | | (Loss) | | Investments | | Activities | | Income | | Transactions | | Dividends | | Period | | Return(a) | | (000’s) | | (b) | | (b) | | (b) | | (b) |
| CLASS A SHARES | | | | | | | | | | | | | | | | | | | | | | | | | | | | | | | | | | | | | | | | | | | | | |
| Year Ended October 31, 2008(c) | | | $1.00 | | | — | | | — | | | — | | | — | | | — | | | — | | | | $1.00 | | | — | % | | $ | — | | | — | % | | — | % | | — | % | | — | % |
| Year Ended October 31, 2009(d) | | | 1.00 | | | — | (e) | | — | (e) | | — | (e) | | — | (e) | | — | (e) | | — | (e) | | | 1.00 | | | 0.01 | %(f) | | | — | (g) | | 0.31 | %(f) | | 0.31 | %(f) | | 0.36 | %(f) | | 0.07 | %(f) |
| Year Ended October 31, 2010 | | | 1.00 | | | — | (e) | | — | (e) | | — | (e) | | — | (e) | | — | | | — | (e) | | | 1.00 | | | — | %(h) | | | — | (g) | | 0.15 | % | | 0.15 | % | | 0.12 | %(h) | | 0.28 | % |
| Year Ended October 31, 2011(i) | | | 1.00 | | | — | (e) | | — | (e) | | — | (e) | | — | | | — | | | — | | | | 1.00 | | | — | % | | | — | | | 0.26 | % | | 0.26 | % | | (0.02 | )% | | 0.46 | % |
| Year Ended October 31, 2012(c) | | | 1.00 | | | — | | | — | | | — | | | — | | | — | | | — | | | | 1.00 | | | — | % | | | — | | | — | % | | — | % | | — | % | | — | % |
| CLASS D SHARES | | | | | | | | | | | | | | | | | | | | | | | | | | | | | | | | | | | | | | | | | | | | | |
| Year Ended October 31, 2008 | | | $1.00 | | | 0.02 | | | — | | | 0.02 | | | (0.02 | ) | | — | | | (0.02 | ) | | | $1.00 | | | 2.13 | % | | $ | 69,787 | | | 0.46 | % | | 0.46 | % | | 2.05 | % | | 0.66 | % |
| Year Ended October 31, 2009 | | | 1.00 | | | — | (e) | | — | (e) | | — | (e) | | — | (e) | | — | (e) | | — | (e) | | | 1.00 | | | 0.31 | %(f) | | | 95,350 | | | 0.43 | %(f) | | 0.43 | %(f) | | 0.29 | %(f) | | 0.63 | %(f) |
| Year Ended October 31, 2010 | | | 1.00 | | | — | (e) | | — | (e) | | — | (e) | | — | (e) | | — | | | — | (e) | | | 1.00 | | | 0.01 | %(h) | | | 73,988 | | | 0.26 | % | | 0.26 | % | | 0.01 | %(h) | | 0.64 | % |
| Year Ended October 31, 2011 | | | 1.00 | | | — | (e) | | — | (e) | | — | (e) | | — | (e) | | — | (e) | | — | (e) | | | 1.00 | | | 0.01 | % | | | 79,963 | | | 0.21 | % | | 0.21 | % | | 0.01 | % | | 0.68 | % |
| Year Ended October 31, 2012 | | | 1.00 | | | — | | | — | | | — | | | — | | | — | | | — | | | | 1.00 | | | — | % | | | 86,660 | | | 0.19 | % | | 0.19 | % | | — | % | | 0.71 | % |
| CLASS I SHARES | | | | | | | | | | | | | | | | | | | | | | | | | | | | | | | | | | | | | | | | | | | | | |
| Year Ended October 31, 2008(c) | | | $1.00 | | | — | | | — | | | — | | | — | | | — | | | — | | | | $1.00 | | | — | % | | $ | — | | | — | % | | — | % | | — | % | | — | % |
| Year Ended October 31, 2009(c) | | | 1.00 | | | — | | | — | | | — | | | — | | | — | | | — | | | | 1.00 | | | — | % | | | — | | | — | % | | — | % | | — | % | | — | % |
| Year Ended October 31, 2010(j) | | | 1.00 | | | — | (e) | | — | | | — | (e) | | — | (e) | | — | | | — | (e) | | | 1.00 | | | 0.01 | %(h) | | | — | | | 0.16 | % | | 0.16 | % | | 0.09 | %(h) | | 0.37 | % |
| Year Ended October 31, 2011(c) | | | 1.00 | | | — | | | — | | | — | | | — | | | — | | | — | | | | 1.00 | | | — | % | | | — | | | — | % | | — | % | | — | % | | — | % |
| Year Ended October 31, 2012(c) | | | 1.00 | | | — | | | — | | | — | | | — | | | — | | | — | | | | 1.00 | | | — | % | | | — | | | — | % | | — | % | | — | % | | — | % |
| CLASS Y SHARES | | | | | | | | | | | | | | | | | | | | | | | | | | | | | | | | | | | | | | | | | | | | | |
| Year Ended October 31, 2008 | | | $1.00 | | | 0.02 | | | — | | | 0.02 | | | (0.02 | ) | | — | | | (0.02 | ) | | | $1.00 | | | 2.38 | % | | $ | 143,730 | | | 0.20 | % | | 0.20 | % | | 2.31 | % | | 0.40 | % |
| Year Ended October 31, 2009 | | | 1.00 | | | 0.01 | | | — | (e) | | 0.01 | | | (0.01 | ) | | — | (e) | | (0.01 | ) | | | 1.00 | | | 0.55 | %(f) | | | 97,789 | | | 0.18 | %(f) | | 0.18 | %(f) | | 0.57 | %(f) | | 0.38 | %(f) |
| Year Ended October 31, 2010 | | | 1.00 | | | — | (e) | | — | (e) | | — | (e) | | — | (e) | | — | | | — | (e) | | | 1.00 | | | 0.08 | %(h) | | | 31,180 | | | 0.18 | % | | 0.18 | % | | 0.09 | %(h) | | 0.39 | % |
| Year Ended October 31, 2011 | | | 1.00 | | | — | (e) | | — | (e) | | — | (e) | | — | (e) | | — | (e) | | — | (e) | | | 1.00 | | | 0.02 | % | | | 40,656 | | | 0.20 | % | | 0.20 | % | | 0.01 | % | | 0.44 | % |
| Year Ended October 31, 2012 | | | 1.00 | | | — | | | — | | | — | | | — | | | — | | | — | | | | 1.00 | | | — | % | | | 18,832 | | | 0.19 | % | | 0.19 | % | | — | % | | 0.46 | % |
| (a) | | Not annualized for periods less than one year. Total return calculations do not include any redemption charges. |
| (b) | | Annualized for periods less than one year. |
| (c) | | During the period the class had no operations. The net asset values reflected represent the last day the class had shareholders. |
| (d) | | Class A Shares were operational during a portion of the year only. Amounts reflect performance for the period of time the class had operations, which was 262 days during the period. The net asset value, end of period, presented as of the last day during the period the class had shareholders. |
| (e) | | Represents less than $0.005 or $(0.005). |
| (f) | | Included in the ratios is the Treasury Guarantee Program fess incurred by the Fund during the period. Without these fees, the gross and net expense ratios would have been decreased by 0.03% and the total return and net investment income ratio would have increased by 0.03%. |
| (g) | | Less than $500. |
| (h) | | During the year ended October 31, 2010, the Fund received a distribution from a “fair fund” established by the SEC in connection with a consent order against BISYS Fund Services, Inc. (See Note 7 in Notes to Financial Statements). The corresponding impact to the net income ratio and the total return was less than 0.005%. |
| (i) | | Class A Shares were operational during a portion of the year only. Amounts reflect performance for the period of the time the class had operations, which was 141 days during the period. The net asset value, end of period, presented is as of the last day during the period the class had shareholders. |
| (j) | | Class I Shares were operational during a portion of the year only. Amounts reflect performance for the period of time the class had operations, which was 51 days during the period. The net asset value, end of period, presented is as of the last day during the period the class had shareholders. |
See notes to financial statements. | HSBC FAMILY OF FUNDS | | 41 |
| HSBC U.S. GOVERNMENT MONEY MARKET FUND |
| Financial Highlights |
| |
| Selected data for a share outstanding throughout the periods indicated. |
| | | | | Investment Activities | | Dividends | | | | | | | Ratios/Supplementary Data |
| | | | | | | | | | | | | | | | | | | | | | | | | | Ratio of | | | | Ratios of |
| | | | | | | | | | | | | | | | | | | | | | | | | | Expenses | | | | Expenses |
| | | | | | | Net Realized | | | | | | | | | | | | | | | | | Ratio of | | to Average | | Ratio of Net | | to Average |
| | | | | | and | | | | | | | | | | | | | | | | | Net | | Net Assets | | Investment | | Net Assets |
| | Net Asset | | Net | | Unrealized | | | | | | Net Realized | | | | | | | | | | Expenses | | (Excluding | | Income | | (Excluding |
| | Value, | | Investment | | Gains | | Total from | | Net | | Gains from | | | | Net Asset | | | | Net Assets at | | to Average | | Fees Paid | | (Loss) to | | Fee |
| | Beginning | | Income | | (Losses) from | | Investment | | Investment | | Investment | | Total | | Value, End | | Total | | End of Period | | Net Assets | | Indirectly) | | Average Net | | Reductions) |
| | of Period | | (Loss) | | Investments | | Activities | | Income | | Transactions | | Dividends | | of Period | | Return(a) | | (000’s) | | (b) | | (b) | | Assets(b) | | (b) |
| CLASS A SHARES | | | | | | | | | | | | | | | | | | | | | | | | | | | | | | | | | | | | | | | | | | | | | |
| Year Ended October 31, 2008 | | | $1.00 | | | 0.02 | | | — | | | 0.02 | | | (0.02 | ) | | — | | | (0.02 | ) | | | $1.00 | | | 2.20 | % | | $ | 703,712 | | | 0.67 | % | | 0.67 | % | | 2.29 | % | | 0.67 | % |
| Year Ended October 31, 2009 | | | 1.00 | | | — | (c) | | — | (c) | | — | (c) | | — | (c) | | — | (c) | | — | (c) | | | 1.00 | | | 0.14 | %(d) | | | 574,577 | | | 0.52 | %(d) | | 0.52 | %(d) | | 0.14 | %(d) | | 0.72 | %(d) |
| Year Ended October 31, 2010 | | | 1.00 | | | — | | | — | | | — | | | — | (c) | | — | (c) | | — | (c) | | | 1.00 | | | 0.02 | %(e) | | | 25,926 | | | 0.23 | % | | 0.23 | % | | 0.01 | %(e) | | 0.67 | % |
| Year Ended October 31, 2011 | | | 1.00 | | | — | (c) | | — | (c) | | — | (c) | | — | (c) | | — | | | — | (c) | | | 1.00 | | | 0.01 | % | | | 3,995 | | | 0.16 | % | | 0.16 | % | | 0.01 | % | | 0.68 | % |
| Year Ended October 31, 2012 | | | 1.00 | | | — | (c) | | — | (c) | | — | (c) | | — | (c) | | — | (c) | | — | (c) | | | 1.00 | | | 0.01 | % | | | 238 | | | 0.14 | % | | 0.15 | % | | 0.01 | % | | 0.69 | % |
| CLASS B SHARES | | | | | | | | | | | | | | | | | | | | | | | | | | | | | | | | | | | | | | | | | | | | | |
| Year Ended October 31, 2008 | | | $1.00 | | | 0.02 | | | — | | | 0.02 | | | (0.02 | ) | | — | | | (0.02 | ) | | | $1.00 | | | 1.67 | % | | $ | 54 | | | 1.29 | % | | 1.29 | % | | 1.24 | % | | 1.29 | % |
| Year Ended October 31, 2009 | | | 1.00 | | | — | (c) | | — | (c) | | — | (c) | | — | (c) | | — | (c) | | — | (c) | | | 1.00 | | | 0.08 | %(d) | | | 84 | | | 0.54 | %(d) | | 0.54 | %(d) | | 0.08 | %(d) | | 1.30 | %(d) |
| Year Ended October 31, 2010 | | | 1.00 | | | — | (c) | | — | (c) | | — | (c) | | — | (c) | | — | (c) | | — | (c) | | | 1.00 | | | 0.02 | %(e) | | | 88 | | | 0.22 | % | | 0.22 | % | | 0.01 | %(e) | | 1.27 | % |
| Year Ended October 31, 2011 | | | 1.00 | | | — | (c) | | — | (c) | | — | (c) | | — | (c) | | — | | | — | (c) | | | 1.00 | | | 0.01 | % | | | 94 | | | 0.17 | % | | 0.17 | % | | 0.01 | % | | 1.28 | % |
| Year Ended October 31, 2012 | | | 1.00 | | | — | (c) | | — | (c) | | — | (c) | | — | (c) | | — | (c) | | — | (c) | | | 1.00 | | | 0.01 | % | | | 76 | | | 0.16 | % | | 0.16 | % | | 0.01 | % | | 1.29 | % |
| CLASS C SHARES | | | | | | | | | | | | | | | | | | | | | | | | | | | | | | | | | | | | | | | | | | | | | |
| Year Ended October 31, 2008 | | | $1.00 | | | 0.02 | | | — | | | 0.02 | | | (0.02 | ) | | — | | | (0.02 | ) | | | $1.00 | | | 1.59 | % | | $ | 101 | | | 1.27 | % | | 1.27 | % | | 1.28 | % | | 1.27 | % |
| Year Ended October 31, 2009(f) | | | 1.00 | | | — | (c) | | — | (c) | | — | (c) | | — | (c) | | — | (c) | | — | (c) | | | 1.00 | | | 0.08 | %(d) | | | 229 | | | 0.50 | %(d) | | 0.50 | %(d) | | 0.04 | %(d) | | 1.32 | %(d) |
| Year Ended October 31, 2010(g) | | | 1.00 | | | — | (c) | | — | (c) | | — | (c) | | — | (c) | | — | (c) | | — | (c) | | | 1.00 | | | 0.02 | %(e) | | | — | (h) | | 0.23 | % | | 0.23 | % | | 0.01 | %(e) | | 1.27 | % |
| Year Ended October 31, 2011(i) | | | 1.00 | | | — | | | — | | | — | | | — | | | — | | | — | | | | 1.00 | | | — | % | | | — | | | — | % | | — | % | | — | % | | — | % |
| Year Ended October 31, 2012(i) | | | 1.00 | | | — | | | — | | | — | | | — | | | — | | | — | | | | 1.00 | | | — | % | | | — | | | — | % | | — | % | | — | % | | — | % |
| CLASS D SHARES | | | | | | | | | | | | | | | | | | | | | | | | | | | | | | | | | | | | | | | | | | | | | |
| Year Ended October 31, 2008 | | | $1.00 | | | 0.02 | | | — | | | 0.02 | | | (0.02 | ) | | — | | | (0.02 | ) | | | $1.00 | | | 2.36 | % | | $ | 1,438,199 | | | 0.52 | % | | 0.52 | % | | 1.92 | % | | 0.52 | % |
| Year Ended October 31, 2009 | | | 1.00 | | | — | (c) | | — | (c) | | — | (c) | | — | (c) | | — | (c) | | — | (c) | | | 1.00 | | | 0.18 | %(d) | | | 767,551 | | | 0.48 | %(d) | | 0.48 | %(d) | | 0.21 | %(d) | | 0.58 | %(d) |
| Year Ended October 31, 2010 | | | 1.00 | | | — | (c) | | — | (c) | | — | (c) | | — | (c) | | — | (c) | | — | (c) | | | 1.00 | | | 0.02 | %(e) | | | 922,510 | | | 0.22 | % | | 0.22 | % | | 0.02 | %(e) | | 0.52 | % |
| Year Ended October 31, 2011 | | | 1.00 | | | — | (c) | | — | (c) | | — | (c) | | — | (c) | | — | | | — | (c) | | | 1.00 | | | 0.01 | % | | | 746,458 | | | 0.17 | % | | 0.17 | % | | 0.01 | % | | 0.53 | % |
| Year Ended October 31, 2012 | | | 1.00 | | | — | (c) | | — | (c) | | — | (c) | | — | (c) | | — | (c) | | — | (c) | | | 1.00 | | | 0.01 | % | | | 614,499 | | | 0.16 | % | | 0.16 | % | | 0.01 | % | | 0.54 | % |
| CLASS I SHARES | | | | | | | | | | | | | | | | | | | | | | | | | | | | | | | | | | | | | | | | | | | | | |
| Year Ended October 31, 2008 | | | $1.00 | | | 0.03 | | | — | | | 0.03 | | | (0.03 | ) | | — | | | (0.03 | ) | | | $1.00 | | | 2.72 | % | | $ | 4,908,887 | | | 0.17 | % | | 0.17 | % | | 2.23 | % | | 0.18 | % |
| Year Ended October 31, 2009 | | | 1.00 | | | — | (c) | | — | (c) | | — | (c) | | — | (c) | | — | (c) | | — | (c) | | | 1.00 | | | 0.43 | %(d) | | | 8,176,980 | | | 0.22 | %(d) | | 0.22 | %(d) | | 0.38 | %(d) | | 0.22 | %(d) |
| Year Ended October 31, 2010 | | | 1.00 | | | — | (c) | | — | (c) | | — | (c) | | — | (c) | | — | (c) | | — | (c) | | | 1.00 | | | 0.08 | %(e) | | | 5,100,891 | | | 0.16 | % | | 0.16 | % | | 0.07 | %(e) | | 0.17 | % |
| Year Ended October 31, 2011 | | | 1.00 | | | — | (c) | | — | (c) | | — | (c) | | — | (c) | | — | | | — | (c) | | | 1.00 | | | 0.03 | % | | | 1,645,764 | | | 0.16 | % | | 0.16 | % | | 0.03 | % | | 0.18 | % |
| Year Ended October 31, 2012 | | | 1.00 | | | — | (c) | | — | (c) | | — | (c) | | — | (c) | | — | (c) | | — | (c) | | | 1.00 | | | 0.02 | % | | | 1,873,166 | | | 0.16 | % | | 0.16 | % | | 0.01 | % | | 0.19 | % |
| 42 | | HSBC FAMILY OF FUNDS | See notes to financial statements. |
| HSBC U.S. GOVERNMENT MONEY MARKET FUND |
| Financial Highlights (continued) |
| | | | | Investment Activities | | Dividends | | | | | | | Ratios/Supplementary Data |
| | | | | | | | | | | | | | | | | | | | | | | | | | Ratio of | | | | Ratios of |
| | | | | | | | | | | | | | | | | | | | | | | | | | Expenses | | | | Expenses |
| | | | | | | Net Realized | | | | | | | | | | | | | | | | | Ratio of | | to Average | | Ratio of Net | | to Average |
| | | | | | | and | | | | | | | | | | | | | | | | | Net | | Net Assets | | Investment | | Net Assets |
| | Net Asset | | Net | | Unrealized | | | | | | Net Realized | | | | | | | | | | | Expenses | | (Excluding | | Income | | (Excluding |
| | Value, | | Investment | | Gains | | Total from | | Net | | Gains from | | | | Net Asset | | | | Net Assets at | | to Average | | Fees Paid | | (Loss) to | | Fee |
| | Beginning | | Income | | (Losses) from | | Investment | | Investment | | Investment | | Total | | Value, End | | Total | | End of Period | | Net Assets | | Indirectly) | | Average Net | | Reductions) |
| | of Period | | (Loss) | | Investments | | Activities | | Income | | Transactions | | Dividends | | of Period | | Return(a) | | (000’s) | | (b) | | (b) | | Assets(b) | | (b) |
| CLASS Y SHARES | | | | | | | | | | | | | | | | | | | | | | | | | | | | | | | | | | | | | | | | | | | |
| Year Ended October 31, 2008 | | | $1.00 | | | 0.03 | | | — | | | 0.03 | | | (0.03 | ) | | — | | | (0.03 | ) | | | $1.00 | | | 2.61 | % | | $6,747,758 | | 0.27 | % | | 0.27 | % | | 2.53 | % | | 0.27 | % |
| Year Ended October 31, 2009 | | | 1.00 | | | — | (c) | | — | (c) | | — | (c) | | — | (c) | | — | (c) | | — | (c) | | | 1.00 | | | 0.32 | %(d) | | 3,370,299 | | 0.33 | %(d) | | 0.33 | %(d) | | 0.38 | %(d) | | 0.33 | %(d) |
| Year Ended October 31, 2010 | | | 1.00 | | | — | (c) | | — | (c) | | — | (c) | | — | (c) | | — | (c) | | — | (c) | | | 1.00 | | | 0.02 | %(e) | | 2,918,347 | | 0.22 | % | | 0.22 | % | | 0.02 | %(e) | | 0.27 | % |
| Year Ended October 31, 2011 | | | 1.00 | | | — | (c) | | — | (c) | | — | (c) | | — | (c) | | — | | | — | (c) | | | 1.00 | | | 0.01 | % | | 1,711,397 | | 0.17 | % | | 0.17 | % | | 0.01 | % | | 0.28 | % |
| Year Ended October 31, 2012 | | | 1.00 | | | — | (c) | | — | (c) | | — | (c) | | — | (c) | | — | (c) | | — | (c) | | | 1.00 | | | 0.01 | % | | 2,505,448 | | 0.17 | % | | 0.17 | % | | 0.01 | % | | 0.29 | % |
| (a) | Not annualized for periods less than one year. Total return calculations do not include any redemption charges. |
| (b) | Annualized for periods less than one year. |
| (c) | Represents less than $0.005 or $(0.005). |
| (d) | Included in the ratios is the Treasury Guarantee Program fees incurred by the Fund during the period. Without these fees, the gross and net expense ratios would have been decreased by 0.06% and the total return and net investment income ratio would have increased by 0.06%. |
| (e) | During the year ended October 31, 2010, the Fund received a distribution from a “fair fund” established by the SEC in connection with a consent order against BISYS Fund Services, Inc. (See Note 7 in Notes to Financial Statements). The corresponding impact to the net income ratio and the total return was less than 0.005%. |
| (f) | Class C Shares were operational during a portion of the year only. Amounts reflect performance for the period of time the class had operations, which was 362 days during the period. |
| (g) | Class C Shares were operational during a portion of the year only. Amounts reflect performance for the period of time the class had operations, which was 351 days during the period. |
| (h) | Less than $500. |
| (i) | During the period the class had no operations. The net asset values reflected represent the last day the class had shareholders. |
See notes to financial statements. | HSBC FAMILY OF FUNDS | | 43 |
| HSBC U.S. TREASURY MONEY MARKET FUND |
| Financial Highlights |
| |
| Selected data for a share outstanding throughout the periods indicated. |
| | | | | Investment Activities | | Dividends | | | | | | | Ratios/Supplementary Data |
| | | | | | | Net | | | | | | | | | | | | | | | | | | | Ratio of | | Ratio of | | | | Ratios of |
| | | | | | | Realized and | | | | | | | | | | | | | | | | | | | Net | | Expenses to | | Ratio of Net | | Expenses to |
| | | | | | | Unrealized | | | | | | | | | | Net | | | | | | | | | Expenses | | Average Net | | Investment | | Average Net |
| | Net Asset | | Net | | Gains | | | | | | Net Realized | | | | Asset | | | | | | | to | | Assets | | Income | | Assets |
| | Value, | | Investment | | (Losses) | | Total from | | Net | | Gains from | | | | Value, | | | | | Net Assets | | Average | | (Excluding | | to Average | | (Excluding |
| | Beginning | | Income | | from | | Investment | | Investment | | Investment | | Total | | End of | | Total | | at End of | | Net | | Fees Paid | | Net | | Fee |
| | of Period | | (Loss) | | Investments | | Activities | | Income | | Transactions | | Dividends | | Period | | Return(a) | | Period (000’s) | | Assets(b) | | Indirectly)(b) | | Assets(b) | | Reductions)(b) |
| CLASS A SHARES | | | | | | | | | | | | | | | | | | | | | | | | | | | | | | | | | | | | | | | | | | | | | |
| Year Ended October 31, 2008 | | $ | 1.00 | | | 0.01 | | | — | | | 0.01 | | | (0.01 | ) | | — | | | (0.01 | ) | | $ | 1.00 | | 1.38 | % | | $ | 580,458 | | | | 0.67 | % | | 0.67 | % | | 1.06 | % | | 0.67 | % |
| Year Ended October 31, 2009 | | | 1.00 | | | — | (c) | | — | (c) | | — | (c) | | — | (c) | | — | (c) | | — | (c) | | | 1.00 | | 0.07 | % | | | 385,994 | | | | 0.24 | % | | 0.24 | % | | 0.07 | % | | 0.66 | % |
| Year Ended October 31, 2010 | | | 1.00 | | | — | (c)(d) | | — | (c) | | — | (c) | | — | (c) | | — | | | — | (c) | | | 1.00 | | 0.01 | %(e) | | | 32,973 | | | | 0.14 | % | | 0.14 | % | | 0.01 | %(e) | | 0.67 | % |
| Year Ended October 31, 2011 | | | 1.00 | | | — | (c)(d) | | — | (c) | | — | (c) | | — | (c) | | — | (c) | | — | (c) | | | 1.00 | | 0.01 | % | | | 613 | | | | 0.11 | % | | 0.12 | % | | 0.01 | % | | 0.68 | % |
| Year Ended October 31, 2012 | | | 1.00 | | | — | (c) | | — | (c) | | — | (c) | | — | | | — | (c) | | — | (c) | | | 1.00 | | — | % | | | 5 | | | | 0.05 | % | | 0.06 | % | | — | % | | 0.70 | % |
| CLASS B SHARES | | | | | | | | | | | | | | | | | | | | | | | | | | | | | | | | | | | | | | | | | | | | | |
| Year Ended October 31, 2008 | | $ | 1.00 | | | 0.01 | | | — | | | 0.01 | | | (0.01 | ) | | — | | | (0.01 | ) | | $ | 1.00 | | 0.86 | % | | | 131 | | | | 1.11 | % | | 1.11 | % | | 1.01 | % | | 1.28 | % |
| Year Ended October 31, 2009 | | | 1.00 | | | — | (c) | | — | (c) | | — | (c) | | — | (c) | | — | (c) | | — | (c) | | | 1.00 | | 0.07 | % | | | 60 | | | | 0.24 | % | | 0.24 | % | | 0.07 | % | | 1.26 | % |
| Year Ended October 31, 2010 | | | 1.00 | | | — | (c)(d) | | — | (c) | | — | (c) | | — | (c) | | — | | | — | (c) | | | 1.00 | | 0.01 | %(e) | | | 50 | | | | 0.14 | % | | 0.14 | % | | 0.01 | %(e) | | 1.27 | % |
| Year Ended October 31, 2011 | | | 1.00 | | | — | (c)(d) | | — | (c) | | — | (c) | | — | (c) | | — | (c) | | — | (c) | | | 1.00 | | 0.01 | % | | | 35 | | | | 0.10 | % | | 0.10 | % | | 0.01 | % | | 1.28 | % |
| Year Ended October 31, 2012 | | | 1.00 | | | — | (c) | | — | (c) | | — | (c) | | — | | | — | (c) | | — | (c) | | | 1.00 | | — | % | | | 1 | | | | 0.06 | % | | 0.06 | % | | — | % | | 1.29 | % |
| CLASS C SHARES | | | | | | | | | | | | | | | | | | | | | | | | | | | | | | | | | | | | | | | | | | | | | |
| Year Ended October 31, 2008(f) | | $ | 1.00 | | | — | (c) | | — | | | — | | | — | | | — | | | — | | | $ | 1.00 | | 0.01 | % | | $ | 1,103 | | | | 0.64 | % | | 0.64 | % | | 0.20 | % | | 1.26 | % |
| Year Ended October 31, 2009 | | | 1.00 | | | — | (c) | | — | (c) | | — | (c) | | — | (c) | | — | (c) | | — | (c) | | | 1.00 | | 0.07 | % | | | 7,138 | | | | 0.22 | % | | 0.22 | % | | 0.04 | % | | 1.26 | % |
| Year Ended October 31, 2010(g) | | | 1.00 | | | — | (c)(d) | | — | (c) | | — | (c) | | — | (c) | | — | | | — | (c) | | | 1.00 | | 0.01 | %(e) | | | — | (h) | | | 0.13 | % | | 0.13 | % | | — | %(e) | | 1.27 | % |
| Year Ended October 31, 2011(i) | | | 1.00 | | | — | (d) | | — | | | — | | | — | | | — | | | — | | | | 1.00 | | — | % | | | — | | | | — | % | | — | % | | — | % | | — | % |
| Year Ended October 31, 2012(i) | | | 1.00 | | | — | | | — | | | — | | | — | | | — | | | — | | | | 1.00 | | — | % | | | — | | | | — | % | | — | % | | — | % | | — | % |
| CLASS D SHARES | | | | | | | | | | | | | | | | | | | | | | | | | | | | | | | | | | | | | | | | | | | | | |
| Year Ended October 31, 2008 | | $ | 1.00 | | | 0.02 | | | — | | | 0.02 | | | (0.02 | ) | | — | | | (0.02 | ) | | $ | 1.00 | | 1.53 | % | | $ | 937,905 | | | | 0.52 | % | | 0.52 | % | | 1.33 | % | | 0.59 | % |
| Year Ended October 31, 2009 | | | 1.00 | | | — | (c) | | — | (c) | | — | (c) | | — | (c) | | — | (c) | | — | (c) | | | 1.00 | | 0.07 | % | | | 955,652 | | | | 0.23 | % | | 0.23 | % | | 0.06 | % | | 0.51 | % |
| Year Ended October 31, 2010 | | | 1.00 | | | — | (c)(d) | | — | (c) | | — | (c) | | — | (c) | | — | | | — | (c) | | | 1.00 | | 0.01 | %(e) | | | 726,244 | | | | 0.14 | % | | 0.14 | % | | 0.01 | %(e) | | 0.52 | % |
| Year Ended October 31, 2011 | | | 1.00 | | | — | (c)(d) | | — | (c) | | — | (c) | | — | (c) | | — | (c) | | — | (c) | | | 1.00 | | 0.01 | % | | | 619,940 | | | | 0.10 | % | | 0.10 | % | | 0.01 | % | | 0.53 | % |
| Year Ended October 31, 2012 | | | 1.00 | | | — | (c) | | — | (c) | | — | (c) | | — | | | — | (c) | | — | (c) | | | 1.00 | | — | % | | | 662,063 | | | | 0.08 | % | | 0.09 | % | | — | % | | 0.54 | % |
| CLASS I SHARES | | | | | | | | | | | | | | | | | | | | | | | | | | | | | | | | | | | | | | | | | | | | | |
| Year Ended October 31, 2008 | | $ | 1.00 | | | 0.02 | | | — | | | 0.02 | | | (0.02 | ) | | — | | | (0.02 | ) | | $ | 1.00 | | 1.90 | % | | $ | 3,771,262 | | | | 0.16 | % | | 0.16 | % | | 1.26 | % | | 0.16 | % |
| Year Ended October 31, 2009 | | | 1.00 | | | — | (c) | | — | (c) | | — | (c) | | — | (c) | | — | (c) | | — | (c) | | | 1.00 | | 0.14 | % | | | 3,322,962 | | | | 0.16 | % | | 0.16 | % | | 0.14 | % | | 0.16 | % |
| Year Ended October 31, 2010 | | | 1.00 | | | — | (c)(d) | | — | (c) | | — | (c) | | — | (c) | | — | | | — | (c) | | | 1.00 | | 0.01 | %(e) | | | 1,379,042 | | | | 0.13 | % | | 0.13 | % | | 0.01 | %(e) | | 0.17 | % |
| Year Ended October 31, 2011 | | | 1.00 | | | — | (c)(d) | | — | (c) | | — | (c) | | — | (c) | | — | (c) | | — | (c) | | | 1.00 | | 0.01 | % | | | 982,974 | | | | 0.10 | % | | 0.10 | % | | 0.01 | % | | 0.18 | % |
| Year Ended October 31, 2012 | | | 1.00 | | | — | (c) | | — | (c) | | — | (c) | | — | | | — | (c) | | — | (c) | | | 1.00 | | — | % | | | 555,287 | | | | 0.08 | % | | 0.08 | % | | — | % | | 0.19 | % |
| 44 | | HSBC FAMILY OF FUNDS | See notes to financial statements. |
| HSBC U.S. TREASURY MONEY MARKET FUND |
| Financial Highlights (continued) |
| | | | | Investment Activities | | Dividends | | | | | | | Ratios/Supplementary Data |
| | | | | | | Net | | | | | | | | | | | | | | | | | | Ratio of | | Ratio of | | | | Ratios of |
| | | | | | | Realized and | | | | | | | | | | | | | | | | | | Net | | Expenses to | | Ratio of Net | | Expenses to |
| | | | | | | Unrealized | | | | | | | | | | Net | | | | | | | Expenses | | Average Net | | Investment | | Average Net |
| | Net Asset | | Net | | Gains | | | | | | Net Realized | | | | Asset | | | | | | | to | | Assets | | Income | | Assets |
| | Value, | | Investment | | (Losses) | | Total from | | Net | | Gains from | | | | Value, | | | | Net Assets | | Average | | (Excluding | | to Average | | (Excluding |
| | Beginning | | Income | | from | | Investment | | Investment | | Investment | | Total | | End of | | Total | | at End of | | Net | | Fees Paid | | Net | | Fee |
| | of Period | | (Loss) | | Investments | | Activities | | Income | | Transactions | | Dividends | | Period | | Return(a) | | Period (000’s) | | Assets(b) | | Indirectly)(b) | | Assets(b) | | Reductions)(b) |
| Class Y SHARES | | | | | | | | | | | | | | | | | | | | | | | | | | | | | | | | | | | | | | | | | | | | | |
| Year Ended October 31, 2008 | | | $1.00 | | | 0.02 | | | — | | | 0.02 | | | (0.02 | ) | | — | | | (0.02 | ) | | | $1.00 | | | 1.78 | % | | | $1,364,310 | | | 0.27 | % | | 0.27 | % | | 1.34 | % | | 0.27 | % |
| Year Ended October 31, 2009 | | | 1.00 | | | — | (c) | | — | (c) | | — | (c) | | — | (c) | | — | (c) | | — | (c) | | | 1.00 | | | 0.08 | % | | | 996,309 | | | 0.22 | % | | 0.22 | % | | 0.08 | % | | 0.26 | % |
| Year Ended October 31, 2010 | | | 1.00 | | | — | (c)(d) | | — | (c) | | — | (c) | | — | (c) | | — | | | — | (c) | | | 1.00 | | | 0.01 | %(e) | | | 1,147,150 | | | 0.14 | % | | 0.14 | % | | 0.01 | %(e) | | 0.27 | % |
| Year Ended October 31, 2011 | | | 1.00 | | | — | (c)(d) | | — | (c) | | — | (c) | | — | (c) | | — | (c) | | — | (c) | | | 1.00 | | | 0.01 | % | | | 999,521 | | | 0.09 | % | | 0.10 | % | | 0.01 | % | | 0.28 | % |
| Year Ended October 31, 2012 | | | 1.00 | | | — | (c) | | — | (c) | | — | (c) | | — | | | — | (c) | | — | (c) | | | 1.00 | | | — | % | | | 1,156,631 | | | 0.09 | % | | 0.09 | % | | — | % | | 0.29 | % |
| (a) | Not annualized for periods less than one year. Total return calculations do not include any redemption charges. |
| (b) | Annualized for periods less than one year. |
| (c) | Represents less than $0.005 or $(0.005). |
| (d) | Calculated based on average shares outstanding. |
| (e) | During the year ended October 31, 2010, the Fund received a distribution from a “fair fund” established by the SEC in connection with a consent order against BISYS Fund Services, Inc. (See Note 7 in Notes to Financial Statements). The corresponding impact to the net income ratio and the total return was less than 0.005%. |
| (f) | Class C Shares were operational during a portion of the year only. Amounts reflect performance for the period of time the class had operations, which was 26 days during the period. |
| (g) | Class C Shares were operational during a portion of the year only. Amounts reflect performance for the period of time the class had operations, which was 351 days during the period. |
| (h) | Less than $500. |
| (i) | During the period the class had no operations. The net asset values reflected represent the last day the class had shareholders. |
See notes to financial statements. | HSBC FAMILY OF FUNDS | | 45 |
| HSBC FAMILY OF FUNDS |
| Notes to Financial Statements—as of October 31, 2012 |
1. Organization:
The HSBC Funds (formerly, HSBC Investor Funds) (the “Trust’’), a Massachusetts business trust organized on April 22, 1987, is registered under the Investment Company Act of 1940, as amended (the “Act’’), as an open-end management investment company. As of October 31, 2012, the Trust is comprised of 17 separate operational funds, each a series of the HSBC Family of Funds (formerly, HSBC Investor Family of Funds), which also includes the HSBC Advisor Fund Trust and the HSBC Portfolios (formerly, HSBC Investor Portfolios) (the “Trusts’’). The accompanying financial statements are presented for the following 5 funds (individually a “Fund,’’ collectively the “Funds’’):
| | Fund | | | Short Name | |
| HSBC New York Tax-Free Money Market Fund | | N.Y. Tax-Free Money Market Fund |
| (formerly, HSBC Investor New York Tax-Free | | |
| Money Market Fund) | | |
| | |
| HSBC Prime Money Market Fund | | Prime Money Market Fund |
| (formerly, HSBC Investor Prime | | |
| Money Market Fund) | | |
| |
| HSBC Tax-Free Money Market Fund | | Tax-Free Money Market Fund |
| (formerly, HSBC Investor Tax-Free | | |
| Money Market Fund) | | |
| |
| HSBC U.S. Government Money Market Fund | | U.S. Government Money Market Fund |
| (formerly, HSBC Investor U.S. Government | | |
| Money Market Fund | | |
| |
| HSBC U.S. Treasury Money Market Fund | | U.S. Treasury Money Market Fund |
| (formerly, HSBC Investor U.S. Treasury | | |
| Money Market Fund) | | |
All the Funds are diversified funds. Financial statements for all other funds of the Trusts are published separately.
The Funds are authorized to issue an unlimited number of shares of beneficial interest with a par value of $0.001 per share. The Funds are authorized to issue six classes of shares: Class A Shares, Class B Shares, Class C Shares, Class D Shares, Class E Shares and Class Y Shares. In addition, the Prime Money Market Fund, Tax-Free Money Market Fund, U.S. Government Money Market Fund and U.S. Treasury Money Market Fund are authorized to issue Class I Shares. The Class B Shares of the Funds are offered without any front-end sales charge but will be subject to a contingent deferred sales charge (“CDSC’’) ranging from a maximum of 4.00% if redeemed less than one year after purchase to 0.00% if redeemed more than four years after purchase. Class C Shares of the Funds are offered without any front-end sales charge but will be subject to a maximum CDSC of 1.00% if redeemed less than one year after purchase. No sales charges are assessed with respect to Class A, Class D, Class E, Class I or Class Y Shares of the Funds. Each class of shares in each Fund has identical rights and privileges, except with respect to arrangements pertaining to shareholder servicing and/or distribution, class-related expenses, voting rights on matters affecting a single class of shares, and exchange privileges. As of October 31, 2012, Class E Shares were not operational.
Under the Trust’s organizational documents, the Funds’ officers and Trustees are indemnified against certain liabilities arising out of the performance of their duties to the Funds. In addition, in the normal course of business, the Trust may enter into contracts with its service providers, which also provide for indemnifications by the Funds. The Funds’ maximum exposure under these arrangements is unknown as this would involve future claims that may be made against the Funds. However, based on experience, the Trust expects that risk of loss to be remote.
| HSBC FAMILY OF FUNDS |
| Notes to Financial Statements—as of October 31, 2012 (continued) |
2. Significant Accounting Policies:
The following is a summary of the significant accounting policies followed by the Funds in the preparation of their financial statements. The policies are in conformity with U.S. generally accepted accounting principles (“GAAP’’). The preparation of financial statements requires management to make certain estimates and assumptions that affect the reported amounts of assets and liabilities and disclosure of contingent assets and liabilities at the date of the financial statements and the reported amounts of increases and decreases in net assets from operations during the reporting period. Actual results could differ from those estimates.
Securities Valuation:
Investments of the Funds are valued using the amortized cost method pursuant to Rule 2a-7 under the Act, which approximates fair value. Fair value is defined as the price that would be received to sell an asset or paid to transfer a liability in an orderly transaction between market participants at the measurement date. The valuation techniques used to determine fair value are further described below.
Investment Transactions and Related Income:
Investment transactions are accounted for not later than on the business day after trade date. However, for financial reporting purposes, investment transactions are accounted for on trade date. Investment gains and losses are calculated on the identified cost basis. Interest income is recognized on the accrual basis and includes, where applicable, the amortization or accretion of premium or discount. Dividend income is recorded on the ex-dividend date.
Restricted and Illiquid Securities:
A restricted security is a security which has been purchased through a private offering and cannot be resold to the general public without prior registration under the Securities Act of 1933 (the “1933 Act’’) or pursuant to the resale limitations provided by Rule 144 under the 1933 Act, or another exemption from the registration requirements of the 1933 Act. Certain restricted securities may be resold in transactions exempt from registration, normally to qualified institutional buyers, and may be deemed liquid by the Investment Adviser (as defined in Note 4) based on procedures established by the Board of Trustees (the “Board’’). Therefore, not all restricted securities are considered illiquid. At October 31, 2012, the Funds did not hold any restricted securities that were deemed illiquid.
Repurchase Agreements:
The Funds (except U.S. Treasury Money Market Fund) may enter into repurchase agreements with an entity which is a member of the Federal Reserve System or which is a “primary dealer’’ (as designated by the Federal Reserve Bank of New York) in U.S. government obligations. The U.S. Treasury Money Market Fund may temporarily invest in repurchase agreements collaterized by U.S. Treasury Obligations. The repurchase price generally equals the price paid by a Fund plus interest negotiated on the basis of current short-term rates, which may be more or less than the rate on the underlying portfolio securities. The seller, under a repurchase agreement, is required to maintain the collateral held pursuant to the agreement, with a fair value equal to or greater than the repurchase price (including accrued interest). Collateral subject to repurchase agreements is held by the Funds’ custodian or another qualified custodian or in the Federal Reserve/Treasury book-entry system. In the event of counterparty default, the Fund has the right to use the collateral to offset losses incurred. There is potential for loss to a Fund in the event the Fund is delayed or prevented from exercising its rights to dispose of the collateral securities, including the risk of a possible decline in the fair value of the underlying securities during the period while the Fund seeks to assert its rights.
Allocations:
Expenses directly attributable to a Fund are charged to that Fund. Expenses not directly attributable to a Fund are allocated proportionately among the applicable series within the Trusts in relation to the net assets of each fund or on another reasonable basis. Class specific expenses are charged directly to the class incurring the expense. In addition, income, expenses (other than class specific expenses), and unrealized and realized gains and losses are allocated to each class based on relative net assets on a daily basis.
HSBC FAMILY OF FUNDS 47
| HSBC FAMILY OF FUNDS |
| Notes to Financial Statements—as of October 31, 2012 (continued) |
Dividends to Shareholders:
Dividends to shareholders from net investment income, if any, are declared daily and paid monthly from each Fund. Dividends from net realized gains, if any, are declared and paid at least annually by the Funds. Additional distributions are also made to the Funds’ shareholders to the extent necessary to avoid the federal excise tax on certain undistributed income and net realized gains of regulated investment companies.
The character of net investment income and net realized gains distributed are determined in accordance with federal income tax regulations, which may differ from GAAP. These “book/tax’’ differences are either considered temporary or permanent in nature. To the extent these differences are permanent in nature (e.g., reclassification of market discounts, certain gain/loss, paydowns, and distributions), such amounts are reclassified within the composition of net assets based on their federal tax-basis treatment; temporary differences (e.g., wash losses and post-October loss deferrals) do not require reclassification. To the extent distributions to shareholders from net investment income and net realized gains exceed net investment income and net realized gains for tax purposes, they are reported as distributions of capital.
Federal Income Taxes:
Each Fund is a separate taxable entity for federal income tax purposes. Each Fund has qualified and intends to continue to qualify each year as a “regulated investment company’’ under Subchapter M of the Internal Revenue Code, as amended, and to distribute substantially all of its taxable net investment income and net realized gains, if any, to its shareholders. Accordingly, no provision for federal income or excise tax is required.
Management of the Funds has reviewed tax positions taken in tax years that remain subject to examination by all major tax jurisdictions, including federal (i.e., the last four tax year ends and the interim tax period since then, as applicable). Management believes that there is no tax liability resulting from unrecognized tax benefits related to uncertain tax positions taken.
3. Investment Valuation Summary:
The valuation techniques employed by the Funds, as described below, maximize the use of observable inputs and minimize the use of unobservable inputs in determining fair value. The inputs used for valuing the Funds’ investments are summarized in the three broad levels listed below:
- Level 1: quoted prices in active markets for identical assets
- Level 2: other significant observable inputs (including quoted prices for similar securities, interest rates, prepayment speeds, credit risk, etc.)
- Level 3: significant unobservable inputs (including a Fund’s own assumptions in determining the fair value of investments)
Changes in valuation techniques may result in transfers in or out of an assigned level within the disclosure hierarchy. The Funds determine transfers between fair value hierarchy levels at the reporting period end. The inputs or methodology used for valuing investments is not necessarily an indication of the risk associated with investing in those investments.
Investments of the Funds are valued using the amortized cost method pursuant to Rule 2a-7 under the Act, which approximates fair value and are typically categorized as Level 2 in the fair value hierarchy. The amortized cost method involves valuing an instrument at its cost initially and thereafter assuming a constant amortization to maturity of any discounts or premium, regardless of the impact of fluctuating interest rates on the market value of the instrument. The amortized cost method may result in periods during which value, as determined by amortized cost, is higher or lower than the price a Fund holding the instrument would receive if it sold the instrument. The fair value of securities in the Funds can be expected to vary with changes in prevailing interest rates.
Investments in other money market funds are priced at net asset value as reported by such companies and are typically categorized as Level 1 in the fair value hierarchy.
Repurchase agreements are valued at original cost and are typically categorized as Level 2 in the fair value hierarchy.
48 HSBC FAMILY OF FUNDS
| HSBC FAMILY OF FUNDS |
| Notes to Financial Statements—as of October 31, 2012 (continued) |
For the year ended October 31, 2012, there were no Level 3 investments for which significant unobservable inputs were used to determine fair value.
The following is a summary of the valuation inputs used as of October 31, 2012 in valuing the Funds’ investments based upon the three levels defined above:
| | LEVEL 1($) | | LEVEL 2($) | | LEVEL 3($) | | Total($) |
| New York Tax-Free Money Market Fund | | | | | | | | | | | | |
| Investment Securities(a): | | | | | | | | | | | | |
| Variable Rate Demand Notes | | | — | | | 267,090,000 | | | — | | | 267,090,000 |
| Municipal Bonds | | | — | | | 10,023,855 | | | — | | | 10,023,855 |
| Total Investment Securities | | | — | | | 277,113,855 | | | — | | | 277,113,855 |
| |
| Prime Money Market Fund | | | | | | | | | | | | |
| Investment Securities(a): | | | | | | | | | | | | |
| Certificates of Deposit | | | — | | | 1,140,054,179 | | | — | | | 1,140,054,179 |
| Commercial Paper and Notes | | | — | | | 2,097,181,209 | | | — | | | 2,097,181,209 |
| Corporate Obligations | | | — | | | 50,377,857 | | | — | | | 50,377,857 |
| Yankee Dollars | | | — | | | 168,579,763 | | | — | | | 168,579,763 |
| Variable Rate Demand Notes | | | — | | | 189,820,000 | | | — | | | 189,820,000 |
| U.S. Treasury Obligations | | | — | | | 348,015,025 | | | — | | | 348,015,025 |
| Repurchase Agreements | | | — | | | 860,000,000 | | | — | | | 860,000,000 |
| Time Deposits | | | — | | | 123,000,000 | | | — | | | 123,000,000 |
| Total Investment Securities | | | — | | | 4,977,028,033 | | | — | | | 4,977,028,033 |
| |
| Tax-Free Money Market Fund | | | | | | | | | | | | |
| Investment Securities(a): | | | | | | | | | | | | |
| Commercial Paper and Notes | | | — | | | 2,000,000 | | | — | | | 2,000,000 |
| Variable Rate Demand Notes | | | — | | | 89,565,000 | | | — | | | 89,565,000 |
| Municipal Bonds | | | — | | | 12,233,574 | | | — | | | 12,233,574 |
| Total Investment Securities | | | — | | | 103,798,574 | | | — | | | 103,798,574 |
| |
| U.S. Government Money Market Fund | | | | | | | | | | | | |
| Investment Securities(a): | | | | | | | | | | | | |
| U.S. Government and Government | | | | | | | | | | | | |
| Agency Obligations | | | — | | | 956,953,895 | | | — | | | 956,953,895 |
| U.S. Treasury Obligations | | | — | | | 1,172,944,085 | | | — | | | 1,172,944,085 |
| Repurchase Agreements | | | — | | | 2,685,000,000 | | | — | | | 2,685,000,000 |
| Total Investment Securities | | | — | | | 4,814,897,980 | | | — | | | 4,814,897,980 |
| |
| U.S. Treasury Money Market Fund | | | | | | | | | | | | |
| Investment Securities(a): | | | | | | | | | | | | |
| U.S. Treasury Obligations | | | — | | | 2,352,226,574 | | | — | | | 2,352,226,574 |
| Total Investment Securities | | | — | | | 2,352,226,574 | | | — | | | 2,352,226,574 |
____________________
| (a) | | For detailed investment categorizations, see the accompanying Schedules of Portfolio Investments. |
HSBC FAMILY OF FUNDS 49
| HSBC FAMILY OF FUNDS |
| Notes to Financial Statements—as of October 31, 2012 (continued) |
New Accounting Pronouncements:
In December 2011, the Financial Accounting Standards Board issued ASU No. 2011-11 “Disclosures about Offsetting Assets and Liabilities” requiring disclosure of both gross and net information related to offsetting and related arrangements enabling users of its financial statements to understand the effect of those arrangements on the entity’s financial position. The objective of this disclosure is to facilitate comparison between those entities that prepare their financial statements on the basis of U.S. GAAP and those entities that prepare their financial statements on the basis of IFRSs. ASU No. 2011-11 is effective for interim and annual periods beginning on or after January 1, 2013. Adoption of ASU No. 2011-11 will have no effect on the Funds’ net assets. At this time, management is evaluating any impact ASU No. 2011-11 may have on the Funds’ financial statements disclosures.
4. Related Party Transactions and Other Agreements and Plans:
Investment Management:
HSBC Global Asset Management (USA) Inc. (“HSBC’’ or the “Investment Adviser’’), a wholly owned subsidiary of HSBC Bank USA, N.A., a national bank organized under the laws of the United States, acts as Investment Adviser to the Funds. As Investment Adviser, HSBC manages the investments of the Funds and continuously reviews, supervises and administers the Funds’ investments pursuant to an Investment Advisory Agreement. For its services as investment adviser, HSBC receives a fee from each Fund, accrued daily and paid monthly, based on the average daily net assets of each respective Fund, at an annual rate of 0.10%.
HSBC also provides operational support services to the Funds pursuant to an Operational Support Services Agreement. For its services in this capacity, HSBC receives a fee, accrued daily and paid monthly, based on the average daily net assets of Class A Shares, Class B Shares, Class C Shares, Class D Shares and Class Y Shares, at an annual rate of:
| Fund | | Fee Rate(%) |
| N.Y. Tax-Free Money Market Fund | 0.05 |
| Prime Money Market Fund | 0.10 |
| Tax-Free Money Market Fund | 0.10 |
| U.S. Government Money Market Fund | 0.10 |
| U.S. Treasury Money Market Fund | 0.10 |
The Bank of New York Mellon (the “Servicer”) provides recordkeeping, reporting and processing services to the Prime Money Market Fund, U.S. Government Money Market Fund and U.S. Treasury Money Market Fund, Class I Shares. The Servicer is paid by the Investment Adviser from its profits and not by the Funds, for these services.
Administration:
HSBC also serves as Administrator to the Trusts. Under the terms of the Administration Agreement, HSBC received from the Trusts a fee, accrued daily and paid monthly, at an annual rate of:
| Based on Average Daily Net Assets of | | Fee Rate(%) |
| Up to $10 billion | 0.0550 |
| In excess of $10 billion but not exceeding $20 billion | 0.0350 |
| In excess of $20 billion but not exceeding $50 billion | 0.0275 |
| In excess of $50 billion | 0.0250 |
The fee breakpoints are determined on the basis of the aggregate average daily net assets of the Trusts. The fee is allocated to each series based upon its proportionate share of the aggregate net assets of the Trusts, subject to certain allocations in cases where one fund invests some or all of its assets in another fund. An amount equal to 50% of the administration fees is deemed to be class specific.
50 HSBC FAMILY OF FUNDS
| HSBC FAMILY OF FUNDS |
| Notes to Financial Statements—as of October 31, 2012 (continued) |
Pursuant to a Sub-Administration Agreement with HSBC, Citi Fund Services Ohio, Inc. (“Citi’’), a wholly-owned subsidiary of Citigroup, Inc., serves as the Trusts’ Sub-Administrator, subject to the general supervision by the Board and HSBC. For these services, Citi is entitled to a fee, payable by HSBC, at an annual rate equivalent to the fee rates set forth above subject to certain reductions associated with services provided to new funds, minus 0.02% which is retained by HSBC. During the year ended October 31, 2012, Citi voluntarily reduced its sub-administration fees by $211,704.
Under a Compliance Services Agreement between the Trusts and Citi (the “CCO Agreement’’), Citi makes an employee available to serve as the Trusts’ Chief Compliance Officer (the “CCO’’). Under the CCO Agreement, Citi also provides infrastructure and support in implementing the written policies and procedures comprising the Trusts’ compliance program, including support services to the CCO. For the services provided under the CCO Agreement, the Trusts paid Citi $281,280 for the year ended October 31, 2012, plus reimbursement of certain out of pocket expenses. Expenses incurred by each Fund are reflected on the Statements of Operations as “Compliance Services.’’ Citi pays the salary and other compensation earned by individuals performing these services, as employees of Citi.
Distribution Arrangements:
Foreside Distribution Services, L.P. (“Foreside’’), a wholly-owned subsidiary of Foreside Financial Group LLC, serves the Trust as Distributor (the “Distributor’’). The Trust has adopted a non-compensatory Distribution Plan and Agreement (the “Distribution Plan’’) pursuant to Rule 12b-1 of the Act. The Distribution Plan provides for reimbursement of expenses incurred by the Distributor related to distribution and marketing, at a rate not to exceed 0.25%, 1.00%, 1.00% and 0.25% of the average daily net assets of Class A Shares (currently not being charged), Class B Shares (currently charging 0.75%), Class C Shares (currently charging 0.75%) and Class D Shares (currently not being charged) of the Funds, respectively. For the year ended October 31, 2012, Foreside, as Distributor, also received $346,561, $261,621 and $34,163 in commissions from sales of the Trusts, for Class A Shares, Class B Shares and Class C Shares, respectively, of which $25, $12 and $0 were reallocated to HSBC-affiliated brokers and dealers for Class A Shares, Class B Shares and Class C Shares, respectively. Expenses reduced during the year ended October 31, 2012 are reflected on the Statements of Operations as “Fees voluntarily reduced by Distributor.’’
Shareholder Servicing:
The Trust has adopted a Shareholder Services Plan, which provides for payments to shareholder servicing agents (which primarily consist of HSBC and its affiliates) for providing various shareholder services. For performing these services, the shareholder servicing agents receive a fee that is computed daily and paid monthly up to 0.60%, 0.25%, 0.25%, 0.25% and 0.10% of the average daily net assets of Class A Shares (currently charging 0.40%), Class B Shares, Class C Shares, Class D Shares and Class E Shares (expected to charge 0.05%) of the Funds, respectively. The fees paid to the Distributor pursuant to the Distribution Plan and to shareholder servicing agents pursuant to the Shareholder Services Plan may not exceed, in the aggregate, 0.85%, 1.00%, 1.00%, 0.50% and 0.10% annually of each Fund’s average daily net assets of Class A Shares, Class B Shares, Class C Shares, Class D Shares and Class E Shares, respectively. Expenses reduced during the year ended October 31, 2012 are reflected on the Statements of Operations as “Fees voluntarily reduced by Shareholder Servicing Agent.’’
Fund Accounting and Transfer Agency:
Citi provides fund accounting and transfer agency services for each Fund. As transfer agent, Citi receives a fee based on the number of funds and shareholder accounts, subject to certain minimums, reductions associated with services provided to new funds and reimbursement of certain expenses. As fund accountant, Citi receives an annual fee per fund and share class, subject to certain minimums and reimbursement of certain expenses. Citi receives additional fees paid by the Trust for blue sky exemption services and money market fund reporting services.
HSBC FAMILY OF FUNDS 51
| HSBC FAMILY OF FUNDS |
| Notes to Financial Statements—as of October 31, 2012 (continued) |
Independent Trustees:
Prior to January 1, 2012, the Trusts, in the aggregate, paid each Independent Trustee an annual retainer of $63,000, a fee of $5,000 for each regular meeting of the Board of Trustees attended, a fee of $3,000 for each special telephonic meeting attended, and a fee of $5,000 for each special in-person meeting attended. The Trusts also paid each Independent Trustee an annual retainer of $3,000 for each Committee on which such Trustee served as a Committee member as well as a fee of $3,000 for each Committee meeting attended. Additionally, the Trusts paid each Committee Chair an annual retainer of $6,000, with the exception of the Chair of the Audit Committee, who received a retainer of $8,000. The Trusts also paid the Chairman of the Board, an additional annual retainer of $20,000, as well as an additional $4,000 for each regular meeting of the Board attended. In addition, for time expended on Board duties outside normal meetings, which is authorized by the Board, a Trustee was compensated at the rate of $500 per hour, up to a maximum of $3,000 per day.
Effective January 1, 2012, the Trusts pay each Independent Trustee an annual retainer of $100,000. The Trusts pay a fee of $10,000 for each regular meeting of the Board of Trustees attended and a fee of $3,000 for each special meeting attended. The Trusts pay each Committee Chair an annual retainer of $3,000, with the exception of the Chair of the Audit Committee, who receives a retainer of $6,000. The Trusts also pay the Chairman of the Board, an additional annual retainer of $24,000. In addition, for time expended on Board duties outside normal meetings, which is authorized by the Board, a Trustee is compensated at the rate of $500 per hour, up to a maximum of $3,000 per day.
Fee Reductions:
The Investment Adviser has agreed to contractually limit through March 1, 2013 the annual total expenses, exclusive of interest, taxes, brokerage commissions, and extraordinary expenses, of certain classes of the Prime Money Market Fund, U.S. Government Money Market Fund and U.S. Treasury Money Market Fund. Each Fund Class has its own expense limitations based on the average daily net assets for any full fiscal year as follows:
| | | | Contractual |
| | | | Expense |
| Fund | | | Class | | Limitations(%) |
| Prime Money Market Fund | | E | | | 0.25 | * | |
| Prime Money Market Fund | | I | | | 0.20 | | |
| U.S. Government Money Market Fund | | E | | | 0.25 | * | |
| U.S. Government Money Market Fund | | I | | | 0.20 | | |
| U.S. Treasury Money Market Fund | | E | | | 0.25 | * | |
| U.S. Treasury Money Market Fund | | I | | | 0.20 | | |
____________________
| * | | As of October 31, 2012, Class E Shares were not operational. |
Any amounts contractually waived or reimbursed by the Investment Adviser will be subject to repayment by the Fund to the Investment Adviser within three years to the extent that the repayment will not cause the Fund’s operating expenses to exceed the contractual expense limit that was in effect at the time of such waiver or reimbursement. At October 31, 2012, there were no remaining contractual reimbursements that are subject to repayment by the Funds in subsequent years.
The Administrator and Citi may voluntarily waive/reimburse fees to help support the expense limits of the Funds. In addition, the Administrator and Investment Adviser, may waive/reimburse additional fees at their discretion. Any voluntary fee waivers/reimbursements are not subject to recoupment in subsequent fiscal periods. Voluntary waivers/reimbursements may be stopped at any time. Amounts waived/reimbursed by the Investment Adviser, Administrator and Citi are reported separately on the Statements of Operations, as applicable.
52 HSBC FAMILY OF FUNDS
| HSBC FAMILY OF FUNDS |
| Notes to Financial Statements—as of October 31, 2012 (continued) |
The Funds have entered into an arrangement with their custodian whereby credits realized as a result of uninvested cash balances are used to reduce a portion of the Funds’ custodian expenses. Expenses reduced during the year ended October 31, 2012 are reflected on the Statements of Operations as “Fees paid indirectly,” as applicable.
5. Concentration of Credit Risk:
The N.Y. Tax-Free Money Market Fund invests primarily in debt obligations issued by the State of New York and its respective political subdivisions, agencies and public authorities. The Fund is more susceptible to economic and political factors adversely affecting issuers of New York municipal securities than are municipal money market funds that are not concentrated in these issuers to the same extent.
6. Federal Income Tax Information:
At October 31, 2012, the cost basis of securities for federal income tax purposes, gross unrealized appreciation, gross unrealized depreciation and net unrealized appreciation/depreciation were as follows:
| | | | | | | | Net Unrealized |
| | | | Tax Unrealized | | Tax Unrealized | | Appreciation/ |
| Fund | | | Tax Cost($) | | Appreciation($) | | Depreciation($) | | (Depreciation)($)* |
| New York Tax-Free Money Market Fund | | 277,113,855 | | — | | — | | — |
| Prime Money Market Fund | | 4,977,028,033 | | — | | — | | — |
| Tax-Free Money Market Fund | | 103,798,574 | | — | | — | | — |
| U.S. Government Money Market Fund | | 4,814,897,980 | | — | | — | | — |
| U.S. Treasury Money Market Fund | | 2,352,226,574 | | — | | — | | — |
____________________
| * | | The difference between book-basis unrealized appreciation (depreciation) is attributable primarily to tax deferral of losses on wash sales. |
The tax character of dividends paid by the Funds as of the year ended October 31, 2012 was as follows:
| | Dividends paid from |
| | | | Net | | | | | | |
| | | | Long Term | | Total | | Tax | | Total |
| | Ordinary | | Capital | | Taxable | | Exempt | | Dividends |
| | Income($) | | Gains($) | | Dividends($) | | Distributions($) | | Paid($)(1) |
| New York Tax-Free Money Market Fund | | — | | — | | — | | — | | — |
| Prime Money Market Fund | | 5,507,290 | | — | | 5,507,290 | | — | | 5,507,290 |
| Tax-Free Money Market Fund | | — | | — | | — | | — | | — |
| U.S. Government Money Market Fund | | 584,227 | | — | | 584,227 | | — | | 584,227 |
| U.S. Treasury Money Market Fund | | 24,266 | | — | | 24,266 | | — | | 24,266 |
The tax character of dividends paid by the Funds as of the year ended October 31, 2011 was as follows:
| | Dividends paid from |
| | | | Net | | | | | | |
| | | | Long Term | | Total | | Tax | | Total |
| | Ordinary | | Capital | | Taxable | | Exempt | | Dividends |
| | Income($) | | Gains($) | | Dividends($) | | Distributions($) | | Paid($)(1) |
| New York Tax-Free Money Market Fund | | 32 | | — | | 32 | | 56,516 | | 56,548 |
| Prime Money Market Fund | | 5,383,471 | | — | | 5,383,471 | | — | | 5,383,471 |
| Tax-Free Money Market Fund | | 1,744 | | 35 | | 1,779 | | 13,931 | | 15,710 |
| U.S. Government Money Market Fund | | 1,676,040 | | — | | 1,676,040 | | — | | 1,676,040 |
| U.S. Treasury Money Market Fund | | 348,882 | | — | | 348,882 | | — | | 348,882 |
____________________
| (1) | | Total dividends paid may differ from the amount reported in the Statement of Changes in Net Assets because dividends are recognized when actually paid for tax purposes. |
HSBC FAMILY OF FUNDS 53
| HSBC FAMILY OF FUNDS |
| Notes to Financial Statements—as of October 31, 2012 (continued) |
As of October 31, 2012, the components of accumulated earnings/(deficit) on a tax basis for the Funds were as follows:
| | | | | | | | | | | | | | | | | | | | | | | Accumulated | | | | Total |
| | Undistributed | | Undistributed | | Undistributed | | | | | | | | | | | Capital | | Unrealized | | Accumulated |
| | Ordinary | | Tax Exempt | | Long Term | | Accumulated | | Dividends | | and Other | | Appreciation/ | | Earnings/ |
| | Income($) | | Income($) | | Capital Gains($) | | Earnings($) | | Payable($) | | Losses($) | | (Depreciation)$ | | (Deficit)($) |
| New York Tax-Free Money | | | | | | | | | | | | | | | | | | | | | | | | | | | | | | | | | |
| Market Fund | | | — | | | | 1 | | | | — | | | | 1 | | | | — | | | | | — | | | | — | | | 1 | | |
| Prime Money Market Fund | | | 457,002 | | | | — | | | | 148 | | | | 457,150 | | | | (445,704 | ) | | | | — | | | | — | | | 11,446 | | |
| Tax-Free Money Market Fund | | | — | | | | 1 | | | | — | | | | 1 | | | | — | | | | | — | | | | — | | | 1 | | |
| U.S. Government Money | | | | | | | | | | | | | | | | | | | | | | | | | | | | | | | | | |
| Market Fund | | | 84,169 | | | | — | | | | — | | | | 84,169 | | | | (84,167 | ) | | | | (3,566 | ) | | | — | | | (3,564 | ) | |
| U.S. Treasury Money | | | | | | | | | | | | | | | | | | | | | | | | | | | | | | | | | |
| Market Fund | | | 9 | | | | — | | | | — | | | | 9 | | | | — | | | | | (11,410 | ) | | | — | | | (11,401 | ) | |
As of the end of the tax year ended October 31, 2012, the Funds have net capital loss carryforwards (“CLCFs”) as summarized in the tables below. CLCFs subjects to expiration are applied as short-term capital loss regardless of whether the originating capital loss was short-term or long-term. CLCFs that are not subject to expiration must be utilized before those that are subject to expiration.
CLCFs not subject to expiration:
| | Short Term | | Long Term | | |
| Fund | | | Amount($) | | Amount($) | | Total($) |
| U.S. Government Money Market Fund | | 3,566 | | — | | 3,566 |
| U.S. Treasury Money Market Fund | | — | | 11,410 | | 11,410 |
For the year ended October 31, 2012, the following Funds utilized capital loss carryforwards to offset capital gains realized:
| Fund | | Amount($) |
| Prime Money Market Fund | 13,380 |
7. Legal and Regulatory Matters:
On September 26, 2006 BISYS Fund Services, Inc. (“BISYS’’), an affiliate of BISYS Fund Services Ohio, Inc. which provided various services to the Funds, reached a settlement with the Securities and Exchange Commission (the “SEC’’) regarding the SEC’s investigation related to BISYS’ past payment of certain marketing and other expenses with respect to certain of its mutual fund clients. The related settlement monies were received by the Funds during the year ended October 31, 2010. The corresponding impact to the net income ratio and total return for the year ended October 31, 2010 are disclosed in the Funds’ Financial Highlights.
8. Subsequent Events:
The Boards of Trustees of HSBC Funds approved Plans of Liquidation to close the HSBC Tax-Free Money Market Fund and HSBC New York Tax-Free Money Market Fund and provide for their orderly liquidation on or about January 31, 2013.
Management has evaluated events and transactions through the date the financial statements were issued, for purposes of recognition or disclosure in these financial statements and there are no additional subsequent events to report.
54 HSBC FAMILY OF FUNDS
Report of Independent Registered Public Accounting Firm
To the Shareholders and Board of Trustees of
HSBC Funds:
We have audited the accompanying statements of assets and liabilities of HSBC New York-Tax Free Money Market Fund, HSBC Prime Money Market Fund, HSBC Tax-Free Money Market Fund, HSBC U.S. Government Money Market Fund and HSBC U.S. Treasury Money Market Fund (formerly known as HSBC Investor New York-Tax Free Money Market Fund, HSBC Investor Prime Money Market Fund, HSBC Investor Tax-Free Money Market Fund, HSBC Investor U.S. Government Money Market Fund and HSBC Investor U.S. Treasury Money Market Fund (the Funds), including the schedules of portfolio investments, as of October 31, 2012, and the related statements of operations for the year then ended, the statements of changes in net assets for each of the years in the two-year period then ended, and the financial highlights for each of the years in the five-year period then ended. These financial statements and financial highlights are the responsibility of the Funds’ management. Our responsibility is to express an opinion on these financial statements and financial highlights based on our audits.
We conducted our audits in accordance with the standards of the Public Company Accounting Oversight Board (United States). Those standards require that we plan and perform the audit to obtain reasonable assurance about whether the financial statements and financial highlights are free of material misstatement. An audit includes examining, on a test basis, evidence supporting the amounts and disclosures in the financial statements. Our procedures included confirmation of securities owned as of October 31, 2012, by correspondence with the custodian or brokers or by other appropriate auditing procedures. An audit also includes assessing the accounting principles used and significant estimates made by management, as well as evaluating the overall financial statement presentation. We believe that our audits provide a reasonable basis for our opinion.
In our opinion, the financial statements and financial highlights referred to above present fairly, in all material respects, the financial position of the Funds as of October 31, 2012, the results of their operations for the year then ended, the changes in their net assets for each of the years in the two-year period then ended, and the financial highlights for each of the years in the five-year period then ended, in conformity with U.S. generally accepted accounting principles.
Columbus, Ohio
December 21, 2012
HSBC FAMILY OF FUNDS 55
| HSBC FAMILY OF FUNDS |
| Other Federal Income Tax Information—as of October 31, 2012 (Unaudited) |
During the year ended October 31, 2012, the following Funds declared net short term capital gain distributions:
| Fund | | | Amount |
| U.S. Government Money Market Fund | | $ | 45,547 |
| U.S. Treasury Money Market Fund | | | 24,266 |
During the year ended October 31, 2012, the following Funds designated the maximum amount allowable as interest-related dividends for certain non-U.S. resident investors:
| Fund | | Qualified Interest Income |
| Prime Money Market Fund | 100% |
| U.S. Government Money Market Fund | 100% |
| U.S. Treasury Money Market Fund | 100% |
56 HSBC FAMILY OF FUNDS
| HSBC FAMILY OF FUNDS |
| Table of Shareholder Expenses—as of October 31, 2012 (Unaudited) |
As a shareholder of the Funds, you incur two types of costs: (1) transaction costs, including sales charges (loads) on purchases, redemption fees and exchange fees; and (2) ongoing costs, including management fees, distribution fees and other Fund expenses. These examples are intended to help you understand your ongoing costs (in dollars) of investing in the Funds and to compare the cost with the ongoing costs of investing in other mutual funds.
These examples are based on an investment of $1,000 invested at the beginning of the period and held for the entire period from May 1, 2012 through October 31, 2012.
Actual Example
The table below provides information about actual account values and actual expenses. You may use the information below, together with the amount you invested, to estimate the expenses that you paid over the period. Simply divide your account value by $1,000 (for example, an $8,600 account value divided by $1,000 = 8.6), then multiply the result by the number in the table under the heading entitled “Expenses Paid During Period” to estimate the expenses you paid on your account during this period.
| | | | | | | | | | | | | Annualized |
| | | | Beginning | | Ending | | Expenses Paid | | Expense Ratio |
| | | | Account Value | | Account Value | | During Period* | | During Period |
| | | | 5/1/12 | | 10/31/12 | | 5/1/12 - 10/31/12 | | 5/1/12 - 10/31/12 |
| New York Tax-Free Money Market Fund | | Class A Shares | | $ | 1,000.00 | | $ | 1,000.00 | | $ | 0.90 | | 0.18 | % |
| | Class D Shares | | | 1,000.00 | | | 1,000.00 | | | 0.90 | | 0.18 | % |
| | Class Y Shares | | | 1,000.00 | | | 1,000.00 | | | 0.90 | | 0.18 | % |
| Prime Money Market Fund | | Class A Shares | | | 1,000.00 | | | 1,000.10 | | | 1.61 | | 0.32 | % |
| | Class B Shares | | | 1,000.00 | | | 1,000.00 | | | 1.61 | | 0.32 | % |
| | Class C Shares | | | 1,000.00 | | | 1,000.30 | | | 1.36 | | 0.27 | % |
| | Class D Shares | | | 1,000.00 | | | 1,000.10 | | | 1.61 | | 0.32 | % |
| | Class I Shares | | | 1,000.00 | | | 1,000.80 | | | 0.85 | | 0.17 | % |
| | Class Y Shares | | | 1,000.00 | | | 1,000.20 | | | 1.46 | | 0.29 | % |
| Tax-Free Money Market Fund | | Class D Shares | | | 1,000.00 | | | 1,000.00 | | | 0.96 | | 0.19 | % |
| | Class Y Shares | | | 1,000.00 | | | 1,000.00 | | | 0.96 | | 0.19 | % |
| U.S. Government Money Market Fund | | Class A Shares | | | 1,000.00 | | | 1,000.10 | | | 0.90 | | 0.18 | % |
| | Class B Shares | | | 1,000.00 | | | 1,000.00 | | | 0.90 | | 0.18 | % |
| | Class D Shares | | | 1,000.00 | | | 1,000.10 | | | 0.90 | | 0.18 | % |
| | Class I Shares | | | 1,000.00 | | | 1,000.10 | | | 0.90 | | 0.18 | % |
| | Class Y Shares | | | 1,000.00 | | | 1,000.10 | | | 0.90 | | 0.18 | % |
| U.S. Treasury Money Market Fund | | Class A Shares | | | 1,000.00 | | | 1,000.00 | | | 0.60 | | 0.12 | % |
| | Class B Shares | | | 1,000.00 | | | 1,000.00 | | | 0.50 | | 0.10 | % |
| | Class D Shares | | | 1,000.00 | | | 1,000.00 | | | 0.55 | | 0.11 | % |
| | Class I Shares | | | 1,000.00 | | | 1,000.00 | | | 0.55 | | 0.11 | % |
| | Class Y Shares | | | 1,000.00 | | | 1,000.00 | | | 0.55 | | 0.11 | % |
____________________
| | |
| * | | Expenses are equal to the average account value over the period, multiplied by the Fund's annualized expense ratio, multiplied by 184/366 (to reflect the one half year period). |
HSBC FAMILY OF FUNDS 57
| HSBC FAMILY OF FUNDS |
| Table of Shareholder Expenses—as of October 31, 2012 (Unaudited) (continued) |
Hypothetical Example for Comparison Purposes
The table below provides information about hypothetical account values and hypothetical expenses based on each Fund’s actual expense ratio and an assumed rate of return of 5% per year before expenses, which is not the Fund’s actual return. The hypothetical account values and expenses may not be used to estimate the actual ending account balance or expenses you paid for the period. You may use this information to compare this 5% hypothetical example with the 5% hypothetical examples that appear in the shareholder reports of other funds.
Please note that the expenses shown in the table are meant to highlight your ongoing costs only and do not reflect any transactional costs, such as sales charges (loads), redemption fees, or exchange fees. Therefore, the table is useful in comparing ongoing costs only, and will not help you determine the relative total costs of owning different funds. In addition, if these transactional costs were included, your costs would have been higher.
| | | | | | | | | | | | | Annualized |
| | | | Beginning | | Ending | | Expenses Paid | | Expense Ratio |
| | | | Account Value | | Account Value | | During Period* | | During Period |
| | | | 5/1/12 | | 10/31/12 | | 5/1/12 - 10/31/12 | | 5/1/12 - 10/31/12 |
| New York Tax-Free Money Market Fund | | Class A Shares | | $ | 1,000.00 | | $ | 1,024.23 | | $ | 0.92 | | 0.18 | % |
| | Class D Shares | | | 1,000.00 | | | 1,024.23 | | | 0.92 | | 0.18 | % |
| | Class Y Shares | | | 1,000.00 | | | 1,024.23 | | | 0.92 | | 0.18 | % |
| Prime Money Market Fund | | Class A Shares | | | 1,000.00 | | | 1,023.53 | | | 1.63 | | 0.32 | % |
| | Class B Shares | | | 1,000.00 | | | 1,023.53 | | | 1.63 | | 0.32 | % |
| | Class C Shares | | | 1,000.00 | | | 1,023.78 | | | 1.37 | | 0.27 | % |
| | Class D Shares | | | 1,000.00 | | | 1,023.53 | | | 1.63 | | 0.32 | % |
| | Class I Shares | | | 1,000.00 | | | 1,024.28 | | | 0.87 | | 0.17 | % |
| | Class Y Shares | | | 1,000.00 | | | 1,023.68 | | | 1.48 | | 0.29 | % |
| Tax-Free Money Market Fund | | Class D Shares | | | 1,000.00 | | | 1,024.18 | | | 0.97 | | 0.19 | % |
| | Class Y Shares | | | 1,000.00 | | | 1,024.18 | | | 0.97 | | 0.19 | % |
| U.S. Government Money Market Fund | | Class A Shares | | | 1,000.00 | | | 1,024.23 | | | 0.92 | | 0.18 | % |
| | Class B Shares | | | 1,000.00 | | | 1,024.23 | | | 0.92 | | 0.18 | % |
| | Class D Shares | | | 1,000.00 | | | 1,024.23 | | | 0.92 | | 0.18 | % |
| | Class I Shares | | | 1,000.00 | | | 1,024.23 | | | 0.92 | | 0.18 | % |
| | Class Y Shares | | | 1,000.00 | | | 1,024.23 | | | 0.92 | | 0.18 | % |
| U.S. Treasury Money Market Fund | | Class A Shares | | | 1,000.00 | | | 1,024.53 | | | 0.61 | | 0.12 | % |
| | Class B Shares | | | 1,000.00 | | | 1,024.63 | | | 0.51 | | 0.10 | % |
| | Class D Shares | | | 1,000.00 | | | 1,024.58 | | | 0.56 | | 0.11 | % |
| | Class I Shares | | | 1,000.00 | | | 1,024.58 | | | 0.56 | | 0.11 | % |
| | Class Y Shares | | | 1,000.00 | | | 1,024.58 | | | 0.56 | | 0.11 | % |
____________________
| | |
| * | | Expenses are equal to the average account value over the period, multiplied by the Fund’s annualized expense ratio, multiplied by 184/366 (to reflect the one half year period). |
58 HSBC FAMILY OF FUNDS
| HSBC FAMILY OF FUNDS |
| Board of Trustees and Officers (Unaudited) |
MANAGEMENT OF THE TRUST
The following table contains information regarding the HSBC Investor Family of Funds’ Board of Trustees (“Trustees”). Asterisks indicate those Trustees who are “interested persons,” as defined in the Investment Company Act of 1940, as amended, of the HSBC Investor Family of Funds. The HSBC Investor Family of Funds’ Statement of Additional Information includes additional information about the Trustees and is available, without charge, upon request by calling (888) 525-5757.
| | | | | | | | Portfolios in | | |
| | Position(s) | | Term of Office | | | | Fund Complex | | Other |
| Name, | | Held with | | and Length of | | Principal Occupation(s) | | Overseen By | | Directorships |
| Address, Age | | Funds | | Time Served | | During Past 5 Years | | Trustee* | | Held by Trustee |
| NON-INTERESTED | | | | | | | | | | |
| TRUSTEES | | | | | | | | | | |
| | | | | | | | | | | |
MARCIA L. BECK
P.O. Box 182845
Columbus, OH
43218-3035
Age: 57 | | Trustee | | Indefinite;
2008 to present | | Private Investor (June 1999 – present); Executive Vice President, Prudential Investments (1997 – 1999); President and Trustee, The Goldman Sachs Mutual Funds (1992 – 1996) | | 23 | | None |
| | | | | | | | | | | |
SUSAN S. HUANG
P.O. Box 182845
Columbus, OH
43218-3035
Age: 58 | | Trustee | | Indefinite;
2008 to present | | Private Investor (2000- present); Senior Vice President, Schroder Investment Management (2001 – 2004); Managing Director, Chase Asset Management (1995-2000) | | 23 | | None |
| | | | | | | | | | | |
ALAN S. PARSOW
P.O. Box 182845
Columbus, OH
43218-3035
Age: 62 | | Trustee | | Indefinite;
1987 to present | | General Partner, Elkhorn Partners, L.P. (a private investment partnership) (1989 – present) | | 23 | | None |
| | | | | | | | | | | |
THOMAS F. ROBARDS
P.O. Box 182845
Columbus, OH
43218-3035
Age: 66 | | Trustee | | Indefinite;
2005 to present | | Partner, Robards & Co. LLC (investment and advisory services) (2005-present); Chief Financial Officer, American Museum of Natural History (2003- 2004); Chief Financial Officer, Datek Online Holdings (2000-2003); Previously EVP and CFO Republic New York Corporation | | 23 | | Overseas Shipholding Group (NYSE listed energy transportation); Ellington Financial LLC (NYSE listed financial services) |
| | | | | | | | | | | |
MICHAEL SEELY
P.O. Box 182845
Columbus, OH
43218-3035
Age: 67 | | Chairman and
Trustee | | Indefinite;
1987 to present | | Private Investor (2003-present); General Partner, Global Multi Manager Partners (1999-2003); President of Investor Access Corporation (1981-2003) | | 23 | | None |
| | | | | | | | | | | |
INTERESTED TRUSTEE | | | | | | | | | | |
| | | | | | | | | | | |
DEBORAH HAZELL
452 Fifth Avenue
New York
NY 10018
Age: 49 | | Trustee | | Indefinite;
2011 to present | | CEO, HSBC Global Asset Management (USA) Inc. (2011-present); President and CEO, Fisher Francis Trees & Watts (“FFTW”) (investment advisor), February 2008-June 2011; Client Service, Business Development and Marketing Group, FFTW (October 1999-February 2008) | | 23 | | None |
____________________
| | |
| * | | Includes the Trust, the HSBC Advisor Fund Trust and the HSBC Portfolios. |
HSBC FAMILY OF FUNDS 59
| HSBC FAMILY OF FUNDS |
| Board of Trustees and Officers (Unaudited) (continued) |
| | Position(s) Held | | Term of Office and | | Principal Occupation(s) |
| Name, Address, Age | | with Funds | | Length of Time Served | | During Past 5 Years |
OFFICERS | | | | | | |
| | | | | | | |
RICHARD A. FABIETTI
452 Fifth Avenue
New York, NY 10018
Age: 54 | | President | | One year;
2004 to present | | Senior Vice President, Head of Product Management, HSBC Global Asset Management (USA) Inc.
(1998 - present) |
| | | | | | | |
STEPHEN SIVILLO
452 Fifth Avenue
New York, NY 10018
Age: 41 | | Vice President | | One year;
2010 to present | | Vice President of Product Administration, HSBC Global Asset Management (USA) Inc. (2010 - present); Chief Compliance Officer, Managers Funds (2009 – 2010); Director, Mutual Fund Compliance, AllianceBernstein (2007-2009); Assistant Vice President, Compliance, AllianceBernstein (2005-2007) |
| | | | | | | |
TY EDWARDS*
3435 Stelzer Road
Columbus, OH 43219-3035
Age: 46 | | Treasurer | | One year;
2010 to present | | Senior Vice President, Citi Fund Services (2010– present); Director, Product Management, Columbia Management (2007-2009); Deputy Treasurer, Columbia Funds, (2006-2007); Director, Fund Administration, Columbia Management (2004-2007) |
| | | | | | | |
JENNIFER A. ENGLISH*
100 Summer Street
Suite 1500
Boston, MA 02110
Age: 40 | | Secretary | | One year;
2008 to present | | Senior Vice President, Regulatory Administration, Citi (2005 - present) |
| | | | | | | |
DANIO MASTROPIERI*
100 Summer Street
Suite 1500
Boston, MA 02110
Age: 40 | | Assistant Secretary | | One year;
December 2012
to present | | Vice President, Regulatory Administration, Citi (2007 - present) |
| | | | | | | |
FREDERICK J. SCHMIDT*
1 Rexcorp Plaza
Uniondale, NY 11556
Age: 53 | | Chief Compliance
Officer | | One year;
2004 to present | | Director and Chief Compliance Officer, CCO Services, Citi (2004 - present) |
____________________
| | |
| * | | Mr. Edwards, Mr. Schmidt, Ms. English and Mr. Mastropieri also are officers of other investment companies of which Citi (or an affiliate) is the administrator or sub-administrator. |
60 HSBC FAMILY OF FUNDS
Other Information (Unaudited):
Information regarding how the Funds voted proxies relating to portfolio securities during the most recent 12-month period ended June 30th is available (i) without charge, upon request, by calling 1-800-525-5757 for HSBC Bank USA and HSBC Brokerage (USA) Inc. clients and 1-800-782-8183 for all other shareholders; (ii) on the Funds’ website at www.investorfunds.us.hsbc.com; and (iii) on the Security and Exchange Commission’s (“Commission”) website at http://www.sec.gov.
The Funds file their complete schedules of portfolio holdings with the Commission for the first and third quarters of each fiscal year on Form N-Q. The Funds’ Forms N-Q are available on the Commission’s website at http://www.sec.gov. The Funds’ Forms N-Q may be reviewed and copied at the Commission’s Public Reference Room in Washington, D.C. and information on the operation of the Public Reference Room may be obtained by calling 1-800-SEC-0330. The Funds’ Schedules of Investments will be available no later than 60 days after each period end, without charge, on the Funds’ website at www.investorfunds.us.hsbc.com.
Each Fund will disclose on its website at www.investorfunds.us.hsbc.com, within five business days after the end of each month, a complete schedule of portfolio holdings and information regarding the weighted average maturity of the Fund. In addition, each Fund will file with the Commission on Form N-MFP, within five business days after the end of each month, more detailed portfolio holdings information. The Funds’ Forms N-MFP will be available on the Commission’s website at http://www.sec.gov, on a delayed basis, and the Funds’ website will also contain a link to these filings.
An investment in a Fund is not a deposit of HSBC Bank USA, National Association, and is not insured or guaranteed by the Federal Deposit Insurance Corporation or any other government agency.
HSBC FAMILY OF FUNDS 61
HSBC FAMILY OF FUNDS:
INVESTMENT ADVISER AND ADMINISTRATOR
HSBC Global Asset Management (USA) Inc.
452 Fifth Avenue
New York, NY 10018
SHAREHOLDER SERVICING AGENTS
For HSBC Bank USA, N.A. and
HSBC Securities (USA) Inc. Clients:
HSBC Bank USA, N.A.
452 Fifth Avenue
New York, NY 10018
1-888-525-5757
For All Other Shareholders:
HSBC Funds
P.O. Box 182845
Columbus, OH 43218
1-800-782-8183
TRANSFER AGENT
Citi Fund Services
3435 Stelzer Road
Columbus, OH 43219
DISTRIBUTOR
Foreside Distribution Services, L.P.
690 Taylor Road, Suite 150
Gahanna, Ohio 43230
CUSTODIAN
The Northern Trust Company
50 South LaSalle Street
Chicago, IL 60603
INDEPENDENT REGISTERED PUBLIC ACCOUNTING FIRM
KPMG LLP
191 West Nationwide Blvd., Suite 500
Columbus, OH 43215
LEGAL COUNSEL
Dechert LLP
1775 I Street, N.W.
Washington, D.C. 20006

The HSBC Family of Funds are distributed by Foreside Distribution Services, L.P. This document must be preceded or accompanied by a current prospectus for the HSBC Funds, which you should read carefully before you invest or send money.
| — NOT FDIC INSURED | — NO BANK GUARANTEE | — MAY LOSE VALUE |
HSBC Global Asset Management (USA) Inc.
HSBC Funds
Annual Report
October 31, 2012
| EMERGING MARKET FUNDS | | Class A | | Class I | | Class S |
| HSBC Emerging Markets Debt Fund | | HCGAX | | HCGIX | | HBESX |
| HSBC Emerging Markets Local Debt Fund | | HBMAX | | HBMIX | | HBMSX |
| HSBC Frontier Markets Fund | | HSFAX | | HSFIX | | — |
| HSBC Total Return Fund | | HTRAX | | HTRIX | | HTRSX |
| HSBC RMB Fixed Income Fund | | HRMBX | | HRMRX | | HRMSX |
| Table of Contents |
| HSBC Family of Funds |
| Annual Report - October 31, 2012 |
| Glossary of Terms | |
| Chairman’s Message | 4 |
| President’s Message | 5 |
| Commentary From the Investment Manager | 6 |
| Portfolio Reviews | 8 |
| Portfolio Composition | 18 |
| | |
| Schedules of Portfolio Investments | |
| HSBC Emerging Markets Debt Fund | 20 |
| HSBC Emerging Markets Local Debt Fund | 24 |
| HSBC Frontier Markets Fund | 28 |
| HSBC Total Return Fund | 30 |
| HSBC RMB Fixed Income Fund | 35 |
| Statements of Assets and Liabilities | 37 |
| Statements of Operations | 39 |
| Statements of Changes in Net Assets | 40 |
| Financial Highlights | 44 |
| Notes to Financial Statements | 49 |
| Report of Independent Registered Public Accounting Firm | 66 |
| Other Federal Income Tax Information | 67 |
| Investment Adviser Contract Approval | 68 |
| Table of Shareholder Expenses | 70 |
| Board of Trustees and Officers | 72 |
| Other Information | 74 |
Barclays U.S. Aggregate Bond Index is an unmanaged index generally representative of investment-grade, fixed-rate debt issues, including government, corporate, asset-backed, and mortgage-backed securities, with maturities of at least one year.
Barclays U.S. High-Yield Corporate Bond Index is an unmanaged index that measures the non-investment grade, USD-denominated, fixed-rate, taxable corporate bond market. Securities are classified as high-yield if the middle rating of Moody’s, Fitch, and S&P is Ba1/BB+/BB+ or below. The index excludes emerging markets debt.
BofA Merrill Lynch 3-Month LIBOR Constant Maturity Index tracks the performance of a synthetic asset paying LIBOR to a stated maturity. The index is based on the assumed purchase at par of a synthetic instrument having exactly its stated maturity and with a coupon equal to that day’s fixing rate. That issue is assumed to be sold the following business day (priced at a yield equal to the current day fixing rate) and rolled into a new instrument.
Gross Domestic Product (“GDP”) measures the market value of the goods and services produced by labor and property in the United States.
HSBC Offshore Renminbi Bond Index tracks total return performance of renminbi-denominated and renminbi-settled bonds and certificates of deposit issued outside the People’s Republic of China.
J.P. Morgan Emerging Local Markets Index Plus is an unmanaged index that tracks total returns for local-currency-denominated money market instruments in 22 emerging markets countries with at least US$10 billion of external trade.
J.P. Morgan Emerging Markets Bond Index Global is an unmanaged index that tracks returns for USD-denominated debt instruments issued by emerging market sovereign and quasi-sovereign entities; Brady bonds, loans, Eurobonds and local market instruments.
J.P. Morgan Government Bond Index – Emerging Markets Global Diversified is an unmanaged comprehensive global emerging markets fixed income index, and consists of regularly traded, liquid fixed-rate, domestic currency government bonds to which international investors can gain exposure.
Morgan Stanley Capital International Europe Australasia and Far East (“MSCI EAFE”) Index is an unmanaged free float-adjusted market capitalization index that is designed to measure the equity market performance of developed markets, excluding the U.S. & Canada. The MSCI EAFE Index consists of the following 22 developed market countries: Australia, Austria, Belgium, Denmark, Finland, France, Germany, Greece, Hong Kong, Ireland, Israel, Italy, Japan, the Netherlands, New Zealand, Norway, Portugal, Singapore, Spain, Sweden, Switzerland, and the United Kingdom.
Morgan Stanley Capital International (“MSCI”) Frontier Markets Index is an unmanaged index which captures large- and mid-cap representation across 25 Frontier Markets (FM) countries. The index includes 155 securities, covering about 84% of the free float-adjusted market capitalization in each country.
Morgan Stanley Capital International (“MSCI”) Frontier Emerging Markets Capped Index is an unmanaged index and was developed for MSCI by HSBC and is a customized capped version of the MSCI Frontier Emerging Markets (FME) Index. The MSCI FME index is a free float-adjusted market capitalization index designed to measure equity market performance in all countries from the MSCI Frontier Markets Index and the lower size spectrum of the MSCI Emerging Markets Index. The Index consists of 25 frontier markets and five emerging markets.
Russell 2000® Index is an unmanaged index that measures the performance of the small-cap segment of the U.S. equity universe. The Russell 2000® Index is a subset of the Russell 3000® Index representing approximately 10% of the total market capitalization of that index. It includes approximately 2000 of the smallest securities based on a combination of their market cap and current index membership.
Standard & Poor’s MidCap 400 Index is an unmanaged index that is the most widely used index for mid-sized companies. The S&P MidCap 400 covers 7% of the U.S. equities market, and is part of a series of S&P U.S. indices that can be used as building blocks for portfolio composition.
Standard & Poor’s 500 (“S&P 500”) Index is an unmanaged index that is widely regarded as a gauge of the U.S. equities market. This index includes 500 leading companies in leading industries of the U.S. economy. The S&P 500 Index focuses on the large-cap segment of the market, with approximately 75% coverage of U.S. equities.
Securities indices assume reinvestment of all distributions and interest payments and do not take in account brokerage fees or expenses. Securities in the Funds do not match those in the indices and performance of the Funds will differ. Investors cannot invest directly in an index.
December 20, 2012
To Our Shareholders:
These are challenging times for investors.
Perhaps the central reason is the slow but remorseless unwinding of a multi-decade build-up in global debt, following the recent sharp decline in the global economy. Much of this debt has been devalued—including, for example, debt associated with U.S. housing stock or Greek government debt.
Despite these modest declines, U.S. private debt—which includes household debt from such things as credit cards and mortgages—remains high. Some historical perspective: In 1951, private sector debt stood at just 53% of the U.S. Gross Domestic Product1 (GDP); today, that debt stands at 159%—a very high level, though down from its 2007 peak of 179%.
The turning point appears to be 2007. In that year, aggressive monetary and fiscal policies were enacted in the U.S. to stimulate the flagging economy. The result has been soaring government debt. Projections from the Congressional Budget Office suggest that the ratio of federal debt to GDP could reach 100% by the middle of the next decade—and that doesn’t reflect the increasing cost of entitlement programs.
These increasing claims on national income are worrisome, profoundly so, and have sparked intense and important debate—between Keynesians and monetarists; between free market capitalists and fans of European-style welfare economies; and, most recently, between Democrats and Republicans in the recent election.
So far, these growing claims by government on private sector income and wealth have failed to push interest rates higher. However, they have arguably, tempered the kind of growth and employment gains one would historically associate with recovery. In fact, the Federal Reserve’s Quantative Easing programs and “Operation Twist” have pushed rates to low levels, frustrating investors’ search for yield and leading our advisor and service providers to absorb about $17 million in fee waivers last year. Without these waivers our money market funds would have provided lower yields. Thus, it is no surprise that total money market fund assets have declined.
Regulators and others, parsing the entrails of the sharp recession, have proposed to change the regulation of such funds in order to prevent a future “run” on the funds during any period of economic upheaval. Proposals include a floating NAV, and variations of stable net asset value that include capital buffers.
Our other funds performed well in this difficult environment, as the following pages show.
Furthermore, the fund group continued to nourish its strategy of providing top-notch emerging market asset management products. Our most recent offering is the HSBC RMB Fixed Income Fund, which affords access to the Renminbi, the official offshore currency of the People’s Republic of China, through a portfolio of “Dim Sum” bonds. As the leading international bank in mainland China, HSBC is uniquely positioned to manage such a vehicle.
On behalf of my colleagues, I thank our investment advisor and portfolio managers, our other service providers, and you, our shareholders, for your support. We will continue to work hard to merit that confidence.
Sincerely,
| Michael Seely |
| Chairman, HSBC Funds |
| 1 | | For additional information, please refer to the Glossary of Terms. |
This literature must be preceded or accompanied by an effective prospectus for the HSBC Funds. Investors should consider the investment objectives, risks, charges, and expenses of the investment company carefully before investing. The prospectus contains this and other important information about the investment company. To obtain more information, for clients of HSBC Securities (USA) Inc., please call 1-888-525-5757 or visit www.investorfunds.us.hsbc.com. For other investors and prospective investors, please call the Funds directly at 1-888-936-4722. Investors should read the prospectus carefully before investing or sending money.
Dear Shareholder,
We are please to send to you the HSBC Funds annual report, covering the Funds’ fiscal year ended October 31, 2012. This report offers detailed information about your Funds’ investments and results. We encourage you to review it carefully.
Inside these pages you will find a letter from the Funds’ Chairman, Michael Seely, in which he comments on recent market developments. The report also includes commentary from the Funds’ portfolio managers in which they discuss the investment markets and their respective Fund’s performance. Each commentary is accompanied by the Fund’s return for the period, listed alongside the returns of its benchmark index and peer group average for comparative purposes.
On June 8 of this year we continued to expand our emerging markets funds offering by launching the HSBC RMB Fixed Income Fund. This Fund gives investors exposure to the Chinese Renminbi (“RMB”) bond market, sometimes referred to as the “dim sum” bond market. The Fund joins the HSBC Emerging Markets Local Debt Fund, HSBC Emerging Markets Debt Fund, HSBC Total Return Fund and the HSBC Frontier Markets Fund in our emerging markets segment.
In closing, we would like to thank you for investing through the HSBC Funds. We continue to focus the HSBC Fund Family investment solutions to assist our shareholders in reaching their financial goals. We appreciate the trust you place in us, and will continue working to earn it. Please contact us at any time with questions or concerns.
Sincerely,
| Richard A. Fabietti |
| President |
| Commentary From the Investment Manager |
| HSBC Global Asset Management (USA) Inc. |
U.S. Economic Review
The global economy made only moderate progress in its ongoing recovery from a historic downturn during the 12-month period between November 1, 2011 and October 31, 2012. Governments around the world fueled the turnaround with aggressive monetary stimulus as policymakers struggled to revive growth against a backdrop, at least in the developed world, of bloated public debt. The Federal Reserve Board (the “Fed”) maintained the federal funds rate—a key factor in lending rates—at a historically low target range between 0.00% to 0.25%, and announced that it would keep the rate in that range until at least 2015.
The period began among concerns that the eurozone debt crisis would cause a new global recession. The situation in Europe improved somewhat during the first months of 2012, largely due to the European Central Bank’s (ECB) efforts to support liquidity. However, the prospect of another global recession loomed throughout much of the period as numerous economic indicators, such as industrial production and unemployment growth, proved disappointing. Although the U.S. economy continued to expand during the period, the pace of its growth slowed.
We believe the ECB helped to stem a liquidity crisis and alleviate fears of deepening credit problems in the eurozone. In December 2011 the ECB began distributing inexpensive loans to European banks as part of its long-term refinancing operation (LTRO) and in March 2012 began doling out an even larger amount of money in similar loans. The LTRO appeared to stabilize financial markets in the short term; nevertheless, significant uncertainties remain regarding the long-term prospects of European economies to regain their competitiveness and prevent default. The ability of Italy and Spain to reestablish market confidence remained in doubt; in addition, the long-term impact of austerity programs on economic growth raised concerns.
Slowing growth in major world economies, including the U.S. and China, presented a significant setback for the global economy. U.S. Gross Domestic Product (“GDP”)1 increased at an annualized rate of 4.1% during the last quarter of 2011, then slowed to 2.7% or less for the remainder of the period under review. Industrial production growth was weak in both developed and emerging markets. U.S. consumer confidence improved somewhat, although real income growth and consumer savings were low. While job growth remained slow, during the last quarter of the period the unemployment rate fell below 8% for the first time in four years. During the period, the U.S. housing market showed significant signs of improvement as sales increased and inventory declined. Towards the end of the period, better economic news was seen from China, the world’s second-largest economy, leading many commentators to suggest that Chinese economic growth had turned a corner. One positive consequence of the slowdown in the global economy was a decrease in the rate of inflation in both developed and emerging economies.
Market Review
U.S. stocks posted strong gains. The first two months of the period were characterized by high volatility, as investors responded to ongoing debt problems and slowing economic growth. Equities began a strong rally in the final weeks of 2011 that continued throughout much of the period, with the exception of a pullback during the late spring. Stocks’ robust performance, despite economic setbacks, was supported in part by the actions of central banks, including the ECB’s launch of a new bond buying scheme it described as “unlimited” and the Fed’s third round of “quantitative easing.” The S&P 500 Index1 of large-company stocks returned 15.21% for the 12 months through October 2012. Small-cap shares slightly outperformed mid- and large-caps: For the same period, the Russell 2000® Index1 of small-company stocks returned 12.08%, and the S&P 400 MidCap Index1 returned 12.11%.
The debt crisis in Europe, along with slowing growth in developing economies, led to less impressive performance for foreign stocks. The Morgan Stanley Capital International Europe Australasia and Far East (“MSCI EAFE”) Index1 of international stocks in developed markets returned 4.61% for the 12-month period.
Fixed-income securities generated significant gains during the period, as global economic worries continued to drive demand for lower-risk assets. Yields on U.S. government bonds reached record lows as an increasing number of investors pursued a flight to safety. Low inflation, healthy corporate balance sheets, consumer and corporate deleveraging and a stabilizing housing market supported gains in corporate fixed-income markets, including both investment and high yield bonds. For the 12-month period the Barclays U.S. Aggregate Bond Index1, which tracks the broad investment-grade fixed-income market, returned 5.25%, while the Barclays U.S. High-Yield Corporate Bond Index1 returned 13.61%.
| 1 | | For additional information, please refer to the Glossary of Terms. |
| Portfolio Reviews (Unaudited) |
| HSBC Emerging Markets Debt Fund |
| (Class A Shares, Class I Shares and Class S Shares) |
by Guillermo Osses, Managing Director,
Head of Emerging Markets Debt Portfolio Management
The HSBC Emerging Markets Debt Fund (the “Fund”) seeks to maximize total return (comprised of capital appreciation and income). Under normal market conditions, the Fund invests at least 80% of its net assets in fixed income instruments of issuers that economically are tied to emerging markets. The Fund will invest in instruments issued by foreign governments and corporations. Investments will generally be made in U.S. dollar denominated instruments, but the Fund will also seek to invest in emerging market local currency denominated instruments.
Investment Concerns
Equity securities (stocks) are more volatile and carry more risk than other forms of investments, including investments in high-grade fixed income securities.
Bond funds will tend to experience smaller fluctuations in value than stock funds. However, investors in any bond fund should anticipate fluctuations in price, especially for longer term issues and in environments of rising interest rates. Investments in a bond fund are subject to possible loss due to the financial failure of underlying securities and their inability to meet their client obligations.
High yield, lower rated securities involve greater price volatility and present greater risk than higher rated fixed income securities. At times, due to market conditions, the Fund may be unable to sell certain of its portfolio securities without a substantial drop in price. Prices of fixed income securities are generally inversely correlated to interest rates. Investments in the Fund are subject to possible loss due to the financial failure of underlying securities and their inability to meet their debt obligations. These risks may increase the Fund’s share price volatility.
International investing involves increased risk and volatility. An investment in international funds entails the special risks of international investing, including currency exchange fluctuation, government regulations, and the potential for political and economic instability.
Prices of securities in emerging markets can fluctuate more significantly than the prices of companies in more developed countries. Securities of emerging market issuers generally have more risk than securities issued by issuers in more developed markets. The less developed the country, the greater affect the risks may have on an investment, and as a result, an investment may exhibit a higher degree of volatility than either the general domestic securities market or the securities markets of developed foreign countries.
Derivatives may be riskier than other types of investments and could result in losses that significantly exceed the Fund’s original investment.
For a complete description of these and other risks associated with investment in a mutual fund, please refer to the Fund’s prospectus.
Market Commentary
The Fund returned 16.90% (without sales charge) for the Class A Shares and 17.19% for the Class I Shares for the year ended October 31, 2012. That compared to a 16.33% total return for the J.P. Morgan Emerging Markets Bond Index Global1.
Portfolio Performance
Emerging markets debt assets rallied at different times during the period as investors looked for higher yields than were available in developed markets. The Fund benefited from this strong performance, and from its positioning within select emerging markets.
For example, overweight positions in Argentina and Venezuela early in the period helped the Fund outperform its benchmark when those countries attracted investors who were willing to take on more risk in exchange for higher yields. The Fund’s overweight position in Lithuania benefited relative performance after those holdings rallied on decisions made by the European Central Bank to address the eurozone debt crisis.
The Fund’s holdings of local emerging market currencies and hard currency corporate bonds that are not included in the index also contributed to performance. The Fund actively adjusted its exposure to both those off-benchmark asset classes in accordance with our views on relative valuation and market risk expectations.*
The Fund’s performance suffered later in the period after we adopted a more cautious stance toward certain high-volatility markets. For example, the Fund moved to underweight Venezuela in the first half of the period after a rally drove up valuations in that market. However, Venezuela continued to perform well, detracting from the Fund’s relative performance. Likewise, the Fund reduced its holdings in Argentina in the third quarter of 2012 because of high valuations. Therefore, when Argentina delivered a 20% return during that quarter, the Fund’s underweight position hurt its relative return.*
| * | | Portfolio composition is subject to change. |
| 1 | | For additional information, please refer to the Glossary of Terms. |
Past performance does not guarantee future results. The performance data quoted represents past performance and current returns may be lower or higher. Total return figures include change in share price, reinvestment of dividends and capital gains and do not reflect taxes that a shareholder would pay on Fund distributions or on the redemption of Fund shares. Investment return and principal value will fluctuate so that an investor’s shares, when redeemed may be worth more or less than the original cost. To obtain performance information current to the most recent month end, please call 1-800-782-8183.
| Portfolio Reviews (Unaudited) |
| HSBC Emerging Markets Debt Fund |
The charts above represent a historical since inception performance comparison of a hypothetical $10,000 investment in the indicated share class versus a similar investment in the Fund’s benchmark and represents the reinvestment of dividends and capital gains in the Fund.
| | | | Average Annual | | Expense |
| Fund Performance | | | | Total Return (%) | | Ratio (%)2 |
| | Inception | | 1 | | Since | | | | |
| As of October 31, 2012 | | Date | | Year | | Inception | | Gross | | Net |
| HSBC Emerging Markets Debt Fund Class A1 | | 4/7/11 | | 11.35 | | 10.47 | | 1.47 | | 1.20 |
| HSBC Emerging Markets Debt Fund Class I | | 4/7/11 | | 17.19 | | 14.36 | | 1.12 | | 0.85 |
| HSBC Emerging Markets Debt Fund Class S | | 4/7/11 | | 17.30 | | 14.46 | | 1.02 | | 0.75 |
| J.P. Morgan Emerging Markets Bond Index Global | | — | | 16.33 | | 14.42 | | N/A | | N/A |
Past performance does not guarantee future results. The performance data quoted represents past performance and current returns may be lower or higher. Total return figures include change in share price, reinvestment of dividends and capital gains and do not reflect the taxes that a shareholder would pay on Fund distributions or on the redemption of Fund shares. Investment return and principal value will fluctuate so that an investor’s shares, when redeemed may be worth more or less than the original cost. To obtain performance information current to the most recent month end, please call 1-800-782-8183.
The performance above reflects any fee waivers that have been in effect during the applicable periods, as well as any expense reimbursements that have periodically been made. Absent such waivers and reimbursements, returns would have been lower. Currently, contractual fee waivers are in effect for the Fund through March 1, 2013.
| 1 | | Reflects the maximum sales charge of 4.75%. |
| 2 | | Reflects the expense ratio as reported in the prospectus dated February 28, 2012. HSBC Global Asset Management (USA) Inc. has entered into a contractual expense limitation agreement with the Fund under which it will limit total expenses of the Fund (excluding interest, taxes, brokerage commissions, extraordinary expenses and estimated indirect expenses attributable to the Fund’s investments in investment companies) to an annual rate of 1.20%, 0.85% and 0.75% for Class A Shares, Class I Shares and Class S Shares, respectively. The expense limitation shall be in effect until March 1, 2013. Additional information pertaining to the October 31, 2012 expense ratios can be found in the financial highlights. |
The Fund’s performance is measured against the J.P. Morgan Emerging Markets Bond Index Global, an unmanaged index that tracks returns for USD-denominated debt instruments issued by emerging market and sovereign quasi-sovereign entities; Brady bonds, loans, Eurobonds and local market markets. The performance of the index does not reflect the deduction of expenses associated with a mutual fund, such as investment management and fund accounting fees. The Fund’s performance reflects the deduction of fees for these value-added services. Investors cannot invest directly in an index.
| Portfolio Reviews (Unaudited) |
| HSBC Emerging Markets Local Debt Fund |
| (Class A Shares, Class I Shares and Class S Shares) |
by Guillermo Osses, Managing Director,
Head of Emerging Markets Debt Portfolio Management
The HSBC Emerging Markets Local Debt Fund (the “Fund”) seeks maximum total return (comprised of capital appreciation and income). Under normal market conditions, the Fund invests at least 80% of its net assets, plus borrowings for investment purposes, in debt instruments issued by foreign governments, government agencies or corporations and denominated in local currencies of countries with emerging securities markets. The Fund may also invest in instruments denominated in U.S. dollars.
Investment Concerns
Equity securities (stocks) are more volatile and carry more risk than other forms of investments, including investments in high-grade fixed income securities.
Bond funds will tend to experience smaller fluctuations in value than stock funds. However, investors in any bond fund should anticipate fluctuations in price, especially for longer term issues and in environments of rising interest rates. Investments in a bond fund are subject to possible loss due to the financial failure of underlying securities and their inability to meet their client obligations.
High yield, lower rated securities involve greater price volatility and present greater risk than higher rated fixed income securities. At times, due to market conditions, the Fund may be unable to sell certain of its portfolio securities without a substantial drop in price. Prices of fixed income securities are generally inversely correlated to interest rates. Investments in the Fund are subject to possible loss due to the financial failure of underlying securities and their inability to meet their debt obligations. These risks may increase the Fund’s share price volatility.
International investing involves increased risk and volatility. An investment in international funds entails the special risks of international investing, including currency exchange fluctuation, government regulations, and the potential for political and economic instability.
Prices of securities in emerging markets can fluctuate more significantly than the prices of companies in more developed countries. Securities of emerging market issuers generally have more risk than securities issued by issuers in more developed markets. The less developed the country, the greater affect the risks may have on an investment, and as a result, an investment may exhibit a higher degree of volatility than either the general domestic securities market or the securities markets of developed foreign countries.
Derivatives may be riskier than other types of investments and could result in losses that significantly exceed the Fund’s original investment.
For a complete description of these and other risks associated with investment in a mutual fund, please refer to the Fund’s prospectus.
Market Commentary
The Fund returned 4.36% (without sales charge) for the Class A Shares and 4.69% for the Class I Shares for the year ended October 31, 2012. That compared to a 4.39% total return for the Fund’s primary performance benchmark, a blended index, which is comprised of equal weightings in the J.P. Morgan Government Bond Index-Emerging Markets Global Diversified1 and the J.P. Morgan Emerging Local Markets Index Plus1. The J.P. Morgan Government Bond Index–Emerging Markets Global Diversified returned 7.25%, and the J.P. Morgan Emerging Local Markets Index Plus returned 1.55%, for the period, respectively.
Portfolio Performance
Emerging markets debt assets rallied at different times during the period as investors looked for higher yields than were available in developed markets. The Fund benefited from this strong performance, and from its positioning within select emerging market local bonds and currencies.
The Fund’s overweight position in the Hungarian forint contributed to the relative outperformance, seen in the Class I Shares and Class S Shares, versus the benchmark early in the period, as European emerging market currencies rallied in early 2012. In addition, an overweight position in the Mexican peso contributed to the Fund’s outperformance. The peso has a close relationship to the health of the U.S. economy, so the currency benefited from stronger-than-expected growth in the U.S. economy in early 2012. Towards the end of the period, an overweight position in the Indian rupee contributed to the Fund’s relative performance as the currency strengthened following government policies to allow more foreign investment.
The Fund’s underweight positions in the Polish zloty and Russian ruble detracted from the Fund’s performance early in the year, as those currencies performed better than expected after the European Central Bank announced policies to address the eurozone debt crisis. Toward the end of the period, an overweight position in the Brazilian real, adopted due to the central bank’s prior success controlling its currency, negatively impacted the Fund’s relative return when the real weakened during the second half of September.*
| * | | Portfolio composition is subject to change. |
| 1 | | For additional information, please refer to the Glossary of Terms. |
Past performance does not guarantee future results. The performance data quoted represents past performance and current returns may be lower or higher. Total return figures include change in share price, reinvestment of dividends and capital gains and do not reflect taxes that a shareholder would pay on Fund distributions or on the redemption of Fund shares. Investment return and principal value will fluctuate so that an investor’s shares, when redeemed may be worth more or less than the original cost. To obtain performance information current to the most recent month end, please call 1-800-782-8183.
| Portfolio Reviews (Unaudited) |
| HSBC Emerging Markets Local Debt Fund |
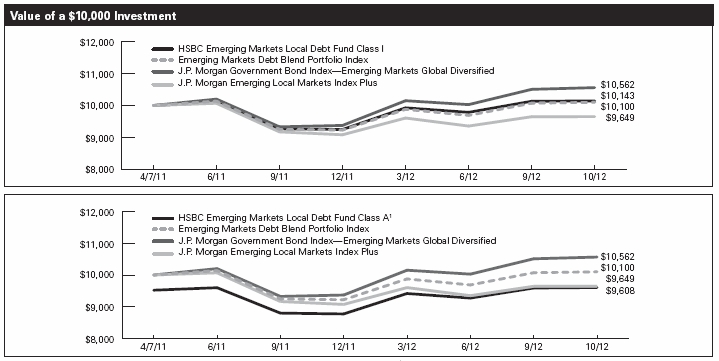
The charts above represent a historical since inception performance comparison of a hypothetical $10,000 investment in the indicated share class versus a similar investment in the Fund’s benchmark and represents the reinvestment of dividends and capital gains in the Fund.
| | | | Average Annual | | Expense |
| Fund Performance | | | | Total Return (%) | | Ratio (%)3 |
| | Inception | | 1 | | Since | | | | |
| As of October 31, 2012 | | Date | | Year | | Inception | | Gross | | Net |
| HSBC Emerging Markets Local Debt Fund Class A1 | | 4/7/11 | | -0.64 | | -2.51 | | 1.75 | | 1.28 |
| HSBC Emerging Markets Local Debt Fund Class I | | 4/7/11 | | 4.69 | | 0.91 | | 1.40 | | 0.93 |
| HSBC Emerging Markets Local Debt Fund Class S | | 4/7/11 | | 4.78 | | 1.01 | | 1.30 | | 0.83 |
| Emerging Markets Debt Blend Portfolio Index2 | | — | | 4.39 | | 0.63 | | N/A | | N/A |
| J.P. Morgan Government Bond Index–Emerging Markets Global Diversified2 | | — | | 7.25 | | 3.54 | | N/A | | N/A |
| J.P. Morgan Emerging Local Markets Index Plus2 | | — | | 1.55 | | -2.25 | | N/A | | N/A |
Past performance does not guarantee future results. The performance data quoted represents past performance and current returns may be lower or higher. Total return figures include change in share price, reinvestment of dividends and capital gains and do not reflect the taxes that a shareholder would pay on Fund distributions or on the redemption of Fund shares. Investment return and principal value will fluctuate so that an investor’s shares, when redeemed may be worth more or less than the original cost. To obtain performance information current to the most recent month end, please call 1-800-782-8183.
The performance above reflects any fee waivers that have been in effect during the applicable periods, as well as any expense reimbursements that have periodically been made. Absent such waivers and reimbursements, returns would have been lower. Currently, contractual fee waivers are in effect for the Fund through March 1, 2013.
| 1 | | Reflects the maximum sales charge of 4.75%. |
| 2 | | For additional information, please refer to the Glossary of Terms. |
| 3 | | Reflects the expense ratio as reported in the prospectus dated February 28, 2012. HSBC Global Asset Management (USA) Inc. has entered into a contractual expense limitation agreement with the Fund under which it will limit total expenses of the Fund (excluding interest, taxes, brokerage commissions, extraordinary expenses and estimated indirect expenses attributable to the Fund’s investments in investment companies) to an annual rate of 1.20%, 0.85% and 0.75% for Class A Shares, Class I Shares and Class S Shares, respectively. The expense limitation shall be in effect until March 1, 2013. The expense ratios reflected include Acquired Fund fees and expenses. Additional information pertaining to the October 31, 2012 expense ratios can be found in the financial highlights. |
The Fund’s performance is measured against the Emerging Markets Debt Blend Portfolio Index, which is a hypothetical combination of unmanaged broad-based indices of equal weightings in the J.P. Morgan Government Bond Index–Emerging Markets Global Diversified and J.P. Morgan Emerging Local Markets Index Plus. The performance of the indexes does not reflect the deduction of expenses associated with a mutual fund, such as investment management and fund accounting fees. The Fund’s performance reflects the deduction of fees for these value-added services. Investors cannot invest directly in an index.
| Portfolio Reviews (Unaudited) |
| HSBC Frontier Markets Fund |
| (Class A Shares and Class I Shares) |
by Andrew Brudenell, Senior Portfolio Manager
The HSBC Frontier Markets Fund (the “Fund”) seeks long-term capital appreciation. Under normal market conditions, the Fund invests at least 80% of its net assets, plus any borrowings for investment purposes, in issuers located in “frontier market countries”. The term “frontier market countries” encompasses those countries that are at an earlier stage of economic, political or financial development, even by emerging markets standards.
Investment Concerns
Equity securities (stocks) are more volatile and carry more risk than other forms of investments, including investments in high-grade fixed income securities.
Foreign securities can be subject to greater risks than U.S. investments, including currency fluctuations, less liquid trading markets, greater price volatility, political and economic instability, less publicly available information, and changes in tax or currency laws or monetary policy. These risks are likely to be greater for emerging markets than in developed markets.
Frontier market countries generally have smaller economies and even less developed capital markets or legal and political systems than traditional emerging market countries. As a result, the risks of investing in emerging market countries are magnified in frontier market countries. The magnification of risks are the result of: the potential for extreme price volatility and illiquidity in frontier markets; government ownership or control of parts of private sector and of certain companies; trade barriers, exchange controls, managed adjustments in relative currency values and other protectionist measures imposed or negotiated by the countries with which frontier market countries trade; and the relatively new and unsettled securities laws in many frontier market countries.
Prices of securities in emerging markets can fluctuate more significantly than the prices of companies in more developed countries. Securities of emerging market issuers generally have more risk than securities issued by issuers in more developed markets. The less developed the country, the greater affect the risks may have on an investment, and as a result, an investment may exhibit a higher degree of volatility than either the general domestic securities market or the securities markets of developed foreign countries.
Derivatives may be riskier than other types of investments and could result in losses that significantly exceed the Fund’s original investment.
For a complete description of these and other risks associated with investment in a mutual fund, please refer to the Fund’s prospectus.
Market Commentary
The Fund returned 13.27% (without sales charge) for the Class A Shares and 13.68% for the Class I Shares for the year ended October 31, 2012. That compared to a 1.03% total return for the MSCI Frontier Markets Index1 and a 6.61% total return for the MSCI Frontier Emerging Markets Capped Index1 for the same period, respectively.
Portfolio Performance
Frontier markets had a positive 12 months, driven by strong performances from individual countries such as Nigeria, Colombia and Saudi Arabia. In addition, frontier markets’ low correlation to developed markets meant that frontier market shares were affected to a lesser extent by global economic concerns such as the eurozone debt crisis and slowing growth in China. Those factors helped attract investors seeking diversification for their portfolios, as well as growth opportunities presented by countries in the early stages of economic and political development.
A stock selection strategy that included several non-benchmark holdings helped the Fund outperform its benchmark during the period. For example, the Fund benefited from its non-benchmark investment in a Cambodian hotel and casino operator that rose with the growth of the Cambodian tourism industry and expansion plans. Another non-benchmark holding, an oil and gas exploration company in Mozambique, boosted the Fund’s returns when the company became the target of a takeover battle between two larger energy firms.*
The Fund’s overweight position in Pakistan helped boost relative performance, particularly due to the strength of the Fund’s investments in that country’s financial services sector. An underweight position in Eastern Europe also helped the Fund outperform its benchmark, as many Eastern European markets suffered due to the eurozone debt crisis and local economic uncertainty.*
Some of the Fund’s weightings detracted from its relative performance. For example, we held an underweight position in Colombia due to what we believed were high valuations in that market. However, Colombian shares continued to appreciate during the period on positive political and economic news. The Fund’s overweight position in Egypt diminished relative performance when a longer-than-expected period of political uncertainty weighed on share values in that country.*
| * | Portfolio composition is subject to change. |
| 1 | For additional information, please refer to the Glossary of Terms. |
Past performance does not guarantee future results. The performance data quoted represents past performance and current returns may be lower or higher. Total return figures include change in share price, reinvestment of dividends and capital gains and do not reflect taxes that a shareholder would pay on Fund distributions or on the redemption of Fund shares. Investment return and principal value will fluctuate so that an investor’s shares, when redeemed may be worth more or less than the original cost. To obtain performance information current to the most recent month end, please call 1-800-782-8183.
12 HSBC FAMILY OF FUNDS
| Portfolio Reviews (Unaudited) |
| HSBC Frontier Markets Fund |
The charts above represent a historical since inception performance comparison of a hypothetical $10,000 investment in the indicated share class versus a similar investment in the Fund’s benchmark and represents the reinvestment of dividends and capital gains in the Fund.
| | | | Average Annual Total | | Expense |
| Fund Performance | | | | Return (%) | | Ratio (%)3 |
| | Inception | | | | Since | | | | |
| As of October 31, 2012 | | Date | | 1 Year | | Inception | | Gross | | Net |
| HSBC Frontier Markets Fund Class A1 | | 9/6/11 | | 7.59 | | 3.36 | | 3.07 | | 2.20 |
| HSBC Frontier Markets Fund Class I | | 9/6/11 | | 13.68 | | 8.49 | | 2.72 | | 1.85 |
| MSCI Frontier Markets Index2 | | — | | 1.03 | | -0.72 | | N/A | | N/A |
| MSCI Frontier Emerging Markets Capped Index2 | | — | | 6.61 | | 1.86 | | N/A | | N/A |
Past performance does not guarantee future results. The performance data quoted represents past performance and current returns may be lower or higher. Total return figures include change in share price, reinvestment of dividends and capital gains and do not reflect the taxes that a shareholder would pay on Fund distributions or on the redemption of Fund shares. Investment return and principal value will fluctuate so that an investor’s shares, when redeemed may be worth more or less than the original cost. To obtain performance information current to the most recent month end, please call 1-800-782-8183.
The performance above reflects any fee waivers that have been in effect during the applicable periods, as well as any expense reimbursements that have periodically been made. Absent such waivers and reimbursements, returns would have been lower. Currently, contractual fee waivers are in effect for the Fund through March 1, 2013.
| 1 | Reflects the maximum sales charge of 5.00%. |
| 2 | For additional information, please refer to the Glossary of Terms. |
| 3 | Reflects the expense ratio as reported in the prospectus dated February 28, 2012. HSBC Global Asset Management (USA) Inc. has entered into a contractual expense limitation agreement with the Fund under which it will limit total expenses of the Fund (excluding interest, taxes, brokerage commissions, extraordinary expenses and estimated indirect expenses attributable to the Fund’s investments in investment companies) to an annual rate of 2.20% and 1.85% for Class A Shares and Class I Shares, respectively. The expense limitation shall be in effect until March 1, 2013. Additional information pertaining to the October 31, 2012 expense ratios can be found in the financial highlights. |
The performance of the Fund is measured against the MSCI Frontier Markets Index and the MSCI Frontier Emerging Markets Capped Index. The Morgan Stanley Capital International (“MSCI”) Frontier Markets Index captures large- and mid-cap representation across 26 Frontier Markets (FM) countries. The index includes 155 securities, covering about 84% of the free float-adjusted market capitalization in each country. The MSCI Frontier Emerging Markets Capped Index was developed for MSCI by HSBC and is a customized capped version of the MSCI Frontier Emerging Markets (FEM) Index. The MSCI FEM Index is a free float-adjusted market capitalization index designed to measure equity market performance in all countries from the MSCI Frontier Markets Index and the lower size spectrum of the MSCI EM Index. The Index consists of 25 frontier markets and five emerging markets. The indexes are unmanaged and the performance of the indexes does not reflect the deduction of expenses associated with a mutual fund, such as investment management and fund accounting fees. The Fund’s performance reflects the deduction of fees for these value-added services. Investors cannot invest directly in an index.
HSBC FAMILY OF FUNDS 13
| Portfolio Reviews (Unaudited) |
| HSBC Total Return Fund |
| (Class A Shares, Class I Shares and Class S Shares) |
by Guillermo Ossés, Managing Director, Head of Emerging Markets Debt Portfolio Management
Lisa Chua, CFA, Senior Vice President, Portfolio Manager
Srinivas (Vas) Paruchuri, PhD., Vice President, Portfolio Manager
Binqi Liu, Assistant Vice President, Portfolio Manager
Phil Yuhn, Senior Vice President, Portfolio Engineer
The HSBC Total Fund (the “Fund”) seeks maximum total return (comprised of capital appreciation and income). Under normal market conditions, the Fund invests its assets (excluding U.S. cash and U.S. cash equivalents) primarily in instruments of issuers that are economically tied to emerging market countries, including in derivative instruments such as futures (including interest rate futures), forwards (including non-deliverable forwards), swaps (including interest rate and total return swaps), options (including interest rate options), swaptions and credit default swaps.
Investment Concerns
Equity securities (stocks) are more volatile and carry more risk than other forms of investments, including investments in high-grade fixed income securities.
Bond funds will tend to experience smaller fluctuations in value than stock funds. However, investors in any bond fund should anticipate fluctuations in price, especially for longer term issues and in environments of rising interest rates. Investments in a bond fund are subject to possible loss due to the financial failure of underlying securities and their inability to meet their client obligations.
High yield, lower rated securities involve greater price volatility and present greater risk than higher rated fixed income securities. At times, due to market conditions, the Fund may be unable to sell certain of its portfolio securities without a substantial drop in price. Prices of fixed income securities are generally inversely correlated to interest rates. Investments in the Fund are subject to possible loss due to the financial failure of underlying securities and their inability to meet their debt obligations. These risks may increase the Fund’s share price volatility.
International investing involves increased risk and volatility. An investment in international funds entails the special risks of international investing, including currency exchange fluctuation, government regulations, and the potential for political and economic instability.
Prices of securities in emerging markets can fluctuate more significantly than the prices of companies in more developed countries. Securities of emerging market issuers generally have more risk than securities issued by issuers in more developed markets. The less developed the country, the greater affect the risks may have on an investment, and as a result, an investment may exhibit a higher degree of volatility than either the general domestic securities market or the securities markets of developed foreign countries.
Derivatives may be riskier than other types of investments and could result in losses that significantly exceed the Fund’s original investment.
For a complete description of these and other risks associated with investment in a mutual fund, please refer to the Fund’s prospectus.
Market Commentary
The Fund returned 3.62% (without sales charge) for the Class A Shares and 3.82% for the Class I Shares from March 30, 2012, the inception date of the Fund, through October 31, 2012. That compared to the 0.30% total return for the BofA Merrill Lynch 3-Month LIBOR Constant Maturity Index1.
Principal Investment Strategies
The Fund seeks to maximize total return, composed of capital appreciation and income, primarily by investing in debt instruments issued by governments of emerging markets countries, or by corporations that are economically tied to emerging markets. Many of these emerging markets rallied during the period, as investors sought higher yields than were available in developed markets.
Several key investing decisions contributed to the Fund’s performance during the period. For example, the Fund’s short position in Argentina boosted performance, as Argentina’s debt suffered in May due to continuing deterioration of that country’s economic fundamentals.*
The Fund also increased its exposure to emerging markets currencies in May, which boosted returns in June as currencies rallied. However, the Fund began reducing its currency exposure in August and September after the continuing rally caused valuations to rise among emerging markets currencies.*
The Fund’s positions in emerging markets corporate debt also boosted performance, as those bonds rallied in response to investor demand for higher yields. The Fund focused on high-quality corporate bonds and quasi-sovereign bonds in countries that offered attractive yields compared to sovereign bonds, such as Gazprom in Russia and Petrobras in Brazil. In addition, the Fund focused on sovereign bonds from Eastern European countries with improving fiscal dynamics that should benefit from stabilizing growth in the eurozone.*
| * | Portfolio composition is subject to change. |
| 1 | For additional information, please refer to the Glossary of Terms. |
Past performance does not guarantee future results. The performance data quoted represents past performance and current returns may be lower or higher. Total return figures include change in share price, reinvestment of dividends and capital gains and do not reflect taxes that a shareholder would pay on Fund distributions or on the redemption of Fund shares. Investment return and principal value will fluctuate so that an investor’s shares, when redeemed may be worth more or less than the original cost. To obtain performance information current to the most recent month end, please call 1-800-782-8183.
14 HSBC FAMILY OF FUNDS
| Portfolio Reviews (Unaudited) |
| HSBC Total Return Fund |
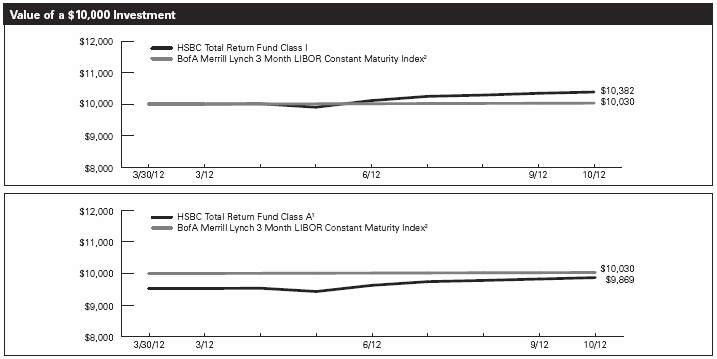
The charts above represent a historical since inception performance comparison of a hypothetical $10,000 investment in the indicated share class versus a similar investment in the Fund’s benchmark and represents the reinvestment of dividends and capital gains in the Fund.
| | | | Aggregate Total | | Expense |
| Fund Performance | | | | Return (%) | | Ratio (%)3 |
| | Inception | | Since | | | | |
| As of October 31, 2012 | | Date | | Inception | | Gross | | Net |
| HSBC Total Return Fund Class A1 | | 3/30/12 | | -1.31 | | 2.11 | | 1.60 |
| HSBC Total Return Fund Class I | | 3/30/12 | | 3.82 | | 1.76 | | 1.25 |
| HSBC Total Return Fund Class S | | 3/30/12 | | 3.87 | | 1.66 | | 1.15 |
| BofA Merrill Lynch 3 Month LIBOR Constant Maturity Index2 | | — | | 0.30 | | N/A | | N/A |
Past performance does not guarantee future results. The performance data quoted represents past performance and current returns may be lower or higher. Total return figures include change in share price, reinvestment of dividends and capital gains and do not reflect the taxes that a shareholder would pay on Fund distributions or on the redemption of Fund shares. Investment return and principal value will fluctuate so that an investor’s shares, when redeemed may be worth more or less than the original cost. To obtain performance information current to the most recent month end, please call 1-800-782-8183.
The performance above reflects any fee waivers that have been in effect during the applicable periods, as well as any expense reimbursements that have periodically been made. Absent such waivers and reimbursements, returns would have been lower. Currently, contractual fee waivers are in effect for the Fund through March 1, 2013.
| 1 | Reflects the maximum sales charge of 4.75%. |
| 2 | For additional information, please refer to the Glossary of Terms. |
| 3 | Reflects the expense ratio as reported in the prospectus dated February 28, 2012 (as supplemented April 9, 2012). HSBC Global Asset Management (USA) Inc. has entered into a contractual expense limitation agreement with the Fund under which it will limit total expenses of the Fund (excluding interest, tax, brokerage commissions, extraordinary expenses and estimated indirect expenses attributable to the Fund’s investment in investment companies) to an annual rate of 1.60%, 1.25% and 1.15% for the Class A Shares, Class I Shares and Class S Shares, respectively. The expense limitation agreement shall be in effect until March 1, 2013. Additional information pertaining to the October 31, 2012 expense ratios can be found in the financial highlights. |
The performance of the Fund is measured against the BofA Merrill Lynch 3-Month LIBOR Constant Maturity Index which tracks the performance of a synthetic asset paying LIBOR to a stated maturity. The index is based on the assumed purchase at par of a synthetic instrument having exactly its stated maturity and with a coupon equal to that day’s fixing rate. That issue is assumed to be sold the following business day (priced at a yield equal to the current day fixing rate) and rolled into a new instrument. The indexes are unmanaged and the performance of the indexes does not reflect the deduction of expenses associated with a mutual fund, such as investment management and fund accounting fees. The Fund’s performance reflects the deduction of fees for these value-added services. Investors cannot invest directly in an index.
HSBC FAMILY OF FUNDS 15
| Portfolio Reviews (Unaudited) |
| HSBC RMB Fixed Income Fund |
| (Class A Shares, Class I Shares and Class S Shares) |
by Cecilia Chan, Jim Veneau, Alfred Mui, Gregory Suen
The HSBC RMB Fixed Income Fund (the “Fund”) seeks to maximize total return by investing principally in debt instruments that provide exposure to Renminbi (“RMB”), the official currency of the People’s Republic of China (“China”). The Fund’s portfolio management team follows a top-down approach in which country credits, currencies, and local rate curves are analyzed based on their fundamental attractiveness. The team seeks to identify risk differentiation across issuers while attempting to manage credit, liquidity and interest rate risks. This investment process allows the team to capture potential opportunities in the growing offshore RMB fixed income market and take advantage of the currency’s potential appreciation. In order to gain such exposure, the Fund may invest in RMB-denominated debt instruments, including RMB-denominated deposits in Hong Kong or US dollar-denominated instruments, as well as derivative instruments, with underlying currency exposure to RMB.
Investment Concerns
Bond funds will tend to experience smaller fluctuations in value than stock funds. However, investors in any bond fund should anticipate fluctuations in price, especially for longer term issues and in environments of rising interest rates. Investments in a bond fund are subject to possible loss due to the financial failure of underlying securities and their inability to meet their client obligations.
High yield, lower rated securities involve greater price volatility and present greater risk than higher rated fixed income securities. At times, due to market conditions, the Fund may be unable to sell certain of its portfolio securities without a substantial drop in price. Prices of fixed income securities are generally inversely correlated to interest rates. Investments in the Fund are subject to possible loss due to the financial failure of underlying securities and their inability to meet their debt obligations. These risks may increase the Fund’s share price volatility.
International investing involves increased risk and volatility. An investment in international funds entails the special risks of international investing, including currency exchange fluctuation, government regulations, and the potential for political and economic instability.
Prices of securities in emerging markets can fluctuate more significantly than the prices of companies in more developed countries. Securities of emerging market issuers generally have more risk than securities issued by issuers in more developed markets. The less developed the country, the greater affect the risks may have on an investment, and as a result, an investment may exhibit a higher degree of volatility than either the general domestic securities market or the securities markets of developed foreign countries.
Derivatives may be riskier than other types of investments and could result in losses that significantly exceed the Fund’s original investment.
For a complete description of these and other risks associated with investment in a mutual fund, please refer to the Fund’s prospectus.
Market Commentary
The Fund returned 3.24% (without sales charge) for Class A Shares and 3.40% for the Class I Shares from June 8, 2012, the inception date of the Fund, through October 31, 2012. That compared to the 3.96% return for the Fund’s benchmark, the HSBC Offshore Renminbi Bond Index1, during the same period.
Principal Investment Strategies
The Fund invests in offshore debt instruments denominated in Renminbi (RMB), the official currency of the People’s Republic of China. The market for offshore RMB-denominated instruments, known as “Dim Sum bonds,” performed well since the Fund’s inception because of growing investor demand for this new asset class. Investors also perceived that yields in the market were attractive compared to credit markets in other major currencies. As a result, prices for Dim Sum bonds rose.
At the same time, the offshore RMB appreciated 2.04% during the period, as China continued a policy of gradual currency appreciation that has delivered steady gains for offshore RMB since the middle of 2012. That appreciation caused the U.S. Dollar (USD) value of investments in the Fund to increase.
The Fund’s underperformance of its benchmark was caused in part by transaction costs incurred while building up the portfolio. This situation was exacerbated by a relatively inactive primary market during the period, requiring the Fund to purchase bonds from the secondary market and incur larger-than-normal transaction costs.*
The Fund’s emphasis on credit quality also caused performance to lag the benchmark when prices of certain troubled credit instruments rebounded sharply during the period. The rebound was driven by investor speculation on the credit outlook of these troubled issuers, but the Fund avoided these instruments due to their higher risk for default.*
Overall, the Fund’s relative return benefited from an overweight position in good-quality credit instruments. We believed these securities had been oversold earlier in 2012 by investors who perceived them to be expensive compared to offerings in other credit markets. These holdings recovered strongly later in the period, which boosted the Fund’s relative performance.*
The Fund maintained a higher average yield-to-maturity than its benchmark, which provided a stable source of coupon income. Also, the Fund’s exposure to short-duration financial sector bonds helped relative performance. Such bonds outperformed longer-duration bonds, which were hampered by a continued supply of new bonds issued by Chinese banks.*
| * | Portfolio composition is subject to change. |
| 1 | For additional information, please refer to the Glossary of Terms. |
Past performance does not guarantee future results. The performance data quoted represents past performance and current returns may be lower or higher. Total return figures include change in share price, reinvestment of dividends and capital gains and do not reflect taxes that a shareholder would pay on Fund distributions or on the redemption of Fund shares. Investment return and principal value will fluctuate so that an investor’s shares, when redeemed may be worth more or less than the original cost. To obtain performance information current to the most recent month end, please call 1-800-782-8183.
16 HSBC FAMILY OF FUNDS
| Portfolio Reviews (Unaudited) |
| HSBC RMB Fixed Income Fund |
| | | | Aggregate Total | | Expense |
| Fund Performance | | | | Return (%) | | Ratio (%)3 |
| | Inception | | 3 | | Since | | | | |
| As of October 31, 2012 | | Date | | Month | | Inception | | Gross | | Net |
| HSBC RMB Fixed Income Class A1 | | 6/8/12 | | -1.75 | | -1.68 | | 2.36 | | 1.45 |
| HSBC RMB Fixed Income Class I | | 6/8/12 | | 3.21 | | 3.40 | | 2.01 | | 1.10 |
| HSBC RMB Fixed Income Class S | | 6/8/12 | | 3.24 | | 3.44 | | 1.91 | | 1.00 |
| HSBC Offshore Renminbi Bond Index2 | | — | | — | | 3.96 | | N/A | | N/A |
Past performance does not guarantee future results. The performance data quoted represents past performance and current returns may be lower or higher. Total return figures include change in share price, reinvestment of dividends and capital gains and do not reflect the taxes that a shareholder would pay on Fund distributions or on the redemption of Fund shares. Investment return and principal value will fluctuate so that an investor’s shares, when redeemed may be worth more or less than the original cost. To obtain performance information current to the most recent month end, please call 1-800-782-8183.
The performance above reflects any fee waivers that have been in effect during the applicable periods, as well as any expense reimbursements that have periodically been made. Absent such waivers and reimbursements, returns would have been lower. Currently, contractual fee waivers are in effect for the Fund through March 1, 2013.
| 1 | Reflects the maximum sales charge of 4.75%. |
| 2 | For additional information, please refer to the Glossary of Terms. |
| 3 | Reflects the expense ratio as reported in the prospectus dated April 30, 2012. HSBC Global Asset management (USA) Inc. has entered into a contractual expense limitation agreement with the Fund under which it will limit total expenses of the Fund (excluding interest, taxes, brokerage commissions, extraordinary expenses and estimated indirect expenses attributable to the Fund’s investments in investment company companies) to an annual rate of 1.45%, 1.10% and 1.00% for Class A Shares, Class I Shares and Class S Shares. The expense limitation shall be in effect until April 30, 2013. |
The performance of the Fund is measured against the HSBC Offshore Renminbi Bond Index tracks total return performance of renminbi-denominated and renminbi-settled bonds and certificates of deposit issued outside the People’s Republic of China. The index, which is unmanaged, and the performance of the indexes does not reflect the deduction of expenses associated with a mutual fund, such as investment management and fund accounting fees. The Fund’s performance reflects the deduction of fees for these value-added services. Investors cannot invest directly in an index.
HSBC FAMILY OF FUNDS 17
| Portfolio Reviews |
| Portfolio Composition* |
| October 31, 2012 (Unaudited) |
| HSBC Emerging Markets Debt Fund† |
| Country | | Percentage of Investments at Value (%) |
| Russian Federation | | | 13.5 | |
| Mexico | | | 11.2 | |
| Venezuela | | | 10.1 | |
| Turkey | | | 9.3 | |
| Indonesia | | | 8.4 | |
| United States | | | 7.1 | |
| Brazil | | | 6.6 | |
| Philippines | | | 4.1 | |
| Colombia | | | 3.5 | |
| Panama | | | 3.1 | |
| South Africa | | | 2.8 | |
| Poland | | | 2.6 | |
| Kazakhstan | | | 2.1 | |
| Ukraine | | | 1.7 | |
| Romania | | | 1.7 | |
| Lithuania | | | 1.6 | |
| Hungary | | | 1.4 | |
| Slovak Republic | | | 1.1 | |
| Peru | | | 1.1 | |
| Uruguay | | | 1.0 | |
| Malaysia | | | 0.8 | |
| El Salvador | | | 0.7 | |
| Chile | | | 0.6 | |
| Iraq | | | 0.6 | |
| Croatia | | | 0.6 | |
| Ireland (Republic of) | | | 0.6 | |
| Sri Lanka | | | 0.5 | |
| Republic of Serbia | | | 0.5 | |
| Dominican Republic | | | 0.3 | |
| Lebanon | | | 0.3 | |
| China | | | 0.3 | |
| Pakistan | | | 0.2 | |
| | | 100.0 | |
| | |
| HSBC Emerging Markets Local Debt Fund† | |
| Country | | Percentage of Investments at Value (%) |
| Malaysia | | | 11.7 | |
| Turkey | | | 11.5 | |
| Poland | | | 11.4 | |
| Mexico | | | 11.0 | |
| Russian Federation | | | 10.7 | |
| South Africa | | | 9.9 | |
| Thailand | | | 8.5 | |
| Indonesia | | | 8.3 | |
| Hungary | | | 5.7 | |
| Kazakhstan | | | 4.2 | |
| Peru | | | 3.0 | |
| Luxembourg | | | 1.4 | |
| Brazil | | | 1.4 | |
| United Arab Emirates | | | 1.2 | |
| United States | | | 0.1 | |
| | | | 100.0 | |
| | | | | |
| HSBC Frontier Markets Fund† | |
| Country | | Percentage of Investments at Value (%) |
| Nigeria | | | 13.1 | |
| United Arab Emirates | | | 13.1 | |
| Qatar | | | 11.6 | |
| Colombia | | | 7.1 | |
| Pakistan | | | 6.7 | |
| Kuwait | | | 5.7 | |
| Kazakhstan | | | 4.2 | |
| Peru | | | 4.1 | |
| Philippines | | | 4.1 | |
| Saudi Arabia | | | 4.0 | |
| Oman | | | 3.7 | |
| Kenya | | | 3.1 | |
| Egypt | | | 2.4 | |
| Vietnam | | | 2.4 | |
| Slovenia | | | 2.0 | |
| Georgia | | | 1.7 | |
| Panama | | | 1.6 | |
| Cambodia | | | 1.5 | |
| Sri Lanka | | | 1.5 | |
| Estonia | | | 1.3 | |
| Lebanon | | | 1.1 | |
| Croatia | | | 1.0 | |
| Romania | | | 0.9 | |
| Bangladesh | | | 0.8 | |
| Argentina | | | 0.7 | |
| Canada | | | 0.5 | |
| Australia | | | 0.4 | |
| | | 100.0 | |
| | |
| HSBC Total Return Fund† | |
| Country | | Percentage of Investments at Value (%) |
| United States | | | 34.7 | |
| Turkey | | | 13.0 | |
| Mexico | | | 9.5 | |
| Brazil | | | 8.8 | |
| Russian Federation | | | 8.6 | |
| Colombia | | | 4.5 | |
| Slovak Republic | | | 3.6 | |
| Indonesia | | | 3.5 | |
| South Africa | | | 3.2 | |
| Venezuela | | | 2.1 | |
| Namibia | | | 1.4 | |
| Gabon | | | 1.3 | |
| Kazakhstan | | | 1.1 | |
| Chile | | | 1.0 | |
| Peru | | | 1.0 | |
| China | | | 0.5 | |
| United Kingdom | | | 0.5 | |
| Netherlands | | | 0.4 | |
| Lithuania | | | 0.4 | |
| Uruguay | | | 0.3 | |
| Luxembourg | | | 0.3 | |
| Dominican Republic | | | 0.3 | |
| | | 100.0 | |
18 HSBC FAMILY OF FUNDS
| Portfolio Reviews |
| Portfolio Composition*(continued) |
| October 31, 2012 (Unaudited) |
| HSBC RMB Fixed Income Fund† |
| Country | | Percentage of Investments at Value (%) |
| China | | | 35.8 | |
| Hong Kong | | | 34.5 | |
| South Korea | | | 7.5 | |
| Singapore | | | 7.3 | |
| Japan | | | 5.9 | |
| France | | | 4.5 | |
| Australia | | | 3.0 | |
| Germany | | | 1.5 | |
| | | 100.0 | |
____________________
| * | Portfolio composition is subject to change. |
| † | Excludes any instruments used for cash management. |
HSBC FAMILY OF FUNDS 19
| HSBC EMERGING MARKETS DEBT FUND |
| Schedule of Portfolio Investments—as of October 31, 2012 |
| Yankee Dollars – 90.2% | | | | |
| | Principal | | |
| | Amount ($) | | Value ($) |
| Brazil – 6.4% | | | | |
| Banco ABC Brasil SA, | | | | |
| 7.88%, 4/8/20 | | 100,000 | | 106,750 |
| Banco do Brasil SA, Registered, | | | | |
| 5.88%, 1/26/22 | | 450,000 | | 488,250 |
| Banco Votorantim, Registered, | | | | |
| 5.25%, 2/11/16, MTN | | 200,000 | | 213,500 |
| Banco Votorantim, Registered, | | | | |
| 7.38%, 1/21/20 | | 100,000 | | 115,500 |
| Federal Republic of Brazil, | | | | |
| 8.75%, 2/4/25 | | 450,000 | | 726,750 |
| Petrobras International Finance Co., | | | | |
| 5.75%, 1/20/20 | | 400,000 | | 461,392 |
| Petrobras International Finance Co., | | | | |
| 5.38%, 1/27/21 | | 100,000 | | 113,406 |
| Vale Overseas Ltd., | | | | |
| 6.88%, 11/21/36 | | 100,000 | | 123,087 |
| Votorantim Cimentos SA, Registered, | | | | |
| 7.25%, 4/5/41 | | 200,000 | | 226,000 |
| | | | 2,574,635 |
| Chile – 0.6% | | | | |
| Empresa Nacional de Petroleo, | | | | |
| Registered, 4.75%, 12/6/21 | | 220,000 | | 240,594 |
| China – 0.3% | | | | |
| Country Garden Holdings Co. Ltd., | | | | |
| Registered, 11.25%, 4/22/17, | | | | |
| Callable 4/22/14 @ 105.62 | | 100,000 | | 111,250 |
| Colombia – 3.4% | | | | |
| Bancolombia SA, 6.13%, 7/26/20 | | 100,000 | | 112,000 |
| Bancolombia SA, 5.95%, 6/3/21 | | 100,000 | | 115,500 |
| Grupo Aval Ltd., Registered, | | | | |
| 5.25%, 2/1/17 | | 200,000 | | 213,658 |
| Republic of Colombia, | | | | |
| 4.38%, 7/12/21 | | 250,000 | | 287,125 |
| Republic of Colombia, | | | | |
| 8.13%, 5/21/24 | | 300,000 | | 449,250 |
| Republic of Colombia, | | | | |
| 6.13%, 1/18/41 | | 150,000 | | 204,750 |
| | | | 1,382,283 |
| Croatia – 0.6% | | | | |
| Croatia, Registered, | | | | |
| 6.38%, 3/24/21 | | 200,000 | | 226,684 |
| Dominican Republic – 0.3% | | | | |
| Dominican Republic, | | | | |
| 7.50%, 5/6/21 | | 100,000 | | 117,500 |
| El Salvador – 0.7% | | | | |
| Republic of El Salvador, | | | | |
| 7.75%, 1/24/23 | | 225,000 | | 268,875 |
| Hungary – 1.4% | | | | |
| Republic of Hungary, | | | | |
| 6.25%, 1/29/20 | | 280,000 | | 310,184 |
| Republic of Hungary, | | | | |
| 6.38%, 3/29/21 | | 130,000 | | 144,794 |
| Republic of Hungary, | | | | |
| 7.63%, 3/29/41 | | 80,000 | | 95,040 |
| | | | 550,018 |
| Indonesia – 8.1% | | | | |
| Majapahit Holding BV, | | | | |
| 8.00%, 8/7/19 | | 225,000 | | 285,750 |
| PT Pertamina Tbk, Registered, | | | | |
| 4.88%, 5/3/22 | | 400,000 | | 435,000 |
| Republic of Indonesia, | | | | |
| 6.88%, 1/17/18 | | 575,000 | | 700,063 |
| Republic of Indonesia, | | | | |
| 5.88%, 3/13/20 | | 1,350,000 | | 1,621,687 |
| Republic of Indonesia, Registered, | | | | |
| 6.63%, 2/17/37 | | 175,000 | | 234,500 |
| | | | 3,277,000 |
| Iraq – 0.6% | | | | |
| Republic of Iraq, Registered, | | | | |
| 5.80%, 1/15/28, | | | | |
| Callable 12/24/12 @ 100.00 | | 250,000 | | 232,500 |
| Ireland (Republic of) – 0.5% | | | | |
| Vnesheconombank, Registered, | | | | |
| 5.38%, 2/13/17 | | 200,000 | | 216,788 |
| Kazakhstan – 2.0% | | | | |
| Development Bank of Kazakhstan, | | | | |
| 5.50%, 12/20/15 | | 525,000 | | 572,880 |
| Kazakhstan Temir Zholy, Registered, | | | | |
| 6.95%, 7/10/42 | | 200,000 | | 244,108 |
| | | | 816,988 |
| Lebanon – 0.3% | | | | |
| Republic of Lebanon, Registered, | | | | |
| Series 42, 8.25%, 4/12/21, MTN | | 100,000 | | 115,350 |
| Lithuania – 1.5% | | | | |
| Republic of Lithuania, Registered, | | | | |
| 7.38%, 2/11/20 | | 100,000 | | 127,000 |
| Republic of Lithuania, Registered, | | | | |
| 6.63%, 2/1/22 | | 400,000 | | 495,000 |
| | | | 622,000 |
| Malaysia – 0.8% | | | | |
| Petronas Capital Ltd., | | | | |
| 5.25%, 8/12/19 | | 275,000 | | 329,273 |
| Mexico – 10.8% | | | | |
| BBVA Bancomer SA Texas, Registered, | | | | |
| 6.75%, 9/30/22 | | 175,000 | | 198,187 |
| Petroleos Mexicanos, | | | | |
| 5.50%, 1/21/21 | | 1,000,000 | | 1,167,500 |
| Petroleos Mexicanos, | | | | |
| 4.88%, 1/24/22 | | 150,000 | | 168,000 |
| United Mexican States, Series A, | | | | |
| 5.13%, 1/15/20, MTN | | 1,370,000 | | 1,637,150 |
| United Mexican States, | | | | |
| 3.63%, 3/15/22 | | 150,000 | | 163,875 |
| United Mexican States, Series A, | | | | |
| 7.50%, 4/8/33, MTN | | 100,000 | | 151,750 |
| United Mexican States, Series A, | | | | |
| 6.05%, 1/11/40 | | 666,000 | | 884,115 |
| | | | 4,370,577 |
| 20 HSBC FAMILY OF FUNDS | See notes to financial statements. |
| HSBC EMERGING MARKETS DEBT FUND |
| Schedule of Portfolio Investments—as of October 31, 2012 (continued) |
| Yankee Dollars, continued | | | | |
| | Principal | | |
| | Amount ($) | | Value ($) |
| Pakistan – 0.2% | | | | |
| Islamic Republic of Pakistan, | | | | |
| 6.88%, 6/1/17 | | 100,000 | | 90,000 |
| Panama – 3.0% | | | | |
| Republic of Panama, | | | | |
| 5.20%, 1/30/20 | | 875,000 | | 1,058,750 |
| Republic of Panama, | | | | |
| 7.13%, 1/29/26 | | 100,000 | | 143,500 |
| | | | 1,202,250 |
| Peru – 1.0% | | | | |
| Republic of Peru, | | | | |
| 8.75%, 11/21/33 | | 110,000 | | 192,500 |
| Republic of Peru, | | | | |
| 6.55%, 3/14/37 | | 150,000 | | 219,750 |
| | | | 412,250 |
| Philippines – 4.0% | | | | |
| Republic of Philippines, | | | | |
| 6.50%, 1/20/20 | | 350,000 | | 447,563 |
| Republic of Philippines, | | | | |
| 4.00%, 1/15/21 | | 1,050,000 | | 1,177,312 |
| | | | 1,624,875 |
| Poland – 2.5% | | | | |
| Republic of Poland, | | | | |
| 6.38%, 7/15/19 | | 150,000 | | 186,750 |
| Republic of Poland, | | | | |
| 5.13%, 4/21/21 | | 415,000 | | 487,683 |
| Republic of Poland, | | | | |
| 5.00%, 3/23/22 | | 290,000 | | 337,905 |
| | | | 1,012,338 |
| Republic of Serbia – 0.5% | | | | |
| Republic of Serbia, Registered, | | | | |
| 7.25%, 9/28/21 | | 200,000 | | 213,000 |
| Romania – 1.7% | | | | |
| Romania, Registered, | | | | |
| 6.75%, 2/7/22, MTN | | 580,000 | | 669,900 |
| Russian Federation – 13.2% | | | | |
| Alfa Issuance Ltd., Series E, | | | | |
| 8.00%, 3/18/15, MTN | | 100,000 | | 108,425 |
| Gazprom OAO, Registered, | | | | |
| 8.13%, 7/31/14 | | 300,000 | | 328,932 |
| Gazprom OAO, Registered, | | | | |
| 9.25%, 4/23/19 | | 125,000 | | 163,125 |
| RSHB Capital SA, 6.30%, 5/15/17 | | 475,000 | | 526,704 |
| Russia Foreign Bond, | | | | |
| 5.00%, 4/29/20 | | 300,000 | | 347,250 |
| Russia Foreign Bond, Registered, | | | | |
| 7.50%, 3/31/30 | | 2,421,875 | | 3,066,820 |
| RZD Capital Ltd., Series E, | | | | |
| 5.74%, 4/3/17, MTN | | 500,000 | | 555,000 |
| Sberbank, Registered, | | | | |
| 5.18%, 6/28/19 | | 200,000 | | 212,450 |
| | | | 5,308,706 |
| Slovak Republic – 1.1% | | | | |
| Slovak Republic, Registered, | | | | |
| 4.38%, 5/21/22 | | 400,000 | | 426,956 |
| South Africa – 2.7% | | | | |
| Republic of South Africa, | | | | |
| 6.88%, 5/27/19 | | 350,000 | | 435,890 |
| Republic of South Africa, | | | | |
| 5.50%, 3/9/20 | | 175,000 | | 204,453 |
| Republic of South Africa, | | | | |
| 5.88%, 5/30/22 | | 200,000 | | 242,074 |
| Republic of South Africa, | | | | |
| 4.67%, 1/17/24 | | 200,000 | | 221,000 |
| | | | 1,103,417 |
| Sri Lanka – 0.5% | | | | |
| Bank of Ceylon, Registered, | | | | |
| 6.88%, 5/3/17 | | 200,000 | | 214,500 |
| Turkey – 9.0% | | | | |
| Republic of Turkey, | | | | |
| 5.63%, 3/30/21 | | 1,875,000 | | 2,179,688 |
| Republic of Turkey, | | | | |
| 5.13%, 3/25/22 | | 850,000 | | 954,125 |
| Republic of Turkey, | | | | |
| 6.25%, 9/26/22 | | 300,000 | | 363,450 |
| Republic of Turkey, | | | | |
| 7.38%, 2/5/25 | | 100,000 | | 130,750 |
| | | | 3,628,013 |
| Ukraine – 1.7% | | | | |
| Ukraine Government, | | | | |
| 6.88%, 9/23/15 | | 475,000 | | 474,383 |
| Ukraine Government, | | | | |
| 7.75%, 9/23/20 | | 200,000 | | 208,724 |
| | | | 683,107 |
| Uruguay – 1.0% | | | | |
| Republic of Uruguay, PIK, | | | | |
| 7.88%, 1/15/33 | | 260,000 | | 403,000 |
| Venezuela – 9.8% | | | | |
| Bolivarian Republic of Venezuela, | | | | |
| 7.65%, 4/21/25 | | 125,000 | | 98,438 |
| Bolivarian Republic of Venezuela, | | | | |
| 9.25%, 5/7/28 | | 750,000 | | 661,875 |
| Petroleos de Venezuela SA, | | | | |
| 8.50%, 11/2/17 | | 1,565,000 | | 1,404,587 |
| Republic of Venezuela, | | | | |
| 7.00%, 12/1/18 | | 100,000 | | 86,000 |
| Republic of Venezuela, | | | | |
| 9.25%, 9/15/27 | | 150,000 | | 135,375 |
| Republic of Venezuela, Registered, | | | | |
| 7.75%, 10/13/19 | | 1,600,000 | | 1,392,000 |
| Republic of Venezuela, Registered, | | | | |
| 8.25%, 10/13/24 | | 200,000 | | 165,000 |
| | | | 3,943,275 |
| |
| TOTAL YANKEE DOLLARS | | | | |
| (COST $32,706,624) | | | | 36,387,902 |
| See notes to financial statements. | HSBC FAMILY OF FUNDS 21 |
| HSBC EMERGING MARKETS DEBT FUND |
| Schedule of Portfolio Investments—as of October 31, 2012 (continued) |
| U.S. Treasury Obligations – 6.9% | | | |
| | | |
| Shares or | | |
| Principal | | |
| Amount ($) | | Value ($) |
| U.S. Treasury Bonds – 2.2% | | | |
| 2.75%, 8/15/42 | 900,000 | | 881,719 |
| U.S. Treasury Notes – 4.7% | | | |
| 1.75%, 5/15/22 | 400,000 | | 403,938 |
| 1.63%, 8/15/22 | 1,500,000 | | 1,491,796 |
| | | | 1,895,734 |
| TOTAL U.S. TREASURY OBLIGATIONS | | | |
| (COST $2,754,513) | | | 2,777,453 |
| | | | |
| Investment Company – 2.2% | | | |
| | | | |
| Northern Institutional Diversified | | | |
| Assets Portfolio, | | | |
| Institutional Shares, 0.01% (a) | 897,934 | | 897,934 |
| TOTAL INVESTMENT COMPANY | | | |
| (COST $897,934) | | | 897,934 |
| TOTAL INVESTMENT SECURITIES | | | |
| (COST $36,359,071) — 99.3% | | | 40,063,289 |
___________________
Percentages indicated are based on net assets of $40,356,081.
(a) The rate represents the annualized one-day yield that was in effect on October 31, 2012.
MTN — Medium Term Note
PIK — Payment-in-Kind
The Fund invested, as a percentage of net assets, in the following industries, as of October 31, 2012:
| Industry | Percentage of Net Assets |
| Sovereign Bonds | 66.5 | % |
| Oil, Gas & Consumable Fuels | 11.9 | % |
| U.S. Treasury Obligations | 6.9 | % |
| Commercial Banks | 6.4 | % |
| Diversified Financial Services | 3.4 | % |
| Investment Companies | 2.2 | % |
| Road & Rail | 1.4 | % |
| Metals & Mining | 0.3 | % |
| Real Estate Management & Development | 0.3 | % |
| Total Investments | 99.3 | % |
| 22 HSBC FAMILY OF FUNDS | See notes to financial statements. |
| HSBC EMERGING MARKETS DEBT FUND |
| Schedule of Portfolio Investments—as of October 31, 2012 (continued) |
Credit Default Swap Agreements - Sell Protection(a)
At October 31, 2012, the Fund’s open credit default swap agreements were as follows:
| | | | | | Implied Credit | | | | | | | | Upfront | | | | |
| | | | | | Spread at | | Notional | | | | | | Premiums | | Unrealized |
| Underlying | | | | Expiration | | October 31, 2012 | | Amount | | Fixed | | | | Paid/ | | Appreciation/ |
| Instrument | | Counterparty | | Date | | (%) (b) | | ($)(c) | | Rate (%) | | Value ($) | | (Received) ($) | | (Depreciation) ($) |
| Federative | | Barclays | | | | | | | | | | | | | | | | | | |
| Republic of Brazil | | Bank PLC | | 09/20/16 | | 0.92 | | 550,000 | | 1.00 | | 3,936 | | (11,666 | ) | | | 15,602 | |
| | |
| Peoples Republic | | JPMorgan | | | | | | | | | | | | | | | | | | |
| of China | | Chase | | | | | | | | | | | | | | | | | | |
| | Bank N.A. | | 09/20/16 | | 0.45 | | 500,000 | | 1.00 | | 12,111 | | | (3,227 | ) | | | 15,338 | |
| | |
| Peoples Republic | | JPMorgan | | | | | | | | | | | | | | | | | | |
| of China | | Chase | | | | | | | | | | | | | | | | | | |
| | Bank N.A. | | 09/20/16 | | 0.45 | | 500,000 | | 1.00 | | 12,111 | | | (4,641 | ) | | | 16,752 | |
| | |
| Markit CDX | | JPMorgan | | | | | | | | | | | | | | | | | | |
| Emerging | | Chase | | | | | | | | | | | | | | | | | | |
| Markets Index | | Bank N.A. | | 06/20/17 | | 2.29 | | 775,000 | | 5.00 | | 96,294 | | | 74,400 | | | | 21,894 | |
| | | | | | | | | | | | 124,452 | | | 54,866 | | | | 69,586 | |
| (a) | | When a credit event occurs as defined under the terms of the swap agreement, the Fund as a seller of credit protection will either (i) pay to the buyer of protection an amount equal to the par value of the defaulted reference entity and take delivery of the reference entity or (ii) pay a net amount equal to the par value of the defaulted reference entity less its recovery value. |
| (b) | | Implied credit spread, represented in absolute terms, utilized in determining the fair value of the credit default swap agreements as of period end serve as an indicator of the current status of the payment/performance risk and represent the likelihood or risk of default for the credit derivative. The implied credit spread of a referenced entity reflects the cost of buying/selling protection and may include upfront payments required to be made to enter into the agreement. Generally, wider credit spreads represent a perceived deterioration of the referenced entity’s credit soundness and a greater likelihood or risk of default or other credit event occurring as defined under the terms of the swap agreement. |
| (c) | | The notional amount represents the maximum potential amount the Fund could be required to make as a seller of credit protection if a credit event occurs, as defined under the terms of the swap agreement. |
At October 31, 2012, the Fund’s open forward foreign currency exchange contracts were as follows:
| | | | | | Contract | | | | | | Unrealized |
| | | | | | Amount | | Contract | | | | Appreciation/ |
| | | | Delivery | | (Local | | Value | | Value | | (Depreciation) |
| Short Contracts | | Counterparty | | Date | | Currency) | | ($) | | ($) | | ($) |
| | JPMorgan | | | | | | | | | | | | |
| Mexican Peso | | Chase Bank N.A. | | 12/7/12 | | 222,230 | | 16,757 | | 16,911 | | | (154 | ) |
| | | | | | | | 16,757 | | 16,911 | | | (154 | ) |
| See notes to financial statements. | HSBC FAMILY OF FUNDS 23 |
| HSBC EMERGING MARKETS LOCAL DEBT FUND |
| Schedule of Portfolio Investments—as of October 31, 2012 |
| Foreign Bonds – 48.5%† | | | |
| | | | |
| Principal | | |
| Amount ($) | | Value ($) |
| Hungary – 3.1% | | | |
| Hungary Government Bond, | | | |
| Series 17/A, 6.75%, 11/24/17 | 120,000,000 | | 555,408 |
| Hungary Government Bond, | | | |
| Series 22/A, 7.00%, 6/24/22 | 100,000,000 | | 458,996 |
| | | | 1,014,404 |
| Indonesia – 4.5% | | | |
| Indonesia Government, | | | |
| Series FR28, 10.00%, 7/15/17 | 9,100,000,000 | | 1,124,977 |
| Indonesia Government, | | | |
| Series FR56, 8.38%, 9/15/26 | 2,855,000,000 | | 356,889 |
| | | 1,481,866 |
| Malaysia – 6.4% | | | |
| Malaysian Government, | | | |
| Series 0409, 3.74%, 2/27/15 | 4,500,000 | | 1,500,844 |
| Malaysian Government, | | | |
| Series 0111, 4.16%, 7/15/21 | 780,000 | | 268,372 |
| Malaysian Government, | | | |
| Series 0112, 3.42%, 8/15/22 | 1,000,000 | | 327,018 |
| | | 2,096,234 |
| Mexico – 6.0% | | | |
| Mexican Bonos Desarr, Series M, | | | |
| 5.00%, 6/15/17 (a) | 25,000,000 | | 1,896,196 |
| Mexican Bonos Desarr, Series M30, | | | |
| 8.50%, 11/18/38 (a) | 800,000 | | 75,624 |
| | | 1,971,820 |
| Peru – 1.7% | | | |
| Peru Bono Soberano, | | | |
| 9.91%, 5/5/15 | 515,000 | | 231,123 |
| Republic of Peru, Registered, | | | |
| 6.95%, 8/12/31 | 650,000 | | 305,869 |
| | | 536,992 |
| Poland – 6.2% | | | |
| Poland Government Bond, | | | |
| Series 0414, 5.75%, 4/25/14 | 4,600,000 | | 1,479,091 |
| Poland Government Bond, | | | |
| Series 1020, 5.25%, 10/25/20 | 150,000 | | 49,559 |
| Poland Government Bond, | | | |
| Series 1021, 5.75%, 10/25/21 | 840,000 | | 286,887 |
| Poland Government Bond, | | | |
| Series 0922, 5.75%, 9/23/22 | 660,000 | | 226,507 |
| | | 2,042,044 |
| Russian Federation – 4.2% | | | |
| Russia Foreign Bond, | | | |
| 7.85%, 3/10/18 | 40,000,000 | | 1,365,949 |
| South Africa – 5.4% | | | |
| Republic of South Africa, | | | |
| Series R203, 8.25%, 9/15/17 | 8,000,000 | | 1,016,435 |
| Republic of South Africa, | | | |
| Series R186, 10.50%, 12/21/26 | 2,050,000 | | 292,530 |
| Republic of South Africa, | | | |
| Series R213, 7.00%, 2/28/31 | 2,400,000 | | 243,202 |
| Republic of South Africa, | | | |
| Series R209, 6.25%, 3/31/36 | 2,500,000 | | 222,884 |
| | | 1,775,051 |
| | | |
| Shares or | | |
| Principal | | |
| Amount ($) | | |
| Thailand – 4.7% | | | |
| Thailand Government Bond, | | | |
| 4.13%, 11/18/16 | 45,000,000 | | 1,527,847 |
| Turkey – 6.3% | | | |
| Turkey Government Bond, | | | |
| 10.00%, 4/10/13 (a) | 2,480,000 | | 1,406,952 |
| Turkey Government Bond, | | | |
| 9.50%, 1/12/22 (a) | 1,070,000 | | 653,750 |
| | | 2,060,702 |
| TOTAL FOREIGN BONDS | | | |
| (COST $16,123,986) | | | 15,872,909 |
| | | | |
| Yankee Dollars – 6.1% | | | |
| | | | |
| Brazil – 0.8% | | | |
| Banco Votorantim, | | | |
| 4.25%, 2/8/13, MTN | 250,000 | | 251,005 |
| Kazakhstan – 2.3% | | | |
| KazMunayGas National Co., | | | |
| Registered, Series 1, | | | |
| 8.38%, 7/2/13, MTN | 725,000 | | 754,957 |
| Luxembourg – 0.8% | | | |
| TNK-BP Finance SA, Series 5, | | | |
| 7.50%, 3/13/13, MTN | 250,000 | | 255,485 |
| Russian Federation – 1.6% | | | |
| AK Transneft OJSC, | | | |
| 7.70%, 8/7/13 | 225,000 | | 234,900 |
| Alfa Invest Ltd., | | | |
| 9.25%, 6/24/13, MTN | 100,000 | | 104,138 |
| Sberbank, Series E, | | | |
| 6.48%, 5/15/13, MTN | 200,000 | | 205,260 |
| | | 544,298 |
| United Arab Emirates – 0.6% | | | |
| The Abu Dhabi National Energy Co. | | | |
| (TAQA), 6.60%, 8/1/13 | 200,000 | | 207,334 |
| TOTAL YANKEE DOLLARS | | | |
| (COST $2,006,432) | | | 2,013,079 |
| |
| Purchased Options – 0.1%‡ | | | |
| |
| TOTAL PURCHASED OPTIONS | | | |
| (COST $35,411) | | | 26,021 |
| |
| Investment Company – 44.2% | | | |
| | | | |
| Northern Institutional Diversified | | | |
| Assets Portfolio, Institutional | | | |
| Shares, 0.01% (b) | 14,478,407 | | 14,478,407 |
| TOTAL INVESTMENT COMPANY | | | |
| (COST $14,478,407) | | | 14,478,407 |
| TOTAL INVESTMENT SECURITIES | | | |
| (COST $32,644,236) — 98.9% | | | 32,390,416 |
| 24 HSBC FAMILY OF FUNDS | See notes to financial statements. |
| HSBC EMERGING MARKETS LOCAL DEBT FUND |
| Schedule of Portfolio Investments—as of October 31, 2012 (continued) |
____________________
| Percentages indicated are based on net assets of $32,756,768. |
| † | | The principal amount is disclosed in local currency and the value is disclosed in U.S. Dollars. |
| (a) | | Variable rate security. The interest rates on these securities are adjusted periodically to reflect then-current short-term interest rates. The rates presented represent the rates in effect on October 31, 2012. The maturity dates presented reflect the final maturity dates. However, some of these securities may contain put or demand features that allow the Fund to require the issuer to repurchase the security from the fund within various time periods, including daily, weekly, monthly, or semi-annually. |
| (b) | | The rate represents the annualized one-day yield that was in effect on October 31, 2012. |
MTN — Medium Term Note |
The Fund invested, as a percentage of net assets, in the following industries, as of October 31, 2012:
| Industry | Percentage of Net Assets |
| Sovereign Bonds | 48.5 | % |
| Investment Companies | 44.2 | % |
| Oil, Gas & Consumable Fuels | 3.1 | % |
| Commercial Banks | 1.4 | % |
| Energy Equipment & Services | 0.7 | % |
| Electric Utilities | 0.6 | % |
| Diversified Financial Services | 0.3 | % |
| Purchased Options | 0.1 | % |
| Total Investments | 98.9 | % |
‡Purchased Currency Options
At October 31, 2012, the Fund’s open options contracts were as follows:
| | | | | | | | Strike | | Premium | | |
| | | | | | | | Price | | Received | | Value |
| Contracts | | Counterparty | | Description | | Expiration Date | | ($) | | ($) | | ($) |
| 270,000 | | Barclays Bank PLC | | Mexican Peso Currency Option (USD/MXN) | | 1/31/2013 | | 14.32 | | 7,031 | | 1,269 |
| | | Standard Charter | | | | | | | | | | |
| 3,000,000 | | Bank | | Brazilian Real Currency Option (USD/BRL) | | 4/26/2013 | | 2.00 | | 28,380 | | 24,752 |
| | | | | | | | | | | | 26,021 |
Interest Rate Swap Agreements
At October 31, 2012, the Fund’s open interest rate swap agreements were as follows:
| | | | | | | | | | | | | | | | Upfront | | | | |
| Pay/ | | | | | | | | | | | | | | | | Premiums | | Unrealized |
| Receive | | | | Fixed | | | | | | Notional | | Notional | | | | Paid/ | | Appreciation/ |
| Floating | | | | Rate | | Expiration | | | | Amount | | Amount | | Value | | (Received) | | (Depreciation) |
| Rate | | Floating Rate Index | | (%) | | Date | | Counterparty | | (Local) | | ($) | | ($) | | ($) | | ($) |
| | | | | | | | JPMorgan | | | | | | | | | | | | | | |
| | | | | | | | Chase | | | | | | | | | | | | | | |
| Pay | | 1-Year BRL CDI | | 10.44 | | 1/3/14 | | Bank N.A. | | 2,200,000 BRL | | 1,083,370 | | 45,447 | | | — | | | | 45,447 | |
| | |
| | | | | | | | Barclays | | | | | | | | | | | | | | |
| Pay | | 1-Year BRL CDI | | 10.02 | | 1/4/21 | | Bank PLC | | 2,400,000 BRL | | 1,181,858 | | 55,435 | | | — | | | | 55,435 | |
| | |
| | 1-Month | | | | | | Barclays | | | | | | | | | | | | | | |
| Pay | | MXN-TIIE-Banxico | | 6.69 | | 12/23/21 | | Bank PLC | | 6,250,000 MXN | | 477,365 | | 28,524 | | | — | | | | 28,524 | |
| | | | | | | | | | | | | | 129,406 | | | — | | | | 129,406 | |
| See notes to financial statements. | HSBC FAMILY OF FUNDS 25 |
| HSBC EMERGING MARKETS LOCAL DEBT FUND |
| Schedule of Portfolio Investments—as of October 31, 2012 (continued) |
At October 31, 2012, the Fund’s open forward foreign currency exchange contracts were as follows:
| | | | | | Contract | | | | | | Unrealized |
| | | | | | Amount | | Contract | | | | Appreciation/ |
| | | | Delivery | | (Local | | Value | | Value | | (Depreciation) |
| Short Contracts | | Counterparty | | Date | | Currency) | | ($) | | ($) | | ($) |
| Brazilian Real | | Standard Charter Bank | | 11/5/12 | | 1,304,640 | | 640,000 | | 642,028 | | (2,028 | ) |
| Brazilian Real | | Standard Charter Bank | | 11/5/12 | | 4,910,730 | | 2,415,510 | | 2,416,624 | | (1,114 | ) |
| Brazilian Real | | Standard Charter Bank | | 11/5/12 | | 1,520,625 | | 750,000 | | 748,316 | | 1,684 | |
| Chilean Peso | | JPMorgan Chase Bank N.A. | | 1/31/13 | | 320,835,000 | | 668,128 | | 659,029 | | 9,099 | |
| Chilean Peso | | Standard Charter Bank | | 1/31/13 | | 19,512,000 | | 40,000 | | 40,080 | | (80 | ) |
| Czech Koruna | | JPMorgan Chase Bank N.A. | | 12/13/12 | | 1,943,805 | | 100,000 | | 100,513 | | (513 | ) |
| Hungarian Forint | | Standard Charter Bank | | 1/4/13 | | 155,026,991 | | 694,254 | | 703,901 | | (9,647 | ) |
| Indian Rupee | | Standard Charter Bank | | 11/15/12 | | 53,667,900 | | 990,000 | | 994,688 | | (4,688 | ) |
| Indian Rupee | | Standard Charter Bank | | 11/15/12 | | 64,643,140 | | 1,201,769 | | 1,198,105 | | 3,664 | |
| Indonesian Rupiah | | JPMorgan Chase Bank N.A. | | 11/23/12 | | 4,098,550,000 | | 427,155 | | 425,712 | | 1,443 | |
| Indonesian Rupiah | | Standard Charter Bank | | 11/23/12 | | 3,092,800,000 | | 320,000 | | 321,246 | | (1,246 | ) |
| Israeli New Shekel | | Standard Charter Bank | | 3/11/13 | | 425,480 | | 110,000 | | 109,155 | | 845 | |
| Malaysian Ringgit | | JPMorgan Chase Bank N.A. | | 11/26/12 | | 398,062 | | 125,346 | | 130,484 | | (5,138 | ) |
| Malaysian Ringgit | | Standard Charter Bank | | 11/26/12 | | 463,050 | | 150,000 | | 151,787 | | (1,787 | ) |
| Malaysian Ringgit | | Standard Charter Bank | | 11/26/12 | | 856,940 | | 280,000 | | 280,904 | | (904 | ) |
| Mexican Peso | | JPMorgan Chase Bank N.A. | | 12/7/12 | | 4,503,815 | | 339,603 | | 342,715 | | (3,112 | ) |
| Mexican Peso | | Standard Charter Bank | | 12/7/12 | | 9,677,700 | | 750,000 | | 736,418 | | 13,582 | |
| Mexican Peso | | JPMorgan Chase Bank N.A. | | 12/7/12 | | 7,144,462 | | 551,849 | | 543,653 | | 8,196 | |
| Mexican Peso | | JPMorgan Chase Bank N.A. | | 12/13/12 | | 644,992 | | 50,000 | | 49,049 | | 951 | |
| Peruvian Nuevo Sol | | Standard Charter Bank | | 1/28/13 | | 65,400 | | 25,000 | | 25,150 | | (150 | ) |
| Peruvian Nuevo Sol | | Standard Charter Bank | | 1/28/13 | | 306,387 | | 118,000 | | 117,824 | | 176 | |
| Polish Zloty | | JPMorgan Chase Bank N.A. | | 12/13/12 | | 639,364 | | 200,000 | | 199,319 | | 681 | |
| Romanian Leu | | Standard Charter Bank | | 12/19/12 | | 88,525 | | 25,000 | | 25,105 | | (105 | ) |
| Romanian Leu | | Standard Charter Bank | | 12/19/12 | | 195,635 | | 55,000 | | 55,481 | | (481 | ) |
| Singapore Dollar | | JPMorgan Chase Bank N.A. | | 1/22/13 | | 61,409 | | 50,000 | | 50,357 | | (357 | ) |
| Singapore Dollar | | Standard Charter Bank | | 1/22/13 | | 67,375 | | 55,000 | | 55,249 | | (249 | ) |
| South African Rand | | JPMorgan Chase Bank N.A. | | 12/13/12 | | 11,405,986 | | 1,380,870 | | 1,308,563 | | 72,307 | |
| South African Rand | | JPMorgan Chase Bank N.A. | | 12/13/12 | | 1,083,956 | | 130,000 | | 124,358 | | 5,642 | |
| Taiwan Dollar | | JPMorgan Chase Bank N.A. | | 11/26/12 | | 6,279,000 | | 210,000 | | 215,017 | | (5,017 | ) |
| Thai Baht | | Standard Charter Bank | | 12/17/12 | | 12,335,600 | | 400,000 | | 401,647 | | (1,647 | ) |
| Turkish Lira | | Barclays Bank PLC | | 11/7/12 | | 863,089 | | 475,000 | | 481,132 | | (6,132 | ) |
| Turkish Lira | | JPMorgan Chase Bank N.A. | | 11/7/12 | | 220,522 | | 120,000 | | 122,930 | | (2,930 | ) |
| Turkish Lira | | JPMorgan Chase Bank N.A. | | 1/9/13 | | 181,458 | | 100,000 | | 100,329 | | (329 | ) |
| Turkish Lira | | JPMorgan Chase Bank N.A. | | 1/9/13 | | 198,569 | | 108,383 | | 109,790 | | (1,407 | ) |
| | | | | | | | 14,055,867 | | 13,986,658 | | 69,209 | |
| 26 HSBC FAMILY OF FUNDS | See notes to financial statements. |
| HSBC EMERGING MARKETS LOCAL DEBT FUND |
| Schedule of Portfolio Investments—as of October 31, 2012 (continued) |
| | | | | | Contract | | | | | | Unrealized |
| | | | | | Amount | | Contract | | | | Appreciation/ |
| | | | Delivery | | (Local | | Value | | Value | | (Depreciation) |
| Long Contracts | | Counterparty | | Date | | Currency) | | ($) | | ($) | | ($) |
| Brazilian Real | | Standard Charter Bank | | 11/5/12 | | 6,011,870 | | 2,954,091 | | 2,958,507 | | 4,416 | |
| Brazilian Real | | Standard Charter Bank | | 11/5/12 | | 203,500 | | 100,000 | | 100,145 | | 145 | |
| Brazilian Real | | Standard Charter Bank | | 11/5/12 | | 1,520,625 | | 750,000 | | 748,316 | | (1,684 | ) |
| Brazilian Real | | Standard Charter Bank | | 1/3/13 | | 4,910,730 | | 2,396,764 | | 2,397,189 | | 425 | |
| Chinese Yuan | | JPMorgan Chase Bank N.A. | | 12/28/12 | | 1,210,300 | | 190,000 | | 192,992 | | 2,992 | |
| Chinese Yuan | | Standard Charter Bank | | 12/28/12 | | 7,781,310 | | 1,224,054 | | 1,240,795 | | 16,741 | |
| Chinese Yuan | | Standard Charter Bank | | 12/28/12 | | 1,269,400 | | 200,000 | | 202,416 | | 2,416 | |
| Chinese Yuan | | Standard Charter Bank | | 12/28/12 | | 4,232,390 | | 670,000 | | 674,890 | | 4,890 | |
| Colombian Peso | | JPMorgan Chase Bank N.A. | | 1/31/13 | | 1,588,744,345 | | 868,356 | | 858,534 | | (9,822 | ) |
| Czech Koruna | | JPMorgan Chase Bank N.A. | | 12/13/12 | | 12,829,396 | | 672,138 | | 663,402 | | (8,736 | ) |
| Hong Kong Dollar | | JPMorgan Chase Bank N.A. | | 12/27/12 | | 12,338,800 | | 1,591,487 | | 1,592,330 | | 843 | |
| Indian Rupee | | JPMorgan Chase Bank N.A. | | 11/15/12 | | 71,846,240 | | 1,282,282 | | 1,331,608 | | 49,326 | |
| Indian Rupee | | JPMorgan Chase Bank N.A. | | 11/15/12 | | 34,428,400 | | 610,000 | | 638,101 | | 28,101 | |
| Indian Rupee | | JPMorgan Chase Bank N.A. | | 11/15/12 | | 6,764,400 | | 120,000 | | 125,372 | | 5,372 | |
| Indian Rupee | | Standard Charter Bank | | 11/15/12 | | 5,272,000 | | 100,000 | | 97,712 | | (2,288 | ) |
| Indian Rupee | | Standard Charter Bank | | 2/22/13 | | 64,643,140 | | 1,183,724 | | 1,177,607 | | (6,117 | ) |
| Indonesian Rupiah | | JPMorgan Chase Bank N.A. | | 11/23/12 | | 1,807,620,000 | | 188,000 | | 187,756 | | (244 | ) |
| Indonesian Rupiah | | Standard Charter Bank | | 11/23/12 | | 5,457,750,000 | | 570,000 | | 566,891 | | (3,109 | ) |
| Indonesian Rupiah | | Standard Charter Bank | | 11/23/12 | | 480,750,000 | | 50,000 | | 49,935 | | (65 | ) |
| Israeli New Shekel | | JPMorgan Chase Bank N.A. | | 3/11/13 | | 1,397,144 | | 348,441 | | 358,431 | | 9,990 | |
| Malaysian Ringgit | | JPMorgan Chase Bank N.A. | | 11/26/12 | | 907,410 | | 290,000 | | 297,448 | | 7,448 | |
| Malaysian Ringgit | | JPMorgan Chase Bank N.A. | | 11/26/12 | | 312,100 | | 100,000 | | 102,306 | | 2,306 | |
| Malaysian Ringgit | | Standard Charter Bank | | 11/26/12 | | 306,400 | | 100,000 | | 100,438 | | 438 | |
| Mexican Peso | | Standard Charter Bank | | 12/7/12 | | 8,252,078 | | 638,311 | | 627,936 | | (10,375 | ) |
| Mexican Peso | | Standard Charter Bank | | 1/7/13 | | 24,306,053 | | 1,875,467 | | 1,843,473 | | (31,994 | ) |
| Peruvian Nuevo Sol | | Standard Charter Bank | | 1/28/13 | | 169,733 | | 65,044 | | 65,272 | | 228 | |
| Philippine Peso | | Barclays Bank PLC | | 12/10/12 | | 54,147,380 | | 1,301,150 | | 1,314,384 | | 13,234 | |
| Polish Zloty | | JPMorgan Chase Bank N.A. | | 12/13/12 | | 1,338,840 | | 417,227 | | 417,377 | | 150 | |
| Romanian Leu | | JPMorgan Chase Bank N.A. | | 12/19/12 | | 1,117,317 | | 322,905 | | 316,862 | | (6,043 | ) |
| Russian Ruble | | Standard Charter Bank | | 1/31/13 | | 45,115,840 | | 1,422,360 | | 1,417,206 | | (5,154 | ) |
| Russian Ruble | | Standard Charter Bank | | 1/31/13 | | 4,743,750 | | 150,000 | | 149,014 | | (986 | ) |
| Singapore Dollar | | Standard Charter Bank | | 1/22/13 | | 952,735 | | 778,744 | | 781,262 | | 2,518 | |
| South African Rand | | Standard Charter Bank | | 12/13/12 | | 13,526,771 | | 1,530,373 | | 1,551,872 | | 21,499 | |
| Taiwan Dollar | | JPMorgan Chase Bank N.A. | | 11/26/12 | | 20,724,100 | | 693,346 | | 709,671 | | 16,325 | |
| Taiwan Dollar | | JPMorgan Chase Bank N.A. | | 11/26/12 | | 2,978,000 | | 100,000 | | 101,978 | | 1,978 | |
| Taiwan Dollar | | Standard Charter Bank | | 11/26/12 | | 9,376,000 | | 320,000 | | 321,070 | | 1,070 | |
| Taiwan Dollar | | Standard Charter Bank | | 11/26/12 | | 2,924,000 | | 100,000 | | 100,129 | | 129 | |
| Thai Baht | | JPMorgan Chase Bank N.A. | | 12/17/12 | | 50,370 | | 1,590 | | 1,640 | | 50 | |
| Thai Baht | | JPMorgan Chase Bank N.A. | | 12/17/12 | | 7,586,040 | | 240,000 | | 247,001 | | 7,001 | |
| Thai Baht | | JPMorgan Chase Bank N.A. | | 12/17/12 | | 2,350,673 | | 75,000 | | 76,538 | | 1,538 | |
| Thai Baht | | Standard Charter Bank | | 12/17/12 | | 10,511,780 | | 340,000 | | 342,263 | | 2,263 | |
| Thai Baht | | JPMorgan Chase Bank N.A. | | 12/17/12 | | 3,085,000 | | 100,000 | | 100,448 | | 448 | |
| Turkish Lira | | Barclays Bank PLC | | 11/7/12 | | 1,266,790 | | 700,000 | | 706,176 | | 6,176 | |
| Turkish Lira | | Barclays Bank PLC | | 1/24/13 | | 1,572,080 | | 862,974 | | 867,533 | | 4,559 | |
| | | | | | | | 28,593,828 | | 28,722,226 | | 128,398 | |
| See notes to financial statements. | HSBC FAMILY OF FUNDS 27 |
| HSBC FRONTIER MARKETS FUND |
| Schedule of Portfolio Investments—as of October 31, 2012 |
| Common Stocks – 80.9% | | | |
| | | | |
| Shares | | Value ($) |
| Argentina – 0.6% | | | |
| Telecom Argentina SA ADR | 11,770 | | 115,817 |
| Australia – 0.3% | | | |
| Centamin plc* | 66,197 | | 61,949 |
| Bangladesh – 0.8% | | | |
| Prime Bank Ltd. | 322,800 | | 135,560 |
| Cambodia – 1.4% | | | |
| NagaCorp Ltd. | 448,000 | | 249,152 |
| Canada – 0.5% | | | |
| EastCoal, Inc.* | 360,500 | | 92,066 |
| Colombia – 3.2% | | | |
| Ecopetrol SA | 190,581 | | 567,103 |
| Croatia – 1.0% | | | |
| Hrvatski Telekom dd | 4,881 | | 172,410 |
| Egypt – 2.3% | | | |
| Commercial International Bank | 22,939 | | 142,289 |
| Orascom Construction | | | |
| Industries (OCI)* | 1,808 | | 76,407 |
| Orascom Telecom Holding SAE | 233,200 | | 138,928 |
| Six of October Development & | | | |
| Investment Co.* | 14,500 | | 53,111 |
| | | 410,735 |
| Estonia – 1.2% | | | |
| Tallink Group Ltd.* | 246,500 | | 216,598 |
| Georgia – 1.6% | | | |
| Bank of Georgia Holdings plc | 15,170 | | 291,029 |
| Kazakhstan – 4.0% | | | |
| KazMunaiGas Exploration | | | |
| Production GDR | 40,463 | | 718,218 |
| Kenya – 3.0% | | | |
| Kenya Commercial Bank Ltd. | 858,000 | | 300,300 |
| Safaricom Ltd. | 4,520,000 | | 233,976 |
| | | 534,276 |
| Kuwait – 5.4% | | | |
| Kuwait Projects Co. (Holding) KSC | 177,500 | | 246,265 |
| Mabanee Co. SAKC | 80,500 | | 326,467 |
| Mobile Telecommunications Co. | 67,500 | | 177,695 |
| National Bank of Kuwait | 62,000 | | 211,740 |
| | | 962,167 |
| Lebanon – 1.1% | | | |
| Banque Audi SAL - Audi Saradar Group | 12,000 | | 65,520 |
| Solidere, Class A | 10,117 | | 124,343 |
| | | 189,863 |
| Nigeria – 12.5% | | | |
| Dangote Cement plc | 232,840 | | 178,119 |
| First Bank of Nigeria plc | 4,264,500 | | 440,275 |
| Guaranty Trust Bank plc | 3,585,000 | | 452,092 |
| Guinness Nigeria plc | 92,200 | | 154,680 |
| Nestle Foods Nigeria plc | 47,200 | | 202,917 |
| Nigerian Breweries plc | 482,277 | | 372,282 |
| Zenith Bank plc | 3,622,000 | | 415,696 |
| | | | 2,216,061 |
| Oman – 3.3% | | | |
| Bank Muscat SAOG | 301,426 | | 429,826 |
| Renaissance Services SAOG | 108,700 | | 155,003 |
| | | 584,829 |
| Pakistan – 6.4% | | | |
| MCB Bank Ltd. | 133,550 | | 263,282 |
| Pakistan Petroleum Ltd. | 163,075 | | 294,331 |
| The Hub Power Co. Ltd. | 719,692 | | 344,828 |
| United Bank Ltd. | 310,600 | | 243,904 |
| | | 1,146,345 |
| Panama ��� 1.6% | | | |
| Copa Holdings SA, Class A | 3,014 | | 279,759 |
| Peru – 3.9% | | | |
| Cia de Minas Buenaventura SA ADR | 5,635 | | 201,508 |
| Credicorp Ltd. | 3,800 | | 491,492 |
| | | 693,000 |
| Philippines – 3.9% | | | |
| Metropolitan Bank & Trust Co. | 44,560 | | 102,798 |
| Security Bank Corp. | 67,900 | | 266,950 |
| SM Investments Corp. | 16,500 | | 321,746 |
| | | 691,494 |
| Qatar – 11.0% | | | |
| Gulf International Services QSC | 14,100 | | 116,380 |
| Industries Qatar QSC | 7,613 | | 317,845 |
| Qatar Electricity & Water Co. | 4,564 | | 166,980 |
| Qatar Insurance Co. | 5,650 | | 107,081 |
| Qatar Islamic Bank | 7,050 | | 148,525 |
| Qatar National Bank | 12,908 | | 474,739 |
| Qatar Telecom (QTEL) QSC | 16,131 | | 467,886 |
| The Commercial Bank of Qatar QSC | 7,588 | | 149,855 |
| | | 1,949,291 |
| Romania – 0.9% | | | |
| SIF 5 Oltenia Craiova | 390,000 | | 158,021 |
| Slovenia – 1.9% | | | |
| KrKa dd Novo Mesto | 5,477 | | 340,715 |
| Sri Lanka – 1.4% | | | |
| John Keells Holdings plc | 157,300 | | 248,101 |
| United Arab Emirates – 7.7% | | | |
| DP World Ltd. | 10,924 | | 129,559 |
| Dragon Oil plc | 27,578 | | 246,959 |
| Emaar Properties PJSC | 558,975 | | 549,402 |
| First Gulf Bank PJSC | 37,913 | | 107,869 |
| National Bank of Abu Dhabi | 46,904 | | 126,426 |
| NMC Health plc* | 59,182 | | 172,837 |
| Union National Bank PJSC | 42,000 | | 35,449 |
| | | 1,368,501 |
| TOTAL COMMON STOCKS | | | |
| (COST $13,000,233) | | | 14,393,060 |
| 28 HSBC FAMILY OF FUNDS | See notes to financial statements. |
| HSBC FRONTIER MARKETS FUND |
| Schedule of Portfolio Investments—as of October 31, 2012 (continued) |
| Preferred Stock – 3.5% | | | |
| | | |
| Shares or | | |
| Principal | | |
| Amount ($) | | Value ($) |
| Colombia – 3.5% | | | |
| Bancolombia SA, Preferred Shares | 38,900 | | 620,606 |
| TOTAL PREFERRED STOCK | | | |
| (COST $617,322) | | | 620,606 |
| |
| Convertible Corporate Bond – 0.2% | | | |
| | | | |
| Oman – 0.2% | | | |
| Renaissance Services SAO, | | | |
| 3.75%, 7/25/17 | 142,800 | | 39,316 |
| TOTAL CONVERTIBLE CORPORATE | | | |
| BOND (COST $41,206) | | | 39,316 |
| |
| Warrants – 0.0% | | | |
| | | | |
| Canada – 0.0% | | | |
| EastCoal, Inc., strike price CAD 0.55, | | | |
| Expires 5/31/15*(a) | 360,500 | | — |
| TOTAL WARRANTS | | | |
| (COST $—) | | | — |
| |
| Participatory Notes – 10.9% | | | |
| | | | |
| Saudi Arabia – 3.9% | | | |
| Samba Financial Group, 12/3/12, | | | |
| (Deutsche Bank AG) | 12,700 | | 148,971 |
| Yanbu National Petrochemicals Co., | | | |
| 12/3/12, (Deutsche Bank AG) | 6,521 | | 75,839 |
| Etihad Etisalat Co., 12/3/12, | | | |
| (Deutsche Bank AG)(b) | 14,524 | | 279,877 |
| United Electronics Co., 2/13/15, | | | |
| (Citigroup Global Markets | | | |
| Holding, Inc.)* | 7,660 | | 190,581 |
| | | 695,268 |
| United Arab Emirates – 4.7% | | | |
| Abu Dhabi Commercial Bank, | | | |
| 4/22/13, (Citigroup Global | | | |
| Markets Holding, Inc.)* | 110,000 | | 98,010 |
| Dana Gas, 3/1/17, | | | |
| (Deutsche Bank AG)* | 361,907 | | 39,810 |
| First Gulf Bank PJSC, 2/11/19, | | | |
| (Deutsche Bank AG)* | 131,729 | | 368,841 |
| National Bank of Abu Dhabi, | | | |
| 11/29/13, (Citigroup Global | | | |
| Markets Holding, Inc.)* | 95,875 | | 253,781 |
| Union National Bank of Abu Dhabi, | | | |
| 9/27/13, (Citigroup Global Markets | | | |
| Holding, Inc.)* | 92,500 | | 77,238 |
| | | 837,680 |
| Vietnam – 2.3% | | | |
| PetroVietnam Drilling & Well Services | | | |
| JSC, 9/6/16, (JPMorgan Chase) | 104,599 | | 174,680 |
| Vietnam Dairy Products JSC, | | | |
| 1/20/15, (Citigroup Global | | | |
| Markets Holding, Inc.)* | 37,800 | | 226,611 |
| | | 401,291 |
| TOTAL PARTICIPATORY NOTES | | | |
| (COST $1,866,921) | | | 1,934,239 |
| | | | |
| Investment Company – 3.3% | | | |
| |
| Shares | | |
| Northern Institutional Diversified | | | |
| Assets Portfolio, Institutional | | | |
| Shares, 0.01% (c) | 578,427 | | 578,427 |
| TOTAL INVESTMENT COMPANY | | | |
| (COST $578,427) | | | 578,427 |
| TOTAL INVESTMENT SECURITIES | | | |
| (COST $16,104,109) — 98.8% | | | 17,565,648 |
____________________
| Percentages indicated are based on net assets of $17,784,545. |
| * | | Represents non-income producing security. |
| (a) | | Security was valued in good faith pursuant to procedures approved by the Board of Trustees as of October 31, 2012. The total of all such securities represent 0.00% of the net assets of the fund. |
| (b) | | Rule 144A security or other security which is restricted as to resale to institutional investors. This security has been deemed liquid by the Investment Adviser based on procedures approved by the Board of Trustees. |
| (c) | | The rate represents the annualized one-day yield that was in effect on October 31, 2012. |
ADR — American Depositary Receipt
GDR — Global Depositary Receipt |
The Fund invested, as a percentage of net assets, in the following industries, as of October 31, 2012:
| Industry | Percent of Net Assets |
| Commercial Banks | 36.3 | % |
| Oil, Gas & Consumable Fuels | 12.4 | % |
| Diversified Financial Services | 6.9 | % |
| Diversified Telecommunication Services | 4.3 | % |
| Real Estate Management & Development | 3.8 | % |
| Industrial Conglomerates | 3.5 | % |
| Wireless Telecommunication Services | 3.4 | % |
| Investment Companies | 3.1 | % |
| Energy Equipment & Services | 3.0 | % |
| Beverages | 3.0 | % |
| Hotels, Restaurants & Leisure | 2.6 | % |
| Food Products | 2.4 | % |
| Metals & Mining | 2.0 | % |
| Pharmaceuticals | 1.9 | % |
| Independent Power Producers & | | |
| Energy Traders | 1.9 | % |
| Marine | 1.7 | % |
| Airlines | 1.6 | % |
| Health Care Providers & Services | 1.0 | % |
| Construction Materials | 1.0 | % |
| Exchange Traded Fund | 0.9 | % |
| Multi-Utilities | 0.9 | % |
| Insurance | 0.6 | % |
| Construction & Engineering | 0.4 | % |
| Transportation Infrastructure | 0.2 | % |
| Total Investments | 98.8 | % |
| See notes to financial statements. | HSBC FAMILY OF FUNDS 29 |
| HSBC TOTAL RETURN FUND |
| Schedule of Portfolio Investments—as of October 31, 2012 |
| Corporate Bond – 0.3% | | | |
| | | | |
| Principal | | |
| Amount ($) | | Value ($) |
| United States – 0.3% | | | |
| Reliance Holdings USA, Inc., | | | |
| Registered, 5.40%, 2/14/22 | 850,000 | | 945,163 |
| TOTAL CORPORATE BOND | | | |
| (COST $874,405) | | | 945,163 |
| |
| Foreign Bonds – 14.2%† | | | |
| | | | |
| Mexico – 6.7% | | | |
| Mexican Bonos Desarr, Series M, | | | |
| 6.50%, 6/10/21 (a) | 1,000,000 | | 81,441 |
| Mexican Bonos Desarr, Series M30, | | | |
| 10.00%, 11/20/36 (a) | 711,800 | | 76,915 |
| Mexican Cetes, Series BI, | | | |
| 0.00%, 11/29/12 (b) | 1,350,000,000 | | 10,275,207 |
| Mexican Cetes, Series BI, | | | |
| 0.00%, 2/21/13 (b) | 1,700,000,000 | | 12,801,905 |
| | | 23,235,468 |
| Turkey – 7.5% | | | |
| Turkey Government Bond, | | | |
| 6.92%, 11/7/12 (b) | 22,000,000 | | 12,262,036 |
| Turkey Government Bond, | | | |
| 10.00%, 1/9/13 (a) | 25,000,000 | | 14,067,905 |
| | | 26,329,941 |
| TOTAL FOREIGN BONDS | | | |
| (COST $49,466,800) | | | 49,565,409 |
| |
| Yankee Dollars – 38.4% | | | |
| | | | |
| Brazil – 7.1% | | | |
| Banco do Brasil SA, Registered, | | | |
| 5.38%, 1/15/21 | 1,800,000 | | 1,921,500 |
| Banco do Brasil SA, Registered, | | | |
| 5.88%, 1/26/22 | 200,000 | | 217,000 |
| Banco do Estado do Rio Grande | | | |
| do Sul SA, Registered, | | | |
| 7.38%, 2/2/22 | 1,300,000 | | 1,483,690 |
| Banco Santander Brasil SA, | | | |
| Registered, 4.63%, 2/13/17 | 500,000 | | 527,500 |
| Banco Santander Brasil SA, | | | |
| Registered, 4.63%, 2/13/17 | 300,000 | | 316,500 |
| Banco Votorantim, Registered, | | | |
| 5.25%, 2/11/16, MTN | 200,000 | | 213,500 |
| Centrais Eletricas Brasileiras SA, | | | |
| Registered, 6.88%, 7/30/19 | 2,000,000 | | 2,365,000 |
| Centrais Eletricas Brasileiras SA, | | | |
| Registered, 5.75%, 10/27/21 | 1,950,000 | | 2,184,000 |
| Oi SA, Registered, | | | |
| 5.75%, 2/10/22 | 1,500,000 | | 1,620,000 |
| Petrobras International Finance Co., | | | |
| 7.88%, 3/15/19 | 2,400,000 | | 3,038,472 |
| Petrobras International Finance Co., | | | |
| 5.75%, 1/20/20 | 4,500,000 | | 5,190,664 |
| Vale Overseas Ltd., | | | |
| 4.38%, 1/11/22 | 3,200,000 | | 3,406,240 |
| Voto-Votorantim Ltd., Registered, | | | |
| 6.75%, 4/5/21 | 1,700,000 | | 2,027,250 |
| Votorantim Cimentos SA, | | | |
| Registered, 7.25%, 4/5/41 | 200,000 | | 226,000 |
| | | 24,737,316 |
| Chile – 0.8% | | | |
| Codelco, Inc., Registered, | | | |
| 7.50%, 1/15/19 | 1,300,000 | | 1,689,366 |
| Empresa Nacional de Petroleo, | | | |
| Registered, 4.75%, 12/6/21 | 1,100,000 | | 1,202,972 |
| | | 2,892,338 |
| China – 0.4% | | | |
| CITIC Resources Holdings Ltd., | | | |
| Registered, 6.75%, 5/15/14 | 1,400,000 | | 1,466,150 |
| Colombia – 3.6% | | | |
| Bancolombia SA, 6.13%, 7/26/20 | 3,750,000 | | 4,200,000 |
| Country Garden Holdings Co. Ltd., | | | |
| Registered, 11.13%, 2/23/18, | | | |
| Callable 2/23/15 @ 105.56 | 1,275,000 | | 1,431,187 |
| Grupo Aval Ltd., Registered, | | | |
| 5.25%, 2/1/17 | 5,410,000 | | 5,779,449 |
| Grupo Aval Ltd., Registered, | | | |
| 4.75%, 9/26/22 | 800,000 | | 800,000 |
| Republic of Colombia, | | | |
| 7.38%, 1/27/17 | 400,000 | | 497,000 |
| | | 12,707,636 |
| Dominican Republic – 0.2% | | | |
| Dominican Republic, | | | |
| 7.50%, 5/6/21 | 600,000 | | 705,000 |
| Gabon – 1.0% | | | |
| Gabonese Republic, Registered, | | | |
| 8.20%, 12/12/17 | 2,925,000 | | 3,546,563 |
| Indonesia – 2.9% | | | |
| PT Pertamina Tbk, Registered, | | | |
| 4.88%, 5/3/22 | 2,300,000 | | 2,501,250 |
| Republic of Indonesia, Registered, | | | |
| 7.25%, 4/20/15 | 1,580,000 | | 1,785,400 |
| Republic of Indonesia, Registered, | | | |
| 7.50%, 1/15/16 | 2,320,000 | | 2,714,400 |
| Republic of Indonesia, Registered, | | | |
| 4.88%, 5/5/21 | 1,300,000 | | 1,482,000 |
| Republic of Indonesia, Registered, | | | |
| 3.75%, 4/25/22 | 1,400,000 | | 1,480,500 |
| | | 9,963,550 |
| Kazakhstan – 0.9% | | | |
| KazMunayGas National Co., | | | |
| Registered, Series 1, | | | |
| 8.38%, 7/2/13, MTN | 3,000,000 | | 3,123,960 |
| Lithuania – 0.3% | | | |
| Republic of Lithuania, Registered, | | | |
| 6.63%, 2/1/22 | 800,000 | | 990,000 |
| 30 HSBC FAMILY OF FUNDS | See notes to financial statements. |
| HSBC TOTAL RETURN FUND |
| Schedule of Portfolio Investments—as of October 31, 2012 (continued) |
| Yankee Dollars, continued | | | |
| | | |
| Principal | | |
| Amount ($) | | Value ($) |
| Luxembourg – 0.2% | | | |
| TNK-BP Finance SA, Series 5, | | | |
| 7.50%, 3/13/13, MTN | 500,000 | | 510,970 |
| VTB Bank OJSC (VTB Capital SA), | | | |
| Registered, 6.00%, 4/12/17 | 200,000 | | 208,750 |
| | | 719,720 |
| Mexico – 1.0% | | | |
| BBVA Bancomer SA Texas, | | | |
| Registered, 6.75%, 9/30/22 | 1,000,000 | | 1,132,500 |
| Mexichem SAB de CV, Registered, | | | |
| 4.88%, 9/19/22 | 250,000 | | 264,375 |
| Petroleos Mexicanos, | | | |
| 4.88%, 3/15/15 | 2,000,000 | | 2,140,000 |
| | | 3,536,875 |
| Namibia – 1.1% | | | |
| Namibia International Bond, | | | |
| Registered, 5.50%, 11/3/21 | 3,400,000 | | 3,808,000 |
| Netherlands – 0.3% | | | |
| Kazakhstan Temir Zholy, Registered, | | | |
| 6.38%, 10/6/20 (a) | 850,000 | | 1,019,159 |
| Peru – 0.8% | | | |
| Banco de Credito del Peru, | | | |
| Registered, 5.38%, 9/16/20 | 780,000 | | 861,900 |
| Continental Senior Trust, | | | |
| Registered, 5.75%, 1/18/17 | 1,500,000 | | 1,665,090 |
| Corp. Financiera de Desarrollo SA, | | | |
| Registered, 4.75%, 2/8/22 | 200,000 | | 223,500 |
| | | 2,750,490 |
| Russian Federation – 7.0% | | | |
| AK Transneft OAO, Registered, | | | |
| 5.67%, 3/5/14 | 400,000 | | 422,332 |
| Alfa Bank OJSC, Registered, | | | |
| 7.88%, 9/25/17 | 1,200,000 | | 1,308,000 |
| Gazprom OAO, Registered, | | | |
| 8.13%, 7/31/14 | 2,200,000 | | 2,412,168 |
| Gazprom OAO, Registered, | | | |
| 9.25%, 4/23/19 | 3,600,000 | | 4,698,000 |
| Gazprom OAO, Registered, | | | |
| 6.51%, 3/7/22, MTN | 1,850,000 | | 2,178,375 |
| Russia Foreign Bond, Registered, | | | |
| 7.50%, 3/31/30 | 5,793,125 | | 7,335,834 |
| Sberbank of Russia (SB Capital SA), | | | |
| Registered, 4.95%, 2/7/17 | 5,600,000 | | 5,935,888 |
| | | 24,290,597 |
| Slovak Republic – 2.9% | | | |
| Slovak Republic, Registered, | | | |
| 4.38%, 5/21/22 | 9,400,000 | | 10,033,466 |
| South Africa – 2.6% | | | |
| Republic of South Africa, | | | |
| 6.88%, 5/27/19 | 6,100,000 | | 7,596,940 |
| Republic of South Africa, | | | |
| 5.50%, 3/9/20 | 1,300,000 | | 1,518,790 |
| | | 9,115,730 |
| | | |
| Shares or | | |
| Principal | | |
| Amount ($) | | |
| Turkey – 2.9% | | | |
| Republic of Turkey, 7.25%, 3/15/15 | 5,400,000 | | 6,029,100 |
| Republic of Turkey, 7.50%, 11/7/19 | 100,000 | | 126,950 |
| Republic of Turkey, 5.13%, 3/25/22 | 2,200,000 | | 2,469,500 |
| Republic of Turkey, 6.25%, 9/26/22 | 1,250,000 | | 1,514,375 |
| | | 10,139,925 |
| United Kingdom – 0.4% | | | |
| Vedanta Resources plc, Registered, | | | |
| 6.75%, 6/7/16 | 1,400,000 | | 1,428,000 |
| Uruguay – 0.3% | | | |
| Republica Oriental del Uruguay, | | | |
| 6.88%, 9/28/25 | 700,000 | | 966,000 |
| Venezuela – 1.7% | | | |
| Republic of Venezuela, | | | |
| 9.38%, 1/13/34 | 2,550,000 | | 2,263,125 |
| Republic of Venezuela, Registered, | | | |
| 7.75%, 10/13/19 | 500,000 | | 435,000 |
| Republic of Venezuela, Registered, | | | |
| 11.95%, 8/5/31 | 3,100,000 | | 3,169,750 |
| | | 5,867,875 |
| TOTAL YANKEE DOLLARS | | | |
| (COST $130,757,054) | | | 133,808,350 |
| |
| U.S. Treasury Obligations – 27.8% | | | |
| | | | |
| U.S. Treasury Bills – 25.8% | | | |
| 0.11%, 11/15/12(c) | 75,000,000 | | 74,998,275 |
| 0.10%, 11/23/12(c) | 15,000,000 | | 14,999,250 |
| | | 89,997,525 |
| U.S. Treasury Notes – 2.0% | | | |
| 1.63%, 8/15/22. | 6,950,000 | | 6,911,991 |
| TOTAL U.S. TREASURY | | | |
| OBLIGATIONS | | | |
| (COST $96,927,769) | | | 96,909,516 |
| |
| Purchased Options – 0.0%‡ | | | |
| |
| TOTAL PURCHASED OPTIONS | | | |
| (COST $12,985) | | | 2,350 |
| |
| Investment Company – 18.7% | | | |
| | | | |
| Northern Institutional Diversified | | | |
| Assets Portfolio, Institutional | | | |
| Shares, 0.01% (d) | 65,349,205 | | 65,349,205 |
| TOTAL INVESTMENT COMPANY | | | |
| (COST $65,349,205) | | | 65,349,205 |
| TOTAL INVESTMENT SECURITIES | | | |
| (COST $343,388,218) — 99.4% | | | 346,579,993 |
| See notes to financial statements. | HSBC FAMILY OF FUNDS 31 |
| HSBC TOTAL RETURN FUND |
| Schedule of Portfolio Investments—as of October 31, 2012 (continued) |
____________________
Percentages indicated are based on net assets of $348,802,919.
| † | | The principal amount is disclosed in local currency and the value is disclosed in U.S. Dollars. |
| (a) | | Variable rate security. The interest rates on these securities are adjusted periodically to reflect then-current short-term interest rates. The rates presented represent the rates in effect on October 31, 2012. The maturity dates presented reflect the final maturity dates. However, some of these securities may contain put or demand features that allow the Fund to require the issuer to repurchase the security from the fund within various time periods, including daily, weekly, monthly, or semi-annually. |
| (b) | | Zero-Coupon Security. |
| (c) | | Discount note. Rate presented represents the effective yield at time of purchase. |
| (d) | | The rate represents the annualized one-day yield that was in effect on October 31, 2012. |
LIBOR — Represents the London InterBank Offered Rate
MTN — Medium Term Note
The Fund invested, as a percentage of net assets, in the following industries, as of October 31, 2012:
| Industry | Percentage of Net Assets |
| Sovereign Bonds | 31.8 | % |
| U.S. Treasury Obligations | 27.8 | % |
| Investment Companies | 18.7 | % |
| Oil, Gas & Consumable Fuels | 8.0 | % |
| Commercial Banks | 5.3 | % |
| Diversified Financial Services | 3.1 | % |
| Metals & Mining | 1.9 | % |
| Electric Utilities | 1.3 | % |
| Diversified Telecommunication Services | 0.5 | % |
| Energy Equipment & Services | 0.5 | % |
| Real Estate Management & Development | 0.4 | % |
| Chemicals | 0.1 | % |
| Purchased Options | 0.0 | % |
| Total Investments | 99.4 | % |
‡Purchased Currency Options
At October 31, 2012, the Fund’s open options contracts were as follows:
| | | | | | | | Strike | | Premium | | |
| | | | | | | | Price | | Received | | Value |
| Contracts | | | Counterparty | | Description | | Expiration Date | | ($) | | ($) | | ($) |
| | JPMorgan Chase | | | | | | | | | | |
| 500,000 | | Bank N.A. | | Mexican Peso Currency Option (USD/MXN) | | 1/31/13 | | 14.32 | | 12,985 | | 2,350 |
| | | | | | | | | | | | 2,350 |
Interest Rate Swap Agreements
At October 31, 2012, the Fund’s open interest rate swap agreements were as follows:
| | | | | | | | | | | | | | | | | | | Upfront | | | | | |
| | | | | | | | | | | | | | | | | | | Premiums | | Unrealized |
| Pay/Receive | | | | | Fixed | | | | | | Notional | | Notional | | | | | | | Paid/ | | Appreciation/ |
| Floating | | | | | Rate | | Expiration | | | | Amount | | Amount | | Value | | (Received) | | (Depreciation) |
| Rate | | | Floating Rate Index | | (%) | | Date | | Counterparty | | (Local) | | ($) | | ($) | | ($) | | ($) |
| | 3-Month | | | | | | Standard | | | | | | | | | | | | | | | | | | |
| Pay | | LIBOR BBA | | 1.96% | | 5/17/22 | | Charter Bank | | 1,200,000 USD | | 1,200,000 | | | (41,877 | ) | | | | — | | | | (41,877 | ) | |
| | 3-Month | | | | | | Barclays Capital | | | | | | | | | | | | | | | | | | |
| Pay | | LIBOR BBA | | 1.77% | | 8/10/22 | | Group | | 13,000,000 USD | | 13,000,000 | | | (123,542 | ) | | | | — | | | | (123,542 | ) | |
| | | | | | | | | | | | | | | (165,419 | ) | | | | — | | | | (165,419 | ) | |
Credit Default Swap Agreements - Sell Protection(e)
At October 31, 2012, the Fund’s open credit default swap agreements were as follows:
| | | | | | | | | | | | | | | | | Upfront | | | | |
| | | | | | Implied Credit | | | | | | | | | | | Premiums | | Unrealized |
| | | | | | Spread at | | Notional | | Fixed | | | | | | | Paid/ | | Appreciation/ |
| | | | Expiration | | October 31, | | Amount | | Rate | | Value | | (Received) | | (Depreciation) |
| Underlying Instrument | | | Counterparty | | Date | | 2012 (%) (f) | | ($)(g) | | (%) | | ($) | | ($) | | ($) |
| | JPMorgan | | | | | | | | | | | | | | | | | | | | | | |
| Peoples Republic of China | | Chase Bank N.A. | | 09/20/17 | | 0.56 | | 100,000 | | 1.00 | | | 1,816 | | | | | (941 | ) | | | | 2,757 | |
| | JPMorgan | | | | | | | | | | | | | | | | | | | | | | |
| Republic of Peru | | Chase Bank N.A. | | 06/20/17 | | 0.93 | | 100,000 | | 1.00 | | | 383 | | | | | (3,224 | ) | | | | 3,607 | |
| Federative Republic of Brazil | | Barclays Bank PLC | | 09/20/17 | | 1.06 | | 3,000,000 | | 1.00 | | | (4,271 | ) | | | | (74,684 | ) | | | | 70,413 | |
| | JPMorgan | | | | | | | | | | | | | | | | | | | | | | |
| Federative Republic of Brazil | | Chase Bank N.A. | | 09/20/17 | | 1.09 | | 3,000,000 | | 1.00 | | | (4,271 | ) | | | | (74,684 | ) | | | | 70,413 | |
| | JPMorgan | | | | | | | | | | | | | | | | | | | | | | |
| Peoples Republic of China | | Chase Bank N.A. | | 09/20/17 | | 0.61 | | 5,000,000 | | 1.00 | | | 90,791 | | | | | (2,417 | ) | | | | 93,208 | |
| Republic of South Africa | | Barclays Bank PLC | | 12/20/17 | | 1.48 | | 3,500,000 | | 1.00 | | | (81,730 | ) | | | | (88,148 | ) | | | | 6,418 | |
| | JPMorgan | | | | | | | | | | | | | | | | | | | | | | |
| Republic of South Africa | | Chase Bank N.A. | | 12/20/17 | | 1.48 | | 3,500,000 | | 1.00 | | | (81,730 | ) | | | | (99,897 | ) | | | | 18,167 | |
| | | | | | | | | | | | | (79,012 | ) | | | | (343,995 | ) | | | | 264,983 | |
| 32 HSBC FAMILY OF FUNDS | See notes to financial statements. |
| HSBC TOTAL RETURN FUND |
| Schedule of Portfolio Investments — as of October 31, 2012 (continued) |
Credit Default Swap Agreements - Buy Protection(e)
At October 31, 2012, the Fund’s open credit default swap agreements were as follows:
| | | | | | | | | | | | | | | | | | | Upfront | | | | | |
| | | | | | Implied Credit | | | | | | | | | | | | | Premiums | | Unrealized |
| | | | | | Spread at | | Notional | | Fixed | | | | | | | Paid/ | | Appreciation/ |
| | | | Expiration | | October 31, | | Amount | | Rate | | Value | | (Received) | | (Depreciation) |
| Underlying Instrument | | | Counterparty | | Date | | 2012 (%) (f) | | ($)(g) | | (%) | | ($) | | ($) | | ($) |
| | JPMorgan | | | | | | | | | | | | | | | | | | | | | | | | |
| Republic of Korea | | Chase Bank N.A. | | 09/20/17 | | 0.58 | | | 100,000 | | | 1.00 | | | (1,832 | ) | | | | 1,211 | | | | (3,043 | ) | |
| State of Qatar | | Barclays Bank PLC | | 09/20/17 | | 0.95 | | | 6,250,000 | | | 1.00 | | | (27,398 | ) | | | | 74,259 | | | | (101,657 | ) | |
| | JPMorgan | | | | | | | | | | | | | | | | | | | | | | | | |
| Republic of the Philippines | | Chase Bank N.A. | | 09/20/17 | | 1.01 | | | 1,700,000 | | | 1.00 | | | (7,571 | ) | | | | 38,756 | | | | (46,327 | ) | |
| | JPMorgan | | | | | | | | | | | | | | | | | | | | | | | | |
| Republic of Korea | | Chase Bank N.A. | | 09/20/17 | | 0.63 | | | 5,000,000 | | | 1.00 | | | (91,598 | ) | | | | 12,067 | | | | (103,665 | ) | |
| Republic of Turkey | | Barclays Bank PLC | | 12/20/17 | | 1.64 | | | 3,500,000 | | | 1.00 | | | 98,791 | | | | | 93,237 | | | | 5,554 | | |
| | JPMorgan | | | | | | | | | | | | | | | | | | | | | | | | |
| Republic of Turkey | | Chase Bank N.A. | | 12/20/17 | | 1.64 | | | 3,500,000 | | | 1.00 | | | 98,791 | | | | | 89,748 | | | | 9,043 | | |
| | | | | | | | | | | | | | | 69,183 | | | | | 309,278 | | | | (240,095 | ) | |
| (e) | | When a credit event occurs as defined under the terms of the swap agreement, the Fund as a seller of credit protection will either (i) pay to the buyer of protection an amount equal to the par value of the defaulted reference entity and take delivery of the reference entity or (ii) pay a net amount equal to the par value of the defaulted reference entity less its recovery value. |
| (f) | | Implied credit spread, represented in absolute terms, utilized in determining the fair value of the credit default swap agreements as of period end serve as an indicator of the current status of the payment/performance risk and represent the likelihood or risk of default for the credit derivative. The implied credit spread of a referenced entity reflects the cost of buying/selling protection and may include upfront payments required to be made to enter into the agreement. Generally, wider credit spreads represent a perceived deterioration of the referenced entity’s credit soundness and a greater likelihood or risk of default or other credit event occurring as defined under the terms of the swap agreement. |
| (g) | | The notional amount represents the maximum potential amount the Fund could be required to make as a seller of credit protection or receive as a buyer of credit protection if a credit event occurs, as defined under the terms of the swap agreement. |
At October 31, 2012, $550,000 of cash was segregated for forward foreign currency contracts:
| | | | | | Contract | | | | | | Unrealized |
| | | | | | Amount | | Contract | | | | Appreciation/ |
| | | | Delivery | | (Local | | Value | | Value | | (Depreciation) |
| Short Contracts | | | Counterparty | | Date | | Currency) | | ($) | | ($) | | ($) |
| Chinese Yuan | | JPMorgan Chase Bank N.A. | | 12/28/12 | | 62,411,250 | | 9,790,000 | | 9,951,995 | | | (161,995 | ) | |
| Chinese Yuan | | Standard Charter Bank | | 12/28/12 | | 4,504,430 | | 708,578 | | 718,269 | | | (9,691 | ) | |
| European Euro | | Standard Charter Bank | | 1/15/13 | | 10,368,480 | | 13,481,346 | | 13,448,140 | | | 33,206 | | |
| European Euro | | Barclays Bank PLC | | 1/15/13 | | 1,376,586 | | 1,800,000 | | 1,785,461 | | | 14,539 | | |
| Mexican Peso | | JPMorgan Chase Bank N.A. | | 11/29/12 | | 135,000,000 | | 10,115,390 | | 10,281,487 | | | (166,097 | ) | |
| Mexican Peso | | Standard Charter Bank | | 12/7/12 | | 5,839,600 | | 451,702 | | 444,360 | | | 7,342 | | |
| Mexican Peso | | Barclays Bank PLC | | 12/7/12 | | 8,395,765 | | 650,000 | | 638,870 | | | 11,130 | | |
| Mexican Peso | | Standard Charter Bank | | 1/7/13 | | 182,379,907 | | 14,072,525 | | 13,832,459 | | | 240,066 | | |
| Mexican Peso | | JPMorgan Chase Bank N.A. | | 2/21/13 | | 170,000,000 | | 12,595,392 | | 12,834,409 | | | (239,017 | ) | |
| Russian Ruble | | JPMorgan Chase Bank N.A. | | 1/31/13 | | 164,996,000 | | 5,200,000 | | 5,182,954 | | | 17,046 | | |
| Russian Ruble | | Barclays Bank PLC | | 1/31/13 | | 20,517,445 | | 650,000 | | 644,506 | | | 5,494 | | |
| Turkish Lira | | JPMorgan Chase Bank N.A. | | 11/7/12 | | 22,000,000 | | 12,186,340 | | 12,263,971 | | | (77,631 | ) | |
| Turkish Lira | | Standard Charter Bank | | 1/9/13 | | 25,000,000 | | 13,777,900 | | 13,822,689 | | | (44,789 | ) | |
| | | | | | | | 95,479,173 | | 95,849,570 | | | (370,397 | ) | |
| See notes to financial statements. | HSBC FAMILY OF FUNDS 33 |
| HSBC TOTAL RETURN FUND |
| Schedule of Portfolio Investments—as of October 31, 2012 (continued) |
| | | | | | Contract | | | | | | Unrealized |
| | | | | | Amount | | Contract | | | | Appreciation/ |
| | | | Delivery | | (Local | | Value | | Value | | (Depreciation) |
| Long Contracts | | | Counterparty | | Date | | Currency) | | ($) | | ($) | | ($) |
| Chinese Yuan | | JPMorgan Chase Bank N.A. | | 12/28/12 | | 3,194,500 | | 500,000 | | 509,390 | | | 9,390 | |
| Chinese Yuan | | JPMorgan Chase Bank N.A. | | 12/28/12 | | 18,502,000 | | 2,900,000 | | 2,950,298 | | | 50,298 | |
| Chinese Yuan | | JPMorgan Chase Bank N.A. | | 12/28/12 | | 18,486,050 | | 2,900,000 | | 2,947,755 | | | 47,755 | |
| Chinese Yuan | | JPMorgan Chase Bank N.A. | | 12/28/12 | | 26,754,000 | | 4,200,000 | | 4,266,149 | | | 66,149 | |
| Chinese Yuan | | Standard Charter Bank | | 12/28/12 | | 92,228,200 | | 14,600,000 | | 14,706,554 | | | 106,554 | |
| Chinese Yuan | | Barclays Bank PLC | | 12/28/12 | | 6,309,400 | | 1,000,000 | | 1,006,087 | | | 6,087 | |
| Mexican Peso | | JPMorgan Chase Bank N.A. | | 12/7/12 | | 8,027,570 | | 605,306 | | 610,852 | | | 5,546 | |
| Turkish Lira | | Standard Charter Bank | | 11/7/12 | | 629,000 | | 348,361 | | 350,638 | | | 2,277 | |
| Turkish Lira | | Barclays Bank PLC | | 1/24/13 | | 76,710 | | 42,109 | | 42,331 | | | 222 | |
| | | | | | | | 27,095,776 | | 27,390,054 | | | 294,278 | |
| 34 HSBC FAMILY OF FUNDS | See notes to financial statements. |
| HSBC RMB FIXED INCOME FUND |
| Schedule of Portfolio Investments—as of October 31, 2012 |
| Foreign Bonds – 73.2%† | | | | |
| | Principal | | |
| | Amount ($) | | Value ($) |
| Australia – 2.7% | | | | |
| Australia & New Zealand Banking | | | | |
| Group Ltd., Series E, 2.90%, | | | | |
| 8/14/15, MTN (a) | | 2,000,000 | | 318,075 |
| China – 25.6% | | | | |
| Baosteel Group Corp. Ltd., Registered, | | | | |
| 4.15%, 3/1/17 (a) | | 2,000,000 | | 325,228 |
| Beijing Enterprises Water Group Ltd., | | | | |
| 3.75%, 6/30/14 (a) | | 3,000,000 | | 478,731 |
| Big Will Investments Ltd., Registered, | | | | |
| 7.00%, 4/29/14 (a) | | 2,000,000 | | 313,523 |
| China Guangdong Nuclear Power | | | | |
| Holding Co. Ltd., Registered, | | | | |
| 3.75%, 11/1/15 (a) | | 1,000,000 | | 160,913 |
| China Shanshui Cement Group Ltd., | | | | |
| 6.50%, 7/22/14 (a) | | 2,000,000 | | 317,345 |
| Intime Department Store (Group) Co. | | | | |
| Ltd., Registered, 4.65%, 7/21/14 (a) | | 2,000,000 | | 311,018 |
| Melco Crown Entertainment Ltd., | | | | |
| 3.75%, 5/9/13 (a) | | 3,000,000 | | 478,287 |
| Right Century Ltd., 1.85%, 6/3/14 (a) | | 2,000,000 | | 310,142 |
| The Export-Import Bank of China, | | | | |
| 2.70%, 4/7/14 (a) | | 2,000,000 | | 318,651 |
| | | | 3,013,838 |
| France – 4.1% | | | | |
| Veolia Environnement SA, Series E, | | | | |
| 4.50%, 6/28/17, MTN (a) | | 3,000,000 | | 483,120 |
| Germany – 1.4% | | | | |
| BSH Bosch und Siemens | | | | |
| Hausgerate GmbH, Registered, | | | | |
| 3.80%, 7/24/17 (a) | | 1,000,000 | | 159,709 |
| Hong Kong – 27.2% | | | | |
| BECL Investment Holding Ltd., | | | | |
| 4.75%, 2/21/14 (a) | | 3,000,000 | | 478,618 |
| China Resources Power Holdings Co. | | | | |
| Ltd., Series A, 2.90%, 11/12/13 (a) | | 2,000,000 | | 318,757 |
| Eastern Air Overseas (Hong Kong) | | | | |
| Corp. Ltd., 4.00%, 8/8/14 (a) | | 2,000,000 | | 320,482 |
| Galaxy Entertainment Group Ltd., | | | | |
| 4.63%, 12/16/13 (a) | | 3,000,000 | | 481,502 |
| Gemdale International Holdings Ltd., | | | | |
| 9.15%, 7/26/15 (a) | | 2,000,000 | | 336,822 |
| Lafarge Shui On Cement Ltd., | | | | |
| Registered, 9.00%, 11/14/14 (a) | | 2,000,000 | | 340,032 |
| Rainbow Days Ltd., Registered, | | | | |
| 3.00%, 6/30/16 (a) | | 2,000,000 | | 307,655 |
| Silvery Castle Ltd., 2.75%, 7/14/14 (a) | | 2,000,000 | | 312,457 |
| Singamas Container Holdings Ltd., | | | | |
| Registered, 4.75%, 4/14/14 (a) | | 2,000,000 | | 309,148 |
| | | | 3,205,473 |
| Japan – 2.7% | | | | |
| Mitsui & Co. Ltd., Series E, | | | | |
| 4.25%, 3/1/17, MTN (a) | | 2,000,000 | | 323,818 |
| Singapore – 2.7% | | | | |
| Global Logistic Properites Ltd., | | | | |
| Registered, 3.37%, 5/11/16 (a) | | 2,000,000 | | 314,164 |
| South Korea – 6.8% | | | | |
| Shinhan Bank, Series G, | | | | |
| 2.50%, 3/15/13, MTN (a) | | 2,000,000 | | 319,354 |
| The Export-Import Bank of Korea, | | | | |
| Series E, 3.40%, 1/18/13, MTN (a) | | 1,000,000 | | 160,292 |
| The Korea Development Bank, Series E, | | | | |
| 2.75%, 11/14/13, MTN | | 2,000,000 | | 318,881 |
| | | | 798,527 |
| TOTAL FOREIGN BONDS | | | | |
| (COST $8,398,304) | | | | 8,616,724 |
| | | | | |
| Certificates of Deposit – 17.4% | | | | |
| | | | | |
| China – 6.8% | | | | |
| Bank of Communications Co. Ltd., | | | | |
| 1.00%, 3/4/13 (a) | | 1,000,000 | | 158,806 |
| China Construction Bank Corp., | | | | |
| 2.95%, 2/21/13 (a) | | 2,000,000 | | 320,569 |
| China Development Bank Corp., | | | | |
| 2.90%, 6/25/14 (a) | | 2,000,000 | | 318,790 |
| | | | 798,165 |
| Hong Kong – 4.0% | | | | |
| ICBC Asia Ltd., 1.05%, 5/13/13 (a) | | 3,000,000 | | 474,280 |
| Japan – 2.6% | | | | |
| Sumitomo Mitsui Banking Corp., | | | | |
| 1.10%, 4/22/14 (a) | | 2,000,000 | | 309,788 |
| Singapore – 4.0% | | | | |
| Oversea-Chinese Banking Corp. Ltd., | | | | |
| 1.10%, 3/28/14 (a) | | 3,000,000 | | 465,983 |
| TOTAL CERTIFICATES OF DEPOSIT | | | | |
| (COST $2,011,158) | | | | 2,048,216 |
| |
| Investment Company – 5.3% | | | | |
| | | | | |
| Northern Institutional Diversified | | | | |
| Assets Portfolio, Institutional | | | | |
| Shares, 0.01% (b) | | 625,195 | | 625,195 |
| TOTAL INVESTMENT COMPANY | | | | |
| (COST $625,195) | | | | 625,195 |
| TOTAL INVESTMENT SECURITIES | | | | |
| (COST $11,034,657) — 95.9% | | | | 11,290,135 |
____________________
Percentages indicated are based on net assets of $11,767,367.
| † | | The principal amount is disclosed in local currency and the value is disclosed in U.S. Dollars. |
| (a) | | Variable rate security. The interest rates on these securities are adjusted periodically to reflect then-current short-term interest rates. The rates presented represent the rates in effect on October 31, 2012. The maturity dates presented reflect the final maturity dates. However, some of these securities may contain put or demand features that allow the Fund to require the issuer to repurchase the security from the fund within various time periods, including daily, weekly, monthly, or semi-annually. |
| (b) | | The rate represents the annualized one-day yield that was in effect on October 31, 2012. |
MTN — Medium Term Note
| See notes to financial statements. | HSBC FAMILY OF FUNDS 35 |
| HSBC RMB FIXED INCOME FUND |
| Schedule of Portfolio Investments—as of October 31, 2012 (continued) |
The Fund invested, as a percentage of net assets, in the following industries, as of October 31, 2012:
| Industry | Percentage of Net Assets |
| Commercial Banks | 26.7 | % |
| Real Estate Management & Development | 9.6 | % |
| Hotels, Restaurants & Leisure | 8.2 | % |
| Water Utilities | 8.2 | % |
| Diversified Financial Services | 8.0 | % |
| Construction Materials | 5.6 | % |
| Investment Companies | 5.3 | % |
| Electric Utilities | 4.1 | % |
| Energy Equipment & Services | 2.8 | % |
| Metals & Mining | 2.8 | % |
| Airlines | 2.7 | % |
| Diversified Consumer Services | 2.7 | % |
| Food Products | 2.6 | % |
| Industrial Conglomerates | 2.6 | % |
| Multiline Retail | 2.6 | % |
| Household Durables | 1.4 | % |
| Total Investments | 95.9 | % |
| 36 HSBC FAMILY OF FUNDS | See notes to financial statements. |
HSBC FAMILY OF FUNDS
Statements of Assets and Liabilities – as of October 31, 2012
| | Emerging | | Emerging | | Frontier | | Total | | RMB Fixed |
| | Markets | | Markets Local | | Markets | | Return | | Income |
| | Debt Fund | | Debt Fund | | Fund | | Fund | | Fund |
| Assets: | | | | | | | | | | | | | | | | | | | | | | | | | |
| Investment securities, at value | | | $ | 40,063,289 | | | | $ | 32,390,416 | | | | $ | 17,565,648 | | | | $ | 346,579,993 | | | | $ | 11,290,135 | |
| Cash | | | | — | | | | | — | | | | | 2,356 | | | | | — | | | | | — | |
| Segregated cash for collateral | | | | — | | | | | — | | | | | — | | | | | 550,000 | | | | | — | |
| Foreign currency, at value | | | | 14,249 | | | | | 225,740 | | | | | 209,517 | | | | | 63,998 | | | | | 483,154 | |
| Unrealized appreciation on forward foreign currency | | | | | | | | | | | | | | | | | | | | | | | | | |
| exchange contracts | | | | — | | | | | 333,285 | | | | | — | | | | | 623,101 | | | | | — | |
| Unrealized appreciation on swap agreements | | | | 69,586 | | | | | 129,406 | | | | | — | | | | | 279,580 | | | | | — | |
| Interest and dividends receivable | | | | 492,135 | | | | | 302,602 | | | | | 29,272 | | | | | 2,022,111 | | | | | 117,927 | |
| Premiums paid on swap agreements | | | | 74,400 | | | | | — | | | | | — | | | | | 309,278 | | | | | — | |
| Receivable for capital shares issued | | | | 158,654 | | | | | 36,065 | | | | | 19,340 | | | | | 2,652,070 | | | | | 34,292 | |
| Reclaims receivable | | | | — | | | | | 45,231 | | | | | 513 | | | | | — | | | | | 115 | |
| Receivable from Investment Adviser | | | | 15,537 | | | | | 33,685 | | | | | 19,609 | | | | | — | | | | | 27,042 | |
| Prepaid expenses and other assets | | | | 10,452 | | | | | 14,087 | | | | | 13,598 | | | | | 42,154 | | | | | 39,934 | |
| Total Assets | | | | 40,898,302 | | | | | 33,510,517 | | | | | 17,859,853 | | | | | 353,122,285 | | | | | 11,992,599 | |
| Liabilities: | | | | | | | | | | | | | | | | | | | | | | | | | |
| Cash overdraft | | | | — | | | | | 540,000 | | | | | — | | | | | 370,000 | | | | | — | |
| Interest and dividends payable | | | | 148,725 | | | | | 33,156 | | | | | — | | | | | 335,105 | | | | | 35,061 | |
| Unrealized depreciation on forward foreign currency exchange | | | | | | | | | | | | | | | | | | | | | | | | | |
| contracts | | | | 154 | | | | | 135,678 | | | | | — | | | | | 699,220 | | | | | — | |
| Unrealized depreciation on swap agreements | | | | — | | | | | — | | | | | — | | | | | 420,111 | | | | | — | |
| Premiums received on swap agreements | | | | 19,534 | | | | | — | | | | | — | | | | | 343,995 | | | | | — | |
| Payable for investments purchased | | | | 335,202 | | | | | — | | | | | 32,683 | | | | | 1,673,479 | | | | | 160,244 | |
| Payable for capital shares redeemed | | | | 6,784 | | | | | 4,952 | | | | | — | | | | | 151,341 | | | | | — | |
| Accrued expenses and other liabilities: | | | | | | | | | | | | | | | | | | | | | | | | | |
| Investment Management | | | | — | | | | | — | | | | | — | | | | | 247,402 | | | | | — | |
| Administration | | | | 1,675 | | | | | 1,362 | | | | | 717 | | | | | 13,001 | | | | | 423 | |
| Shareholder Servicing | | | | 96 | | | | | 435 | | | | | 175 | | | | | 77 | | | | | 374 | |
| Compliance Service | | | | 51 | | | | | 54 | | | | | 48 | | | | | 517 | | | | | 49 | |
| Accounting | | | | 282 | | | | | 51 | | | | | 67 | | | | | 91 | | | | | 54 | |
| Custodian | | | | 4,760 | | | | | 17,064 | | | | | 17,250 | | | | | 22,710 | | | | | 14,865 | |
| Transfer Agent | | | | 1,986 | | | | | 2,187 | | | | | 2,050 | | | | | 456 | | | | | 887 | |
| Trustee | | | | 119 | | | | | 104 | | | | | 45 | | | | | 2,882 | | | | | 51 | |
| Other | | | | 22,853 | | | | | 18,706 | | | | | 22,273 | | | | | 38,979 | | | | | 13,224 | |
| Total Liabilities | | | | 542,221 | | | | | 753,749 | | | | | 75,308 | | | | | 4,319,366 | | | | | 225,232 | |
| Net Assets | | | $ | 40,356,081 | | | | $ | 32,756,768 | | | | $ | 17,784,545 | | | | $ | 348,802,919 | | | | $ | 11,767,367 | |
| | | | | | | | | | | | | | | | | | | | | | | | | | |
| See notes to financial statements. | HSBC FAMILY OF FUNDS 37 |
HSBC FAMILY OF FUNDS
Statements of Assets and Liabilities – as of October 31, 2012 (continued)
| | Emerging | | Emerging | | Frontier | | Total | | RMB Fixed |
| | Markets | | Markets Local | | Markets | | Return | | Income |
| | Debt Fund | | Debt Fund | | Fund | | Fund | | Fund |
| Composition of Net Assets: | | | | | | | | | | | | | | | | | | | | | | | | | | | | |
| Capital | | | $ | 35,604,266 | | | | $ | 32,580,636 | | | | | $ | 16,314,515 | | | | | $ | 344,400,866 | | | | $ | 11,482,155 | | |
| Accumulated net investment income (loss) | | | | 156,381 | | | | | (98,794 | ) | | | | | 568,629 | | | | | | 209,007 | | | | | 26,606 | | |
| Accumulated net realized gains (losses) | | | | | | | | | | | | | | | | | | | | | | | | | | | | |
| from investments | | | | 821,161 | | | | | 199,633 | | | | | | (561,094 | ) | | | | | 1,228,159 | | | | | 6 | | |
| Unrealized appreciation/depreciation on investments | | | | 3,774,273 | | | | | 75,293 | | | | | | 1,462,495 | | | | | | 2,964,887 | | | | | 258,600 | | |
| Net Assets | | | $ | 40,356,081 | | | | $ | 32,756,768 | | | | | $ | 17,784,545 | | | | | $ | 348,802,919 | | | | $ | 11,767,367 | | |
| | | | | | | | | | | | | | | | | | | | | | | | | | | | | |
| Net Assets: | | | | | | | | | | | | | | | | | | | | | | | | | | | | |
| Class A Shares | | | $ | 481,639 | | | | $ | 2,052,841 | | | | | $ | 1,409,153 | | | | | $ | 256,469 | | | | $ | 1,530,085 | | |
| Class I Shares | | | | 39,750,804 | | | | | 30,602,326 | | | | | | 16,375,392 | | | | | | 348,442,557 | | | | | 10,133,834 | | |
| Class S Shares | | | | 123,638 | | | | | 101,601 | | | | | | — | | | | | | 103,893 | | | | | 103,448 | | |
| | | | $ | 40,356,081 | | | | $ | 32,756,768 | | | | | $ | 17,784,545 | | | | | $ | 348,802,919 | | | | $ | 11,767,367 | | |
| Shares Outstanding | | | | | | | | | | | | | | | | | | | | | | | | | | | | |
| ($0.001 par value, unlimited number of | | | | | | | | | | | | | | | | | | | | | | | | | | | | |
| shares authorized): | | | | | | | | | | | | | | | | | | | | | | | | | | | | |
| Class A Shares | | | | 42,184 | | | | | 208,228 | | | | | | 128,921 | | | | | | 24,860 | | | | | 149,384 | | |
| Class I Shares | | | | 3,474,534 | | | | | 3,100,117 | | | | | | 1,493,150 | | | | | | 33,717,169 | | | | | 988,619 | | |
| Class S Shares | | | | 10,806 | | | | | 10,292 | | | | | | — | | | | | | 10,055 | | | | | 10,091 | | |
| Net Asset Value, Offering Price and Redemption Price | | | | | | | | | | | | | | | | | | | | | | | | | | | | |
| per share: | | | | | | | | | | | | | | | | | | | | | | | | | | | | |
| Class A Shares | | | $ | 11.42 | | | | $ | 9.86 | | | | | $ | 10.93 | | | | | $ | 10.32 | | | | $ | 10.24 | | |
| Class I Shares | | | $ | 11.44 | | | | $ | 9.87 | | | | | $ | 10.97 | | | | | $ | 10.33 | | | | $ | 10.25 | | |
| Class S Shares | | | $ | 11.44 | | | | $ | 9.87 | | | | | $ | — | | | | | $ | 10.33 | | | | $ | 10.25 | | |
| Maximum Sales Charge - Class A Shares | | | | 4.75% | | | | | 4.75% | | | | | | 5.00% | | | | | | 4.75% | | | | | 4.75% | | |
| Maximum Offering Price per share (Net Asset Value/ | | | | | | | | | | | | | | | | | | | | | | | | | | | | |
| (100%-maximum sales charge)) - Class A Shares | | | $ | 11.99 | | | | $ | 10.35 | | | | | $ | 11.51 | | | | | $ | 10.83 | | | | $ | 10.75 | | |
| Total Investments, at cost | | | $ | 36,359,071 | | | | $ | 32,644,236 | | | | | $ | 16,104,109 | | | | | $ | 343,388,218 | | | | $ | 11,034,657 | | |
| Foreign currency, at cost | | | $ | 13,626 | | | | $ | 223,026 | | | | | $ | 207,748 | | | | | $ | 63,979 | | | | $ | 481,816 | | |
| 38 HSBC FAMILY OF FUNDS | See notes to financial statements. |
HSBC FAMILY OF FUNDS
Statements of Operations—For the period ended October 31, 2012
| | | | | | | | Emerging | | | | | | | | | | | | | | RMB |
| | Emerging | | Markets | | Frontier | | Total | | Fixed |
| | Markets | | Local Debt | | Markets | | Return | | Income |
| | Debt Fund | | Fund | | Fund | | Fund(a) | | Fund(b) |
| Investment Income: | | | | | | | | | | | | | | | | | | | | | | | | | | | | | | |
| Interest | | | $ | 2,074,116 | | | | | $ | 972,703 | | | | | $ | 6,689 | | | | | $ | 1,876,122 | | | | | $ | 155,520 | | |
| Dividends | | | | 65 | | | | | | 1,475 | | | | | | 743,574 | | | | | | 1,791 | | | | | | 24 | | |
| Foreign tax withholding | | | | — | | | | | | (30,067 | ) | | | | | (36,570 | ) | | | | | — | | | | | | (3,154 | ) | |
| Total Investment Income (Loss) | | | | 2,074,181 | | | | | | 944,111 | | | | | | 713,693 | | | | | | 1,877,913 | | | | | | 152,390 | | |
| Expenses: | | | | | | | | | | | | | | | | | | | | | | | | | | | | | | |
| Investment Management | | | | 187,612 | | | | | | 142,123 | | | | | | 190,981 | | | | | | 695,979 | | | | | | 23,521 | | |
| Advisory Services: | | | | | | | | | | | | | | | | | | | | | | | | | | | | | | |
| Operational Support - Class A Shares | | | | 823 | | | | | | 3,735 | | | | | | 439 | | | | | | 185 | | | | | | 576 | | |
| Operational Support - Class I Shares | | | | 36,997 | | | | | | 26,459 | | | | | | 15,059 | | | | | | 81,727 | | | | | | 3,948 | | |
| Administration: | | | | | | | | | | | | | | | | | | | | | | | | | | | | | | |
| Class A Shares | | | | 202 | | | | | | 916 | | | | | | 81 | | | | | | 29 | | | | | | 88 | | |
| Class I Shares | | | | 18,144 | | | | | | 12,977 | | | | | | 7,000 | | | | | | 39,659 | | | | | | 1,184 | | |
| Class S Shares | | | | 55 | | | | | | 47 | | | | | | — | | | | | | 12 | | | | | | 12 | | |
| Shareholder Servicing: | | | | | | | | | | | | | | | | | | | | | | | | | | | | | | |
| Class A Shares | | | | 708 | | | | | | 4,348 | | | | | | 305 | | | | | | 77 | | | | | | 724 | | |
| Accounting | | | | 63,925 | | | | | | 57,217 | | | | | | 58,045 | | | | | | 23,616 | | | | | | 10,815 | | |
| Audit | | | | 21,404 | | | | | | 21,357 | | | | | | 21,468 | | | | | | 21,367 | | | | | | 21,245 | | |
| Compliance Service | | | | 785 | | | | | | 607 | | | | | | 339 | | | | | | 1,670 | | | | | | 103 | | |
| Custodian | | | | 17,493 | | | | | | 74,477 | | | | | | 69,209 | | | | | | 25,326 | | | | | | 16,526 | | |
| Printing | | | | 36,059 | | | | | | 27,831 | | | | | | 13,141 | | | | | | 22,249 | | | | | | 6,147 | | |
| Transfer Agent | | | | 27,700 | | | | | | 27,423 | | | | | | 22,322 | | | | | | 36,804 | | | | | | 2,760 | | |
| Trustee | | | | 2,139 | | | | | | 1,615 | | | | | | 766 | | | | | | 4,740 | | | | | | 184 | | |
| Registration fees | | | | 52,413 | | | | | | 54,858 | | | | | | 22,720 | | | | | | 10,327 | | | | | | 10,372 | | |
| Other | | | | 13,041 | | | | | | 10,205 | | | | | | 6,897 | | | | | | 16,930 | | | | | | 1,532 | | |
| Total expenses before fee reductions | | | | 479,500 | | | | | | 466,195 | | | | | | 428,772 | | | | | | 980,697 | | | | | | 99,737 | | |
| Fees contractually reduced/reimbursed by | | | | | | | | | | | | | | | | | | | | | | | | | | | | | | |
| Investment Adviser | | | | (159,226 | ) | | | | | (218,089 | ) | | | | | (145,285 | ) | | | | | (207 | ) | | | | | (51,659 | ) | |
| Net Expenses | | | | 320,274 | | | | | | 248,106 | | | | | | 283,487 | | | | | | 980,490 | | | | | | 48,078 | | |
| | | | | | | | | | | | | | | | | | | | | | | | | | | | | | | |
| Net Investment Income (Loss) | | | | 1,753,907 | | | | | | 696,005 | | | | | | 430,206 | | | | | | 897,423 | | | | | | 104,312 | | |
| | | | | | | | | | | | | | | | | | | | | | | | | | | | | | | |
| Net Realized/Unrealized Gains (Losses) from Investments: | | | | | | | | | | | | | | | | | | | | | | | | | | | | | | |
| Net realized gains (losses) from investment securities and | | | | | | | | | | | | | | | | | | | | | | | | | | | | | | |
| foreign currency transactions | | | | 778,237 | | | | | | (577,161 | ) | | | | | (295,483 | ) | | | | | 272,391 | | | | | | 9,748 | | |
| Net realized gains (losses) from swap agreements | | | | 48,333 | | | | | | 64,855 | | | | | | — | | | | | | 1,191,188 | | | | | | — | | |
| Net realized gains (losses) from options transactions | | | | — | | | | | | 20,535 | | | | | | — | | | | | | (2,043 | ) | | | | | — | | |
| Net realized gains (losses) from forward foreign currency | | | | | | | | | | | | | | | | | | | | | | | | | | | | | | |
| exchange contracts | | | | 163,964 | | | | | | 472,480 | | | | | | (9,194 | ) | | | | | 188,920 | | | | | | (141 | ) | |
| Change in unrealized appreciation/depreciation on investments | | | | 3,109,845 | | | | | | 986,694 | | | | | | 1,859,842 | | | | | | 2,964,887 | | | | | | 258,600 | | |
| Net realized/unrealized gains from investments | | | | 4,100,379 | | | | | | 967,403 | | | | | | 1,555,165 | | | | | | 4,615,343 | | | | | | 268,207 | | |
| Change In Net Assets Resulting From Operations | | | $ | 5,854,286 | | | | | $ | 1,663,408 | | | | | $ | 1,985,371 | | | | | $ | 5,512,766 | | | | | $ | 372,519 | | |
____________________
| (a) | | Represents period from March 30, 2012 (commencement of operations) to October 31, 2012. |
| (b) | | Represents period from June 8, 2012 (commencement of operations) to October 31, 2012. |
| See notes to financial statements. | HSBC FAMILY OF FUNDS 39 |
HSBC FAMILY OF FUNDS
Statements of Changes in Net Assets
| | Emerging Markets Debt Fund | | Emerging Markets Local Debt Fund |
| | For the year | | For the period | | For the year | | For the period |
| | ended | | ended | | ended | | ended |
| | October 31, | | October 31, | | October 31, | | October 31, |
| | 2012 | | 2011(a) | | 2012 | | 2011(a) |
| Investment Activities: | | | | | | | | | | | | | | | | | | | | | | | | |
| Operations: | | | | | | | | | | | | | | | | | | | | | | | | |
| Net investment income (loss) | | | $ | 1,753,907 | | | | | $ | 936,346 | | | | | $ | 696,005 | | | | | $ | 357,731 | | |
| Net realized gains (losses) from investments | | | | 990,534 | | | | | | 20,688 | | | | | | (19,291 | ) | | | | | (303,861 | ) | |
| Change in unrealized appreciation/depreciation | | | | | | | | | | | | | | | | | | | | | | | | |
| on investments | | | | 3,109,845 | | | | | | 664,428 | | | | | | 986,694 | | | | | | (911,401 | ) | |
| Change in net assets resulting from operations | | | | 5,854,286 | | | | | | 1,621,462 | | | | | | 1,663,408 | | | | | | (857,531 | ) | |
| | | | | | | | | | | | | | | | | | | | | | | | | |
| Dividends: | | | | | | | | | | | | | | | | | | | | | | | | |
| Net investment income: | | | | | | | | | | | | | | | | | | | | | | | | |
| Class A Shares | | | | (18,843 | ) | | | | | (6,868 | ) | | | | | (19,827 | ) | | | | | (7,609 | ) | |
| Class I Shares | | | | (1,790,370 | ) | | | | | (901,845 | ) | | | | | (364,422 | ) | | | | | (247,296 | ) | |
| Class S Shares | | | | (5,580 | ) | | | | | (2,868 | ) | | | | | (1,447 | ) | | | | | (1,037 | ) | |
| Net realized gains: | | | | | | | | | | | | | | | | | | | | | | | | |
| Class A Shares | | | | (82 | ) | | | | | — | | | | | | — | | | | | | — | | |
| Class I Shares | | | | (7,859 | ) | | | | | — | | | | | | — | | | | | | — | | |
| Class S Shares | | | | (24 | ) | | | | | — | | | | | | — | | | | | | — | | |
| From tax return of capital: | | | | | | | | | | | | | | | | | | | | | | | | |
| Class A Shares | | | | — | | | | | | — | | | | | | — | | | | | | (2,600 | ) | |
| Class I Shares | | | | — | | | | | | — | | | | | | — | | | | | | (84,499 | ) | |
| Class S Shares | | | | — | | | | | | — | | | | | | — | | | | | | (354 | ) | |
| Change in net assets resulting from shareholder dividends | | | | (1,822,758 | ) | | | | | (911,581 | ) | | | | | (385,696 | ) | | | | | (343,395 | ) | |
| Change in net assets resulting from capital transactions | | | | 1,607,083 | | | | | | 34,007,589 | | | | | | 5,488,843 | | | | | | 27,191,139 | | |
| Change in Net Assets | | | | 5,638,611 | | | | | | 34,717,470 | | | | | | 6,766,555 | | | | | | 25,990,213 | | |
| | | | | | | | | | | | | | | | | | | | | | | | | |
| Net Assets: | | | | | | | | | | | | | | | | | | | | | | | | |
| Beginning of period | | | | 34,717,470 | | | | | | — | | | | | | 25,990,213 | | | | | | — | | |
| End of period | | | $ | 40,356,081 | | | | | $ | 34,717,470 | | | | | $ | 32,756,768 | | | | | $ | 25,990,213 | | |
| Accumulated net investment income (loss) | | | $ | 156,381 | | | | | $ | 53,317 | | | | | $ | (98,794 | ) | | | | $ | (206,471 | ) | |
____________________
| (a) | | Commenced operations on April 7, 2011. |
| 40 HSBC FAMILY OF FUNDS | See notes to financial statements. |
HSBC FAMILY OF FUNDS
Statements of Changes in Net Assets (continued)
| | Emerging Markets Debt Fund | | Emerging Markets Local Debt Fund |
| | For the year | | For the period | | For the year | | For the period |
| | ended | | ended | | ended | | ended |
| | October 31, | | October 31, | | October 31, | | October 31, |
| | 2012 | | 2011(a) | | 2012 | | 2011(a) |
| CAPITAL TRANSACTIONS: | | | | | | | | | | | | | | | | | | | | | | | | |
| Class A Shares: | | | | | | | | | | | | | | | | | | | | | | | | |
| Proceeds from shares issued | | | $ | 114,676 | | | | | $ | 345,825 | | | | | $ | 317,157 | | | | | $ | 1,871,102 | | |
| Dividends reinvested | | | | 18,862 | | | | | | 6,868 | | | | | | 19,823 | | | | | | 10,209 | | |
| Value of shares redeemed | | | | (53,069 | ) | | | | | — | | | | | | (165,752 | ) | | | | | — | | |
| Class A Shares capital transactions | | | | 80,469 | | | | | | 352,693 | | | | | | 171,228 | | | | | | 1,881,311 | | |
| | | | | | | | | | | | | | | | | | | | | | | | | |
| Class I Shares: | | | | | | | | | | | | | | | | | | | | | | | | |
| Proceeds from shares issued | | | | 4,722,544 | | | | | | 34,302,757 | | | | | | 5,310,513 | | | | | | 24,876,657 | | |
| Dividends reinvested | | | | 1,789,564 | | | | | | 901,809 | | | | | | 363,845 | | | | | | 331,795 | | |
| Value of shares redeemed | | | | (4,991,098 | ) | | | | | (1,652,538 | ) | | | | | (358,190 | ) | | | | | (15 | ) | |
| Class I Shares capital transactions | | | | 1,521,010 | | | | | | 33,552,028 | | | | | | 5,316,168 | | | | | | 25,208,437 | | |
| | | | | | | | | | | | | | | | | | | | | | | | | |
| Class S Shares: | | | | | | | | | | | | | | | | | | | | | | | | |
| Proceeds from shares issued | | | | — | | | | | | 100,000 | | | | | | 39 | | | | | | 100,000 | | |
| Dividends reinvested | | | | 5,604 | | | | | | 2,868 | | | | | | 1,447 | | | | | | 1,391 | | |
| Value of shares redeemed | | | | — | | | | | | — | | | | | | (39 | ) | | | | | — | | |
| Class S Shares capital transactions | | | | 5,604 | | | | | | 102,868 | | | | | | 1,447 | | | | | | 101,391 | | |
| Change in net assets resulting from capital transactions | | | $ | 1,607,083 | | | | | $ | 34,007,589 | | | | | $ | 5,488,843 | | | | | $ | 27,191,139 | | |
| | | | | | | | | | | | | | | | | | | | | | | | | |
| SHARE TRANSACTIONS: | | | | | | | | | | | | | | | | | | | | | | | | |
| Class A Shares: | | | | | | | | | | | | | | | | | | | | | | | | |
| Issued | | | | 10,704 | | | | | | 33,986 | | | | | | 34,067 | | | | | | 188,305 | | |
| Reinvested | | | | 1,763 | | | | | | 676 | | | | | | 2,080 | | | | | | 1,054 | | |
| Redeemed | | | | (4,945 | ) | | | | | — | | | | | | (17,278 | ) | | | | | — | | |
| Change in Class A Shares | | | | 7,522 | | | | | | 34,662 | | | | | | 18,869 | | | | | | 189,359 | | |
| | | | | | | | | | | | | | | | | | | | | | | | | |
| Class I Shares: | | | | | | | | | | | | | | | | | | | | | | | | |
| Issued | | | | 439,010 | | | | | | 3,417,116 | | | | | | 577,774 | | | | | | 2,487,763 | | |
| Reinvested | | | | 167,373 | | | | | | 88,707 | | | | | | 38,045 | | | | | | 33,541 | | |
| Redeemed | | | | (475,609 | ) | | | | | (162,063 | ) | | | | | (37,005 | ) | | | | | (1 | ) | |
| Change in Class I Shares | | | | 130,774 | | | | | | 3,343,760 | | | | | | 578,814 | | | | | | 2,521,303 | | |
| | | | | | | | | | | | | | | | | | | | | | | | | |
| Class S Shares: | | | | | | | | | | | | | | | | | | | | | | | | |
| Issued | | | | — | | | | | | 10,000 | | | | | | 4 | | | | | | 10,000 | | |
| Reinvested | | | | 524 | | | | | | 282 | | | | | | 151 | | | | | | 141 | | |
| Redeemed | | | | — | | | | | | — | | | | | | (4 | ) | | | | | — | | |
| Change in Class S Shares | | | | 524 | | | | | | 10,282 | | | | | | 151 | | | | | | 10,141 | | |
____________________
| (a) | | Commenced operations on April 7, 2011. |
| See notes to financial statements. | HSBC FAMILY OF FUNDS 41 |
HSBC FAMILY OF FUNDS
Statements of Changes in Net Assets (continued)
| | Frontier Markets Fund | | Total Return Fund | | RMB Fixed
Income Fund |
| | | |
| | For the year | | For the period | | For the period | | For the period |
| | ended | | ended | | ended | | ended |
| | October 31, | | October 31, | | October 31, | | October 31, |
| | 2012 | | 2011(a) | | 2012(b) | | 2012(c) |
| Investment Activities: | | | | | | | | | | | | | | | | | | | | | | | | |
| Operations: | | | | | | | | | | | | | | | | | | | | | | | | |
| Net investment income (loss) | | | $ | 430,206 | | | | | $ | 1,837 | | | | | $ | 897,423 | | | | | $ | 104,312 | | |
| Net realized gains (losses) from investments | | | | (304,677 | ) | | | | | (100,622 | ) | | | | | 1,650,456 | | | | | | 9,607 | | |
| Change in unrealized appreciation/depreciation on investments | | | | 1,859,842 | | | | | | (397,347 | ) | | | | | 2,964,887 | | | | | | 258,600 | | |
| Change in net assets resulting from operations | | | | 1,985,371 | | | | | | (496,132 | ) | | | | | 5,512,766 | | | | | | 372,519 | | |
| | | | | | | | | | | | | | | | | | | | | | | | | |
| Dividends: | | | | | | | | | | | | | | | | | | | | | | | | |
| Net investment income: | | | | | | | | | | | | | | | | | | | | | | | | |
| Class A Shares | | | | (102 | ) | | | | | — | | | | | | (872 | ) | | | | | (9,438 | ) | |
| Class I Shares | | | | (28,979 | ) | | | | | — | | | | | | (1,117,289 | ) | | | | | (87,437 | ) | |
| Class S Shares | | | | — | | | | | | — | | | | | | (566 | ) | | | | | (926 | ) | |
| Change in net assets resulting from shareholder dividends | | | | (29,081 | ) | | | | | — | | | | | | (1,118,727 | ) | | | | | (97,801 | ) | |
| Change in net assets resulting from capital transactions | | | | 1,324,387 | | | | | | 15,000,000 | | | | | | 344,408,880 | | | | | | 11,492,649 | | |
| Change in Net Assets | | | | 3,280,677 | | | | | | 14,503,868 | | | | | | 348,802,919 | | | | | | 11,767,367 | | |
| | | | | | | | | | | | | | | | | | | | | | | | | |
| Net Assets: | | | | | | | | | | | | | | | | | | | | | | | | |
| Beginning of period | | | | 14,503,868 | | | | | | — | | | | | | — | | | | | | — | | |
| End of period | | | $ | 17,784,545 | | | | | $ | 14,503,868 | | | | | $ | 348,802,919 | | | | | $ | 11,767,367 | | |
| Accumulated net investment income (loss) | | | $ | 568,629 | | | | | $ | (7,276 | ) | | | | $ | 209,007 | | | | | $ | 26,606 | | |
____________________
| (a) | | Commenced operations on September 6, 2011. |
| (b) | | Commenced operations on March 30, 2012. |
| (c) | | Commenced operations on June 8, 2012. |
| 42 HSBC FAMILY OF FUNDS | See notes to financial statements. |
HSBC FAMILY OF FUNDS
Statements of Changes in Net Assets (continued)
| | | | | | | | | | | | | | | | | | | RMB Fixed |
| | Frontier Markets Fund | | Total Return Fund | | Income Fund |
| | For the year | | For the period | | For the period | | For the period |
| | ended | | ended | | ended | | ended |
| | October 31, | | October 31, | | October 31, | | October 31, |
| | 2012 | | 2011(a) | | 2012(b) | | 2012(c) |
| CAPITAL TRANSACTIONS: | | | | | | | | | | | | | | | | | | | | | | |
| Class A Shares: | | | | | | | | | | | | | | | | | | | | | | |
| Proceeds from shares issued | | | $ | 1,295,654 | | | | | $ | 100,000 | | | | $ | 251,147 | | | | | $ | 1,496,245 | |
| Dividends reinvested | | | | 102 | | | | | | — | | | | | 858 | | | | | | 8,041 | |
| Value of shares redeemed | | | | (348 | ) | | | | | — | | | | | — | | | | | | — | |
| Class A Shares capital transactions | | | | 1,295,408 | | | | | | 100,000 | | | | | 252,005 | | | | | | 1,504,286 | |
| | | | | | | | | | | | | | | | | | | | | | | |
| Class I Shares: | | | | | | | | | | | | | | | | | | | | | | |
| Proceeds from shares issued | | | | — | | | | | | 14,900,000 | | | | | 355,170,152 | | | | | | 9,800,000 | |
| Dividends reinvested | | | | 28,979 | | | | | | — | | | | | 53,217 | | | | | | 87,437 | |
| Value of shares redeemed | | | | — | | | | | | — | | | | | (11,167,060 | ) | | | | | — | |
| Class I Shares capital transactions | | | | 28,979 | | | | | | 14,900,000 | | | | | 344,056,309 | | | | | | 9,887,437 | |
| Change in net assets resulting from capital transactions | | | | | | | | | | | | | | | | | | | | | | |
| | | | | | | | | | | | | | | | | | | | | | | |
| Class S Shares: | | | | | | | | | | | | | | | | | | | | | | |
| Proceeds from shares issued | | | | — | | | | | | — | | | | | 100,000 | | | | | | 100,000 | |
| Dividends reinvested | | | | — | | | | | | — | | | | | 566 | | | | | | 926 | |
| Class S Shares capital transactions | | | | — | | | | | | — | | | | | 100,566 | | | | | | 100,926 | |
| Change in net assets resulting from capital transactions | | | $ | 1,324,387 | | | | | $ | 15,000,000 | | | | $ | 344,408,880 | | | | | $ | 11,492,649 | |
| | | | | | | | | | | | | | | | | | | | | | | |
| SHARE TRANSACTIONS: | | | | | | | | | | | | | | | | | | | | | | |
| Class A Shares: | | | | | | | | | | | | | | | | | | | | | | |
| Issued | | | | 118,945 | | | | | | 10,000 | | | | | 24,776 | | | | | | 148,592 | |
| Reinvested | | | | 11 | | | | | | — | | | | | 84 | | | | | | 792 | |
| Redeemed | | | | (35 | ) | | | | | — | | | | | — | | | | | | — | |
| Change in Class A Shares | | | | 118,921 | | | | | | 10,000 | | | | | 24,860 | | | | | | 149,384 | |
| | | | | | | | | | | | | | | | | | | | | | | |
| Class I Shares: | | | | | | | | | | | | | | | | | | | | | | |
| Issued | | | | — | | | | | | 1,490,000 | | | | | 34,798,480 | | | | | | 980,000 | |
| Reinvested | | | | 3,150 | | | | | | — | | | | | 5,198 | | | | | | 8,619 | |
| Redeemed | | | | — | | | | | | — | | | | | (1,086,509 | ) | | | | | — | |
| Change in Class I Shares | | | | 3,150 | | | | | | 1,490,000 | | | | | 33,717,169 | | | | | | 988,619 | |
| | | | | | | | | | | | | | | | | | | | | | | |
| Class S Shares: | | | | | | | | | | | | | | | | | | | | | | |
| Issued | | | | — | | | | | | — | | | | | 10,000 | | | | | | 10,000 | |
| Reinvested | | | | — | | | | | | — | | | | | 55 | | | | | | 91 | |
| Change in Class S Shares | | | | — | | | | | | — | | | | | 10,055 | | | | | | 10,091 | |
____________________
| (a) | Commenced operations on September 6, 2011. |
| (b) | Commenced operations on March 30, 2012. |
| (c) | Commenced operations on June 8, 2012. |
| See notes to financial statements. | HSBC FAMILY OF FUNDS 43 |
| HSBC EMERGING MARKETS DEBT FUND |
| Financial Highlights |
Selected data for a share outstanding throughout the periods indicated.
| | | | Investment Activities | | Dividends | | | | | | | | | Ratios/Supplementary Data |
| | | | | | Net Realized | | | | | | | | | | | | | | | | | | | | | | | | | | | | Ratios of | | |
| | | | | | and | | | | | | | | | | | | | | | | | | | | Net | | | | Ratio of Net | | Expenses | | |
| | Net Asset | | Net | | Unrealized | | | | | | Net Realized | | | | | | | | | | | Assets | | Ratio of Net | | Investment | | to Average | | |
| | | Value, | | Investment | | Gains | | Total from | | Net | | Gains from | | | | Net Asset | | | | | | | at End of | | Expenses to | | Income to | | Net Assets | | Portfolio |
| | Beginning | | Income | | (Losses) from | | Investment | | Investment | | Investment | | Total | | Value, End | | Total | | Period | | Average Net | | Average Net | | (Excluding Fee | | Turnover |
| | of Period | | (Loss) | | Investments | | Activities | | Income | | Transactions | | Dividends | | of Period | | Return(a) | | (000’s) | | Assets(b) | | Assets(b) | | Reductions)(b) | | (a)(c) |
| CLASS A SHARES | | | | | | | | | | | | | | | | | | | | | | | | | | | | | | | | | | | | |
| Period Ended October 31, 2011(d) | | $10.00 | | 0.25 | | 0.25 | | 0.50 | | (0.27) | | | — | | | | (0.27) | | $10.23 | | | 5.02 | % | | | | $355 | | | 1.20% | | 4.81% | | 1.38% | | 10% |
| Year Ended October 31, 2012 | | $10.23 | | 0.47 | | 1.21 | | 1.68 | | (0.49) | | | — | (e) | | | (0.49) | | $11.42 | | | 16.90 | % | | | | $482 | | | 1.20% | | 4.32% | | 1.55% | | 54% |
| CLASS I SHARES | | | | | | | | | | | | | | | | | | | | | | | | | | | | | | | | | | | | |
| Period Ended October 31, 2011(d) | | $10.00 | | 0.29 | | 0.24 | | 0.53 | | (0.28) | | | — | | | | (0.28) | | $10.25 | | | 5.34 | % | | | | $34,257 | | | 0.85% | | 5.07% | | 1.12% | | 10% |
| Year Ended October 31, 2012 | | $10.25 | | 0.51 | | 1.20 | | 1.71 | | (0.52) | | | — | (e) | | | (0.52) | | $11.44 | | | 17.19 | % | | | | $39,751 | | | 0.85% | | 4.68% | | 1.28% | | 54% |
| CLASS S SHARES | | | | | | | | | | | | | | | | | | | | | | | | | | | | | | | | | | | | |
| Period Ended October 31, 2011(d) | | $10.00 | | 0.30 | | 0.23 | | 0.53 | | (0.28) | | | — | | | | (0.28) | | $10.25 | | | 5.39 | % | | | | $105 | | | 0.75% | | 5.14% | | 1.02% | | 10% |
| Year Ended October 31, 2012 | | $10.25 | | 0.52 | | 1.20 | | 1.72 | | (0.53) | | | — | (e) | | | (0.53) | | $11.44 | | | 17.30 | % | | | | $124 | | | 0.75% | | 4.78% | | 1.18% | | 54% |
| (a) | Not annualized for periods less than one year. Total return calculations do not include any redemption charges. |
| (b) | Annualized for periods less than one year. |
| (c) | Portfolio turnover rate is calculated on the basis of the Fund as a whole without the distinguishing between the classes of shares issued. |
| (d) | Commenced operations on April 7, 2011. |
| (e) | Represents less than $0.005 or $(0.005). |
| 44 HSBC FAMILY OF FUNDS | See notes to financial statements. |
| HSBC EMERGING MARKETS LOCAL DEBT FUND |
| Financial Highlights |
Selected data for a share outstanding throughout the periods indicated.
| | | | | | Investment Activities | | Dividends | | | | | | | | | Ratios/Supplementary Data |
| | | | | | | | | | | | | | | | | | | | | | | | | | | | | | | | | | | | | | | | | | Ratios of | | |
| | | | | | | | | | | | | | | | | | | | | | | | | | | | | | | | | | | | | | | | | | Expenses | | |
| | | | | | | | Net Realized | | | | | | | | | | | | | | | | | | | | | | | | | | | | | | | to Average | | |
| | | | | | | | and | | | | | | | | | | | | | | | | | | | | | | | | | | | | | Ratio of Net | | Net Assets | | |
| | | Net Asset | | Net | | Unrealized | | | | | | | | | | | | | | | | | | | | | | | Net Assets | | Ratios of | | Investment | | (Excluding | | |
| | Value, | | Investment | | Gains | | Total from | | Net | | | | | | | | | Net Asset | | | | | | | at End of | | Expenses to | | Income to | | Fee | | Portfolio |
| | Beginning | | Income | | (Losses) from | | Investment | | Investment | | Return of | | Total | | Value, End | | Total | | Period | | Average Net | | Average Net | | Reductions) | | Turnover |
| | of Period | | (Loss) | | Investments | | Activities | | Income | | Capital | | Dividends | | of Period | | Return(a) | | (000’s) | | Assets(b) | | Assets(b) | | (b) | | (a)(c) |
| CLASS A SHARES | | | | | | | | | | | | | | | | | | | | | | | | | | | | | | | | | | | | | | | | | | | | |
| Period Ended October 31, 2011(d) | | | $10.00 | | | 0.12 | | | (0.46 | ) | | | | (0.34 | ) | | | (0.09) | | | (0.03 | ) | | | (0.12) | | $9.54 | | | (3.43 | )% | | | | $1,807 | | | 1.20% | | 2.29% | | 1.66% | | 66% |
| Year Ended October 31, 2012 | | | $9.54 | | | 0.21 | | | 0.21 | | | | | 0.42 | | | | (0.10) | | | — | | | | (0.10) | | $9.86 | | | 4.47 | % | | | | $2,053 | | | 1.20% | | 2.13% | | 1.94% | | 43% |
| CLASS I SHARES | | | | | | | | | | | | | | | | | | | | | | | | | | | | | | | | | | | | | | | | | | | | |
| Period Ended October 31, 2011(d) | | | $10.00 | | | 0.13 | | | (0.45 | ) | | | | (0.32 | ) | | | (0.10) | | | (0.03 | ) | | | (0.13) | | $9.55 | | | (3.21 | )% | | | | $24,086 | | | 0.85% | | 2.46% | | 1.32% | | 66% |
| Year Ended October 31, 2012 | | | $9.55 | | | 0.24 | | | 0.21 | | | | | 0.45 | | | | (0.13) | | | — | | | | (0.13) | | $9.87 | | | 4.80 | % | | | | $30,602 | | | 0.85% | | 2.47% | | 1.62% | | 43% |
| CLASS S SHARES | | | | | | | | | | | | | | | | | | | | | | | | | | | | | | | | | | | | | | | | | | | | |
| Period Ended October 31, 2011(d) | | | $10.00 | | | 0.14 | | | (0.45 | ) | | | | (0.31 | ) | | | (0.11) | | | (0.03 | ) | | | (0.14) | | $9.55 | | | (3.16 | )% | | | | $97 | | | 0.75% | | 2.58% | | 1.22% | | 66% |
| Year Ended October 31, 2012 | | | $9.55 | | | 0.25 | | | 0.21 | | | | | 0.46 | | | | (0.14) | | | — | | | | (0.14) | | $9.87 | | | 4.89 | % | | | | $102 | | | 0.75% | | 2.59% | | 1.51% | | 43% |
| (a) | Not annualized for periods less than one year. Total return calculations do not include any redemption charges. |
| (b) | Annualized for periods less than one year. |
| (c) | Portfolio turnover rate is calculated on the basis of the Fund as a whole without the distinguishing between the classes of shares issued. |
| (d) | Commenced operations on April 7, 2011. |
| See notes to financial statements. | HSBC FAMILY OF FUNDS 45 |
| HSBC FRONTIER MARKETS FUND |
| Financial Highlights |
Selected data for a share outstanding throughout the periods indicated.
| | | | | | Investment Activities | | Dividends | | | | | | | | | | | | Ratios/Supplementary Data |
| | | | | | | | | | | | Net Realized | | | | | | | | | | | | | | | | | | | | | | | | | | | | | | | | | | | | | Ratios of | | | | | |
| | | | | | | | | | | and | | | | | | | | | | | | | | | | | | | | | | | | | | | | | | | | Ratio of Net | | Expenses | | | | | |
| | Net Asset | | Net | | Unrealized | | | | | | | | | | | | | | | | | | | | | | | | | | Net Assets | | Ratio of Net | | Investment | | to Average | | | | | |
| | Value, | | Investment | | Gains | | Total from | | Net | | | | | | | Net Asset | | | | | | | at End of | | Expenses to | | Income (Loss) | | Net Assets | | Portfolio |
| | Beginning | | Income | | (Losses) from | | Investment | | Investment | | Total | | Value, End | | Total | | Period | | Average Net | | to Average Net | | (Excluding Fee | | Turnover |
| | of Period | | (Loss) | | Investments | | Activities | | Income | | Dividends | | of Period | | Return(a) | | (000’s) | | Assets(b) | | Assets(b) | | Reductions)(b) | | (a)(c) |
| CLASS A SHARES | | | | | | | | | | | | | | | | | | | | | | | | | | | | | | | | | | | | | | | | | | | | | | | | | | | | | | | | |
| Period Ended October 31, 2011(d) | | | $10.00 | | | | — | (e) | | | | (0.34 | ) | | | | (0.34 | ) | | | | — | | | | | — | | | | | $9.66 | | | | (3.40 | )% | | | | $97 | | | 2.30% | | | (0.26 | )% | | | 2.57% | | | 6 | % | |
| Year Ended October 31, 2012 | | | $9.66 | | | | 0.16 | (f) | | | | 1.12 | | | | | 1.28 | | | | | (0.01 | ) | | | | (0.01 | ) | | | | $10.93 | | | | 13.27 | % | | | | $1,409 | | | 2.20% | | | 1.51 | % | | | 3.79% | | | 26 | % | |
| CLASS I SHARES | | | | | | | | | | | | | | | | | | | | | | | | | | | | | | | | | | | | | | | | | | | | | | | | | | | | | | | | |
| Period Ended October 31, 2011(d) | | | $10.00 | | | | — | (e) | | | | (0.33 | ) | | | | (0.33 | ) | | | | — | | | | | — | | | | | $9.67 | | | | (3.30 | )% | | | | $14,407 | | | 1.96% | | | 0.09 | % | | | 2.23% | | | 6 | % | |
| Year Ended October 31, 2012 | | | $9.67 | | | | 0.29 | (f) | | | | 1.03 | | | | | 1.32 | | | | | (0.02 | ) | | | | (0.02 | ) | | | | $10.97 | | | | 13.68 | % | | | | $16,375 | | | 1.85% | | | 2.83 | % | | | 2.79% | | | 26 | % | |
| (a) | Not annualized for periods less than one year. Total return calculations do not include any redemption charges. |
| (b) | Annualized for periods less than one year. |
| (c) | Portfolio turnover rate is calculated on the basis of the Fund as a whole without the distinguishing between the classes of shares issued. |
| (d) | Commenced operations on September 6, 2011. |
| (e) | Represents less than $0.005 or $(0.005). |
| (f) | Calculated based on average shares outstanding. |
| 46 HSBC FAMILY OF FUNDS | See notes to financial statements. |
| HSBC TOTAL RETURN FUND |
| Financial Highlights |
Selected data for a share outstanding throughout the periods indicated.
| | | | Investment Activities | | Dividends | | | | | | Ratios/Supplementary Data |
| | | | | | Net Realized | | | | | | | | | | | | | | | | | | | | Ratios of | | |
| | | | | | and | | | | | | | | | | | | | | | | | | Ratio of Net | | Expenses | | |
| | | Net Asset | | Net | | Unrealized | | | | | | | | | | | | Net Assets | | Ratio of Net | | Investment | | to Average | | |
| | Value, | | Investment | | Gains | | Total from | | Net | | | | Net Asset | | | | at End of | | Expenses to | | Income (Loss) | | Net Assets | | Portfolio |
| | Beginning | | Income | | (Losses) from | | Investment | | Investment | | Total | | Value, End | | Total | | Period | | Average Net | | to Average | | (Excluding Fee | | Turnover |
| | of Period | | (Loss)(a) | | Investments | | Activities | | Income | | Dividends | | of Period | | Return(b) | | (000’s) | | Assets(c) | | Net Assets(c) | | Reductions)(c) | | (b)(d) |
| CLASS A SHARES | | | | | | | | | | | | | | | | | | | | | | | | | | | | |
| Period Ended October 31, 2012(e) | | $10.00 | | 0.03 | | 0.33 | | 0.36 | | (0.04) | | (0.04) | | $10.32 | | 3.62% | | | $256 | | | 1.60% | | 0.56% | | 1.61% | | 83% |
| CLASS I SHARES | | | | | | | | | | | | | | | | | | | | | | | | | | | | |
| Period Ended October 31, 2012(e) | | $10.00 | | 0.07 | | 0.31 | | 0.38 | | (0.05) | | (0.05) | | $10.33 | | 3.82% | | | $348,443 | | | 1.18% | | 1.08% | | 1.18% | | 83% |
| CLASS S SHARES | | | | | | | | | | | | | | | | | | | | | | | | | | | | |
| Year Ended October 31, 2012(e) | | $10.00 | | 0.05 | | 0.34 | | 0.39 | | (0.06) | | (0.06) | | $10.33 | | 3.87% | | | $104 | | | 1.15% | | 0.91% | | 1.48% | | 83% |
| (a) | Calculated using average share method. |
| (b) | Not annualized for periods less than one year. Total return calculations do not include any sales or redemption charges. |
| (c) | Annualized for periods less than one year. |
| (d) | Portfolio turnover rate is calculated on the basis of the Fund as a whole without the distinguishing between the classes of shares issued. |
| (e) | Commenced operations on March 30, 2012. |
| See notes to financial statements. | HSBC FAMILY OF FUNDS 47 |
| HSBC RMB FIXED INCOME FUND |
| Financial Highlights |
Selected data for a share outstanding throughout the periods indicated.
| | | | Investment Activities | | Dividends | | | | | | | | Ratios/Supplementary Data |
| | | | | | Net Realized | | | | | | | | | | | | | | | | | | | | | | Ratios of | | |
| | | | | | and | | | | | | | | | | | | | | Net | | Ratio of | | Ratio of Net | | Expenses | | |
| | | Net Asset | | Net | | Unrealized | | | | | | | | | | | | | | Assets | | Net | | Investment | | to Average | | |
| | Value, | | Investment | | Gains | | Total from | | Net | | | | Net Asset | | | | at End of | | Expenses to | | Income (Loss) | | Net Assets | | Portfolio |
| | Beginning of | | Income | | (Losses) from | | Investment | | Investment | | Total | | Value, End | | Total | | Period | | Average Net | | to Average | | (Excluding Fee | | Turnover |
| | Period | | (Loss)(a) | | Investments | | Activities | | Income | | Dividends | | of Period | | Return(b) | | (000’s) | | Assets(c) | | Net Assets(c) | | Reductions)(c) | | (b)(d) |
| CLASS A SHARES | | | | | | | | | | | | | | | | | | | | | | | | | | | | | | |
| Period Ended October 31, 2012(e) | | $10.00 | | 0.10 | | 0.22 | | 0.32 | | (0.08) | | (0.08) | | | $10.24 | | | 3.24% | | | $1,530 | | | 1.45% | | 2.54% | | 3.26% | | —% |
| CLASS I SHARES | | | | | | | | | | | | | | | | | | | | | | | | | | | | | | |
| Period Ended October 31, 2012(e) | | $10.00 | | 0.10 | | 0.24 | | 0.34 | | (0.09) | | (0.09) | | | 10.25 | | | 3.40% | | | $10,134 | | | 1.10% | | 2.43% | | 2.26% | | —% |
| CLASS S SHARES | | | | | | | | | | | | | | | | | | | | | | | | | | | | | | |
| Period Ended October 31, 2012(e) | | $10.00 | | 0.10 | | 0.24 | | 0.34 | | (0.09) | | (0.09) | | | 10.25 | | | 3.44% | | | $103 | | | 1.00% | | 2.53% | | 2.16% | | —% |
| (a) | Calculated based on average shares outstanding. |
| (b) | Not annualized for periods less than one year. Total return calculations do not include any sales or redemption charges. |
| (c) | Annualized for periods less than one year. |
| (d) | Portfolio turnover rate is calculated on the basis of the Fund as a whole without the distinguishing between the classes of shares issued. |
| (e) | Commenced operations on June 8, 2012. |
| 48 HSBC FAMILY OF FUNDS | See notes to financial statements. |
| HSBC FAMILY OF FUNDS |
| Notes to Financial Statements — as of October 31, 2012 |
1. Organization:
The HSBC Funds (formerly, HSBC Investor Funds) (the “Trust’’), a Massachusetts business trust organized on April 22, 1987, is registered under the Investment Company Act of 1940, as amended (the “Act’’), as an open-end management investment company. As of October 31, 2012, the Trust is comprised of 17 separate operational funds, each a series of the HSBC Family of Funds (formerly, HSBC Investor Family of Funds), which also includes the HSBC Advisor Fund Trust and the HSBC Portfolios (formerly, HSBC Investor Portfolios) (the “Trusts’’). The accompanying financial statements are presented for the following 5 funds (individually a “Fund,’’ collectively the “Funds’’ or the “Emerging Markets Funds’’):
| Fund | | Short Name |
| HSBC Emerging Markets Debt Fund | | Emerging Markets Debt Fund |
| | | |
| HSBC Emerging Markets Local Debt Fund | | Emerging Markets Local Debt Fund |
| | | |
| HSBC Frontier Markets Fund | | Frontier Markets Fund |
| | | |
| HSBC Total Return Fund | | Total Return Fund |
| | | |
| HSBC RMB Fixed Income Fund | | RMB Fixed Income Fund |
Each of the Funds is a non-diversified fund. Financial statements for all other funds of the Trusts are published separately.
The Funds are authorized to issue an unlimited number of shares of beneficial interest with a par value of $0.001 per share. The Emerging Markets Debt Fund, the Emerging Markets Local Debt Fund, the Total Return Fund and the RMB Fixed Income Fund (“Debt Funds’’) are authorized to issue three classes of shares: Class A Shares, Class I Shares, and Class S Shares. Class A Shares of the Debt Funds have a maximum sales charge of 4.75% as a percentage of the original purchase price. The Frontier Markets Fund is authorized to issue two classes of shares: Class A Shares and Class I Shares. Class A Shares of the Frontier Markets Fund has a maximum sales charge of 5.00% as a percentage of the original purchase price. Each class of shares in each Fund has identical rights and privileges, except with respect to arrangements pertaining to shareholder servicing and/or distribution, class-related expenses, voting rights on matters affecting a single class of shares, and exchange privileges of each class of shares.
Under the Trust’s organizational documents, the Funds’ officers and Trustees are indemnified against certain liabilities arising out of the performance of their duties to the Funds. In addition, in the normal course of business, the Trust may enter into contracts with its service providers, which also provide for indemnifications by the Funds. The Funds’ maximum exposure under these arrangements is unknown as this would involve future claims that may be made against the Funds. However, based on experience, the Trust expects the risk of loss to be remote.
2. Significant Accounting Policies:
The following is a summary of the significant accounting policies followed by the Funds in the preparation of their financial statements. The policies are in conformity with U.S. generally accepted accounting principles (“GAAP’’). The preparation of financial statements requires management to make certain estimates and assumptions that affect the reported amounts of assets and liabilities and disclosure of contingent assets and liabilities at the date of the financial statements and the reported amounts of increases and decreases in net assets from operations during the reporting period. Actual results could differ from those estimates.
Securities Valuation:
The Funds record their investments at fair value. Fair value is defined as the price that would be received to sell an asset or paid to transfer a liability in an orderly transaction between market participants at the measurement date. The valuation techniques used to determine fair value are further described in Note 3 below.
HSBC FAMILY OF FUNDS 49
| HSBC FAMILY OF FUNDS |
| Notes to Financial Statements — as of October 31, 2012 (continued) |
Investment Transactions and Related Income:
Investment transactions are accounted for not later than on the business day after trade date. However, for financial reporting purposes, investment transactions are accounted for on trade date. Investment gains and losses are calculated on the identified cost basis. Interest income is recognized on the accrual basis and includes, where applicable, the amortization or accretion of premium or discount. Dividend income is recorded on the ex-dividend date except in the case of foreign securities, in which case dividends are recorded as soon as such information becomes available.
Foreign Currency Translation:
The accounting records of the Funds are maintained in U.S. dollars. Foreign currency amounts are translated into U.S. dollars at the current rate of exchange to determine the value of investments, assets and liabilities. Purchases and sales of securities, and income and expenses are translated at the prevailing rate of exchange on the respective dates of such transactions. The Funds do not isolate the portion of the results of operations resulting from changes in foreign exchange rates on investments from fluctuations arising from changes in market prices of securities held. Such fluctuations are included with the net realized and unrealized gain or loss from investments and foreign currencies.
Income received by the Funds from sources within foreign countries may be subject to withholding and other income or similar taxes imposed by such countries. The Funds accrue such taxes, as applicable, based on their current interpretation of tax rules in the foreign markets in which they invest.
Restricted and Illiquid Securities:
A restricted security is a security which has been purchased through a private offering and cannot be resold to the general public without prior registration under the Securities Act of 1933 (the “1933 Act’’) or pursuant to the resale limitations provided by Rule 144 under the 1933 Act, or another exemption from the registration requirements of the 1933 Act. Certain restricted securities may be resold in transactions exempt from registration, normally to qualified institutional buyers, and may be deemed liquid by the Investment Adviser (as defined in Note 4) based on procedures established by the Board of Trustees (the “Board’’). Therefore, not all restricted securities are considered illiquid. At October 31, 2012, the Funds did not hold any restricted securities that were deemed illiquid.
Participation Notes and Participatory Notes:
The Frontier Markets Fund may invest in participation notes or participatory notes (“P-notes”). P-notes are participation interest notes that are issued by banks or broker-dealers and are designed to offer a return linked to a particular underlying equity, debt, currency or market. If the P-note were held to maturity, the issuer would pay to, or receive from, the purchaser the difference between the nominal value of the underlying instrument at the time of purchase and that instrument’s value at maturity. The holder of a P-note that is linked to a particular underlying security or instrument may be entitled to receive any dividends paid in connection with that underlying security or instrument, but typically does not receive voting rights as it would if it directly owned the underlying security or instrument. P-notes involve transaction costs. Investments in P-notes involve the same risks associated with a direct investment in the underlying securities, instruments or markets that they seek to replicate. In addition, there can be no assurance that there will be a trading market for a P-note or that the trading price of a P-note will equal the underlying value of the security, instrument or market that it seeks to replicate. Due to liquidity and transfer restrictions, the secondary markets on which a P-note is traded may be less liquid than the market for other securities, or may be completely illiquid, which may also affect the ability of a fund to accurately value a P-note. P-notes typically constitute general unsecured contractual obligations of the banks or broker- dealers that issue them, which subjects the Fund that holds them to counterparty risk (and this risk may be amplified if the Fund purchases P-notes from only a small number of issuers).
Derivative Instruments:
All open derivative positions at period end are reflected on the Funds’ Schedule of Portfolio Investments. The following is a description of the derivative instruments utilized by the Funds, including the primary underlying risk exposure related to each instrument type.
50 HSBC FAMILY OF FUNDS
| HSBC FAMILY OF FUNDS |
| Notes to Financial Statements — as of October 31, 2012 (continued) |
Forward Foreign Currency Exchange Contracts:
Each Fund may enter into forward foreign currency exchange contracts. The Funds may enter into forward foreign currency exchange contracts in connection with planned purchases or sales of securities, to hedge the U.S. dollar value of securities denominated in a particular currency or to enhance return. The forward foreign currency exchange contracts are adjusted by the daily exchange rate of the underlying currency and any gains or losses are recorded for financial statement purposes as unrealized gains or losses until the contract settlement date.
The Funds could be exposed to risks if the counterparties to the contracts are unable to meet the terms of their contracts and from unanticipated movements in the value of a foreign currency relative to the U.S. dollar.
The Funds remain subject to credit risk with respect to the amount they expect to receive from counterparties. However, the Funds have sought to mitigate these risks by generally requiring the posting of collateral to a Fund at prearranged exposure levels to cover a Fund’s exposure to the counterparty.
During the period ended October 31, 2012, the Funds entered into forward foreign currency exchange contracts to gain exposure to certain markets and for hedging purposes. The notional amount of forward foreign currency exchange contracts outstanding as of October 31, 2012 and the monthly average notional amount for these contracts during the period ended October 31, 2012 were as follows:
| | Outstanding | | Monthly Average |
| | Notional Amount ($) | | Notional Amount ($) |
| Forward Foreign Currency Exchange Contracts: | | | | | | | | |
| Emerging Markets Debt Fund | | | 16,757 | | | | 1,981,316 | |
| Emerging Markets Local Debt Fund | | | 42,649,695 | | | | 38,267,867 | |
| Total Return Fund | | | 122,574,949 | | | | 56,459,032 | |
Options Contracts:
The Funds may purchase or write put and call options on securities, indices, foreign currencies and derivative instruments. When purchasing options, the Funds pay a premium which is recorded as the cost basis in the investment and which is subsequently marked to market to reflect the current value of the option. Premiums paid for purchasing options that expire are treated as realized losses. When an option is exercised or closed, premiums paid for purchasing options are offset against proceeds to determine the realized gain or loss on the transaction. When writing options, the Funds receive a premium which is recorded as a liability and which is subsequently marked to market to reflect the current value of the option written. Premiums received from writing options that expire are treated as realized gains. Premiums received from writing options that are either exercised or closed are offset against the proceeds received or the amount paid on the transaction to determine the realized gains or losses.
The Funds may purchase or write put and call options on foreign currencies for the purpose of protecting against declines in the dollar value of foreign portfolio securities and against increases in the U.S. dollar cost of foreign securities to be acquired. The Funds could be exposed to risks if the counterparties to the contracts are unable to meet the terms of their contracts and from unanticipated movements in the value of a foreign currency relative to the U.S. dollar.
The Funds may enter into interest rate swaption agreements for hedging purposes. A swaption is an option to enter into a pre-defined swap agreement by some specified date in the future. The writer of the swaption becomes the counterparty to the swap if the buyer exercises their option. The interest rate swaption agreement will specify whether the buyer of the swaption will be a fixed rate receiver or a fixed rate buyer. The Funds could be exposed to risks if the counterparties to the contracts are unable to meet the terms of their contracts and from unanticipated movements in interest rates.
HSBC FAMILY OF FUNDS 51
| HSBC FAMILY OF FUNDS |
| Notes to Financial Statements — as of October 31, 2012 (continued) |
During the period ended October 31, 2012, the Emerging Markets Local Debt Fund and the Total Return Fund invested in options on foreign currencies for the purpose of protecting against declines in the dollar value of foreign portfolio securities and against increases in the U.S. dollar cost of foreign securities to be acquired. The Emerging Markets Local Debt Fund also entered into interest rate swaption agreements for hedging purposes.
The Funds remain subject to credit risk with respect to the amount they expect to receive from counterparties. However, the Funds have sought to mitigate these risks by generally requiring the posting of collateral to an Emerging Markets Fund at prearranged exposure levels to cover an Emerging Markets Fund’s exposure to the counterparty.
As of October 31, 2012, the Emerging Markets Local Debt Fund and the Total Return Fund invested in options on foreign currencies for the purpose of protecting against declines in the dollar value of foreign portfolio securities and against increases in the U.S. dollar cost of foreign securities to be acquired. The Emerging Markets Local Debt Fund and Total Return Fund entered into interest rate swaption agreements for hedging purposes.
The Emerging Markets Local Debt Fund and the Total Return Fund had the following transactions in purchased call and put options during the period ended October 31, 2012:
| | Number of | | | |
| Emerging Markets Local Debt Fund | | Contracts | | Cost ($) |
| Options outstanding at October 31, 2011 | | — | | | — | |
| Options purchased | | 6,273,540 | | | 93,046 | |
| Options exercised | | (500,000 | ) | | (6,500 | ) |
| Options expired | | (2,503,540 | ) | | (51,135 | ) |
| Options outstanding at October 31, 2012 | | 3,270,000 | | | 35,411 | |
| |
| | | Number of | | | |
| Total Return Fund | | Contracts | | Cost ($) |
| Options outstanding at October 31, 2011 | | — | | | — | |
| Options purchased | | 1,201,340 | | | 30,073 | |
| Options expired | | (701,340 | ) | | (17,088 | ) |
| Options outstanding at October 31, 2012 | | 500,000 | | | 12,985 | |
The Emerging Markets Local Debt Fund and the Total Return Fund had the following transactions in written call and put options during the period ended October 31, 2012:
| | Number of | | Premiums |
| Emerging Markets Local Debt Fund | | Contracts | | Received ($) |
| Options outstanding at October 31, 2011 | | — | | | — | |
| Options written | | (2,706,440 | ) | | (97,496 | ) |
| Options exercised | | 1,425,000 | | | 20,075 | |
| Options expired | | 1,280,340 | | | 73,879 | |
| Options closed | | 1,100 | | | 3,543 | |
| Options outstanding at October 31, 2012 | | — | | | — | |
| |
| | Number of | | Premiums |
| Total Return Fund | | Contracts | | Received ($) |
| Options outstanding at October 31, 2011 | | — | | | — | |
| Options written | | (502,680 | ) | | (15,046 | ) |
| Options expired | | 502,680 | | | 15,046 | |
| Options outstanding at October 31, 2012 | | — | | | — | |
52 HSBC FAMILY OF FUNDS
| HSBC FAMILY OF FUNDS |
| Notes to Financial Statements — as of October 31, 2012 (continued) |
Futures Contracts:
The Funds may invest in futures contracts for the purpose of hedging existing portfolio securities or securities they intend to purchase against fluctuations in fair value caused by changes in prevailing market interest conditions. Upon entering into futures contracts, the Funds are required to pledge to the broker an amount of cash and/or other assets equal to a certain percentage of the contract amount (initial margin deposit). Subsequent payments, known as “variation margin”, are made or received each day, depending on the daily fluctuations in the fair value of the underlying security. The Funds recognize a gain or loss equal to the daily variation margin. Should market conditions move unexpectedly, the Funds may not achieve the anticipated benefits of the futures contracts and may realize a loss. Futures contracts involve, to varying degrees, elements of market risk (generally equity price risk related to stock futures, interest rate risk related to bond futures, and foreign currency risk related to currency futures) and exposure to loss in excess of the variation margin. The primary risks associated with the use of futures contracts are the imperfect correlation between the change in market value of the securities held by the Funds and the prices of futures contracts, the possibility of an illiquid market, and the inability of the counterparty to meet the terms of the contract. During the period ended October 31, 2012, the Funds did not enter into any futures contracts.
Swap Agreements:
The Funds may enter into swap contracts and other similar instruments in accordance with their investment objectives and policies. A swap is an agreement to exchange the return generated by one instrument for the return generated by another instrument. The payment streams are calculated by reference to a specified index and agreed upon notional amount. The term specified index includes currencies, fixed interest rates, prices and total return on interest rate indices, fixed income indices, stock indices and commodity indices.
The Funds will usually enter into swaps on a net basis, which means that the two return streams are netted out in a cash settlement on the payment date or dates specified in the instrument, with a Fund receiving or paying only the net amount of the two returns. Upfront receipts and payments are recorded as deferred income (liability) or deferred expense (asset), as the case may be. These upfront receipts and payments are amortized to income or expense over the life of the swap agreement. Until a swap agreement is settled in cash, the gain or loss on the notional amount plus income on the instruments, less the interest paid by the Fund on the notional amount, is recorded as “unrealized appreciation or depreciation on swap agreements” and, when cash is exchanged, the gain or loss realized is recorded as “realized gains or losses on swap agreements”. A Fund’s obligations under a swap agreement will be accrued daily (offset against any amounts owing to the Fund) and any accrued but unpaid net amounts owed to a swap counterparty will be covered by the maintenance of a segregated account consisting of cash, U.S. government securities, or other liquid securities or by pledging such securities as collateral.
Interest rate swaps involve the exchange of commitments to pay and receive interest based on a notional amount and are subject to interest rate risk exposure. Interest rate swaps do not involve the delivery of securities, other underlying assets or principal. Accordingly, the risk of loss with respect to interest rate swaps is limited to the net amount of interest payments that a Fund is contractually obligated to make. If the other party to an interest rate swap defaults, a Fund’s risk of loss consists of the net amount of interest payments that the Fund is contractually entitled to receive.
Credit default swap agreements involve one party making a stream of payments (referred to as the buyer of protection) to another party (the seller of protection) in exchange for the right to receive a specified return in the event of a default or other credit event for the referenced entity, obligation or index and are subject to credit risk exposure. The maximum potential amount of future payments that a Fund as a seller of protection could be required to make under a credit default swap agreement would be an amount equal to the notional amount of the agreement. Notional amounts of each individual credit default swap agreement outstanding as of October 31, 2012 for which a Fund is the seller of protection are disclosed in the Schedules of Portfolio Investments. These potential amounts would be partially offset by any recovery values of the respective referenced obligations, upfront payments received upon entering into the agreement, or net amounts received from the settlement of buy protection credit default swap agreements entered into by a Fund for the same referenced entity or entities.
HSBC FAMILY OF FUNDS 53
| HSBC FAMILY OF FUNDS |
| Notes to Financial Statements — as of October 31, 2012 (continued) |
The Funds remain subject to credit risk with respect to the amount they expect to receive from counterparties. However, the Funds have sought to mitigate these risks by generally requiring the posting of collateral to a Fund at pre-arranged exposure levels to cover a Fund’s exposure to the counterparty.
The use of swaps is a highly specialized activity that involves investment techniques and risks different from those associated with ordinary portfolio securities transactions. If the Investment Adviser is incorrect in its forecasts of market values, interest rates and currency exchange rates, the investment performance of a Fund would be less favorable than it would have been if this investment technique were not used.
During the period ended October 31, 2012, the Emerging Markets Local Debt Fund and the Total Return Fund entered into interest rate swap agreements to manage their exposure to interest rates and as a substitute for investing directly in securities. The Emerging Markets Debt Fund and Total Return Fund also entered into credit default swap agreements primarily to manage and/or gain exposure to credit risk. The notional amount of swap agreements outstanding as of October 31, 2012 and the monthly average notional amount for these agreements during the period ended October 31, 2012 were as follows:
| Outstanding | | Monthly Average |
| Notional Amount ($) | | Notional Amount ($) |
| Interest Rate Swap Agreements: | | | | |
| Emerging Markets Local Debt Fund | 2,742,593 | | | 4,032,405 |
| Total Return Fund | 14,200,000 | | | 5,775,000 |
| | | | | |
| Credit Default Swap Agreements: | | | | |
| Emerging Markets Debt Fund | 2,325,000 | | | 2,237,500 |
| Total Return Fund | 1,850,000 | | | 8,337,500 |
Summary of Derivative Instruments:
Fair Values of Derivative Instruments on the Statements of Assets and Liabilities as of October 31, 2012:
| | Assets | | Liabilities |
| | Unrealized | | | | | | | | Unrealized | | | |
| | Appreciation | | Investment | | | | | Depreciation | | | |
| | on Forward | | Securities | | Unrealized | | on Forward | | Unrealized |
| | Foreign Currency | | at Value | | Appreciation | | Foreign Currency | | Depreciation |
| | Exchange | | (Purchased | | on Swap | | Exchange | | on Swap |
| Fund | | Contracts ($) | | Options) ($) | | Agreements ($) | | Contracts ($) | | Agreements ($) |
| Foreign Exchange Rate Risk Exposure: | | | | | | | | | | | | | | | |
| Emerging Markets Debt Fund | | — | | | — | | | — | | | 154 | | | — | |
| Emerging Market Local Debt Fund | | 333,285 | | | 26,021 | | | — | | | 135,678 | | | — | |
| Total Return Fund | | 623,101 | | | 2,350 | | | — | | | 699,220 | | | — | |
| | | | | | | | | | | | | | | | |
| Credit Contracts Risk Exposure: | | | | | | | | | | | | | | | |
| Emerging Markets Debt Fund | | — | | | — | | | 69,586 | | | — | | | — | |
| Total Return Fund | | — | | | — | | | 279,580 | | | — | | | 254,692 | |
| | | | | | | | | | | | | | | | |
| Interest Rate Risk Exposure: | | | | | | | | | | | | | | | |
| Emerging Market Local Debt Fund | | — | | | — | | | 129,406 | | | — | | | — | |
| Total Return Fund | | — | | | — | | | — | | | — | | | 165,419 | |
54 HSBC FAMILY OF FUNDS
| HSBC FAMILY OF FUNDS |
| Notes to Financial Statements — as of October 31, 2012 (continued) |
The Effect of Derivative Instruments on the Statements of Operations for the year ended October 31, 2012:
| | | | | | | | | | | Net Change in Unrealized |
| | | | | | | | | | | Appreciation/Depreciation |
| | Realized Gain (Loss) on Derivatives | | on Derivatives Recognized |
| | Recognized as a Result from Operations | | as a Result from Operations |
| | Net Realized | | | | | | | | | |
| | Gains (Losses) | | Net Realized | | Net Realized | | Change in |
| | from Forward | | Gains (Losses) | | Gains (Losses) | | Unrealized |
| | Foreign Currency | | from Swap | | from Options | | Appreciation/Depreciation |
| Fund | | Exchange Contracts ($) | | Agreements ($) | | Transactions ($) | | on Investments ($) |
| Foreign Exchange Rate Risk Exposure: | | | | | | | | | | | | |
| Emerging Markets Debt Fund | | 163,964 | | | — | | | — | | | (13,451 | ) |
| Emerging Market Local Debt Fund | | 472,480 | | | — | | | 20,535 | | | 64,707 | |
| Frontier Markets Fund | | (9,194 | ) | | — | | | — | | | — | |
| Total Return Fund | | 188,920 | | | — | | | (2,043 | ) | | (86,754 | ) |
| RMB Fixed Income Fund | | (141 | ) | | — | | | — | | | — | |
| |
| Credit Contracts Risk Exposure: | | | | | | | | | | | | |
| Emerging Markets Debt Fund | | — | | | 33,829 | | | — | | | 69,285 | |
| Total Return Fund | | — | | | 1,145,718 | | | — | | | 24,888 | |
| |
| Interest Rate Risk Exposure: | | | | | | | | | | | | |
| Emerging Markets Debt Fund | | — | | | 14,504 | | | — | | | — | |
| Emerging Market Local Debt Fund | | — | | | 64,855 | | | — | | | 77,174 | |
| Total Return Fund | | — | | | 45,470 | | | — | | | (165,419 | ) |
Allocations:
Expenses directly attributable to a Fund are charged to that Fund. Expenses not directly attributable to a Fund are allocated proportionately among the applicable series within the Trusts in relation to the net assets of each fund or on another reasonable basis. Class specific expenses are charged directly to the class incurring the expense. In addition, income, expenses (other than class specific expenses), and unrealized and realized gains and losses are allocated to each class based on relative net assets on a daily basis.
Dividends to Shareholders:
Dividends from net investment income, if any, are declared and distributed monthly in the case of the Emerging Markets Debt Fund, Emerging Markets Local Debt Fund, Total Return Fund and the RMB Fixed Income Fund, and annually in the case of Frontier Markets Fund. Distributions from net realized gains, if any, are declared and paid at least annually by the Funds. Additional distributions are also made to the Funds’ shareholders to the extent necessary to avoid the federal excise tax on certain undistributed income and net realized gains of regulated investment companies.
The amount and character of net investment income and net realized gains distributions are determined in accordance with federal income tax regulations which may differ from GAAP. These “book/tax’’ differences are either considered temporary or permanent in nature. To the extent these differences are permanent in nature (e.g., certain gain/loss, differing treatment on certain swap agreements, and certain distributions), such amounts are reclassified within the composition of net assets; temporary differences (e.g., wash losses and the realization for tax purposes of unrealized gains/losses on investments in passive foreign investment companies) do not require reclassification. The Funds may utilize equalization accounting for tax purposes and designate earnings and profits, including net realized gains distributed to shareholders on redemption of shares,
HSBC FAMILY OF FUNDS 55
| HSBC FAMILY OF FUNDS |
| Notes to Financial Statements — as of October 31, 2012 (continued) |
as a part of the dividends paid deduction for income tax purposes. To the extent distributions to shareholders from net investment income and net realized gains exceed net investment income and net realized gains for tax purposes, they are reported as distributions of capital.
Redemption Fee:
Prior to June 29, 2012, a redemption fee of 2.00% was charged and recorded as paid-in-capital for any shares redeemed or exchanged after holding them for less than 30 days. This fee did not apply to shares purchased through reinvested dividends or capital gains or in other circumstance described in the Funds’ Prospectuses. Effective June 29, 2012, the 2.00% redemption/exchange fee relating to redemptions or exchanges of shares of the Funds held for less than 30 days was eliminated. For the year ended October 31, 2012, no redemption fees were collected.
Federal Income Taxes:
Each Fund is a separate taxable entity for federal income tax purposes. Each Fund has qualified and intends to continue to qualify each year as a “regulated investment company’’ under Subchapter M of the Internal Revenue Code, as amended, and to distribute substantially all of its taxable net investment income and net realized gains, if any, to its shareholders. Accordingly, no provision for federal income or excise tax is required.
Management of the Funds has reviewed tax positions taken in tax years that remain subject to examination by all major tax jurisdictions, including federal (i.e., the last four tax year ends and the interim tax period since then, as applicable). Management believes that there is no tax liability resulting from unrecognized tax benefits related to uncertain tax positions taken.
3. Investment Valuation Summary:
The valuation techniques employed by the Funds, as described below, maximize the use of observable inputs and minimize the use of unobservable inputs in determining fair value. The inputs used for valuing the Funds’ investments are summarized in the three broad levels listed below:
- Level 1: quoted prices in active markets for identical assets
- Level 2: other significant observable inputs (including quoted prices for similar securities, interest rates, prepayment speeds, credit risk, etc.)
- Level 3: significant unobservable inputs (including a Fund’s own assumptions in determining the fair value of investments)
Changes in valuation techniques may result in transfers in or out of an assigned level within the disclosure hierarchy. The Funds determine transfers between fair value hierarchy levels at the reporting period end. The inputs or methodology used for valuing investments is not necessarily an indication of the risk associated with investing in those investments.
Bonds and other fixed income securities (other than short-term obligations but including listed issues) are valued at the bid price as of the time net asset value is determined on the basis of valuations furnished by a pricing service, the use of which has been approved by the Funds’ Board of Trustees. In making such valuations, the pricing service utilizes both dealer-supplied valuations and matrix techniques which take into account appropriate factors such as the institutional-size trading in similar groups of securities, yield, quality, coupon rate, maturity, type of issue, trading characteristics other than market data and without exclusive reliance upon quoted prices or exchanges or over-the-counter prices, since such valuations are believed to reflect more accurately the fair value of such securities and are typically categorized as Level 2 in the fair value hierarchy.
56 HSBC FAMILY OF FUNDS
| HSBC FAMILY OF FUNDS |
| Notes to Financial Statements — as of October 31, 2012 (continued) |
Exchange traded, domestic equity securities are valued at the last sale price on a national securities exchange, or in the absence of recorded sales, at the readily available closing bid price on such exchanges, or at the quoted bid price in the over-the-counter market and are typically categorized as Level 1 in the fair value hierarchy.
Exchange traded, foreign equity securities are valued in the appropriate currency on the last quoted sale price and are typically categorized as Level 1 in the fair value hierarchy. Foreign equity securities that are not exchange traded are valued in the appropriate currency at the average of the quoted bid and asked prices in the over-the-counter market and are typically categorized as Level 2 in the fair value hierarchy.
Mutual funds are valued at their net asset values, as reported by such companies and are typically categorized as Level 1 in the fair value hierarchy.
Exchange traded futures contracts are valued at their settlement price on the exchange on which they are traded and are typically categorized as Level 1 in the fair value hierarchy.
Forward foreign currency exchange contracts are valued at the current day’s interpolated foreign exchange rate, as calculated using the current day’s spot rate, and the 30 to 720 day forward rates and converted to U.S. dollars at the exchange rate of such currencies against the U.S. dollar, as of the close of regular trading on the New York Stock Exchange, as provided by an approved pricing service, and are typically categorized as Level 2 in the fair value hierarchy. Non-exchange traded derivatives, such as swaps and options, are generally valued by using a valuation provided by an approved independent pricing service and are typically categorized as Level 2 in the fair value hierarchy.
Securities or other assets for which market quotations are not readily available, or are deemed unreliable due to a significant event, are valued pursuant to procedures adopted by the Trusts’ Board (“Procedures”). Depending on the source and relative significance of valuation inputs, these instruments may be classified as Level 2 or Level 3 in the fair value hierarchy. Examples of potentially significant events that could affect the value of an individual security and thus require pricing under the Procedures include corporate actions by the issuer, announcements by the issuer relating to its earnings or products, regulatory news, natural disasters, and litigation. Examples of potentially significant events that could affect multiple securities held by a Fund include governmental actions, natural disasters, and armed conflicts.
In addition, if events materially affecting the value of foreign securities occur between the time when the exchange on which they are traded closes and the time when the Funds’ net assets are calculated, such securities may be valued using fair value pricing in accordance with procedures adopted by the Board. Management identifies possible fluctuations in foreign securities by monitoring the rise or fall in the value of a designated benchmark index. In the event of a rise or fall greater than predetermined levels, the Funds may use a systematic valuation model provided by an independent third party to value its foreign securities, rather than local market closing prices. When a Fund uses such a valuation model, the value assigned to the Fund’s foreign securities may not be the quoted or published prices of the investment on their primary markets or exchanges and are typically categorized as Level 2 in the fair value hierarchy. The valuation of these securities may represent a transfer between Levels 1 and 2. The number of days on which fair value prices will be used will depend on market activity and it is possible that fair value prices will be used by the Funds to a significant extent.
HSBC FAMILY OF FUNDS 57
| HSBC FAMILY OF FUNDS |
| Notes to Financial Statements — as of October 31, 2012 (continued) |
The following is a summary of the valuation inputs used as of October 31, 2012 in valuing the Funds’ investments based upon the three levels defined above:
| | LEVEL 1($) | | LEVEL 2($) | | LEVEL 3($) | | Total($) |
| Emerging Markets Debt Fund | | | | | | | | |
| Investment Securities: | | | | | | | | |
| Yankee Dollars(a) | | — | | 36,387,902 | | — | | 36,387,902 |
| U.S. Treasury Obligations | | — | | 2,777,453 | | — | | 2,777,453 |
| Investment Company | | 897,934 | | — | | — | | 897,934 |
| Total Investment Securities | | 897,934 | | 39,165,355 | | — | | 40,063,289 |
| Other Financial Instruments:(b) | | | | | | | | |
| Credit Default Swap Agreements | | — | | 69,586 | | — | | 69,586 |
| Forward Foreign Currency Exchange | | | | | | | | |
| Contracts | | — | | (154) | | — | | (154) |
| Total Investments | | 897,934 | | 39,234,787 | | — | | 40,132,721 |
| Emerging Markets Local Debt Fund | | | | | | | | |
| Investment Securities: | | | | | | | | |
| Foreign Bonds(a) | | — | | 15,872,909 | | — | | 15,872,909 |
| Yankee Dollars(a) | | — | | 2,013,079 | | — | | 2,013,079 |
| Purchased Options | | — | | 26,021 | | | | 26,021 |
| Investment Company | | 14,478,407 | | — | | — | | 14,478,407 |
| Total Investment Securities | | 14,478,407 | | 17,912,009 | | — | | 32,390,416 |
| Other Financial Instruments:(b) | | | | | | | | |
| Interest Rate Swap Agreements | | — | | 129,406 | | — | | 129,406 |
| Forward Foreign Currency Exchange | | | | | | | | |
| Contracts | | — | | 197,607 | | — | | 197,607 |
| Total Investment Securities | | 14,478,407 | | 18,239,022 | | — | | 32,717,429 |
| Frontier Markets Fund | | | | | | | | |
| Investment Securities: | | | | | | | | |
| Common Stocks(a) | | 14,393,060 | | — | | — | | 14,393,060 |
| Preferred Stock(a) | | 620,606 | | — | | — | | 620,606 |
| Convertible Corporate Bond(a) | | — | | 39,316 | | — | | 39,316 |
| Warrants | | — | | — | | — | (c) | — |
| Participatory Notes(a) | | — | | 1,934,239 | | — | | 1,934,239 |
| Investment Company | | 578,427 | | — | | — | | 578,427 |
| Total Investment Securities | | 15,592,093 | | 1,973,555 | | — | | 17,565,648 |
58 HSBC FAMILY OF FUNDS
| HSBC FAMILY OF FUNDS |
| Notes to Financial Statements — as of October 31, 2012 (continued) |
| | LEVEL 1($) | | LEVEL 2($) | | LEVEL 3($) | | Total($) |
| Total Return Fund | | | | | | | | | | |
| Investment Securities: | | | | | | | | | | |
| Corporate Bonds(a) | | — | | 945,163 | | | — | | 945,163 | |
| Foreign Bonds(a) | | — | | 49,565,409 | | | — | | 49,565,409 | |
| Yankee Dollars(a) | | — | | 133,808,350 | | | — | | 133,808,350 | |
| U.S. Treasury Obligations | | — | | 96,909,516 | | | — | | 96,909,516 | |
| Purchased Options | | — | | 2,350 | | | — | | 2,350 | |
| Investment Company | | 65,349,205 | | — | | | — | | 65,349,205 | |
| Total Investment Securities | | 65,349,205 | | 281,230,788 | | | — | | 346,579,993 | |
| Other Financial Instruments:(b) | | | | | | | | | | |
| Credit Default Swap Agreements | | | | 24,888 | | | | | 24,888 | |
| Interest Rate Swap Agreements | | | | (165,419 | ) | | | | (165,419 | ) |
| Forward Foreign Currency Exchange | | | | | | | | | | |
| Contracts | | — | | (76,119 | ) | | — | | (76,119 | ) |
| Total Investment Securities | | 65,349,205 | | 281,014,138 | | | — | | 346,363,343 | |
| RMB Fixed Income Fund | | | | | | | | | | |
| Investment Securities: | | | | | | | | | | |
| Foreign Bonds(a) | | — | | 8,616,724 | | | — | | 8,616,724 | |
| Certificates of Deposit(a) | | — | | 2,048,216 | | | — | | 2,048,216 | |
| Investment Company | | 625,195 | | — | | | — | | 625,195 | |
| Total Investment Companies | | 625,195 | | 10,664,940 | | | — | | 11,290,135 | |
____________________
| (a) | | For detailed country descriptions, see the accompanying Schedules of Portfolio Investments. |
| (b) | | Other financial instruments would include any derivative instruments, such as forward foreign currency exchange contracts and swap agreements. These investments are generally recorded in the financial statements at the unrealized gain or loss on the investment. |
| (c) | | Security was received during the period as part of a private placement offering. The underlying stock price is trading significantly below the strike price of the warrants. There have been no bidders for these warrants and none of the warrants have traded. Security valued at $0 in good faith pursuant to procedures approved by the Board of Trustees as of October 31, 2012. |
The only transfers between levels as of October 31, 2012 are related to the use of the systematic valuation model to value foreign securities in the Frontier Markets Fund.
New Accounting Pronouncements:
In December 2011, the Financial Accounting Standards Board issued ASU No. 2011-11 “Disclosures about Offsetting Assets and Liabilities” requiring disclosure of both gross and net information related to offsetting and related arrangements enabling users of its financial statements to understand the effect of those arrangements on the entity’s financial position. The objective of this disclosure is to facilitate comparison between those entities that prepare their financial statements on the basis of U.S. GAAP and those entities that prepare their financial statements on the basis of IFRSs. ASU No. 2011-11 is effective for interim and annual periods beginning on or after January 1, 2013. Adoption of ASU No. 2011-11 will have no effect on the Funds’ net assets. At this time, management is evaluating any impact ASU No. 2011-11 may have on the Funds’ financial statements disclosures.
HSBC FAMILY OF FUNDS 59
| HSBC FAMILY OF FUNDS |
| Notes to Financial Statements — as of October 31, 2012 (continued) |
4. Related Party Transactions and Other Agreements and Plans:
Investment Management:
HSBC Global Asset Management (USA) Inc. (“HSBC’’ or the “Investment Adviser’’), a wholly owned subsidiary of HSBC Bank USA, N.A., a national bank organized under the laws of the United States, acts as Investment Adviser to the Funds. As Investment Adviser, HSBC manages the investments of the Funds and continuously reviews, supervises and administers the Funds’ investments pursuant to an Investment Advisory Contract. For its services in this capacity, HSBC receives a fee, accrued daily and paid monthly, based on the average daily net assets of Class A Shares, Class I Shares and Class S Shares, at annual rate of:
| Fund | | Fee Rate(%) |
| Emerging Markets Debt Fund | 0.50 |
| Emerging Markets Local Debt Fund | 0.50 |
| Frontier Markets Fund | 1.25 |
| Total Return Fund | 0.85 |
| RMB Fixed Income Fund | 0.55 |
HSBC Global Asset Management (UK) Limited (“AMEU”) acts as sub-adviser to the Frontier Markets Fund. The Sub-Adviser receives a fee from the Frontier Markets Fund, accrued daily and paid monthly, based on average daily net assets of the Fund at an annual rate of 0.70% from the fees paid to the Investment Adviser.
HSBC Global Asset Management (Hong Kong) Limited (“AMHK”) acts as sub-adviser to the RMB Fixed Income Fund. AMHK receives a fee from the RMB Fixed Income Fund, accrued daily and paid monthly, based on average daily net assets of the Fund at an annual rate of 0.275% from the fees paid to the Investment Adviser.
HSBC also provides support services to the Funds pursuant to a Support Services Agreement. For its services in this capacity, HSBC receives a fee, accrued daily and paid monthly, based on the average daily net assets of Class A Shares and Class I Shares, at an annual rate of 0.20% and 0.10%, respectively.
Administration:
HSBC serves the Funds as Administrator. Under the terms of the Administration Agreement, HSBC receives from the Funds (as well as other funds in the Trusts) a fee, accrued daily and paid monthly, at an annual rate of:
| Based on Average Daily Net Assets of | | | Fee Rate(%) |
| Up to $10 billion | 0.0550 |
| In excess of $10 billion but not exceeding $20 billion | | 0.0350 |
| In excess of $20 billion but not exceeding $50 billion | | 0.0275 |
| In excess of $50 billion | | 0.0250 |
The fee breakpoints are determined on the basis of the aggregate average daily net assets of the Trusts. The fee is allocated to each series based upon its proportionate share of the aggregate net assets of the Trusts, subject to certain allocations in cases where one fund invests some or all of its assets in another fund. An amount equal to 50% of the administration fee is deemed to be class specific.
60 HSBC FAMILY OF FUNDS
| HSBC FAMILY OF FUNDS |
| Notes to Financial Statements — as of October 31, 2012 (continued) |
Pursuant to a Sub-Administration Agreement with HSBC, Citi Fund Services Ohio, Inc. (“Citi’’), a wholly-owned subsidiary of Citigroup, Inc., serves as Sub-Administrator for the Trusts, subject to the general supervision by the Trusts’ Board and HSBC. For these services, Citi is entitled to a fee, payable by HSBC, at an annual rate equivalent to the fee rates set forth above subject to certain reductions associated with services provided to new funds, minus 0.02%, which is retained by HSBC.
Under a Compliance Services Agreement between the Trusts and Citi (the “CCO Agreement’’), Citi makes an employee available to serve as the Funds’ Chief Compliance Officer (the “CCO’’). Under the CCO Agreement, Citi also provides infrastructure and support in implementing the written policies and procedures comprising the Trusts’ compliance program, including support services to the CCO. For the services provided under the CCO Agreement, the Trusts paid Citi $281,280 for the year ended October 31, 2012, plus reimbursement of certain out of pocket expenses. Expenses incurred by each Fund are reflected on the Statements of Operations as “Compliance Services.’’ Citi pays the salary and other compensation earned by individuals performing these services, as employees of Citi.
Distribution Arrangements:
Foreside Distribution Services, L.P. (“Foreside”), a wholly-owned subsidiary of Foreside Financial Group LLC, serves the Trust as Distributor (the “Distributor’’). The Trust has adopted a non-compensatory Distribution Plan and Agreement (the “Distribution Plan’’) pursuant to Rule 12b-1 of the Act. The Distribution Plan provides for reimbursement of expenses incurred by the Distributor related to distribution and marketing, at a rate not to exceed 0.25% of the average daily net assets of Class A Shares (currently not being charged). For the year ended October 31, 2012, Foreside, as Distributor, also received $346,561 in commissions from sales of HSBC Family of Funds for Class A Shares, of which $25 were reallocated to HSBC-affiliated brokers and dealers for Class A Shares.
Shareholder Servicing:
The Trust has adopted a Shareholder Services Plan, which provides for payments to shareholder servicing agents for providing various shareholder services. For performing these services, the shareholder servicing agents receive a fee that is computed daily and paid monthly up to 0.25% of the average daily net assets of Class A Shares. The fees paid to the Distributor pursuant to the Distribution Plan and to shareholder servicing agents pursuant to the Shareholder Services Plan may not exceed, in the aggregate, 0.50% annually of each Fund’s average daily net assets of Class A Shares.
Fund Accounting and Transfer Agency:
Citi provides fund accounting and transfer agency services for each Fund. As transfer agent, Citi receives a fee based on the number of funds and shareholder accounts, subject to certain minimums, reductions associated with services provided to new funds and reimbursement of certain expenses. As fund accountant, Citi receives an annual fee per Fund and share class, subject to minimums, reductions associated with services provided to new funds and reimbursement of certain expenses. Citi receives additional fees paid by the Trust for blue sky exemption services.
Independent Trustees:
Prior to January 1, 2012, the Trusts, in the aggregate, paid each Independent Trustee an annual retainer of $63,000, a fee of $5,000 for each regular meeting of the Board of Trustees attended, a fee of $3,000 for each special telephonic meeting attended, and a fee of $5,000 for each special in-person meeting attended. The Trusts also paid each Independent Trustee an annual retainer of $3,000 for each Committee on which such Trustee served as a Committee member as well as a fee of $3,000 for each Committee meeting attended. Additionally, the Trusts paid each Committee Chair an annual retainer of $6,000, with the exception of the Chair of the Audit Committee, who received a retainer of $8,000. The Trusts also paid the Chairman of the Board, an additional annual retainer of $20,000, as well as an additional $4,000 for each regular meeting of the Board attended. In addition, for time expended on Board duties outside normal meetings, which is authorized by the Board, a Trustee was compensated at the rate of $500 per hour, up to a maximum of $3,000 per day.
HSBC FAMILY OF FUNDS 61
| HSBC FAMILY OF FUNDS |
| Notes to Financial Statements — as of October 31, 2012 (continued) |
Effective January 1, 2012, the Trusts pay each Independent Trustee an annual retainer of $100,000. The Trusts pay a fee of $10,000 for each regular meeting of the Board of Trustees attended and a fee of $3,000 for each special meeting attended. The Trusts pay each Committee Chair an annual retainer of $3,000, with the exception of the Chair of the Audit Committee, who receives a retainer of $6,000. The Trusts also pay the Chairman of the Board, an additional annual retainer of $24,000. In addition, for time expended on Board duties outside normal meetings, which is authorized by the Board, a Trustee is compensated at the rate of $500 per hour, up to a maximum of $3,000 per day.
Fee Reductions:
The Investment Adviser has agreed to contractually limit, through April 30, 2013 for the RMB Fixed Income Fund and March 1, 2013 for the other Funds, the total expenses, exclusive of interest, taxes, brokerage commissions, and extraordinary expenses, of the Funds. Each Fund Class has its own expense limitations based on the average daily net assets for any full fiscal year as follows:
| | | Current |
| | | Contractual |
| Fund | | Class | | Expense Limitation(%) |
| Emerging Markets Debt Fund | A | | 1.20 |
| Emerging Markets Debt Fund | I | | 0.85 |
| Emerging Markets Debt Fund | S | | 0.75 |
| Emerging Markets Local Debt Fund | A | | 1.20 |
| Emerging Markets Local Debt Fund | I | | 0.85 |
| Emerging Markets Local Debt Fund | S | | 0.75 |
| Frontier Markets Fund | A | | 2.20 |
| Frontier Markets Fund | I | | 1.85 |
| Total Return Fund | A | | 1.60 |
| Total Return Fund | I | | 1.25 |
| Total Return Fund | S | | 1.15 |
| RMB Fixed Income Fund | A | | 1.45 |
| RMB Fixed Income Fund | I | | 1.10 |
| RMB Fixed Income Fund | S | | 1.00 |
Any amounts contractually waived or reimbursed by the Investment Adviser will be subject to repayment by the Fund to the Investment Adviser within three years to the extent that the repayment will not cause the Fund’s operating expenses to exceed the contractual expense limit that was in effect at the time of such waiver or reimbursement. During the year ended October 31, 2012, the Investment Adviser did not recapture any of its prior contractual waivers or reimbursements. As of October 31, 2012, the repayments that may potentially be made by the Funds are as follows:
| Fund | | 2015($)* | | 2014($)* | | Total($) |
| Emerging Markets Debt Fund | 159,226 | | 31,279 | | 190,505 |
| Emerging Markets Local Debt Fund | 218,089 | | 41,089 | | 259,178 |
| Frontier Markets Fund | 145,285 | | 5,922 | | 151,207 |
| Total Return Fund | 207 | | N/A | | 207 |
| RMB Fixed Income Fund | 51,659 | | N/A | | 51,659 |
____________________
* The year listed above the amounts is the fiscal year ending in which the amounts will no longer be able to be recoupable.
The Administrator and Citi may voluntarily waive/reimburse fees to help support the expense limits of each Fund. In addition, HSBC, in its role as Investment Adviser and Administrator, may waive/reimburse additional fees at its discretion. Any voluntary fee waivers/reimbursements are not subject to recoupment in subsequent fiscal periods. Voluntary waivers/reimbursements may be stopped at any time. Amounts waived/reimbursed by the Investment Adviser, Administrator, and Citi are reported separately on the Statements of Operations, as applicable.
62 HSBC FAMILY OF FUNDS
| HSBC FAMILY OF FUNDS |
| Notes to Financial Statements — as of October 31, 2012 (continued) |
5. Investment Transactions:
Cost of purchases and proceeds from sales of securities (excluding securities maturing less than one year from acquisition) for the year ended October 31, 2012 were as follows:
| Purchases($) | | Sales($) |
| Emerging Markets Debt Fund | 21,795,282 | | 19,591,956 |
| Emerging Markets Local Debt Fund | 11,053,899 | | 7,053,008 |
| Frontier Markets Fund | 5,343,461 | | 3,921,723 |
| Total Return Fund | 181,876,161 | | 48,733,230 |
| RMB Fixed Income Fund | 8,509,130 | | — |
For the year ended October 31, 2012, there were no long-term U.S. government securities held by the Funds.
6. Investment Risks:
Foreign Securities Risk: Investments in foreign securities are generally considered riskier than investments in U.S. securities. Foreign securities, including those of emerging and frontier market issuers, are subject to additional risks, including international trade, political and regulatory risks.
Emerging Markets Risk: The prices of securities in emerging markets can fluctuate more significantly than the prices of companies in more developed countries. Securities of emerging market issuers generally have more risk than securities issued by issuers in more developed markets. The less developed the country, the greater affect the risks may have in an investment, and as a result, an investment may exhibit a higher degree of volatility than either the general domestic securities market or the securities markets of developed foreign countries.
Frontier Market Countries Risk: Frontier market countries generally have smaller economies and even less developed capital markets or legal and political systems than traditional emerging market countries. As a result, the risks of investing in emerging market countries are magnified in frontier market countries. The magnification of risks are the result of: the potential for extreme price volatility and illiquidity in frontier markets; government ownership or control of parts of private sector and of certain companies; trade barriers, exchange controls, managed adjustments in relative currency values and other protectionist measures imposed or negotiated by the countries with which frontier market countries trade; and the relatively new and unsettled securities laws in many frontier market countries.
Concentration of Credit Risk: The RMB Fixed Income Fund is likely to be more volatile than the performance of other mutual funds due to its focused investment in instruments having exposure to China. Because the Fund concentrates its investments in China, the Fund’s performance is expected to be closely tied to social, political, and economic conditions within China and to be more volatile than the performance of more geographically diversified funds.
Derivatives Risk: The term “derivatives” covers a broad range of investments, including futures and currency forwards. In general, a derivative refers to any financial instrument whose value is derived, at least in part, from the price of another security or a specified index, asset or rate. The use of derivatives presents risks different from, and possibly greater than, the risks associated with investing directly in traditional securities. The use of derivatives can lead to losses because of adverse movements in the price or value of the underlying asset, index or rate, which may be magnified by certain features of the derivatives. These risks are heightened when derivatives are used to enhance a Fund’s return or as a substitute for a position or security, rather than solely to hedge (or offset) the risk of a position or security held by a Fund. The success of the fund’s derivatives strategies will also be affected by its ability to assess and predict the impact of market or economic developments on the underlying asset, index or rate and the derivative itself, without the benefit of observing the performance of the derivative under all possible market conditions. Derivatives involve the risk of mispricing or improper valuation and the risk that changes in the value of the derivative may not correlate perfectly with the underlying asset, index or rate. Certain derivative positions may be difficult to close out when a Fund’s portfolio manager may believe it would be appropriate to do so. Also, suitable derivative transactions may not be available in all circumstances and there can be no assurance that a Fund will engage in these transactions to reduce exposure to other risks when that would be beneficial.
HSBC FAMILY OF FUNDS 63
| HSBC FAMILY OF FUNDS |
| Notes to Financial Statements — as of October 31, 2012 (continued) |
Swap Risk: The use of swap agreements, which are agreements to exchange the return generated by one instrument for the return generated by another instrument (or index), and similar instruments involves risks that are different from those associated with ordinary portfolio securities transactions. For example, a Fund bears the risk of loss of the amount expected to be received under a swap agreement in the event of the default or bankruptcy of a swap agreement counterparty. Swap agreements may also subject a Fund to the risk that the counterparty to the transaction may not meet its obligations, causing the Fund’s value to decrease. Swap agreements may also be considered illiquid.
CFTC Regulation Risk: The Funds, as registered investment companies, are presently exempt from regulation as “commodity pool operators” under Commodity Futures Trading Commission (“CFTC”) Rule 4.5. However, the CFTC has recently adopted amendments to CFTC Rule 4.5, which, when effective, may subject a Fund to regulation by the CFTC, and a Fund may be required to operate subject to applicable CFTC requirements, including registration, disclosure and operational requirements under the Commodity Exchange Act (“CEA”). Compliance with these additional requirements may increase Fund expenses. Certain of the rules that would apply to a Fund if it becomes subject to CFTC regulation have not yet been adopted, and it is unclear what the effect of those rules would be on the Fund if they are adopted.
7. Federal Income Tax Information:
At October 31, 2012, the cost basis of securities for federal income tax purposes, gross unrealized appreciation, gross unrealized depreciation and net unrealized appreciation/depreciation were as follows:
| | | | | | | | | Net Unrealized |
| | | Tax Unrealized | | Tax Unrealized | | Appreciation/ |
| Fund | | Tax Cost($) | | Appreciation($) | | Depreciation($) | | (Depreciation)($)* |
| Emerging Markets Debt Fund | 36,357,989 | | 3,727,509 | | | (22,209 | ) | | 3,705,300 | |
| Emerging Markets Local Debt Fund | 32,626,163 | | 421,713 | | | (683,481 | ) | | (261,768 | ) |
| Frontier Markets Fund | 16,193,018 | | 2,203,489 | | | (830,859 | ) | | 1,372,630 | |
| Total Return Fund | 343,462,580 | | 3,498,047 | | | (382,984 | ) | | 3,115,063 | |
| RMB Fixed Income Fund | 11,034,657 | | 255,478 | | | — | | | 255,478 | |
____________________
| * | The difference between book-basis unrealized appreciation (depreciation) is attributable primarily to tax deferral of losses on wash sales and the realization for tax purposes of unrealized gains/losses on investments in passive foreign investment companies. |
The tax character of dividends paid by the Funds as of the year ended October 31, 2012 was as follows:
| Dividends paid from | |
| Ordinary | | Total Taxable | | Return of | | Total Dividends |
| Income($) | | Dividends($) | | Capital($) | | Paid($)(1) |
| Emerging Markets Debt Fund | 1,823,427 | | 1,823,427 | | — | | 1,823,427 | |
| Emerging Markets Local Debt Fund | 379,720 | | 379,720 | | — | | 379,720 | |
| Frontier Markets Fund | 29,081 | | 29,081 | | — | | 29,081 | |
| Total Return Fund | 783,622 | | 783,622 | | — | | 783,622 | |
| RMB Fixed Income Fund | 62,740 | | 62,740 | | — | | 62,740 | |
The tax character of dividends paid by the Funds as of the year ended October 31, 2011 was as follows:
| Dividends paid from | |
| Ordinary | | Total Taxable | | Return of | | Total Dividends |
| Income($) | | Dividends($) | | Capital($) | | Paid($)(1) |
| Emerging Markets Debt Fund | 762,187 | | 762,187 | | | — | | | 762,187 | |
| Emerging Markets Local Debt Fund | 228,762 | | 228,762 | | | 87,453 | | | 316,215 | |
| Frontier Markets Fund | — | | — | | | — | | | — | |
____________________
| (1) | Total dividends paid may differ from the amount reported in the Statement of Changes in Net Assets because dividends are recognized when actually paid for tax purposes. |
64 HSBC FAMILY OF FUNDS
| HSBC FAMILY OF FUNDS |
| Notes to Financial Statements — as of October 31, 2012 (continued) |
As of October 31, 2012, the components of accumulated earnings/(deficit) on a tax basis for the Funds were as follows:
| | | | | | | | | | | | | | | | | | | | | | Total |
| | Undistributed | | Undistributed | | Undistributed | | | | | | | | Accumulated | | Unrealized | | Accumulated |
| | Ordinary | | Tax Exempt | | Long Term | | Accumulated | | Dividends | | Capital and | | Appreciation/ | | Earnings/ |
| | Income($) | | Income($) | | Capital Gains($) | | Earnings($) | | Payable($) | | Other Losses($) | | (Depreciation)($) | | (Deficit)($) |
| Emerging Markets | | | | | | | | | | | | | | | | | | | | | | | |
| Debt Fund | | 520,630 | | | — | | 608,591 | | | 1,129,221 | | | (148,725 | ) | | — | | | 3,771,319 | | | 4,751,815 | |
| Emerging Markets | | | | | | | | | | | | | | | | | | | | | | | |
| Local Debt Fund | | 223,635 | | | — | | 1,154 | | | 224,789 | | | (33,156 | ) | | — | | | (15,501 | ) | | 176,132 | |
| Frontier Markets | | | | | | | | | | | | | | | | | | | | | | | |
| Fund | | 649,626 | | | — | | — | | | 649,626 | | | — | | | (553,182 | ) | | 1,373,586 | | | 1,470,030 | |
| Total Return Fund | | 1,701,929 | | | — | | — | | | 1,701,929 | | | (335,105 | ) | | — | | | 3,035,229 | | | 4,402,053 | |
| RMB Fixed | | | | | | | | | | | | | | | | | | | | | | | |
| Income Fund | | 61,673 | | | — | | — | | | 61,673 | | | (35,061 | ) | | — | | | 258,600 | | | 285,212 | |
As of the end of the tax year ended October 31, 2012, the Funds have net capital loss carryforwards (“CLCFs”) as summarized in the tables below. CLCFs subjects to expiration are applied as short-term capital loss regardless of whether the originating capital loss was short-term or long-term. CLCFs that are not subject to expiration must be utilized before those that are subject to expiration.
CLCFs not subject to expiration:
| Short Term | | Long Term | | |
| Fund | | Amount($) | | Amount($) | | Total($) |
| Frontier Markets Fund | 553,182 | | — | | 553,182 |
8. Ownership and Principal Holders
The beneficial ownership, either directly or indirectly, of more than 25% of the voting securities of a Fund creates presumptions of control of the Fund, under section 2 (a)(9) of the 1940 Act. As of October 31, 2012, the Emerging Markets Debt Fund, Emerging Markets Local Debt Fund, Frontier Markets and RMB Fixed Income Fund had individual shareholder accounts and/or omnibus shareholder accounts (comprised of a group of individual shareholders), each of which is affiliated with the Investment Adviser, and representing ownership in excess of 75% of each Fund, respectively.
9. Subsequent Events:
Management has evaluated events and transactions through the date the financial statements were issued, for purposes of recognition or disclosure in these financial statements and there are no subsequent events to report.
HSBC FAMILY OF FUNDS 65
Report of Independent Registered Public Accounting Firm
To the Shareholders and Board of Trustees of
HSBC Funds:
We have audited the accompanying statements of assets and liabilities of HSBC Emerging Markets Debt Fund, HSBC Emerging Markets Local Debt Fund, HSBC Frontier Markets Fund, HSBC Total Return Fund and HSBC RMB Fixed Income Fund (the Funds), including the schedules of portfolio investments, as of October 31, 2012, the related statements of operations for the year or periods then ended, and the statements of changes in net assets and the financial highlights for each of the years or periods in the two-year period then ended. These financial statements and financial highlights are the responsibility of the Funds’ management. Our responsibility is to express an opinion on these financial statements and financial highlights based on our audits.
We conducted our audits in accordance with the standards of the Public Company Accounting Oversight Board (United States). Those standards require that we plan and perform the audit to obtain reasonable assurance about whether the financial statements and financial highlights are free of material misstatement. An audit includes examining, on a test basis, evidence supporting the amounts and disclosures in the financial statements. Our procedures included confirmation of securities owned as of October 31, 2012, by correspondence with the custodian or brokers or by other appropriate auditing procedures. An audit also includes assessing the accounting principles used and significant estimates made by management, as well as evaluating the overall financial statement presentation. We believe that our audits provide a reasonable basis for our opinion.
In our opinion, the financial statements and financial highlights referred to above present fairly, in all material respects, the financial position of the Funds as of October 31, 2012, the results of their operations for the year or periods then ended, and the changes in their net assets and the financial highlights for each of the years or periods in the two-year period then ended, in conformity with U.S. generally accepted accounting principles.

Columbus, Ohio
December 21, 2012
66 HSBC FAMILY OF FUNDS
| HSBC FAMILY OF FUNDS |
| Other Federal Income Tax Information — as of October 31, 2012 (Unaudited) |
During the year ended October 31, 2012, the following Funds declared net short term capital gain distributions:
| Fund | | Amount |
| Emerging Markets Debt Fund | $7,965 |
During the year ended October 31, 2012, the following Funds designated the maximum amount allowable as interest-related dividends for certain non-U.S. resident investors:
| Qualified |
| Fund | | Interest Income |
| Emerging Markets Debt Fund | 31.94% |
| Emerging Markets Local Debt Fund | 9.06% |
For the year ended October 31, 2012, dividends paid by the Funds may be subject to a maximum tax rate of 15%, as provided for by the Jobs and Growth Tax Relief Reconciliation Act of 2003. The Funds intend to designate the maximum amount allowable as taxed at a maximum rate of 15%. Complete information will be reported in conjunction with your 2012 Form 1099-DIV
| Qualified |
| Fund | | Dividend Income |
| Frontier Markets Fund | 14.98% |
The following Funds intend to elect to pass through to shareholders the income tax credit for taxes paid to foreign countries. Foreign source income and foreign tax expense per outstanding share on October 31, 2012 are as follows:
| | Foreign | | Foreign |
| | Source Income | | Tax Expense |
| Fund | | | Per Share | | Per Share |
| Emerging Markets Local Debt Fund | | $0.35 | | $0.01 |
| Frontier Markets Fund | | 0.38 | | 0.02 |
| RMB Fixed Income Fund | | 0.11 | | 0.00 |
The pass-through of this foreign tax credit will only affect those persons who are shareholders on the dividend record date in December 2012. These shareholders will receive more detailed information along with their 2012 Form 1099-DIV.
HSBC FAMILY OF FUNDS 67
| HSBC FAMILY OF FUNDS |
| Investment Advisory Approval Contract (Unaudited) |
Section 15(c) of the Investment Company Act of 1940, as amended (the “1940 Act”), generally requires that a majority of the trustees of a mutual fund who are not parties to an investment advisory agreement for the fund or “interested persons” of the fund, as defined in the 1940 Act (the “Independent Trustees”) review and approve the investment advisory agreement at an in person meeting for an initial period of up to two years and thereafter on an annual basis. A summary of the material factors considered by the Independent Trustees and the Board of Trustees (the “Board”) of HSBC Funds (formerly, HSBC Investor Funds) (the “Trust”) in connection with approving investment advisory and sub-advisory agreements for the HSBC RMB Fixed Income Fund and the conclusions the Independent Trustees and Board made as a result of those considerations are set forth below.
I. Approval of an Advisory Contract Supplement and Sub-Advisory Agreement for the HSBC RMB Fixed Income Fund
On December 15, 2011, the Contracts Committee met in person and on December 15-16, 2011, the Board met in person to consider the expansion of the HSBC Family of Funds to include a new series of the Trust, the HSBC RMB Bond Fund (subsequently renamed the HSBC RMB Fixed Income Fund) (the “Fund”) and, in connection therewith, approving:
- the Advisory Contract between HSBC Global Asset Management (USA) Inc. (the “Adviser”) and the Trust with respect to the Fund and the related Contract Supplement applicable to the Fund (“Advisory Agreement”);
- a Sub-Advisory Agreement between the Adviser and HSBC Global Asset Management (Hong Kong) Limited (“AMHK”) with respect to the Fund (“Sub-Advisory Agreement”); and
- the Trust’s Ancillary Agreements applicable to the Fund.
Prior to the meetings, the Independent Trustees received and reviewed the information they thought reasonably necessary to evaluate the terms of the Advisory Agreement, the Sub-Advisory Agreement and the Ancillary Agreements applicable to the Fund (collectively, the “Agreements”). This information included, among other things, information about: (i) the services the Adviser and AMHK would provide to the Fund; (ii) personnel who provide such services; (iii) the investment management capabilities of the Adviser and AMHK; and (iv) fees proposed to be received by the Adviser and AMHK with respect to the Fund in comparison with other similar funds, based on materials provided by the Adviser from a database compiled by Lipper Inc. Counsel to the Trust and to the Independent Trustees were present at the Contracts Committee meeting and the Board meeting. In this regard, counsel to the Independent Trustees advised the Independent Trustees with respect to their deliberations during the process and their fiduciary obligations under Section 15(c) of the 1940 Act.
At its meeting, the Contracts Committee reviewed and discussed the information provided in advance of the meeting and received a presentation about the Adviser and AMHK. Based on its deliberations, the Committee determined to recommend to the Board, including the Independent Trustees, that the Agreements be approved with respect to the Fund, subject to the Adviser providing additional information regarding the Fund in response to requests from the Independent Trustees. At the meeting of the Board, the Independent Trustees considered the recommendation of the Contracts Committee and further evaluated the proposal. As a result of this process, the Board and Independent Trustees determined to approve the Agreements with respect to the Fund, subject to the review of additional information to be provided by the Adviser, which was provided to the satisfaction the Contracts Committee.
The Board and the Independent Trustees made these determinations on the basis of the following considerations, among others:
Nature, Extent, and Quality of Services Provided by the Adviser and AMHK. The Independent Trustees considered the nature, quality and extent of the investment advisory services proposed to be provided by the Adviser and AMHK with respect to the Fund, as well as the quality and experience of the Adviser’s and AMHK’s personnel, including the Asia Fixed Income Team that would manage the Fund. With respect to the Adviser, the Independent Trustees considered that the services provided by the Adviser would be consistent
68 HSBC FAMILY OF FUNDS
| HSBC FAMILY OF FUNDS |
| Investment Advisory Approval Contract (Unaudited) (continued) |
with those provided to other Funds, and therefore considered the same points as they did in considering the annual renewal of the Advisory Contracts in December 2011 as set forth above. The Independent Trustees further considered the Adviser’s experience in emerging markets and its stature as one of the world’s leading emerging markets asset management organizations.
Based upon these considerations, the Independent Trustees concluded that they were satisfied with the nature, quality and extent of the services proposed to be provided by the Adviser and AMHK with respect to the Fund, and that the services proposed to be provided supported the approval of the Advisory Agreement and the Sub-Advisory Agreement.
Investment Performance of the Adviser and AMHK. The Independent Trustees considered that the Adviser, AMHK or their affiliates currently manage similar, non-registered funds that invest in RMB denominated debt, although those funds were recently launched and do not have a meaningful performance history, as well as information that the Adviser and AMHK provided about AMHK’s investment management capabilities. Based on these considerations, and the level of the Adviser’s and AMHK’s expertise in the Asian markets, the Independent Trustees determined that the lack of directly relevant investment performance for a fund that invests in RMB denominated debt did not preclude initial approval of the Advisory Agreement and the Sub-Advisory Agreement.
Costs of Proposed Services and Profits to be Realized by the Adviser and AMHK. The Independent Trustees considered the costs of the proposed services to be provided by the Adviser and AMHK to the Fund. In this regard, the Independent Trustees considered information pertaining to the proposed advisory and sub-advisory fees and the projected total expense ratios for the Fund as compared to other similar funds, based on materials provided by the Adviser from a database compiled by Lipper Inc. The Independent Trustees also considered the profitability information regarding the Adviser more generally that the Adviser has provided to the Independent Trustees in connection with the annual renewal of the 15(c) process. The Independent Trustees concluded that the advisory fees proposed to be payable to the Adviser are fair and reasonable in light of the factors set forth above.
Other Relevant Considerations. The Independent Trustees also considered the extent to which the Fund’s proposed expense structure may permit economies of scale to be shared with the Fund’s shareholders and, if so, the extent to which the Fund’s shareholders may benefit from these potential economies of scale. The Independent Trustees also noted the proposed contractual caps on certain Fund expenses proposed to be provided by the Adviser with respect to the Fund in order to reduce or control the overall operating expenses of the Fund. The Independent Trustees also considered U.S. investor demand for such a product and the Adviser’s outlook with respect to China and RMB-denominated investments.
Accordingly, in light of the above considerations and such other factors and information it considered relevant, the Board of Trustees by a unanimous vote of those present in person at the meeting (including a separate unanimous vote of the Independent Trustees present in person at the meeting) approved the Agreements.
HSBC FAMILY OF FUNDS 69
| HSBC FAMILY OF FUNDS |
| Table of Shareholder Expenses—as of October 31, 2012 (Unaudited) |
As a shareholder of the Funds, you incur two types of costs: (1) transaction costs, including sales charges (loads) on purchases, redemption fees and exchange fees; and (2) ongoing costs, including management fees, distribution fees and other Fund expenses. These examples are intended to help you understand your ongoing costs (in dollars) of investing in the Funds and to compare the cost with the ongoing costs of investing in other mutual funds.
These examples are based on an investment of $1,000 invested at the beginning of the period and held for the entire period from May 1, 2012 through October 31, 2012.
Actual Example
The table below provides information about actual account values and actual expenses. You may use the information below, together with the amount you invested, to estimate the expenses that you paid over the period. Simply divide your account value by $1,000 (for example, an $8,600 account value divided by $1,000 = 8.6), then multiply the result by the number in the table under the heading entitled “Expenses Paid During Period” to estimate the expenses you paid on your account during this period.
| | | | Beginning | | | | | | | | Annualized |
| | | | Account | | Ending | | Expenses Paid | | Expense Ratio |
| | | | Value | | Account Value | | During Period* | | During Period |
| | | | 5/1/12 | | 10/31/12 | | 5/1/12 - 10/31/12 | | 5/1/12 - 10/31/12 |
| Emerging Markets Debt Fund | | Class A | | $1,000.00 | | $1,088.90 | | | $6.30 | | | 1.20% |
| | Class I | | 1,000.00 | | 1,091.00 | | | 4.47 | | | 0.85% |
| | Class S | | 1,000.00 | | 1,091.50 | | | 3.94 | | | 0.75% |
| Emerging Markets Local Debt Fund | | Class A | | 1,000.00 | | 1,016.10 | | | 6.08 | | | 1.20% |
| | | Class I | | 1,000.00 | | 1,017.70 | | | 4.31 | | | 0.85% |
| | Class S | | 1,000.00 | | 1,018.20 | | | 3.80 | | | 0.75% |
| Frontier Markets Fund | | Class A | | 1,000.00 | | 1,039.00 | | | 11.28 | | | 2.20% |
| | Class I | | 1,000.00 | | 1,041.80 | | | 9.49 | | | 1.85% |
| Total Return Fund | | Class A | | 1,000.00 | | 1,035.20 | | | 8.19 | | | 1.60% |
| | Class I | | 1,000.00 | | 1,037.00 | | | 6.04 | | | 1.18% |
| | Class S | | 1,000.00 | | 1,037.50 | | | 5.89 | | | 1.15% |
| RMB Fixed Income Fund** | | Class A | | 1,000.00 | | 1,032.40 | | | 5.88 | | | 1.45% |
| | Class I | | 1,000.00 | | 1,034.00 | | | 4.46 | | | 1.10% |
| | Class S | | 1,000.00 | | 1,034.40 | | | 4.06 | | | 1.00% |
____________________
| * | | Expenses are equal to the average account value over the period, multiplied by the Fund’s annualized expense ratio, multiplied by 184/366 (to reflect the one half year period). |
| ** | | Expenses are equal to the average account value over the period multiplied by the Fund’s annualized expense ratio, multiplied by the number of days in the period from June 8, 2012 (date of commencement of operations) to October 31, 2012 divided by the number of days in the fiscal year (to reflect the one half year period). |
70 HSBC FAMILY OF FUNDS
| HSBC FAMILY OF FUNDS |
| Table of Shareholder Expenses—as of October 31, 2012 (Unaudited) (continued) |
Hypothetical Example for Comparison Purposes
The table below provides information about hypothetical account values and hypothetical expenses based on each Fund’s actual expense ratio and an assumed rate of return of 5% per year before expenses, which is not the Fund’s actual return. The hypothetical account values and expenses may not be used to estimate the actual ending account balance or expenses you paid for the period. You may use this information to compare this 5% hypothetical example with the 5% hypothetical examples that appear in the shareholder reports of other funds.
Please note that the expenses shown in the table are meant to highlight your ongoing costs only and do not reflect any transactional costs, such as sales charges (loads), redemption fees, or exchange fees. Therefore, the table is useful in comparing ongoing costs only, and will not help you determine the relative total costs of owning different funds. In addition, if these transactional costs were included, your costs would have been higher.
| | | | | | | | | | | | Annualized |
| | | | Beginning | | Ending | | Expenses Paid | | Expense Ratio |
| | | | Account Value | | Account Value | | During Period* | | During Period |
| | | | 5/1/12 | | 10/31/12 | | 5/1/12 - 10/31/12 | | 5/1/12 - 10/31/12 |
| Emerging Markets Debt Fund | | Class A | | $1,000.00 | | $1,019.10 | | $ | 6.09 | | | 1.20% |
| | | Class I | | 1,000.00 | | 1,020.86 | | | 4.32 | | | 0.85% |
| | Class S | | 1,000.00 | | 1,021.37 | | | 3.81 | | | 0.75% |
| Emerging Markets Local Debt Fund | | Class A | | 1,000.00 | | 1,019.10 | | | 6.09 | | | 1.20% |
| | Class I | | 1,000.00 | | 1,020.86 | | | 4.32 | | | 0.85% |
| | Class S | | 1,000.00 | | 1,021.37 | | | 3.81 | | | 0.75% |
| Frontier Markets Fund | | Class A | | 1,000.00 | | 1,014.08 | | | 11.14 | | | 2.20% |
| | Class I | | 1,000.00 | | 1,015.84 | | | 9.37 | | | 1.85% |
| Total Return Fund | | Class A | | 1,000.00 | | 1,017.09 | | | 8.11 | | | 1.60% |
| | Class I | | 1,000.00 | | 1,019.20 | | | 5.99 | | | 1.18% |
| | Class S | | 1,000.00 | | 1,019.36 | | | 5.84 | | | 1.15% |
| RMB Fixed Income Fund** | | Class A | | 1,000.00 | | 1,017.90 | | | 7.35 | | | 1.45% |
| | Class I | | 1,000.00 | | 1,019.66 | | | 5.58 | | | 1.10% |
| | Class S | | 1,000.00 | | 1,020.16 | | | 5.08 | | | 1.00% |
____________________
| * | | Expenses are equal to the average account value over the period, multiplied by the Fund’s annualized expense ratio, multiplied by 184/366 (to reflect the one half year period). |
| ** | | Expenses are equal to the average account value over the period multiplied by the Fund’s annualized expense ratio, multiplied by the number of days in the most recent fiscal half-year divided by the number of days in the fiscal year (to reflect the one half year period). Information shown reflects values using the expense ratios for the 146 days of operations during the period, and has been annualized to reflect values for the period June 8, 2012 to October 31, 2012. |
HSBC FAMILY OF FUNDS 71
| HSBC FAMILY OF FUNDS |
| Board of Trustees and Officers (Unaudited) |
MANAGEMENT OF THE TRUST
The following table contains information regarding the HSBC Family of Funds’ Board of Trustees (“Trustees”). Asterisks indicate those Trustees who are “interested persons,” as defined in the Investment Company Act of 1940, as amended, of the HSBC Family of Funds. The HSBC Family of Funds’ Statement of Additional Information includes additional information about the Trustees and is available, without charge, upon request by calling (888) 525-5757.
| | | | | | | | Portfolios in | | |
| | Position(s) | | Term of Office | | | | Fund Complex | | Other |
| Name, | | Held with | | and Length of | | Principal Occupation(s) | | Overseen By | | Directorships |
| Address, Age | | Funds | | Time Served | | During Past 5 Years | | Trustee* | | Held by Trustee |
NON-INTERESTED
TRUSTEES | | | | | | | | | | |
| | | | | | | | | | | |
MARCIA L. BECK
P.O. Box 182845
Columbus, OH
43218-3035
Age: 57 | | Trustee | | Indefinite;
2008 to present | | Private Investor (June 1999 – present); Executive Vice President, Prudential Investments (1997 – 1999); President and Trustee, The Goldman Sachs Mutual Funds (1992 – 1996) | | 23 | | None |
| | | | | | | | | | | |
SUSAN S. HUANG
P.O. Box 182845
Columbus, OH
43218-3035
Age: 58 | | Trustee | | Indefinite;
2008 to present | | Private Investor (2000- present); Senior Vice President, Schroder Investment Management (2001 – 2004); Managing Director, Chase Asset Management (1995-2000) | | 23 | | None |
| | | | | | | | | | | |
ALAN S. PARSOW
P.O. Box 182845
Columbus, OH
43218-3035
Age: 62 | | Trustee | | Indefinite;
1987 to present | | General Partner, Elkhorn Partners, L.P. (a private investment partnership) (1989 – present) | | 23 | | None |
| | | | | | | | | | | |
THOMAS F. ROBARDS
P.O. Box 182845
Columbus, OH
43218-3035
Age: 66 | | Trustee | | Indefinite;
2005 to present | | Partner, Robards & Co. LLC (investment and advisory services) (2005-present); Chief Financial Officer, American Museum of Natural History (2003- 2004); Chief Financial Officer, Datek Online Holdings (2000-2003); Previously EVP and CFO Republic New York Corporation | | 23 | | Overseas
Shipholding Group
(NYSE listed energy
transportation); Ellington
Financial LLC (NYSE
listed financial services) |
| | | | | | | | | | | |
MICHAEL SEELY
P.O. Box 182845
Columbus, OH
43218-3035
Age: 67 | | Chairman and
Trustee | | Indefinite;
1987 to present | | Private Investor (2003-present); General Partner, Global Multi Manager Partners (1999-2003); President of Investor Access Corporation (1981-2003) | | 23 | | None |
| | | | | | | | | | | |
INTERESTED TRUSTEE | | | | | | | | | | |
| | | | | | | | | | | |
DEBORAH HAZELL
452 Fifth Avenue
New York
NY 10018
Age: 49 | | Trustee | | Indefinite;
2011 to present | | CEO, HSBC Global Asset Management (USA) Inc. (2011-present); President and CEO, Fisher Francis Trees & Watts (“FFTW”) (investment advisor), February 2008-June 2011; Client Service, Business Development and Marketing Group, FFTW (October 1999-February 2008) | | 23 | | None |
____________________
* Includes the Trust, the HSBC Advisor Fund Trust and the HSBC Portfolios.
72 HSBC FAMILY OF FUNDS
| | Position(s) Held | | Term of Office and | | Principal Occupation(s) |
| Name, Address, Age | | with Funds | | Length of Time Served | | During Past 5 Years |
OFFICERS | | | | | | |
| | | | | | | |
RICHARD A. FABIETTI
452 Fifth Avenue
New York, NY 10018
Age: 54 | | President | | One year;
2004 to present | | Senior Vice President, Head of Product Management, HSBC Global Asset Management (USA) Inc. (1998 - present) |
| | | | | | | |
STEPHEN SIVILLO
452 Fifth Avenue
New York, NY 10018
Age: 41 | | Vice President | | One year;
2010 to present | | Vice President of Product Administration, HSBC Global Asset Management (USA) Inc. (2010 - present); Chief Compliance Officer, Managers Funds (2009 – 2010); Director, Mutual Fund Compliance, AllianceBernstein (2007-2009); Assistant Vice President, Compliance, AllianceBernstein (2005-2007) |
| | | | | | | |
TY EDWARDS*
3435 Stelzer Road
Columbus, OH 43219-3035
Age: 46 | | Treasurer | | One year;
2010 to present | | Senior Vice President, Citi Fund Services (2010– present); Director, Product Management, Columbia Management (2007-2009); Deputy Treasurer, Columbia Funds, (2006-2007); Director, Fund Administration, Columbia Management (2004-2007) |
| | | | | | | |
JENNIFER A. ENGLISH*
100 Summer Street
Suite 1500
Boston, MA 02110
Age: 40 | | Secretary | | One year;
2008 to present | | Senior Vice President, Regulatory Administration, Citi (2005 - present) |
| | | | | | | |
DANIO MASTROPIERI*
100 Summer Street
Suite 1500
Boston, MA 02110
Age: 40 | | Assistant Secretary | | One year;
December 2012
to present | | Vice President, Regulatory Administration, Citi (2007 - present) |
| | | | | | | |
FREDERICK J. SCHMIDT*
1 Rexcorp Plaza
Uniondale, NY 11556
Age: 53 | | Chief Compliance
Officer | | One year;
2004 to present | | Director and Chief Compliance Officer, CCO Services, Citi (2004 - present) |
____________________
| * | Mr. Edwards, Mr. Schmidt, Ms. English and Mr. Mastropieri also are officers of other investment companies of which Citi (or an affiliate) is the administrator or sub-administrator. |
HSBC FAMILY OF FUNDS 73
Other Information (Unaudited):
A description of the policies and procedures the Funds use to determine how to vote proxies relating to portfolio securities of each Fund, and information regarding how the Funds voted proxies relating to portfolio securities during the most recent 12-month period ended June 30th is available (i) without charge, upon request, by calling 1-800-525-5757 for HSBC Bank USA and HSBC Brokerage (USA) Inc. clients and 1-800-782-8183 for all other shareholders; (ii) on the Funds’ website at www.emfunds.us.hsbc.com or at www.investorfunds.us.hsbc.com; and (iii) on the Securities and Exchange Commission’s (“Commission”) website at http://www.sec.gov.
The Funds file their complete schedules of portfolio holdings with the Commission for the first and third quarters of each fiscal year on Form N-Q. The Funds’ Forms N-Q are available on the Commission’s website at http://www.sec.gov. The Funds’ Forms N-Q may be reviewed and copied at the Commission’s Public Reference Room in Washington, D.C. and information on the operation of the Public Reference Room may be obtained by calling 1-800-SEC-0330. The Funds’ Schedules of Investments will be available no later than 60 days after each period end, without charge, on the Funds’ website at www.emfunds.us.hsbc.com or at www.investorfunds.us.hsbc.com.
An investment in a Fund is not a deposit of HSBC Bank USA, N.A., and is not insured or guaranteed by the Federal Deposit Insurance Corporation or any other government agency.
74 HSBC FAMILY OF FUNDS
HSBC FAMILY OF FUNDS: INVESTMENT ADVISER AND ADMINISTRATOR HSBC Global Asset Management (USA) Inc.
452 Fifth Avenue
New York, NY 10018 SHAREHOLDER SERVICING AGENTS For HSBC Bank USA, N.A. and
HSBC Securities (USA) Inc. Clients:
HSBC Bank USA, N.A.
452 Fifth Avenue
New York, NY 10018
1-888-525-5757 For All Other Shareholders: HSBC Funds
P.O. Box 182845
Columbus, OH 43218
1-800-782-8183 TRANSFER AGENT Citi Fund Services
3435 Stelzer Road
Columbus, OH 43219 DISTRIBUTOR Foreside Distribution Services, L.P.
690 Taylor Road, Suite 150
Gahanna, Ohio 43230 | CUSTODIAN The Northern Trust Company
50 South LaSalle Street
Chicago, IL 60603 INDEPENDENT REGISTERED PUBLIC ACCOUNTING FIRM KPMG LLP
191 West Nationwide Blvd., Suite 500
Columbus, OH 43215 LEGAL COUNSEL Dechert LLP
1775 I Street, N.W.
Washington, D.C. 20006 |

The HSBC Family of Funds are distributed by Foreside Distribution Services, L.P. This document must be preceded or accompanied by a current prospectus for the HSBC Funds, which you should read carefully before you invest or send money.
— NOT FDIC INSURED — NO BANK GUARANTEE — MAY LOSE VALUE
Item 2. Code of Ethics.
(a) The registrant has adopted a code of ethics that applies to the registrant’s principal executive officer, principal financial officer, principal accounting officer or controller, or persons performing similar functions. This code of ethics is included as an Exhibit.
(b) During the period covered by the report, with respect to the registrant's code of ethics that applies to its principal executive officer, principal financial officer, principal accounting officer or controller, or persons performing similar functions; there have been no amendments to, nor any waivers granted from, a provision that relates to any element of the code of ethics definition enumerated in paragraph (b) of this Item 2.
Item 3. Audit Committee Financial Expert.
3(a)(1) The registrant’s board of directors has determined that the registrant has at least one audit committee financial expert serving on its audit committee.
3(a)(2) The audit committee financial expert is Thomas Robards, who is “independent” for purposes of this Item 3 of Form N-CSR.
Item 4. Principal Accountant Fees and Services.
| | (a) Audit Fees, |
| | 2011 | | $244,970 |
| 2012 | | $220,147 |
| | (b) Audit-Related Fees, |
| | 2011 | | $7,000 |
| 2012 | | $7,000 |
2011 – Fees of $7,000 relate to the consent of N-1A filing.
2012 – Fees of $7,000 relate to the consent of N-1A filing.
| | (c) Tax Fees, |
| | 2011 | | $124,855 |
| 2012 | | $143,400 |
| | | |
| Fees for both 2011 and 2012 relate to the preparation of federal income and excise tax returns and the review of excise tax distributions. |
| (d) All Other Fees, |
| | 2011 | | $0 |
| 2012 | | $0 |
(e)(1) The audit committee is required to pre-approve all audit and permitted non-audit services performed by the registrant’s independent auditors in accordance with the audit committee charter and the Investment Company Act of 1940.
(2) Disclose the percentage of services described in each of paragraphs (b) through (d) of this Item that were approved by the audit committee pursuant to paragraph (c)(7)(i)(C) of Rule 2-01 of Regulation S-X.
None of the services summarized in (b) – (d), above, were approved by the audit Committee pursuant to Rule 2-01(c)(7)(i)(C) of Regulation S-X.
| (f) Not applicable. |
| |
| (g) Non-Audit Fees. |
| | 2011 | | $131,855 |
| 2012 | | $150,400 |
(h) The audit committee considered the nonaudit services rendered to the registrant’s investment adviser and any entity controlling, controlled by, or under common control with the investment adviser, and believes the services are compatible with the principal accountant’s independence.
Item 5. Audit Committee of Listed Registrants.
Not applicable.
Item 6. Investments.
(a) Included as a part of the report to shareholders filed under Item 1.
(b) Not applicable.
Item 7. Disclosure of Proxy Voting Policies and Procedures for Closed-End Management Investment Companies.
Not applicable.
Item 8. Portfolio Managers of Closed-End Management Investment Companies.
Not applicable.
Item 9. Purchases of Equity Securities by Closed-End Management Investment Company and Affiliated Purchasers.
Not applicable.
Item 10. Submission of Matters to a Vote of Security Holders.
Not applicable.
Item 11. Controls and Procedures.
(a)The registrant’s principal executive officer and principal financial officer have concluded, based on their evaluation of the registrant's disclosure controls and procedures as conducted within 90 days of the filing date of this report, that these disclosure controls and procedures are adequately designed and are operating effectively to ensure that information required to be disclosed by the registrant on Form N-CSR is recorded, processed, summarized and reported within the time periods specified in the Securities and Exchange Commission's rules and forms.
(b)There were no changes in the registrant’s internal control over financial reporting (as defined in Rule 30a-3(d) under the Act (17 CFR 270.30a-3(d)) that occurred during the second fiscal quarter of the period covered by this report that have materially affected or are reasonably likely to materially affect, the registrant’s internal control over financial reporting.
Item 12. Exhibits.
(a)(1) The code of ethics that is the subject of the disclosure required by Item 2 is attached hereto.
(a)(2) Certifications pursuant to Rule 30a-2(a) are attached hereto.
(a)(3) Not applicable.
(b) Certifications pursuant to Rule 30a-2(b) are furnished herewith.
SIGNATURES
Pursuant to the requirements of the Securities Exchange Act of 1934 and the Investment Company Act of 1940, the registrant has duly caused this report to be signed on its behalf by the undersigned, thereunto duly authorized.
| By (Signature and Title) | /s/ Richard A. Fabietti | |
| Richard A. Fabietti |
| President |
Pursuant to the requirements of the Securities Exchange Act of 1934 and the Investment Company Act of 1940, this report has been signed below by the following persons on behalf of the registrant and in the capacities and on the dates indicated.
| By (Signature and Title) | /s/ Richard A. Fabietti | |
| Richard A. Fabietti |
| President |
| By (Signature and Title) | /s/ Ty Edwards | |
| Ty Edwards |
| Treasurer |